Lenovo ThinkPad T14s G4 Core i7 laptop review: Uphill battle against AMD Ryzen 7

The venerable ThinkPad T14s series is back this year with wide-ranging SKUs encompassing Intel, AMD, IPS, and OLED options. We've already reviewed the AMD and OLED systems and so now is the perfect time to check out an Intel IPS configuration to see how it compares.
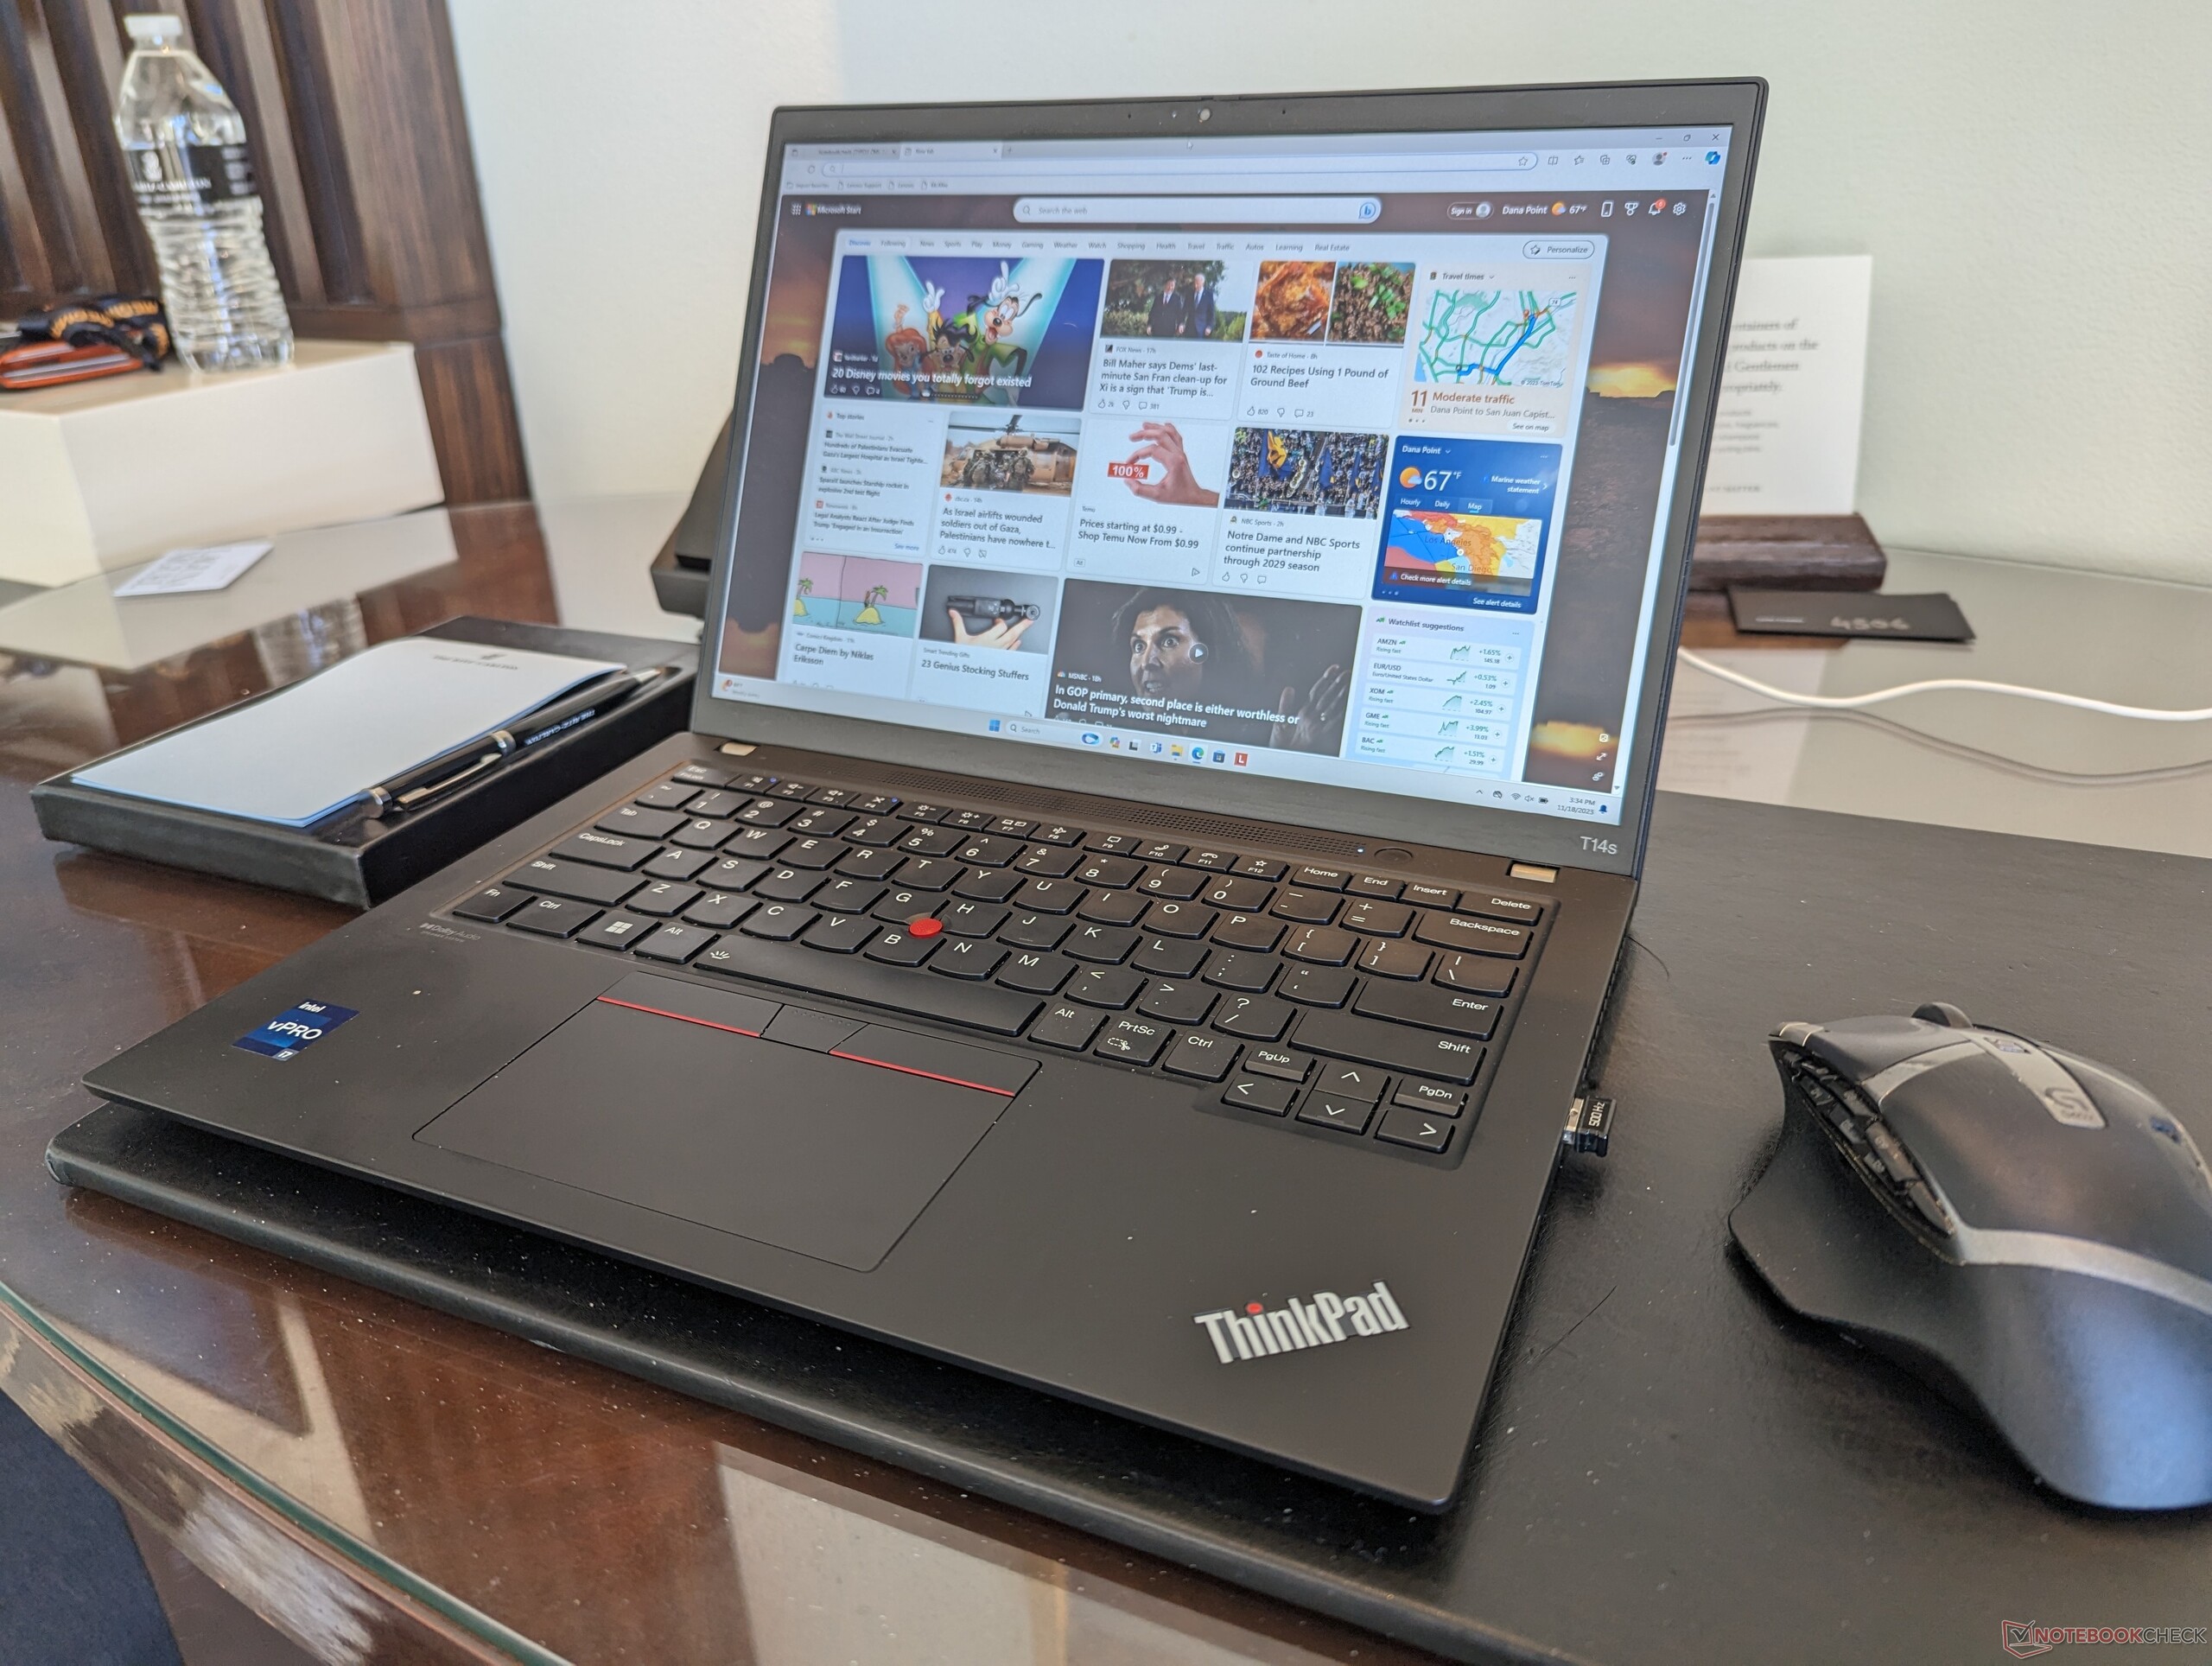
Our test unit ships with the Core i7-1365U vPro and 1200p IPS display for approximately $1400 USD. It is one of the more affordable configurations as it excludes some luxuries like WAN, Smart Card, and the 5 MP webcam.
The ThinkPad T14s competes with other 14-inch business subnotebooks like the Dell Latitude 7440, HP EliteBook 845 G10, or Asus ExpertBook B9.
More Lenovo reviews:
Potential Competitors in Comparison
Rating | Date | Model | Weight | Height | Size | Resolution | Price |
|---|---|---|---|---|---|---|---|
| 88.9 % v7 (old) | 11 / 2023 | Lenovo ThinkPad T14s G4 i7-1365U i7-1365U, Iris Xe G7 96EUs | 1.4 kg | 16.9 mm | 14.00" | 1920x1200 | |
| 90.4 % v7 (old) | 11 / 2023 | Lenovo ThinkPad T14s G4-21F8002TGE R7 7840U, Radeon 780M | 1.4 kg | 16.9 mm | 14.00" | 1920x1200 | |
| 88.5 % v7 (old) | 09 / 2023 | Lenovo ThinkPad T14 G4 21HD0043GE i5-1335U, Iris Xe G7 80EUs | 1.4 kg | 17.9 mm | 14.00" | 1920x1200 | |
| 90.5 % v7 (old) | 09 / 2023 | HP EliteBook 845 G10 5Z4X0ES R7 7840U, Radeon 780M | 1.5 kg | 17.9 mm | 14.00" | 1920x1200 | |
| 90.3 % v7 (old) | 07 / 2023 | Dell Latitude 7440 i5-1345U, Iris Xe G7 80EUs | 1.2 kg | 17.95 mm | 14.00" | 2560x1600 | |
| 91.5 % v7 (old) | 11 / 2023 | Asus ExpertBook B9 B9403CVA-KM0153X i7-1355U, Iris Xe G7 96EUs | 1 kg | 17.6 mm | 14.00" | 2880x1800 |
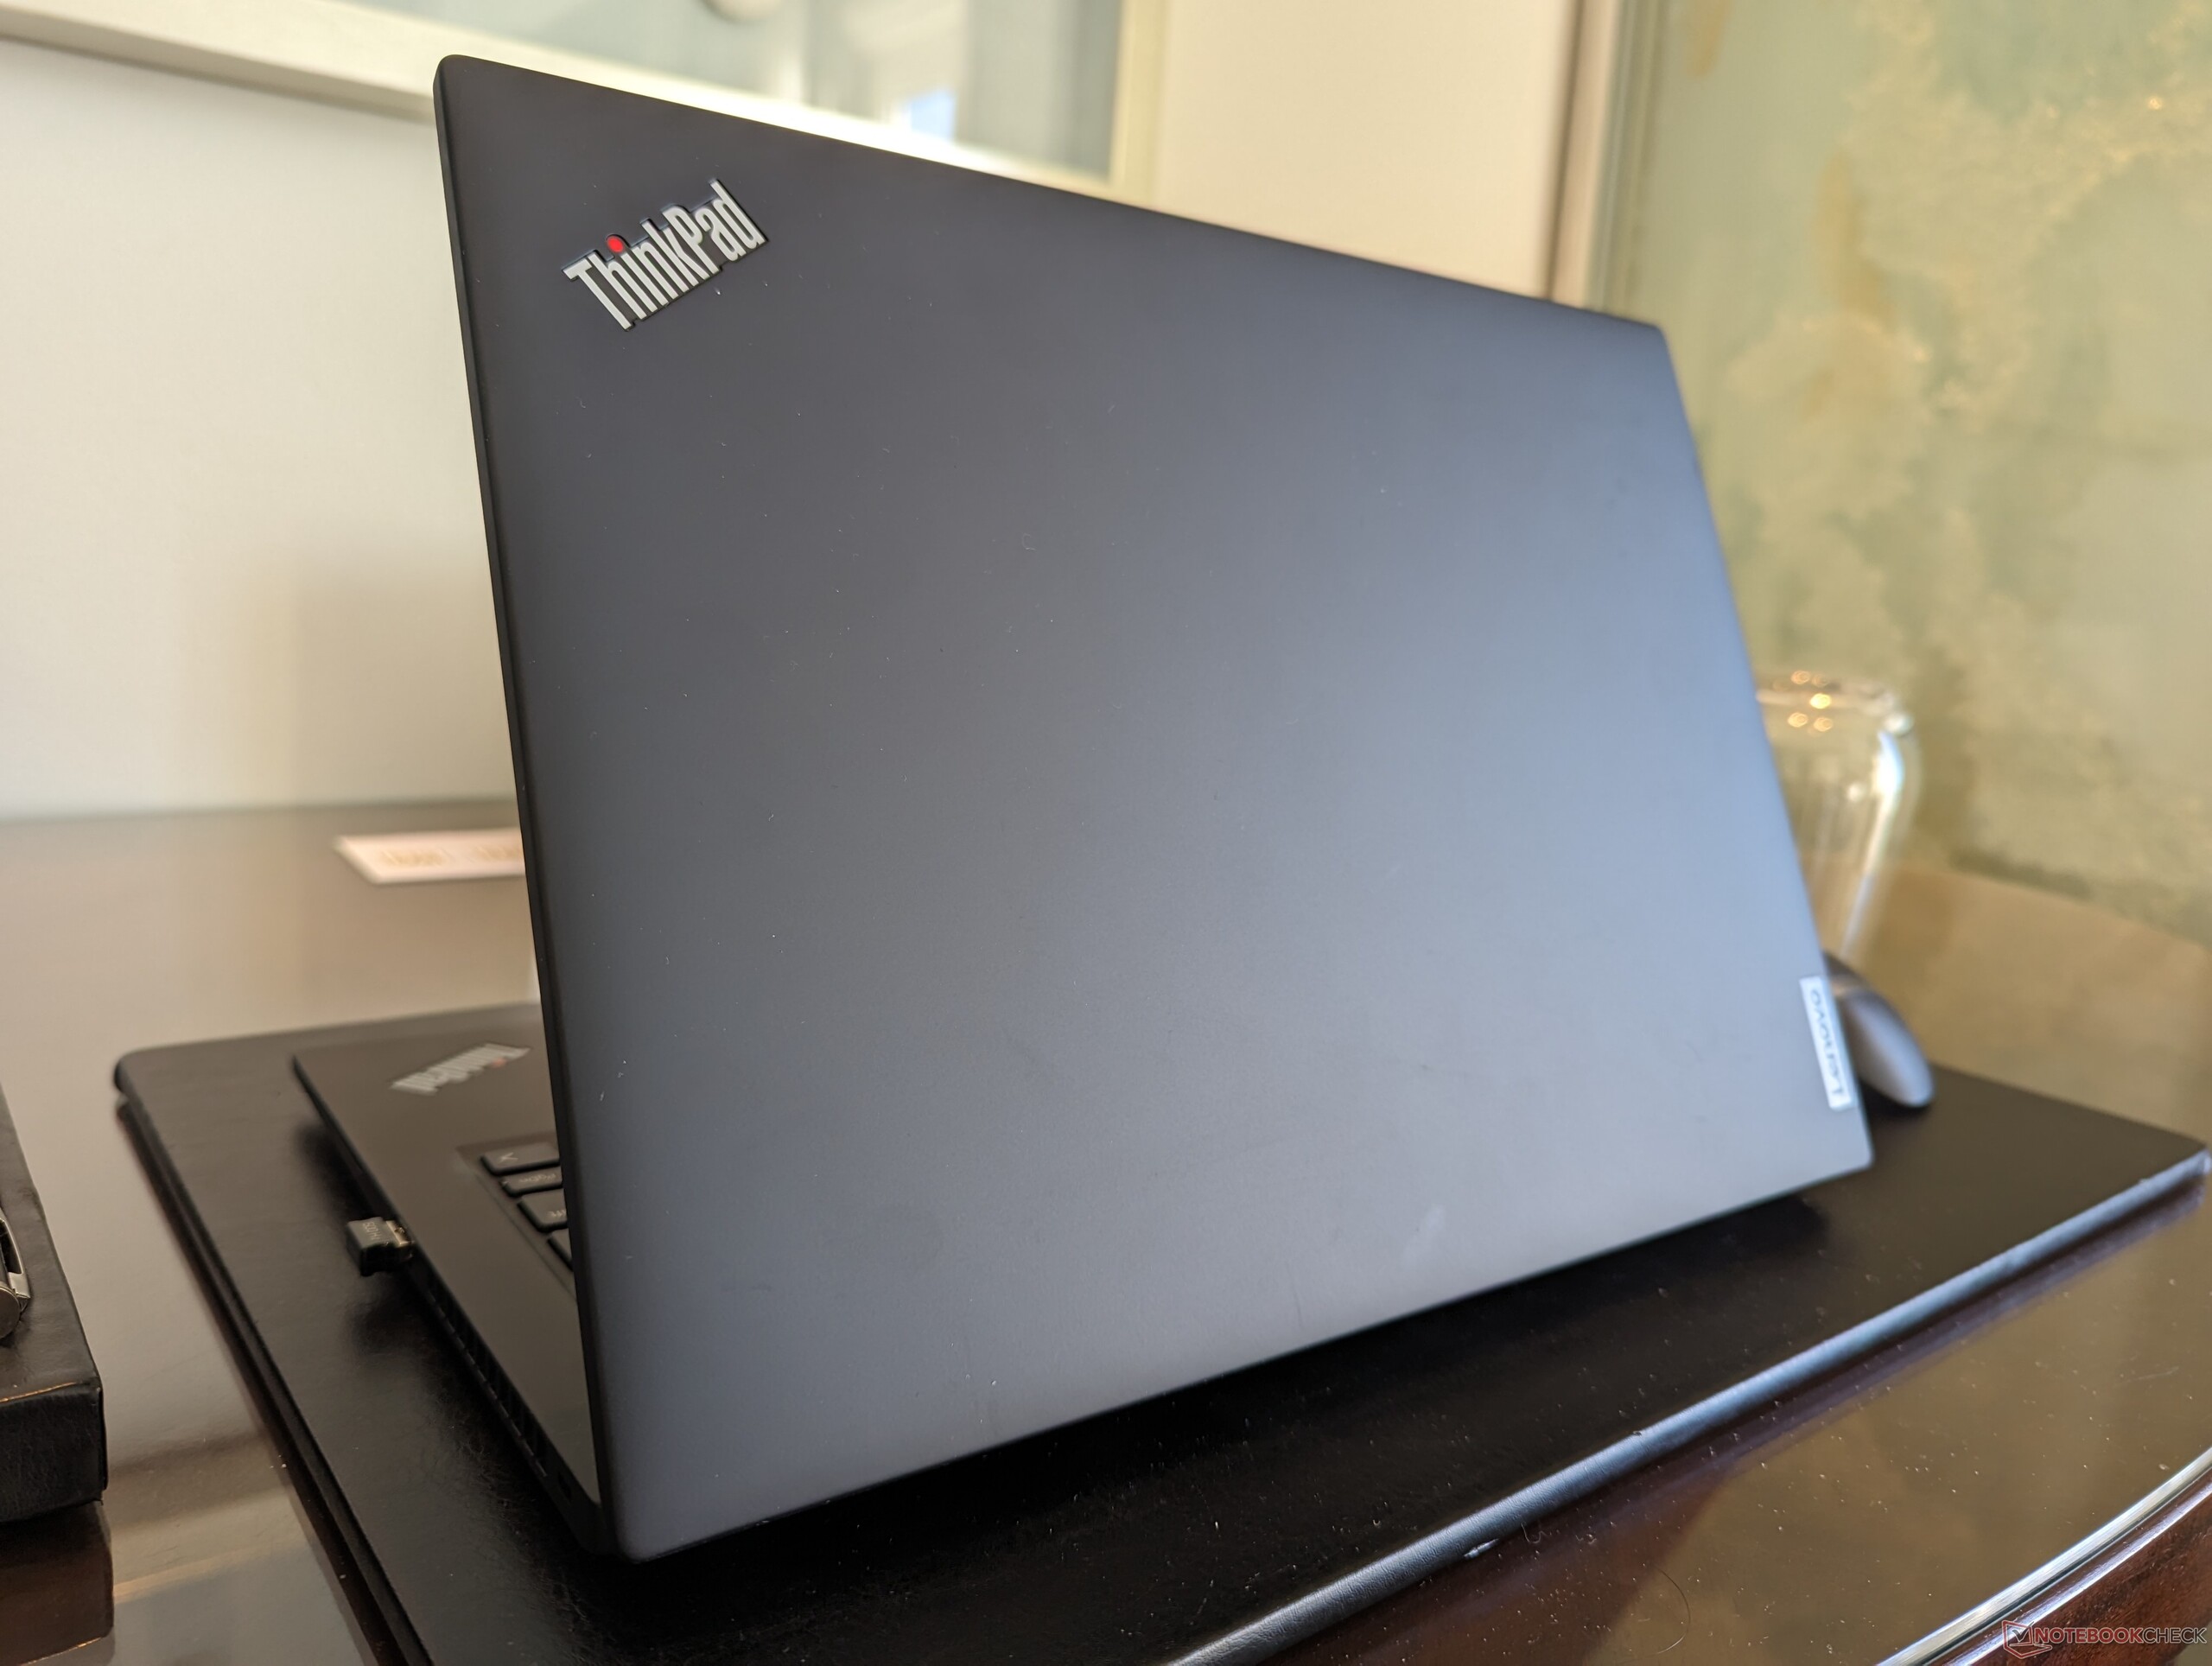
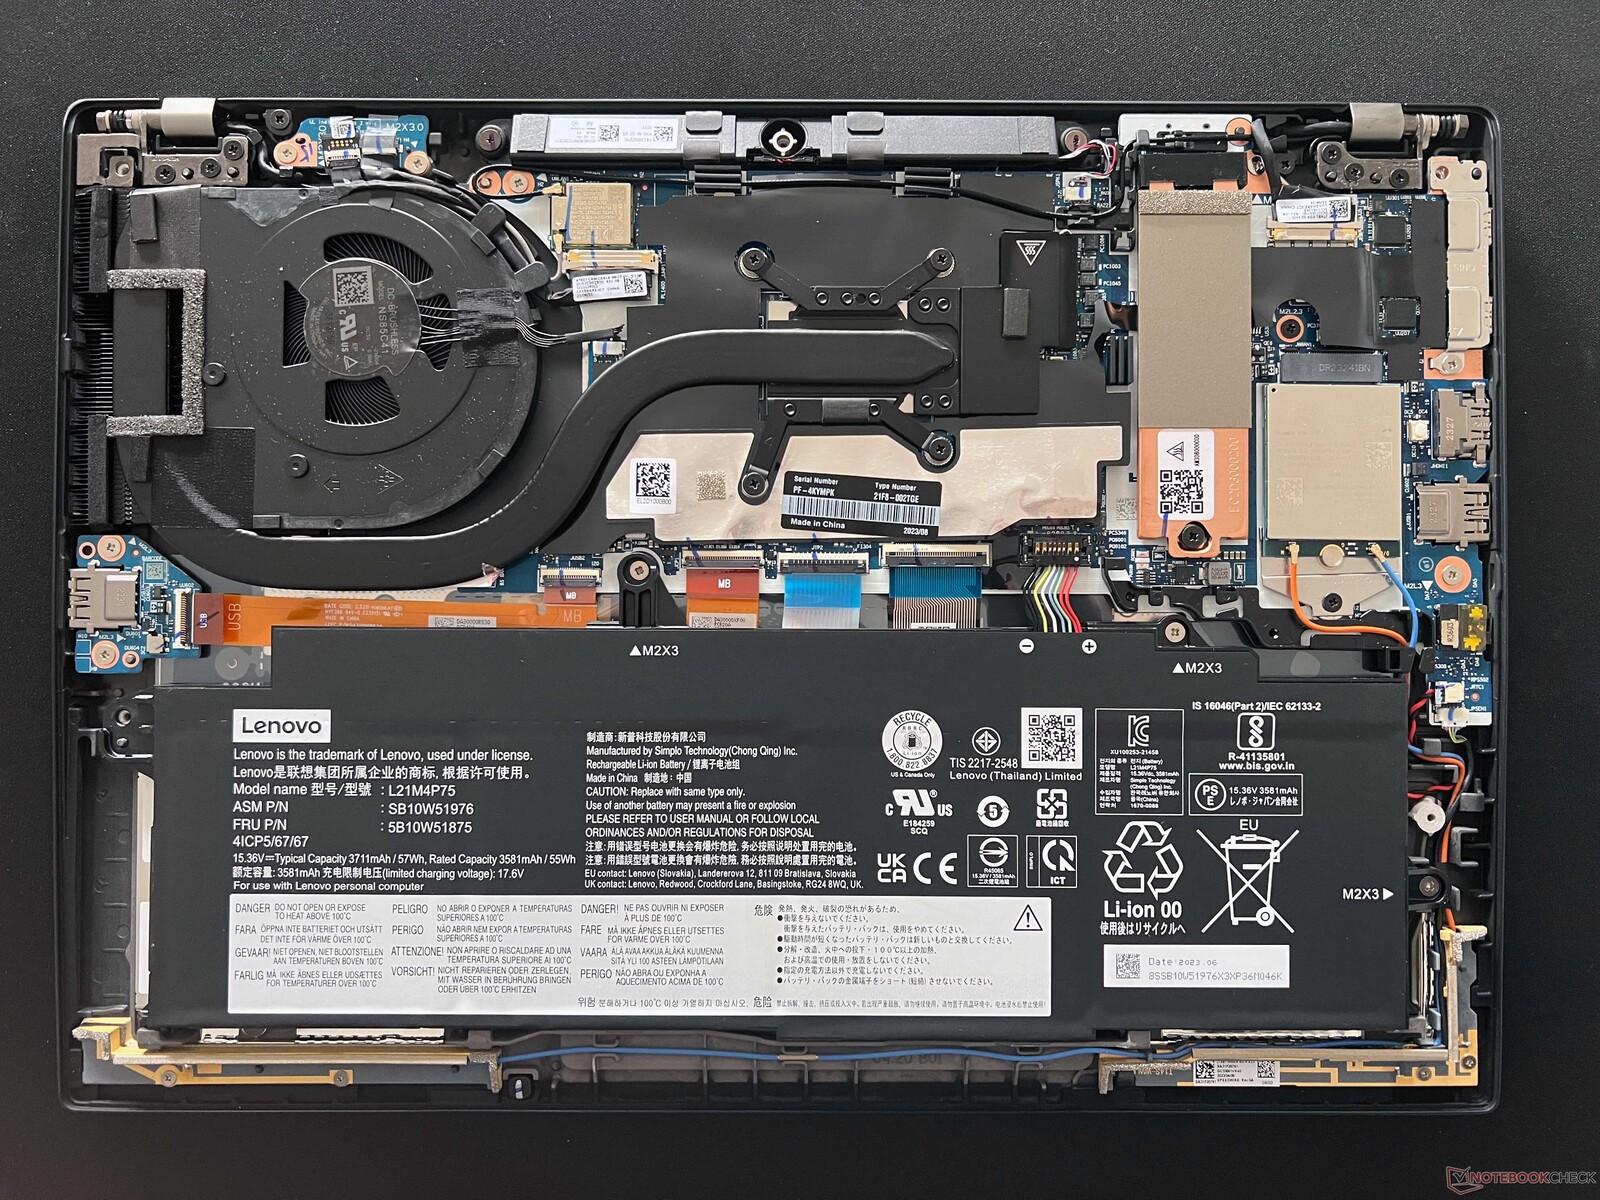
Case
An easy way to distinguish between an Intel configuration from an AMD configuration — aside from their sticker logos — is to look for the Thunderbolt icon next to the USB-C ports. Otherwise, the Intel and AMD configurations share the same chassis design with no other visual differences.
Communication
WLAN performance is consistent and excellent when paired to our Wi-Fi 6E (6 GHz) network. Performance on Wi-Fi 6 (5 GHz) is a bit more shaky as shown by the graph below but it is nonetheless reliable and perfectly serviceable.
Webcam
Our test unit comes configured with a 2 MP webcam instead of a 5 MP as found on our AMD unit. IR is only optional while the privacy slider comes standard.


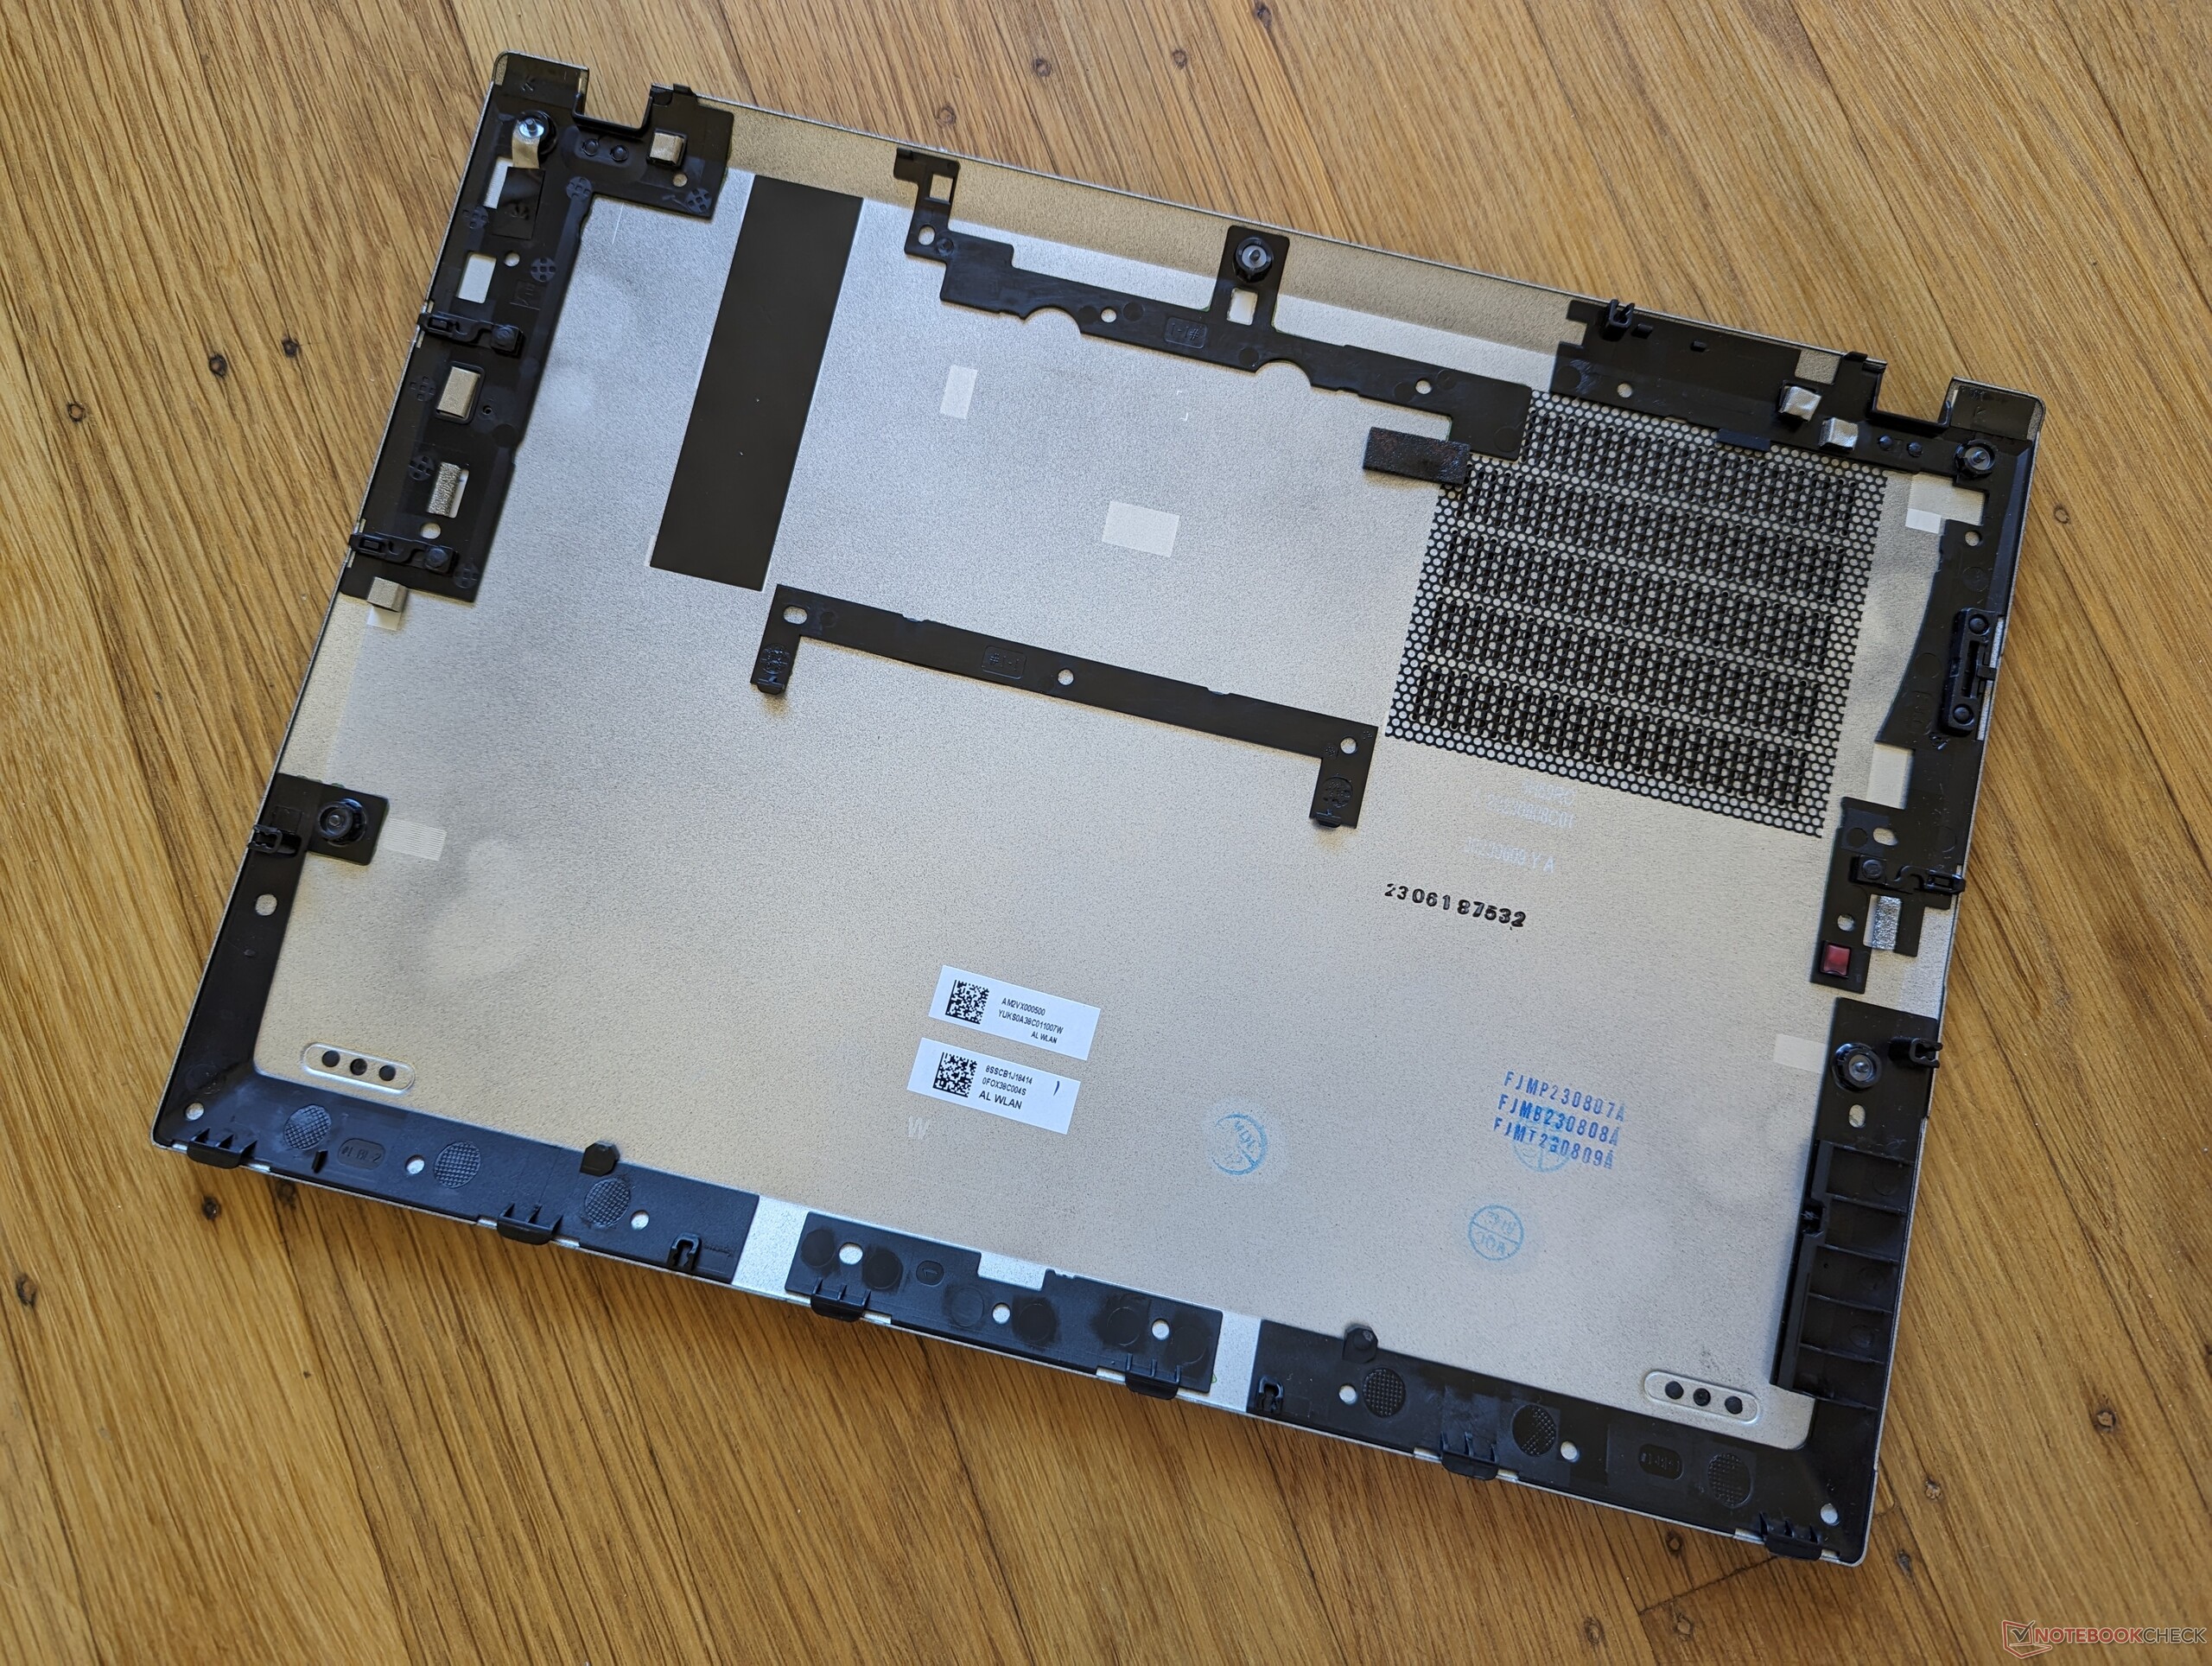
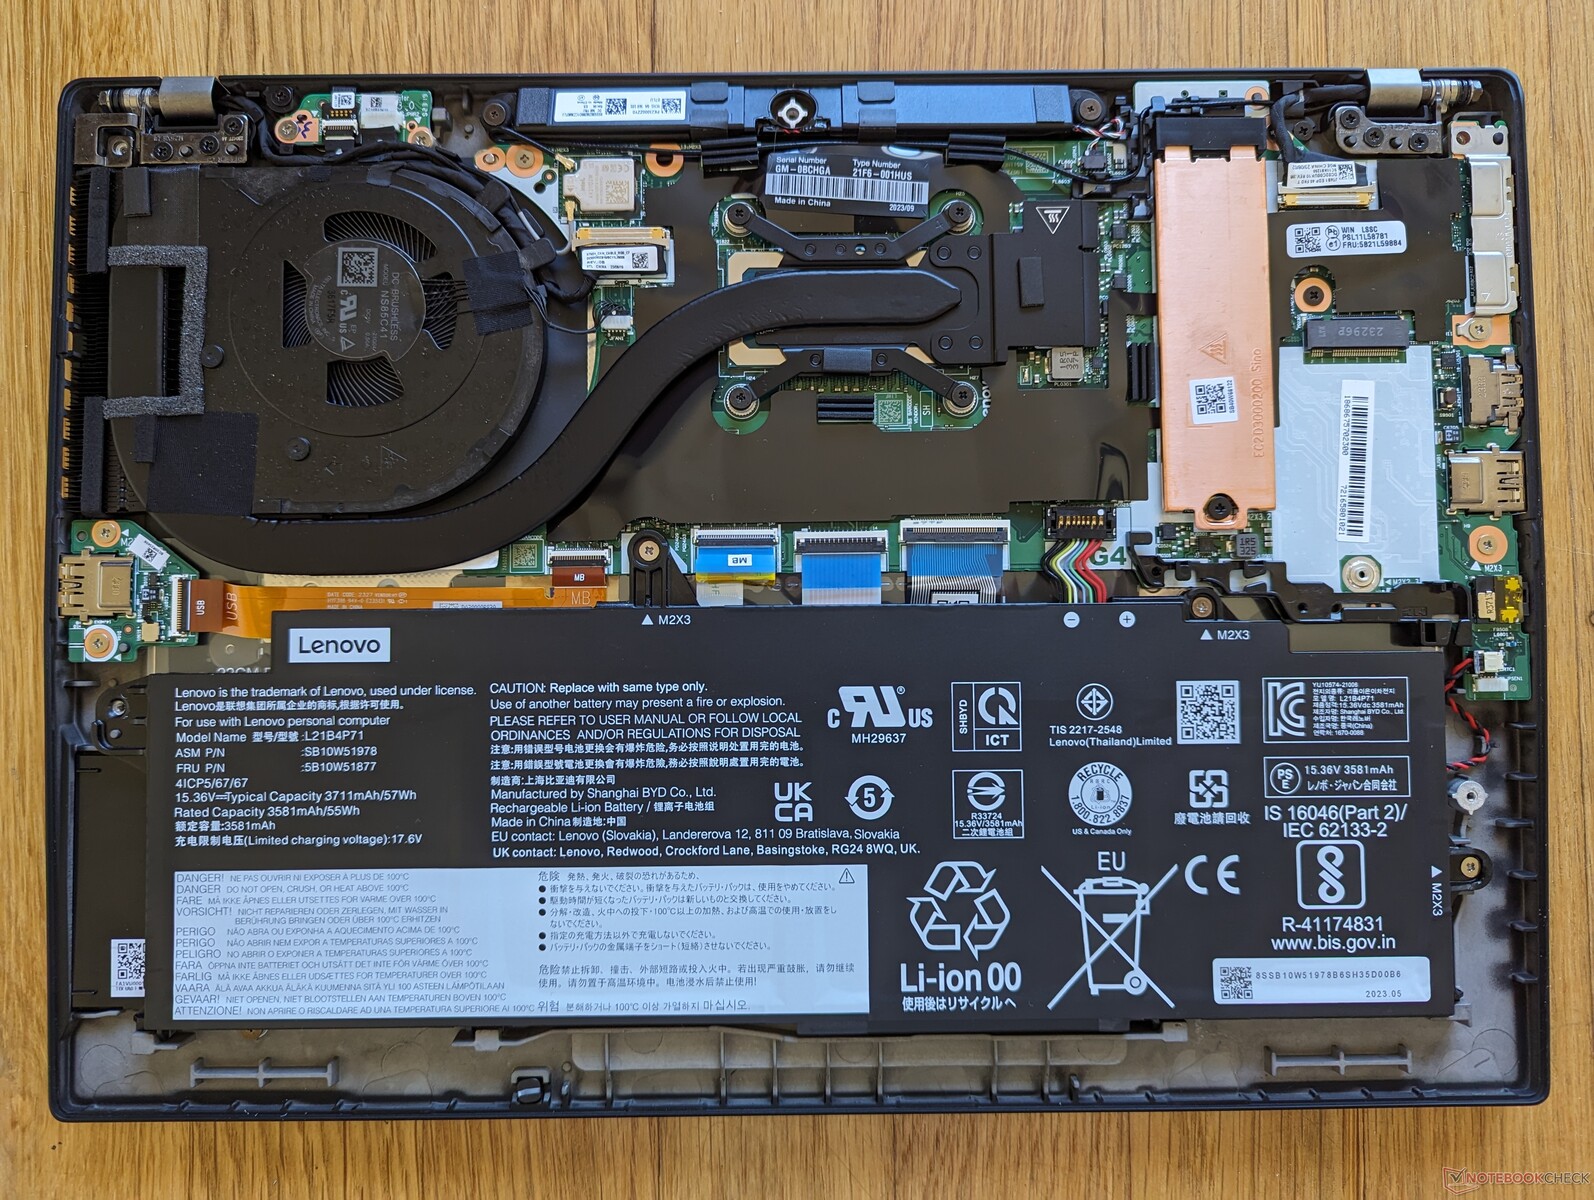
Maintenance
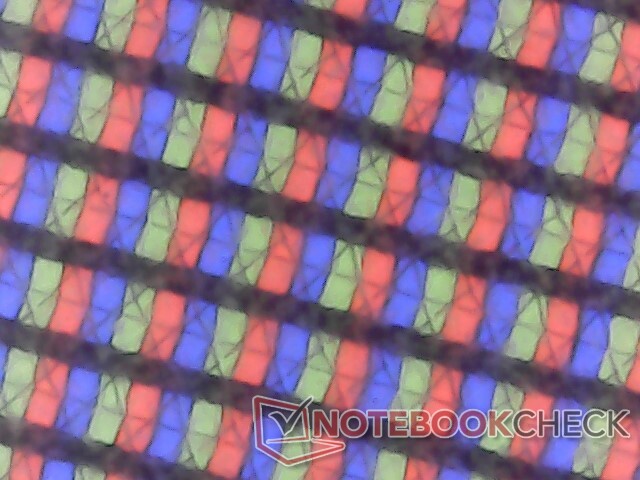
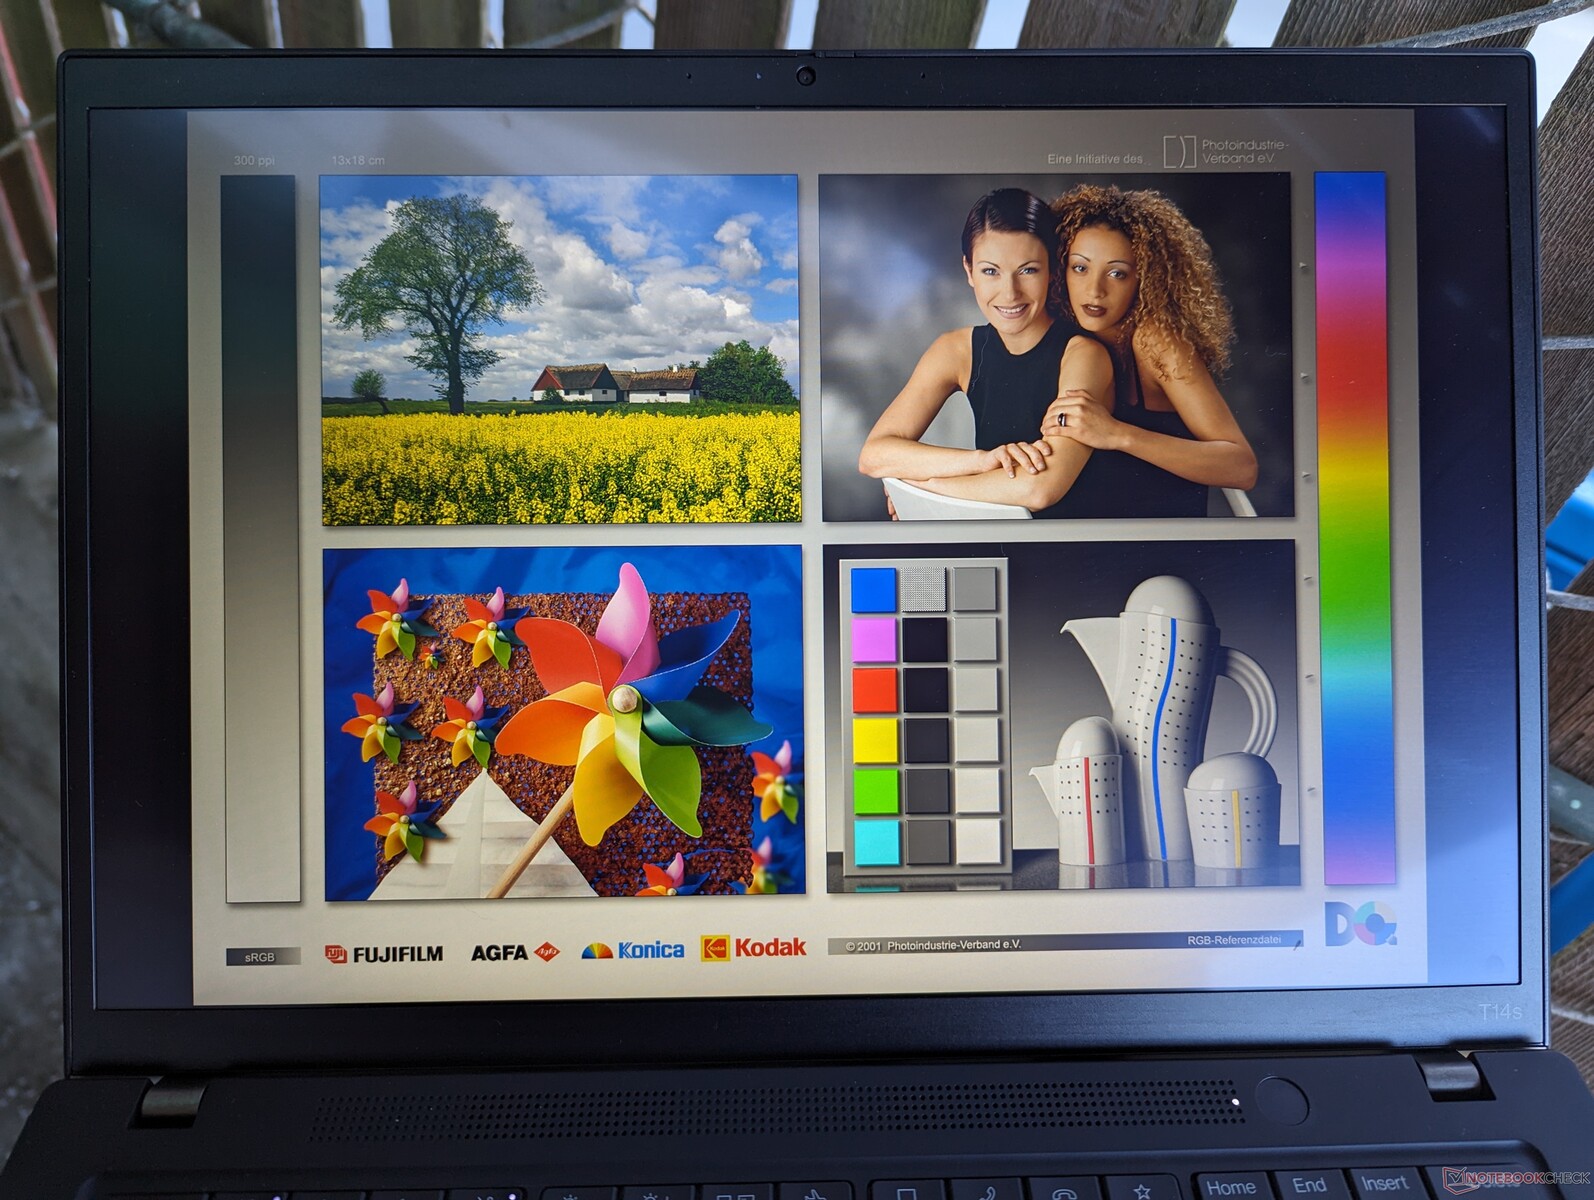
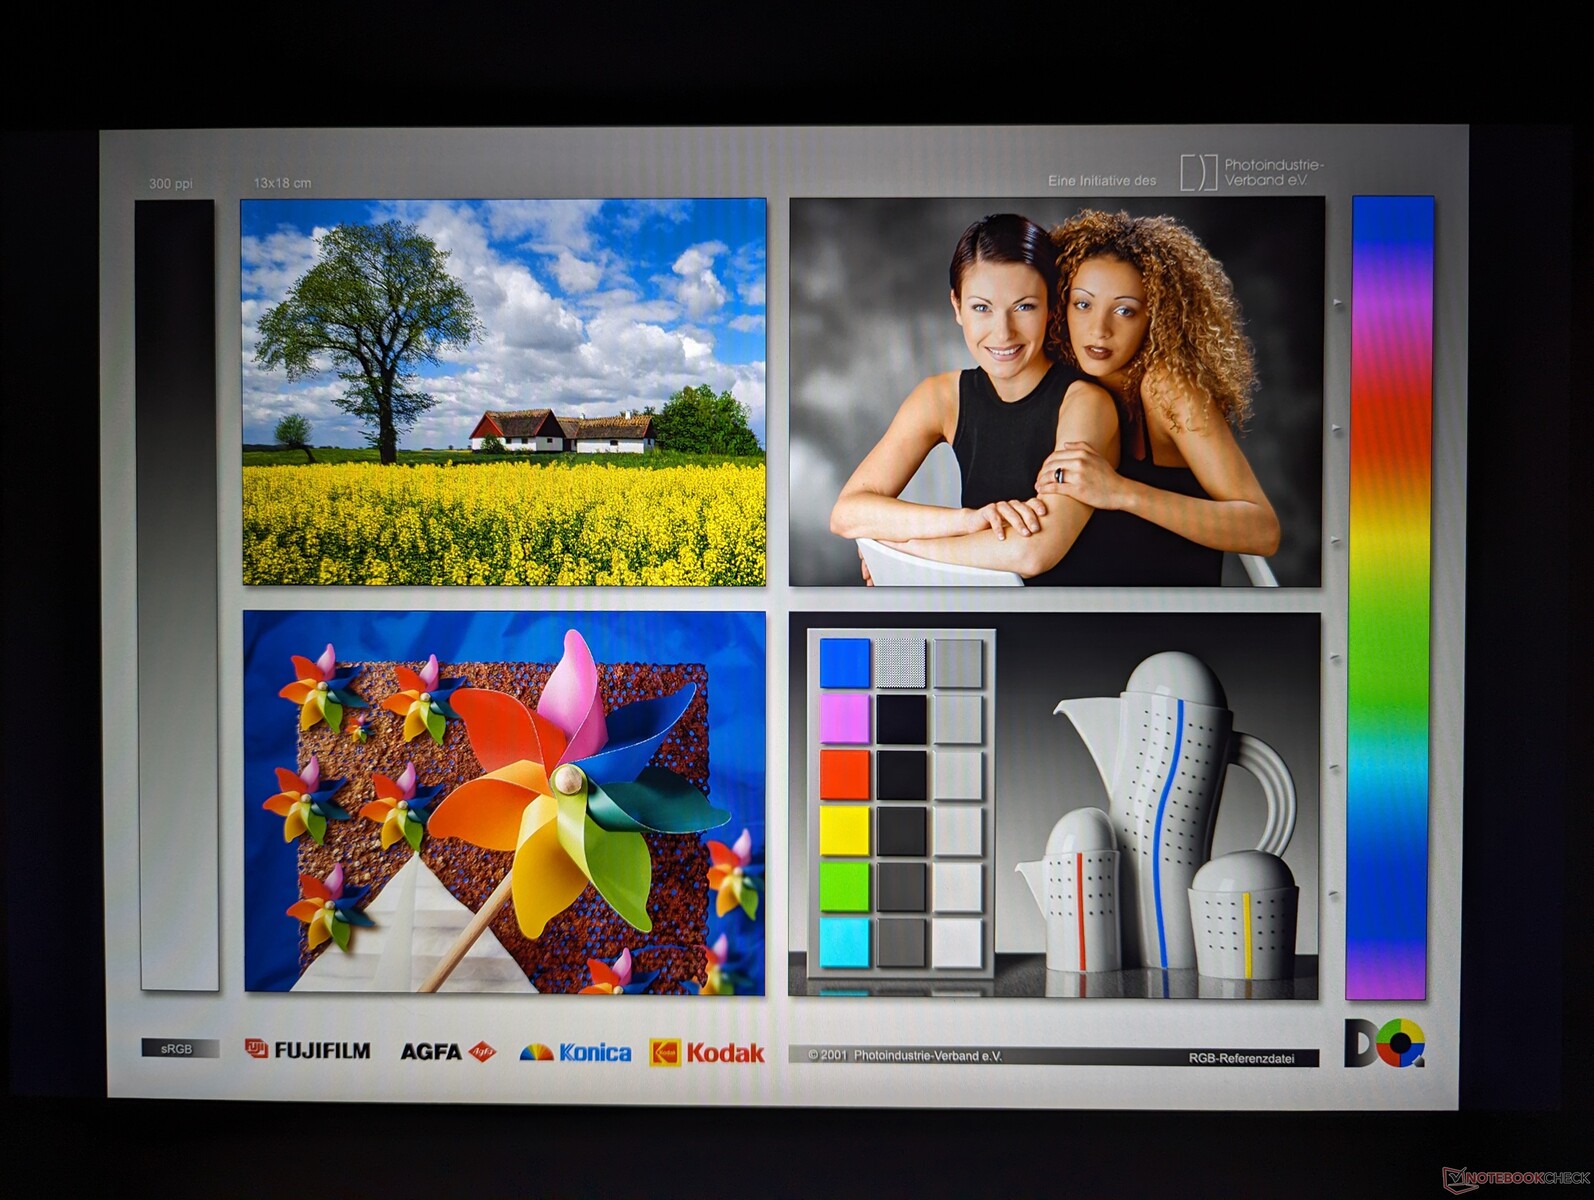
Display
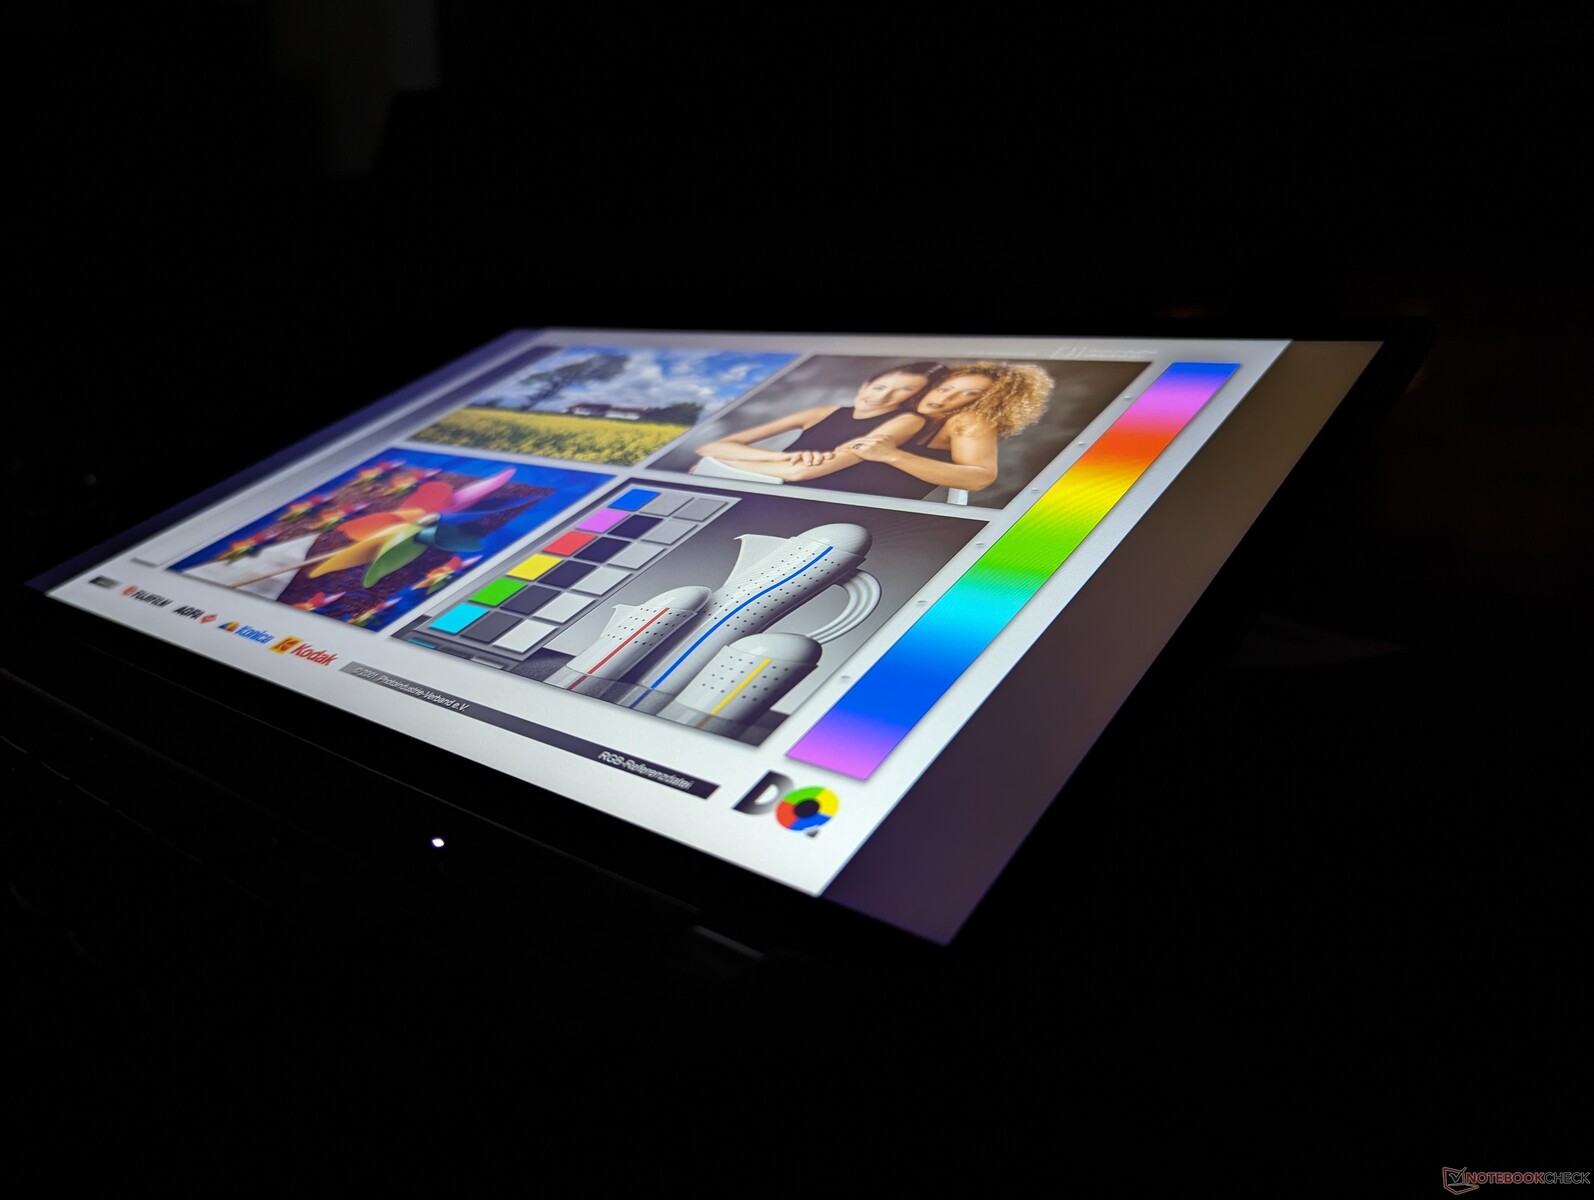
There are a total of six(!) display options available as follows. Our test unit has been configured with the one in bold which is one of the cheaper options.
- 1920 x 1200, IPS, 300 nits, touchscreen, matte, ~60% sRGB
- 1920 x 1200, IPS, 300 nits, matte, ~60% sRGB
- 2240 x 1400, IPS, 300 nits, matte, ~60% sRGB
- 1920 x 1200, IPS, 400 nits, matte, 100% sRGB
- 2800 x 1800, OLED, 400 nits (500 nits HDR), glossy, 100% DCI-P3
- 1920 x 1200, IPS, 500 nits, touchscreen, matte, 100% sRGB
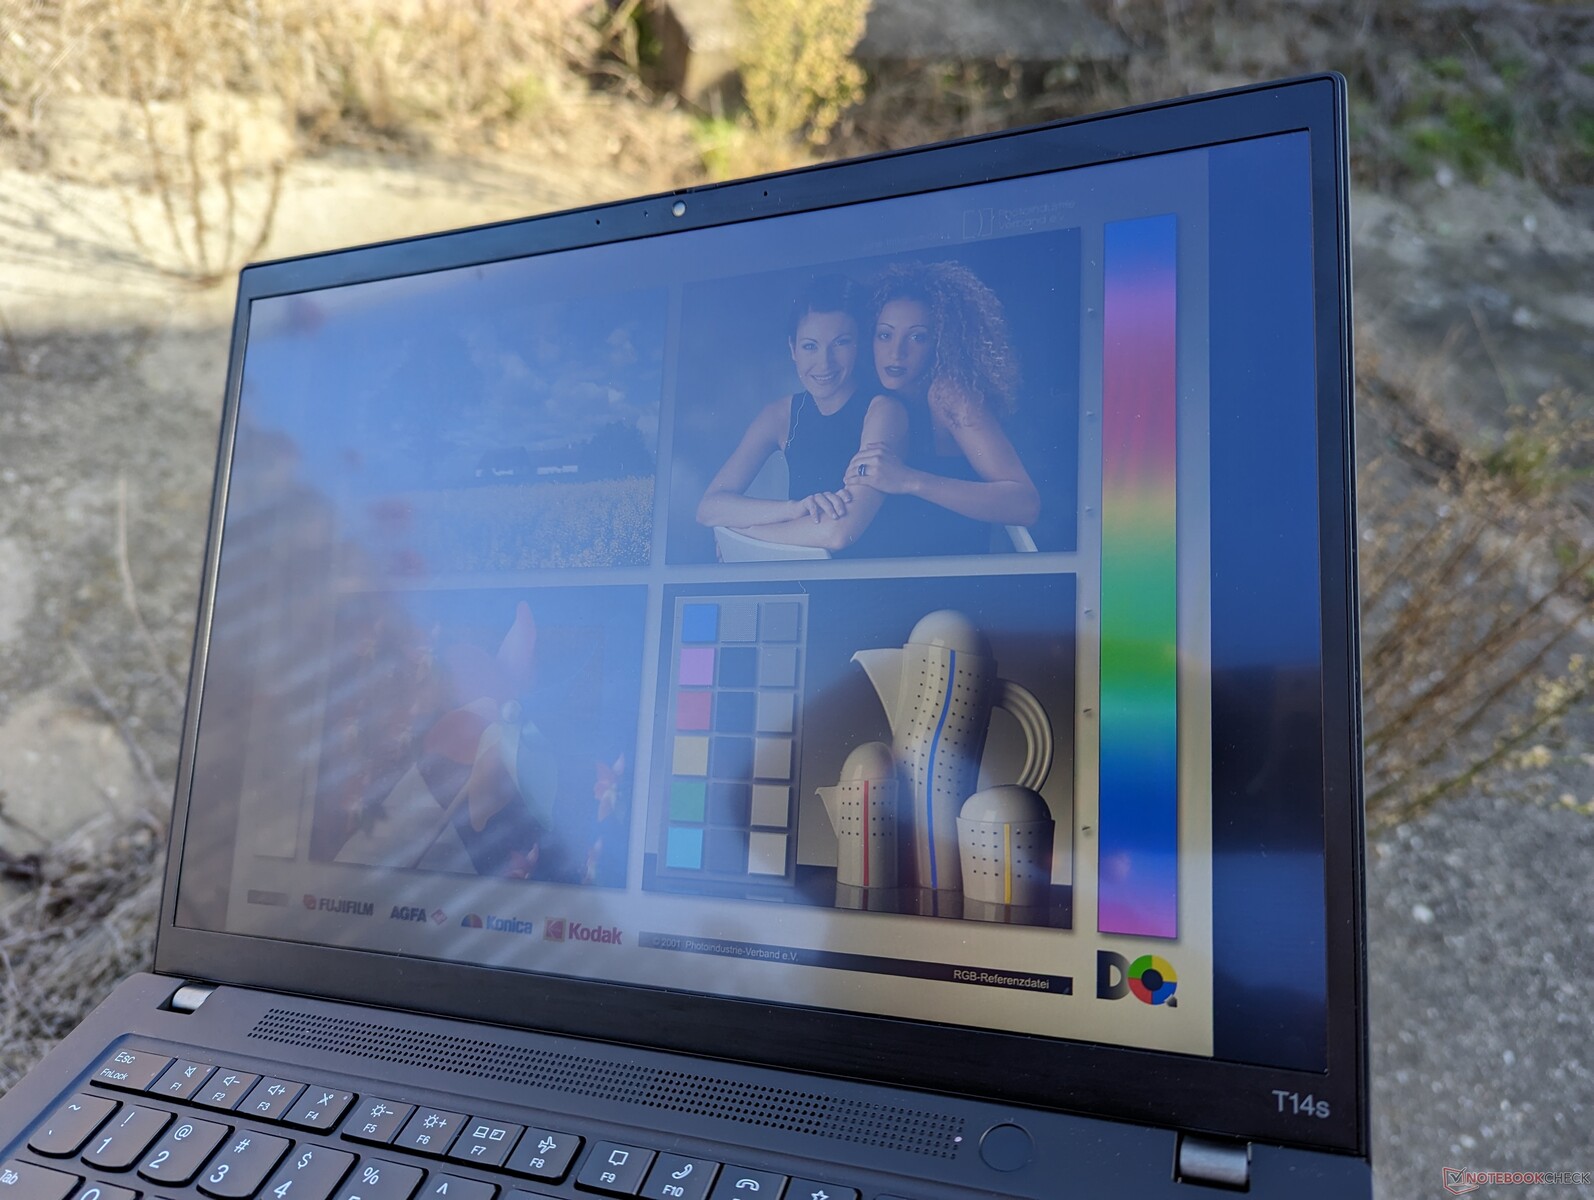
As shown by our measurements below, opting for the lower-end panel entails noticeable sacrifices to colors and brightness when compared to the higher-end options. We recommend the fourth option with full sRGB coverage at the very least especially for any graphics editing and to improve outdoor visibility.
There are no display options greater than 60 Hz which is a shame as competing 14-inch subnotebooks like the Asus ExpertBook B9 have 90 Hz OLED panels.

| |||||||||||||||||||||||||
Brightness Distribution: 85 %
Center on Battery: 322.5 cd/m²
Contrast: 733:1 (Black: 0.44 cd/m²)
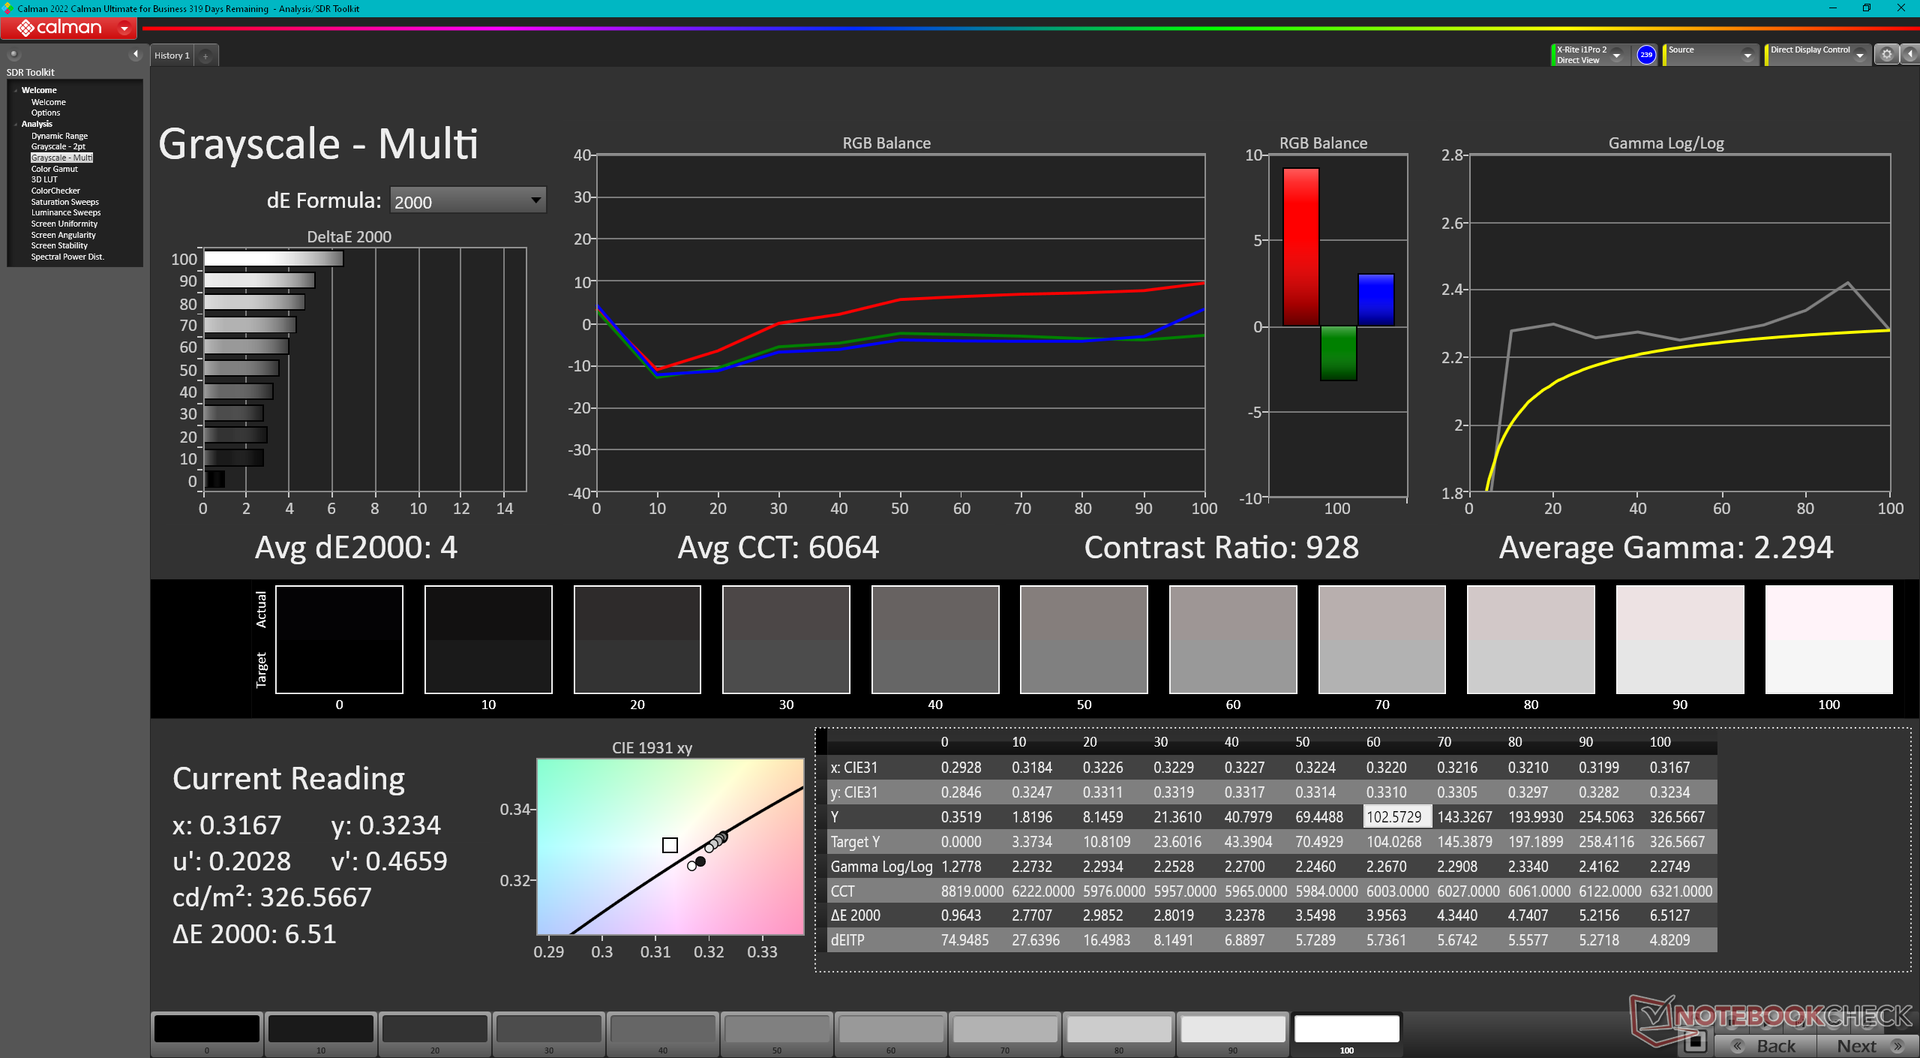
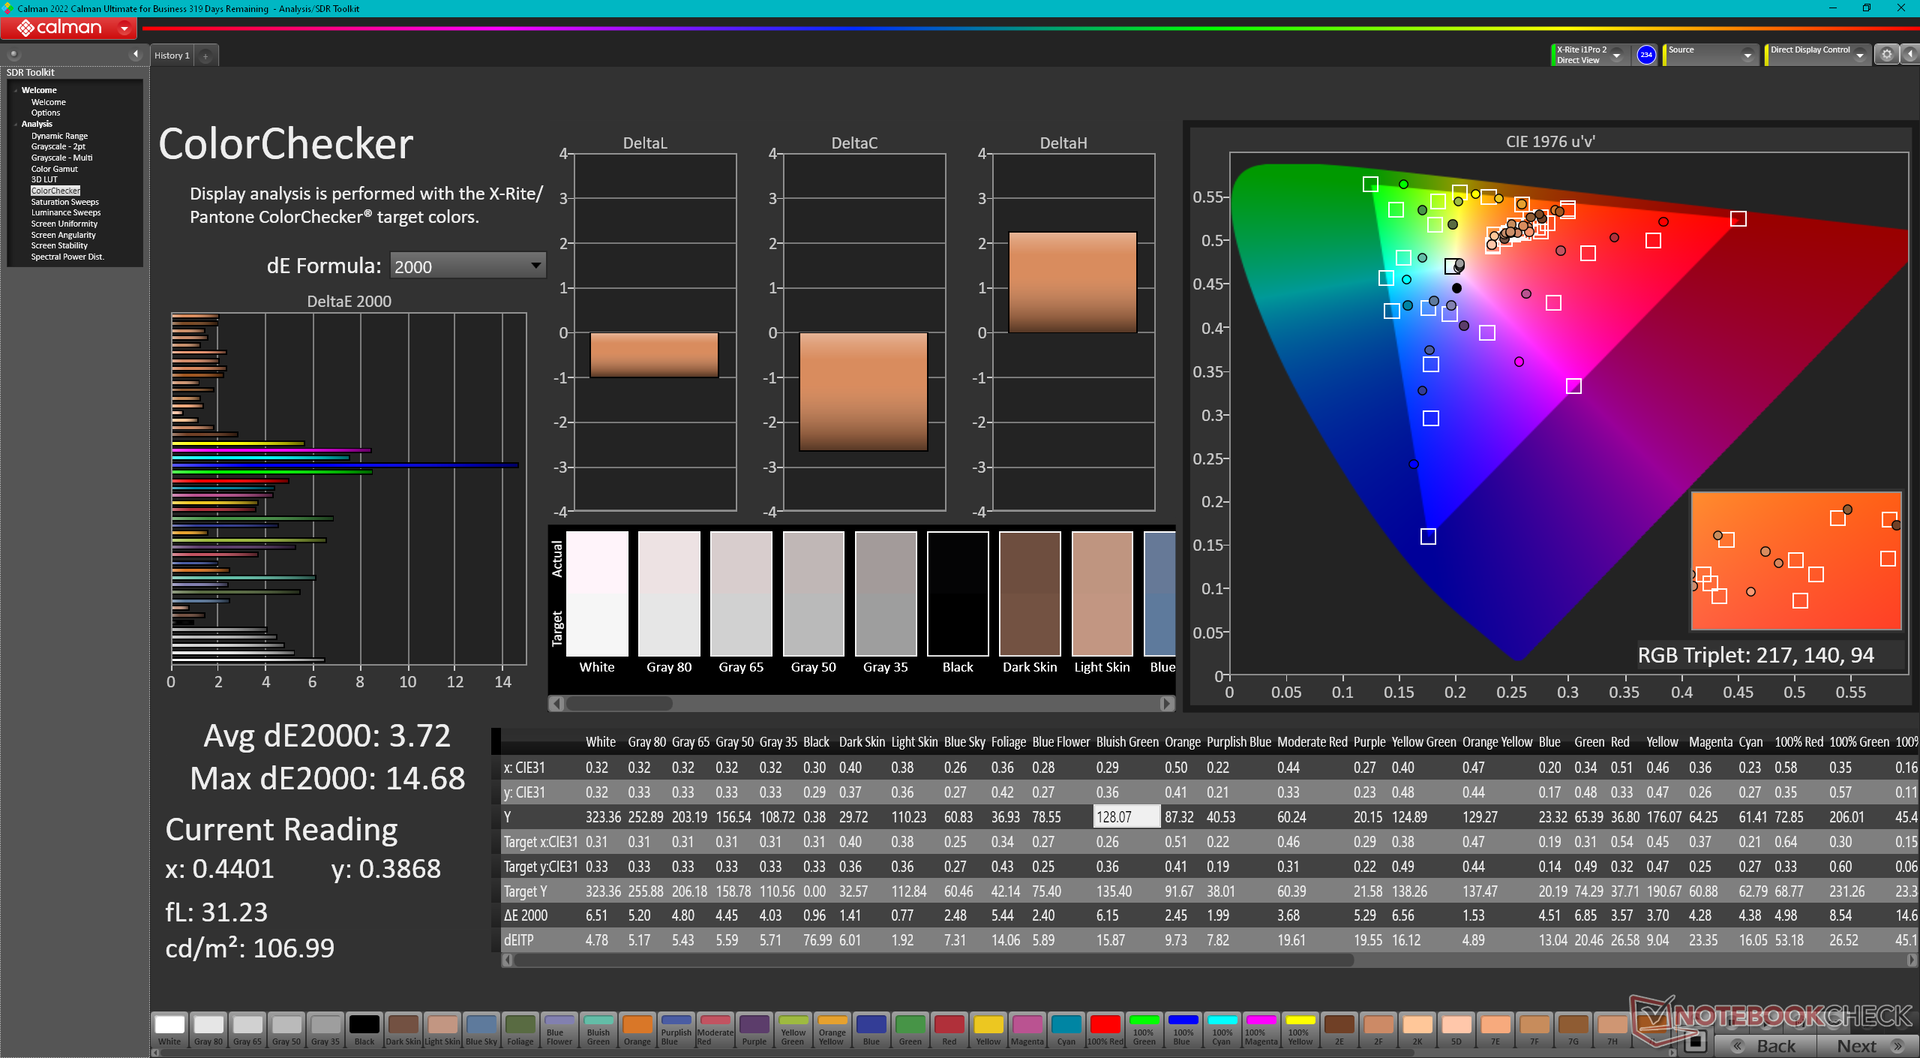
ΔE ColorChecker Calman: 3.72 | ∀{0.5-29.43 Ø4.71}
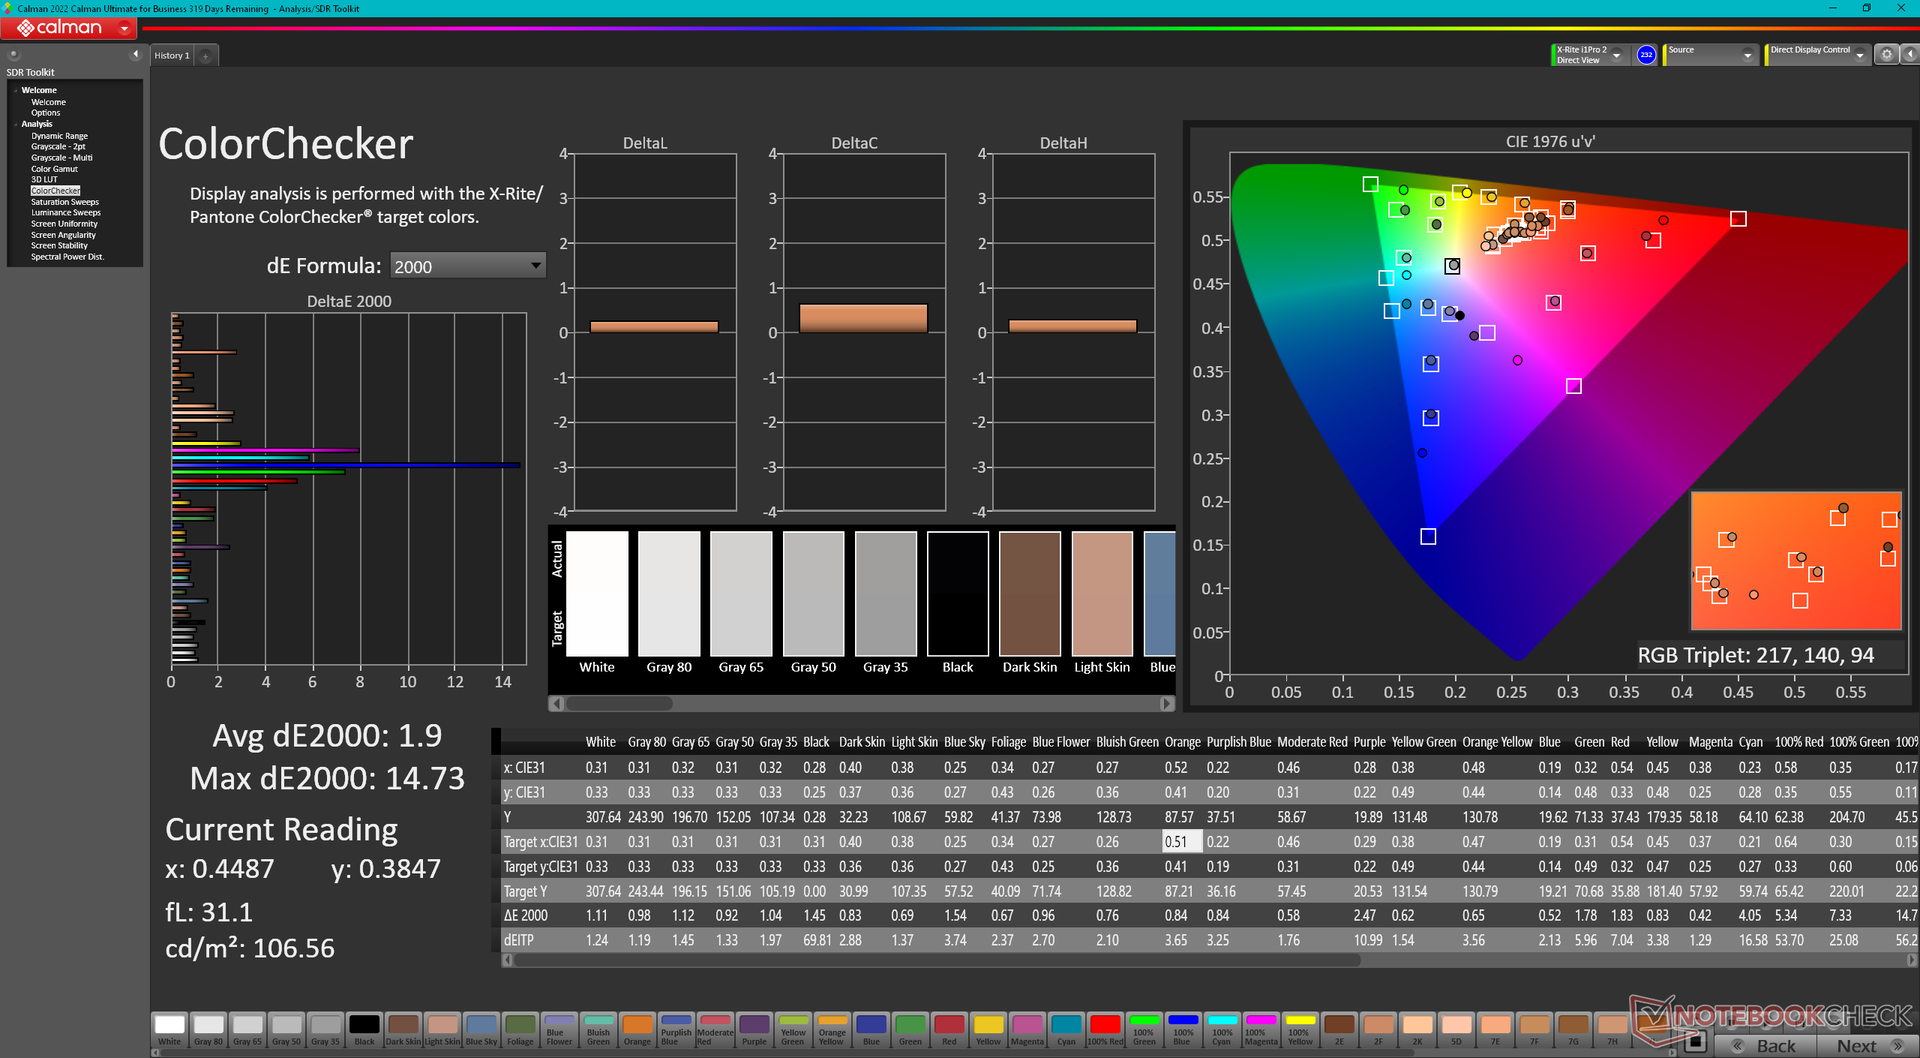
calibrated: 1.9
ΔE Greyscale Calman: 4 | ∀{0.09-98 Ø4.96}
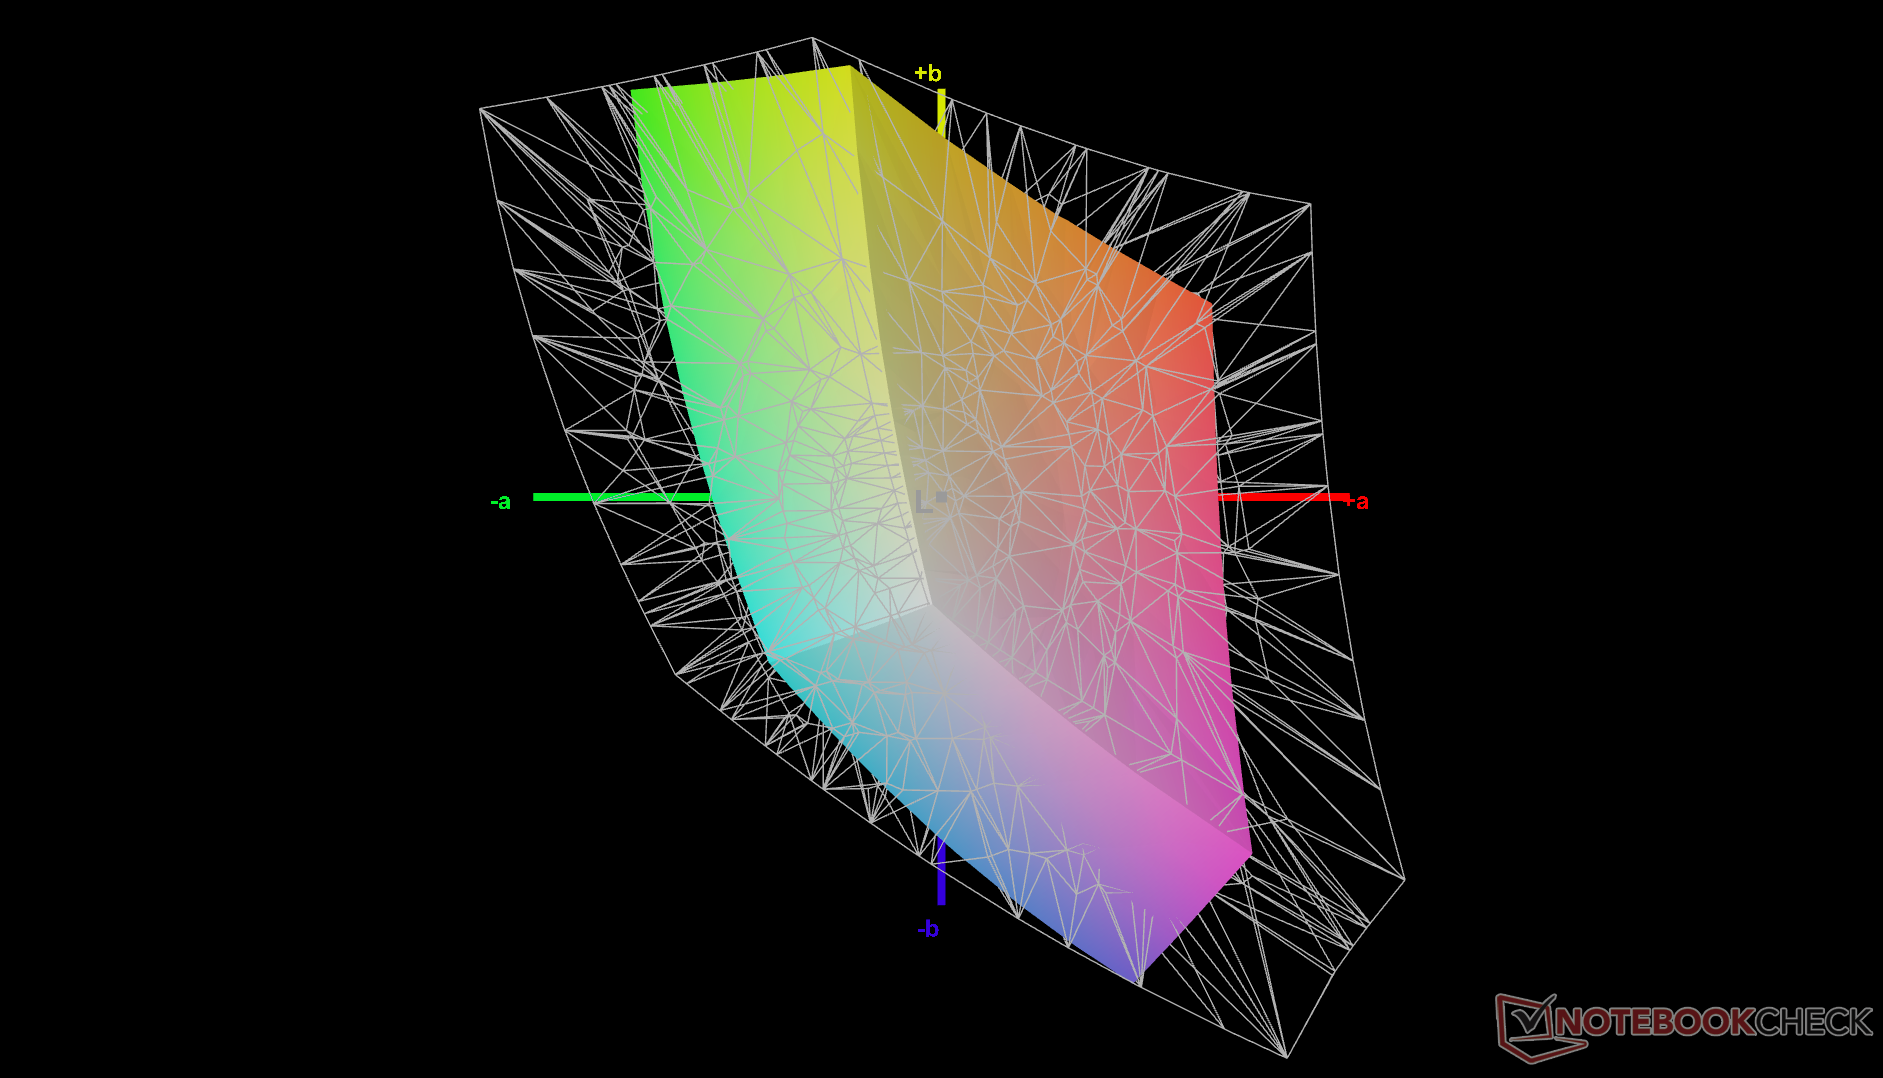
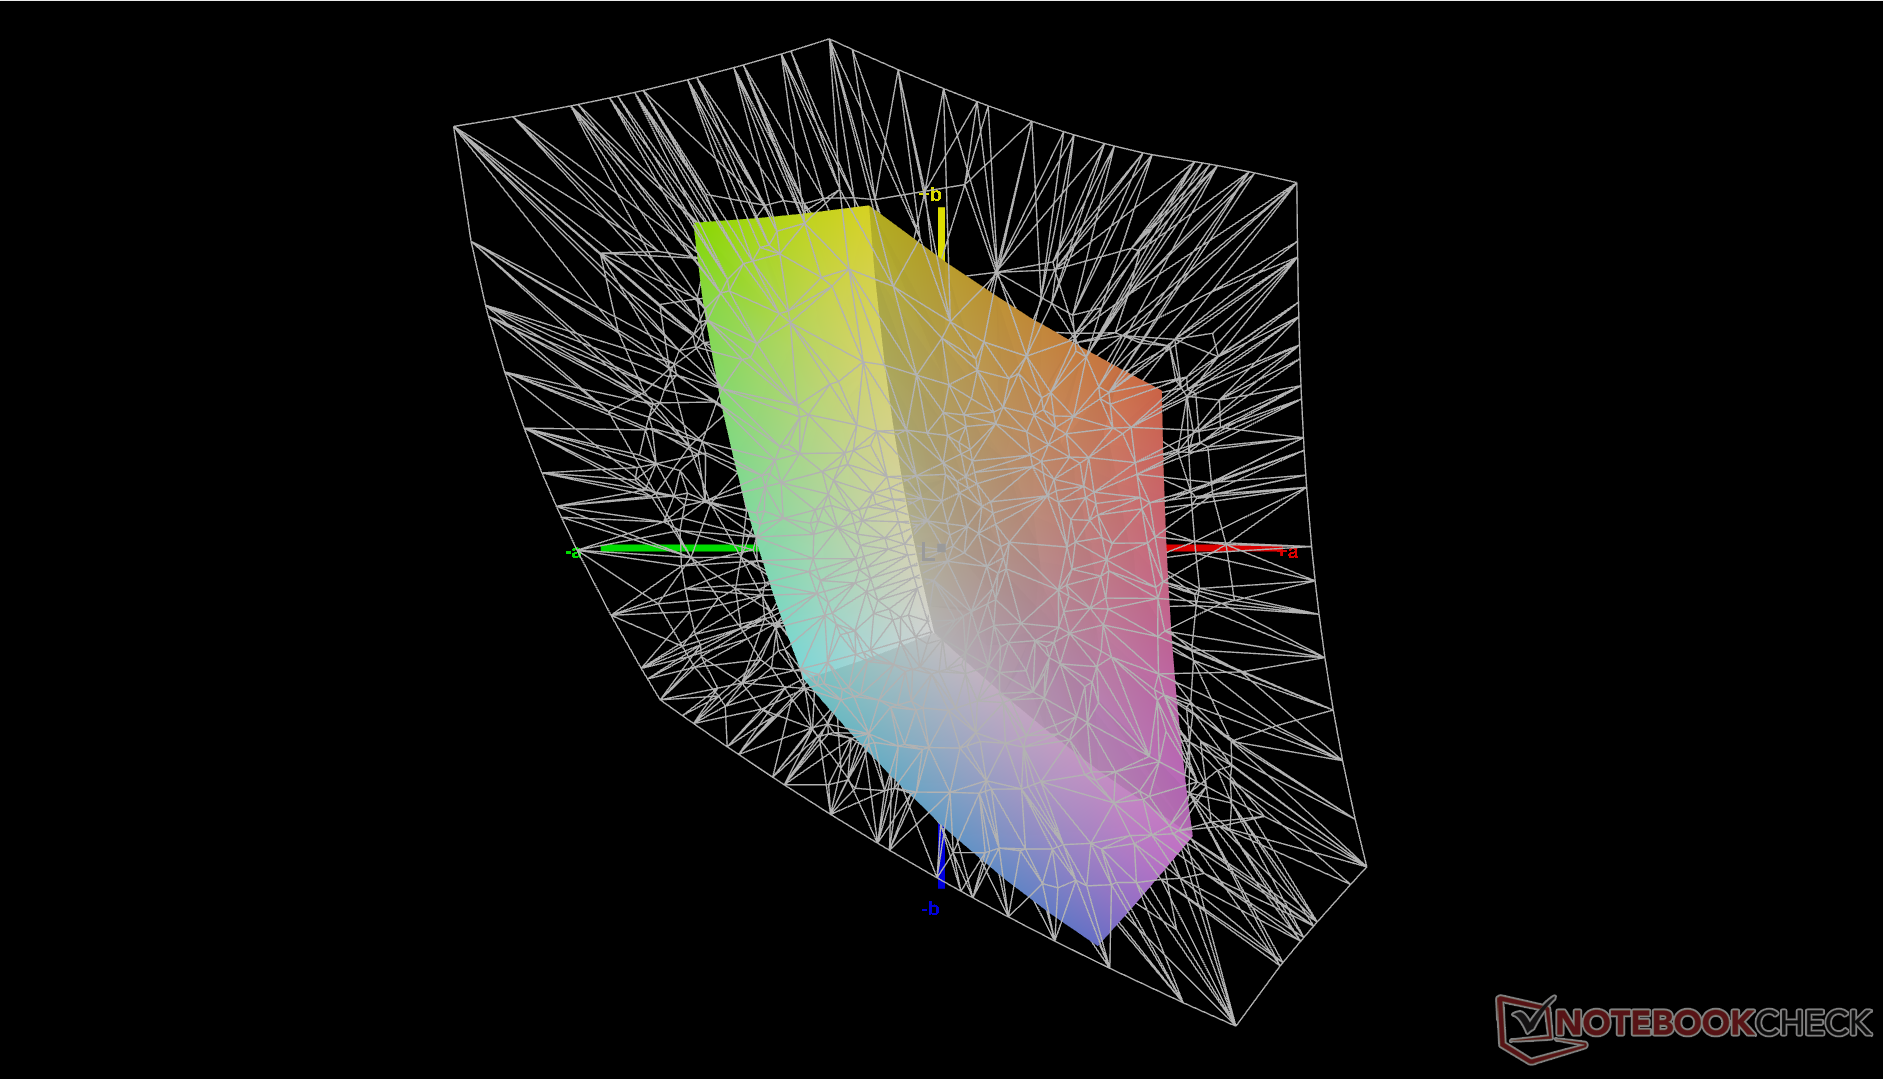
41.2% AdobeRGB 1998 (Argyll 3D)
59.7% sRGB (Argyll 3D)
39.9% Display P3 (Argyll 3D)
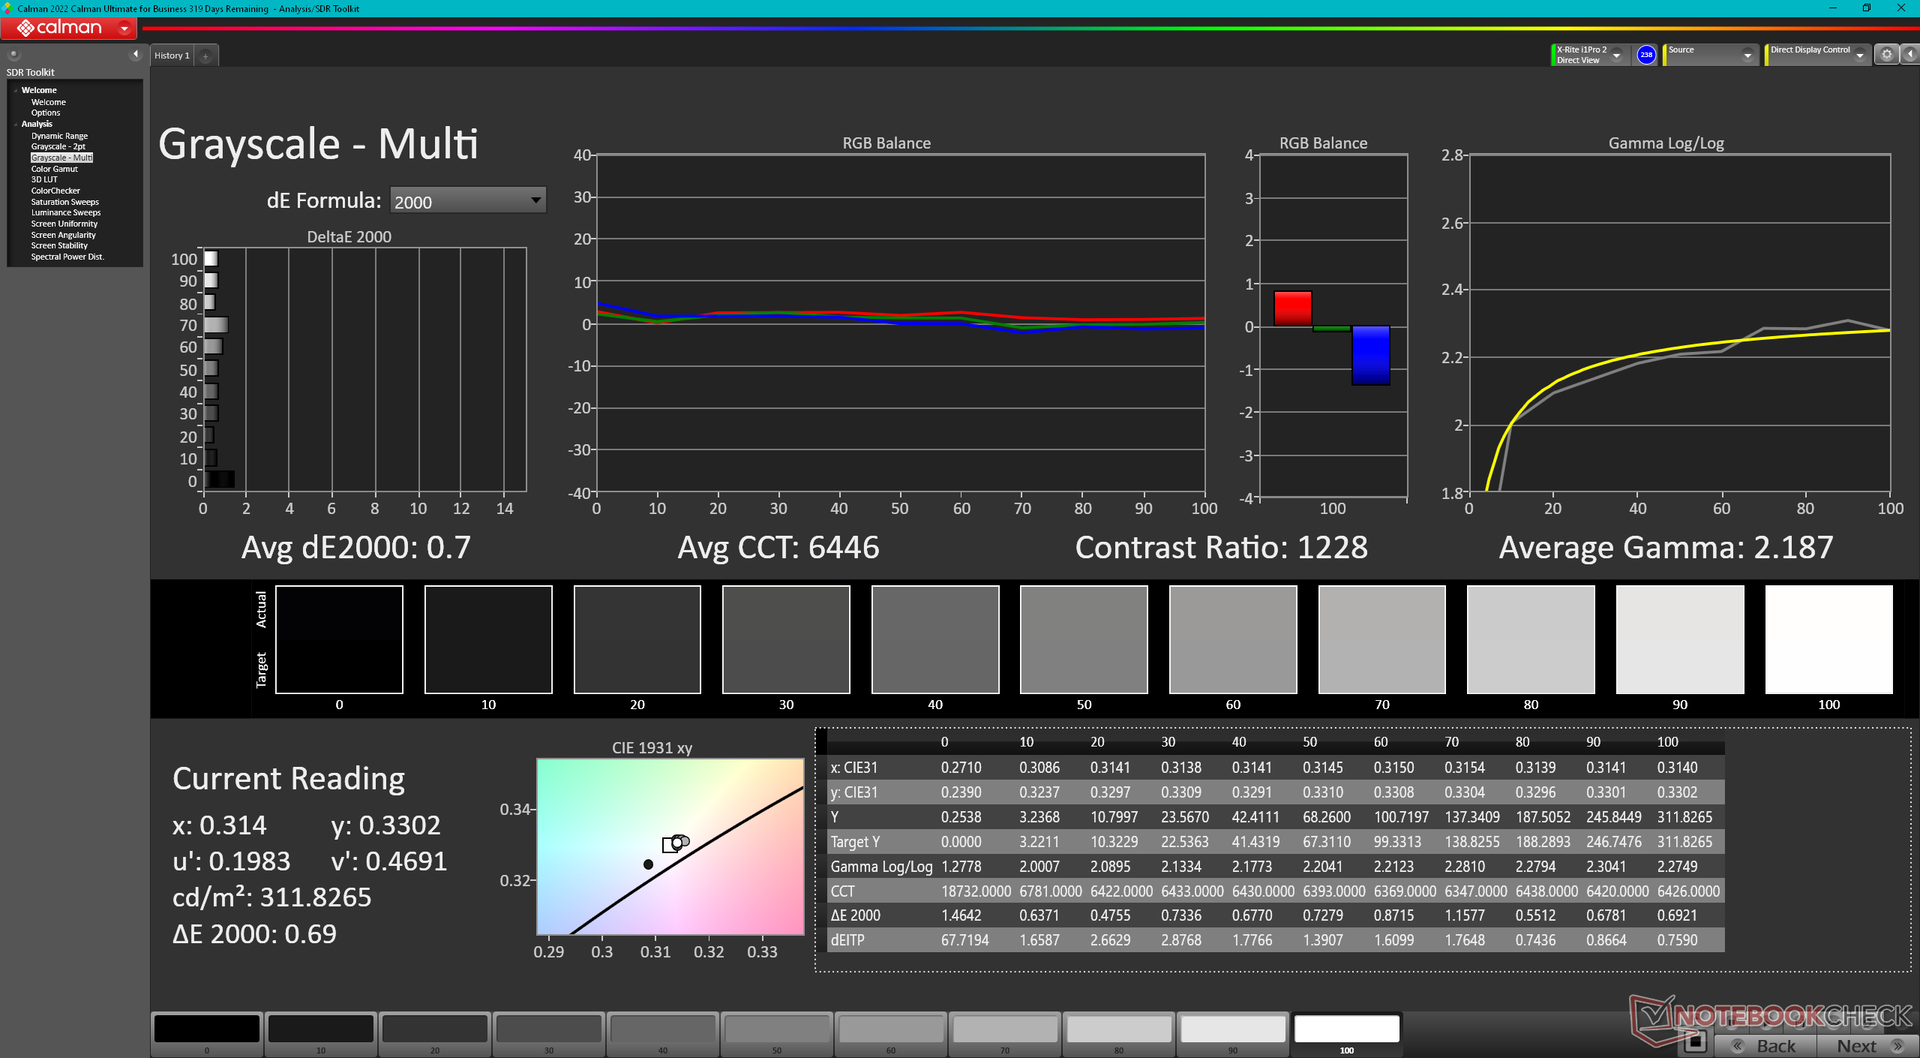
Gamma: 2.29
CCT: 6064 K
| Lenovo ThinkPad T14s G4 i7-1365U B140UAK01.2, IPS, 1920x1200, 14" | Lenovo ThinkPad T14s G4-21F8002TGE LP140WU1-SPB2, IPS, 1920x1200, 14" | Lenovo ThinkPad T14 G4 21HD0043GE B140UAN02.1, IPS-AHVA LTPS wLED, 1920x1200, 14" | HP EliteBook 845 G10 5Z4X0ES CMN1435, IPS, 1920x1200, 14" | Dell Latitude 7440 AU Optronics B140QAX, IPS, 2560x1600, 14" | Asus ExpertBook B9 B9403CVA-KM0153X ATNA40YK07-1 SDC4171, OLED, 2880x1800, 14" | |
|---|---|---|---|---|---|---|
| Display | 68% | 80% | 74% | 80% | 115% | |
| Display P3 Coverage (%) | 39.9 | 68.3 71% | 74.8 87% | 70.6 77% | 75.4 89% | 99.9 150% |
| sRGB Coverage (%) | 59.7 | 96.5 62% | 98.9 66% | 100 68% | 99.9 67% | 100 68% |
| AdobeRGB 1998 Coverage (%) | 41.2 | 70.6 71% | 76.7 86% | 72.4 76% | 76.2 85% | 93.6 127% |
| Response Times | -54% | -90% | -88% | -98% | 90% | |
| Response Time Grey 50% / Grey 80% * (ms) | 27.7 ? | 41.6 ? -50% | 48.3 ? -74% | 59.7 ? -116% | 56 ? -102% | 2 ? 93% |
| Response Time Black / White * (ms) | 15.9 ? | 25.1 ? -58% | 32.6 ? -105% | 25.5 ? -60% | 30.8 ? -94% | 2 ? 87% |
| PWM Frequency (Hz) | 360 ? | |||||
| Screen | 48% | 21% | 46% | 36% | 160% | |
| Brightness middle (cd/m²) | 322.5 | 455 41% | 376 17% | 409 27% | 517.3 60% | 389.9 21% |
| Brightness (cd/m²) | 296 | 453 53% | 369 25% | 391 32% | 488 65% | 390 32% |
| Brightness Distribution (%) | 85 | 90 6% | 86 1% | 92 8% | 88 4% | 99 16% |
| Black Level * (cd/m²) | 0.44 | 0.24 45% | 0.23 48% | 0.27 39% | 0.34 23% | 0.0497 89% |
| Contrast (:1) | 733 | 1896 159% | 1635 123% | 1515 107% | 1521 108% | 7845 970% |
| Colorchecker dE 2000 * | 3.72 | 2.8 25% | 4.3 -16% | 2.3 38% | 3.3 11% | 2.22 40% |
| Colorchecker dE 2000 max. * | 14.68 | 4.2 71% | 9.9 33% | 4.4 70% | 7.81 47% | 3.75 74% |
| Colorchecker dE 2000 calibrated * | 1.9 | 1.2 37% | 1.6 16% | 0.9 53% | 1.02 46% | |
| Greyscale dE 2000 * | 4 | 4.3 -8% | 6.4 -60% | 2.4 40% | 5.6 -40% | 2.4 40% |
| Gamma | 2.29 96% | 2.11 104% | 2.24 98% | 2.06 107% | 2.37 93% | 2.187 101% |
| CCT | 6064 107% | 7268 89% | 6019 108% | 6293 103% | 6804 96% | 6426 101% |
| Total Average (Program / Settings) | 21% /
38% | 4% /
18% | 11% /
33% | 6% /
26% | 122% /
139% |
* ... smaller is better
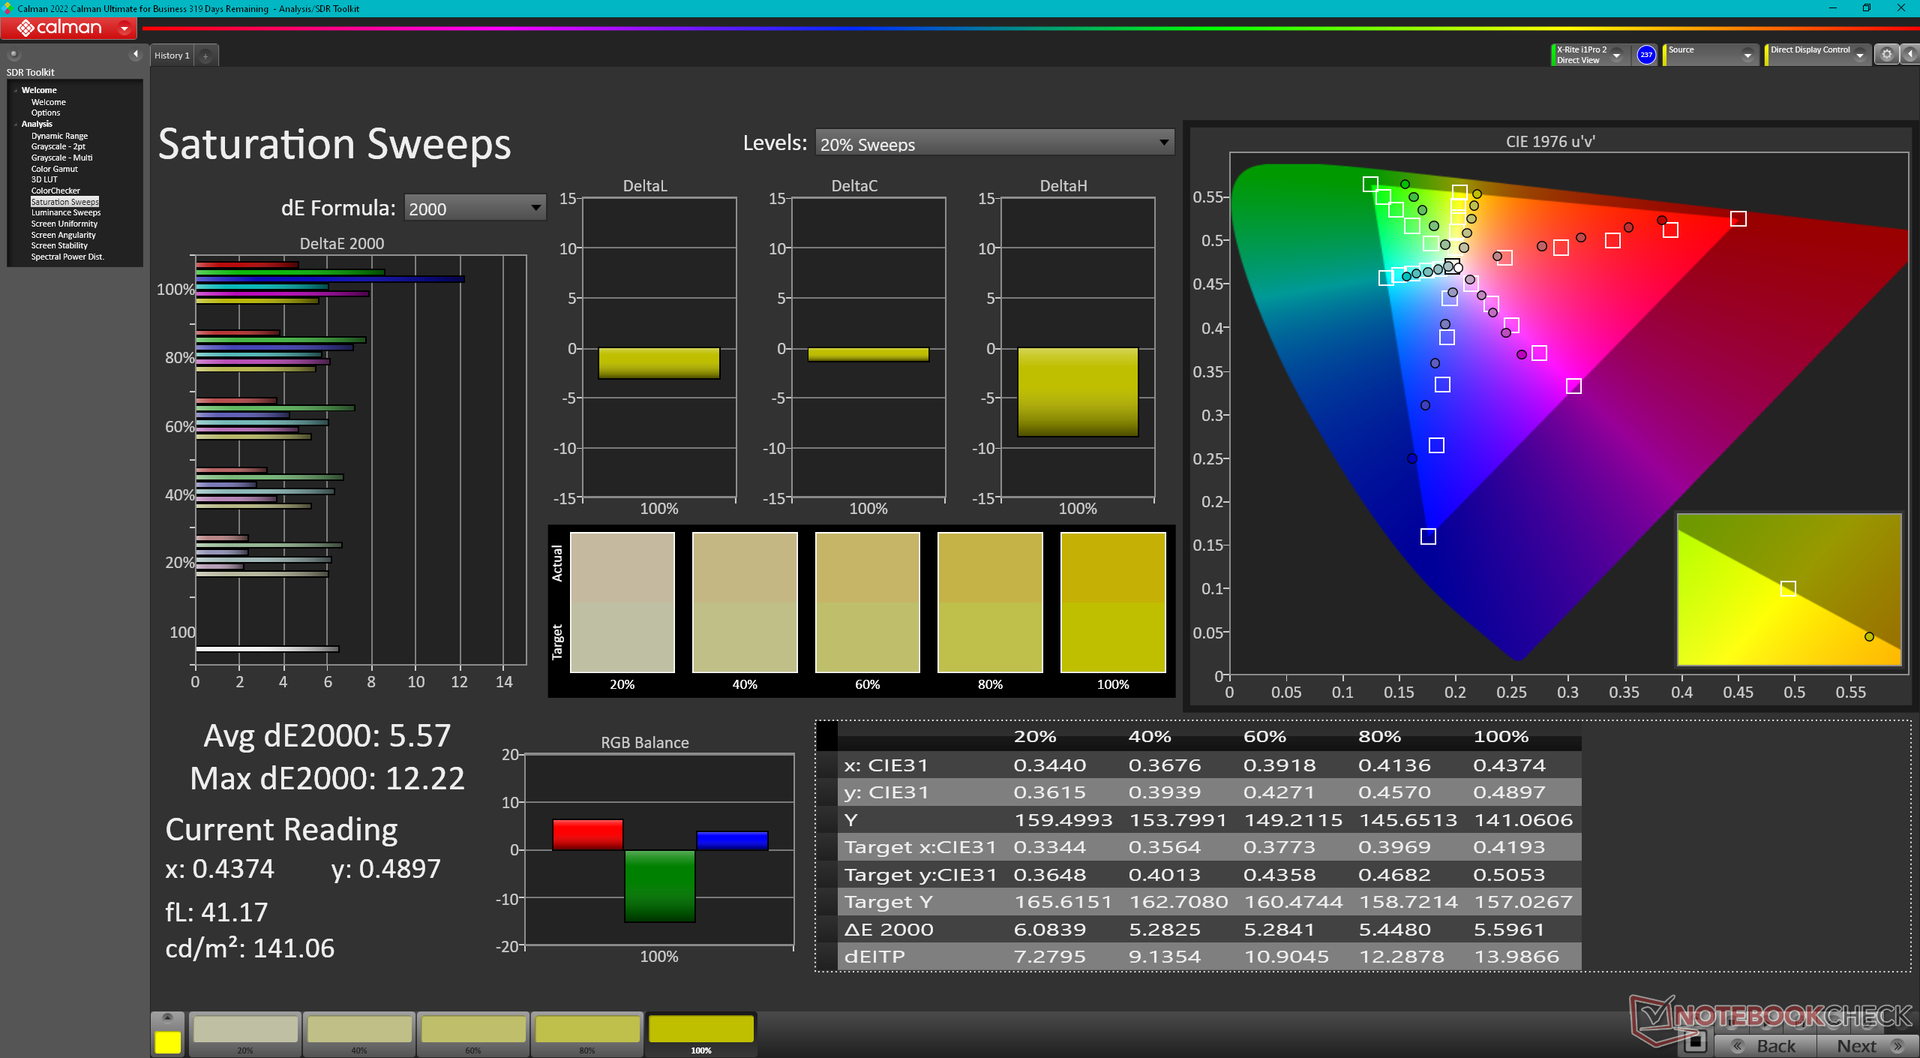
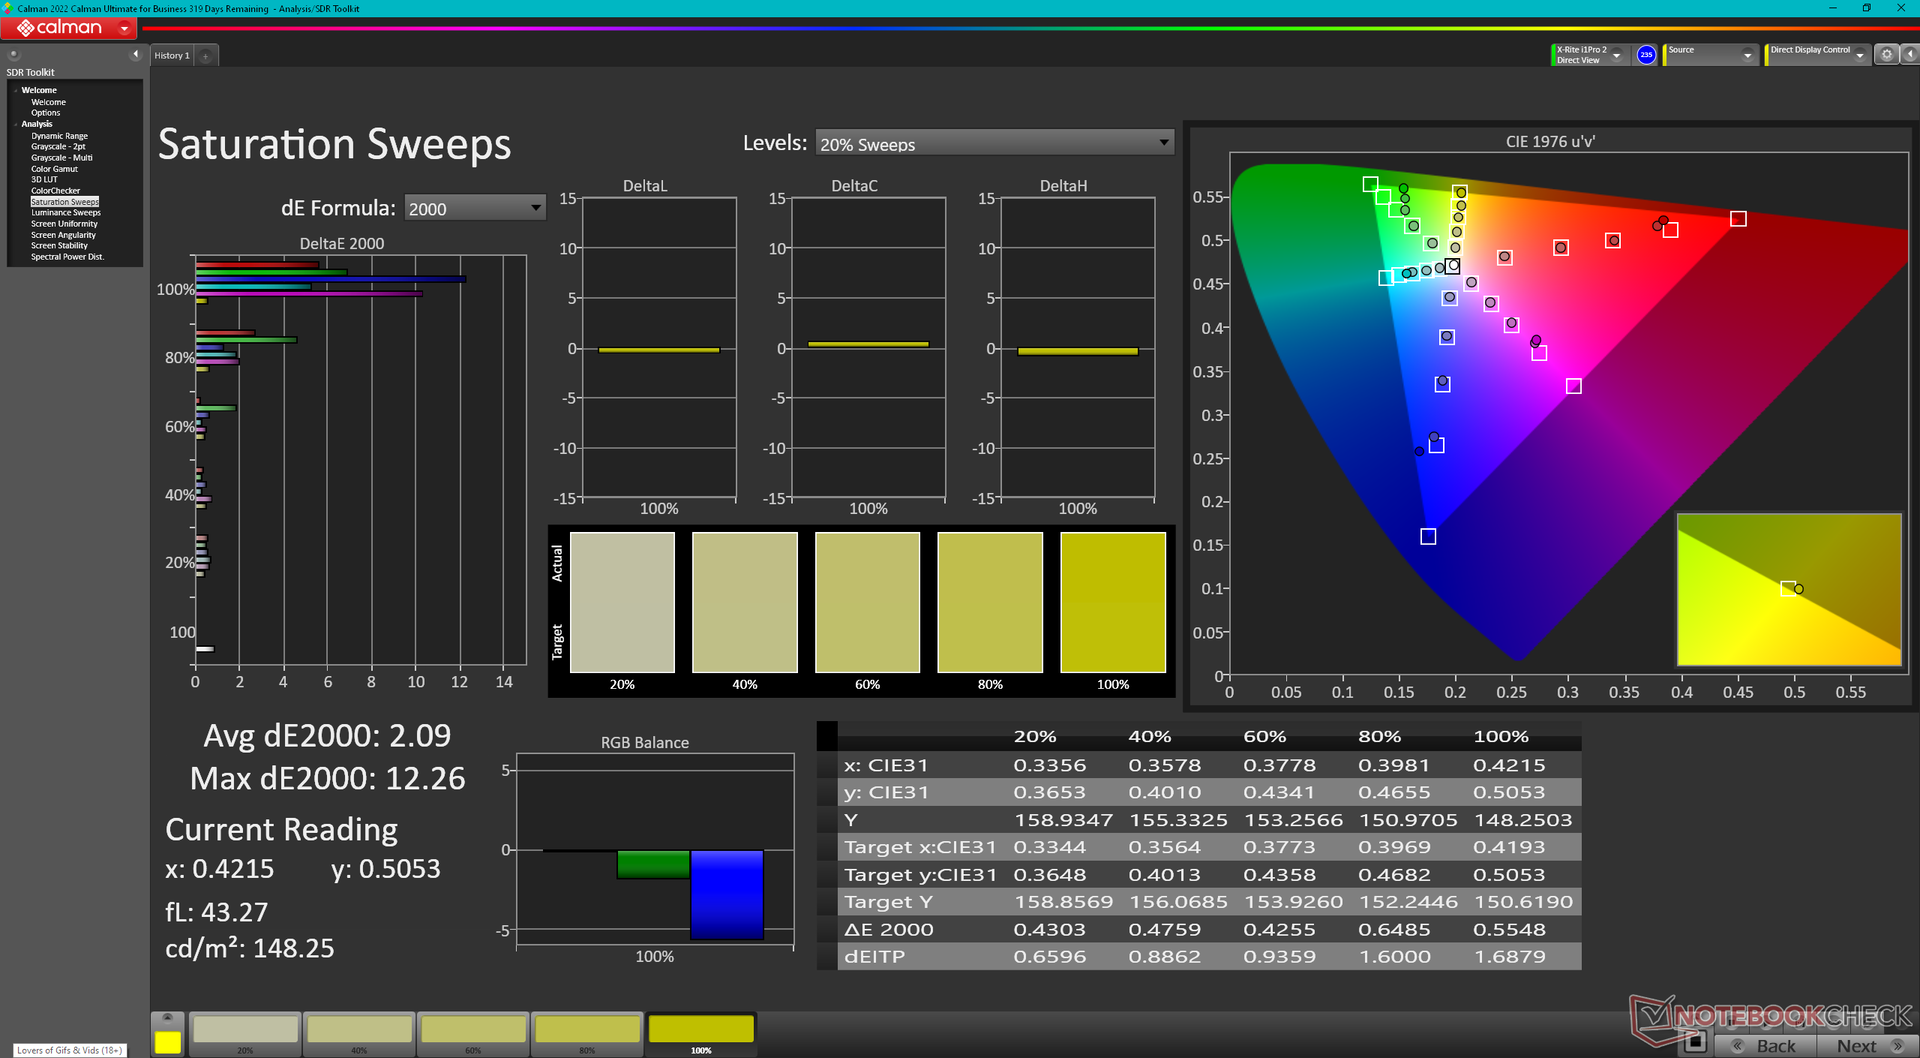
The display does not come calibrated with its average grayscale and color deltaE values of 4 and 3.72, respectively. Calibrating it ourselves addresses the overly warm color temperature for more accurate grayscale and colors as shown by our CalMAN screenshots below. Even so, the display still becomes more inaccurate at higher saturation levels due to the narrow color coverage mentioned above.
Display Response Times
| ↔ Response Time Black to White | ||
|---|---|---|
| 15.9 ms ... rise ↗ and fall ↘ combined | ↗ 8.1 ms rise | 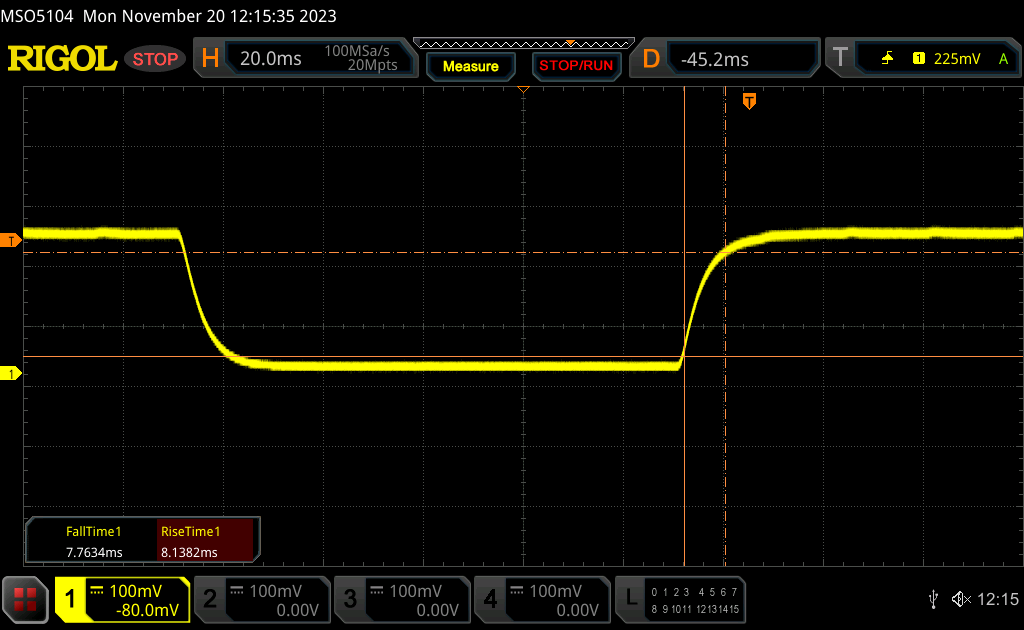 |
| ↘ 7.8 ms fall | ||
| The screen shows good response rates in our tests, but may be too slow for competitive gamers. In comparison, all tested devices range from 0.1 (minimum) to 240 (maximum) ms. » 37 % of all devices are better. This means that the measured response time is better than the average of all tested devices (19.8 ms). | ||
| ↔ Response Time 50% Grey to 80% Grey | ||
| 27.7 ms ... rise ↗ and fall ↘ combined | ↗ 12.2 ms rise | 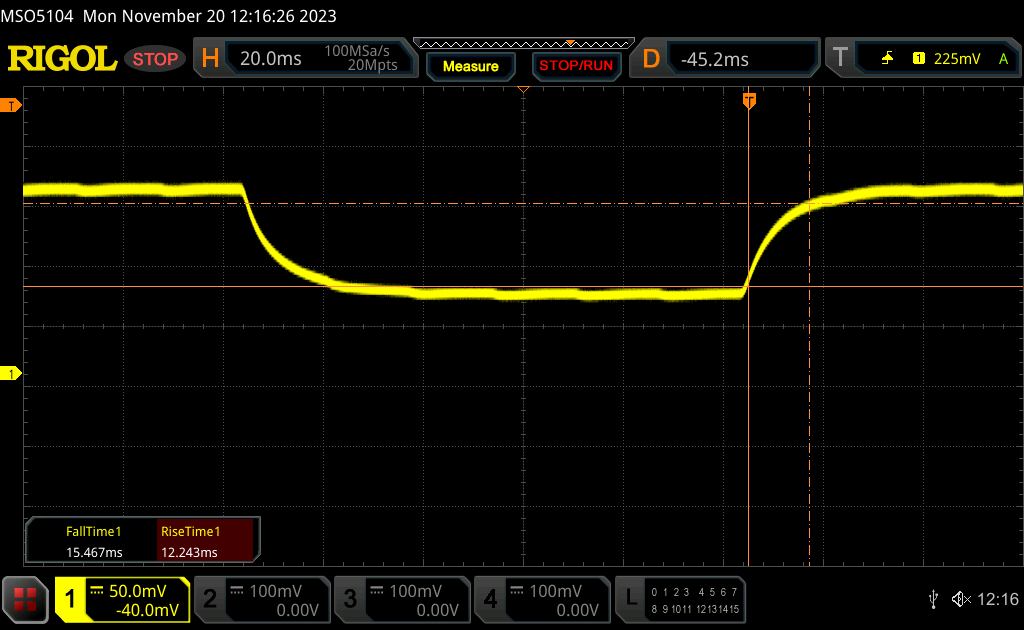 |
| ↘ 15.5 ms fall | ||
| The screen shows relatively slow response rates in our tests and may be too slow for gamers. In comparison, all tested devices range from 0.165 (minimum) to 636 (maximum) ms. » 38 % of all devices are better. This means that the measured response time is better than the average of all tested devices (31 ms). | ||
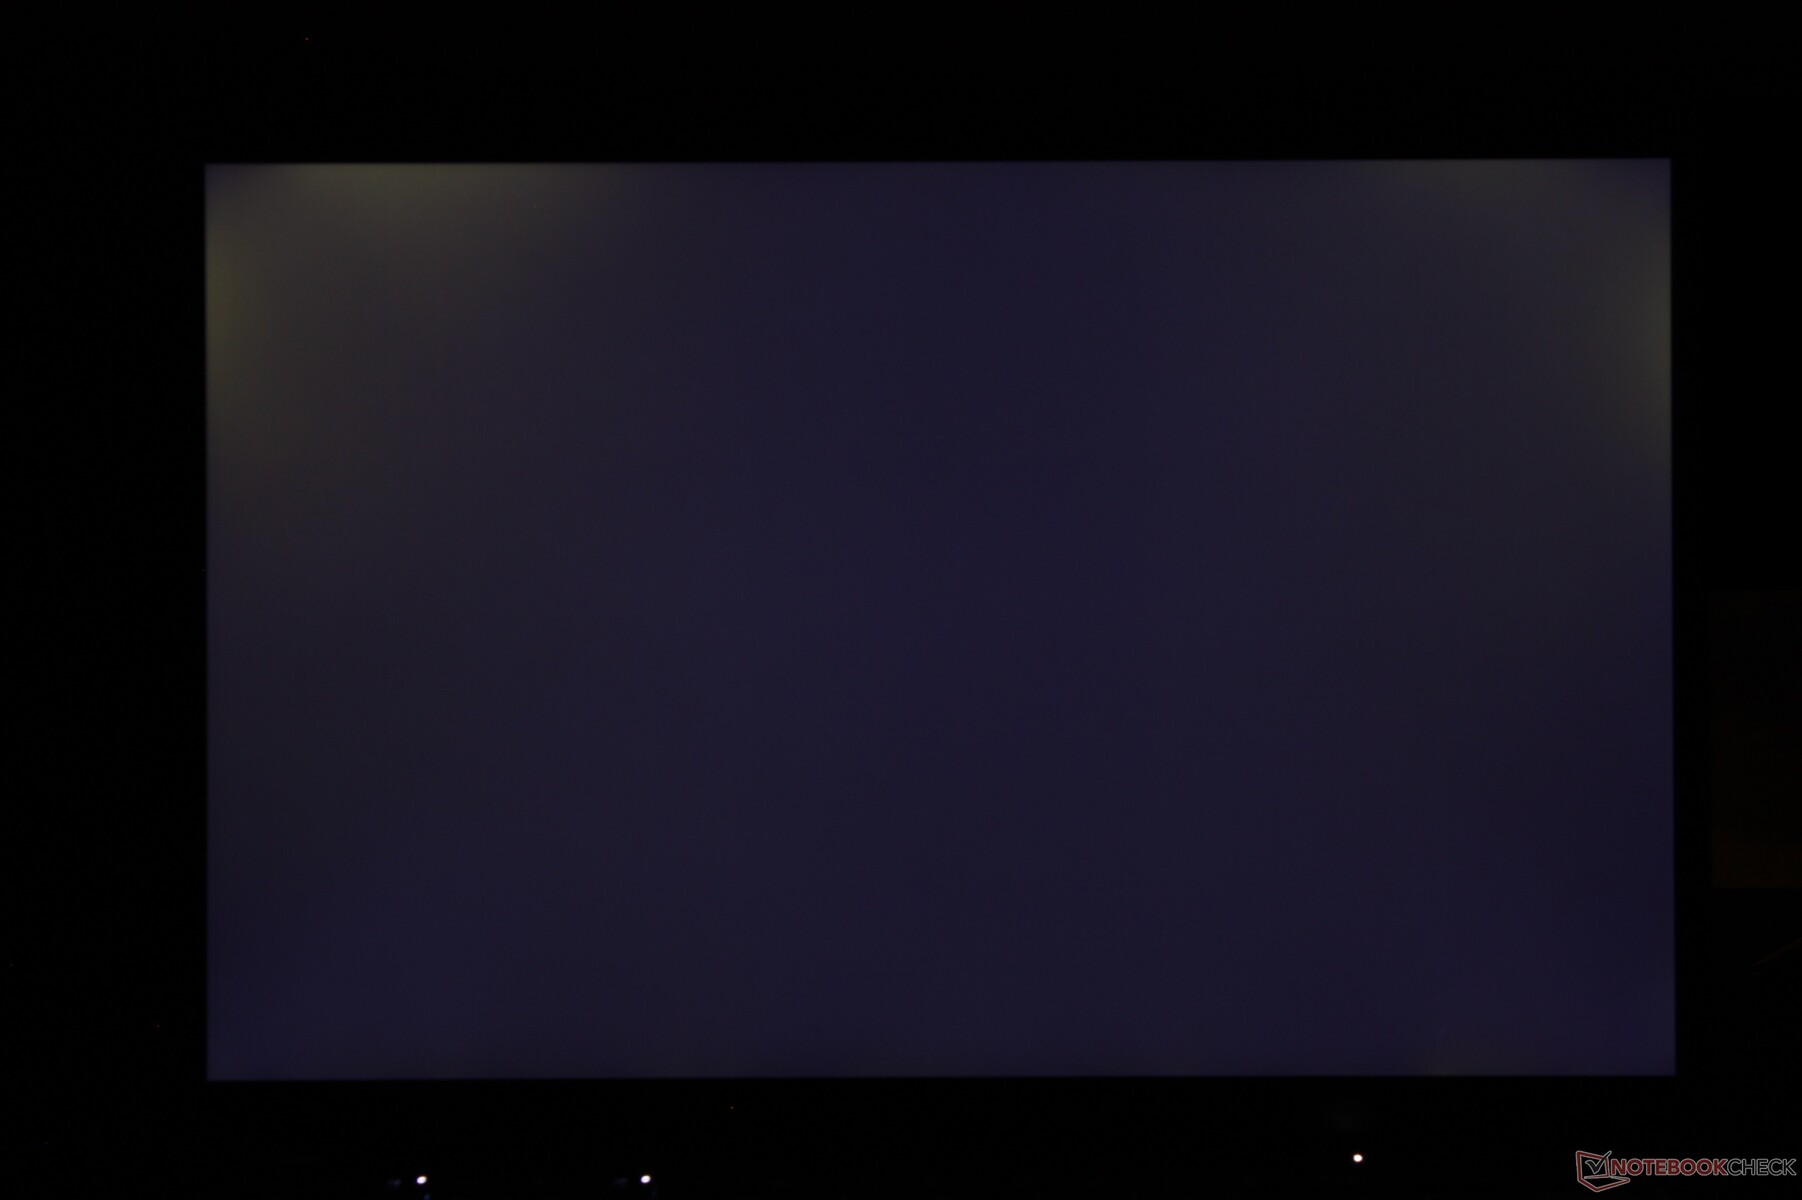
Screen Flickering / PWM (Pulse-Width Modulation)
| Screen flickering / PWM not detected | 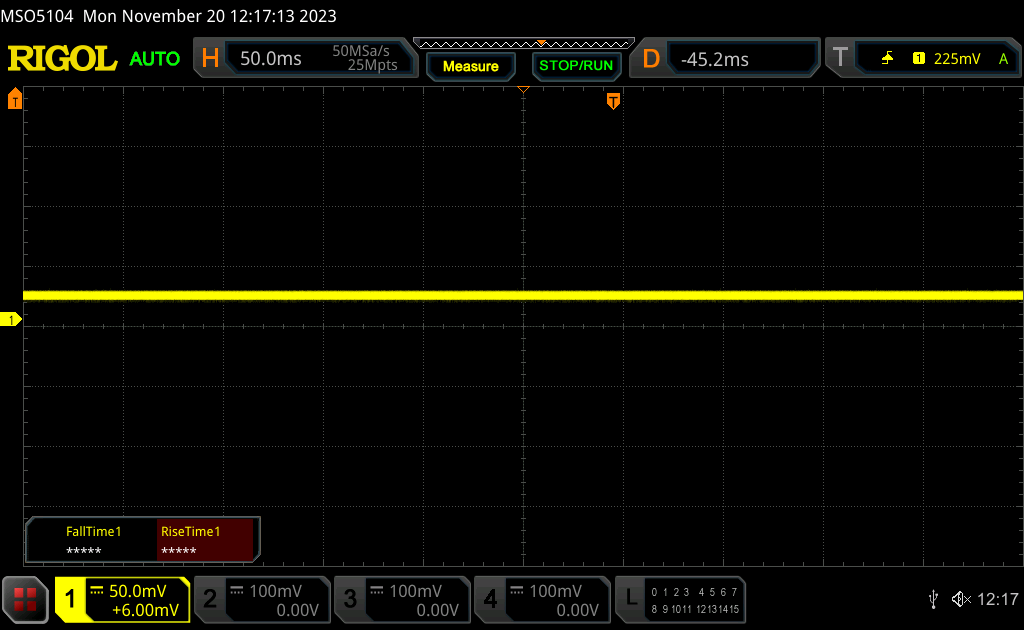 | ||
In comparison: 52 % of all tested devices do not use PWM to dim the display. If PWM was detected, an average of 7751 (minimum: 5 - maximum: 343500) Hz was measured. | |||
Performance
Testing Conditions
We set Windows to Performance mode prior to running the benchmarks below. Lenovo Vantage does not have its own set of power profiles to reduce confusion.
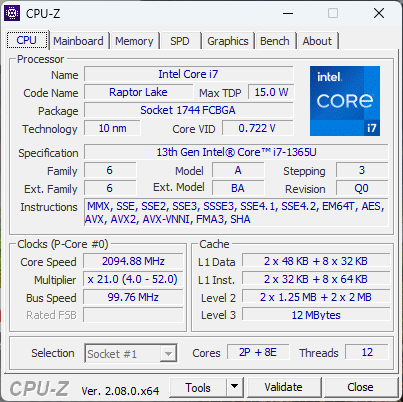
Processor
The Core i7-1365U offers just 10 percent faster single-thread performance than the Core i5-1335U. Otherwise, the two CPUs perform almost identically when it comes to multi-thread performance. You'll have to consider the AMD Zen 4 configurations for greater performance.
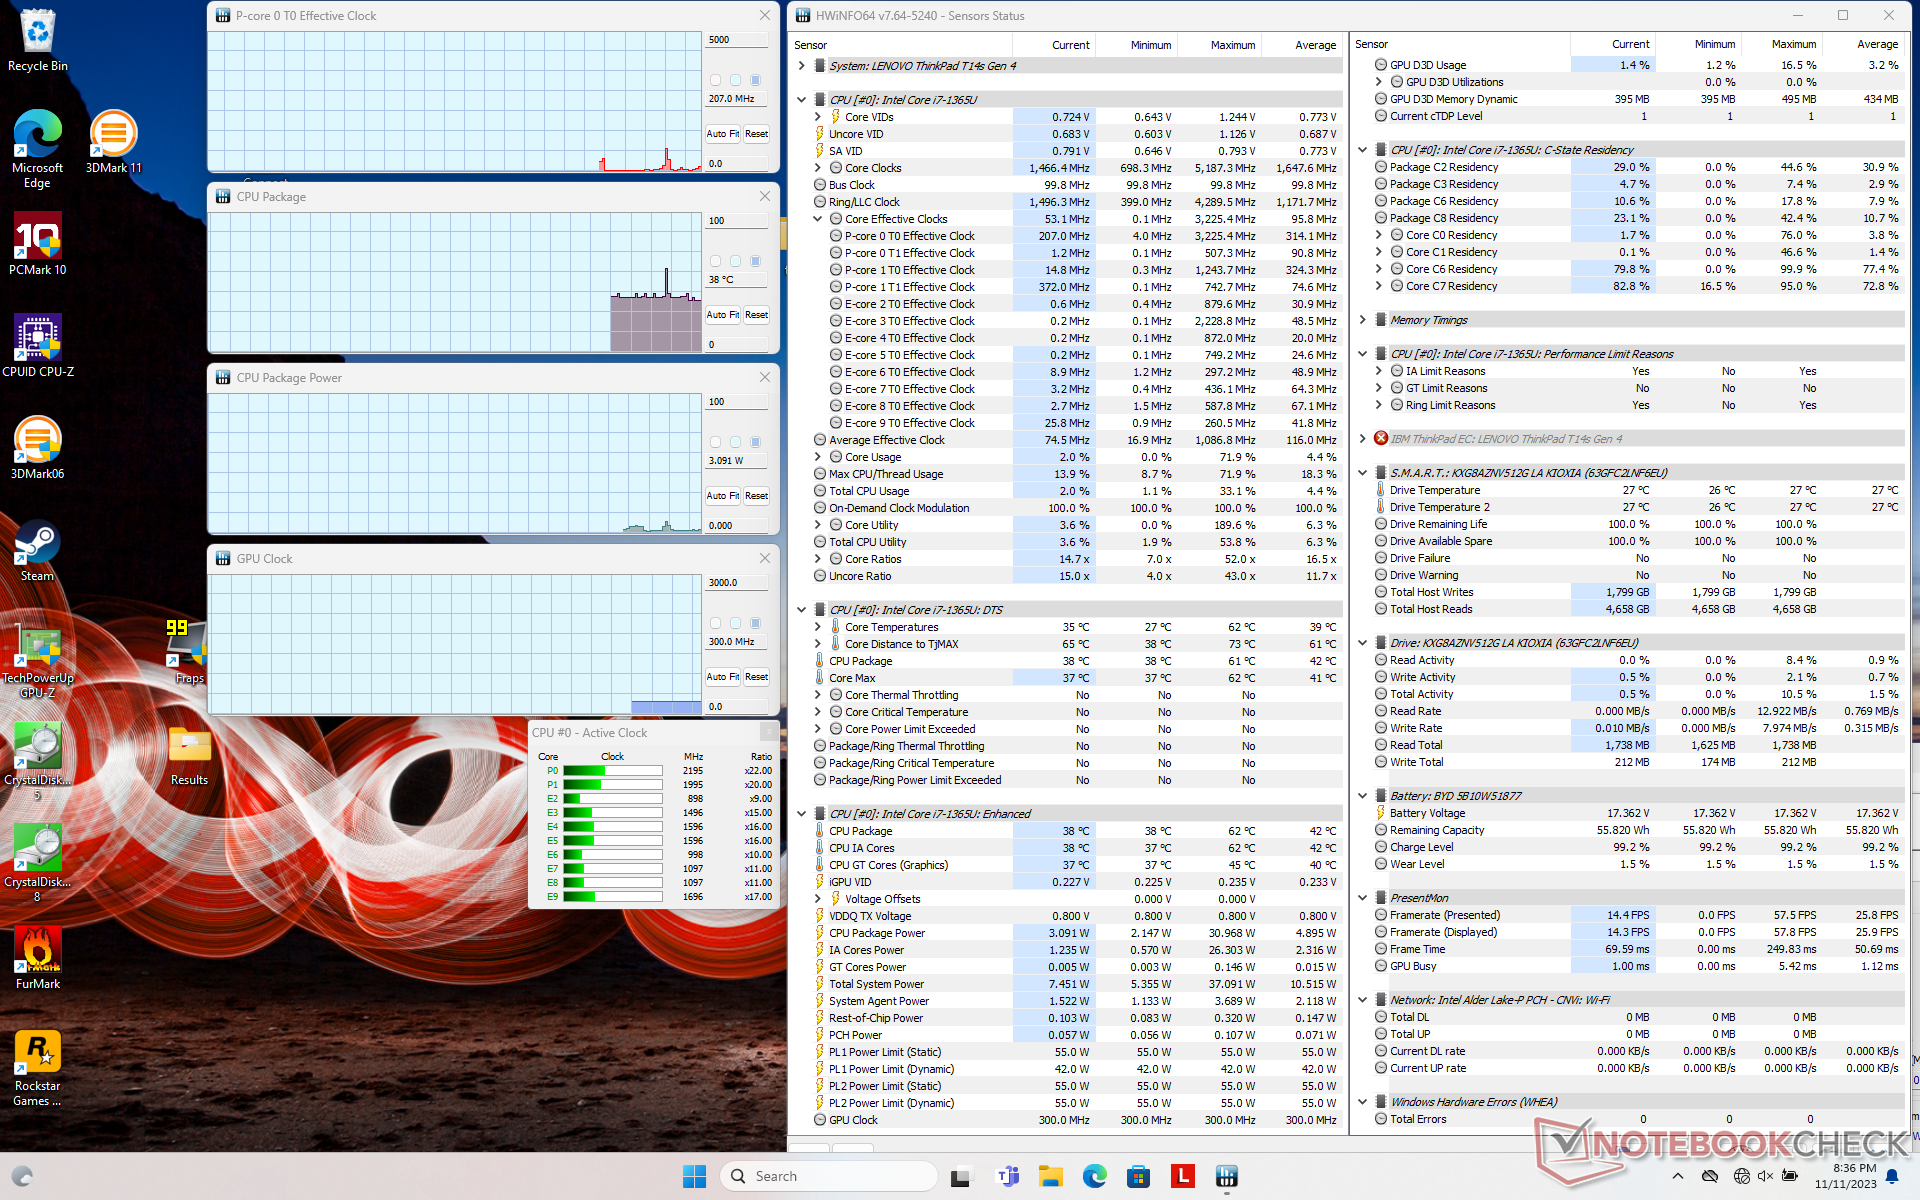
Performance sustainability is only average. When running CineBench R15 xT in a loop, for example, multi-thread performance would drop by about 20 percent over time to indicate slowing Turbo Boost speeds.
Cinebench R15 Multi Loop
Cinebench R23: Multi Core | Single Core
Cinebench R20: CPU (Multi Core) | CPU (Single Core)
Cinebench R15: CPU Multi 64Bit | CPU Single 64Bit
Blender: v2.79 BMW27 CPU
7-Zip 18.03: 7z b 4 | 7z b 4 -mmt1
Geekbench 5.5: Multi-Core | Single-Core
HWBOT x265 Benchmark v2.2: 4k Preset
LibreOffice : 20 Documents To PDF
R Benchmark 2.5: Overall mean
* ... smaller is better
AIDA64: FP32 Ray-Trace | FPU Julia | CPU SHA3 | CPU Queen | FPU SinJulia | FPU Mandel | CPU AES | CPU ZLib | FP64 Ray-Trace | CPU PhotoWorxx
| Performance rating | |
| HP EliteBook 845 G10 5Z4X0ES | |
| Dell Latitude 7440 | |
| Average Intel Core i7-1365U | |
| Lenovo ThinkPad T14s G4 i7-1365U | |
| Asus ExpertBook B9 B9403CVA-KM0153X | |
| Lenovo ThinkPad T14 G4 21HD0043GE | |
| AIDA64 / FP32 Ray-Trace | |
| HP EliteBook 845 G10 5Z4X0ES | |
| Dell Latitude 7440 | |
| Average Intel Core i7-1365U (6720 - 8270, n=4) | |
| Lenovo ThinkPad T14s G4 i7-1365U | |
| Asus ExpertBook B9 B9403CVA-KM0153X | |
| Lenovo ThinkPad T14 G4 21HD0043GE | |
| AIDA64 / FPU Julia | |
| HP EliteBook 845 G10 5Z4X0ES | |
| Dell Latitude 7440 | |
| Average Intel Core i7-1365U (33777 - 41487, n=4) | |
| Lenovo ThinkPad T14s G4 i7-1365U | |
| Asus ExpertBook B9 B9403CVA-KM0153X | |
| Lenovo ThinkPad T14 G4 21HD0043GE | |
| AIDA64 / CPU SHA3 | |
| HP EliteBook 845 G10 5Z4X0ES | |
| Dell Latitude 7440 | |
| Average Intel Core i7-1365U (1754 - 2216, n=4) | |
| Lenovo ThinkPad T14s G4 i7-1365U | |
| Asus ExpertBook B9 B9403CVA-KM0153X | |
| Lenovo ThinkPad T14 G4 21HD0043GE | |
| AIDA64 / CPU Queen | |
| HP EliteBook 845 G10 5Z4X0ES | |
| Average Intel Core i7-1365U (67557 - 69991, n=4) | |
| Lenovo ThinkPad T14s G4 i7-1365U | |
| Dell Latitude 7440 | |
| Lenovo ThinkPad T14 G4 21HD0043GE | |
| Asus ExpertBook B9 B9403CVA-KM0153X | |
| AIDA64 / FPU SinJulia | |
| HP EliteBook 845 G10 5Z4X0ES | |
| Dell Latitude 7440 | |
| Average Intel Core i7-1365U (4589 - 5145, n=4) | |
| Lenovo ThinkPad T14s G4 i7-1365U | |
| Asus ExpertBook B9 B9403CVA-KM0153X | |
| Lenovo ThinkPad T14 G4 21HD0043GE | |
| AIDA64 / FPU Mandel | |
| HP EliteBook 845 G10 5Z4X0ES | |
| Dell Latitude 7440 | |
| Average Intel Core i7-1365U (16808 - 20668, n=4) | |
| Lenovo ThinkPad T14s G4 i7-1365U | |
| Asus ExpertBook B9 B9403CVA-KM0153X | |
| Lenovo ThinkPad T14 G4 21HD0043GE | |
| AIDA64 / CPU AES | |
| HP EliteBook 845 G10 5Z4X0ES | |
| Dell Latitude 7440 | |
| Lenovo ThinkPad T14s G4 i7-1365U | |
| Average Intel Core i7-1365U (34968 - 41413, n=4) | |
| Lenovo ThinkPad T14 G4 21HD0043GE | |
| Asus ExpertBook B9 B9403CVA-KM0153X | |
| AIDA64 / CPU ZLib | |
| HP EliteBook 845 G10 5Z4X0ES | |
| Dell Latitude 7440 | |
| Average Intel Core i7-1365U (519 - 650, n=4) | |
| Lenovo ThinkPad T14s G4 i7-1365U | |
| Lenovo ThinkPad T14 G4 21HD0043GE | |
| Asus ExpertBook B9 B9403CVA-KM0153X | |
| AIDA64 / FP64 Ray-Trace | |
| HP EliteBook 845 G10 5Z4X0ES | |
| Dell Latitude 7440 | |
| Average Intel Core i7-1365U (3513 - 4367, n=4) | |
| Lenovo ThinkPad T14s G4 i7-1365U | |
| Asus ExpertBook B9 B9403CVA-KM0153X | |
| Lenovo ThinkPad T14 G4 21HD0043GE | |
| AIDA64 / CPU PhotoWorxx | |
| Average Intel Core i7-1365U (37846 - 43780, n=4) | |
| Dell Latitude 7440 | |
| Lenovo ThinkPad T14s G4 i7-1365U | |
| Asus ExpertBook B9 B9403CVA-KM0153X | |
| HP EliteBook 845 G10 5Z4X0ES | |
| Lenovo ThinkPad T14 G4 21HD0043GE | |
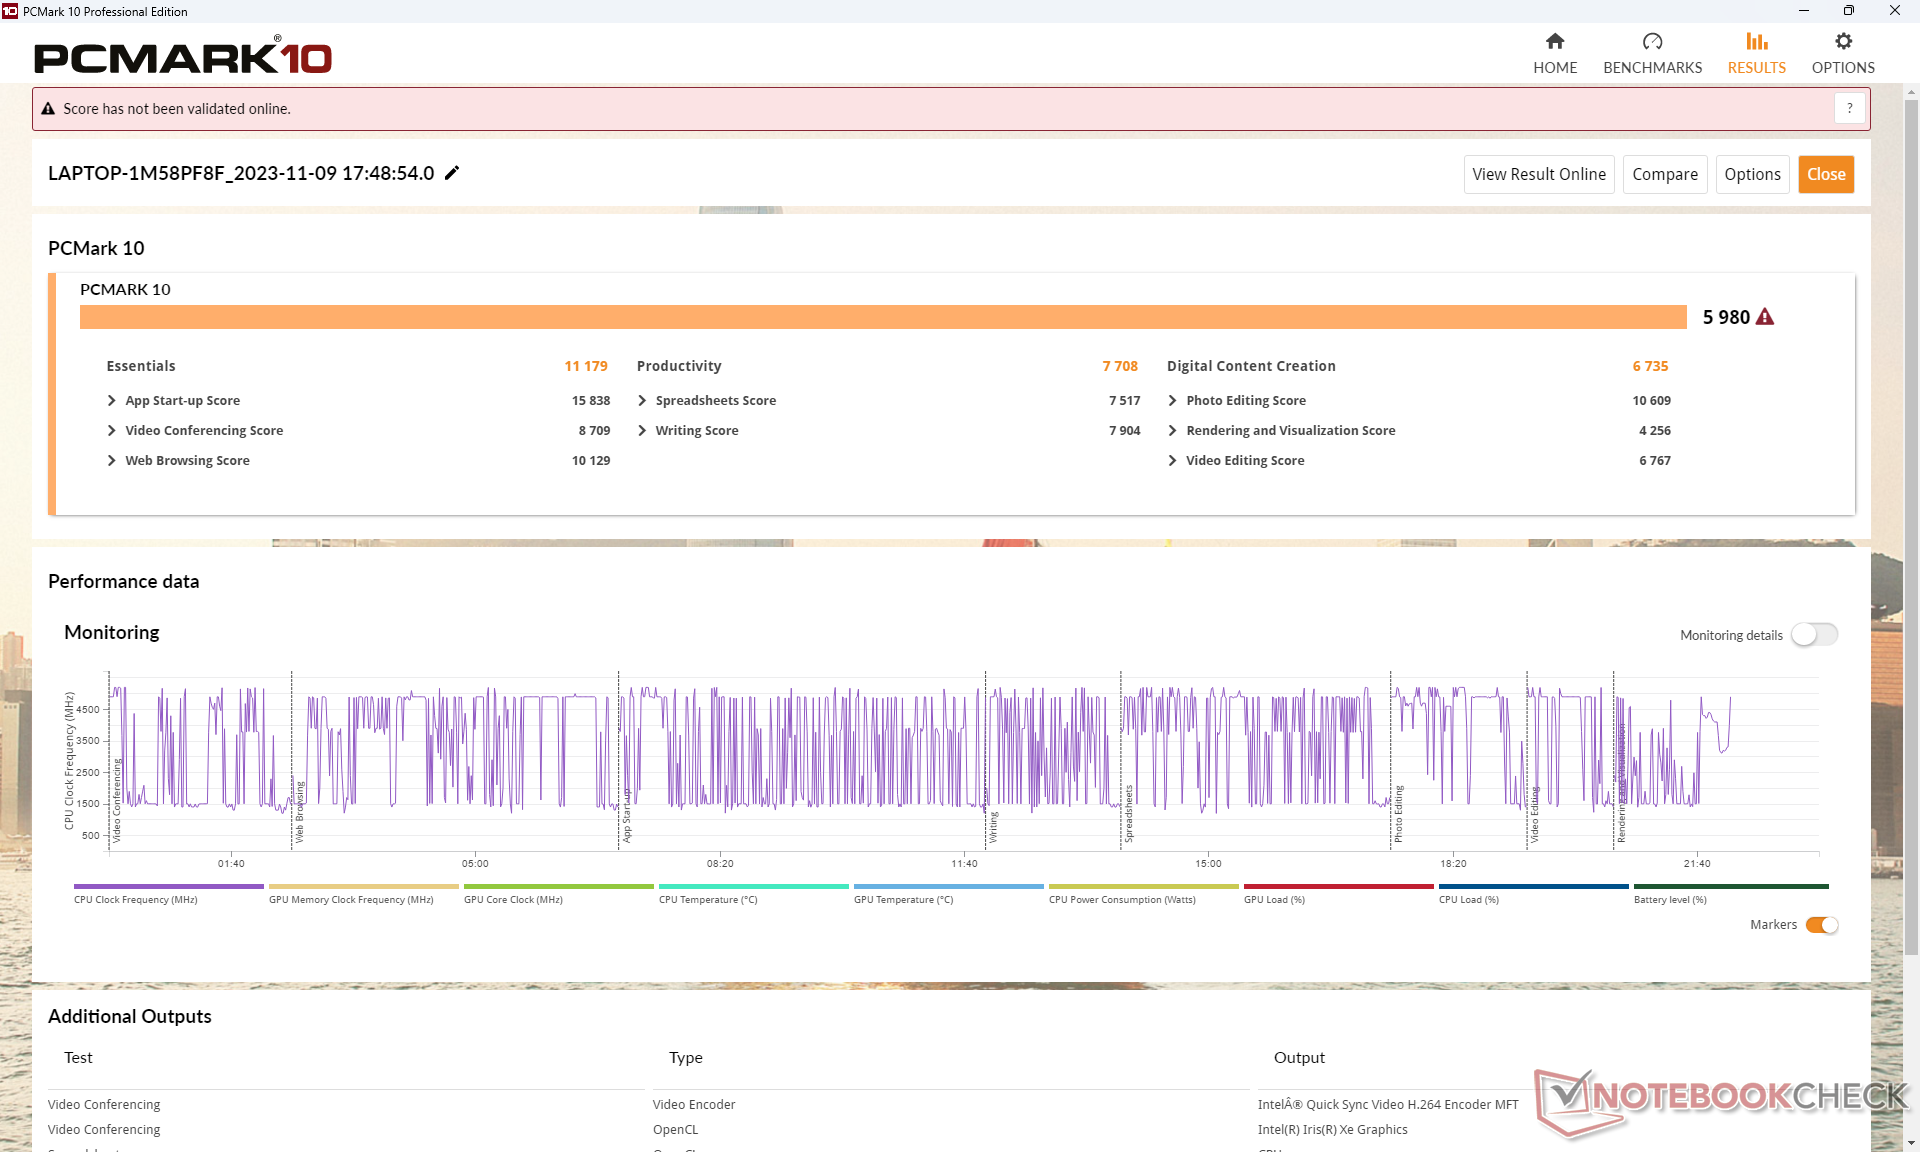
System Performance
PCMark Productivity and Digital Content Creation subtest results are well behind the AMD-based ThinkPad T14s G4 due to the slower CPU multi-thread performance and integrated GPU performance of our Intel model.
CrossMark: Overall | Productivity | Creativity | Responsiveness
| PCMark 10 / Score | |
| HP EliteBook 845 G10 5Z4X0ES | |
| Lenovo ThinkPad T14s G4-21F8002TGE | |
| Lenovo ThinkPad T14s G4 i7-1365U | |
| Average Intel Core i7-1365U, Intel Iris Xe Graphics G7 96EUs (5690 - 5980, n=4) | |
| Asus ExpertBook B9 B9403CVA-KM0153X | |
| Dell Latitude 7440 | |
| Lenovo ThinkPad T14 G4 21HD0043GE | |
| PCMark 10 / Essentials | |
| Lenovo ThinkPad T14s G4 i7-1365U | |
| Average Intel Core i7-1365U, Intel Iris Xe Graphics G7 96EUs (10635 - 11827, n=4) | |
| Asus ExpertBook B9 B9403CVA-KM0153X | |
| Dell Latitude 7440 | |
| HP EliteBook 845 G10 5Z4X0ES | |
| Lenovo ThinkPad T14 G4 21HD0043GE | |
| Lenovo ThinkPad T14s G4-21F8002TGE | |
| PCMark 10 / Productivity | |
| HP EliteBook 845 G10 5Z4X0ES | |
| Lenovo ThinkPad T14s G4-21F8002TGE | |
| Lenovo ThinkPad T14s G4 i7-1365U | |
| Asus ExpertBook B9 B9403CVA-KM0153X | |
| Average Intel Core i7-1365U, Intel Iris Xe Graphics G7 96EUs (7206 - 7708, n=4) | |
| Lenovo ThinkPad T14 G4 21HD0043GE | |
| Dell Latitude 7440 | |
| PCMark 10 / Digital Content Creation | |
| HP EliteBook 845 G10 5Z4X0ES | |
| Lenovo ThinkPad T14s G4-21F8002TGE | |
| Lenovo ThinkPad T14s G4 i7-1365U | |
| Average Intel Core i7-1365U, Intel Iris Xe Graphics G7 96EUs (6392 - 6735, n=4) | |
| Dell Latitude 7440 | |
| Lenovo ThinkPad T14 G4 21HD0043GE | |
| Asus ExpertBook B9 B9403CVA-KM0153X | |
| CrossMark / Overall | |
| Average Intel Core i7-1365U, Intel Iris Xe Graphics G7 96EUs (1605 - 1675, n=4) | |
| Lenovo ThinkPad T14s G4 i7-1365U | |
| Asus ExpertBook B9 B9403CVA-KM0153X | |
| Lenovo ThinkPad T14s G4-21F8002TGE | |
| HP EliteBook 845 G10 5Z4X0ES | |
| Lenovo ThinkPad T14 G4 21HD0043GE | |
| CrossMark / Productivity | |
| Average Intel Core i7-1365U, Intel Iris Xe Graphics G7 96EUs (1582 - 1650, n=4) | |
| Lenovo ThinkPad T14s G4 i7-1365U | |
| Asus ExpertBook B9 B9403CVA-KM0153X | |
| Lenovo ThinkPad T14s G4-21F8002TGE | |
| HP EliteBook 845 G10 5Z4X0ES | |
| Lenovo ThinkPad T14 G4 21HD0043GE | |
| CrossMark / Creativity | |
| Average Intel Core i7-1365U, Intel Iris Xe Graphics G7 96EUs (1713 - 1797, n=4) | |
| Lenovo ThinkPad T14s G4 i7-1365U | |
| HP EliteBook 845 G10 5Z4X0ES | |
| Lenovo ThinkPad T14s G4-21F8002TGE | |
| Asus ExpertBook B9 B9403CVA-KM0153X | |
| Lenovo ThinkPad T14 G4 21HD0043GE | |
| CrossMark / Responsiveness | |
| Average Intel Core i7-1365U, Intel Iris Xe Graphics G7 96EUs (1373 - 1427, n=4) | |
| Lenovo ThinkPad T14s G4 i7-1365U | |
| Asus ExpertBook B9 B9403CVA-KM0153X | |
| HP EliteBook 845 G10 5Z4X0ES | |
| Lenovo ThinkPad T14s G4-21F8002TGE | |
| Lenovo ThinkPad T14 G4 21HD0043GE | |
| PCMark 10 Score | 5980 points | |
Help | ||
| AIDA64 / Memory Copy | |
| Lenovo ThinkPad T14s G4-21F8002TGE | |
| Average Intel Core i7-1365U (57654 - 69736, n=4) | |
| HP EliteBook 845 G10 5Z4X0ES | |
| Asus ExpertBook B9 B9403CVA-KM0153X | |
| Dell Latitude 7440 | |
| Lenovo ThinkPad T14s G4 i7-1365U | |
| Lenovo ThinkPad T14 G4 21HD0043GE | |
| AIDA64 / Memory Read | |
| HP EliteBook 845 G10 5Z4X0ES | |
| Average Intel Core i7-1365U (49203 - 54068, n=4) | |
| Dell Latitude 7440 | |
| Lenovo ThinkPad T14s G4 i7-1365U | |
| Asus ExpertBook B9 B9403CVA-KM0153X | |
| Lenovo ThinkPad T14s G4-21F8002TGE | |
| Lenovo ThinkPad T14 G4 21HD0043GE | |
| AIDA64 / Memory Write | |
| Lenovo ThinkPad T14s G4-21F8002TGE | |
| HP EliteBook 845 G10 5Z4X0ES | |
| Average Intel Core i7-1365U (70434 - 85570, n=4) | |
| Asus ExpertBook B9 B9403CVA-KM0153X | |
| Lenovo ThinkPad T14s G4 i7-1365U | |
| Dell Latitude 7440 | |
| Lenovo ThinkPad T14 G4 21HD0043GE | |
| AIDA64 / Memory Latency | |
| Lenovo ThinkPad T14s G4-21F8002TGE | |
| Lenovo ThinkPad T14s G4 i7-1365U | |
| Dell Latitude 7440 | |
| Asus ExpertBook B9 B9403CVA-KM0153X | |
| Average Intel Core i7-1365U (90.2 - 102.2, n=4) | |
| HP EliteBook 845 G10 5Z4X0ES | |
| Lenovo ThinkPad T14 G4 21HD0043GE | |
* ... smaller is better
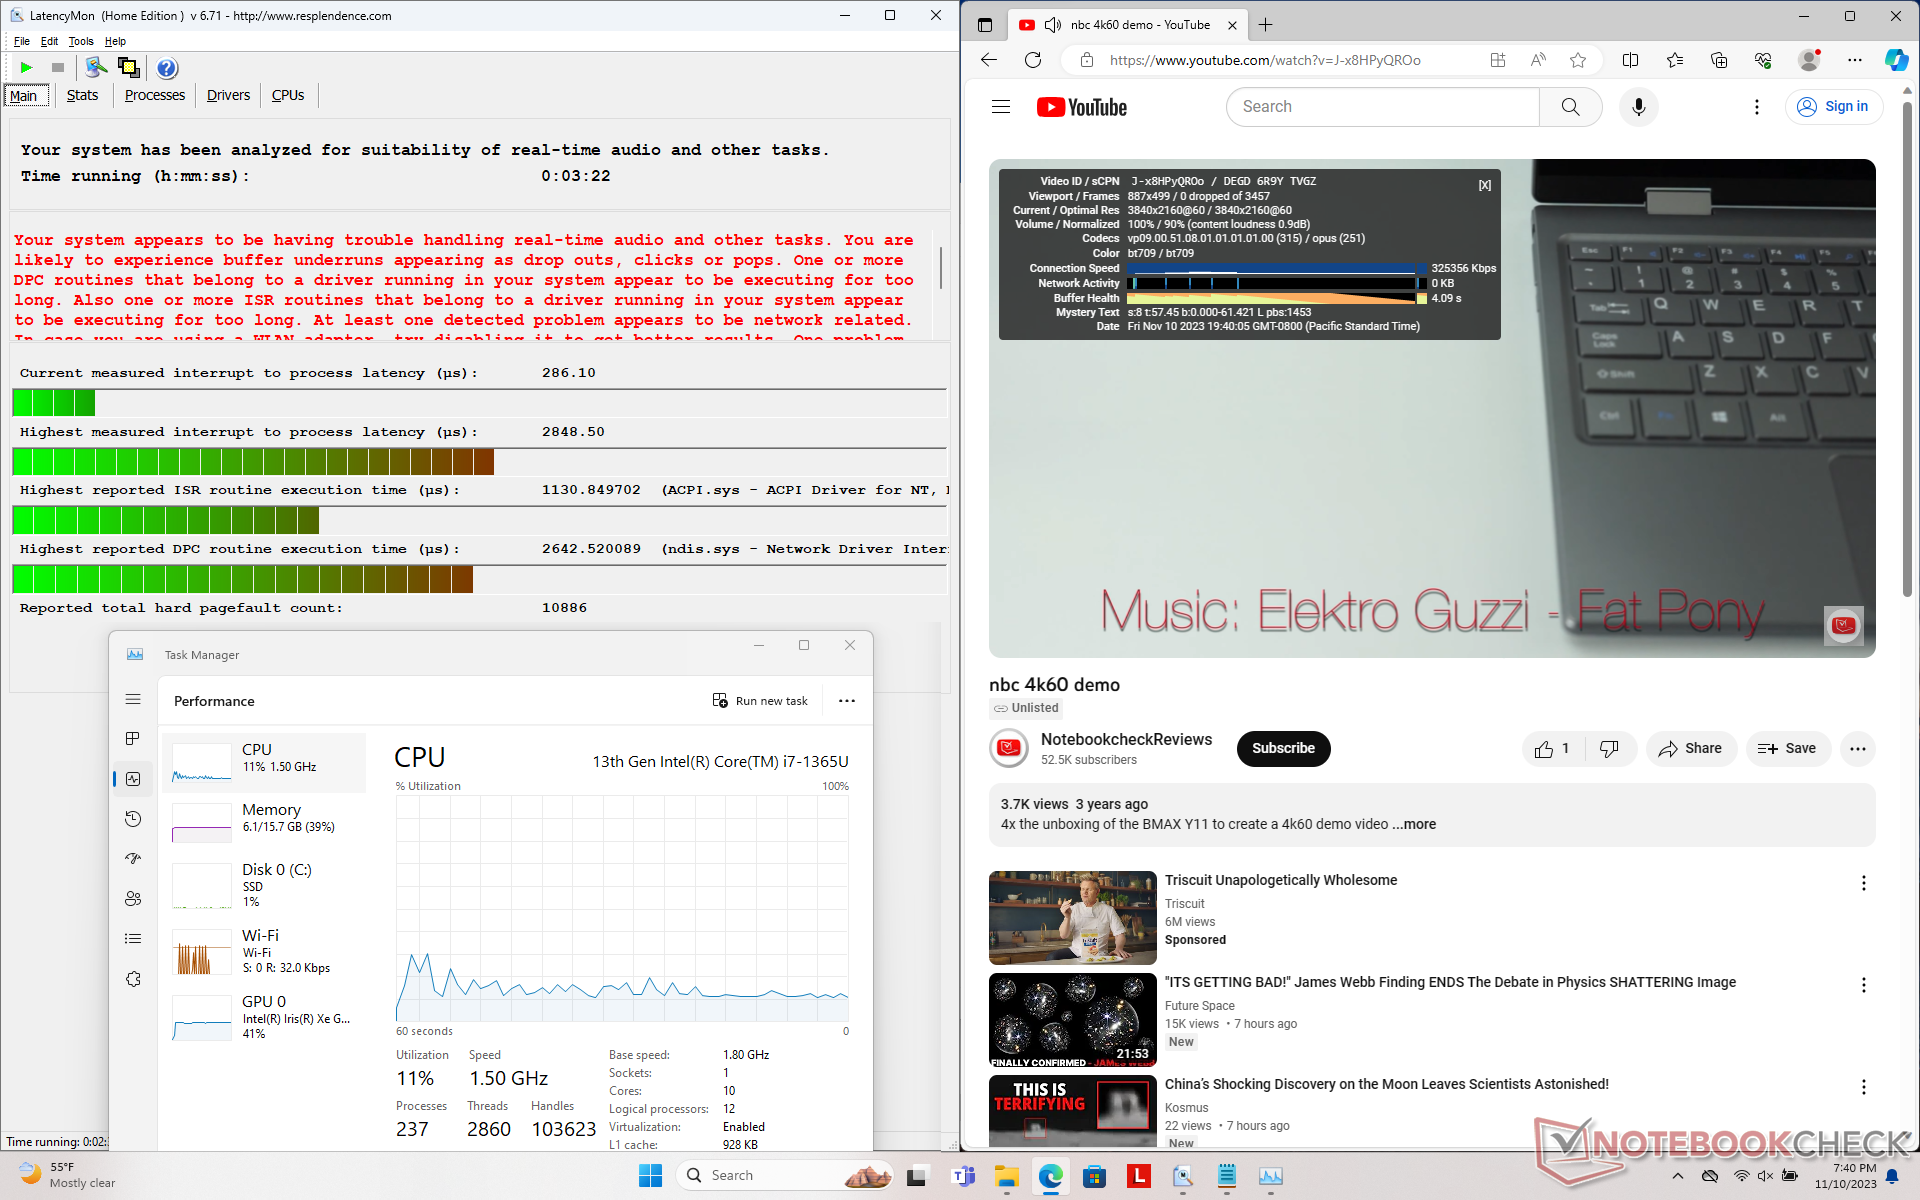
DPC Latency
LatencyMon reveals DPC issues when opening multiple browser tabs of our homepage. 4K video playback at 60 FPS is otherwise perfect with no dropped frames recorded.
| DPC Latencies / LatencyMon - interrupt to process latency (max), Web, Youtube, Prime95 | |
| Lenovo ThinkPad T14s G4 i7-1365U | |
| Lenovo ThinkPad T14 G4 21HD0043GE | |
| Dell Latitude 7440 | |
| Asus ExpertBook B9 B9403CVA-KM0153X | |
| HP EliteBook 845 G10 5Z4X0ES | |
| Lenovo ThinkPad T14s G4-21F8002TGE | |
* ... smaller is better
Storage Devices
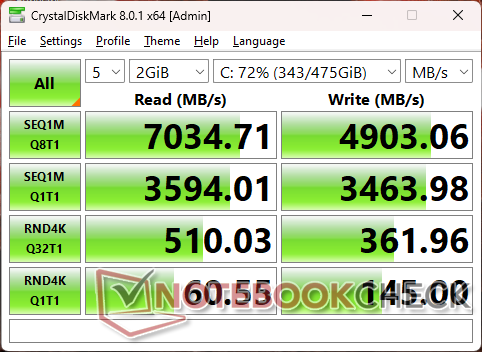
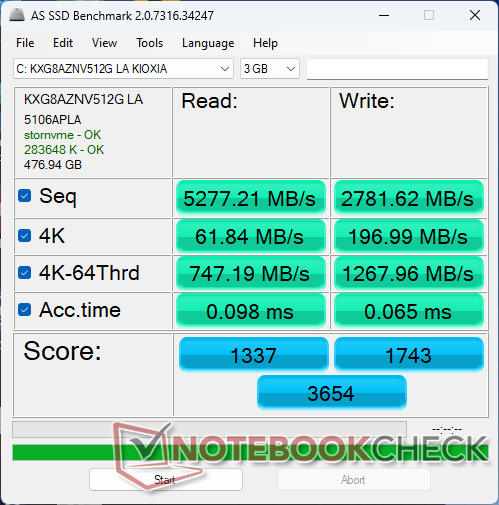
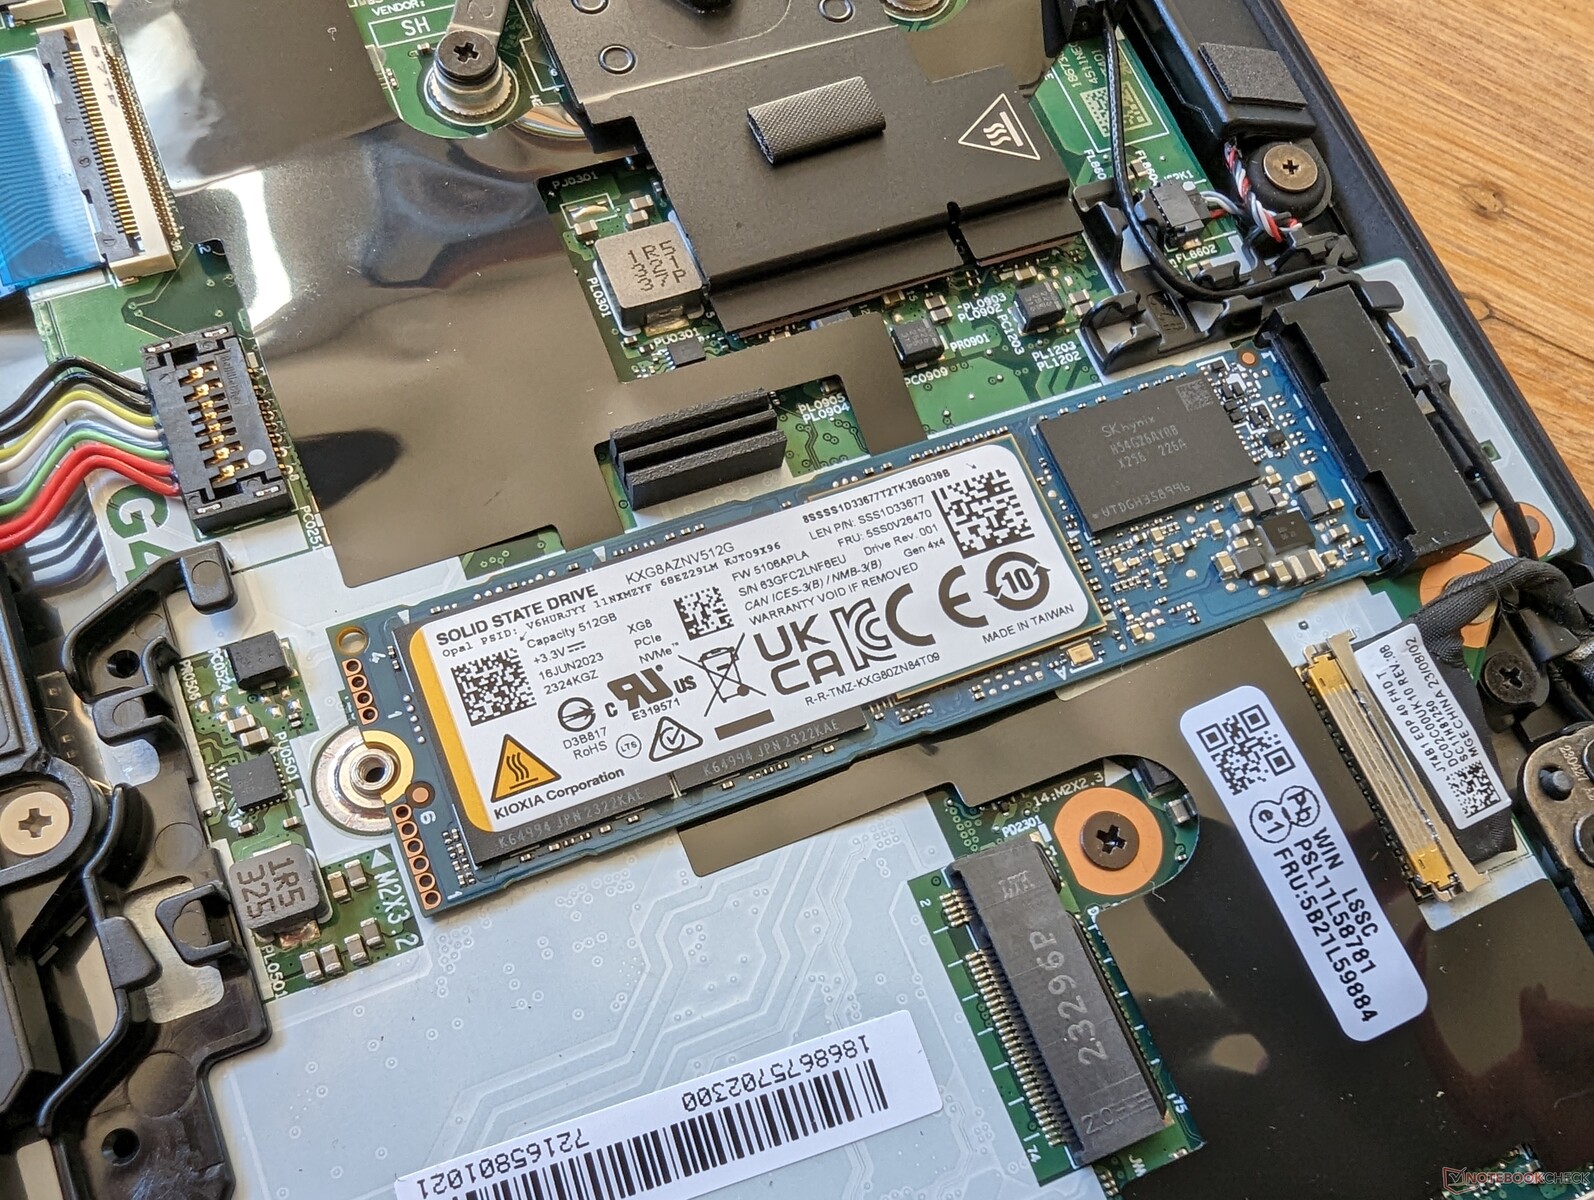
Our test unit includes a 512 GB Kioxia XG8 KXG8AZNV512G promising sequential read and write rates of up to 7000 MB/s and 5000 MB/s, respectively. The drive in our unit can indeed reach 7000 MB/s, but this rate would only last for a minute or two before it begins to throttle to the 5000 MB/s range as shown by our DiskSpd loop results below. In comparison, the Samsung PM9A1a in the AMD version of our ThinkPad T14s G4 would have no issues maintaining maximum speeds for longer periods. We suspect that the controller on the Kioxia is reaching its temperature ceiling at a faster rate than on the Samsung.

* ... smaller is better
Disk Throttling: DiskSpd Read Loop, Queue Depth 8
GPU Performance
The Iris Xe 96 EUs is due for an upgrade as it has fallen behind recent alternatives from AMD. The Radeon 780M in the AMD version of the ThinkPad 14s G4 can offer 40 to 60 percent faster performance which is not insignificant by any means. Downgrading to the Core i5-1335U configuration with the Iris Xe 80 EUs instead of our Iris Xe 96 EUs will impact graphics performance by 25 to 30 percent.
Interestingly, overall performance remains about the same between battery power, Balanced mode, and Performance mode as shown by our 3DMark 11 results table below.
| Power Profile | Physics Score | Graphics Score | Combined Score |
| Battery Power | 13557 | 6293 | 6359 |
| Balanced | 12255 | 6424 | 6148 |
| Performance | 12580 | 6403 | 6268 |
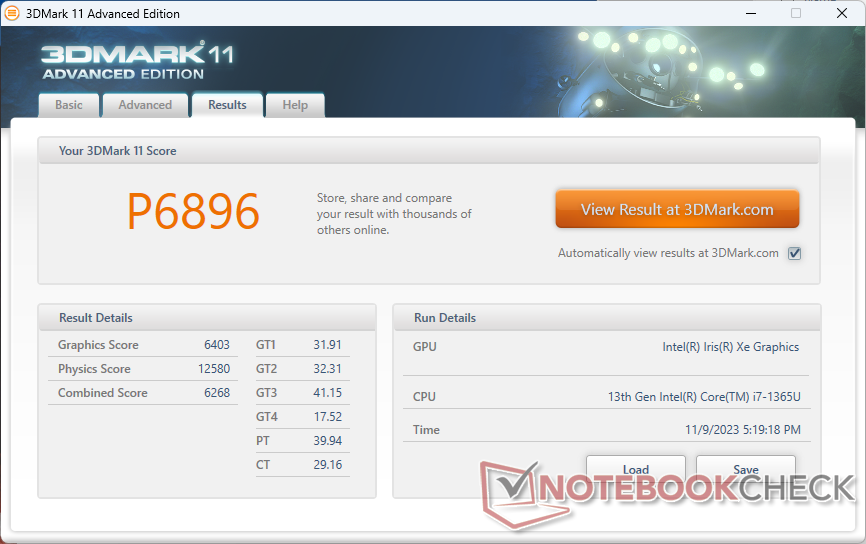
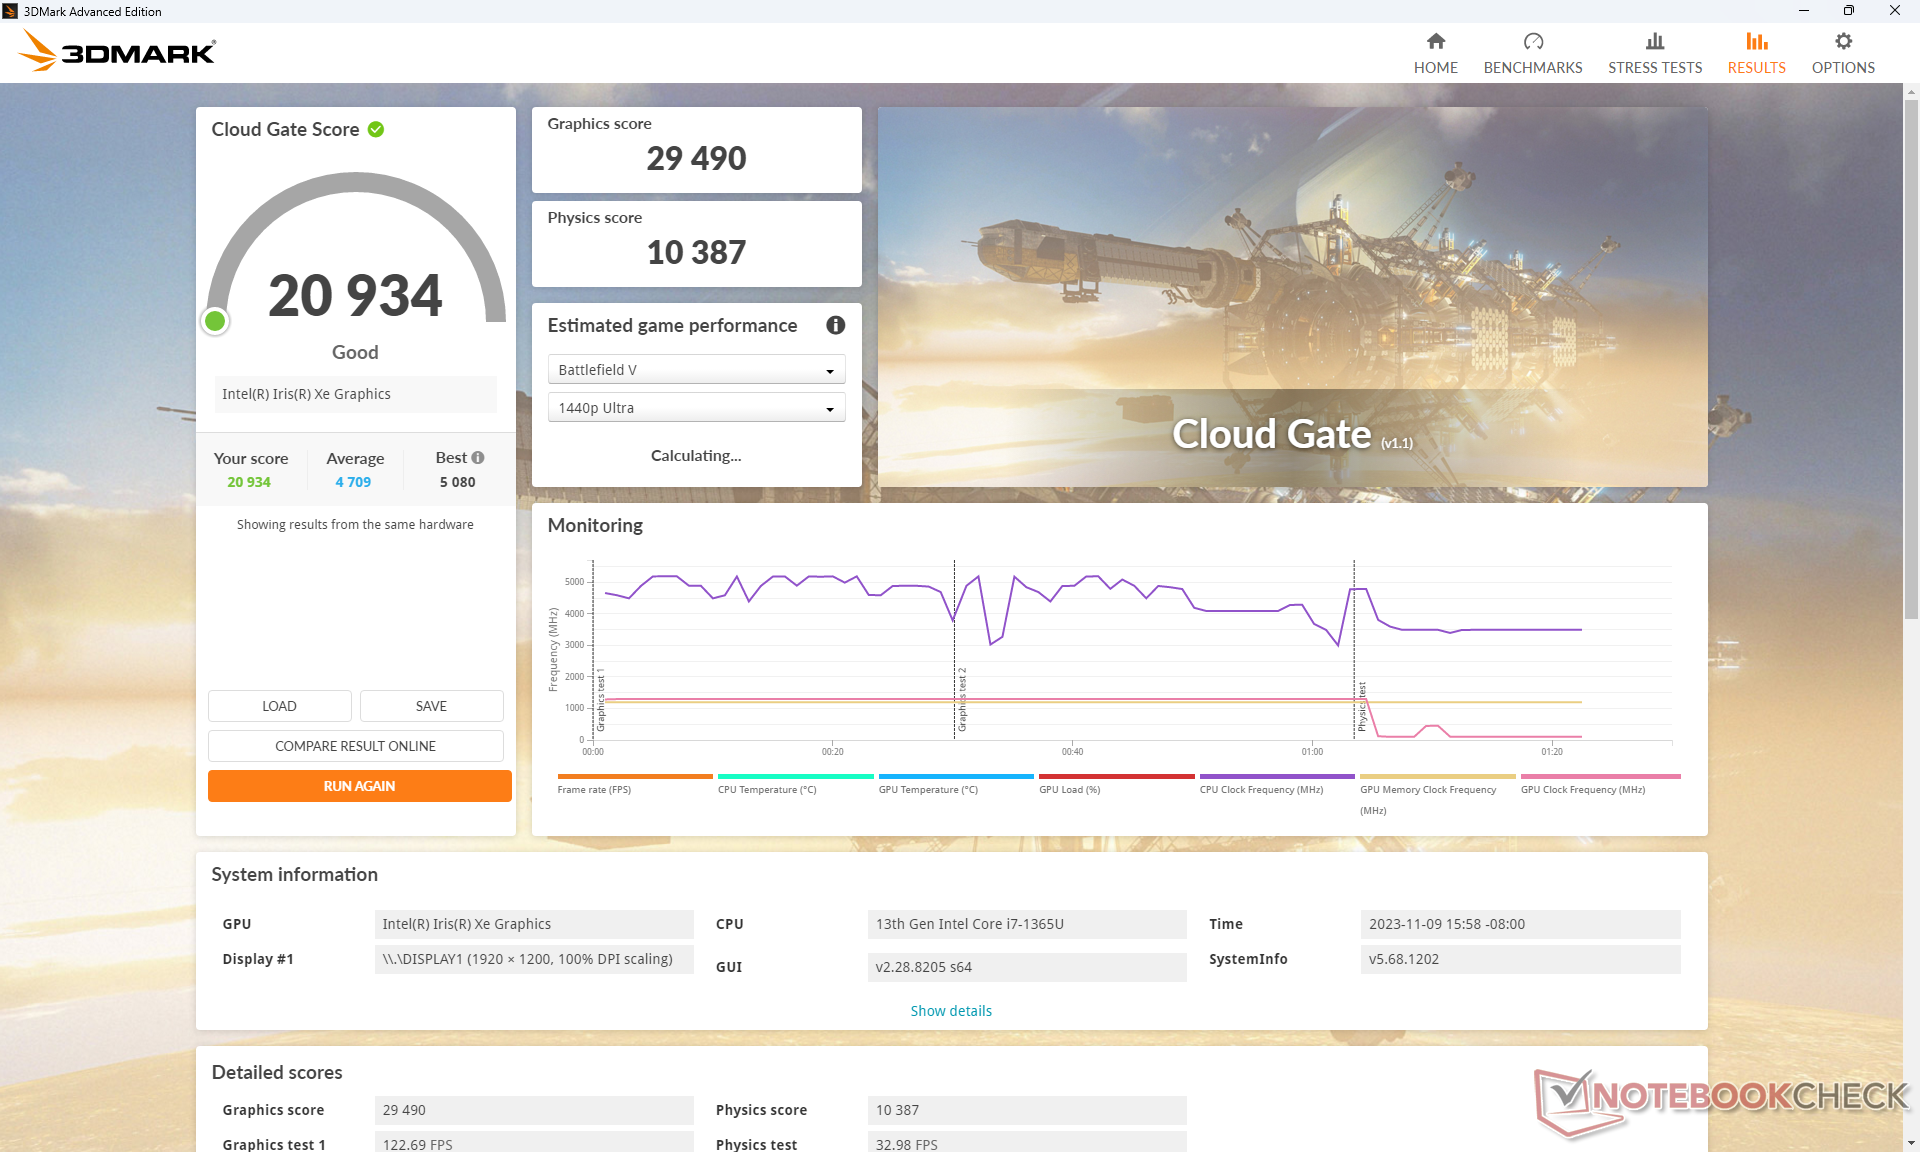
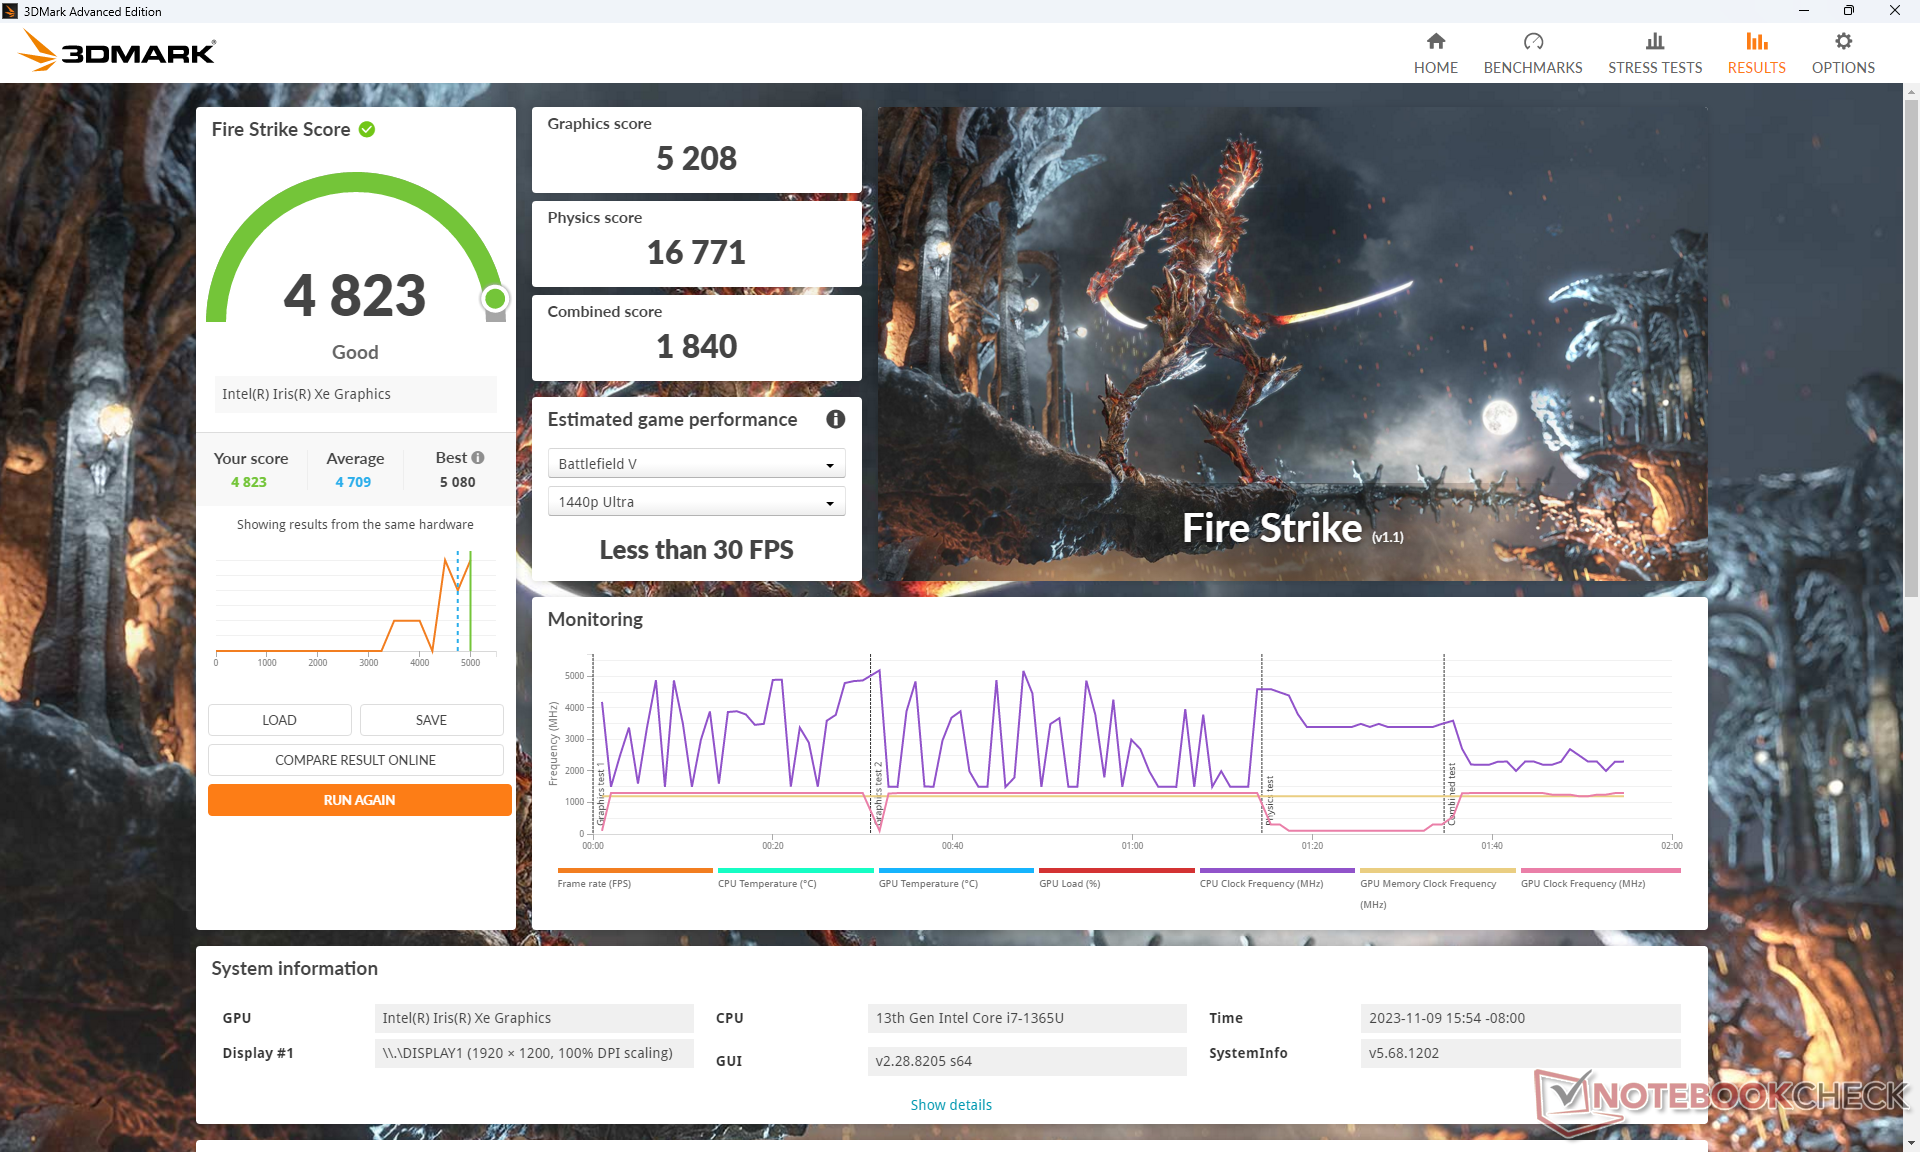
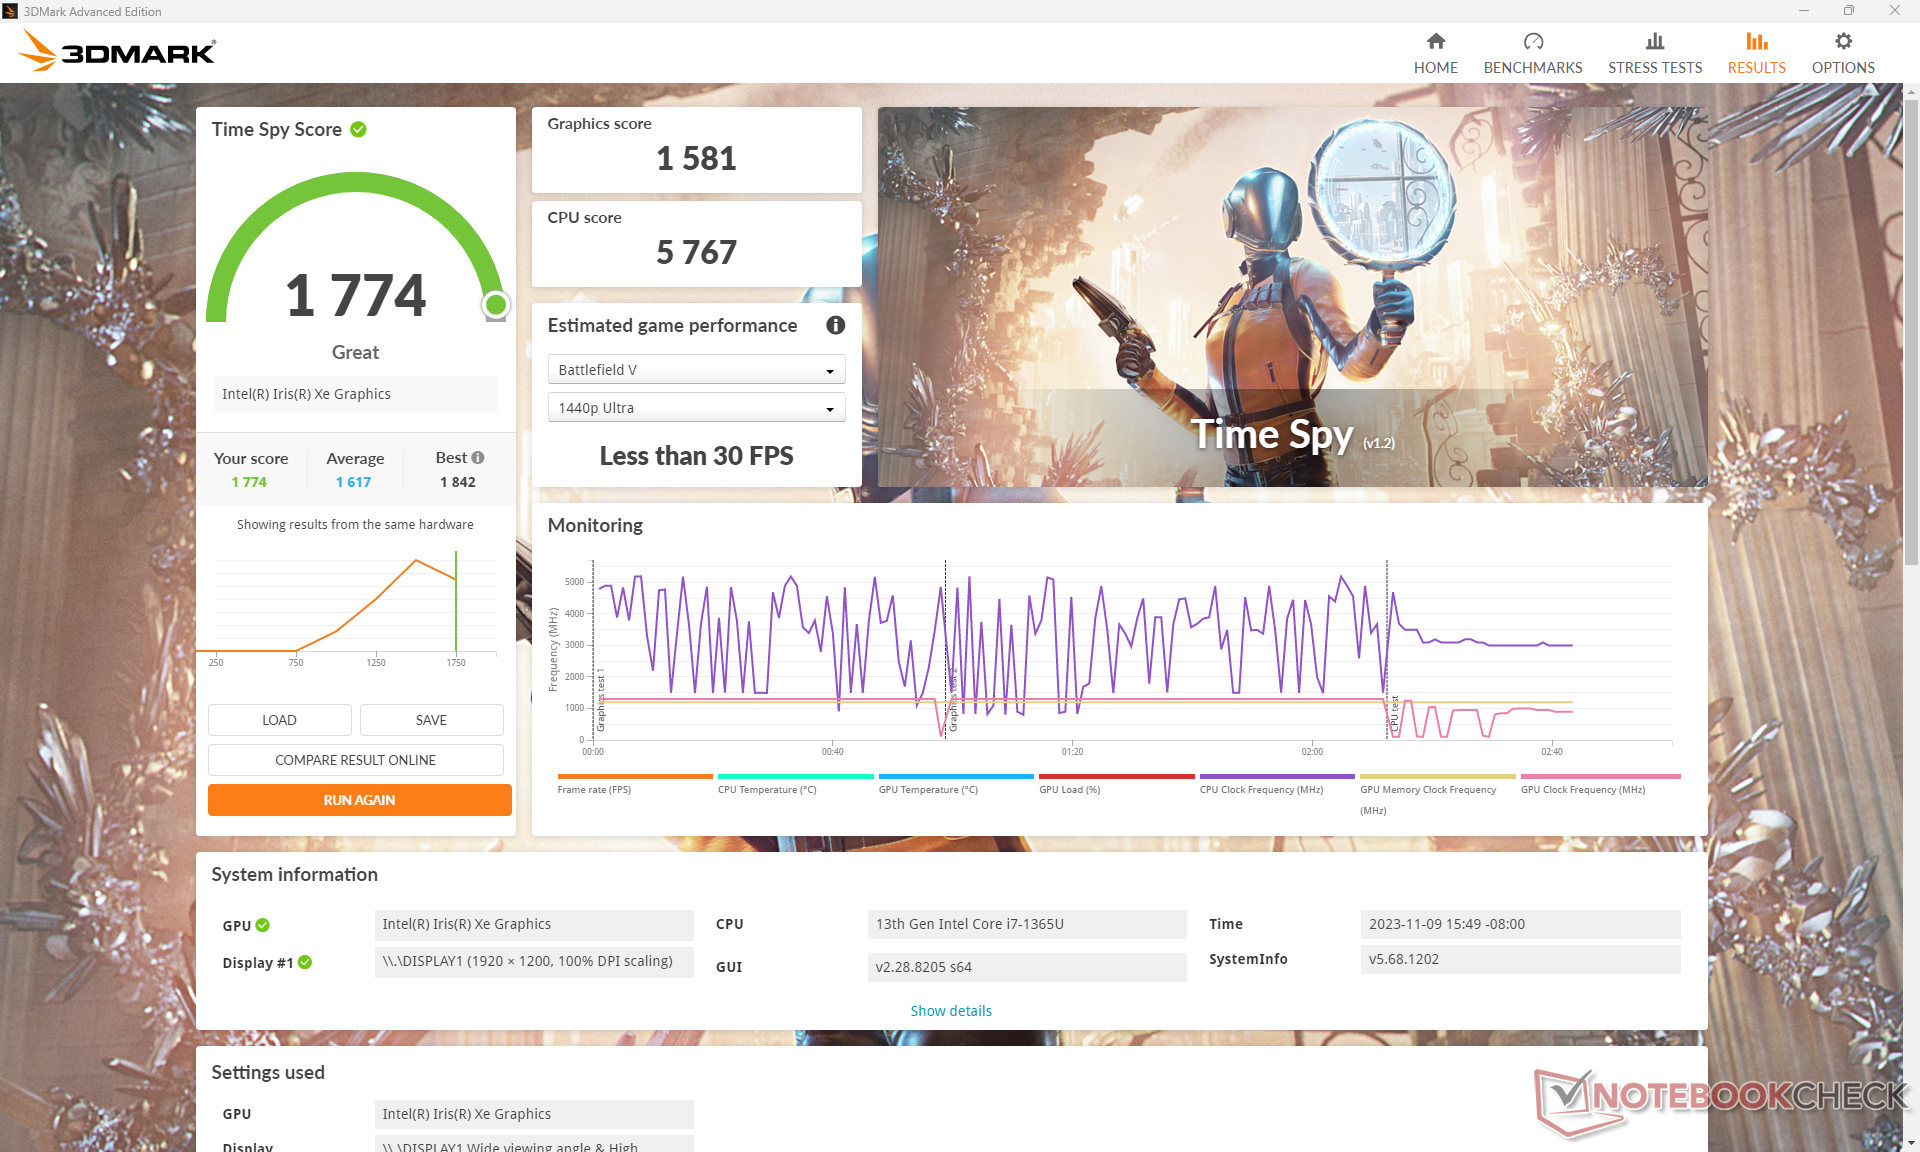
| 3DMark 11 Performance | 6896 points | |
| 3DMark Cloud Gate Standard Score | 20934 points | |
| 3DMark Fire Strike Score | 4823 points | |
| 3DMark Time Spy Score | 1774 points | |
Help | ||
* ... smaller is better
| Cyberpunk 2077 1.6 | |
| 1280x720 Low Preset | |
| HP Dragonfly Pro 2023 | |
| Dell Latitude 7440 | |
| Average Intel Iris Xe Graphics G7 96EUs (20.6 - 44.7, n=17) | |
| Lenovo ThinkPad T14s G4 i7-1365U | |
| 1920x1080 Low Preset | |
| HP Dragonfly Pro 2023 | |
| Average Intel Iris Xe Graphics G7 96EUs (13 - 25.9, n=42) | |
| Dell Latitude 7440 | |
| Lenovo ThinkPad T14s G4 i7-1365U | |
| Tiny Tina's Wonderlands | |
| 1280x720 Lowest Preset (DX12) | |
| Average Intel Iris Xe Graphics G7 96EUs (25.9 - 67.3, n=32) | |
| Lenovo ThinkPad T14s G4 i7-1365U | |
| 1920x1080 Low Preset (DX12) | |
| Average Intel Iris Xe Graphics G7 96EUs (22.3 - 53, n=32) | |
| Lenovo ThinkPad T14s G4 i7-1365U | |
| Dell Latitude 7440 | |
Idling on Witcher 3 shows steady performance aside from a single instance where frame rates would temporarily dip to the single-digit range. The inconsistency was fortunately not repeatable.
Witcher 3 FPS Chart
| low | med. | high | ultra | |
|---|---|---|---|---|
| GTA V (2015) | 103.3 | 89.6 | 10.1 | |
| The Witcher 3 (2015) | 85.5 | 55.7 | 30.2 | 14.7 |
| Dota 2 Reborn (2015) | 101.6 | 77.7 | 61.6 | 54.2 |
| Final Fantasy XV Benchmark (2018) | 42.8 | 23.9 | 17.1 | |
| X-Plane 11.11 (2018) | 47.2 | 36.4 | 31.7 | |
| Far Cry 5 (2018) | 48 | 29 | 27 | 25 |
| Strange Brigade (2018) | 89.3 | 38.2 | 30.8 | 24.7 |
| Cyberpunk 2077 1.6 (2022) | 17.8 | |||
| Tiny Tina's Wonderlands (2022) | 27.1 | |||
| F1 22 (2022) | 46 | 41.3 | 30.4 | 22.9 |
Emissions
System Noise
Fan noise, or more specifically the lack thereof, is one of the best aspects of the ThinkPad T14s G4. Our Intel unit in particular runs slightly quieter than the AMD configuration when demanding loads are introduced. In other words, the internal fan is able to remain quieter for longer before higher RPMs are needed.
Noise level
| Idle |
| 23.2 / 23.2 / 23.6 dB(A) |
| Load |
| 24.3 / 35.7 dB(A) |
 | ||
30 dB silent 40 dB(A) audible 50 dB(A) loud |
||
min: | ||
| Lenovo ThinkPad T14s G4 i7-1365U Iris Xe G7 96EUs, i7-1365U | Lenovo ThinkPad T14s G4-21F8002TGE Radeon 780M, R7 7840U, Samsung PM9A1a MZVL21T0HDLU | Lenovo ThinkPad T14 G4 21HD0043GE Iris Xe G7 80EUs, i5-1335U, Kioxia BG5 KBG5AZNV512G | HP EliteBook 845 G10 5Z4X0ES Radeon 780M, R7 7840U, WD PC SN740 512GB SDDPNQD-512G | Dell Latitude 7440 Iris Xe G7 80EUs, i5-1345U, Samsung MZ9L4512HBLU-00BMV | Asus ExpertBook B9 B9403CVA-KM0153X Iris Xe G7 96EUs, i7-1355U, Samsung PM9A1 MZVL21T0HCLR | |
|---|---|---|---|---|---|---|
| Noise | -9% | -4% | 3% | 1% | -15% | |
| off / environment * (dB) | 23.2 | 24.6 -6% | 23 1% | 22.9 1% | 22.8 2% | 24.9 -7% |
| Idle Minimum * (dB) | 23.2 | 24.6 -6% | 23 1% | 22.9 1% | 22.8 2% | 24.9 -7% |
| Idle Average * (dB) | 23.2 | 24.6 -6% | 23 1% | 22.9 1% | 22.8 2% | 24.9 -7% |
| Idle Maximum * (dB) | 23.6 | 26 -10% | 24.9 -6% | 22.9 3% | 22.8 3% | 24.9 -6% |
| Load Average * (dB) | 24.3 | 29.8 -23% | 26.1 -7% | 24.3 -0% | 26.3 -8% | 33 -36% |
| Witcher 3 ultra * (dB) | 35.7 | 36.1 -1% | 38.4 -8% | 32.4 9% | 30 16% | |
| Load Maximum * (dB) | 35.7 | 39.2 -10% | 38.5 -8% | 33.9 5% | 38.3 -7% | 45 -26% |
* ... smaller is better
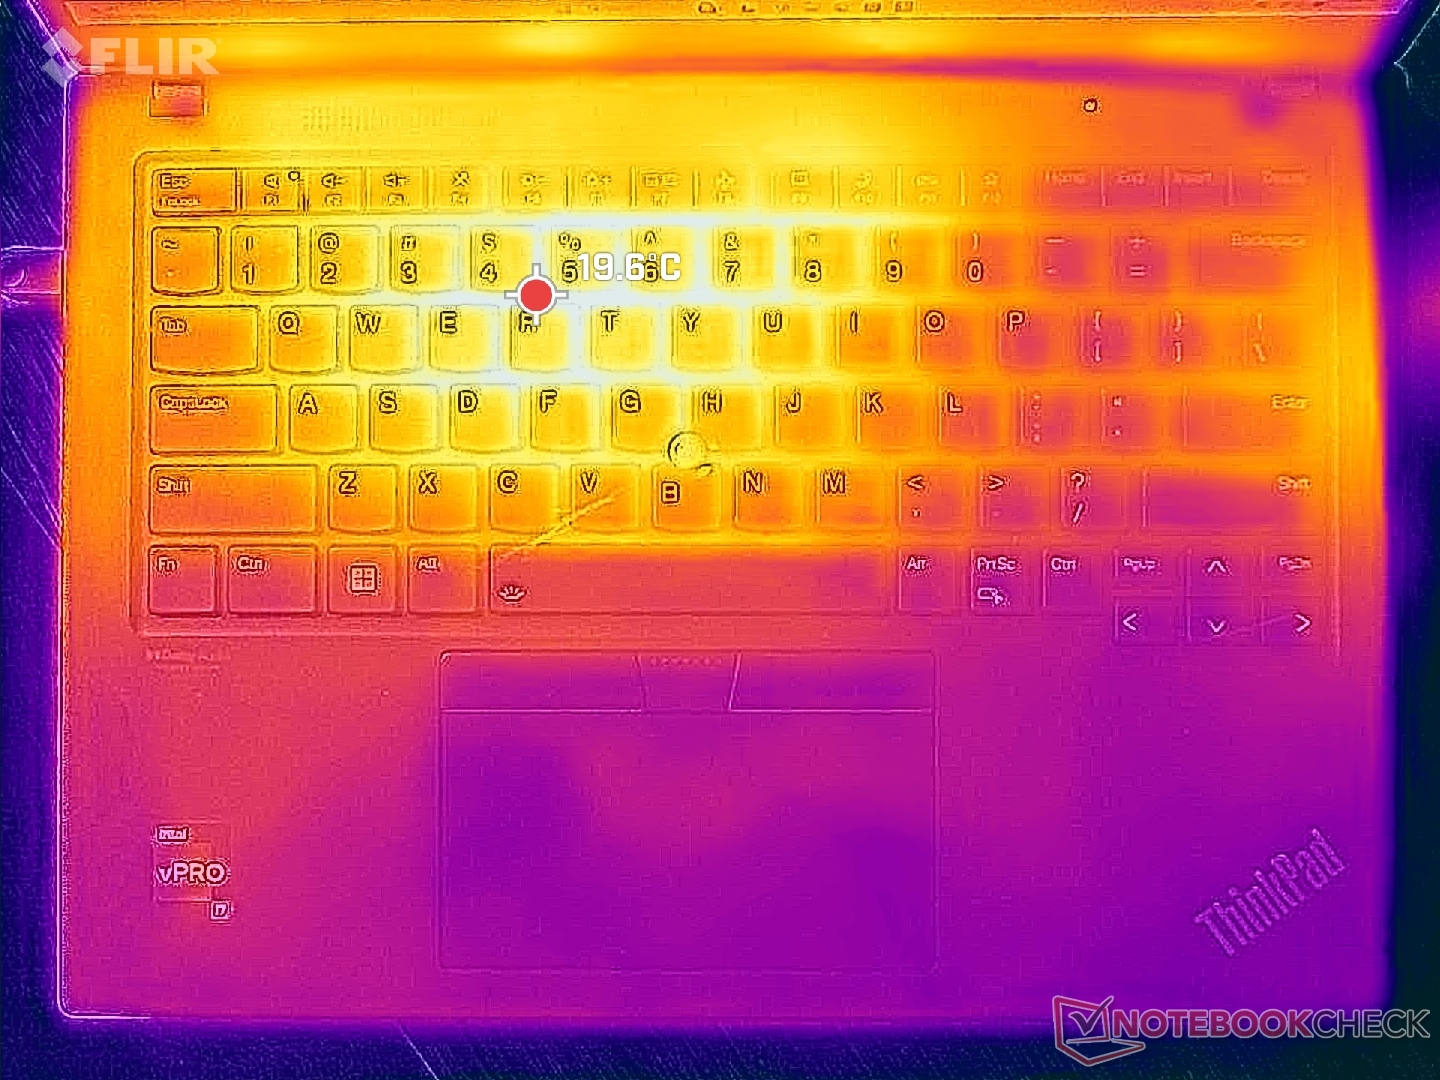
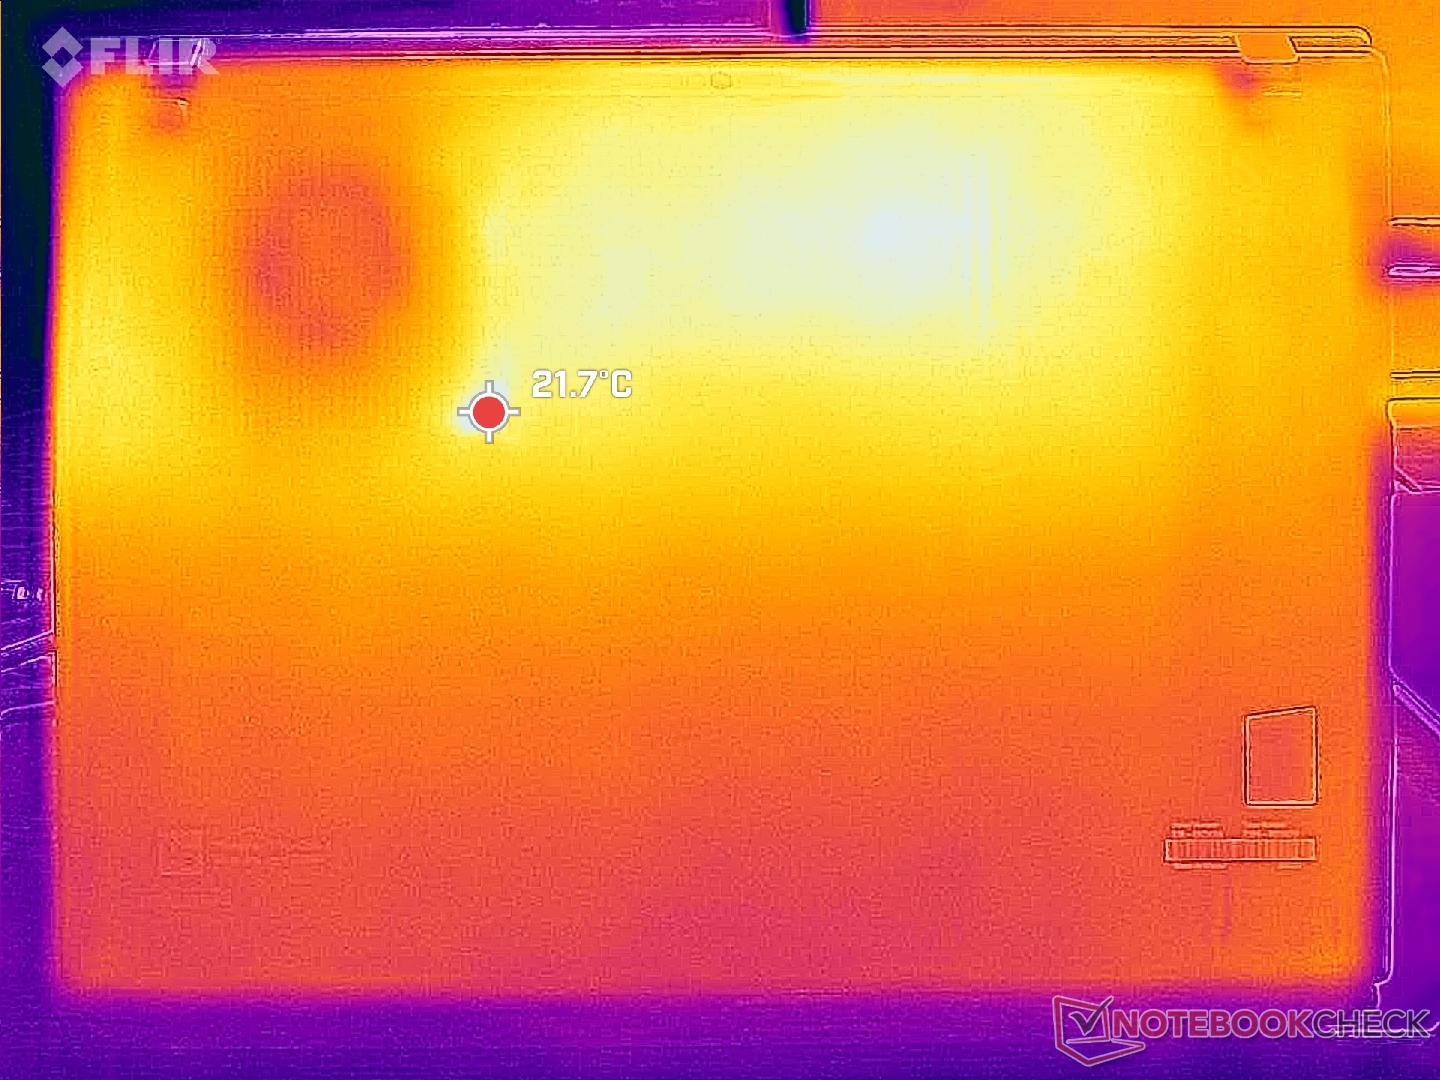
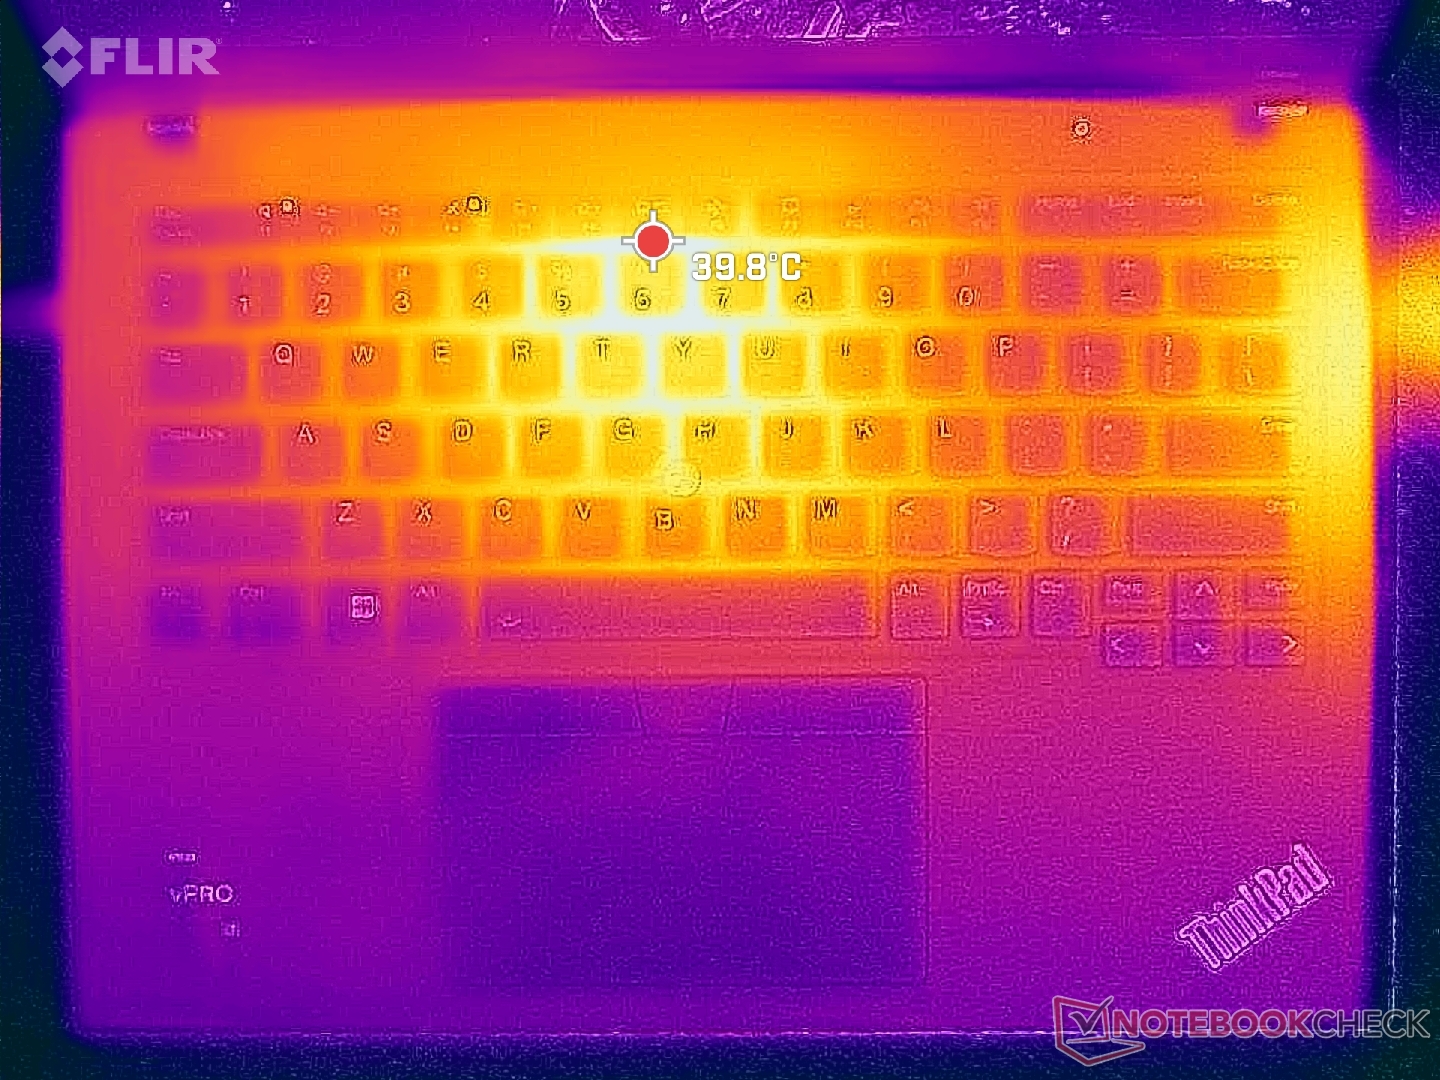
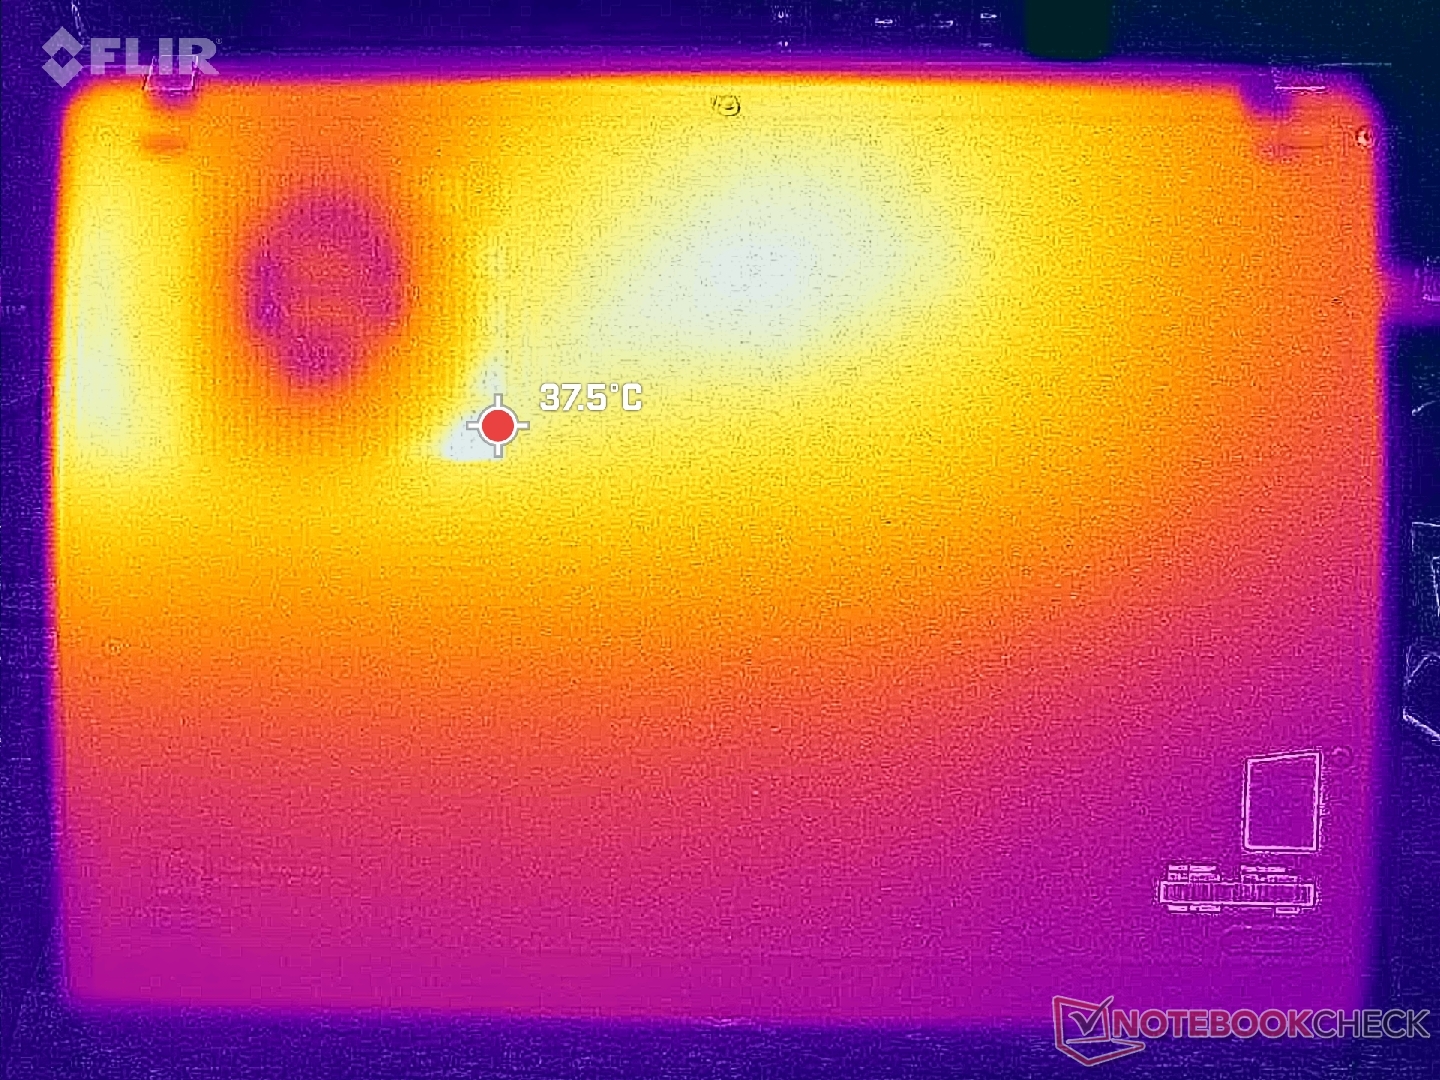
Temperature
Surface temperatures top out at 40 C on the top and bottom (C and D covers) when running demanding loads similar to what we recorded on the AMD version. The hot spots are toward the rear away from the palm rests and many of the commonly used keyboard keys.
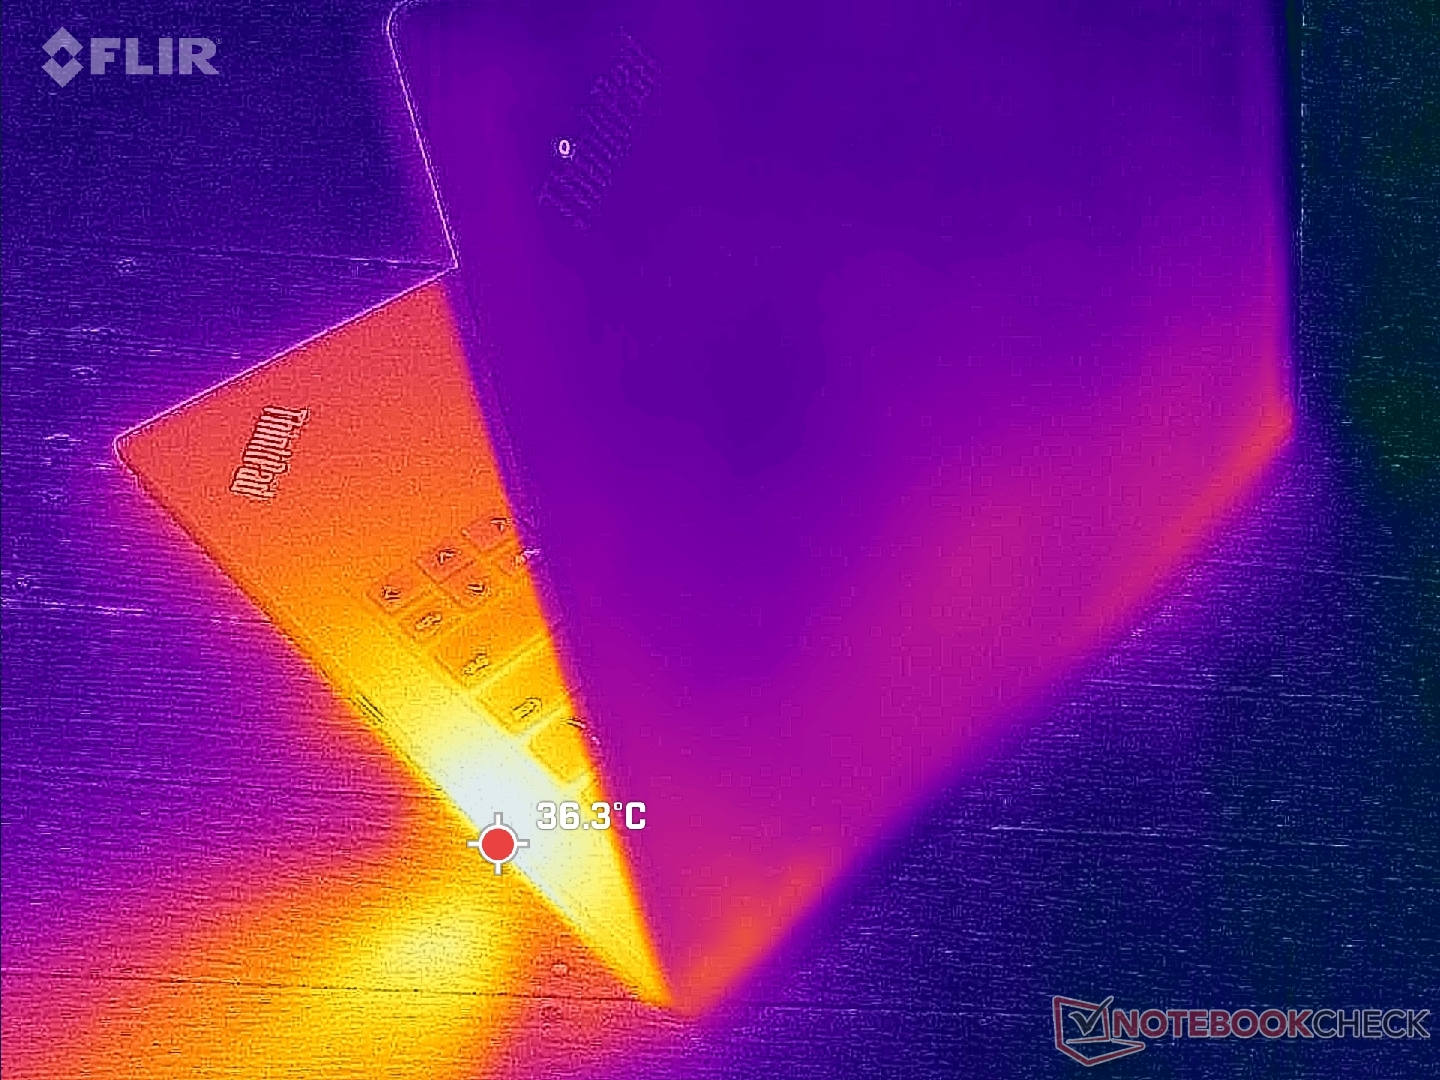
(+) The maximum temperature on the upper side is 39.8 °C / 104 F, compared to the average of 34.3 °C / 94 F, ranging from 21.2 to 62.5 °C for the class Office.
(+) The bottom heats up to a maximum of 35.2 °C / 95 F, compared to the average of 36.8 °C / 98 F
(+) In idle usage, the average temperature for the upper side is 23.6 °C / 74 F, compared to the device average of 29.5 °C / 85 F.
(+) The palmrests and touchpad are cooler than skin temperature with a maximum of 26.2 °C / 79.2 F and are therefore cool to the touch.
(±) The average temperature of the palmrest area of similar devices was 27.5 °C / 81.5 F (+1.3 °C / 2.3 F).
| Lenovo ThinkPad T14s G4 i7-1365U Intel Core i7-1365U, Intel Iris Xe Graphics G7 96EUs | Lenovo ThinkPad T14s G4-21F8002TGE AMD Ryzen 7 7840U, AMD Radeon 780M | Lenovo ThinkPad T14 G4 21HD0043GE Intel Core i5-1335U, Intel Iris Xe Graphics G7 80EUs | HP EliteBook 845 G10 5Z4X0ES AMD Ryzen 7 7840U, AMD Radeon 780M | Dell Latitude 7440 Intel Core i5-1345U, Intel Iris Xe Graphics G7 80EUs | Asus ExpertBook B9 B9403CVA-KM0153X Intel Core i7-1355U, Intel Iris Xe Graphics G7 96EUs | |
|---|---|---|---|---|---|---|
| Heat | -1% | -12% | -18% | -10% | -39% | |
| Maximum Upper Side * (°C) | 39.8 | 42.1 -6% | 41.5 -4% | 45.4 -14% | 39 2% | 48.8 -23% |
| Maximum Bottom * (°C) | 35.2 | 39.7 -13% | 43 -22% | 50.6 -44% | 40.6 -15% | 56.5 -61% |
| Idle Upper Side * (°C) | 25.6 | 23 10% | 27.8 -9% | 26.8 -5% | 28 -9% | 33.3 -30% |
| Idle Bottom * (°C) | 24.4 | 22.8 7% | 27.8 -14% | 26.8 -10% | 28.8 -18% | 35 -43% |
* ... smaller is better
Stress Test
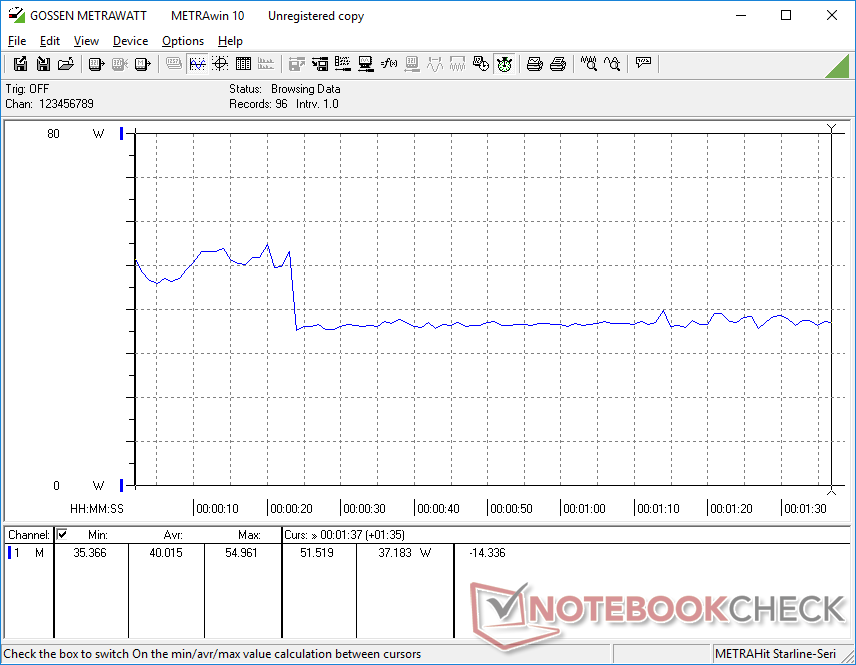
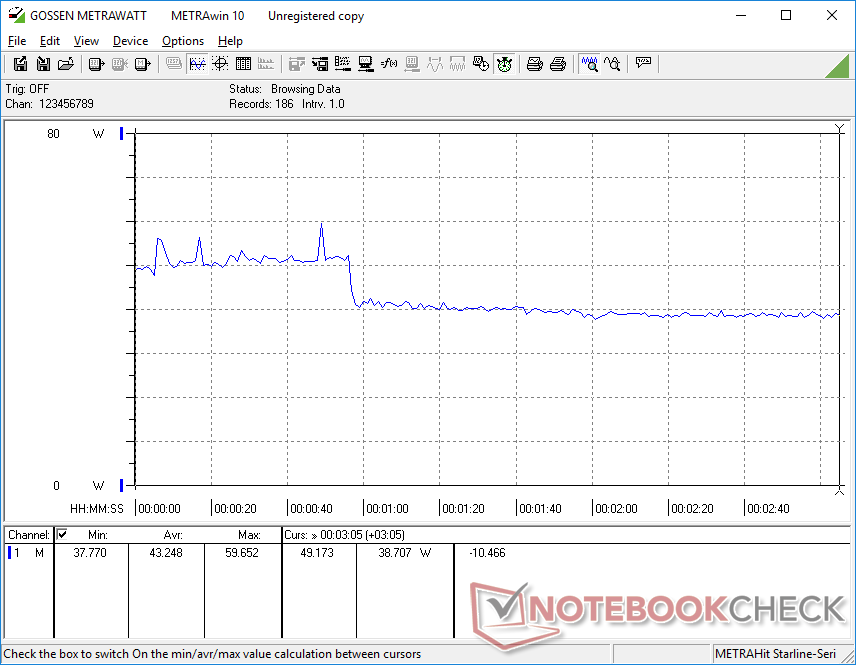
The CPU would boost to 3.8 GHz, 53 W, and 100 C when initiating Prime95 stress. After about 10 seconds or so, however, the CPU would drop to 2.5 GHz and 23 W in order to maintain a more manageable core temperature of 77 C. The short-lived Turbo Boost potential is common amongst U-series-powered Ultrabooks and it is consistent with our CineBench R15 xT results above.
Core temperature when running Witcher 3 to represent high GPU load would stabilize at 73 C compared to 77 C on the recent Pavilion Plus 14 with the faster Ryzen 7 7840U.
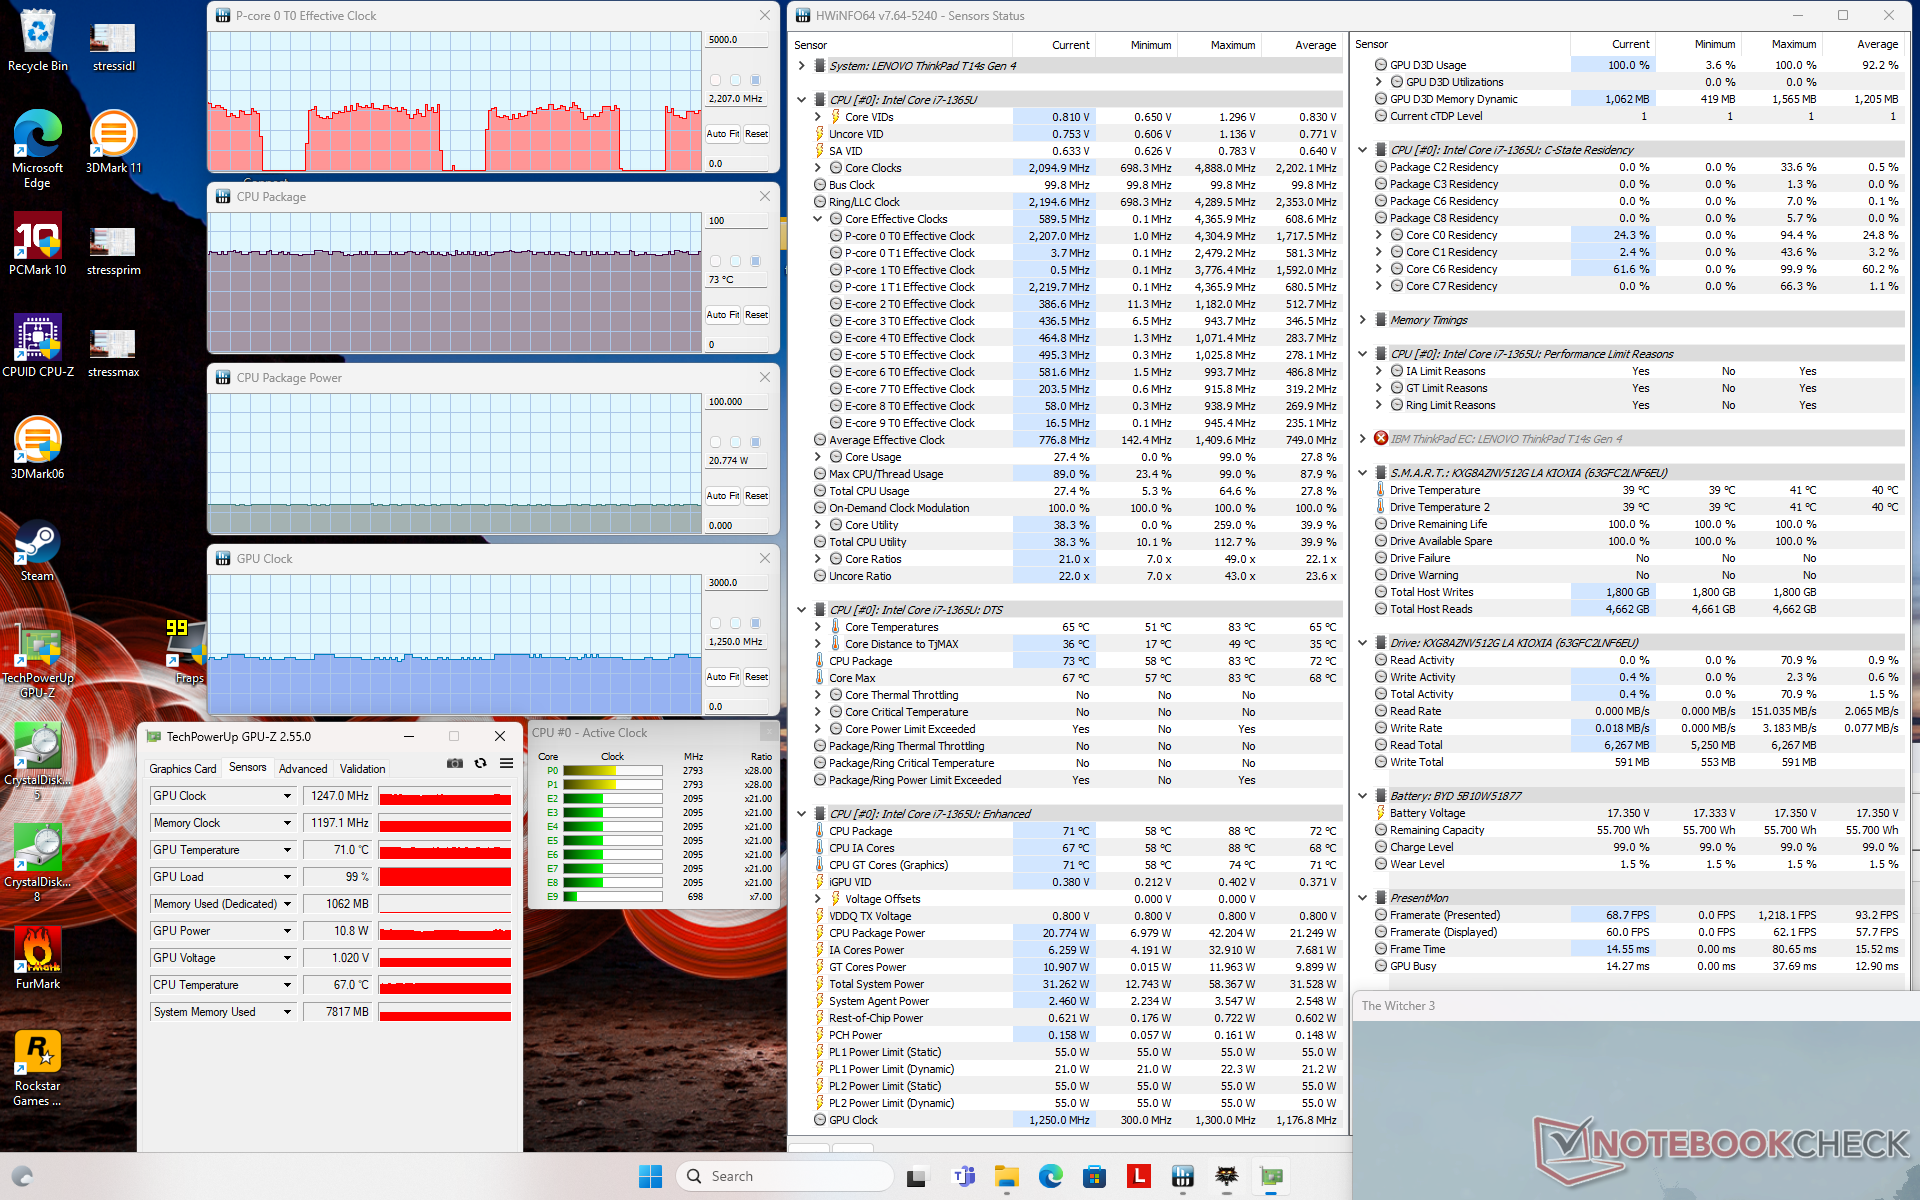
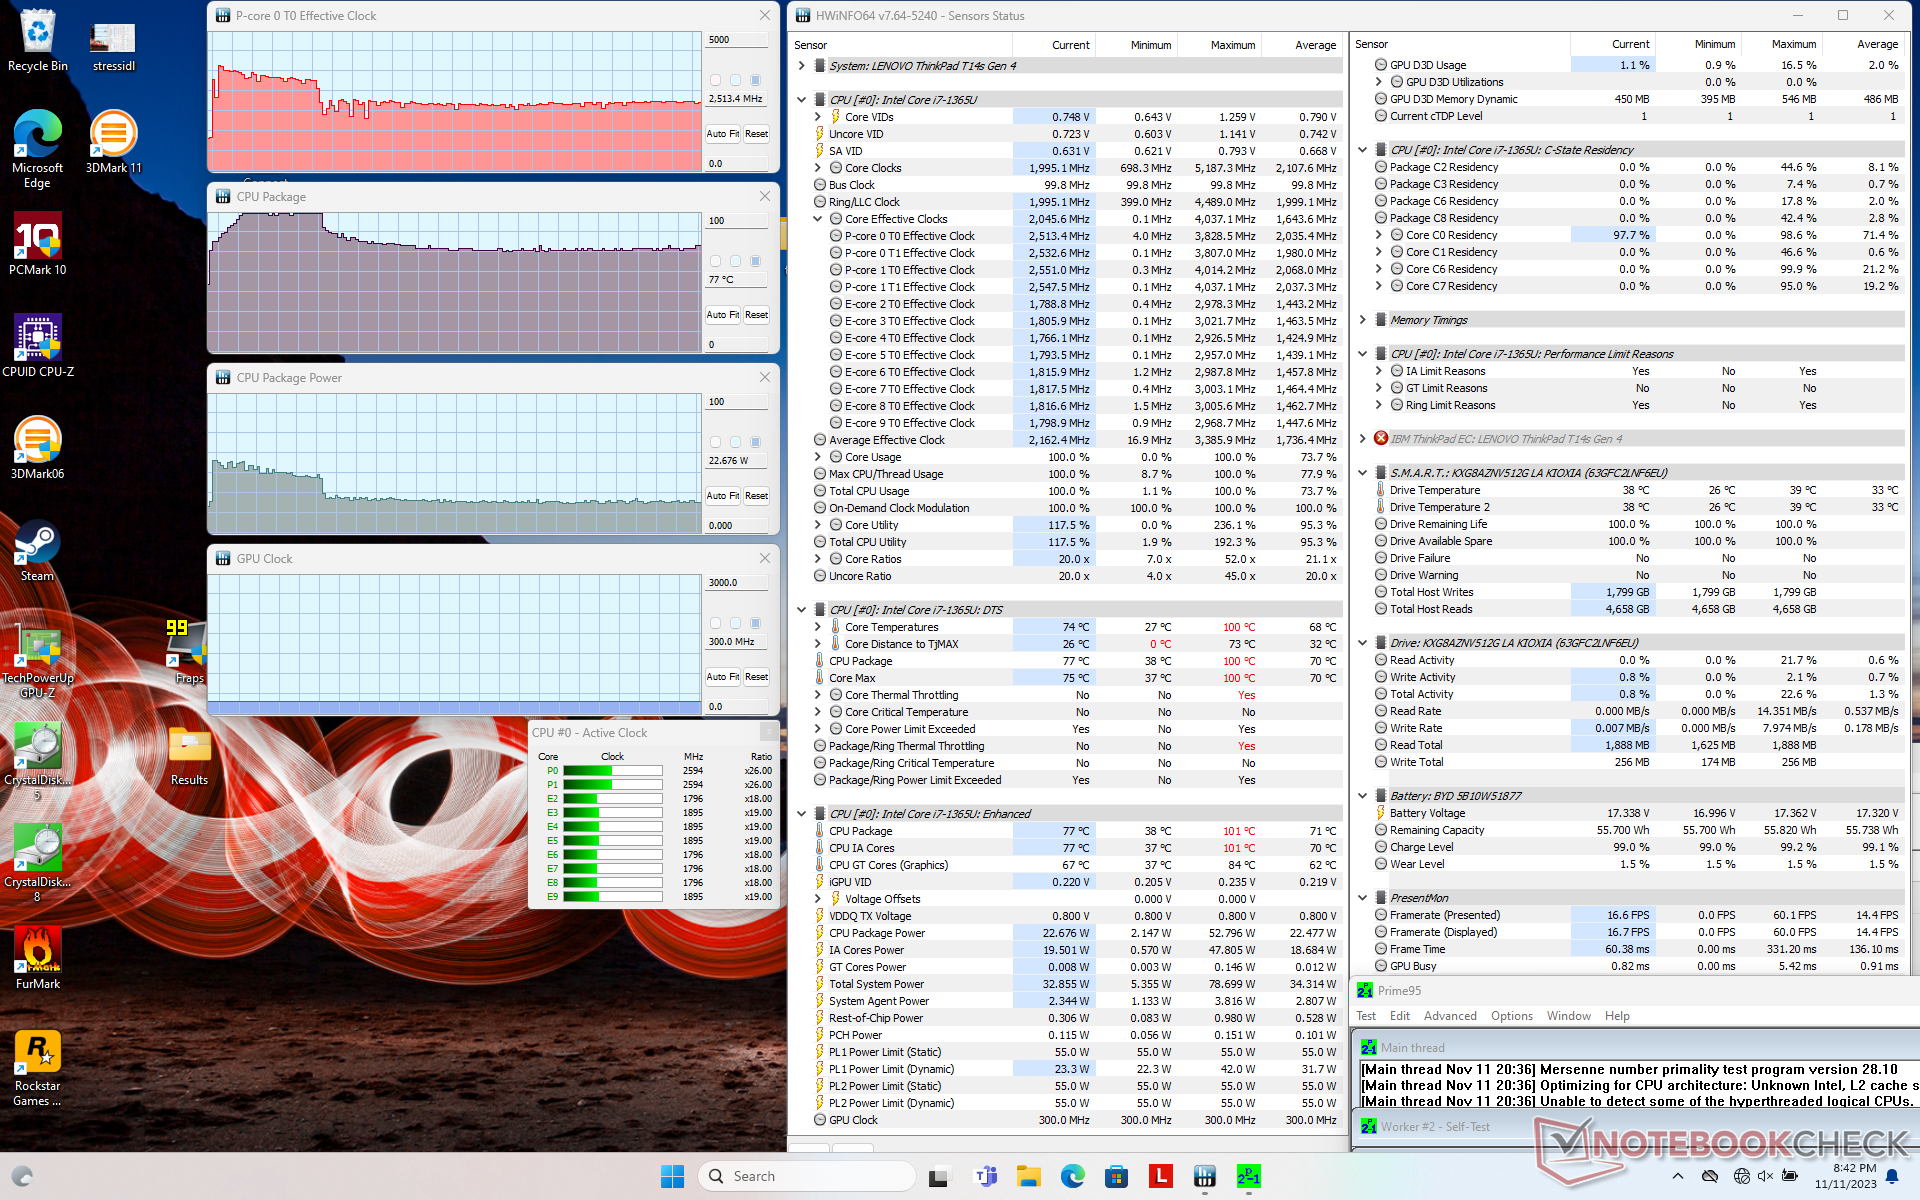
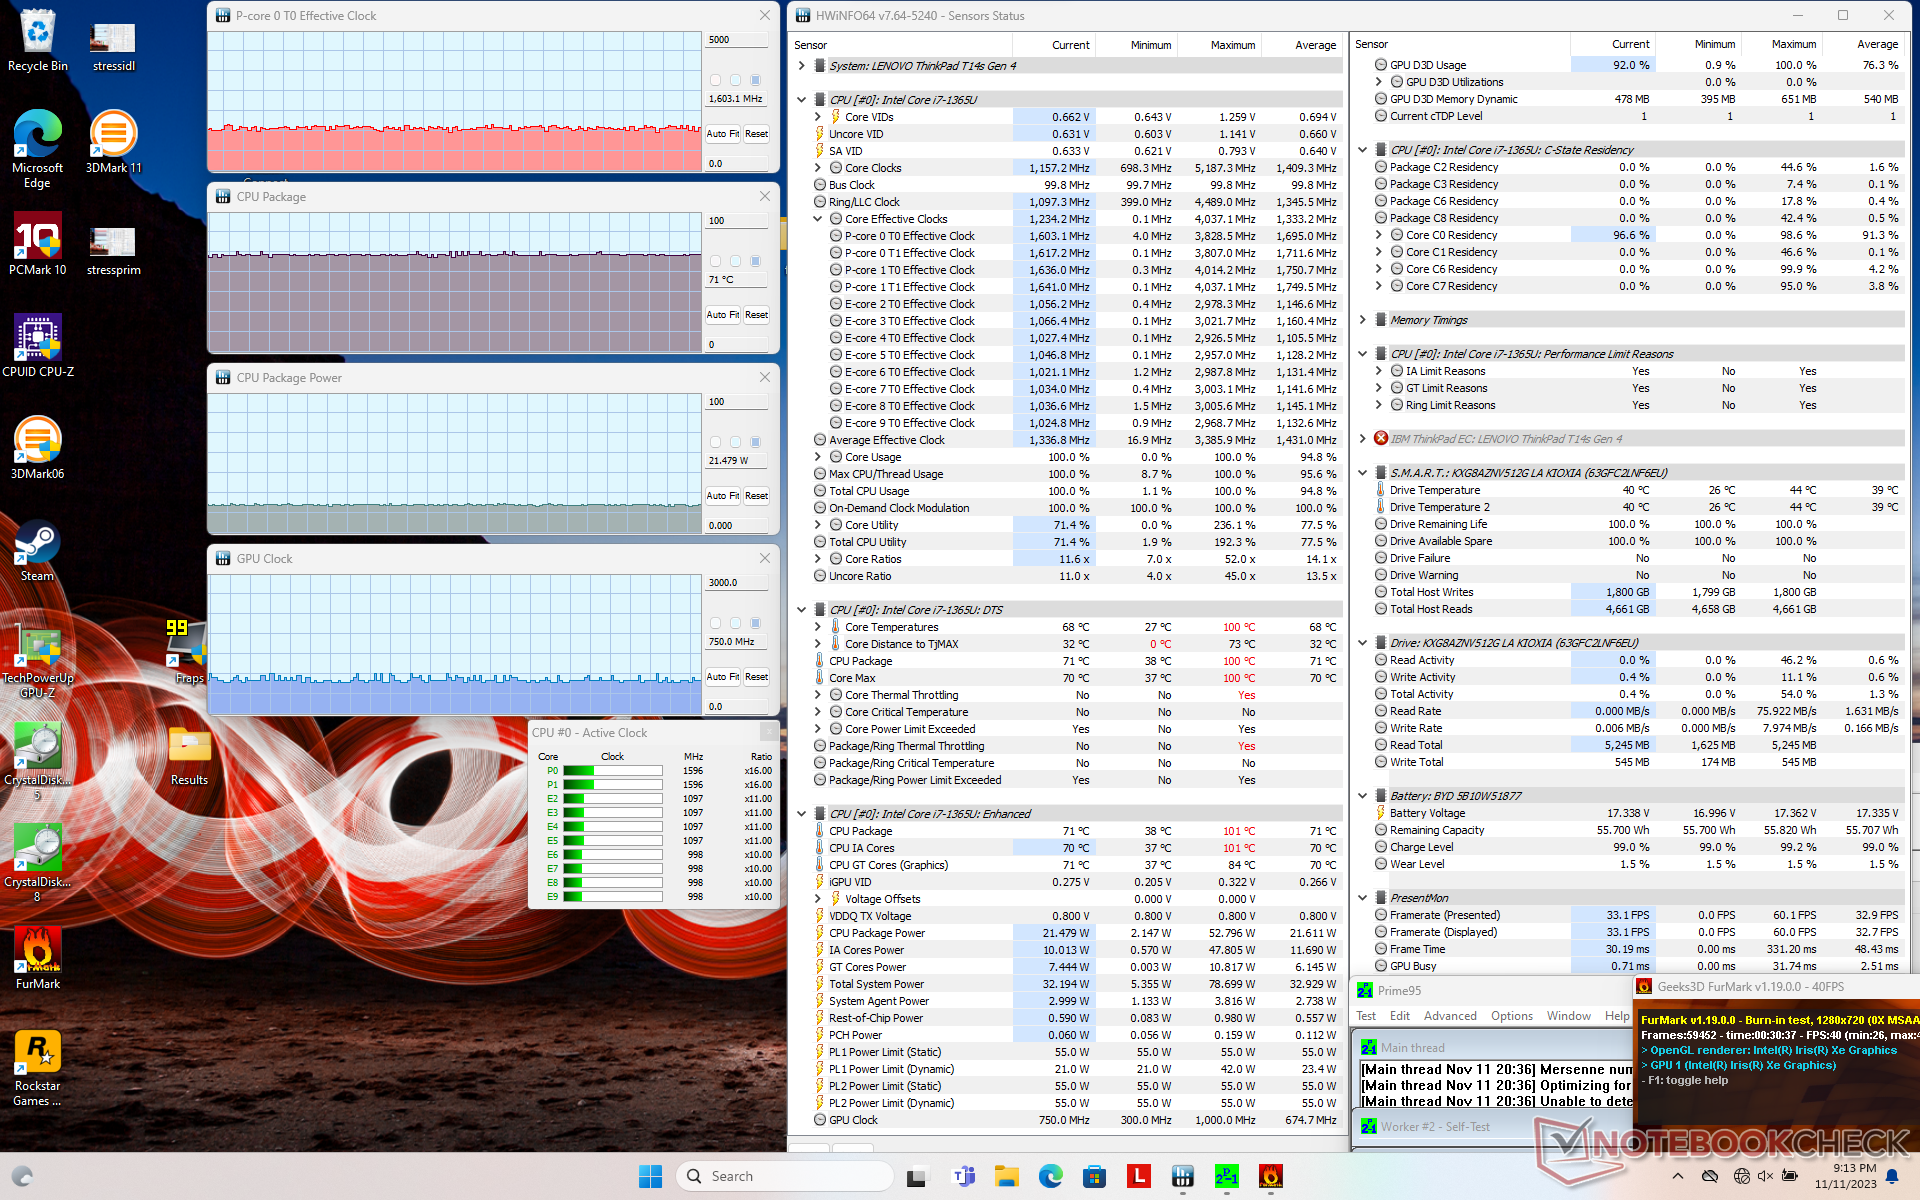
| CPU Clock (GHz) | GPU Clock (MHz) | Average CPU Temperature (°C) | |
| System Idle | -- | -- | 38 |
| Prime95 Stress | 2.5 | -- | 77 |
| Prime95 + FurMark Stress | 1.6 | 71 | 750 |
| Witcher 3 Stress | ~2.2 | 1250 | 73 |
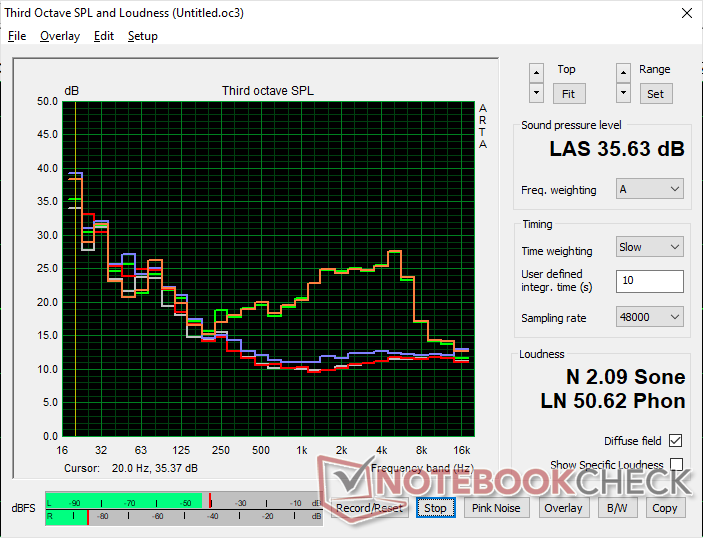
Speakers
Lenovo ThinkPad T14s G4 i7-1365U audio analysis
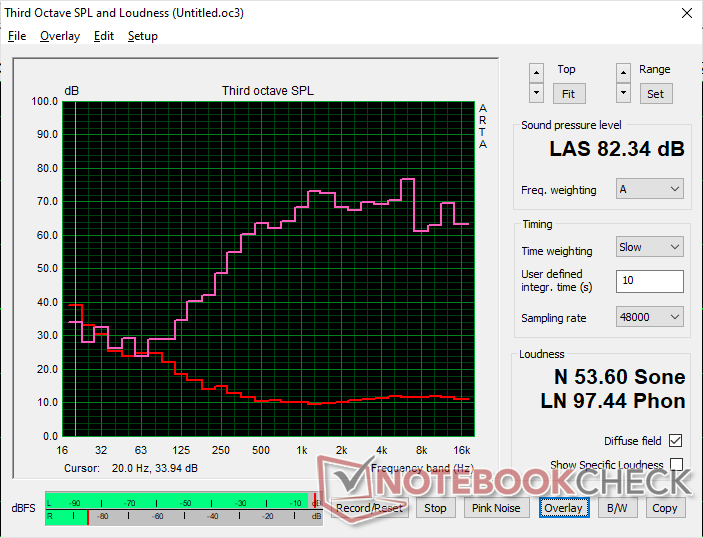
(+) | speakers can play relatively loud (82.3 dB)
Bass 100 - 315 Hz
(-) | nearly no bass - on average 21.9% lower than median
(±) | linearity of bass is average (8.3% delta to prev. frequency)
Mids 400 - 2000 Hz
(+) | balanced mids - only 4.2% away from median
(+) | mids are linear (6.2% delta to prev. frequency)
Highs 2 - 16 kHz
(±) | higher highs - on average 5.6% higher than median
(±) | linearity of highs is average (7.8% delta to prev. frequency)
Overall 100 - 16.000 Hz
(±) | linearity of overall sound is average (18.4% difference to median)
Compared to same class
» 33% of all tested devices in this class were better, 7% similar, 59% worse
» The best had a delta of 7%, average was 21%, worst was 53%
Compared to all devices tested
» 41% of all tested devices were better, 8% similar, 51% worse
» The best had a delta of 4%, average was 23%, worst was 134%
Apple MacBook Pro 16 2021 M1 Pro audio analysis
(+) | speakers can play relatively loud (84.7 dB)
Bass 100 - 315 Hz
(+) | good bass - only 3.8% away from median
(+) | bass is linear (5.2% delta to prev. frequency)
Mids 400 - 2000 Hz
(+) | balanced mids - only 1.3% away from median
(+) | mids are linear (2.1% delta to prev. frequency)
Highs 2 - 16 kHz
(+) | balanced highs - only 1.9% away from median
(+) | highs are linear (2.7% delta to prev. frequency)
Overall 100 - 16.000 Hz
(+) | overall sound is linear (4.6% difference to median)
Compared to same class
» 0% of all tested devices in this class were better, 0% similar, 100% worse
» The best had a delta of 5%, average was 17%, worst was 45%
Compared to all devices tested
» 0% of all tested devices were better, 0% similar, 100% worse
» The best had a delta of 4%, average was 23%, worst was 134%
Energy Management
Power Consumption
Our Intel system is slightly more demanding than the AMD version by a few watts when idling on desktop. Extend this by several hours and the minor differences can add up as exemplified by our battery life results in the next section.
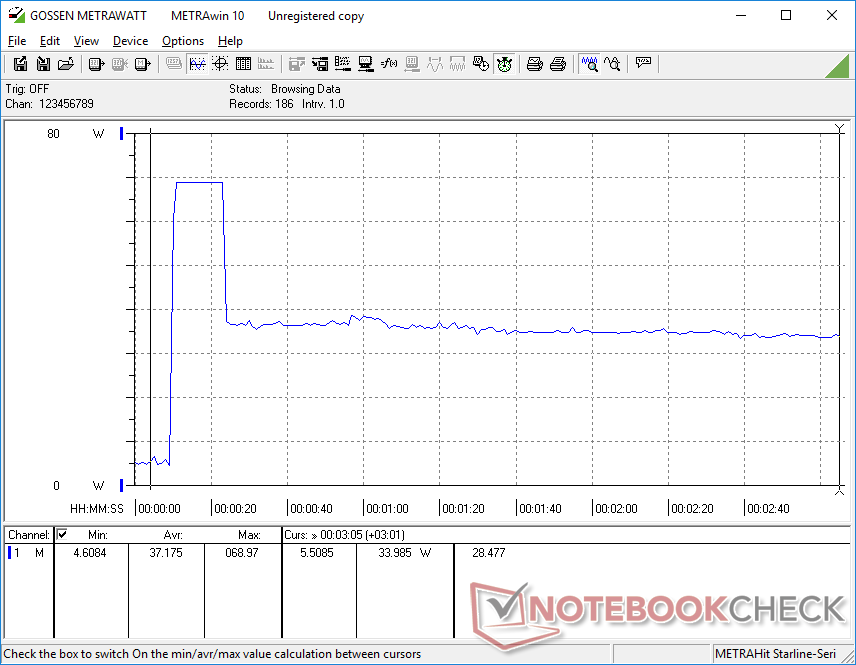
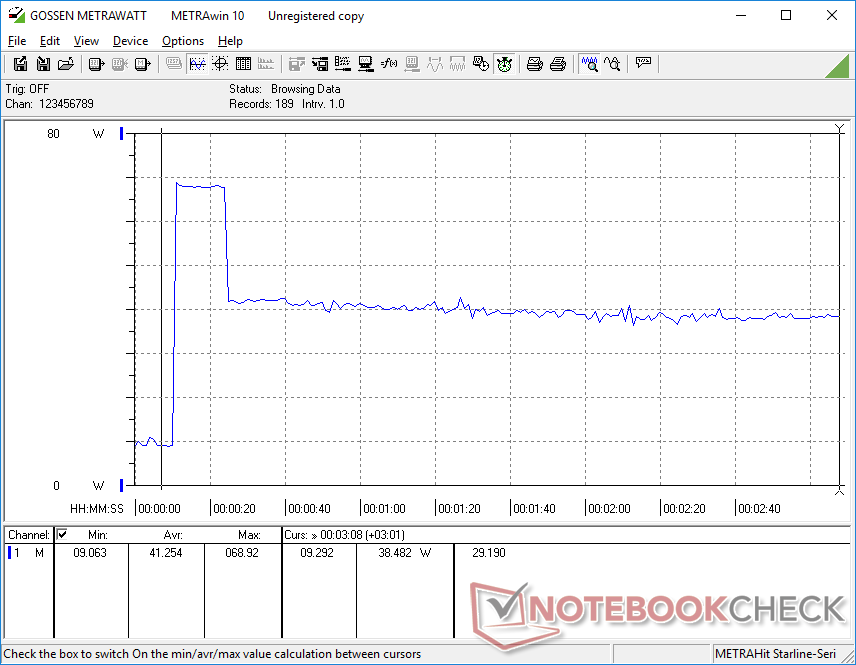
Power consumption when initiating CPU-intensive tasks will draw much more power with our Intel unit than an AMD unit due to the generally higher Turbo Boost potential of the Core series. However, the power spike would only last for just a few seconds before consumption normalizes between the Intel and AMD models as shown by our comparison graphs below.
Performance-per-watt is clearly in AMD's favor. Running Witcher 3 or Prime95, for example, demands about the same from each model after accounting for throttling and yet the AMD Ryzen 7 configuration would provide noticeably faster multi-thread CPU performance and graphics performance than our Intel Core i7 configuration.
| Off / Standby | |
| Idle | |
| Load |
|
Key:
min: | |
| Lenovo ThinkPad T14s G4 i7-1365U i7-1365U, Iris Xe G7 96EUs, , IPS, 1920x1200, 14" | Lenovo ThinkPad T14s G4-21F8002TGE R7 7840U, Radeon 780M, Samsung PM9A1a MZVL21T0HDLU, IPS, 1920x1200, 14" | Lenovo ThinkPad T14 G4 21HD0043GE i5-1335U, Iris Xe G7 80EUs, Kioxia BG5 KBG5AZNV512G, IPS-AHVA LTPS wLED, 1920x1200, 14" | HP EliteBook 845 G10 5Z4X0ES R7 7840U, Radeon 780M, WD PC SN740 512GB SDDPNQD-512G, IPS, 1920x1200, 14" | Dell Latitude 7440 i5-1345U, Iris Xe G7 80EUs, Samsung MZ9L4512HBLU-00BMV, IPS, 2560x1600, 14" | Asus ExpertBook B9 B9403CVA-KM0153X i7-1355U, Iris Xe G7 96EUs, Samsung PM9A1 MZVL21T0HCLR, OLED, 2880x1800, 14" | |
|---|---|---|---|---|---|---|
| Power Consumption | 17% | 20% | 16% | -11% | -45% | |
| Idle Minimum * (Watt) | 3.1 | 2.7 13% | 2.4 23% | 3.2 -3% | 4.5 -45% | 4.9 -58% |
| Idle Average * (Watt) | 6.5 | 5.2 20% | 4.5 31% | 5.1 22% | 6.5 -0% | 12.5 -92% |
| Idle Maximum * (Watt) | 7.9 | 5.6 29% | 5.6 29% | 5.4 32% | 7.3 8% | 16.8 -113% |
| Load Average * (Watt) | 40 | 40.1 -0% | 29.5 26% | 39.1 2% | 52.5 -31% | 43.8 -10% |
| Witcher 3 ultra * (Watt) | 43.2 | 40.2 7% | 40.8 6% | 39.8 8% | 46.2 -7% | 41.2 5% |
| Load Maximum * (Watt) | 69 | 48.3 30% | 67.2 3% | 46.6 32% | 63 9% | 68.1 1% |
* ... smaller is better
Power Consumption Witcher 3 / Stresstest
Power Consumption external Monitor
Battery Life
WLAN runtime is noticeably shorter than on the AMD model by several hours even though battery capacity is the same between them. We're able to record almost 8 hours of real-world browsing compared to over 13 hours on the AMD-based version which is still good but nonetheless underwhelming against the HP EliteBook 845 G10 or Latitude 7440.
| Lenovo ThinkPad T14s G4 i7-1365U i7-1365U, Iris Xe G7 96EUs, 57 Wh | Lenovo ThinkPad T14s G4-21F8002TGE R7 7840U, Radeon 780M, 57 Wh | Lenovo ThinkPad T14 G4 21HD0043GE i5-1335U, Iris Xe G7 80EUs, 52.5 Wh | HP EliteBook 845 G10 5Z4X0ES R7 7840U, Radeon 780M, 51 Wh | Dell Latitude 7440 i5-1345U, Iris Xe G7 80EUs, 57 Wh | Asus ExpertBook B9 B9403CVA-KM0153X i7-1355U, Iris Xe G7 96EUs, 63 Wh | |
|---|---|---|---|---|---|---|
| Battery runtime | 67% | 41% | 65% | 65% | 29% | |
| WiFi v1.3 (h) | 7.9 | 13.2 67% | 11.1 41% | 13 65% | 13 65% | 10.2 29% |
| H.264 (h) | 16.5 | 12.7 | 10.1 | |||
| Load (h) | 1.7 | 1.6 | 1.4 | 2.7 | 2.3 | |
| Reader / Idle (h) | 23.8 |
Pros
Cons
Verdict — Tough Competition From AMD
The Core i7 vPro ThinkPad T14s G4 is the fastest Intel configuration available and yet it is still slower than the cheaper Ryzen 7 Pro configuration in both multi-thread CPU performance and graphics performance. Not only that, battery life is actually shorter than the AMD option despite the overall slower performance. These drawbacks alone make it easier to recommend the AMD Ryzen 7 configuration which can be found for $1200 USD or $200 less than our Core i7 review configuration equipped with the same 16 GB of RAM, 512 GB SSD, and 1200p IPS touchscreen.
The Core i7 ThinkPad T14s G4 isn't terrible by any means. Instead, the Intel U-series is simply outclassed by the current crop of AMD Zen 4 CPUs especially when it comes with the impressive Ryzen 7 7840U.
The Intel SKUs benefit from Thunderbolt support, but the AMD options ship with USB4 which supports most Thunderbolt devices anyway like eGPUs and monitors. The benefits of going Intel instead of AMD are therefore very minor for the vast majority of users. Users can save money or get more bang for the buck by going with a Ryzen 7 unit and then configuring with additional auxiliary options like WAN or Smart Card.
Price and Availability
Lenovo is now shipping the ThinkPad T14s in multiple configurations starting at $1110 USD for the Intel SKUs or $920 for the AMD SKUs. Our specific Intel Core i7 configuration retails for around $1400.
Lenovo ThinkPad T14s G4 i7-1365U
- 11/22/2023 v7 (old)
Allen Ngo
Transparency
The selection of devices to be reviewed is made by our editorial team. The test sample was provided to the author as a loan by the manufacturer or retailer for the purpose of this review. The lender had no influence on this review, nor did the manufacturer receive a copy of this review before publication. There was no obligation to publish this review. As an independent media company, Notebookcheck is not subjected to the authority of manufacturers, retailers or publishers.
This is how Notebookcheck is testing
Every year, Notebookcheck independently reviews hundreds of laptops and smartphones using standardized procedures to ensure that all results are comparable. We have continuously developed our test methods for around 20 years and set industry standards in the process. In our test labs, high-quality measuring equipment is utilized by experienced technicians and editors. These tests involve a multi-stage validation process. Our complex rating system is based on hundreds of well-founded measurements and benchmarks, which maintains objectivity. Further information on our test methods can be found here.
Price comparison
