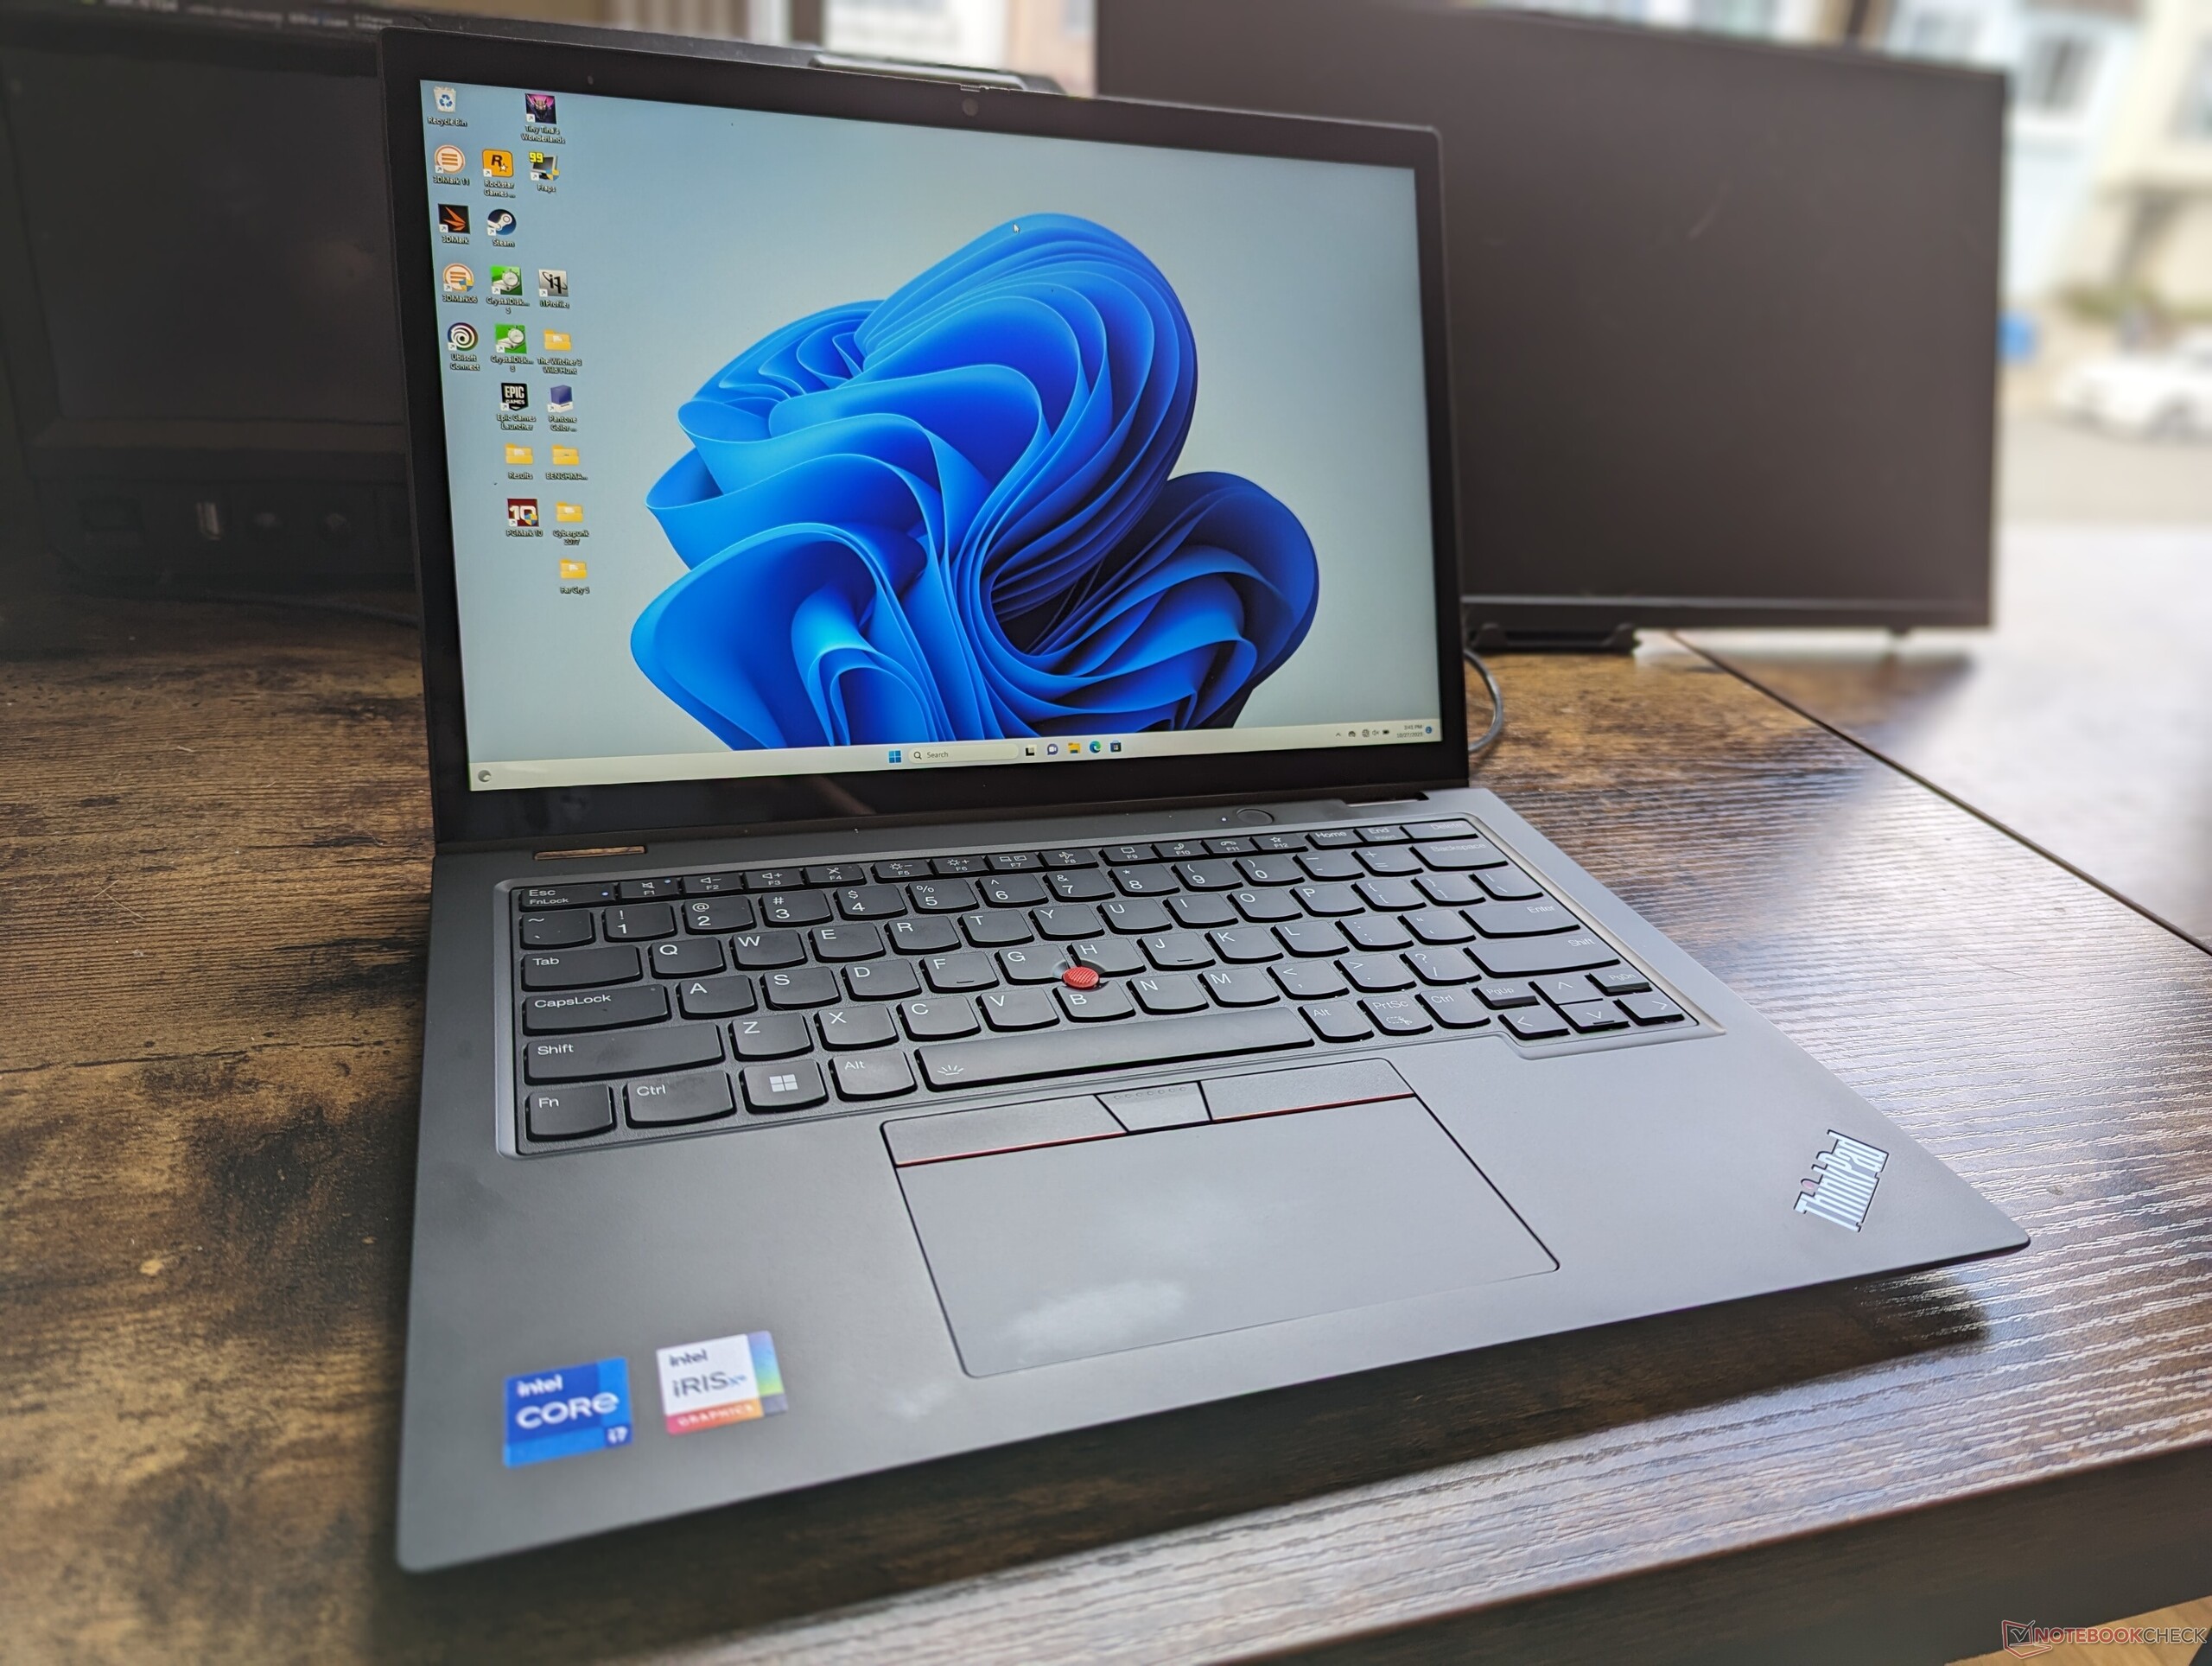
Lenovo ThinkPad L13 Yoga G4 Intel convertible review: Shorter battery life than AMD

The ThinkPad L13 Yoga Gen 4 is available in both Intel and AMD versions to attract users on both sides of the fence. This review page will focus on the Intel version as we recently reviewed the AMD version back in August. All our comments on the physical features of the AMD version apply here since the two versions are visually identical.
Our Intel review unit is a higher-end configuration with the 13th gen Raptor Lake-U Core i7-1355U CPU, 16 GB RAM, and 1200p IPS touchscreen for approximately $1400 to 600 USD retail. Other configurations range from the Core i3-1315U up to the Core i7-1365U with vPro, but all options are otherwise limited to integrated graphics and a 1200p display.
Alternatives to the ThinkPad L13 Yoga G4 include other business-centric convertibles like the MSI Summit E13 Flip Evo, HP Elite Dragonfly Folio 13.5, or the Dell Latitude 7330 2-in-1.
More Lenovo reviews:
Potential Competitors in Comparison
Rating | Date | Model | Weight | Height | Size | Resolution | Price |
|---|---|---|---|---|---|---|---|
| 88.1 % v7 (old) | 10 / 2023 | Lenovo ThinkPad L13 Yoga G4 i7-1355U i7-1355U, Iris Xe G7 96EUs | 1.4 kg | 17.1 mm | 13.30" | 1920x1200 | |
| 88.7 % v7 (old) | 08 / 2023 | Lenovo ThinkPad L13 Yoga G4 21FSS00100 R5 7530U, Vega 7 | 1.4 kg | 17.1 mm | 13.30" | 1920x1200 | |
| 90.3 % v7 (old) | 12 / 2022 | HP Elite Dragonfly Folio 13.5 G3 i7-1265U, Iris Xe G7 96EUs | 1.4 kg | 17.8 mm | 13.50" | 1920x1280 | |
| 89 % v7 (old) | 11 / 2022 | Dell Latitude 9330 i7-1260U, Iris Xe G7 96EUs | 1.2 kg | 14.1 mm | 13.30" | 2560x1600 | |
| 86.9 % v7 (old) | 04 / 2021 | MSI Summit E13 Flip Evo A11MT i7-1185G7, Iris Xe G7 96EUs | 1.4 kg | 14.9 mm | 13.40" | 1920x1200 | |
| 87.5 % v7 (old) | 10 / 2023 | Framework Laptop 13.5 Ryzen 7 7840U R7 7840U, Radeon 780M | 1.3 kg | 15.85 mm | 13.50" | 2256x1504 |
Case
Much like on the recent ThinkPad E14 G5, the quickest way to identify the Intel version from AMD is to look for the Thunderbolt logo along the left edge as the AMD options lack the feature. Note that while the model ships with two USB-C ports, only the left port is compatible with Thunderbolt devices like eGPUs.
Communication
An Intel AX201 comes standard for Wi-Fi 6 and Bluetooth 5.1 support while the Intel AX211 with Wi-Fi 6E is optional.

| Networking | |
| iperf3 transmit AX12 | |
| MSI Summit E13 Flip Evo A11MT | |
| iperf3 receive AX12 | |
| MSI Summit E13 Flip Evo A11MT | |
| iperf3 transmit AXE11000 | |
| Framework Laptop 13.5 Ryzen 7 7840U | |
| Lenovo ThinkPad L13 Yoga G4 i7-1355U | |
| HP Elite Dragonfly Folio 13.5 G3 | |
| Dell Latitude 9330 | |
| Lenovo ThinkPad L13 Yoga G4 21FSS00100 | |
| iperf3 receive AXE11000 | |
| Lenovo ThinkPad L13 Yoga G4 21FSS00100 | |
| Framework Laptop 13.5 Ryzen 7 7840U | |
| Lenovo ThinkPad L13 Yoga G4 i7-1355U | |
| HP Elite Dragonfly Folio 13.5 G3 | |
| Dell Latitude 9330 | |
| iperf3 transmit AXE11000 6GHz | |
| Framework Laptop 13.5 Ryzen 7 7840U | |
| HP Elite Dragonfly Folio 13.5 G3 | |
| Dell Latitude 9330 | |
| Lenovo ThinkPad L13 Yoga G4 21FSS00100 | |
| iperf3 receive AXE11000 6GHz | |
| Lenovo ThinkPad L13 Yoga G4 21FSS00100 | |
| HP Elite Dragonfly Folio 13.5 G3 | |
| Framework Laptop 13.5 Ryzen 7 7840U | |
| Dell Latitude 9330 | |
Webcam
IR is optional while the privacy shutter comes standard. Lower-end SKUs only come with a 720p webcam whereas higher-end SKUs offer 1080p.


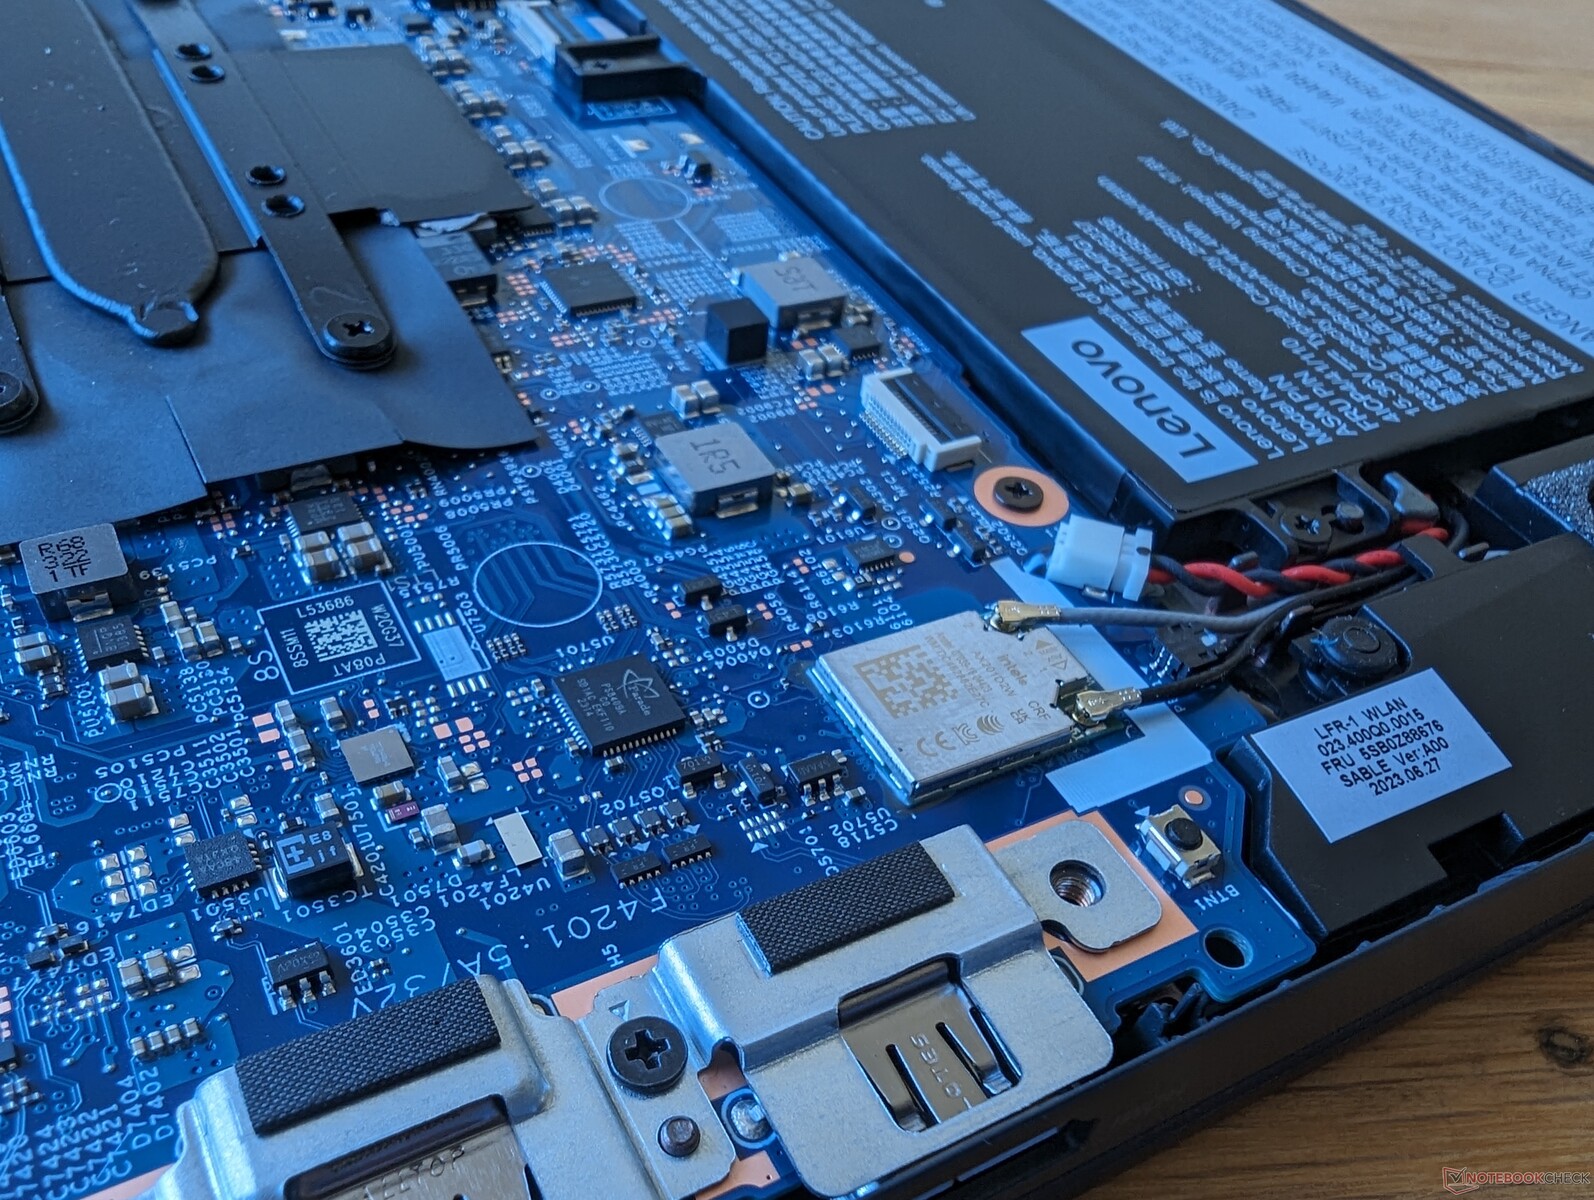
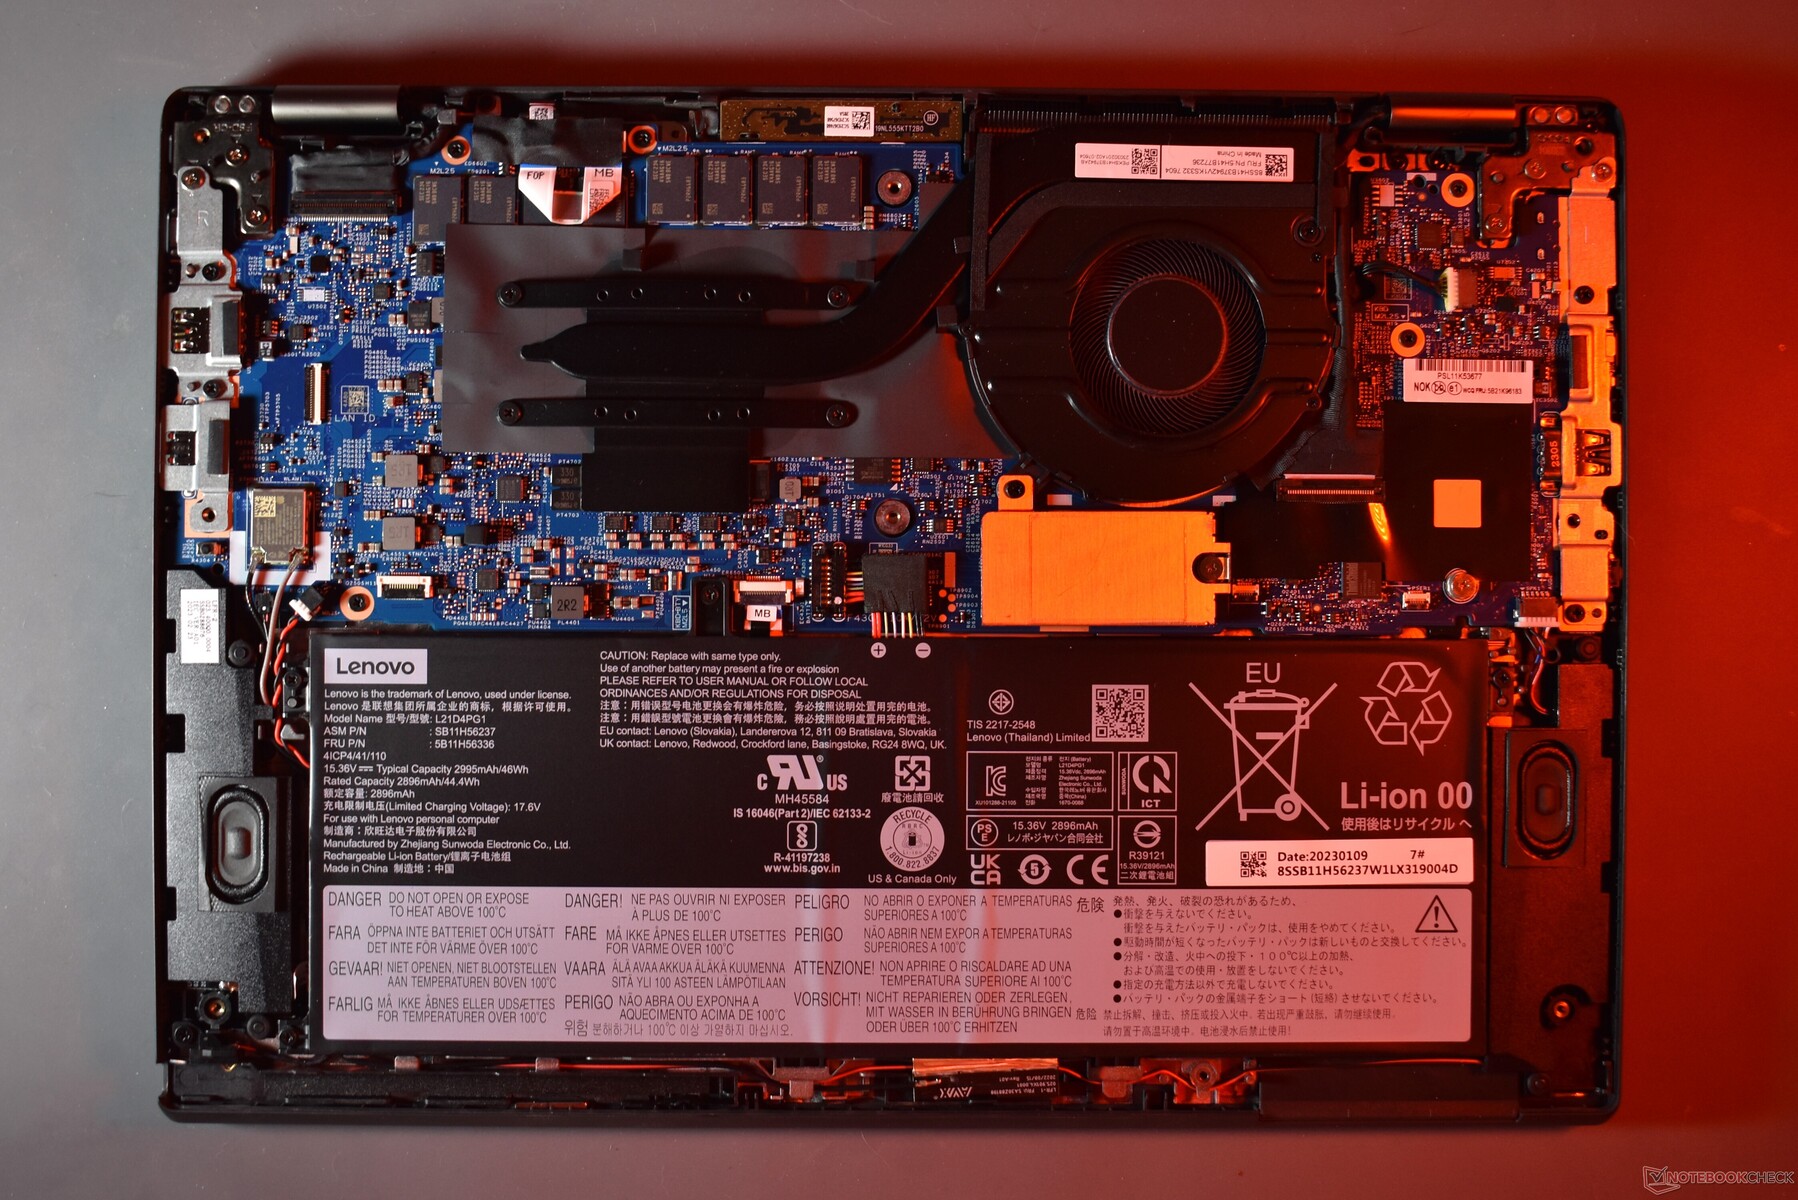
Maintenance
There are no major internal differences in terms of upgradeability between the AMD and Intel versions as shown by the comparison images below.

Accessories And Warranty
The retail box includes an AC adapter and active stylus pen. The pen is housed within the laptop itself for both convenience and charging.
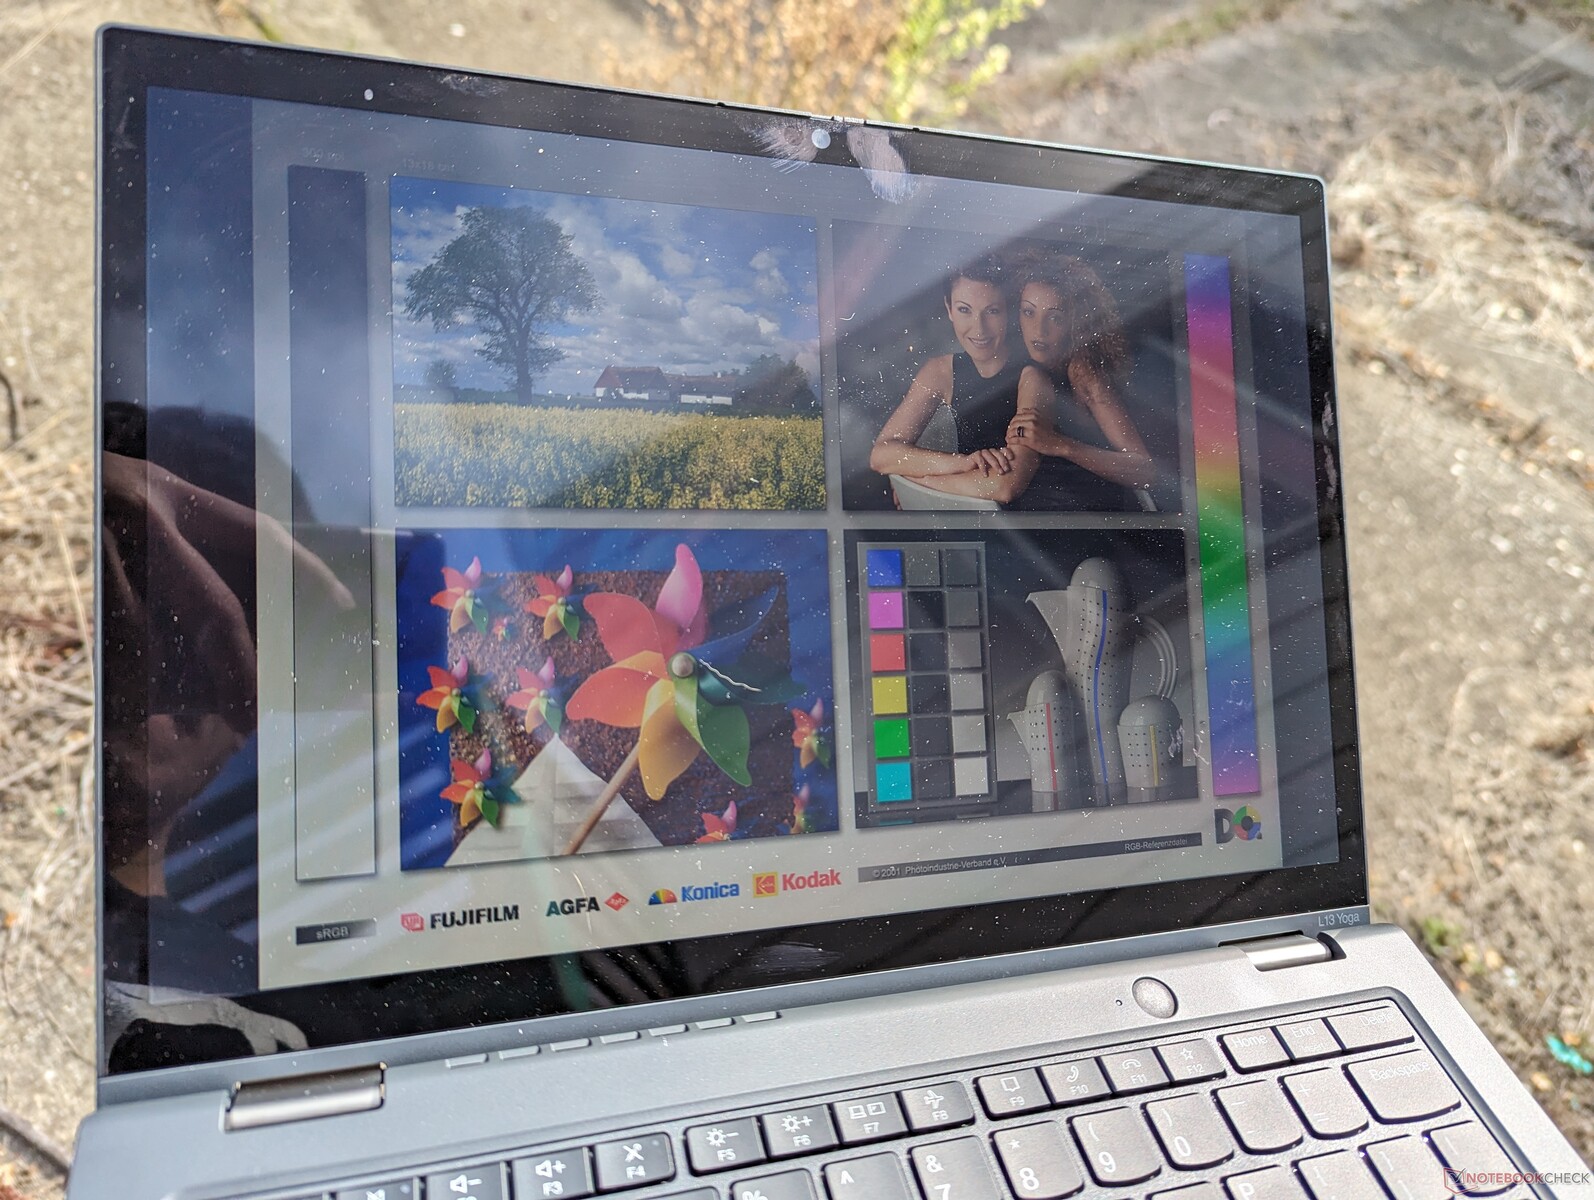
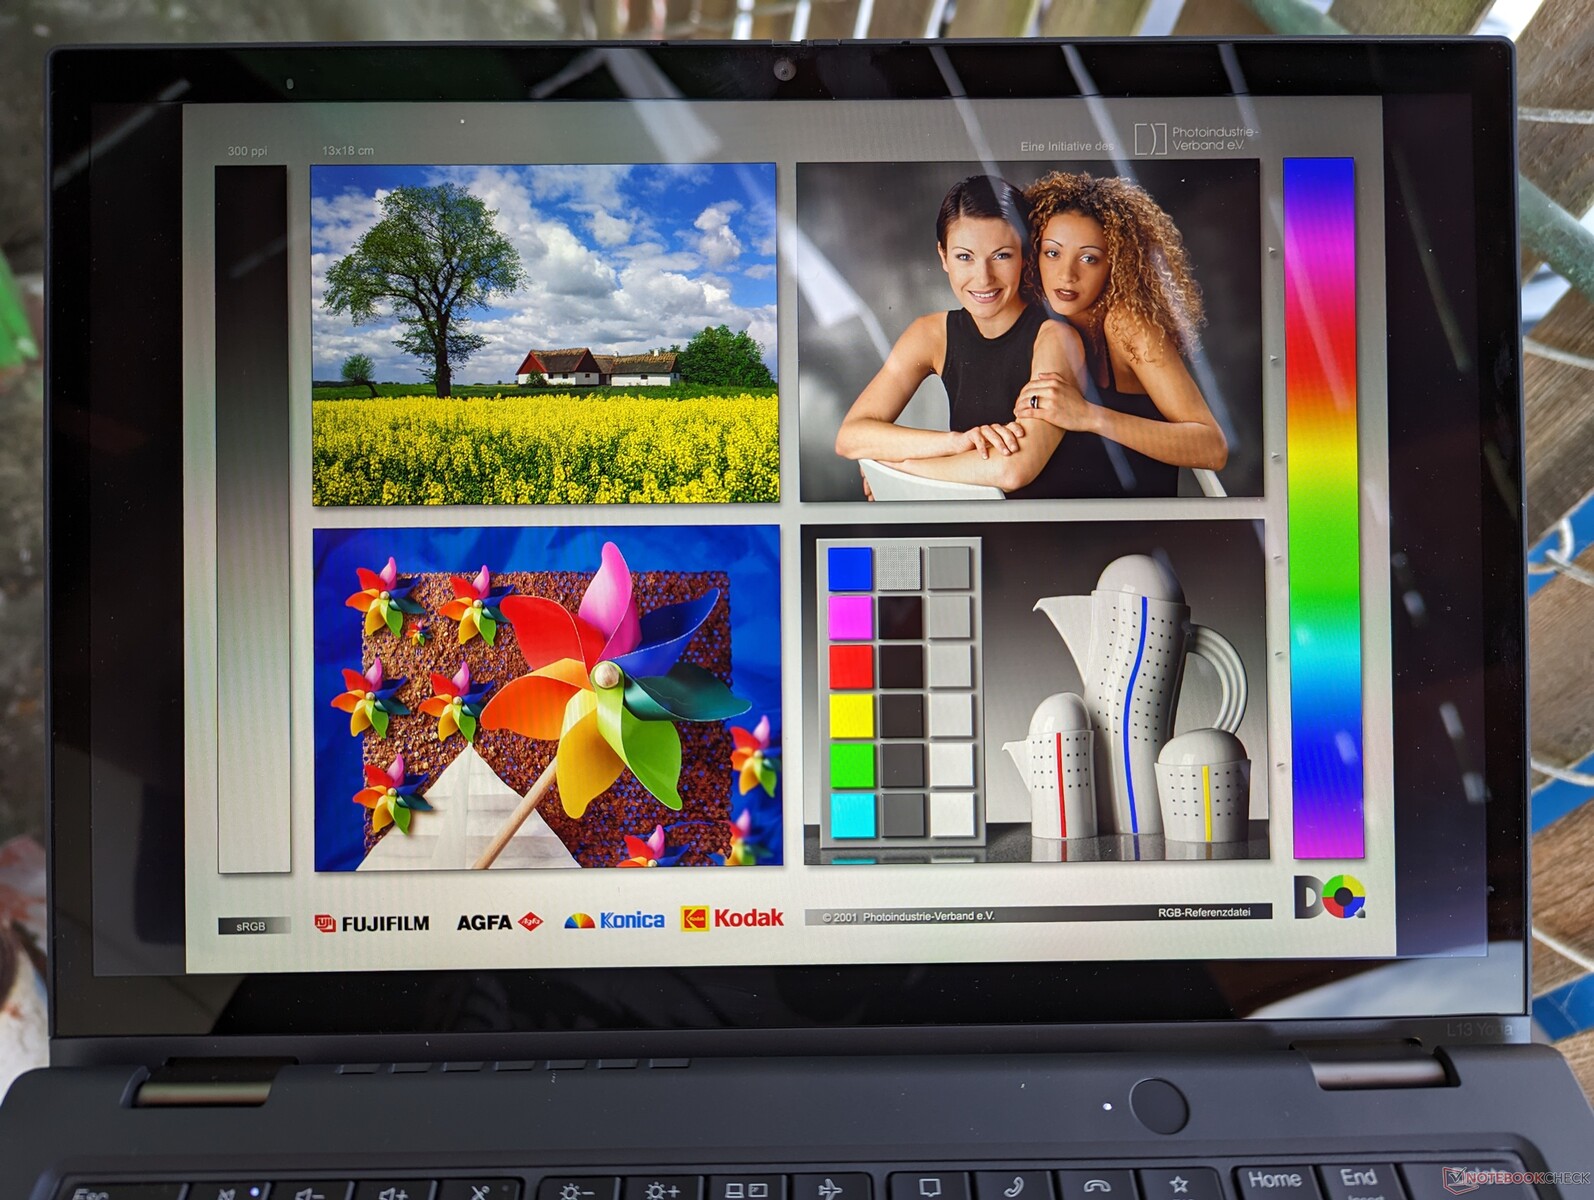
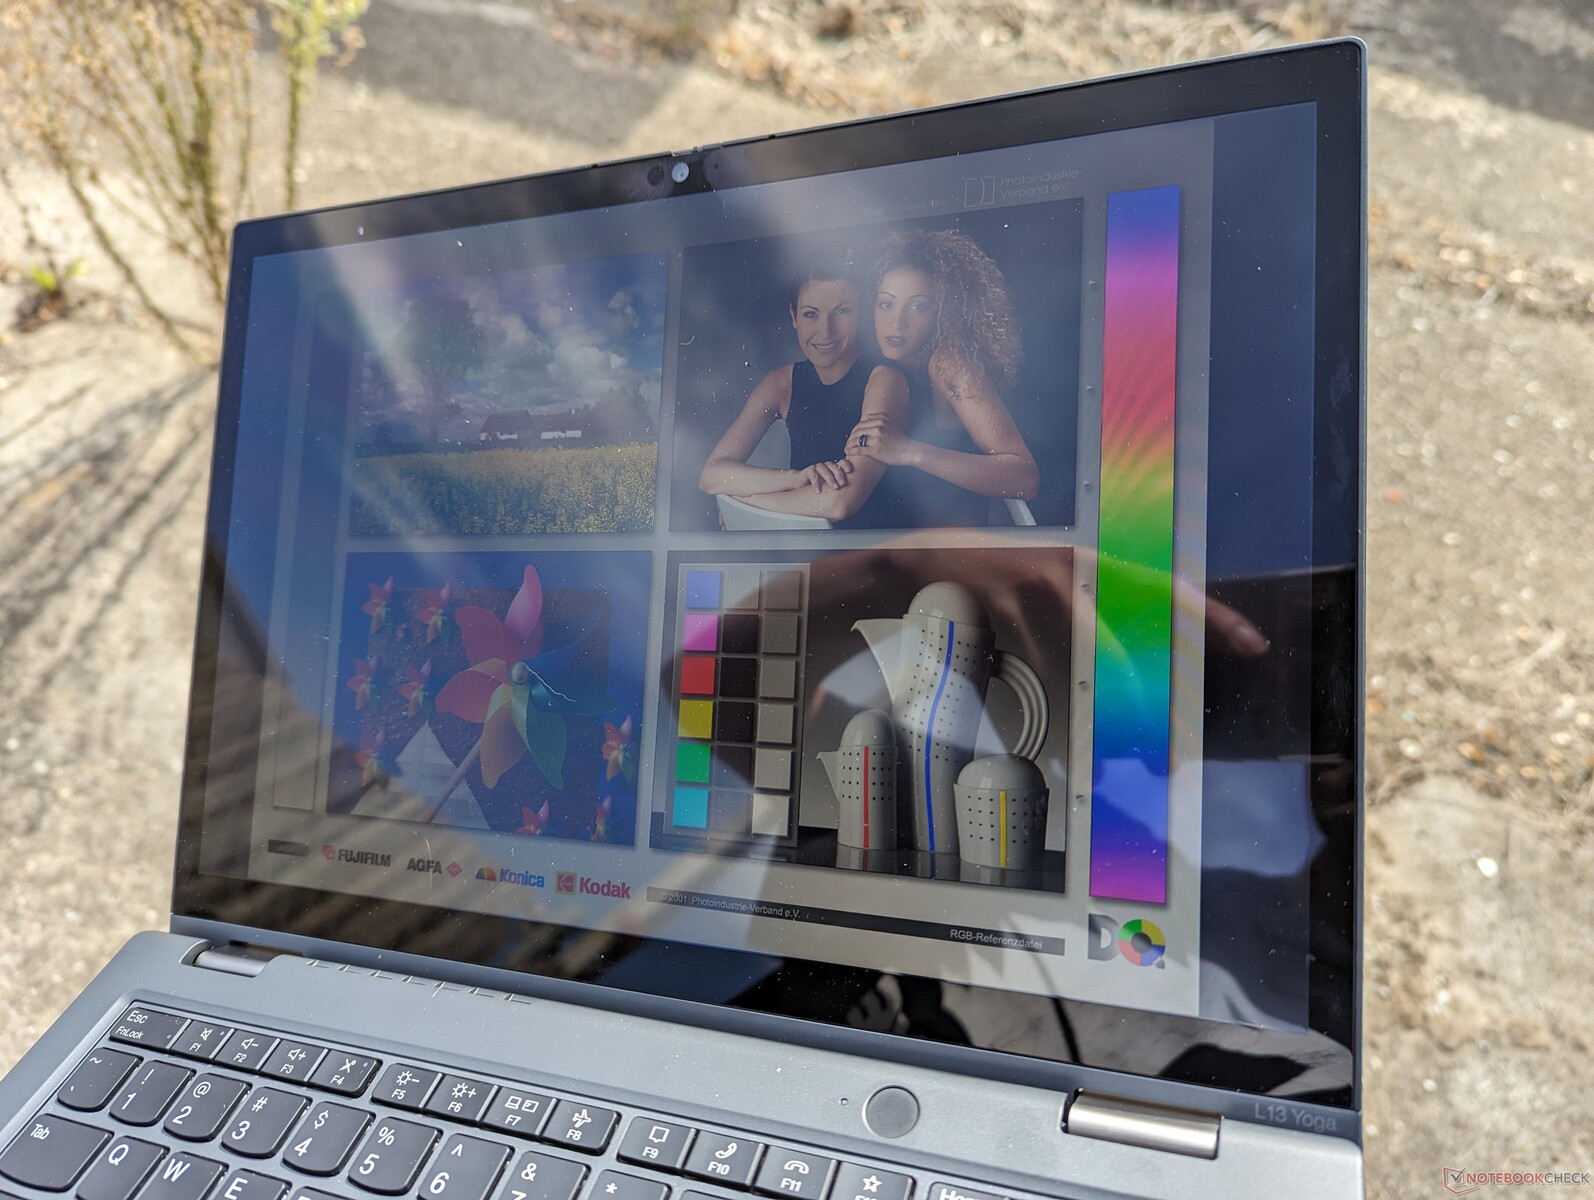
Display
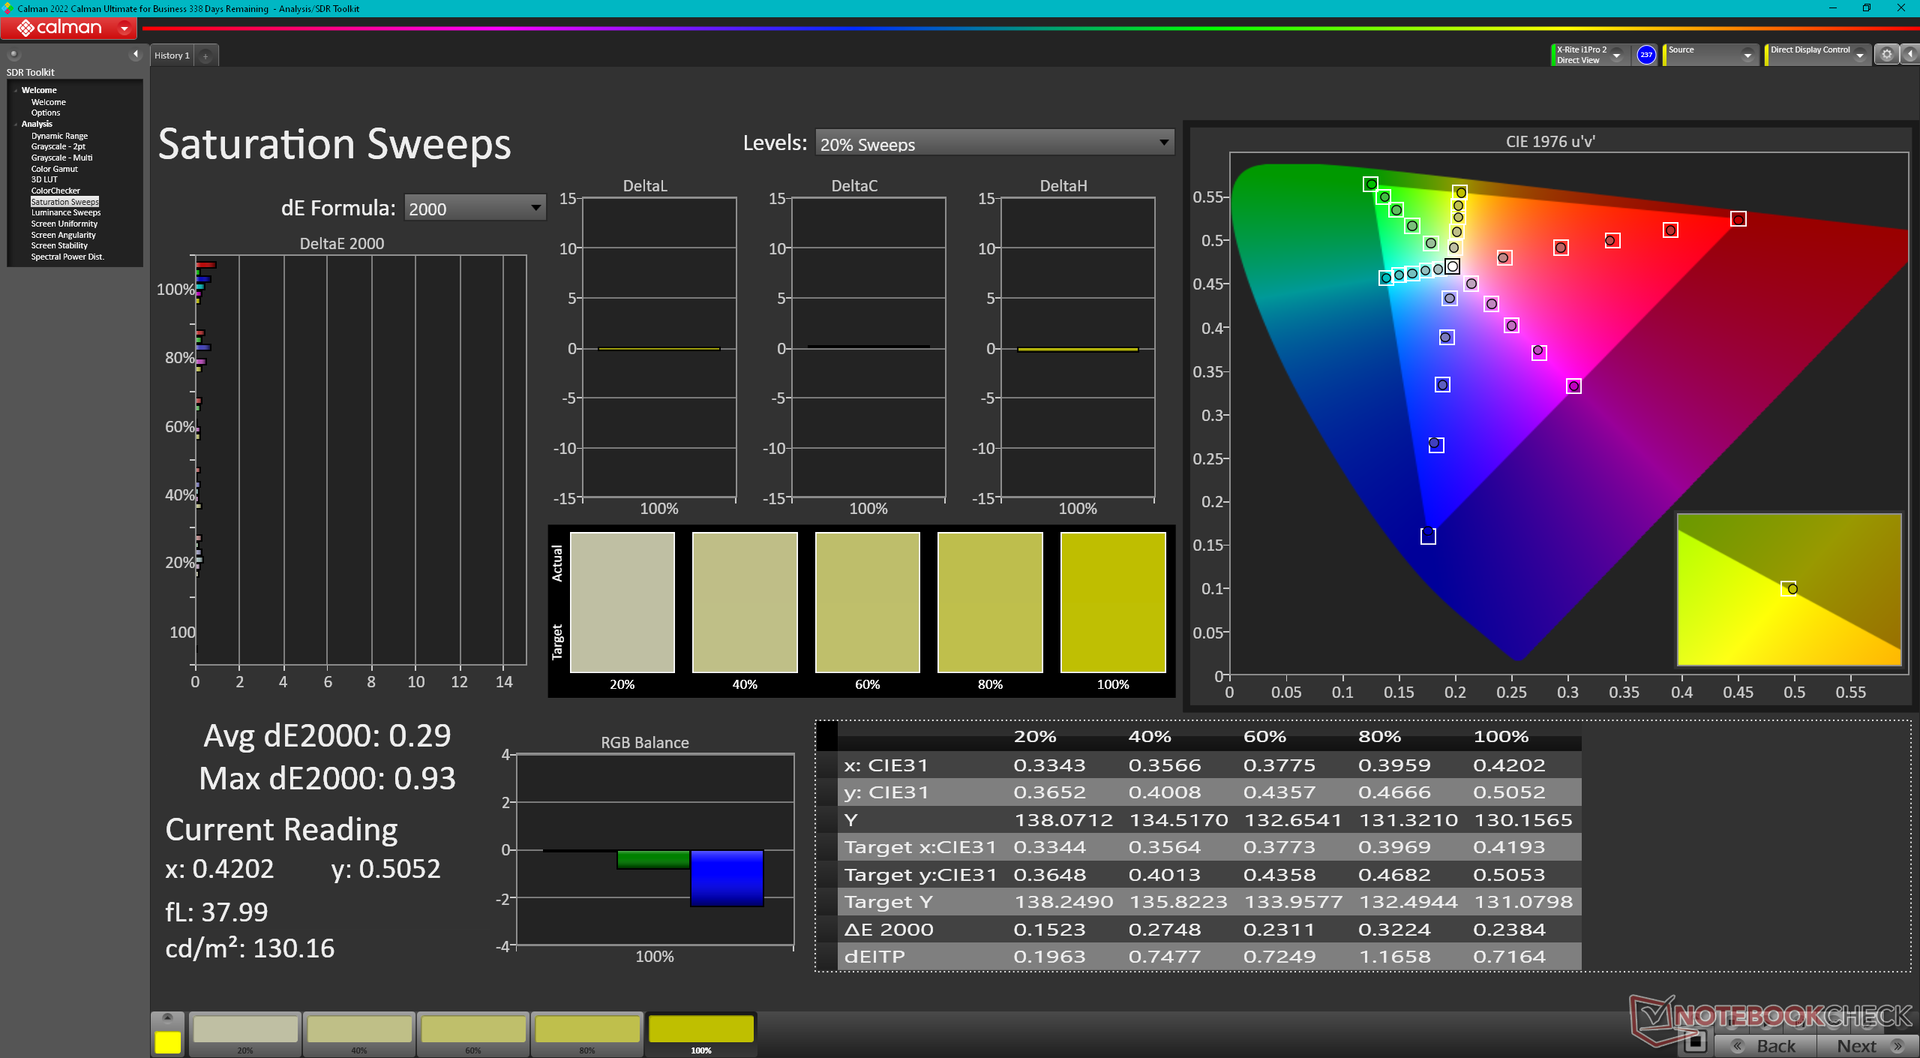
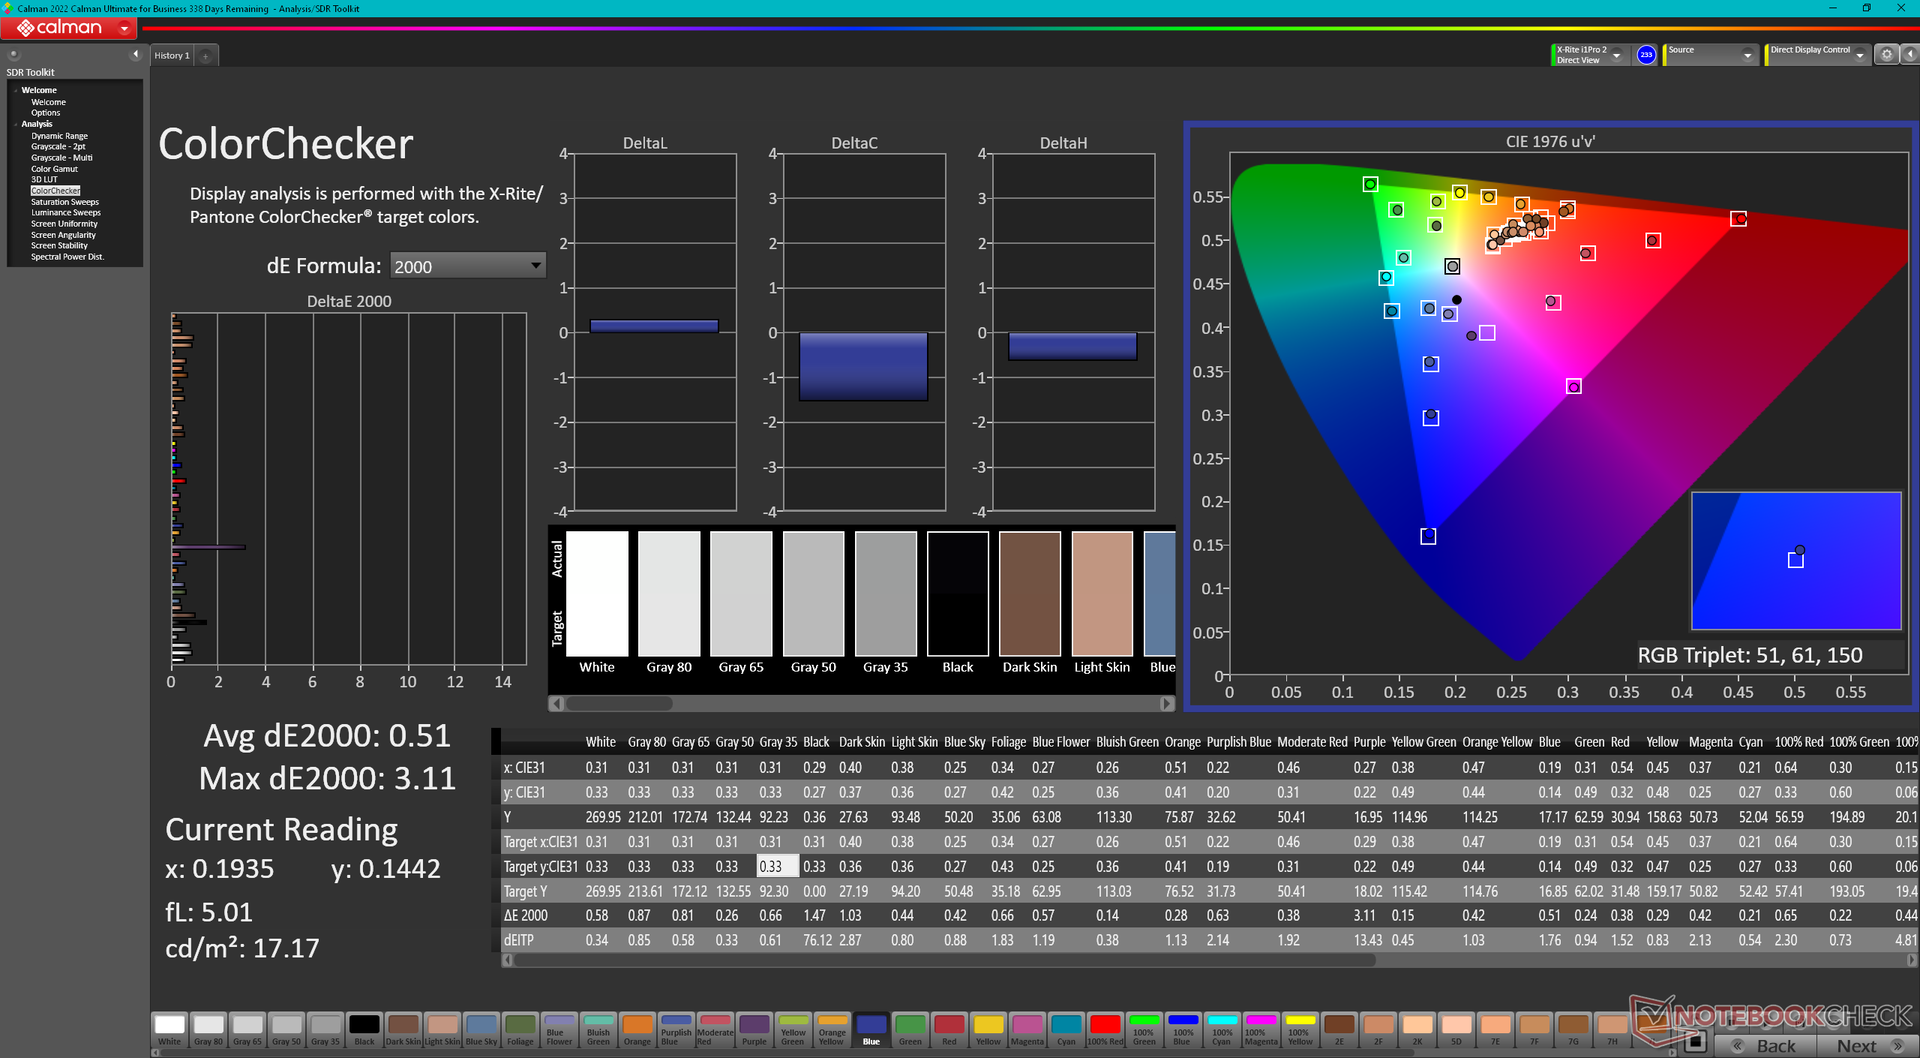
Our Intel unit comes with a different 1200p IPS panel as found on our AMD unit (NV133WUM-N61 vs. B133UAN01.2). This particular panel appears to be slightly dimmer by about 50 to 60 nits while offering faster black-white and gray-gray response times to minimize ghosting. Color and image quality are otherwise very similar between the two models.
It's unfortunate that Lenovo offers no 90 Hz or 120 Hz refresh rate options considering the high $1500+ asking price.


| |||||||||||||||||||||||||
Brightness Distribution: 92 %
Center on Battery: 278.1 cd/m²
Contrast: 818:1 (Black: 0.34 cd/m²)
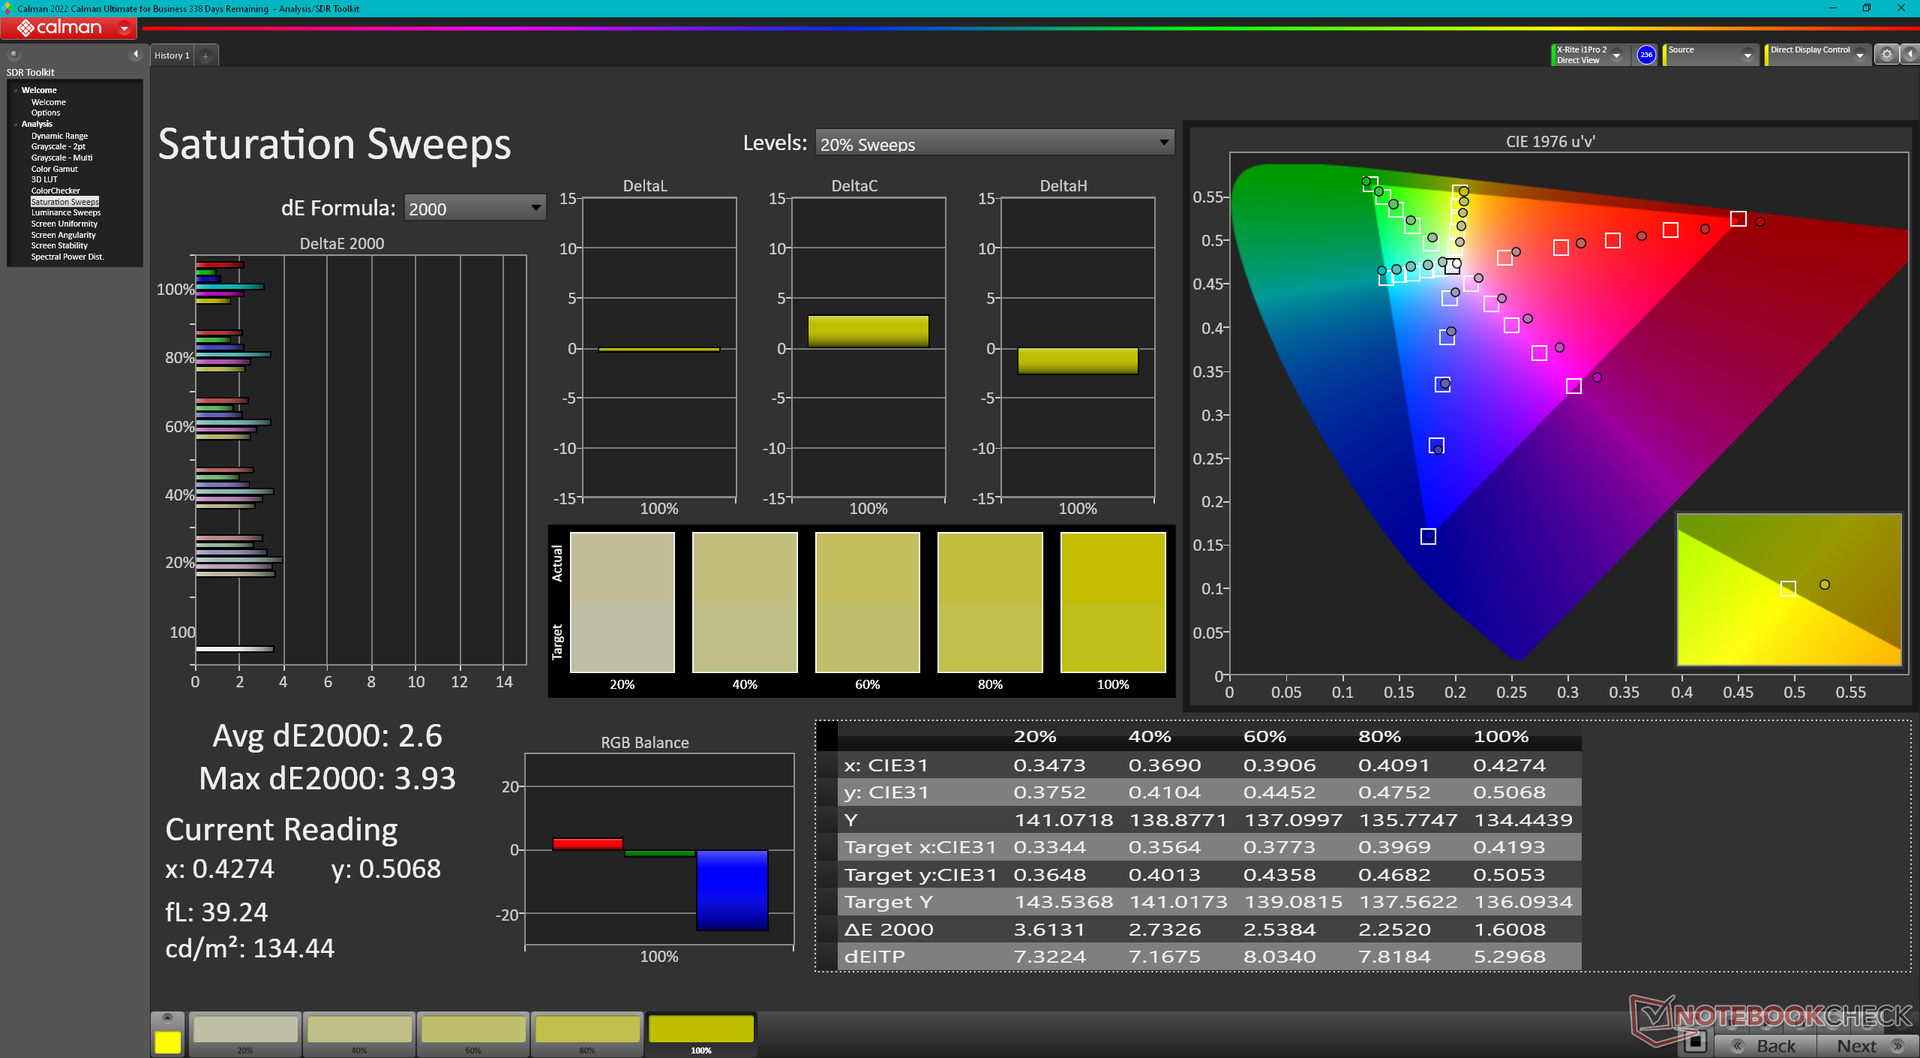
ΔE ColorChecker Calman: 2.6 | ∀{0.5-29.43 Ø4.71}
calibrated: 0.51
ΔE Greyscale Calman: 3.9 | ∀{0.09-98 Ø4.96}
71.9% AdobeRGB 1998 (Argyll 3D)
99.8% sRGB (Argyll 3D)
71.6% Display P3 (Argyll 3D)
Gamma: 2.29
CCT: 5877 K
| Lenovo ThinkPad L13 Yoga G4 i7-1355U NV133WUM-N61, IPS, 1920x1200, 13.3" | Lenovo ThinkPad L13 Yoga G4 21FSS00100 B133UAN01.2 , IPS LED, 1920x1200, 13.3" | HP Elite Dragonfly Folio 13.5 G3 Chi Mei CMN13C0, IPS, 1920x1280, 13.5" | Dell Latitude 9330 AU Optronics B133QAA, IPS, 2560x1600, 13.3" | MSI Summit E13 Flip Evo A11MT Sharp LQ134N1JW53, IPS, 1920x1200, 13.4" | Framework Laptop 13.5 Ryzen 7 7840U BOE CQ NE135FBM-N41, IPS, 2256x1504, 13.5" | |
|---|---|---|---|---|---|---|
| Display | 2% | -3% | 6% | -2% | -2% | |
| Display P3 Coverage (%) | 71.6 | 74.1 3% | 68.3 -5% | 77.8 9% | 69.8 -3% | 69 -4% |
| sRGB Coverage (%) | 99.8 | 99.3 -1% | 98.6 -1% | 99.9 0% | 98.8 -1% | 99.1 -1% |
| AdobeRGB 1998 Coverage (%) | 71.9 | 74.5 4% | 70.2 -2% | 77.5 8% | 70.6 -2% | 71.1 -1% |
| Response Times | -58% | -147% | -165% | -140% | -81% | |
| Response Time Grey 50% / Grey 80% * (ms) | 27.3 ? | 43.3 ? -59% | 66.8 ? -145% | 67.6 ? -148% | 64 ? -134% | 50.4 ? -85% |
| Response Time Black / White * (ms) | 17.9 ? | 28 ? -56% | 44.4 ? -148% | 50.4 ? -182% | 44 ? -146% | 31.5 ? -76% |
| PWM Frequency (Hz) | ||||||
| Screen | -8% | 22% | 19% | 19% | 24% | |
| Brightness middle (cd/m²) | 278.1 | 336 21% | 369.5 33% | 542.3 95% | 551.3 98% | 436 57% |
| Brightness (cd/m²) | 280 | 321 15% | 350 25% | 516 84% | 517 85% | 416 49% |
| Brightness Distribution (%) | 92 | 88 -4% | 87 -5% | 85 -8% | 91 -1% | 89 -3% |
| Black Level * (cd/m²) | 0.34 | 0.22 35% | 0.24 29% | 0.38 -12% | 0.37 -9% | 0.36 -6% |
| Contrast (:1) | 818 | 1527 87% | 1540 88% | 1427 74% | 1490 82% | 1211 48% |
| Colorchecker dE 2000 * | 2.6 | 2.8 -8% | 2.3 12% | 3.18 -22% | 1.45 44% | 1.81 30% |
| Colorchecker dE 2000 max. * | 4.81 | 6.9 -43% | 4.34 10% | 6.05 -26% | 2.86 41% | 4.73 2% |
| Colorchecker dE 2000 calibrated * | 0.51 | 1.4 -175% | 0.6 -18% | 0.67 -31% | 1.7 -233% | 0.45 12% |
| Greyscale dE 2000 * | 3.9 | 3.8 3% | 3.1 21% | 3.1 21% | 1.3 67% | 2.9 26% |
| Gamma | 2.29 96% | 2.15 102% | 2.1 105% | 2.08 106% | 2.14 103% | 2.27 97% |
| CCT | 5877 111% | 6664 98% | 6248 104% | 6140 106% | 6580 99% | 6784 96% |
| Color Space (Percent of AdobeRGB 1998) (%) | 65 | |||||
| Color Space (Percent of sRGB) (%) | 99 | |||||
| Total Average (Program / Settings) | -21% /
-13% | -43% /
-8% | -47% /
-10% | -41% /
-8% | -20% /
3% |
* ... smaller is better


Calibrating the panel ourselves with an X-Rite colorimeter would improve average grayscale and color DeltaE values from 3.9 and 2.6 to just 0.4 and 0.51, respectively. Our calibrated ICM profile is available above to download for free.


Display Response Times
| ↔ Response Time Black to White | ||
|---|---|---|
| 17.9 ms ... rise ↗ and fall ↘ combined | ↗ 9 ms rise | 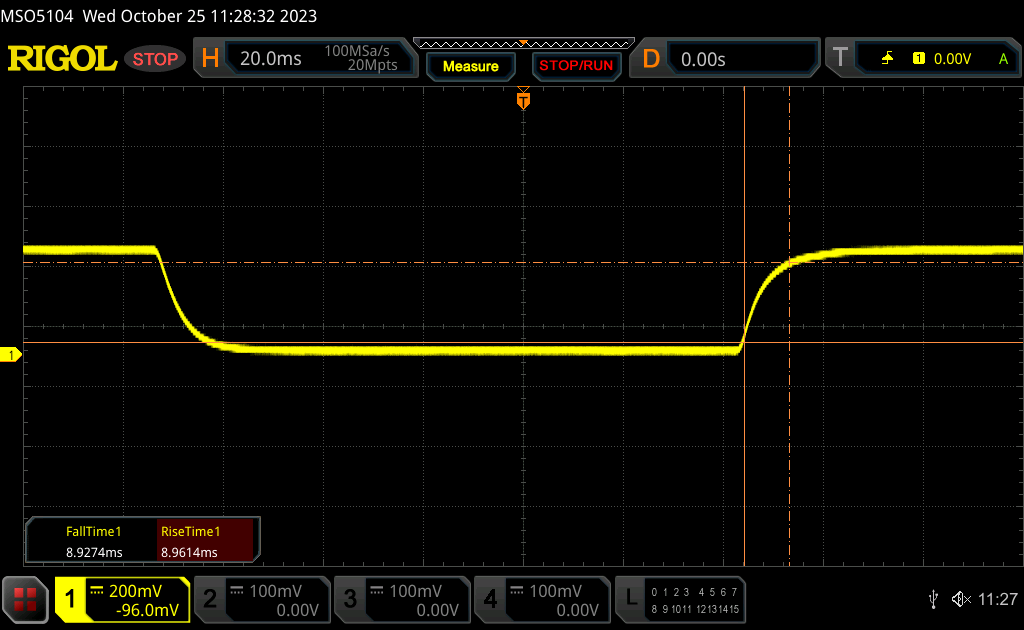 |
| ↘ 8.9 ms fall | ||
| The screen shows good response rates in our tests, but may be too slow for competitive gamers. In comparison, all tested devices range from 0.1 (minimum) to 240 (maximum) ms. » 40 % of all devices are better. This means that the measured response time is similar to the average of all tested devices (19.8 ms). | ||
| ↔ Response Time 50% Grey to 80% Grey | ||
| 27.3 ms ... rise ↗ and fall ↘ combined | ↗ 12.7 ms rise |  |
| ↘ 14.6 ms fall | ||
| The screen shows relatively slow response rates in our tests and may be too slow for gamers. In comparison, all tested devices range from 0.165 (minimum) to 636 (maximum) ms. » 37 % of all devices are better. This means that the measured response time is better than the average of all tested devices (31 ms). | ||
Screen Flickering / PWM (Pulse-Width Modulation)
| Screen flickering / PWM not detected | 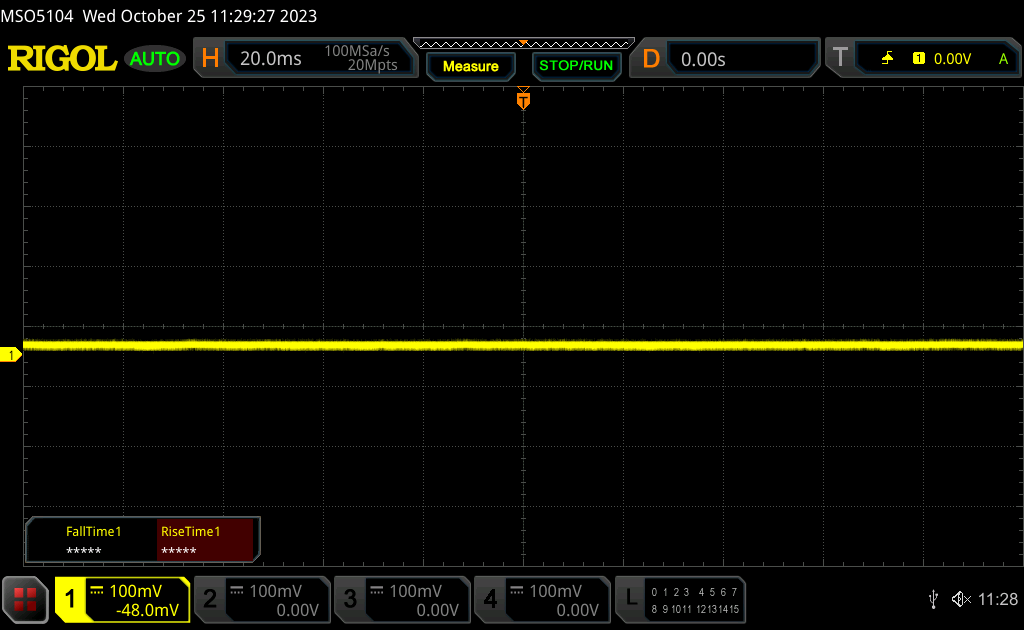 | ||
In comparison: 52 % of all tested devices do not use PWM to dim the display. If PWM was detected, an average of 7751 (minimum: 5 - maximum: 343500) Hz was measured. | |||


Performance


Testing Conditions
We set Windows to Performance mode prior to running the benchmarks below. There are no additional power profiles beyond the standard Windows ones (Power Saver, Balanced, and Performance).


Processor
CPU performance is slightly slower than most other laptops with the same Core i7-1355U due to throttling. When running CineBench R15 xT in a loop, for example, the initial score of 1274 points would fall by as much as 35 percent over time as shown by the graph below. Multi-thread performance is thus only a bit better than the competing Ryzen 5 7530U configuration after accounting for the higher throttling on the Intel version.
The main advantage for Intel continues to be in single-thread performance where our Core i7 has a 20 to 25 percent lead over the Ryzen 5 7530U.
Cinebench R15 Multi Loop
Cinebench R23: Multi Core | Single Core
Cinebench R20: CPU (Multi Core) | CPU (Single Core)
Cinebench R15: CPU Multi 64Bit | CPU Single 64Bit
Blender: v2.79 BMW27 CPU
7-Zip 18.03: 7z b 4 | 7z b 4 -mmt1
Geekbench 5.5: Multi-Core | Single-Core
HWBOT x265 Benchmark v2.2: 4k Preset
LibreOffice : 20 Documents To PDF
R Benchmark 2.5: Overall mean
* ... smaller is better
AIDA64: FP32 Ray-Trace | FPU Julia | CPU SHA3 | CPU Queen | FPU SinJulia | FPU Mandel | CPU AES | CPU ZLib | FP64 Ray-Trace | CPU PhotoWorxx
| AIDA64 / FP32 Ray-Trace | |
| Framework Laptop 13.5 Ryzen 7 7840U | |
| Lenovo ThinkPad L13 Yoga G4 21FSS00100 | |
| Average Intel Core i7-1355U (5673 - 8424, n=18) | |
| MSI Summit E13 Flip Evo A11MT | |
| Dell Latitude 9330 | |
| HP Elite Dragonfly Folio 13.5 G3 | |
| Lenovo ThinkPad L13 Yoga G4 i7-1355U | |
| AIDA64 / FPU SinJulia | |
| Framework Laptop 13.5 Ryzen 7 7840U | |
| Lenovo ThinkPad L13 Yoga G4 21FSS00100 | |
| MSI Summit E13 Flip Evo A11MT | |
| Average Intel Core i7-1355U (4045 - 5426, n=18) | |
| HP Elite Dragonfly Folio 13.5 G3 | |
| Lenovo ThinkPad L13 Yoga G4 i7-1355U | |
| Dell Latitude 9330 | |
| AIDA64 / FP64 Ray-Trace | |
| Framework Laptop 13.5 Ryzen 7 7840U | |
| Lenovo ThinkPad L13 Yoga G4 21FSS00100 | |
| MSI Summit E13 Flip Evo A11MT | |
| Average Intel Core i7-1355U (2991 - 4453, n=18) | |
| Dell Latitude 9330 | |
| HP Elite Dragonfly Folio 13.5 G3 | |
| Lenovo ThinkPad L13 Yoga G4 i7-1355U | |
| AIDA64 / CPU PhotoWorxx | |
| HP Elite Dragonfly Folio 13.5 G3 | |
| MSI Summit E13 Flip Evo A11MT | |
| Dell Latitude 9330 | |
| Lenovo ThinkPad L13 Yoga G4 i7-1355U | |
| Average Intel Core i7-1355U (21800 - 46154, n=18) | |
| Framework Laptop 13.5 Ryzen 7 7840U | |
| Lenovo ThinkPad L13 Yoga G4 21FSS00100 | |
System Performance
PCMark scores are higher in the GPU-heavy Digital Content Creation subtest whereas the CPU-heavy Productivity test favors the AMD version. This suggests that our Intel version offers better integrated graphics performance but slower CPU multi-thread performance than the AMD version.

CrossMark: Overall | Productivity | Creativity | Responsiveness
| PCMark 10 / Score | |
| Framework Laptop 13.5 Ryzen 7 7840U | |
| Lenovo ThinkPad L13 Yoga G4 i7-1355U | |
| HP Elite Dragonfly Folio 13.5 G3 | |
| Average Intel Core i7-1355U, Intel Iris Xe Graphics G7 96EUs (5455 - 5933, n=15) | |
| Lenovo ThinkPad L13 Yoga G4 21FSS00100 | |
| Dell Latitude 9330 | |
| MSI Summit E13 Flip Evo A11MT | |
| PCMark 10 / Essentials | |
| HP Elite Dragonfly Folio 13.5 G3 | |
| Lenovo ThinkPad L13 Yoga G4 i7-1355U | |
| Lenovo ThinkPad L13 Yoga G4 21FSS00100 | |
| Framework Laptop 13.5 Ryzen 7 7840U | |
| Average Intel Core i7-1355U, Intel Iris Xe Graphics G7 96EUs (10203 - 11822, n=15) | |
| Dell Latitude 9330 | |
| MSI Summit E13 Flip Evo A11MT | |
| PCMark 10 / Productivity | |
| Framework Laptop 13.5 Ryzen 7 7840U | |
| Lenovo ThinkPad L13 Yoga G4 21FSS00100 | |
| Lenovo ThinkPad L13 Yoga G4 i7-1355U | |
| HP Elite Dragonfly Folio 13.5 G3 | |
| Average Intel Core i7-1355U, Intel Iris Xe Graphics G7 96EUs (6763 - 7536, n=15) | |
| Dell Latitude 9330 | |
| MSI Summit E13 Flip Evo A11MT | |
| PCMark 10 / Digital Content Creation | |
| Framework Laptop 13.5 Ryzen 7 7840U | |
| Lenovo ThinkPad L13 Yoga G4 i7-1355U | |
| Average Intel Core i7-1355U, Intel Iris Xe Graphics G7 96EUs (5723 - 6712, n=15) | |
| HP Elite Dragonfly Folio 13.5 G3 | |
| Dell Latitude 9330 | |
| MSI Summit E13 Flip Evo A11MT | |
| Lenovo ThinkPad L13 Yoga G4 21FSS00100 | |
| CrossMark / Overall | |
| Framework Laptop 13.5 Ryzen 7 7840U | |
| HP Elite Dragonfly Folio 13.5 G3 | |
| Average Intel Core i7-1355U, Intel Iris Xe Graphics G7 96EUs (1478 - 1643, n=15) | |
| Lenovo ThinkPad L13 Yoga G4 i7-1355U | |
| Lenovo ThinkPad L13 Yoga G4 21FSS00100 | |
| CrossMark / Productivity | |
| Framework Laptop 13.5 Ryzen 7 7840U | |
| HP Elite Dragonfly Folio 13.5 G3 | |
| Average Intel Core i7-1355U, Intel Iris Xe Graphics G7 96EUs (1444 - 1665, n=15) | |
| Lenovo ThinkPad L13 Yoga G4 i7-1355U | |
| Lenovo ThinkPad L13 Yoga G4 21FSS00100 | |
| CrossMark / Creativity | |
| Framework Laptop 13.5 Ryzen 7 7840U | |
| HP Elite Dragonfly Folio 13.5 G3 | |
| Lenovo ThinkPad L13 Yoga G4 i7-1355U | |
| Average Intel Core i7-1355U, Intel Iris Xe Graphics G7 96EUs (1563 - 1732, n=15) | |
| Lenovo ThinkPad L13 Yoga G4 21FSS00100 | |
| CrossMark / Responsiveness | |
| HP Elite Dragonfly Folio 13.5 G3 | |
| Framework Laptop 13.5 Ryzen 7 7840U | |
| Average Intel Core i7-1355U, Intel Iris Xe Graphics G7 96EUs (1217 - 1681, n=15) | |
| Lenovo ThinkPad L13 Yoga G4 i7-1355U | |
| Lenovo ThinkPad L13 Yoga G4 21FSS00100 | |
| PCMark 10 Score | 5823 points | |
Help | ||
| AIDA64 / Memory Write | |
| Framework Laptop 13.5 Ryzen 7 7840U | |
| HP Elite Dragonfly Folio 13.5 G3 | |
| Lenovo ThinkPad L13 Yoga G4 i7-1355U | |
| Average Intel Core i7-1355U (35910 - 93342, n=18) | |
| Dell Latitude 9330 | |
| MSI Summit E13 Flip Evo A11MT | |
| Lenovo ThinkPad L13 Yoga G4 21FSS00100 | |
| AIDA64 / Memory Latency | |
| HP Elite Dragonfly Folio 13.5 G3 | |
| Lenovo ThinkPad L13 Yoga G4 21FSS00100 | |
| Average Intel Core i7-1355U (72.2 - 346, n=18) | |
| Dell Latitude 9330 | |
| Lenovo ThinkPad L13 Yoga G4 i7-1355U | |
| MSI Summit E13 Flip Evo A11MT | |
| Framework Laptop 13.5 Ryzen 7 7840U | |
* ... smaller is better
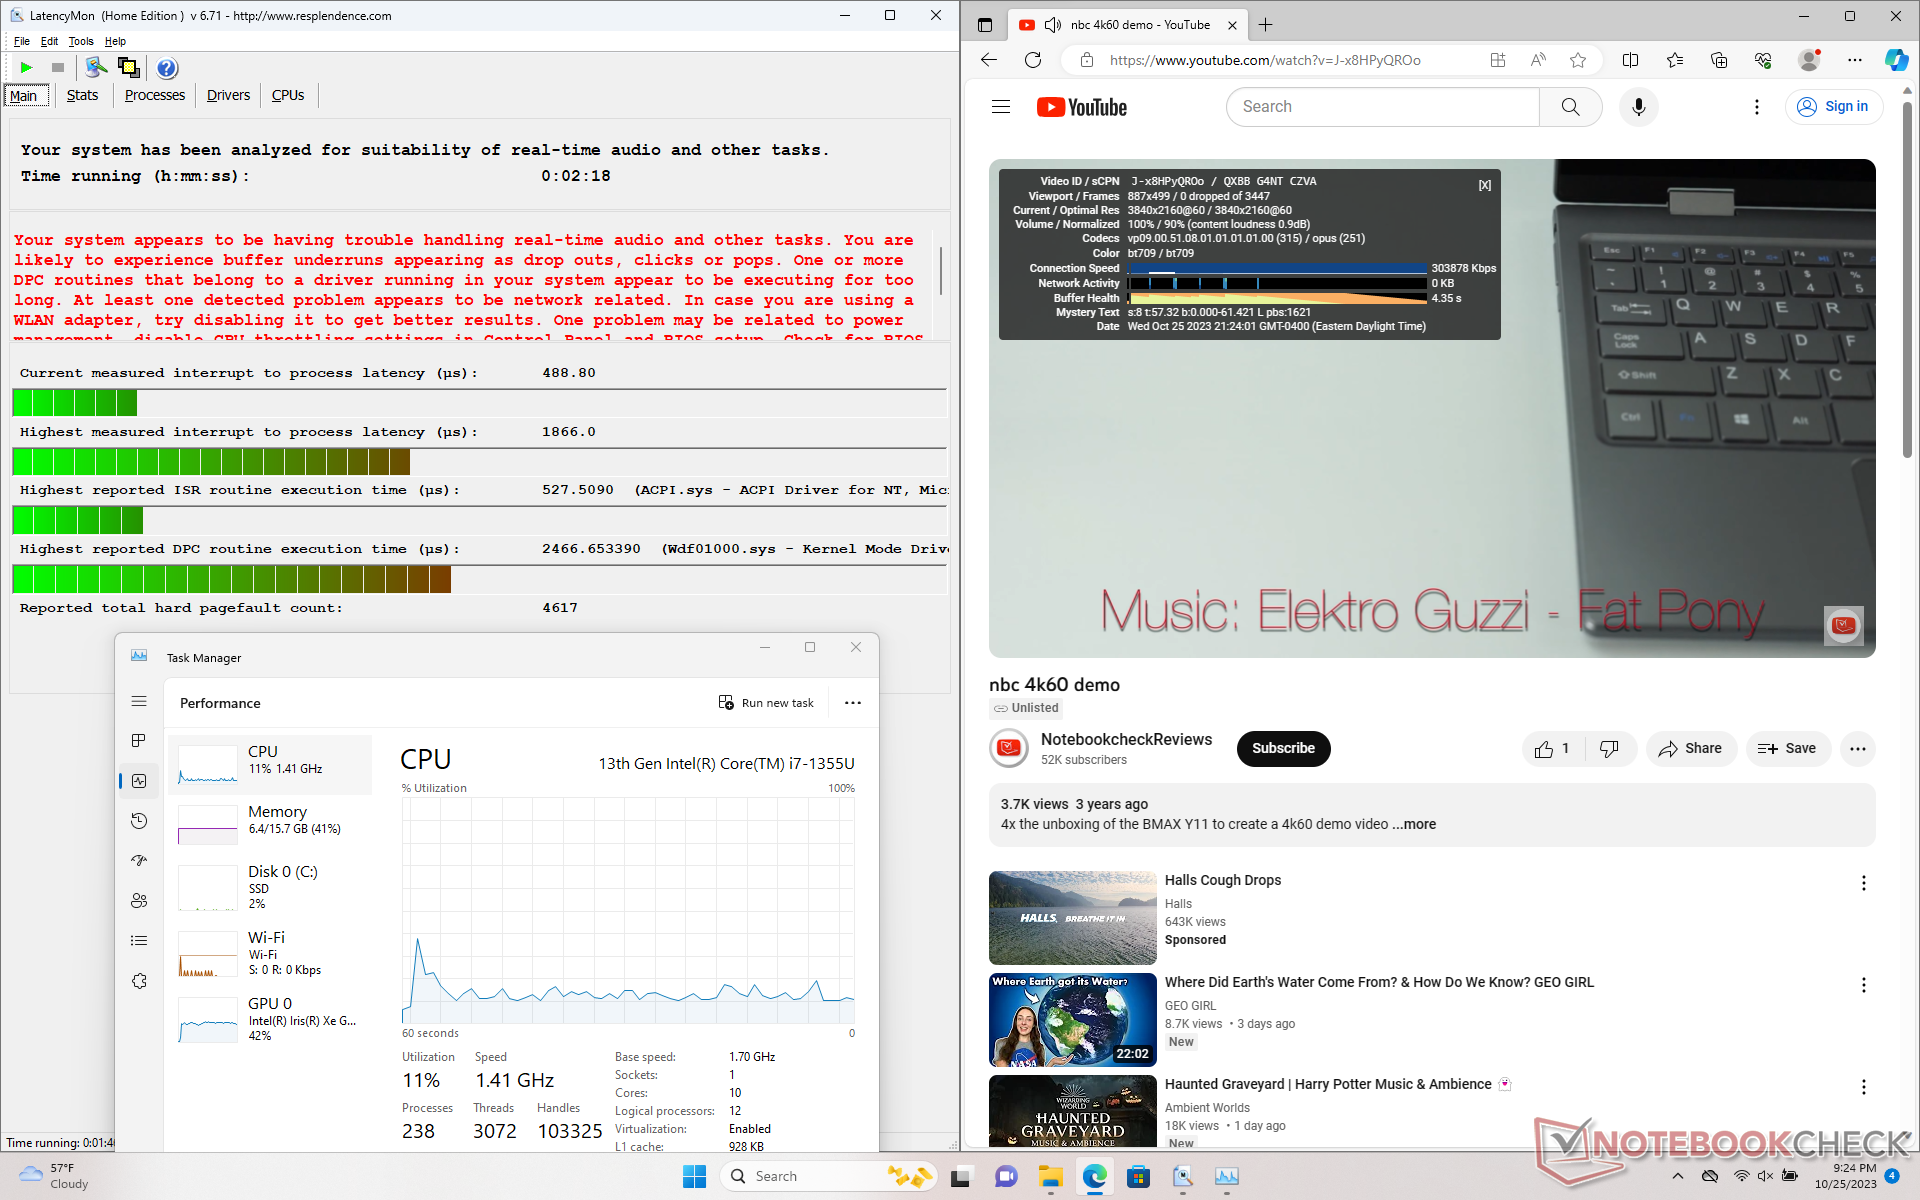
DPC Latency
LatencyMon reveals slight DPC issues when opening multiple browser tabs of our homepage. 4K video playback at 60 FPS is otherwise smooth and with no dropped frames recorded.

| DPC Latencies / LatencyMon - interrupt to process latency (max), Web, Youtube, Prime95 | |
| Dell Latitude 9330 | |
| HP Elite Dragonfly Folio 13.5 G3 | |
| MSI Summit E13 Flip Evo A11MT | |
| Lenovo ThinkPad L13 Yoga G4 i7-1355U | |
| Framework Laptop 13.5 Ryzen 7 7840U | |
| Lenovo ThinkPad L13 Yoga G4 21FSS00100 | |
* ... smaller is better
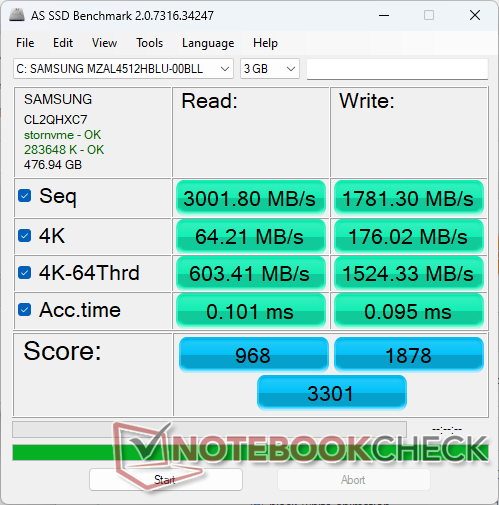
Storage Devices
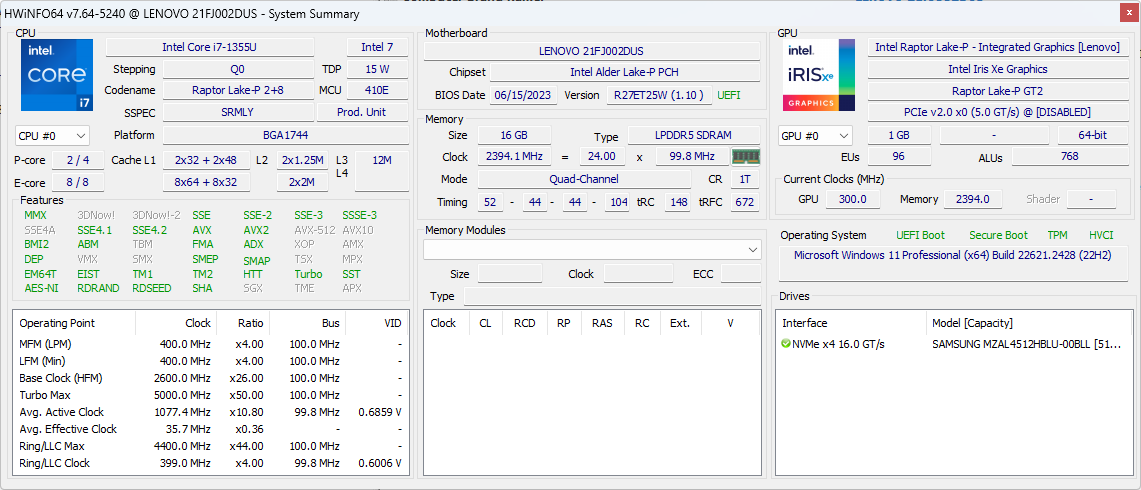
Our unit ships with a midrange 512 GB Samsung PM9B1 instead of the Kioxia BG5 as found on our AMD version. Transfer rates top out at around 3600 MB/s before throttling kicks in after a few minutes of stress in which case transfer rates can be as low as 2200 MB/s.


| Drive Performance rating - Percent | |
| HP Elite Dragonfly Folio 13.5 G3 -11! | |
| MSI Summit E13 Flip Evo A11MT | |
| Framework Laptop 13.5 Ryzen 7 7840U -11! | |
| Dell Latitude 9330 | |
| Lenovo ThinkPad L13 Yoga G4 21FSS00100 | |
| Lenovo ThinkPad L13 Yoga G4 i7-1355U | |
* ... smaller is better
Disk Throttling: DiskSpd Read Loop, Queue Depth 8
GPU Performance
Our Iris Xe 96 EUs has a clear advantage over the Radeon RX Vega 7 in the Ryzen 5 7530U in DX11 and DX12 applications. 3DMark Fire Strike and Time Spy results, for example, are 50 to 60 percent faster with our Intel configuration.


| 3DMark 11 Performance | 6398 points | |
| 3DMark Cloud Gate Standard Score | 19794 points | |
| 3DMark Fire Strike Score | 4178 points | |
| 3DMark Time Spy Score | 1715 points | |
Help | ||
* ... smaller is better
Frame rate stability when gaming is unfortunately unsteady. When idling on Witcher 3 on low settings, for example, frame rates would fluctuate between 70 and 85 FPS as shown by the graph below to suggest fluctuating clock rates over time. The ThinkPad L13 is thankfully not a gaming laptop and so this specific disadvantage shouldn't be a deal breaker to the target audience. Streaming applications still run smoothly on the machine.
Witcher 3 FPS Chart
| low | med. | high | ultra | |
|---|---|---|---|---|
| GTA V (2015) | 106.7 | 84.1 | 9.99 | |
| The Witcher 3 (2015) | 92.8 | 56.7 | 31 | 13.8 |
| Dota 2 Reborn (2015) | 94.3 | 65.3 | 52.4 | 46.2 |
| Final Fantasy XV Benchmark (2018) | 36.6 | 20.1 | 15 | |
| X-Plane 11.11 (2018) | 39.8 | 27.3 | 25.1 | |
| Far Cry 5 (2018) | 45 | 24 | 22 | 21 |
| Strange Brigade (2018) | 87.2 | 38.1 | 30.5 | 23 |
| Cyberpunk 2077 1.6 (2022) | 17.8 | |||
| Tiny Tina's Wonderlands (2022) | 23.3 | 17.7 | 10.9 | 8.6 |
| F1 22 (2022) | 45 | 41.1 | 29.8 | 22.6 |
Emissions
System Noise
Fan noise can be louder on the Intel version than on the AMD version when running demanding loads like 3DMark which may be attributed to the faster graphics performance and overall power consumption of the Intel version. Otherwise, fan noise would typically hover in the low 30 dB(A) range when web browsing or streaming to be easily ignorable in most office or conference settings.


Noise level
| Idle |
| 23.4 / 23.4 / 23.4 dB(A) |
| Load |
| 33.9 / 36.9 dB(A) |
 | ||
30 dB silent 40 dB(A) audible 50 dB(A) loud |
||
min: | ||
| Lenovo ThinkPad L13 Yoga G4 i7-1355U Iris Xe G7 96EUs, i7-1355U, Samsung PM9B1 512GB MZAL4512HBLU | Lenovo ThinkPad L13 Yoga G4 21FSS00100 Vega 7, R5 7530U, Kioxia BG5 KBG5AZNT512G | HP Elite Dragonfly Folio 13.5 G3 Iris Xe G7 96EUs, i7-1265U, Samsung PM9A1 MZVL2512HCJQ | Dell Latitude 9330 Iris Xe G7 96EUs, i7-1260U | MSI Summit E13 Flip Evo A11MT Iris Xe G7 96EUs, i7-1185G7, Phison 1TB SM2801T24GKBB4S-E162 | Framework Laptop 13.5 Ryzen 7 7840U Radeon 780M, R7 7840U, WD PC SN740 512GB SDDPNQD-512G | |
|---|---|---|---|---|---|---|
| Noise | 9% | 2% | -4% | -12% | -9% | |
| off / environment * (dB) | 23.1 | 23.4 -1% | 24.6 -6% | 23 -0% | 24.5 -6% | 22.6 2% |
| Idle Minimum * (dB) | 23.4 | 23.4 -0% | 24.6 -5% | 23 2% | 24.7 -6% | 22.6 3% |
| Idle Average * (dB) | 23.4 | 23.4 -0% | 24.6 -5% | 23.1 1% | 24.7 -6% | 22.6 3% |
| Idle Maximum * (dB) | 23.4 | 23.4 -0% | 24.6 -5% | 23.1 1% | 26.4 -13% | 24.2 -3% |
| Load Average * (dB) | 33.9 | 24 29% | 27.8 18% | 37.1 -9% | 37.8 -12% | 35.8 -6% |
| Witcher 3 ultra * (dB) | 36.9 | 30.8 17% | 33.4 9% | 40.6 -10% | 41.4 -12% | 46.5 -26% |
| Load Maximum * (dB) | 36.9 | 30.1 18% | 33.4 9% | 40.5 -10% | 48.8 -32% | 48.9 -33% |
* ... smaller is better
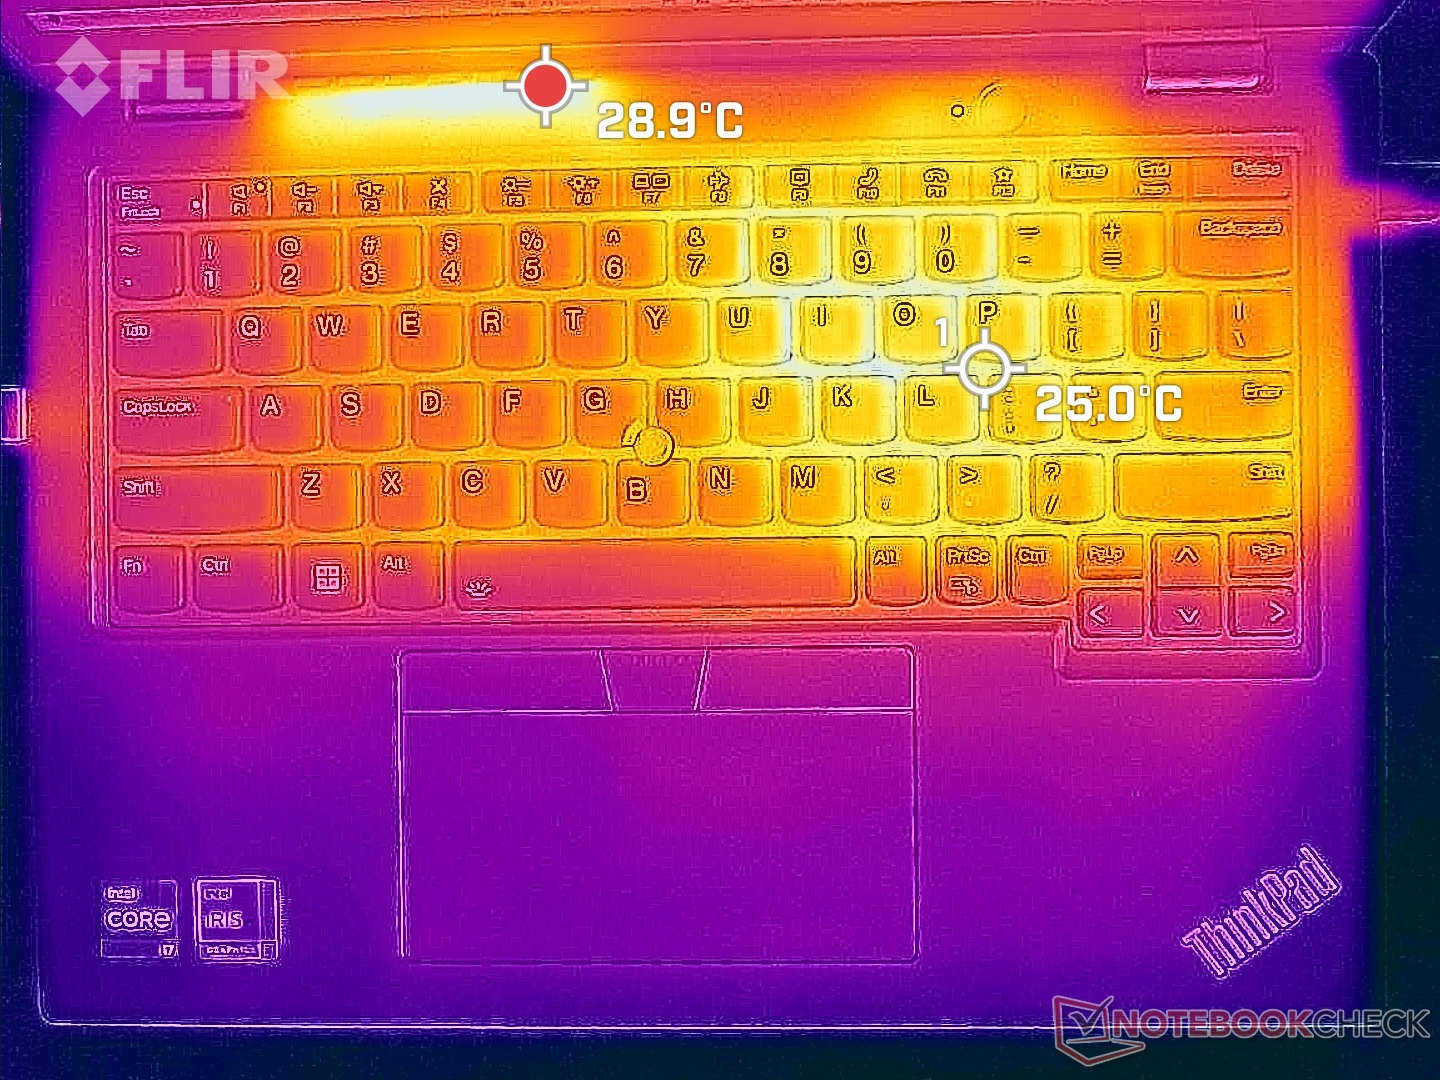
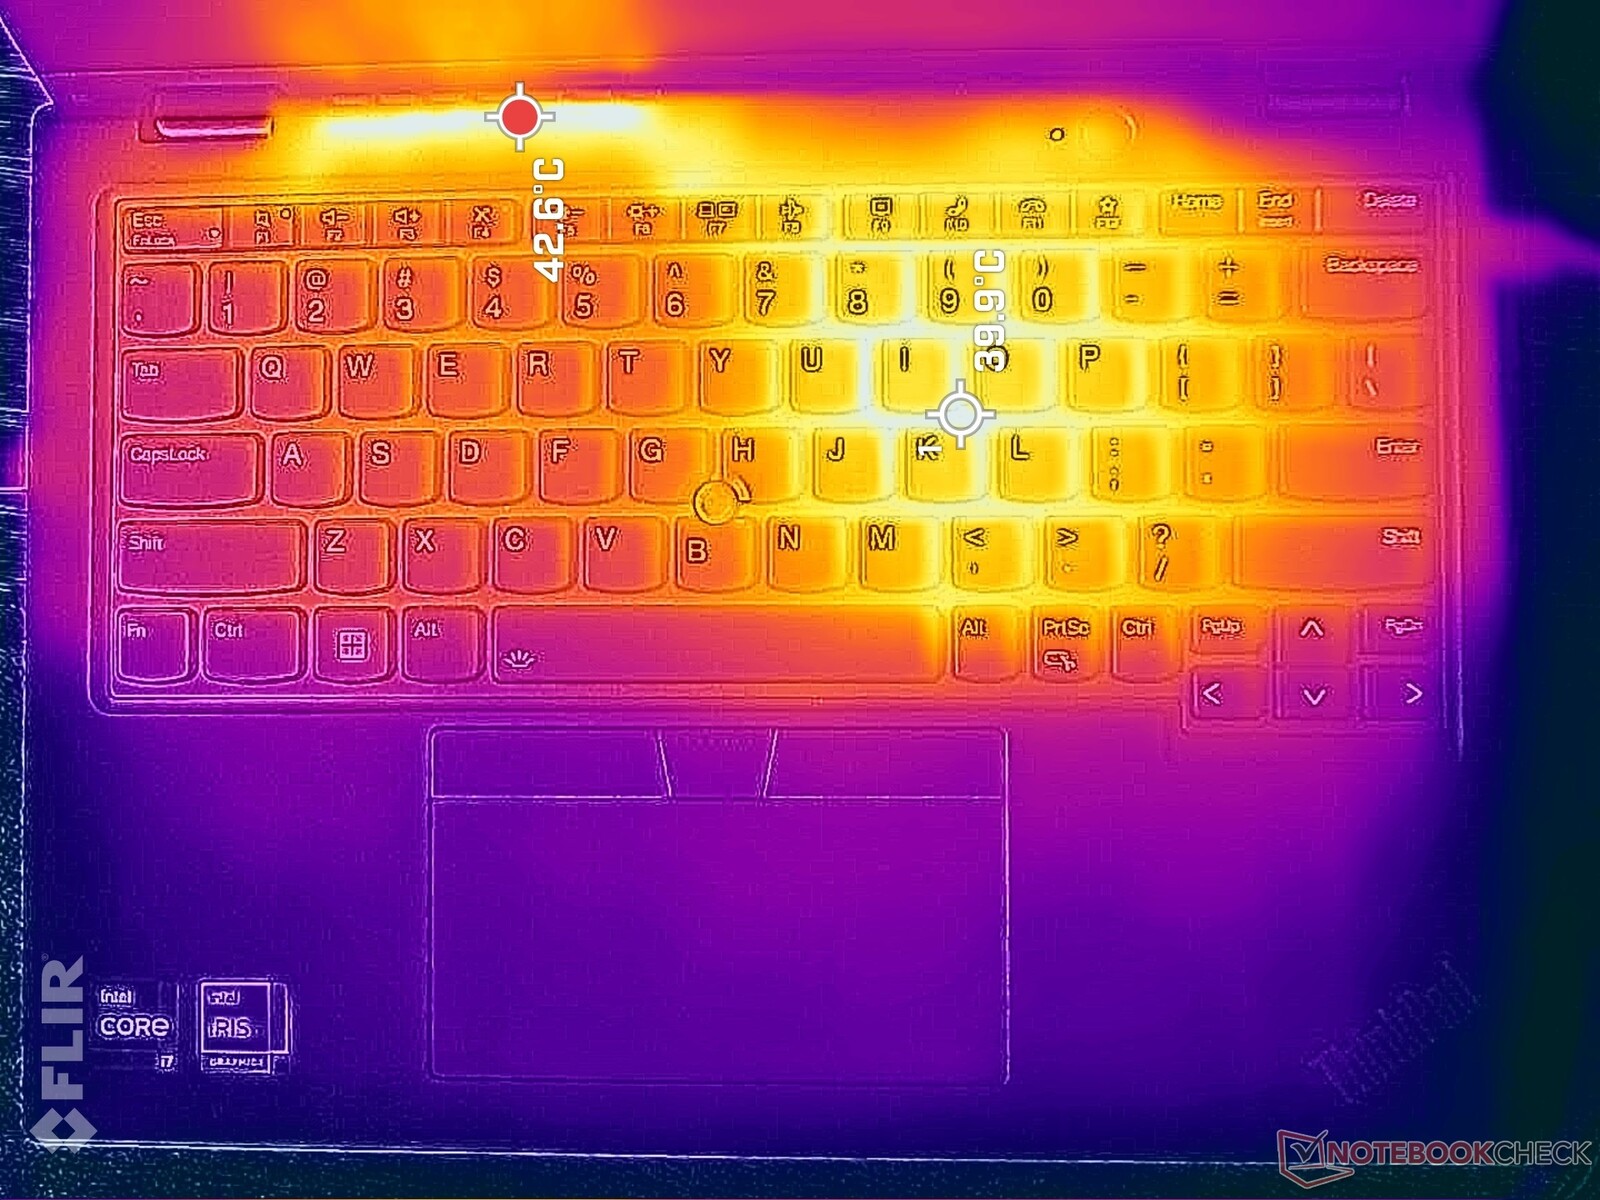
Temperature
Hot spots can reach 40 C on the right side of the keyboard similar to what we recorded on the AMD configuration. Thus, the Intel unit does not run significantly cooler or warmer despite their performance differences.

(+) The maximum temperature on the upper side is 38.4 °C / 101 F, compared to the average of 35.4 °C / 96 F, ranging from 19.6 to 60 °C for the class Convertible.
(-) The bottom heats up to a maximum of 46 °C / 115 F, compared to the average of 36.9 °C / 98 F
(+) In idle usage, the average temperature for the upper side is 27.2 °C / 81 F, compared to the device average of 30.3 °C / 87 F.
(+) The palmrests and touchpad are cooler than skin temperature with a maximum of 23.6 °C / 74.5 F and are therefore cool to the touch.
(+) The average temperature of the palmrest area of similar devices was 28 °C / 82.4 F (+4.4 °C / 7.9 F).


| Lenovo ThinkPad L13 Yoga G4 i7-1355U Intel Core i7-1355U, Intel Iris Xe Graphics G7 96EUs | Lenovo ThinkPad L13 Yoga G4 21FSS00100 AMD Ryzen 5 7530U, AMD Radeon RX Vega 7 | HP Elite Dragonfly Folio 13.5 G3 Intel Core i7-1265U, Intel Iris Xe Graphics G7 96EUs | Dell Latitude 9330 Intel Core i7-1260U, Intel Iris Xe Graphics G7 96EUs | MSI Summit E13 Flip Evo A11MT Intel Core i7-1185G7, Intel Iris Xe Graphics G7 96EUs | Framework Laptop 13.5 Ryzen 7 7840U AMD Ryzen 7 7840U, AMD Radeon 780M | |
|---|---|---|---|---|---|---|
| Heat | -3% | 23% | 7% | -14% | 3% | |
| Maximum Upper Side * (°C) | 38.4 | 43.3 -13% | 32.8 15% | 40.6 -6% | 52 -35% | 42 -9% |
| Maximum Bottom * (°C) | 46 | 46.5 -1% | 33.4 27% | 50.2 -9% | 57.4 -25% | 47.4 -3% |
| Idle Upper Side * (°C) | 31.2 | 31.9 -2% | 24.6 21% | 25 20% | 30.4 3% | 28.8 8% |
| Idle Bottom * (°C) | 34.8 | 33.1 5% | 24.6 29% | 27.6 21% | 34.2 2% | 29.6 15% |
* ... smaller is better
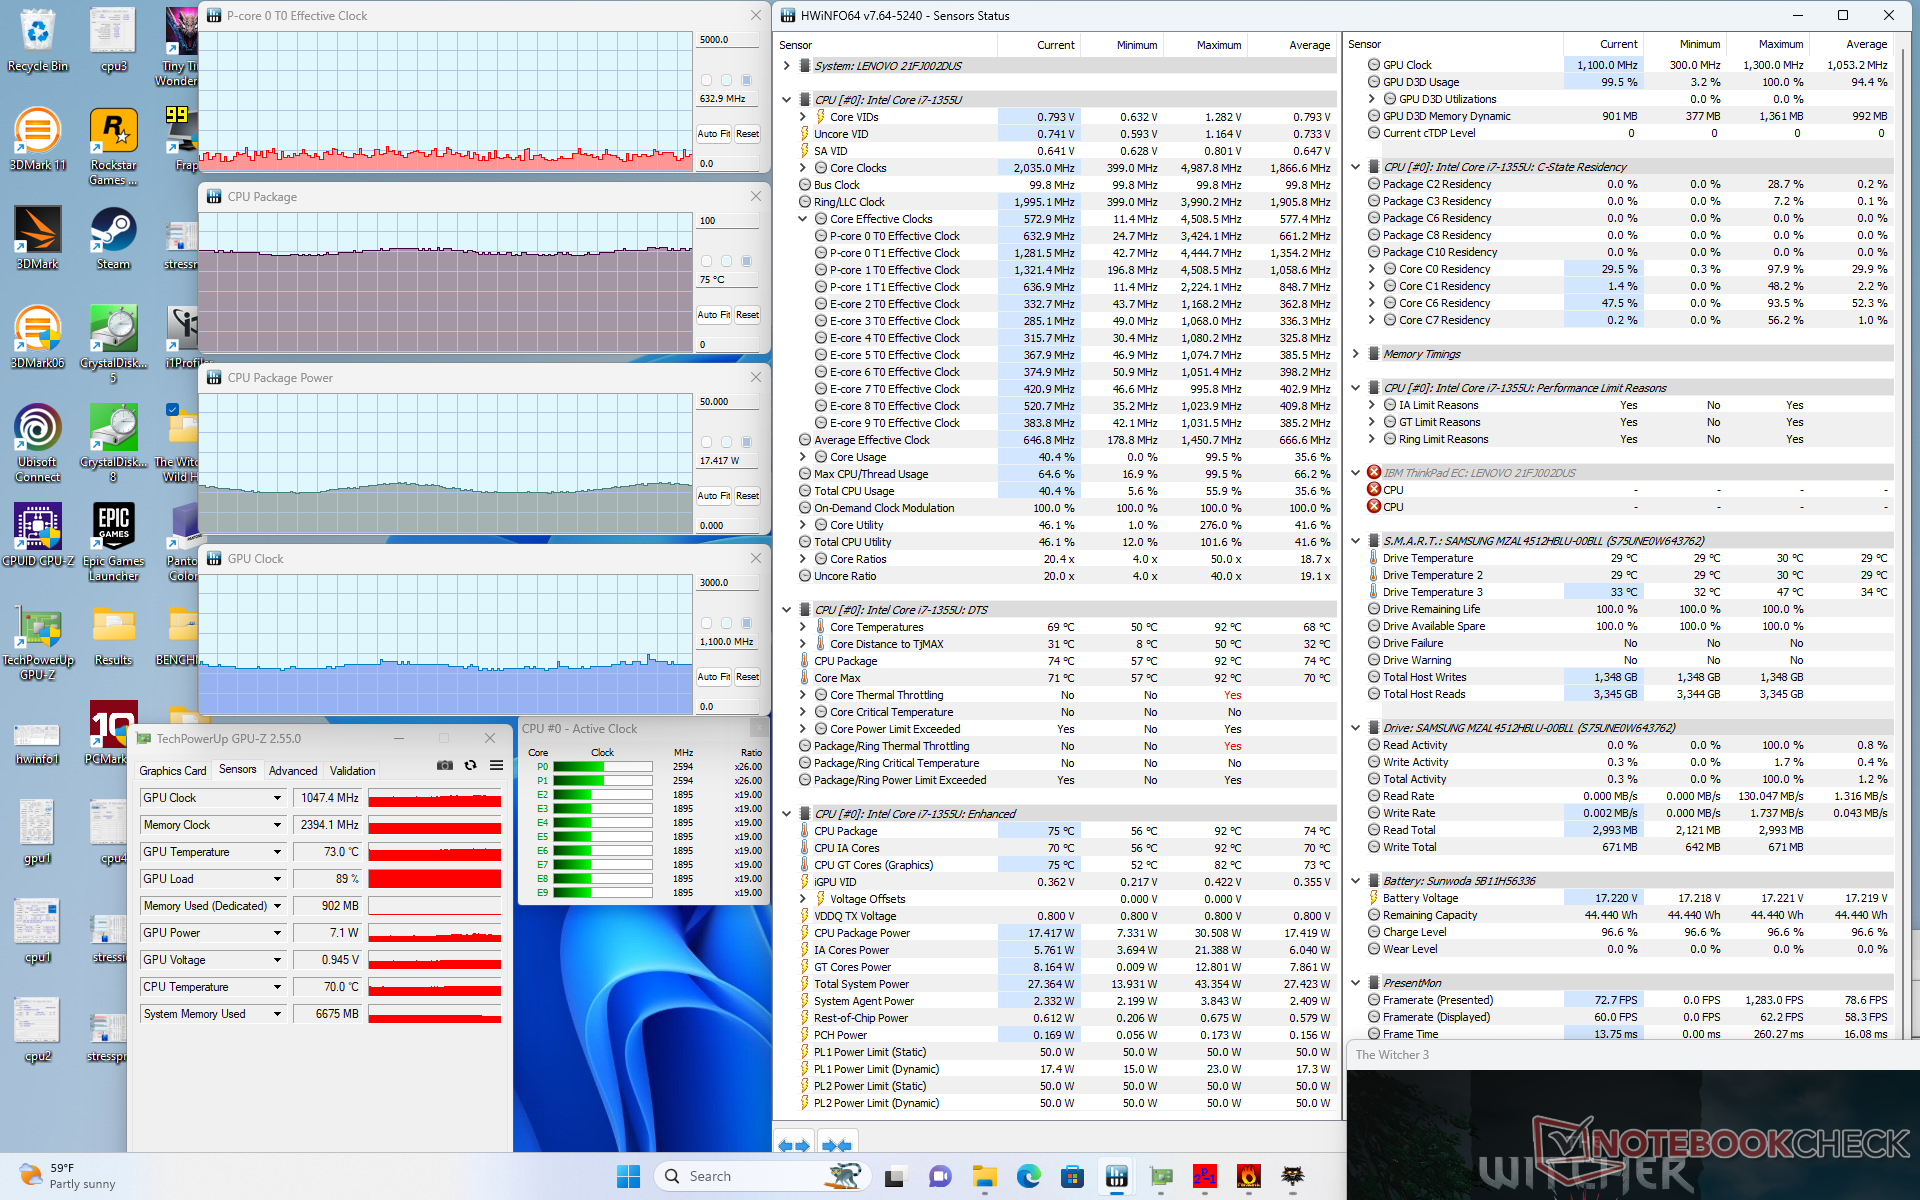
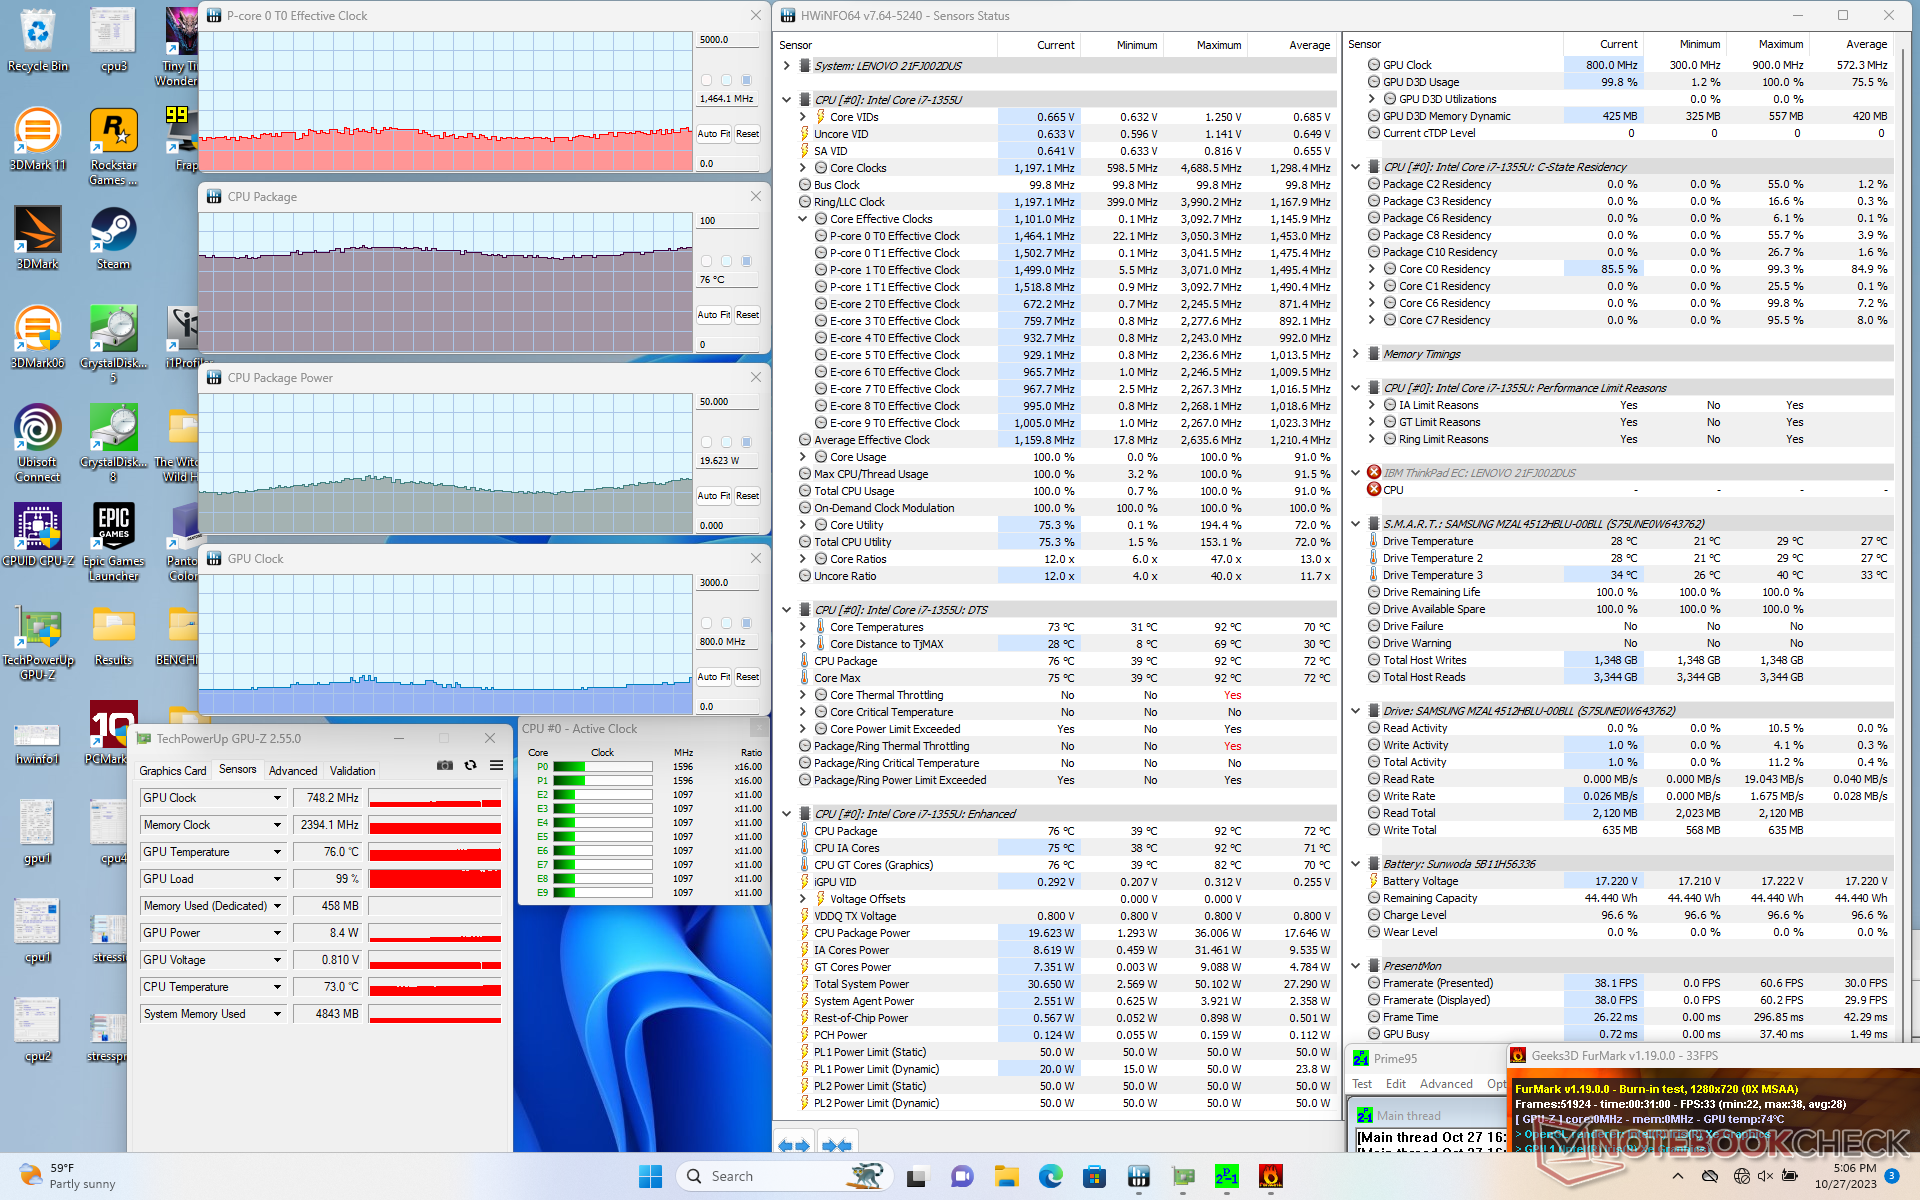
Stress Test
When initiating Prime95 stress, the CPU would boost to 3 GHz, 89 C, and 35 W for only the first few seconds before steadily falling and stabilizing at 2.2 GHz, 75 C, and 19 W. This behavior aligns with our CineBench R15 xT observations above where performance would be highest during the start of the test before trailing off.
GPU clock rates when running Witcher 3 would cycle between 950 and 1150 MHz which contributes to the cycling frame rates mentioned above.


| CPU Clock (GHz) | GPU Clock (MHz) | Average CPU Temperature (°C) | |
| System Idle | -- | -- | 36 |
| Prime95 Stress | 2.2 | -- | 75 |
| Prime95 + FurMark Stress | 1.0 - 1.5 | 550 - 850 | 68 - 79 |
| Witcher 3 Stress | ~0.6 | 950 - 1150 | 75 |
Speakers


Lenovo ThinkPad L13 Yoga G4 i7-1355U audio analysis
(+) | speakers can play relatively loud (82 dB)
Bass 100 - 315 Hz
(-) | nearly no bass - on average 24.7% lower than median
(±) | linearity of bass is average (7.7% delta to prev. frequency)
Mids 400 - 2000 Hz
(+) | balanced mids - only 4.9% away from median
(+) | mids are linear (5.4% delta to prev. frequency)
Highs 2 - 16 kHz
(+) | balanced highs - only 2.7% away from median
(±) | linearity of highs is average (7% delta to prev. frequency)
Overall 100 - 16.000 Hz
(±) | linearity of overall sound is average (17.7% difference to median)
Compared to same class
» 35% of all tested devices in this class were better, 9% similar, 55% worse
» The best had a delta of 6%, average was 20%, worst was 57%
Compared to all devices tested
» 35% of all tested devices were better, 8% similar, 57% worse
» The best had a delta of 4%, average was 23%, worst was 134%
Apple MacBook Pro 16 2021 M1 Pro audio analysis
(+) | speakers can play relatively loud (84.7 dB)
Bass 100 - 315 Hz
(+) | good bass - only 3.8% away from median
(+) | bass is linear (5.2% delta to prev. frequency)
Mids 400 - 2000 Hz
(+) | balanced mids - only 1.3% away from median
(+) | mids are linear (2.1% delta to prev. frequency)
Highs 2 - 16 kHz
(+) | balanced highs - only 1.9% away from median
(+) | highs are linear (2.7% delta to prev. frequency)
Overall 100 - 16.000 Hz
(+) | overall sound is linear (4.6% difference to median)
Compared to same class
» 0% of all tested devices in this class were better, 0% similar, 100% worse
» The best had a delta of 5%, average was 17%, worst was 45%
Compared to all devices tested
» 0% of all tested devices were better, 0% similar, 100% worse
» The best had a delta of 4%, average was 23%, worst was 134%
Energy Management
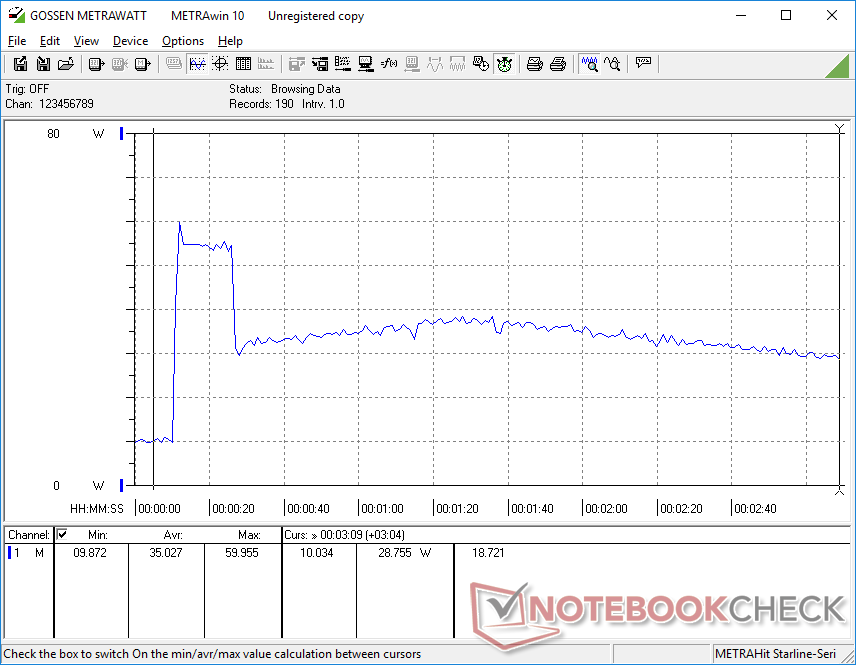
Power Consumption
Power consumption is higher across the board on the Intel configuration when compared to AMD particularly when running higher loads. These differences could be due to both the higher initial Turbo Boost potential of the Core i7 CPU when compared to Ryzen 5 and the faster integrated graphics performance when compared to the Radeon RX Vega 7. Running Witcher 3, for example, would consume about 30 percent more power on our Intel unit.


| Off / Standby | |
| Idle | |
| Load |
|
Key:
min: | |
| Lenovo ThinkPad L13 Yoga G4 i7-1355U i7-1355U, Iris Xe G7 96EUs, Samsung PM9B1 512GB MZAL4512HBLU, IPS, 1920x1200, 13.3" | Lenovo ThinkPad L13 Yoga G4 21FSS00100 R5 7530U, Vega 7, Kioxia BG5 KBG5AZNT512G, IPS LED, 1920x1200, 13.3" | HP Elite Dragonfly Folio 13.5 G3 i7-1265U, Iris Xe G7 96EUs, Samsung PM9A1 MZVL2512HCJQ, IPS, 1920x1280, 13.5" | Dell Latitude 9330 i7-1260U, Iris Xe G7 96EUs, , IPS, 2560x1600, 13.3" | MSI Summit E13 Flip Evo A11MT i7-1185G7, Iris Xe G7 96EUs, Phison 1TB SM2801T24GKBB4S-E162, IPS, 1920x1200, 13.4" | Framework Laptop 13.5 Ryzen 7 7840U R7 7840U, Radeon 780M, WD PC SN740 512GB SDDPNQD-512G, IPS, 2256x1504, 13.5" | |
|---|---|---|---|---|---|---|
| Power Consumption | 24% | 16% | 16% | -2% | 11% | |
| Idle Minimum * (Watt) | 5.5 | 4.4 20% | 3.4 38% | 4.7 15% | 4.8 13% | 4 27% |
| Idle Average * (Watt) | 8.3 | 7.2 13% | 4.9 41% | 8.2 1% | 8.4 -1% | 6.5 22% |
| Idle Maximum * (Watt) | 9.1 | 8.3 9% | 9.3 -2% | 8.4 8% | 8.6 5% | 6.8 25% |
| Load Average * (Watt) | 49.9 | 21.6 57% | 41.9 16% | 36.8 26% | 47.1 6% | 48 4% |
| Witcher 3 ultra * (Watt) | 42.4 | 32.1 24% | 36.4 14% | 30.4 28% | 51.6 -22% | 52.3 -23% |
| Load Maximum * (Watt) | 60 | 49.3 18% | 67.5 -13% | 49.9 17% | 65.9 -10% | 55.2 8% |
* ... smaller is better
Power Consumption Witcher 3 / Stresstest
Power Consumption external Monitor
Battery Life
The generally higher power consumption mentioned above takes its toll on battery life. Web browsing on our Intel unit would last just over 6 hours compared to 7.5 hours on the AMD unit when both are on the same Balanced power profile. Charging is also slower than expected at around 2 hours even when Lenovo Rapid Charge is enabled.
| Lenovo ThinkPad L13 Yoga G4 i7-1355U i7-1355U, Iris Xe G7 96EUs, 46 Wh | Lenovo ThinkPad L13 Yoga G4 21FSS00100 R5 7530U, Vega 7, 46 Wh | HP Elite Dragonfly Folio 13.5 G3 i7-1265U, Iris Xe G7 96EUs, 53 Wh | Dell Latitude 9330 i7-1260U, Iris Xe G7 96EUs, 50 Wh | MSI Summit E13 Flip Evo A11MT i7-1185G7, Iris Xe G7 96EUs, 70 Wh | Framework Laptop 13.5 Ryzen 7 7840U R7 7840U, Radeon 780M, 61 Wh | |
|---|---|---|---|---|---|---|
| Battery runtime | 24% | 52% | 52% | 81% | 95% | |
| WiFi v1.3 (h) | 6.2 | 7.7 24% | 9.4 52% | 9.4 52% | 11.2 81% | 12.1 95% |
| Load (h) | 1.5 | 2.6 | 2.3 | 1.8 | ||
| Reader / Idle (h) | 27.3 | 15.4 | 21.1 |
Pros
Cons
Verdict — Trading Battery Life And Quieter Fans For Thunderbolt And Faster Graphics

Perhaps the most surprising finding about the Intel version of the ThinkPad L13 Yoga G4 is the steeper-than-expected CPU performance throttling. While we never expect any Core U processor to maintain high Turbo Boost clock rates for extended periods, the Core i7 in this particular Lenovo model would throttle more than on most other laptops with the exact same CPU. This performance deficit mitigates a key advantage point for Intel against AMD especially since the throttling issue is not as severe on the AMD configuration.
Another aspect worth mentioning is the higher power consumption of the Intel version leading to shorter runtimes by 1 to 2 hours. Users who value longer battery life may therefore want to select the AMD version of the ThinkPad L13 Yoga G4 instead.
Unless if you really need the extra graphics performance and Thunderbolt support from Intel, the AMD version of the ThinkPad L13 Yoga G4 should be sufficient for the majority of interested users.
The main reasons for choosing the Intel version of model over AMD are for vPro (instead of AMD PRO), Thunderbolt support, and faster graphics performance and single-thread CPU performance. Otherwise, the AMD SKUs have the upper-hand when it comes to multi-thread CPU performance, battery life, and price.
Price and Availability
Lenovo is not yet shipping the ThinkPad L13 Yoga Gen 4 at the time of publishing. However, CDW is currently shipping our Core i7 configuration for $1419 USD.
Lenovo ThinkPad L13 Yoga G4 i7-1355U
- 10/30/2023 v7 (old)
Allen Ngo
Transparency
The selection of devices to be reviewed is made by our editorial team. The test sample was provided to the author as a loan by the manufacturer or retailer for the purpose of this review. The lender had no influence on this review, nor did the manufacturer receive a copy of this review before publication. There was no obligation to publish this review. As an independent media company, Notebookcheck is not subjected to the authority of manufacturers, retailers or publishers.
This is how Notebookcheck is testing
Every year, Notebookcheck independently reviews hundreds of laptops and smartphones using standardized procedures to ensure that all results are comparable. We have continuously developed our test methods for around 20 years and set industry standards in the process. In our test labs, high-quality measuring equipment is utilized by experienced technicians and editors. These tests involve a multi-stage validation process. Our complex rating system is based on hundreds of well-founded measurements and benchmarks, which maintains objectivity. Further information on our test methods can be found here.
Price comparison
