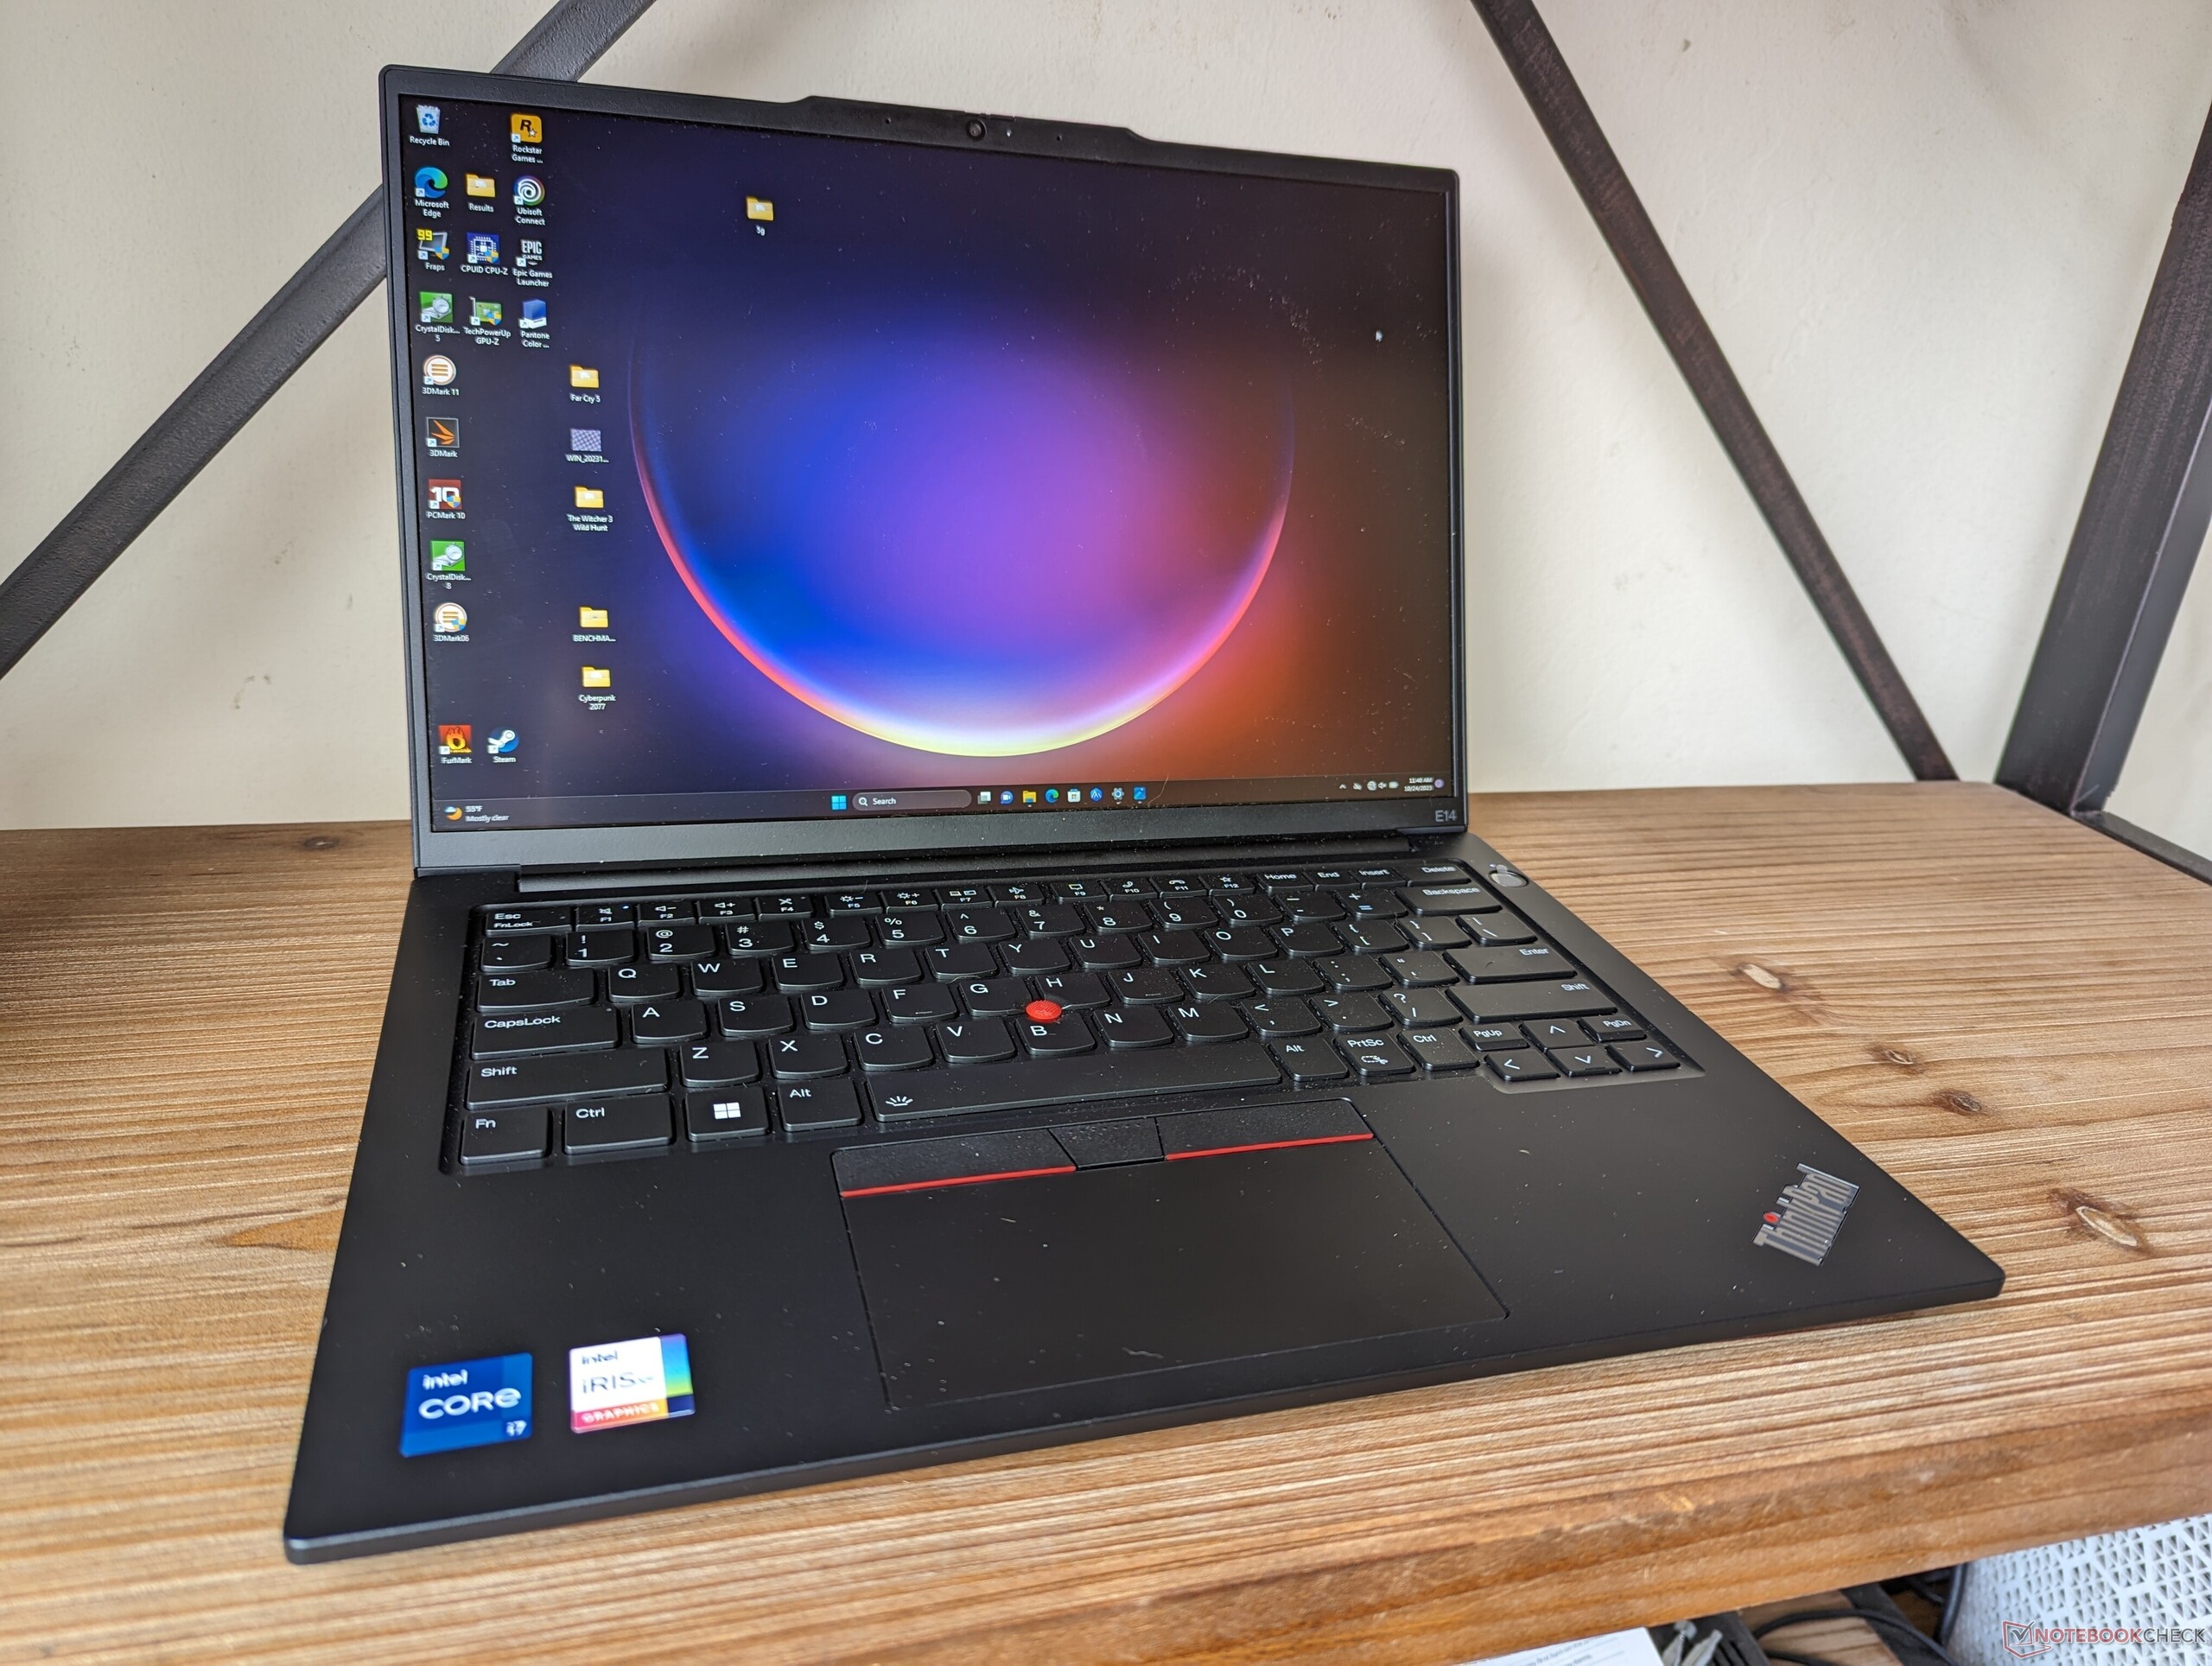
Lenovo ThinkPad E14 G5 Intel laptop review: Core i7-1355U vs. Ryzen 7 7730U

After recently reviewing the ThinkPad E14 G5 AMD version, we're now ready to tackle the ThinkPad E14 G5 Intel version. Both versions share the same chassis design and so we recommend checking out our review on the AMD version to learn more about the physical features of the model. Nonetheless, there are a few internal differences between the two which we will mention in the review below.
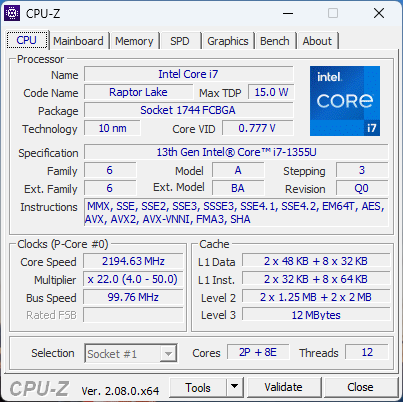
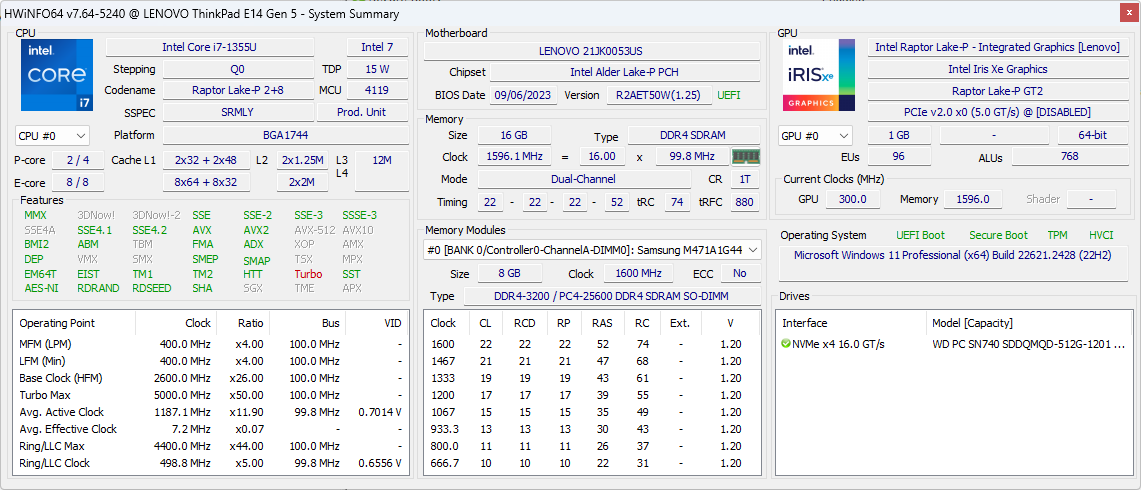
Our test unit is a middle Intel configuration with the 13th gen Raptor Lake Core i7-1355U CPU and 1200p FHD+ display for approximately $915 USD. Other SKUs start from the Core i3-1315U up to the Core i7-13700H with optional GeForce MX550 graphics and a higher resolution 2240 x 1400 IPS display. The configurable range is wider than expected especially for a 14-inch subnotebook.
Alternatives to the ThinkPad E14 G5 include other upper midrange business subnotebooks like the HP EliteBook 845 or Dell Latitude 7440.
More Lenovo reviews:
Potential Competitors in Comparison
Rating | Date | Model | Weight | Height | Size | Resolution | Price |
|---|---|---|---|---|---|---|---|
| 86 % v7 (old) | 10 / 2023 | Lenovo ThinkPad E14 G5 i7-1355U i7-1355U, Iris Xe G7 96EUs | 1.5 kg | 17.99 mm | 14.00" | 1920x1200 | |
| 88.3 % v7 (old) | 08 / 2023 | Lenovo ThinkPad E14 G5-21JSS05C00 R7 7730U, Vega 8 | 1.4 kg | 18 mm | 14.00" | 2240x1400 | |
| 90.1 % v7 (old) | 08 / 2023 | HP EliteBook 845 G10 818N0EA R9 PRO 7940HS, Radeon 780M | 1.5 kg | 17.9 mm | 14.00" | 2560x1600 | |
| 85.3 % v7 (old) | 06 / 2023 | Asus ZenBook 14 UM3402Y R7 7730U, Vega 8 | 1.4 kg | 16.9 mm | 14.00" | 2880x1800 | |
| 86.6 % v7 (old) | 10 / 2022 | LG Gram 14Z90Q i5-1240P, Iris Xe G7 80EUs | 980 g | 16.8 mm | 14.00" | 1920x1200 | |
| 90.3 % v7 (old) | 07 / 2023 | Dell Latitude 7440 i5-1345U, Iris Xe G7 80EUs | 1.2 kg | 17.95 mm | 14.00" | 2560x1600 |
Case
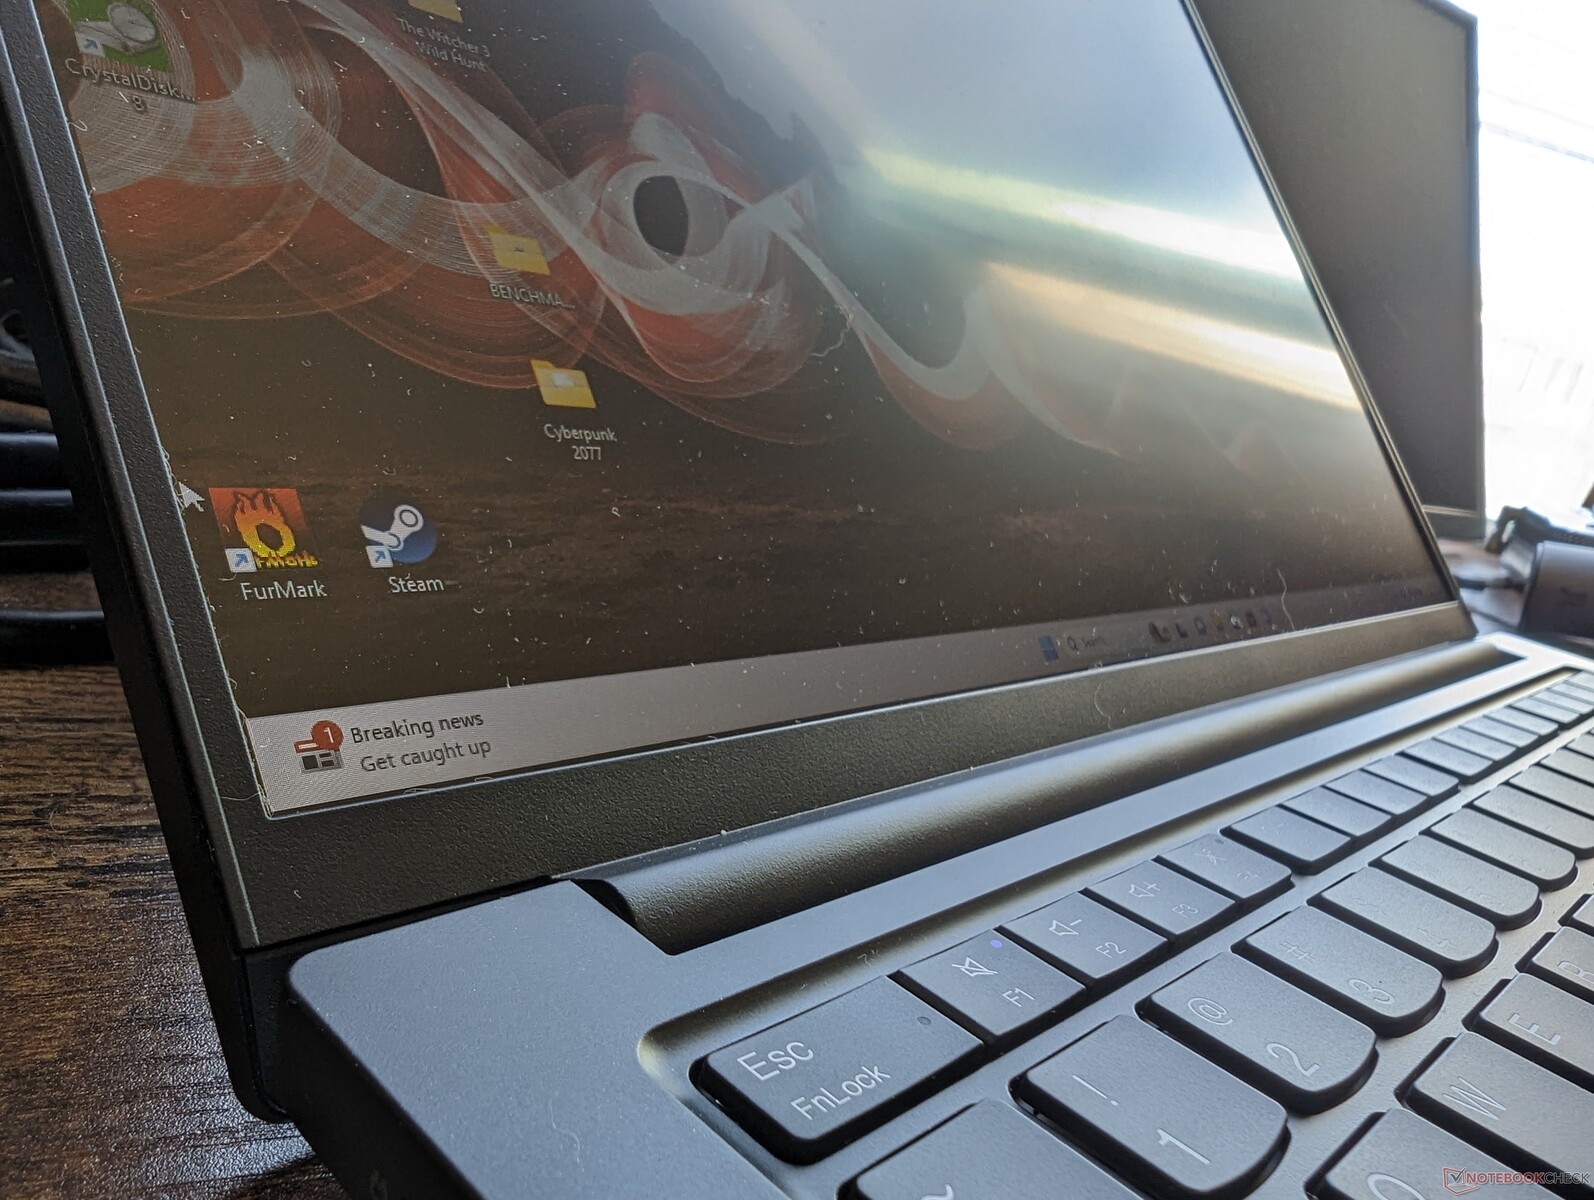
Perhaps the easiest way to distinguish between the ThinkPad E14 G5 Intel and AMD versions is to look for the Thunderbolt logo along the left edge. The AMD versions lack both Thunderbolt and USB4 support giving the Intel versions the upper-hand when it comes to docking capabilities.
Communication
An Intel AX201 is included for Wi-Fi 6 and Bluetooth 5.1 support. The pricier AX211 is optional for users who want Wi-Fi 6E connectivity.
| Networking | |
| iperf3 transmit AXE11000 | |
| Lenovo ThinkPad E14 G5-21JSS05C00 | |
| Lenovo ThinkPad E14 G5 i7-1355U | |
| Dell Latitude 7440 | |
| Asus ZenBook 14 UM3402Y | |
| iperf3 receive AXE11000 | |
| Lenovo ThinkPad E14 G5-21JSS05C00 | |
| Lenovo ThinkPad E14 G5 i7-1355U | |
| Asus ZenBook 14 UM3402Y | |
| Dell Latitude 7440 | |
| iperf3 transmit AXE11000 6GHz | |
| HP EliteBook 845 G10 818N0EA | |
| Asus ZenBook 14 UM3402Y | |
| Dell Latitude 7440 | |
| iperf3 receive AXE11000 6GHz | |
| HP EliteBook 845 G10 818N0EA | |
| LG Gram 14Z90Q | |
| Asus ZenBook 14 UM3402Y | |
| Dell Latitude 7440 | |
Webcam
While the privacy shutter comes standard on all SKUs, the 1080p resolution and IR sensor are optional. Lower-end SKUs may ship with a 720p sensor.


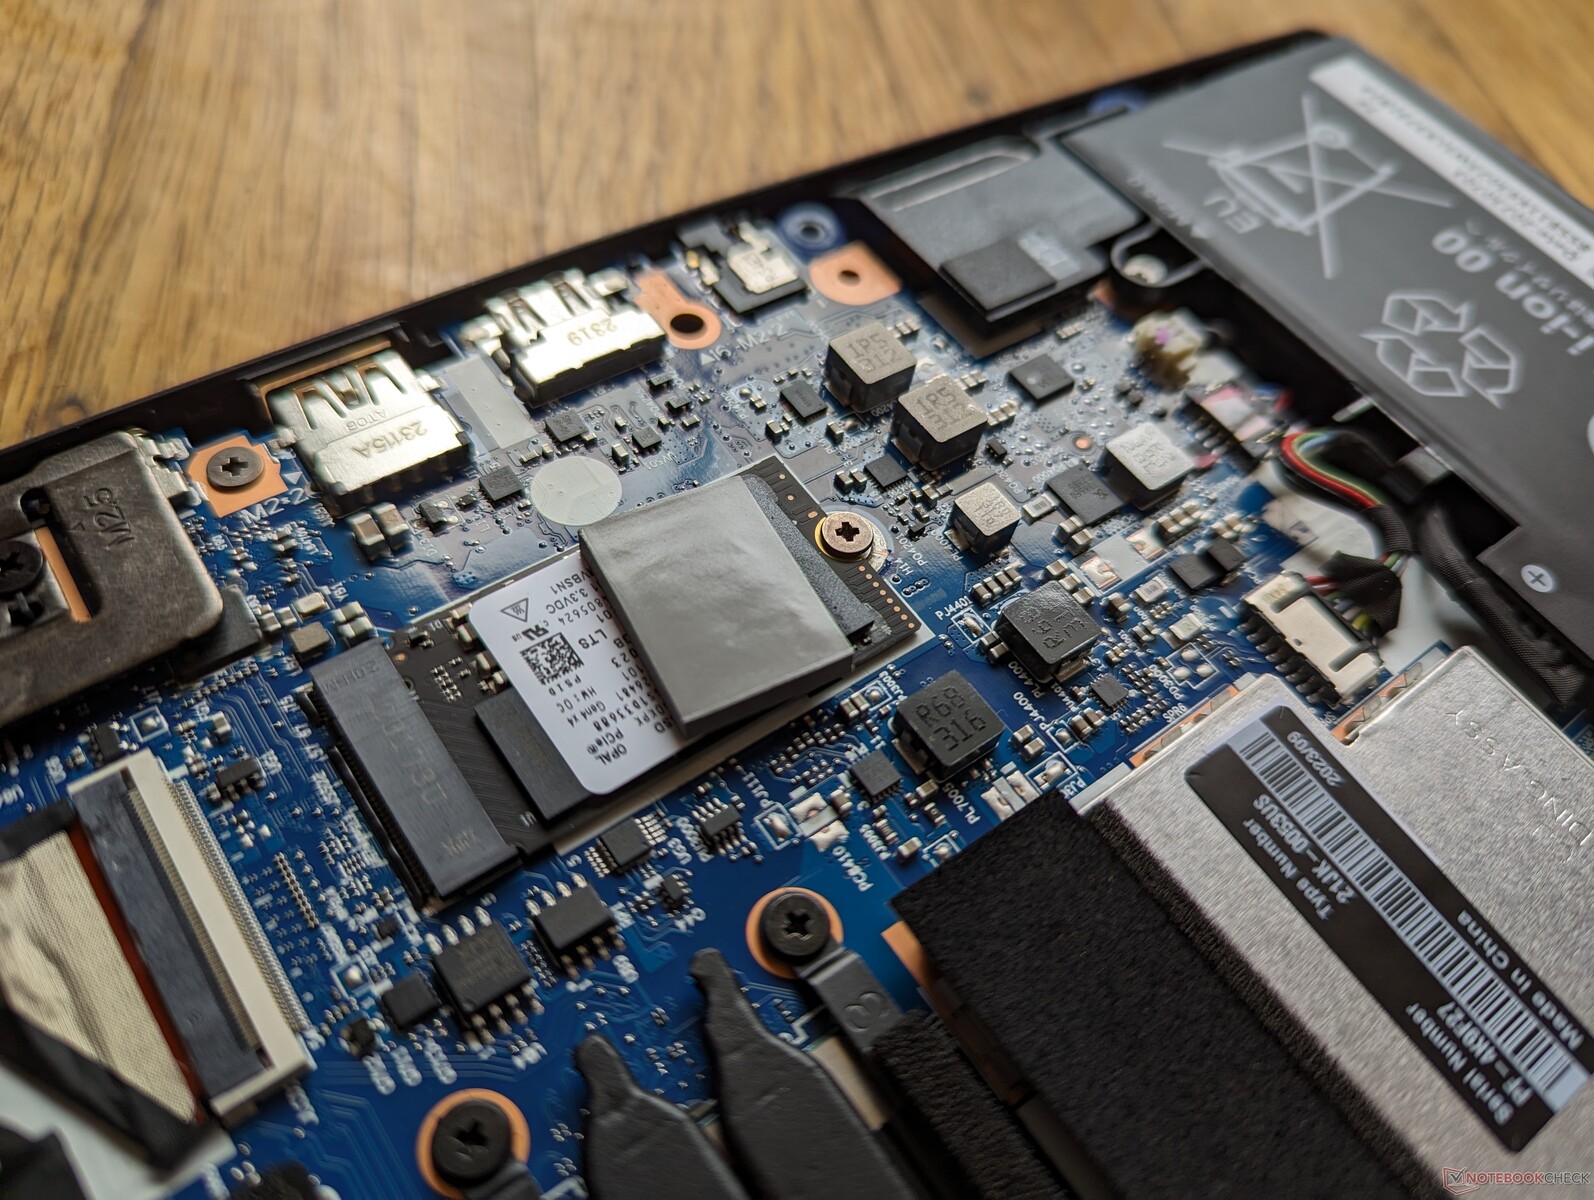
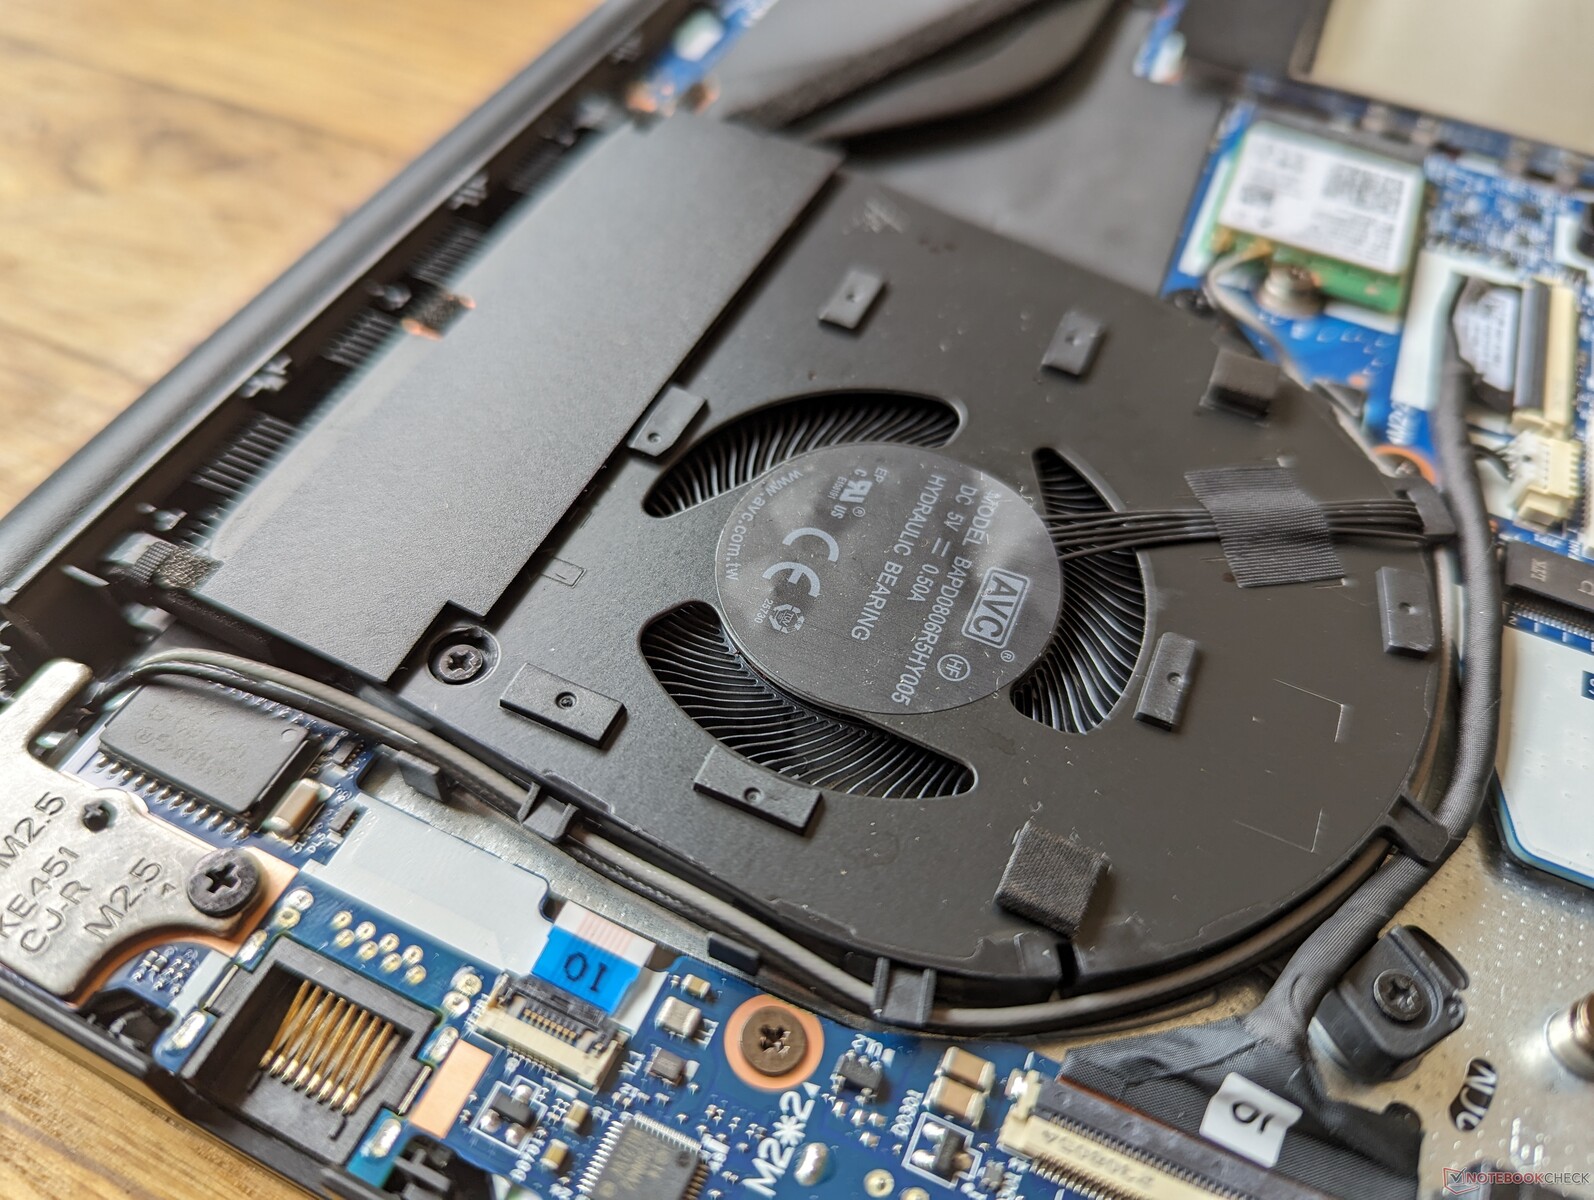
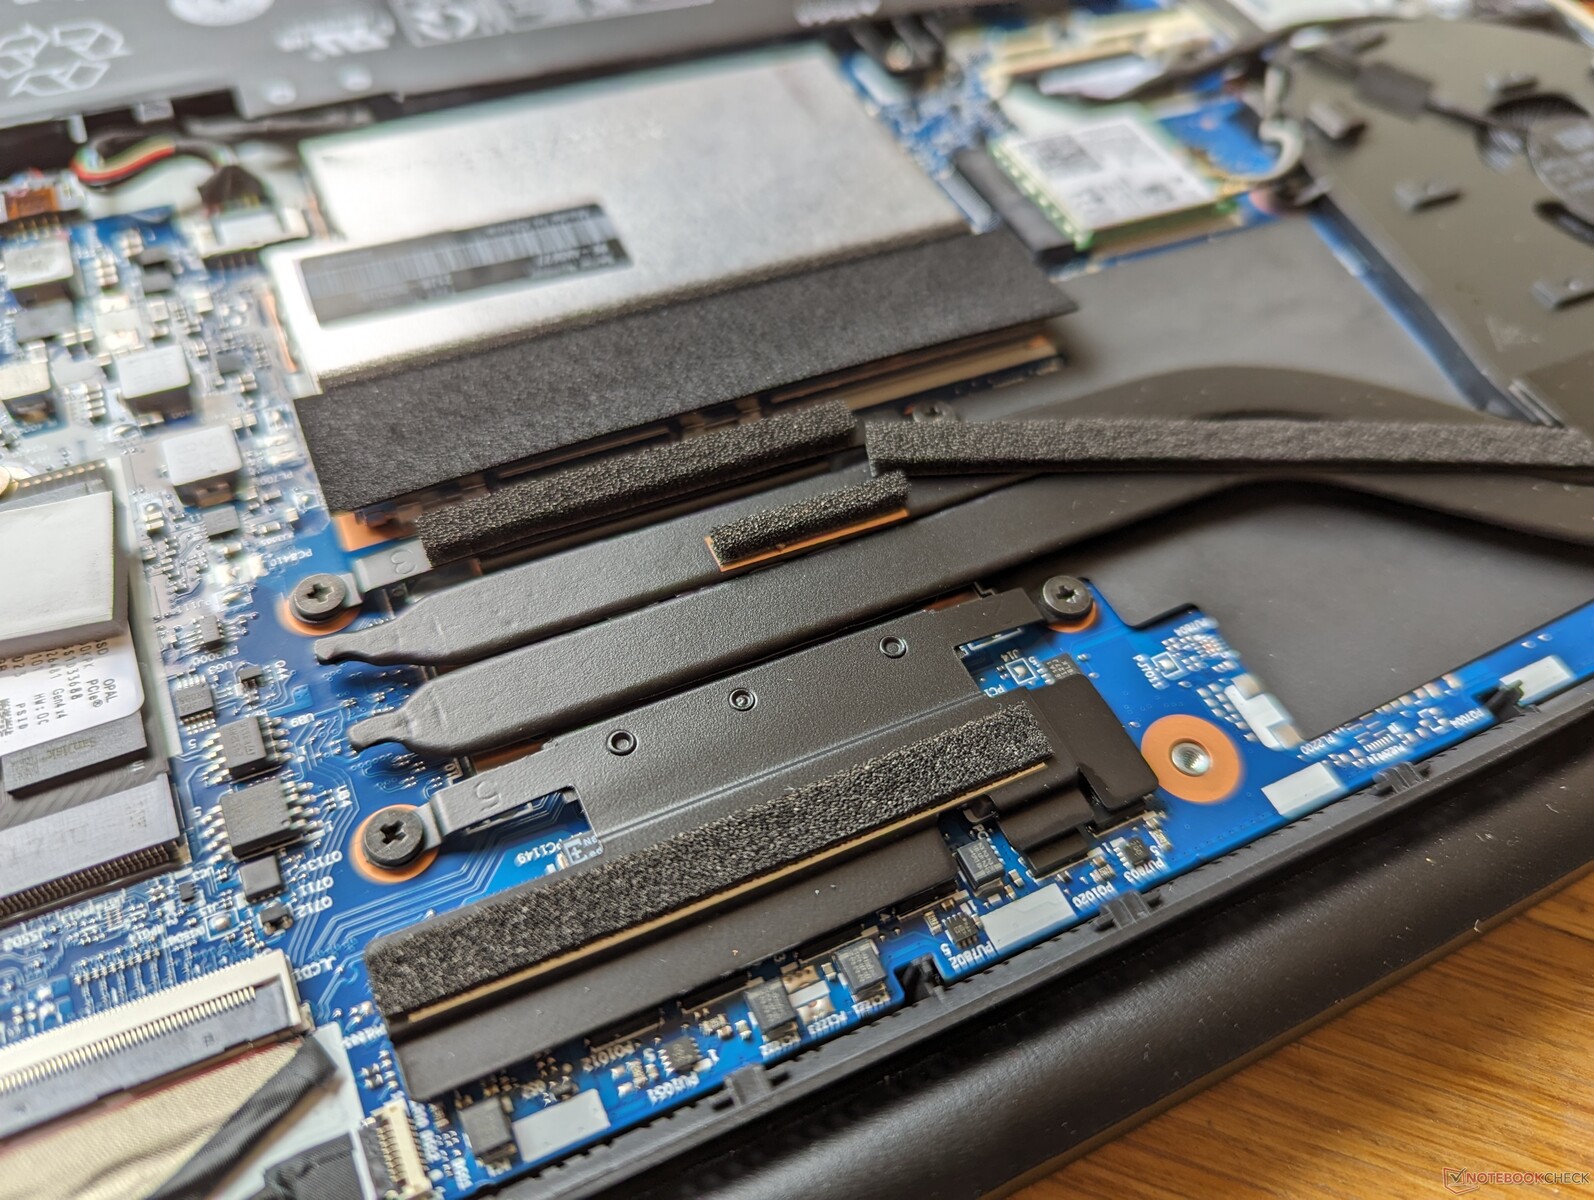
Maintenance
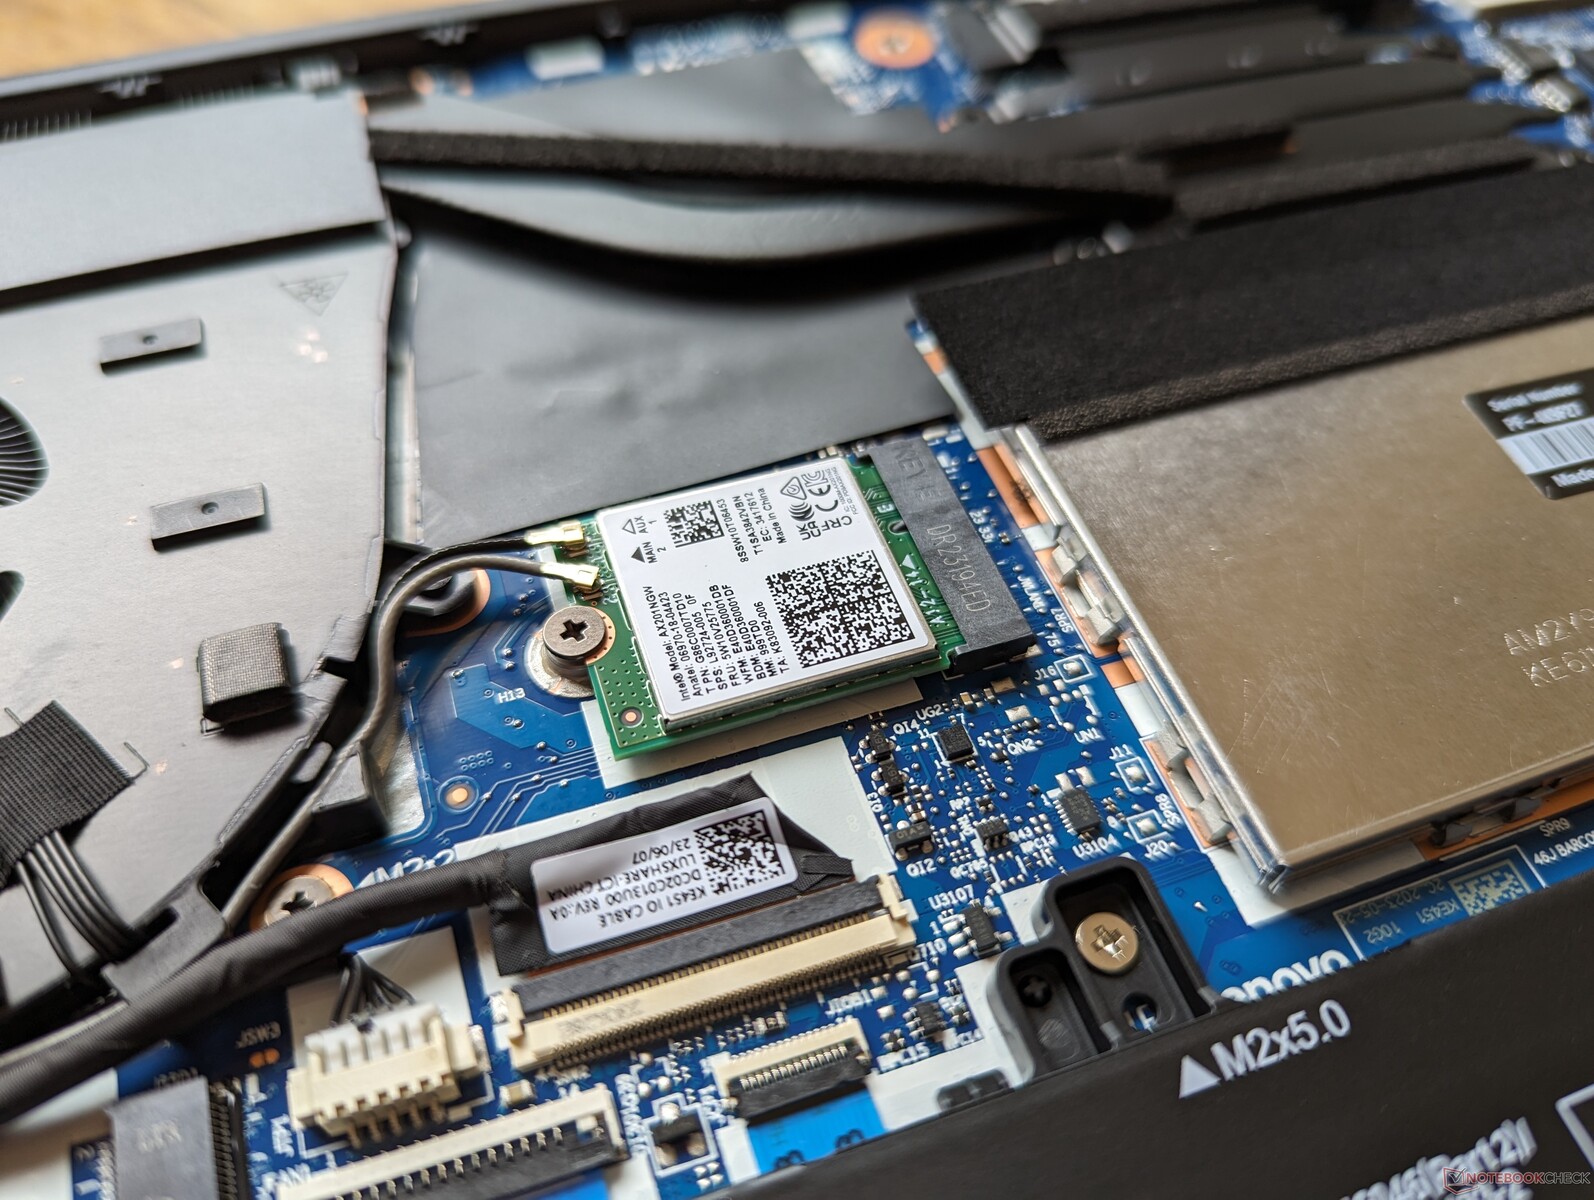
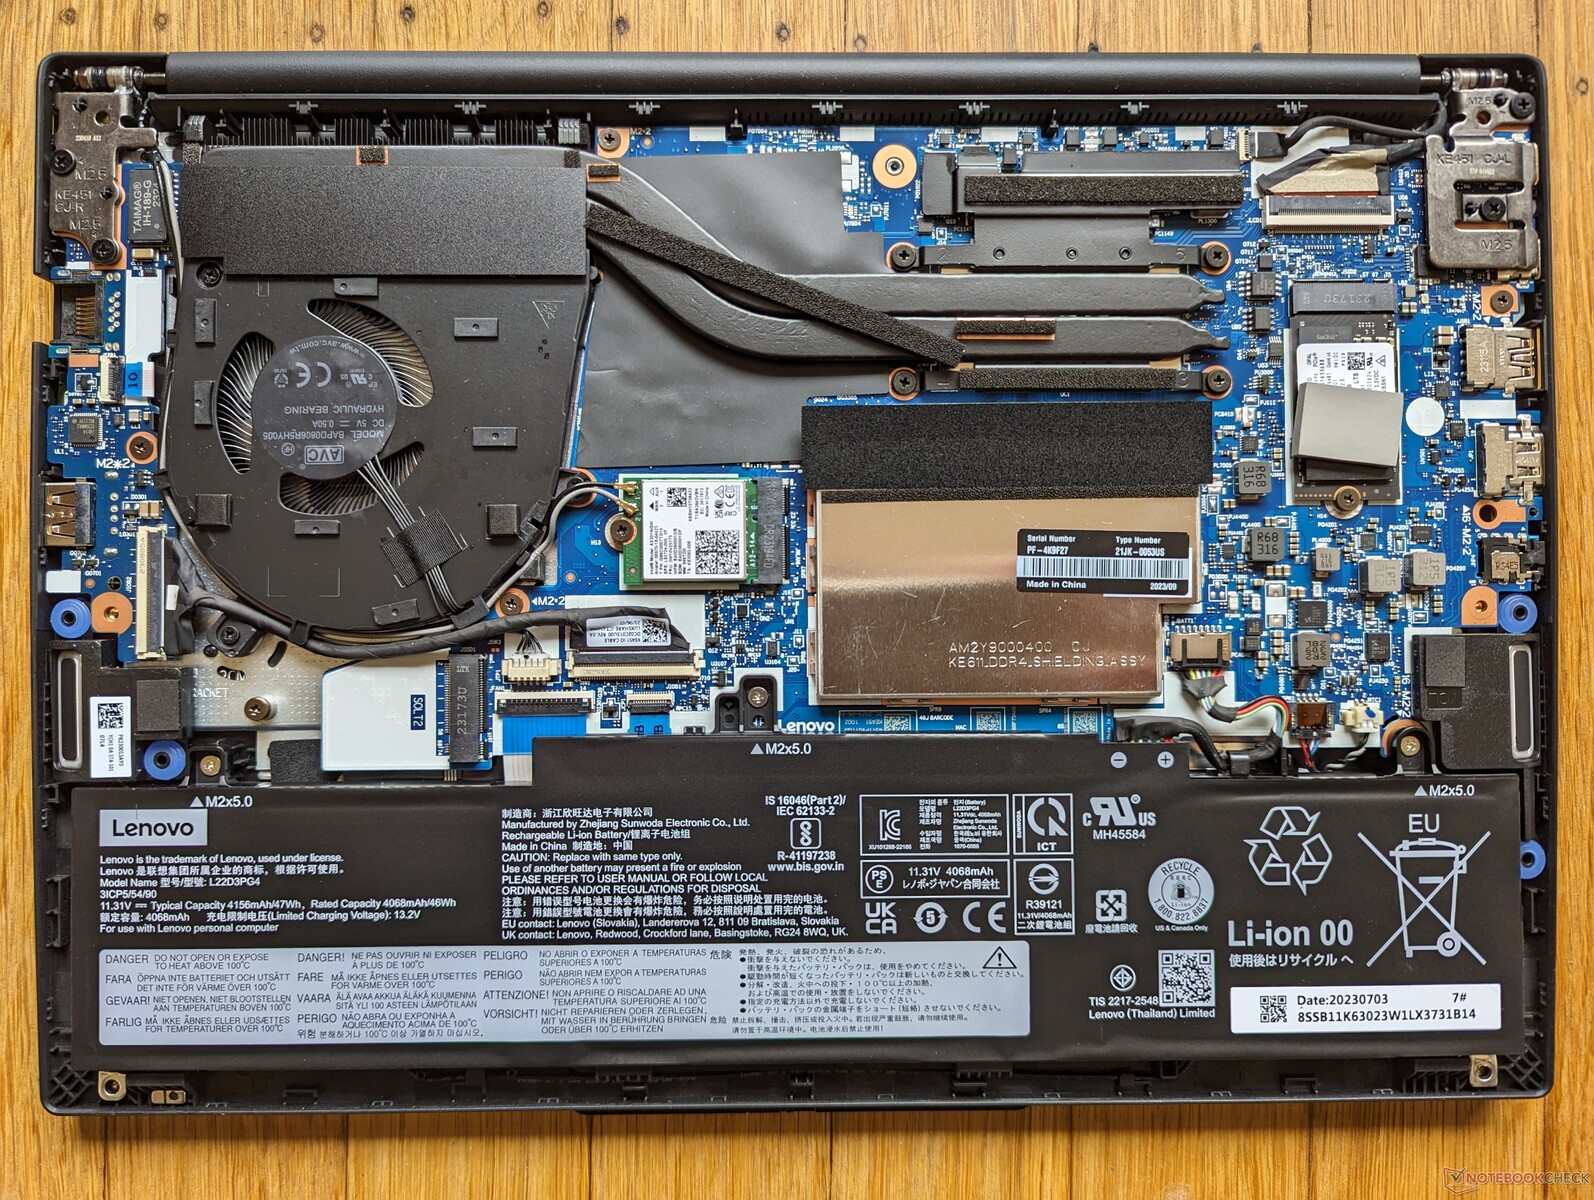
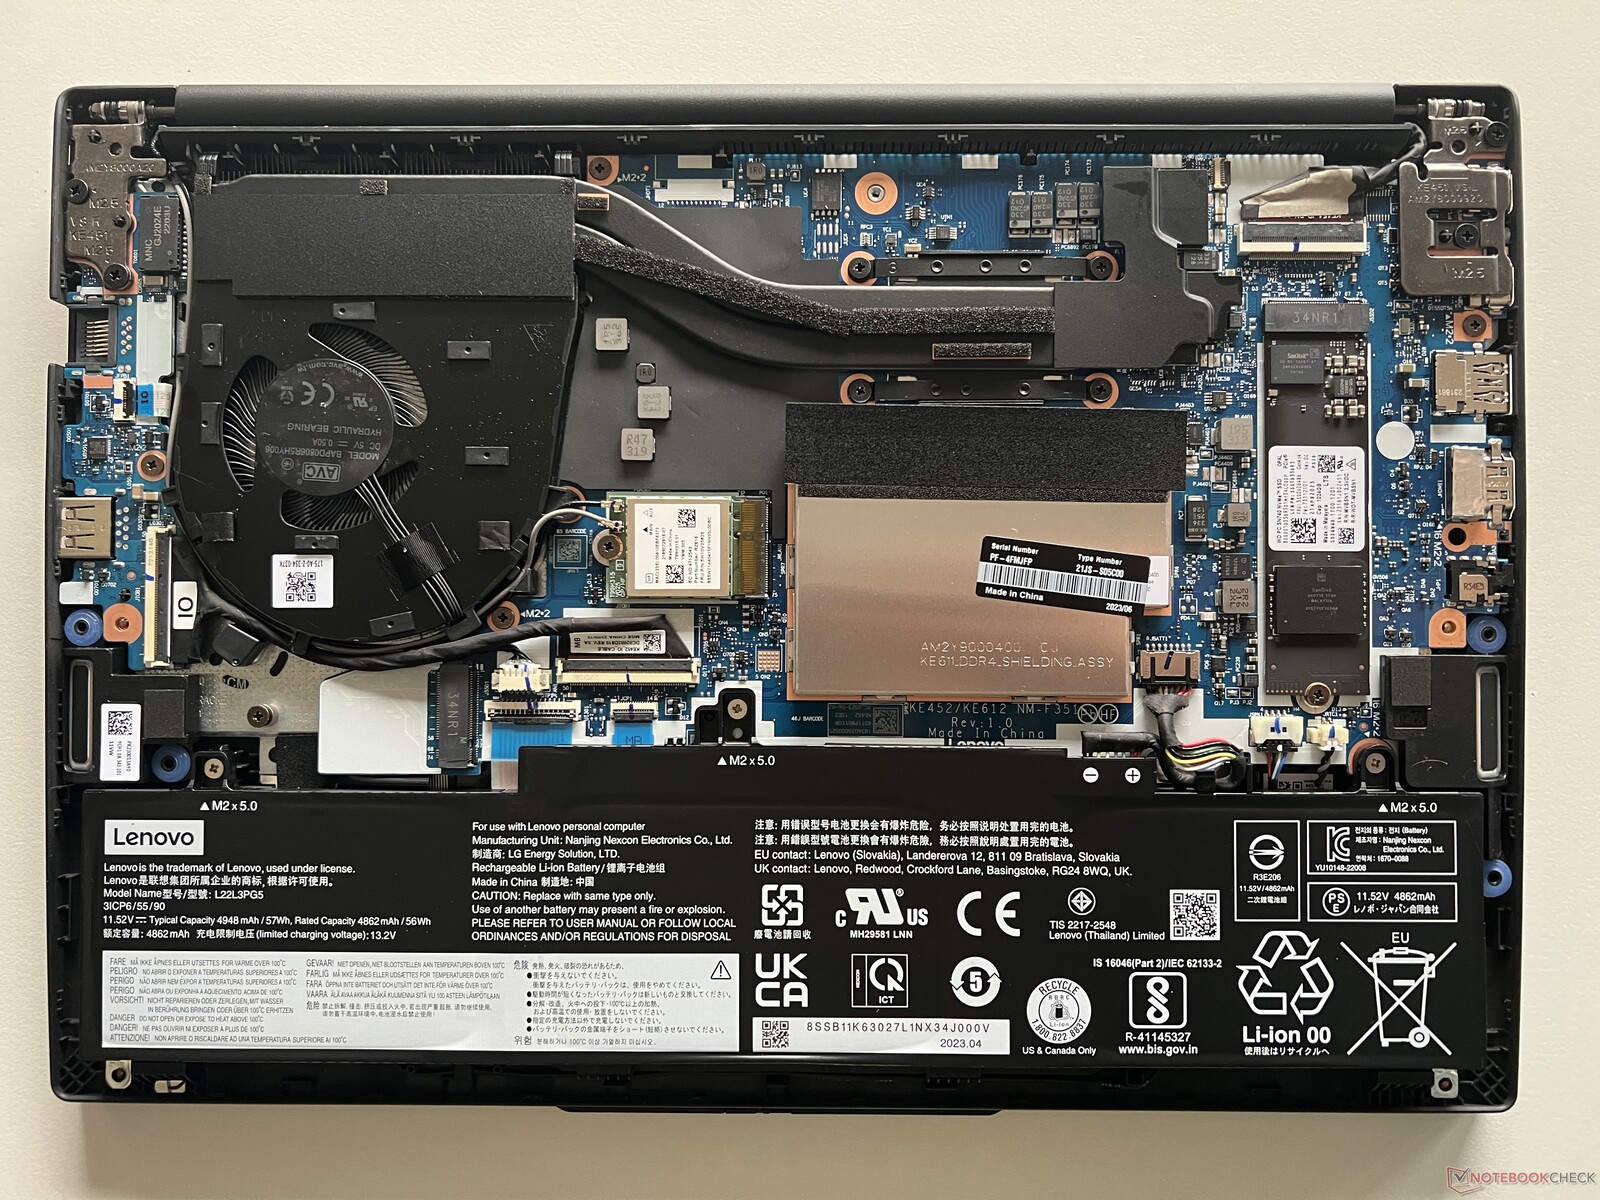
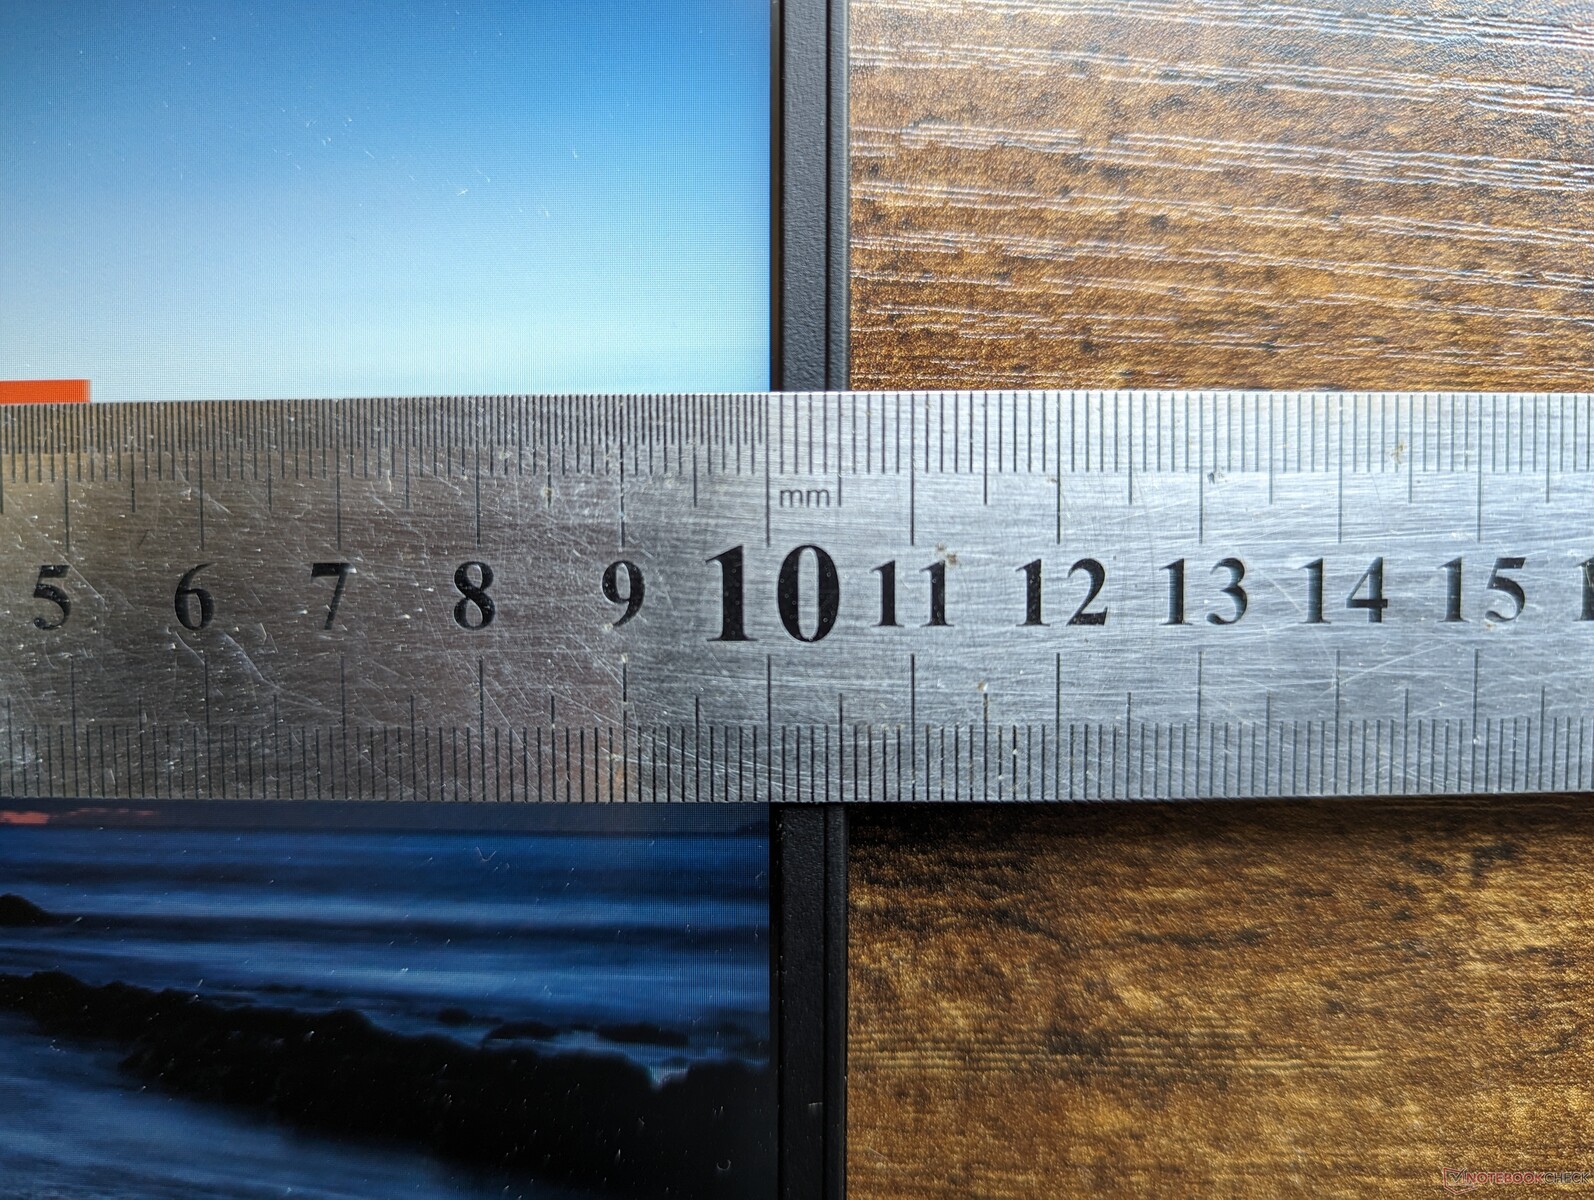
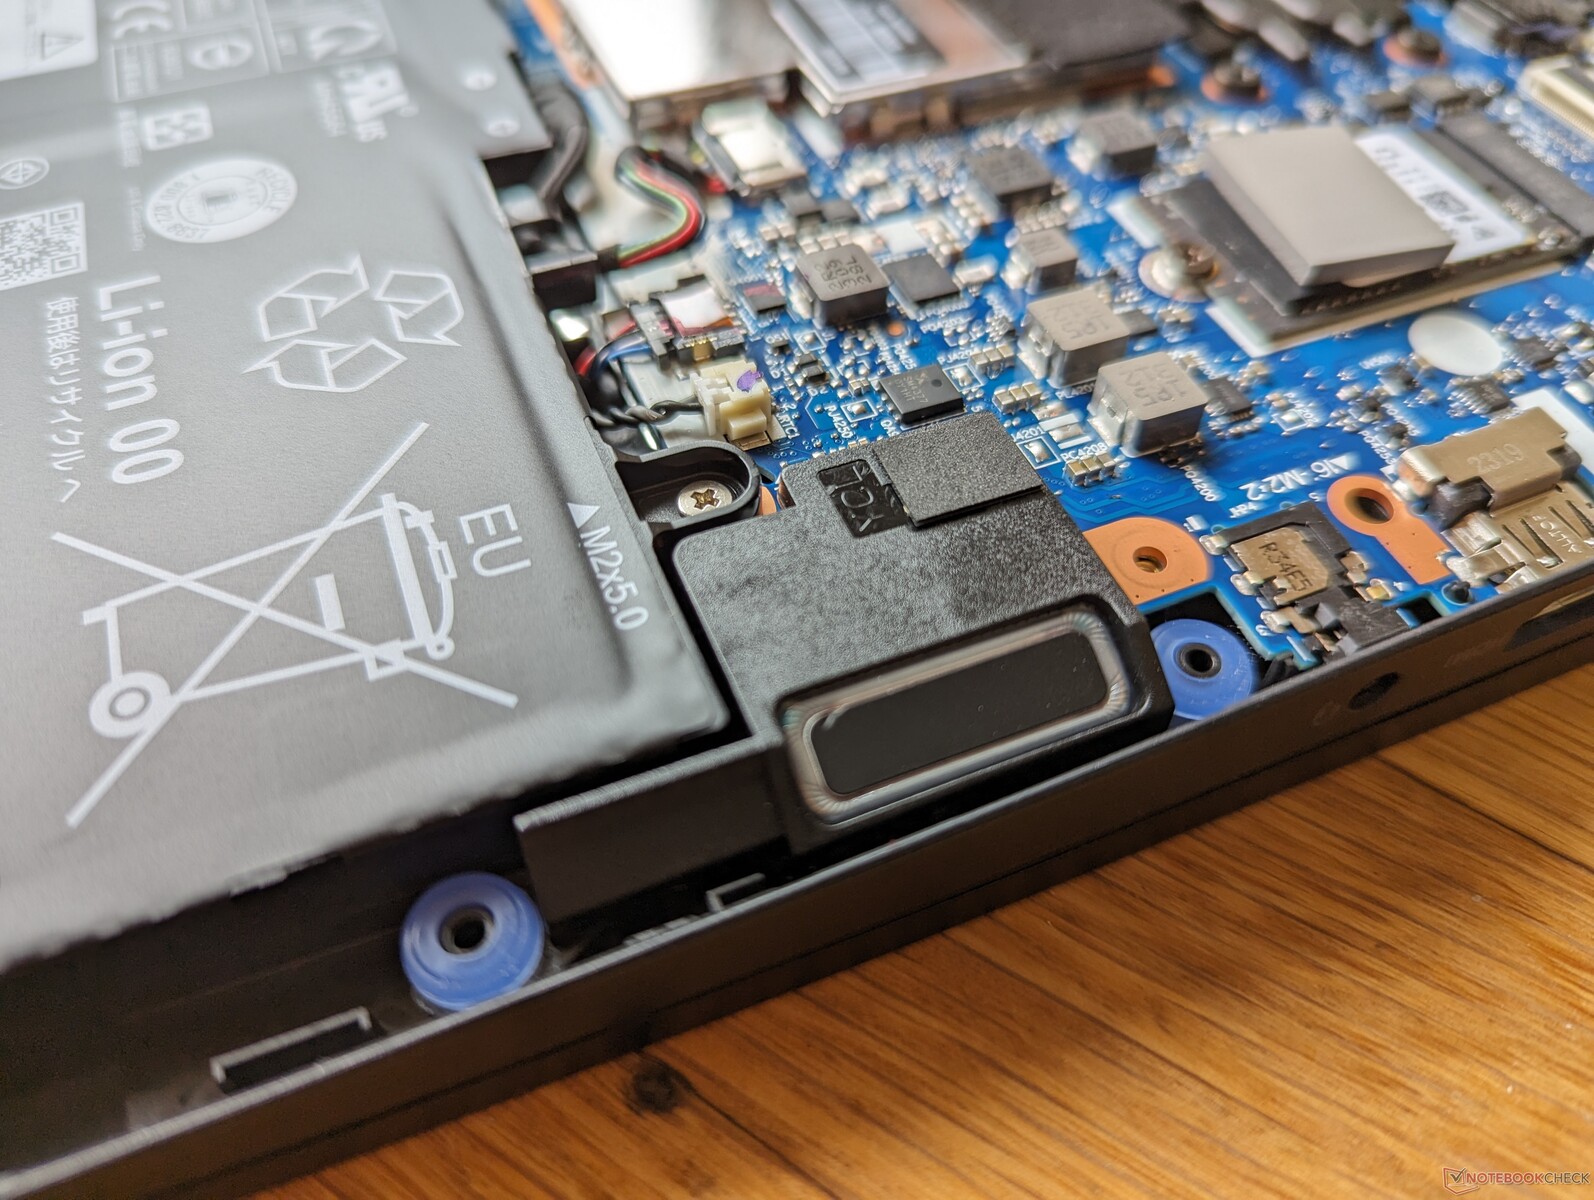
One interesting difference between the Intel and AMD versions is that the Intel version does not support full-length M.2 2280 SSDs as shown by the comparison images below. Up to two drives (PCIe4 x4 + PCIe3 x4) can still be installed, but they each must be up to 42 mm (2242) in length.
Accessories And Warranty
There are no extras in the box other than the AC adapter and paperwork. A one-year limited manufacturer warranty applies if purchased in the US.
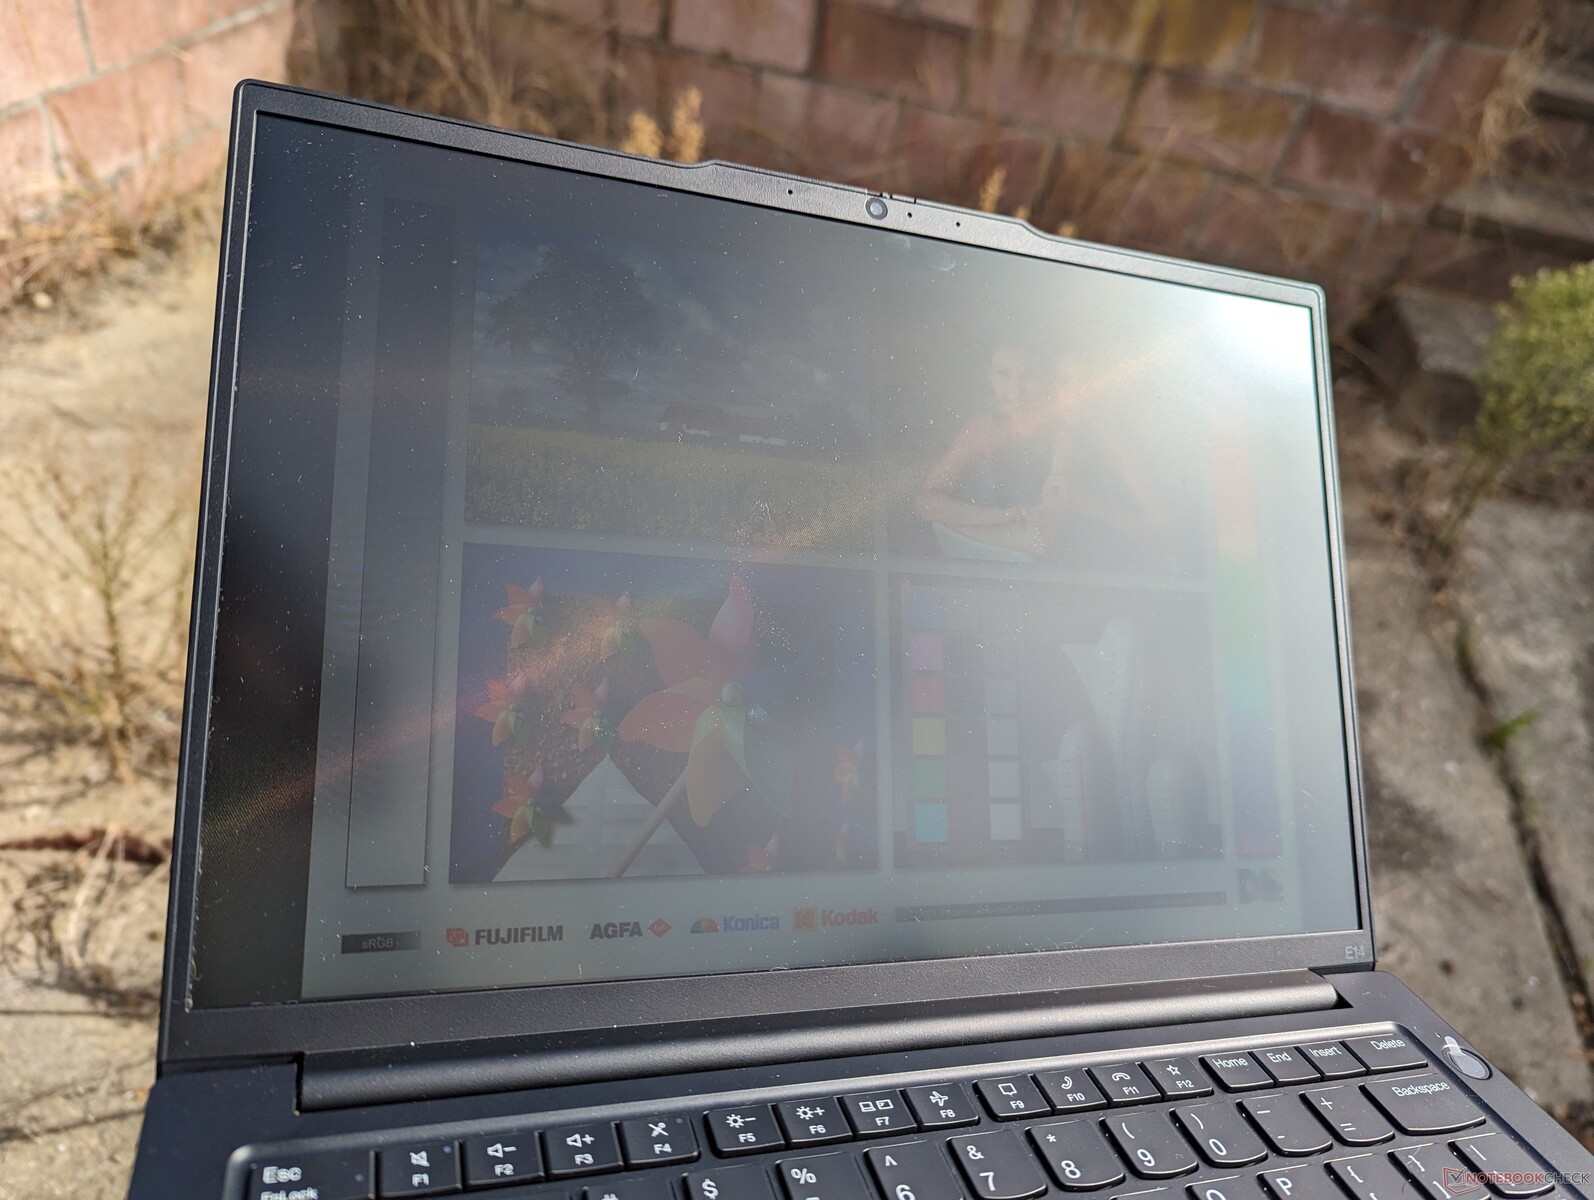
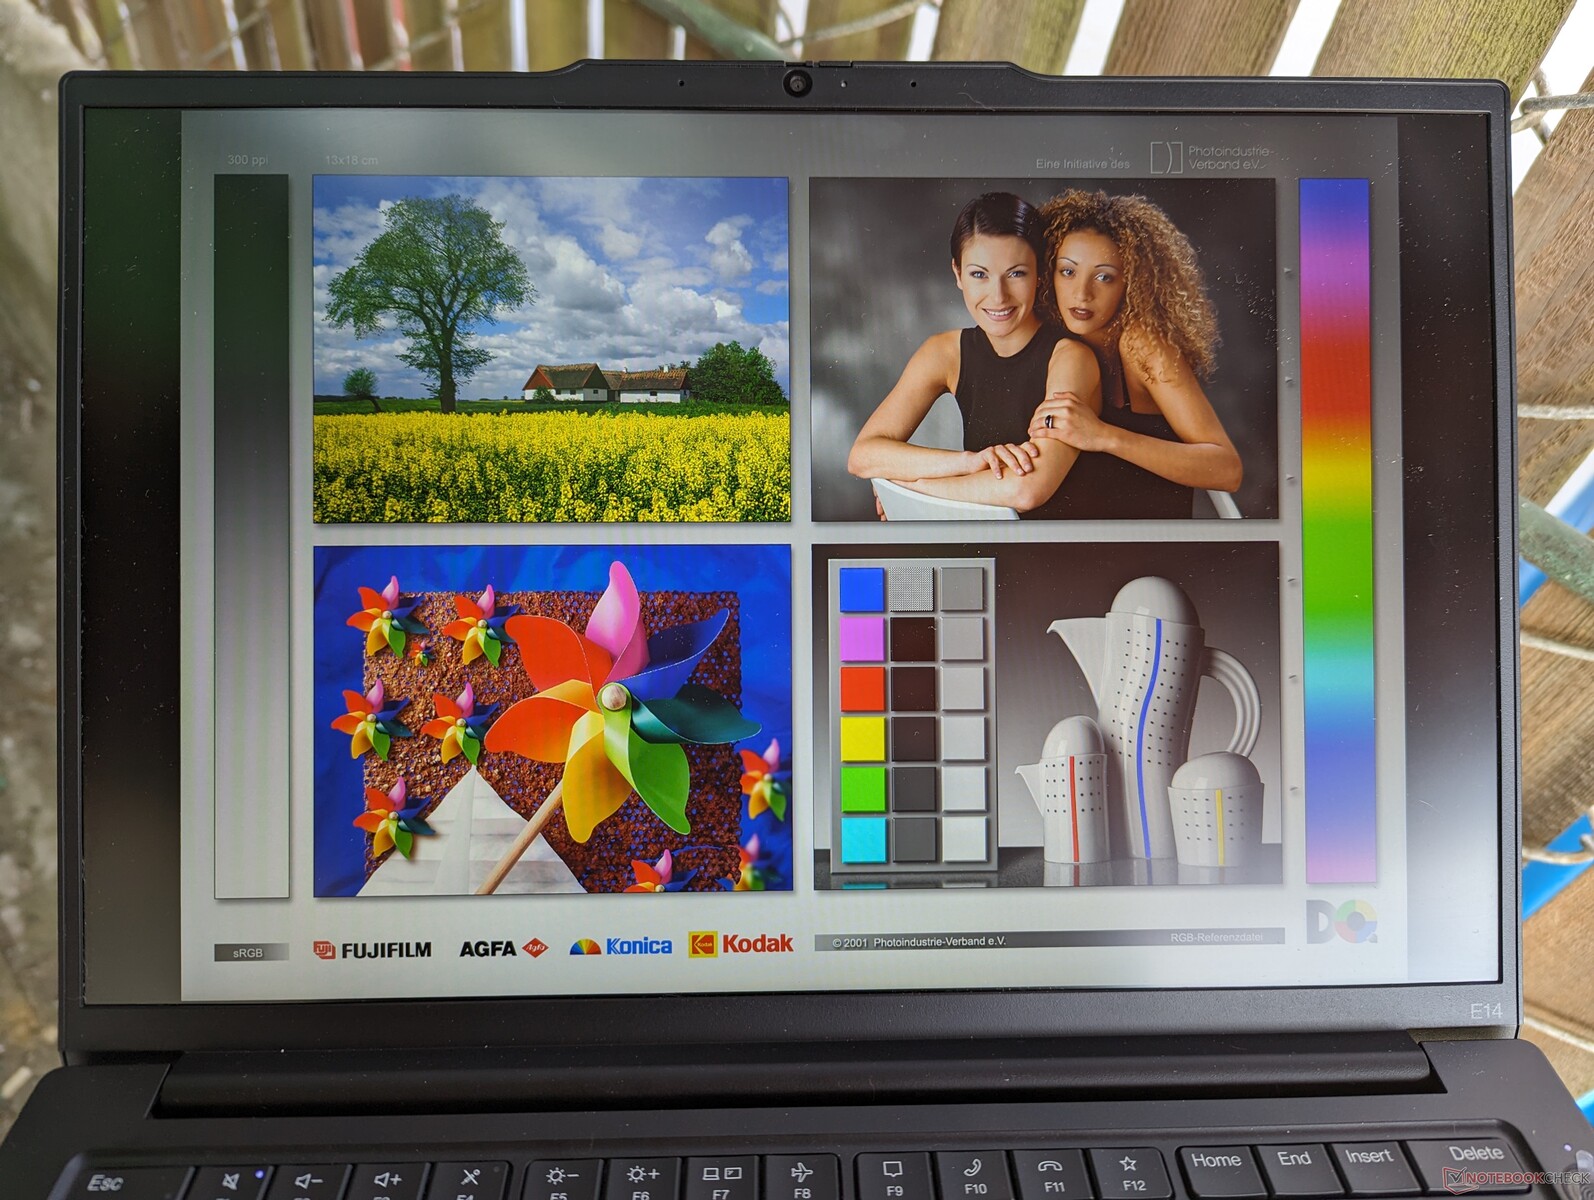
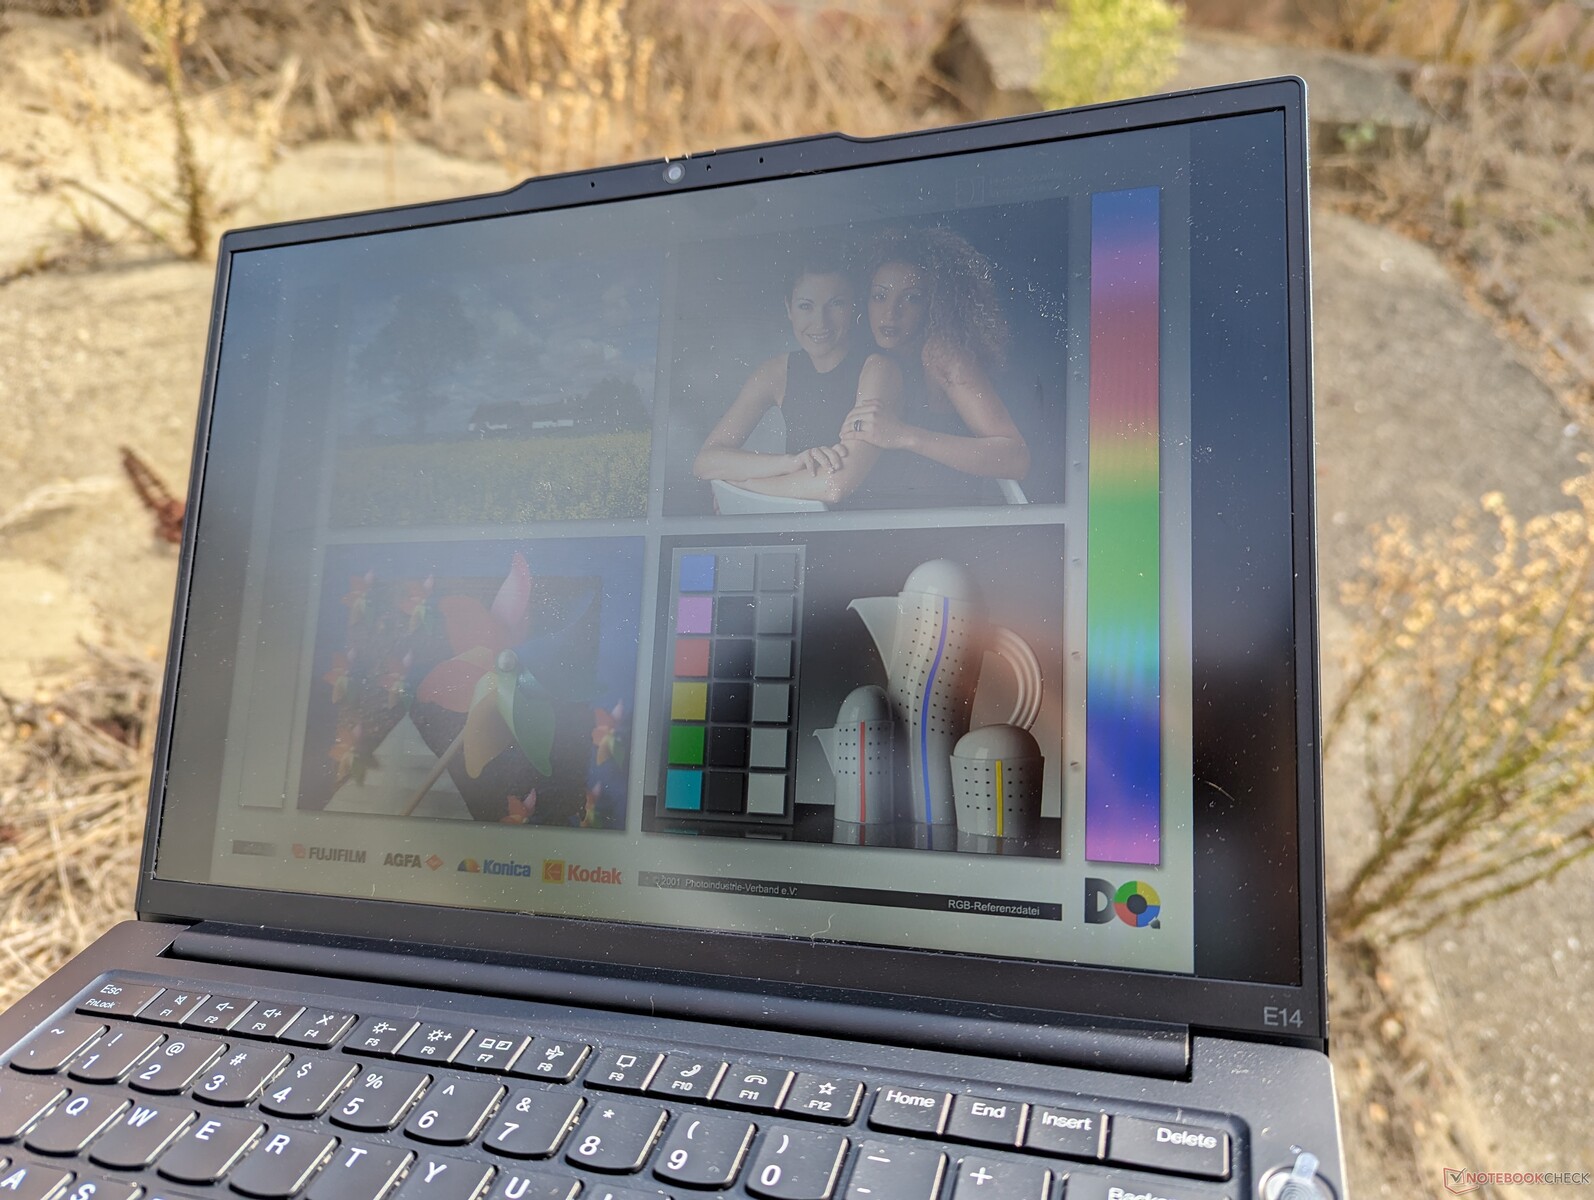
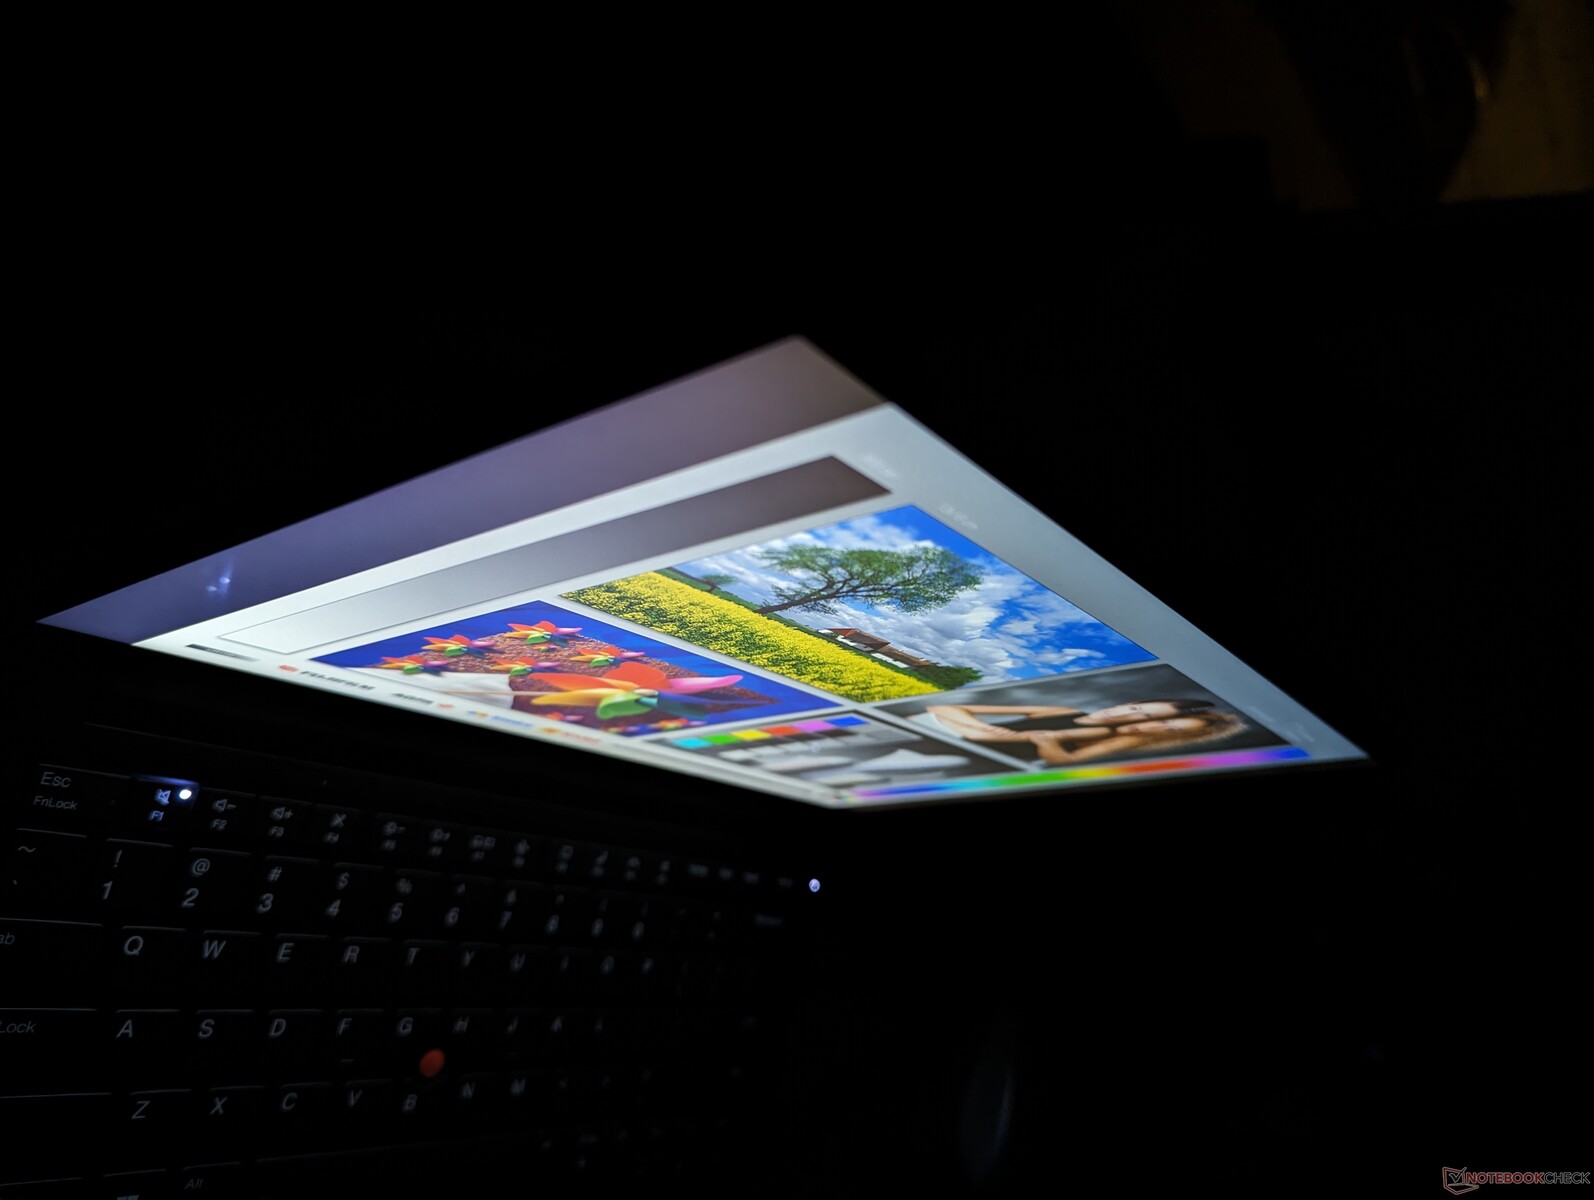
Display
Three display options are available as follows:
- 1920 x 1200, IPS, 60% sRGB, 60 Hz, 300-nits, non-touch, matte
- 1920 x 1200, IPS, 60% sRGB, 60 Hz, 300-nits, touch, matte
- 2240 x 1400, IPS, 100% sRGB, 60 Hz, 300-nits, non-touch, matte
While our AMD unit was configured with the 1400p panel, our Intel unit comes with the bolded option instead. We recommend the 1400p panel if your workloads demand more accurate colors and a higher contrast ratio. Otherwise, other attributes like brightness and black-white response times appear to be consistent between all options.

| |||||||||||||||||||||||||
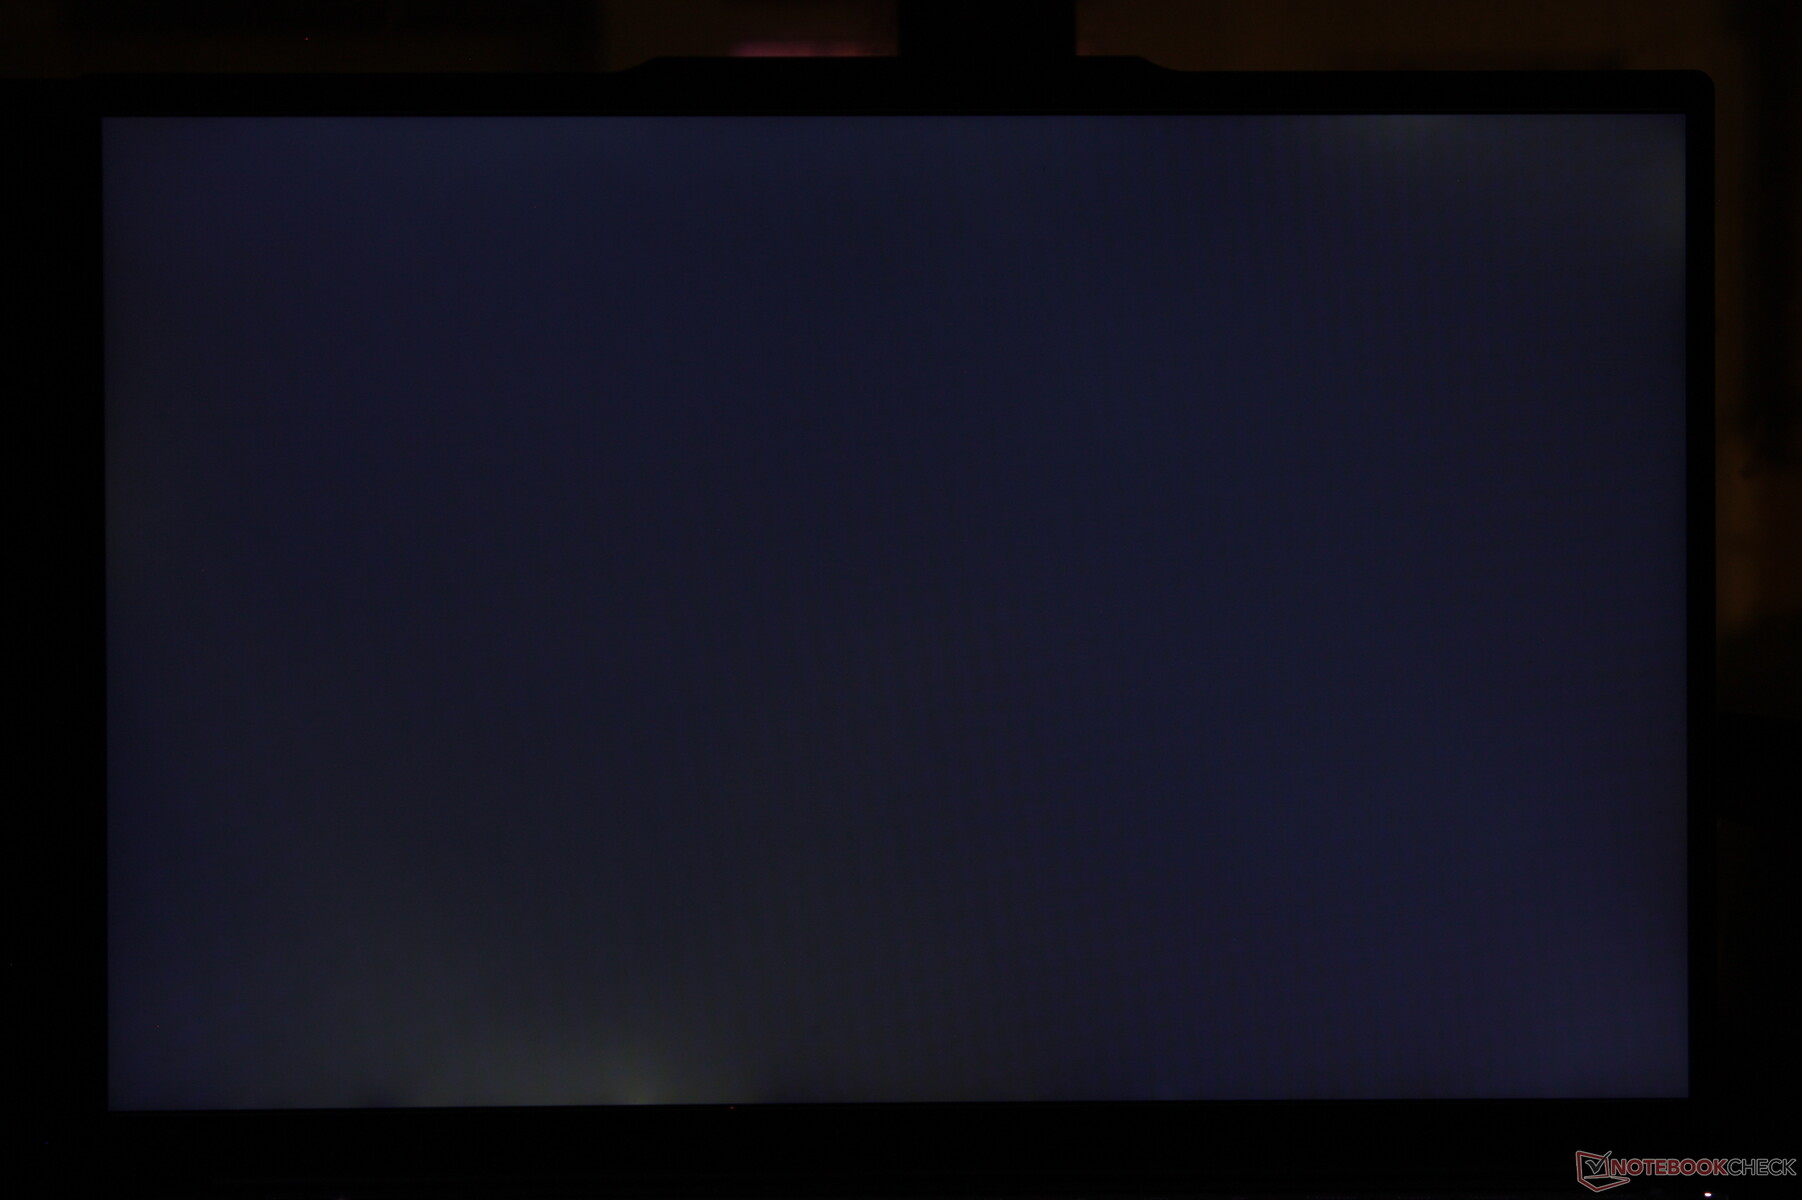
Brightness Distribution: 86 %
Center on Battery: 352.3 cd/m²
Contrast: 1305:1 (Black: 0.27 cd/m²)
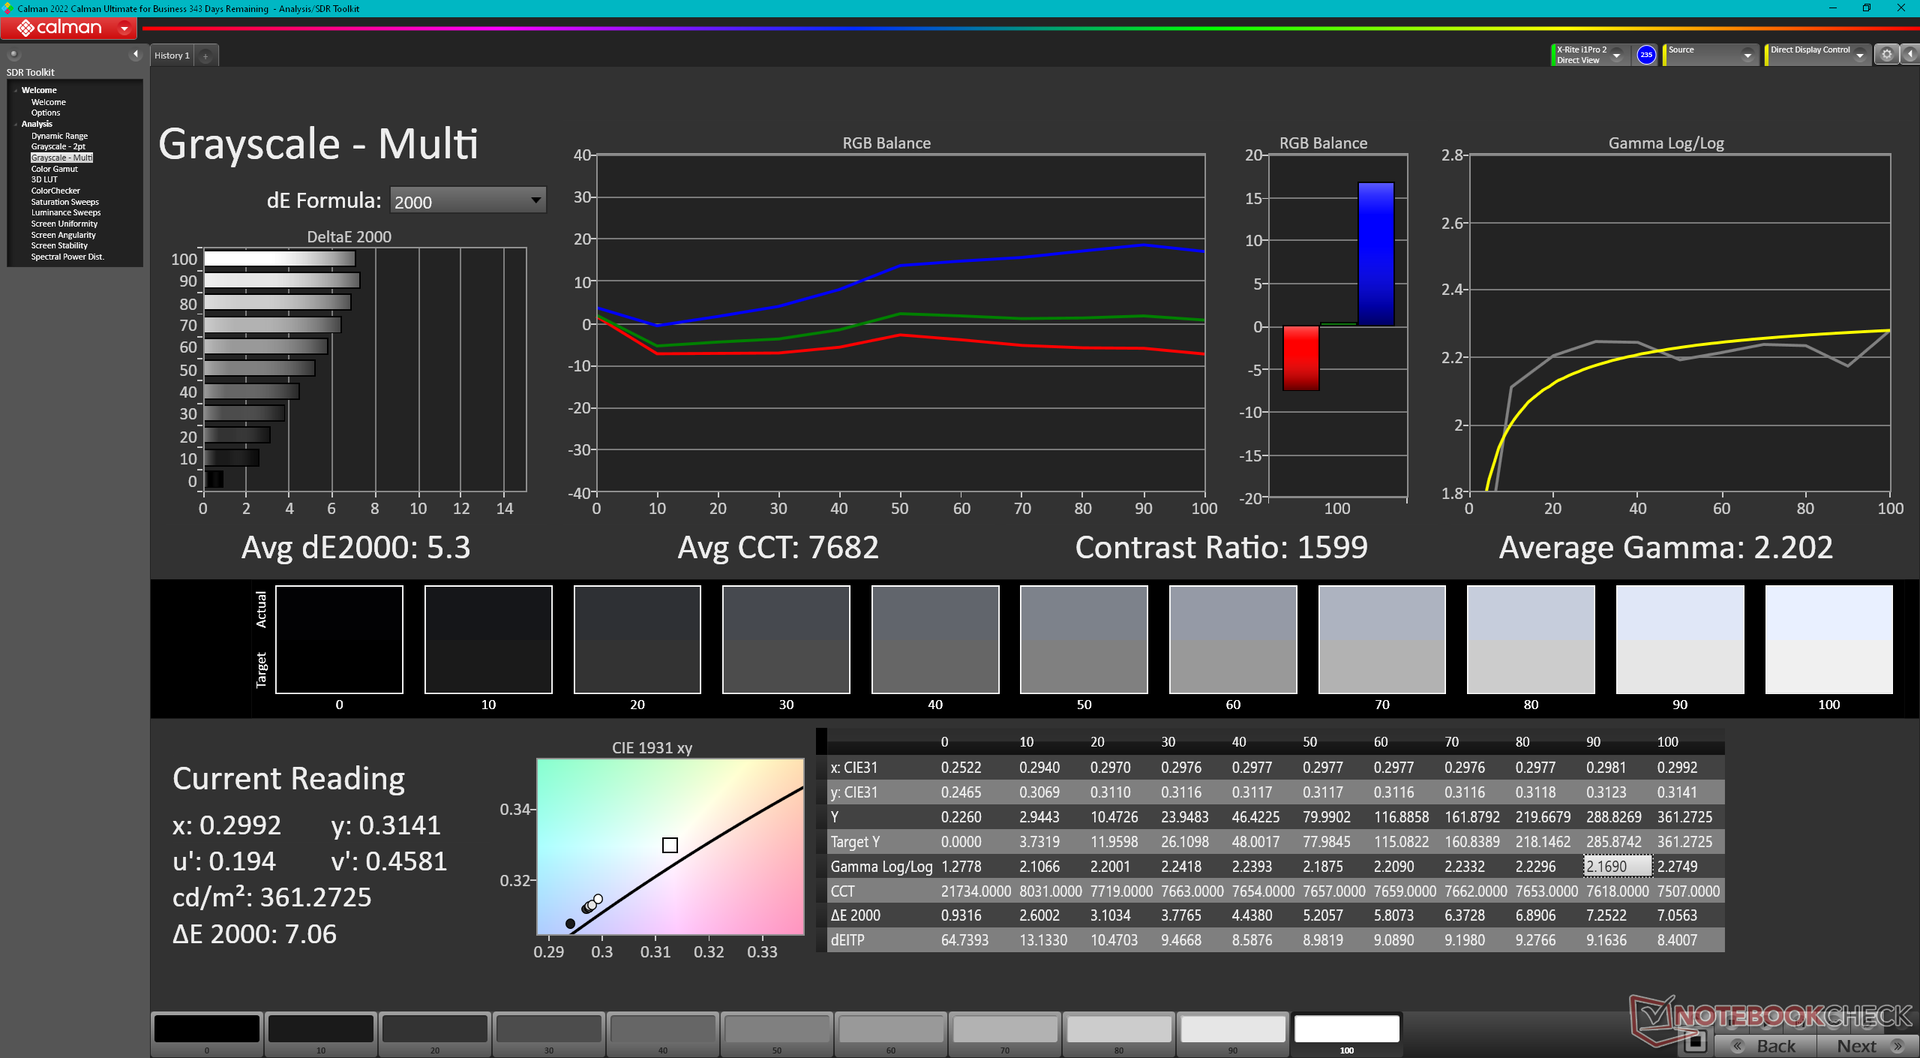
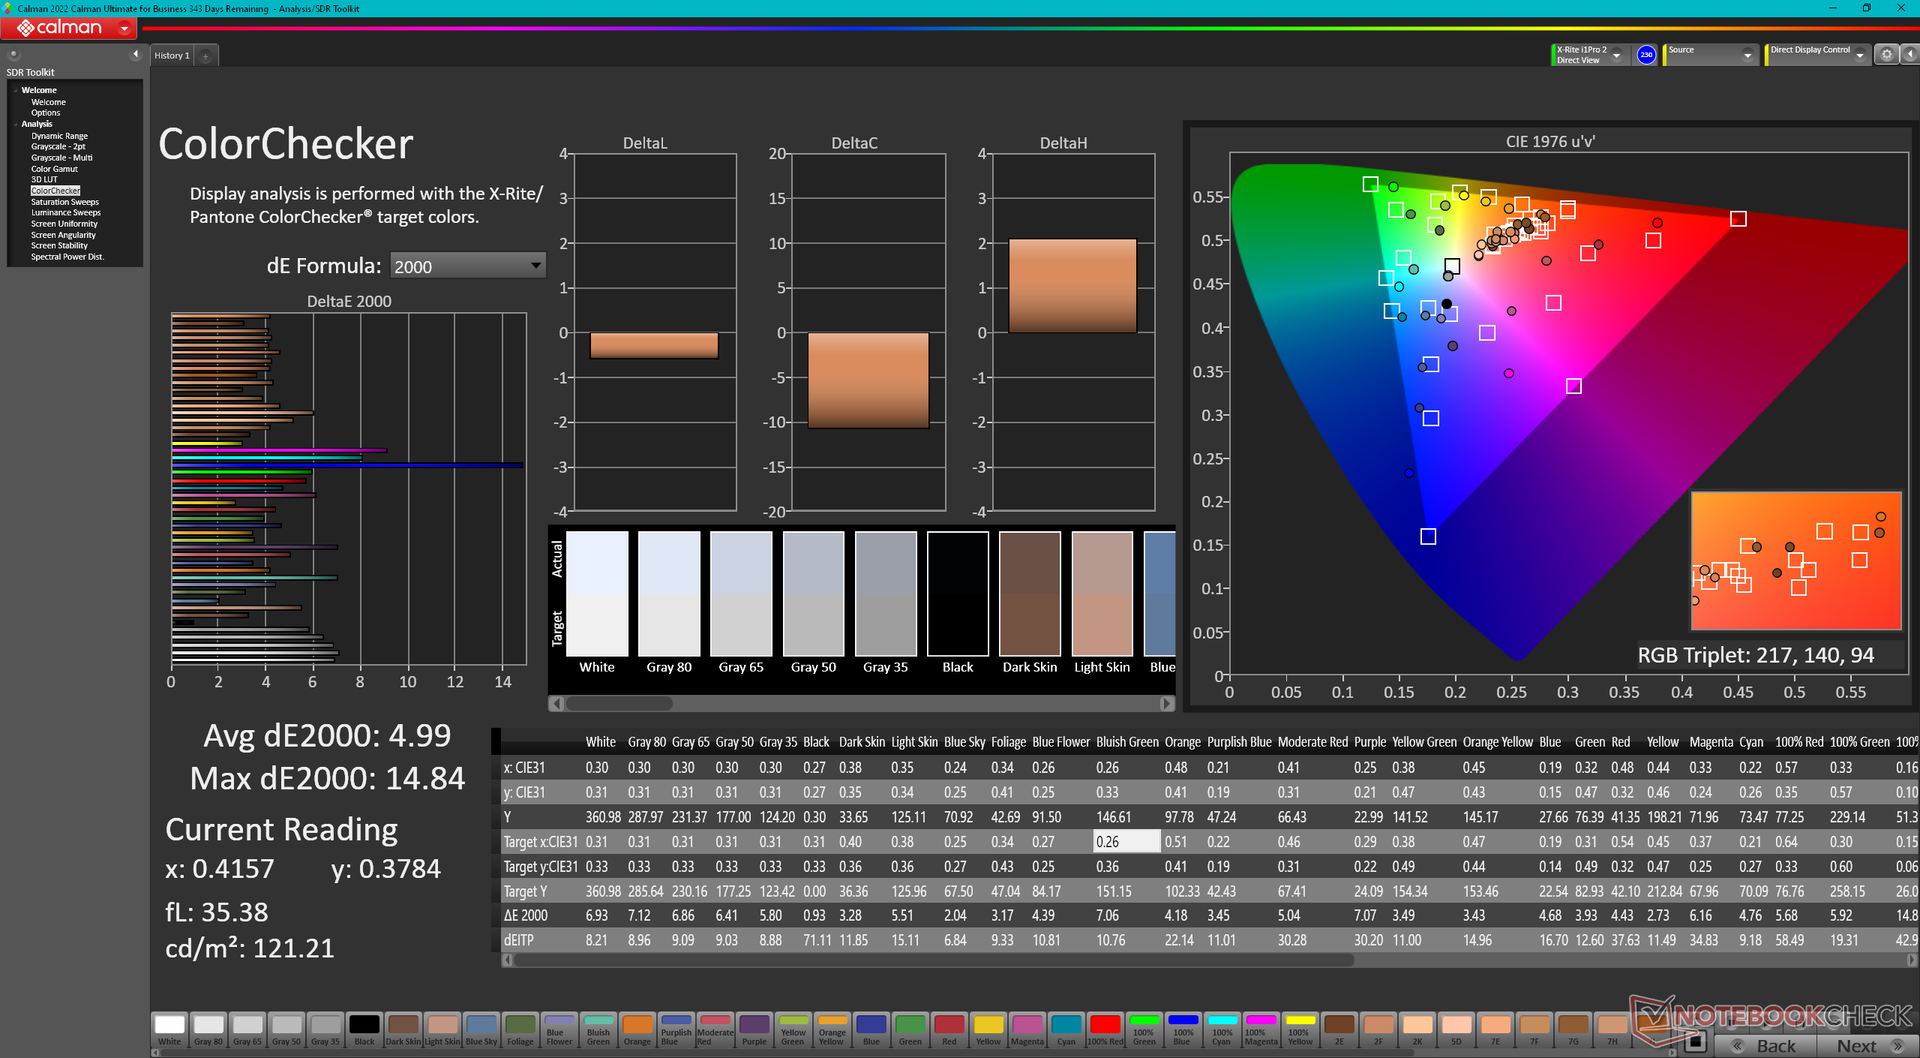
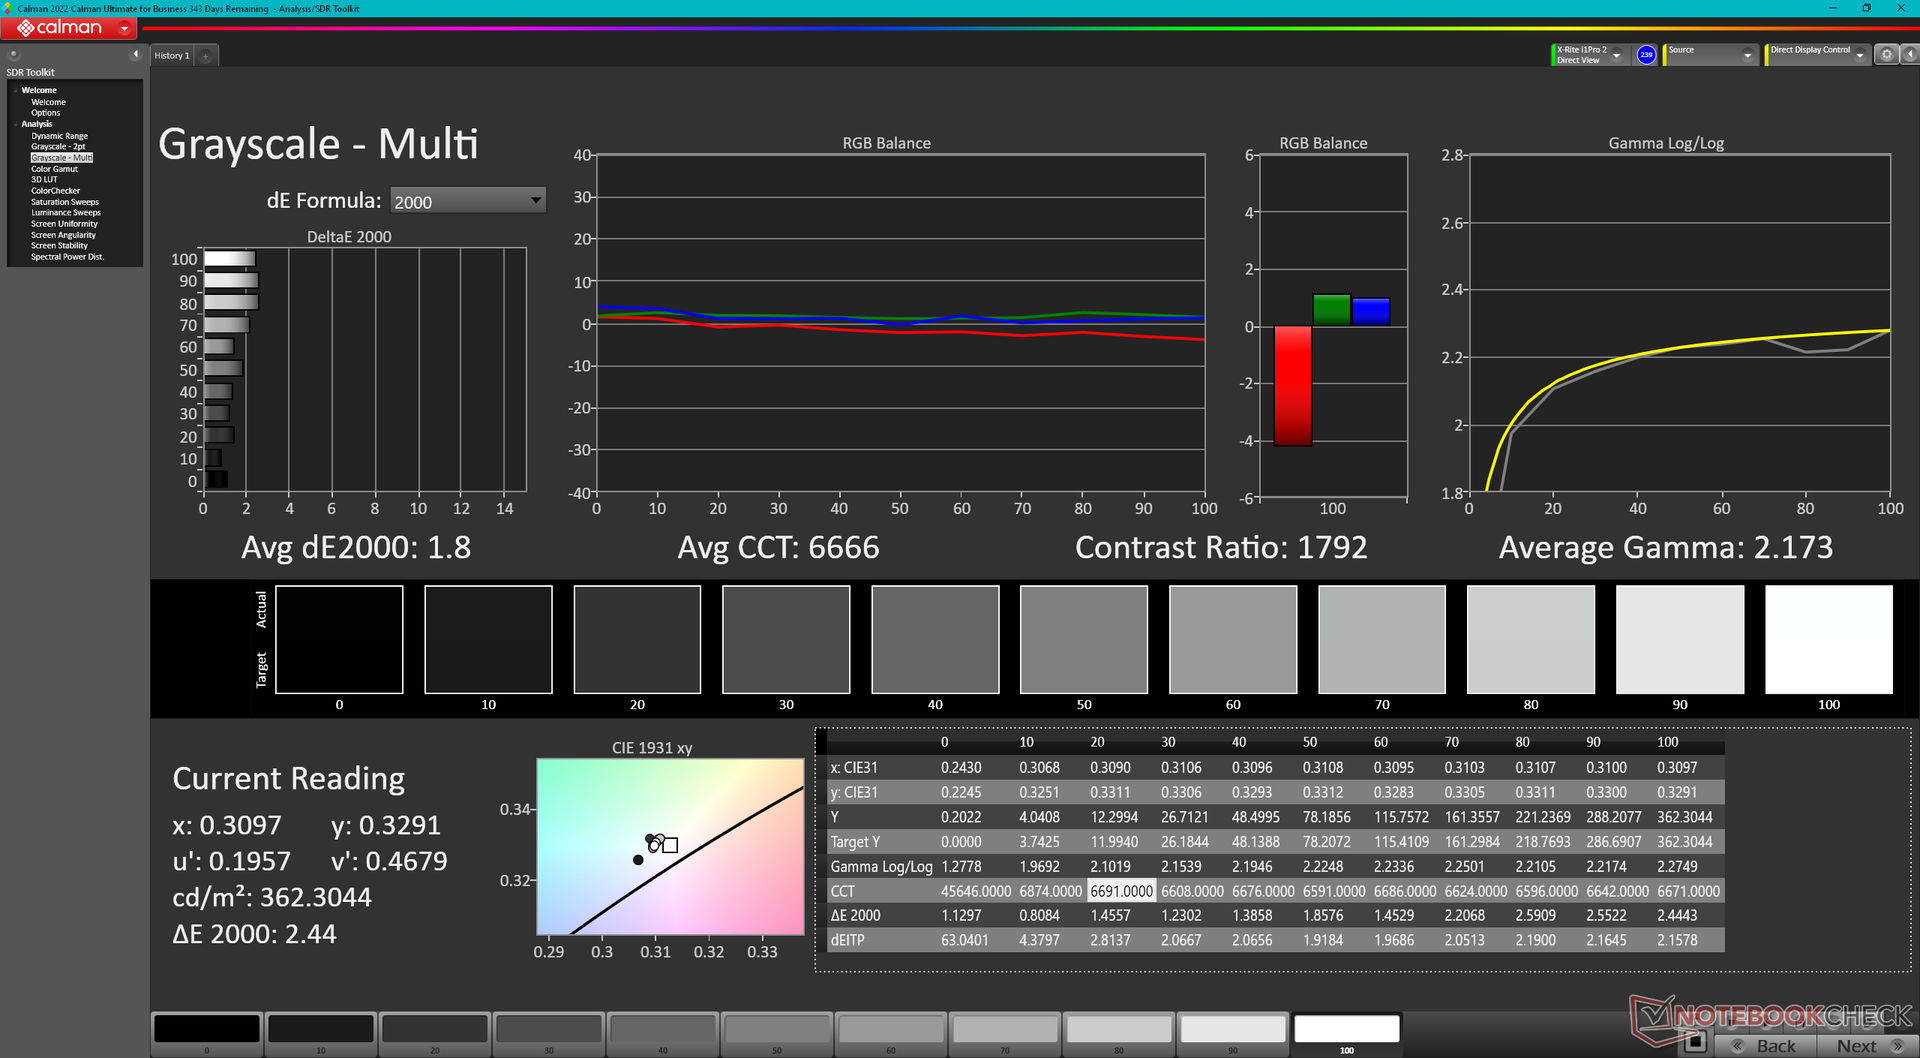
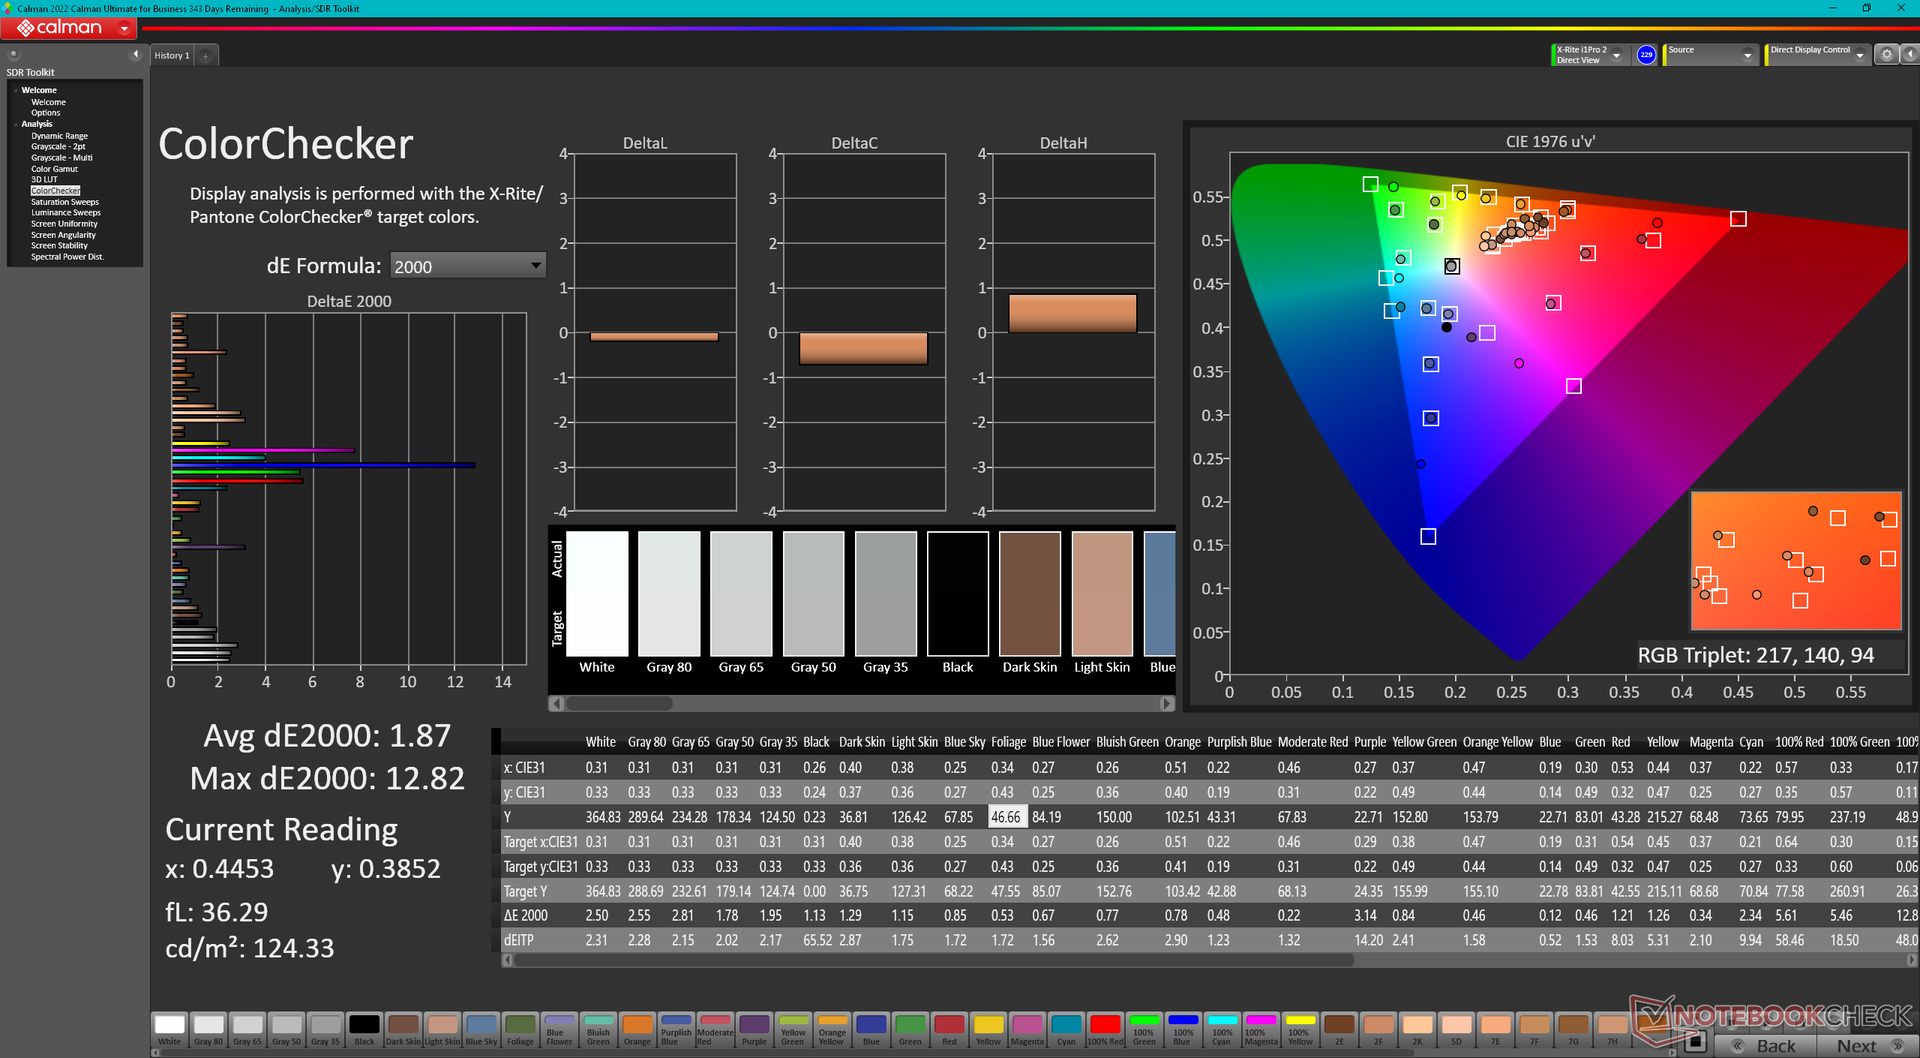
ΔE ColorChecker Calman: 4.99 | ∀{0.5-29.43 Ø4.71}
calibrated: 1.87
ΔE Greyscale Calman: 5.3 | ∀{0.09-98 Ø4.96}
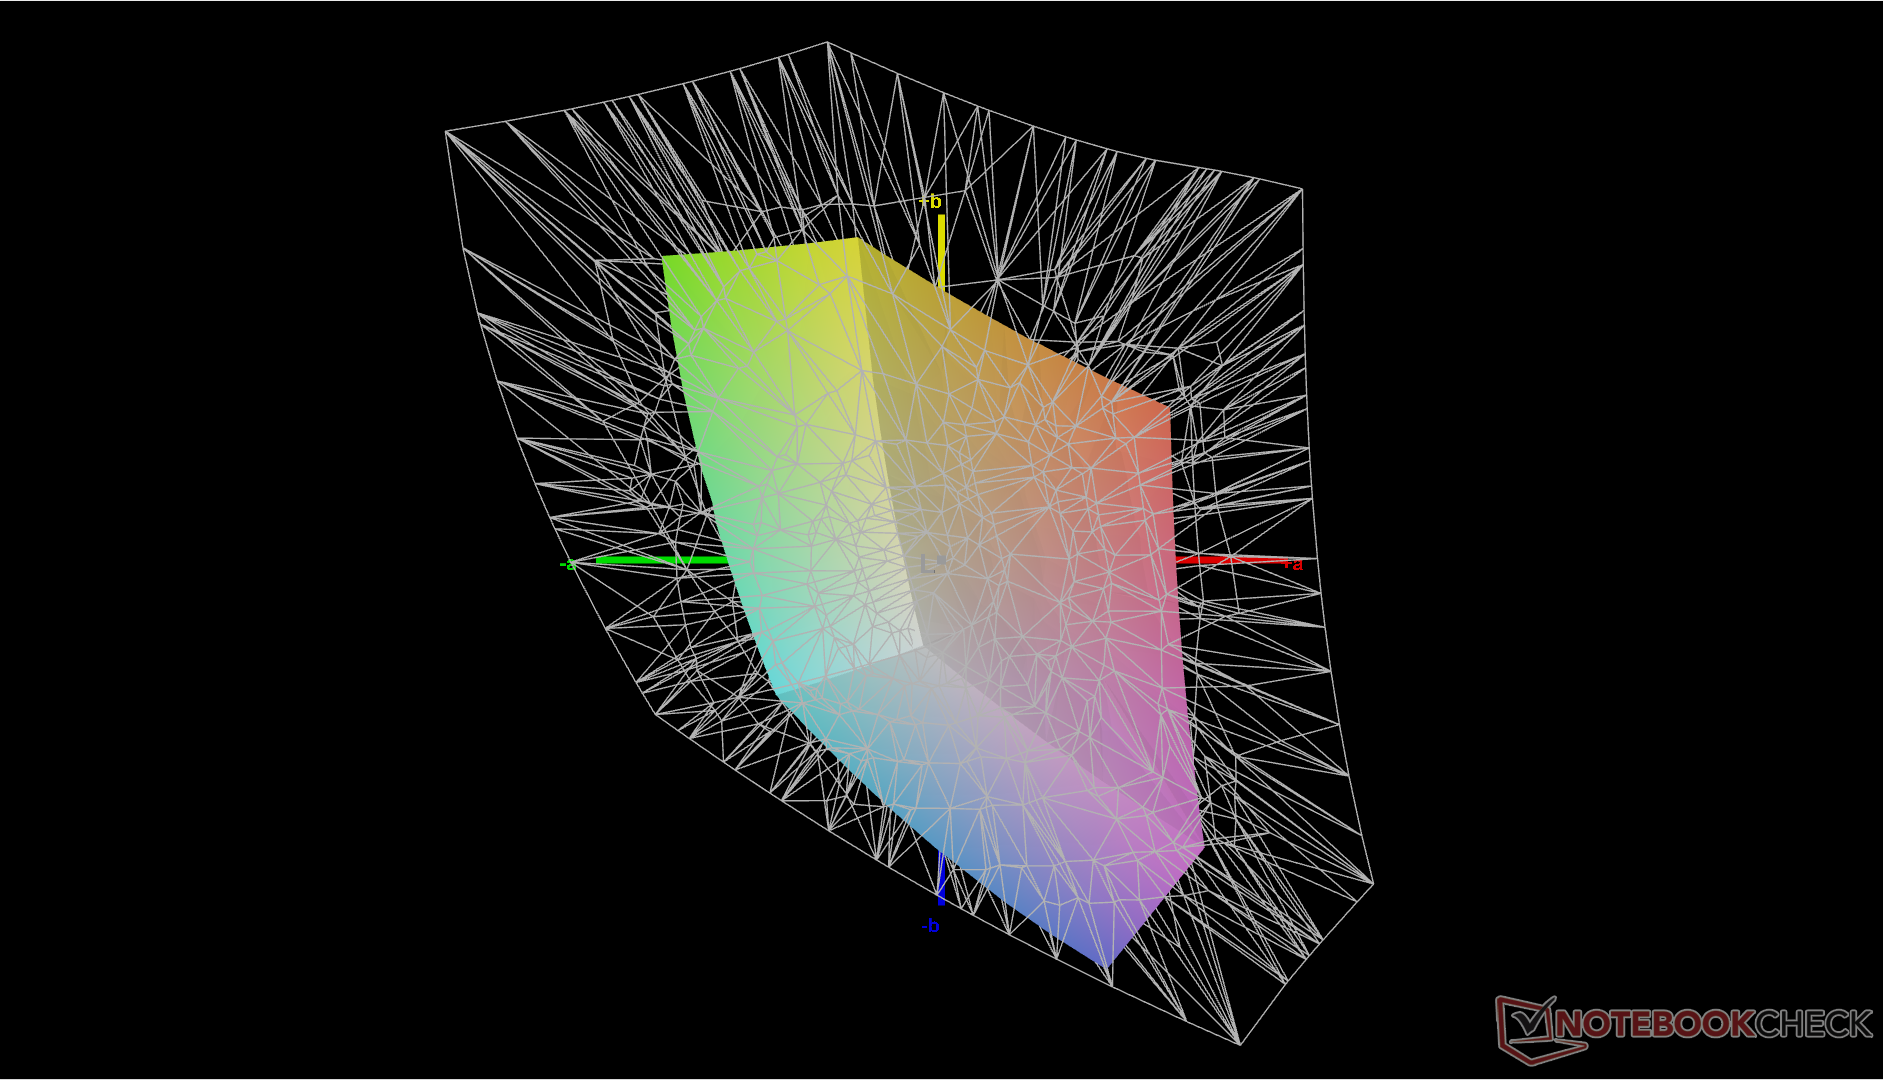
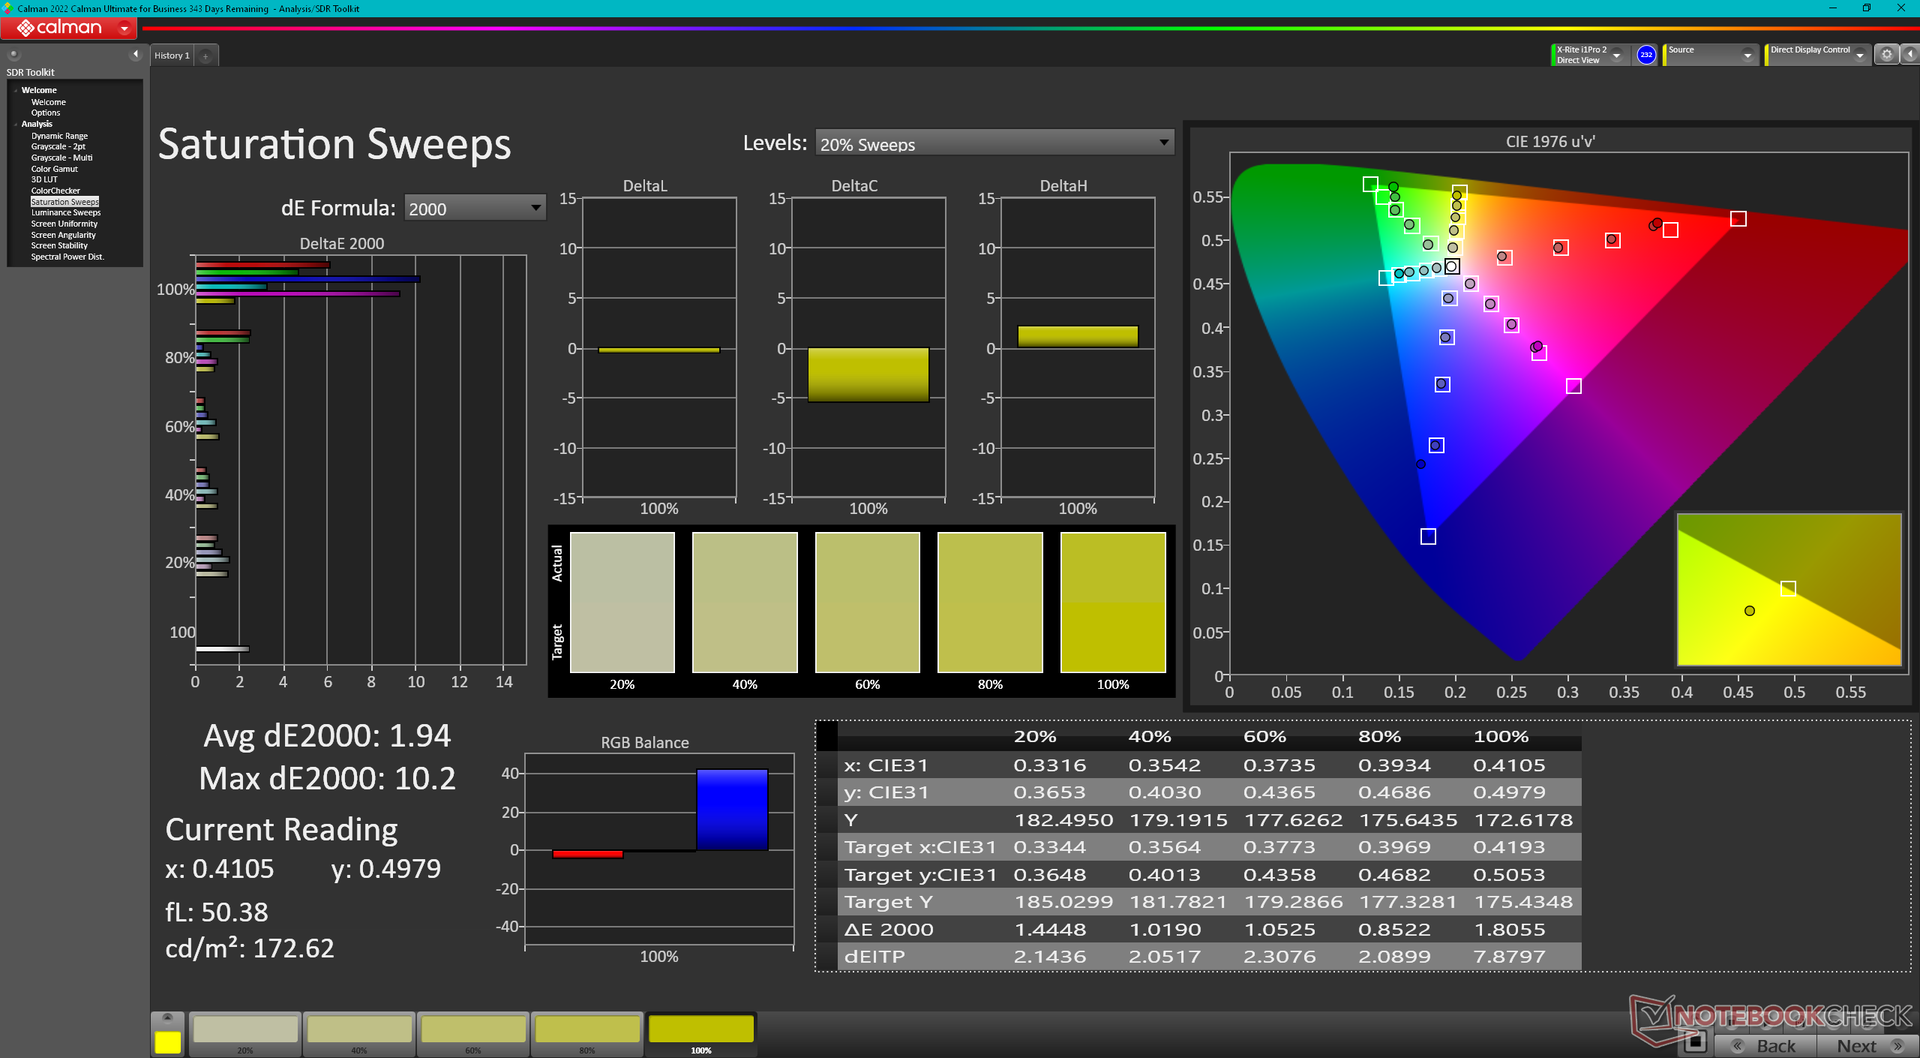
43.3% AdobeRGB 1998 (Argyll 3D)
63% sRGB (Argyll 3D)
41.9% Display P3 (Argyll 3D)
Gamma: 2.2
CCT: 7682 K
| Lenovo ThinkPad E14 G5 i7-1355U R140NW4D R5, IPS, 1920x1200, 14" | Lenovo ThinkPad E14 G5-21JSS05C00 M140NWHE R1, IPS, 2240x1400, 14" | HP EliteBook 845 G10 818N0EA AUO6DA8, IPS, 2560x1600, 14" | Asus ZenBook 14 UM3402Y Samsung ATNA40YK07-1, OLED, 2880x1800, 14" | LG Gram 14Z90Q LG LP140WU1-SPF1, IPS, 1920x1200, 14" | Dell Latitude 7440 AU Optronics B140QAX, IPS, 2560x1600, 14" | |
|---|---|---|---|---|---|---|
| Display | 61% | 97% | 108% | 97% | 72% | |
| Display P3 Coverage (%) | 41.9 | 69.3 65% | 98.3 135% | 99.9 138% | 98.4 135% | 75.4 80% |
| sRGB Coverage (%) | 63 | 97.6 55% | 99.8 58% | 100 59% | 99.9 59% | 99.9 59% |
| AdobeRGB 1998 Coverage (%) | 43.3 | 70.4 63% | 86.2 99% | 98.3 127% | 85.9 98% | 76.2 76% |
| Response Times | -9% | 60% | 94% | -40% | -70% | |
| Response Time Grey 50% / Grey 80% * (ms) | 30.7 ? | 36.3 ? -18% | 12.7 ? 59% | 1.19 ? 96% | 47.5 ? -55% | 56 ? -82% |
| Response Time Black / White * (ms) | 19.6 ? | 19.5 ? 1% | 7.9 ? 60% | 1.62 ? 92% | 24.5 ? -25% | 30.8 ? -57% |
| PWM Frequency (Hz) | 362.3 ? | |||||
| Screen | 33% | 38% | 41% | 14% | 22% | |
| Brightness middle (cd/m²) | 352.3 | 362 3% | 546 55% | 336.6 -4% | 341 -3% | 517.3 47% |
| Brightness (cd/m²) | 344 | 354 3% | 564 64% | 339 -1% | 305 -11% | 488 42% |
| Brightness Distribution (%) | 86 | 91 6% | 86 0% | 98 14% | 87 1% | 88 2% |
| Black Level * (cd/m²) | 0.27 | 0.18 33% | 0.38 -41% | 0.26 4% | 0.34 -26% | |
| Contrast (:1) | 1305 | 2011 54% | 1437 10% | 1312 1% | 1521 17% | |
| Colorchecker dE 2000 * | 4.99 | 2.6 48% | 1.3 74% | 0.84 83% | 3.11 38% | 3.3 34% |
| Colorchecker dE 2000 max. * | 14.84 | 3.7 75% | 5.3 64% | 3.1 79% | 8.29 44% | 7.81 47% |
| Colorchecker dE 2000 calibrated * | 1.87 | 1.1 41% | 1.2 36% | 0.83 56% | 1.02 45% | |
| Greyscale dE 2000 * | 5.3 | 3.3 38% | 1.1 79% | 1.4 74% | 5.3 -0% | 5.6 -6% |
| Gamma | 2.2 100% | 2.28 96% | 2.27 97% | 2.24 98% | 2.037 108% | 2.37 93% |
| CCT | 7682 85% | 6761 96% | 6463 101% | 6439 101% | 7571 86% | 6804 96% |
| Total Average (Program / Settings) | 28% /
33% | 65% /
54% | 81% /
69% | 24% /
24% | 8% /
20% |
* ... smaller is better
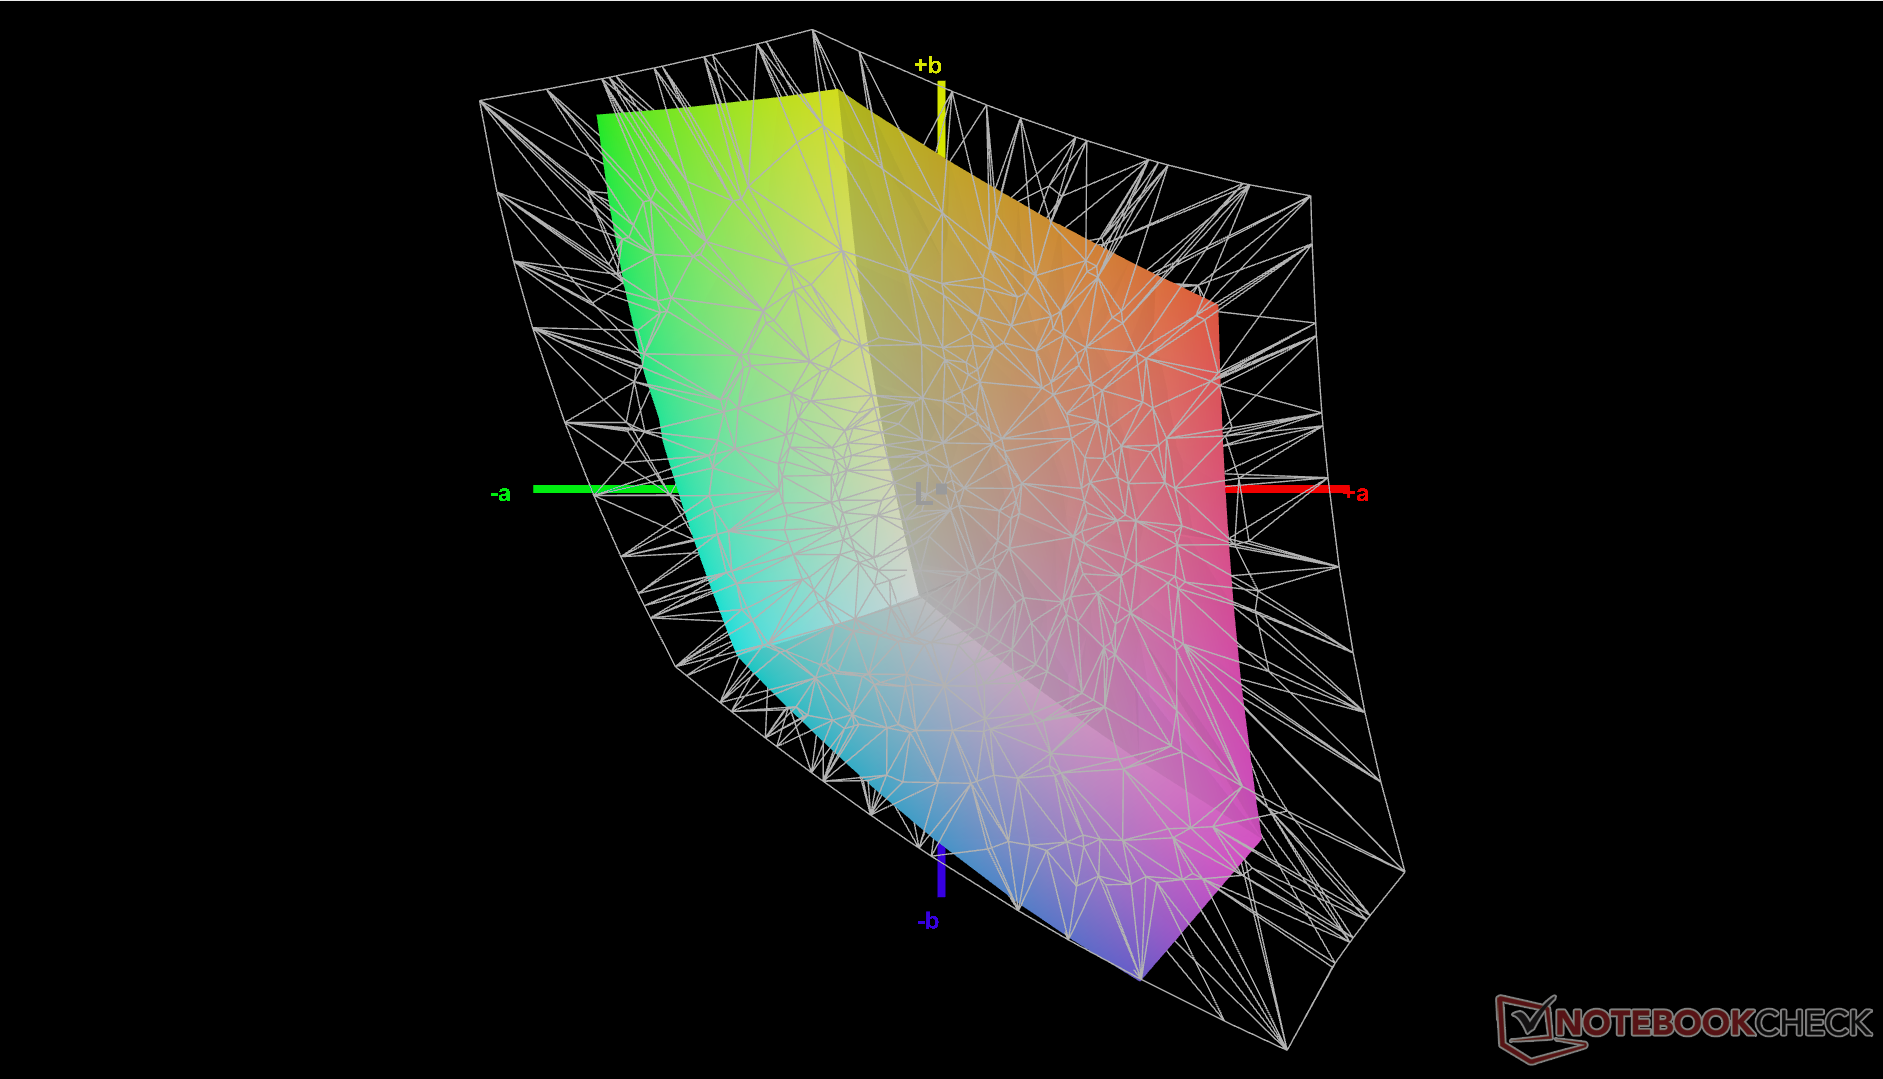
The display does not come pre-calibrated. Calibrating the panel ourselves with an X-Rite colorimeter would improve average grayscale and color deltaE values from 5.3 and 4.99 to just 1.8 and 1.87, respectively. Our ICM profile is available to download above for free.
Display Response Times
| ↔ Response Time Black to White | ||
|---|---|---|
| 19.6 ms ... rise ↗ and fall ↘ combined | ↗ 9.8 ms rise | 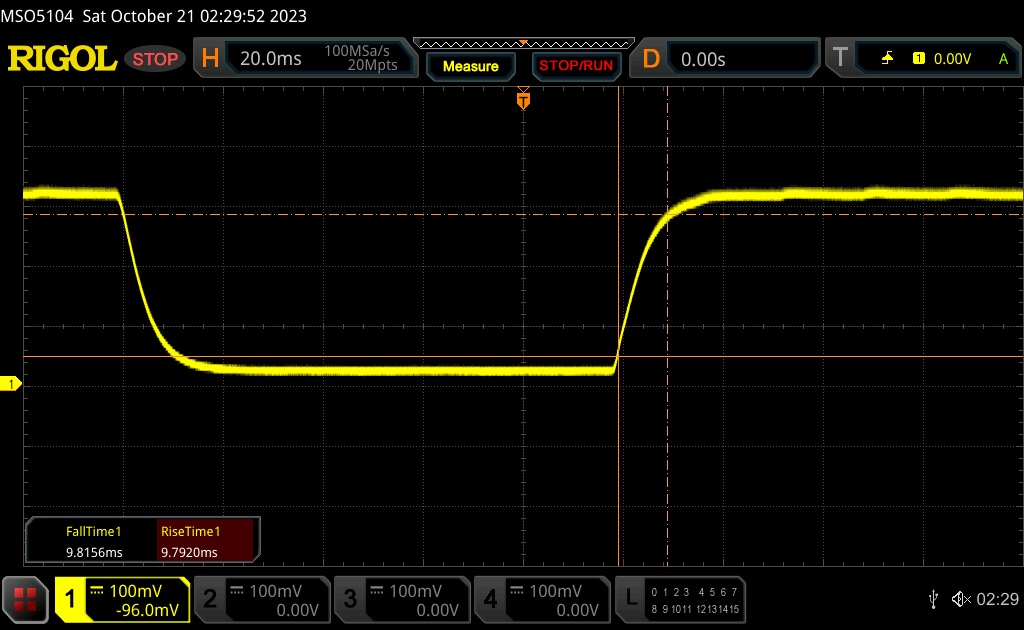 |
| ↘ 9.8 ms fall | ||
| The screen shows good response rates in our tests, but may be too slow for competitive gamers. In comparison, all tested devices range from 0.1 (minimum) to 240 (maximum) ms. » 43 % of all devices are better. This means that the measured response time is similar to the average of all tested devices (19.8 ms). | ||
| ↔ Response Time 50% Grey to 80% Grey | ||
| 30.7 ms ... rise ↗ and fall ↘ combined | ↗ 14.7 ms rise |  |
| ↘ 16 ms fall | ||
| The screen shows slow response rates in our tests and will be unsatisfactory for gamers. In comparison, all tested devices range from 0.165 (minimum) to 636 (maximum) ms. » 41 % of all devices are better. This means that the measured response time is similar to the average of all tested devices (30.9 ms). | ||
Screen Flickering / PWM (Pulse-Width Modulation)
| Screen flickering / PWM not detected |  | ||
In comparison: 52 % of all tested devices do not use PWM to dim the display. If PWM was detected, an average of 7741 (minimum: 5 - maximum: 343500) Hz was measured. | |||


Performance
Testing Conditions
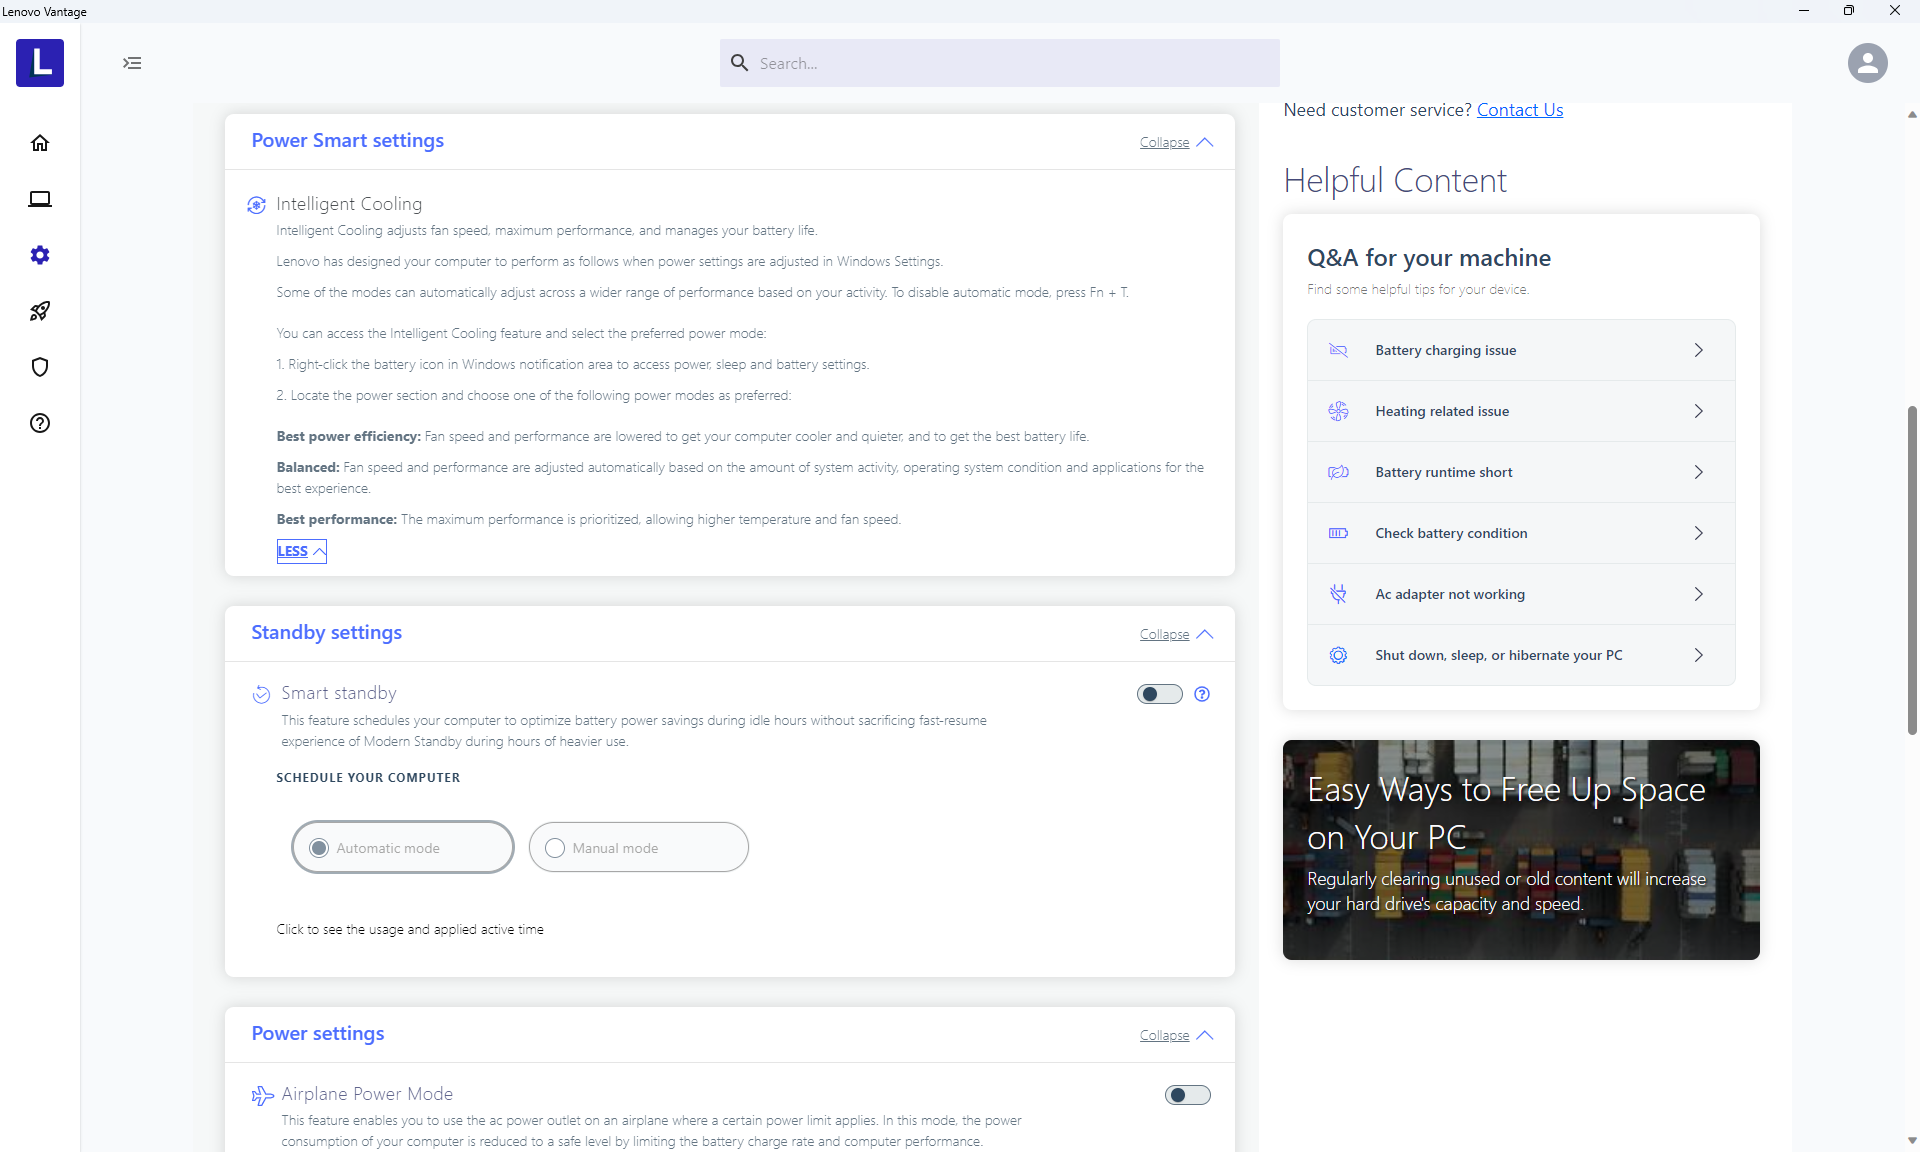
We set Windows to Performance mode prior to testing. Lenovo does not include any specialized power profiles and instead relies on the Windows power profiles to reduce confusion.

Processor
Processor performance is weaker than expected at about 10 to 15 percent slower than the average laptop in our database equipped with the same Core i7-1355U. The deficit can be attributed to the weak Turbo Boost sustainability of the system. When running CineBench R15 xT in a loop, for example, the initial score of 1539 points would fall by as much as 35 to 40 percent by the second loop as shown by the graph below.
When compared to the Ryzen 7 7730U in the AMD-based ThinkPad E14 G5, our Core i7-1355U offers 25 to 30 percent faster single-thread performance but 25 to 30 percent slower multi-thread performance once throttling has been accounted for.
Cinebench R15 Multi Loop
Cinebench R23: Multi Core | Single Core
Cinebench R20: CPU (Multi Core) | CPU (Single Core)
Cinebench R15: CPU Multi 64Bit | CPU Single 64Bit
Blender: v2.79 BMW27 CPU
7-Zip 18.03: 7z b 4 | 7z b 4 -mmt1
Geekbench 5.5: Multi-Core | Single-Core
HWBOT x265 Benchmark v2.2: 4k Preset
LibreOffice : 20 Documents To PDF
R Benchmark 2.5: Overall mean
* ... smaller is better
AIDA64: FP32 Ray-Trace | FPU Julia | CPU SHA3 | CPU Queen | FPU SinJulia | FPU Mandel | CPU AES | CPU ZLib | FP64 Ray-Trace | CPU PhotoWorxx
| Performance rating | |
| HP EliteBook 845 G10 818N0EA | |
| Asus ZenBook 14 UM3402Y | |
| Lenovo ThinkPad E14 G5-21JSS05C00 | |
| Dell Latitude 7440 | |
| Average Intel Core i7-1355U | |
| Lenovo ThinkPad E14 G5 i7-1355U | |
| LG Gram 14Z90Q | |
| AIDA64 / FP32 Ray-Trace | |
| HP EliteBook 845 G10 818N0EA | |
| Asus ZenBook 14 UM3402Y | |
| Lenovo ThinkPad E14 G5-21JSS05C00 | |
| Dell Latitude 7440 | |
| Average Intel Core i7-1355U (5673 - 8424, n=18) | |
| Lenovo ThinkPad E14 G5 i7-1355U | |
| LG Gram 14Z90Q | |
| AIDA64 / FPU Julia | |
| HP EliteBook 845 G10 818N0EA | |
| Asus ZenBook 14 UM3402Y | |
| Lenovo ThinkPad E14 G5-21JSS05C00 | |
| Dell Latitude 7440 | |
| Average Intel Core i7-1355U (29580 - 42706, n=18) | |
| Lenovo ThinkPad E14 G5 i7-1355U | |
| LG Gram 14Z90Q | |
| AIDA64 / CPU SHA3 | |
| HP EliteBook 845 G10 818N0EA | |
| Asus ZenBook 14 UM3402Y | |
| Lenovo ThinkPad E14 G5-21JSS05C00 | |
| Dell Latitude 7440 | |
| Average Intel Core i7-1355U (1529 - 2200, n=18) | |
| Lenovo ThinkPad E14 G5 i7-1355U | |
| LG Gram 14Z90Q | |
| AIDA64 / CPU Queen | |
| HP EliteBook 845 G10 818N0EA | |
| Asus ZenBook 14 UM3402Y | |
| Lenovo ThinkPad E14 G5-21JSS05C00 | |
| LG Gram 14Z90Q | |
| Lenovo ThinkPad E14 G5 i7-1355U | |
| Dell Latitude 7440 | |
| Average Intel Core i7-1355U (21547 - 66907, n=18) | |
| AIDA64 / FPU SinJulia | |
| HP EliteBook 845 G10 818N0EA | |
| Asus ZenBook 14 UM3402Y | |
| Lenovo ThinkPad E14 G5-21JSS05C00 | |
| Dell Latitude 7440 | |
| Lenovo ThinkPad E14 G5 i7-1355U | |
| Average Intel Core i7-1355U (4045 - 5426, n=18) | |
| LG Gram 14Z90Q | |
| AIDA64 / FPU Mandel | |
| HP EliteBook 845 G10 818N0EA | |
| Asus ZenBook 14 UM3402Y | |
| Lenovo ThinkPad E14 G5-21JSS05C00 | |
| Dell Latitude 7440 | |
| Average Intel Core i7-1355U (14596 - 21627, n=18) | |
| Lenovo ThinkPad E14 G5 i7-1355U | |
| LG Gram 14Z90Q | |
| AIDA64 / CPU AES | |
| HP EliteBook 845 G10 818N0EA | |
| Asus ZenBook 14 UM3402Y | |
| Lenovo ThinkPad E14 G5-21JSS05C00 | |
| Dell Latitude 7440 | |
| Average Intel Core i7-1355U (31432 - 75408, n=18) | |
| Lenovo ThinkPad E14 G5 i7-1355U | |
| LG Gram 14Z90Q | |
| AIDA64 / CPU ZLib | |
| HP EliteBook 845 G10 818N0EA | |
| Asus ZenBook 14 UM3402Y | |
| Lenovo ThinkPad E14 G5-21JSS05C00 | |
| Dell Latitude 7440 | |
| Average Intel Core i7-1355U (454 - 684, n=18) | |
| Lenovo ThinkPad E14 G5 i7-1355U | |
| LG Gram 14Z90Q | |
| AIDA64 / FP64 Ray-Trace | |
| HP EliteBook 845 G10 818N0EA | |
| Asus ZenBook 14 UM3402Y | |
| Lenovo ThinkPad E14 G5-21JSS05C00 | |
| Dell Latitude 7440 | |
| Average Intel Core i7-1355U (2991 - 4453, n=18) | |
| LG Gram 14Z90Q | |
| Lenovo ThinkPad E14 G5 i7-1355U | |
| AIDA64 / CPU PhotoWorxx | |
| Dell Latitude 7440 | |
| Average Intel Core i7-1355U (21800 - 46154, n=18) | |
| HP EliteBook 845 G10 818N0EA | |
| LG Gram 14Z90Q | |
| Lenovo ThinkPad E14 G5 i7-1355U | |
| Asus ZenBook 14 UM3402Y | |
| Lenovo ThinkPad E14 G5-21JSS05C00 | |
System Performance
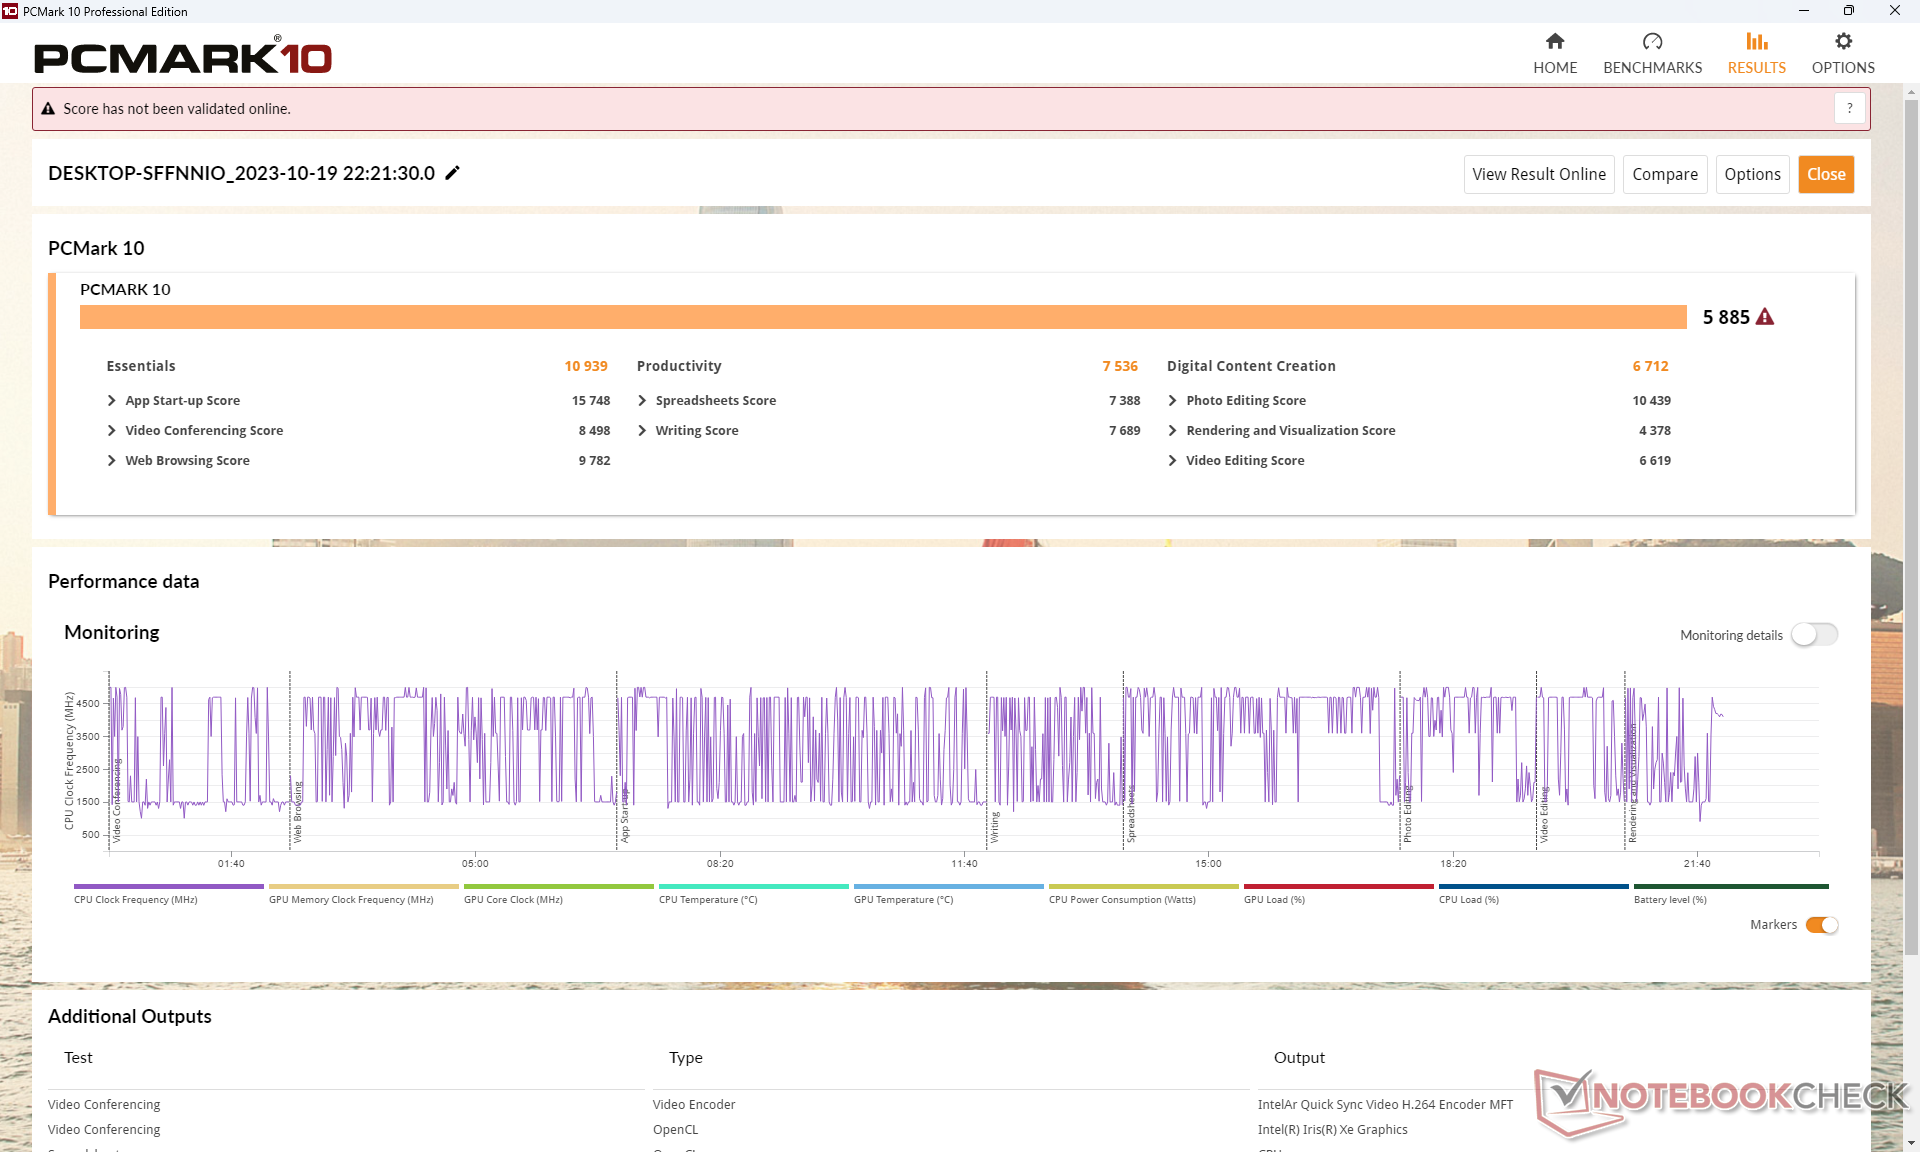
PCMark scores are generally lower than on the AMD configuration especially in the Productivity subtest where multi-thread performance matters most.
CrossMark: Overall | Productivity | Creativity | Responsiveness
| PCMark 10 / Score | |
| HP EliteBook 845 G10 818N0EA | |
| Lenovo ThinkPad E14 G5-21JSS05C00 | |
| Asus ZenBook 14 UM3402Y | |
| Lenovo ThinkPad E14 G5 i7-1355U | |
| Average Intel Core i7-1355U, Intel Iris Xe Graphics G7 96EUs (5455 - 5933, n=15) | |
| Dell Latitude 7440 | |
| LG Gram 14Z90Q | |
| PCMark 10 / Essentials | |
| Average Intel Core i7-1355U, Intel Iris Xe Graphics G7 96EUs (10203 - 11822, n=15) | |
| Lenovo ThinkPad E14 G5 i7-1355U | |
| Dell Latitude 7440 | |
| Lenovo ThinkPad E14 G5-21JSS05C00 | |
| Asus ZenBook 14 UM3402Y | |
| HP EliteBook 845 G10 818N0EA | |
| LG Gram 14Z90Q | |
| PCMark 10 / Productivity | |
| Asus ZenBook 14 UM3402Y | |
| Lenovo ThinkPad E14 G5-21JSS05C00 | |
| HP EliteBook 845 G10 818N0EA | |
| Lenovo ThinkPad E14 G5 i7-1355U | |
| Average Intel Core i7-1355U, Intel Iris Xe Graphics G7 96EUs (6763 - 7536, n=15) | |
| Dell Latitude 7440 | |
| LG Gram 14Z90Q | |
| PCMark 10 / Digital Content Creation | |
| HP EliteBook 845 G10 818N0EA | |
| Lenovo ThinkPad E14 G5 i7-1355U | |
| Average Intel Core i7-1355U, Intel Iris Xe Graphics G7 96EUs (5723 - 6712, n=15) | |
| Lenovo ThinkPad E14 G5-21JSS05C00 | |
| Asus ZenBook 14 UM3402Y | |
| Dell Latitude 7440 | |
| LG Gram 14Z90Q | |
| CrossMark / Overall | |
| Average Intel Core i7-1355U, Intel Iris Xe Graphics G7 96EUs (1478 - 1643, n=15) | |
| Lenovo ThinkPad E14 G5 i7-1355U | |
| HP EliteBook 845 G10 818N0EA | |
| Asus ZenBook 14 UM3402Y | |
| Lenovo ThinkPad E14 G5-21JSS05C00 | |
| CrossMark / Productivity | |
| Average Intel Core i7-1355U, Intel Iris Xe Graphics G7 96EUs (1444 - 1665, n=15) | |
| Lenovo ThinkPad E14 G5 i7-1355U | |
| HP EliteBook 845 G10 818N0EA | |
| Asus ZenBook 14 UM3402Y | |
| Lenovo ThinkPad E14 G5-21JSS05C00 | |
| CrossMark / Creativity | |
| Average Intel Core i7-1355U, Intel Iris Xe Graphics G7 96EUs (1563 - 1732, n=15) | |
| Lenovo ThinkPad E14 G5 i7-1355U | |
| HP EliteBook 845 G10 818N0EA | |
| Asus ZenBook 14 UM3402Y | |
| Lenovo ThinkPad E14 G5-21JSS05C00 | |
| CrossMark / Responsiveness | |
| Average Intel Core i7-1355U, Intel Iris Xe Graphics G7 96EUs (1217 - 1681, n=15) | |
| Lenovo ThinkPad E14 G5 i7-1355U | |
| HP EliteBook 845 G10 818N0EA | |
| Asus ZenBook 14 UM3402Y | |
| Lenovo ThinkPad E14 G5-21JSS05C00 | |
| PCMark 10 Score | 5885 points | |
Help | ||
| AIDA64 / Memory Copy | |
| Dell Latitude 7440 | |
| Average Intel Core i7-1355U (35017 - 71600, n=18) | |
| LG Gram 14Z90Q | |
| Asus ZenBook 14 UM3402Y | |
| Lenovo ThinkPad E14 G5 i7-1355U | |
| HP EliteBook 845 G10 818N0EA | |
| Lenovo ThinkPad E14 G5-21JSS05C00 | |
| AIDA64 / Memory Read | |
| LG Gram 14Z90Q | |
| Average Intel Core i7-1355U (38551 - 73377, n=18) | |
| Dell Latitude 7440 | |
| Asus ZenBook 14 UM3402Y | |
| Lenovo ThinkPad E14 G5-21JSS05C00 | |
| Lenovo ThinkPad E14 G5 i7-1355U | |
| HP EliteBook 845 G10 818N0EA | |
| AIDA64 / Memory Write | |
| Dell Latitude 7440 | |
| Average Intel Core i7-1355U (35910 - 93342, n=18) | |
| LG Gram 14Z90Q | |
| Lenovo ThinkPad E14 G5 i7-1355U | |
| Asus ZenBook 14 UM3402Y | |
| HP EliteBook 845 G10 818N0EA | |
| Lenovo ThinkPad E14 G5-21JSS05C00 | |
| AIDA64 / Memory Latency | |
| LG Gram 14Z90Q | |
| Average Intel Core i7-1355U (72.2 - 346, n=18) | |
| Asus ZenBook 14 UM3402Y | |
| HP EliteBook 845 G10 818N0EA | |
| Dell Latitude 7440 | |
| Lenovo ThinkPad E14 G5-21JSS05C00 | |
| Lenovo ThinkPad E14 G5 i7-1355U | |
* ... smaller is better
DPC Latency
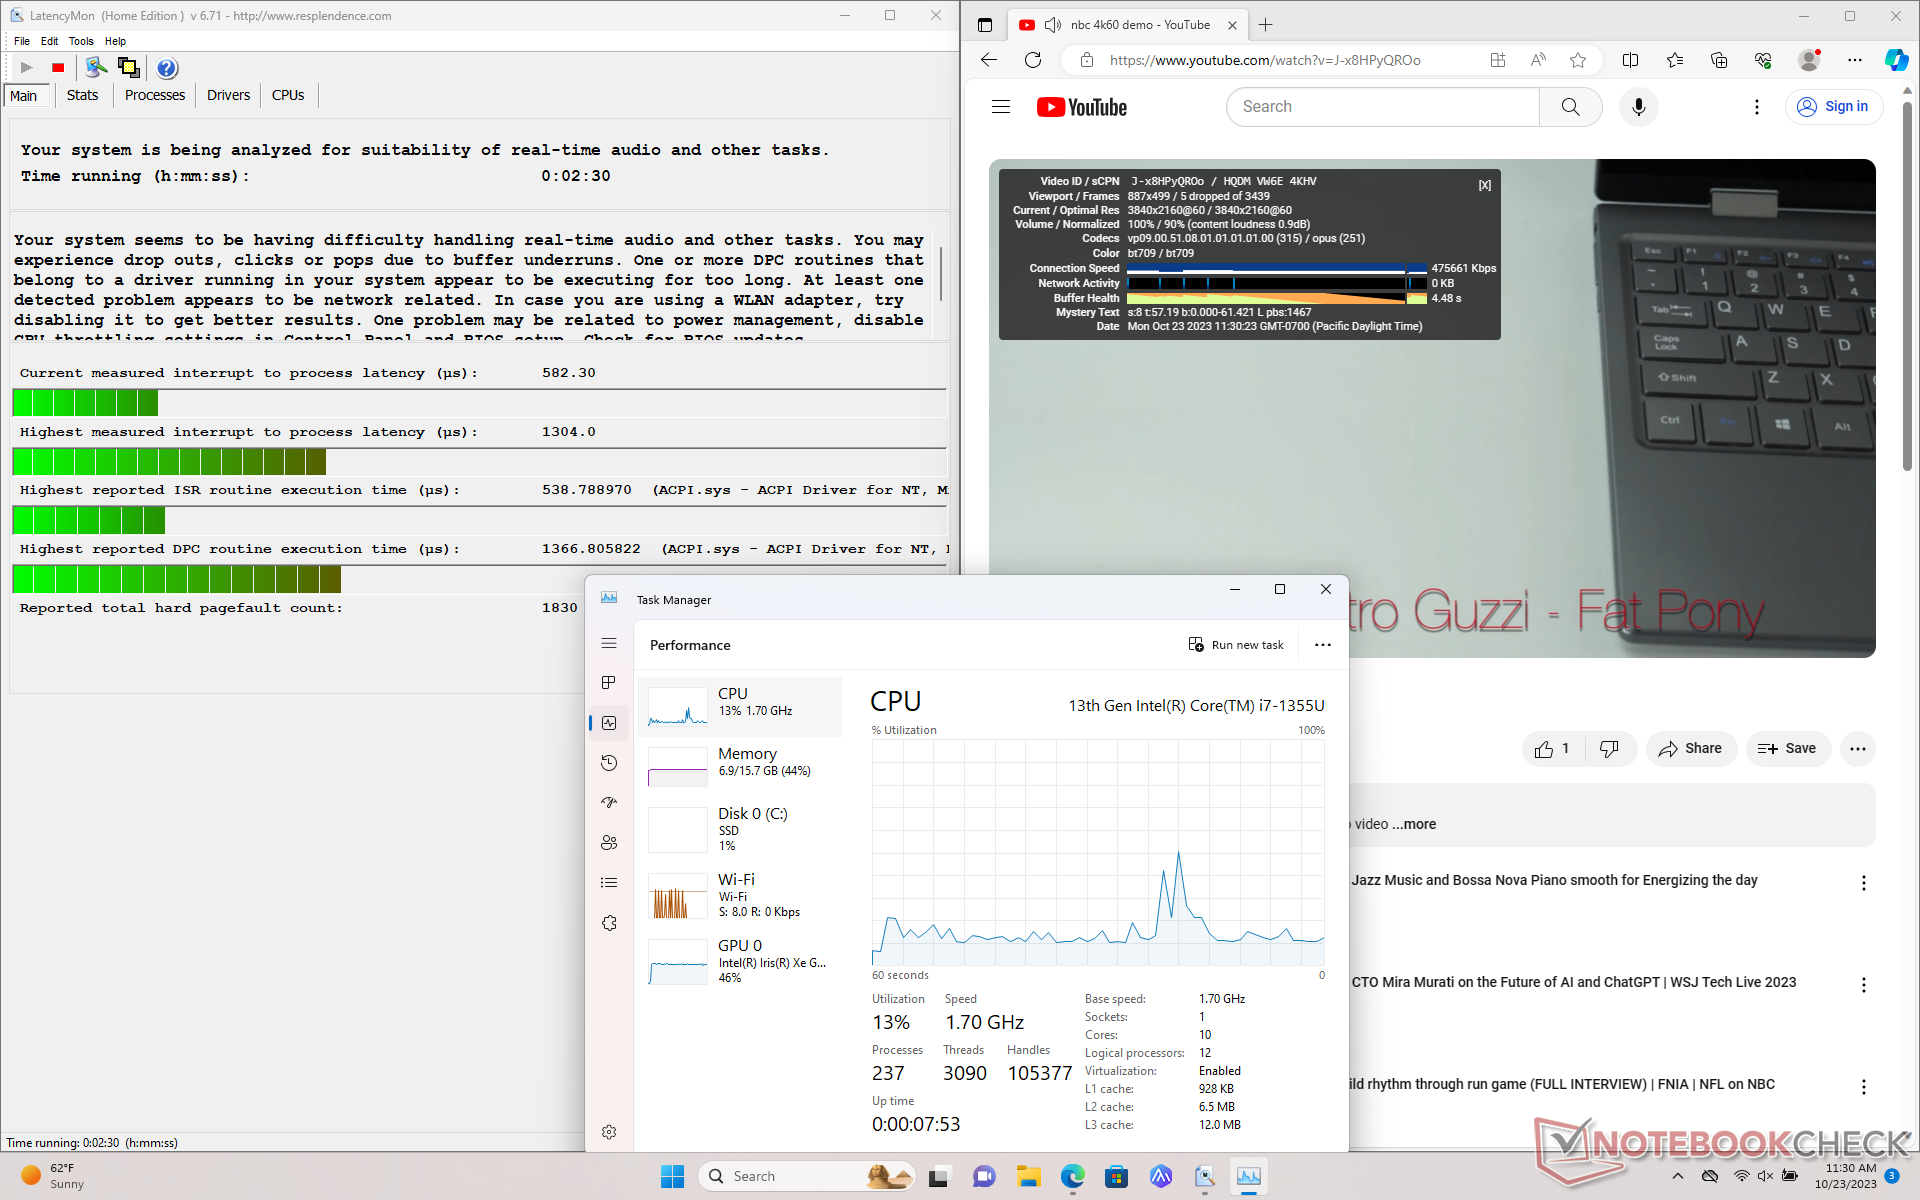
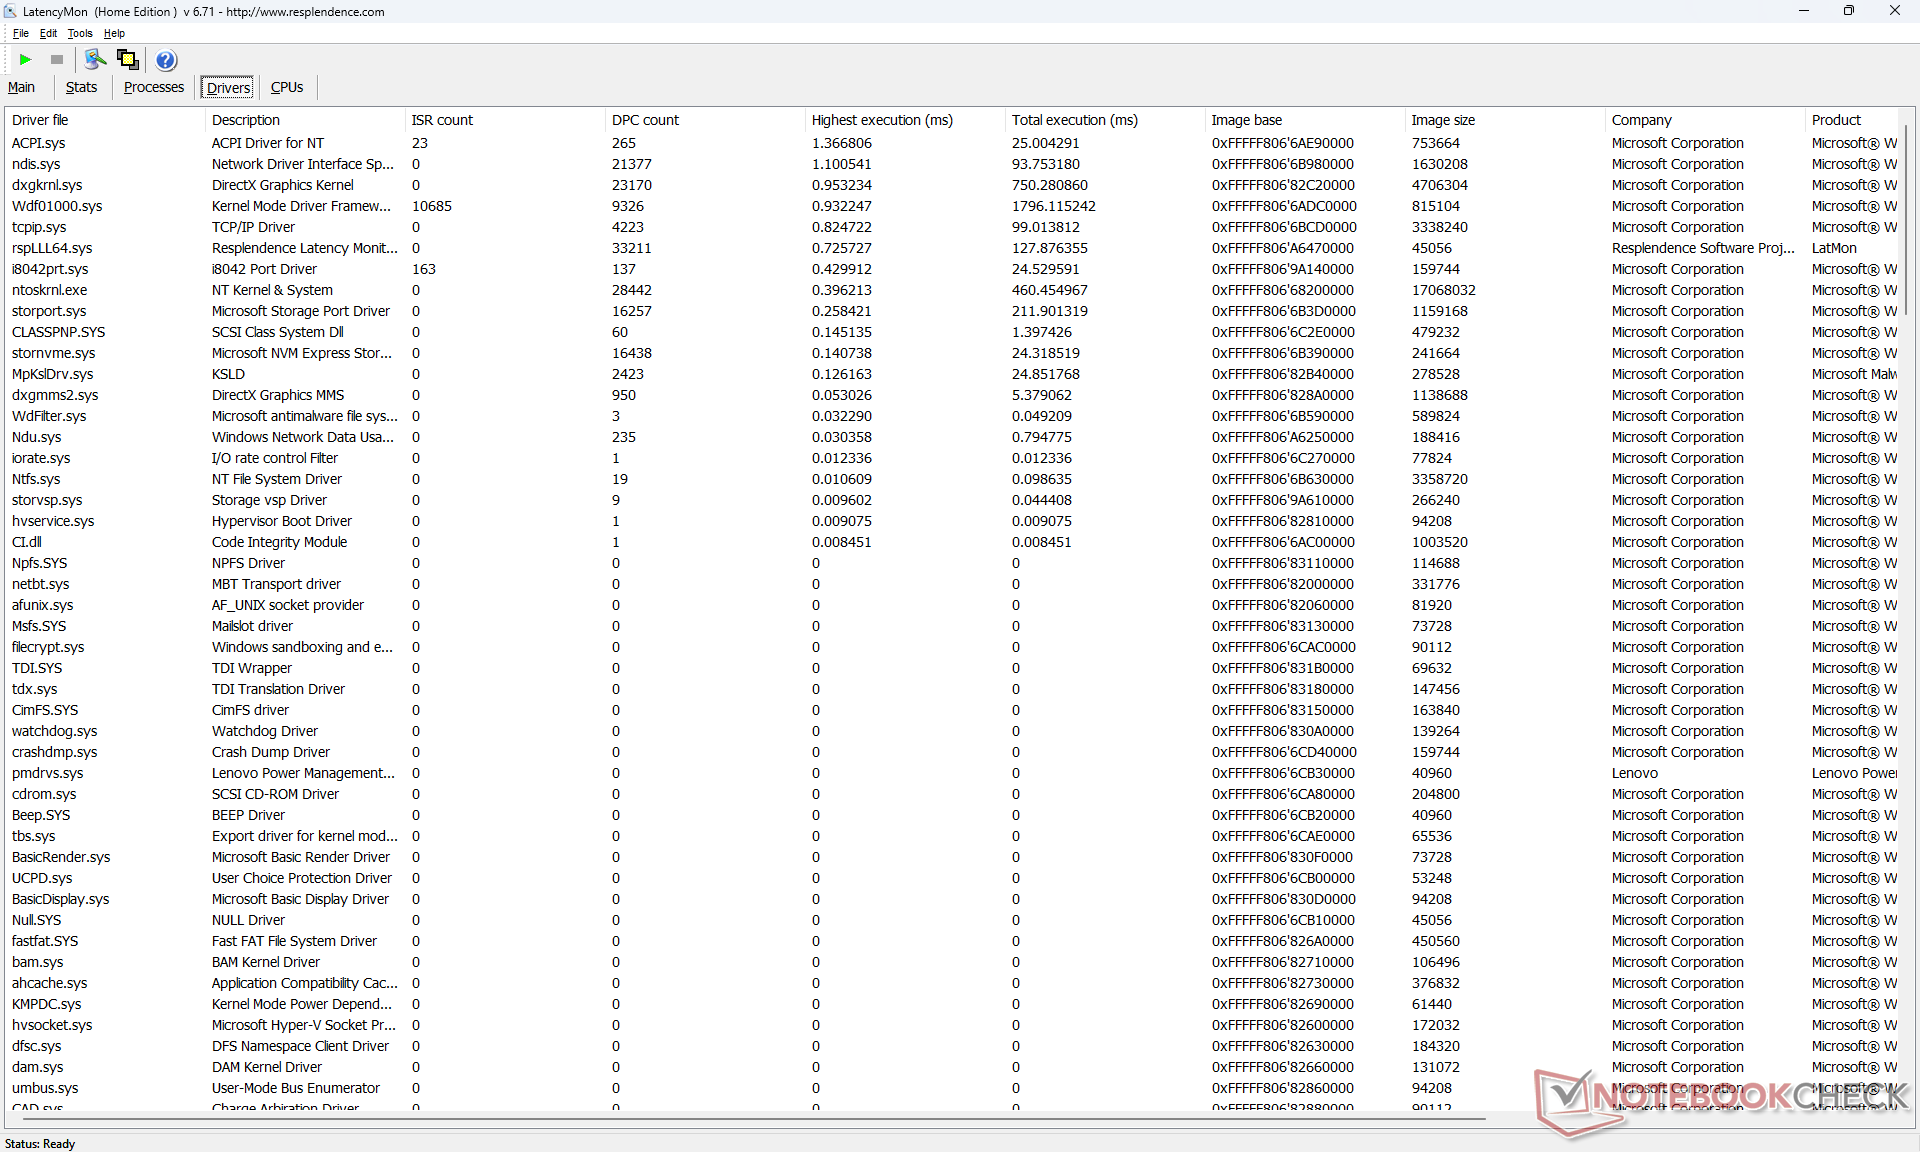
LatencyMon shows DPC issues when opening multiple browser tabs of our homepage. 4K video playback at 60 FPS is also imperfect with 5 dropped frames recorded during a 60-second period.
| DPC Latencies / LatencyMon - interrupt to process latency (max), Web, Youtube, Prime95 | |
| Asus ZenBook 14 UM3402Y | |
| Lenovo ThinkPad E14 G5-21JSS05C00 | |
| Lenovo ThinkPad E14 G5 i7-1355U | |
| Dell Latitude 7440 | |
| LG Gram 14Z90Q | |
| HP EliteBook 845 G10 818N0EA | |
* ... smaller is better
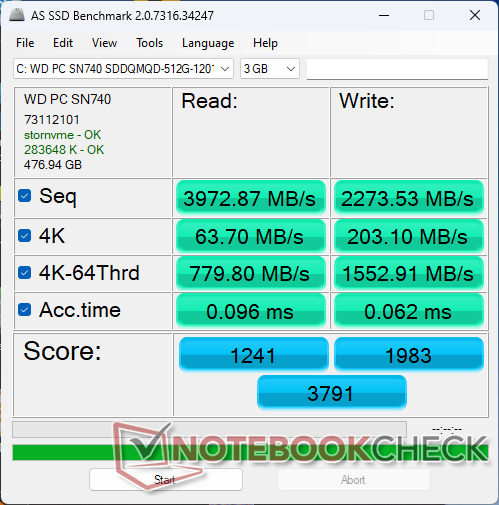
Storage Devices
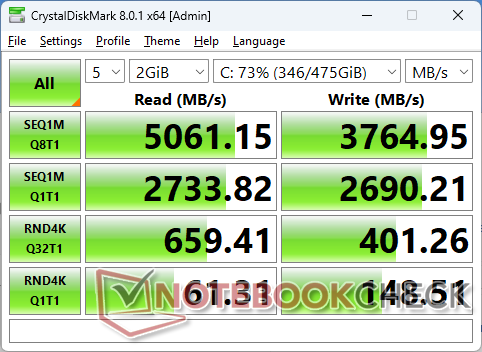
Our unit comes with the 42 mm version of the WD PC SN740 whereas the AMD configuration ships with the 80 mm WD PC SN740. This midrange PCIe4 x4 NVMe SSD offers read rates of up to 5000 MB/s but only for a couple of minutes before throttling kicks in as shown by the graph below.

| Drive Performance rating - Percent | |
| LG Gram 14Z90Q | |
| HP EliteBook 845 G10 818N0EA | |
| Lenovo ThinkPad E14 G5 i7-1355U | |
| Dell Latitude 7440 | |
| Lenovo ThinkPad E14 G5-21JSS05C00 | |
| Asus ZenBook 14 UM3402Y | |
* ... smaller is better
Disk Throttling: DiskSpd Read Loop, Queue Depth 8
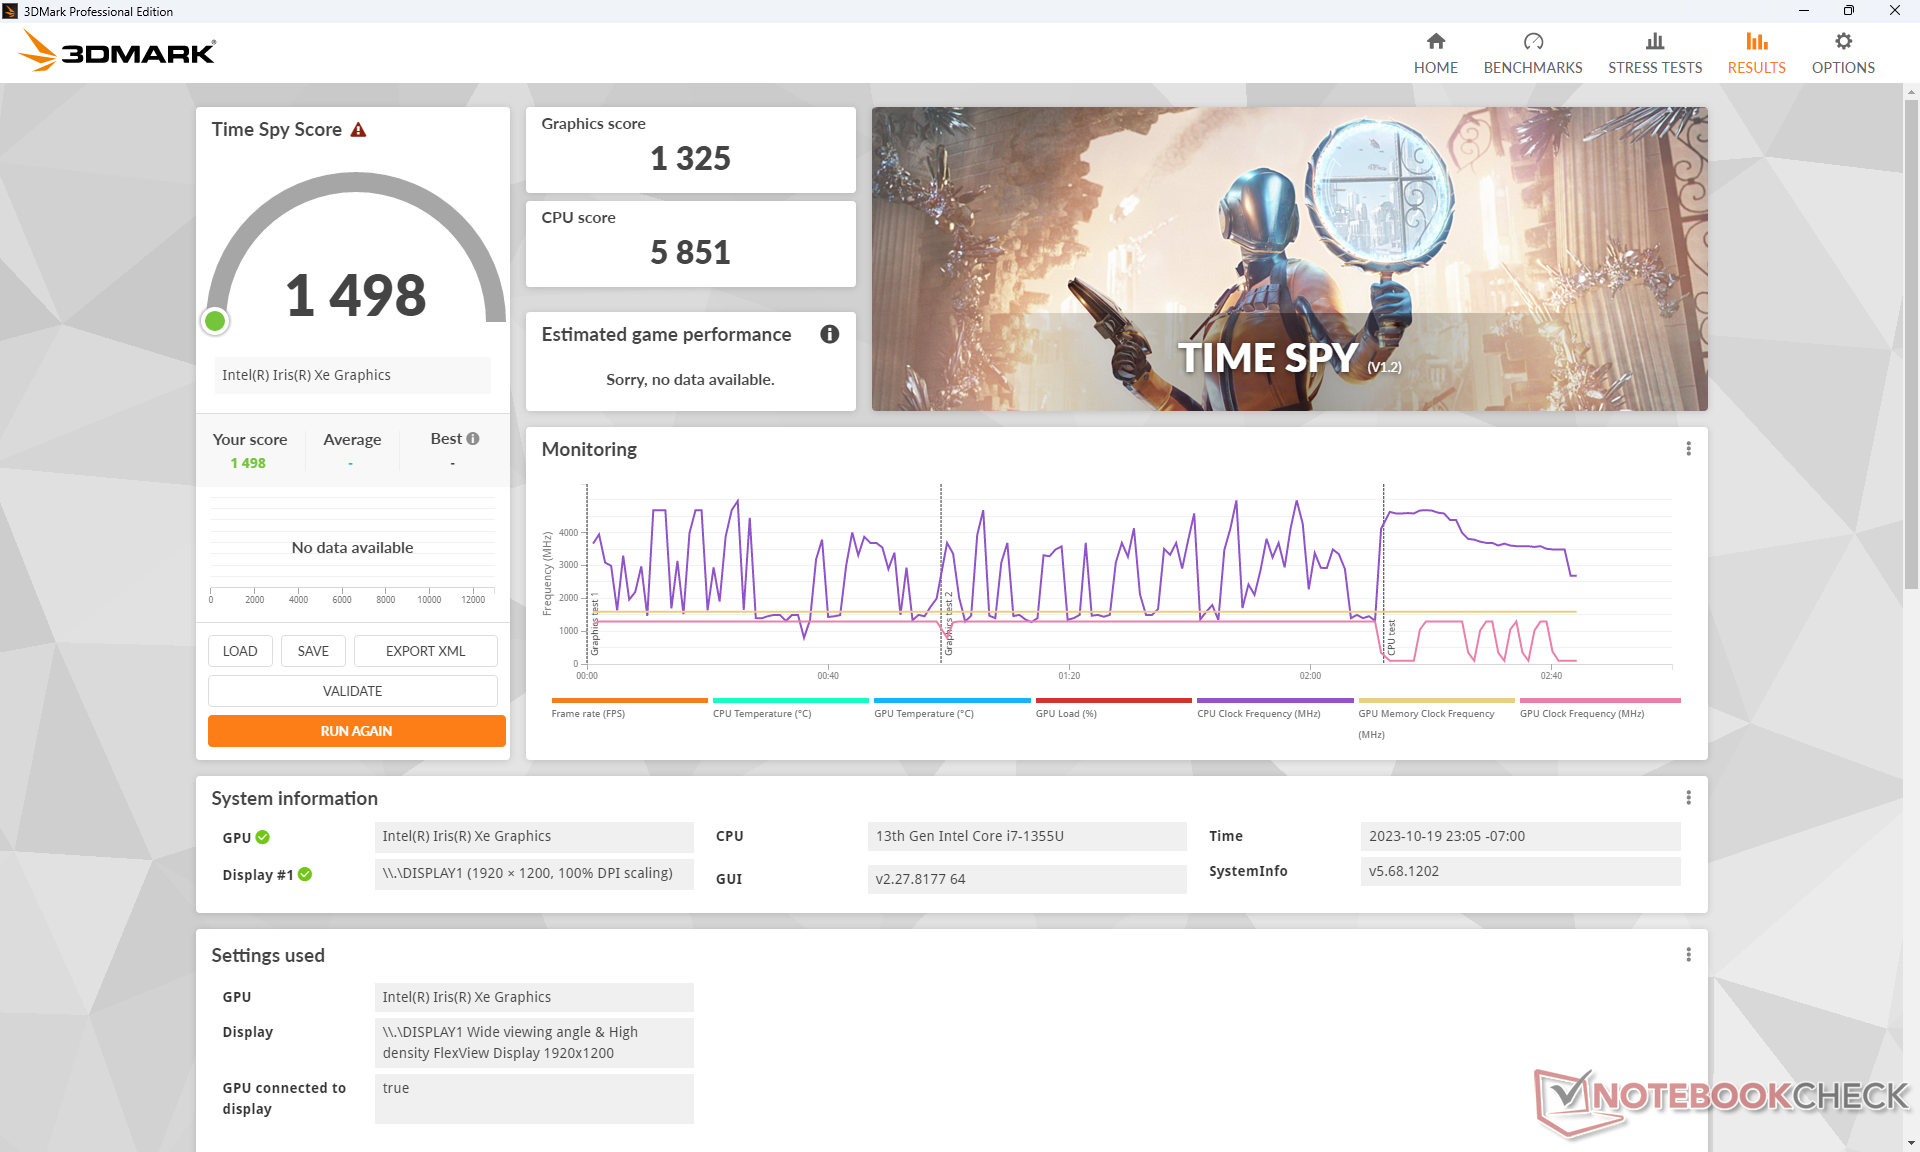
GPU Performance
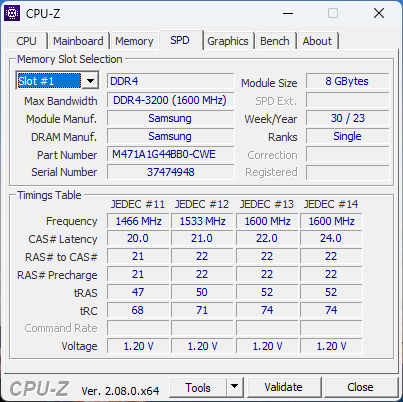
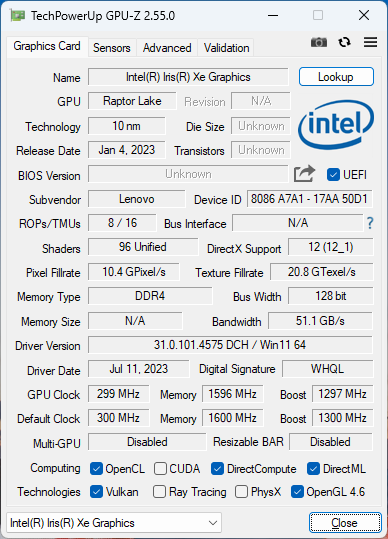
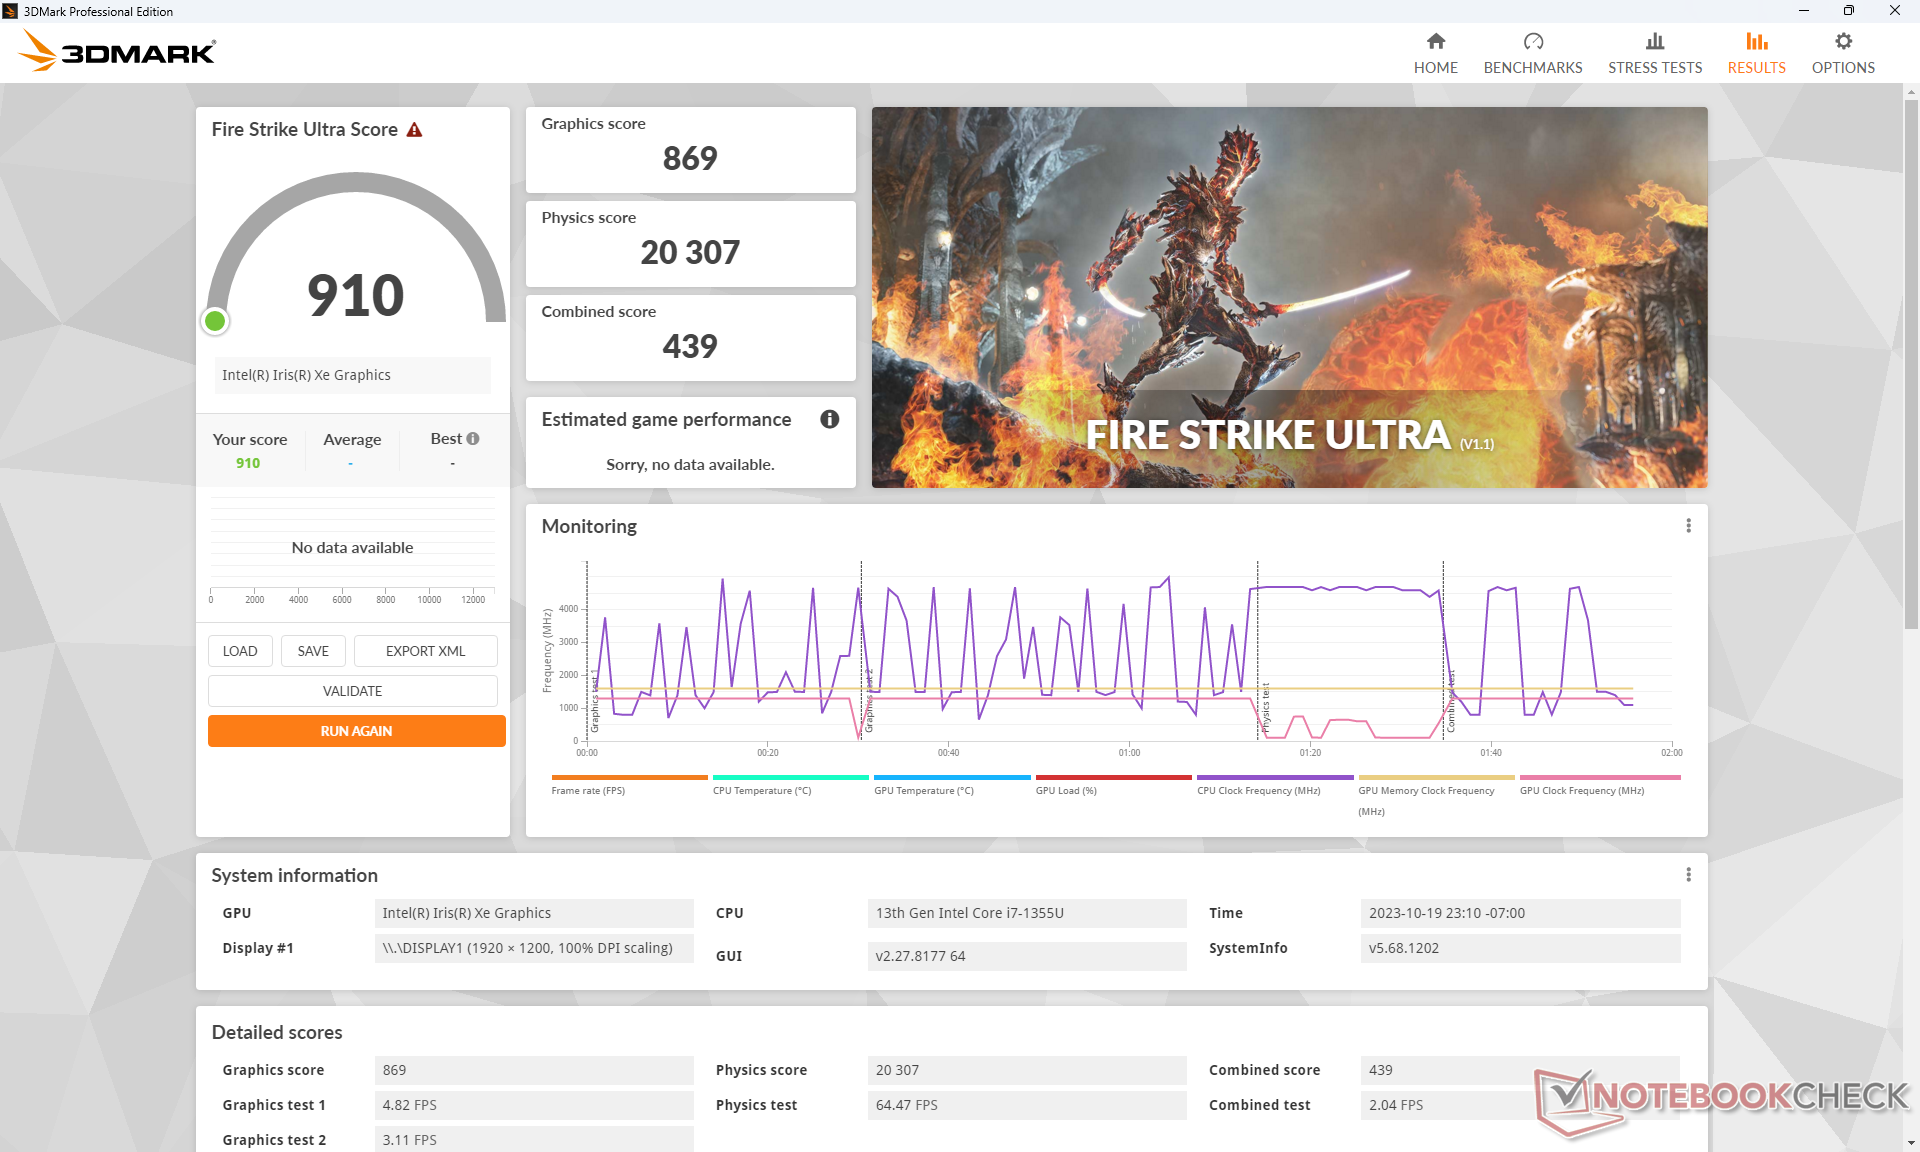
RAM is slower than average at just DDR4-3200 which negatively impacts integrated graphics performance. Our Iris Xe 96 EUs is about 10 to 15 percent slower than the average laptop in our database with the same GPU due to the throttling CPU and slow RAM. Overall performance is about the same as the RX Vega 8 in the Ryzen 7 7730U version as a result.
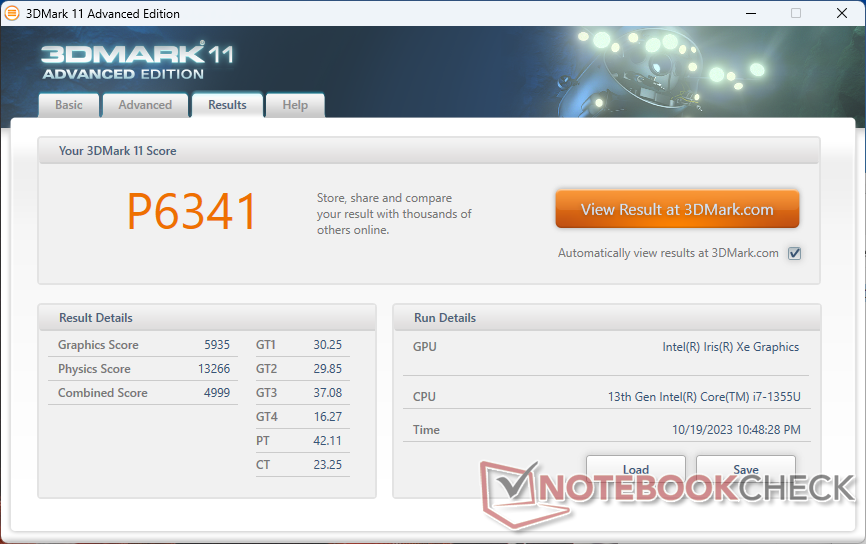
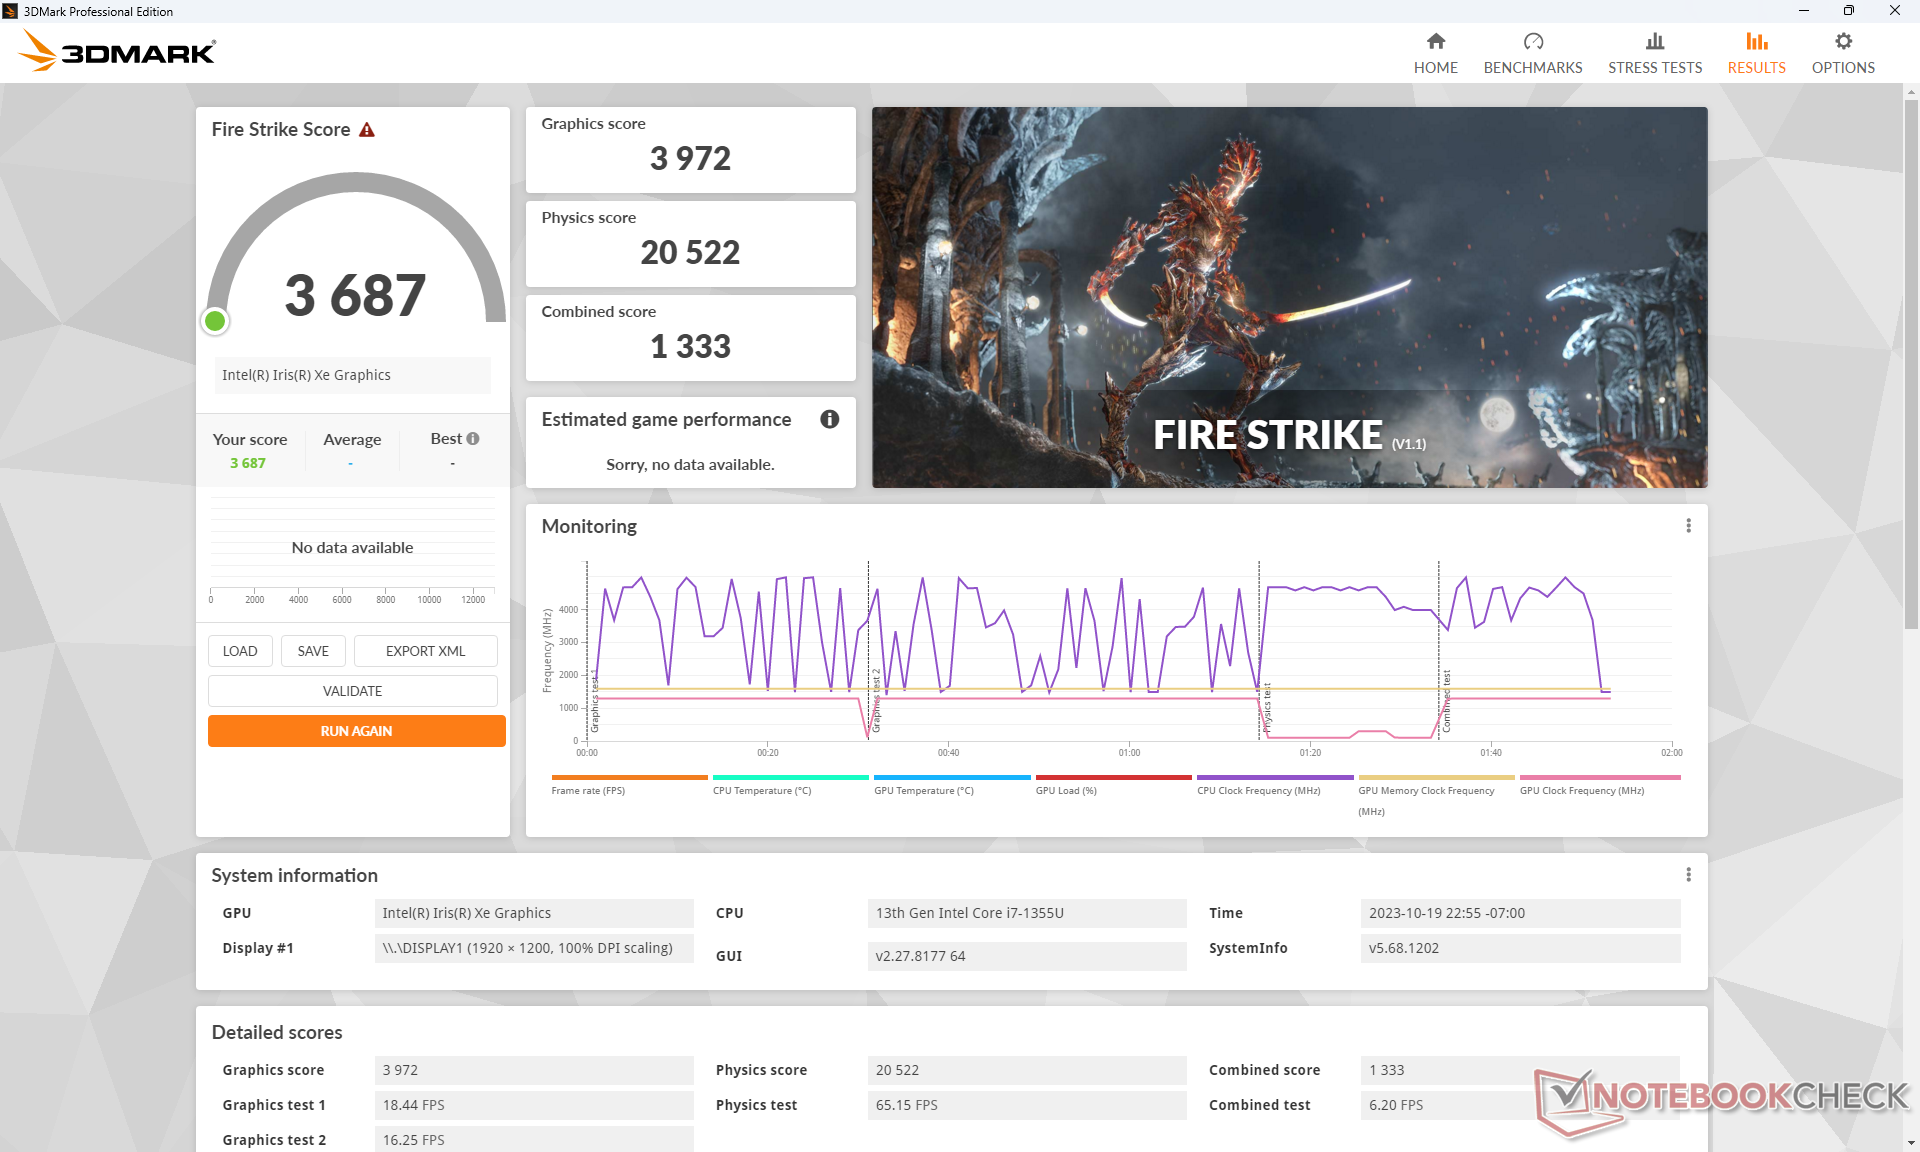
| 3DMark 11 Performance | 6341 points | |
| 3DMark Fire Strike Score | 3687 points | |
| 3DMark Time Spy Score | 1498 points | |
Help | ||
* ... smaller is better
| Tiny Tina's Wonderlands | |
| 1280x720 Lowest Preset (DX12) | |
| Dell Inspiron 14 7435 2-in-1 | |
| Average Intel Iris Xe Graphics G7 96EUs (25.9 - 67.3, n=32) | |
| Lenovo ThinkPad E14 G5 i7-1355U | |
| 1920x1080 Low Preset (DX12) | |
| Average Intel Iris Xe Graphics G7 96EUs (22.3 - 53, n=32) | |
| Dell Inspiron 14 7435 2-in-1 | |
| Dell Latitude 7440 | |
| Lenovo ThinkPad E14 G5 i7-1355U | |
| HP Envy 14-eb0252ng | |
| 1920x1080 Medium Preset (DX12) | |
| Average Intel Iris Xe Graphics G7 96EUs (17 - 40.1, n=30) | |
| Dell Latitude 7440 | |
| Lenovo ThinkPad E14 G5 i7-1355U | |
| HP Envy 14-eb0252ng | |
| 1920x1080 High Preset (DX12) | |
| Average Intel Iris Xe Graphics G7 96EUs (10.6 - 24.1, n=29) | |
| Dell Latitude 7440 | |
| Lenovo ThinkPad E14 G5 i7-1355U | |
| HP Envy 14-eb0252ng | |
| 1920x1080 Badass Preset (DX12) | |
| Average Intel Iris Xe Graphics G7 96EUs (8.4 - 18.4, n=26) | |
| Dell Latitude 7440 | |
| Lenovo ThinkPad E14 G5 i7-1355U | |
Witcher 3 FPS Chart
| low | med. | high | ultra | |
|---|---|---|---|---|
| GTA V (2015) | 85.2 | 67 | 13.7 | 5.57 |
| The Witcher 3 (2015) | 74.9 | 48.9 | 24.1 | 12.1 |
| Dota 2 Reborn (2015) | 104.5 | 77.3 | 51.5 | 47.3 |
| Final Fantasy XV Benchmark (2018) | 34.3 | 18.1 | 13.1 | |
| X-Plane 11.11 (2018) | 34.2 | 28.2 | 25.6 | |
| Far Cry 5 (2018) | 40 | 20 | 19 | 18 |
| Strange Brigade (2018) | 74.5 | 28.4 | 24.2 | 19.3 |
| Cyberpunk 2077 1.6 (2022) | 13 | |||
| Tiny Tina's Wonderlands (2022) | 23.8 | 17 | 10.6 | 9.1 |
| F1 22 (2022) | 35.3 | 32.3 | 23.6 | 18.3 |
Emissions
System Noise
Fan noise between the AMD and Intel versions is not very different. High loads like games would reach similar maximums of just over 40 dB(A) on each version while slight fan pulsing would still occur during lower loads like browsing or streaming. The fan is otherwise easy to ignore when running low to medium loads.
Noise level
| Idle |
| 23.2 / 23.2 / 23.2 dB(A) |
| Load |
| 36 / 41 dB(A) |
 | ||
30 dB silent 40 dB(A) audible 50 dB(A) loud |
||
min: | ||
| Lenovo ThinkPad E14 G5 i7-1355U Iris Xe G7 96EUs, i7-1355U, WD PC SN740 512GB SDDQMQD-512G | Lenovo ThinkPad E14 G5-21JSS05C00 Vega 8, R7 7730U, WD PC SN740 SDDPNQD-1T00 | HP EliteBook 845 G10 818N0EA Radeon 780M, R9 PRO 7940HS, SK hynix PC801 HFS001TEJ9X101N | Asus ZenBook 14 UM3402Y Vega 8, R7 7730U, Micron 2400 MTFDKBA512QFM | LG Gram 14Z90Q Iris Xe G7 80EUs, i5-1240P, Samsung PM9A1 MZVL2512HCJQ | Dell Latitude 7440 Iris Xe G7 80EUs, i5-1345U, Samsung MZ9L4512HBLU-00BMV | |
|---|---|---|---|---|---|---|
| Noise | -1% | -7% | -7% | -5% | 9% | |
| off / environment * (dB) | 23.2 | 24.4 -5% | 25.3 -9% | 22.6 3% | 25 -8% | 22.8 2% |
| Idle Minimum * (dB) | 23.2 | 24.4 -5% | 25.3 -9% | 22.6 3% | 26 -12% | 22.8 2% |
| Idle Average * (dB) | 23.2 | 24.4 -5% | 25.3 -9% | 22.6 3% | 27 -16% | 22.8 2% |
| Idle Maximum * (dB) | 23.2 | 25.7 -11% | 25.3 -9% | 22.6 3% | 28 -21% | 22.8 2% |
| Load Average * (dB) | 36 | 31.8 12% | 34.4 4% | 40.7 -13% | 35 3% | 26.3 27% |
| Witcher 3 ultra * (dB) | 38.5 | 36.7 5% | 43.4 -13% | 46.6 -21% | 36 6% | 30 22% |
| Load Maximum * (dB) | 41 | 41.2 -0% | 43.4 -6% | 52.5 -28% | 36 12% | 38.3 7% |
* ... smaller is better
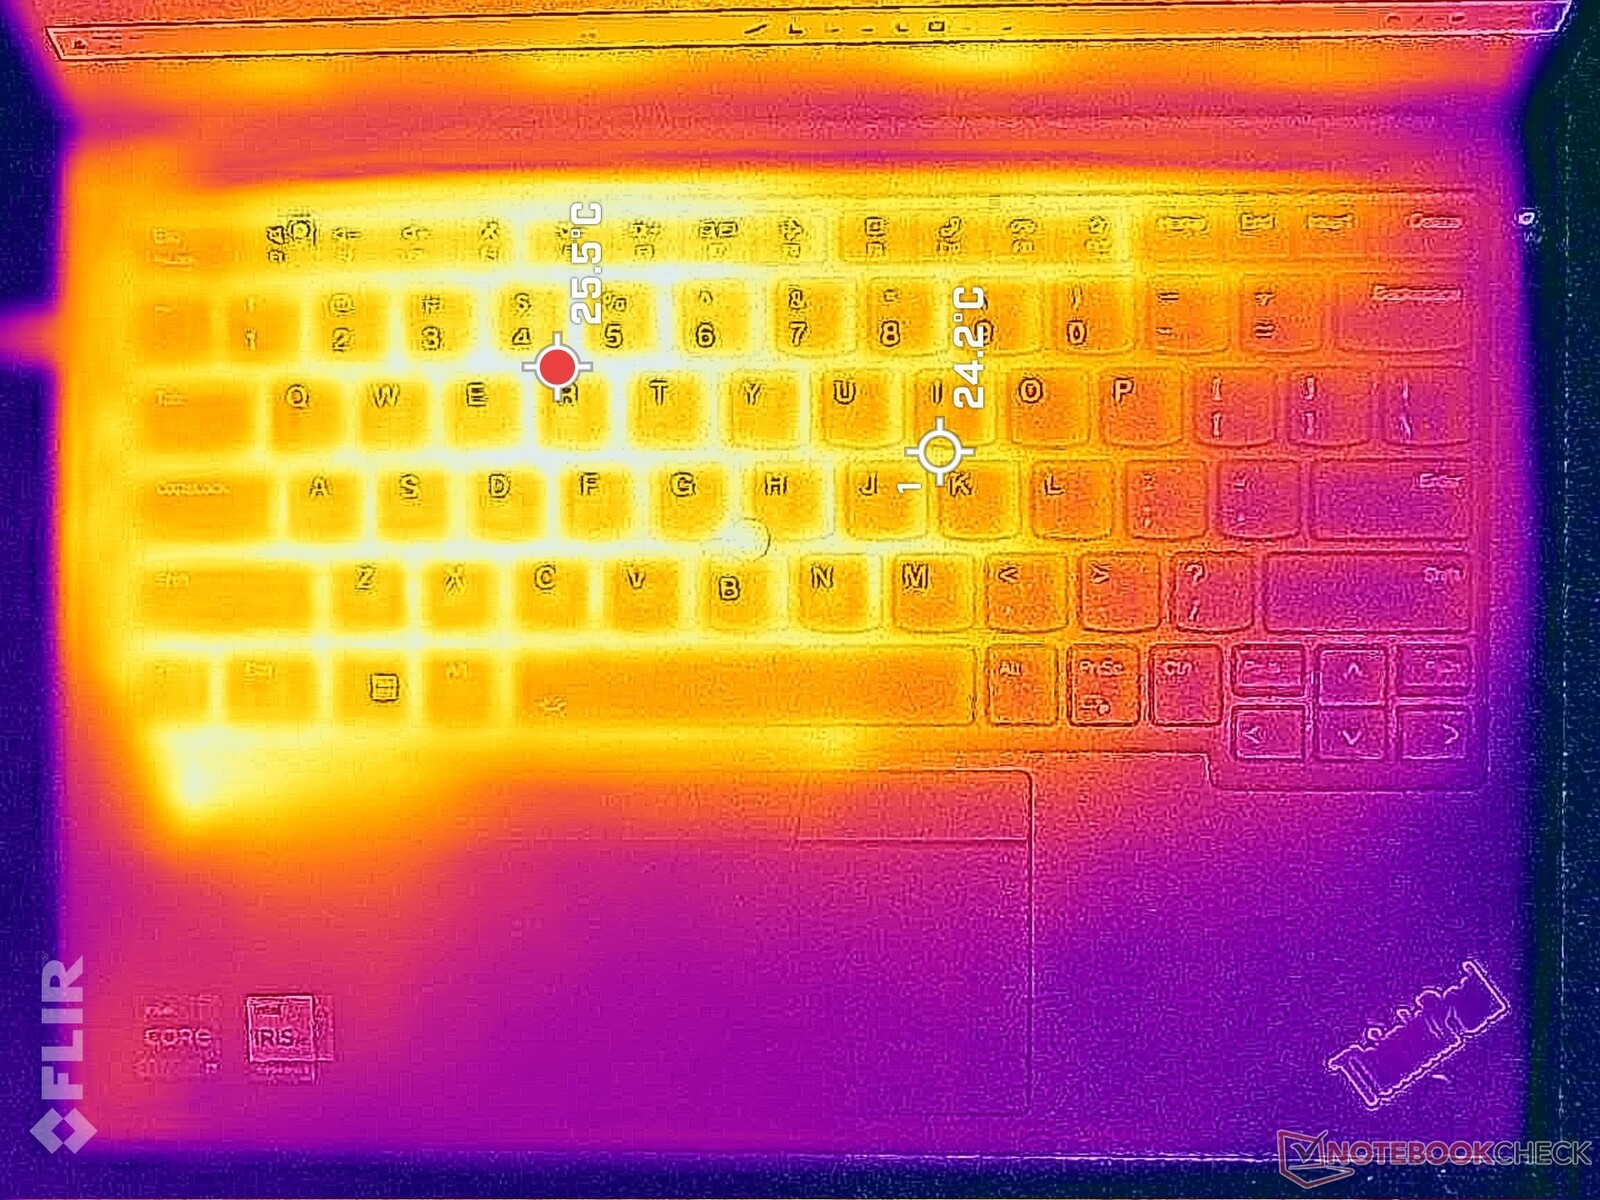
Temperature
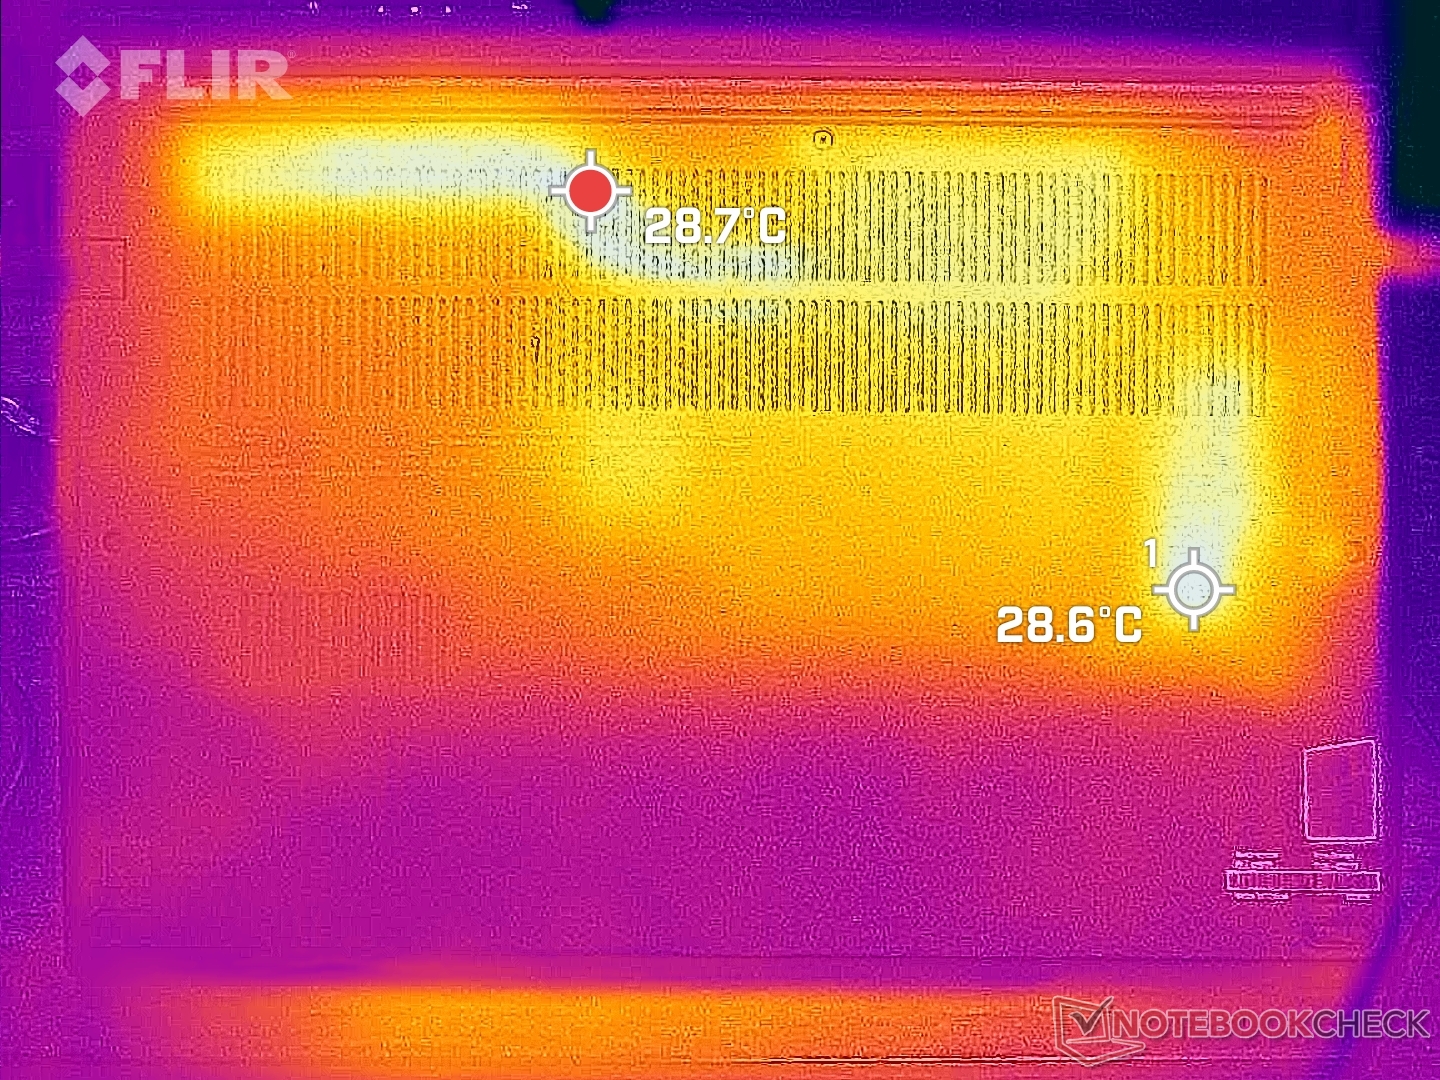
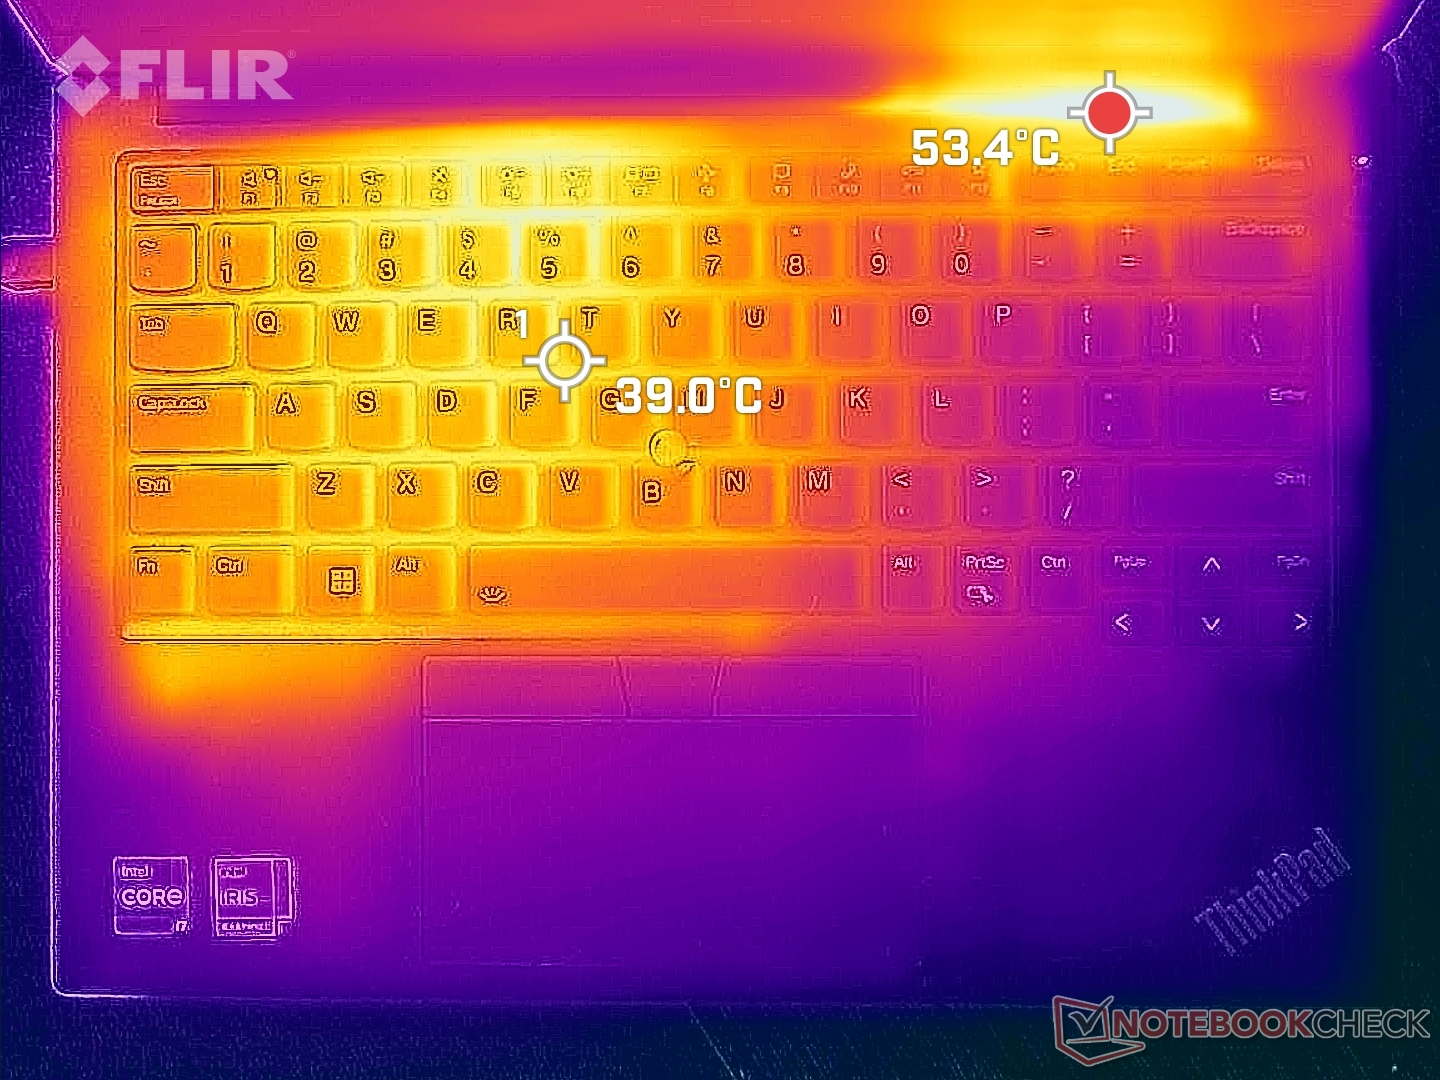
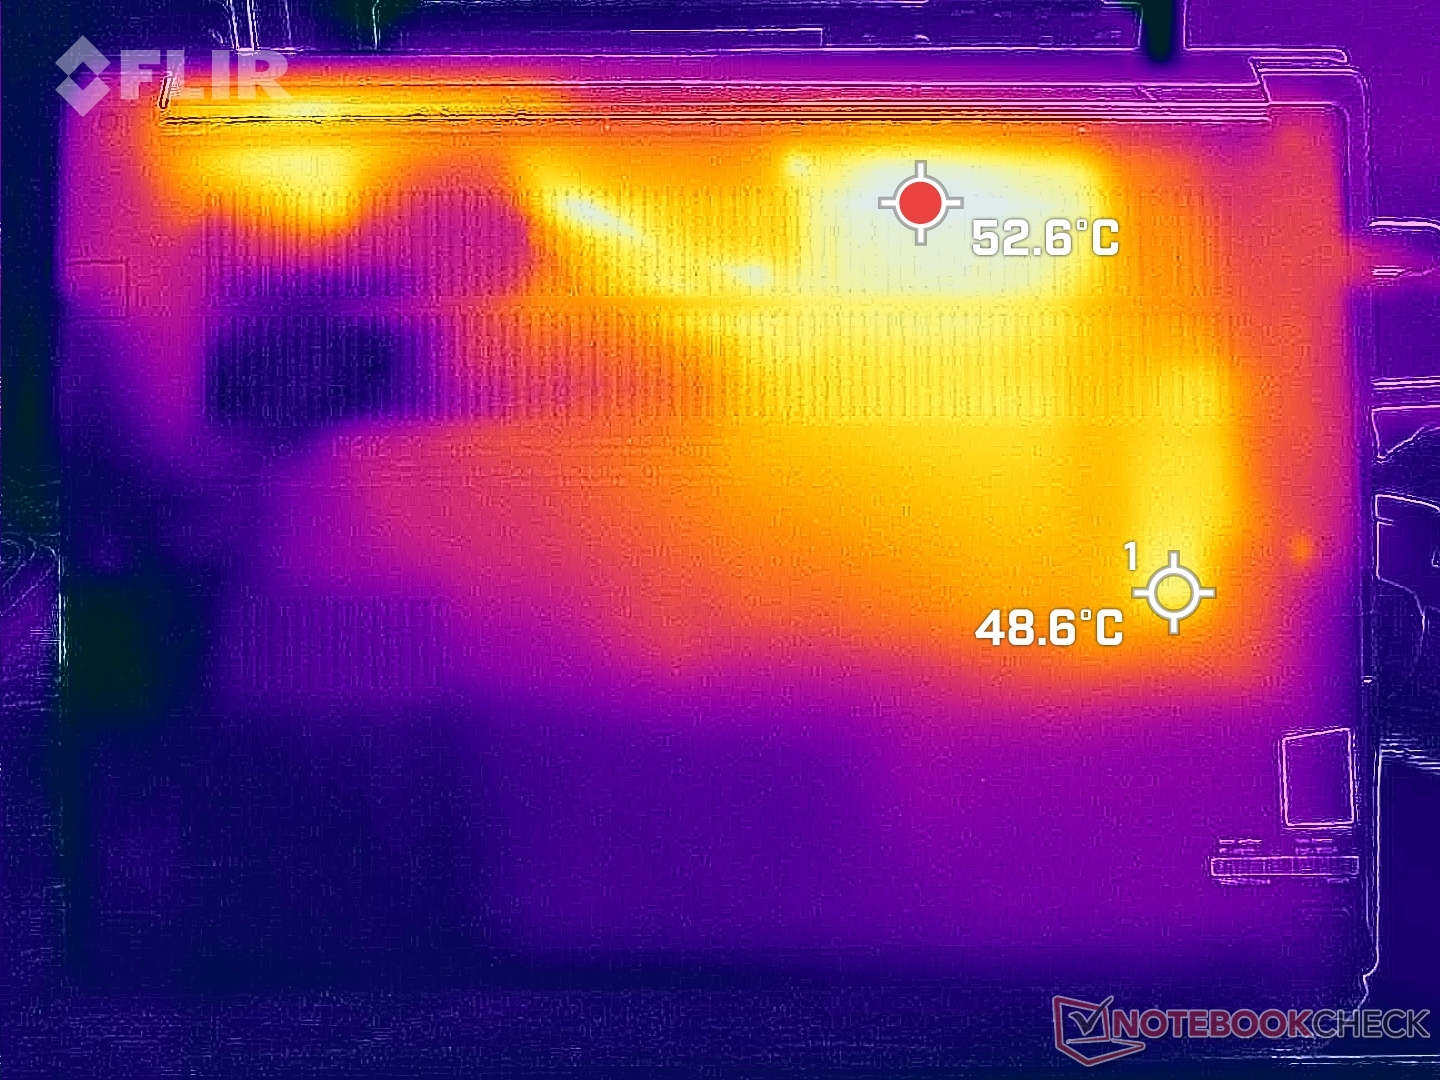
Surface temperatures are warmest on the left half of the chassis and near the rear ventilation grilles. Hot spots on the keyboard and bottom surfaces can reach up to 41 C and 54 C, respectively, similar to what we recorded on the AMD configuration.
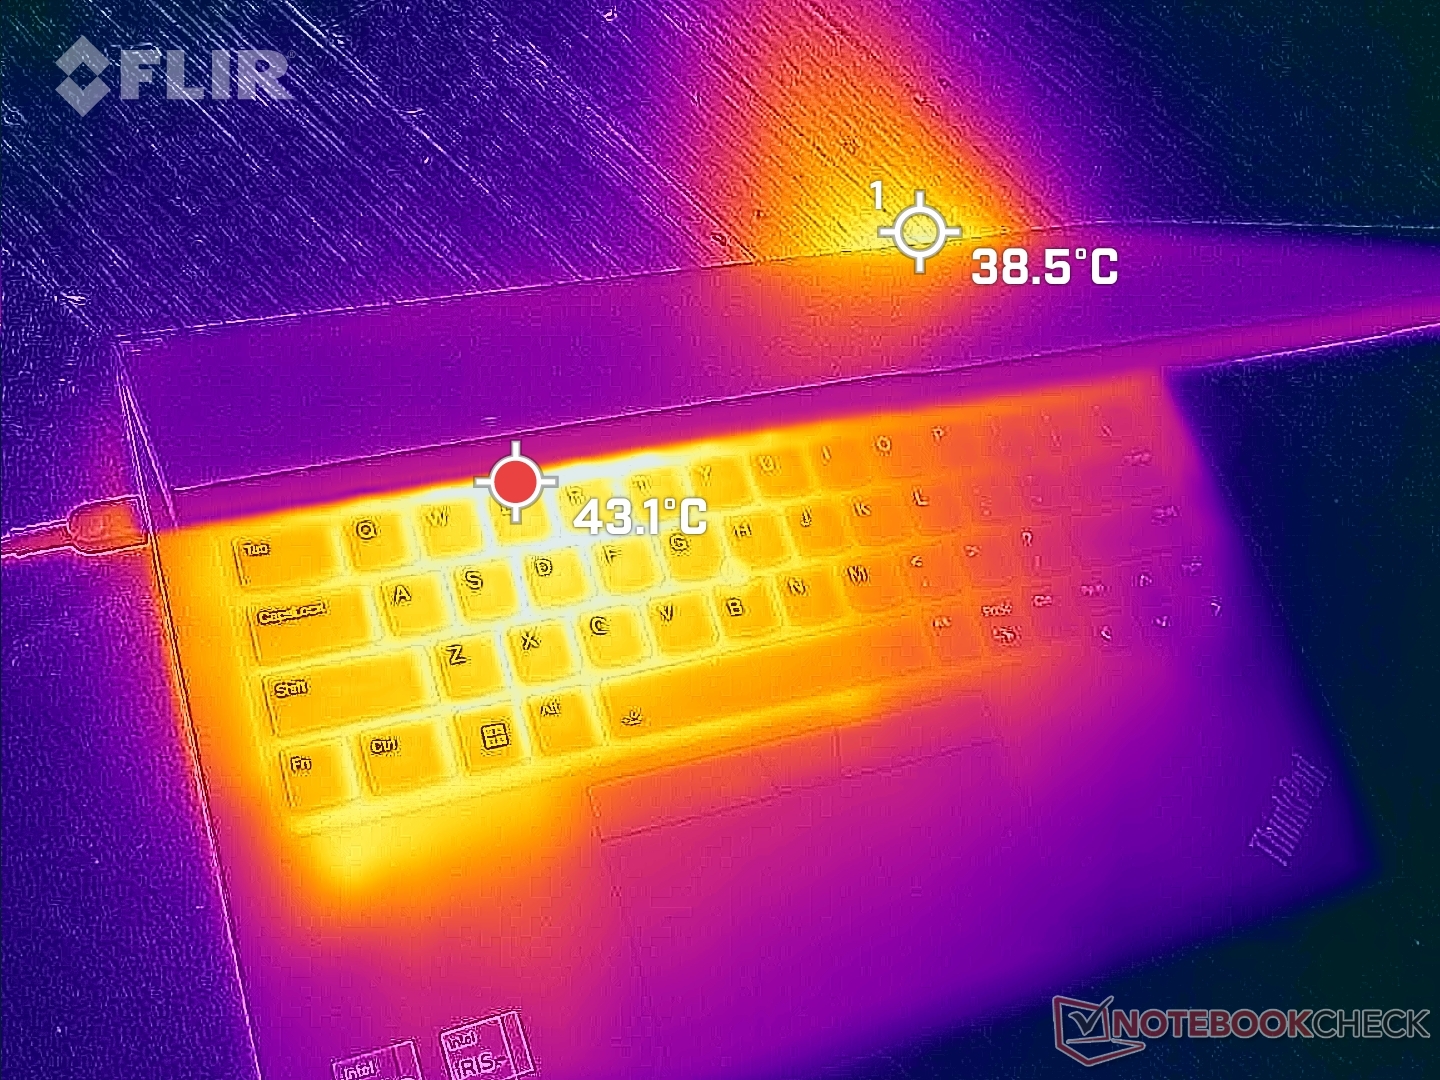
(-) The maximum temperature on the upper side is 45.4 °C / 114 F, compared to the average of 34.3 °C / 94 F, ranging from 21.2 to 62.5 °C for the class Office.
(-) The bottom heats up to a maximum of 50.8 °C / 123 F, compared to the average of 36.8 °C / 98 F
(+) In idle usage, the average temperature for the upper side is 28.8 °C / 84 F, compared to the device average of 29.5 °C / 85 F.
(+) The palmrests and touchpad are cooler than skin temperature with a maximum of 29.8 °C / 85.6 F and are therefore cool to the touch.
(-) The average temperature of the palmrest area of similar devices was 27.6 °C / 81.7 F (-2.2 °C / -3.9 F).
| Lenovo ThinkPad E14 G5 i7-1355U Intel Core i7-1355U, Intel Iris Xe Graphics G7 96EUs | Lenovo ThinkPad E14 G5-21JSS05C00 AMD Ryzen 7 7730U, AMD Radeon RX Vega 8 (Ryzen 4000/5000) | HP EliteBook 845 G10 818N0EA AMD Ryzen 9 PRO 7940HS, AMD Radeon 780M | Asus ZenBook 14 UM3402Y AMD Ryzen 7 7730U, AMD Radeon RX Vega 8 (Ryzen 4000/5000) | LG Gram 14Z90Q Intel Core i5-1240P, Intel Iris Xe Graphics G7 80EUs | Dell Latitude 7440 Intel Core i5-1345U, Intel Iris Xe Graphics G7 80EUs | |
|---|---|---|---|---|---|---|
| Heat | 8% | 7% | 10% | 11% | 14% | |
| Maximum Upper Side * (°C) | 45.4 | 42.6 6% | 45.6 -0% | 39.4 13% | 43 5% | 39 14% |
| Maximum Bottom * (°C) | 50.8 | 55.3 -9% | 51.9 -2% | 43.2 15% | 45 11% | 40.6 20% |
| Idle Upper Side * (°C) | 30.2 | 25.8 15% | 26.5 12% | 28.6 5% | 27 11% | 28 7% |
| Idle Bottom * (°C) | 33.4 | 27.4 18% | 27 19% | 30.6 8% | 28 16% | 28.8 14% |
* ... smaller is better
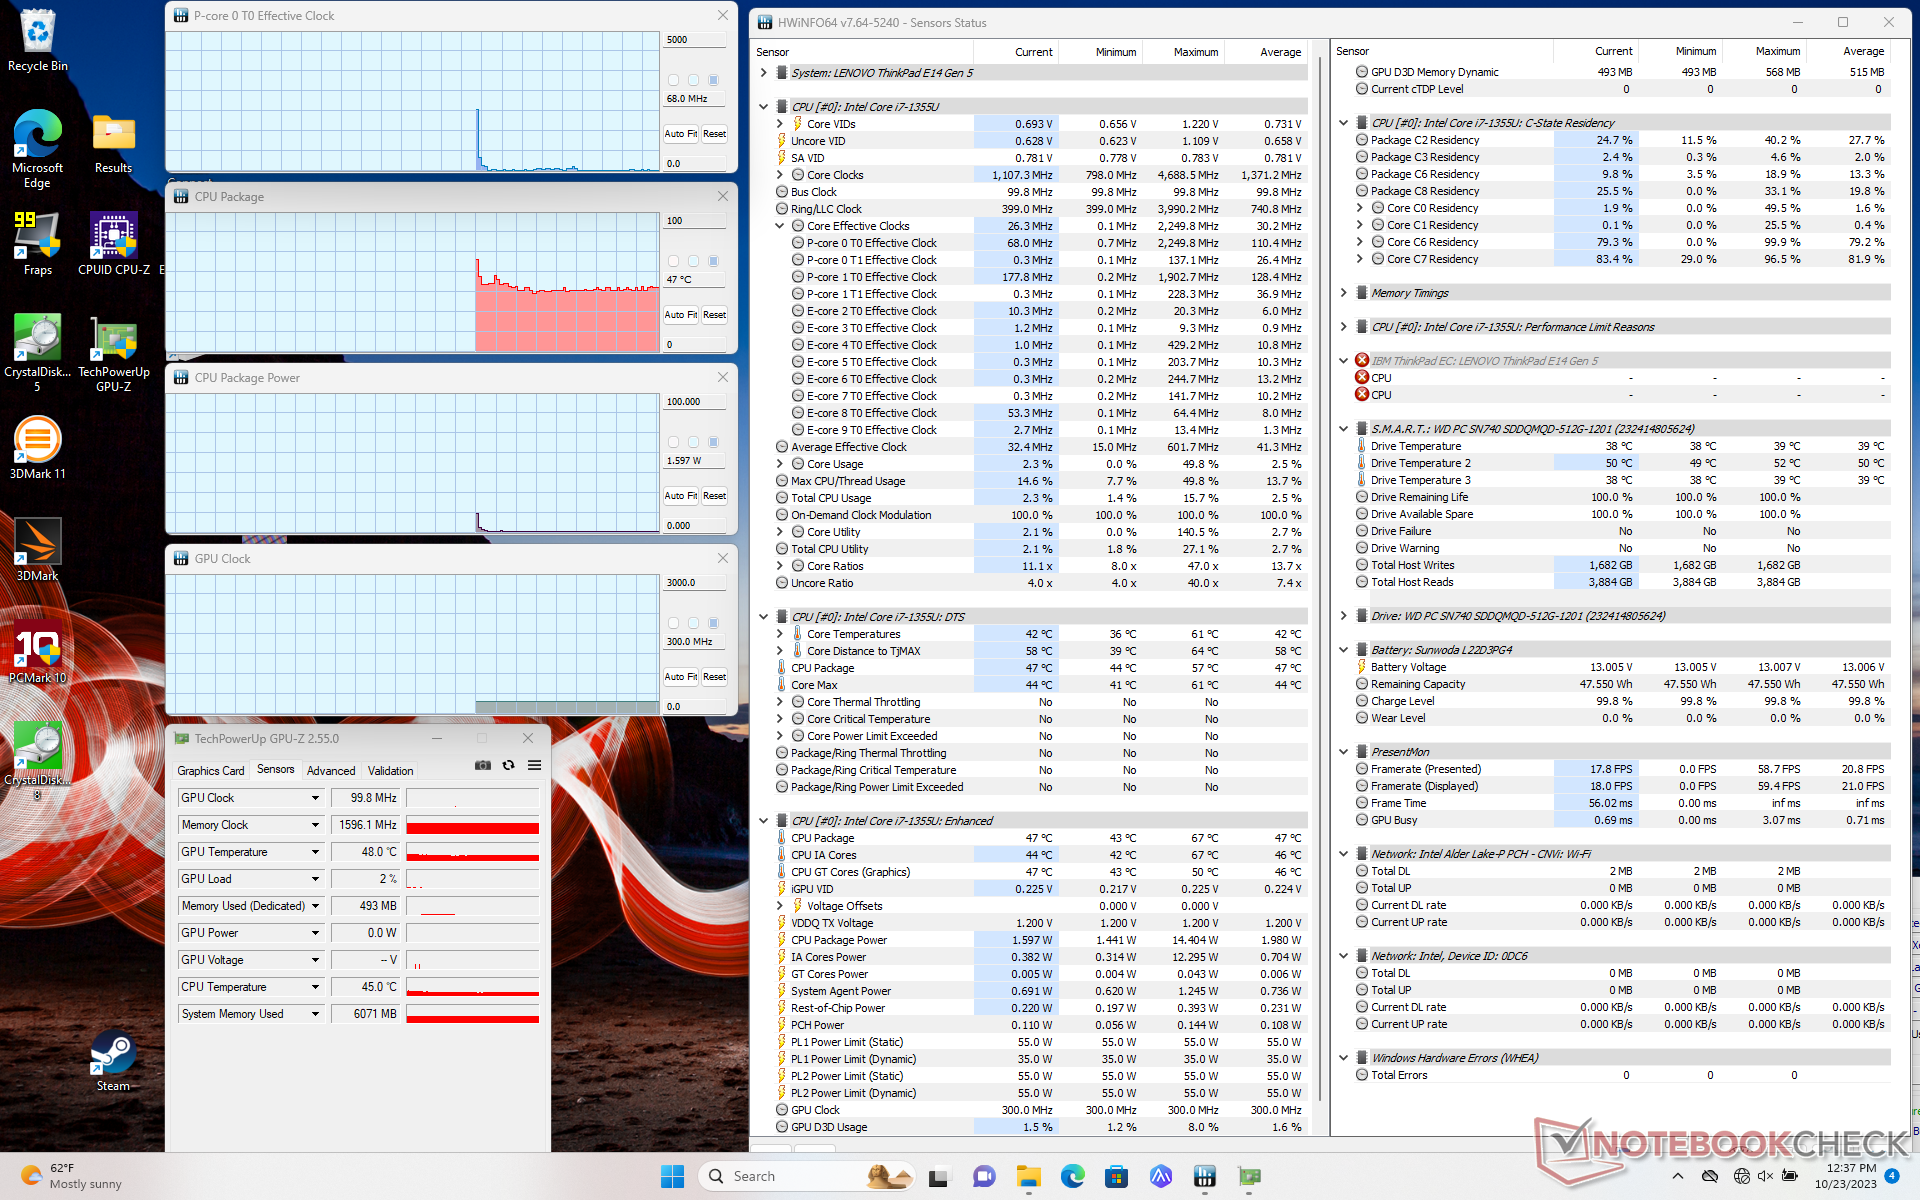
Stress Test
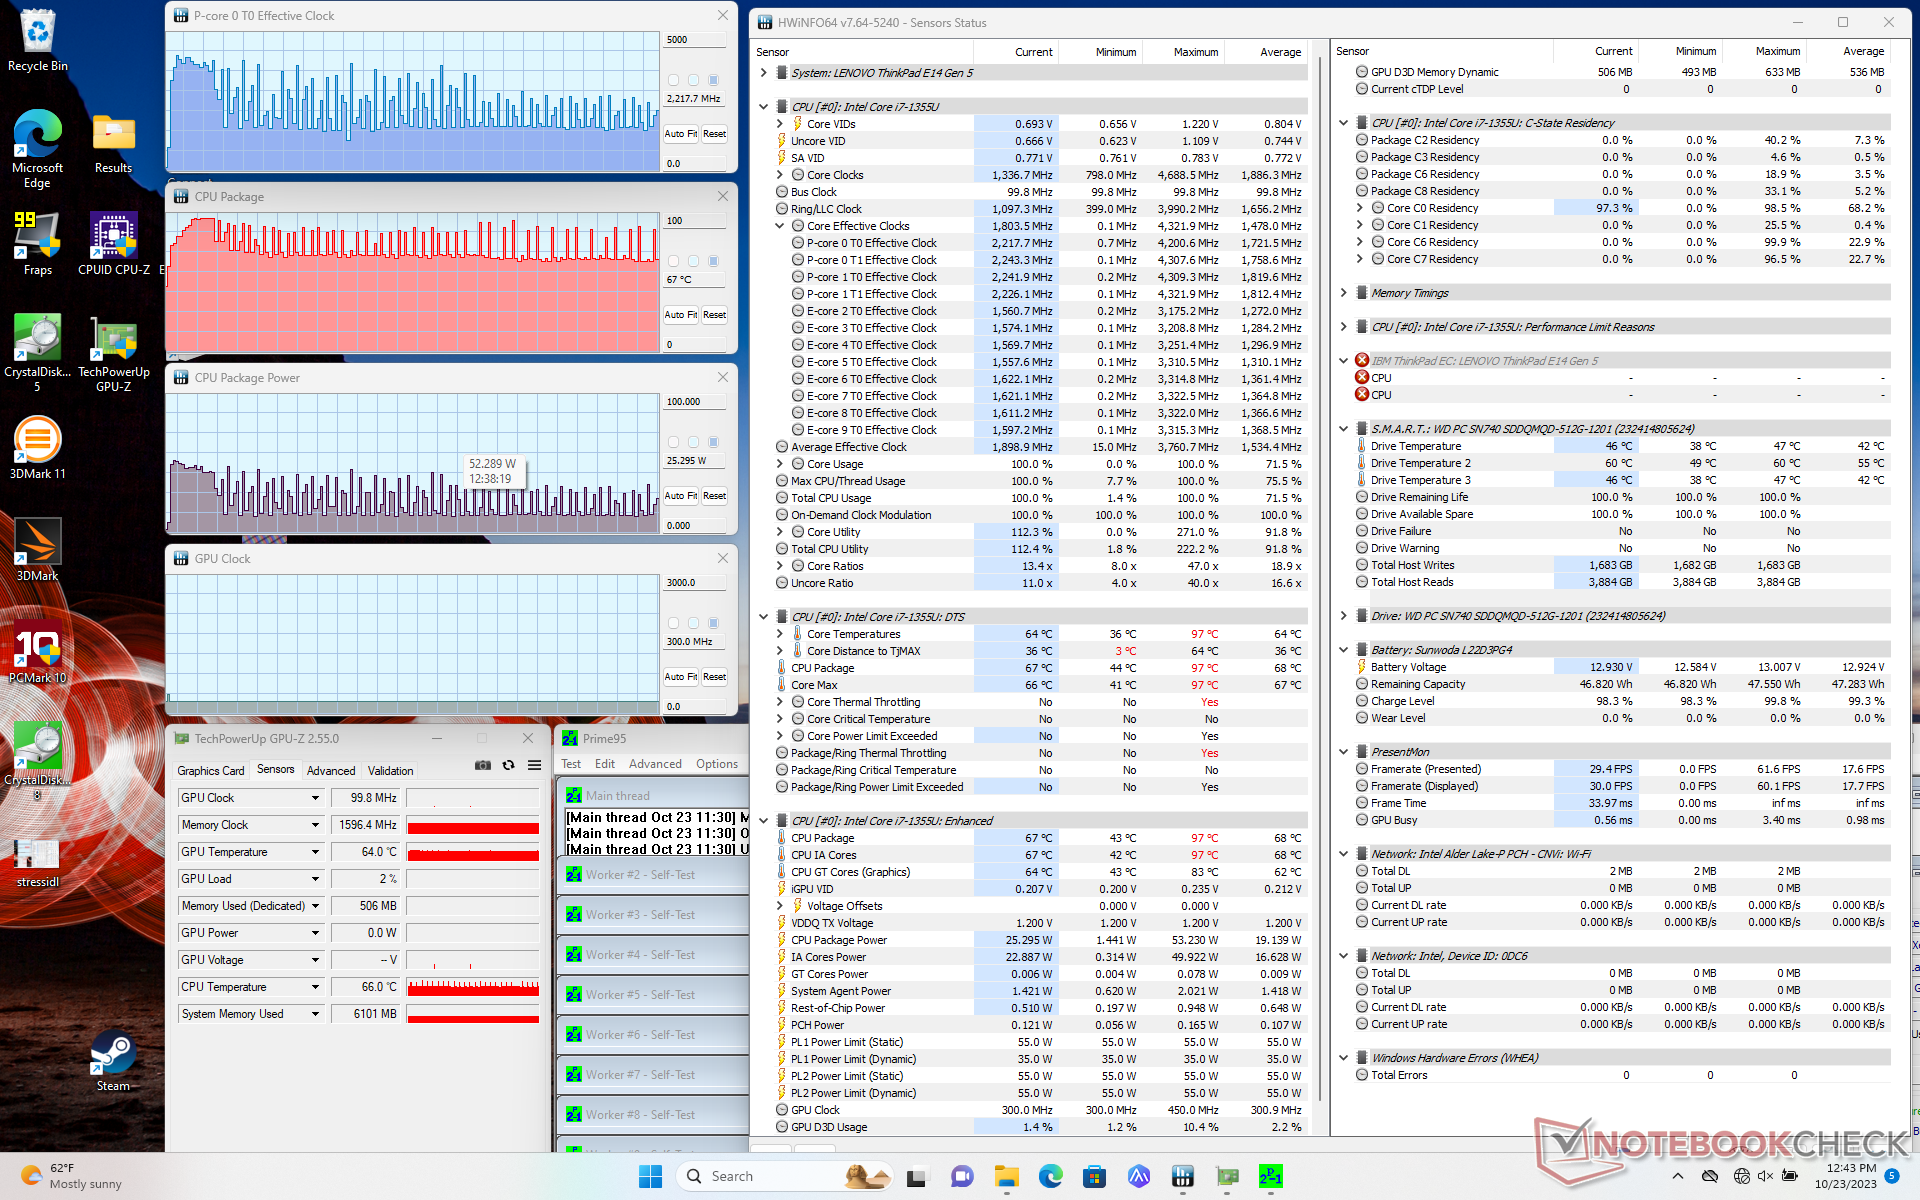
CPU clock rate and board power draw when initiating Prime95 stress would spike to 4 GHz and 52 W, respectively, lasting for about 30 seconds and at a core temperature of 97 C. The processor would then cycle between 1.6 GHz to 3.9 GHz and 14 W to 43 W thereafter in order to maintain cooler core temperatures as shown by the screenshot below. The clock rate throttling range is very wide which explains the slower-than-expected CineBench results mentioned above and the wide-ranging power consumption numbers in the next section.
Core temperature would hover around 80 C when running stressful loads compared to just under 70 C on the Dell Latitude 7440.
| CPU Clock (GHz) | GPU Clock (MHz) | Average CPU Temperature (°C) | |
| System Idle | -- | -- | 47 |
| Prime95 Stress | 1.6 - 3.9 | -- | 70 - 90 |
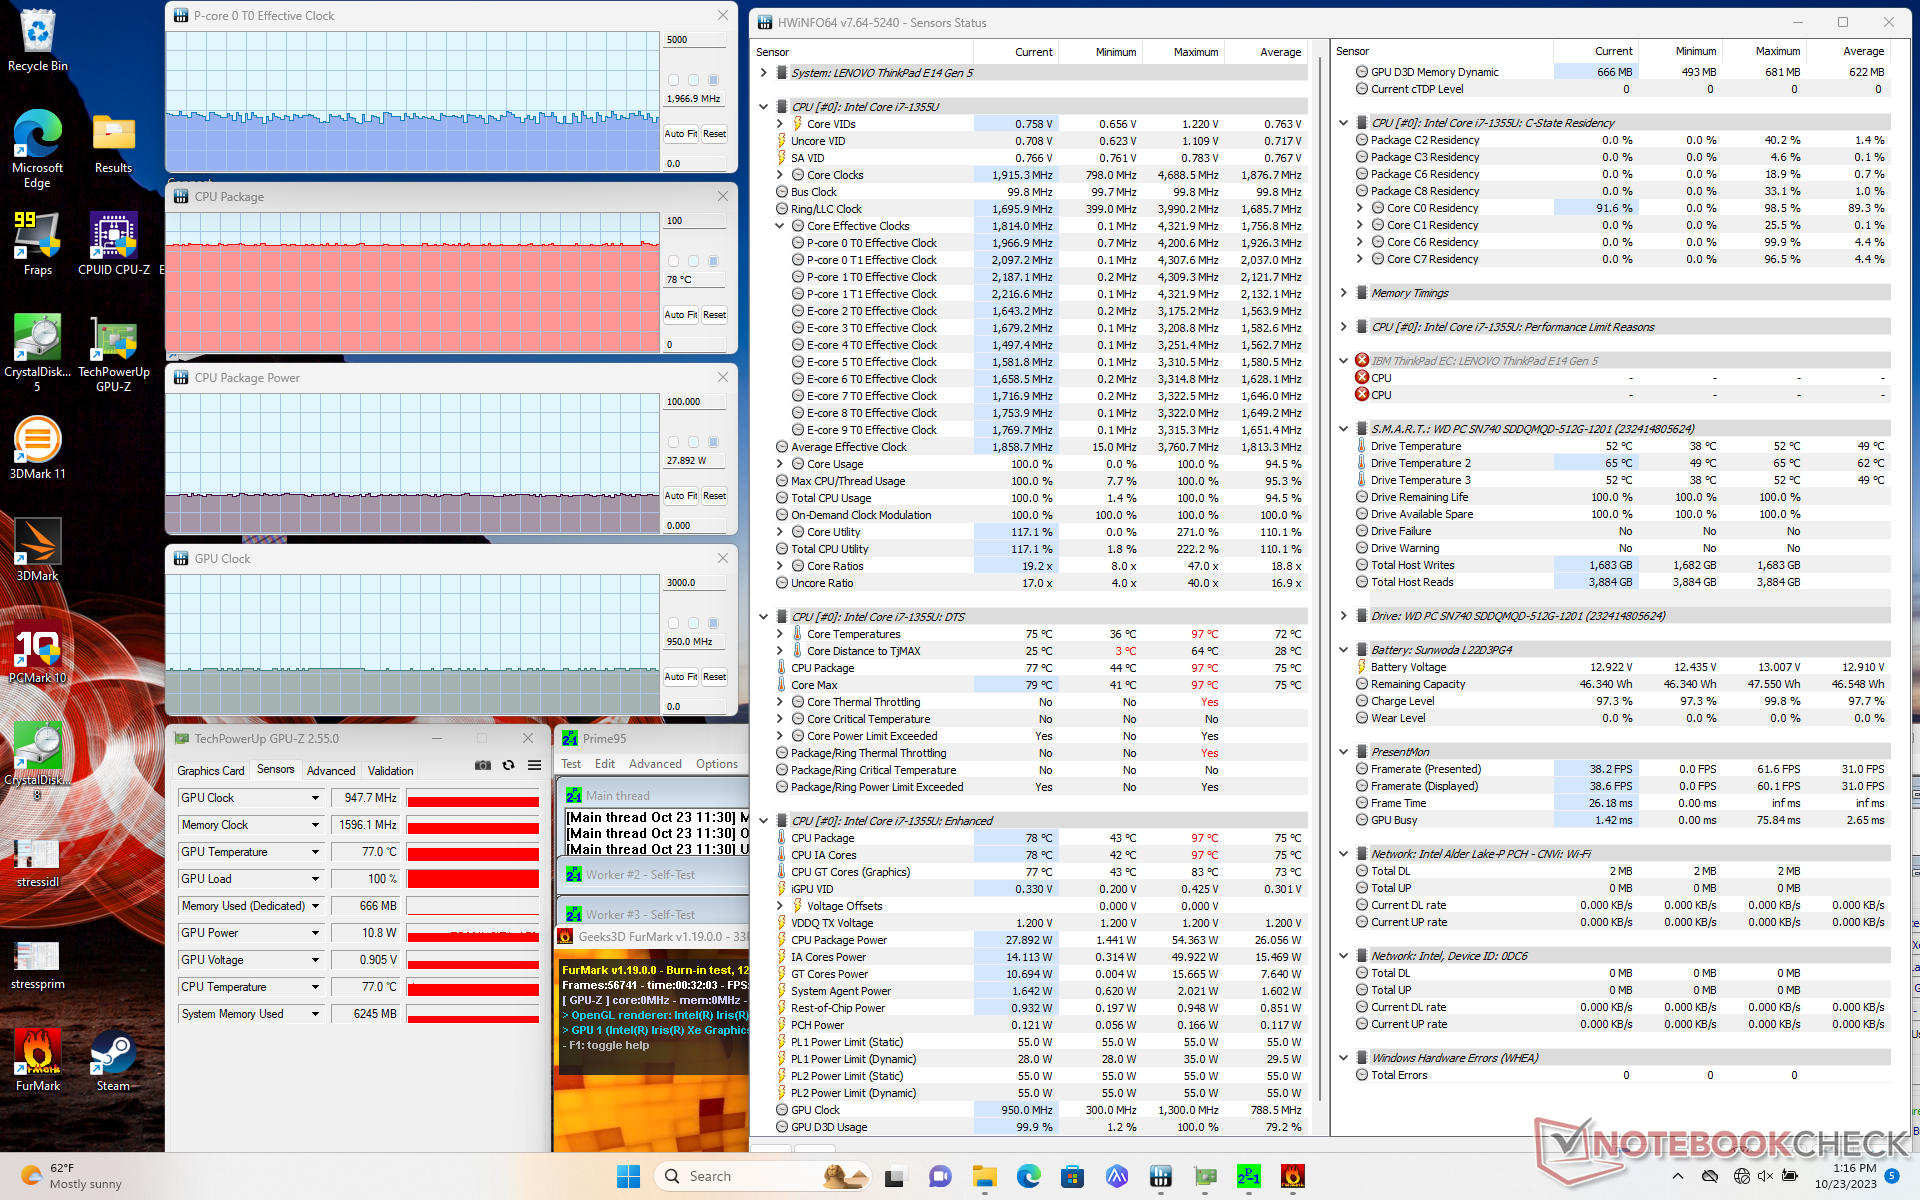
| Prime95 + FurMark Stress | ~2.0 | 950 | 78 |
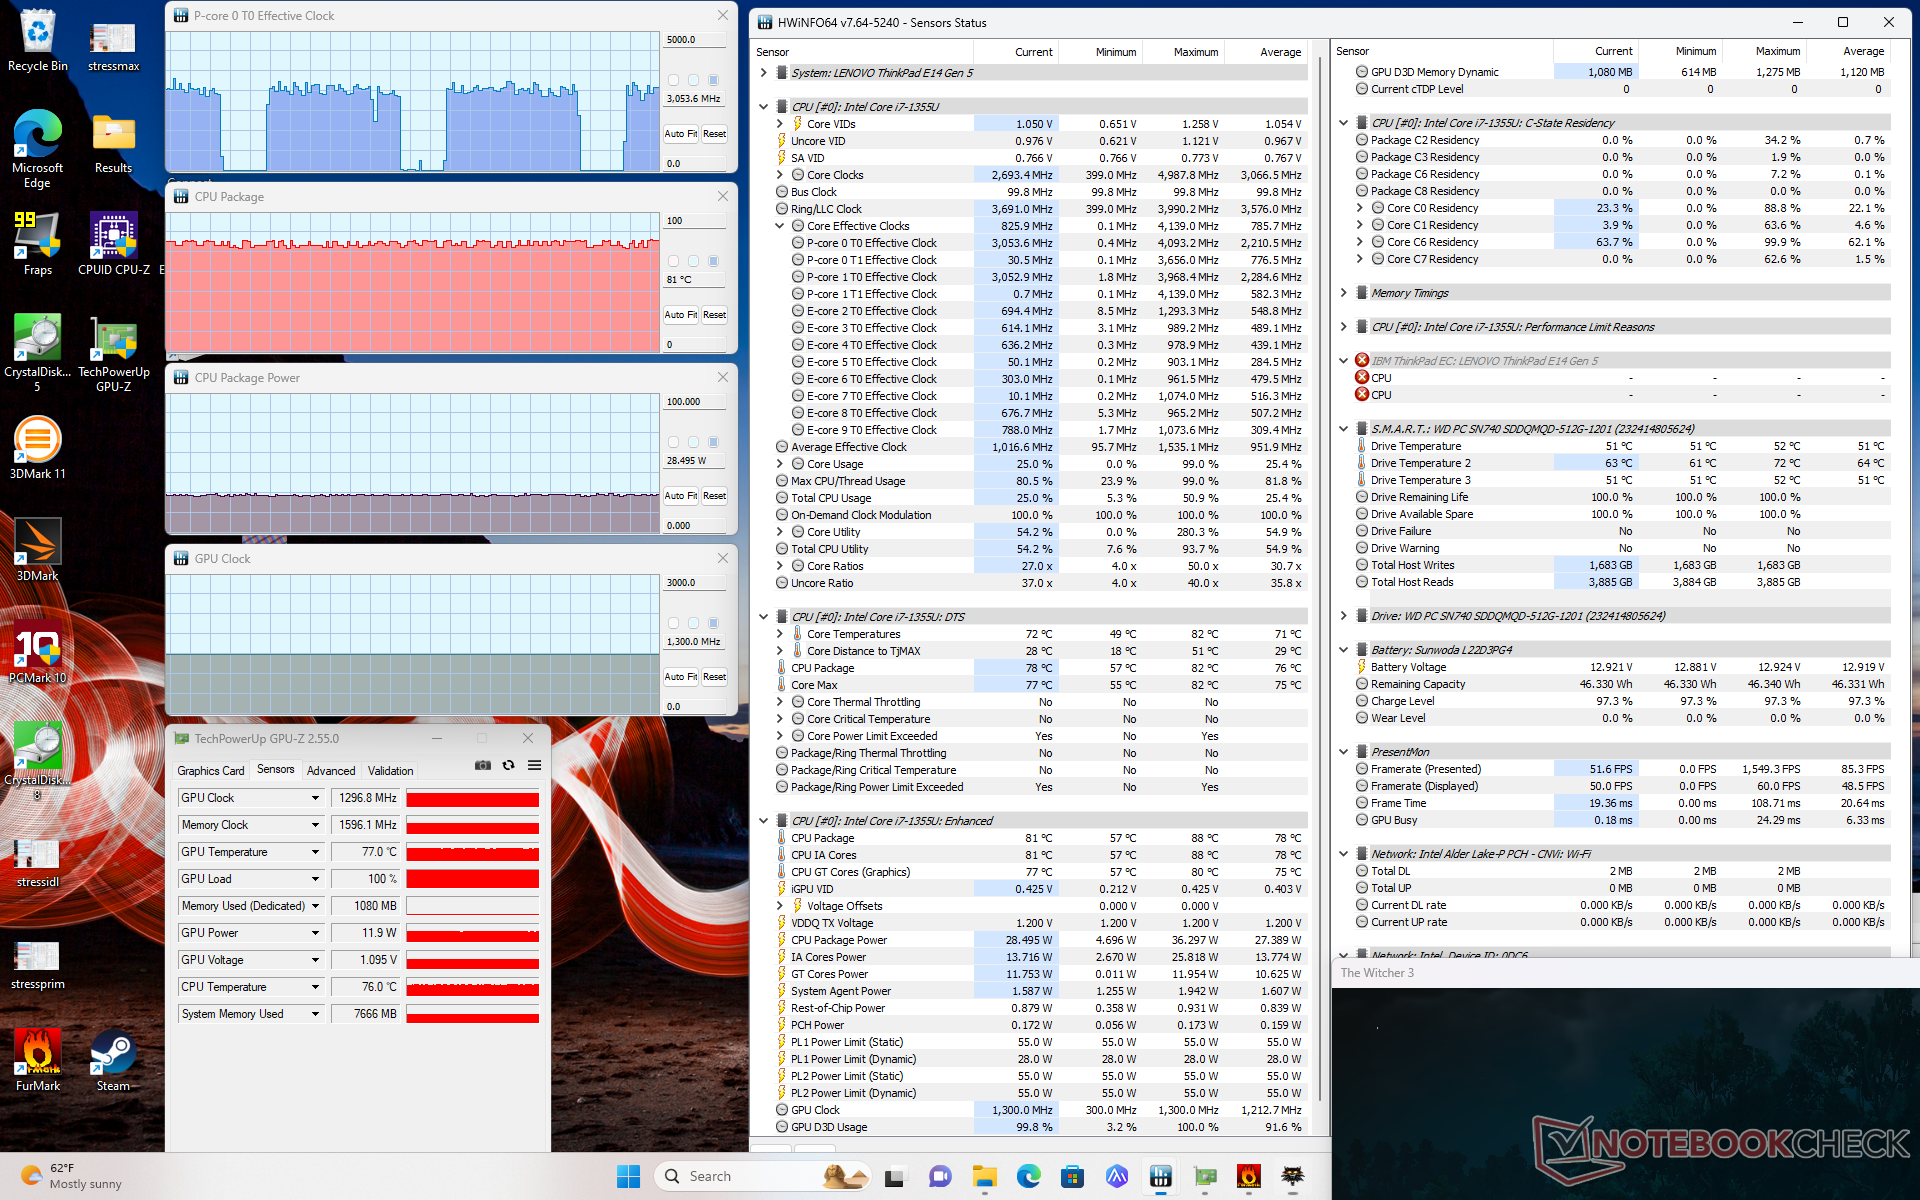
| Witcher 3 Stress | ~3.0 | 1300 | 81 |
Speakers
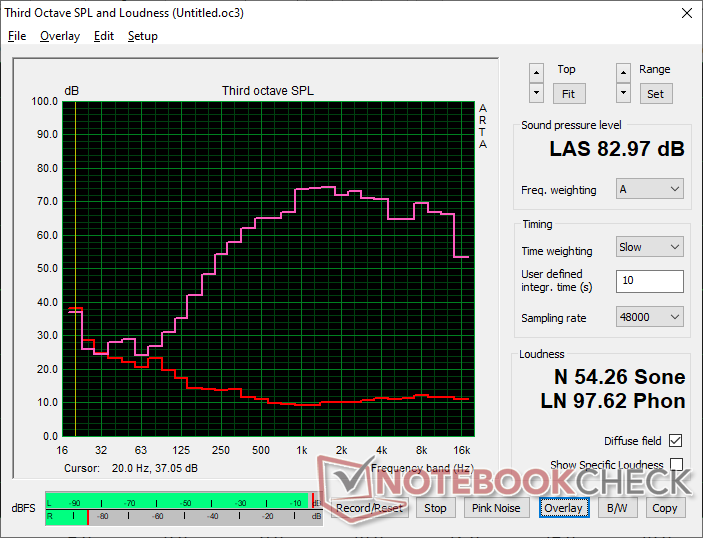
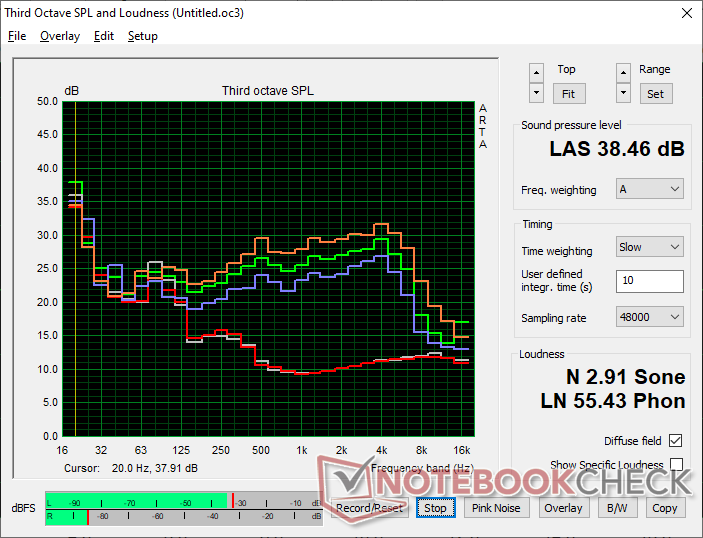
Lenovo ThinkPad E14 G5 i7-1355U audio analysis
(+) | speakers can play relatively loud (83 dB)
Bass 100 - 315 Hz
(-) | nearly no bass - on average 20.3% lower than median
(±) | linearity of bass is average (9.6% delta to prev. frequency)
Mids 400 - 2000 Hz
(+) | balanced mids - only 4.8% away from median
(+) | mids are linear (4.3% delta to prev. frequency)
Highs 2 - 16 kHz
(+) | balanced highs - only 3.7% away from median
(+) | highs are linear (4.4% delta to prev. frequency)
Overall 100 - 16.000 Hz
(±) | linearity of overall sound is average (16.9% difference to median)
Compared to same class
» 24% of all tested devices in this class were better, 7% similar, 70% worse
» The best had a delta of 7%, average was 21%, worst was 53%
Compared to all devices tested
» 30% of all tested devices were better, 8% similar, 62% worse
» The best had a delta of 4%, average was 23%, worst was 134%
Apple MacBook Pro 16 2021 M1 Pro audio analysis
(+) | speakers can play relatively loud (84.7 dB)
Bass 100 - 315 Hz
(+) | good bass - only 3.8% away from median
(+) | bass is linear (5.2% delta to prev. frequency)
Mids 400 - 2000 Hz
(+) | balanced mids - only 1.3% away from median
(+) | mids are linear (2.1% delta to prev. frequency)
Highs 2 - 16 kHz
(+) | balanced highs - only 1.9% away from median
(+) | highs are linear (2.7% delta to prev. frequency)
Overall 100 - 16.000 Hz
(+) | overall sound is linear (4.6% difference to median)
Compared to same class
» 0% of all tested devices in this class were better, 0% similar, 100% worse
» The best had a delta of 5%, average was 17%, worst was 45%
Compared to all devices tested
» 0% of all tested devices were better, 0% similar, 100% worse
» The best had a delta of 4%, average was 23%, worst was 134%
Energy Management
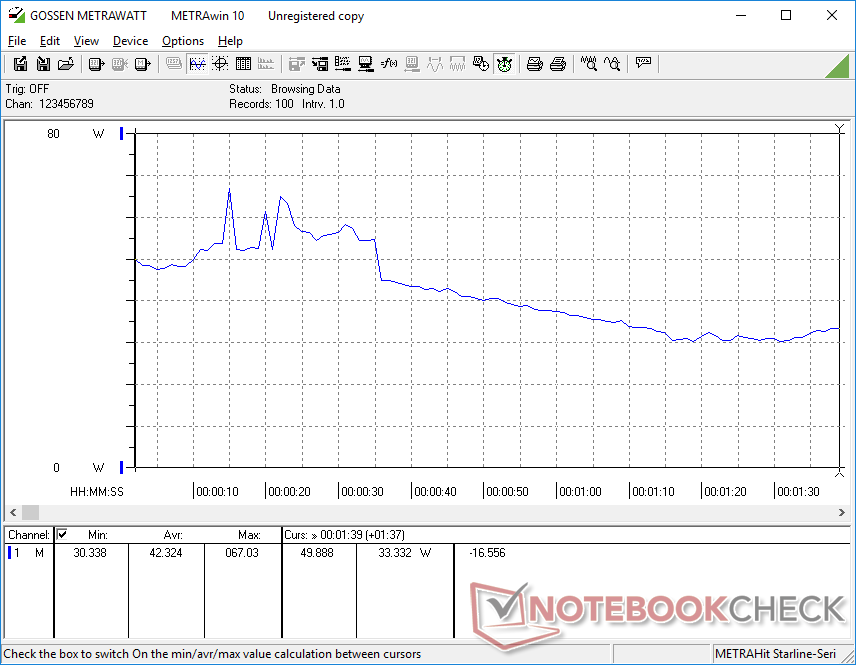
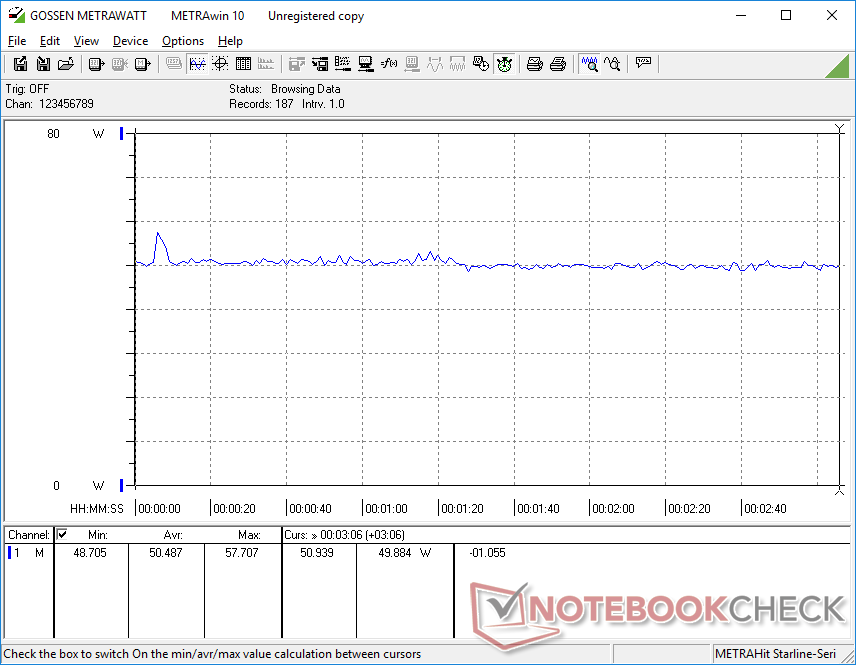
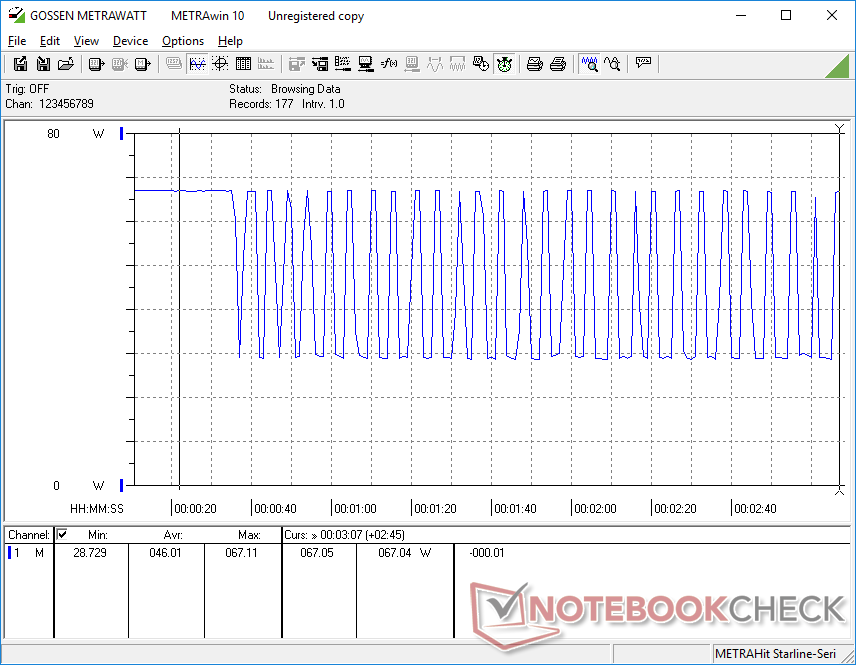
Power Consumption
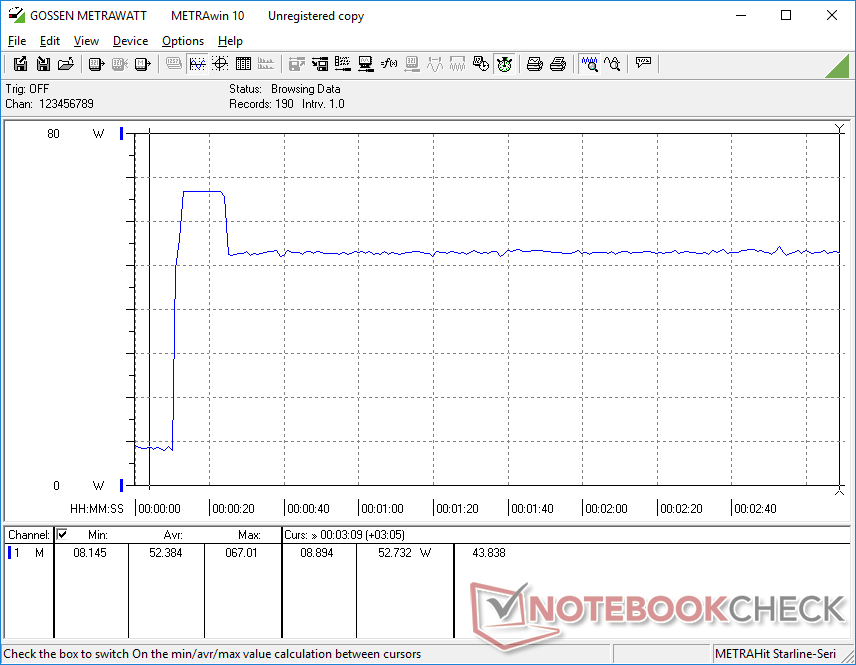
Power consumption behavior reflects the steep CPU throttling behavior mentioned above. When running Prime95, for example, consumption would cycle between 29 W and 67 W whereas the exact same test on the AMD ThinkPad E14 G5 would return a more steady rate of 47 W.
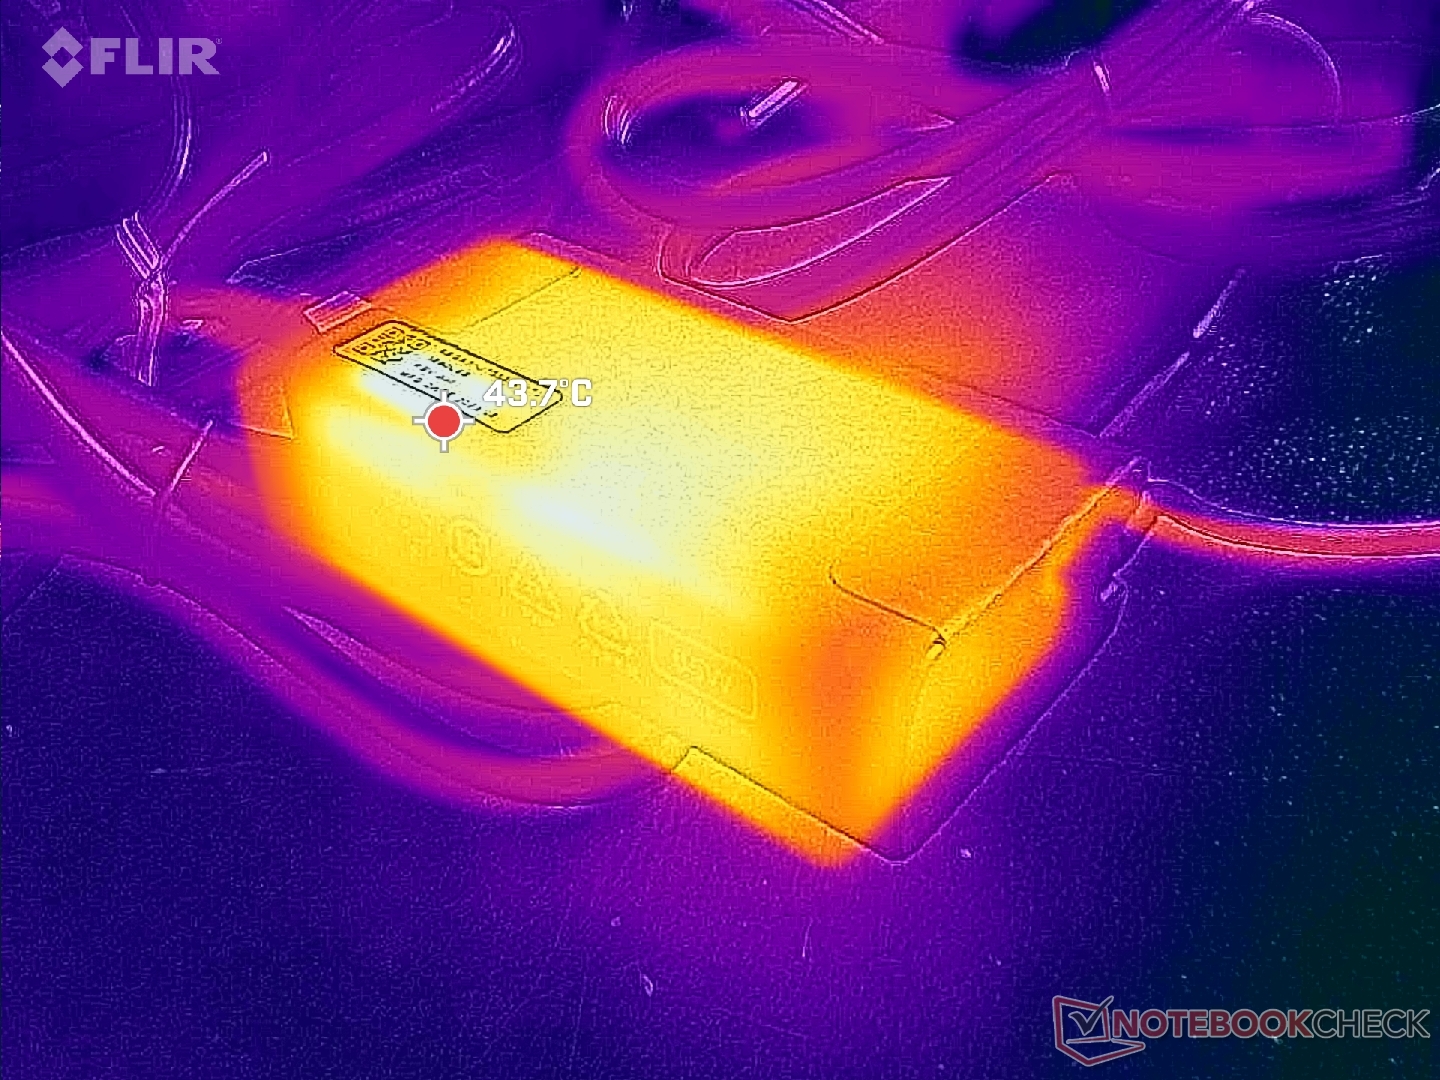
Consumption can be as high as 67 W from the small (9 x 4.7 x 2.7 cm) 65 W USB-C AC adapter when the CPU is at 100 percent utilization. The Intel system is therefore more power demanding than the AMD system when Turbo Boost is at its fastest such as when multitasking or launching applications. This can also be observed when initiating the CineBench R15 xT benchmark as shown by the comparison graph below. Otherwise, consumption is about the same between the two versions when idling on desktop or when running less demanding loads.
| Off / Standby | |
| Idle | |
| Load |
|
Key:
min: | |
| Lenovo ThinkPad E14 G5 i7-1355U i7-1355U, Iris Xe G7 96EUs, WD PC SN740 512GB SDDQMQD-512G, IPS, 1920x1200, 14" | Lenovo ThinkPad E14 G5-21JSS05C00 R7 7730U, Vega 8, WD PC SN740 SDDPNQD-1T00, IPS, 2240x1400, 14" | HP EliteBook 845 G10 818N0EA R9 PRO 7940HS, Radeon 780M, SK hynix PC801 HFS001TEJ9X101N, IPS, 2560x1600, 14" | Asus ZenBook 14 UM3402Y R7 7730U, Vega 8, Micron 2400 MTFDKBA512QFM, OLED, 2880x1800, 14" | LG Gram 14Z90Q i5-1240P, Iris Xe G7 80EUs, Samsung PM9A1 MZVL2512HCJQ, IPS, 1920x1200, 14" | Dell Latitude 7440 i5-1345U, Iris Xe G7 80EUs, Samsung MZ9L4512HBLU-00BMV, IPS, 2560x1600, 14" | |
|---|---|---|---|---|---|---|
| Power Consumption | -3% | -33% | -42% | -0% | -5% | |
| Idle Minimum * (Watt) | 3.6 | 3.3 8% | 4.3 -19% | 7.9 -119% | 3 17% | 4.5 -25% |
| Idle Average * (Watt) | 6.9 | 7.6 -10% | 10.1 -46% | 8.8 -28% | 6 13% | 6.5 6% |
| Idle Maximum * (Watt) | 7 | 8.9 -27% | 11.2 -60% | 14.7 -110% | 12 -71% | 7.3 -4% |
| Load Average * (Watt) | 42.3 | 47.3 -12% | 64.4 -52% | 46.9 -11% | 40 5% | 52.5 -24% |
| Witcher 3 ultra * (Watt) | 50.5 | 45.1 11% | 59.4 -18% | 44.9 11% | 36.5 28% | 46.2 9% |
| Load Maximum * (Watt) | 67 | 57.8 14% | 66.7 -0% | 65.2 3% | 63 6% | 63 6% |
* ... smaller is better
Power Consumption Witcher 3 / Stresstest
Power Consumption external Monitor
Battery Life
The battery is smaller for some Intel configurations when compared to our AMD configuration (47 Wh vs. 57 Wh) and so users should expect shorter runtimes if configured with the smaller option. We're able to browse the web for about 5.5 hours before automatic shutdown compared to almost 10 hours on the AMD version.
Charging from empty to full capacity is otherwise very fast at just over an hour with the included AC adapter. Rapid Charge is enabled by default.
| Lenovo ThinkPad E14 G5 i7-1355U i7-1355U, Iris Xe G7 96EUs, 47 Wh | Lenovo ThinkPad E14 G5-21JSS05C00 R7 7730U, Vega 8, 57 Wh | HP EliteBook 845 G10 818N0EA R9 PRO 7940HS, Radeon 780M, 51 Wh | Asus ZenBook 14 UM3402Y R7 7730U, Vega 8, 75 Wh | LG Gram 14Z90Q i5-1240P, Iris Xe G7 80EUs, 72 Wh | Dell Latitude 7440 i5-1345U, Iris Xe G7 80EUs, 57 Wh | |
|---|---|---|---|---|---|---|
| Battery runtime | 80% | 44% | 120% | 116% | 136% | |
| WiFi v1.3 (h) | 5.5 | 9.9 80% | 7.9 44% | 12.1 120% | 11.9 116% | 13 136% |
| H.264 (h) | 10.8 | 9.3 | ||||
| Load (h) | 1.2 | 0.9 | 3.4 | 2.8 | 2.7 | |
| Reader / Idle (h) | 18.5 | 28.9 | 23.8 |
Pros
Cons
Verdict — Good But Harder To Recommend Over The AMD Ryzen 7 Version
Our Intel unit as configured with the Core i7 CPU, 16 GB RAM, 1200p touchscreen, and 512 GB SSD retails for about $915 USD compared to $865 for the Ryzen 7 version with the same RAM, touchscreen, and SSD. Opting for the AMD version will net you faster multi-thread performance, longer battery life, and proper M.2 2280 SSD support while the Intel version will net you faster single-thread performance and Thunderbolt support. Other aspects like graphics performance, surface temperature, and fan noise are otherwise very similar between the two versions. Thus, unless if you really value single-thread performance and Thunderbolt, the AMD version is easier to recommend over the Intel version for the majority of interested buyers.
The Intel-based ThinkPad E14 G5 exhibits steeper throttling behavior than its less expensive Ryzen 7 alternative.
A few business-centric auxiliary features like WAN and Smart Card are missing, but that is by design as the ThinkPad E series is supposed to be a more affordable alternative to the higher-end and much more expensive ThinkPad T series or X series.
Price and Availability
Amazon is now shipping the ThinkPad E14 Gen 5 as reviewed for $915 USD. Lenovo is also shipping the same model but with additional RAM for just over $1030.
Lenovo ThinkPad E14 G5 i7-1355U
- 10/26/2023 v7 (old)
Allen Ngo
Transparency
The selection of devices to be reviewed is made by our editorial team. The test sample was provided to the author as a loan by the manufacturer or retailer for the purpose of this review. The lender had no influence on this review, nor did the manufacturer receive a copy of this review before publication. There was no obligation to publish this review. As an independent media company, Notebookcheck is not subjected to the authority of manufacturers, retailers or publishers.
This is how Notebookcheck is testing
Every year, Notebookcheck independently reviews hundreds of laptops and smartphones using standardized procedures to ensure that all results are comparable. We have continuously developed our test methods for around 20 years and set industry standards in the process. In our test labs, high-quality measuring equipment is utilized by experienced technicians and editors. These tests involve a multi-stage validation process. Our complex rating system is based on hundreds of well-founded measurements and benchmarks, which maintains objectivity. Further information on our test methods can be found here.
Price comparison
