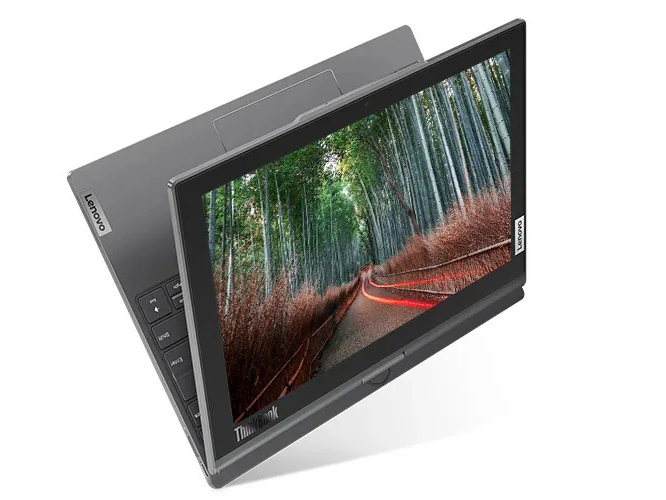
Lenovo ThinkBook Plus Twist Gen 4 convertible review: E Ink and OLED hybrid ↺

The Lenovo ThinkBook Plus Gen 4, otherwise known as the ThinkBook Plus Twist, is now widely available after its initial unveiling at CES 2023. Despite what its name may suggest, the ThinkBook Plus Gen 4 does not directly replace the ThinkBook Plus Gen 3 due to their vastly different design philosophies and screen sizes. They do, however, share similar chassis materials and target similar semi-professional users who may be turned off by the consumer-centric IdeaPad series or office-heavy ThinkPad series.
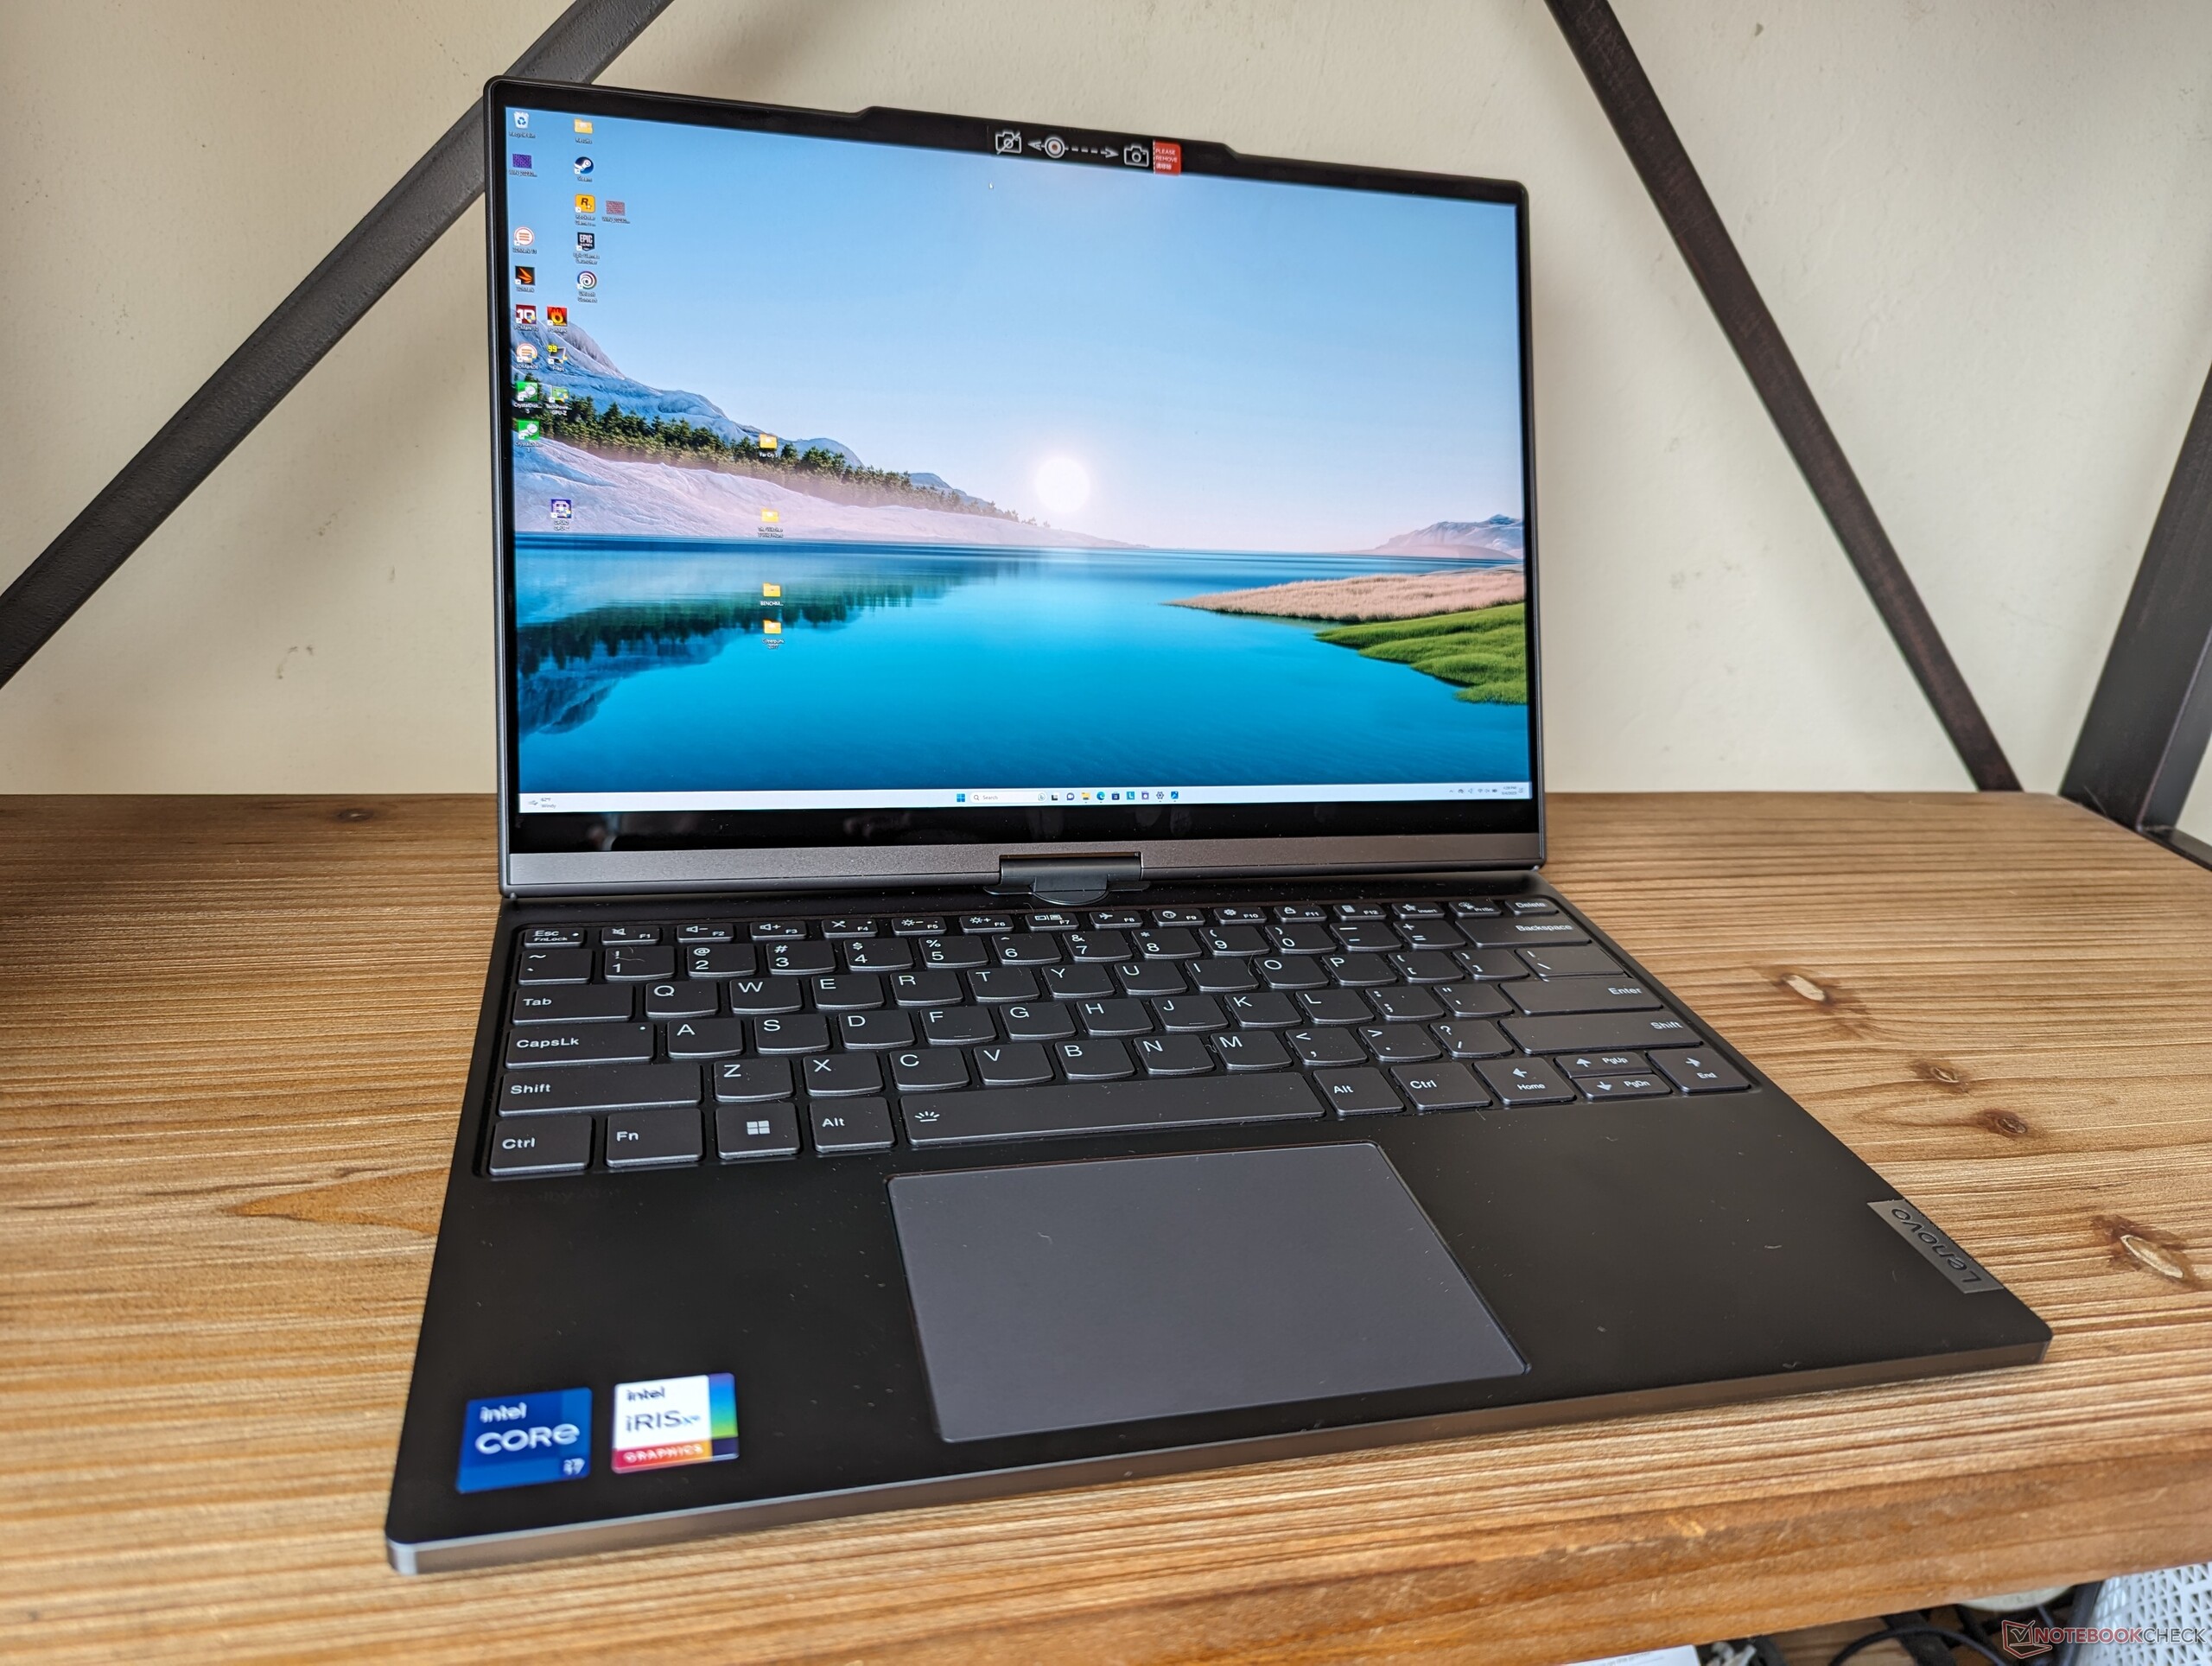
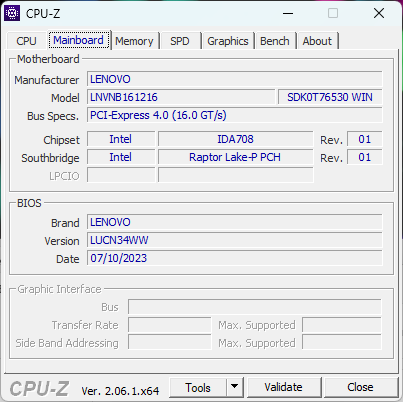
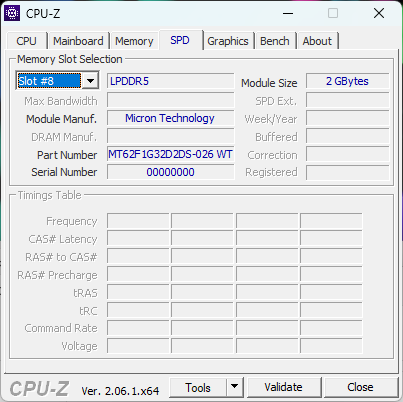
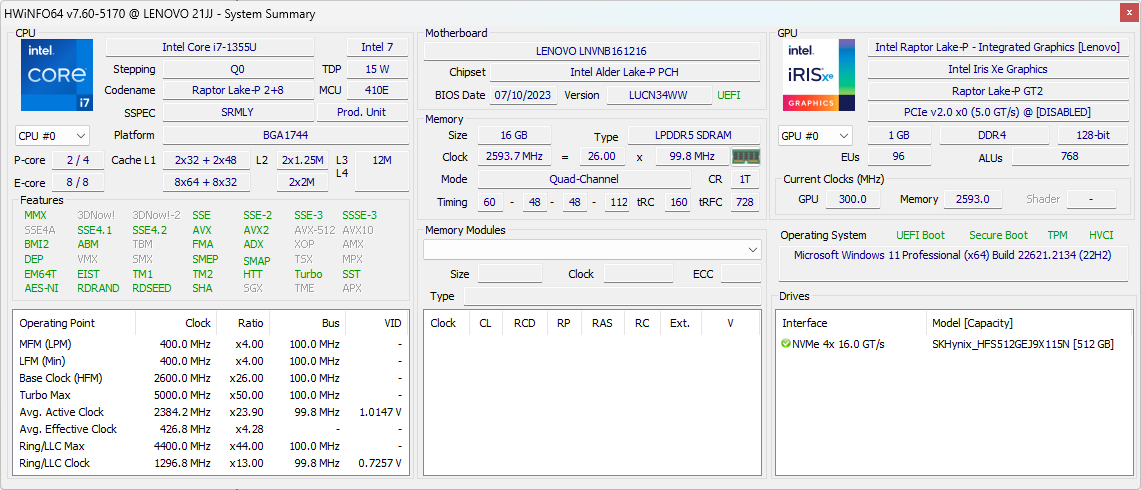
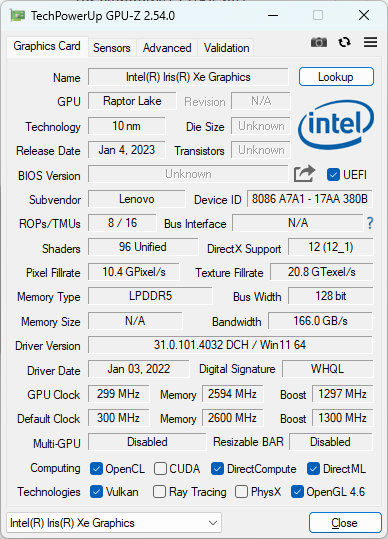
Our unit in review is a higher-end SKU with the Core i7-1355U CPU and integrated E Ink display for just over $3000 USD. Lesser configurations come with the Core i5-1335U and no E Ink display for $2800, but all options ship with integrated graphics only, 16 GB of soldered RAM, and a primary 13.3-inch 2.8K OLED touchscreen.
Competitors include other high-end convertible subnotebooks like the Dell Latitude 9330, MSI Summit E14 Flip, Asus ZenBook Flip 14, or the HP Spectre 13.5 series. Of course, none offer E Ink touchscreen features as our Lenovo.
More Lenovo reviews:
Potential Competitors in Comparison
Rating | Date | Model | Weight | Height | Size | Resolution | Price |
|---|---|---|---|---|---|---|---|
| 87.4 % v7 (old) | 09 / 2023 | Lenovo ThinkBook Plus Gen4 IRU i7-1355U, Iris Xe G7 96EUs | 1.4 kg | 17.7 mm | 13.30" | 2880x1800 | |
| 89.5 % v7 (old) | 08 / 2023 | Lenovo ThinkPad X1 Nano Gen 3 i7-1360P, Iris Xe G7 96EUs | 989 g | 14.8 mm | 13.00" | 2160x1350 | |
| 91.9 % v7 (old) | 07 / 2023 | HP Dragonfly G4 i7-1365U, Iris Xe G7 96EUs | 1.1 kg | 16.3 mm | 13.50" | 1920x1280 | |
| 85.4 % v7 (old) | 05 / 2023 | Asus ZenBook S13 OLED UX5304 i7-1355U, Iris Xe G7 96EUs | 1 kg | 11.8 mm | 13.30" | 2880x1800 | |
| 89 % v7 (old) | 11 / 2022 | Dell Latitude 9330 i7-1260U, Iris Xe G7 96EUs | 1.2 kg | 14.1 mm | 13.30" | 2560x1600 | |
| 86.9 % v7 (old) | 04 / 2021 | MSI Summit E13 Flip Evo A11MT i7-1185G7, Iris Xe G7 96EUs | 1.4 kg | 14.9 mm | 13.40" | 1920x1200 |
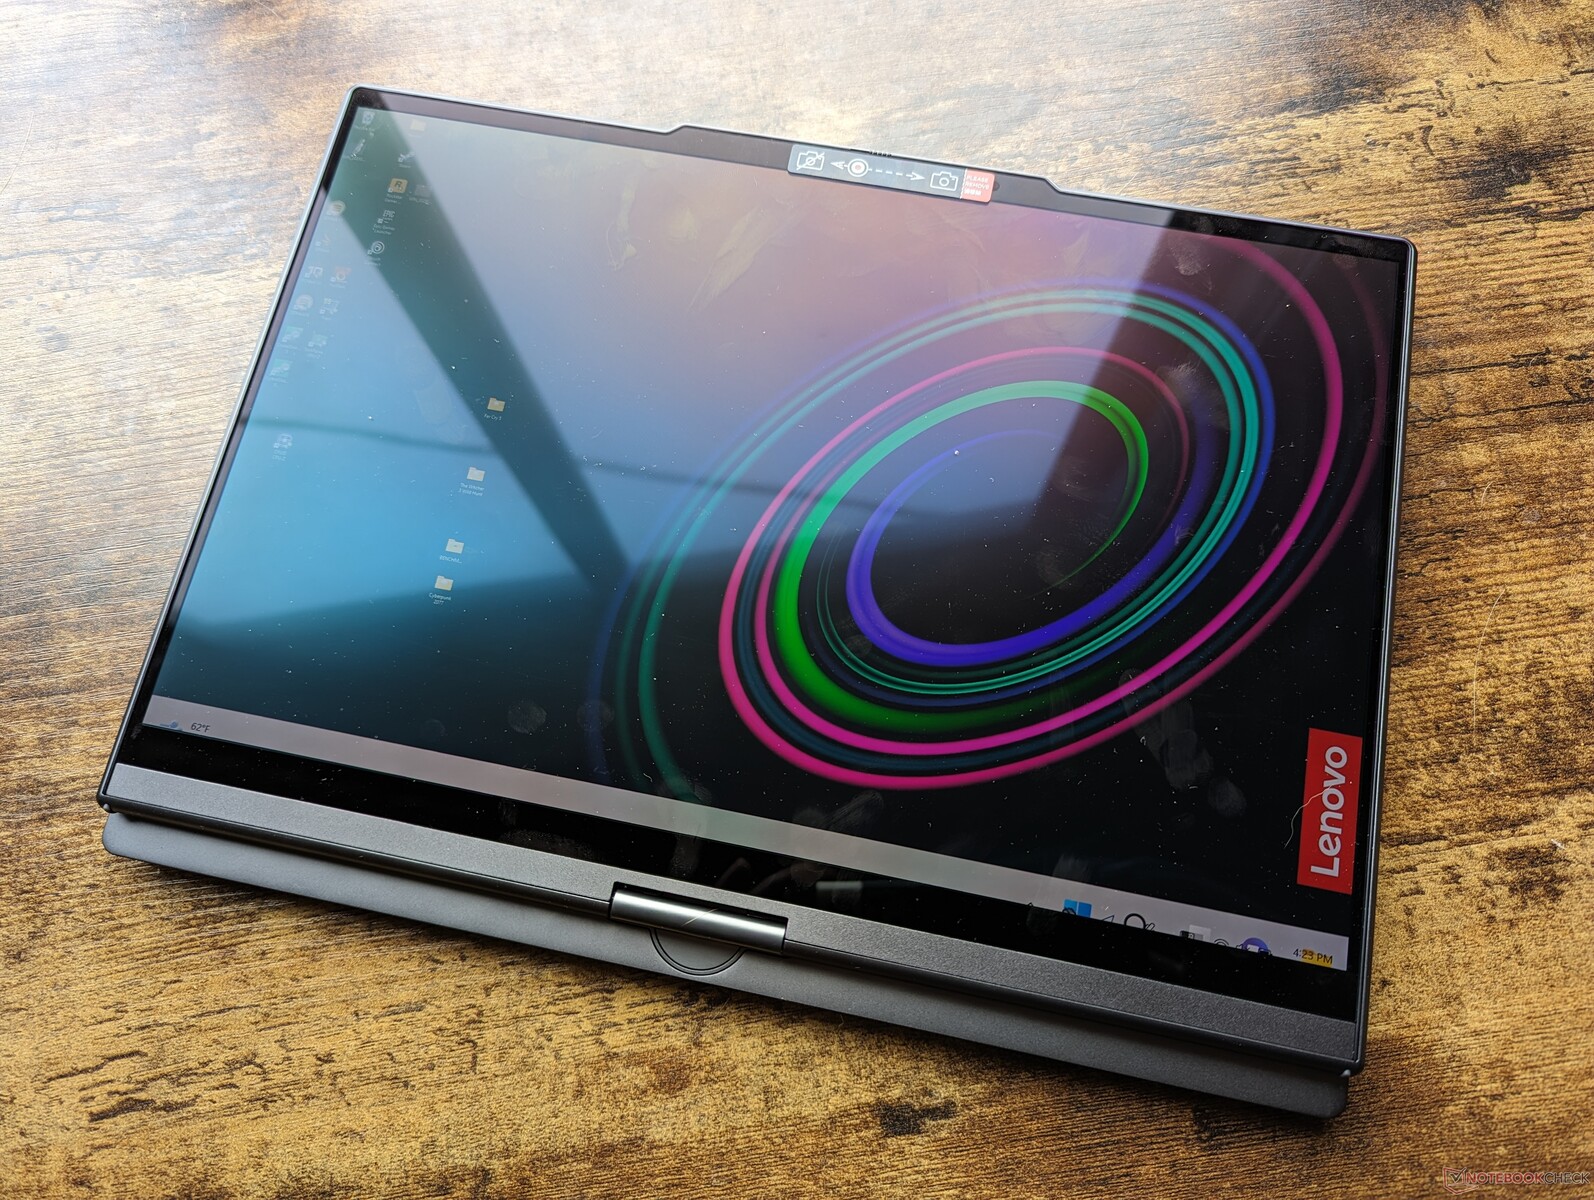
Case — The ThinkPad Twist Lives On In Spirit
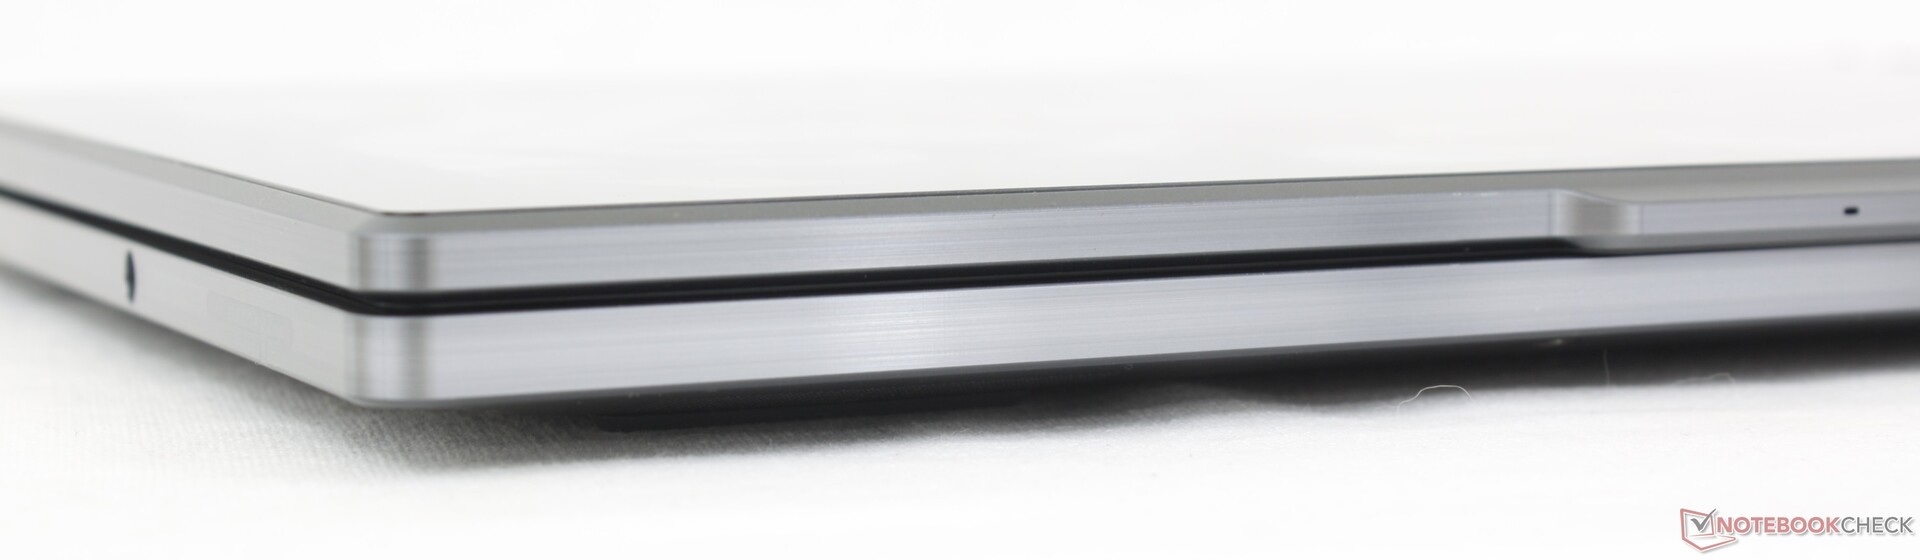
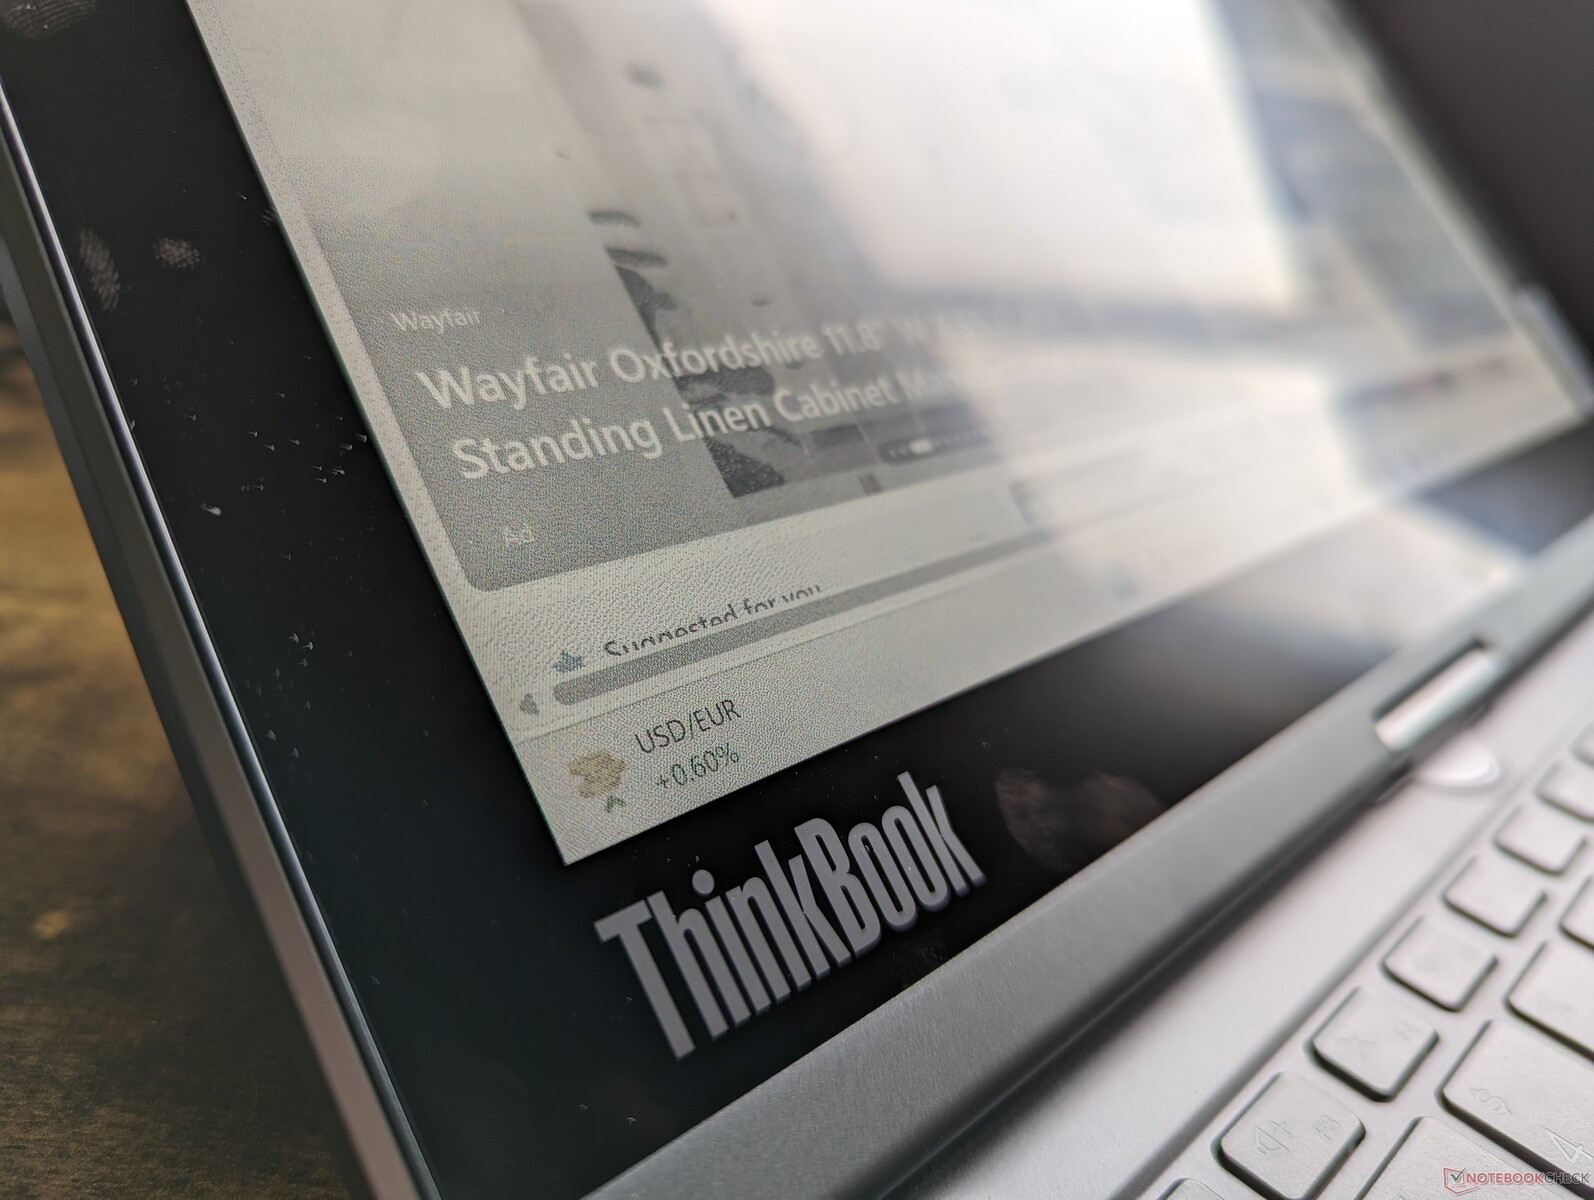
Unlike other ThinkBook models like the ThinkBook 15 G3, the ThinkBook Plus Gen 4 utilizes more metal than plastic for a more luxurious feel that's more reflective of its high price range. The base, for example, is noticeably more resistant to twisting and creaking to be on par with the HP Spectre x360 13.5. The lid is also quite firm due to it having two panes of glass reinforcement for the OLED and E Ink displays compared to just one pane on most other laptops.
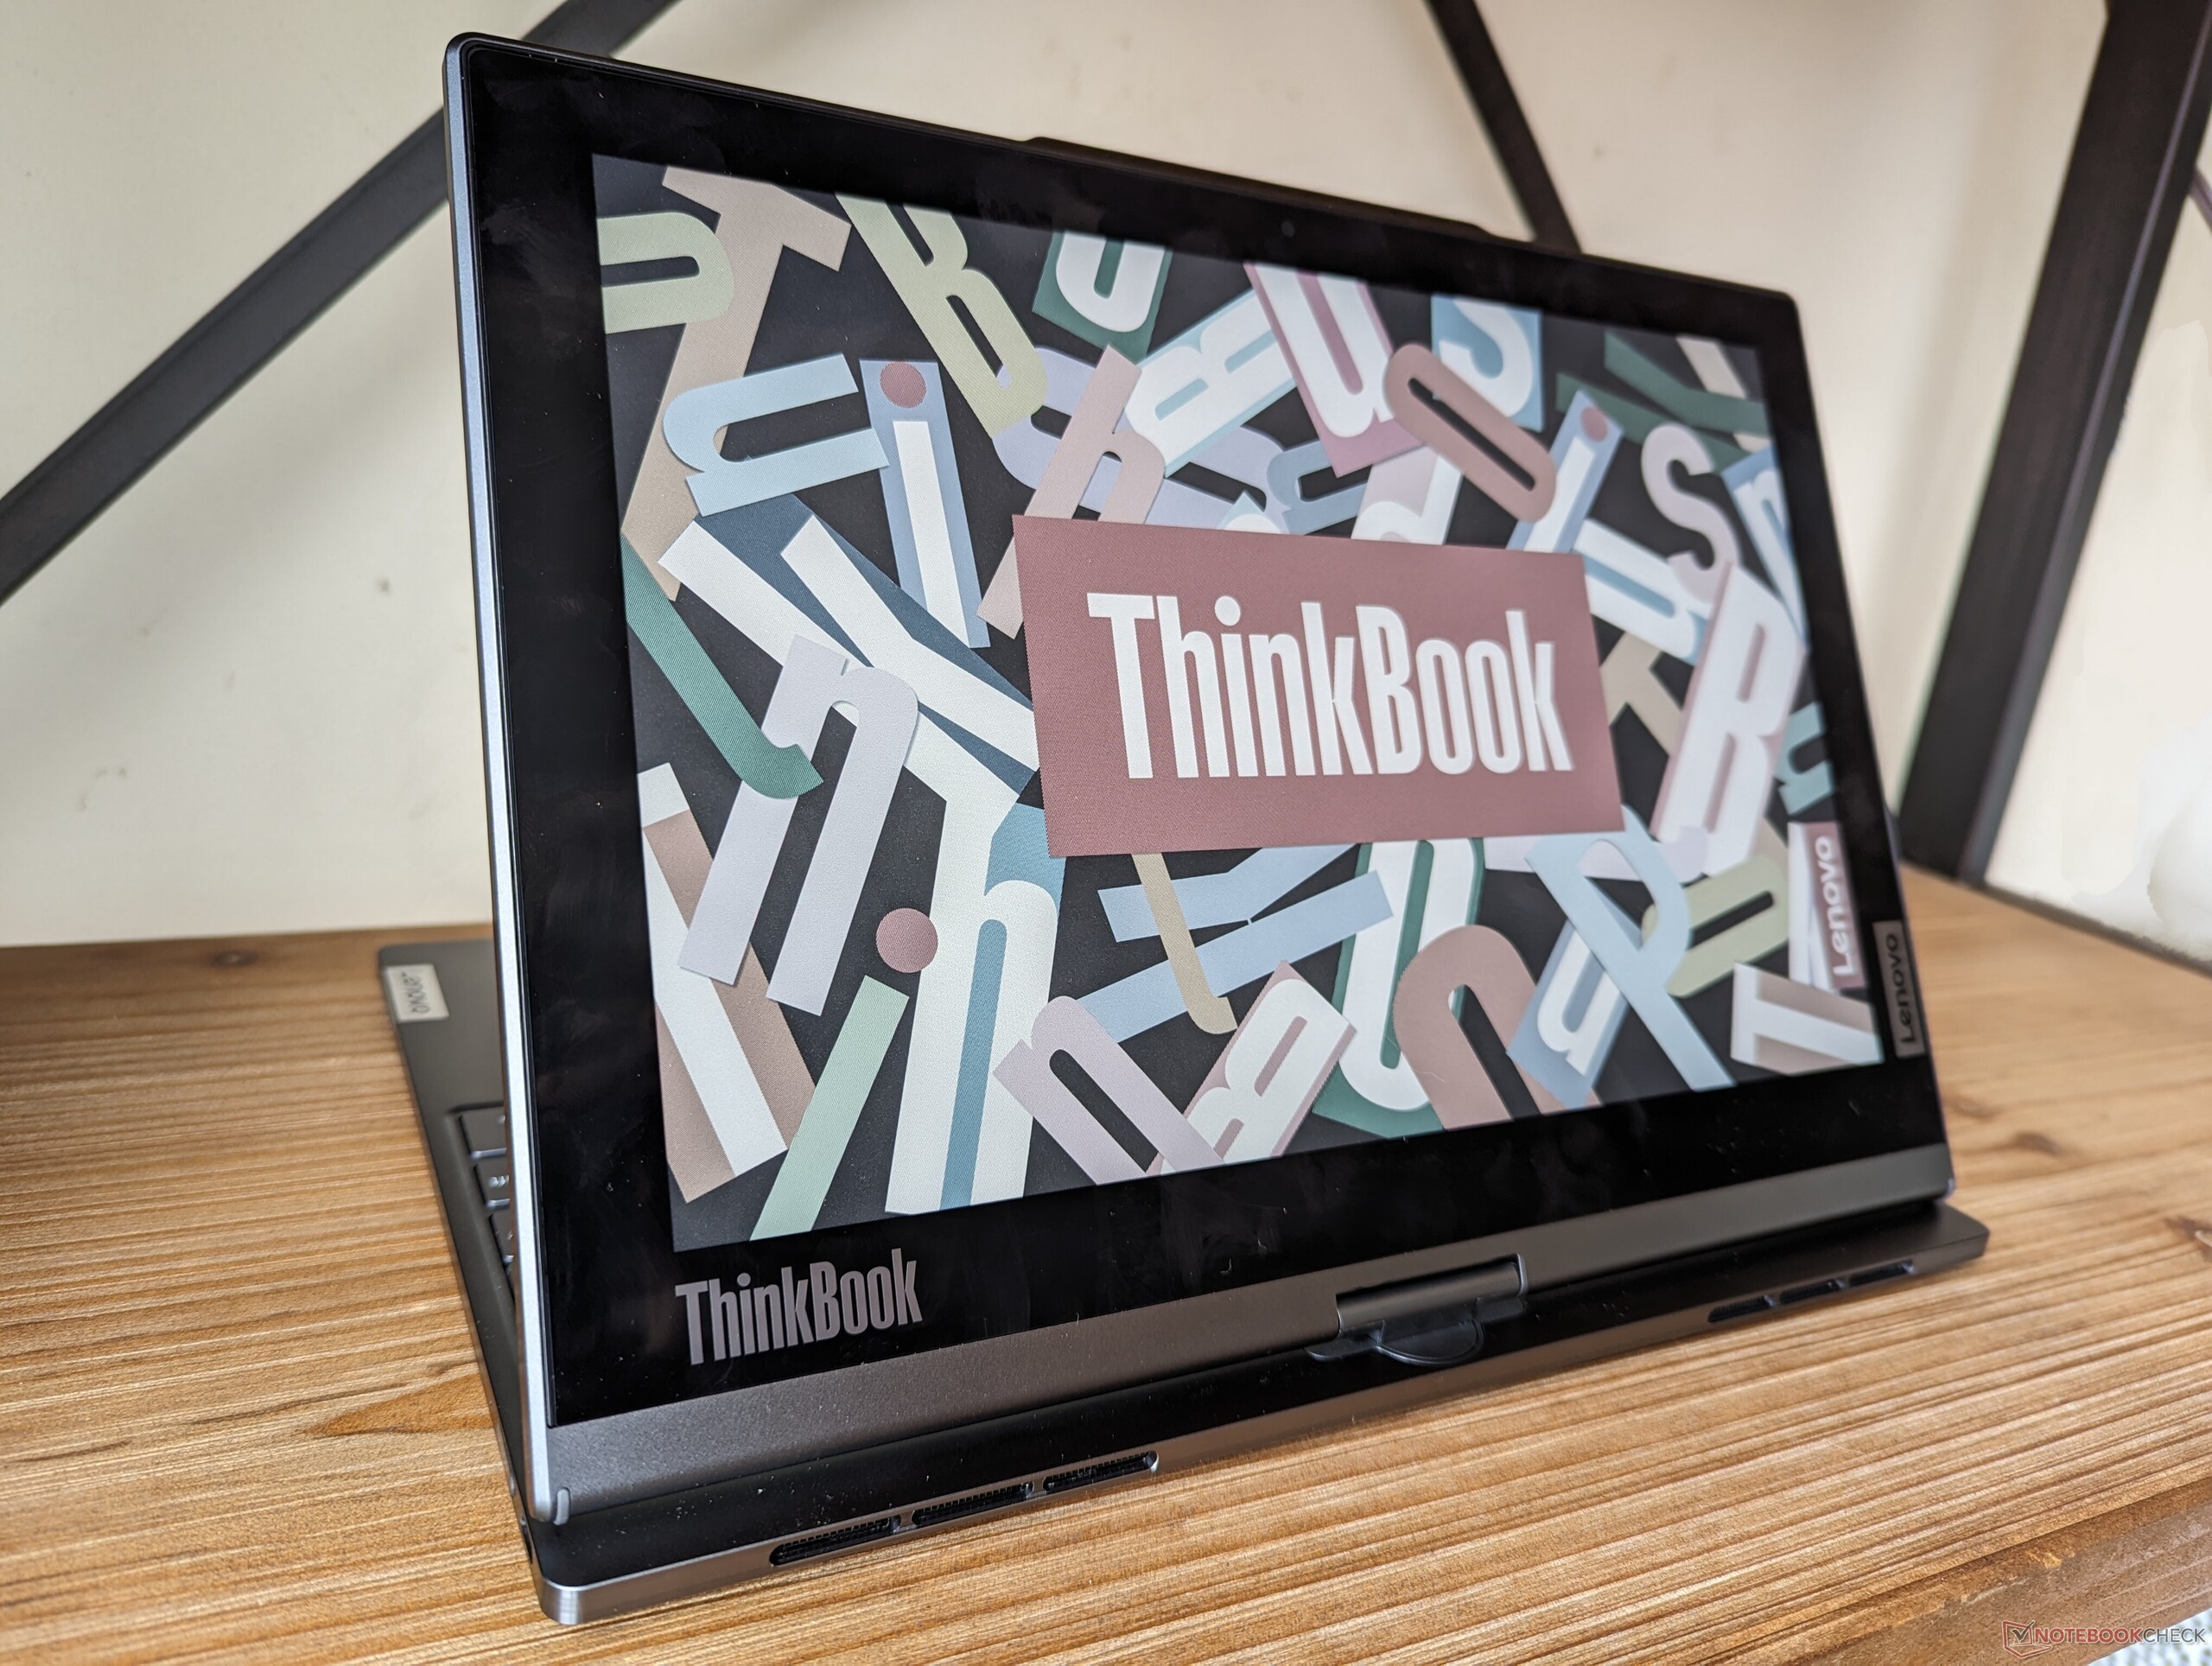
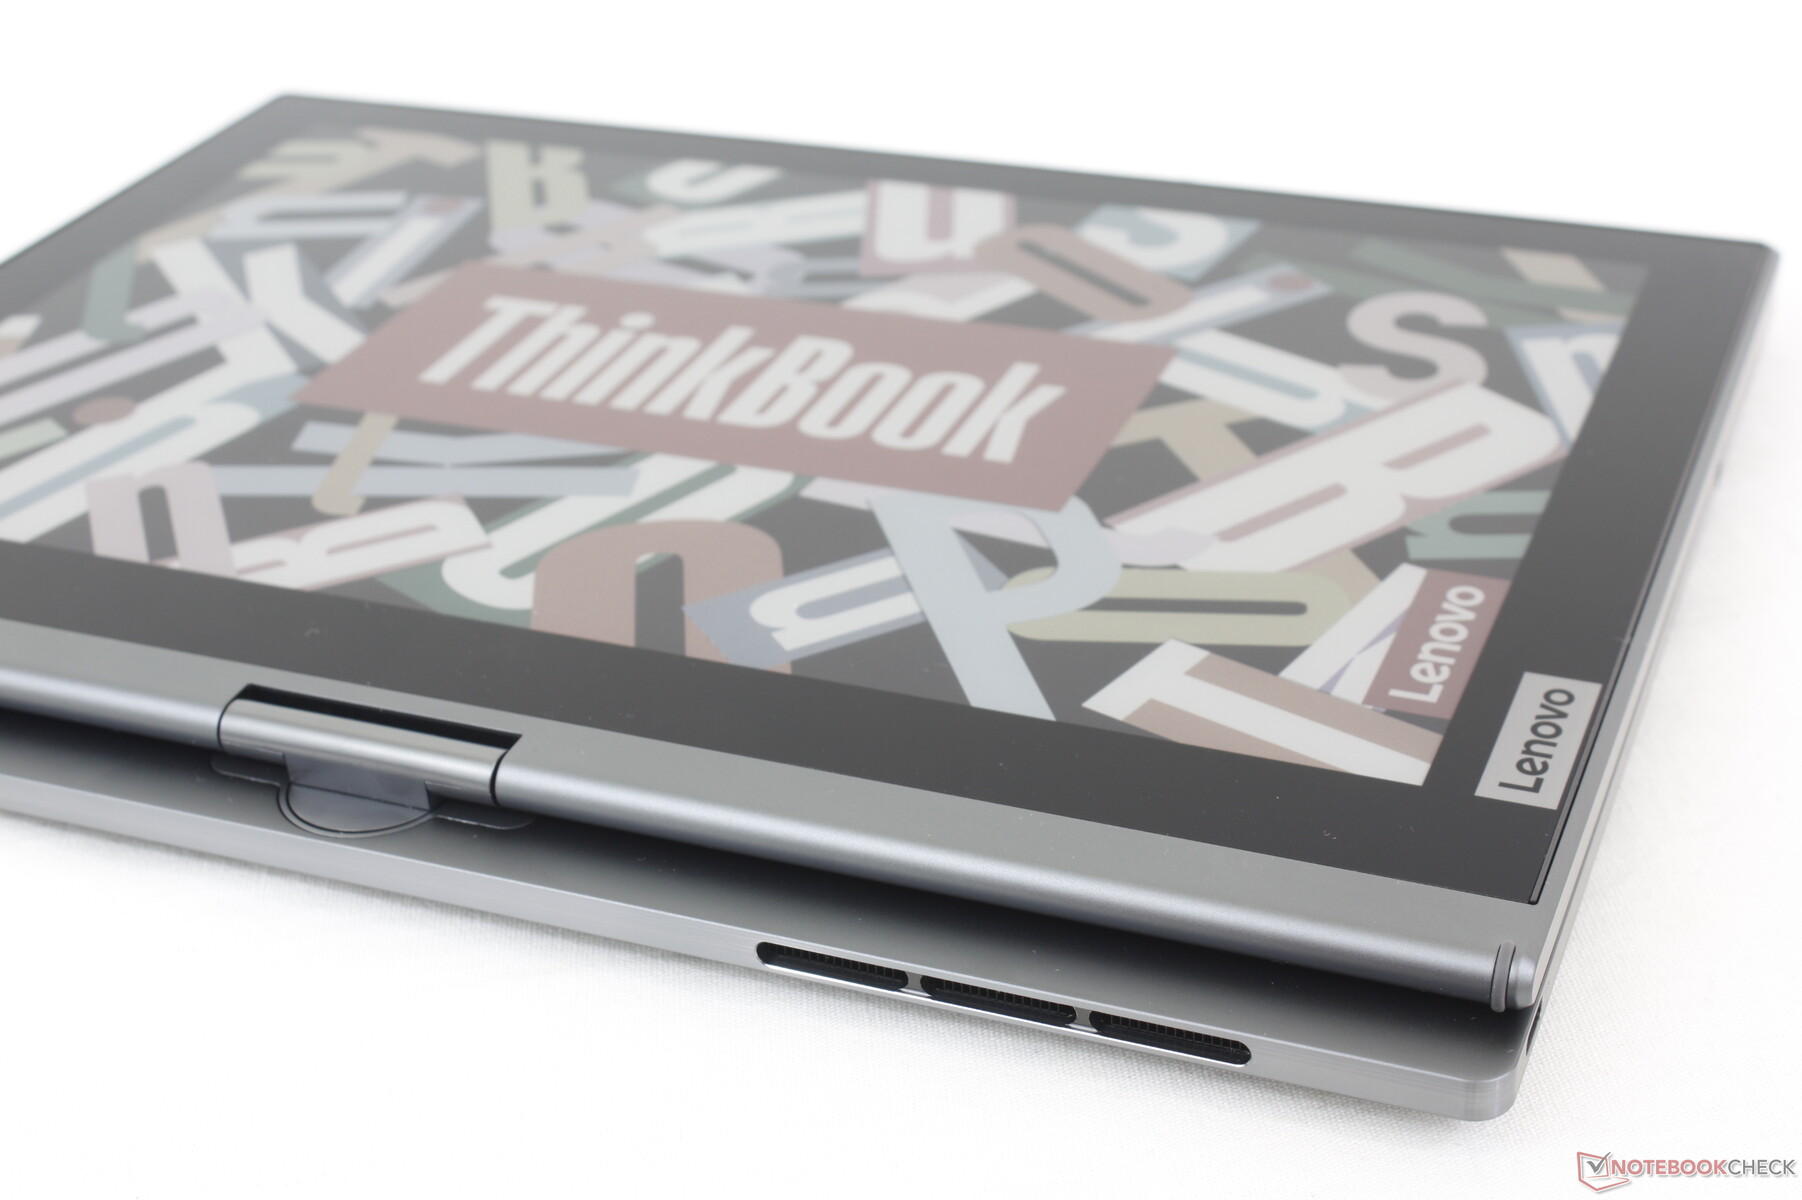
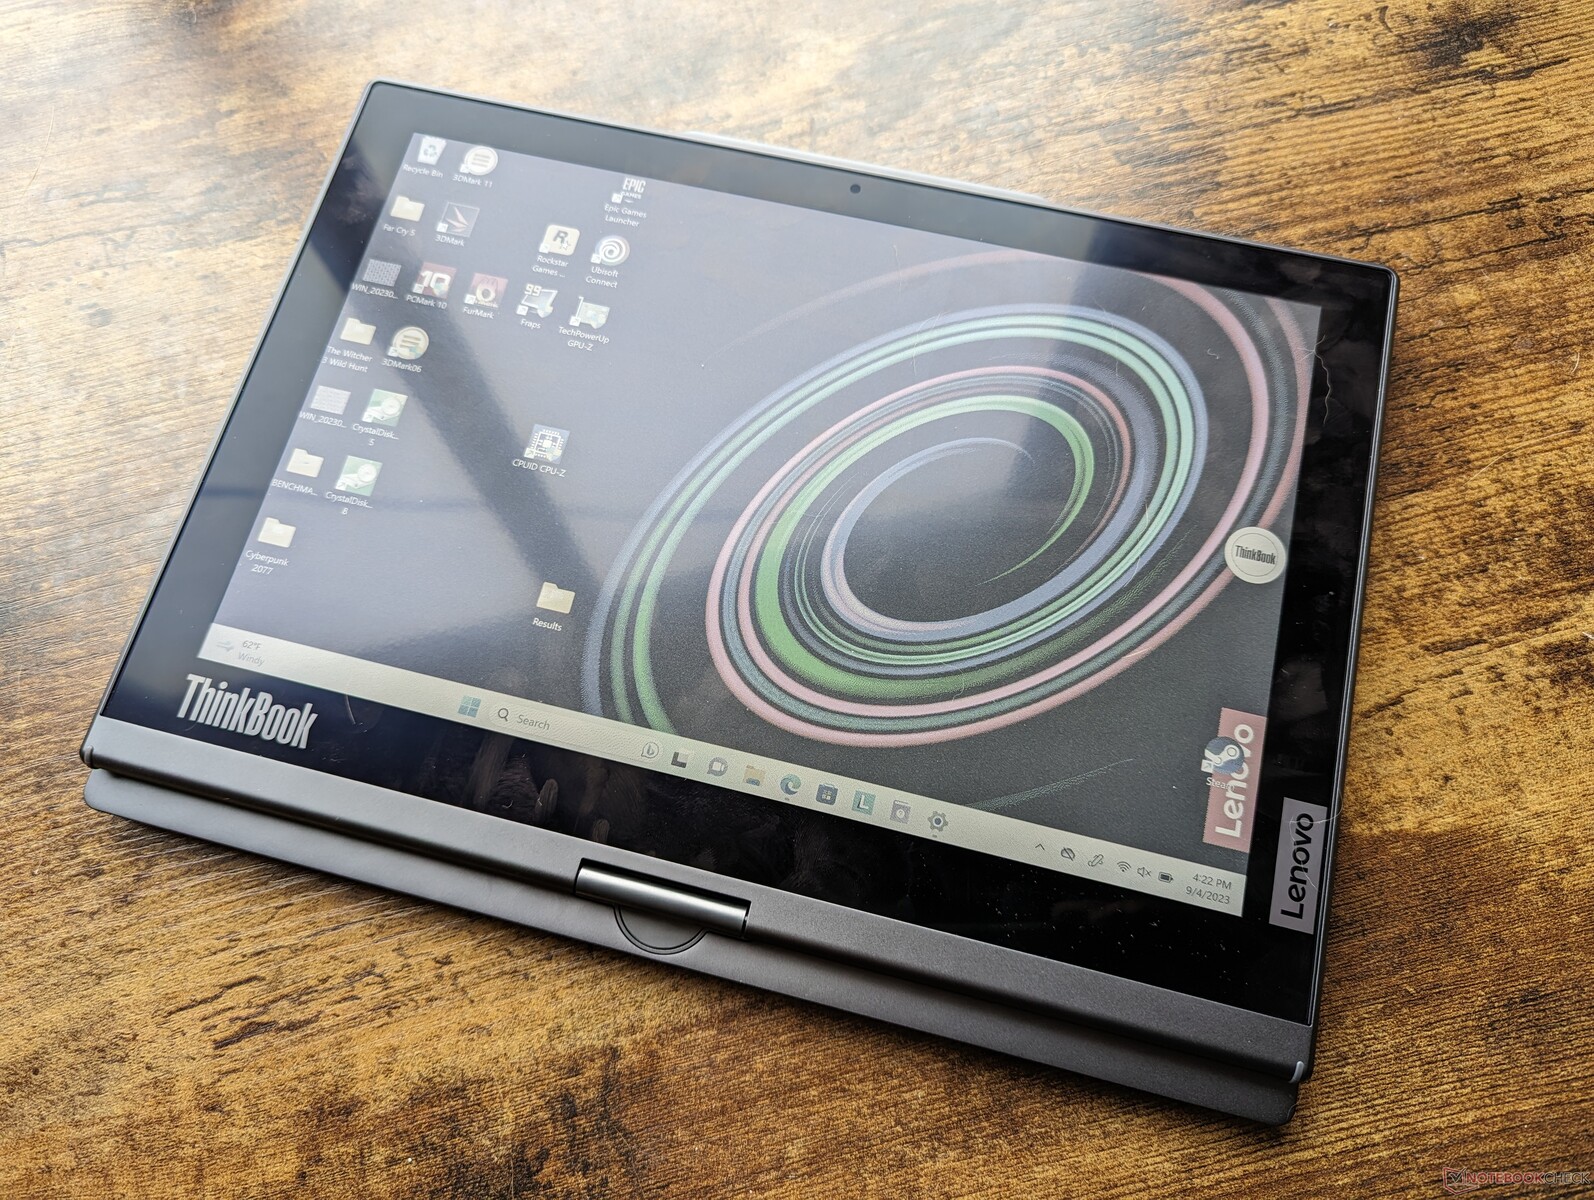
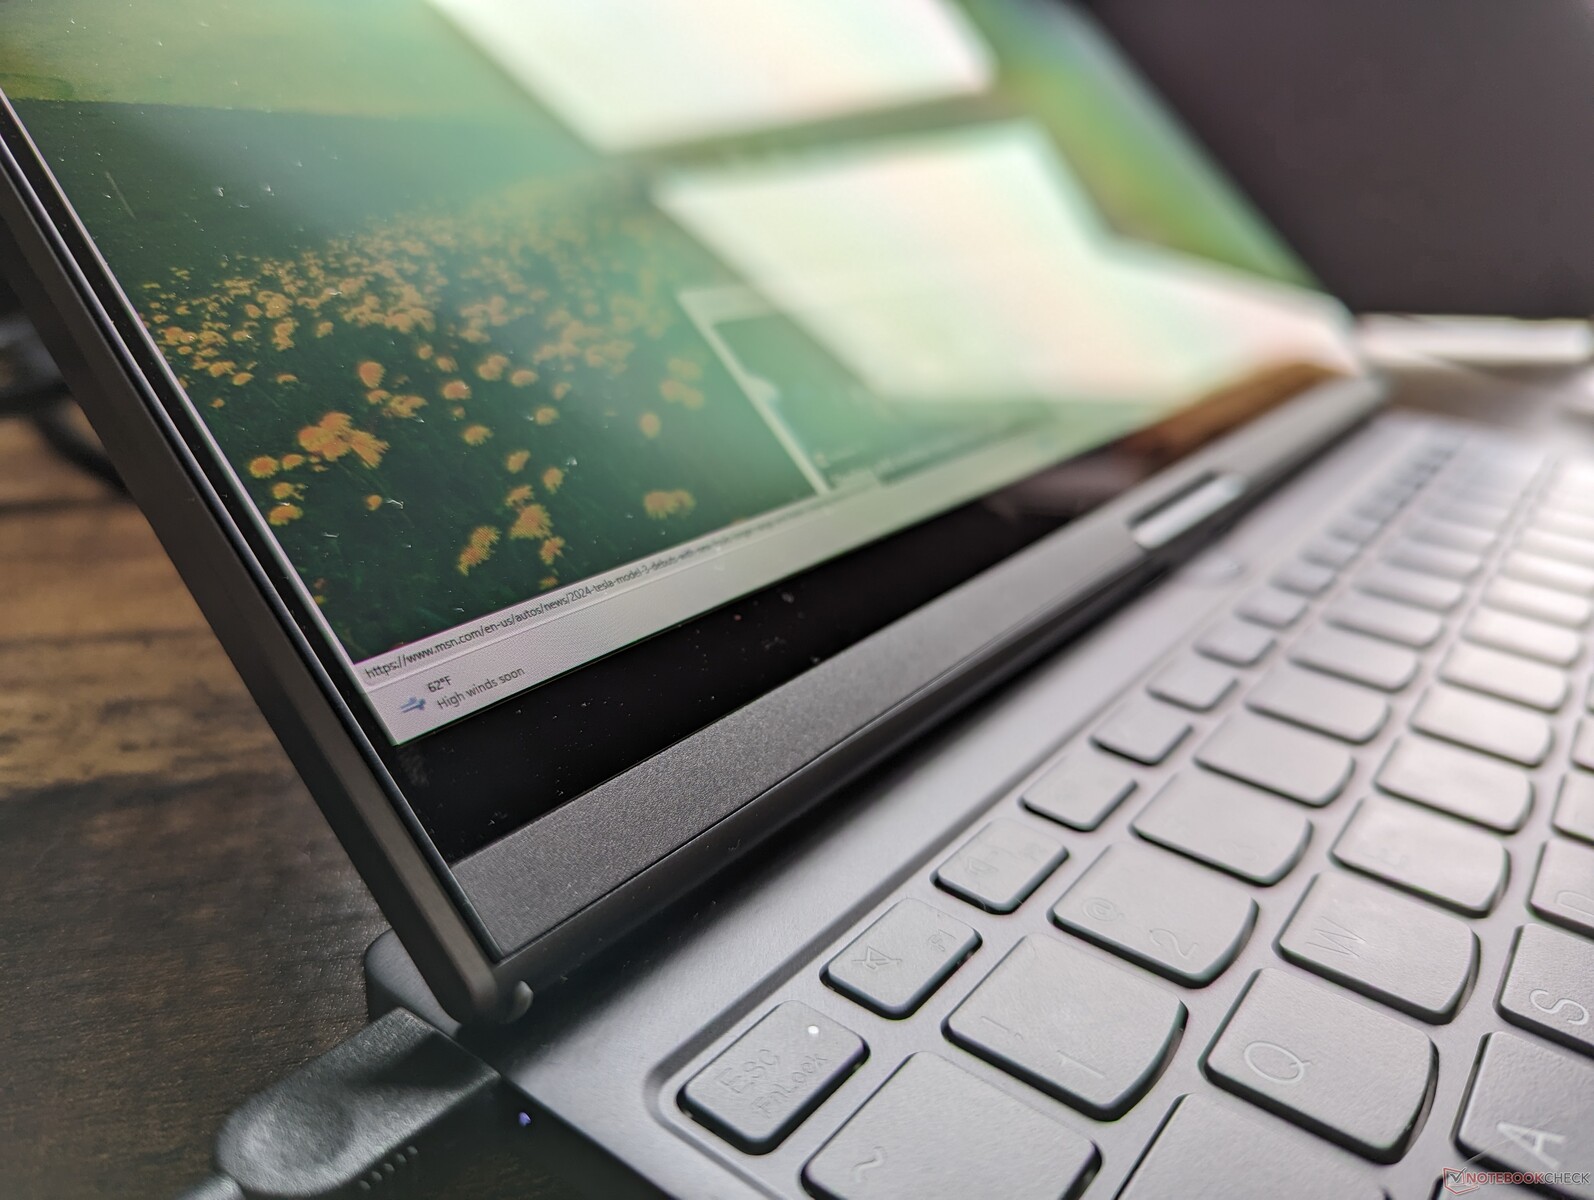
Aside from the 12-inch E Ink touchscreen on the outer lid, the twisting mechanism also helps to differentiate the Lenovo model from most other convertibles in the market. The small hinge can be rotated 180 degrees clockwise for tablet mode and then 180 degrees counterclockwise for laptop mode to contrast the standard 360-degree hinges on typical convertibles. It works well from a mechanical point of view, but the lid tends to teeter more readily when compared to traditionally larger hinges. Hopefully the unique rotating hinge can last for several years of daily abuse.
The twisting mechanism and secondary display add a bit of thickness and weight when compared to standard 13-inch subnotebooks. The Dragonfly G4, for example, is very nearly the same size in all three dimensions but it is noticeably lighter by 300 grams to be more travel-friendly. Thus, you'll have to really value the unique features of the ThinkBook Plus Gen 4 to justify the additional weight.


Connectivity
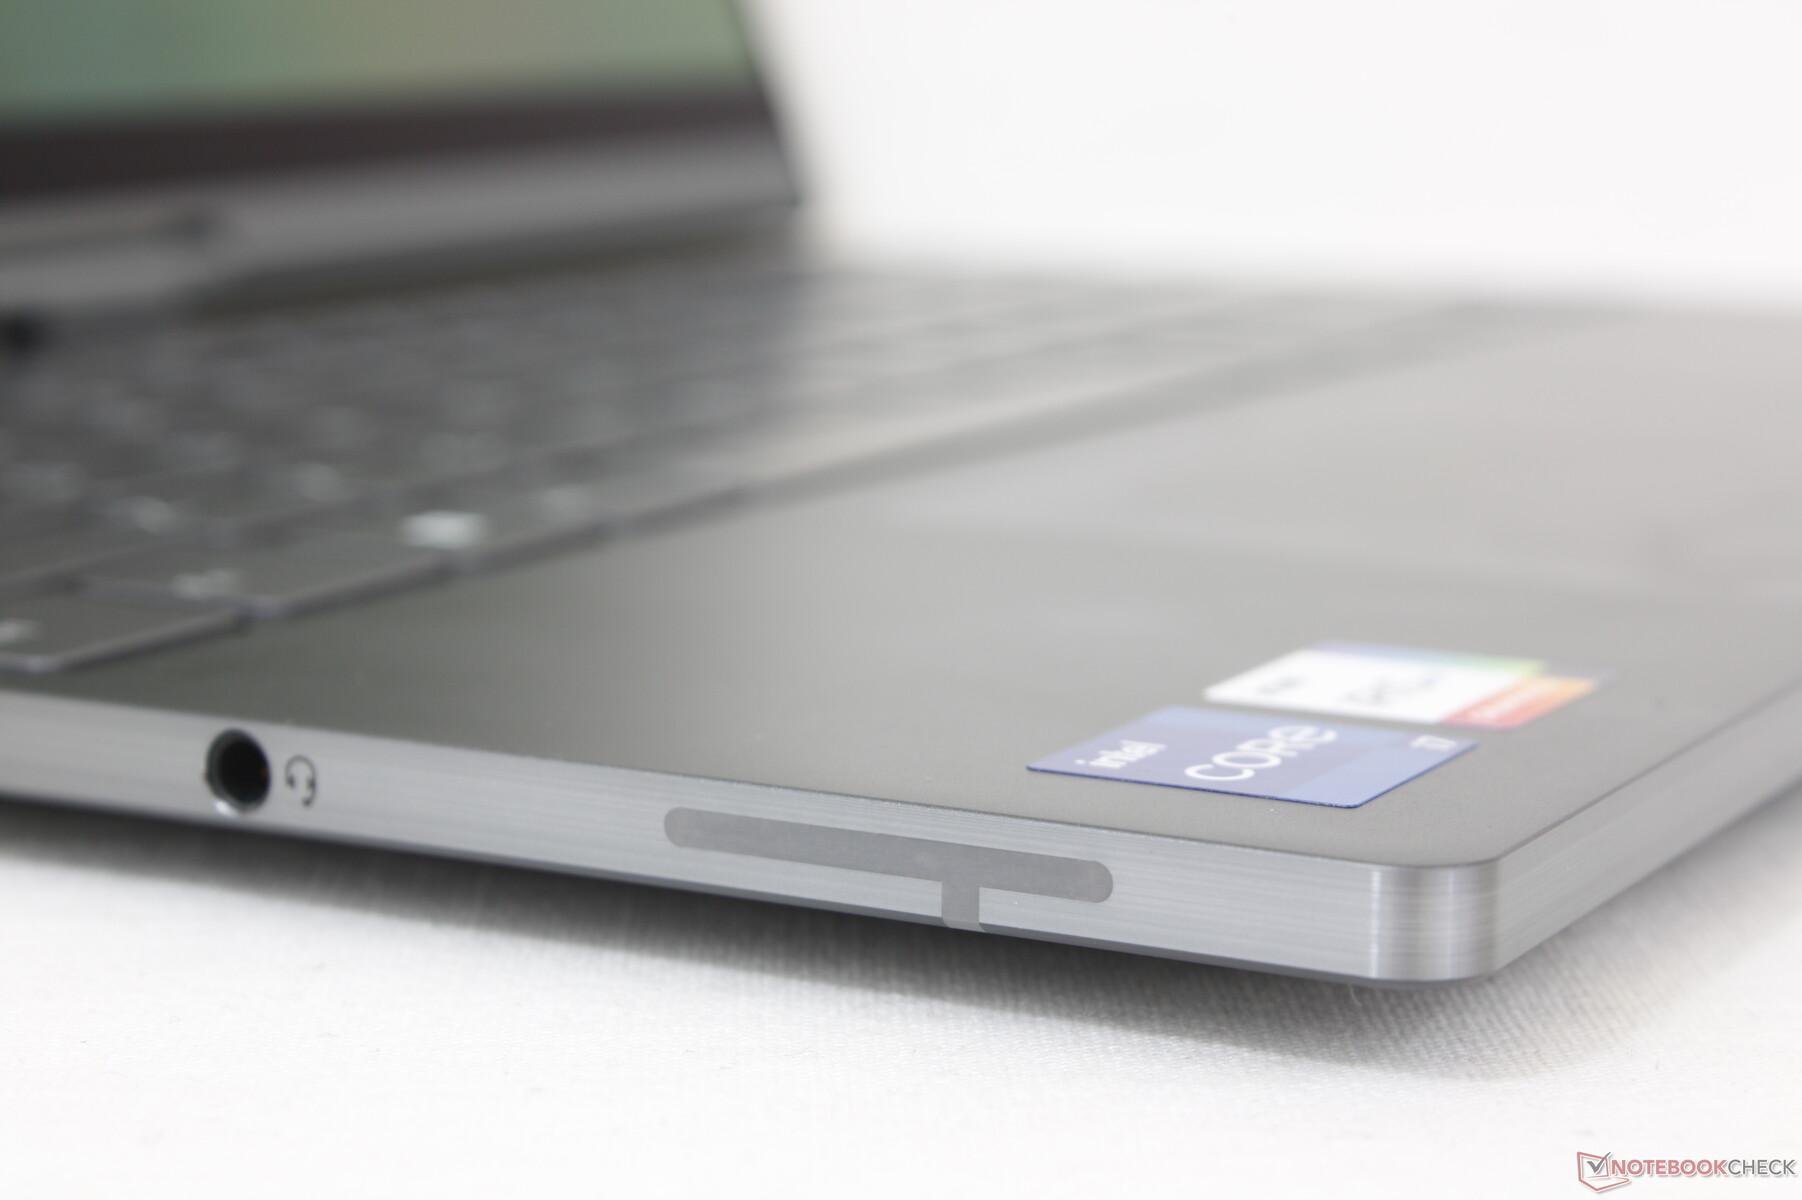
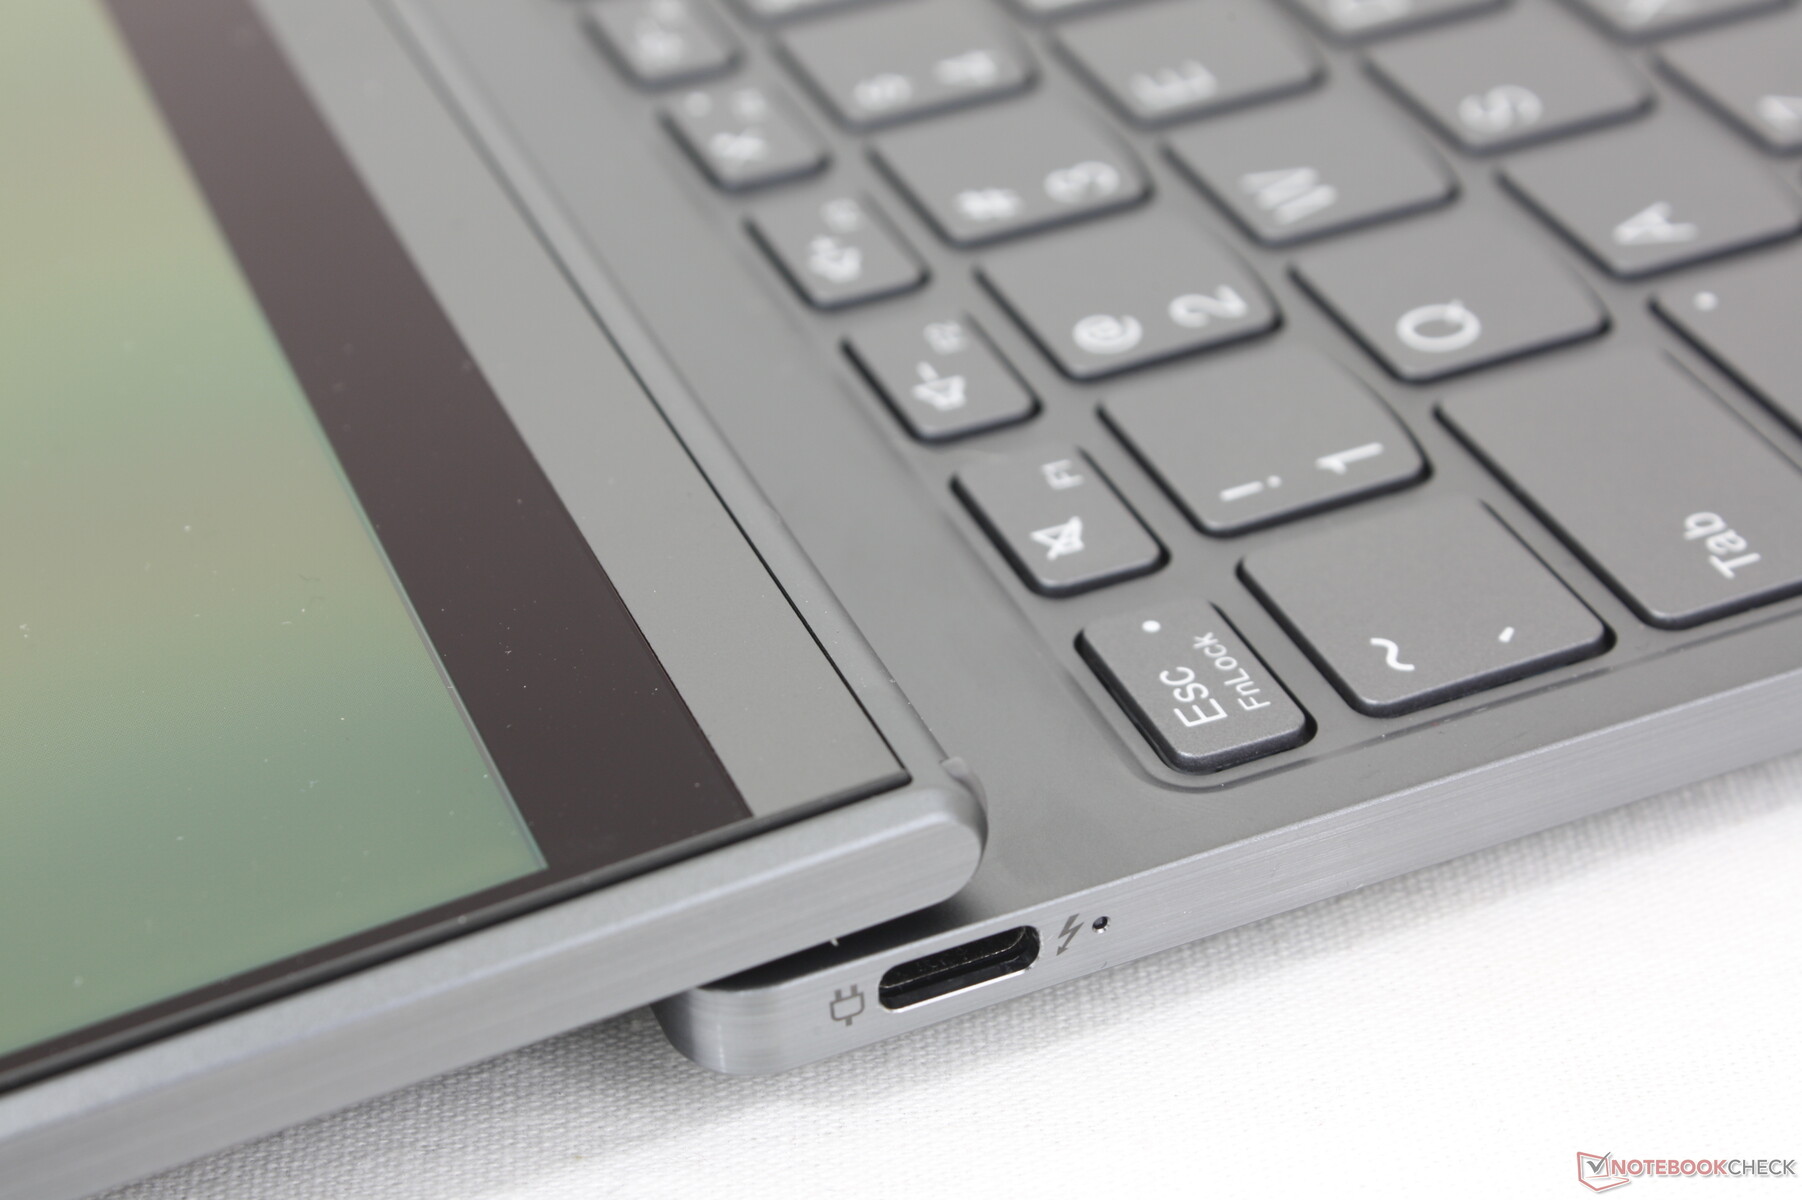
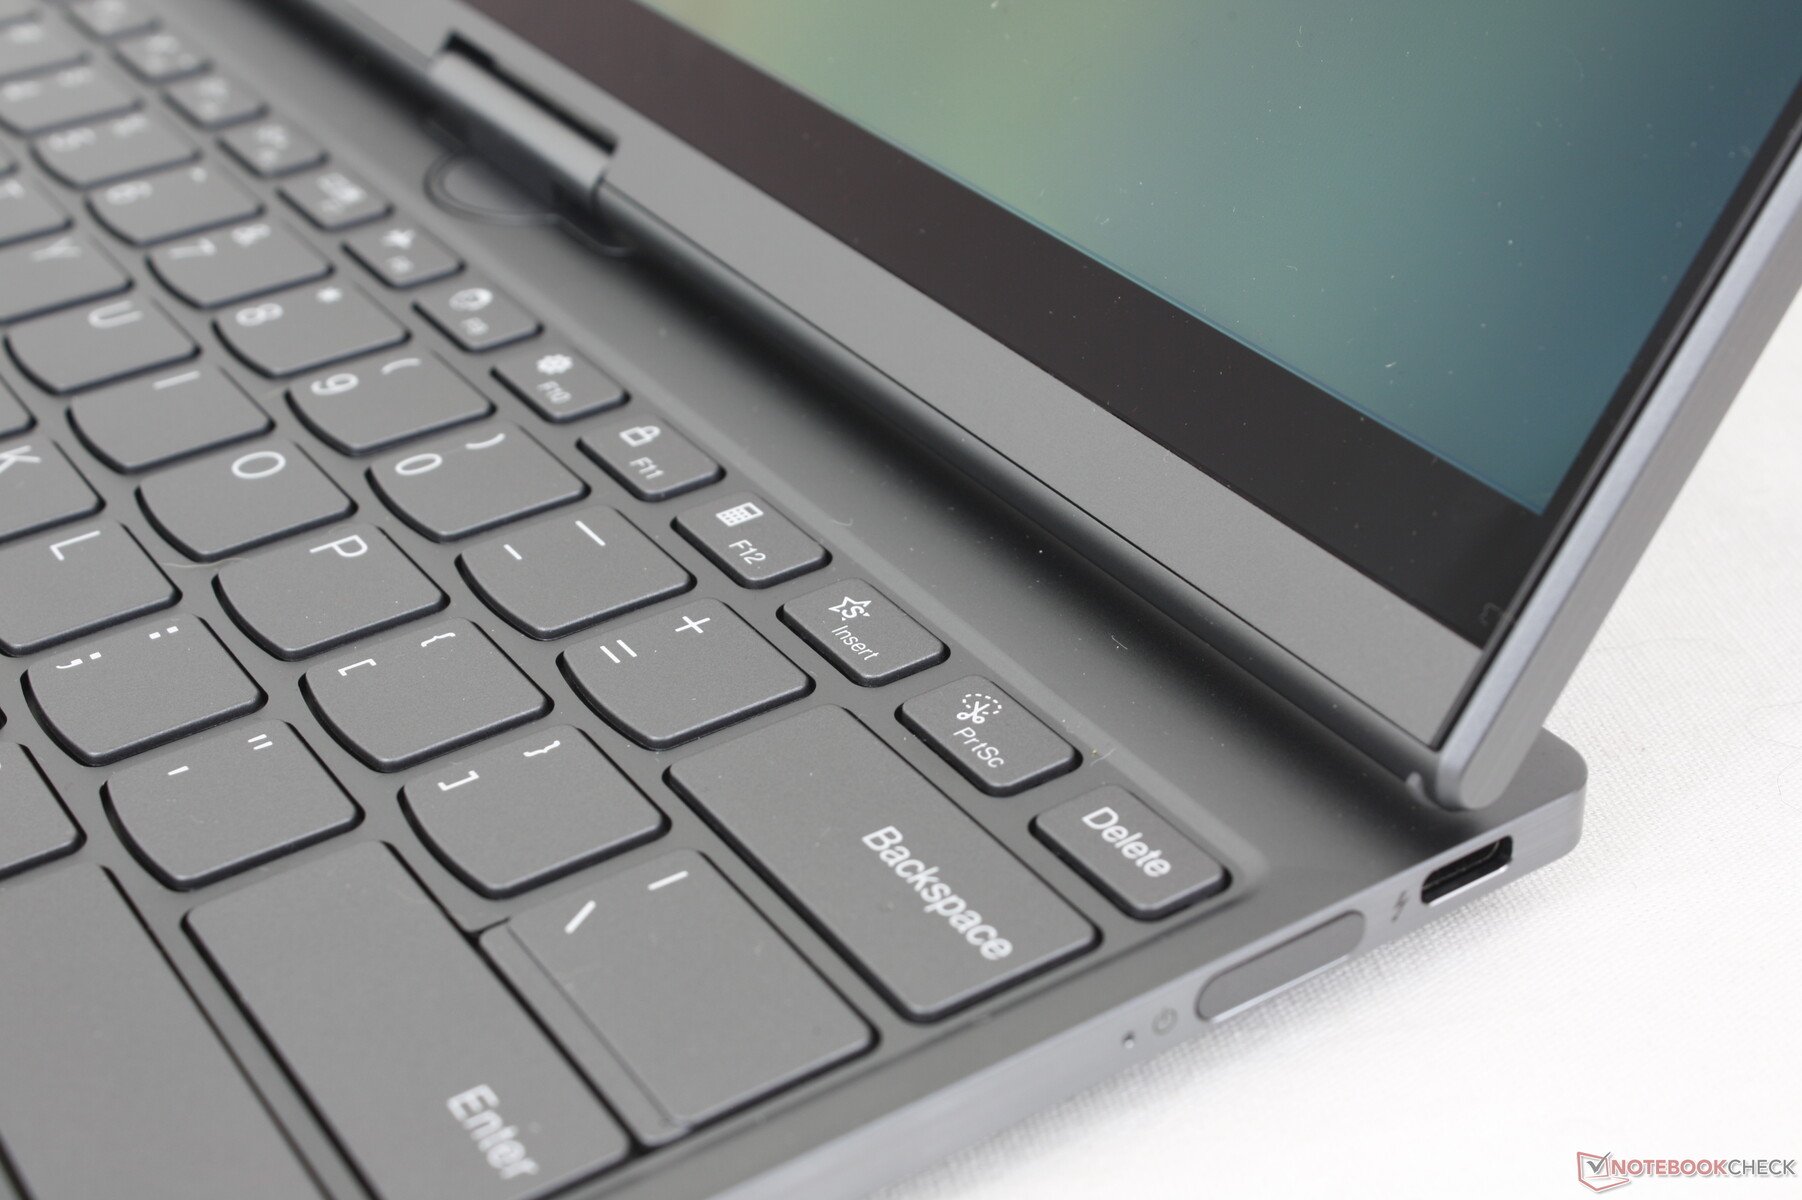
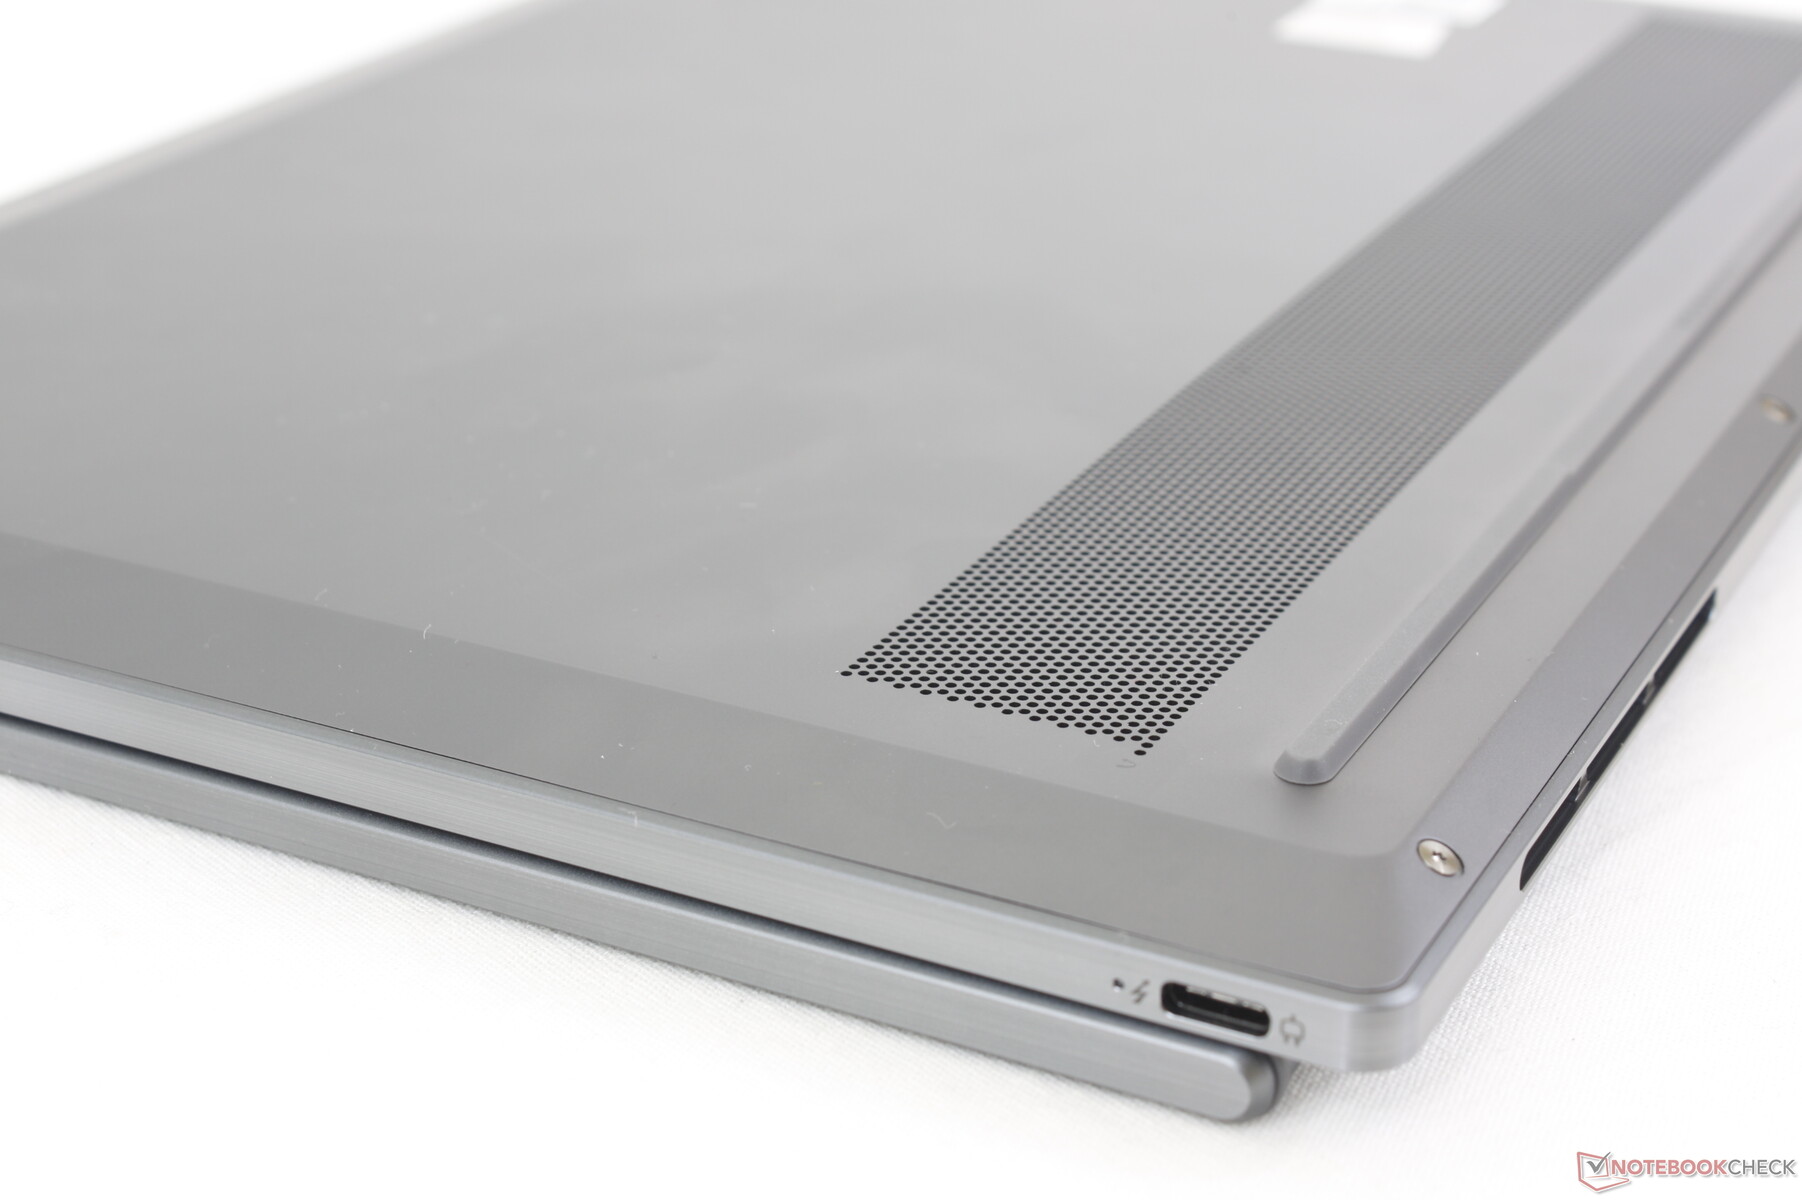
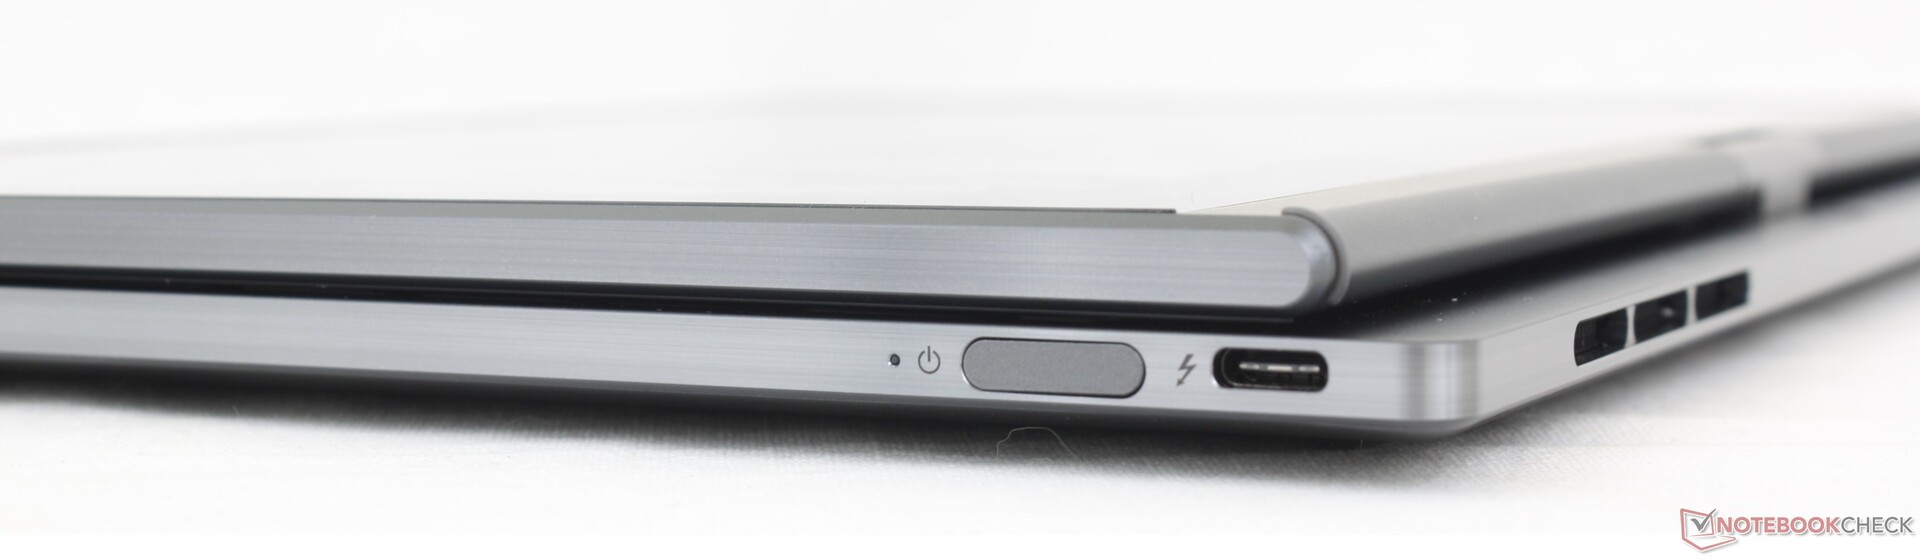
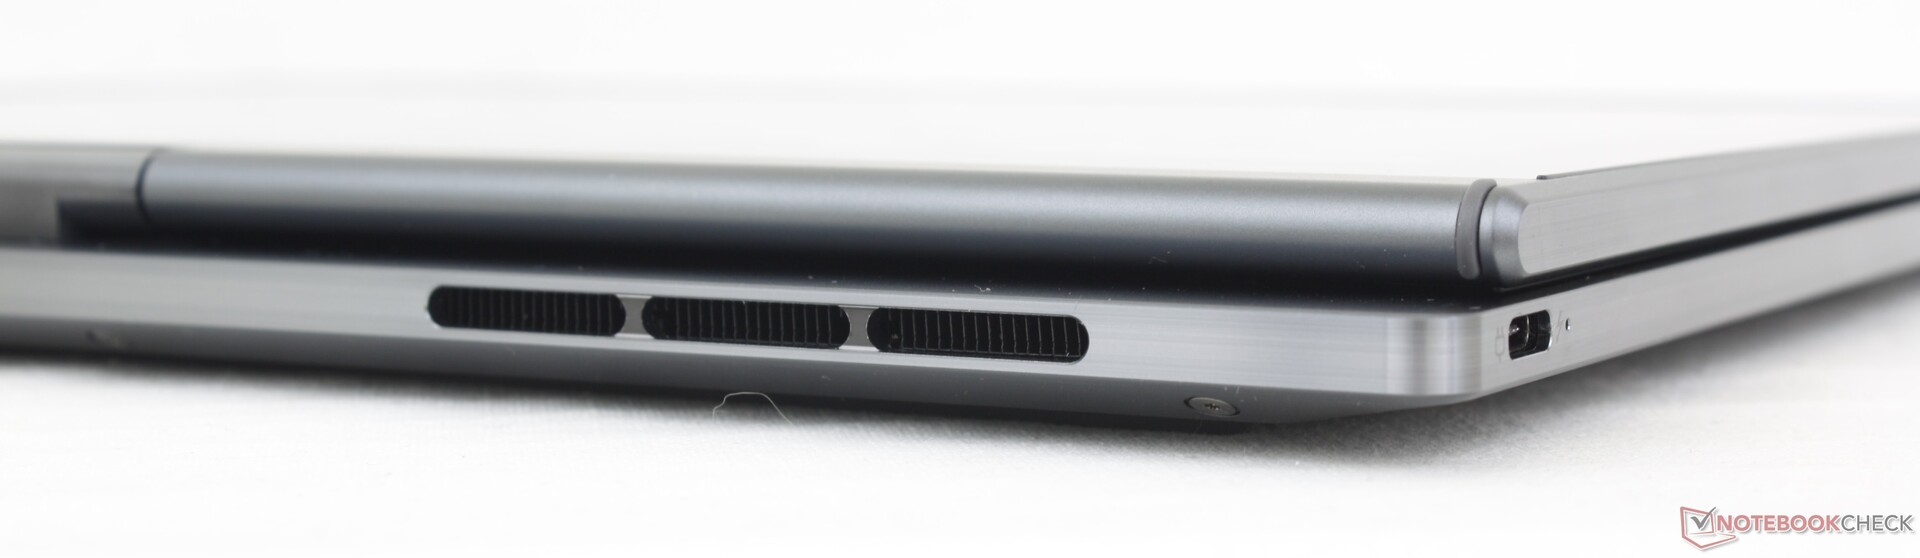
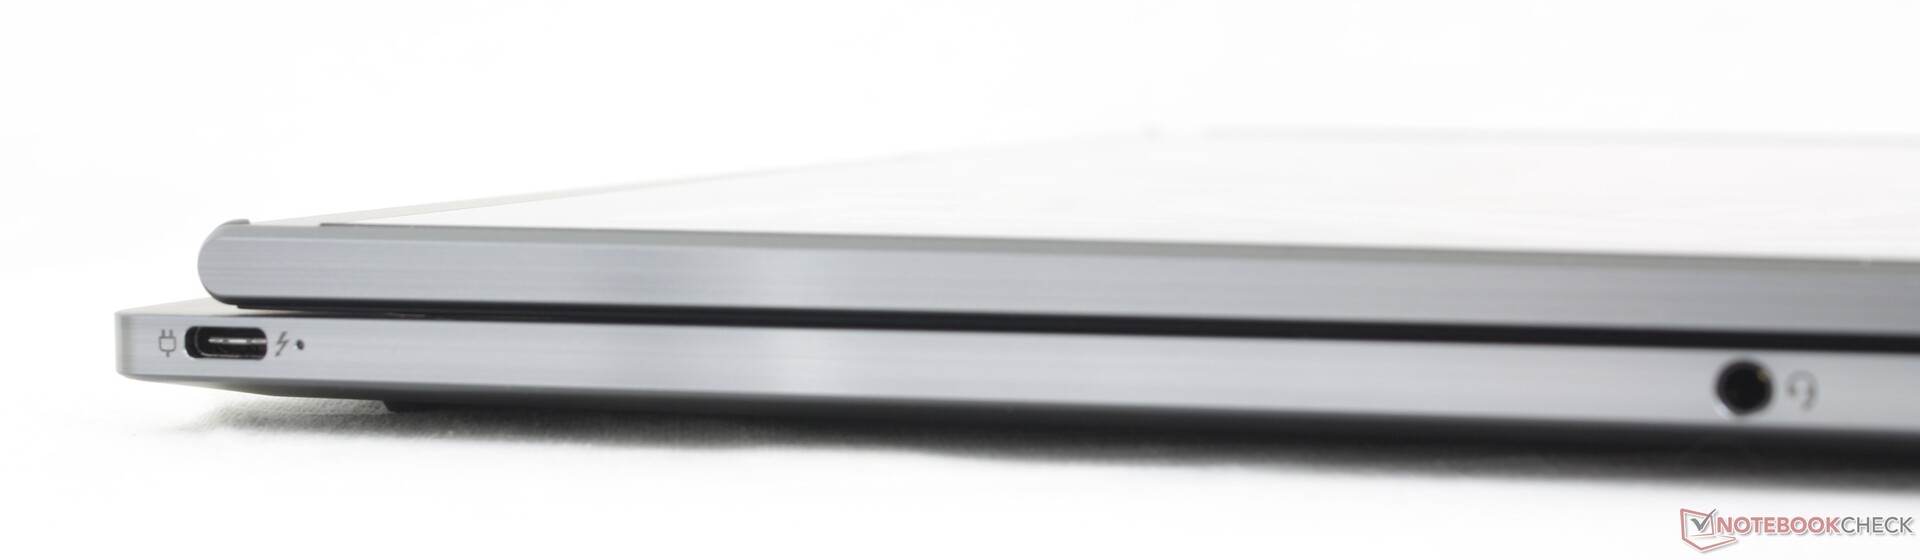
The model integrates just two Thunderbolt 4 ports and a 3.5 mm audio jack. The latter is notable as a few subnotebooks like the ZenBook 13 do not have headphone jacks at all. Be prepared to have adapters and docking stations ready if you plan on connecting USB-A or HDMI devices.
We appreciate that there is a USB-C port on each of the two sides of the laptop meaning you can charge the laptop from either side. This is in contrast to the Spectre x360 13.5 which can only charge via its right edge.
Communication
An Intel AX211 comes standard for Wi-Fi 6E and Bluetooth 5.2 support. Transfer rates are reliable and more or less steady when paired to our Asus AXE11000 6GHz test router.
4G LTE or 5G options are unfortunately not supported since this is not a ThinkPad.

| Networking | |
| iperf3 transmit AX12 | |
| MSI Summit E13 Flip Evo A11MT | |
| iperf3 receive AX12 | |
| MSI Summit E13 Flip Evo A11MT | |
| iperf3 transmit AXE11000 | |
| Asus ZenBook S13 OLED UX5304 | |
| Lenovo ThinkBook Plus Gen4 IRU | |
| Lenovo ThinkPad X1 Nano Gen 3 | |
| HP Dragonfly G4 | |
| Dell Latitude 9330 | |
| iperf3 receive AXE11000 | |
| Asus ZenBook S13 OLED UX5304 | |
| Lenovo ThinkPad X1 Nano Gen 3 | |
| Lenovo ThinkBook Plus Gen4 IRU | |
| HP Dragonfly G4 | |
| Dell Latitude 9330 | |
| iperf3 transmit AXE11000 6GHz | |
| Lenovo ThinkBook Plus Gen4 IRU | |
| Lenovo ThinkPad X1 Nano Gen 3 | |
| HP Dragonfly G4 | |
| Dell Latitude 9330 | |
| iperf3 receive AXE11000 6GHz | |
| Lenovo ThinkBook Plus Gen4 IRU | |
| Lenovo ThinkPad X1 Nano Gen 3 | |
| HP Dragonfly G4 | |
| Dell Latitude 9330 | |
Webcam
A 2 MP webcam with sliding shutter and IR come standard. Competitors like HP have already begun shipping laptops with 5 MP and even 8 MP sensors for sharper images.


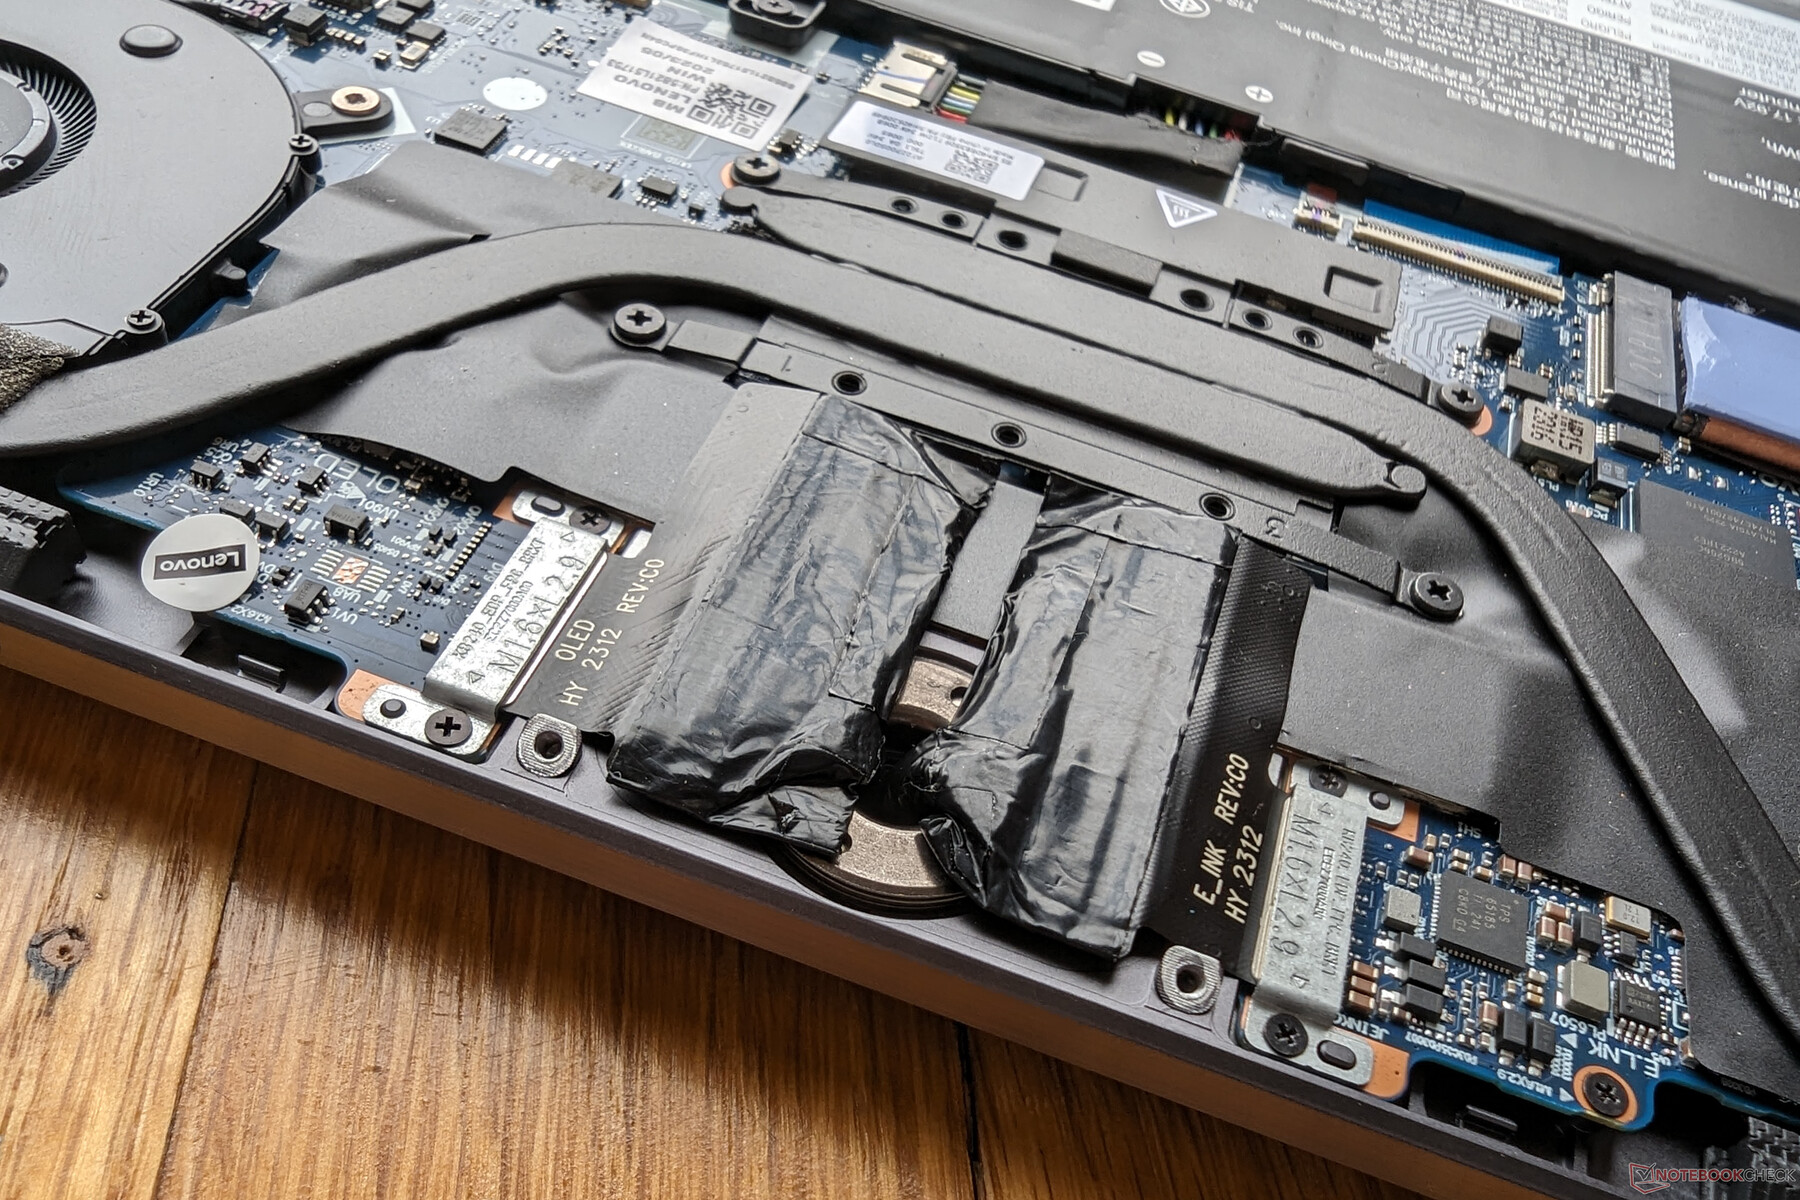
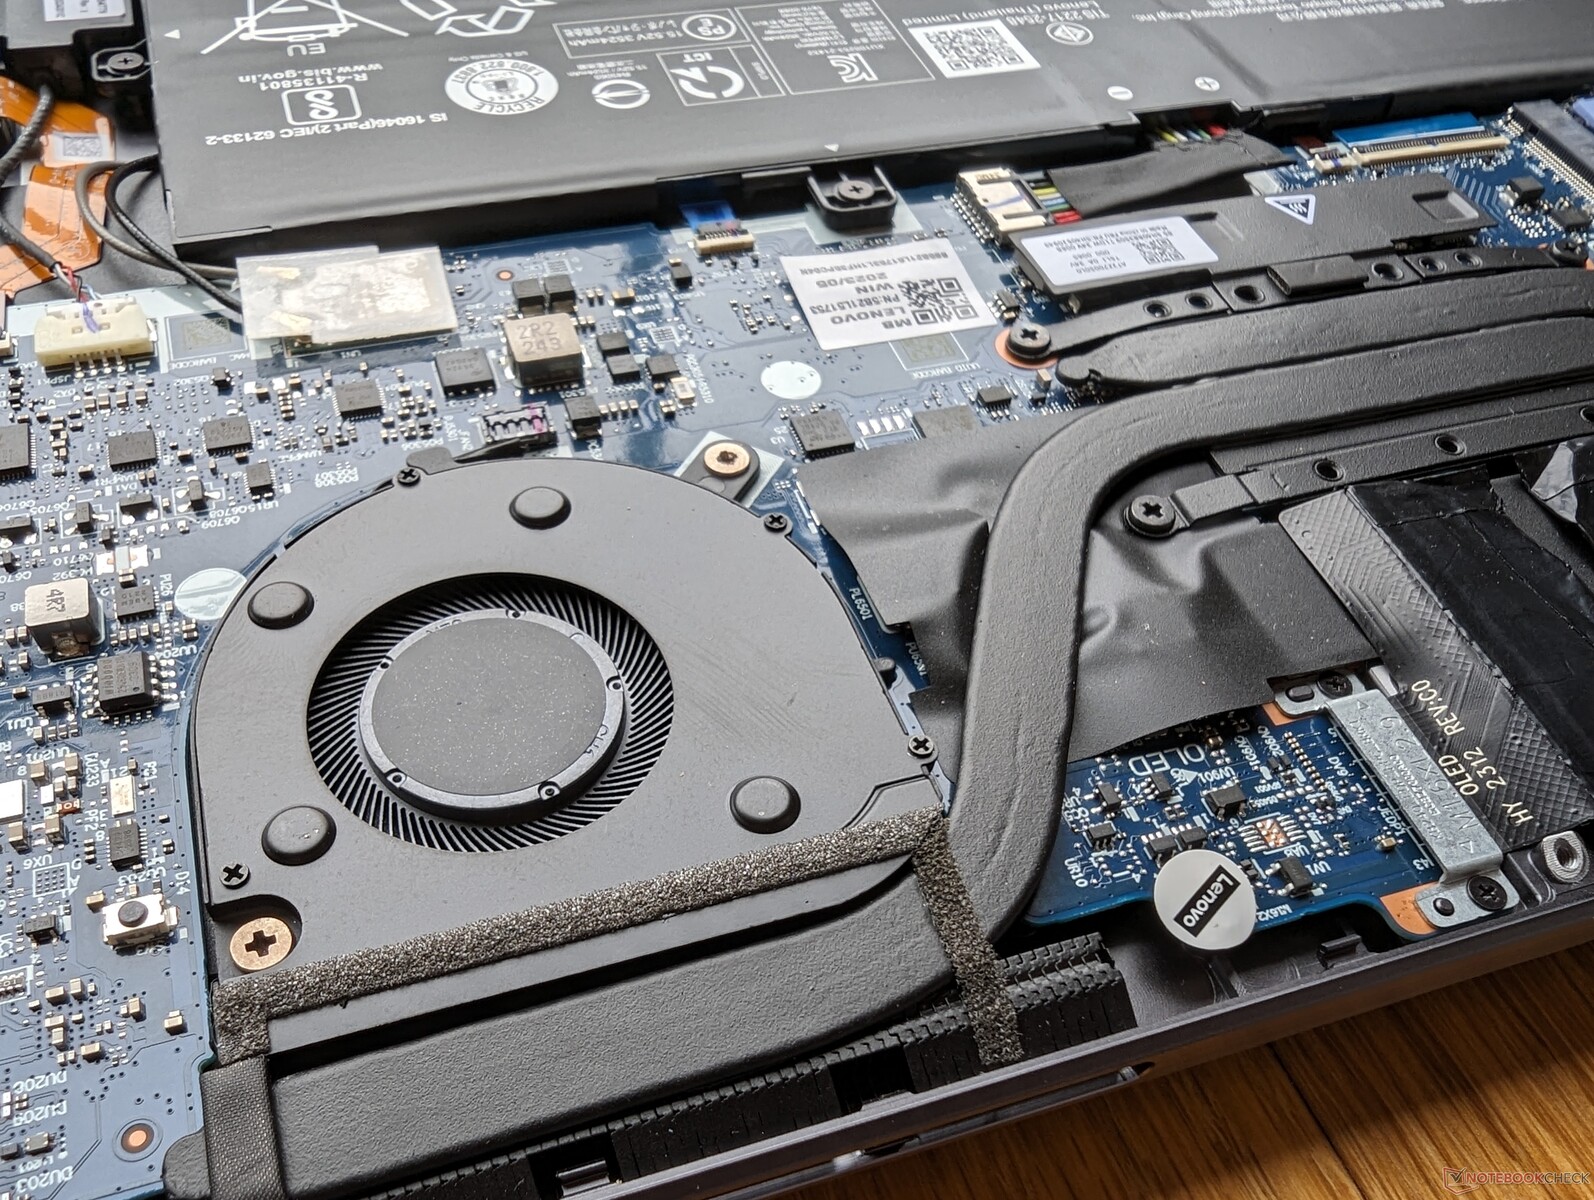
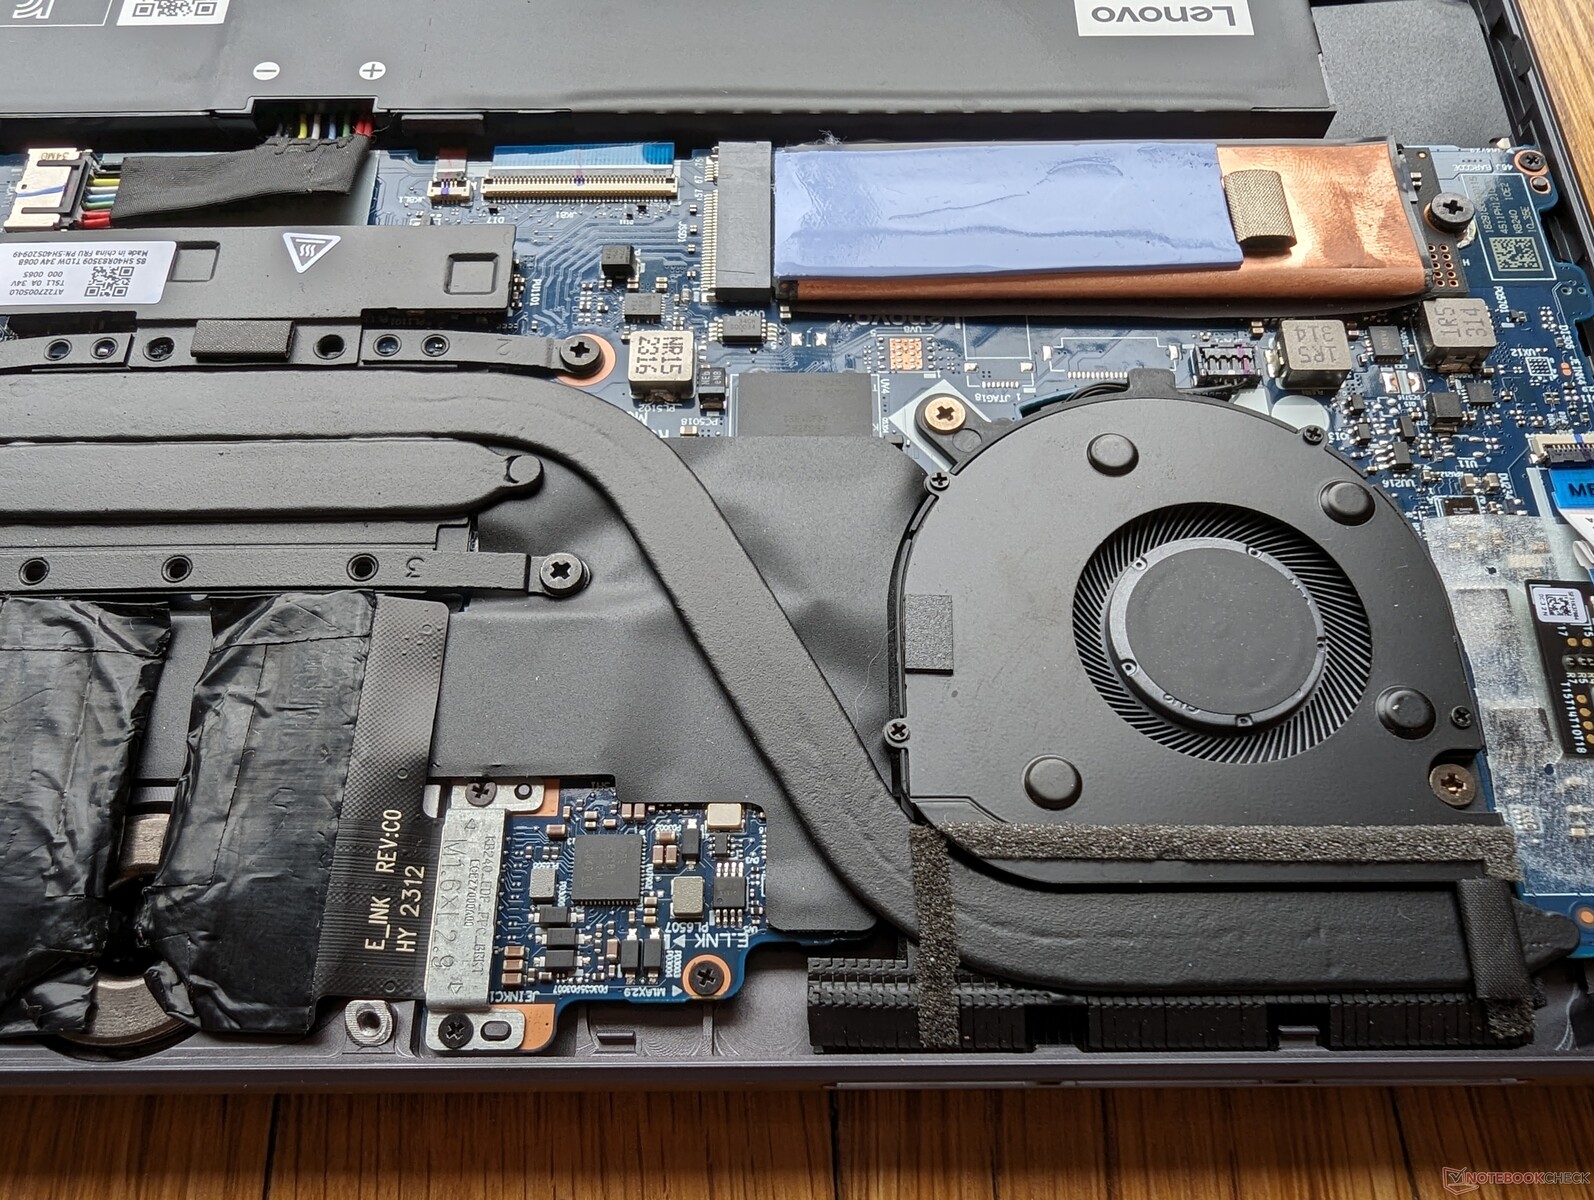
Maintenance
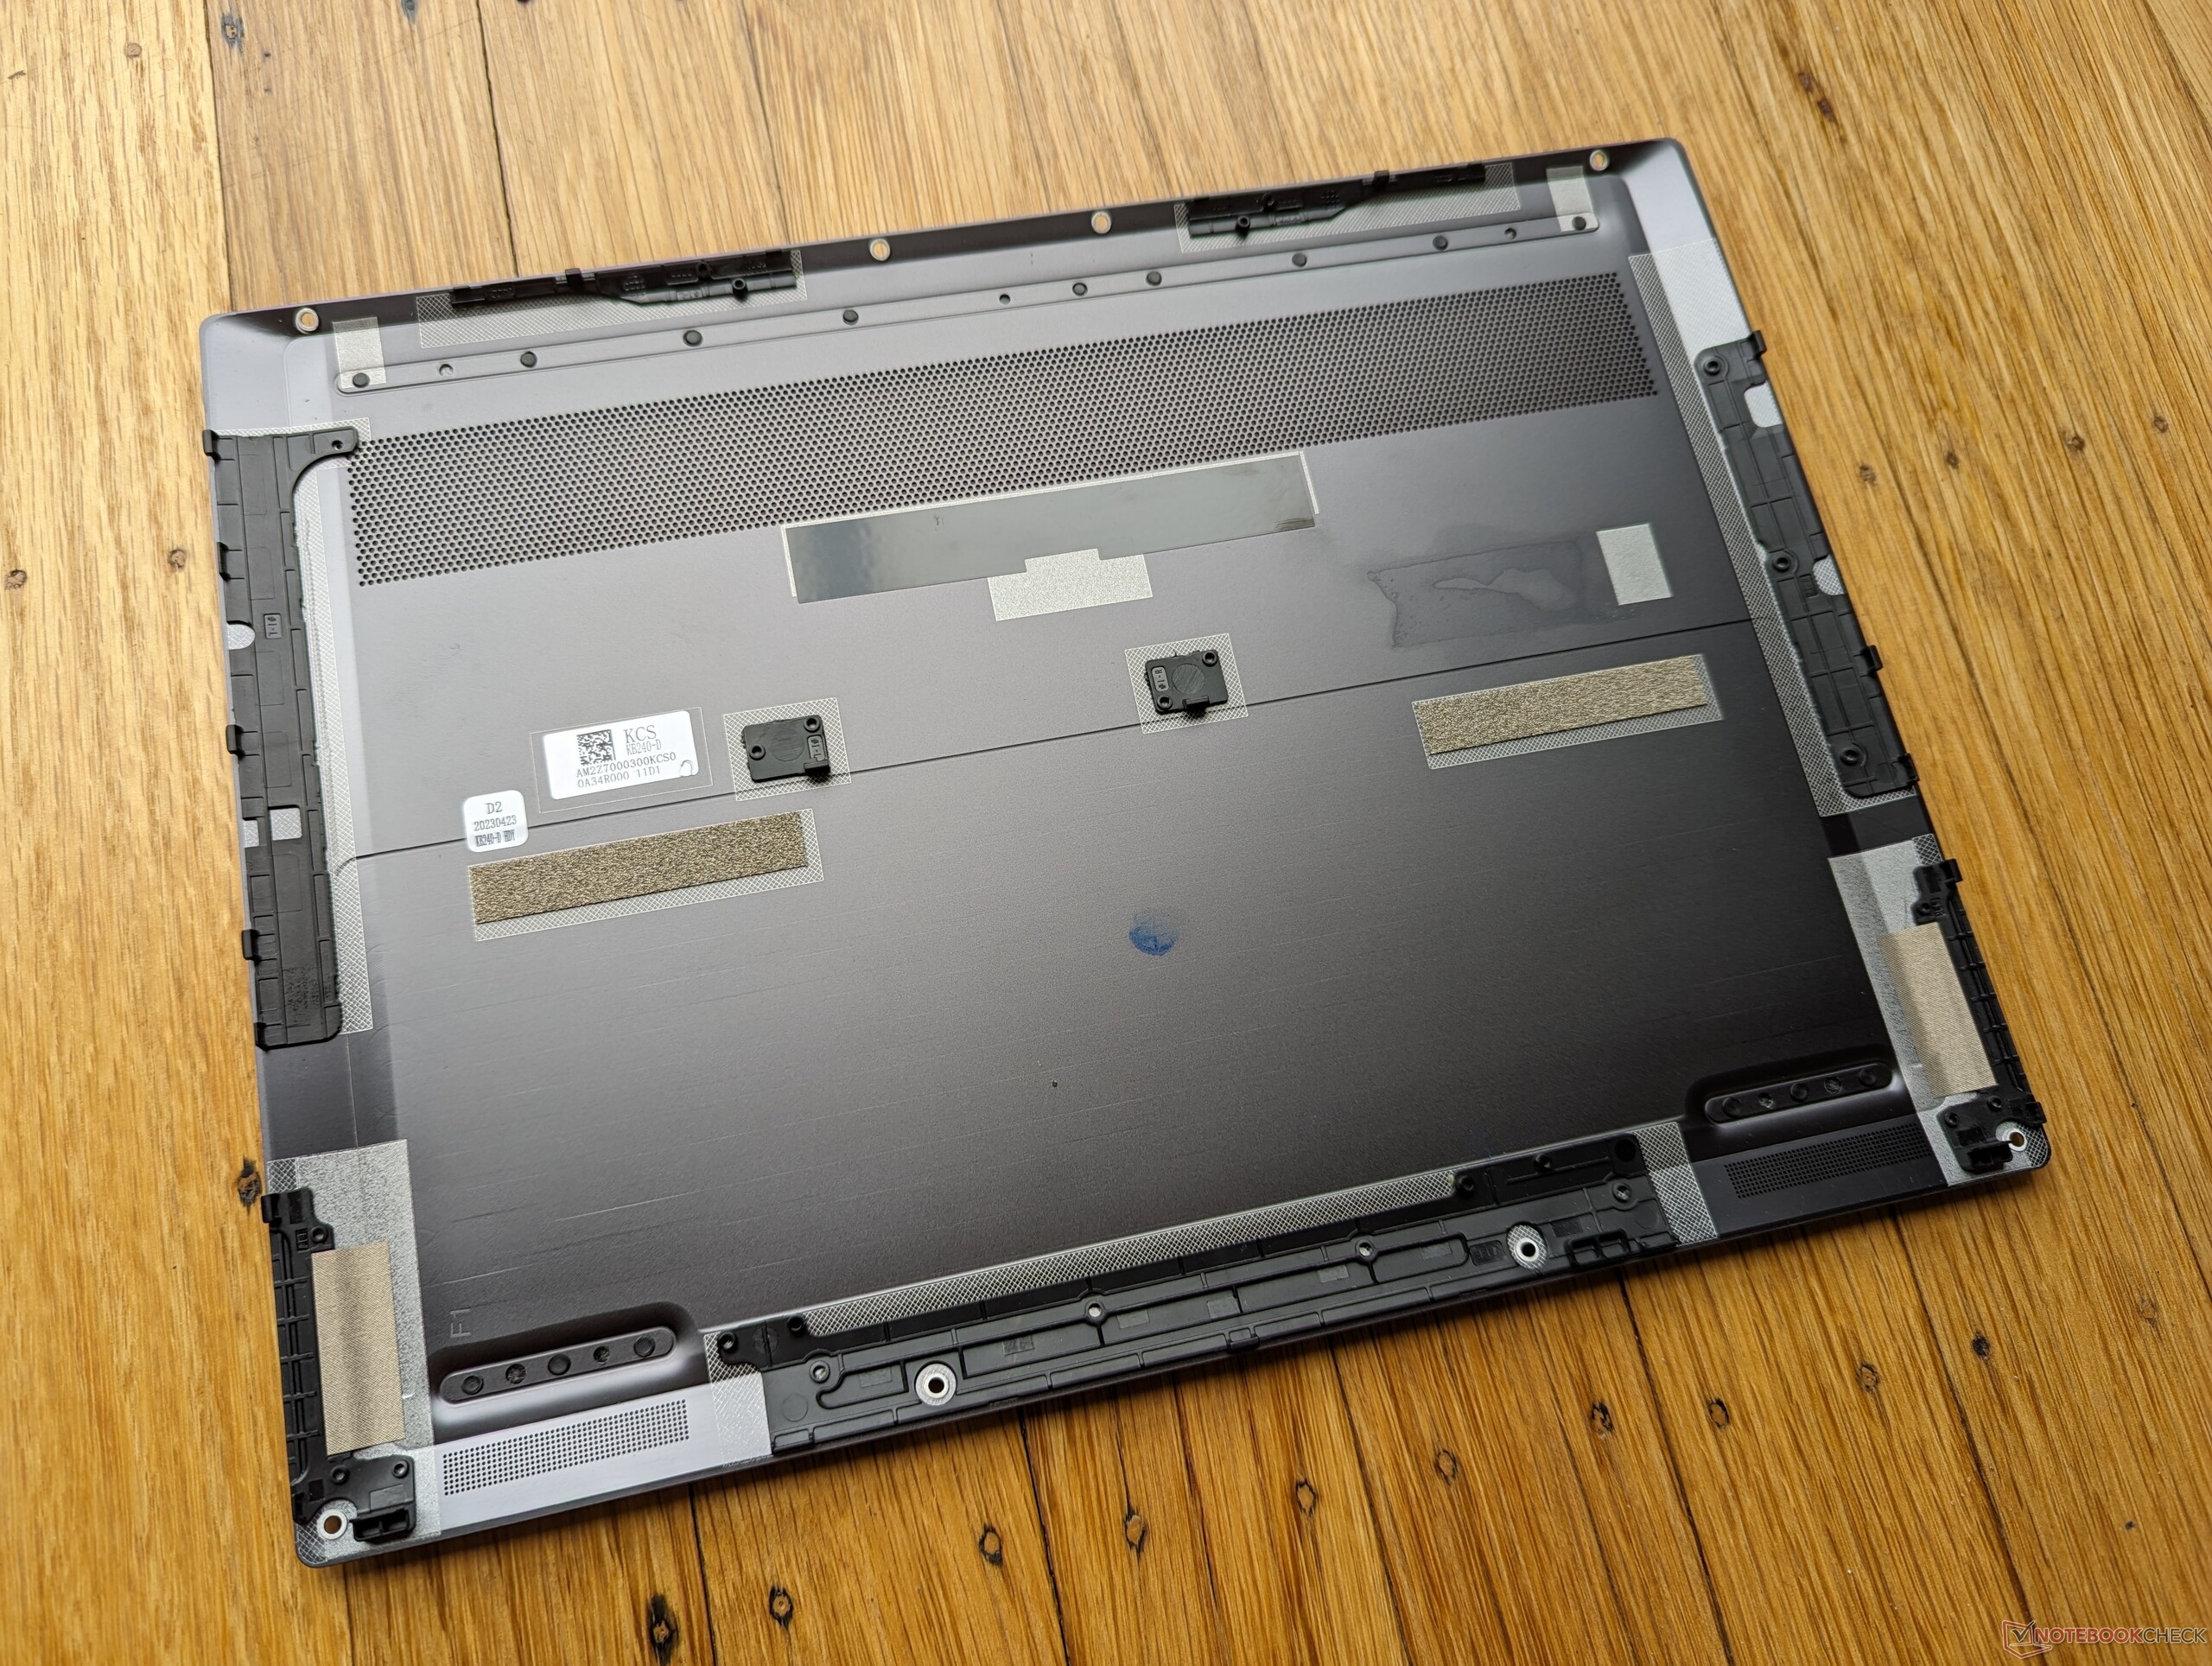
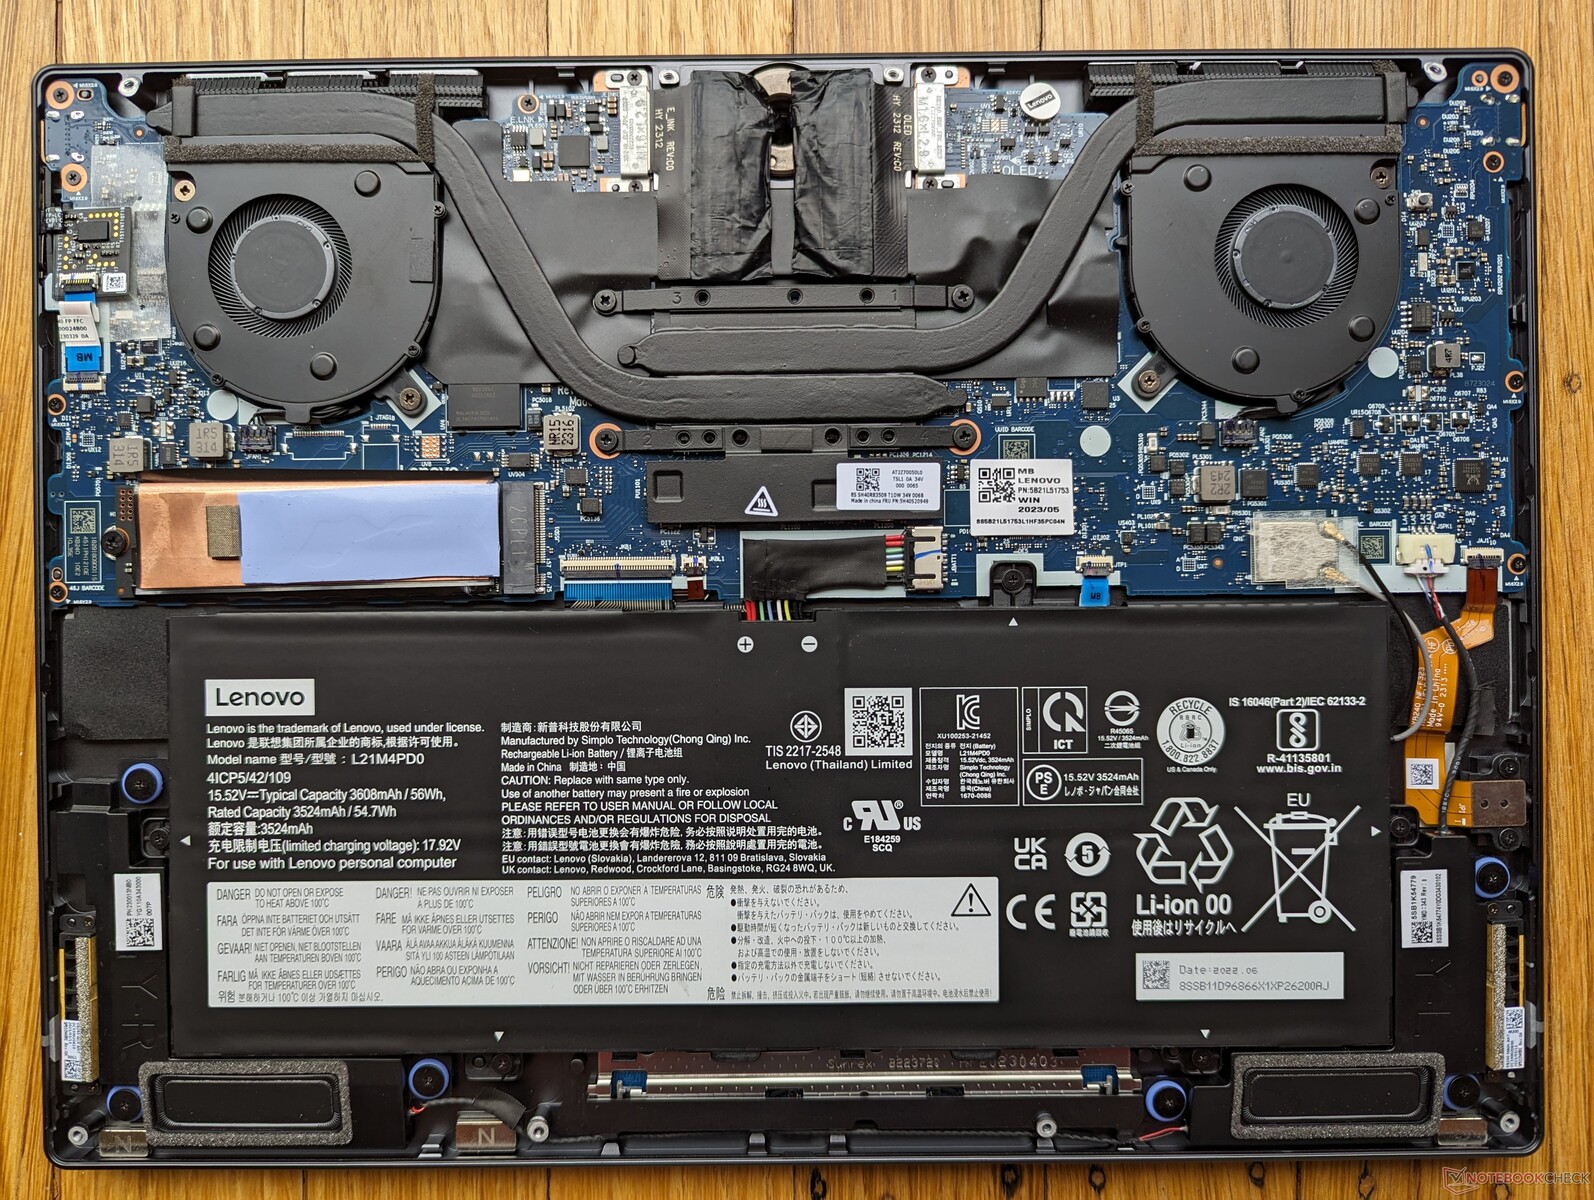
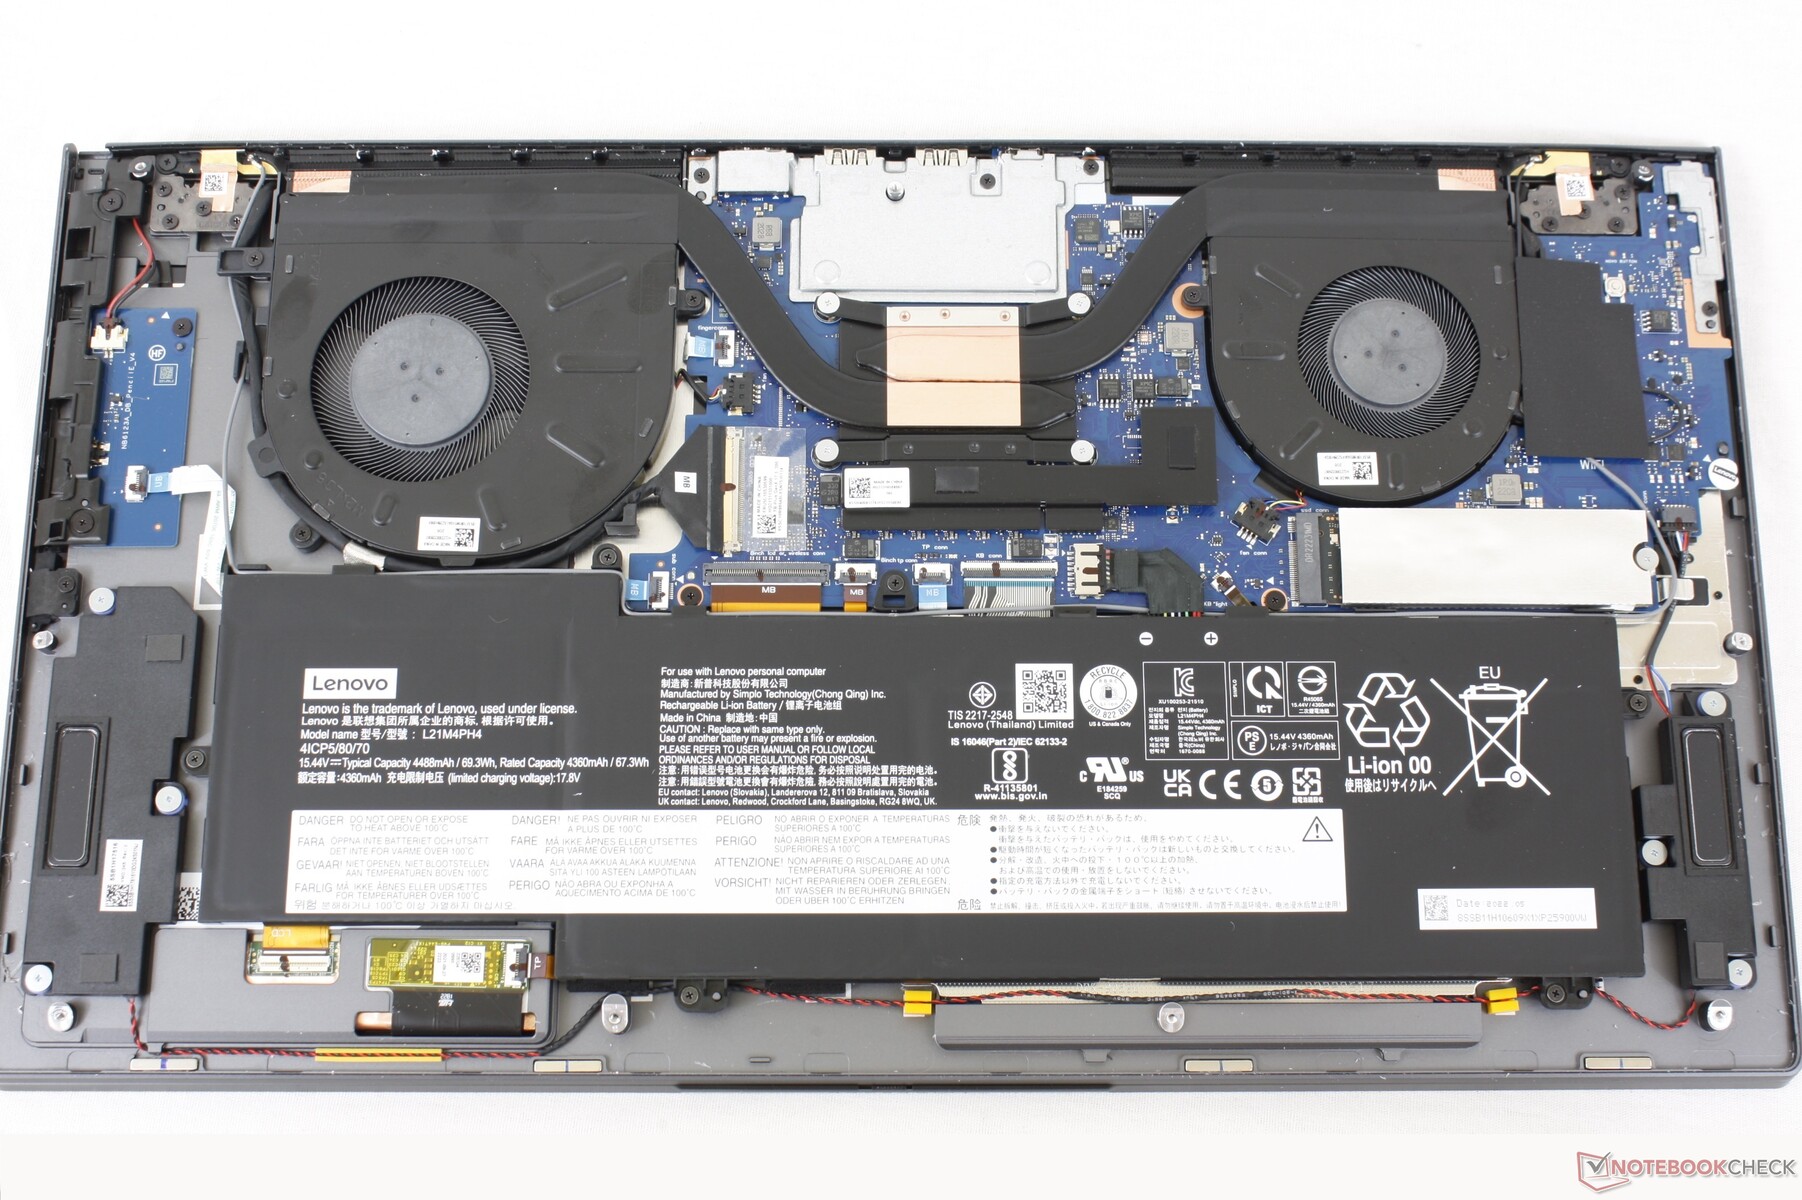
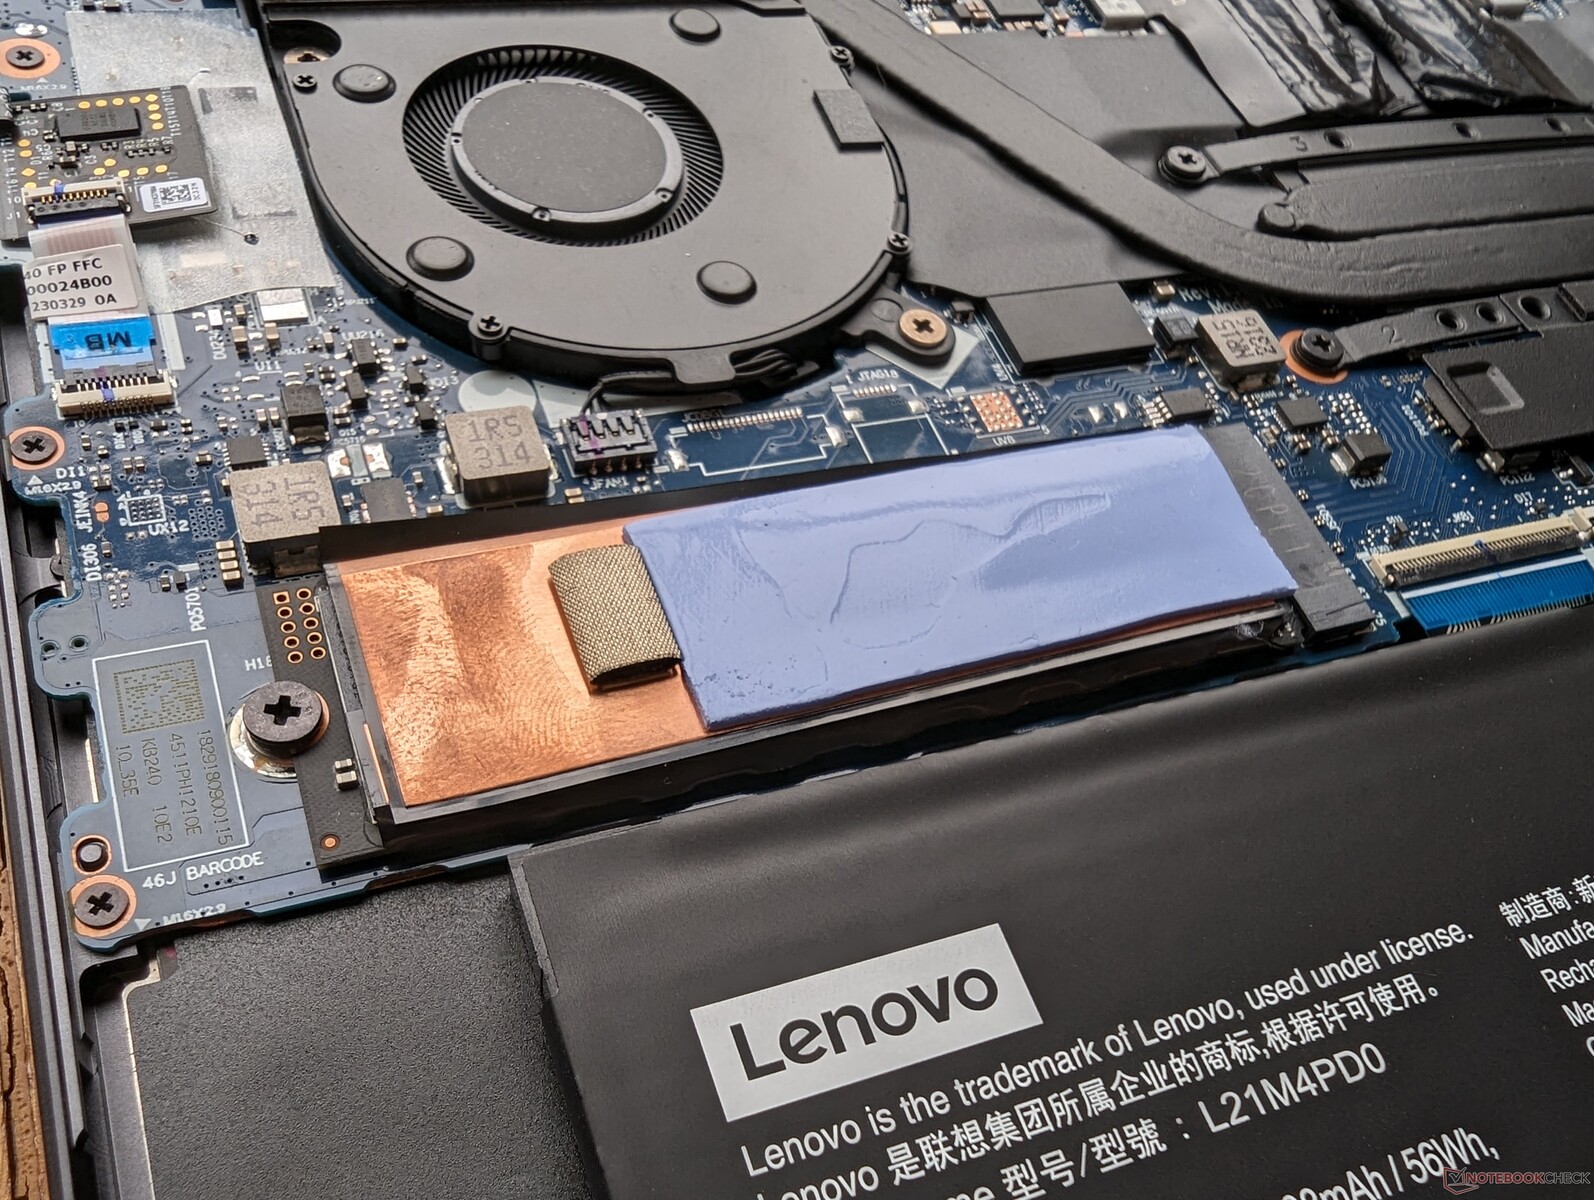
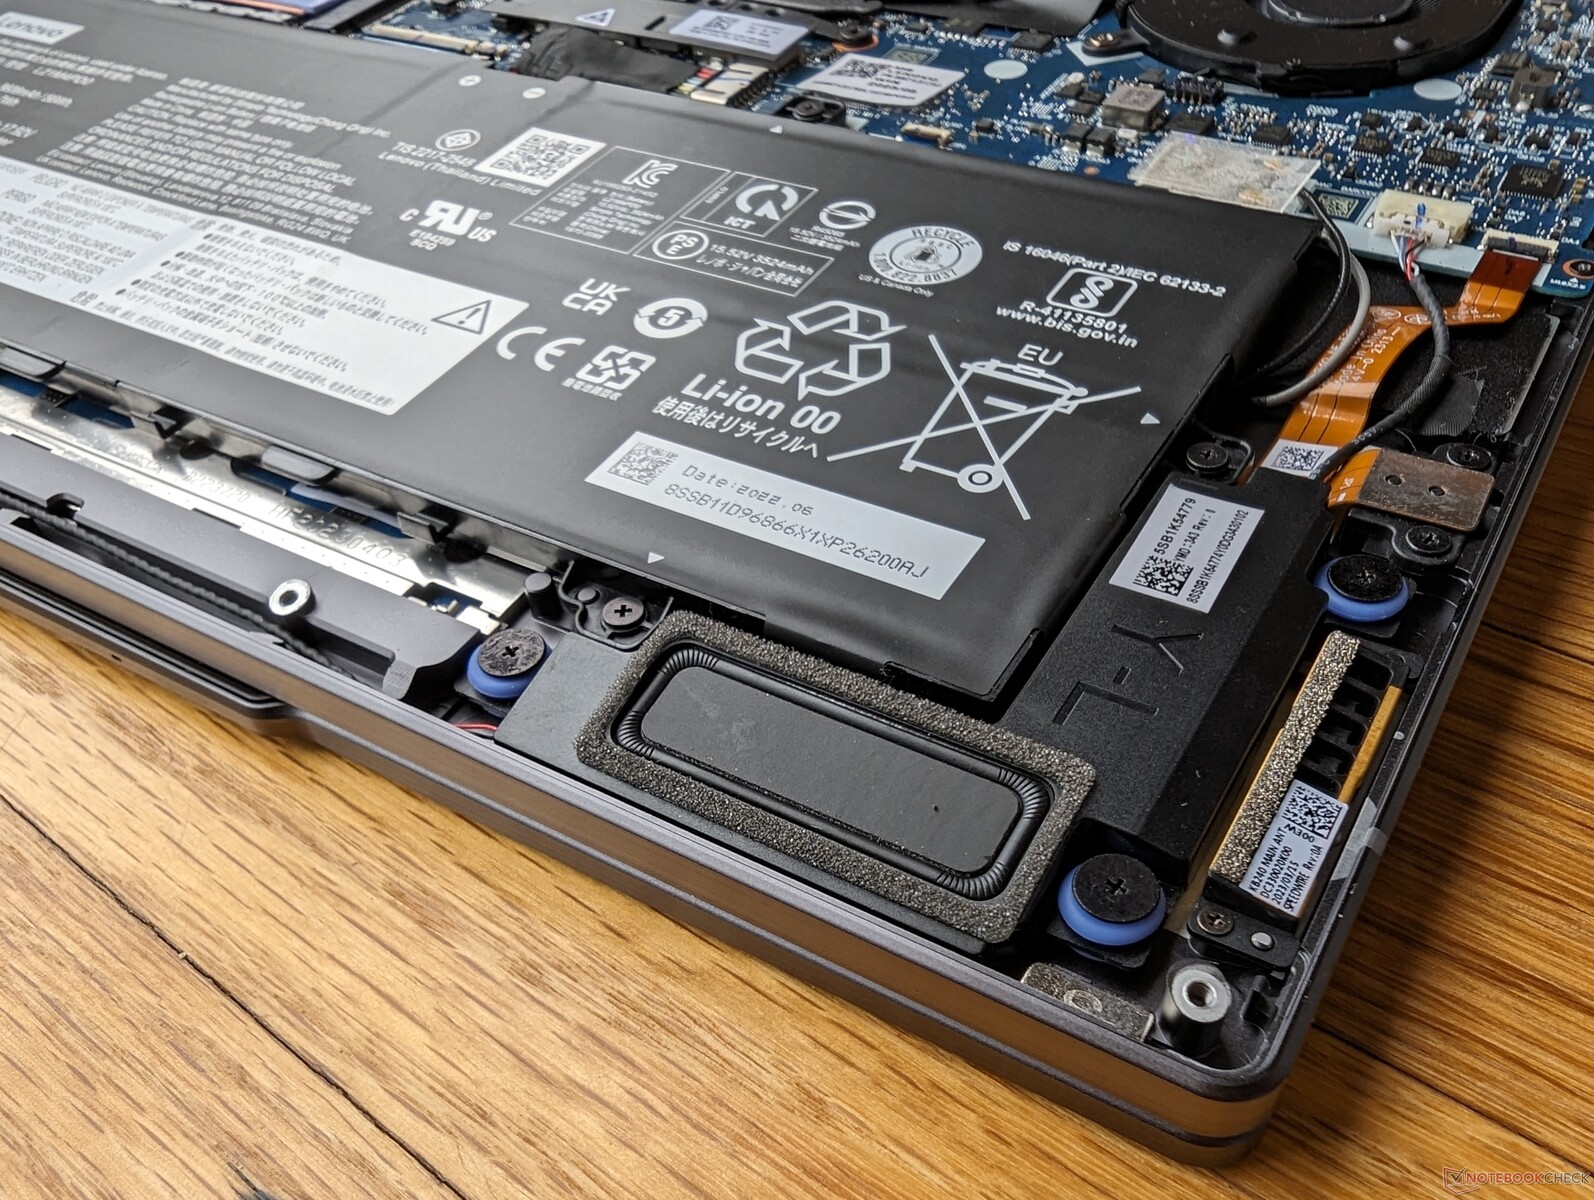
The bottom panel is secured by eight T5 Torx screws for relatively quick servicing. Even so, there isn't much to upgrade as only the M.2 SSD and battery are easily removable which is a common property of convertible laptops.
Accessories And Warranty
The retail box includes a Lenovo Digital Pen 2 and AAAA battery alongside the usual paperwork and AC adapter. There are unfortunately no magnets on the laptop for attaching or securing the stylus and so you'll have to keep it in your pocket or bag for safer transport.
A one-year limited manufacturer warranty applies if purchased in the US.
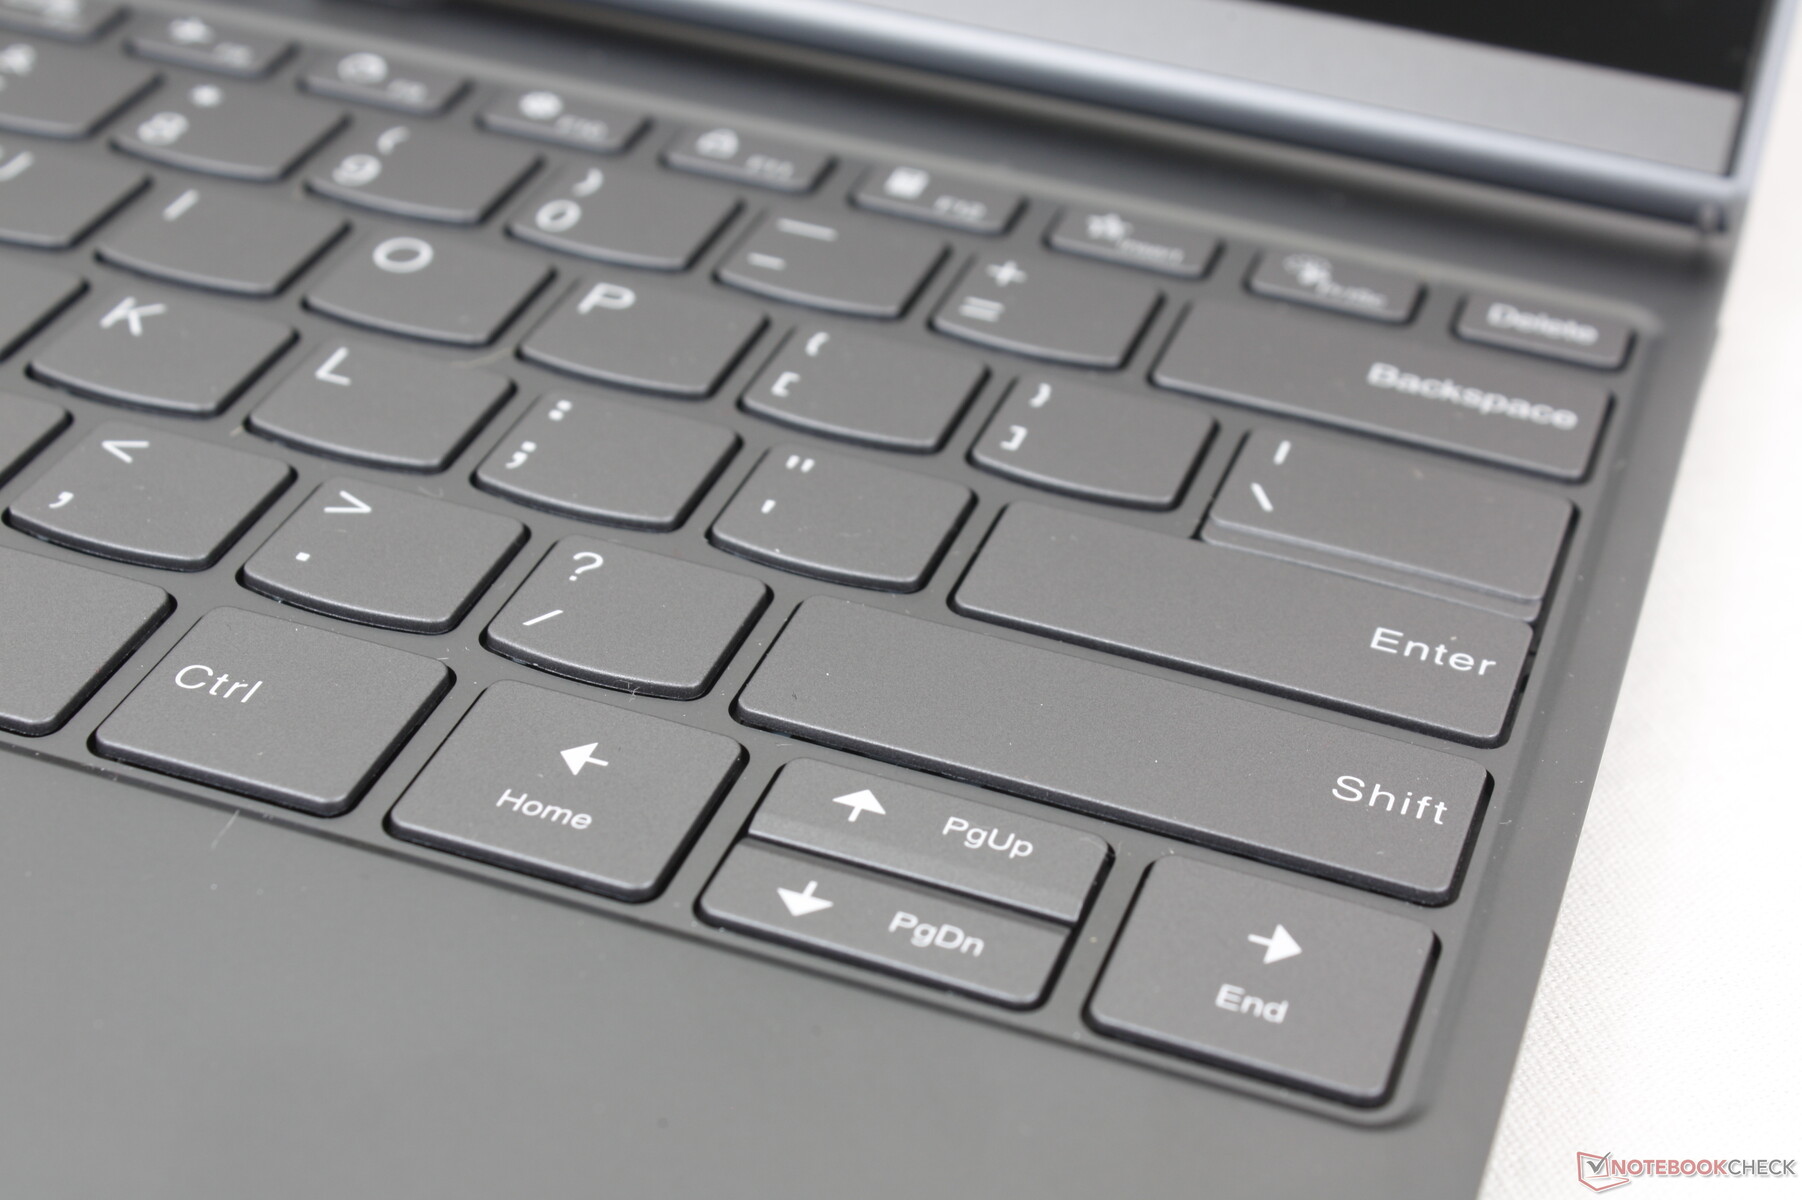
Input Devices — Could Be Better
Keyboard
The keyboard is a mixed bag as it almost feels like it has taken a backseat to the displays. More specifically, the keys are spongier than we are used to even when compared to other IdeaPad models. The Space key is especially frustrating as its right half would feel spongier than the left half when pressed. Meanwhile, the Enter and Backspace keys are shallower than we would like. Lenovo is generally very good when it comes to keyboards on ThinkPads and so it's a bit disappointing to see them drop the ball on the ThinkBook Plus Gen 4.
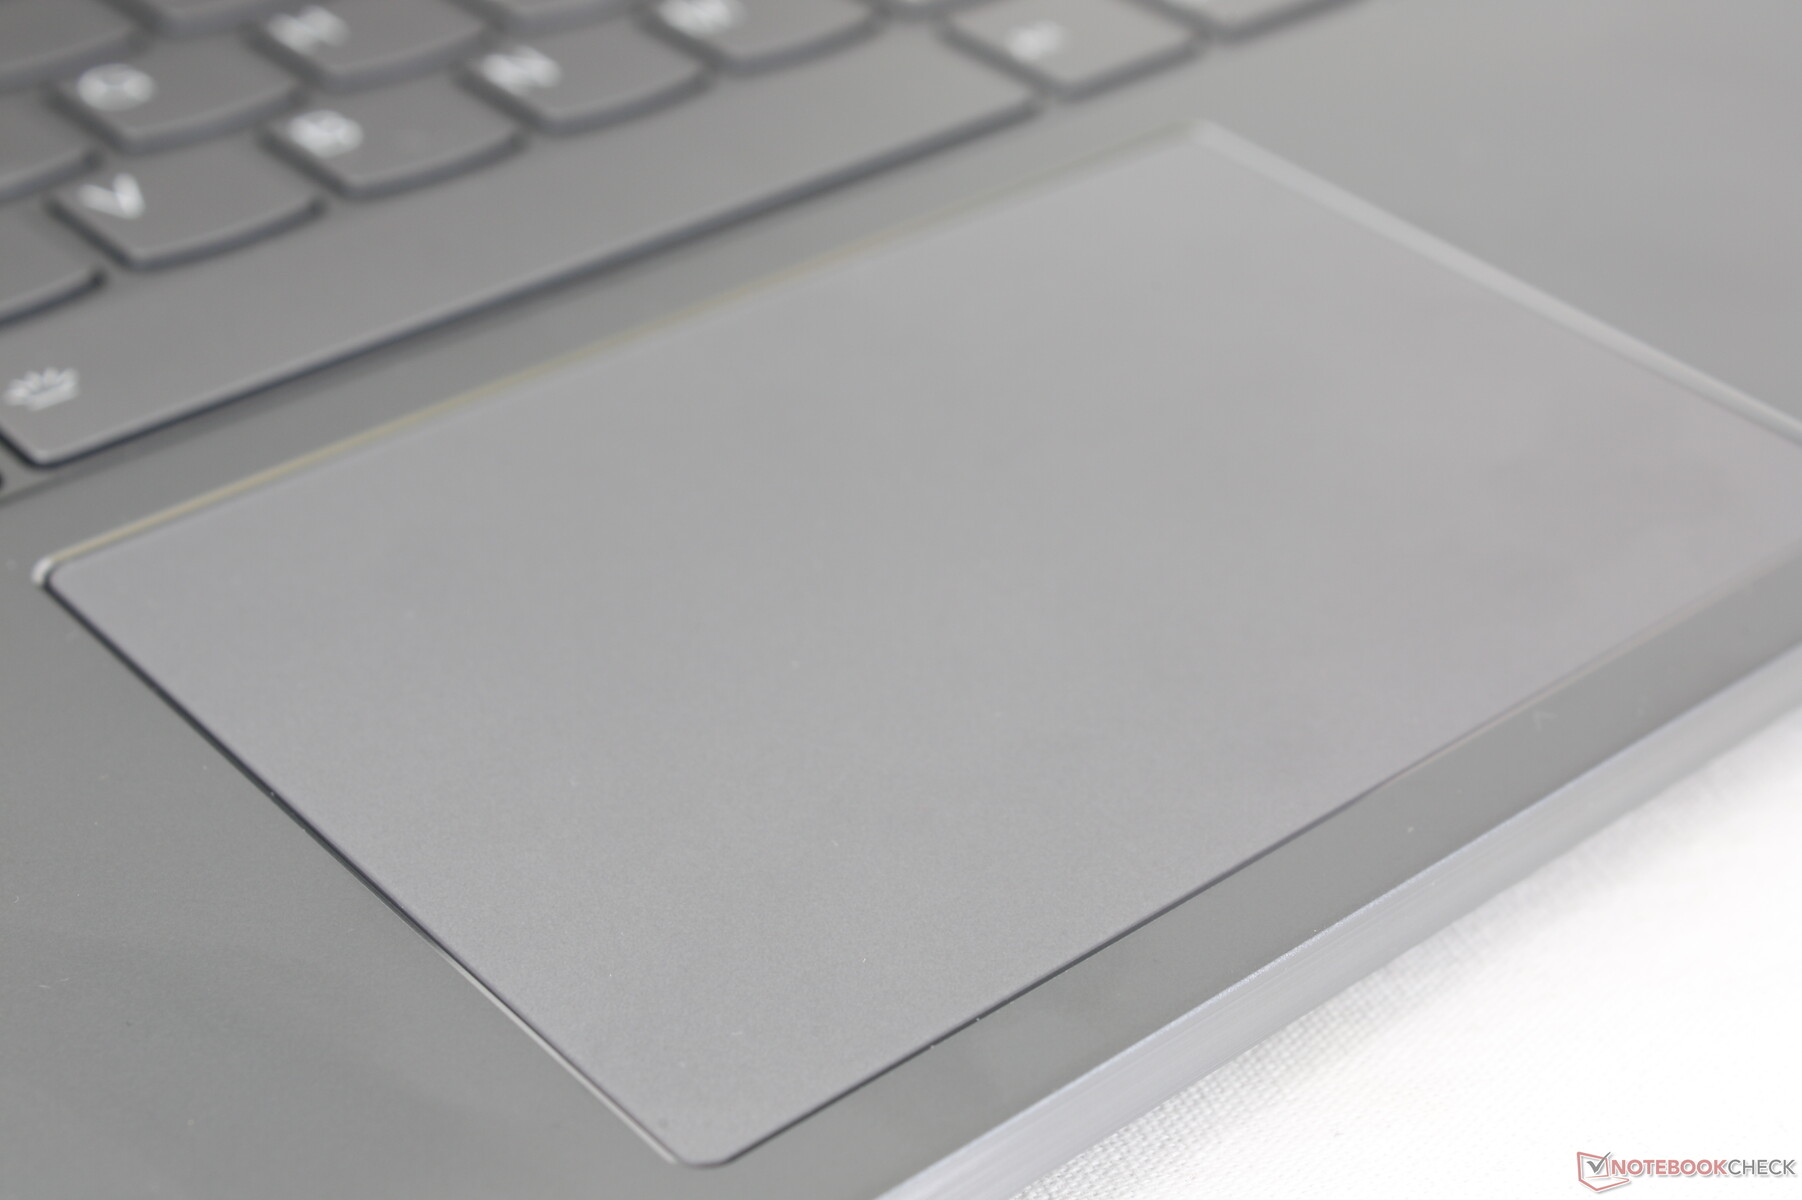
Touchpad
The clickpad (10.5 x 7 cm) is larger than the one on the ThinkPad X1 Nano Gen 3 (10 x 5.6 cm) while being smaller than on the Dragonfly G4 (12 x 8 cm). It is very clicky when pressed for more satisfying feedback than the softer or spongier clickpads on most other laptops. Clatter is sharper and louder as a result, but the trade-off is well worth the clickier feedback.


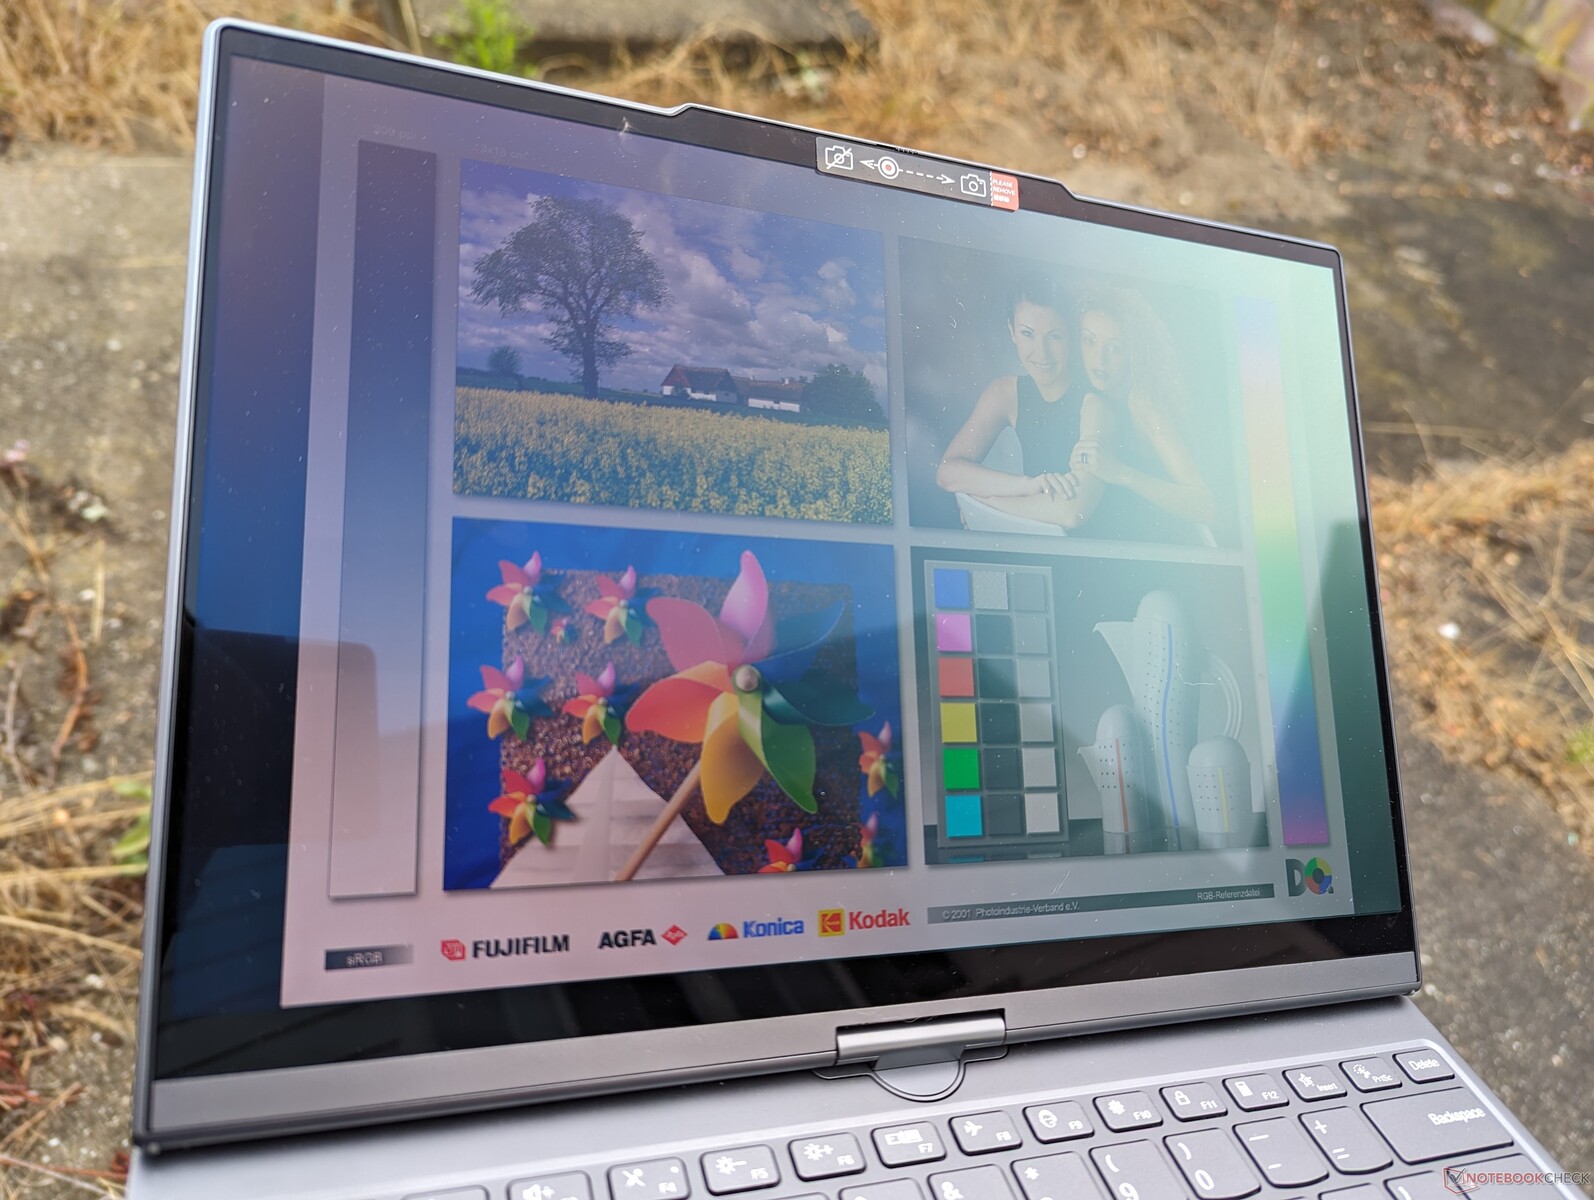
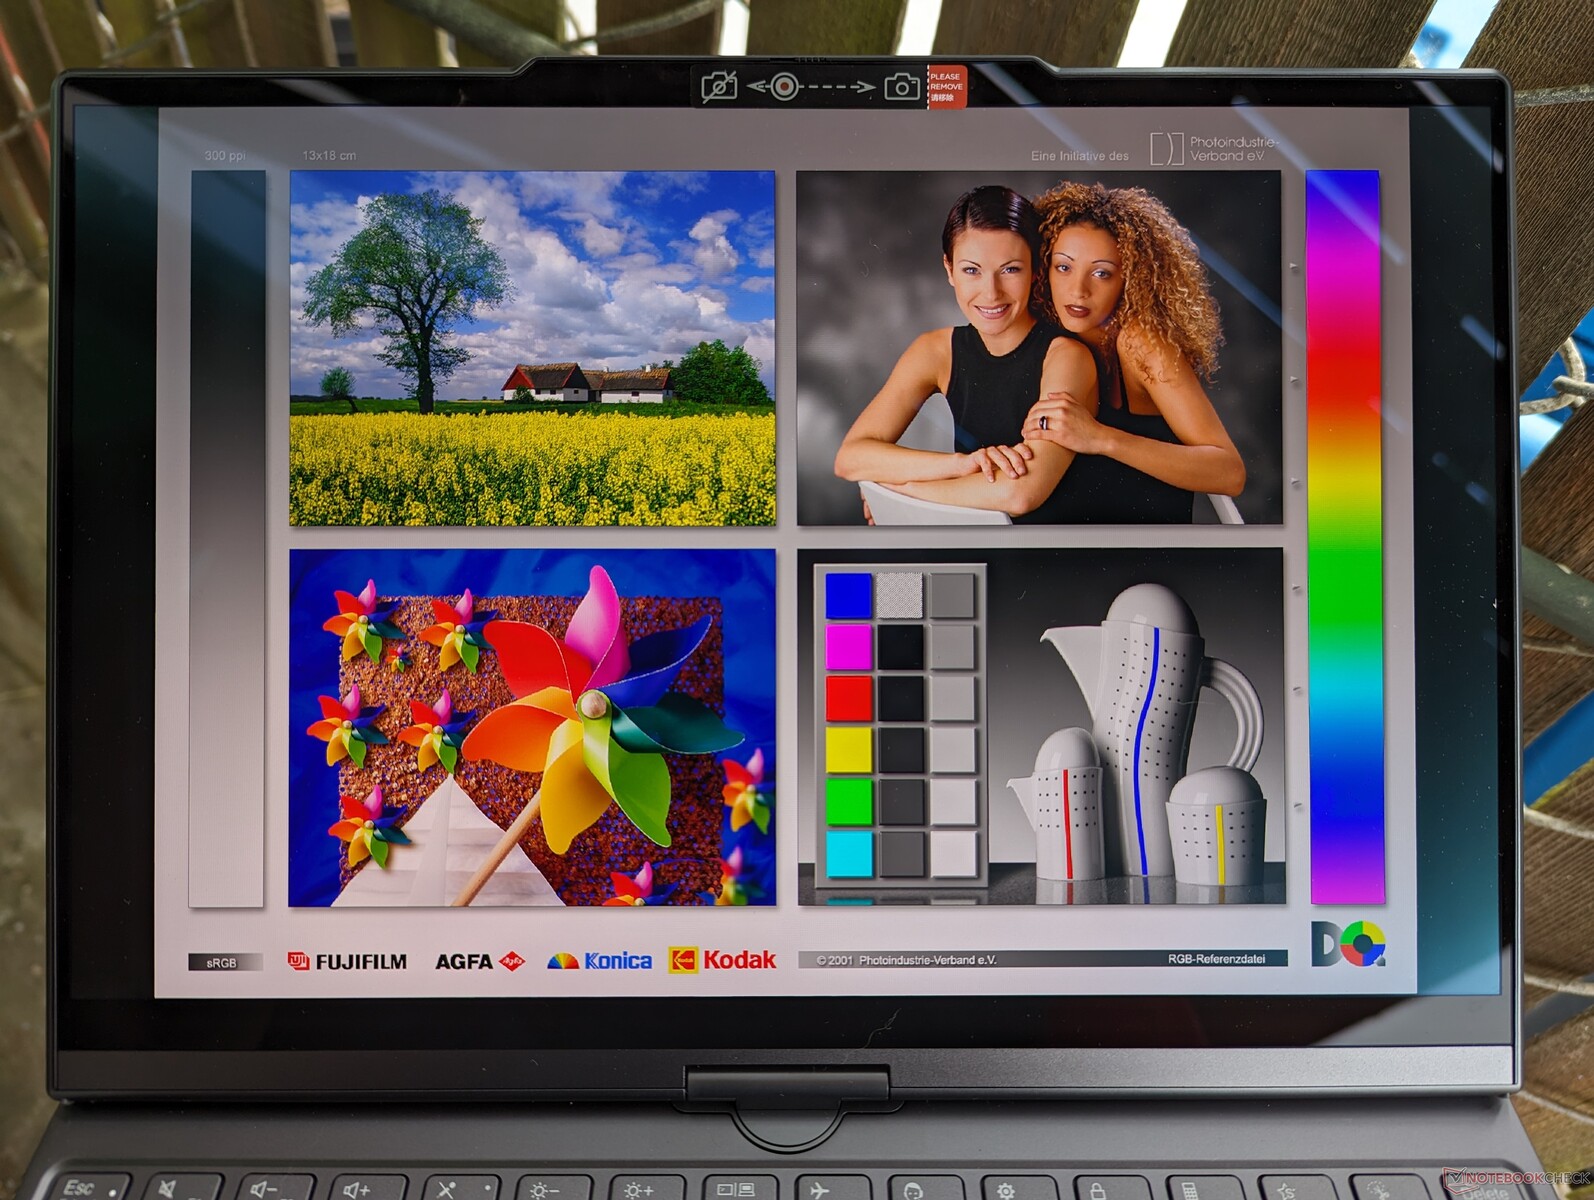
Displays — The Main Attraction
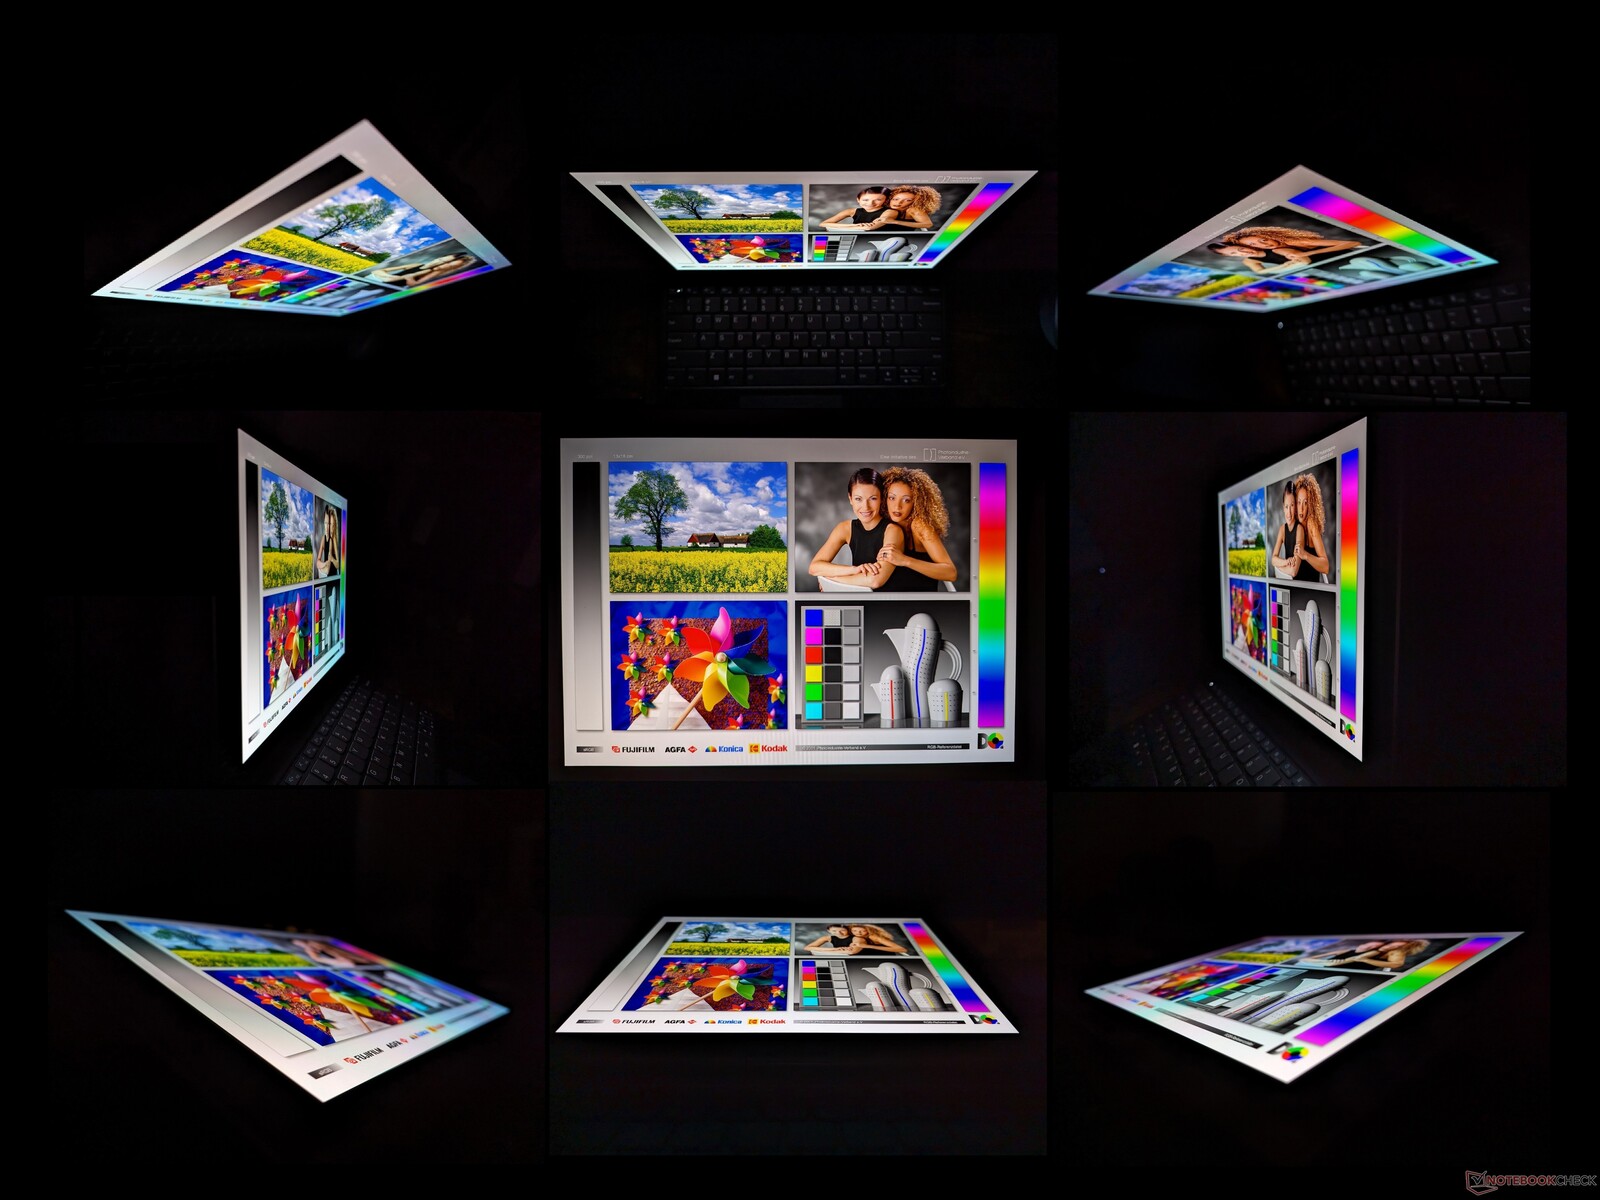
The primary touchscreen has all the basic qualities we've come to expect from OLED including extremely fast response times, pitch perfect black levels, and full P3 color coverage. Perhaps the biggest sour spot of our panel is that its refresh rate is limited to just 60 Hz. The Asus ZenBook and VivoBook series have been shipping with 90 Hz or 120 Hz OLED panels for a while now which feel instantly smoother and more responsive when it comes to navigation and touchscreen controls. Hopefully such panels will become more widely available if Lenovo decides to update this model in the future.
| Display | Screen Size | Native Resolution | Native Refresh Rate | Rated Maximum Brightness |
| E Ink | 12-inch | 2560 x 1600 | 12 Hz | 100 nits |
| OLED | 13.3-inch | 2880 x 1800 | 60 Hz | 400 nits |

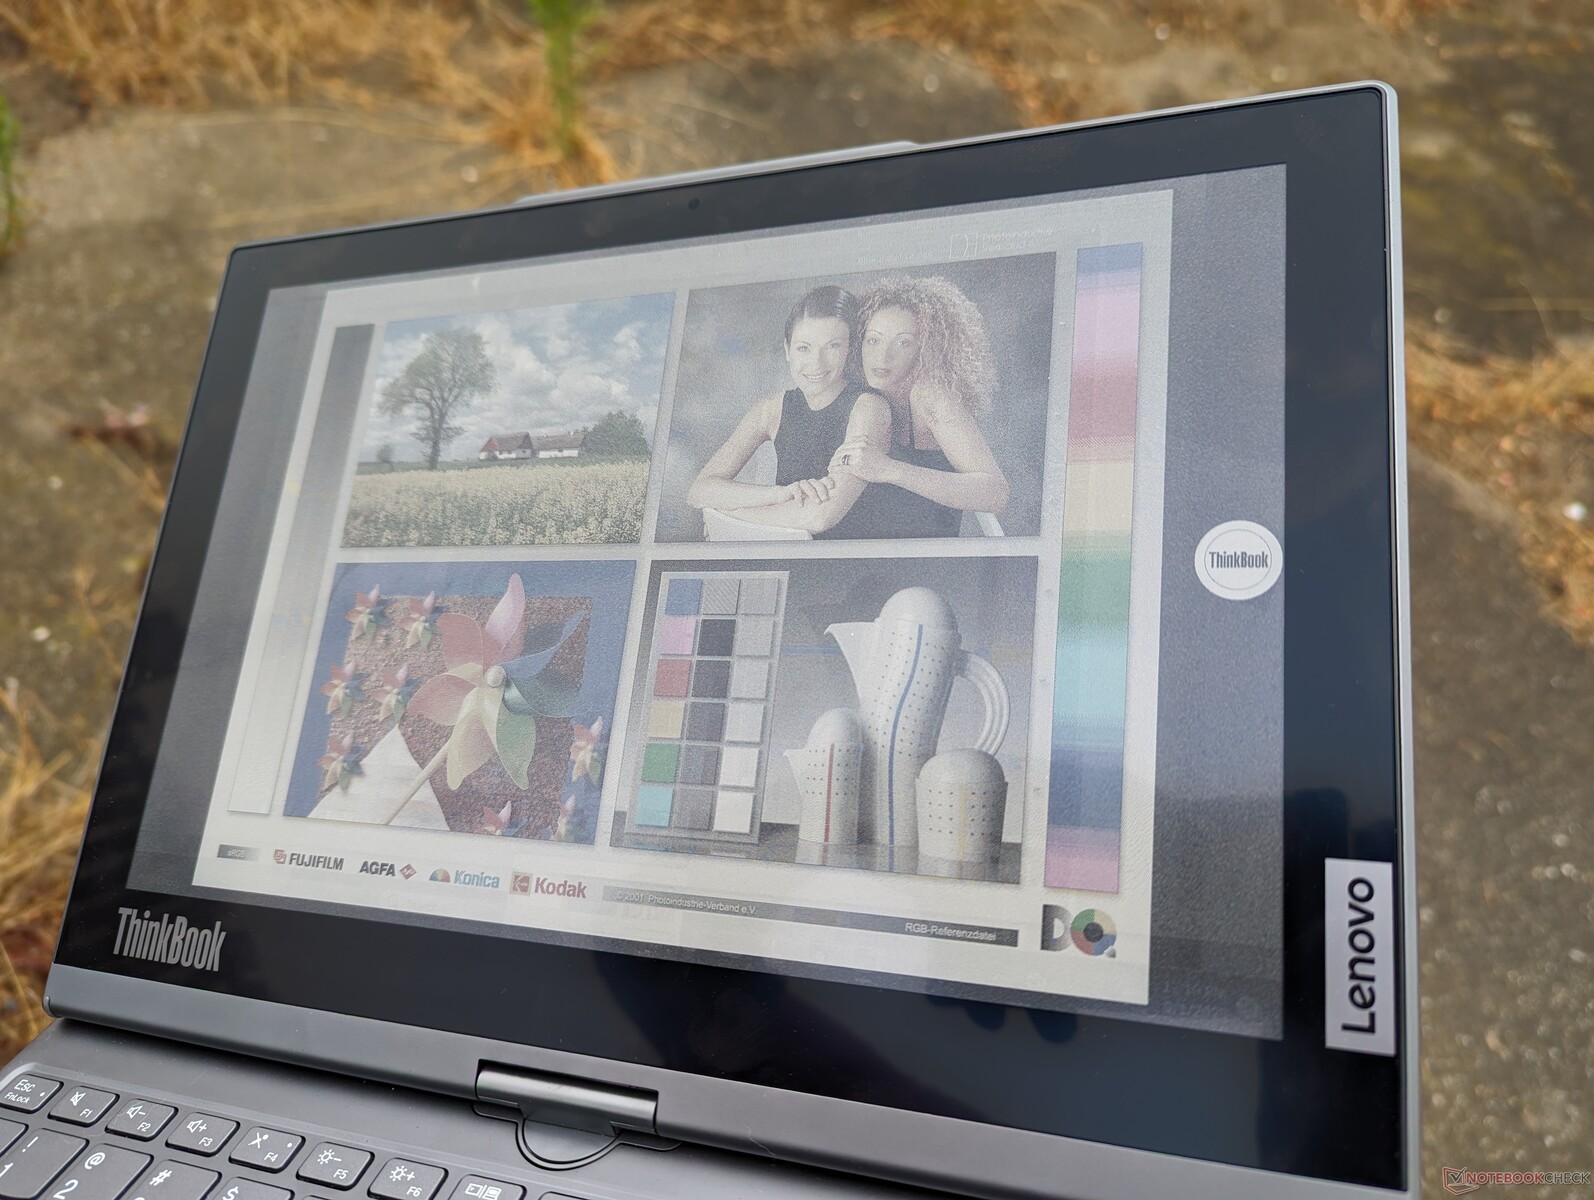
There are two notable drawbacks to the E Ink display. Firstly, its native resolution is smaller than the main OLED display which creates problems when Windows is switching between the two screens. All your content becomes resized and repositioned whenever you switch screens which you must then manually fix. A 1:1 resolution ratio between the two displays would have addressed this annoying issue.
The second problem relates to how clunky the E Ink touchscreen feels even after taking into account the slow response times. This is mostly due to how unoptimized Windows OS can be for eReader purposes. Automatic rotation, for example, doesn't work reliably in eReader mode and the screens would take several seconds to load when switching between the screens. The transition phase is therefore not as smooth or seamless as simply switching between laptop and tablet modes on traditional convertible models with just one screen.

| |||||||||||||||||||||||||
Brightness Distribution: 98 %
Center on Battery: 367.5 cd/m²
Contrast: ∞:1 (Black: 0 cd/m²)
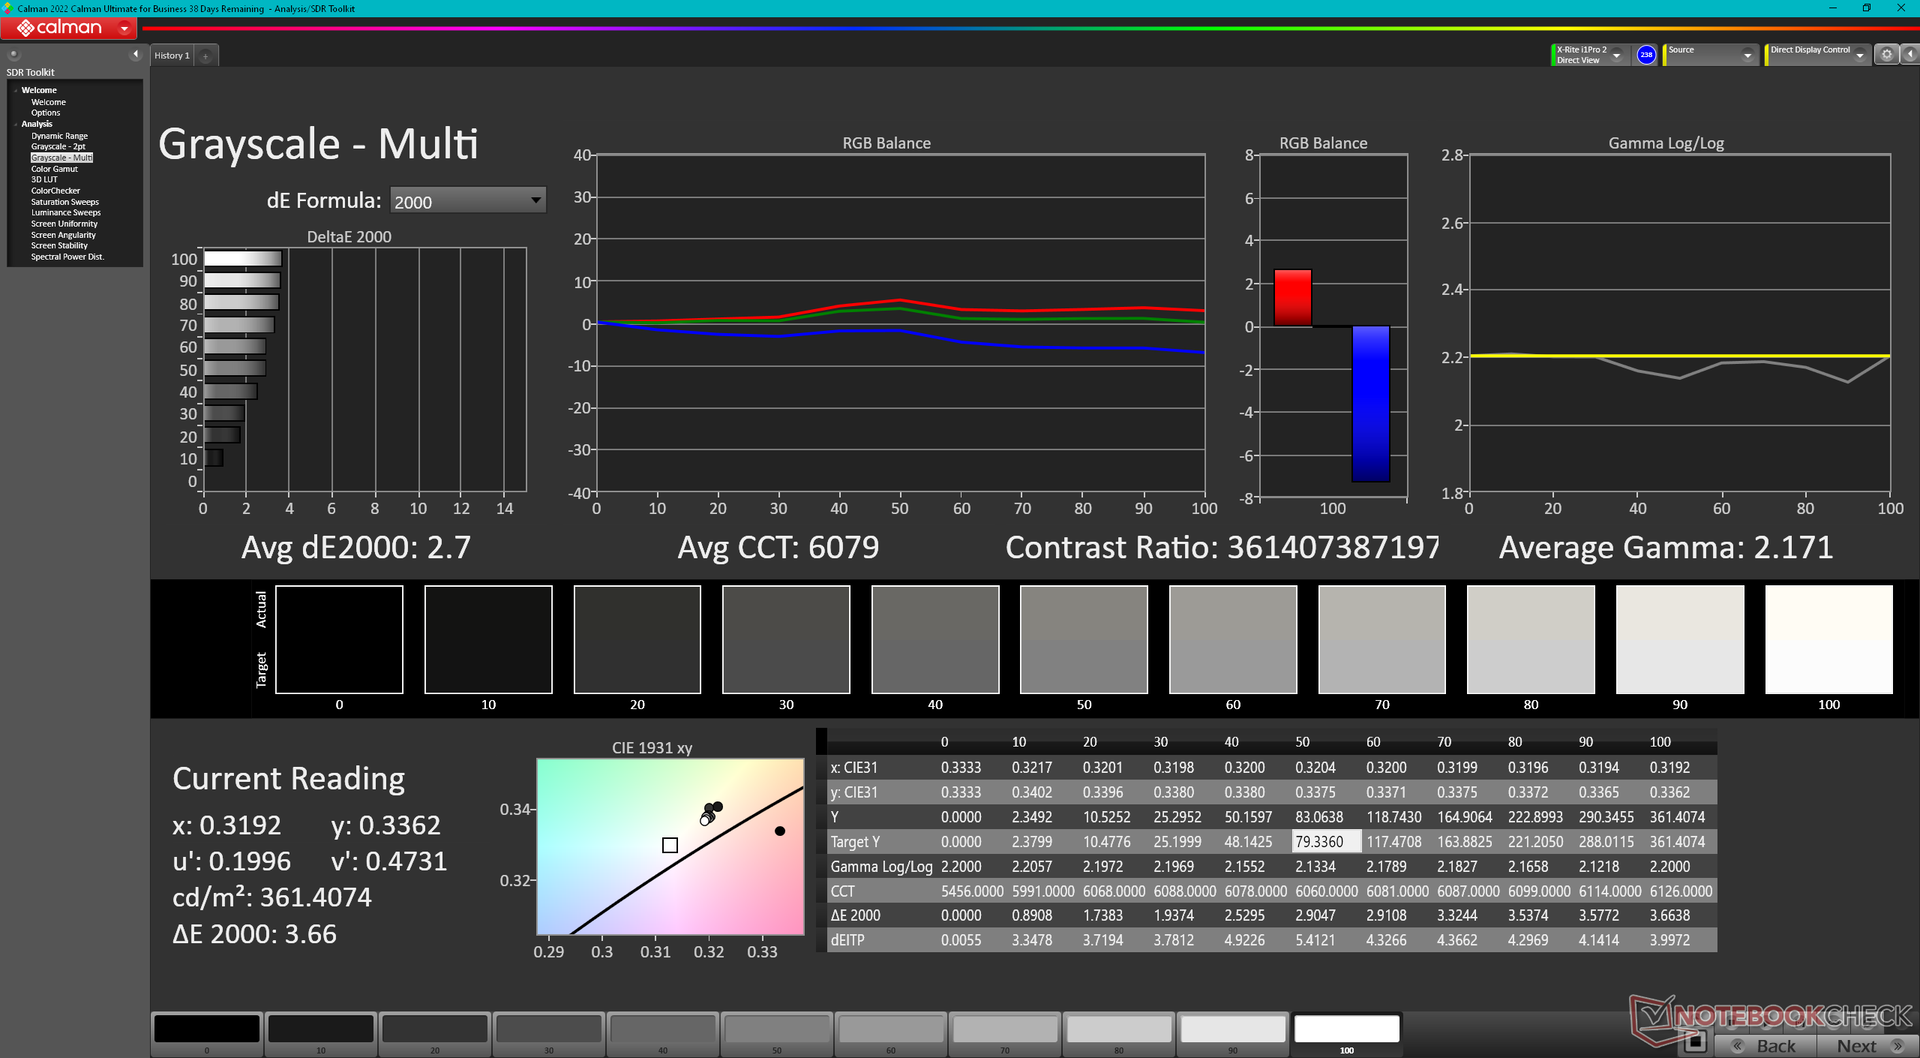
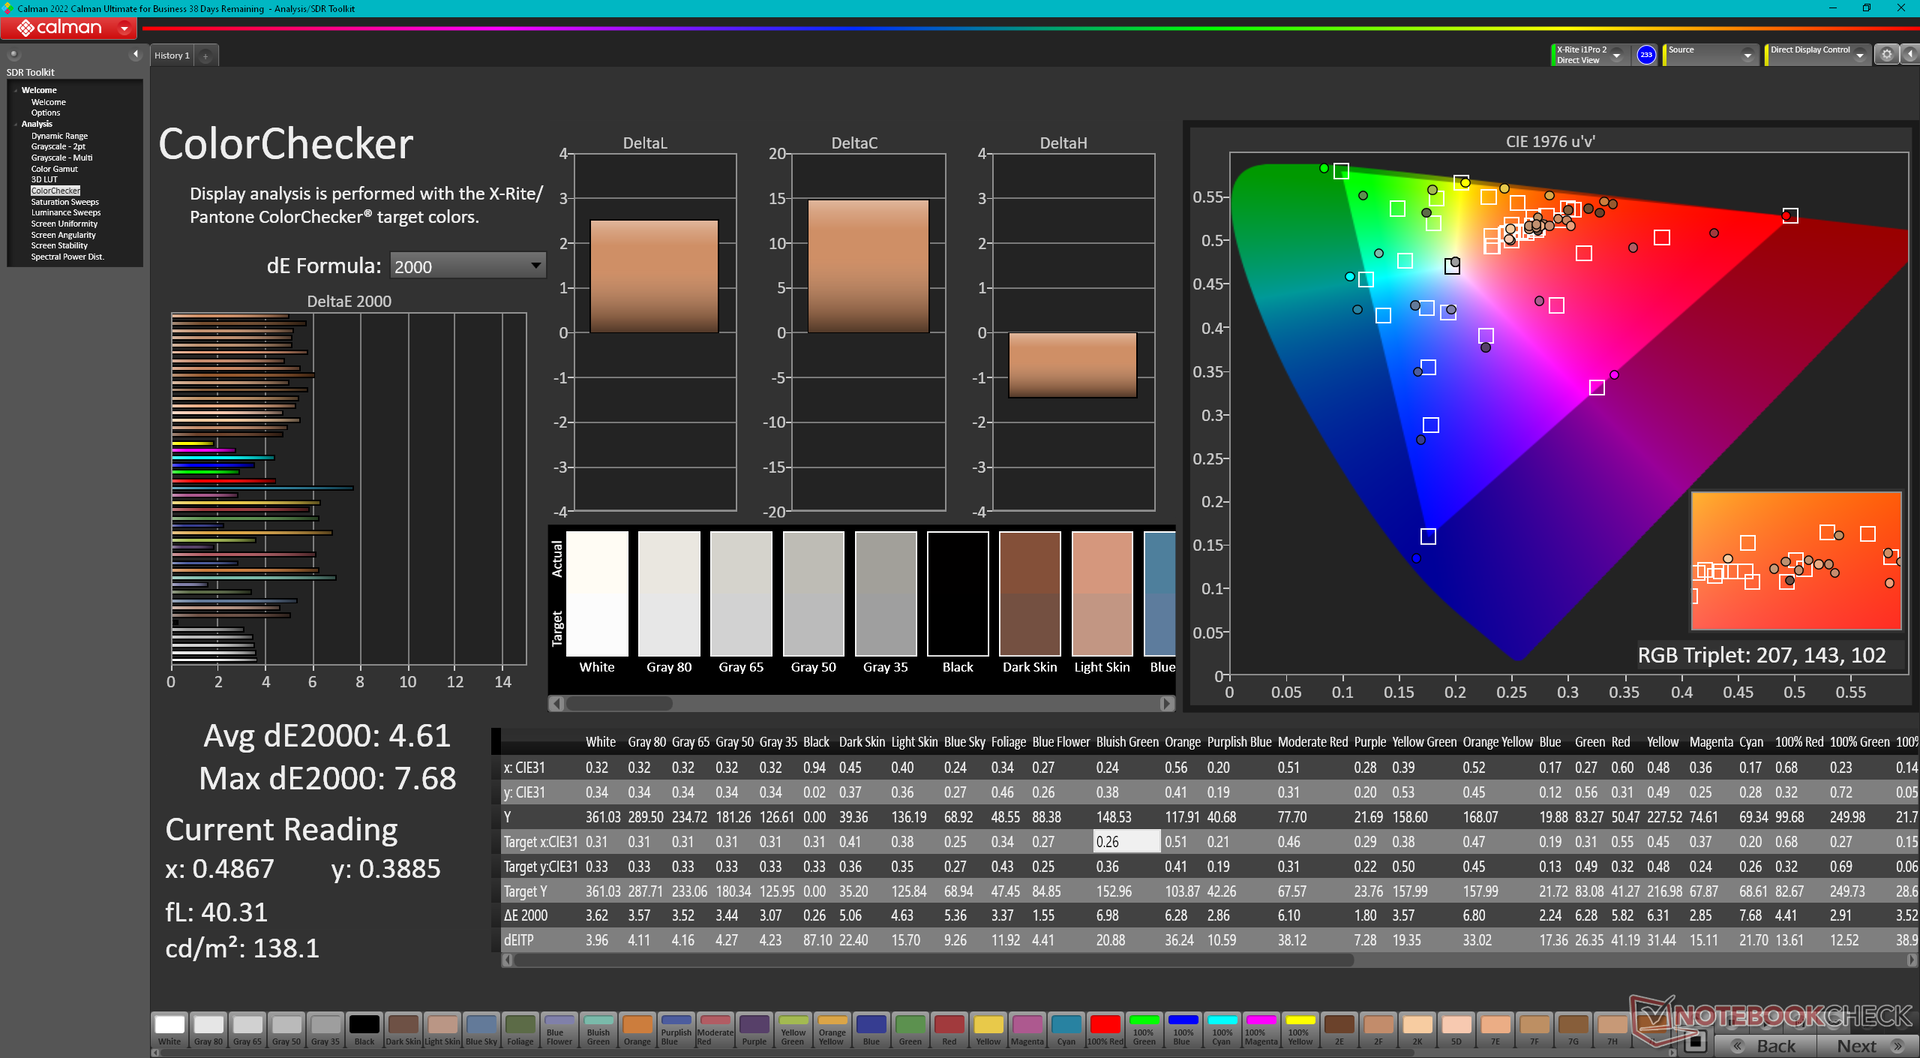
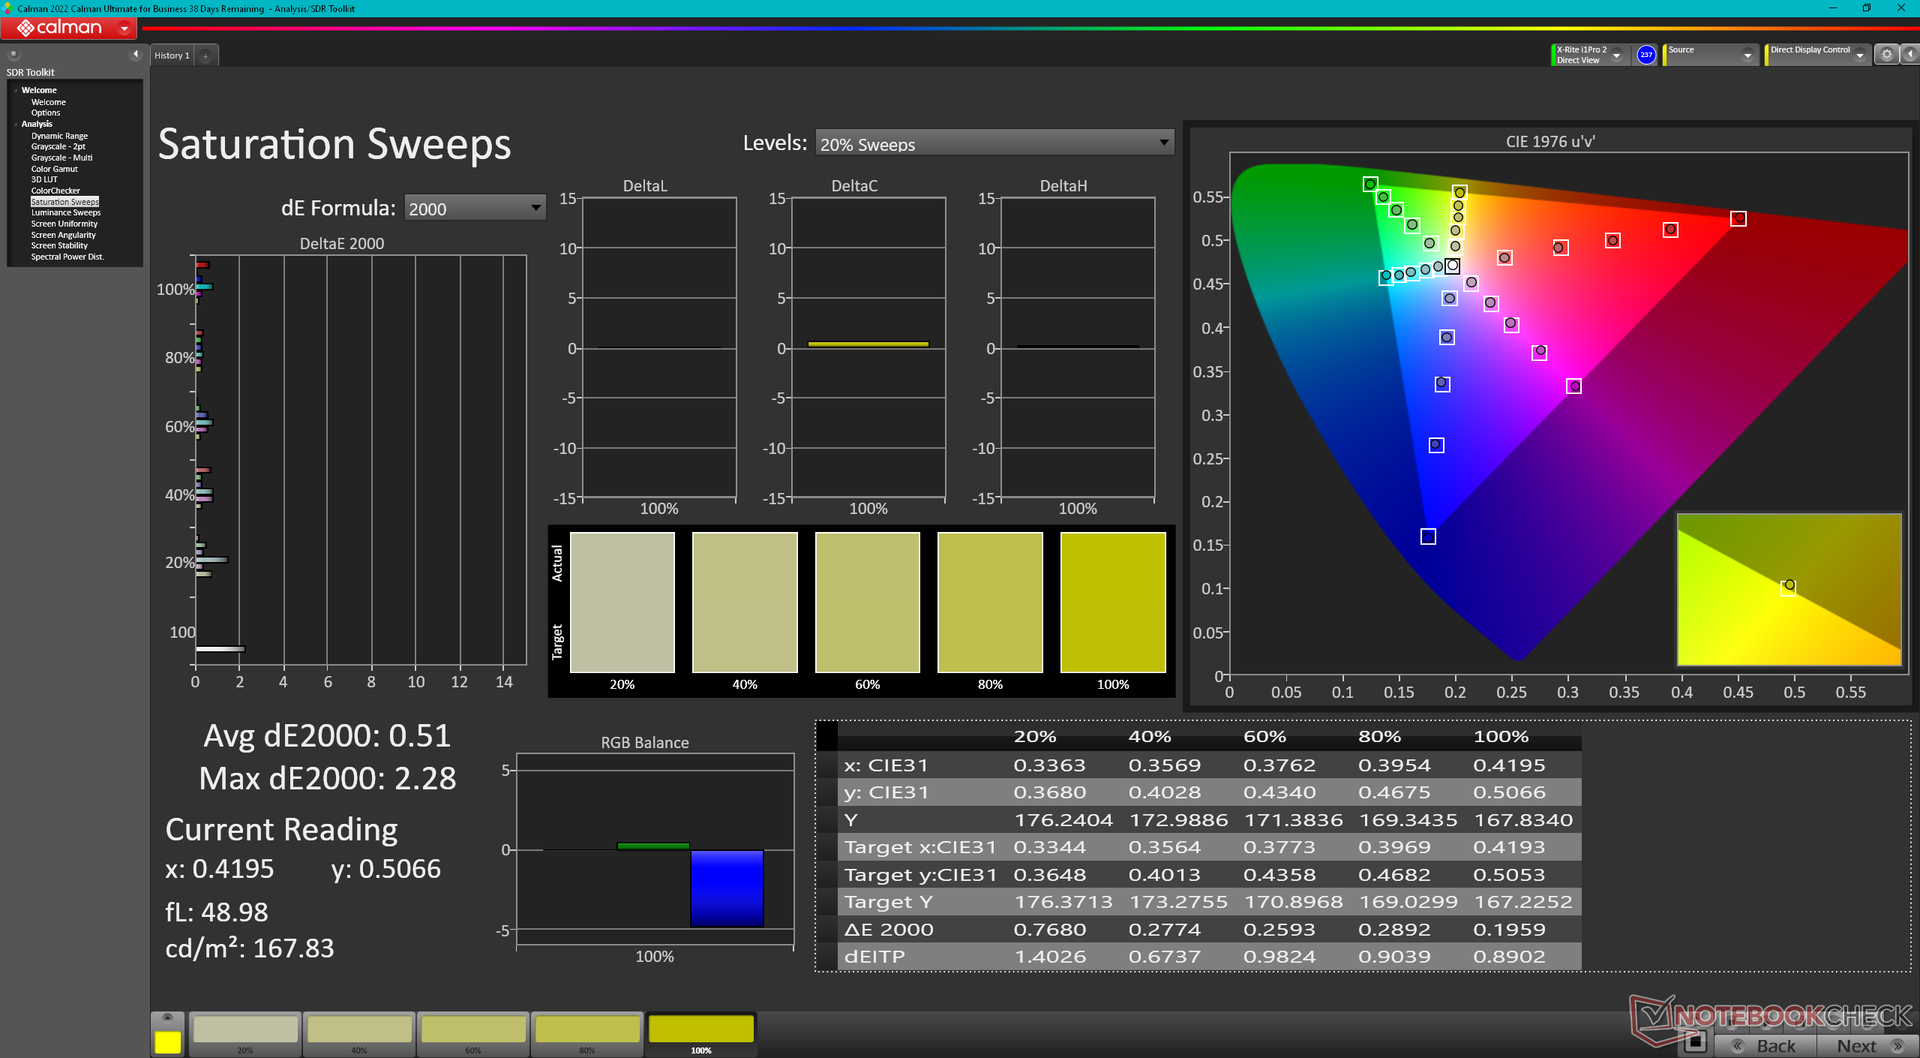
ΔE ColorChecker Calman: 4.61 | ∀{0.5-29.43 Ø4.71}
calibrated: 0.66
ΔE Greyscale Calman: 2.7 | ∀{0.09-98 Ø4.96}
97.1% AdobeRGB 1998 (Argyll 3D)
100% sRGB (Argyll 3D)
99.6% Display P3 (Argyll 3D)
Gamma: 2.17
CCT: 6079 K
| Lenovo ThinkBook Plus Gen4 IRU SDC ATNA33AA06-0, OLED, 2880x1800, 13.3" | Lenovo ThinkPad X1 Nano Gen 3 MND007ZA1-3, IPS, 2160x1350, 13" | HP Dragonfly G4 Chi Mei CMN13C0, IPS, 1920x1280, 13.5" | Asus ZenBook S13 OLED UX5304 SDC417B, OLED, 2880x1800, 13.3" | Dell Latitude 9330 AU Optronics B133QAA, IPS, 2560x1600, 13.3" | MSI Summit E13 Flip Evo A11MT Sharp LQ134N1JW53, IPS, 1920x1200, 13.4" | |
|---|---|---|---|---|---|---|
| Display | -20% | -20% | 0% | -14% | -19% | |
| Display P3 Coverage (%) | 99.6 | 68.5 -31% | 68.4 -31% | 99.7 0% | 77.8 -22% | 69.8 -30% |
| sRGB Coverage (%) | 100 | 99.5 0% | 98.3 -2% | 100 0% | 99.9 0% | 98.8 -1% |
| AdobeRGB 1998 Coverage (%) | 97.1 | 69.7 -28% | 70.4 -27% | 96.9 0% | 77.5 -20% | 70.6 -27% |
| Response Times | -1565% | -1929% | 10% | -2879% | -2632% | |
| Response Time Grey 50% / Grey 80% * (ms) | 1.9 ? | 39.9 ? -2000% | 48.8 ? -2468% | 2 ? -5% | 67.6 ? -3458% | 64 ? -3268% |
| Response Time Black / White * (ms) | 2.1 ? | 25.8 ? -1129% | 31.3 ? -1390% | 1.6 ? 24% | 50.4 ? -2300% | 44 ? -1995% |
| PWM Frequency (Hz) | 60 ? | 240 ? | ||||
| Screen | 30% | 20% | 34% | 16% | 16% | |
| Brightness middle (cd/m²) | 367.5 | 461.2 25% | 408.8 11% | 361 -2% | 542.3 48% | 551.3 50% |
| Brightness (cd/m²) | 370 | 428 16% | 399 8% | 365 -1% | 516 39% | 517 40% |
| Brightness Distribution (%) | 98 | 86 -12% | 90 -8% | 98 0% | 85 -13% | 91 -7% |
| Black Level * (cd/m²) | 0.29 | 0.32 | 0.38 | 0.37 | ||
| Colorchecker dE 2000 * | 4.61 | 1.79 61% | 2.02 56% | 1.2 74% | 3.18 31% | 1.45 69% |
| Colorchecker dE 2000 max. * | 7.68 | 3.3 57% | 3.84 50% | 1.9 75% | 6.05 21% | 2.86 63% |
| Colorchecker dE 2000 calibrated * | 0.66 | 0.47 29% | 0.61 8% | 0.67 -2% | 1.7 -158% | |
| Greyscale dE 2000 * | 2.7 | 1.8 33% | 2.3 15% | 1.2 56% | 3.1 -15% | 1.3 52% |
| Gamma | 2.17 101% | 2.24 98% | 2.2 100% | 2.27 97% | 2.08 106% | 2.14 103% |
| CCT | 6079 107% | 6588 99% | 6203 105% | 6486 100% | 6140 106% | 6580 99% |
| Contrast (:1) | 1590 | 1278 | 1427 | 1490 | ||
| Color Space (Percent of AdobeRGB 1998) (%) | 65 | |||||
| Color Space (Percent of sRGB) (%) | 99 | |||||
| Total Average (Program / Settings) | -518% /
-248% | -643% /
-315% | 15% /
20% | -959% /
-474% | -878% /
-434% |
* ... smaller is better

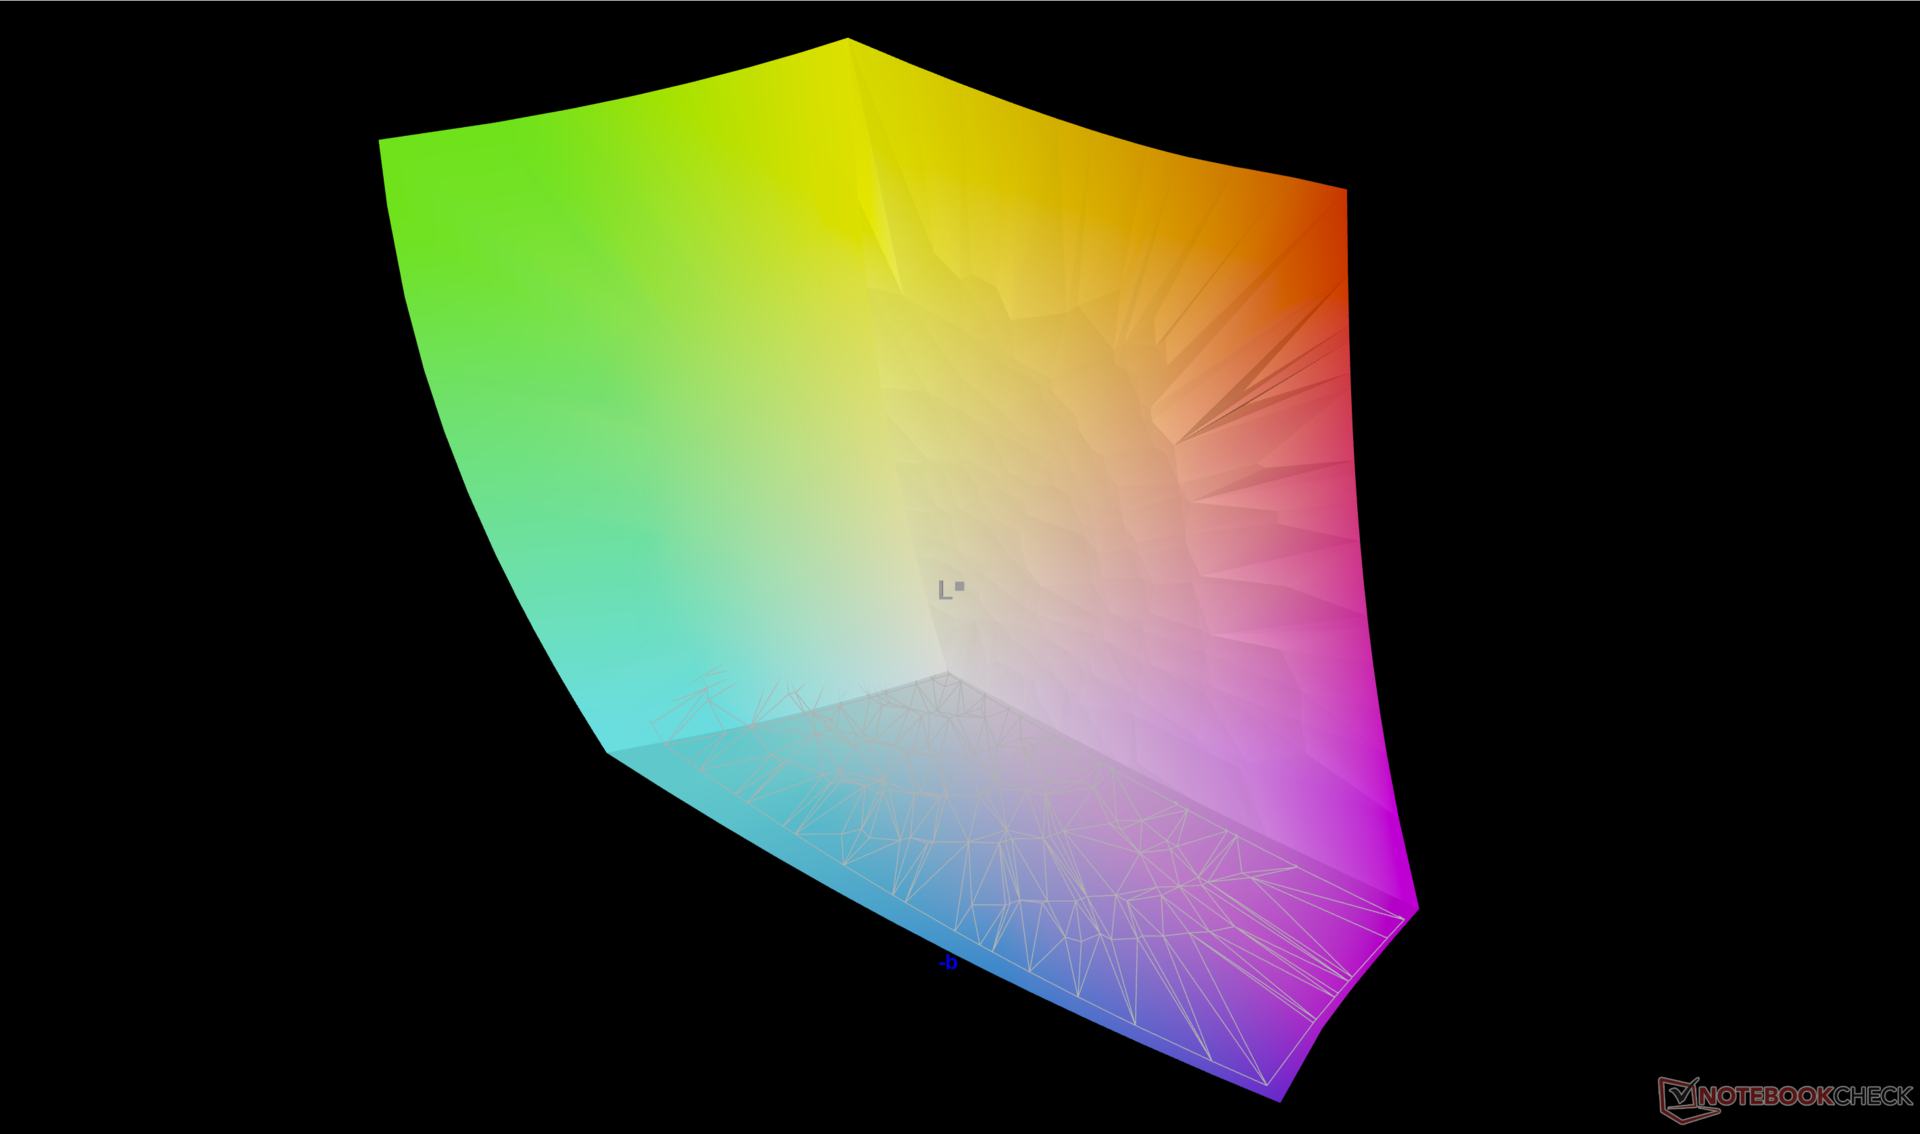
The OLED display is decently calibrated against the P3 standard with average grayscale and color deltaE values of 2.7 and 4.61, respectively. Graphics editors benefit the most from the deeper colors of OLED where P3 colors are common. Our calibrated ICM profile is available to download above for free.

Display Response Times
| ↔ Response Time Black to White | ||
|---|---|---|
| 2.1 ms ... rise ↗ and fall ↘ combined | ↗ 0.9 ms rise | 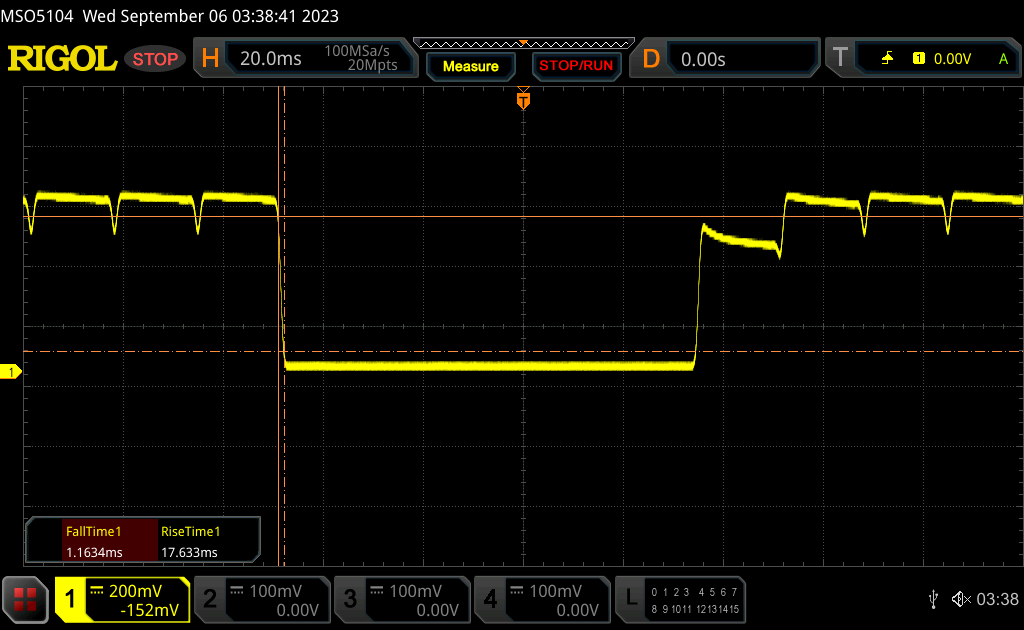 |
| ↘ 1.2 ms fall | ||
| The screen shows very fast response rates in our tests and should be very well suited for fast-paced gaming. In comparison, all tested devices range from 0.1 (minimum) to 240 (maximum) ms. » 12 % of all devices are better. This means that the measured response time is better than the average of all tested devices (19.8 ms). | ||
| ↔ Response Time 50% Grey to 80% Grey | ||
| 1.9 ms ... rise ↗ and fall ↘ combined | ↗ 1 ms rise | 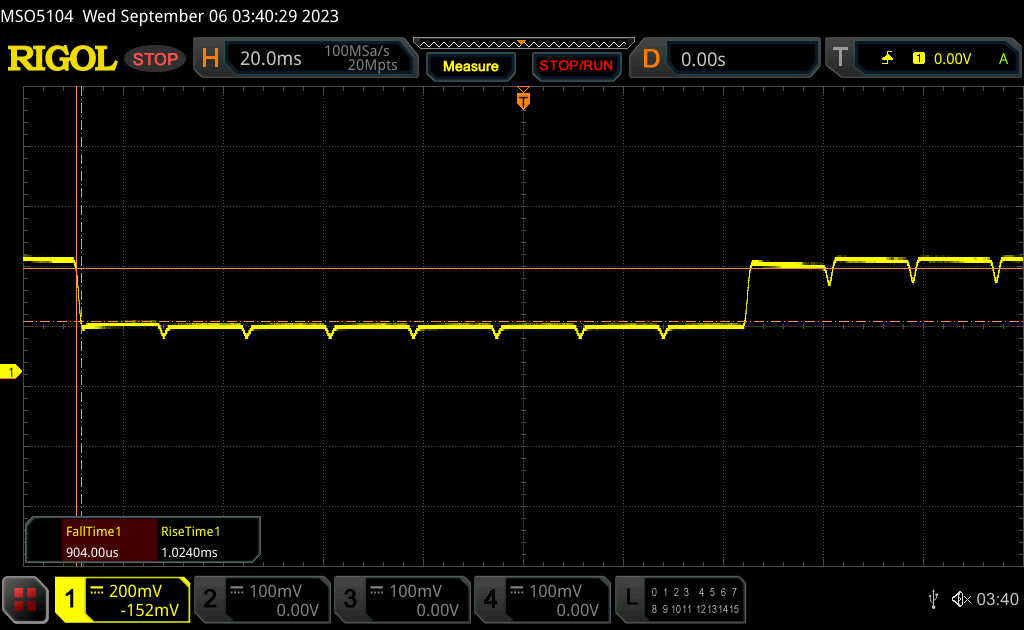 |
| ↘ 0.9 ms fall | ||
| The screen shows very fast response rates in our tests and should be very well suited for fast-paced gaming. In comparison, all tested devices range from 0.165 (minimum) to 636 (maximum) ms. » 10 % of all devices are better. This means that the measured response time is better than the average of all tested devices (30.9 ms). | ||
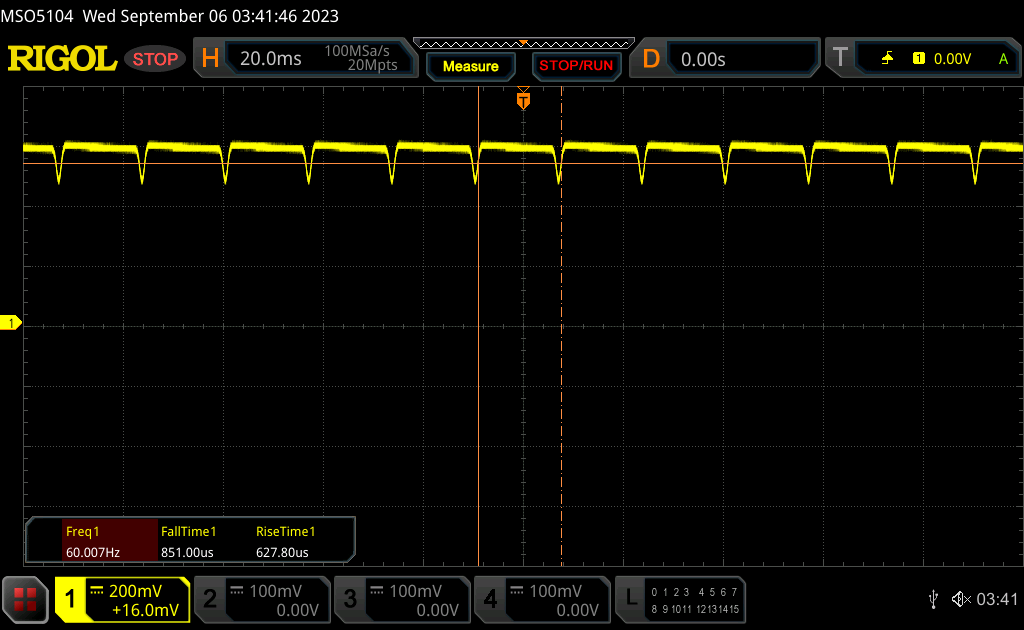
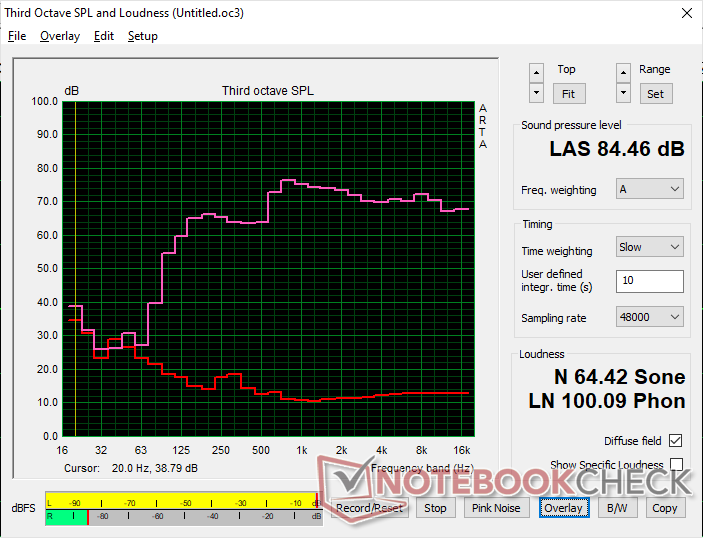
Screen Flickering / PWM (Pulse-Width Modulation)
| Screen flickering / PWM detected | 60 Hz | ≤ 100 % brightness setting | 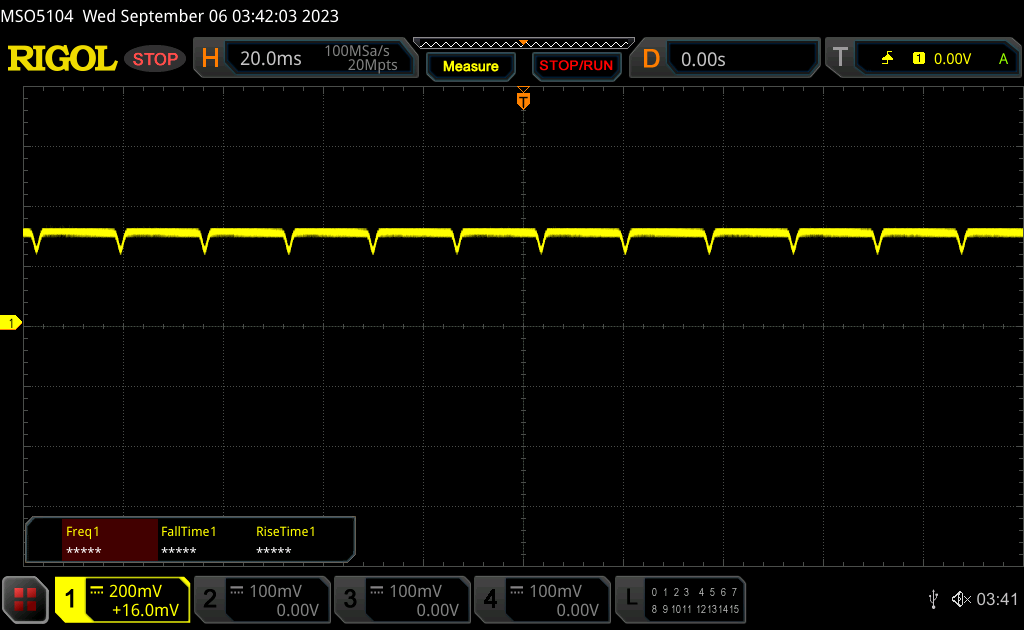 |
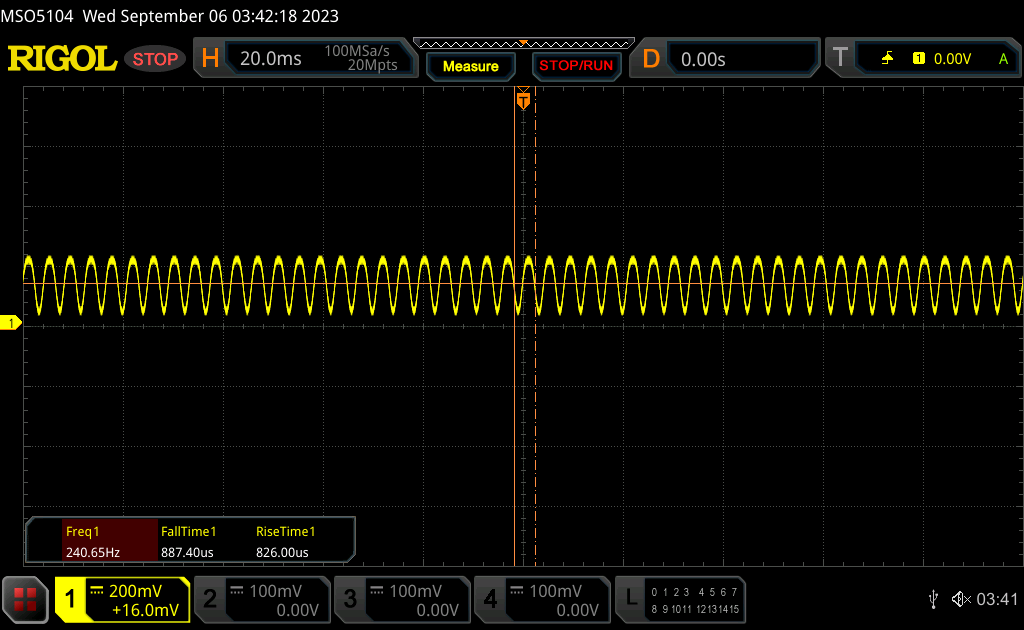
The display backlight flickers at 60 Hz (worst case, e.g., utilizing PWM) Flickering detected at a brightness setting of 100 % and below. There should be no flickering or PWM above this brightness setting. The frequency of 60 Hz is very low, so the flickering may cause eyestrain and headaches after extended use. In comparison: 52 % of all tested devices do not use PWM to dim the display. If PWM was detected, an average of 7741 (minimum: 5 - maximum: 343500) Hz was measured. | |||
Pulse-width modulation is present on all brightness levels much like on other OLED panels. We're able to record a frequency of 238 Hz from 0 to 57 percent brightness and 60 Hz from 58 to 100 percent brightness.

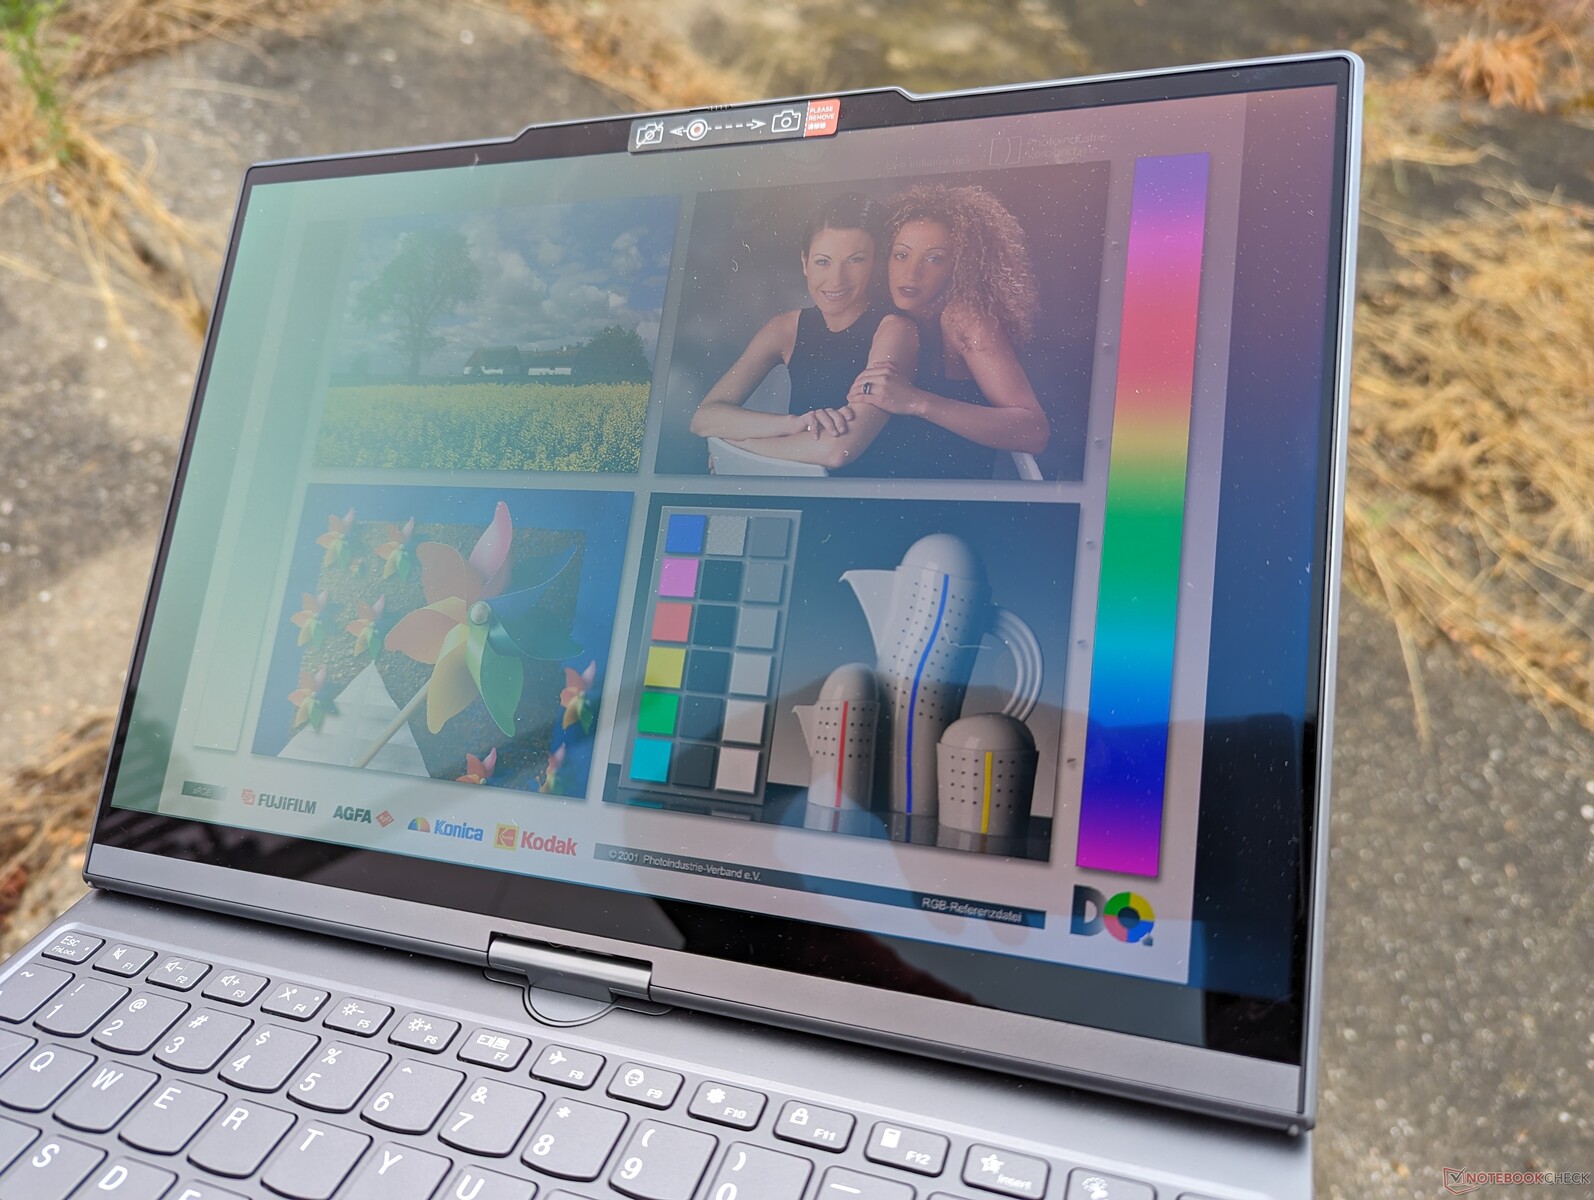
Outdoor visibility is good but not great for an OLED panel. At about 350 nits maximum, the display is dimmer than some alternatives with IPS panels like the MSI Summit E13 or Dell Latitude 9330 which can each reach 550 nits. Glare is therefore difficult to avoid unless if you're working under shade.
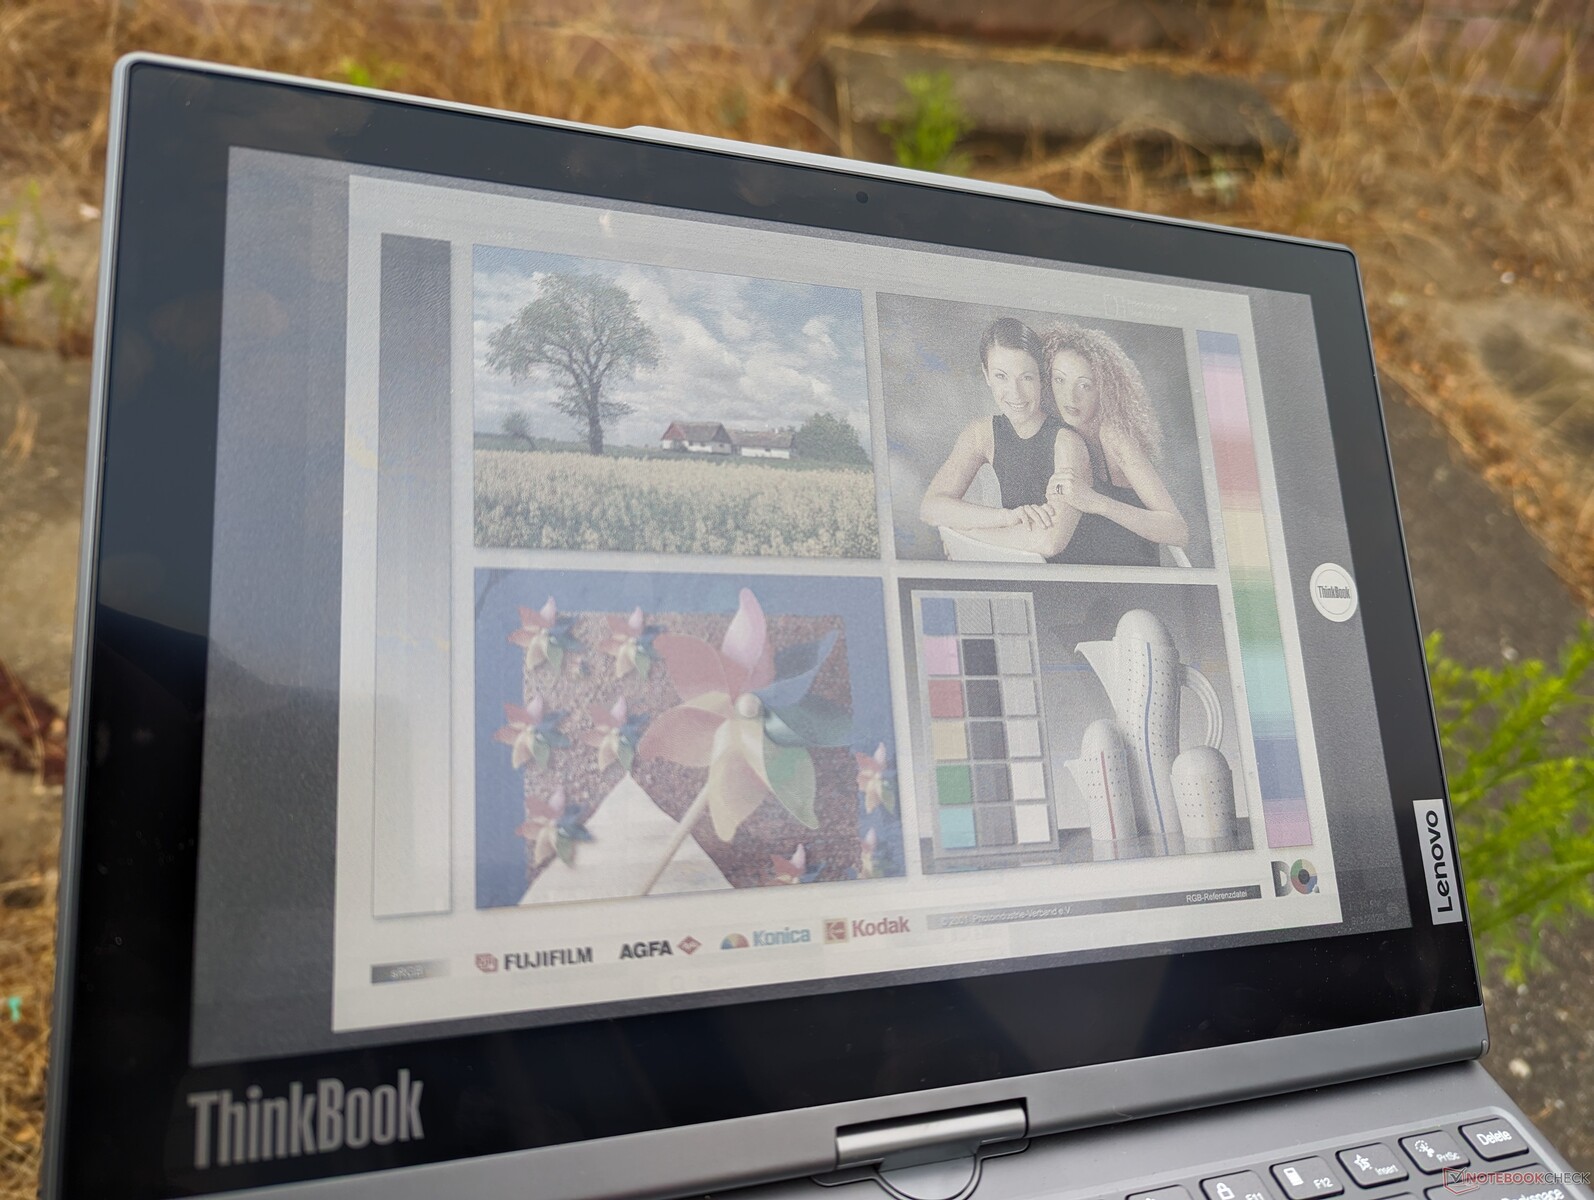
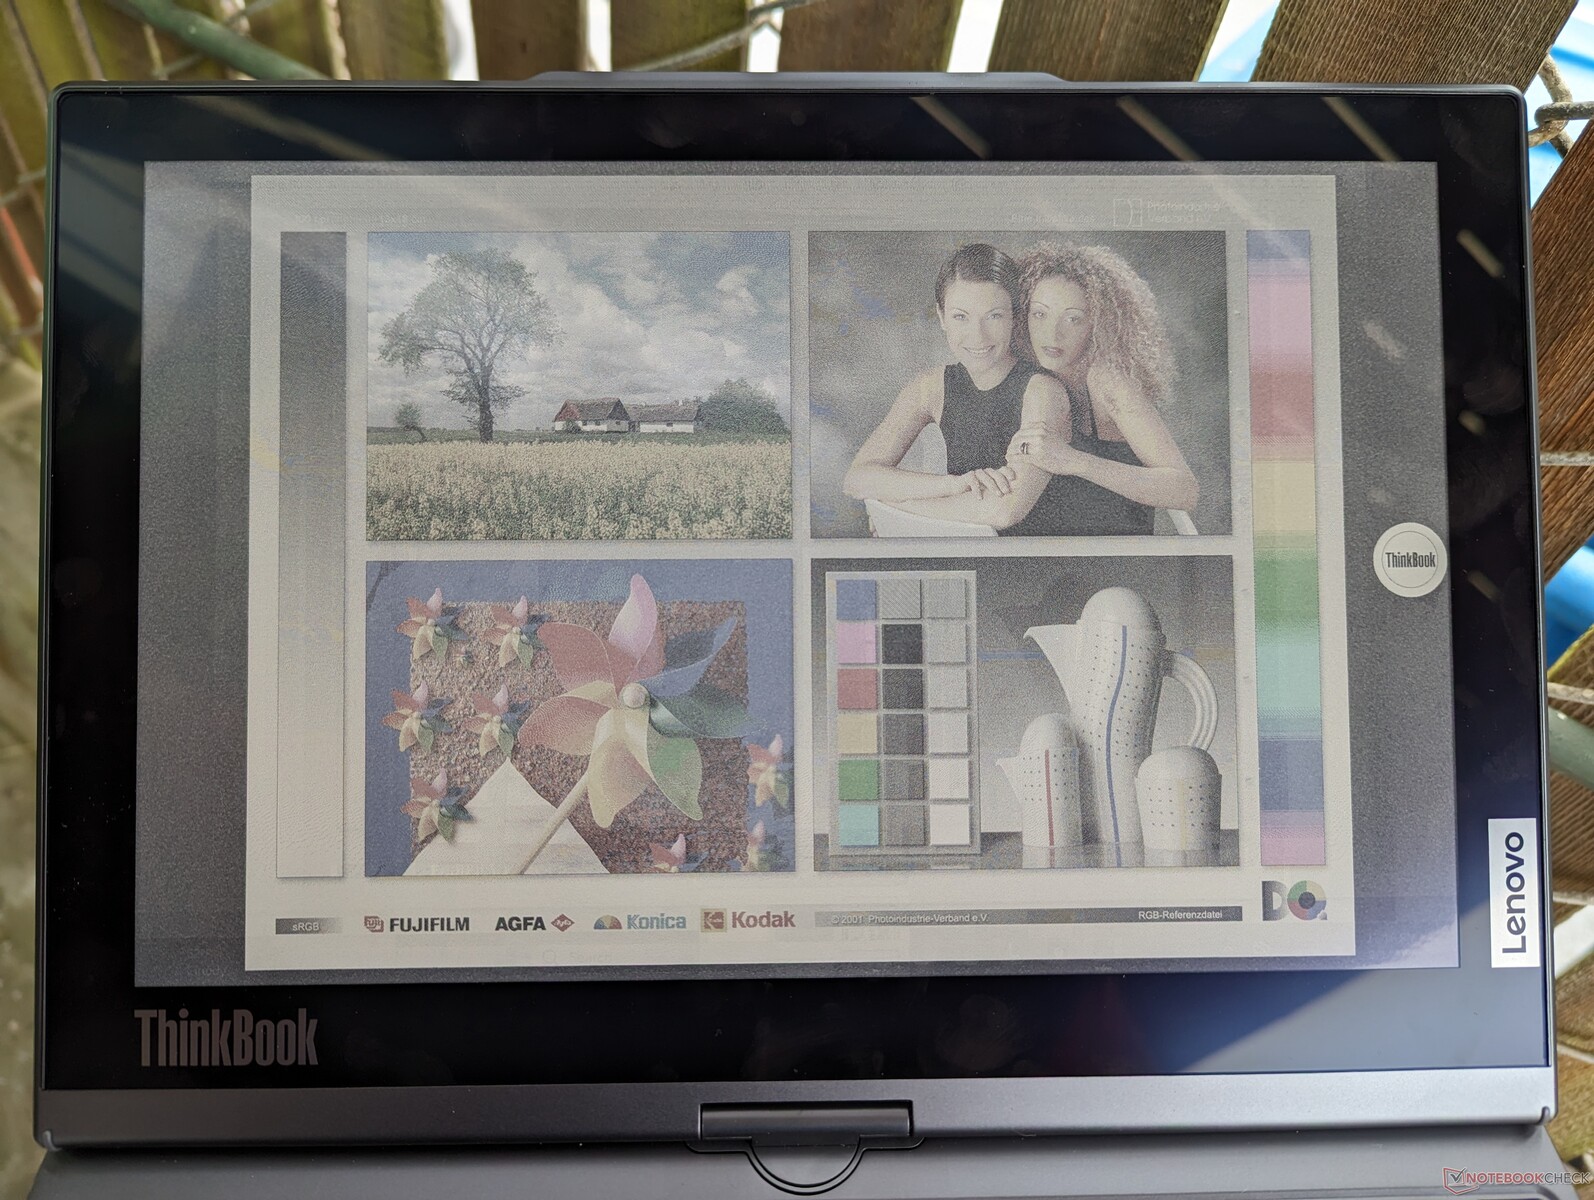
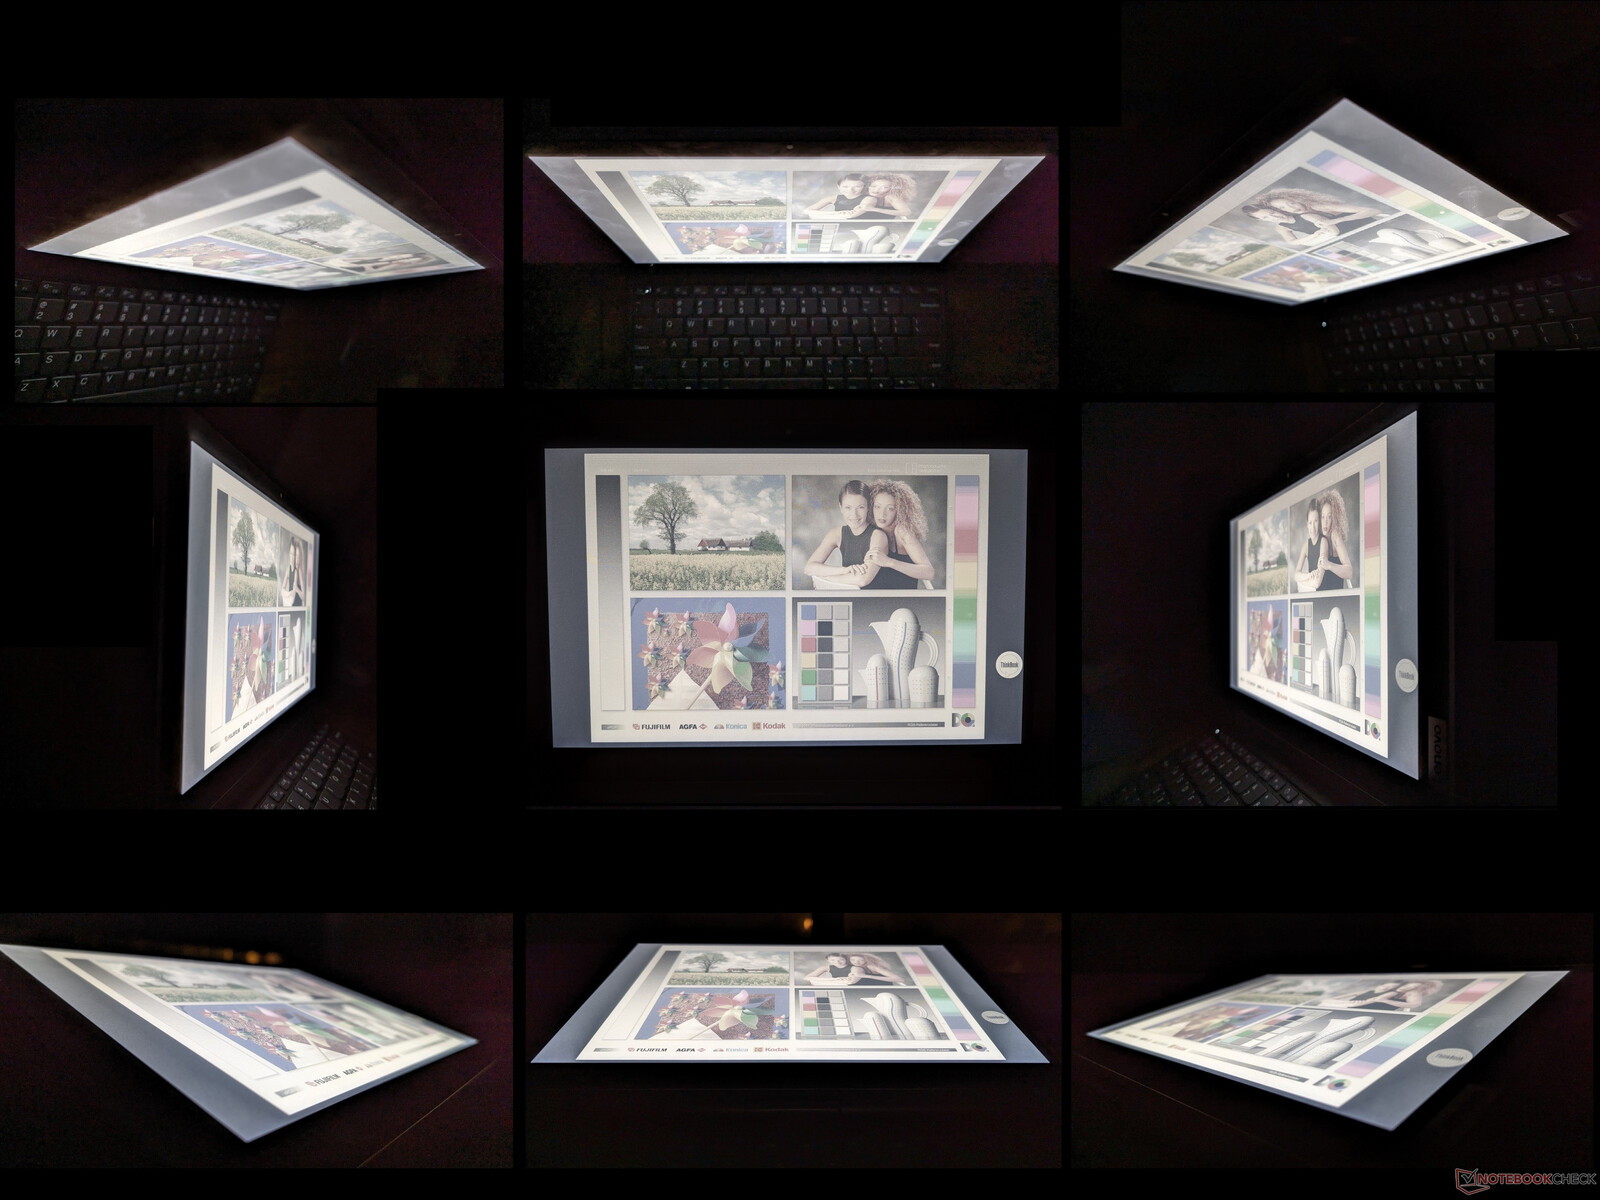
On the other hand, the E Ink display remains readable even when under sunlight. There is still a bit of glare as the glass overlay isn't completely matte, but it's minor and can be easily ignored.
Performance — Intel 13th Gen Raptor Lake-U
Testing Conditions
We set the unit to Performance mode via Windows and the Lenovo Vantage software prior to running the benchmarks below. We recommend becoming familiar with Vantage as it is the hub for Lenovo-specific settings and software updates.
Processor
CPU performance is only about 5 percent slower than the average laptop in our database equipped with the same Core i7-1355U CPU. The slight performance deficit can be attributed to the limited Turbo Boost of the Lenovo as performance would dip by up to 18 percent after the initial run of our CineBench R15 xT loop test.
Downgrading to the Core i5-1335U configuration will only impact CPU performance by just 10 to 15 percent. If you don't need the graphics performance benefits of the Core i7-1355U, then it may be worth considering the cheaper Core i5-1335U instead since it is not noticeably slower for common usage scenarios like web browsing, moderate multi-tasking, or video streaming.
Cinebench R15 Multi Loop
Cinebench R23: Multi Core | Single Core
Cinebench R20: CPU (Multi Core) | CPU (Single Core)
Cinebench R15: CPU Multi 64Bit | CPU Single 64Bit
Blender: v2.79 BMW27 CPU
7-Zip 18.03: 7z b 4 | 7z b 4 -mmt1
Geekbench 5.5: Multi-Core | Single-Core
HWBOT x265 Benchmark v2.2: 4k Preset
LibreOffice : 20 Documents To PDF
R Benchmark 2.5: Overall mean
* ... smaller is better
AIDA64: FP32 Ray-Trace | FPU Julia | CPU SHA3 | CPU Queen | FPU SinJulia | FPU Mandel | CPU AES | CPU ZLib | FP64 Ray-Trace | CPU PhotoWorxx
| Performance rating | |
| Lenovo ThinkPad X1 Nano Gen 3 | |
| Lenovo ThinkBook Plus Gen4 IRU | |
| Average Intel Core i7-1355U | |
| MSI Summit E13 Flip Evo A11MT | |
| HP Dragonfly G4 | |
| Dell Latitude 9330 | |
| Asus ZenBook S13 OLED UX5304 | |
| AIDA64 / FP32 Ray-Trace | |
| Lenovo ThinkPad X1 Nano Gen 3 | |
| Lenovo ThinkBook Plus Gen4 IRU | |
| Average Intel Core i7-1355U (5673 - 8424, n=18) | |
| MSI Summit E13 Flip Evo A11MT | |
| HP Dragonfly G4 | |
| Dell Latitude 9330 | |
| Asus ZenBook S13 OLED UX5304 | |
| AIDA64 / FPU Julia | |
| Lenovo ThinkPad X1 Nano Gen 3 | |
| Lenovo ThinkBook Plus Gen4 IRU | |
| Average Intel Core i7-1355U (29580 - 42706, n=18) | |
| Dell Latitude 9330 | |
| HP Dragonfly G4 | |
| Asus ZenBook S13 OLED UX5304 | |
| MSI Summit E13 Flip Evo A11MT | |
| AIDA64 / CPU SHA3 | |
| MSI Summit E13 Flip Evo A11MT | |
| Average Intel Core i7-1355U (1529 - 2200, n=18) | |
| Lenovo ThinkBook Plus Gen4 IRU | |
| Lenovo ThinkPad X1 Nano Gen 3 | |
| Dell Latitude 9330 | |
| HP Dragonfly G4 | |
| Asus ZenBook S13 OLED UX5304 | |
| AIDA64 / CPU Queen | |
| Lenovo ThinkPad X1 Nano Gen 3 | |
| HP Dragonfly G4 | |
| Asus ZenBook S13 OLED UX5304 | |
| Lenovo ThinkBook Plus Gen4 IRU | |
| Average Intel Core i7-1355U (21547 - 66907, n=18) | |
| MSI Summit E13 Flip Evo A11MT | |
| Dell Latitude 9330 | |
| AIDA64 / FPU SinJulia | |
| Lenovo ThinkPad X1 Nano Gen 3 | |
| MSI Summit E13 Flip Evo A11MT | |
| Lenovo ThinkBook Plus Gen4 IRU | |
| Average Intel Core i7-1355U (4045 - 5426, n=18) | |
| HP Dragonfly G4 | |
| Asus ZenBook S13 OLED UX5304 | |
| Dell Latitude 9330 | |
| AIDA64 / FPU Mandel | |
| Lenovo ThinkPad X1 Nano Gen 3 | |
| Average Intel Core i7-1355U (14596 - 21627, n=18) | |
| Lenovo ThinkBook Plus Gen4 IRU | |
| MSI Summit E13 Flip Evo A11MT | |
| Dell Latitude 9330 | |
| HP Dragonfly G4 | |
| Asus ZenBook S13 OLED UX5304 | |
| AIDA64 / CPU AES | |
| MSI Summit E13 Flip Evo A11MT | |
| Average Intel Core i7-1355U (31432 - 75408, n=18) | |
| Lenovo ThinkPad X1 Nano Gen 3 | |
| Lenovo ThinkBook Plus Gen4 IRU | |
| HP Dragonfly G4 | |
| Dell Latitude 9330 | |
| Asus ZenBook S13 OLED UX5304 | |
| AIDA64 / CPU ZLib | |
| Average Intel Core i7-1355U (454 - 684, n=18) | |
| Lenovo ThinkPad X1 Nano Gen 3 | |
| Lenovo ThinkBook Plus Gen4 IRU | |
| HP Dragonfly G4 | |
| Dell Latitude 9330 | |
| Asus ZenBook S13 OLED UX5304 | |
| MSI Summit E13 Flip Evo A11MT | |
| AIDA64 / FP64 Ray-Trace | |
| Lenovo ThinkPad X1 Nano Gen 3 | |
| Lenovo ThinkBook Plus Gen4 IRU | |
| MSI Summit E13 Flip Evo A11MT | |
| Average Intel Core i7-1355U (2991 - 4453, n=18) | |
| Dell Latitude 9330 | |
| HP Dragonfly G4 | |
| Asus ZenBook S13 OLED UX5304 | |
| AIDA64 / CPU PhotoWorxx | |
| Lenovo ThinkPad X1 Nano Gen 3 | |
| Lenovo ThinkBook Plus Gen4 IRU | |
| MSI Summit E13 Flip Evo A11MT | |
| Asus ZenBook S13 OLED UX5304 | |
| HP Dragonfly G4 | |
| Dell Latitude 9330 | |
| Average Intel Core i7-1355U (21800 - 46154, n=18) | |
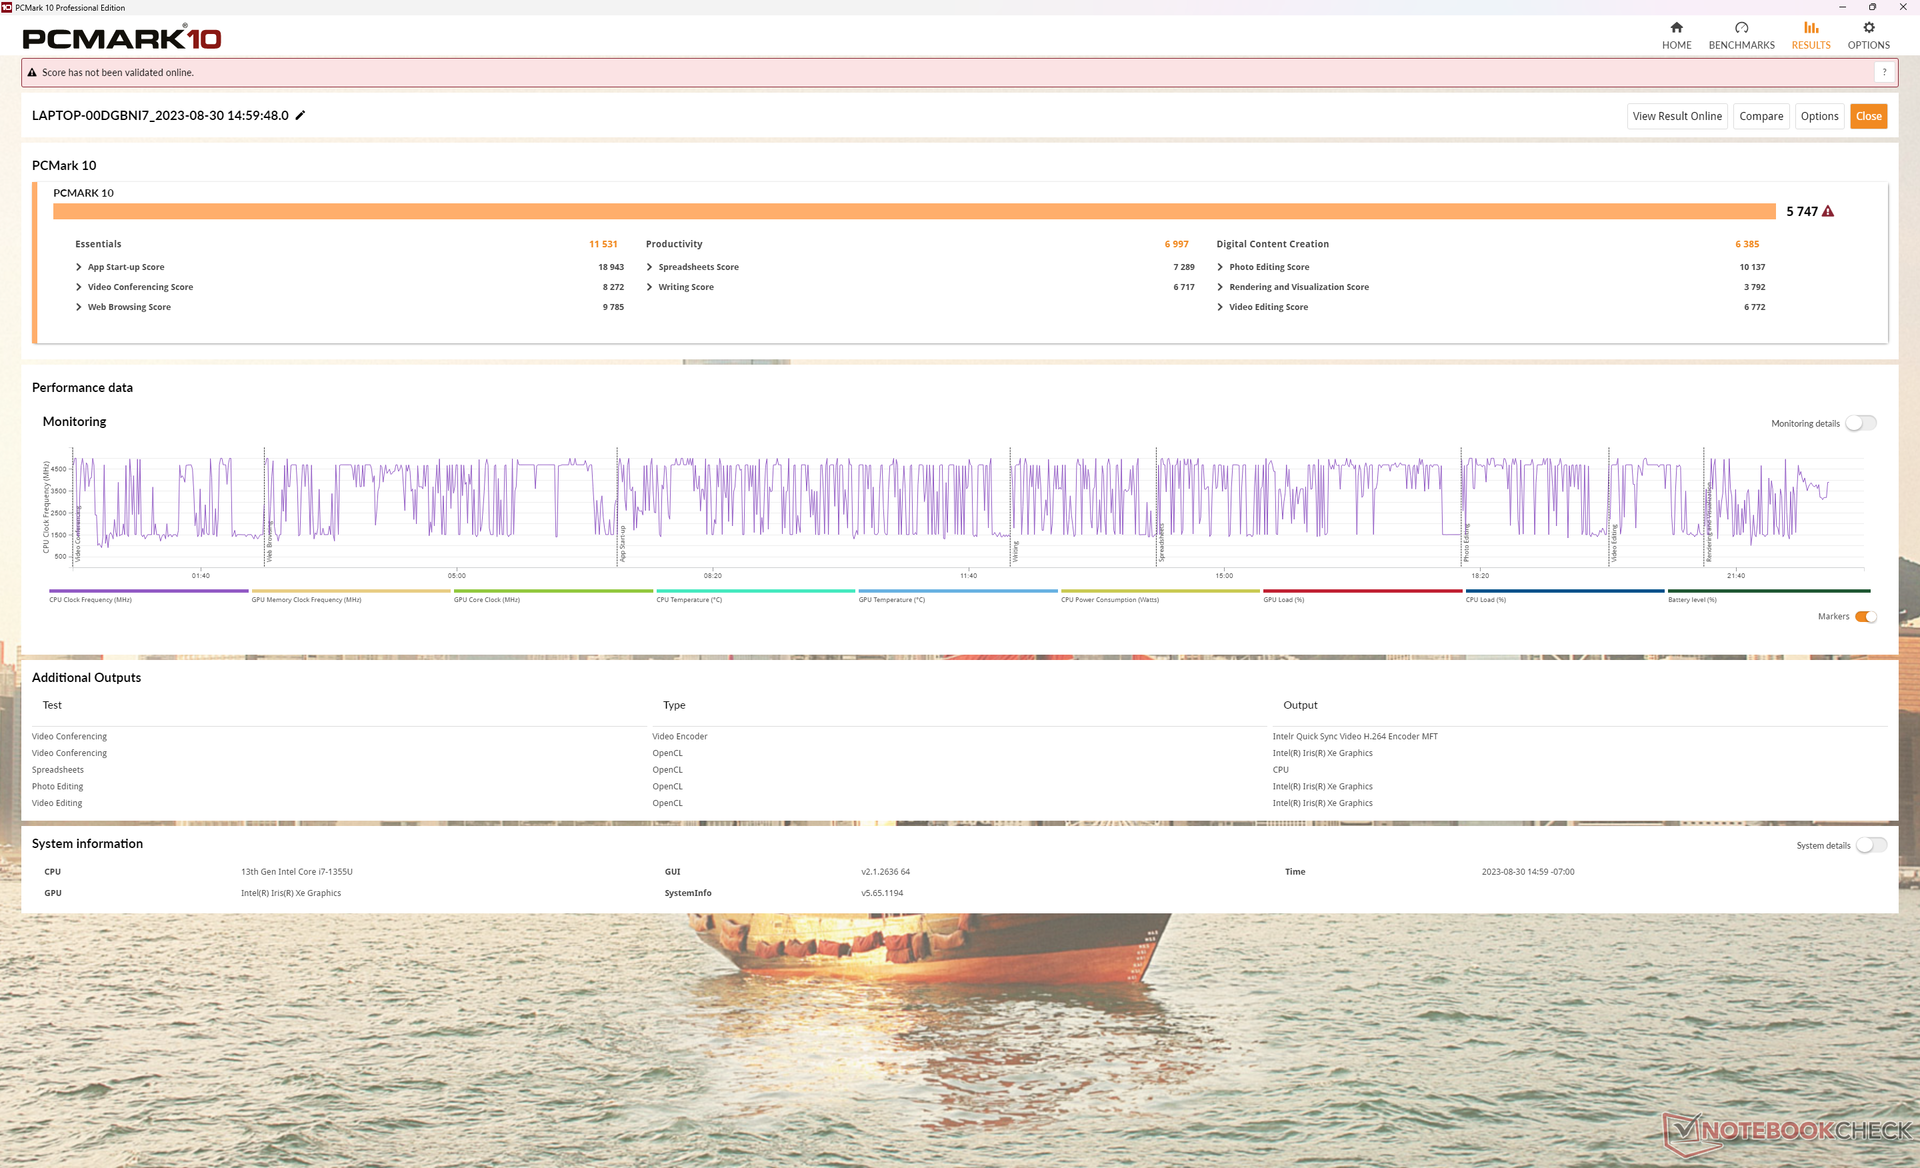
System Performance
PCMark scores are slightly above most other laptops powered by similar Intel Core-U series CPUs. Subnotebooks powered by AMD Zen 3+ or Zen 4 CPUs like the Lenovo Yoga 7-14 or HP EliteBook 845 G10 tend to score higher due to their much faster integrated GPUs when compared to our aging Iris Xe.
CrossMark: Overall | Productivity | Creativity | Responsiveness
| PCMark 10 / Score | |
| Lenovo ThinkPad X1 Nano Gen 3 | |
| Lenovo ThinkBook Plus Gen4 IRU | |
| Average Intel Core i7-1355U, Intel Iris Xe Graphics G7 96EUs (5455 - 5933, n=15) | |
| HP Dragonfly G4 | |
| Asus ZenBook S13 OLED UX5304 | |
| Dell Latitude 9330 | |
| MSI Summit E13 Flip Evo A11MT | |
| PCMark 10 / Essentials | |
| Lenovo ThinkBook Plus Gen4 IRU | |
| Average Intel Core i7-1355U, Intel Iris Xe Graphics G7 96EUs (10203 - 11822, n=15) | |
| HP Dragonfly G4 | |
| Lenovo ThinkPad X1 Nano Gen 3 | |
| Asus ZenBook S13 OLED UX5304 | |
| Dell Latitude 9330 | |
| MSI Summit E13 Flip Evo A11MT | |
| PCMark 10 / Productivity | |
| Lenovo ThinkPad X1 Nano Gen 3 | |
| Average Intel Core i7-1355U, Intel Iris Xe Graphics G7 96EUs (6763 - 7536, n=15) | |
| HP Dragonfly G4 | |
| Asus ZenBook S13 OLED UX5304 | |
| Dell Latitude 9330 | |
| Lenovo ThinkBook Plus Gen4 IRU | |
| MSI Summit E13 Flip Evo A11MT | |
| PCMark 10 / Digital Content Creation | |
| Lenovo ThinkPad X1 Nano Gen 3 | |
| HP Dragonfly G4 | |
| Lenovo ThinkBook Plus Gen4 IRU | |
| Average Intel Core i7-1355U, Intel Iris Xe Graphics G7 96EUs (5723 - 6712, n=15) | |
| Asus ZenBook S13 OLED UX5304 | |
| Dell Latitude 9330 | |
| MSI Summit E13 Flip Evo A11MT | |
| CrossMark / Overall | |
| Lenovo ThinkPad X1 Nano Gen 3 | |
| HP Dragonfly G4 | |
| Lenovo ThinkBook Plus Gen4 IRU | |
| Asus ZenBook S13 OLED UX5304 | |
| Average Intel Core i7-1355U, Intel Iris Xe Graphics G7 96EUs (1478 - 1643, n=15) | |
| CrossMark / Productivity | |
| Lenovo ThinkPad X1 Nano Gen 3 | |
| HP Dragonfly G4 | |
| Lenovo ThinkBook Plus Gen4 IRU | |
| Asus ZenBook S13 OLED UX5304 | |
| Average Intel Core i7-1355U, Intel Iris Xe Graphics G7 96EUs (1444 - 1665, n=15) | |
| CrossMark / Creativity | |
| Lenovo ThinkPad X1 Nano Gen 3 | |
| HP Dragonfly G4 | |
| Lenovo ThinkBook Plus Gen4 IRU | |
| Asus ZenBook S13 OLED UX5304 | |
| Average Intel Core i7-1355U, Intel Iris Xe Graphics G7 96EUs (1563 - 1732, n=15) | |
| CrossMark / Responsiveness | |
| Lenovo ThinkPad X1 Nano Gen 3 | |
| Lenovo ThinkBook Plus Gen4 IRU | |
| Asus ZenBook S13 OLED UX5304 | |
| HP Dragonfly G4 | |
| Average Intel Core i7-1355U, Intel Iris Xe Graphics G7 96EUs (1217 - 1681, n=15) | |
| PCMark 10 Score | 5747 points | |
Help | ||
| AIDA64 / Memory Copy | |
| Lenovo ThinkPad X1 Nano Gen 3 | |
| Dell Latitude 9330 | |
| Lenovo ThinkBook Plus Gen4 IRU | |
| Asus ZenBook S13 OLED UX5304 | |
| HP Dragonfly G4 | |
| Average Intel Core i7-1355U (35017 - 71600, n=18) | |
| MSI Summit E13 Flip Evo A11MT | |
| AIDA64 / Memory Read | |
| Lenovo ThinkPad X1 Nano Gen 3 | |
| Dell Latitude 9330 | |
| MSI Summit E13 Flip Evo A11MT | |
| Lenovo ThinkBook Plus Gen4 IRU | |
| Average Intel Core i7-1355U (38551 - 73377, n=18) | |
| Asus ZenBook S13 OLED UX5304 | |
| HP Dragonfly G4 | |
| AIDA64 / Memory Write | |
| Lenovo ThinkPad X1 Nano Gen 3 | |
| Lenovo ThinkBook Plus Gen4 IRU | |
| Asus ZenBook S13 OLED UX5304 | |
| HP Dragonfly G4 | |
| Average Intel Core i7-1355U (35910 - 93342, n=18) | |
| Dell Latitude 9330 | |
| MSI Summit E13 Flip Evo A11MT | |
| AIDA64 / Memory Latency | |
| Average Intel Core i7-1355U (72.2 - 346, n=18) | |
| Dell Latitude 9330 | |
| Lenovo ThinkBook Plus Gen4 IRU | |
| MSI Summit E13 Flip Evo A11MT | |
| Lenovo ThinkPad X1 Nano Gen 3 | |
| HP Dragonfly G4 | |
| Asus ZenBook S13 OLED UX5304 | |
* ... smaller is better
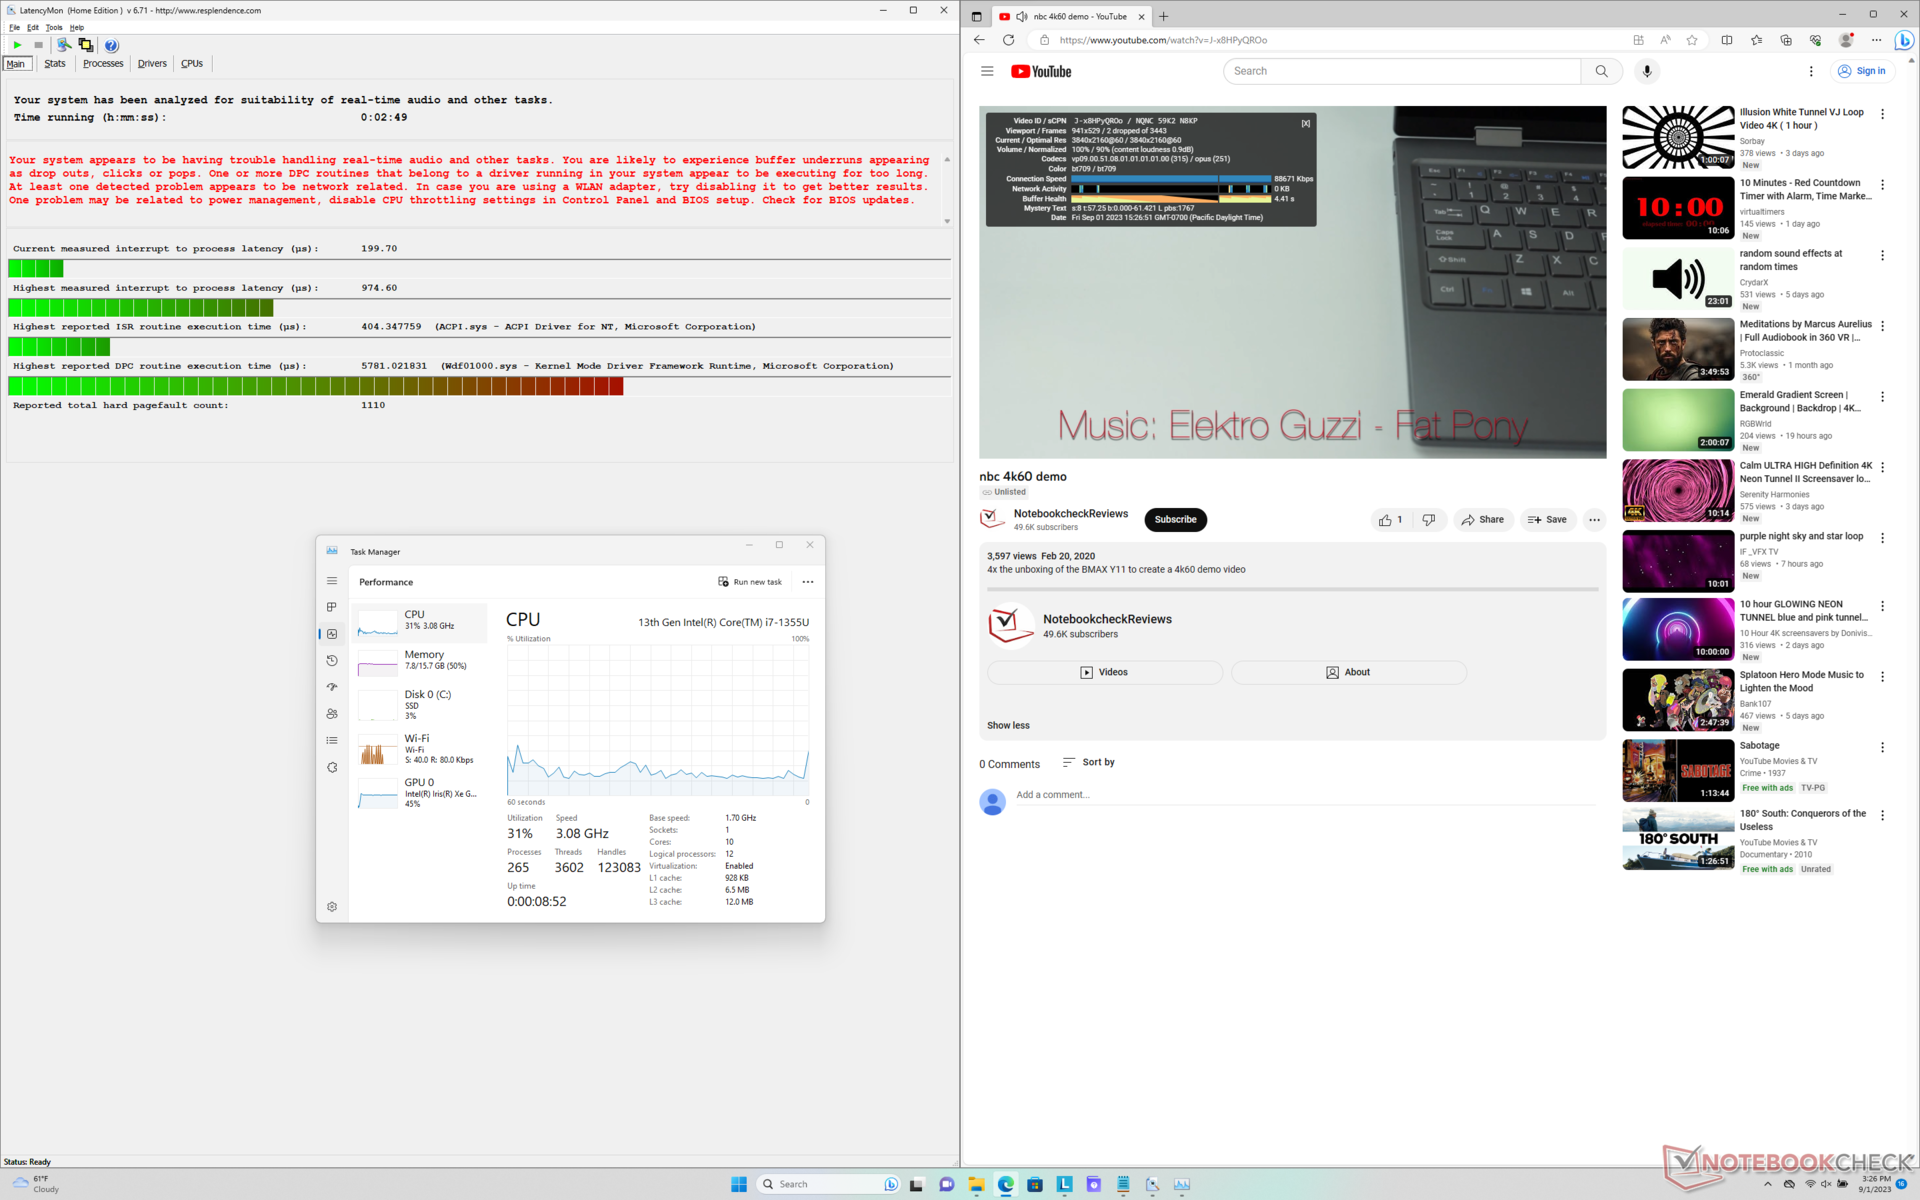
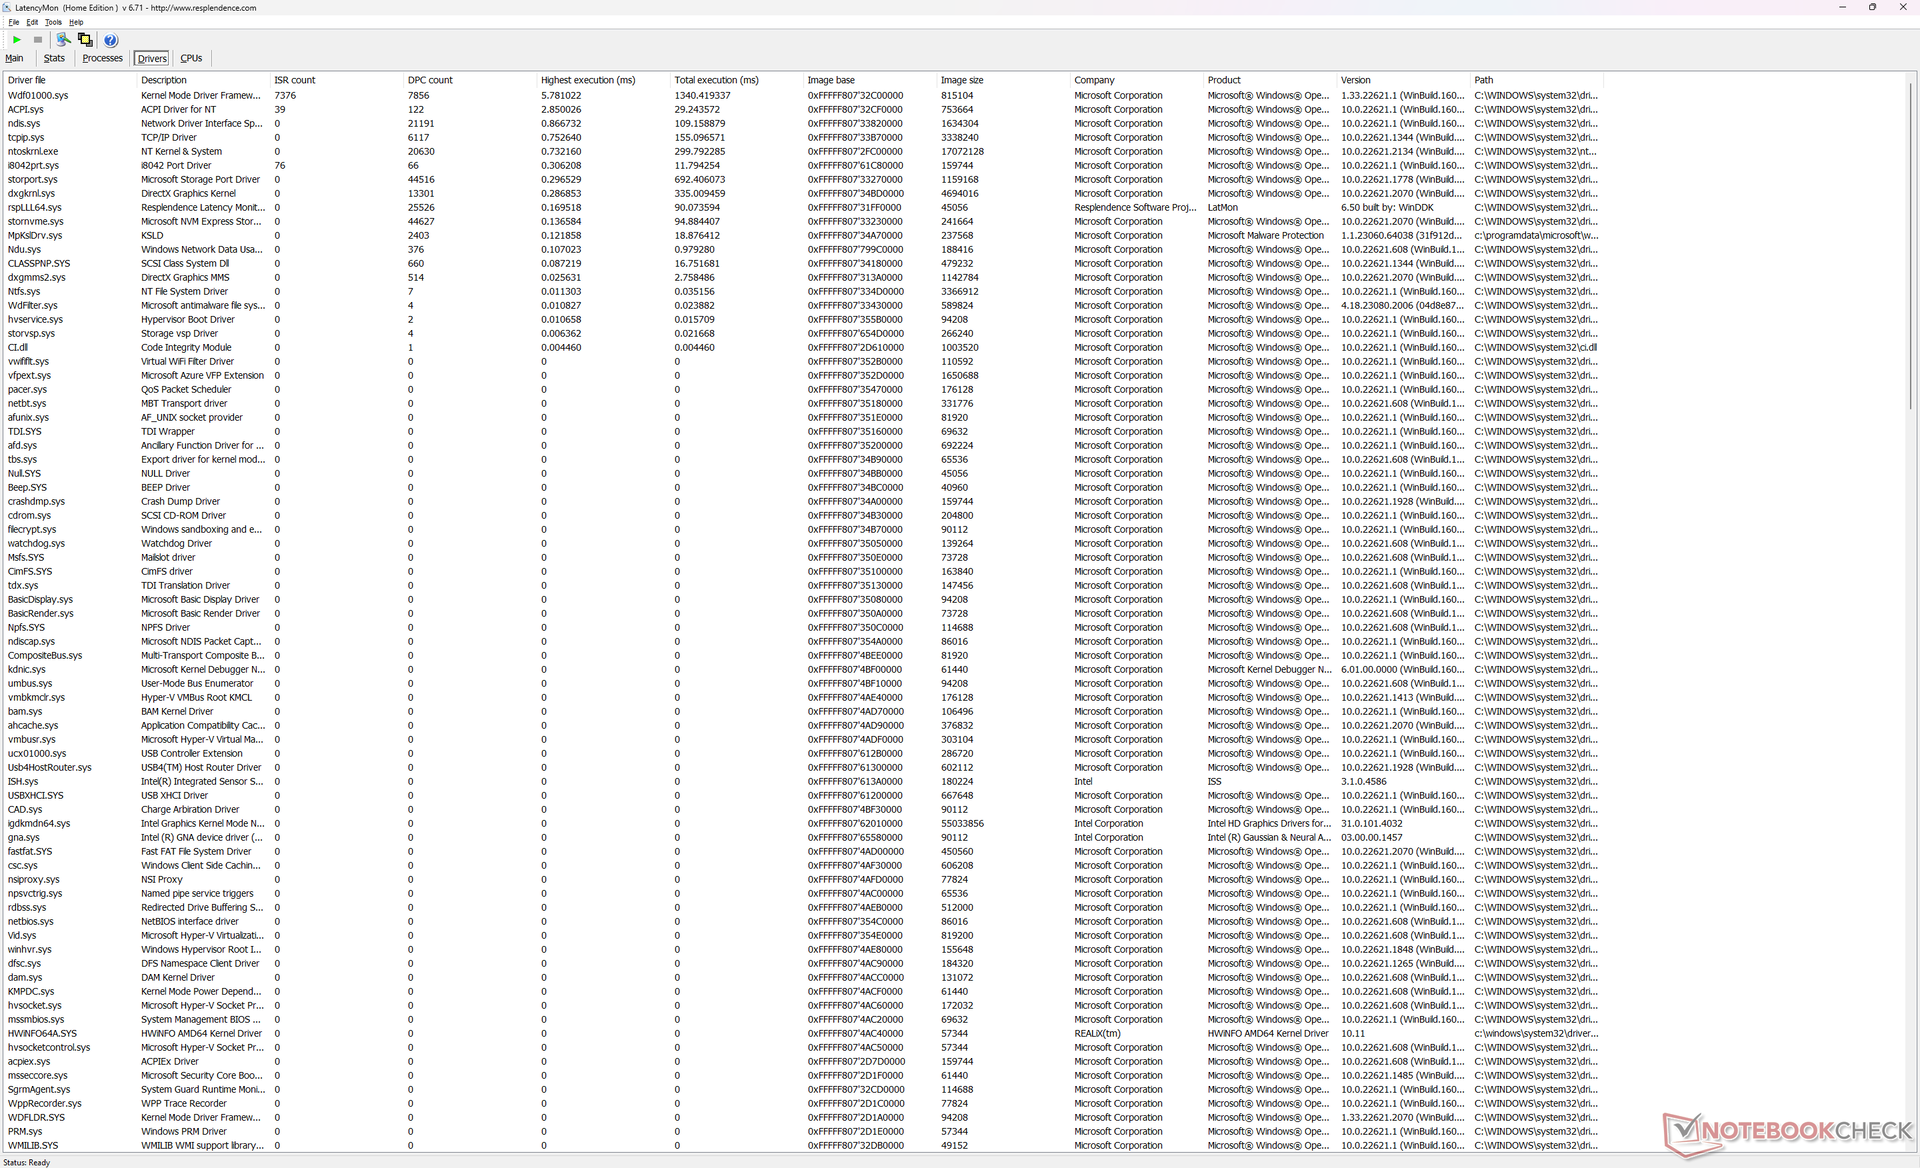
DPC Latency
LatencyMon reveals minor-moderate DPC issues when opening multiple browser tabs of our homepage. 4K video playback at 60 FPS is nearly perfect with just 2 dropped frames during a 60-second window.
| DPC Latencies / LatencyMon - interrupt to process latency (max), Web, Youtube, Prime95 | |
| Dell Latitude 9330 | |
| MSI Summit E13 Flip Evo A11MT | |
| Lenovo ThinkPad X1 Nano Gen 3 | |
| Asus ZenBook S13 OLED UX5304 | |
| HP Dragonfly G4 | |
| Lenovo ThinkBook Plus Gen4 IRU | |
* ... smaller is better
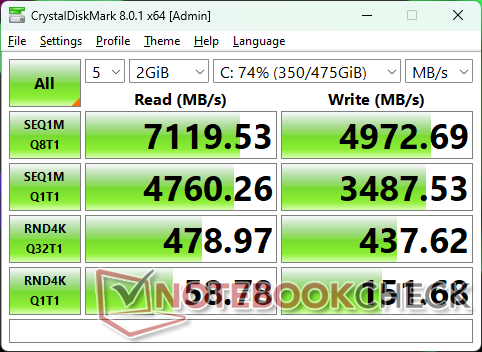
Storage Devices — Just One SSD Only
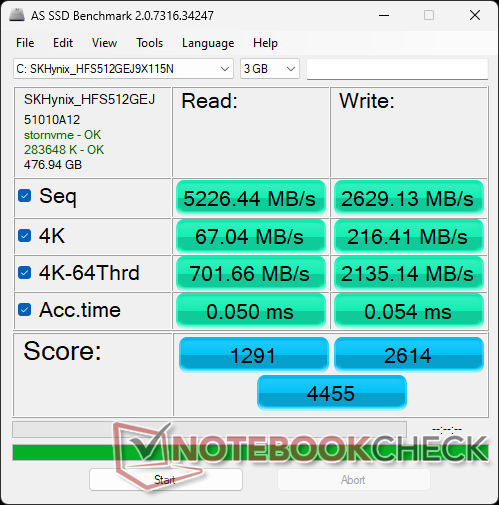
Our test unit ships with a high-end SK hynix PC801 PCIe4 x4 NVMe SSD which competes directly with the popular Samsung PM9A1. Performance is excellent and maximum read rates are sustainable at a high 6200 MB/s despite the small and thin form factor of the ThinkBook Plus Gen 4.

| Drive Performance rating - Percent | |
| Asus ZenBook S13 OLED UX5304 | |
| MSI Summit E13 Flip Evo A11MT | |
| Lenovo ThinkBook Plus Gen4 IRU | |
| HP Dragonfly G4 | |
| Dell Latitude 9330 | |
| Lenovo ThinkPad X1 Nano Gen 3 | |
* ... smaller is better
Disk Throttling: DiskSpd Read Loop, Queue Depth 8
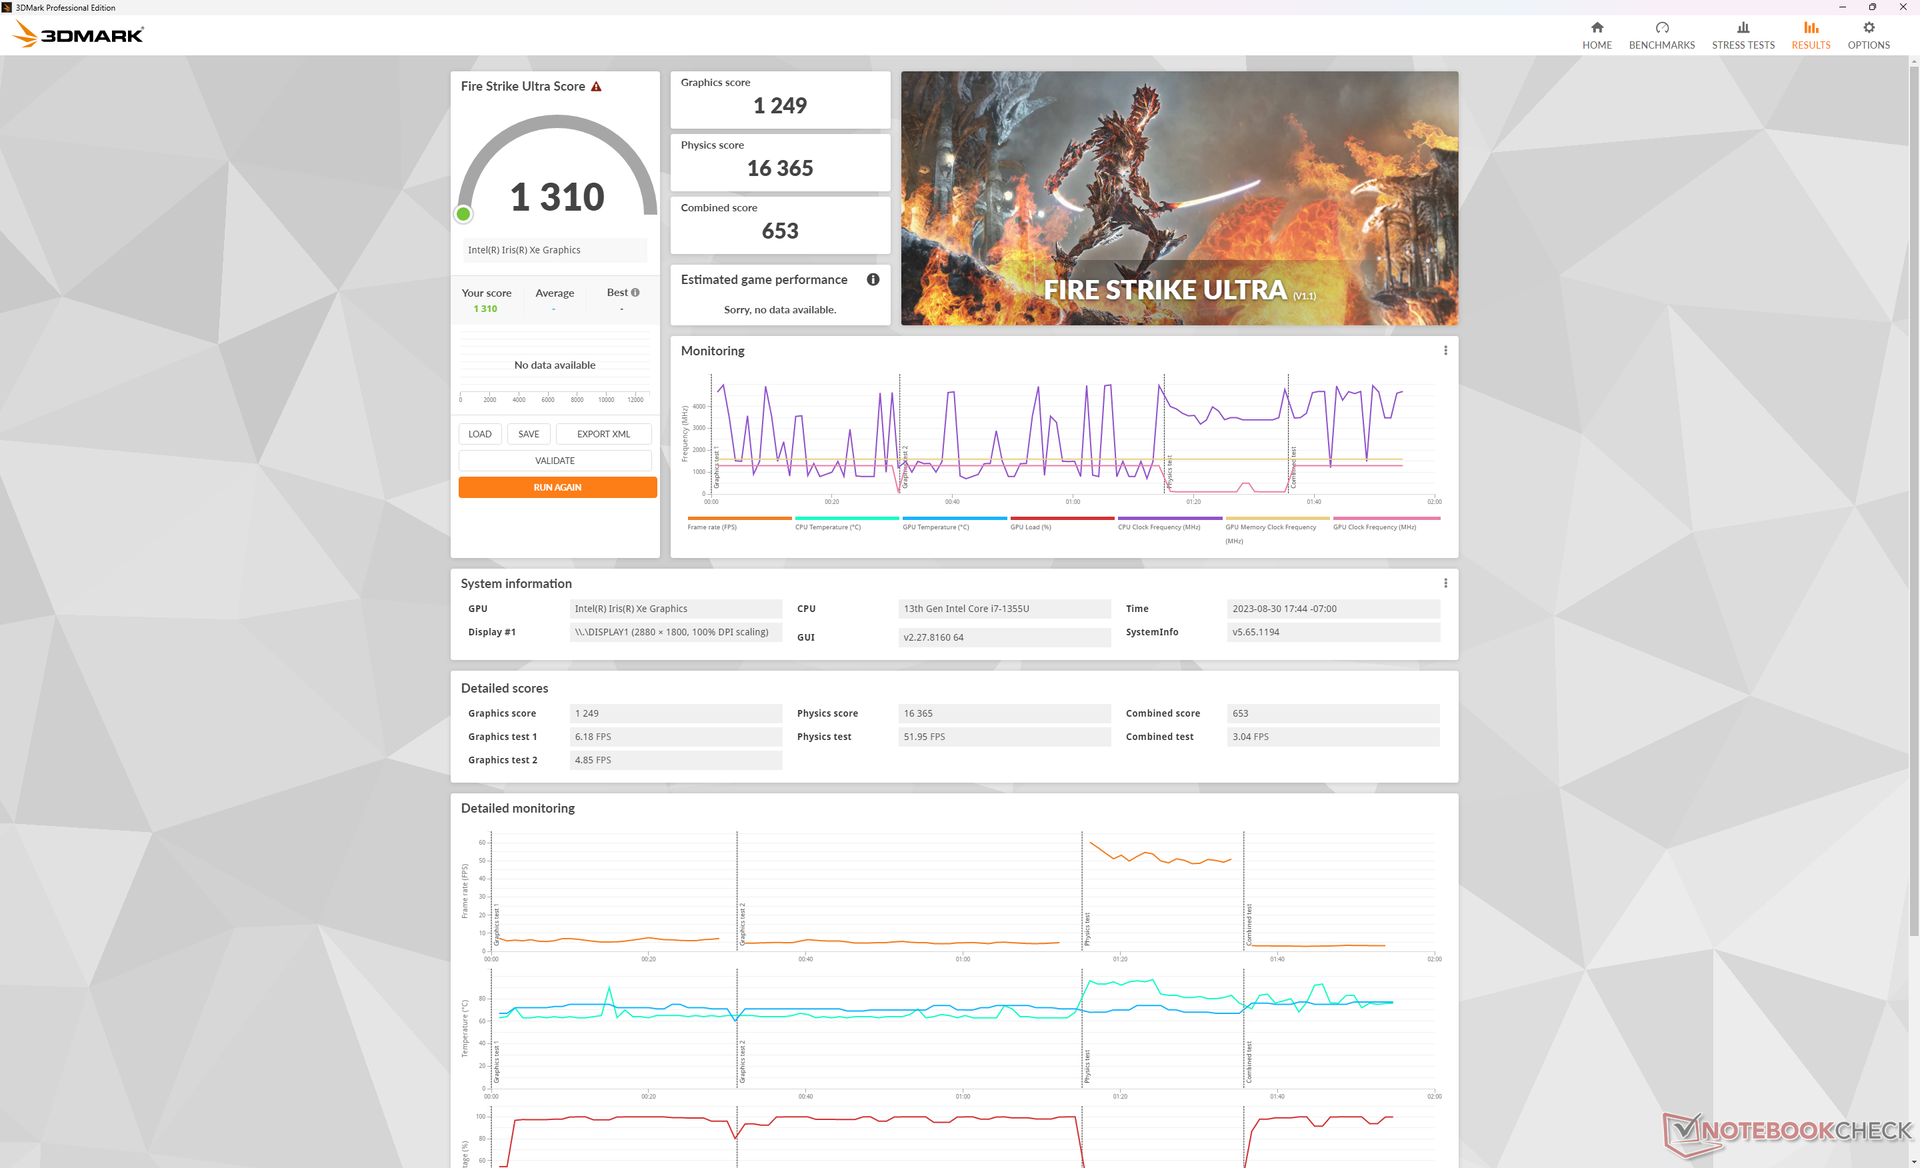
GPU Performance — Familiar Xe
The integrated Iris Xe 96 EUs is performing where we expect it to be relative to other laptops with the same GPU if not slightly faster by just a few percentage points. Downgrading to the Core i5 SKU with the Iris Xe 80 EUs is expected to decrease graphics performance somewhat significantly by about 30 to 35 percent based on our experience with the Lenovo ThinkPad X13 Yoga G4. Current AMD alternatives like the Radeon 680M or 780M are much faster than any Intel iGPU solution at the time of writing.
External GPUs are supported for faster performance. You can also technically run 3D games on the E Ink display which is neat to see but otherwise impractical.
3DMark 11 scores would remain relatively similar between battery, Balanced, and Performance modes as shown by the table below. This suggests that overall performance is impacted more by the limited Turbo Boost boost of the system rather than the current profile setting.
| Power Profile | Graphics Score | Physics Score | Combined Score |
| Battery Power | 6468 | 13039 | 6591 |
| Balanced Mode | 6509 | 11451 (-12%) | 5636 |
| Performance Mode | 6456 | 13055 | 6586 |
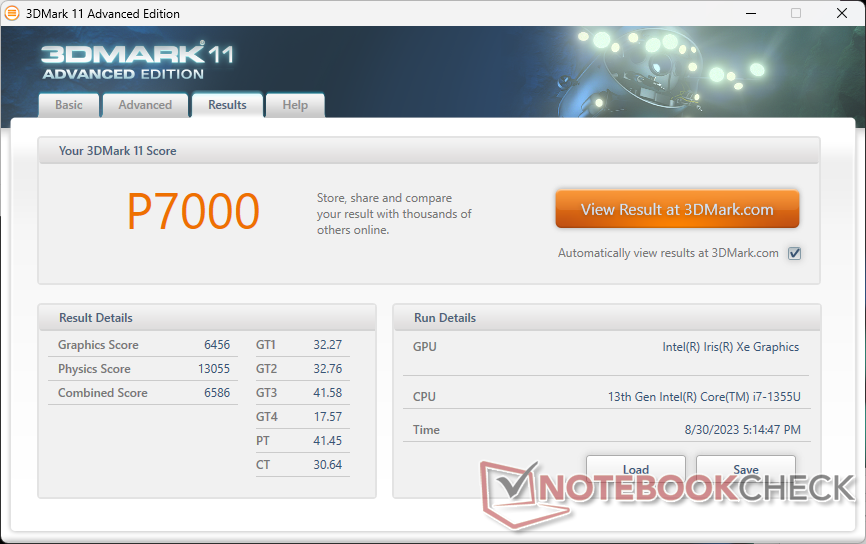
| 3DMark 11 Performance | 7000 points | |
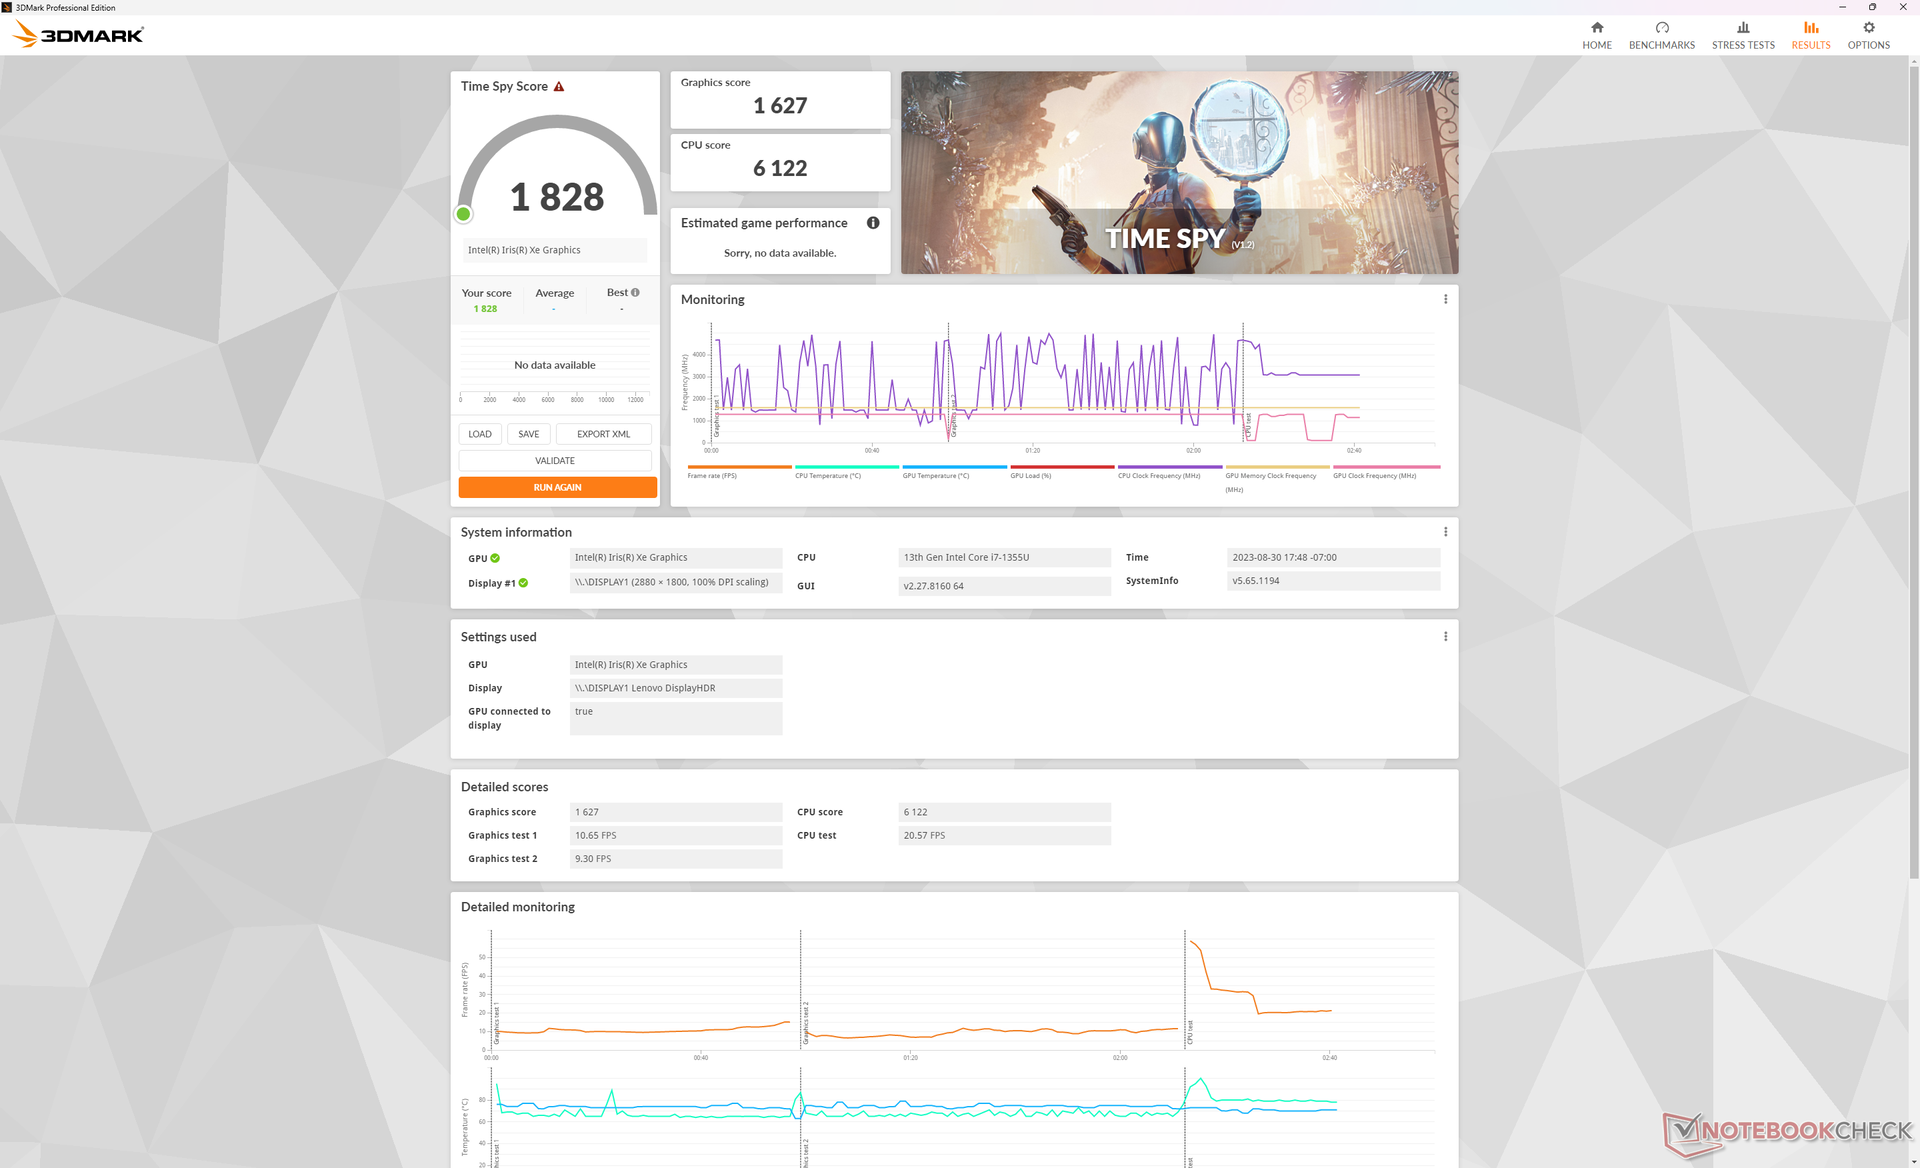
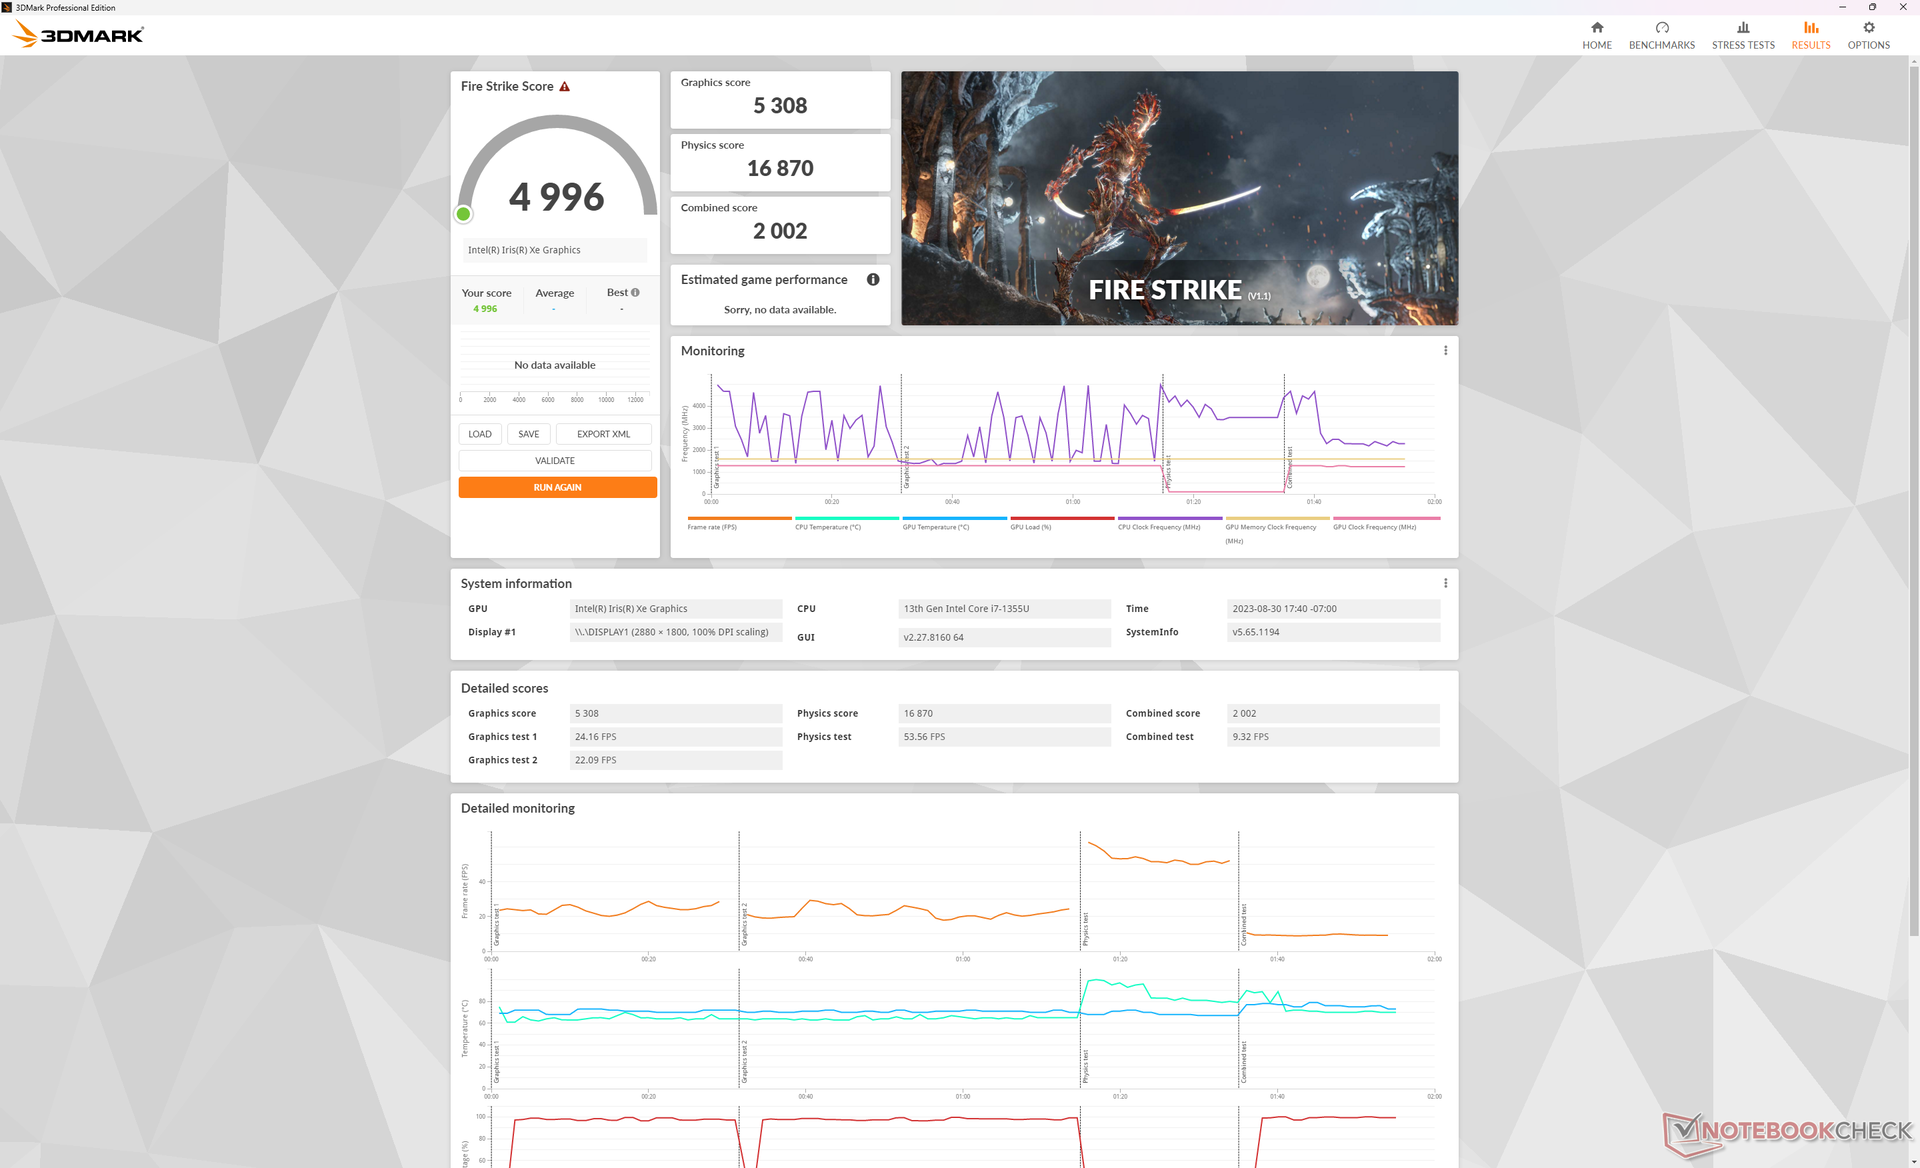
| 3DMark Fire Strike Score | 4996 points | |
| 3DMark Time Spy Score | 1828 points | |
Help | ||
| Blender | |
| v3.3 Classroom HIP/AMD | |
| Lenovo Yoga 6 13 83B2001SGE | |
| v3.3 Classroom OPTIX/RTX | |
| Lenovo Yoga Pro 7 14IRH G8 | |
| v3.3 Classroom CUDA | |
| Lenovo Yoga Pro 7 14IRH G8 | |
| v3.3 Classroom CPU | |
| Asus ZenBook S13 OLED UX5304 | |
| Dell Latitude 9330 | |
| HP Dragonfly G4 | |
| Lenovo ThinkPad X1 Nano Gen 3 | |
| Lenovo ThinkBook Plus Gen4 IRU | |
| Average Intel Iris Xe Graphics G7 96EUs (336 - 1259, n=109) | |
| Lenovo Yoga 6 13 83B2001SGE | |
| Framework Laptop 13.5 13th Gen Intel | |
| Lenovo Yoga Pro 7 14IRH G8 | |
* ... smaller is better
Witcher 3 FPS Chart
| low | med. | high | ultra | |
|---|---|---|---|---|
| GTA V (2015) | 102.8 | 91.3 | 26.2 | 11.1 |
| The Witcher 3 (2015) | 89.8 | 59.1 | 32.5 | 15.4 |
| Dota 2 Reborn (2015) | 114.8 | 84.3 | 68.7 | 60.5 |
| Final Fantasy XV Benchmark (2018) | 46.4 | 25.6 | 17.9 | |
| X-Plane 11.11 (2018) | 38.8 | 34.4 | 34.3 | |
| Far Cry 5 (2018) | 50 | 31 | 29 | 27 |
| Strange Brigade (2018) | 94.4 | 41.1 | 32.5 | 26.1 |
| Cyberpunk 2077 1.6 (2022) | 18 | 14.3 | 12.1 | 11.4 |
| Tiny Tina's Wonderlands (2022) | 30.8 | 23.5 | 15.4 | 12 |
| F1 22 (2022) | 48.5 | 44.7 | 32 | 23.8 |
Emissions — Only Loud When Stressed
System Noise
Fan noise is barely noticeable during common loads like web browsing, reading, or video streaming where it hovers around 27 dB(A) against a silent background of 24.3 dB(A). Higher loads like 3DMark 06 or would increase fan noise to a more noticeable 38 dB(A) similar to what we observed on the Latitude 9330.
We're able to record a maximum fan noise of just under 42 dB(A) when running games or other intense loads for extended periods. The low 40 dB(A) range is typical of most convertibles and laptops powered by U-series CPUs.
Noise level
| Idle |
| 24.3 / 24.3 / 24.3 dB(A) |
| Load |
| 38.2 / 41.8 dB(A) |
 | ||
30 dB silent 40 dB(A) audible 50 dB(A) loud |
||
min: | ||
| Lenovo ThinkBook Plus Gen4 IRU Iris Xe G7 96EUs, i7-1355U, SK hynix PC801 HFS512GEJ9X115N | Lenovo ThinkPad X1 Nano Gen 3 Iris Xe G7 96EUs, i7-1360P, Lenovo UMIS AM6A0 RPJTJ512MKP1QDQ | HP Dragonfly G4 Iris Xe G7 96EUs, i7-1365U, Micron 3400 MTFDKBA512TFH 512GB | Asus ZenBook S13 OLED UX5304 Iris Xe G7 96EUs, i7-1355U, Samsung PM9A1 MZVL21T0HCLR | Dell Latitude 9330 Iris Xe G7 96EUs, i7-1260U | MSI Summit E13 Flip Evo A11MT Iris Xe G7 96EUs, i7-1185G7, Phison 1TB SM2801T24GKBB4S-E162 | |
|---|---|---|---|---|---|---|
| Noise | 8% | 10% | 4% | 4% | -4% | |
| off / environment * (dB) | 24.3 | 22.9 6% | 23.3 4% | 23.3 4% | 23 5% | 24.5 -1% |
| Idle Minimum * (dB) | 24.3 | 23 5% | 23.5 3% | 23.3 4% | 23 5% | 24.7 -2% |
| Idle Average * (dB) | 24.3 | 23 5% | 23.5 3% | 23.3 4% | 23.1 5% | 24.7 -2% |
| Idle Maximum * (dB) | 24.3 | 23 5% | 26.8 -10% | 23.3 4% | 23.1 5% | 26.4 -9% |
| Load Average * (dB) | 38.2 | 32.8 14% | 27.2 29% | 37.7 1% | 37.1 3% | 37.8 1% |
| Witcher 3 ultra * (dB) | 41.9 | 36.9 12% | 32.7 22% | 40.1 4% | 40.6 3% | 41.4 1% |
| Load Maximum * (dB) | 41.8 | 36.9 12% | 35 16% | 40.1 4% | 40.5 3% | 48.8 -17% |
* ... smaller is better
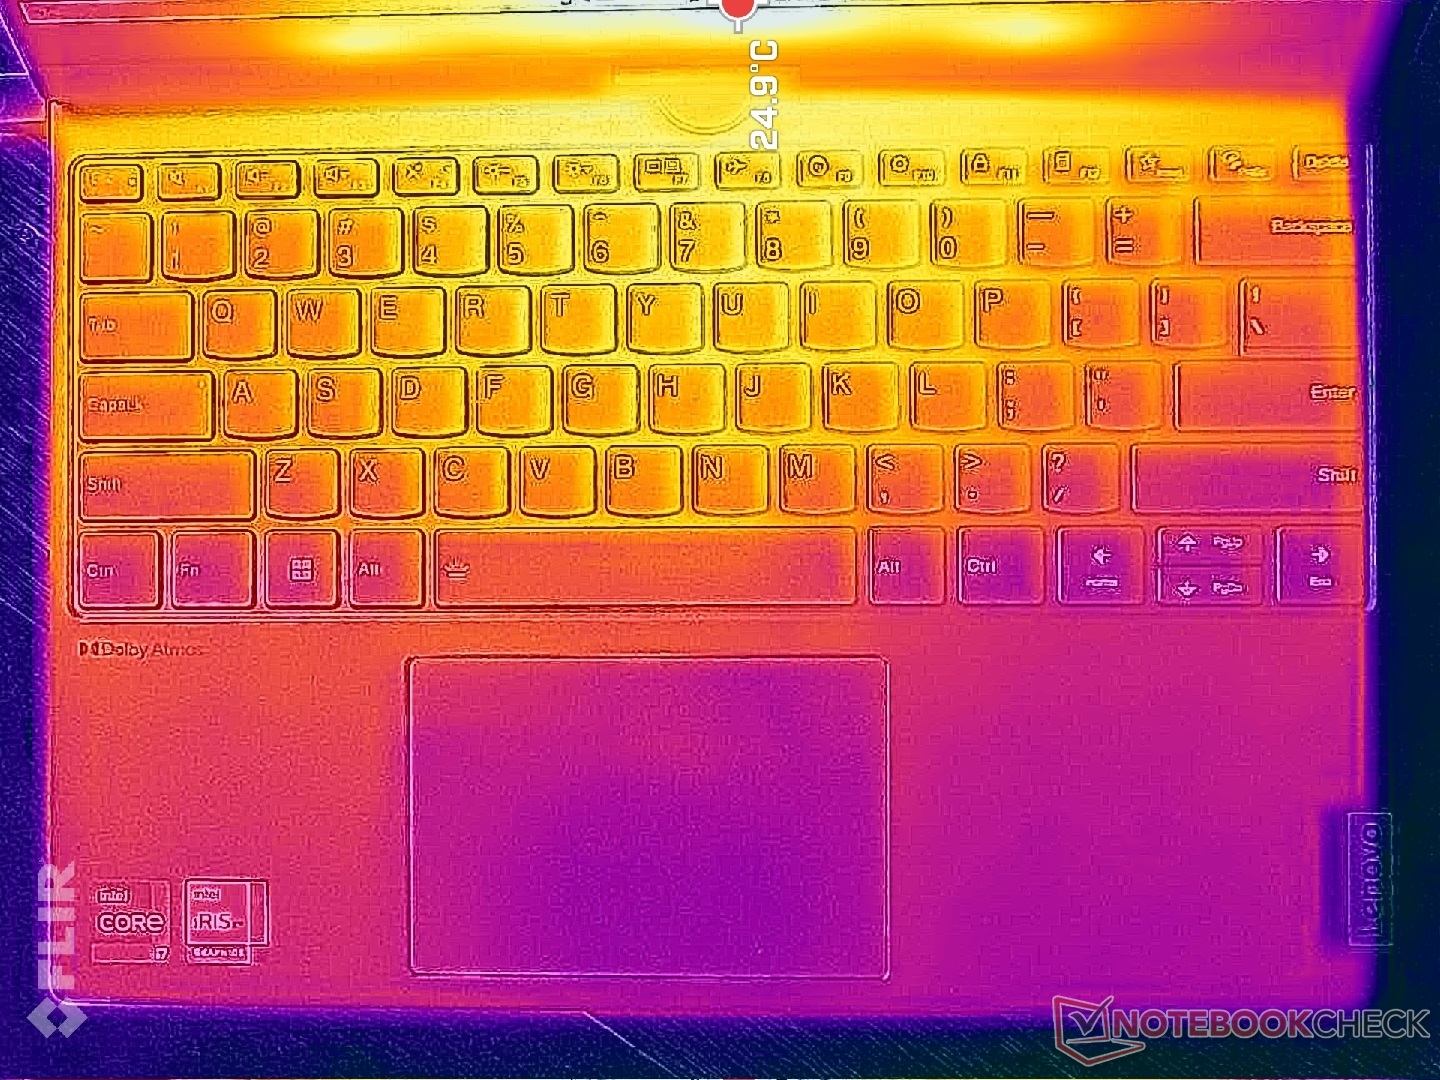
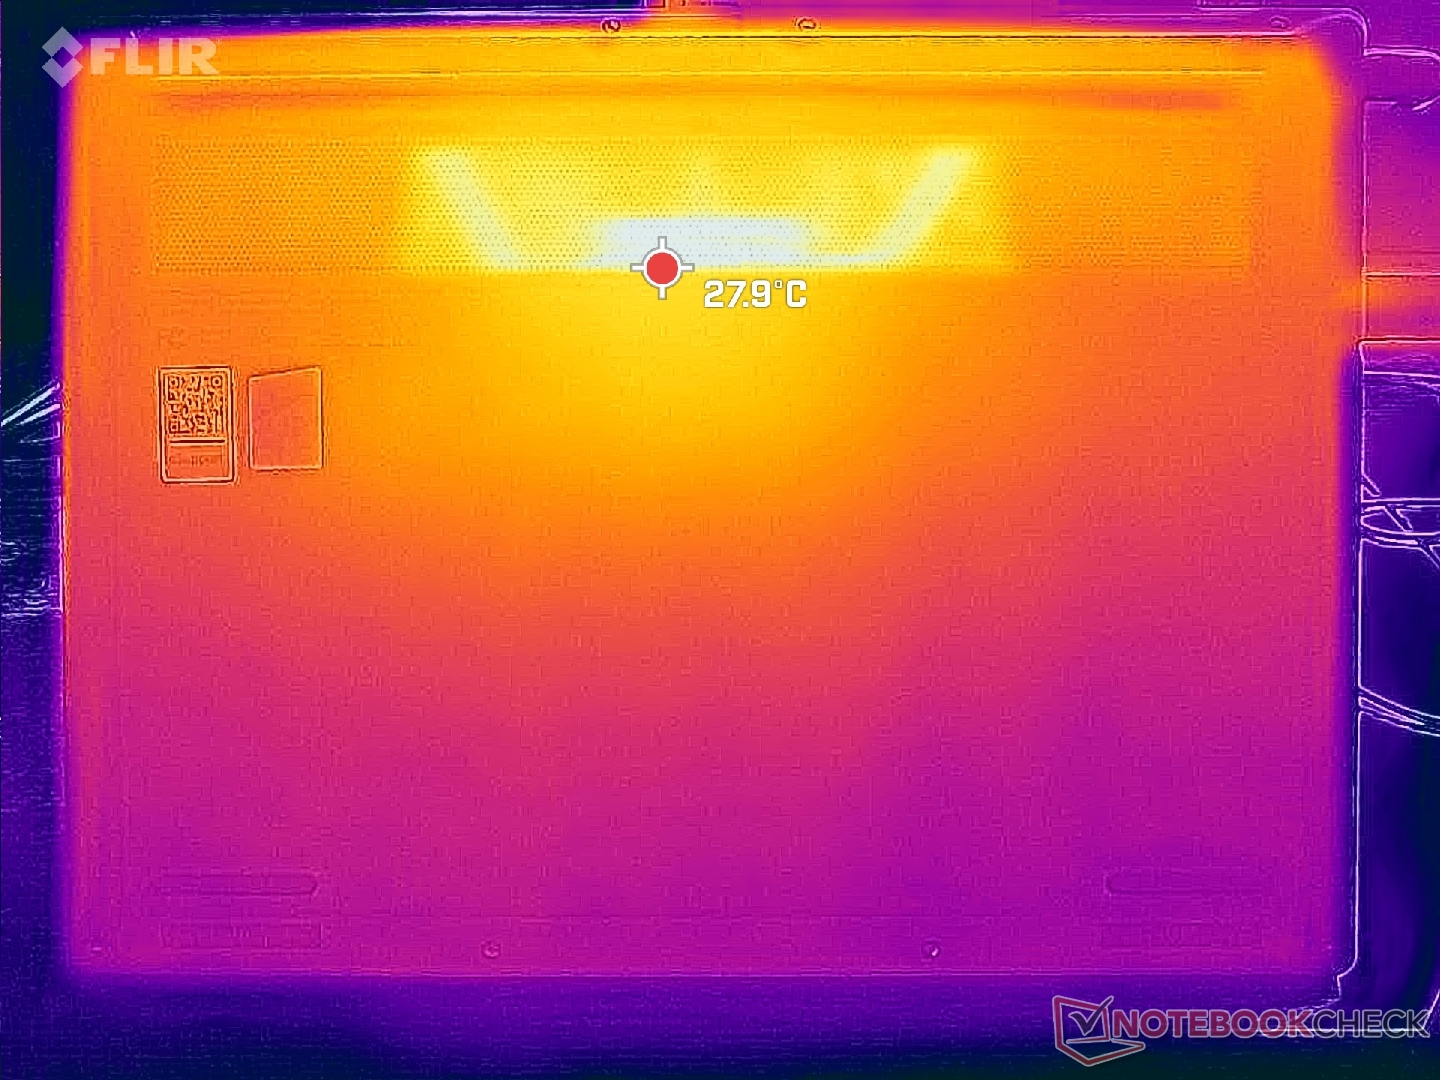
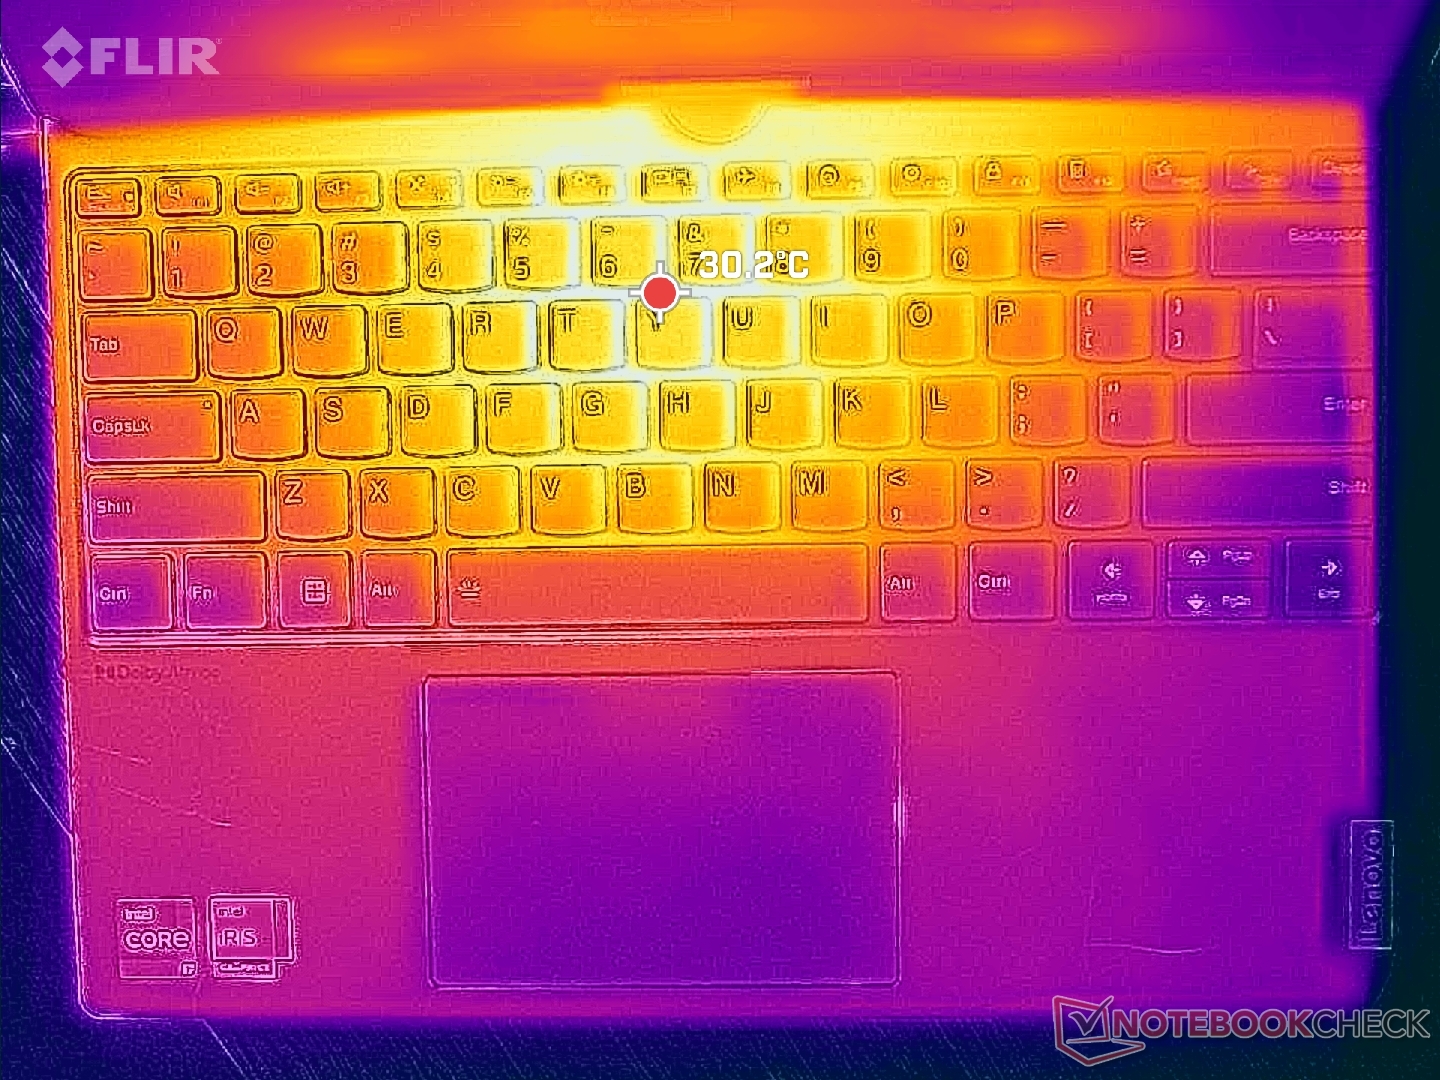
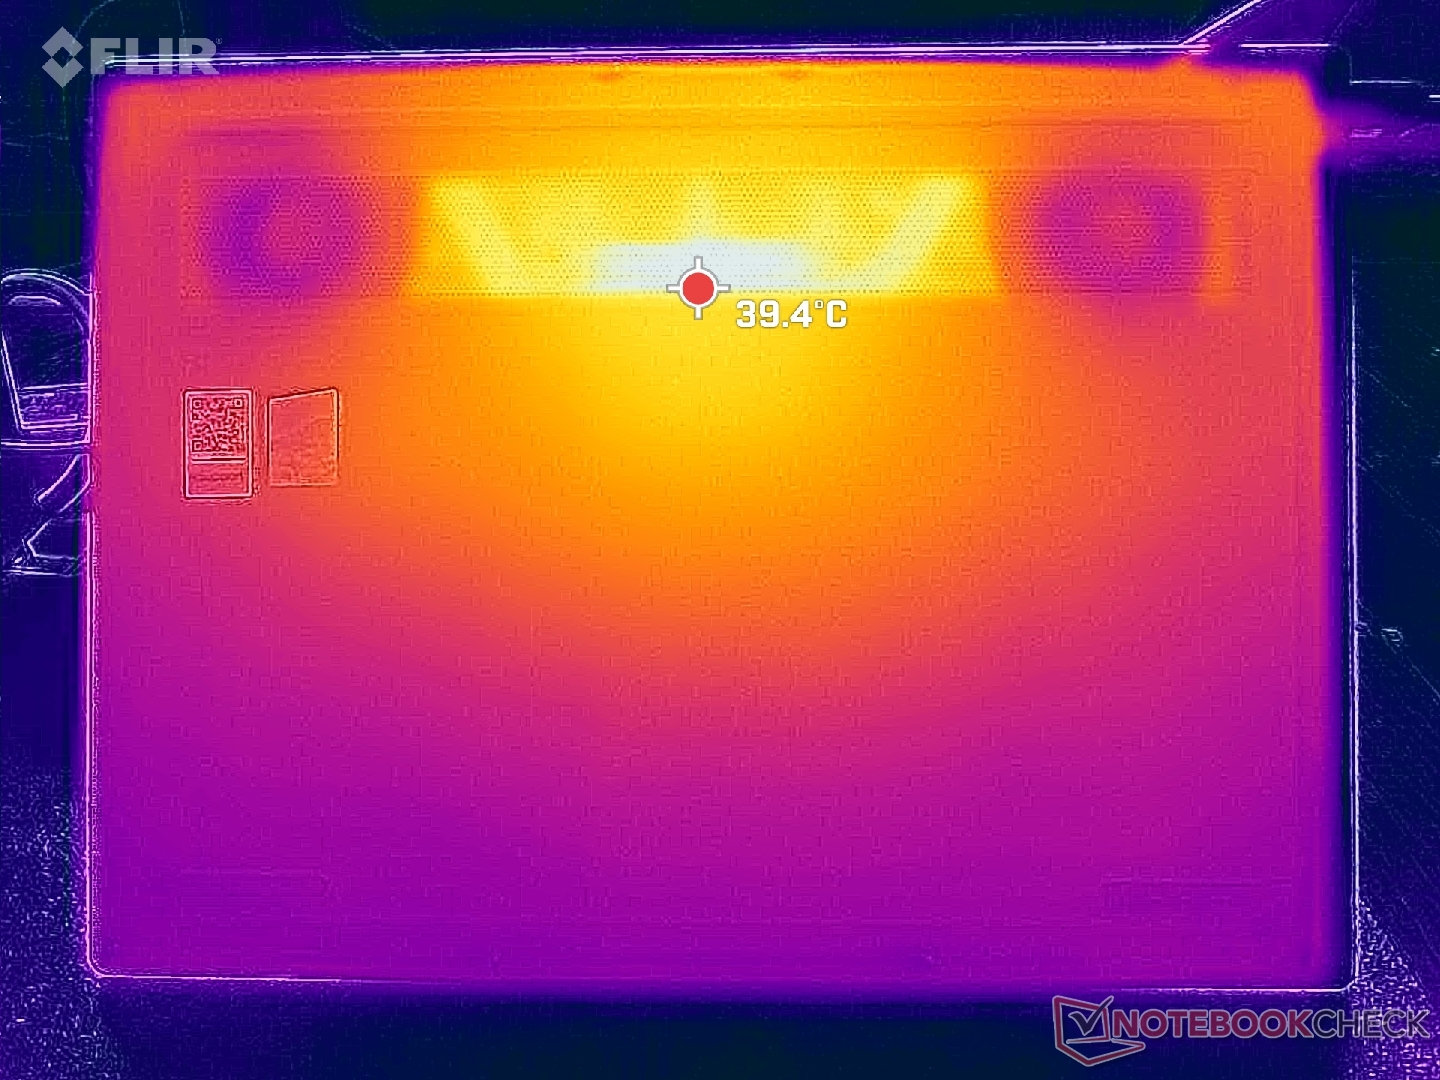
Temperature
Surface temperatures are cooler than expected on the keyboard side while the underside can get much warmer. Hot spots on the keyboard only reach around 30 C compared to 39 C on the bottom. The warmth is noticeable but never distracting on laptop or tablet modes.
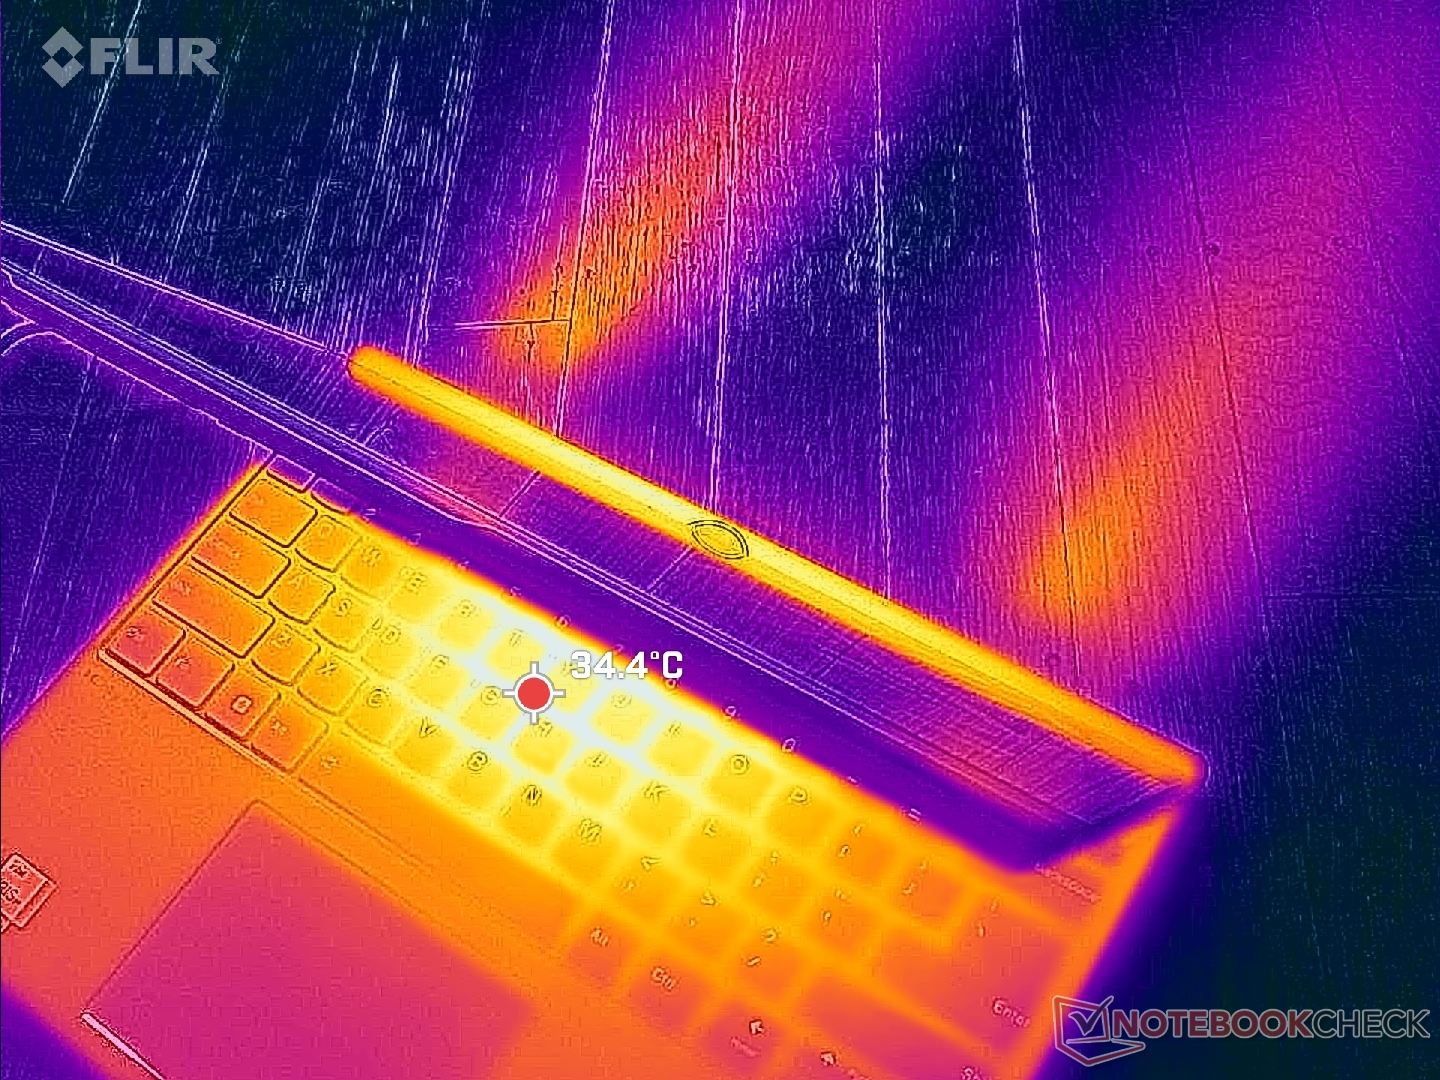
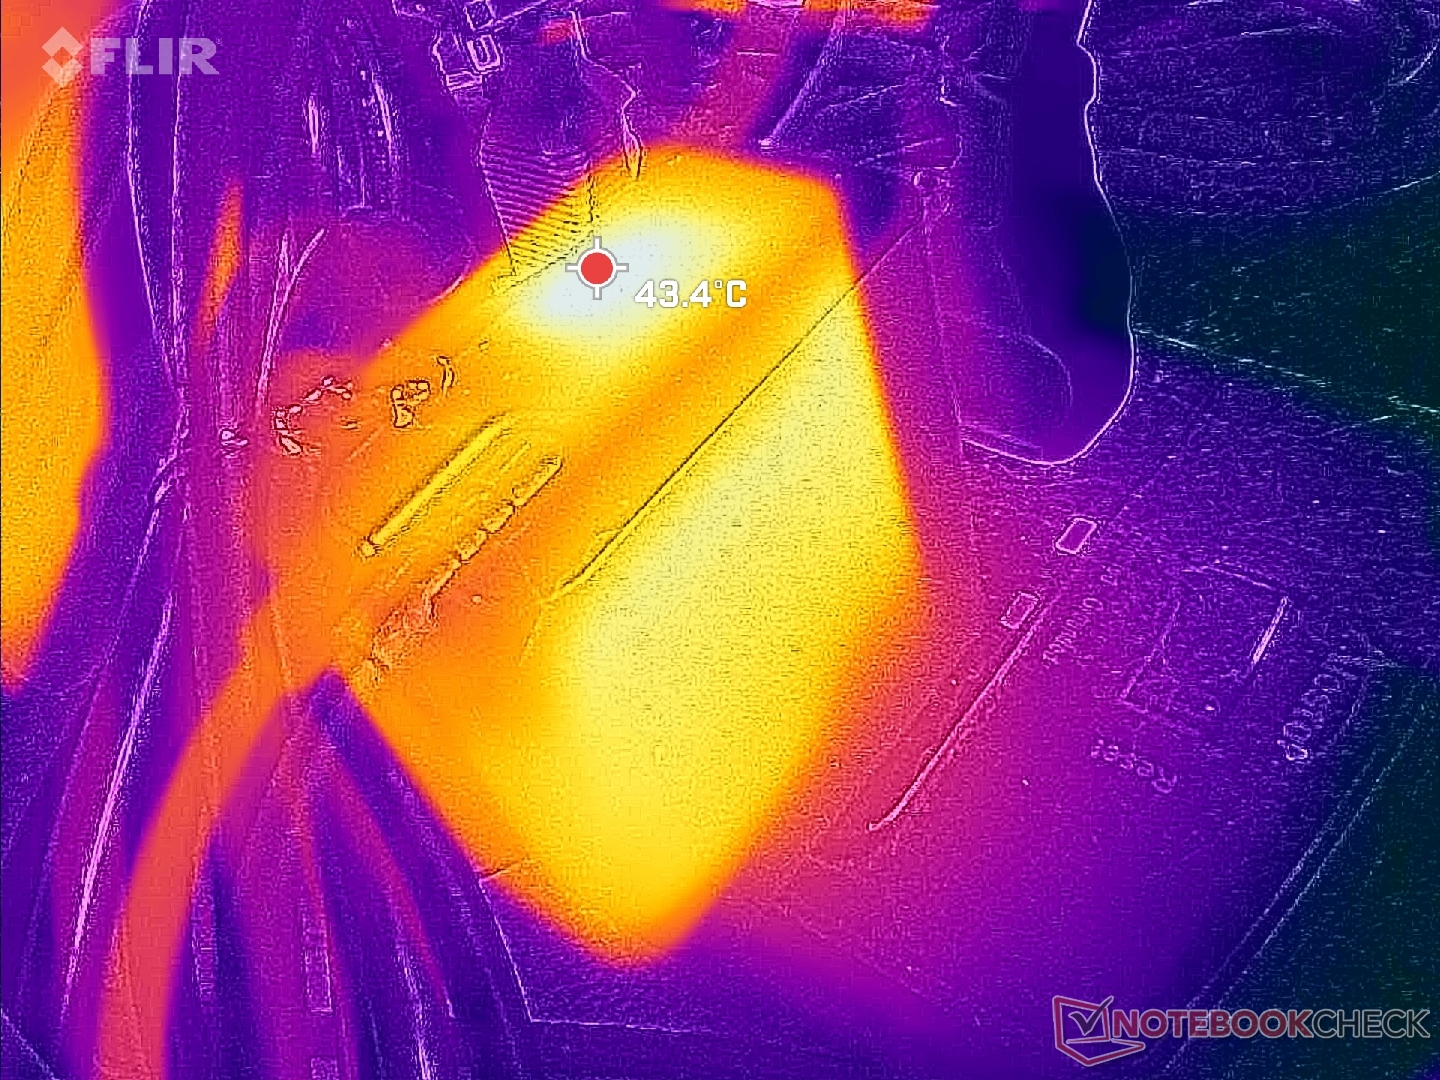
(+) The maximum temperature on the upper side is 34.2 °C / 94 F, compared to the average of 35.4 °C / 96 F, ranging from 19.6 to 60 °C for the class Convertible.
(+) The bottom heats up to a maximum of 35.8 °C / 96 F, compared to the average of 36.9 °C / 98 F
(+) In idle usage, the average temperature for the upper side is 26.7 °C / 80 F, compared to the device average of 30.3 °C / 87 F.
(+) The palmrests and touchpad are cooler than skin temperature with a maximum of 26.6 °C / 79.9 F and are therefore cool to the touch.
(±) The average temperature of the palmrest area of similar devices was 28 °C / 82.4 F (+1.4 °C / 2.5 F).
| Lenovo ThinkBook Plus Gen4 IRU Intel Core i7-1355U, Intel Iris Xe Graphics G7 96EUs | Lenovo ThinkPad X1 Nano Gen 3 Intel Core i7-1360P, Intel Iris Xe Graphics G7 96EUs | HP Dragonfly G4 Intel Core i7-1365U, Intel Iris Xe Graphics G7 96EUs | Asus ZenBook S13 OLED UX5304 Intel Core i7-1355U, Intel Iris Xe Graphics G7 96EUs | Dell Latitude 9330 Intel Core i7-1260U, Intel Iris Xe Graphics G7 96EUs | MSI Summit E13 Flip Evo A11MT Intel Core i7-1185G7, Intel Iris Xe Graphics G7 96EUs | |
|---|---|---|---|---|---|---|
| Heat | -6% | -5% | -10% | -9% | -33% | |
| Maximum Upper Side * (°C) | 34.2 | 44 -29% | 38.6 -13% | 43.1 -26% | 40.6 -19% | 52 -52% |
| Maximum Bottom * (°C) | 35.8 | 43.2 -21% | 40.4 -13% | 45 -26% | 50.2 -40% | 57.4 -60% |
| Idle Upper Side * (°C) | 28.6 | 25.6 10% | 28.2 1% | 27.3 5% | 25 13% | 30.4 -6% |
| Idle Bottom * (°C) | 30.4 | 25.6 16% | 29 5% | 27.8 9% | 27.6 9% | 34.2 -13% |
* ... smaller is better
Stress Test
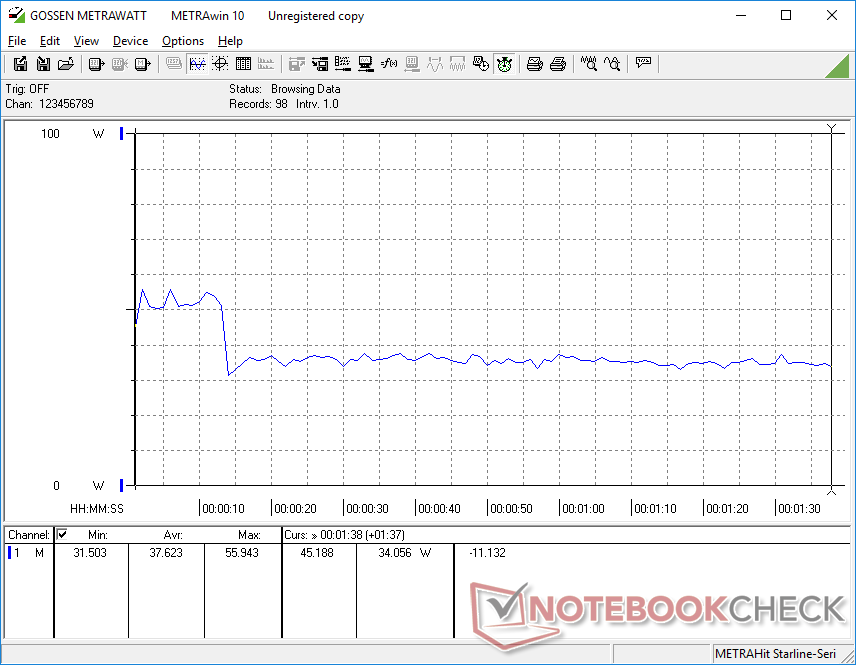
When running Prime95, CPU clock rates and package power draw would spike to 3.3 GHz and 54 W, respectively, and at a high core temperature of 97 C. This would last for only 10 to 15 seconds before clock rates and board power draw would fall to just 2.4 GHz and 26 W in order to maintain a cooler core temperature of 75 C. Turbo Boost potential is thus limited to just several seconds at most which is not uncommon on Core U-series subnotebooks.
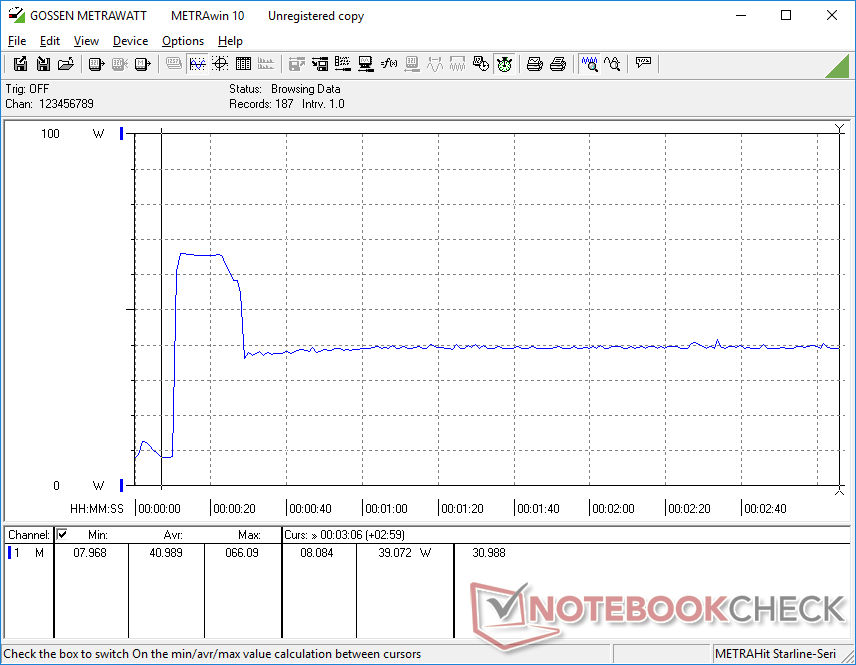
GPU clock rates and temperature when running Witcher 3 would stabilize at 1297 MHz and 71 C, respectively, compared to 69 C on the Intel-powered Dragonfly G4.
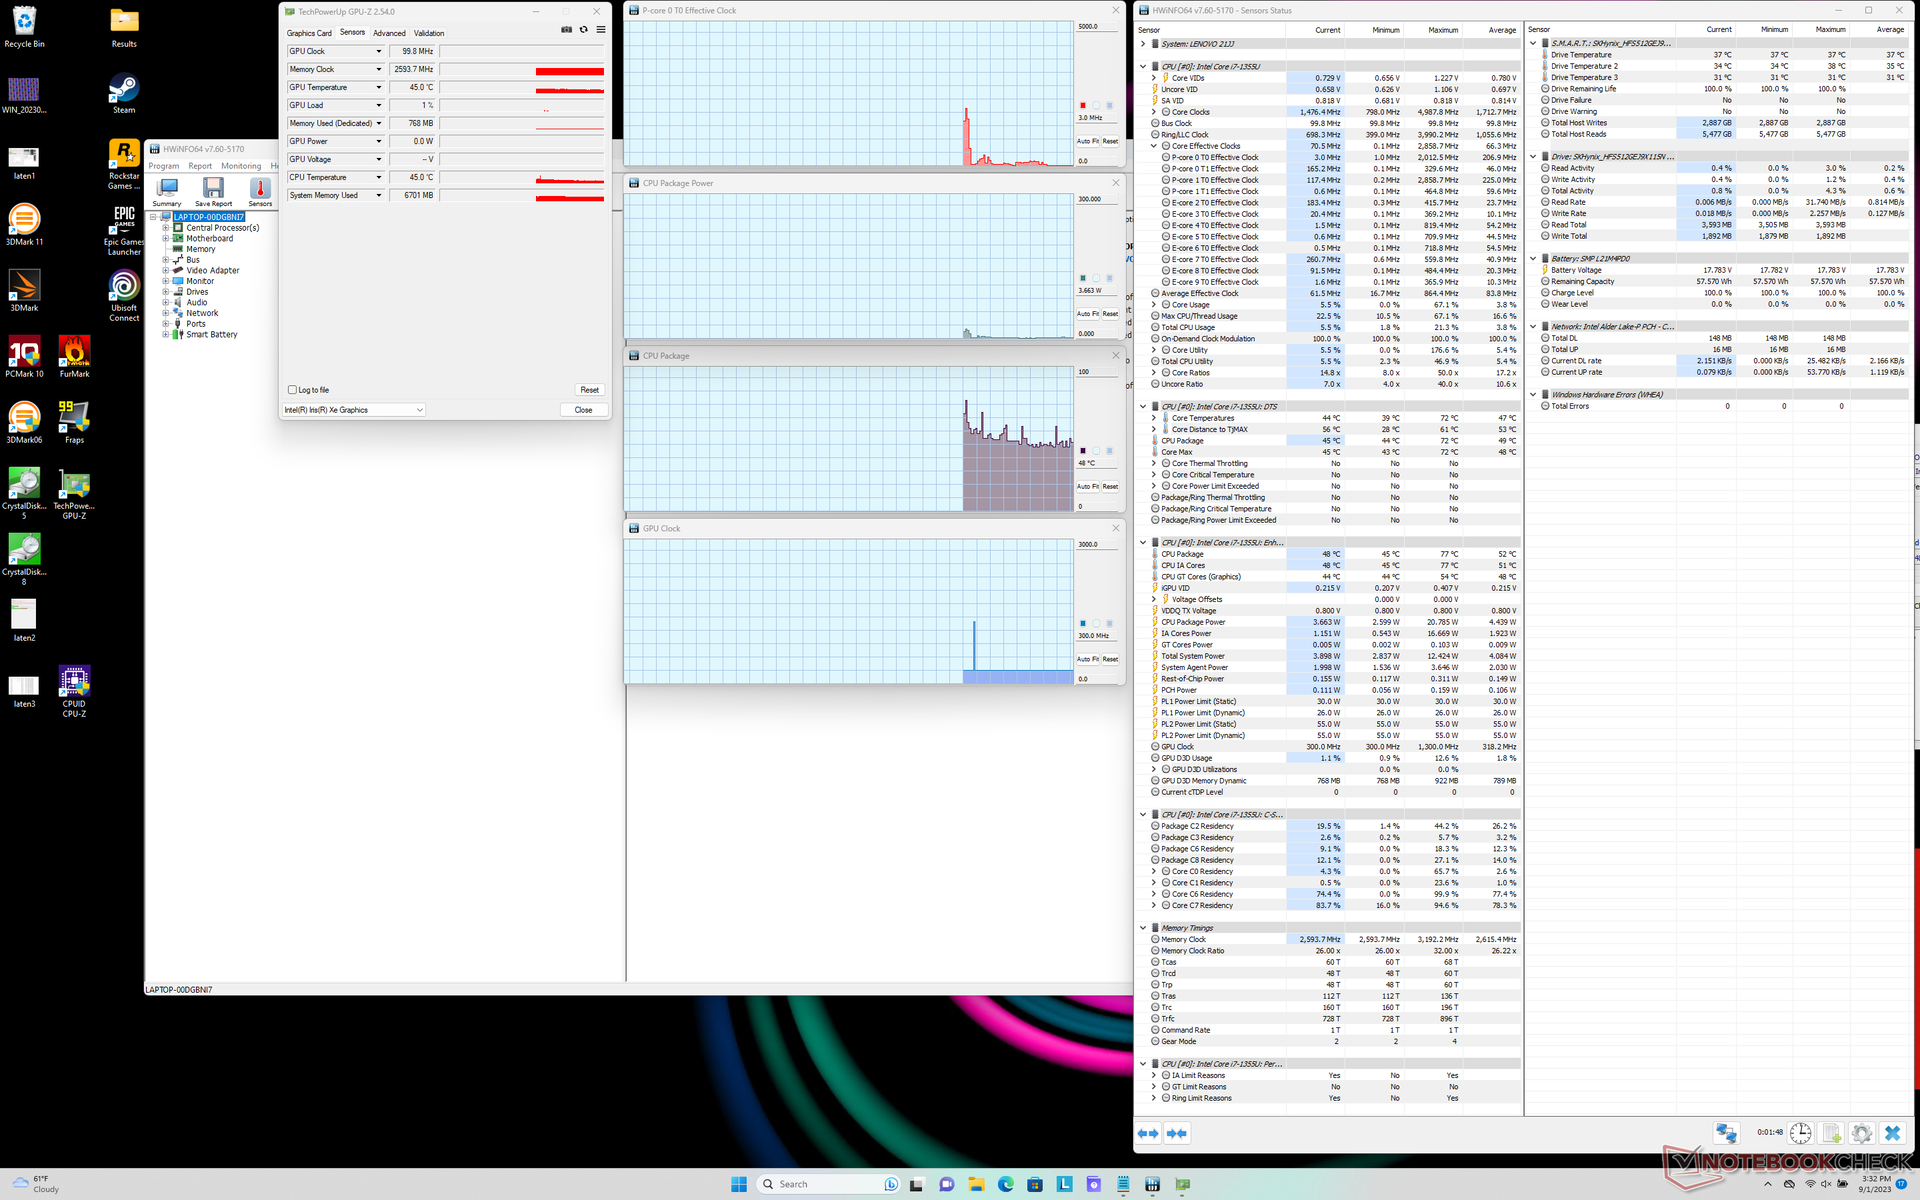
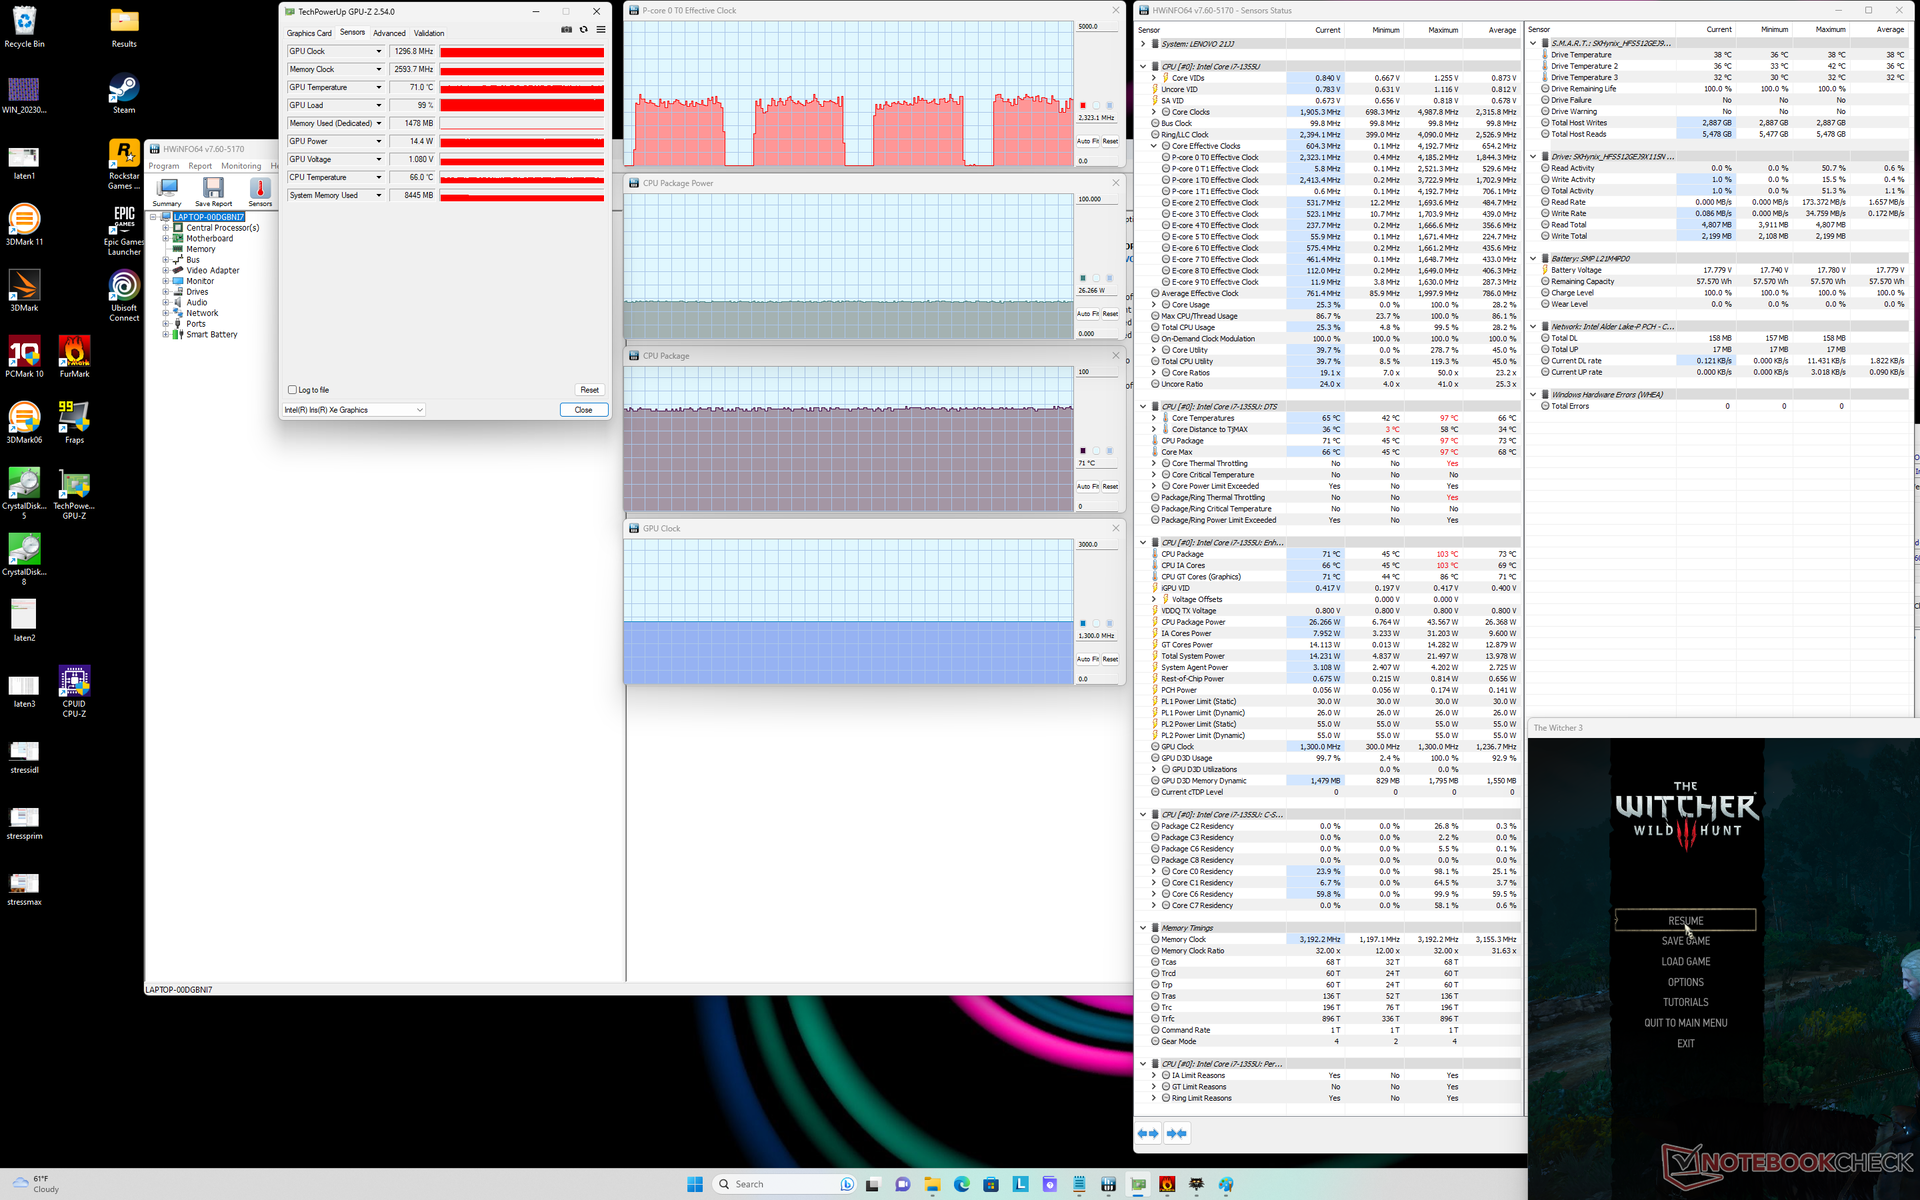
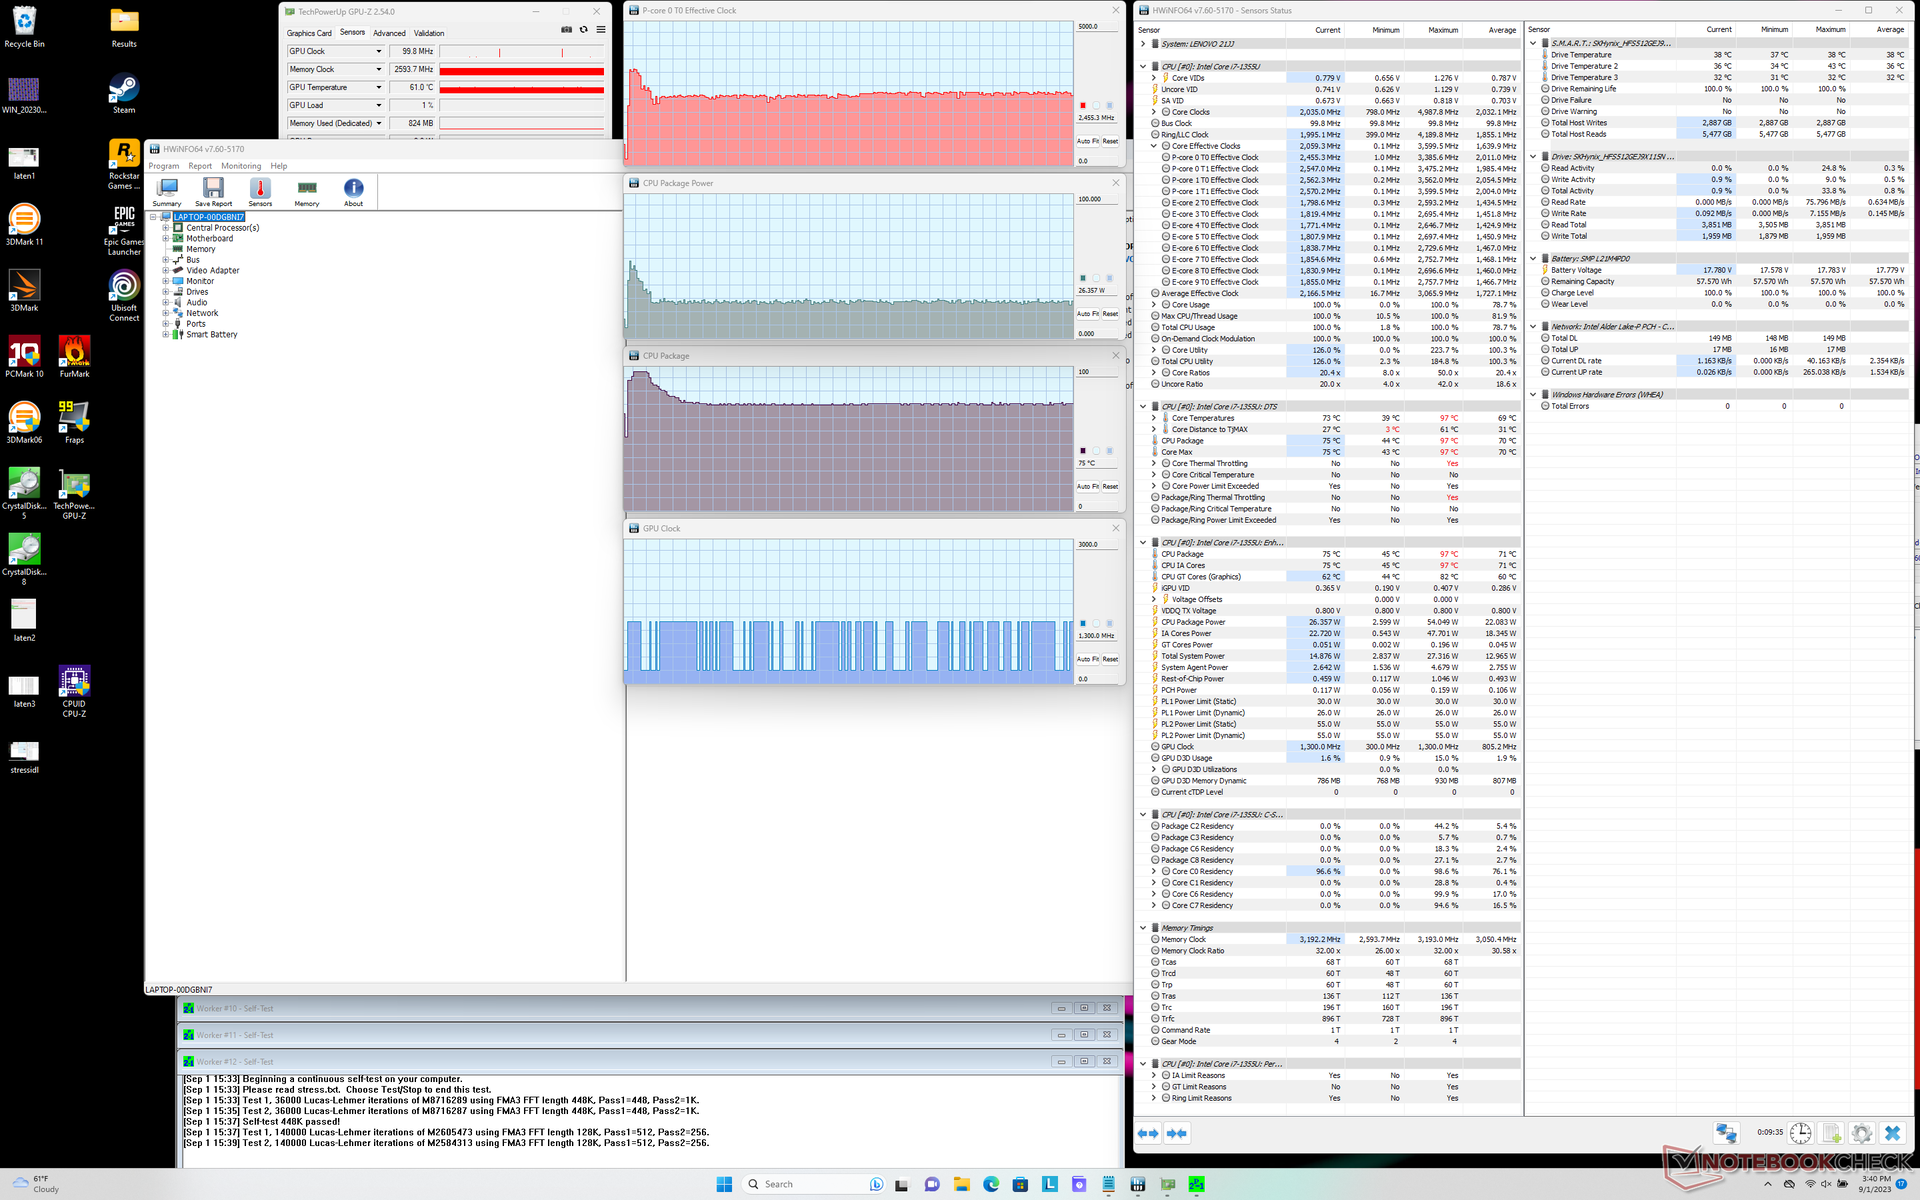
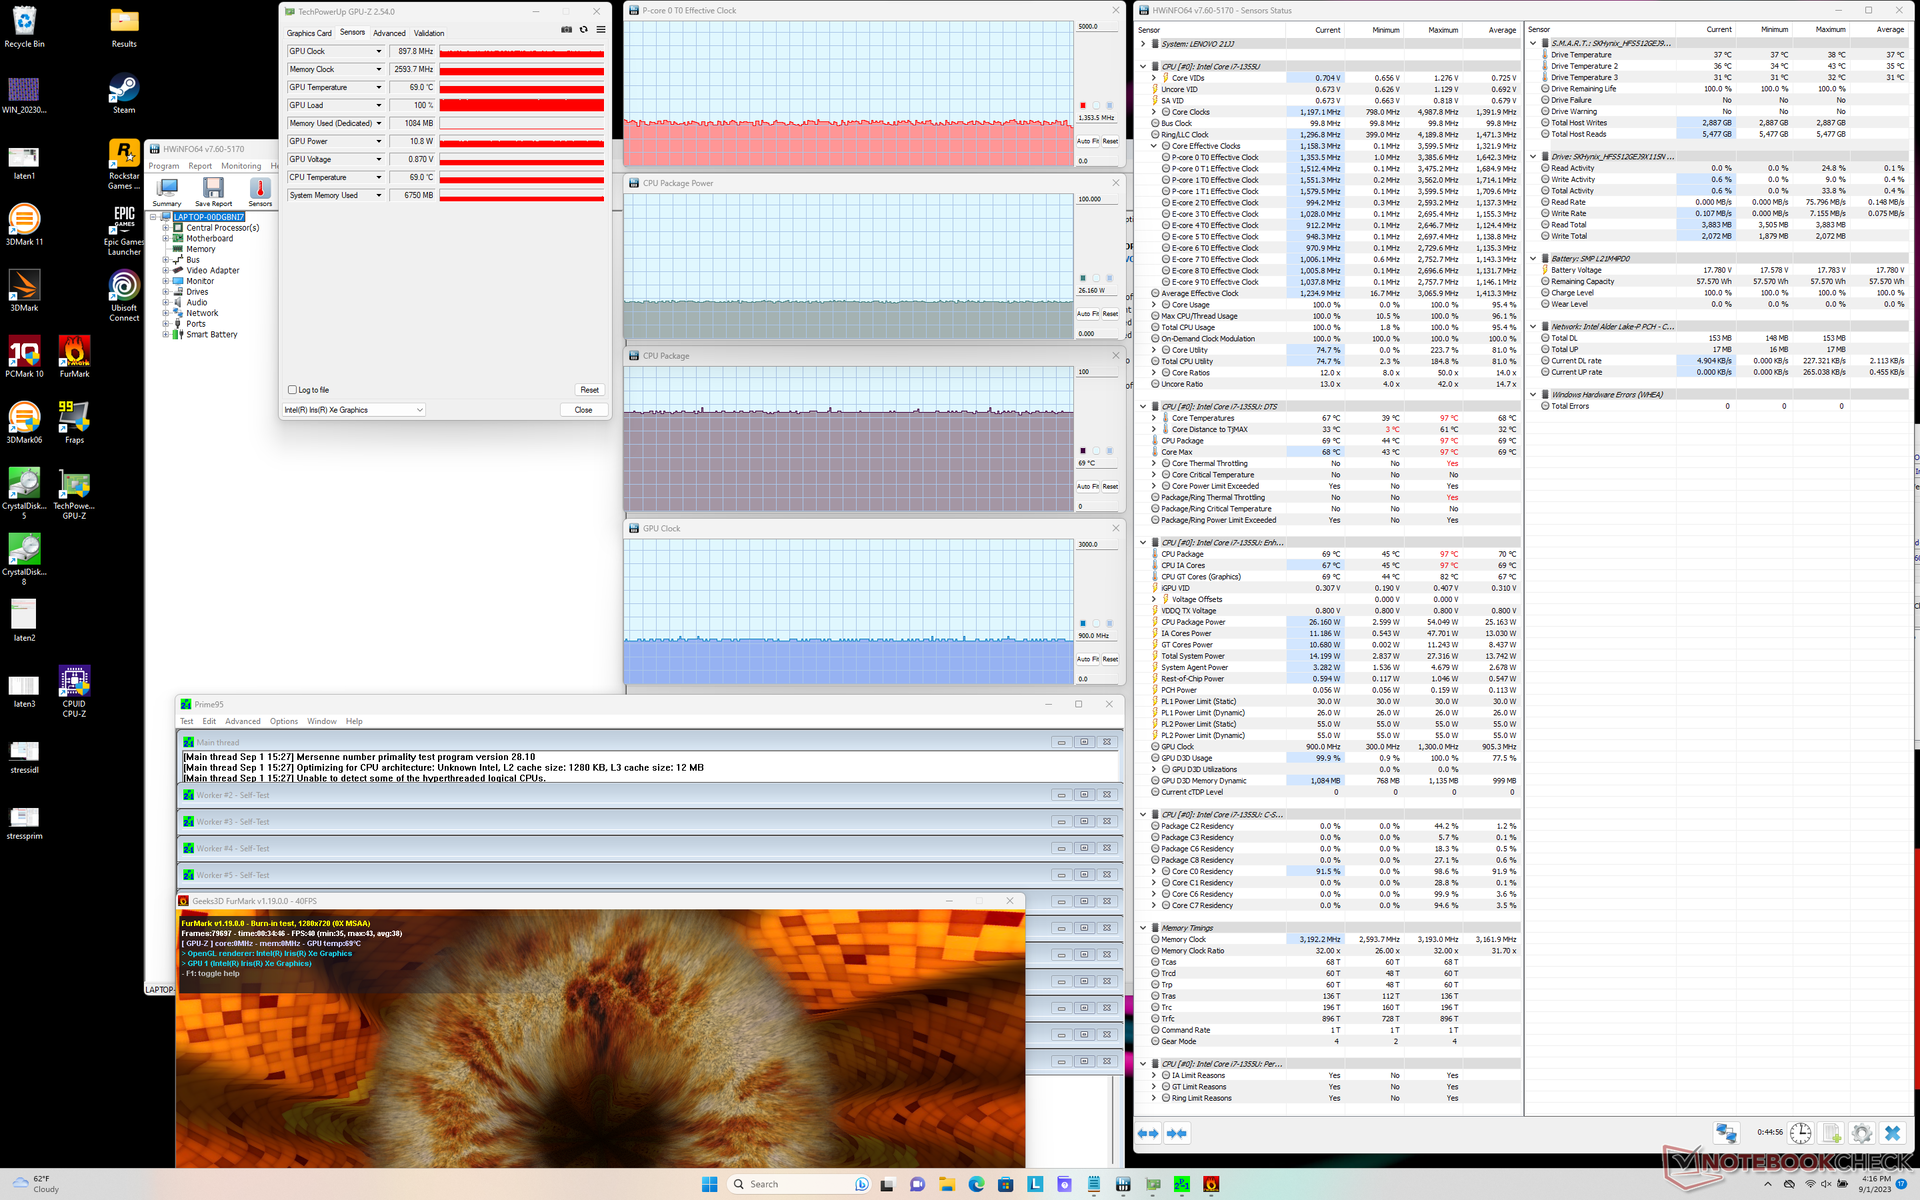
| CPU Clock (GHz) | GPU Clock (MHz) | Average CPU Temperature (°C) | |
| System Idle | -- | -- | 48 |
| Prime95 Stress | 2.4 | -- | 75 |
| Prime95 + FurMark Stress | 1.3 | 898 | 69 |
| Witcher 3 Stress | 2.2 | 1297 | 71 |
Speakers
Lenovo ThinkBook Plus Gen4 IRU audio analysis
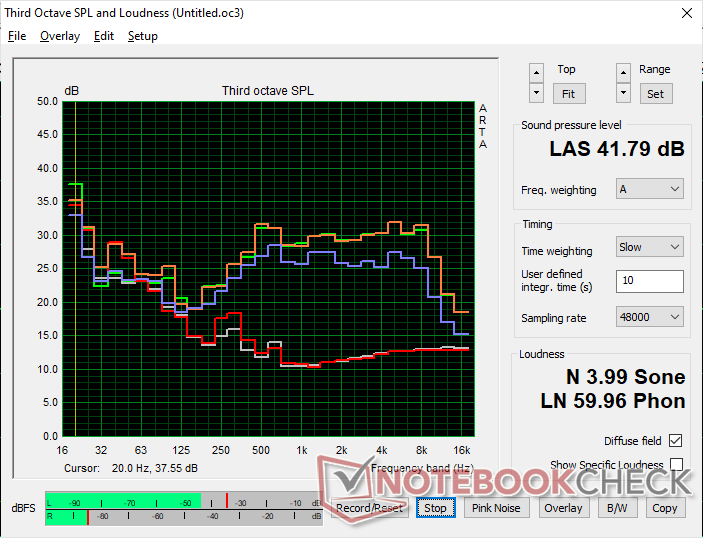
(+) | speakers can play relatively loud (84.5 dB)
Bass 100 - 315 Hz
(±) | reduced bass - on average 7.5% lower than median
(±) | linearity of bass is average (8.5% delta to prev. frequency)
Mids 400 - 2000 Hz
(+) | balanced mids - only 4.8% away from median
(+) | mids are linear (3.6% delta to prev. frequency)
Highs 2 - 16 kHz
(+) | balanced highs - only 0.8% away from median
(+) | highs are linear (2.3% delta to prev. frequency)
Overall 100 - 16.000 Hz
(+) | overall sound is linear (8% difference to median)
Compared to same class
» 2% of all tested devices in this class were better, 1% similar, 97% worse
» The best had a delta of 6%, average was 20%, worst was 57%
Compared to all devices tested
» 2% of all tested devices were better, 1% similar, 98% worse
» The best had a delta of 4%, average was 23%, worst was 134%
Apple MacBook Pro 16 2021 M1 Pro audio analysis
(+) | speakers can play relatively loud (84.7 dB)
Bass 100 - 315 Hz
(+) | good bass - only 3.8% away from median
(+) | bass is linear (5.2% delta to prev. frequency)
Mids 400 - 2000 Hz
(+) | balanced mids - only 1.3% away from median
(+) | mids are linear (2.1% delta to prev. frequency)
Highs 2 - 16 kHz
(+) | balanced highs - only 1.9% away from median
(+) | highs are linear (2.7% delta to prev. frequency)
Overall 100 - 16.000 Hz
(+) | overall sound is linear (4.6% difference to median)
Compared to same class
» 0% of all tested devices in this class were better, 0% similar, 100% worse
» The best had a delta of 5%, average was 17%, worst was 45%
Compared to all devices tested
» 0% of all tested devices were better, 0% similar, 100% worse
» The best had a delta of 4%, average was 23%, worst was 134%
Energy Management
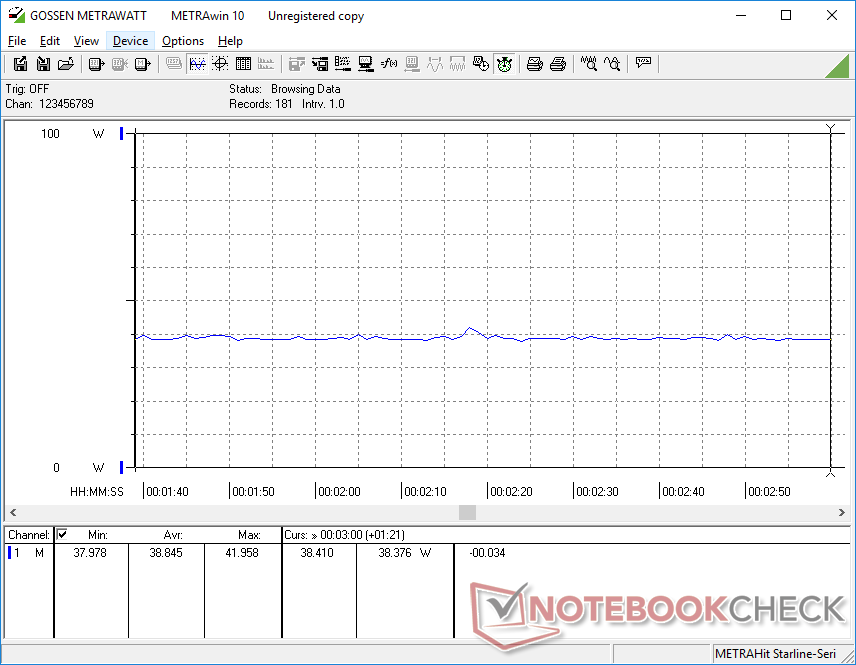
Power Consumption — Not Bad For OLED
Power consumption when idling on desktop is about 7 to 8 W, but it can be as high as 13 W when displaying content that is mostly white in color such as the vast majority of web pages due to the OLED touchscreen. In comparison, other subnotebooks with traditional IPS panels like the ThinkPad X1 Nano Gen 3 or Dragonfly G4 would draw almost half as much power even when on their maximum brightness settings.
When running heavier loads, consumption would be much closer to what we've come to expect from a Core U-series notebook. In fact, the overall consumption range would be very similar to what we recorded on the ZenBook S 13 OLED or Dragonfly G4.
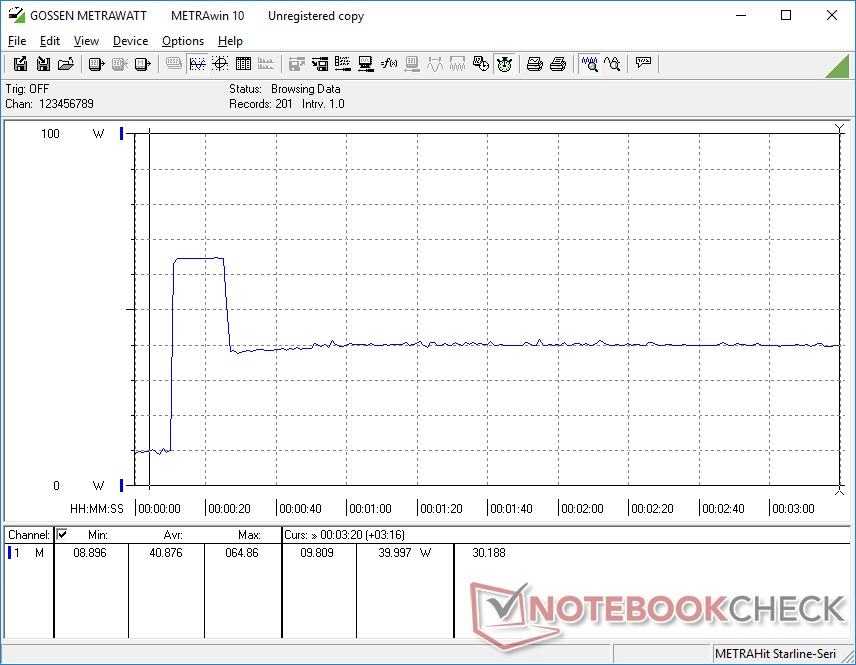
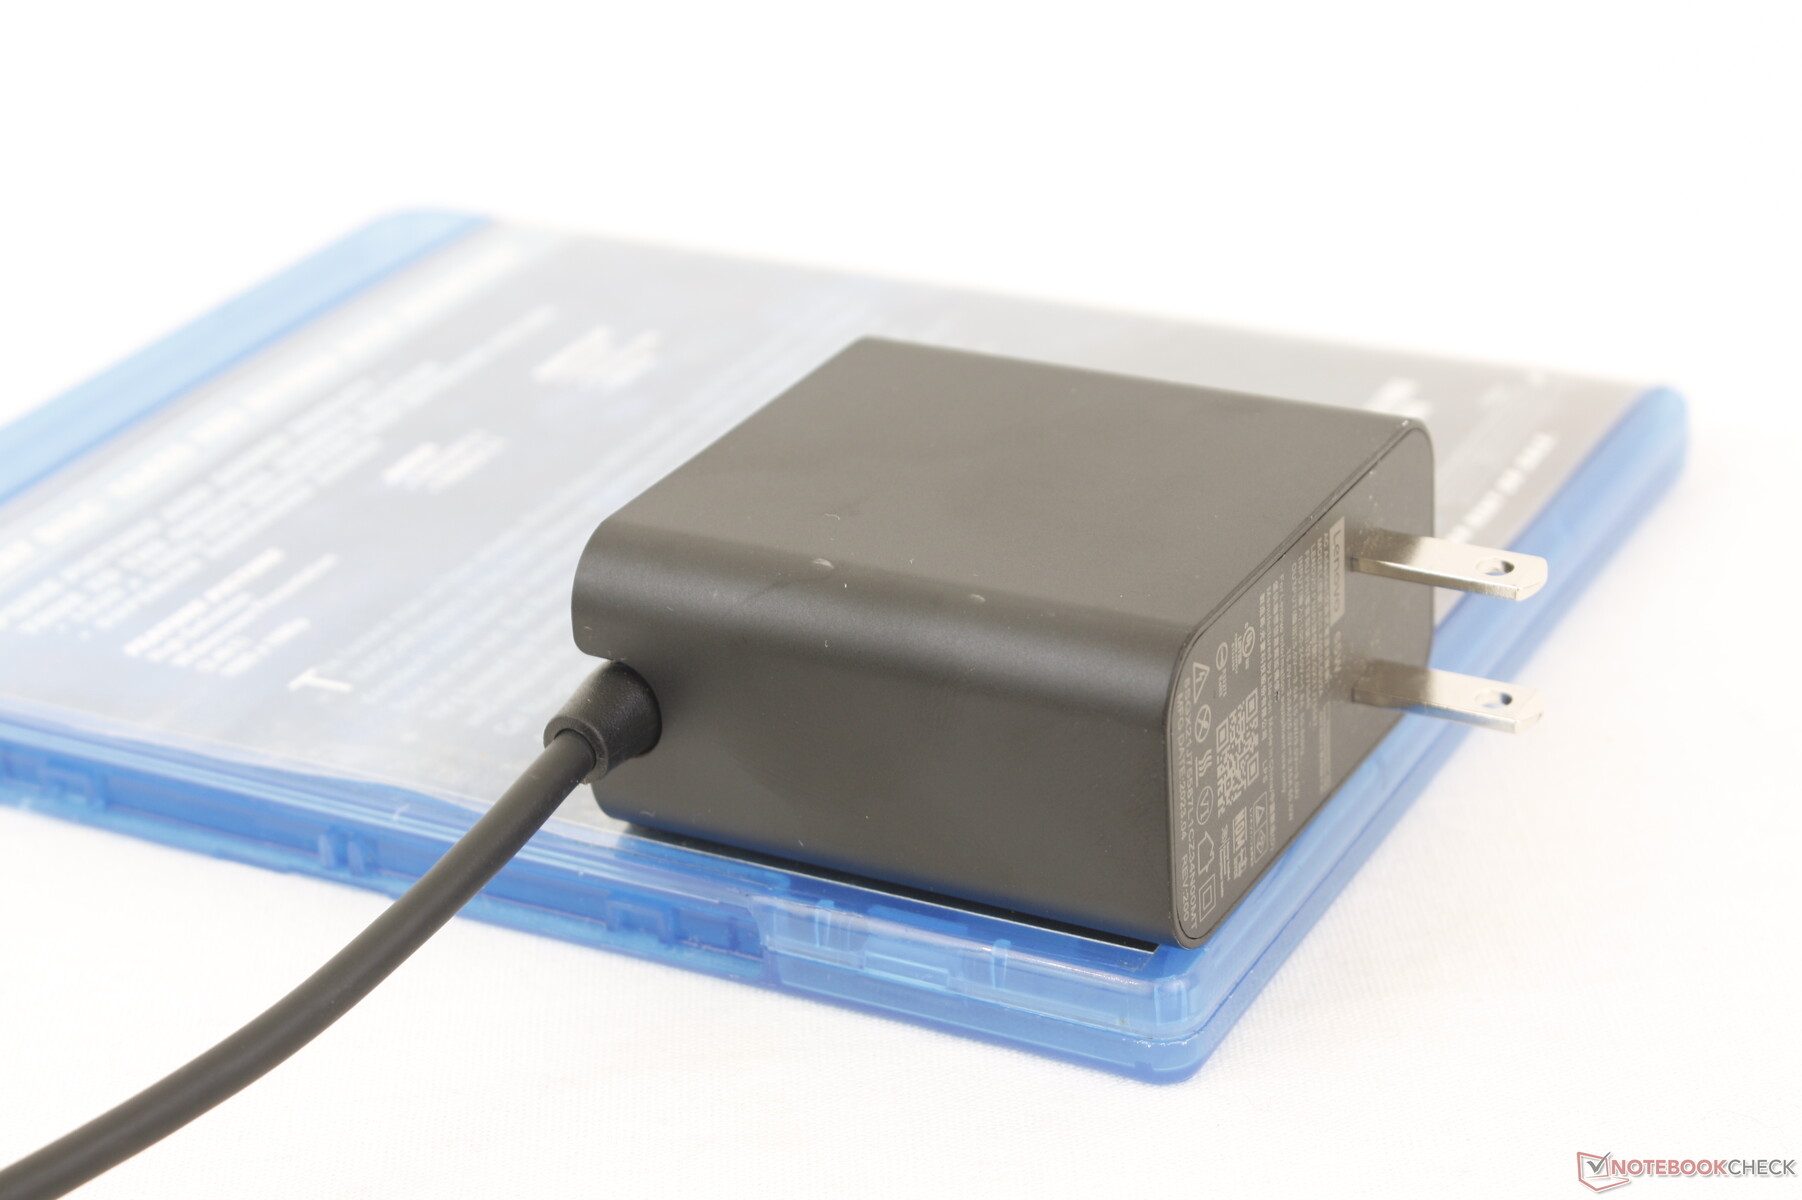
We're able to measure a maximum consumption of 66 W from the small (~5.5 x 5.5 x 2.8 cm) 65 W USB-C adapter when the CPU is at 100 percent utilization. This rate would only last for 10 to 15 seconds as shown by the screenshots below due to the thermal limitations of the model.
| Off / Standby | |
| Idle | |
| Load |
|
Key:
min: | |
| Lenovo ThinkBook Plus Gen4 IRU i7-1355U, Iris Xe G7 96EUs, SK hynix PC801 HFS512GEJ9X115N, OLED, 2880x1800, 13.3" | Lenovo ThinkPad X1 Nano Gen 3 i7-1360P, Iris Xe G7 96EUs, Lenovo UMIS AM6A0 RPJTJ512MKP1QDQ, IPS, 2160x1350, 13" | HP Dragonfly G4 i7-1365U, Iris Xe G7 96EUs, Micron 3400 MTFDKBA512TFH 512GB, IPS, 1920x1280, 13.5" | Asus ZenBook S13 OLED UX5304 i7-1355U, Iris Xe G7 96EUs, Samsung PM9A1 MZVL21T0HCLR, OLED, 2880x1800, 13.3" | Dell Latitude 9330 i7-1260U, Iris Xe G7 96EUs, , IPS, 2560x1600, 13.3" | MSI Summit E13 Flip Evo A11MT i7-1185G7, Iris Xe G7 96EUs, Phison 1TB SM2801T24GKBB4S-E162, IPS, 1920x1200, 13.4" | |
|---|---|---|---|---|---|---|
| Power Consumption | 21% | 15% | 14% | 19% | 0% | |
| Idle Minimum * (Watt) | 7.2 | 3.3 54% | 4.1 43% | 5.8 19% | 4.7 35% | 4.8 33% |
| Idle Average * (Watt) | 7.9 | 6.5 18% | 7.5 5% | 8.5 -8% | 8.2 -4% | 8.4 -6% |
| Idle Maximum * (Watt) | 12.7 | 7.1 44% | 8.2 35% | 8.8 31% | 8.4 34% | 8.6 32% |
| Load Average * (Watt) | 37.6 | 40.7 -8% | 35.5 6% | 35.1 7% | 36.8 2% | 47.1 -25% |
| Witcher 3 ultra * (Watt) | 39.1 | 37 5% | 37.5 4% | 27.6 29% | 30.4 22% | 51.6 -32% |
| Load Maximum * (Watt) | 65 | 58.6 10% | 66.5 -2% | 59.5 8% | 49.9 23% | 65.9 -1% |
* ... smaller is better
Power Consumption Witcher 3 / Stresstest
Power Consumption external Monitor
Battery Life
Battery capacity is slightly higher than on the ThinkPad X1 Nano Gen 3 to compensate for our more demanding OLED touchscreen. WLAN runtime is therefore almost the same between the two models at approximately 8 hours. Competing systems like the Latitude 9330 or HP Dragonfly G4 can last for one or two hours longer at least.
Battery life when reading on E Ink mode lasts for longer at about 12 hours.
Charging from empty to full capacity takes about 80 minutes even when Lenovo Rapid Charge is enabled.
| Lenovo ThinkBook Plus Gen4 IRU i7-1355U, Iris Xe G7 96EUs, 56 Wh | Lenovo ThinkPad X1 Nano Gen 3 i7-1360P, Iris Xe G7 96EUs, 49.5 Wh | HP Dragonfly G4 i7-1365U, Iris Xe G7 96EUs, 68 Wh | Asus ZenBook S13 OLED UX5304 i7-1355U, Iris Xe G7 96EUs, 63 Wh | Dell Latitude 9330 i7-1260U, Iris Xe G7 96EUs, 50 Wh | MSI Summit E13 Flip Evo A11MT i7-1185G7, Iris Xe G7 96EUs, 70 Wh | |
|---|---|---|---|---|---|---|
| Battery runtime | -2% | 140% | 63% | 31% | 38% | |
| Reader / Idle (h) | 15.5 | 42.5 174% | 15.4 -1% | 21.1 36% | ||
| WiFi v1.3 (h) | 8 | 7.8 -2% | 15.9 99% | 11.3 41% | 9.4 18% | 11.2 40% |
| Load (h) | 1.3 | 3.2 146% | 2.4 85% | 2.3 77% | 1.8 38% | |
| H.264 (h) | 13.8 |
Pros
Cons
Verdict — Excellent 2-in-1 For A Very Specific Audience
If you like to carry both a laptop and an eReader at all times, then the ThinkBook Plus Gen 4 was made for you. The E Ink screen works reasonably well under Windows 11 and it doesn't negatively impact the quality of the rest of the model. In fact, the lid and base are stronger than expected due to the additional metal and glass.
There is definitely room for improvement. The slow transition and constant resizing of windows when switching between the two screens feel clunky in practice even though the screens themselves are of high quality. Meanwhile, automatic rotation is unreliable as its orientation is often incorrect likely due to the unique twisting mechanic of the model.
Perhaps the biggest asterisk to keep in mind is that the ThinkBook Plus Gen 4 is significantly heavier than any traditional eReader which can make handling difficult in eReader mode. You'll have to really work around the weight if you like to do a lot of reading in bed or on the bus.
The ThinkBook Plus Gen 4 works well as a standard convertible, but it's eReader functionality is hindered by clunky software and a heavier weight when compared to standalone eReaders.
If you don't value the E Ink display, then alternatives like the Dell XPS 13 2-in-1 or LG Gram 14 2-in-1 are noticeably lighter and with longer battery life or more integrated ports. There's no denying that the E Ink screen adds tangible weight and thickness to the design of the ThinkBook Plus Gen 4 even if configured without the feature.
Price and Availability
Lenovo is now shipping the ThinkBook Plus Gen 4 starting at $2800 USD for the Core i5 non-E Ink configuration up to $3000 for the Core i7 E Ink configuration.
Lenovo ThinkBook Plus Gen4 IRU
- 09/06/2023 v7 (old)
Allen Ngo
Transparency
The selection of devices to be reviewed is made by our editorial team. The test sample was provided to the author as a loan by the manufacturer or retailer for the purpose of this review. The lender had no influence on this review, nor did the manufacturer receive a copy of this review before publication. There was no obligation to publish this review. As an independent media company, Notebookcheck is not subjected to the authority of manufacturers, retailers or publishers.
This is how Notebookcheck is testing
Every year, Notebookcheck independently reviews hundreds of laptops and smartphones using standardized procedures to ensure that all results are comparable. We have continuously developed our test methods for around 20 years and set industry standards in the process. In our test labs, high-quality measuring equipment is utilized by experienced technicians and editors. These tests involve a multi-stage validation process. Our complex rating system is based on hundreds of well-founded measurements and benchmarks, which maintains objectivity. Further information on our test methods can be found here.
Price comparison
