Lenovo ThinkBook 13s G3 AMD laptop in review: Subnotebook with fast Ryzen CPU
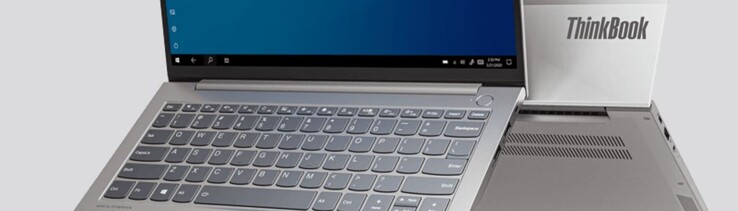
Last year, we had reviewed the Lenovo ThinkBook 13s G2 with Intel Tiger Lake processors. Now, we take a look at the G3 model, which is equipped with AMD Ryzen CPUs. However, Lenovo only changes the processor while the case, ports, input devices, and even the displays, are identical in both versions.
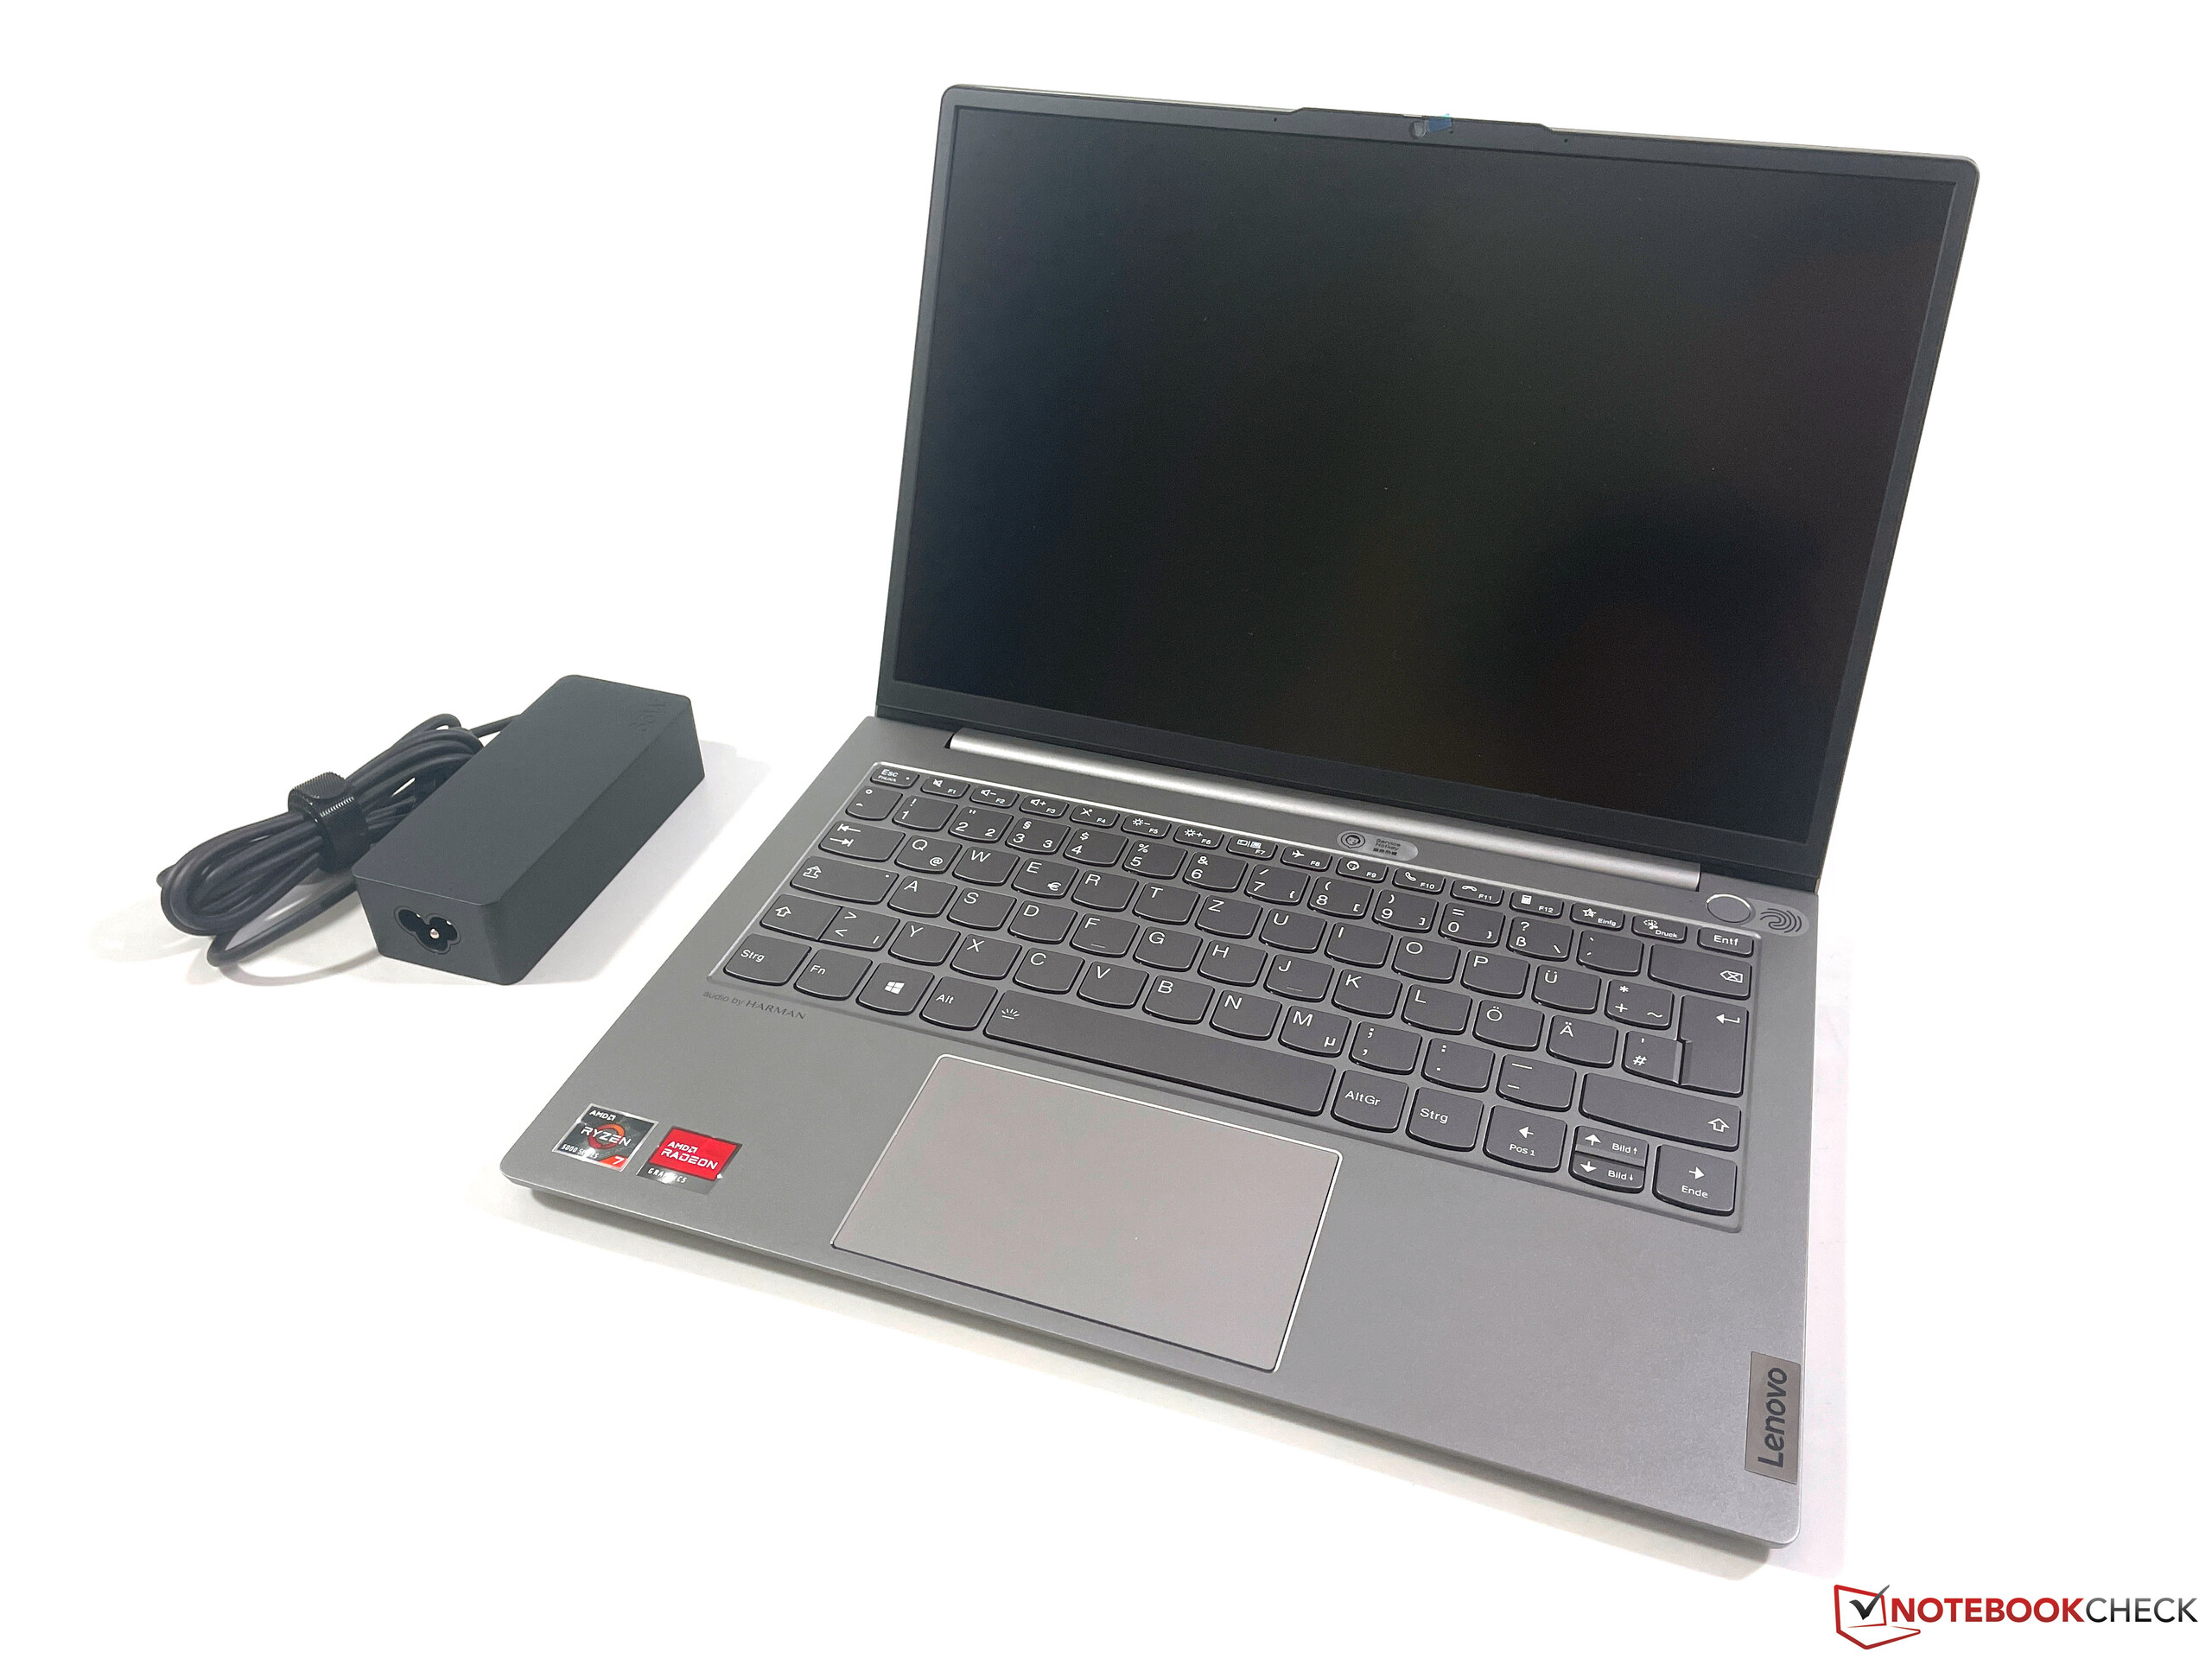
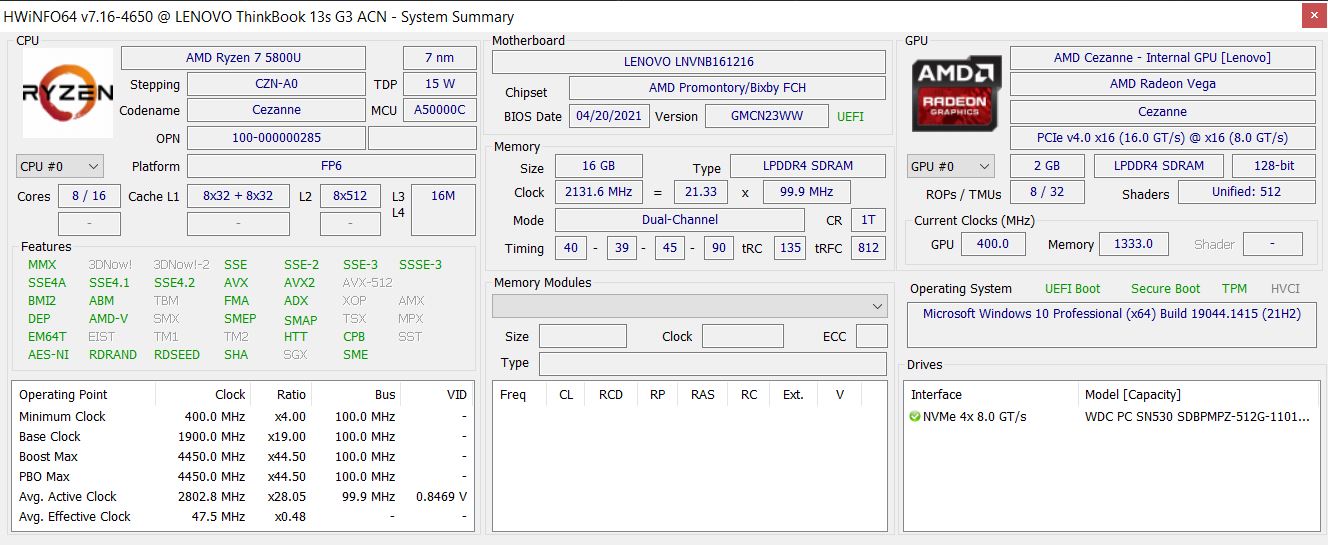
The ThinkBook 13s G3 SKU we have for review features the AMD Ryzen 7 5800U, 16 GB RAM, 512 GB SSD storage, and a matte Full HD panel (16:10) for around 1,000 Euros (~$1,000). Our test device (20YA005YGE) continues to offer Windows 10. Lenovo recently introduced the identically built 20YA002YGE model with Windows 11, which will presumably also be available for 1,000 Euros (Campus version, 930 Euros) from mid/late January.
Possible competitors in comparison
Rating | Date | Model | Weight | Height | Size | Resolution | Price |
|---|---|---|---|---|---|---|---|
| 87.8 % v7 (old) | 01 / 2022 | Lenovo ThinkBook 13s G3 20YA0005GE R7 5800U, Vega 8 | 1.3 kg | 14.9 mm | 13.30" | 1920x1200 | |
| 88.5 % v7 (old) | 05 / 2021 | Asus ZenBook 13 UM325S R7 5800U, Vega 8 | 1.2 kg | 13.9 mm | 13.30" | 1920x1080 | |
| 88.9 % v7 (old) | 05 / 2021 | Asus ZenBook 13 UX325EA i7-1165G7, Iris Xe G7 96EUs | 1.2 kg | 13.9 mm | 13.30" | 1920x1080 | |
| 84.4 % v7 (old) | 08 / 2021 | HP Pavilion Aero 13 be0097nr R7 5800U, Vega 8 | 953 g | 17 mm | 13.30" | 1920x1200 | |
| 91.1 % v7 (old) | 12 / 2020 | Apple MacBook Air 2020 M1 Entry M1, M1 7-Core GPU | 1.3 kg | 16.1 mm | 13.30" | 2560x1600 |
Case, equipment, and input devices
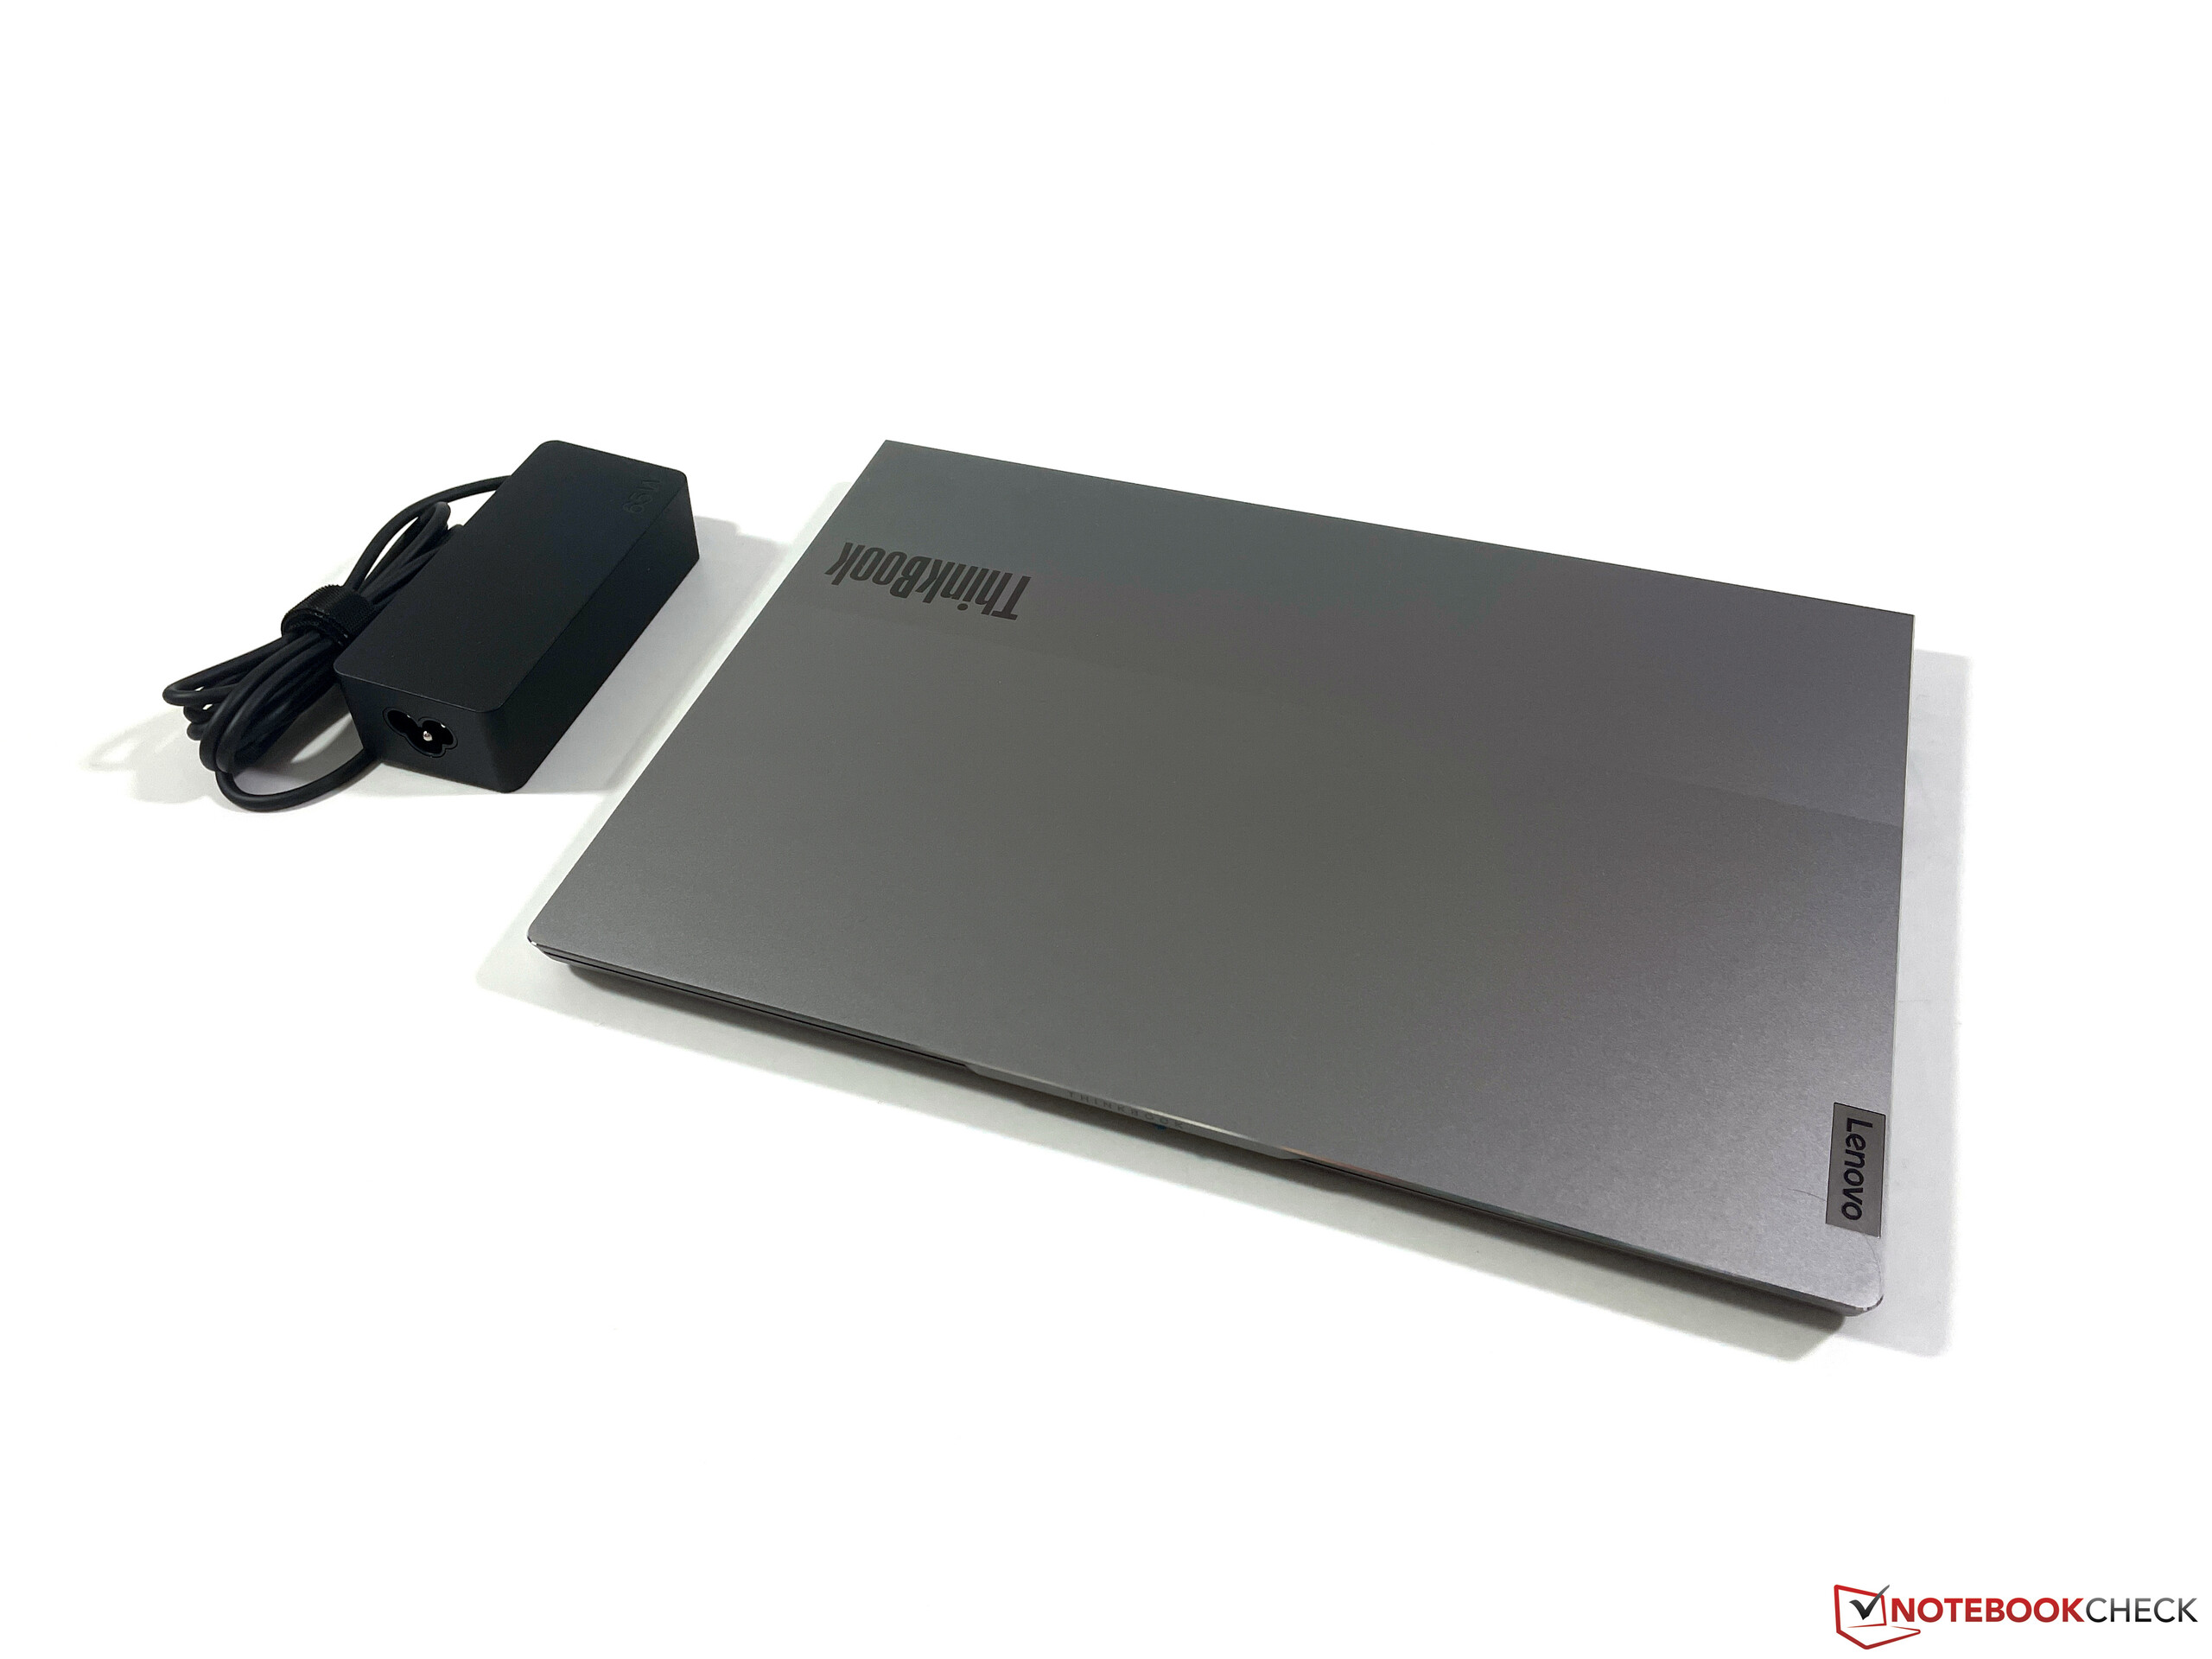
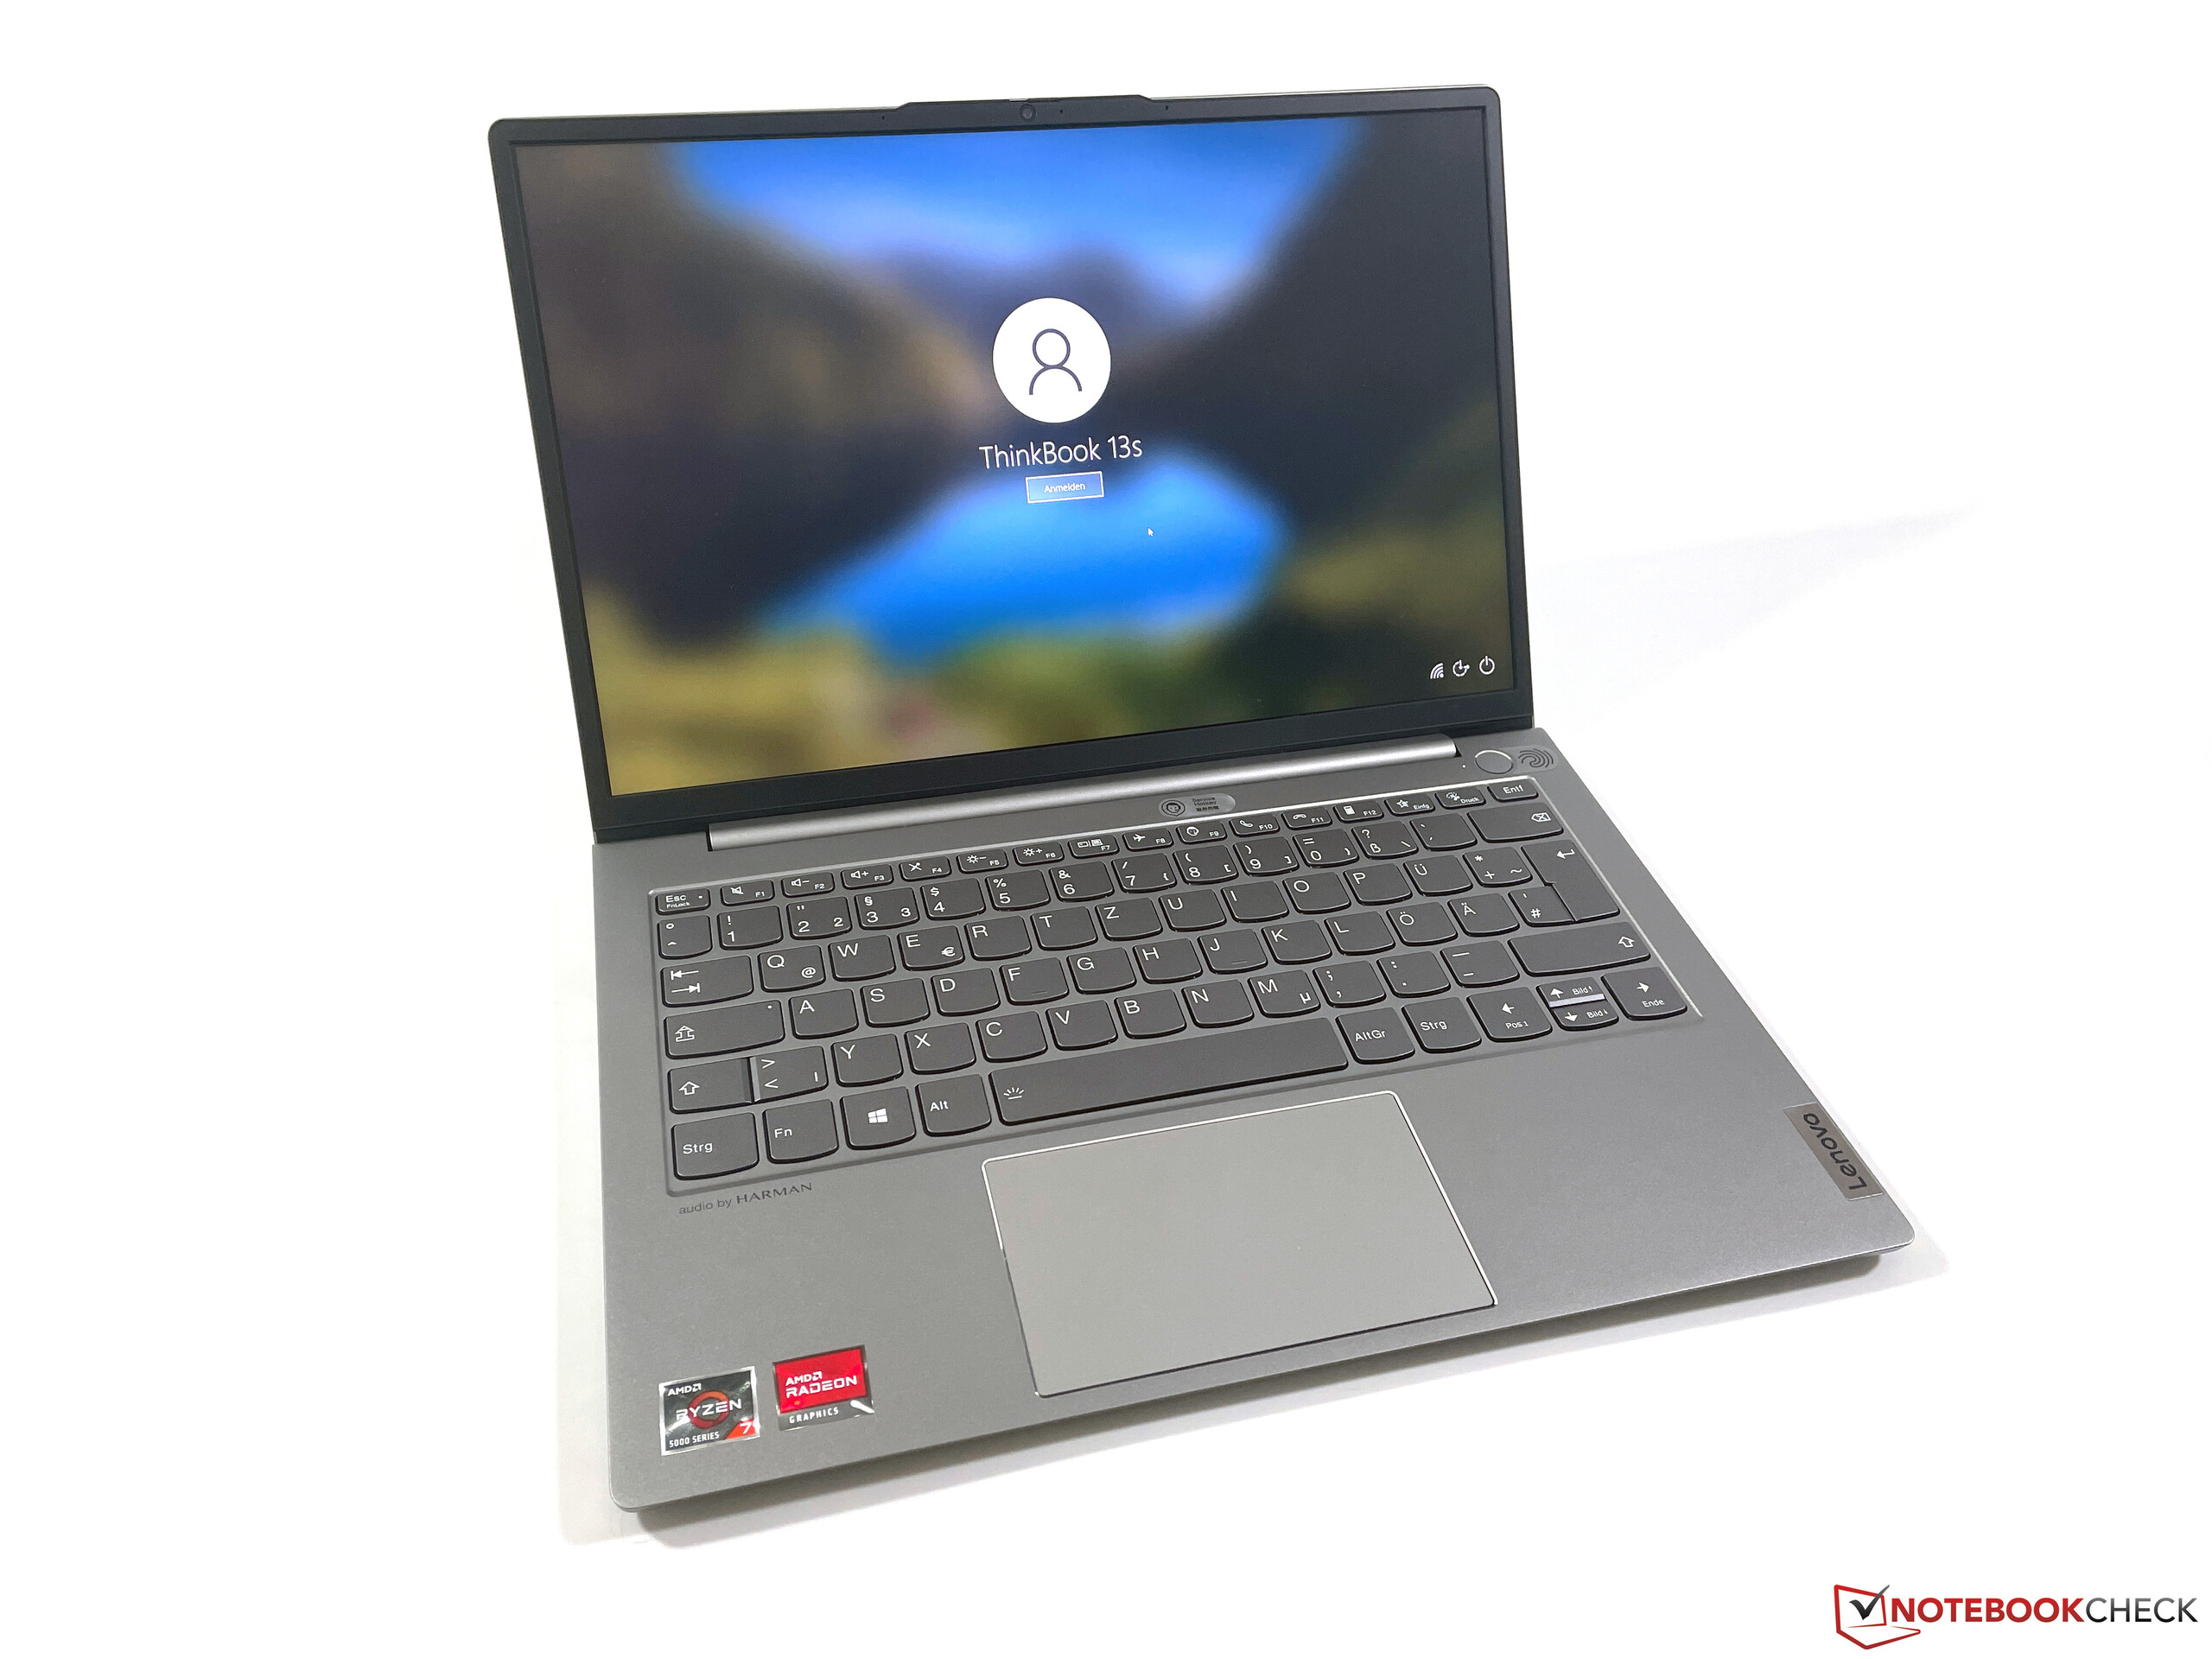
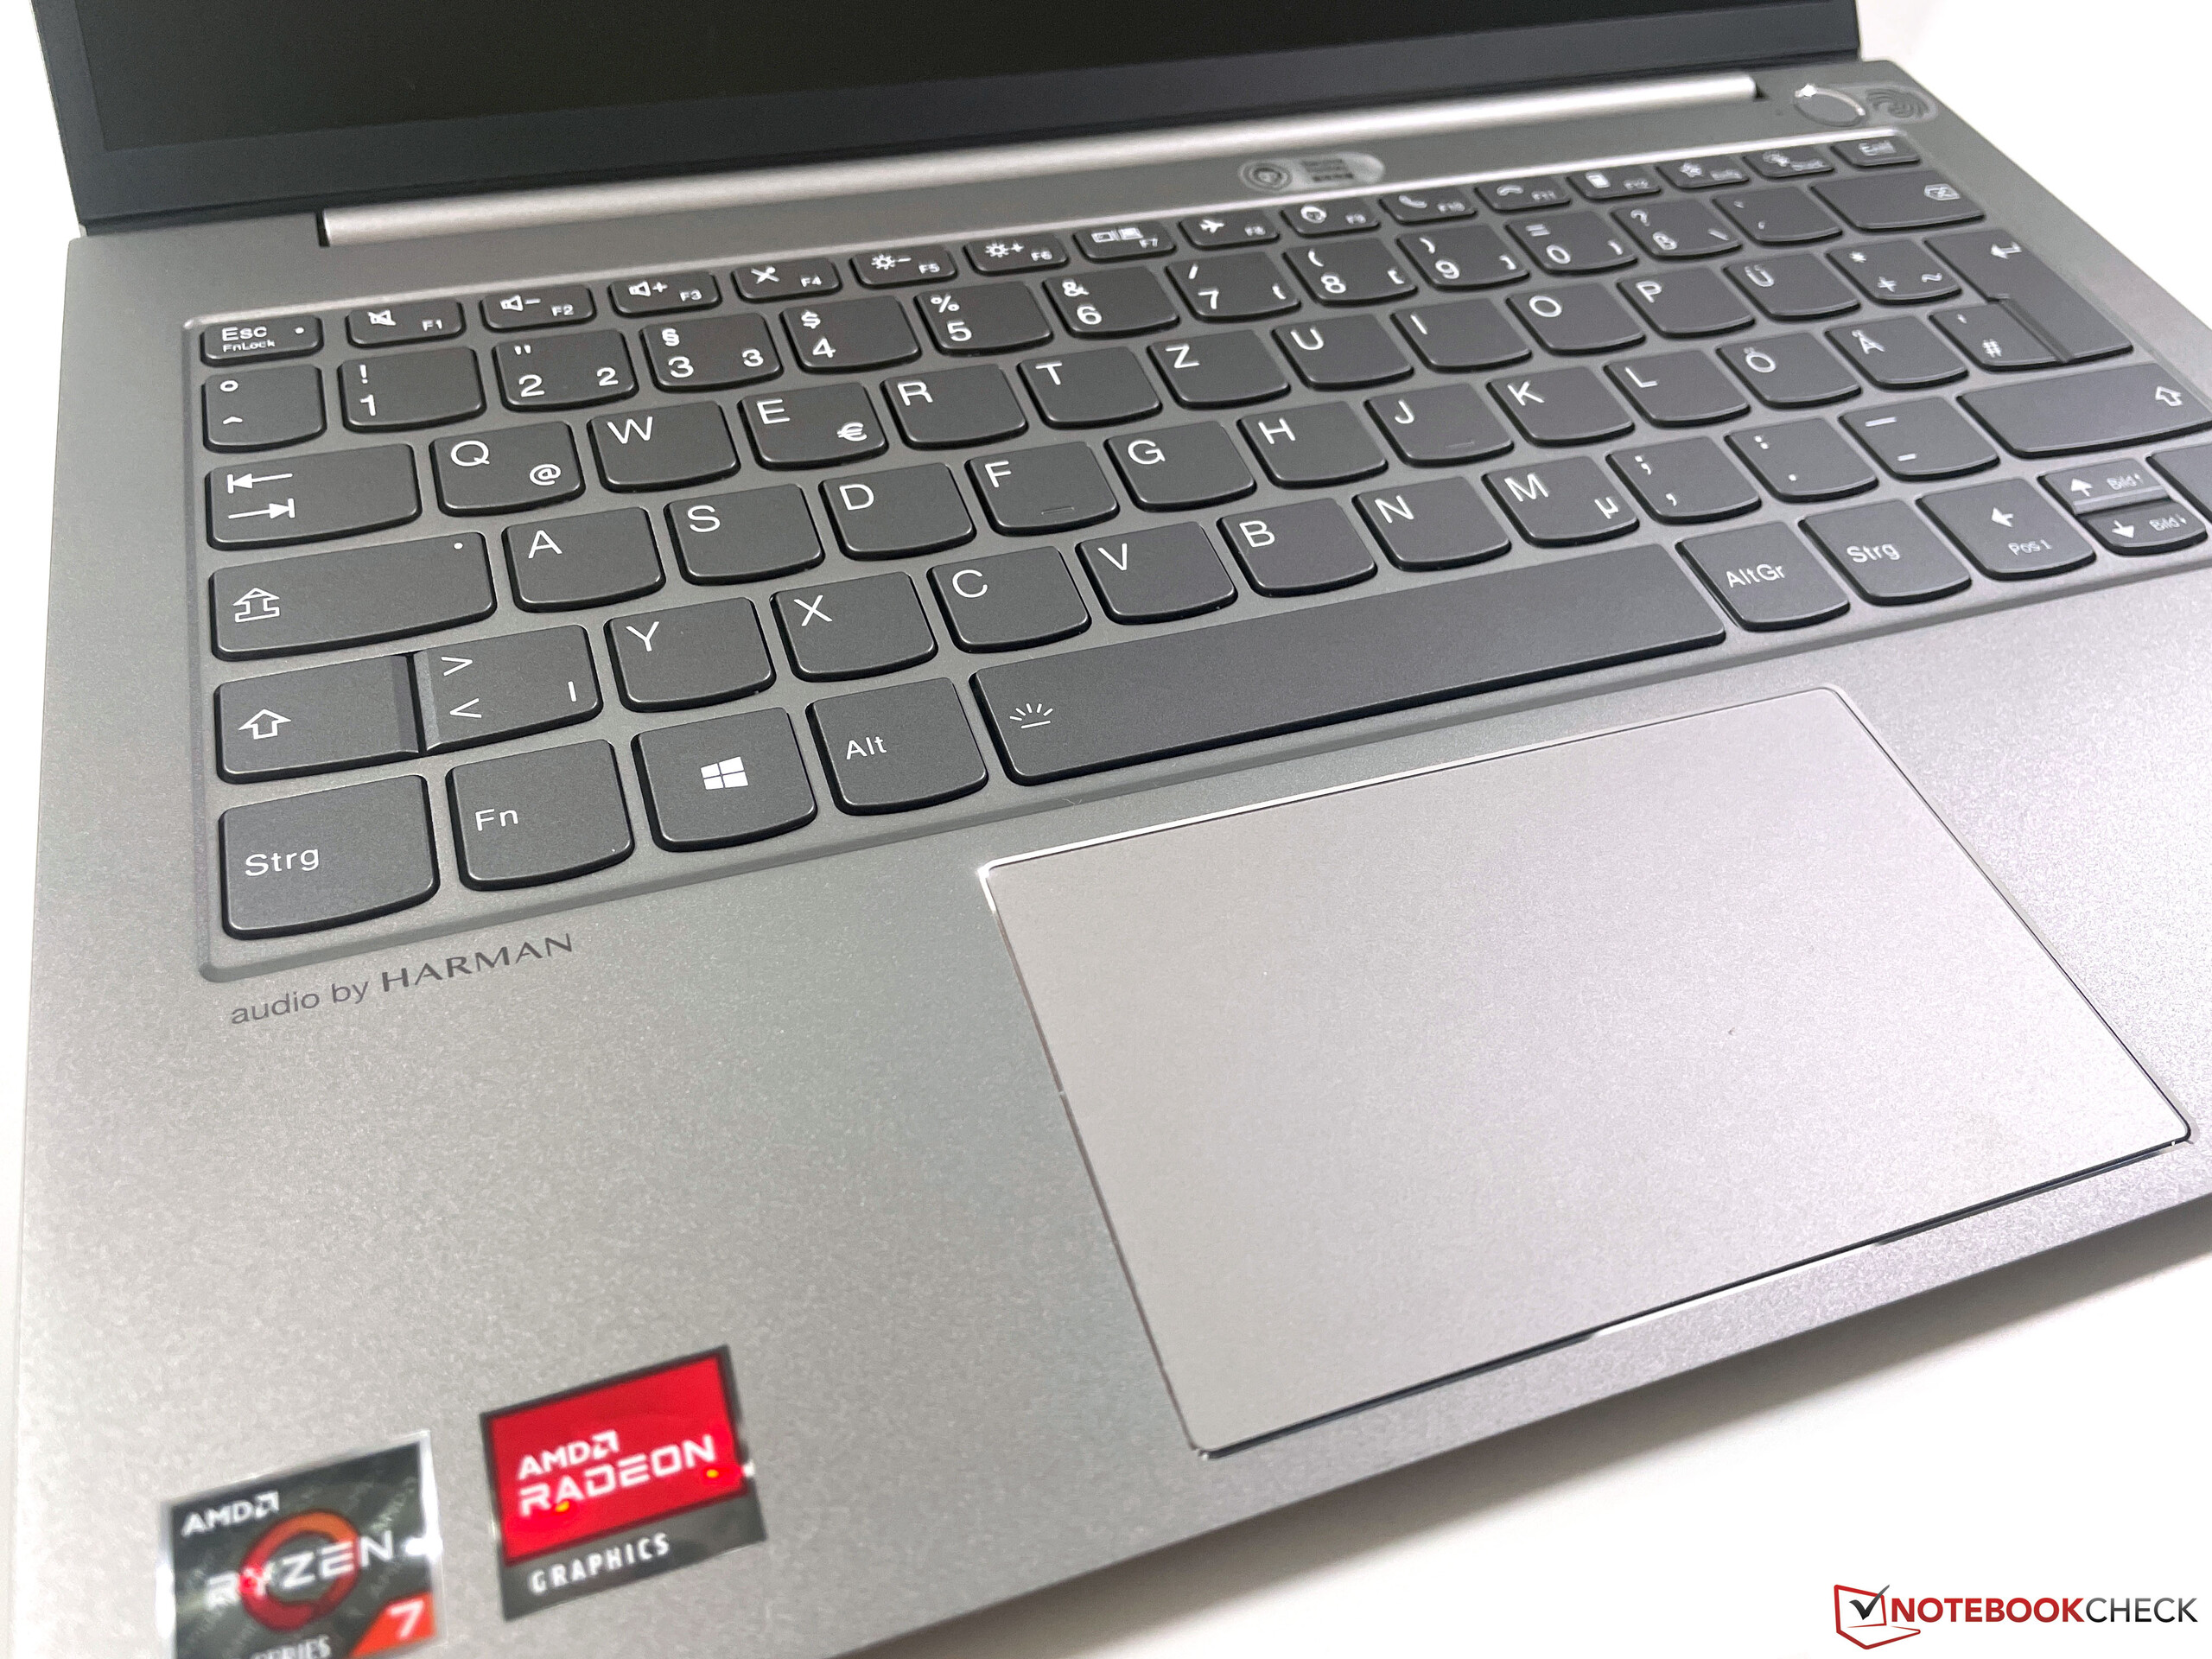
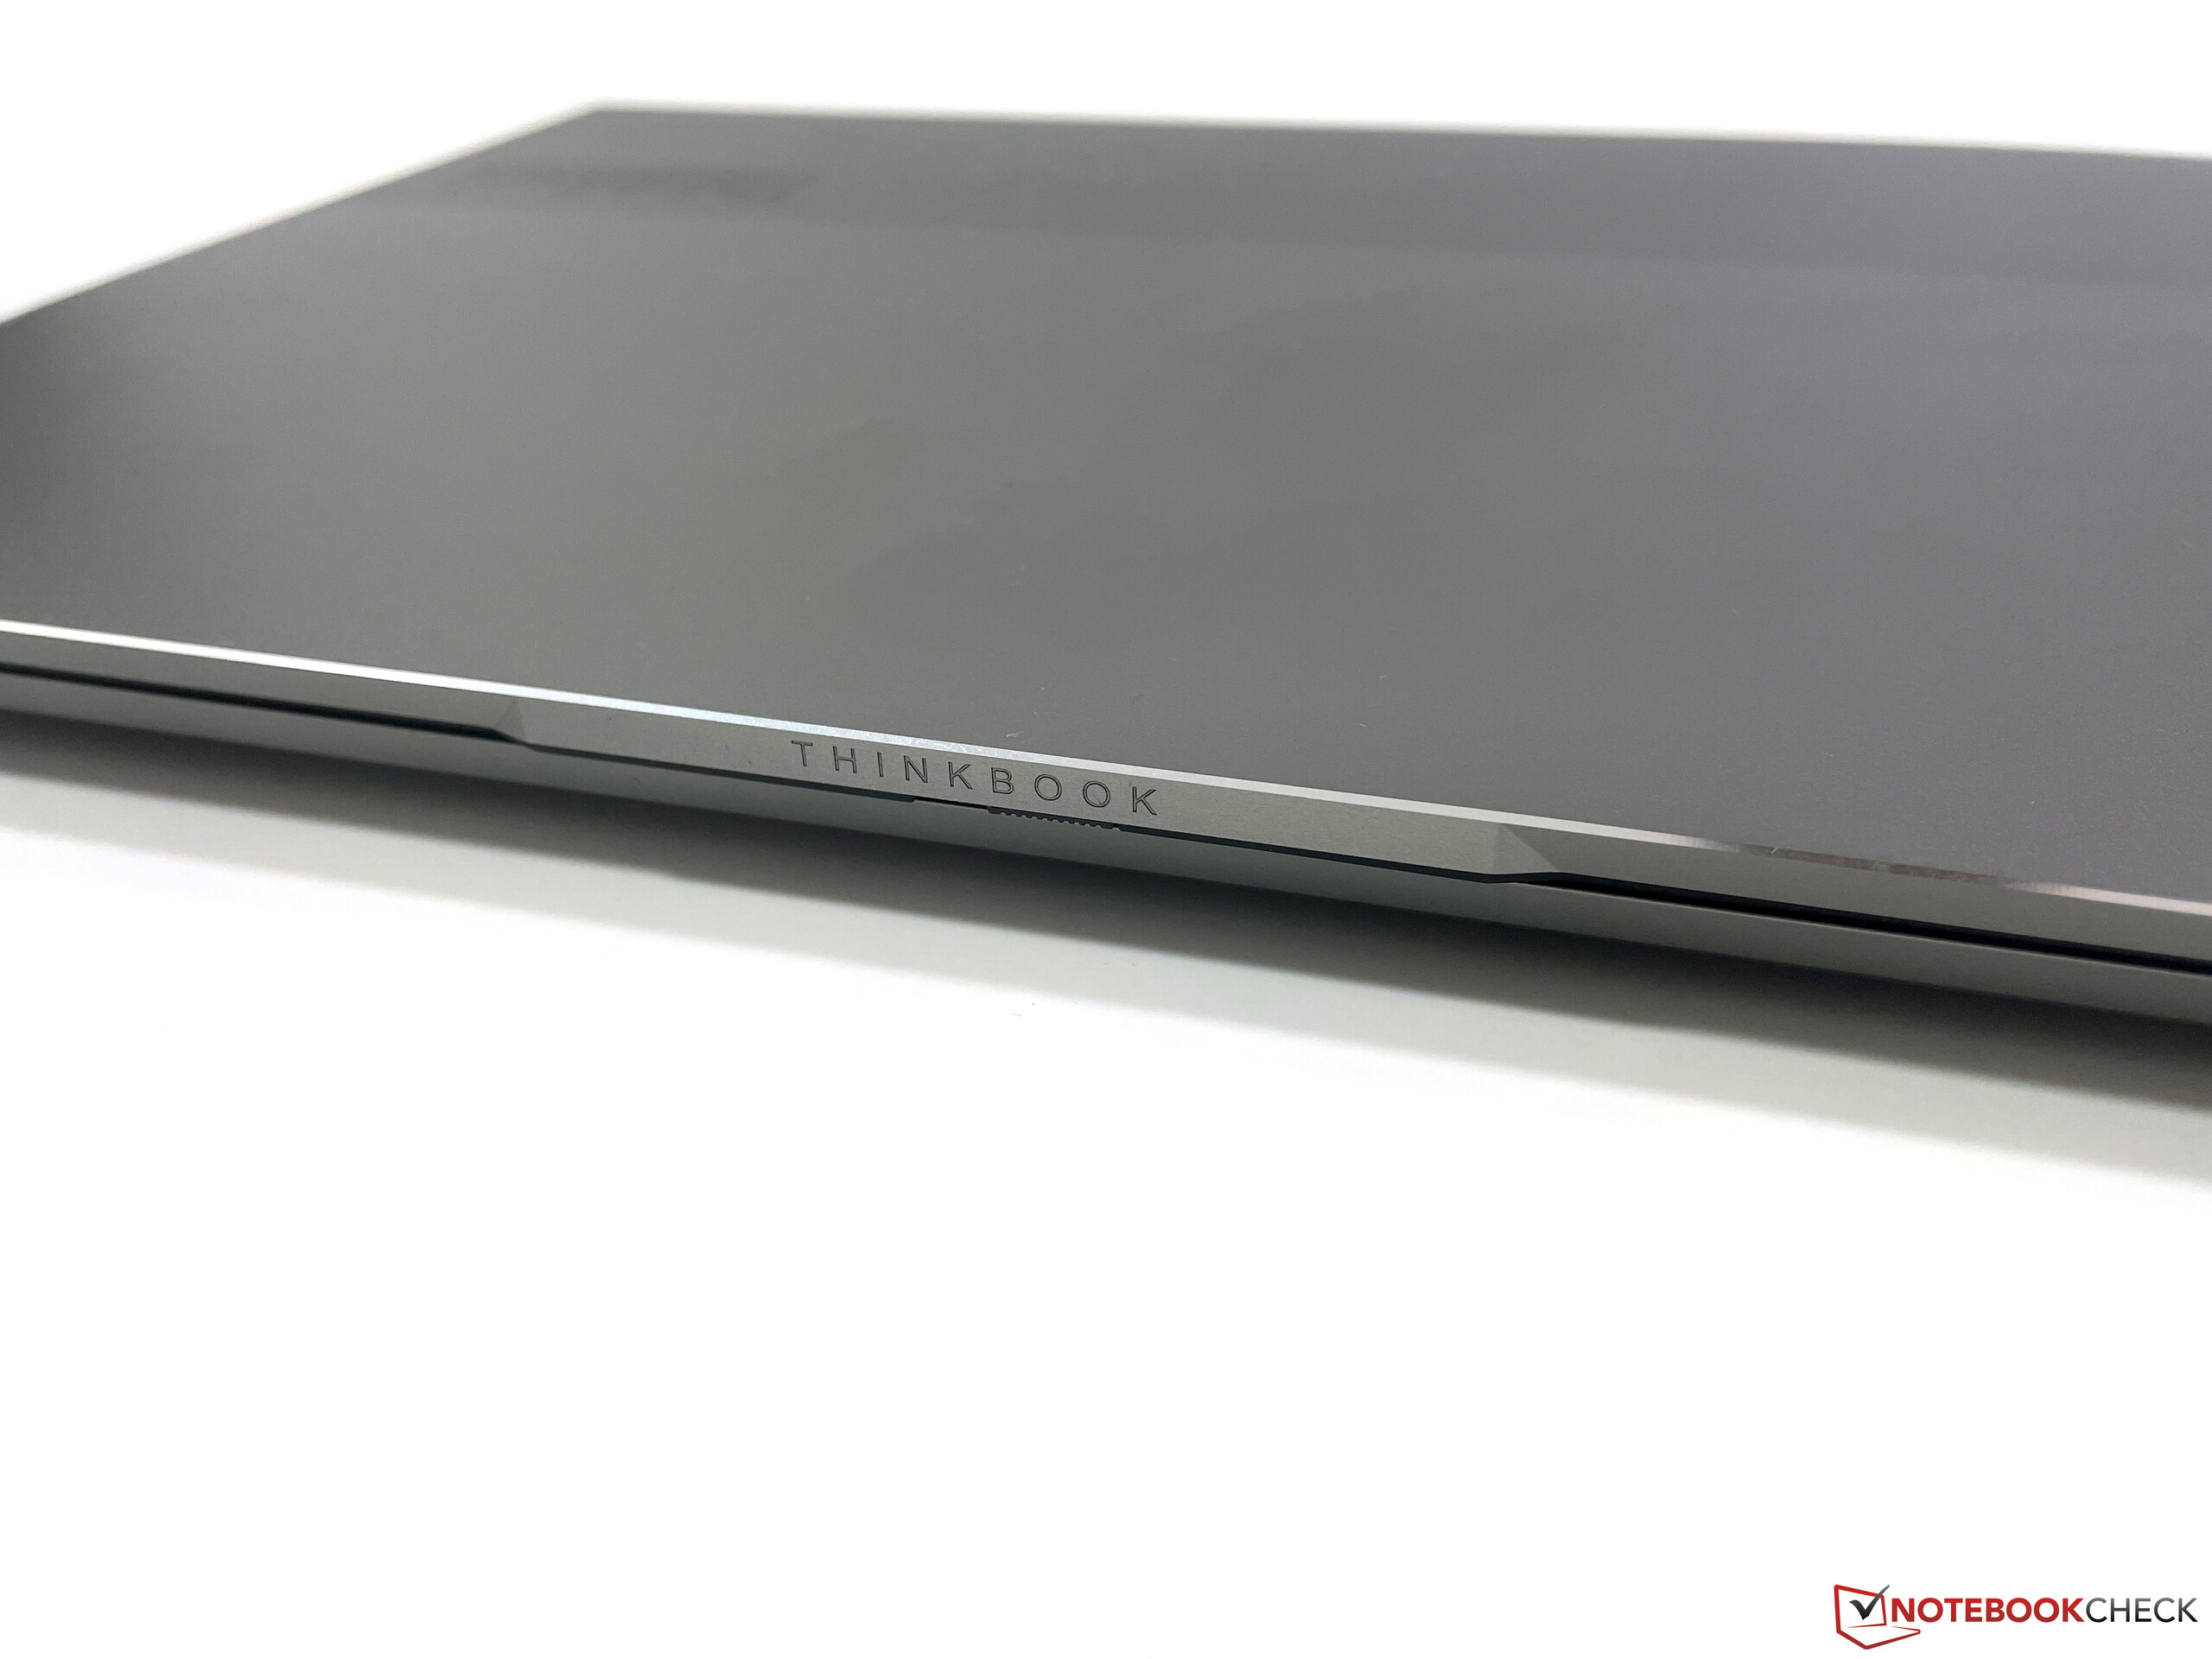
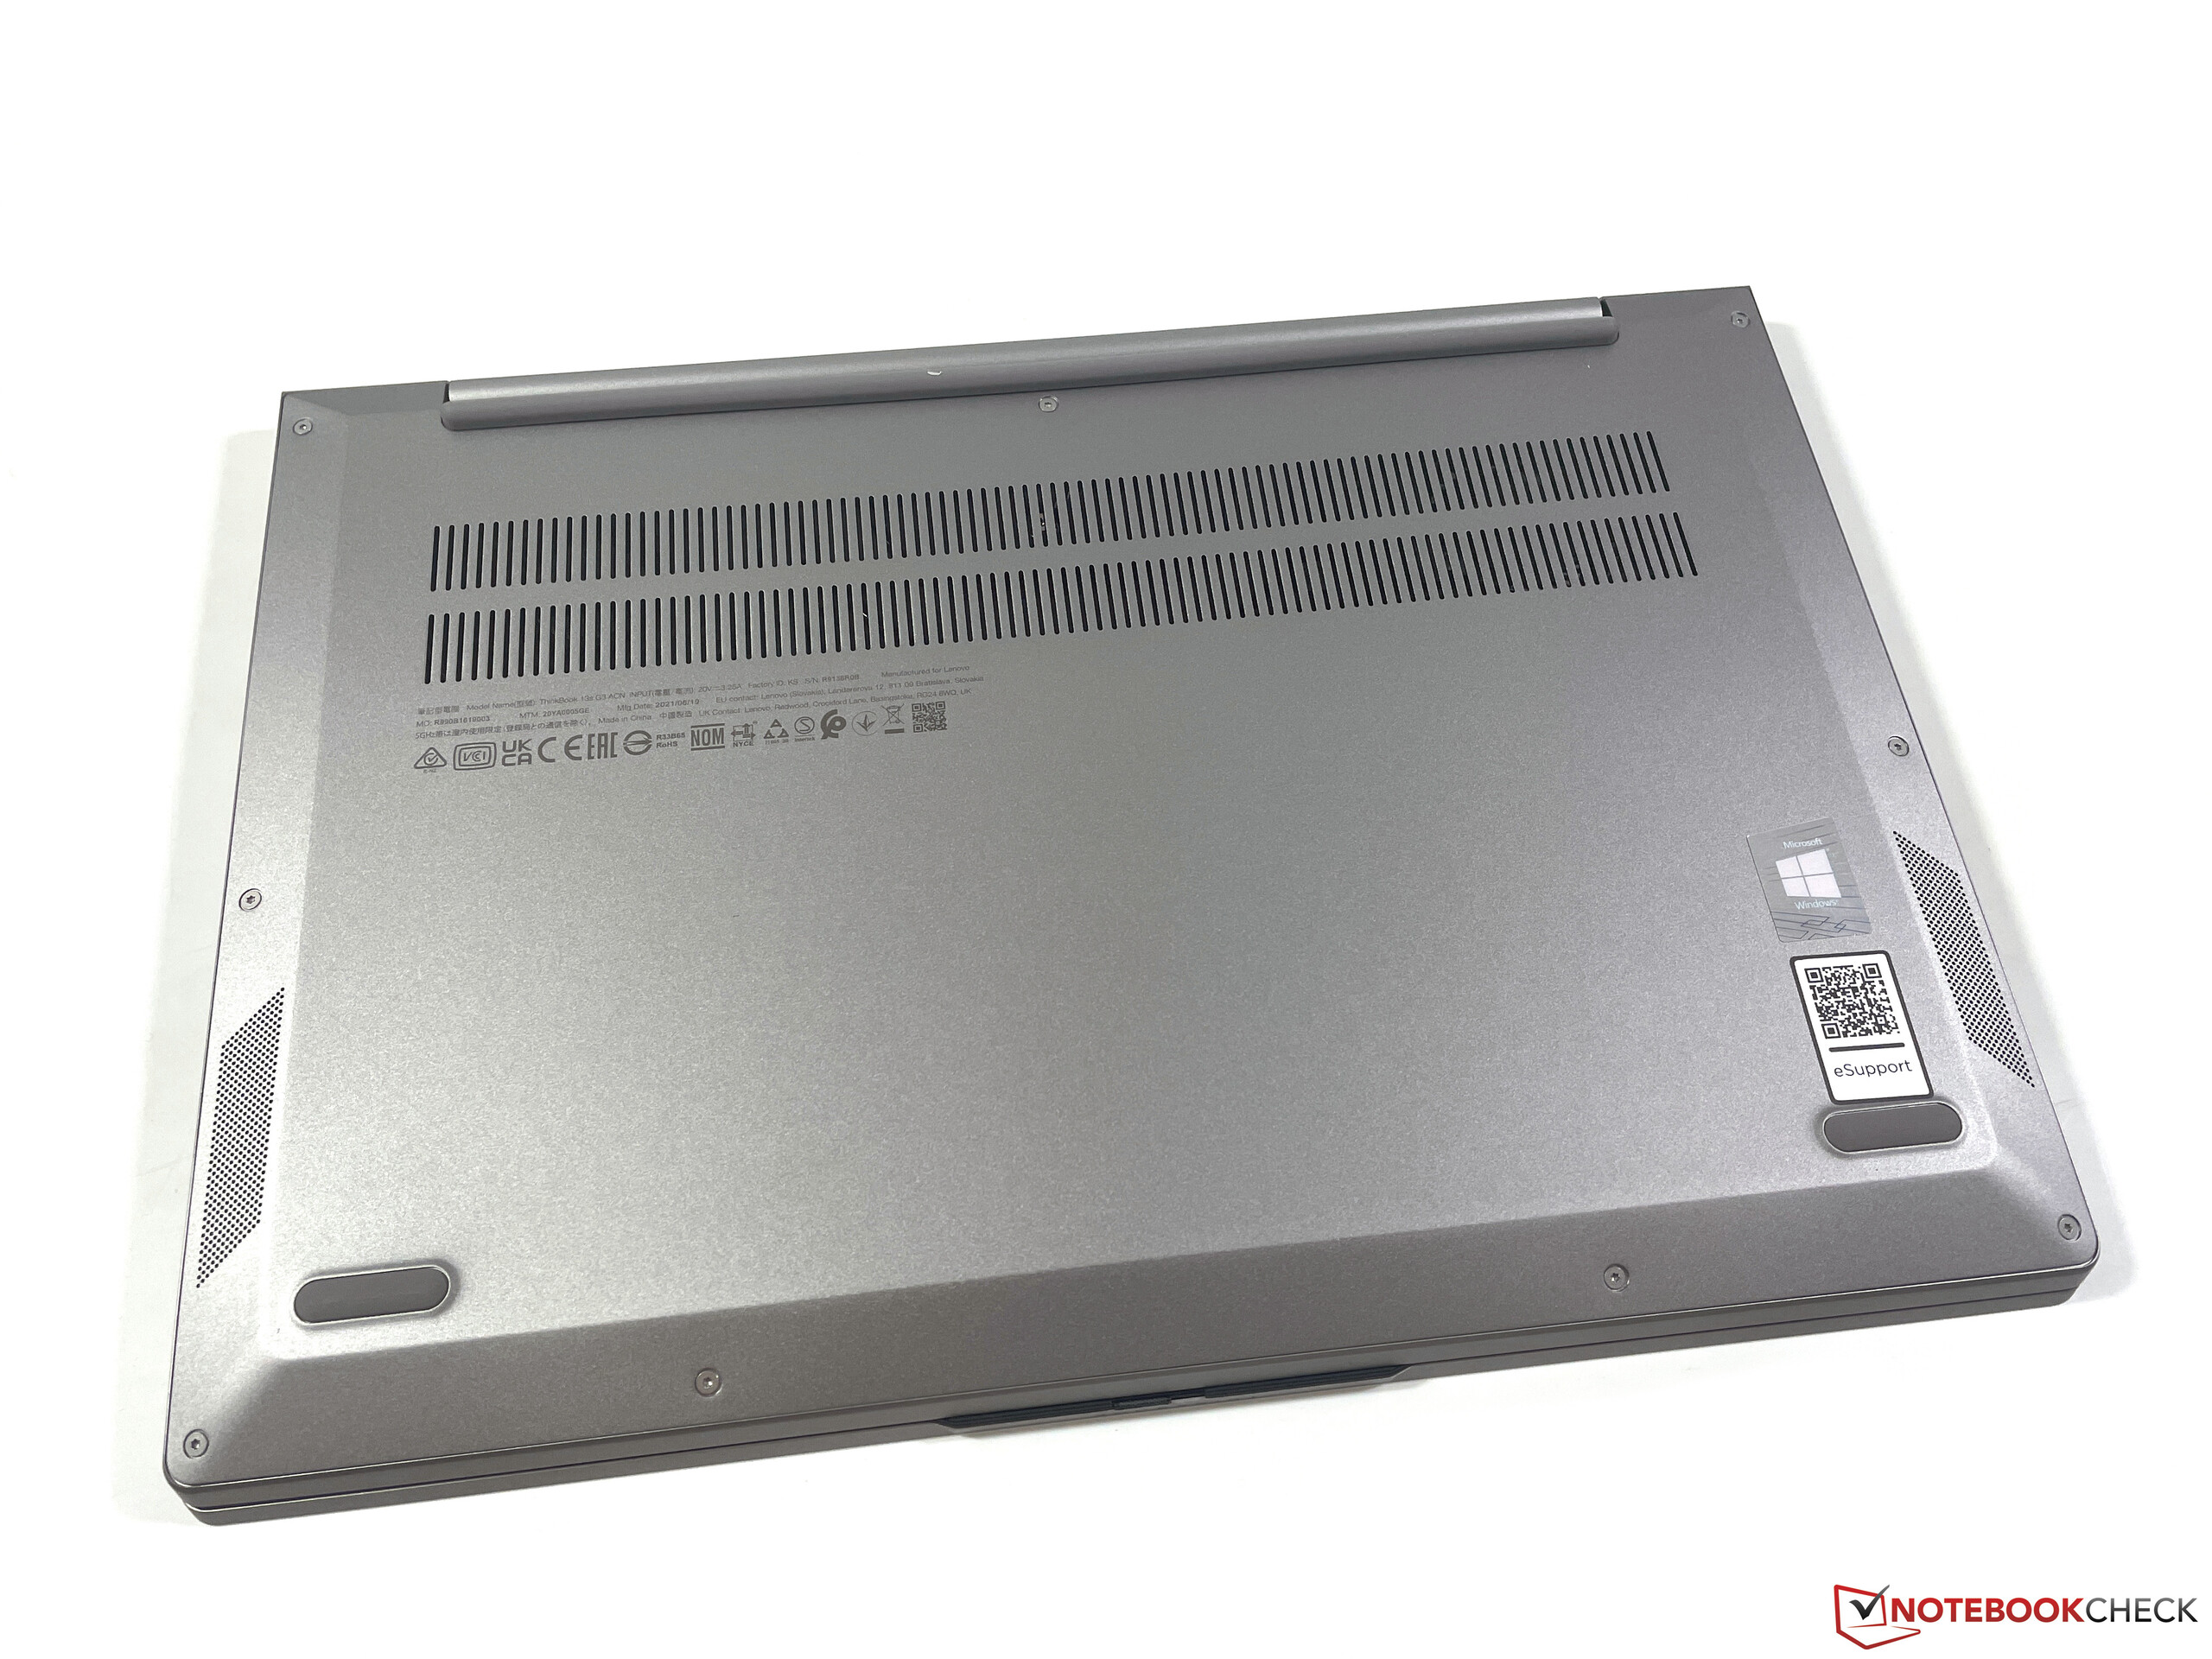
We are already aware of the silver-colored aluminum case of the ThinkBook 13s from the G2 model. With a weight just under 1.3 kg and a height just under 15 mm, this ThinkBook 13s G3 subnotebook is very compact. The device looks modern thanks to the narrow screen edges on all sides. Both the build quality and the stability are perfectly acceptable for this price range, and we could not identify any noteworthy problems.
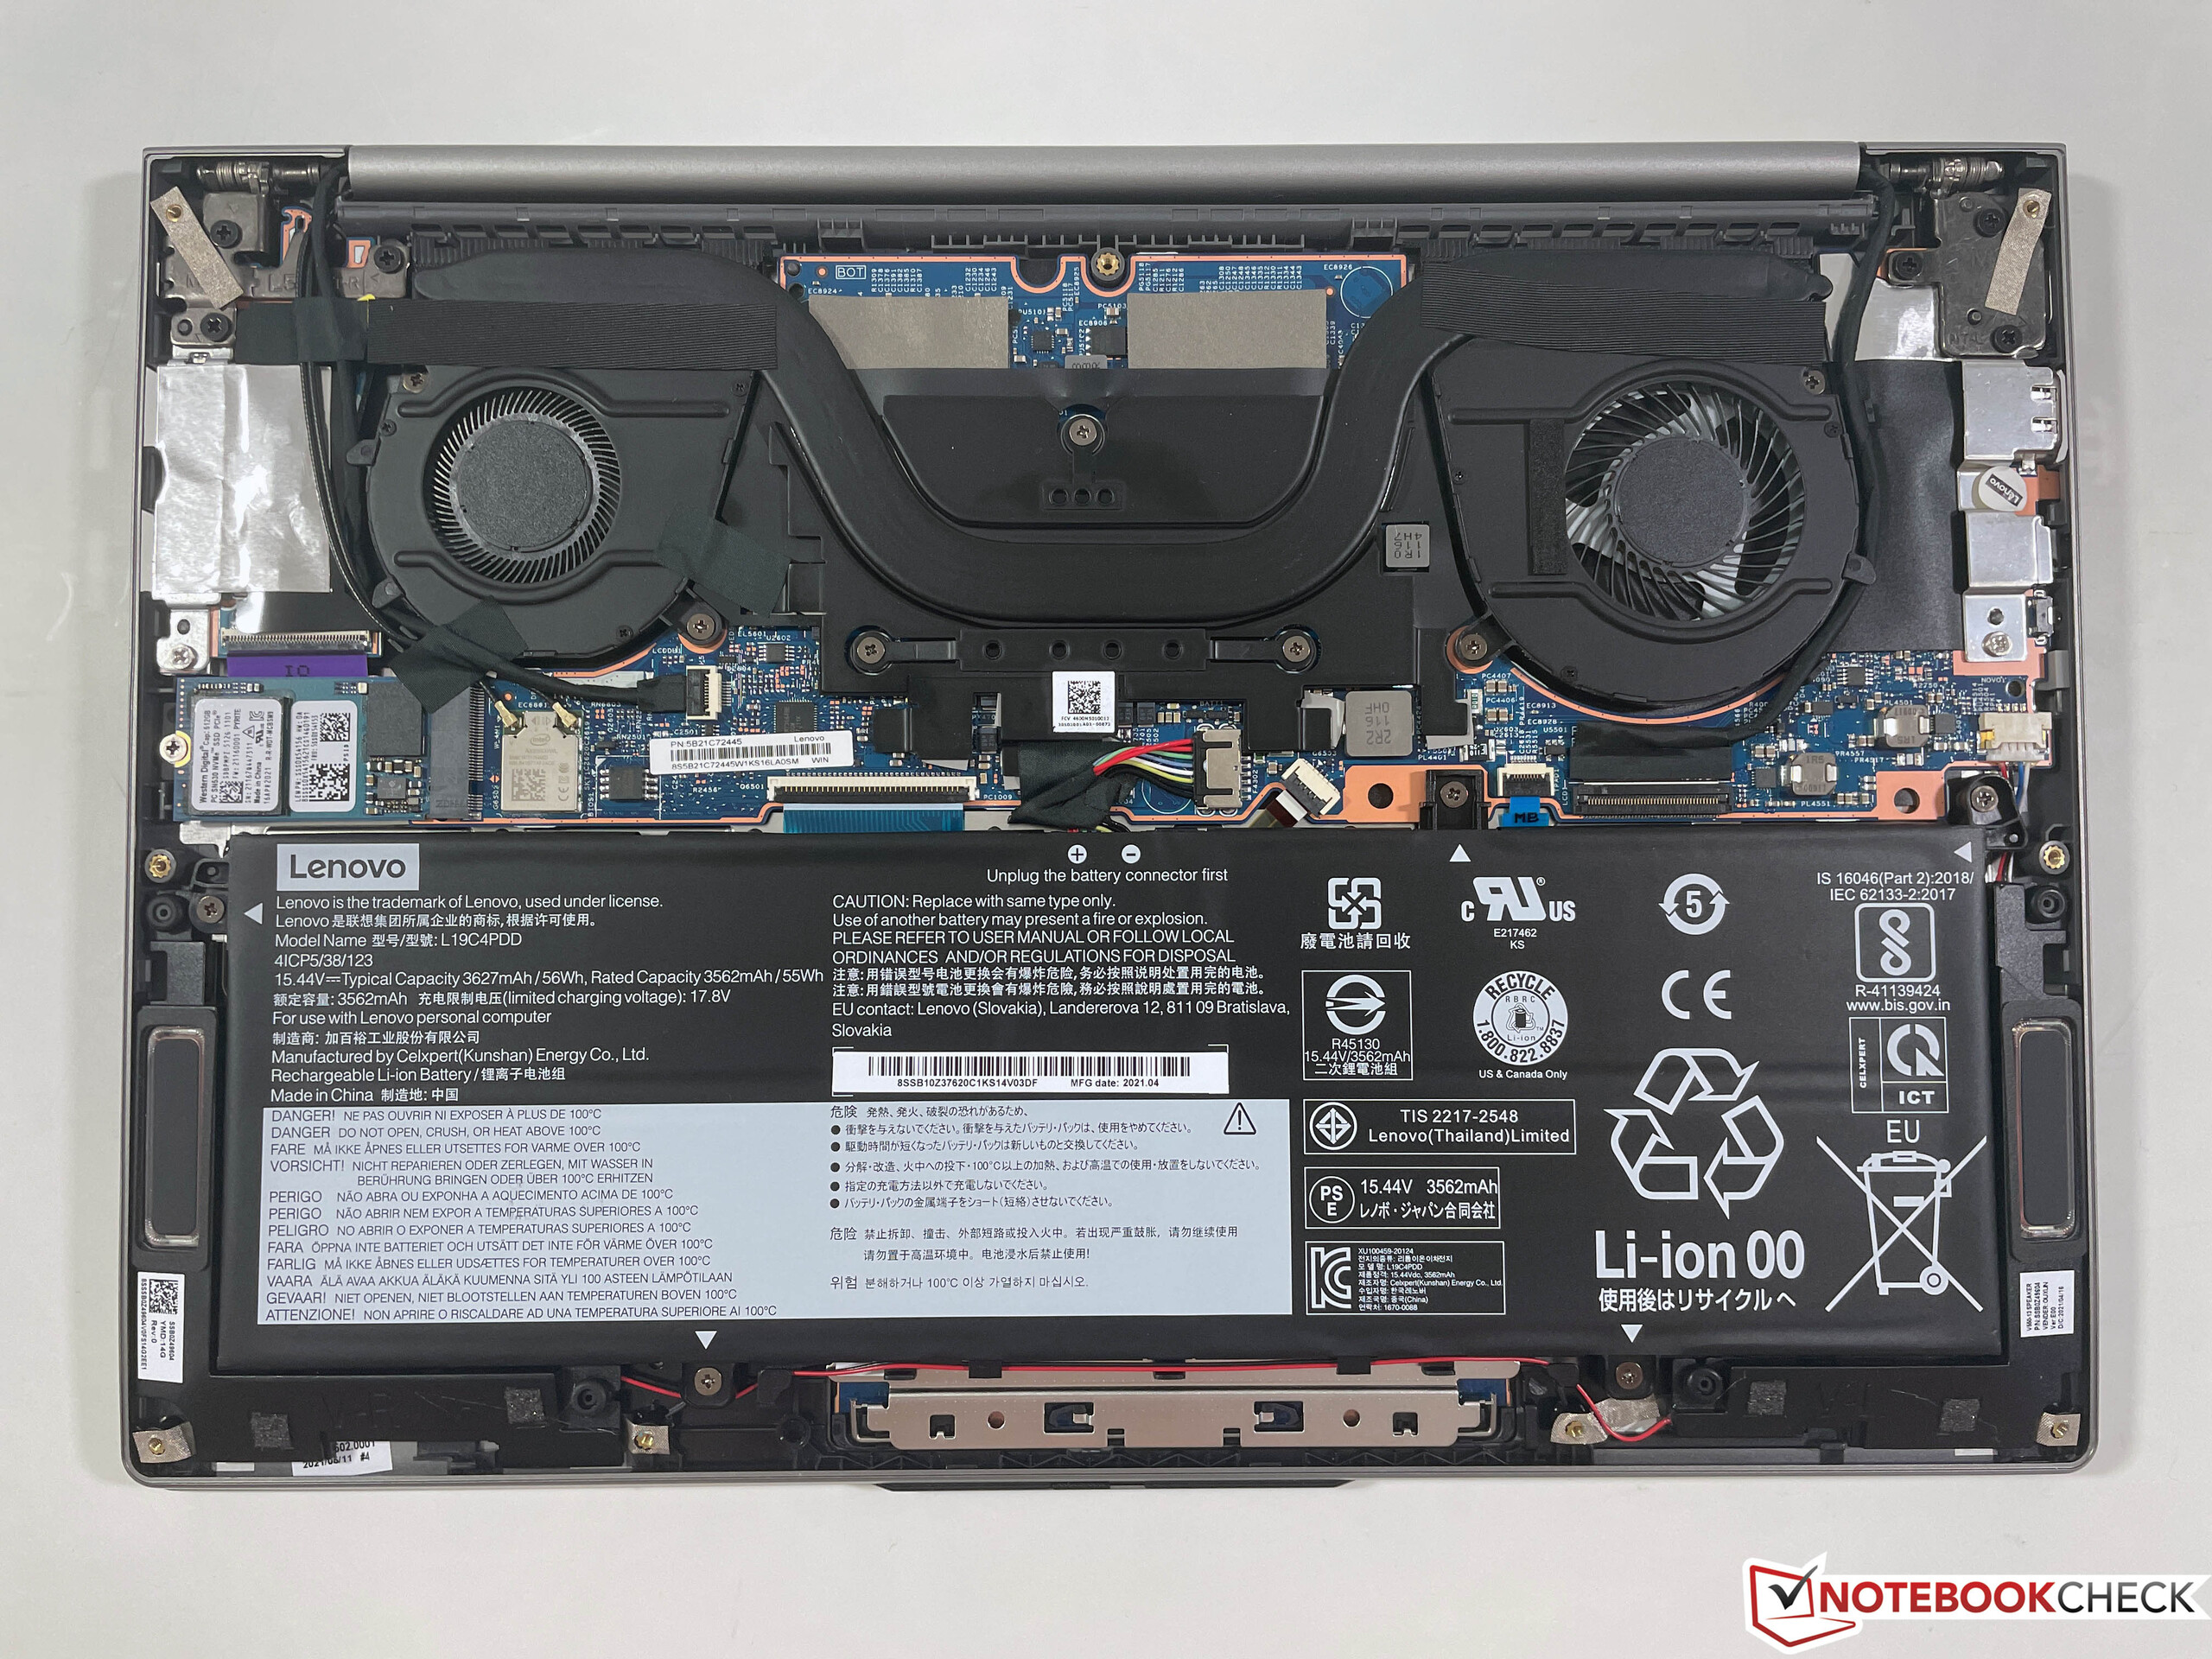
The bottom of the case is secured with Torx screws (T5) and can be removed easily. Inside, however, only the compact M.2 2242 SSD can be replaced whereas all other components, such as the working memory and the WLAN module are soldered.
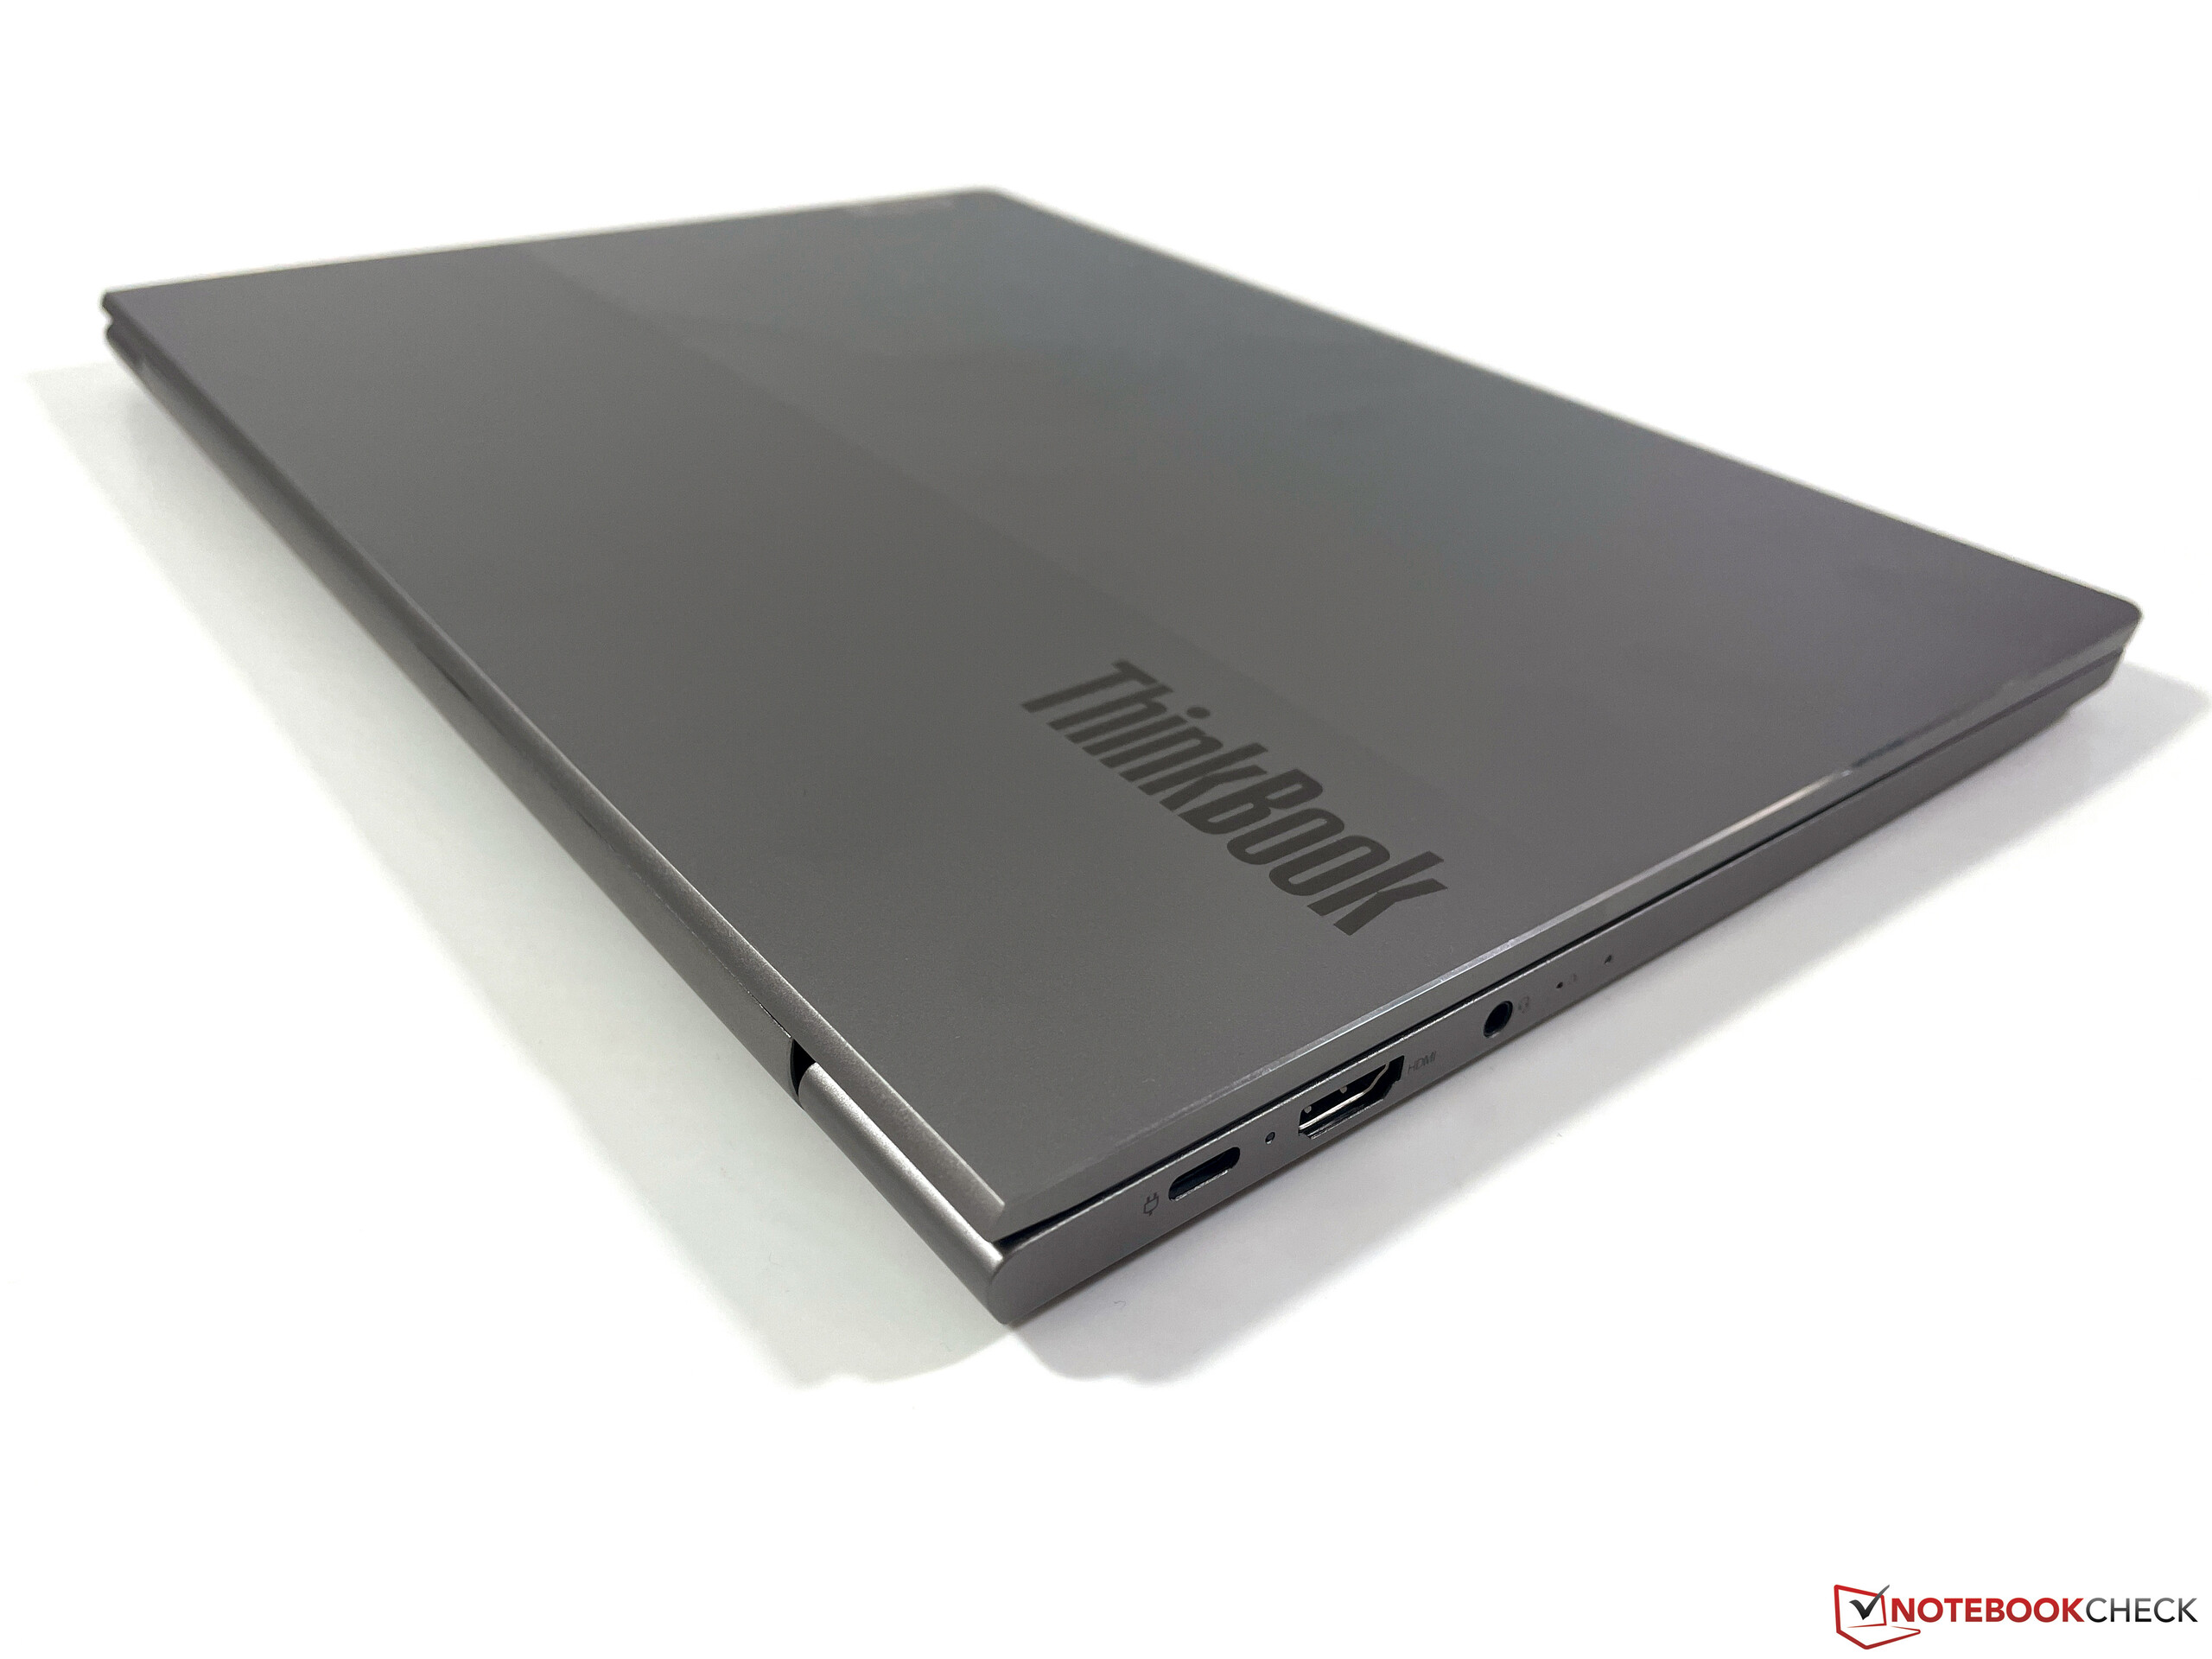
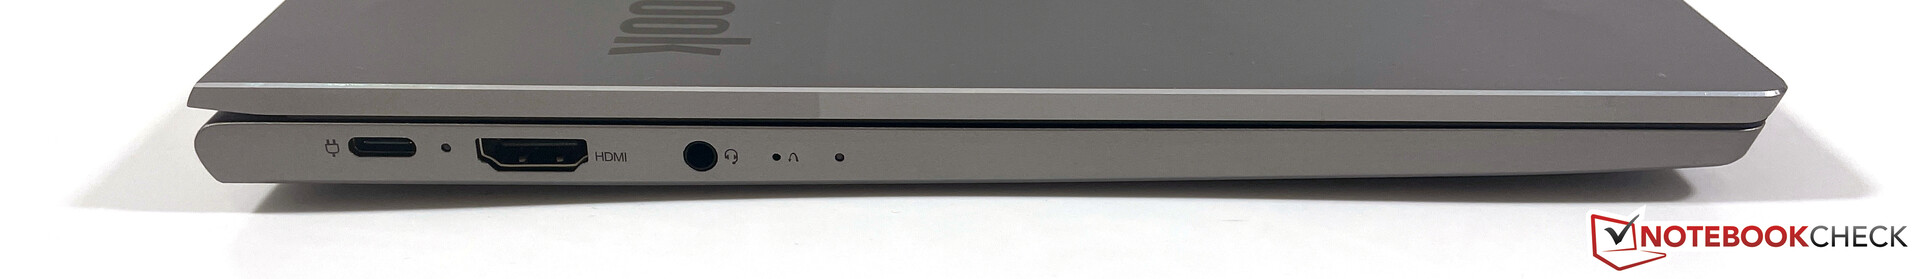
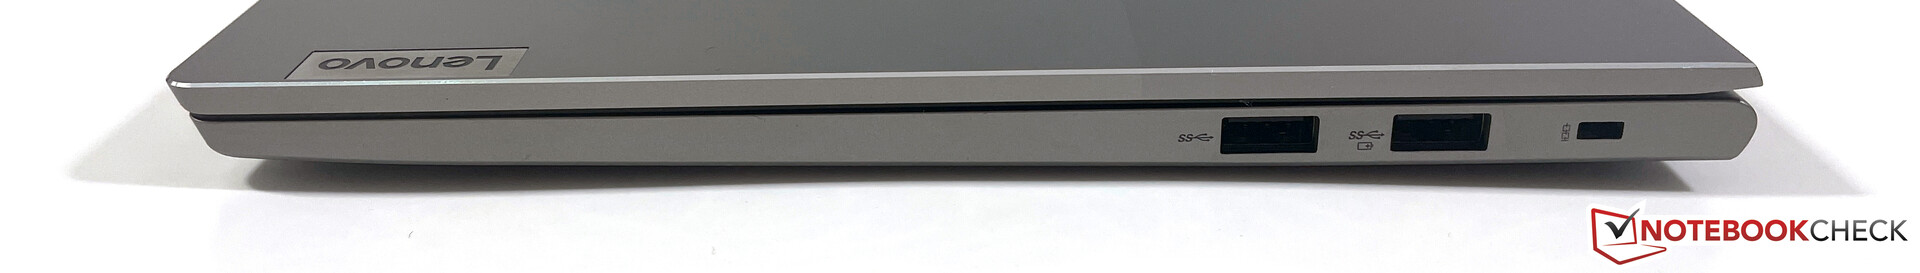
There is only one difference between the Intel and AMD models in terms of ports, and that is because the AMD variant has to do without Thunderbolt 4. Nevertheless, the built-in USB-C port still supports charging and video output. However, Lenovo still does not offer an SD card reader. The Wi-Fi module (Intel AX200) supports the Wi-Fi 6 standard, and it achieved good transfer rates in our test.
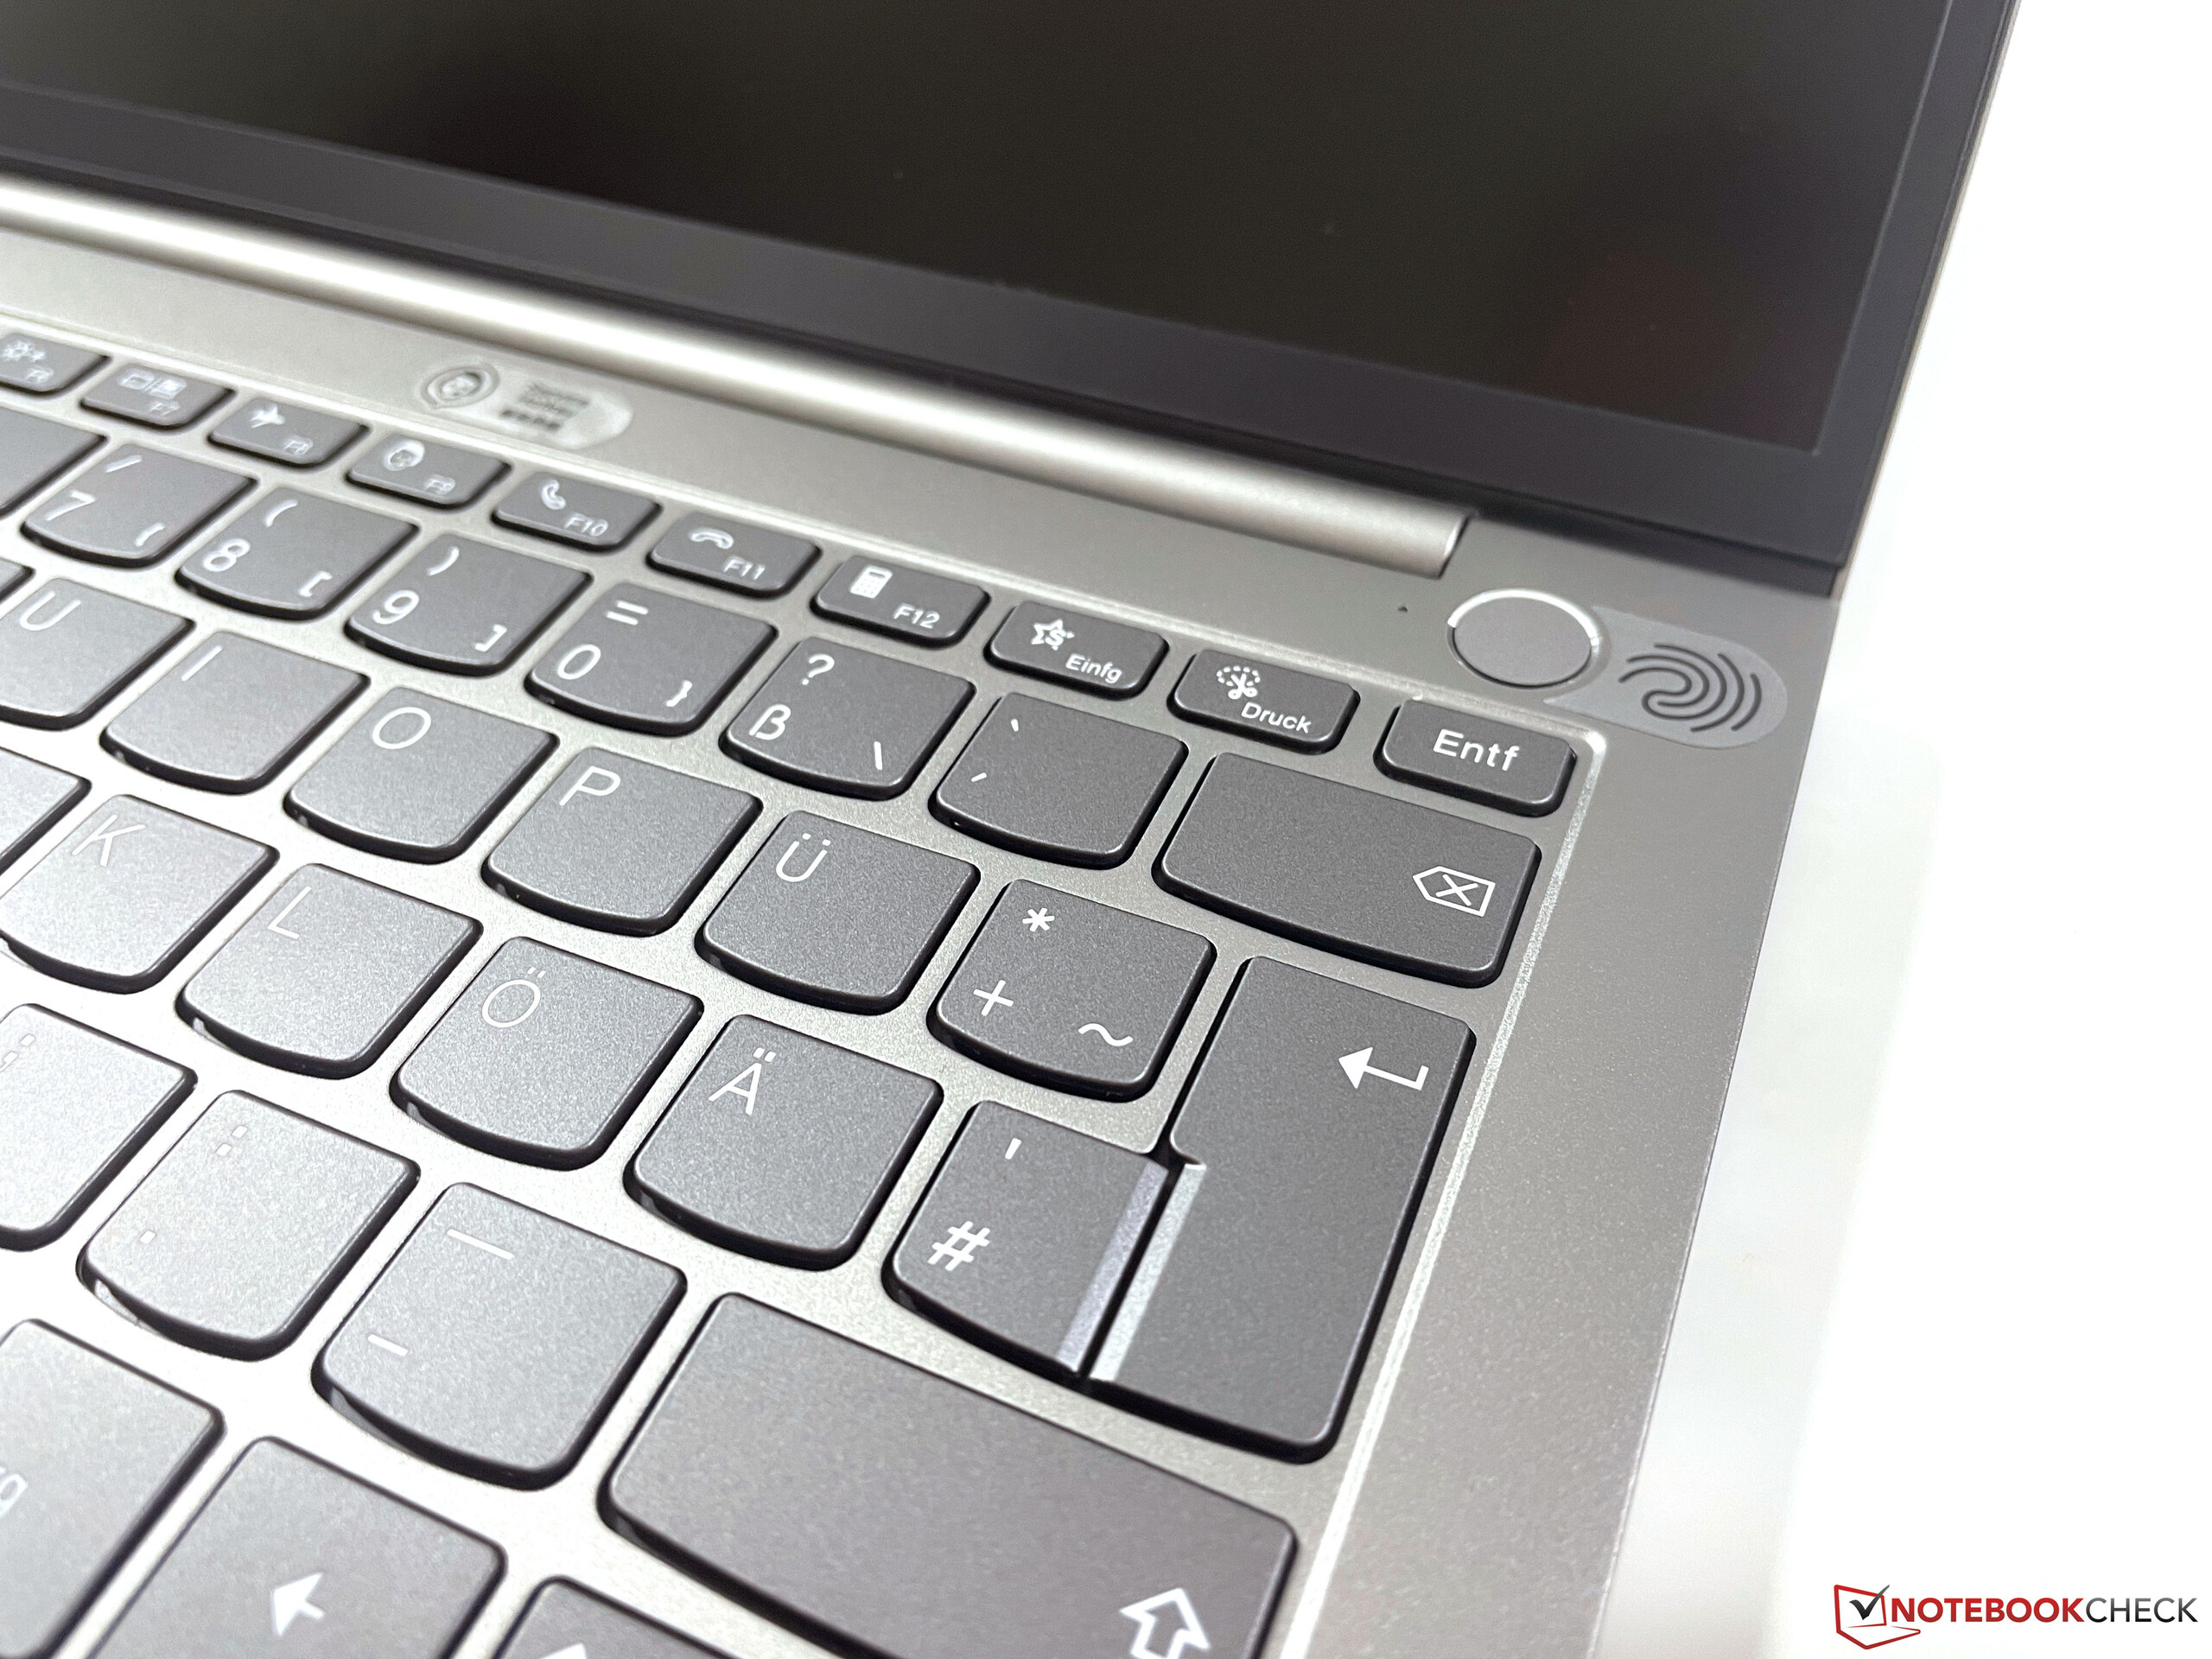
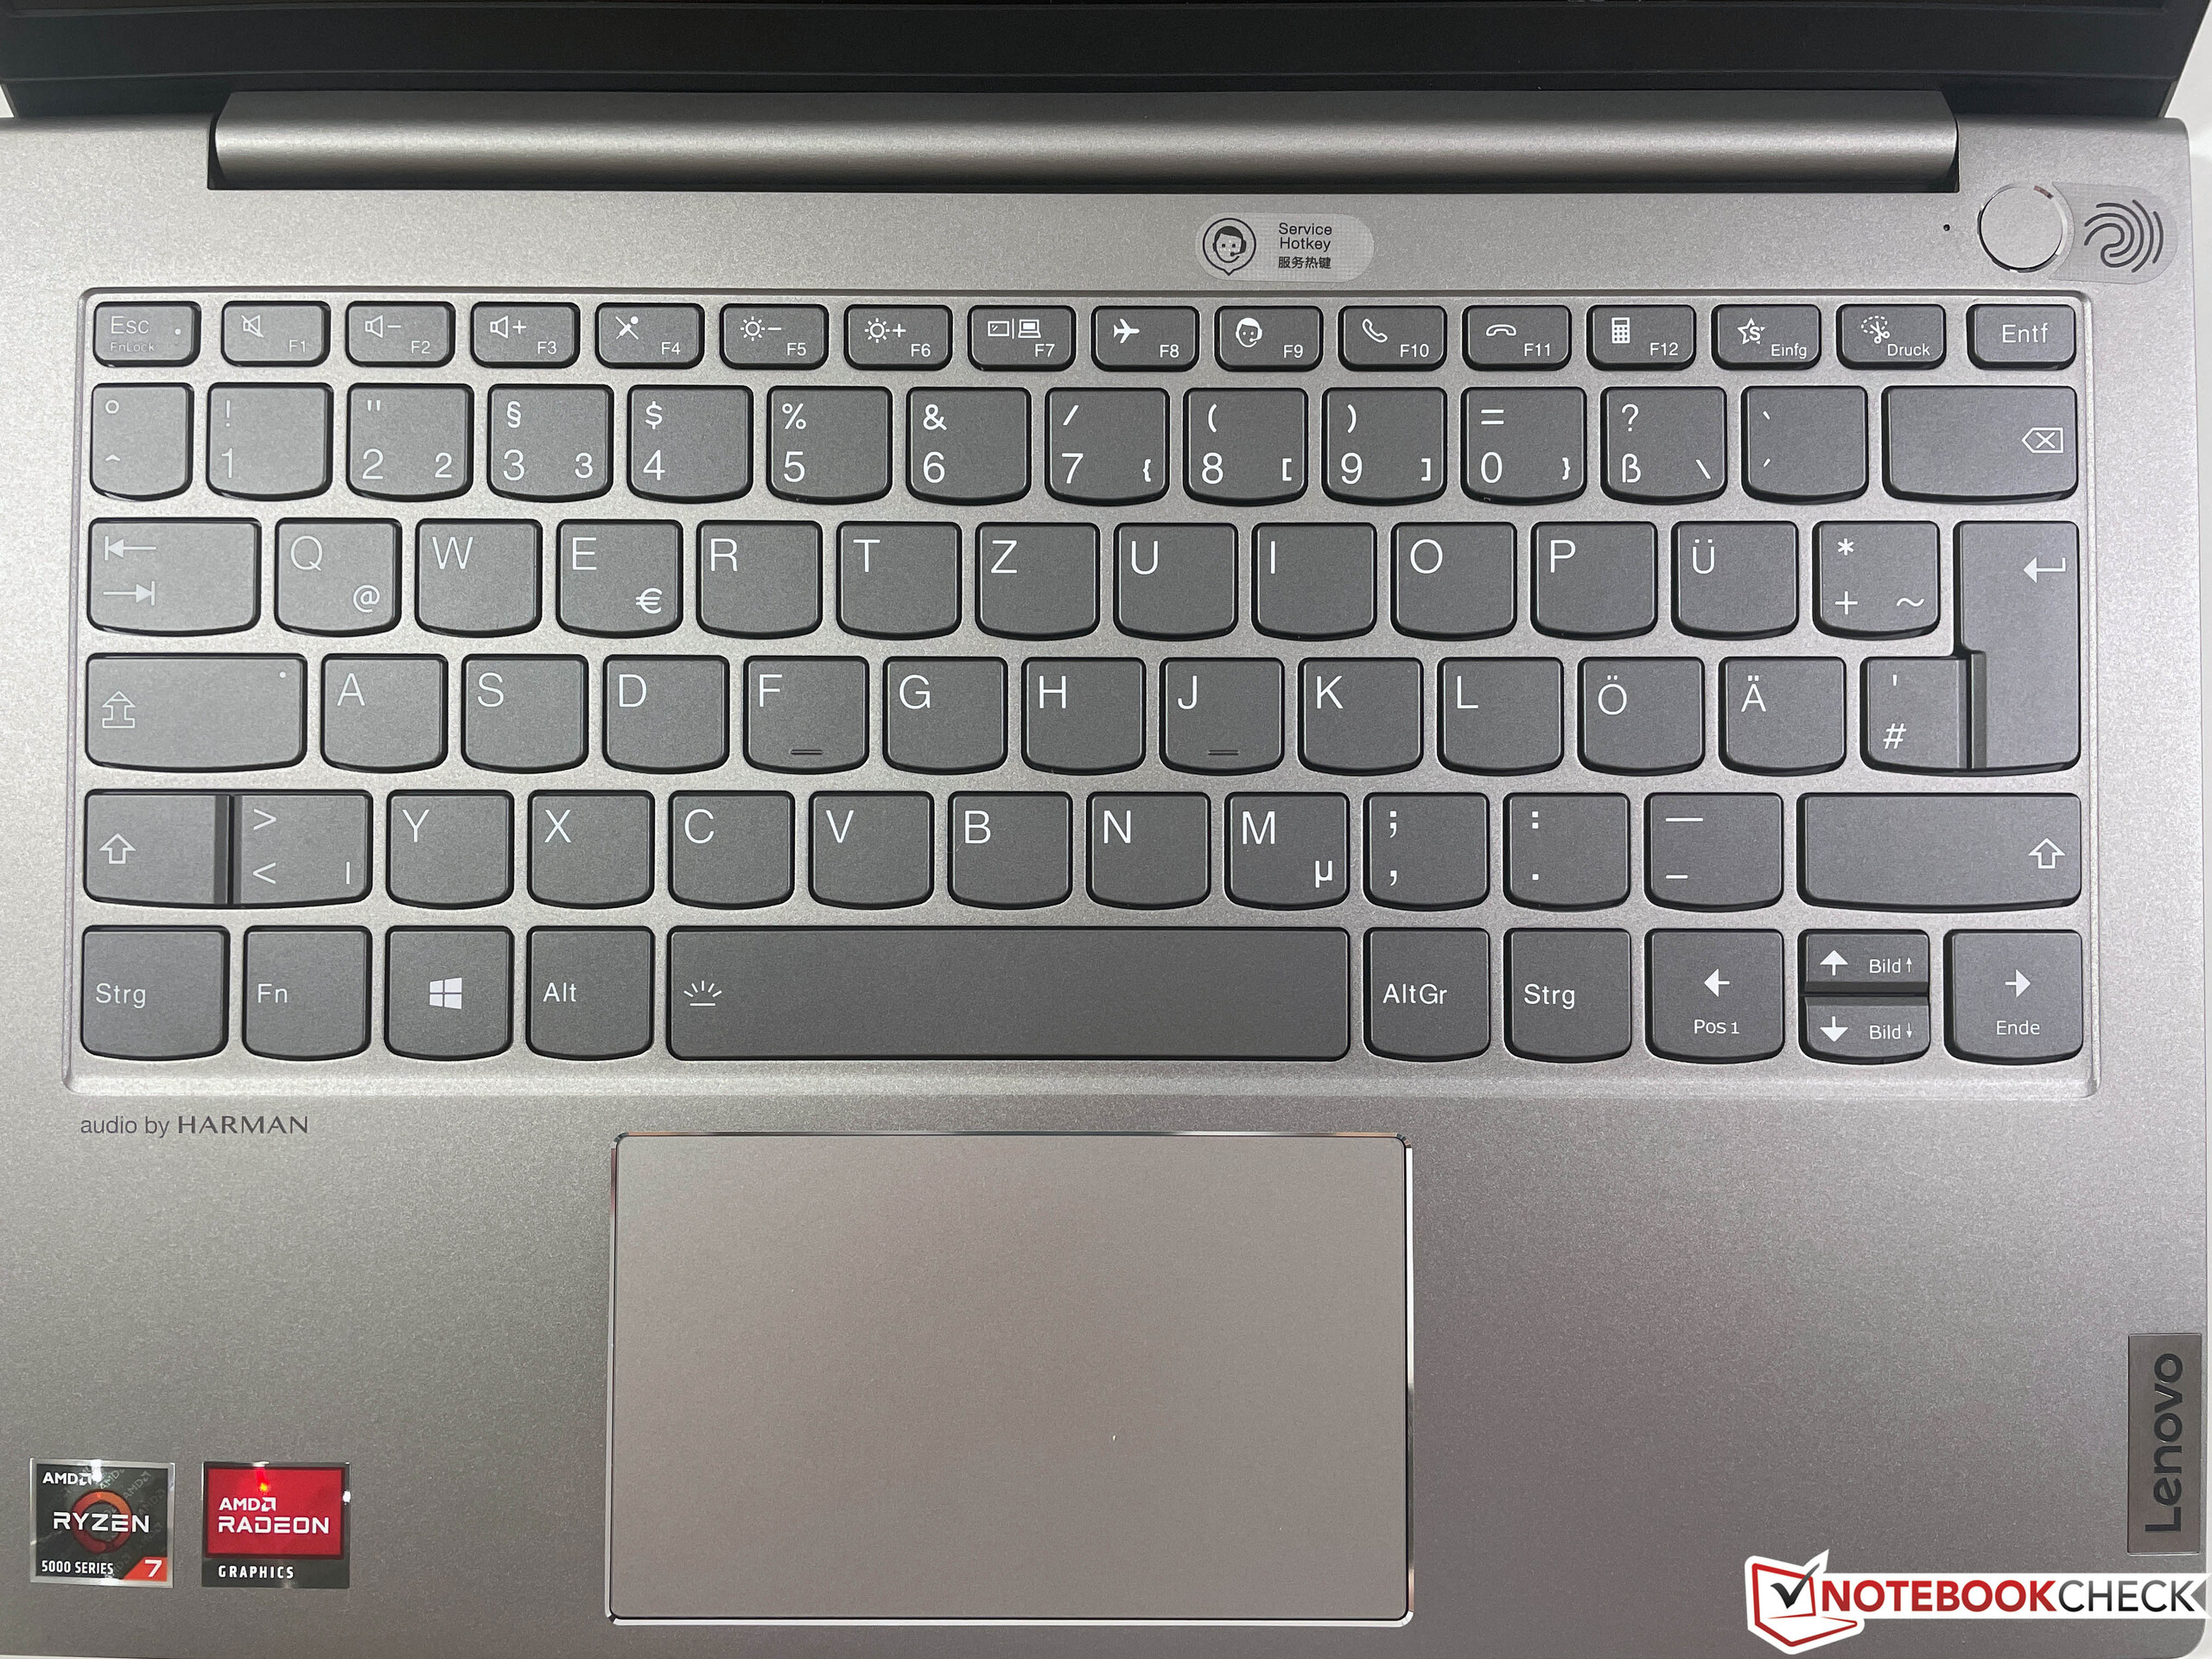
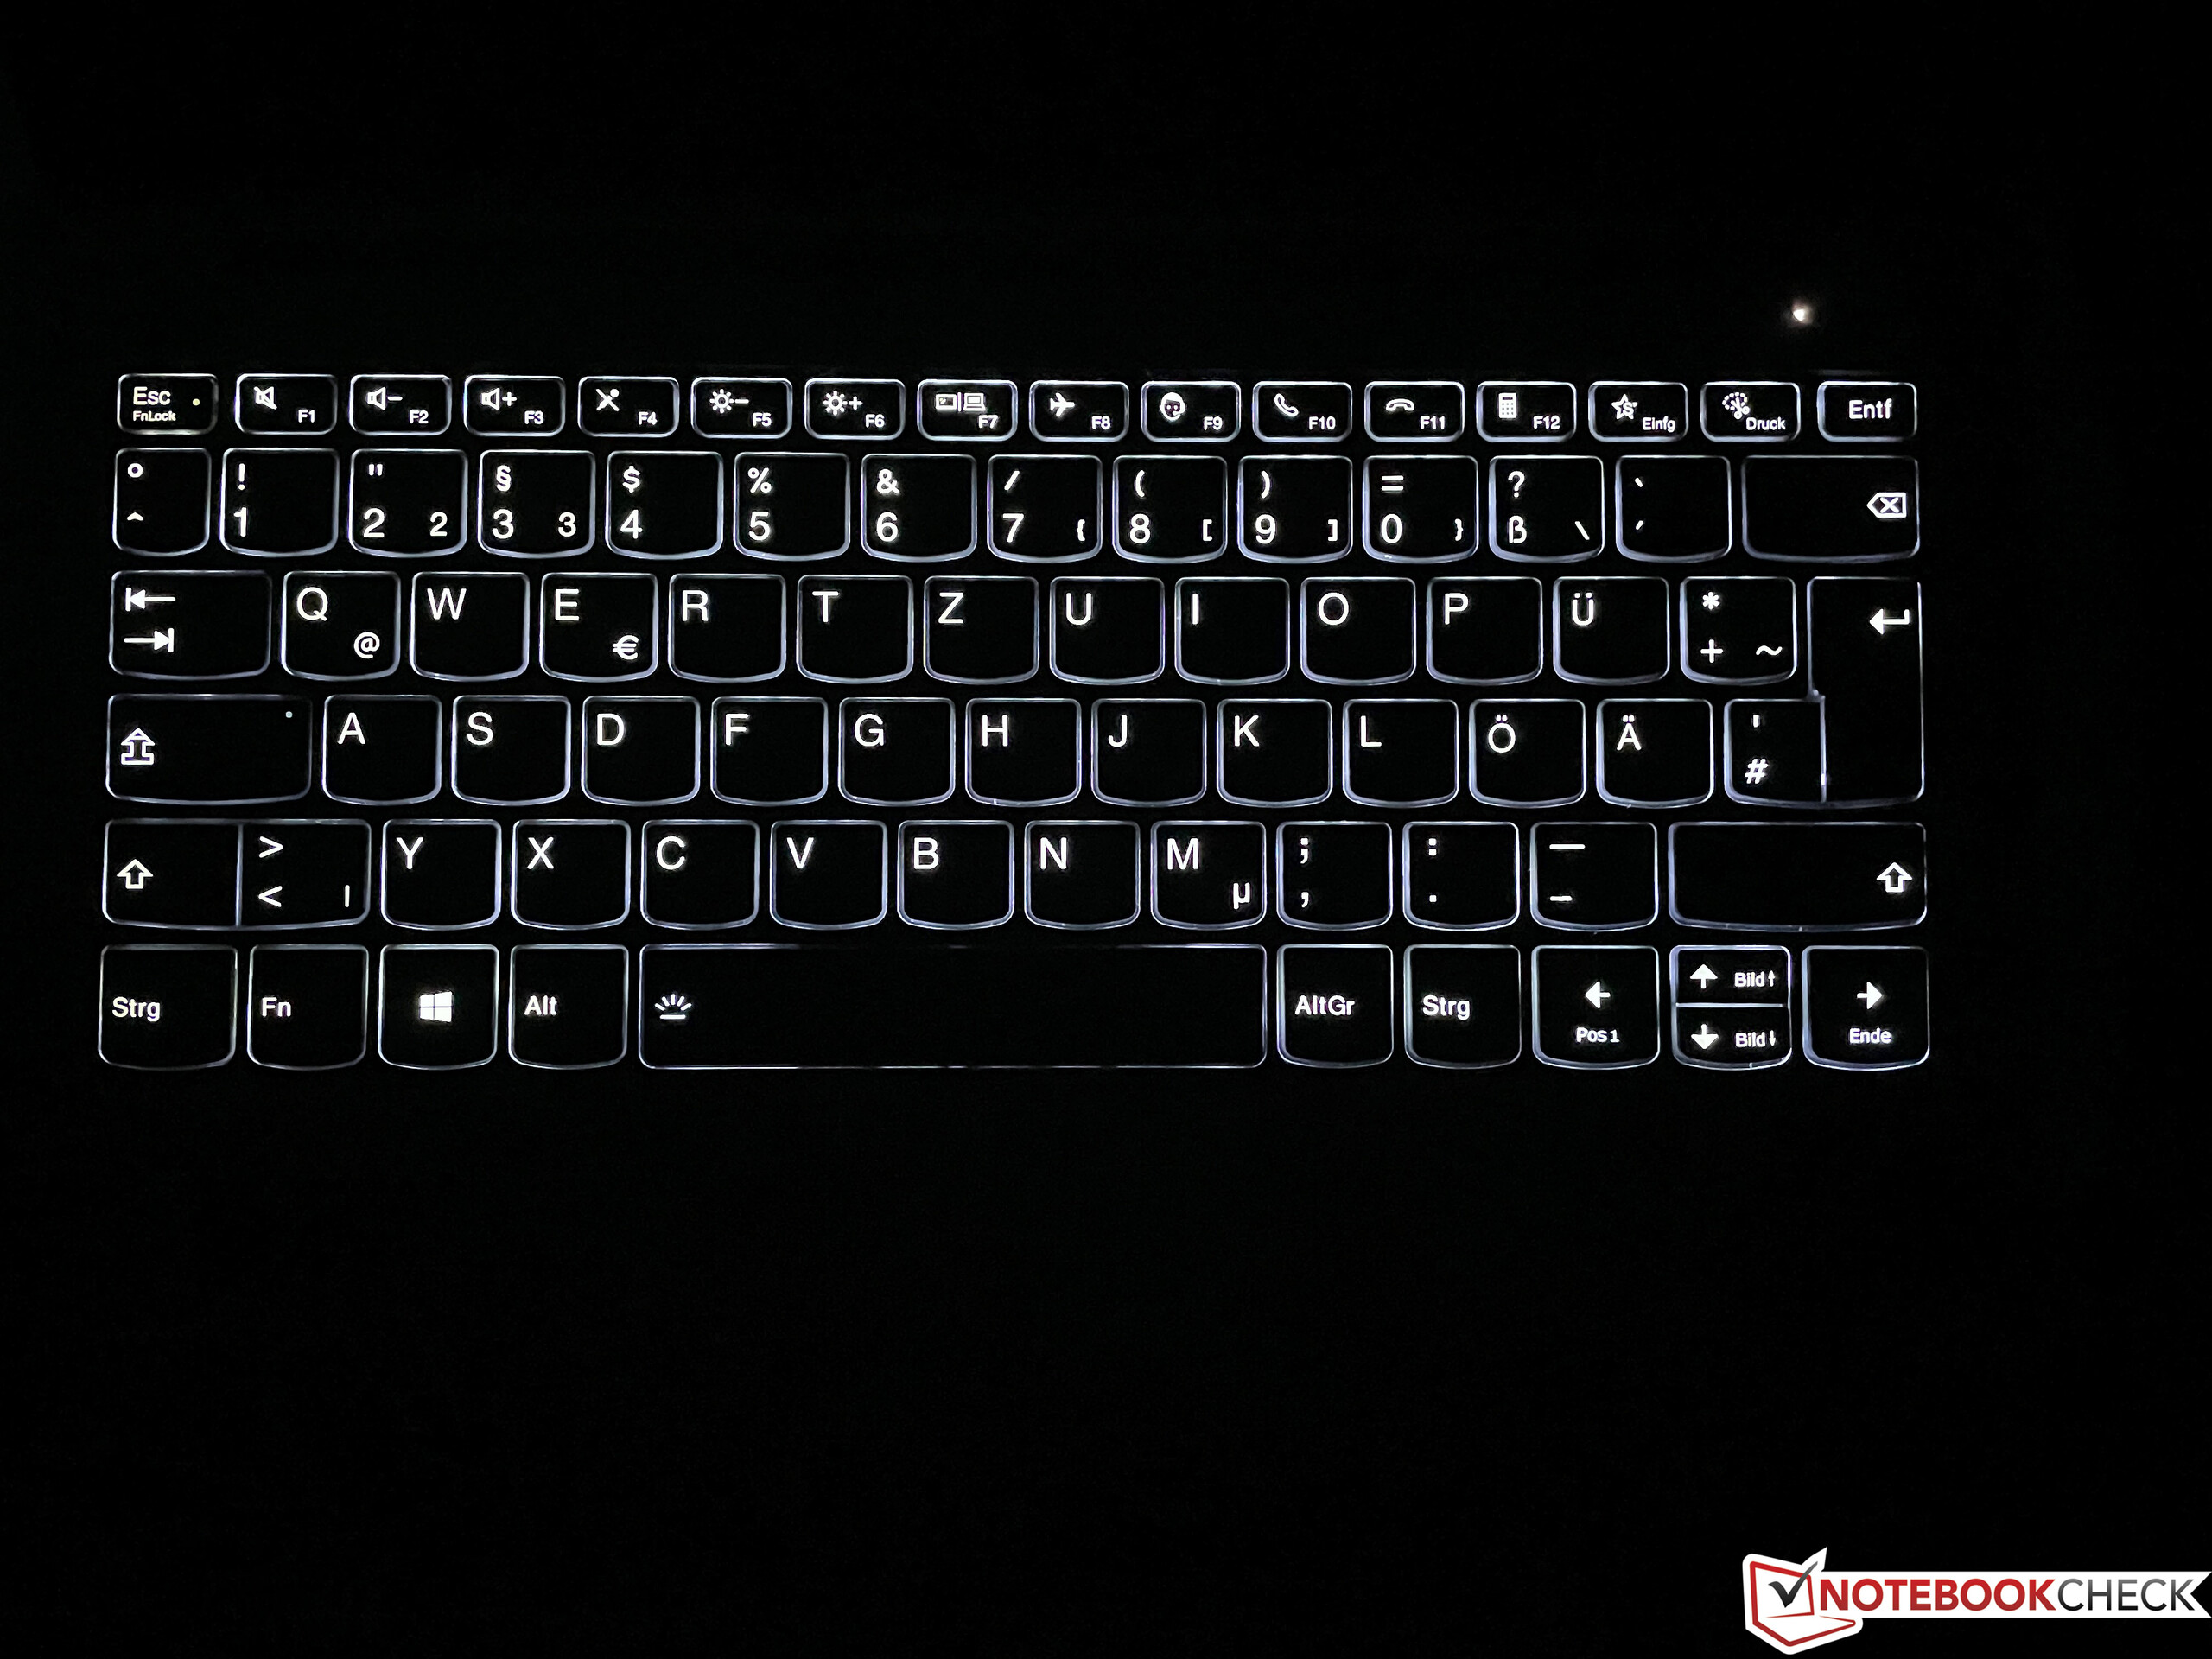
The fingerprint scanner is located in the power button and works quite reliably. The keyboard is clearly one step below that of the ThinkPads in terms of quality due to the limited key travel. It corresponds to the normal IdeaPads but is still well suited for everyday work thanks to the two-stage illumination. The ClickPad also functioned inconspicuously without much issue in everyday use; however, there is no TrackPoint like on the ThinkPads.


Display - ThinkBook with matte 16:10 panel
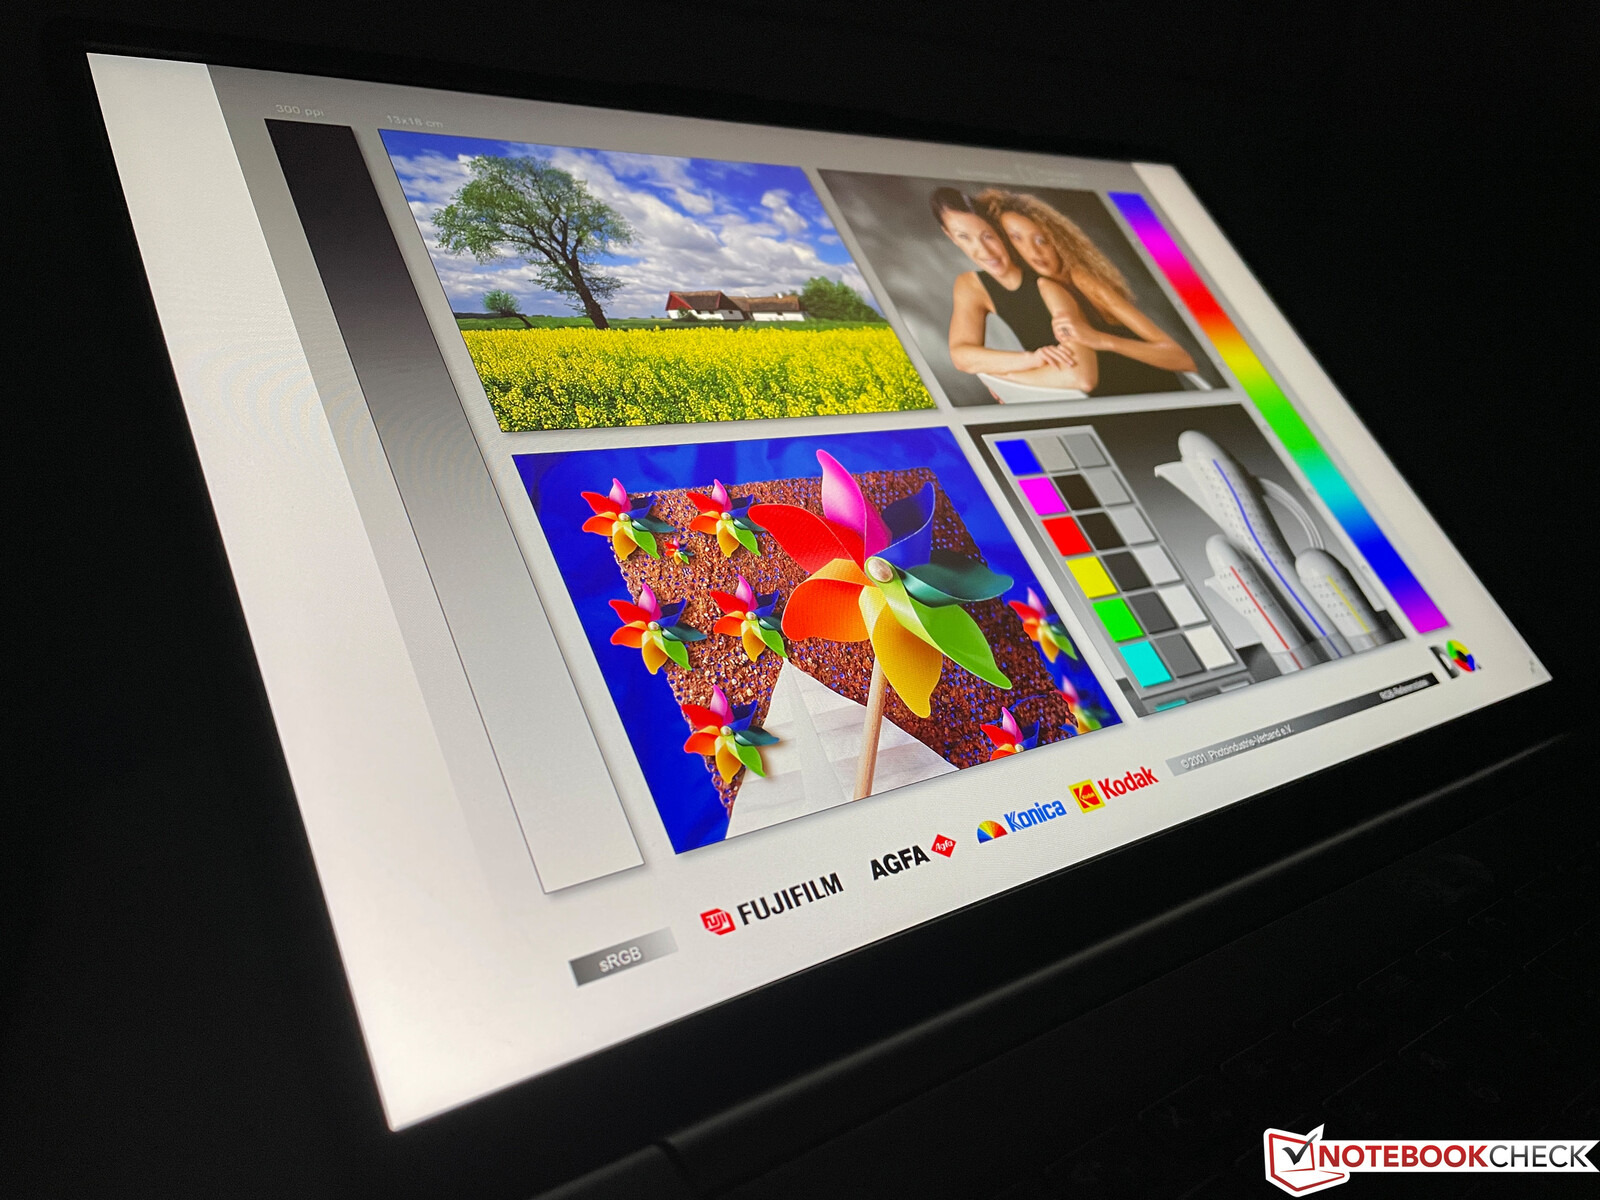
Our test device uses the standard FHD panel with a resolution of 1,920 x 1,200 pixels (16:10). The subjective image impression of the matte IPS panel is good and even bright areas are only minimally grainy. However, the colors are not quite as vivid and brilliant as is the case with many glossy displays such as in the MacBook Air, for example.
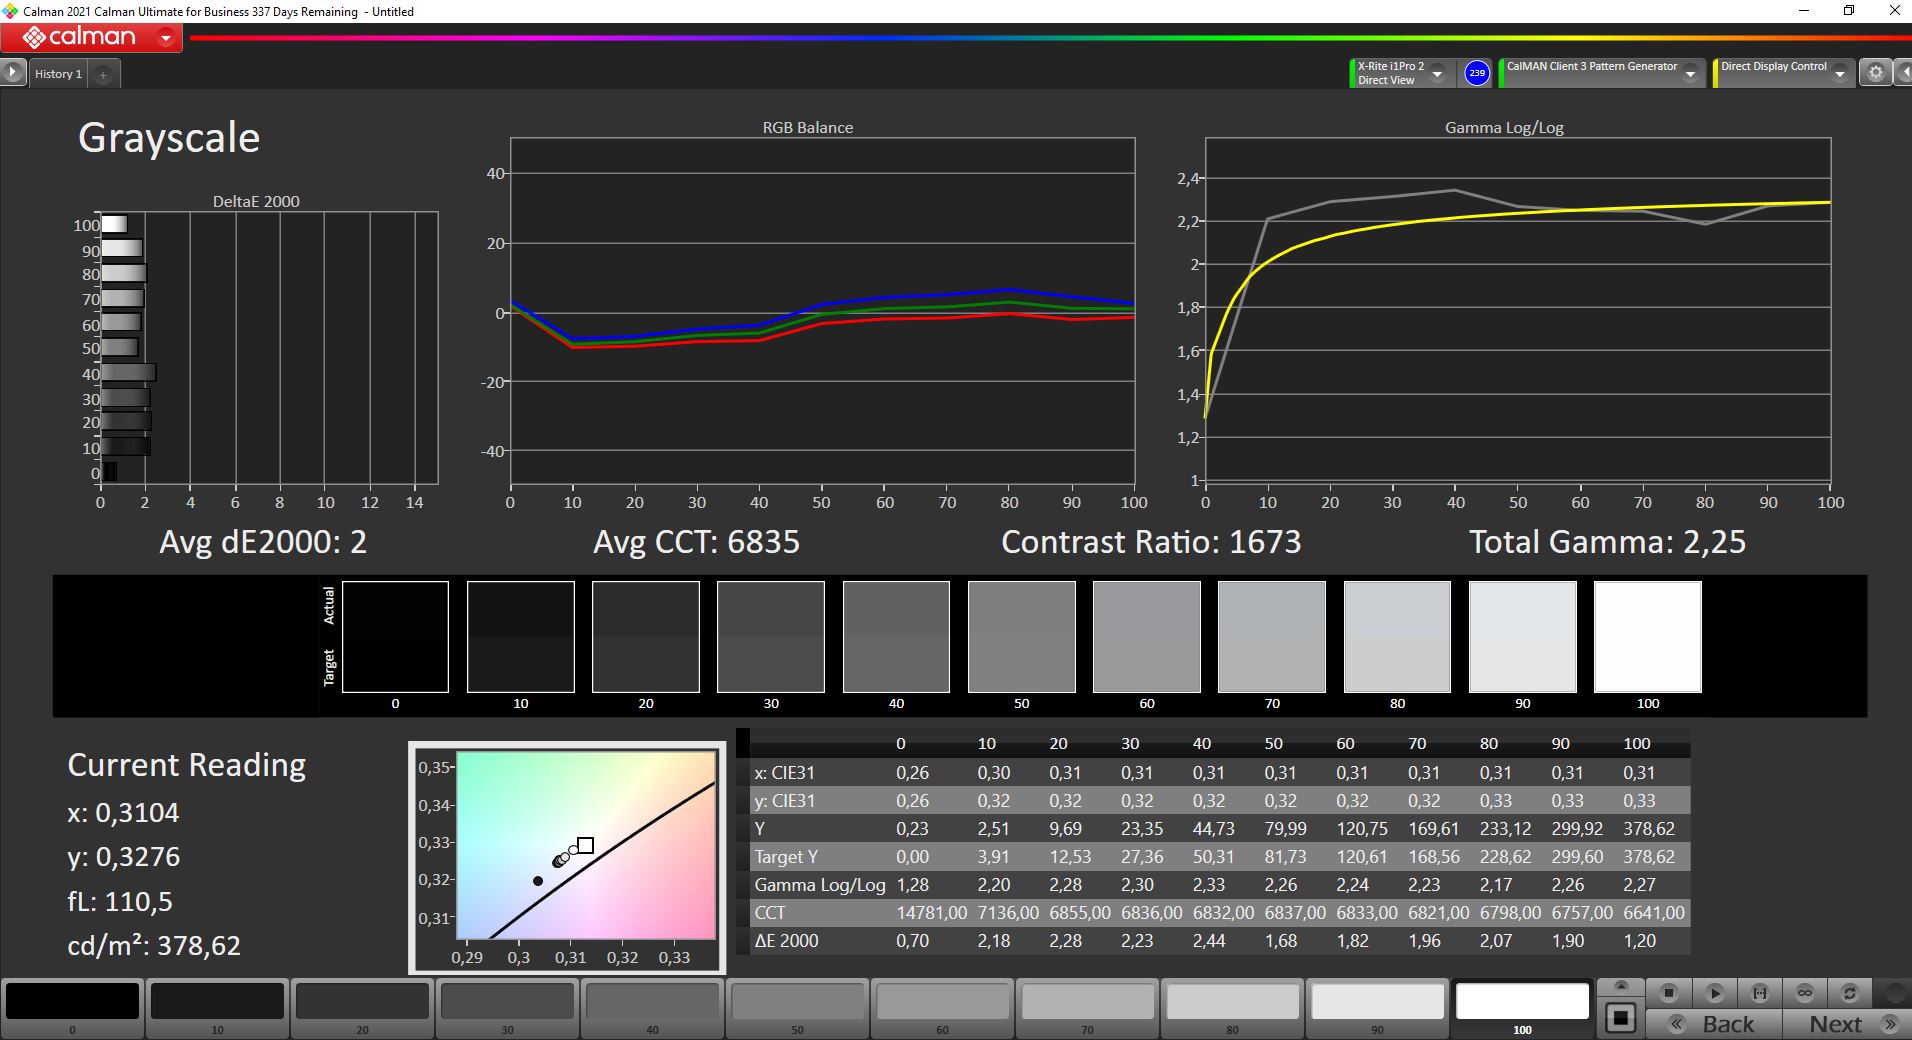
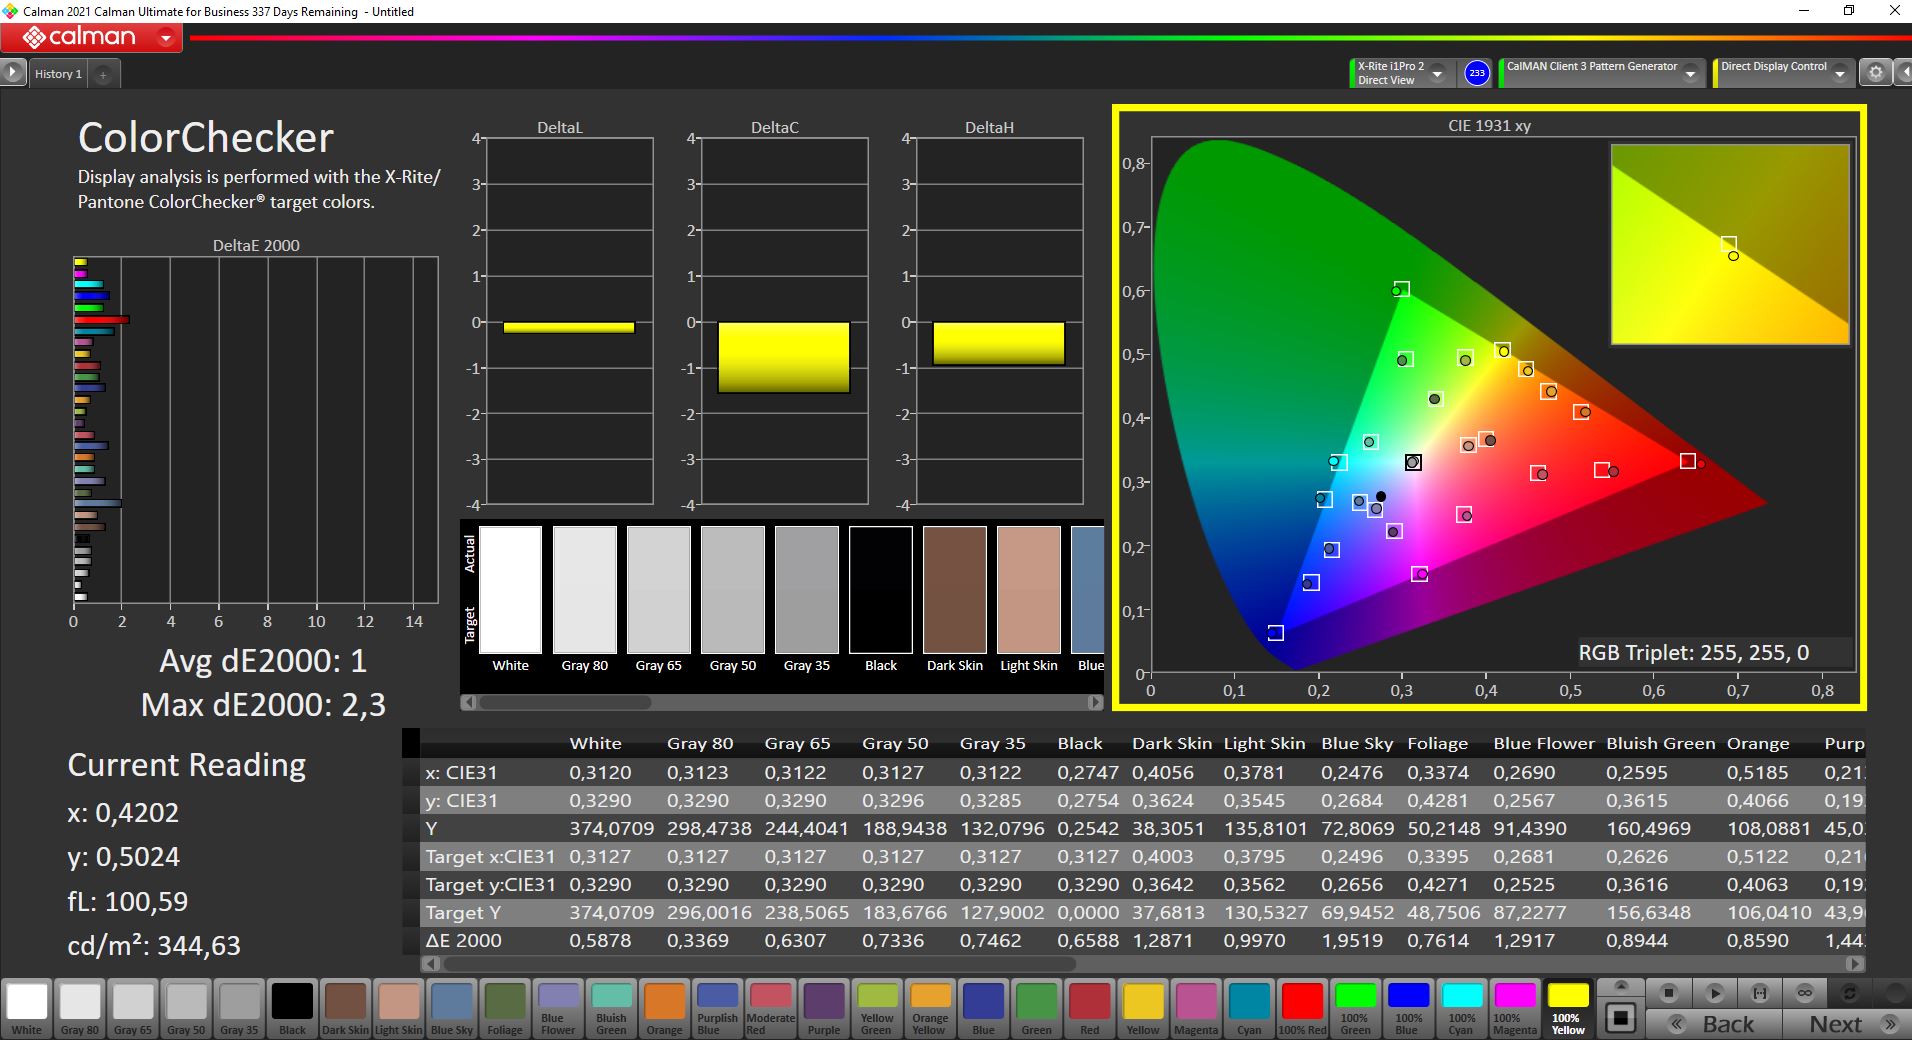
InfoVision's panel clearly exceeds the manufacturer's brightness specification of 300 cd/m², as we measured a maximum of just under 380 cd/m². The black value is also low and results in a very good contrast ratio of more than 1,600:1. Light halos are only minimally visible at full brightness and are not a problem in everyday use. The response times are not among the fastest and you can see slight ghosting, but we could not measure any PWM flickering.
| |||||||||||||||||||||||||
Brightness Distribution: 88 %
Center on Battery: 377 cd/m²
Contrast: 1648:1 (Black: 0.23 cd/m²)
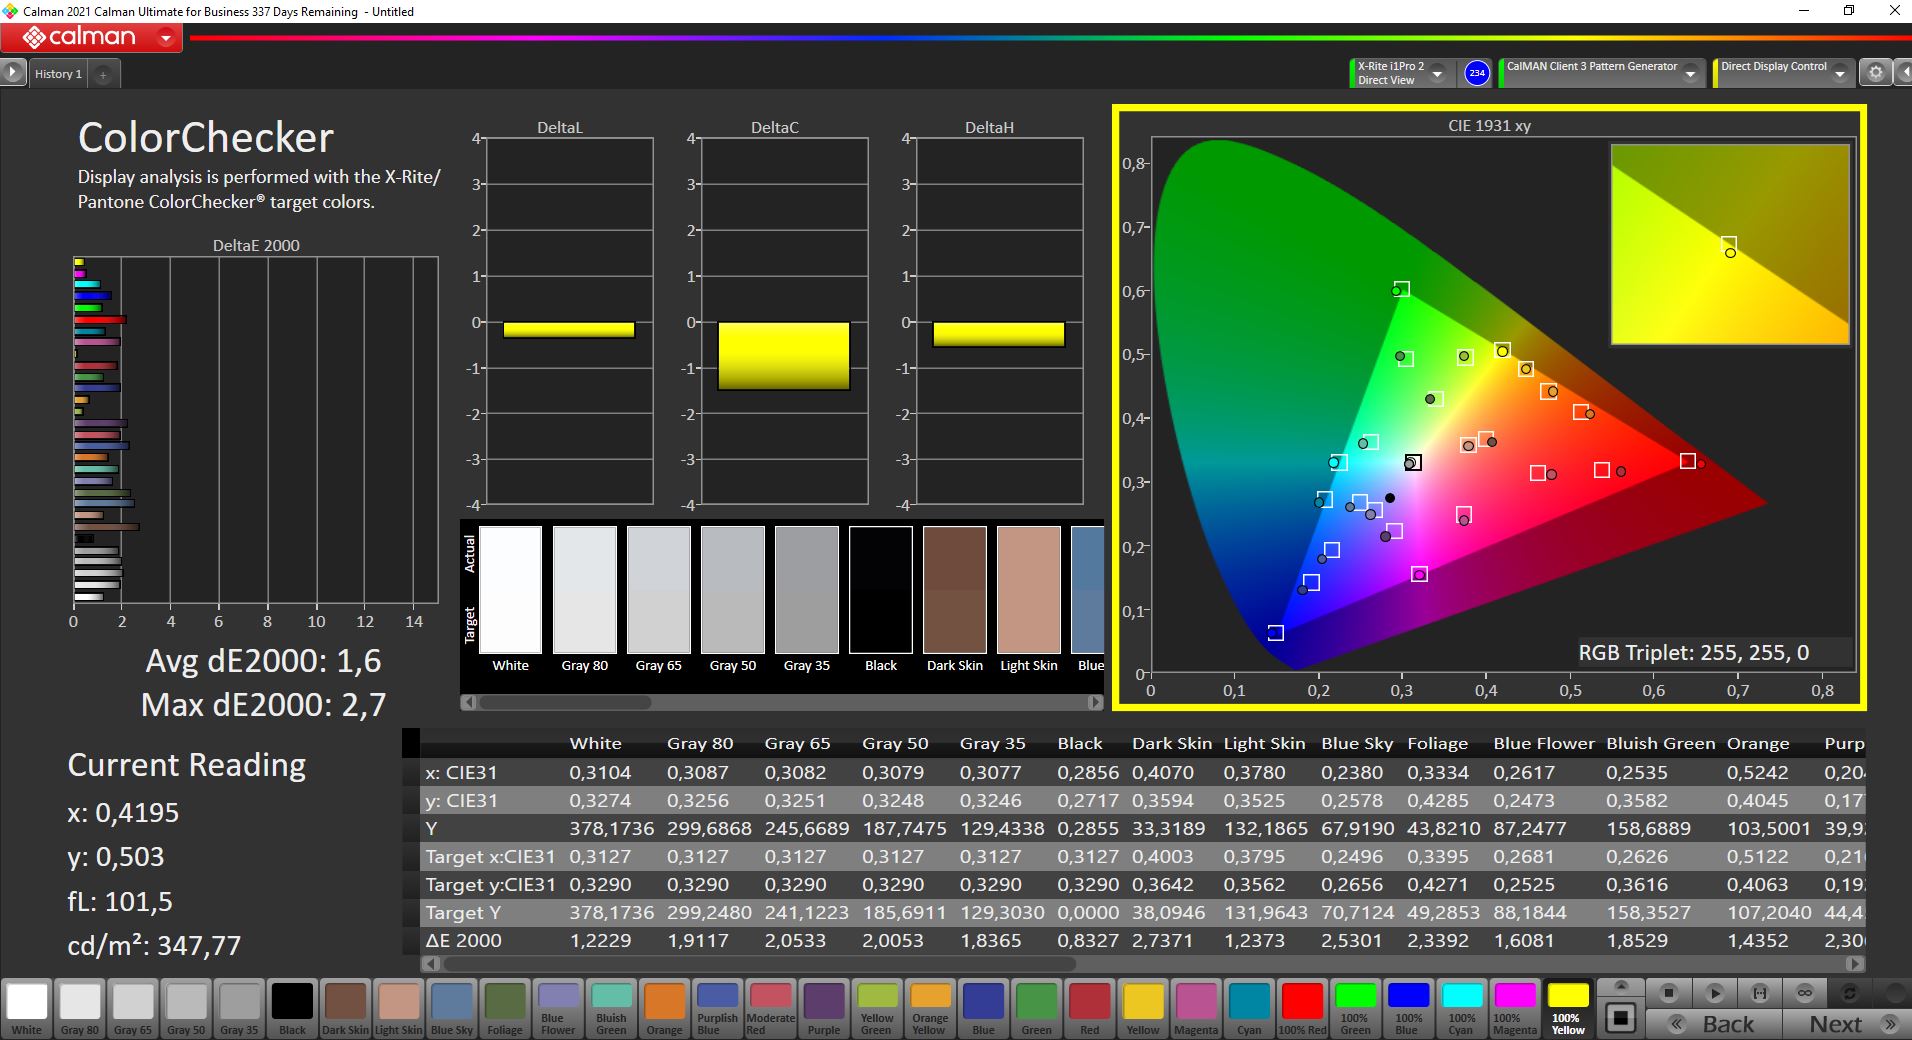
ΔE ColorChecker Calman: 1.6 | ∀{0.5-29.43 Ø4.72}
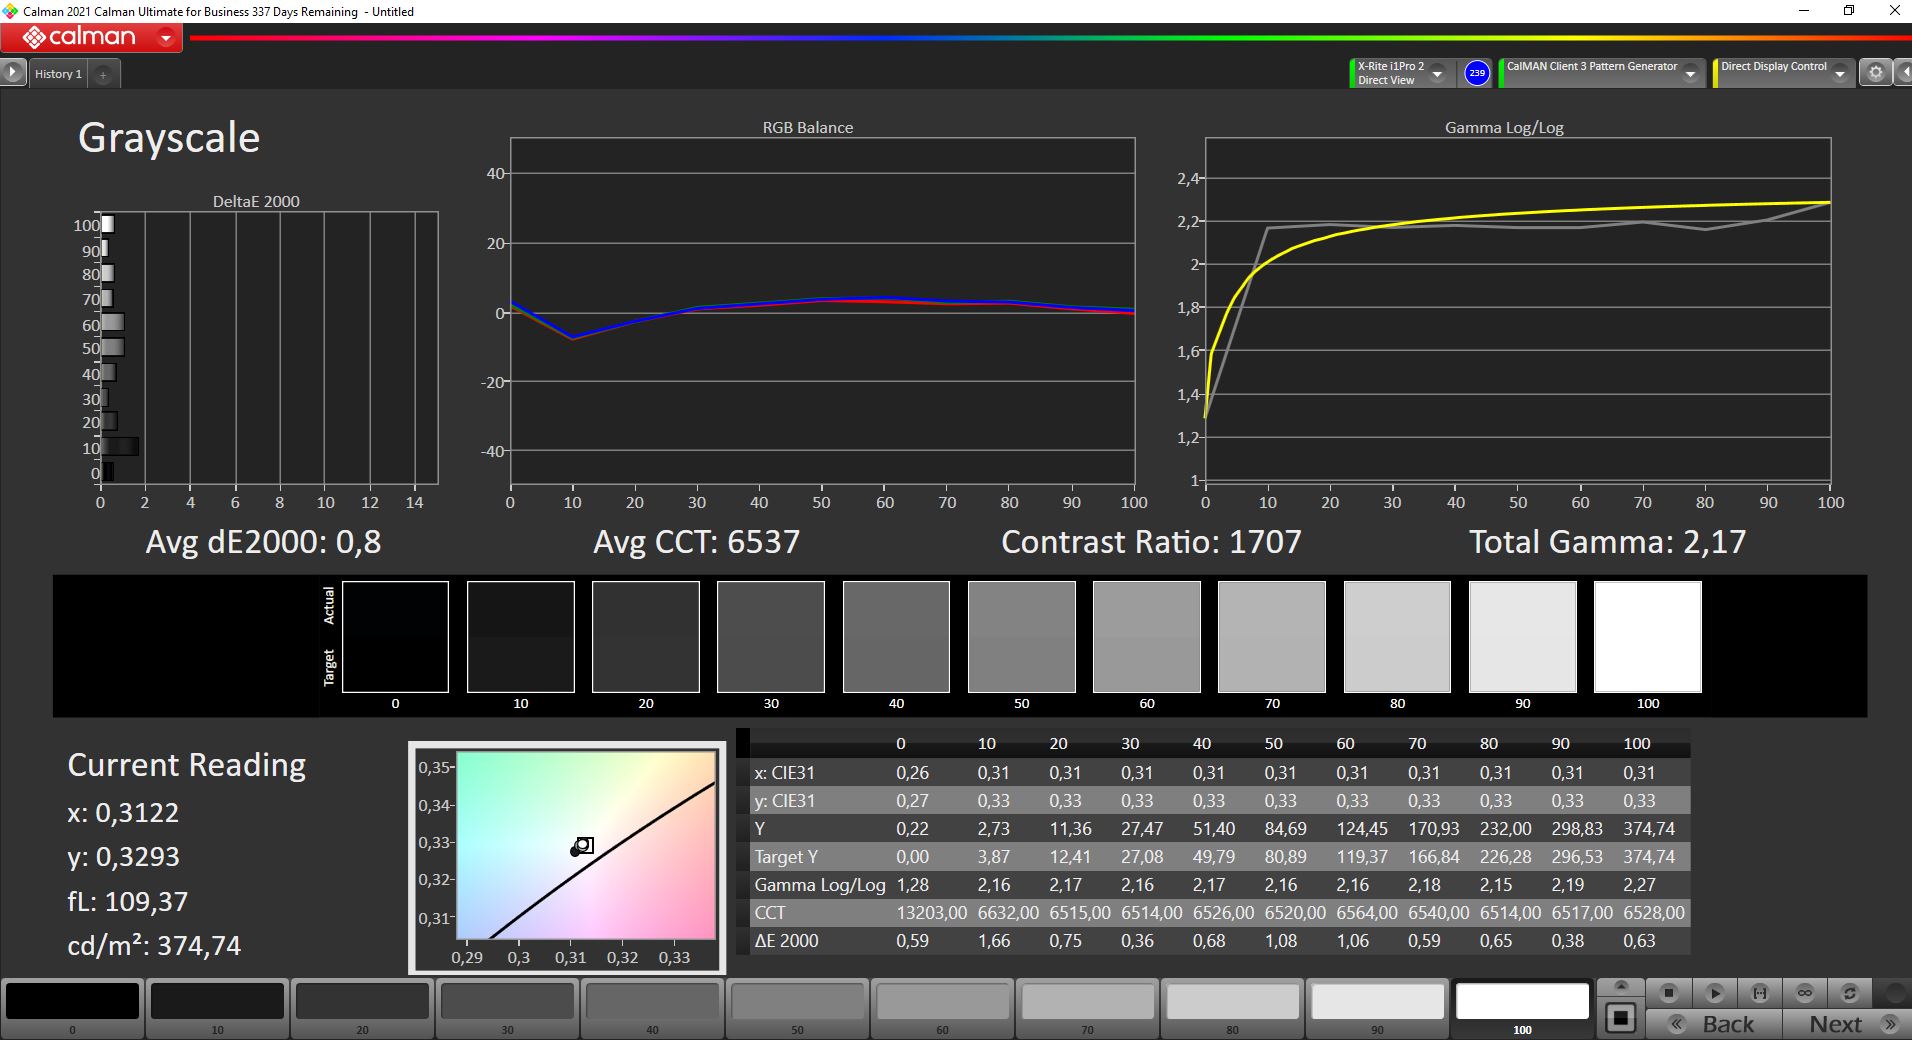
calibrated: 1
ΔE Greyscale Calman: 2 | ∀{0.09-98 Ø4.97}
68.8% AdobeRGB 1998 (Argyll 3D)
97.1% sRGB (Argyll 3D)
67.5% Display P3 (Argyll 3D)
Gamma: 2.25
CCT: 6835 K
| Lenovo ThinkBook 13s G3 20YA0005GE M133NW4JR0, IPS, 1920x1200, 13.3" | Asus ZenBook 13 UM325S Samsung (SDC4158), OLED, 1920x1080, 13.3" | Asus ZenBook 13 UX325EA Samsung SDC4155 (ATNA33XC09-0), OLED, 1920x1080, 13.3" | HP Pavilion Aero 13 be0097nr AU Optronics AUO6496, IPS, 1920x1200, 13.3" | Apple MacBook Air 2020 M1 Entry IPS, 2560x1600, 13.3" | Lenovo ThinkBook 13s-ITL-20V90003GE InfoVision M133NW4J R0, IPS, 1920x1080, 13.3" | |
|---|---|---|---|---|---|---|
| Display | 32% | 31% | 7% | 25% | 1% | |
| Display P3 Coverage (%) | 67.5 | 99.9 48% | 99.9 48% | 73.4 9% | 98.6 46% | 68.1 1% |
| sRGB Coverage (%) | 97.1 | 100 3% | 100 3% | 99.8 3% | 100 3% | 97.2 0% |
| AdobeRGB 1998 Coverage (%) | 68.8 | 99.7 45% | 97.5 42% | 74.8 9% | 85.9 25% | 69.2 1% |
| Response Times | 90% | 95% | 12% | 31% | 19% | |
| Response Time Grey 50% / Grey 80% * (ms) | 53.2 ? | 4 ? 92% | 2 ? 96% | 42.4 ? 20% | 31 ? 42% | 43 ? 19% |
| Response Time Black / White * (ms) | 32.8 ? | 4 ? 88% | 2 ? 94% | 31.6 ? 4% | 26.1 ? 20% | 27 ? 18% |
| PWM Frequency (Hz) | 60 ? | 60 ? | 118000 ? | |||
| Screen | -17% | -34% | -31% | -1% | 2% | |
| Brightness middle (cd/m²) | 379 | 370 -2% | 390 3% | 473.9 25% | 417 10% | 369 -3% |
| Brightness (cd/m²) | 356 | 378 6% | 368 3% | 458 29% | 395 11% | 334 -6% |
| Brightness Distribution (%) | 88 | 96 9% | 66 -25% | 91 3% | 91 3% | 83 -6% |
| Black Level * (cd/m²) | 0.23 | 0.05 78% | 0.36 -57% | 0.39 -70% | 0.14 39% | |
| Contrast (:1) | 1648 | 7400 349% | 1316 -20% | 1069 -35% | 2636 60% | |
| Colorchecker dE 2000 * | 1.6 | 4.33 -171% | 2.03 -27% | 2.99 -87% | 1.12 30% | 2.02 -26% |
| Colorchecker dE 2000 max. * | 2.7 | 7.04 -161% | 3.14 -16% | 4.35 -61% | 2.71 -0% | 3.05 -13% |
| Colorchecker dE 2000 calibrated * | 1 | 4.14 -314% | 3.1 -210% | 1.1 -10% | 0.77 23% | 1.08 -8% |
| Greyscale dE 2000 * | 2 | 0.92 54% | 1.28 36% | 4 -100% | 1.7 15% | 2.34 -17% |
| Gamma | 2.25 98% | 2.38 92% | 2.4 92% | 2.35 94% | 2207 0% | 2.44 90% |
| CCT | 6835 95% | 6394 102% | 6359 102% | 6269 104% | 6870 95% | 6552 99% |
| Color Space (Percent of AdobeRGB 1998) (%) | 89.4 | 87 | 63 | |||
| Color Space (Percent of sRGB) (%) | 100 | 100 | 97 | |||
| Total Average (Program / Settings) | 35% /
9% | 31% /
4% | -4% /
-17% | 18% /
9% | 7% /
4% |
* ... smaller is better
Our measurements with the professional CalMAN software (X-Rite i1 Pro 2) show that the panel is already well-calibrated in its factory state and that there is also only a minimal blue cast, which can hardly be seen with the naked eye. We could nevertheless slightly improve the display further with our calibration (ICC color profile is available to download for free above), but it is not really necessary. The panel covers the sRGB color space almost completely, so you can also edit pictures/videos (sRGB) without problems even with the minor color deviations.

Display Response Times
| ↔ Response Time Black to White | ||
|---|---|---|
| 32.8 ms ... rise ↗ and fall ↘ combined | ↗ 16.4 ms rise | 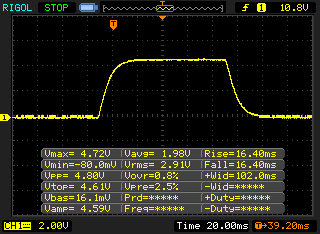 |
| ↘ 16.4 ms fall | ||
| The screen shows slow response rates in our tests and will be unsatisfactory for gamers. In comparison, all tested devices range from 0.1 (minimum) to 240 (maximum) ms. » 88 % of all devices are better. This means that the measured response time is worse than the average of all tested devices (19.8 ms). | ||
| ↔ Response Time 50% Grey to 80% Grey | ||
| 53.2 ms ... rise ↗ and fall ↘ combined | ↗ 25.6 ms rise | 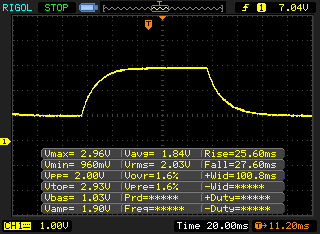 |
| ↘ 27.6 ms fall | ||
| The screen shows slow response rates in our tests and will be unsatisfactory for gamers. In comparison, all tested devices range from 0.165 (minimum) to 636 (maximum) ms. » 90 % of all devices are better. This means that the measured response time is worse than the average of all tested devices (31 ms). | ||
Screen Flickering / PWM (Pulse-Width Modulation)
| Screen flickering / PWM not detected | 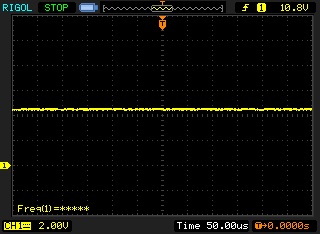 | ||
In comparison: 52 % of all tested devices do not use PWM to dim the display. If PWM was detected, an average of 7747 (minimum: 5 - maximum: 343500) Hz was measured. | |||
Thanks to the matte surface, the ThinkBook 13s G3 can also be used outdoors quite reasonably. The viewing-angle stability of the IPS panel does not warrant much criticism.
Performance, emissions, and battery life
While the ThinkBook 13s G2 relies on Intel's Tiger Lake CPUs, Lenovo equips the G3 models with current AMD Ryzen chips. Our test device is equipped with the fast Ryzen 7 5800U (Zen 3), but there is also the option of the Ryzen 5 5600U (fewer CPU cores and slower iGPU). There are additional performance settings in the preloaded Lenovo Vantage app, but we used the Intelligent Cooling preset for the ensuing tests and measurements.
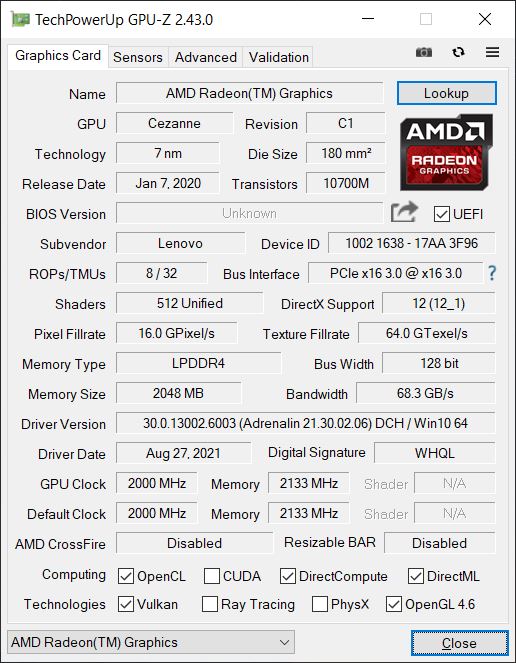
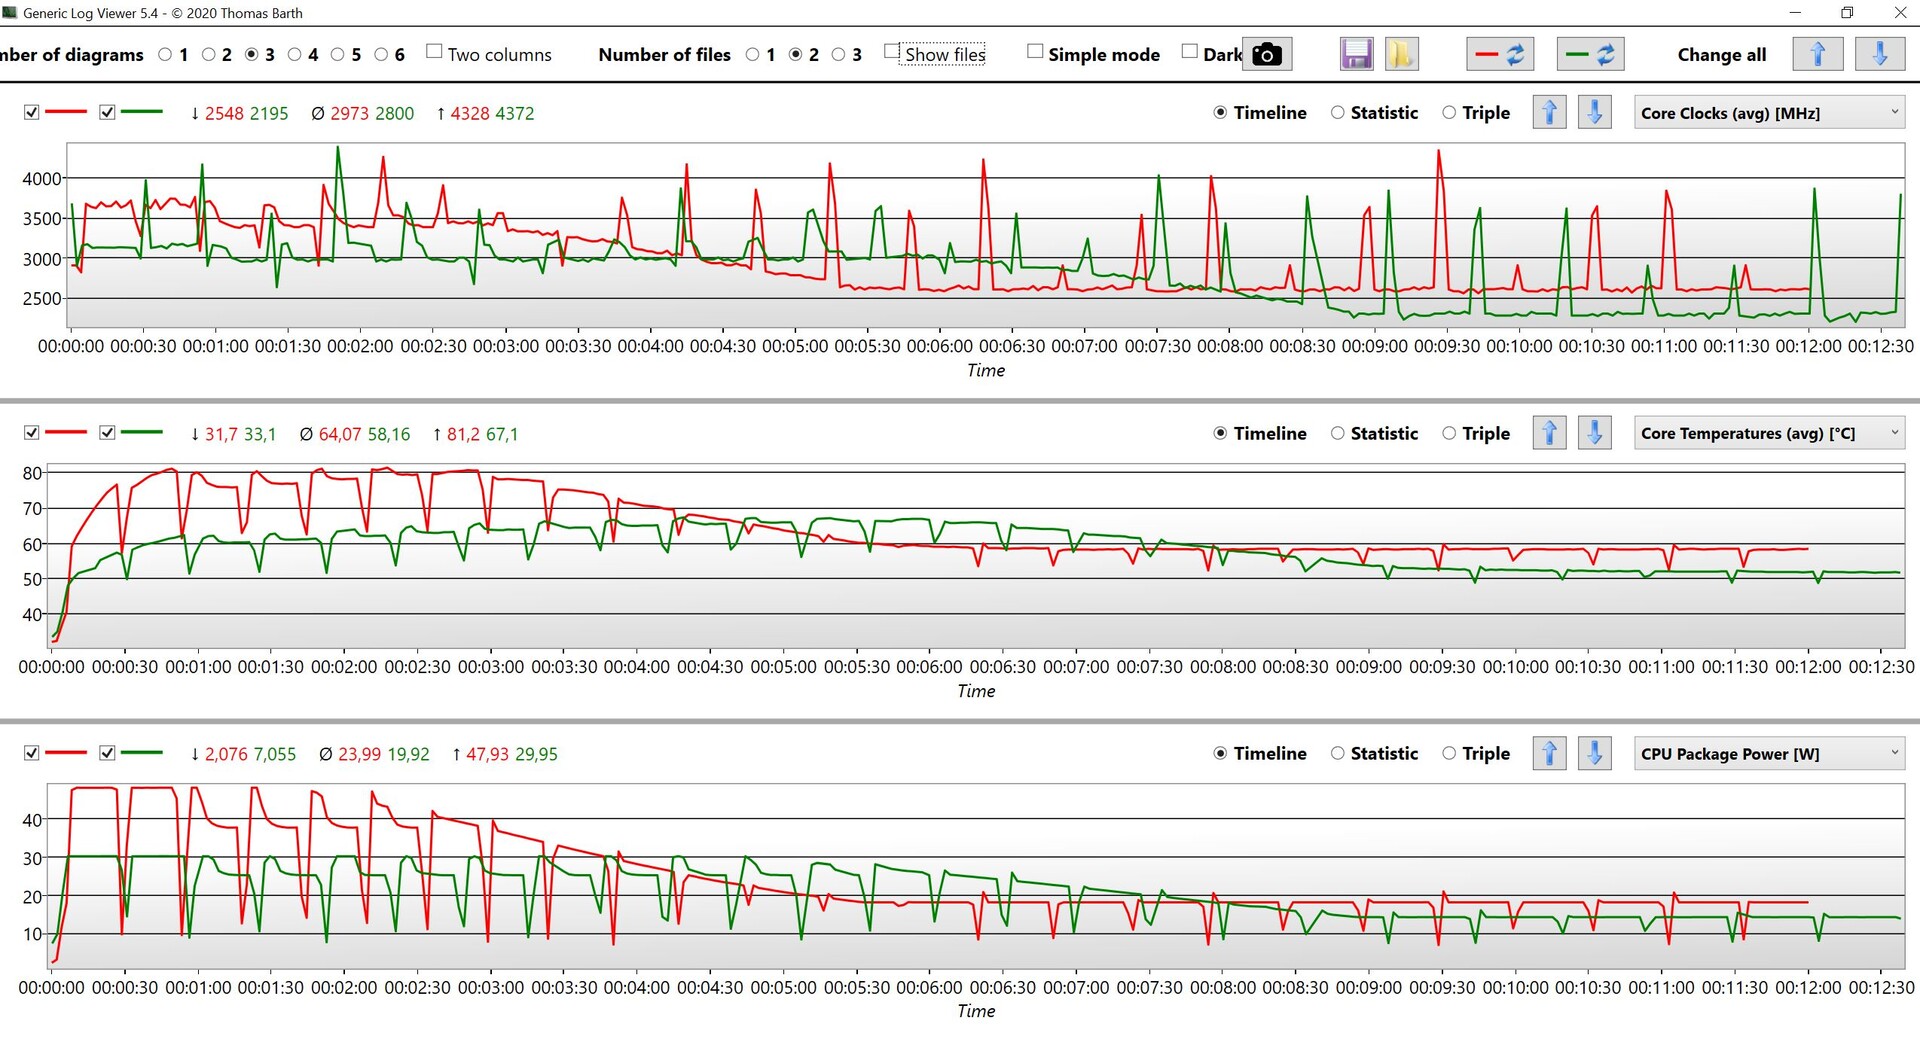
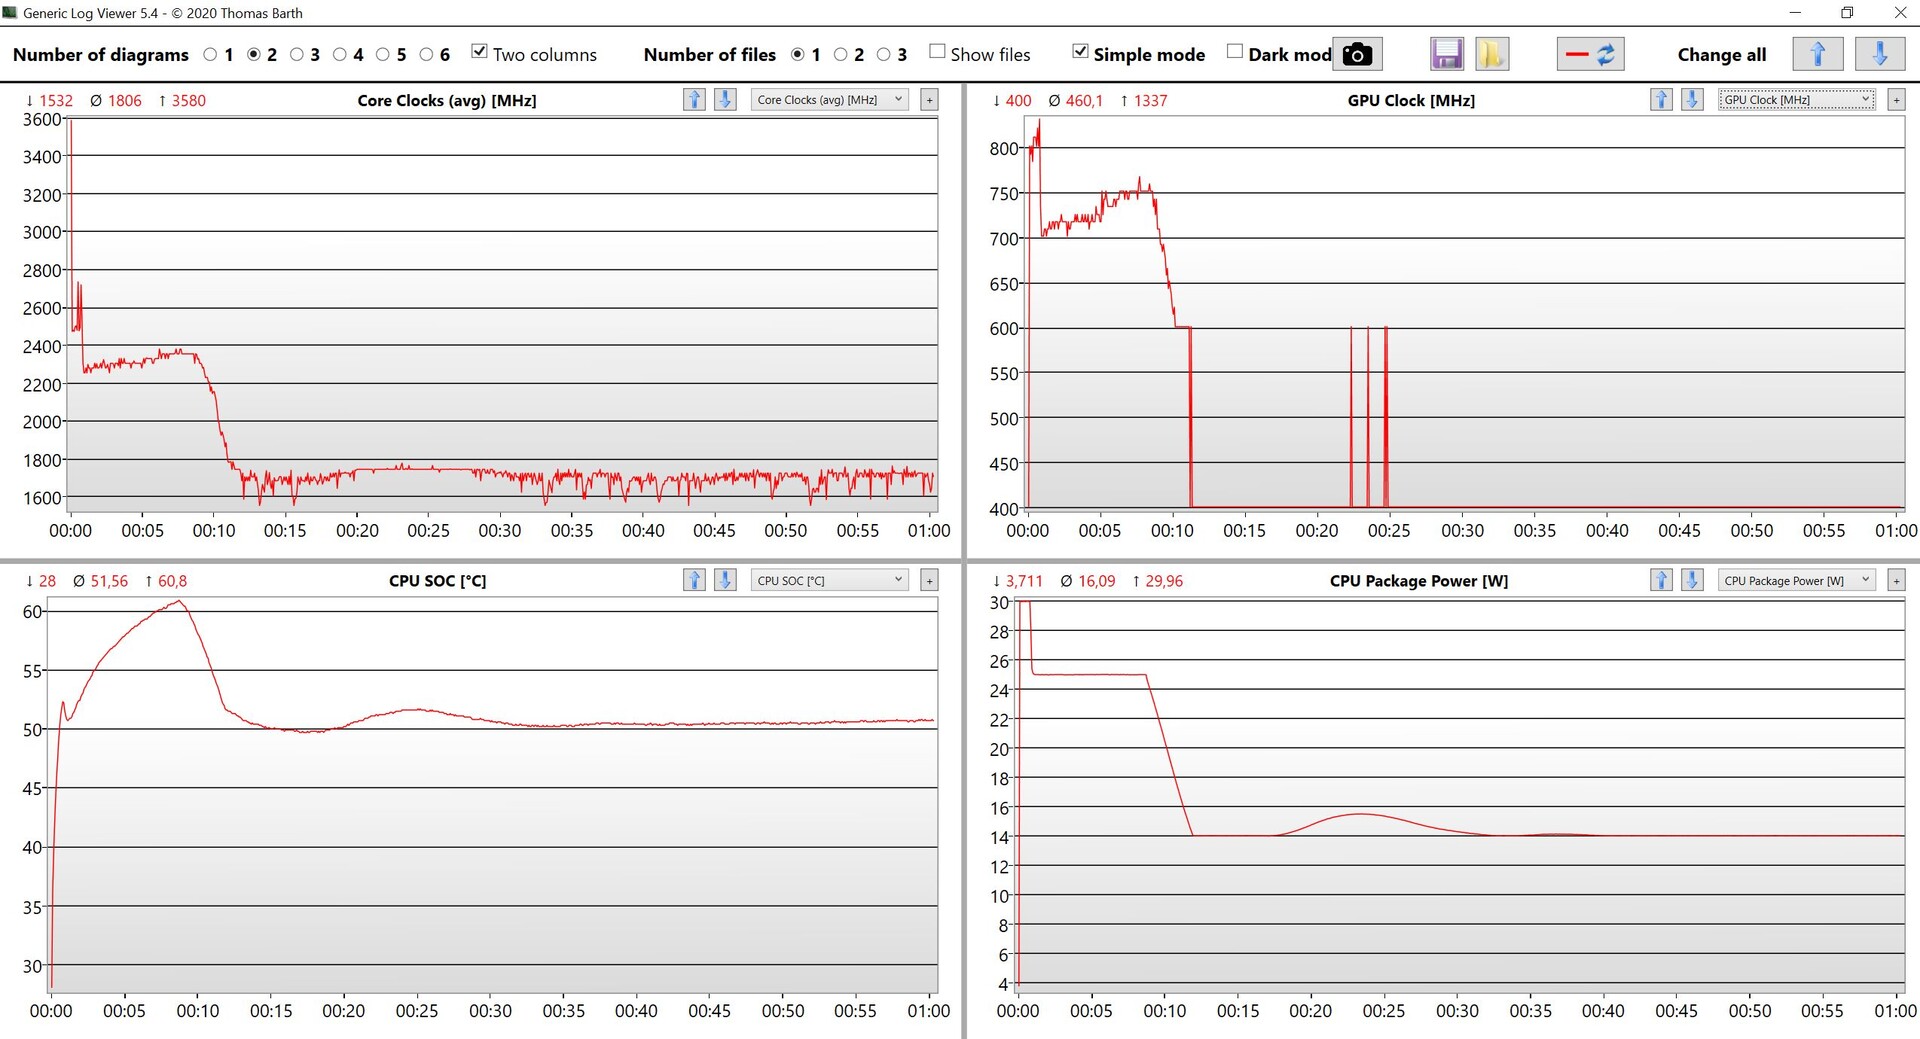
The performance is very good overall as the processor is allowed to consume 30 W for a short time, which then settles at 25 W. This value can be maintained for about 5 minutes in our Cinebench loop, and the power consumption reduces to just 14 W afterwards. The CPU performance, especially in multi-core tests, is significantly higher than that of the Intel Tiger Lake variant of the ThinkBook 13s.
You can use the optional Maximum Performance mode for eking out even more performance. Here, the TDP increases up to 48 W, but then it gets limited to 19 W after a few minutes. At least for short periods, the ThinkBook 13s G3 can thus offer the CPU performance of full-fledged mobile workstations with 45 W CPUs from Intel.
The graphics performance of the integrated Vega-8 GPU is also good, but there is a slight performance drop under longer load. Thus, you will have to contend with a performance reduction of about 10-15% after a few minutes of gaming. The behavior is identical in battery mode.
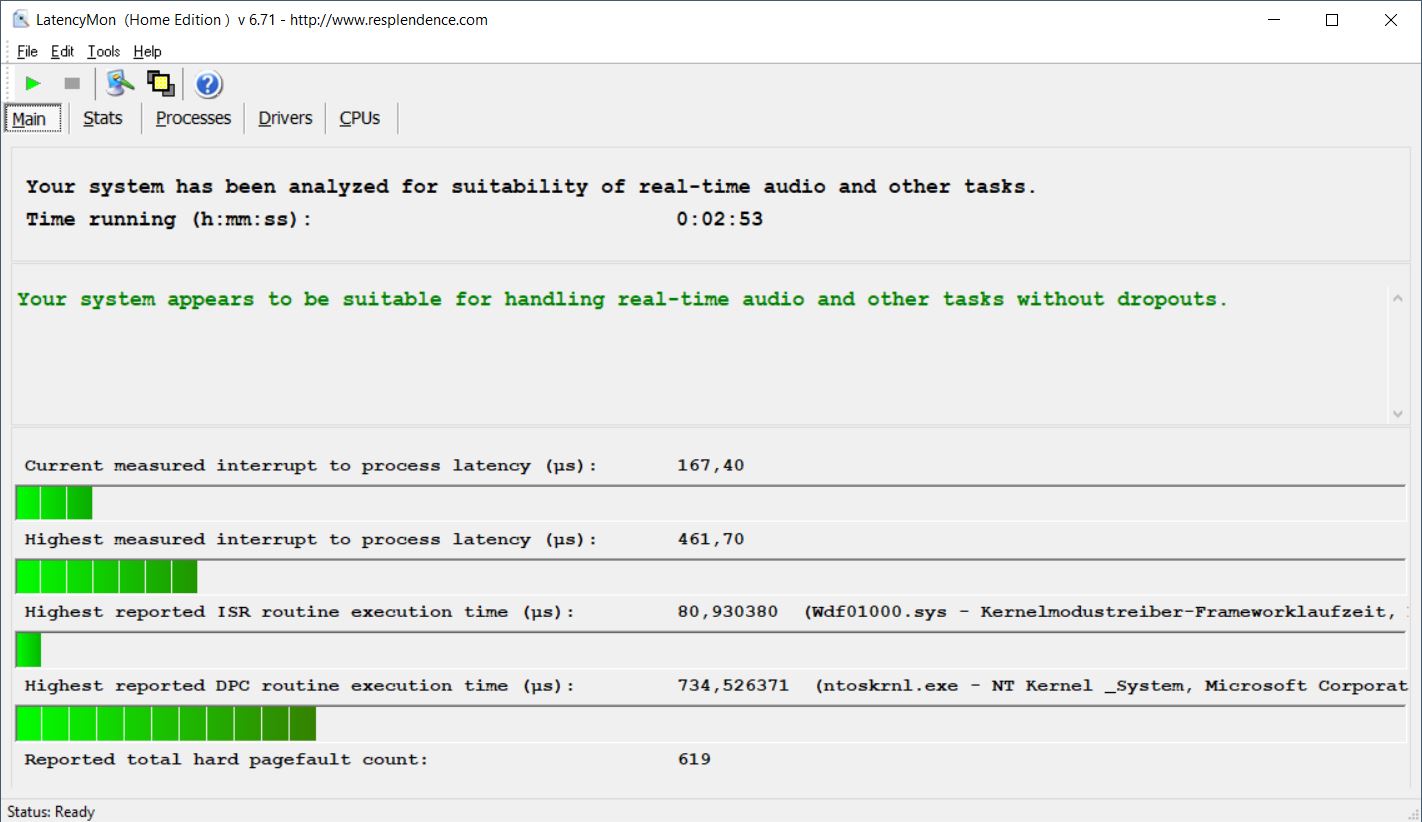
The subjective performance impression is also very good thanks to the SSD. All inputs are implemented quickly and there were no problems with latencies in our tests.
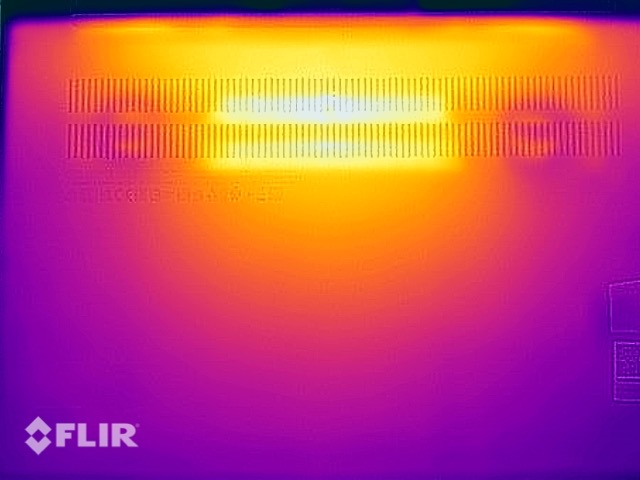
Due to the performance reduction after a few minutes, the surface temperatures are completely harmless even in the stress test. We measured the underside temperature to be slightly higher than 40 °C, so using the device on the thighs is possible without much problem.
The fans are clearly audible at 42 dB(A) under load. However, it is annoying that the fans start every now and then even at low load, which makes them seem a bit restless. There are no other electronic noises, though.
Cinebench R15 Multi endurance test
Cinebench R23: Multi Core | Single Core
Cinebench R20: CPU (Multi Core) | CPU (Single Core)
Cinebench R15: CPU Multi 64Bit | CPU Single 64Bit
Blender: v2.79 BMW27 CPU
7-Zip 18.03: 7z b 4 | 7z b 4 -mmt1
Geekbench 5.5: Multi-Core | Single-Core
HWBOT x265 Benchmark v2.2: 4k Preset
LibreOffice : 20 Documents To PDF
R Benchmark 2.5: Overall mean
| CPU Performance rating | |
| Average of class Subnotebook | |
| Average AMD Ryzen 7 5800U | |
| Lenovo ThinkBook 13s G3 20YA0005GE | |
| Asus ZenBook 13 UM325S | |
| HP Pavilion Aero 13 be0097nr -2! | |
| Apple MacBook Air 2020 M1 Entry -1! | |
| Lenovo ThinkBook 13s-ITL-20V90003GE -12! | |
| Asus ZenBook 13 UX325EA | |
| Cinebench R23 / Multi Core | |
| Average of class Subnotebook (1555 - 21812, n=60, last 2 years) | |
| Average AMD Ryzen 7 5800U (7872 - 10624, n=5) | |
| Asus ZenBook 13 UM325S | |
| Lenovo ThinkBook 13s G3 20YA0005GE | |
| HP Pavilion Aero 13 be0097nr | |
| Apple MacBook Air 2020 M1 Entry | |
| Asus ZenBook 13 UX325EA | |
| Cinebench R23 / Single Core | |
| Average of class Subnotebook (358 - 2213, n=61, last 2 years) | |
| Apple MacBook Air 2020 M1 Entry | |
| Lenovo ThinkBook 13s G3 20YA0005GE | |
| Asus ZenBook 13 UM325S | |
| Average AMD Ryzen 7 5800U (1415 - 1430, n=5) | |
| Asus ZenBook 13 UX325EA | |
| HP Pavilion Aero 13 be0097nr | |
| Cinebench R20 / CPU (Multi Core) | |
| Average of class Subnotebook (579 - 8541, n=57, last 2 years) | |
| Average AMD Ryzen 7 5800U (2995 - 3691, n=5) | |
| Asus ZenBook 13 UM325S | |
| HP Pavilion Aero 13 be0097nr | |
| Lenovo ThinkBook 13s G3 20YA0005GE | |
| Apple MacBook Air 2020 M1 Entry | |
| Asus ZenBook 13 UX325EA | |
| Cinebench R20 / CPU (Single Core) | |
| Average of class Subnotebook (128 - 832, n=57, last 2 years) | |
| Lenovo ThinkBook 13s G3 20YA0005GE | |
| Asus ZenBook 13 UM325S | |
| Average AMD Ryzen 7 5800U (551 - 560, n=5) | |
| HP Pavilion Aero 13 be0097nr | |
| Asus ZenBook 13 UX325EA | |
| Apple MacBook Air 2020 M1 Entry | |
| Cinebench R15 / CPU Multi 64Bit | |
| Average of class Subnotebook (327 - 3345, n=57, last 2 years) | |
| Lenovo ThinkBook 13s G3 20YA0005GE | |
| Lenovo ThinkBook 13s G3 20YA0005GE | |
| Average AMD Ryzen 7 5800U (1390 - 1925, n=5) | |
| Asus ZenBook 13 UM325S | |
| HP Pavilion Aero 13 be0097nr | |
| Apple MacBook Air 2020 M1 Entry | |
| Lenovo ThinkBook 13s-ITL-20V90003GE | |
| Asus ZenBook 13 UX325EA | |
| Cinebench R15 / CPU Single 64Bit | |
| Average of class Subnotebook (72.4 - 322, n=57, last 2 years) | |
| HP Pavilion Aero 13 be0097nr | |
| Lenovo ThinkBook 13s G3 20YA0005GE | |
| Average AMD Ryzen 7 5800U (227 - 229, n=4) | |
| Asus ZenBook 13 UM325S | |
| Asus ZenBook 13 UX325EA | |
| Apple MacBook Air 2020 M1 Entry | |
| Lenovo ThinkBook 13s-ITL-20V90003GE | |
| Blender / v2.79 BMW27 CPU | |
| Asus ZenBook 13 UX325EA | |
| Apple MacBook Air 2020 M1 Entry | |
| Lenovo ThinkBook 13s G3 20YA0005GE | |
| Average of class Subnotebook (159 - 2271, n=58, last 2 years) | |
| Asus ZenBook 13 UM325S | |
| Average AMD Ryzen 7 5800U (319 - 391, n=4) | |
| HP Pavilion Aero 13 be0097nr | |
| 7-Zip 18.03 / 7z b 4 | |
| Average of class Subnotebook (11668 - 77867, n=57, last 2 years) | |
| HP Pavilion Aero 13 be0097nr | |
| Average AMD Ryzen 7 5800U (39618 - 45985, n=4) | |
| Asus ZenBook 13 UM325S | |
| Lenovo ThinkBook 13s G3 20YA0005GE | |
| Apple MacBook Air 2020 M1 Entry | |
| Asus ZenBook 13 UX325EA | |
| 7-Zip 18.03 / 7z b 4 -mmt1 | |
| Average of class Subnotebook (2643 - 6699, n=59, last 2 years) | |
| Apple MacBook Air 2020 M1 Entry | |
| HP Pavilion Aero 13 be0097nr | |
| Asus ZenBook 13 UM325S | |
| Average AMD Ryzen 7 5800U (5285 - 5405, n=4) | |
| Lenovo ThinkBook 13s G3 20YA0005GE | |
| Asus ZenBook 13 UX325EA | |
| Geekbench 5.5 / Multi-Core | |
| Average of class Subnotebook (2557 - 17218, n=48, last 2 years) | |
| Apple MacBook Air 2020 M1 Entry | |
| Asus ZenBook 13 UM325S | |
| Lenovo ThinkBook 13s G3 20YA0005GE | |
| Average AMD Ryzen 7 5800U (6093 - 7026, n=4) | |
| Asus ZenBook 13 UX325EA | |
| Geekbench 5.5 / Single-Core | |
| Average of class Subnotebook (726 - 2224, n=48, last 2 years) | |
| Apple MacBook Air 2020 M1 Entry | |
| Asus ZenBook 13 UX325EA | |
| Asus ZenBook 13 UM325S | |
| Lenovo ThinkBook 13s G3 20YA0005GE | |
| Average AMD Ryzen 7 5800U (1411 - 1450, n=4) | |
| HWBOT x265 Benchmark v2.2 / 4k Preset | |
| Average of class Subnotebook (0.97 - 25.1, n=57, last 2 years) | |
| HP Pavilion Aero 13 be0097nr | |
| Average AMD Ryzen 7 5800U (9.68 - 11, n=4) | |
| Asus ZenBook 13 UM325S | |
| Lenovo ThinkBook 13s G3 20YA0005GE | |
| Asus ZenBook 13 UX325EA | |
| LibreOffice / 20 Documents To PDF | |
| Average of class Subnotebook (39.9 - 220, n=56, last 2 years) | |
| Asus ZenBook 13 UX325EA | |
| Average AMD Ryzen 7 5800U (50.9 - 60.2, n=4) | |
| Asus ZenBook 13 UM325S | |
| HP Pavilion Aero 13 be0097nr | |
| Lenovo ThinkBook 13s G3 20YA0005GE | |
| Apple MacBook Air 2020 M1 Entry | |
| R Benchmark 2.5 / Overall mean | |
| Apple MacBook Air 2020 M1 Entry | |
| Asus ZenBook 13 UX325EA | |
| Lenovo ThinkBook 13s G3 20YA0005GE | |
| Asus ZenBook 13 UM325S | |
| Average AMD Ryzen 7 5800U (0.54 - 0.546, n=4) | |
| HP Pavilion Aero 13 be0097nr | |
| Average of class Subnotebook (0.4024 - 1.456, n=58, last 2 years) | |
* ... smaller is better
AIDA64: FP32 Ray-Trace | FPU Julia | CPU SHA3 | CPU Queen | FPU SinJulia | FPU Mandel | CPU AES | CPU ZLib | FP64 Ray-Trace | CPU PhotoWorxx
| Performance rating | |
| Lenovo ThinkBook 13s G3 20YA0005GE | |
| Average of class Subnotebook | |
| Average AMD Ryzen 7 5800U | |
| HP Pavilion Aero 13 be0097nr | |
| Asus ZenBook 13 UX325EA | |
| AIDA64 / FP32 Ray-Trace | |
| Average of class Subnotebook (1135 - 32888, n=58, last 2 years) | |
| Lenovo ThinkBook 13s G3 20YA0005GE | |
| Average AMD Ryzen 7 5800U (9627 - 11518, n=3) | |
| HP Pavilion Aero 13 be0097nr | |
| Asus ZenBook 13 UX325EA | |
| AIDA64 / FPU Julia | |
| Lenovo ThinkBook 13s G3 20YA0005GE | |
| Average AMD Ryzen 7 5800U (63569 - 72406, n=3) | |
| HP Pavilion Aero 13 be0097nr | |
| Average of class Subnotebook (5218 - 123315, n=58, last 2 years) | |
| Asus ZenBook 13 UX325EA | |
| AIDA64 / CPU SHA3 | |
| Average of class Subnotebook (444 - 5287, n=58, last 2 years) | |
| Lenovo ThinkBook 13s G3 20YA0005GE | |
| Average AMD Ryzen 7 5800U (2192 - 2484, n=3) | |
| HP Pavilion Aero 13 be0097nr | |
| Asus ZenBook 13 UX325EA | |
| AIDA64 / CPU Queen | |
| HP Pavilion Aero 13 be0097nr | |
| Average AMD Ryzen 7 5800U (83872 - 85454, n=3) | |
| Lenovo ThinkBook 13s G3 20YA0005GE | |
| Average of class Subnotebook (10579 - 95002, n=49, last 2 years) | |
| Asus ZenBook 13 UX325EA | |
| AIDA64 / FPU SinJulia | |
| Lenovo ThinkBook 13s G3 20YA0005GE | |
| Average AMD Ryzen 7 5800U (9832 - 10938, n=3) | |
| HP Pavilion Aero 13 be0097nr | |
| Average of class Subnotebook (744 - 18418, n=58, last 2 years) | |
| Asus ZenBook 13 UX325EA | |
| AIDA64 / FPU Mandel | |
| Lenovo ThinkBook 13s G3 20YA0005GE | |
| Average AMD Ryzen 7 5800U (34526 - 40544, n=3) | |
| HP Pavilion Aero 13 be0097nr | |
| Average of class Subnotebook (3341 - 65433, n=58, last 2 years) | |
| Asus ZenBook 13 UX325EA | |
| AIDA64 / CPU AES | |
| Lenovo ThinkBook 13s G3 20YA0005GE | |
| HP Pavilion Aero 13 be0097nr | |
| Average AMD Ryzen 7 5800U (39773 - 101120, n=3) | |
| Asus ZenBook 13 UX325EA | |
| Average of class Subnotebook (638 - 96917, n=58, last 2 years) | |
| AIDA64 / CPU ZLib | |
| Average of class Subnotebook (164.9 - 1379, n=58, last 2 years) | |
| Lenovo ThinkBook 13s G3 20YA0005GE | |
| Average AMD Ryzen 7 5800U (584 - 665, n=3) | |
| HP Pavilion Aero 13 be0097nr | |
| Asus ZenBook 13 UX325EA | |
| AIDA64 / FP64 Ray-Trace | |
| Average of class Subnotebook (610 - 17495, n=58, last 2 years) | |
| Lenovo ThinkBook 13s G3 20YA0005GE | |
| Average AMD Ryzen 7 5800U (5180 - 5939, n=3) | |
| HP Pavilion Aero 13 be0097nr | |
| Asus ZenBook 13 UX325EA | |
| AIDA64 / CPU PhotoWorxx | |
| Average of class Subnotebook (6569 - 85600, n=58, last 2 years) | |
| Asus ZenBook 13 UX325EA | |
| Lenovo ThinkBook 13s G3 20YA0005GE | |
| HP Pavilion Aero 13 be0097nr | |
| Average AMD Ryzen 7 5800U (12258 - 16417, n=3) | |
CrossMark: Overall | Productivity | Creativity | Responsiveness
| PCMark 10 / Score | |
| Average of class Subnotebook (4920 - 9939, n=45, last 2 years) | |
| Lenovo ThinkBook 13s G3 20YA0005GE | |
| Asus ZenBook 13 UM325S | |
| HP Pavilion Aero 13 be0097nr | |
| Average AMD Ryzen 7 5800U, AMD Radeon RX Vega 8 (Ryzen 4000/5000) (5334 - 6090, n=4) | |
| Asus ZenBook 13 UX325EA | |
| Lenovo ThinkBook 13s-ITL-20V90003GE | |
| PCMark 10 / Essentials | |
| Average of class Subnotebook (8552 - 11646, n=45, last 2 years) | |
| Lenovo ThinkBook 13s G3 20YA0005GE | |
| HP Pavilion Aero 13 be0097nr | |
| Asus ZenBook 13 UM325S | |
| Average AMD Ryzen 7 5800U, AMD Radeon RX Vega 8 (Ryzen 4000/5000) (9476 - 10182, n=4) | |
| Asus ZenBook 13 UX325EA | |
| Lenovo ThinkBook 13s-ITL-20V90003GE | |
| PCMark 10 / Productivity | |
| Average of class Subnotebook (5435 - 16606, n=45, last 2 years) | |
| Lenovo ThinkBook 13s G3 20YA0005GE | |
| Asus ZenBook 13 UM325S | |
| Average AMD Ryzen 7 5800U, AMD Radeon RX Vega 8 (Ryzen 4000/5000) (8336 - 9657, n=4) | |
| HP Pavilion Aero 13 be0097nr | |
| Asus ZenBook 13 UX325EA | |
| Lenovo ThinkBook 13s-ITL-20V90003GE | |
| PCMark 10 / Digital Content Creation | |
| Average of class Subnotebook (5722 - 13779, n=45, last 2 years) | |
| Lenovo ThinkBook 13s G3 20YA0005GE | |
| HP Pavilion Aero 13 be0097nr | |
| Asus ZenBook 13 UM325S | |
| Average AMD Ryzen 7 5800U, AMD Radeon RX Vega 8 (Ryzen 4000/5000) (5214 - 6235, n=4) | |
| Asus ZenBook 13 UX325EA | |
| Lenovo ThinkBook 13s-ITL-20V90003GE | |
| CrossMark / Overall | |
| Average of class Subnotebook (365 - 2356, n=60, last 2 years) | |
| Apple MacBook Air 2020 M1 Entry | |
| Lenovo ThinkBook 13s G3 20YA0005GE | |
| Average AMD Ryzen 7 5800U, AMD Radeon RX Vega 8 (Ryzen 4000/5000) (n=1) | |
| CrossMark / Productivity | |
| Average of class Subnotebook (364 - 2277, n=60, last 2 years) | |
| Lenovo ThinkBook 13s G3 20YA0005GE | |
| Average AMD Ryzen 7 5800U, AMD Radeon RX Vega 8 (Ryzen 4000/5000) (n=1) | |
| Apple MacBook Air 2020 M1 Entry | |
| CrossMark / Creativity | |
| Average of class Subnotebook (372 - 2743, n=60, last 2 years) | |
| Apple MacBook Air 2020 M1 Entry | |
| Lenovo ThinkBook 13s G3 20YA0005GE | |
| Average AMD Ryzen 7 5800U, AMD Radeon RX Vega 8 (Ryzen 4000/5000) (n=1) | |
| CrossMark / Responsiveness | |
| Average of class Subnotebook (312 - 1854, n=60, last 2 years) | |
| Lenovo ThinkBook 13s G3 20YA0005GE | |
| Average AMD Ryzen 7 5800U, AMD Radeon RX Vega 8 (Ryzen 4000/5000) (n=1) | |
| Apple MacBook Air 2020 M1 Entry | |
| PCMark 10 Score | 6090 points | |
Help | ||
| AIDA64 / Memory Copy | |
| Average of class Subnotebook (14554 - 131023, n=58, last 2 years) | |
| Asus ZenBook 13 UX325EA | |
| Lenovo ThinkBook 13s G3 20YA0005GE | |
| HP Pavilion Aero 13 be0097nr | |
| Average AMD Ryzen 7 5800U (21599 - 36070, n=3) | |
| AIDA64 / Memory Read | |
| Average of class Subnotebook (15948 - 127174, n=58, last 2 years) | |
| Asus ZenBook 13 UX325EA | |
| HP Pavilion Aero 13 be0097nr | |
| Lenovo ThinkBook 13s G3 20YA0005GE | |
| Average AMD Ryzen 7 5800U (24057 - 39360, n=3) | |
| AIDA64 / Memory Write | |
| Average of class Subnotebook (15709 - 135141, n=58, last 2 years) | |
| Asus ZenBook 13 UX325EA | |
| Lenovo ThinkBook 13s G3 20YA0005GE | |
| HP Pavilion Aero 13 be0097nr | |
| Average AMD Ryzen 7 5800U (24125 - 35606, n=3) | |
| AIDA64 / Memory Latency | |
| Lenovo ThinkBook 13s G3 20YA0005GE | |
| Average of class Subnotebook (6.1 - 159.9, n=56, last 2 years) | |
| Average AMD Ryzen 7 5800U (89.3 - 107, n=3) | |
| HP Pavilion Aero 13 be0097nr | |
| Asus ZenBook 13 UX325EA | |
* ... smaller is better
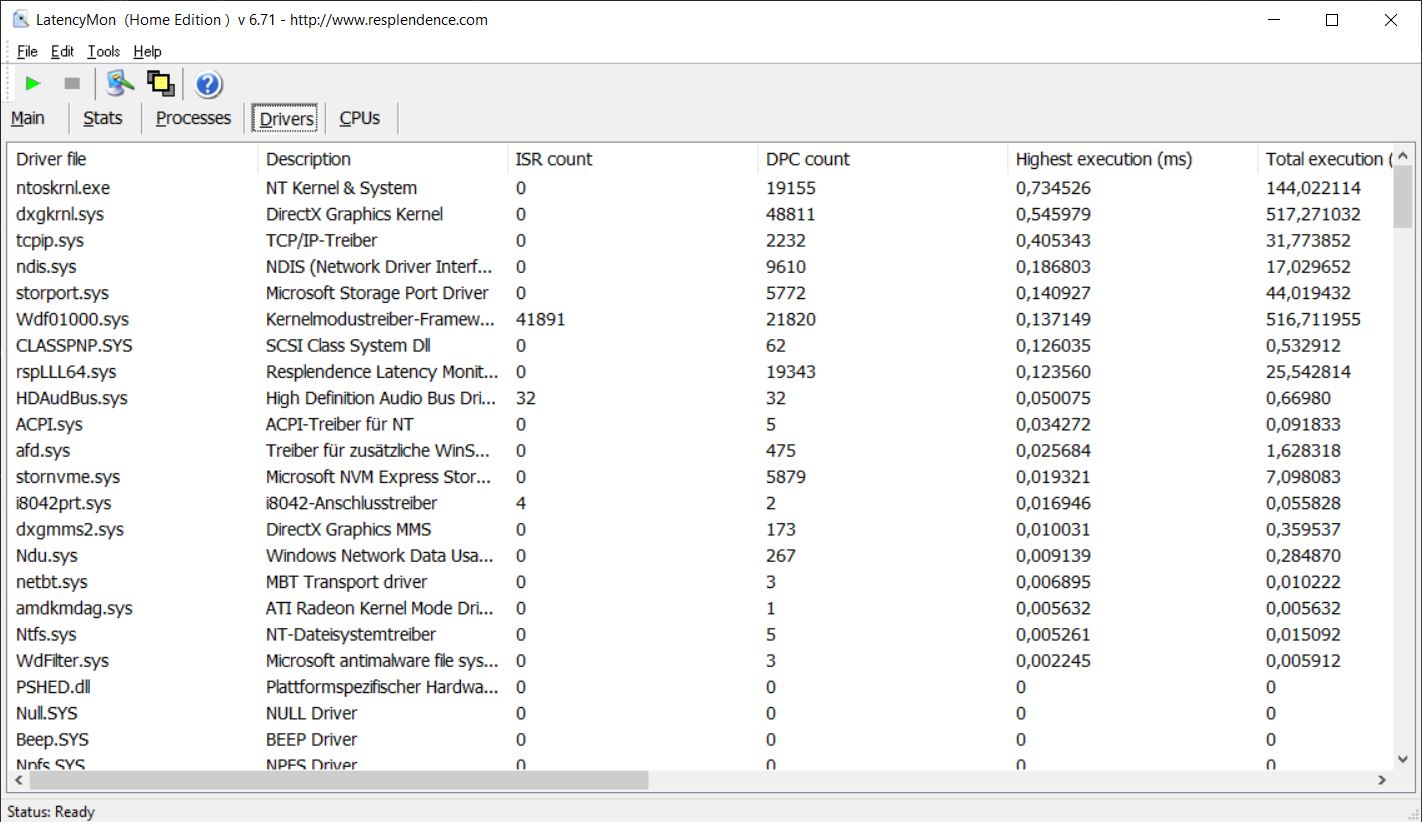
DPC latencies
| DPC Latencies / LatencyMon - interrupt to process latency (max), Web, Youtube, Prime95 | |
| Asus ZenBook 13 UX325EA | |
| HP Pavilion Aero 13 be0097nr | |
| Lenovo ThinkBook 13s-ITL-20V90003GE | |
| Lenovo ThinkBook 13s G3 20YA0005GE | |
| Asus ZenBook 13 UM325S | |
* ... smaller is better

* ... smaller is better
Continuous load read: DiskSpd Read Loop, Queue Depth 8
| 3DMark 11 Performance | 6377 points | |
| 3DMark Cloud Gate Standard Score | 22949 points | |
| 3DMark Fire Strike Score | 3087 points | |
| 3DMark Time Spy Score | 1212 points | |
Help | ||
Witcher 3 FPS-Diagramm
| low | med. | high | ultra | |
|---|---|---|---|---|
| The Witcher 3 (2015) | 75 | 23 | 14.3 | |
| Dota 2 Reborn (2015) | 113 | 88.4 | 51.1 | 47.5 |
| Final Fantasy XV Benchmark (2018) | 39.1 | 18.8 | 12.7 | |
| X-Plane 11.11 (2018) | 44.1 | 34.1 | 29.5 |
Noise level
| Idle |
| 24.7 / 27 / 29.8 dB(A) |
| Load |
| 42.4 / 42.4 dB(A) |
 | ||
30 dB silent 40 dB(A) audible 50 dB(A) loud |
||
min: | ||
| Lenovo ThinkBook 13s G3 20YA0005GE Vega 8, R7 5800U, WDC PC SN530 SDBPNPZ-512G | Asus ZenBook 13 UM325S Vega 8, R7 5800U, SK Hynix HFM001TD3JX013N | Asus ZenBook 13 UX325EA Iris Xe G7 96EUs, i7-1165G7, SK Hynix HFM001TD3JX013N | HP Pavilion Aero 13 be0097nr Vega 8, R7 5800U, Intel SSD 660p SSDPEKNW512G8 | Lenovo ThinkBook 13s-ITL-20V90003GE Iris Xe G7 80EUs, i5-1135G7, Samsung PM991 MZALQ256HAJD | |
|---|---|---|---|---|---|
| Noise | -5% | -3% | 14% | 1% | |
| off / environment * (dB) | 24.7 | 29.6 -20% | 26 -5% | 23.9 3% | 24.9 -1% |
| Idle Minimum * (dB) | 24.7 | 30.5 -23% | 26 -5% | 23.9 3% | 24.9 -1% |
| Idle Average * (dB) | 27 | 30.5 -13% | 26 4% | 23.9 11% | 24.9 8% |
| Idle Maximum * (dB) | 29.8 | 30.5 -2% | 30.5 -2% | 23.9 20% | 30.4 -2% |
| Load Average * (dB) | 42.4 | 35.7 16% | 43.9 -4% | 32.2 24% | 40.8 4% |
| Witcher 3 ultra * (dB) | 42.4 | 34.7 18% | 42 1% | ||
| Load Maximum * (dB) | 42.4 | 37.2 12% | 43.9 -4% | 34.8 18% | 43 -1% |
* ... smaller is better
Temperature
(+) The maximum temperature on the upper side is 36.5 °C / 98 F, compared to the average of 35.9 °C / 97 F, ranging from 21.4 to 59 °C for the class Subnotebook.
(+) The bottom heats up to a maximum of 39.6 °C / 103 F, compared to the average of 39.2 °C / 103 F
(+) In idle usage, the average temperature for the upper side is 23.8 °C / 75 F, compared to the device average of 30.8 °C / 87 F.
(±) Playing The Witcher 3, the average temperature for the upper side is 33 °C / 91 F, compared to the device average of 30.8 °C / 87 F.
(+) The palmrests and touchpad are cooler than skin temperature with a maximum of 27.1 °C / 80.8 F and are therefore cool to the touch.
(±) The average temperature of the palmrest area of similar devices was 28.2 °C / 82.8 F (+1.1 °C / 2 F).

| Lenovo ThinkBook 13s G3 20YA0005GE AMD Ryzen 7 5800U, AMD Radeon RX Vega 8 (Ryzen 4000/5000) | Asus ZenBook 13 UM325S AMD Ryzen 7 5800U, AMD Radeon RX Vega 8 (Ryzen 4000/5000) | Asus ZenBook 13 UX325EA Intel Core i7-1165G7, Intel Iris Xe Graphics G7 96EUs | HP Pavilion Aero 13 be0097nr AMD Ryzen 7 5800U, AMD Radeon RX Vega 8 (Ryzen 4000/5000) | Apple MacBook Air 2020 M1 Entry Apple M1, Apple M1 7-Core GPU | Lenovo ThinkBook 13s-ITL-20V90003GE Intel Core i5-1135G7, Intel Iris Xe Graphics G7 80EUs | |
|---|---|---|---|---|---|---|
| Heat | -26% | -11% | -8% | -13% | 2% | |
| Maximum Upper Side * (°C) | 36.5 | 42.6 -17% | 39.3 -8% | 35.6 2% | 44 -21% | 32.8 10% |
| Maximum Bottom * (°C) | 39.6 | 43.6 -10% | 47.3 -19% | 38.6 3% | 44 -11% | 36.1 9% |
| Idle Upper Side * (°C) | 24.5 | 36 -47% | 25.9 -6% | 29.6 -21% | 27 -10% | 26 -6% |
| Idle Bottom * (°C) | 25 | 32.8 -31% | 27.8 -11% | 29 -16% | 27 -8% | 26.3 -5% |
* ... smaller is better
Lenovo ThinkBook 13s G3 20YA0005GE audio analysis
(±) | speaker loudness is average but good (79.8 dB)
Bass 100 - 315 Hz
(-) | nearly no bass - on average 18.4% lower than median
(±) | linearity of bass is average (9.3% delta to prev. frequency)
Mids 400 - 2000 Hz
(+) | balanced mids - only 1.7% away from median
(+) | mids are linear (4.5% delta to prev. frequency)
Highs 2 - 16 kHz
(+) | balanced highs - only 3.7% away from median
(±) | linearity of highs is average (9.4% delta to prev. frequency)
Overall 100 - 16.000 Hz
(+) | overall sound is linear (14.3% difference to median)
Compared to same class
» 28% of all tested devices in this class were better, 6% similar, 66% worse
» The best had a delta of 5%, average was 18%, worst was 53%
Compared to all devices tested
» 17% of all tested devices were better, 4% similar, 78% worse
» The best had a delta of 4%, average was 23%, worst was 134%
Apple MacBook Air 2020 M1 Entry audio analysis
(±) | speaker loudness is average but good (79.6 dB)
Bass 100 - 315 Hz
(±) | reduced bass - on average 7.1% lower than median
(±) | linearity of bass is average (9.5% delta to prev. frequency)
Mids 400 - 2000 Hz
(+) | balanced mids - only 2.2% away from median
(+) | mids are linear (5.3% delta to prev. frequency)
Highs 2 - 16 kHz
(+) | balanced highs - only 2.3% away from median
(+) | highs are linear (4% delta to prev. frequency)
Overall 100 - 16.000 Hz
(+) | overall sound is linear (8.7% difference to median)
Compared to same class
» 3% of all tested devices in this class were better, 1% similar, 96% worse
» The best had a delta of 5%, average was 18%, worst was 53%
Compared to all devices tested
» 3% of all tested devices were better, 1% similar, 97% worse
» The best had a delta of 4%, average was 23%, worst was 134%
| Off / Standby | |
| Idle | |
| Load |
|
Key:
min: | |
Power consumption Witcher 3 / Stress test
Power consumption with external monitor
Battery life
Battery run times turn out to be good in conjunction with the 56 Whr battery. In our WLAN test with an adjusted brightness of 150 cd/m² (corresponds to 81% of the maximum brightness in the test device), we recorded a battery run time of just under 11 hours, which is even a few minutes more than the Intel variant. The battery run time is slightly longer than 8 hours at maximum brightness.
The ThinkBook 13s G3 has the lead within the comparison group, at least among Windows devices. The Apple MacBook Air M1 offers significantly more endurance with 16 hours at 150 cd/m² brightness, but the two are mostly on par in terms of endurance at maximum brightness.
| Lenovo ThinkBook 13s G3 20YA0005GE R7 5800U, Vega 8, 56 Wh | Asus ZenBook 13 UM325S R7 5800U, Vega 8, 67 Wh | Asus ZenBook 13 UX325EA i7-1165G7, Iris Xe G7 96EUs, 67 Wh | HP Pavilion Aero 13 be0097nr R7 5800U, Vega 8, 43 Wh | Apple MacBook Air 2020 M1 Entry M1, M1 7-Core GPU, 49.9 Wh | Lenovo ThinkBook 13s-ITL-20V90003GE i5-1135G7, Iris Xe G7 80EUs, 55 Wh | Average of class Subnotebook | |
|---|---|---|---|---|---|---|---|
| Battery runtime | -16% | -3% | -18% | 45% | -2% | 27% | |
| WiFi v1.3 (h) | 11 | 9.2 -16% | 10.7 -3% | 9 -18% | 16 45% | 10.8 -2% | 14 ? 27% |
| Witcher 3 ultra (h) | 3.2 |
Pros
Cons
Verdict - ThinkBook 13s G3 is a good subnotebook


Regardless of whether you choose an AMD Ryzen processor in the G3 model or an Intel Tiger Lake chip in the identical G2 version, Lenovo's ThinkBook 13s is a high-quality and compact subnotebook with enough ports, fast Wi-Fi, a good 16:10 IPS display with matte surface, and decent input devices. The battery run times are also more or less the same, and you can expect between 8 and 11 hours of backup in WLAN mode depending on the brightness. The only difference is that a Thunderbolt 4 port is not available in the AMD model.
The Ryzen processor offers higher multi-core CPU performance, but you will have to specifically leverage the same with appropriate applications. Users will not really notice a difference between the two CPUs in everyday tasks like writing emails, surfing the Internet or watching YouTube videos. In this aspect, the ThinkBook 13s G3 variant with the Ryzen 5 5600U is also an interesting prospect. Though it offers fewer cores, it is also a bit cheaper.
The ThinkBook 13s G3 is once again a compelling subnotebook. The AMD Ryzen 5000 processor offers a lot of multi-core performance and there is no noticeable difference between AMD and Intel in terms of battery life. However, only the Intel variant offers a Thunderbolt 4 port.
The only real drawback is the cooling, as the fans tend to kick in even when you are not doing anything demanding. This is especially noticeable when you also consider, for example, the MacBook Air which is completely passively cooled and also offers a better (albeit reflective) screen. The optional OLED screen of the Asus ZenBook 13 subjectively offers better picture quality. On the other hand, those who prefer a quieter and a noticeably lighter device should take a look at the HP Pavilion Aero 13, which also offers more than enough performance for on the go with the Ryzen 7 5800U.
Pricing and Availability
Our test device with Windows 10 is still available occasionally in retail stores (for example at Cyberport), but the identical model with Windows 11 and the model number 20YA002YGE is available for 999 Euros (929 Euros as campus model) at Campuspoint or for about 1,060 Euro at Cyberport (available immediately).
Lenovo ThinkBook 13s G3 20YA0005GE
- 01/10/2022 v7 (old)
Andreas Osthoff
Price comparison

