Reviews for the AMD Ryzen 7 5800U processor
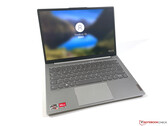
Lenovo ThinkBook 13s G3 AMD laptop in review: Subnotebook with fast Ryzen CPU
Lenovo equips the compact ThinkBook 13s G3, now in its third generation, with AMD's mobile Ryzen processors (Zen 3), which offer a lot of performance. Together with the 16:10 display, you get an exciting package for around 1,000 Euros.
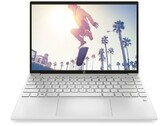
AMD Ryzen 7 5800U, Vega 8, 13.3", 1.3 kgHP Pavilion Aero 13 review: The Pavilion series is growing up
The 2021 Pavilion 13 is a huge leap over previous generations in almost every aspect. If you're looking to maximize performance, display quality, and portability without emptying your bank account, then the new Pavilion is looking like a top contender.
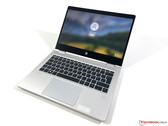
AMD Ryzen 7 5800U, Vega 8, 13.3", 953 gHP ProBook x360 435 G8 AMD in review - Entry-level business convertible with Zen 3 Ryzen CPU
HP equips the eighth generation of its business convertible with fast Ryzen 5000 CPUs from AMD, which offer significantly more performance than the Intel competition. However, the problem is still the extremely reflective touchscreen, which can also make life difficult indoors.
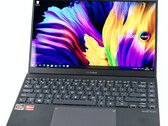
AMD Ryzen 7 5800U, Vega 8, 13.3", 1.5 kgAsus ZenBook 13 Review - A compact 13-inch laptop with a fast Ryzen 7 5800U and OLED display
The ZenBook 13 from Asus is an ultra-compact 13-inch laptop with an excellent OLED display. Despite its small size, it doesn't lack performance, since with the AMD Ryzen 7 5800U, a native octa-core SoC runs the slim device. Our detailed review with numerous measurements and benchmarks examines what performance you can really expect and whether the OLED display can fulfill our expectations.
AMD Ryzen 7 5800U, Vega 8, 13.3", 1.2 kgHP Pavilion Aero 13-be1002ns: AMD Radeon RX Vega 8 (Ryzen 4000/5000), 13.30", 1 kg
External Review » HP Pavilion Aero 13-be1002ns
Dynabook Satellite Pro C50D-B-11A: AMD Radeon RX Vega 8 (Ryzen 4000/5000), 15.60", 1.9 kg
External Review » Dynabook Satellite Pro C50D-B-11A
Lenovo Yoga 7 14ACN6-82N7004HGE: AMD Radeon RX Vega 8 (Ryzen 4000/5000), 14.00", 1.5 kg
External Review » Lenovo Yoga 7 14ACN6-82N7004HGE
HP Pavilion Aero 13-be0009ns: AMD Radeon RX Vega 8 (Ryzen 4000/5000), 13.30", 1 kg
External Review » HP Pavilion Aero 13-be0009ns
Lenovo IdeaPad 5 Pro 14ACN6-82L7004XMH: AMD Radeon RX Vega 8 (Ryzen 4000/5000), 14.00", 1.4 kg
External Review » Lenovo IdeaPad 5 Pro 14ACN6-82L7004XMH
HP Pavilion Aero 13-be0008ns: AMD Radeon RX Vega 8 (Ryzen 4000/5000), 13.30", 1 kg
External Review » HP Pavilion Aero 13-be0008ns
HP Envy x360 13-ay1054AU: AMD Radeon RX Vega 8 (Ryzen 4000/5000), 13.30", 1.3 kg
External Review » HP Envy x360 13-ay1054AU
HP ProBook 455 G8-45R47ES: AMD Radeon RX Vega 8 (Ryzen 4000/5000), 15.60", 1.7 kg
External Review » HP ProBook 455 G8-45R47ES
Acer Swift X SFX14-41G-R1GH: NVIDIA GeForce RTX 3050 Ti Laptop GPU, 14.00", 1.5 kg
External Review » Acer Swift X SFX14-41G-R1GH
Lenovo Yoga Slim 7 Carbon 14ACN6-82L0005DGE: AMD Radeon RX Vega 8 (Ryzen 4000/5000), 14.00", 1.1 kg
External Review » Lenovo Yoga Slim 7 Carbon 14ACN6-82L0005DGE
HP Pavilion Aero 13-be0002AU: AMD Radeon RX Vega 8 (Ryzen 4000/5000), 13.30", 1 kg
External Review » HP Pavilion Aero 13-be0002AU
HP Envy x360 13-ay1001ns: AMD Radeon RX Vega 8 (Ryzen 4000/5000), 13.30", 1.3 kg
External Review » HP Envy x360 13-ay1001ns
HP Envy x360 13-ay1074ng: AMD Radeon RX Vega 8 (Ryzen 4000/5000), 13.30", 1.3 kg
External Review » HP Envy x360 13-ay1074ng
Acer Swift X SFX14-41G-R5EM: NVIDIA GeForce RTX 3050 4GB Laptop GPU, 14.00", 1.5 kg
External Review » Acer Swift X SFX14-41G-R5EM
Lenovo Yoga Slim 7 Carbon 14ACN6, 5800U: NVIDIA GeForce MX450, 14.00", 1.1 kg
External Review » Lenovo Yoga Slim 7 Carbon 14ACN-6, 5800U
HP Pavilion Aero 13-be0007ns: AMD Radeon RX Vega 8 (Ryzen 4000/5000), 13.30", 1 kg
External Review » HP Pavilion Aero 13-be0007ns
HP Pavilion Aero 13-be0240nd: AMD Radeon RX Vega 8 (Ryzen 4000/5000), 13.30", 1 kg
External Review » HP Pavilion Aero 13-be0240nd
Acer Swift X SFX14-41G-R1S6: NVIDIA GeForce RTX 3050 Ti Laptop GPU, 14.00", 1.5 kg
External Review » Acer Swift X SFX14-41G-R1S6
Lenovo IdeaPad 5 Pro 14ACN6-82L7003NGE: AMD Radeon RX Vega 8 (Ryzen 4000/5000), 14.00", 1.4 kg
External Review » Lenovo IdeaPad 5 Pro 14ACN6-82L7003NGE
HP Pavilion Aero 13-be0006ns: AMD Radeon RX Vega 8 (Ryzen 4000/5000), 13.30", 1 kg
External Review » HP Pavilion Aero 13-be0006ns
HP Pavilion Aero 13 be0097nr: AMD Radeon RX Vega 8 (Ryzen 4000/5000), 13.30", 1 kg
External Review » HP Pavilion Aero 13 be0097nr
Lenovo Yoga Slim 7 13ACN5, R7 5800U: AMD Radeon RX Vega 8 (Ryzen 4000/5000), 13.30", 1.2 kg
External Review » Lenovo Yoga Slim 7 13ACN5, R7 5800U
Acer Swift X SFX14-41G-R4VH: NVIDIA GeForce RTX 3050 Ti Laptop GPU, 14.00", 1.4 kg
External Review » Acer Swift X SFX14-41G-R4VH
Asus ZenBook 13 UM325S: AMD Radeon RX Vega 8 (Ryzen 4000/5000), 13.30", 1.2 kg
External Review » Asus ZenBook 13 UM325S
HP Pavilion Aero 13 be0097nr: AMD Radeon RX Vega 8 (Ryzen 4000/5000), 13.30", 1 kg
» Cheap HP Pavilion Aero 13 is faster than any Spectre 13 currently available all thanks to the AMD Zen 3 Ryzen 7 5800U