Reviews for the Intel Core i7-1255U processor
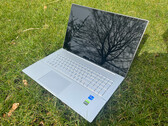
Durabook S15 rugged laptop review: Surprisingly thin and light for the category
The S15 is back with more optional features including a super-bright 1000-nit IPS display and discrete Quadro T1000 graphics. Its relatively lightweight build is perhaps most impressive, but keyboard and battery life could be a little better.
Intel Core i7-1255U, Iris Xe G7 96EUs, 15.6", 2.7 kgMicrosoft Surface Laptop 5 15 review - Old design for a premium price
Microsoft have updated the Surface Laptop 5 with Alder Lake processors and Thunderbolt 4 - but the rest of the device has remained the same. Neither performance nor features can make up for the laptop's premium price.
Intel Core i7-1255U, Iris Xe G7 96EUs, 15", 1.6 kgHP Envy 17 laptop review: GeForce GPU plays on elegant 4K display of the multimedia laptop
A large display with a high, 4K resolution in a simple case together with computing power from Intel's 12th generation, 32 GB of DDR4 RAM, and a dedicated GeForce GPU – the HP Envy 17-cr0079ng package sounds interesting. Find out in our Notebookcheck test whether the multimedia laptop is also convincing users in practice.
Intel Core i7-1255U, NVIDIA GeForce RTX 2050 Mobile, 17.3", 2.6 kgHP ProBook 440 G9 Review: Efficient Core i7-1255U laptop without shine
Stable, stowed away easily thanks to the compact 14-inch chassis, and by no means underpowered, the HP ProBook 440 G9 shines with sobriety. It offers necessary equipment for mobile work, leaves plenty of room for expansion, and provides a whole range of security features. Our review shows aspects where the ProBook 440 G9 excels.
Intel Core i7-1255U, Iris Xe G7 96EUs, 14", 1.4 kgAsus Chromebook Flip CX5 review: High performance at a high price
meets a high-quality case in the Asus Chromebook Flip CX5. Hardly any other Chromebook has a more powerful processor or more RAM. The convertible delivers strong performance and is also suitable for gaming, as some tests with Steam games show. Only the price of the CX5 is annoying.
Intel Core i7-1255U, Iris Xe G7 96EUs, 15.8", 2.1 kgMicrosoft Surface Pro 9, i7-1255U: Intel Iris Xe Graphics G7 96EUs, 13.00", 0.9 kg
Review » Microsoft Surface Pro 9 review: Convertible now with significantly more CPU power
Acer Aspire Vero AV14-51-72DL: Intel Iris Xe Graphics G7 96EUs, 14.00", 1.5 kg
Review » Acer Aspire Vero AV14 laptop review: Striking chassis made of recycled materials
Lenovo IdeaPad Flex 7i 14IAU7: Intel Iris Xe Graphics G7 96EUs, 14.00", 1.5 kg
Review » Lenovo IdeaPad Flex 7 vs. IdeaPad Flex 5 review: Faster processor and better touchscreen
HP ProBook 450 G9 6A180EA: Intel Iris Xe Graphics G7 96EUs, 15.60", 1.7 kg
Review » HP ProBook 450 G9 laptop review: An efficient Intel CPU at last
HP Spectre x360 13.5 14t-ef000: Intel Iris Xe Graphics G7 96EUs, 13.50", 1.4 kg
Review » 2022 HP Spectre x360 13.5 review: The pinnacle subnotebook convertible
Dell Inspiron 14 7420 2-in-1: Intel Iris Xe Graphics G7 96EUs, 14.00", 1.6 kg
Review » Intel Core i7-1255U debut: Dell Inspiron 14 7420 2-in-1 convertible review
HP ProBook 440 G9-5Y3Z3EA: Intel Iris Xe Graphics G7 96EUs, 14.00", 1.4 kg
External Review » HP ProBook 440 G9-5Y3Z3EA
Acer Aspire Lite 16 AL16-51P: Intel Iris Xe Graphics G7 96EUs, 16.00", 1.8 kg
External Review » Acer Aspire Lite 16 AL16-51P
Asus Vivobook 14 X1404ZA, i7-1255U: Intel Iris Xe Graphics G7 96EUs, 14.00", 1.4 kg
External Review » Asus Vivobook 14 X1404ZA, i7-1255U
Asus ExpertBook B1 B1502CB, i7-1255U: Intel Iris Xe Graphics G7 96EUs, 15.60", 1.7 kg
External Review » Asus ExpertBook B1 B1502CB, i7-1255U
Infinix INBook Y3 Max: Intel Iris Xe Graphics G7 96EUs, 16.00", 1.8 kg
External Review » Infinix INBook Y3 Max
Medion Akoya S17413: Intel Iris Xe Graphics G7 96EUs, 17.30", 2.3 kg
External Review » Medion Akoya S17413
Asus VivoBook 16 X1605, i7-1255U: Intel Iris Xe Graphics G7 96EUs, 16.00", 1.9 kg
External Review » Asus VivoBook 16 X1605, i7-1255U
Lenovo ThinkBook 16 G4+: Intel Iris Xe Graphics G7 96EUs, 16.00", 1.8 kg
External Review » Lenovo ThinkBook 16 G4+
Asus VivoBook 16X X1605, i7-1255U: Intel Iris Xe Graphics G7 96EUs, 16.00", 1.9 kg
External Review » Asus VivoBook 16X X1605, i7-1255U
HP 15s-fq5121ns: Intel Iris Xe Graphics G7 96EUs, 15.60", 1.7 kg
External Review » HP 15s-fq5121ns
Lenovo IdeaPad 3 15IAU7: Intel Iris Xe Graphics G7 96EUs, 15.60", 1.6 kg
External Review » Lenovo IdeaPad 3 15IAU7
HP Pavilion 15-eg2772nd: Intel Iris Xe Graphics G7 96EUs, 15.60", 1.7 kg
External Review » HP Pavilion 15-eg2772n
Durabook R11 Rugged: Intel Iris Xe Graphics G7 96EUs, 11.60", 1.2 kg
External Review » Durabook R11 Rugged
HP 15s-fq5054ns: Intel Iris Xe Graphics G7 96EUs, 15.60", 1.7 kg
External Review » HP 15s-fq5054ns
Acer Aspire 5 A515-57-77VF: Intel Iris Xe Graphics G7 96EUs, 15.60", 1.8 kg
External Review » Acer Aspire 5 A515-57-77VF
HP EliteBook 1040 G9, i7-1255U: Intel Iris Xe Graphics G7 96EUs, 14.00", 1.2 kg
External Review » HP EliteBook 1040 G9, i7-1255U
Asus VivoBook 14 F1402ZA, i7-1255U: Intel Iris Xe Graphics G7 96EUs, 14.00", 1.5 kg
External Review » Asus VivoBook 14 F1402ZA, i7-1255U
HP ZBook Firefly 14 G9, i7-1255U: Intel Iris Xe Graphics G7 96EUs, 14.00", 1.5 kg
External Review » HP ZBook Firefly 14 G9, i7-1255U
HP EliteBook 840 G9: Intel Iris Xe Graphics G7 96EUs, 14.00", 1.4 kg
External Review » HP EliteBook 840 G9
Acer Aspire 5 A515-57-76BV: Intel Iris Xe Graphics G7 96EUs, 15.60", 1.8 kg
External Review » Acer Aspire 5 A515-57-76BV
HP 15s-fq5061ns: Intel Iris Xe Graphics G7 96EUs, 15.60", 1.7 kg
External Review » HP 15s-fq5061ns
Lenovo ThinkBook 13x Gen 2, i7-1255U: Intel Iris Xe Graphics G7 96EUs, 13.30", 1.2 kg
External Review » Lenovo ThinkBook 13x Gen 2, i7-1255U
HP 15s-fq5047ns: Intel Iris Xe Graphics G7 96EUs, 15.60", 1.7 kg
External Review » HP 15s-fq5047ns
HP 15s-fq5098ns: Intel Iris Xe Graphics G7 96EUs, 15.60", 1.6 kg
External Review » HP 15s-fq5098ns
HP Envy 17-cr0079ng: NVIDIA GeForce RTX 2050 Mobile, 17.30", 2.6 kg
External Review » HP Envy 17-cr0079ng
Lenovo V15 G3 IAP, i7-1255U: Intel Iris Xe Graphics G7 96EUs, 15.60", 1.7 kg
External Review » Lenovo V15 G3 IAP, i7-1255U
HP Spectre x360 14-ef0075ng: Intel Iris Xe Graphics G7 96EUs, 13.50", 1.4 kg
External Review » HP Spectre x360 14-ef0075ng
Acer Chromebook Vero 514 CBV514-1H, i7-1255U: Intel Iris Xe Graphics G7 96EUs, 14.00", 1.5 kg
External Review » Acer Chromebook Vero 514 CBV514-1H, i7-1255U
Asus VivoBook 14 F1402ZA-EK329W: Intel Iris Xe Graphics G7 96EUs, 14.00", 1.5 kg
External Review » Asus VivoBook 14 F1402ZA-EK329W
HP Pavilion Plus 14-eh0032TX: NVIDIA GeForce RTX 2050 Mobile, 14.00", 1.4 kg
External Review » HP Pavilion Plus 14-eh0032TX
Acer Aspire 3 A317-54-768S: Intel Iris Xe Graphics G7 96EUs, 13.30", 2.5 kg
External Review » Acer Aspire 3 A317-54-768S
Acer Aspire 5 A517-53G-757V: NVIDIA GeForce MX550, 17.30", 2.3 kg
External Review » Acer Aspire 5 A517-53G-757V
HP EliteBook 830 G9, i7-1255U: Intel Iris Xe Graphics G7 96EUs, 13.30", 1.3 kg
External Review » HP EliteBook 830 G9, i7-1255U
HP ProBook 450 G9 6A180EA: Intel Iris Xe Graphics G7 96EUs, 15.60", 1.7 kg
External Review » HP ProBook 450 G9 6A180EA
Acer Aspire Vero AV14-51-73LM: Intel Iris Xe Graphics G7 96EUs, 14.00", 1.5 kg
External Review » Acer Aspire Vero AV14-51-73LM
Acer Aspire Vero AV15-52-73F2: Intel Iris Xe Graphics G7 96EUs, 15.60", 1.8 kg
External Review » Acer Aspire Vero AV15-52-73F2
Lenovo IdeaPad Duet 5 12IAU7, i7-1255U: Intel Iris Xe Graphics G7 96EUs, 12.40", 0.8 kg
External Review » Lenovo IdeaPad Duet 5 12IAU7, i7-1255U
HP Envy x360 15-eu1026nr: Intel Iris Xe Graphics G7 96EUs, 15.60", 1.8 kg
External Review » HP Envy x360 15-eu1026nr
HP Envy x360 15-ew0170nd: NVIDIA GeForce RTX 2050 Mobile, 15.60", 1.7 kg
External Review » HP Envy x360 15-ew0170nd
Samsung Galaxy Book2 360 13-NP730QED: Intel Iris Xe Graphics G7 96EUs, 13.30", 1.2 kg
External Review » Samsung Galaxy Book2 360 13-NP730QED
HP Spectre x360 14-ef0073ng: Intel Iris Xe Graphics G7 96EUs, 13.50", 1.4 kg
External Review » HP Spectre x360 14-ef0073ng
HP EliteBook 860 G9, i7-1255U: Intel Iris Xe Graphics G7 96EUs, 16.00", 1.8 kg
External Review » HP EliteBook 860 G9, i7-1255U
MSI Modern 14 C12M, i7-1255U: Intel Iris Xe Graphics G7 96EUs, 14.00", 1.4 kg
External Review » MSI Modern 14 C12M, i7-1255U
Microsoft Surface Laptop 5 13, i7-1255U: Intel Iris Xe Graphics G7 96EUs, 13.50", 1.3 kg
External Review » Microsoft Surface Laptop 5 13, i7-1255U
Acer Aspire 5 A515-57G-74D3: NVIDIA GeForce MX550, 15.60", 1.8 kg
External Review » Acer Aspire 5 A515-57G-74D3
Asus ExpertBook B9 B9400, i7-1255U: Intel Iris Xe Graphics G7 96EUs, 14.00", 1 kg
External Review » Asus ExpertBook B9 B9400, i7-1255U
Acer Aspire Vero AV14-51-72DL: Intel Iris Xe Graphics G7 96EUs, 14.00", 1.5 kg
External Review » Acer Aspire Vero AV14-51-72DL
HP Pavilion Plus 14-eh0001nf: NVIDIA GeForce RTX 2050 Mobile, 14.00", 1.4 kg
External Review » HP Pavilion Plus 14-eh0001nf
Microsoft Surface Pro 9, i7-1255U: Intel Iris Xe Graphics G7 96EUs, 13.00", 0.9 kg
External Review » Microsoft Surface Pro 9, i7-1255U
Microsoft Surface Laptop 5 15, i7-1255U: Intel Iris Xe Graphics G7 96EUs, 15.00", 1.6 kg
External Review » Microsoft Surface Laptop 5 15, i7-1255U
MSI Modern 15 B12M, i7-1255U: Intel Iris Xe Graphics G7 96EUs, 15.60", 1.8 kg
External Review » MSI Modern 15 B12M, i7-1255U
Lenovo ThinkPad X1 Carbon G10-21CB009SGE: Intel Iris Xe Graphics G7 96EUs, 14.00", 1.1 kg
External Review » Lenovo ThinkPad X1 Carbon G10-21CB009SGE
Acer Aspire Vero AV15-52-712Q: Intel Iris Xe Graphics G7 96EUs, 15.60", 1.8 kg
External Review » Acer Aspire Vero AV15-52-712Q
Acer Aspire Vero AV15-52-772X: Intel Iris Xe Graphics G7 96EUs, 15.60", 1.8 kg
External Review » Acer Aspire Vero AV15-52-772X
HP Pavilion x360 14-ek0000: Intel Iris Xe Graphics G7 96EUs, 14.00", 1.5 kg
External Review » HP Pavilion x360 14-ek0000
Lenovo Yoga 7 14IAL7-82QE000KUS: Intel Iris Xe Graphics G7 96EUs, 14.00", 1.5 kg
External Review » Lenovo Yoga 7 14IAL7-82QE000KUS
HP Elite Dragonfly G3, i7-1255U: Intel Iris Xe Graphics G7 96EUs, 13.50", 1 kg
External Review » HP Elite Dragonfly G3, i7-1255U
Lenovo ThinkBook 14s Yoga G2 IAP 21DM000FGE: Intel Iris Xe Graphics G7 96EUs, 14.00", 1.5 kg
External Review » Lenovo ThinkBook 14s Yoga G2 IAP 21DM000FGE
VAIO FE 14.1 VWNC71429-BK: Intel Iris Xe Graphics G7 96EUs, 14.10", 1.6 kg
External Review » VAIO FE 14.1 VWNC71429-BK
HP 15-dw4020nu: NVIDIA GeForce MX550, 15.60", 1.8 kg
External Review » HP 15-dw4020nu
Lenovo ThinkPad E15 G4-21E60050GE: Intel Iris Xe Graphics G7 96EUs, 15.60", 1.7 kg
External Review » Lenovo ThinkPad E15 G4-21E60050GE
Samsung Galaxy Book2 15, i7-1255U: Intel Iris Xe Graphics G7 96EUs, 15.60", 1.6 kg
External Review » Samsung Galaxy Book2 15, i7-1255U
Dell Inspiron 14 7420 2-in-1: Intel Iris Xe Graphics G7 96EUs, 14.00", 1.6 kg
External Review » Dell Inspiron 14 7420 2-in-1
Lenovo IdeaPad Flex 5 14IAU7-82R7002QGE: Intel Iris Xe Graphics G7 96EUs, 14.00", 1.6 kg
External Review » Lenovo IdeaPad Flex 5 14IAU7-82R7002QGE
Samsung Galaxy Book2 Pro 360 13, i7-1255U: Intel Iris Xe Graphics G7 96EUs, 13.30", 1.2 kg
External Review » Samsung Galaxy Book2 360 Pro 13, i7-1255U
HP Spectre x360 13.5 14t-ef000: Intel Iris Xe Graphics G7 96EUs, 13.50", 1.4 kg
External Review » HP Spectre x360 13.5 14t-ef000
Asus Chromebook Flip CX5 CX5601FB: Intel Iris Xe Graphics G7 96EUs, 15.80", 2.1 kg
Article » Gaming on Chromebooks - Testing out Steam beta with many current games
Microsoft Surface Pro 9, i7-1255U: Intel Iris Xe Graphics G7 96EUs, 13.00", 0.9 kg
» Microsoft Surface Pro 9 i7 models on sale up to 32% off MSRP on Amazon
Microsoft Surface Laptop 5 13, i7-1255U: Intel Iris Xe Graphics G7 96EUs, 13.50", 1.3 kg
» Microsoft Surface Laptop 5 and Pro 9 tablet on sale at US$500 off retail at Amazon and BestBuy this Christmas season
Microsoft Surface Laptop 5 15, i7-1255U: Intel Iris Xe Graphics G7 96EUs, 15.00", 1.6 kg
» Microsoft Surface Laptop 5 and Pro 9 tablet on sale at US$500 off retail at Amazon and BestBuy this Christmas season
Microsoft Surface Pro 9, i7-1255U: Intel Iris Xe Graphics G7 96EUs, 13.00", 0.9 kg
» Microsoft Surface Laptop 5 and Pro 9 tablet on sale at US$500 off retail at Amazon and BestBuy this Christmas season
» Microsoft Surface Pro 9 tablet with Core i7, 32GB RAM and 1TB SSD marked down by 31% on Amazon
» Microsoft Surface Pro 9 tablet with i7-1255U, 16GB RAM and 120Hz touchscreen gets 25% discount
» Microsoft Surface Pro 9 tablet with Core i7 and 16GB RAM is back on sale at Amazon
HP Envy 17-cr0079ng: NVIDIA GeForce RTX 2050 Mobile, 17.30", 2.6 kg
» HP Envy 17 tested: A large multimedia laptop with GeForce RTX and 4K display
Microsoft Surface Pro 9, i7-1255U: Intel Iris Xe Graphics G7 96EUs, 13.00", 0.9 kg
» Microsoft's Surface Pro 9 is now faster, but no longer offers an audio jack
Acer Aspire Vero AV14-51-72DL: Intel Iris Xe Graphics G7 96EUs, 14.00", 1.5 kg
» Acer Aspire Vero AV14-51: 14-inch notebook with superb battery life
HP ProBook 450 G9 6A180EA: Intel Iris Xe Graphics G7 96EUs, 15.60", 1.7 kg
» HP ProBook 450 G9 reviewed: 15.6-inch laptop features long battery life thanks to efficient Core i7-1255U
HP Spectre x360 13.5 14t-ef000: Intel Iris Xe Graphics G7 96EUs, 13.50", 1.4 kg
» 2022 HP Spectre x360 13.5 has fewer keyboard keys and a slower MicroSD reader than the 2020 model
Dell Inspiron 14 7420 2-in-1: Intel Iris Xe Graphics G7 96EUs, 14.00", 1.6 kg
» Our first Core i7-1255U benchmarks are in. Now let's see how they compare to the Core i7-1260P