HP Envy 17 laptop review: GeForce GPU powers the elegant 4K display of the multimedia laptop ↺

HP's Envy model series stands for powerful laptops for mobile creative professionals. In this series, the manufacturer offers models beginning from compact 13.3 up to large 17.3-inch sizes. The HP Envy 17-cr0079ng is positioned at the top end, bringing a large 17.3-inch UHD display in this model version.
Under the hood, the HP Envy 17-cr0079ng is able to offer some good equipment as well: HP uses the Intel Core i7-1255U processor of the 12th generation (Alder Lake), combining this with a dedicated Nvidia GeForce RTX 2050 Laptop lower mid-range GPU with 4 GB GDDR6, 32 GB DDR4 working memory, and a large, 1-TB SSD. Together with a 55-Wh battery, this results in a ~2.5 kg (~5.5 lb) 17-inch laptop that now has to prove itself in our test.
In our review, the Envy 17 has to compete against other laptops with the Core i7-1255U, such as the more compact HP ProBook 450 G9 6A180EA, and also the same graphics solution, such as the Acer Aspire 5 A515-57G-53N8 and the 17-inch LG Gram 17 endurance champion.
Possible Competitors in Comparison
Rating | Date | Model | Weight | Height | Size | Resolution | Price |
|---|---|---|---|---|---|---|---|
| 86.3 % v7 (old) | 04 / 2023 | HP Envy 17-cr0079ng i7-1255U, GeForce RTX 2050 Mobile | 2.6 kg | 19.6 mm | 17.30" | 3840x2160 | |
| 85 % v7 (old) | 08 / 2022 | HP ProBook 450 G9 6A180EA i7-1255U, Iris Xe G7 96EUs | 1.7 kg | 19.9 mm | 15.60" | 1920x1080 | |
| 86.4 % v7 (old) | 03 / 2023 | LG Gram 17Z90Q-E.AD78G i7-1260P, GeForce RTX 2050 Mobile | 1.4 kg | 17.8 mm | 17.00" | 2560x1600 | |
| 80.7 % v7 (old) | 09 / 2022 | Acer Aspire 5 A515-57G-53N8 i5-1240P, GeForce RTX 2050 Mobile | 1.8 kg | 18 mm | 15.60" | 1920x1080 | |
| 89.3 % v7 (old) | 06 / 2022 | Dell XPS 17 9720 i7-12700H, GeForce RTX 3050 4GB Laptop GPU | 2.5 kg | 19.5 mm | 17.00" | 3840x2400 | |
| 79.4 % v7 (old) | 03 / 2023 | Lenovo IdeaPad 3 17ABA7 R5 5625U, Vega 7 | 2 kg | 19.9 mm | 17.30" | 1920x1080 |
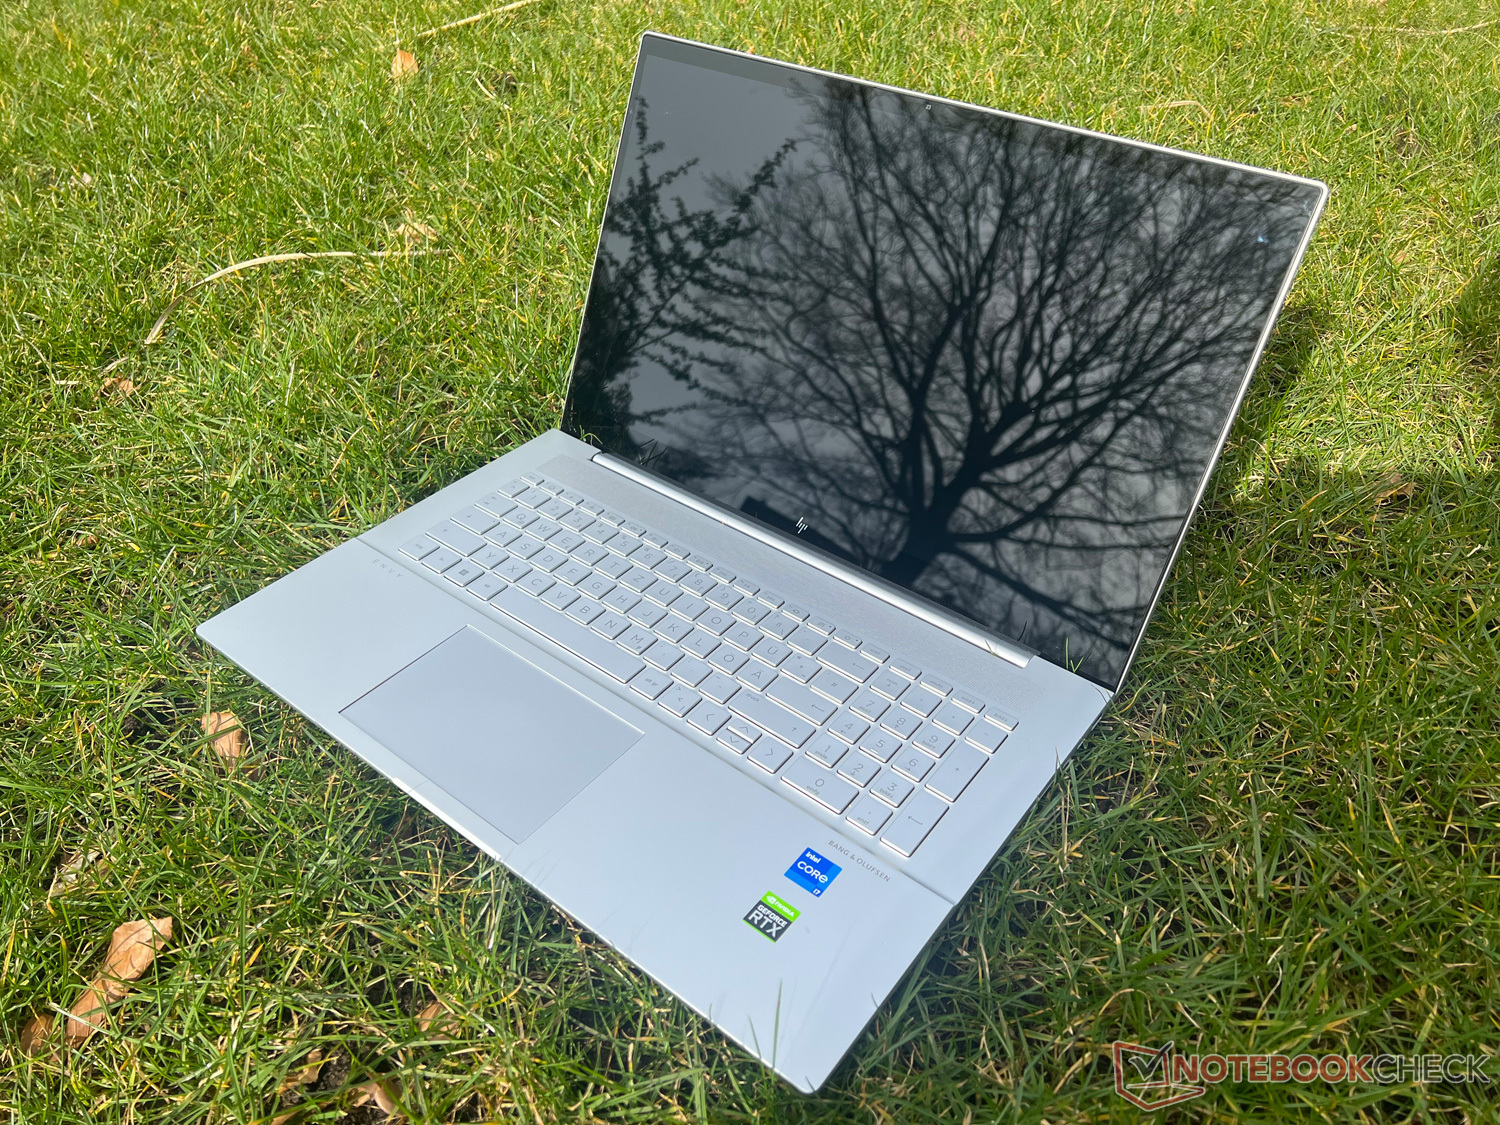
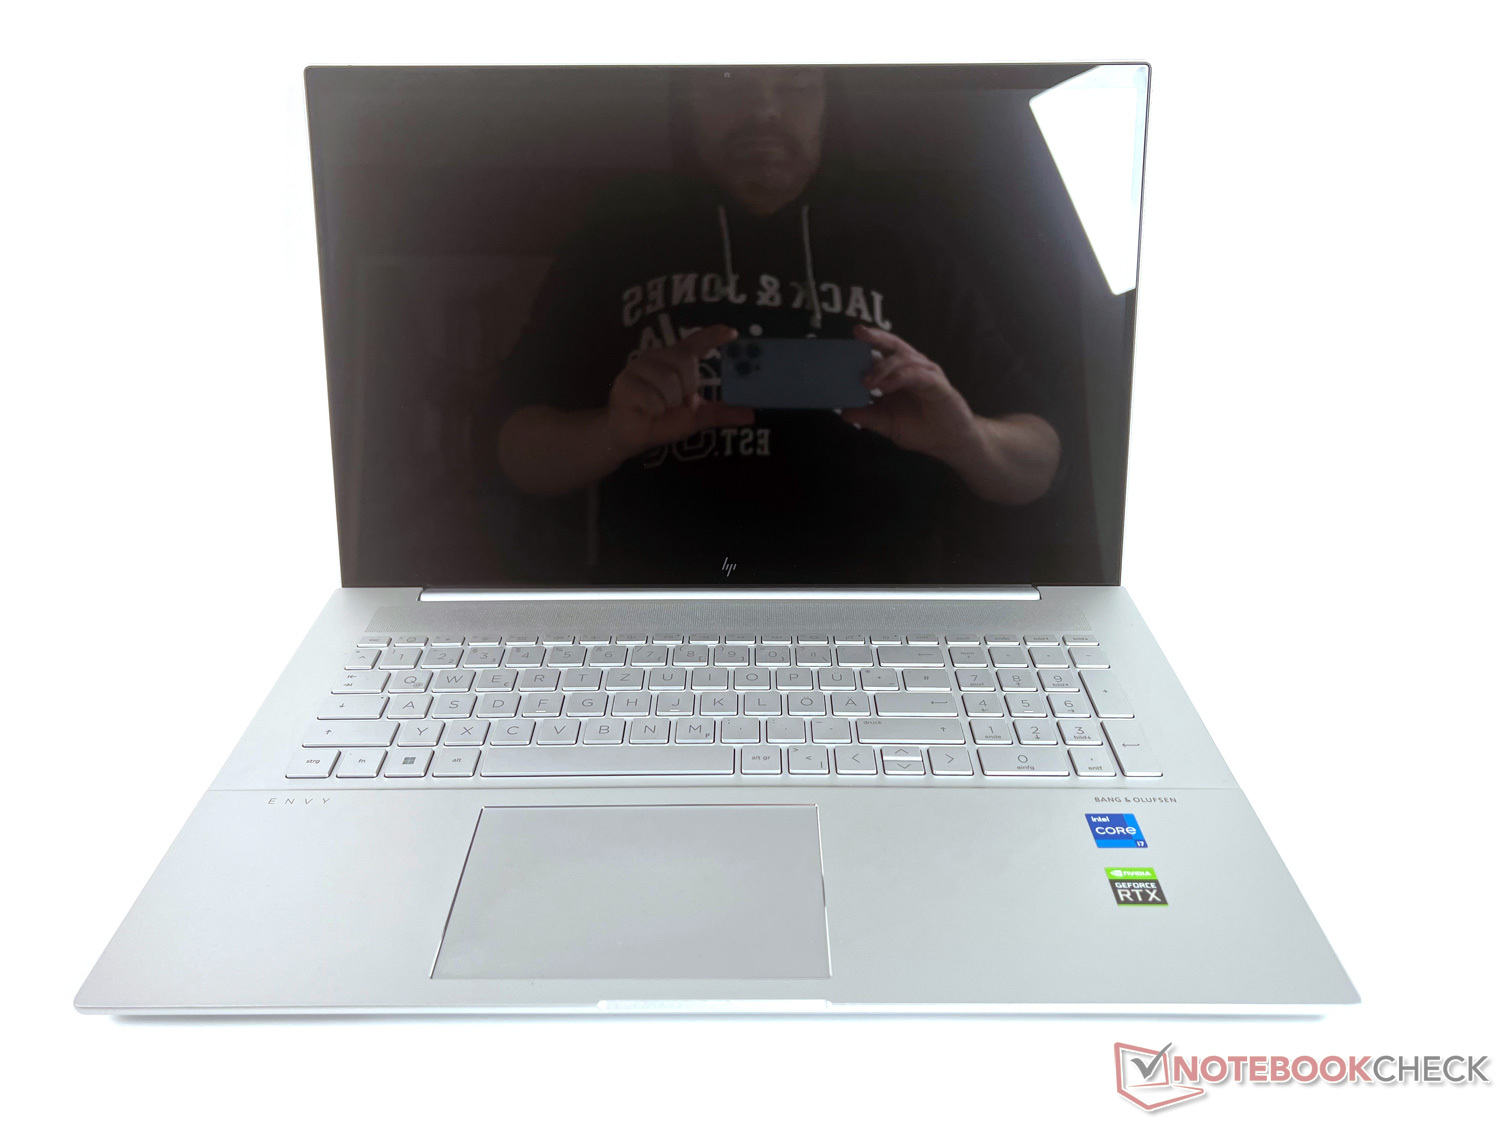
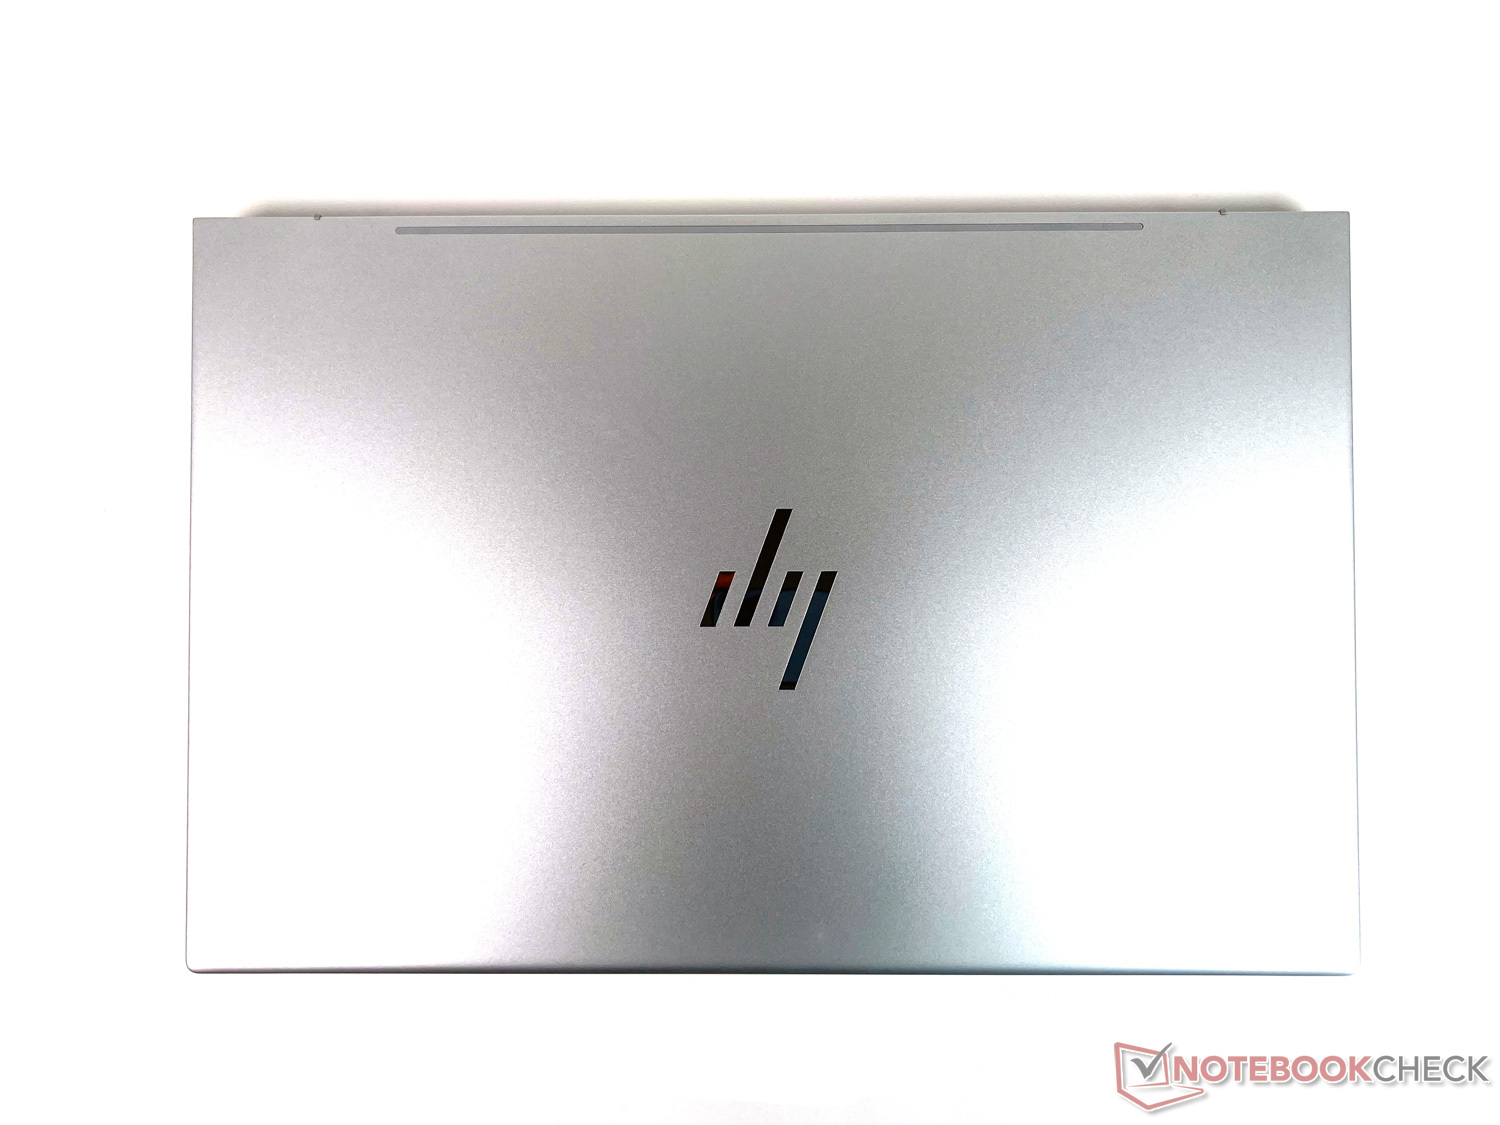
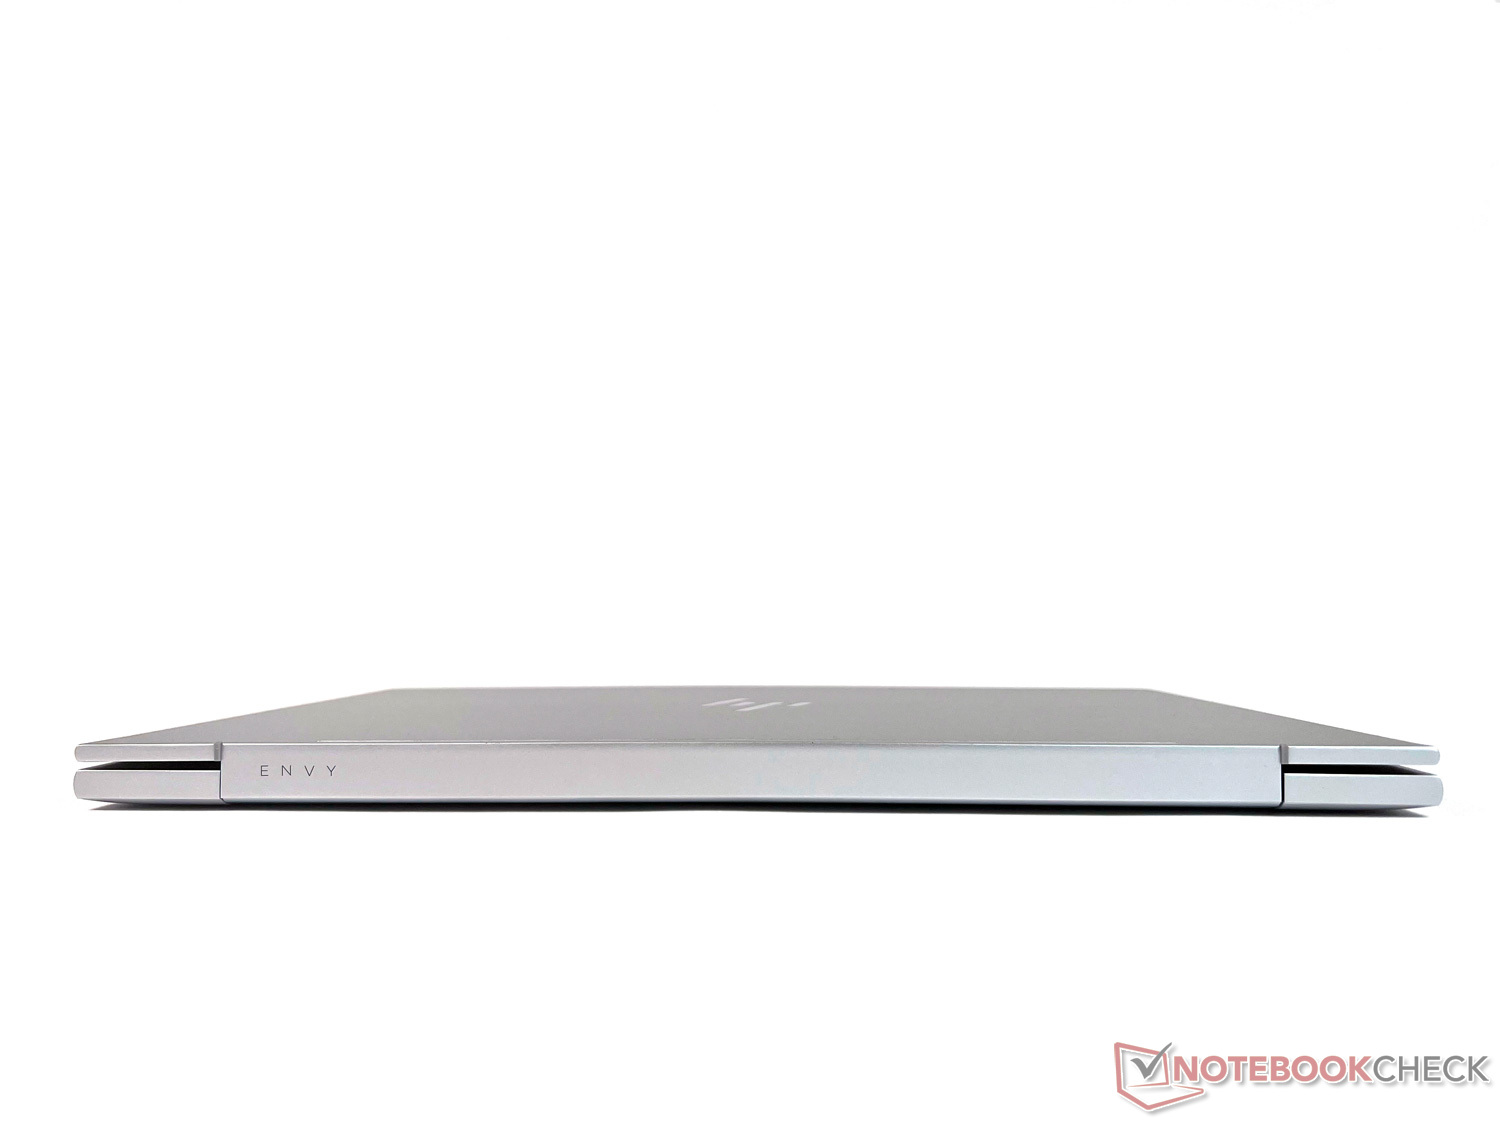
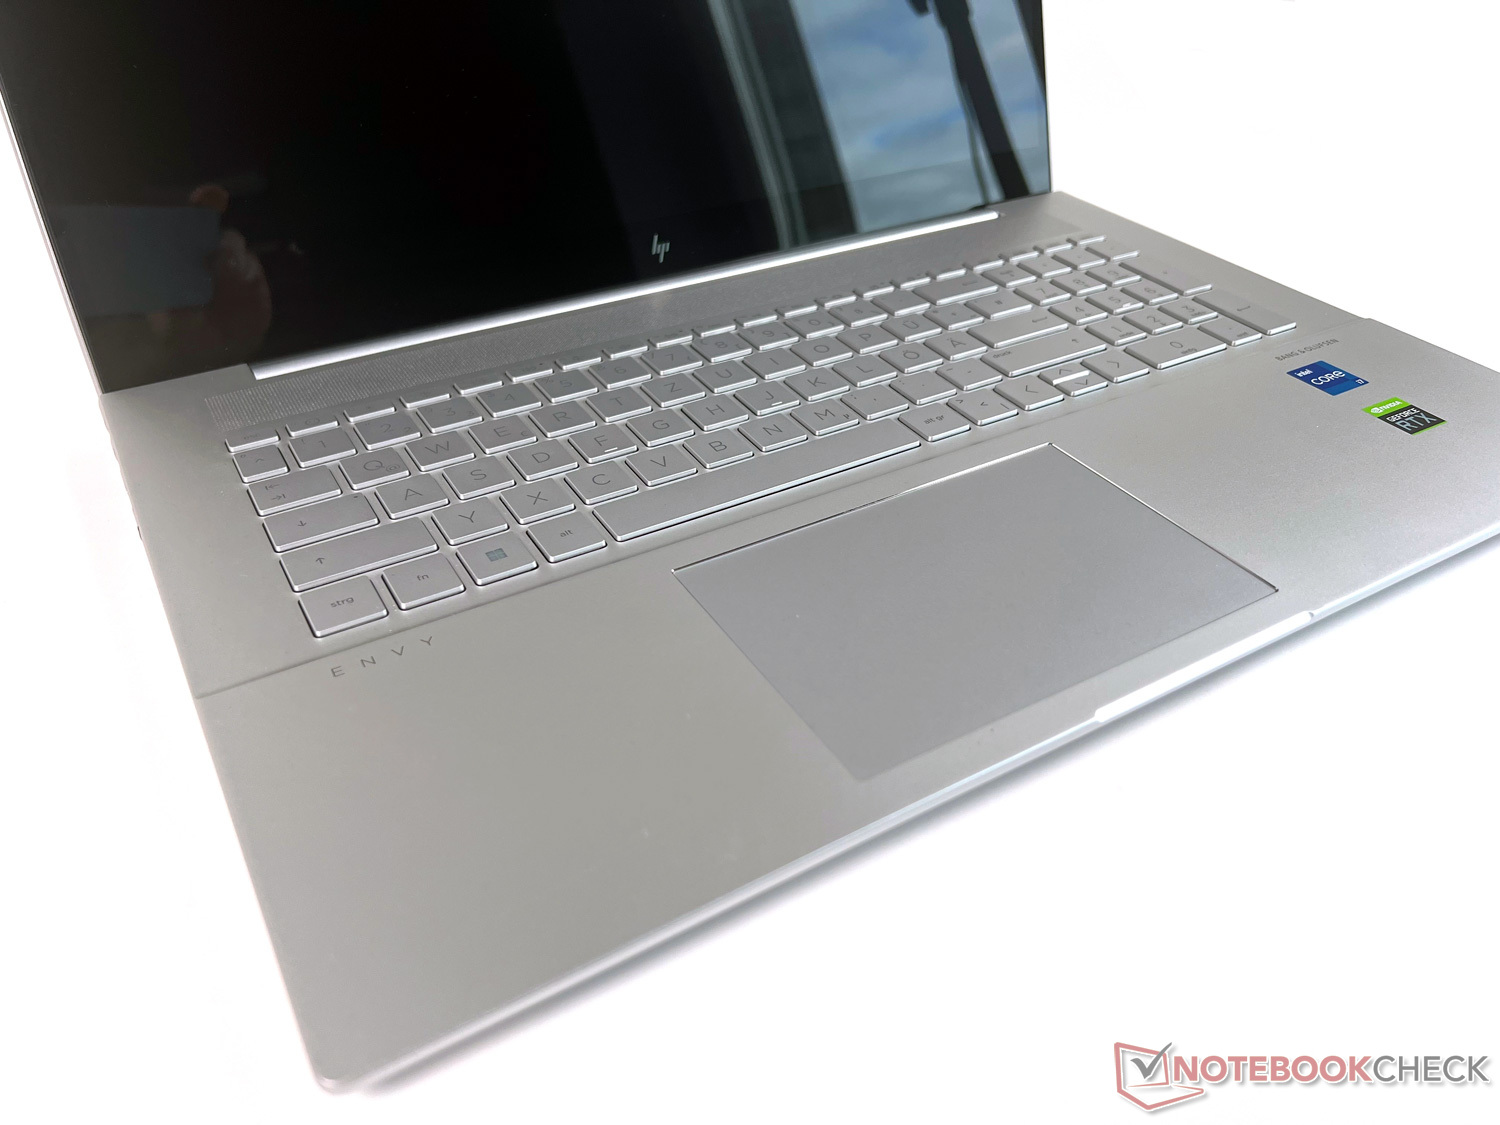
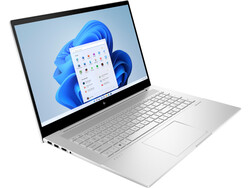
Case: Elegant and simple in silver color
The HP Envy 17 presents itself in a simple design in silver color. Even though most of the case is made from plastic, it offers a high-quality impression with good workmanship. The wide hinge keeps the large display fairly tightly in place, so that you have to use both hands to open the laptop.
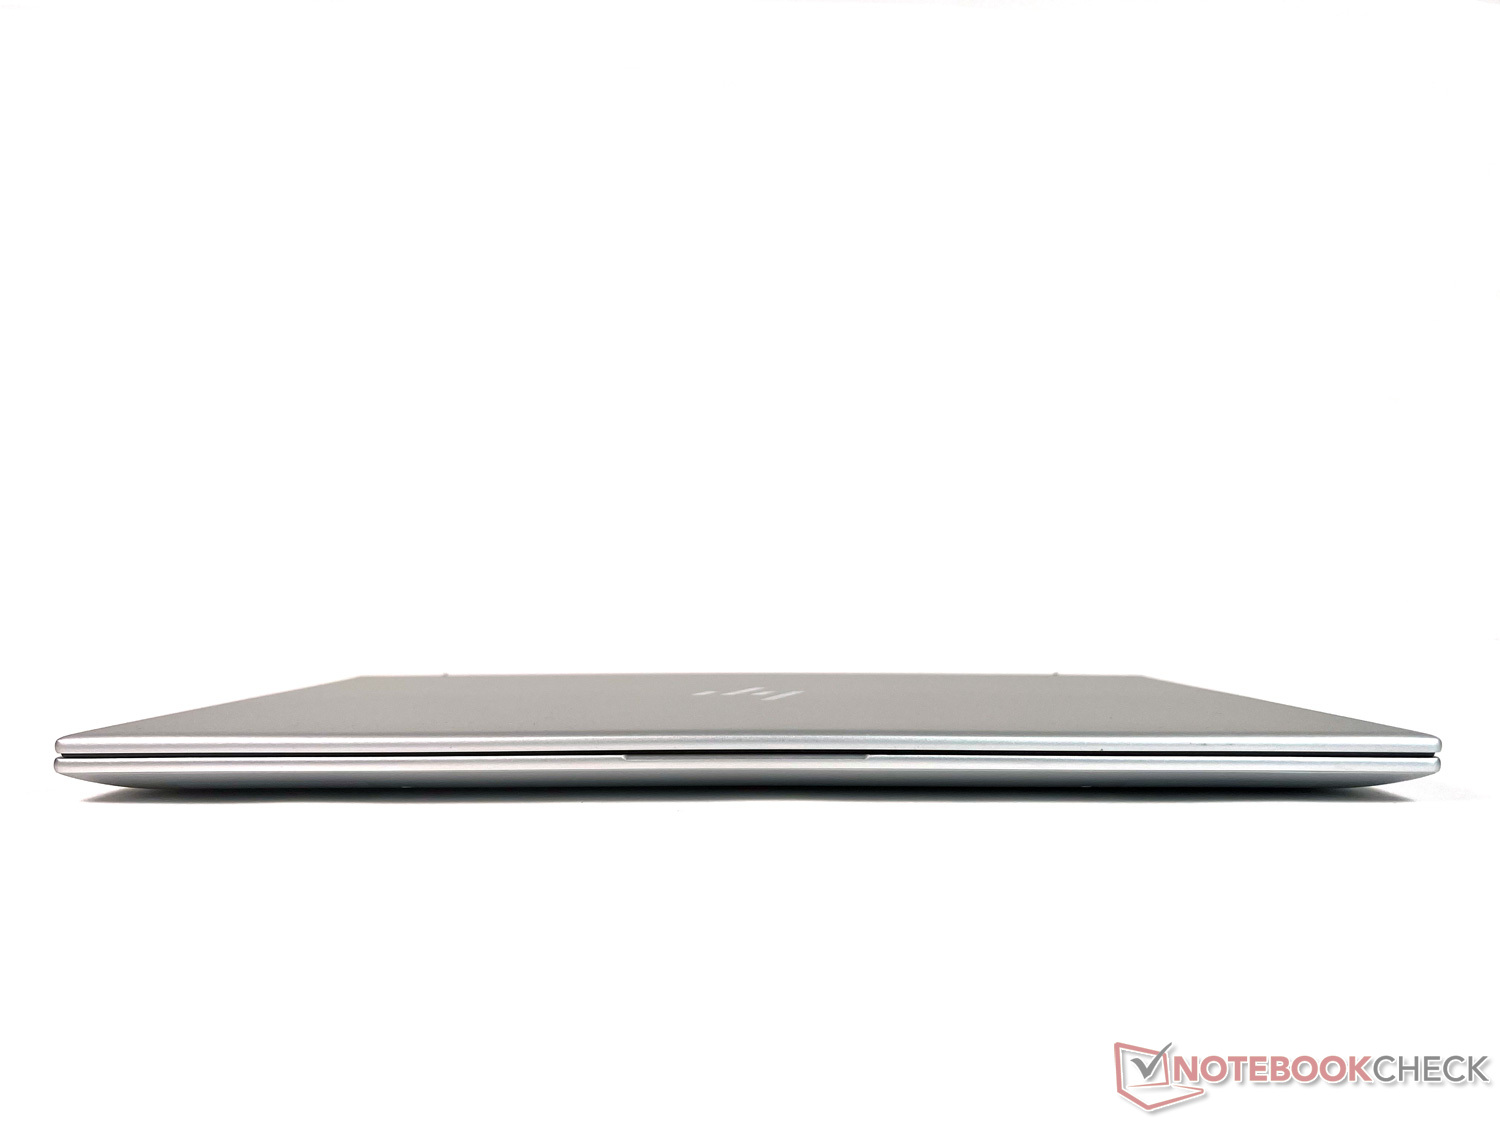
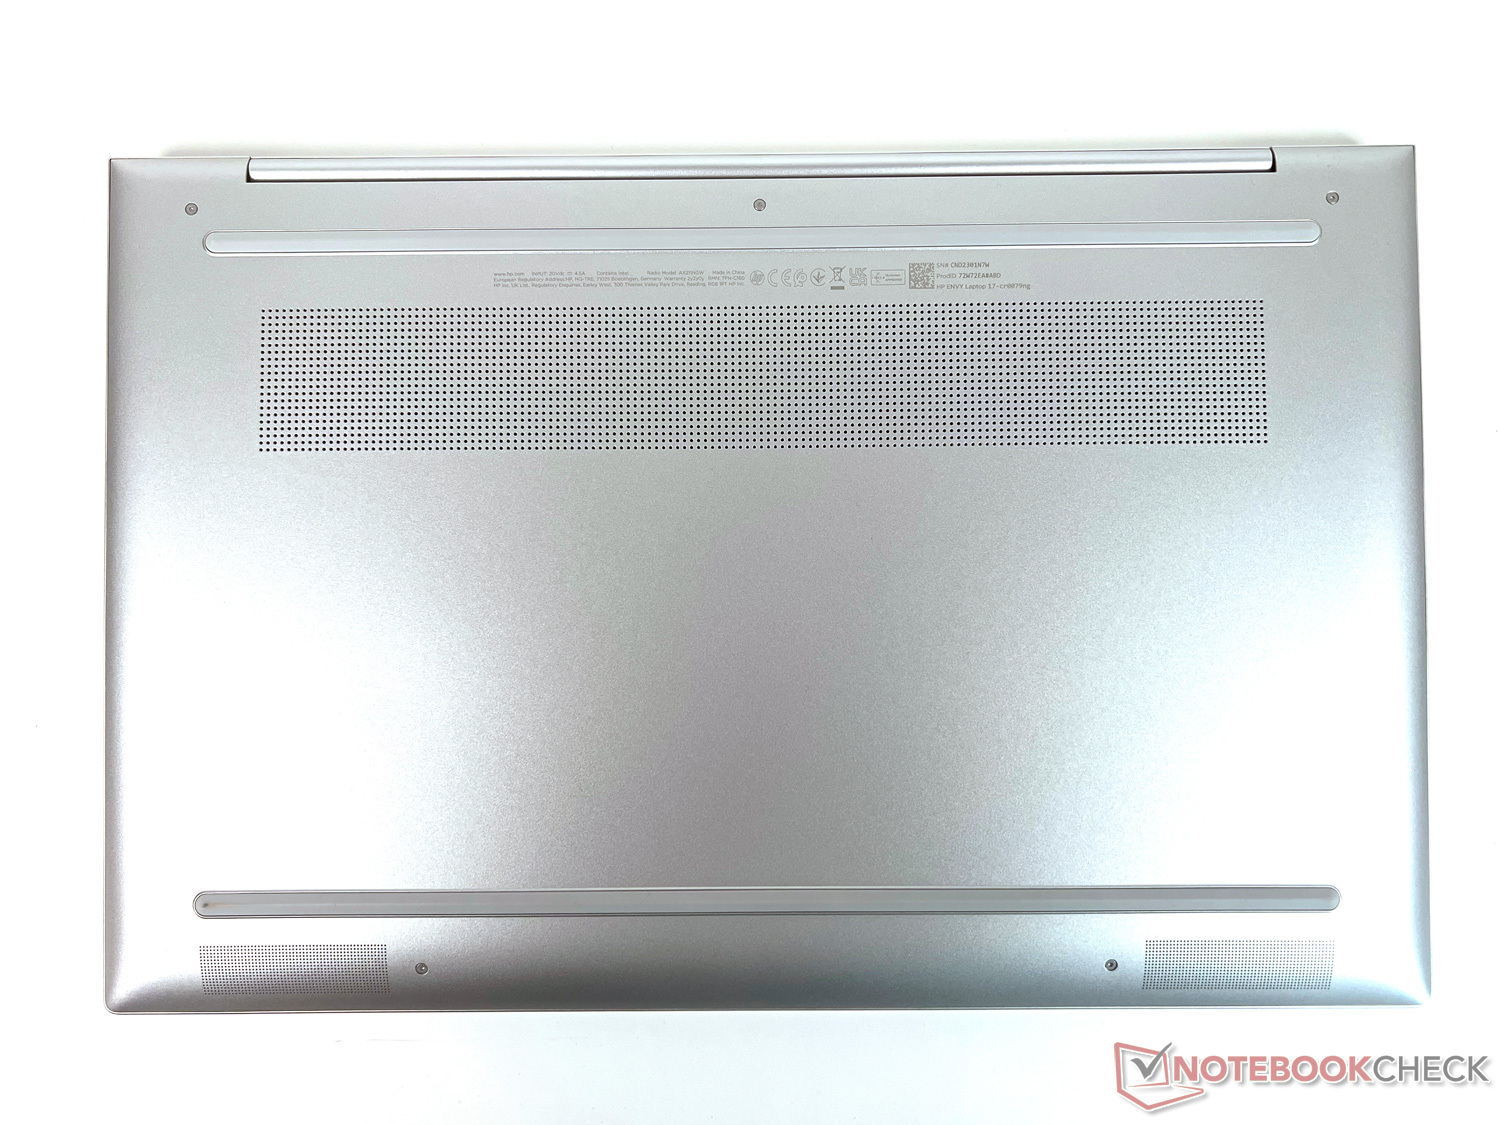
As a 17-inch laptop, the HP Envy 17 is of course not very compact. But thanks to the slim display bezels particularly on the left and right side, the overall size remains within limits. Compared to the other large 17-inch devices, it places in the middle of the test field.
The ~2.5 kg (~5.5 lb) weight plus 500g (~1.1 lb) for the charger have an impact on mobile use. A large display diagonal demands its due. However, even at that size, laptops can even be lighter, as the competitors show. Our test unit is one of the heaviest models here, which is a negative point for mobile usage.
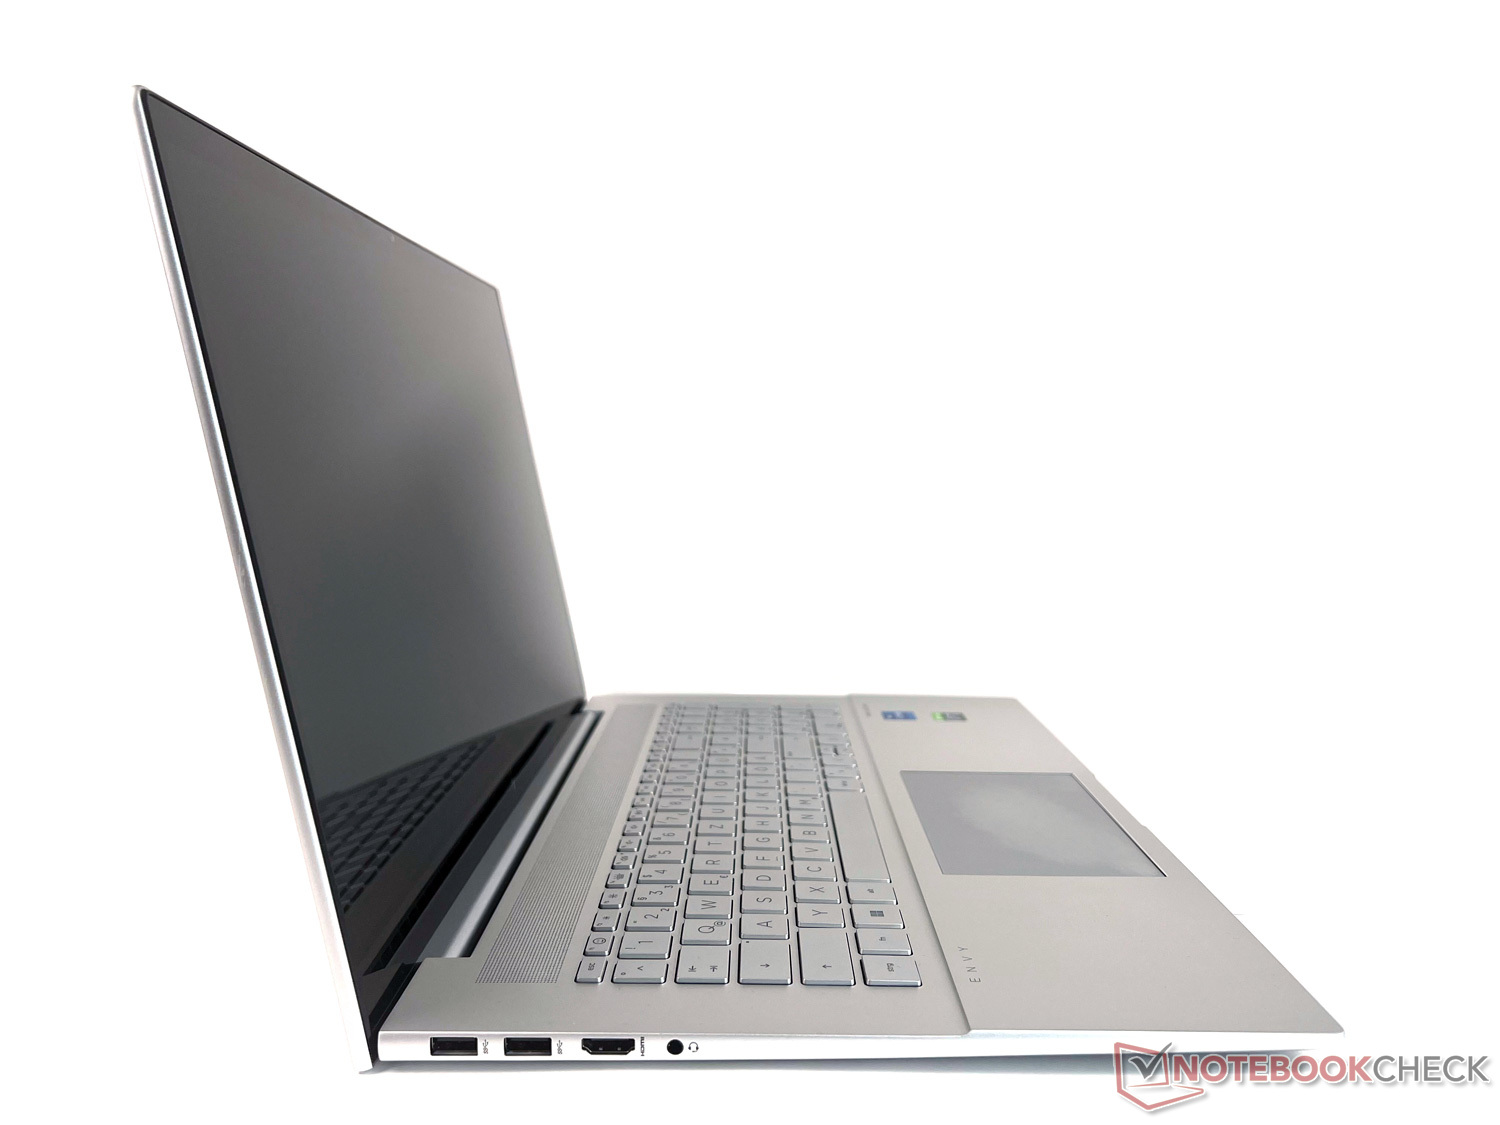
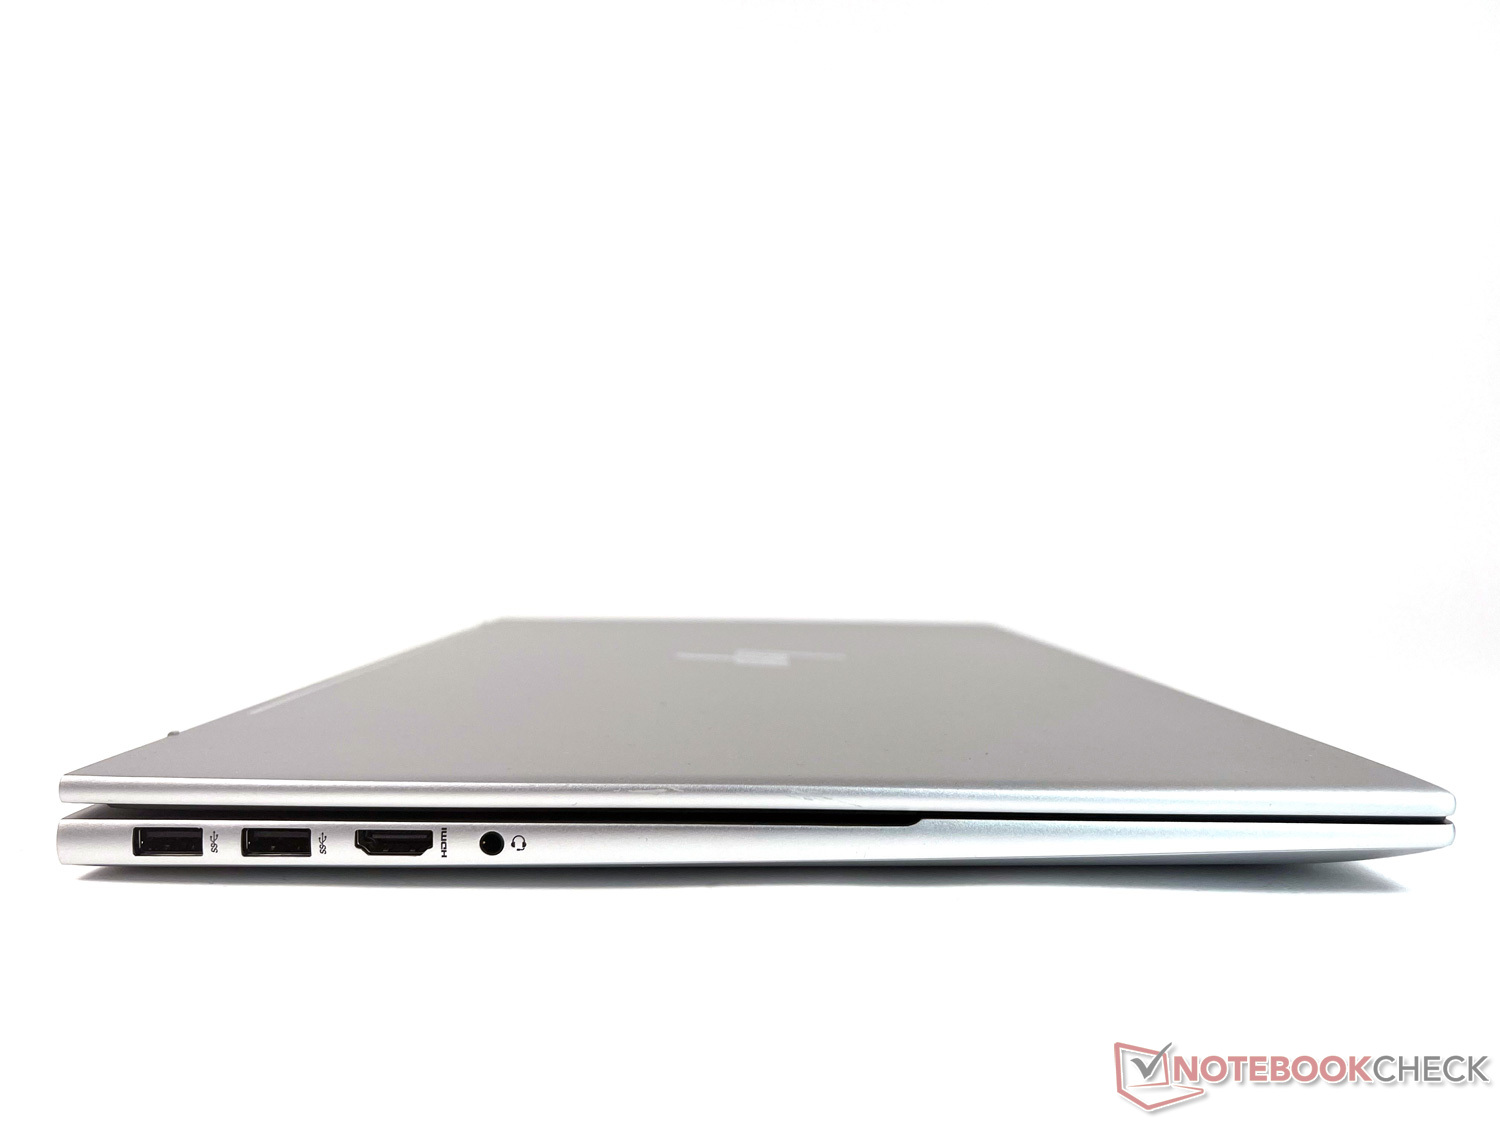
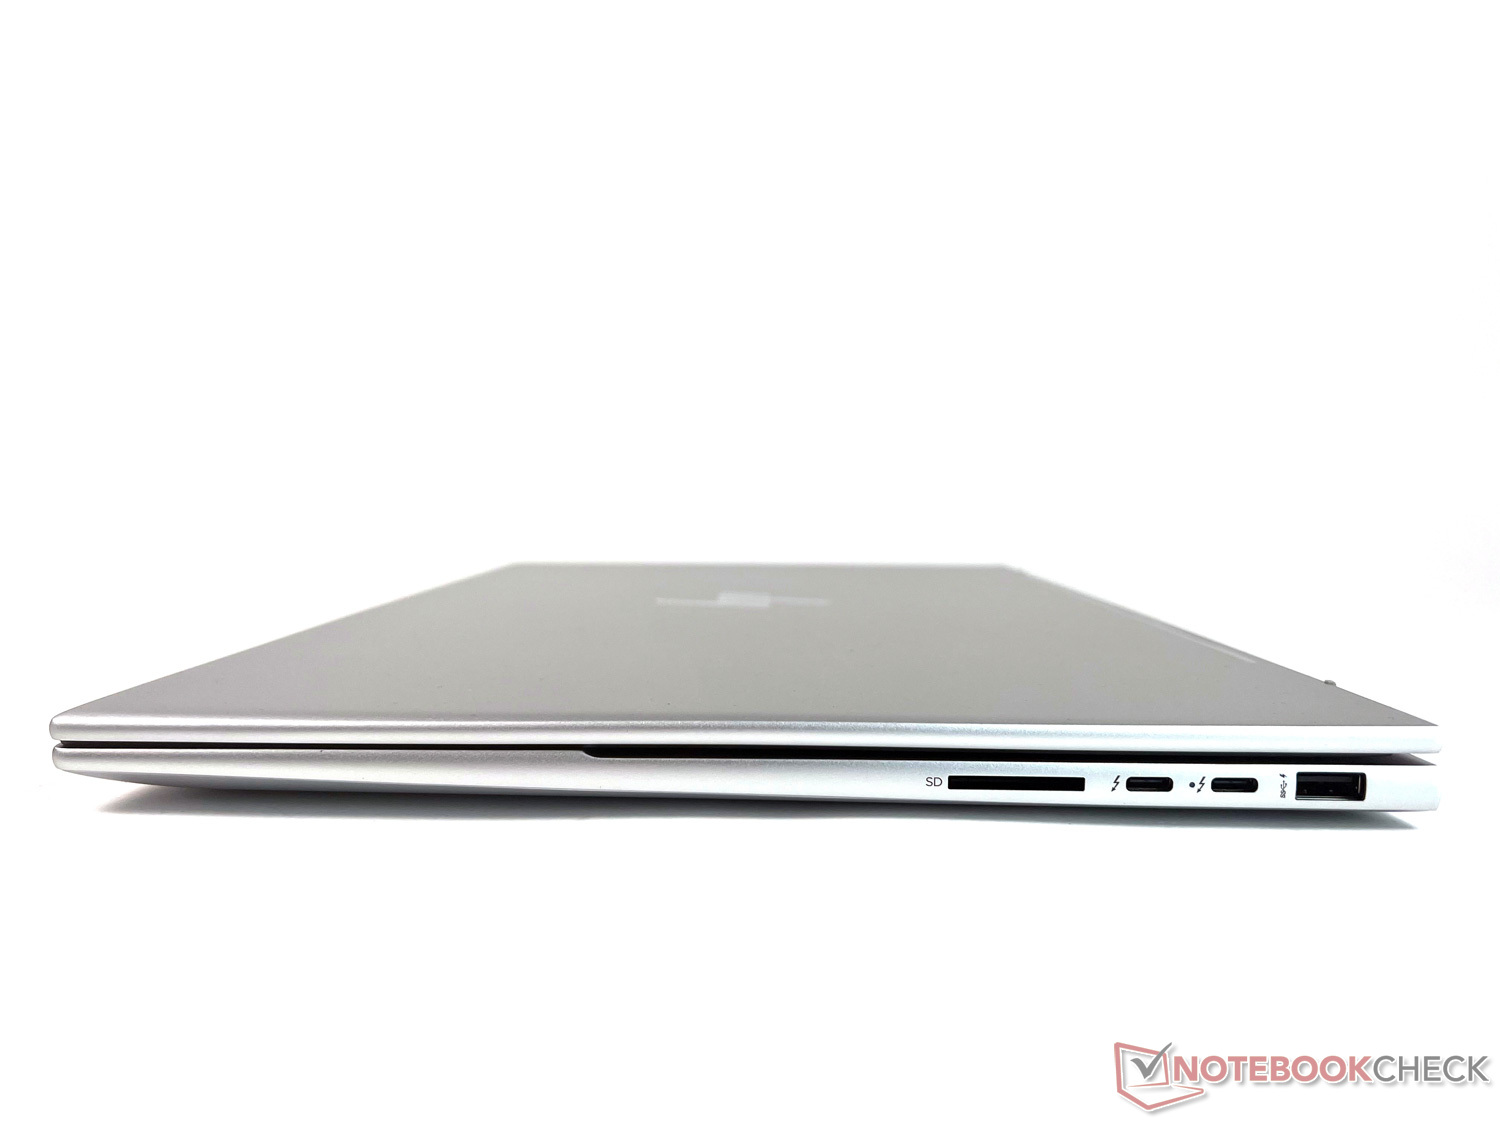
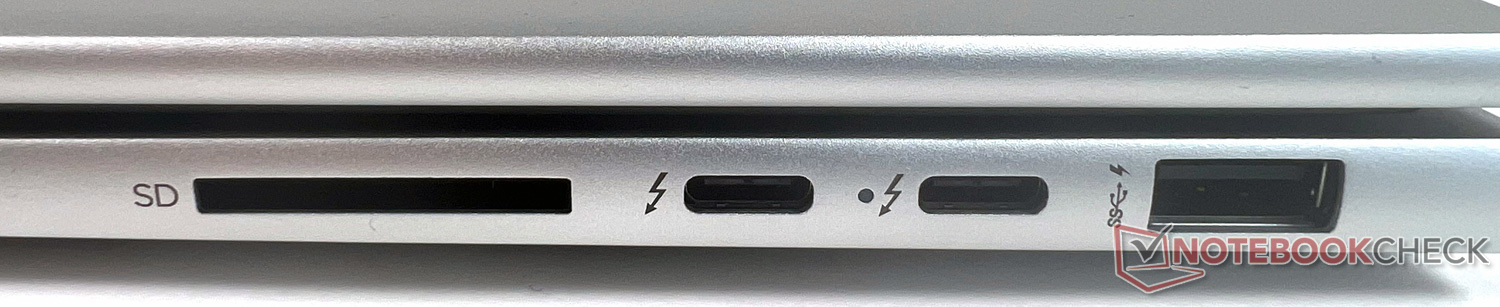
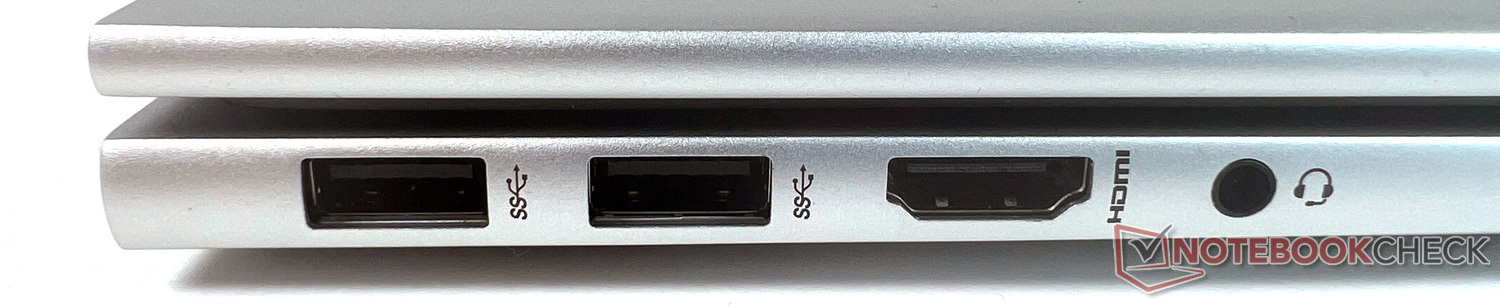
Equipment: Multimedia laptop with 2x Thunderbolt 4
The Envy 17 offers extensive port equipment, except for a LAN port. Included are two Thunderbolt 4 ports with USB 4 Type-C for data transfer up to 40 Gbit/s, charging, and DisplayPort 1.4, with both of the ports positioned on the right side. In some situations, distributing them over both sides would be more desirable. One of the Thunderbolt ports is used by the included charger to provide the power.
On the left side, an HDMI-2.1 port allows you to connect an external monitor, alternatively to the DisplayPort connection. Three additional USB-A ports distributed over both sides are sufficient, and there is also an SD card reader. All the connections are easily accessible.
SD Card Reader
The built-in SD card reader isn't one of the fast representatives of its kind. In our measurements using our AV PRO microSD 128 GB V60 reference storage card, it always places last, but the distance behind most of the competitors isn't very far. However, those who often need to copy large amounts of data from a storage card will still be better served by other devices.
| SD Card Reader | |
| average JPG Copy Test (av. of 3 runs) | |
| Dell XPS 17 9720 (Toshiba Exceria Pro SDXC 64 GB UHS-II) | |
| Average of class Multimedia (23 - 531, n=43, last 2 years) | |
| Lenovo IdeaPad 3 17ABA7 (AV Pro SD microSD 128 GB V60) | |
| LG Gram 17Z90Q-E.AD78G (AV Pro SD microSD 128 GB V60) | |
| HP Envy 17-cr0079ng (AV Pro SD microSD 128 GB V60) | |
| maximum AS SSD Seq Read Test (1GB) | |
| Dell XPS 17 9720 (Toshiba Exceria Pro SDXC 64 GB UHS-II) | |
| Average of class Multimedia (27.9 - 1455, n=42, last 2 years) | |
| LG Gram 17Z90Q-E.AD78G (AV Pro SD microSD 128 GB V60) | |
| Lenovo IdeaPad 3 17ABA7 (AV Pro SD microSD 128 GB V60) | |
| HP Envy 17-cr0079ng (AV Pro SD microSD 128 GB V60) | |
Communication
The Wi-Fi 6E AX211 module from Intel used here ensures a speedy WLAN connection that almost remains constant over time. Our measurements are at the level of the average for this WLAN module. A wired network connection in form of a LAN port or a mobile connection is not available.
Webcam
The HP True Vision infrared camera is set in the center of the top display bezel. It offers temporary noise suppression and an integrated dual-array digital microphone. At 5 MP, its resolution is fairly high, and it can also be used for Windows Hello. While the image quality is good, it has a slight red tint. Compared to the competitors in our test, it has the second lowest color deviation with a solid ∆E of 8. This is absolutely sufficient for professional or private video calls.
A nice gimmick: the privacy shutter is not opened and closed manually via slider but via keypress on the keyboard. In addition, a small light next to the camera indicates when this is activated.


Security
In addition to privacy protection for the camera, the HP Envy 17 also supports the Trusted Platform Module (firmware TPM). There is no Kensington Lock or fingerprint sensor, but Windows Hello is supported for unlocking via face recognition.
Accessories
HP includes a powerful 90-Watt USB-C charger with the laptop. Optionally, HP also offers a number of accessories, but they are not specifically designed for this laptop.
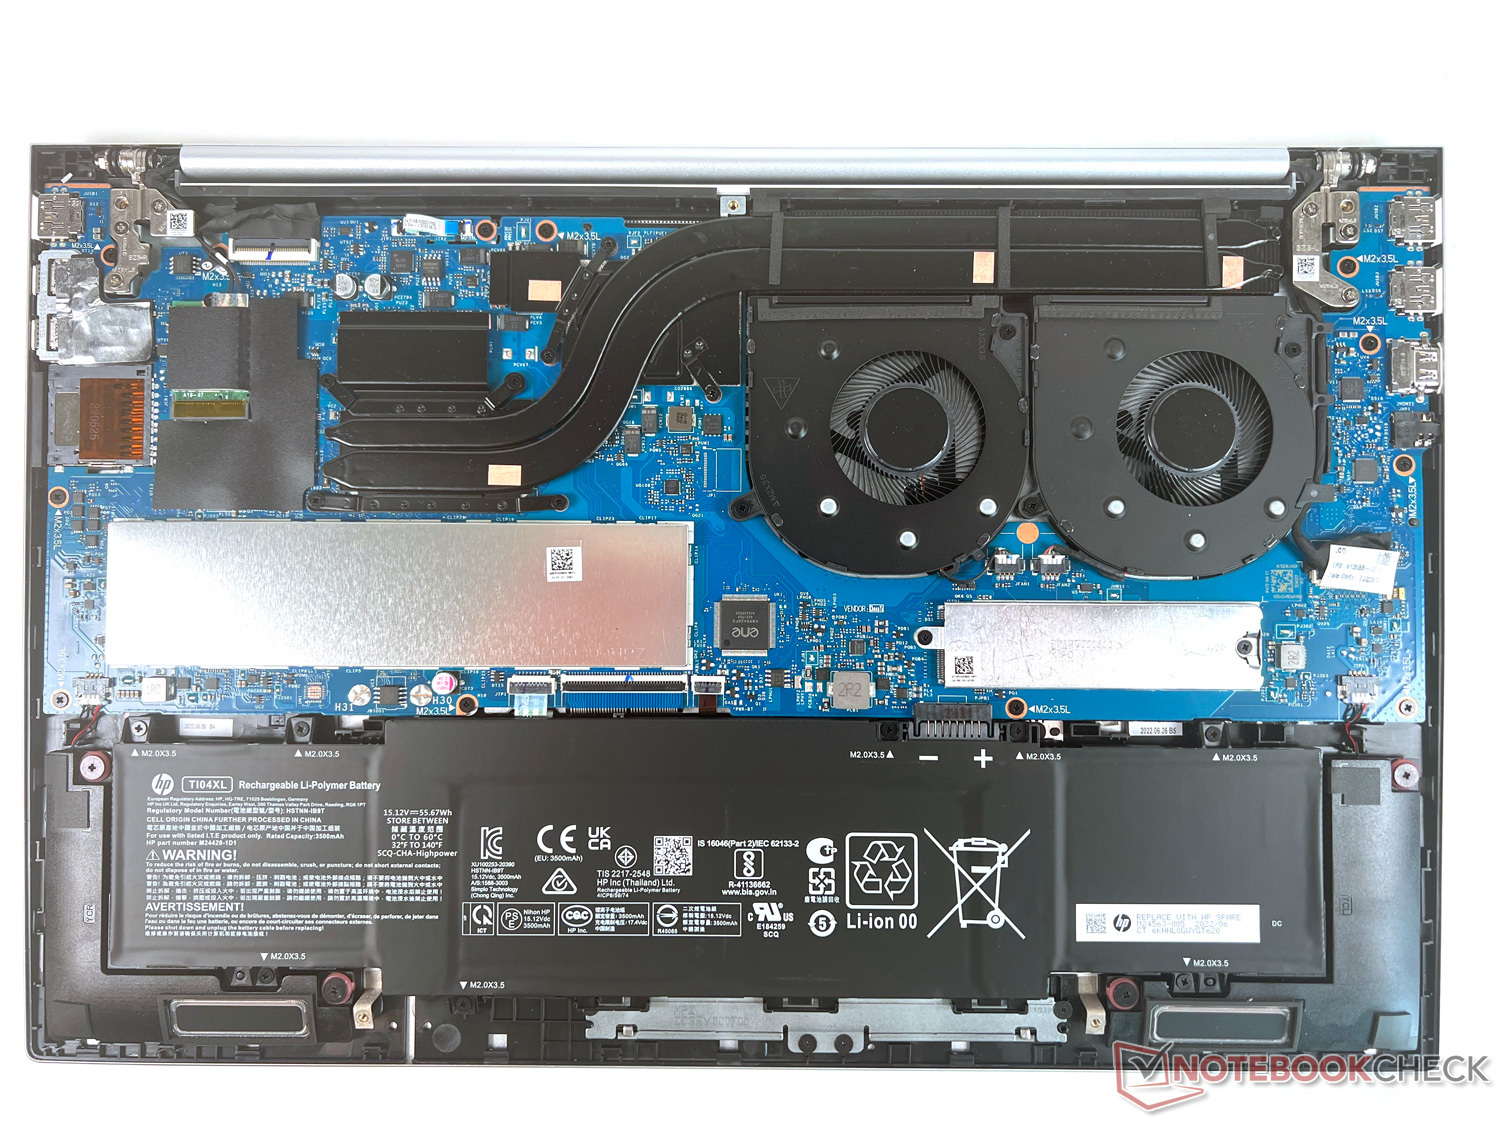
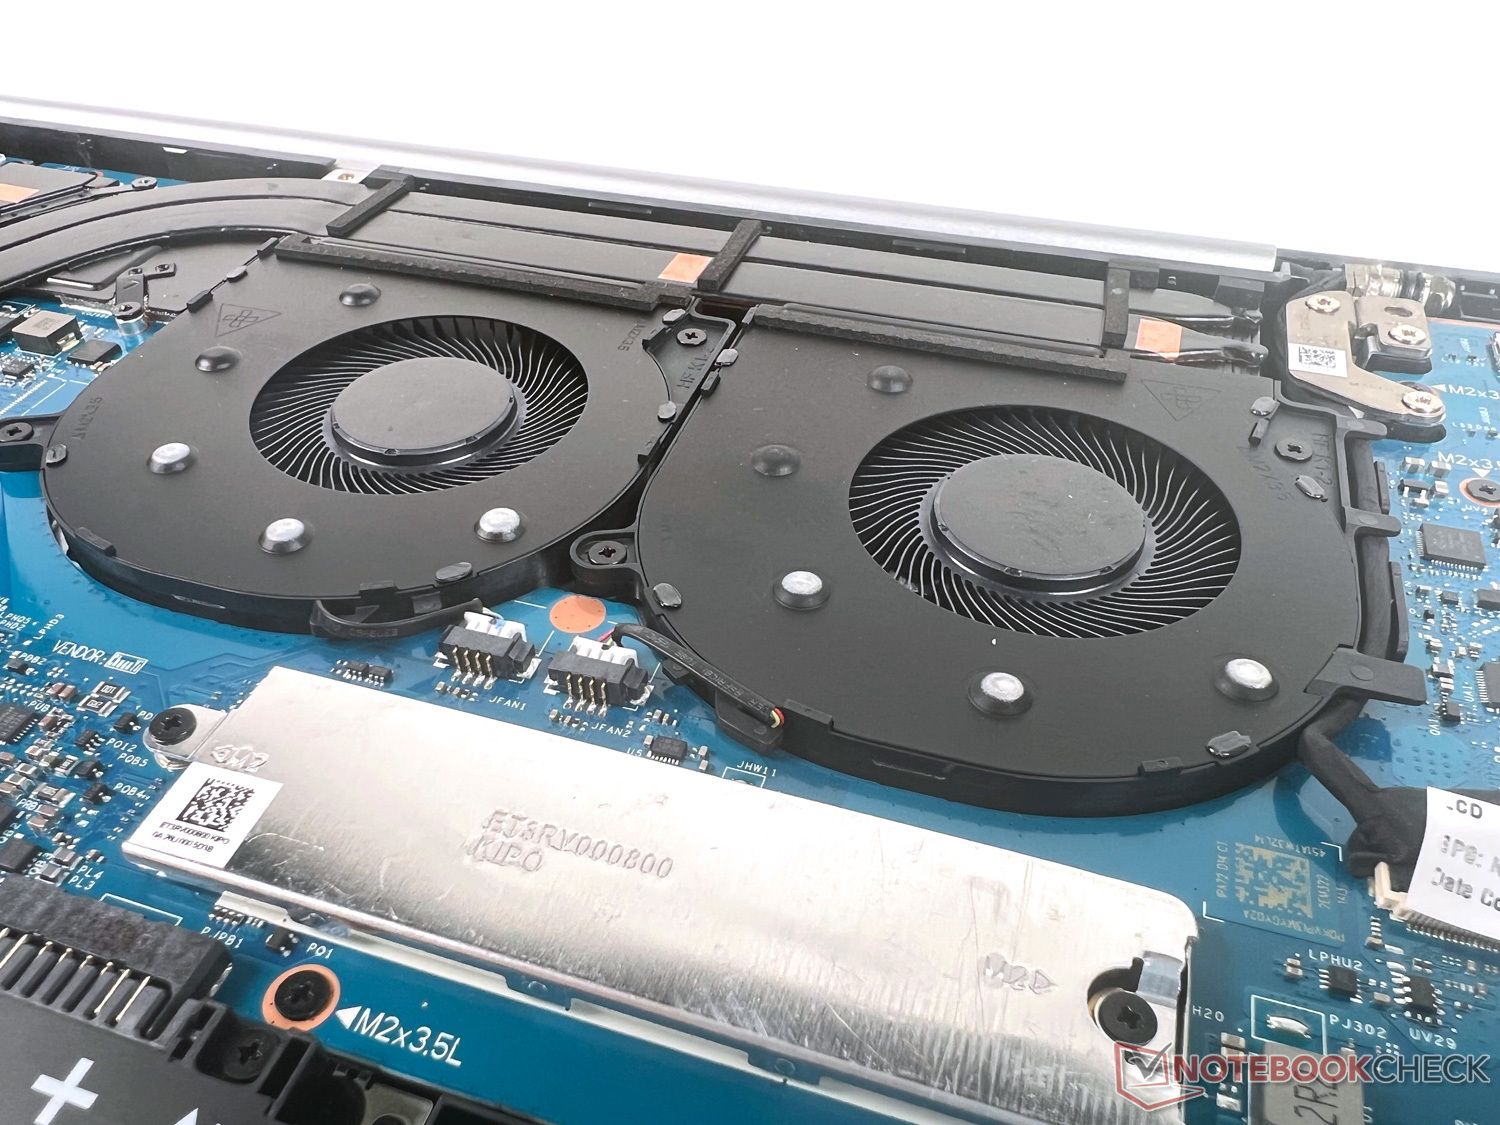
Maintenance
The access to the insides is blocked by five tiny Torx screws. Once you gained access, you are hardly offered any opportunities for maintenance. There are no free slots for storage expansion, but considering it already offers 32 GB of RAM, this shouldn't be too hard to accept. The battery, the M.2 SSD, and the Wi-Fi module can be replaced.
Warranty
In Germany, HP offers a 2-year manufacturer's warranty for parts and labor.
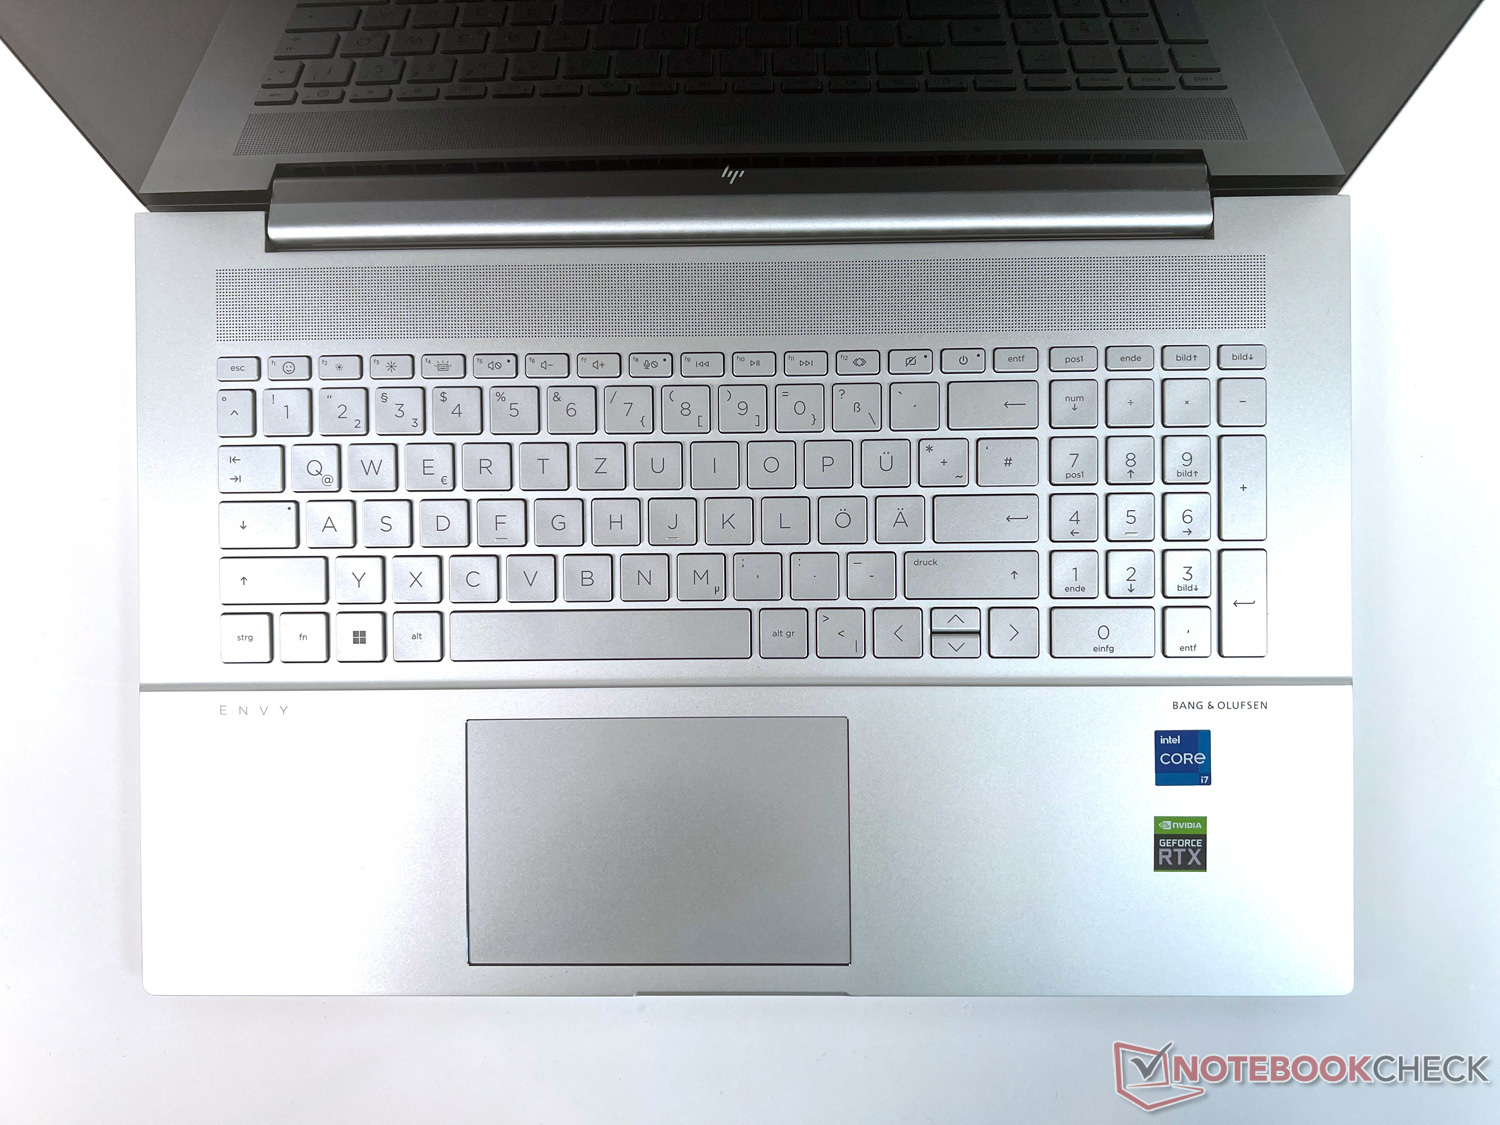
Input Devices: The large keyboard gives no reason for complaints
A 17.3-inch display diagonal also means that there is a lot of space for the keyboard. Aside from about 3 cm (~1.2 in) on the edges, HP uses this space for a sufficiently large keyboard together with a numpad on the side.
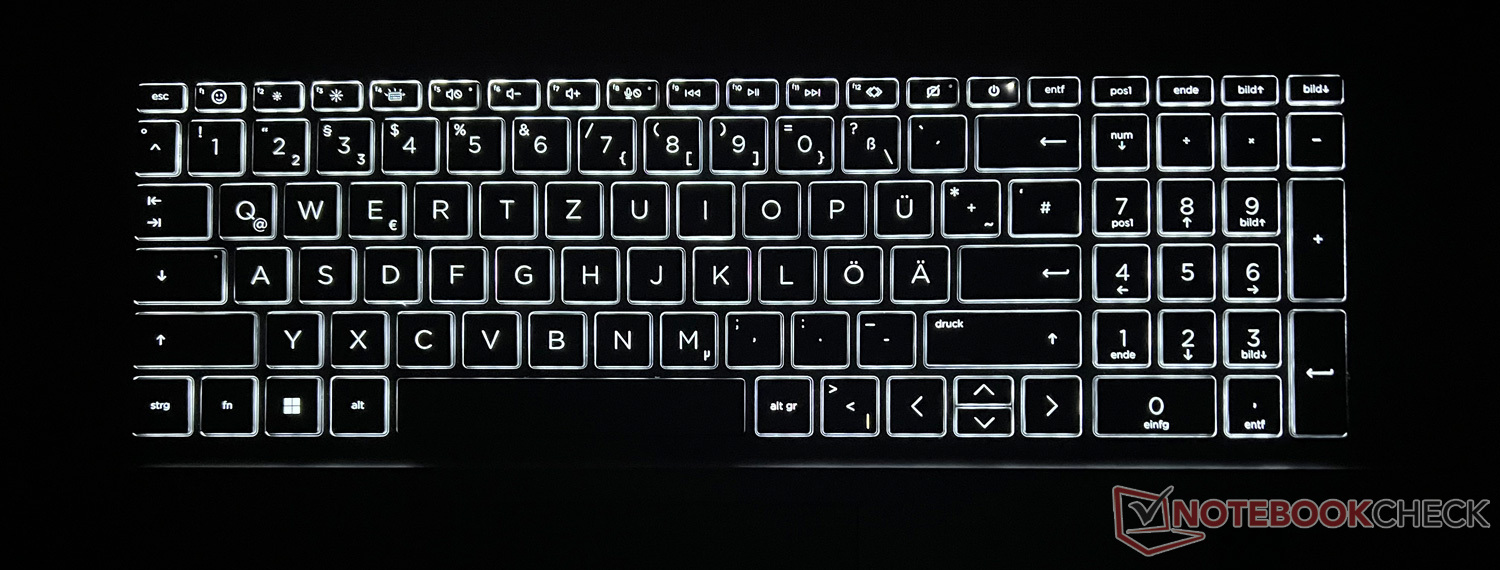
Keyboard
At about 1.7 x 1.7 cm (~0.67 in), the keys are sufficiently large, and with a key stoke of around 2 mm (~0.08 in), the keyboard offers a comfortable typing experience. The manufacturer occupies the F1 to F12 keys with the usual additional functions, for example to control the three-step keyboard illumination, volume, display brightness, or the camera shutter we already mentioned. On the right side is the power key to turn on the device.
The numpad is convenient particularly for number input. The keyboard illumination ensures an even key illumination and good readability of the labels.
Touchpad
The touchpad is placed below the keyboard slightly to the left of the center. At around 12.5 x 8 cm (~4.9 x 3.15 in), we neither have any reason for complaint about the size nor about the haptics, thanks to the smooth surface. Left clicks are possible on almost the whole surface of the touchpad, and aside from the right bottom corner, right clicks as well. There is no haptic separation of the areas, but in everyday operation you won't notice that this is missing.
The response to inputs is swift and without any problems. Multi-touch gestures such as scrolling with two fingers or zooming in and out are supported.
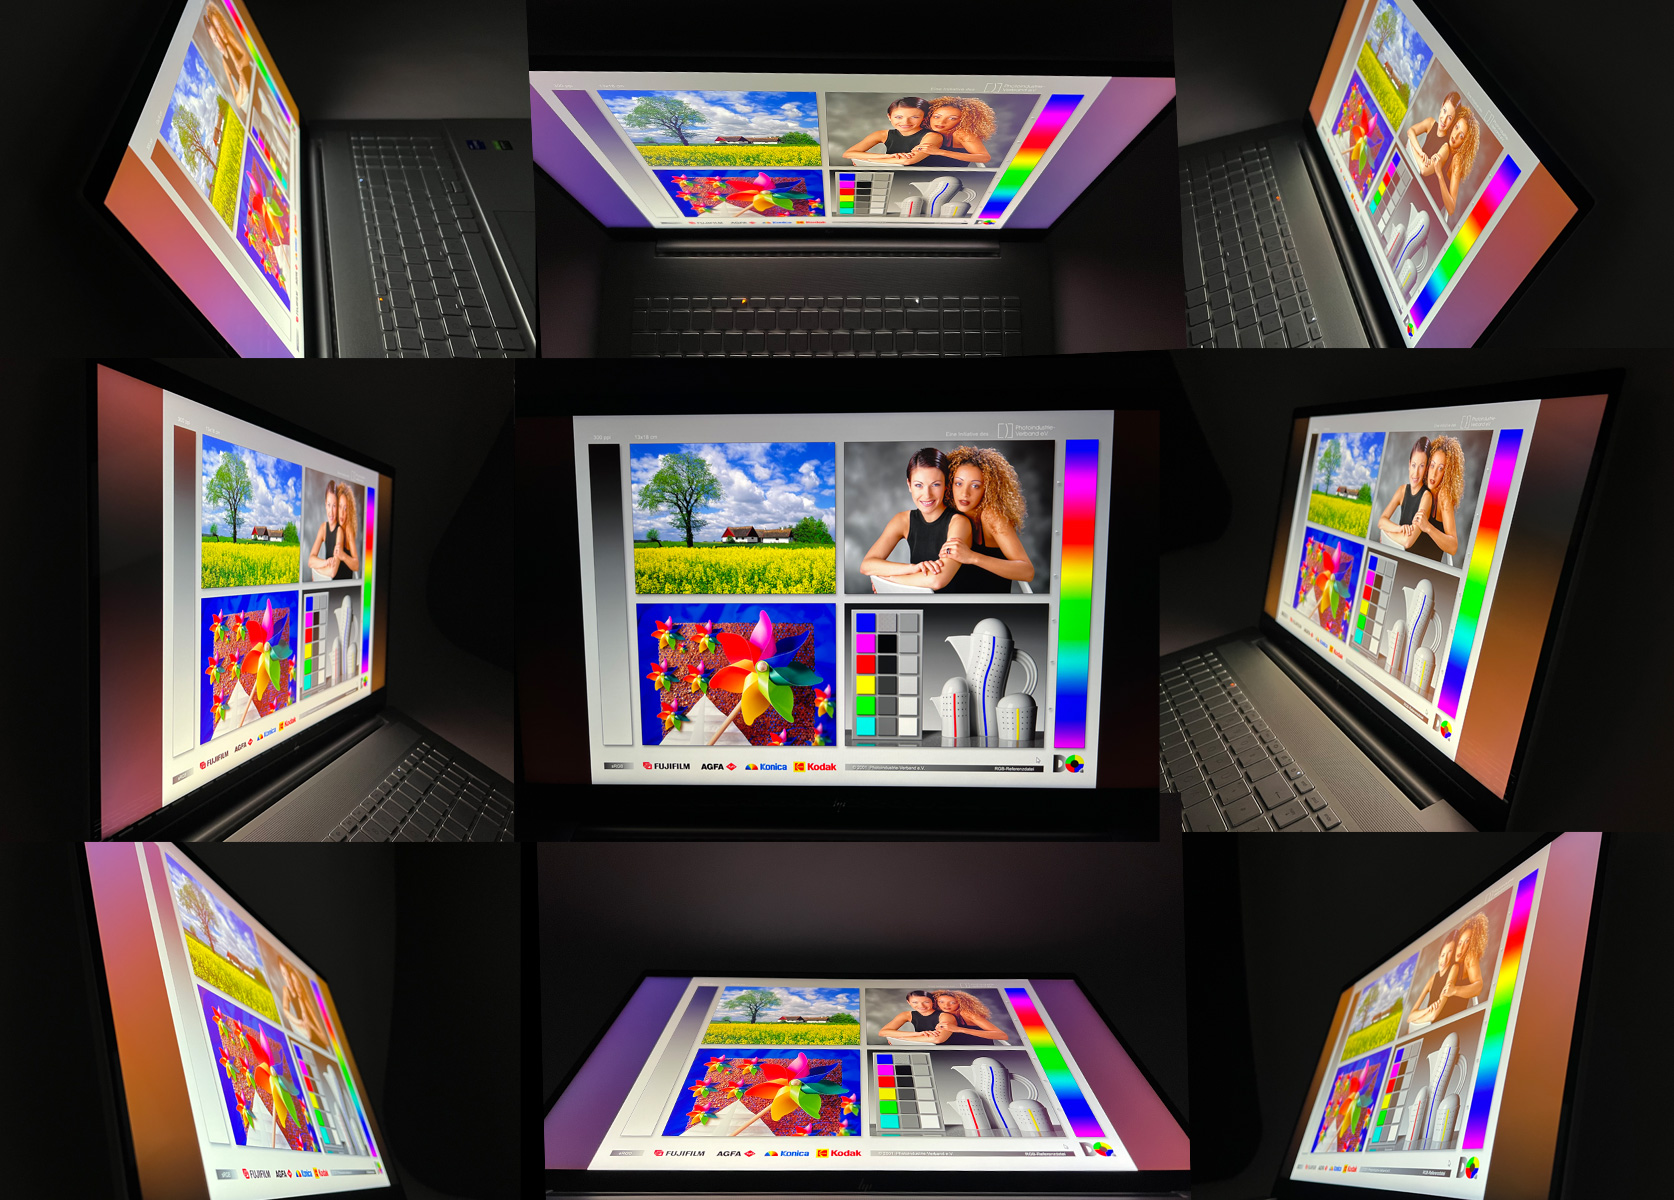
Display: High resolution and good, but very reflective
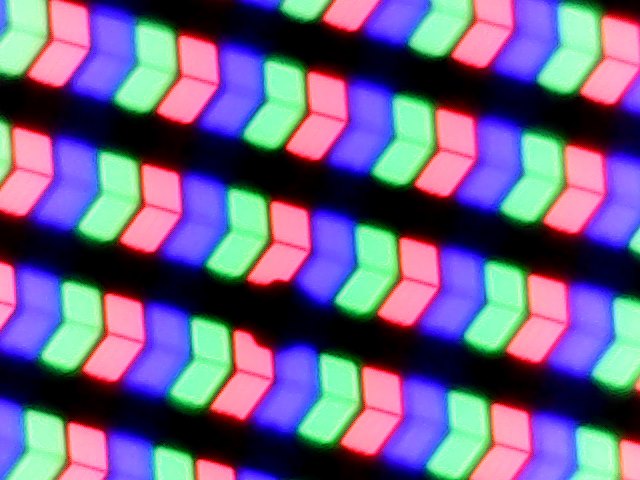

HP has equipped the Envy 17-cr0079ng with a large 17.3-inch, high resolution 4K IPS panel from BOE with 3,840 x 2,160 pixels, 60 Hz, and short response times. Alternatively, you can also choose versions with an FHD display in this model series.
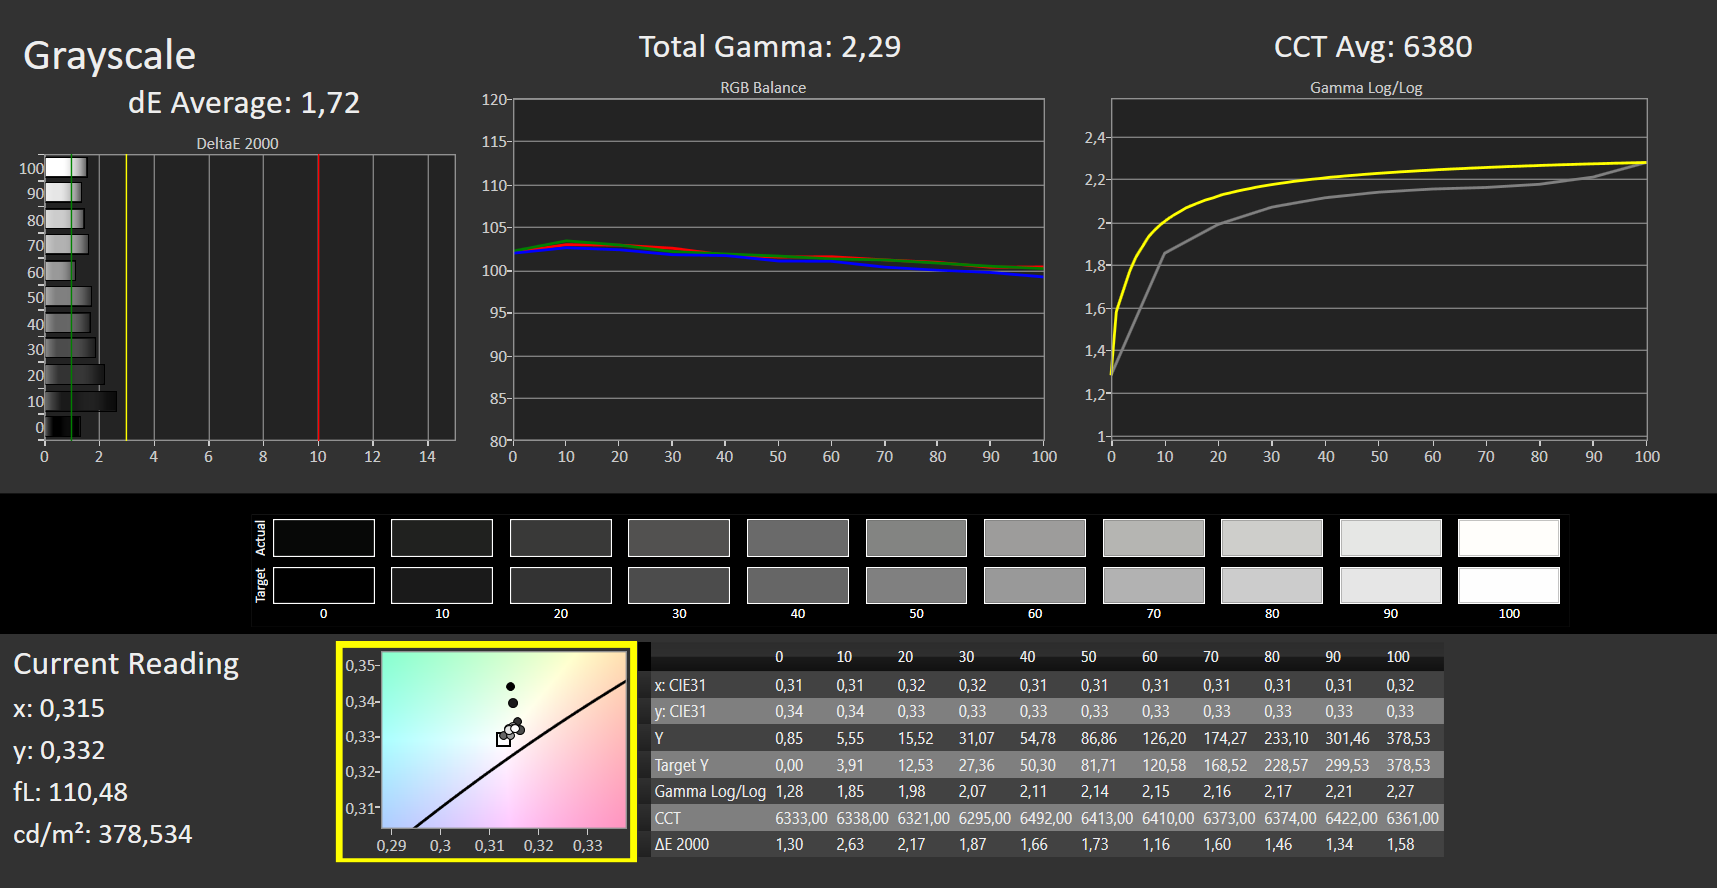
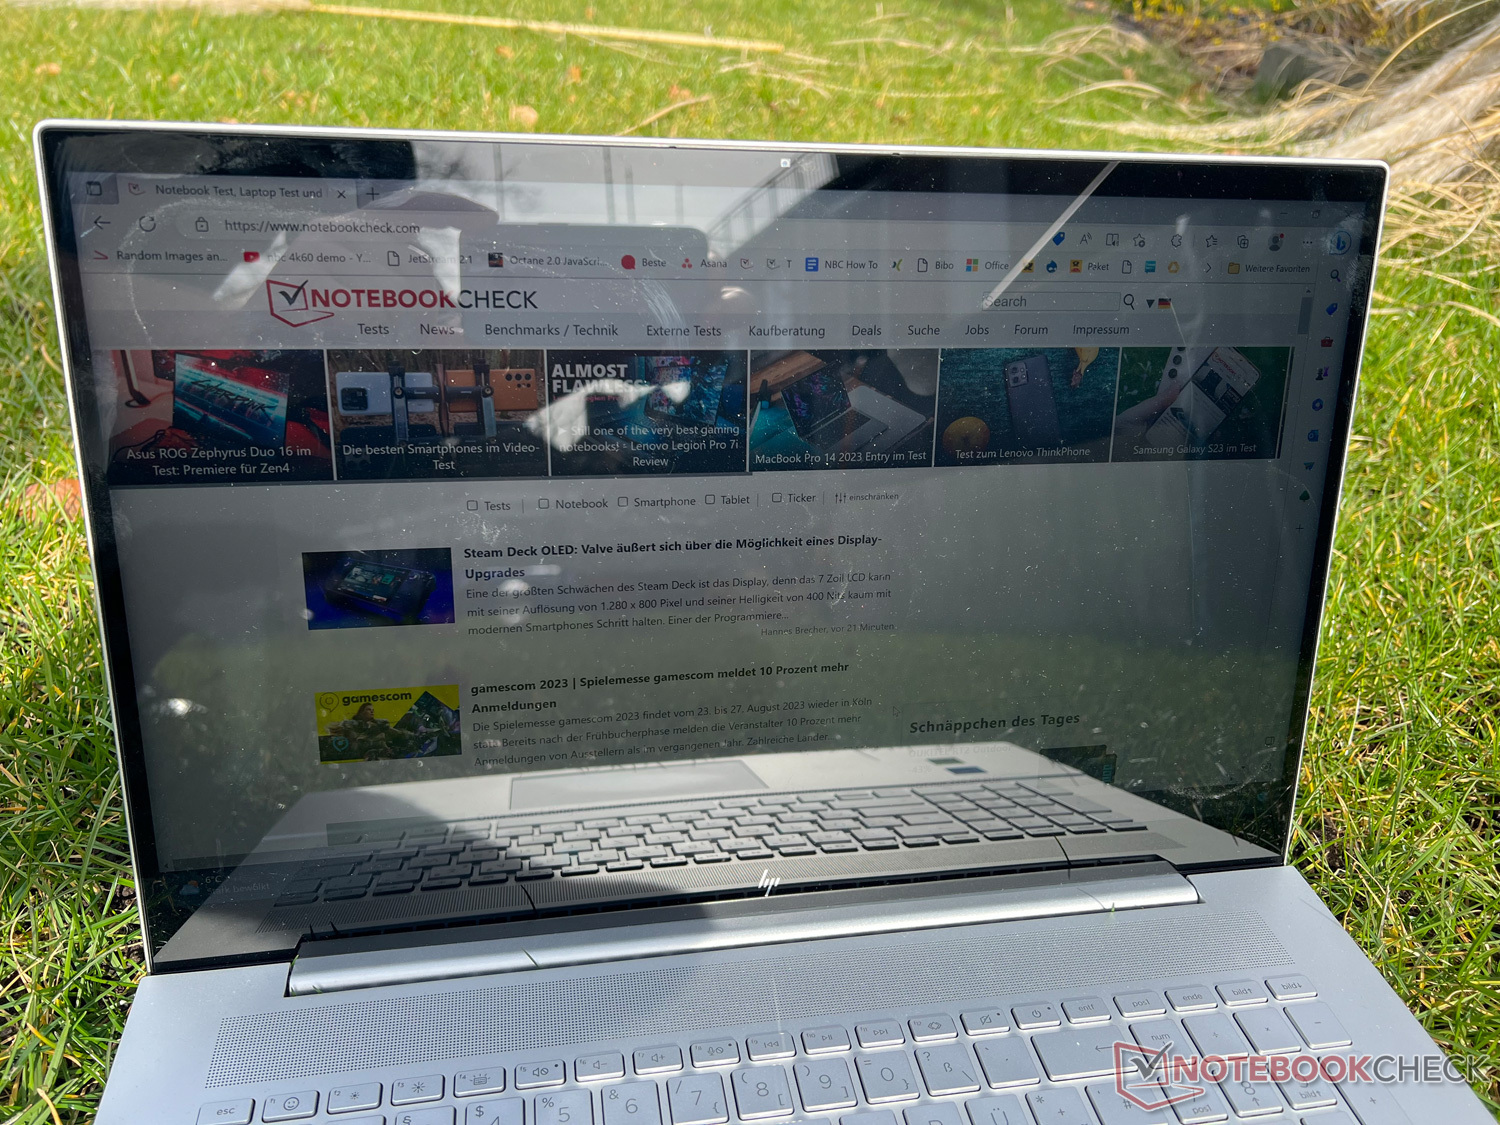
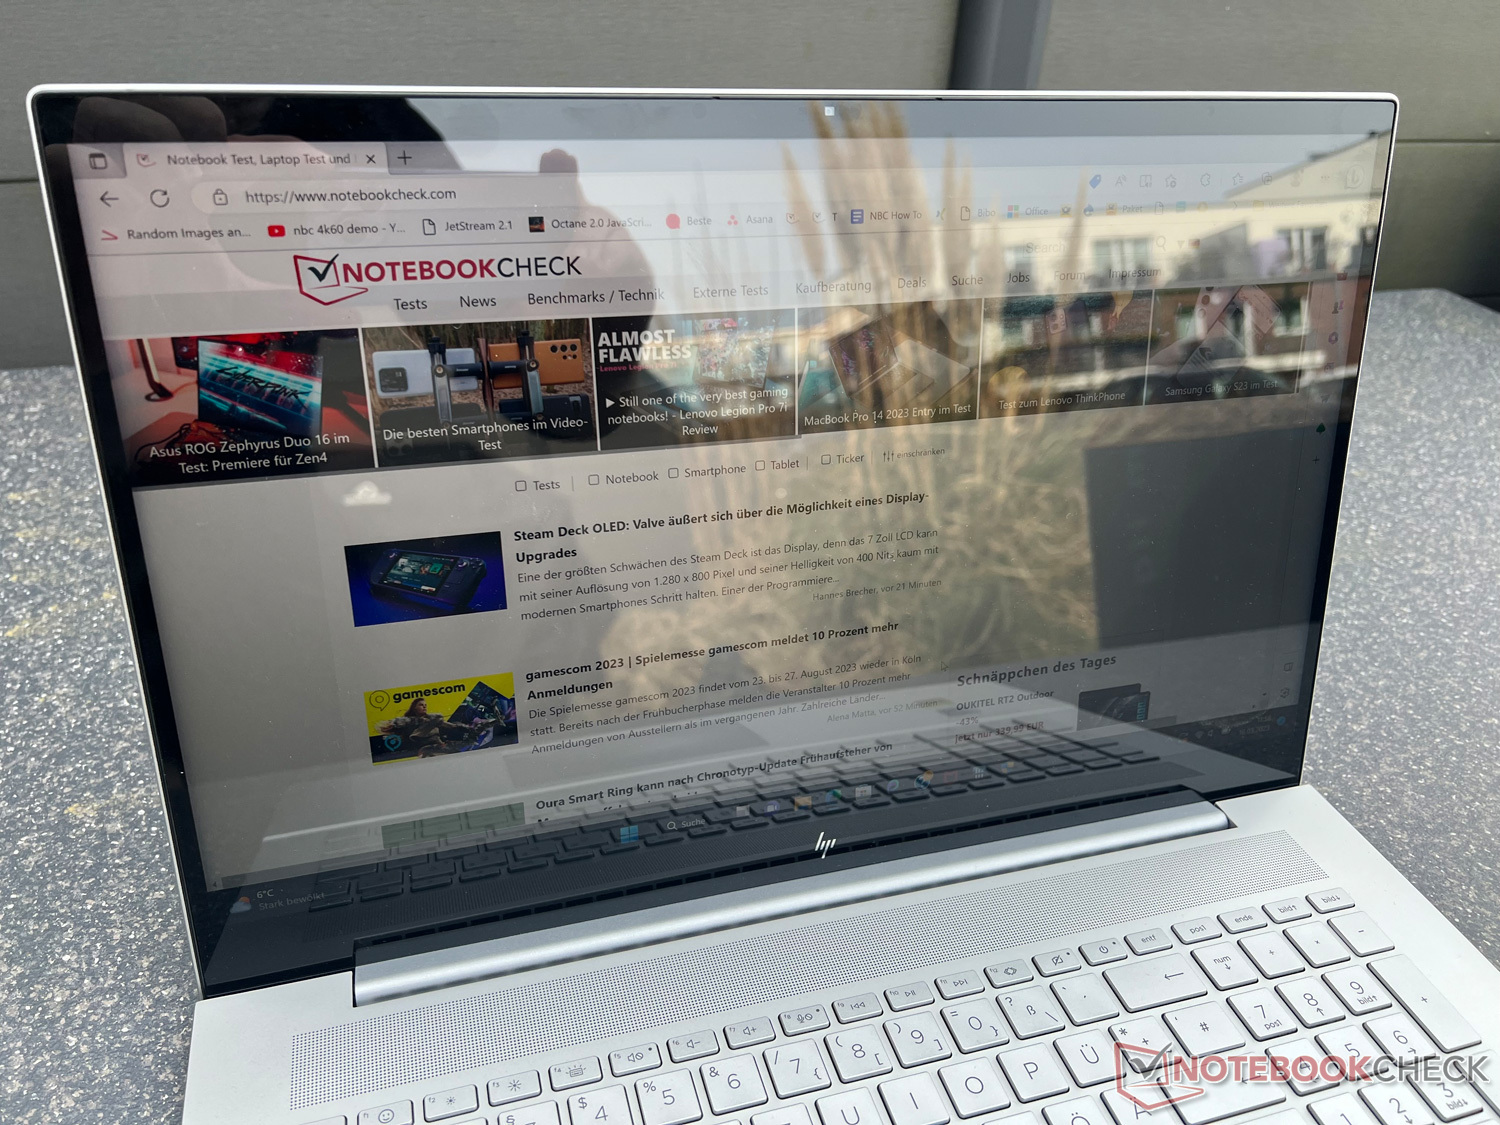
The manufacturer promises a display brightness of 400 Nits, which we are able to confirm in our test measurements in some spots and also almost on average across the whole area. In our comparison field, our test unit offers one of the brightest displays, but unfortunately that doesn't help when using it outdoors, since the manufacturer has decided to use a reflective version. Even though that looks great, it also creates strong reflections, making the contents hardly recognizable outdoors (see pictures below). Indoors, this works better, but you still get annoying reflections from light sources such as lamps or windows.
In terms of the black value and contrast, the HP Envy 17 is surpassed by most of our competitors. In our comparison field, the display produces one of the best overall results, but it also suffers from some slight clouding and significant backlight bleeding, meaning that you can see some lighter spots in the background illumination at the edges when dark contents are displayed.
| |||||||||||||||||||||||||
Brightness Distribution: 86 %
Center on Battery: 390 cd/m²
Contrast: 987:1 (Black: 0.395 cd/m²)
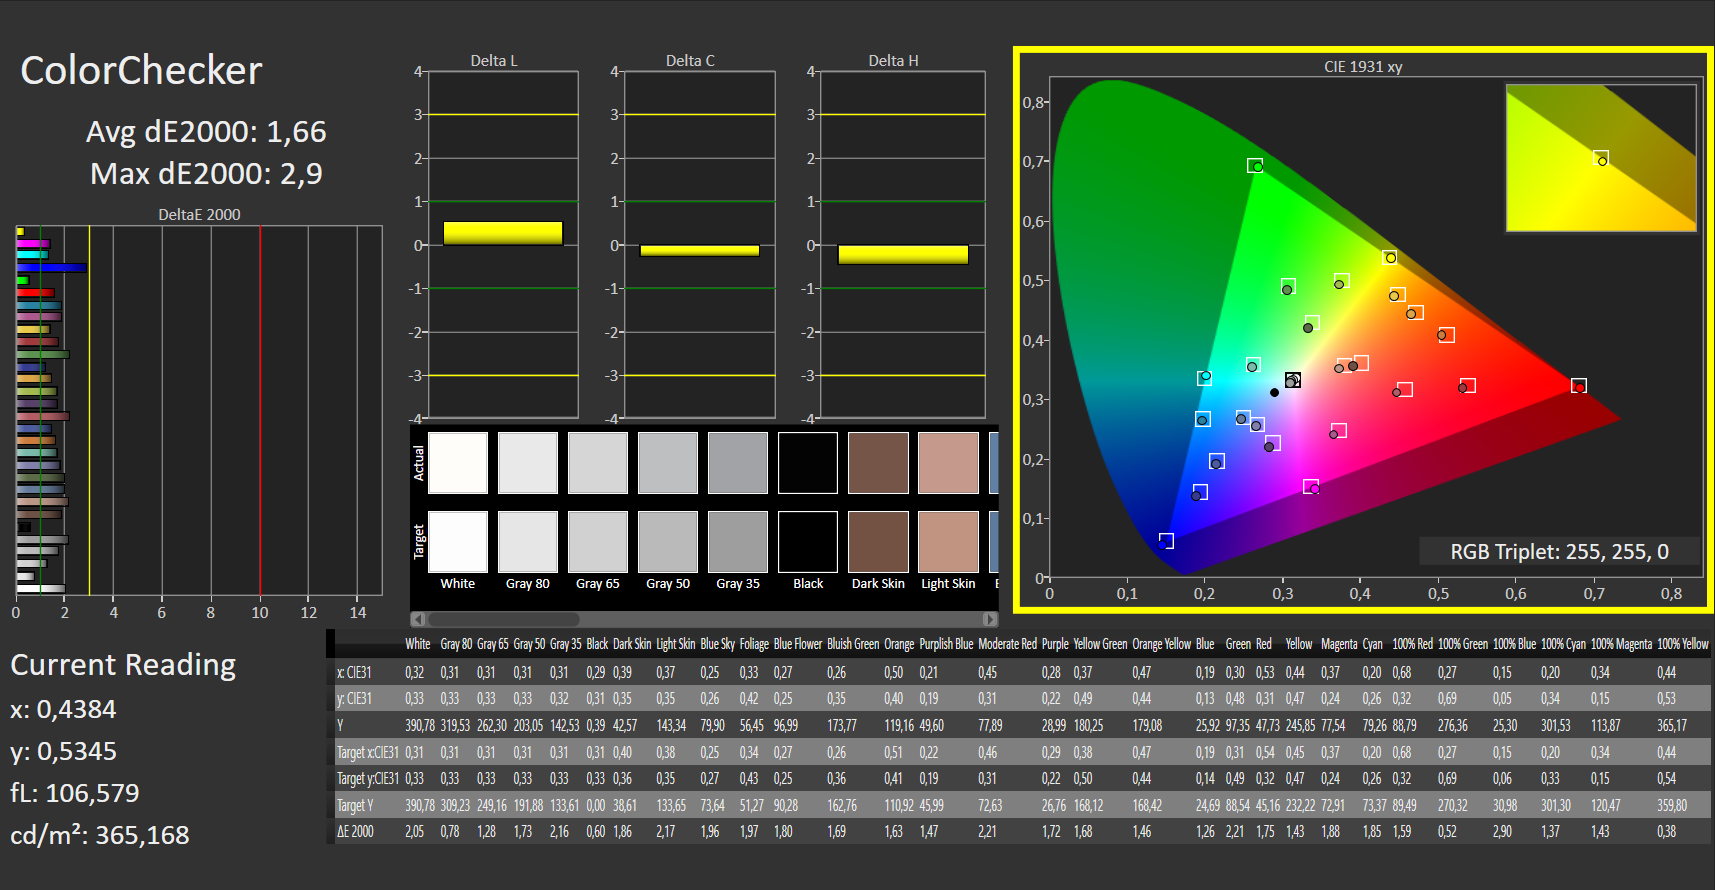
ΔE ColorChecker Calman: 1.66 | ∀{0.5-29.43 Ø4.73}
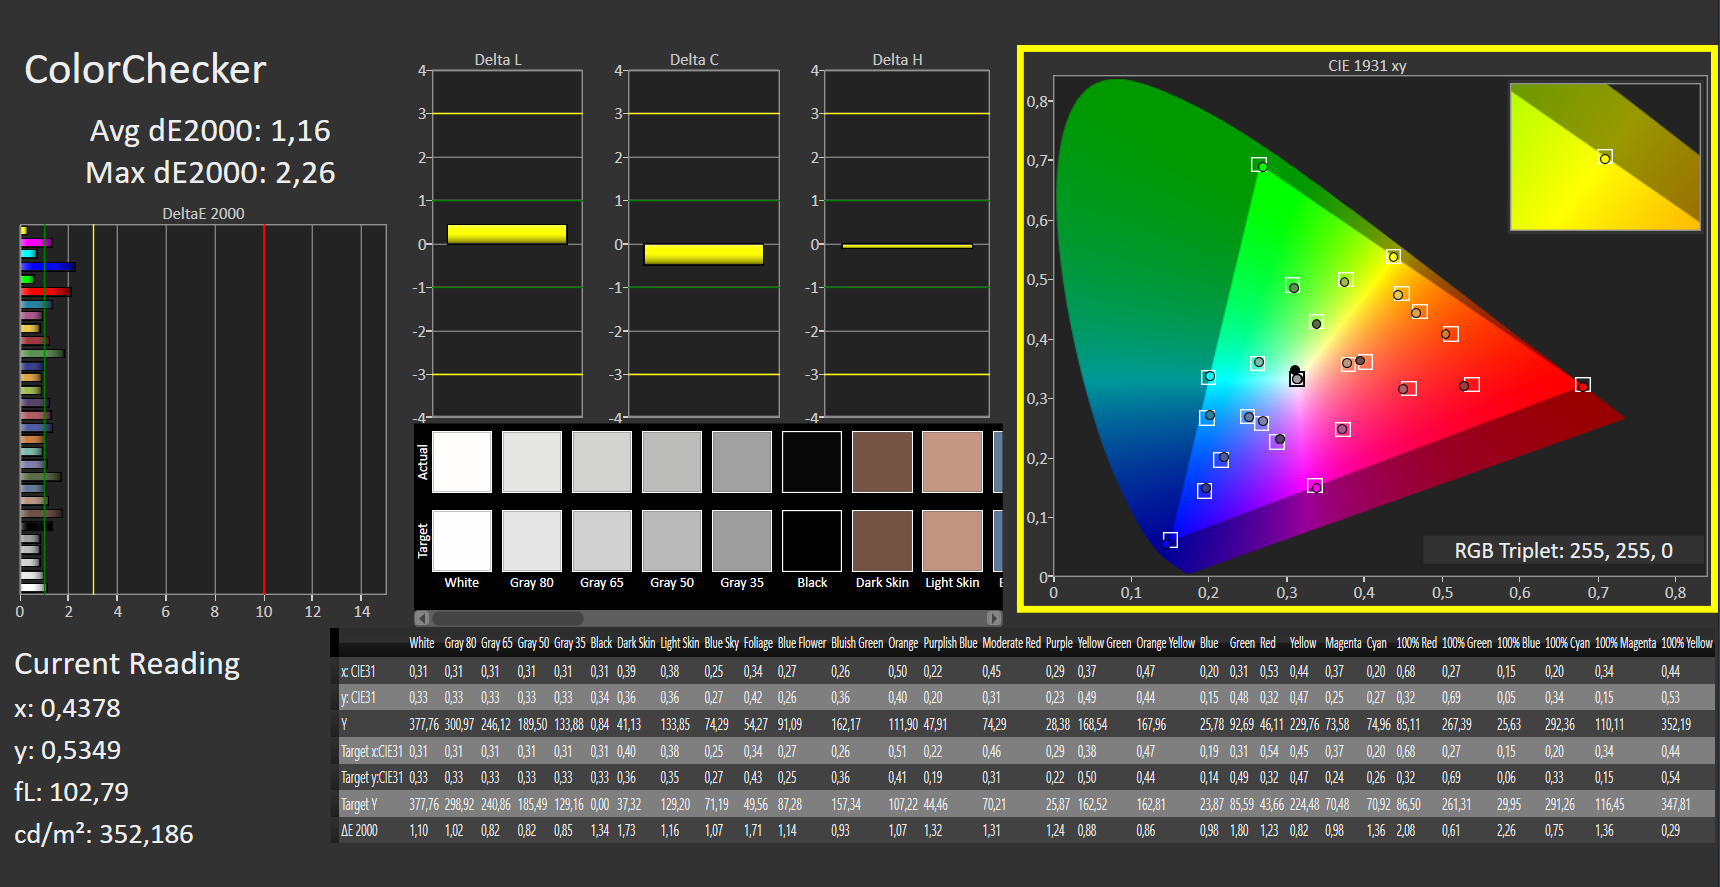
calibrated: 1.16
ΔE Greyscale Calman: 1.83 | ∀{0.09-98 Ø4.97}
87.03% AdobeRGB 1998 (Argyll 3D)
100% sRGB (Argyll 3D)
98.31% Display P3 (Argyll 3D)
Gamma: 2.25
CCT: 6727 K
| HP Envy 17-cr0079ng BOE0A66, IPS, 3840x2160, 17.3" | HP ProBook 450 G9 6A180EA Chi Mei CMN1512, , 1920x1080, 15.6" | LG Gram 17Z90Q-E.AD78G LG Display LP170WQ1-SPF2, IPS, 2560x1600, 17" | Acer Aspire 5 A515-57G-53N8 CMN N156HCA-EAB, IPS, 1920x1080, 15.6" | Dell XPS 17 9720 Sharp LQ170R1, IPS, 3840x2400, 17" | Lenovo IdeaPad 3 17ABA7 Lenovo LEN173FHD, IPS, 1920x1080, 17.3" | |
|---|---|---|---|---|---|---|
| Display | -47% | -4% | -47% | 4% | -22% | |
| Display P3 Coverage (%) | 98.31 | 42.76 -57% | 92.2 -6% | 43.3 -56% | 94.8 -4% | 67.8 -31% |
| sRGB Coverage (%) | 100 | 63.9 -36% | 98.66 -1% | 65 -35% | 100 0% | 88.9 -11% |
| AdobeRGB 1998 Coverage (%) | 87.03 | 44.2 -49% | 82.98 -5% | 44.8 -49% | 100 15% | 65 -25% |
| Response Times | -1443% | -1086% | -1855% | -2763% | -443% | |
| Response Time Grey 50% / Grey 80% * (ms) | 1 | 28 ? -2700% | 22 ? -2100% | 35.6 ? -3460% | 53.2 ? -5220% | 10 ? -900% |
| Response Time Black / White * (ms) | 7 ? | 20 ? -186% | 12 ? -71% | 24.5 ? -250% | 28.4 ? -306% | 6 ? 14% |
| PWM Frequency (Hz) | 17990 ? | |||||
| Screen | -124% | -36% | -97% | -17% | -109% | |
| Brightness middle (cd/m²) | 390 | 234 -40% | 391 0% | 250 -36% | 438 12% | 353 -9% |
| Brightness (cd/m²) | 385 | 218 -43% | 358 -7% | 234 -39% | 411 7% | 307 -20% |
| Brightness Distribution (%) | 86 | 85 -1% | 84 -2% | 79 -8% | 86 0% | 78 -9% |
| Black Level * (cd/m²) | 0.395 | 0.17 57% | 0.29 27% | 0.19 52% | 0.27 32% | 0.775 -96% |
| Contrast (:1) | 987 | 1376 39% | 1348 37% | 1316 33% | 1622 64% | 455 -54% |
| Colorchecker dE 2000 * | 1.66 | 5.04 -204% | 3.52 -112% | 3.94 -137% | 2.5 -51% | 5.48 -230% |
| Colorchecker dE 2000 max. * | 2.9 | 18.04 -522% | 6.06 -109% | 16.73 -477% | 6.3 -117% | 10.13 -249% |
| Colorchecker dE 2000 calibrated * | 1.16 | 4.13 -256% | 1.43 -23% | 3.09 -166% | 0.8 31% | 2.44 -110% |
| Greyscale dE 2000 * | 1.83 | 4.43 -142% | 4.27 -133% | 3.6 -97% | 4.2 -130% | 5.56 -204% |
| Gamma | 2.25 98% | 2.41 91% | 2.3 96% | 2.081 106% | 2.22 99% | 2.43 91% |
| CCT | 6727 97% | 6350 102% | 7203 90% | 6476 100% | 7034 92% | 7582 86% |
| Total Average (Program / Settings) | -538% /
-296% | -375% /
-179% | -666% /
-338% | -925% /
-405% | -191% /
-138% |
* ... smaller is better
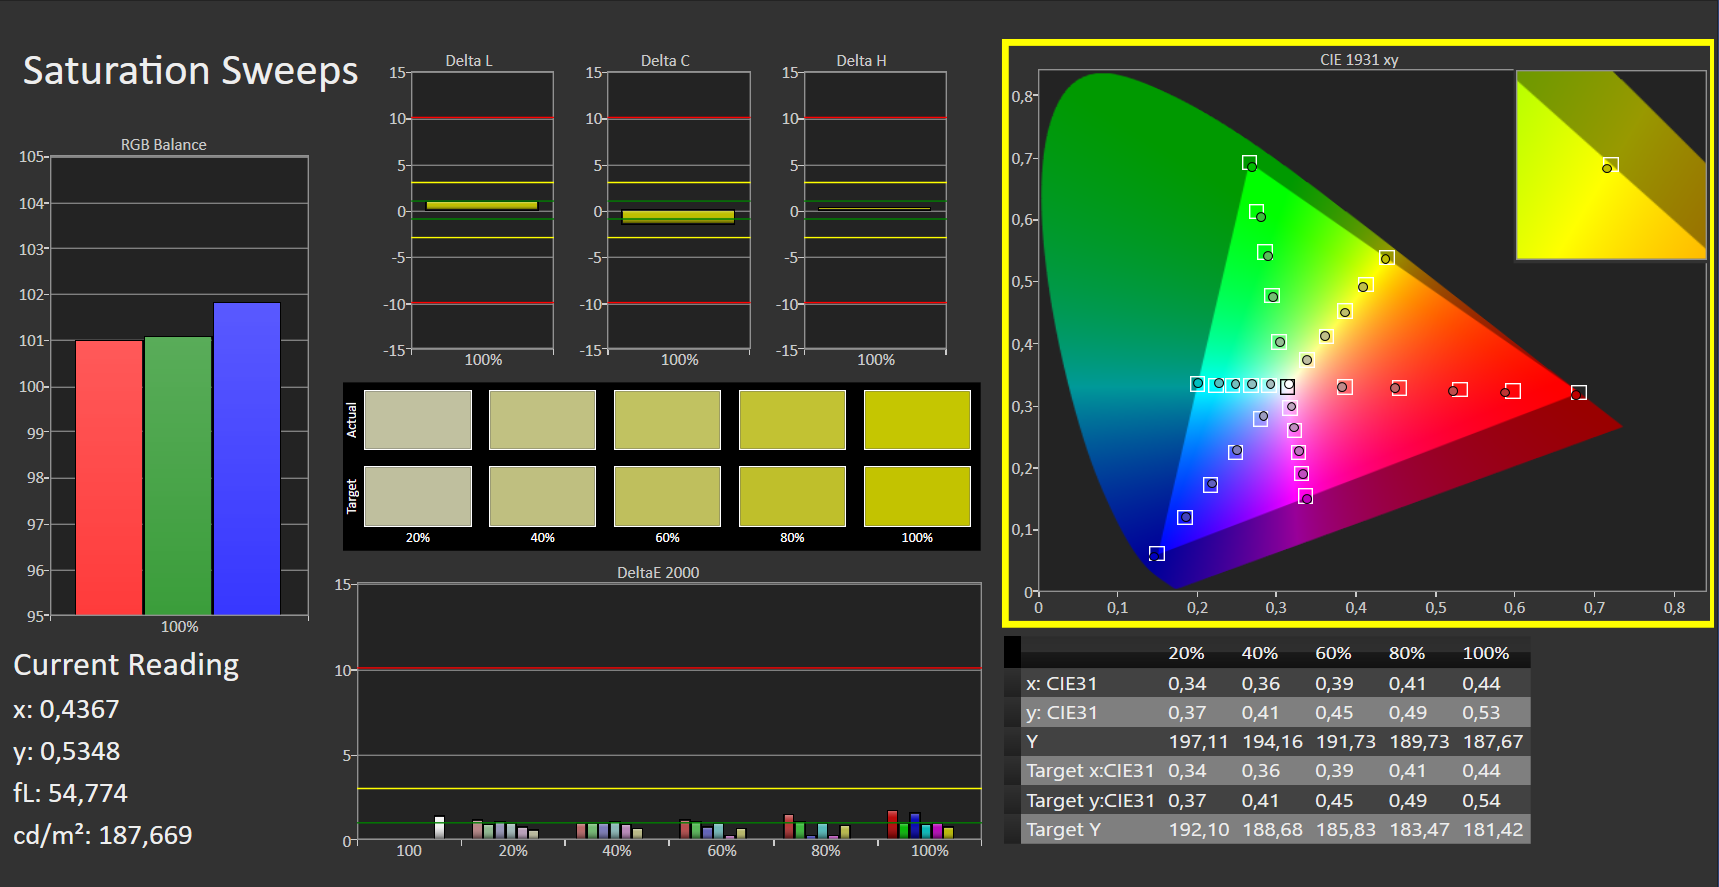
Compared to the other test candidates, the color space coverage is good. The panel covers 100% of the smaller sRGB color space. With a good 98% of the P3 and 87% of the AdobeRGB color space, it achieves good values but still wouldn't be the perfect choice for graphics designers.
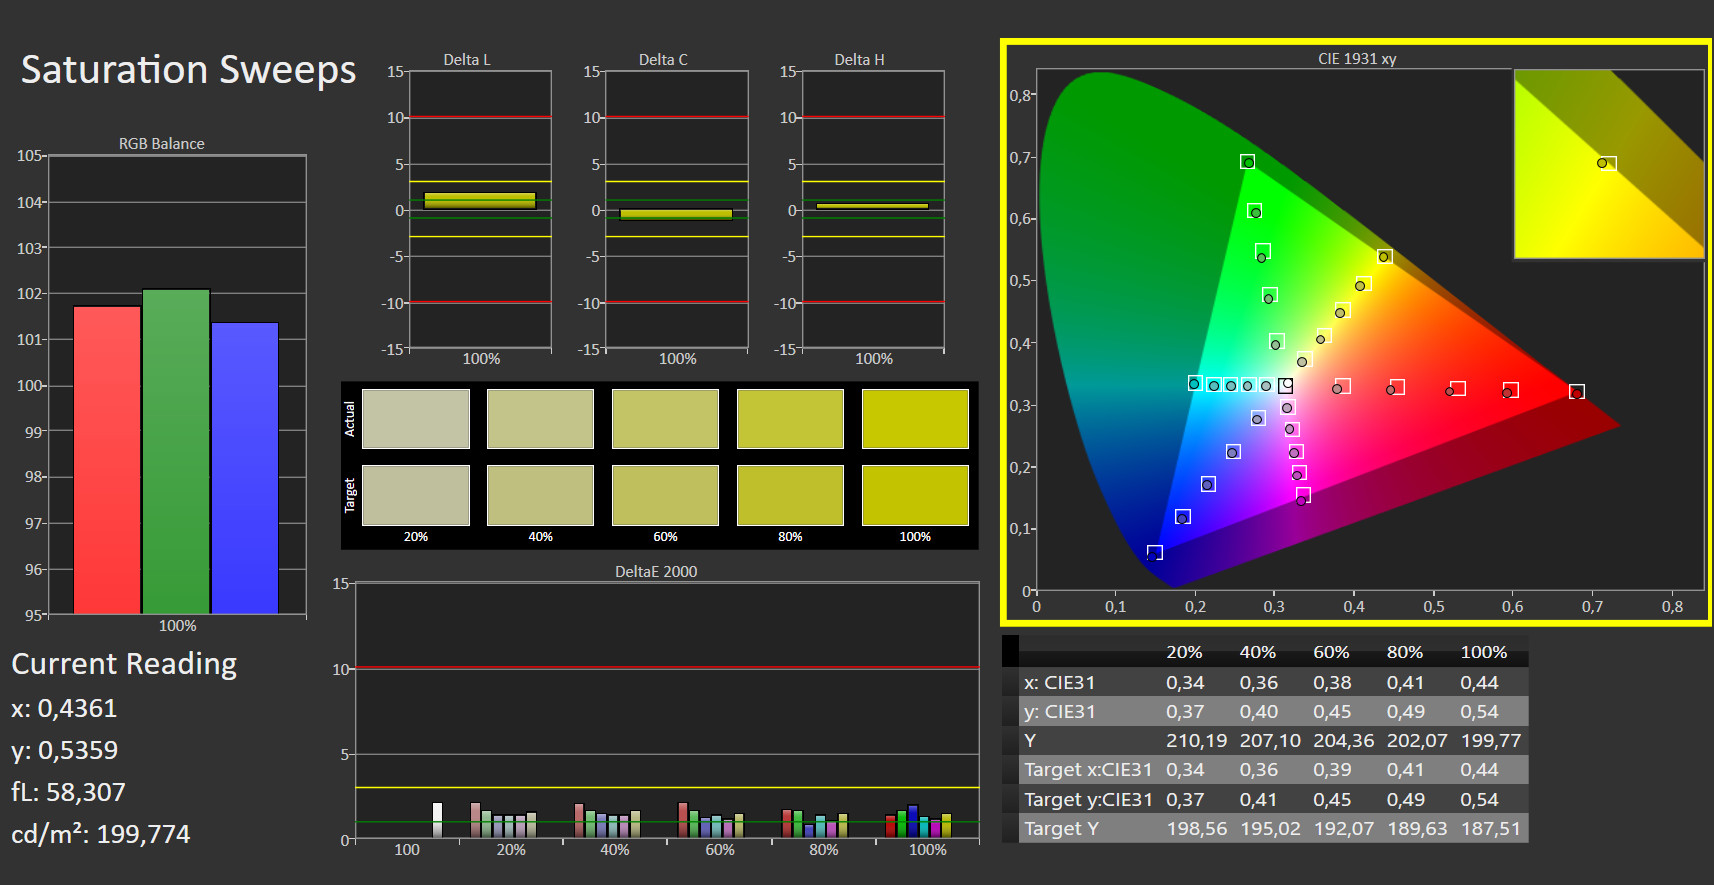
The device also offers a good color reproduction compared to the competitors, as the low Delta E measurements show. The values that are already fairly balanced in the state of delivery can be further improved by a calibration.

Display Response Times
| ↔ Response Time Black to White | ||
|---|---|---|
| 7 ms ... rise ↗ and fall ↘ combined | ↗ 1 ms rise |  |
| ↘ 6 ms fall | ||
| The screen shows very fast response rates in our tests and should be very well suited for fast-paced gaming. In comparison, all tested devices range from 0.1 (minimum) to 240 (maximum) ms. » 21 % of all devices are better. This means that the measured response time is better than the average of all tested devices (19.9 ms). | ||
| ↔ Response Time 50% Grey to 80% Grey | ||
| 1 ms ... rise ↗ and fall ↘ combined | ↗ 0 ms rise |  |
| ↘ 0 ms fall | ||
| The screen shows very fast response rates in our tests and should be very well suited for fast-paced gaming. In comparison, all tested devices range from 0.165 (minimum) to 636 (maximum) ms. » 4 % of all devices are better. This means that the measured response time is better than the average of all tested devices (31.1 ms). | ||
Screen Flickering / PWM (Pulse-Width Modulation)
| Screen flickering / PWM not detected |  | ||
In comparison: 52 % of all tested devices do not use PWM to dim the display. If PWM was detected, an average of 7798 (minimum: 5 - maximum: 343500) Hz was measured. | |||
The reflective display creates some problems when using it outdoors. The IPS display offers the good viewing angle stability that is typical for this kind of panel.
Performance: With GeForce RTX 2050 also suitable for gaming
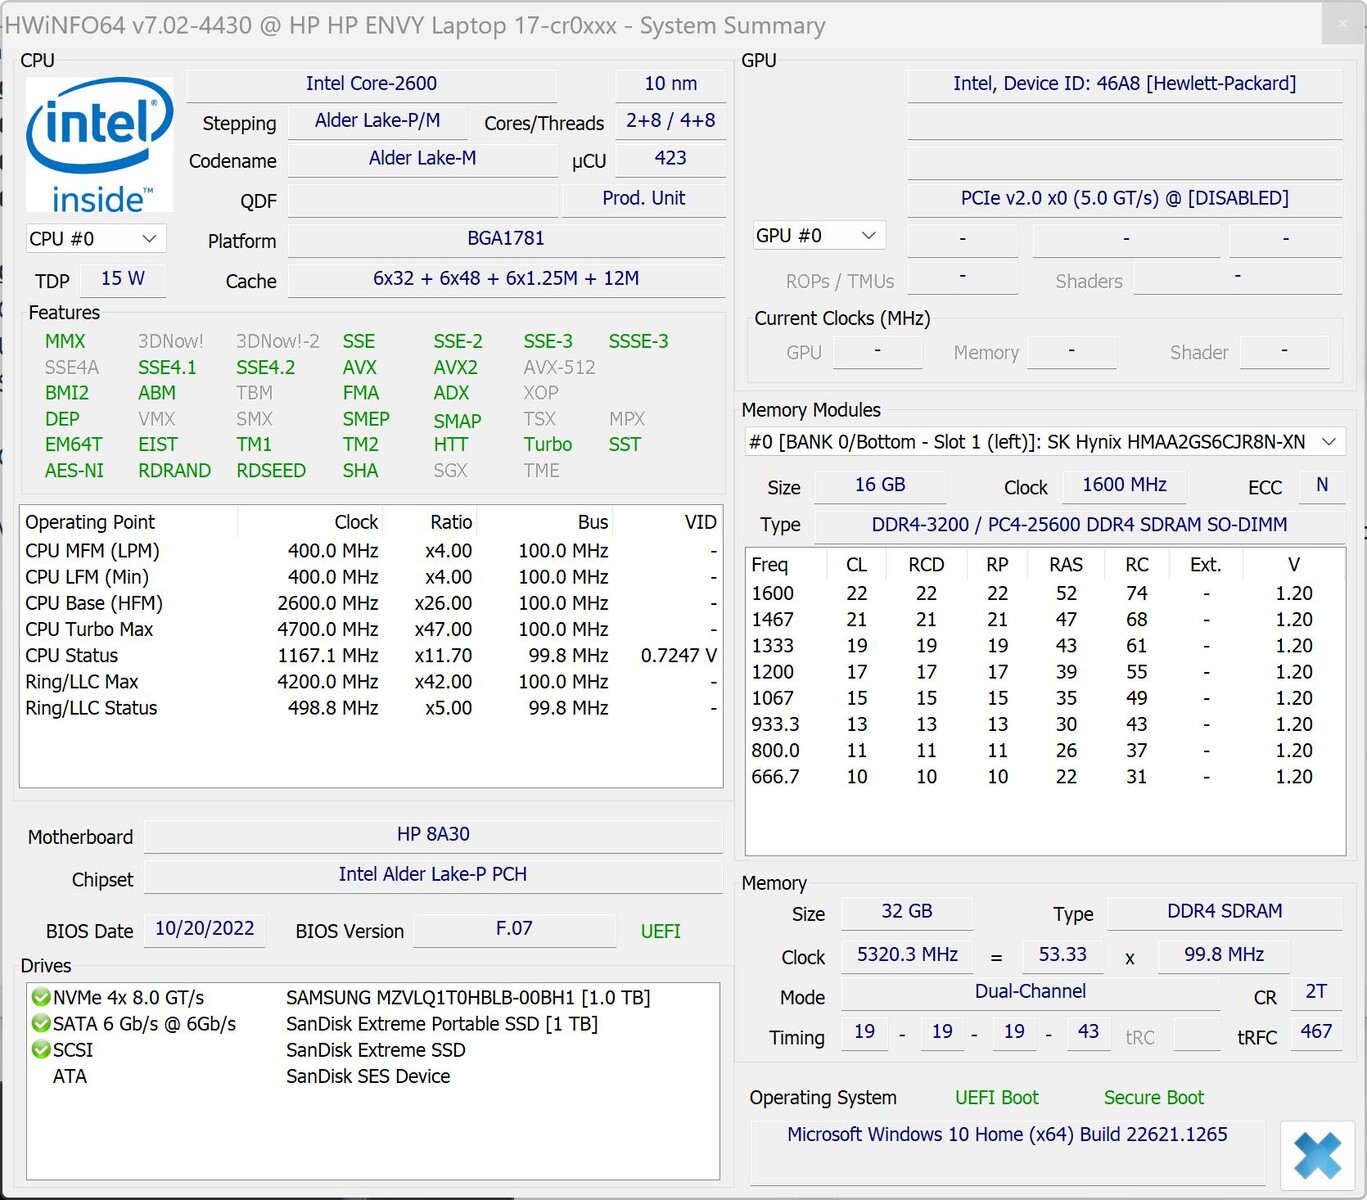
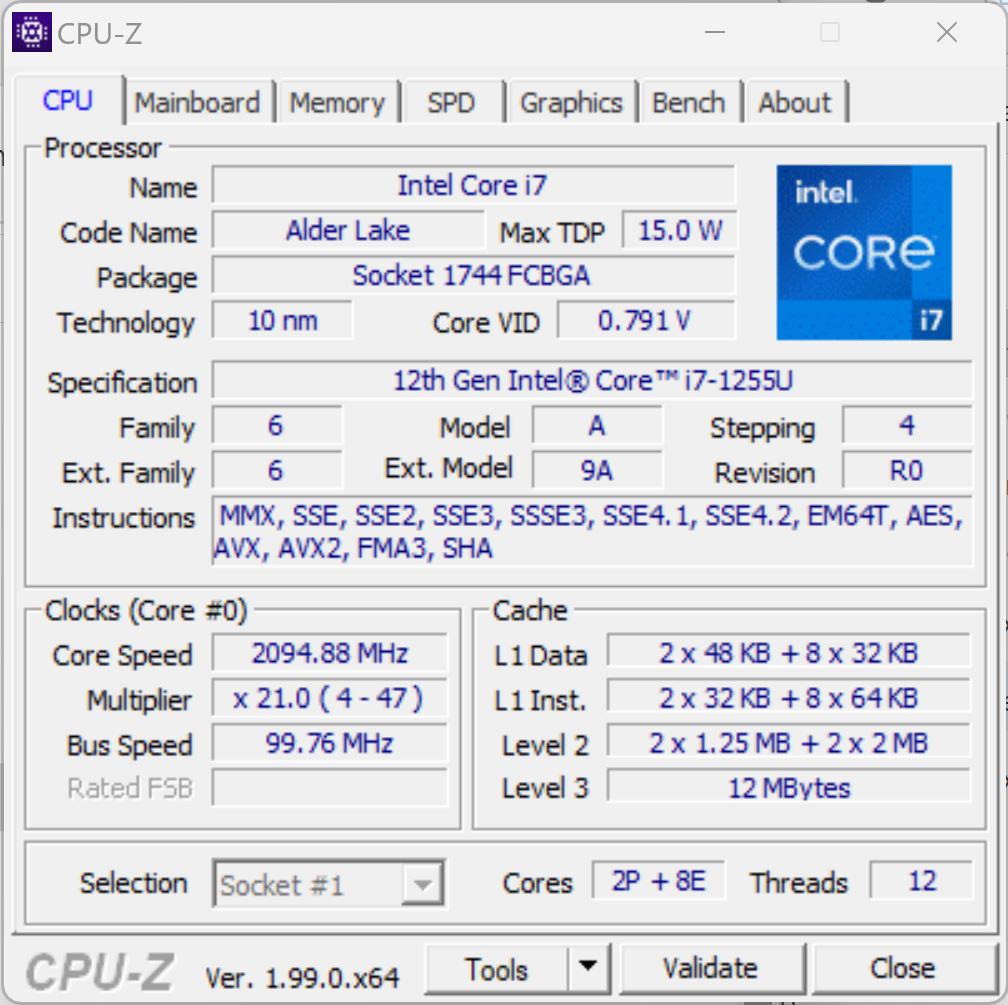
In our cr0079ng (72W72EA) test configuration, the HP Envy 17 is equipped with the Core i7-1255U from Intel's 12th processor generation (Alder Lake U). The manufacturer combines this with an additional 32 GB of DDR4 3200 MHz RAM (2x 16 GB) and a large 1-TB PCIe NVMe M.2 SSD. Depending on the demands, the dedicated Nvidia GeForce RTX 2050 Laptop GPU with 4 GB GDDR6 or the internal Intel Iris Xe Graphics handle the graphics output.
Alternatively, HP also offers the Envy 17 in many other configurations, for example with less RAM and storage or different CPUs such as the Intel Core i5-1235U or Core i7-1260P.
Test Conditions
With the Command Center, HP offers its own tool, allowing you to choose among the performance modes "Balanced," "Performance," and "Cool," as well as a "Power Saving" mode in battery operation, or you can also select an automatic "Intelligent Adjustment" mode. For our benchmarks, we usually chose the "Performance" HP mode together with the "Best Performance" Windows setting.
| Performance mode | Intelligent Adjustment mode | Cool mode | |
|---|---|---|---|
| Power Limit 1 | 18 Watt | 15 Watt | 10 Watt |
| Power Limit 2 | 51 Watt | 46 Watt | 15 Watt |
Processor
The Core i7-1255U used here comes from Intel's 12th processor generation (Alder Lake) and is designed for high-end laptops. The ten-core processor consists of two Performance and eight Efficiency cores, resulting in twelve threads due to hyperthreading of the P cores. The clock speed ranges between 1.7 and 4.7 GHz.
In the CPU benchmarks during our tests, the HP Envy 17 delivers mostly very good results, usually positioning above the average for the CPU and the competitors with the same CPU. In our constant load test, the performance is also available constantly. In battery operation, the performance is reduced by around 70%.
Cinebench R15 Multi Constant Load Test
Cinebench R23: Multi Core | Single Core
Cinebench R20: CPU (Multi Core) | CPU (Single Core)
Cinebench R15: CPU Multi 64Bit | CPU Single 64Bit
Blender: v2.79 BMW27 CPU
7-Zip 18.03: 7z b 4 | 7z b 4 -mmt1
Geekbench 5.5: Multi-Core | Single-Core
HWBOT x265 Benchmark v2.2: 4k Preset
LibreOffice : 20 Documents To PDF
R Benchmark 2.5: Overall mean
| CPU Performance rating | |
| Average of class Multimedia | |
| Dell XPS 17 9720 | |
| Acer Aspire 5 A515-57G-53N8 | |
| HP Envy 17-cr0079ng | |
| LG Gram 17Z90Q-E.AD78G | |
| Average Intel Core i7-1255U | |
| Lenovo IdeaPad 3 17ABA7 | |
| HP ProBook 450 G9 6A180EA | |
| HP Envy 17-cg | |
| Cinebench R23 / Multi Core | |
| Average of class Multimedia (4861 - 33362, n=81, last 2 years) | |
| Dell XPS 17 9720 | |
| Acer Aspire 5 A515-57G-53N8 | |
| HP Envy 17-cr0079ng | |
| LG Gram 17Z90Q-E.AD78G | |
| LG Gram 17Z90Q-E.AD78G | |
| Lenovo IdeaPad 3 17ABA7 | |
| Average Intel Core i7-1255U (5269 - 9628, n=11) | |
| HP ProBook 450 G9 6A180EA | |
| HP Envy 17-cg | |
| Cinebench R23 / Single Core | |
| Average of class Multimedia (1128 - 2459, n=73, last 2 years) | |
| Dell XPS 17 9720 | |
| Acer Aspire 5 A515-57G-53N8 | |
| Average Intel Core i7-1255U (1408 - 1775, n=11) | |
| LG Gram 17Z90Q-E.AD78G | |
| HP Envy 17-cr0079ng | |
| HP ProBook 450 G9 6A180EA | |
| Lenovo IdeaPad 3 17ABA7 | |
| HP Envy 17-cg | |
| Cinebench R20 / CPU (Multi Core) | |
| Average of class Multimedia (1887 - 12912, n=64, last 2 years) | |
| Dell XPS 17 9720 | |
| Acer Aspire 5 A515-57G-53N8 | |
| HP Envy 17-cr0079ng | |
| Lenovo IdeaPad 3 17ABA7 | |
| LG Gram 17Z90Q-E.AD78G | |
| Average Intel Core i7-1255U (2095 - 3702, n=11) | |
| HP ProBook 450 G9 6A180EA | |
| HP Envy 17-cg | |
| Cinebench R20 / CPU (Single Core) | |
| Average of class Multimedia (425 - 853, n=64, last 2 years) | |
| Dell XPS 17 9720 | |
| Acer Aspire 5 A515-57G-53N8 | |
| Average Intel Core i7-1255U (550 - 682, n=11) | |
| HP Envy 17-cr0079ng | |
| LG Gram 17Z90Q-E.AD78G | |
| HP ProBook 450 G9 6A180EA | |
| Lenovo IdeaPad 3 17ABA7 | |
| HP Envy 17-cg | |
| Cinebench R15 / CPU Multi 64Bit | |
| Dell XPS 17 9720 | |
| Dell XPS 17 9720 | |
| Average of class Multimedia (856 - 5224, n=68, last 2 years) | |
| Acer Aspire 5 A515-57G-53N8 | |
| LG Gram 17Z90Q-E.AD78G | |
| Lenovo IdeaPad 3 17ABA7 | |
| HP Envy 17-cr0079ng | |
| Average Intel Core i7-1255U (919 - 1577, n=11) | |
| HP ProBook 450 G9 6A180EA | |
| HP Envy 17-cg | |
| Cinebench R15 / CPU Single 64Bit | |
| Average of class Multimedia (184.8 - 326, n=66, last 2 years) | |
| Dell XPS 17 9720 | |
| HP Envy 17-cr0079ng | |
| Acer Aspire 5 A515-57G-53N8 | |
| Average Intel Core i7-1255U (161 - 251, n=12) | |
| Lenovo IdeaPad 3 17ABA7 | |
| LG Gram 17Z90Q-E.AD78G | |
| HP ProBook 450 G9 6A180EA | |
| HP Envy 17-cg | |
| Blender / v2.79 BMW27 CPU | |
| HP ProBook 450 G9 6A180EA | |
| HP Envy 17-cg | |
| HP Envy 17-cr0079ng | |
| Average Intel Core i7-1255U (372 - 601, n=11) | |
| LG Gram 17Z90Q-E.AD78G | |
| Acer Aspire 5 A515-57G-53N8 | |
| Lenovo IdeaPad 3 17ABA7 | |
| Average of class Multimedia (100 - 557, n=65, last 2 years) | |
| Dell XPS 17 9720 | |
| 7-Zip 18.03 / 7z b 4 | |
| Dell XPS 17 9720 | |
| Average of class Multimedia (29095 - 130368, n=62, last 2 years) | |
| Acer Aspire 5 A515-57G-53N8 | |
| LG Gram 17Z90Q-E.AD78G | |
| HP Envy 17-cr0079ng | |
| Lenovo IdeaPad 3 17ABA7 | |
| Average Intel Core i7-1255U (24126 - 37365, n=11) | |
| HP ProBook 450 G9 6A180EA | |
| HP Envy 17-cg | |
| 7-Zip 18.03 / 7z b 4 -mmt1 | |
| Average of class Multimedia (3666 - 7545, n=63, last 2 years) | |
| Dell XPS 17 9720 | |
| HP Envy 17-cr0079ng | |
| Average Intel Core i7-1255U (5059 - 5529, n=11) | |
| Lenovo IdeaPad 3 17ABA7 | |
| HP ProBook 450 G9 6A180EA | |
| Acer Aspire 5 A515-57G-53N8 | |
| LG Gram 17Z90Q-E.AD78G | |
| HP Envy 17-cg | |
| Geekbench 5.5 / Multi-Core | |
| Dell XPS 17 9720 | |
| Average of class Multimedia (4652 - 20422, n=62, last 2 years) | |
| Acer Aspire 5 A515-57G-53N8 | |
| LG Gram 17Z90Q-E.AD78G | |
| HP Envy 17-cr0079ng | |
| Average Intel Core i7-1255U (4463 - 8821, n=12) | |
| HP ProBook 450 G9 6A180EA | |
| Lenovo IdeaPad 3 17ABA7 | |
| HP Envy 17-cg | |
| Geekbench 5.5 / Single-Core | |
| Average of class Multimedia (805 - 2974, n=62, last 2 years) | |
| Dell XPS 17 9720 | |
| HP Envy 17-cr0079ng | |
| HP ProBook 450 G9 6A180EA | |
| Average Intel Core i7-1255U (1560 - 1712, n=12) | |
| Acer Aspire 5 A515-57G-53N8 | |
| LG Gram 17Z90Q-E.AD78G | |
| HP Envy 17-cg | |
| Lenovo IdeaPad 3 17ABA7 | |
| HWBOT x265 Benchmark v2.2 / 4k Preset | |
| Average of class Multimedia (5.26 - 36.1, n=63, last 2 years) | |
| Dell XPS 17 9720 | |
| Acer Aspire 5 A515-57G-53N8 | |
| HP Envy 17-cr0079ng | |
| LG Gram 17Z90Q-E.AD78G | |
| Lenovo IdeaPad 3 17ABA7 | |
| Average Intel Core i7-1255U (6.31 - 10.1, n=11) | |
| HP ProBook 450 G9 6A180EA | |
| HP Envy 17-cg | |
| LibreOffice / 20 Documents To PDF | |
| LG Gram 17Z90Q-E.AD78G | |
| Acer Aspire 5 A515-57G-53N8 | |
| HP Envy 17-cg | |
| Lenovo IdeaPad 3 17ABA7 | |
| HP ProBook 450 G9 6A180EA | |
| Average of class Multimedia (23.9 - 146.7, n=64, last 2 years) | |
| Average Intel Core i7-1255U (35.6 - 52.5, n=11) | |
| HP Envy 17-cr0079ng | |
| Dell XPS 17 9720 | |
| R Benchmark 2.5 / Overall mean | |
| HP Envy 17-cg | |
| Lenovo IdeaPad 3 17ABA7 | |
| HP ProBook 450 G9 6A180EA | |
| LG Gram 17Z90Q-E.AD78G | |
| Average Intel Core i7-1255U (0.4688 - 0.558, n=11) | |
| Acer Aspire 5 A515-57G-53N8 | |
| HP Envy 17-cr0079ng | |
| Average of class Multimedia (0.3604 - 0.947, n=63, last 2 years) | |
| Dell XPS 17 9720 | |
* ... smaller is better
AIDA64: FP32 Ray-Trace | FPU Julia | CPU SHA3 | CPU Queen | FPU SinJulia | FPU Mandel | CPU AES | CPU ZLib | FP64 Ray-Trace | CPU PhotoWorxx
| Performance rating | |
| Average of class Multimedia | |
| Lenovo IdeaPad 3 17ABA7 | |
| Dell XPS 17 9720 | |
| HP Envy 17-cr0079ng | |
| Acer Aspire 5 A515-57G-53N8 | |
| Average Intel Core i7-1255U | |
| LG Gram 17Z90Q-E.AD78G | |
| HP ProBook 450 G9 6A180EA | |
| HP Envy 17-cg -9! | |
| AIDA64 / FP32 Ray-Trace | |
| Average of class Multimedia (2214 - 50388, n=60, last 2 years) | |
| Lenovo IdeaPad 3 17ABA7 | |
| HP Envy 17-cr0079ng | |
| Dell XPS 17 9720 | |
| Average Intel Core i7-1255U (4313 - 8127, n=11) | |
| Acer Aspire 5 A515-57G-53N8 | |
| HP ProBook 450 G9 6A180EA | |
| LG Gram 17Z90Q-E.AD78G | |
| AIDA64 / FPU Julia | |
| Average of class Multimedia (12867 - 201874, n=61, last 2 years) | |
| Lenovo IdeaPad 3 17ABA7 | |
| HP Envy 17-cr0079ng | |
| Average Intel Core i7-1255U (19813 - 41353, n=11) | |
| Dell XPS 17 9720 | |
| Acer Aspire 5 A515-57G-53N8 | |
| HP ProBook 450 G9 6A180EA | |
| LG Gram 17Z90Q-E.AD78G | |
| AIDA64 / CPU SHA3 | |
| Average of class Multimedia (653 - 8623, n=61, last 2 years) | |
| Dell XPS 17 9720 | |
| Lenovo IdeaPad 3 17ABA7 | |
| HP Envy 17-cr0079ng | |
| Average Intel Core i7-1255U (1325 - 2135, n=11) | |
| Acer Aspire 5 A515-57G-53N8 | |
| LG Gram 17Z90Q-E.AD78G | |
| HP ProBook 450 G9 6A180EA | |
| AIDA64 / CPU Queen | |
| Dell XPS 17 9720 | |
| Acer Aspire 5 A515-57G-53N8 | |
| Lenovo IdeaPad 3 17ABA7 | |
| Average of class Multimedia (13483 - 181505, n=49, last 2 years) | |
| LG Gram 17Z90Q-E.AD78G | |
| HP Envy 17-cr0079ng | |
| Average Intel Core i7-1255U (61375 - 65892, n=11) | |
| HP ProBook 450 G9 6A180EA | |
| AIDA64 / FPU SinJulia | |
| Lenovo IdeaPad 3 17ABA7 | |
| Average of class Multimedia (1240 - 28794, n=61, last 2 years) | |
| Dell XPS 17 9720 | |
| Acer Aspire 5 A515-57G-53N8 | |
| LG Gram 17Z90Q-E.AD78G | |
| HP Envy 17-cr0079ng | |
| Average Intel Core i7-1255U (3577 - 5095, n=11) | |
| HP ProBook 450 G9 6A180EA | |
| AIDA64 / FPU Mandel | |
| Average of class Multimedia (6395 - 105740, n=60, last 2 years) | |
| Lenovo IdeaPad 3 17ABA7 | |
| HP Envy 17-cr0079ng | |
| Dell XPS 17 9720 | |
| Average Intel Core i7-1255U (11759 - 20187, n=11) | |
| Acer Aspire 5 A515-57G-53N8 | |
| LG Gram 17Z90Q-E.AD78G | |
| HP ProBook 450 G9 6A180EA | |
| AIDA64 / CPU AES | |
| Lenovo IdeaPad 3 17ABA7 | |
| Dell XPS 17 9720 | |
| Average of class Multimedia (13243 - 126790, n=61, last 2 years) | |
| HP Envy 17-cr0079ng | |
| Average Intel Core i7-1255U (27900 - 67458, n=11) | |
| Acer Aspire 5 A515-57G-53N8 | |
| LG Gram 17Z90Q-E.AD78G | |
| HP ProBook 450 G9 6A180EA | |
| AIDA64 / CPU ZLib | |
| Average of class Multimedia (167.2 - 2022, n=61, last 2 years) | |
| Dell XPS 17 9720 | |
| Acer Aspire 5 A515-57G-53N8 | |
| HP Envy 17-cr0079ng | |
| LG Gram 17Z90Q-E.AD78G | |
| Lenovo IdeaPad 3 17ABA7 | |
| Average Intel Core i7-1255U (393 - 640, n=11) | |
| HP ProBook 450 G9 6A180EA | |
| HP Envy 17-cg | |
| AIDA64 / FP64 Ray-Trace | |
| Average of class Multimedia (1014 - 26875, n=61, last 2 years) | |
| Lenovo IdeaPad 3 17ABA7 | |
| HP Envy 17-cr0079ng | |
| Dell XPS 17 9720 | |
| Average Intel Core i7-1255U (2474 - 4400, n=11) | |
| Acer Aspire 5 A515-57G-53N8 | |
| LG Gram 17Z90Q-E.AD78G | |
| HP ProBook 450 G9 6A180EA | |
| AIDA64 / CPU PhotoWorxx | |
| Average of class Multimedia (12860 - 88154, n=61, last 2 years) | |
| Dell XPS 17 9720 | |
| LG Gram 17Z90Q-E.AD78G | |
| Average Intel Core i7-1255U (13899 - 44054, n=11) | |
| HP Envy 17-cr0079ng | |
| Acer Aspire 5 A515-57G-53N8 | |
| HP ProBook 450 G9 6A180EA | |
| Lenovo IdeaPad 3 17ABA7 | |
System Performance
In practical operation, the hardware used here delivers more than a solid performance. In benchmarks such as PCMark 10, the laptop is able to keep up well with the top of the field and is mostly only surpassed by the two laptops that are equipped with more powerful hardware. Those who want even more performance are even better served by the Intel Core i7-12700H in the Dell XPS 17 9720, for example.
For some strange reasons, the Creative Benchmark test of PCMark 8 was always interrupted in the middle with the hardware and driver configuration of our test unit. We therefore left out this benchmark.
CrossMark: Overall | Productivity | Creativity | Responsiveness
| PCMark 10 / Score | |
| Average of class Multimedia (4325 - 10386, n=58, last 2 years) | |
| Dell XPS 17 9720 | |
| LG Gram 17Z90Q-E.AD78G | |
| HP Envy 17-cr0079ng | |
| Average Intel Core i7-1255U, NVIDIA GeForce RTX 2050 Mobile (n=1) | |
| Acer Aspire 5 A515-57G-53N8 | |
| Lenovo IdeaPad 3 17ABA7 | |
| HP Envy 17-cg | |
| HP ProBook 450 G9 6A180EA | |
| PCMark 10 / Essentials | |
| Average of class Multimedia (8025 - 11664, n=57, last 2 years) | |
| Lenovo IdeaPad 3 17ABA7 | |
| Dell XPS 17 9720 | |
| HP Envy 17-cr0079ng | |
| Average Intel Core i7-1255U, NVIDIA GeForce RTX 2050 Mobile (n=1) | |
| LG Gram 17Z90Q-E.AD78G | |
| HP ProBook 450 G9 6A180EA | |
| Acer Aspire 5 A515-57G-53N8 | |
| HP Envy 17-cg | |
| PCMark 10 / Productivity | |
| Average of class Multimedia (7323 - 18233, n=57, last 2 years) | |
| LG Gram 17Z90Q-E.AD78G | |
| Dell XPS 17 9720 | |
| Lenovo IdeaPad 3 17ABA7 | |
| HP Envy 17-cr0079ng | |
| Average Intel Core i7-1255U, NVIDIA GeForce RTX 2050 Mobile (n=1) | |
| HP Envy 17-cg | |
| Acer Aspire 5 A515-57G-53N8 | |
| HP ProBook 450 G9 6A180EA | |
| PCMark 10 / Digital Content Creation | |
| Average of class Multimedia (3651 - 16240, n=57, last 2 years) | |
| Dell XPS 17 9720 | |
| LG Gram 17Z90Q-E.AD78G | |
| HP Envy 17-cr0079ng | |
| Average Intel Core i7-1255U, NVIDIA GeForce RTX 2050 Mobile (n=1) | |
| Acer Aspire 5 A515-57G-53N8 | |
| HP Envy 17-cg | |
| Lenovo IdeaPad 3 17ABA7 | |
| HP ProBook 450 G9 6A180EA | |
| CrossMark / Overall | |
| Dell XPS 17 9720 | |
| Average of class Multimedia (866 - 2728, n=67, last 2 years) | |
| LG Gram 17Z90Q-E.AD78G | |
| HP Envy 17-cr0079ng | |
| Average Intel Core i7-1255U, NVIDIA GeForce RTX 2050 Mobile (n=1) | |
| HP ProBook 450 G9 6A180EA | |
| Lenovo IdeaPad 3 17ABA7 | |
| CrossMark / Productivity | |
| Average of class Multimedia (931 - 2489, n=67, last 2 years) | |
| Dell XPS 17 9720 | |
| LG Gram 17Z90Q-E.AD78G | |
| HP Envy 17-cr0079ng | |
| Average Intel Core i7-1255U, NVIDIA GeForce RTX 2050 Mobile (n=1) | |
| HP ProBook 450 G9 6A180EA | |
| Lenovo IdeaPad 3 17ABA7 | |
| CrossMark / Creativity | |
| Average of class Multimedia (907 - 3465, n=67, last 2 years) | |
| Dell XPS 17 9720 | |
| LG Gram 17Z90Q-E.AD78G | |
| HP Envy 17-cr0079ng | |
| Average Intel Core i7-1255U, NVIDIA GeForce RTX 2050 Mobile (n=1) | |
| HP ProBook 450 G9 6A180EA | |
| Lenovo IdeaPad 3 17ABA7 | |
| CrossMark / Responsiveness | |
| Dell XPS 17 9720 | |
| Average of class Multimedia (605 - 2024, n=67, last 2 years) | |
| LG Gram 17Z90Q-E.AD78G | |
| HP Envy 17-cr0079ng | |
| Average Intel Core i7-1255U, NVIDIA GeForce RTX 2050 Mobile (n=1) | |
| Lenovo IdeaPad 3 17ABA7 | |
| HP ProBook 450 G9 6A180EA | |
| PCMark 8 Home Score Accelerated v2 | 5469 points | |
| PCMark 8 Work Score Accelerated v2 | 5812 points | |
| PCMark 10 Score | 6351 points | |
Help | ||
| AIDA64 / Memory Copy | |
| Average of class Multimedia (21158 - 132135, n=61, last 2 years) | |
| LG Gram 17Z90Q-E.AD78G | |
| Dell XPS 17 9720 | |
| Average Intel Core i7-1255U (22846 - 67017, n=11) | |
| HP Envy 17-cr0079ng | |
| Acer Aspire 5 A515-57G-53N8 | |
| HP ProBook 450 G9 6A180EA | |
| Lenovo IdeaPad 3 17ABA7 | |
| AIDA64 / Memory Read | |
| Average of class Multimedia (19699 - 174586, n=61, last 2 years) | |
| LG Gram 17Z90Q-E.AD78G | |
| Dell XPS 17 9720 | |
| Average Intel Core i7-1255U (22877 - 67398, n=11) | |
| HP Envy 17-cr0079ng | |
| Acer Aspire 5 A515-57G-53N8 | |
| HP ProBook 450 G9 6A180EA | |
| Lenovo IdeaPad 3 17ABA7 | |
| AIDA64 / Memory Write | |
| Average of class Multimedia (17733 - 134998, n=61, last 2 years) | |
| Dell XPS 17 9720 | |
| LG Gram 17Z90Q-E.AD78G | |
| Average Intel Core i7-1255U (22883 - 65839, n=11) | |
| HP Envy 17-cr0079ng | |
| Acer Aspire 5 A515-57G-53N8 | |
| HP ProBook 450 G9 6A180EA | |
| Lenovo IdeaPad 3 17ABA7 | |
| AIDA64 / Memory Latency | |
| Average of class Multimedia (7 - 535, n=60, last 2 years) | |
| LG Gram 17Z90Q-E.AD78G | |
| Dell XPS 17 9720 | |
| Lenovo IdeaPad 3 17ABA7 | |
| Average Intel Core i7-1255U (76 - 163.2, n=11) | |
| HP ProBook 450 G9 6A180EA | |
| HP Envy 17-cr0079ng | |
| HP Envy 17-cg | |
* ... smaller is better
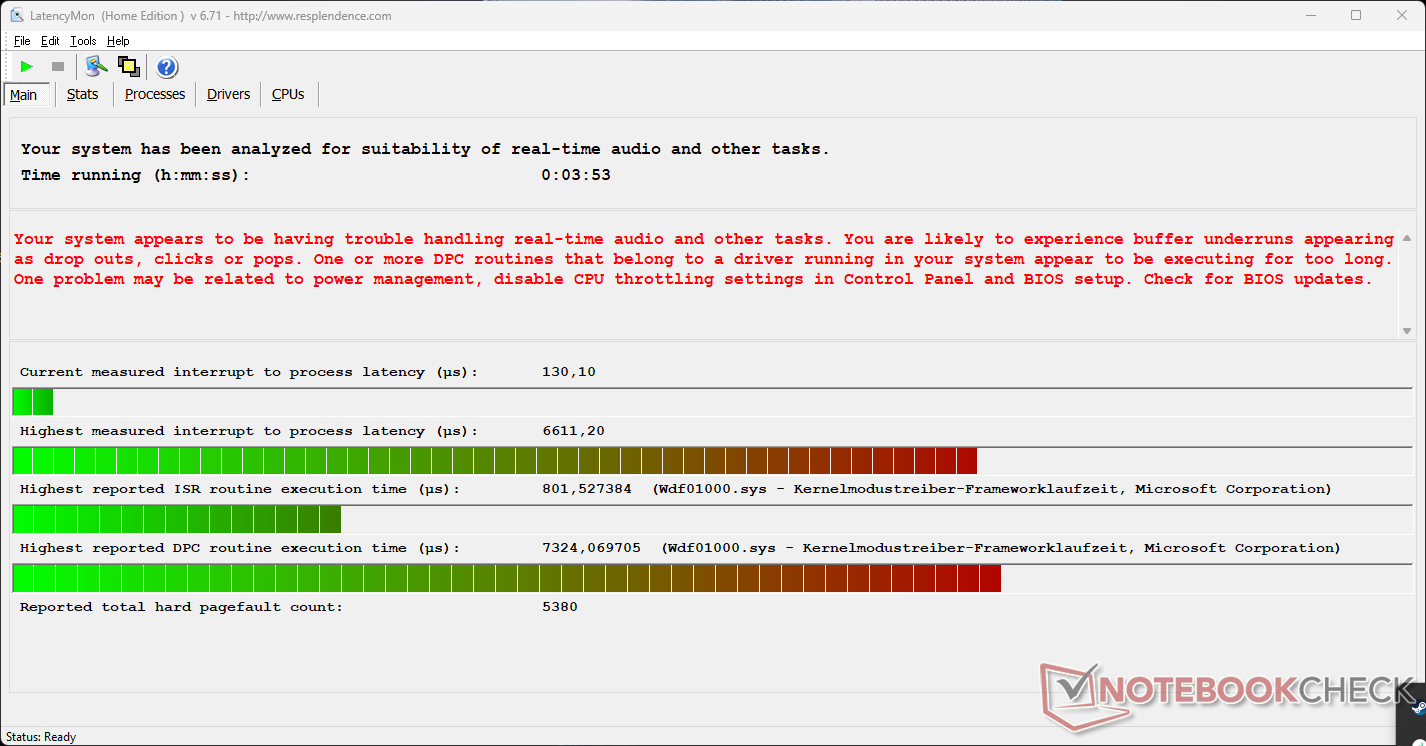
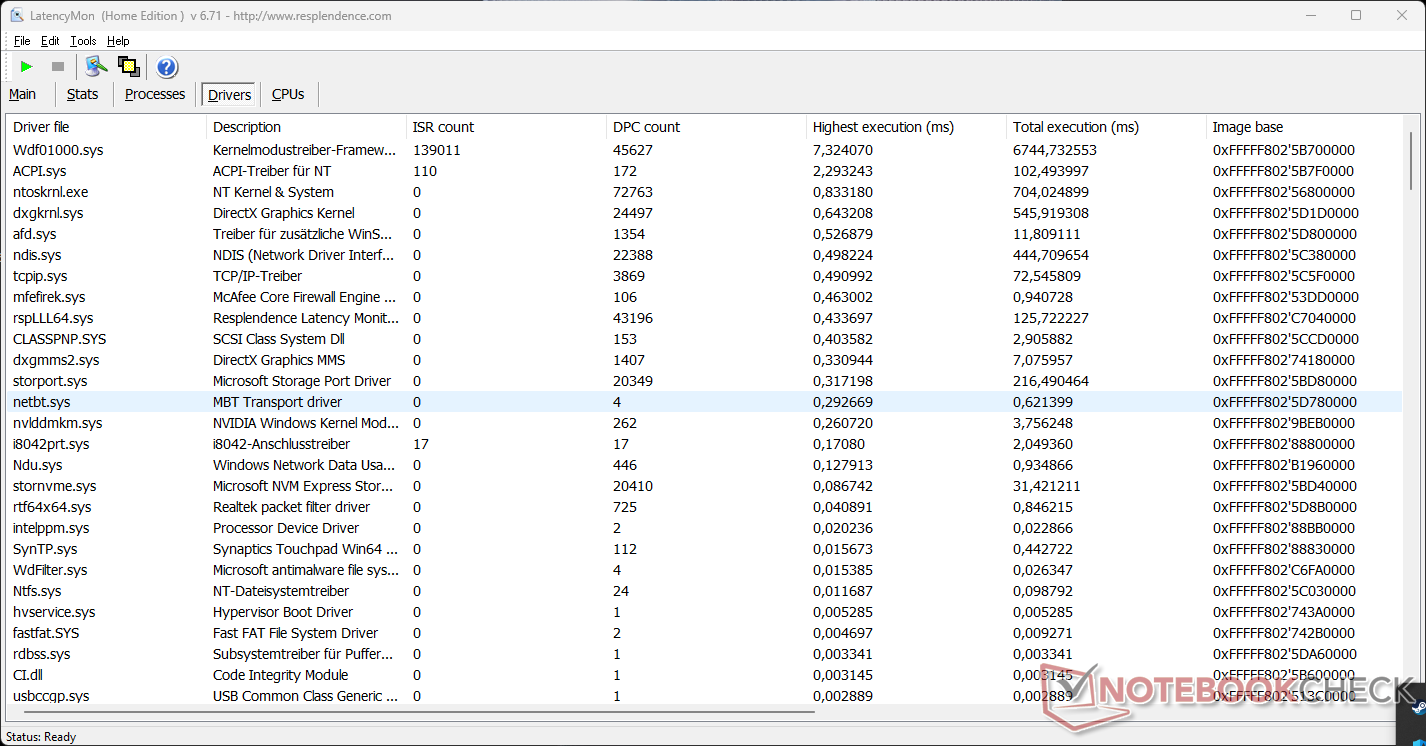
DPC Latencies
Our test unit shows relatively high DPC latencies. While this could be an indication that some problems might occur with real-time audio and video processing, as always this is also only a momentary snapshot of the current driver configuration.
| DPC Latencies / LatencyMon - interrupt to process latency (max), Web, Youtube, Prime95 | |
| HP ProBook 450 G9 6A180EA | |
| HP Envy 17-cr0079ng | |
| LG Gram 17Z90Q-E.AD78G | |
| HP Envy 17-cg | |
| Acer Aspire 5 A515-57G-53N8 | |
| Lenovo IdeaPad 3 17ABA7 | |
| Dell XPS 17 9720 | |
* ... smaller is better
Storage Solution
The 1-TB SSD from Samsung doesn't perform particularly well in our test measurements. Not only does it place behind most of the other competitors but also below the average level for the SSD. HP didn't do itself any favors with this choice, but you still wouldn't notice any limitations during daily operation. At least the values remain almost identical in the constant performance, without starting to be throttled.

* ... smaller is better
Disk Throttling: DiskSpd Read Loop, Queue Depth 8
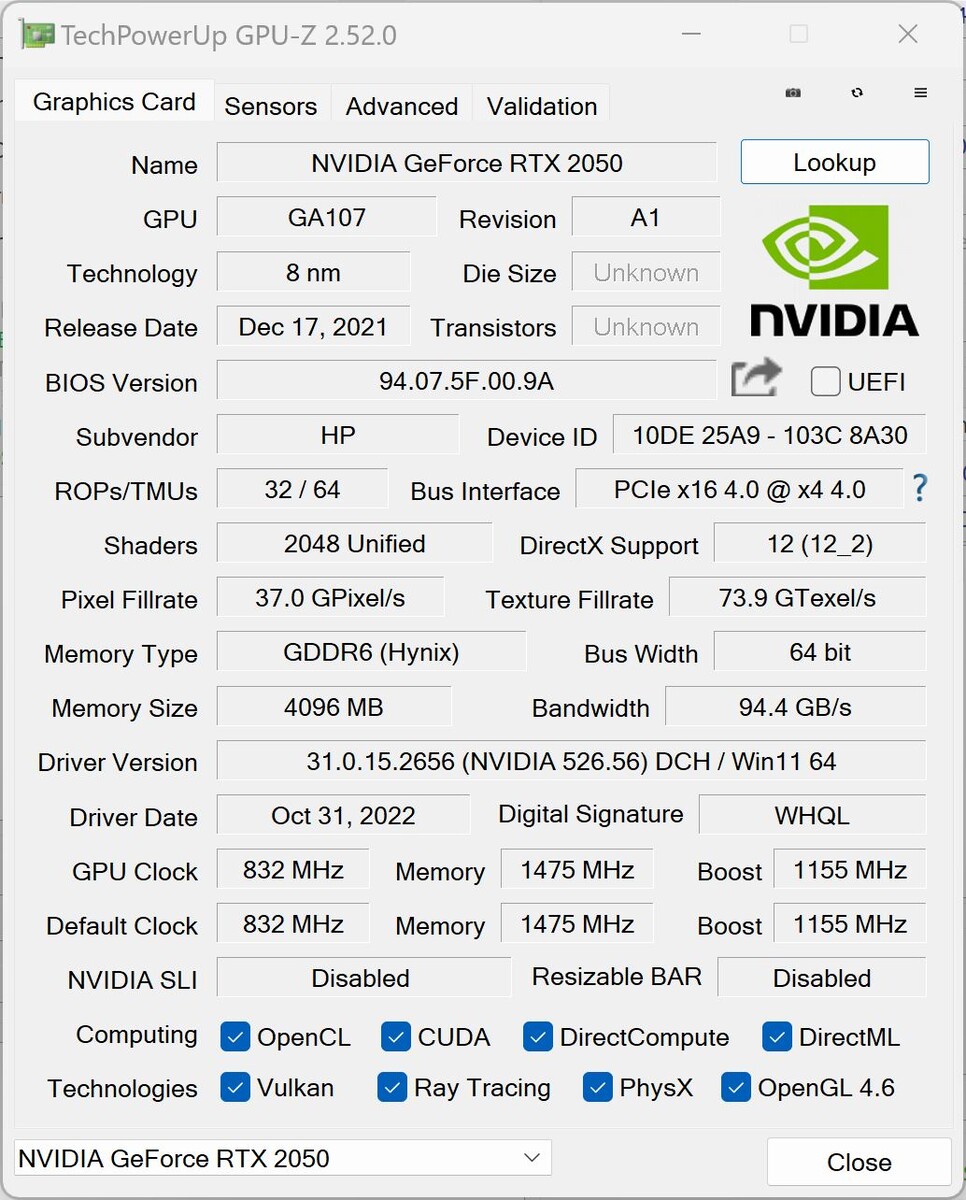
Graphics Card
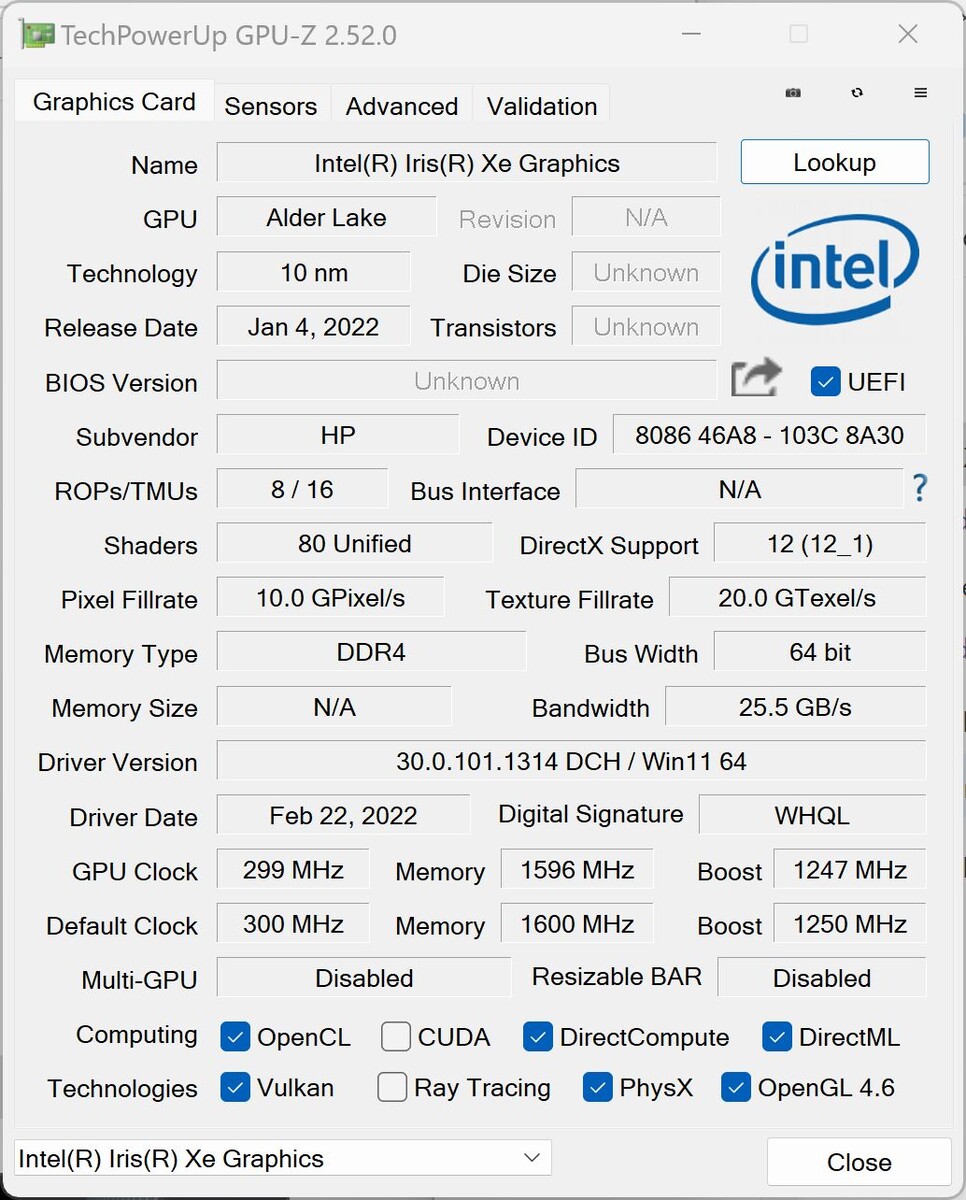
While the Intel Iris Xe Graphics iGPU handles the less demanding graphics tasks, with higher demands the Nvidia GeForce RTX 2050 Laptop GPU is activated. With this, a dedicated graphics solution of the lower midrange is onboard. However, the GPU also comes from 2021 so it is no spring chicken anymore. The graphics card is equipped with 4 GB GDDR6 graphics storage and runs at a clock speed of up to 1,477 MHz. It is unable to keep up with the GeForce RTX 4050 that was recently introduced by Nvidia, which leaves it far behind.
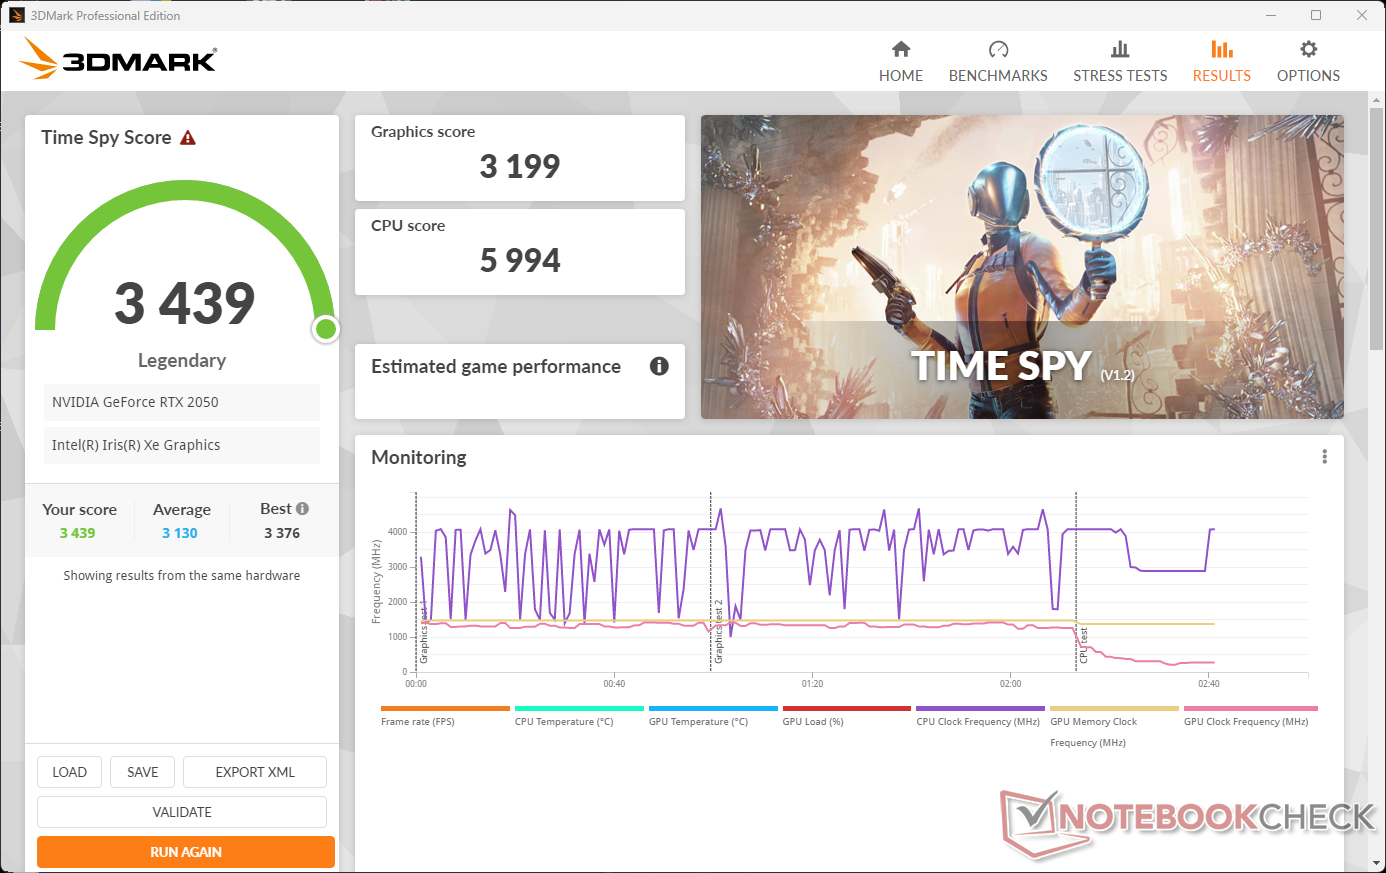
In the graphics benchmarks, the HP Envy 17-cr0079ng reaches solid values in our test. Even though they remain in parts below the average of this graphics solution, they are always above those of the lightweight LG Gram 17Z90Q endurance champion and at the level of the Acer Aspire 5 A515, which are both equipped with the same dGPU.
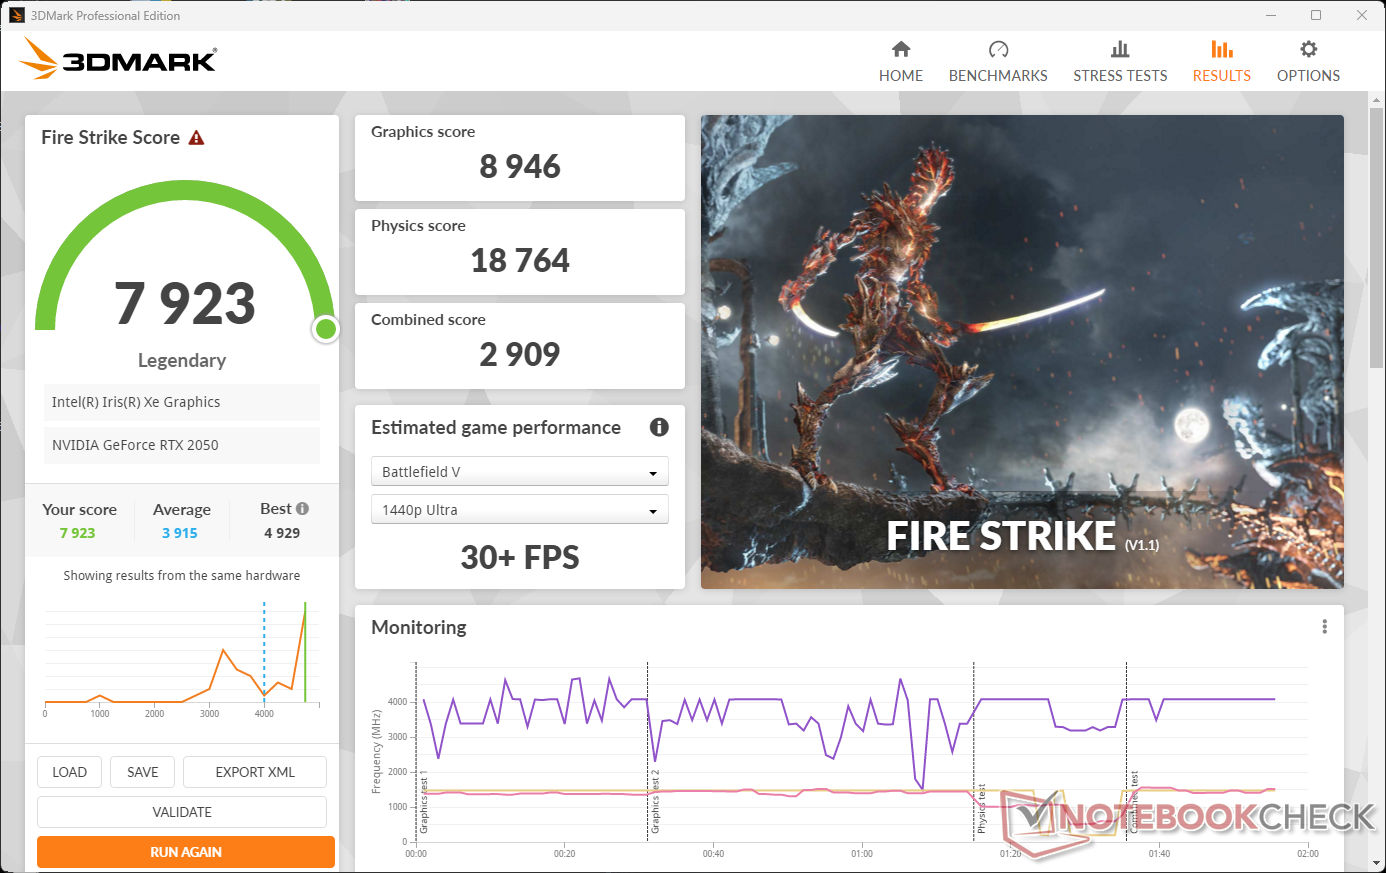
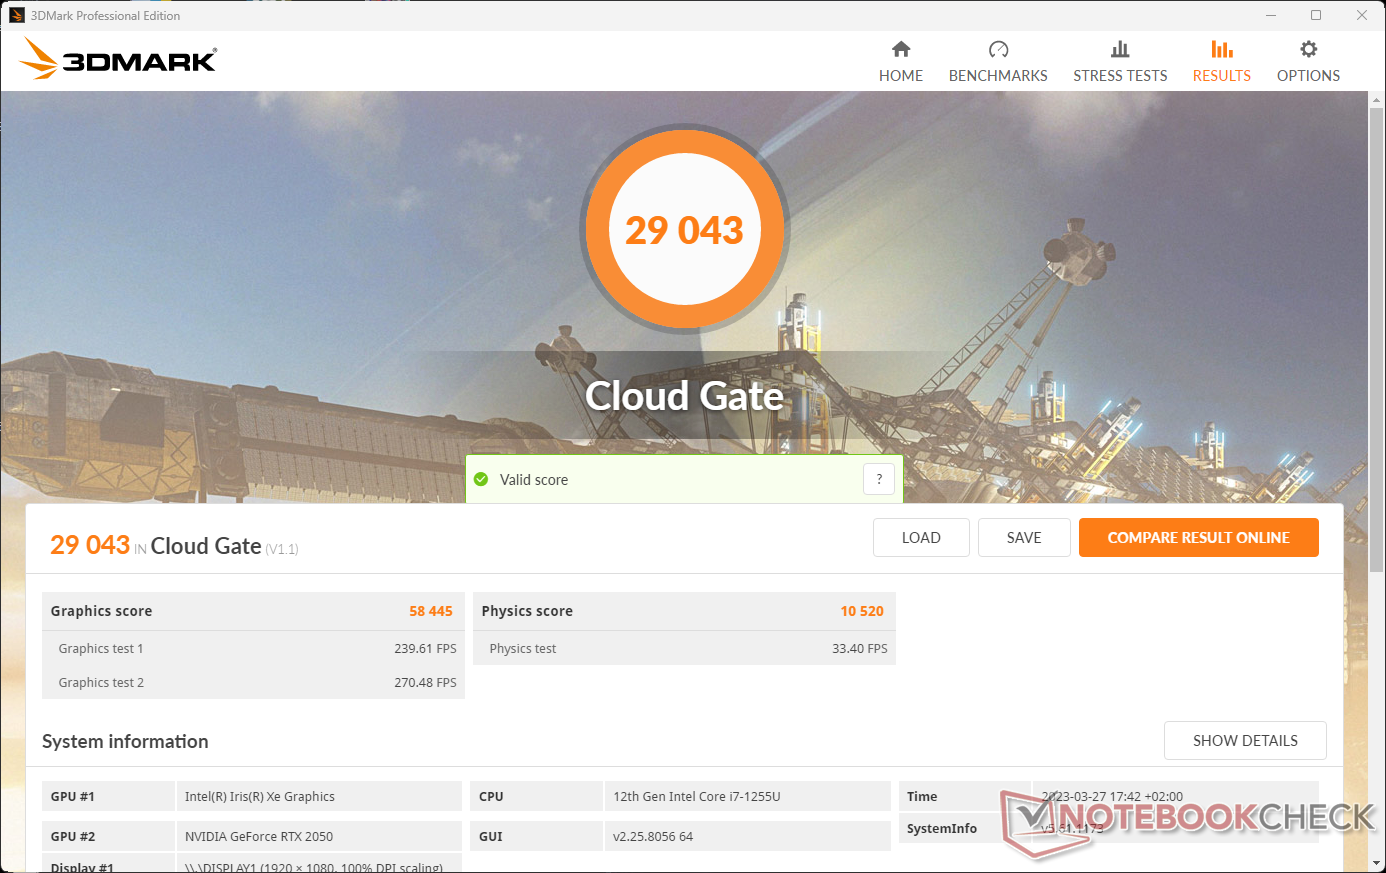
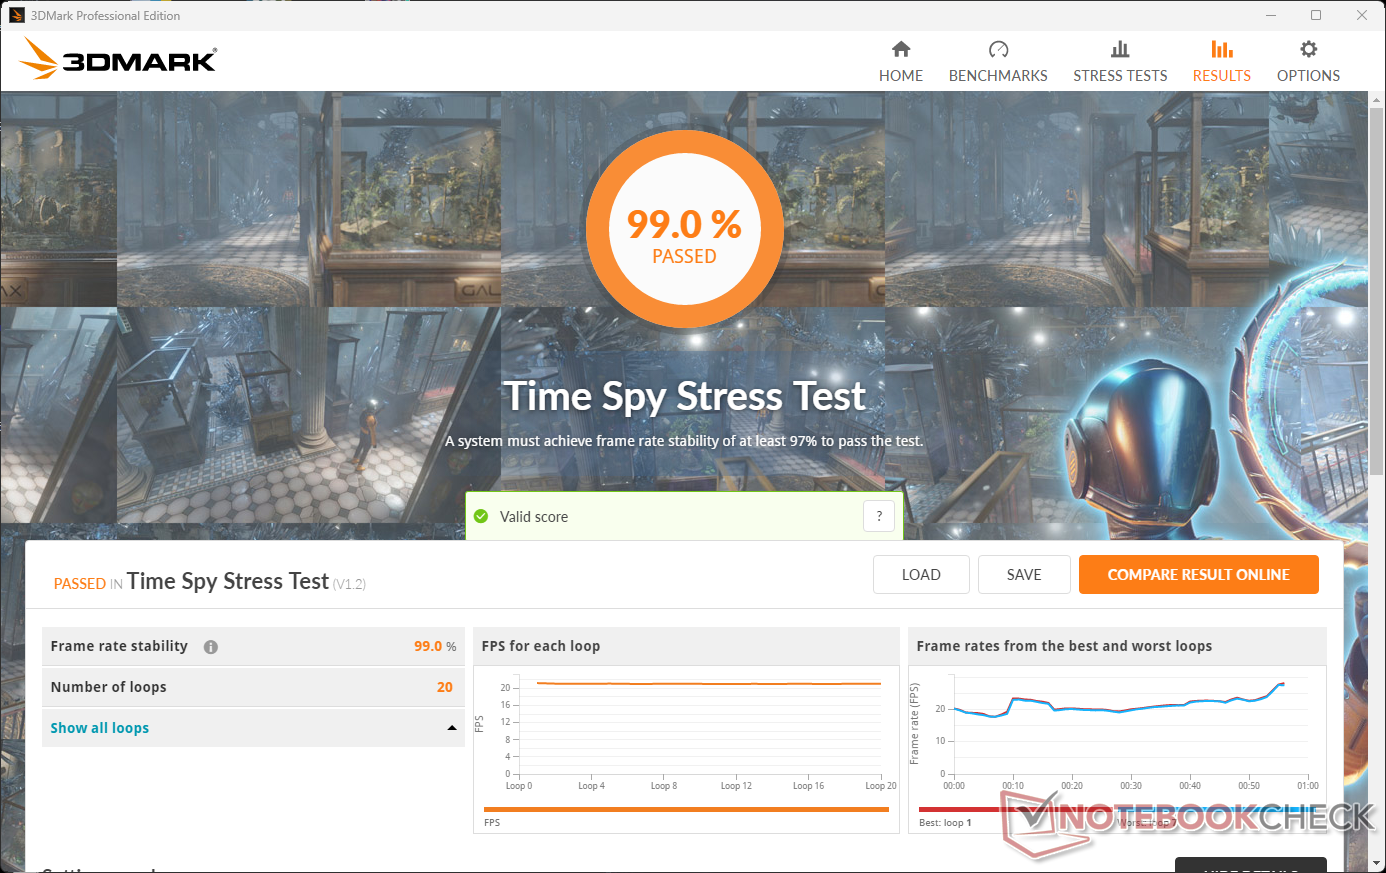
In mains operation, the graphics performance remains constant over time, as the stress test of 3DMark (result: 99%) shows. In battery operation, the laptop still reaches 80 to 90% depending on the benchmark (3DMark 11: 11,017 graphics points).
| 3DMark 11 Performance | 12472 points | |
| 3DMark Cloud Gate Standard Score | 29043 points | |
| 3DMark Fire Strike Score | 7923 points | |
| 3DMark Time Spy Score | 3439 points | |
Help | ||
* ... smaller is better
Gaming Performance
For a cultivated round of gaming with the HP Envy 17 multimedia laptop, the dedicated graphics solution is easily sufficient. Most of the games we chose for our test run smoothly at high or often even maximum graphics settings in FHD resolution. However, the GPU will hardly allow you to enjoy the full 4K resolution of the display.
An annoyance: Using the "Performance" mode in the HP Command Center, many games minimized when changing the display resolution, and we were unable to continue them afterward, or they even crashed completely. We were unable to get a handle on this problem during our tests of the HP Envy 17. Therefore, some of the game measurements were only performed using the "Intelligent Adjustment" mode, where the problem didn't occur.
| The Witcher 3 - 1920x1080 Ultra Graphics & Postprocessing (HBAO+) | |
| MSI Katana 15 B12VEK | |
| Dell XPS 17 9720 | |
| Average of class Multimedia (11 - 121, n=13, last 2 years) | |
| LG Gram 17Z90Q-E.AD78G | |
| HP Envy 17-cr0079ng | |
| Acer Aspire 5 A515-57G-53N8 | |
| HP ProBook 450 G9 6A180EA | |
| Lenovo IdeaPad 3 17ABA7 | |
| GTA V - 1920x1080 Highest AA:4xMSAA + FX AF:16x | |
| MSI Katana 15 B12VEK | |
| Dell XPS 17 9720 | |
| Average of class Multimedia (7.92 - 141.6, n=63, last 2 years) | |
| HP Envy 17-cr0079ng | |
| Acer Aspire 5 A515-57G-53N8 | |
| LG Gram 17Z90Q-E.AD78G | |
| Lenovo IdeaPad 3 17ABA7 | |
| Final Fantasy XV Benchmark - 1920x1080 High Quality | |
| MSI Katana 15 B12VEK | |
| Average of class Multimedia (7.61 - 144.4, n=66, last 2 years) | |
| Dell XPS 17 9720 | |
| HP Envy 17-cr0079ng | |
| Acer Aspire 5 A515-57G-53N8 | |
| LG Gram 17Z90Q-E.AD78G | |
| HP ProBook 450 G9 6A180EA | |
| Lenovo IdeaPad 3 17ABA7 | |
| Strange Brigade - 1920x1080 ultra AA:ultra AF:16 | |
| MSI Katana 15 B12VEK | |
| Average of class Multimedia (13.3 - 303, n=66, last 2 years) | |
| Dell XPS 17 9720 | |
| HP Envy 17-cr0079ng | |
| LG Gram 17Z90Q-E.AD78G | |
| HP ProBook 450 G9 6A180EA | |
| Lenovo IdeaPad 3 17ABA7 | |
| Dota 2 Reborn - 1920x1080 ultra (3/3) best looking | |
| Dell XPS 17 9720 | |
| MSI Katana 15 B12VEK | |
| HP Envy 17-cr0079ng | |
| Acer Aspire 5 A515-57G-53N8 | |
| Average of class Multimedia (29 - 179.9, n=68, last 2 years) | |
| LG Gram 17Z90Q-E.AD78G | |
| HP ProBook 450 G9 6A180EA | |
| Lenovo IdeaPad 3 17ABA7 | |
In our "The Witcher 3" constant load test, the frame rate remains at a constant level, and we don't measure any drops.
The Witcher 3 FPS Chart
| low | med. | high | ultra | QHD | 4K | |
|---|---|---|---|---|---|---|
| GTA V (2015) | 150.7 | 139.3 | 90.2 | 44.8 | ||
| The Witcher 3 (2015) | 175.7 | 106.4 | 58.2 | 33.4 | ||
| Dota 2 Reborn (2015) | 140.9 | 125.8 | 119.5 | 112.6 | 54.8 | |
| Final Fantasy XV Benchmark (2018) | 90.5 | 49 | 35 | 25 | 13.4 | |
| X-Plane 11.11 (2018) | 97.8 | 83.9 | 68.1 | 51.7 | ||
| Far Cry 5 (2018) | 107 | 59 | 53 | 49 | 35 | 18 |
| Strange Brigade (2018) | 170.8 | 74.2 | 60.9 | 53.3 | ||
| Monster Hunter Stories 2 (2021) | 94.4 | 91.2 | 89.7 | 72.5 | ||
| F1 2021 (2021) | 190.7 | 105.6 | 66.2 | 36.1 | 27 | 11 |
| GRID Legends (2022) | 100.6 | 80.8 | 67.9 | 49.5 | 39.4 | 23.3 |
| F1 22 (2022) | 167.7 | 106.6 | 92.7 | 59 | 12 | |
| Dead Space Remake (2023) | 30.8 | 25.8 | 20.4 | 17.8 | 7.4 |
Emissions: Bass, bass, where is the bass...
Noise Levels
During idle operation and under low load, the HP Envy 17 is not audible. Under some light demands, the two fans for CPU and GPU purr constantly, without being particularly annoying. On the other hand, if you challenge the built-in hardware (for example during gaming), the device reaches a noise level of up to 48 dB. The "Intelligent Adjustment" mode hardly brings any noise advantages when the load is slightly lowered.
Our test unit does not produce any other annoying noises.
Noise level
| Idle |
| 28.5 / 28.5 / 29.7 dB(A) |
| Load |
| 39.5 / 48 dB(A) |
 | ||
30 dB silent 40 dB(A) audible 50 dB(A) loud |
||
min: | ||
| HP Envy 17-cr0079ng GeForce RTX 2050 Mobile, i7-1255U, Samsung PM991a MZVLQ1T0HBLB | HP ProBook 450 G9 6A180EA Iris Xe G7 96EUs, i7-1255U, SK Hynix HFM512GD3JX013N | LG Gram 17Z90Q-E.AD78G GeForce RTX 2050 Mobile, i7-1260P, Samsung PM9A1 MZVL21T0HCLR | Acer Aspire 5 A515-57G-53N8 GeForce RTX 2050 Mobile, i5-1240P, Micron 2450 512GB MTFDKBA512TFK | Dell XPS 17 9720 GeForce RTX 3050 4GB Laptop GPU, i7-12700H, Micron 3400 MTFDKBA512TFH 512GB | Lenovo IdeaPad 3 17ABA7 Vega 7, R5 5625U, Intel SSDPEKNW512GZL | |
|---|---|---|---|---|---|---|
| Noise | 19% | -3% | -0% | 8% | -5% | |
| off / environment * (dB) | 26.5 | 25.5 4% | 26 2% | 25 6% | 24 9% | 26 2% |
| Idle Minimum * (dB) | 28.5 | 25.5 11% | 28 2% | 25 12% | 24 16% | 26 9% |
| Idle Average * (dB) | 28.5 | 25.5 11% | 28 2% | 29 -2% | 24 16% | 30.8 -8% |
| Idle Maximum * (dB) | 29.7 | 25.5 14% | 28.8 3% | 31 -4% | 24 19% | 33.4 -12% |
| Load Average * (dB) | 39.5 | 28 29% | 49.3 -25% | 46 -16% | 43.9 -11% | 47.6 -21% |
| Load Maximum * (dB) | 48 | 27.7 42% | 49.1 -2% | 47 2% | 48.4 -1% | 47.5 1% |
| Witcher 3 ultra * (dB) | 42 | 48.4 |
* ... smaller is better
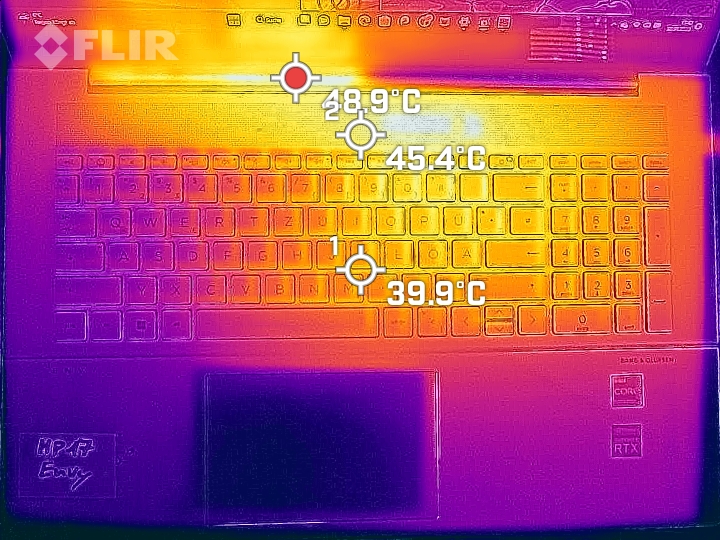
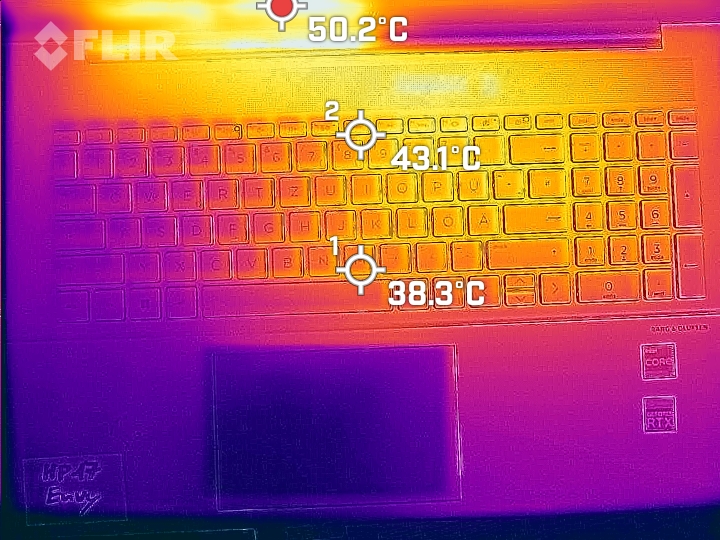
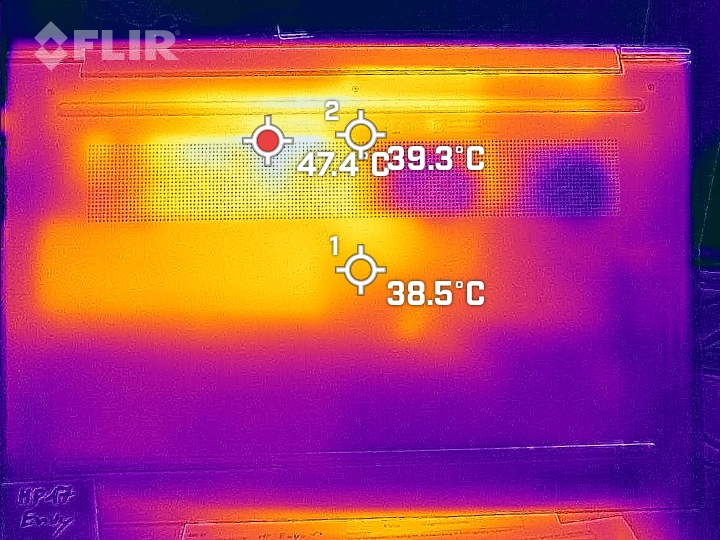
Temperature
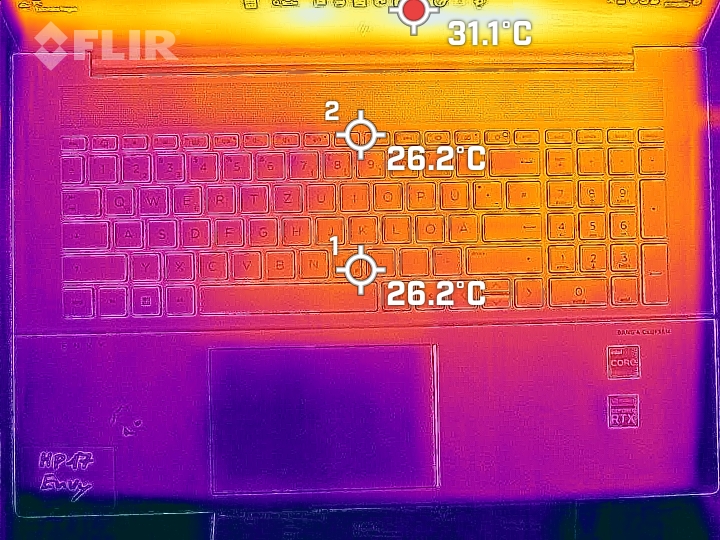
During idle operation, the laptop gets hardly any warmer than room temperature. Under load, a hotspot develops in the center in front of the display, which then expands toward the keyboard, reaching temperatures close to the 50-°C mark (122 °F). While this warming is noticeable while typing, it doesn't become too uncomfortable.
(-) The maximum temperature on the upper side is 47.1 °C / 117 F, compared to the average of 36.8 °C / 98 F, ranging from 21 to 71 °C for the class Multimedia.
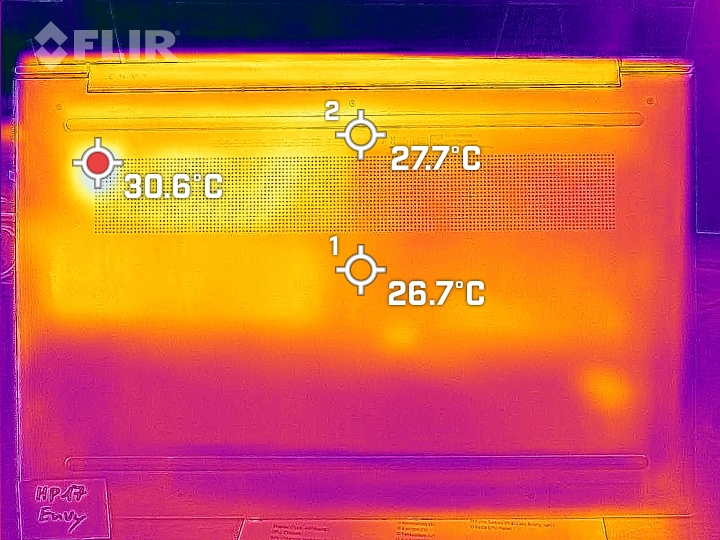
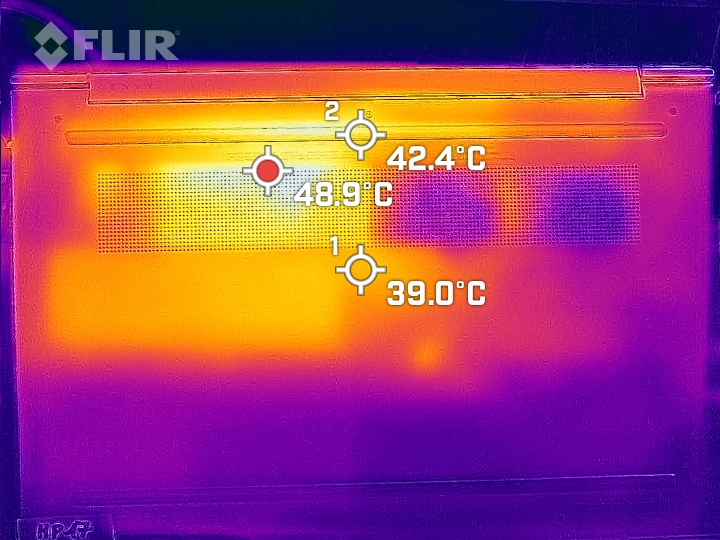
(±) The bottom heats up to a maximum of 43.8 °C / 111 F, compared to the average of 39.1 °C / 102 F
(+) In idle usage, the average temperature for the upper side is 23.9 °C / 75 F, compared to the device average of 31.3 °C / 88 F.
(±) Playing The Witcher 3, the average temperature for the upper side is 34.5 °C / 94 F, compared to the device average of 31.3 °C / 88 F.
(+) The palmrests and touchpad are cooler than skin temperature with a maximum of 31.7 °C / 89.1 F and are therefore cool to the touch.
(-) The average temperature of the palmrest area of similar devices was 28.7 °C / 83.7 F (-3 °C / -5.4 F).
| HP Envy 17-cr0079ng Intel Core i7-1255U, NVIDIA GeForce RTX 2050 Mobile | HP ProBook 450 G9 6A180EA Intel Core i7-1255U, Intel Iris Xe Graphics G7 96EUs | LG Gram 17Z90Q-E.AD78G Intel Core i7-1260P, NVIDIA GeForce RTX 2050 Mobile | Acer Aspire 5 A515-57G-53N8 Intel Core i5-1240P, NVIDIA GeForce RTX 2050 Mobile | Dell XPS 17 9720 Intel Core i7-12700H, NVIDIA GeForce RTX 3050 4GB Laptop GPU | Lenovo IdeaPad 3 17ABA7 AMD Ryzen 5 5625U, AMD Radeon RX Vega 7 | Average of class Multimedia | |
|---|---|---|---|---|---|---|---|
| Heat | -14% | -9% | -2% | -3% | 1% | -1% | |
| Maximum Upper Side * (°C) | 47.1 | 40.5 14% | 50.3 -7% | 43 9% | 49.5 -5% | 43.1 8% | 41.5 ? 12% |
| Maximum Bottom * (°C) | 43.8 | 47.6 -9% | 52.5 -20% | 48 -10% | 38.4 12% | 43.6 -0% | 44.1 ? -1% |
| Idle Upper Side * (°C) | 25.2 | 32.6 -29% | 26.9 -7% | 26 -3% | 28 -11% | 25.1 -0% | 27.1 ? -8% |
| Idle Bottom * (°C) | 25.9 | 34.2 -32% | 26.5 -2% | 27 -4% | 27.8 -7% | 27 -4% | 28 ? -8% |
* ... smaller is better
Stress Test
In our stress test with Prime95 and Furmark challenging the hardware for at least one hour, the CPU and GPU maintain a constant result without any larger drops during the test. The CPU levels out at an average of 71 °C (160 °F) and around 1.65 GHz, which is slightly below the basic clock speed of 1.7 GHz. However, this doesn't have any impact on daily operation. The GPU consumes 35 watts, running at about 1.1 GHz with temperatures around 75 °C (167 °F).
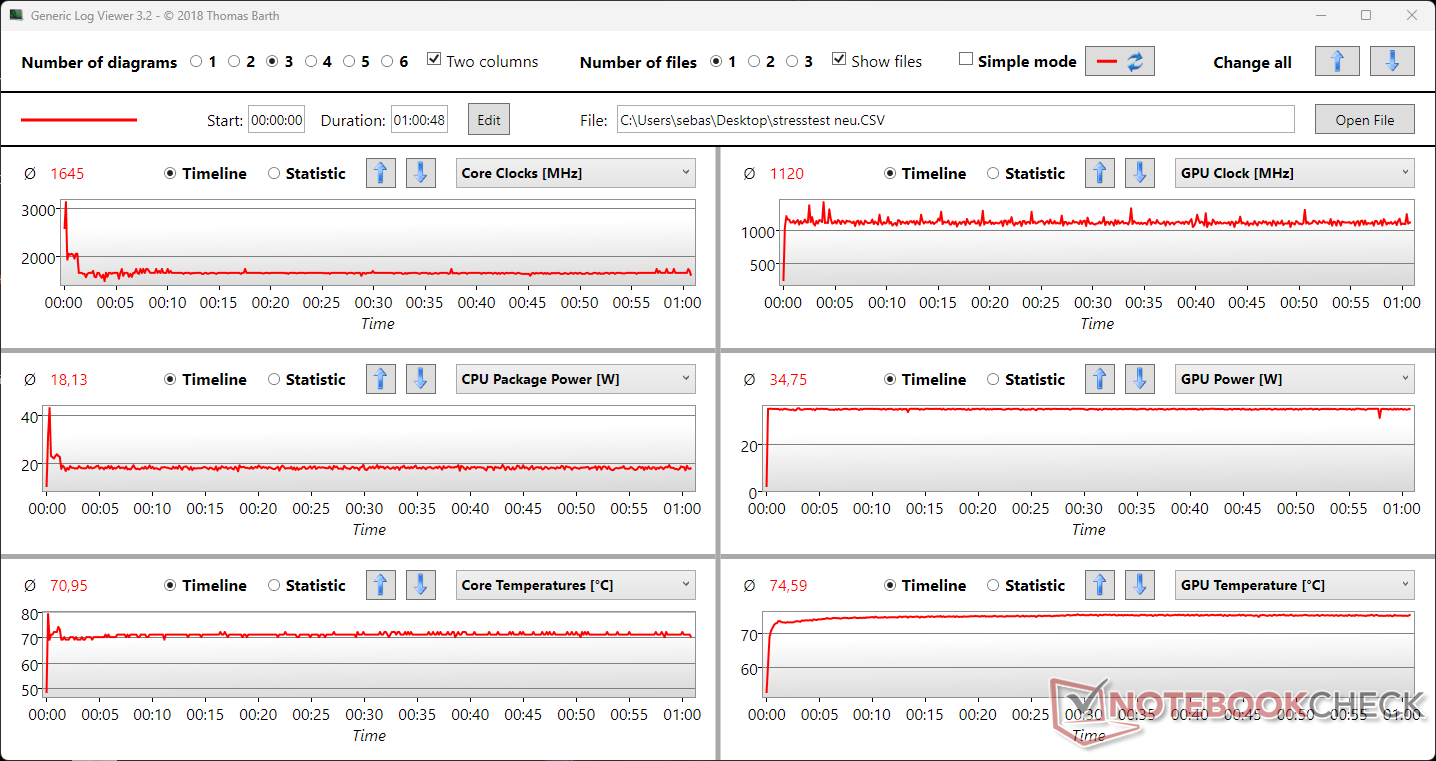
| CPU Clock (GHz) | GPU Clock (MHz) | Average CPU Temperature (°C) | Average GPU Temperature (°C) | |
| System Idle | 2.0 | 0 | 49 | 55 |
| Prime95, Stress | 2.5 | 0 | 68 | 55 |
| Prime95 + FurMark, Stress | 1.65 | 1.1 | 71 | 75 |
| The Witcher 3, Stress | 3.3 | 1.3 | 65 | 71 |
Speakers
The stereo loudspeakers from Bang & Olufsen can play relatively loud and offer fairly balanced mids and highs. However, the bass is lacking almost completely. Overall, our test unit places in the lower half the multimedia field in terms of the audio reproduction. Particularly for music or gaming, we recommend connecting headphones or a headset via the 3.5-mm audio port.
HP Envy 17-cr0079ng audio analysis
(+) | speakers can play relatively loud (86.2 dB)
Bass 100 - 315 Hz
(-) | nearly no bass - on average 17.6% lower than median
(±) | linearity of bass is average (12.4% delta to prev. frequency)
Mids 400 - 2000 Hz
(+) | balanced mids - only 2.5% away from median
(+) | mids are linear (3.6% delta to prev. frequency)
Highs 2 - 16 kHz
(±) | higher highs - on average 10.1% higher than median
(+) | highs are linear (4.2% delta to prev. frequency)
Overall 100 - 16.000 Hz
(±) | linearity of overall sound is average (18.3% difference to median)
Compared to same class
» 56% of all tested devices in this class were better, 7% similar, 38% worse
» The best had a delta of 5%, average was 17%, worst was 45%
Compared to all devices tested
» 40% of all tested devices were better, 8% similar, 52% worse
» The best had a delta of 4%, average was 24%, worst was 134%
Apple MacBook Pro 16 2021 M1 Pro audio analysis
(+) | speakers can play relatively loud (84.7 dB)
Bass 100 - 315 Hz
(+) | good bass - only 3.8% away from median
(+) | bass is linear (5.2% delta to prev. frequency)
Mids 400 - 2000 Hz
(+) | balanced mids - only 1.3% away from median
(+) | mids are linear (2.1% delta to prev. frequency)
Highs 2 - 16 kHz
(+) | balanced highs - only 1.9% away from median
(+) | highs are linear (2.7% delta to prev. frequency)
Overall 100 - 16.000 Hz
(+) | overall sound is linear (4.6% difference to median)
Compared to same class
» 0% of all tested devices in this class were better, 0% similar, 100% worse
» The best had a delta of 5%, average was 17%, worst was 45%
Compared to all devices tested
» 0% of all tested devices were better, 0% similar, 100% worse
» The best had a delta of 4%, average was 24%, worst was 134%
Power Management: The HP Envy 17 isn't an endurance champion
Power Consumption
The HP Envy 17-cr0079ng isn't very efficient. Compared to the LG Gram 17 with the same display diagonal and dGPU, as well as most other comparison models, it consumes more power from the charger, which at 90 W is sufficiently large for a power consumption of around 70 W. Only under absolute peak load, the consumption reaches just barely higher at 93 W.
| Off / Standby | |
| Idle | |
| Load |
|
Key:
min: | |
| HP Envy 17-cr0079ng i7-1255U, GeForce RTX 2050 Mobile, Samsung PM991a MZVLQ1T0HBLB, IPS, 3840x2160, 17.3" | HP ProBook 450 G9 6A180EA i7-1255U, Iris Xe G7 96EUs, SK Hynix HFM512GD3JX013N, , 1920x1080, 15.6" | LG Gram 17Z90Q-E.AD78G i7-1260P, GeForce RTX 2050 Mobile, Samsung PM9A1 MZVL21T0HCLR, IPS, 2560x1600, 17" | Acer Aspire 5 A515-57G-53N8 i5-1240P, GeForce RTX 2050 Mobile, Micron 2450 512GB MTFDKBA512TFK, IPS, 1920x1080, 15.6" | Dell XPS 17 9720 i7-12700H, GeForce RTX 3050 4GB Laptop GPU, Micron 3400 MTFDKBA512TFH 512GB, IPS, 3840x2400, 17" | Lenovo IdeaPad 3 17ABA7 R5 5625U, Vega 7, Intel SSDPEKNW512GZL, IPS, 1920x1080, 17.3" | Average NVIDIA GeForce RTX 2050 Mobile | Average of class Multimedia | |
|---|---|---|---|---|---|---|---|---|
| Power Consumption | 47% | 31% | 26% | -35% | 42% | 18% | 10% | |
| Idle Minimum * (Watt) | 5.8 | 4.5 22% | 4.1 29% | 4 31% | 7.8 -34% | 5.1 12% | 5.11 ? 12% | 5.71 ? 2% |
| Idle Average * (Watt) | 14.3 | 7.3 49% | 9.8 31% | 8 44% | 15.1 -6% | 8.3 42% | 9.15 ? 36% | 10.1 ? 29% |
| Idle Maximum * (Watt) | 18.4 | 8.1 56% | 12 35% | 13 29% | 17 8% | 9.6 48% | 11.2 ? 39% | 12.4 ? 33% |
| Load Average * (Watt) | 70 | 32.8 53% | 49.3 30% | 62 11% | 114 -63% | 33.6 52% | 70.6 ? -1% | 65 ? 7% |
| Witcher 3 ultra * (Watt) | 69.4 | 32 54% | 49.3 29% | 60 14% | 115.2 -66% | 33.3 52% | ||
| Load Maximum * (Watt) | 93 | 47 49% | 66 29% | 70 25% | 135.6 -46% | 51.9 44% | 87.4 ? 6% | 112.2 ? -21% |
* ... smaller is better
Power Consumption The Witcher 3 / Stress Test
Power Consumption with External Monitor
Battery Life
HP has equipped our Envy 17 test unit with a 55-Wh battery. With this, it is slightly larger than that of most other comparison devices. Only the LG Gram 17 endurance champion and the Dell XPS 17 power laptop have significantly larger batteries.
However, the battery size is only reflected to a limited sense in the battery life of our test unit. In the comparison field, our device places last, which is probably due mainly to the fairly bright, high-resolution 4K display. Under load, the battery runs out after only about 90 minutes, and while surfing or watching videos, the values don't really invite some enthusiasm either with about 4.5 and 5.5 hours respectively.
| HP Envy 17-cr0079ng i7-1255U, GeForce RTX 2050 Mobile, 55 Wh | HP ProBook 450 G9 6A180EA i7-1255U, Iris Xe G7 96EUs, 51 Wh | LG Gram 17Z90Q-E.AD78G i7-1260P, GeForce RTX 2050 Mobile, 90 Wh | Acer Aspire 5 A515-57G-53N8 i5-1240P, GeForce RTX 2050 Mobile, 50 Wh | Dell XPS 17 9720 i7-12700H, GeForce RTX 3050 4GB Laptop GPU, 97 Wh | Lenovo IdeaPad 3 17ABA7 R5 5625U, Vega 7, 38 Wh | Average of class Multimedia | |
|---|---|---|---|---|---|---|---|
| Battery runtime | 111% | 124% | 19% | 58% | 45% | 119% | |
| H.264 (h) | 5.5 | 11.2 104% | 16.4 ? 198% | ||||
| WiFi v1.3 (h) | 4.7 | 10.1 115% | 14.5 209% | 7.1 51% | 9.2 96% | 6.8 45% | 12 ? 155% |
| Load (h) | 1.6 | 3.3 106% | 2.2 38% | 1.4 -13% | 1.2 -25% | 1.675 ? 5% | |
| Witcher 3 ultra (h) | 2.7 | 1.7 | |||||
| Reader / Idle (h) | 15.8 | 25.2 ? |
Pros
Cons
Verdict: The HP Envy 17 is a good allrounder with few highlights
In our test, the HP Envy 17-cr0079ng presents itself as a balanced multimedia laptop. Thanks to its solid CPU performance and dedicated entry-level GeForce, it can also be used for playing video games, as long as the demands aren't too high. Those looking for more can find it in the Dell XPS 17 for example.
One of the highlights should really be the large and bright display with a UHD resolution. Thanks to its high-gloss design it also looks really good, but that turns out to be a problem with light reflections or outdoors.
The laptop also shows some weaknesses in the battery life, so it is not an ideal companion for outdoor or mobile use. Those who want to be able to work away from the outlet for as long as possible should definitely choose another laptop such as the extremely long-lasting LG Gram 17.
Overall, the HP Envy 17 scores in our test with more strengths than weaknesses but is unable to really stand out in any area. It offers a good mixture for multimedia, gaming, and Office but also costs a hefty price at an MSRP of almost 2,000 Euros (~$2,210). Other devices offer more for the money here, such as the Acer Aspire 5 A515-57G with the same dGPU but without 4K display costing only half as much, or the even more expensive but also more powerful and overall more "perfect" Dell XPS 17.
Price and Availability
The HP Envy 17 is available in many configurations from HP starting from $699.99. A model with an almost similar configuration as our test unit (Intel Core i7-1260P instead of i7-1255U, 32 GB RAM, 1-TB SSD, QHD display) but lacking the dedicated graphics card is available for $1309.99, and another configuration with the graphics card but less RAM and a smaller FHD screen costs $1049.99.
HP Envy 17-cr0079ng
- 03/28/2023 v7 (old)
Marcus Schwarten
Transparency
The selection of devices to be reviewed is made by our editorial team. The test sample was provided to the author as a loan by the manufacturer or retailer for the purpose of this review. The lender had no influence on this review, nor did the manufacturer receive a copy of this review before publication. There was no obligation to publish this review. As an independent media company, Notebookcheck is not subjected to the authority of manufacturers, retailers or publishers.
This is how Notebookcheck is testing
Every year, Notebookcheck independently reviews hundreds of laptops and smartphones using standardized procedures to ensure that all results are comparable. We have continuously developed our test methods for around 20 years and set industry standards in the process. In our test labs, high-quality measuring equipment is utilized by experienced technicians and editors. These tests involve a multi-stage validation process. Our complex rating system is based on hundreds of well-founded measurements and benchmarks, which maintains objectivity. Further information on our test methods can be found here.
Price comparison

