HP Omen 16 2023 laptop review: 145 W GeForce RTX 4080 performance

The 2023 Omen 16 succeeds last year's model with faster 13th gen Raptor Lake-H processors, Nvidia Ada Lovelace RTX GPUs, and a revamped chassis design. It can be considered a few steps up from the more budget-oriented HP Pavilion Gaming 16.
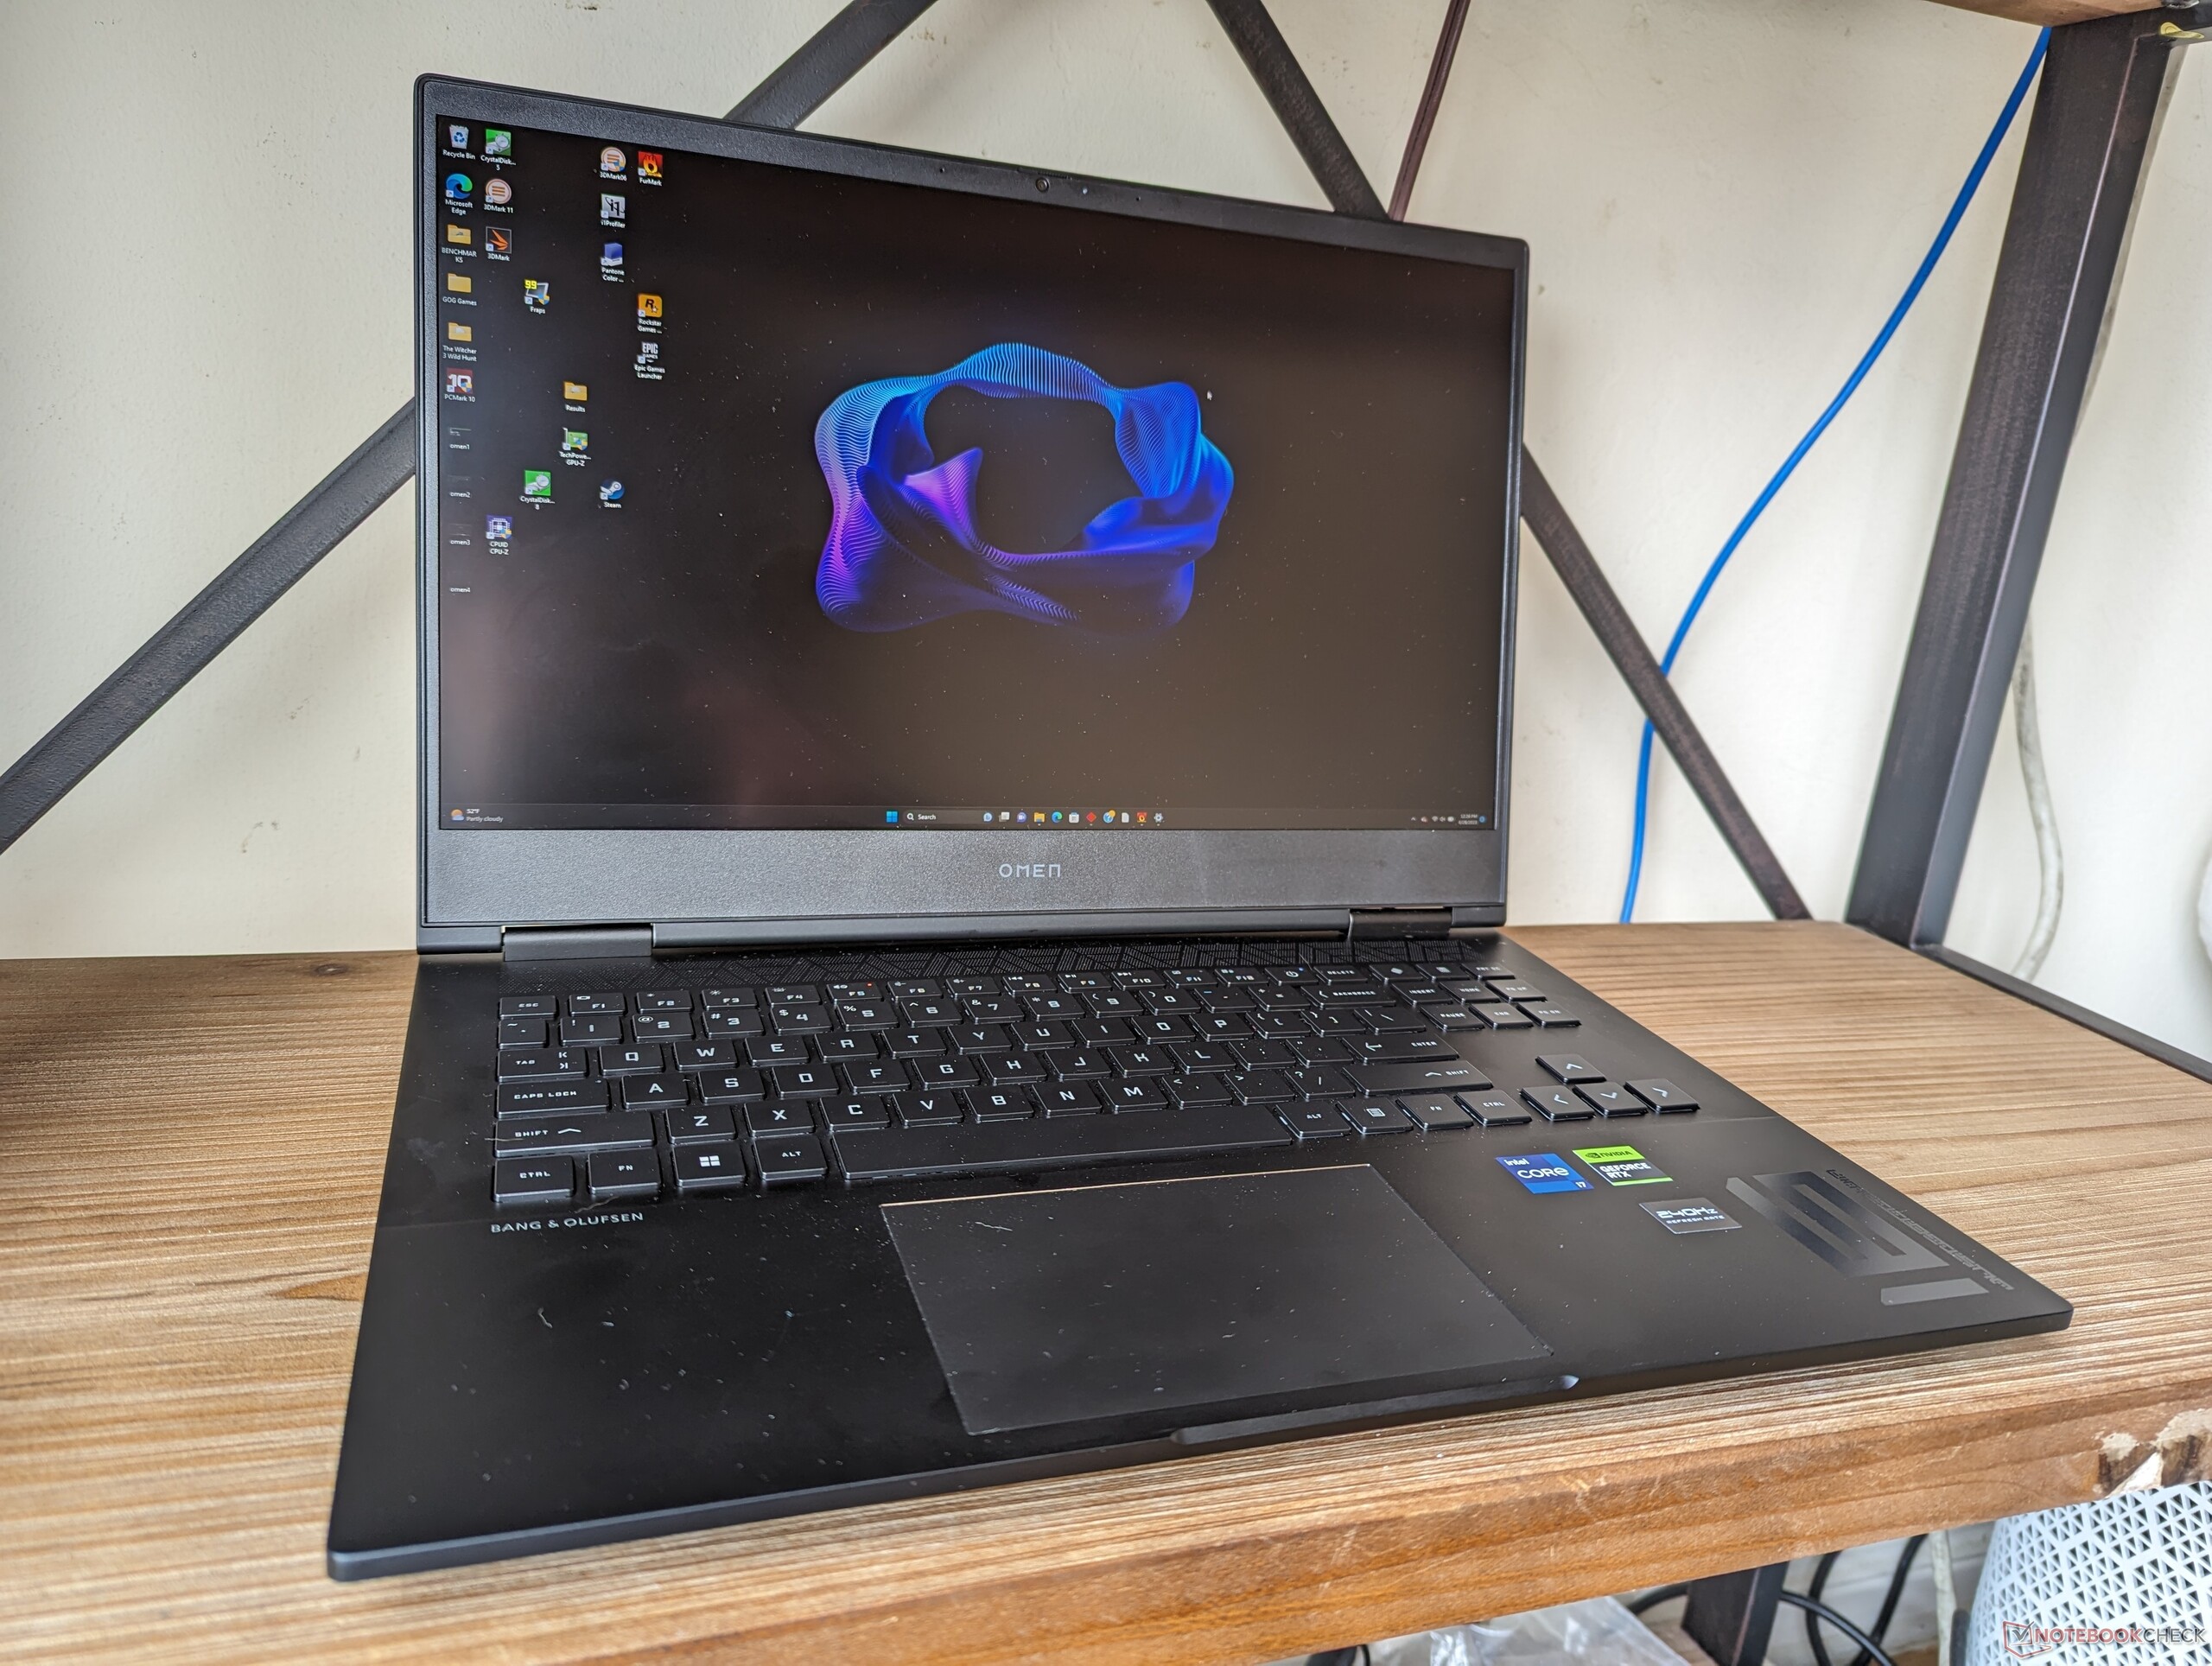
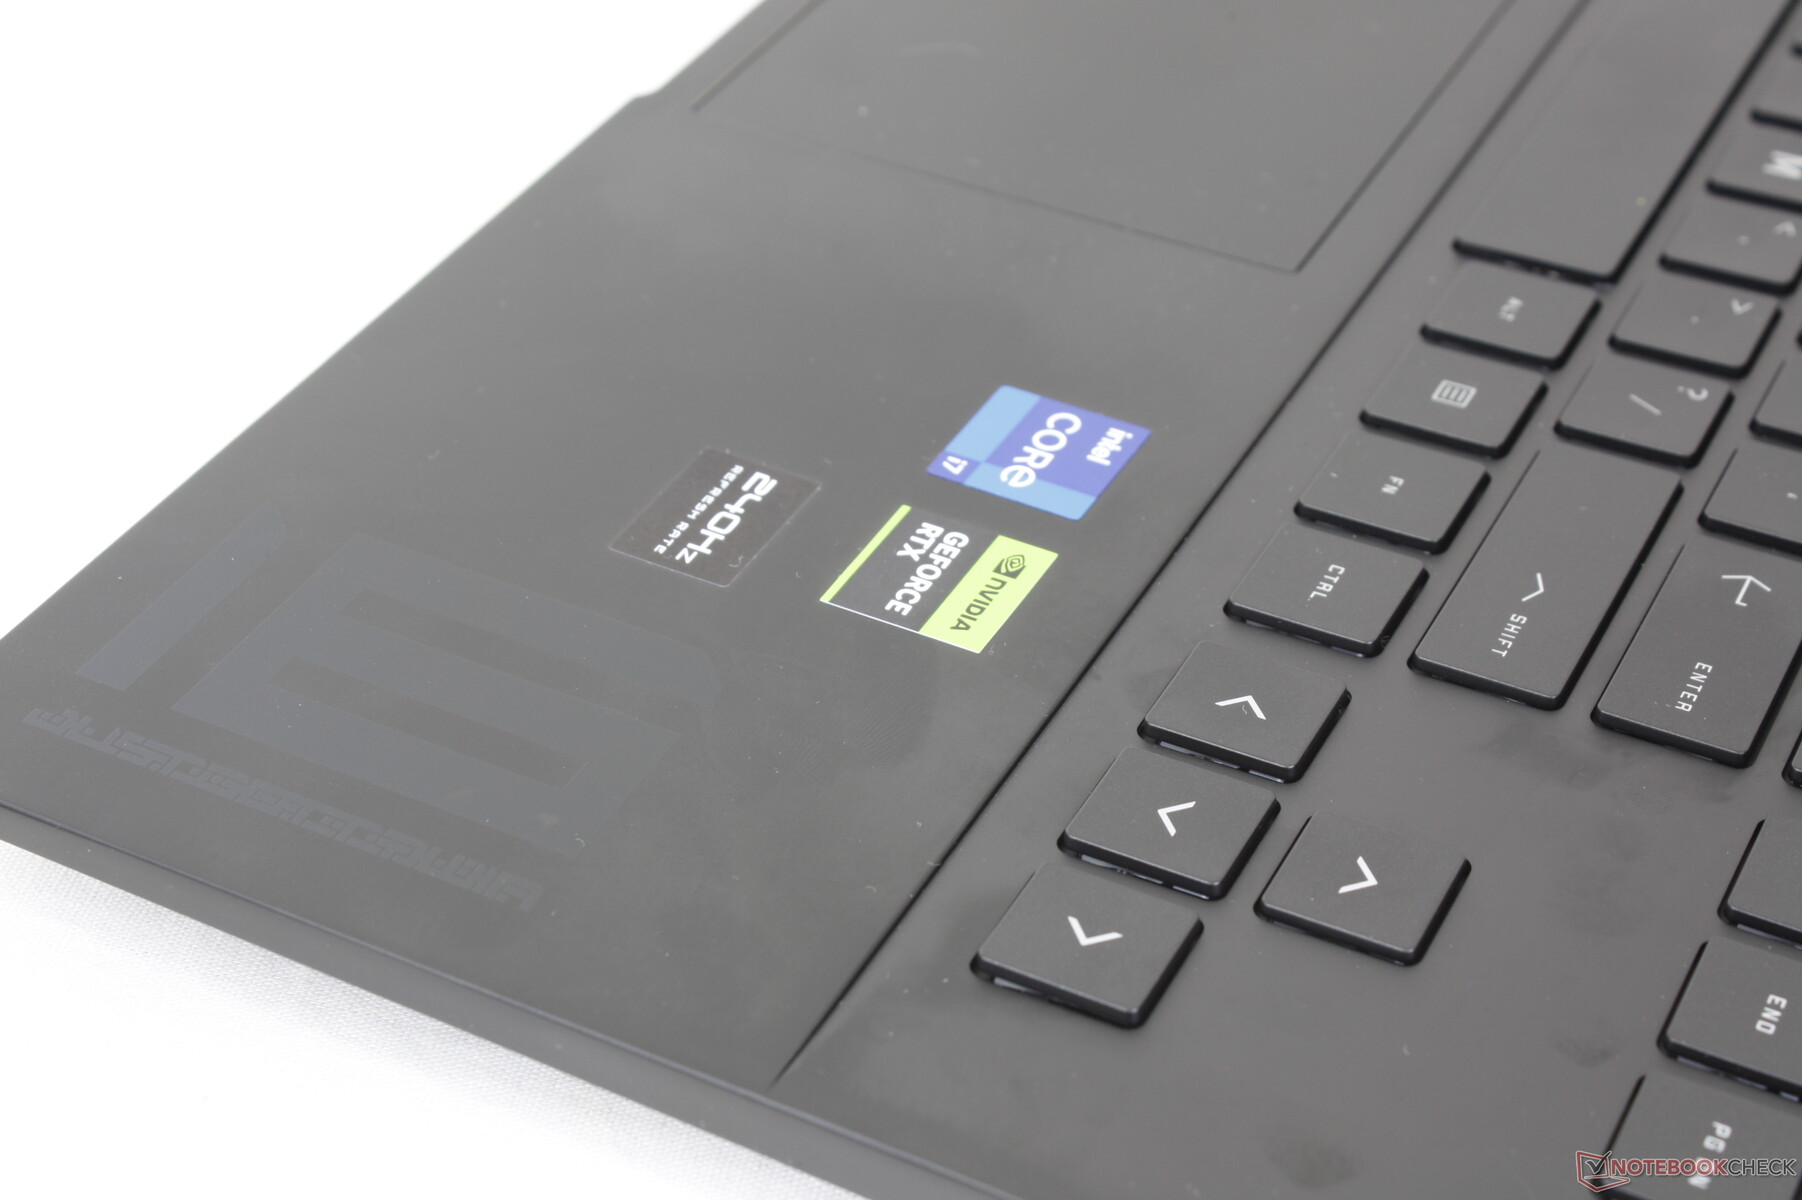
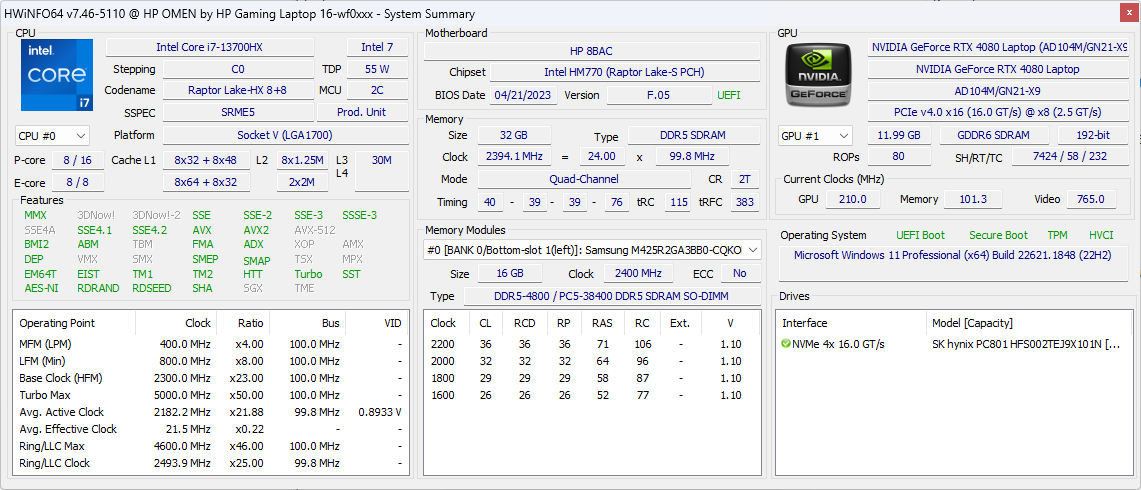
Our review unit is the highest-end configuration with the 13th gen Raptor Lake Core i7-13700HX CPU, 145 W GeForce RTX 4080 GPU, 1440p240 IPS display, per-key RGB lighting, and 32 GB RAM for just under $2600 USD. Lesser SKUs with the RTX 4060, 1080p165 IPS display, and single-zone keyboard lighting are also available starting at $1100. All options at the moment must come with the same Core i7-13700HX CPU, however. Note that HP has dropped the AMD and Radeon options this year.
Alternatives to the Omen 16 include other high-end 16-inch gaming laptops like the Alienware x16 R1, Lenovo Legion Pro 7 16, Asus ROG Strix G16, or Razer Blade 16.
More HP reviews:
Potential Competitors in Comparison
Rating | Date | Model | Weight | Height | Size | Resolution | Price |
|---|---|---|---|---|---|---|---|
| 87.4 % v7 (old) | 06 / 2023 | HP Omen 16-wf000 i7-13700HX, GeForce RTX 4080 Laptop GPU | 2.4 kg | 23.6 mm | 16.10" | 2560x1440 | |
| 86.4 % v7 (old) | 11 / 2022 | HP Omen 16-n0033dx R7 6800H, Radeon RX 6650M | 2.4 kg | 22.6 mm | 16.10" | 1920x1080 | |
| 88.4 % v7 (old) | 06 / 2023 | Alienware x16 R1 i9-13900HK, GeForce RTX 4080 Laptop GPU | 2.6 kg | 18.57 mm | 16.00" | 2560x1600 | |
| 88.8 % v7 (old) | 06 / 2023 | Lenovo Legion Pro 7 RTX4090 i9-13900HX, GeForce RTX 4090 Laptop GPU | 2.7 kg | 26 mm | 16.00" | 2560x1600 | |
| 88.4 % v7 (old) | 03 / 2023 | Asus ROG Strix G16 G614JZ i9-13980HX, GeForce RTX 4080 Laptop GPU | 2.4 kg | 30.4 mm | 16.00" | 2560x1600 | |
| 91.2 % v7 (old) | 02 / 2023 | Razer Blade 16 Early 2023 i9-13950HX, GeForce RTX 4080 Laptop GPU | 2.4 kg | 21.99 mm | 16.00" | 2560x1600 |
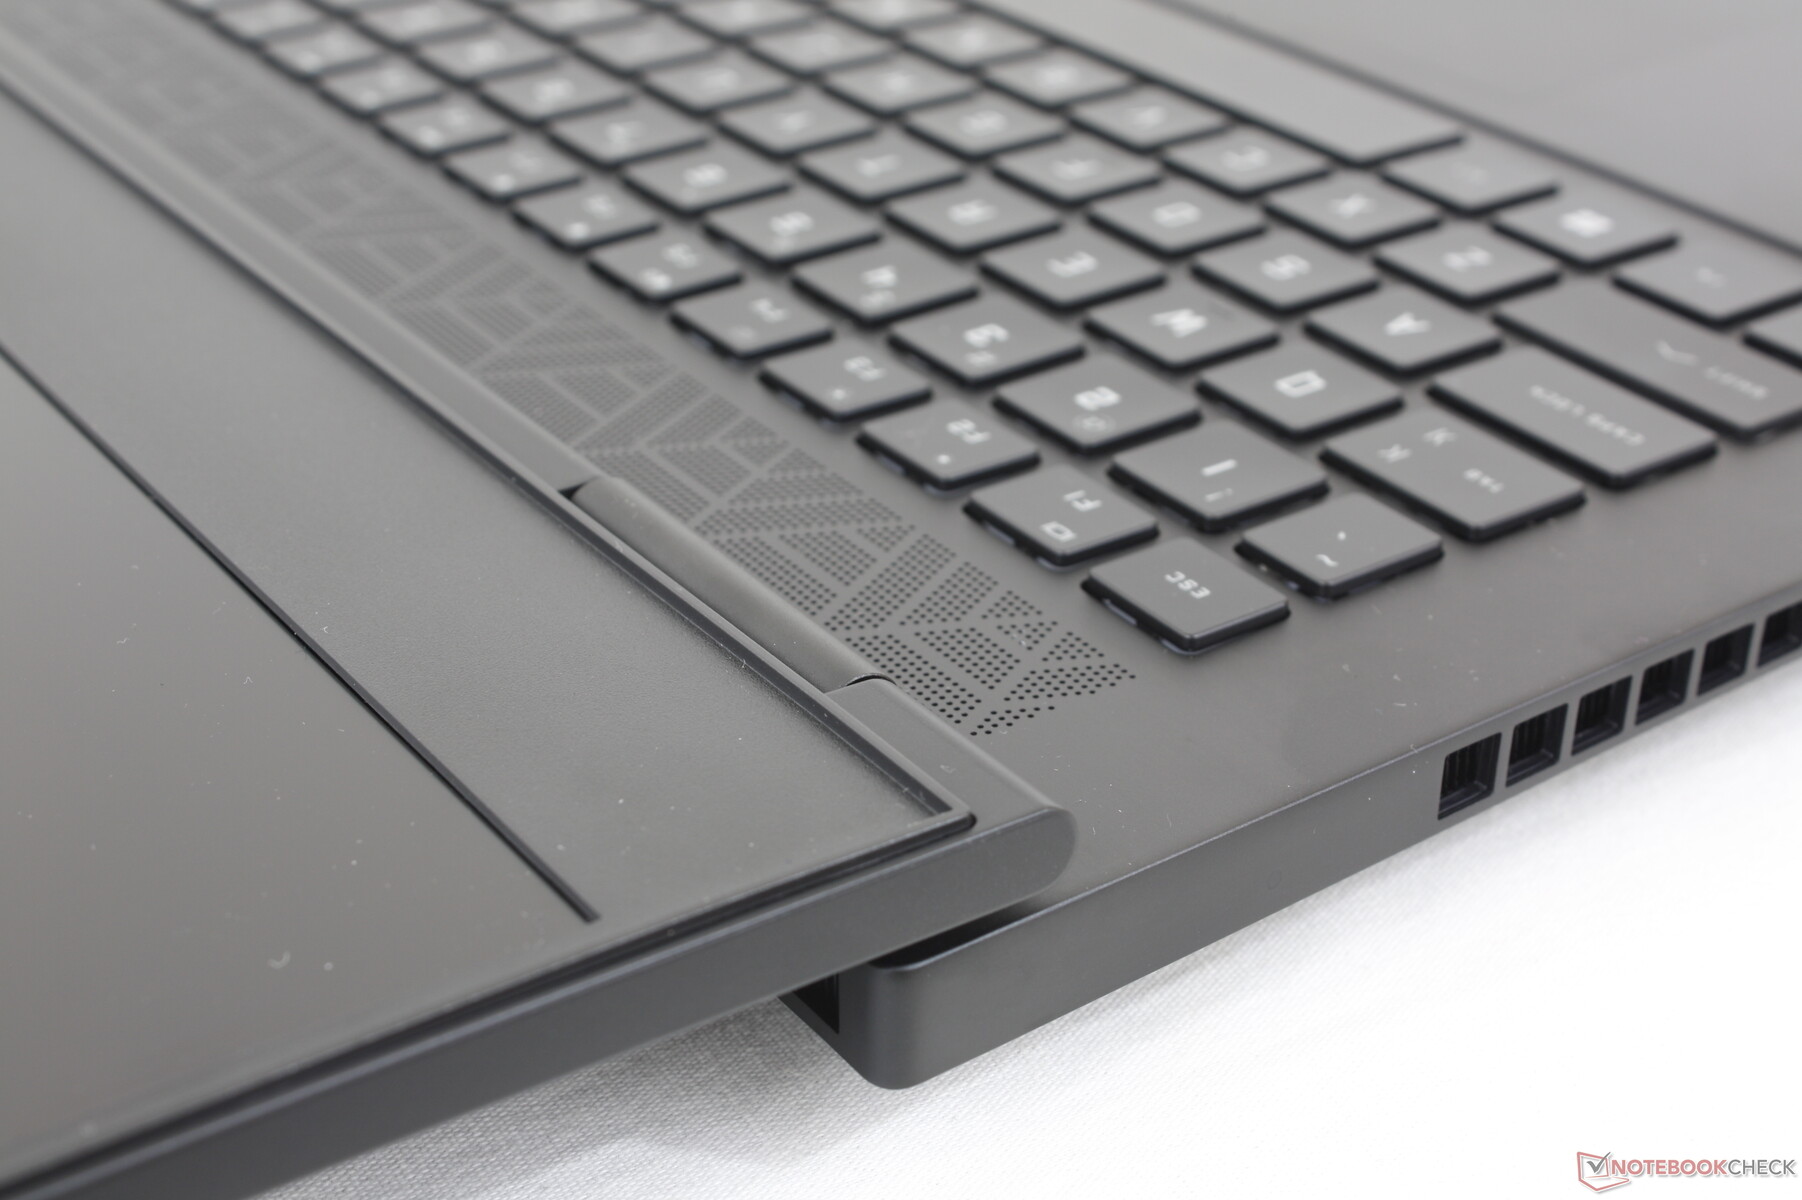
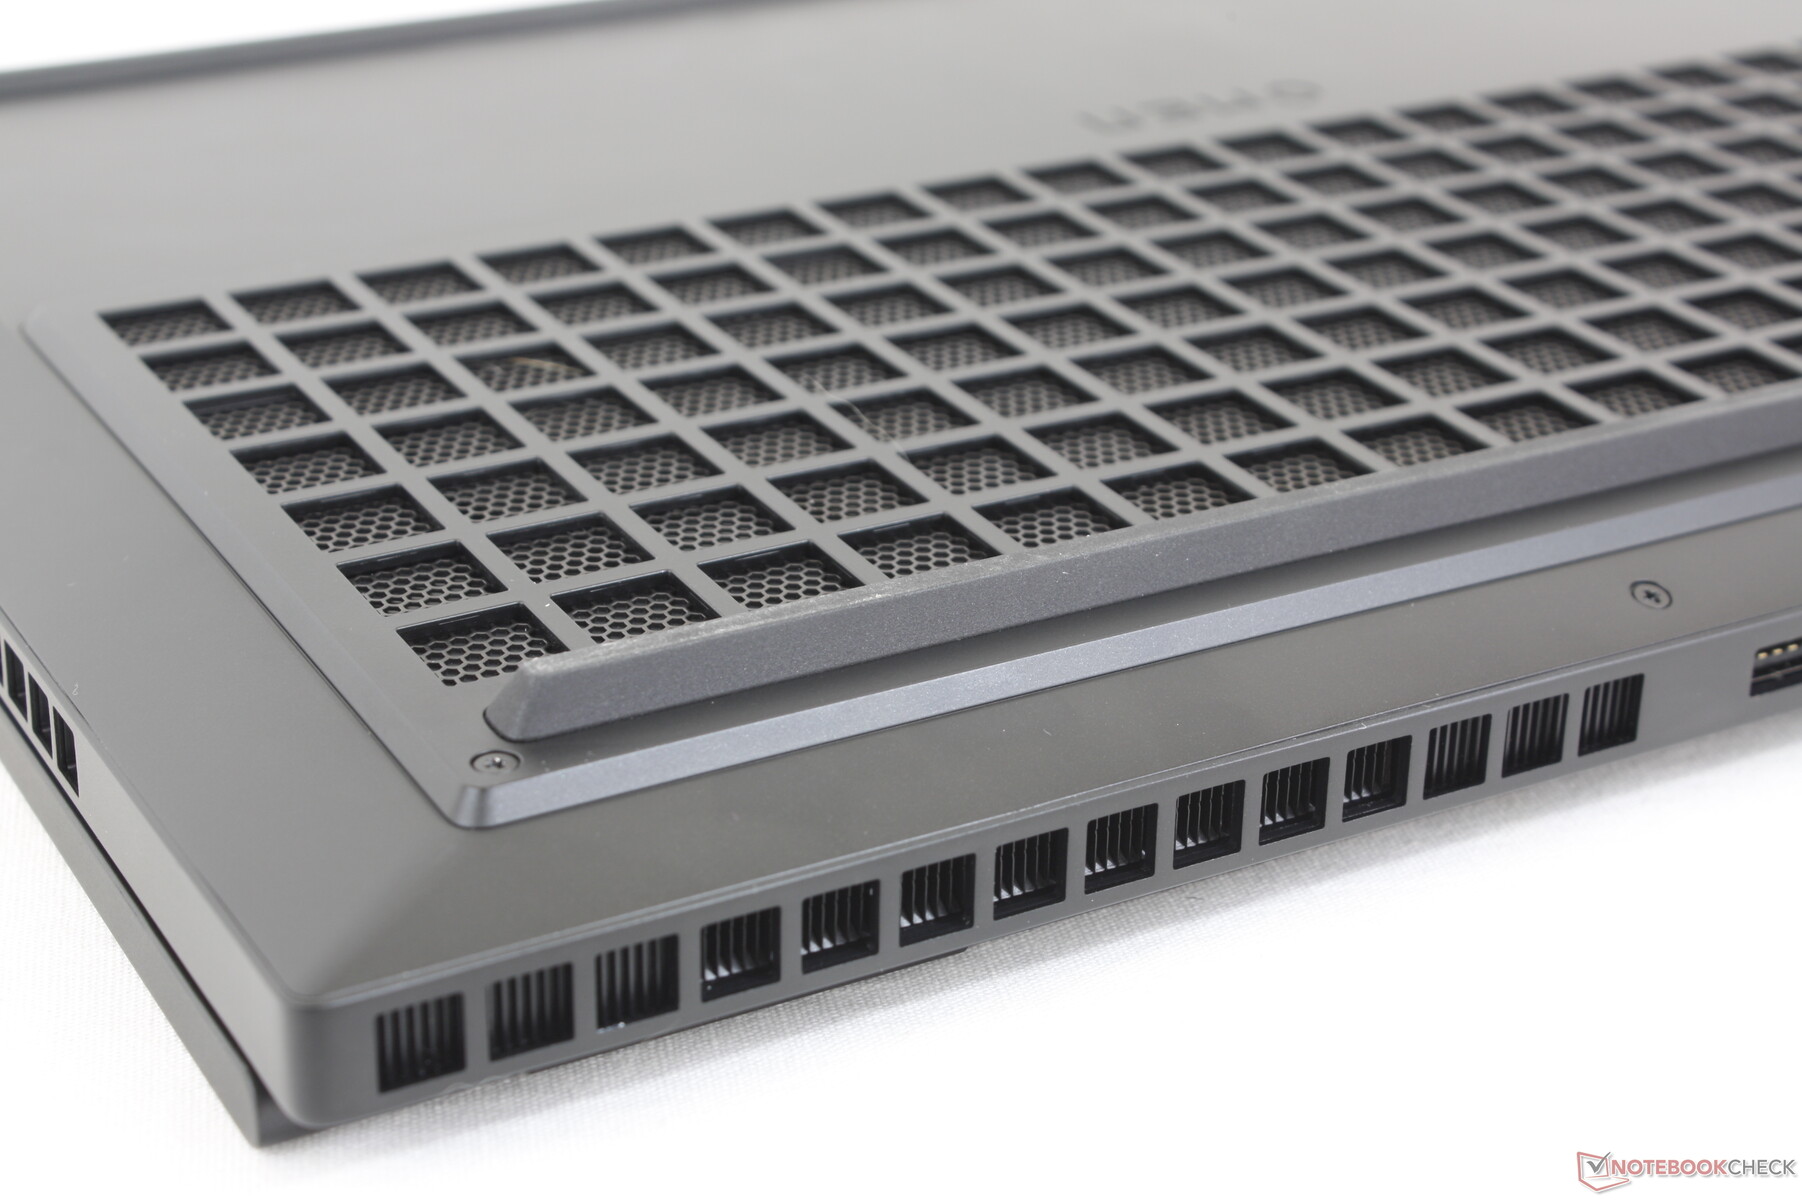
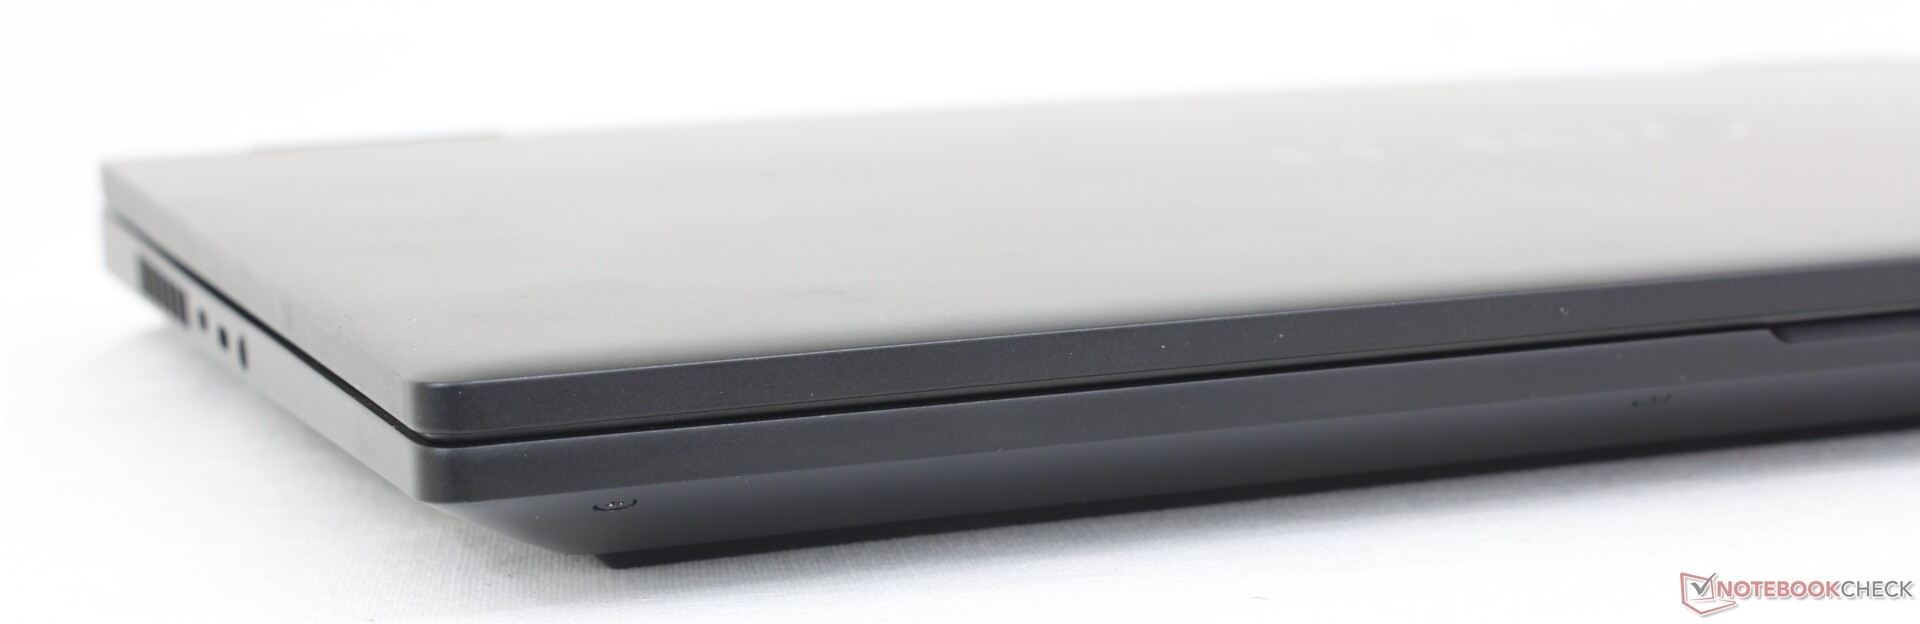
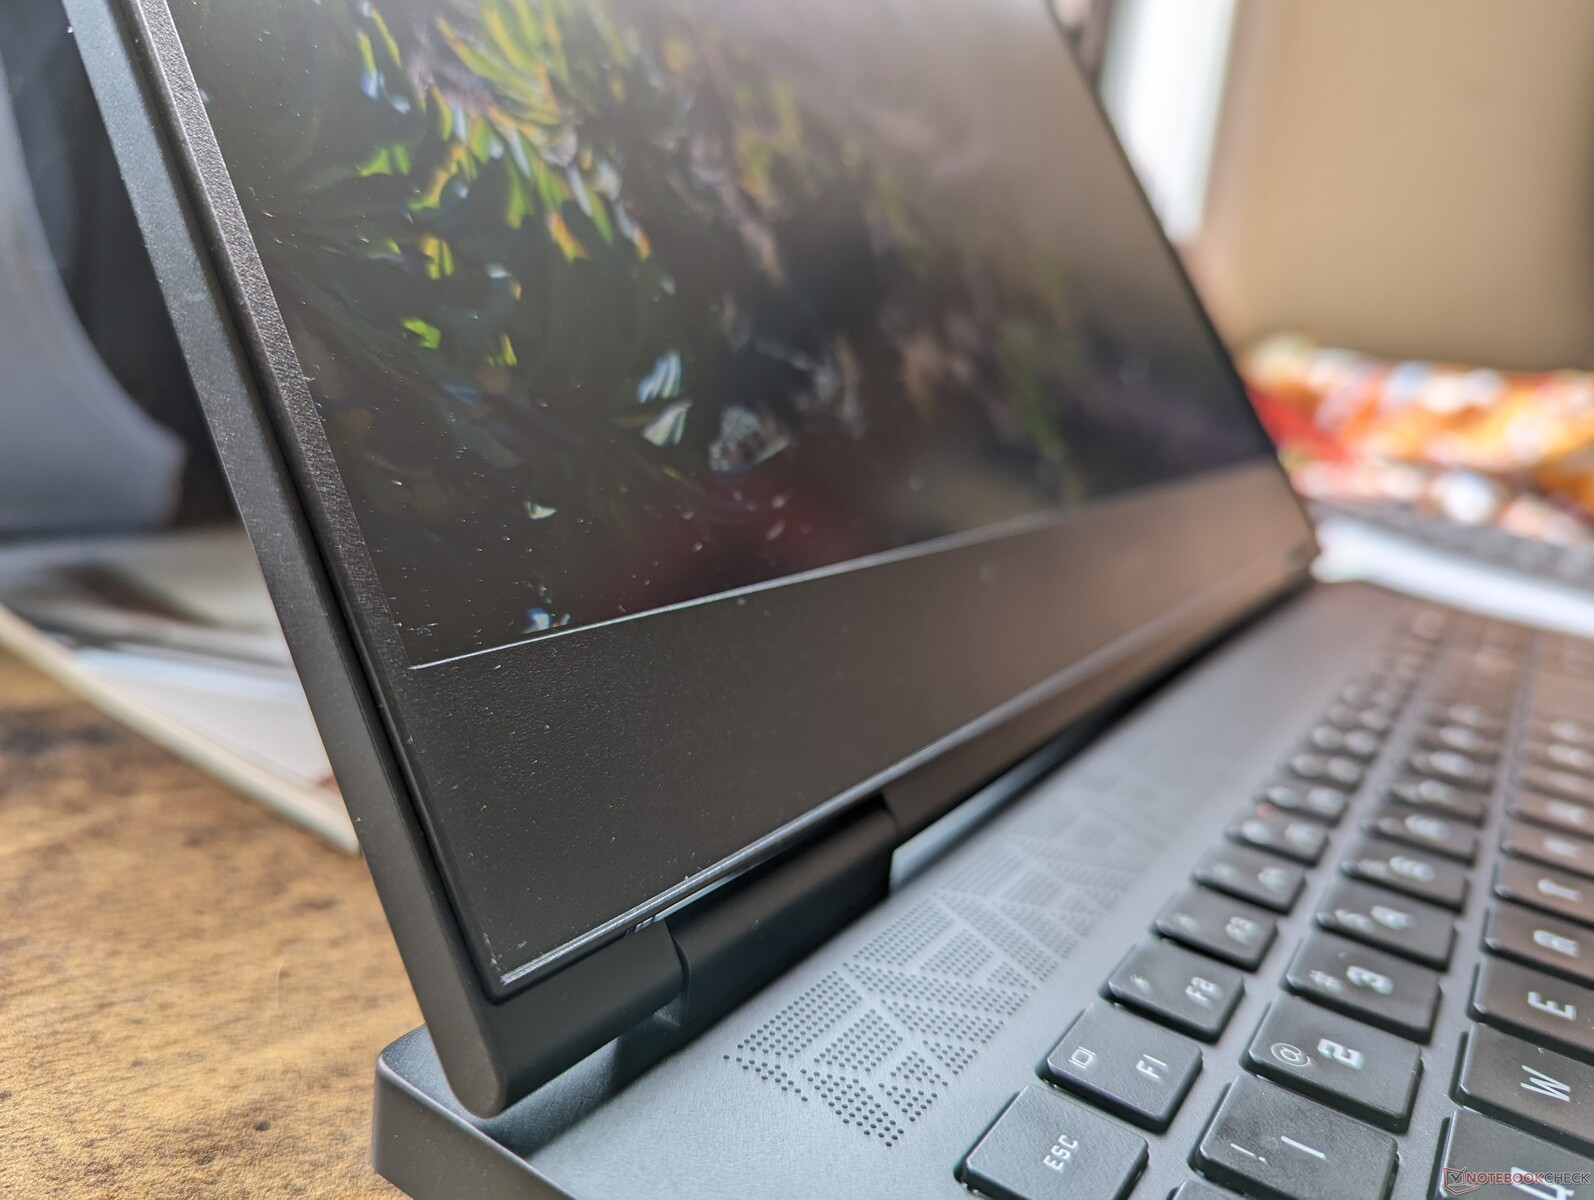
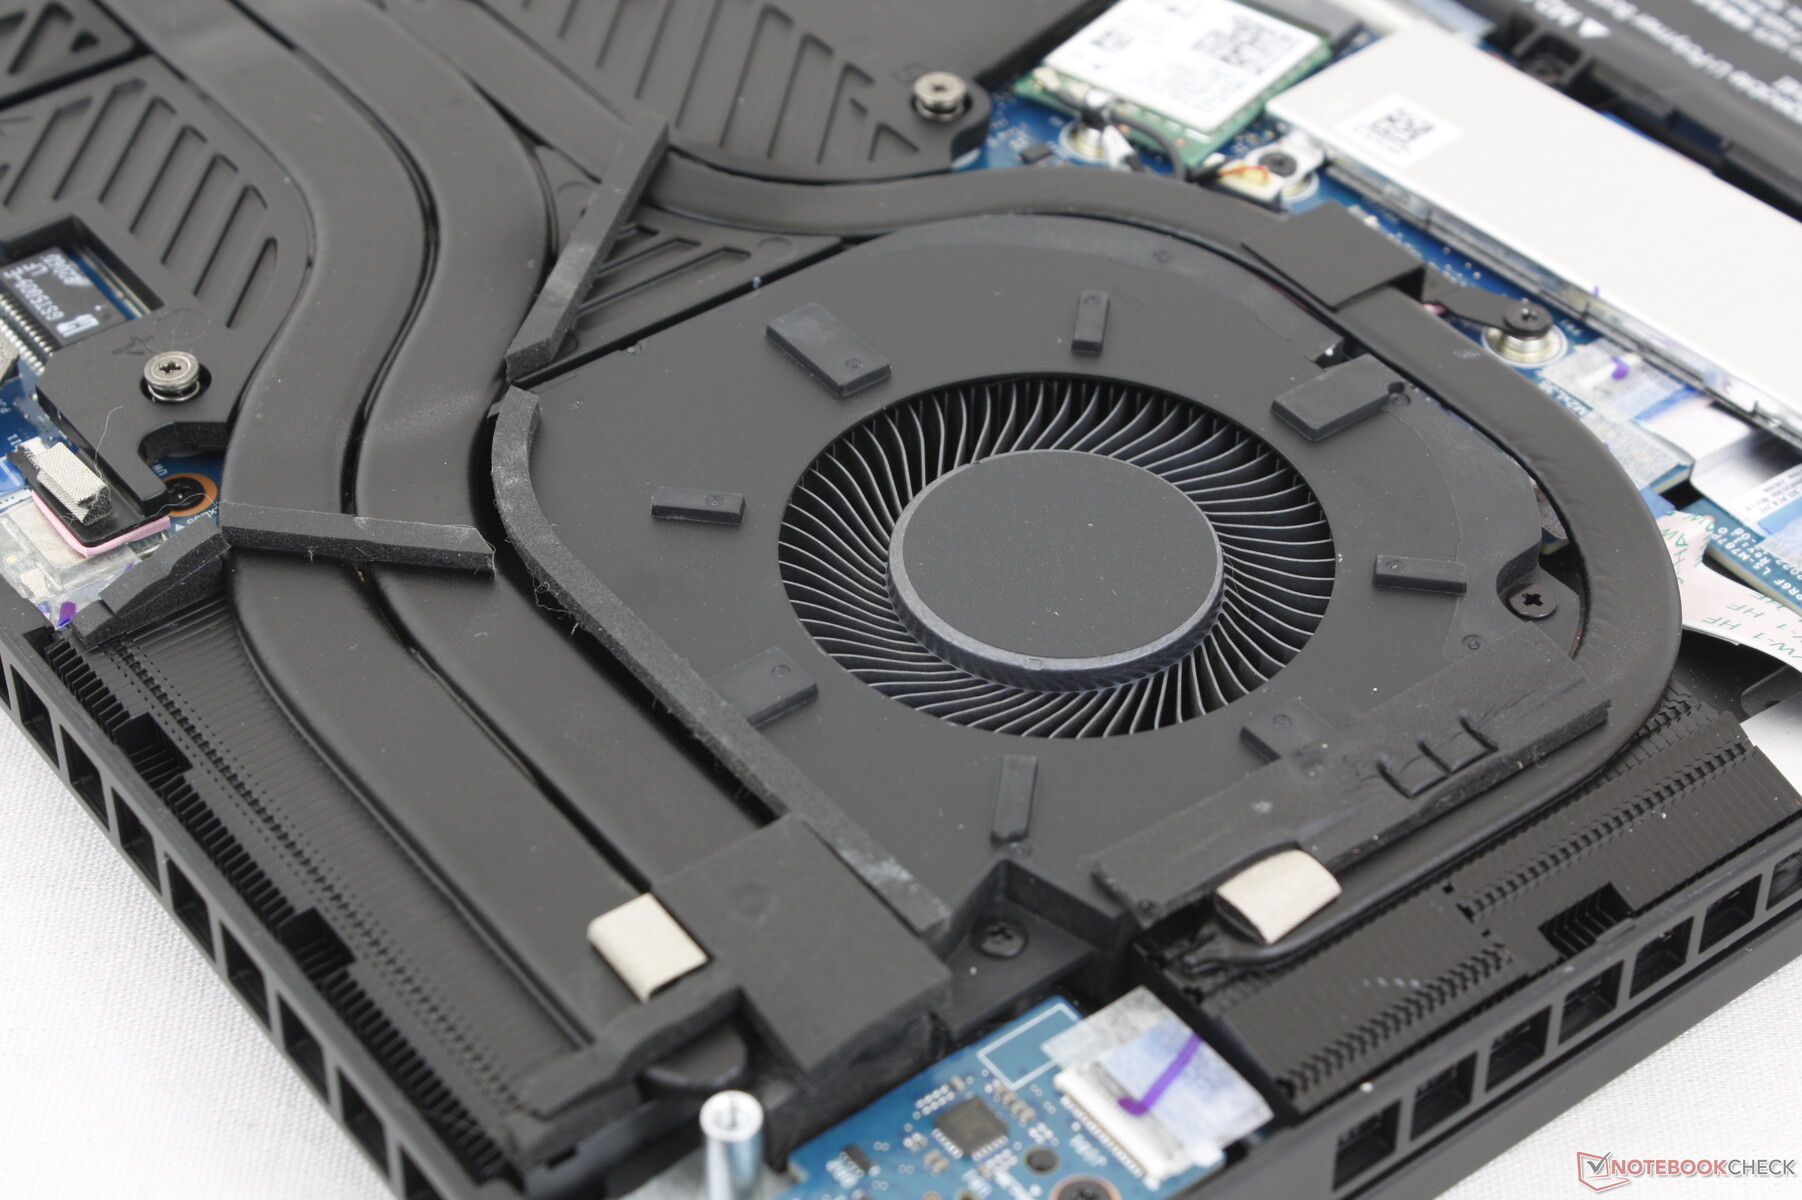
Case — Extended Rear For Better Cooling
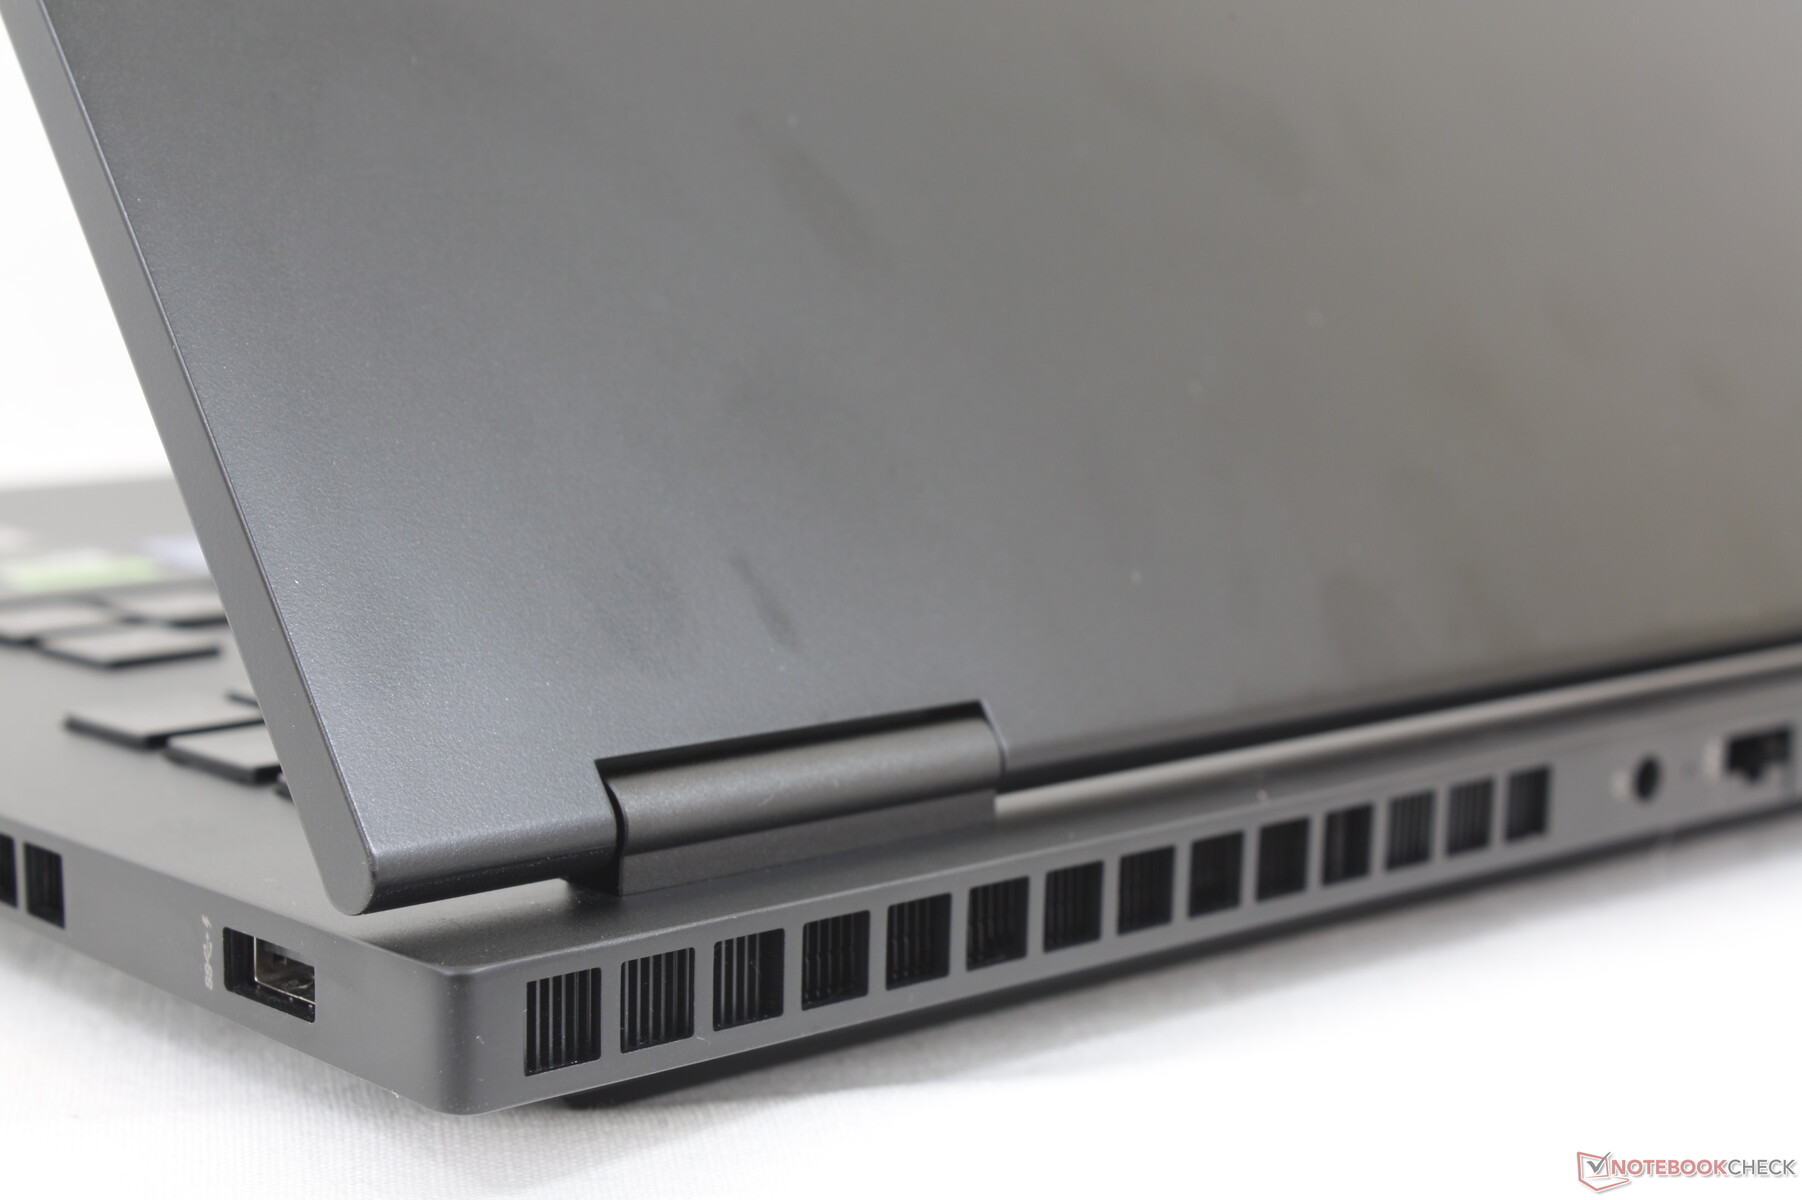
The major visual updates this year involve the extended rear and larger ventilation grilles to better accommodate higher TGP targets and faster performance. Thus, the model looks similar to its predecessor from the front while the changes are much more noticeable from the back. The metal materials and smooth surfaces otherwise feel and appear identical between the two designs.
Chassis rigidity is very good albeit not as firm or unyielding as the Razer Blade 16. Attempting to twist the base and lid, for example, would result in slightly more warping on the HP in comparison. At least we can notice no creaking or visual defects on our unit.
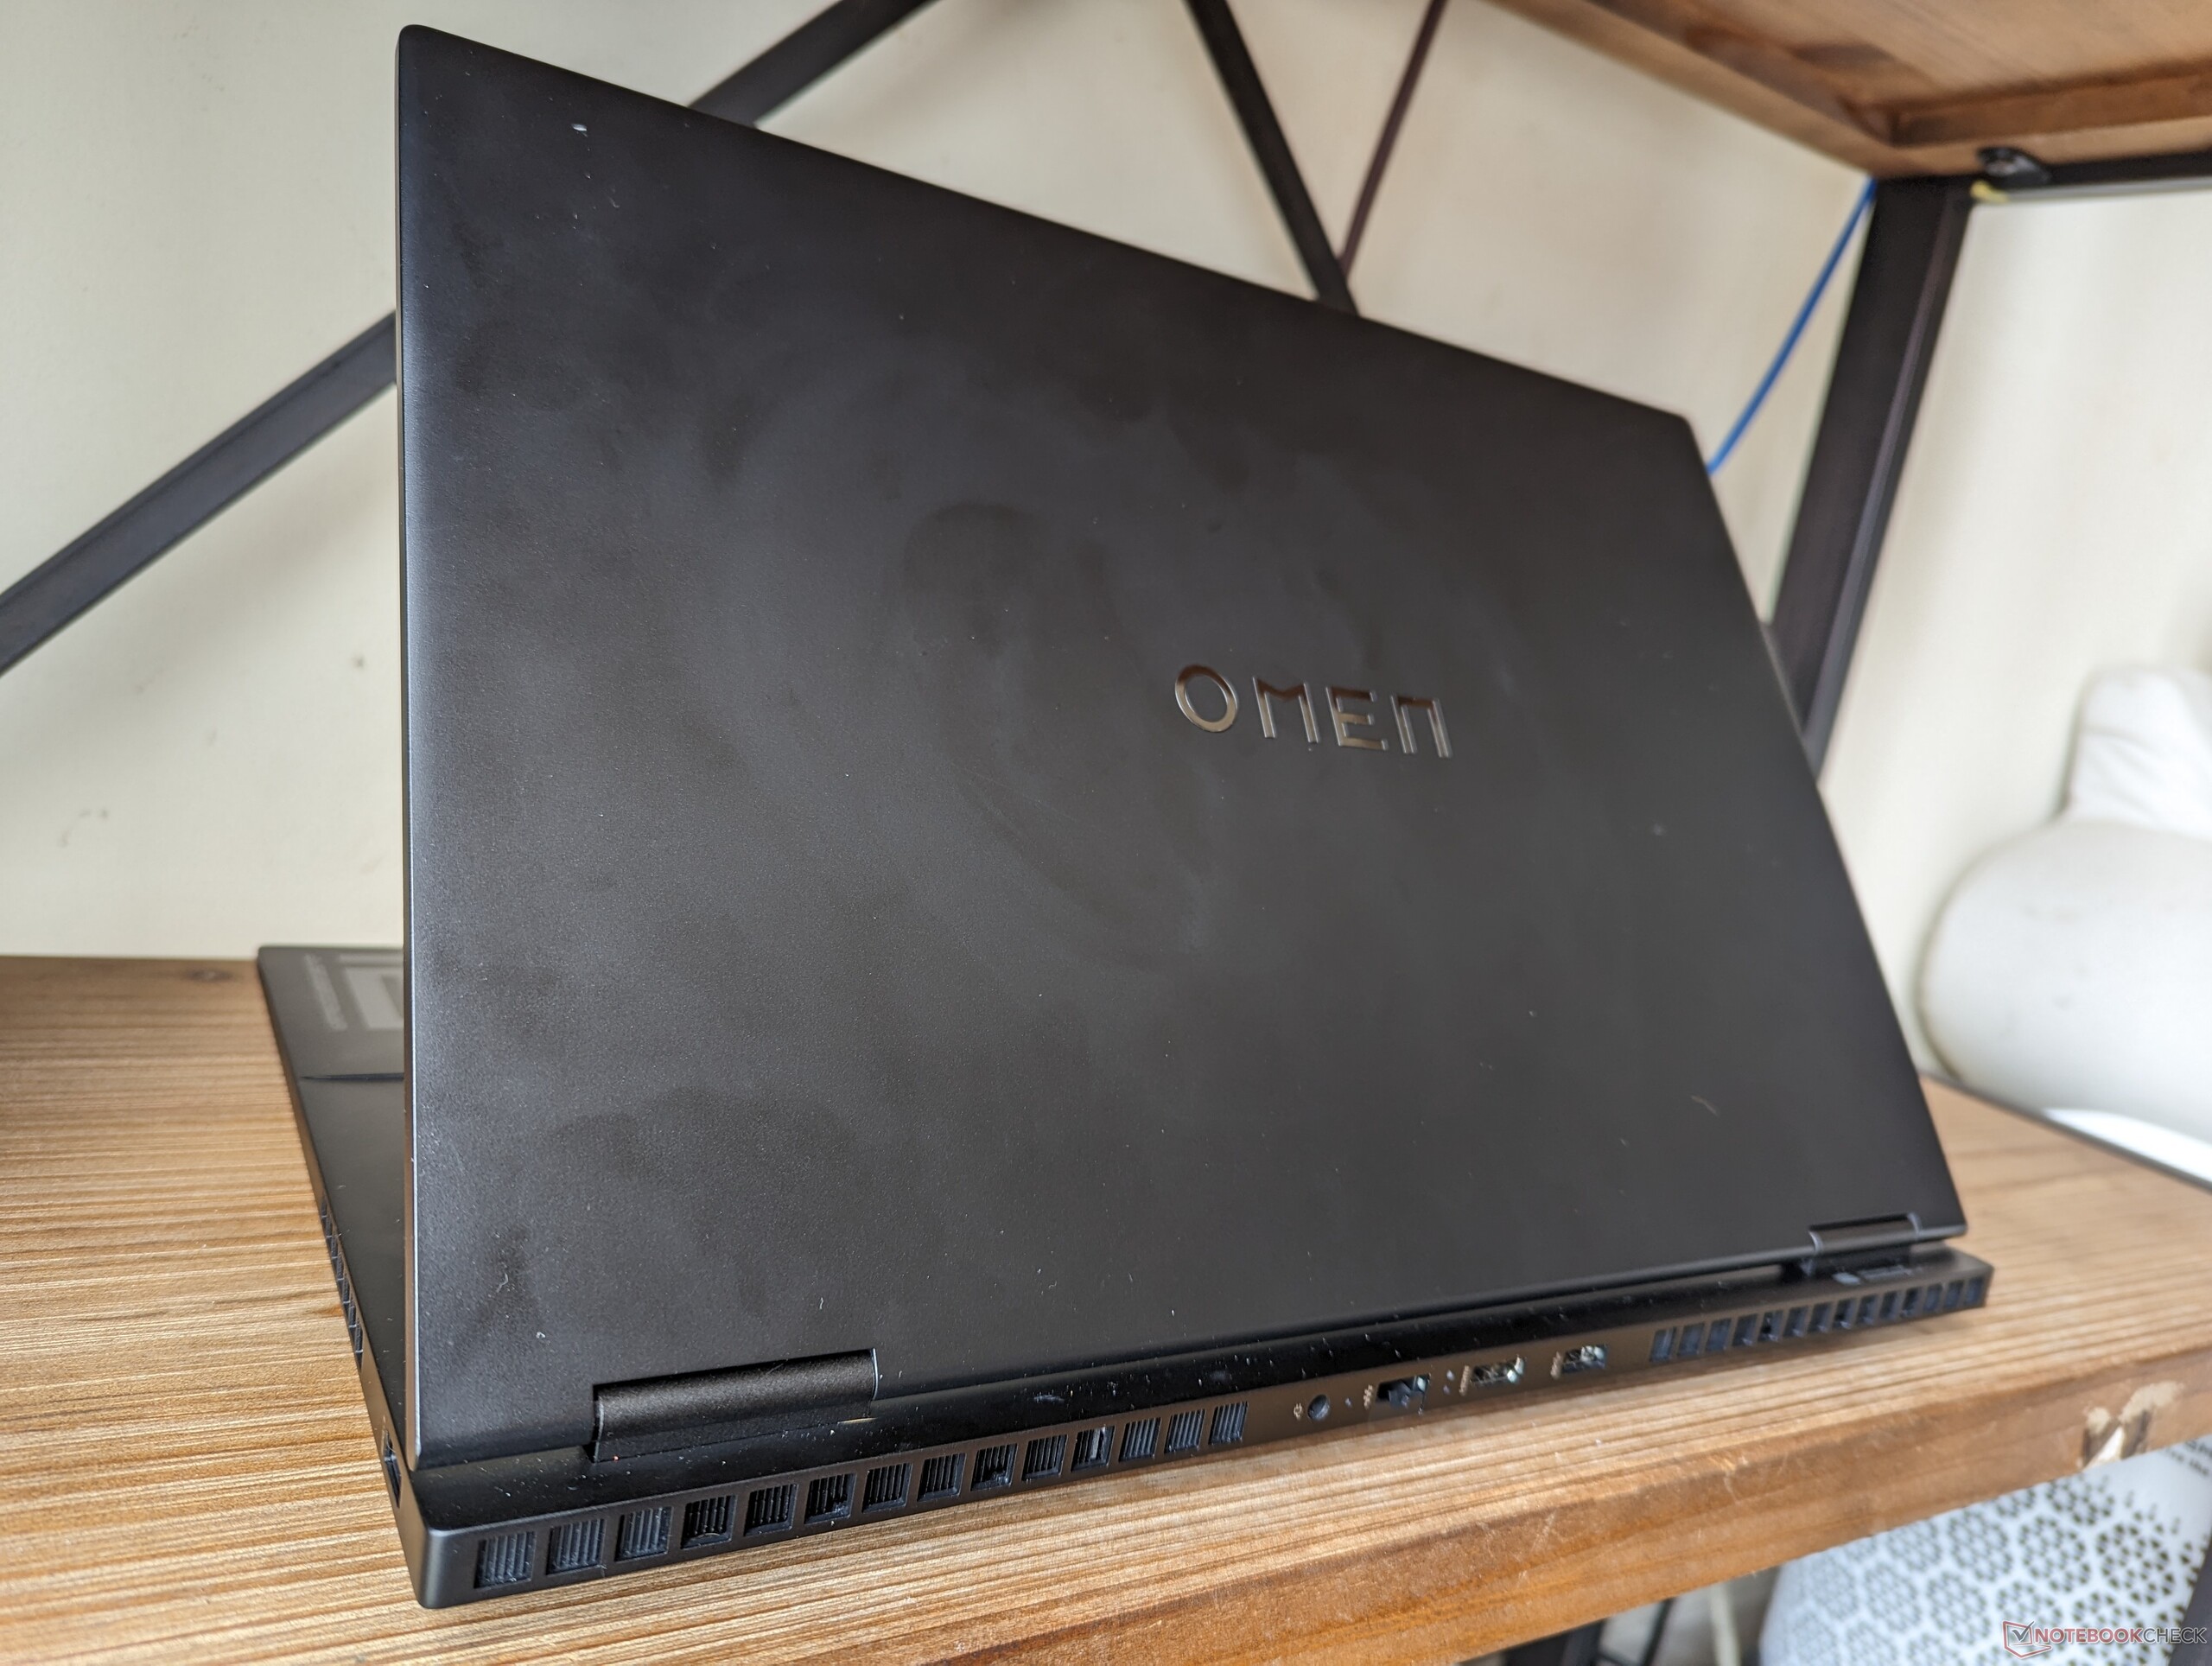
The new Omen 16 is actually longer than the 2022 design by about 11 mm due to the extended rear mentioned above. Even so, overall weight remains about the same and the size of the system is still smaller than the ROG Strix G16, Legion Pro 7 16, or Alienware x16 R1.
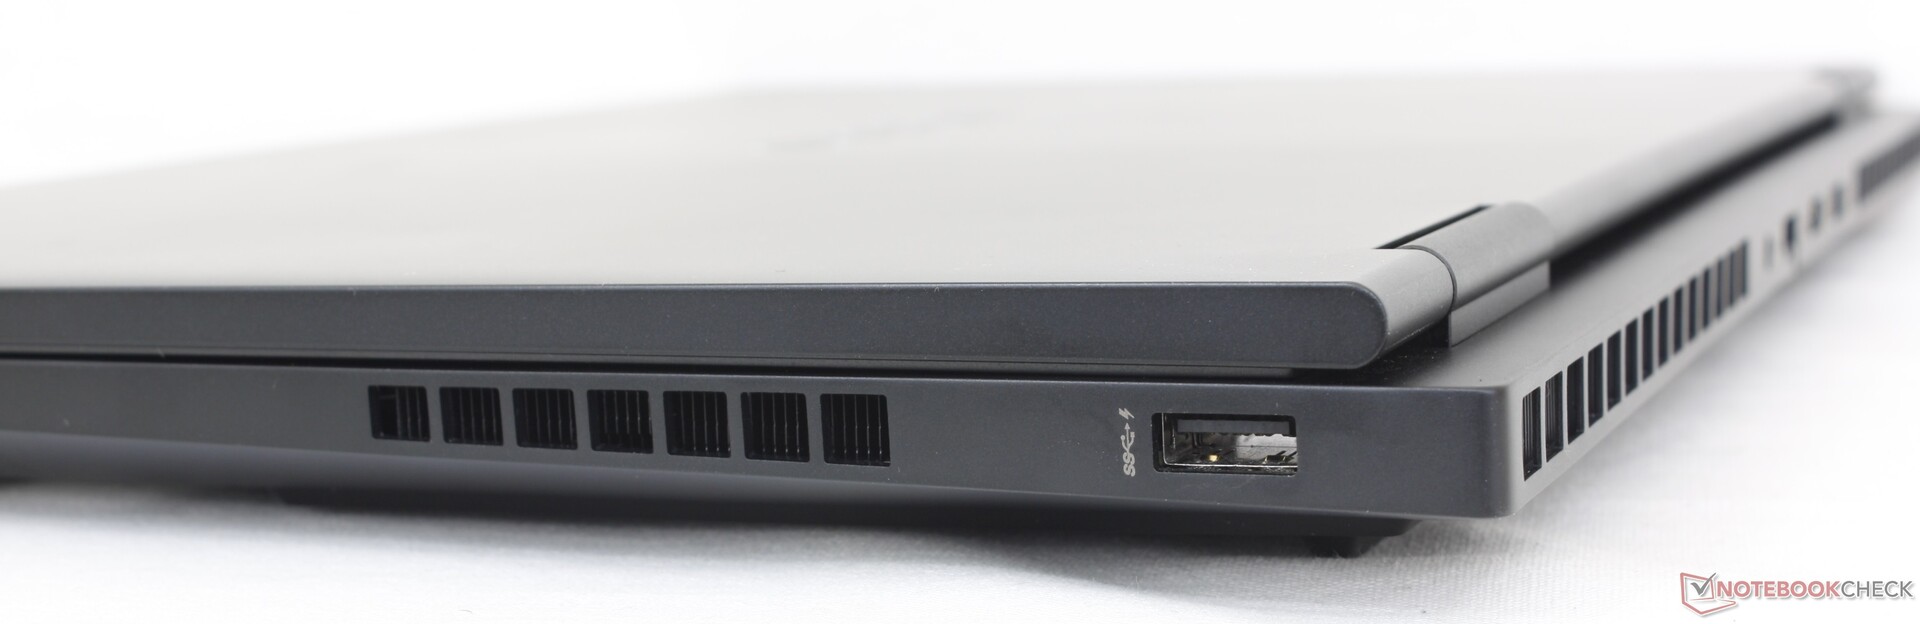
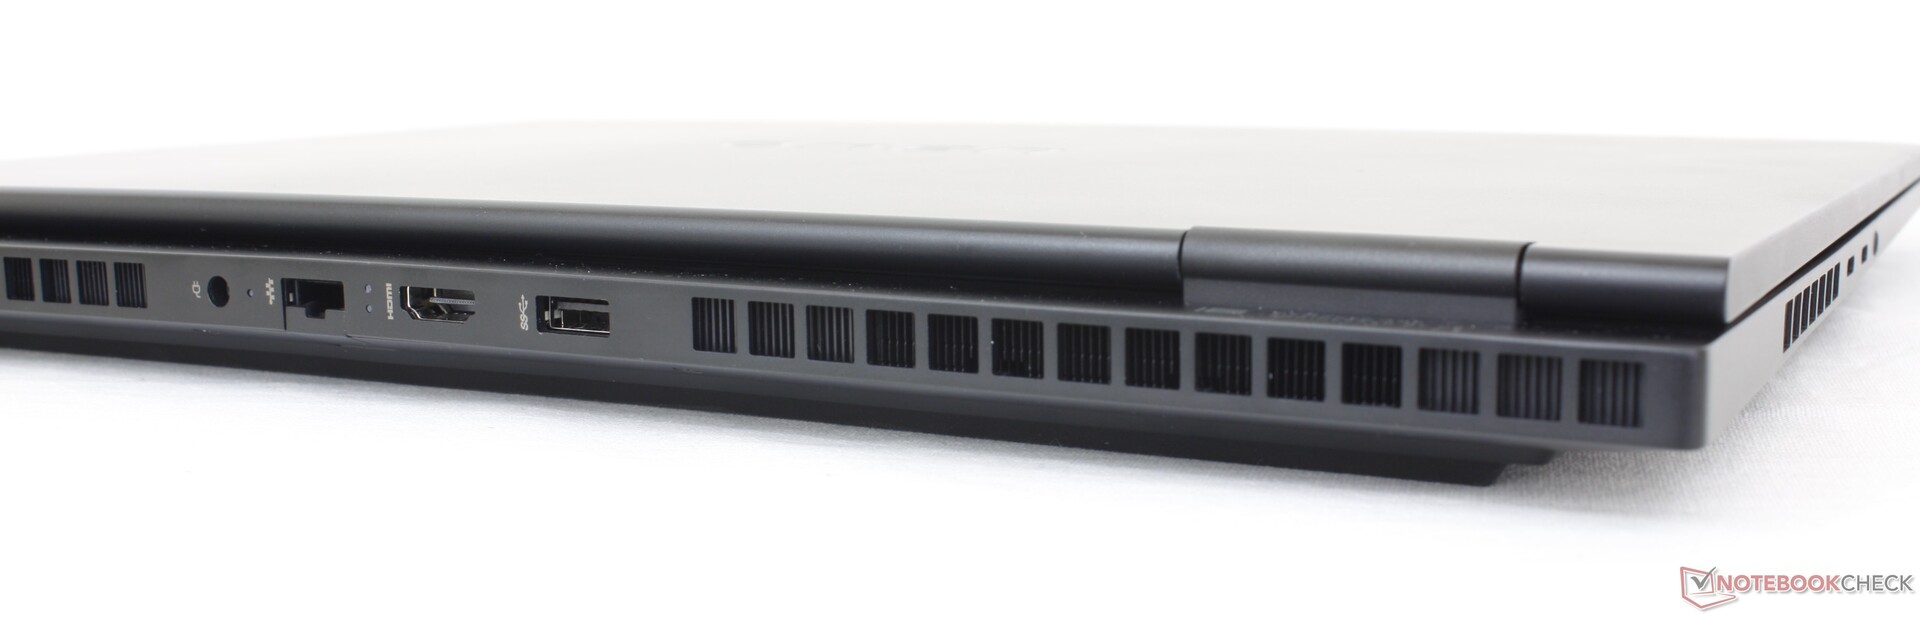
Connectivity
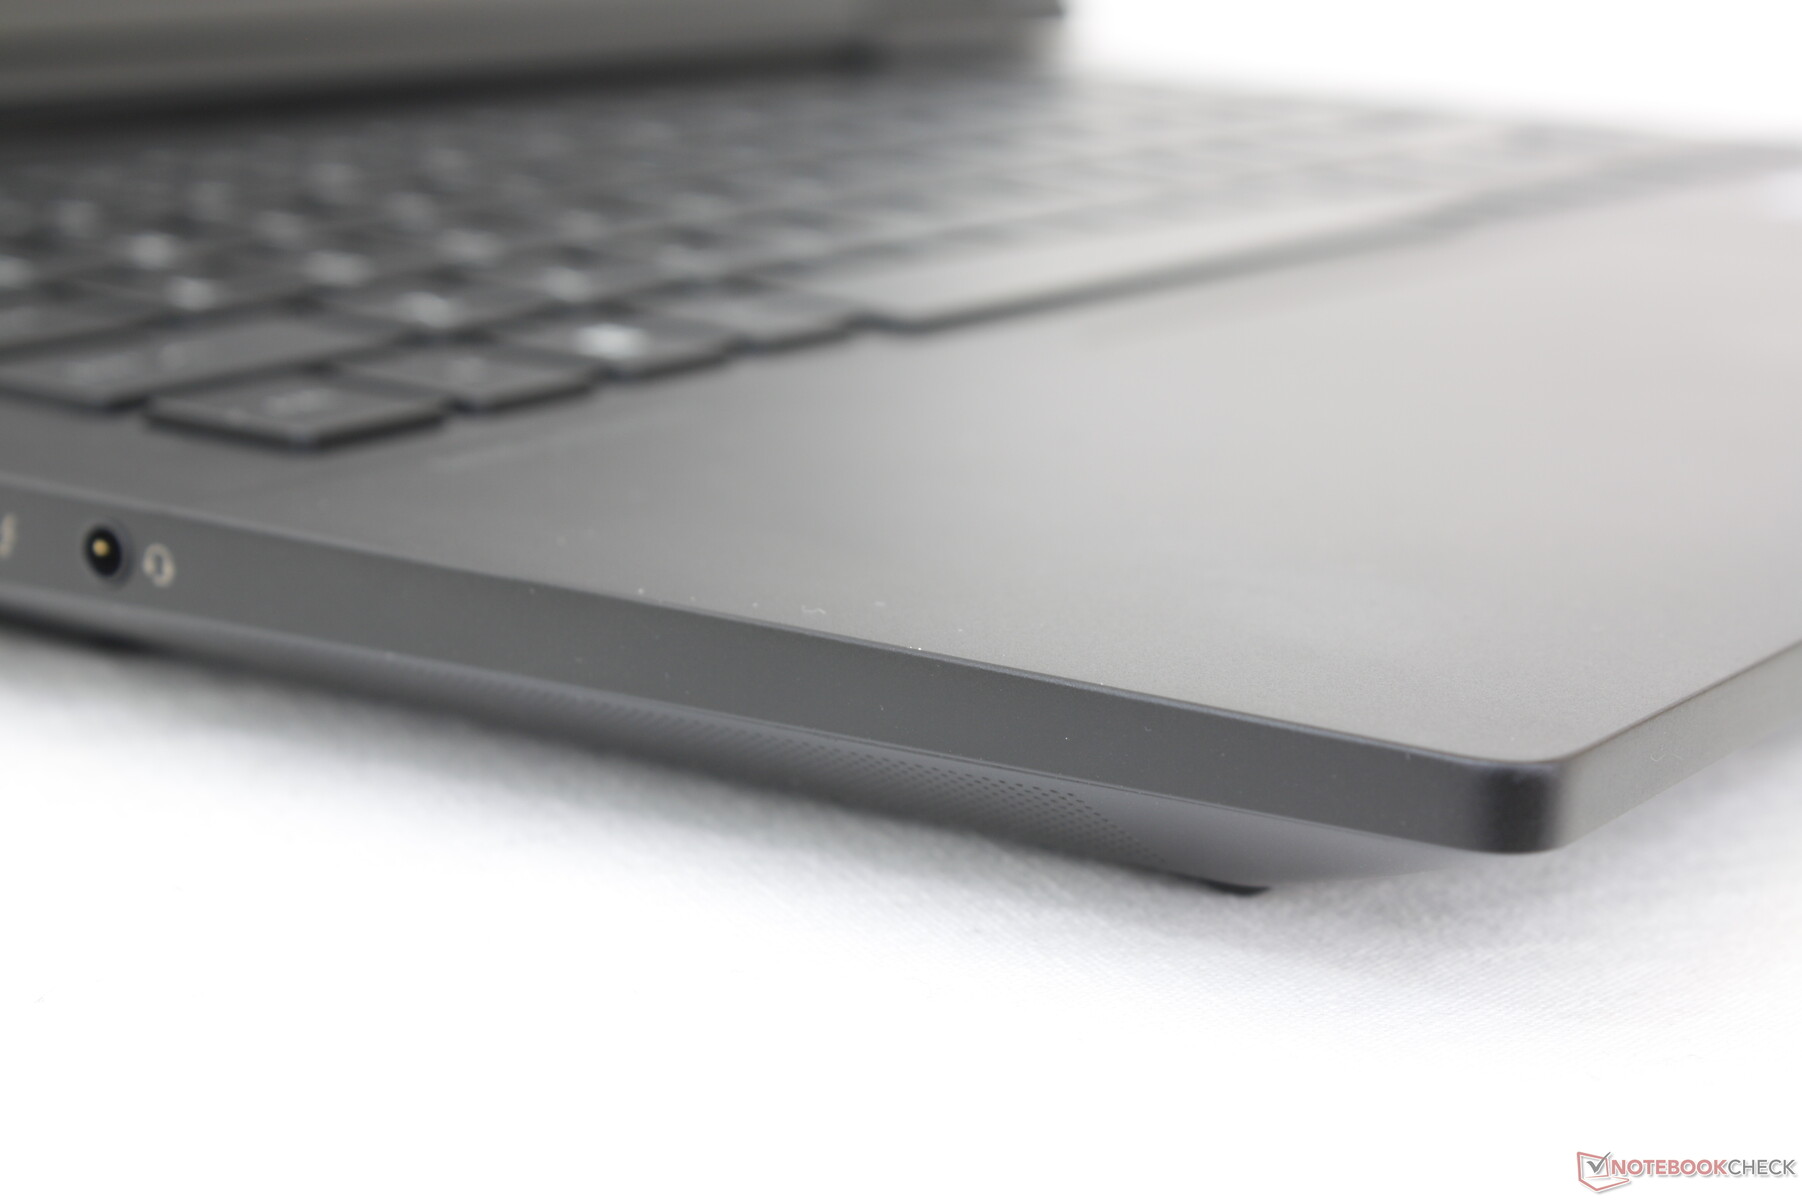
Port options have been reduced from last year's model as there is now one fewer USB-A port and no more SD card reader. Both USB-C ports have been relocated from the rear edge to the left edge for easier access.

Communication
An Intel AX211 is optional for Wi-Fi6E and Bluetooth 5.3 connectivity. We experienced no issues when paired to our Asus AXE11000 6 GHz network.
| Networking | |
| iperf3 transmit AXE11000 | |
| Lenovo Legion Pro 7 RTX4090 | |
| Asus ROG Strix G16 G614JZ | |
| HP Omen 16-n0033dx | |
| Razer Blade 16 Early 2023 | |
| HP Omen 16-wf000 | |
| Alienware x16 R1 | |
| iperf3 receive AXE11000 | |
| Lenovo Legion Pro 7 RTX4090 | |
| Asus ROG Strix G16 G614JZ | |
| HP Omen 16-n0033dx | |
| Razer Blade 16 Early 2023 | |
| Alienware x16 R1 | |
| HP Omen 16-wf000 | |
| iperf3 transmit AXE11000 6GHz | |
| HP Omen 16-n0033dx | |
| Razer Blade 16 Early 2023 | |
| HP Omen 16-wf000 | |
| Alienware x16 R1 | |
| iperf3 receive AXE11000 6GHz | |
| Razer Blade 16 Early 2023 | |
| HP Omen 16-wf000 | |
| HP Omen 16-n0033dx | |
| Alienware x16 R1 | |
Webcam — 2 MP Upgrade
A 2 MP webcam comes standard alongside a privacy shutter to replace the 1 MP webcam on the 2022 Omen 16. IR, however, is not supported on this series.


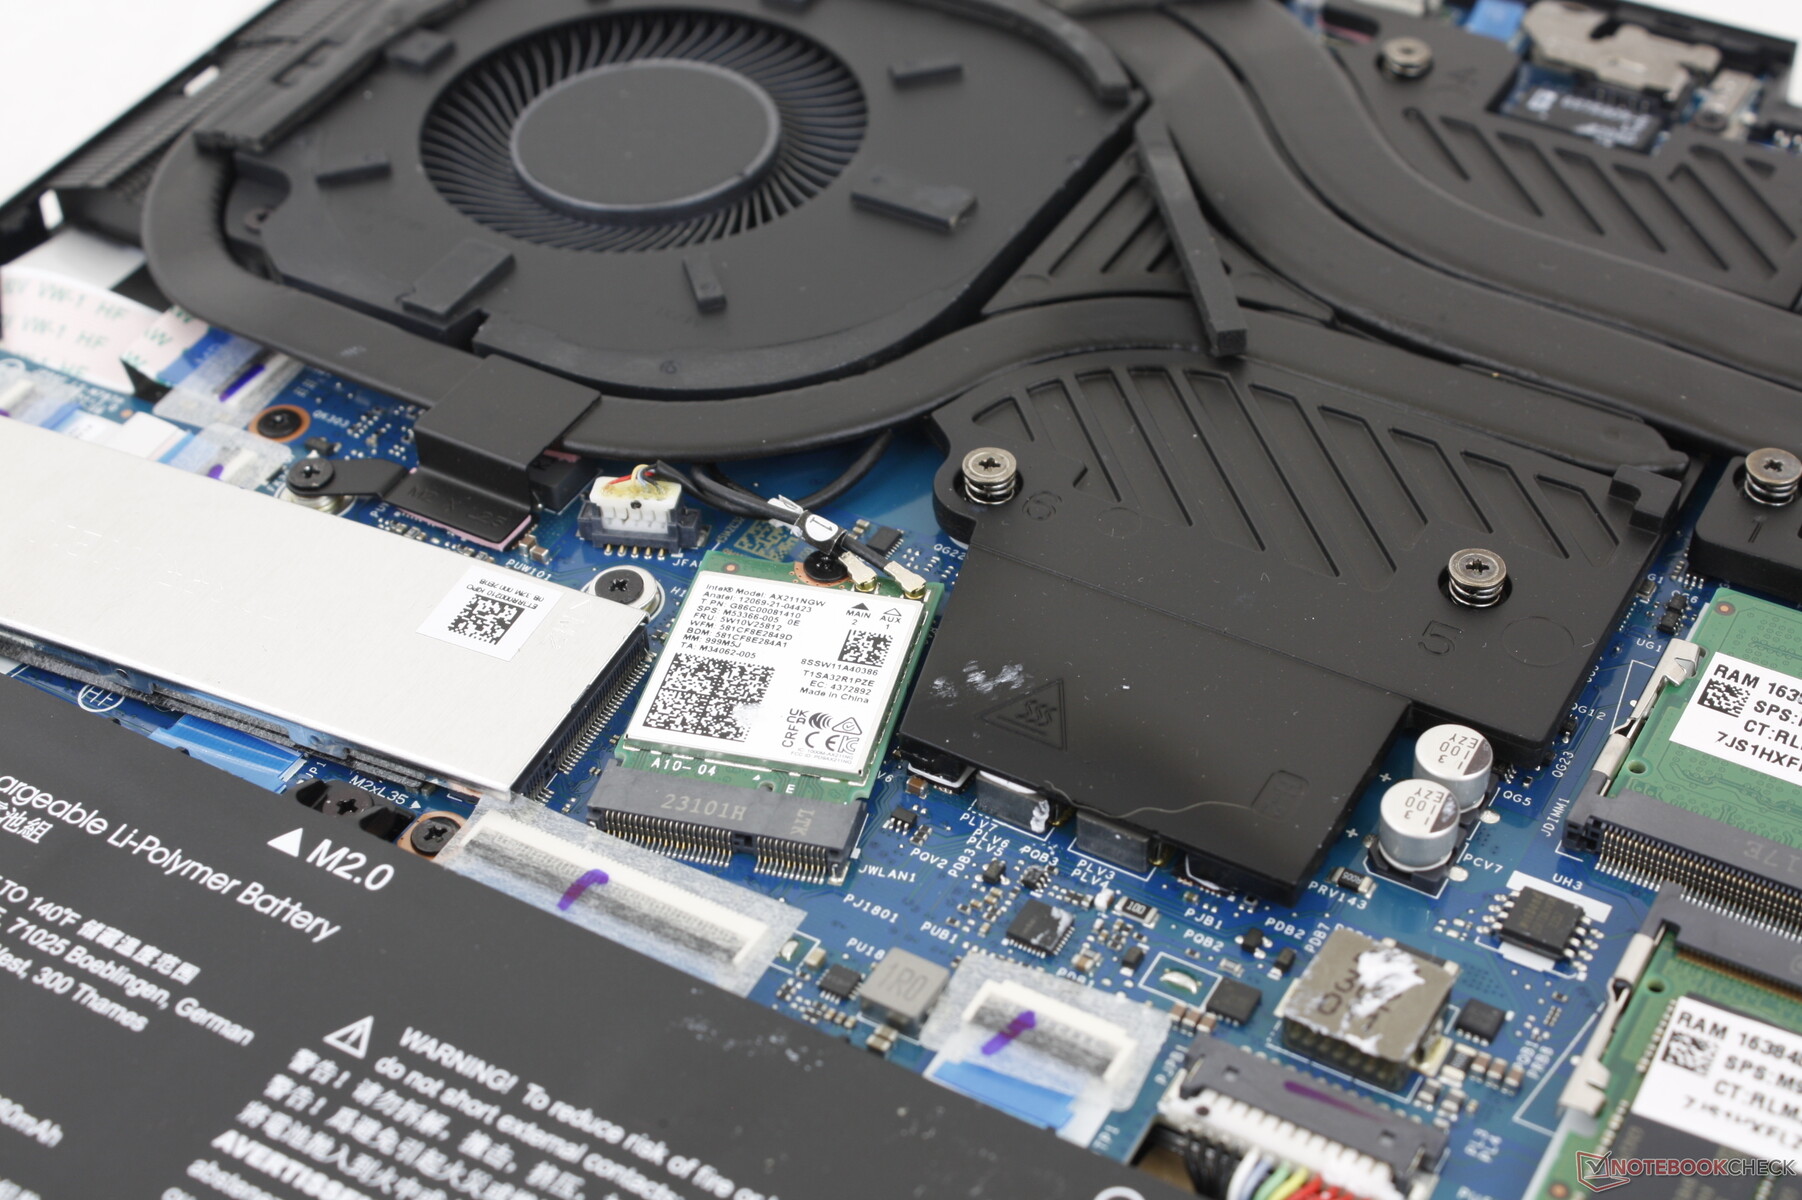
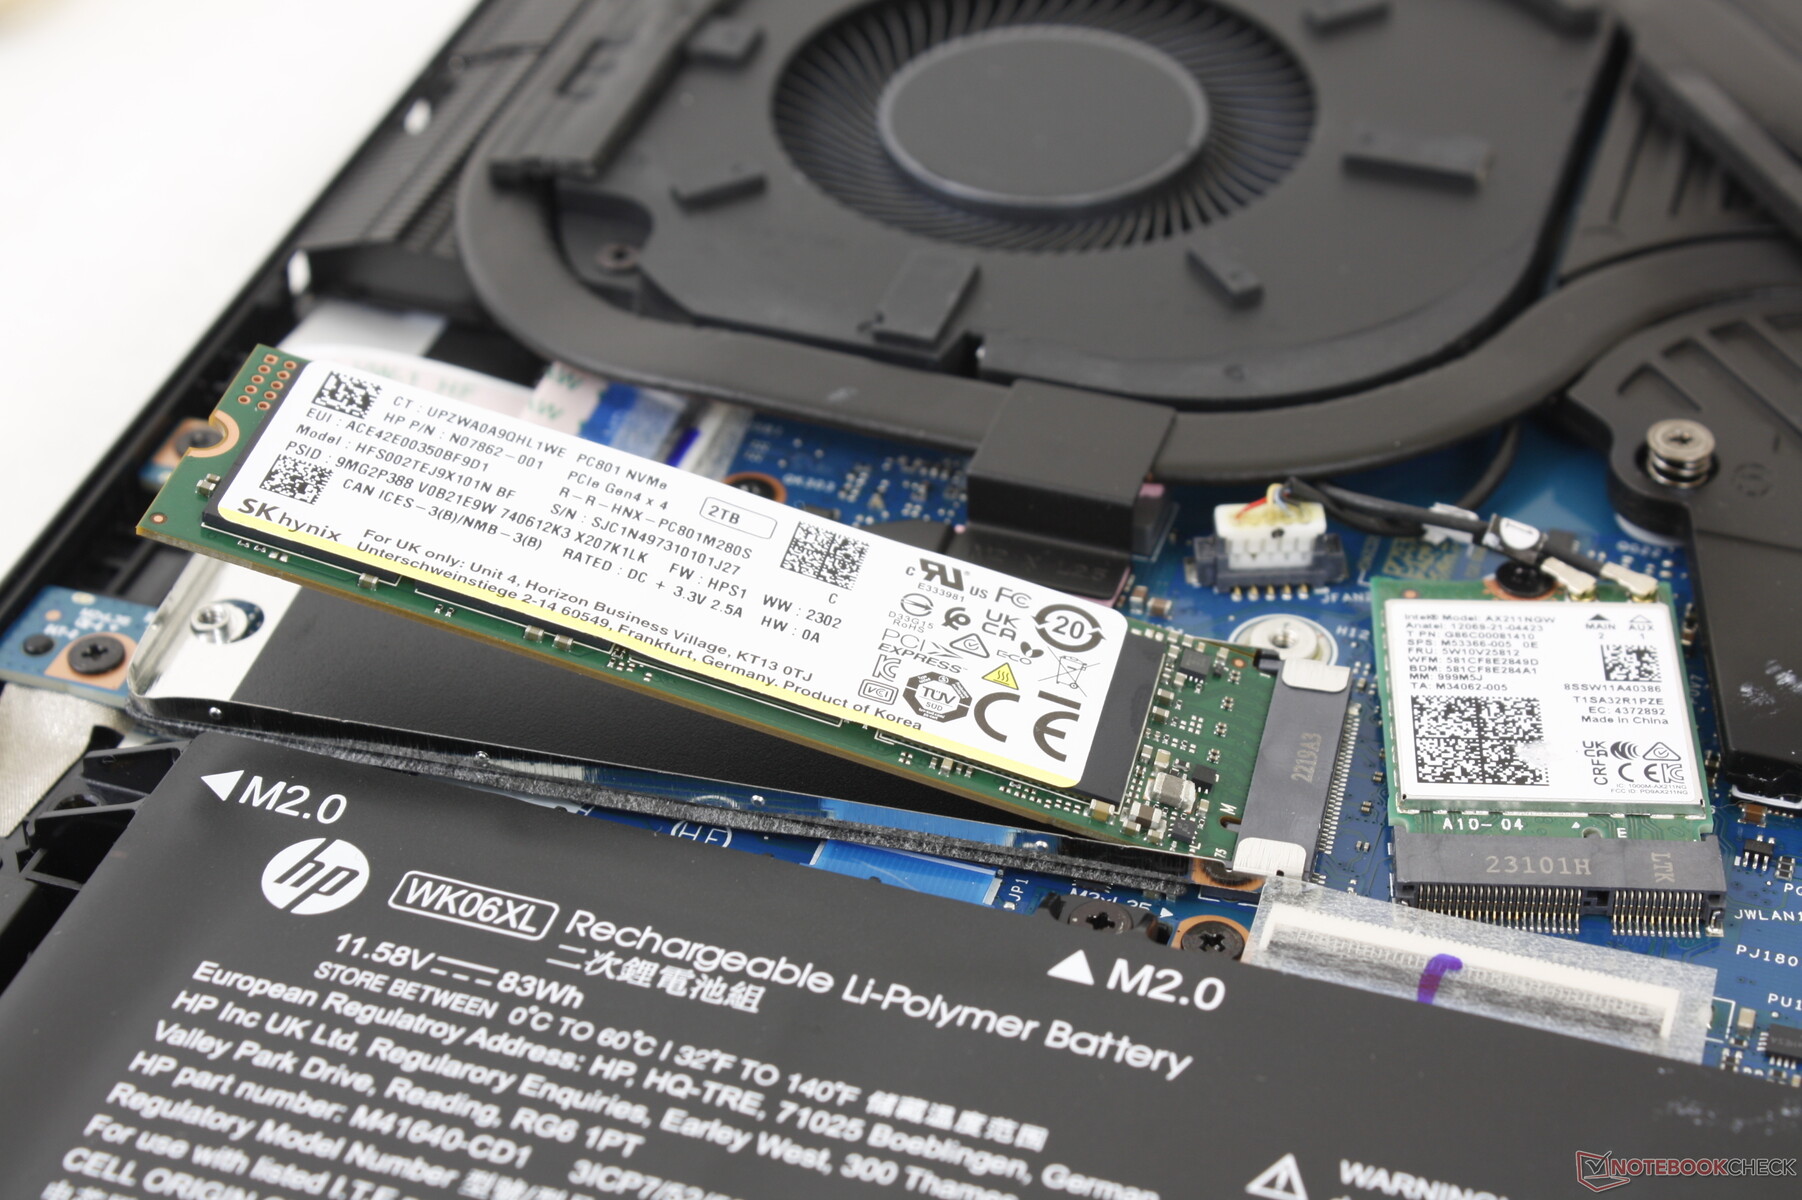
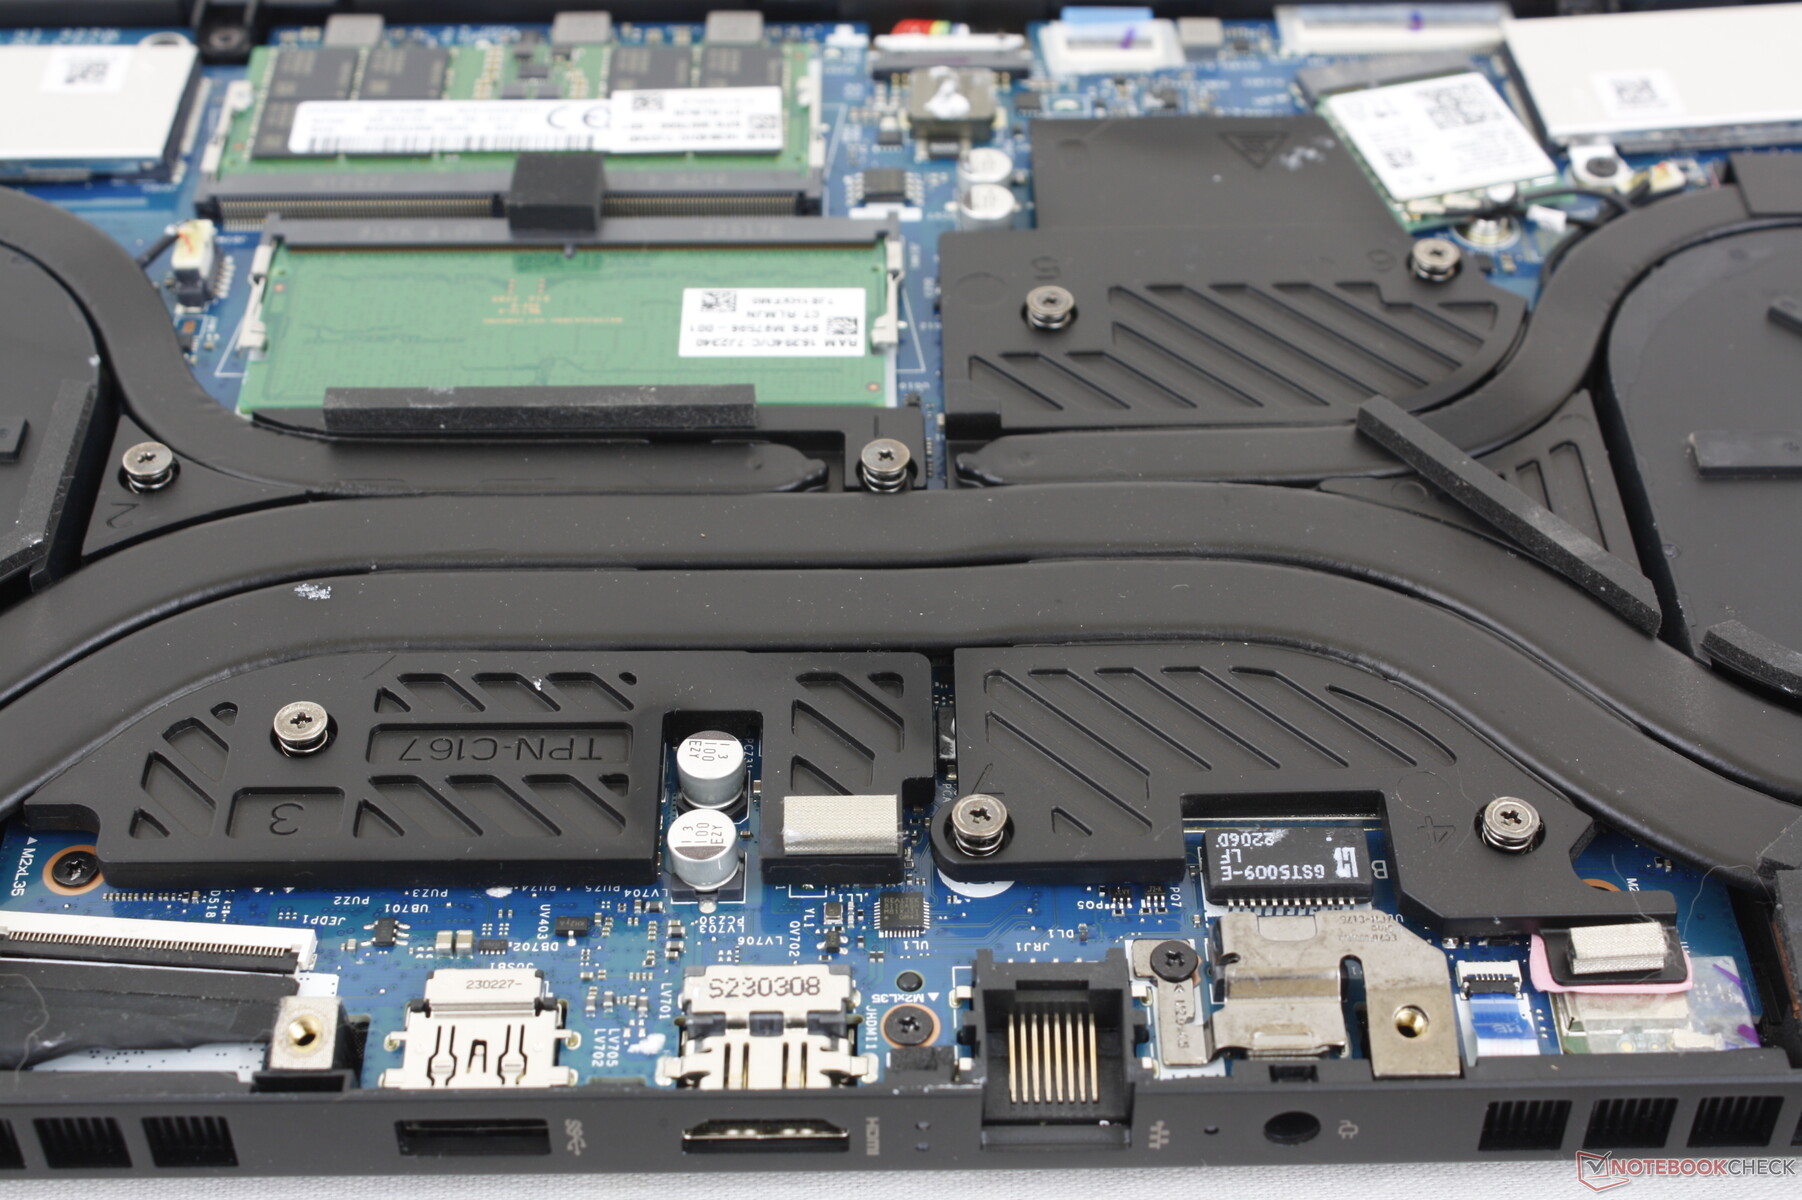
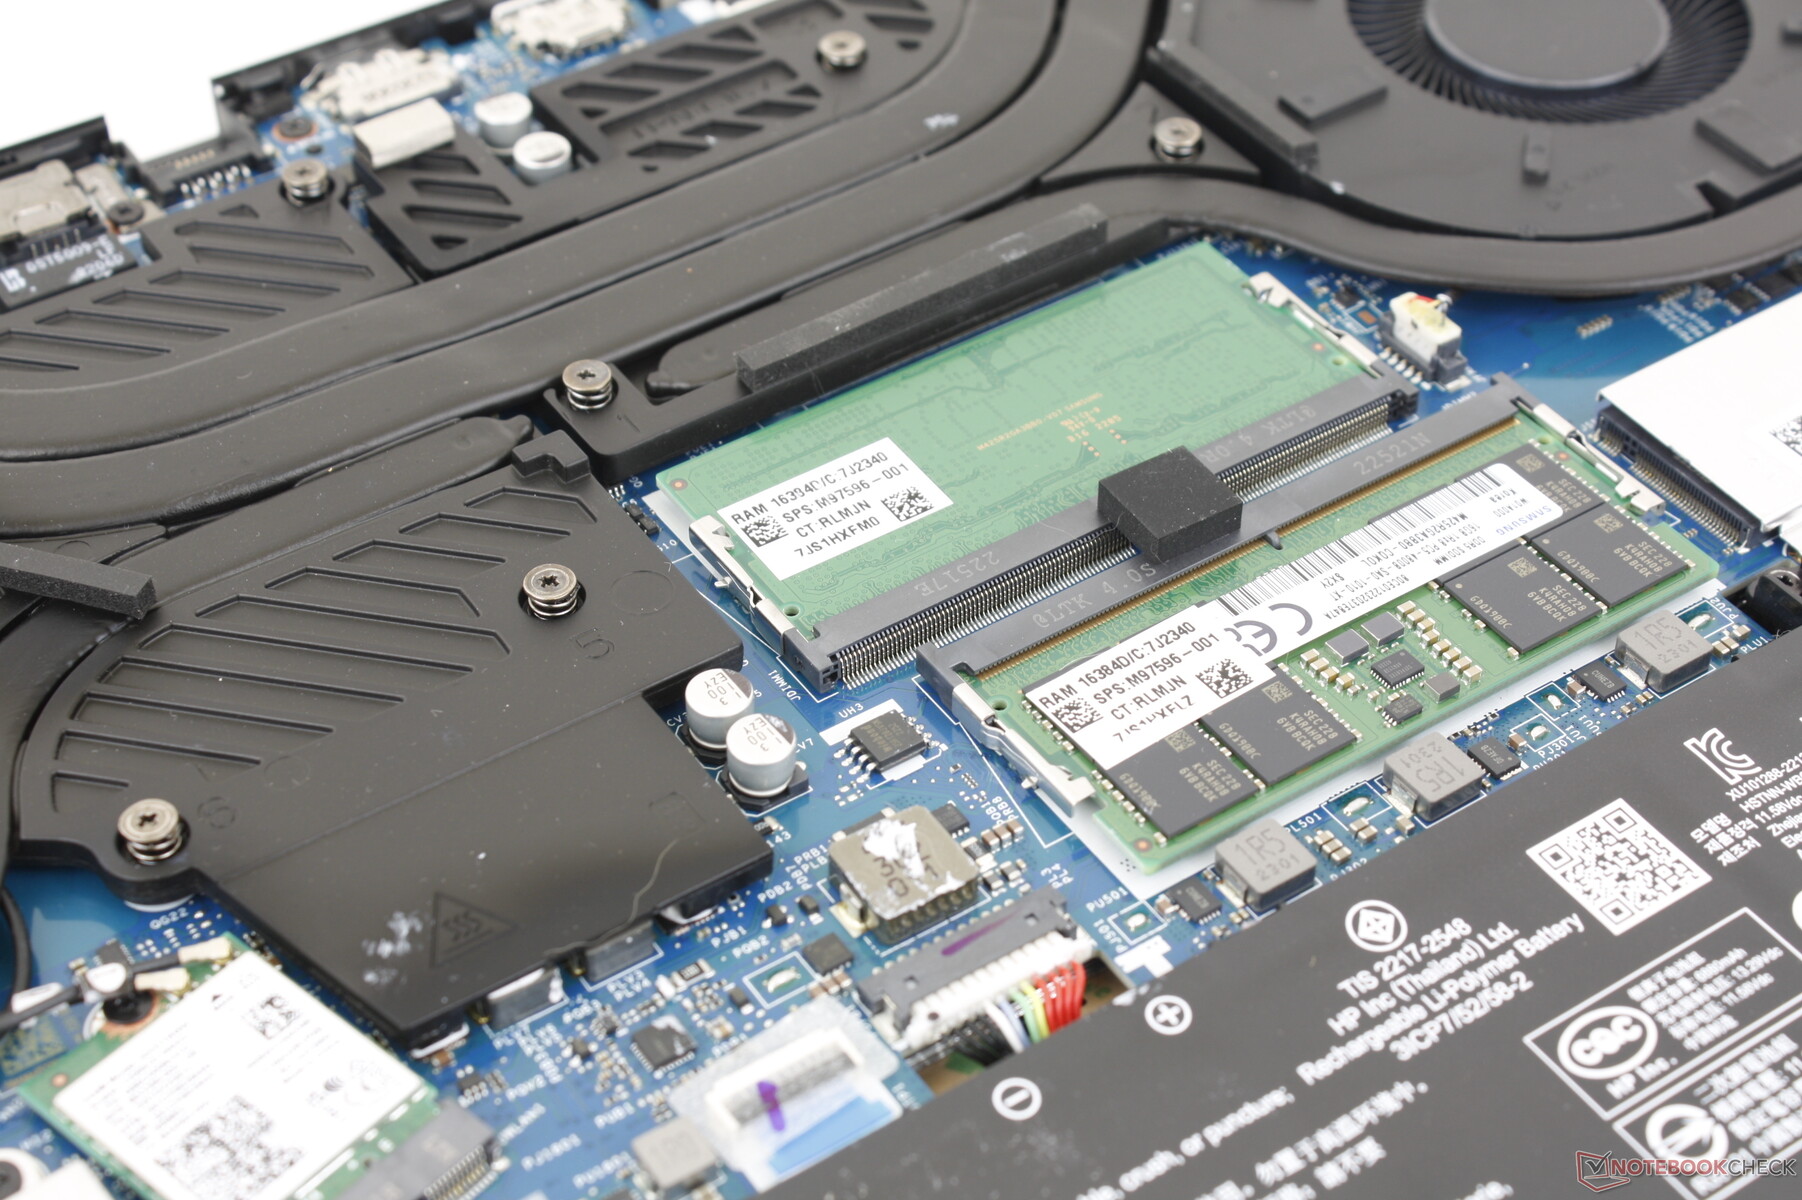
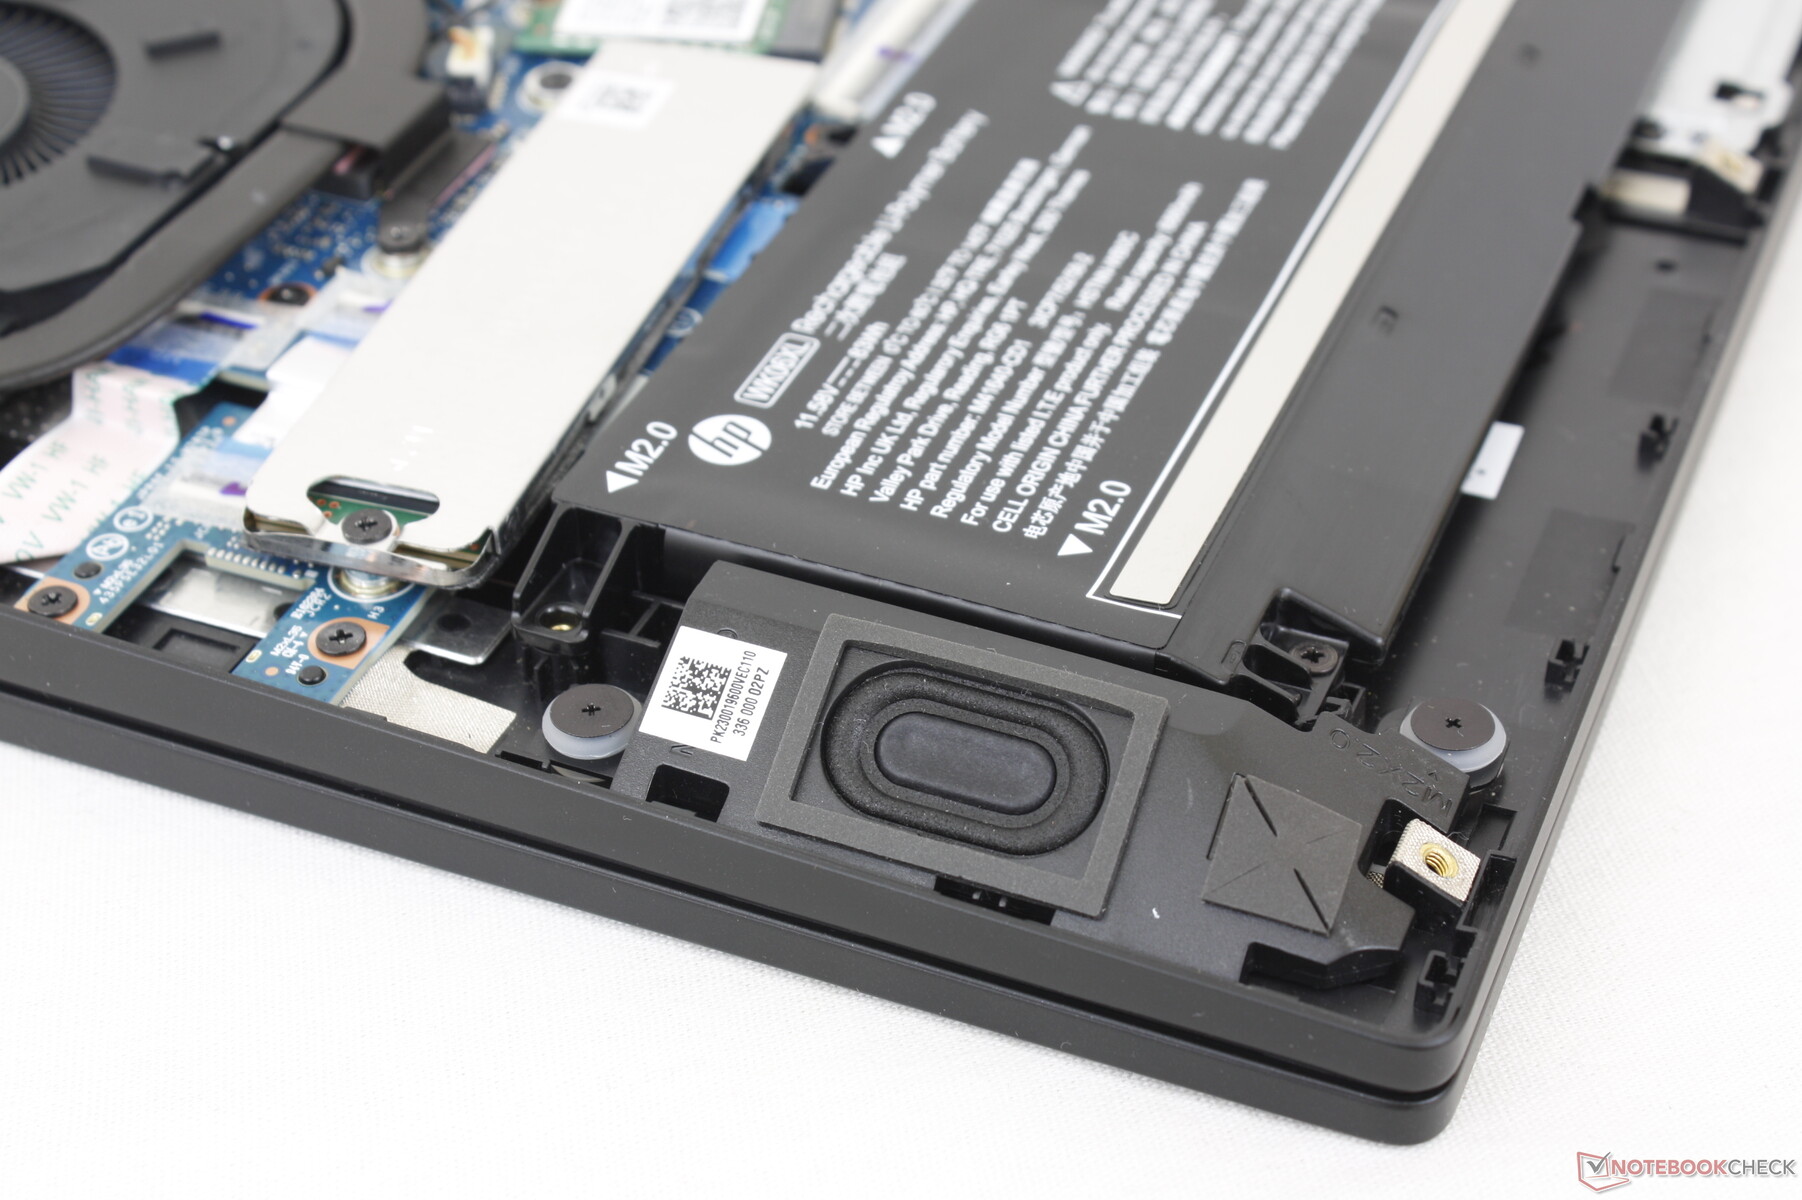
Maintenance
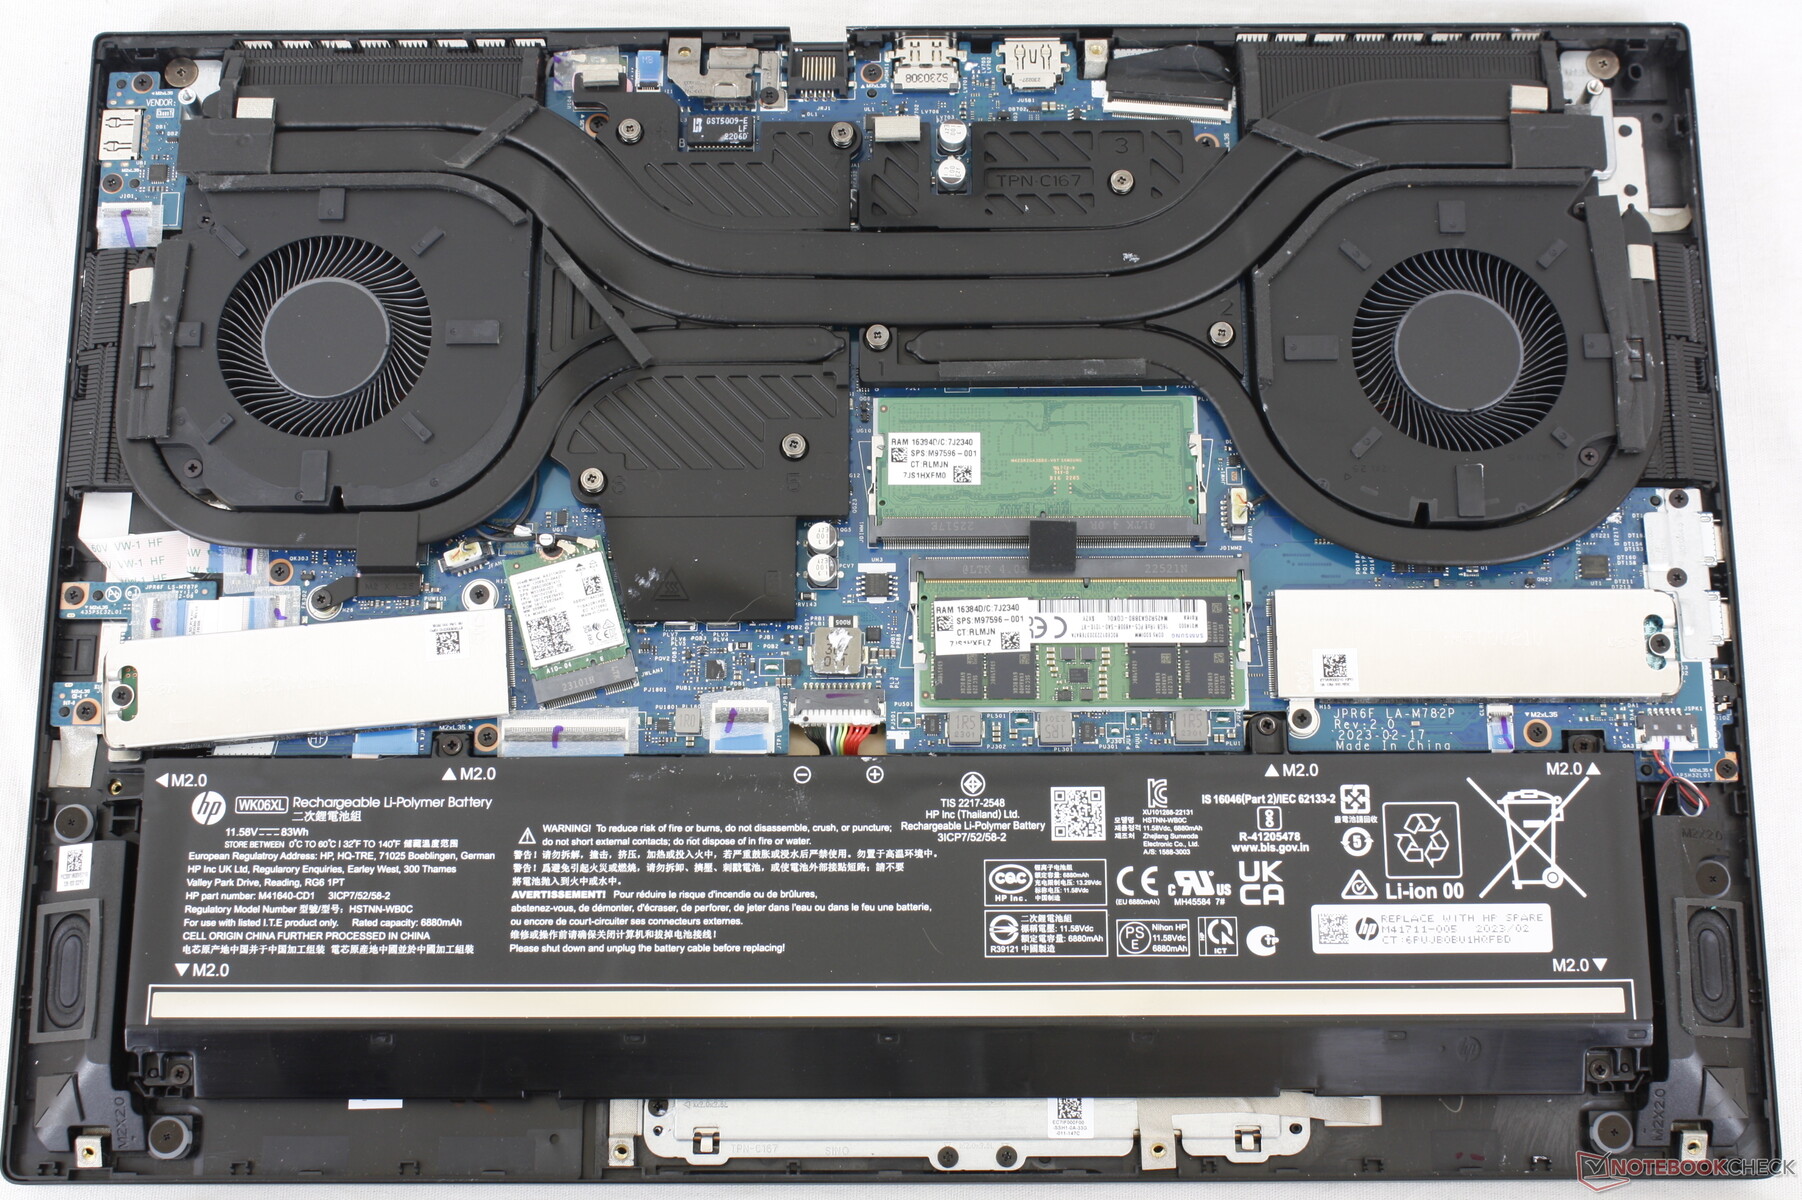
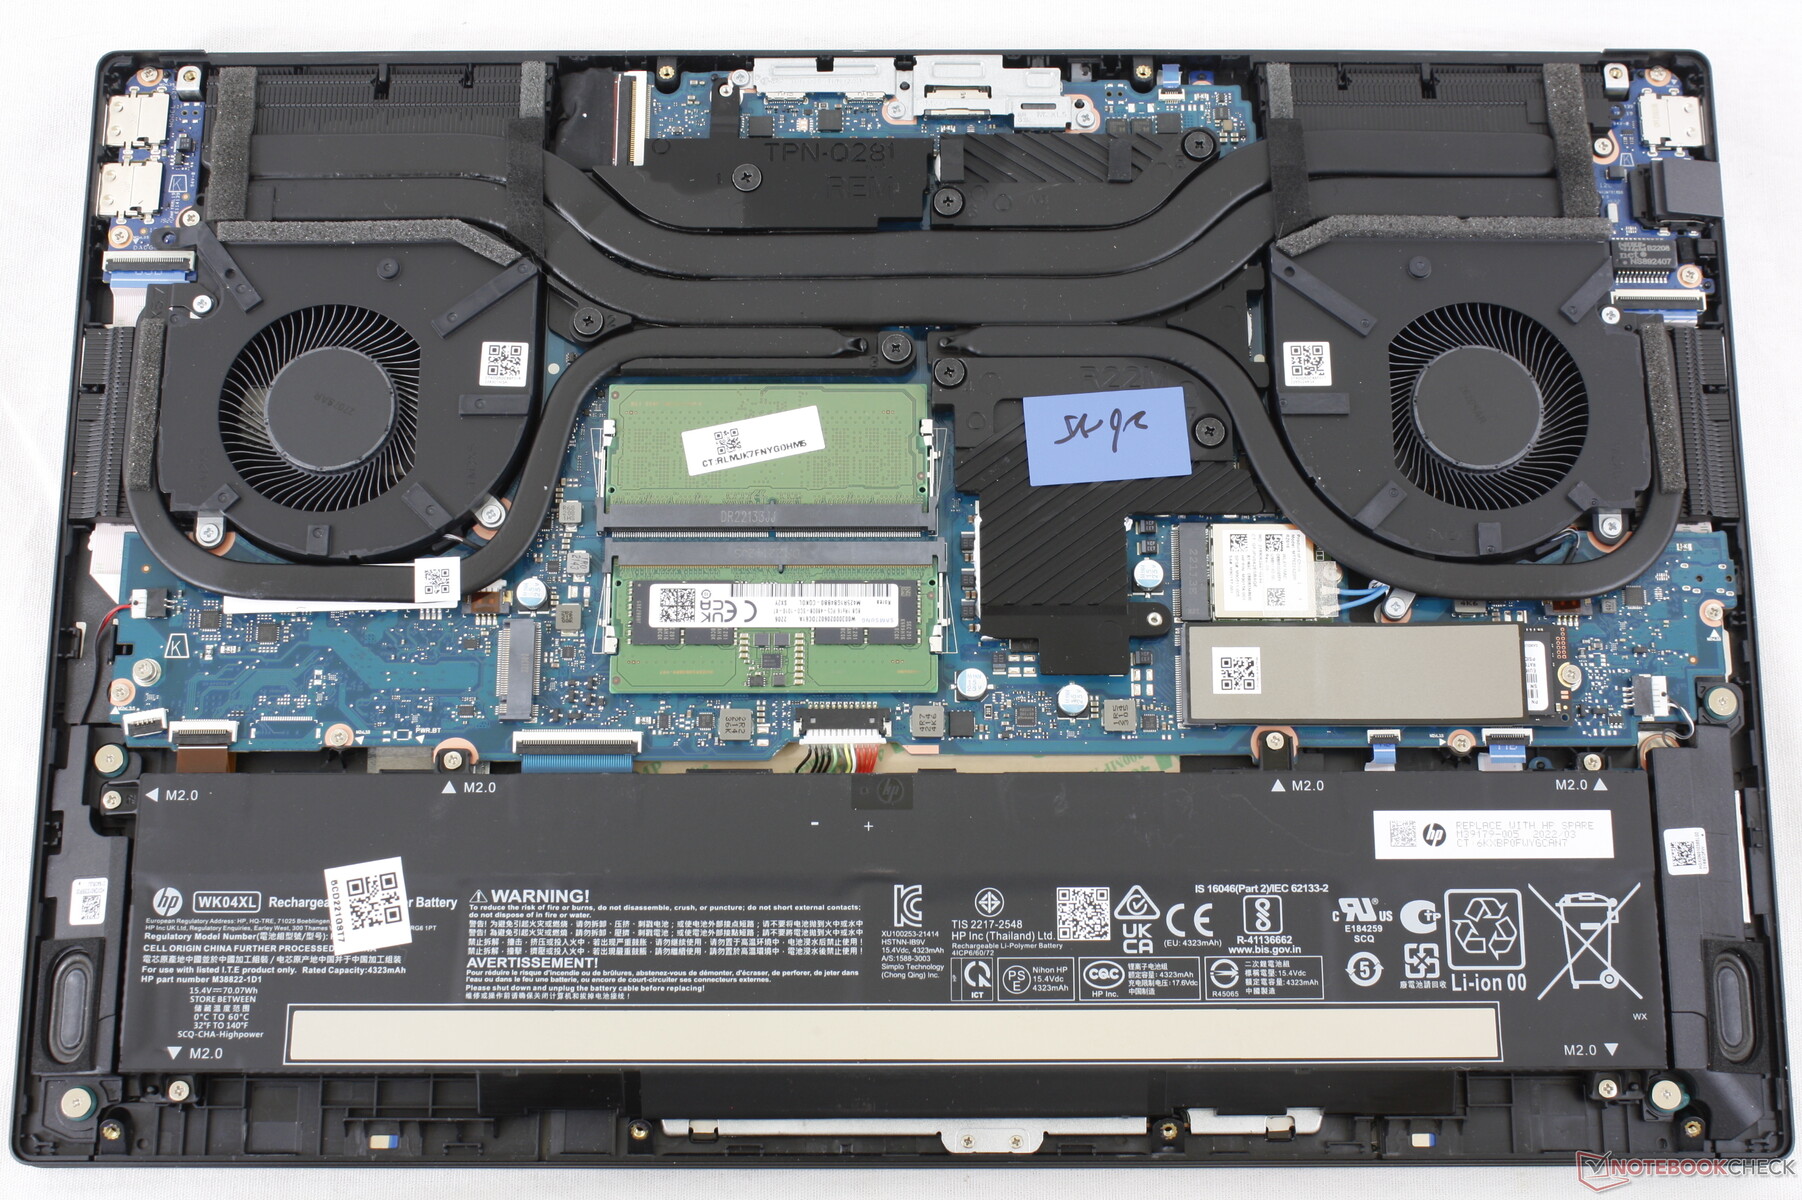
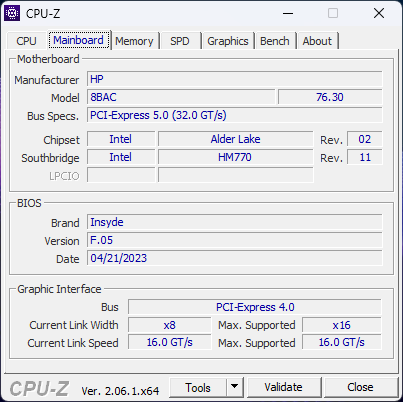
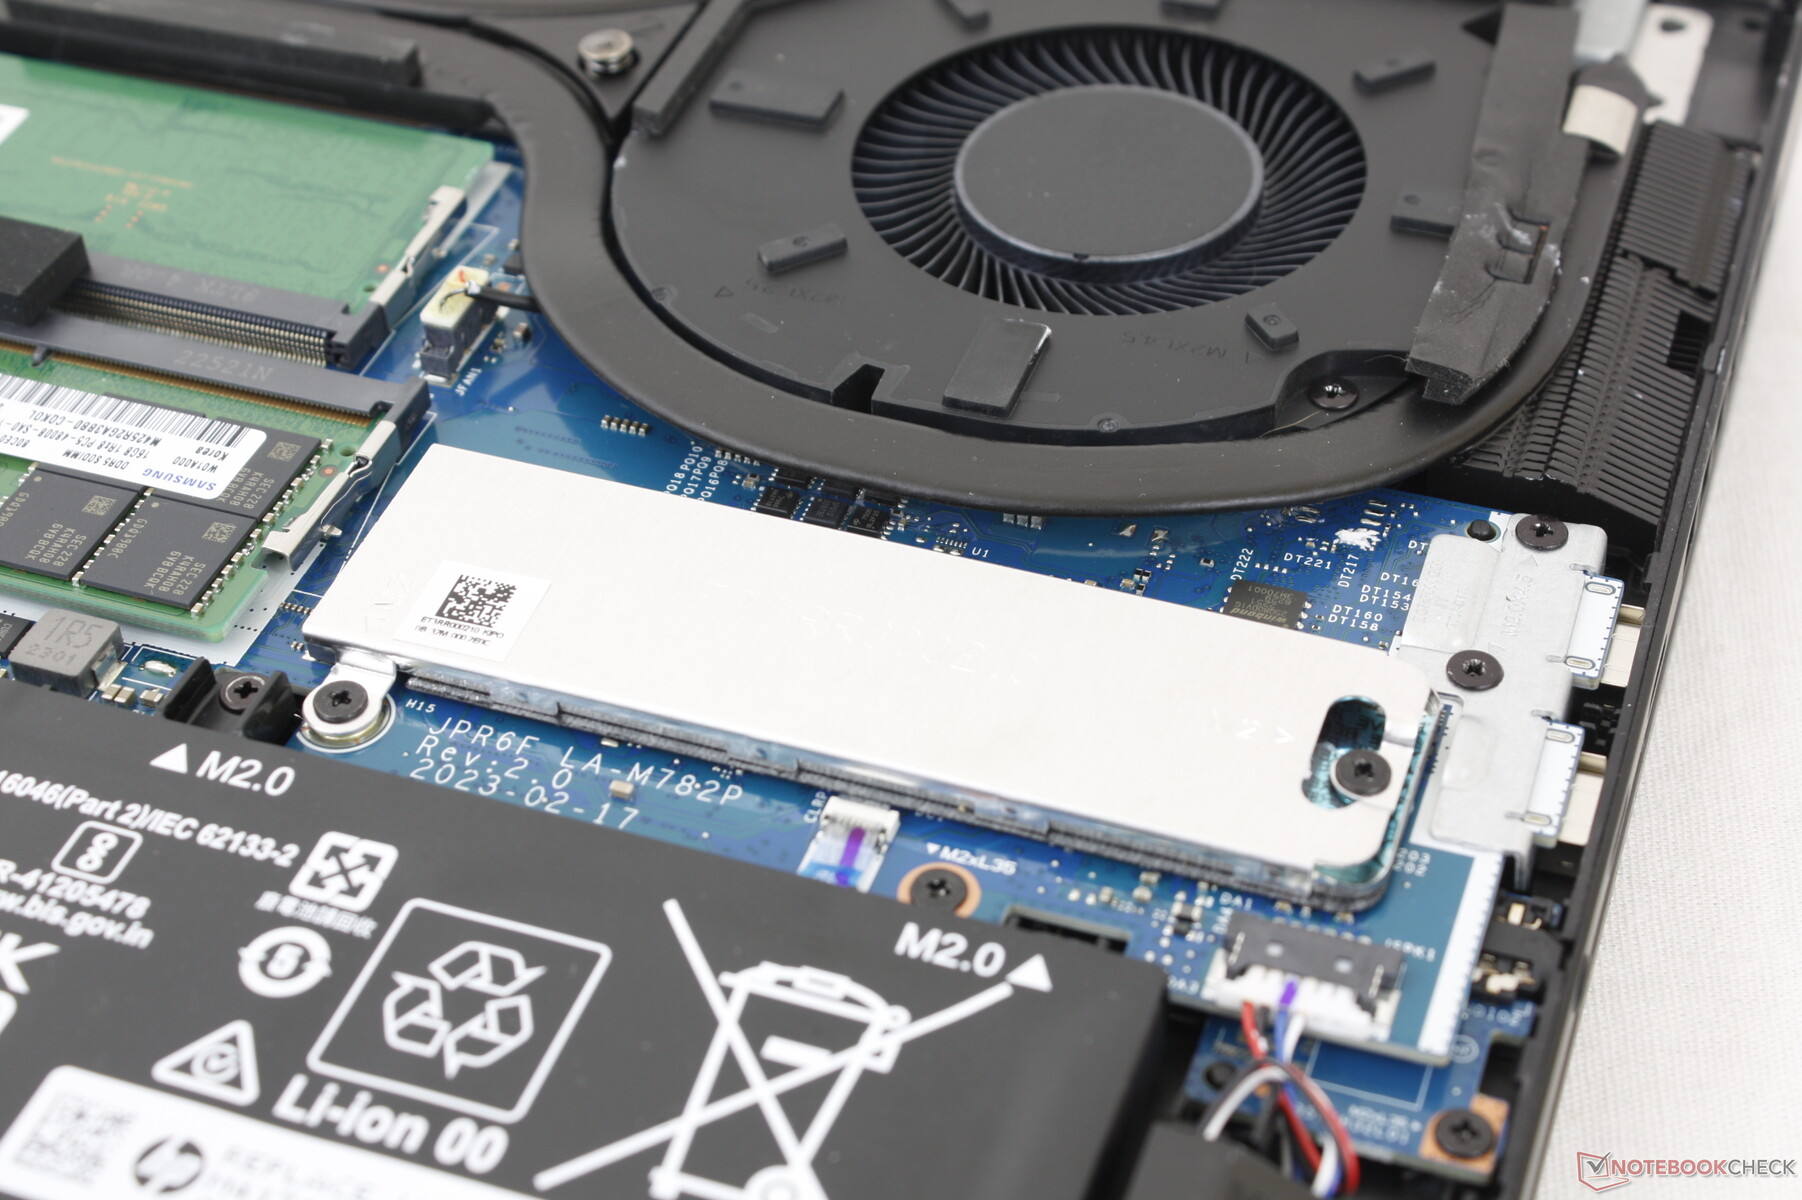
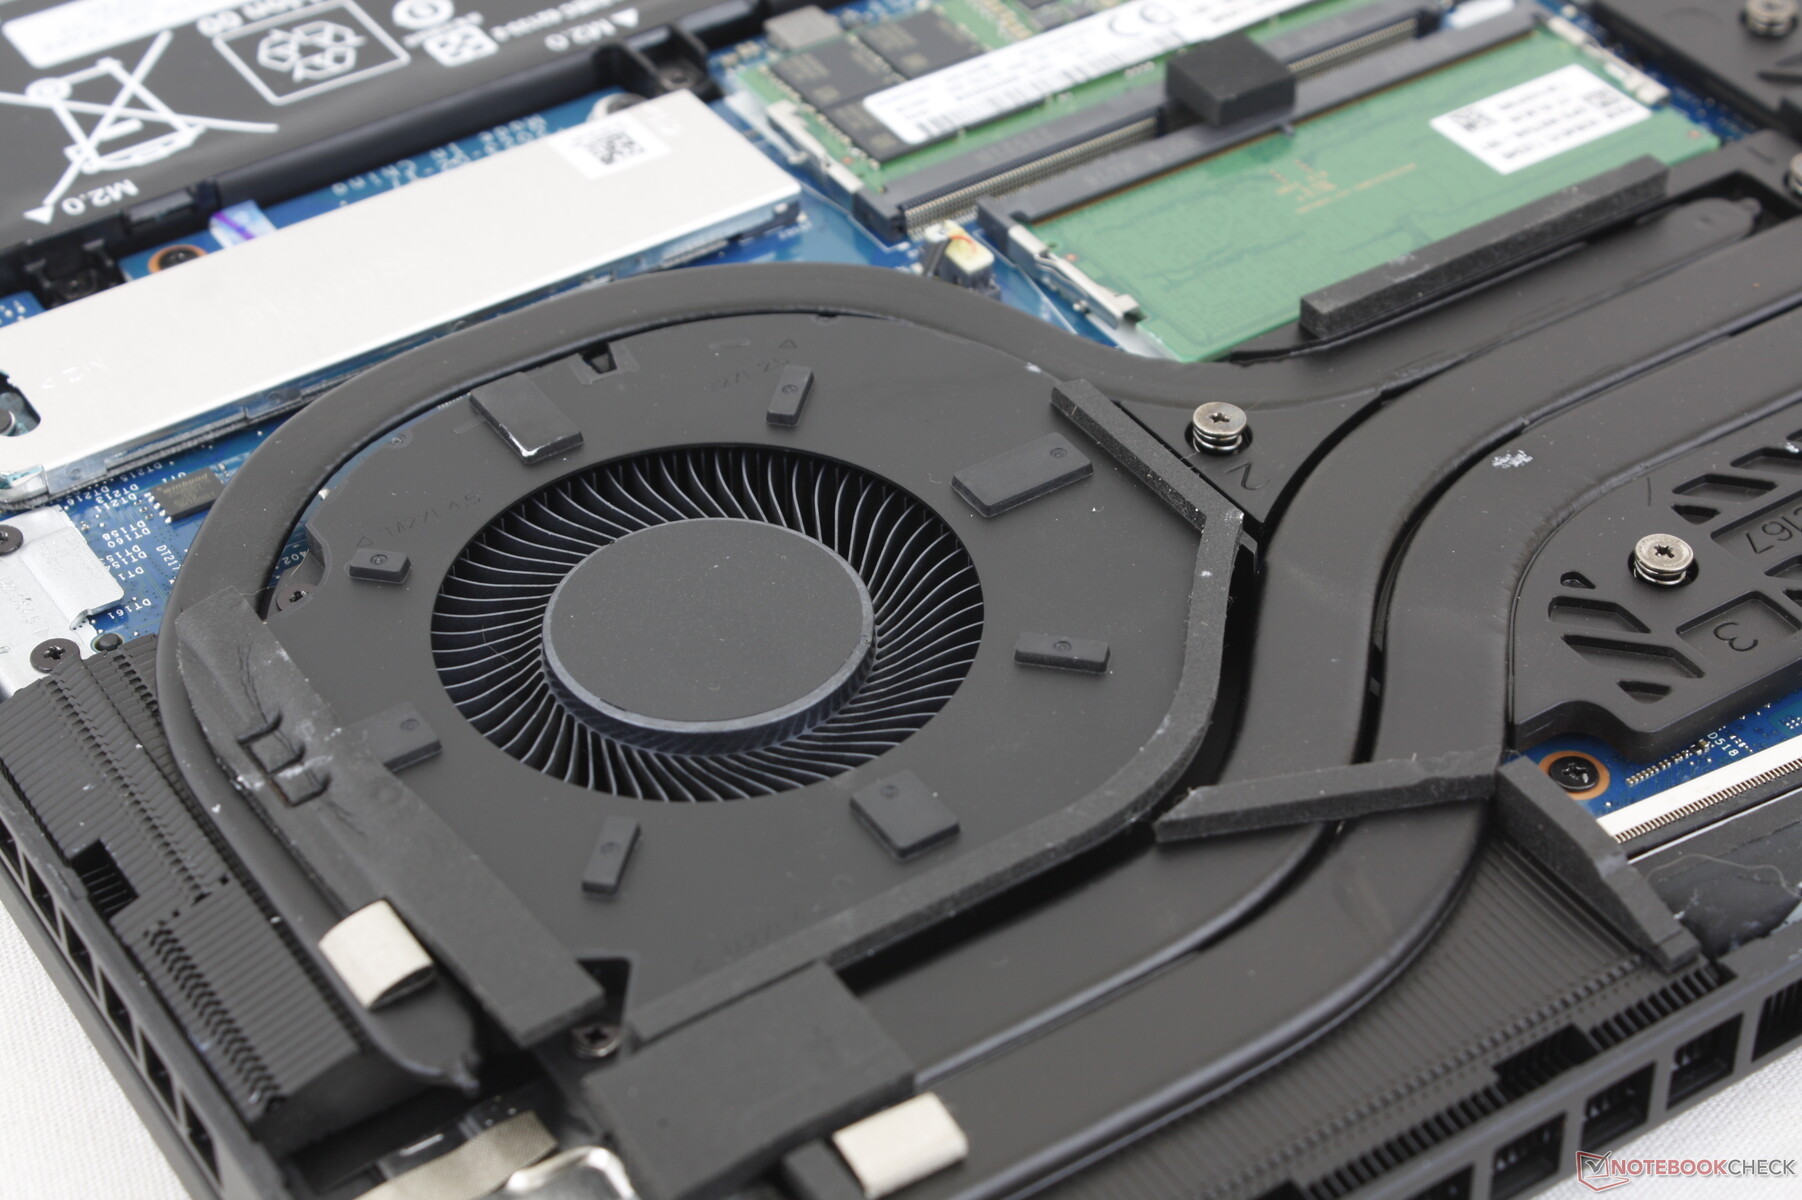
The bottom panel is secured by six Phillips screws for easy removal. Owners have direct access to 2x M.2 PCIe4 x4 2280 SSD slots, 2x SODIMM slots, battery, and removable WLAN module much like on the 2022 design.
Accessories And Warranty
The retail box include a HyperX Cloud II Core wireless headset if configured with the RTX 4080. Otherwise, the retail box includes only the usual AC adapter and paperwork.
A one-year limited manufacturer warranty comes standard if purchased from the US.
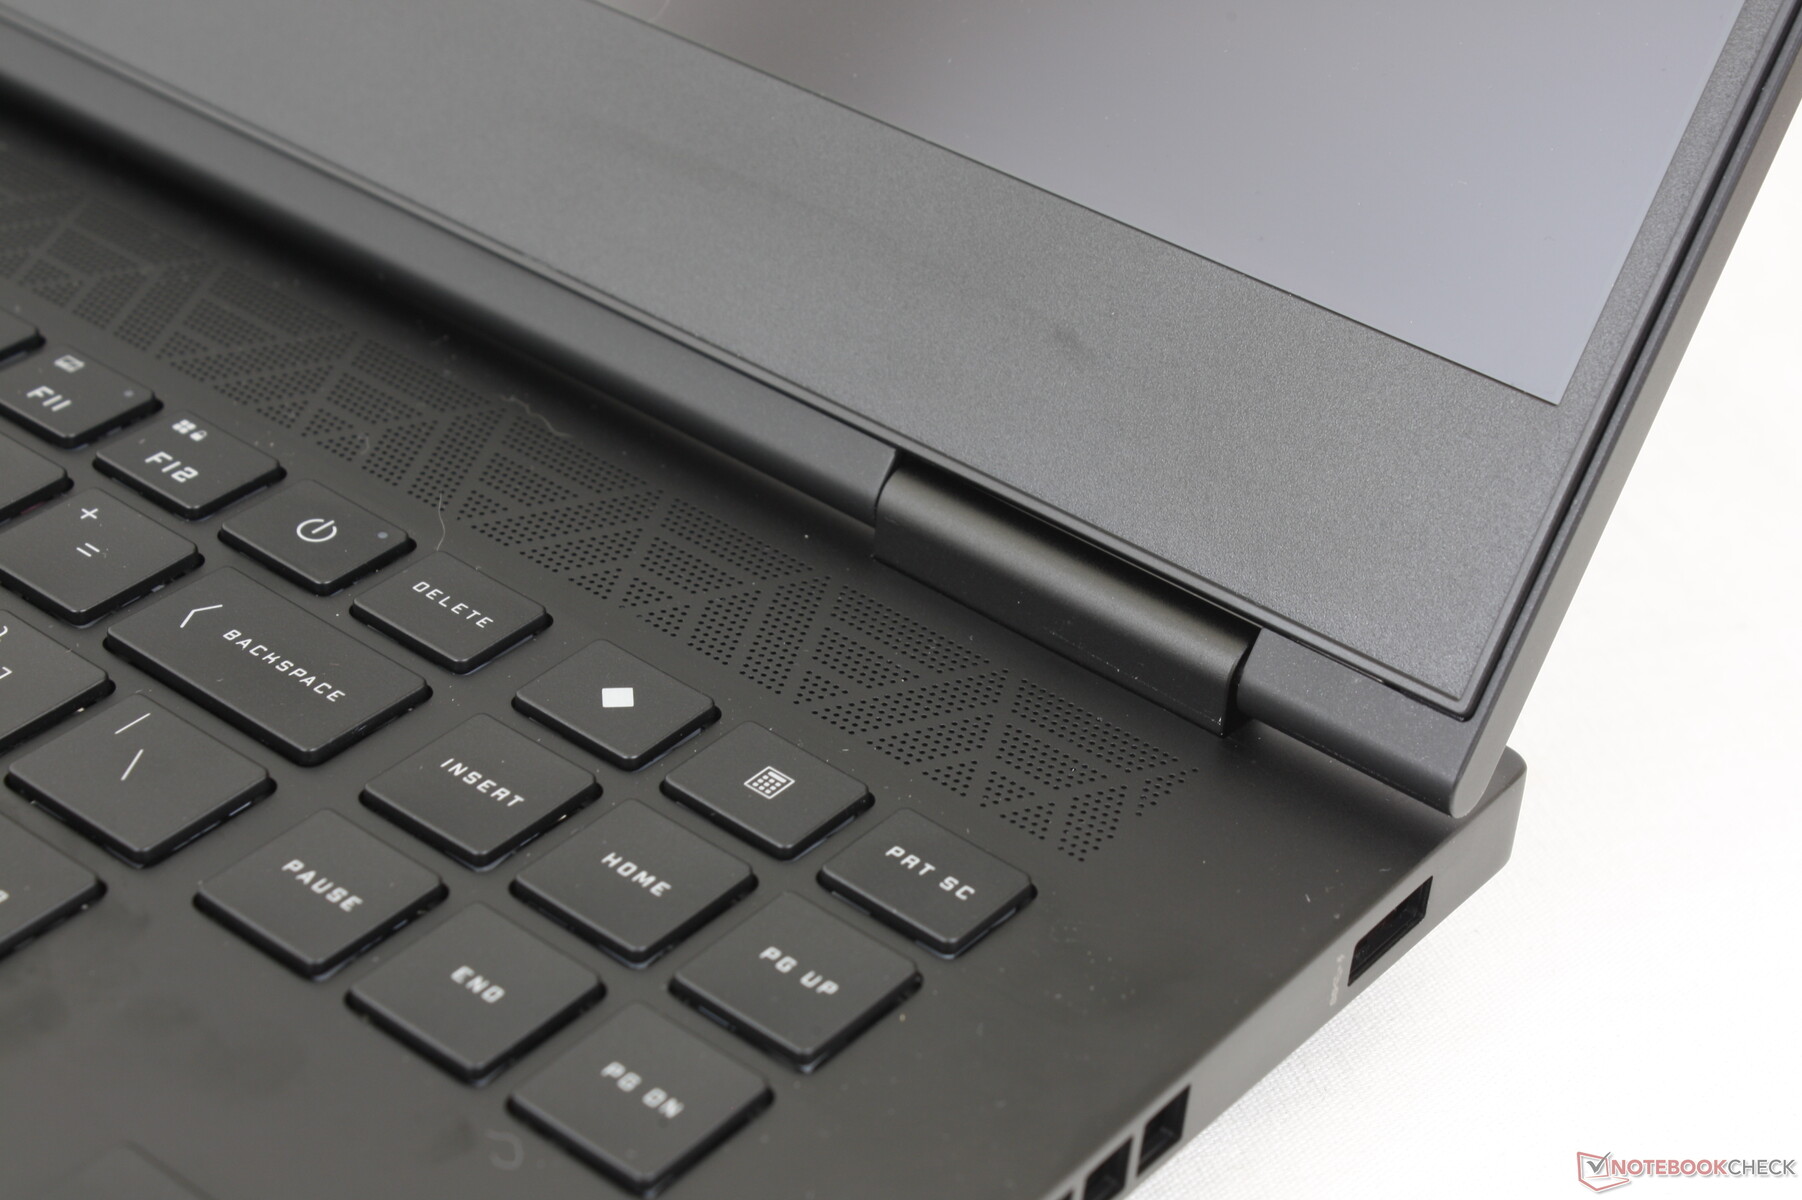
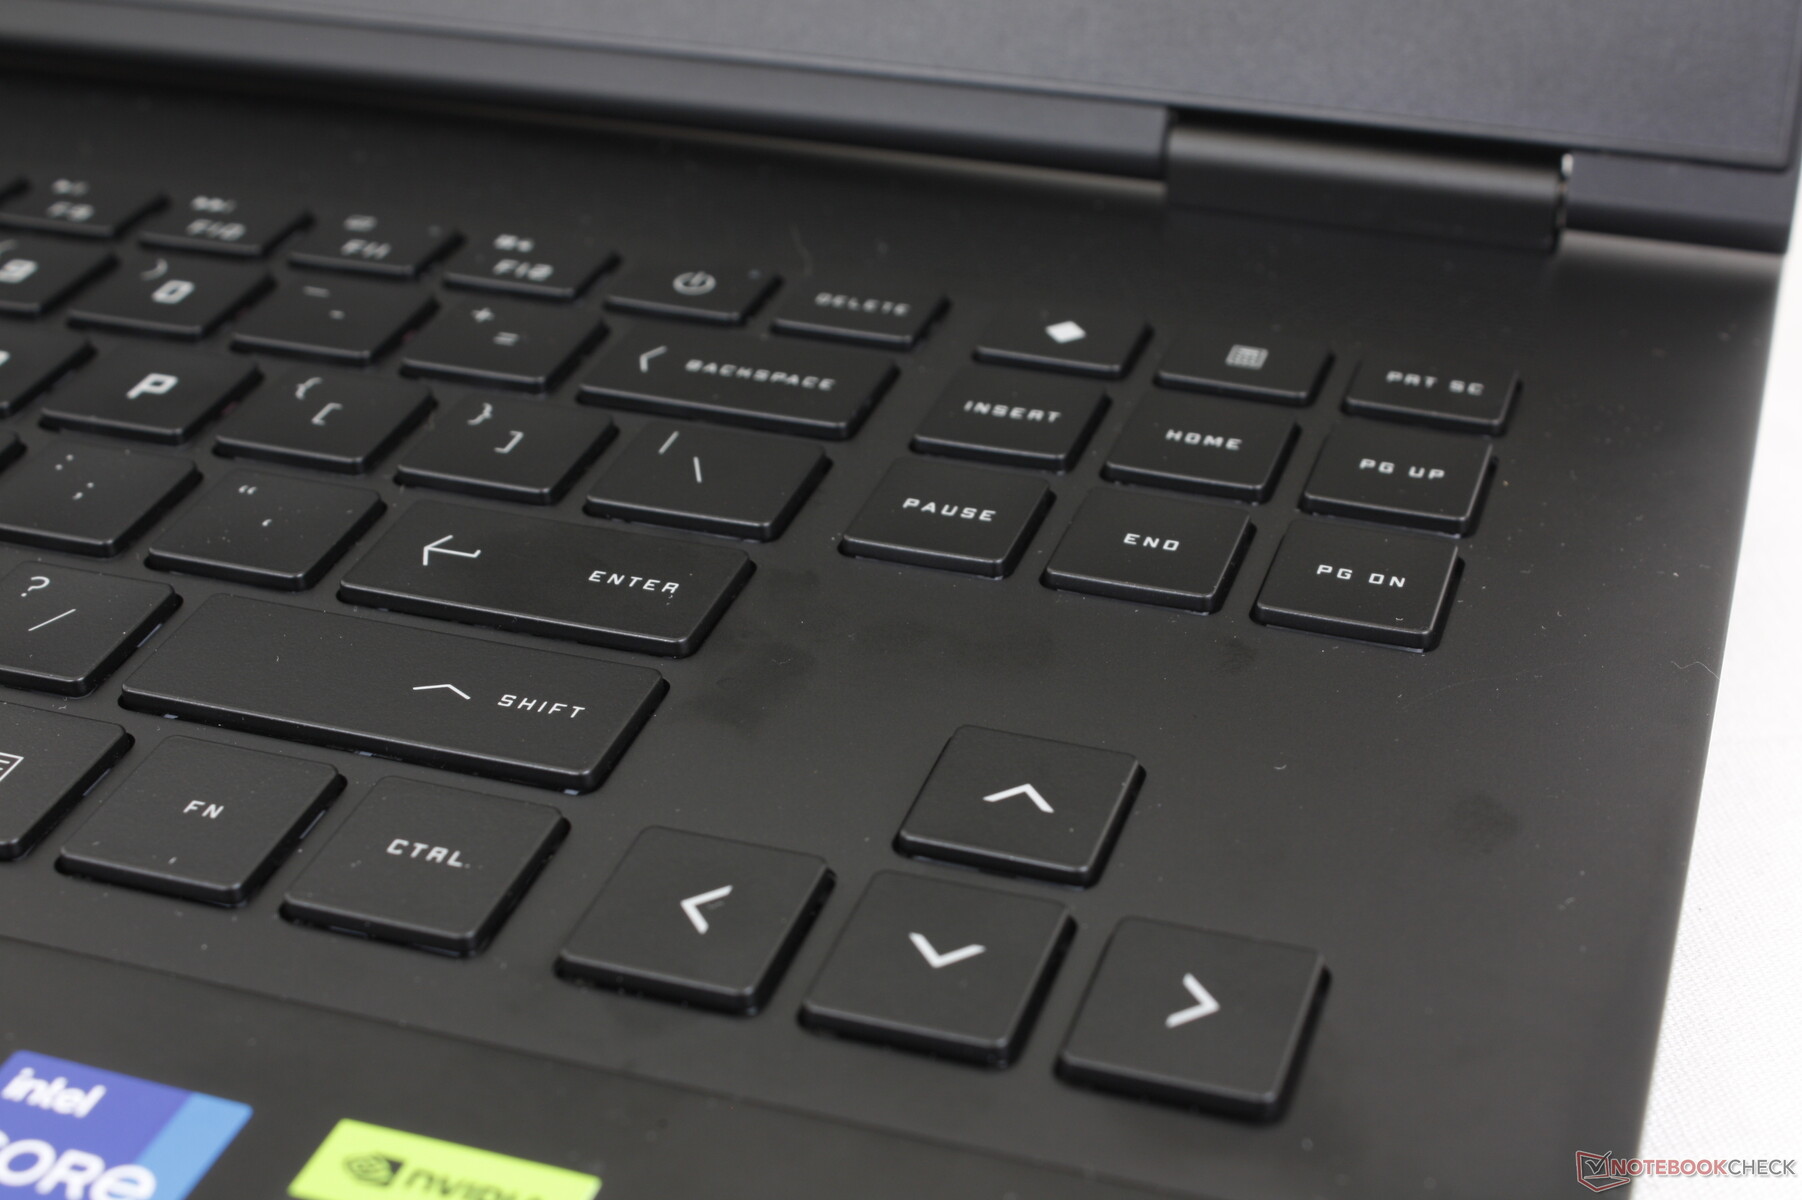
Input Devices — Smaller But Better Touchpad
Keyboard
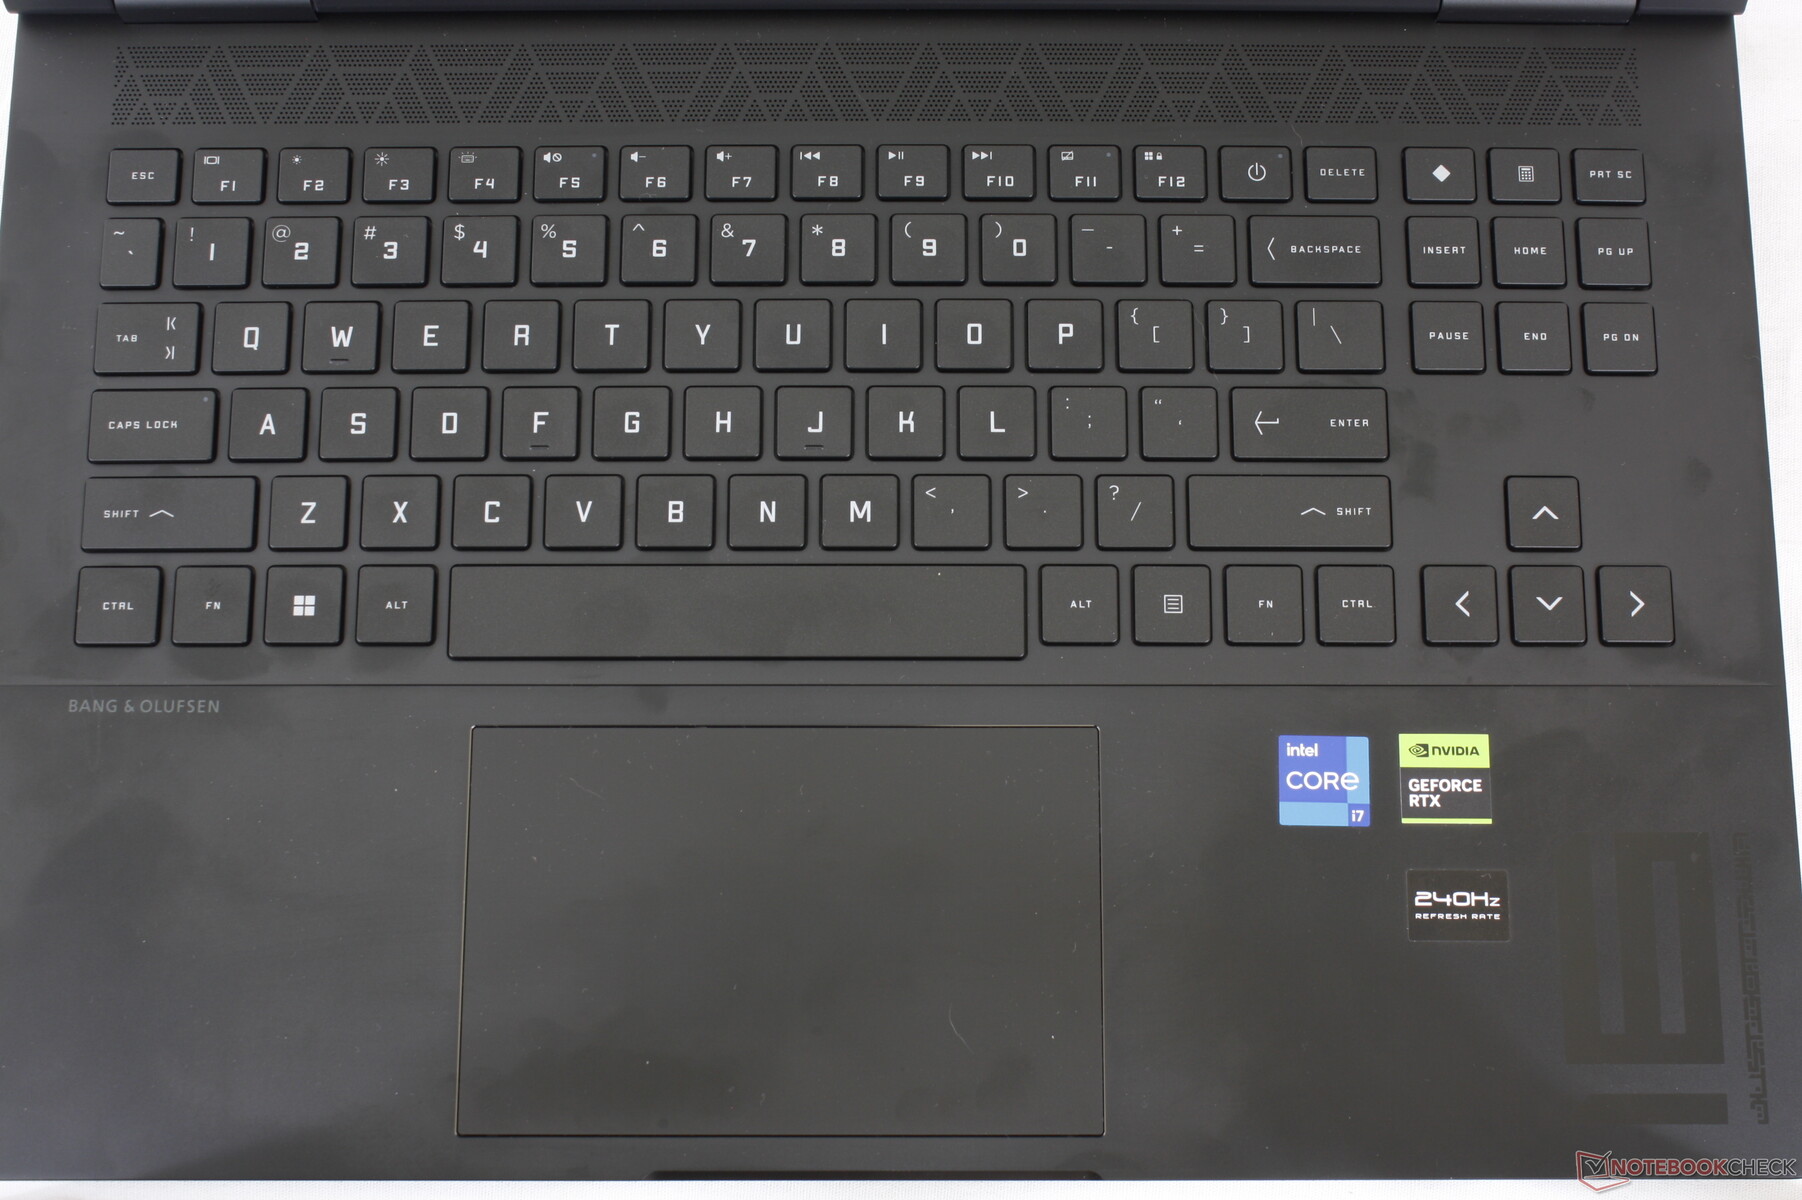
While the chassis and clickpad have received overhauls, the keyboard hasn't changed and so the typing experience remains identical to the 2022 Omen 16. Key feedback is satisfying especially for the clicky Space key, but the Enter key could have been firmer. Typing feels more spacious here than on the Blade 16.
Touchpad
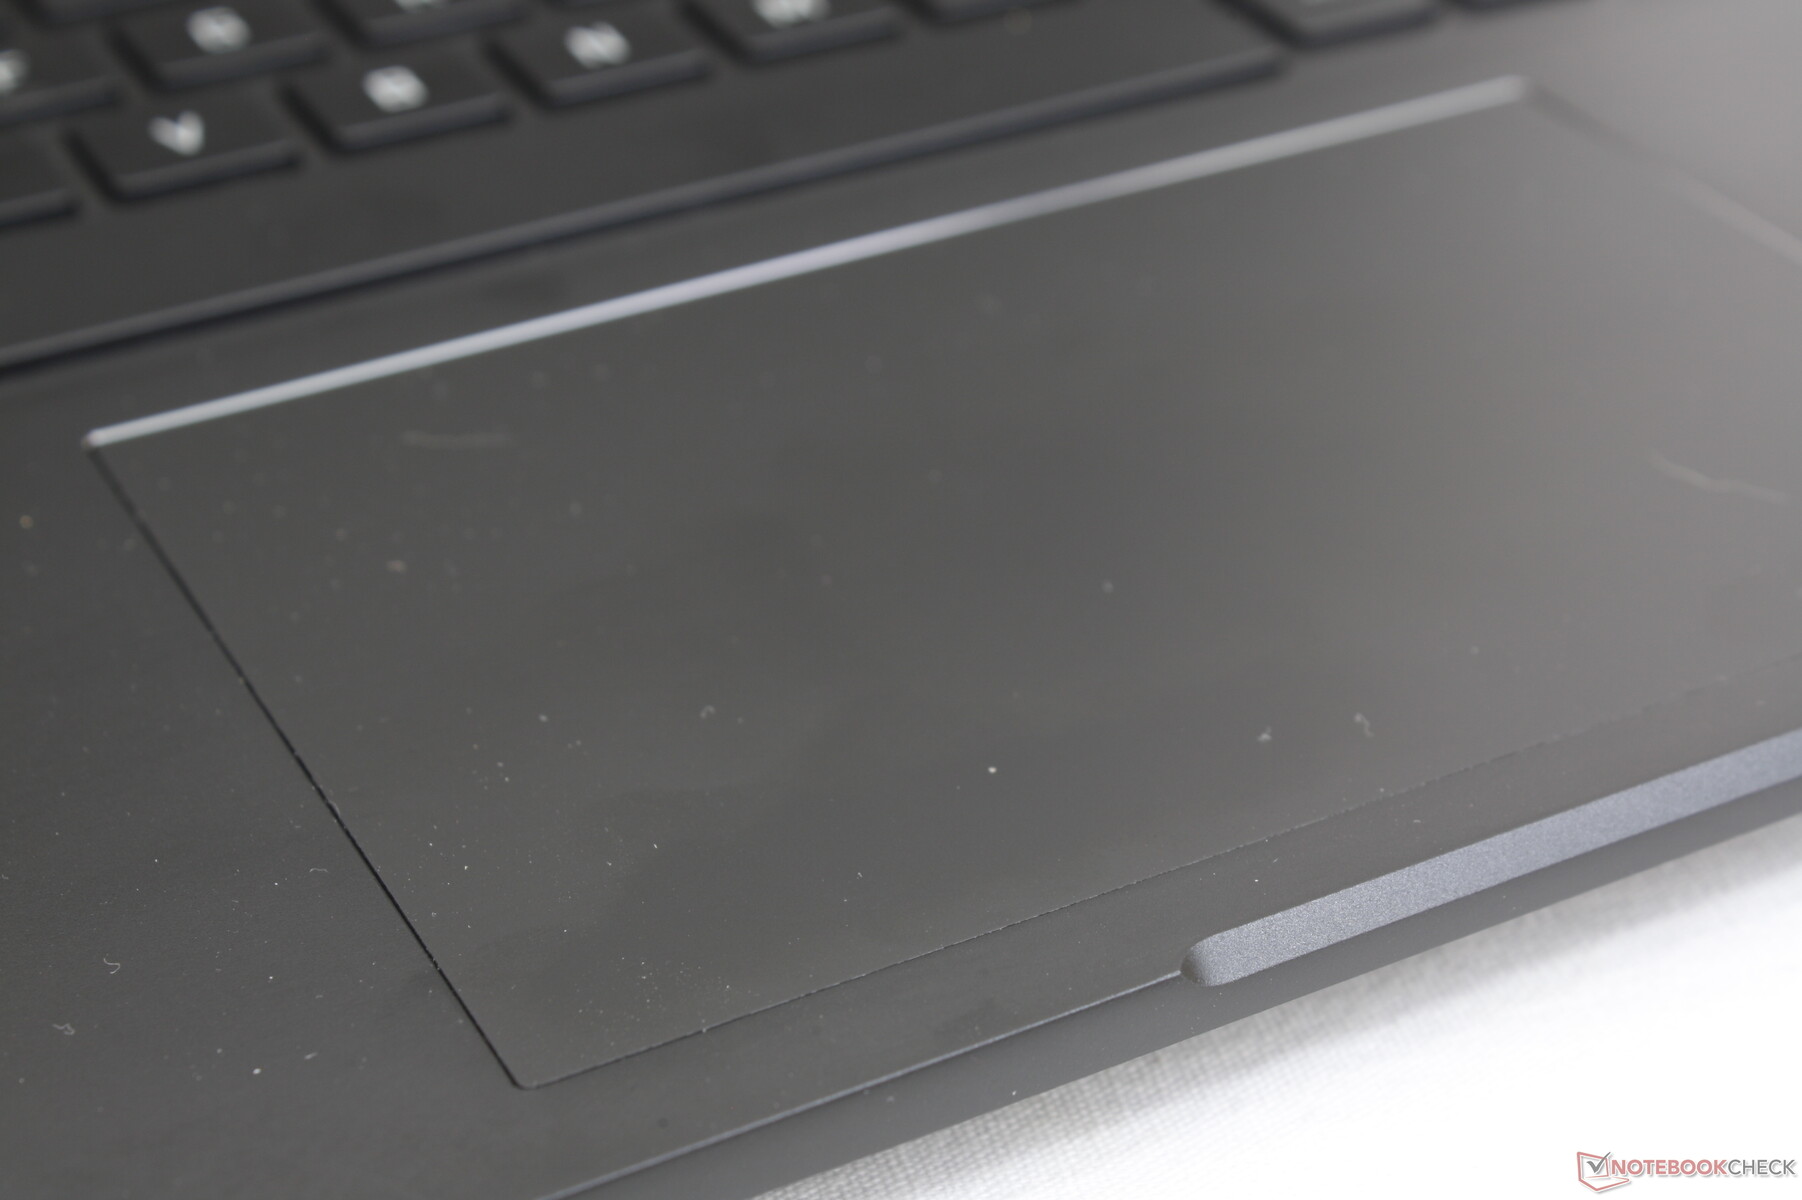
Interestingly, HP has reduced the size of the clickpad from 13 x 8.6 cm on the 2022 Omen 16 to just 12.5 x 8 cm on our newer 2023 model. However, feedback when pressing down on its surface has improved for a more satisfying and audible click. Thus, we're not too bothered by the smaller size.

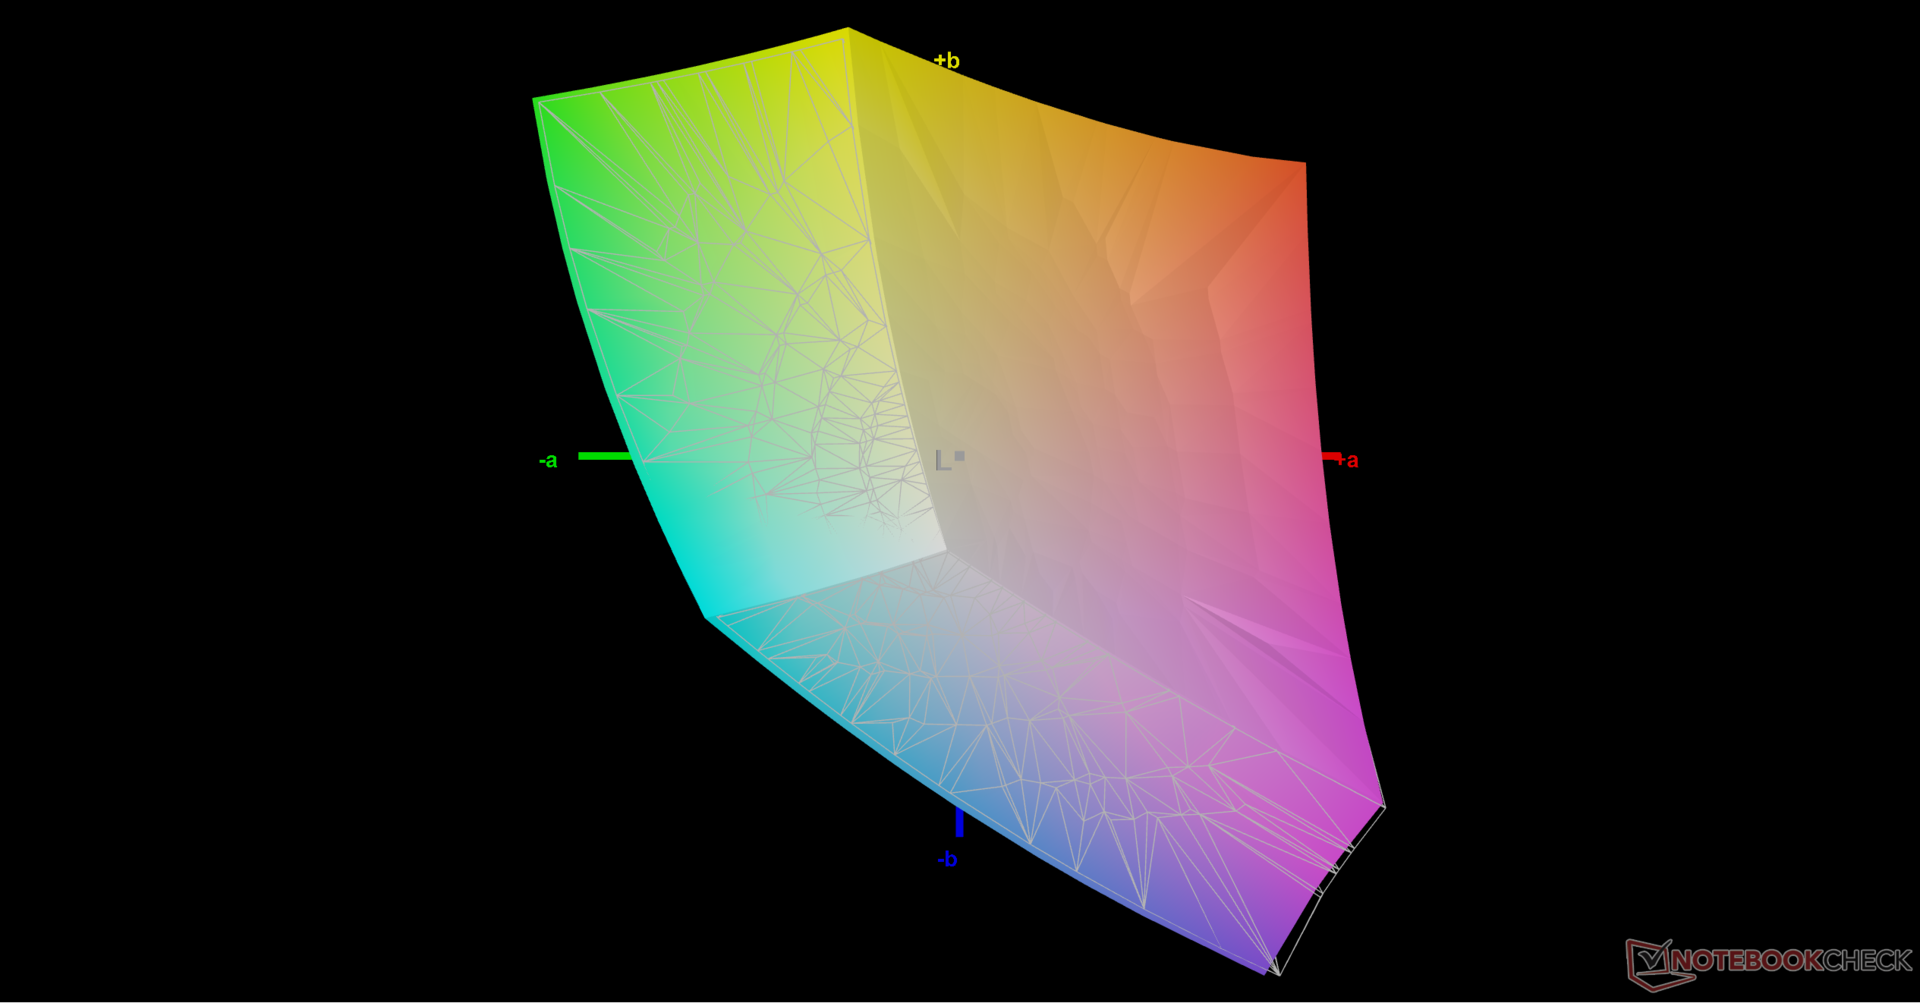
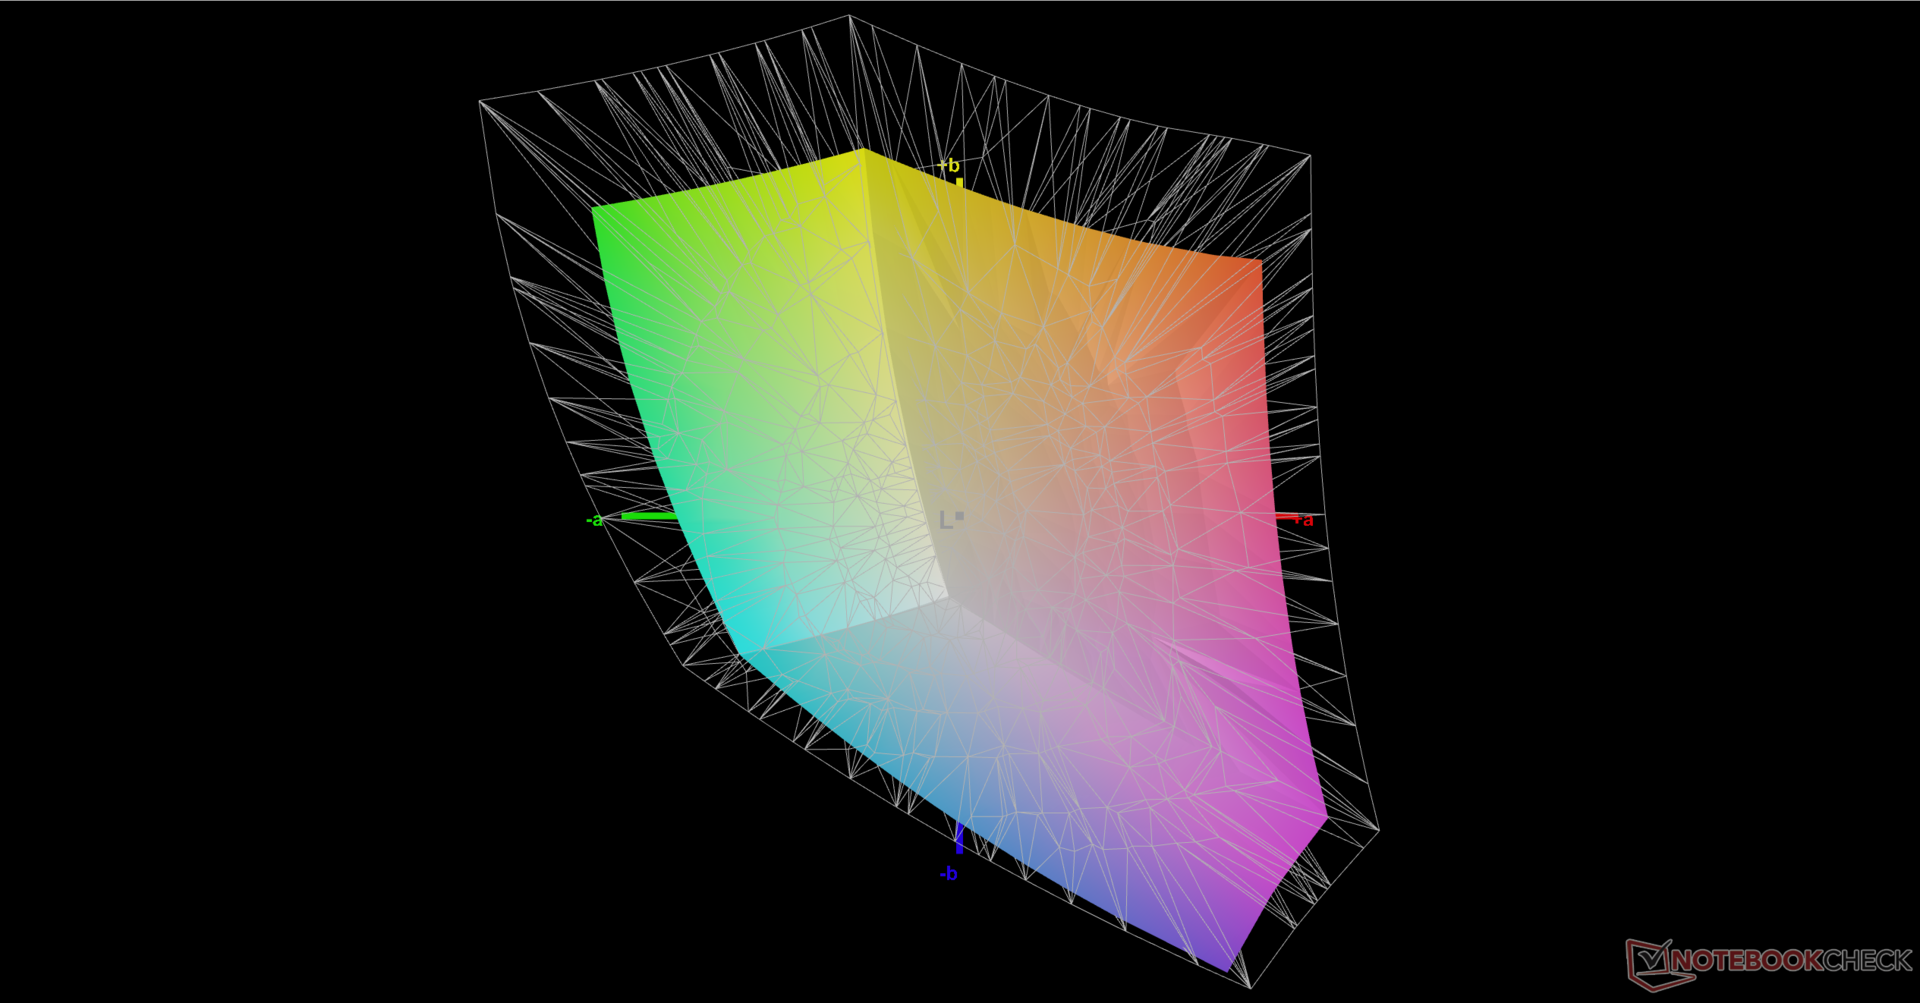
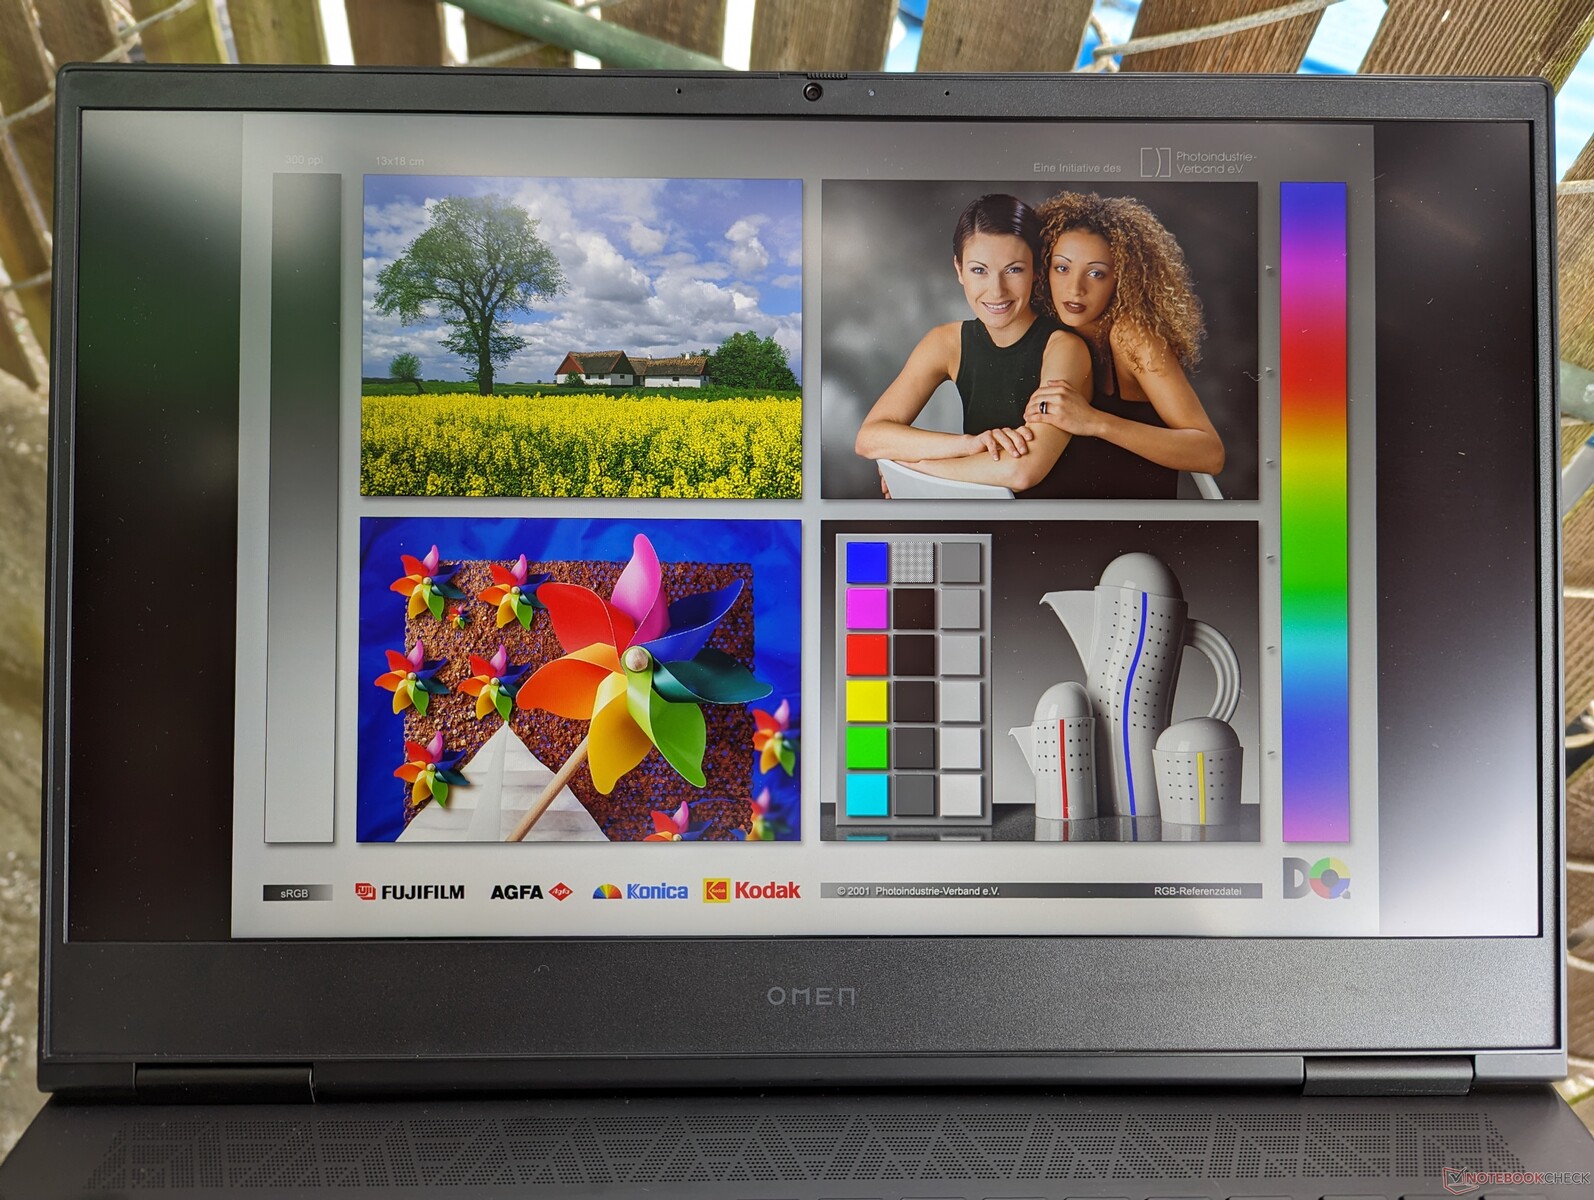
Display — No Bad Option
HP offers two display options as listed below. Our measurements reflect only the panel in bold.
- 1920 x 1080, 165 Hz, IPS, 7 ms response time, matte, 300 nits
- 2560 x 1440, 240 Hz, IPS, 3 ms response time, matte, 300 nits
Neither panel can be considered a bad option for gaming purposes, but players of fast-paced titles like Overwatch 2 or Valorant may want to consider the 1440p option for its faster response times and refresh rates. Color coverage is limited to 100% sRGB whereas competitors like the Legion Pro 7 or ROG Strix G16 may have fuller DCI-P3 panels.
Note that the Omen 16 is one of the few remaining 16:9 gaming laptops in its size category as most others have already moved on to 16:10.


| |||||||||||||||||||||||||
Brightness Distribution: 91 %
Center on Battery: 310.9 cd/m²
Contrast: 888:1 (Black: 0.35 cd/m²)
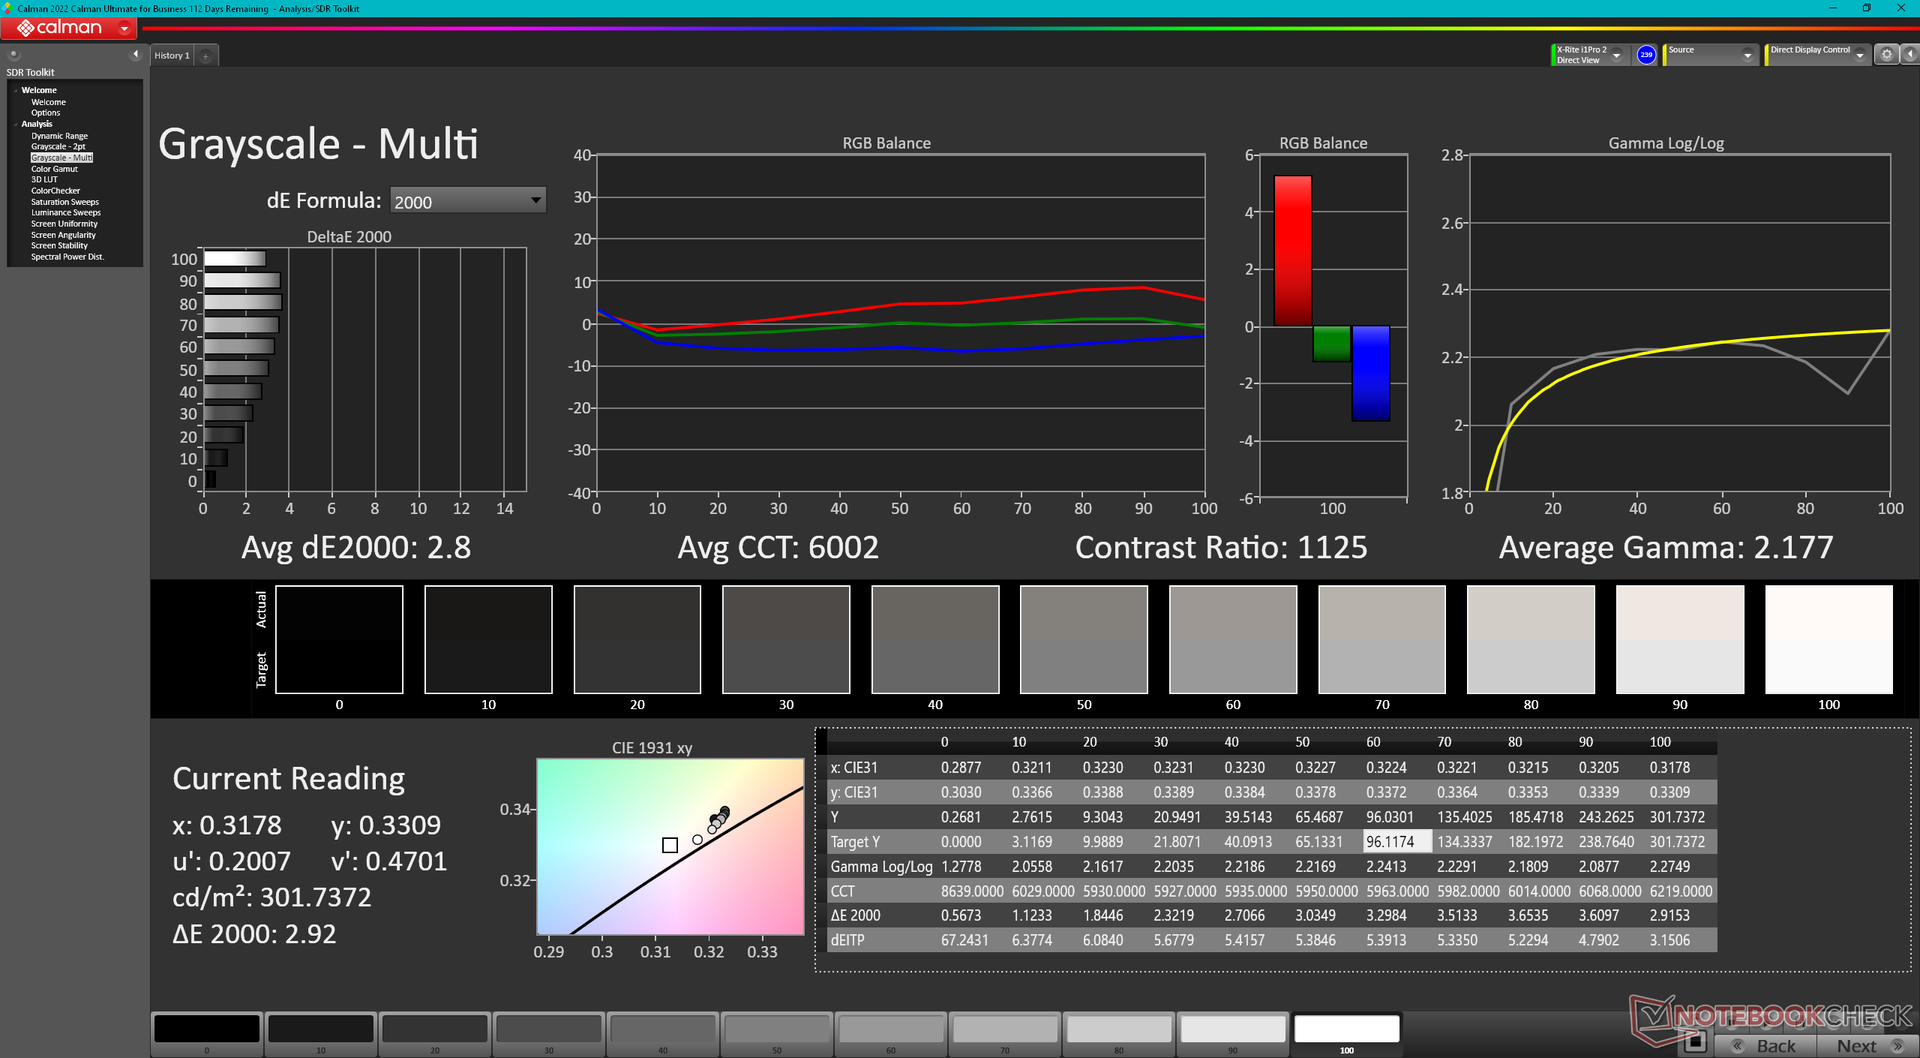
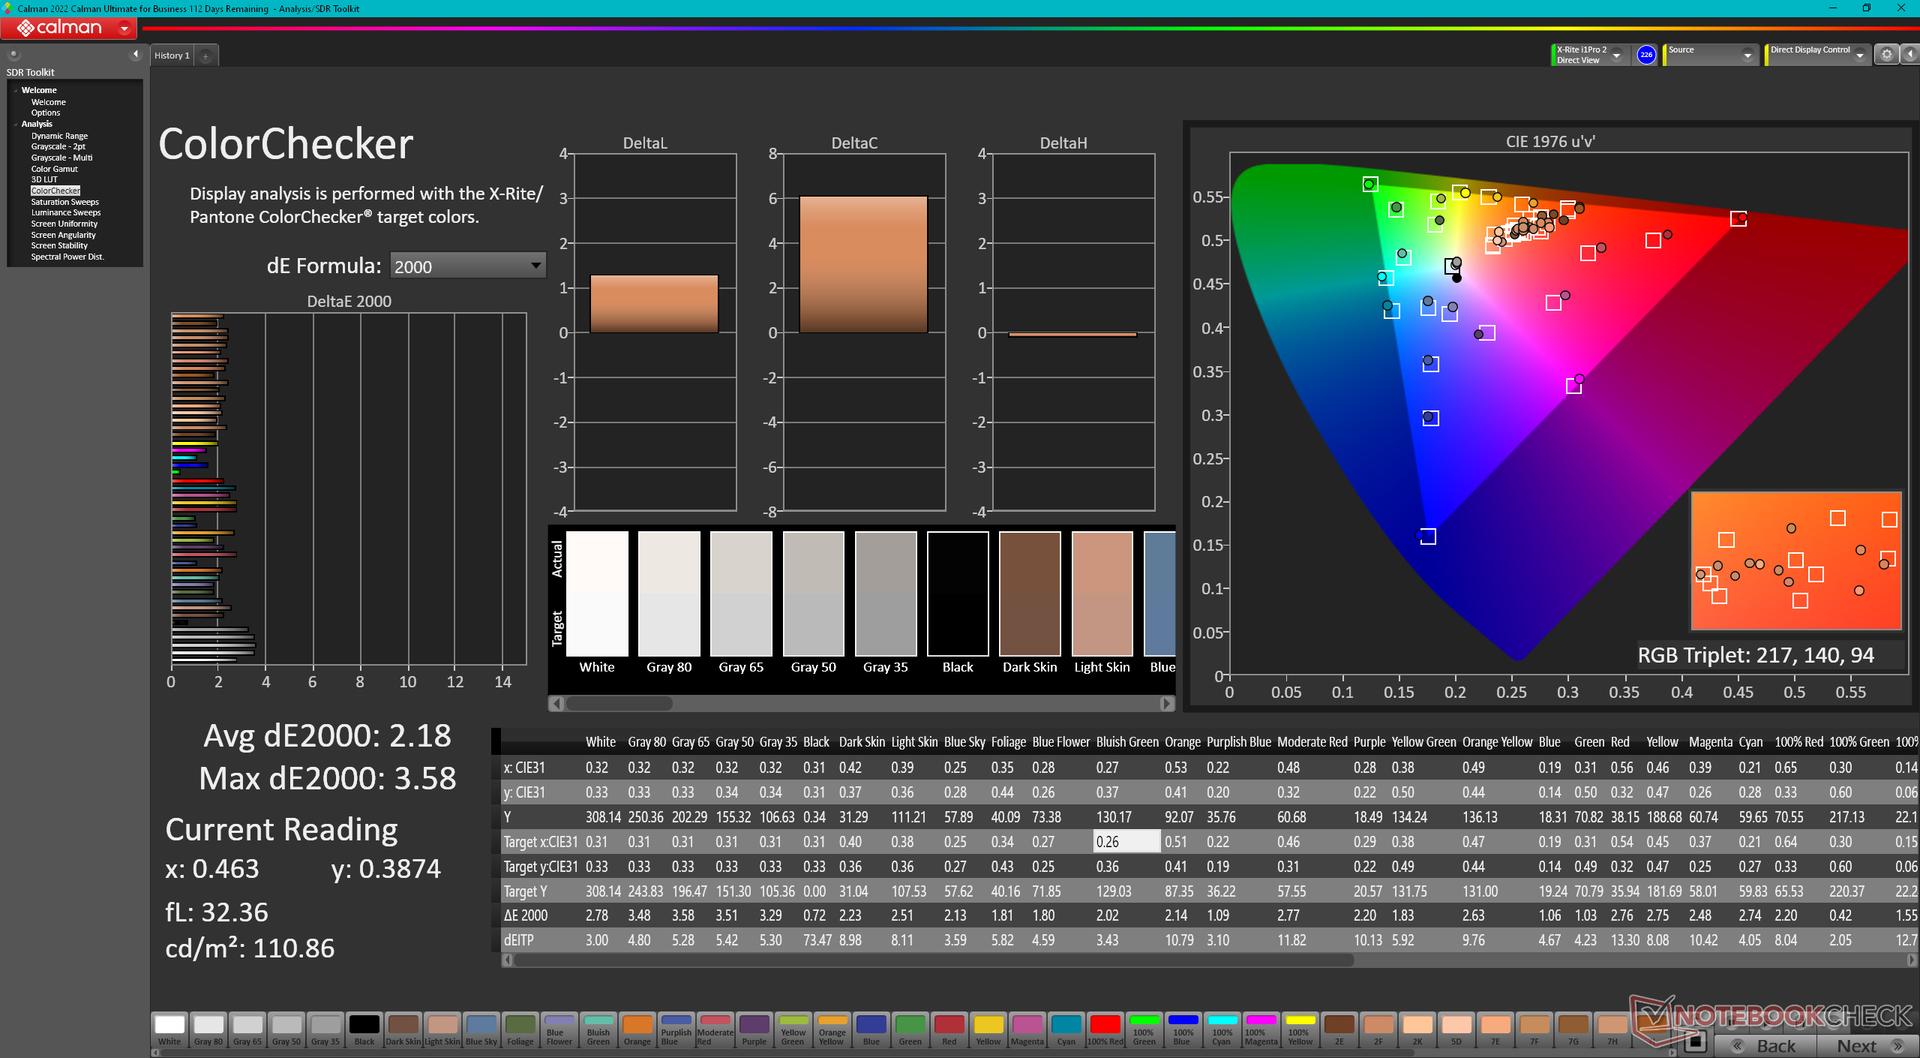
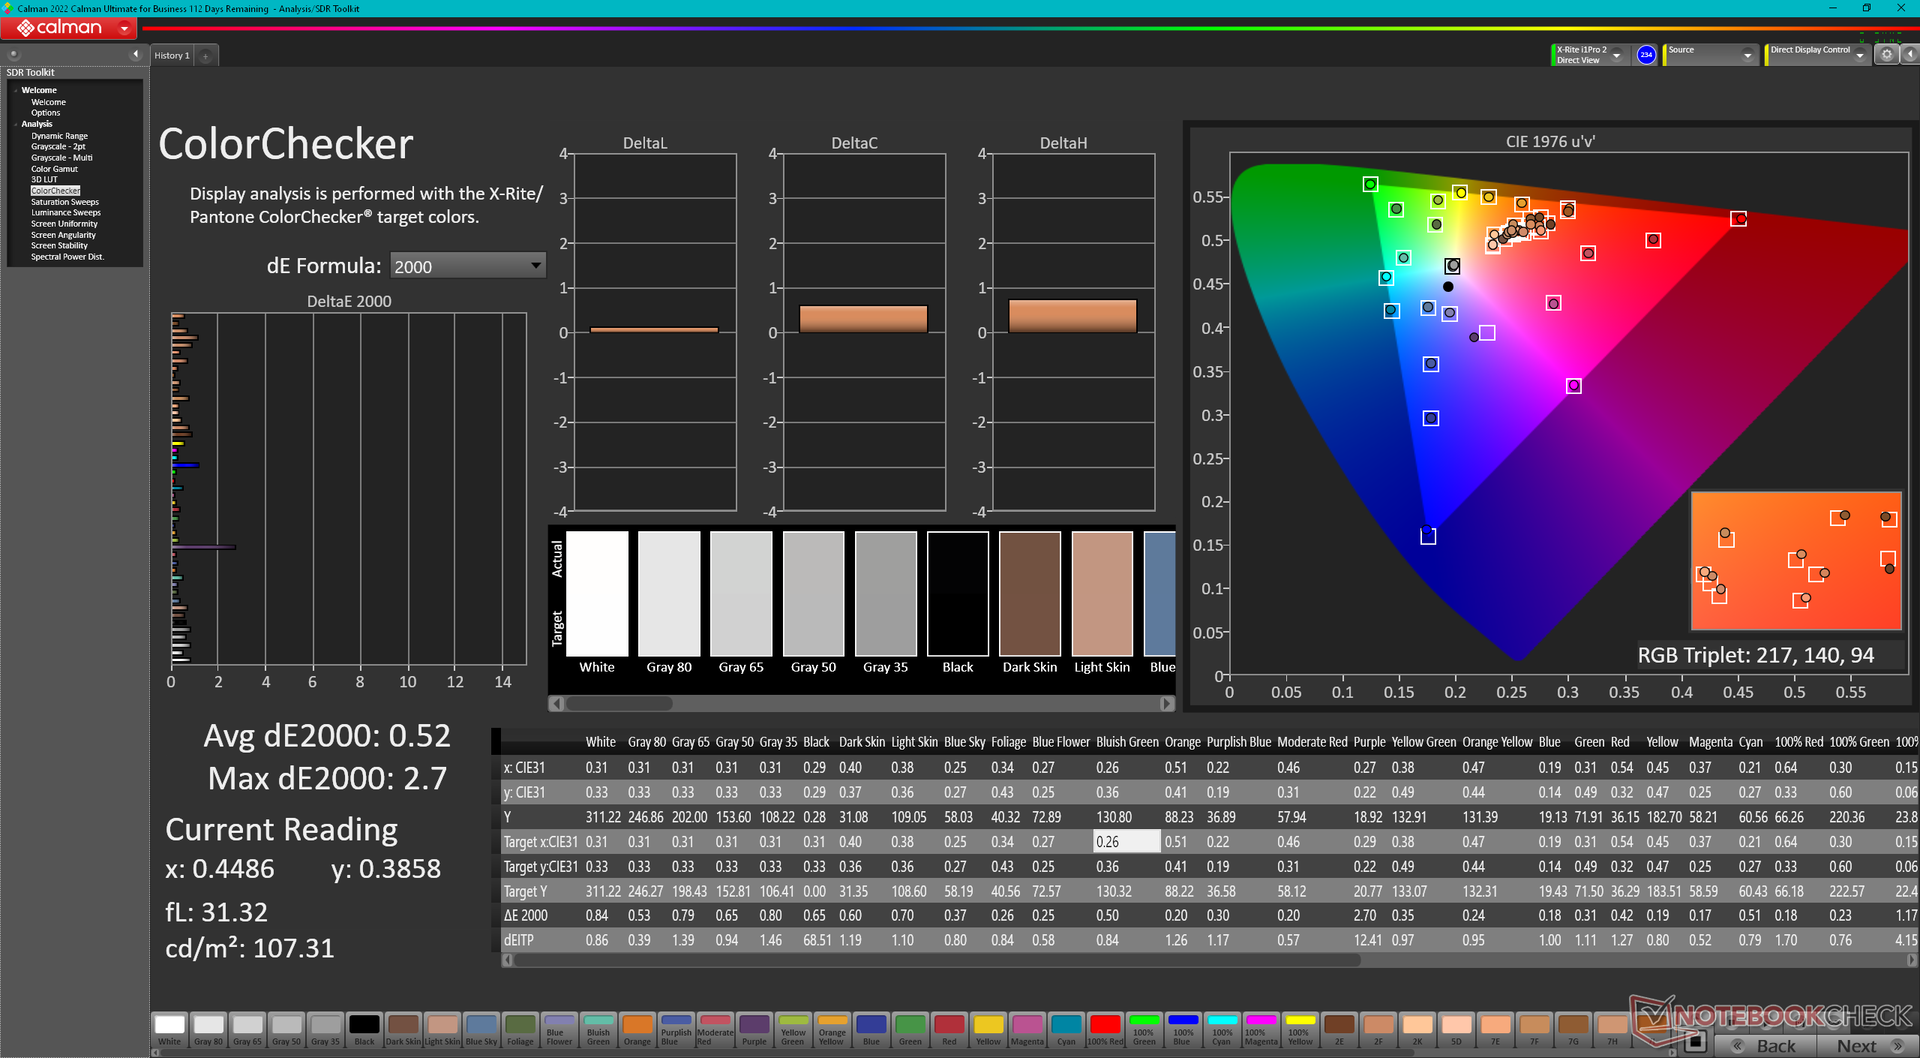
ΔE ColorChecker Calman: 2.18 | ∀{0.5-29.43 Ø4.73}
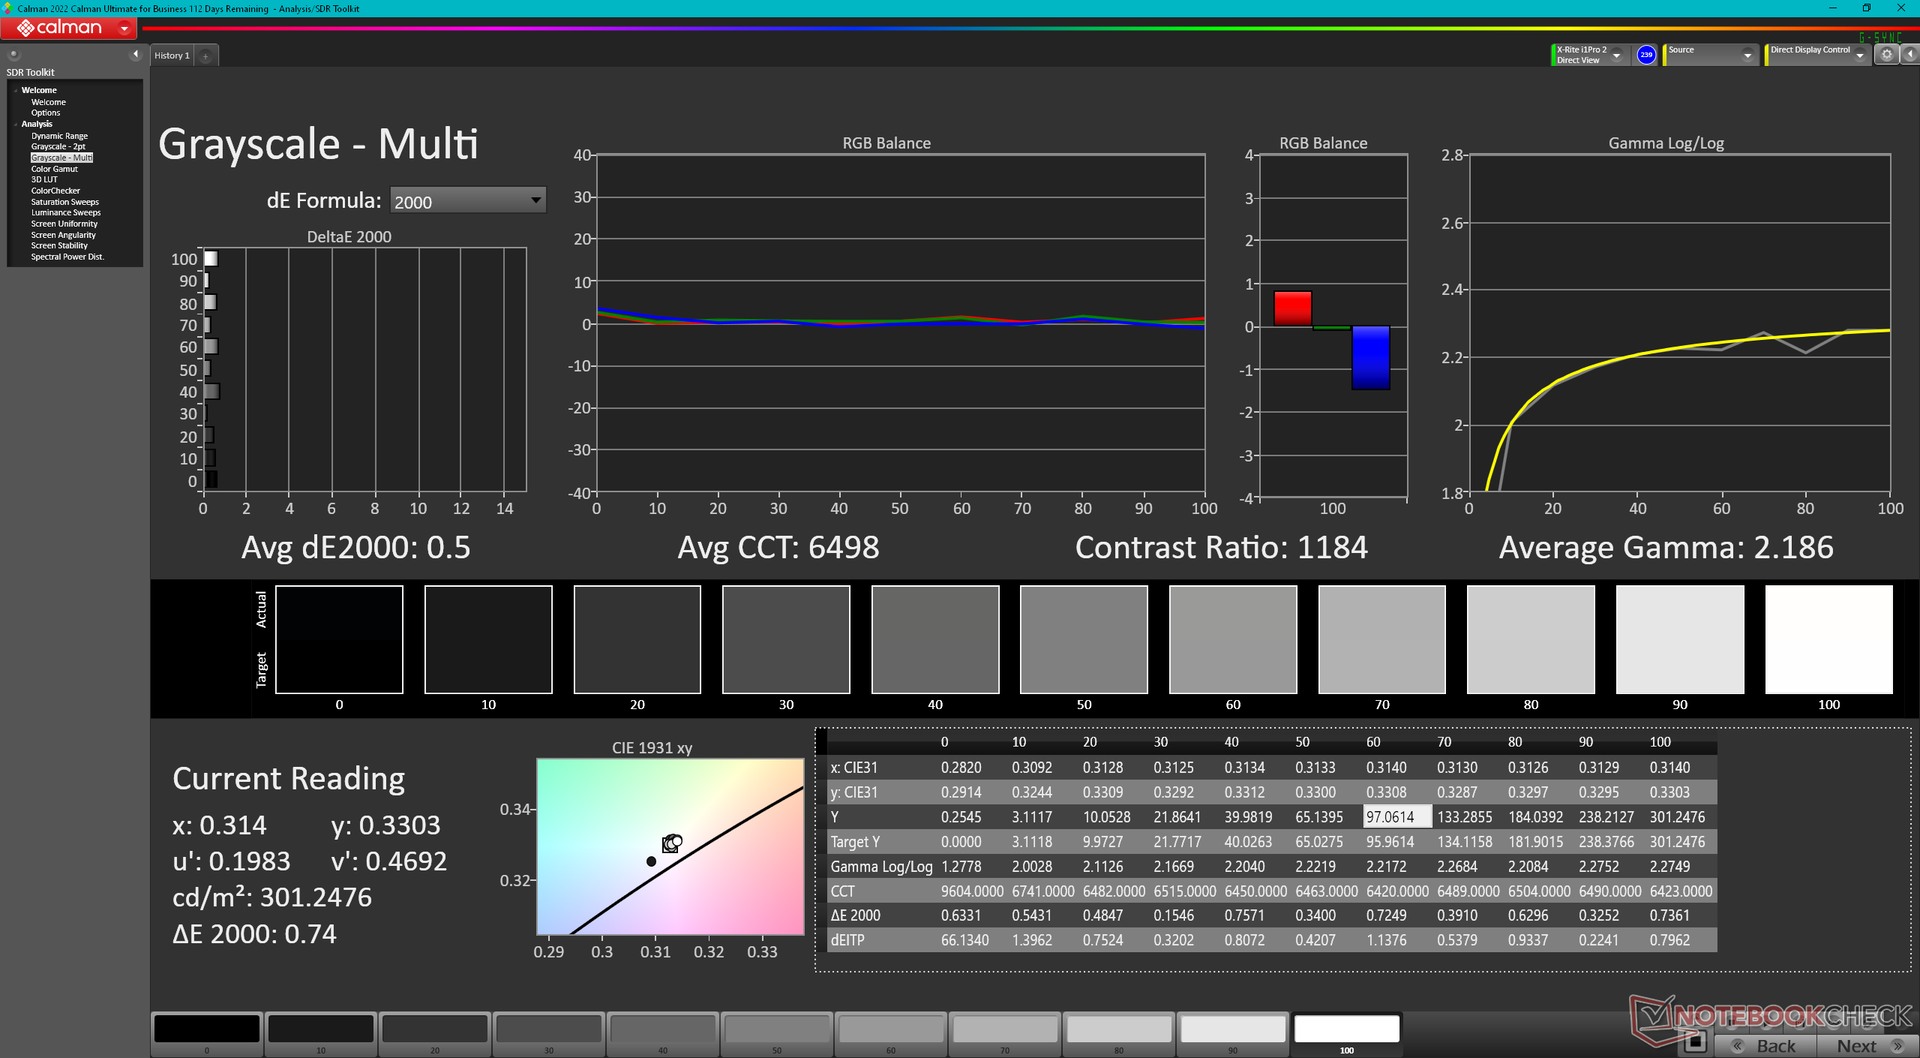
calibrated: 0.52
ΔE Greyscale Calman: 2.8 | ∀{0.09-98 Ø4.97}
71.2% AdobeRGB 1998 (Argyll 3D)
99.2% sRGB (Argyll 3D)
69% Display P3 (Argyll 3D)
Gamma: 2.18
CCT: 6002 K
| HP Omen 16-wf000 BOE0B7D, IPS, 2560x1440, 16.1" | HP Omen 16-n0033dx BOE0AAE, IPS, 1920x1080, 16.1" | Alienware x16 R1 BOE NE16NZ4, IPS, 2560x1600, 16" | Lenovo Legion Pro 7 RTX4090 MNG007DA2-3 (CSO1628), IPS, 2560x1600, 16" | Asus ROG Strix G16 G614JZ TL160ADMP03-0, IPS, 2560x1600, 16" | Razer Blade 16 Early 2023 CSOT T3 MNG007DA4-1, IPS, 2560x1600, 16" | |
|---|---|---|---|---|---|---|
| Display | 4% | 23% | 1% | 20% | 23% | |
| Display P3 Coverage (%) | 69 | 74.4 8% | 99.2 44% | 69.5 1% | 97 41% | 98.5 43% |
| sRGB Coverage (%) | 99.2 | 99.2 0% | 100 1% | 99.8 1% | 99.9 1% | 100 1% |
| AdobeRGB 1998 Coverage (%) | 71.2 | 73.4 3% | 88.6 24% | 71.6 1% | 84.9 19% | 89.7 26% |
| Response Times | -149% | -9% | -42% | 11% | -34% | |
| Response Time Grey 50% / Grey 80% * (ms) | 4.6 ? | 17.6 ? -283% | 5.1 ? -11% | 10.9 ? -137% | 5.1 ? -11% | 6.6 ? -43% |
| Response Time Black / White * (ms) | 9.7 ? | 11.2 ? -15% | 10.3 ? -6% | 4.6 ? 53% | 6.6 ? 32% | 12 ? -24% |
| PWM Frequency (Hz) | ||||||
| Screen | -38% | -6% | 3% | 5% | -4% | |
| Brightness middle (cd/m²) | 310.9 | 373.3 20% | 302.2 -3% | 491 58% | 470 51% | 456.8 47% |
| Brightness (cd/m²) | 296 | 361 22% | 285 -4% | 472 59% | 459 55% | 437 48% |
| Brightness Distribution (%) | 91 | 79 -13% | 89 -2% | 91 0% | 93 2% | 83 -9% |
| Black Level * (cd/m²) | 0.35 | 0.44 -26% | 0.26 26% | 0.4 -14% | 0.42 -20% | 0.35 -0% |
| Contrast (:1) | 888 | 848 -5% | 1162 31% | 1228 38% | 1119 26% | 1305 47% |
| Colorchecker dE 2000 * | 2.18 | 2.12 3% | 1.63 25% | 1.6 27% | 1.86 15% | 3.7 -70% |
| Colorchecker dE 2000 max. * | 3.58 | 5.62 -57% | 4.13 -15% | 5.15 -44% | 3.87 -8% | 6.42 -79% |
| Colorchecker dE 2000 calibrated * | 0.52 | 2.06 -296% | 1.17 -125% | 0.97 -87% | 0.93 -79% | 0.66 -27% |
| Greyscale dE 2000 * | 2.8 | 2.5 11% | 2.5 11% | 3 -7% | 2.7 4% | 2.6 7% |
| Gamma | 2.18 101% | 2.3 96% | 2.23 99% | 2.211 100% | 2.246 98% | 2.3 96% |
| CCT | 6002 108% | 6408 101% | 6590 99% | 6979 93% | 6711 97% | 6108 106% |
| Total Average (Program / Settings) | -61% /
-45% | 3% /
-0% | -13% /
-4% | 12% /
9% | -5% /
-2% |
* ... smaller is better
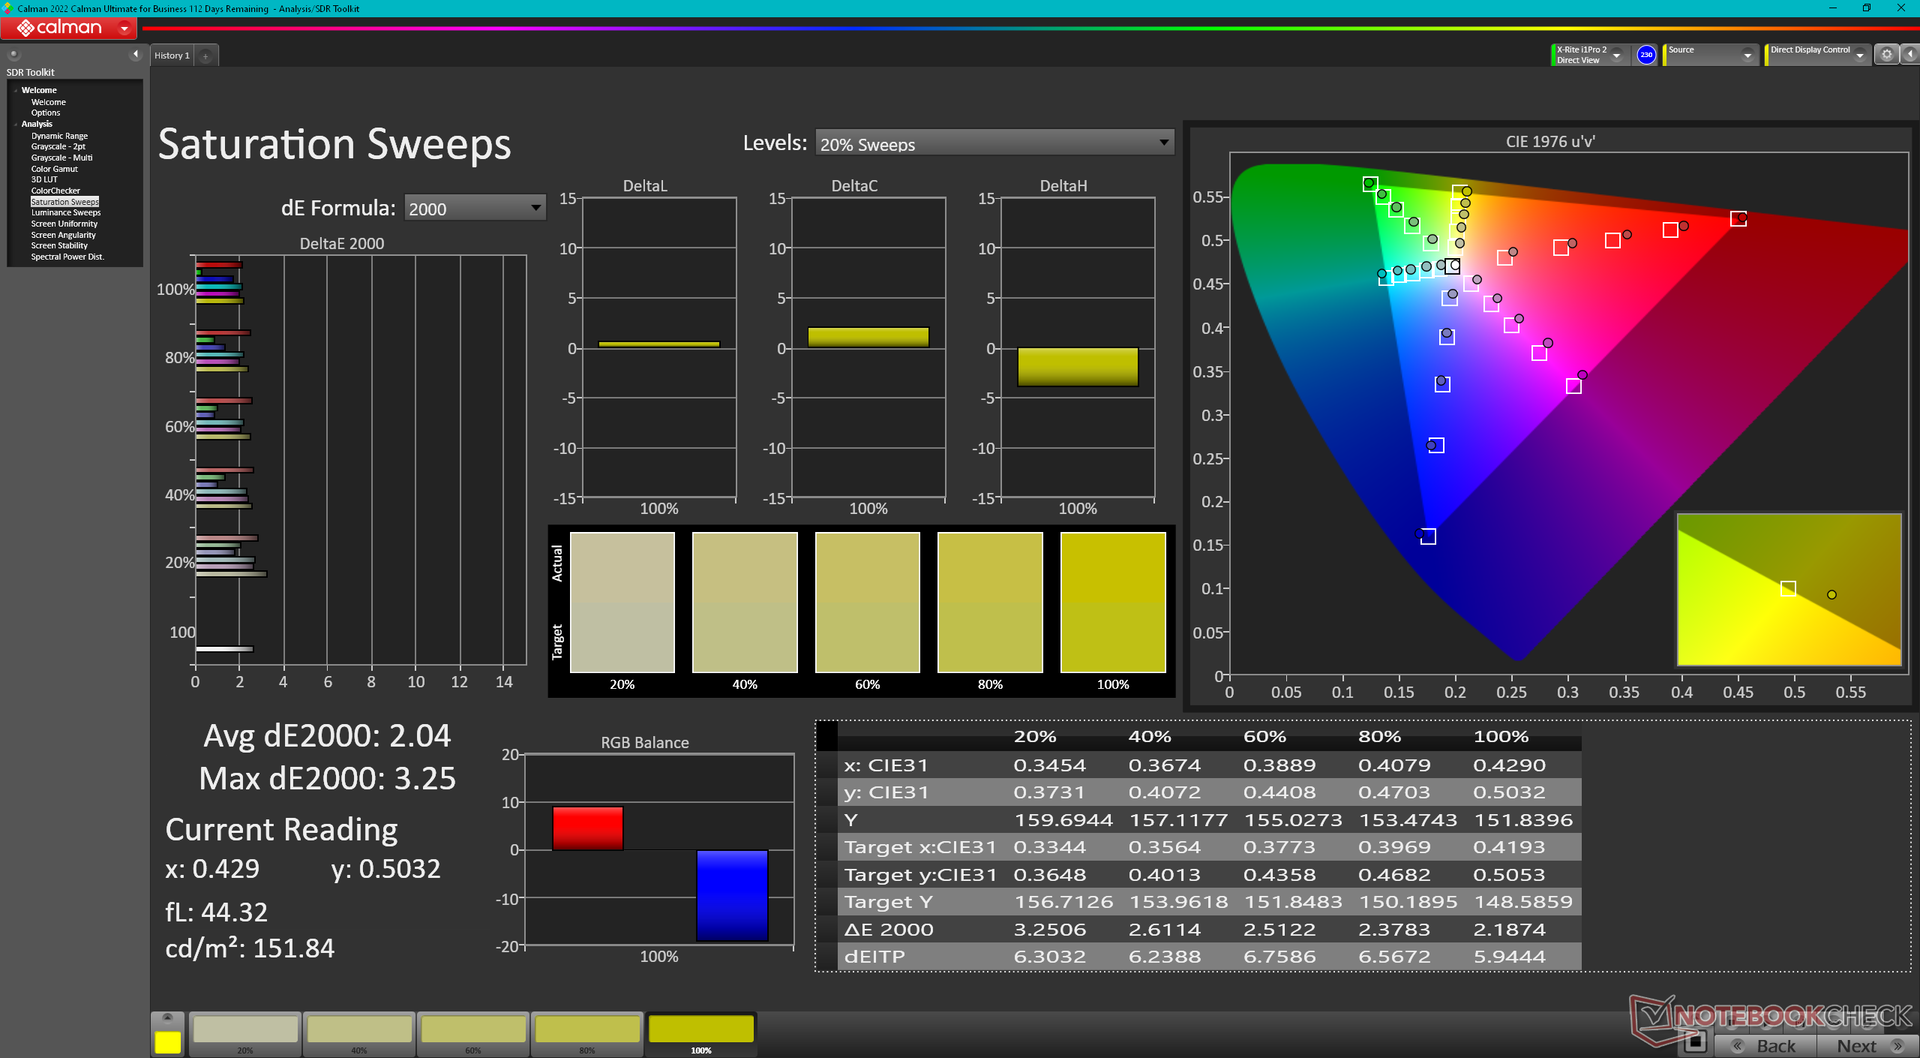
The display is decently calibrated out of the box with average grayscale and color deltaE values of 2.8 and 2.18, respectively. Calibrating the panel ourselves with an X-Rite colorimeter would improve the average values even further to just 0.5 and 0.52, respectively. Owners can apply our calibrated ICM profile above if desired.

Display Response Times
| ↔ Response Time Black to White | ||
|---|---|---|
| 9.7 ms ... rise ↗ and fall ↘ combined | ↗ 4.6 ms rise | 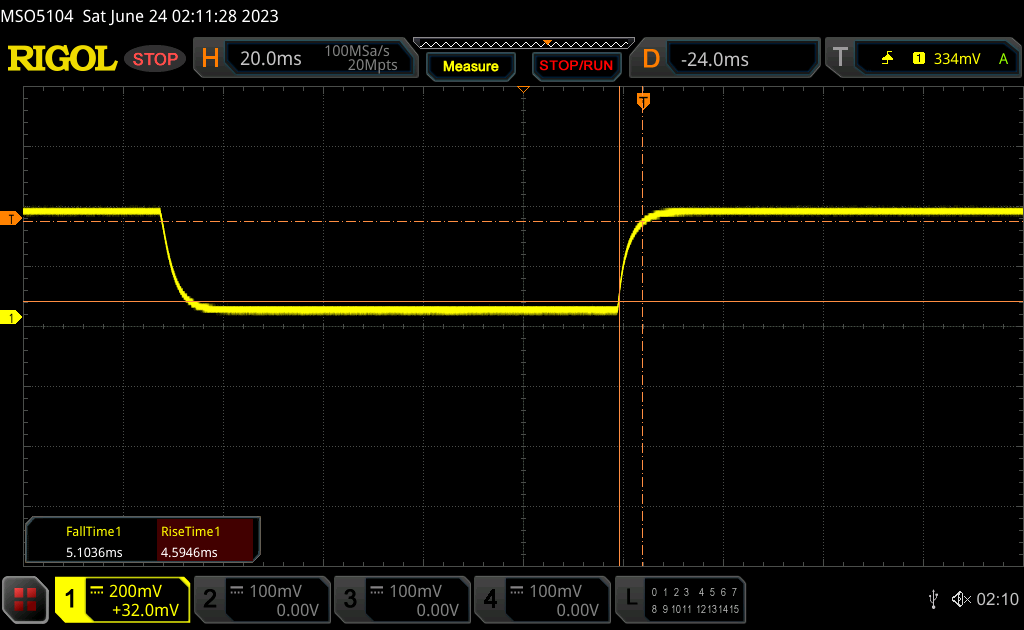 |
| ↘ 5.1 ms fall | ||
| The screen shows fast response rates in our tests and should be suited for gaming. In comparison, all tested devices range from 0.1 (minimum) to 240 (maximum) ms. » 27 % of all devices are better. This means that the measured response time is better than the average of all tested devices (19.9 ms). | ||
| ↔ Response Time 50% Grey to 80% Grey | ||
| 4.6 ms ... rise ↗ and fall ↘ combined | ↗ 2.1 ms rise | 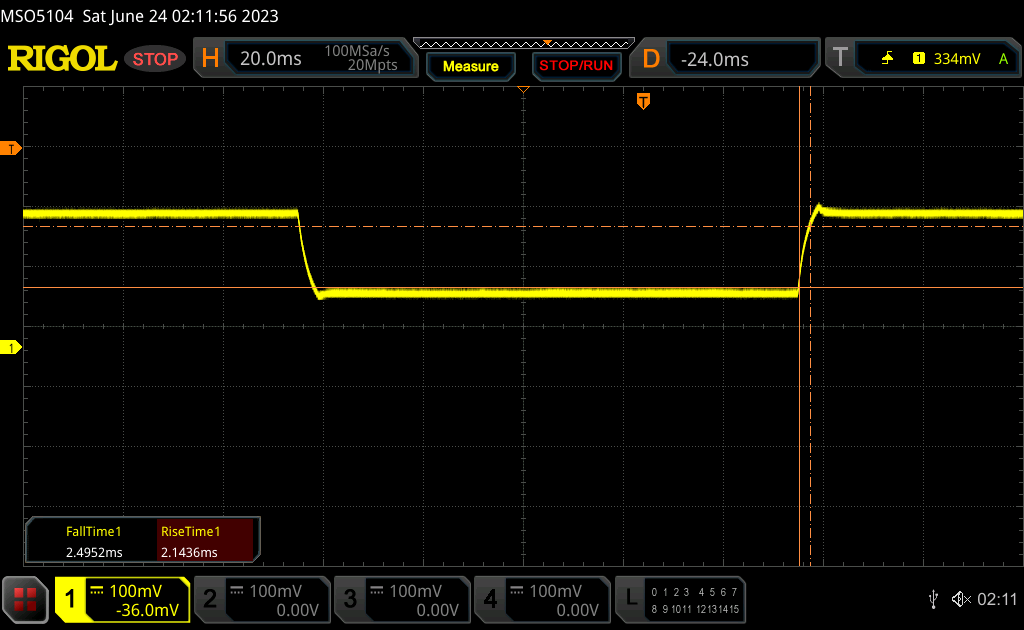 |
| ↘ 2.5 ms fall | ||
| The screen shows very fast response rates in our tests and should be very well suited for fast-paced gaming. In comparison, all tested devices range from 0.165 (minimum) to 636 (maximum) ms. » 16 % of all devices are better. This means that the measured response time is better than the average of all tested devices (31.1 ms). | ||
Screen Flickering / PWM (Pulse-Width Modulation)
| Screen flickering / PWM not detected | 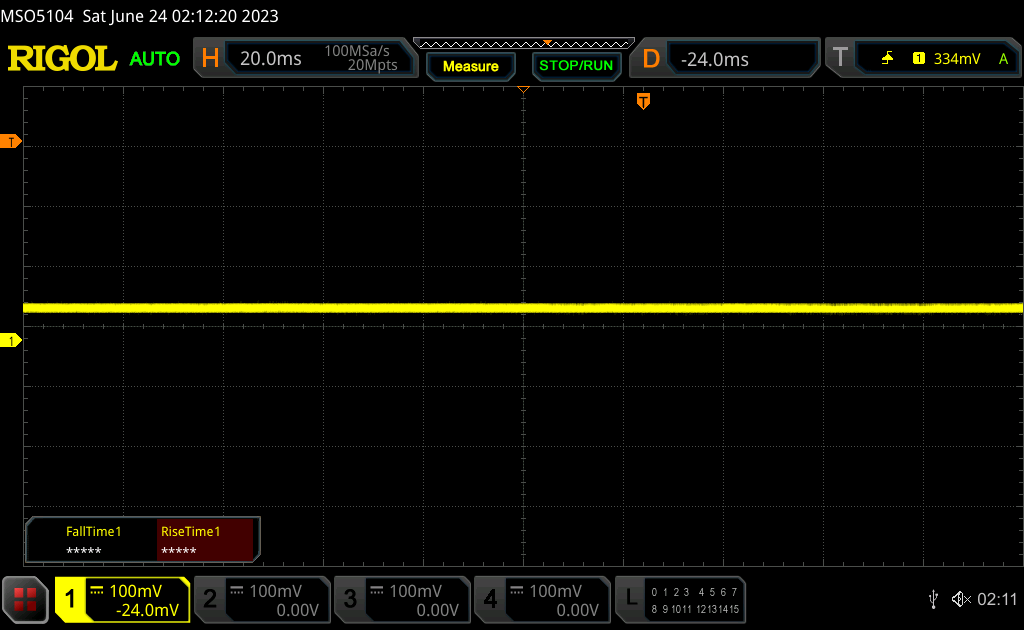 | ||
In comparison: 52 % of all tested devices do not use PWM to dim the display. If PWM was detected, an average of 7810 (minimum: 5 - maximum: 343500) Hz was measured. | |||
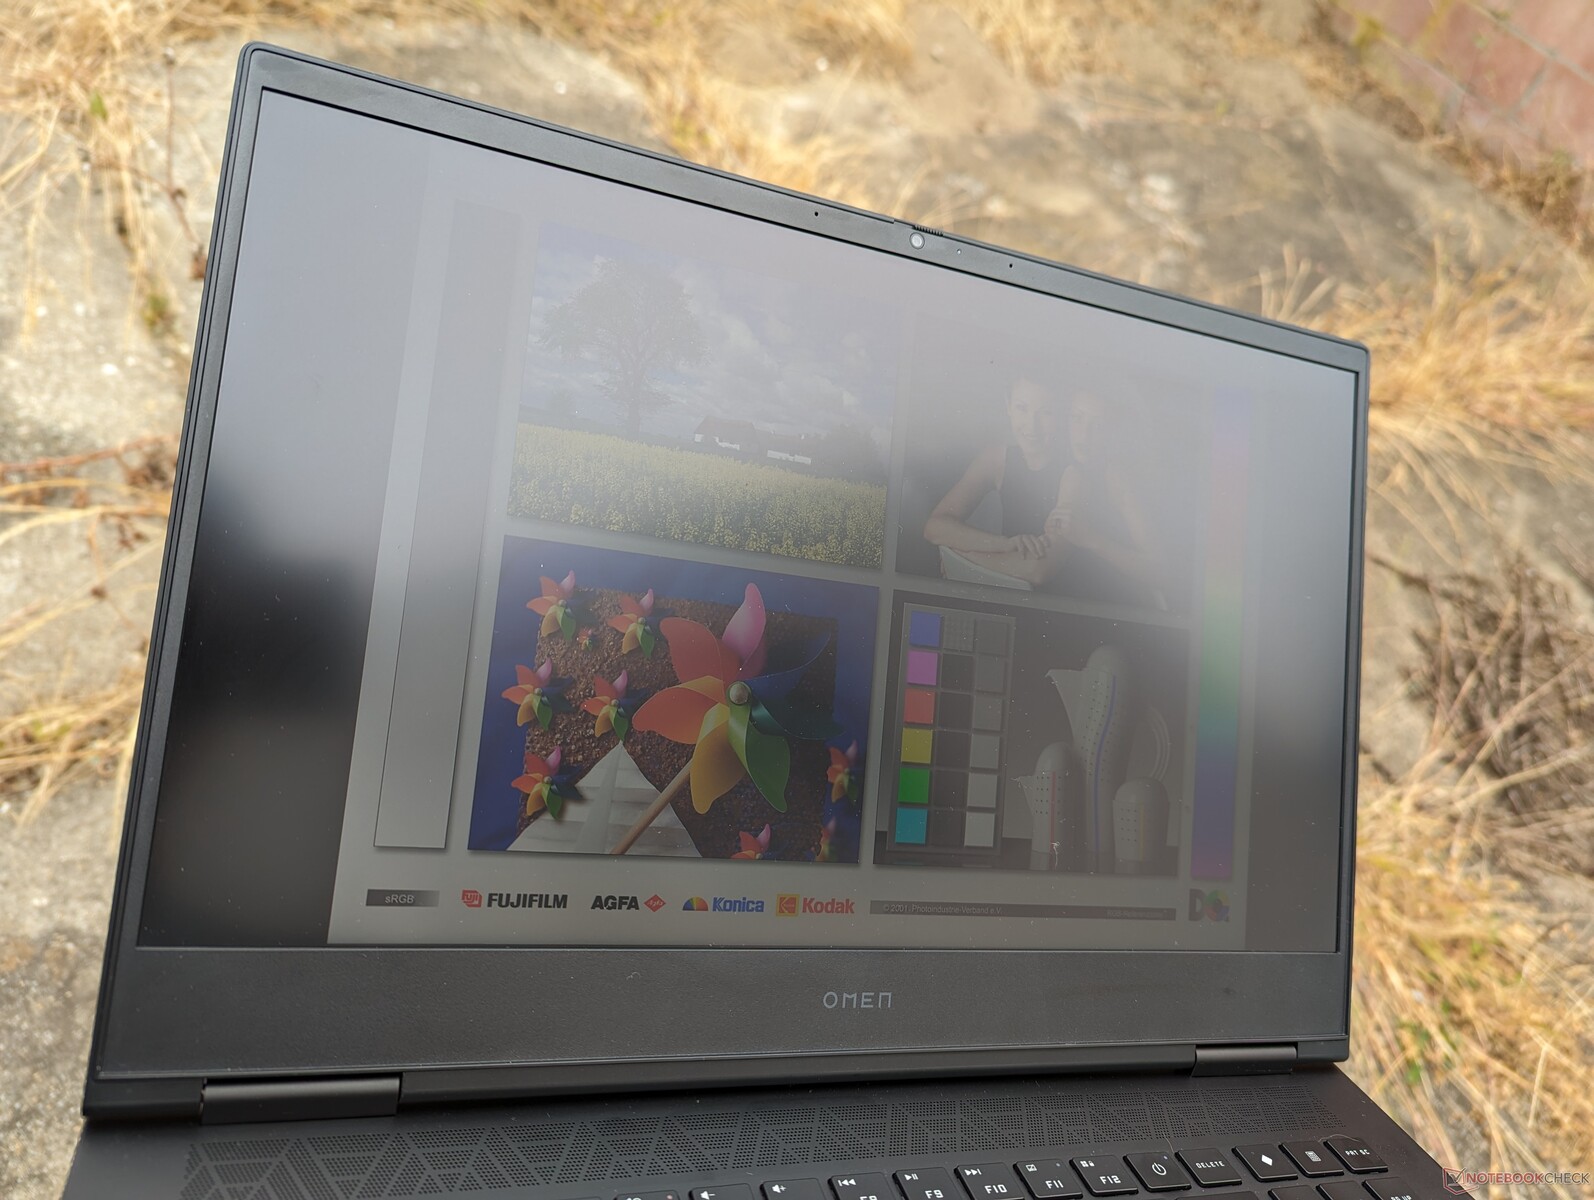
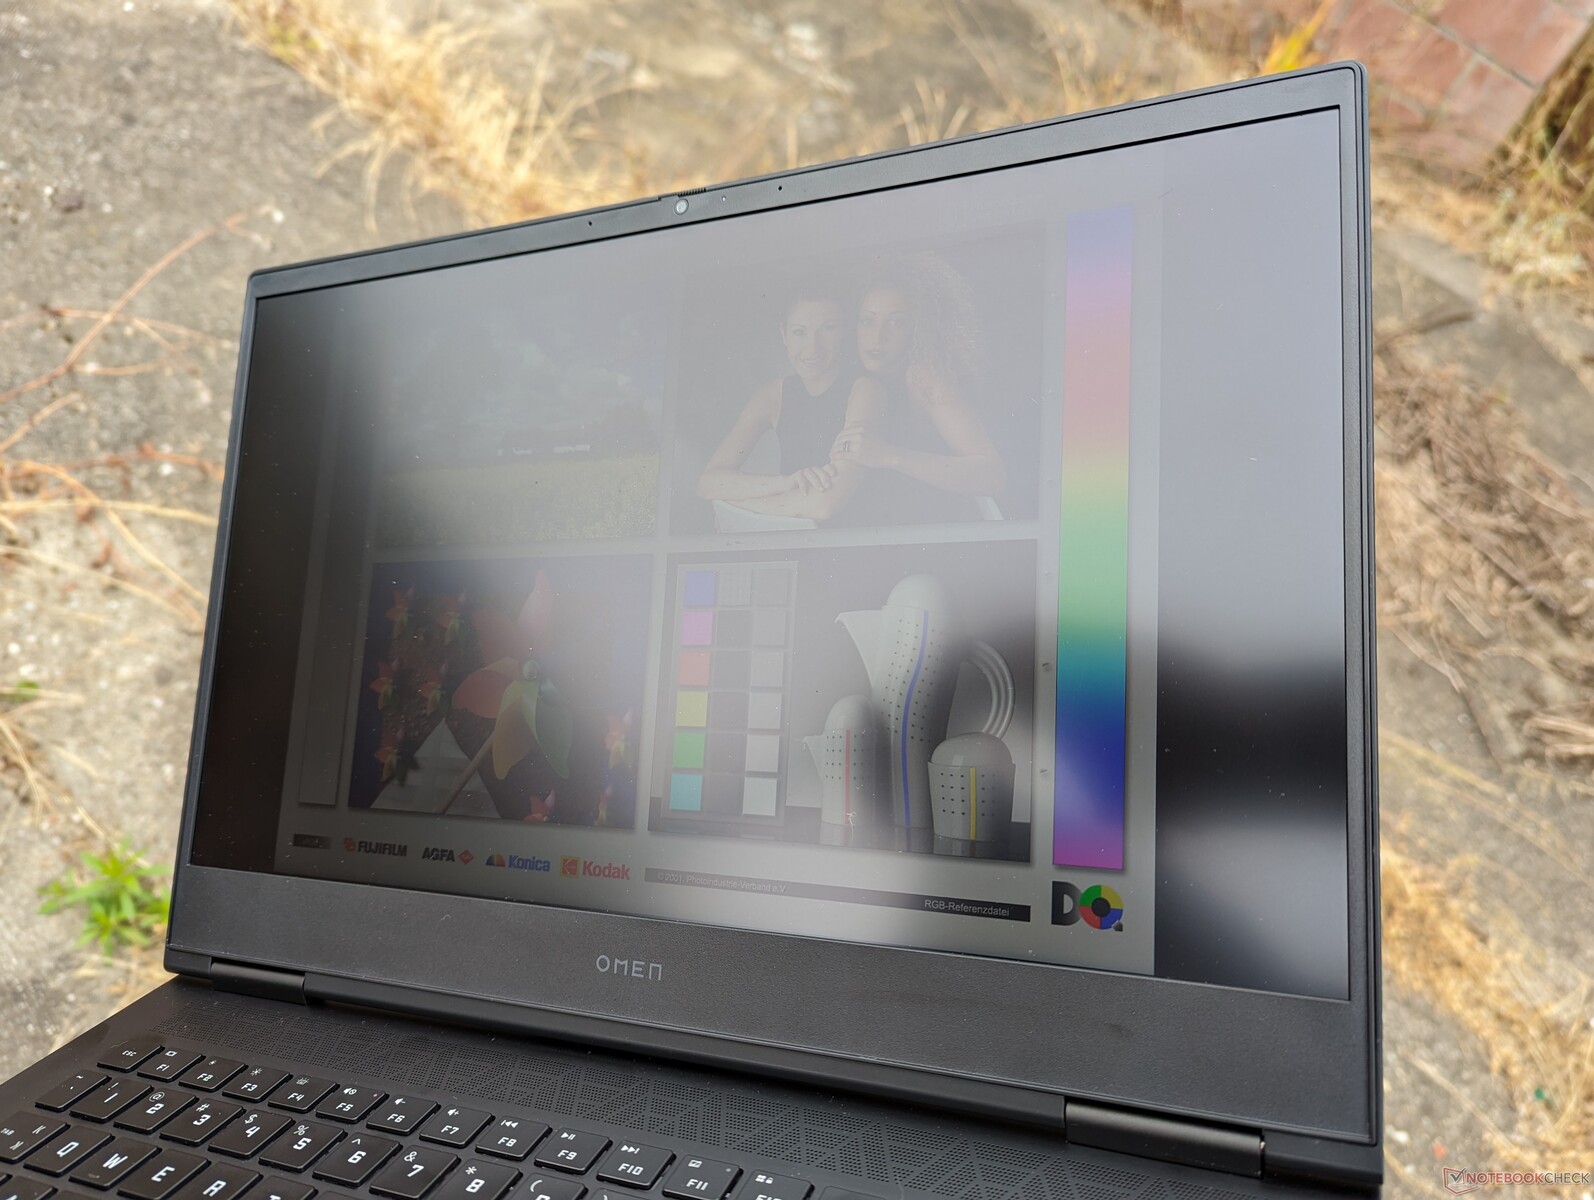
Outdoor visibility is acceptable only when under shade. The display is not as bright as the displays on the Legion Pro 7, ROG Strix G16, or Blade 16 which are easier to see outdoors.

Performance — 13th Gen Intel Raptor Lake-H
Testing Conditions
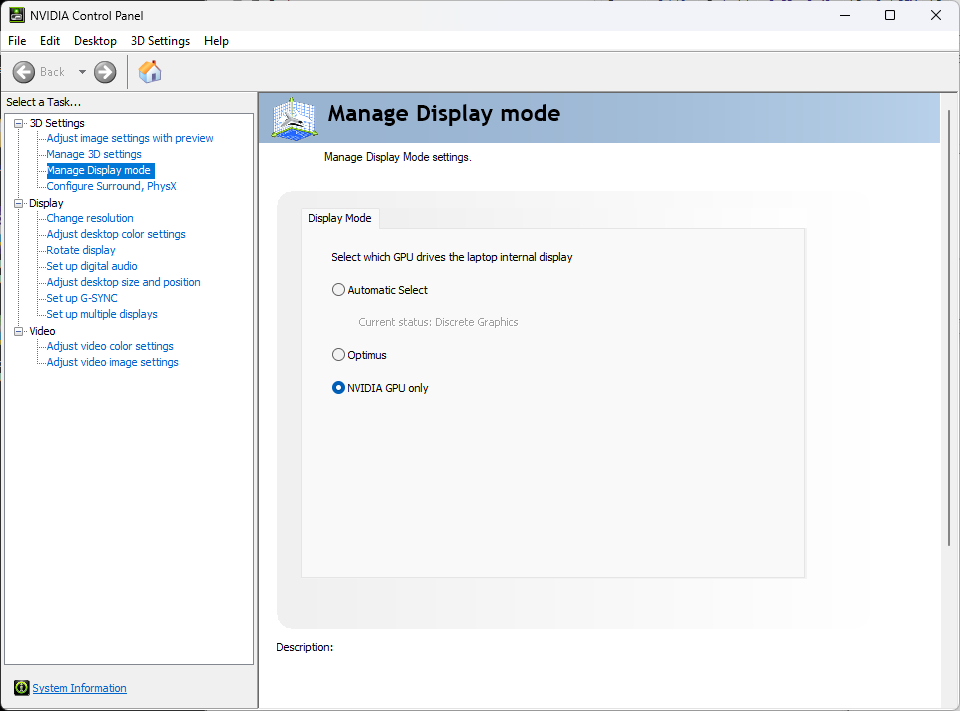
We set our unit to dGPU mode via Nvidia control panel and Performance mode via both Omen Gaming Hub and Windows prior to running the benchmarks below. There is also a Max Fan setting in addition to the regular Performance mode. We recommend owners become familiar with Omen Gaming Hub as it is the control center for adjusting power profiles, RGB lighting, gaming settings, and more. Annoyingly, the HP power profile settings are not synced with the regular Windows power profiles.
Advanced Optimus or MUX and G-Sync are supported.
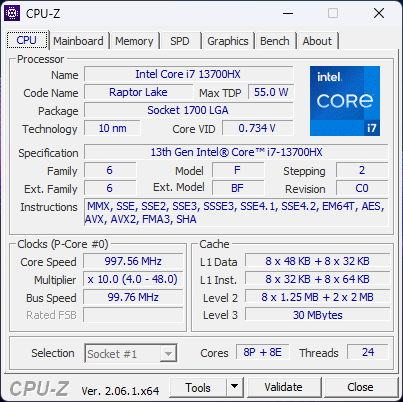
Processor
CPU performance is where we expect it to be relative to other laptops with the same Core i7-13700HX CPU meaning there is no major performance throttling on the Omen 16. Notably, the processor is neck-to-neck with the more expensive Core i9-13900HK in the Alienware x16 R1 while being about 15 to 20 percent faster than the outgoing 12th gen Core i7-12700H. The Core i9-13900HX offers a much more significant boost in performance, but such an option is not available on this model.
Cinebench R15 Multi Loop
Cinebench R20: CPU (Multi Core) | CPU (Single Core)
Cinebench R23: Multi Core | Single Core
Cinebench R15: CPU Multi 64Bit | CPU Single 64Bit
Blender: v2.79 BMW27 CPU
7-Zip 18.03: 7z b 4 | 7z b 4 -mmt1
Geekbench 5.5: Multi-Core | Single-Core
HWBOT x265 Benchmark v2.2: 4k Preset
LibreOffice : 20 Documents To PDF
R Benchmark 2.5: Overall mean
* ... smaller is better
AIDA64: FP32 Ray-Trace | FPU Julia | CPU SHA3 | CPU Queen | FPU SinJulia | FPU Mandel | CPU AES | CPU ZLib | FP64 Ray-Trace | CPU PhotoWorxx
| Performance rating | |
| Lenovo Legion Pro 7 RTX4090 | |
| Asus ROG Strix G16 G614JZ | |
| Razer Blade 16 Early 2023 | |
| Alienware x16 R1 | |
| Average Intel Core i7-13700HX | |
| HP Omen 16-wf000 | |
| HP Omen 16-n0033dx | |
| AIDA64 / FP32 Ray-Trace | |
| Asus ROG Strix G16 G614JZ | |
| Lenovo Legion Pro 7 RTX4090 | |
| Razer Blade 16 Early 2023 | |
| Razer Blade 16 Early 2023 | |
| Razer Blade 16 Early 2023 | |
| Average Intel Core i7-13700HX (14261 - 21999, n=11) | |
| HP Omen 16-wf000 | |
| Alienware x16 R1 | |
| HP Omen 16-n0033dx | |
| AIDA64 / FPU Julia | |
| Lenovo Legion Pro 7 RTX4090 | |
| Asus ROG Strix G16 G614JZ | |
| Razer Blade 16 Early 2023 | |
| Razer Blade 16 Early 2023 | |
| Razer Blade 16 Early 2023 | |
| HP Omen 16-n0033dx | |
| HP Omen 16-wf000 | |
| Average Intel Core i7-13700HX (74636 - 109364, n=11) | |
| Alienware x16 R1 | |
| AIDA64 / CPU SHA3 | |
| Lenovo Legion Pro 7 RTX4090 | |
| Asus ROG Strix G16 G614JZ | |
| Razer Blade 16 Early 2023 | |
| Razer Blade 16 Early 2023 | |
| Razer Blade 16 Early 2023 | |
| Average Intel Core i7-13700HX (3359 - 5053, n=11) | |
| HP Omen 16-wf000 | |
| Alienware x16 R1 | |
| HP Omen 16-n0033dx | |
| AIDA64 / CPU Queen | |
| Asus ROG Strix G16 G614JZ | |
| Lenovo Legion Pro 7 RTX4090 | |
| Razer Blade 16 Early 2023 | |
| Razer Blade 16 Early 2023 | |
| Alienware x16 R1 | |
| Average Intel Core i7-13700HX (86532 - 114717, n=11) | |
| HP Omen 16-n0033dx | |
| HP Omen 16-wf000 | |
| AIDA64 / FPU SinJulia | |
| Asus ROG Strix G16 G614JZ | |
| Razer Blade 16 Early 2023 | |
| Razer Blade 16 Early 2023 | |
| Razer Blade 16 Early 2023 | |
| Lenovo Legion Pro 7 RTX4090 | |
| HP Omen 16-n0033dx | |
| Average Intel Core i7-13700HX (9290 - 13519, n=11) | |
| HP Omen 16-wf000 | |
| Alienware x16 R1 | |
| AIDA64 / FPU Mandel | |
| Lenovo Legion Pro 7 RTX4090 | |
| Asus ROG Strix G16 G614JZ | |
| Razer Blade 16 Early 2023 | |
| Razer Blade 16 Early 2023 | |
| Razer Blade 16 Early 2023 | |
| HP Omen 16-n0033dx | |
| HP Omen 16-wf000 | |
| Average Intel Core i7-13700HX (35751 - 53484, n=11) | |
| Alienware x16 R1 | |
| AIDA64 / CPU ZLib | |
| Lenovo Legion Pro 7 RTX4090 | |
| Asus ROG Strix G16 G614JZ | |
| Razer Blade 16 Early 2023 | |
| Razer Blade 16 Early 2023 | |
| Razer Blade 16 Early 2023 | |
| HP Omen 16-wf000 | |
| Average Intel Core i7-13700HX (981 - 1451, n=11) | |
| Alienware x16 R1 | |
| HP Omen 16-n0033dx | |
| AIDA64 / FP64 Ray-Trace | |
| Asus ROG Strix G16 G614JZ | |
| Lenovo Legion Pro 7 RTX4090 | |
| Razer Blade 16 Early 2023 | |
| Razer Blade 16 Early 2023 | |
| Razer Blade 16 Early 2023 | |
| Average Intel Core i7-13700HX (7728 - 11837, n=11) | |
| HP Omen 16-wf000 | |
| Alienware x16 R1 | |
| HP Omen 16-n0033dx | |
| AIDA64 / CPU PhotoWorxx | |
| Razer Blade 16 Early 2023 | |
| Razer Blade 16 Early 2023 | |
| Razer Blade 16 Early 2023 | |
| Lenovo Legion Pro 7 RTX4090 | |
| Alienware x16 R1 | |
| HP Omen 16-wf000 | |
| Asus ROG Strix G16 G614JZ | |
| Average Intel Core i7-13700HX (19678 - 42415, n=11) | |
| HP Omen 16-n0033dx | |
System Performance
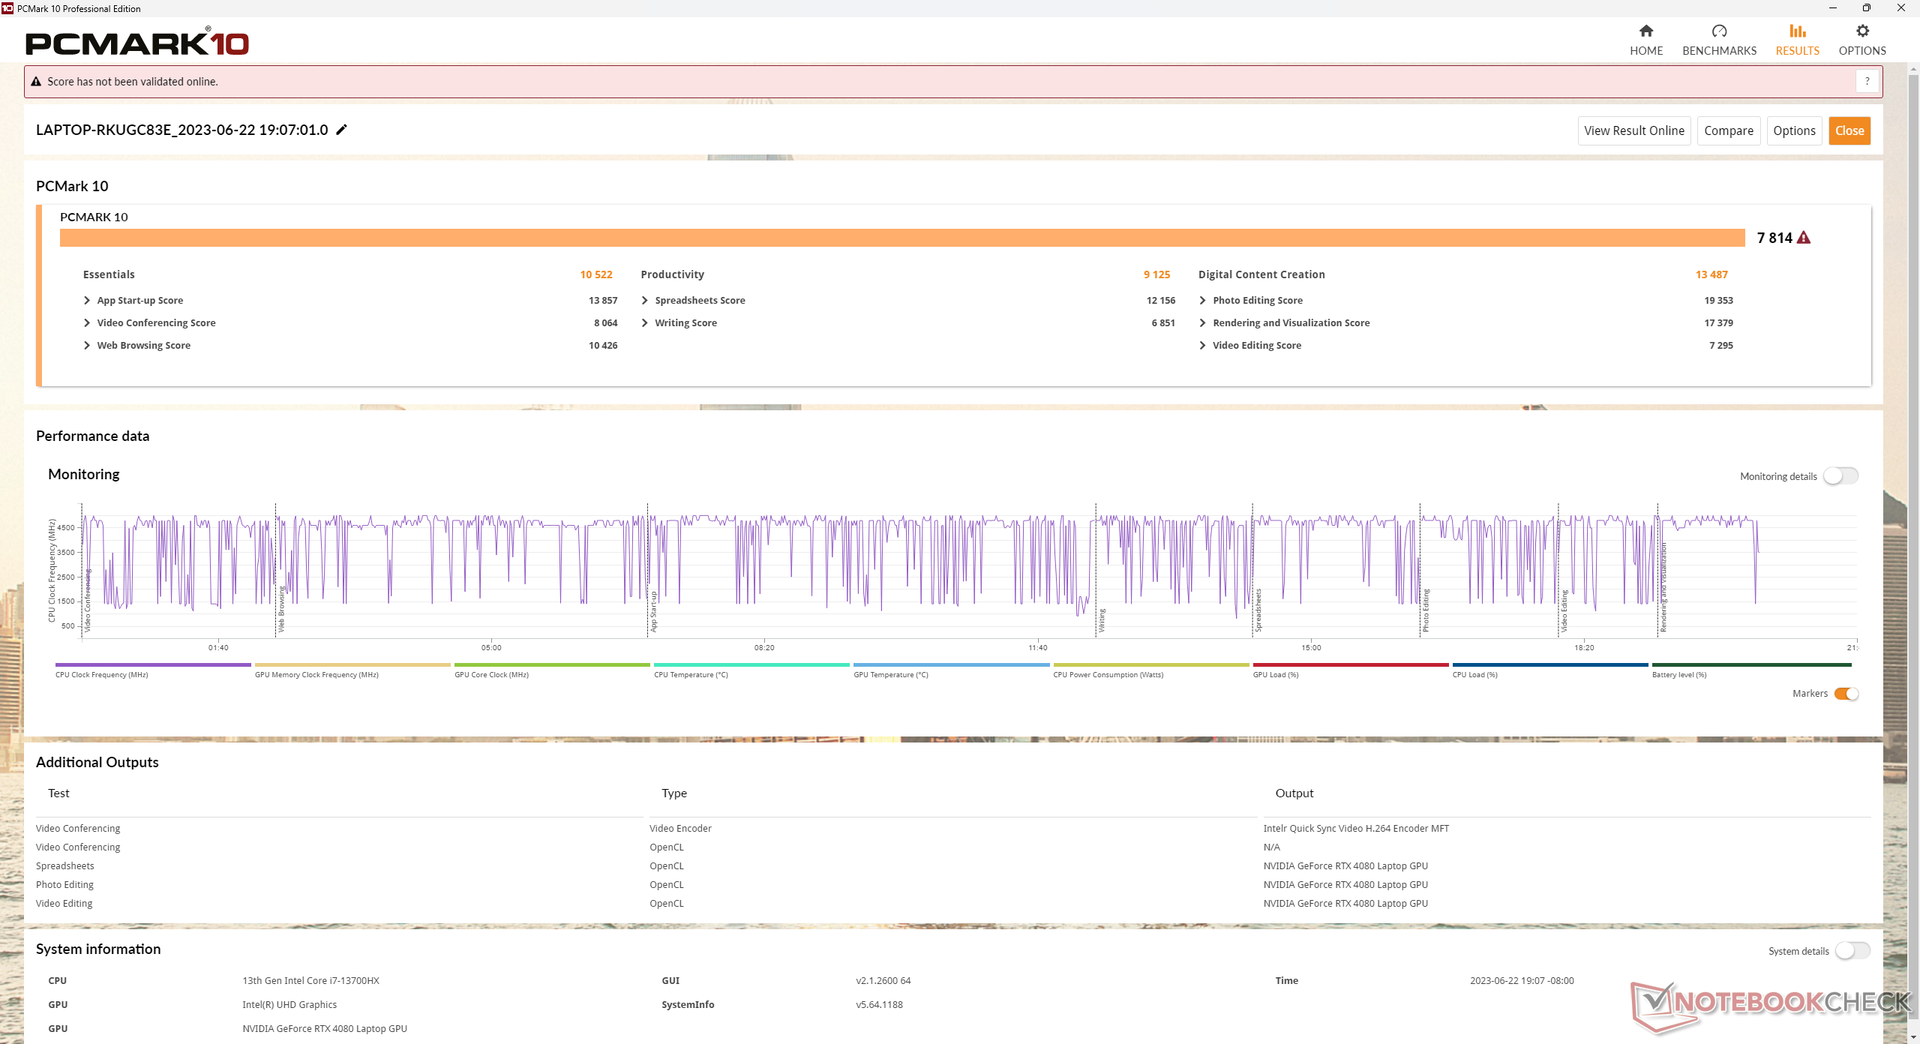
PCMark results are ahead of last year's Omen 16 especially in the GPU-heavy Digital Content Creation subtest because of our faster RTX 4080.
CrossMark: Overall | Productivity | Creativity | Responsiveness
| PCMark 10 / Score | |
| Alienware x16 R1 | |
| Lenovo Legion Pro 7 RTX4090 | |
| Razer Blade 16 Early 2023 | |
| HP Omen 16-wf000 | |
| Average Intel Core i7-13700HX, NVIDIA GeForce RTX 4080 Laptop GPU (n=1) | |
| Asus ROG Strix G16 G614JZ | |
| HP Omen 16-n0033dx | |
| PCMark 10 / Essentials | |
| Asus ROG Strix G16 G614JZ | |
| Alienware x16 R1 | |
| Lenovo Legion Pro 7 RTX4090 | |
| Razer Blade 16 Early 2023 | |
| HP Omen 16-wf000 | |
| Average Intel Core i7-13700HX, NVIDIA GeForce RTX 4080 Laptop GPU (n=1) | |
| HP Omen 16-n0033dx | |
| PCMark 10 / Productivity | |
| Alienware x16 R1 | |
| HP Omen 16-n0033dx | |
| HP Omen 16-wf000 | |
| Average Intel Core i7-13700HX, NVIDIA GeForce RTX 4080 Laptop GPU (n=1) | |
| Lenovo Legion Pro 7 RTX4090 | |
| Razer Blade 16 Early 2023 | |
| Asus ROG Strix G16 G614JZ | |
| PCMark 10 / Digital Content Creation | |
| Lenovo Legion Pro 7 RTX4090 | |
| Razer Blade 16 Early 2023 | |
| Alienware x16 R1 | |
| HP Omen 16-wf000 | |
| Average Intel Core i7-13700HX, NVIDIA GeForce RTX 4080 Laptop GPU (n=1) | |
| Asus ROG Strix G16 G614JZ | |
| HP Omen 16-n0033dx | |
| CrossMark / Overall | |
| Asus ROG Strix G16 G614JZ | |
| Alienware x16 R1 | |
| HP Omen 16-wf000 | |
| Average Intel Core i7-13700HX, NVIDIA GeForce RTX 4080 Laptop GPU (n=1) | |
| Razer Blade 16 Early 2023 | |
| HP Omen 16-n0033dx | |
| CrossMark / Productivity | |
| Asus ROG Strix G16 G614JZ | |
| Alienware x16 R1 | |
| HP Omen 16-wf000 | |
| Average Intel Core i7-13700HX, NVIDIA GeForce RTX 4080 Laptop GPU (n=1) | |
| HP Omen 16-n0033dx | |
| Razer Blade 16 Early 2023 | |
| CrossMark / Creativity | |
| Asus ROG Strix G16 G614JZ | |
| Alienware x16 R1 | |
| HP Omen 16-wf000 | |
| Average Intel Core i7-13700HX, NVIDIA GeForce RTX 4080 Laptop GPU (n=1) | |
| Razer Blade 16 Early 2023 | |
| HP Omen 16-n0033dx | |
| CrossMark / Responsiveness | |
| Asus ROG Strix G16 G614JZ | |
| Alienware x16 R1 | |
| HP Omen 16-wf000 | |
| Average Intel Core i7-13700HX, NVIDIA GeForce RTX 4080 Laptop GPU (n=1) | |
| Razer Blade 16 Early 2023 | |
| HP Omen 16-n0033dx | |
| PCMark 10 Score | 7814 points | |
Help | ||
| AIDA64 / Memory Copy | |
| Razer Blade 16 Early 2023 | |
| Razer Blade 16 Early 2023 | |
| Razer Blade 16 Early 2023 | |
| Lenovo Legion Pro 7 RTX4090 | |
| Alienware x16 R1 | |
| HP Omen 16-wf000 | |
| Asus ROG Strix G16 G614JZ | |
| Average Intel Core i7-13700HX (36125 - 63990, n=11) | |
| HP Omen 16-n0033dx | |
| AIDA64 / Memory Read | |
| Lenovo Legion Pro 7 RTX4090 | |
| Razer Blade 16 Early 2023 | |
| Razer Blade 16 Early 2023 | |
| Razer Blade 16 Early 2023 | |
| Asus ROG Strix G16 G614JZ | |
| Alienware x16 R1 | |
| HP Omen 16-wf000 | |
| Average Intel Core i7-13700HX (36510 - 69729, n=11) | |
| HP Omen 16-n0033dx | |
| AIDA64 / Memory Write | |
| Alienware x16 R1 | |
| Razer Blade 16 Early 2023 | |
| Razer Blade 16 Early 2023 | |
| Razer Blade 16 Early 2023 | |
| Lenovo Legion Pro 7 RTX4090 | |
| HP Omen 16-wf000 | |
| Asus ROG Strix G16 G614JZ | |
| Average Intel Core i7-13700HX (33598 - 85675, n=11) | |
| HP Omen 16-n0033dx | |
| AIDA64 / Memory Latency | |
| Alienware x16 R1 | |
| Razer Blade 16 Early 2023 | |
| Razer Blade 16 Early 2023 | |
| Razer Blade 16 Early 2023 | |
| Asus ROG Strix G16 G614JZ | |
| HP Omen 16-n0033dx | |
| HP Omen 16-wf000 | |
| Average Intel Core i7-13700HX (81.5 - 97.9, n=11) | |
| Lenovo Legion Pro 7 RTX4090 | |
* ... smaller is better
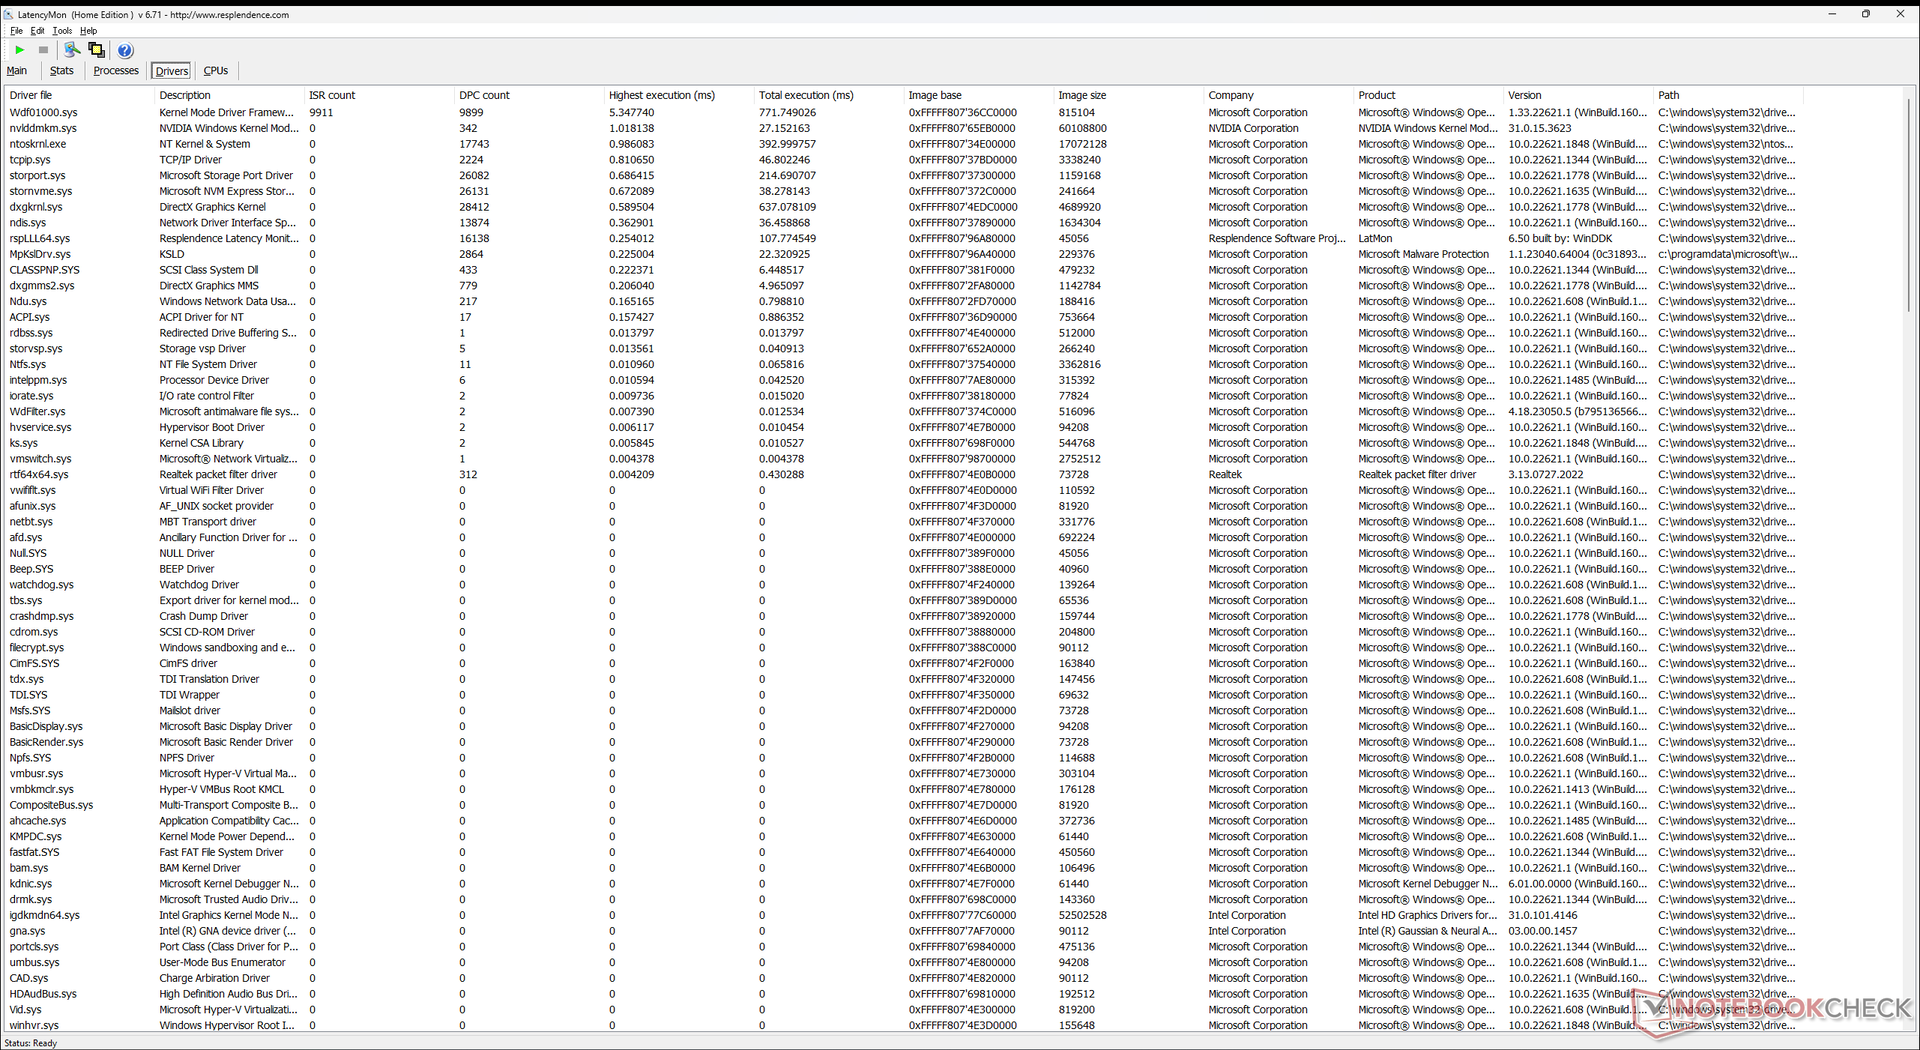
DPC Latency
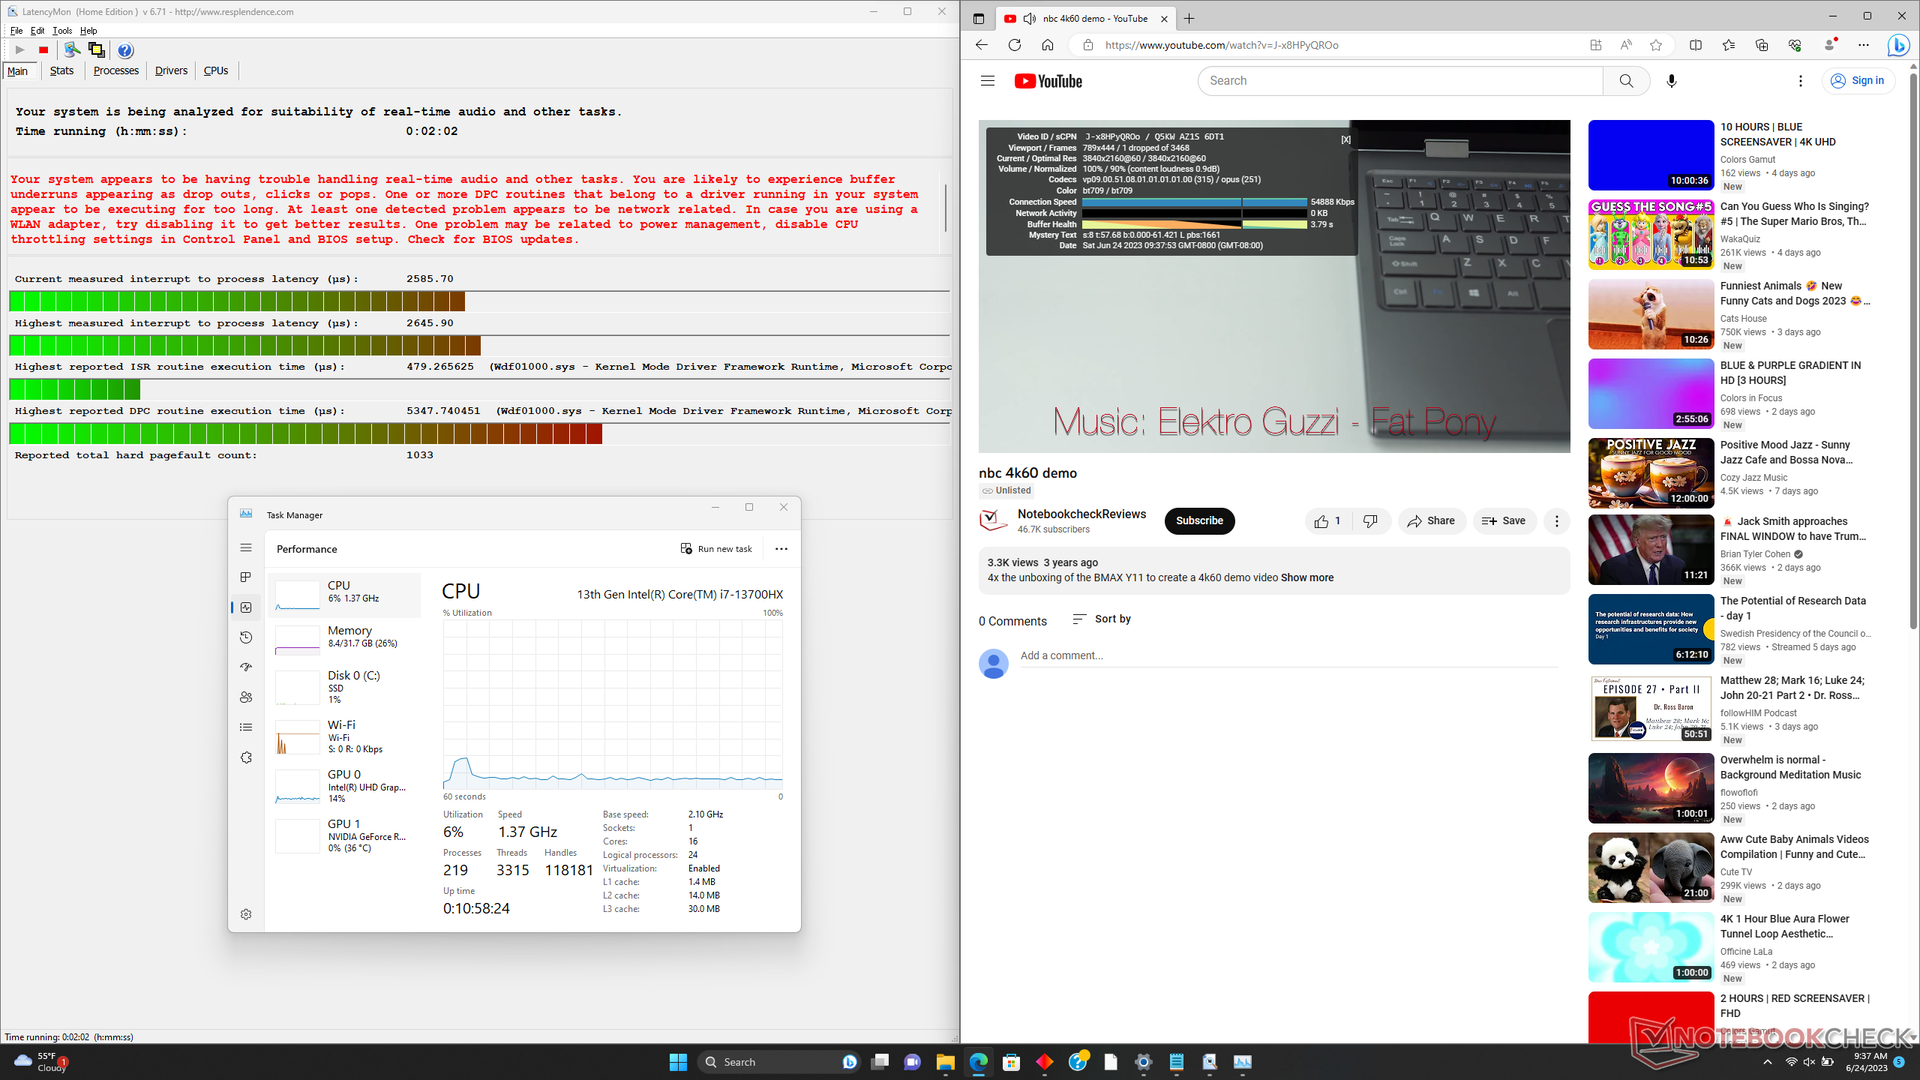
LatencyMon reveals DPC issues when opening multiple browser tabs of our homepage similar to the ROG Strix G16 or Blade 16. 4K60 video playback is otherwise nearly perfect with just one dropped frame during our minute-long video test.
| DPC Latencies / LatencyMon - interrupt to process latency (max), Web, Youtube, Prime95 | |
| Lenovo Legion Pro 7 RTX4090 | |
| HP Omen 16-wf000 | |
| Asus ROG Strix G16 G614JZ | |
| Razer Blade 16 Early 2023 | |
| Alienware x16 R1 | |
| HP Omen 16-n0033dx | |
* ... smaller is better
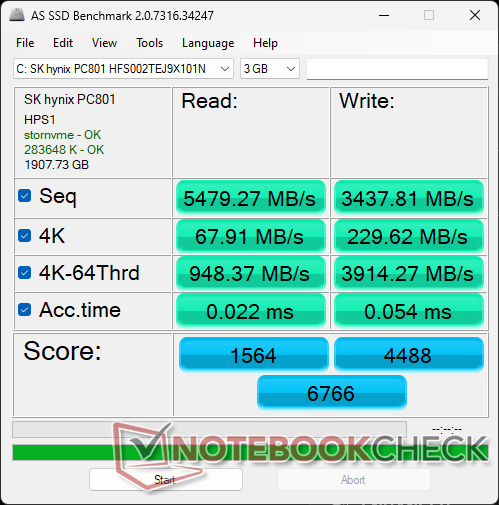
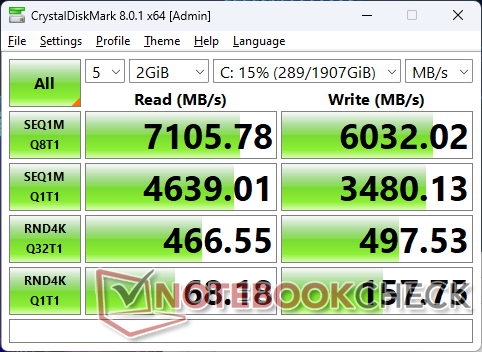
Storage Devices
Our test unit ships with a 2 TB SK hynix PC801 NVMe SSD for sequential read and write rates of up to 7100 MB/s and 6000 MB/s, respectively, to be comparable to the popular Samsung PM9A1. However, read and write rates on smaller 4k q32 block sizes are unusually slow even after multiple retests. Overall performance is nonetheless steady when stressed to suggest excellent heat dissipation.

| Drive Performance rating - Percent | |
| Alienware x16 R1 | |
| Lenovo Legion Pro 7 RTX4090 | |
| HP Omen 16-wf000 | |
| Razer Blade 16 Early 2023 | |
| Asus ROG Strix G16 G614JZ | |
| HP Omen 16-n0033dx | |
* ... smaller is better
Disk Throttling: DiskSpd Read Loop, Queue Depth 8
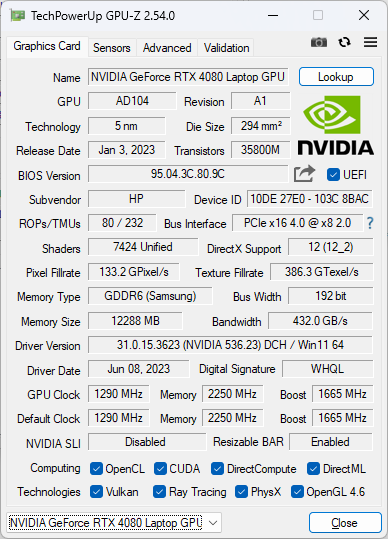
GPU Performance — 145 W GeForce RTX 4080
Graphics performance is excellent and comparable to other gaming laptops with the same GeForce RTX 4080 GPU within a 5 percent margin. Downgrading to the RTX 4070 or RTX 4060 from our RTX 4080 is expected to reduce graphics performance by about 20 percent and 30 percent, respectively.
If Max Fan mode is disabled, overall performance would suffer by just a hair as shown by the table below. GPU performance decreases by almost 15 percent if set to Balanced mode while the impact to CPU performance is much less severe.
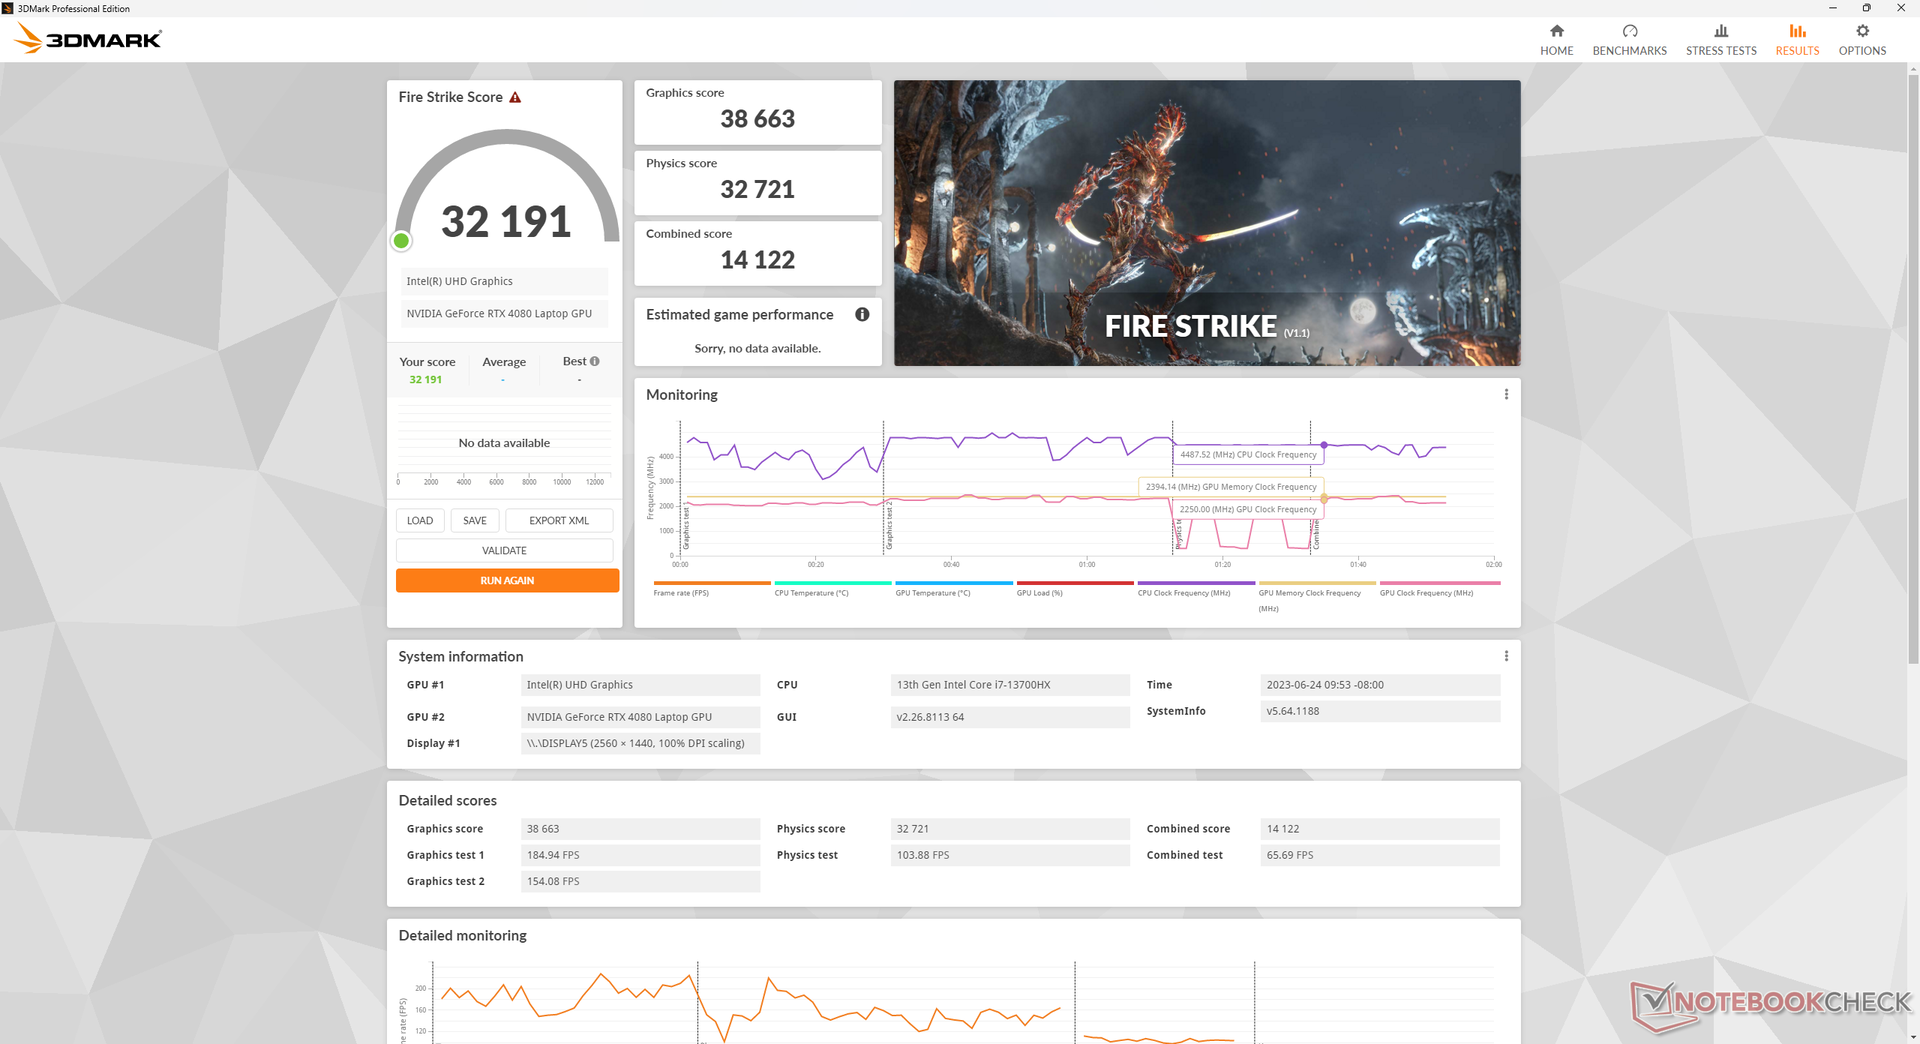
| Power Profile Setting | Fire Strike Physics Score | Fire Strike GPU Score | Fire Strike Combined Score |
| Performance + Max Fan On | 32721 | 38663 | 14122 |
| Performance + Max Fan Off | 31314 (-4%) | 38142 (-1%) | 13655 (-3%) |
| Balanced | 31837 (-3%) | 33328 (-14%) | 12426 (-12%) |
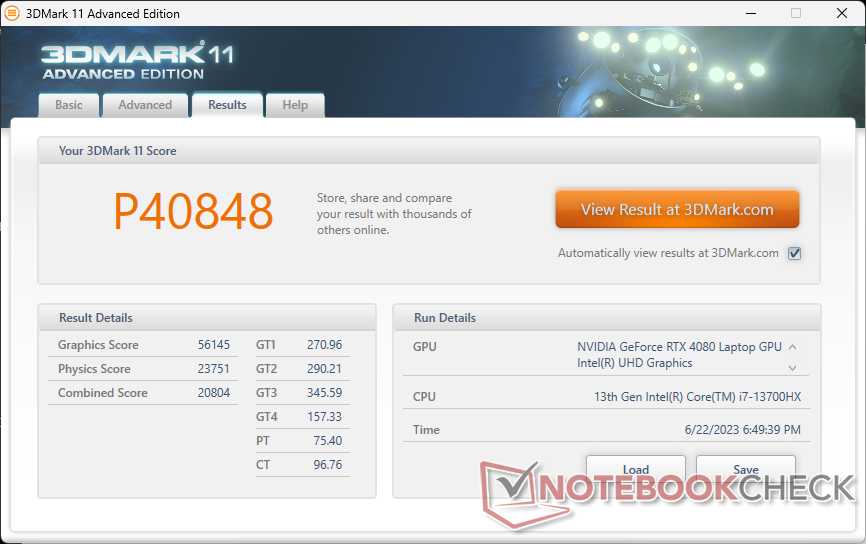
| 3DMark 11 Performance | 40848 points | |
| 3DMark Fire Strike Score | 32191 points | |
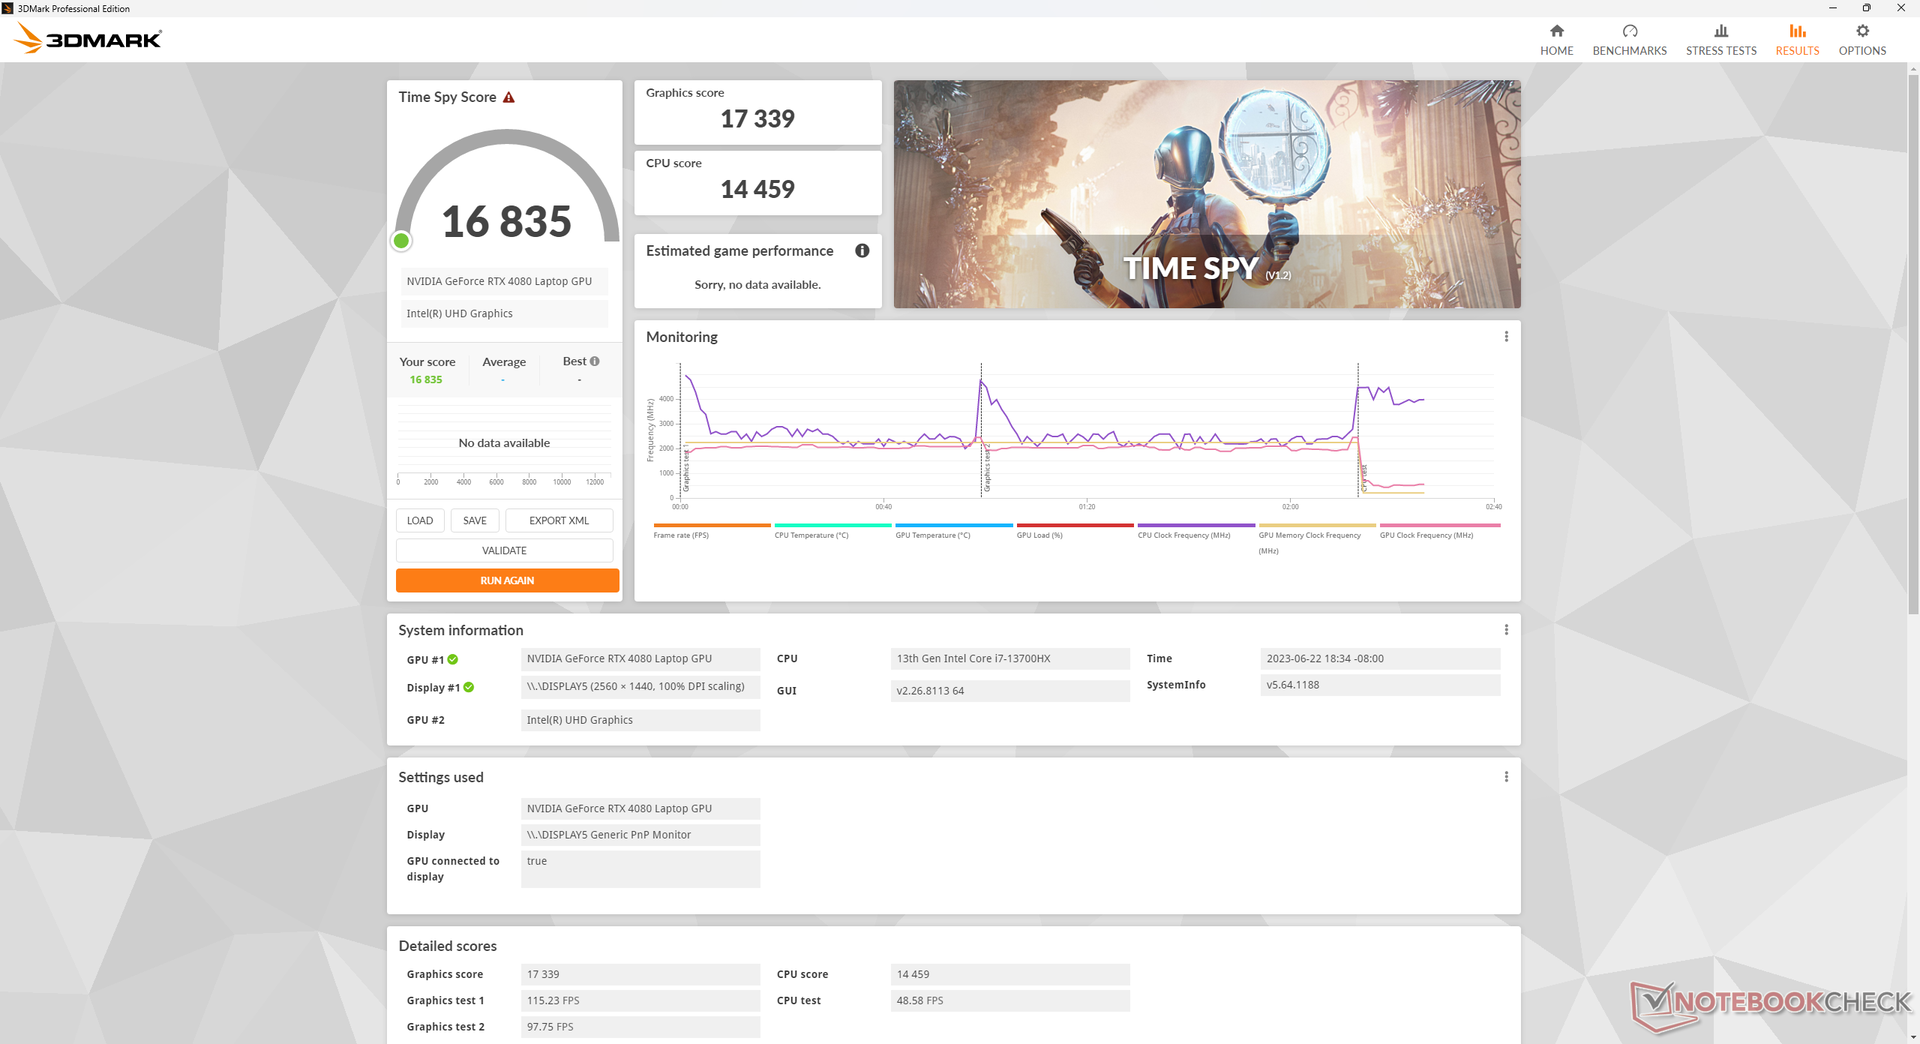
| 3DMark Time Spy Score | 16835 points | |
Help | ||
* ... smaller is better
Gaming Performance
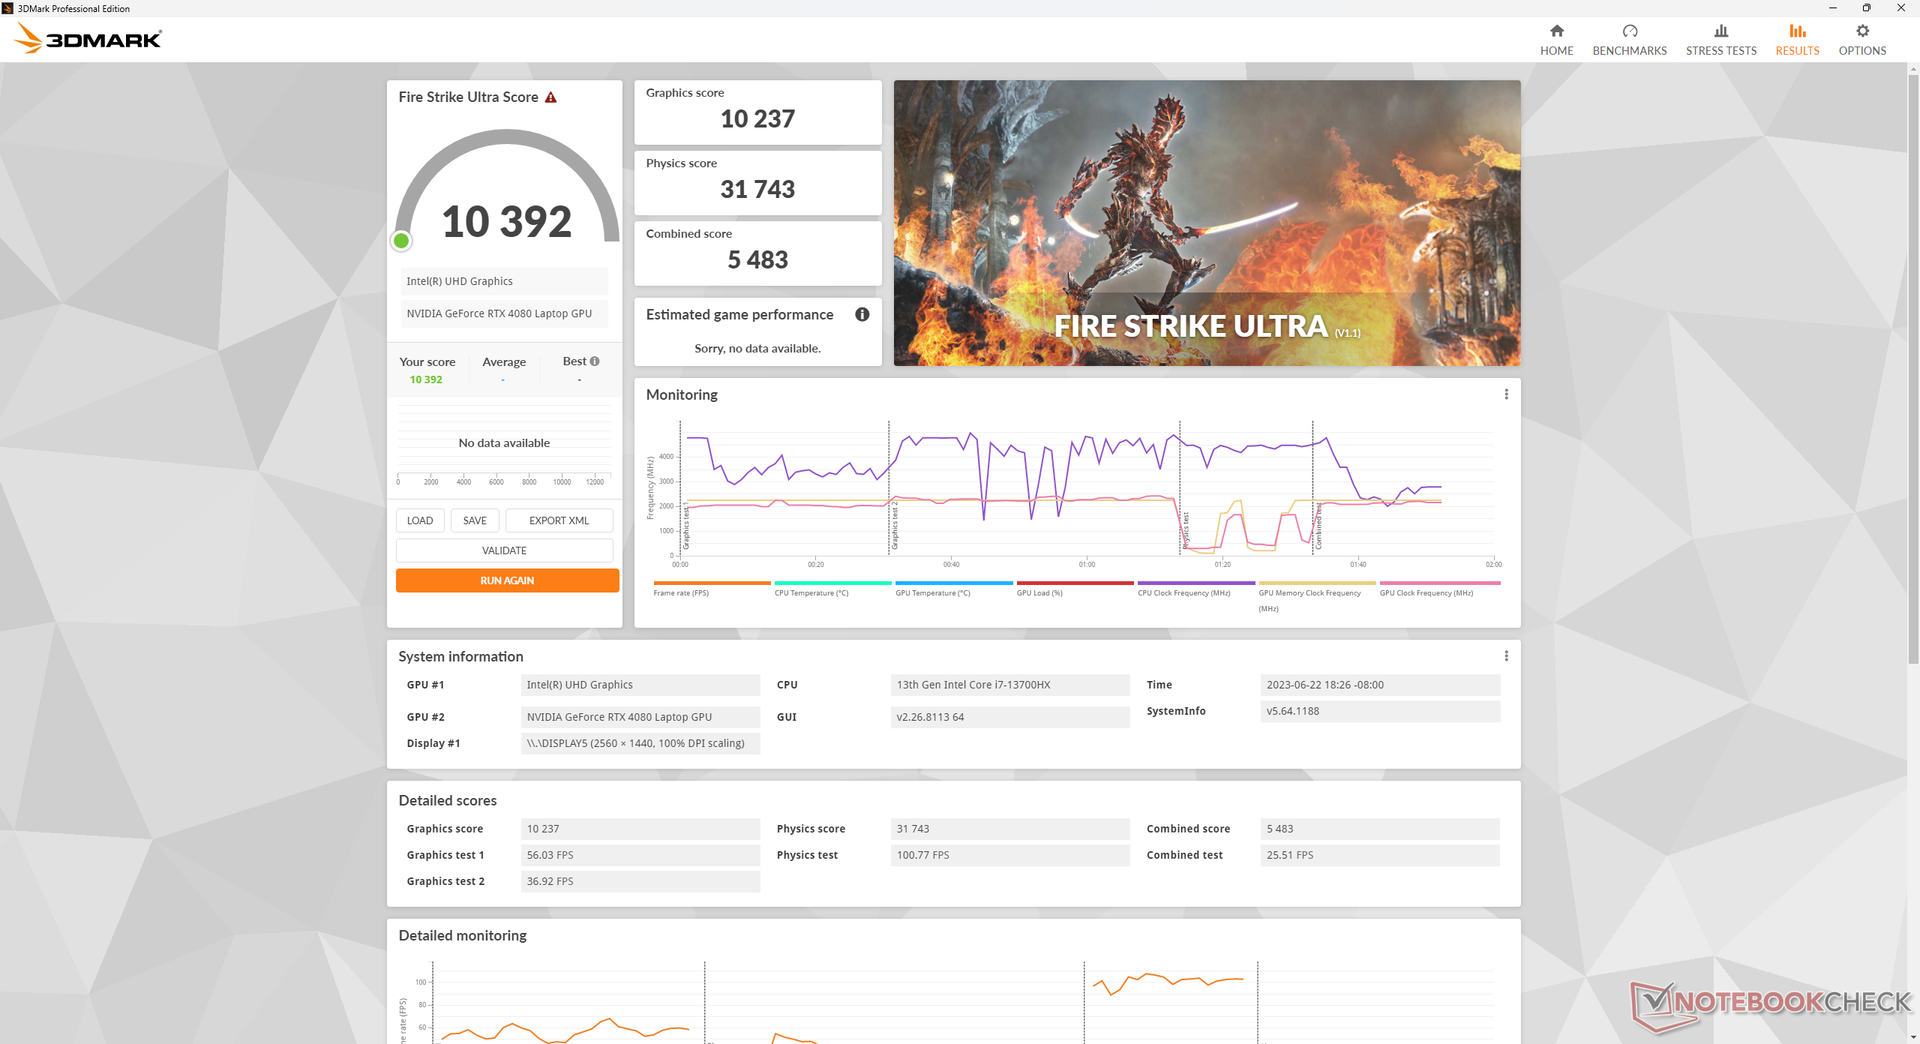
All games are playable at the native 1440p resolution with average frame rates above 60 FPS even on demanding games like Returnal. The mobile RTX 4080 pairs very well with the 1440p panel.
DLSS is recommended if enabling RT or if gaming on an external 4K monitor since the mobile RTX 4080 is much weaker than a desktop RTX 4080. Average frame rates when running Cyberpunk 2077 in 4K, for example, would jump from 35 FPS with DLSS 2 disabled to 55 FPS with DLSS 2 enabled.
| The Witcher 3 - 1920x1080 Ultra Graphics & Postprocessing (HBAO+) | |
| Lenovo Legion Pro 7 RTX4090 | |
| Zotac Gaming GeForce RTX 4070 AMP Airo | |
| HP Omen 16-wf000 | |
| Alienware x16 R1 | |
| Asus ROG Zephyrus Duo 16 GX650RX | |
| Lenovo Legion Pro 5 16IRX8 | |
| HP Omen 16-b1090ng | |
| Lenovo Legion 7 15IMH05-81YT001VGE | |
| Dell G16 7620 | |
| Lenovo Legion C7 15IMH05 82EH0030GE | |
| GTA V - 1920x1080 Highest AA:4xMSAA + FX AF:16x | |
| Zotac Gaming GeForce RTX 4070 AMP Airo | |
| Lenovo Legion Pro 7 RTX4090 | |
| Alienware x16 R1 | |
| Lenovo Legion Pro 5 16IRX8 | |
| HP Omen 16-wf000 | |
| HP Omen 16-b1090ng | |
| Dell G16 7620 | |
| Asus ROG Zephyrus Duo 16 GX650RX | |
| Final Fantasy XV Benchmark - 1920x1080 High Quality | |
| Lenovo Legion Pro 7 RTX4090 | |
| Zotac Gaming GeForce RTX 4070 AMP Airo | |
| Alienware x16 R1 | |
| HP Omen 16-wf000 | |
| Lenovo Legion Pro 5 16IRX8 | |
| Asus ROG Zephyrus Duo 16 GX650RX | |
| HP Omen 16-b1090ng | |
| Dell G16 7620 | |
| Strange Brigade - 1920x1080 ultra AA:ultra AF:16 | |
| Lenovo Legion Pro 7 RTX4090 | |
| Alienware x16 R1 | |
| Zotac Gaming GeForce RTX 4070 AMP Airo | |
| HP Omen 16-wf000 | |
| Asus ROG Zephyrus Duo 16 GX650RX | |
| Dell G16 7620 | |
| HP Omen 16-b1090ng | |
| Tiny Tina's Wonderlands | |
| 1920x1080 Low Preset (DX12) | |
| Average NVIDIA GeForce RTX 4080 Laptop GPU (221 - 353, n=6) | |
| HP Omen 16-wf000 | |
| 1920x1080 Medium Preset (DX12) | |
| Average NVIDIA GeForce RTX 4080 Laptop GPU (199.6 - 297, n=6) | |
| HP Omen 16-wf000 | |
| 1920x1080 High Preset (DX12) | |
| Average NVIDIA GeForce RTX 4080 Laptop GPU (166.7 - 213, n=6) | |
| HP Omen 16-wf000 | |
| 1920x1080 Badass Preset (DX12) | |
| Asus Zephyrus Duo 16 GX650PY-NM006W | |
| Average NVIDIA GeForce RTX 4080 Laptop GPU (112.9 - 167.1, n=9) | |
| HP Omen 16-wf000 | |
| 2560x1440 Badass Preset (DX12) | |
| Asus Zephyrus Duo 16 GX650PY-NM006W | |
| Average NVIDIA GeForce RTX 4080 Laptop GPU (85 - 114.8, n=9) | |
| HP Omen 16-wf000 | |
| 3840x2160 Badass Preset (DX12) | |
| Average NVIDIA GeForce RTX 4080 Laptop GPU (46.4 - 60.9, n=9) | |
| HP Omen 16-wf000 | |
| Returnal | |
| 1920x1080 Low Preset | |
| HP Omen 16-wf000 | |
| Average NVIDIA GeForce RTX 4080 Laptop GPU (116 - 150, n=4) | |
| 1920x1080 Medium Preset | |
| HP Omen 16-wf000 | |
| Average NVIDIA GeForce RTX 4080 Laptop GPU (117 - 148, n=4) | |
| 1920x1080 High Preset | |
| HP Omen 16-wf000 | |
| Average NVIDIA GeForce RTX 4080 Laptop GPU (114 - 137, n=4) | |
| 1920x1080 Epic Preset | |
| Average NVIDIA GeForce RTX 4080 Laptop GPU (107 - 121, n=4) | |
| HP Omen 16-wf000 | |
| 2560x1440 Epic Preset | |
| HP Omen 16-wf000 | |
| Average NVIDIA GeForce RTX 4080 Laptop GPU (79 - 92, n=4) | |
| 3840x2160 Epic Preset | |
| HP Omen 16-wf000 | |
| Average NVIDIA GeForce RTX 4080 Laptop GPU (43 - 53, n=3) | |
Witcher 3 FPS Chart
| low | med. | high | ultra | QHD | 4K | |
|---|---|---|---|---|---|---|
| GTA V (2015) | 184.7 | 176.8 | 171.6 | 114 | 108.6 | 142.8 |
| The Witcher 3 (2015) | 453.2 | 407 | 296.5 | 163.4 | 113.1 | |
| Dota 2 Reborn (2015) | 187.4 | 173 | 164.2 | 153.7 | 145.7 | |
| Final Fantasy XV Benchmark (2018) | 208 | 194.9 | 153.9 | 120.6 | 71.6 | |
| X-Plane 11.11 (2018) | 172.4 | 151.2 | 118.5 | 102.3 | ||
| Strange Brigade (2018) | 413 | 334 | 320 | 299 | 225 | 116.7 |
| Cyberpunk 2077 1.6 (2022) | 132.3 | 127.1 | 124.4 | 116.7 | 77.6 | 35.3 |
| Tiny Tina's Wonderlands (2022) | 260.2 | 232.5 | 177.1 | 145.2 | 102.6 | 54.4 |
| F1 22 (2022) | 261 | 260 | 245 | 100.7 | 70.7 | 35.5 |
| Returnal (2023) | 148 | 148 | 136 | 107 | 91 | 53 |
Emissions
System Noise — Still Very Loud On Performance Mode
The fans are always active at almost 30 dB(A) against a silent background of 23 dB(A) no matter the setting or onscreen load. On the flip side, the fans don't need to pulse as often and so fan noise is usually in the low and relatively unobtrusive 30 to 33 dB(A) range when running undemanding loads like video streaming.
Gaming on Balanced mode instead of Performance mode results in noticeably quieter fans of just 44.2 dB(A) which may be worth the 15 percent decrease in graphics performance. Otherwise, the Omen 16 is one of the louder gaming laptops on the market at over 57 dB(A) when set to Performance mode.
| Power Profile Setting | Witcher 3 Fan Noise dB(A) |
| Balanced | 44.2 |
| Performance + Max Fan Off | 57 |
| Performance + Man Fan On | 58.3 |
Noise level
| Idle |
| 29.6 / 29.8 / 30.4 dB(A) |
| Load |
| 33.8 / 58.3 dB(A) |
 | ||
30 dB silent 40 dB(A) audible 50 dB(A) loud |
||
min: | ||
| HP Omen 16-wf000 GeForce RTX 4080 Laptop GPU, i7-13700HX, SK hynix PC801 HFS002TEJ9X101N | HP Omen 16-n0033dx Radeon RX 6650M, R7 6800H, Samsung PM9A1 MZVL21T0HCLR | Alienware x16 R1 GeForce RTX 4080 Laptop GPU, i9-13900HK, SK hynix PC801 HFS001TEJ9X101N | Lenovo Legion Pro 7 RTX4090 GeForce RTX 4090 Laptop GPU, i9-13900HX, Samsung PM9A1 MZVL21T0HCLR | Asus ROG Strix G16 G614JZ GeForce RTX 4080 Laptop GPU, i9-13980HX, WD PC SN560 SDDPNQE-1T00 | Razer Blade 16 Early 2023 GeForce RTX 4080 Laptop GPU, i9-13950HX, SSSTC CA6-8D1024 | |
|---|---|---|---|---|---|---|
| Noise | 4% | 8% | -8% | -1% | 10% | |
| off / environment * (dB) | 23 | 24.2 -5% | 22.7 1% | 25 -9% | 25 -9% | 23 -0% |
| Idle Minimum * (dB) | 29.6 | 27.4 7% | 23.1 22% | 28 5% | 26 12% | 23 22% |
| Idle Average * (dB) | 29.8 | 27.4 8% | 25.8 13% | 30 -1% | 28 6% | 23 23% |
| Idle Maximum * (dB) | 30.4 | 28.9 5% | 25.8 15% | 38 -25% | 30 1% | 23.6 22% |
| Load Average * (dB) | 33.8 | 32.3 4% | 39.3 -16% | 48 -42% | 48 -42% | 39 -15% |
| Witcher 3 ultra * (dB) | 57 | 54.1 5% | 49.9 12% | 53 7% | 49 14% | 51.6 9% |
| Load Maximum * (dB) | 58.3 | 57.6 1% | 54.8 6% | 55 6% | 52 11% | 51.3 12% |
* ... smaller is better
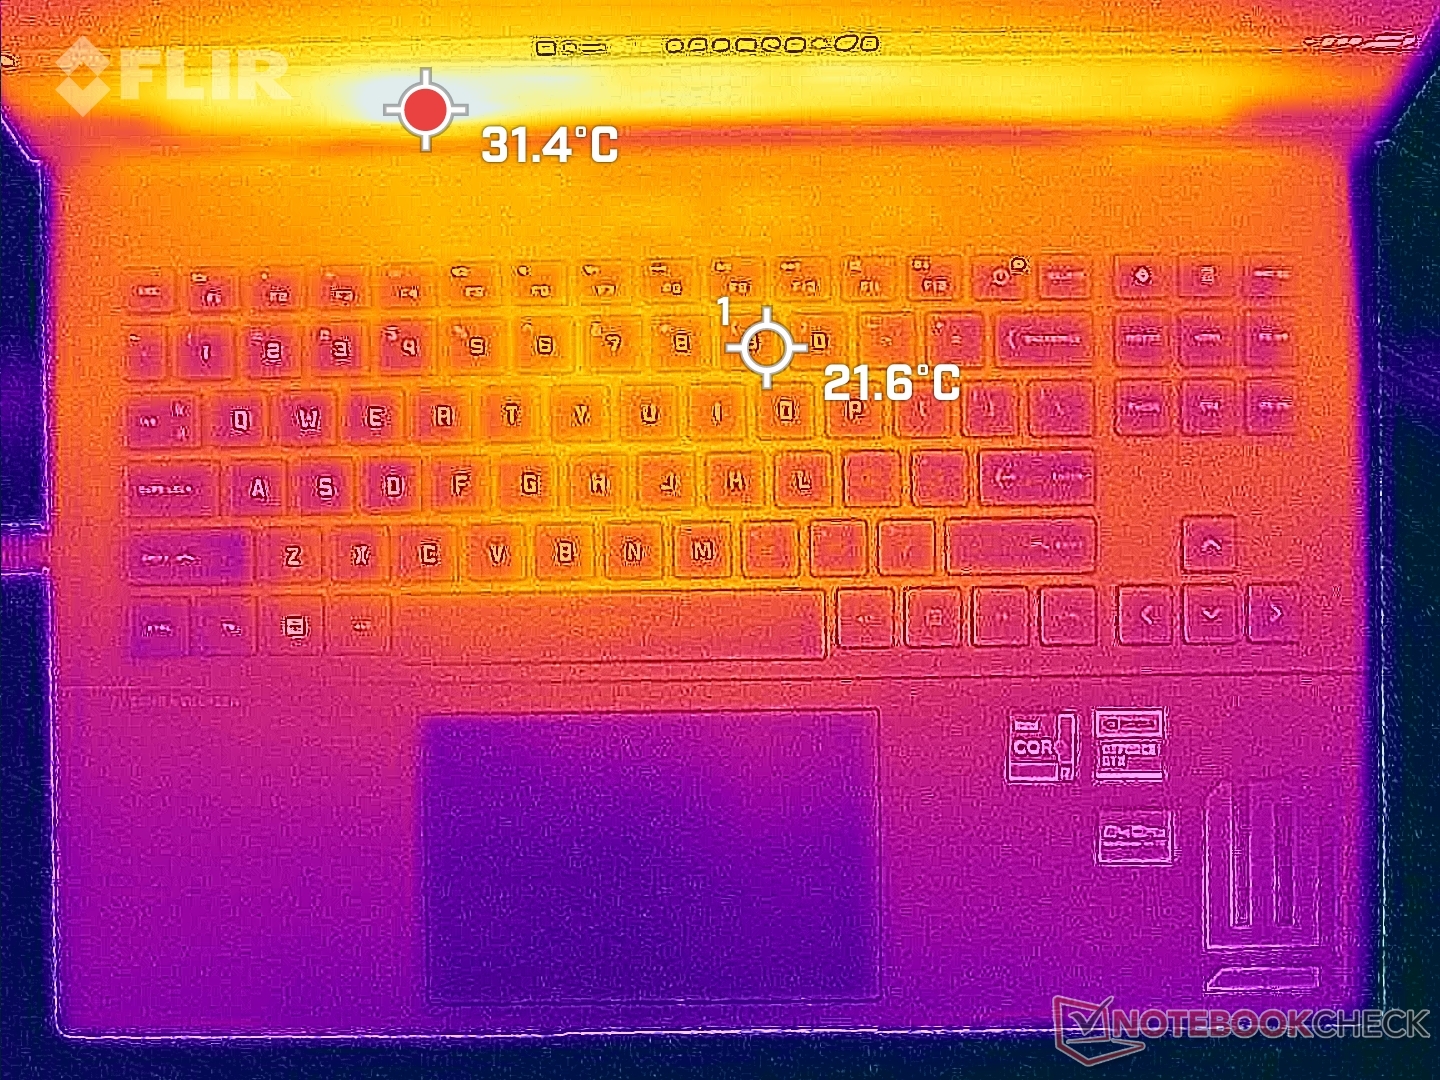
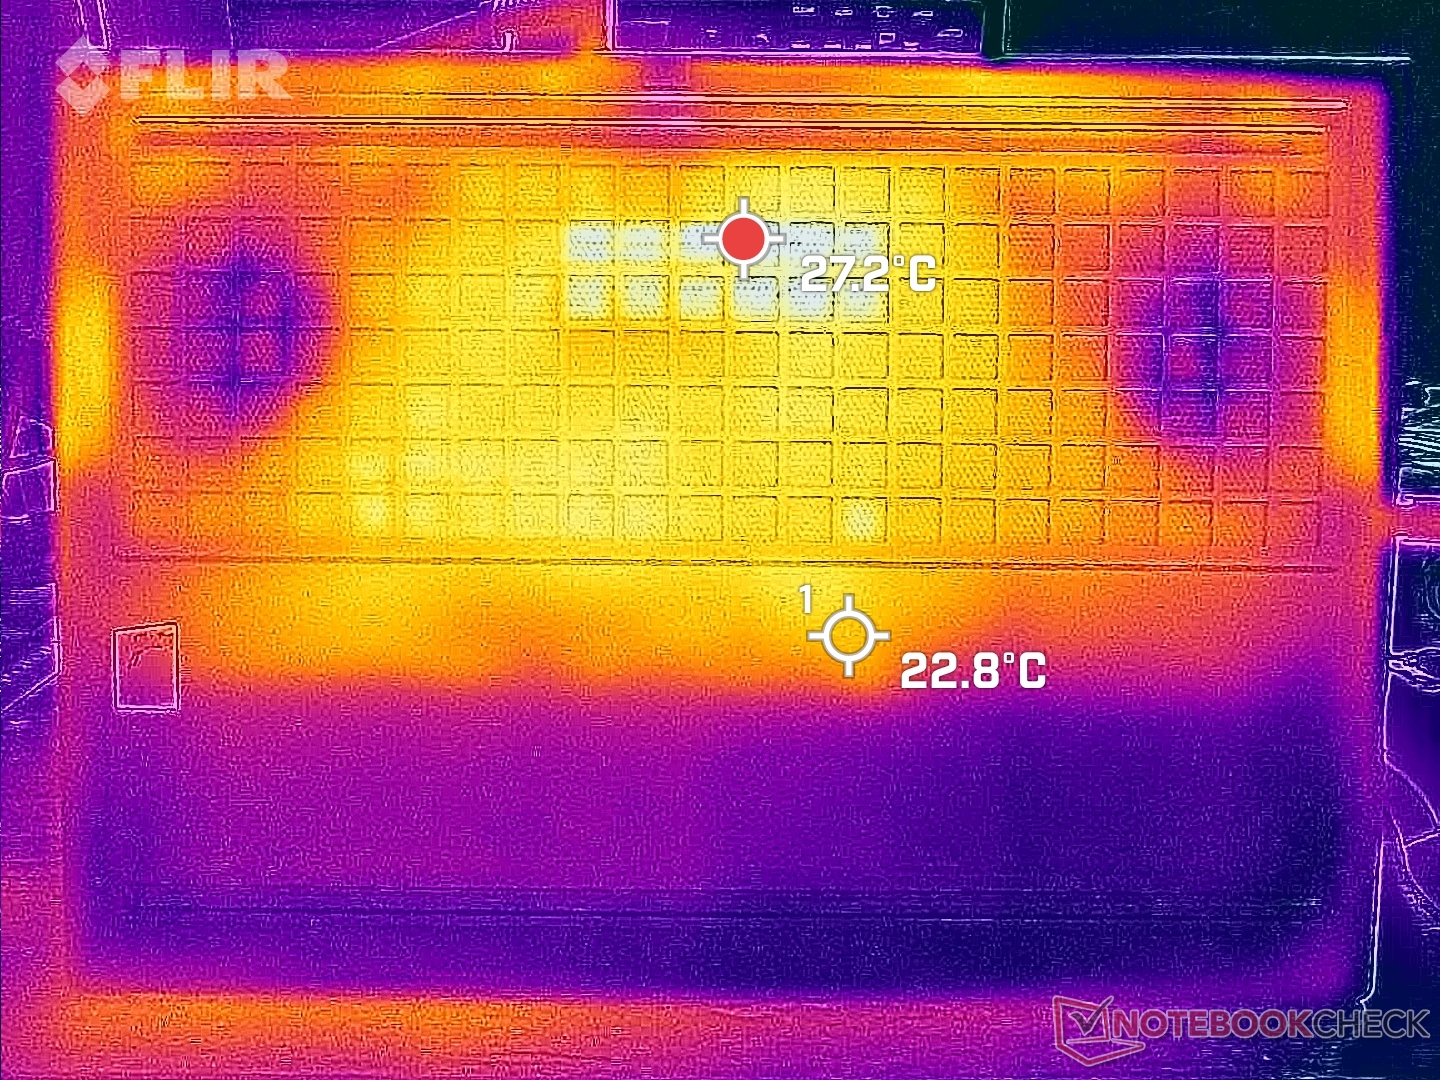
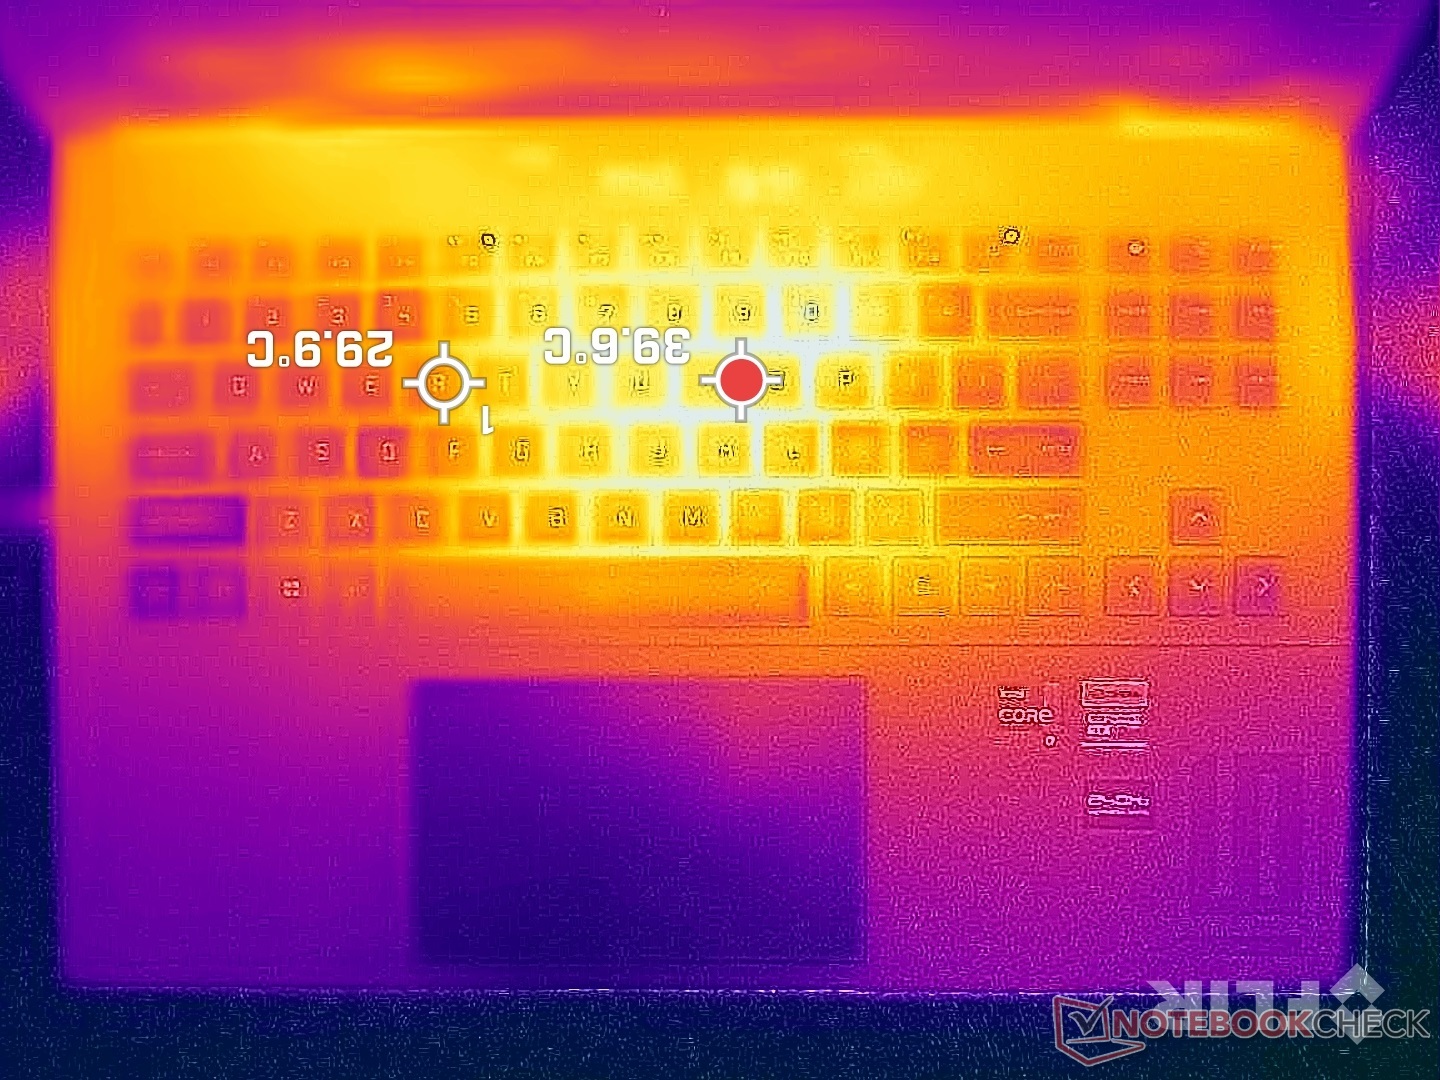
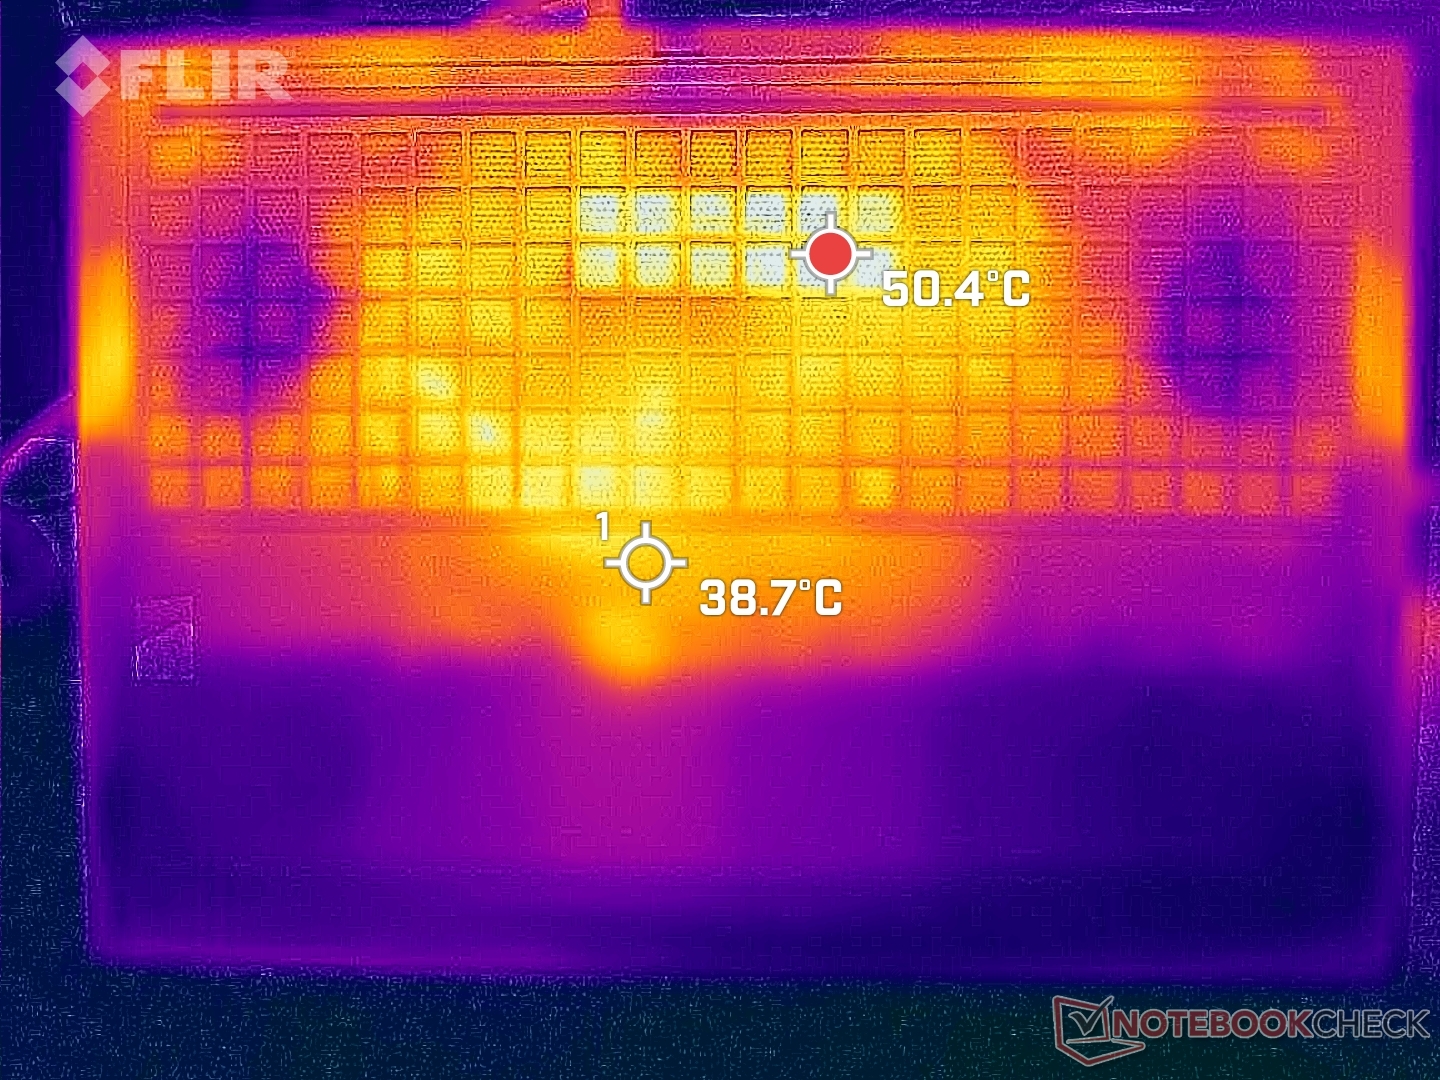
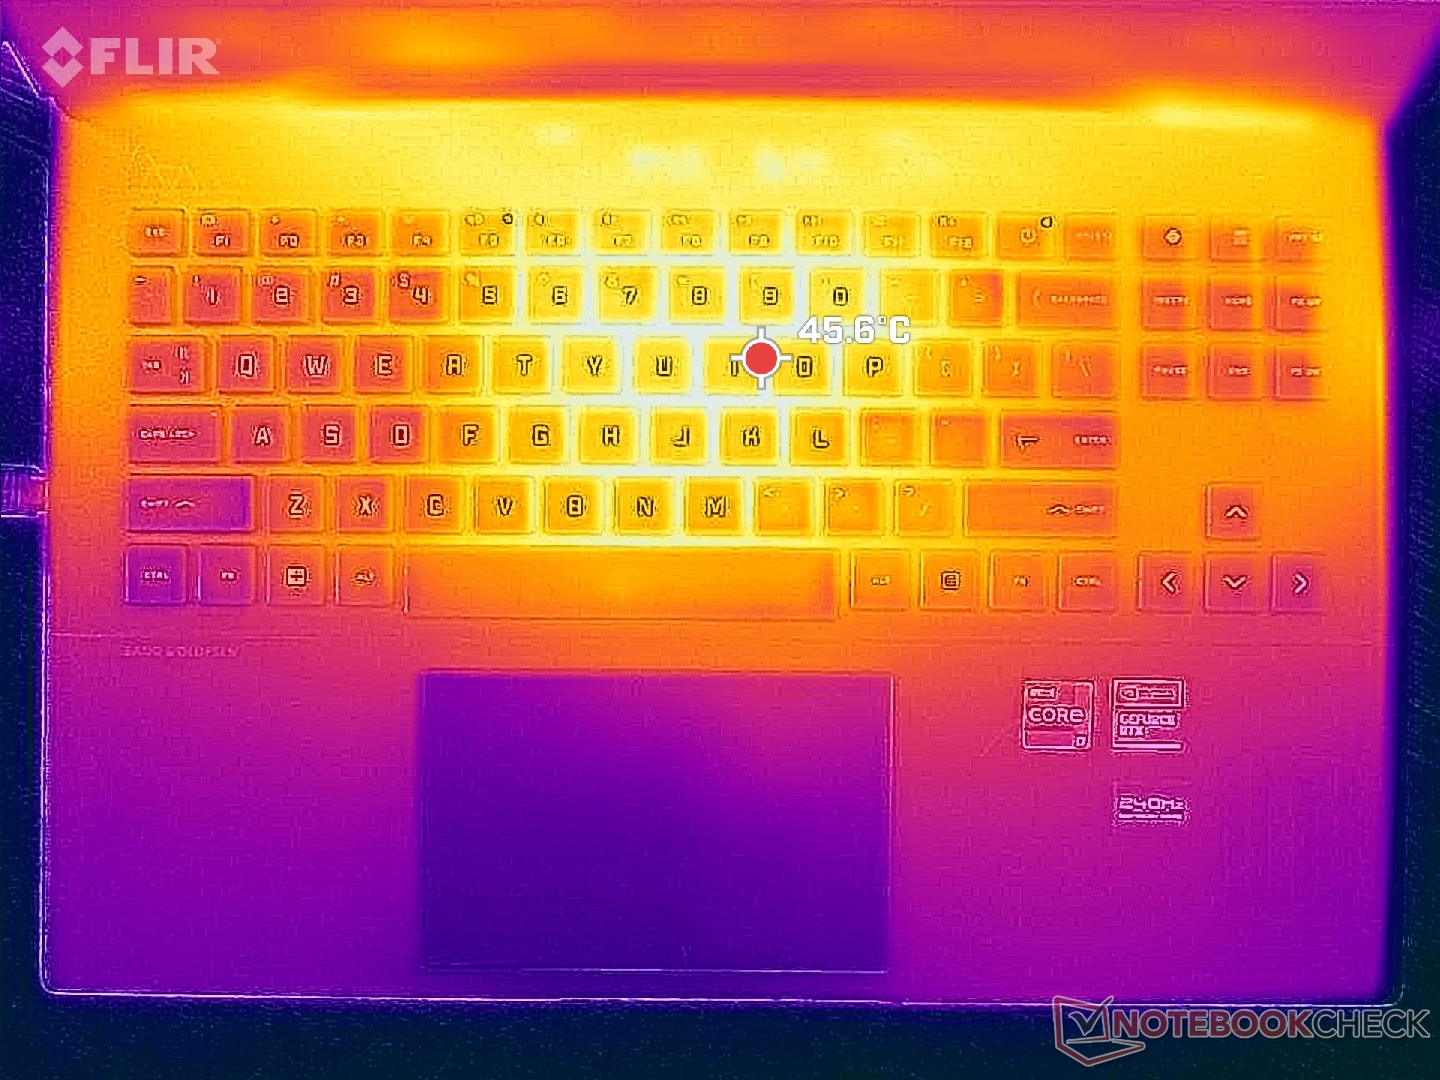
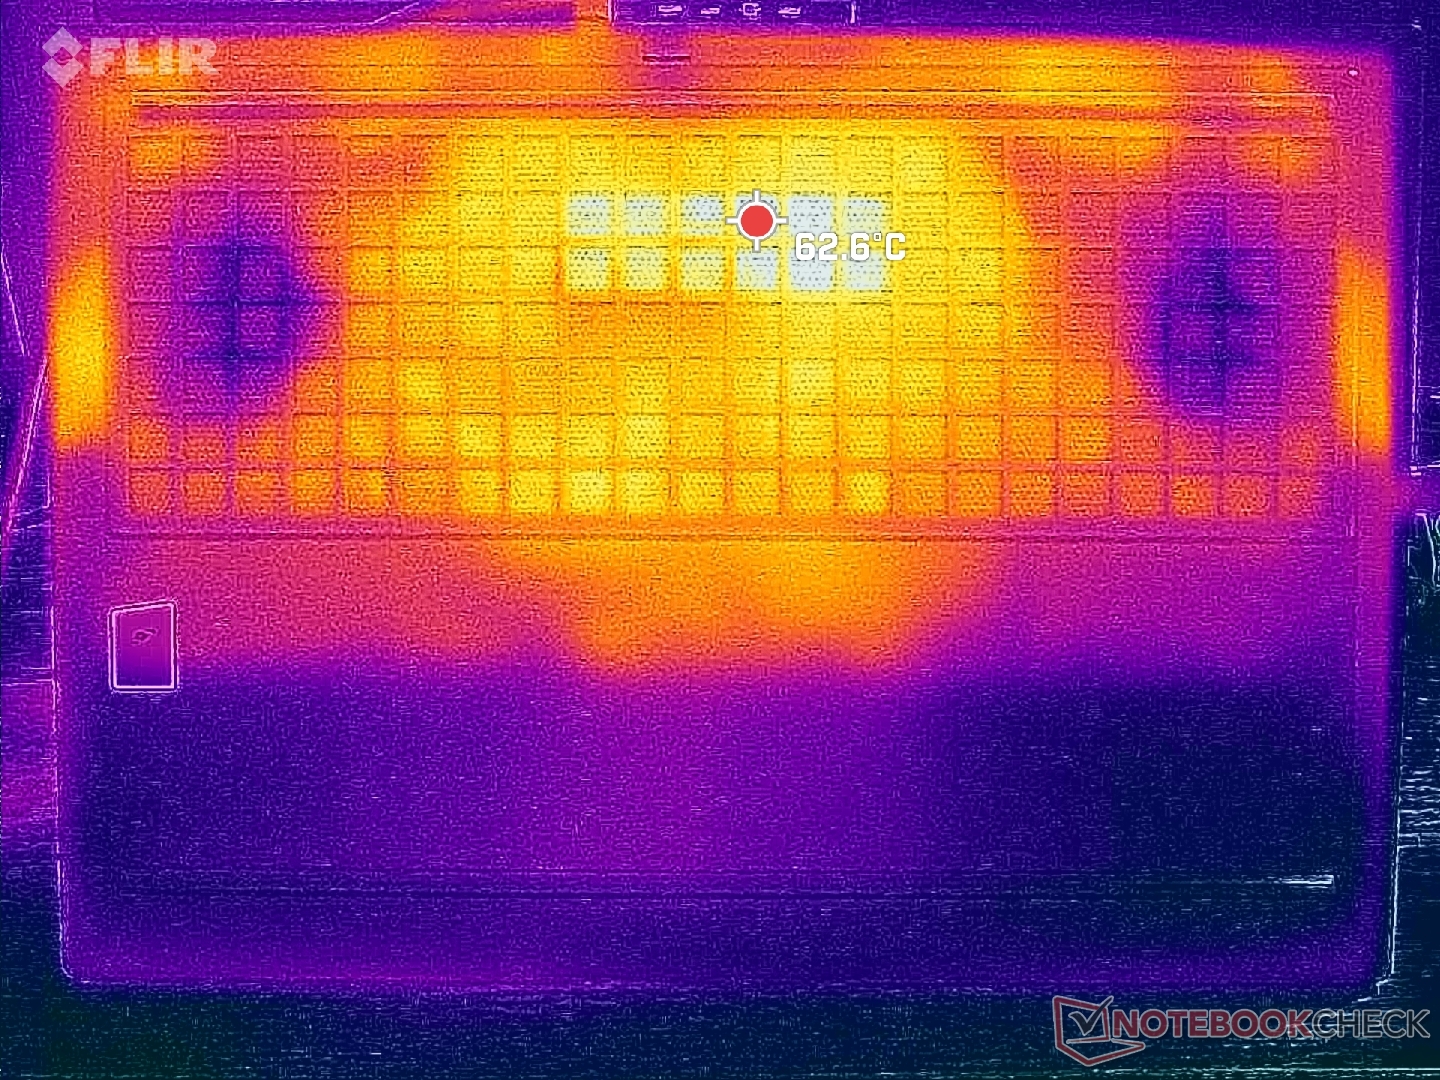
Temperature
Surface temperatures are symmetrical with hot spots nearest the keyboard center. This region can reach 40 to 45 C when gaming compared to 55 to 60 C on the thicker, heavier, and faster Lenovo Legion Pro 7 16. The generally cooler surface temperatures may be attributed to the larger ventilation grilles and lower TGP target of the HP design.
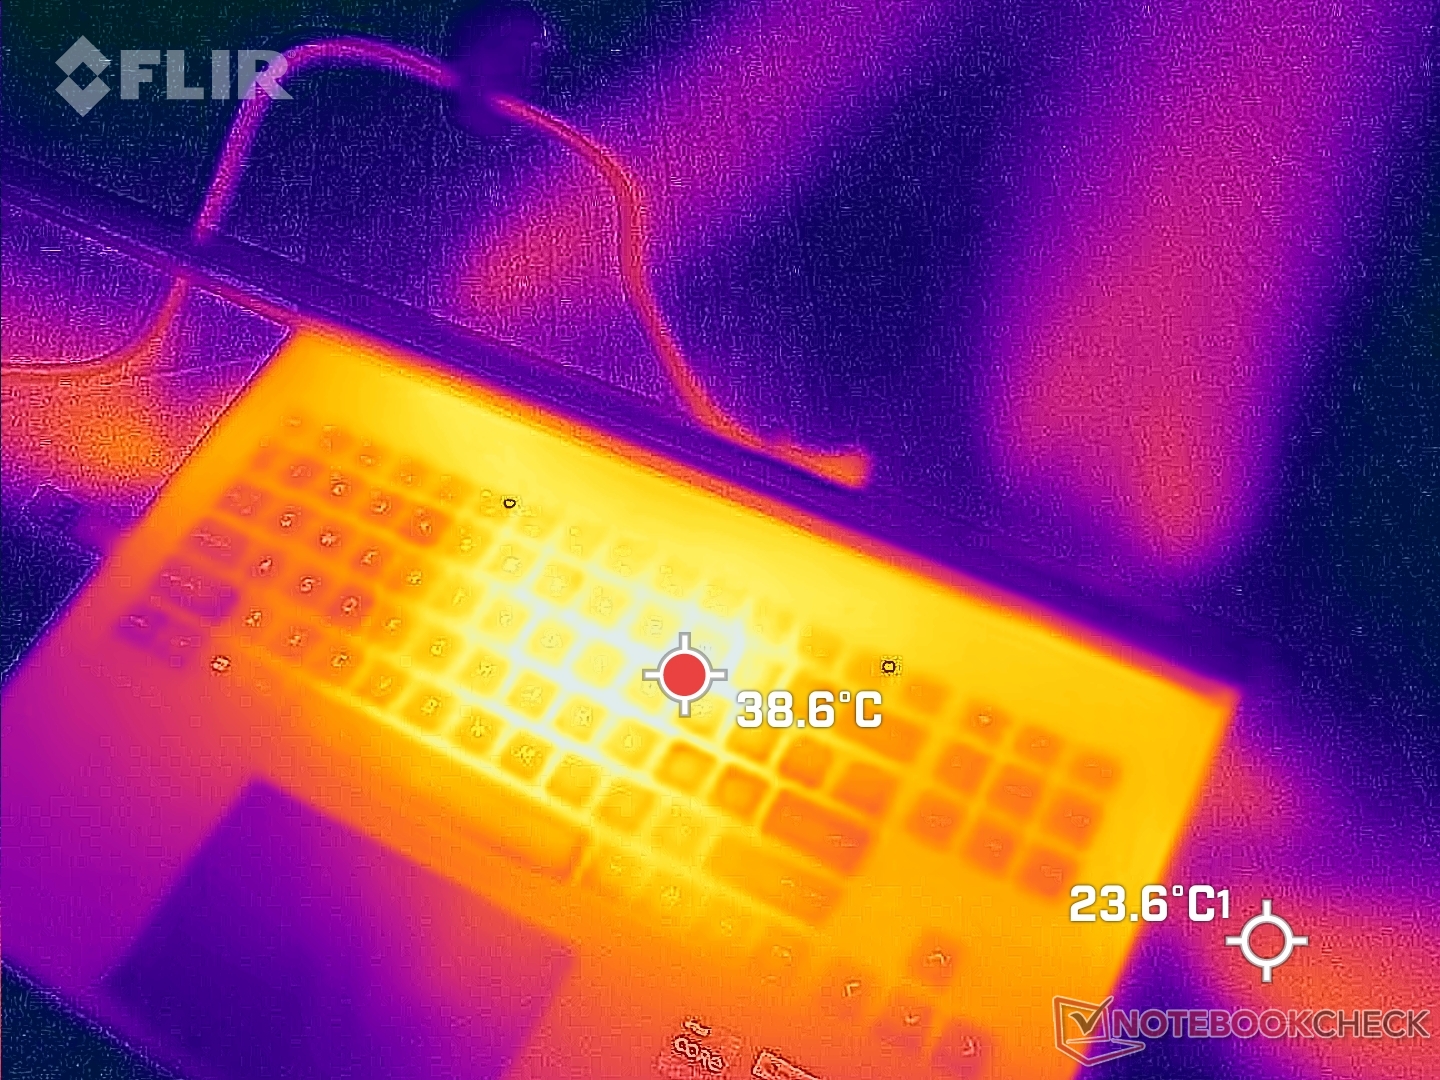
(±) The maximum temperature on the upper side is 45 °C / 113 F, compared to the average of 40.4 °C / 105 F, ranging from 21.2 to 68.8 °C for the class Gaming.
(-) The bottom heats up to a maximum of 48.8 °C / 120 F, compared to the average of 43.2 °C / 110 F
(+) In idle usage, the average temperature for the upper side is 26.6 °C / 80 F, compared to the device average of 33.9 °C / 93 F.
(±) Playing The Witcher 3, the average temperature for the upper side is 33.9 °C / 93 F, compared to the device average of 33.9 °C / 93 F.
(+) The palmrests and touchpad are cooler than skin temperature with a maximum of 31.4 °C / 88.5 F and are therefore cool to the touch.
(-) The average temperature of the palmrest area of similar devices was 28.8 °C / 83.8 F (-2.6 °C / -4.7 F).
| HP Omen 16-wf000 Intel Core i7-13700HX, NVIDIA GeForce RTX 4080 Laptop GPU | HP Omen 16-n0033dx AMD Ryzen 7 6800H, AMD Radeon RX 6650M | Alienware x16 R1 Intel Core i9-13900HK, NVIDIA GeForce RTX 4080 Laptop GPU | Lenovo Legion Pro 7 RTX4090 Intel Core i9-13900HX, NVIDIA GeForce RTX 4090 Laptop GPU | Asus ROG Strix G16 G614JZ Intel Core i9-13980HX, NVIDIA GeForce RTX 4080 Laptop GPU | Razer Blade 16 Early 2023 Intel Core i9-13950HX, NVIDIA GeForce RTX 4080 Laptop GPU | |
|---|---|---|---|---|---|---|
| Heat | 3% | -13% | -17% | -12% | 4% | |
| Maximum Upper Side * (°C) | 45 | 41.2 8% | 47.2 -5% | 53 -18% | 54 -20% | 40 11% |
| Maximum Bottom * (°C) | 48.8 | 53.2 -9% | 47.8 2% | 59 -21% | 55 -13% | 37.6 23% |
| Idle Upper Side * (°C) | 29.2 | 26.4 10% | 36.8 -26% | 34 -16% | 29 1% | 32.4 -11% |
| Idle Bottom * (°C) | 28.8 | 27.8 3% | 35.8 -24% | 32 -11% | 33 -15% | 31.4 -9% |
* ... smaller is better
Stress Test
CPU clock rates and board power draw when initiating Prime95 stress would spike to 3.4 GHz and 110 W, respectively, lasting for about two minutes or until core temperature reaches 91 C. Thereafter, the CPU would average around 3.0 GHz and 90 W in order to maintain a cooler temperature range between 80 to 90 C. This temperature range is similar to what we recorded on the AMD-powered 2022 Omen 16 and on the faster Blade 16.
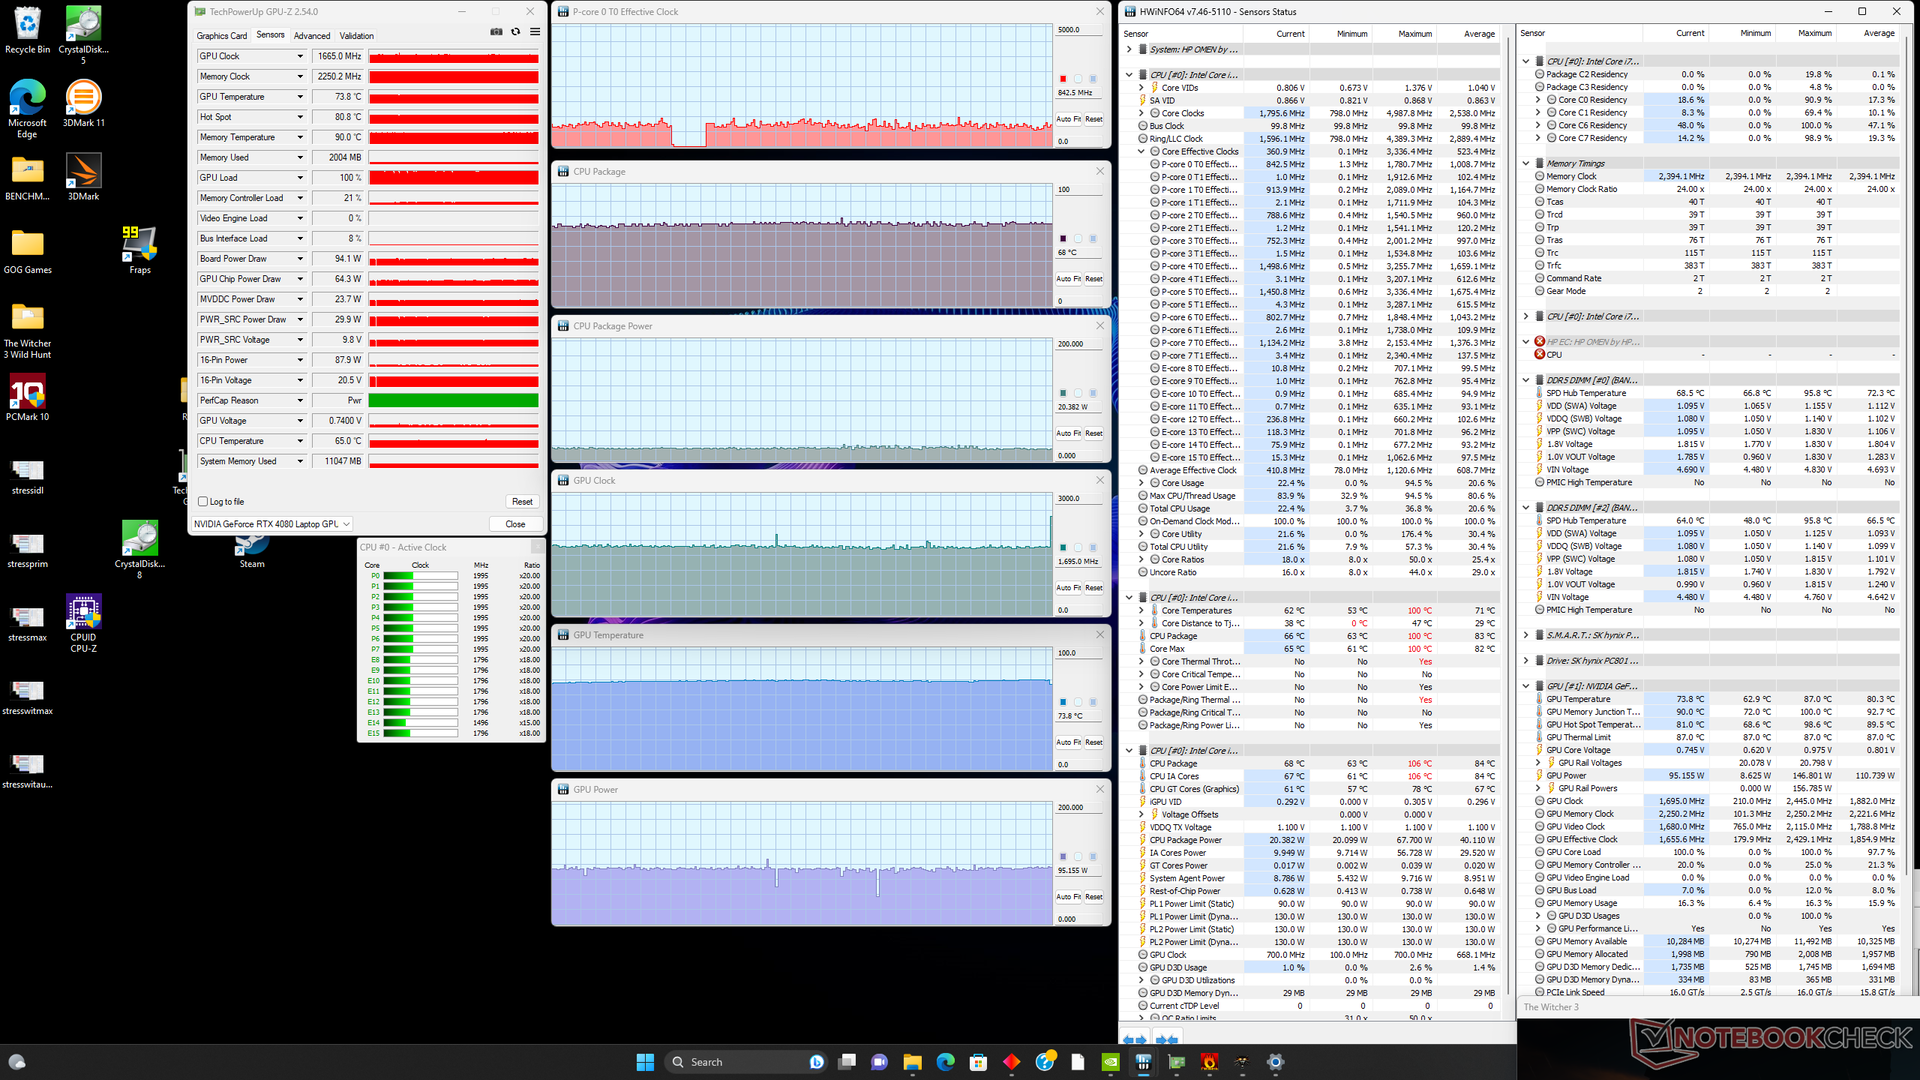
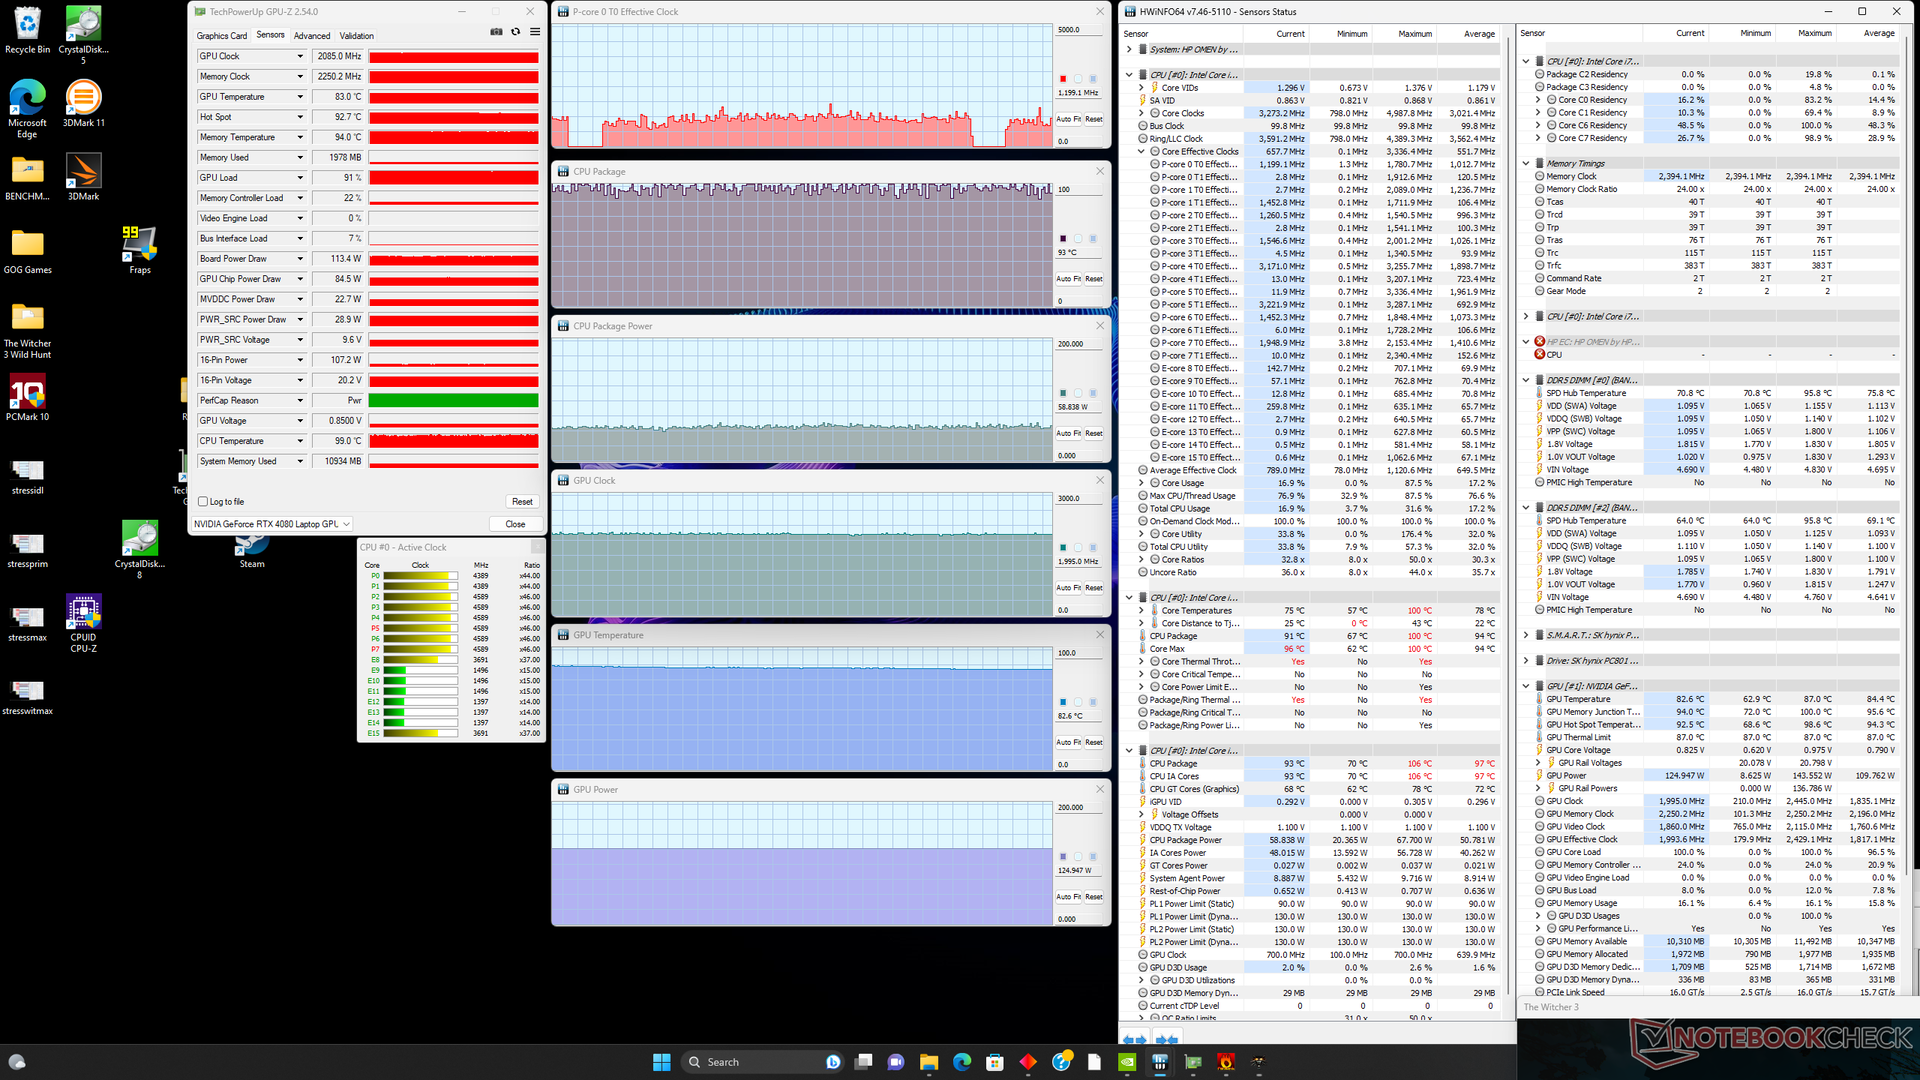
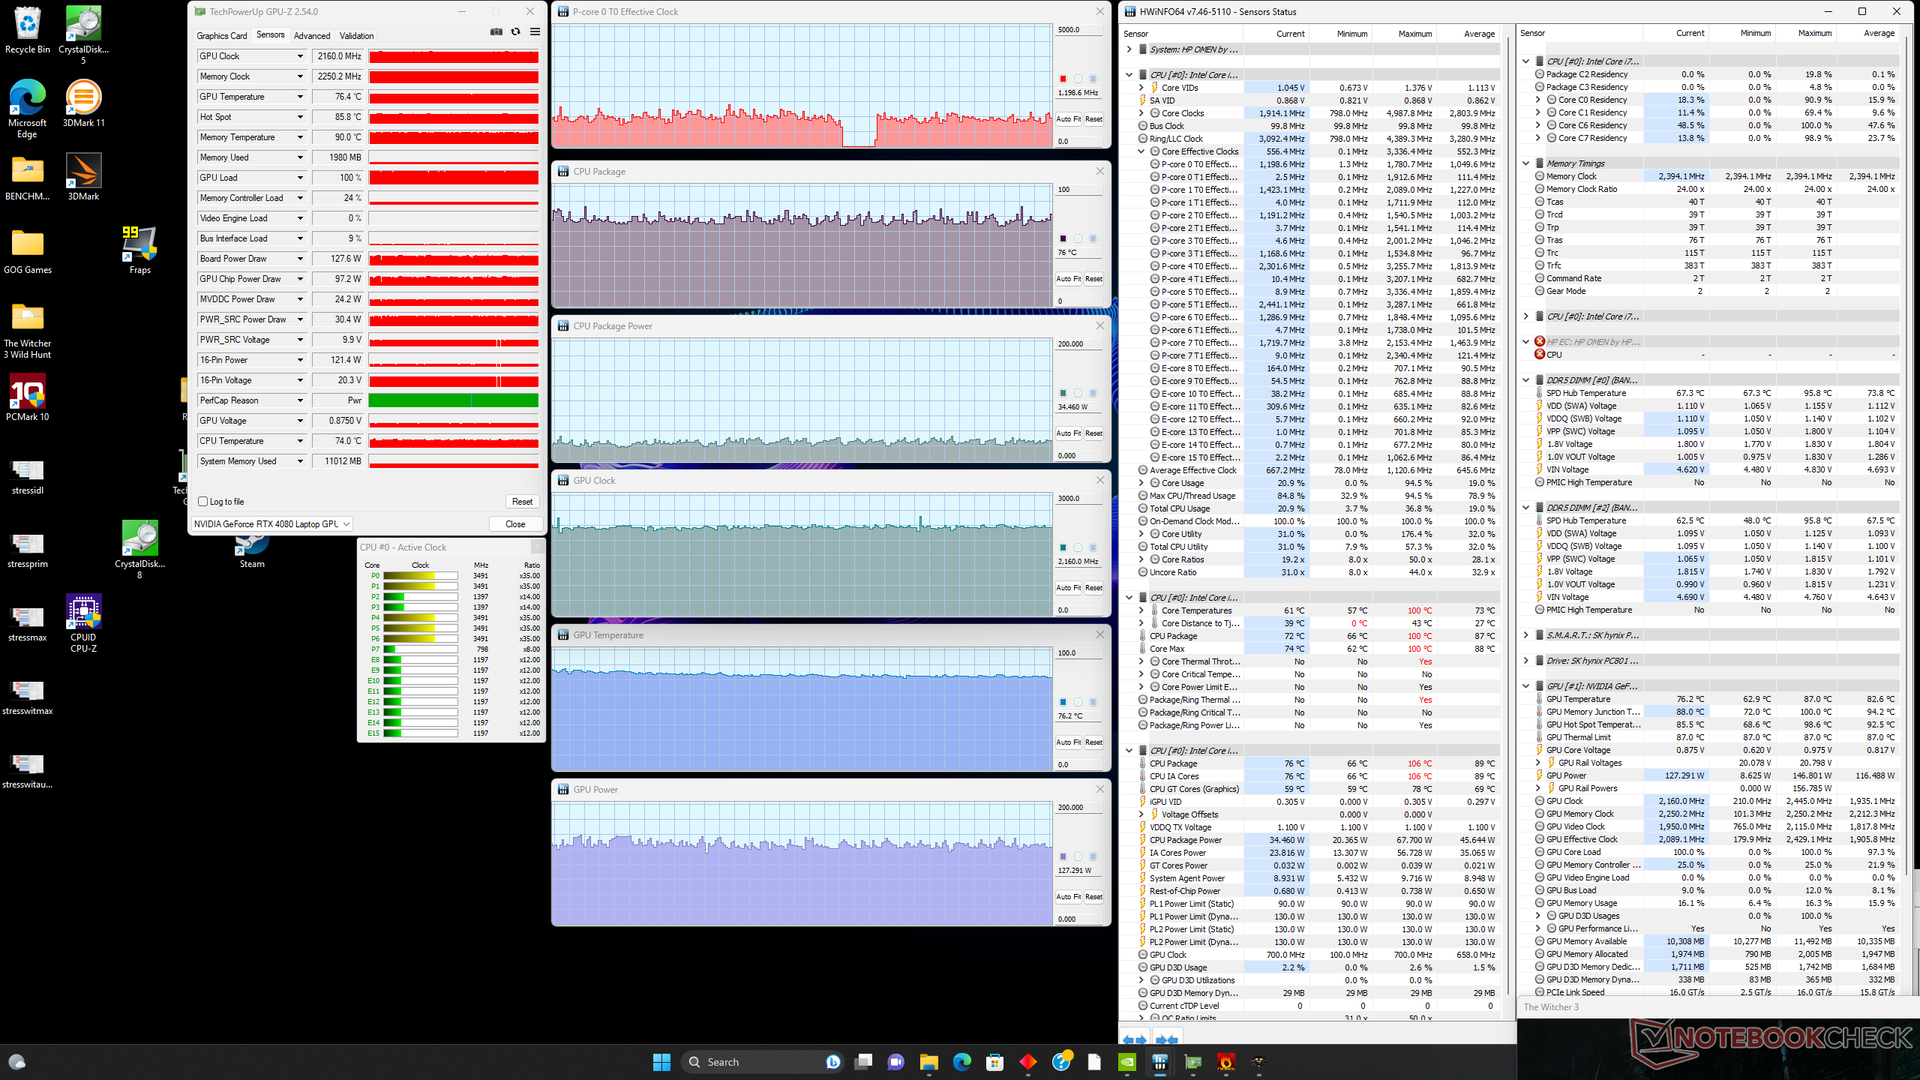
When running Witcher 3 on Performance mode with Max Fan on, GPU clock rates and board power draw would be slightly higher than on Performance mode with Max Fan off as shown by our screenshots below. The results match our Fire Strike results above and core temperatures would also be noticeably cooler with Max Fan on as well. Thus, you'll have to enable Man Fan mode if you want to squeeze as much performance out of the laptop as possible.
Running Witcher 3 on Balanced mode would limit board power draw to just 95 W from a maximum of around 130 to 145 W. Fan noise is quieter, of course, but at the cost of graphics performance.
Running on battery power severely limits performance. A 3DMark 11 test on Batteries would return Physics and Graphics scores of 8347 and 10654 points, respectively, compared to 23751 and 56145 points when on mains.
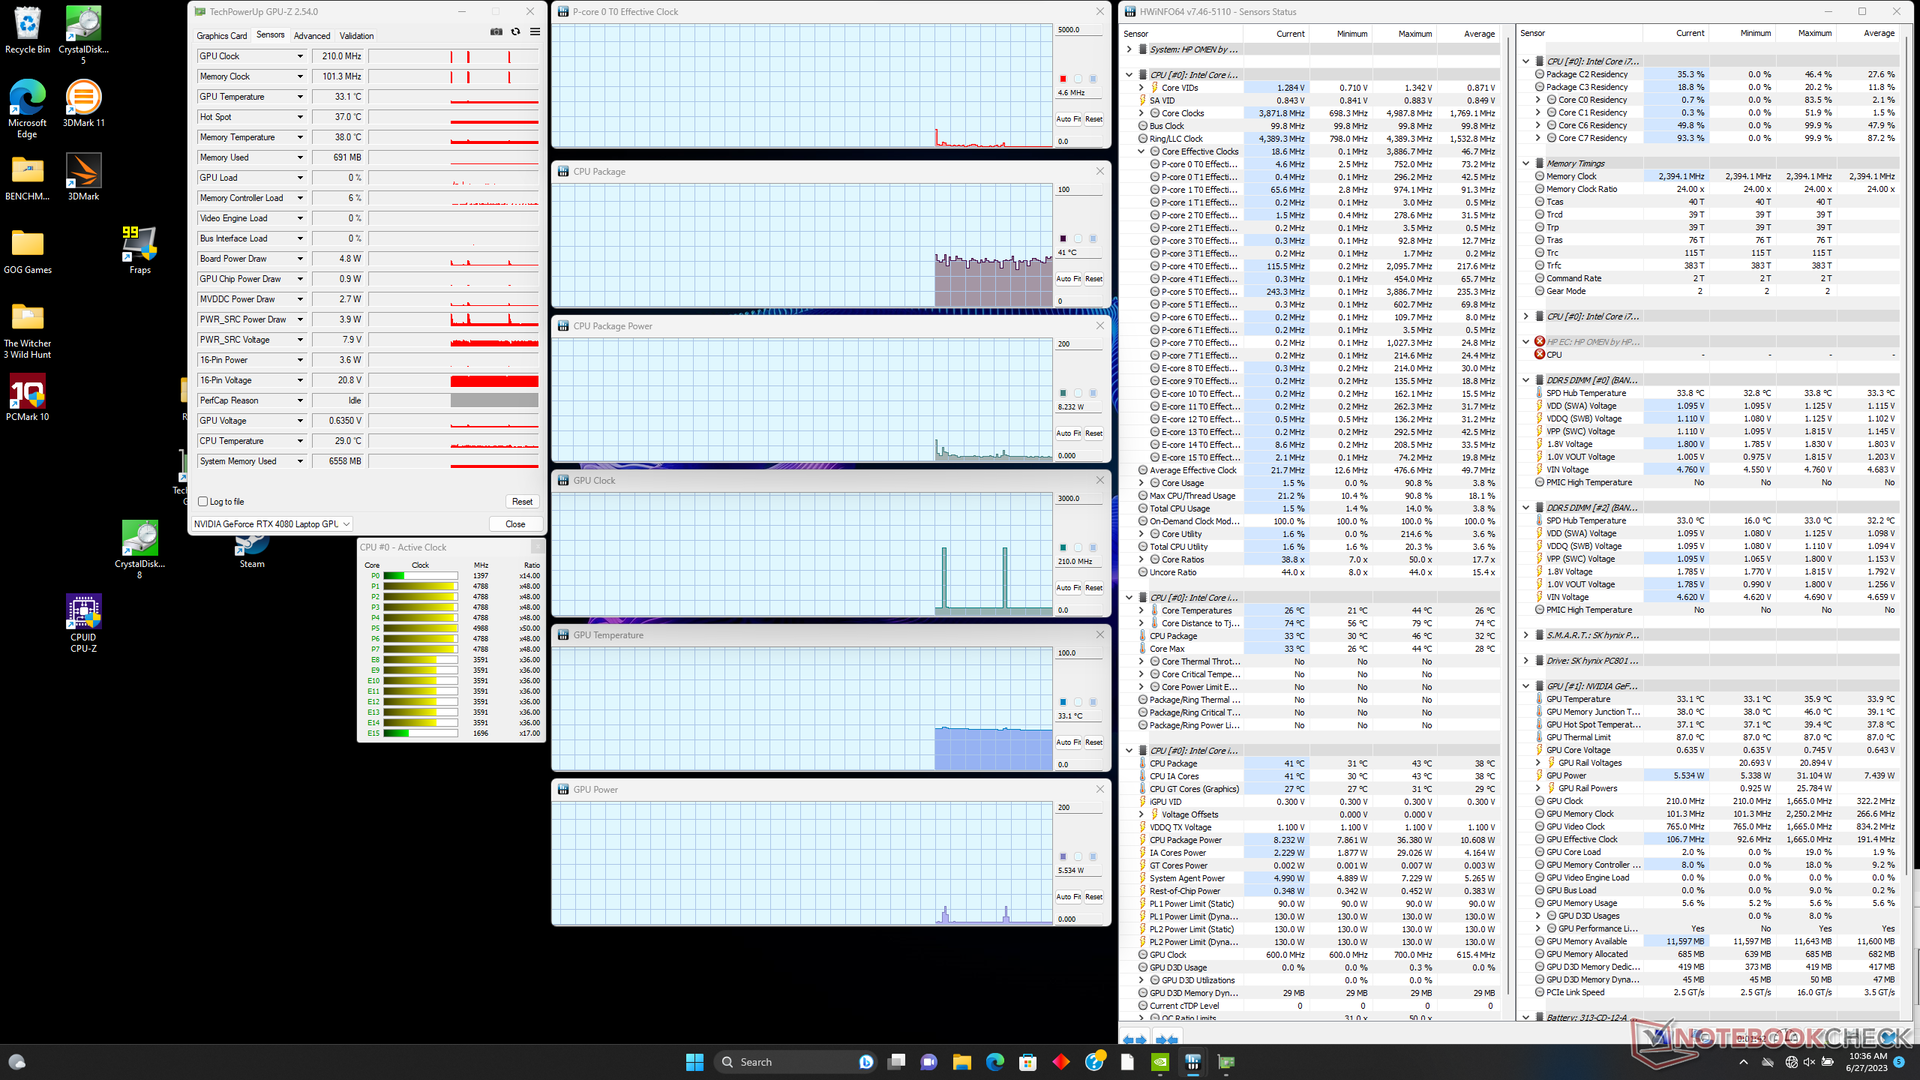
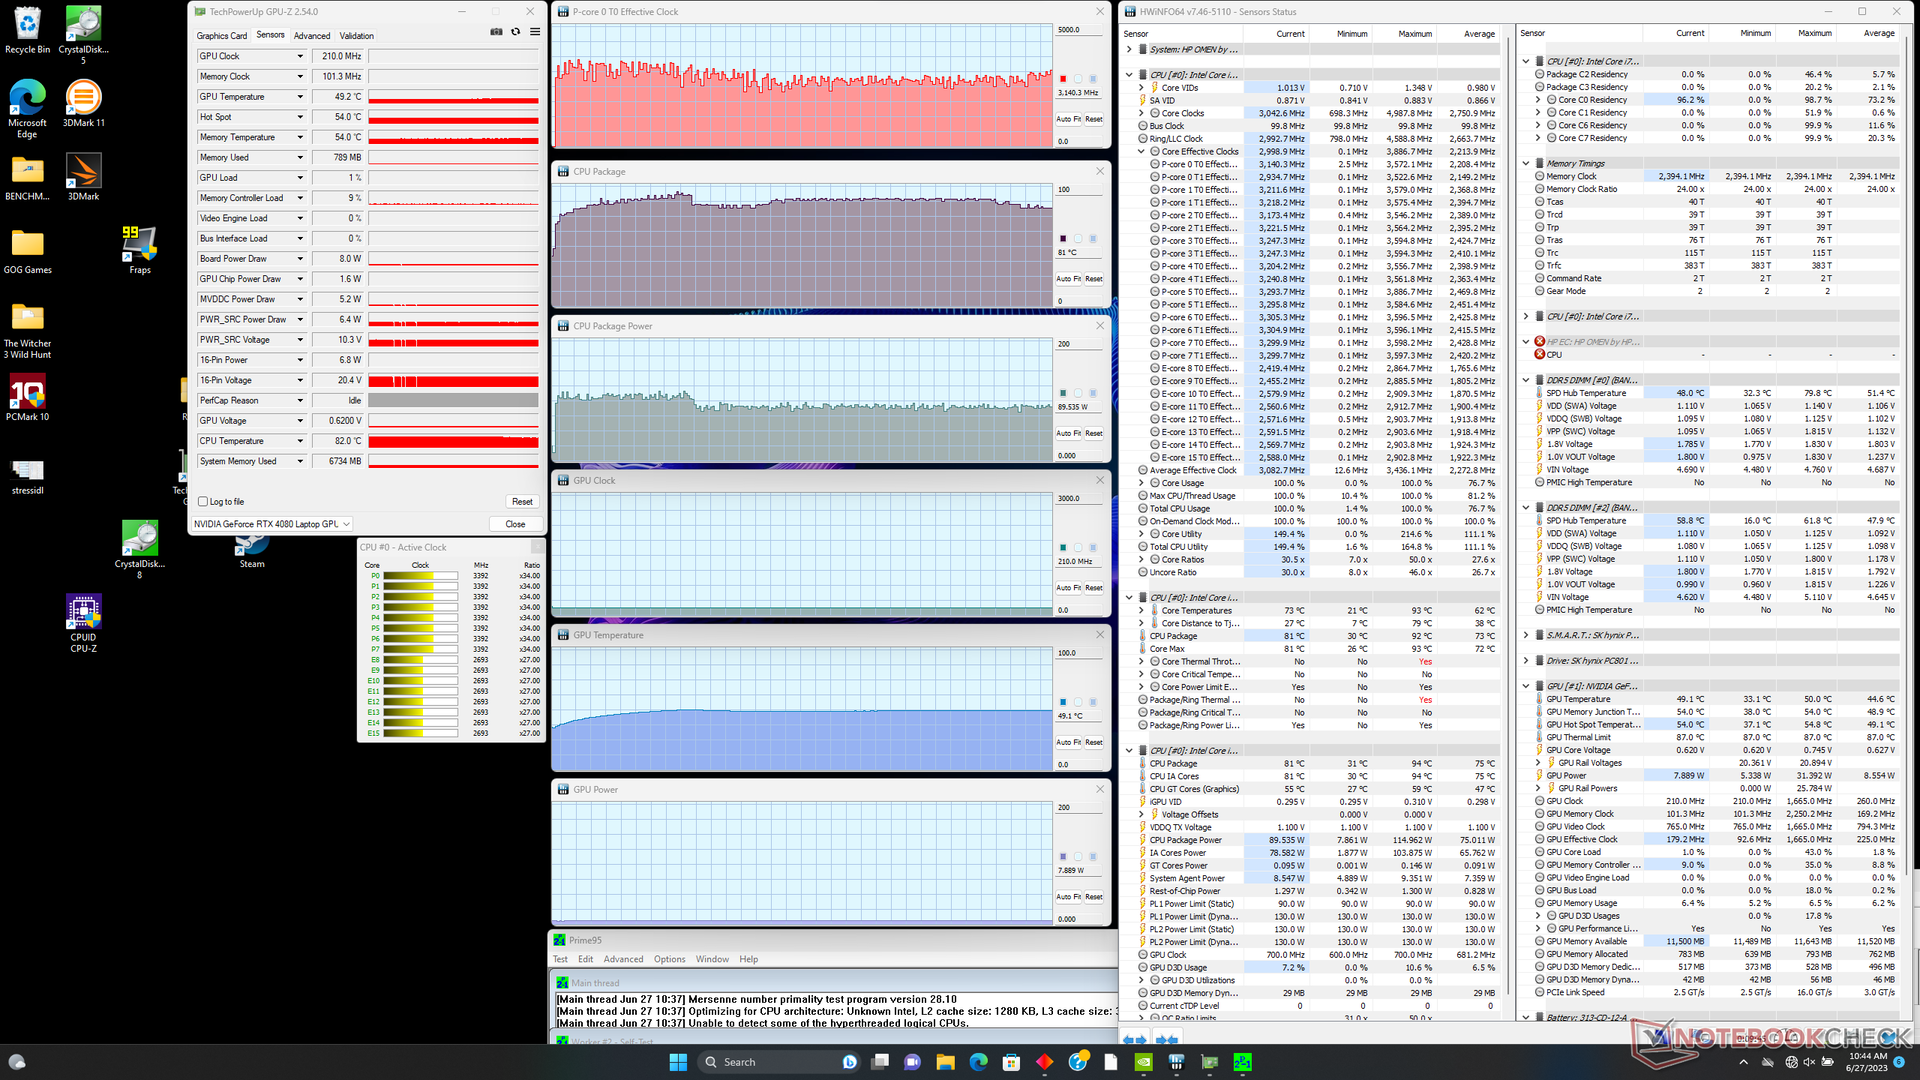
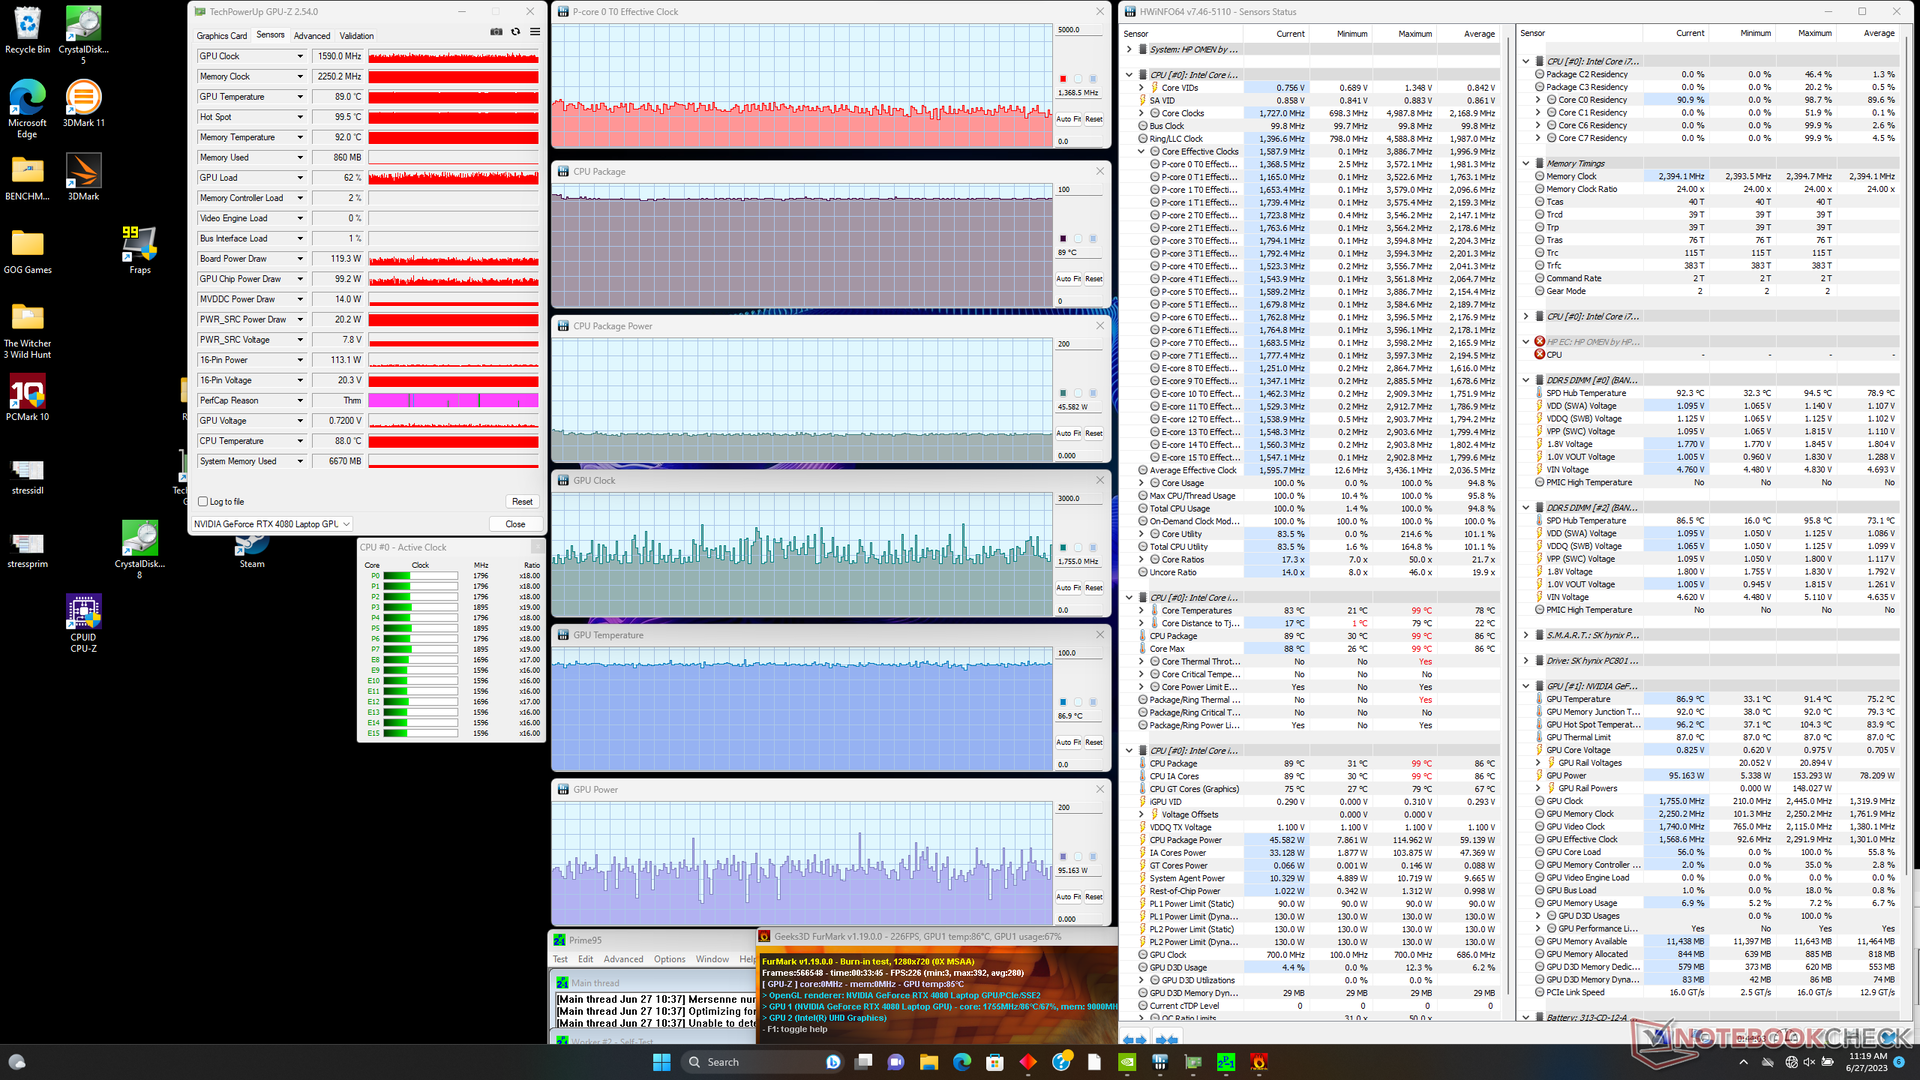
| CPU Clock (GHz) | GPU Clock (MHz) | Average CPU Temperature (°C) | Average GPU Temperature (°C) | |
| System Idle | -- | -- | 41 | 33 |
| Prime95 Stress | 2.4 - 3.2 | -- | 81 - 88 | 49 |
| Prime95 + FurMark Stress | 1.3 - 1.8 | 1300 - 2250 | 89 | 87 |
| Witcher 3 Stress (Balanced mode) | ~0.8 | 1665 | 68 | 74 |
| Witcher 3 Stress (Performance mode + Max Fan Off) | ~1.2 | 2085 | ~95 | 83 |
| Witcher 3 Stress (Performance mode + Max Fan On) | ~1.2 | 2160 | 76 | 76 |
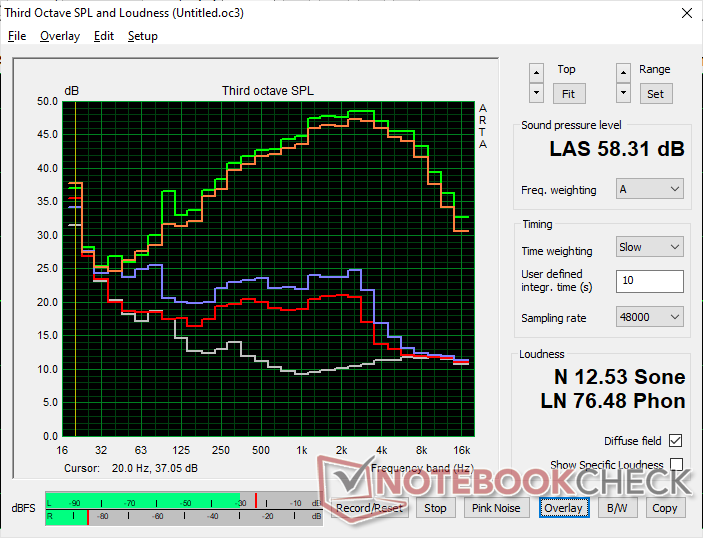
Speakers
The stereo speakers are not nearly as loud as the quad speakers on the Alienware x16 R1, but balance is respectable nonetheless. Sound quality falls noticeably when gaming due to the loud fans.
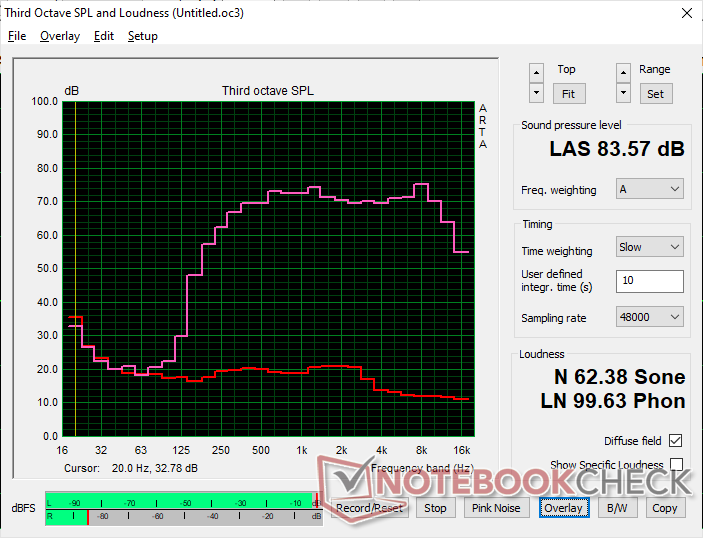
HP Omen 16-wf000 audio analysis
(+) | speakers can play relatively loud (83.6 dB)
Bass 100 - 315 Hz
(-) | nearly no bass - on average 21.9% lower than median
(±) | linearity of bass is average (14.7% delta to prev. frequency)
Mids 400 - 2000 Hz
(+) | balanced mids - only 2.1% away from median
(+) | mids are linear (3% delta to prev. frequency)
Highs 2 - 16 kHz
(+) | balanced highs - only 1.4% away from median
(+) | highs are linear (3.5% delta to prev. frequency)
Overall 100 - 16.000 Hz
(±) | linearity of overall sound is average (15.3% difference to median)
Compared to same class
» 34% of all tested devices in this class were better, 6% similar, 60% worse
» The best had a delta of 6%, average was 18%, worst was 132%
Compared to all devices tested
» 22% of all tested devices were better, 4% similar, 74% worse
» The best had a delta of 4%, average was 24%, worst was 134%
Apple MacBook Pro 16 2021 M1 Pro audio analysis
(+) | speakers can play relatively loud (84.7 dB)
Bass 100 - 315 Hz
(+) | good bass - only 3.8% away from median
(+) | bass is linear (5.2% delta to prev. frequency)
Mids 400 - 2000 Hz
(+) | balanced mids - only 1.3% away from median
(+) | mids are linear (2.1% delta to prev. frequency)
Highs 2 - 16 kHz
(+) | balanced highs - only 1.9% away from median
(+) | highs are linear (2.7% delta to prev. frequency)
Overall 100 - 16.000 Hz
(+) | overall sound is linear (4.6% difference to median)
Compared to same class
» 0% of all tested devices in this class were better, 0% similar, 100% worse
» The best had a delta of 5%, average was 17%, worst was 45%
Compared to all devices tested
» 0% of all tested devices were better, 0% similar, 100% worse
» The best had a delta of 4%, average was 24%, worst was 134%
Energy Management — Bigger Battery, Shorter Life
Power Consumption
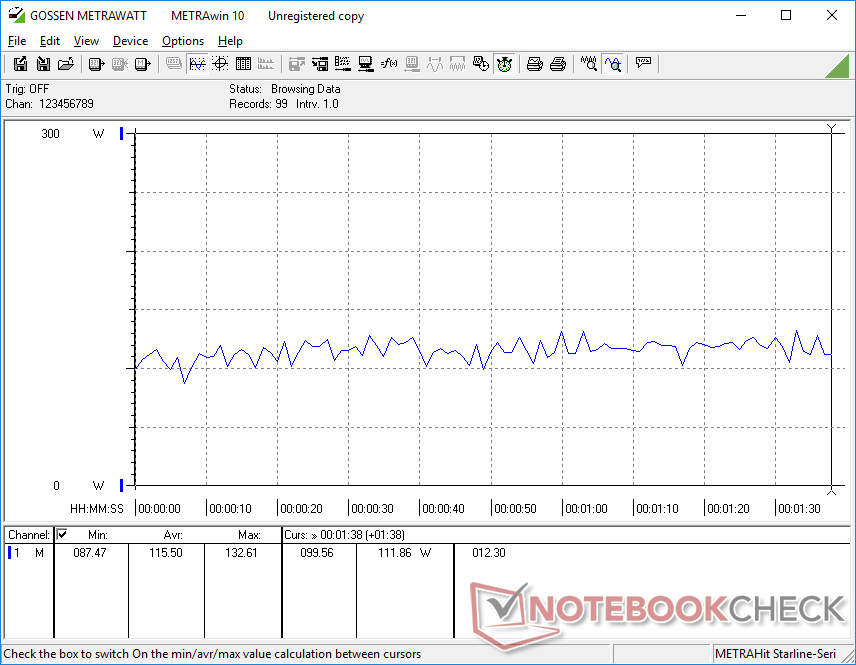
Power consumption when idling is higher than expected even when on the Power Saver profile with the iGPU active and the brightness set to minimum. The high floor may be responsible for the shorter battery life results in the next section below.
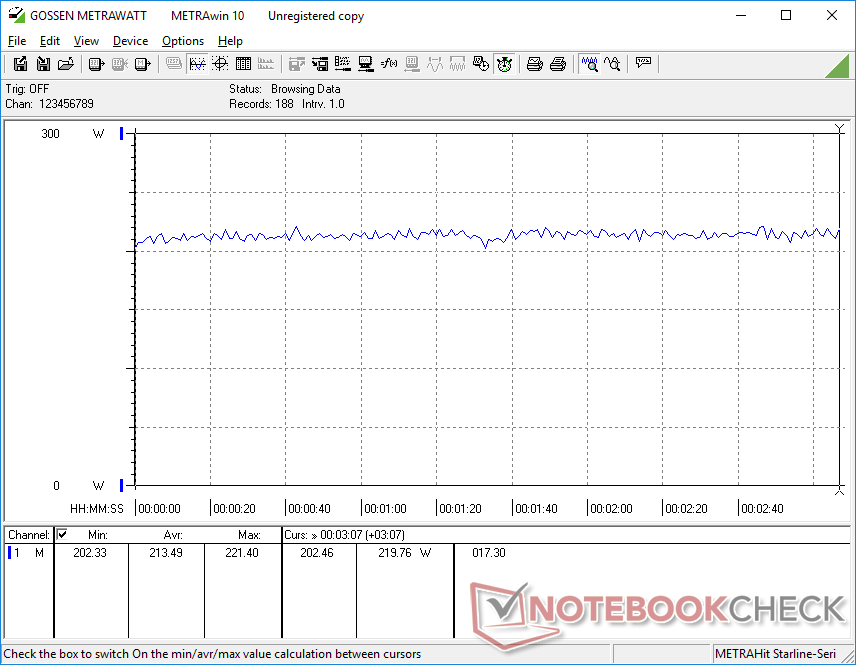
Fortunately, consumption when gaming shows significant improvements over the AMD-powered 2022 Omen 16. Running Witcher 3 draws just 4 percent more power on average while providing 1.5x to 2x the GPU performance of the Radeon RX 6650M. This fact alone may explain why HP decided to drop any Radeon options for this year's Omen 16 as the performance-per-watt advantages of Ada Lovelace is striking.
Competing laptops with the same RTX 4080 GPU like the ROG Strix G16 or Blade 16 each demand about 30 W more than our HP system when running the same title. However, they also come with much faster Core i9 HX CPUs to compensate.
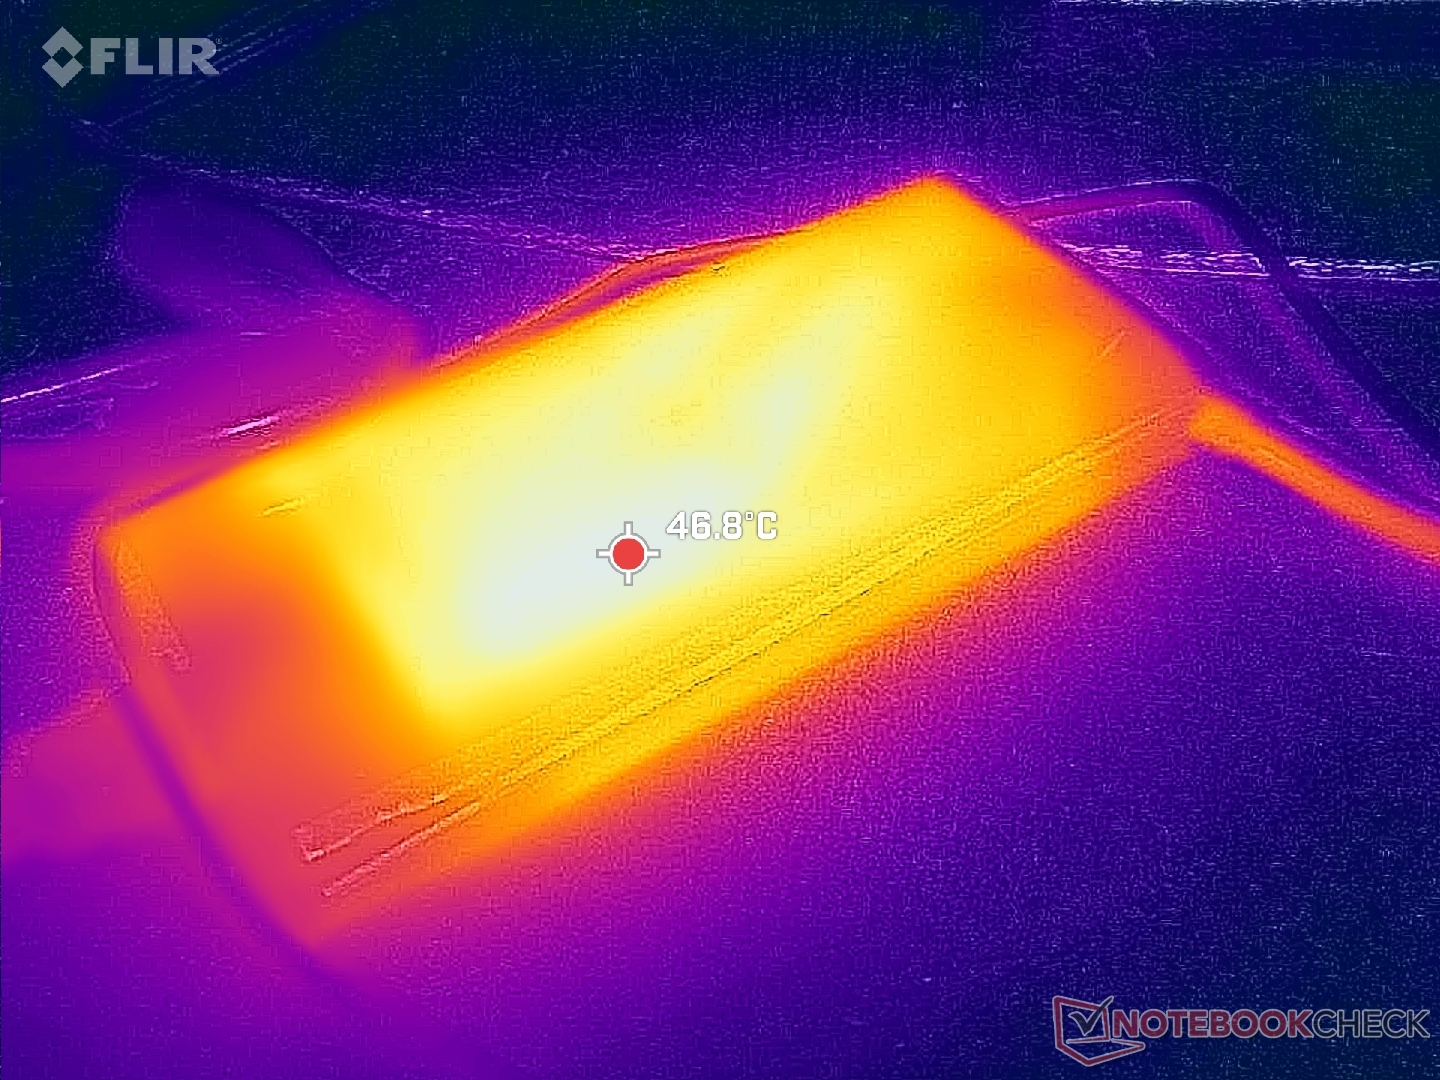
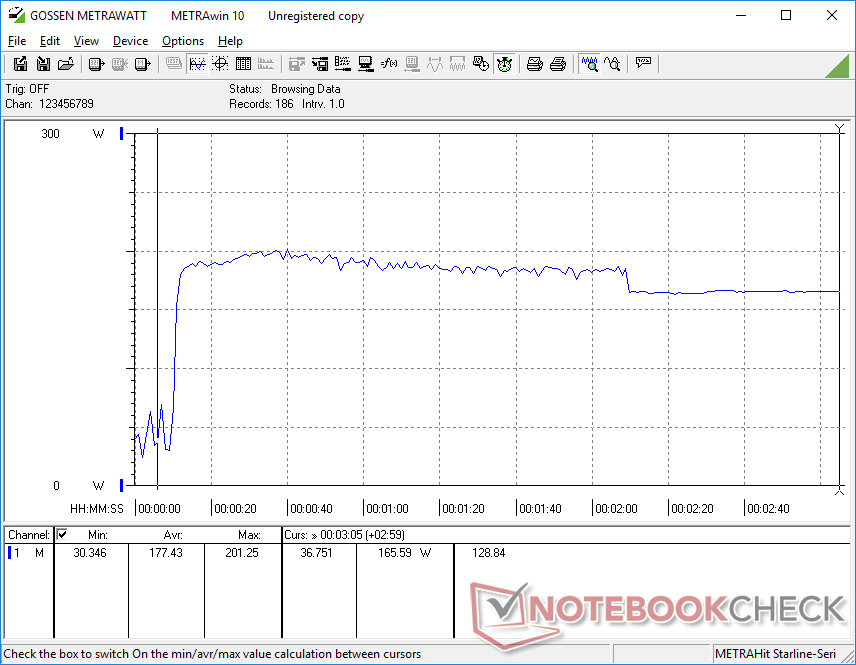
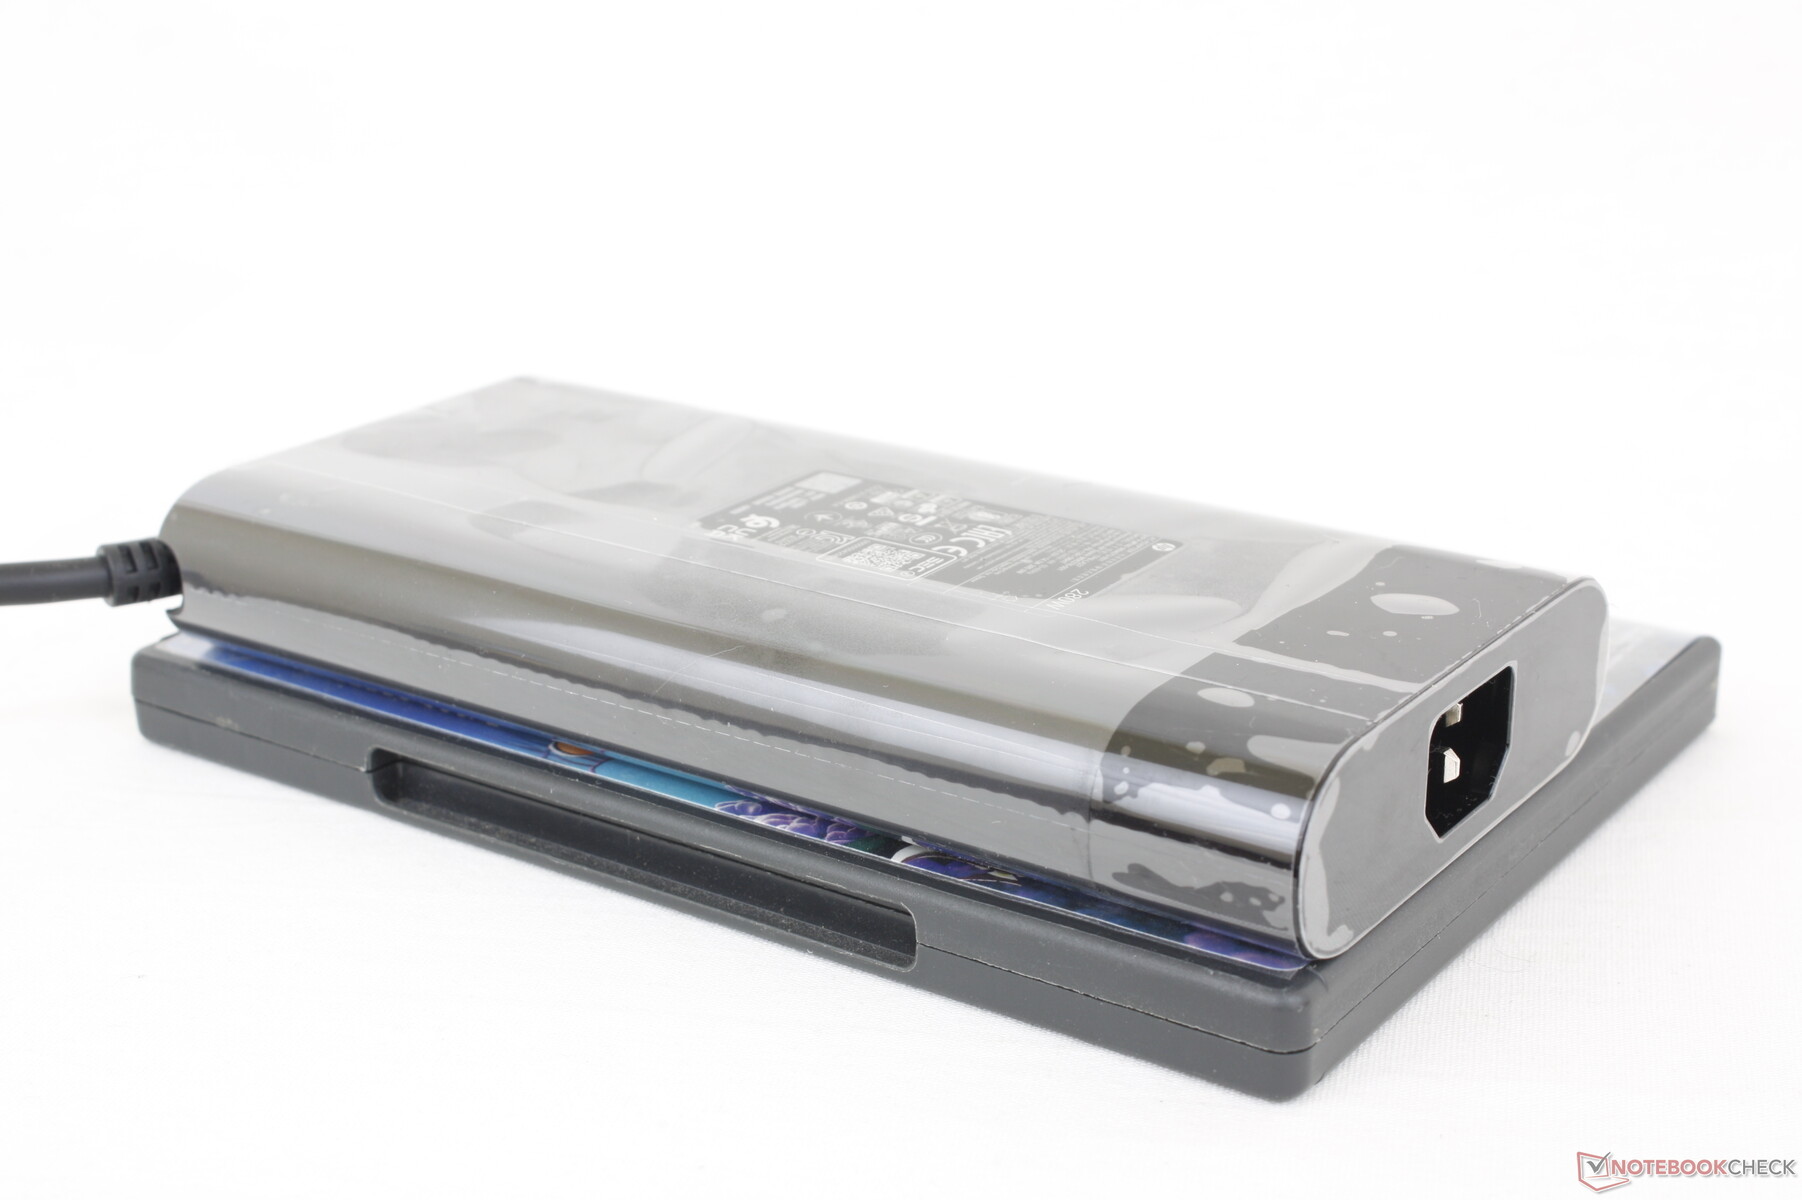
We're able to record a temporary maximum draw of 270 W from the medium-sized (~18 x 8.8 x 2.4 cm) 280 W AC adapter when the CPU and GPU are each at 100 percent utilization. A larger 330 W AC adapter would have likely been overkill.

| Off / Standby | |
| Idle | |
| Load |
|
Key:
min: | |
| HP Omen 16-wf000 i7-13700HX, GeForce RTX 4080 Laptop GPU, SK hynix PC801 HFS002TEJ9X101N, IPS, 2560x1440, 16.1" | HP Omen 16-n0033dx R7 6800H, Radeon RX 6650M, Samsung PM9A1 MZVL21T0HCLR, IPS, 1920x1080, 16.1" | Alienware x16 R1 i9-13900HK, GeForce RTX 4080 Laptop GPU, SK hynix PC801 HFS001TEJ9X101N, IPS, 2560x1600, 16" | Lenovo Legion Pro 7 RTX4090 i9-13900HX, GeForce RTX 4090 Laptop GPU, Samsung PM9A1 MZVL21T0HCLR, IPS, 2560x1600, 16" | Asus ROG Strix G16 G614JZ i9-13980HX, GeForce RTX 4080 Laptop GPU, WD PC SN560 SDDPNQE-1T00, IPS, 2560x1600, 16" | Razer Blade 16 Early 2023 i9-13950HX, GeForce RTX 4080 Laptop GPU, SSSTC CA6-8D1024, IPS, 2560x1600, 16" | |
|---|---|---|---|---|---|---|
| Power Consumption | 34% | -17% | -9% | 11% | -3% | |
| Idle Minimum * (Watt) | 21.8 | 7.9 64% | 25.2 -16% | 20 8% | 10 54% | 15.2 30% |
| Idle Average * (Watt) | 26 | 11.5 56% | 29.9 -15% | 25 4% | 16 38% | 22.8 12% |
| Idle Maximum * (Watt) | 36 | 18.3 49% | 49.8 -38% | 35 3% | 27 25% | 49.8 -38% |
| Load Average * (Watt) | 115.5 | 88.1 24% | 105.4 9% | 136 -18% | 129 -12% | 121.2 -5% |
| Witcher 3 ultra * (Watt) | 214 | 206 4% | 263 -23% | 282 -32% | 247 -15% | 242 -13% |
| Load Maximum * (Watt) | 269.7 | 246.4 9% | 313.8 -16% | 320 -19% | 342 -27% | 273.7 -1% |
* ... smaller is better
Power Consumption Witcher 3 / Stresstest
Power Consumption external Monitor
Battery Life
Battery capacity has increased to 83 Wh from 68 Wh on last year's model. Unfortunately, battery life is shorter than before by almost 2 full hours. We're able to record a WLAN runtime of just over 5 hours similar to the Legion Pro 7 even when on the Balanced power profile with the iGPU active.
Charging from empty to full capacity takes about 90 minutes with the included barrel AC adapter. The system can also be charged via USB-C, but compatibility is not guaranteed. For example, connecting our 130 W Dell USB-C AC adapter would result in a pop-up message claiming incompatibility while our 135 W Lenovo USB-C adapter would charge without any issues.
| HP Omen 16-wf000 i7-13700HX, GeForce RTX 4080 Laptop GPU, 83 Wh | HP Omen 16-n0033dx R7 6800H, Radeon RX 6650M, 68 Wh | Alienware x16 R1 i9-13900HK, GeForce RTX 4080 Laptop GPU, 90 Wh | Lenovo Legion Pro 7 RTX4090 i9-13900HX, GeForce RTX 4090 Laptop GPU, 99.9 Wh | Asus ROG Strix G16 G614JZ i9-13980HX, GeForce RTX 4080 Laptop GPU, 90 Wh | Razer Blade 16 Early 2023 i9-13950HX, GeForce RTX 4080 Laptop GPU, 95.2 Wh | |
|---|---|---|---|---|---|---|
| Battery runtime | 40% | -18% | 0% | 45% | 36% | |
| Reader / Idle (h) | 5.5 | 10 82% | 7.3 33% | 8.9 62% | ||
| WiFi v1.3 (h) | 5.1 | 7 37% | 2.5 -51% | 5.1 0% | 9.7 90% | 6.1 20% |
| Load (h) | 1.1 | 1.1 0% | 0.7 -36% | 1.1 0% | 1.4 27% |
Pros
Cons
Verdict — Low Barrier To Entry For A Thin And Attractive Design
Perhaps the most lucrative aspect of the 2023 Omen 16 is its affordable starting price of $1100 USD for the Core i7-13700HX, RTX 4060, and 16 GB RAM configuration. It's an upper midrange chassis with better build quality and a sleeker design than similarly-priced budget gaming laptops like the MSI Katana, Dell G16 series, or the Asus TUF F series. If you're in the market for an RTX 4060 laptop without having to settle for cheap plastic materials, then the Omen 16 is worth considering.
The new model is slightly thicker and wider than its predecessor and with shorter battery life as well, but the changes are arguably worth the much faster CPU and GPU performance. Weight remains about the same despite the size differences and most gamers may not mind the shorter runtimes.
The 2023 Omen 16 looks and performs better than what its low starting price would otherwise suggest.
Two notable features missing from the Omen 16 are DCI-P3 support and an integrated SD card reader. These don't impact the core gaming experience of the system, but gamers who are also content creators may want to consider the Alienware x16 R1 or Razer Blade 16 instead which offer card readers, wider colors, and higher native resolutions. Of course, these double-duty alternatives are also notably more expensive.
Price and Availability
The 2023 Omen 16 is now directly shipping from HP starting at $1100 USD for the base RTX 4060 configuration up to $2600 USD for our RTX 4080 configuration as reviewed.
HP Omen 16-wf000
- 09/13/2023 v7 (old)
Allen Ngo
Transparency
The selection of devices to be reviewed is made by our editorial team. The test sample was provided to the author as a loan by the manufacturer or retailer for the purpose of this review. The lender had no influence on this review, nor did the manufacturer receive a copy of this review before publication. There was no obligation to publish this review. As an independent media company, Notebookcheck is not subjected to the authority of manufacturers, retailers or publishers.
This is how Notebookcheck is testing
Every year, Notebookcheck independently reviews hundreds of laptops and smartphones using standardized procedures to ensure that all results are comparable. We have continuously developed our test methods for around 20 years and set industry standards in the process. In our test labs, high-quality measuring equipment is utilized by experienced technicians and editors. These tests involve a multi-stage validation process. Our complex rating system is based on hundreds of well-founded measurements and benchmarks, which maintains objectivity. Further information on our test methods can be found here.
Price comparison
