HP Omen 16 (2024) review: QHD gaming notebook with Core i9 and RTX 4080 for €3,200
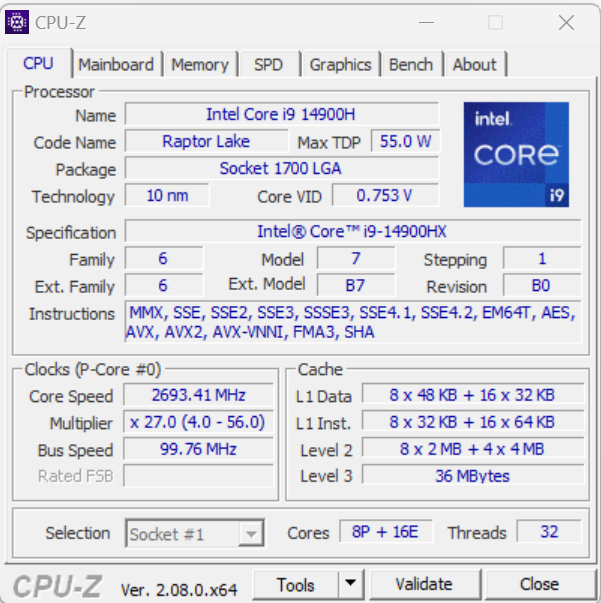
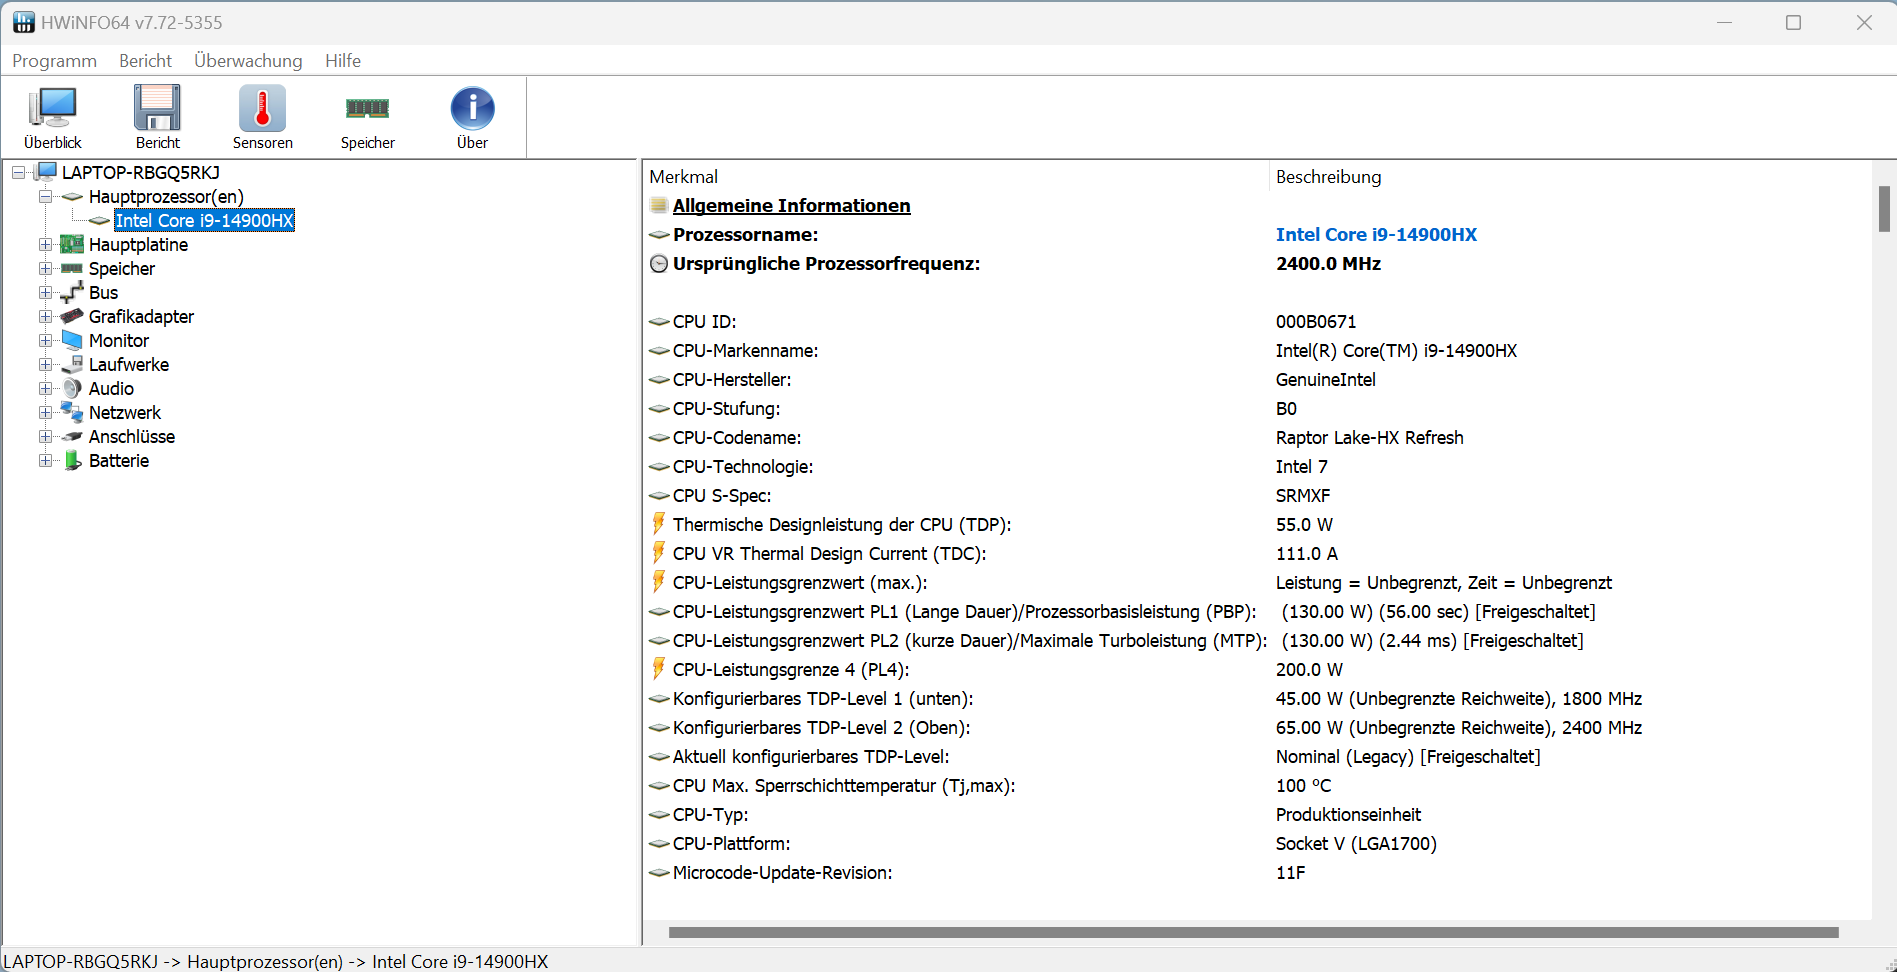
The latest incarnation of the Omen 16 – a high-end gaming laptop – shares the same chassis and largely the same hardware as the predecessor. The CPU has been improved: Raptor Lake Refresh replaces the original Raptor Lake. The GeForce RTX 4080, Core i9-14900HX and 32 GB of RAM drive up the laptop’s price to €3,200 (US$3,446). The Omen 16 is up against gaming laptops like the MSI Vector 16 HX A14V, the Acer Predator Helios 18 and the Alienware m16 R1.
Comparison with possible competitors
Rating | Date | Model | Weight | Height | Size | Resolution | Price |
|---|---|---|---|---|---|---|---|
| 86.7 % v7 (old) | 02 / 2024 | HP Omen 16 (2024) i9-14900HX, GeForce RTX 4080 Laptop GPU | 2.4 kg | 23.5 mm | 16.10" | 2560x1440 | |
| 88 % v7 (old) | 02 / 2024 | MSI Vector 16 HX A14V i9-14900HX, GeForce RTX 4080 Laptop GPU | 2.7 kg | 28.55 mm | 16.00" | 2560x1600 | |
| 89.2 % v7 (old) | 08 / 2023 | Alienware m16 R1 AMD R9 7845HX, GeForce RTX 4080 Laptop GPU | 3.1 kg | 25.4 mm | 16.00" | 2560x1600 | |
| 88.3 % v7 (old) | 10 / 2023 | Acer Predator Helios 18 N23Q2 i9-13900HX, GeForce RTX 4080 Laptop GPU | 3.2 kg | 29.15 mm | 18.00" | 2560x1600 |
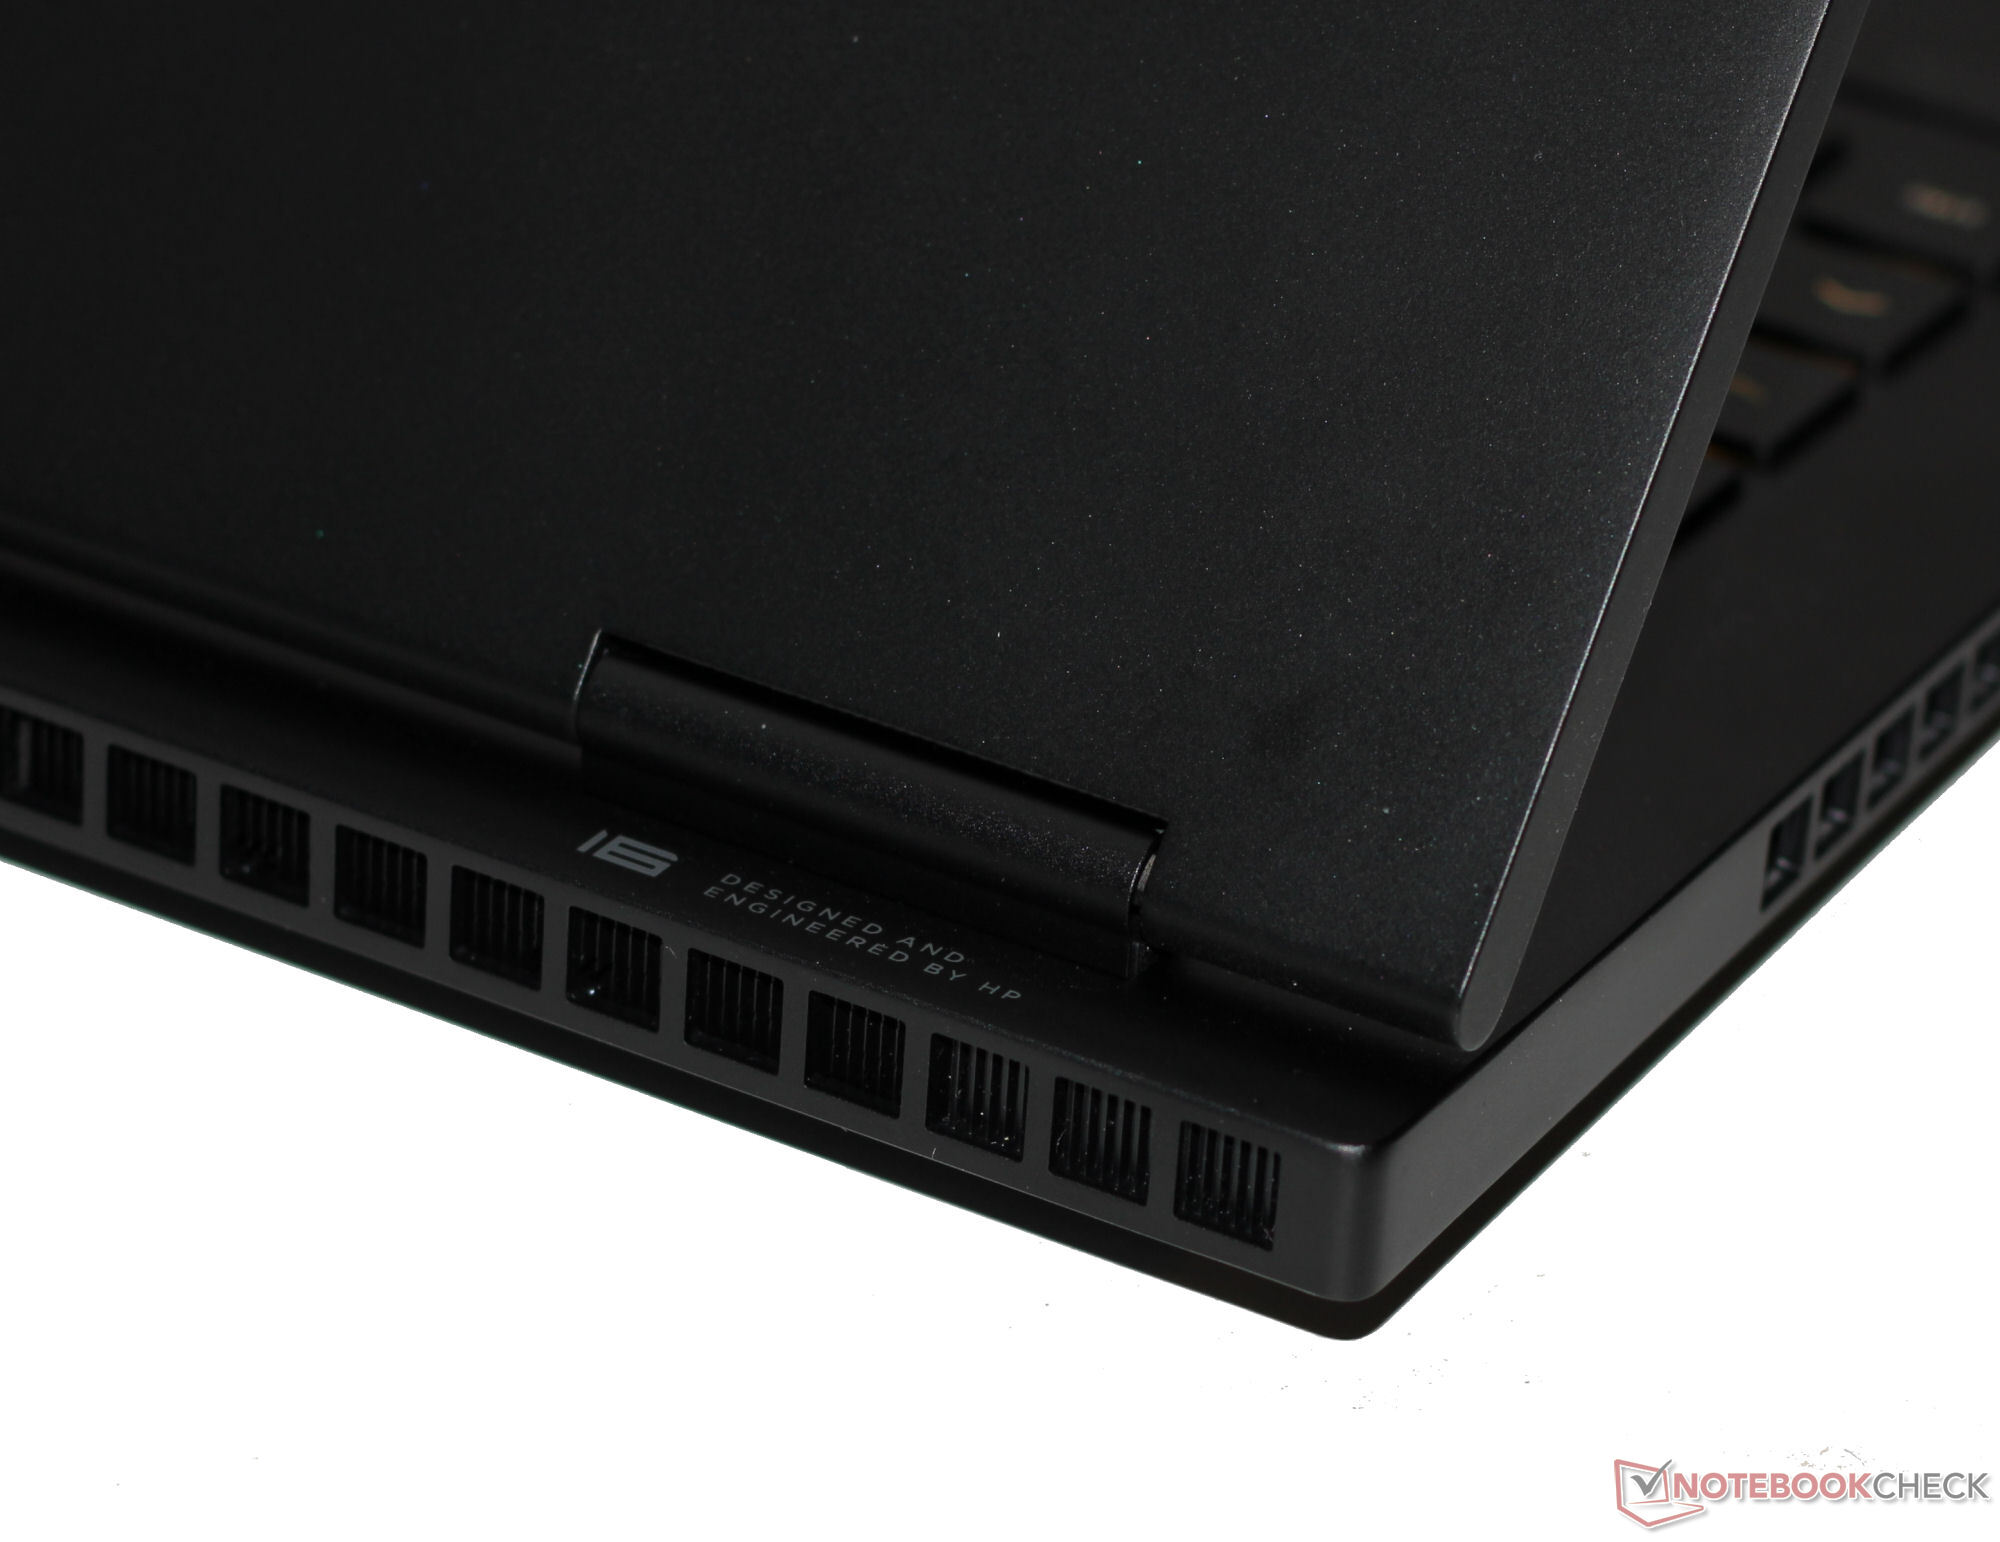
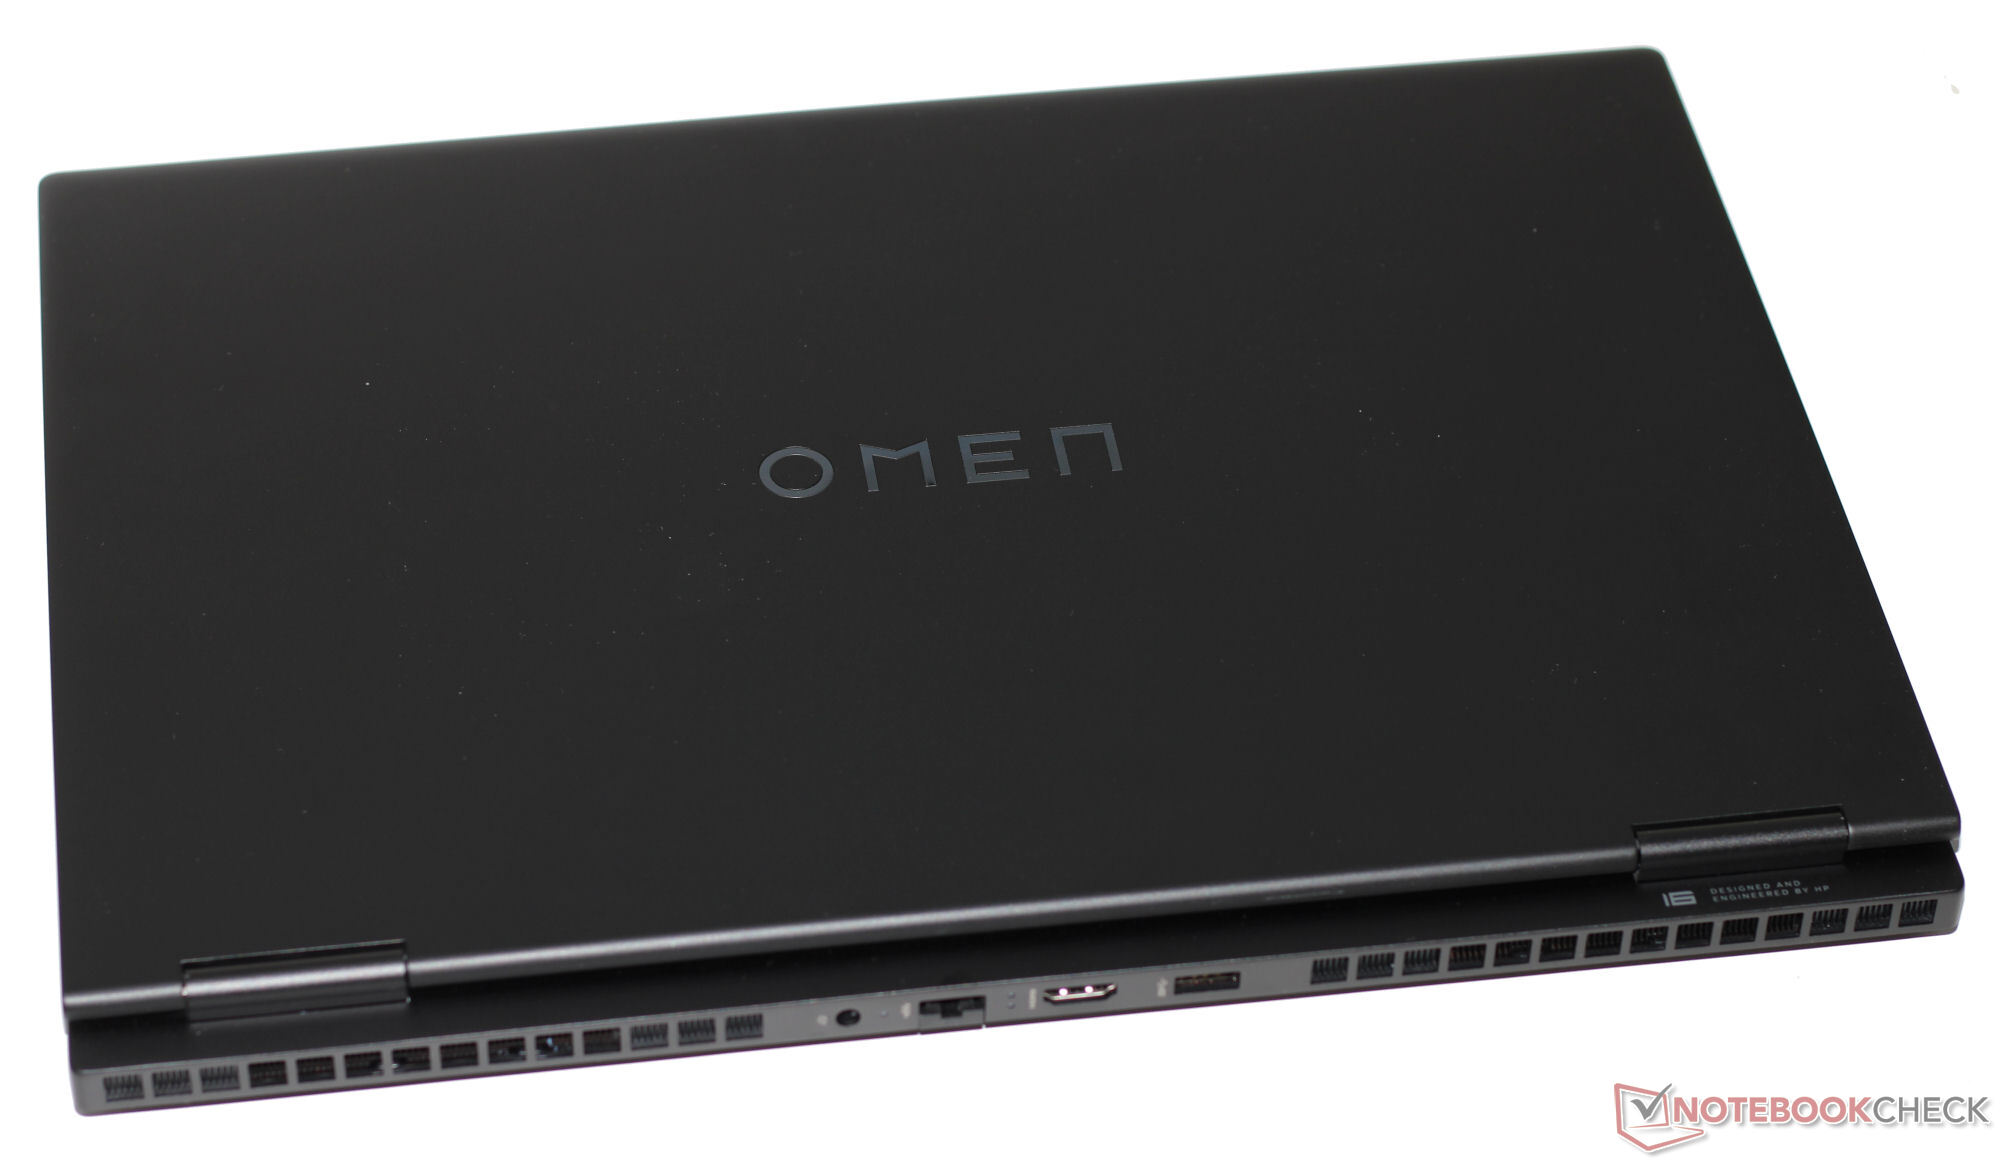
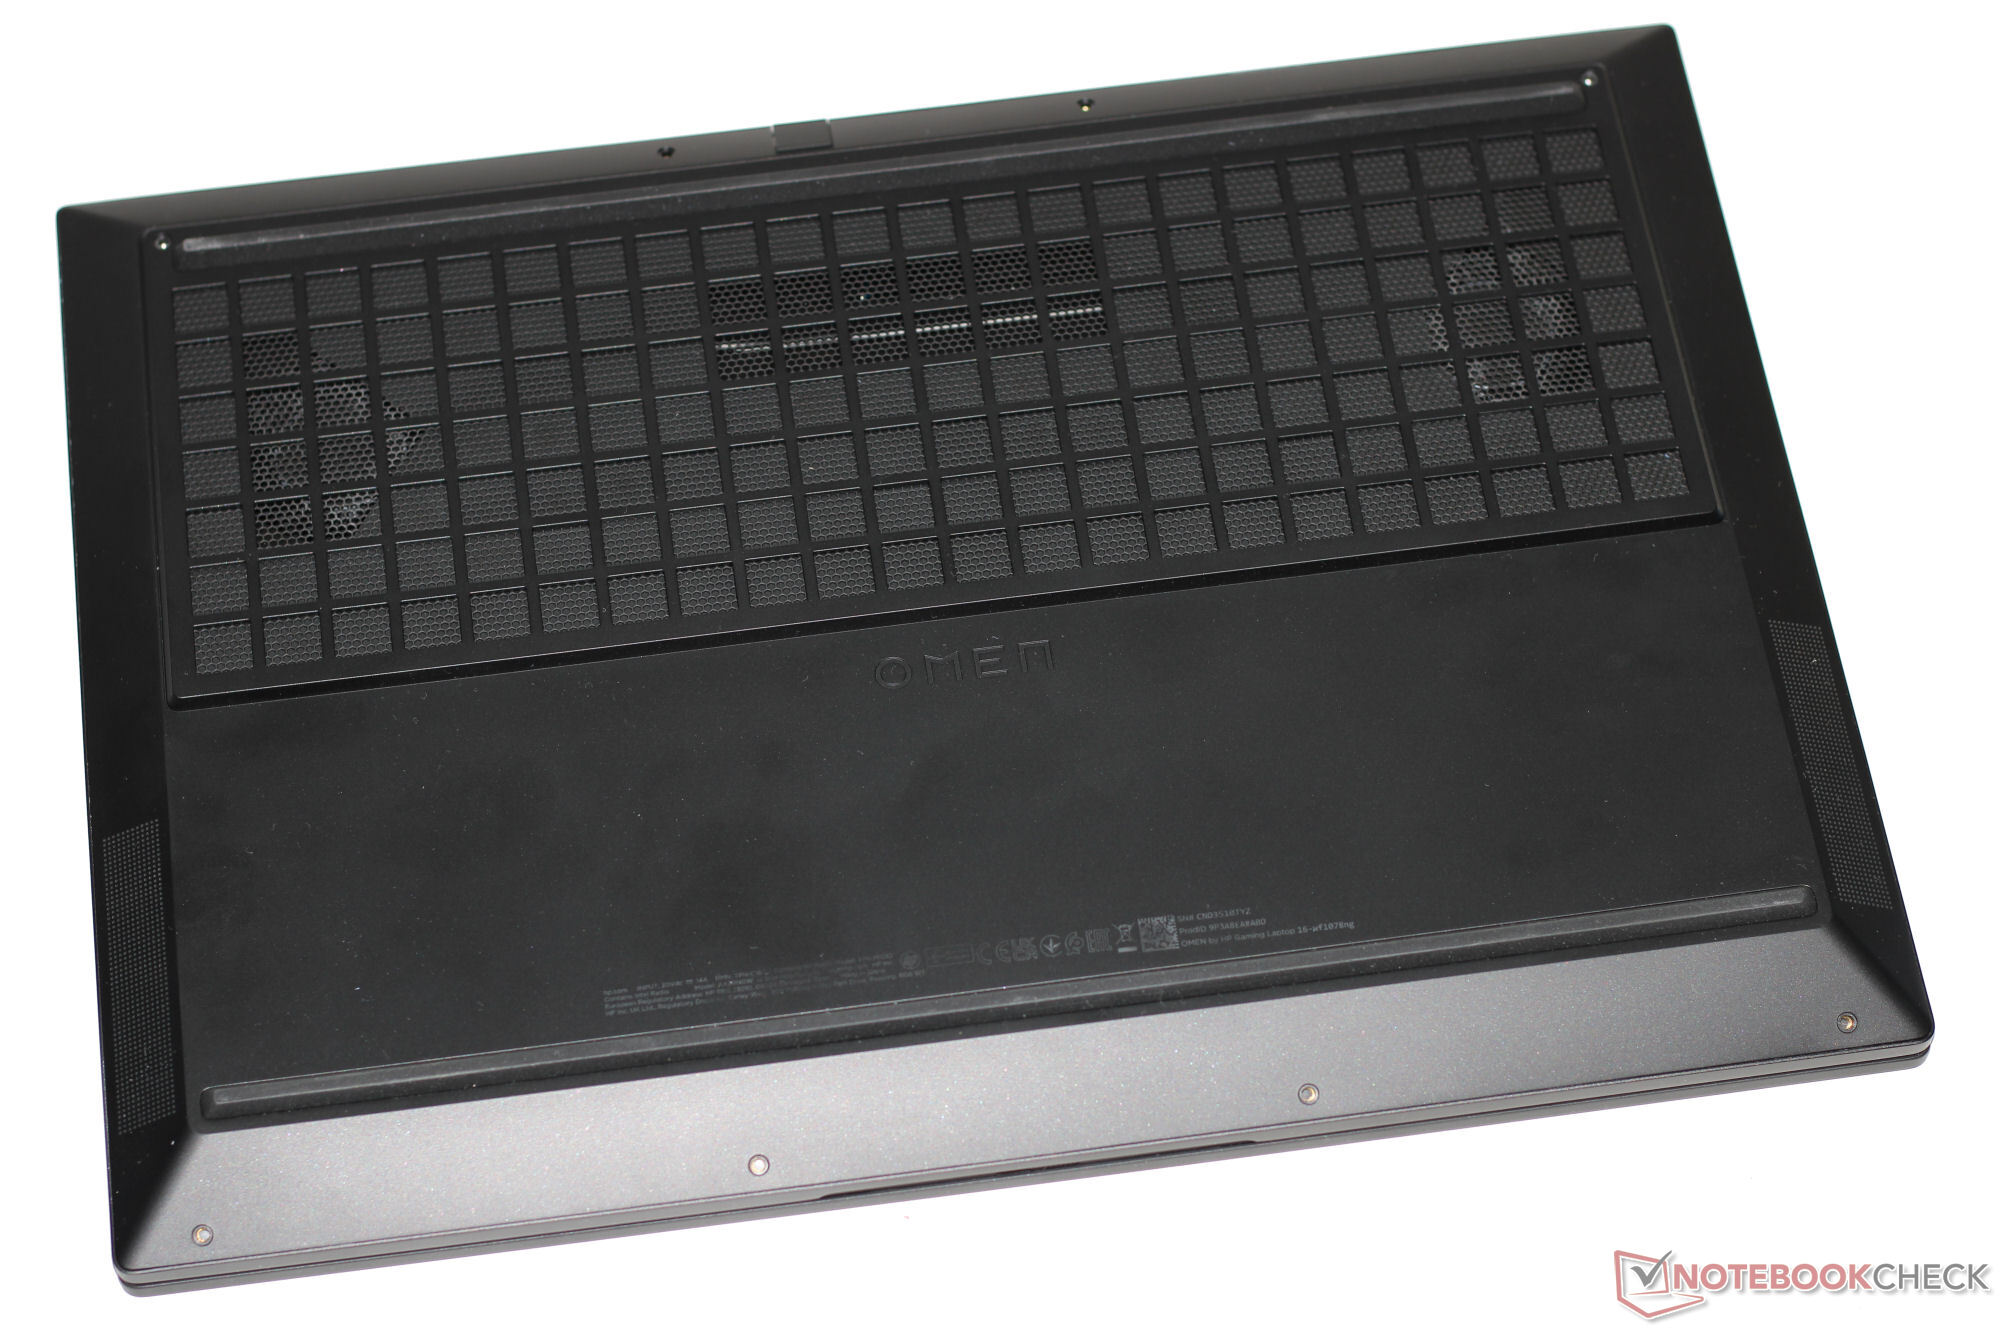
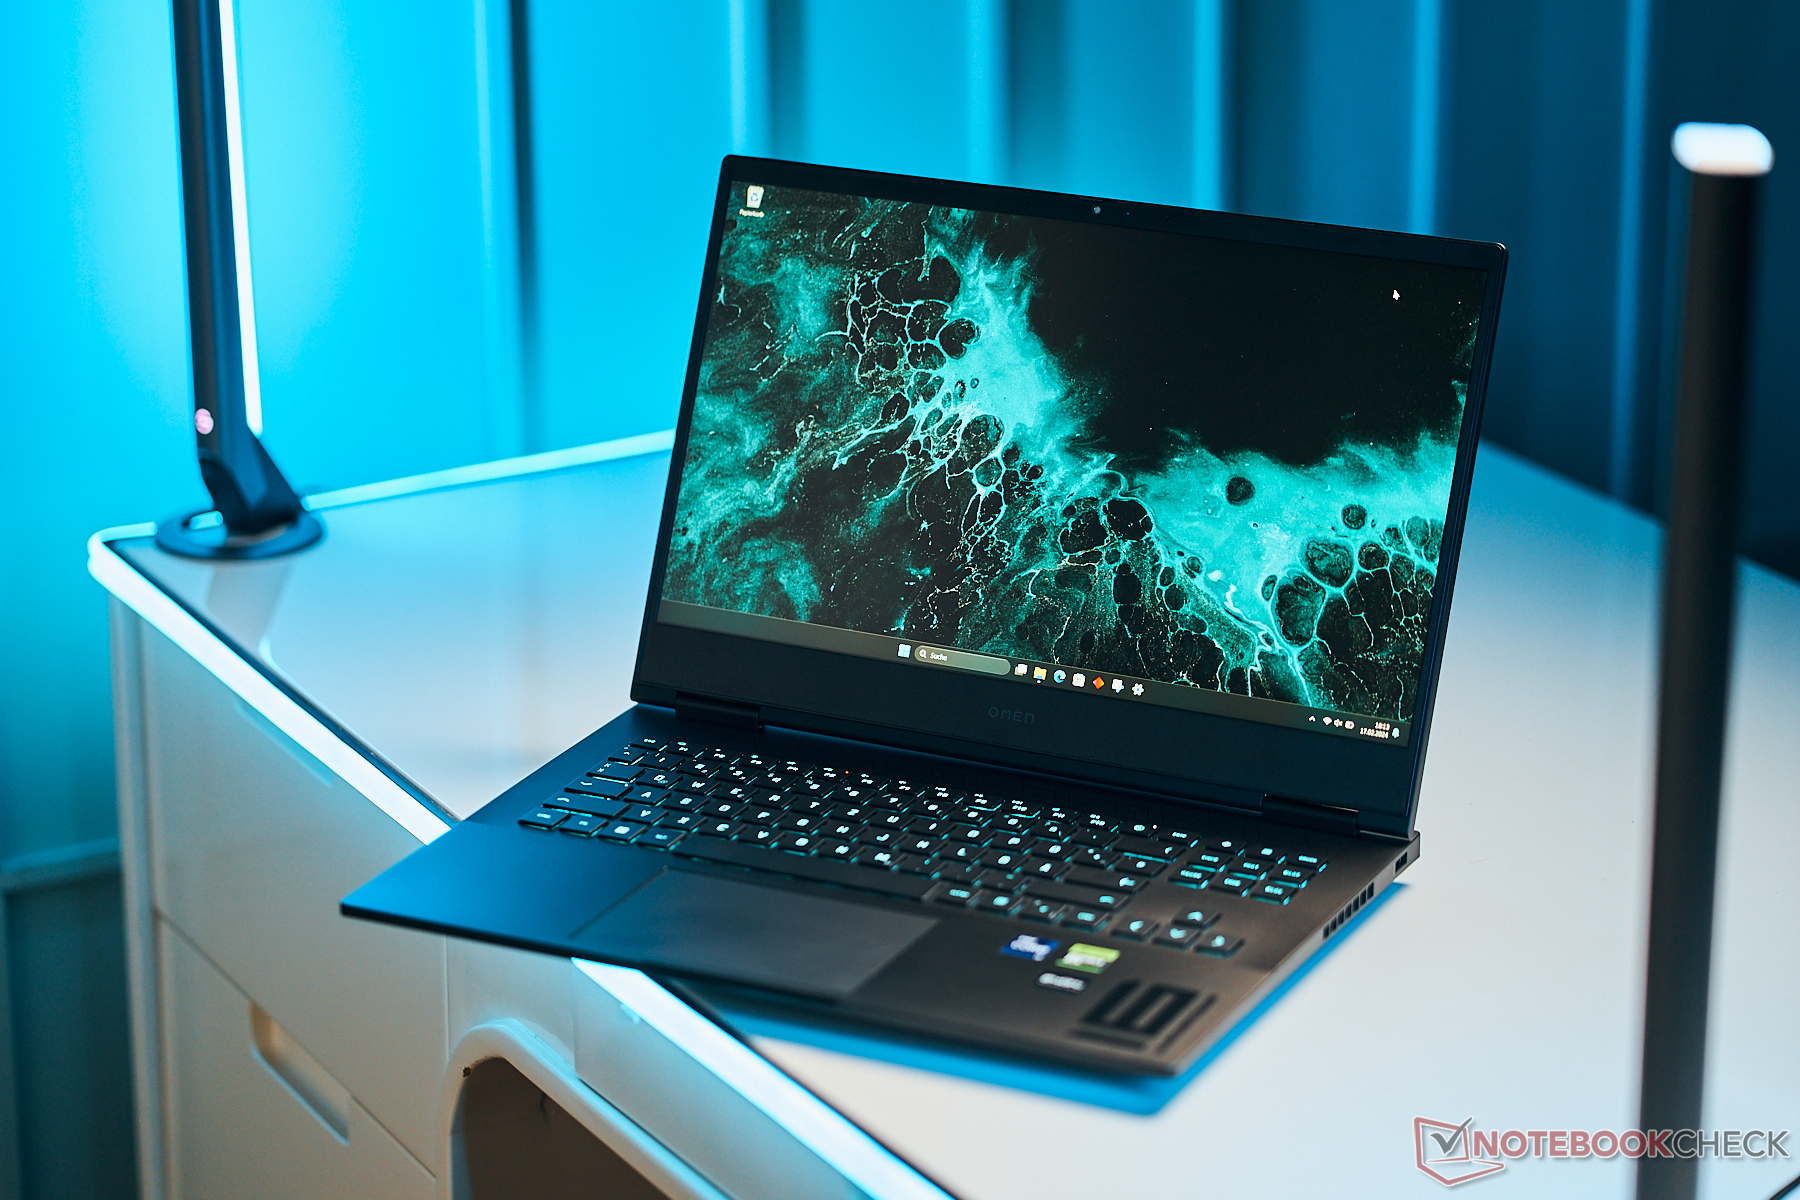
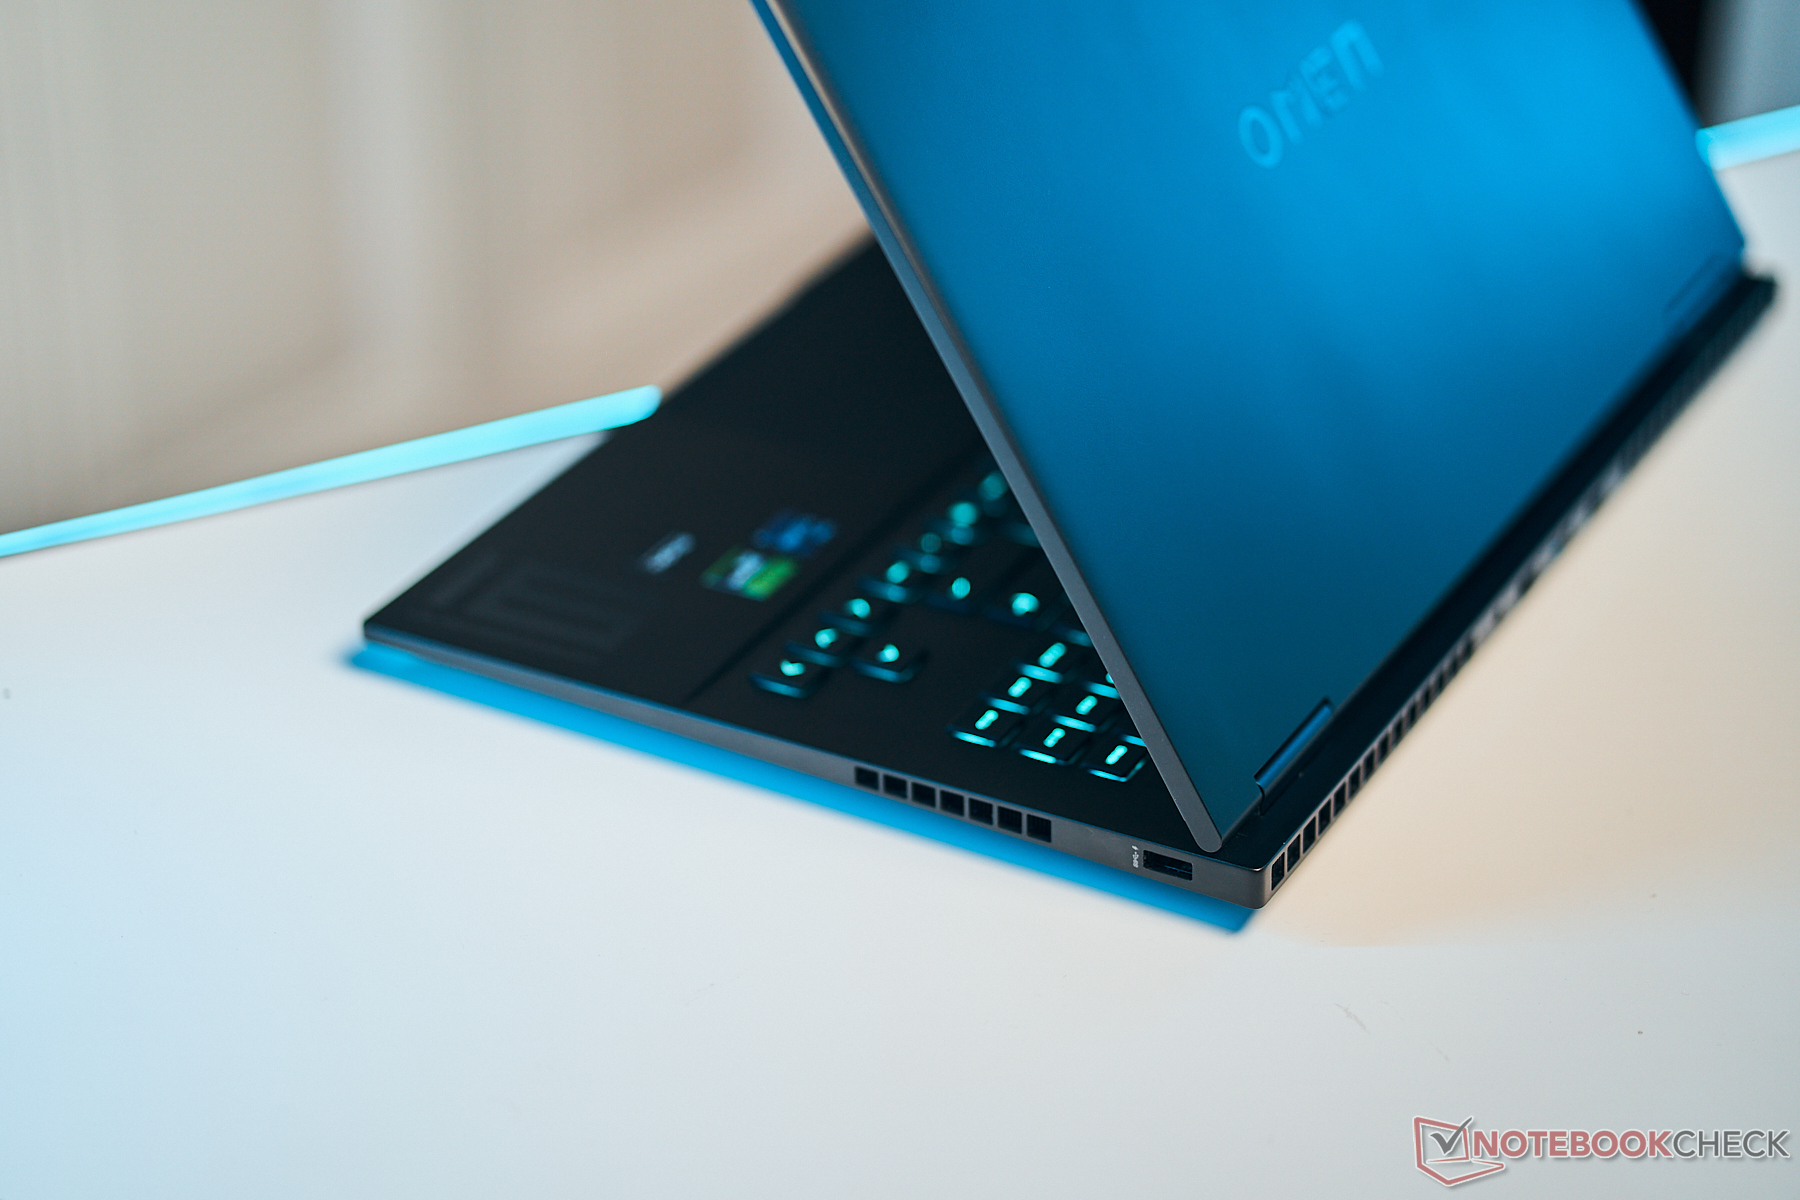
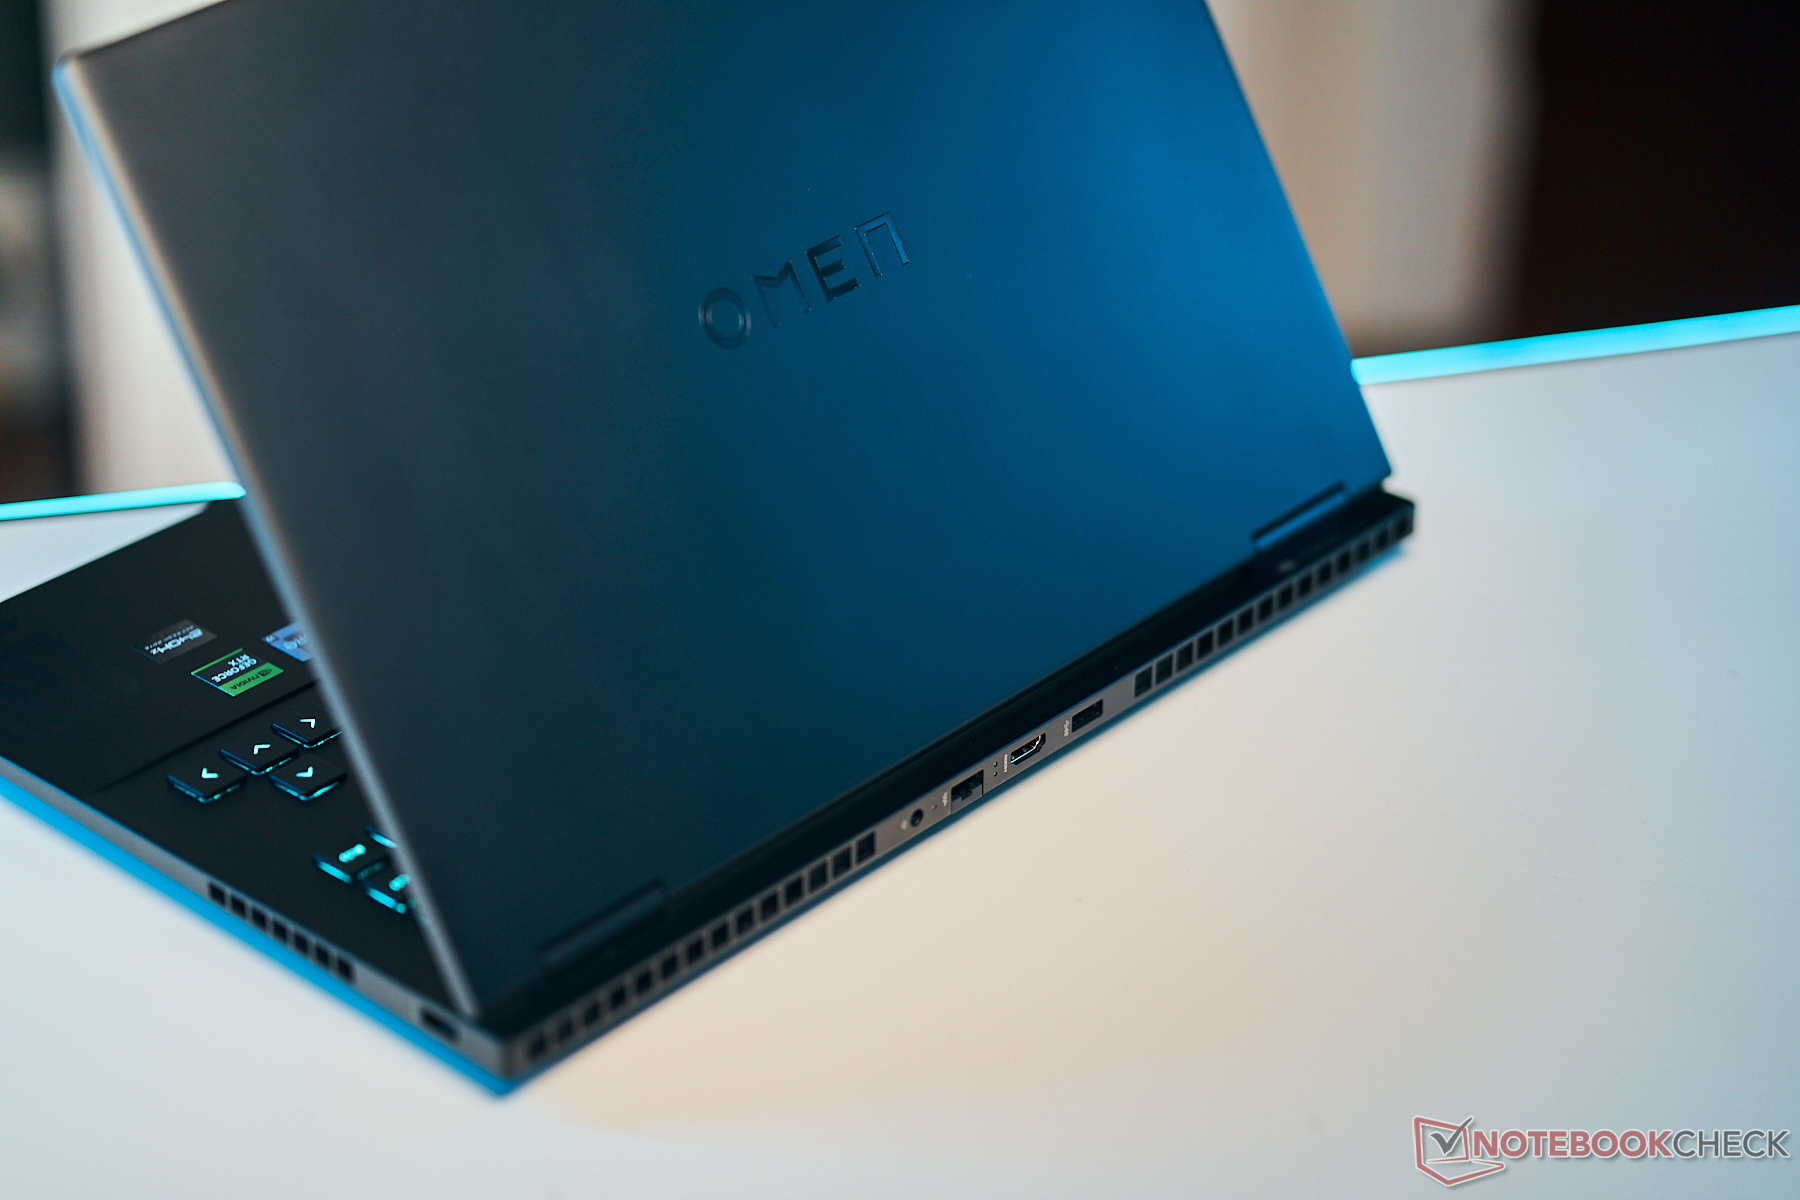
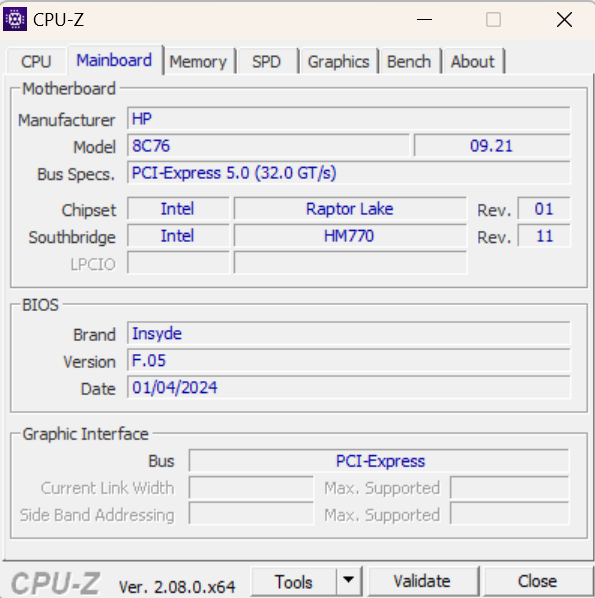
Case & specifications - HP laptop with Thunderbolt 4
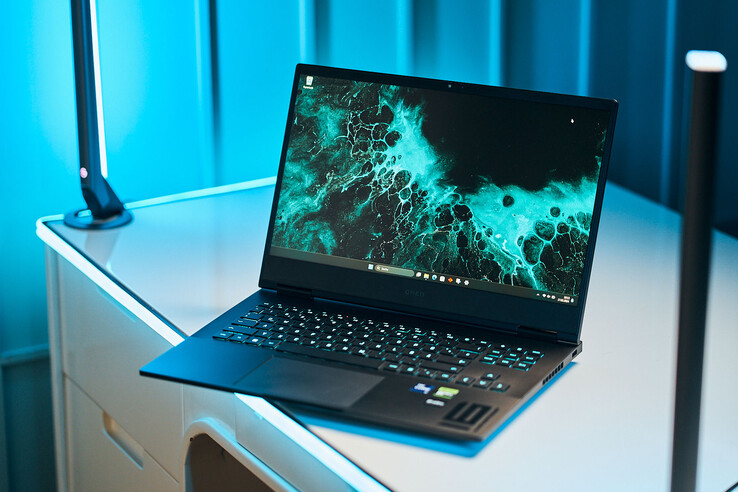
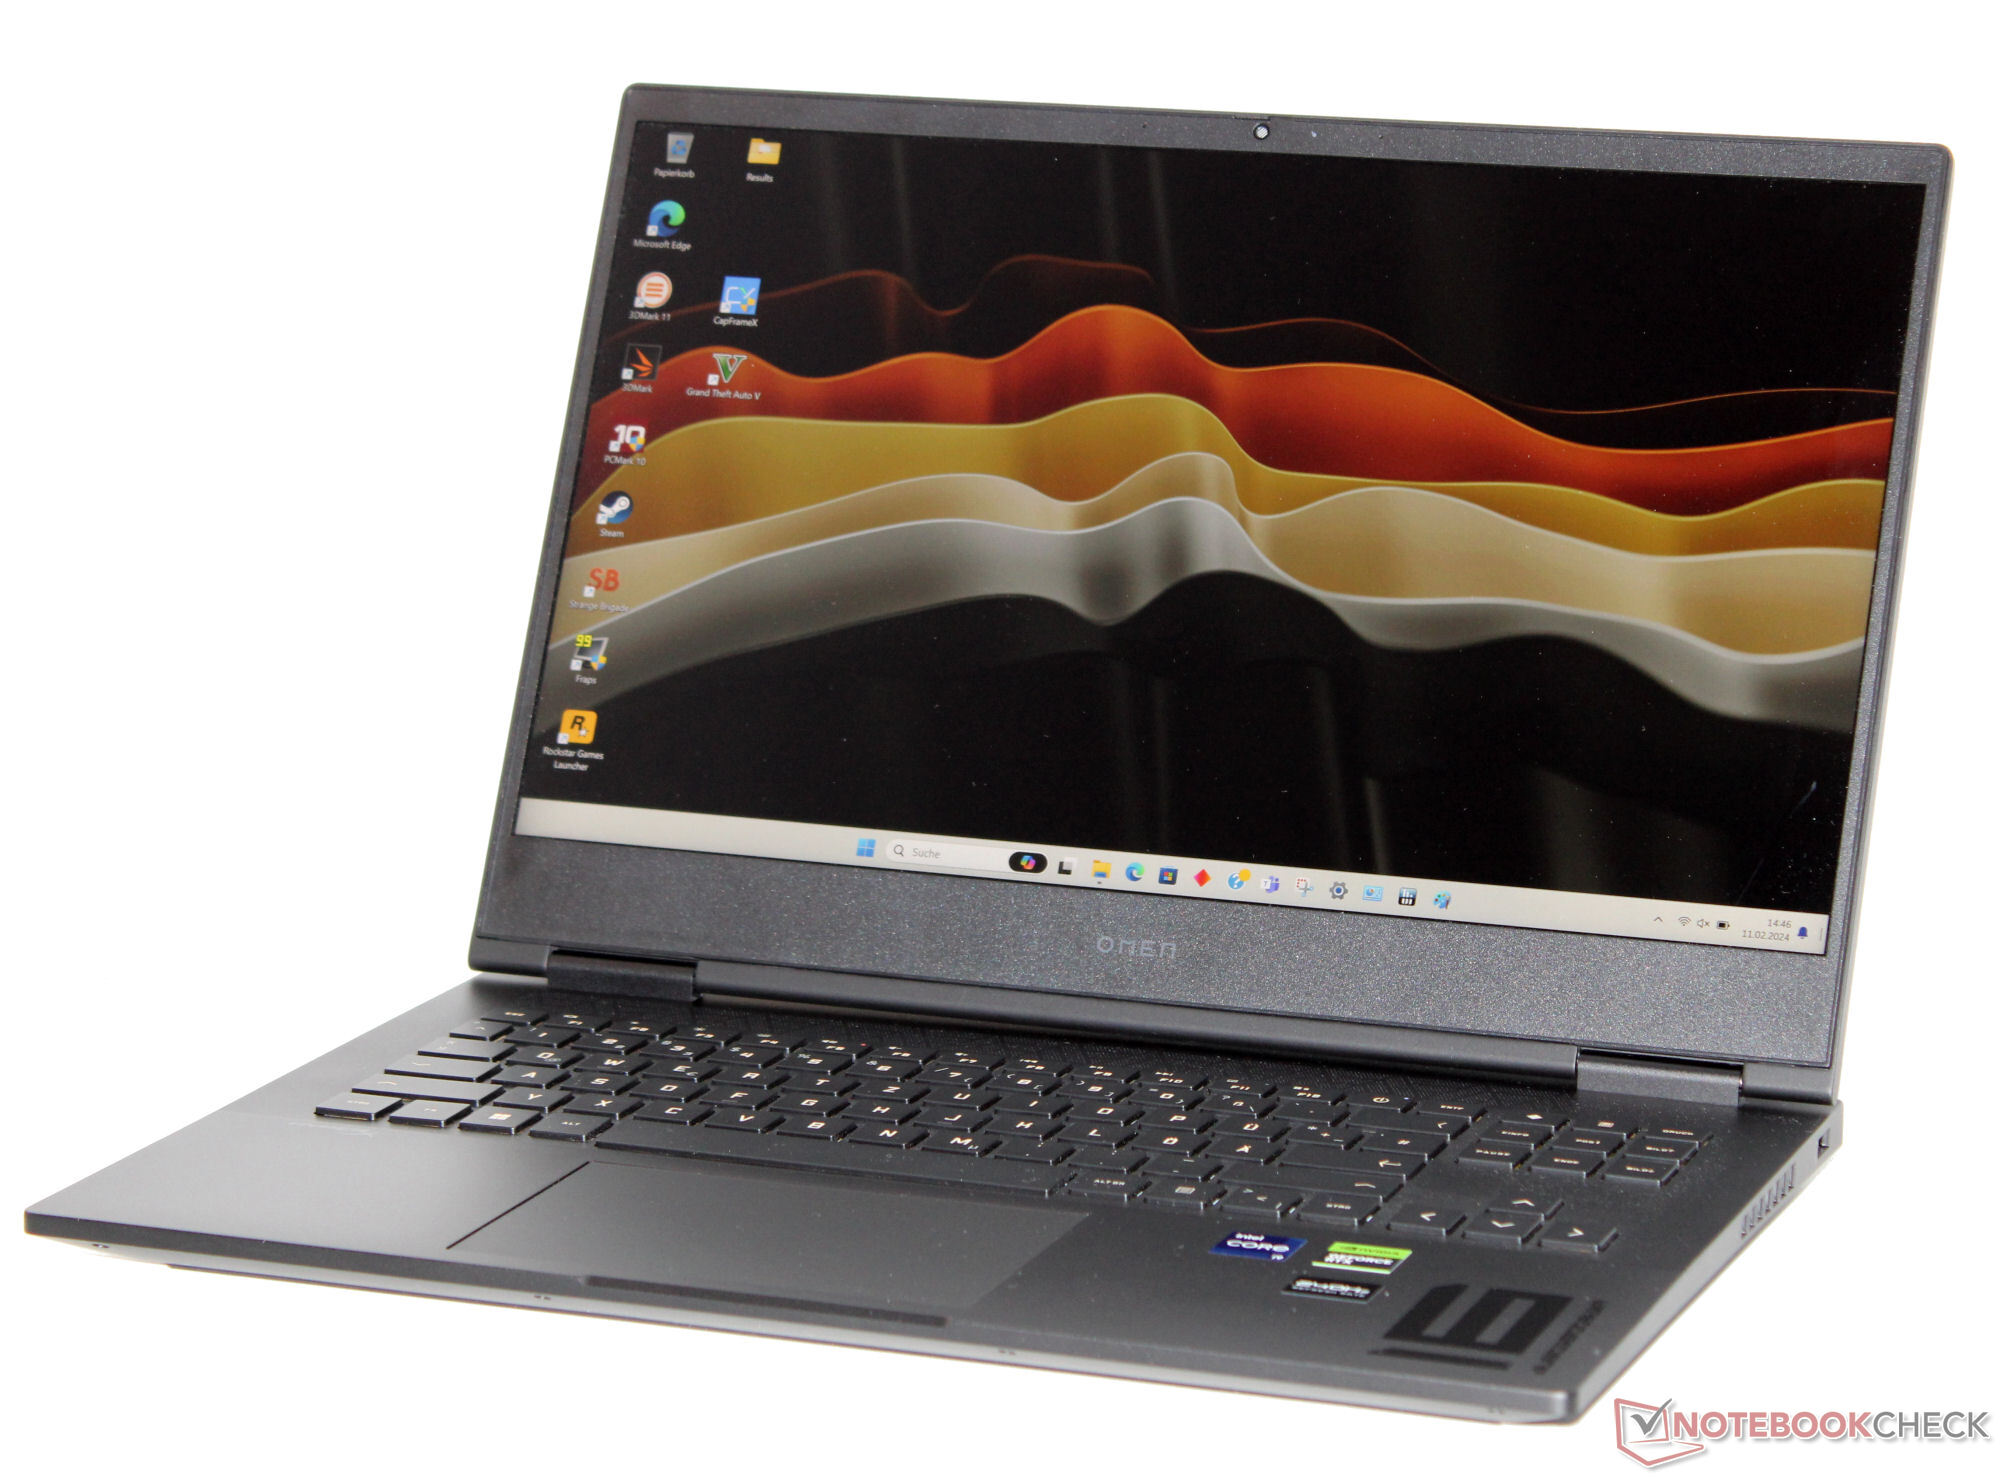
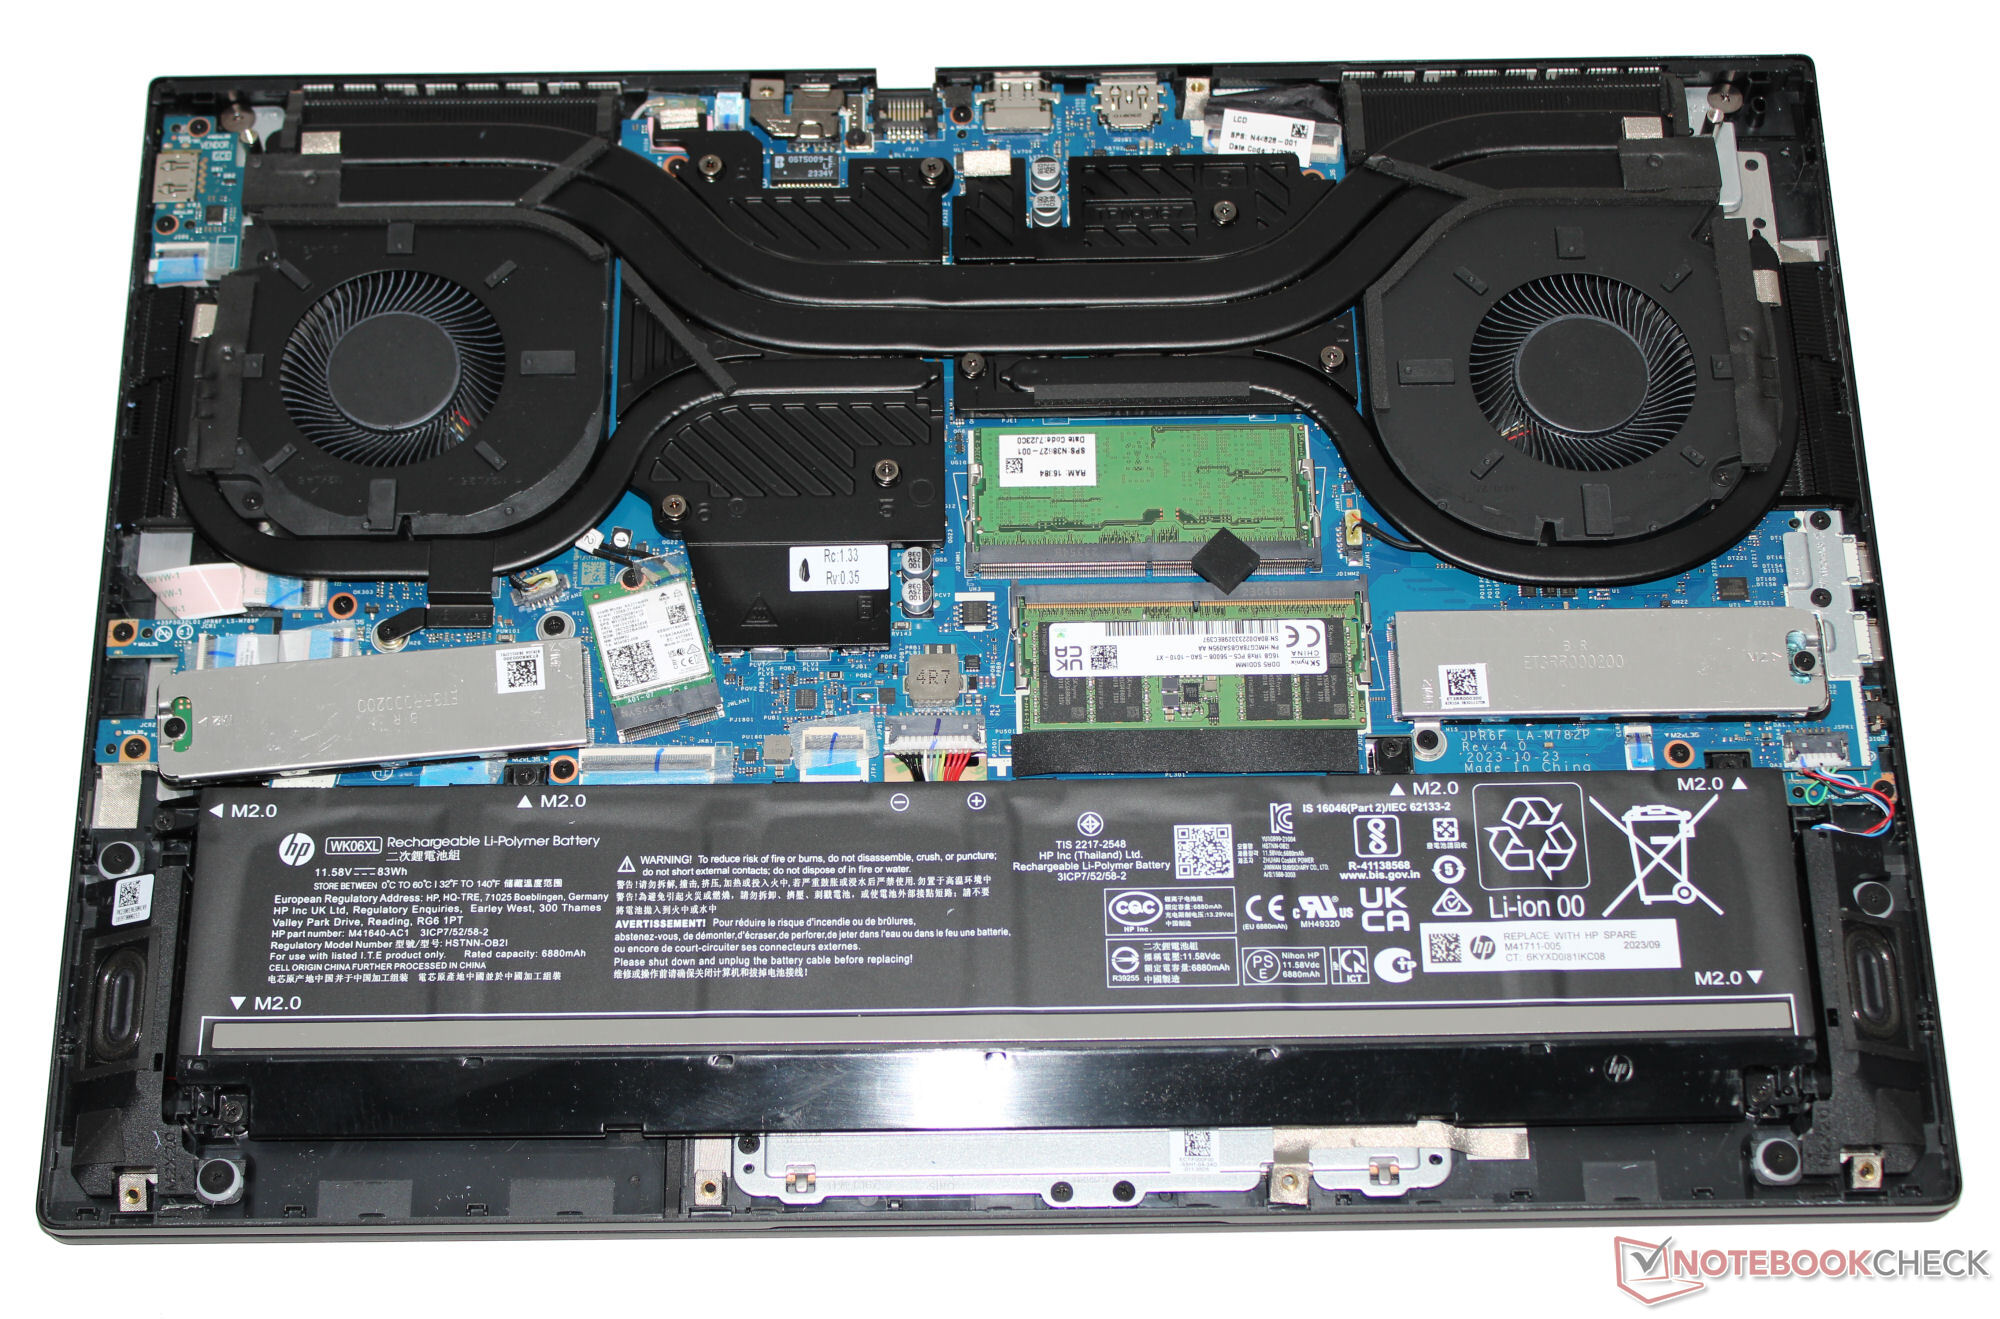
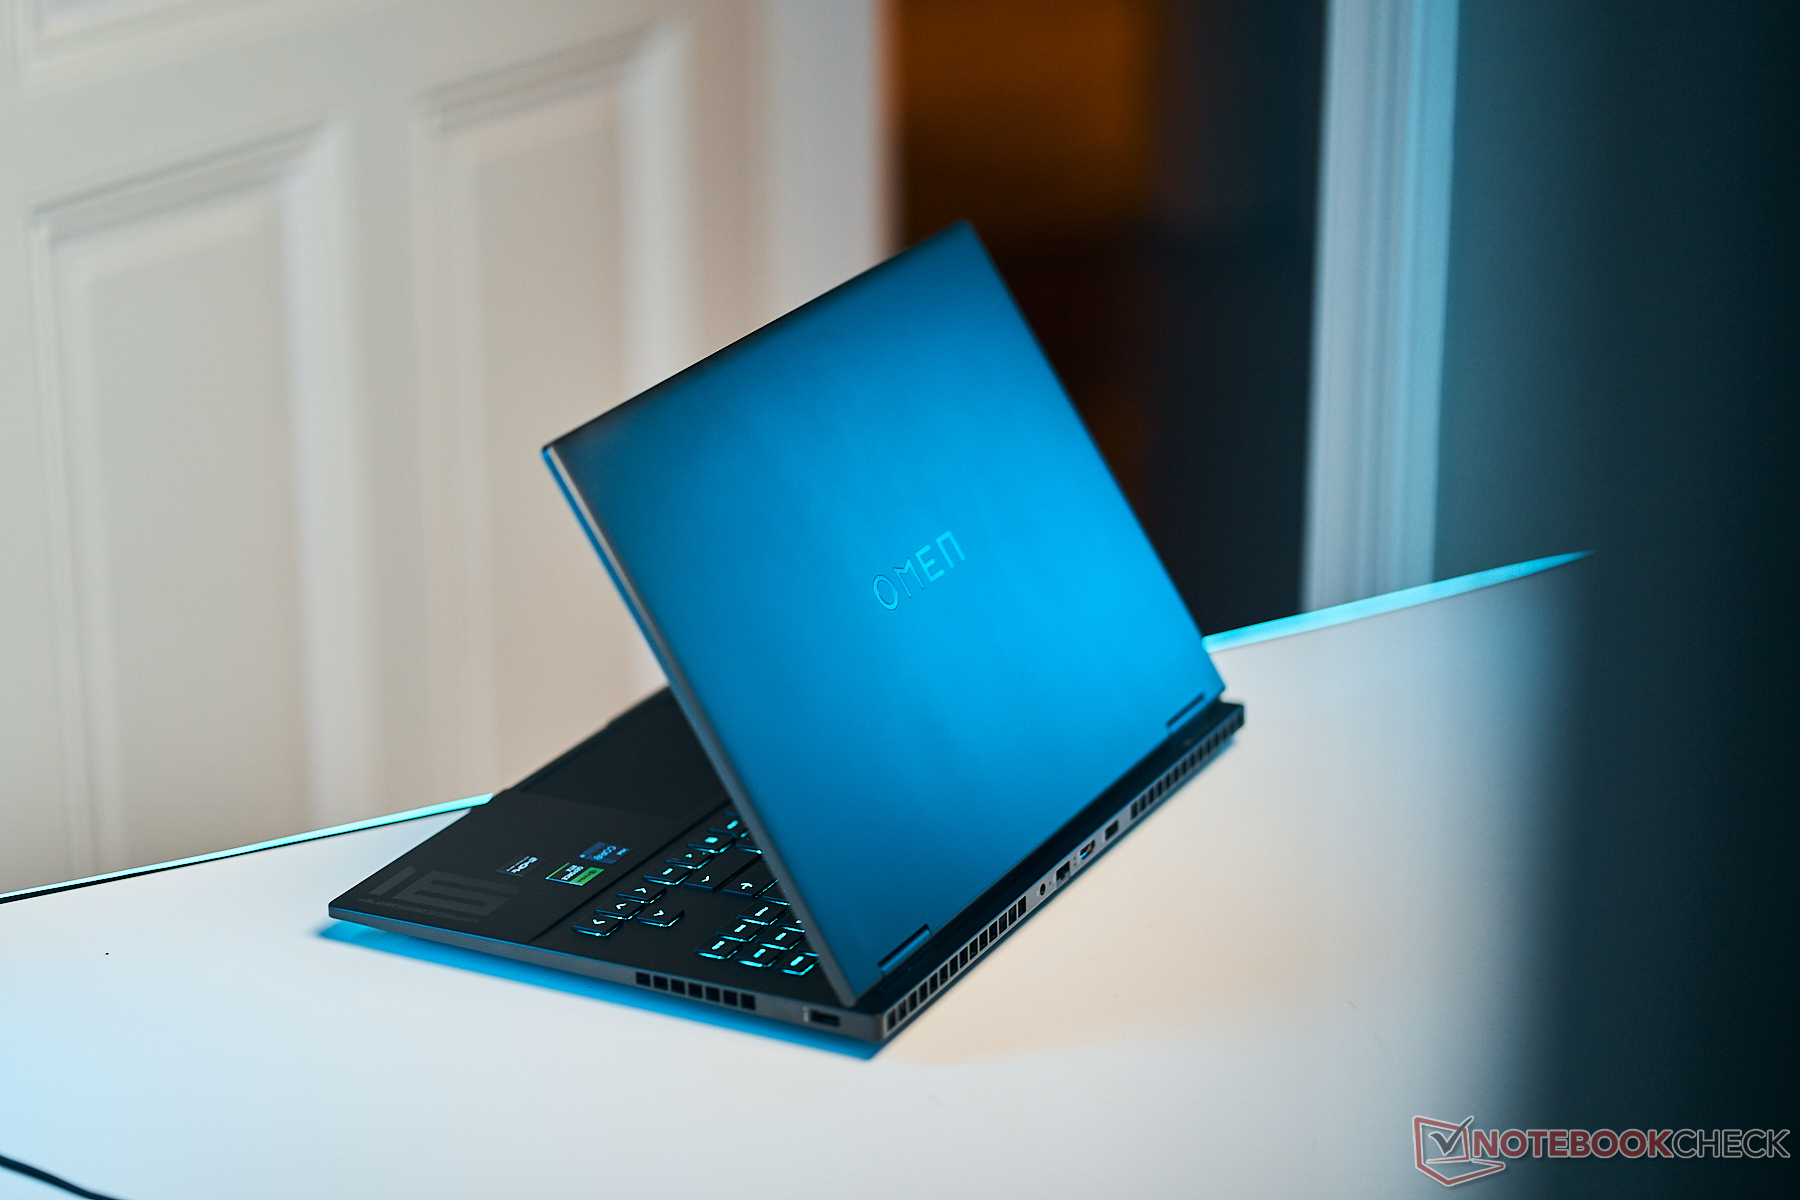
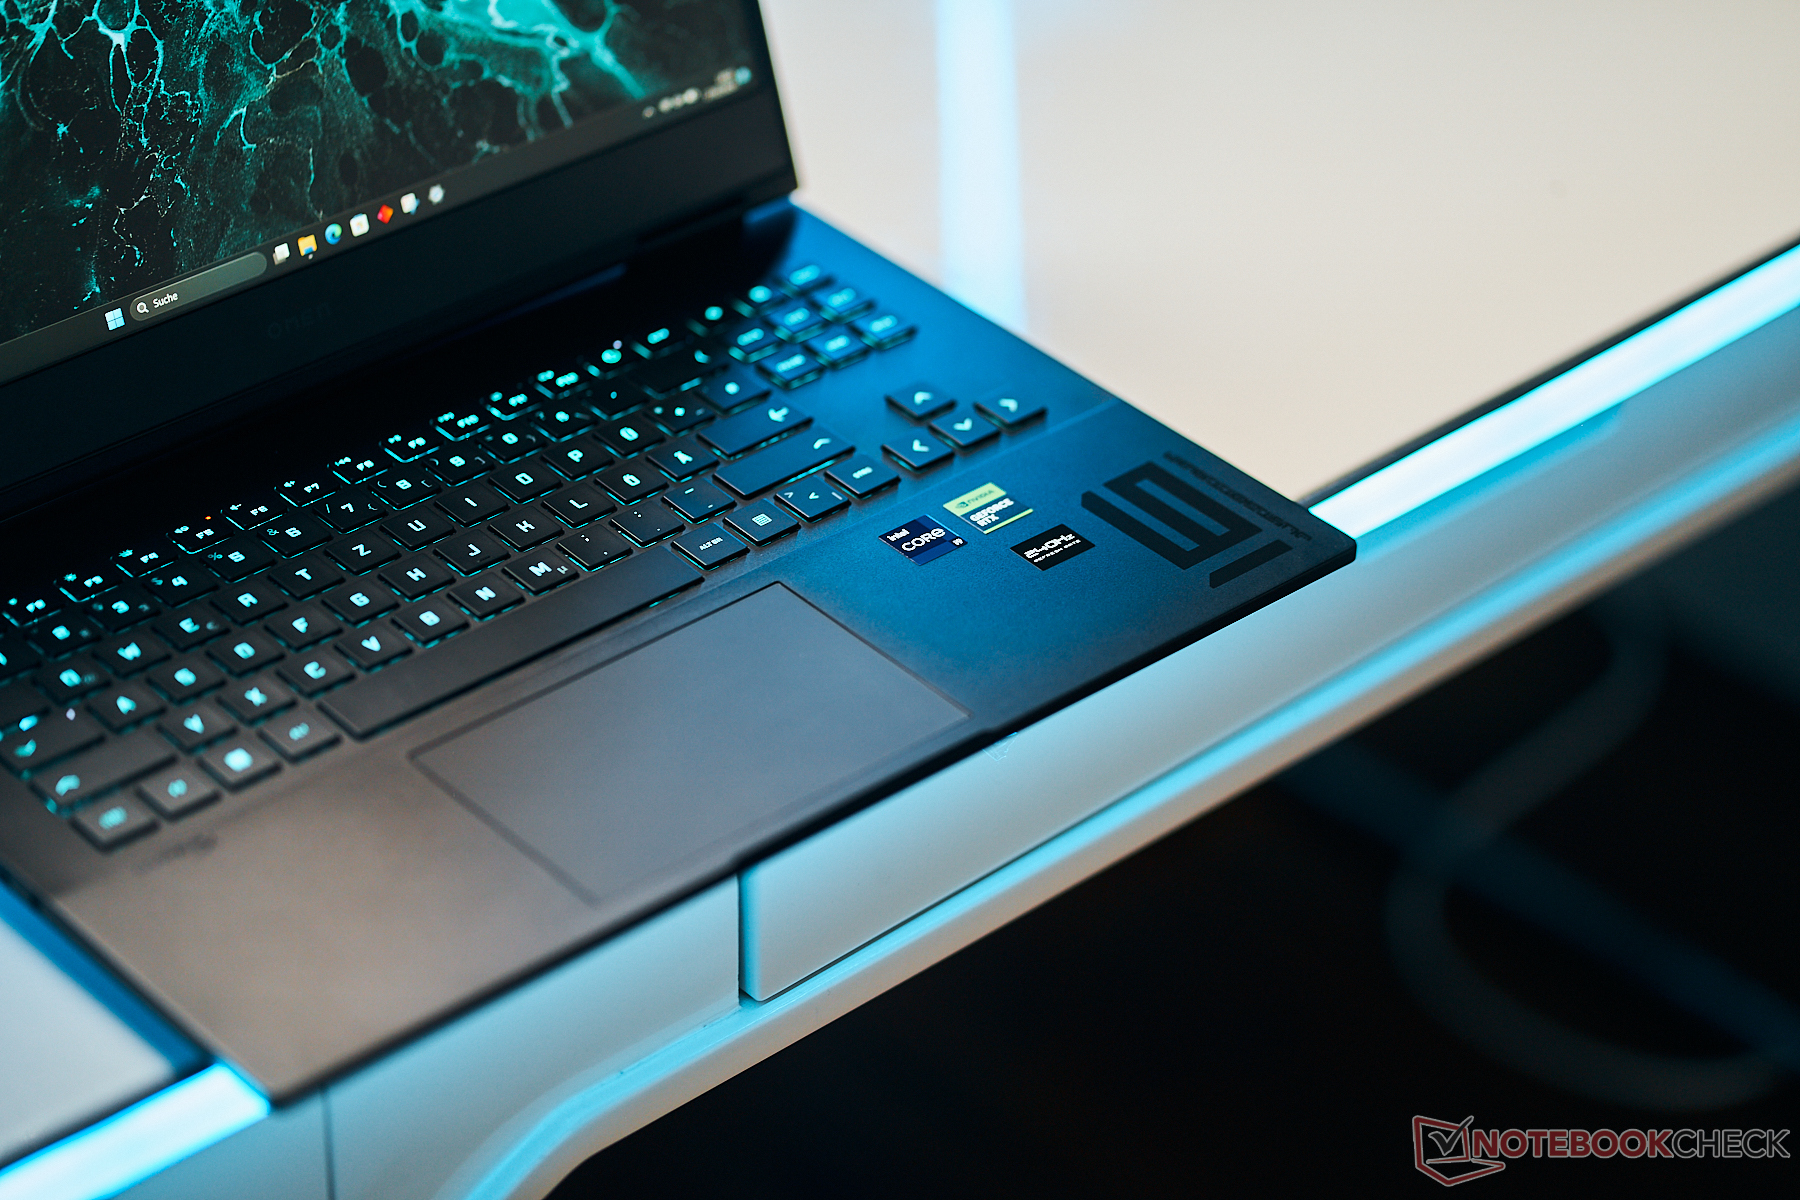
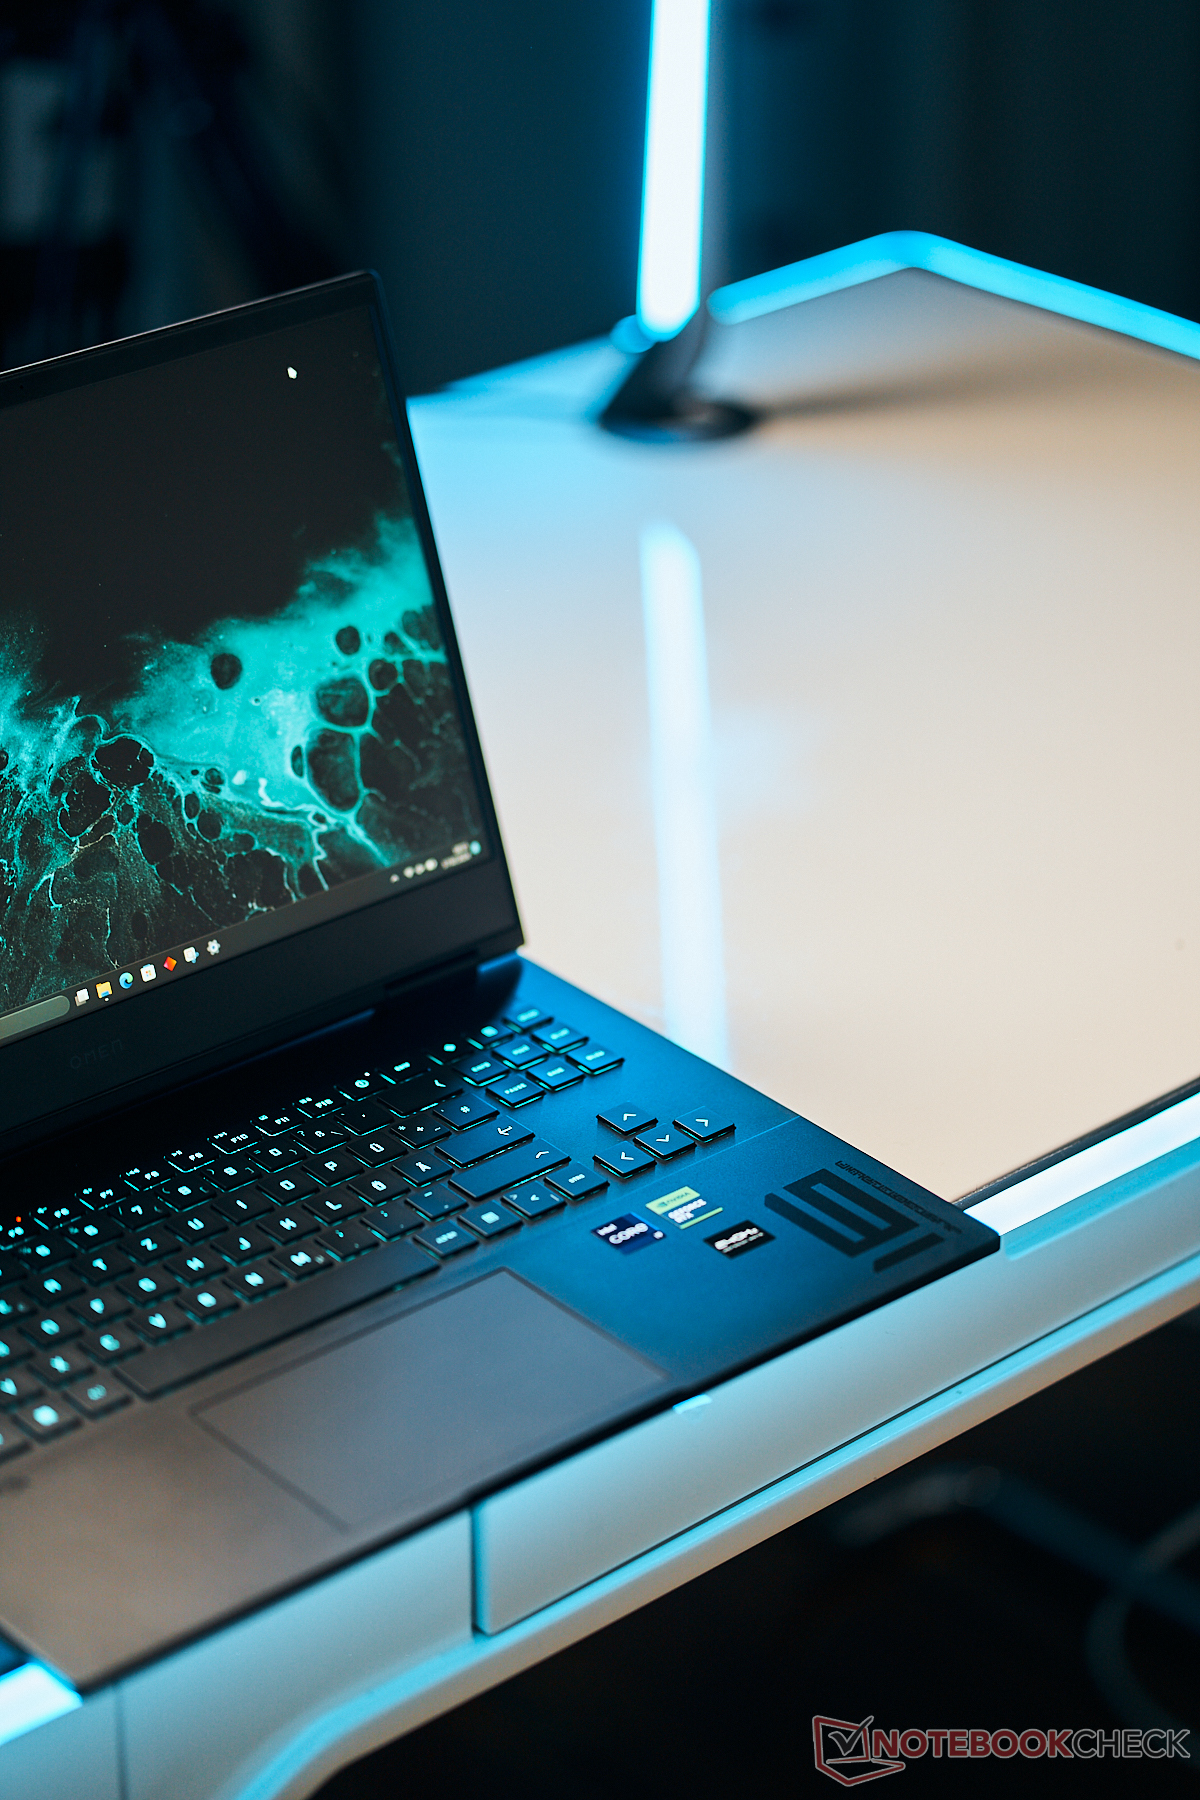
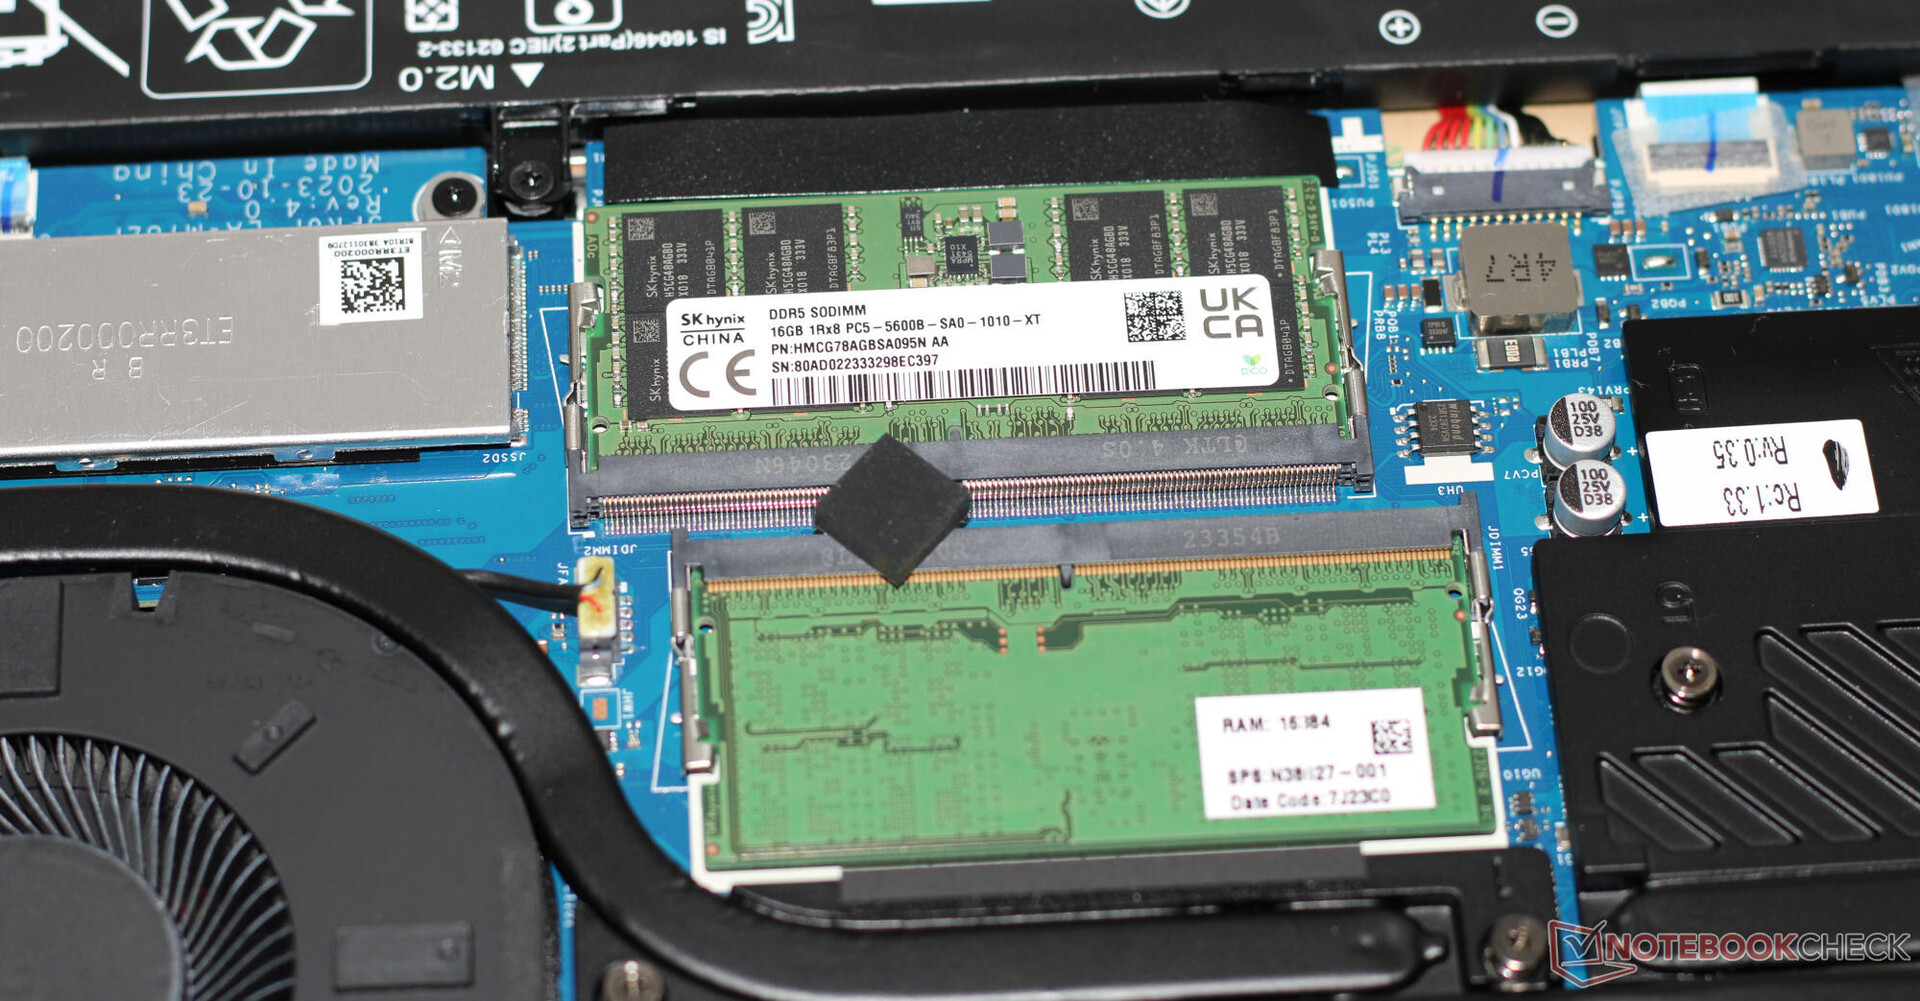
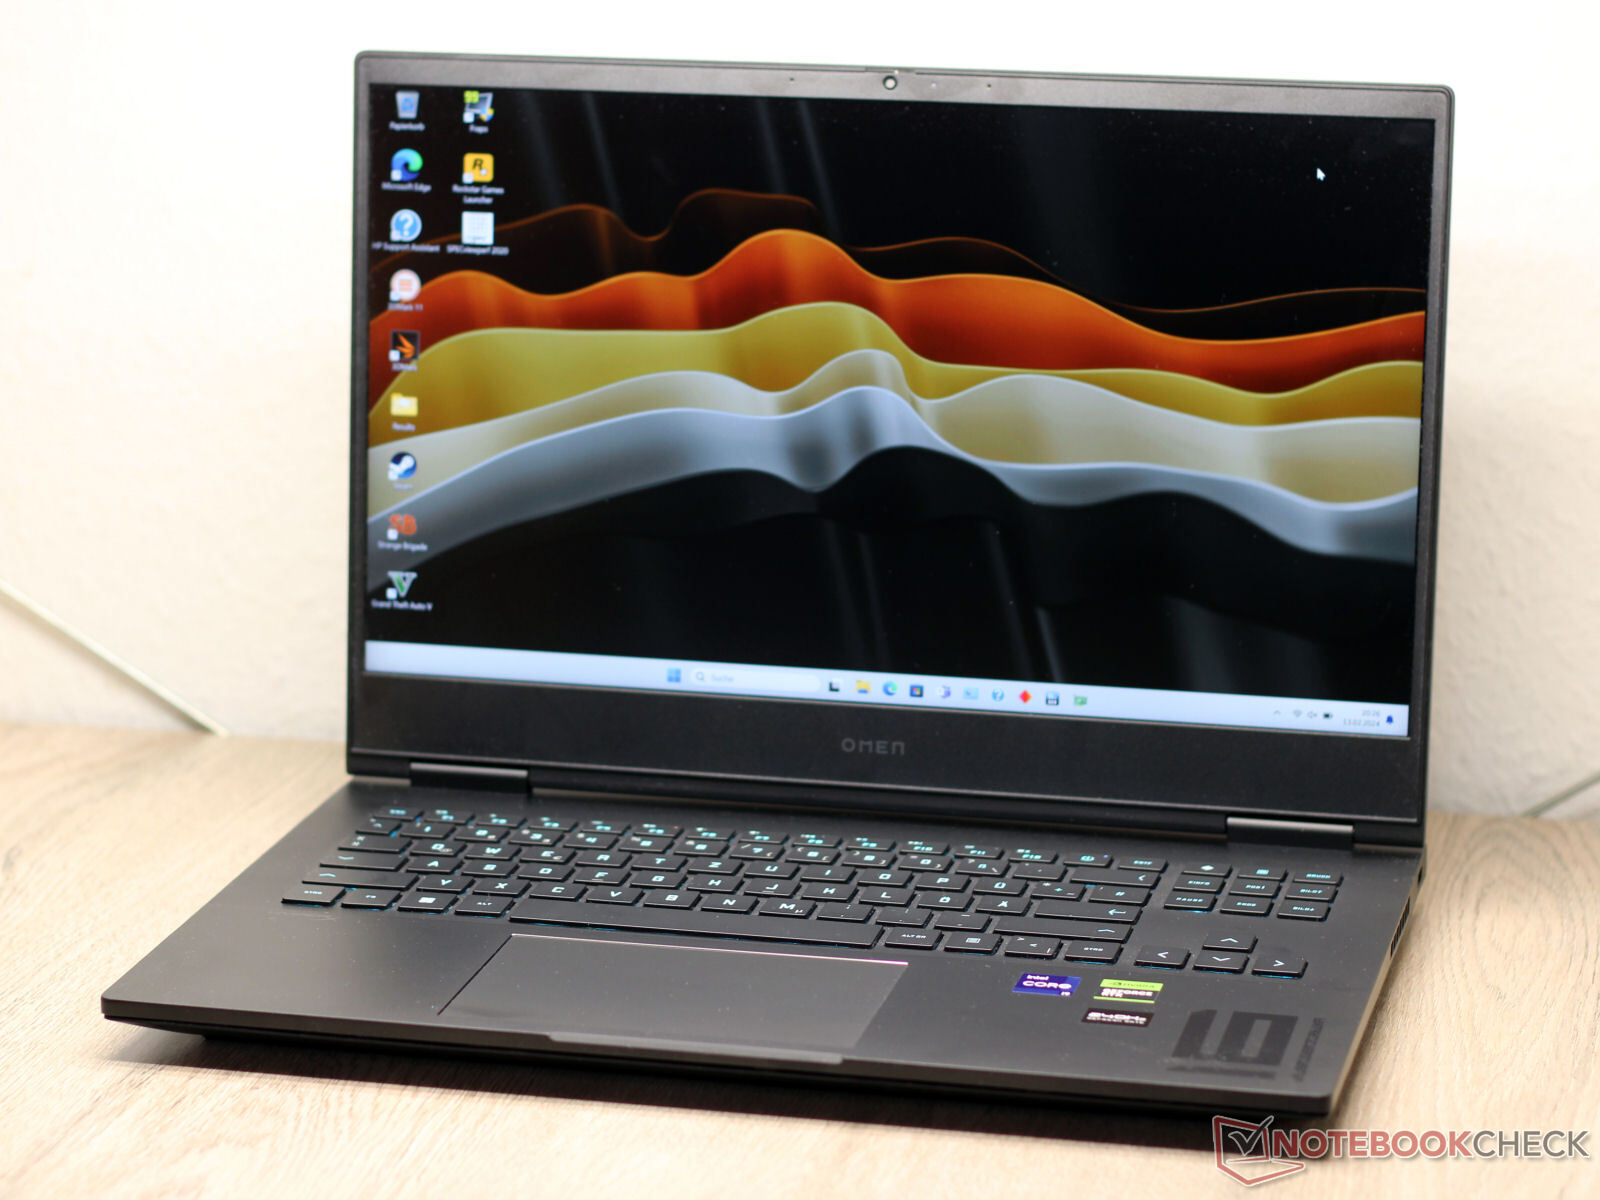
HP retains the same matt-black chassis with smooth surfaces as its predecessor. A plastic lid stands in contrast to an aluminium base section. The chassis doesn’t feature any striking designs or LED elements apart from the keyboard lighting. The battery (screwed down, not glued on) and the rest of the hardware are accessible once the bottom cover has been removed.
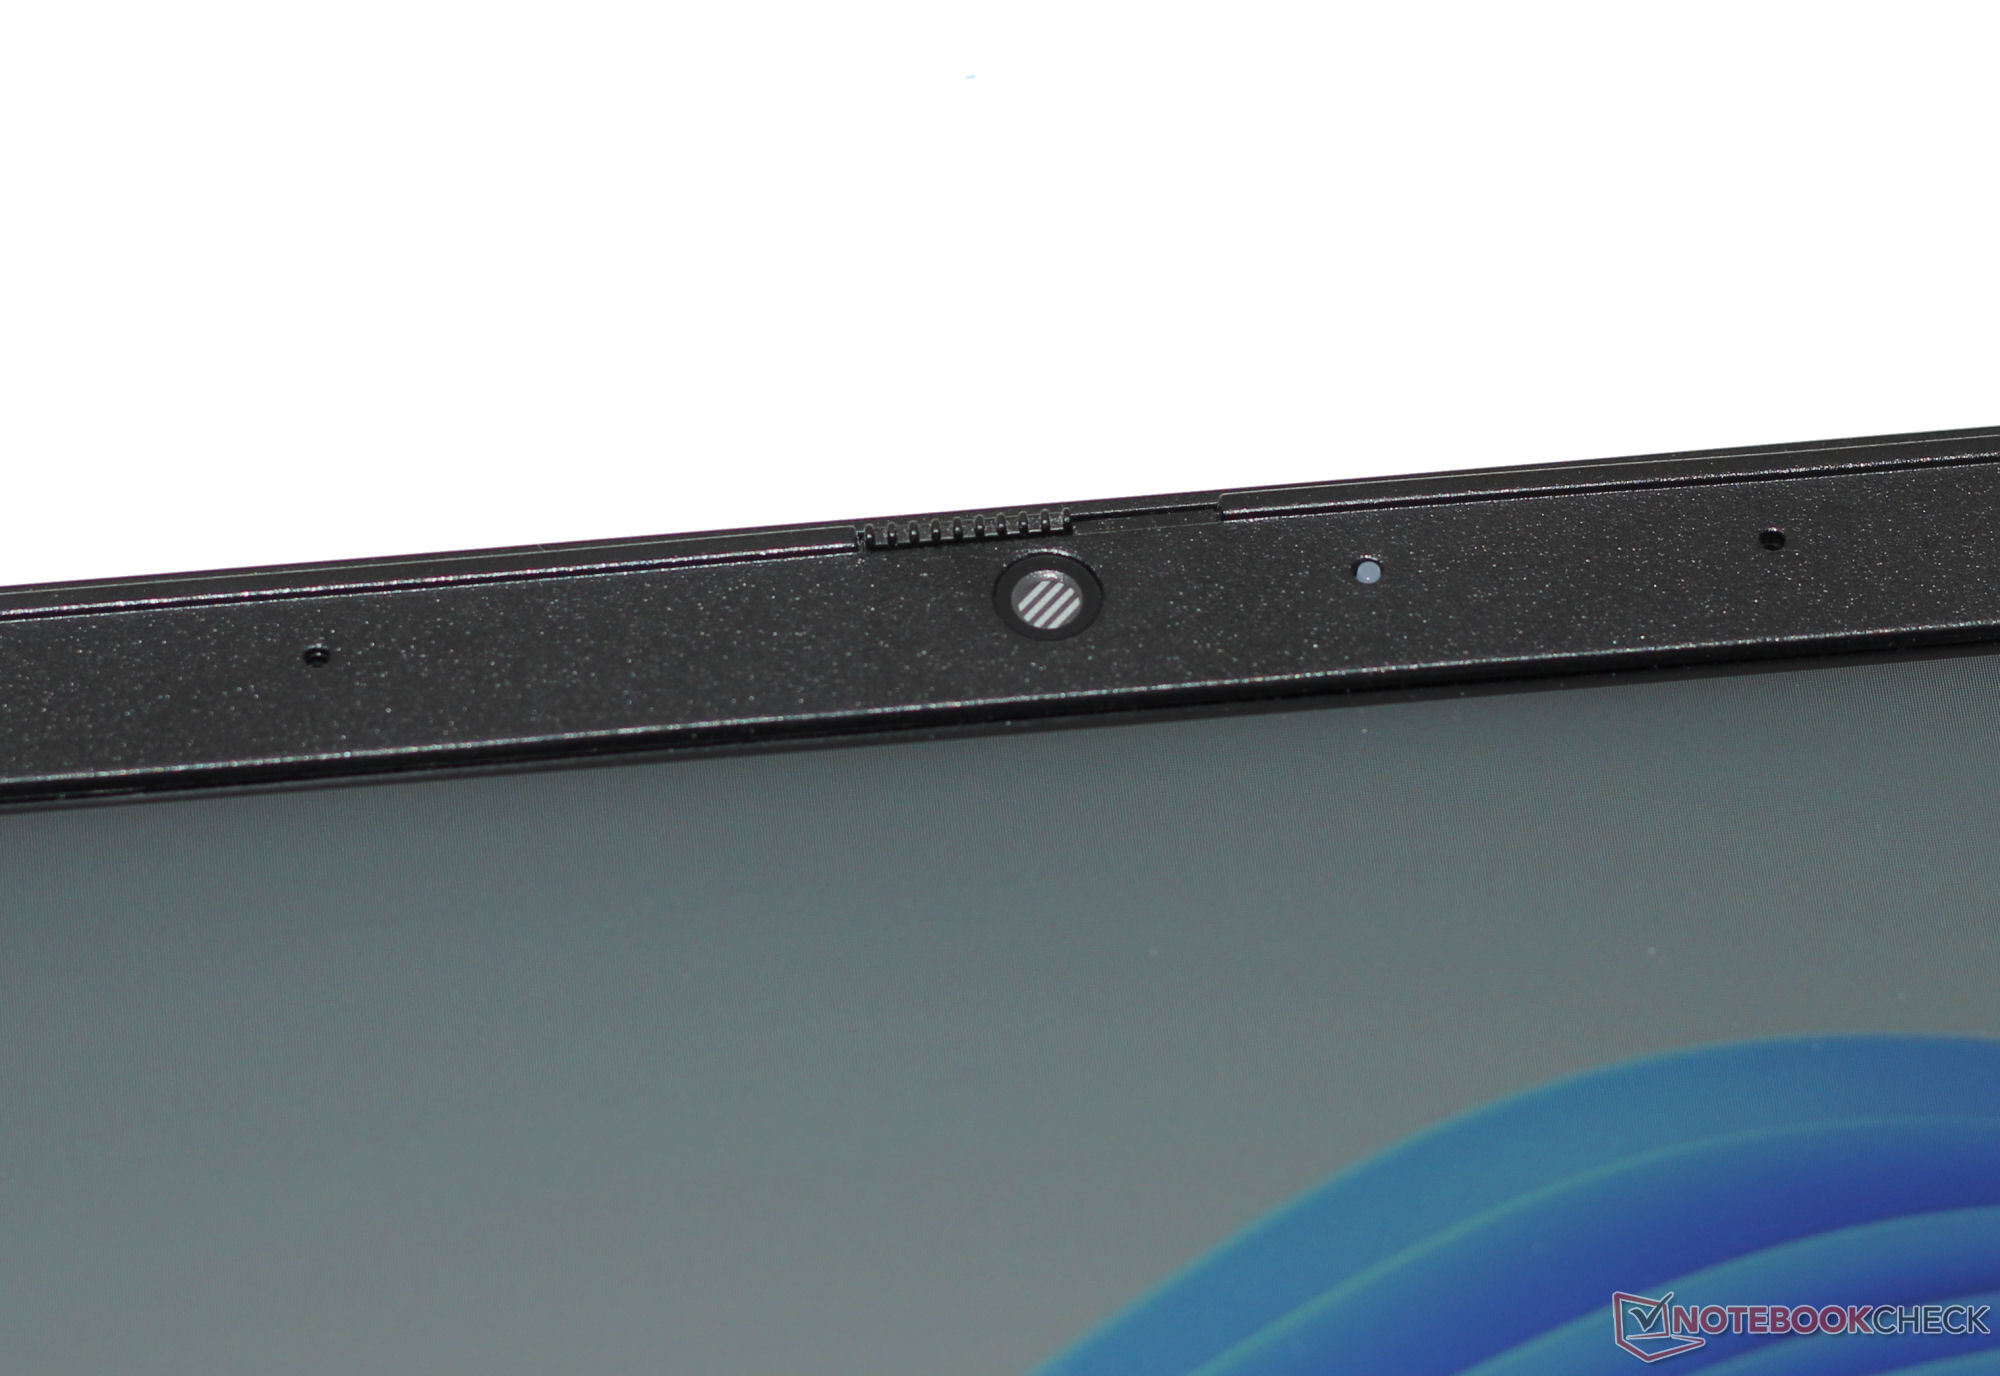
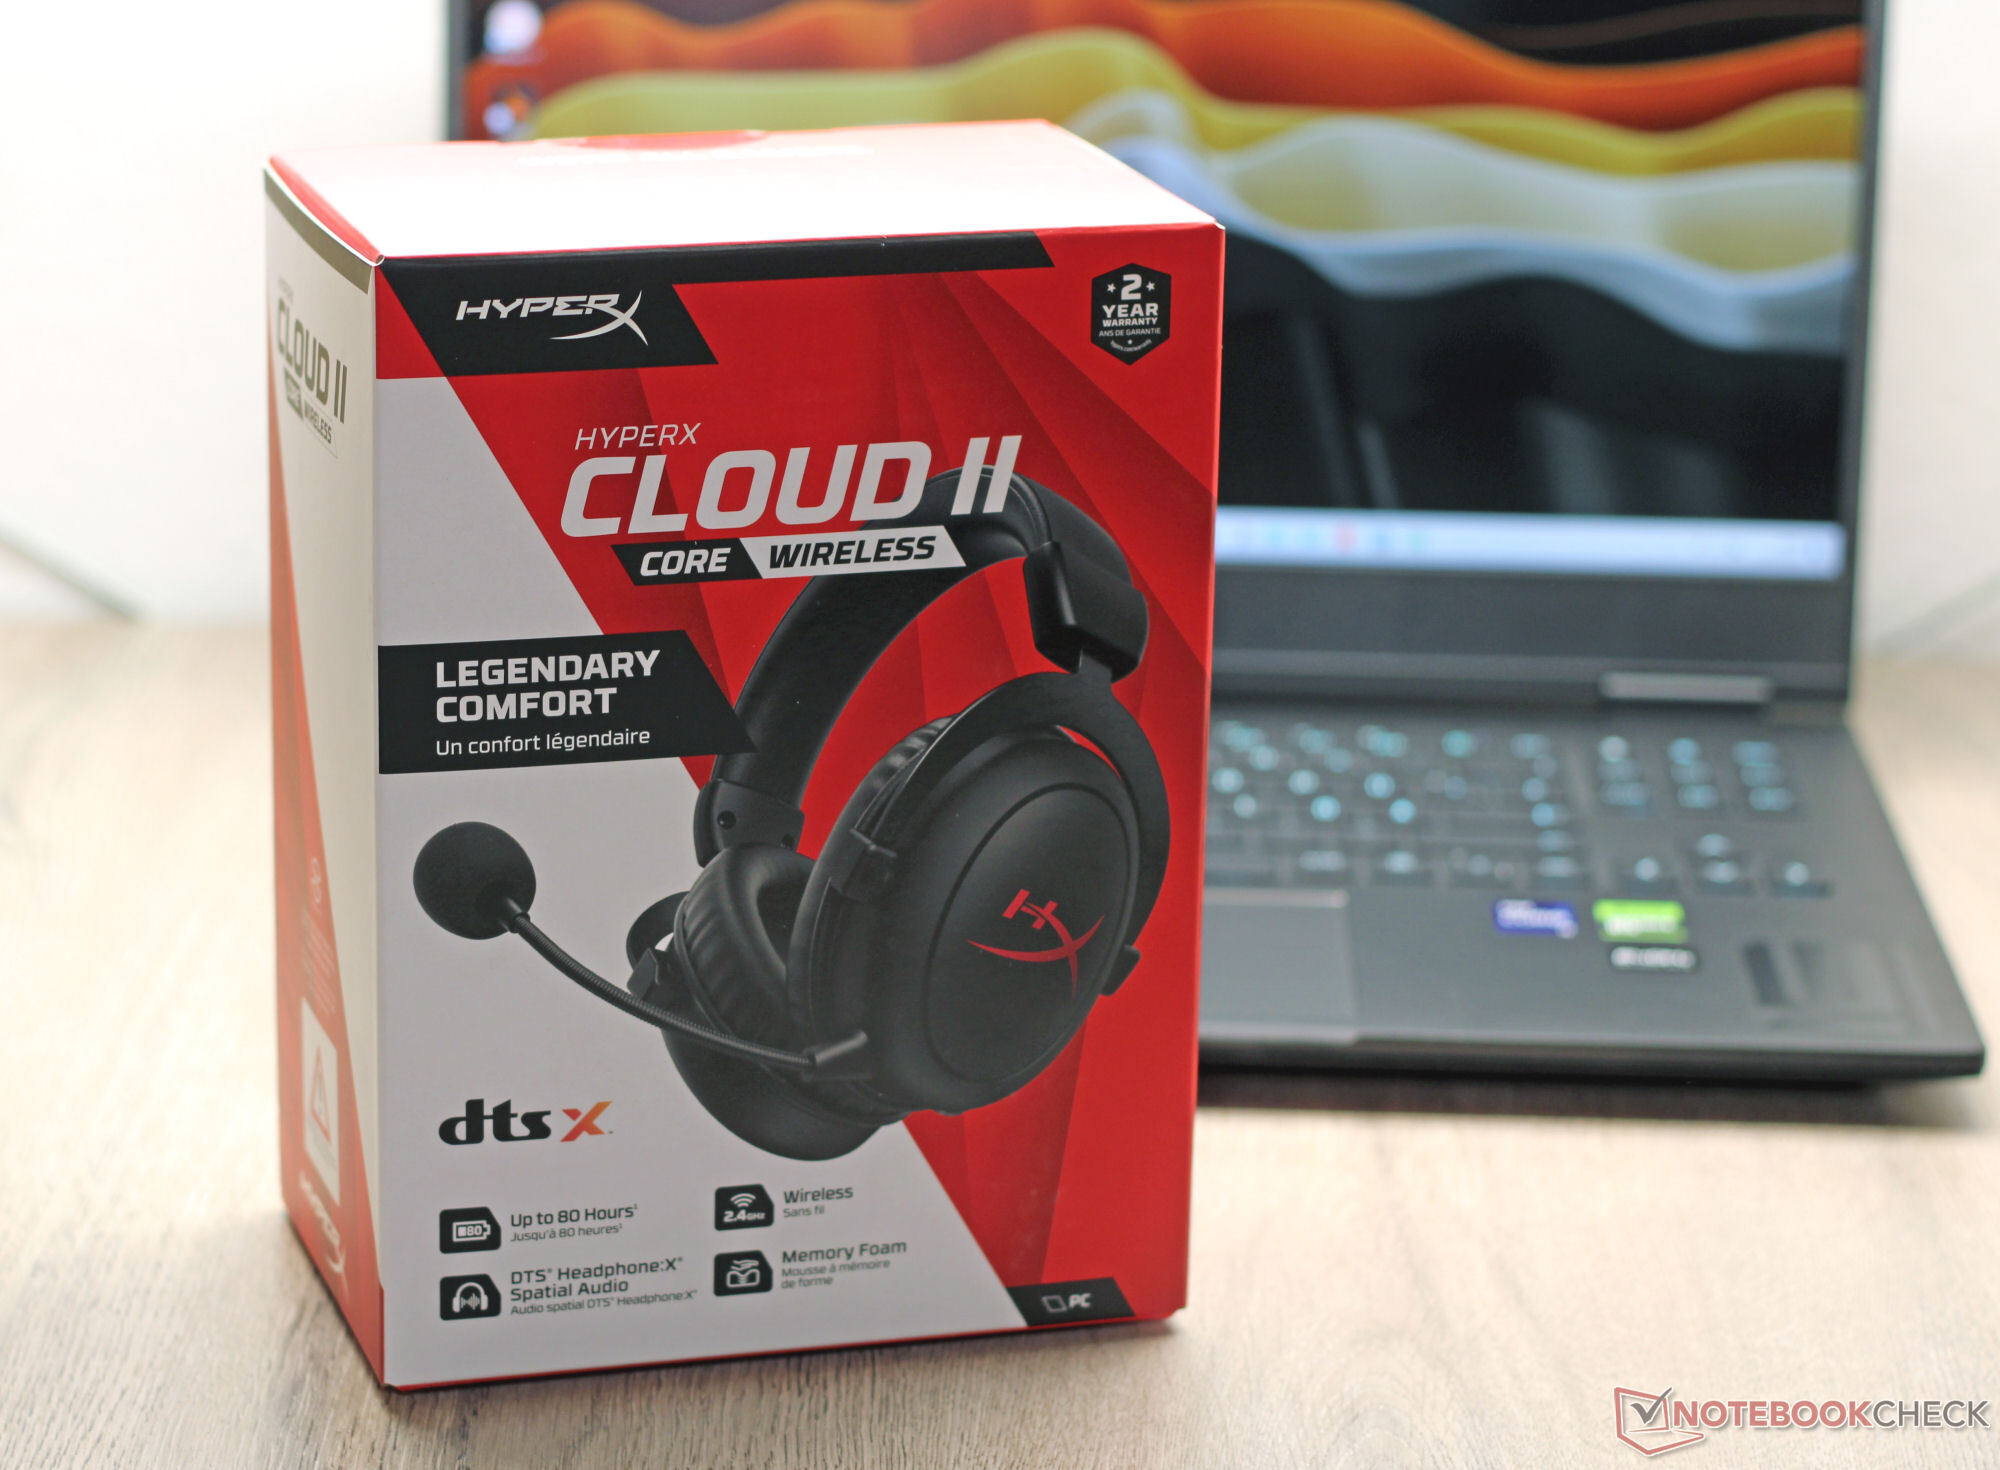
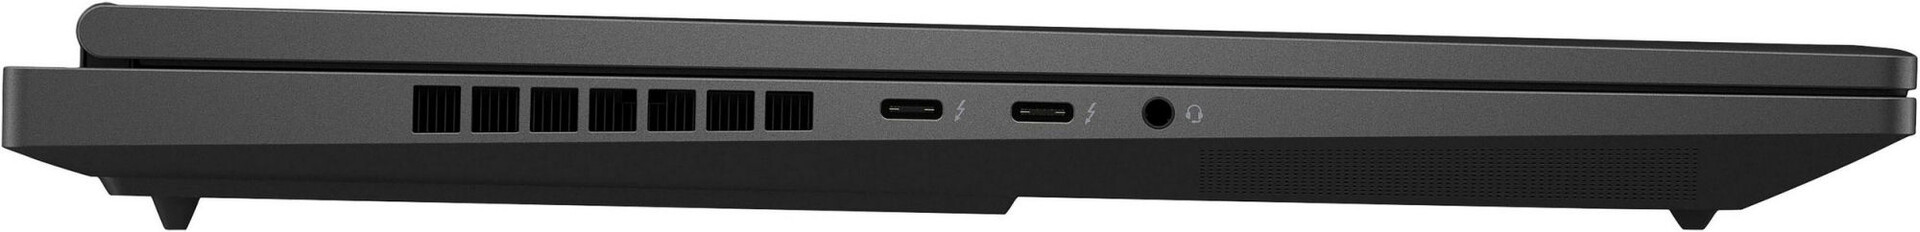
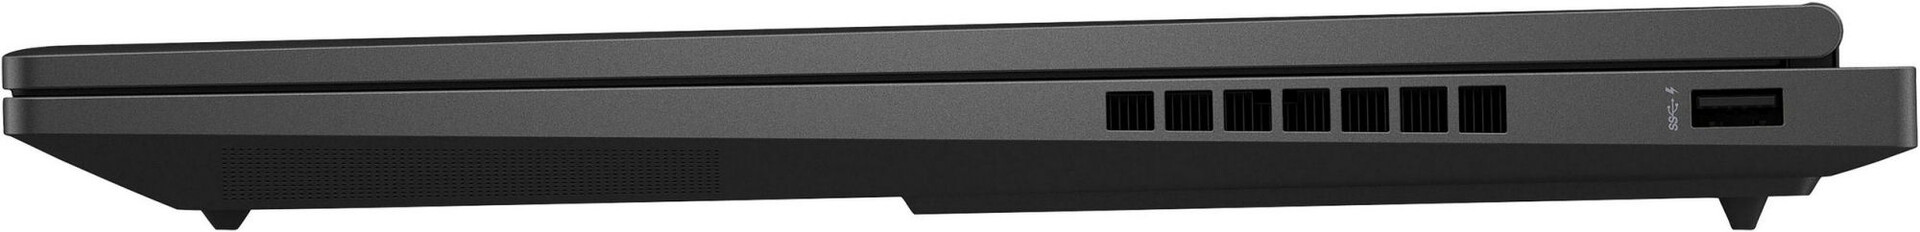
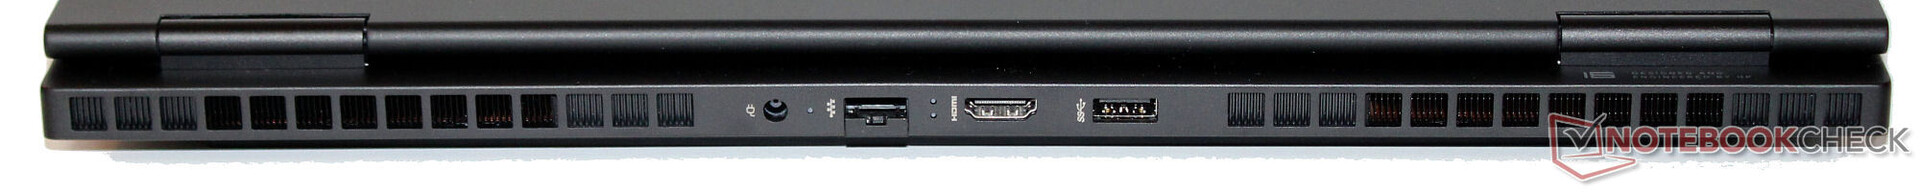
The HP notebook has two USB-A (USB 3.2 Gen 1) and two USB-C ports (Thunderbolt 4/USB4) on board. The latter support Power Delivery and can output a DisplayPort signal. All in all, the Omen 16 has three video outputs (1x HDMI, 2x DP). HP hasn’t equipped the device with a memory card reader. The webcam (2.1 MP, maximum 1,920 x 1,080 pixels, with privacy shutter) delivers standard image quality. Included with the laptop is a HyperX Cloud II Core wireless headset.
The Omen 16 comes with an Intel Wi-Fi 6E AX211 module and can achieve excellent Wi-Fi transfer speeds under optimal conditions (no Wi-Fi devices in immediate surroundings, short distance between laptop and server PC). Wired connections are handled by a Realtek RTL8168/8111 Ethernet controller (1 Gbit/s).


 GeForce RTX 4080 Laptop GPU, i9-14900HX, SK hynix PC801 HFS001TEJ9X101N")
 GeForce RTX 4080 Laptop GPU, i9-14900HX, SK hynix PC801 HFS001TEJ9X101N")
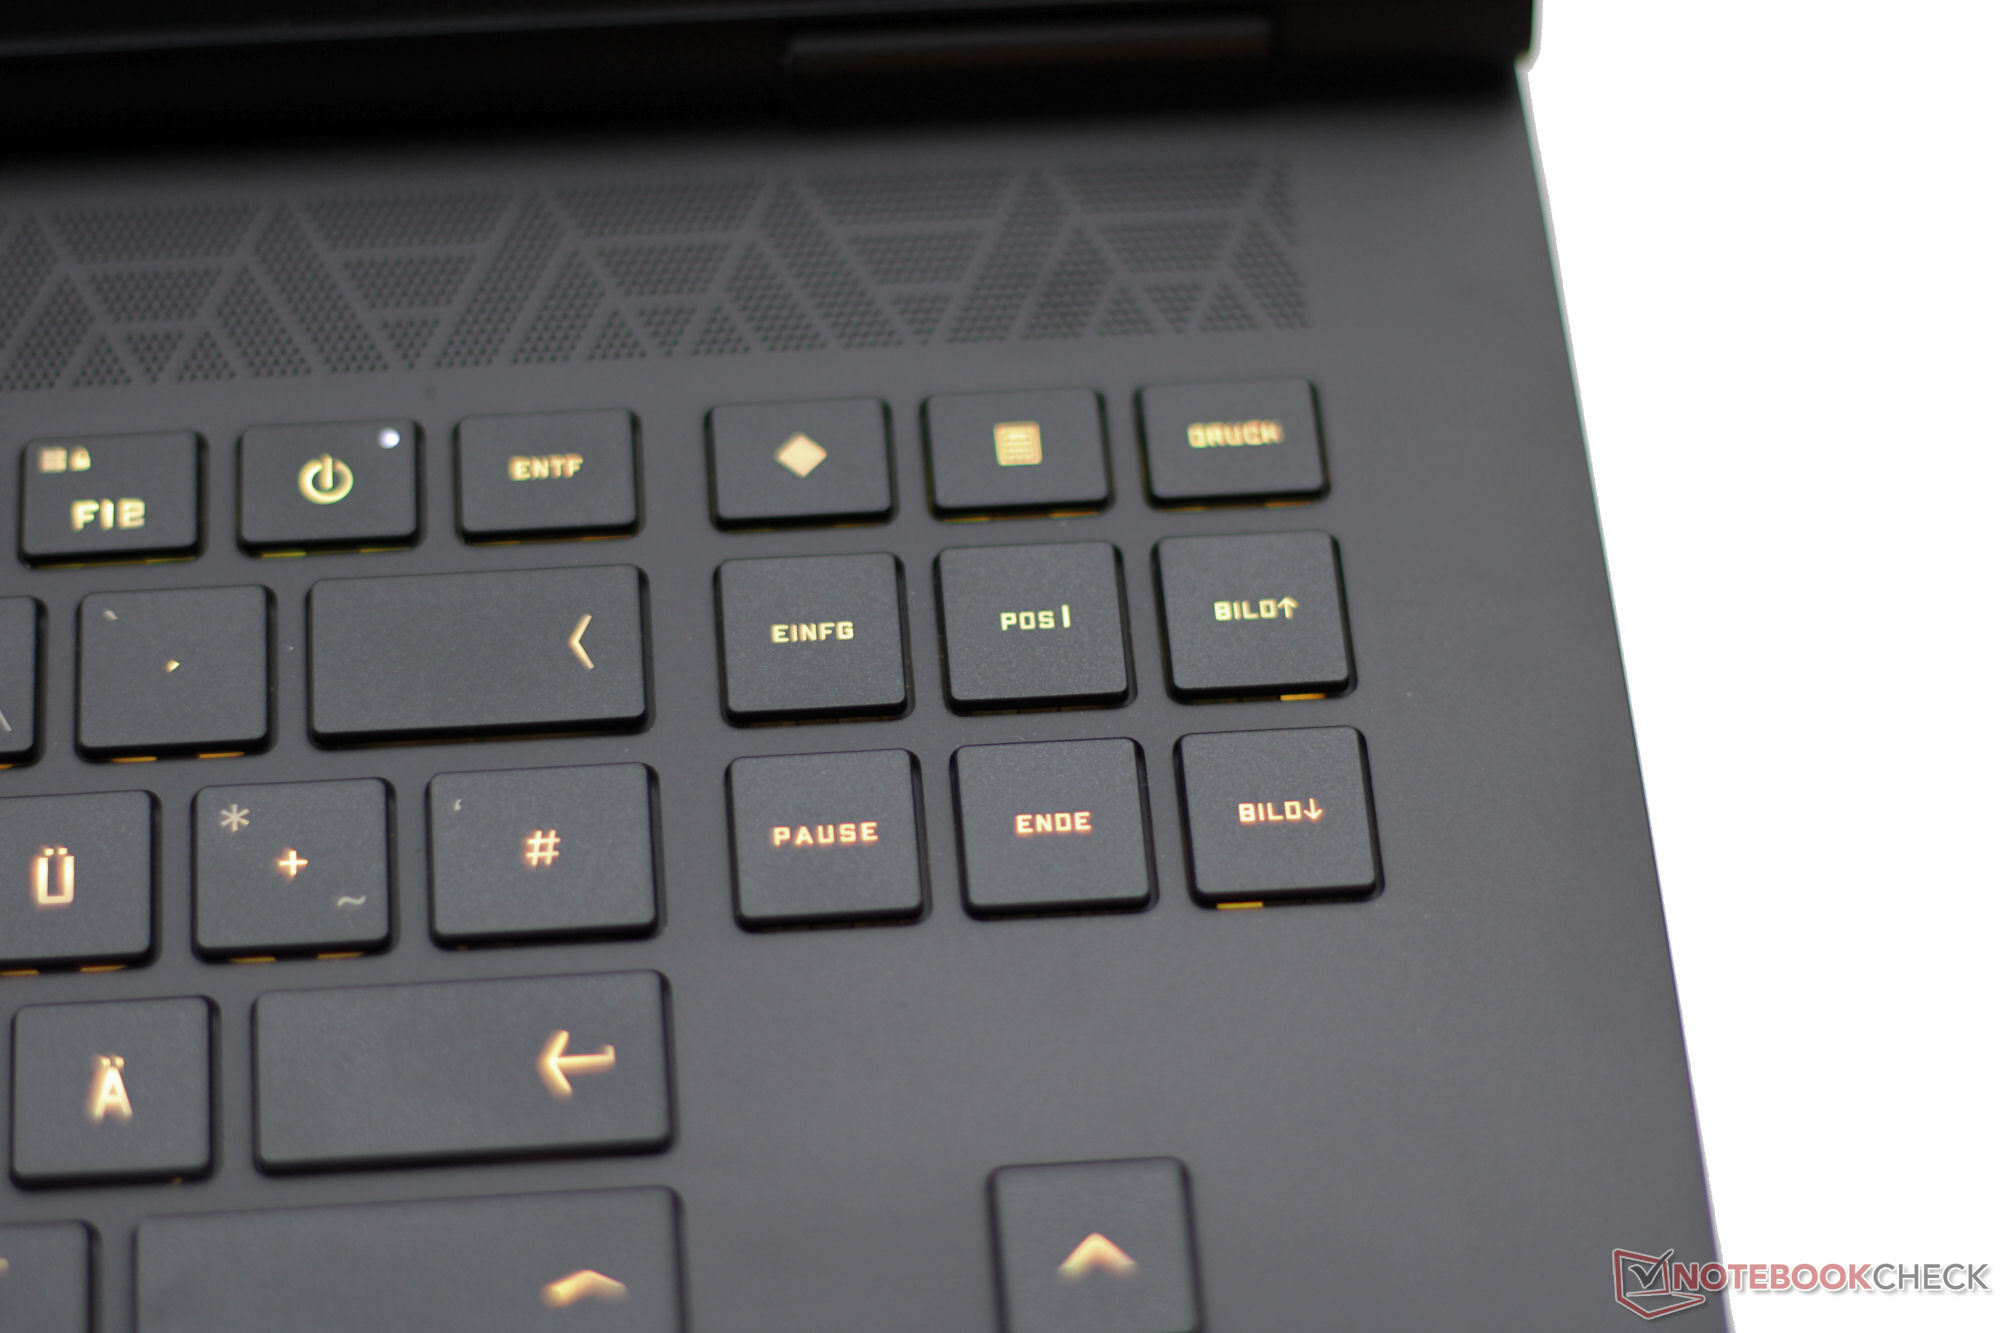
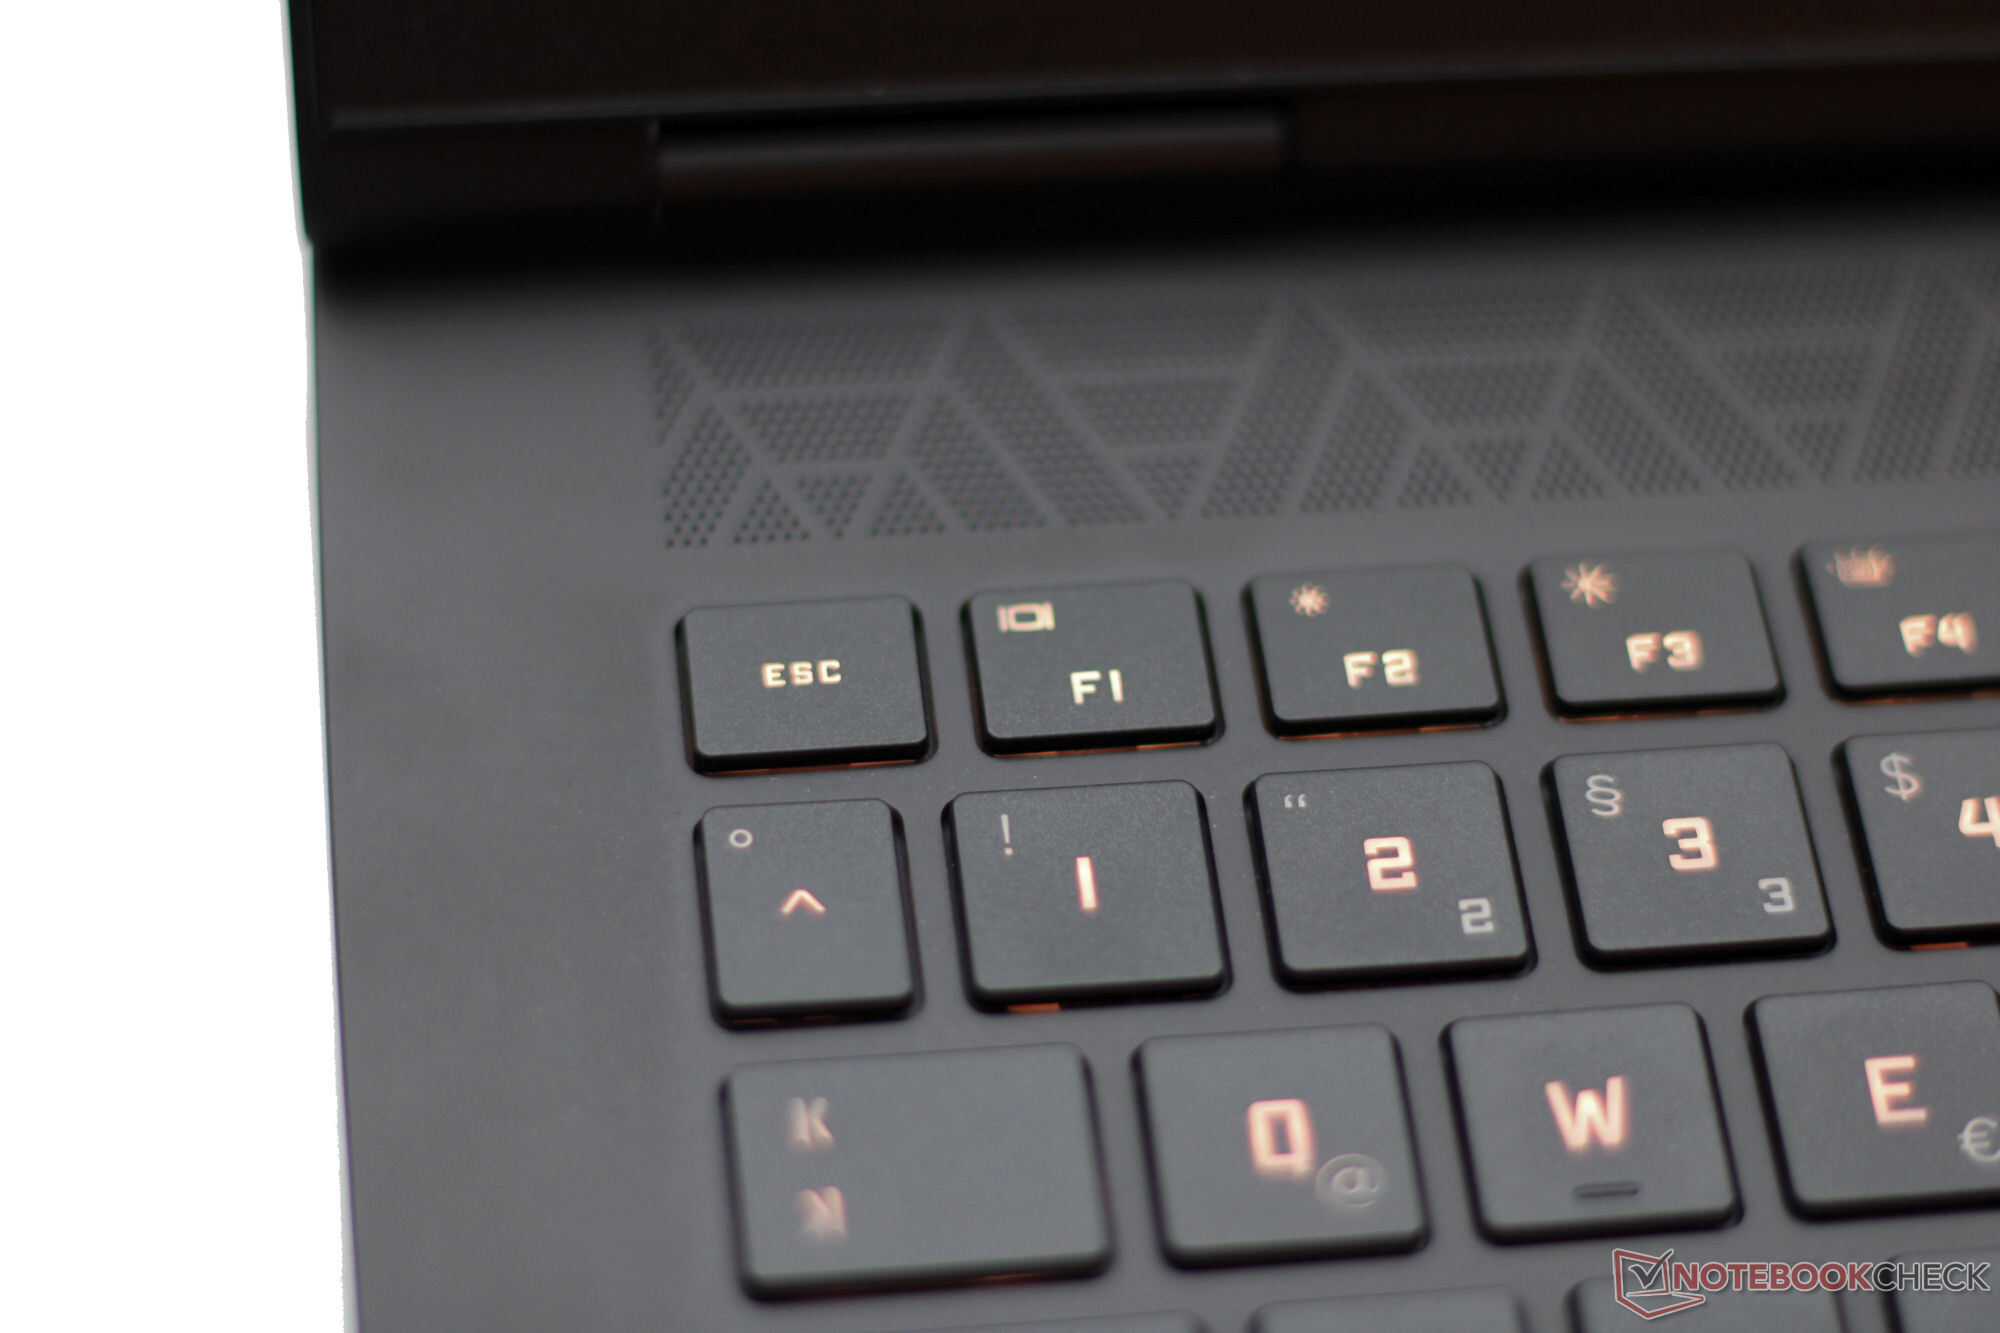
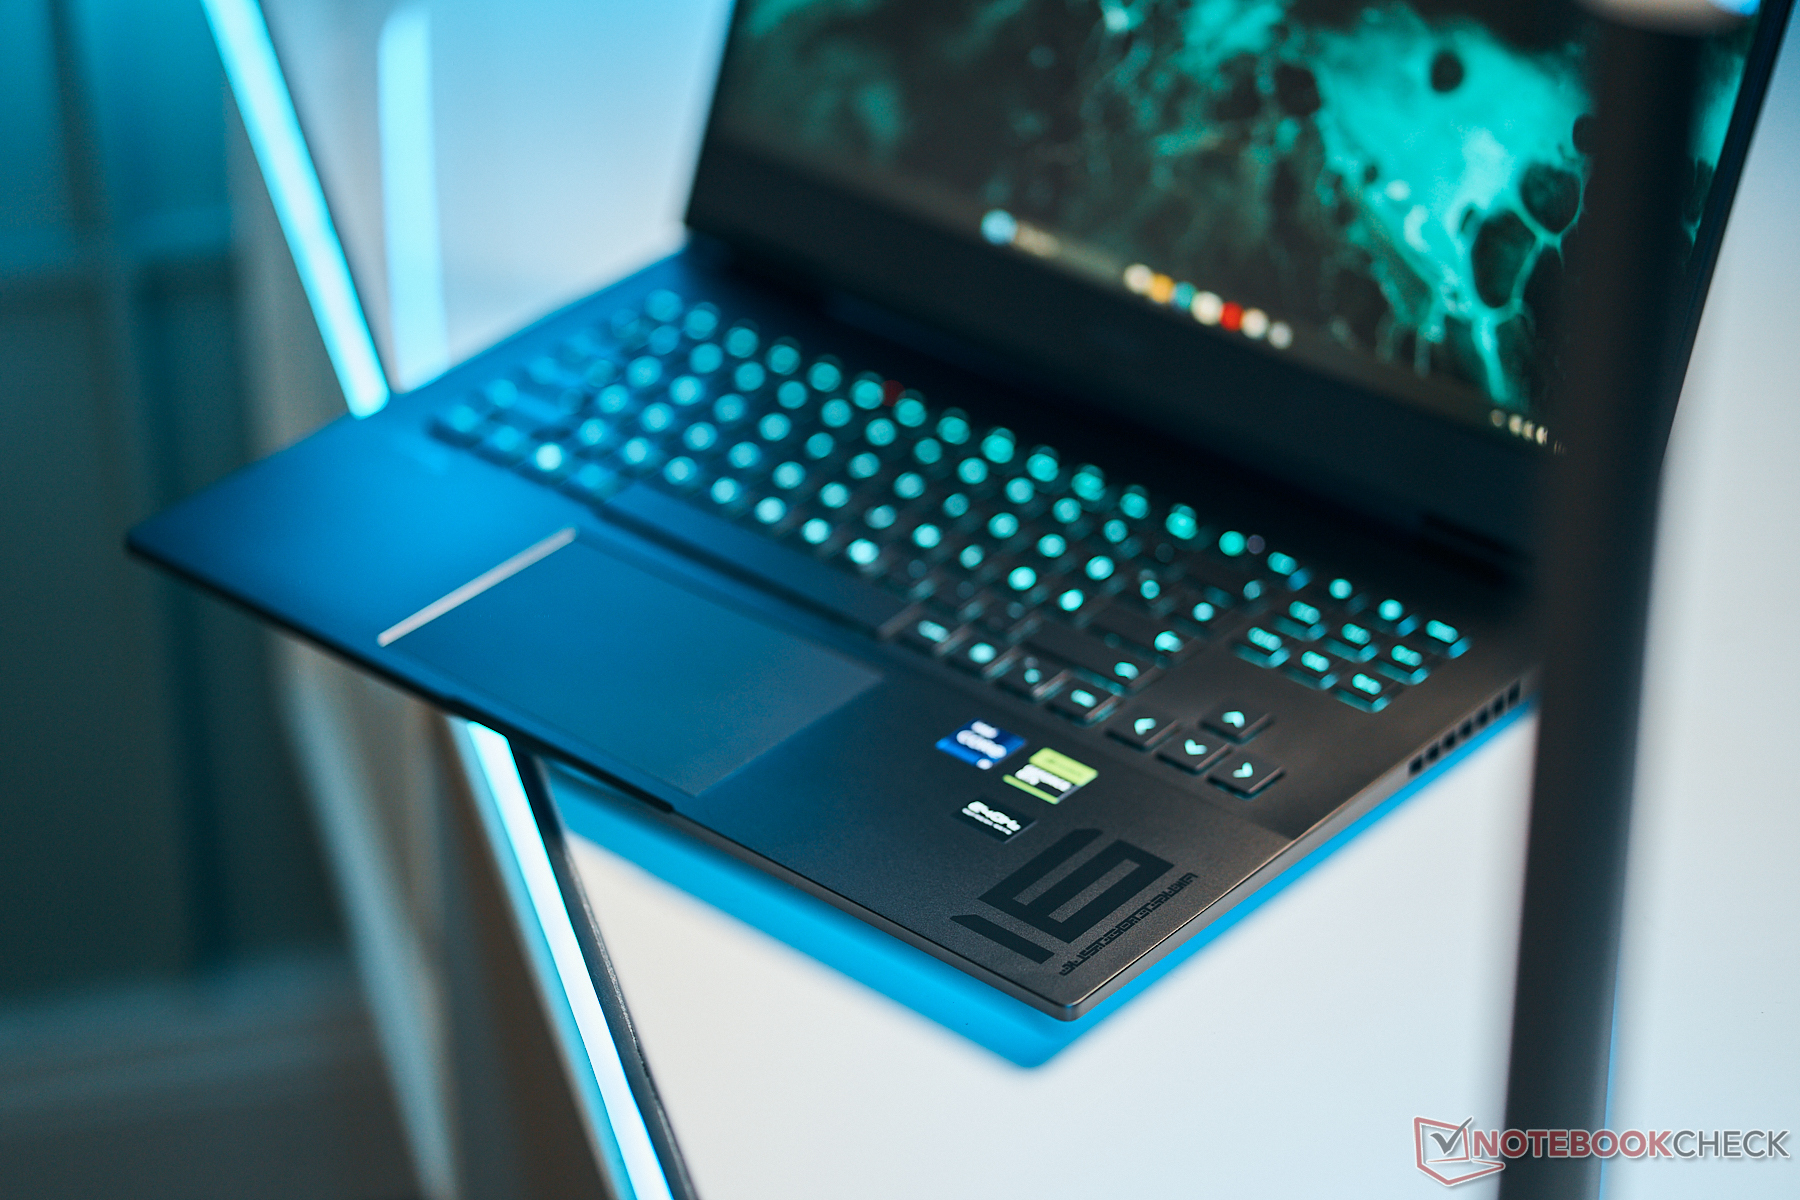
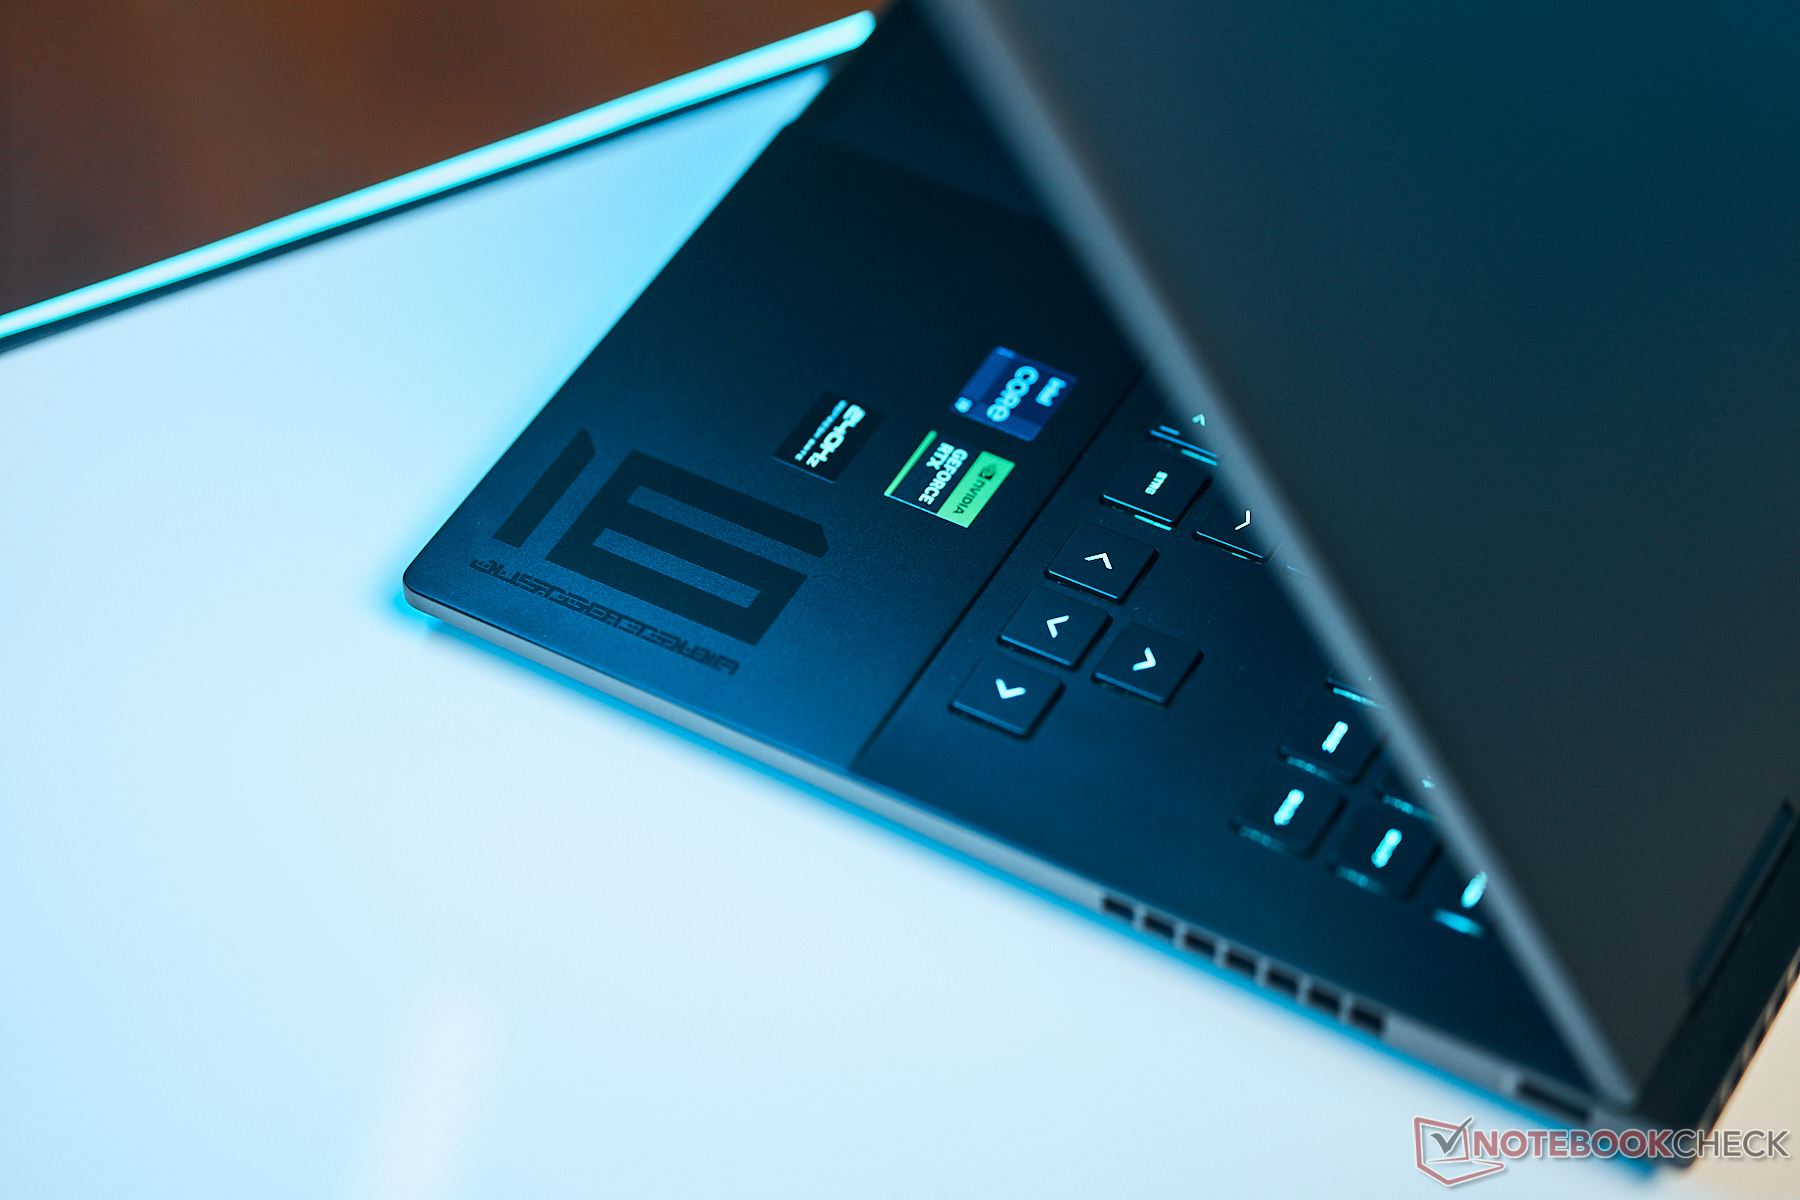
Input devices - Omen offers per-key RGB lighting
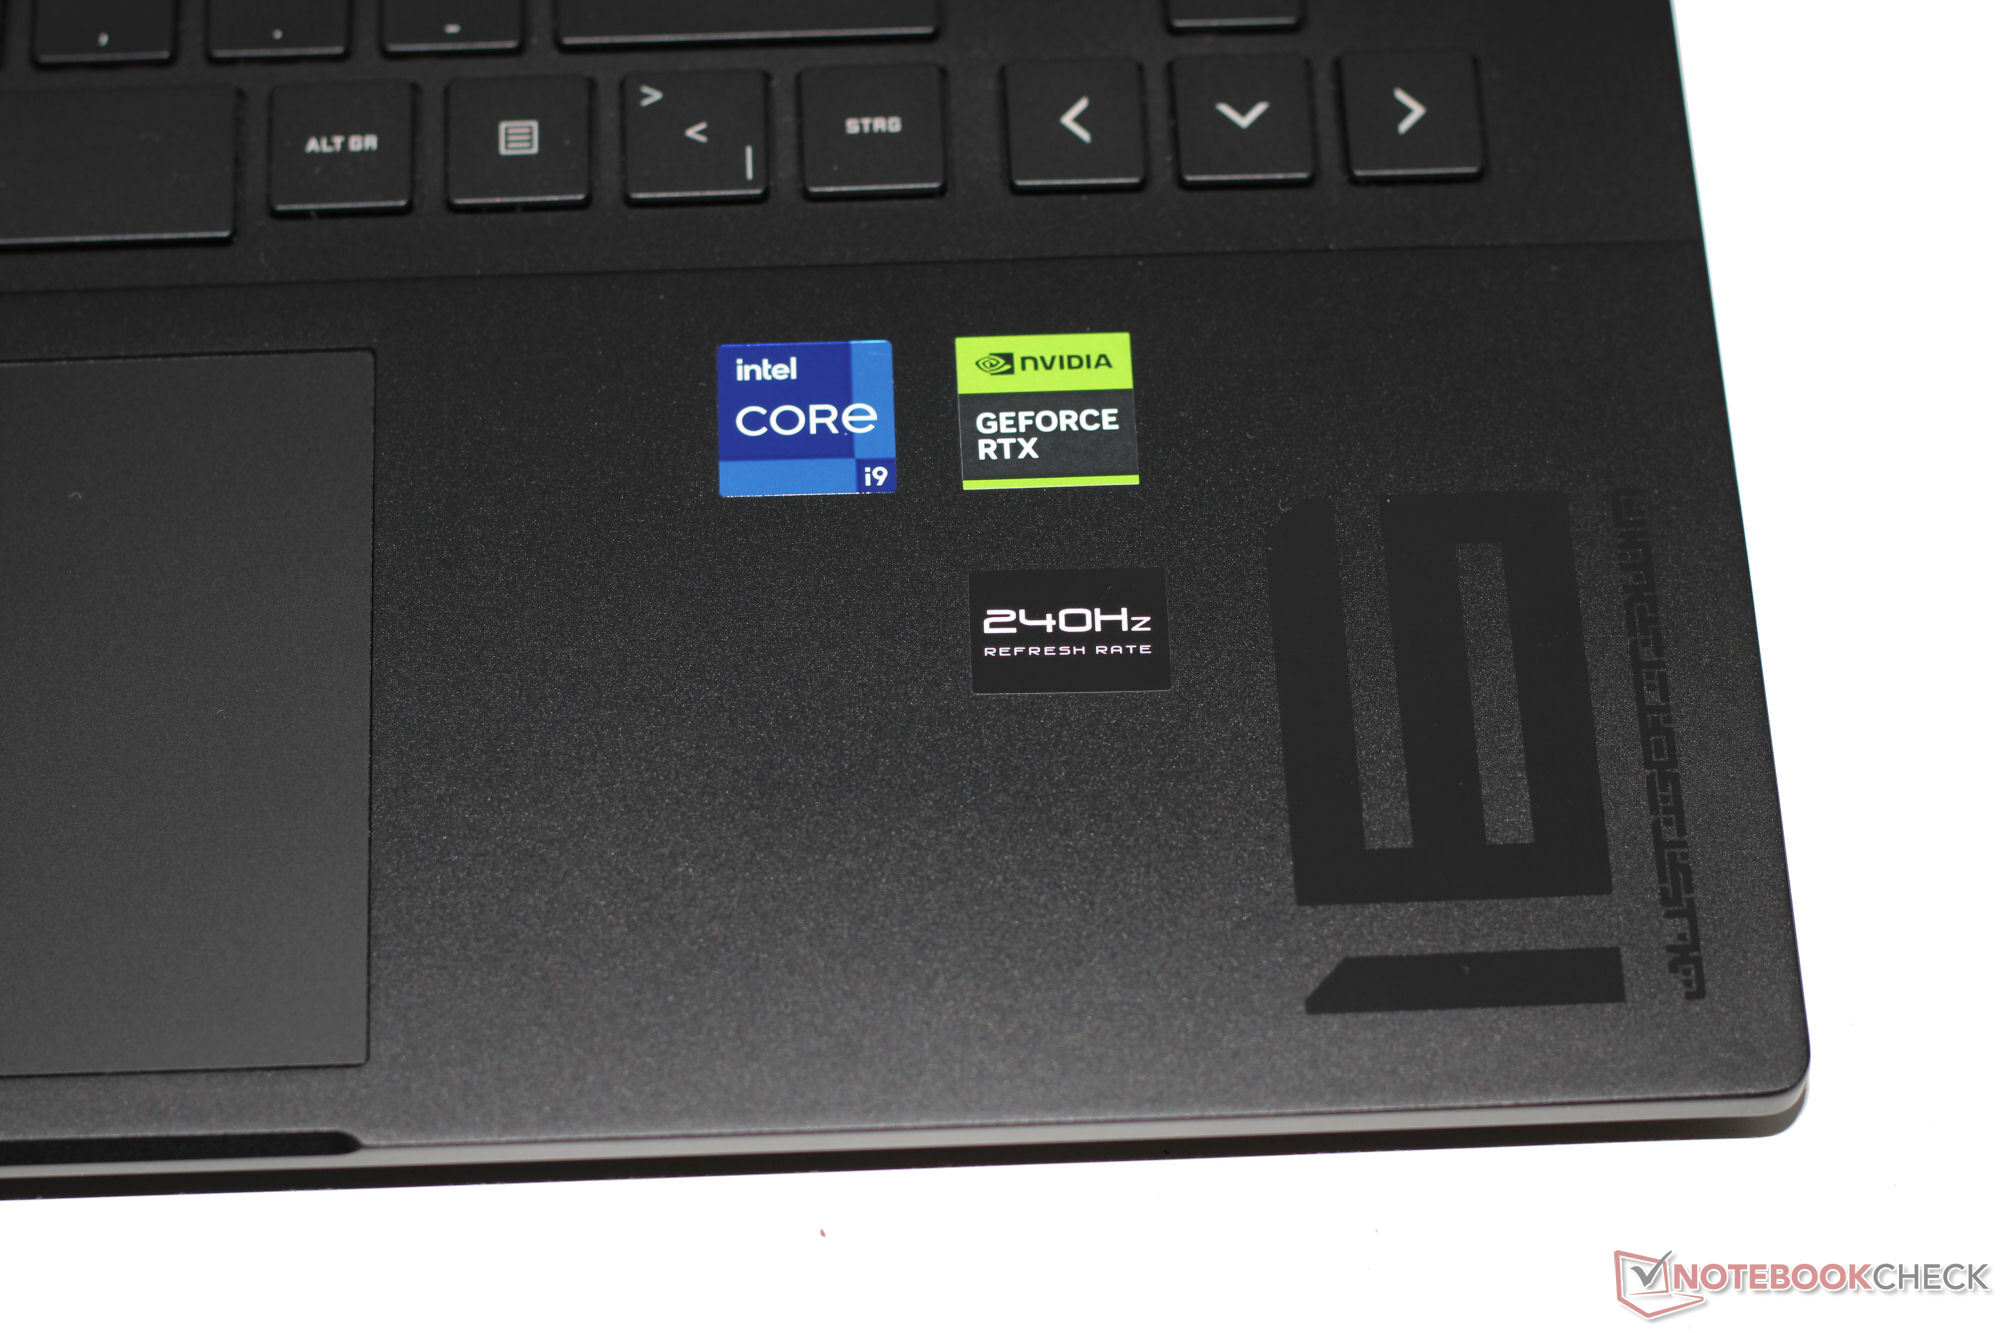
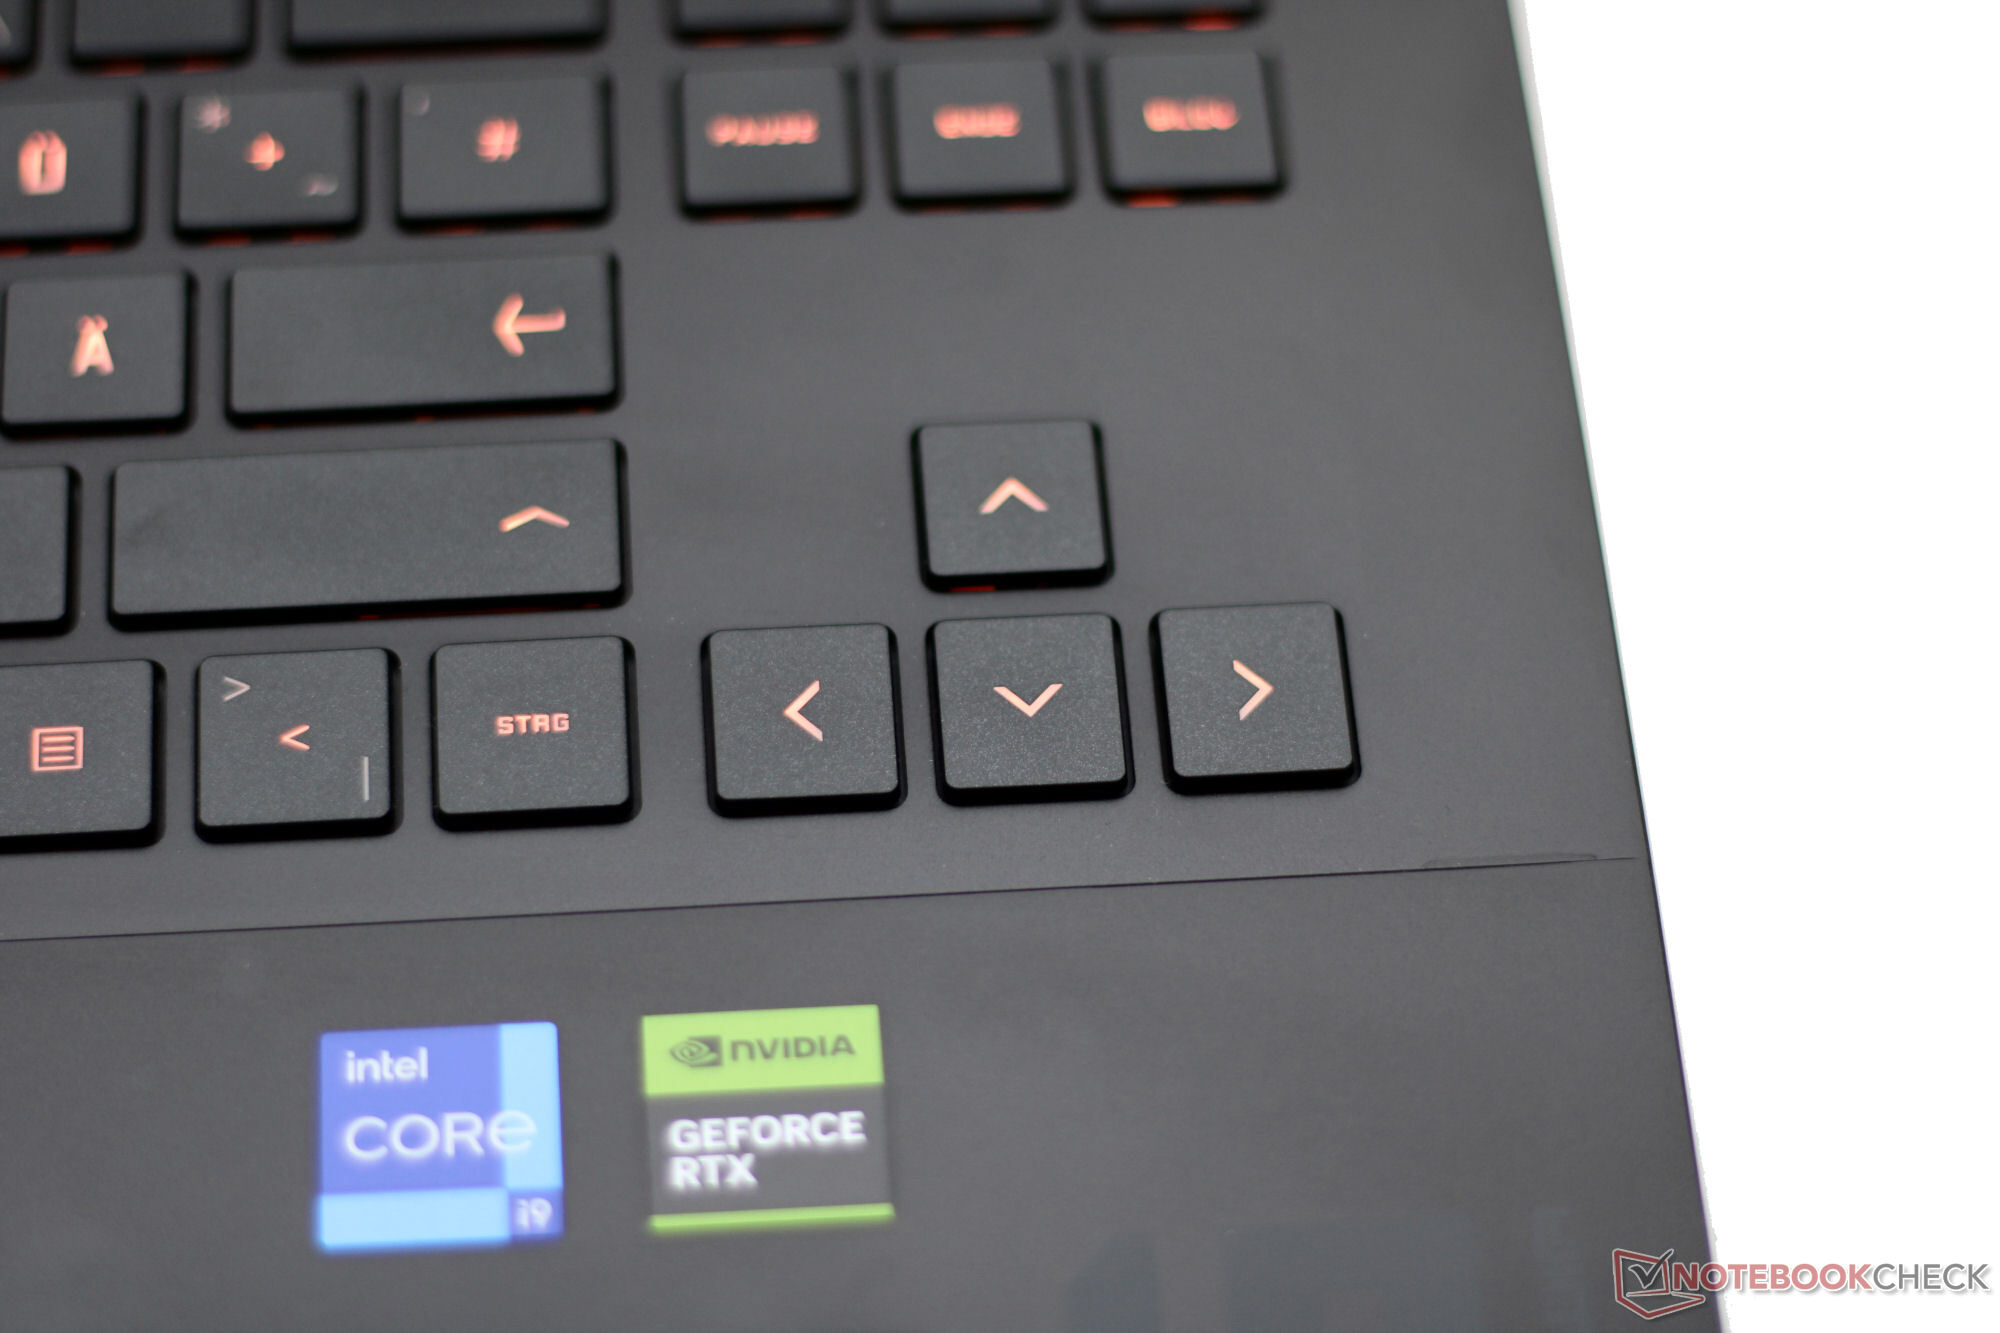
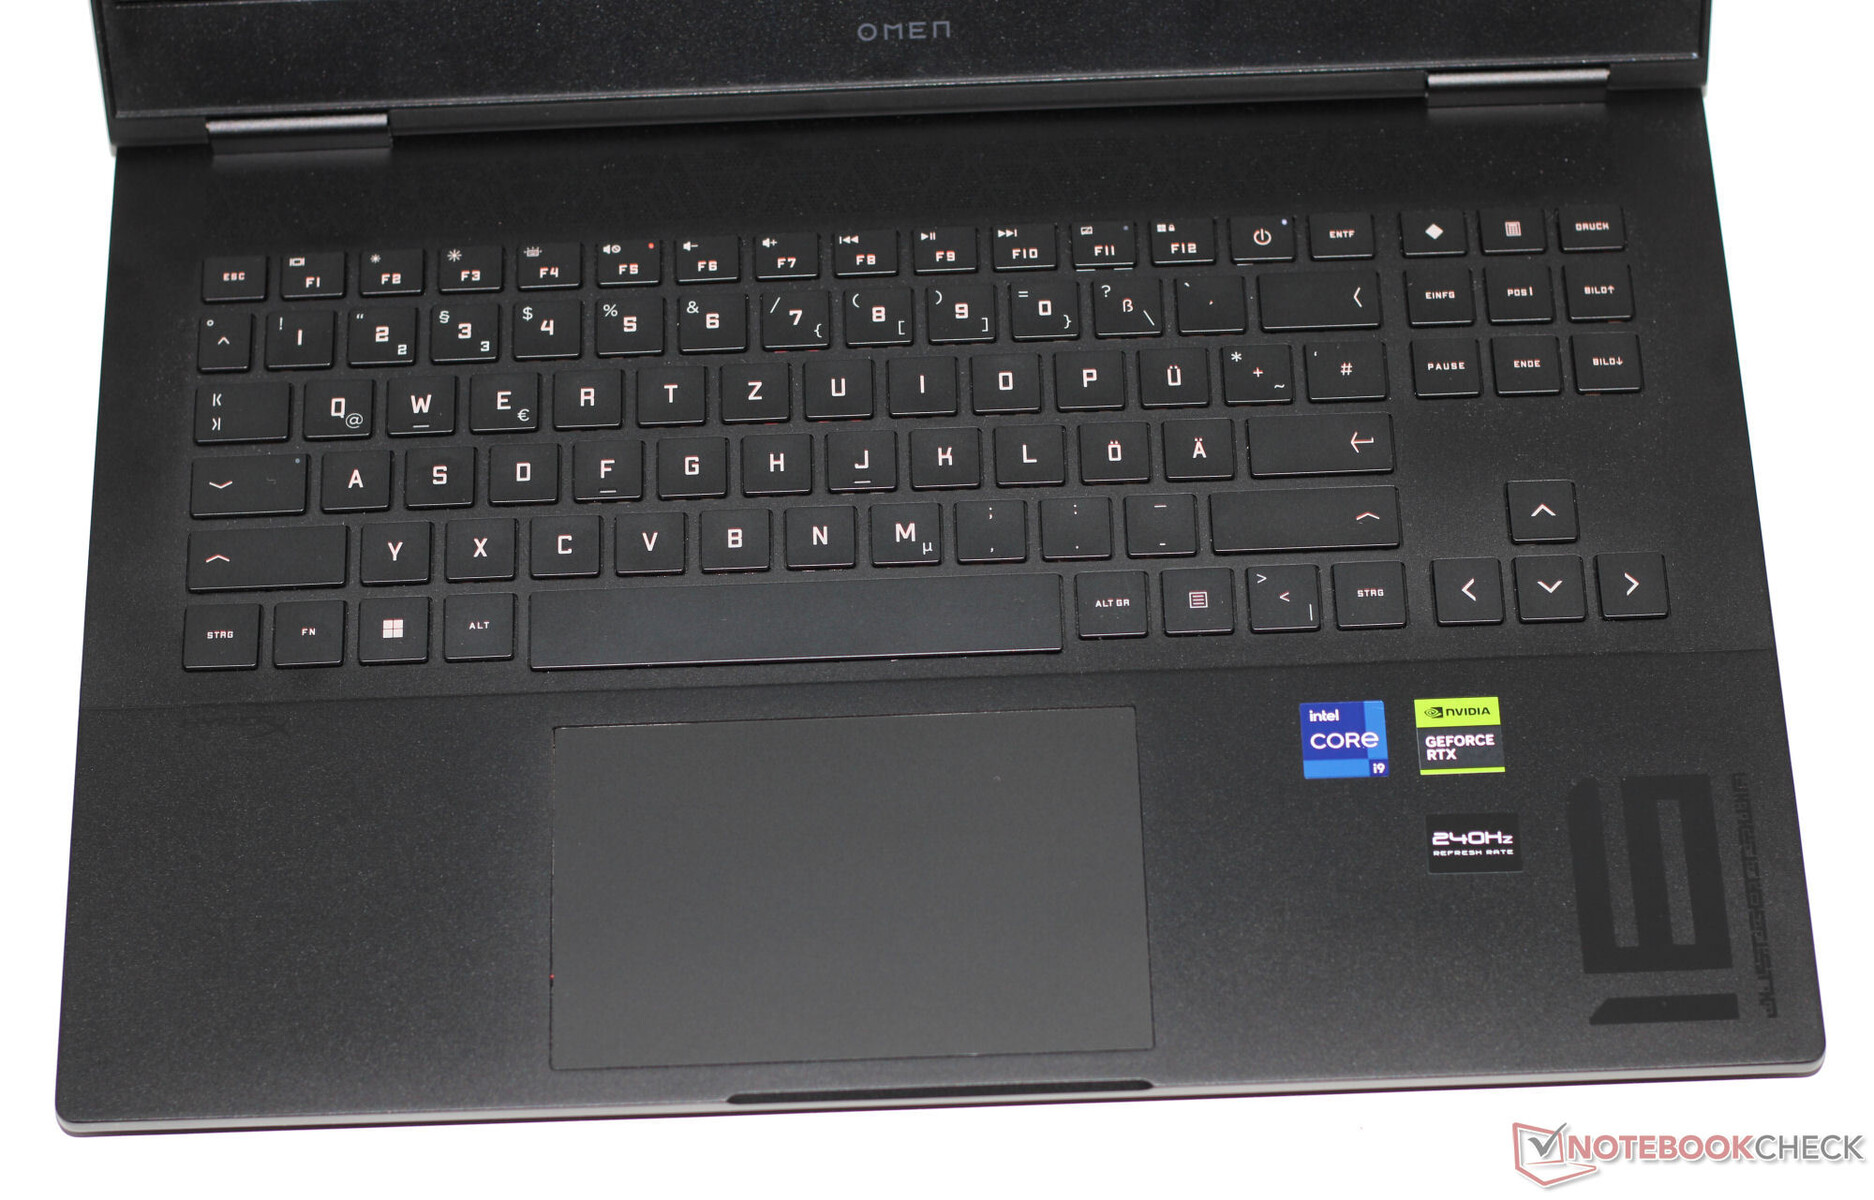
The RGB-backlit chiclet keyboard on the Omen 16 doesn’t have a number pad. The space usually set aside for a numpad is now occupied by the control keys as well as the large, separate arrow keys. The concave keys are easy to press, offer a moderate travel and a clear actuation point, and also have decent resistance. Measuring approx. 12.5 x 8 cm (4.9 x 3.1 in), the touchpad has a short travel and a distinct click point.
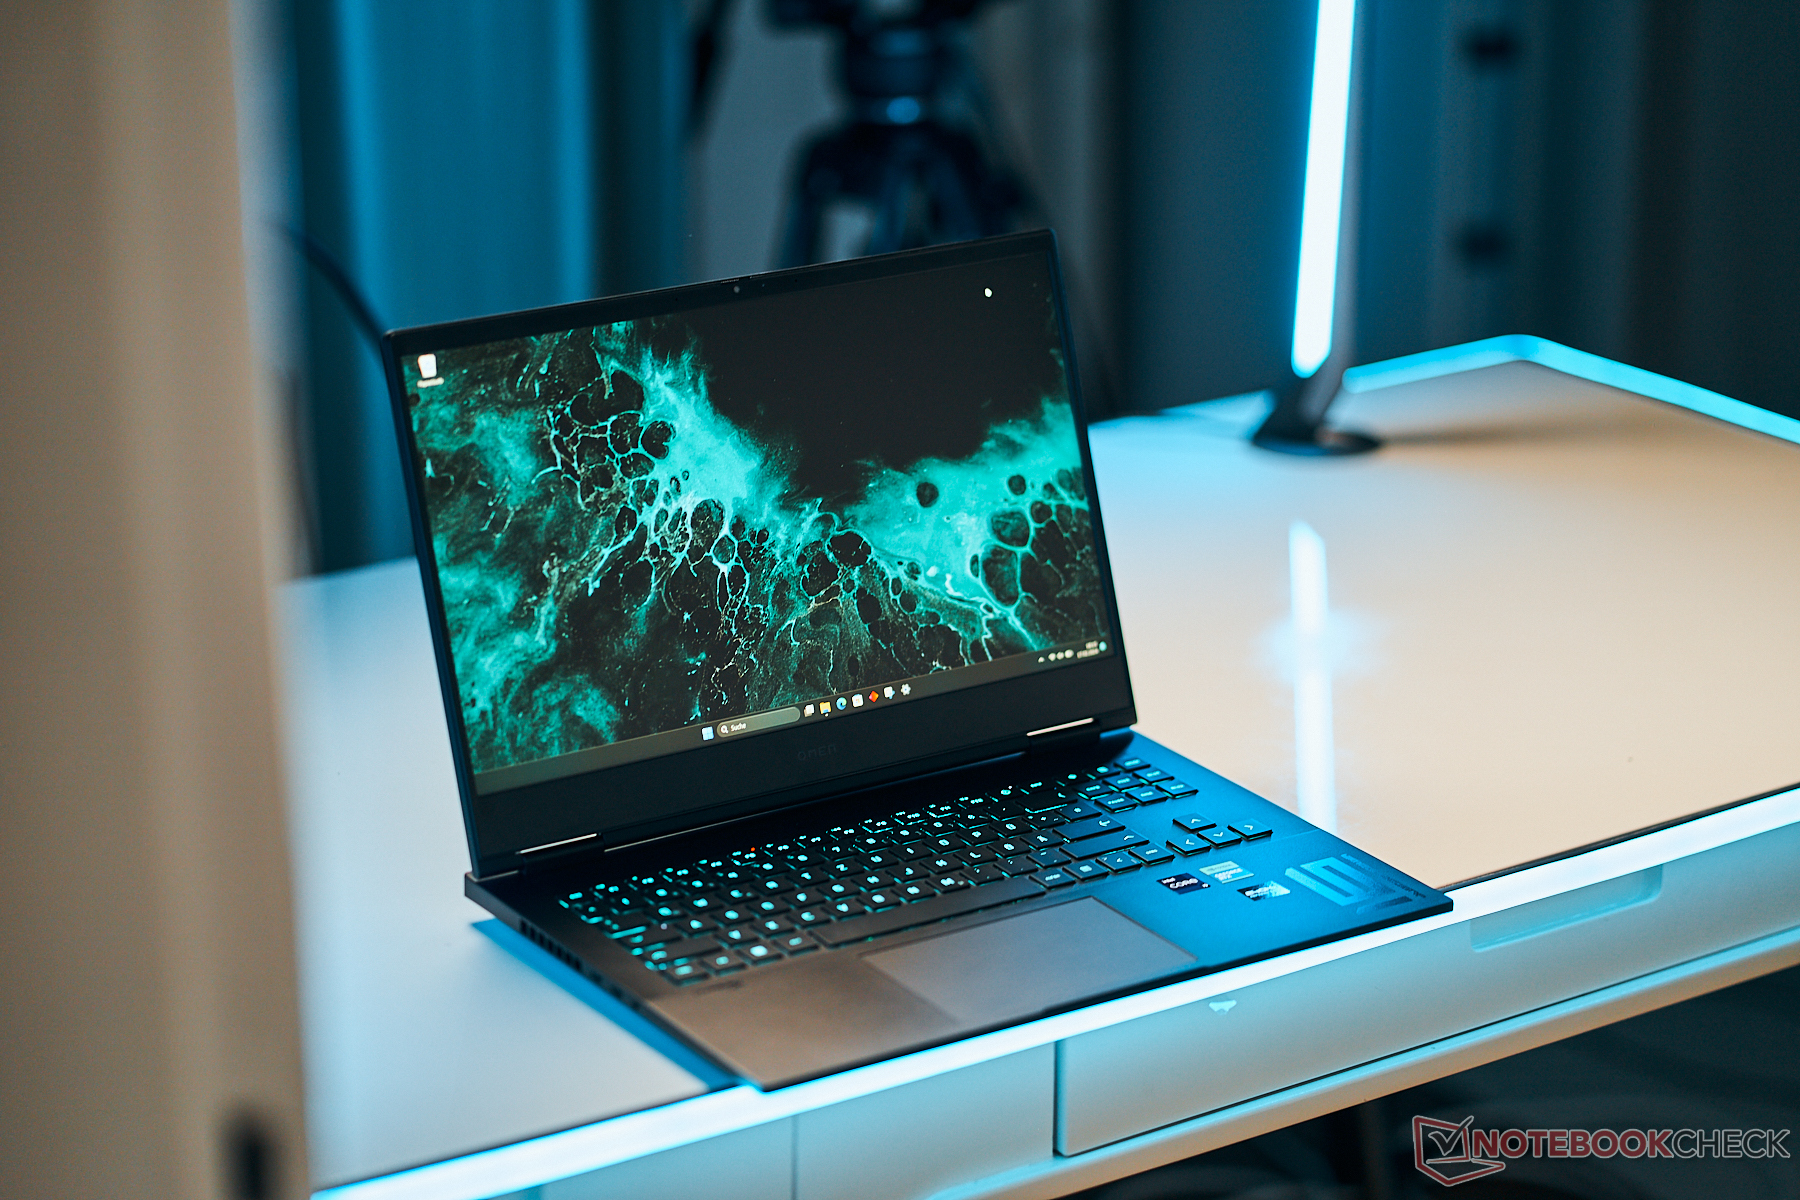
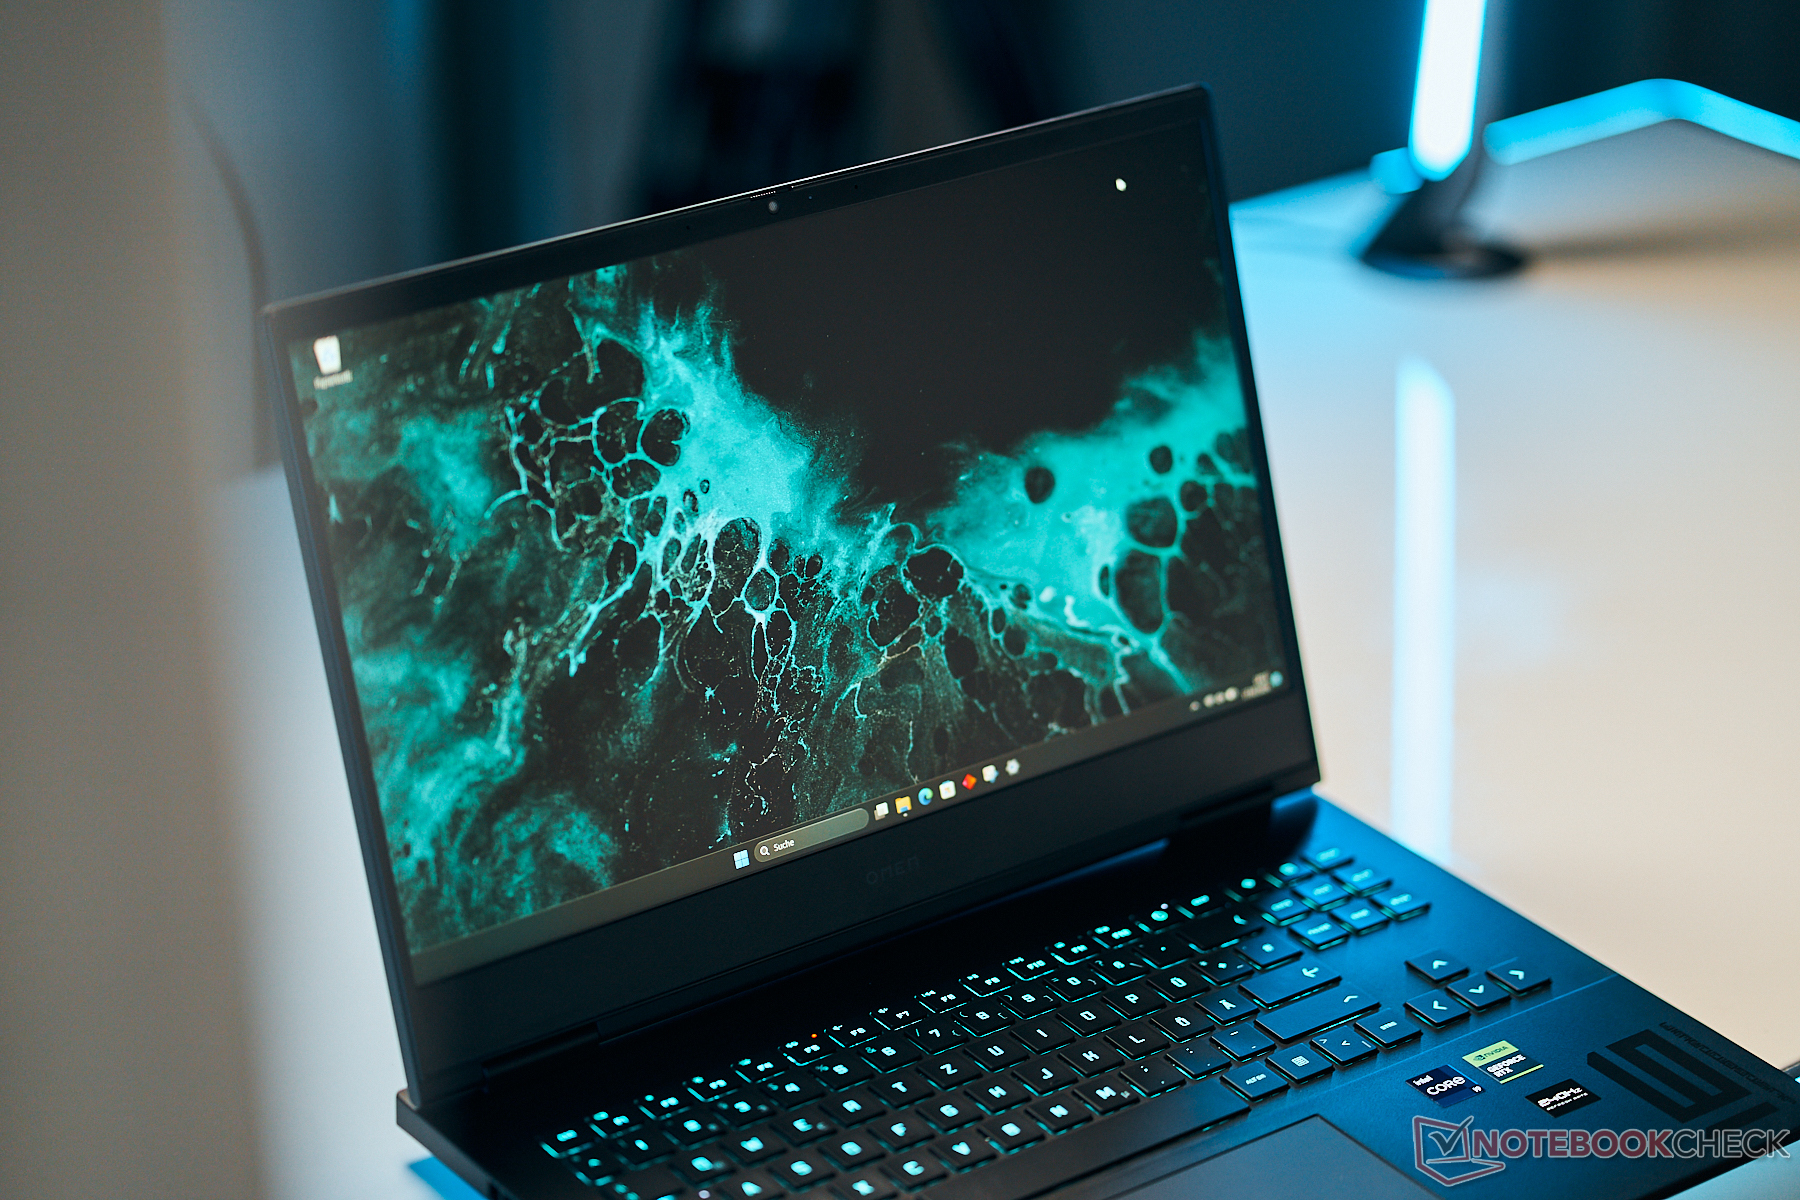
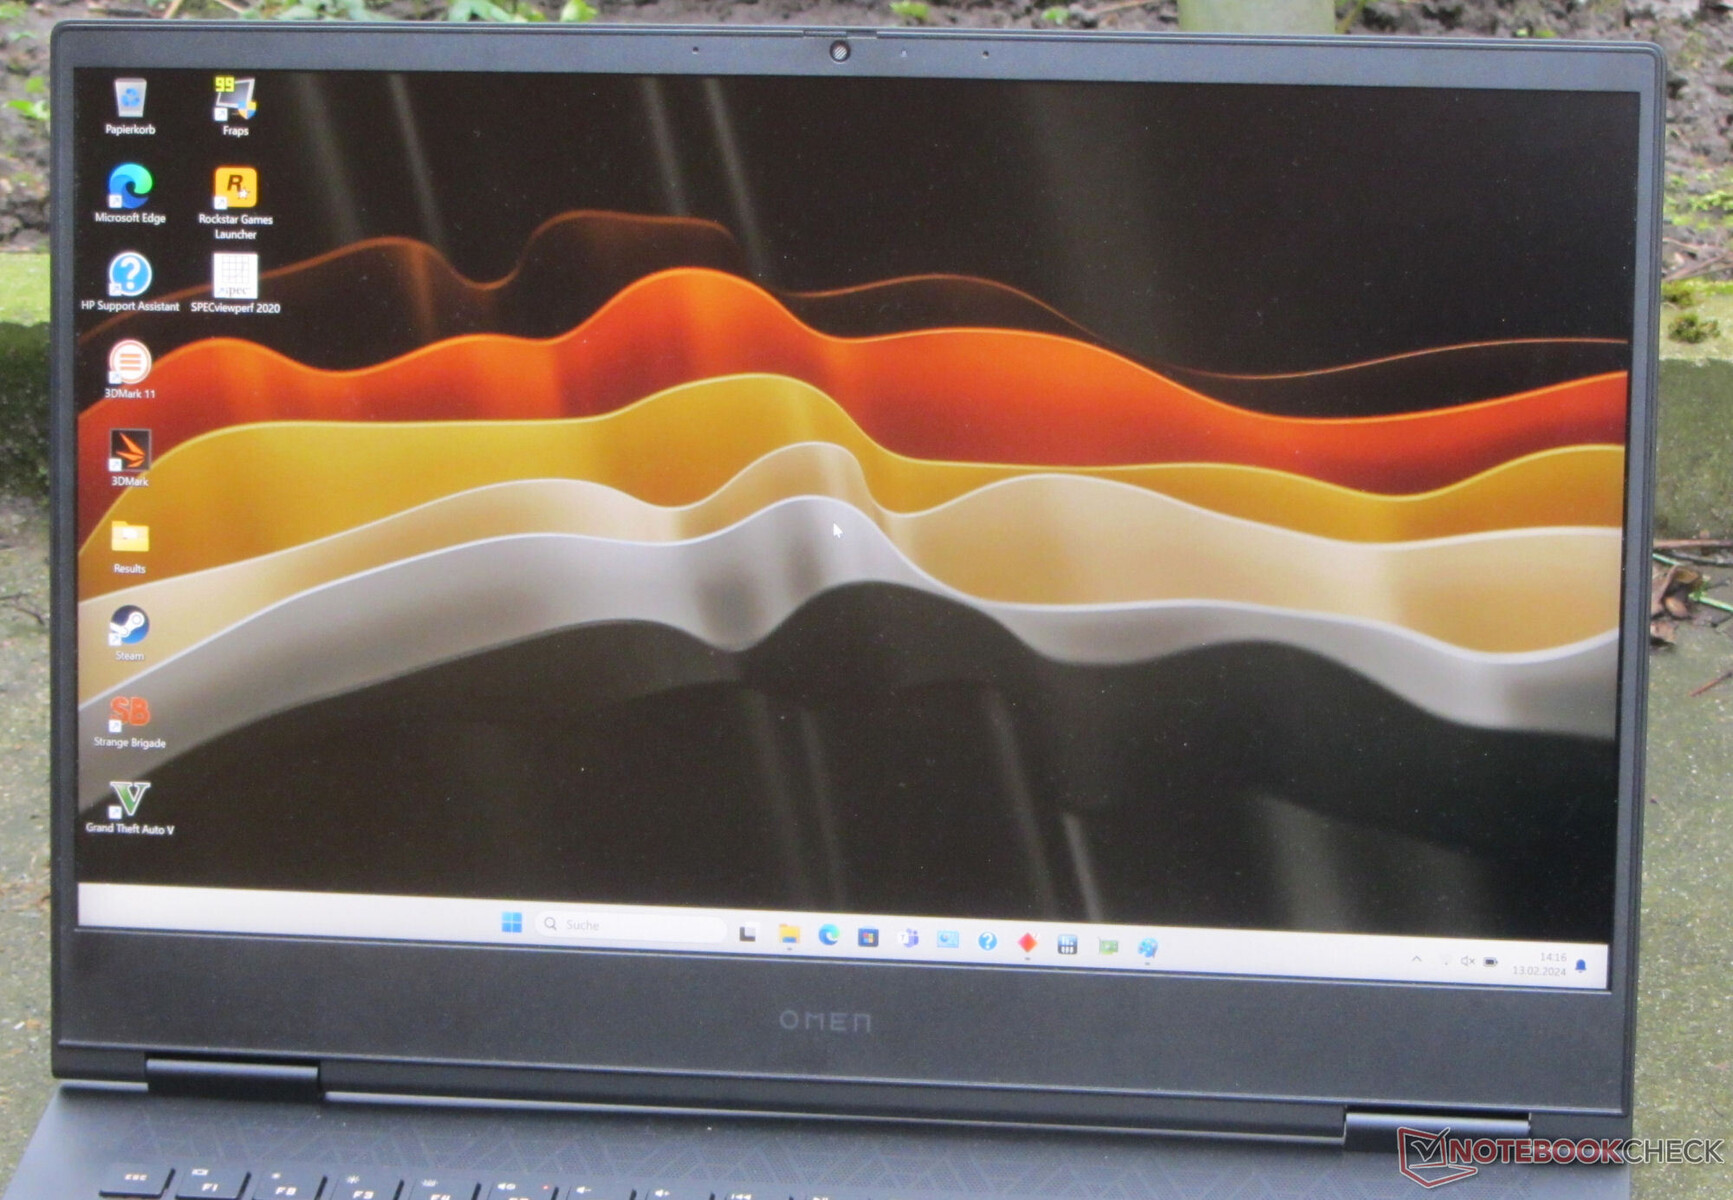
Display - QHD panel with full sRGB coverage
To its credit, the 16.1-inch IPS display (1440p) with a 16:9 aspect ratio doesn’t exhibit PWM flicker, supports G-Sync and has quick response times. Though the contrast ratio of the display is good enough (> 1,000:1), the peak brightness is slightly below the target level (> 300 cd/m²).

| |||||||||||||||||||||||||
Brightness Distribution: 85 %
Center on Battery: 292 cd/m²
Contrast: 1217:1 (Black: 0.24 cd/m²)
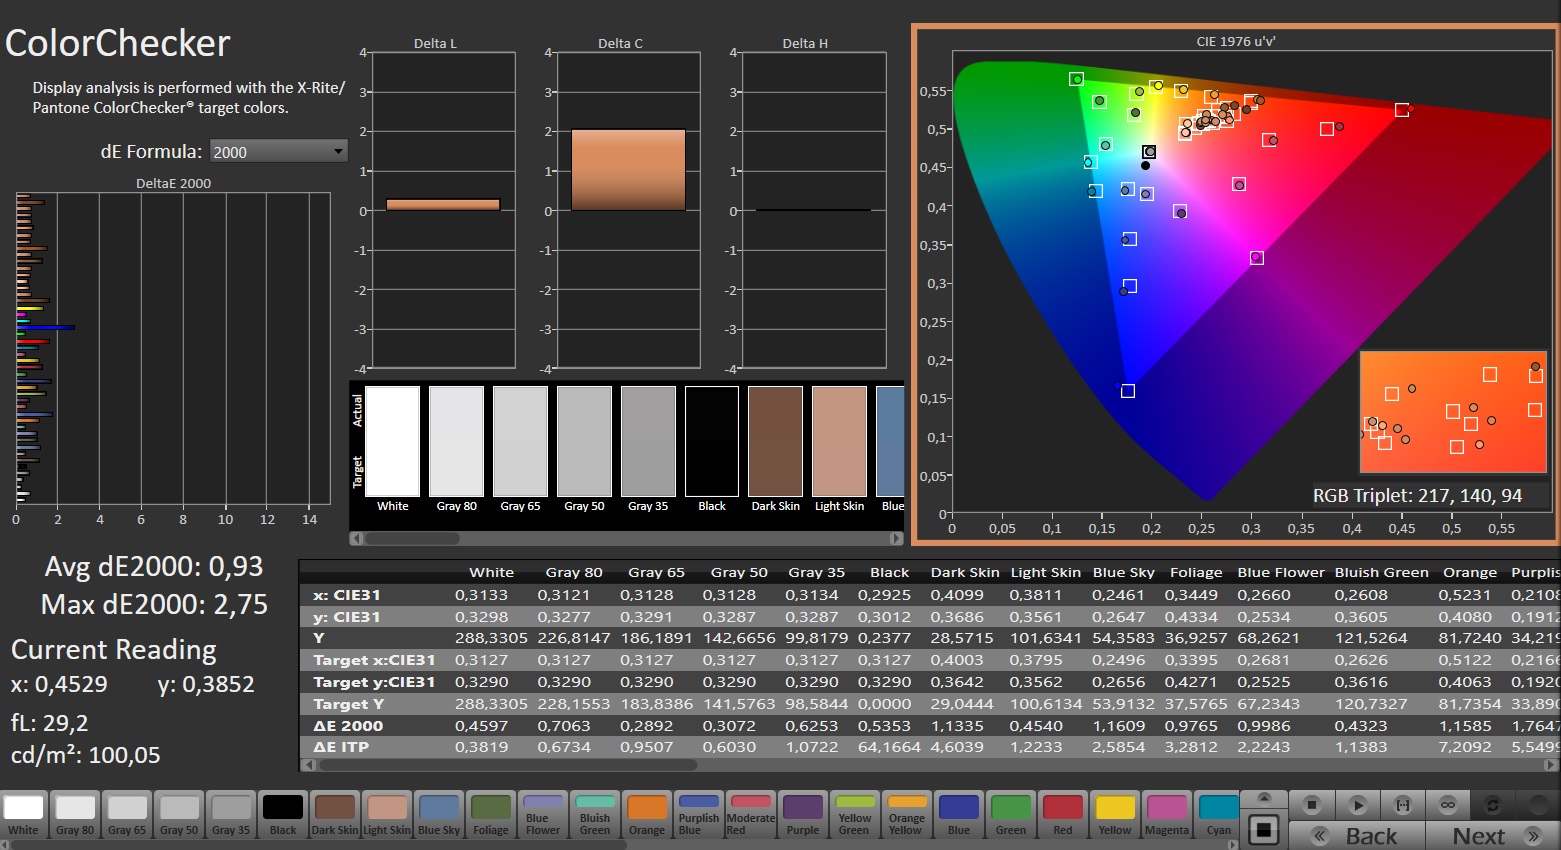
ΔE ColorChecker Calman: 2.36 | ∀{0.5-29.43 Ø4.73}
calibrated: 0.93
ΔE Greyscale Calman: 3 | ∀{0.09-98 Ø4.97}
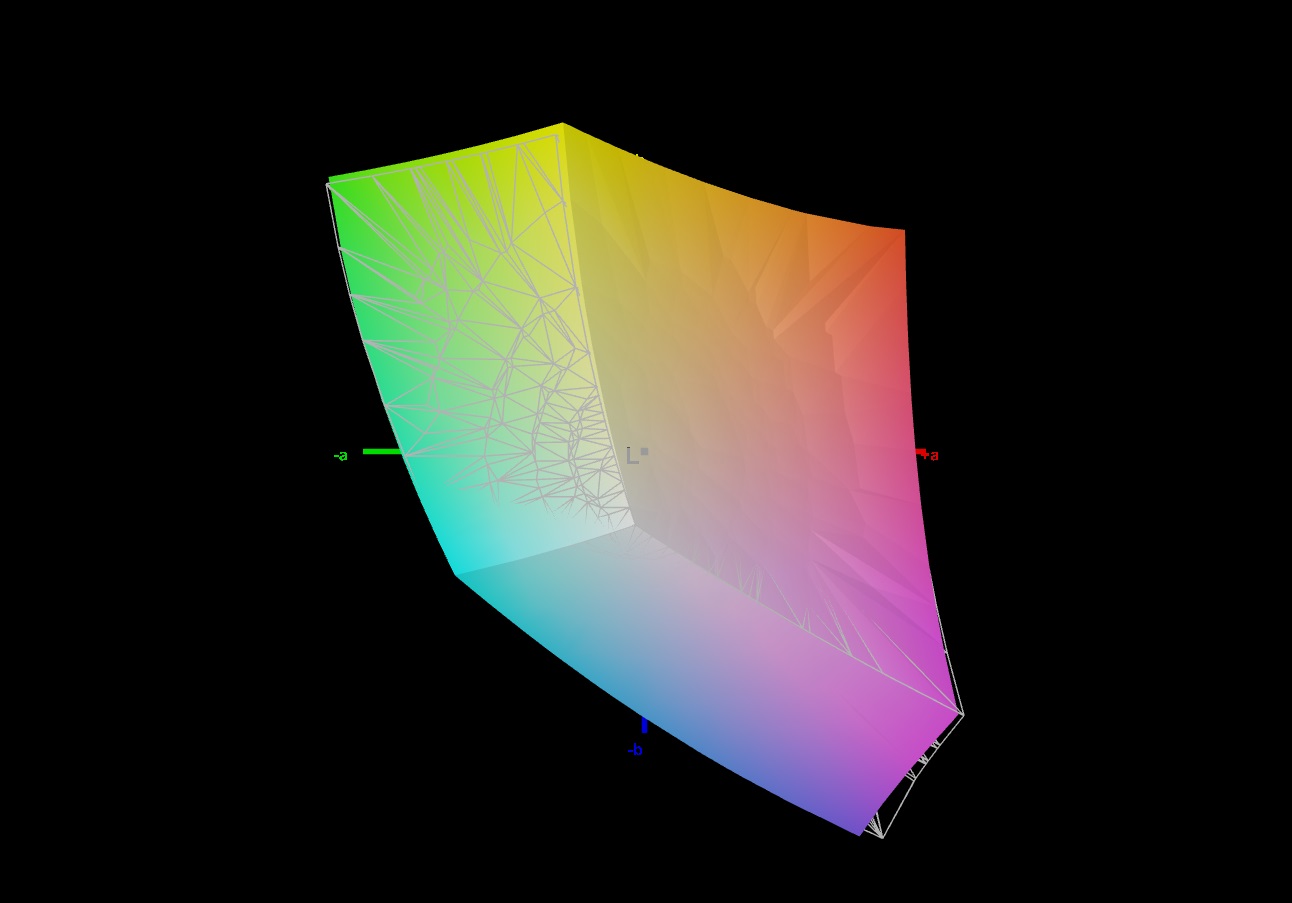
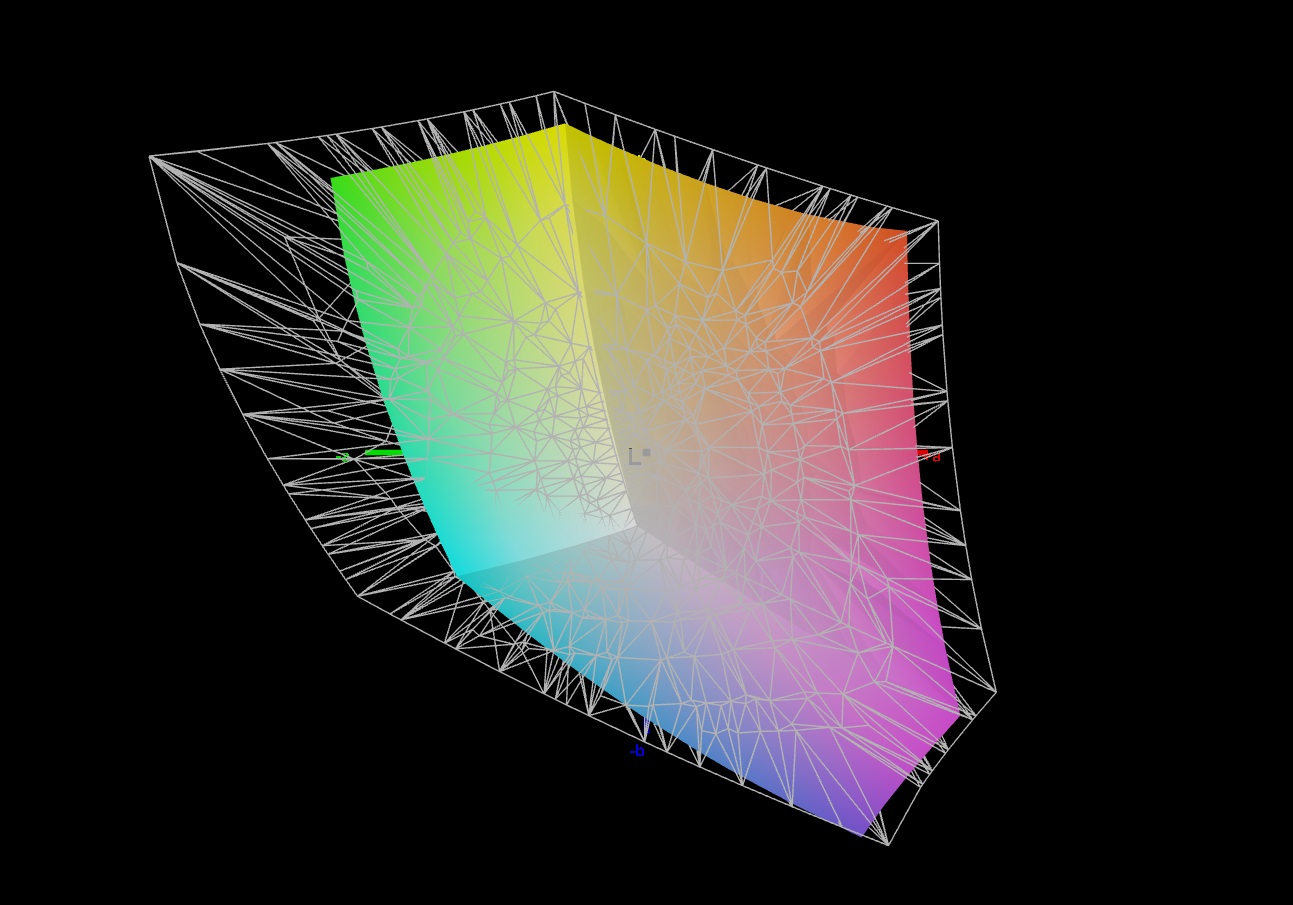
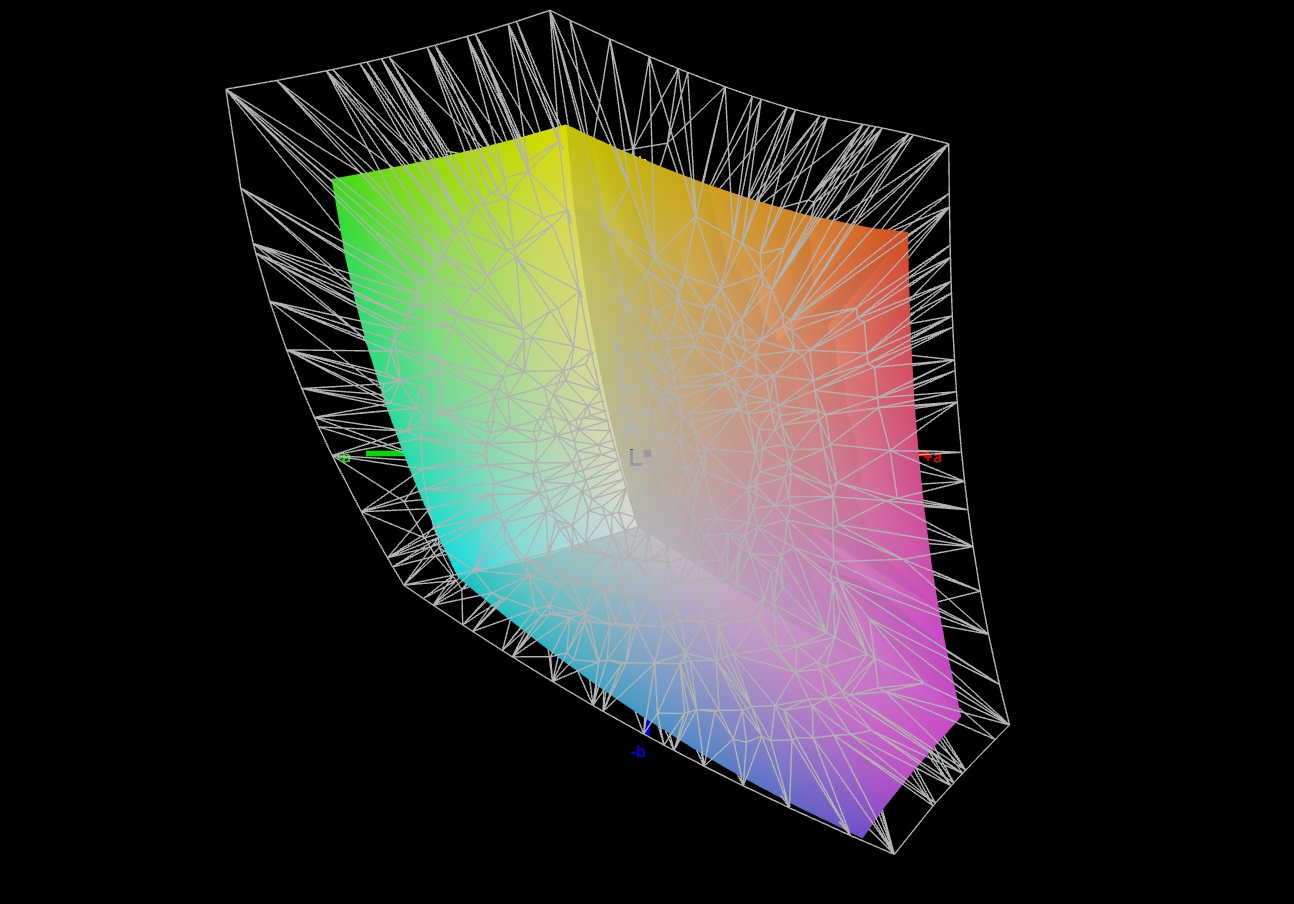
70.6% AdobeRGB 1998 (Argyll 3D)
98.6% sRGB (Argyll 3D)
68.6% Display P3 (Argyll 3D)
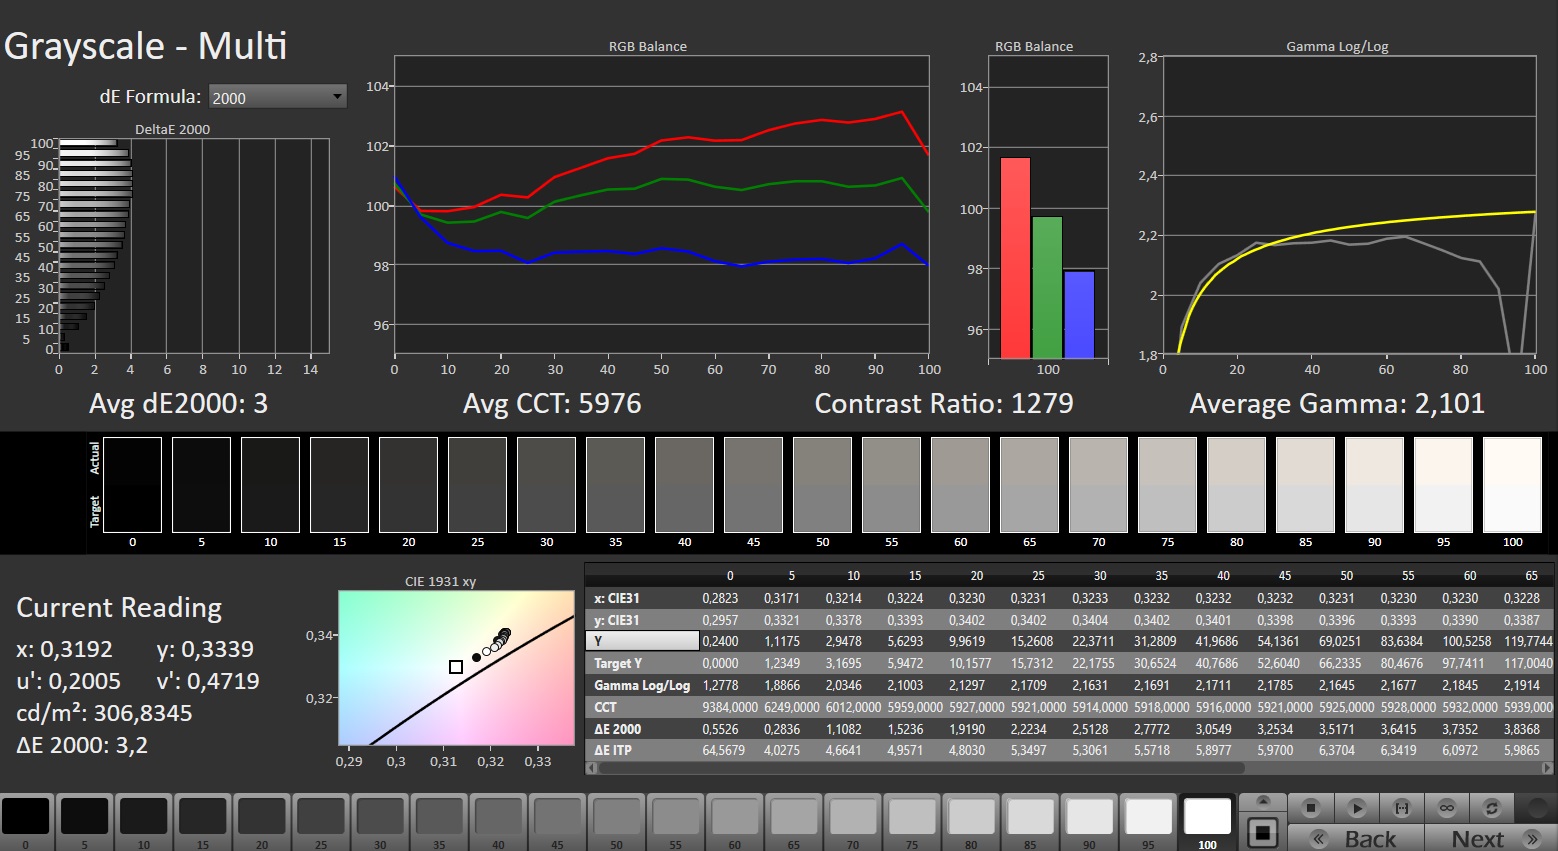
Gamma: 2.101
CCT: 5976 K
| HP Omen 16 (2024) BOE BOE0B7D, IPS, 2560x1440, 16.1" | MSI Vector 16 HX A14V Chi Mei N160GME-GTB, IPS, 2560x1600, 16" | Alienware m16 R1 AMD BOE NE16NZ4, IPS, 2560x1600, 16" | Acer Predator Helios 18 N23Q2 AUO45A8 (B180QAN01.2), IPS, 2560x1600, 18" | HP Omen 16-wf000 BOE0B7D, IPS, 2560x1440, 16.1" | |
|---|---|---|---|---|---|
| Display | 20% | 24% | 25% | 1% | |
| Display P3 Coverage (%) | 68.6 | 95.4 39% | 98.6 44% | 99.8 45% | 69 1% |
| sRGB Coverage (%) | 98.6 | 99.7 1% | 99.9 1% | 100 1% | 99.2 1% |
| AdobeRGB 1998 Coverage (%) | 70.6 | 85.4 21% | 88.9 26% | 91.8 30% | 71.2 1% |
| Response Times | 19% | 34% | -23% | 32% | |
| Response Time Grey 50% / Grey 80% * (ms) | 14.1 ? | 5.7 ? 60% | 5.1 ? 64% | 7.6 ? 46% | 4.6 ? 67% |
| Response Time Black / White * (ms) | 9.3 ? | 11.4 ? -23% | 9 ? 3% | 17.8 ? -91% | 9.7 ? -4% |
| PWM Frequency (Hz) | 2509 | ||||
| Screen | -7% | -37% | -27% | 1% | |
| Brightness middle (cd/m²) | 292 | 557.2 91% | 329 13% | 360 23% | 310.9 6% |
| Brightness (cd/m²) | 291 | 506 74% | 317 9% | 355 22% | 296 2% |
| Brightness Distribution (%) | 85 | 83 -2% | 89 5% | 92 8% | 91 7% |
| Black Level * (cd/m²) | 0.24 | 0.41 -71% | 0.32 -33% | 0.21 12% | 0.35 -46% |
| Contrast (:1) | 1217 | 1359 12% | 1028 -16% | 1714 41% | 888 -27% |
| Colorchecker dE 2000 * | 2.36 | 2.91 -23% | 3.71 -57% | 3.82 -62% | 2.18 8% |
| Colorchecker dE 2000 max. * | 4.08 | 5.94 -46% | 7.23 -77% | 7.38 -81% | 3.58 12% |
| Colorchecker dE 2000 calibrated * | 0.93 | 1.63 -75% | 2.82 -203% | 2.24 -141% | 0.52 44% |
| Greyscale dE 2000 * | 3 | 3.8 -27% | 2.2 27% | 5.06 -69% | 2.8 7% |
| Gamma | 2.101 105% | 2.23 99% | 2.3 96% | 2.52 87% | 2.18 101% |
| CCT | 5976 109% | 6408 101% | 6270 104% | 5657 115% | 6002 108% |
| Total Average (Program / Settings) | 11% /
2% | 7% /
-14% | -8% /
-15% | 11% /
6% |
* ... smaller is better
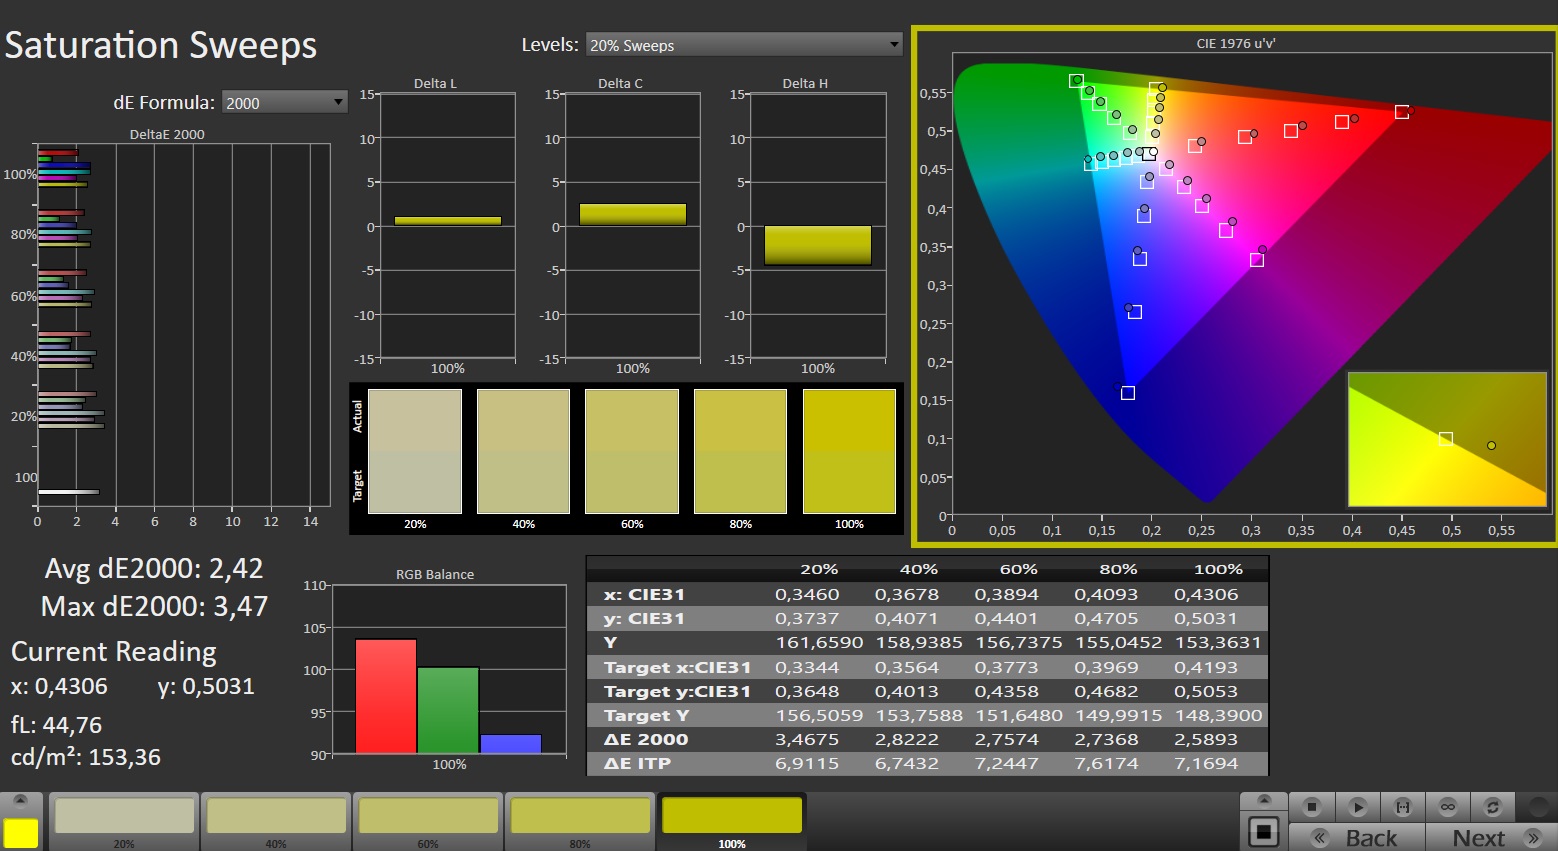
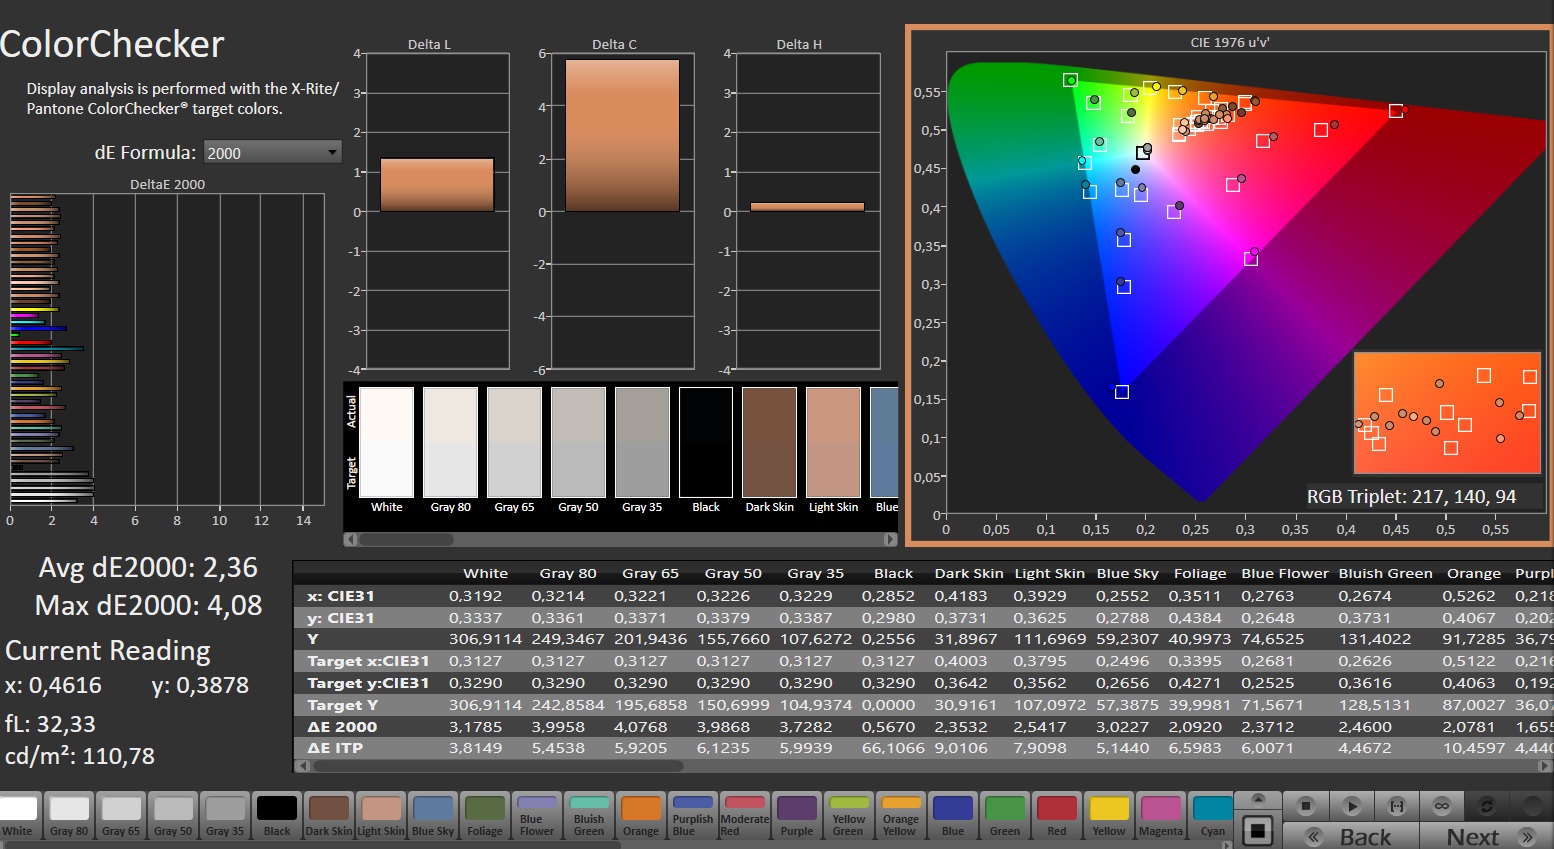
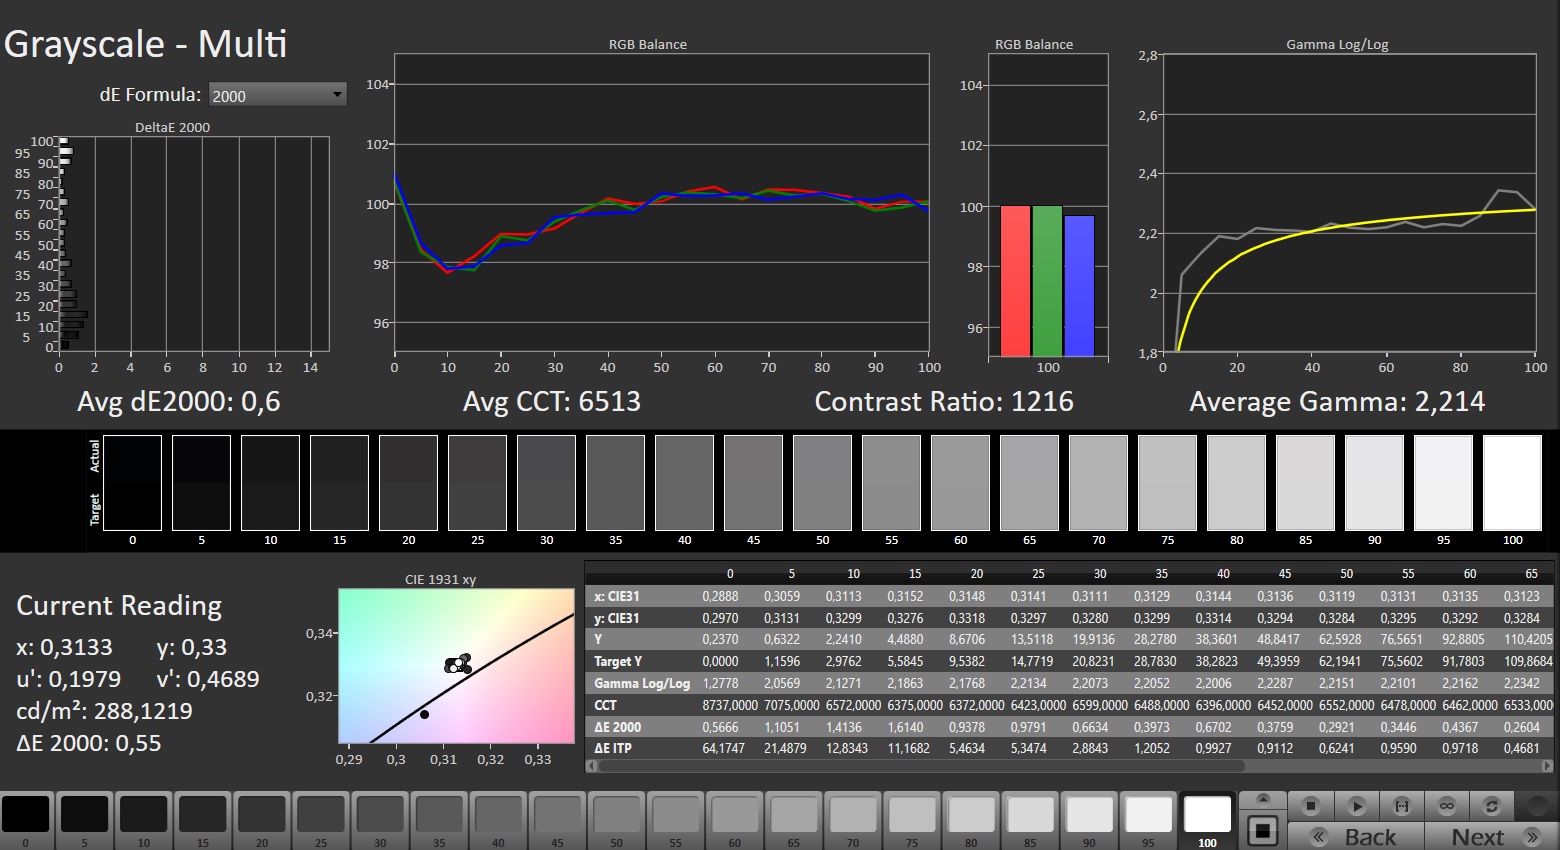
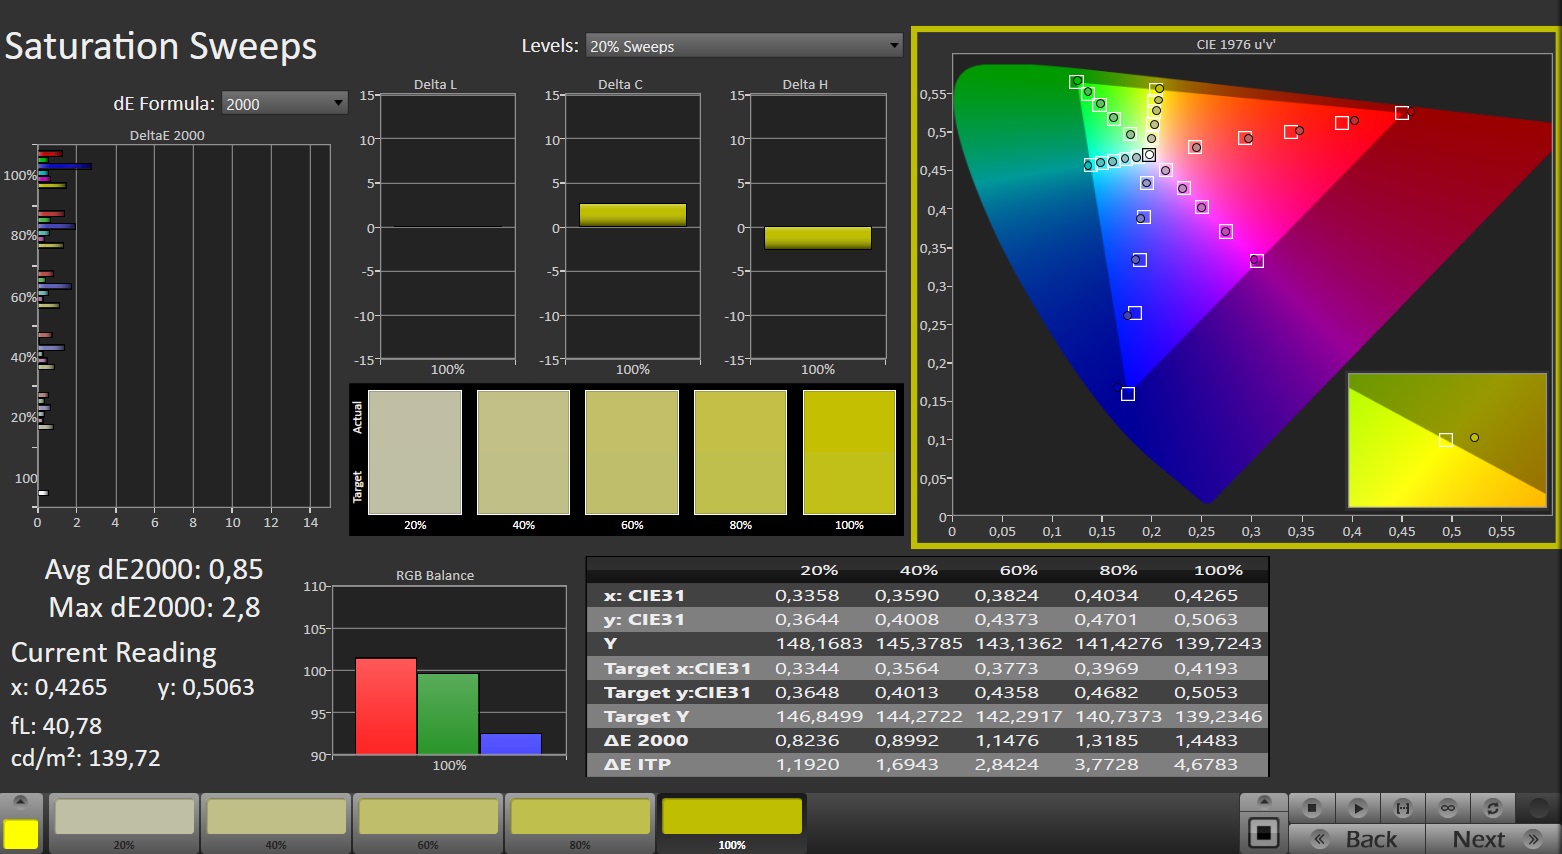
The display has great colour reproduction right out of the box. With an average colour difference of around 2.4, it is at a level we consider good (Delta E < 3). Calibrating the screen reduced the average Delta E to 0.93 and resulted in a more balanced greyscale. The panel can reproduce the full sRGB colour space, but doesn't have full AdobeRGB and DCI-P3 coverage. The displays on competing devices have more to offer in this department.
Display Response Times
| ↔ Response Time Black to White | ||
|---|---|---|
| 9.3 ms ... rise ↗ and fall ↘ combined | ↗ 4.6 ms rise | 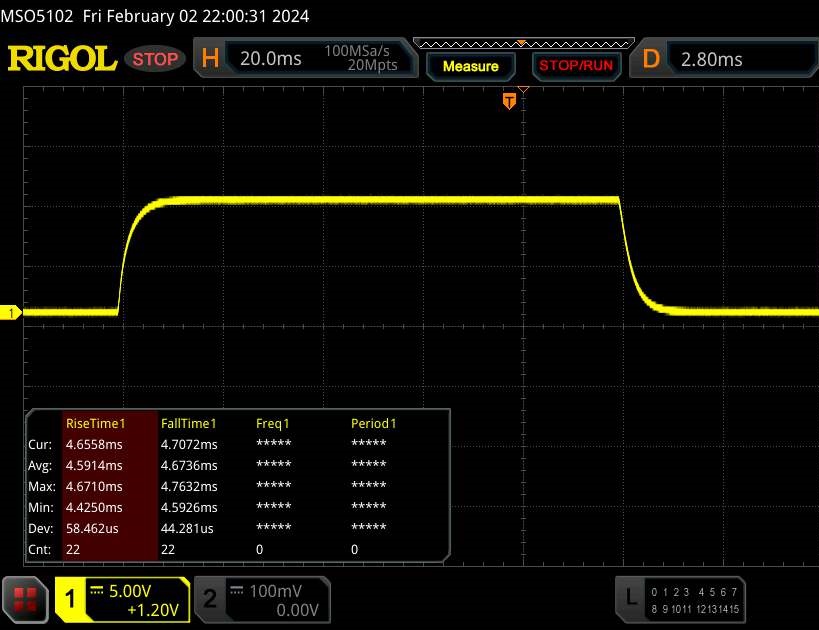 |
| ↘ 4.7 ms fall | ||
| The screen shows fast response rates in our tests and should be suited for gaming. In comparison, all tested devices range from 0.1 (minimum) to 240 (maximum) ms. » 26 % of all devices are better. This means that the measured response time is better than the average of all tested devices (19.9 ms). | ||
| ↔ Response Time 50% Grey to 80% Grey | ||
| 14.1 ms ... rise ↗ and fall ↘ combined | ↗ 6.7 ms rise | 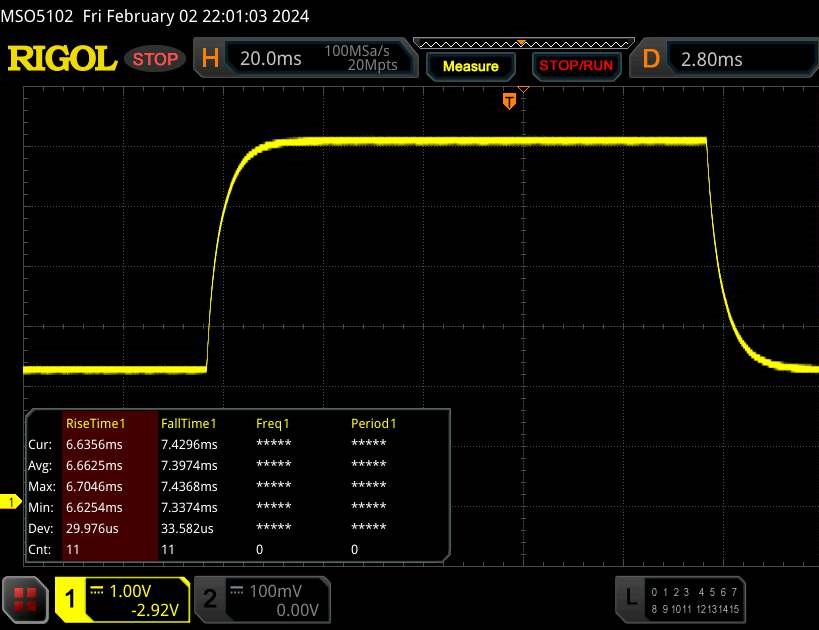 |
| ↘ 7.4 ms fall | ||
| The screen shows good response rates in our tests, but may be too slow for competitive gamers. In comparison, all tested devices range from 0.165 (minimum) to 636 (maximum) ms. » 28 % of all devices are better. This means that the measured response time is better than the average of all tested devices (31.1 ms). | ||
Screen Flickering / PWM (Pulse-Width Modulation)
| Screen flickering / PWM not detected | 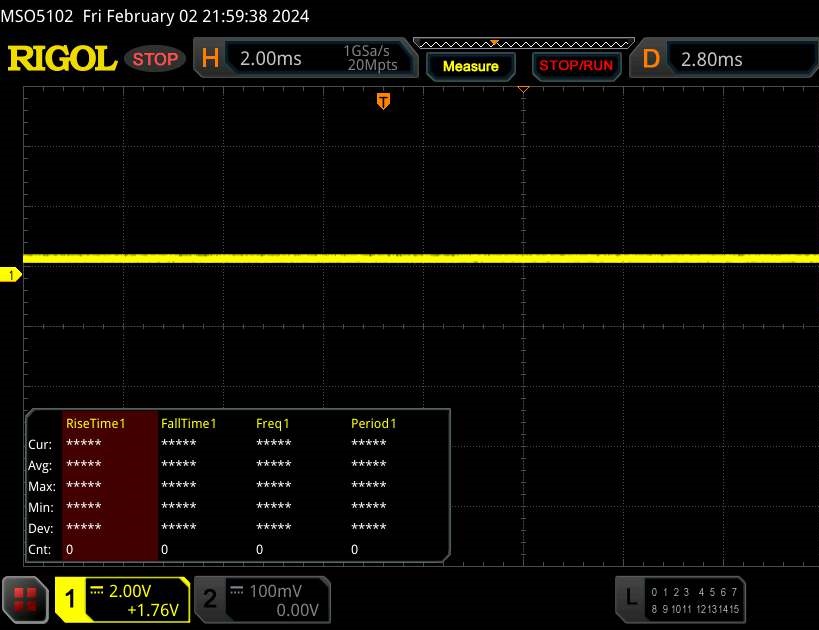 | ||
In comparison: 52 % of all tested devices do not use PWM to dim the display. If PWM was detected, an average of 7798 (minimum: 5 - maximum: 343500) Hz was measured. | |||
Having a wide viewing angle means the IPS panel is readable from any position. It is also possible to use the display outdoors, provided the sun isn’t too bright.
Performance - Powered by Raptor Lake and Ada Lovelace
The HP Omen 16 is a QHD gaming laptop that also cuts a good figure in other performance-hungry applications. The necessary computing power is delivered by Raptor Lake and Ada Lovelace. The Omen model as spec'd costs around €3,200 (US$3,446). Cheaper configurations are available starting at just €1,900 (US$2,760).
Test conditions
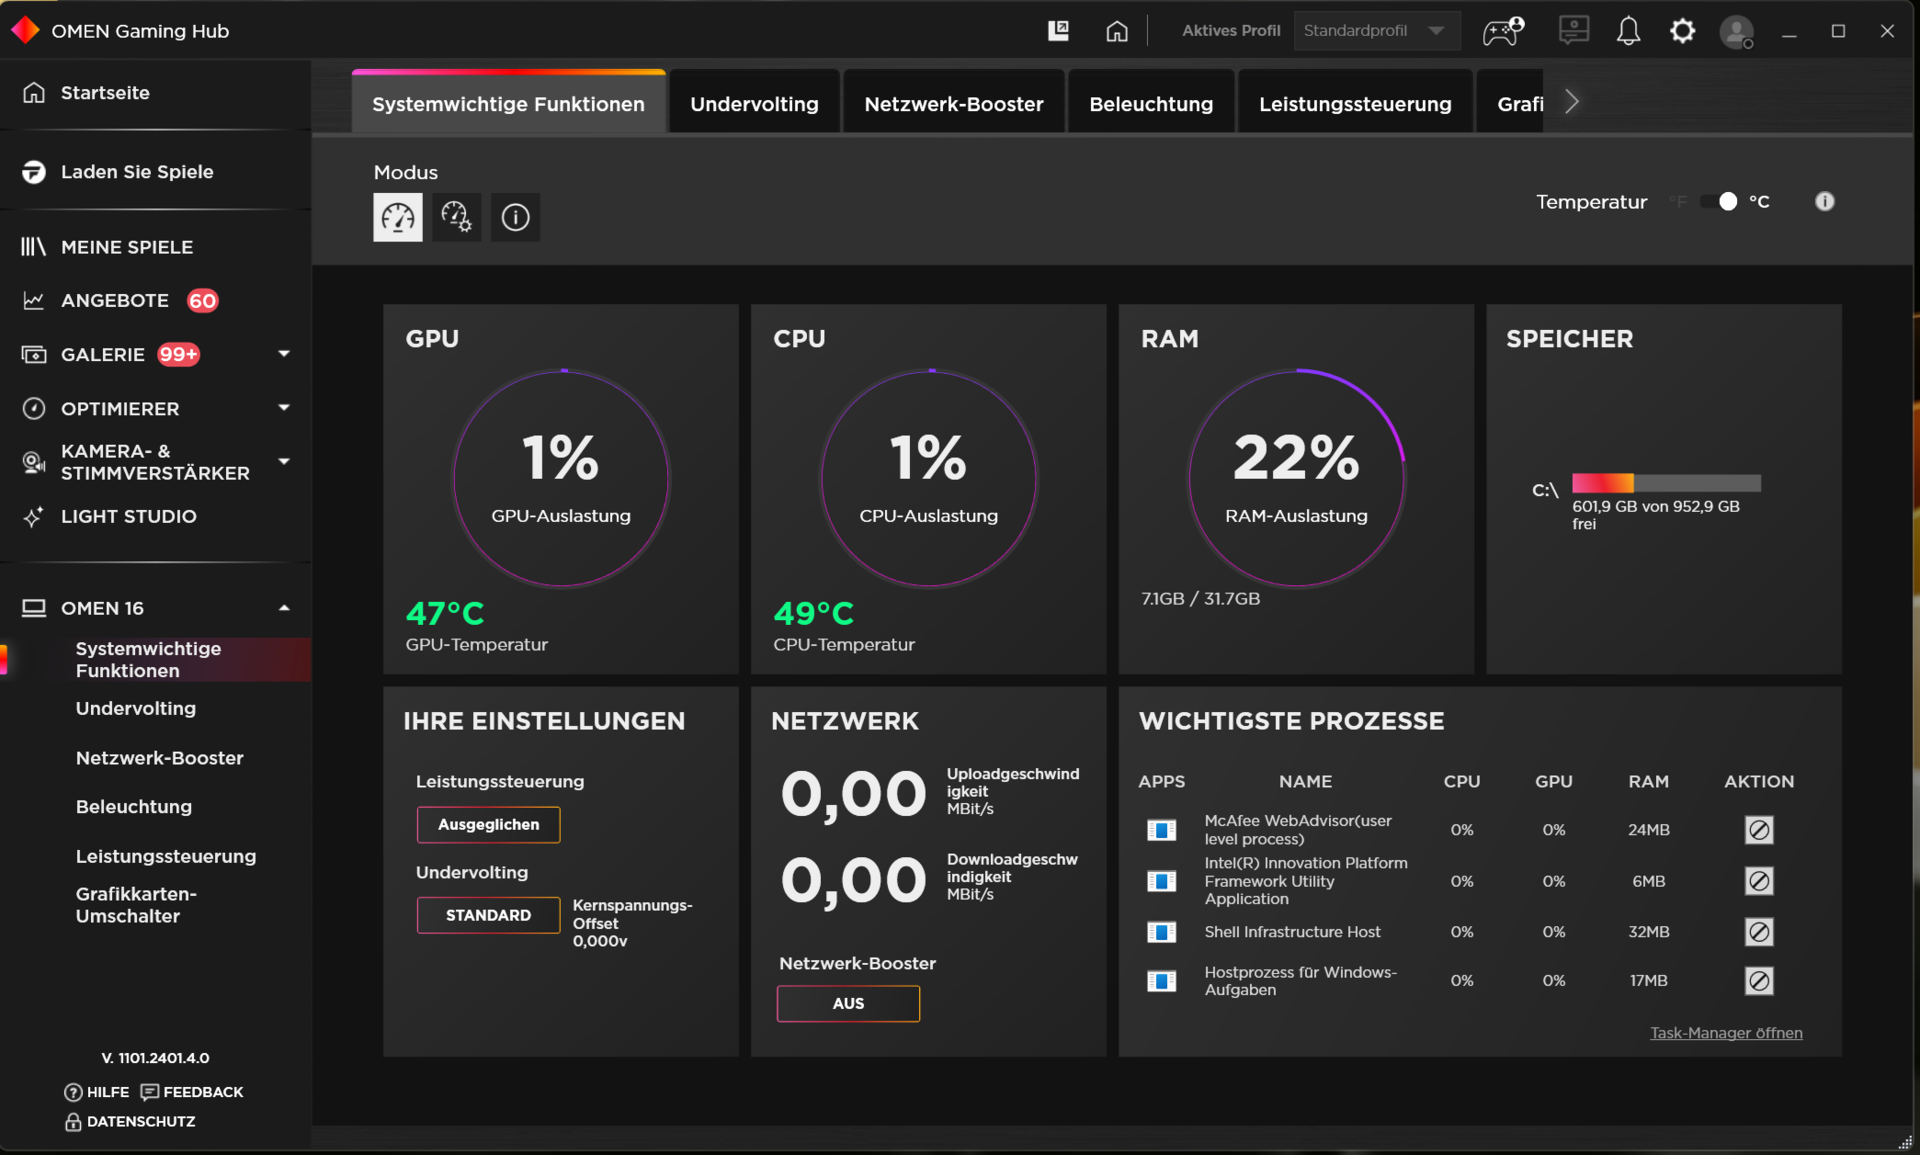
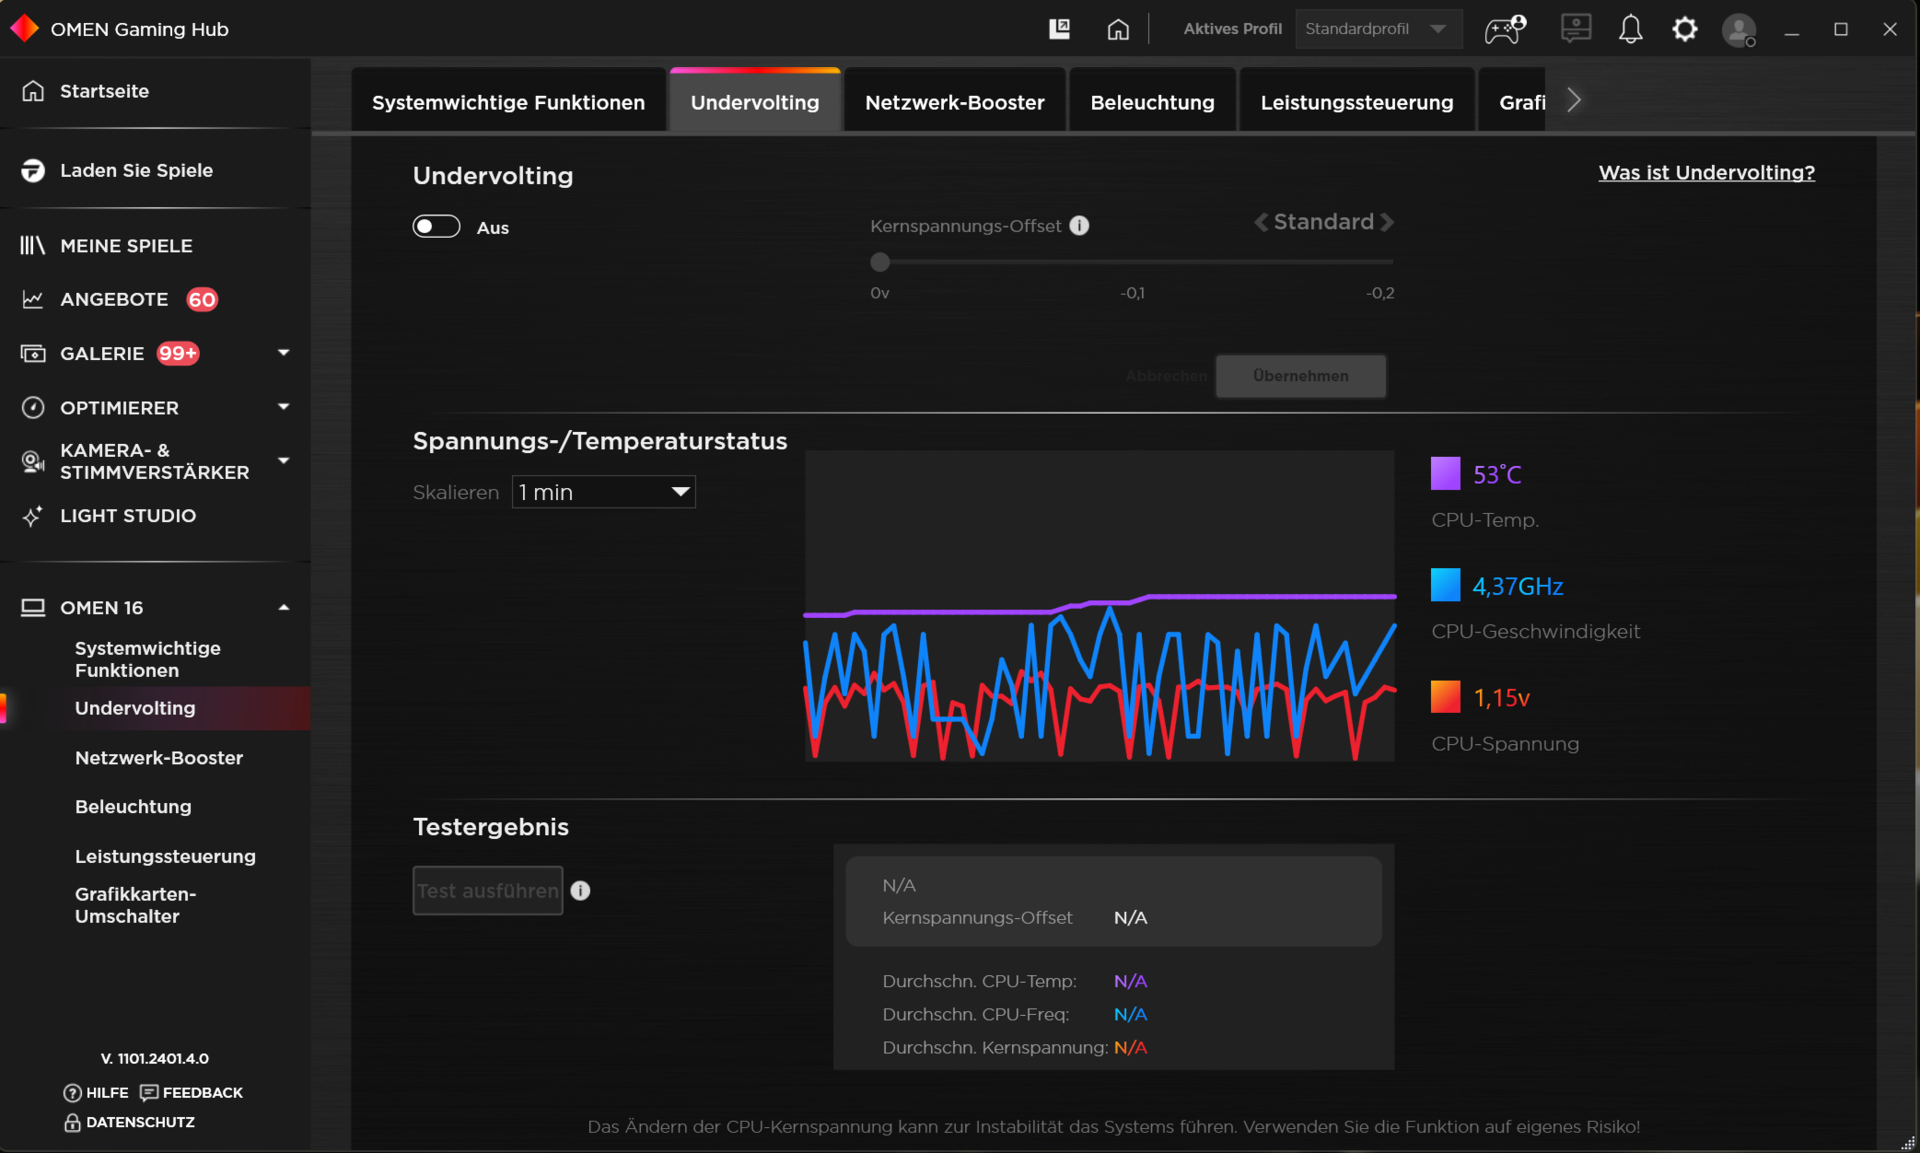
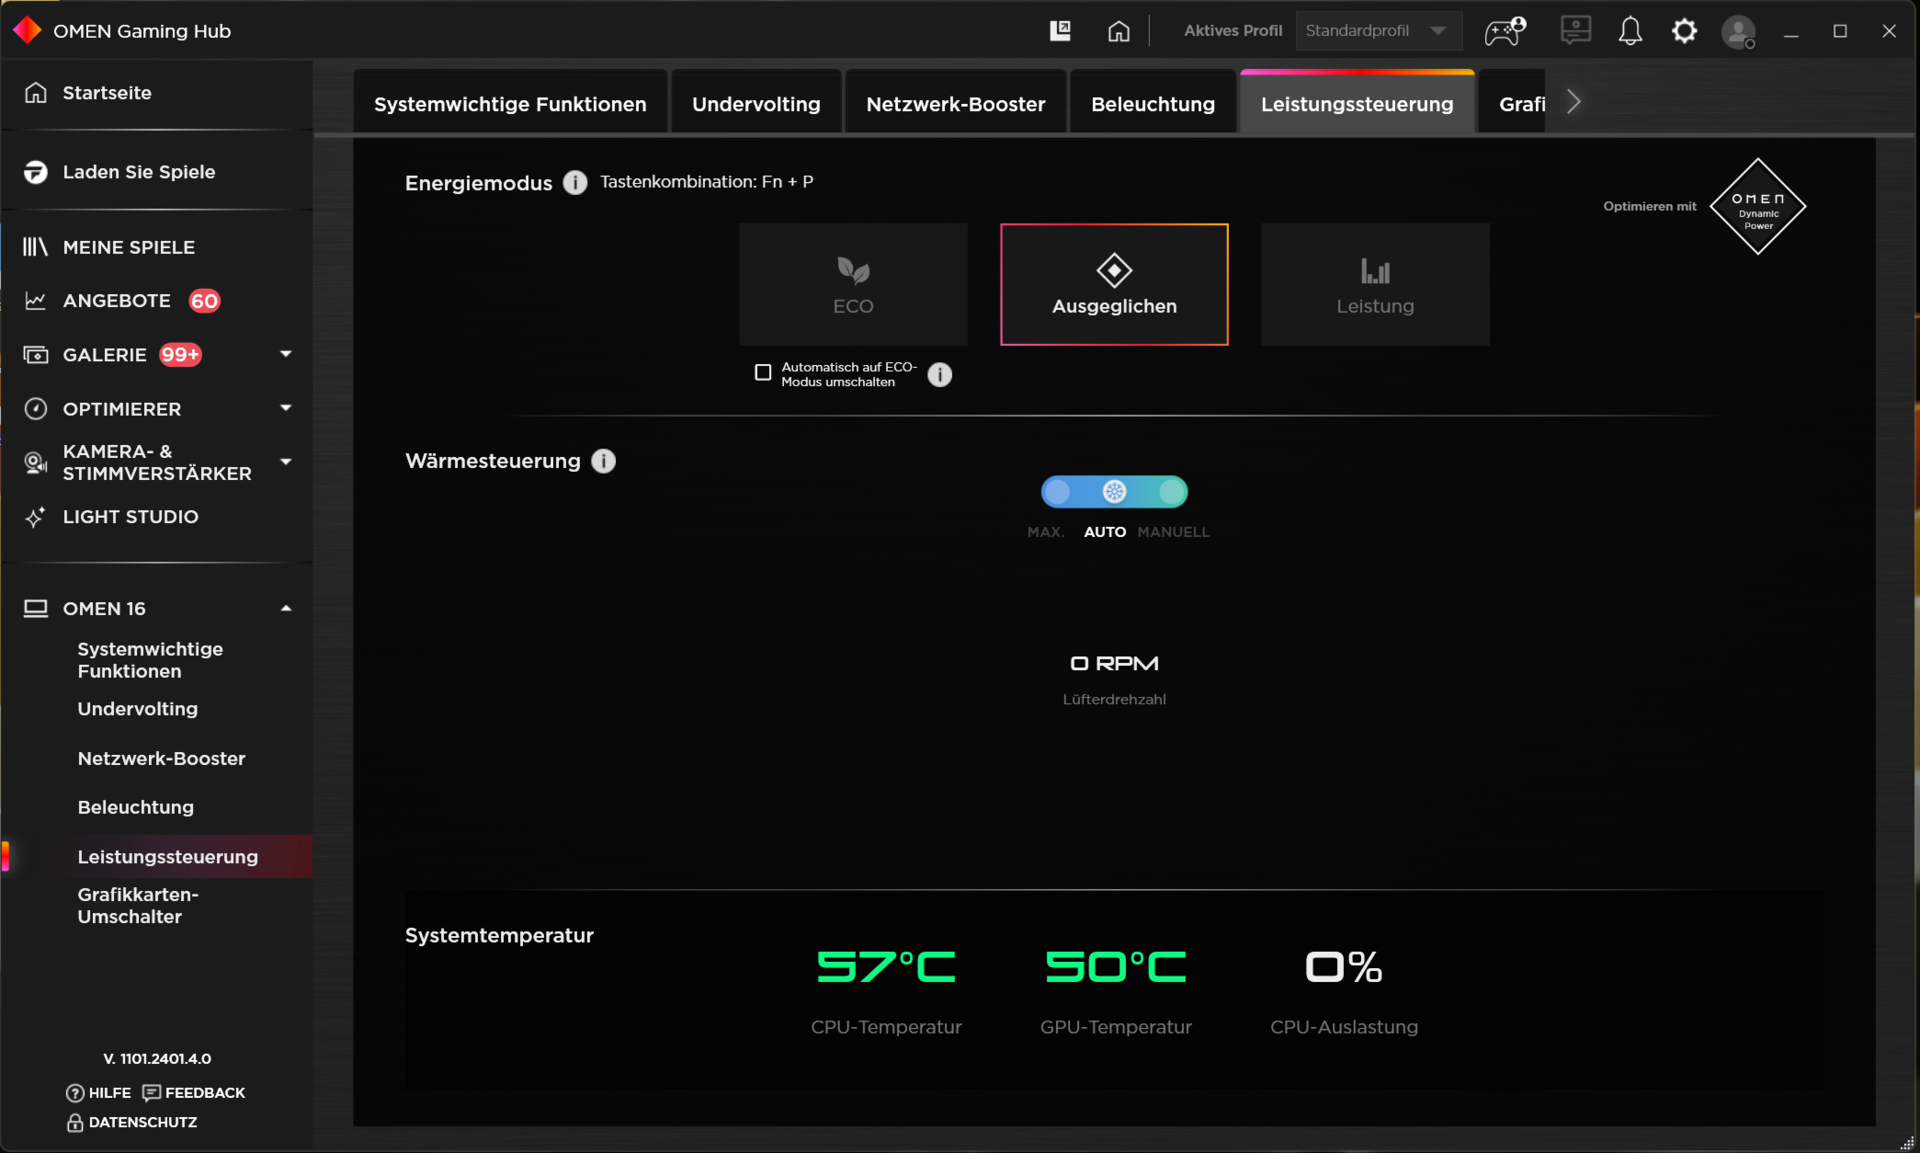
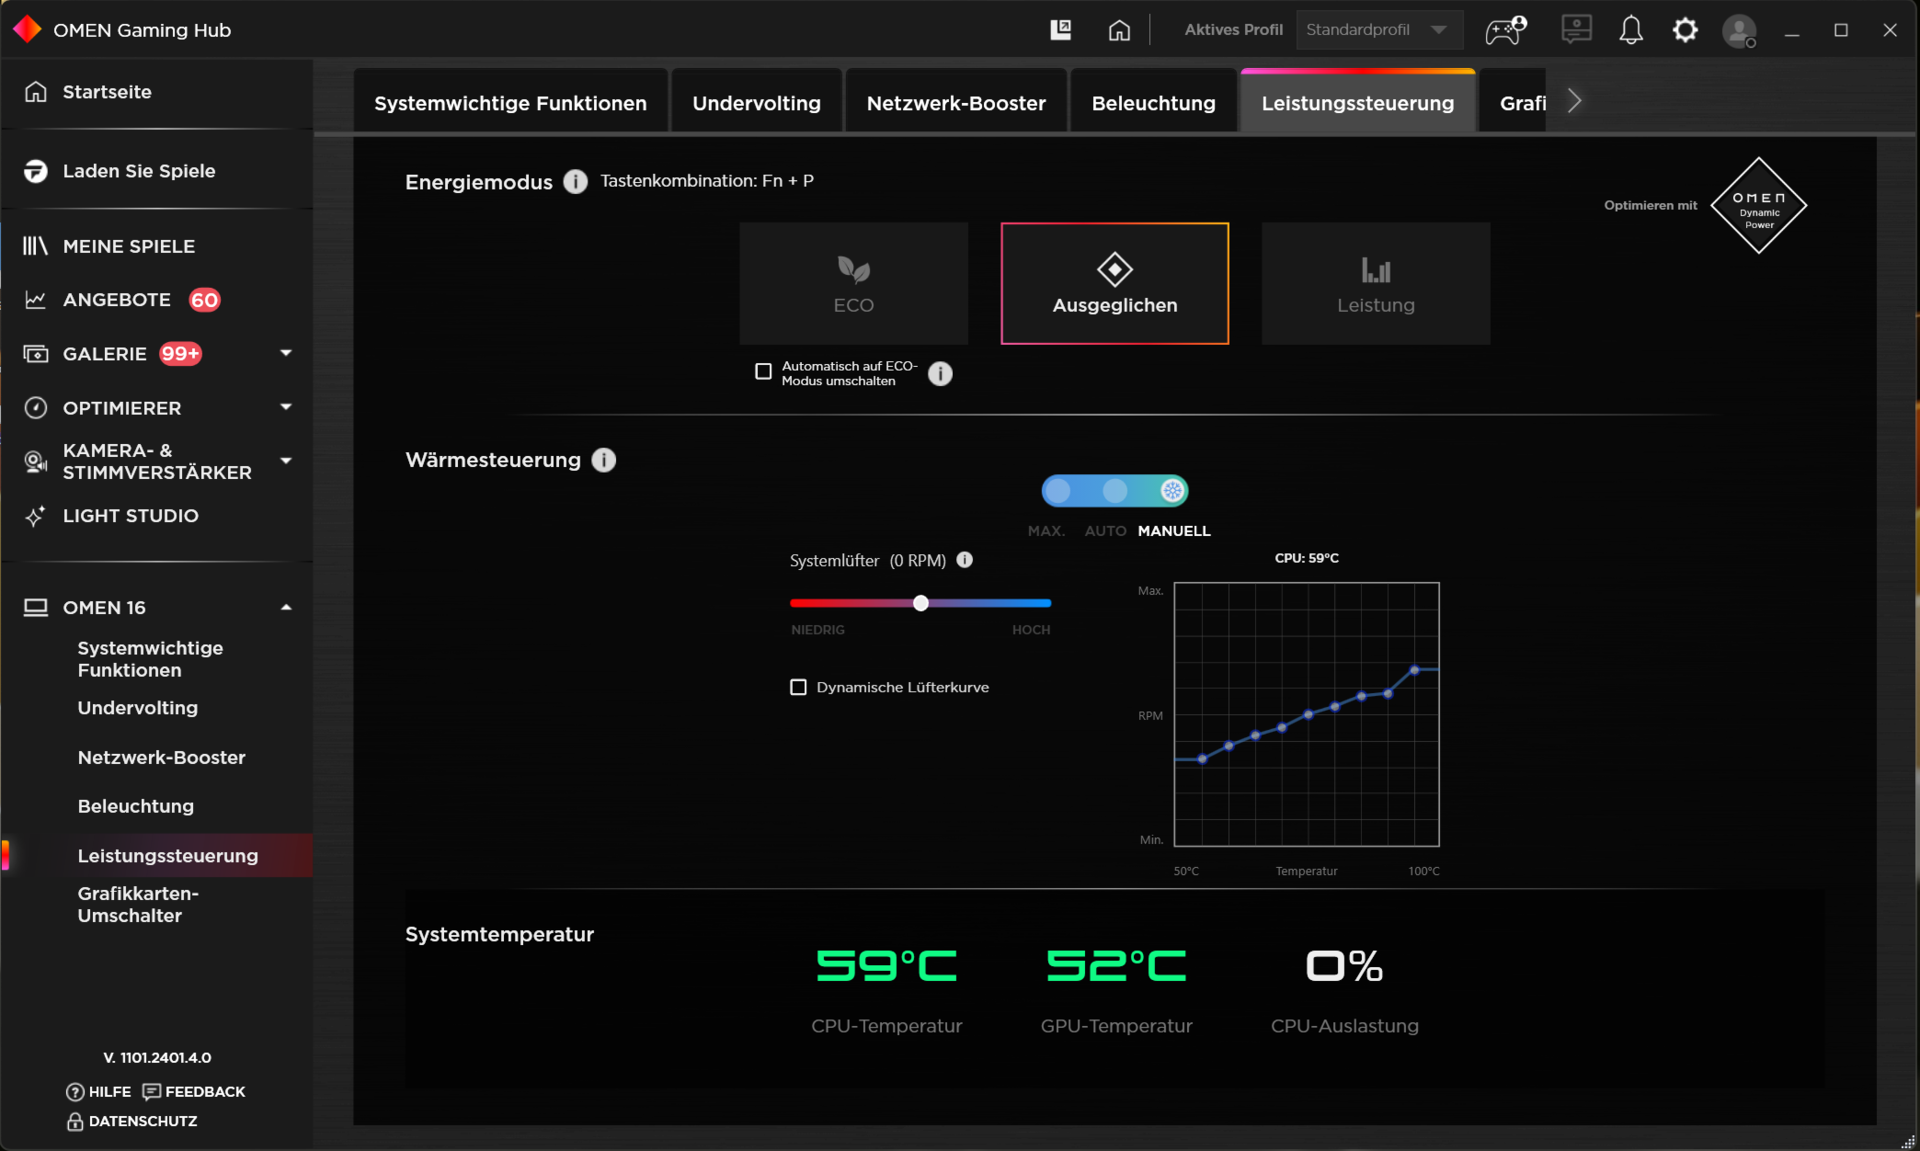
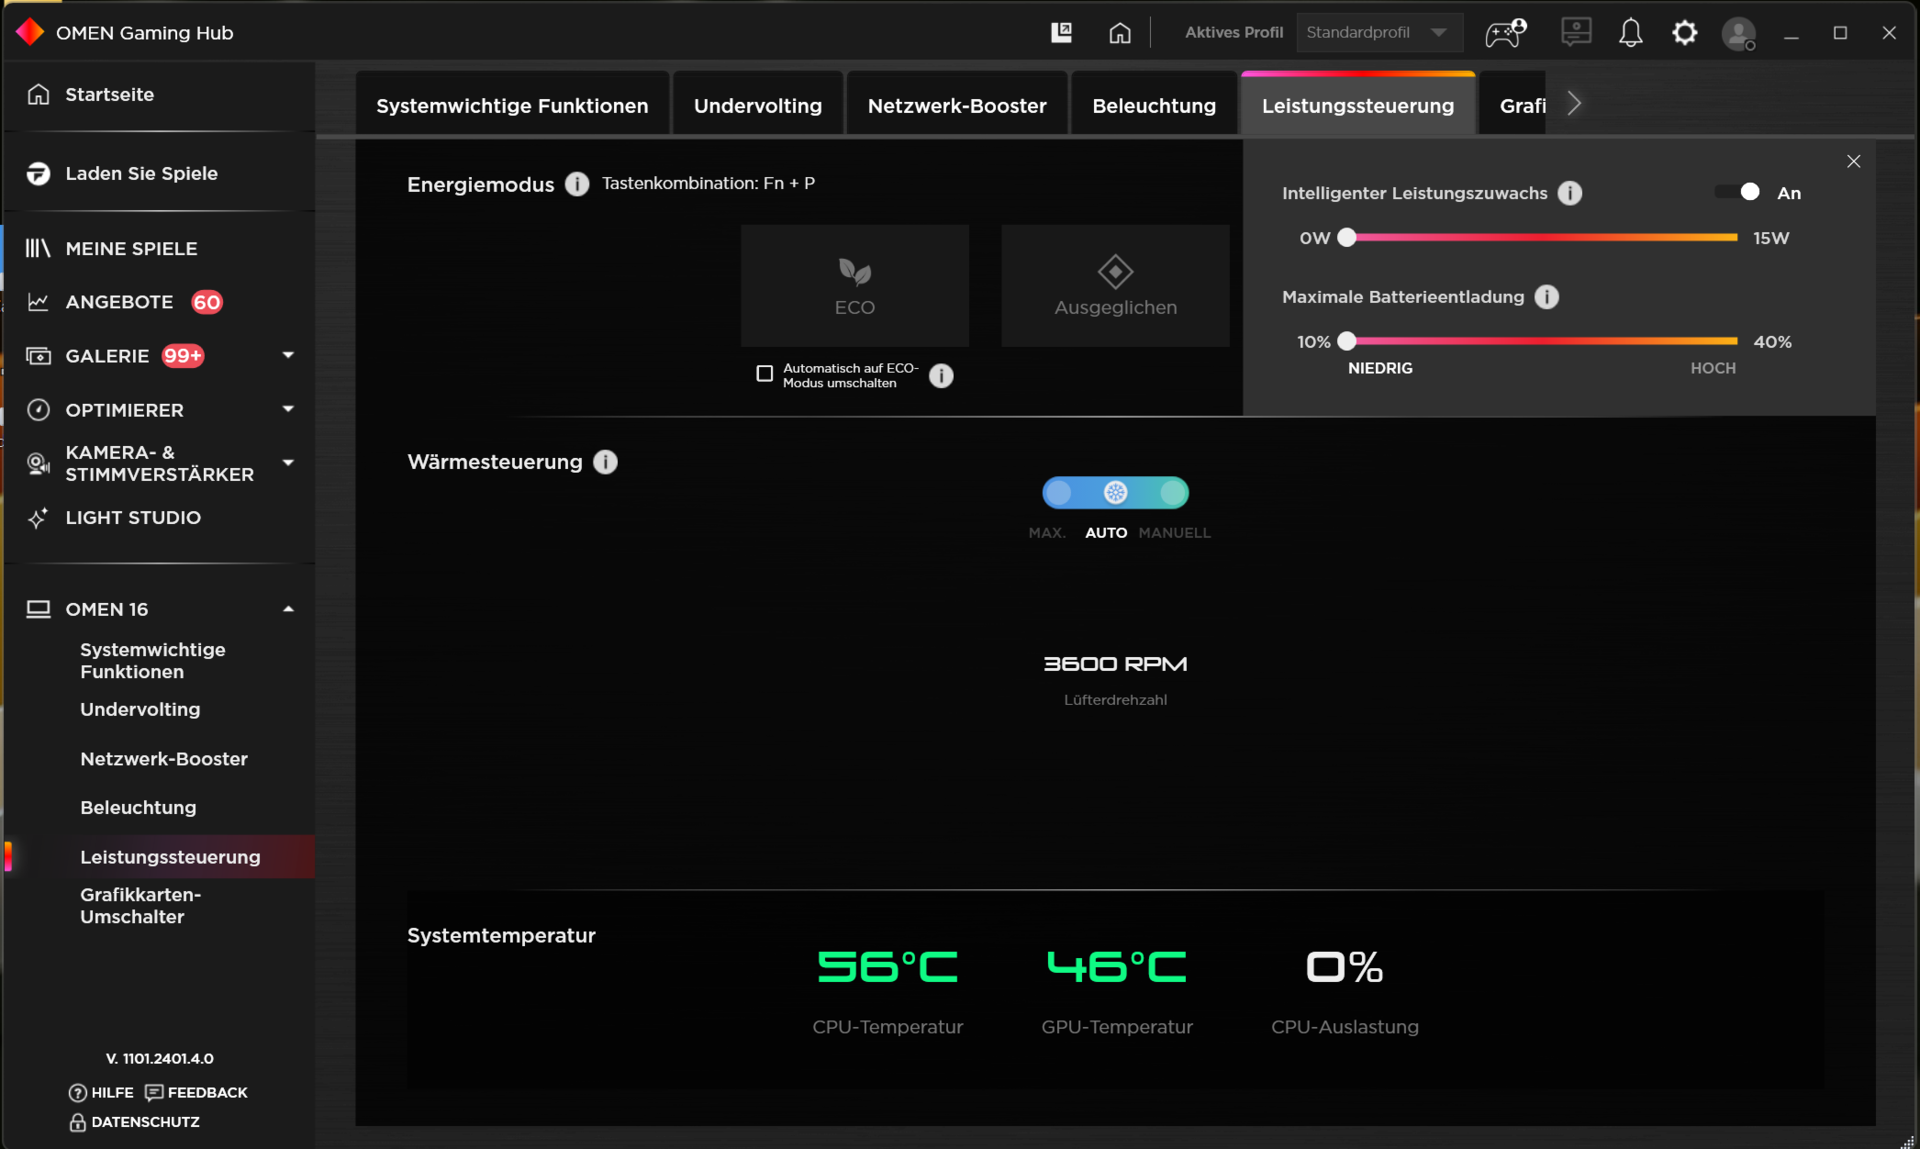
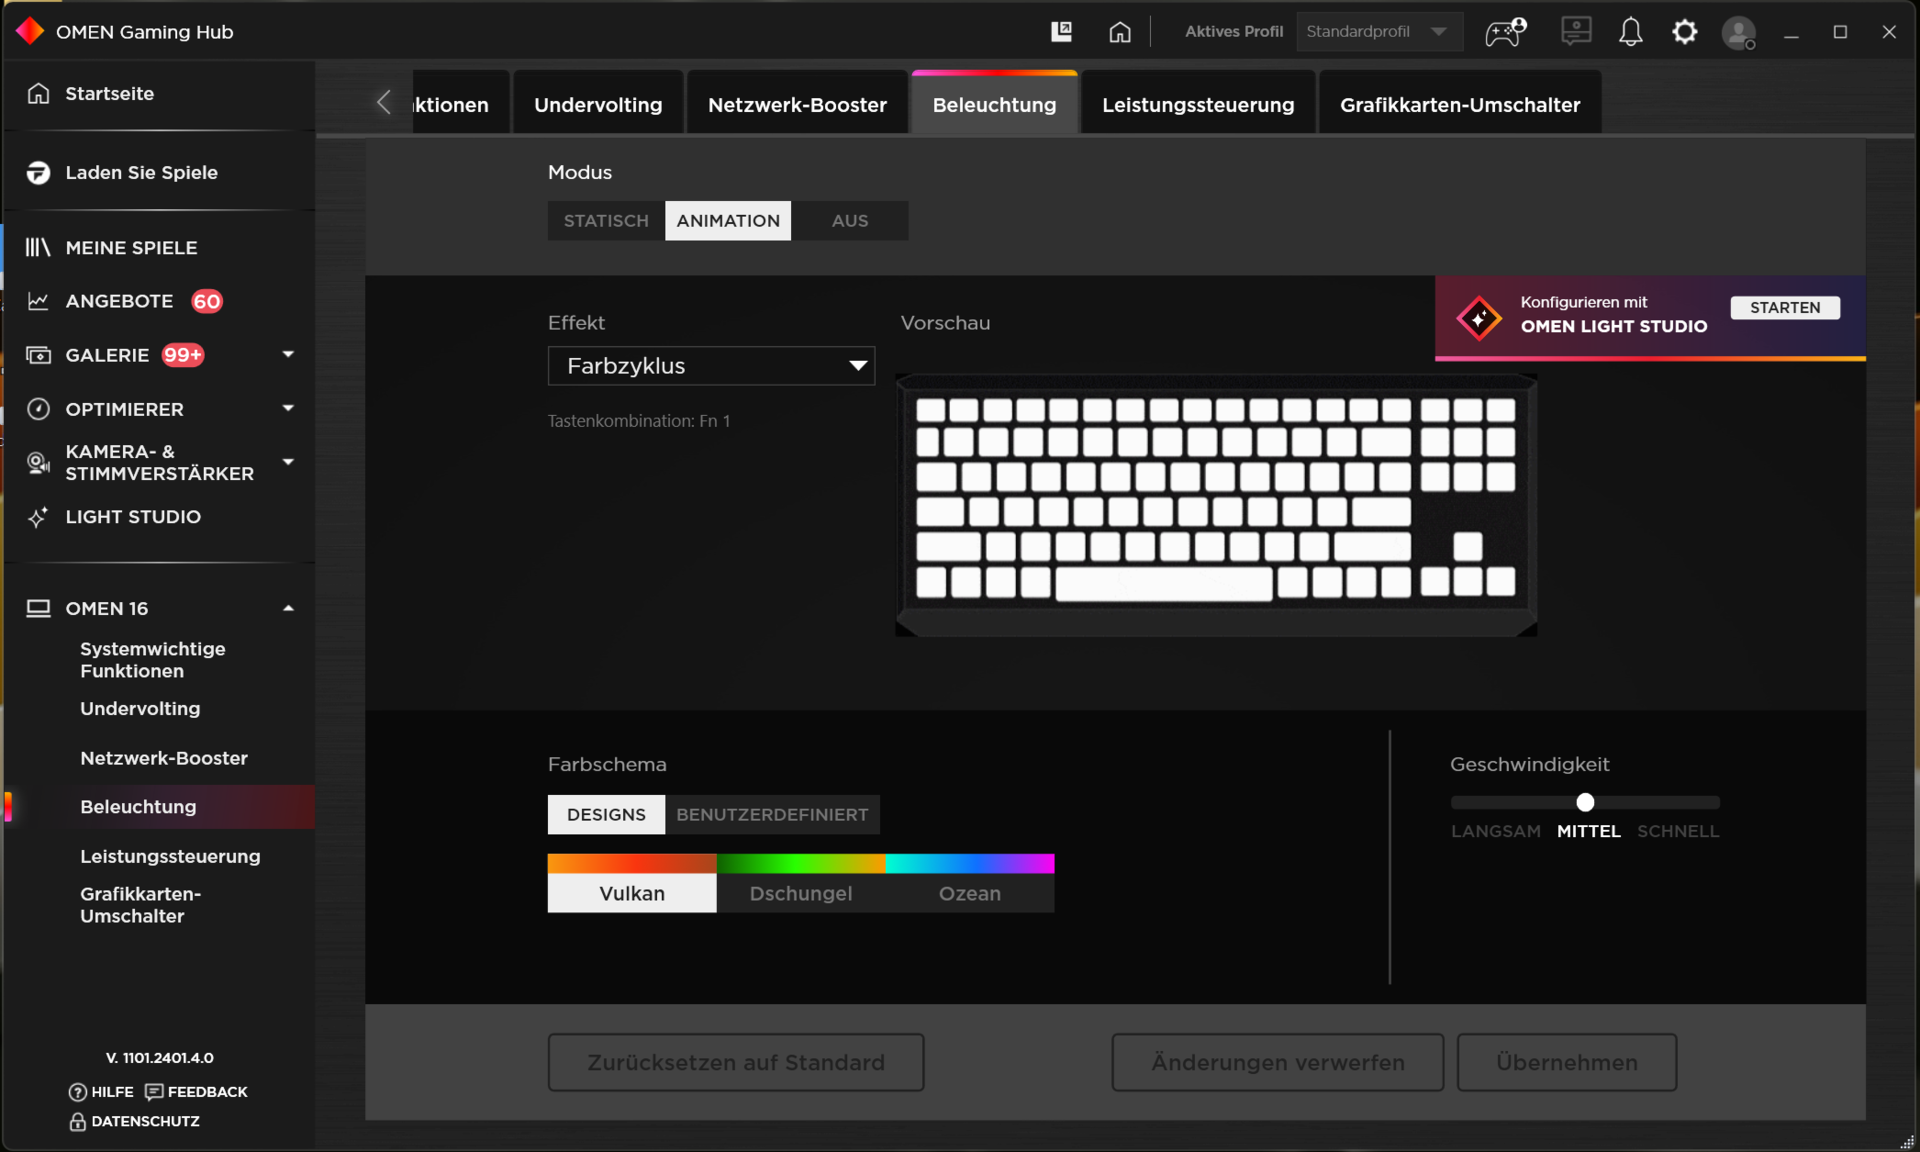
The preinstalled Omen Gaming Hub is the laptop’s control centre. Besides selecting a power mode (see table), you can use the software to undervolt the CPU and specify a customised fan curve, amongst other things. Pressing the Fn + P key combination also lets you quickly switch between the three HP-specific modes. Balanced and ECO modes were used for our benchmarks and battery test respectively.
| Performance | Balanced | ECO | |
|---|---|---|---|
| Power Limit 1 (HWInfo) | 130 Watt | 130 Watt | 130 Watt |
| Power Limit 2 (HWInfo) | 130 Watt | 130 Watt | 130 Watt |
| Noise (Witcher 3) | 58 dB(A) | 47 dB(A) | 39 dB(A) |
| Performance (Witcher 3) | ~ 164 fps | ~ 142 fps | 60 fps (locked) |
Processor
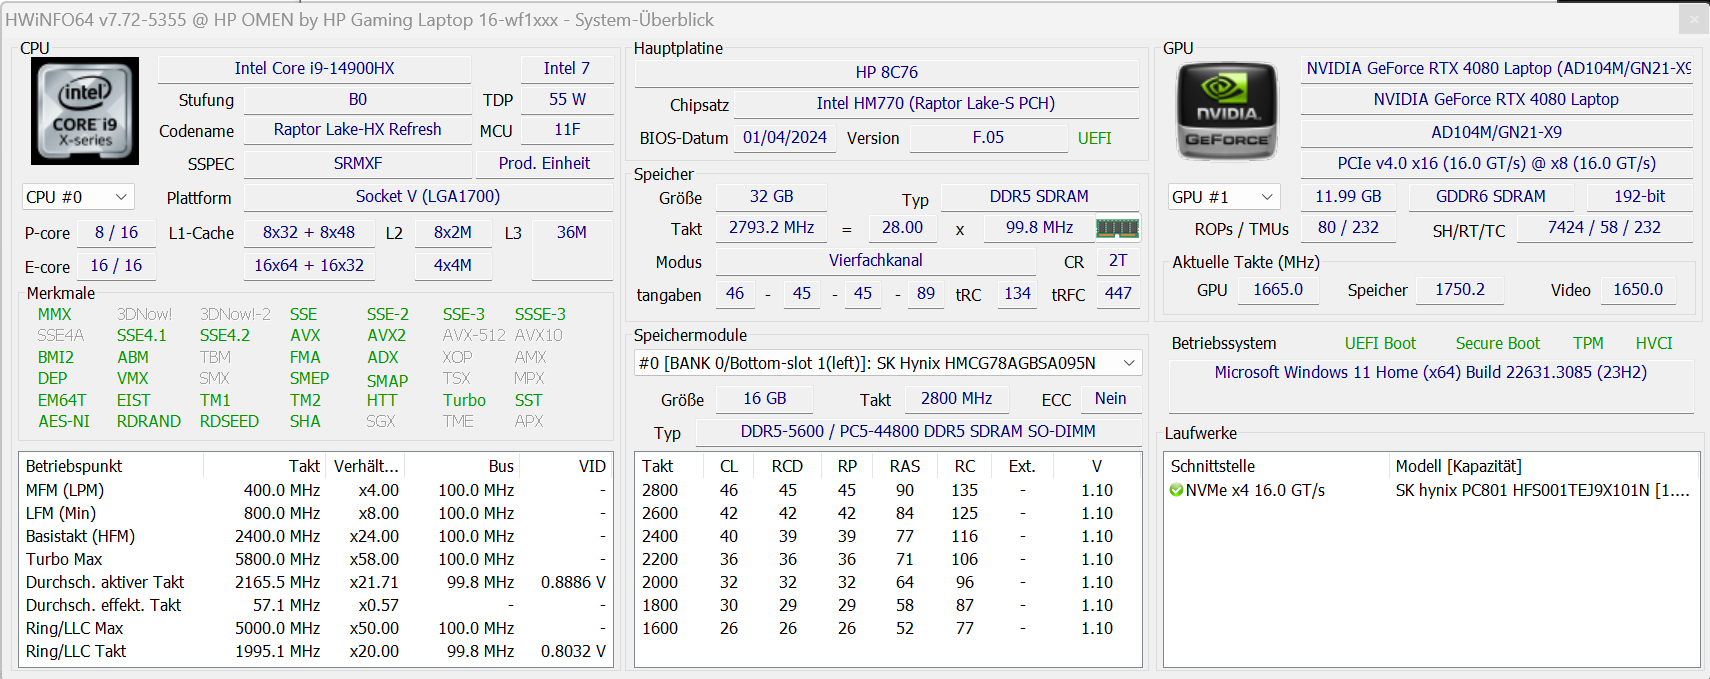
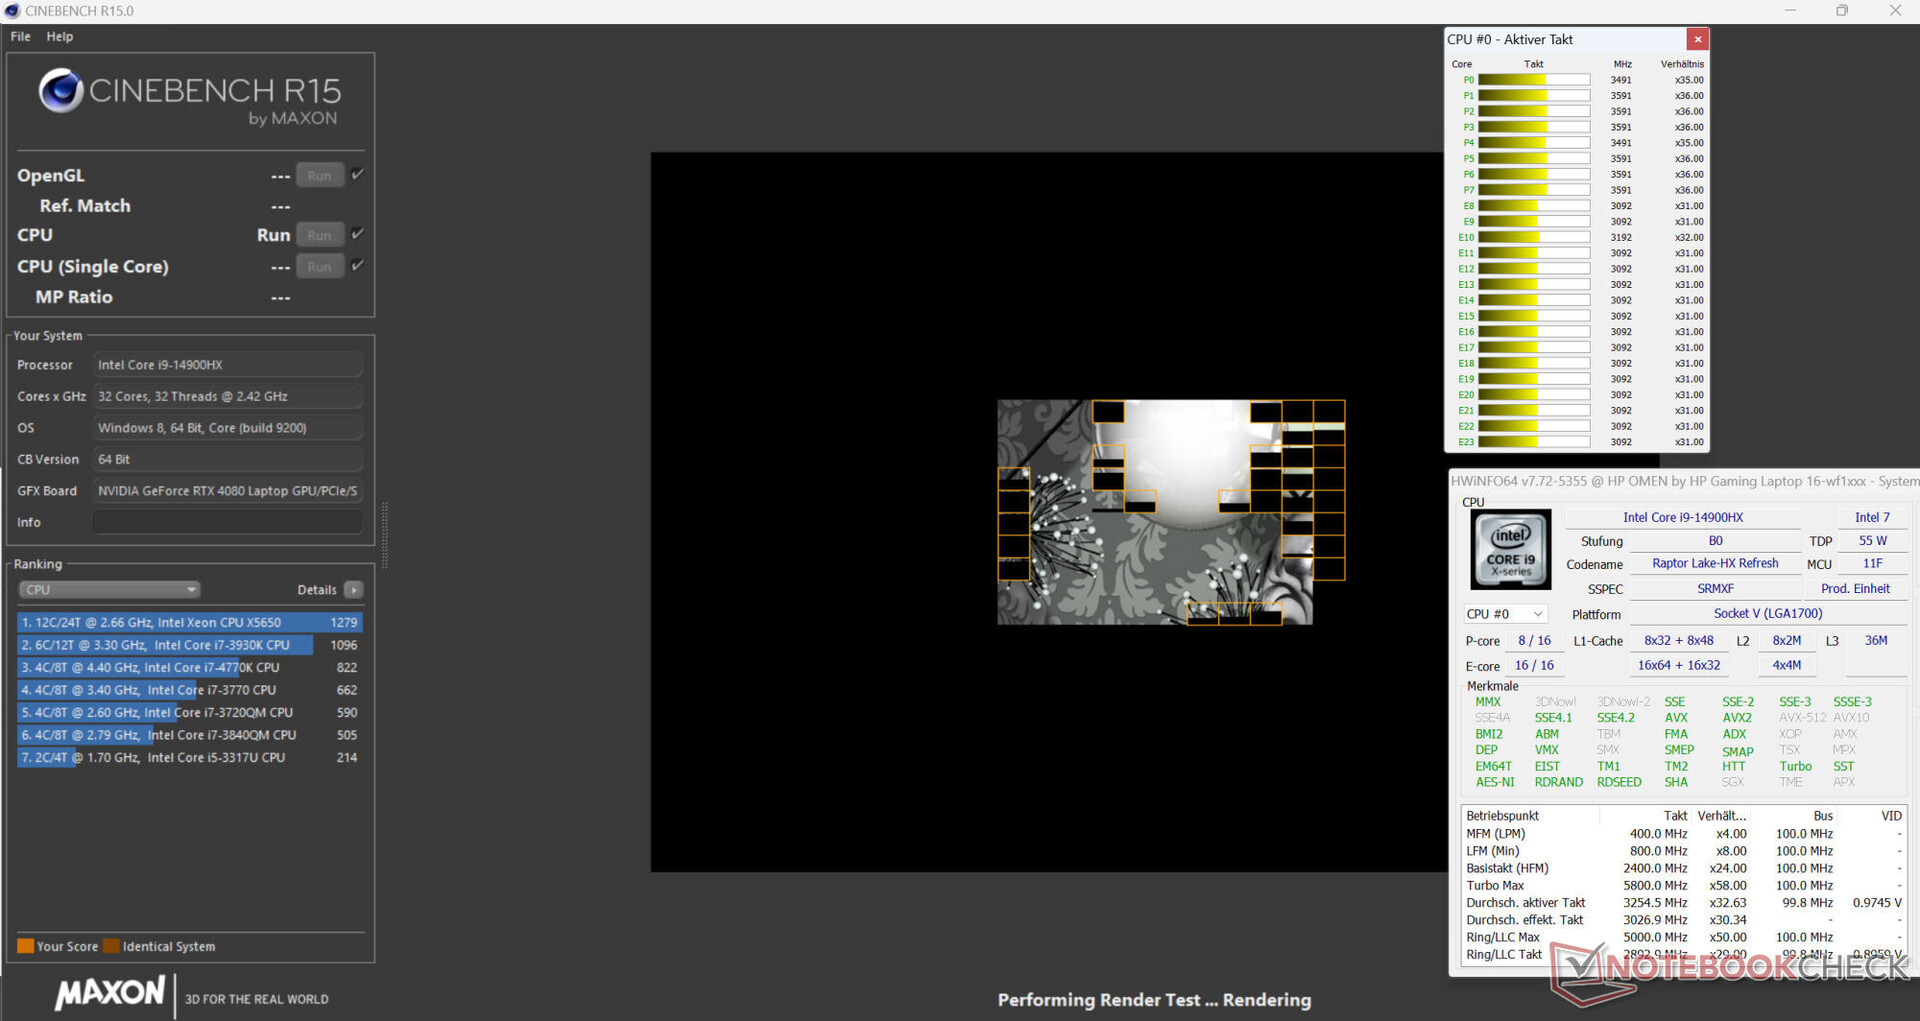
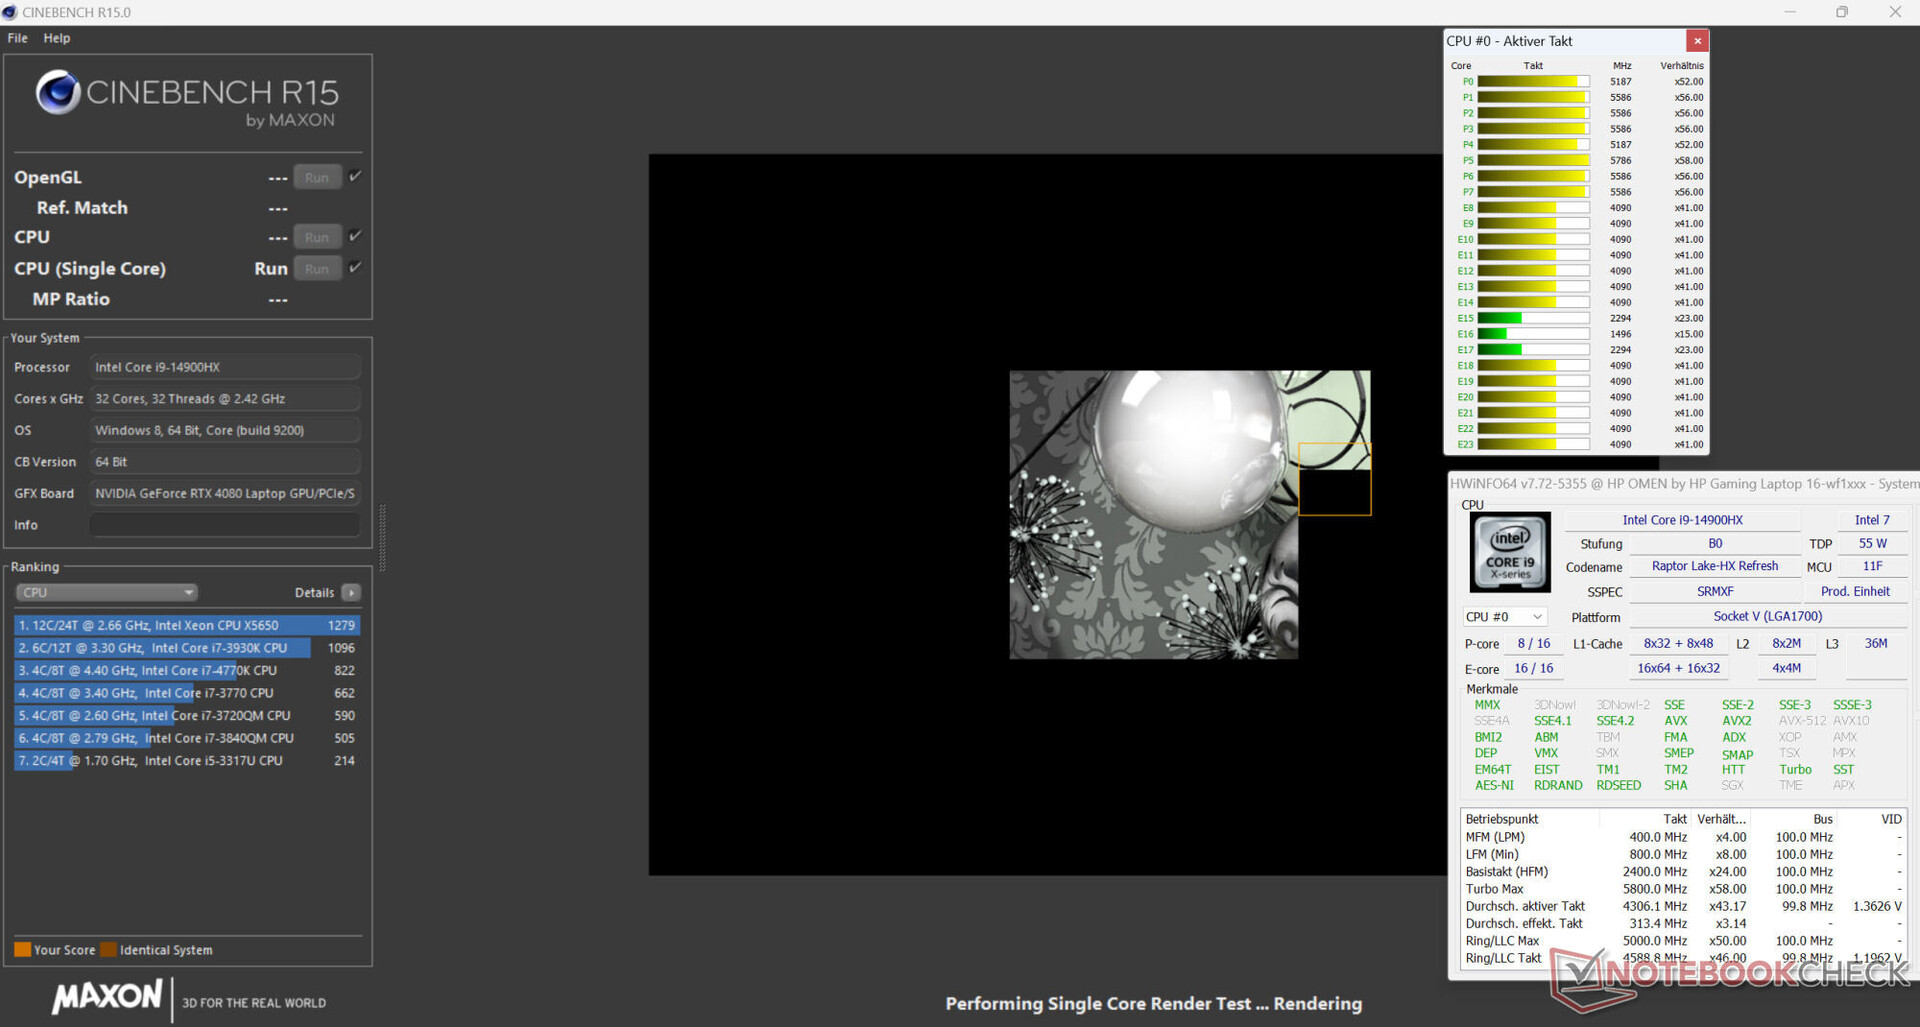
The Core i9-14900HX contains 8 P- and 16 E-cores, giving a total of 32 threads. The P- and E-cores have a max clock speed of 5.8 GHz and 4.1 GHz respectively. In Balanced mode, benchmark scores are below the CPU’s average. Switching to Performance mode only provides a small boost.
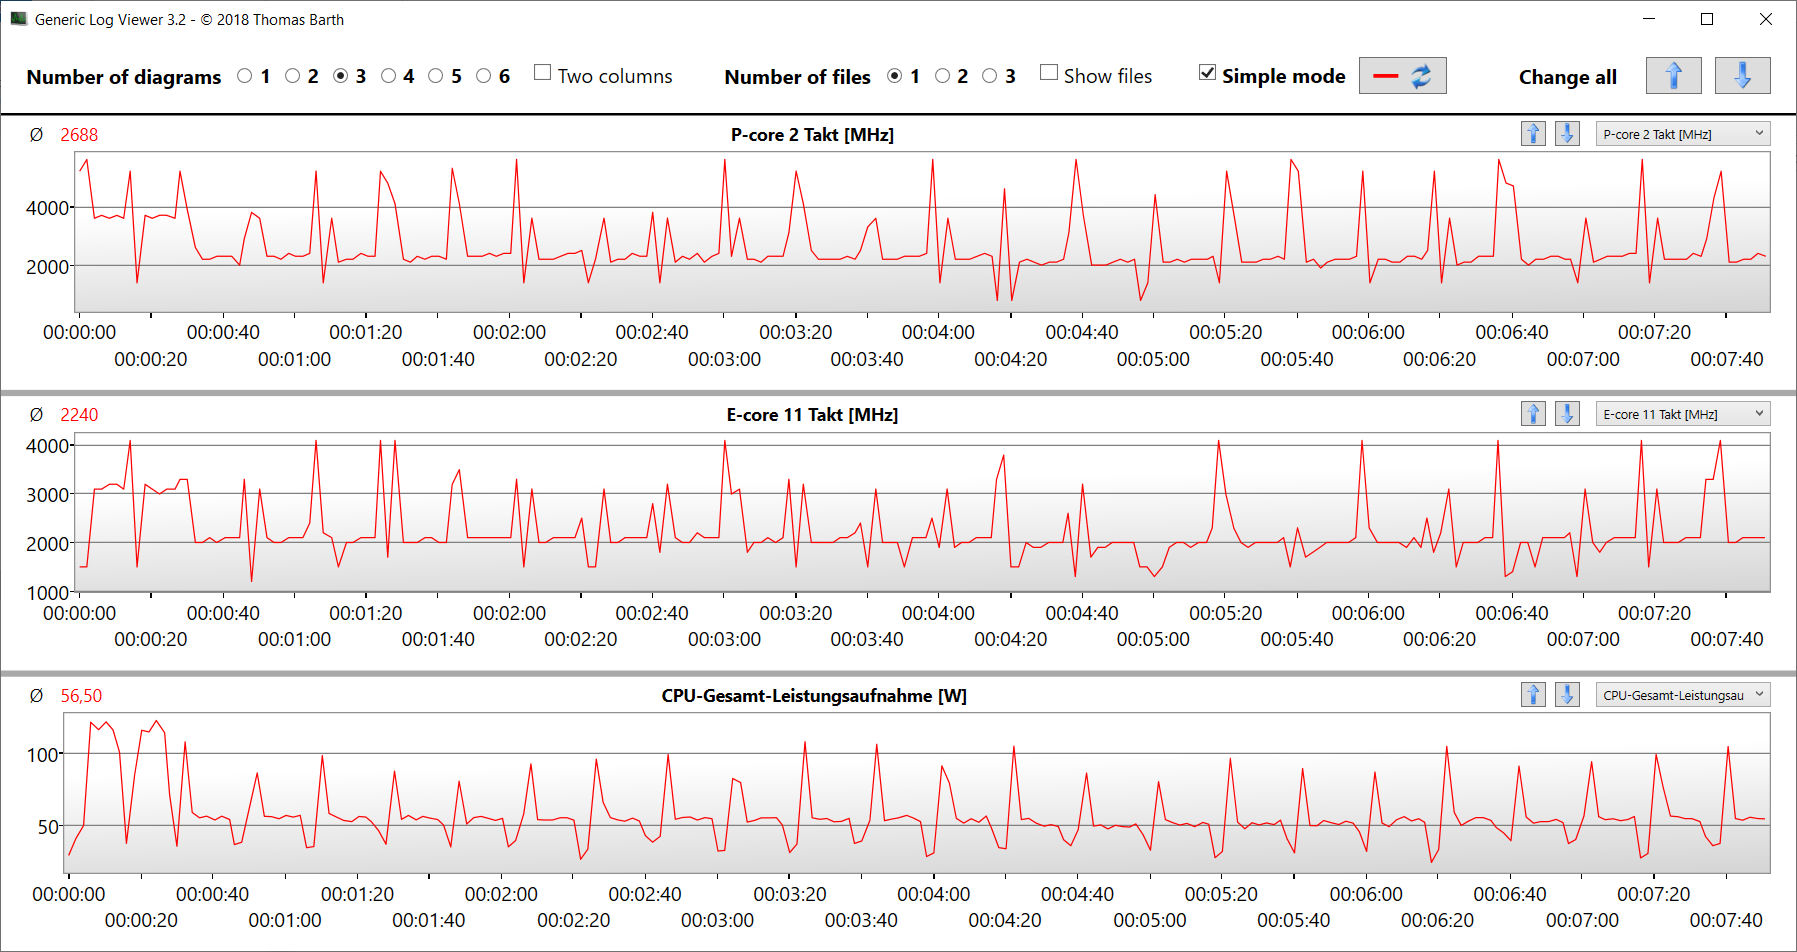
The gap widened under sustained multi-thread load (CB15 loop). At the start of the fourth run, the clock speed dropped significantly before settling down at a relatively consistent level for the rest of the test. In Performance mode, the clock speed was maintained at its initial level. On battery power, the more relevant single-thread score (206 points; CB15) decreased by a smaller margin than the multi-thread score (1,596; CB15).
Refer to our analysis for more information on the Core i9.
Cinebench R15 Multi Sustained Load
| CPU Performance rating - Percent | |
| MSI Vector 16 HX A14V | |
| Acer Predator Helios 18 N23Q2 | |
| Average Intel Core i9-14900HX | |
| HP Omen 16 (2024) | |
| HP Omen 16 (2024) | |
| Alienware m16 R1 AMD | |
| Average of class Gaming | |
| HP Omen 16-wf000 -3! | |
| Cinebench R23 | |
| Multi Core | |
| MSI Vector 16 HX A14V | |
| Acer Predator Helios 18 N23Q2 | |
| Average Intel Core i9-14900HX (17078 - 36249, n=37) | |
| Alienware m16 R1 AMD | |
| HP Omen 16 (2024) | |
| HP Omen 16 (2024) (Leistung) | |
| Average of class Gaming (10488 - 40970, n=113, last 2 years) | |
| HP Omen 16-wf000 | |
| Single Core | |
| HP Omen 16 (2024) (Leistung) | |
| HP Omen 16 (2024) | |
| MSI Vector 16 HX A14V | |
| Average Intel Core i9-14900HX (1720 - 2245, n=37) | |
| Acer Predator Helios 18 N23Q2 | |
| Average of class Gaming (1166 - 2356, n=113, last 2 years) | |
| HP Omen 16-wf000 | |
| Alienware m16 R1 AMD | |
| Cinebench R20 | |
| CPU (Multi Core) | |
| MSI Vector 16 HX A14V | |
| Acer Predator Helios 18 N23Q2 | |
| Average Intel Core i9-14900HX (6579 - 13832, n=37) | |
| Alienware m16 R1 AMD | |
| HP Omen 16 (2024) | |
| HP Omen 16 (2024) (Leistung) | |
| Average of class Gaming (4029 - 16108, n=112, last 2 years) | |
| HP Omen 16-wf000 | |
| CPU (Single Core) | |
| HP Omen 16 (2024) (Leistung) | |
| HP Omen 16 (2024) | |
| MSI Vector 16 HX A14V | |
| Average Intel Core i9-14900HX (657 - 859, n=37) | |
| Acer Predator Helios 18 N23Q2 | |
| Average of class Gaming (442 - 895, n=112, last 2 years) | |
| HP Omen 16-wf000 | |
| Alienware m16 R1 AMD | |
| Cinebench R15 | |
| CPU Multi 64Bit | |
| Acer Predator Helios 18 N23Q2 | |
| MSI Vector 16 HX A14V | |
| Average Intel Core i9-14900HX (3263 - 5589, n=38) | |
| Alienware m16 R1 AMD | |
| HP Omen 16 (2024) (Leistung) | |
| HP Omen 16 (2024) | |
| Average of class Gaming (1578 - 6271, n=113, last 2 years) | |
| HP Omen 16-wf000 | |
| CPU Single 64Bit | |
| HP Omen 16 (2024) (Leistung) | |
| HP Omen 16 (2024) | |
| MSI Vector 16 HX A14V | |
| Average Intel Core i9-14900HX (247 - 323, n=37) | |
| Alienware m16 R1 AMD | |
| Acer Predator Helios 18 N23Q2 | |
| Average of class Gaming (188.8 - 343, n=112, last 2 years) | |
| HP Omen 16-wf000 | |
| Blender - v2.79 BMW27 CPU | |
| HP Omen 16 (2024) | |
| Average of class Gaming (80 - 330, n=110, last 2 years) | |
| HP Omen 16 (2024) (Leistung) | |
| Average Intel Core i9-14900HX (91 - 206, n=37) | |
| Alienware m16 R1 AMD | |
| Acer Predator Helios 18 N23Q2 | |
| MSI Vector 16 HX A14V | |
| Geekbench 6.7 | |
| Multi-Core | |
| MSI Vector 16 HX A14V (6.2.1) | |
| Acer Predator Helios 18 N23Q2 | |
| Average Intel Core i9-14900HX (13158 - 19665, n=37) | |
| HP Omen 16 (2024) (6.2.1, Leistung) | |
| HP Omen 16 (2024) (6.2.1) | |
| Average of class Gaming (6625 - 22104, n=112, last 2 years) | |
| Alienware m16 R1 AMD | |
| Single-Core | |
| HP Omen 16 (2024) (6.2.1) | |
| HP Omen 16 (2024) (6.2.1, Leistung) | |
| MSI Vector 16 HX A14V (6.2.1) | |
| Average Intel Core i9-14900HX (2419 - 3129, n=37) | |
| Acer Predator Helios 18 N23Q2 | |
| Average of class Gaming (1490 - 3259, n=112, last 2 years) | |
| Alienware m16 R1 AMD | |
| Geekbench 5.5 | |
| Multi-Core | |
| MSI Vector 16 HX A14V | |
| Acer Predator Helios 18 N23Q2 | |
| Average Intel Core i9-14900HX (8618 - 23194, n=37) | |
| HP Omen 16 (2024) (Leistung) | |
| HP Omen 16 (2024) | |
| Average of class Gaming (6460 - 27010, n=111, last 2 years) | |
| Alienware m16 R1 AMD | |
| HP Omen 16-wf000 | |
| Single-Core | |
| HP Omen 16 (2024) (Leistung) | |
| HP Omen 16 (2024) | |
| MSI Vector 16 HX A14V | |
| Average Intel Core i9-14900HX (1669 - 2210, n=37) | |
| Acer Predator Helios 18 N23Q2 | |
| Average of class Gaming (986 - 2474, n=111, last 2 years) | |
| Alienware m16 R1 AMD | |
| HP Omen 16-wf000 | |
| HWBOT x265 Benchmark v2.2 - 4k Preset | |
| MSI Vector 16 HX A14V | |
| Acer Predator Helios 18 N23Q2 | |
| Alienware m16 R1 AMD | |
| Average Intel Core i9-14900HX (16.8 - 38.9, n=37) | |
| Average of class Gaming (11.5 - 44.3, n=111, last 2 years) | |
| HP Omen 16 (2024) (Leistung) | |
| HP Omen 16 (2024) | |
| HP Omen 16-wf000 | |
| LibreOffice - 20 Documents To PDF | |
| Acer Predator Helios 18 N23Q2 | |
| Average of class Gaming (19 - 88.8, n=111, last 2 years) | |
| MSI Vector 16 HX A14V (6.3.4.2) | |
| HP Omen 16-wf000 | |
| HP Omen 16 (2024) (6.3.4.2) | |
| HP Omen 16 (2024) (6.3.4.2, Leistung) | |
| Average Intel Core i9-14900HX (19 - 85.1, n=37) | |
| Alienware m16 R1 AMD | |
| R Benchmark 2.5 - Overall mean | |
| HP Omen 16-wf000 | |
| Average of class Gaming (0.3439 - 0.759, n=112, last 2 years) | |
| Alienware m16 R1 AMD | |
| Acer Predator Helios 18 N23Q2 | |
| Average Intel Core i9-14900HX (0.3604 - 0.4859, n=37) | |
| MSI Vector 16 HX A14V | |
| HP Omen 16 (2024) (Leistung) | |
| HP Omen 16 (2024) | |
* ... smaller is better
AIDA64: FP32 Ray-Trace | FPU Julia | CPU SHA3 | CPU Queen | FPU SinJulia | FPU Mandel | CPU AES | CPU ZLib | FP64 Ray-Trace | CPU PhotoWorxx
| Performance rating | |
| Alienware m16 R1 AMD | |
| Acer Predator Helios 18 N23Q2 | |
| MSI Vector 16 HX A14V | |
| Average Intel Core i9-14900HX | |
| Average of class Gaming | |
| HP Omen 16 (2024) | |
| HP Omen 16 (2024) | |
| HP Omen 16-wf000 | |
| AIDA64 / FP32 Ray-Trace | |
| Alienware m16 R1 AMD (v6.85.6300) | |
| Average of class Gaming (10227 - 85542, n=110, last 2 years) | |
| MSI Vector 16 HX A14V (v6.92.6600) | |
| Acer Predator Helios 18 N23Q2 (v6.85.6300) | |
| Average Intel Core i9-14900HX (13098 - 33474, n=36) | |
| HP Omen 16 (2024) (v6.92.6600, Leistung) | |
| HP Omen 16-wf000 (v6.85.6300) | |
| HP Omen 16 (2024) (v6.92.6600) | |
| AIDA64 / FPU Julia | |
| Alienware m16 R1 AMD (v6.85.6300) | |
| MSI Vector 16 HX A14V (v6.92.6600) | |
| Acer Predator Helios 18 N23Q2 (v6.85.6300) | |
| Average of class Gaming (51376 - 238426, n=110, last 2 years) | |
| Average Intel Core i9-14900HX (67573 - 166040, n=36) | |
| HP Omen 16 (2024) (v6.92.6600, Leistung) | |
| HP Omen 16-wf000 (v6.85.6300) | |
| HP Omen 16 (2024) (v6.92.6600) | |
| AIDA64 / CPU SHA3 | |
| Alienware m16 R1 AMD (v6.85.6300) | |
| MSI Vector 16 HX A14V (v6.92.6600) | |
| Acer Predator Helios 18 N23Q2 (v6.85.6300) | |
| Average Intel Core i9-14900HX (3589 - 7979, n=36) | |
| Average of class Gaming (2180 - 9817, n=110, last 2 years) | |
| HP Omen 16 (2024) (v6.92.6600, Leistung) | |
| HP Omen 16 (2024) (v6.92.6600) | |
| HP Omen 16-wf000 (v6.85.6300) | |
| AIDA64 / CPU Queen | |
| Alienware m16 R1 AMD (v6.85.6300) | |
| MSI Vector 16 HX A14V (v6.92.6600) | |
| Average Intel Core i9-14900HX (118405 - 148966, n=36) | |
| Acer Predator Helios 18 N23Q2 (v6.85.6300) | |
| HP Omen 16 (2024) (v6.92.6600) | |
| HP Omen 16 (2024) (v6.92.6600, Leistung) | |
| Average of class Gaming (49785 - 173351, n=101, last 2 years) | |
| HP Omen 16-wf000 (v6.85.6300) | |
| AIDA64 / FPU SinJulia | |
| Alienware m16 R1 AMD (v6.85.6300) | |
| MSI Vector 16 HX A14V (v6.92.6600) | |
| Acer Predator Helios 18 N23Q2 (v6.85.6300) | |
| Average Intel Core i9-14900HX (10475 - 18517, n=36) | |
| Average of class Gaming (4424 - 33636, n=110, last 2 years) | |
| HP Omen 16 (2024) (v6.92.6600, Leistung) | |
| HP Omen 16 (2024) (v6.92.6600) | |
| HP Omen 16-wf000 (v6.85.6300) | |
| AIDA64 / FPU Mandel | |
| Alienware m16 R1 AMD (v6.85.6300) | |
| MSI Vector 16 HX A14V (v6.92.6600) | |
| Average of class Gaming (25115 - 128721, n=110, last 2 years) | |
| Acer Predator Helios 18 N23Q2 (v6.85.6300) | |
| Average Intel Core i9-14900HX (32543 - 83662, n=36) | |
| HP Omen 16 (2024) (v6.92.6600, Leistung) | |
| HP Omen 16-wf000 (v6.85.6300) | |
| HP Omen 16 (2024) (v6.92.6600) | |
| AIDA64 / CPU AES | |
| Acer Predator Helios 18 N23Q2 (v6.85.6300) | |
| Average Intel Core i9-14900HX (86964 - 241777, n=36) | |
| MSI Vector 16 HX A14V (v6.92.6600) | |
| HP Omen 16 (2024) (v6.92.6600, Leistung) | |
| Alienware m16 R1 AMD (v6.85.6300) | |
| Average of class Gaming (39258 - 247074, n=110, last 2 years) | |
| HP Omen 16-wf000 (v6.85.6300) | |
| HP Omen 16 (2024) (v6.92.6600) | |
| AIDA64 / CPU ZLib | |
| MSI Vector 16 HX A14V (v6.92.6600) | |
| Acer Predator Helios 18 N23Q2 (v6.85.6300) | |
| Average Intel Core i9-14900HX (1054 - 2292, n=36) | |
| Alienware m16 R1 AMD (v6.85.6300) | |
| HP Omen 16 (2024) (v6.92.6600, Leistung) | |
| Average of class Gaming (574 - 2531, n=110, last 2 years) | |
| HP Omen 16-wf000 (v6.85.6300) | |
| HP Omen 16 (2024) (v6.92.6600) | |
| AIDA64 / FP64 Ray-Trace | |
| Alienware m16 R1 AMD (v6.85.6300) | |
| Average of class Gaming (5509 - 45446, n=110, last 2 years) | |
| MSI Vector 16 HX A14V (v6.92.6600) | |
| Acer Predator Helios 18 N23Q2 (v6.85.6300) | |
| Average Intel Core i9-14900HX (6809 - 18349, n=36) | |
| HP Omen 16 (2024) (v6.92.6600, Leistung) | |
| HP Omen 16-wf000 (v6.85.6300) | |
| HP Omen 16 (2024) (v6.92.6600) | |
| AIDA64 / CPU PhotoWorxx | |
| Acer Predator Helios 18 N23Q2 (v6.85.6300) | |
| HP Omen 16 (2024) (v6.92.6600, Leistung) | |
| HP Omen 16 (2024) (v6.92.6600) | |
| MSI Vector 16 HX A14V (v6.92.6600) | |
| Average Intel Core i9-14900HX (23903 - 54702, n=36) | |
| Average of class Gaming (12271 - 89891, n=110, last 2 years) | |
| HP Omen 16-wf000 (v6.85.6300) | |
| Alienware m16 R1 AMD (v6.85.6300) | |
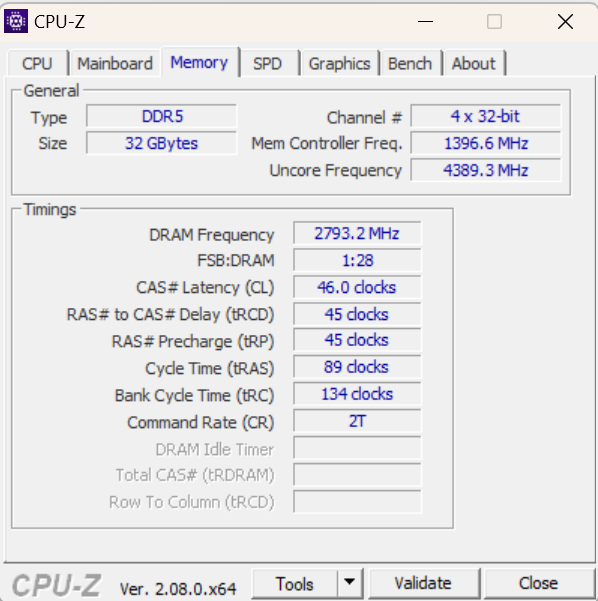
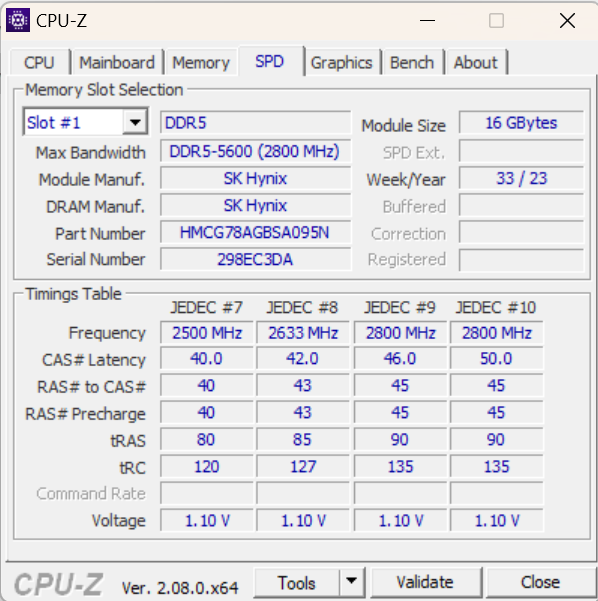
System performance
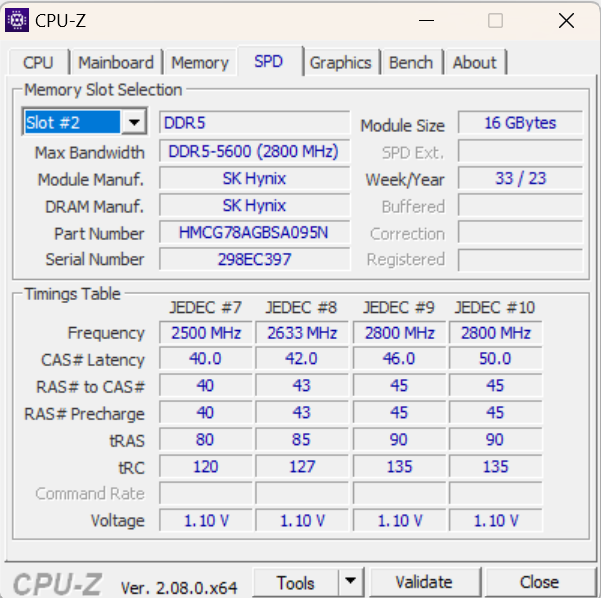
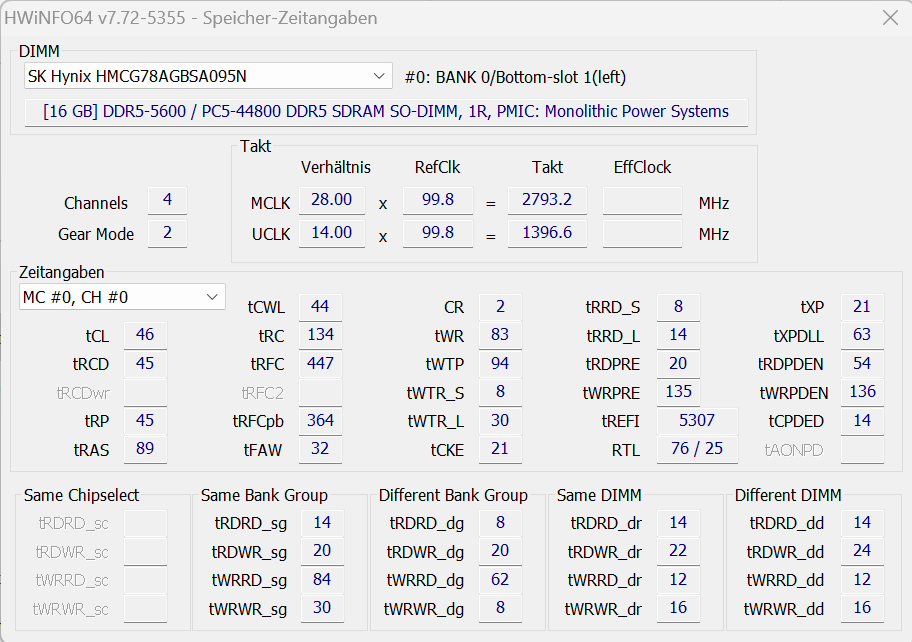
The snappy system is characterised by a large amount of processing power. The hardware is capable of handling things like gaming and rendering effortlessly. The memory’s transfer speeds are at a typical level for DDR5-5600 RAM.
CrossMark: Overall | Productivity | Creativity | Responsiveness
WebXPRT 3: Overall
WebXPRT 4: Overall
Mozilla Kraken 1.1: Total
| PCMark 10 / Score | |
| HP Omen 16 (2024) | |
| Alienware m16 R1 AMD | |
| Average Intel Core i9-14900HX, NVIDIA GeForce RTX 4080 Laptop GPU (7703 - 9223, n=7) | |
| MSI Vector 16 HX A14V | |
| Acer Predator Helios 18 N23Q2 | |
| Average of class Gaming (5828 - 11574, n=96, last 2 years) | |
| HP Omen 16-wf000 | |
| PCMark 10 / Essentials | |
| Average Intel Core i9-14900HX, NVIDIA GeForce RTX 4080 Laptop GPU (11255 - 12600, n=7) | |
| Alienware m16 R1 AMD | |
| MSI Vector 16 HX A14V | |
| HP Omen 16 (2024) | |
| Acer Predator Helios 18 N23Q2 | |
| Average of class Gaming (8810 - 12600, n=100, last 2 years) | |
| HP Omen 16-wf000 | |
| PCMark 10 / Productivity | |
| HP Omen 16 (2024) | |
| Average of class Gaming (6845 - 18766, n=98, last 2 years) | |
| Acer Predator Helios 18 N23Q2 | |
| Alienware m16 R1 AMD | |
| Average Intel Core i9-14900HX, NVIDIA GeForce RTX 4080 Laptop GPU (6662 - 11410, n=7) | |
| MSI Vector 16 HX A14V | |
| HP Omen 16-wf000 | |
| PCMark 10 / Digital Content Creation | |
| MSI Vector 16 HX A14V | |
| Alienware m16 R1 AMD | |
| Average Intel Core i9-14900HX, NVIDIA GeForce RTX 4080 Laptop GPU (14211 - 16246, n=7) | |
| HP Omen 16 (2024) | |
| Acer Predator Helios 18 N23Q2 | |
| Average of class Gaming (7602 - 19657, n=98, last 2 years) | |
| HP Omen 16-wf000 | |
| CrossMark / Overall | |
| HP Omen 16 (2024) | |
| Acer Predator Helios 18 N23Q2 | |
| MSI Vector 16 HX A14V | |
| Average Intel Core i9-14900HX, NVIDIA GeForce RTX 4080 Laptop GPU (1992 - 2334, n=7) | |
| Alienware m16 R1 AMD | |
| Average of class Gaming (1366 - 2409, n=98, last 2 years) | |
| HP Omen 16-wf000 | |
| CrossMark / Productivity | |
| HP Omen 16 (2024) | |
| Acer Predator Helios 18 N23Q2 | |
| MSI Vector 16 HX A14V | |
| Average Intel Core i9-14900HX, NVIDIA GeForce RTX 4080 Laptop GPU (1812 - 2204, n=7) | |
| Alienware m16 R1 AMD | |
| Average of class Gaming (1386 - 2254, n=98, last 2 years) | |
| HP Omen 16-wf000 | |
| CrossMark / Creativity | |
| MSI Vector 16 HX A14V | |
| Acer Predator Helios 18 N23Q2 | |
| Average Intel Core i9-14900HX, NVIDIA GeForce RTX 4080 Laptop GPU (2327 - 2500, n=7) | |
| HP Omen 16 (2024) | |
| Average of class Gaming (1343 - 2729, n=98, last 2 years) | |
| Alienware m16 R1 AMD | |
| HP Omen 16-wf000 | |
| CrossMark / Responsiveness | |
| HP Omen 16 (2024) | |
| Acer Predator Helios 18 N23Q2 | |
| MSI Vector 16 HX A14V | |
| Average Intel Core i9-14900HX, NVIDIA GeForce RTX 4080 Laptop GPU (1520 - 2254, n=7) | |
| Alienware m16 R1 AMD | |
| Average of class Gaming (1226 - 2334, n=98, last 2 years) | |
| HP Omen 16-wf000 | |
| WebXPRT 3 / Overall | |
| Alienware m16 R1 AMD | |
| Average Intel Core i9-14900HX, NVIDIA GeForce RTX 4080 Laptop GPU (310 - 345, n=7) | |
| HP Omen 16 (2024) | |
| MSI Vector 16 HX A14V | |
| Acer Predator Helios 18 N23Q2 | |
| Average of class Gaming (242 - 532, n=101, last 2 years) | |
| HP Omen 16-wf000 | |
| WebXPRT 4 / Overall | |
| Average Intel Core i9-14900HX, NVIDIA GeForce RTX 4080 Laptop GPU (300 - 321, n=7) | |
| HP Omen 16 (2024) | |
| MSI Vector 16 HX A14V | |
| Average of class Gaming (176.4 - 354, n=101, last 2 years) | |
| Alienware m16 R1 AMD | |
| HP Omen 16-wf000 | |
| Mozilla Kraken 1.1 / Total | |
| HP Omen 16-wf000 | |
| Alienware m16 R1 AMD | |
| Average of class Gaming (391 - 590, n=106, last 2 years) | |
| Acer Predator Helios 18 N23Q2 | |
| MSI Vector 16 HX A14V | |
| Average Intel Core i9-14900HX, NVIDIA GeForce RTX 4080 Laptop GPU (437 - 446, n=7) | |
| HP Omen 16 (2024) | |
* ... smaller is better
| PCMark 10 Score | 8915 points | |
Help | ||
| AIDA64 / Memory Copy | |
| HP Omen 16 (2024) | |
| Acer Predator Helios 18 N23Q2 | |
| MSI Vector 16 HX A14V | |
| Average Intel Core i9-14900HX (38028 - 83392, n=36) | |
| Average of class Gaming (21750 - 129946, n=110, last 2 years) | |
| HP Omen 16-wf000 | |
| Alienware m16 R1 AMD | |
| AIDA64 / Memory Read | |
| HP Omen 16 (2024) | |
| Acer Predator Helios 18 N23Q2 | |
| MSI Vector 16 HX A14V | |
| Average Intel Core i9-14900HX (43306 - 87568, n=36) | |
| Average of class Gaming (22956 - 118858, n=110, last 2 years) | |
| HP Omen 16-wf000 | |
| Alienware m16 R1 AMD | |
| AIDA64 / Memory Write | |
| HP Omen 16 (2024) | |
| MSI Vector 16 HX A14V | |
| Average of class Gaming (22297 - 135096, n=110, last 2 years) | |
| Acer Predator Helios 18 N23Q2 | |
| Average Intel Core i9-14900HX (37146 - 80589, n=36) | |
| HP Omen 16-wf000 | |
| Alienware m16 R1 AMD | |
| AIDA64 / Memory Latency | |
| Average of class Gaming (75.3 - 259, n=110, last 2 years) | |
| Alienware m16 R1 AMD | |
| HP Omen 16-wf000 | |
| Average Intel Core i9-14900HX (76.1 - 105, n=36) | |
| HP Omen 16 (2024) | |
| Acer Predator Helios 18 N23Q2 | |
| MSI Vector 16 HX A14V | |
* ... smaller is better
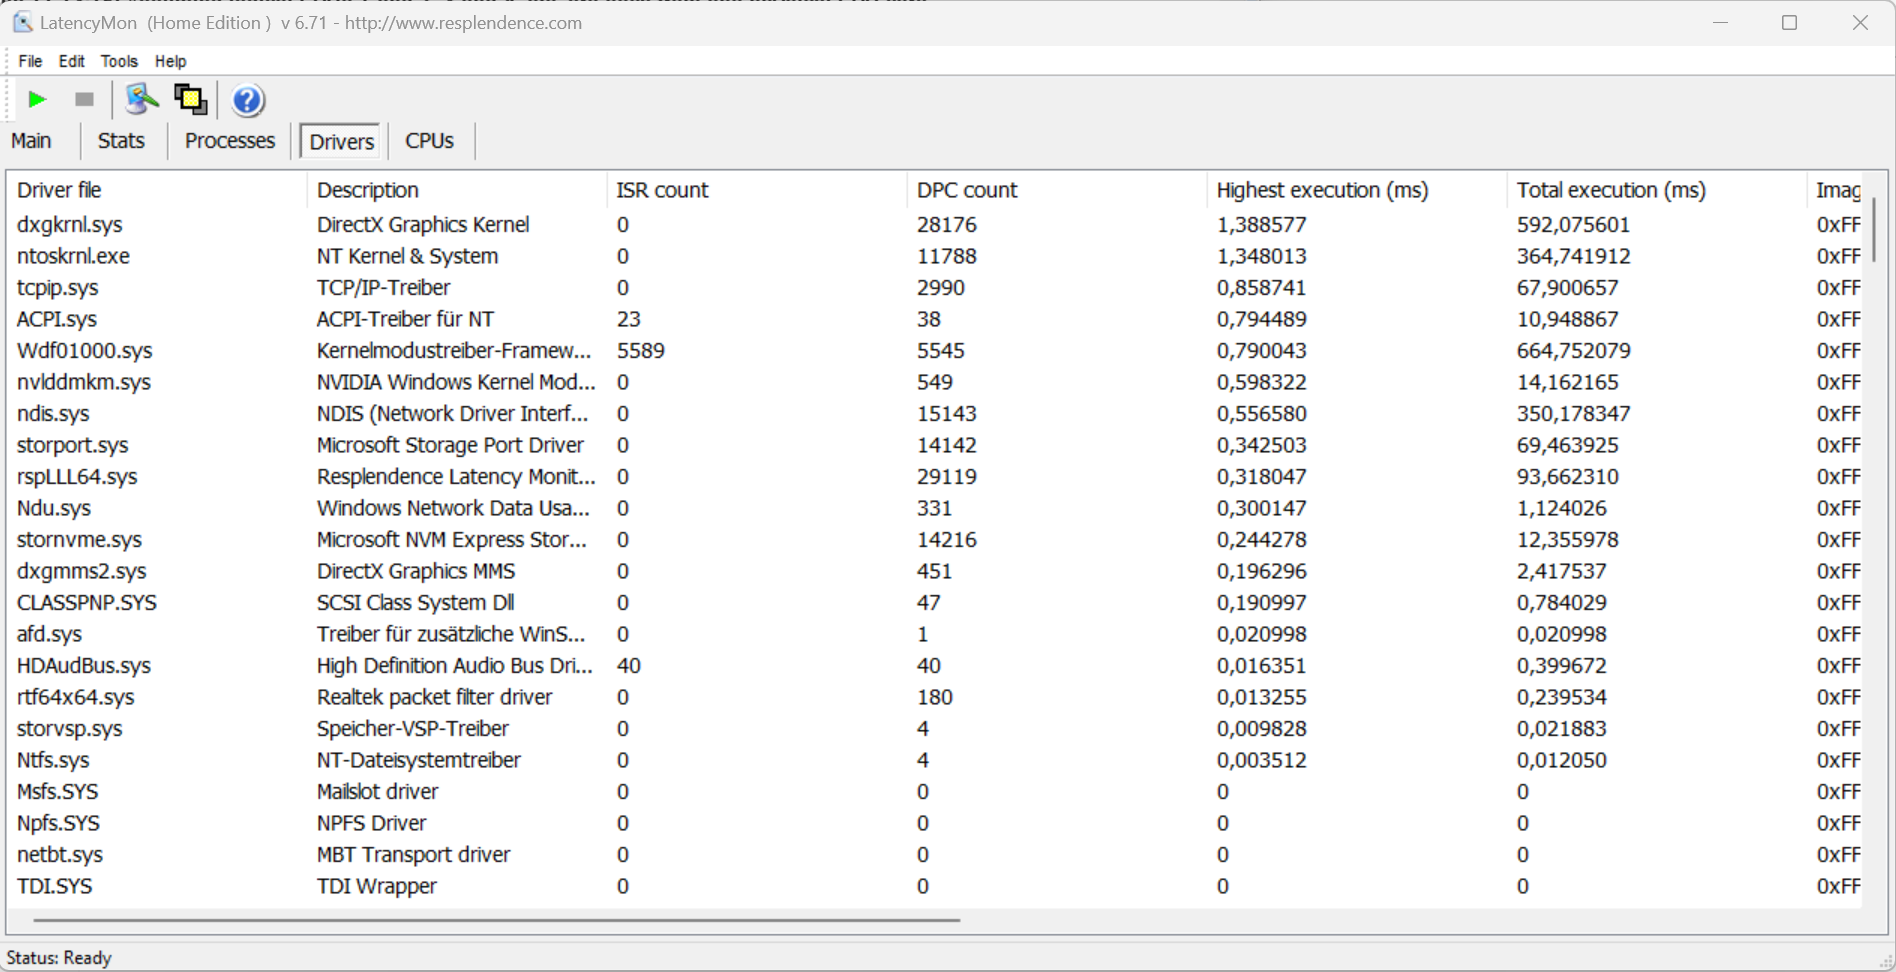
DPC latency
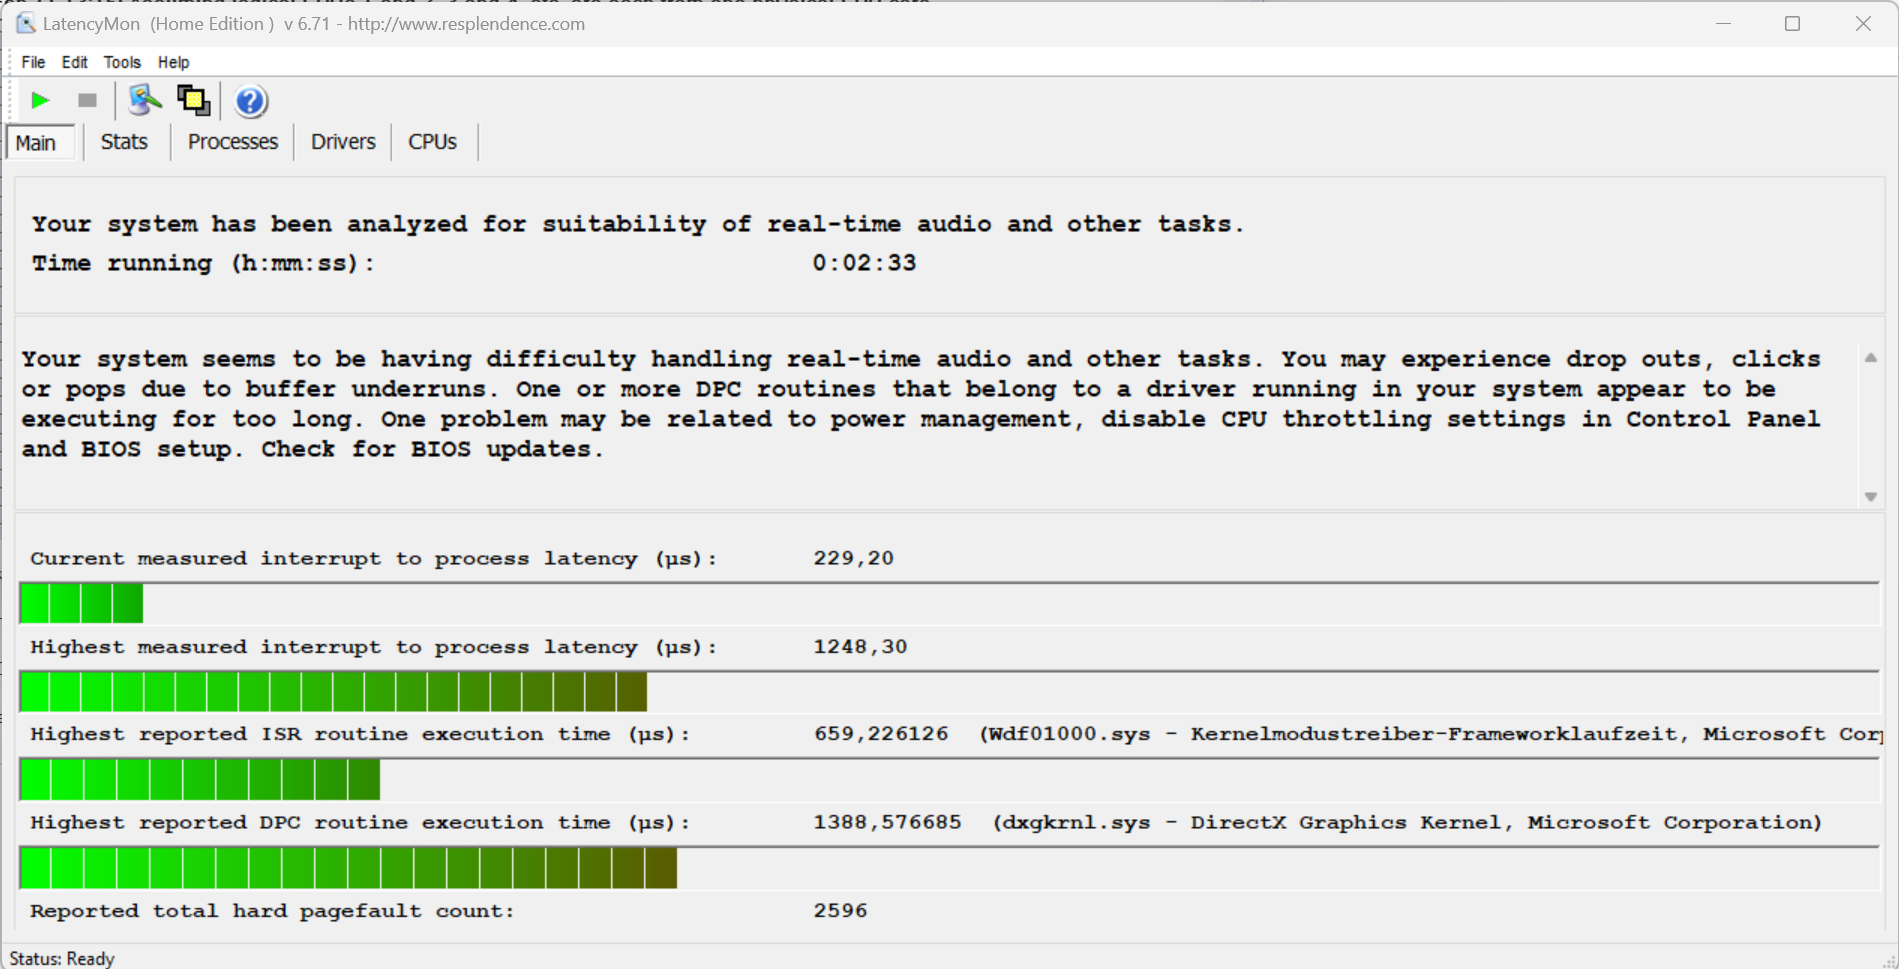
Our standardised Latency Monitor test (web surfing, 4K video playback, and Prime95 High-load) revealed some issues. The system doesn’t seem to be suitable for real-time video and audio editing. Hopefully, future software updates would bring improvement.
| DPC Latencies / LatencyMon - interrupt to process latency (max), Web, Youtube, Prime95 | |
| Acer Predator Helios 18 N23Q2 | |
| HP Omen 16-wf000 | |
| Alienware m16 R1 AMD | |
| MSI Vector 16 HX A14V | |
| HP Omen 16 (2024) | |
* ... smaller is better
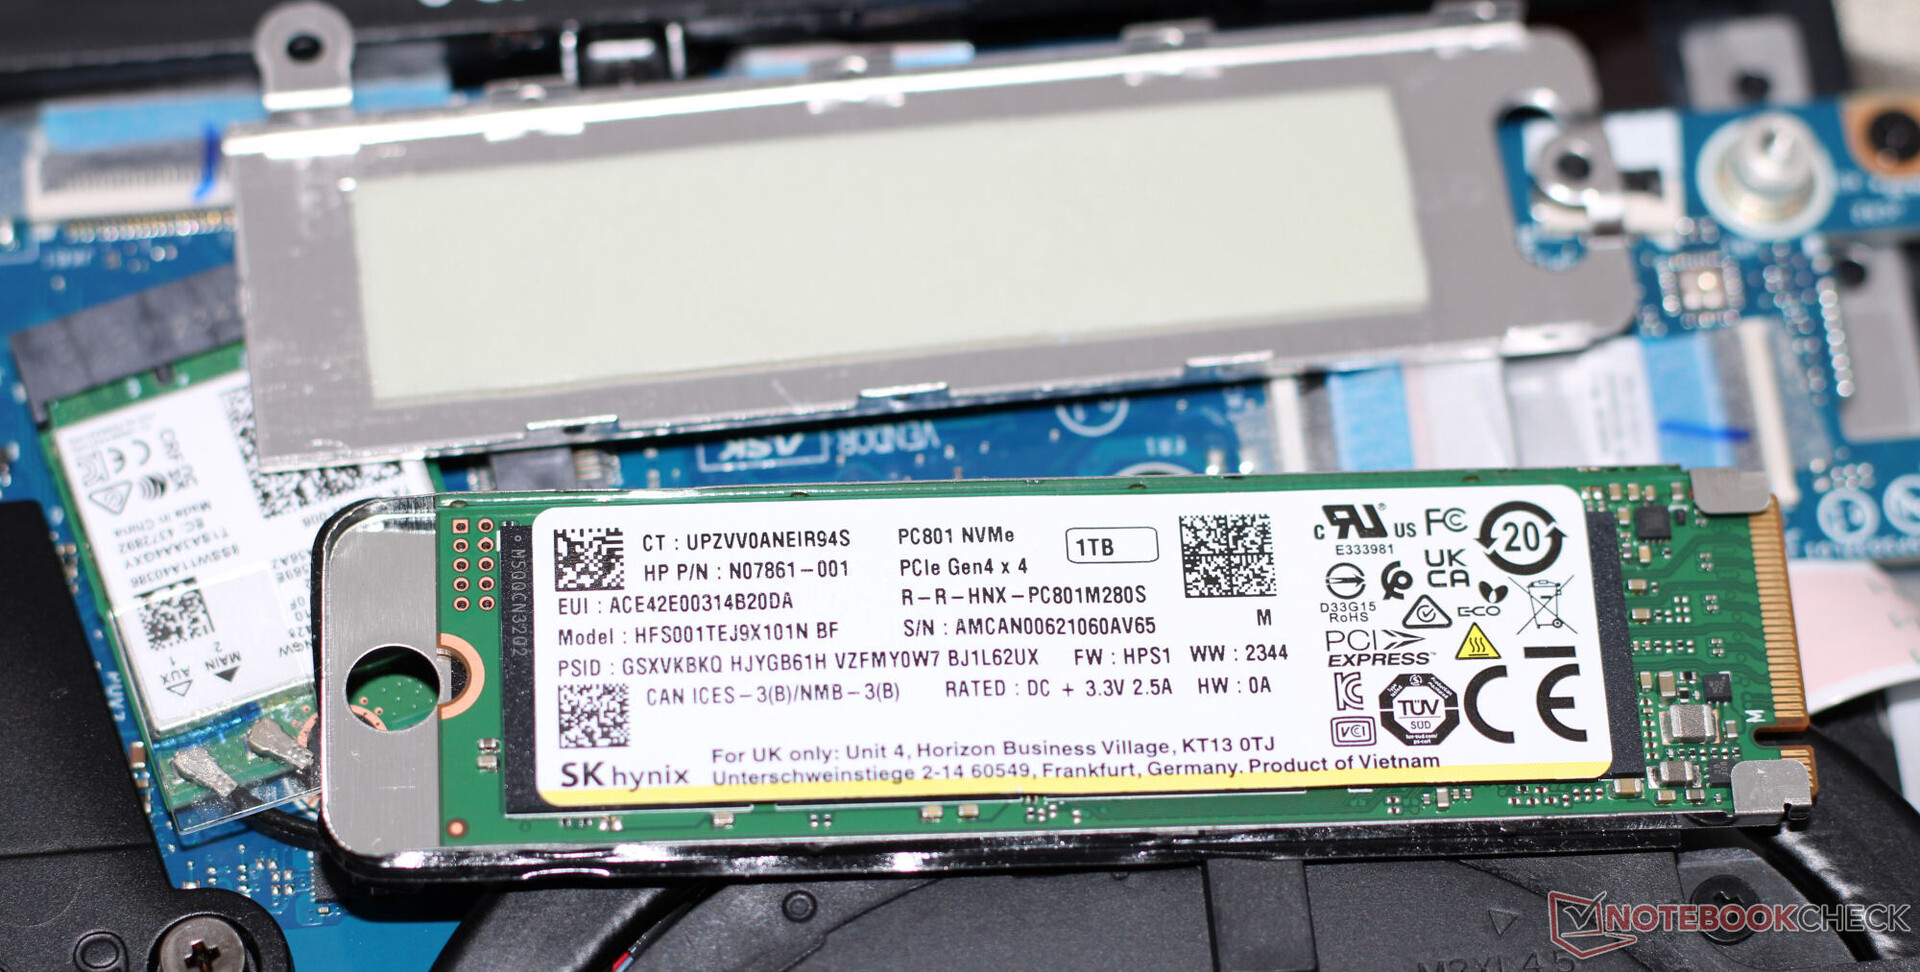
Mass storage
The Omen 16 can accommodate a total of two PCIe 4.0 M.2-2280 SSDs. The 1 TB SK Hynix drive in our review unit delivers excellent transfer speeds and didn’t experience thermal throttling in our testing.

| Drive Performance rating - Percent | |
| HP Omen 16 (2024) | |
| Acer Predator Helios 18 N23Q2 | |
| Alienware m16 R1 AMD | |
| Average of class Gaming | |
| Average SK hynix PC801 HFS001TEJ9X101N | |
| HP Omen 16-wf000 | |
| MSI Vector 16 HX A14V | |
* ... smaller is better
Sustained Load Read: DiskSpd Read Loop, Queue Depth 8
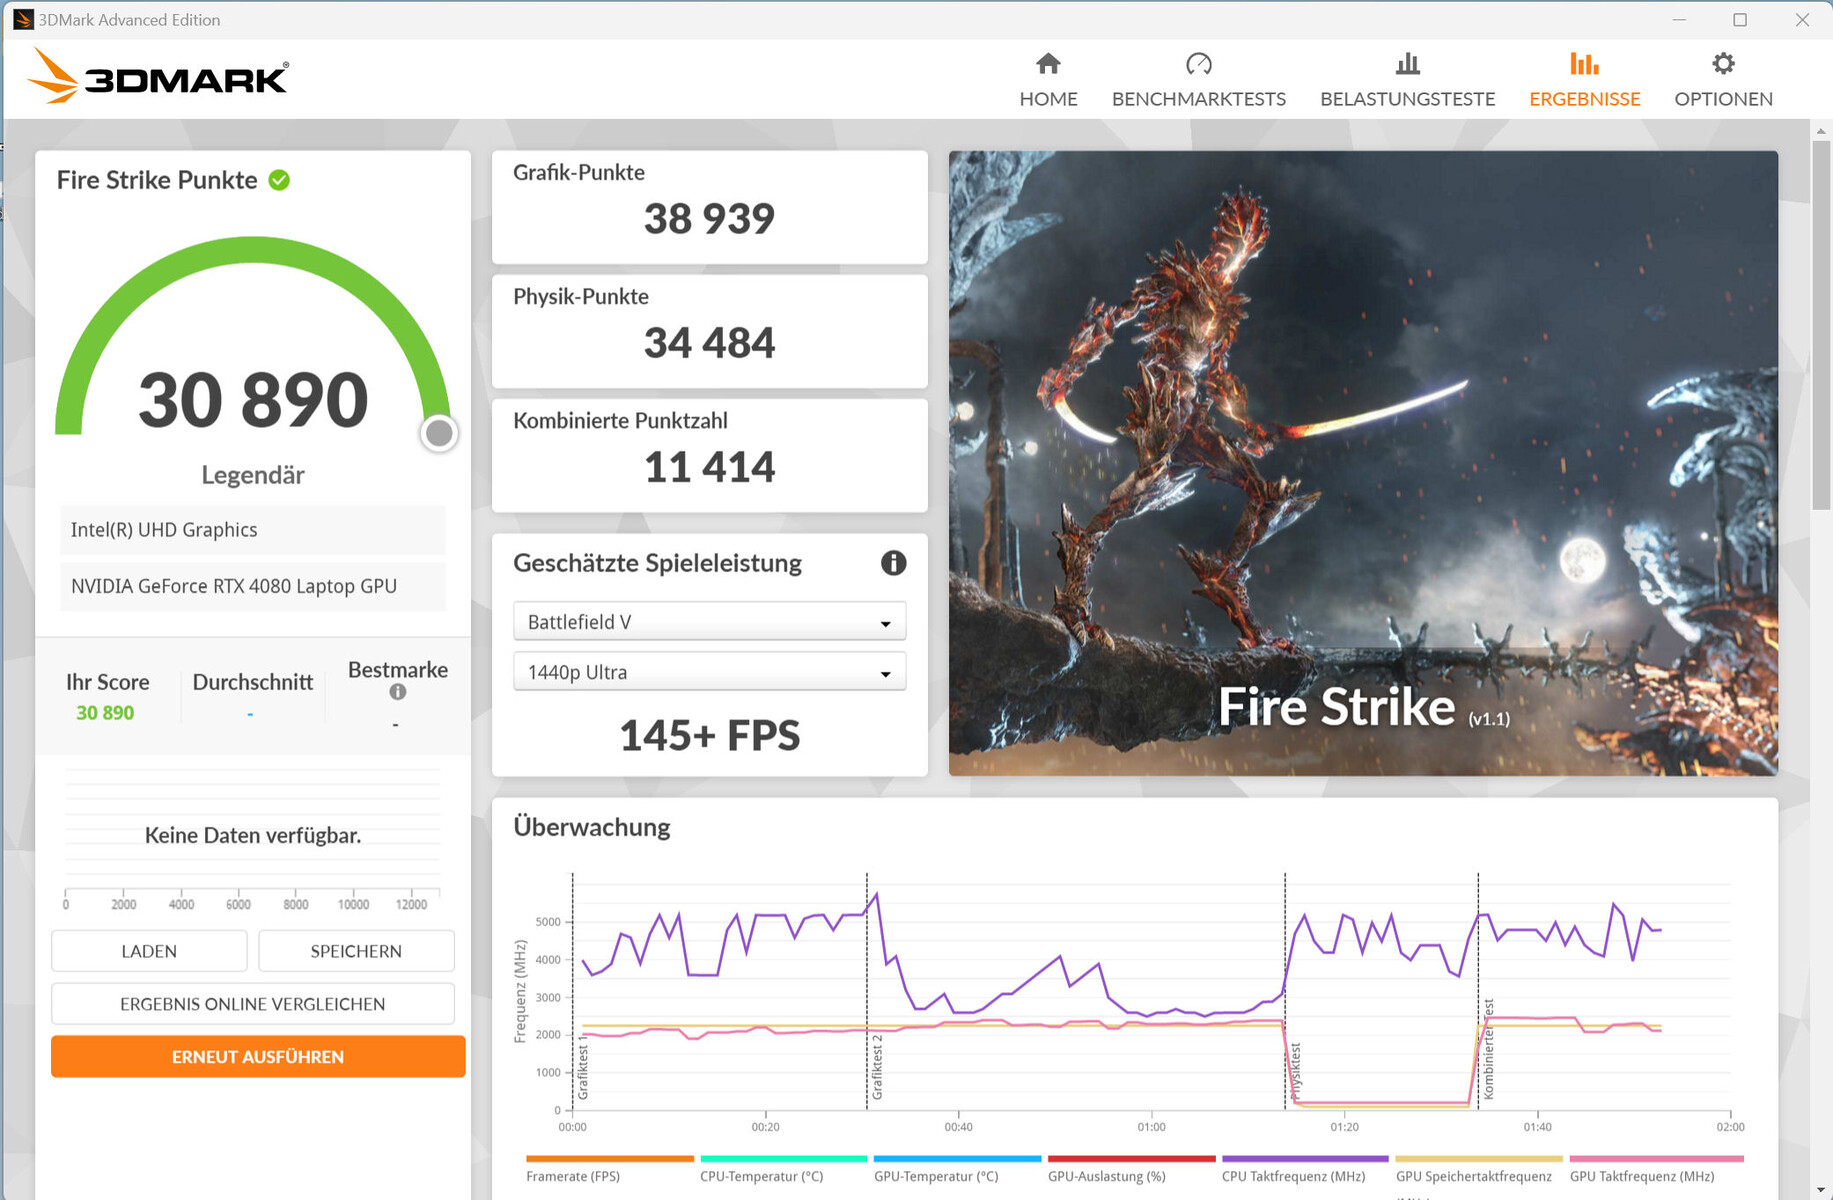
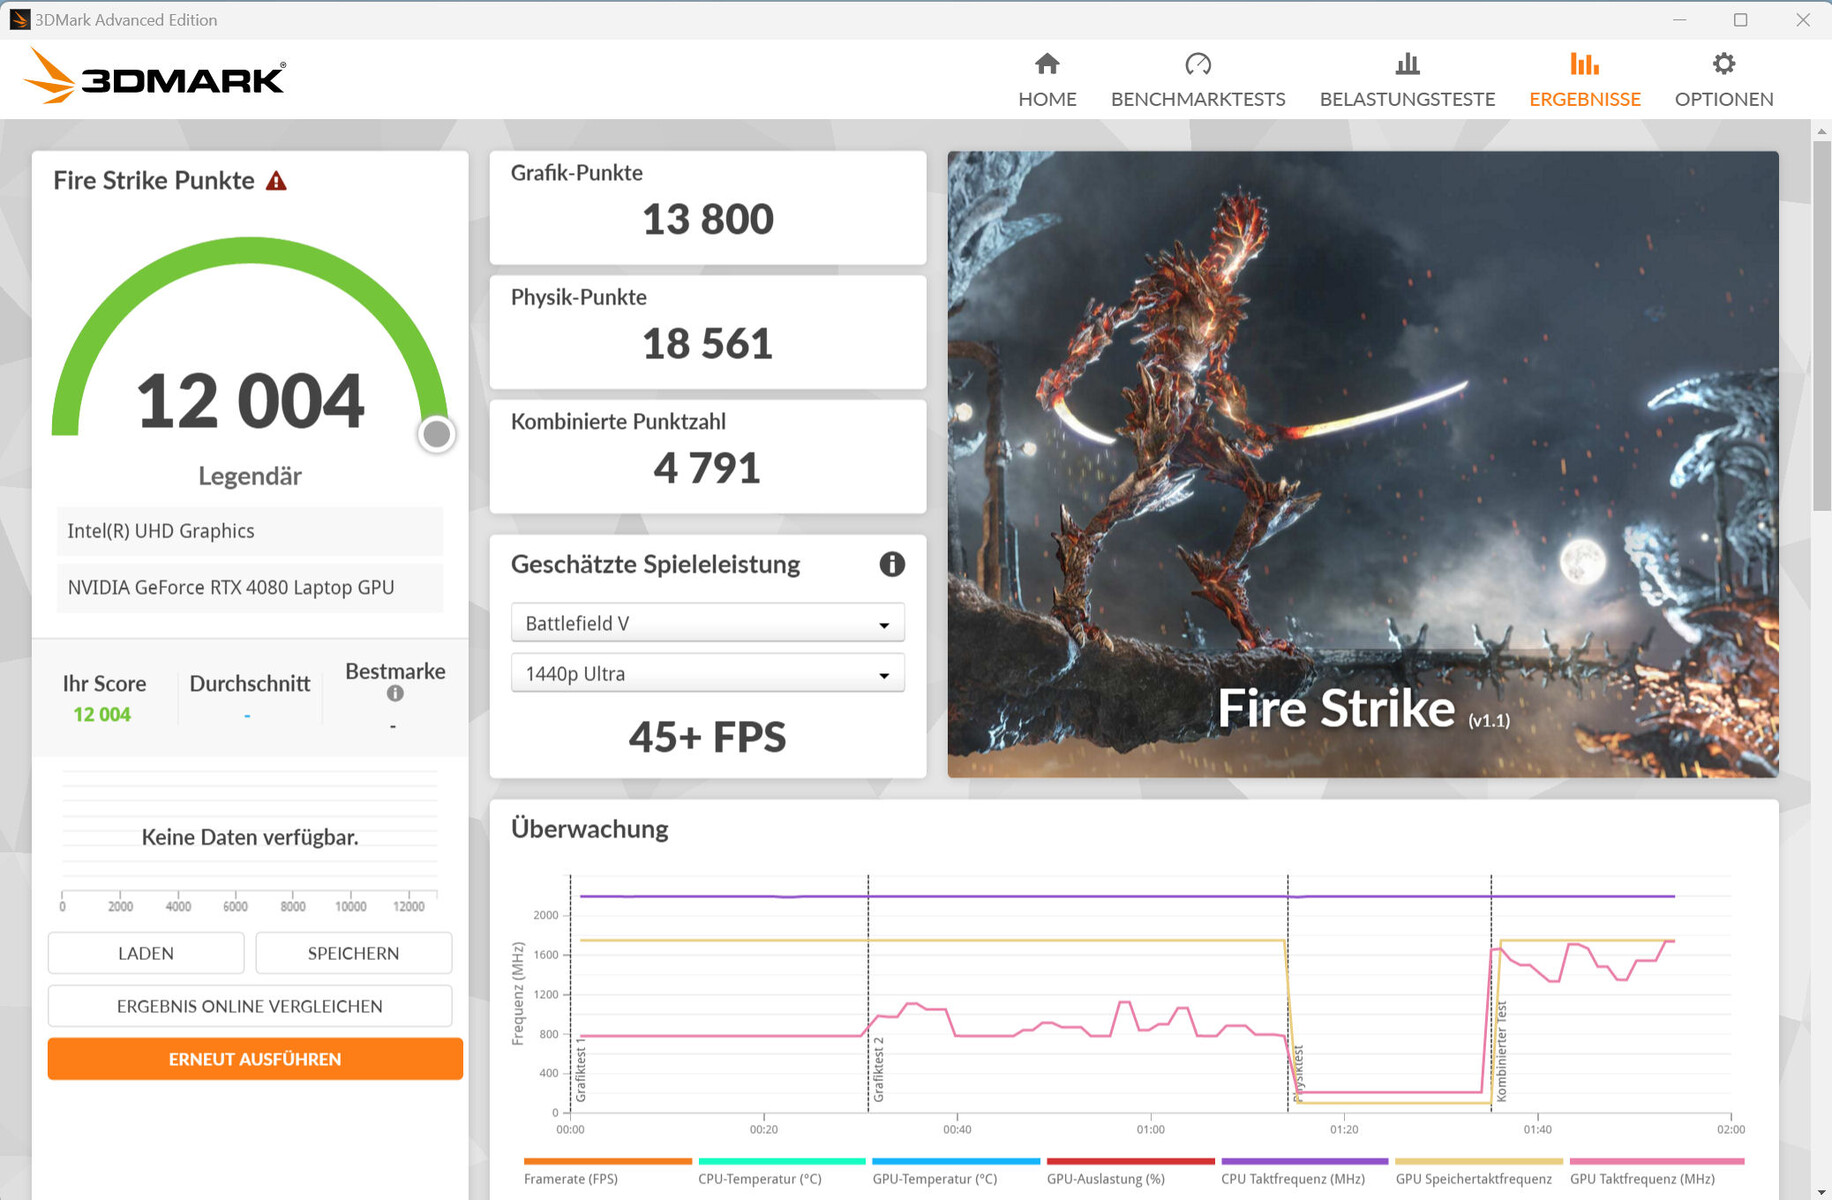
Graphics card
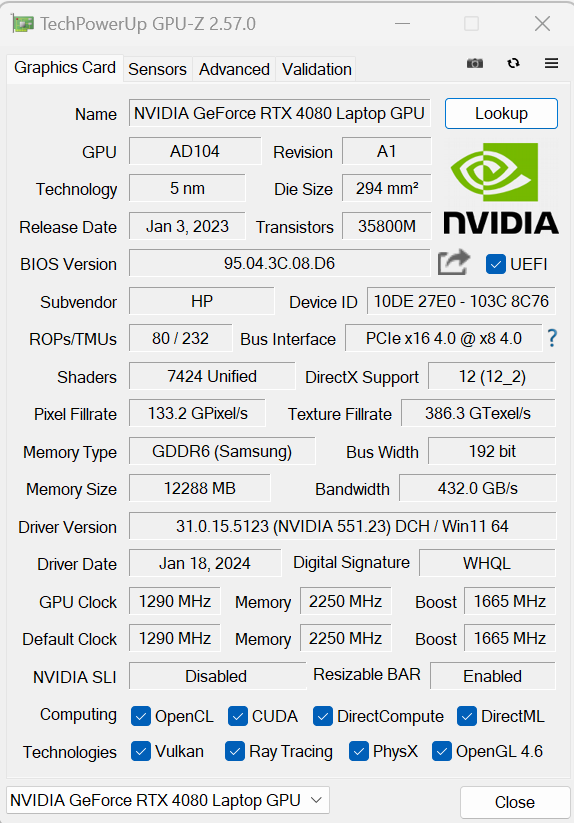
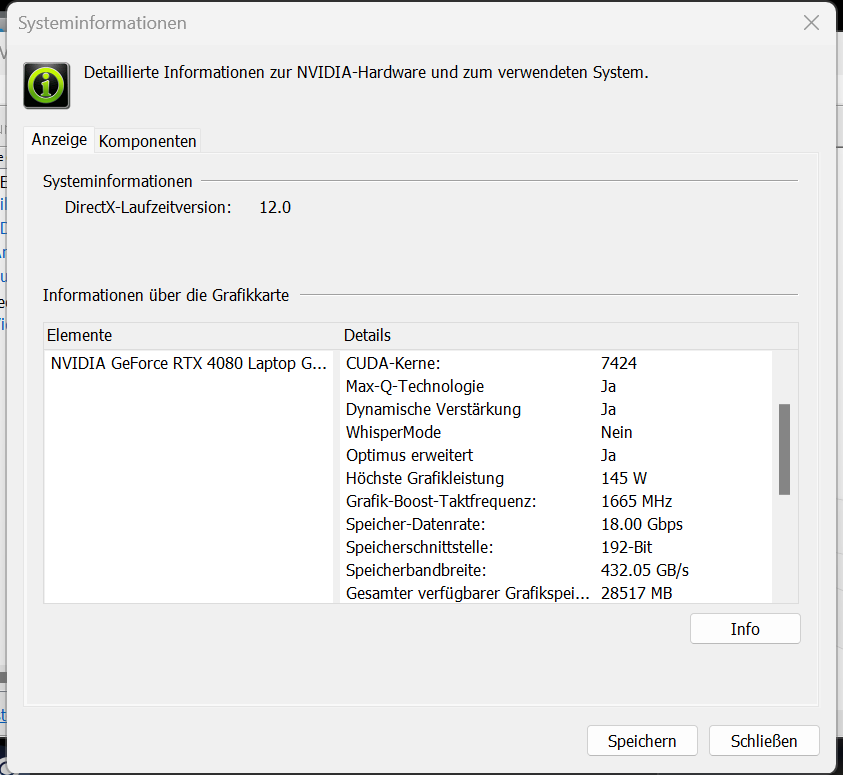
The GeForce RTX 4080 features 7,424 CUDA cores, a 192-bit memory bus and 12,288 MB of GDDR6 memory. HP has given the graphics card a TGP of 145 watts – below the 175-watt max TGP specified by Nvidia.
Benchmark results and frame rates obtained from the Omen 16 are below what we’ve seen from the RTX 4080 Laptop on average. Switching to Performance mode results in improved performance. The GPU lets you game at QHD resolution and high to max settings. With the help of DLSS 3 and Frame Generation, it is also possible to enable max settings and additional ray tracing effects at higher resolutions – though you can only do so in games with the appropriate support.


| 3DMark Performance rating - Percent | |
| MSI Vector 16 HX A14V | |
| Alienware m16 R1 AMD | |
| Acer Predator Helios 18 N23Q2 | |
| Average NVIDIA GeForce RTX 4080 Laptop GPU | |
| HP Omen 16-wf000 | |
| HP Omen 16 (2024) | |
| Average of class Gaming | |
| HP Omen 16 (2024) | |
| 3DMark 11 - 1280x720 Performance GPU | |
| MSI Vector 16 HX A14V | |
| Acer Predator Helios 18 N23Q2 | |
| Average NVIDIA GeForce RTX 4080 Laptop GPU (45199 - 63128, n=24) | |
| Alienware m16 R1 AMD | |
| HP Omen 16-wf000 | |
| HP Omen 16 (2024) (Leistung) | |
| Average of class Gaming (21841 - 80022, n=109, last 2 years) | |
| HP Omen 16 (2024) | |
| 3DMark | |
| 1920x1080 Fire Strike Graphics | |
| Alienware m16 R1 AMD | |
| MSI Vector 16 HX A14V | |
| Acer Predator Helios 18 N23Q2 | |
| Average NVIDIA GeForce RTX 4080 Laptop GPU (33058 - 45220, n=23) | |
| HP Omen 16 (2024) (Leistung) | |
| HP Omen 16-wf000 | |
| Average of class Gaming (12242 - 62849, n=121, last 2 years) | |
| HP Omen 16 (2024) | |
| 2560x1440 Time Spy Graphics | |
| MSI Vector 16 HX A14V | |
| Alienware m16 R1 AMD | |
| Acer Predator Helios 18 N23Q2 | |
| Average NVIDIA GeForce RTX 4080 Laptop GPU (13282 - 19663, n=23) | |
| HP Omen 16-wf000 | |
| HP Omen 16 (2024) (Leistung) | |
| Average of class Gaming (5012 - 26212, n=120, last 2 years) | |
| HP Omen 16 (2024) | |
| 3DMark 11 Performance | 35380 points | |
| 3DMark Cloud Gate Standard Score | 51266 points | |
| 3DMark Fire Strike Score | 27191 points | |
| 3DMark Time Spy Score | 13636 points | |
Help | ||
| Blender | |
| v3.3 Classroom OPTIX/RTX | |
| Average of class Gaming (9 - 32, n=112, last 2 years) | |
| HP Omen 16-wf000 (3.3.3) | |
| HP Omen 16 (2024) (3.3.3) | |
| Alienware m16 R1 AMD (3.3.3) | |
| Average NVIDIA GeForce RTX 4080 Laptop GPU (13 - 20, n=22) | |
| Acer Predator Helios 18 N23Q2 (3.3.3) | |
| MSI Vector 16 HX A14V (3.3.3) | |
| HP Omen 16 (2024) (3.3.3, Leistung) | |
| v3.3 Classroom CUDA | |
| Average of class Gaming (15 - 228, n=112, last 2 years) | |
| HP Omen 16 (2024) (3.3.3) | |
| Alienware m16 R1 AMD (3.3.3) | |
| HP Omen 16 (2024) (3.3.3, Leistung) | |
| Average NVIDIA GeForce RTX 4080 Laptop GPU (21 - 28, n=23) | |
| HP Omen 16-wf000 (3.3.3) | |
| MSI Vector 16 HX A14V (3.3.3) | |
| Acer Predator Helios 18 N23Q2 (3.3.3) | |
| v3.3 Classroom CPU | |
| HP Omen 16-wf000 (3.3.3) | |
| HP Omen 16 (2024) (3.3.3) | |
| Average of class Gaming (122 - 565, n=108, last 2 years) | |
| Average NVIDIA GeForce RTX 4080 Laptop GPU (177 - 337, n=23) | |
| HP Omen 16 (2024) (3.3.3, Leistung) | |
| Acer Predator Helios 18 N23Q2 (3.3.3) | |
| Alienware m16 R1 AMD (3.3.3) | |
| MSI Vector 16 HX A14V (3.3.3) | |
| Geekbench 5.5 | |
| OpenCL Score | |
| Alienware m16 R1 AMD | |
| Acer Predator Helios 18 N23Q2 | |
| Average NVIDIA GeForce RTX 4080 Laptop GPU (146413 - 189320, n=23) | |
| HP Omen 16 (2024) (Leistung) | |
| HP Omen 16-wf000 | |
| Average of class Gaming (80702 - 277970, n=108, last 2 years) | |
| MSI Vector 16 HX A14V | |
| HP Omen 16 (2024) | |
| Vulkan Score 5.5 | |
| HP Omen 16 (2024) (Leistung) | |
| Average of class Gaming (9296 - 246759, n=84, last 2 years) | |
| Average NVIDIA GeForce RTX 4080 Laptop GPU (9296 - 122085, n=15) | |
| HP Omen 16 (2024) | |
| HP Omen 16-wf000 | |
| MSI Vector 16 HX A14V | |
| Geekbench 6.7 | |
| GPU Vulkan | |
| HP Omen 16 (2024) (6.2.1, Leistung) | |
| HP Omen 16 (2024) (6.2.1) | |
| Average NVIDIA GeForce RTX 4080 Laptop GPU (104581 - 159261, n=11) | |
| Average of class Gaming (20128 - 231659, n=61, last 2 years) | |
| MSI Vector 16 HX A14V (6.2.1) | |
| GPU OpenCL | |
| Alienware m16 R1 AMD | |
| Acer Predator Helios 18 N23Q2 | |
| HP Omen 16 (2024) (6.2.1, Leistung) | |
| Average NVIDIA GeForce RTX 4080 Laptop GPU (136770 - 181484, n=15) | |
| HP Omen 16 (2024) (6.2.1) | |
| Average of class Gaming (67235 - 253130, n=109, last 2 years) | |
| MSI Vector 16 HX A14V (6.2.1) | |
| V-Ray 5 Benchmark | |
| GPU RTX | |
| MSI Vector 16 HX A14V (5.0.1) | |
| Alienware m16 R1 AMD (5.0.1) | |
| Average of class Gaming (1146 - 4363, n=38, last 2 years) | |
| HP Omen 16 (2024) (5.0.1, Leistung) | |
| HP Omen 16-wf000 (5.0.1) | |
| Average NVIDIA GeForce RTX 4080 Laptop GPU (2128 - 2843, n=17) | |
| HP Omen 16 (2024) (5.0.1) | |
| GPU CUDA | |
| Alienware m16 R1 AMD (5.0.1) | |
| Average of class Gaming (887 - 3288, n=38, last 2 years) | |
| MSI Vector 16 HX A14V (5.0.1) | |
| HP Omen 16-wf000 (5.0.1) | |
| Average NVIDIA GeForce RTX 4080 Laptop GPU (1647 - 2112, n=17) | |
| HP Omen 16 (2024) (5.0.1, Leistung) | |
| HP Omen 16 (2024) | |
| CPU | |
| MSI Vector 16 HX A14V (5.0.1) | |
| Alienware m16 R1 AMD (5.0.1) | |
| Average of class Gaming (5864 - 30302, n=37, last 2 years) | |
| HP Omen 16 (2024) (5.0.1, Leistung) | |
| Average NVIDIA GeForce RTX 4080 Laptop GPU (11906 - 21823, n=17) | |
| HP Omen 16 (2024) (5.0.1) | |
| HP Omen 16-wf000 (5.0.1) | |
| V-Ray Benchmark Next 4.10 | |
| GPU | |
| Acer Predator Helios 18 N23Q2 (v4.10.07 ) | |
| Average NVIDIA GeForce RTX 4080 Laptop GPU (812 - 1036, n=16) | |
| HP Omen 16 (2024) (v4.10.07, Leistung) | |
| MSI Vector 16 HX A14V (v4.10.07 ) | |
| HP Omen 16 (2024) (v4.10.07 ) | |
| Average of class Gaming (427 - 1333, n=106, last 2 years) | |
| CPU | |
| MSI Vector 16 HX A14V (v4.10.07 ) | |
| Acer Predator Helios 18 N23Q2 (v4.10.07 ) | |
| Average NVIDIA GeForce RTX 4080 Laptop GPU (19636 - 31653, n=16) | |
| HP Omen 16 (2024) (v4.10.07, Leistung) | |
| Average of class Gaming (10048 - 45327, n=105, last 2 years) | |
| HP Omen 16 (2024) (v4.10.07 ) | |
* ... smaller is better
| Performance rating - Percent | |
| Acer Predator Helios 18 N23Q2 | |
| MSI Vector 16 HX A14V | |
| Alienware m16 R1 AMD -1! | |
| HP Omen 16 (2024) | |
| Average NVIDIA GeForce RTX 4080 Laptop GPU | |
| HP Omen 16-wf000 | |
| Average of class Gaming | |
| HP Omen 16 (2024) | |
| The Witcher 3 - 1920x1080 Ultra Graphics & Postprocessing (HBAO+) | |
| MSI Vector 16 HX A14V | |
| Acer Predator Helios 18 N23Q2 | |
| Average of class Gaming (95 - 240, n=8, last 2 years) | |
| Alienware m16 R1 AMD | |
| Average NVIDIA GeForce RTX 4080 Laptop GPU (130.4 - 186.1, n=20) | |
| HP Omen 16 (2024) (Leistung) | |
| HP Omen 16-wf000 | |
| HP Omen 16 (2024) | |
| GTA V - 1920x1080 Highest AA:4xMSAA + FX AF:16x | |
| Acer Predator Helios 18 N23Q2 | |
| MSI Vector 16 HX A14V | |
| HP Omen 16 (2024) (Leistung) | |
| Average NVIDIA GeForce RTX 4080 Laptop GPU (102.9 - 152.7, n=21) | |
| Average of class Gaming (48.3 - 186.9, n=103, last 2 years) | |
| HP Omen 16-wf000 | |
| HP Omen 16 (2024) | |
| Final Fantasy XV Benchmark - 1920x1080 High Quality | |
| Acer Predator Helios 18 N23Q2 (1.3) | |
| MSI Vector 16 HX A14V (1.3) | |
| Alienware m16 R1 AMD (1.3) | |
| HP Omen 16 (2024) (1.3, Leistung) | |
| Average NVIDIA GeForce RTX 4080 Laptop GPU (129 - 182.1, n=23) | |
| HP Omen 16-wf000 (1.3) | |
| Average of class Gaming (41 - 215, n=104, last 2 years) | |
| HP Omen 16 (2024) (1.3) | |
| Strange Brigade - 1920x1080 ultra AA:ultra AF:16 | |
| Alienware m16 R1 AMD (1.47.22.14 D3D12) | |
| MSI Vector 16 HX A14V (1.47.22.14 D3D12) | |
| Acer Predator Helios 18 N23Q2 (1.47.22.14 D3D12) | |
| Average NVIDIA GeForce RTX 4080 Laptop GPU (239 - 357, n=22) | |
| HP Omen 16 (2024) (1.47.22.14 D3D12, Leistung) | |
| HP Omen 16-wf000 (1.47.22.14 D3D12) | |
| Average of class Gaming (76.3 - 456, n=94, last 2 years) | |
| HP Omen 16 (2024) (1.47.22.14 D3D12) | |
| Dota 2 Reborn - 1920x1080 ultra (3/3) best looking | |
| Acer Predator Helios 18 N23Q2 | |
| MSI Vector 16 HX A14V | |
| HP Omen 16 (2024) (Leistung) | |
| Alienware m16 R1 AMD | |
| Average NVIDIA GeForce RTX 4080 Laptop GPU (133 - 194.7, n=23) | |
| HP Omen 16 (2024) | |
| HP Omen 16-wf000 | |
| Average of class Gaming (84.8 - 248, n=113, last 2 years) | |
| X-Plane 11.11 - 1920x1080 high (fps_test=3) | |
| Acer Predator Helios 18 N23Q2 | |
| HP Omen 16 (2024) (Leistung) | |
| MSI Vector 16 HX A14V | |
| HP Omen 16 (2024) | |
| Average NVIDIA GeForce RTX 4080 Laptop GPU (89.3 - 143.5, n=25) | |
| HP Omen 16-wf000 | |
| Alienware m16 R1 AMD | |
| Average of class Gaming (52.1 - 143.5, n=116, last 2 years) | |
| Enshrouded | |
| 1920x1080 Max. Quality AA:FX | |
| HP Omen 16 (2024) (Leistung) | |
| Average NVIDIA GeForce RTX 4080 Laptop GPU (67.6 - 82.6, n=3) | |
| HP Omen 16 (2024) | |
| Average of class Gaming (n=1last 2 years) | |
| 2560x1440 Max. Quality AA:FX | |
| HP Omen 16 (2024) (Leistung) | |
| Average NVIDIA GeForce RTX 4080 Laptop GPU (52.8 - 64.5, n=3) | |
| HP Omen 16 (2024) | |
| Ready or Not | |
| 2560x1440 Epic Preset | |
| Average NVIDIA GeForce RTX 4080 Laptop GPU (102.1 - 128, n=3) | |
| HP Omen 16 (2024) (Leistung) | |
| HP Omen 16 (2024) | |
| 1920x1080 Epic Preset | |
| Average NVIDIA GeForce RTX 4080 Laptop GPU (118.6 - 202, n=3) | |
| HP Omen 16 (2024) (Leistung) | |
| HP Omen 16 (2024) | |
| Helldivers 2 | |
| 2560x1440 Ultra Preset | |
| Average of class Gaming (81.3 - 140.1, n=4, last 2 years) | |
| HP Omen 16 (2024) (Leistung) | |
| Average NVIDIA GeForce RTX 4080 Laptop GPU (85.7 - 106, n=3) | |
| HP Omen 16 (2024) | |
| 1920x1080 Ultra Preset | |
| HP Omen 16 (2024) (Leistung) | |
| Average NVIDIA GeForce RTX 4080 Laptop GPU (100.8 - 132.3, n=3) | |
| Average of class Gaming (18.4 - 153.8, n=5, last 2 years) | |
| HP Omen 16 (2024) | |
| The Finals | |
| 1920x1080 Epic Preset + Epic RTX Global Illumination | |
| HP Omen 16 (2024) (Leistung) | |
| Average NVIDIA GeForce RTX 4080 Laptop GPU (147.8 - 181.5, n=3) | |
| HP Omen 16 (2024) | |
| 2560x1440 Epic Preset | |
| HP Omen 16 (2024) (Leistung) | |
| Average NVIDIA GeForce RTX 4080 Laptop GPU (104.7 - 128.5, n=3) | |
| HP Omen 16 (2024) | |
| Average of class Gaming (n=1last 2 years) | |
| 1920x1080 Epic Preset | |
| HP Omen 16 (2024) (Leistung) | |
| Average NVIDIA GeForce RTX 4080 Laptop GPU (143.9 - 192.5, n=3) | |
| HP Omen 16 (2024) | |
| Average of class Gaming (n=1last 2 years) | |
Witcher 3 FPS chart

| low | med. | high | ultra | QHD | |
|---|---|---|---|---|---|
| GTA V (2015) | 184.2 | 181.1 | 173.8 | 109.7 | 100 |
| The Witcher 3 (2015) | 485 | 384 | 246 | 142 | 102.5 |
| Dota 2 Reborn (2015) | 215 | 191.6 | 177 | 163.4 | |
| Final Fantasy XV Benchmark (2018) | 183.9 | 152.8 | 129 | 98 | |
| X-Plane 11.11 (2018) | 177.3 | 156.2 | 126.9 | ||
| Strange Brigade (2018) | 382 | 307 | 263 | 239 | 179.5 |
| Cyberpunk 2077 (2023) | 111.3 | 96.4 | 94.1 | 83.9 | 56.2 |
| The Finals (2023) | 188.9 | 179.3 | 170.7 | 143.9 | 104.7 |
| Ready or Not (2023) | 267 | 127.6 | 121.5 | 118.6 | 102.1 |
| Enshrouded (2024) | 103.3 | 90.9 | 77.7 | 67.6 | 52.8 |
| Helldivers 2 (2024) | 110.6 | 110.4 | 103.9 | 100.8 | 85.7 |
Emissions & Power - The HP laptop has decent battery life
Noise emissions
In Balanced mode, the noise level reached as high as 47 dB(A) under full load. Using Performance mode resulted in a significantly higher noise level of 58 dB(A). The Omen 16 ran at a comfortable noise level of 39 dB(A) whilst in ECO mode – at the cost of performance.
The fans are constantly spinning even when the laptop is at idle or handling everyday tasks (e.g. office and Internet applications). This is because of HP’s “Fan Always On” option in the BIOS. Disabling it will allow both fans to stop running occasionally.
Noise level
| Idle |
| 29 / 30 / 31 dB(A) |
| Load |
| 46 / 47 dB(A) |
 | ||
30 dB silent 40 dB(A) audible 50 dB(A) loud |
||
min: | ||
| HP Omen 16 (2024) GeForce RTX 4080 Laptop GPU, i9-14900HX, SK hynix PC801 HFS001TEJ9X101N | MSI Vector 16 HX A14V GeForce RTX 4080 Laptop GPU, i9-14900HX, WD PC SN560 SDDPNQE-1T00 | Alienware m16 R1 AMD GeForce RTX 4080 Laptop GPU, R9 7845HX, Kioxia XG8 KXG80ZNV1T02 | Acer Predator Helios 18 N23Q2 GeForce RTX 4080 Laptop GPU, i9-13900HX, Samsung PM9A1 MZVL22T0HBLB | HP Omen 16-wf000 GeForce RTX 4080 Laptop GPU, i7-13700HX, SK hynix PC801 HFS002TEJ9X101N | |
|---|---|---|---|---|---|
| Noise | -15% | 5% | 4% | -1% | |
| off / environment * (dB) | 25 | 23.2 7% | 22.9 8% | 23 8% | 23 8% |
| Idle Minimum * (dB) | 29 | 33.5 -16% | 22.9 21% | 23 21% | 29.6 -2% |
| Idle Average * (dB) | 30 | 33.5 -12% | 29.7 1% | 23 23% | 29.8 1% |
| Idle Maximum * (dB) | 31 | 33.5 -8% | 29.7 4% | 23 26% | 30.4 2% |
| Load Average * (dB) | 46 | 52.1 -13% | 29.8 35% | 45.26 2% | 33.8 27% |
| Witcher 3 ultra * (dB) | 47 | 62 -32% | 54.7 -16% | 59.82 -27% | 57 -21% |
| Load Maximum * (dB) | 47 | 62 -32% | 54.7 -16% | 59.94 -28% | 58.3 -24% |
* ... smaller is better
Temperature
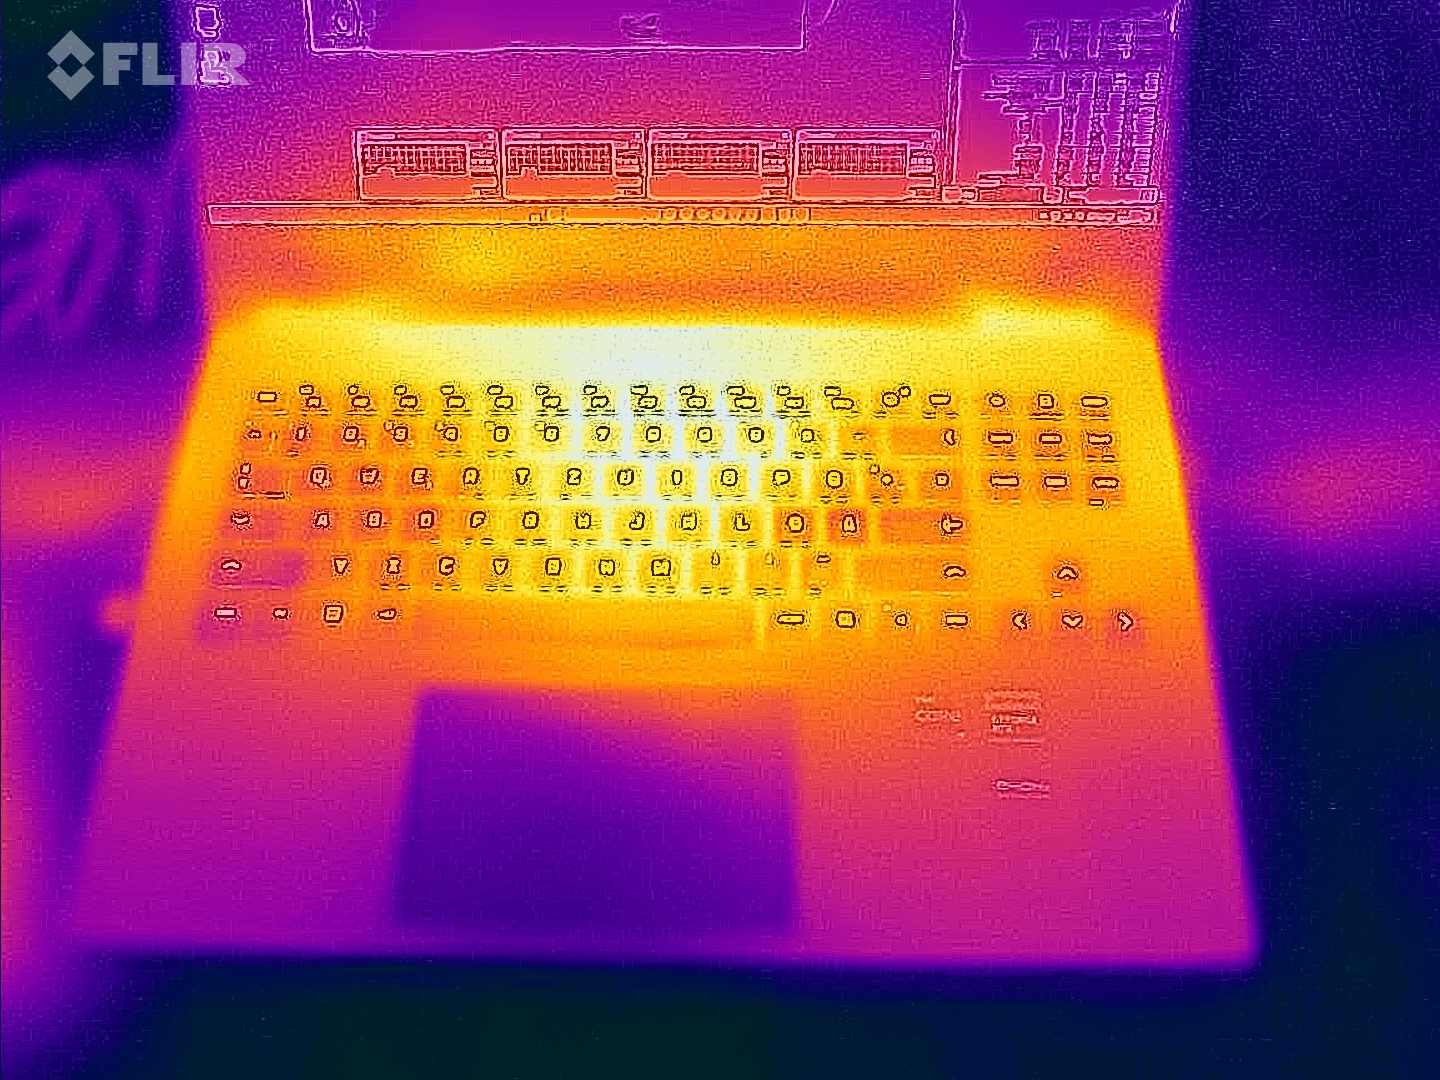
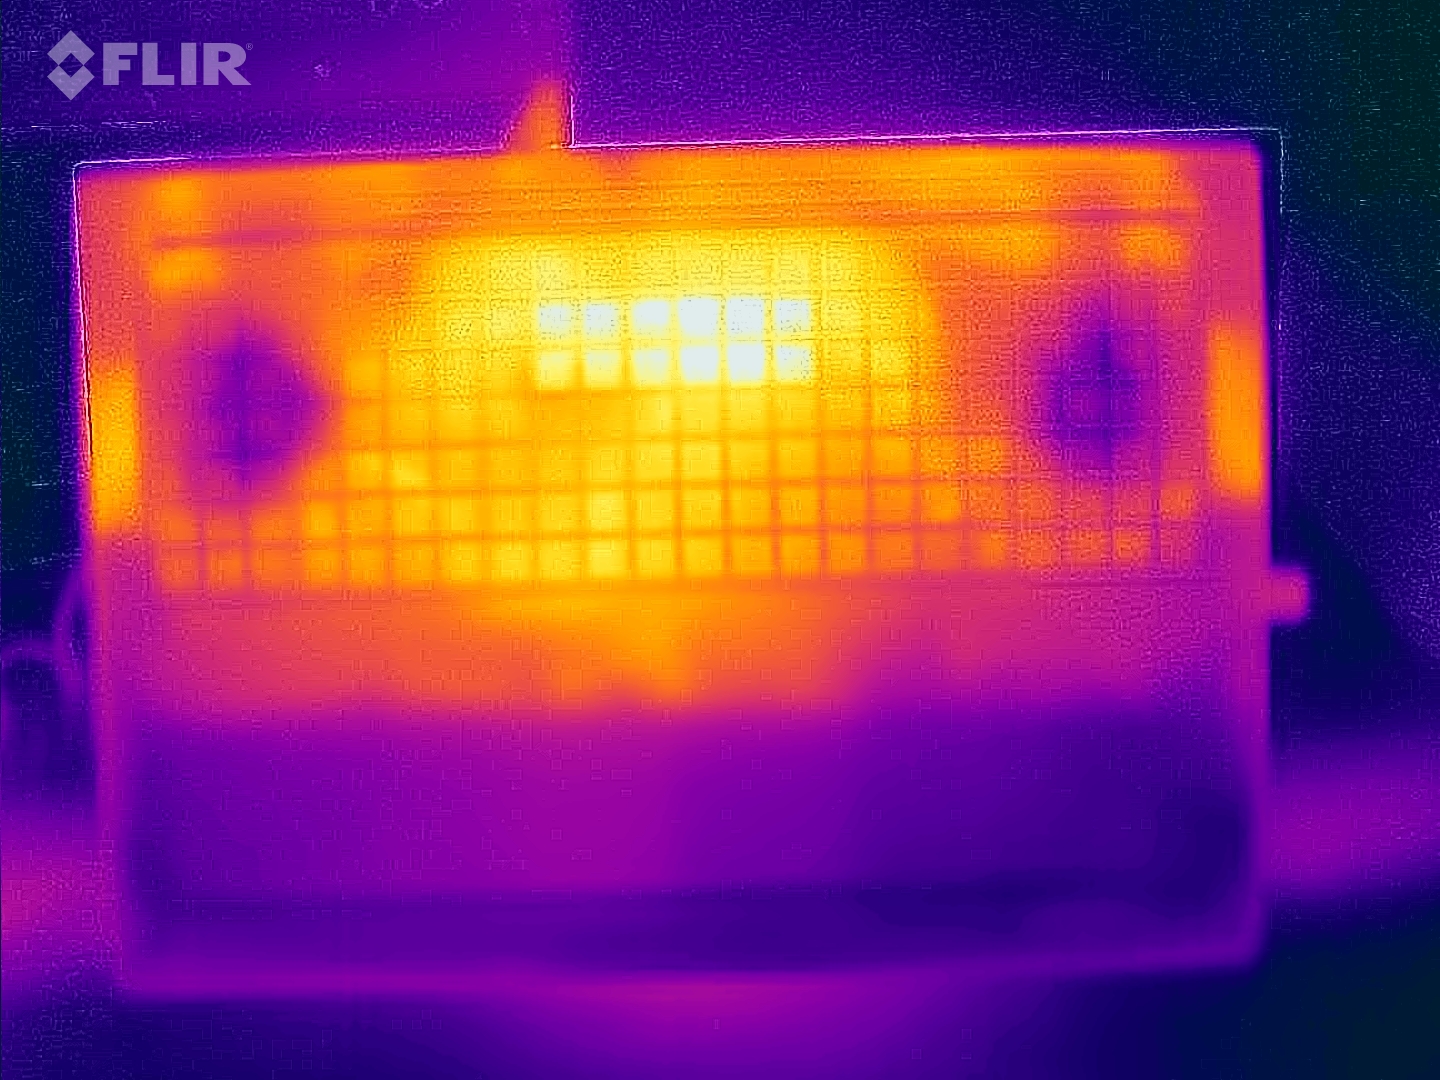
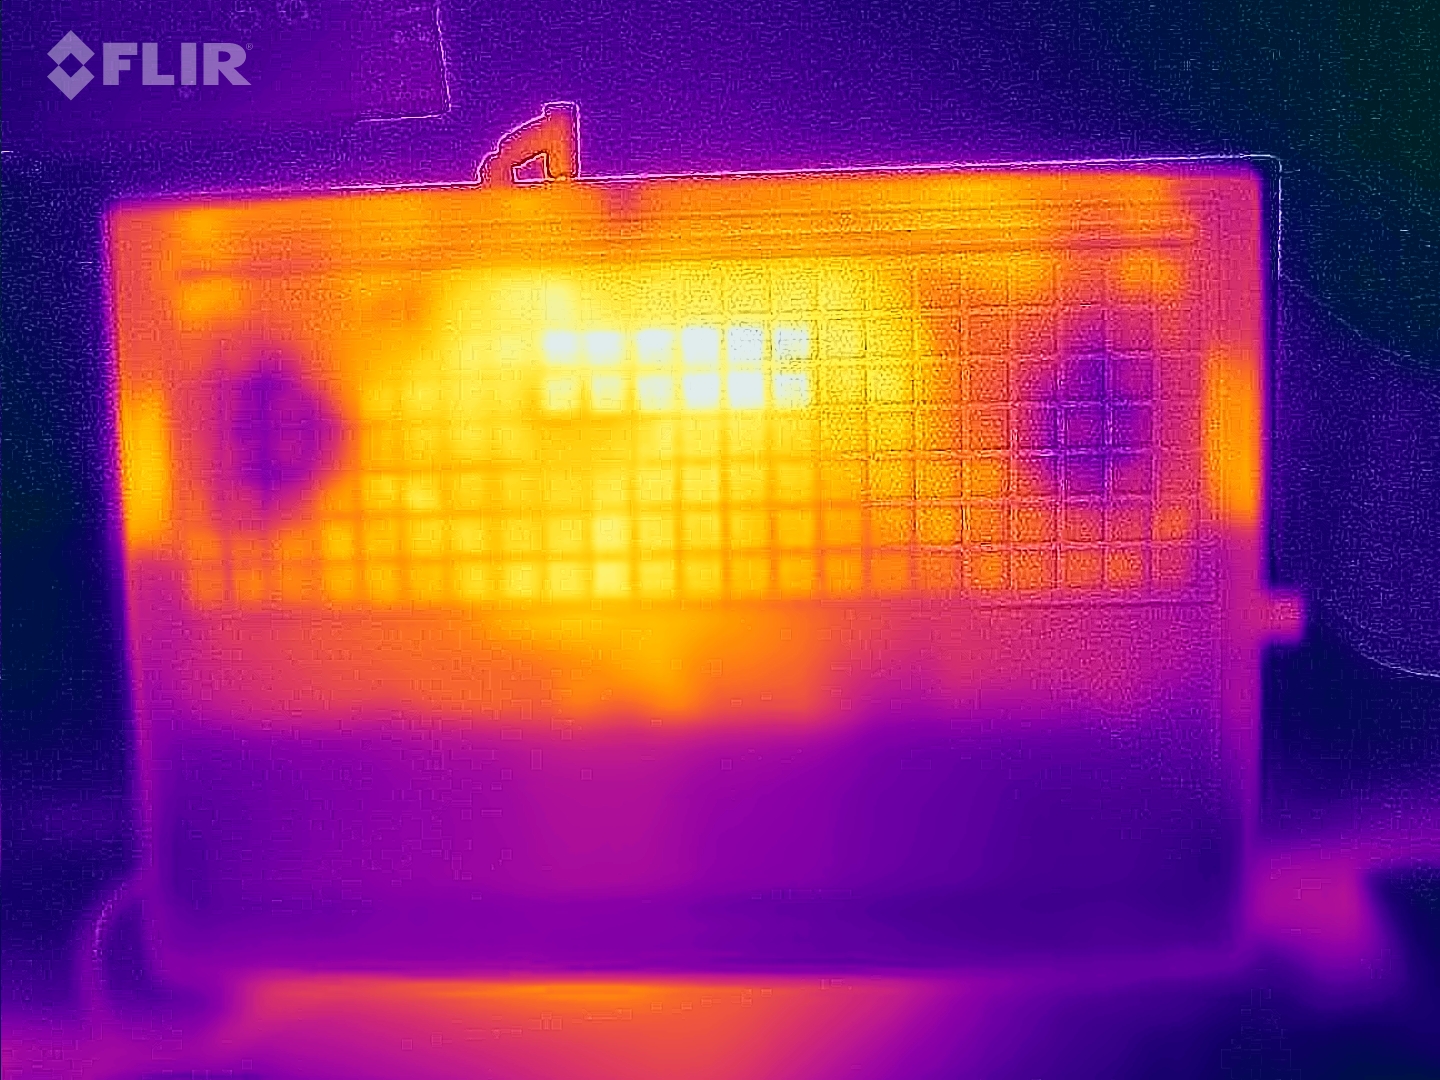
Our stress test and Witcher 3 test caused the laptop to become noticeably warmer, with skin temperatures exceeding 50°C (122°F) at some spots. Though temps remained within an acceptable range in everyday use.
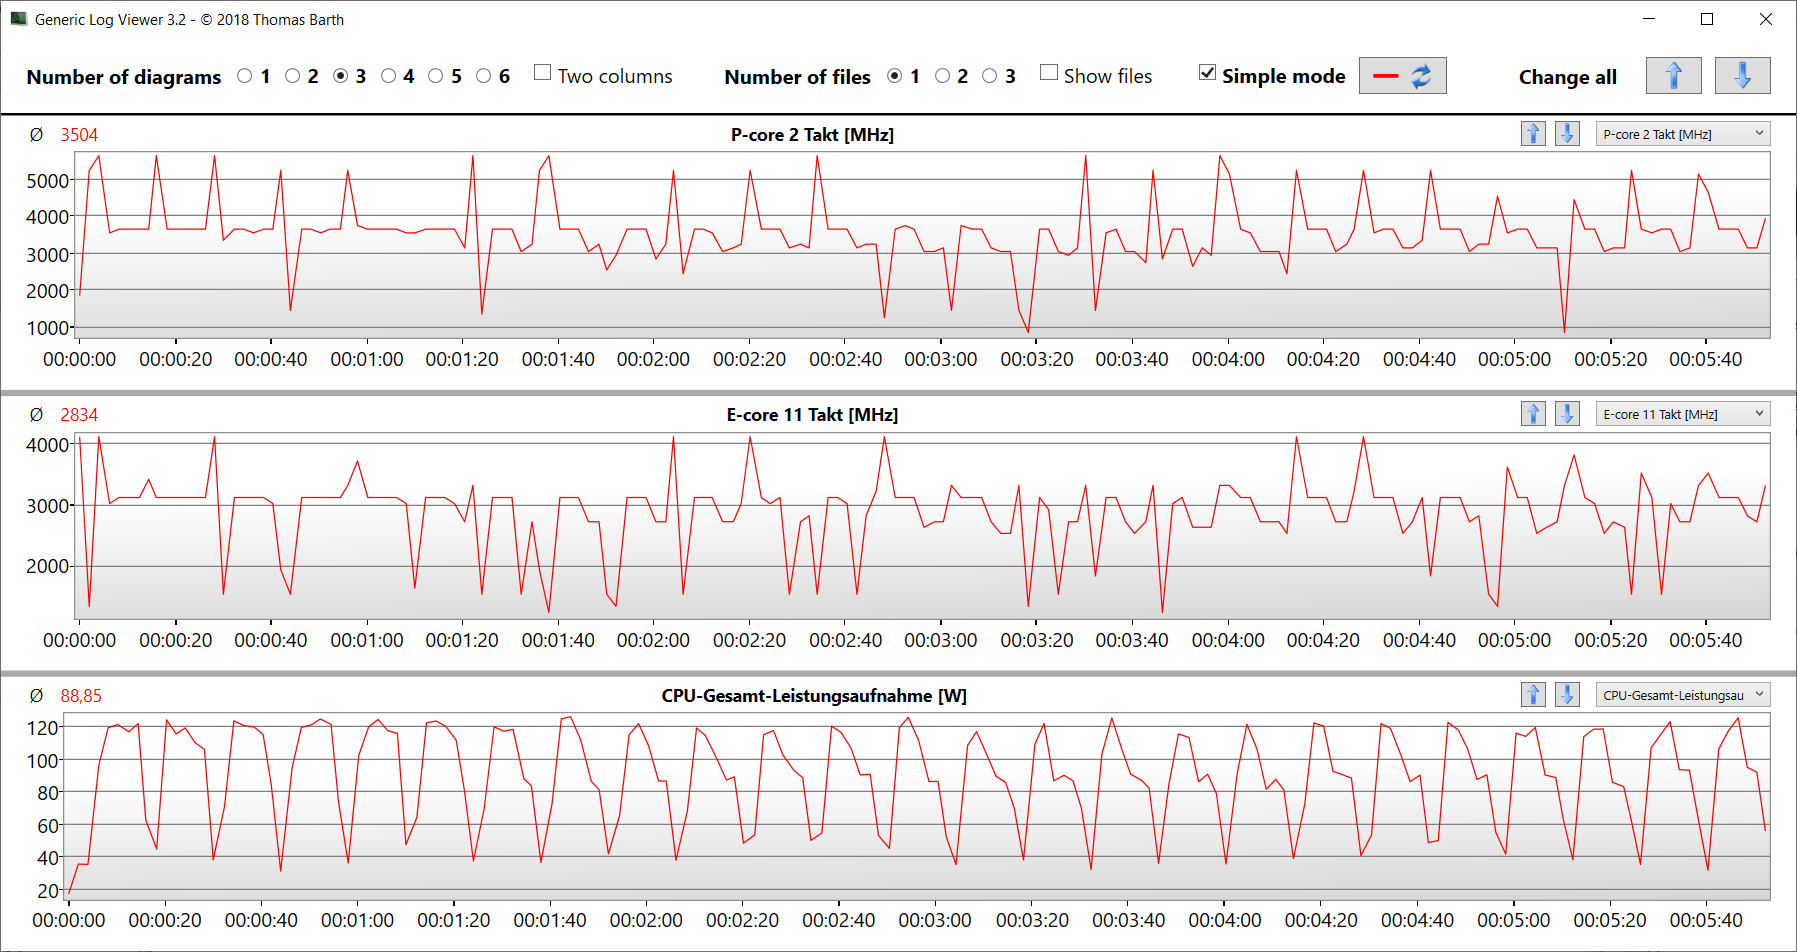
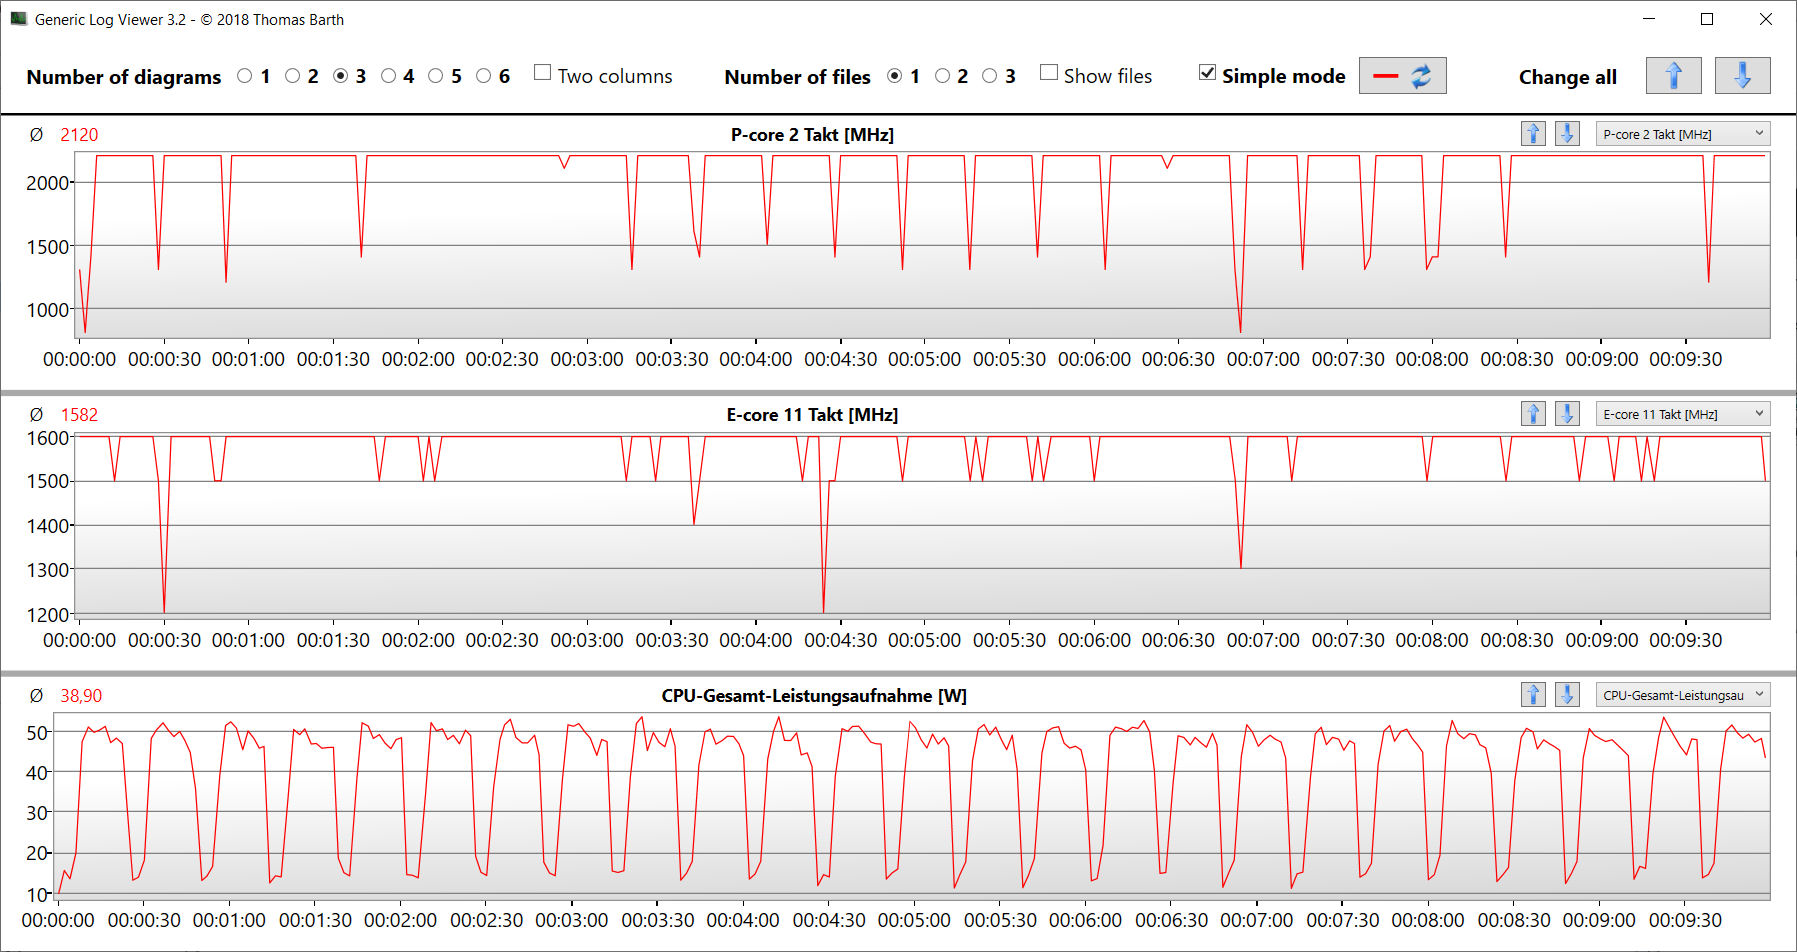
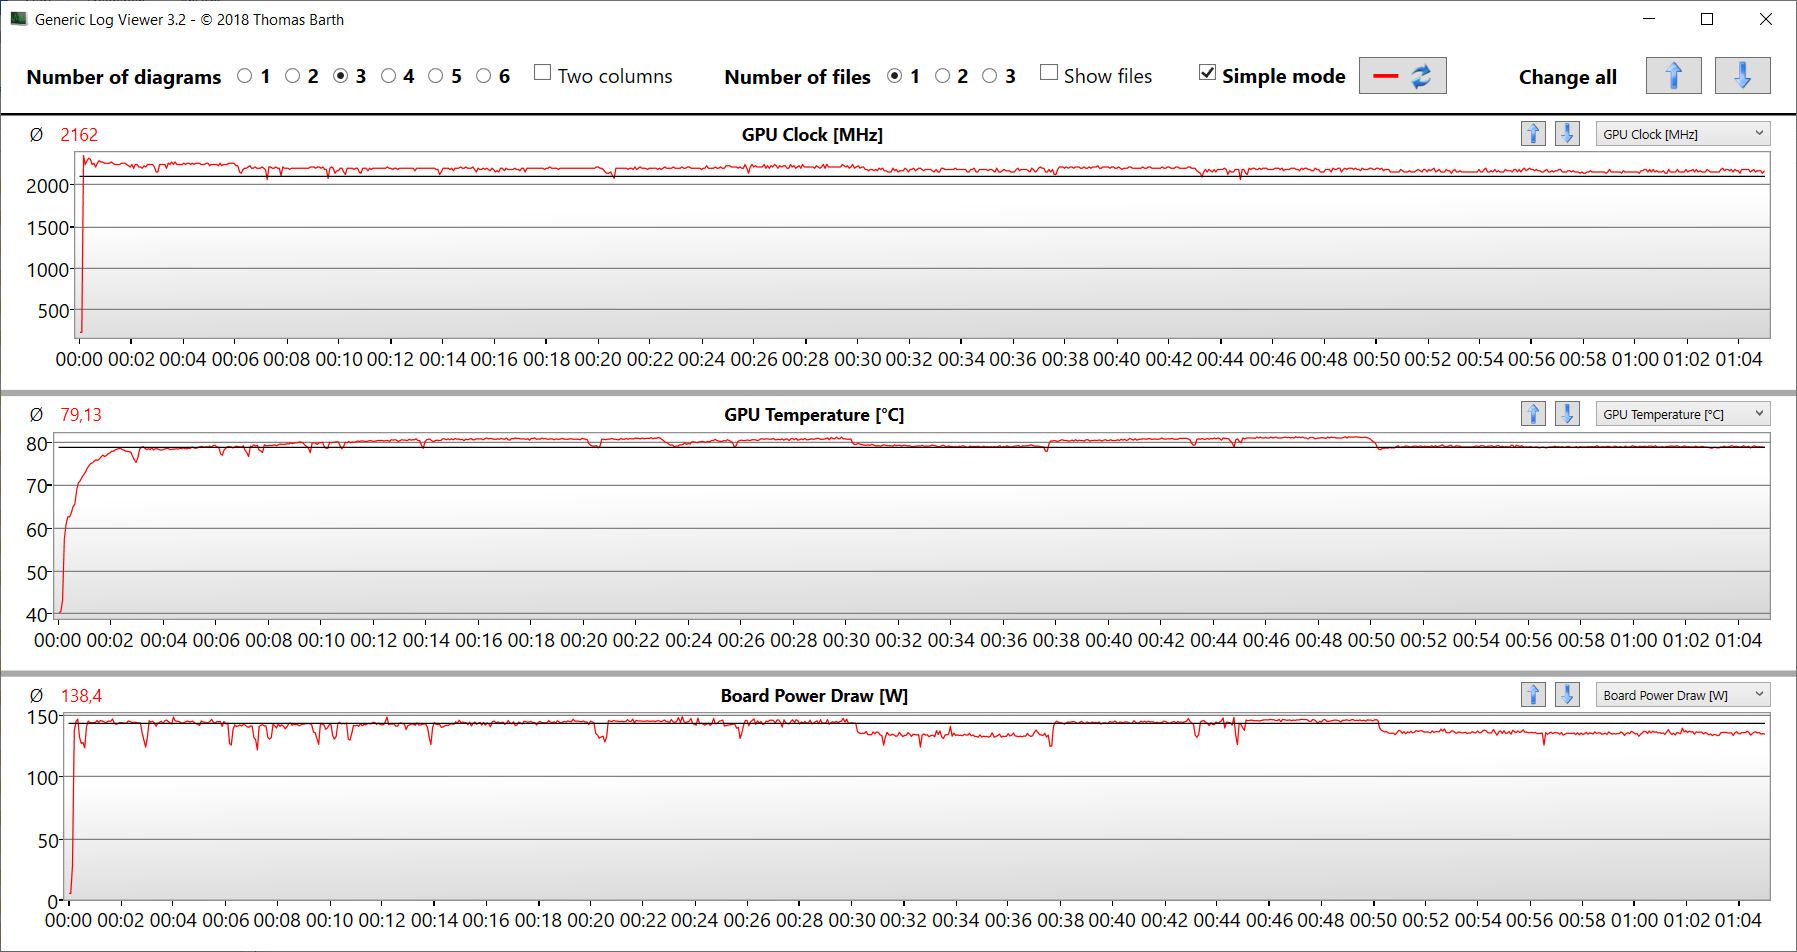
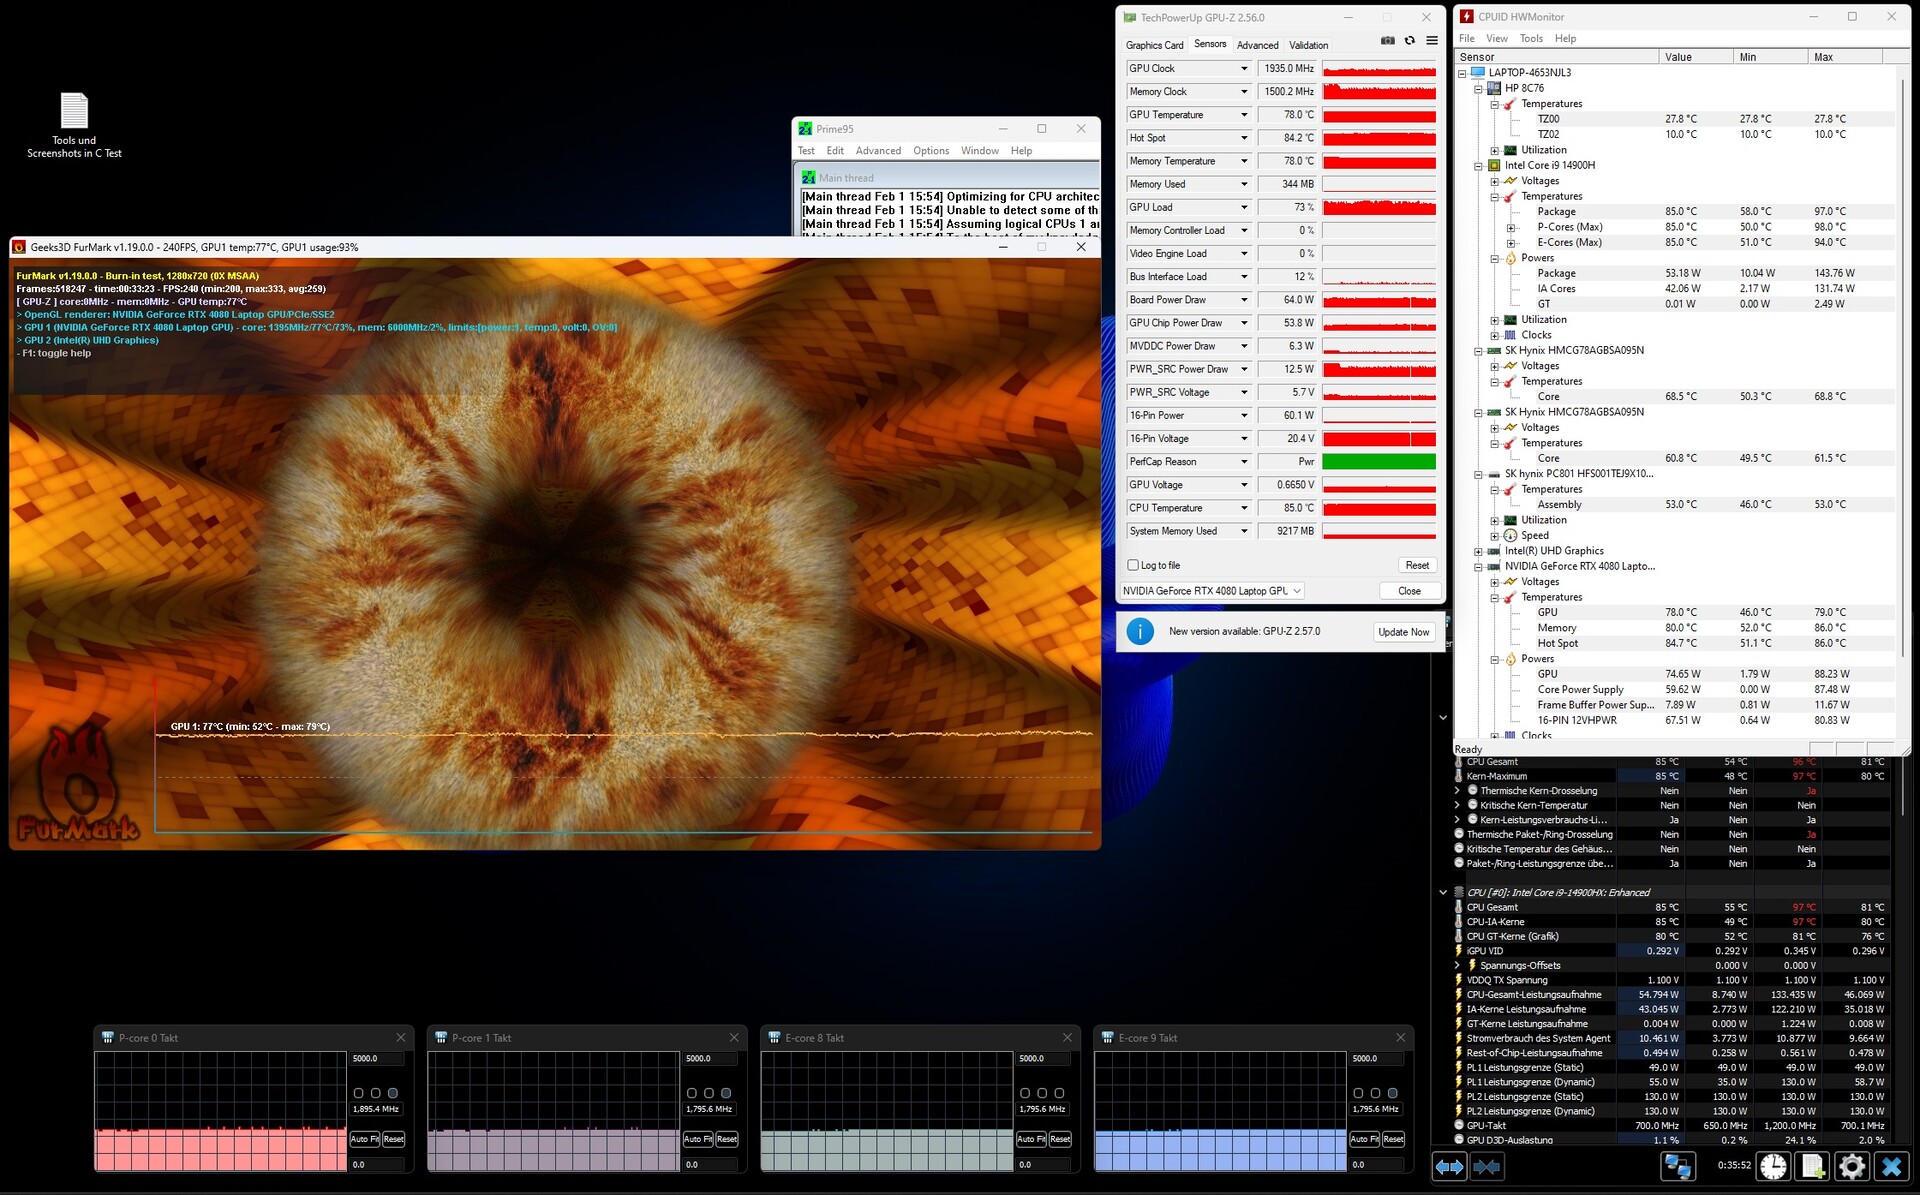
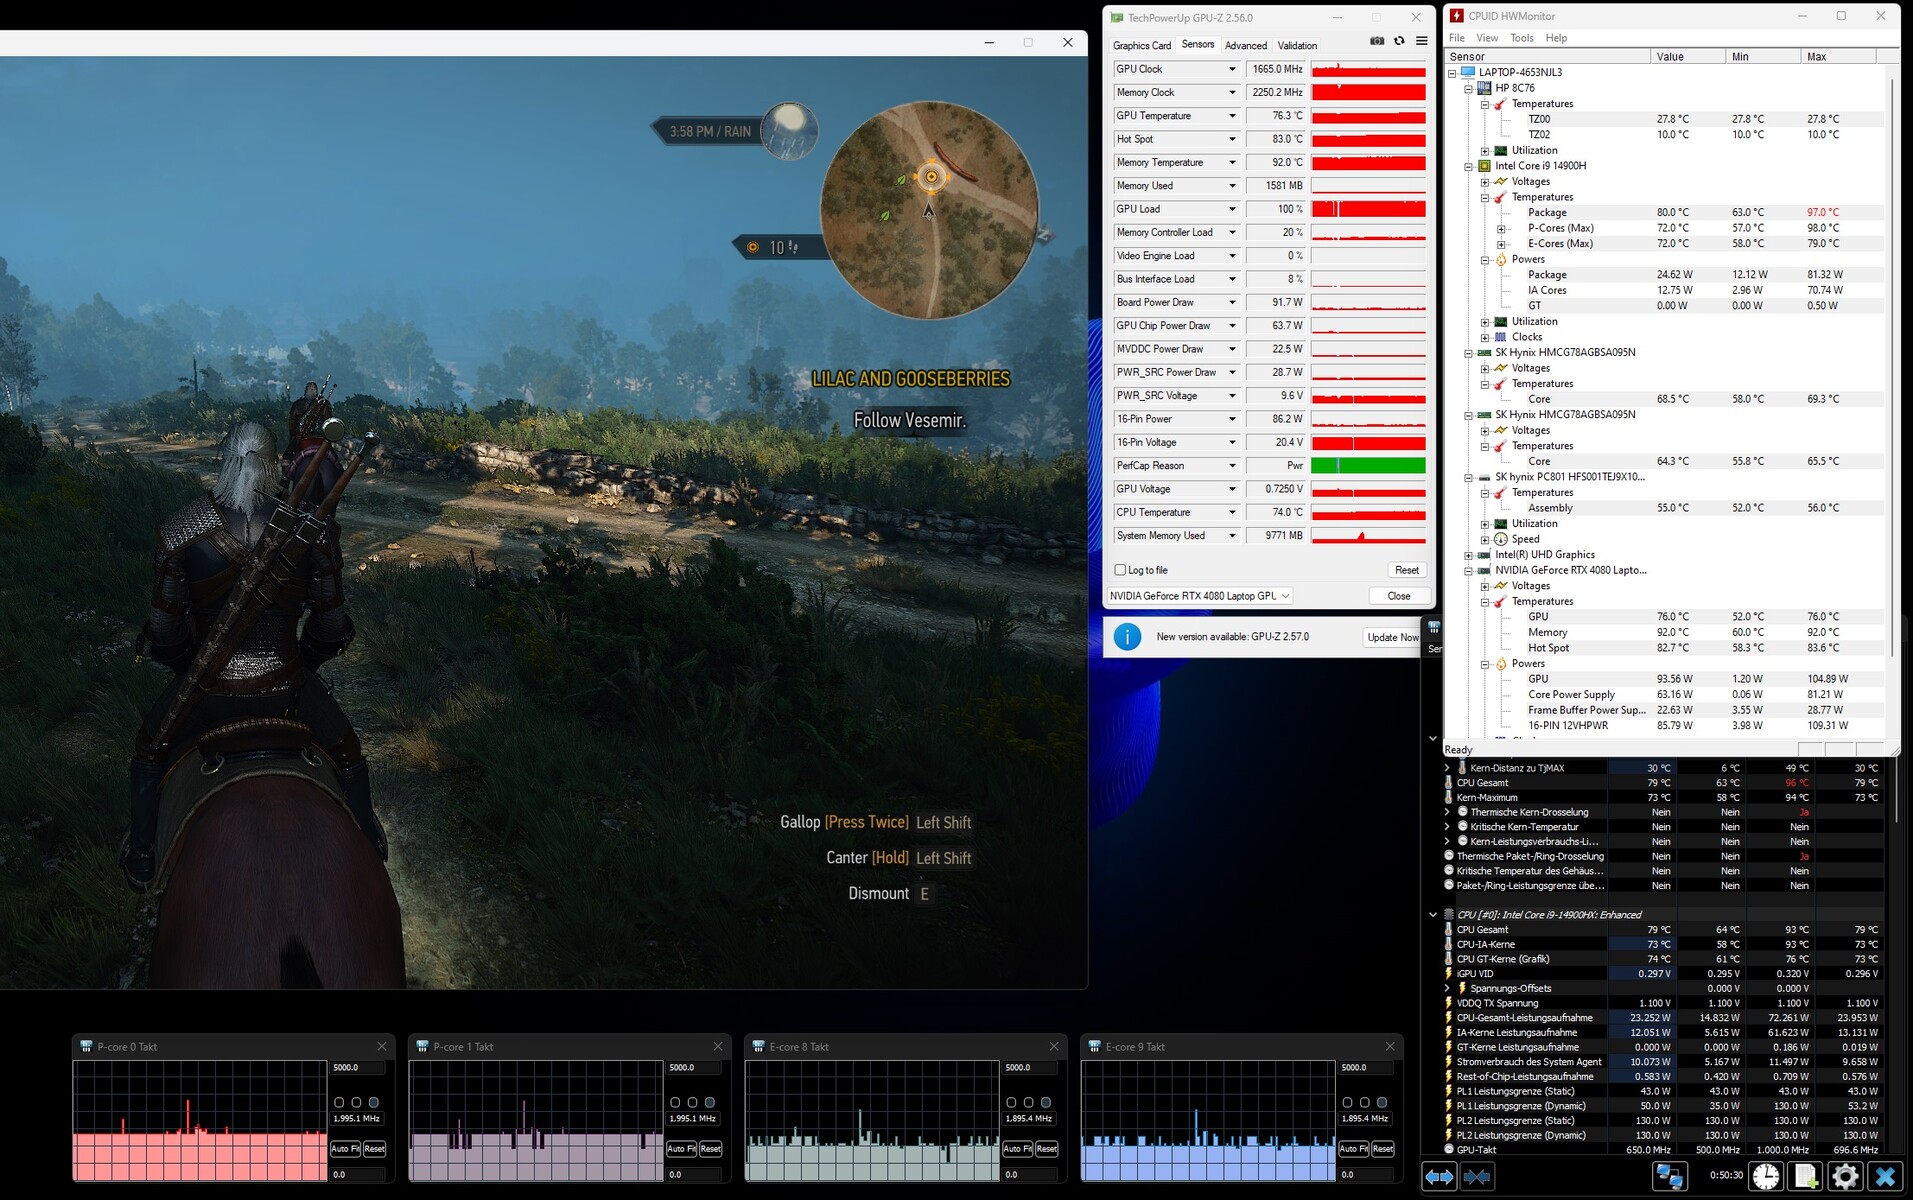
Our stress test involves running Prime95 and FurMark for a prolonged period and represents an extreme scenario designed to evaluate system stability under full load. CPU clock speeds plummeted fairly quickly from the initial 3.4 GHz (P) and 2.9 GHz (E) to around 1.8 to 1.9 GHz (both P & E), and then stayed at this level. The GPU operated at speeds between 1.9 and 2 GHz.
(-) The maximum temperature on the upper side is 47 °C / 117 F, compared to the average of 40.4 °C / 105 F, ranging from 21.2 to 68.8 °C for the class Gaming.
(-) The bottom heats up to a maximum of 57 °C / 135 F, compared to the average of 43.2 °C / 110 F
(+) In idle usage, the average temperature for the upper side is 23.9 °C / 75 F, compared to the device average of 33.9 °C / 93 F.
(-) Playing The Witcher 3, the average temperature for the upper side is 39.3 °C / 103 F, compared to the device average of 33.9 °C / 93 F.
(+) The palmrests and touchpad are reaching skin temperature as a maximum (35 °C / 95 F) and are therefore not hot.
(-) The average temperature of the palmrest area of similar devices was 28.8 °C / 83.8 F (-6.2 °C / -11.2 F).

| HP Omen 16 (2024) Intel Core i9-14900HX, NVIDIA GeForce RTX 4080 Laptop GPU | MSI Vector 16 HX A14V Intel Core i9-14900HX, NVIDIA GeForce RTX 4080 Laptop GPU | Alienware m16 R1 AMD AMD Ryzen 9 7845HX, NVIDIA GeForce RTX 4080 Laptop GPU | Acer Predator Helios 18 N23Q2 Intel Core i9-13900HX, NVIDIA GeForce RTX 4080 Laptop GPU | HP Omen 16-wf000 Intel Core i7-13700HX, NVIDIA GeForce RTX 4080 Laptop GPU | |
|---|---|---|---|---|---|
| Heat | 13% | -14% | -15% | -3% | |
| Maximum Upper Side * (°C) | 47 | 36.4 23% | 48 -2% | 35 26% | 45 4% |
| Maximum Bottom * (°C) | 57 | 35.6 38% | 39 32% | 56 2% | 48.8 14% |
| Idle Upper Side * (°C) | 25 | 26.6 -6% | 37 -48% | 34 -36% | 29.2 -17% |
| Idle Bottom * (°C) | 26 | 27 -4% | 36.2 -39% | 39 -50% | 28.8 -11% |
* ... smaller is better
Speakers
The stereo speakers produce a decent sound overall, but are lacking in bass.
HP Omen 16 (2024) audio analysis
(±) | speaker loudness is average but good (78 dB)
Bass 100 - 315 Hz
(-) | nearly no bass - on average 15.2% lower than median
(±) | linearity of bass is average (14.3% delta to prev. frequency)
Mids 400 - 2000 Hz
(+) | balanced mids - only 4.8% away from median
(+) | mids are linear (5% delta to prev. frequency)
Highs 2 - 16 kHz
(+) | balanced highs - only 2% away from median
(+) | highs are linear (4.1% delta to prev. frequency)
Overall 100 - 16.000 Hz
(+) | overall sound is linear (14.7% difference to median)
Compared to same class
» 28% of all tested devices in this class were better, 7% similar, 64% worse
» The best had a delta of 6%, average was 18%, worst was 132%
Compared to all devices tested
» 19% of all tested devices were better, 4% similar, 77% worse
» The best had a delta of 4%, average was 24%, worst was 134%
MSI Vector 16 HX A14V audio analysis
(+) | speakers can play relatively loud (85 dB)
Bass 100 - 315 Hz
(±) | reduced bass - on average 12.7% lower than median
(+) | bass is linear (6.8% delta to prev. frequency)
Mids 400 - 2000 Hz
(+) | balanced mids - only 3% away from median
(+) | mids are linear (3.6% delta to prev. frequency)
Highs 2 - 16 kHz
(+) | balanced highs - only 3.1% away from median
(+) | highs are linear (6.7% delta to prev. frequency)
Overall 100 - 16.000 Hz
(+) | overall sound is linear (12.6% difference to median)
Compared to same class
» 16% of all tested devices in this class were better, 3% similar, 81% worse
» The best had a delta of 6%, average was 18%, worst was 132%
Compared to all devices tested
» 11% of all tested devices were better, 2% similar, 86% worse
» The best had a delta of 4%, average was 24%, worst was 134%
Power consumption
The Omen 16 didn’t exhibit any problems related to power usage, with levels within the normal range for the hardware inside. The laptop consumed a consistent amount of power when undergoing our Witcher 3 test and stress test. Rated at 280 watts, the charger is powerful enough for the Omen.
| Off / Standby | |
| Idle | |
| Load |
|
Key:
min: | |
Power consumption Witcher 3 / Stress test
Power consumption with external monitor
Battery life
The 16-inch laptop managed to last 5h 52min in our realistic Wi-Fi test (accessing websites with a script to simulate a load) – a decent result. The Omen thus delivered the best battery life in our comparison and outperformed its predecessor by 45 minutes.
Pros
Cons
Verdict - Solid gaming beast
Gaming, streaming and rendering are some things that the HP Omen 16 is adept at. The Core i9-14900HX and GeForce RTX 4080 deliver the necessary performance, whilst the 1 TB PCIe 4.0 SSD ensures short load times. Heat and noise emissions are usually high on this class of laptop. But the Omen 16 is able to keep them at a moderate level – by forgoing performance.
The HP Omen 16 (2024) is a solid, powerful gaming laptop with a focus on the essentials.
Bucking the trend of using 16:10 displays, HP has decided to stick to a 16:9 aspect ratio. The 16.1-inch panel (2,560 x 1,440 pixel, sRGB, IPS, 240Hz, G-Sync) left a great impression overall. Nonetheless, the display on a laptop costing €3,200 (US$3,446) should offer more in terms of brightness and colour coverage.
The two USB-C ports (Thunderbolt 4) make it a breeze to integrate the laptop into existing workstation setups and open up expansion options (e.g. external GPU, dock). Both ports can output a DisplayPort signal and support Power Delivery. The laptop’s battery life is also decent.
The MSI Vector 16 HX A14V is a potential alternative to the Omen 16. With the same CPU/GPU combination, the Vector 16 offers more performance and has a much brighter and more vibrant display (DCI-P3, 16:10). However, the Vector has only one Thunderbolt 4 port and a screen that doesn’t support G-Sync.
Price and availability
In Germany, the HP Omen 16-wf1078ng is available from retailers like Office-Partner.de and Otto.de at €3,200 (US$3,446). You can also find a lower-spec model with a Core i7-13700HX and RTX 4060 for US$1,500 from Amazon US.
HP Omen 16 (2024)
- 02/16/2024 v7 (old)
Sascha Mölck
Transparency
The selection of devices to be reviewed is made by our editorial team. The test sample was provided to the author as a loan by the manufacturer or retailer for the purpose of this review. The lender had no influence on this review, nor did the manufacturer receive a copy of this review before publication. There was no obligation to publish this review. As an independent media company, Notebookcheck is not subjected to the authority of manufacturers, retailers or publishers.
This is how Notebookcheck is testing
Every year, Notebookcheck independently reviews hundreds of laptops and smartphones using standardized procedures to ensure that all results are comparable. We have continuously developed our test methods for around 20 years and set industry standards in the process. In our test labs, high-quality measuring equipment is utilized by experienced technicians and editors. These tests involve a multi-stage validation process. Our complex rating system is based on hundreds of well-founded measurements and benchmarks, which maintains objectivity. Further information on our test methods can be found here.
Price comparison

