Acer Predator Helios 18 laptop review: RTX 4080 gamer with MiniLED display at over 1,000 nits

The RTX 4060 equipped Acer Predator Helios 16 scored a full 90 percent in our review in July. Now, we take a look at the 18-inch high-end model with an Intel HX processor, an RTX 4080 and a MiniLED display.
For comparison, we use other 18-inch gamers as well as 17-inch gamers with similar specs, since the Predator Helios 18 is the first with an RTX 4080 among our reviews of 18-inch laptops. Competitors include the MSI Raider GE78 HX 13VH, the HP Omen 17, the Alienware m18 R1, the Asus ROG Strix G18 G814JI and the Razer Blade 18.
Possible competitors in comparison
Rating | Date | Model | Weight | Height | Size | Resolution | Price |
|---|---|---|---|---|---|---|---|
| 88.3 % v7 (old) | 10 / 2023 | Acer Predator Helios 18 N23Q2 i9-13900HX, GeForce RTX 4080 Laptop GPU | 3.2 kg | 29.15 mm | 18.00" | 2560x1600 | |
| 88.3 % v7 (old) | 03 / 2023 | MSI GE78HX 13VH-070US i9-13950HX, GeForce RTX 4080 Laptop GPU | 3 kg | 23 mm | 17.00" | 2560x1600 | |
| 85.4 % v7 (old) | 03 / 2023 | HP Omen 17-ck2097ng i9-13900HX, GeForce RTX 4080 Laptop GPU | 2.8 kg | 27 mm | 17.30" | 2560x1440 | |
| 90.7 % v7 (old) | 04 / 2023 | Alienware m18 R1 i9-13980HX, GeForce RTX 4090 Laptop GPU | 3.9 kg | 26.7 mm | 18.00" | 1920x1200 | |
| 87.4 % v7 (old) | 03 / 2023 | Asus ROG Strix G18 G814JI i7-13650HX, GeForce RTX 4070 Laptop GPU | 3 kg | 31 mm | 18.00" | 2560x1600 | |
| 91.4 % v7 (old) | 02 / 2023 | Razer Blade 18 RTX 4070 i9-13950HX, GeForce RTX 4070 Laptop GPU | 3 kg | 21.9 mm | 18.00" | 2560x1600 |
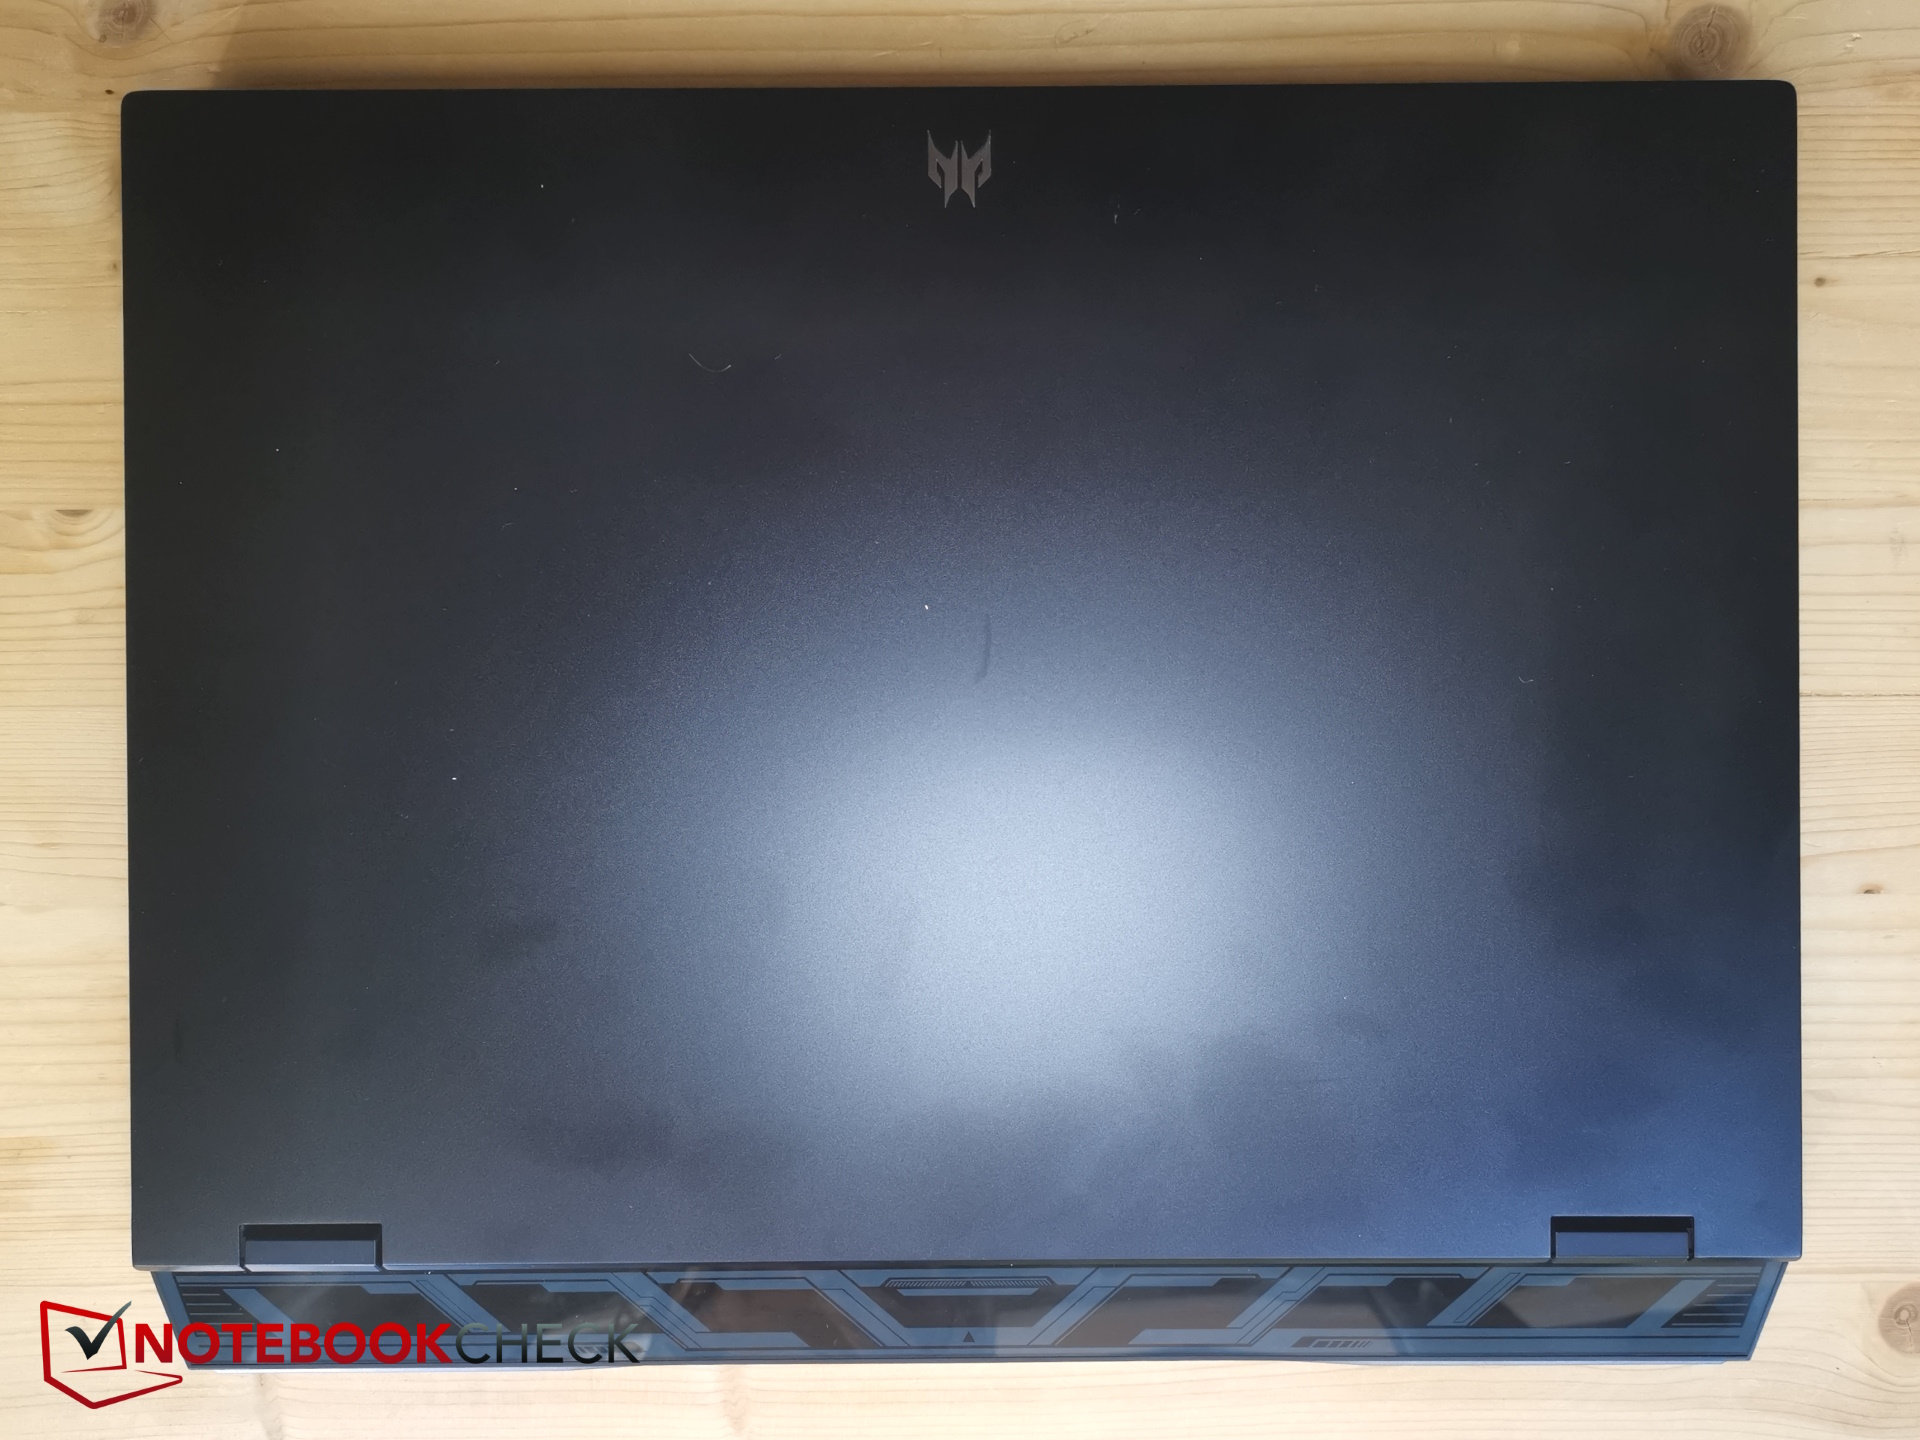
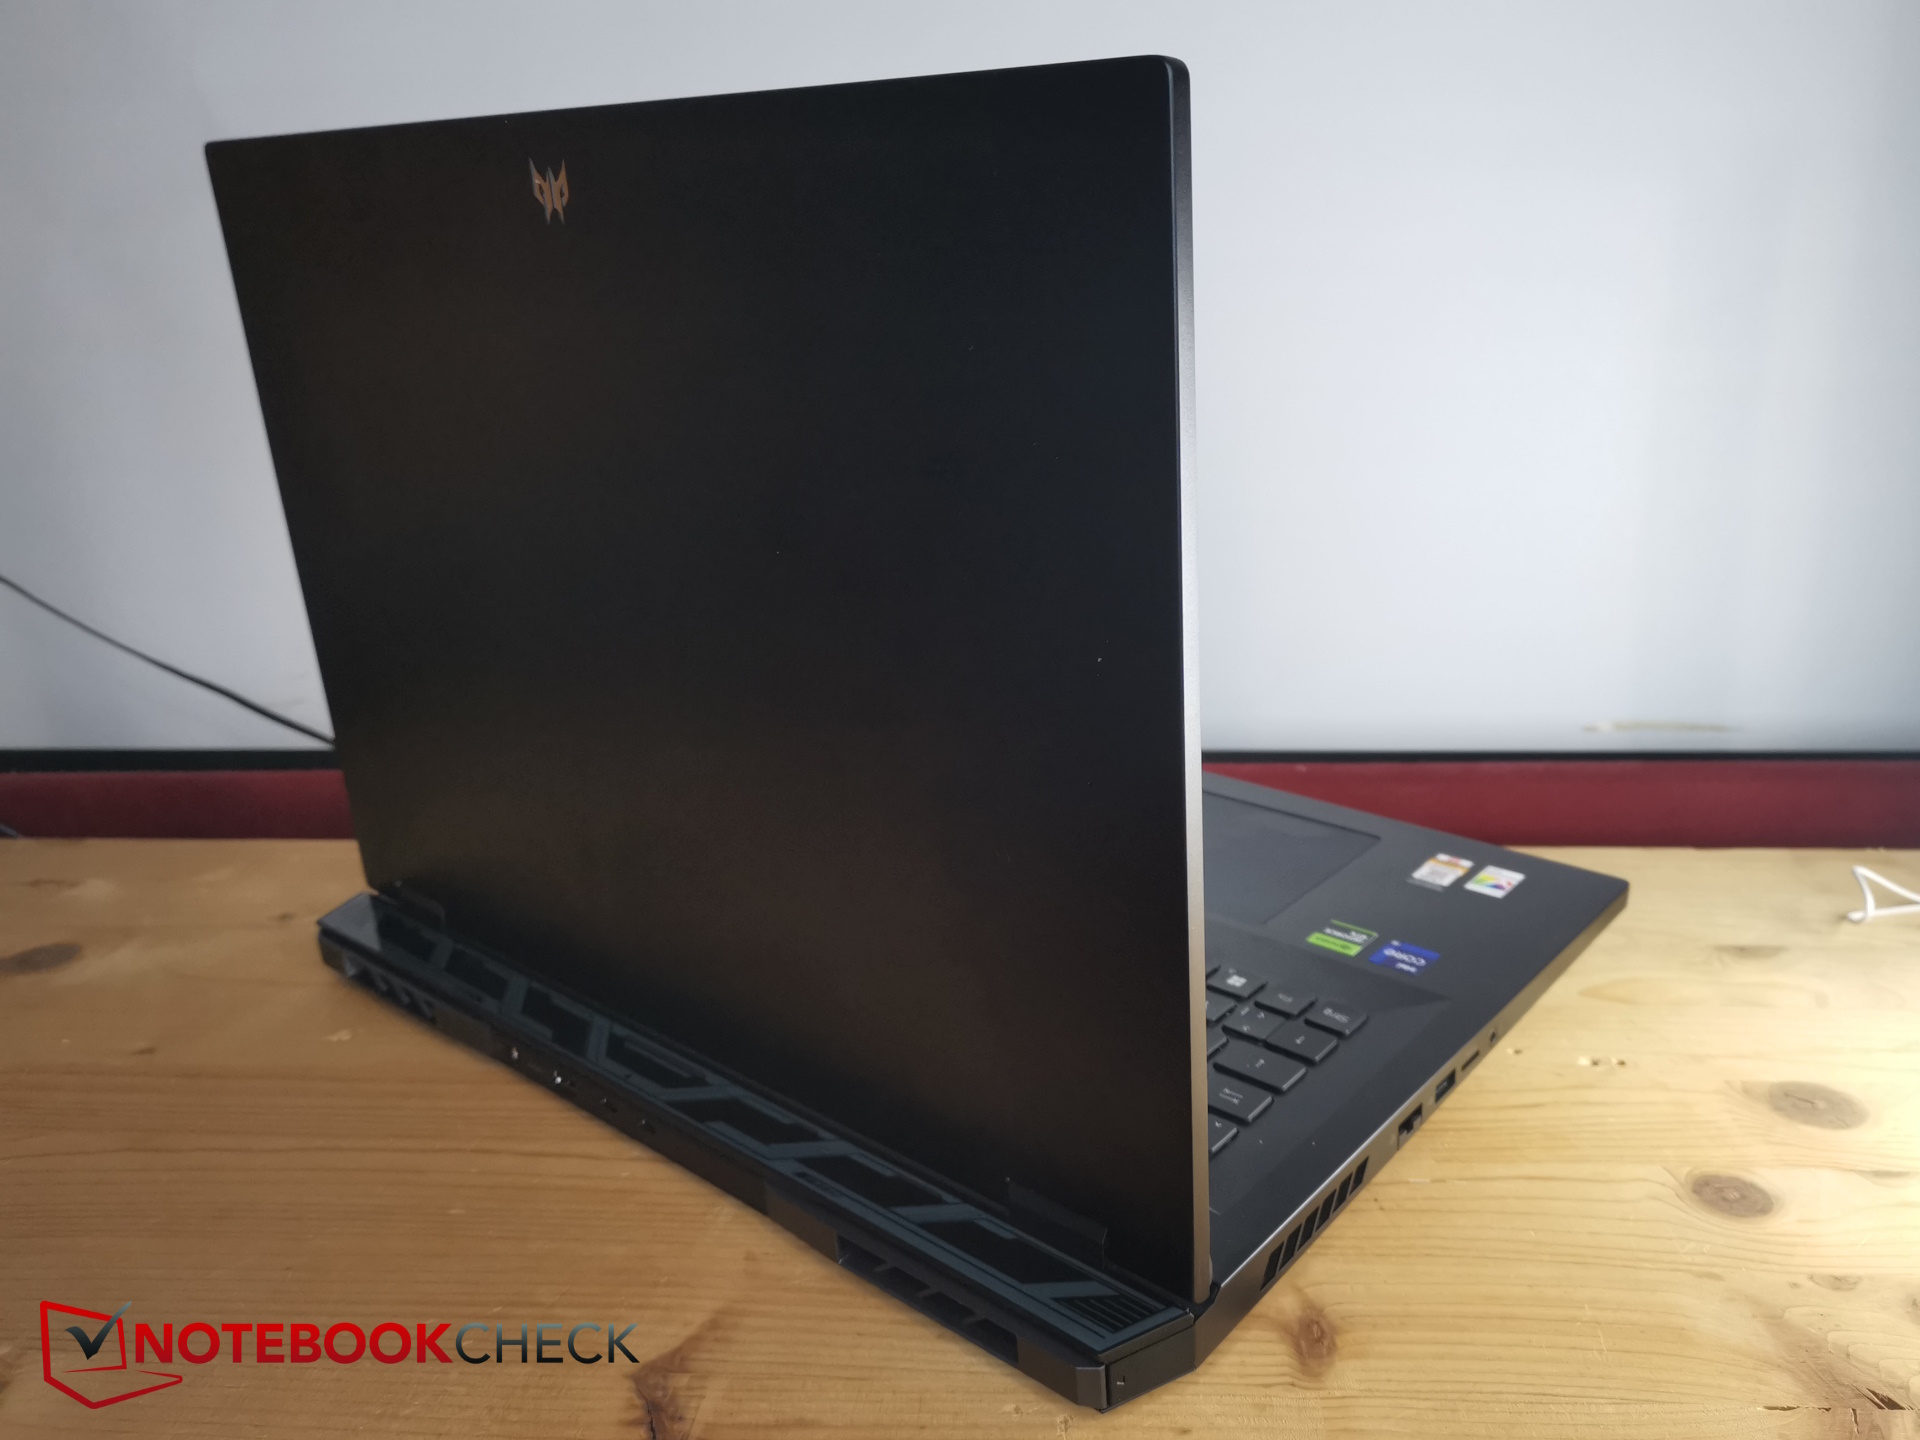
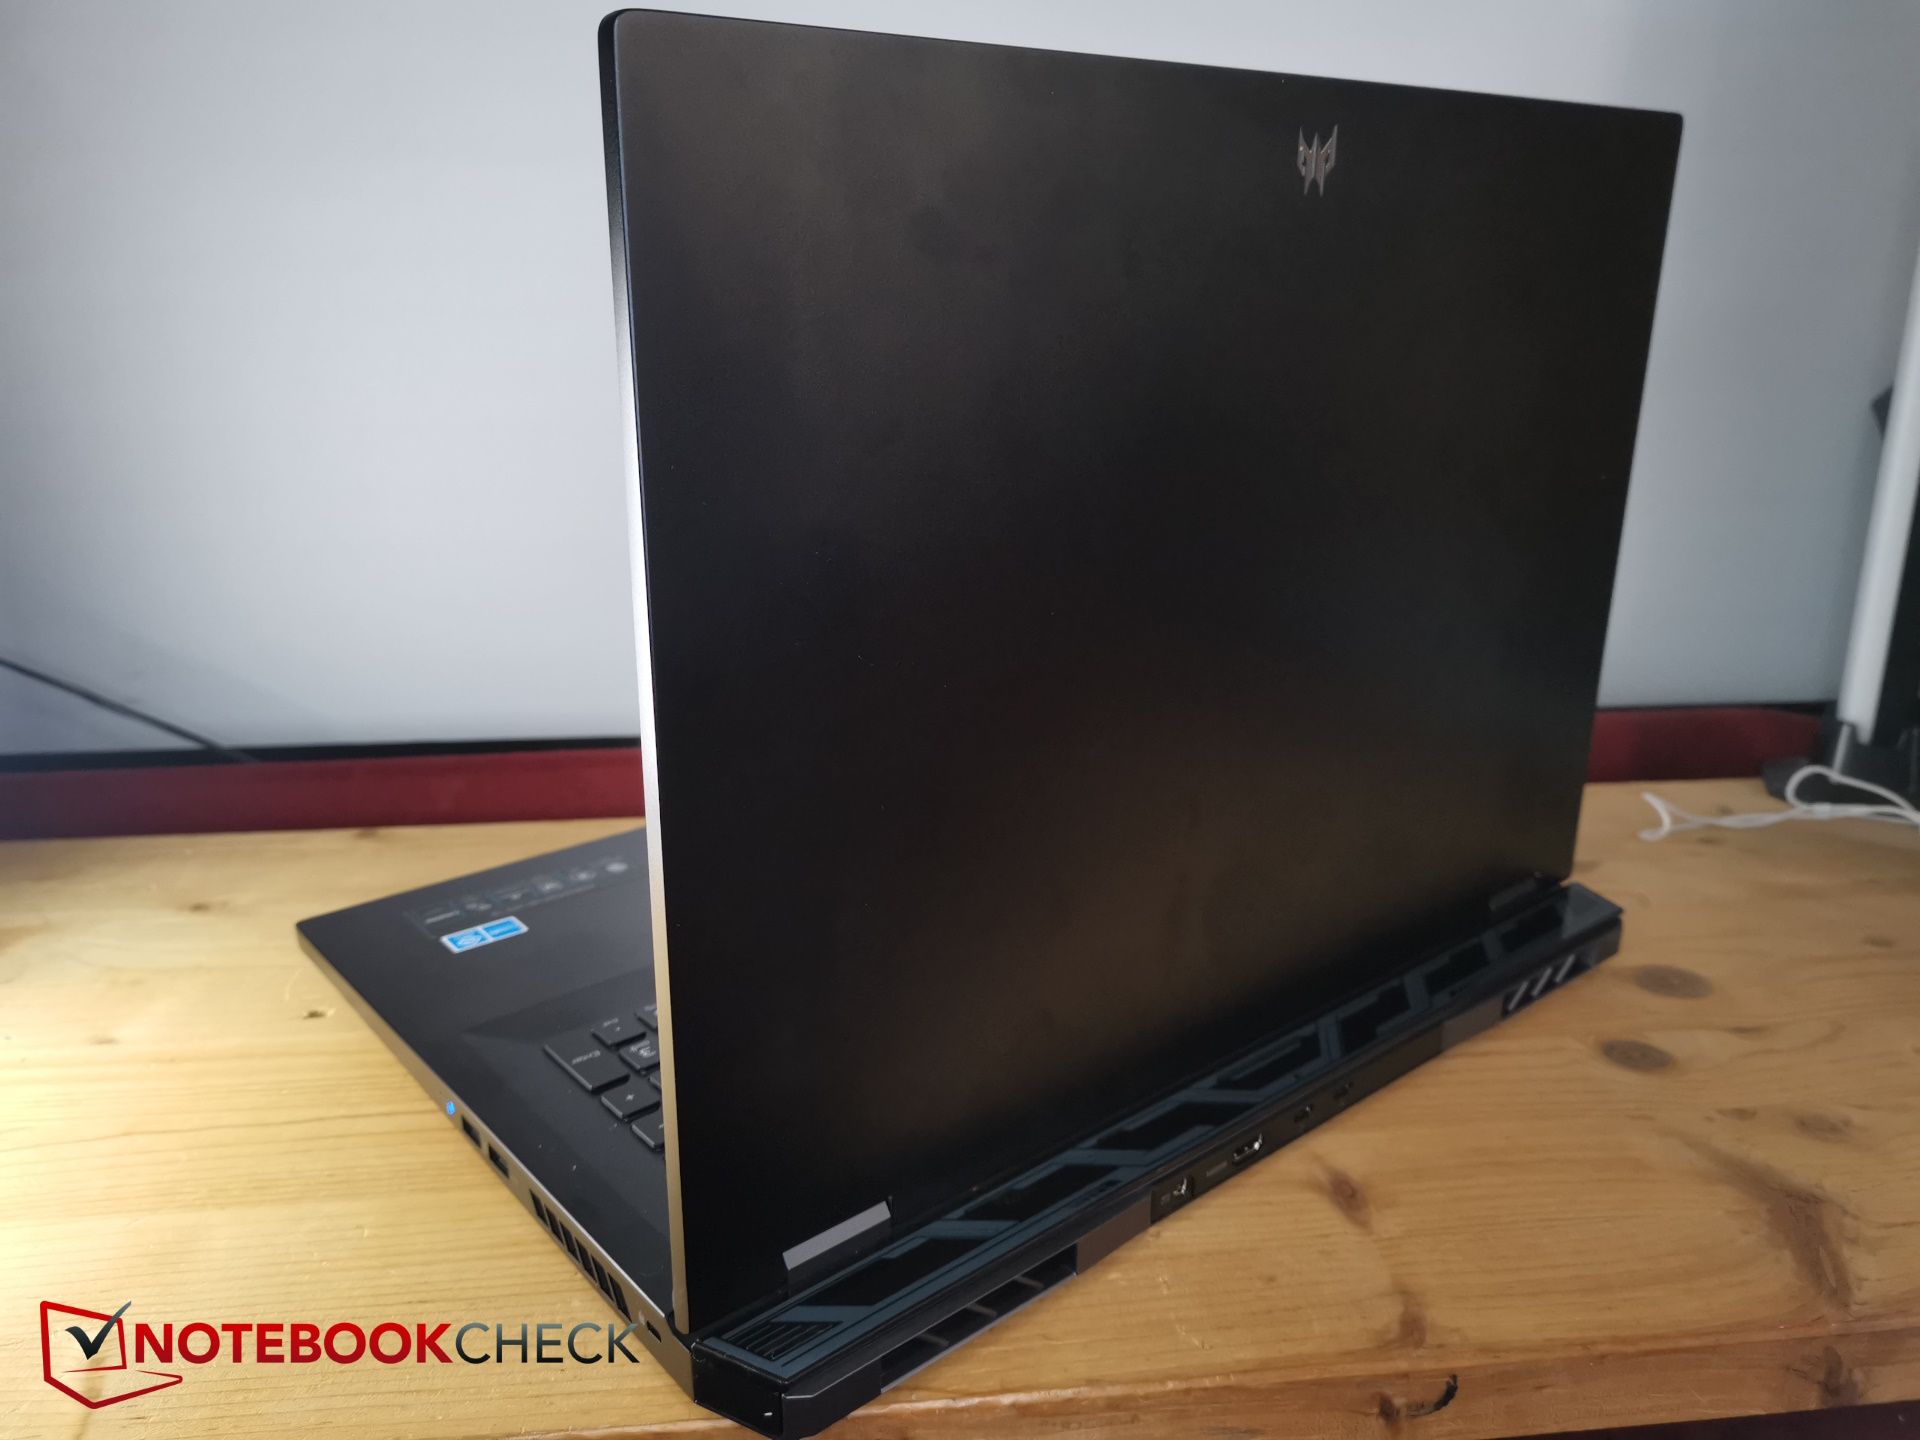
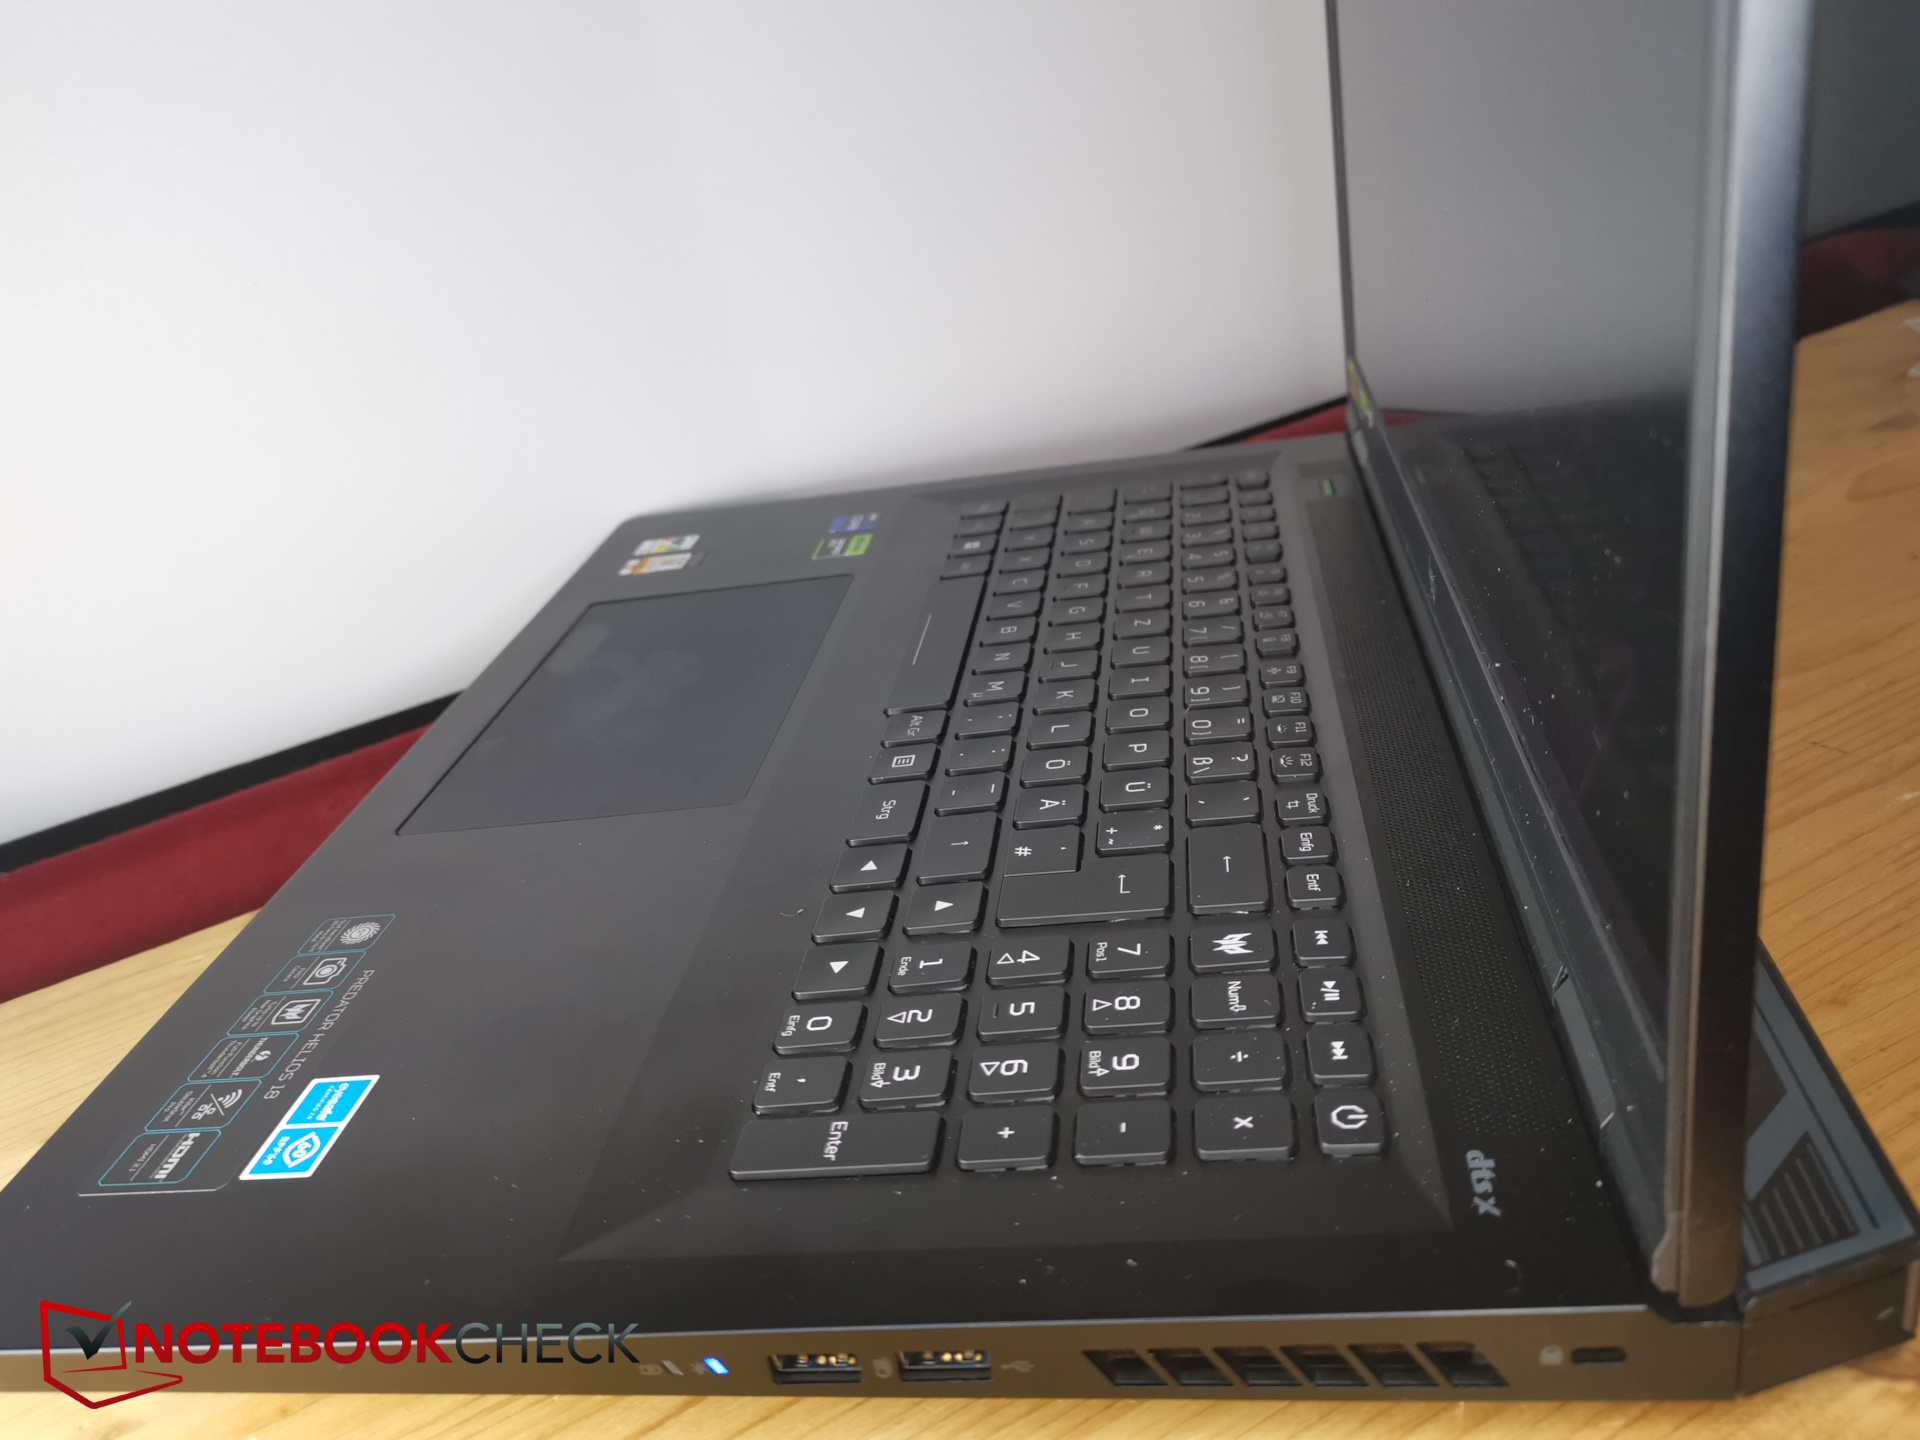
Case - Black aluminum for the Acer Predator
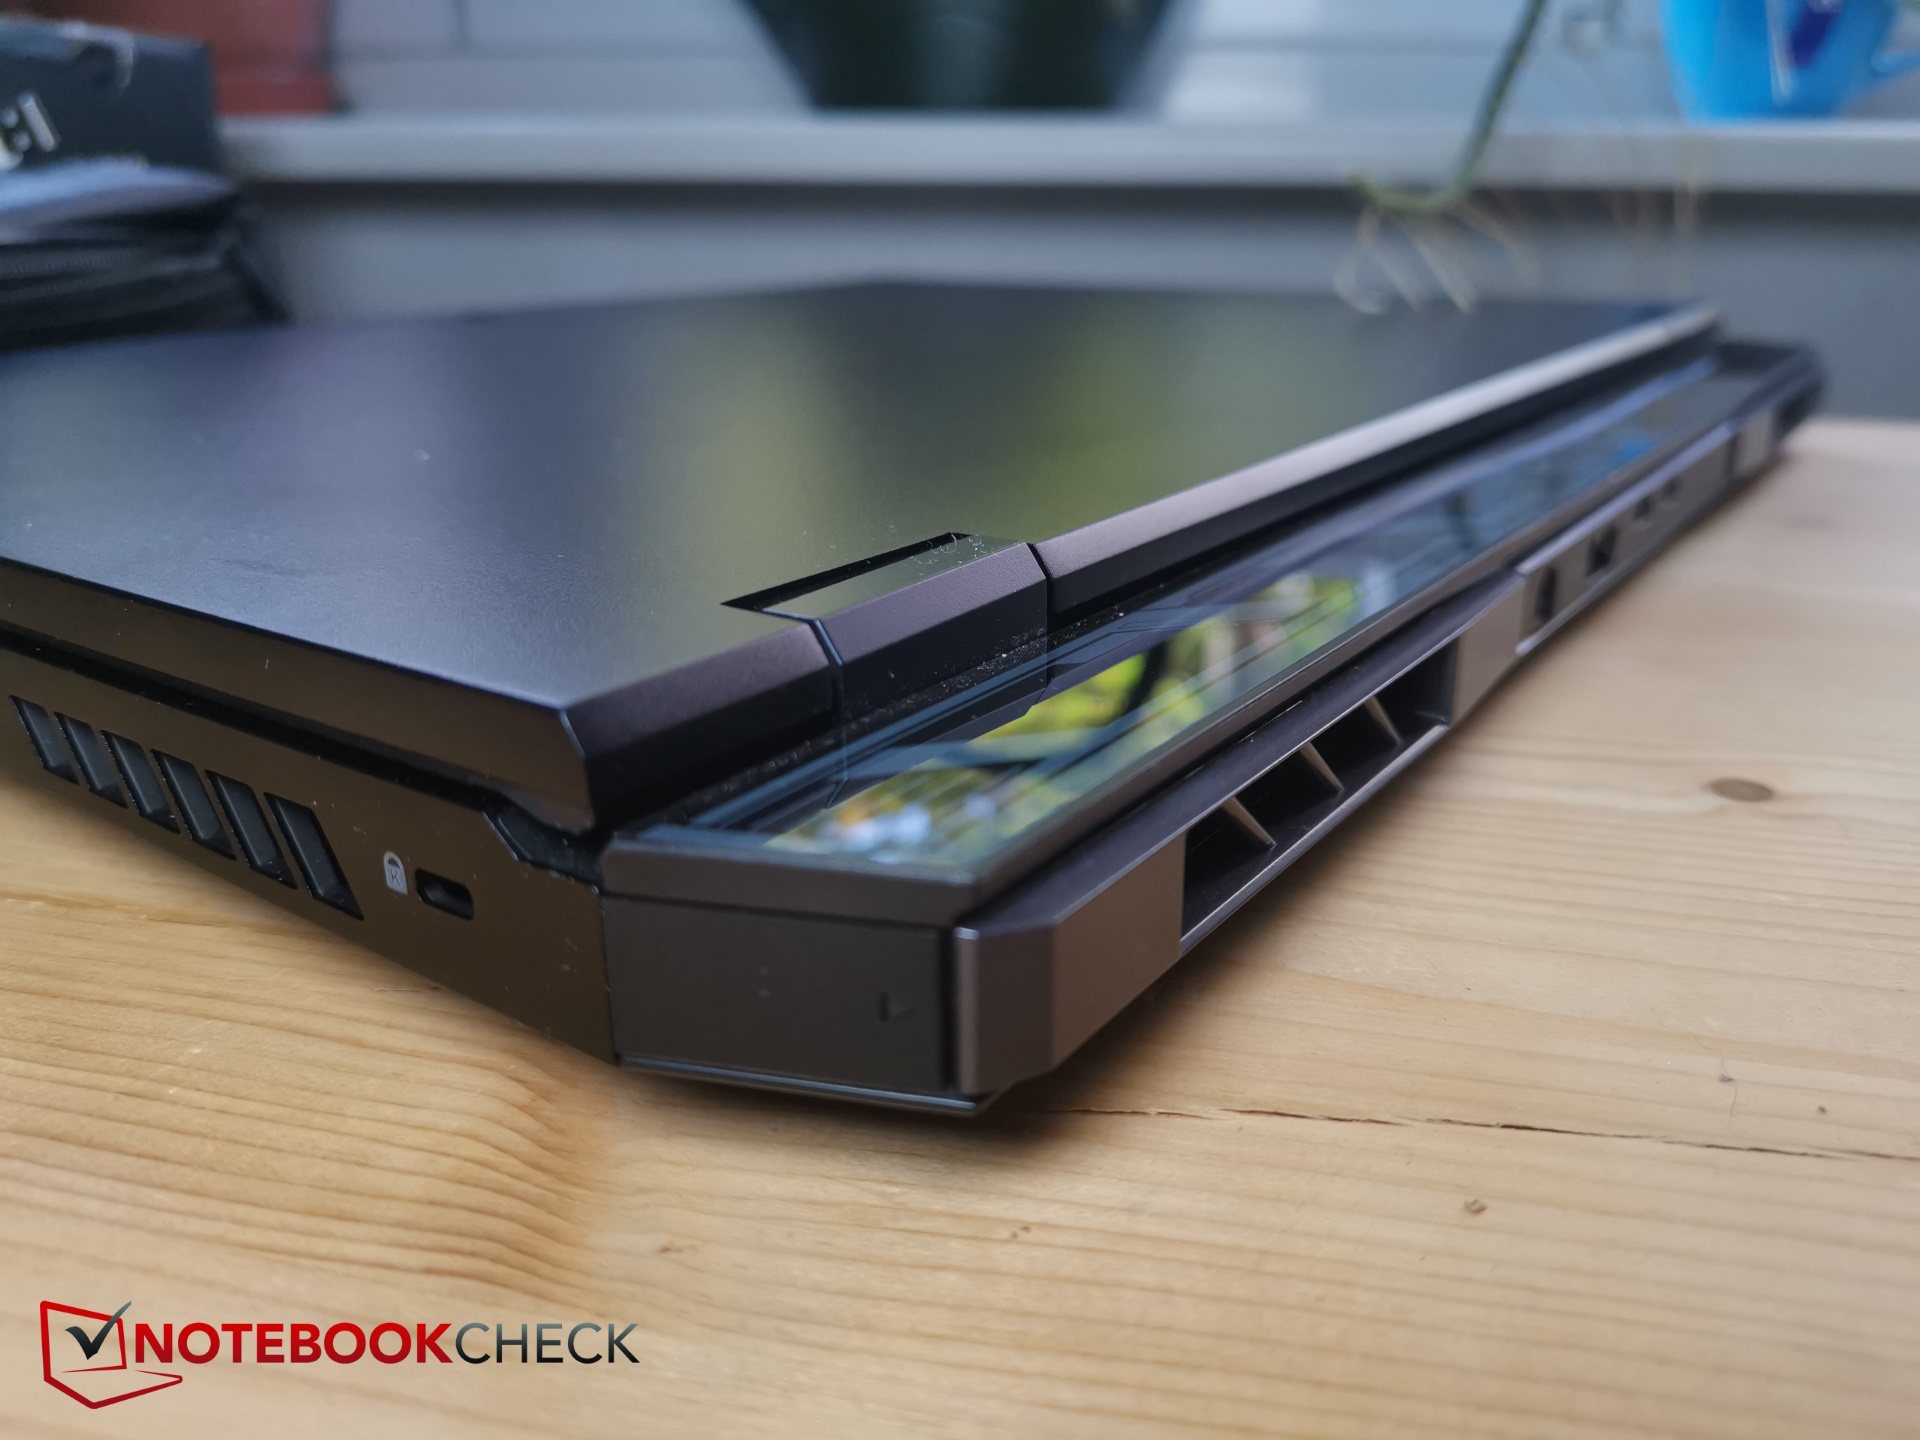
Acer designs the Helios 18 in dark, almost-inconspicuous black. But the device makes no attempt to conceal its gaming nature, characterized by the small Predator logo on the display lid and the protruding cooling system at the back.
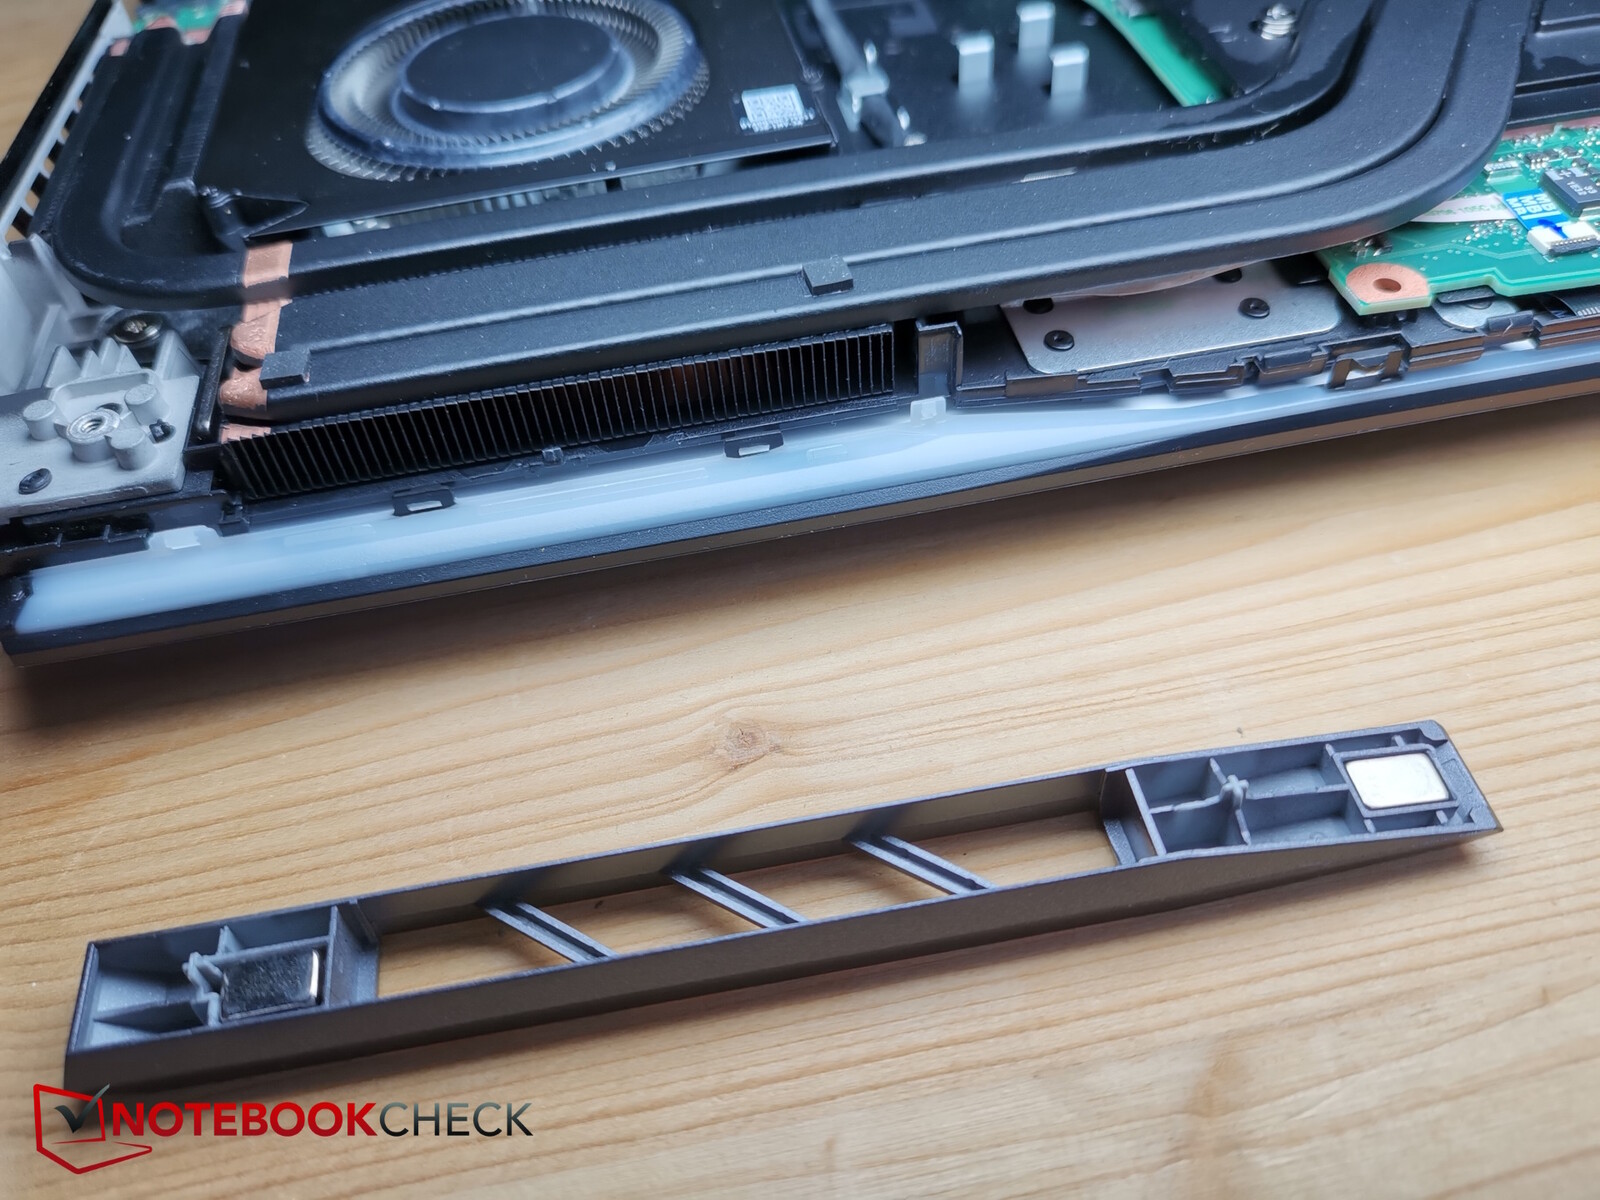
The workmanship leaves no room for criticism: gaps are unnoticeable. The rear air outlets can even be customized - Acer includes another pair of ventilation grilles, which can be further customized with a 3D printer.
The display lid and base are made of aluminum, while the display edges, the rear cooling unit and the laptop's underside are made of plastic. The metal provides the Helios 18 with good rigidity and nothing creaks or cracks when subject to torsional stress. However, fingerprints easily accumulate here, and the base's upper side can be pressed in a little despite the metal, even when typing. But this remains within limits and is due to the large surface.

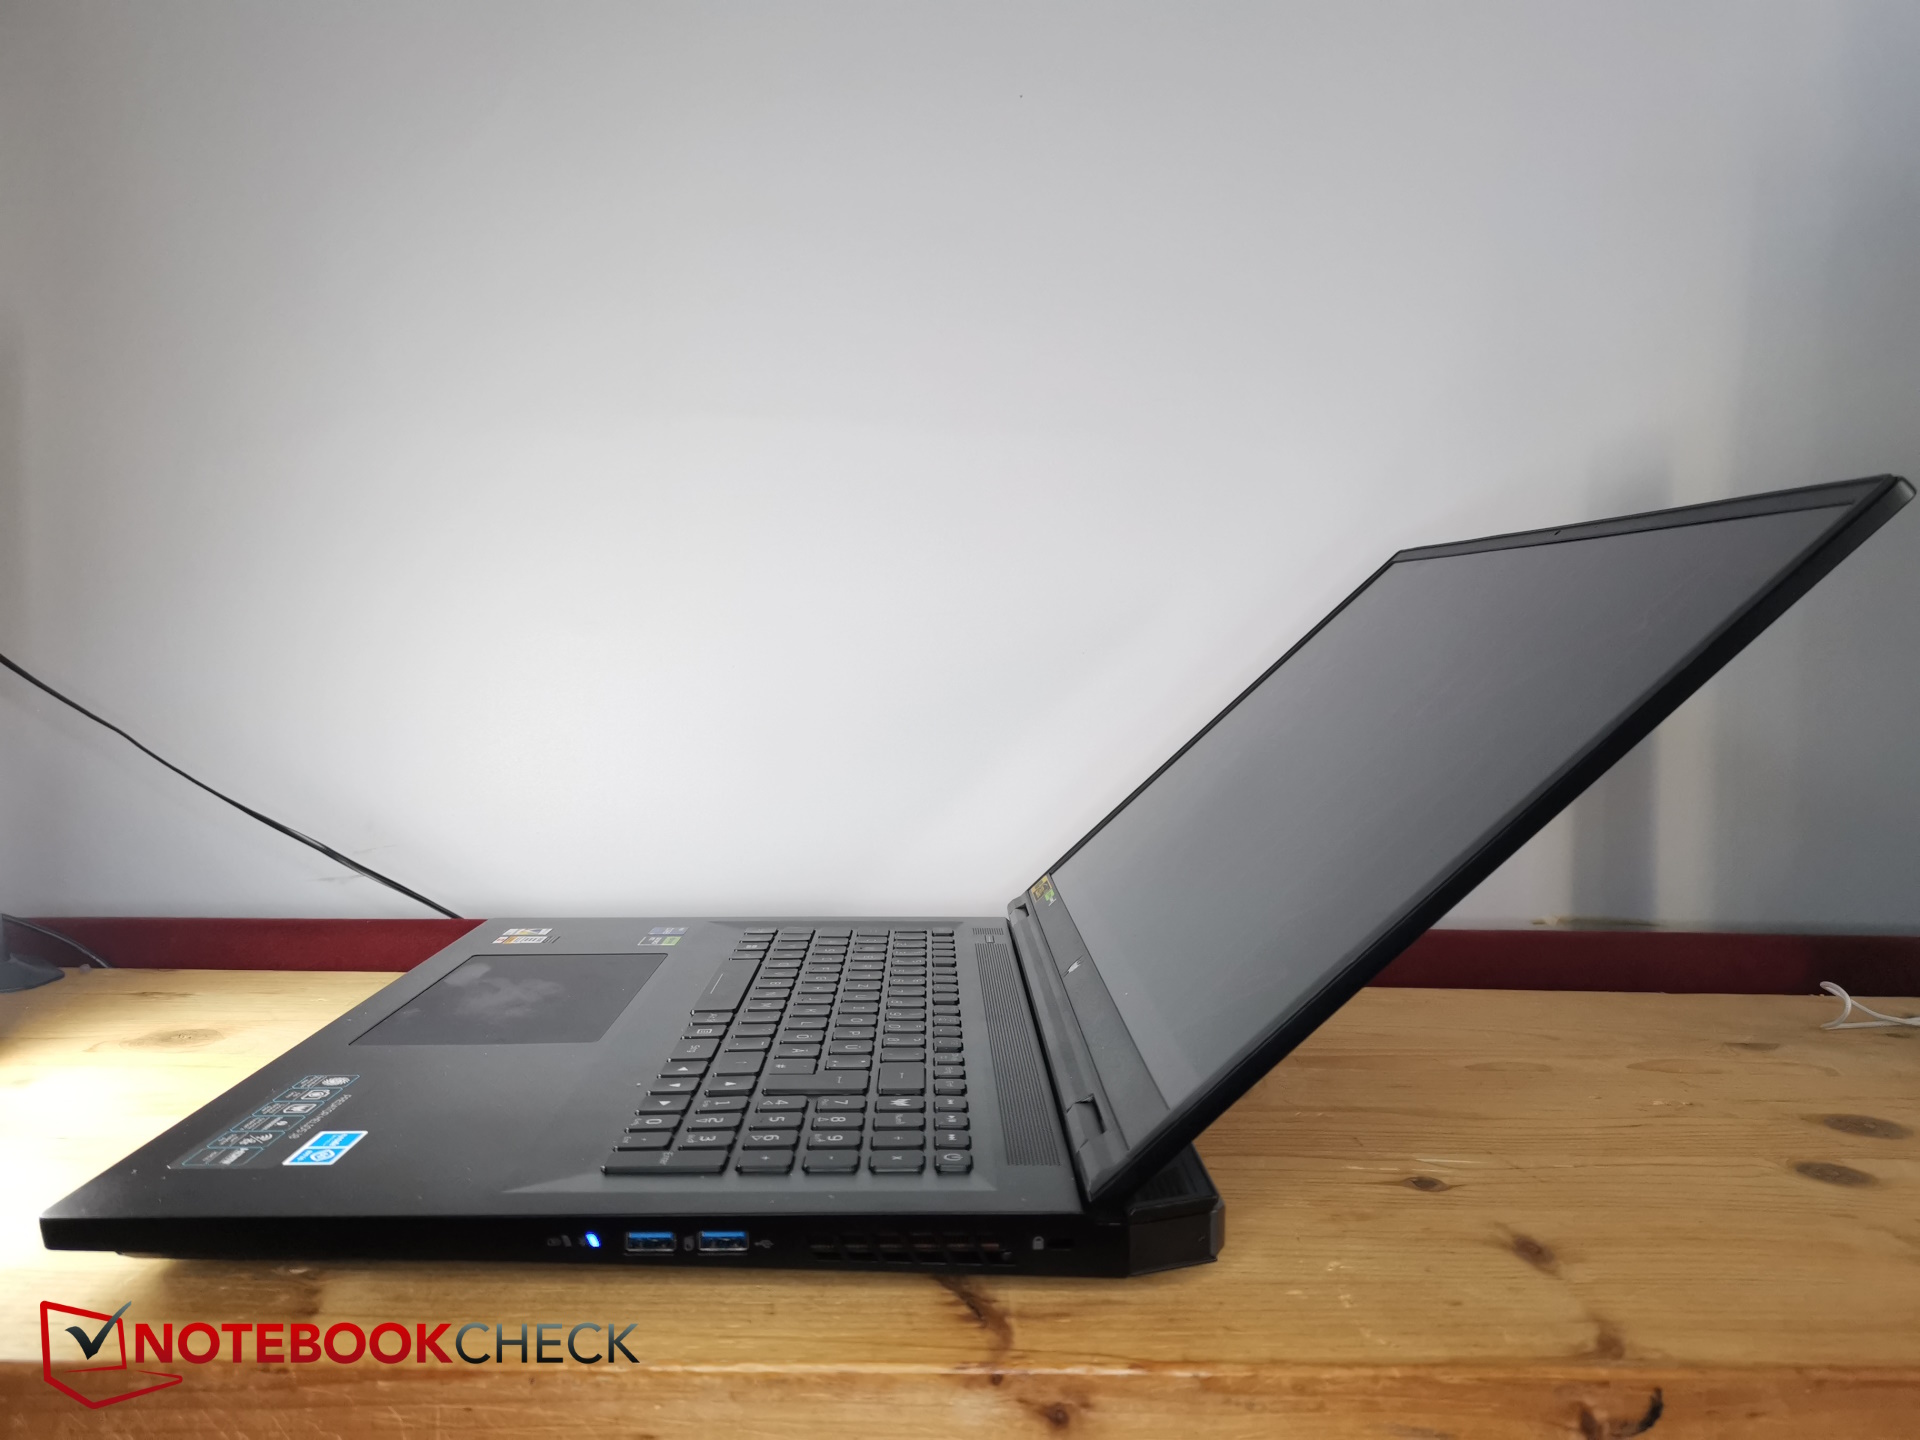
Compared to the 18-inch competition, the Helios 18 falls in the middle in terms of size. The Alienware m18 is slightly larger, the Asus ROG Strix G18 is smaller. The latter is a bit thicker, while the Alienware m18 is thinner. In terms of weight, the Alien is clearly heavier, the G18 slightly lighter.
The 17-inch gamers are partly much smaller and also thinner.
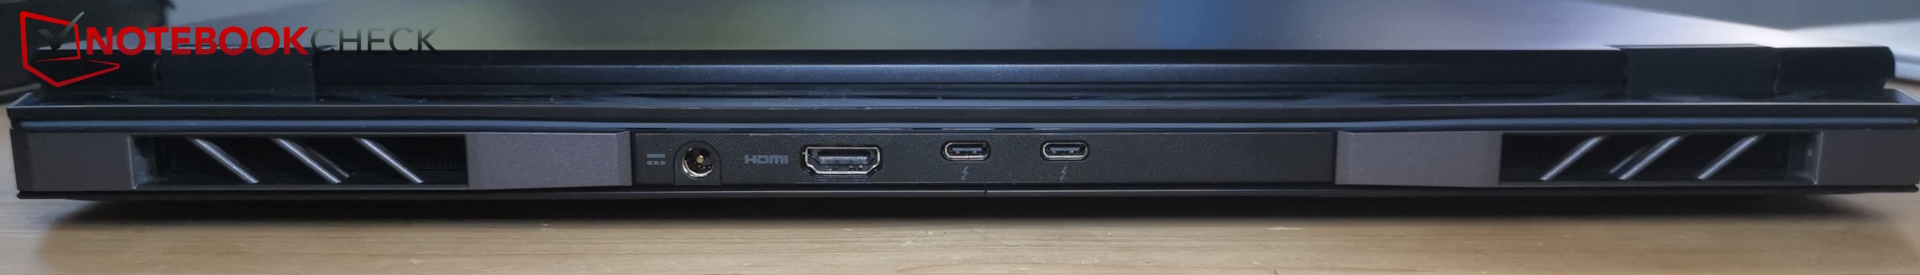
Equipment - 2x Thunderbolt 4 in the Predator Helios
The Helios 18 has all the necessary ports. Two Thunderbolt 4 ports in the form of USB-C are on board. Only PowerDelivery is not available. The SD card reader "only" accepts MicroSD cards.
The ports are spread out over three sides, although the back still has room and could have easily accommodated one of the many ports on the left. We would have preferred the LAN port on the back and one of the increasingly important USB-C ports on the side.
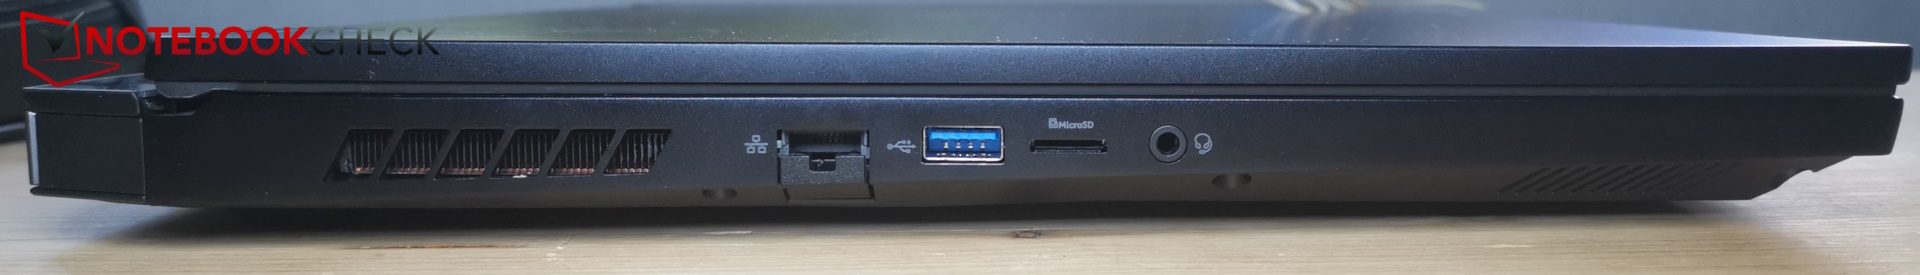

SD card reader
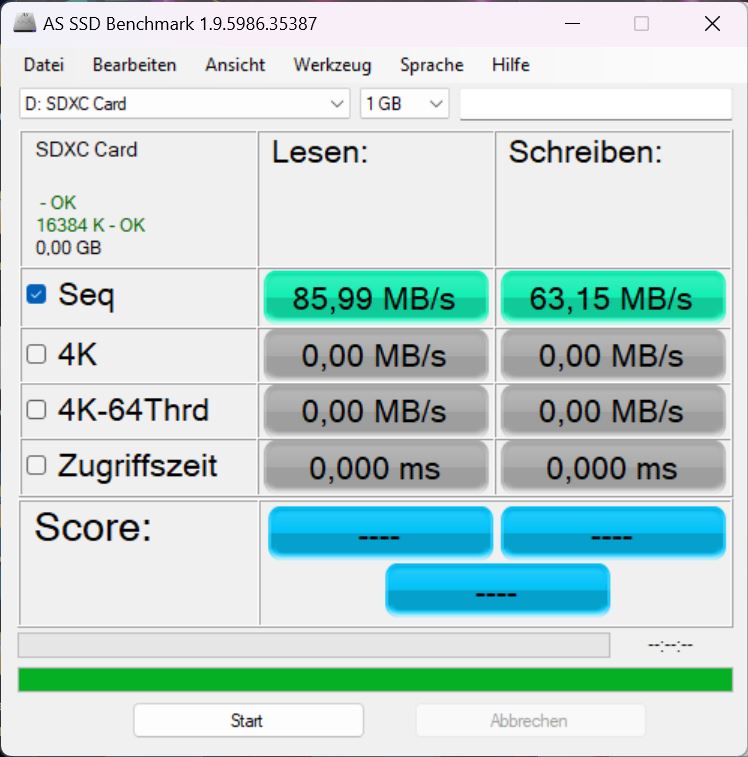
Inserted microSD cards slide into place and do not protrude. Inserting our AV PRO microSD 128 GB V60 proved a little fiddly because it had to be pushed inwards a little further than flush to lock it in and disengage.
The speed is on an unremarkable, medium level; card readers in the Blade 18 or the Alienware m18 are significantly faster.
| SD Card Reader | |
| average JPG Copy Test (av. of 3 runs) | |
| Razer Blade 18 RTX 4070 (Angelibird AV Pro V60) | |
| Alienware m18 R1 (Angelibird AV Pro V60) | |
| Average of class Gaming (20.9 - 210, n=54, last 2 years) | |
| HP Omen 17-ck2097ng (AV PRO microSD 128 GB V60) | |
| Acer Predator Helios 18 N23Q2 | |
| MSI GE78HX 13VH-070US (Angelibird AV Pro V60) | |
| maximum AS SSD Seq Read Test (1GB) | |
| Alienware m18 R1 (Angelibird AV Pro V60) | |
| Razer Blade 18 RTX 4070 (Angelibird AV Pro V60) | |
| Average of class Gaming (25.5 - 261, n=51, last 2 years) | |
| MSI GE78HX 13VH-070US (Angelibird AV Pro V60) | |
| Acer Predator Helios 18 N23Q2 | |
| HP Omen 17-ck2097ng (AV PRO microSD 128 GB V60) | |
Communication
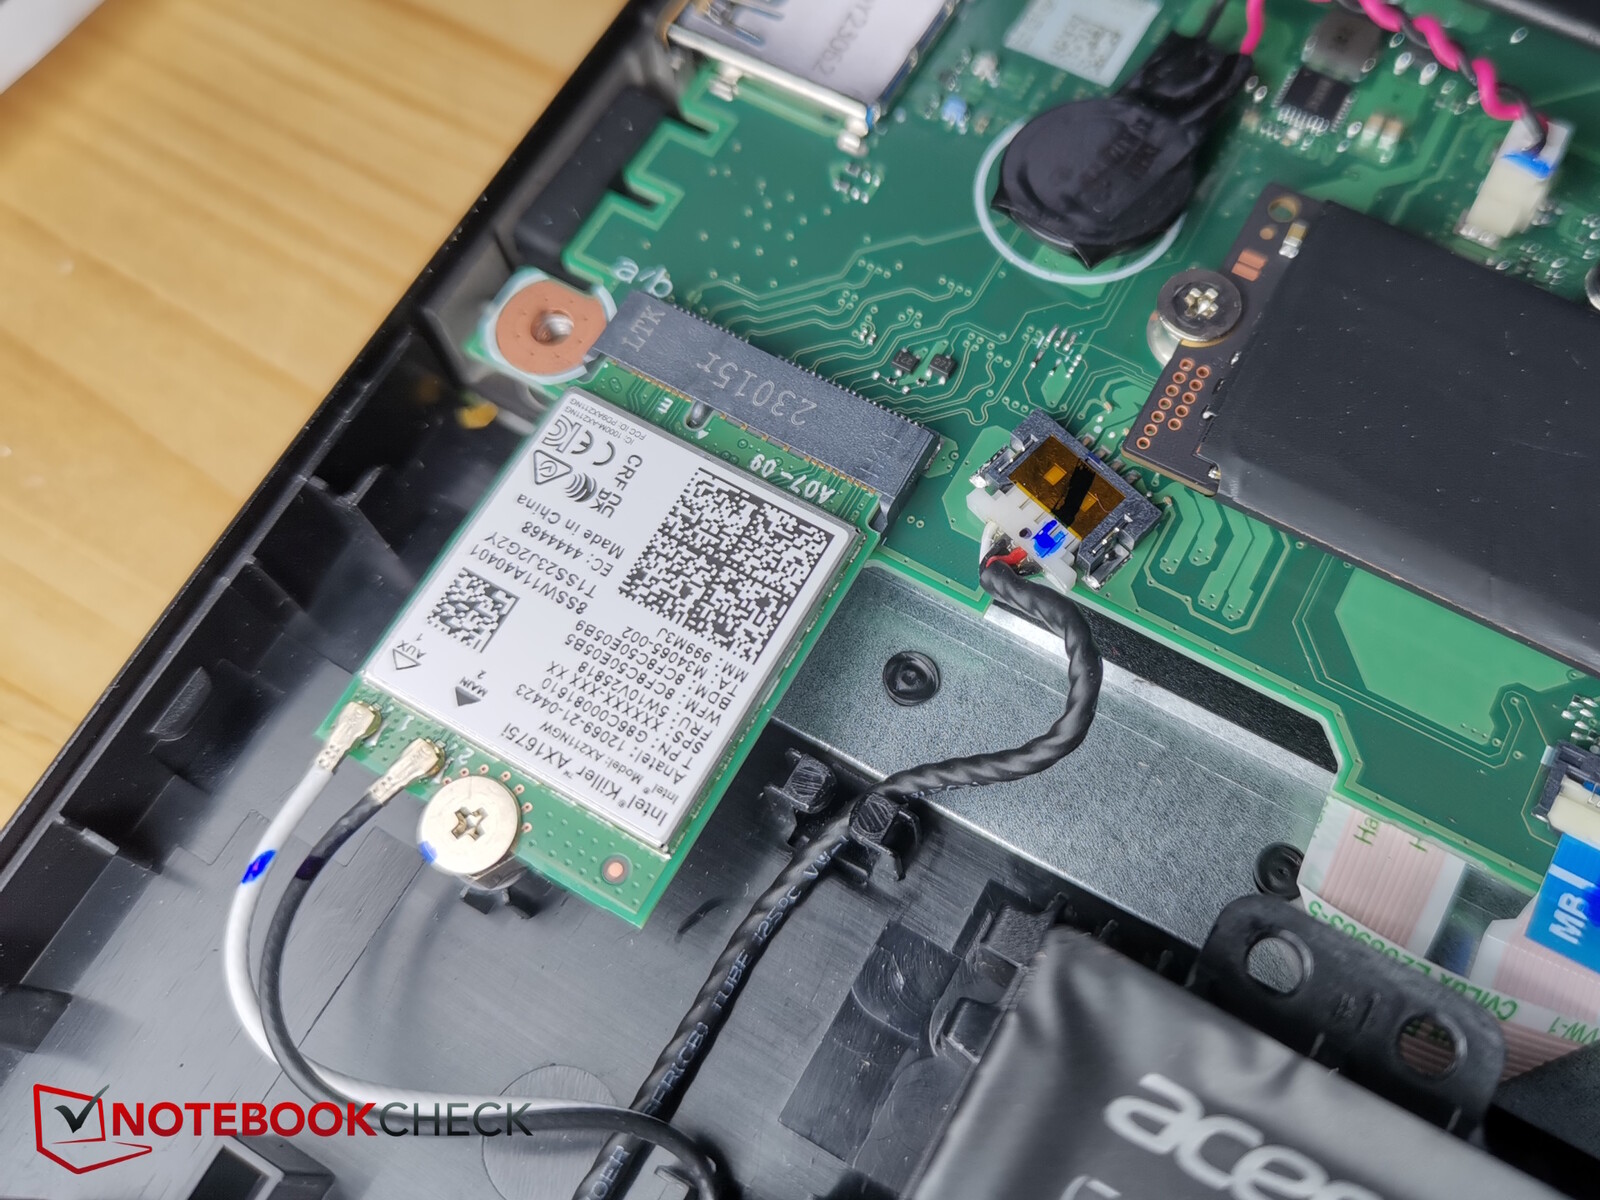
Acer uses the Killer WiFi 6E AX1675i WiFi module, which supports 6E in 6 GHz mode and ensures good transfer rates of around 1.5 Mbps. In the 5 GHz network it is considerably slower, reaching around 900 Mbit/s.
The transfer rates prove to be very stable.
Webcam
The camera takes pictures and videos in FullHD. Quality is acceptable: color deviations remain within limits. The blue tones display the highest deviations.


Security
TPM is on board, as is a connection for a steel lock. However, there is no fingerprint sensor.
Accessories & warranty
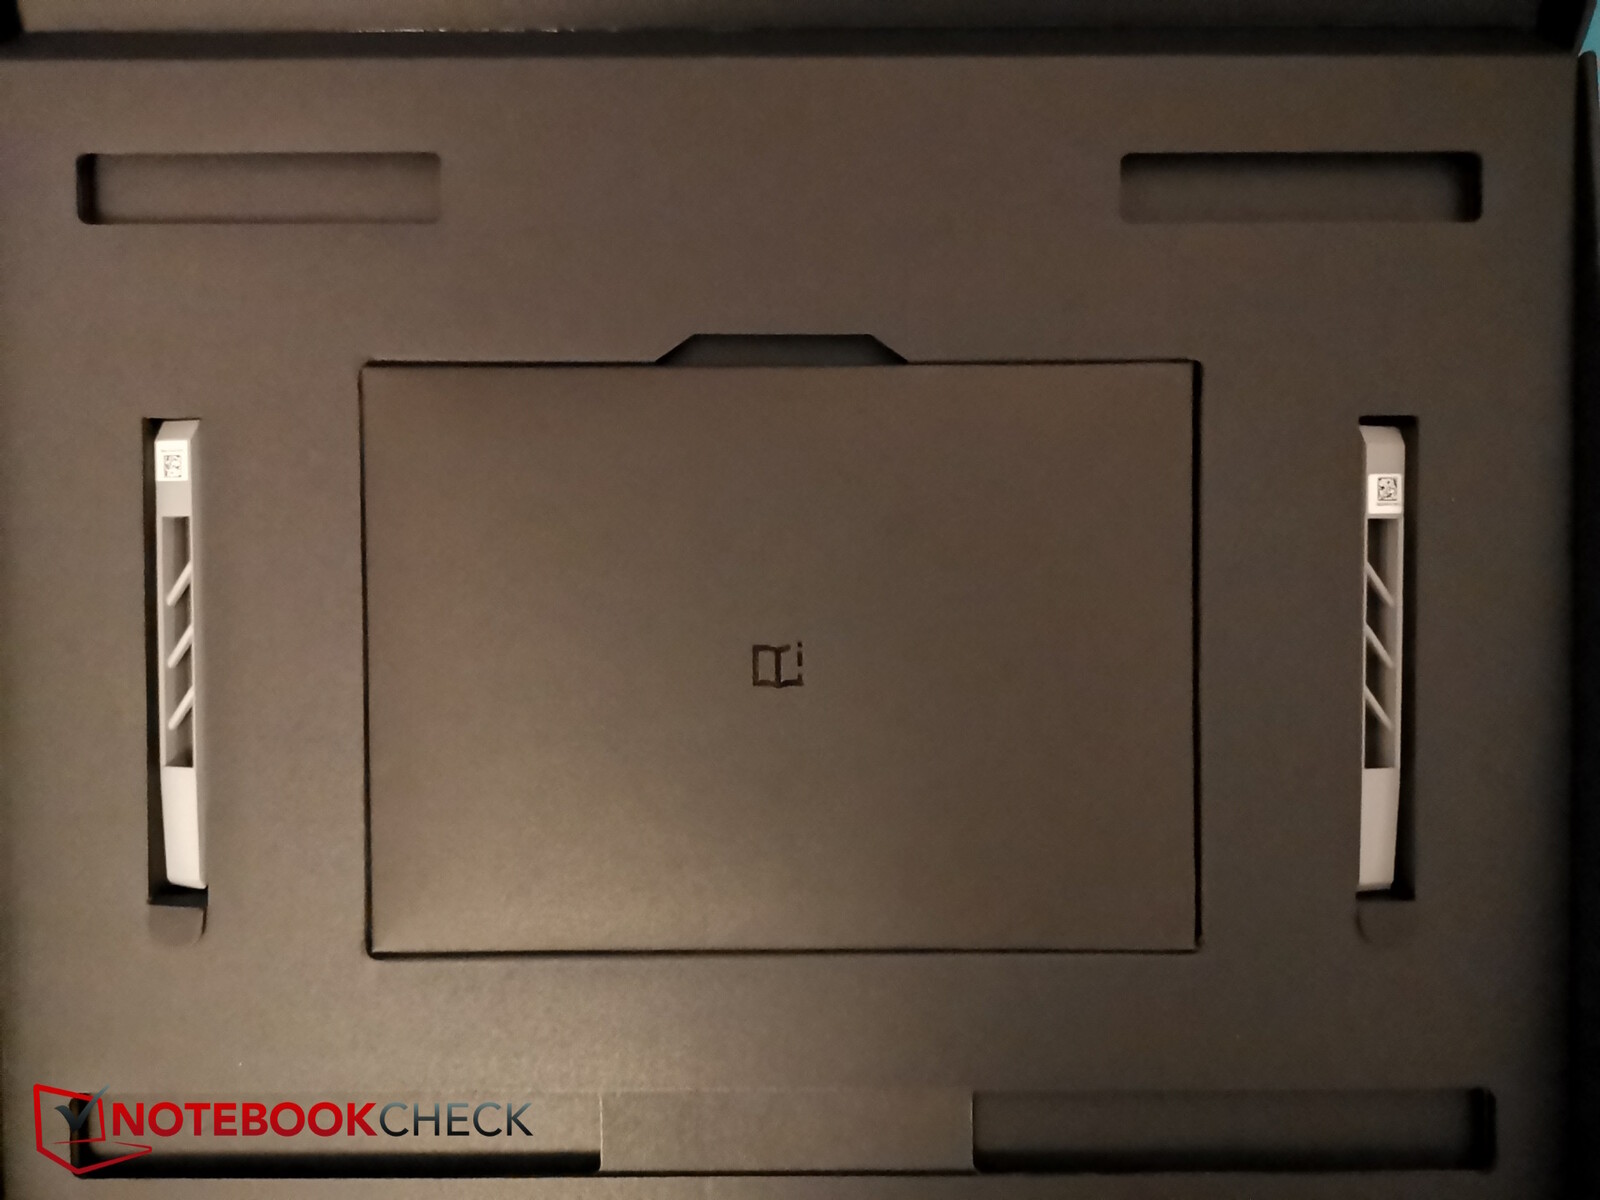
On top of the laptop, power supply and the usual paperwork, a pair of alternative fan covers for the back of the Helios 18 are included in the scope of delivery.
Acer provides a 24-month standard warranty in Germany. This may differ in other countries, so potential buyers should double check before purchasing.
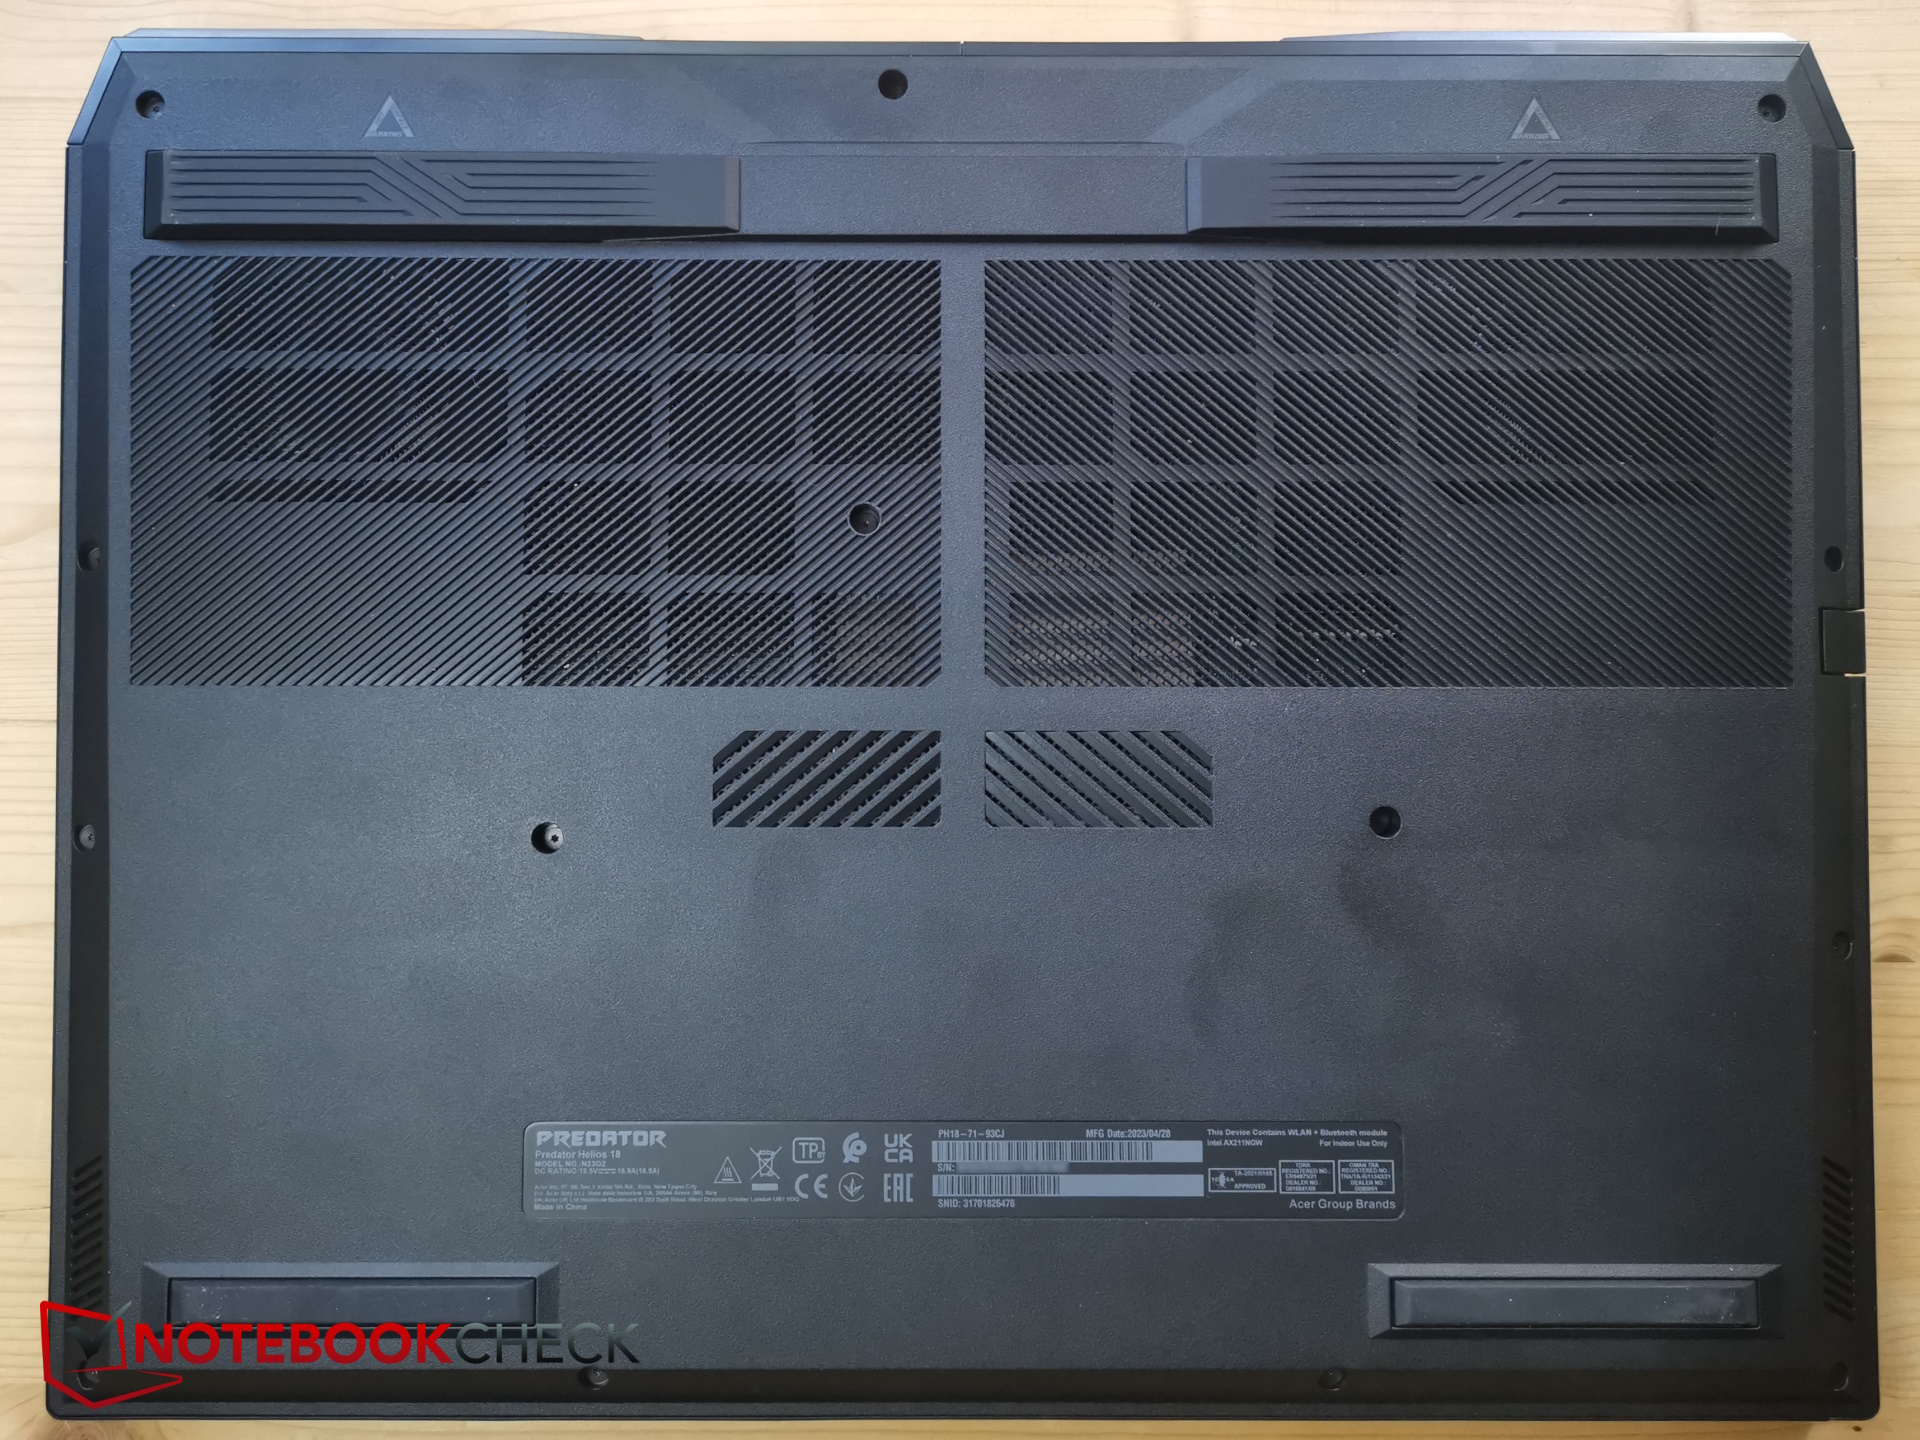
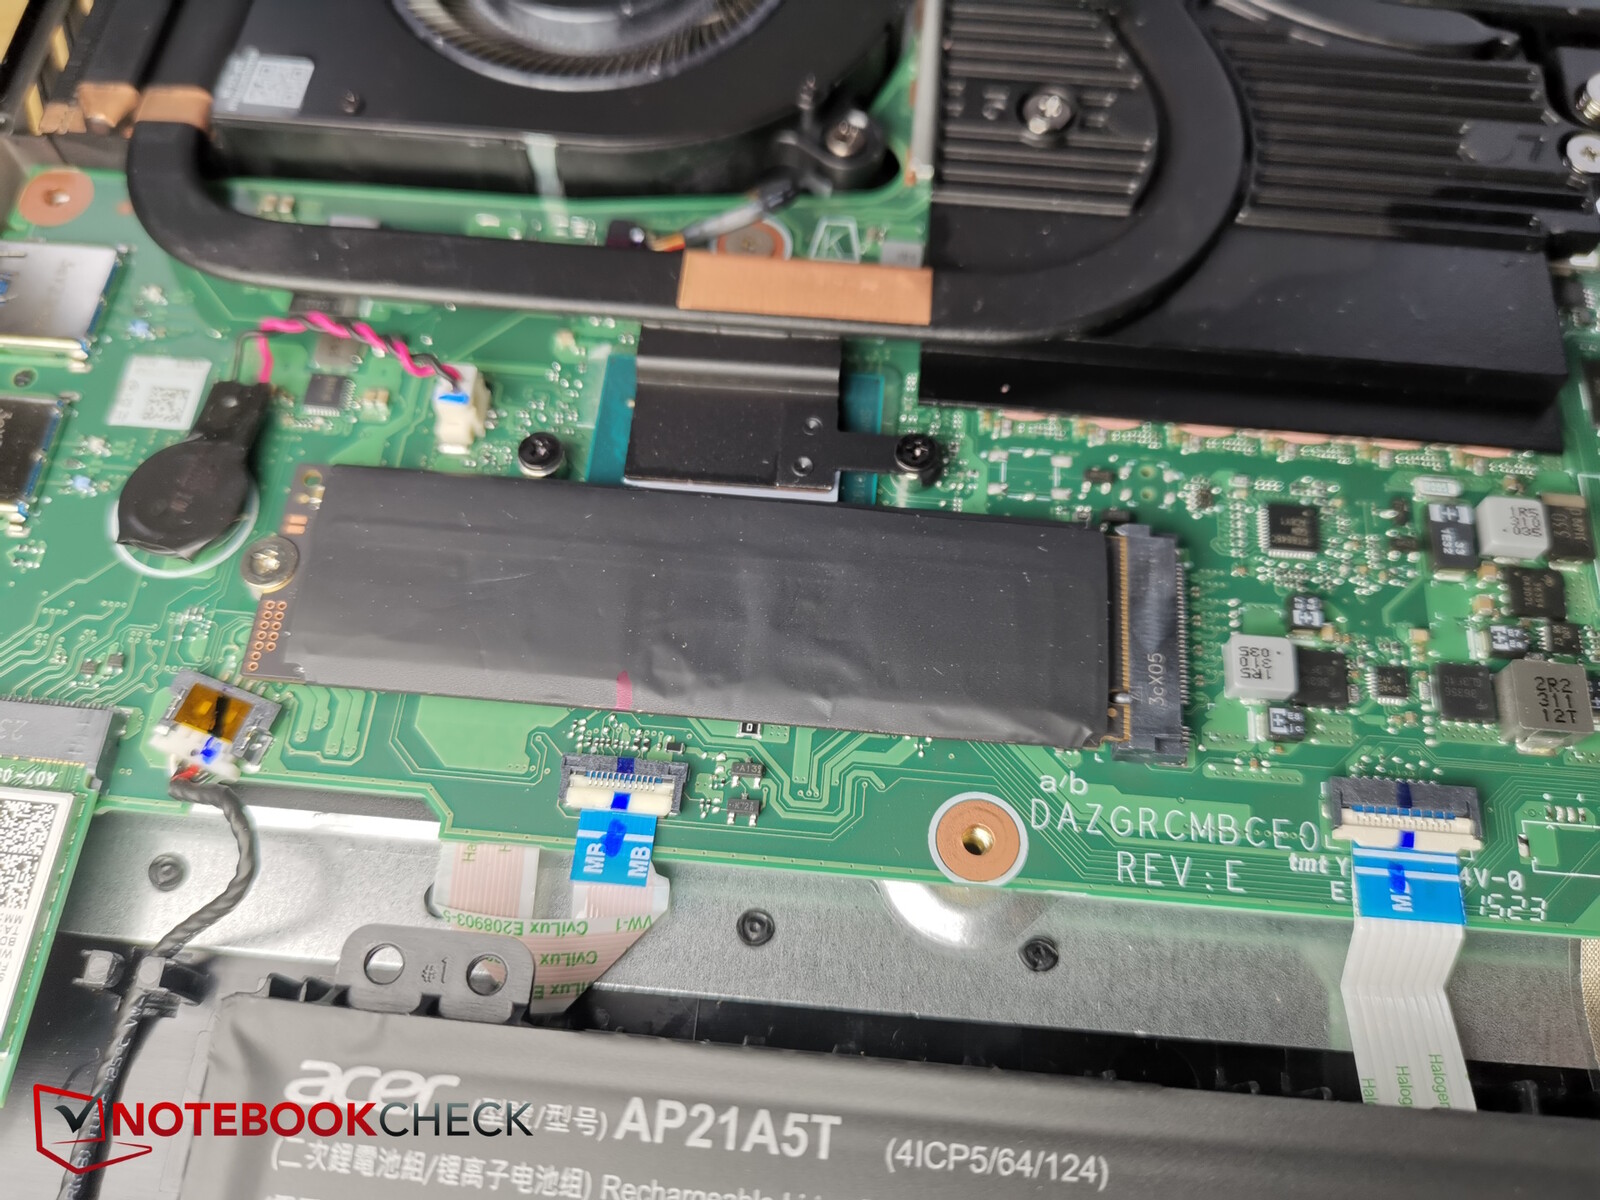
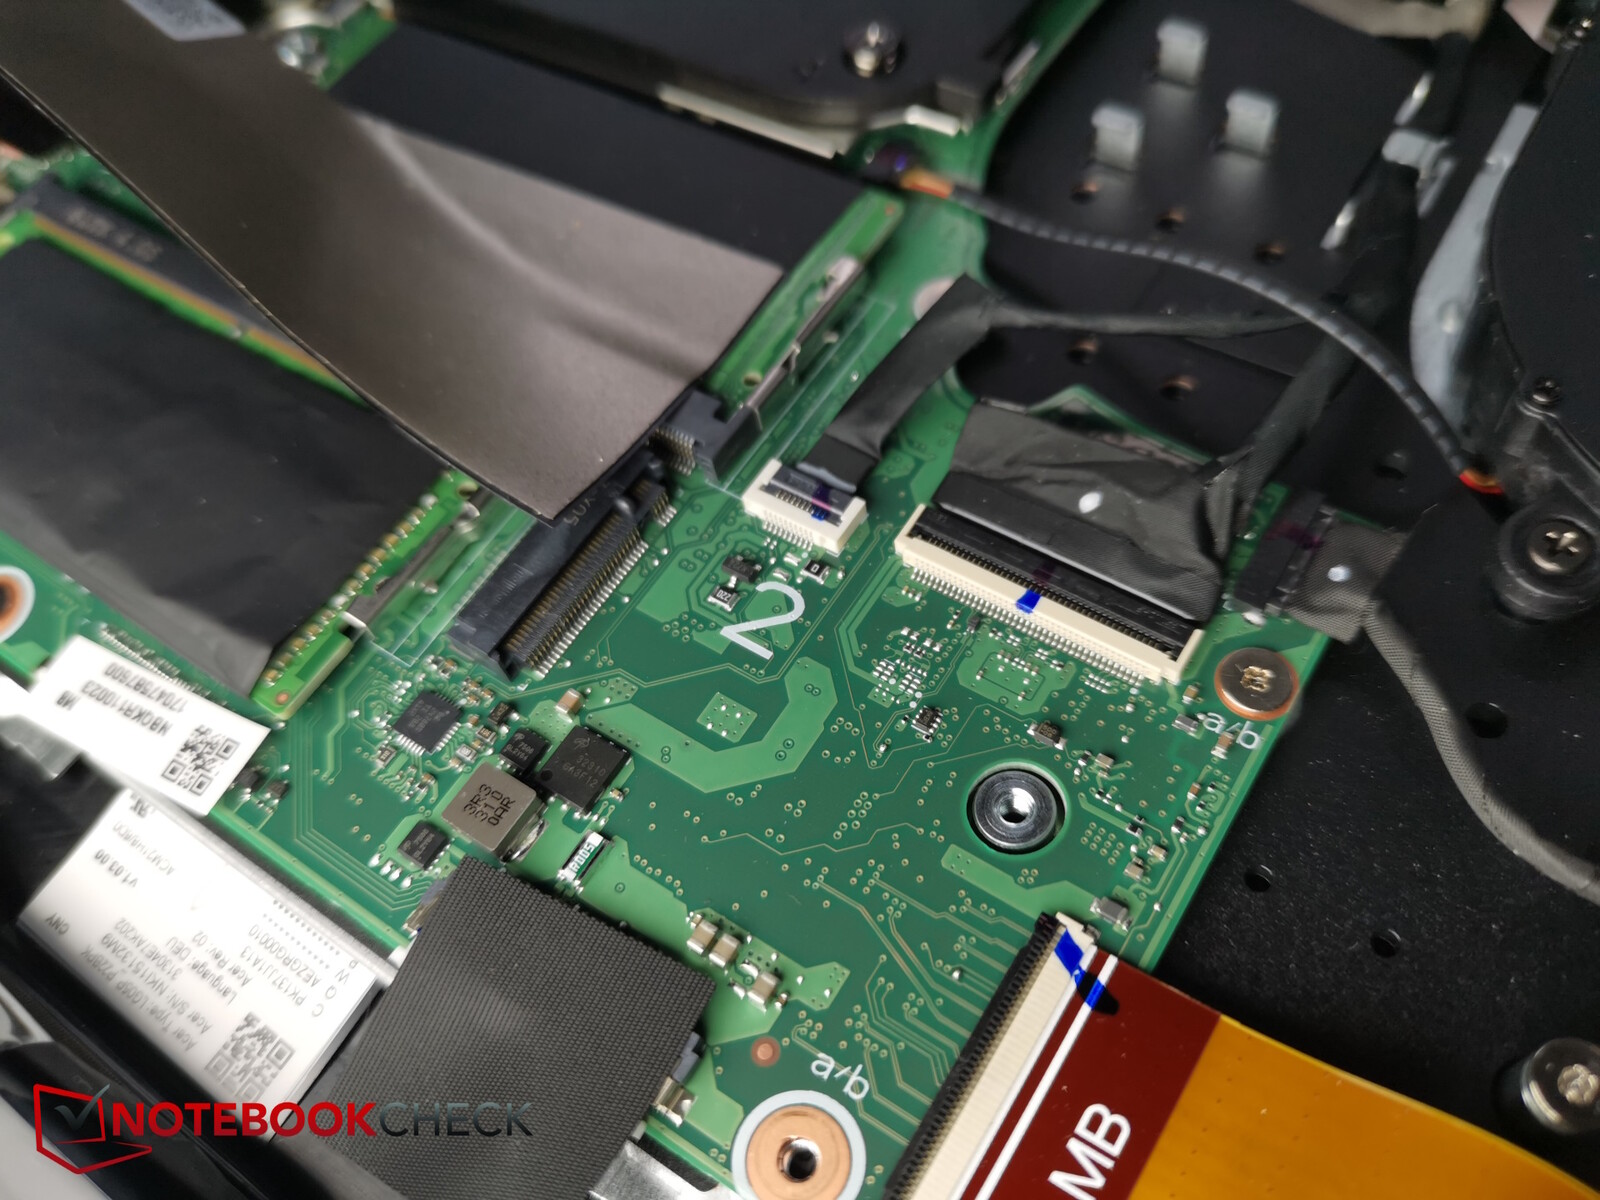
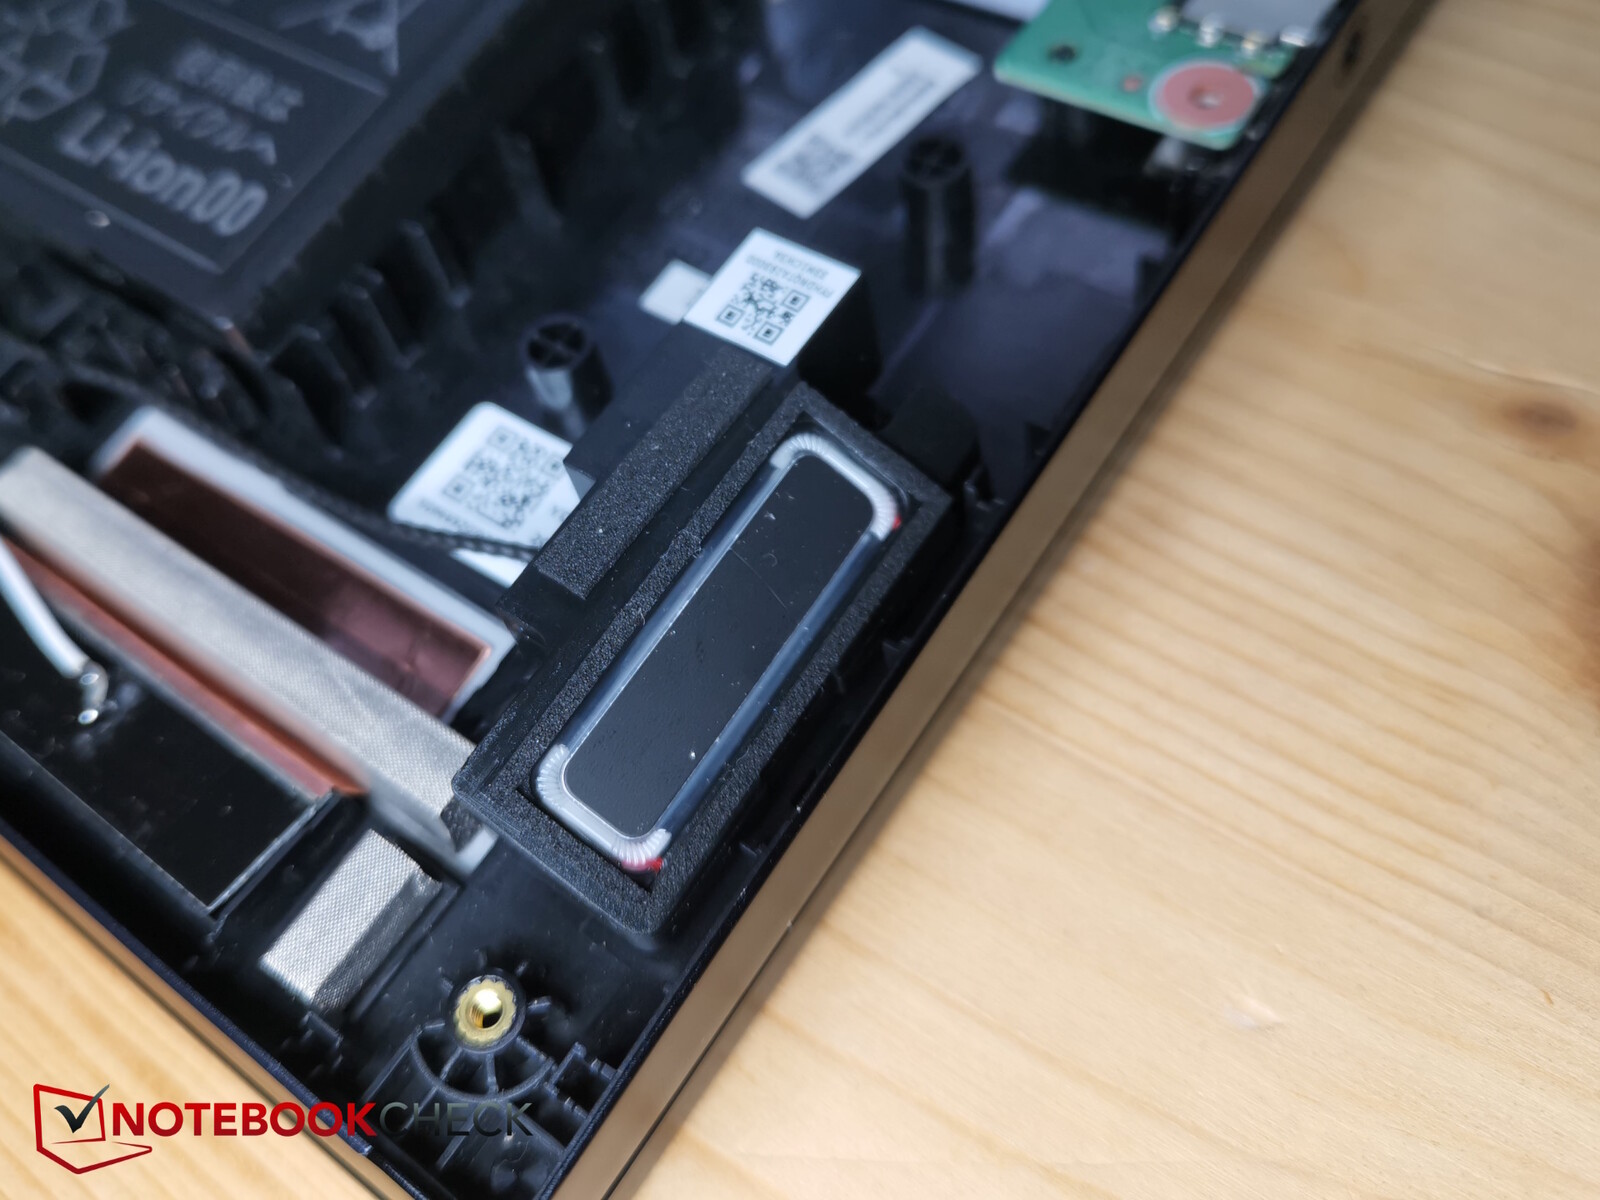
Maintenance
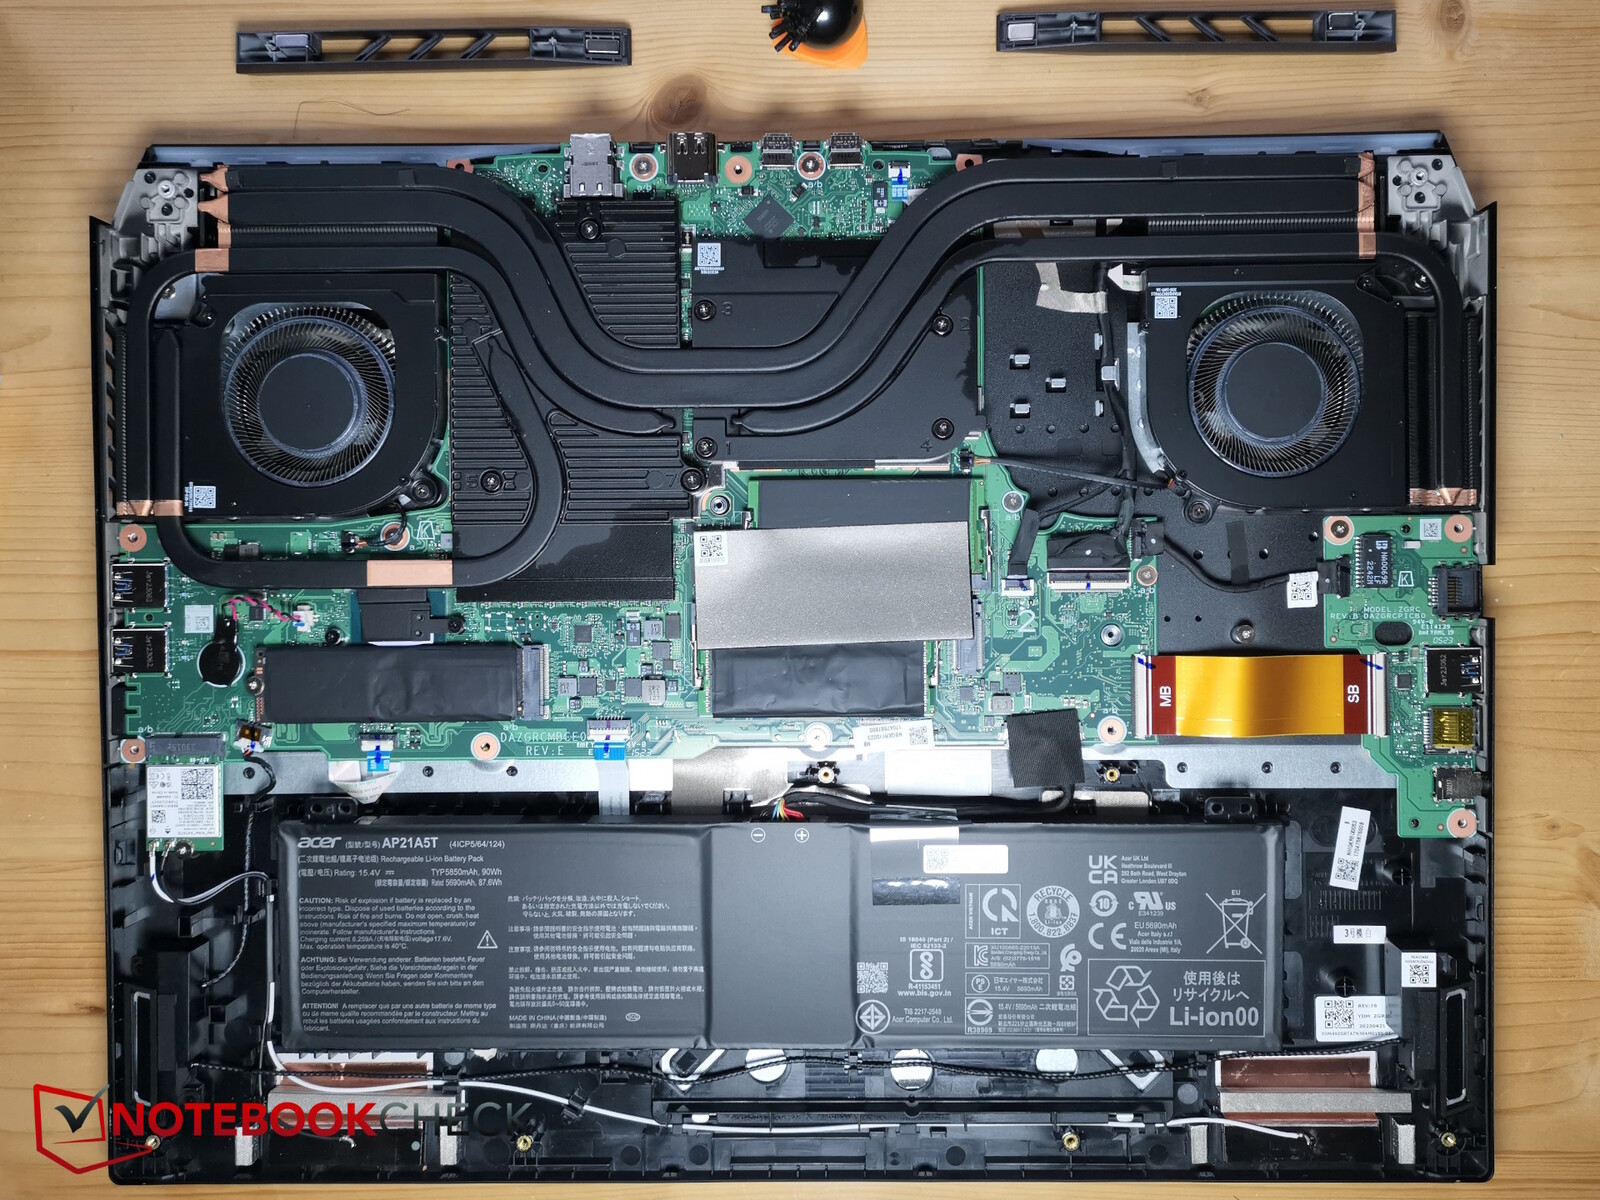
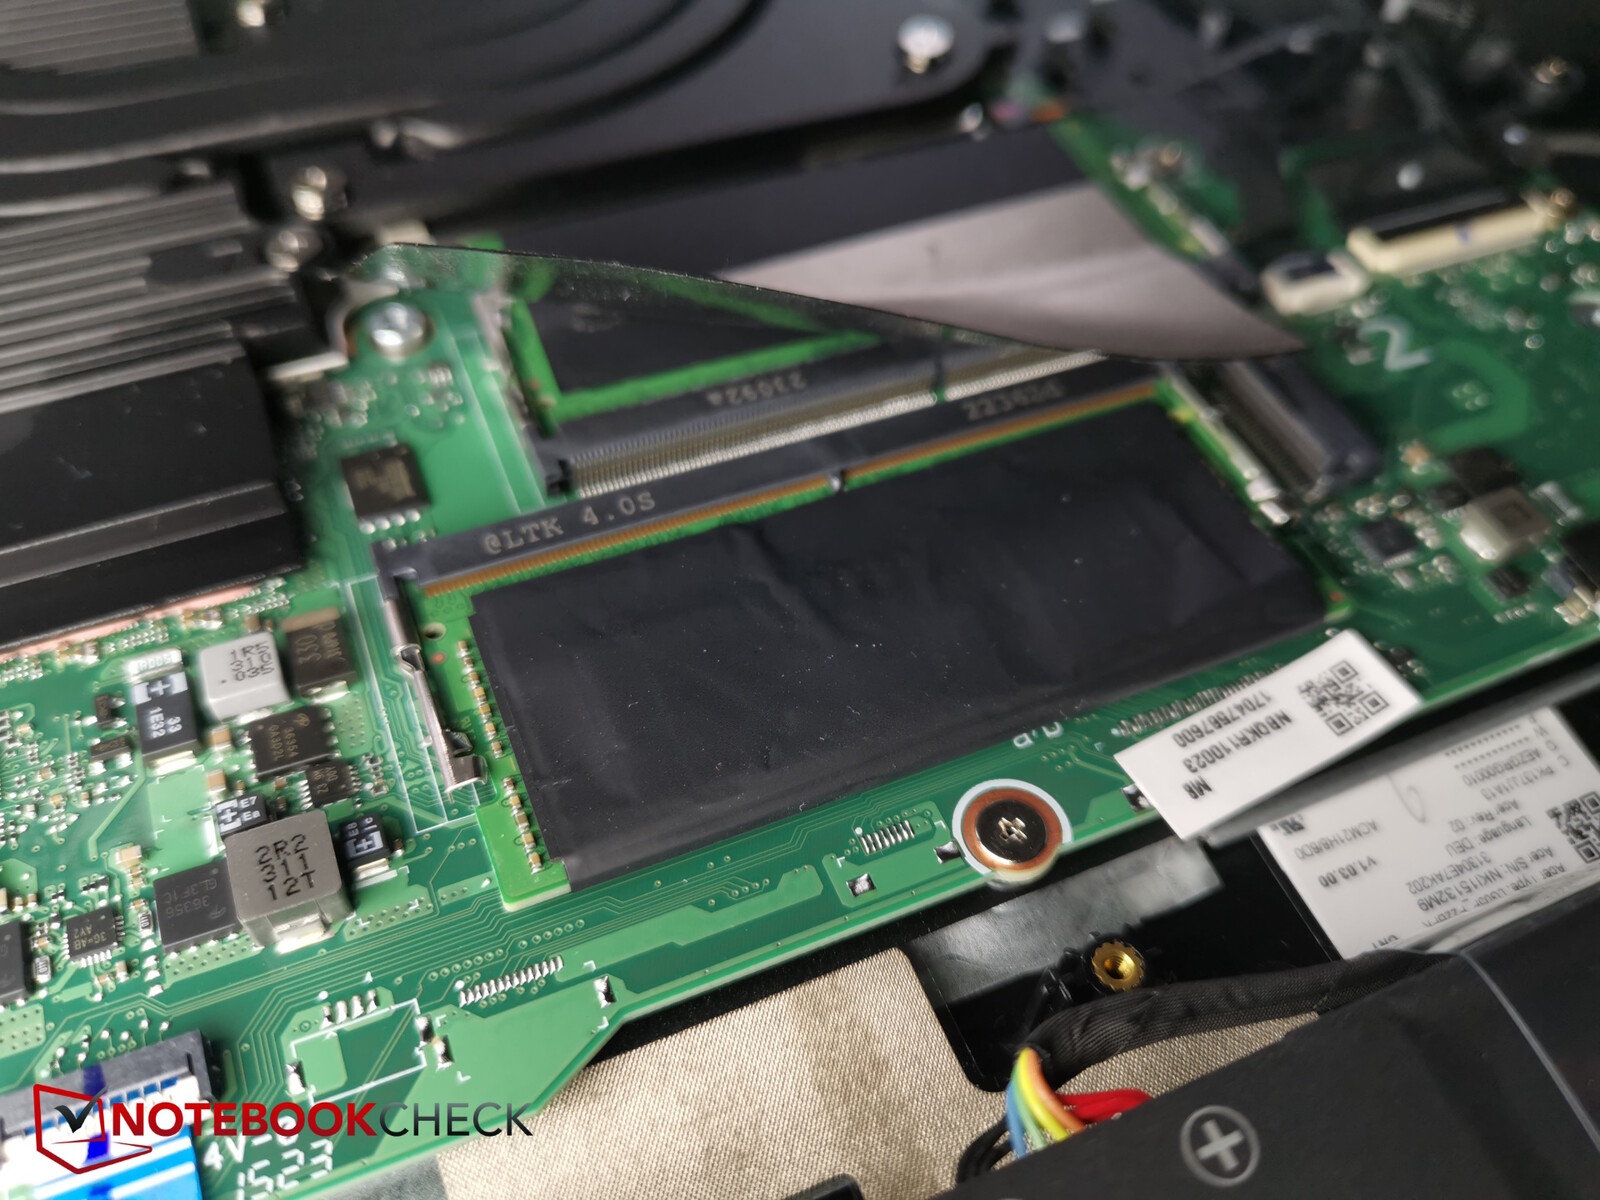
Opening the Helios 18 is not quite as easy because of the tight clamps and the rigid aluminum base, but it is still manageable. First, 14 Torx screws of the same size have to be loosened. Afterwards, it is best to pry the backside open from the front corners, preferably with a narrow-edged plastic tool.
Once inside the Acer Predator, users have access to the fans, the battery, the SSD (plus second slot), the RAM slots and the WiFi module.
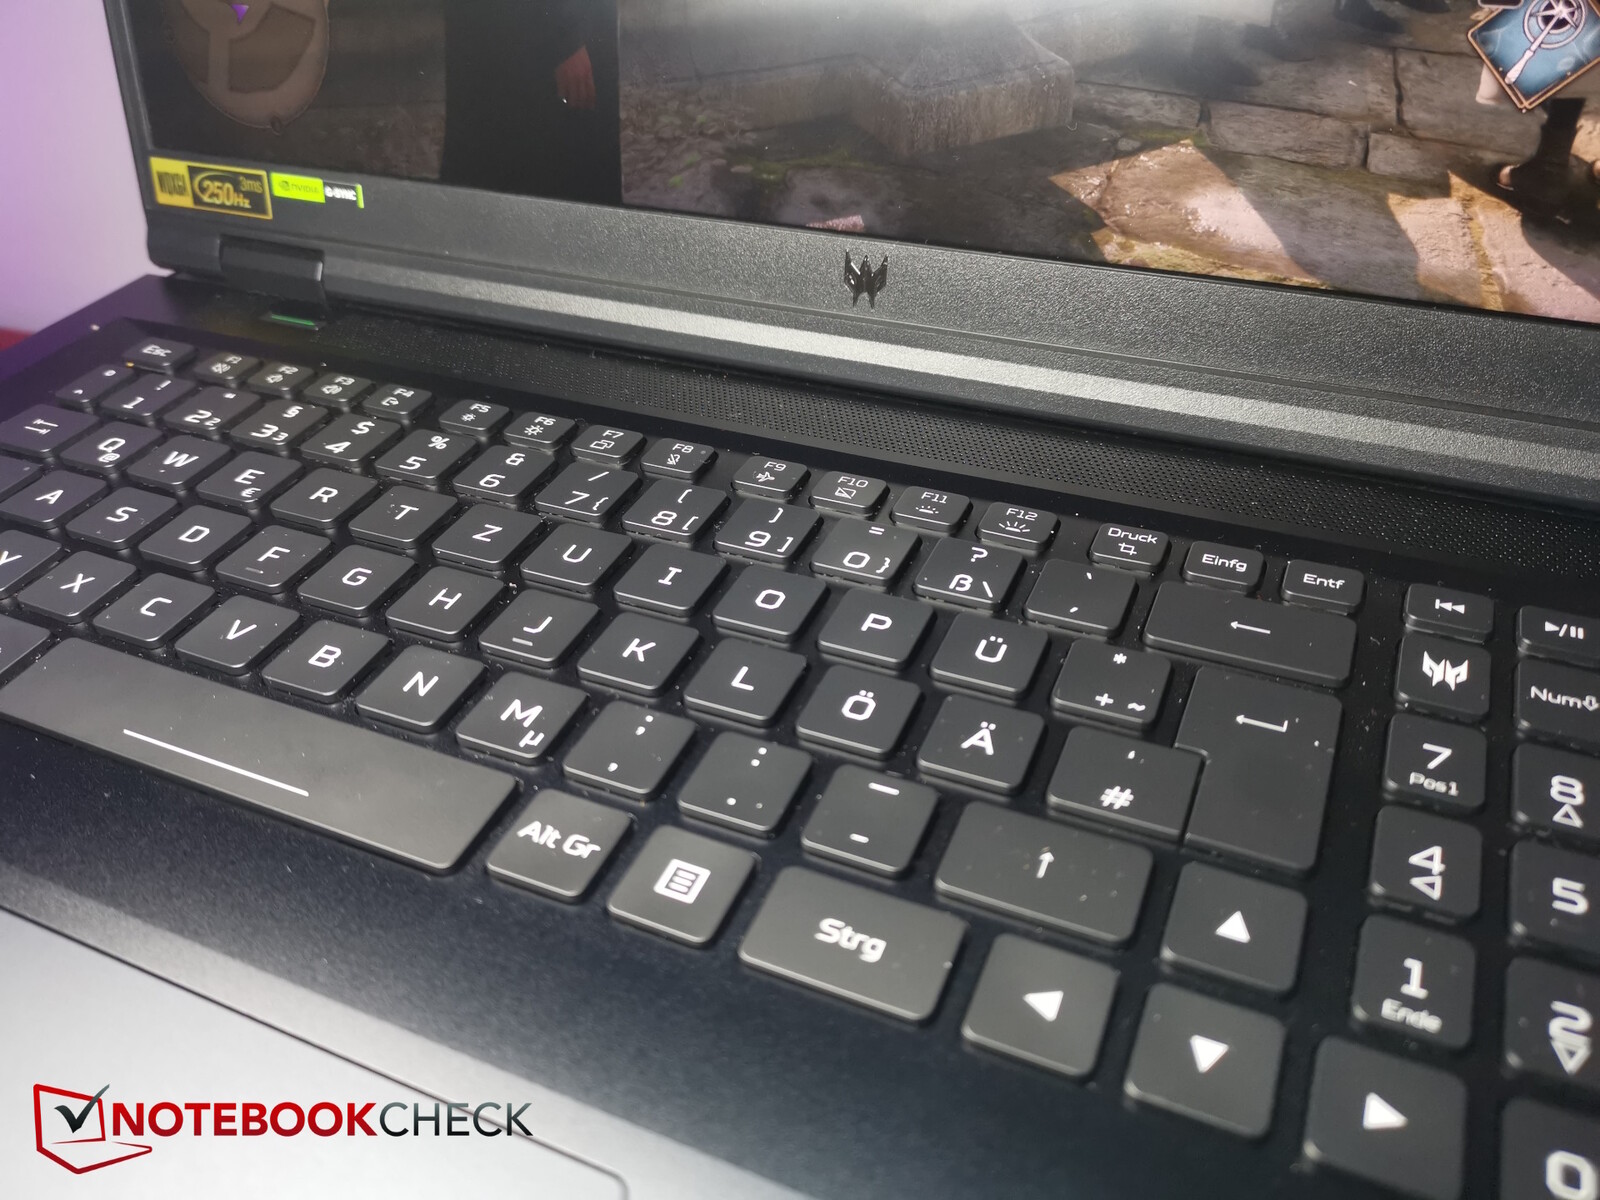
Input devices - MiniLED for the keys as well
Keyboard

The Predator has a very tidy layout that includes full-size arrow keys, a number pad on the right and extra keys for calling up the Predator Sense software and switching performance modes.
The keys are 1.5 x 1.5 mm, have a medium travel and noticeable feedback, which could be a little firmer. Typing noise is moderate and typing speed is quick.
According to Acer, the RGB-per-key backlight functions via MiniLEDs, just like the display, and can be adjusted in four levels.
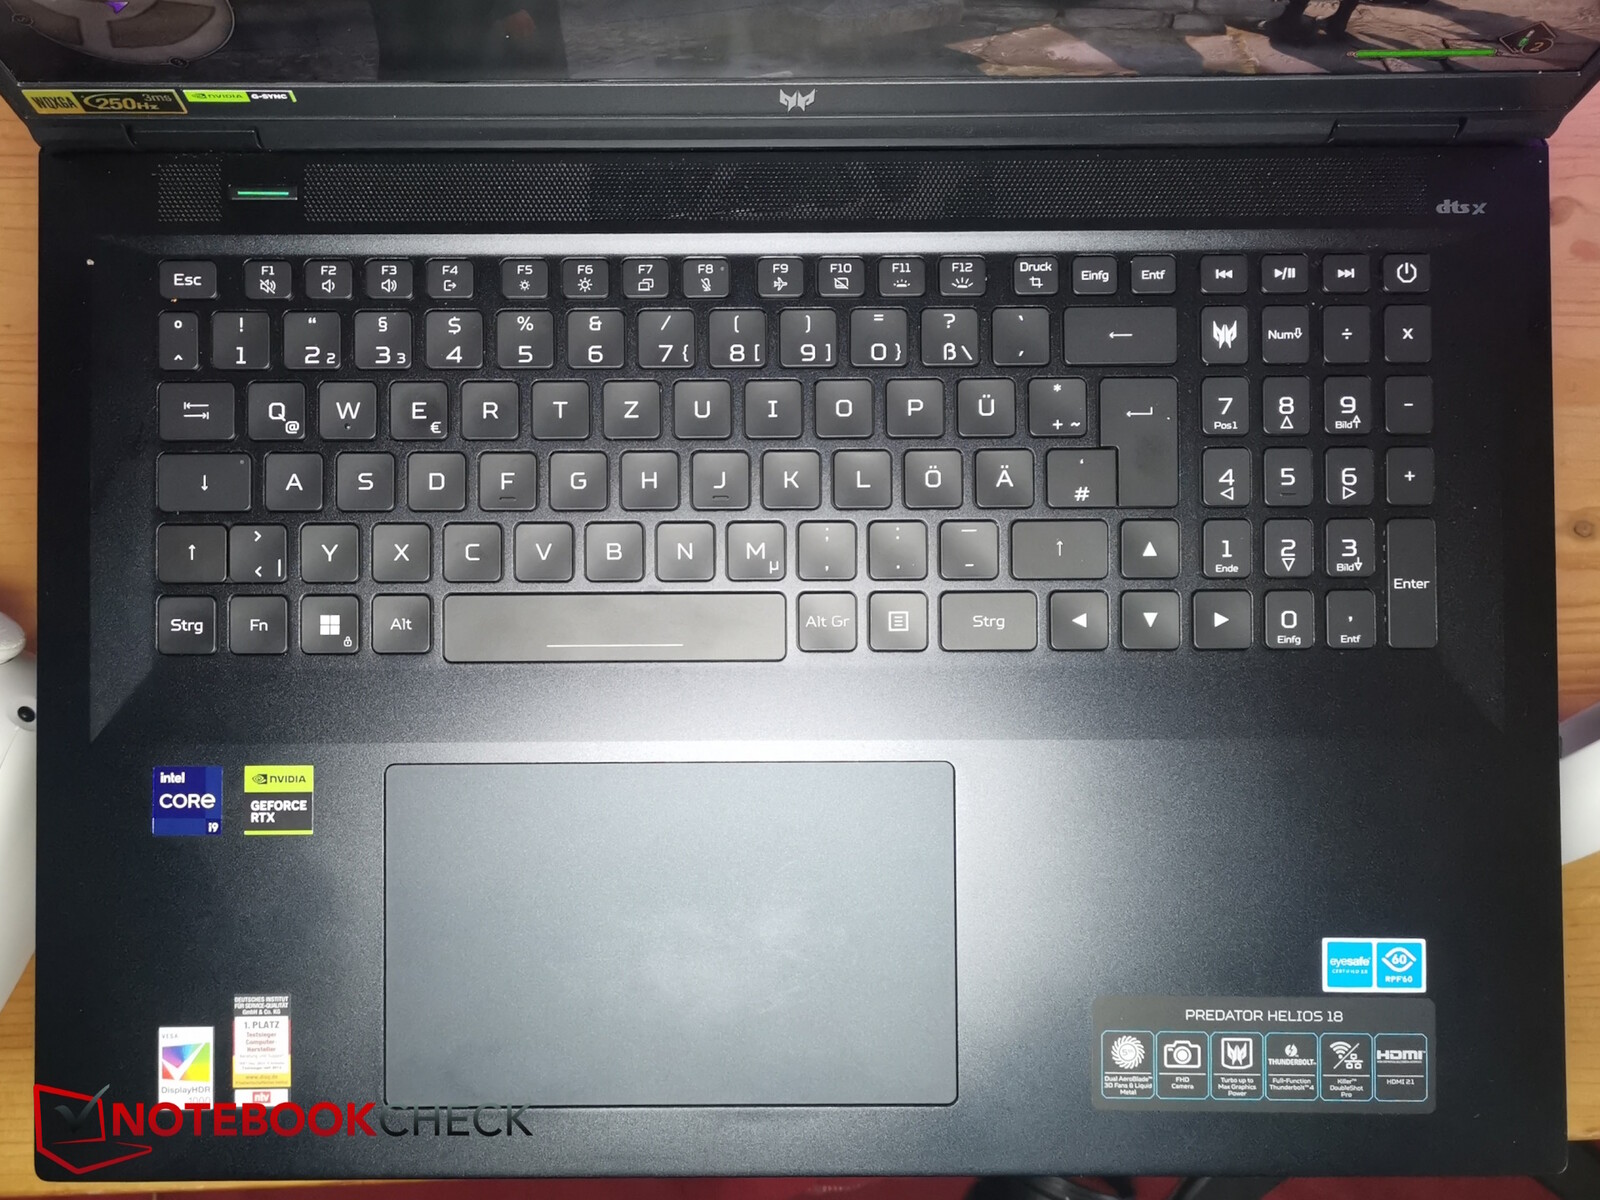
Touchpad
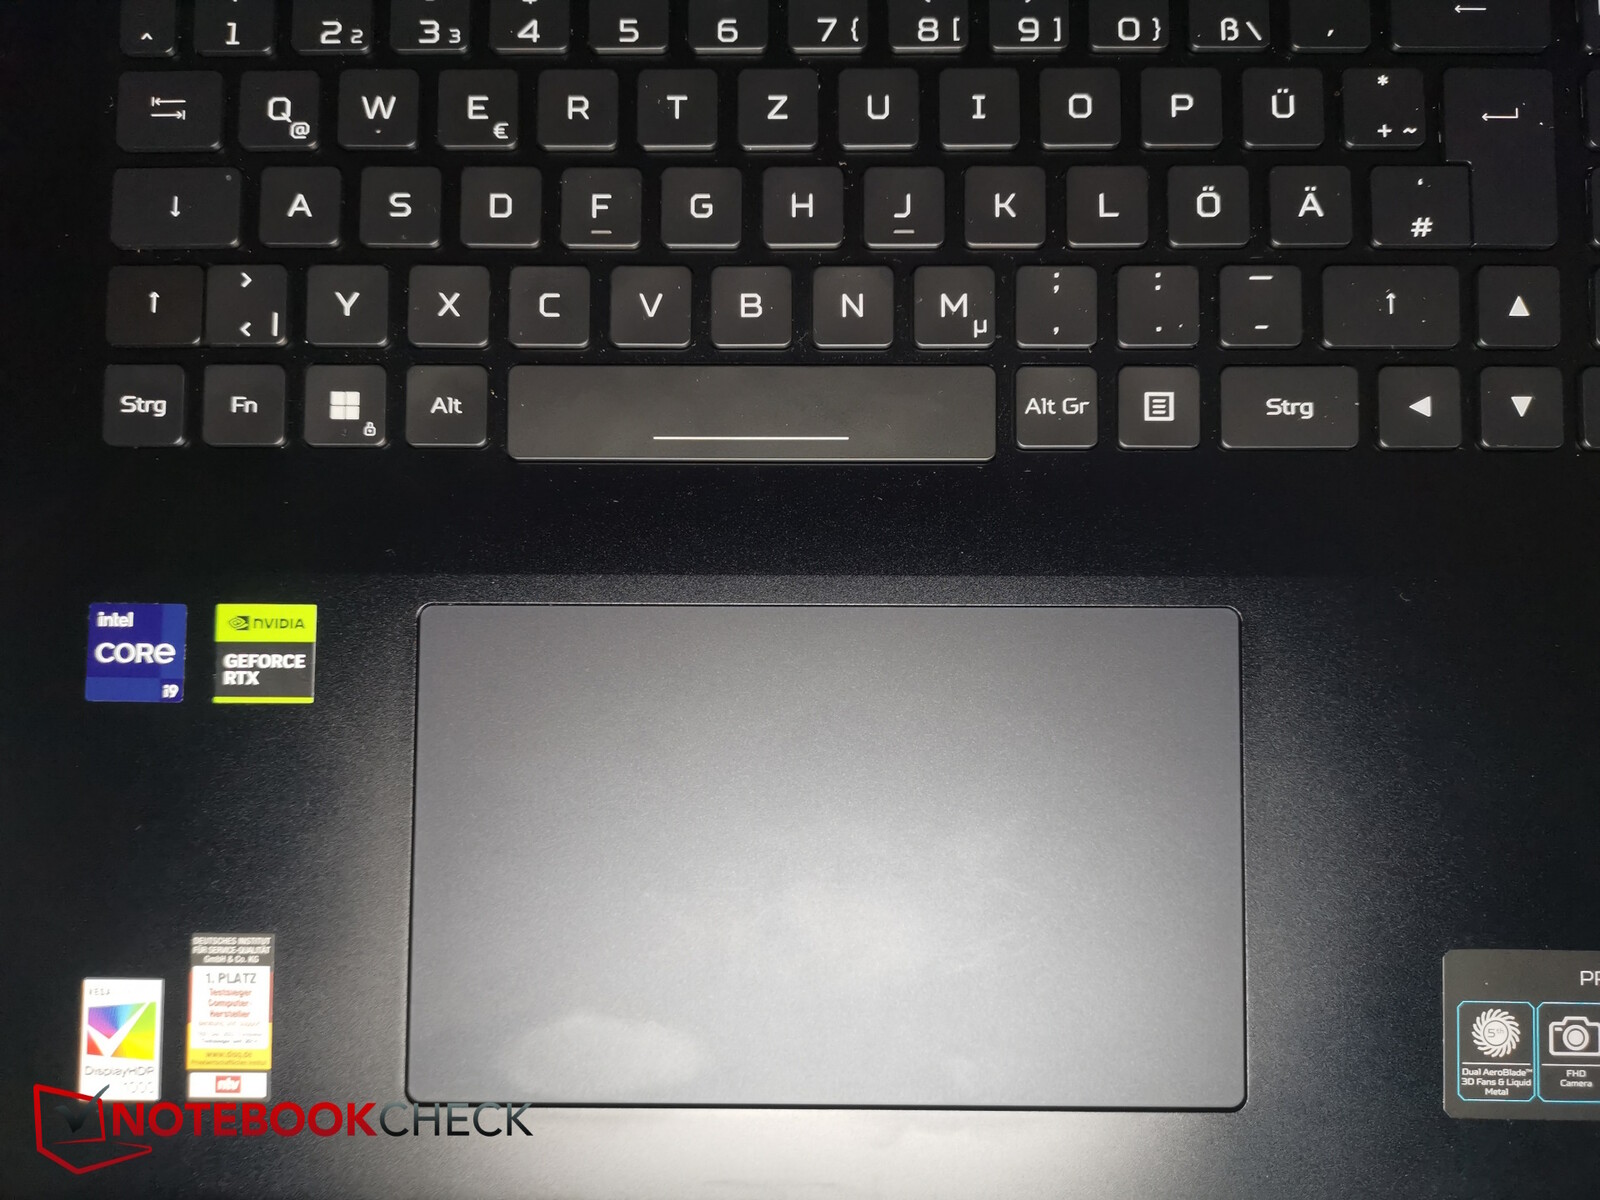
The 18-incher's touchpad is downright huge (approx. 15.2 x 9.1 cm) and offers very good gliding properties that almost never cause stuttering.
The integrated click buttons are very quiet and have an extremely short travel, but trigger reliably and provide good feedback.
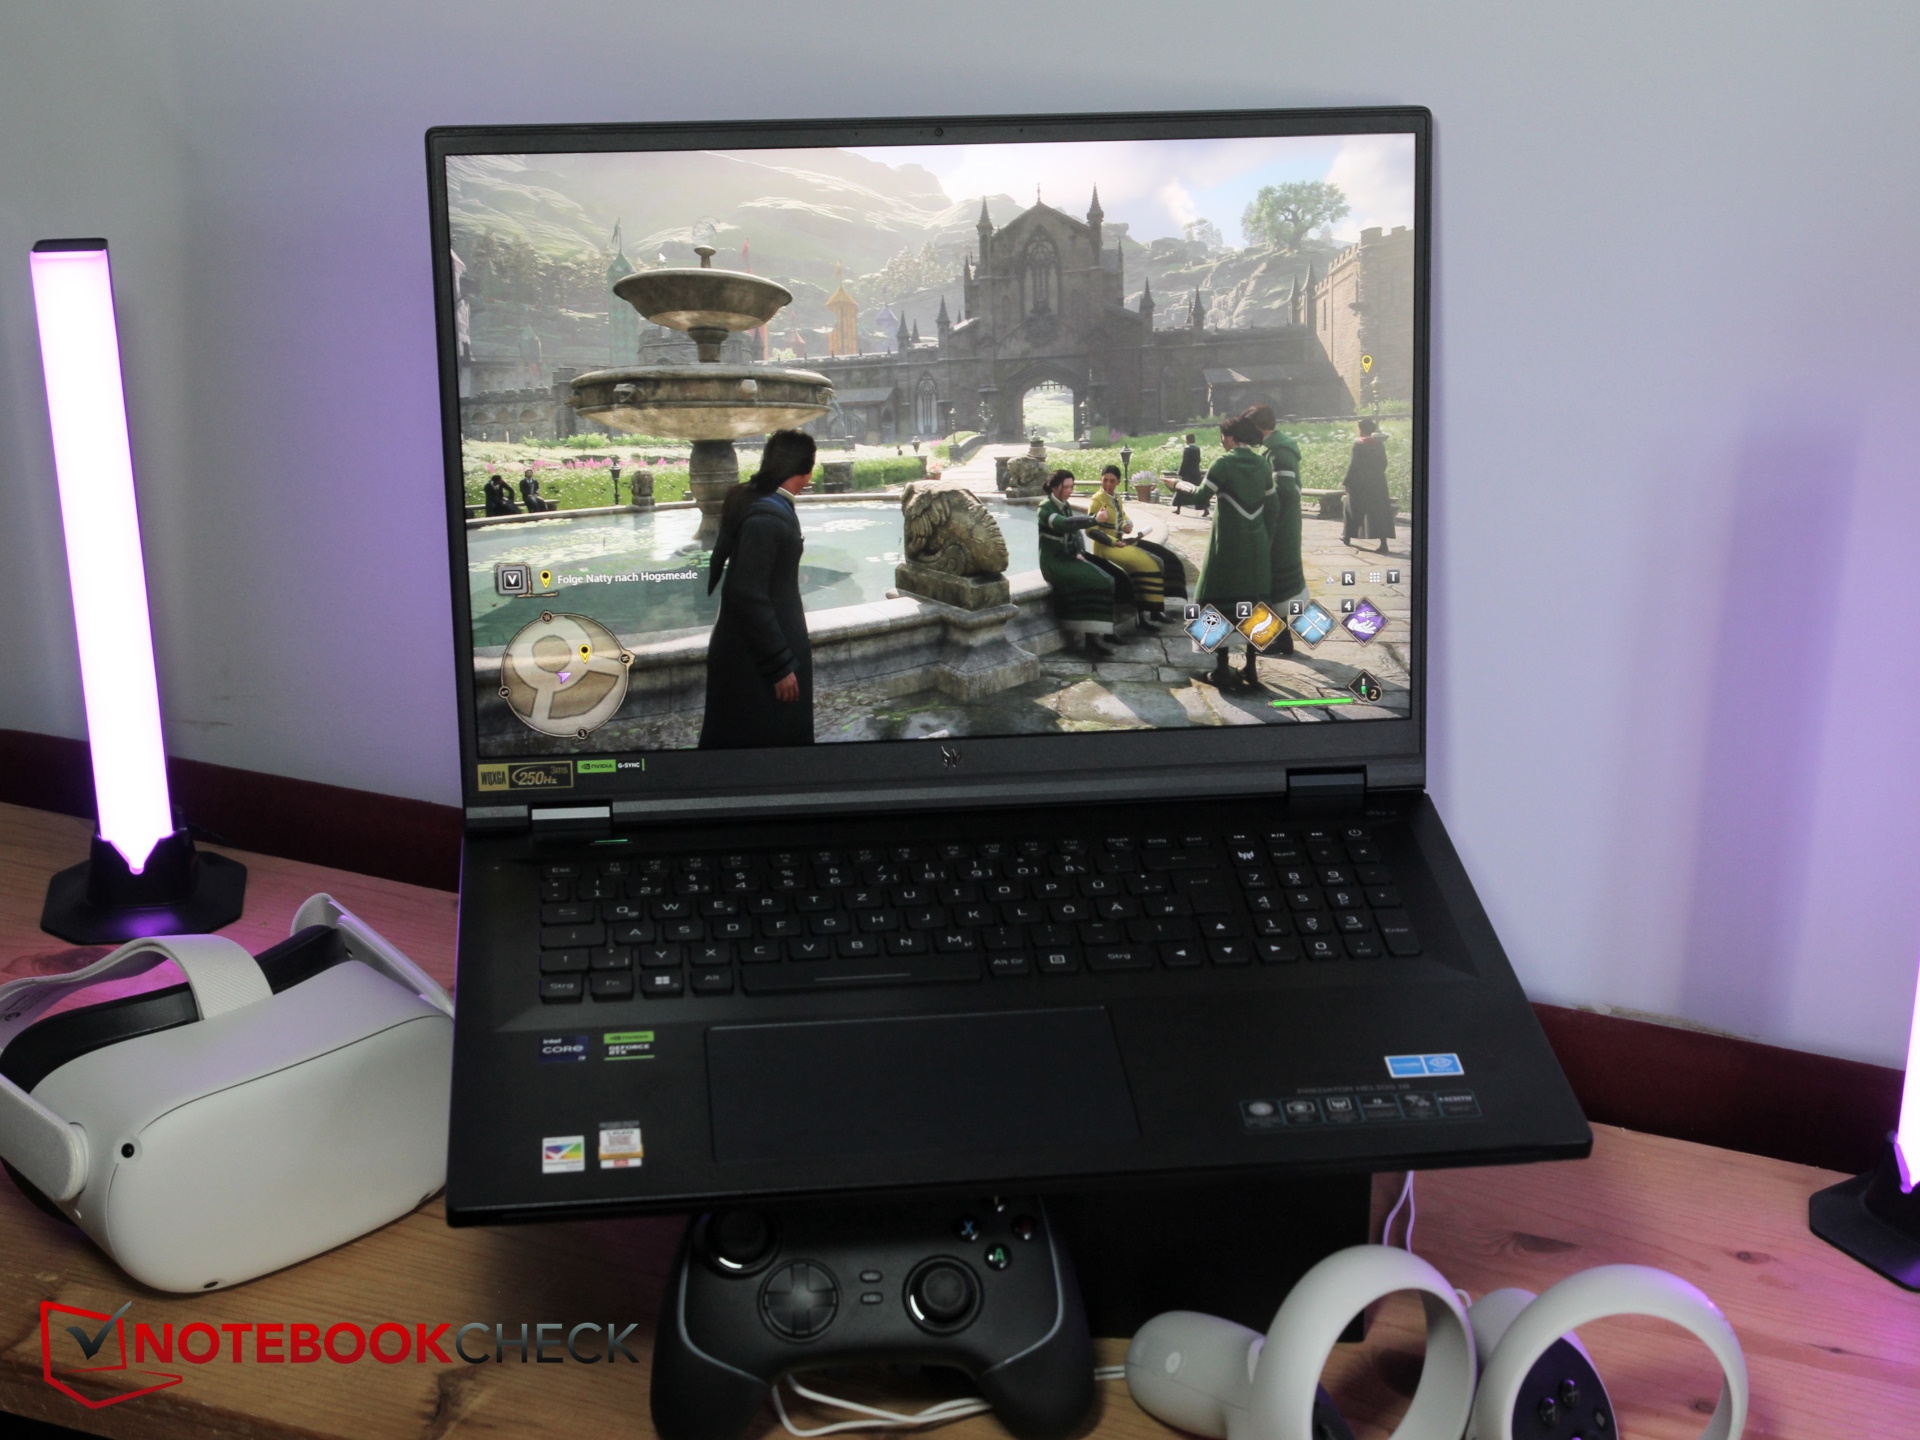
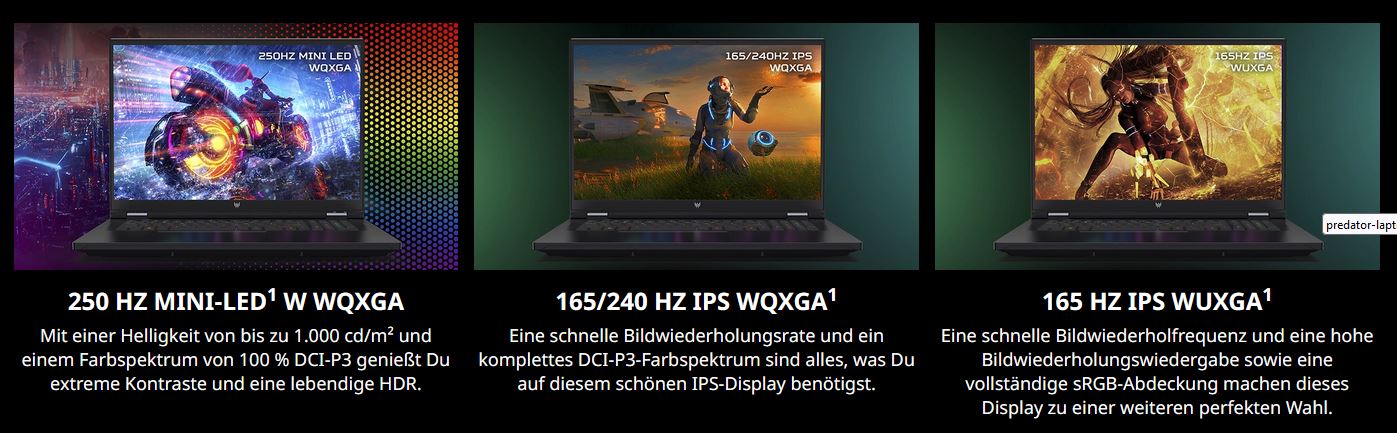
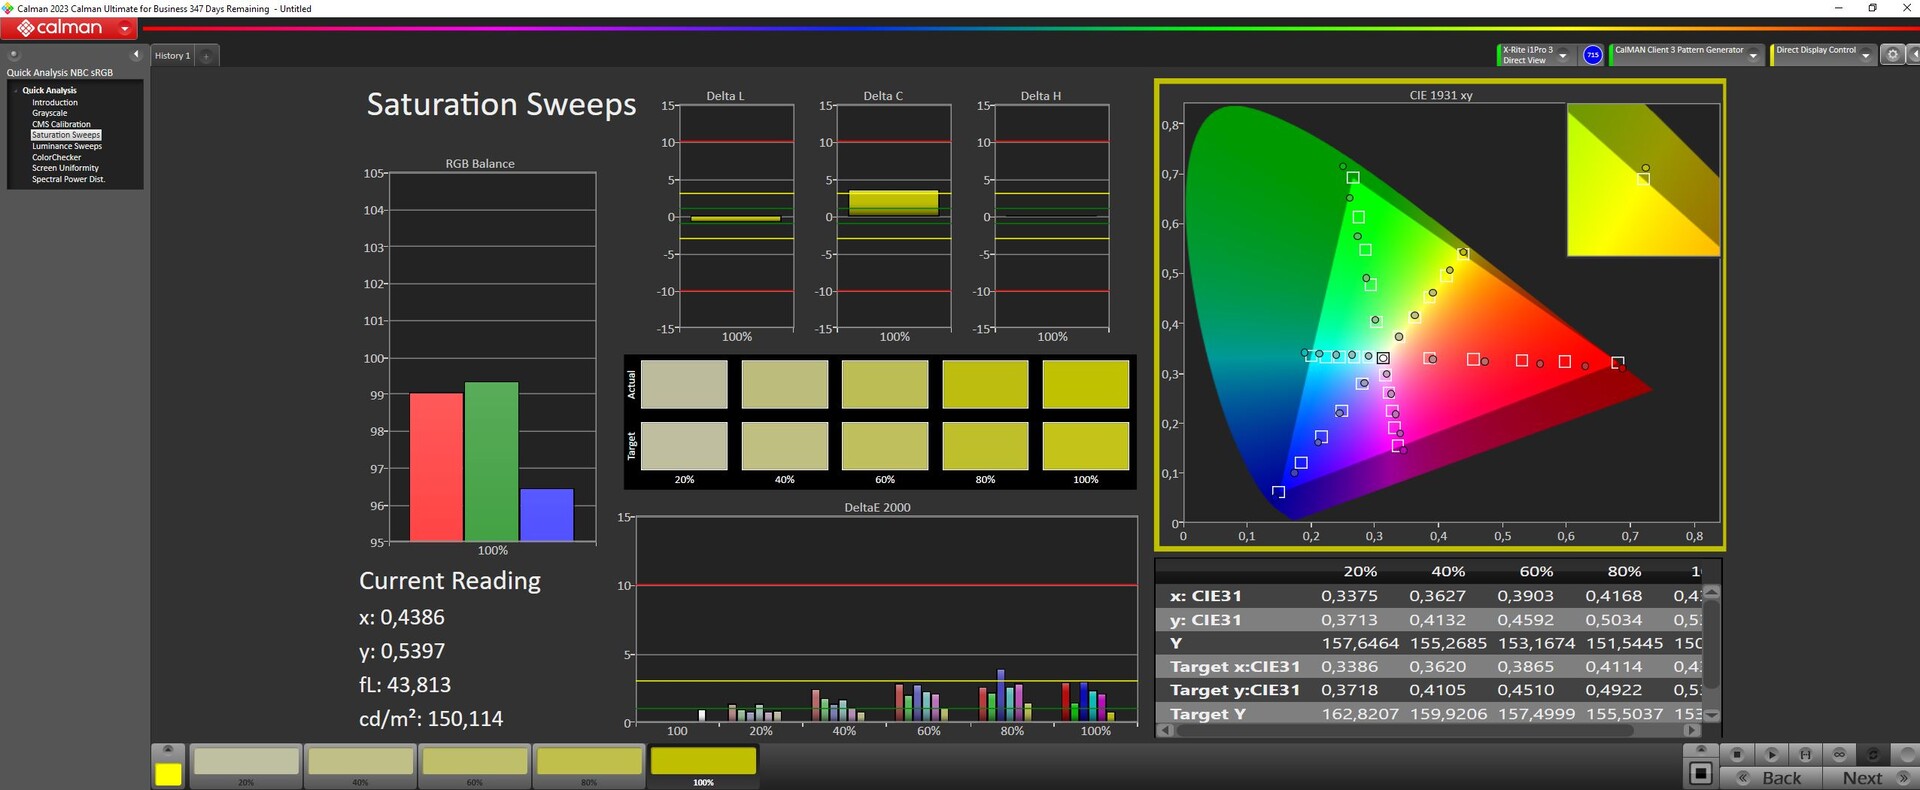
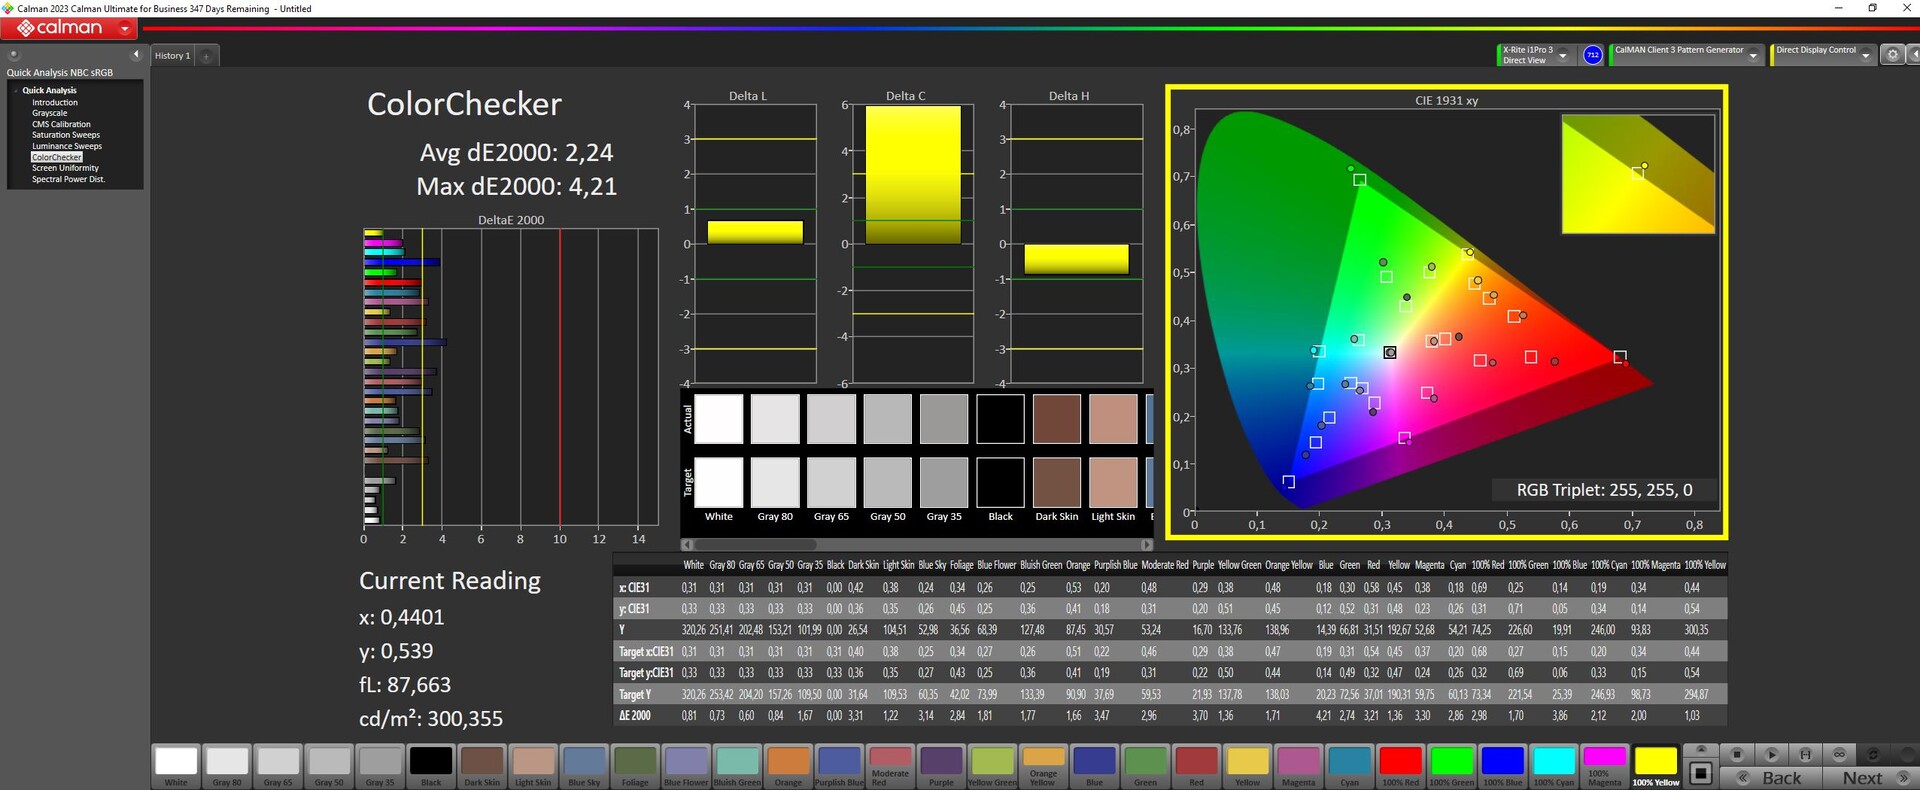
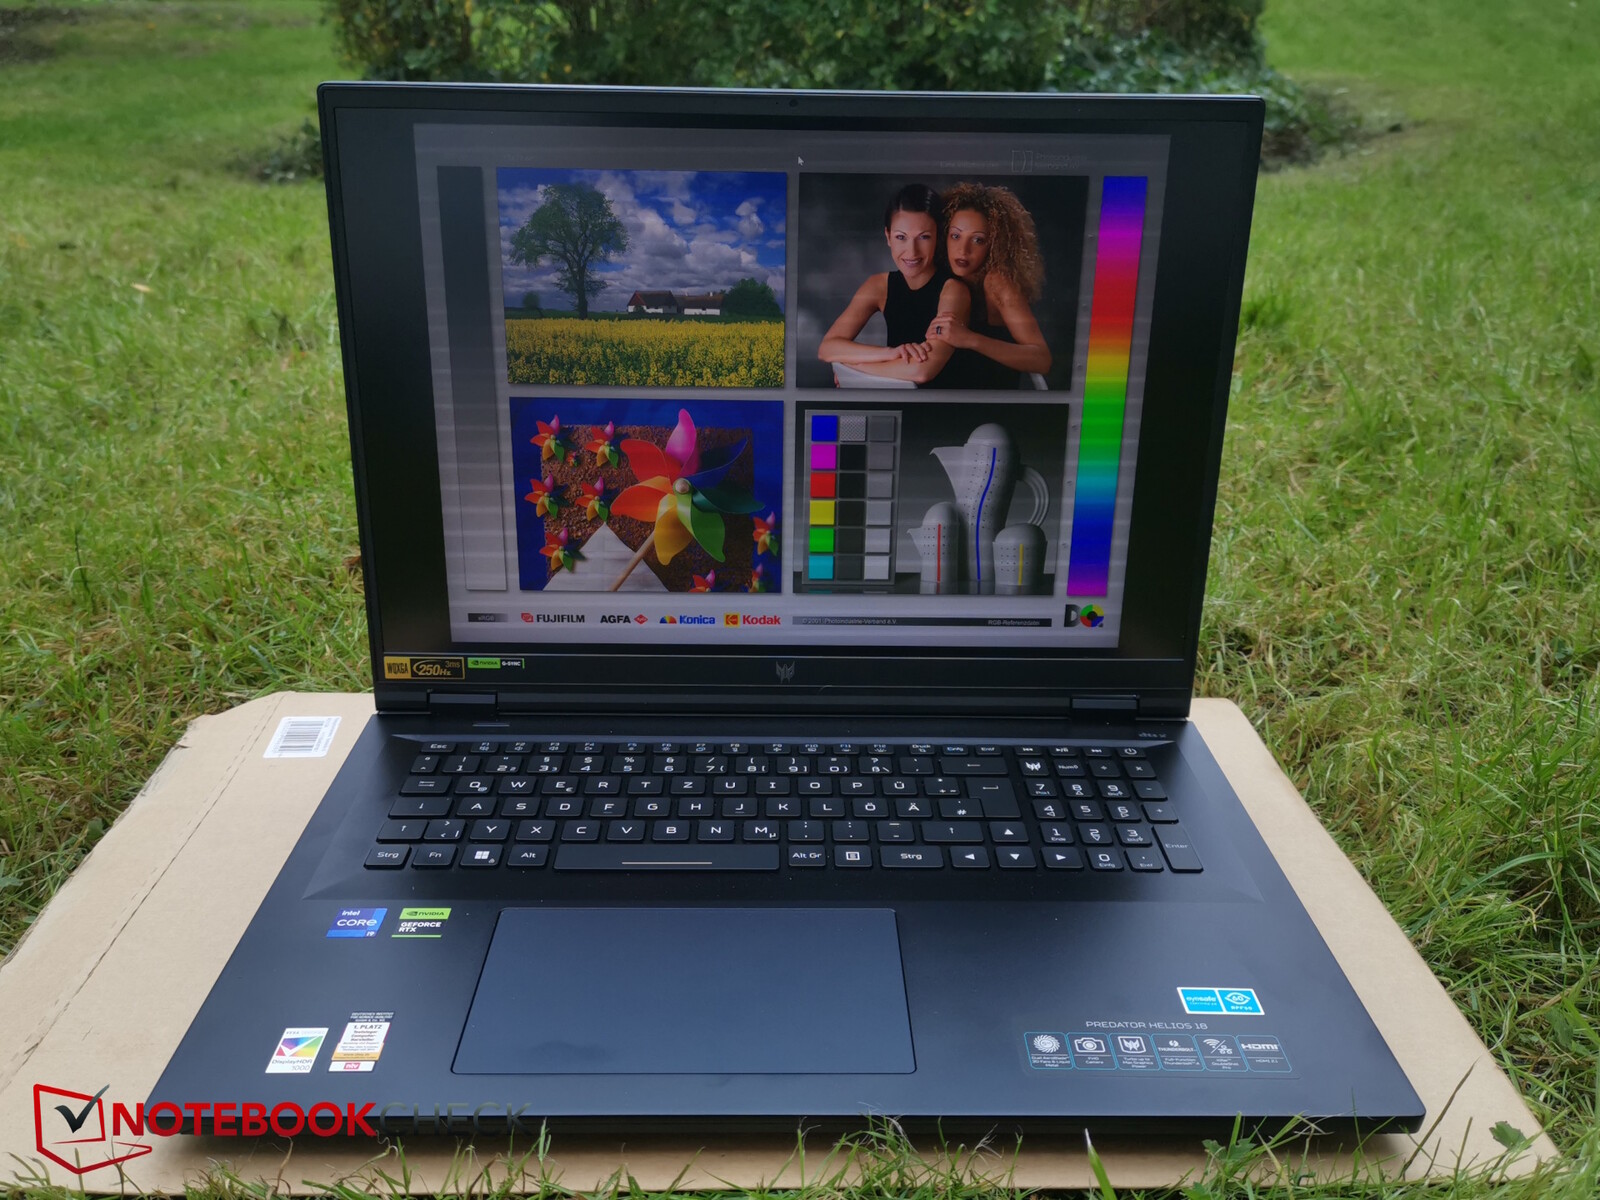
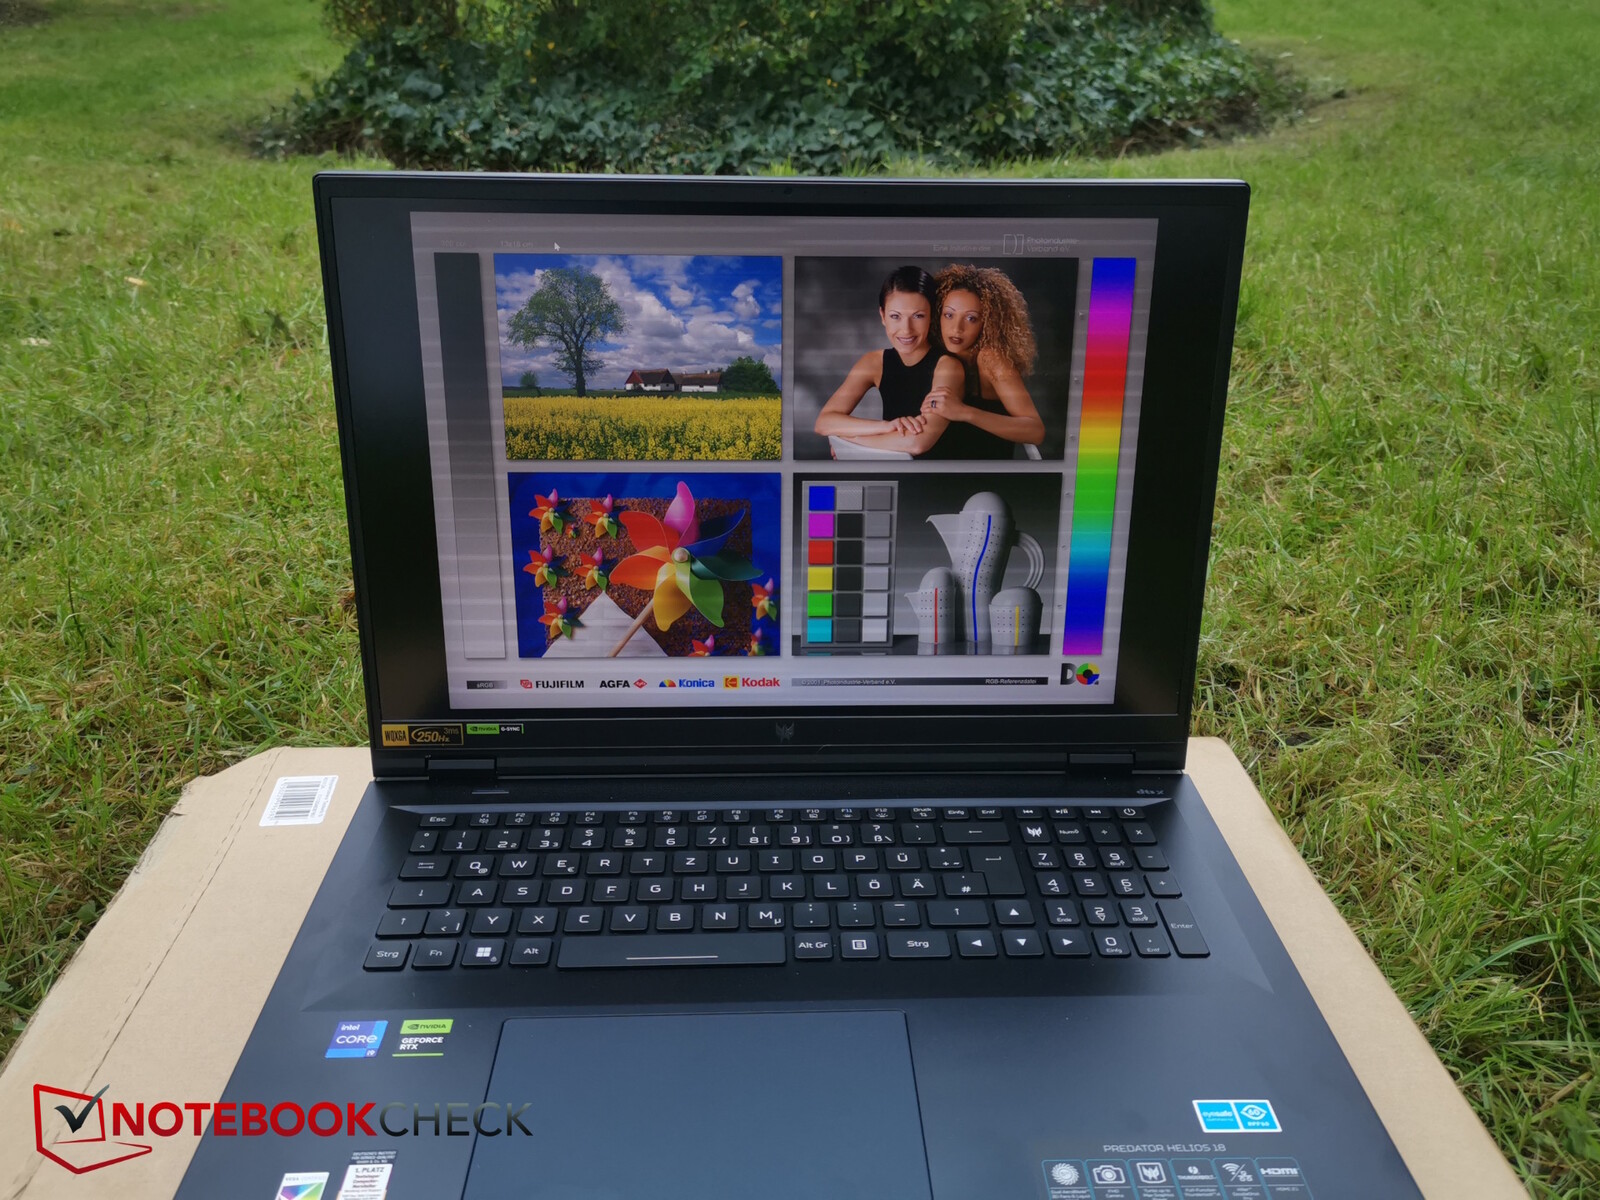
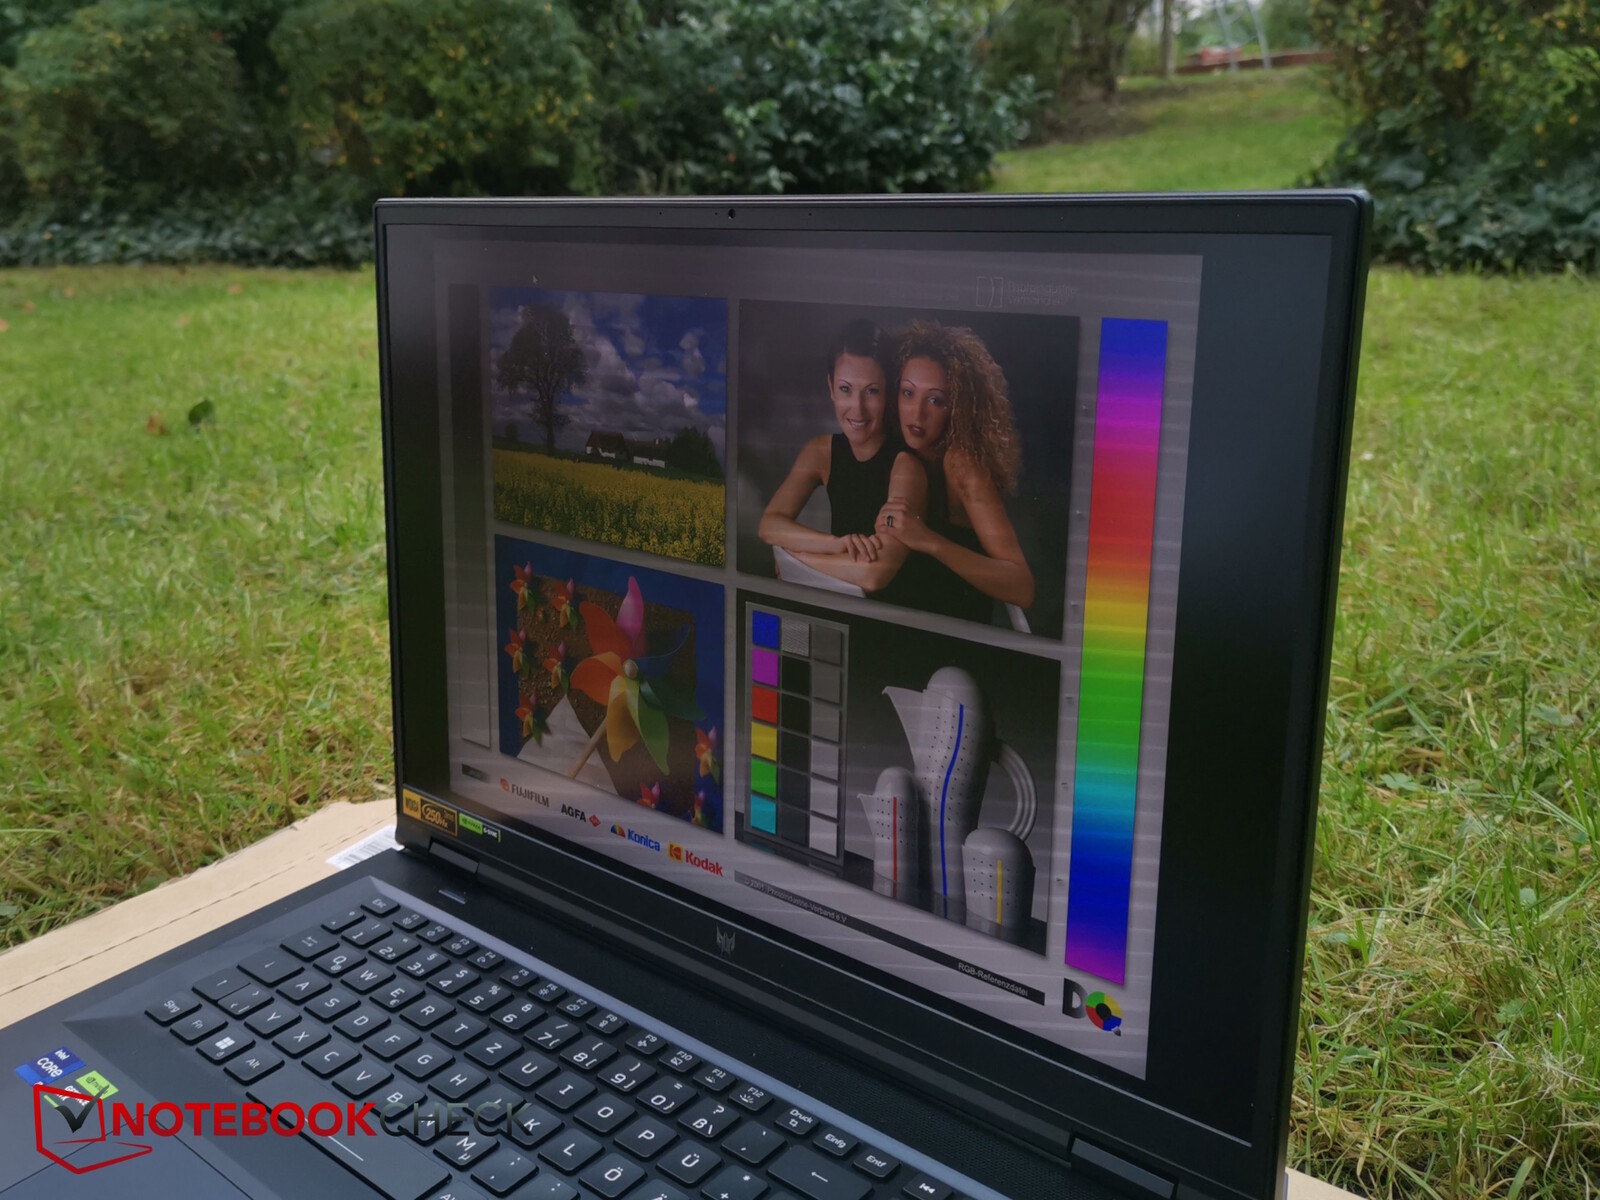
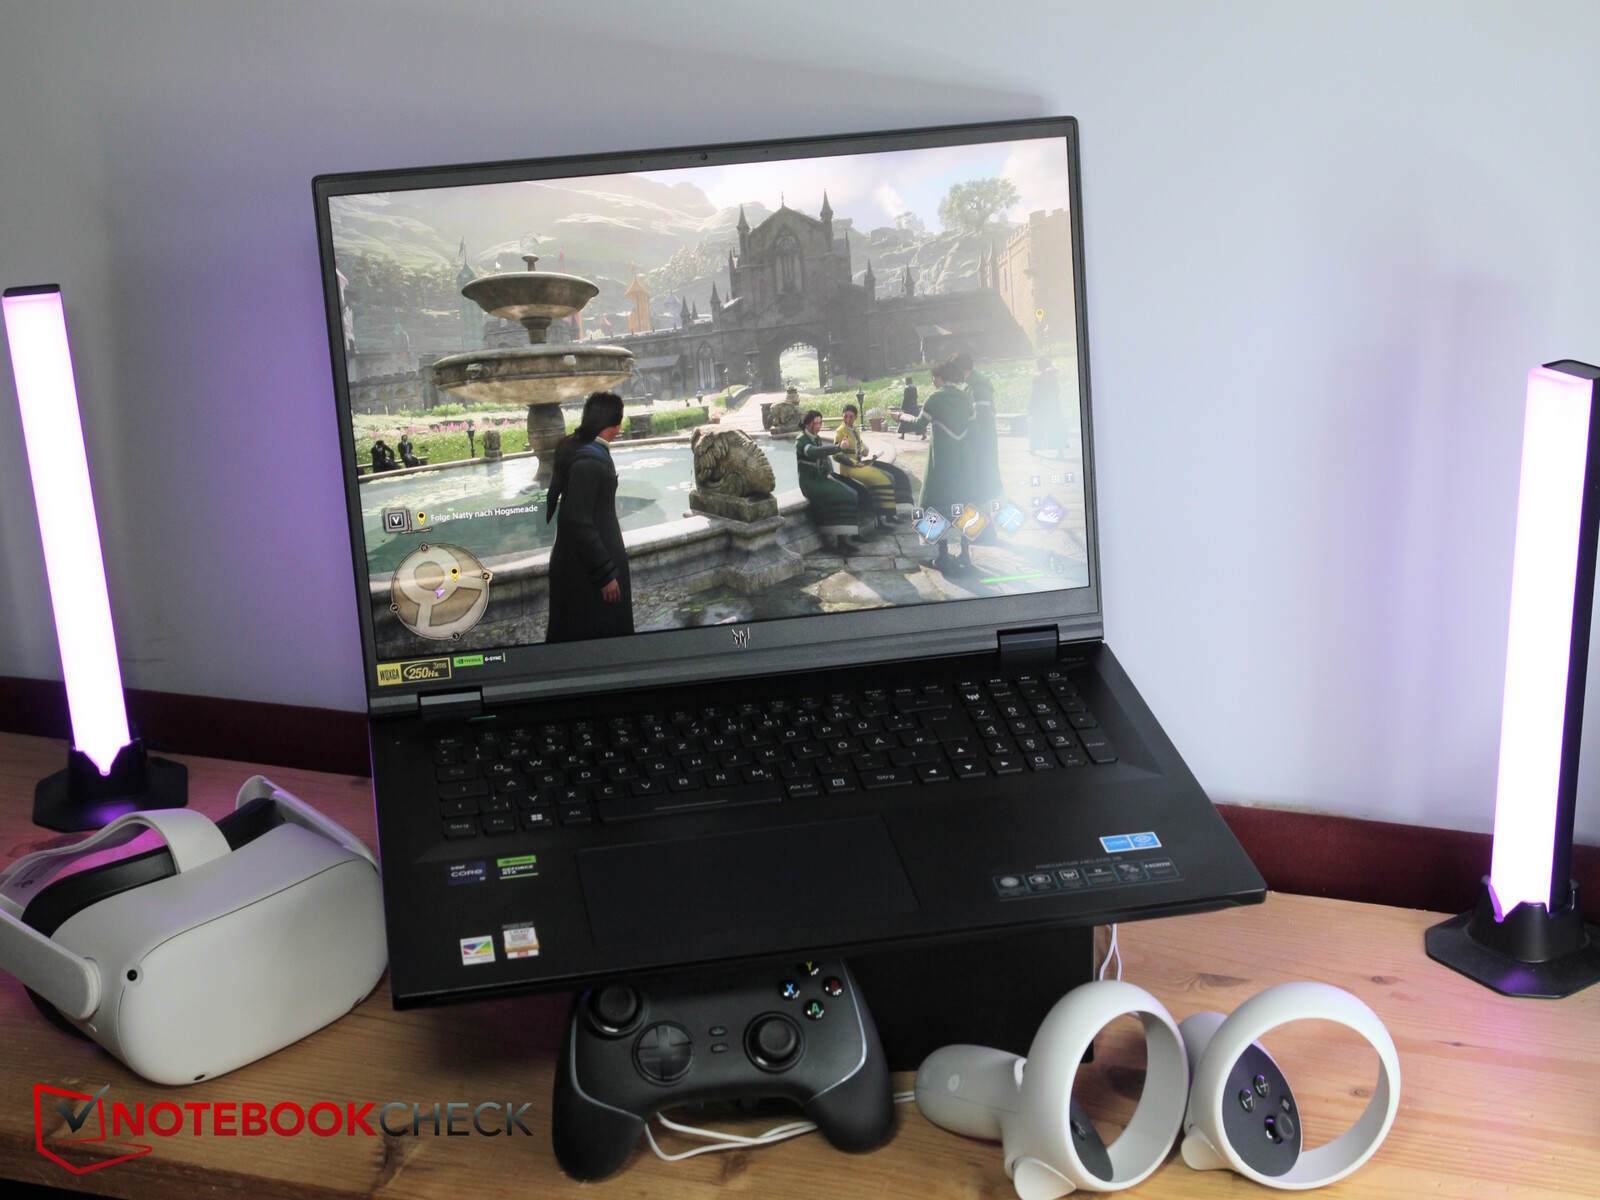
Display - MiniLEDs at over 1,000 nits
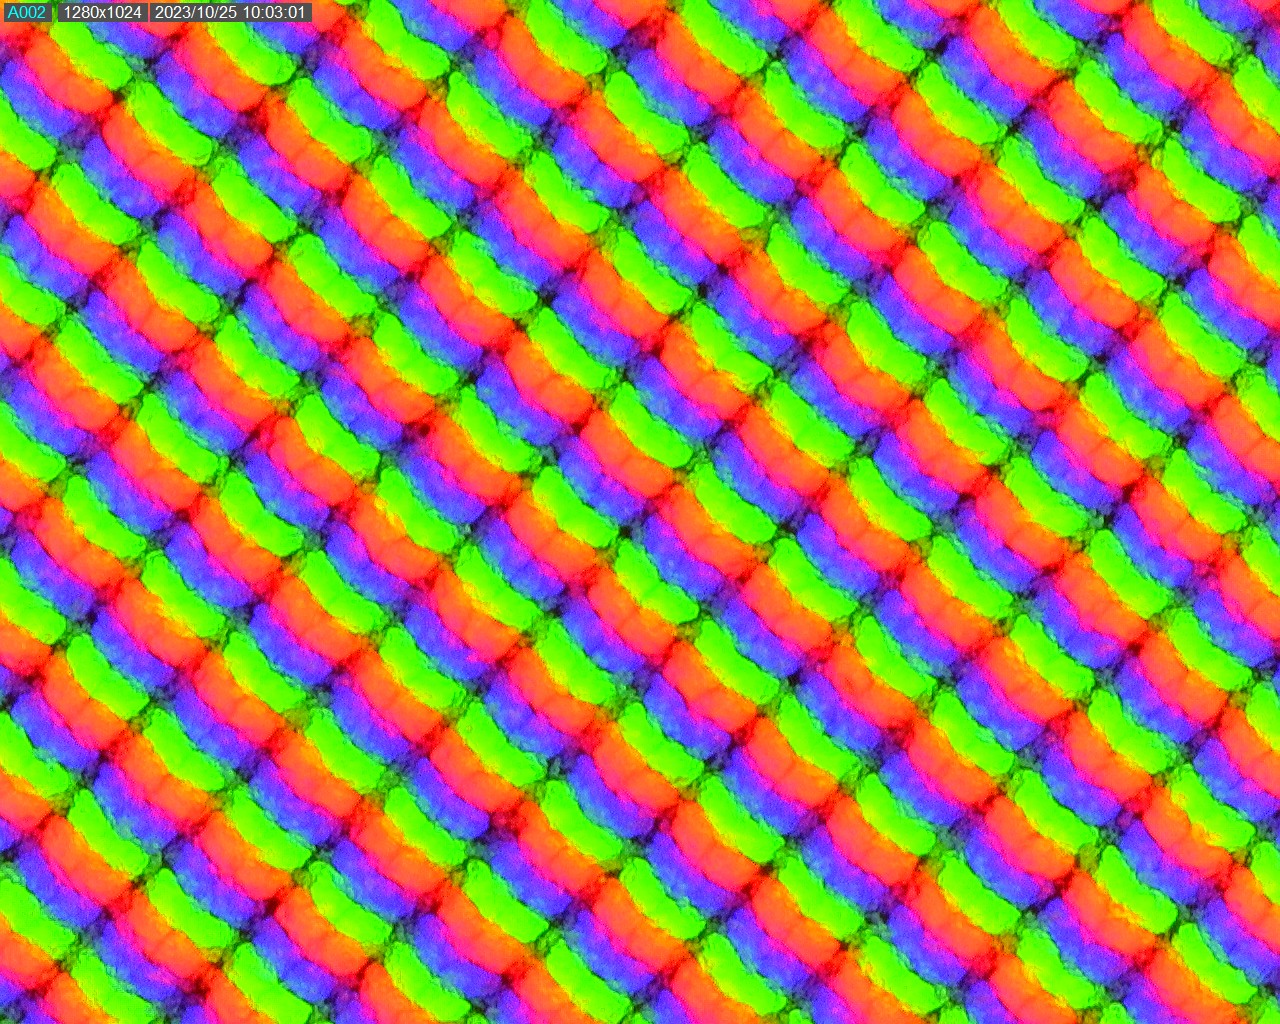
The Helios 18 is optionally available with the fantastic MiniLED display at 250 Hz, which is also installed in our test device. No halos are visible here, the black is rich without any annoying light artifacts, and the contrast is correspondingly good.
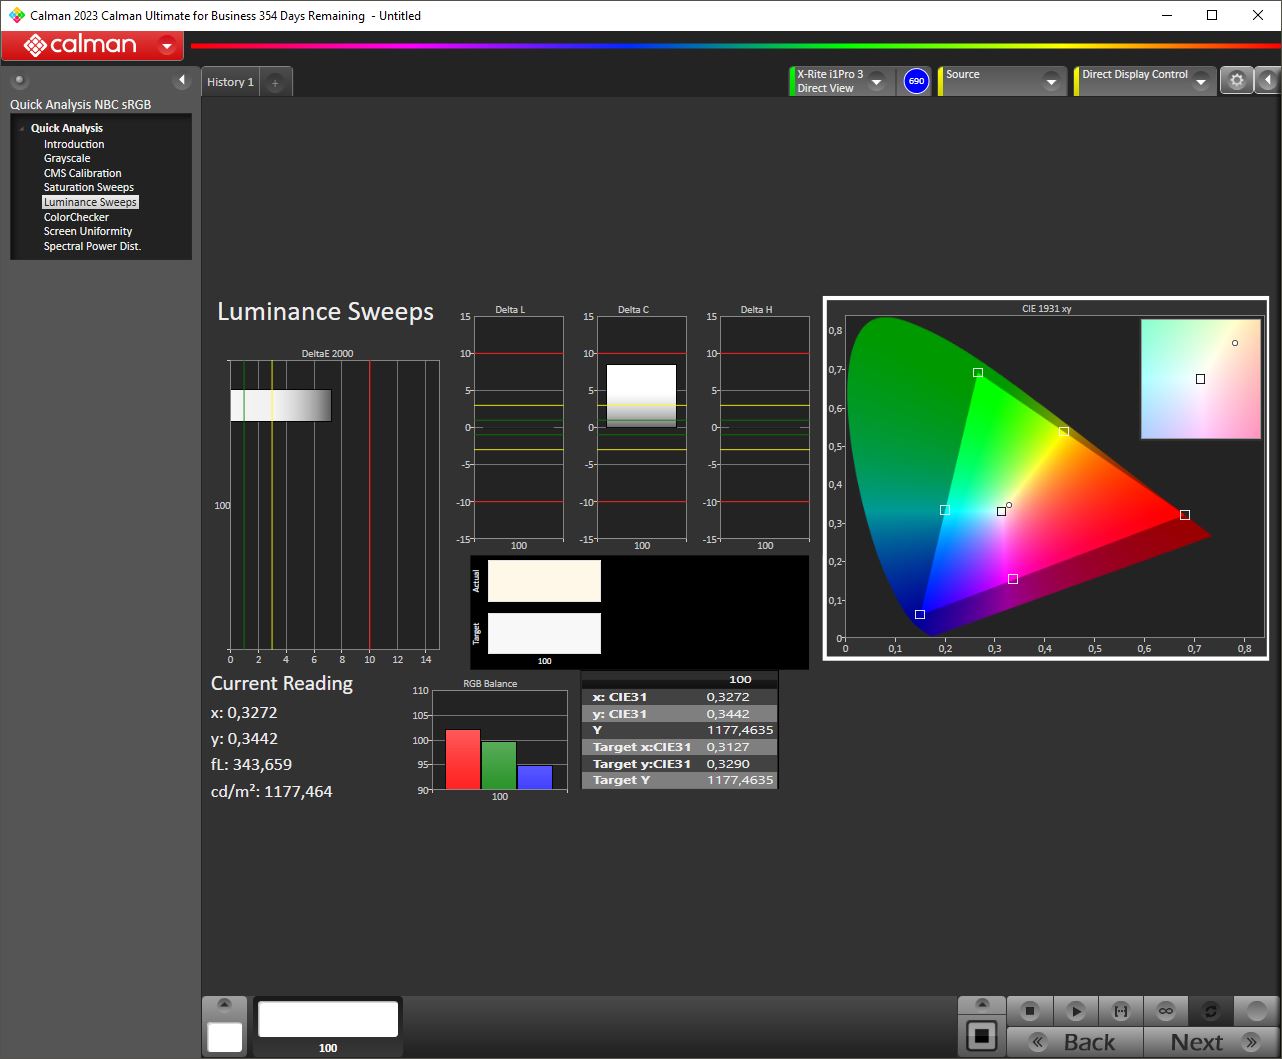
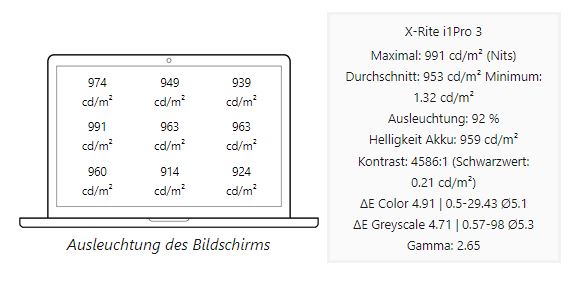
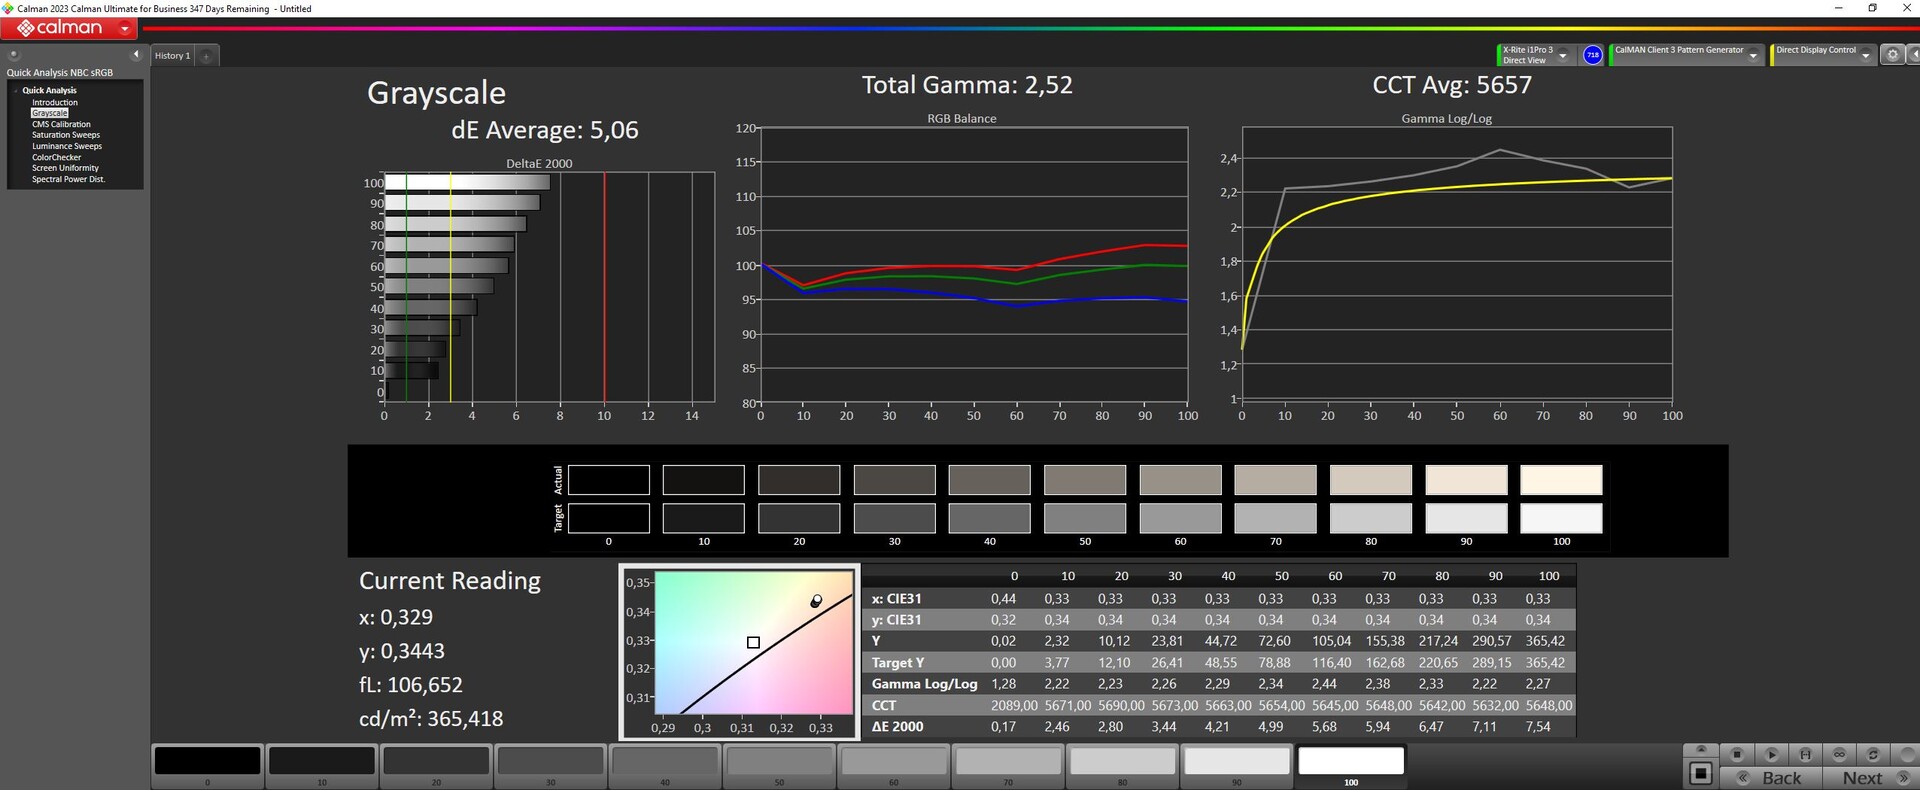
In normal SDR mode, the AU Optronics panel achieves around 350 nits. However, the screen produces even more brightness in HDR mode. Here, we measured a peak brightness of over 1,100 nits! The illumination is a very good 92% in both cases.
Illumination in HDR mode
Illumination in SDR mode
| |||||||||||||||||||||||||
Brightness Distribution: 92 %
Center on Battery: 359 cd/m²
Contrast: 1714:1 (Black: 0.21 cd/m²)
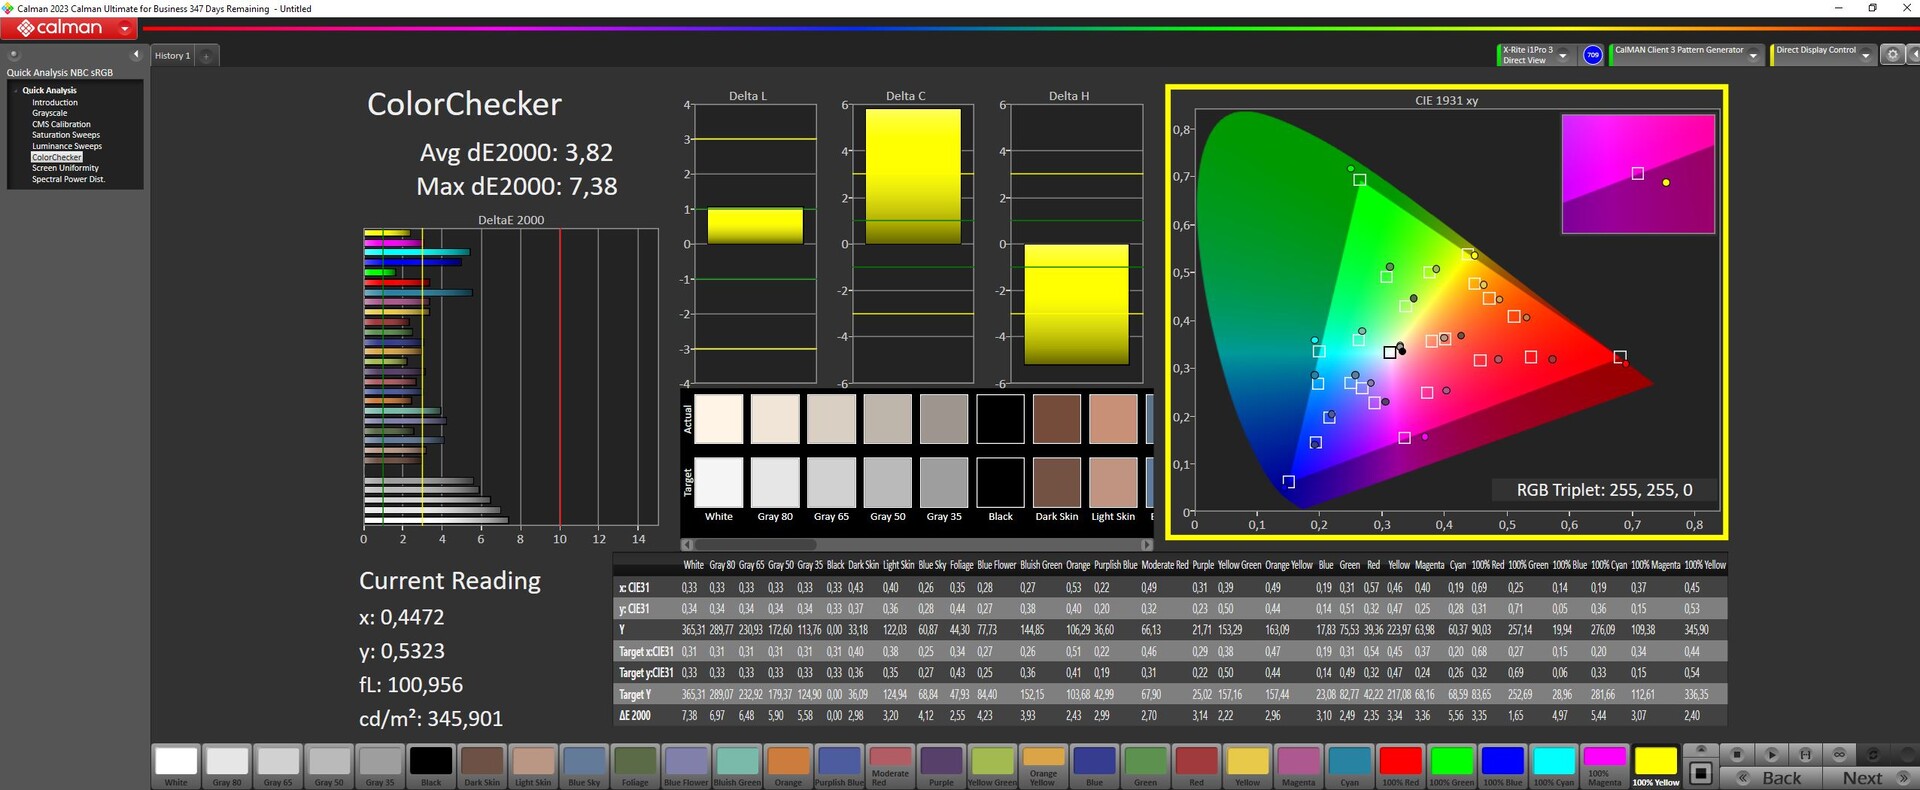
ΔE ColorChecker Calman: 3.82 | ∀{0.5-29.43 Ø4.71}
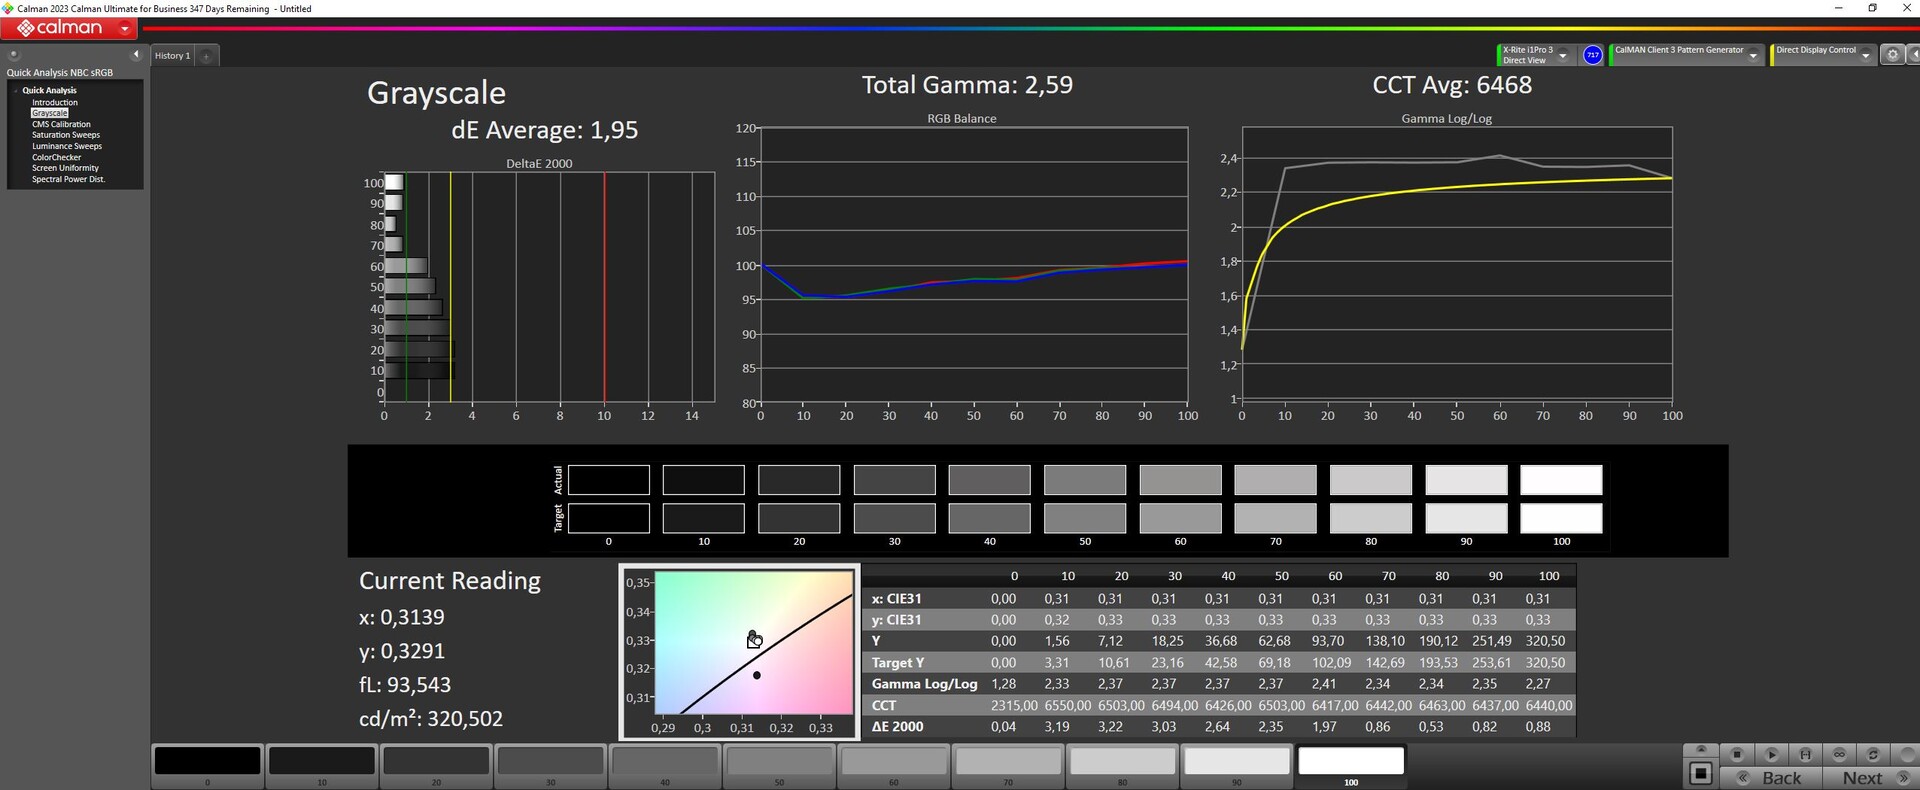
calibrated: 2.24
ΔE Greyscale Calman: 5.06 | ∀{0.09-98 Ø4.96}
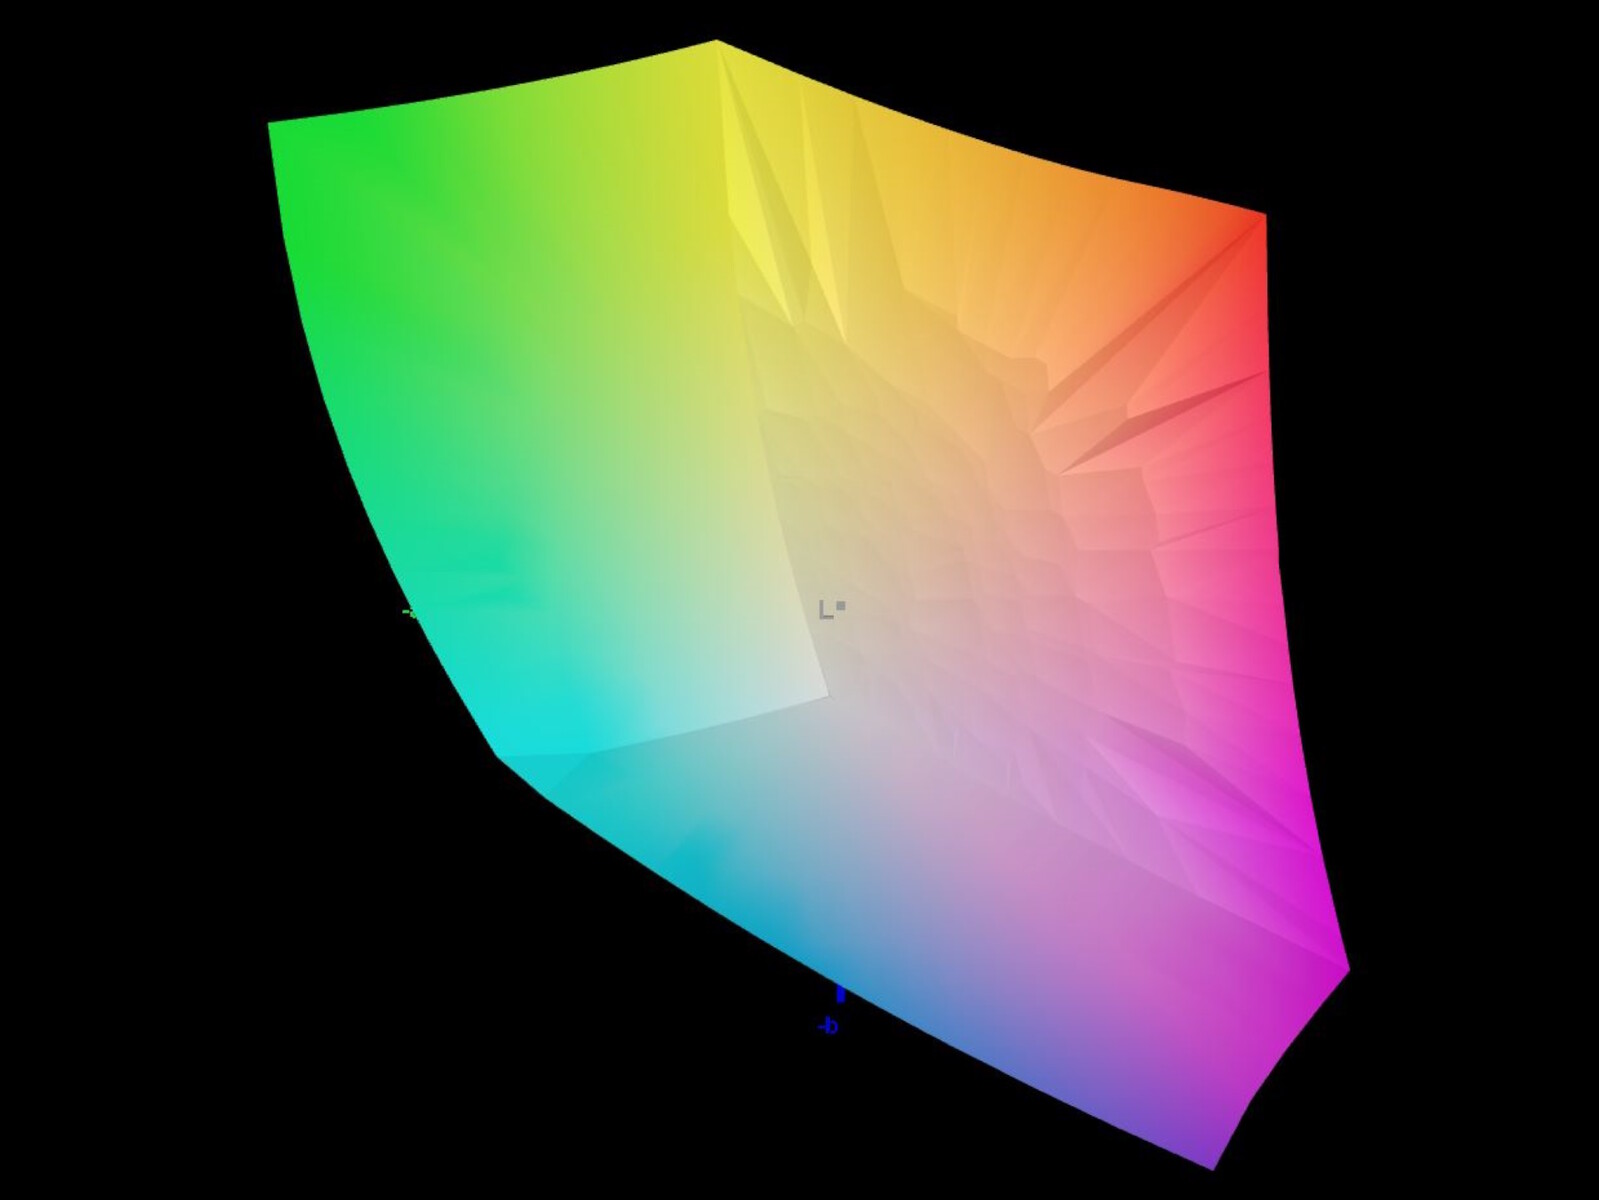
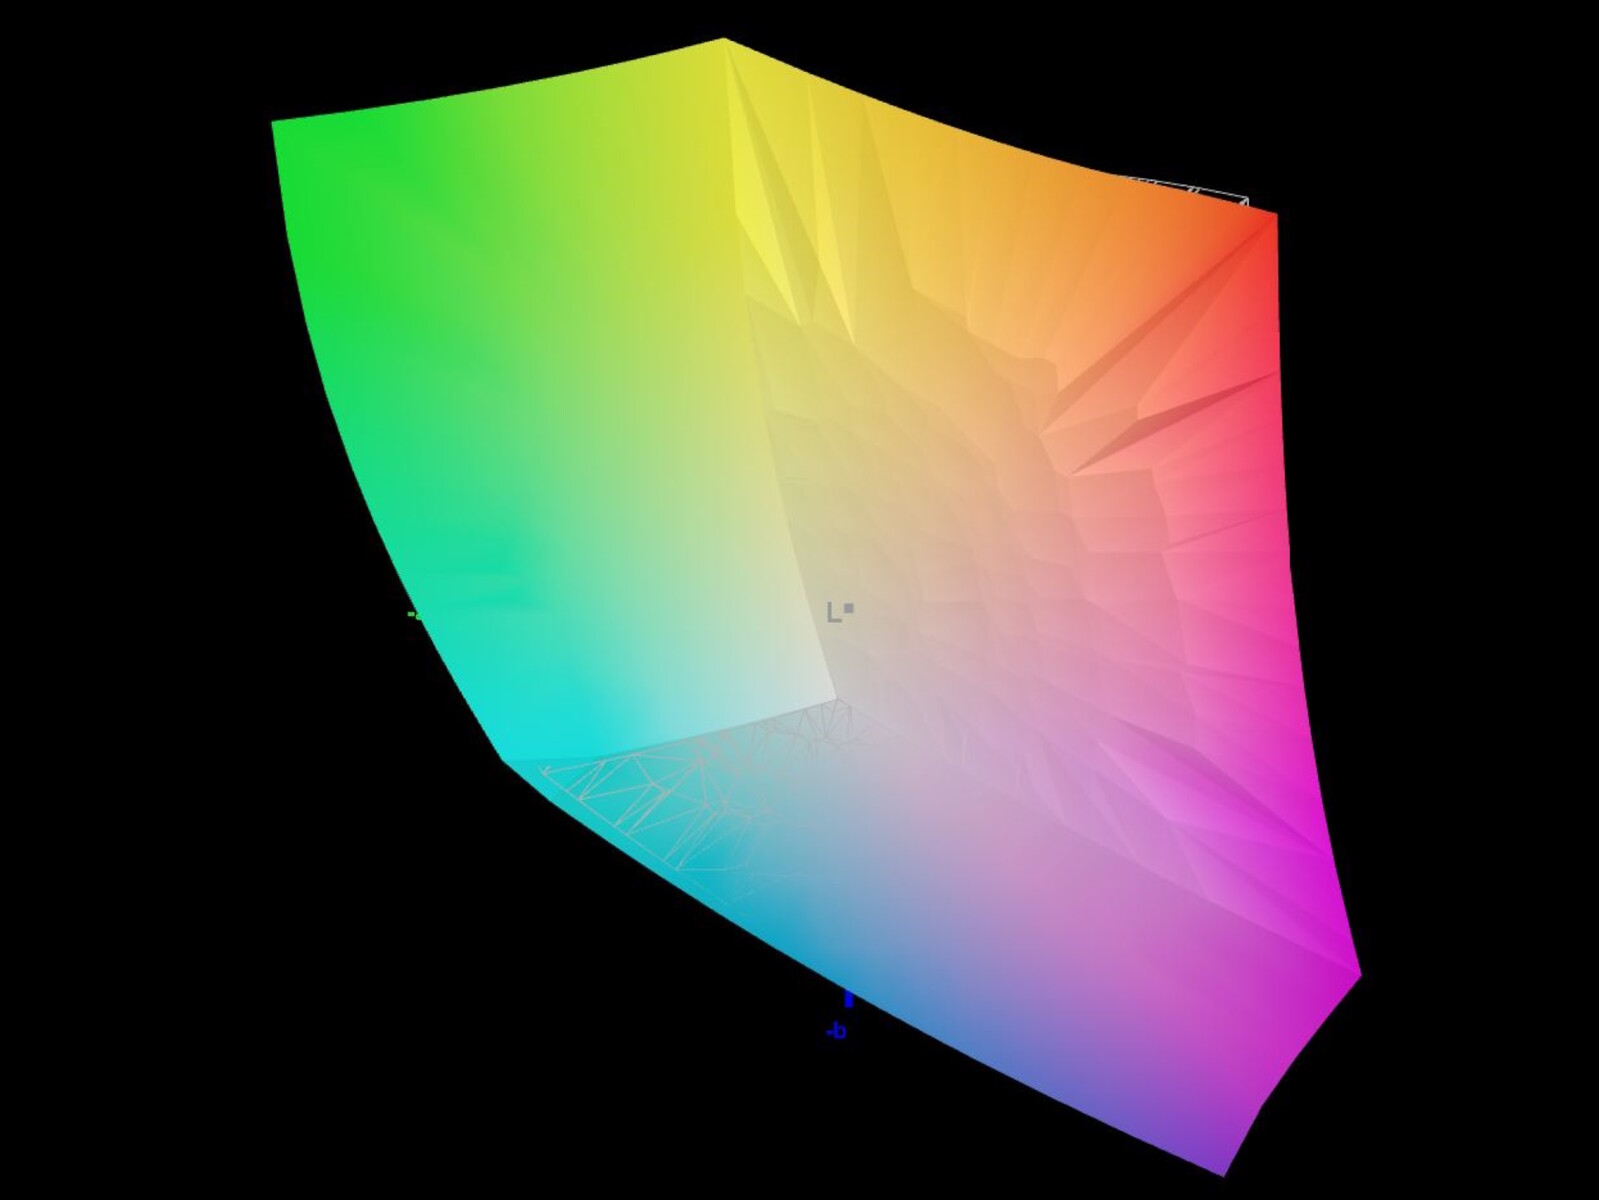
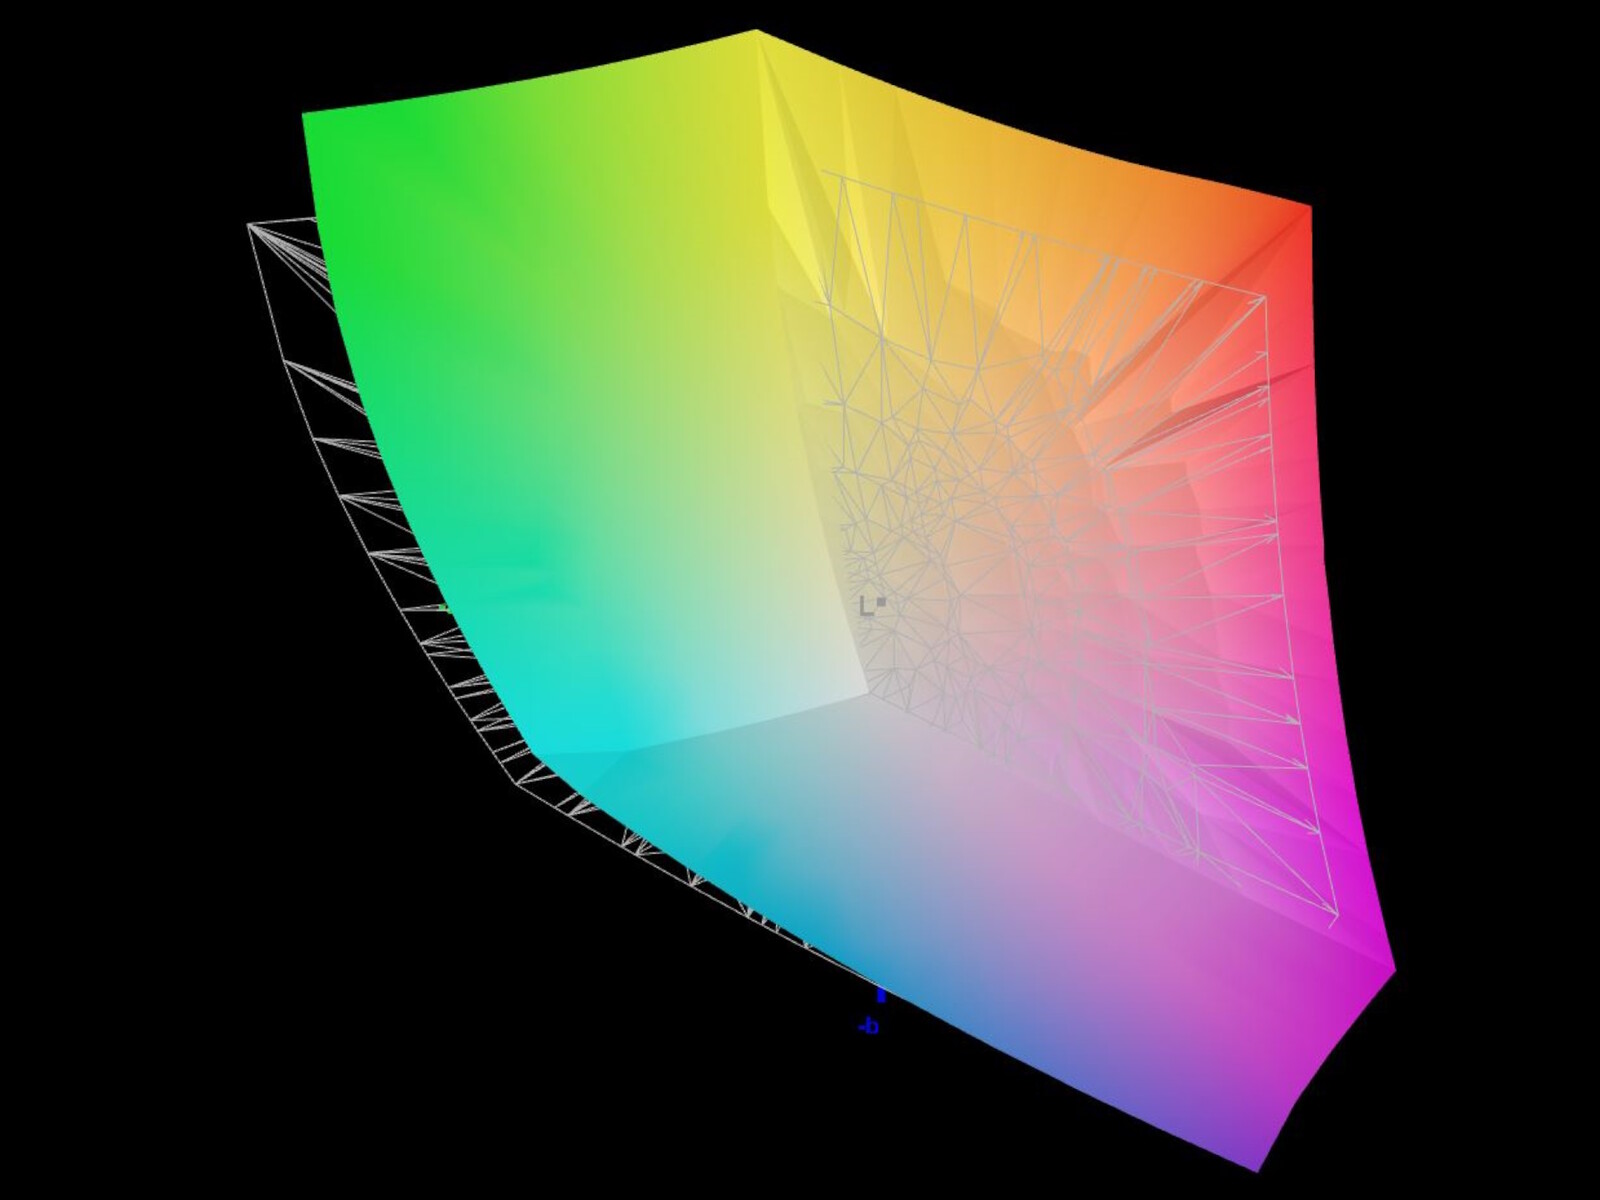
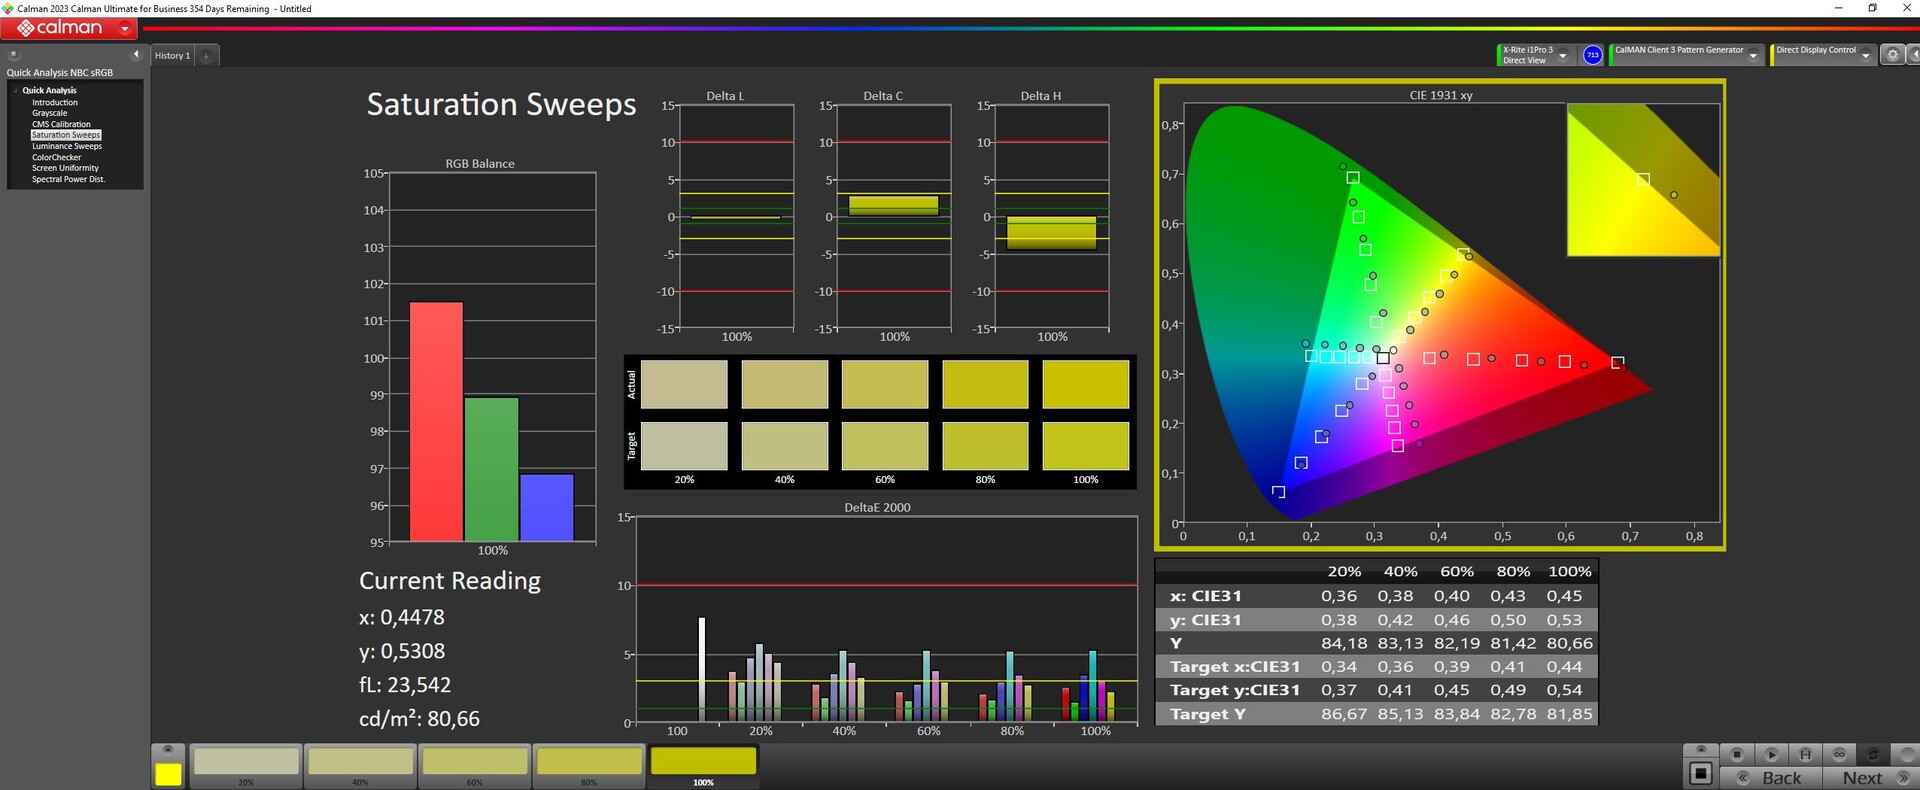
91.8% AdobeRGB 1998 (Argyll 3D)
100% sRGB (Argyll 3D)
99.8% Display P3 (Argyll 3D)
Gamma: 2.52
CCT: 5657 K
| Acer Predator Helios 18 N23Q2 AUO45A8 (B180QAN01.2), IPS, 2560x1600, 18" | MSI GE78HX 13VH-070US AU Optronics B170QAN01.2, IPS, 2560x1600, 17" | HP Omen 17-ck2097ng BOE BOE09BF, IPS, 2560x1440, 17.3" | Alienware m18 R1 Chi Mei 180JME, IPS, 1920x1200, 18" | Asus ROG Strix G18 G814JI NE180QDM-NZ2 (BOE0B35), IPS, 2560x1600, 18" | Razer Blade 18 RTX 4070 AU Optronics B180QAN01.0, IPS, 2560x1600, 18" | |
|---|---|---|---|---|---|---|
| Display | -3% | -19% | -1% | -3% | -3% | |
| Display P3 Coverage (%) | 99.8 | 97.6 -2% | 67.4 -32% | 97.7 -2% | 98.1 -2% | 96.9 -3% |
| sRGB Coverage (%) | 100 | 99.9 0% | 97.6 -2% | 100 0% | 99.9 0% | 99.8 0% |
| AdobeRGB 1998 Coverage (%) | 91.8 | 86.5 -6% | 69.6 -24% | 89.8 -2% | 85.6 -7% | 85.3 -7% |
| Response Times | 55% | -28% | 53% | 38% | 50% | |
| Response Time Grey 50% / Grey 80% * (ms) | 7.6 ? | 4.2 ? 45% | 15.6 ? -105% | 3 ? 61% | 5.6 ? 26% | 4.2 ? 45% |
| Response Time Black / White * (ms) | 17.8 ? | 6.4 ? 64% | 8.9 ? 50% | 9.9 ? 44% | 9 ? 49% | 8 ? 55% |
| PWM Frequency (Hz) | 2509 | |||||
| Screen | -17% | 13% | 20% | 8% | -3% | |
| Brightness middle (cd/m²) | 360 | 398.6 11% | 371 3% | 372.8 4% | 471 31% | 549.6 53% |
| Brightness (cd/m²) | 355 | 384 8% | 350 -1% | 367 3% | 422 19% | 524 48% |
| Brightness Distribution (%) | 92 | 89 -3% | 90 -2% | 97 5% | 83 -10% | 89 -3% |
| Black Level * (cd/m²) | 0.21 | 0.46 -119% | 0.32 -52% | 0.32 -52% | 0.47 -124% | 0.53 -152% |
| Contrast (:1) | 1714 | 867 -49% | 1159 -32% | 1165 -32% | 1002 -42% | 1037 -39% |
| Colorchecker dE 2000 * | 3.82 | 4.05 -6% | 1.74 54% | 1.92 50% | 2.05 46% | 3.32 13% |
| Colorchecker dE 2000 max. * | 7.38 | 8.68 -18% | 3.59 51% | 3.65 51% | 4.15 44% | 6.63 10% |
| Colorchecker dE 2000 calibrated * | 2.24 | 1.02 54% | 1.01 55% | 0.51 77% | 0.8 64% | 2.7 -21% |
| Greyscale dE 2000 * | 5.06 | 6.5 -28% | 2.8 45% | 1.5 70% | 2.8 45% | 2 60% |
| Gamma | 2.52 87% | 2.11 104% | 2.19 100% | 2.34 94% | 2.204 100% | 2.29 96% |
| CCT | 5657 115% | 7518 86% | 6474 100% | 6607 98% | 7122 91% | 6319 103% |
| Total Average (Program / Settings) | 12% /
-4% | -11% /
1% | 24% /
20% | 14% /
10% | 15% /
4% |
* ... smaller is better
We measured against the P3 color space. The display covers sRGB and DisplayP3 almost completely. AdobeRGB has 92 percent coverage. Thanks to P3 in particular, the bright and high-contrast screen is also suitable for image and video editing.
However, out of the box, the display shoots above the important DeltaE value of 3 for colors and grayscale. Our manual calibration improves the color deviations and pushes the DeltaE values below the threshold. Lowering the brightness to 160 nits can also bring further improvement. Our calibrated icc file can be downloaded free of charge above.
Display Response Times
| ↔ Response Time Black to White | ||
|---|---|---|
| 17.8 ms ... rise ↗ and fall ↘ combined | ↗ 15.6 ms rise | 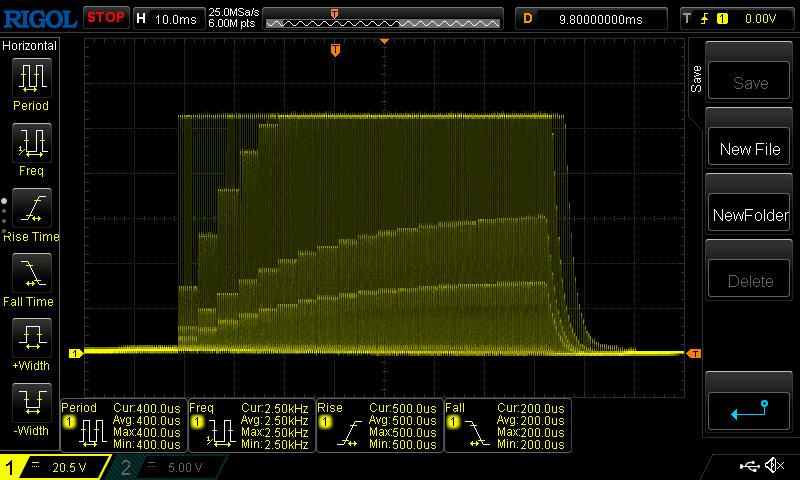 |
| ↘ 2.2 ms fall | ||
| The screen shows good response rates in our tests, but may be too slow for competitive gamers. In comparison, all tested devices range from 0.1 (minimum) to 240 (maximum) ms. » 40 % of all devices are better. This means that the measured response time is better than the average of all tested devices (19.8 ms). | ||
| ↔ Response Time 50% Grey to 80% Grey | ||
| 7.6 ms ... rise ↗ and fall ↘ combined | ↗ 4.4 ms rise | 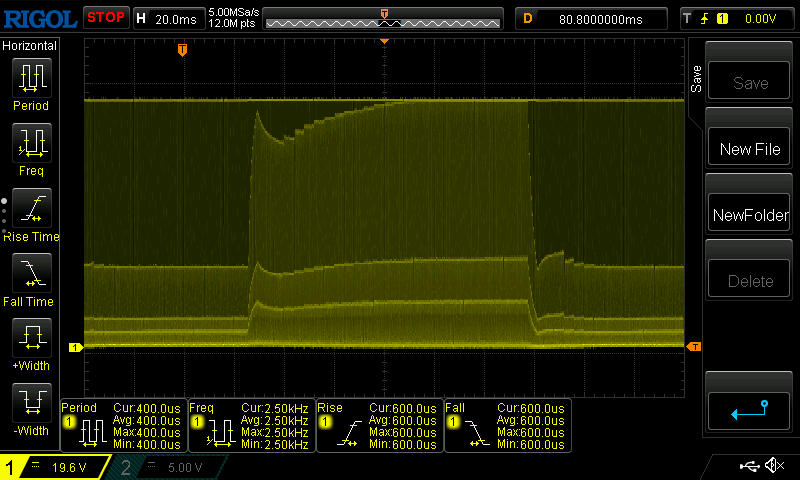 |
| ↘ 3.2 ms fall | ||
| The screen shows very fast response rates in our tests and should be very well suited for fast-paced gaming. In comparison, all tested devices range from 0.165 (minimum) to 636 (maximum) ms. » 20 % of all devices are better. This means that the measured response time is better than the average of all tested devices (31 ms). | ||
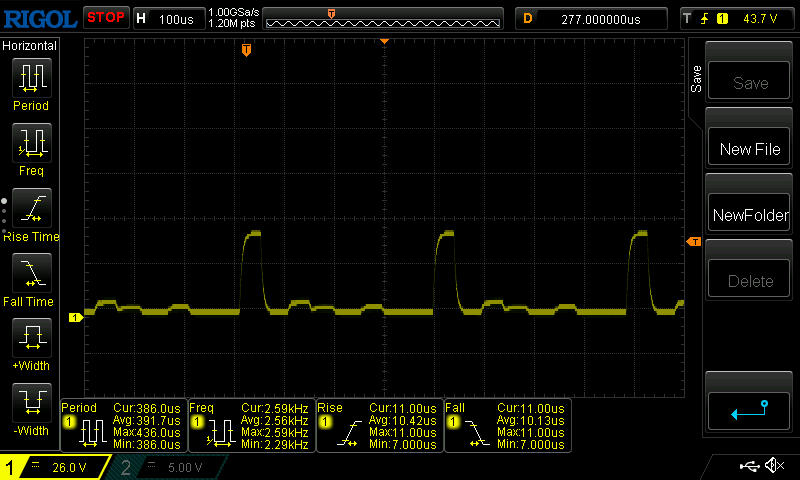
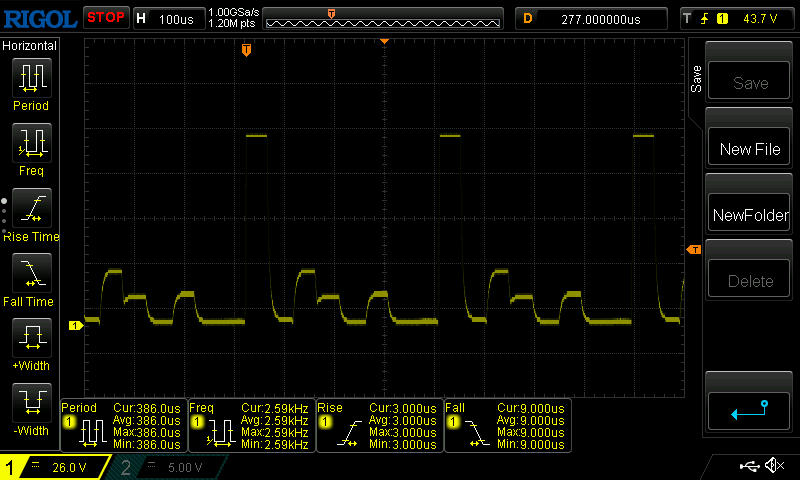
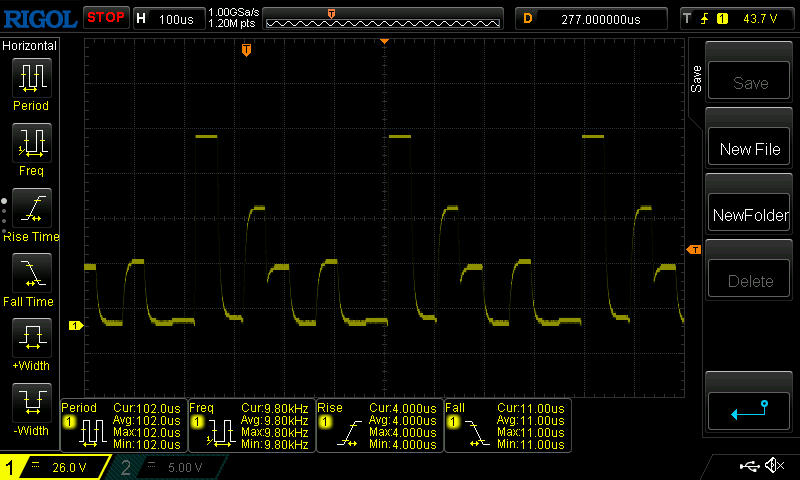
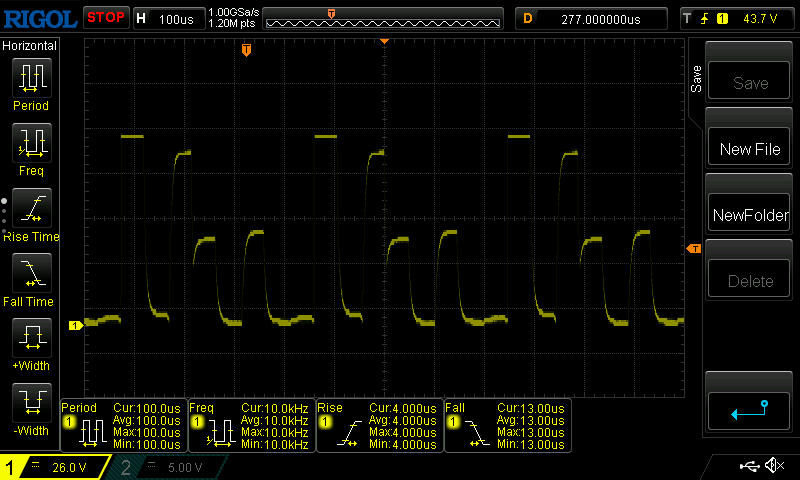
Screen Flickering / PWM (Pulse-Width Modulation)
| Screen flickering / PWM detected | 2509 Hz | 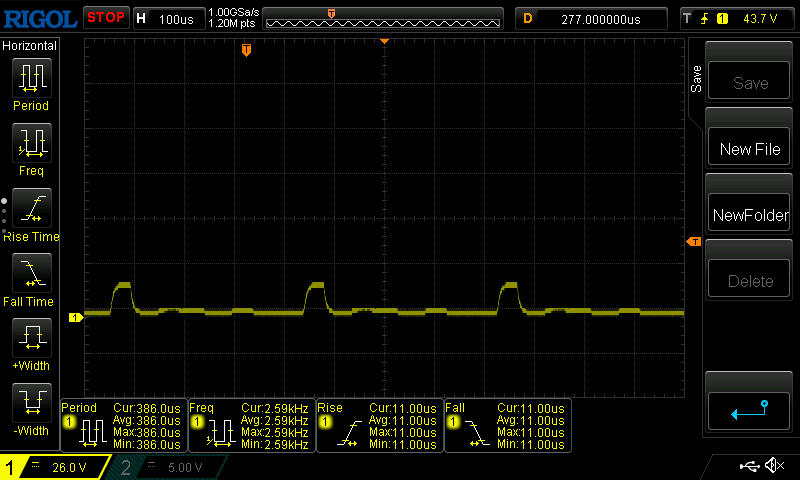 | |
The display backlight flickers at 2509 Hz (worst case, e.g., utilizing PWM) . The frequency of 2509 Hz is quite high, so most users sensitive to PWM should not notice any flickering. In comparison: 52 % of all tested devices do not use PWM to dim the display. If PWM was detected, an average of 7757 (minimum: 5 - maximum: 343500) Hz was measured. | |||
PWM is used for brightness control in the display. At minimum brightness, the frequency is lowest at around 2.5 kHz, but still high enough not to cause problems for sensitive individuals.
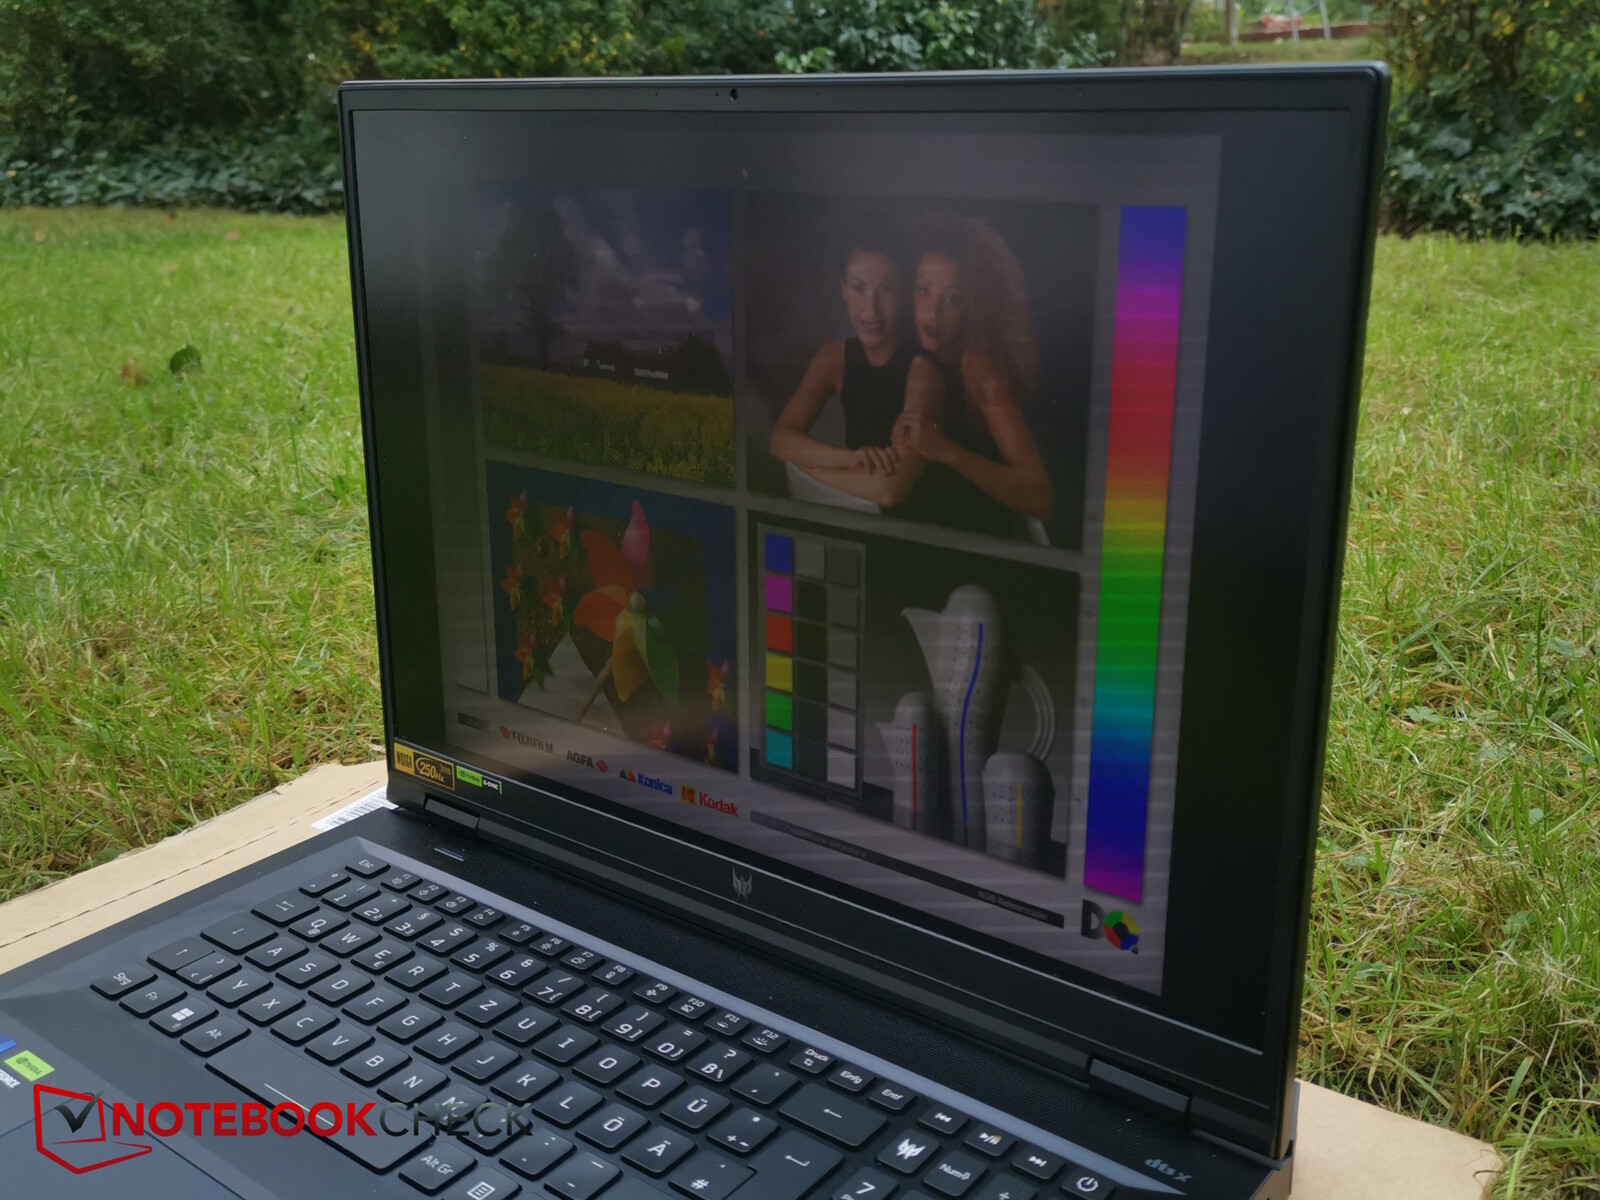
Outdoors, it may be worthwhile setting the screen to HDR to make it even brighter. In the shade, content can still be seen very well.

Performance - HX CPU and RTX 4080
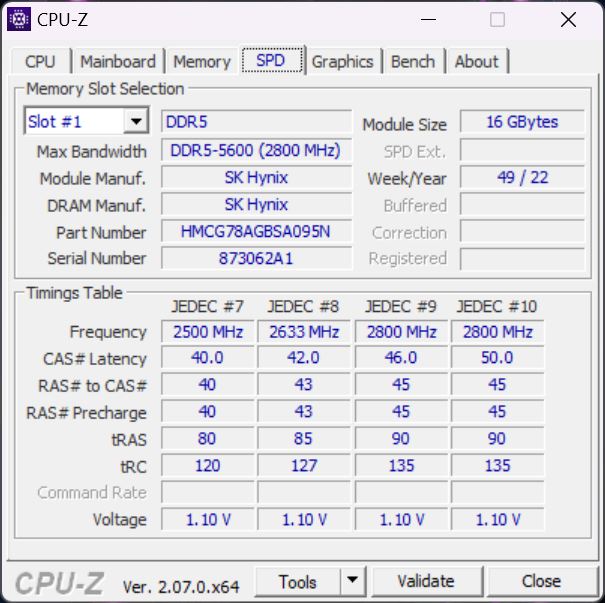
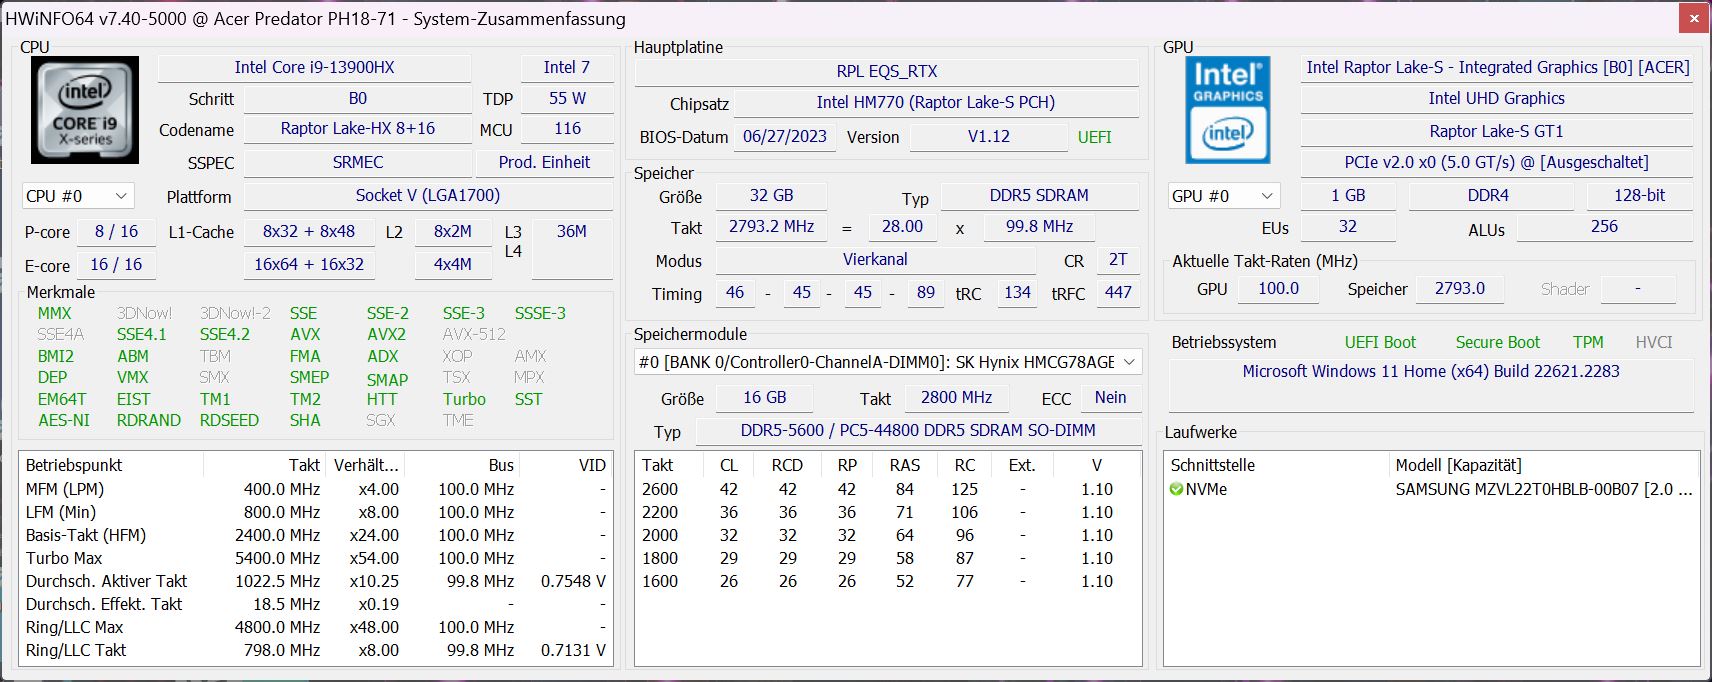
Equipped with an Intel Core i9-13900HX and a GeForce RTX 4080 Laptop GPU, plus 32 GB of RAM and an 18-inch MiniLED display, we have an extremely powerful desktop replacement and high-end gamer that should render all current games smoothly, even in the native WQXGA resolution.
Thanks to the good display, the laptop can also serve as a workstation for creative people.
Testing Conditions
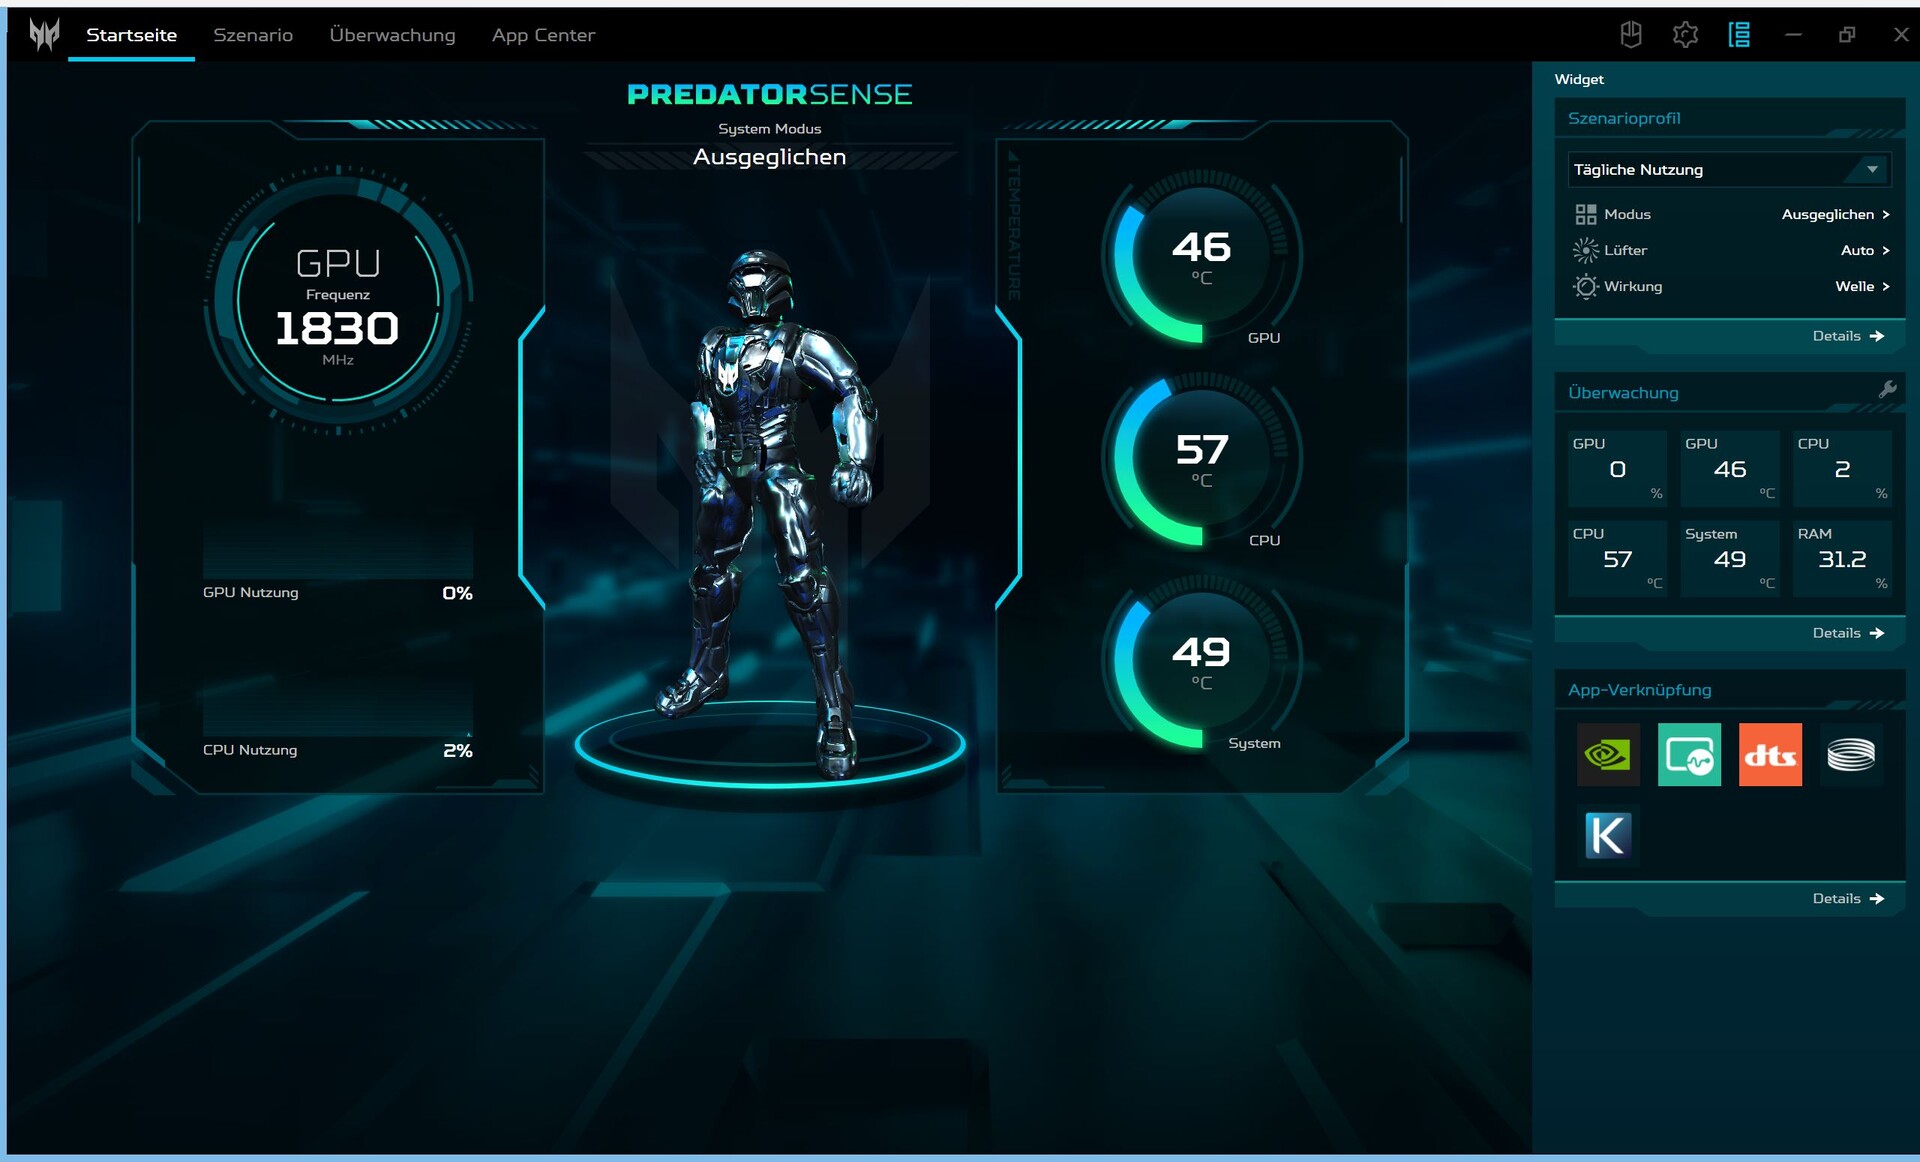
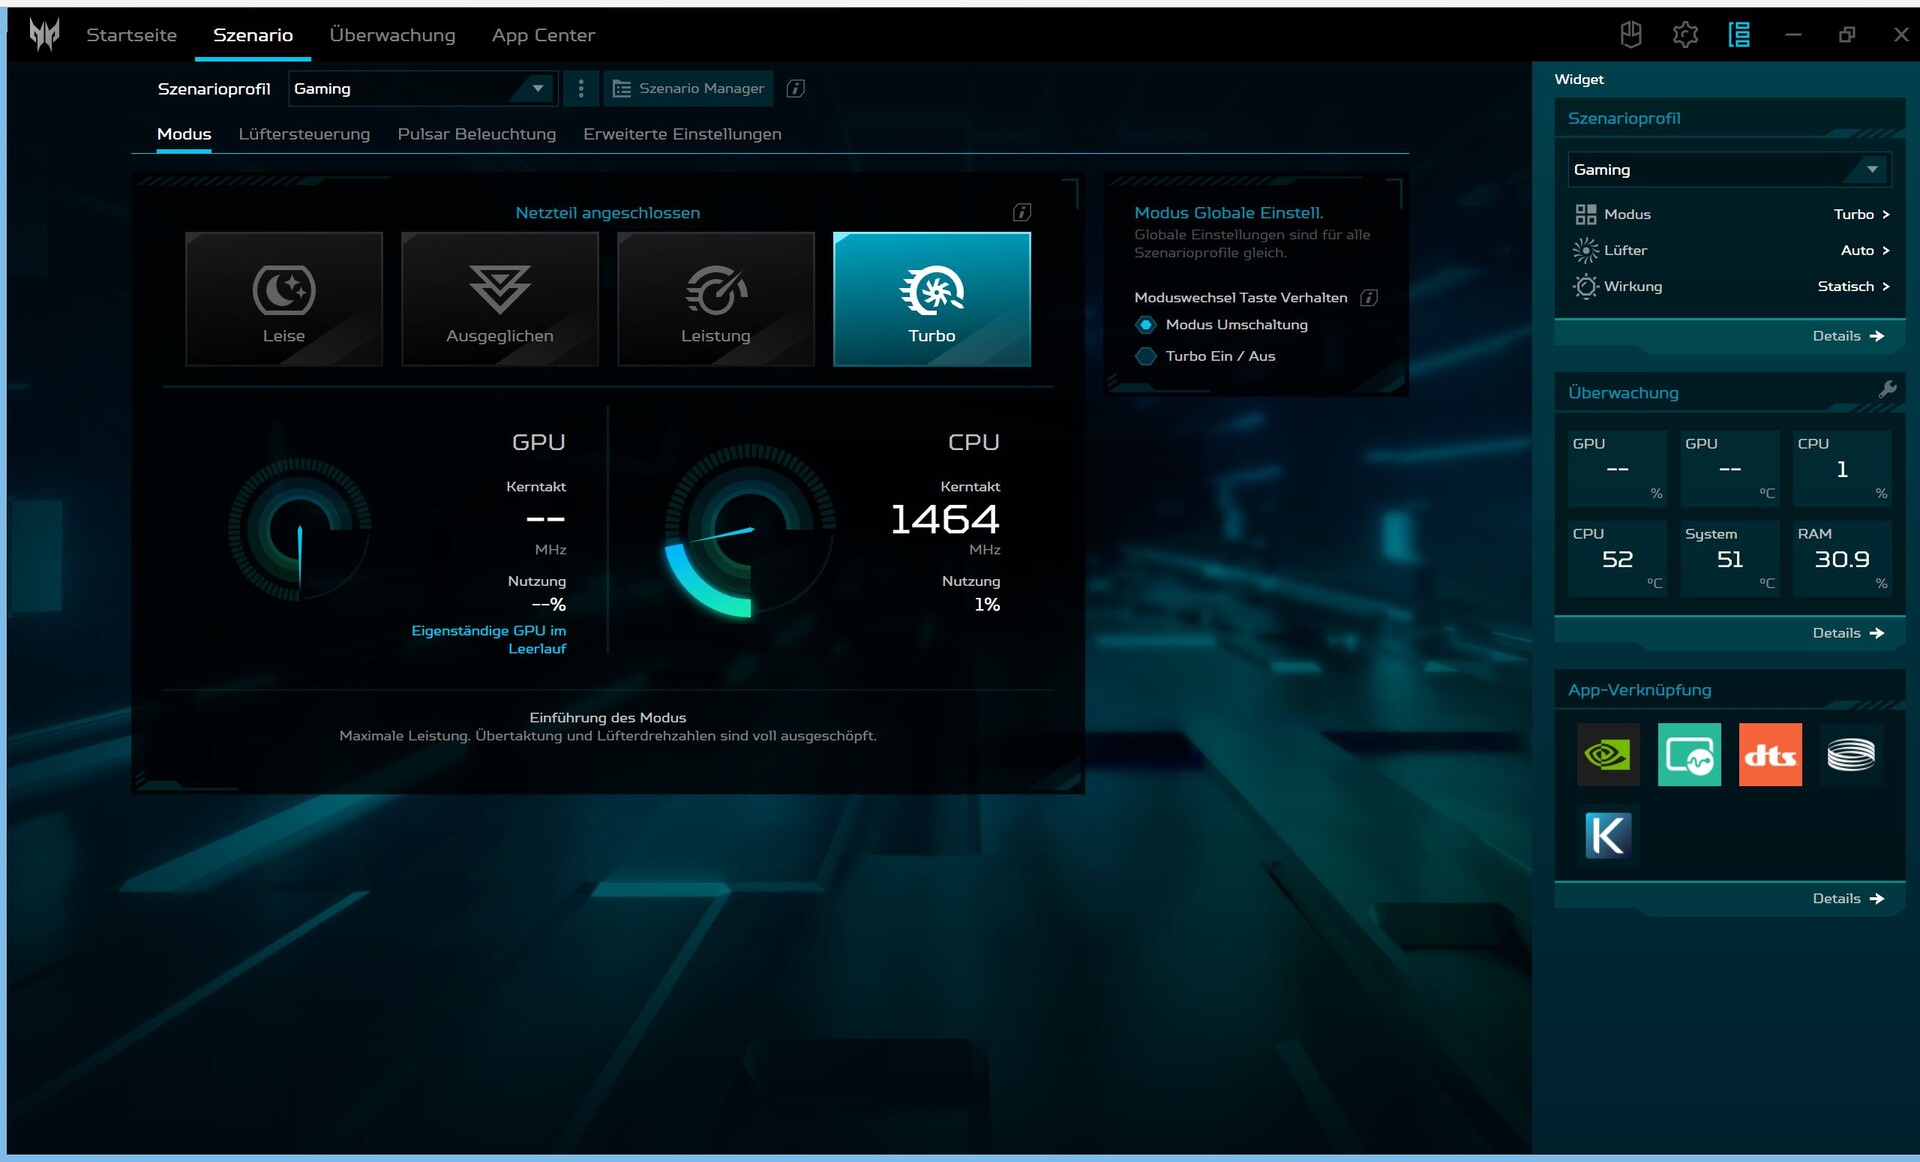
Acer installs, among other things, Predator Sense software on its gaming laptop. Four performance modes (Eco, Balanced, Performance, Turbo) as well as other options (e.g. for keyboard lighting) can be customized here. The software is quite clear, but does not offer nearly as many (manual) settings as competing devices. For example, we lack an option for GPU switching as well as settings for manually adjusting the performance parameters.
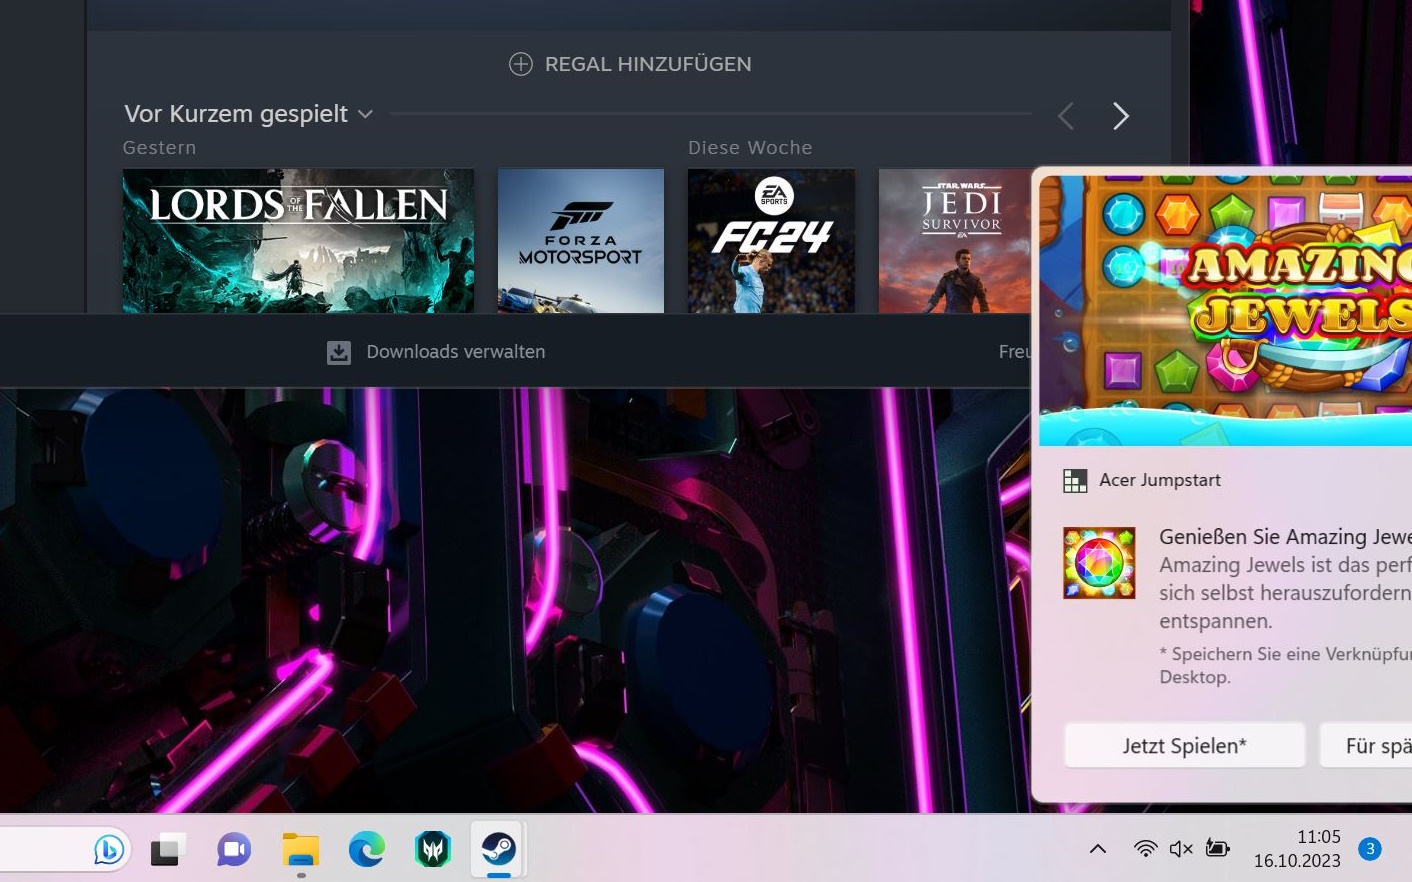
Unfortunately, Acer also installs other software such as McAfee or Acer Care, which is more about support. Furthermore, we received unsolicited advertising from Acer. Once we even received an unsolicited request to install the Opera browser. Such forced advertising via mandatory manufacturer software is a real nuisance and is unfortunately becoming more and more frequent, for example by Lenovo in the LOQ 16. Clicking on the "Planet9" games hub in Sense triggers a cookie request that includes annoying, various "legitimate interest" buttons, which all have to be individually deselected if users wish to opt out.
We mainly used Turbo mode for the best benchmark results, but we also list information about the other modes.

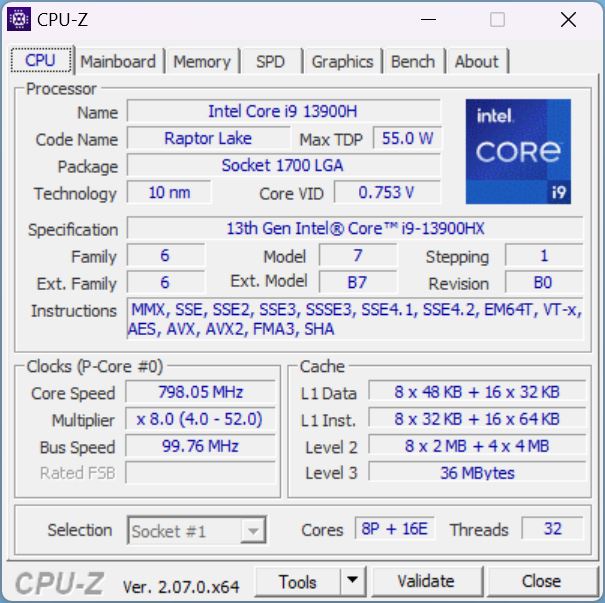
Processor
The Intel Core i9-13900HX is a true high-end CPU from the Raptor-Lake series. It can run 32 threads with 8 P-cores (including hyperthreading) and 16 E-cores. Its cores have a base clock of 1.6 (E cores) and 2.2 GHz (P cores) and reach a single-core turbo of 3.9 - 5.4 GHz.
In the Cinebench R15 loop (CB15 loop), the Helios delivers strong and, above all, consistent performance, which is, however, minimally outperformed by the MSI GE78HX and the Alienware m18 R1 with a slightly more powerful CPU (i9-13950HX und i9-13980HX). The Helios easily outperforms the HP Omen with the same CPU, as well as competing devices with H instead of HX CPUs.
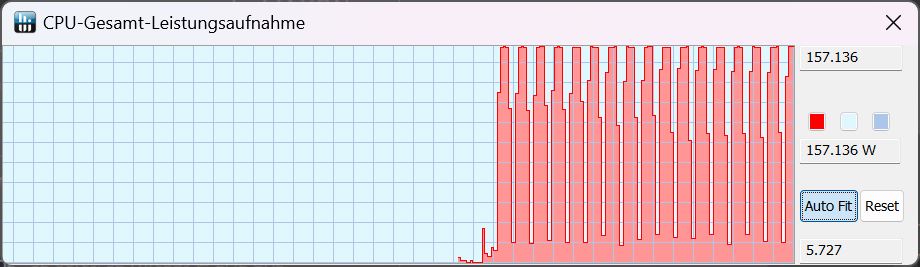
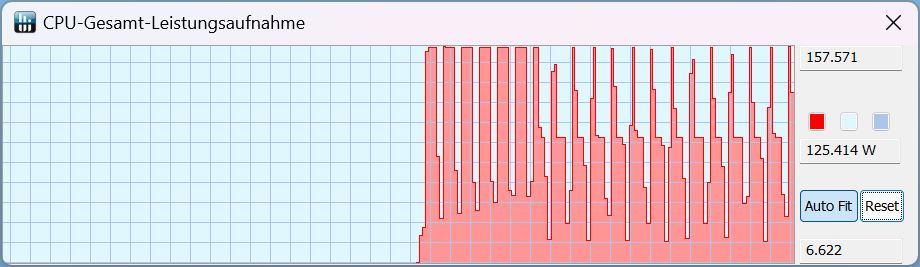
We have listed all TDP values achieved for each performance mode during the CB15 loops in a table below. In battery mode, you still have the choice between the Balanced and Eco modes. In both modes, the TDP is still 25 W and the CB15 score around 1,300 points, a drop of over 70%! So there is no real performance difference between the two modes.
| TDP/Performance mode | Turbo | Performance | Balanced | Silent | Battery Balanced | Battery Silent |
|---|---|---|---|---|---|---|
| Start of CB15 | 157 | 157 | 157 | 157 | 25 | 25 |
| Later CB15 history | 157 | 125 | 85 | 25 | 55 | 25 |
Cinebench R15 Multi Sustained Load
Cinebench R23: Multi Core | Single Core
Cinebench R20: CPU (Multi Core) | CPU (Single Core)
Cinebench R15: CPU Multi 64Bit | CPU Single 64Bit
Blender: v2.79 BMW27 CPU
7-Zip 18.03: 7z b 4 | 7z b 4 -mmt1
Geekbench 5.5: Multi-Core | Single-Core
HWBOT x265 Benchmark v2.2: 4k Preset
LibreOffice : 20 Documents To PDF
R Benchmark 2.5: Overall mean
| CPU Performance rating | |
| MSI GE78HX 13VH-070US | |
| Alienware m18 R1 | |
| Acer Predator Helios 18 N23Q2 | |
| Razer Blade 18 RTX 4070 | |
| Average Intel Core i9-13900HX | |
| HP Omen 17-ck2097ng | |
| Average of class Gaming | |
| Asus ROG Strix G18 G814JI | |
| Cinebench R23 / Multi Core | |
| MSI GE78HX 13VH-070US | |
| Alienware m18 R1 | |
| Acer Predator Helios 18 N23Q2 | |
| Razer Blade 18 RTX 4070 | |
| Average Intel Core i9-13900HX (24270 - 32623, n=23) | |
| HP Omen 17-ck2097ng | |
| Average of class Gaming (10488 - 42661, n=107, last 2 years) | |
| Asus ROG Strix G18 G814JI | |
| Cinebench R23 / Single Core | |
| MSI GE78HX 13VH-070US | |
| Alienware m18 R1 | |
| HP Omen 17-ck2097ng | |
| Acer Predator Helios 18 N23Q2 | |
| Razer Blade 18 RTX 4070 | |
| Average Intel Core i9-13900HX (1867 - 2105, n=20) | |
| Average of class Gaming (1166 - 2415, n=107, last 2 years) | |
| Asus ROG Strix G18 G814JI | |
| Cinebench R20 / CPU (Multi Core) | |
| MSI GE78HX 13VH-070US | |
| Alienware m18 R1 | |
| Acer Predator Helios 18 N23Q2 | |
| Razer Blade 18 RTX 4070 | |
| Average Intel Core i9-13900HX (9152 - 12541, n=21) | |
| Average of class Gaming (4029 - 16433, n=106, last 2 years) | |
| HP Omen 17-ck2097ng | |
| Asus ROG Strix G18 G814JI | |
| Cinebench R20 / CPU (Single Core) | |
| Alienware m18 R1 | |
| HP Omen 17-ck2097ng | |
| Acer Predator Helios 18 N23Q2 | |
| MSI GE78HX 13VH-070US | |
| Razer Blade 18 RTX 4070 | |
| Average Intel Core i9-13900HX (722 - 810, n=21) | |
| Average of class Gaming (442 - 913, n=106, last 2 years) | |
| Asus ROG Strix G18 G814JI | |
| Cinebench R15 / CPU Multi 64Bit | |
| MSI GE78HX 13VH-070US | |
| Alienware m18 R1 | |
| Acer Predator Helios 18 N23Q2 | |
| Average Intel Core i9-13900HX (3913 - 4970, n=22) | |
| Razer Blade 18 RTX 4070 | |
| HP Omen 17-ck2097ng | |
| Average of class Gaming (1578 - 6330, n=105, last 2 years) | |
| Asus ROG Strix G18 G814JI | |
| Cinebench R15 / CPU Single 64Bit | |
| MSI GE78HX 13VH-070US | |
| Alienware m18 R1 | |
| HP Omen 17-ck2097ng | |
| Razer Blade 18 RTX 4070 | |
| Average of class Gaming (188.8 - 350, n=106, last 2 years) | |
| Acer Predator Helios 18 N23Q2 | |
| Average Intel Core i9-13900HX (247 - 304, n=22) | |
| Asus ROG Strix G18 G814JI | |
| Blender / v2.79 BMW27 CPU | |
| Asus ROG Strix G18 G814JI | |
| HP Omen 17-ck2097ng | |
| Average of class Gaming (79 - 330, n=104, last 2 years) | |
| Average Intel Core i9-13900HX (101 - 153, n=22) | |
| Razer Blade 18 RTX 4070 | |
| Acer Predator Helios 18 N23Q2 | |
| MSI GE78HX 13VH-070US | |
| Alienware m18 R1 | |
| 7-Zip 18.03 / 7z b 4 | |
| Alienware m18 R1 | |
| MSI GE78HX 13VH-070US | |
| Acer Predator Helios 18 N23Q2 | |
| Razer Blade 18 RTX 4070 | |
| Average Intel Core i9-13900HX (90675 - 127283, n=21) | |
| HP Omen 17-ck2097ng | |
| Average of class Gaming (33491 - 148086, n=105, last 2 years) | |
| Asus ROG Strix G18 G814JI | |
| 7-Zip 18.03 / 7z b 4 -mmt1 | |
| MSI GE78HX 13VH-070US | |
| Acer Predator Helios 18 N23Q2 | |
| HP Omen 17-ck2097ng | |
| Alienware m18 R1 | |
| Razer Blade 18 RTX 4070 | |
| Average Intel Core i9-13900HX (6340 - 7177, n=21) | |
| Average of class Gaming (4199 - 7436, n=105, last 2 years) | |
| Asus ROG Strix G18 G814JI | |
| Geekbench 5.5 / Multi-Core | |
| Alienware m18 R1 | |
| MSI GE78HX 13VH-070US | |
| Acer Predator Helios 18 N23Q2 | |
| HP Omen 17-ck2097ng | |
| Razer Blade 18 RTX 4070 | |
| Average Intel Core i9-13900HX (17614 - 21075, n=22) | |
| Average of class Gaming (6460 - 28263, n=105, last 2 years) | |
| Asus ROG Strix G18 G814JI | |
| Geekbench 5.5 / Single-Core | |
| MSI GE78HX 13VH-070US | |
| HP Omen 17-ck2097ng | |
| Alienware m18 R1 | |
| Average of class Gaming (986 - 2474, n=105, last 2 years) | |
| Acer Predator Helios 18 N23Q2 | |
| Razer Blade 18 RTX 4070 | |
| Average Intel Core i9-13900HX (1345 - 2093, n=22) | |
| Asus ROG Strix G18 G814JI | |
| HWBOT x265 Benchmark v2.2 / 4k Preset | |
| MSI GE78HX 13VH-070US | |
| Alienware m18 R1 | |
| Razer Blade 18 RTX 4070 | |
| Acer Predator Helios 18 N23Q2 | |
| Average Intel Core i9-13900HX (23.5 - 34.4, n=22) | |
| Average of class Gaming (11.5 - 44.4, n=105, last 2 years) | |
| HP Omen 17-ck2097ng | |
| Asus ROG Strix G18 G814JI | |
| LibreOffice / 20 Documents To PDF | |
| Asus ROG Strix G18 G814JI | |
| Average of class Gaming (33.2 - 88.8, n=105, last 2 years) | |
| Acer Predator Helios 18 N23Q2 | |
| MSI GE78HX 13VH-070US | |
| Alienware m18 R1 | |
| HP Omen 17-ck2097ng | |
| Razer Blade 18 RTX 4070 | |
| Average Intel Core i9-13900HX (32.8 - 51.1, n=21) | |
| R Benchmark 2.5 / Overall mean | |
| Asus ROG Strix G18 G814JI | |
| Average of class Gaming (0.3439 - 0.759, n=106, last 2 years) | |
| Average Intel Core i9-13900HX (0.375 - 0.4564, n=22) | |
| Acer Predator Helios 18 N23Q2 | |
| Razer Blade 18 RTX 4070 | |
| Alienware m18 R1 | |
| HP Omen 17-ck2097ng | |
| MSI GE78HX 13VH-070US | |
* ... smaller is better
AIDA64: FP32 Ray-Trace | FPU Julia | CPU SHA3 | CPU Queen | FPU SinJulia | FPU Mandel | CPU AES | CPU ZLib | FP64 Ray-Trace | CPU PhotoWorxx
| Performance rating | |
| Alienware m18 R1 | |
| Acer Predator Helios 18 N23Q2 | |
| MSI GE78HX 13VH-070US | |
| Average of class Gaming | |
| Razer Blade 18 RTX 4070 | |
| Average Intel Core i9-13900HX | |
| HP Omen 17-ck2097ng | |
| Asus ROG Strix G18 G814JI | |
| AIDA64 / FP32 Ray-Trace | |
| Average of class Gaming (10227 - 85542, n=105, last 2 years) | |
| Alienware m18 R1 | |
| MSI GE78HX 13VH-070US | |
| Acer Predator Helios 18 N23Q2 | |
| Razer Blade 18 RTX 4070 | |
| Average Intel Core i9-13900HX (17589 - 27615, n=22) | |
| Asus ROG Strix G18 G814JI | |
| HP Omen 17-ck2097ng | |
| AIDA64 / FPU Julia | |
| Alienware m18 R1 | |
| MSI GE78HX 13VH-070US | |
| Average of class Gaming (51376 - 238426, n=105, last 2 years) | |
| Acer Predator Helios 18 N23Q2 | |
| Razer Blade 18 RTX 4070 | |
| Average Intel Core i9-13900HX (88686 - 137015, n=22) | |
| Asus ROG Strix G18 G814JI | |
| HP Omen 17-ck2097ng | |
| AIDA64 / CPU SHA3 | |
| Alienware m18 R1 | |
| MSI GE78HX 13VH-070US | |
| Acer Predator Helios 18 N23Q2 | |
| Average of class Gaming (2180 - 10115, n=105, last 2 years) | |
| Razer Blade 18 RTX 4070 | |
| Average Intel Core i9-13900HX (4362 - 7029, n=22) | |
| Asus ROG Strix G18 G814JI | |
| HP Omen 17-ck2097ng | |
| AIDA64 / CPU Queen | |
| Alienware m18 R1 | |
| MSI GE78HX 13VH-070US | |
| Razer Blade 18 RTX 4070 | |
| Acer Predator Helios 18 N23Q2 | |
| HP Omen 17-ck2097ng | |
| Average Intel Core i9-13900HX (125644 - 141385, n=22) | |
| Average of class Gaming (49785 - 173351, n=90, last 2 years) | |
| Asus ROG Strix G18 G814JI | |
| AIDA64 / FPU SinJulia | |
| MSI GE78HX 13VH-070US | |
| Alienware m18 R1 | |
| Razer Blade 18 RTX 4070 | |
| Acer Predator Helios 18 N23Q2 | |
| Average Intel Core i9-13900HX (12334 - 17179, n=22) | |
| Average of class Gaming (4424 - 33636, n=105, last 2 years) | |
| HP Omen 17-ck2097ng | |
| Asus ROG Strix G18 G814JI | |
| AIDA64 / FPU Mandel | |
| Alienware m18 R1 | |
| Average of class Gaming (25115 - 128721, n=105, last 2 years) | |
| MSI GE78HX 13VH-070US | |
| Acer Predator Helios 18 N23Q2 | |
| Razer Blade 18 RTX 4070 | |
| Average Intel Core i9-13900HX (43850 - 69202, n=22) | |
| Asus ROG Strix G18 G814JI | |
| HP Omen 17-ck2097ng | |
| AIDA64 / CPU AES | |
| Acer Predator Helios 18 N23Q2 | |
| Average Intel Core i9-13900HX (89413 - 237881, n=22) | |
| Alienware m18 R1 | |
| MSI GE78HX 13VH-070US | |
| Razer Blade 18 RTX 4070 | |
| Average of class Gaming (39258 - 247074, n=105, last 2 years) | |
| HP Omen 17-ck2097ng | |
| Asus ROG Strix G18 G814JI | |
| AIDA64 / CPU ZLib | |
| MSI GE78HX 13VH-070US | |
| Alienware m18 R1 | |
| Acer Predator Helios 18 N23Q2 | |
| Razer Blade 18 RTX 4070 | |
| Average Intel Core i9-13900HX (1284 - 1958, n=22) | |
| Average of class Gaming (574 - 2531, n=105, last 2 years) | |
| HP Omen 17-ck2097ng | |
| Asus ROG Strix G18 G814JI | |
| AIDA64 / FP64 Ray-Trace | |
| Average of class Gaming (5509 - 45446, n=105, last 2 years) | |
| Alienware m18 R1 | |
| MSI GE78HX 13VH-070US | |
| Acer Predator Helios 18 N23Q2 | |
| Razer Blade 18 RTX 4070 | |
| Average Intel Core i9-13900HX (9481 - 15279, n=22) | |
| Asus ROG Strix G18 G814JI | |
| HP Omen 17-ck2097ng | |
| AIDA64 / CPU PhotoWorxx | |
| Alienware m18 R1 | |
| HP Omen 17-ck2097ng | |
| Acer Predator Helios 18 N23Q2 | |
| MSI GE78HX 13VH-070US | |
| Razer Blade 18 RTX 4070 | |
| Average Intel Core i9-13900HX (42994 - 51994, n=22) | |
| Average of class Gaming (12271 - 89891, n=105, last 2 years) | |
| Asus ROG Strix G18 G814JI | |
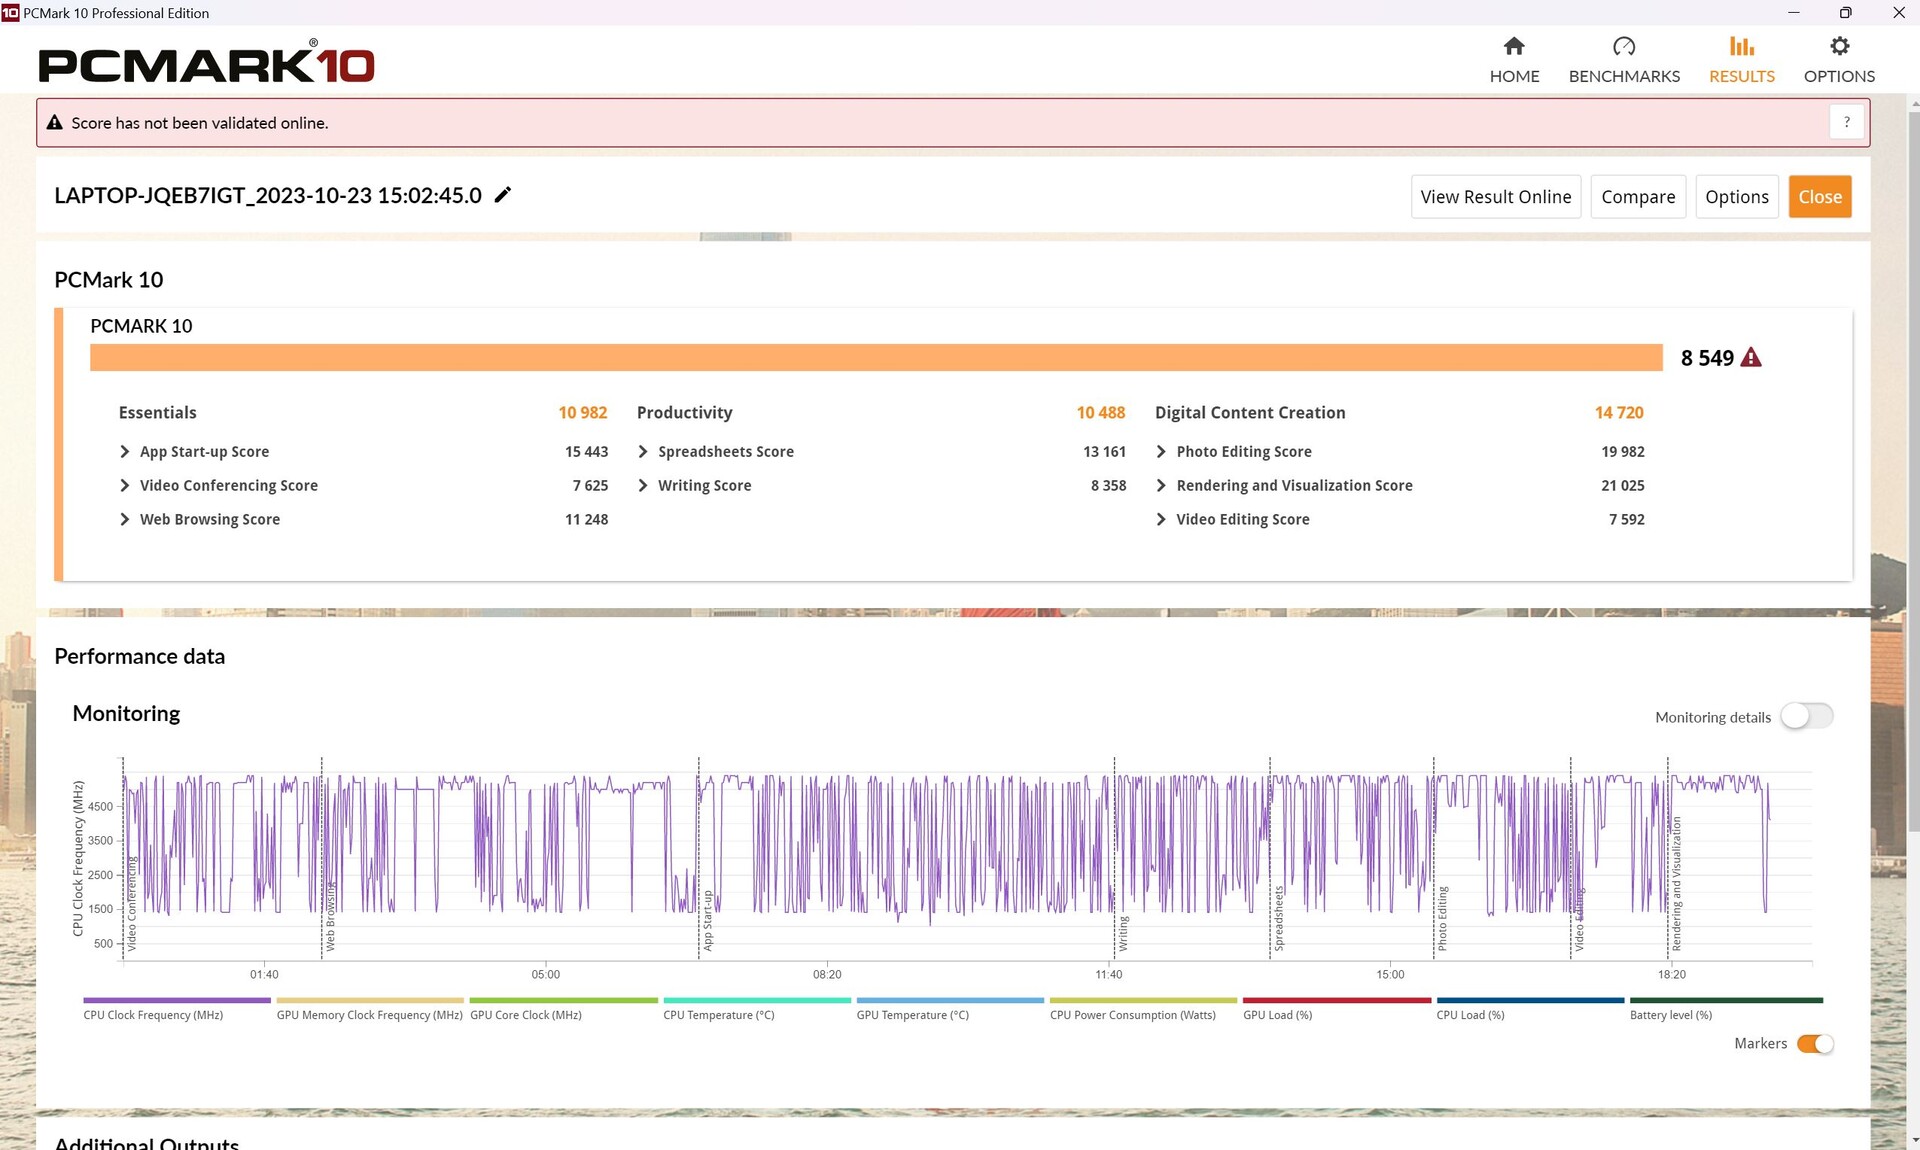
System Performance
Just like CPU performance, the Helios is only marginally behind the MSI GE78HX and the Alienware m18 R1.
Most applications subjectively feel smooth. Only the graphics switching (Advanced Optimus) is a constant problem for the laptop. More about this and latency issues in the following sections.
CrossMark: Overall | Productivity | Creativity | Responsiveness
| PCMark 10 / Score | |
| MSI GE78HX 13VH-070US | |
| Alienware m18 R1 | |
| Acer Predator Helios 18 N23Q2 | |
| Average of class Gaming (5828 - 12414, n=93, last 2 years) | |
| Average Intel Core i9-13900HX, NVIDIA GeForce RTX 4080 Laptop GPU (7609 - 8549, n=3) | |
| Razer Blade 18 RTX 4070 | |
| HP Omen 17-ck2097ng | |
| Asus ROG Strix G18 G814JI | |
| PCMark 10 / Essentials | |
| HP Omen 17-ck2097ng | |
| Razer Blade 18 RTX 4070 | |
| Average Intel Core i9-13900HX, NVIDIA GeForce RTX 4080 Laptop GPU (10982 - 11824, n=3) | |
| MSI GE78HX 13VH-070US | |
| Alienware m18 R1 | |
| Acer Predator Helios 18 N23Q2 | |
| Average of class Gaming (8810 - 11935, n=97, last 2 years) | |
| Asus ROG Strix G18 G814JI | |
| PCMark 10 / Productivity | |
| Average of class Gaming (6845 - 25323, n=95, last 2 years) | |
| Acer Predator Helios 18 N23Q2 | |
| MSI GE78HX 13VH-070US | |
| Average Intel Core i9-13900HX, NVIDIA GeForce RTX 4080 Laptop GPU (9976 - 10788, n=3) | |
| Alienware m18 R1 | |
| HP Omen 17-ck2097ng | |
| Razer Blade 18 RTX 4070 | |
| Asus ROG Strix G18 G814JI | |
| PCMark 10 / Digital Content Creation | |
| Alienware m18 R1 | |
| MSI GE78HX 13VH-070US | |
| Acer Predator Helios 18 N23Q2 | |
| Average of class Gaming (7602 - 19954, n=95, last 2 years) | |
| Average Intel Core i9-13900HX, NVIDIA GeForce RTX 4080 Laptop GPU (10135 - 14720, n=3) | |
| Razer Blade 18 RTX 4070 | |
| HP Omen 17-ck2097ng | |
| Asus ROG Strix G18 G814JI | |
| CrossMark / Overall | |
| Acer Predator Helios 18 N23Q2 | |
| Alienware m18 R1 | |
| Razer Blade 18 RTX 4070 | |
| Average Intel Core i9-13900HX, NVIDIA GeForce RTX 4080 Laptop GPU (1991 - 2194, n=2) | |
| HP Omen 17-ck2097ng | |
| Average of class Gaming (1366 - 2409, n=94, last 2 years) | |
| MSI GE78HX 13VH-070US | |
| CrossMark / Productivity | |
| Acer Predator Helios 18 N23Q2 | |
| Alienware m18 R1 | |
| Razer Blade 18 RTX 4070 | |
| Average Intel Core i9-13900HX, NVIDIA GeForce RTX 4080 Laptop GPU (1828 - 2059, n=2) | |
| Average of class Gaming (1386 - 2254, n=94, last 2 years) | |
| MSI GE78HX 13VH-070US | |
| HP Omen 17-ck2097ng | |
| CrossMark / Creativity | |
| Alienware m18 R1 | |
| Acer Predator Helios 18 N23Q2 | |
| Razer Blade 18 RTX 4070 | |
| Average Intel Core i9-13900HX, NVIDIA GeForce RTX 4080 Laptop GPU (2239 - 2411, n=2) | |
| Average of class Gaming (1343 - 2786, n=94, last 2 years) | |
| HP Omen 17-ck2097ng | |
| MSI GE78HX 13VH-070US | |
| CrossMark / Responsiveness | |
| Acer Predator Helios 18 N23Q2 | |
| Alienware m18 R1 | |
| Average Intel Core i9-13900HX, NVIDIA GeForce RTX 4080 Laptop GPU (1808 - 1998, n=2) | |
| Razer Blade 18 RTX 4070 | |
| HP Omen 17-ck2097ng | |
| Average of class Gaming (1226 - 2334, n=94, last 2 years) | |
| MSI GE78HX 13VH-070US | |
| PCMark 10 Score | 8549 points | |
Help | ||
| AIDA64 / Memory Copy | |
| Alienware m18 R1 | |
| Acer Predator Helios 18 N23Q2 | |
| HP Omen 17-ck2097ng | |
| MSI GE78HX 13VH-070US | |
| Razer Blade 18 RTX 4070 | |
| Average Intel Core i9-13900HX (67716 - 79193, n=22) | |
| Average of class Gaming (21750 - 129946, n=105, last 2 years) | |
| Asus ROG Strix G18 G814JI | |
| AIDA64 / Memory Read | |
| Alienware m18 R1 | |
| Acer Predator Helios 18 N23Q2 | |
| HP Omen 17-ck2097ng | |
| Razer Blade 18 RTX 4070 | |
| MSI GE78HX 13VH-070US | |
| Average Intel Core i9-13900HX (73998 - 88462, n=22) | |
| Average of class Gaming (22956 - 118858, n=105, last 2 years) | |
| Asus ROG Strix G18 G814JI | |
| AIDA64 / Memory Write | |
| Alienware m18 R1 | |
| HP Omen 17-ck2097ng | |
| MSI GE78HX 13VH-070US | |
| Average of class Gaming (22297 - 135096, n=105, last 2 years) | |
| Razer Blade 18 RTX 4070 | |
| Acer Predator Helios 18 N23Q2 | |
| Average Intel Core i9-13900HX (65472 - 77045, n=22) | |
| Asus ROG Strix G18 G814JI | |
| AIDA64 / Memory Latency | |
| Average of class Gaming (75.3 - 259, n=105, last 2 years) | |
| Average Intel Core i9-13900HX (75.3 - 91.1, n=22) | |
| HP Omen 17-ck2097ng | |
| Razer Blade 18 RTX 4070 | |
| MSI GE78HX 13VH-070US | |
| Asus ROG Strix G18 G814JI | |
| Acer Predator Helios 18 N23Q2 | |
| Alienware m18 R1 | |
* ... smaller is better
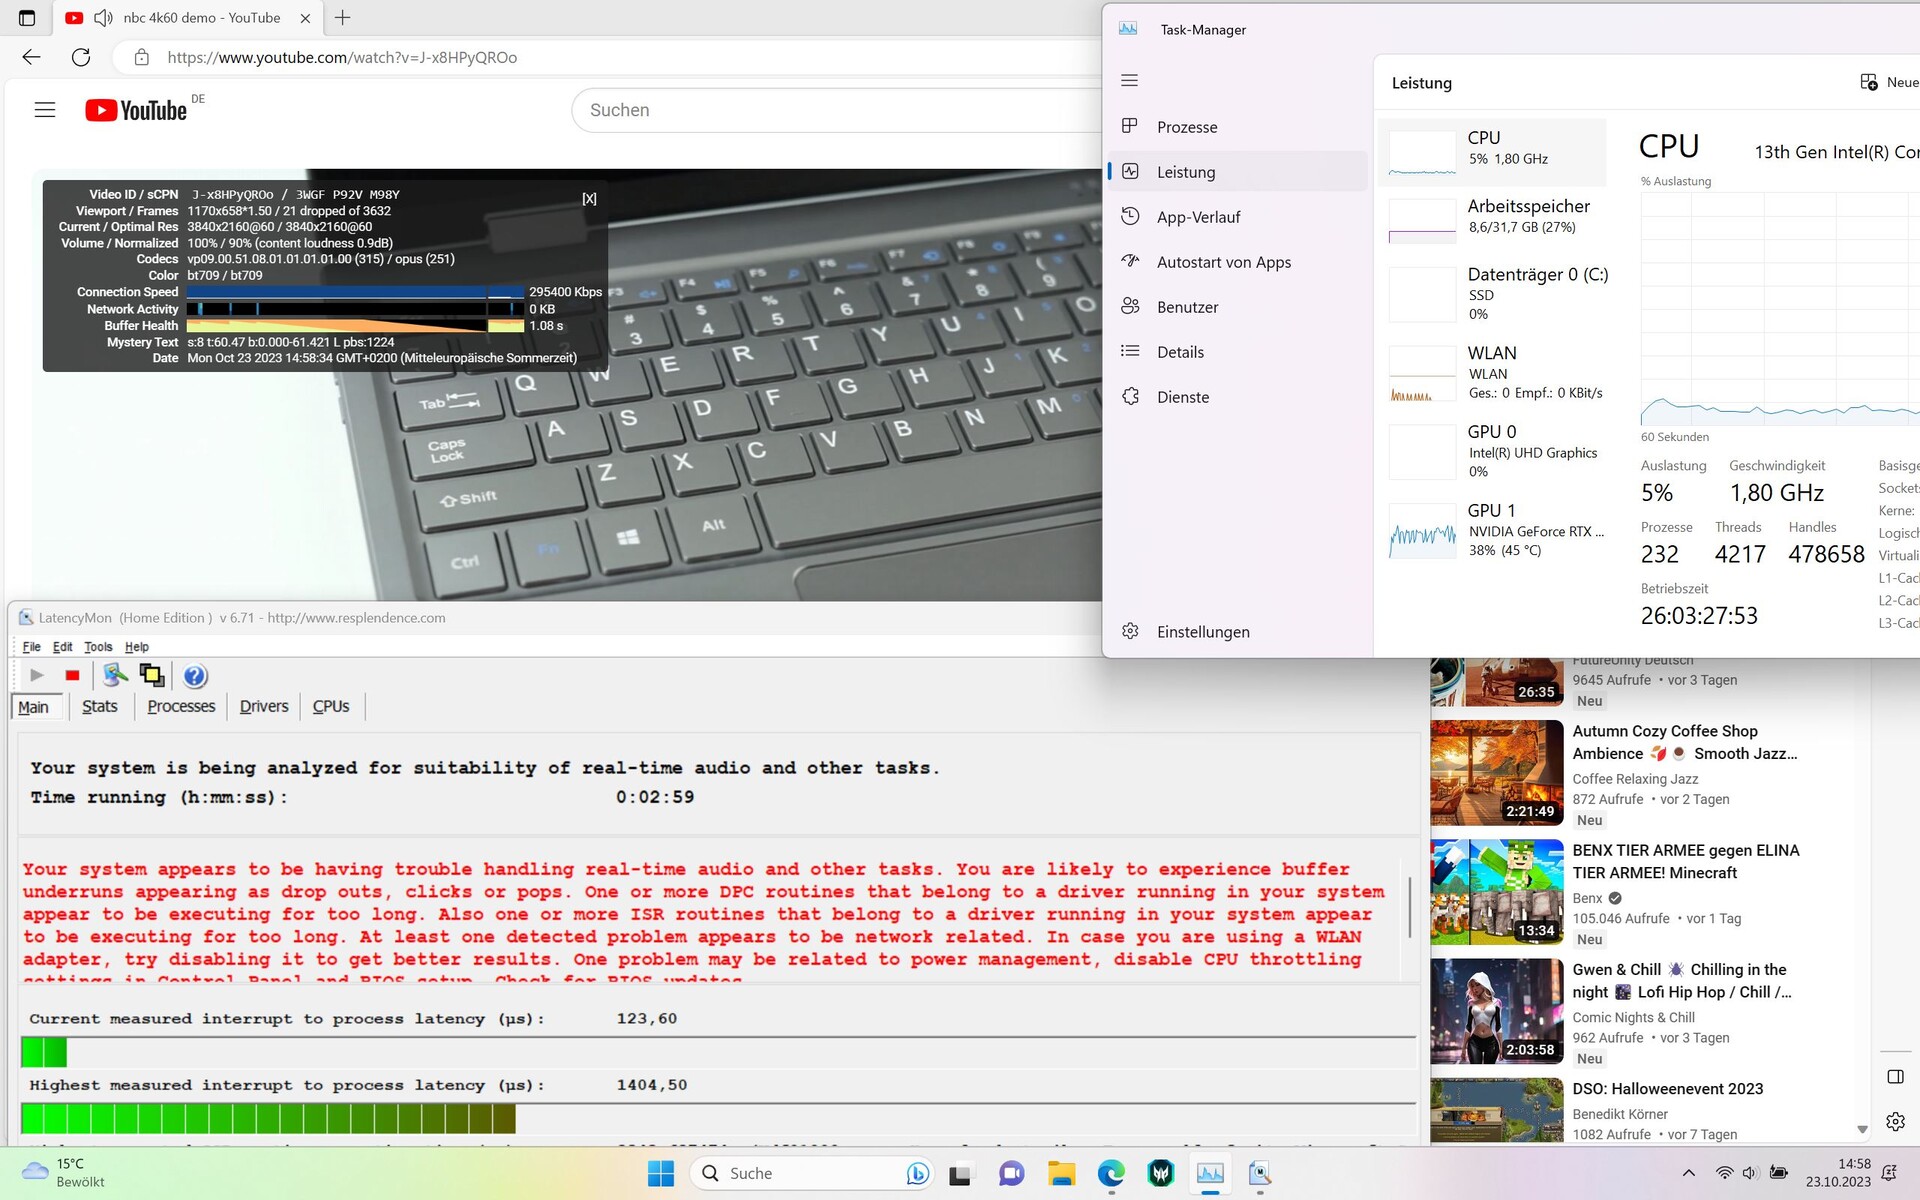
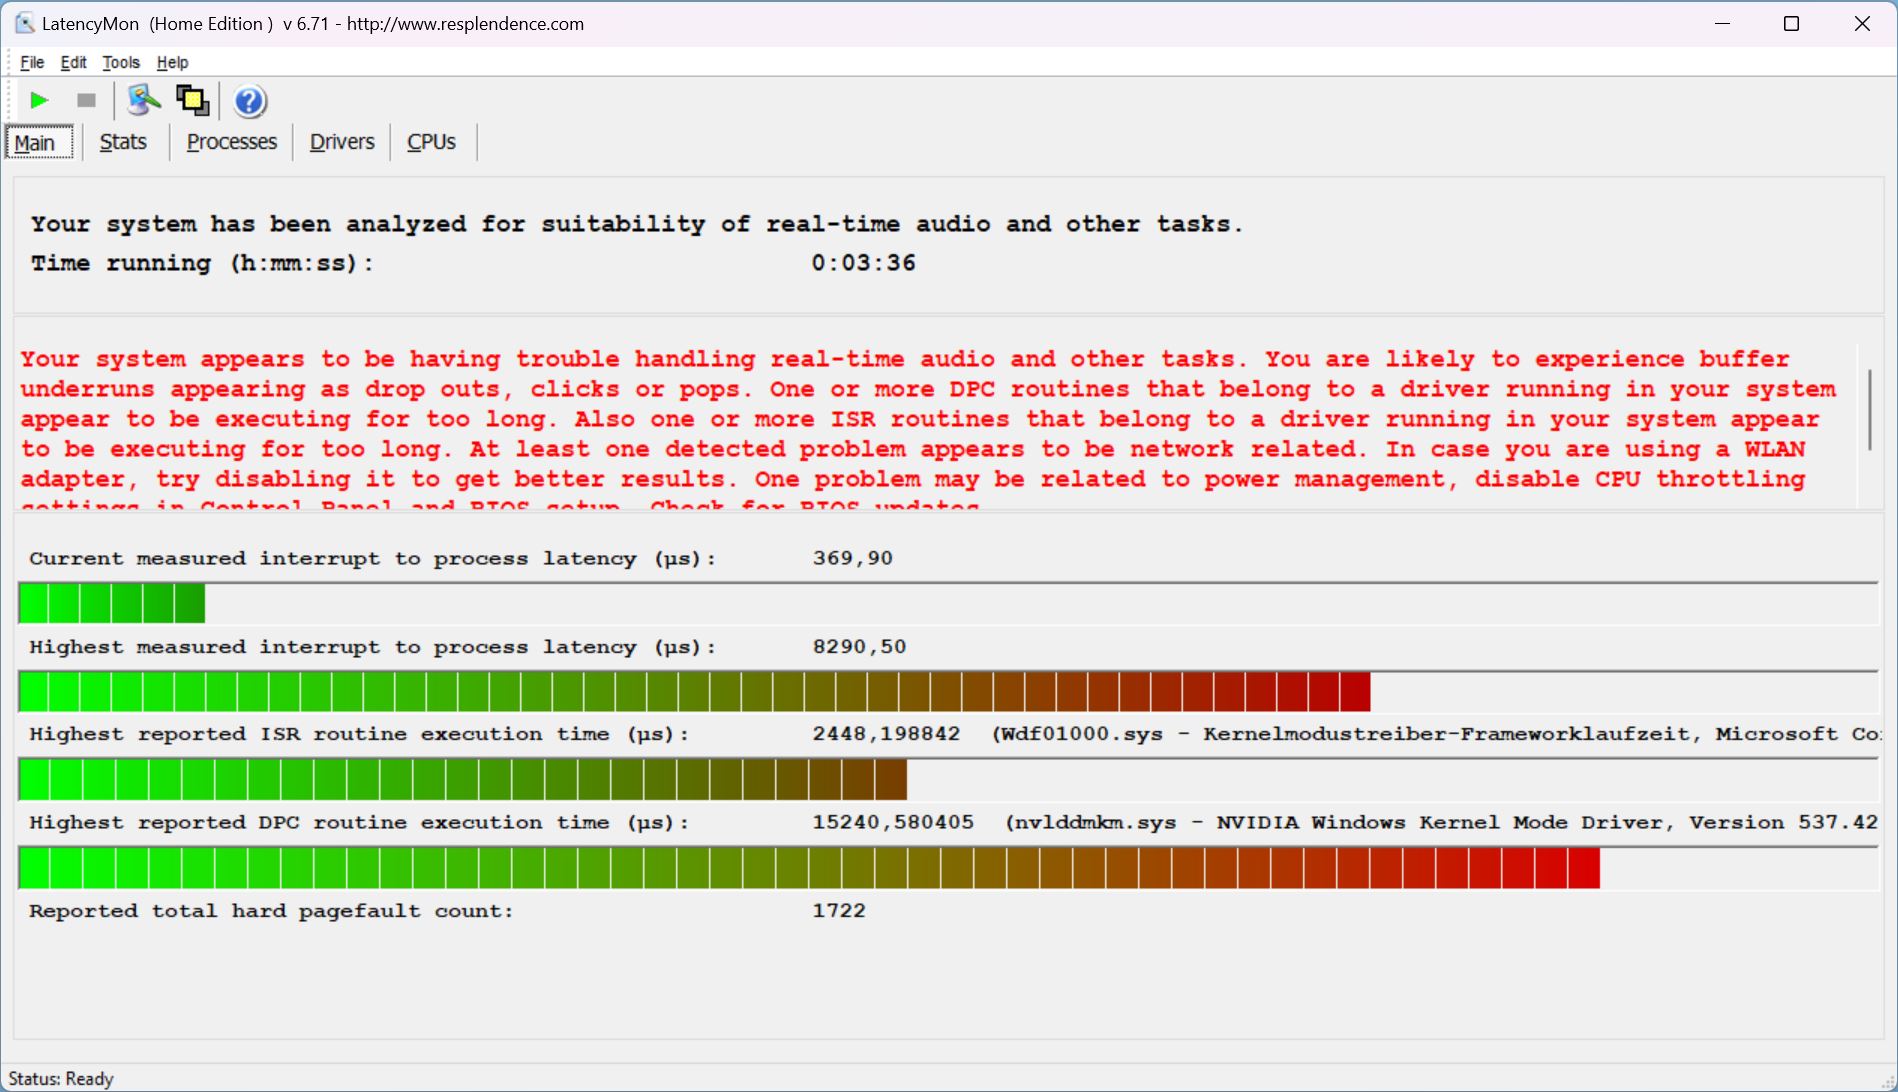
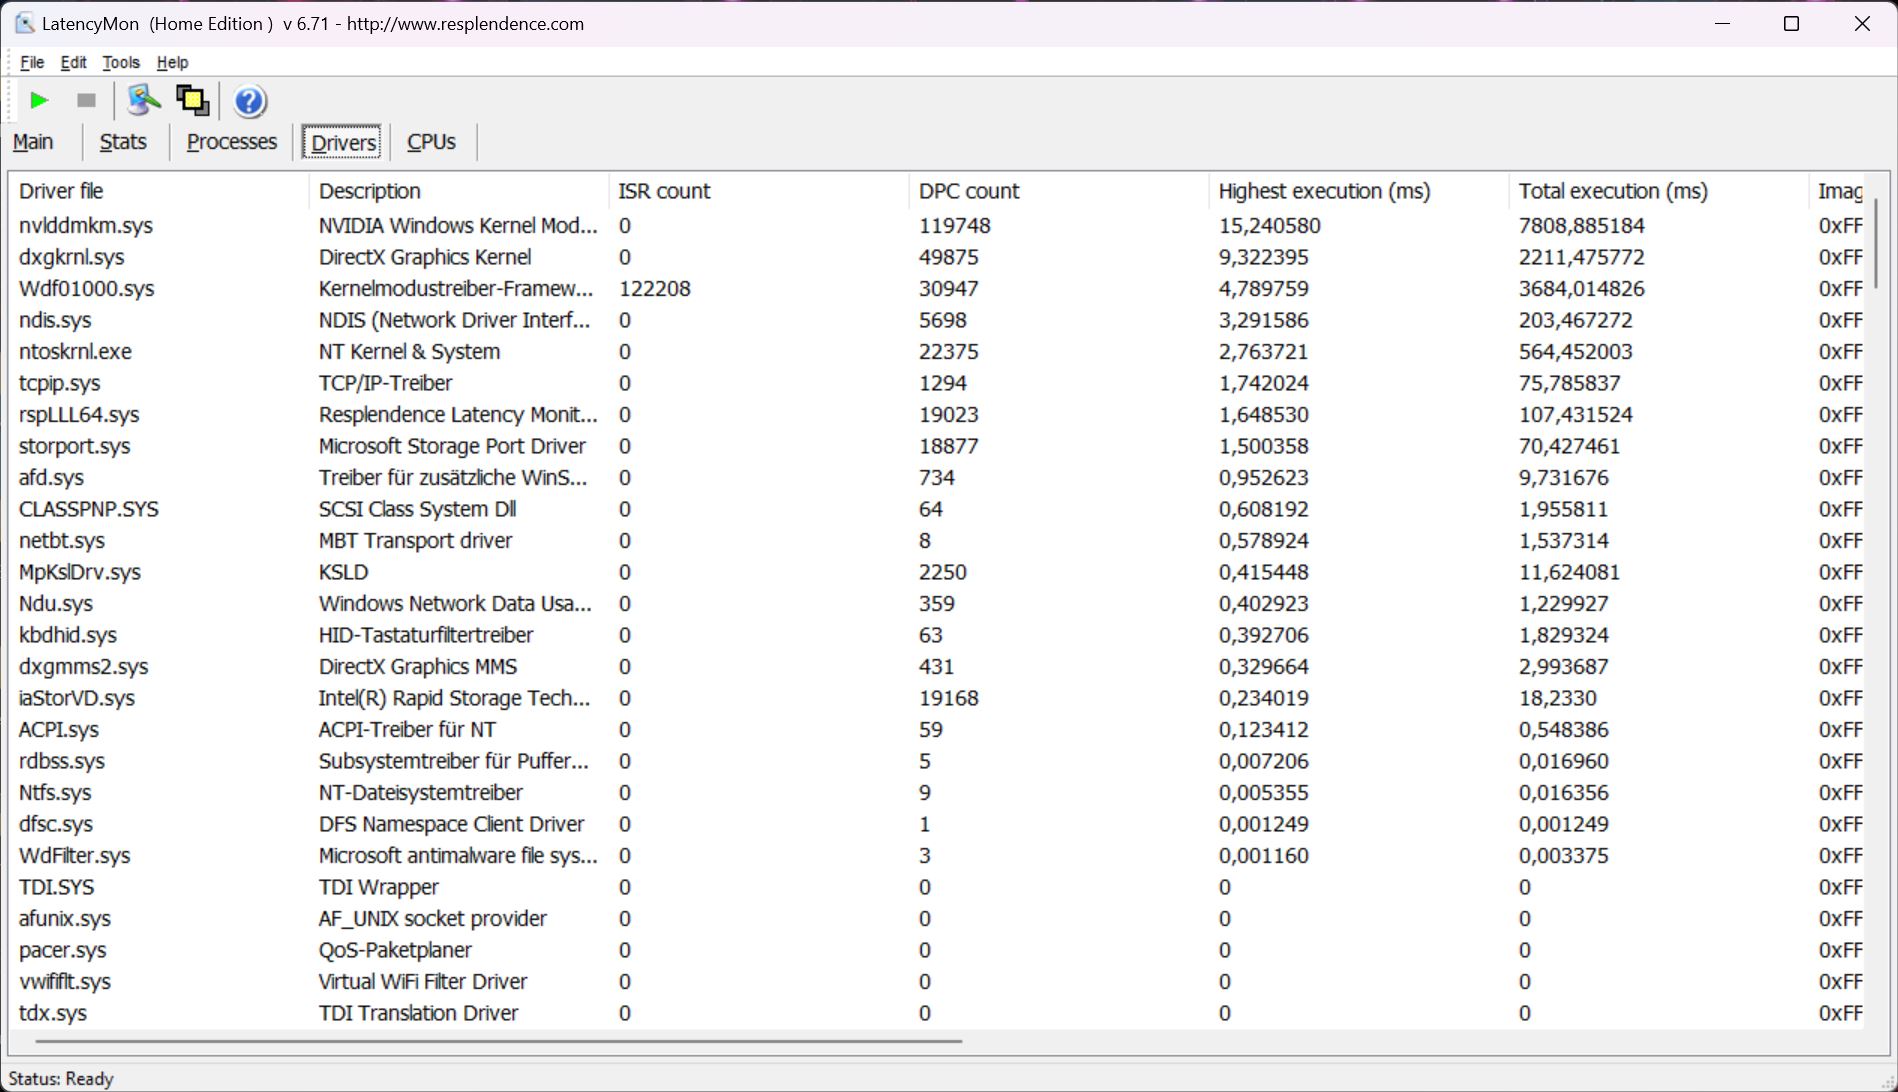
DPC latency
In the current driver state, the laptop has acute latency problems, as LatencyMon reveals. In Balanced mode, delays occur when opening the browser or moving a desktop window. These increase when opening multiple browser tabs on our website, and even playing a 4K/60 fps YouTube video results in a full 18 skipped frames. Acer needs to improve the driver here. However, rival laptops also have similar problems.
| DPC Latencies / LatencyMon - interrupt to process latency (max), Web, Youtube, Prime95 | |
| Acer Predator Helios 18 N23Q2 | |
| MSI GE78HX 13VH-070US | |
| Alienware m18 R1 | |
| HP Omen 17-ck2097ng | |
| Razer Blade 18 RTX 4070 | |
| Asus ROG Strix G18 G814JI | |
* ... smaller is better
Storage Devices
The Helios 18 is equipped with the Samsung PM9A1, one of the fastest SSDs in our SSD best list. Unfortunately, this doesn't perform well in the Predator and its performance is very quickly throttled, as our graph below shows. We repeated the same test later and got the same result because we were surprised by the rapid and strong drop. Similar SSD throttling behavior was also observed in the previously reviewed Predator Helios 16.

* ... smaller is better
Sustained Read Performance: DiskSpd Read Loop, Queue Depth 8
Graphics
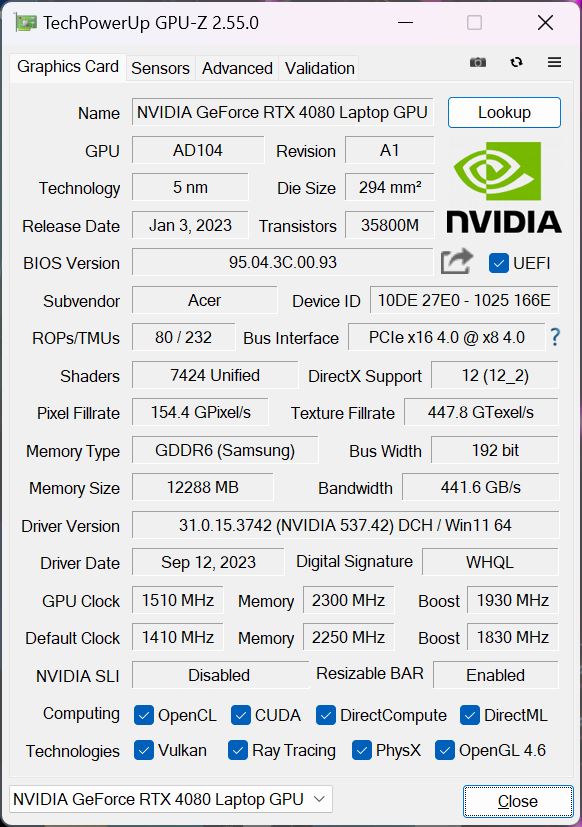
The RTX 4080 is a high-end GPU that was introduced in early 2023. In the Helios 18, it can draw on the maximum 175 W, including Dynamic Boost.
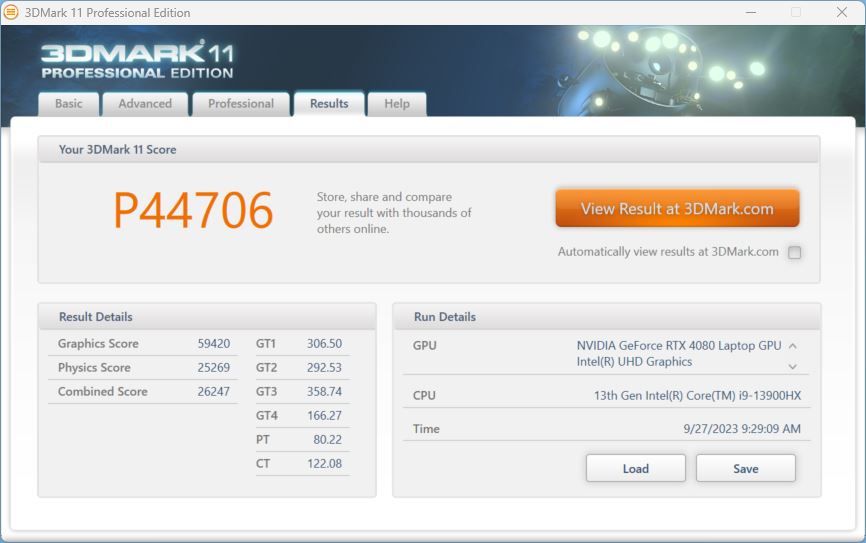
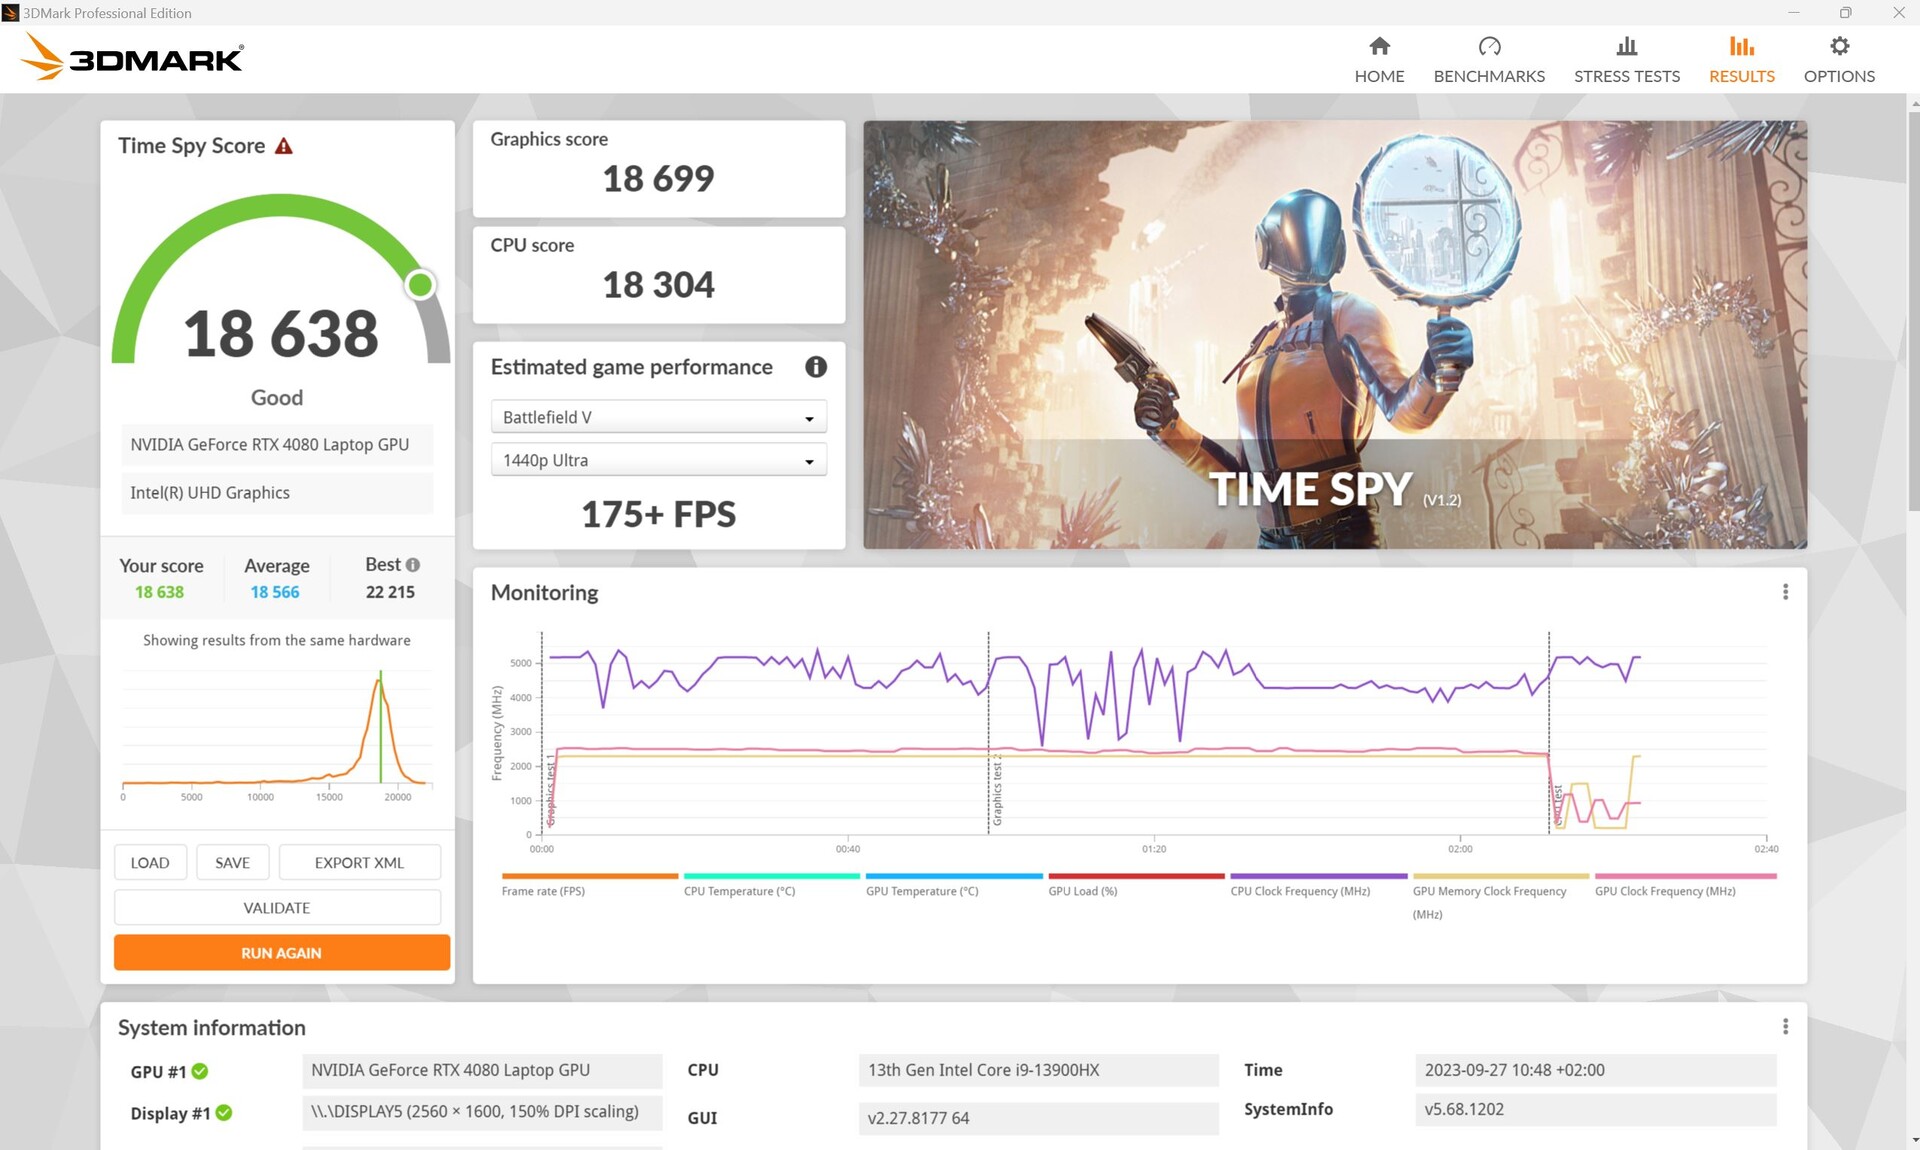
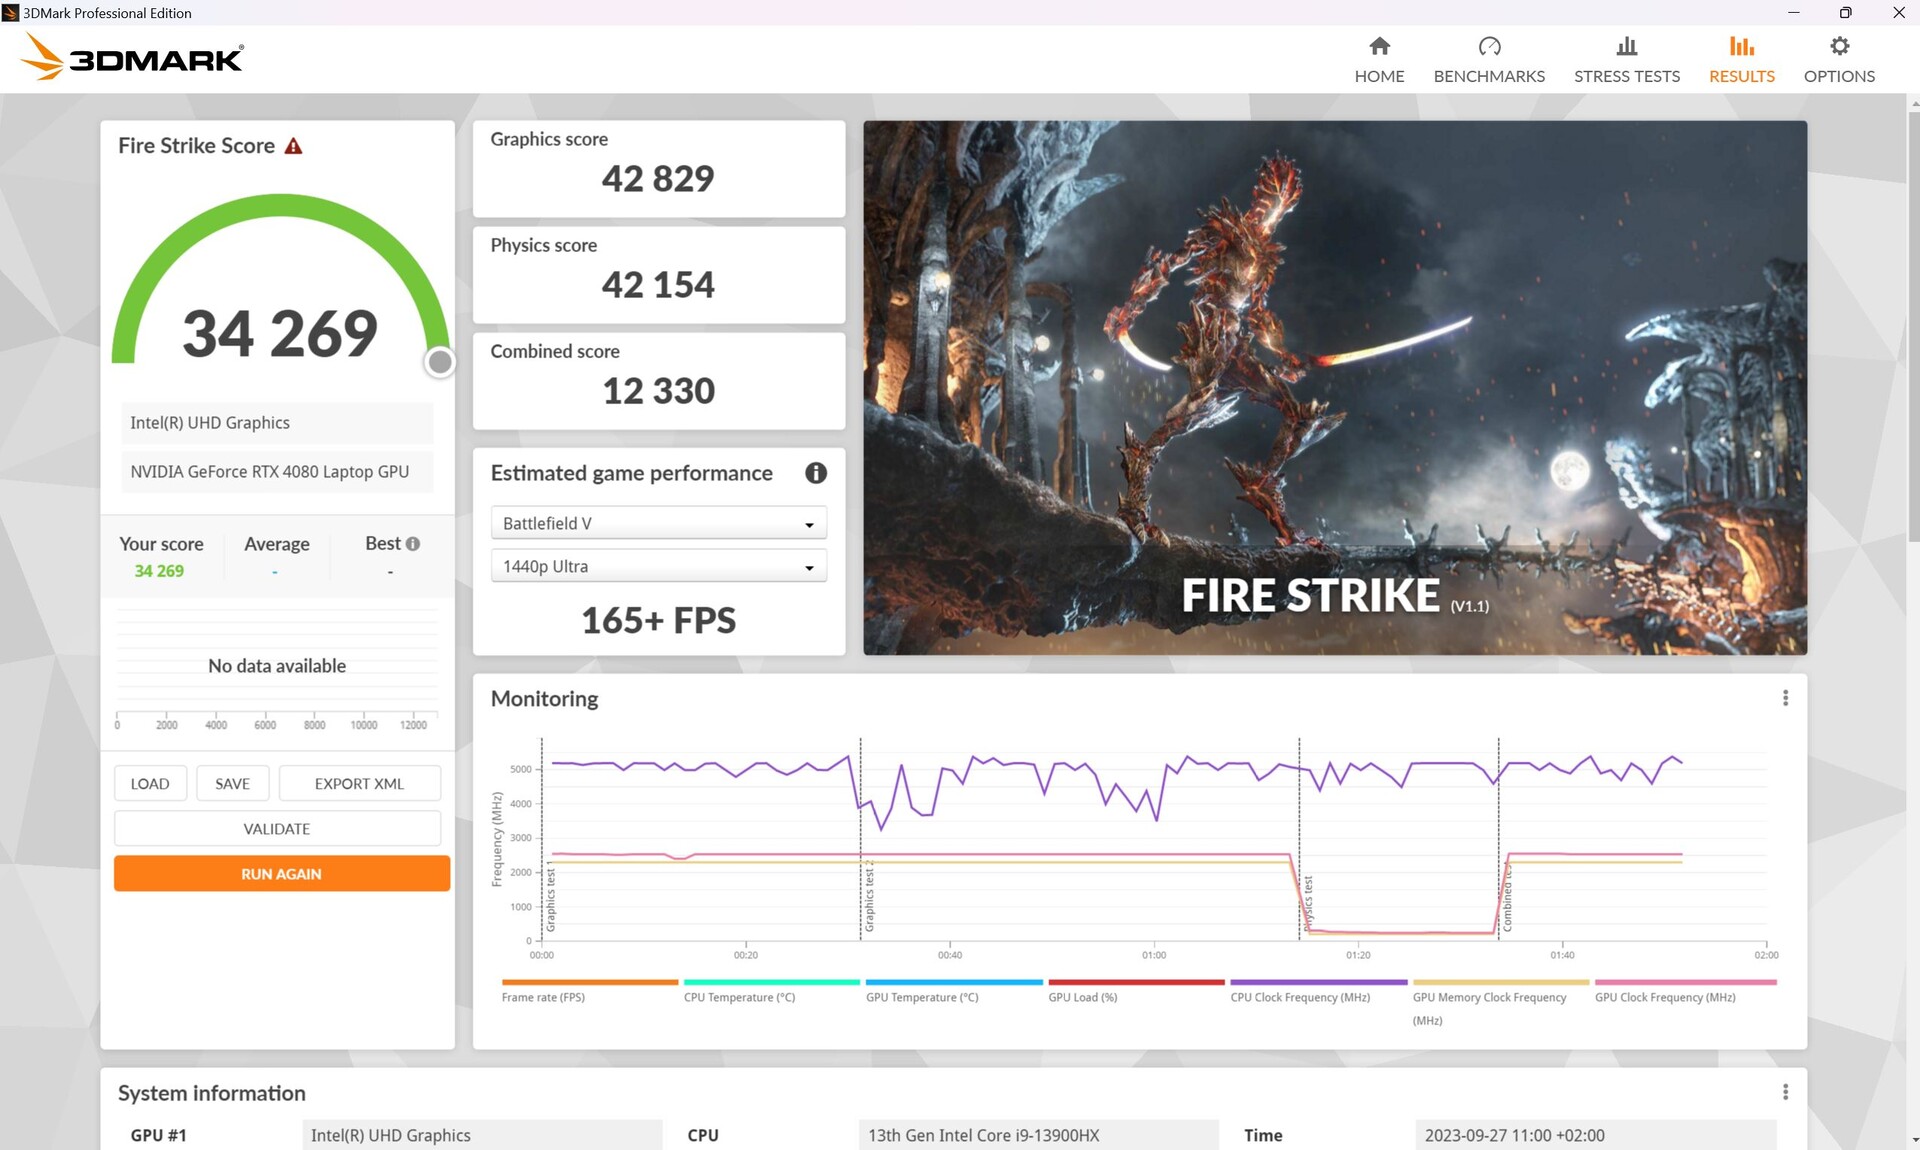
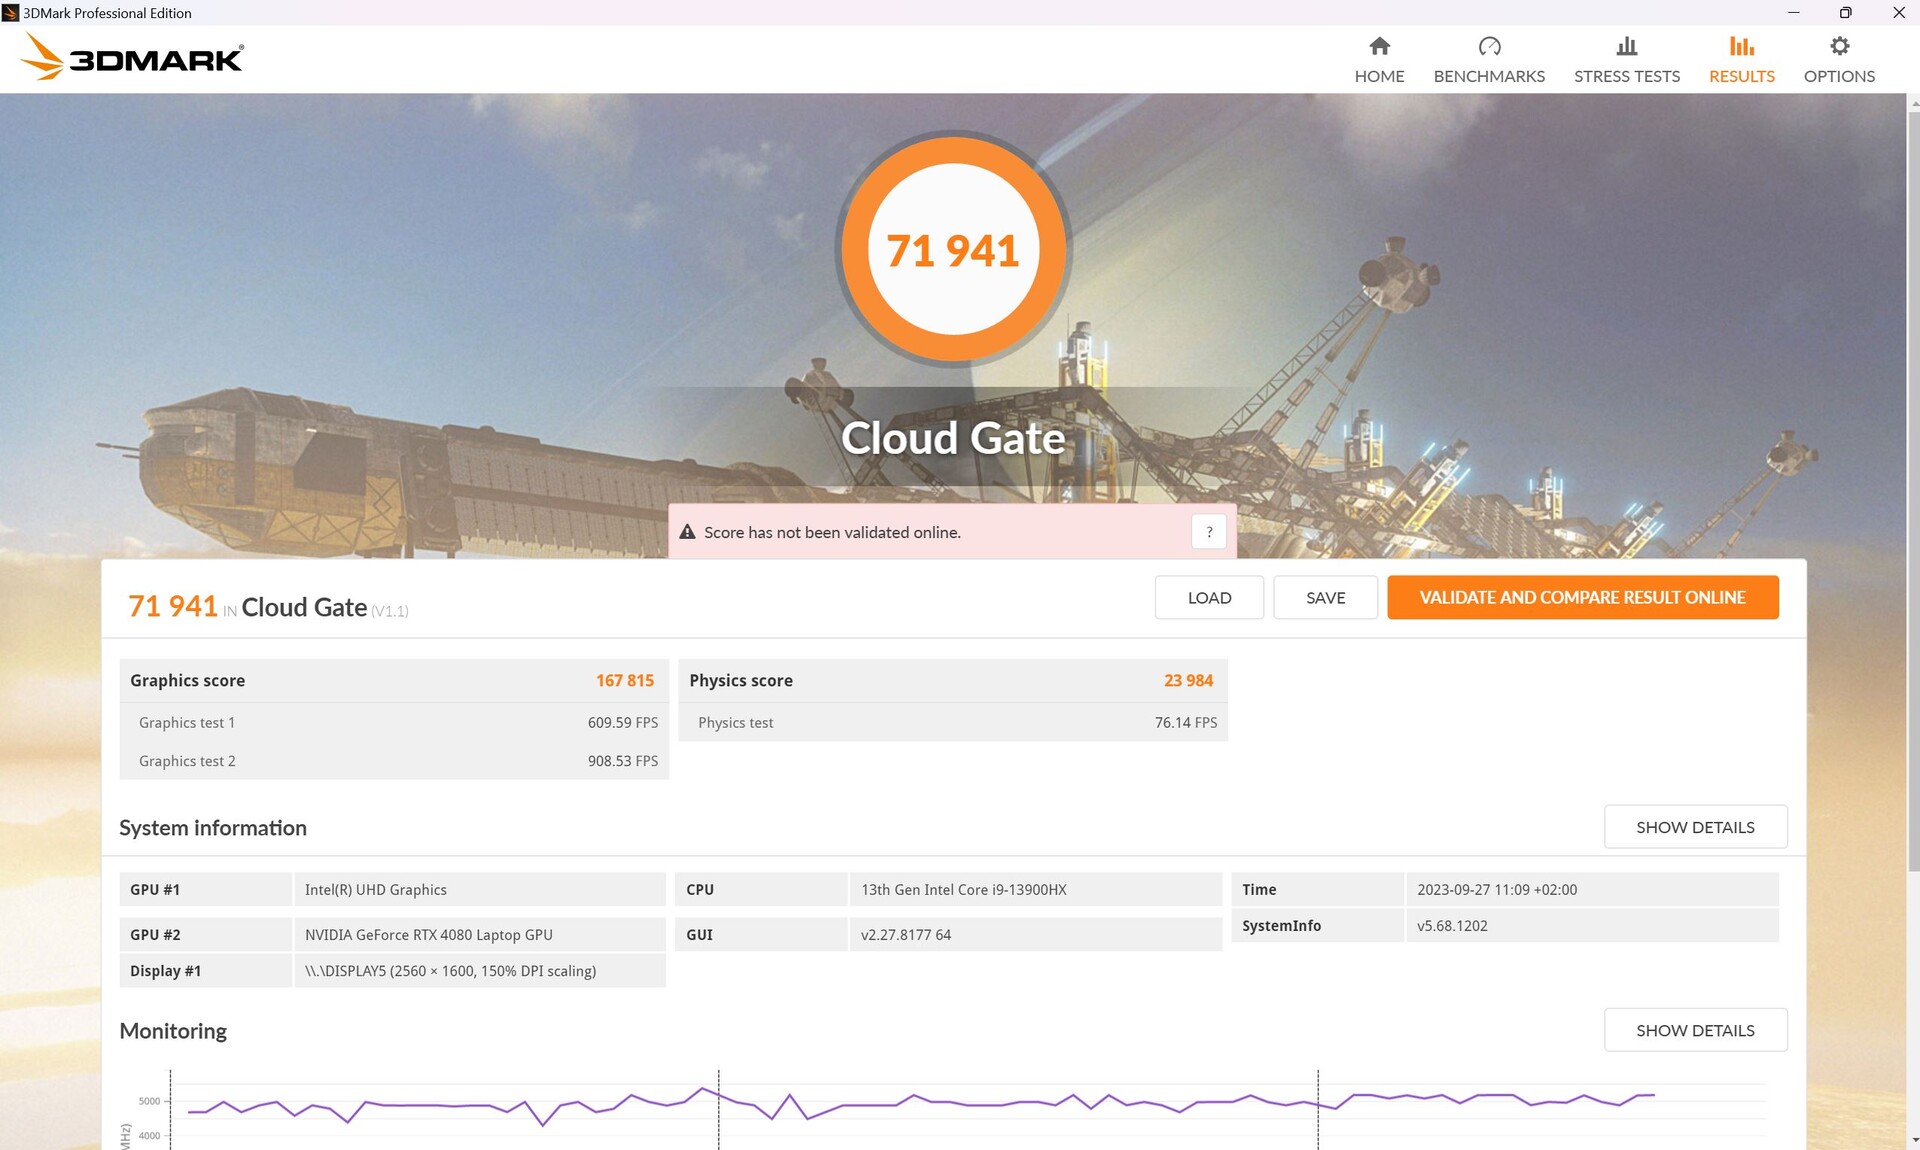
In the synthetic 3DMark tests, the Helios narrowly overtakes the MSI GE78HX with the same GPU for the first time. The performance of the RTX 4080 is about 10% higher than the average of all laptops with the same GPU in our database.
Away from the socket, the Predator still manages 6,897 graphics points in Fire Strike, a drop of 84 percent!
| 3DMark Performance rating - Percent | |
| Alienware m18 R1 -1! | |
| Acer Predator Helios 18 N23Q2 | |
| MSI GE78HX 13VH-070US -1! | |
| Average NVIDIA GeForce RTX 4080 Laptop GPU | |
| Average of class Gaming | |
| HP Omen 17-ck2097ng | |
| Asus ROG Strix G18 G814JI | |
| Razer Blade 18 RTX 4070 -1! | |
| 3DMark 11 Performance | 44706 points | |
| 3DMark Cloud Gate Standard Score | 71941 points | |
| 3DMark Fire Strike Score | 34269 points | |
| 3DMark Time Spy Score | 18638 points | |
Help | ||
* ... smaller is better
Gaming Performance
The Helios 18 also narrowly surpasses the MSI GE78HX in gaming, but both are ultimately on par. The Alienware m18 R1 with its RTX 4090 is around 7% faster; the difference is greatest in Witcher 3 at +22%, and our Predator even leads in GTA V.
| Performance rating - Percent | |
| Alienware m18 R1 | |
| Acer Predator Helios 18 N23Q2 | |
| Average of class Gaming | |
| HP Omen 17-ck2097ng | |
| MSI GE78HX 13VH-070US | |
| Razer Blade 18 RTX 4070 | |
| Asus ROG Strix G18 G814JI | |
| The Witcher 3 - 1920x1080 Ultra Graphics & Postprocessing (HBAO+) | |
| Alienware m18 R1 | |
| Average of class Gaming (104.7 - 240, n=7, last 2 years) | |
| MSI GE78HX 13VH-070US | |
| Acer Predator Helios 18 N23Q2 | |
| HP Omen 17-ck2097ng | |
| Asus ROG Strix G18 G814JI | |
| Razer Blade 18 RTX 4070 | |
| GTA V - 1920x1080 Highest AA:4xMSAA + FX AF:16x | |
| Acer Predator Helios 18 N23Q2 | |
| Alienware m18 R1 | |
| Average of class Gaming (48.3 - 186.9, n=94, last 2 years) | |
| Razer Blade 18 RTX 4070 | |
| HP Omen 17-ck2097ng | |
| Asus ROG Strix G18 G814JI | |
| MSI GE78HX 13VH-070US | |
| Final Fantasy XV Benchmark - 1920x1080 High Quality | |
| Alienware m18 R1 | |
| Acer Predator Helios 18 N23Q2 | |
| Average of class Gaming (41 - 215, n=95, last 2 years) | |
| MSI GE78HX 13VH-070US | |
| HP Omen 17-ck2097ng | |
| Asus ROG Strix G18 G814JI | |
| Razer Blade 18 RTX 4070 | |
| Strange Brigade - 1920x1080 ultra AA:ultra AF:16 | |
| Alienware m18 R1 | |
| Acer Predator Helios 18 N23Q2 | |
| Average of class Gaming (76.3 - 458, n=87, last 2 years) | |
| HP Omen 17-ck2097ng | |
| MSI GE78HX 13VH-070US | |
| Asus ROG Strix G18 G814JI | |
| Razer Blade 18 RTX 4070 | |
| Dota 2 Reborn - 1920x1080 ultra (3/3) best looking | |
| Alienware m18 R1 | |
| Acer Predator Helios 18 N23Q2 | |
| Razer Blade 18 RTX 4070 | |
| HP Omen 17-ck2097ng | |
| Asus ROG Strix G18 G814JI | |
| Average of class Gaming (84.8 - 248, n=107, last 2 years) | |
| MSI GE78HX 13VH-070US | |
| The Witcher 3 | |
| 1920x1080 High Graphics & Postprocessing (Nvidia HairWorks Off) | |
| Alienware m18 R1 | |
| MSI GE78HX 13VH-070US | |
| Average of class Gaming (341 - 404, n=2, last 2 years) | |
| Acer Predator Helios 18 N23Q2 | |
| Average NVIDIA GeForce RTX 4080 Laptop GPU (246 - 385, n=14) | |
| HP Omen 17-ck2097ng | |
| Razer Blade 18 RTX 4070 | |
| Asus ROG Strix G18 G814JI | |
| 1920x1080 Ultra Graphics & Postprocessing (HBAO+) | |
| Alienware m18 R1 | |
| Average of class Gaming (104.7 - 240, n=7, last 2 years) | |
| MSI GE78HX 13VH-070US | |
| Acer Predator Helios 18 N23Q2 | |
| Average NVIDIA GeForce RTX 4080 Laptop GPU (130.4 - 186.1, n=20) | |
| HP Omen 17-ck2097ng | |
| Asus ROG Strix G18 G814JI | |
| Razer Blade 18 RTX 4070 | |
| Hogwarts Legacy | |
| 1920x1080 Ultra Preset AA:High T | |
| Average NVIDIA GeForce RTX 4080 Laptop GPU (108 - 131, n=3) | |
| Average of class Gaming (n=1last 2 years) | |
| Acer Predator Helios 18 N23Q2 | |
| Asus ROG Strix G18 G814JI | |
| 2560x1440 Ultra Preset AA:High T | |
| Average of class Gaming (n=1last 2 years) | |
| Average NVIDIA GeForce RTX 4080 Laptop GPU (76 - 102, n=3) | |
| Acer Predator Helios 18 N23Q2 | |
| Asus ROG Strix G18 G814JI | |
| 1920x1080 Ultra Preset + Full Ray Tracing AA:High T | |
| Acer Predator Helios 18 N23Q2 | |
| Average NVIDIA GeForce RTX 4080 Laptop GPU (53 - 66, n=2) | |
| Asus ROG Strix G18 G814JI | |
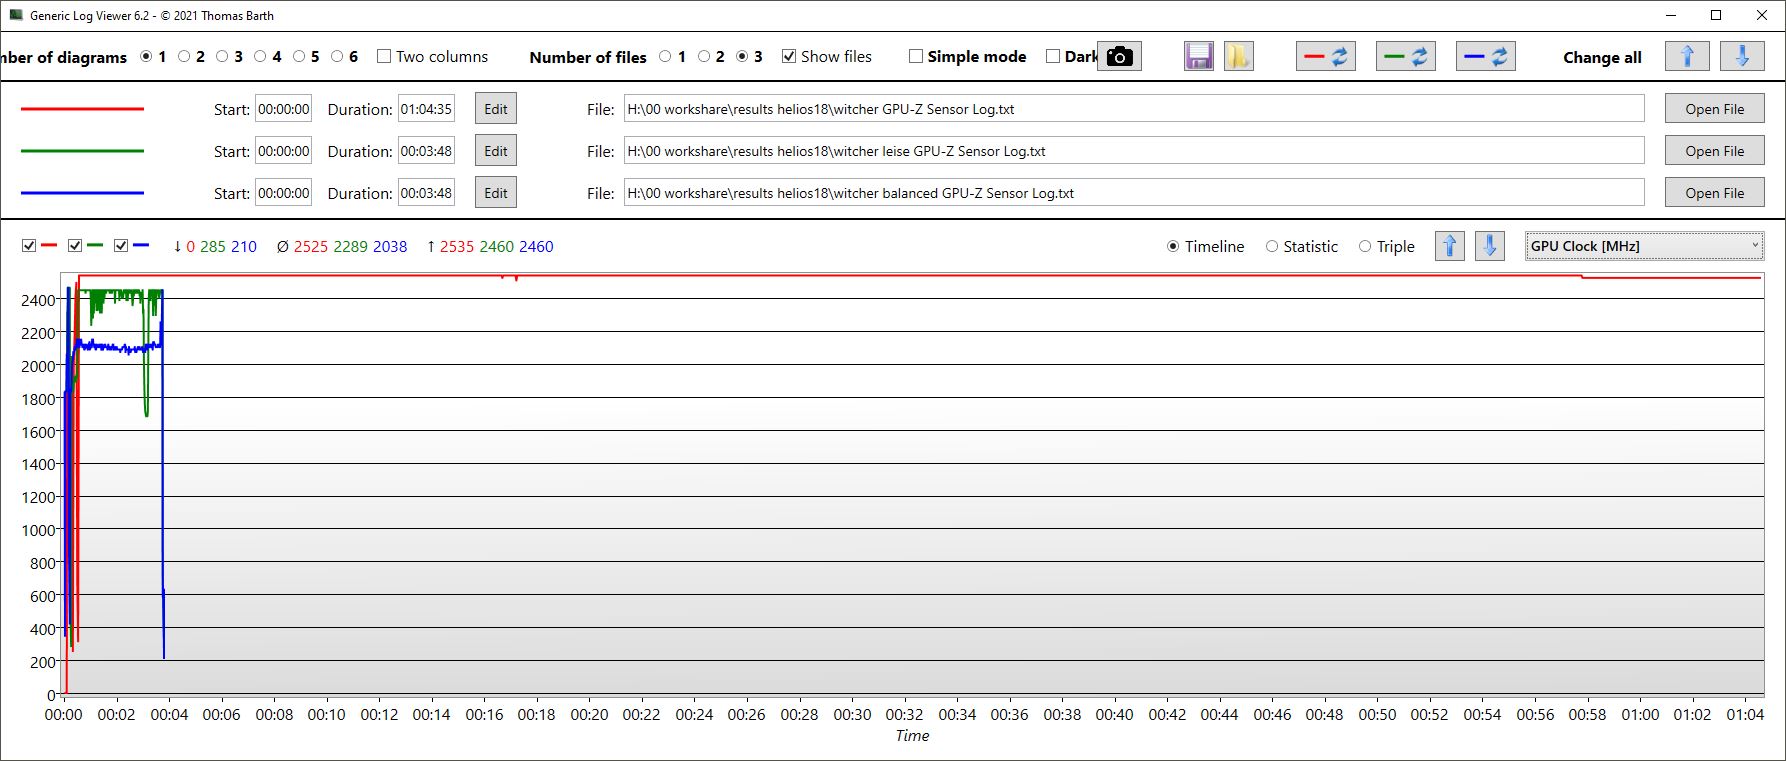
Over the course of an hour, the frame rate in Witcher 3 remains quite stable; the slight fluctuations are due to the typical day/night cycle in the game.
Unlike in the CPU benchmark, there is now a clear difference between the Balanced and Silent modes when gaming. The latter is, true to its namesake, very silent and also uses less power. Tables for fps, consumption and volume of the individual performance modes for Witcher 3 Ultra can be found in the following Emissions/Temperature sections.
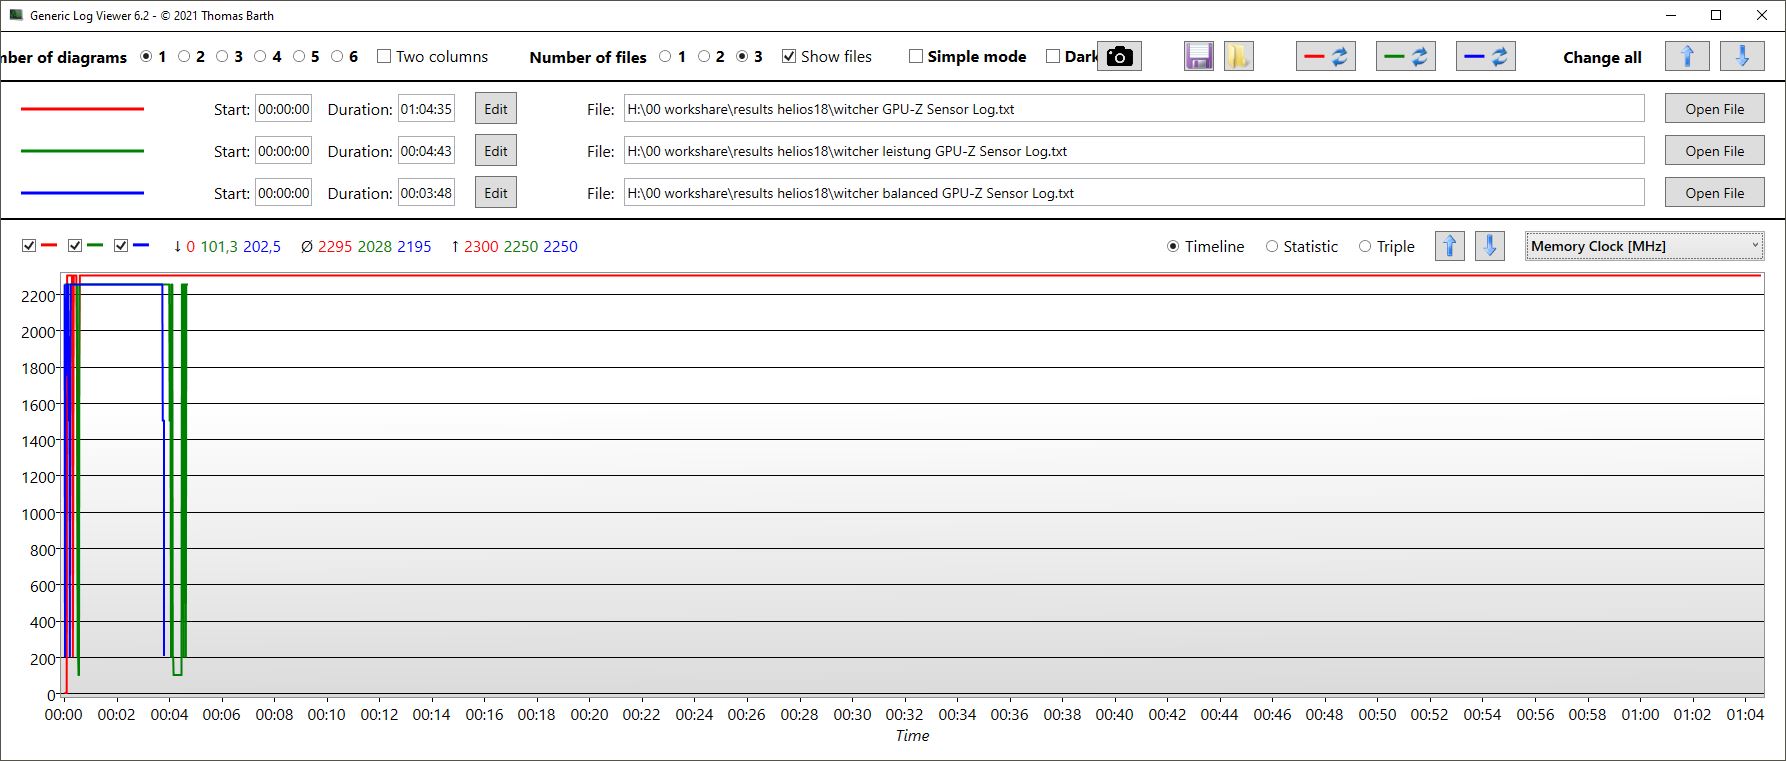
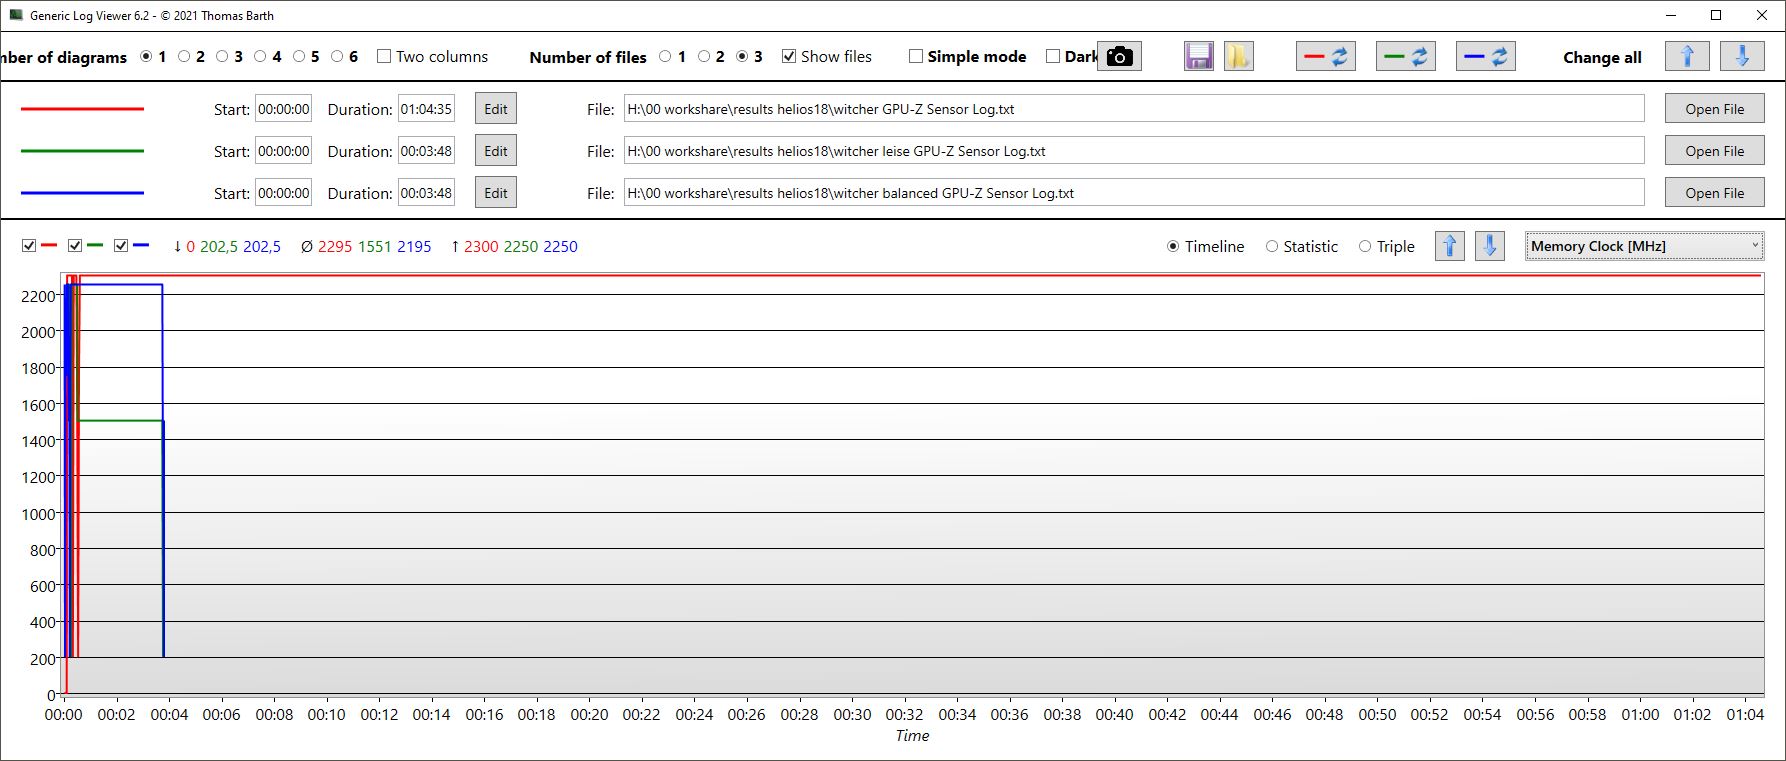
Interestingly, the GPU clocks slightly higher in Silent mode than in Balanced, but the memory clock is significantly lower and the power consumption is also lower.
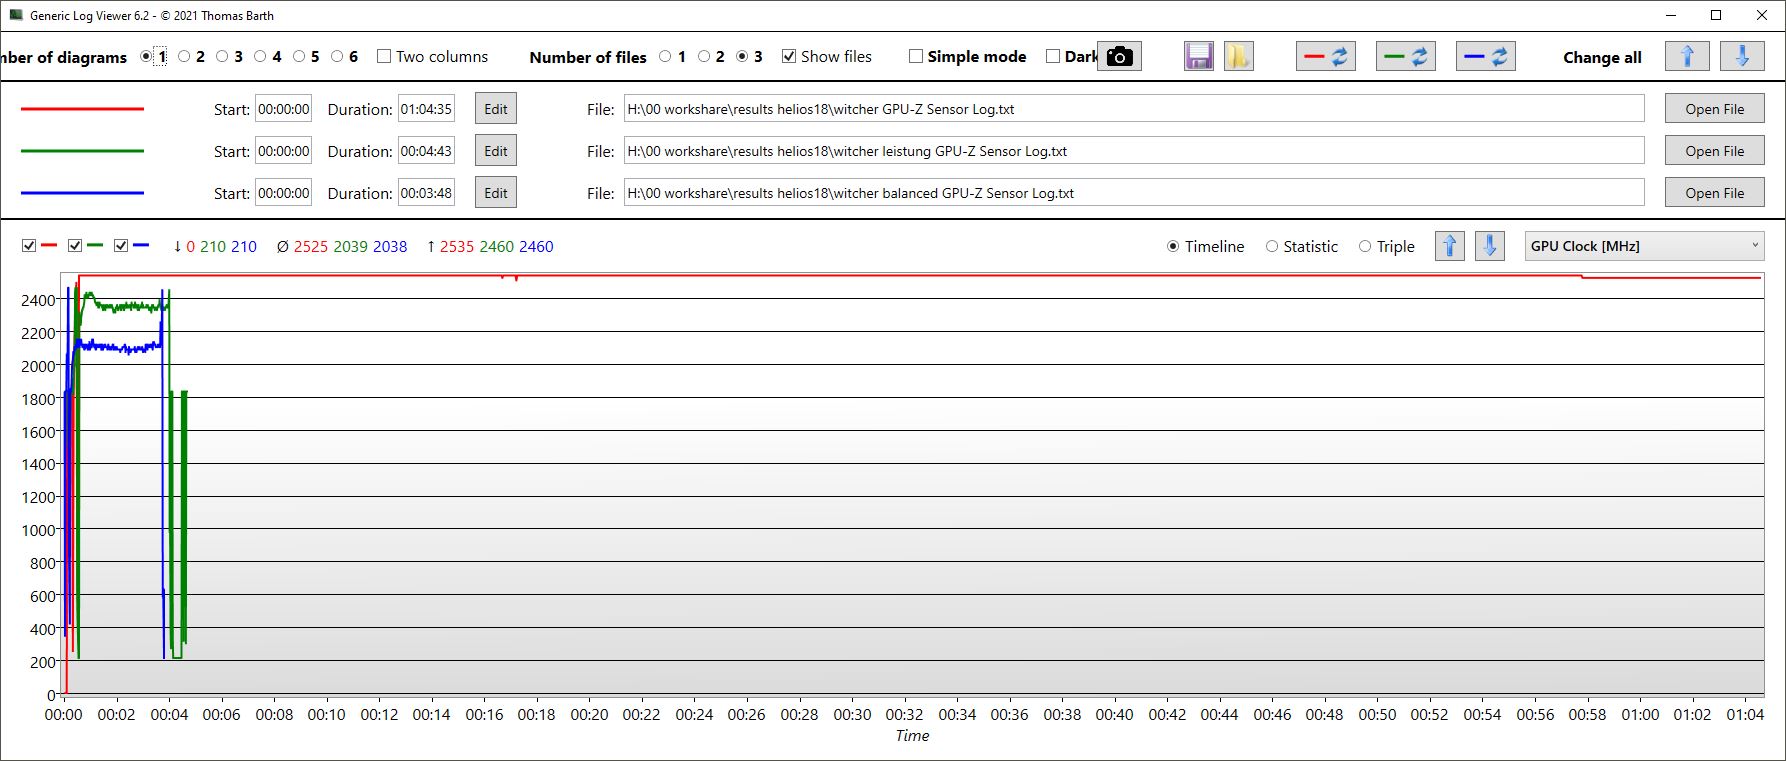
Witcher 3 FPS chart
| low | med. | high | ultra | QHD | 4K | |
|---|---|---|---|---|---|---|
| GTA V (2015) | 187.3 | 187.6 | 186.7 | 152.7 | 140.7 | |
| The Witcher 3 (2015) | 642 | 568 | 368 | 175 | 153 | |
| Dota 2 Reborn (2015) | 234 | 211 | 202 | 186.4 | 131 | |
| Final Fantasy XV Benchmark (2018) | 234 | 225 | 182.1 | 136.6 | 79.4 | |
| X-Plane 11.11 (2018) | 199 | 183.5 | 139.5 | 143.7 | ||
| Far Cry 5 (2018) | 199 | 175 | 168 | 158 | 155 | |
| Strange Brigade (2018) | 562 | 448 | 382 | 339 | 238 | |
| Call of Duty Modern Warfare 2 2022 (2022) | 167 | 124 | ||||
| Hogwarts Legacy (2023) | 173 | 157 | 134 | 108 | 81 | |
| F1 23 (2023) | 329 | 329 | 304 | 111 | 73 | |
| Cyberpunk 2077 (2023) | 127.13 | 77.03 | ||||
| Alan Wake 2 (2023) | 100.7 | 71 |
Emissions - Helios 18 very loud in turbo
Noise
The fan noise naturally depends heavily on the chosen performance mode. In Turbo mode, background noise is very high under load; we measured a maximum of just under 60 dB, making it the loudest device in the comparison field. The Alienware with its RTX 4090 remains quieter; only the MSI is similarly loud. At maximum volume, the chassis even starts to vibrate slightly. We thus recommend Performance mode or lower. In the former, you only forego 3 to 5 percent of performance in Witcher 3, but the volume drops by almost 10 dB!
At least the Helios 18 regulates its fans well depending on the load and doesn't immediately unleash full volume on users under medium loads. However, the fan spin does not remain constant while gaming, but fluctuates cyclically, sometimes more and sometimes less loudly (Witcher 3).
The other performance modes can reduce the noise level considerably, see table below.
| Parameters/Performance mode | Turbo | Performance | Balanced | Silent |
|---|---|---|---|---|
| fps | 176 | 171 | 157 | 100 |
| Volume in dB | 59.82 | 50.74 | 40.77 | 32.36 |
| Consumption in W | 289 | 227 | 182 | 153 |
Noise level
| Idle |
| 23 / 23 / 23 dB(A) |
| Load |
| 45.26 / 59.94 dB(A) |
 | ||
30 dB silent 40 dB(A) audible 50 dB(A) loud |
||
min: | ||
| Acer Predator Helios 18 N23Q2 GeForce RTX 4080 Laptop GPU, i9-13900HX, Samsung PM9A1 MZVL22T0HBLB | MSI GE78HX 13VH-070US GeForce RTX 4080 Laptop GPU, i9-13950HX, Samsung PM9A1 MZVL22T0HBLB | HP Omen 17-ck2097ng GeForce RTX 4080 Laptop GPU, i9-13900HX, SK hynix PC801 HFS001TEJ9X101N | Alienware m18 R1 GeForce RTX 4090 Laptop GPU, i9-13980HX, SK hynix PC801 HFS001TEJ9X101N | Asus ROG Strix G18 G814JI GeForce RTX 4070 Laptop GPU, i7-13650HX, Micron 2400 MTFDKBA1T0QFM | Razer Blade 18 RTX 4070 GeForce RTX 4070 Laptop GPU, i9-13950HX, SSSTC CA6-8D1024 | |
|---|---|---|---|---|---|---|
| Noise | -6% | -11% | 6% | -2% | 3% | |
| off / environment * (dB) | 23 | 23.4 -2% | 24 -4% | 22.8 1% | 25 -9% | 23.5 -2% |
| Idle Minimum * (dB) | 23 | 24.2 -5% | 31 -35% | 23 -0% | 26 -13% | 23.8 -3% |
| Idle Average * (dB) | 23 | 25.6 -11% | 32 -39% | 23 -0% | 28 -22% | 23.8 -3% |
| Idle Maximum * (dB) | 23 | 31 -35% | 33 -43% | 23 -0% | 29 -26% | 26.8 -17% |
| Load Average * (dB) | 45.26 | 43.3 4% | 45 1% | 35.6 21% | 41 9% | 37.3 18% |
| Witcher 3 ultra * (dB) | 59.82 | 56.3 6% | 45 25% | 51.3 14% | 44 26% | 48 20% |
| Load Maximum * (dB) | 59.94 | 59.1 1% | 50 17% | 56.7 5% | 46 23% | 53.5 11% |
* ... smaller is better
Temperature
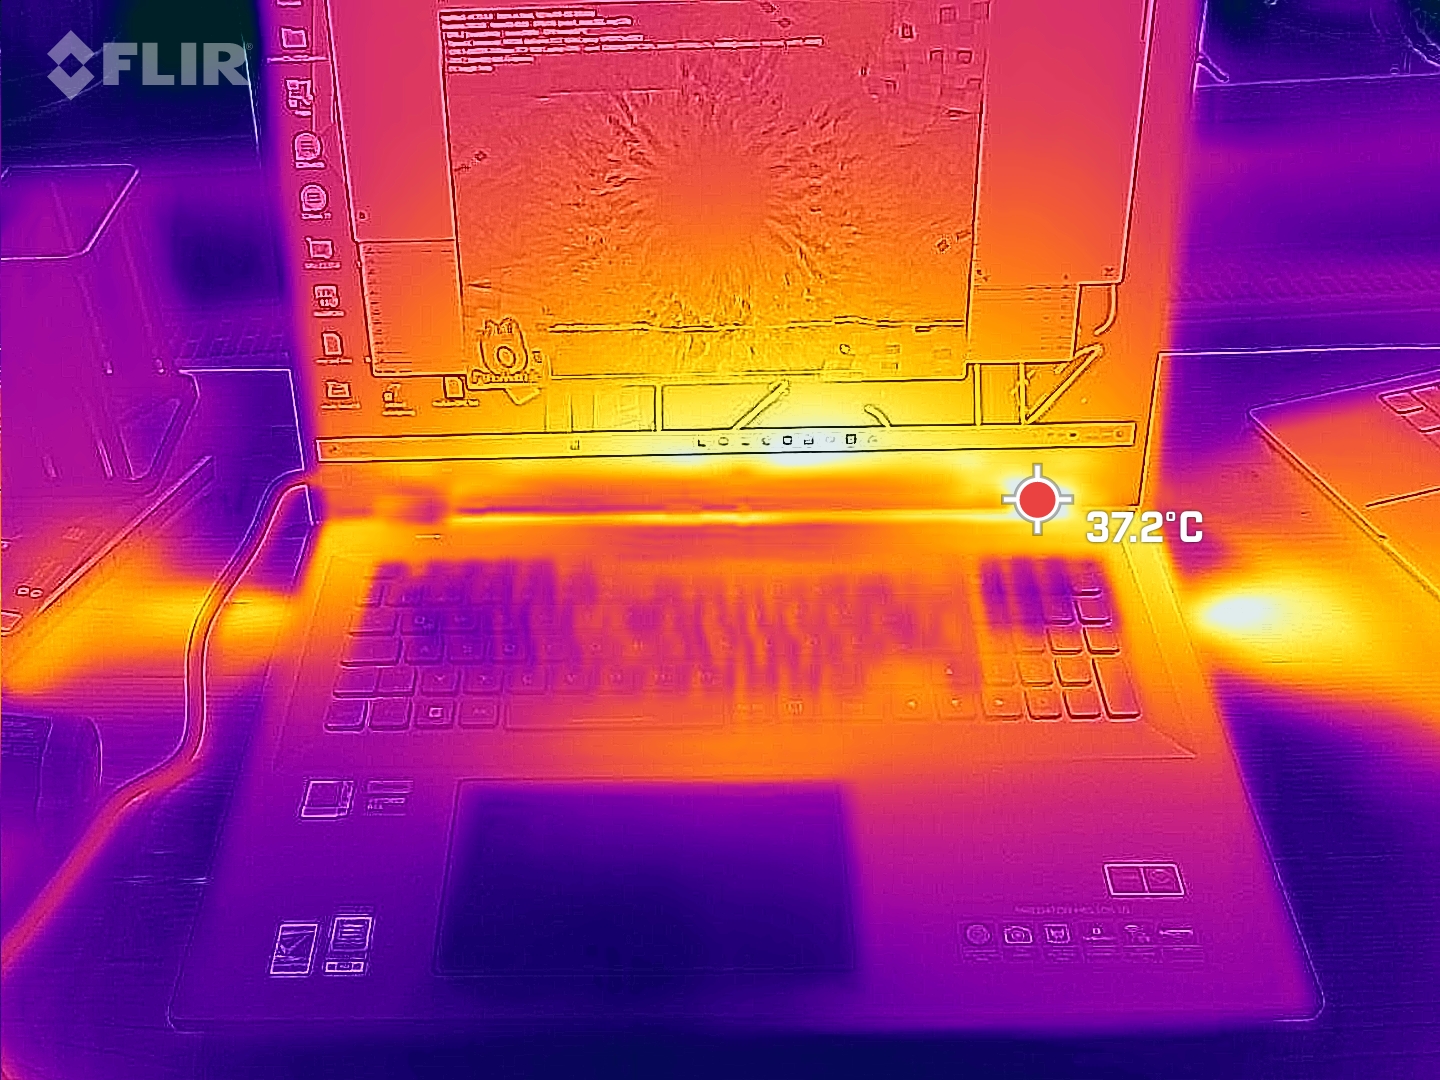
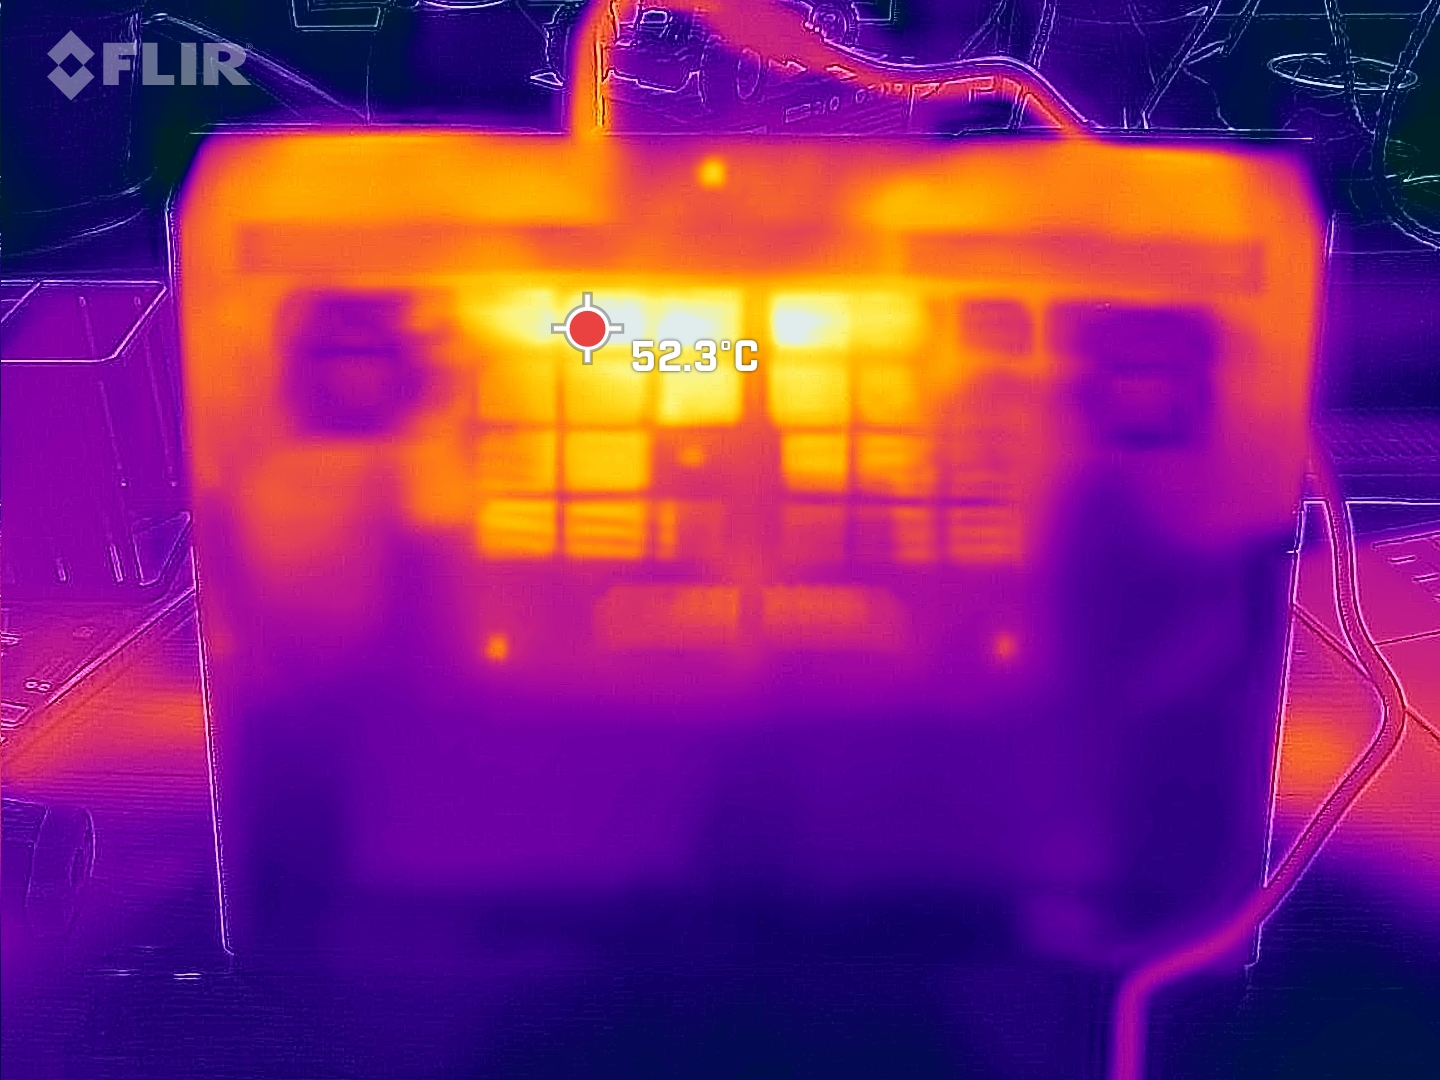
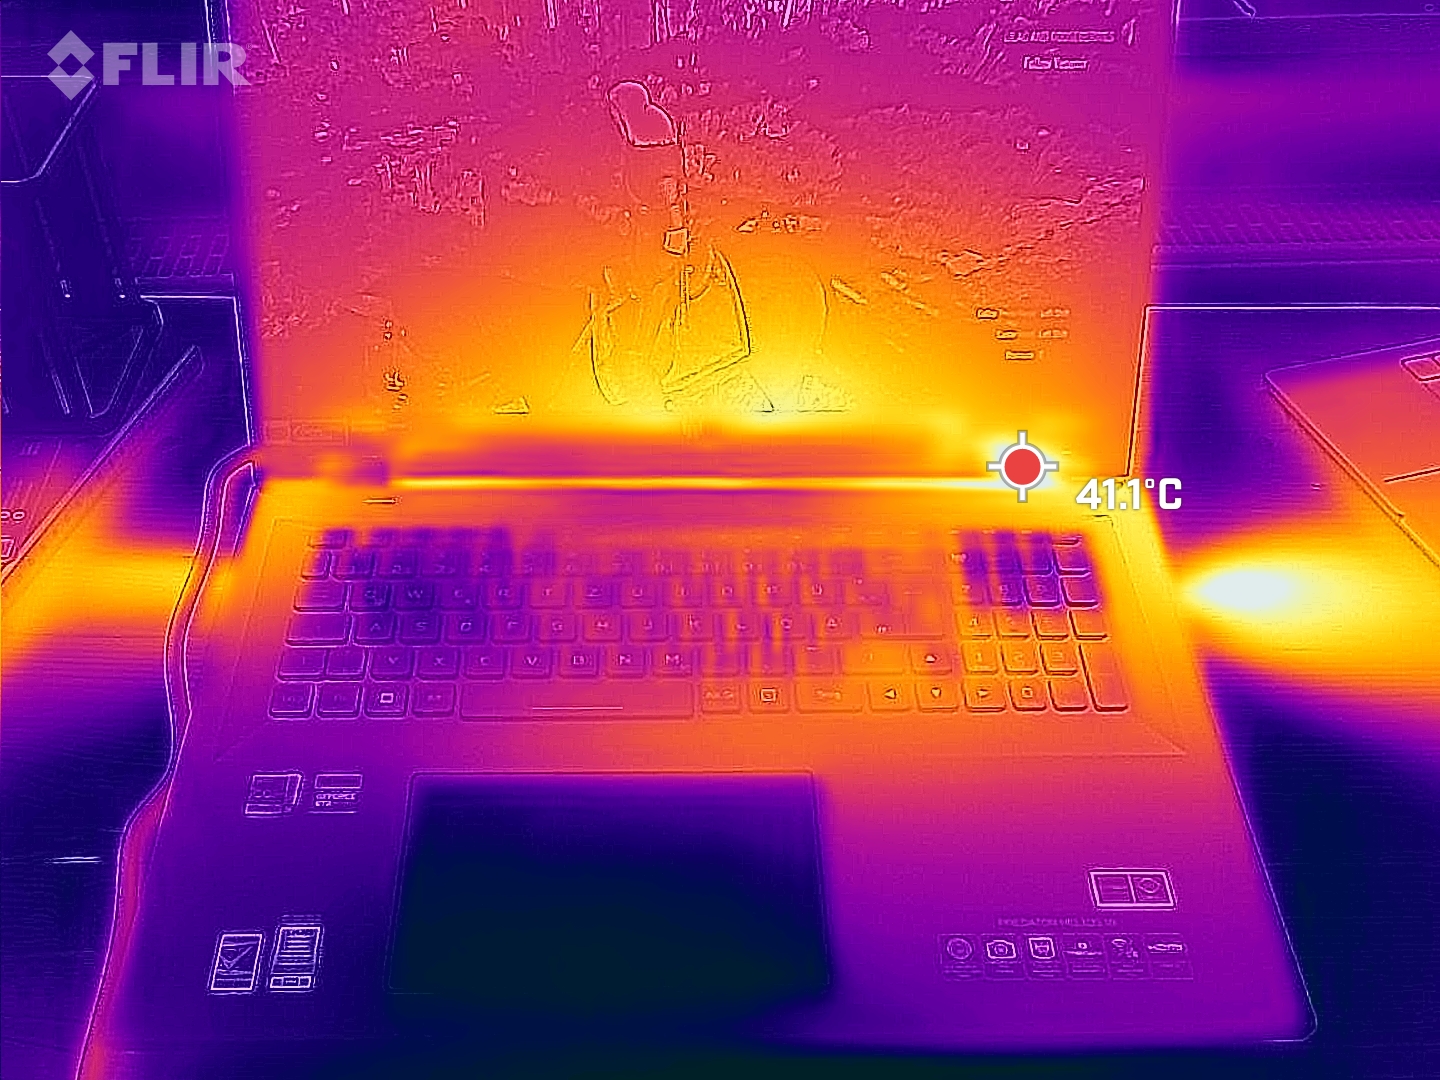
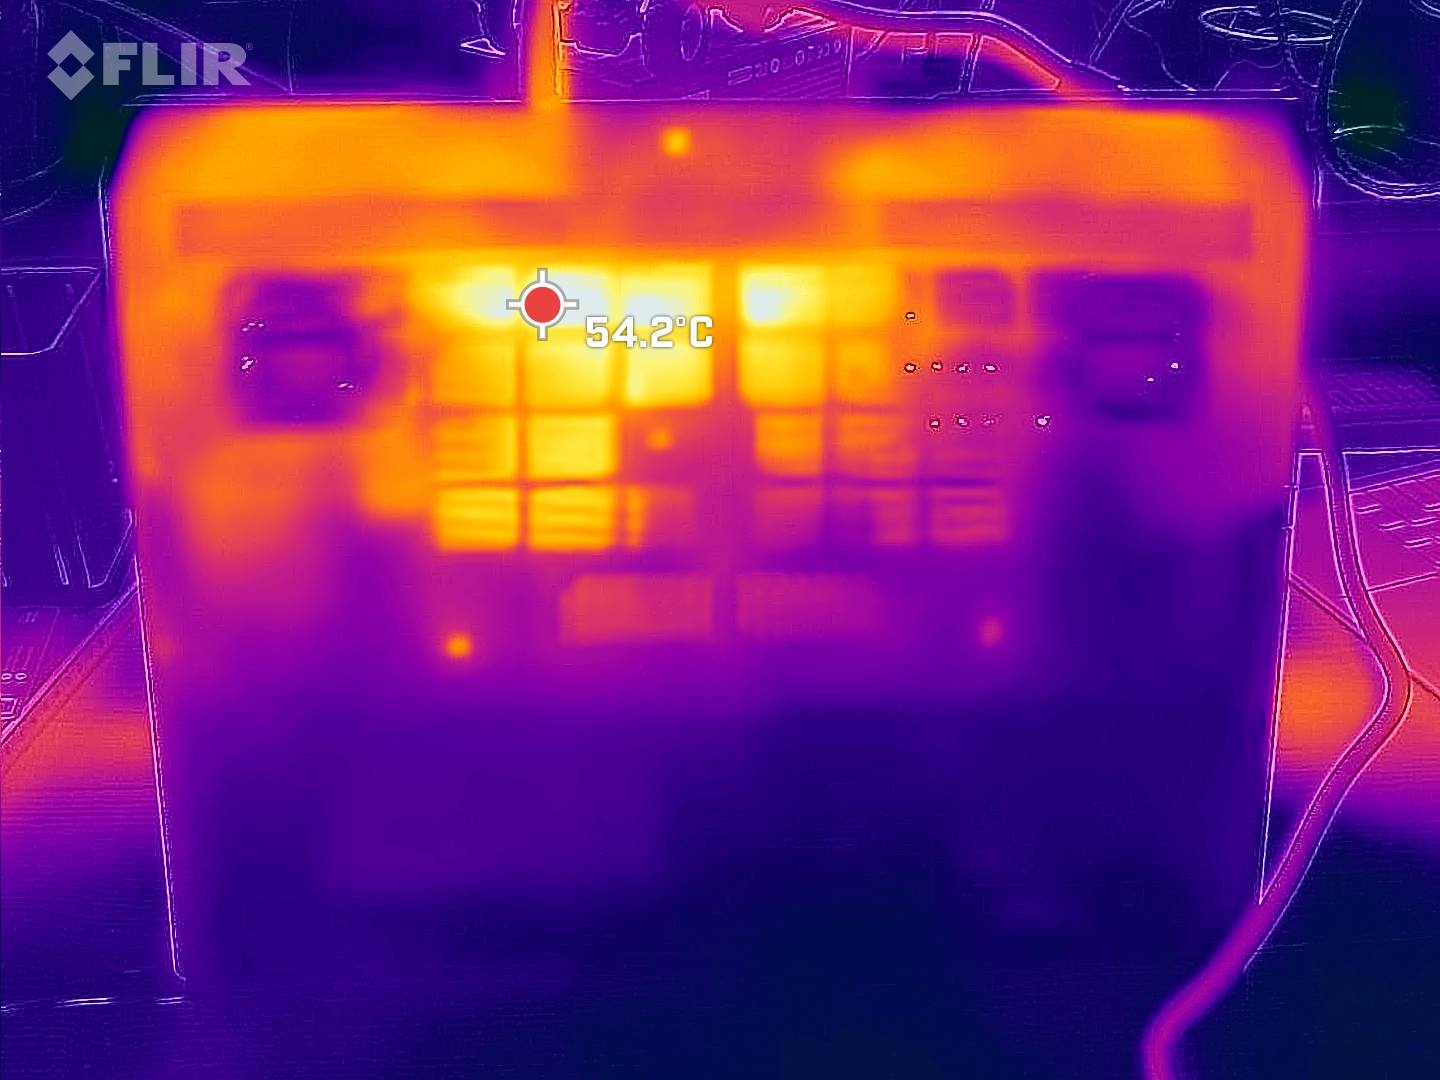
The surface temperatures show that loud fans also have a positive aspect. The Helios 18 only heats up very selectively (underside centrally and to the left of the display), but otherwise remains almost unusually cool. For example, the left palm rest feels downright cold after an hour of gaming. This shows that, on the one hand, the loud fans are too aggressively configured and, on the other hand, the heat is not distributed very well.
(+) The maximum temperature on the upper side is 35 °C / 95 F, compared to the average of 40.4 °C / 105 F, ranging from 21.2 to 68.8 °C for the class Gaming.
(-) The bottom heats up to a maximum of 56 °C / 133 F, compared to the average of 43.2 °C / 110 F
(+) In idle usage, the average temperature for the upper side is 31.1 °C / 88 F, compared to the device average of 33.9 °C / 93 F.
(+) Playing The Witcher 3, the average temperature for the upper side is 30.7 °C / 87 F, compared to the device average of 33.9 °C / 93 F.
(+) The palmrests and touchpad are cooler than skin temperature with a maximum of 29 °C / 84.2 F and are therefore cool to the touch.
(±) The average temperature of the palmrest area of similar devices was 28.8 °C / 83.8 F (-0.2 °C / -0.4 F).
| Acer Predator Helios 18 N23Q2 Intel Core i9-13900HX, NVIDIA GeForce RTX 4080 Laptop GPU | MSI GE78HX 13VH-070US Intel Core i9-13950HX, NVIDIA GeForce RTX 4080 Laptop GPU | HP Omen 17-ck2097ng Intel Core i9-13900HX, NVIDIA GeForce RTX 4080 Laptop GPU | Alienware m18 R1 Intel Core i9-13980HX, NVIDIA GeForce RTX 4090 Laptop GPU | Asus ROG Strix G18 G814JI Intel Core i7-13650HX, NVIDIA GeForce RTX 4070 Laptop GPU | Razer Blade 18 RTX 4070 Intel Core i9-13950HX, NVIDIA GeForce RTX 4070 Laptop GPU | |
|---|---|---|---|---|---|---|
| Heat | 11% | 14% | 17% | 7% | 11% | |
| Maximum Upper Side * (°C) | 35 | 37.4 -7% | 41 -17% | 39 -11% | 45 -29% | 39.2 -12% |
| Maximum Bottom * (°C) | 56 | 45 20% | 51 9% | 36.4 35% | 47 16% | 35.6 36% |
| Idle Upper Side * (°C) | 34 | 29.8 12% | 24 29% | 29.2 14% | 28 18% | 31.8 6% |
| Idle Bottom * (°C) | 39 | 32.4 17% | 25 36% | 27.8 29% | 31 21% | 33.2 15% |
* ... smaller is better
Stress testing
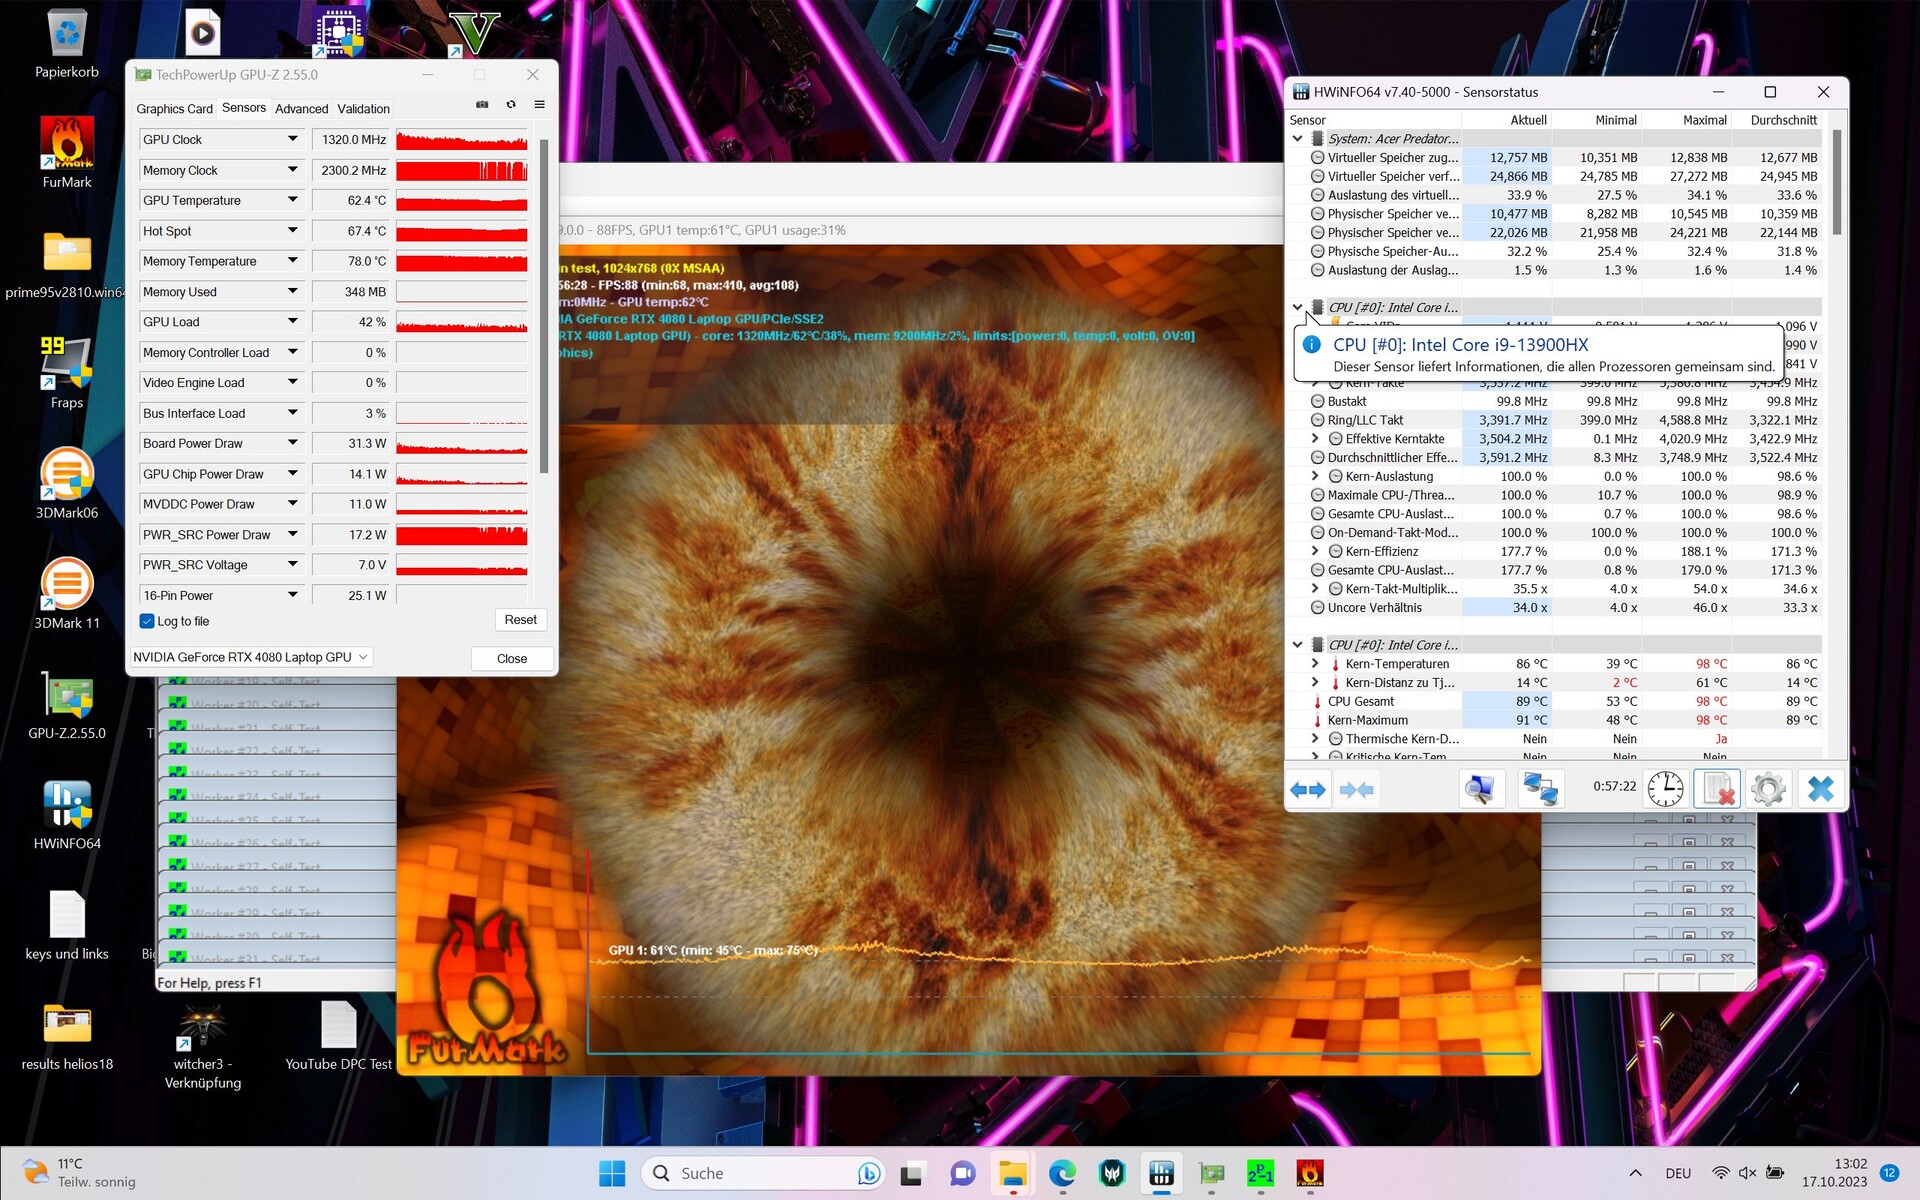
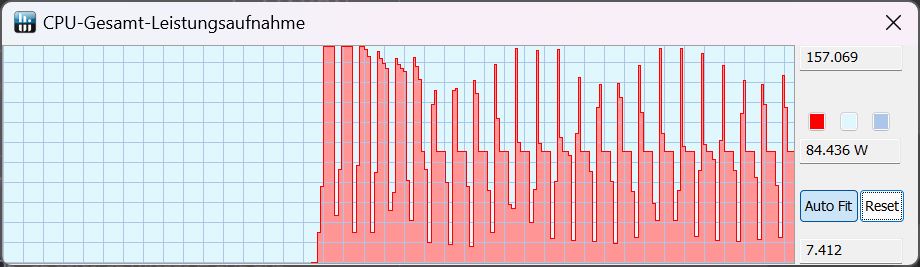
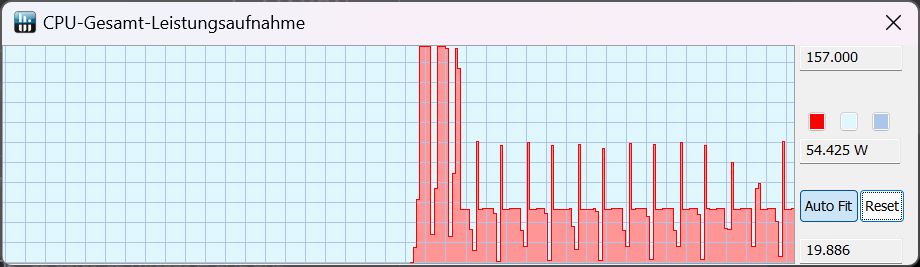
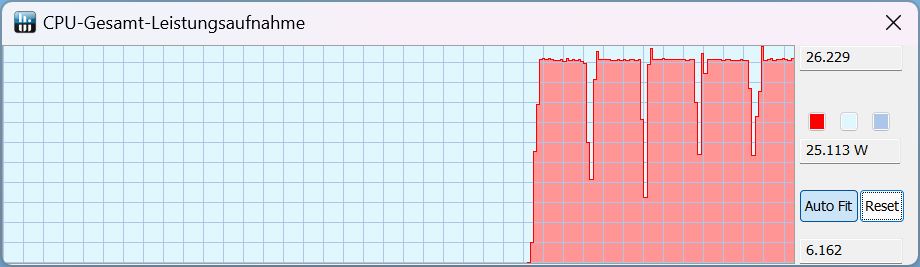
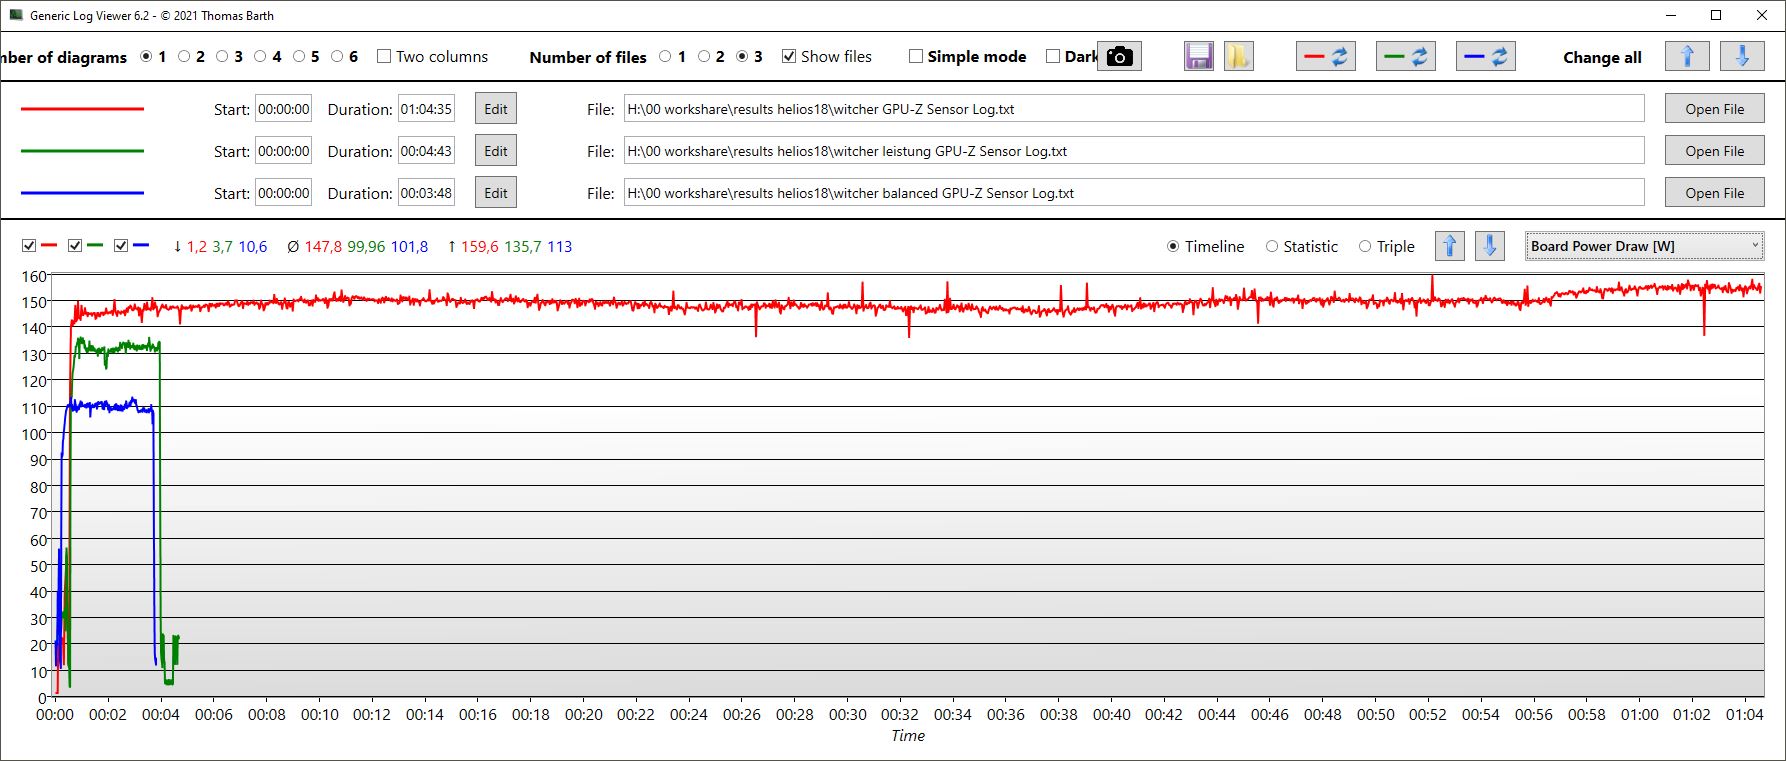
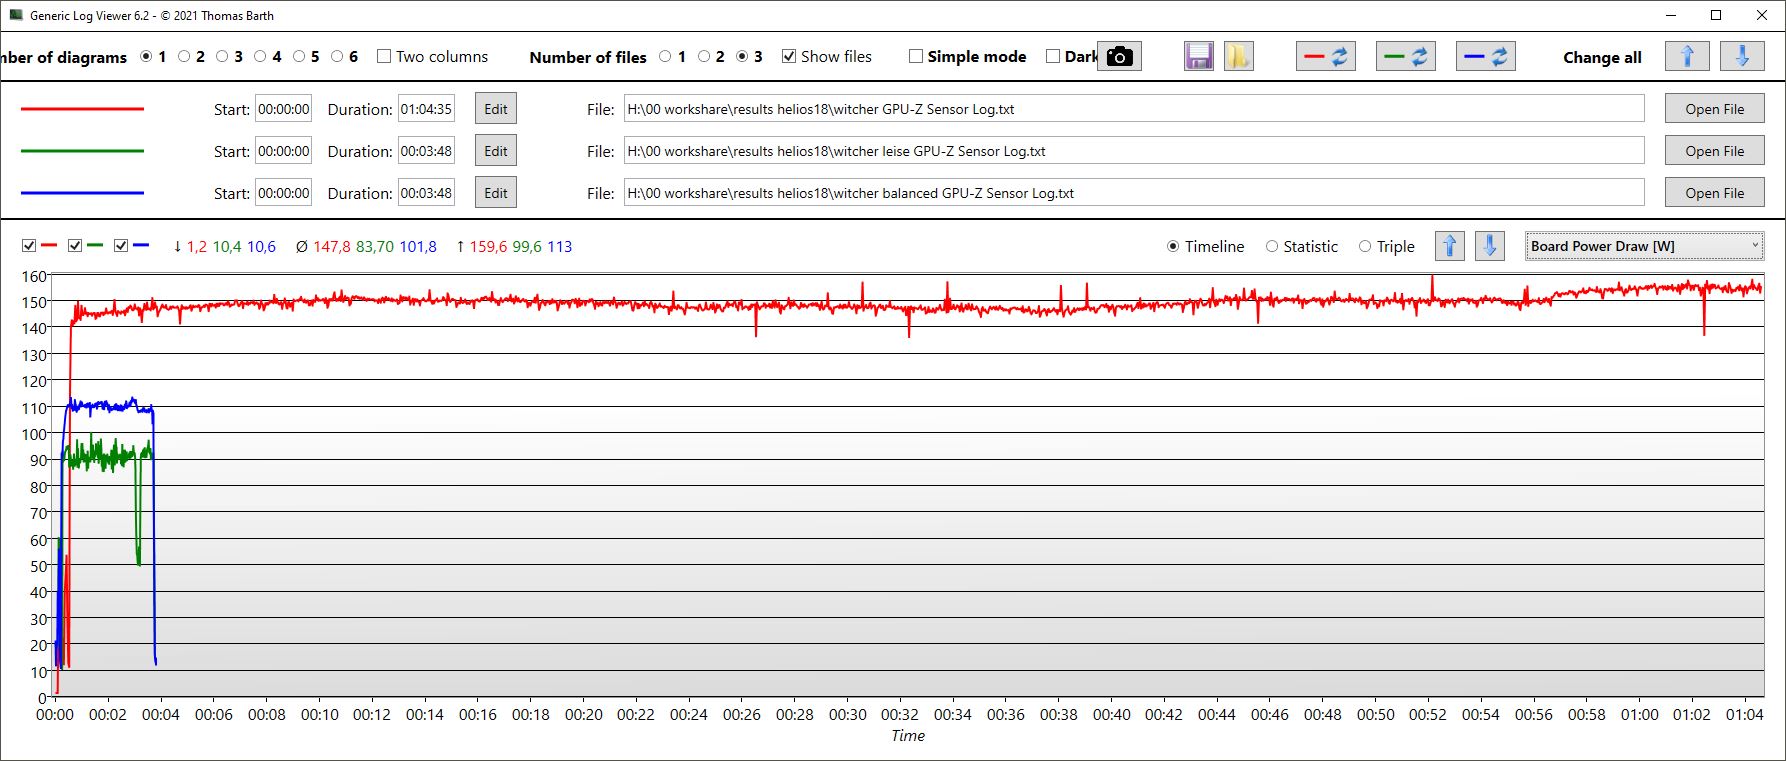
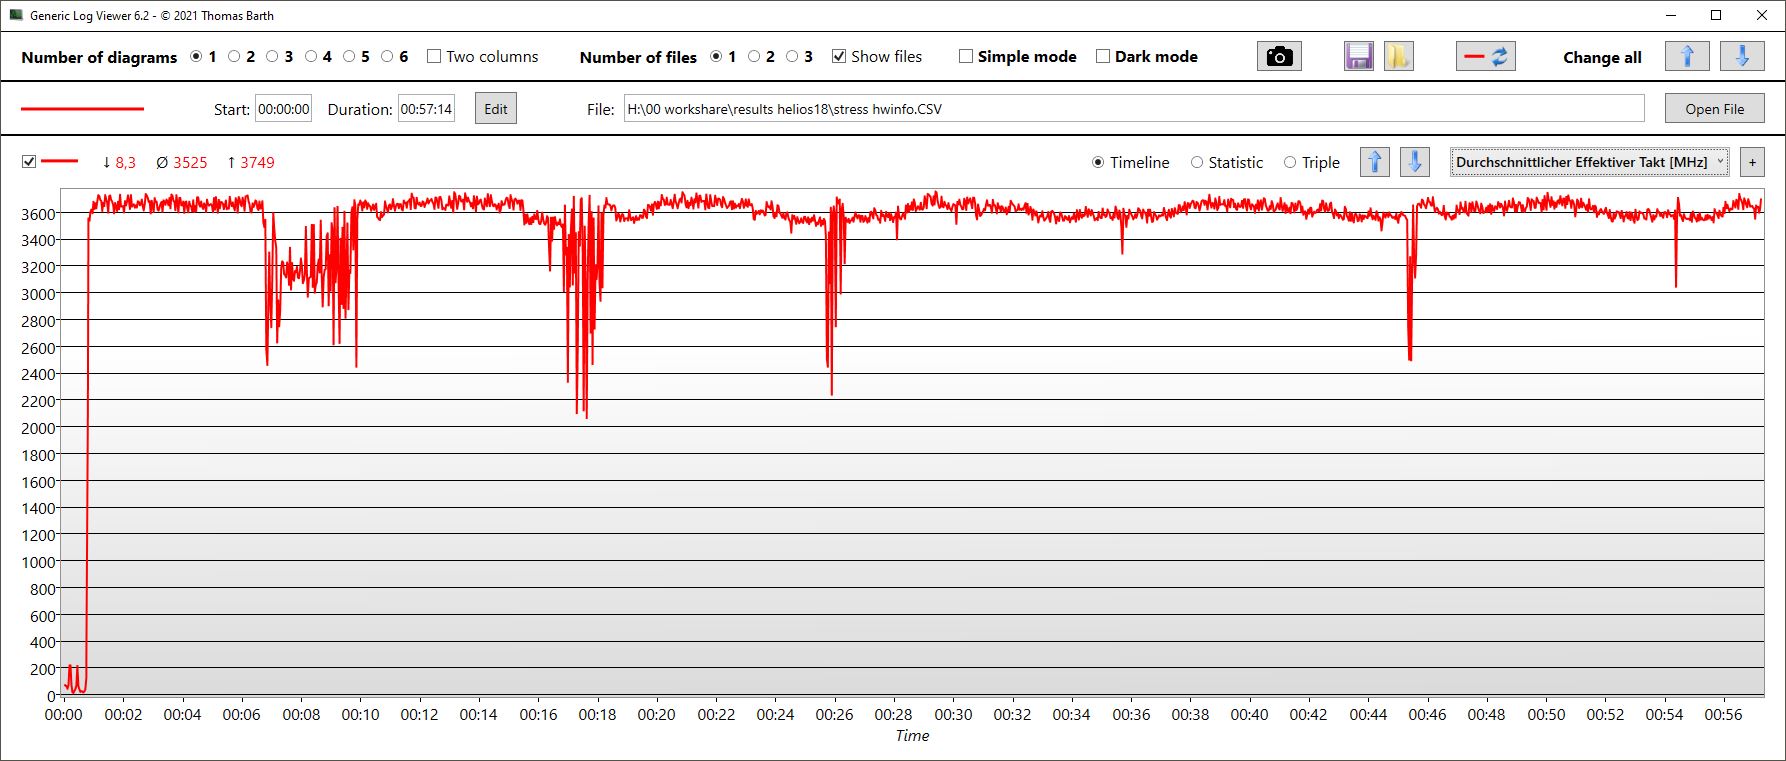
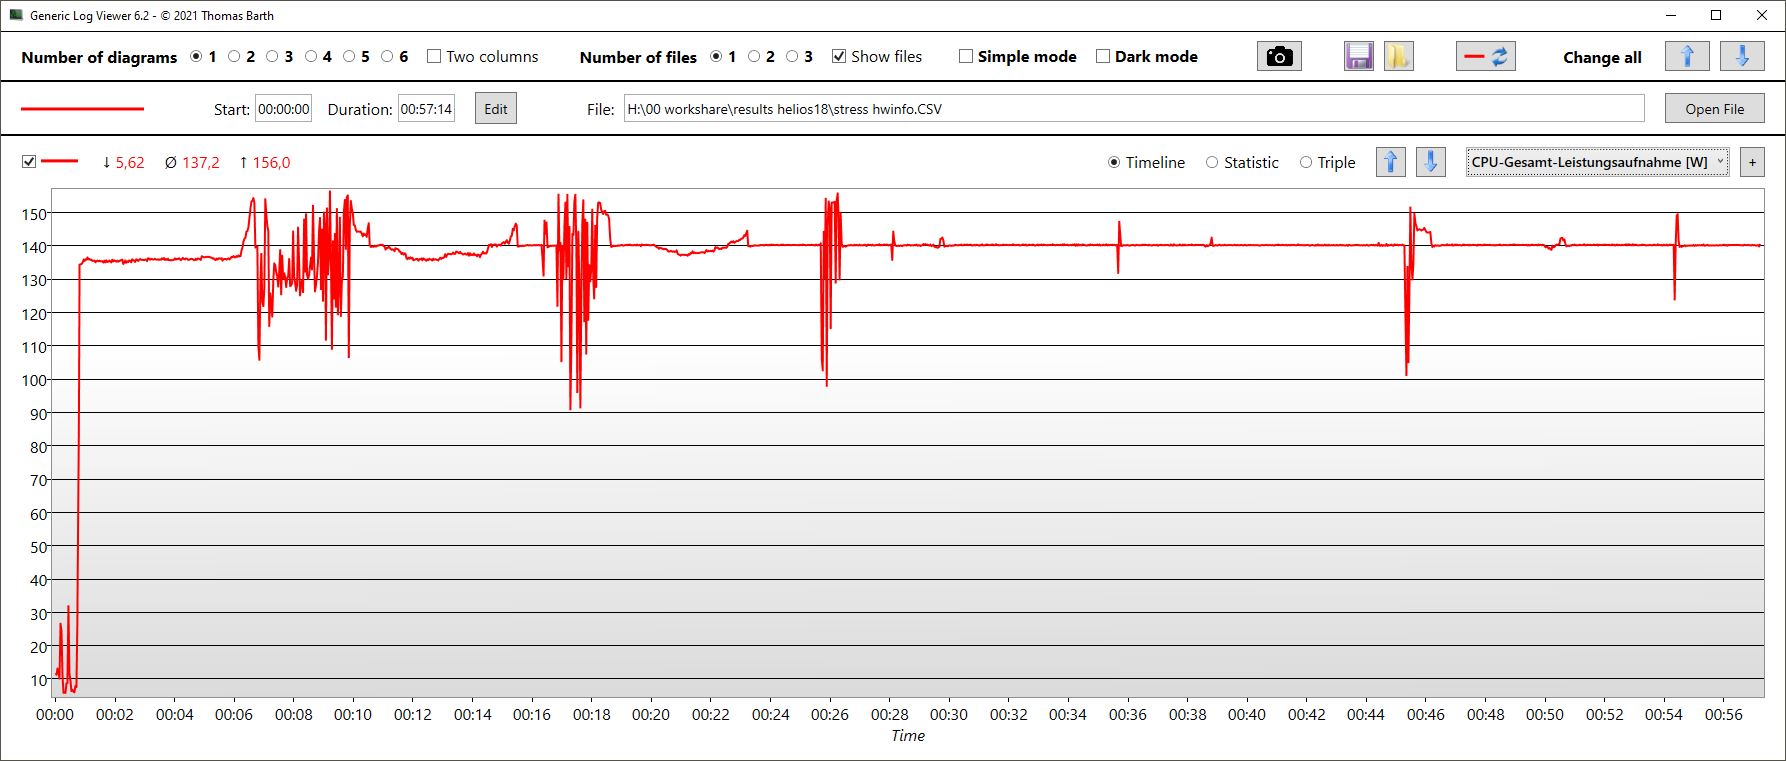
After launching our stress test, the CPU performance of the Predator remains relatively constant, with the cores consistently clocking between 3.4 and 3.6 GHz. There are always minor fluctuations that are reflected in the power consumption and also the core temperature. CPU core temperatures rise up to 98 °C, but average at 89 °C. CPU power consumption peaks at 156 W and averages 137 W.
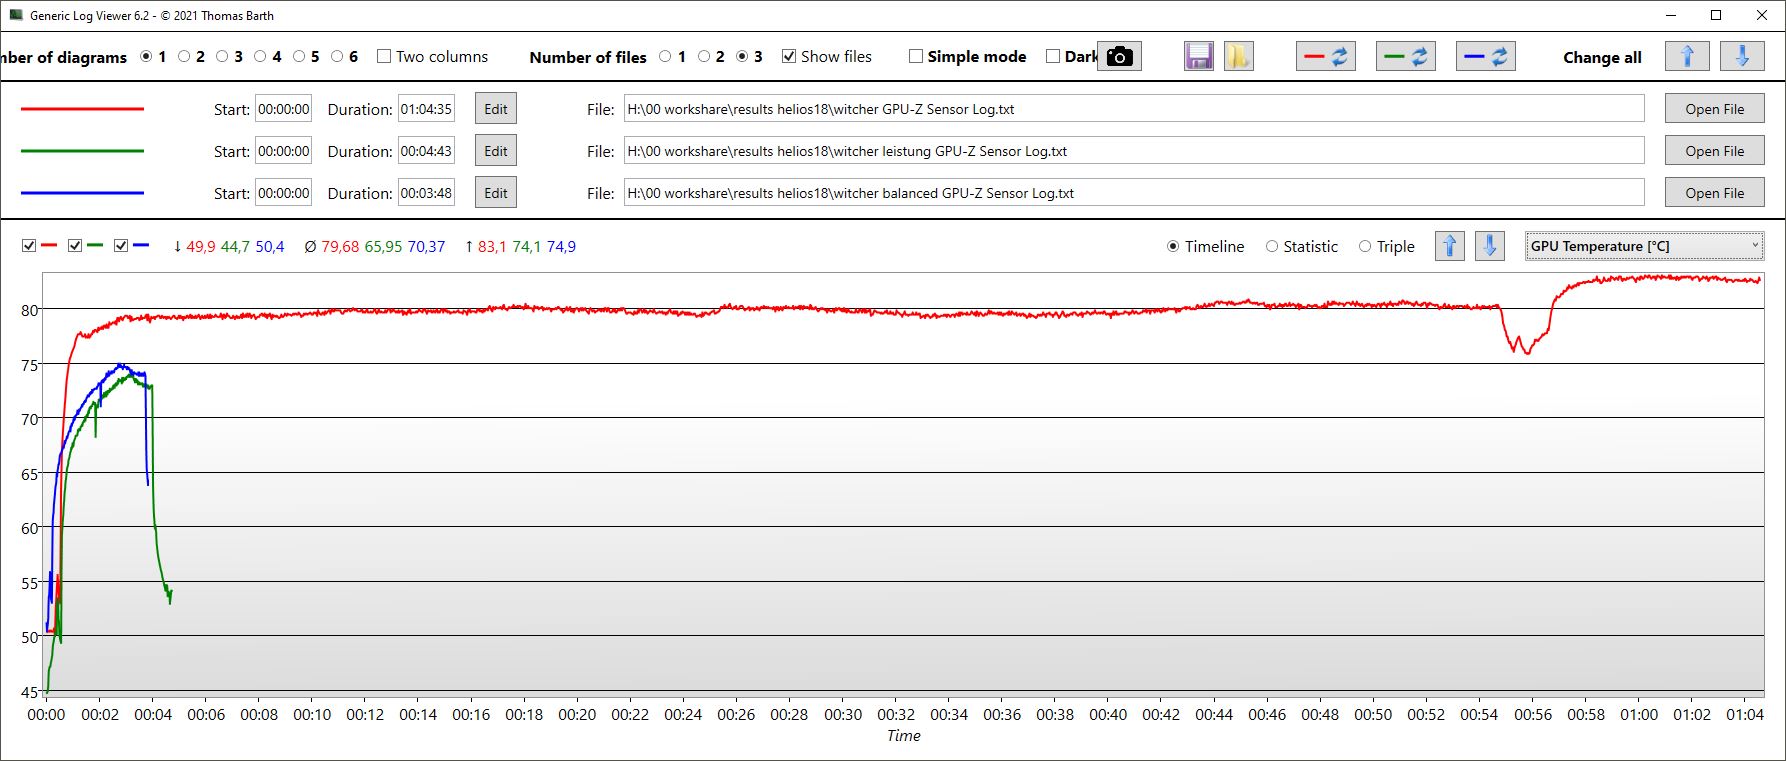
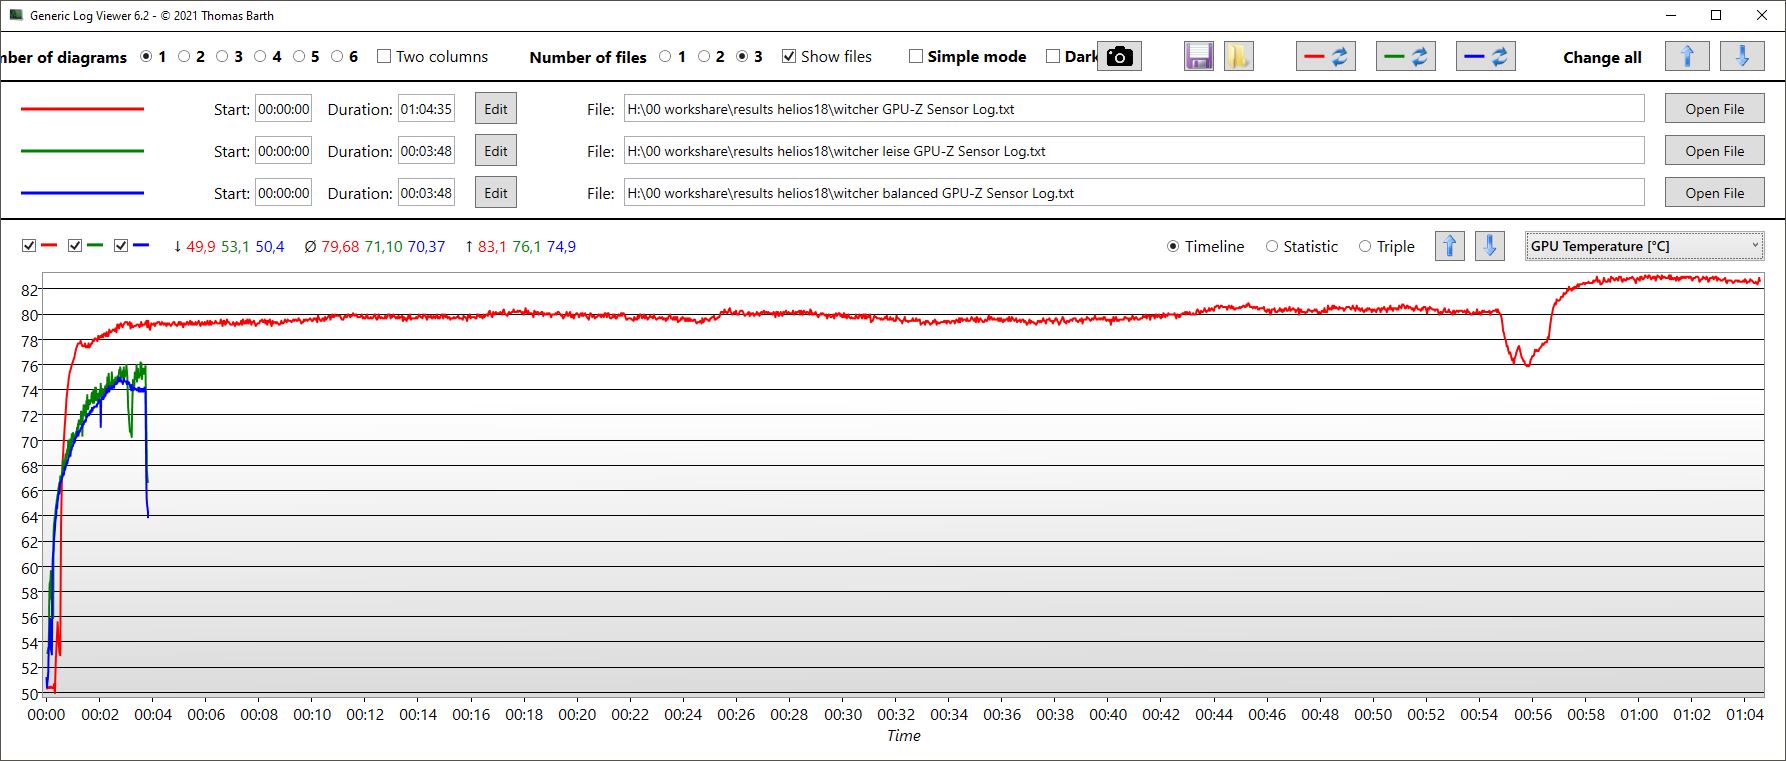
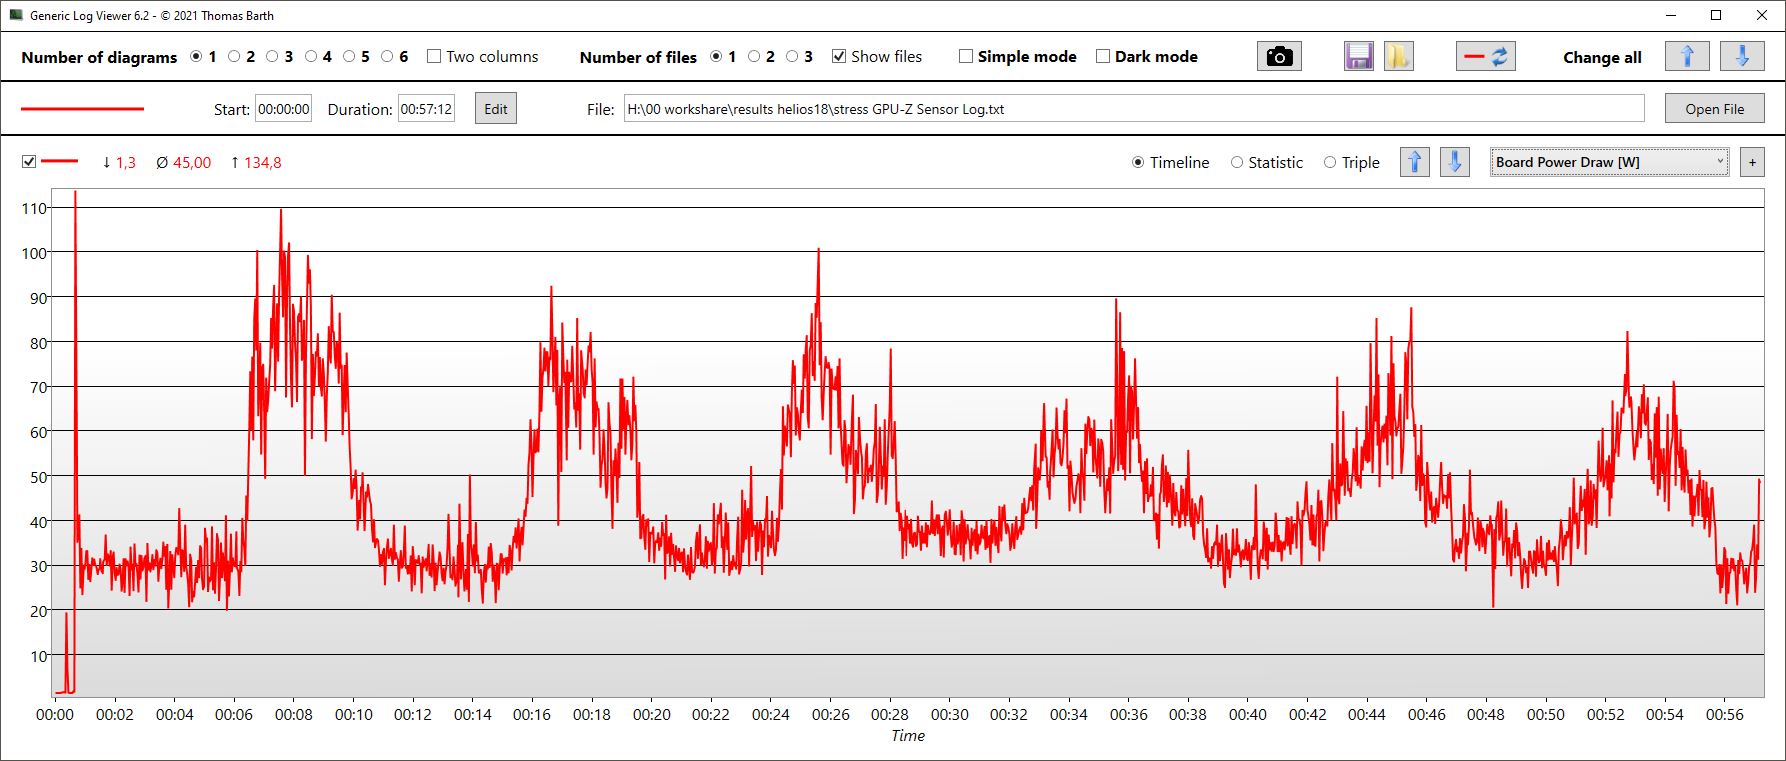
The GPU is much less consistent and exhibits a performance wave curve. The clock rate reaches a cyclically recurring maximum of 2.5 GHz and the curve valleys are around 1.2 GHz. At the same time, we measured very spontaneous drops down to just 200 MHz for fractions of a second in the otherwise constant memory clock of 2.3 GHz. The GPU temperature fluctuates as well, but is only 64 °C on average, maximum 76 °C. Power consumption fluctuates between 25 W and 90 to 100 W.
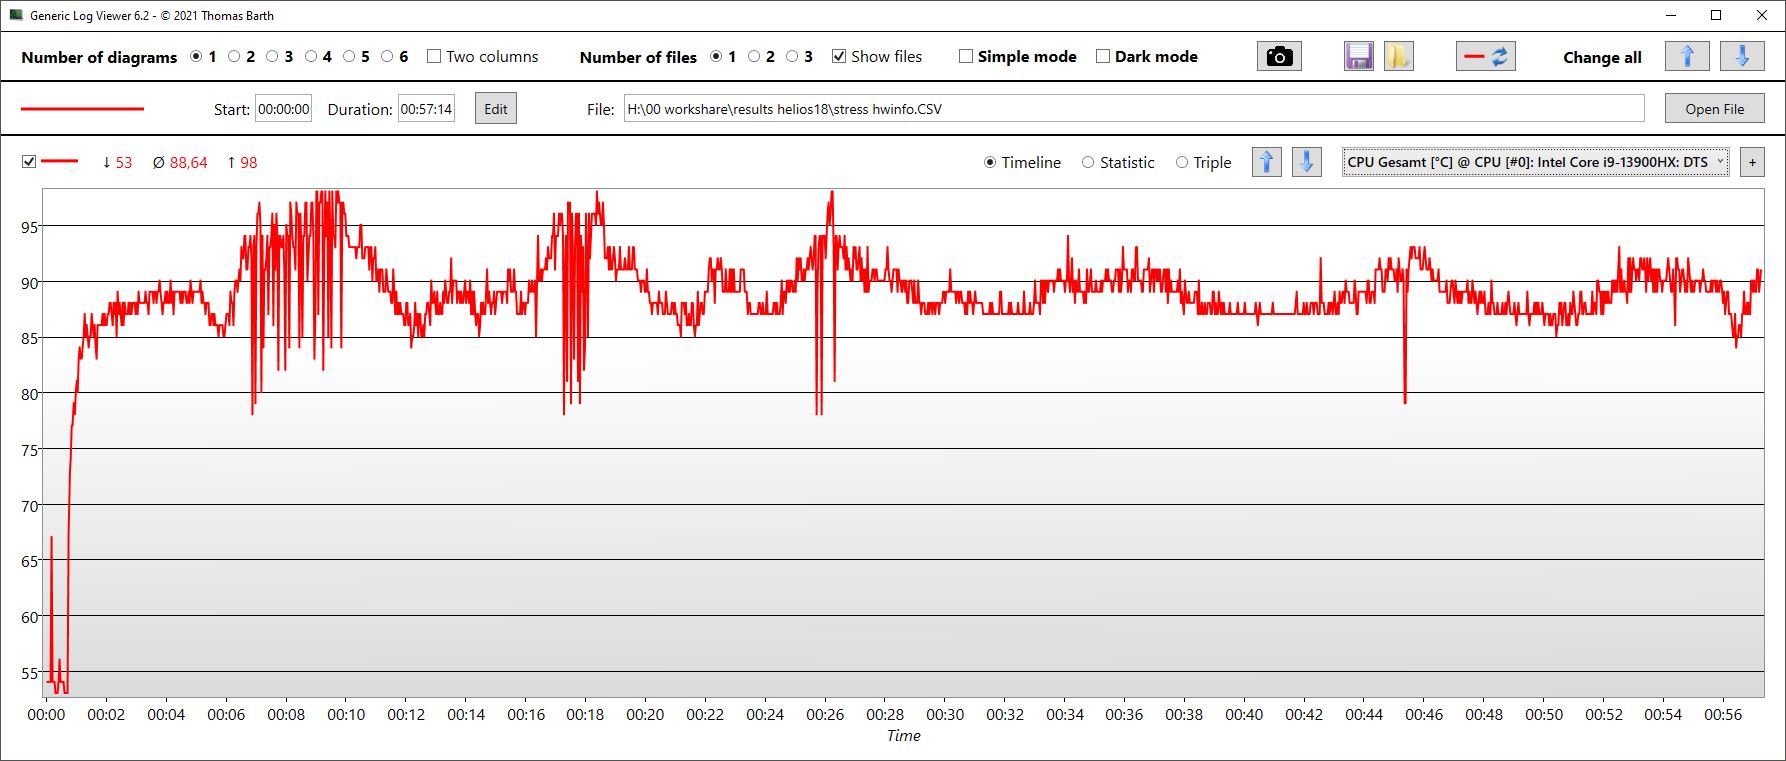
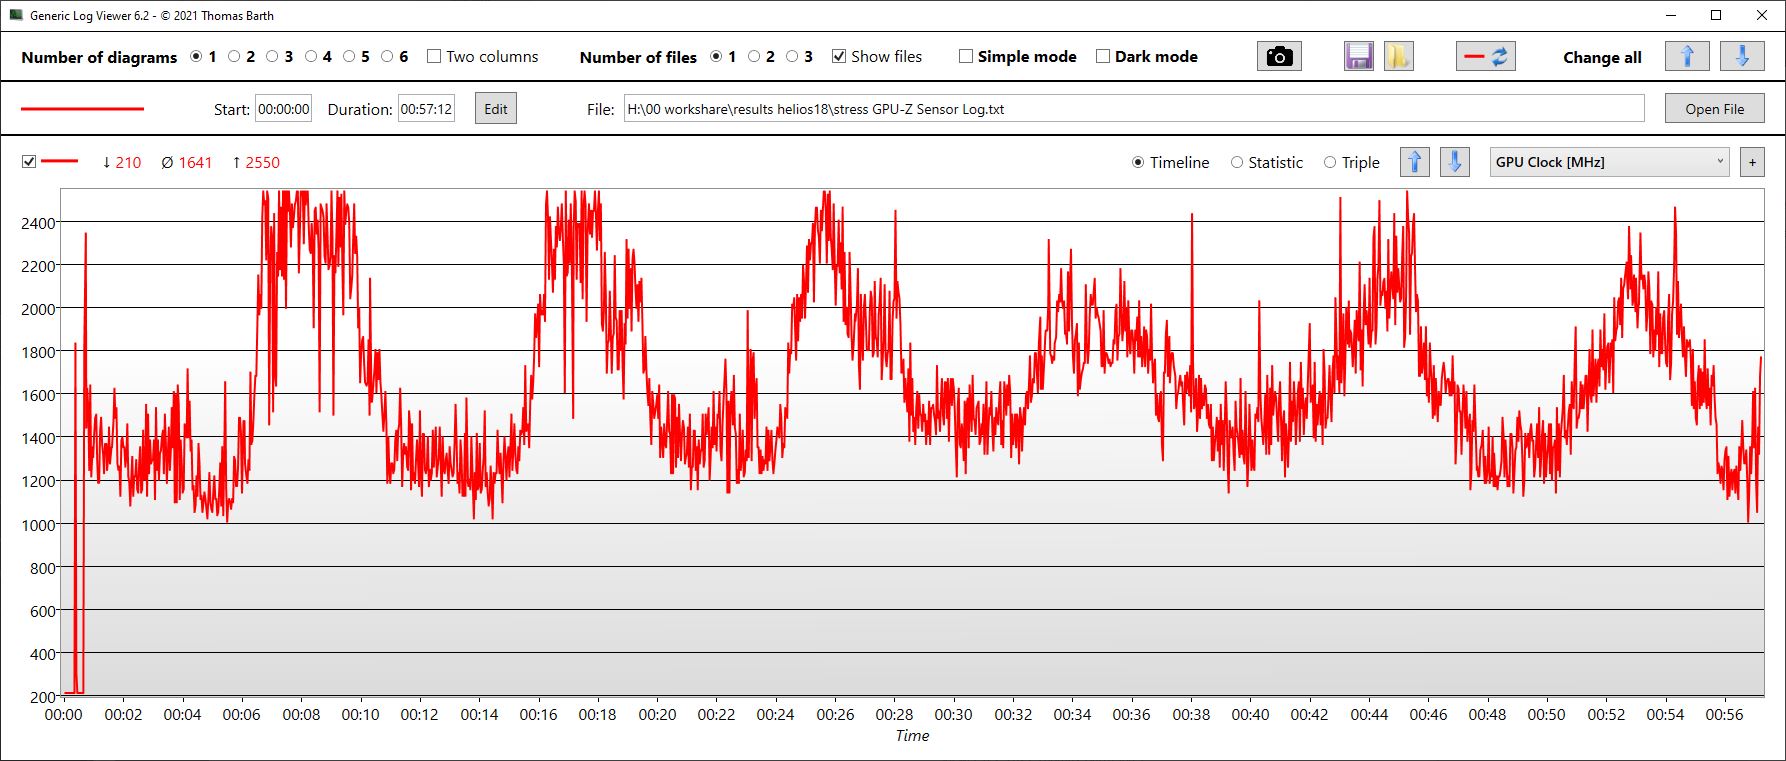
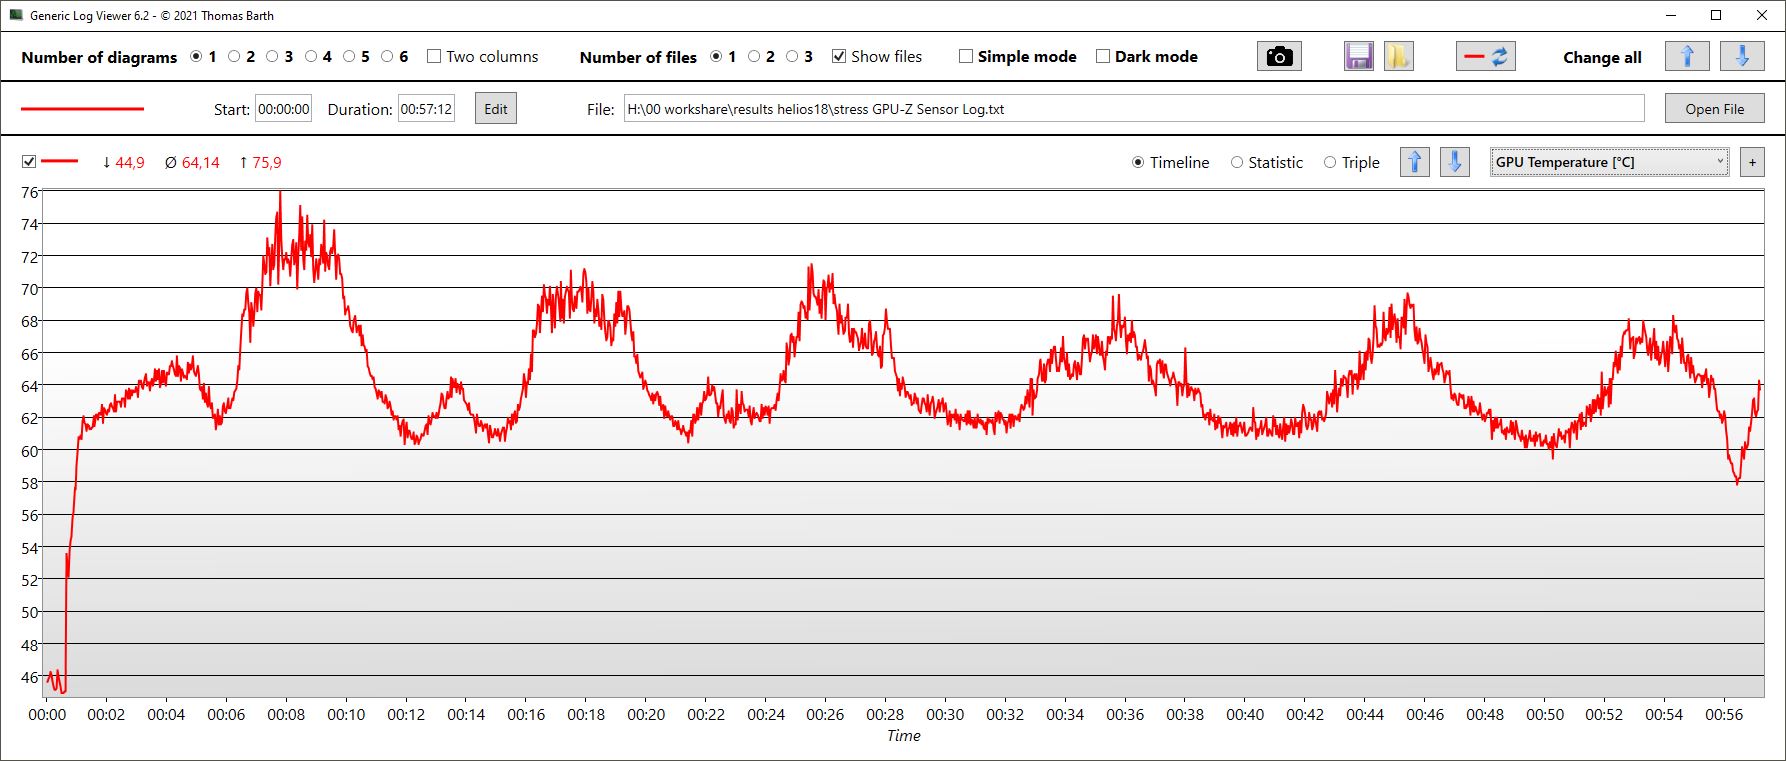
| CPU Clock (GHz) | GPU Clock (MHz) | Average CPU Temperature (°C) | Average GPU Temperature (°C) | |
| Prime95 + FurMark Stress | 3,5 | 1.640 | 89 | 64 |
| Witcher 3 Stress | 527 | 2.525 | 88.5 | 80 |
Speakers
The speakers can be quite loud, but that's about it for the positive news. The sound is tinny, bass is virtually non-existent and even the mids and trebles are not particularly balanced. We expected better sound quality, especially from such a big laptop.
External audio devices can be connected via the combined headset jack, among other things. Headphones are a must anyway when playing in loud Turbo mode.
Acer Predator Helios 18 N23Q2 audio analysis
(+) | speakers can play relatively loud (82.74 dB)
Bass 100 - 315 Hz
(-) | nearly no bass - on average 17.6% lower than median
(±) | linearity of bass is average (9.8% delta to prev. frequency)
Mids 400 - 2000 Hz
(±) | higher mids - on average 9.1% higher than median
(±) | linearity of mids is average (8.8% delta to prev. frequency)
Highs 2 - 16 kHz
(±) | higher highs - on average 5.3% higher than median
(+) | highs are linear (6.4% delta to prev. frequency)
Overall 100 - 16.000 Hz
(±) | linearity of overall sound is average (20.3% difference to median)
Compared to same class
» 72% of all tested devices in this class were better, 6% similar, 23% worse
» The best had a delta of 6%, average was 18%, worst was 132%
Compared to all devices tested
» 53% of all tested devices were better, 8% similar, 39% worse
» The best had a delta of 4%, average was 23%, worst was 134%
Apple MacBook Pro 16 2021 M1 Pro audio analysis
(+) | speakers can play relatively loud (84.7 dB)
Bass 100 - 315 Hz
(+) | good bass - only 3.8% away from median
(+) | bass is linear (5.2% delta to prev. frequency)
Mids 400 - 2000 Hz
(+) | balanced mids - only 1.3% away from median
(+) | mids are linear (2.1% delta to prev. frequency)
Highs 2 - 16 kHz
(+) | balanced highs - only 1.9% away from median
(+) | highs are linear (2.7% delta to prev. frequency)
Overall 100 - 16.000 Hz
(+) | overall sound is linear (4.6% difference to median)
Compared to same class
» 0% of all tested devices in this class were better, 0% similar, 100% worse
» The best had a delta of 5%, average was 17%, worst was 45%
Compared to all devices tested
» 0% of all tested devices were better, 0% similar, 100% worse
» The best had a delta of 4%, average was 23%, worst was 134%
Power management - Consumption and runtime in line with expectations
Power consumption
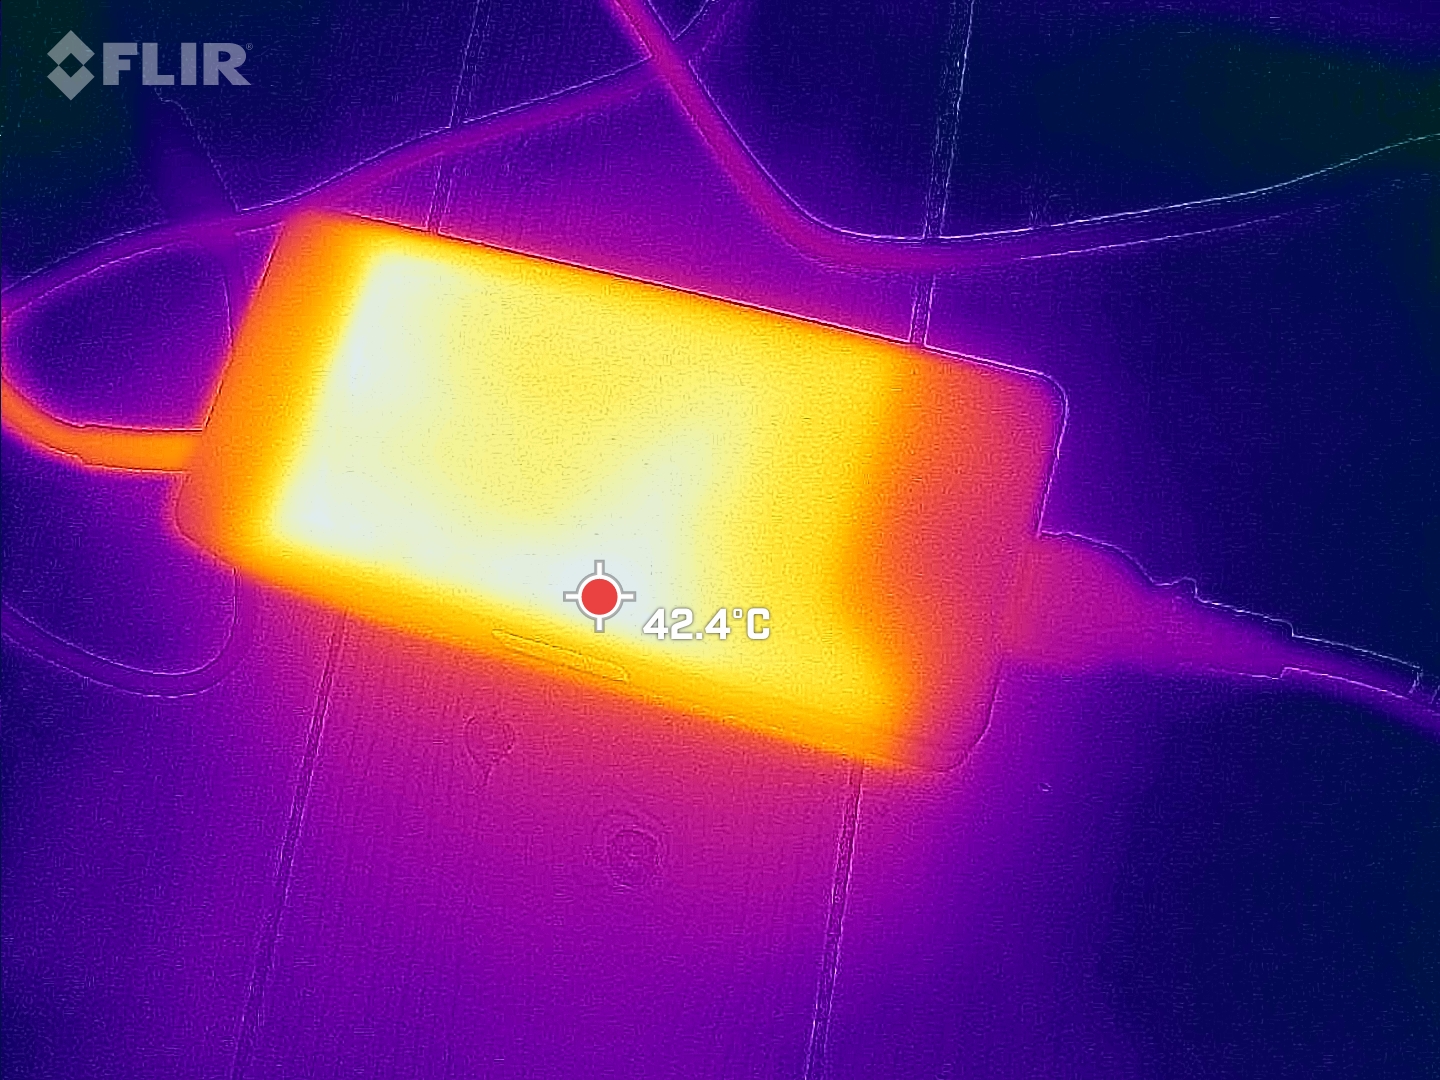
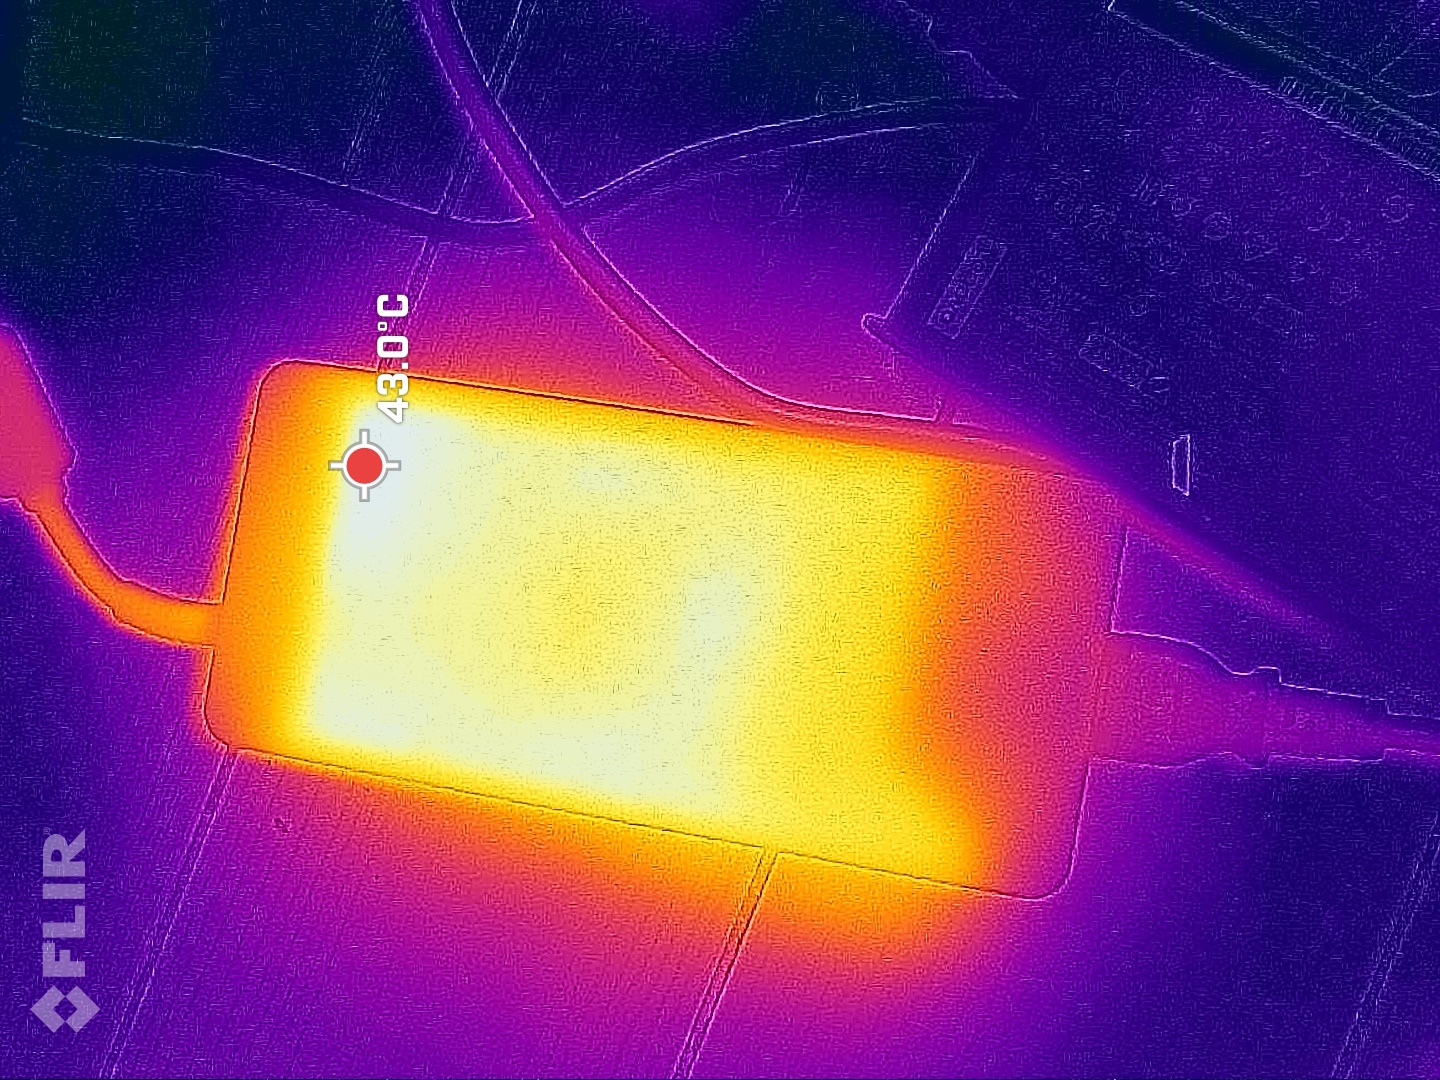
Nobody expects frugality from an HX CPU and an RTX 4080, and so the Helios 18 is no surprise. It's quite frugal when idle, but when gaming it needs almost as much as the roughly equally powerful MSI GE78HX. Only the short-term maximum consumption of 319 W is higher than the MSI. The large and heavy Chicony power supply is rated at 330 W and should be able to supply the Predator with enough power at all times, even in demanding scenarios.
| Off / Standby | |
| Idle | |
| Load |
|
Key:
min: | |
| Acer Predator Helios 18 N23Q2 i9-13900HX, GeForce RTX 4080 Laptop GPU, Samsung PM9A1 MZVL22T0HBLB, IPS, 2560x1600, 18" | MSI GE78HX 13VH-070US i9-13950HX, GeForce RTX 4080 Laptop GPU, Samsung PM9A1 MZVL22T0HBLB, IPS, 2560x1600, 17" | HP Omen 17-ck2097ng i9-13900HX, GeForce RTX 4080 Laptop GPU, SK hynix PC801 HFS001TEJ9X101N, IPS, 2560x1440, 17.3" | Alienware m18 R1 i9-13980HX, GeForce RTX 4090 Laptop GPU, SK hynix PC801 HFS001TEJ9X101N, IPS, 1920x1200, 18" | Asus ROG Strix G18 G814JI i7-13650HX, GeForce RTX 4070 Laptop GPU, Micron 2400 MTFDKBA1T0QFM, IPS, 2560x1600, 18" | Razer Blade 18 RTX 4070 i9-13950HX, GeForce RTX 4070 Laptop GPU, SSSTC CA6-8D1024, IPS, 2560x1600, 18" | Average NVIDIA GeForce RTX 4080 Laptop GPU | Average of class Gaming | |
|---|---|---|---|---|---|---|---|---|
| Power Consumption | -13% | -1% | -47% | 20% | -37% | -14% | 7% | |
| Idle Minimum * (Watt) | 16 | 16.1 -1% | 16 -0% | 21.6 -35% | 8 50% | 24.5 -53% | 16.9 ? -6% | 13 ? 19% |
| Idle Average * (Watt) | 19 | 24 -26% | 20 -5% | 25.2 -33% | 15 21% | 34.1 -79% | 22 ? -16% | 19 ? -0% |
| Idle Maximum * (Watt) | 21.3 | 34 -60% | 26 -22% | 56.7 -166% | 26 -22% | 47.7 -124% | 34.1 ? -60% | 24.6 ? -15% |
| Load Average * (Watt) | 124 | 123.6 -0% | 135 -9% | 164.1 -32% | 102 18% | 140 -13% | 117.9 ? 5% | 110.7 ? 11% |
| Witcher 3 ultra * (Watt) | 289 | 286 1% | 215 26% | 311 -8% | 178.6 38% | 202 30% | ||
| Load Maximum * (Watt) | 319 | 285.7 10% | 299 6% | 338.9 -6% | 267 16% | 261 18% | 297 ? 7% | 259 ? 19% |
* ... smaller is better
Power consumption Witcher 3 / Stress test
Power consumption with an external monitor
Battery life
Acer installs a 90 Wh battery, while the MSI and Alienware have 99 and 97 Wh, respectively. Users should definitely use SDR mode for the display in battery mode, otherwise the 1000 HDR nits will drain the battery much faster.
The Helios 18 lasts for 4.5 to almost 5 hours in the WiFi and video test at a reduced brightness of 150 nits. The MSI is slightly more enduring, and the Alienware lasts similarly long in the WiFi test.
| Acer Predator Helios 18 N23Q2 i9-13900HX, GeForce RTX 4080 Laptop GPU, 90 Wh | MSI GE78HX 13VH-070US i9-13950HX, GeForce RTX 4080 Laptop GPU, 99 Wh | HP Omen 17-ck2097ng i9-13900HX, GeForce RTX 4080 Laptop GPU, 83 Wh | Alienware m18 R1 i9-13980HX, GeForce RTX 4090 Laptop GPU, 97 Wh | Asus ROG Strix G18 G814JI i7-13650HX, GeForce RTX 4070 Laptop GPU, 90 Wh | Razer Blade 18 RTX 4070 i9-13950HX, GeForce RTX 4070 Laptop GPU, 91.7 Wh | Average of class Gaming | |
|---|---|---|---|---|---|---|---|
| Battery runtime | 14% | -20% | -31% | 28% | -17% | 41% | |
| H.264 (h) | 4.8 | 3.7 -23% | 8.32 ? 73% | ||||
| WiFi v1.3 (h) | 4.4 | 6.1 39% | 3.6 -18% | 4.3 -2% | 8.1 84% | 4 -9% | 7.11 ? 62% |
| Load (h) | 1.7 | 1.5 -12% | 1.4 -18% | 0.7 -59% | 1.2 -29% | 1.3 -24% | 1.502 ? -12% |
| Reader / Idle (h) | 7.3 | 4.2 | 5.6 | 11.7 | 7 | 8.27 ? |
Pros
Cons
Verdict - Strong gamer with optimization potential in cooling
The gamer reveals zero weaknesses in terms of performance. Both the CPU and GPU perform slightly better than the average laptop with the same configuration from our database. There is also the bright and high-contrast MiniLED display, while workmanship and features are also impressive.
In contrast to the well-tuned Helios 16 with its RTX 4060, the weaknesses of the Helios 18 with a more demanding RTX 4080 become apparent: the cooling system is very loud in Turbo mode and does not seem to be optimized in other areas. While most areas of the laptop remain unusually cool, the hot spot is still one of the hottest in the class. At the same time, the theoretically strong SSD model is throttled very quickly. We recommend running the laptop in the quieter Performance mode.
The Acer Predator Helios 18 is a behemoth with strong performance, but the loud cooling system needs optimization.
We have only reviewed 18-inch competitors with weaker GPUs to date, which is why recommending alternatives is not so easy. In terms of performance, the 17-inch MSI Raider GE78HX can keep up, but has a weaker display.
Price and availability
In the US, the RTX 4080 configuration of the Acer Predator Helios 18 appears to be in short supply. Best Buy has the RTX 4070 and 4060 configurations on offer for US$1999.99 and US$1699.99, respectively.
Prices are as of 27.10.2023 and are subject to change.
Acer Predator Helios 18 N23Q2
- 10/25/2023 v7 (old)
Christian Hintze
Transparency
The selection of devices to be reviewed is made by our editorial team. The test sample was provided to the author as a loan by the manufacturer or retailer for the purpose of this review. The lender had no influence on this review, nor did the manufacturer receive a copy of this review before publication. There was no obligation to publish this review. As an independent media company, Notebookcheck is not subjected to the authority of manufacturers, retailers or publishers.
This is how Notebookcheck is testing
Every year, Notebookcheck independently reviews hundreds of laptops and smartphones using standardized procedures to ensure that all results are comparable. We have continuously developed our test methods for around 20 years and set industry standards in the process. In our test labs, high-quality measuring equipment is utilized by experienced technicians and editors. These tests involve a multi-stage validation process. Our complex rating system is based on hundreds of well-founded measurements and benchmarks, which maintains objectivity. Further information on our test methods can be found here.
Price comparison

