Asus ROG Strix G18 G814JI laptop review: Light and shade with the 18-inch gaming machine

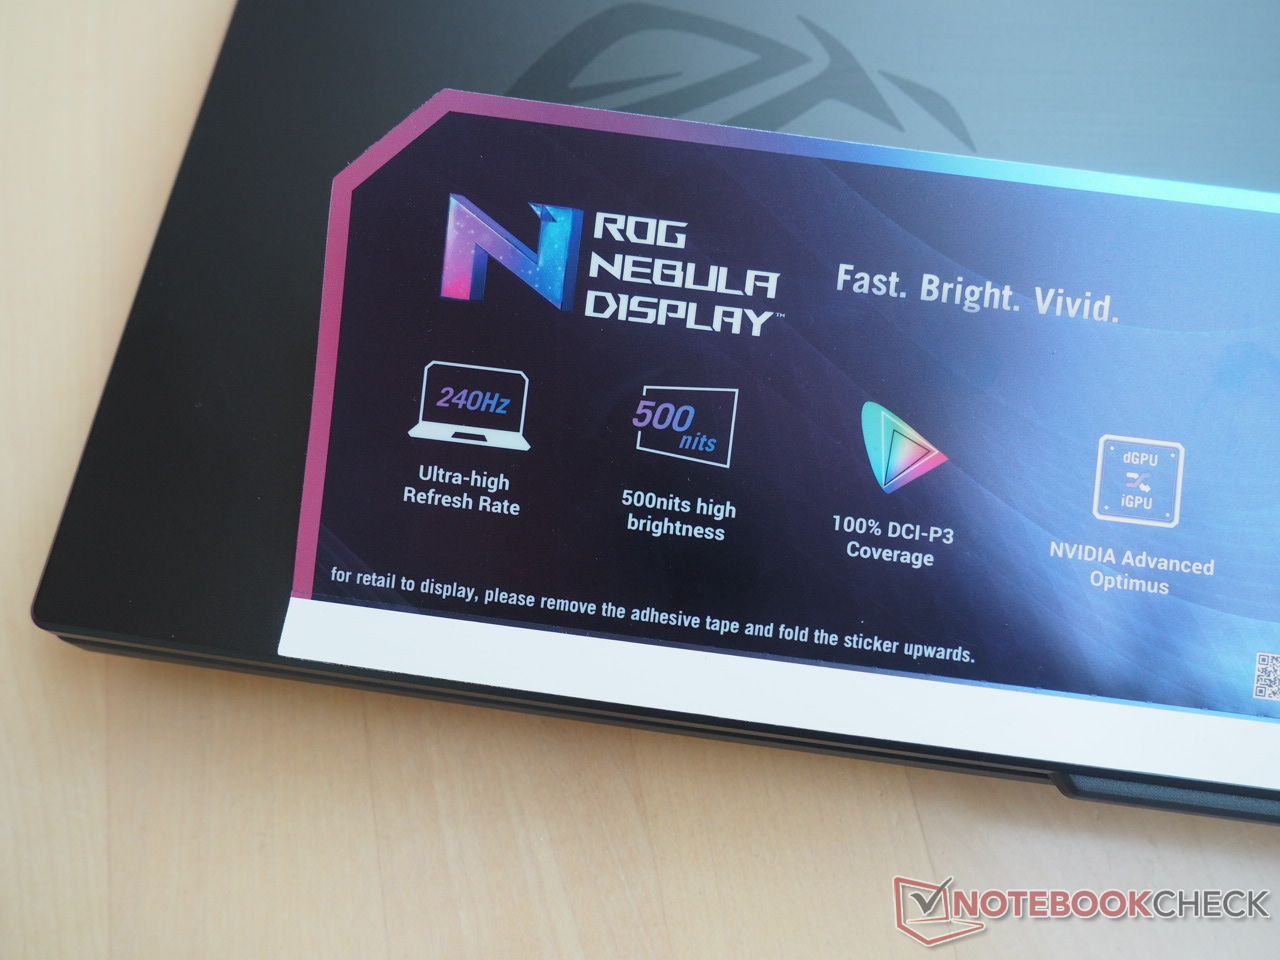
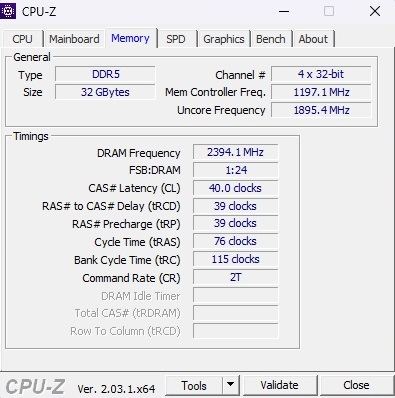
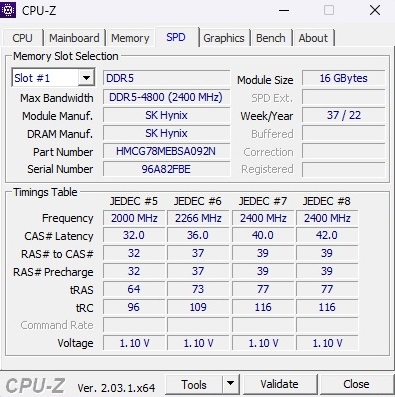
ROG Strix, ROG Strix Scar.…it can often be difficult to keep track of Asus' range of products. After having recently reviewed the Strix Scar 18 G834JY with a Core i9-13980HX and GeForce RTX 4090, the manufacturer has now presented us with the considerably cheaper but also less powerful Strix G18 G814JI with a Core i7-13650HX and GeForce RTX 4070. Additional features include 2 x 16 GB DDR5-4800 of dual-channel RAM and a 1 TB NVMe SSD. Regarding the 2560 x 1600 pixel, WQXGA display, Asus has thrown in features and buzzwords such as 240 Hz, 500 nits, 100 % DCI-P3, 3 ms response time, G-Sync and Pantone certification which, incidentally, is not only aimed at gamers but creators too. The device (unavailable at the time of this review) can be had for 2300 dollars. A cheaper option is the RTX 4060-based G814JV. Bringing up the rear is the G814JU which has to make do with a GeForce RTX 4050. However, regardless of which model you are considering, current gaming laptops are very expensive and that is why you should think carefully before deciding which one to buy.
The Strix G18's competitors are primarily other 18-inch gaming laptops such as the Razer Blade 18, the review version of which was equipped with an RTX 4070. Apart from that, the performance difference compared to older graphics cards is particularly interesting. For this reason, the table includes the Gigabyte A7 X1 (RTX 3070 @140 watts), the Lenovo Legion 5 Pro 16ARH7H (RTX 3070 Ti @150 watts), the Alienware x17 R1 (RTX 3080 @165 watts) and the MSI Raider GE77 HX 12UHS (RTX 3080 Ti @175 watts), all of which - the same as the Strix G18 (175 watts) - are specified with a high TGP.
Possible competitors compared
Rating | Date | Model | Weight | Height | Size | Resolution | Price |
|---|---|---|---|---|---|---|---|
| 87.4 % v7 (old) | 03 / 2023 | Asus ROG Strix G18 G814JI i7-13650HX, GeForce RTX 4070 Laptop GPU | 3 kg | 31 mm | 18.00" | 2560x1600 | |
| 91.4 % v7 (old) | 02 / 2023 | Razer Blade 18 RTX 4070 i9-13950HX, GeForce RTX 4070 Laptop GPU | 3 kg | 21.9 mm | 18.00" | 2560x1600 | |
| 83.2 % v7 (old) | 10 / 2021 | Gigabyte A7 X1 R9 5900HX, GeForce RTX 3070 Laptop GPU | 2.5 kg | 34 mm | 17.30" | 1920x1080 | |
| 87.7 % v7 (old) | 10 / 2022 | Lenovo Legion 5 Pro 16ARH7H RTX 3070 Ti R7 6800H, GeForce RTX 3070 Ti Laptop GPU | 2.6 kg | 26.6 mm | 16.00" | 2560x1600 | |
| 89 % v7 (old) | 09 / 2021 | Alienware x17 RTX 3080 P48E i7-11800H, GeForce RTX 3080 Laptop GPU | 3.2 kg | 21.4 mm | 17.30" | 3840x2160 | |
| 86.8 % v7 (old) | 07 / 2022 | MSI Raider GE77 HX 12UHS i9-12900HX, GeForce RTX 3080 Ti Laptop GPU | 3.1 kg | 25.9 mm | 17.30" | 3840x2160 |
Case
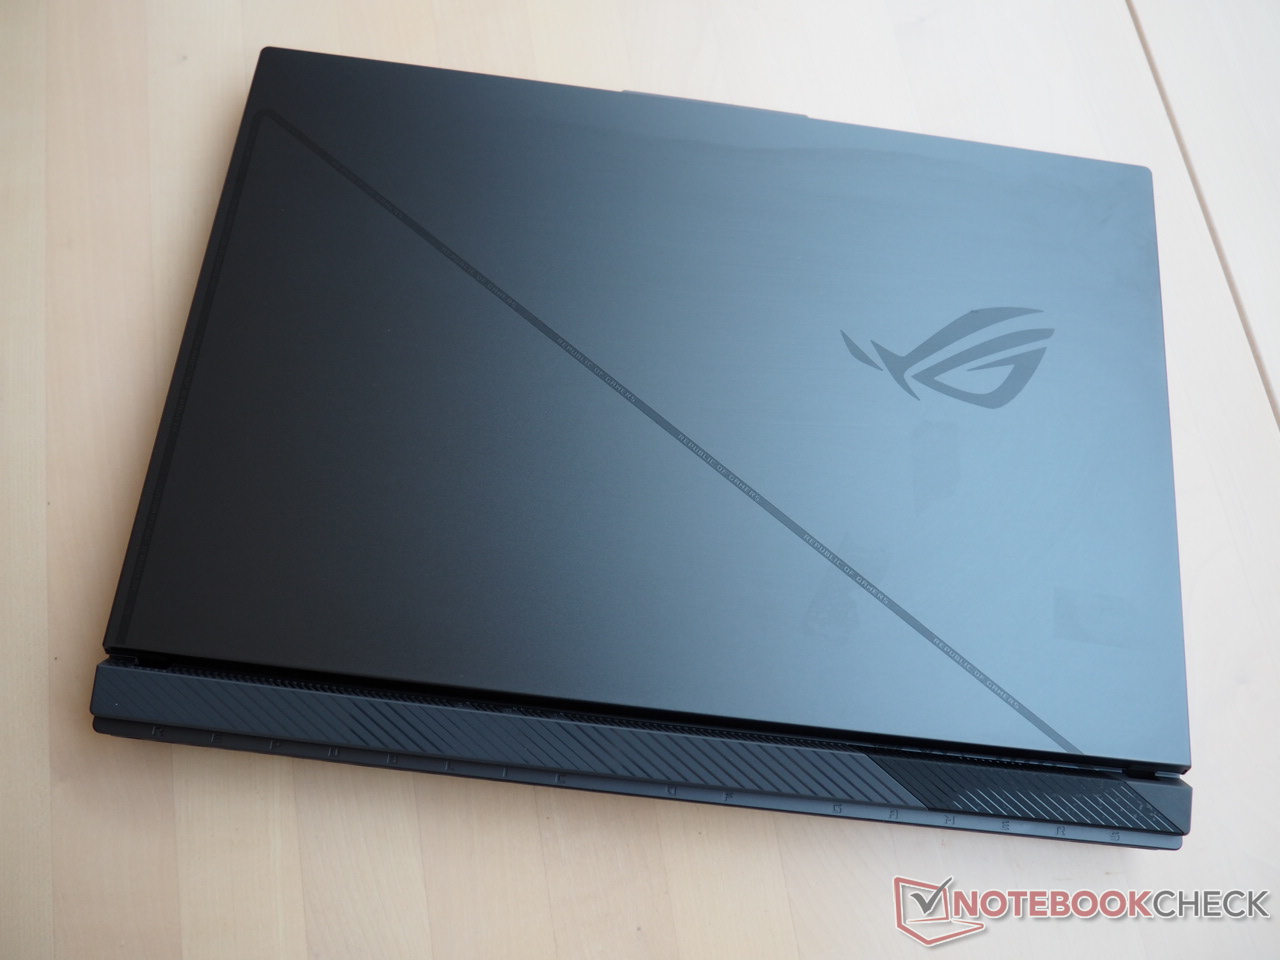
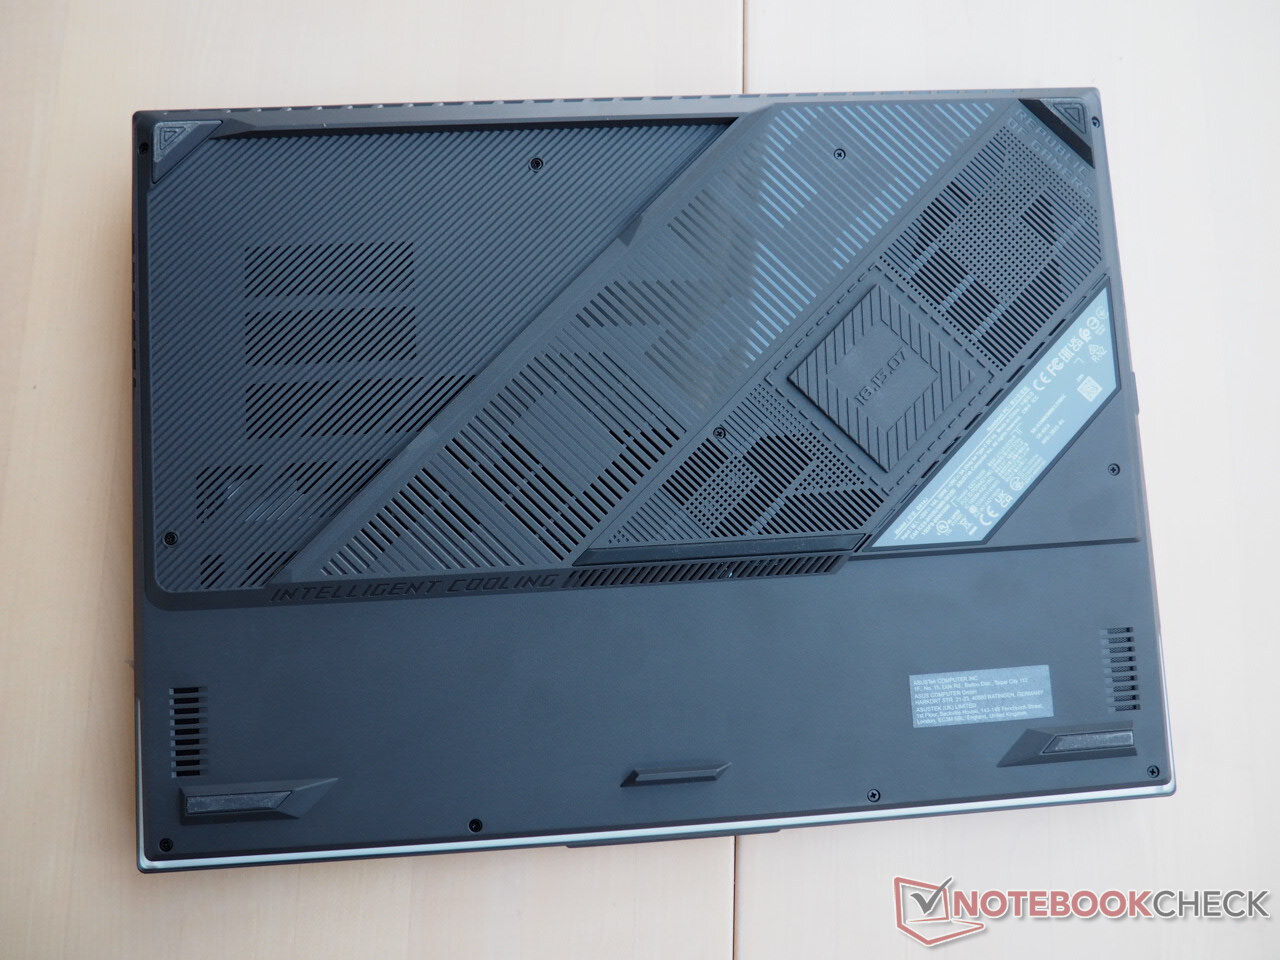
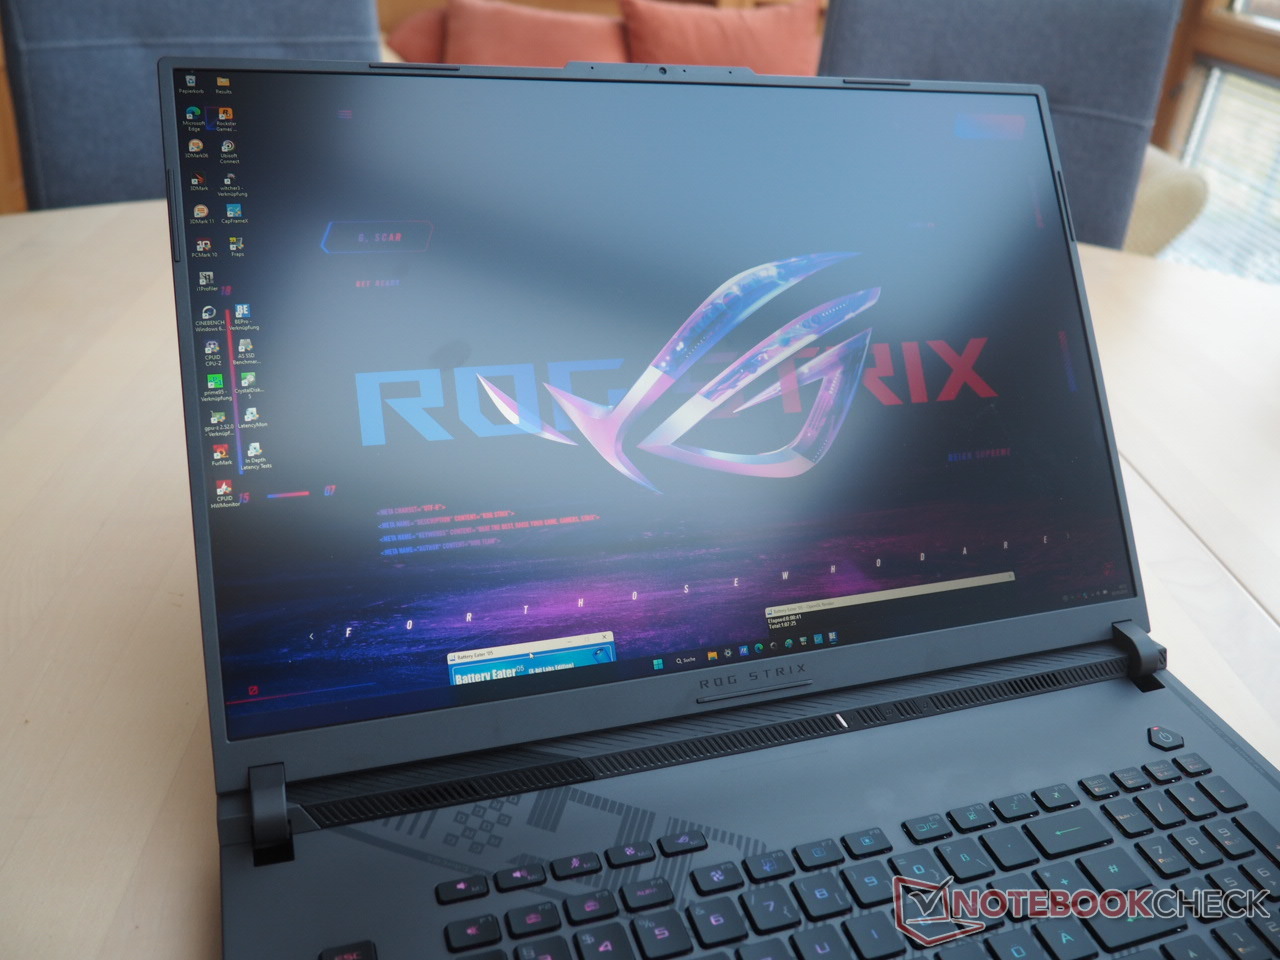
The case's design borrows from the Strix Scar 18, whereby the "normal“ Strix G18 has to do without the partially transparent surface. The robust lid consists of metal and looks very unobtrusive, and, with the exception of the ROG logo and narrow stripes, many design elements can be found on the plastic base unit. From a visual point of view, even on the case's base, which normally never sees the light of day, the manufacturer has visually speaking, gone a bit wild. However, it would have been better if more resources were poured into the build quality. In some parts such as the arrow key area, the base unit flexes tangibly, at least when a lot of pressure is applied. On top of that, the case is quickly prone to rattling which negatively affects the device's premium feel - especially considering the price.
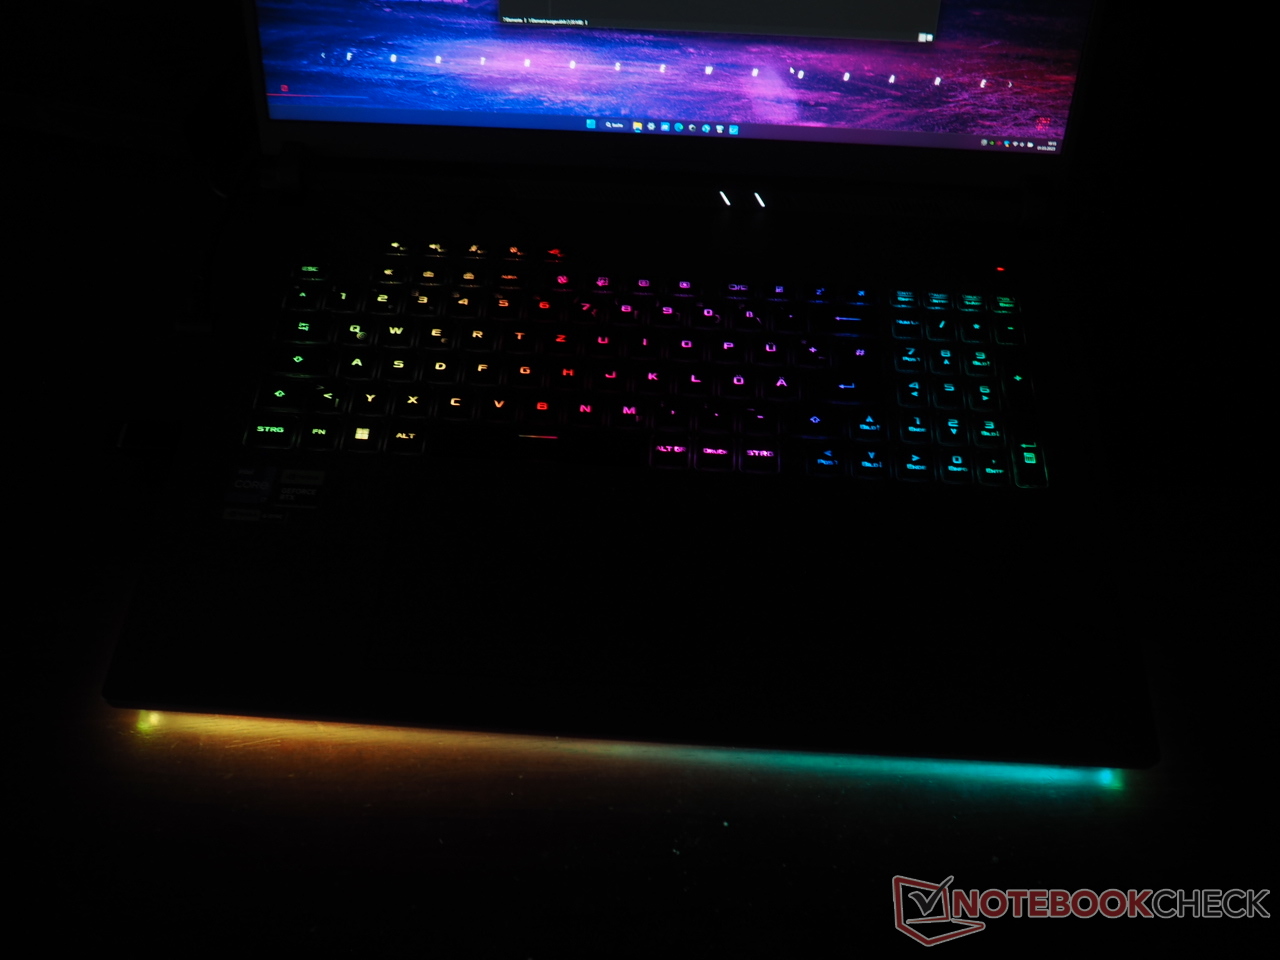
Otherwise, no criticism can be levelled at the chassis. The finish is unassuming and the hinges also do a good job, even though the maximum opening angle could be somewhat greater. In order to appeal to the gaming audience, Asus hasn't just limited itself to an RGB keyboard but has also treated the case front with a smart-looking LED light bar (see photo gallery).
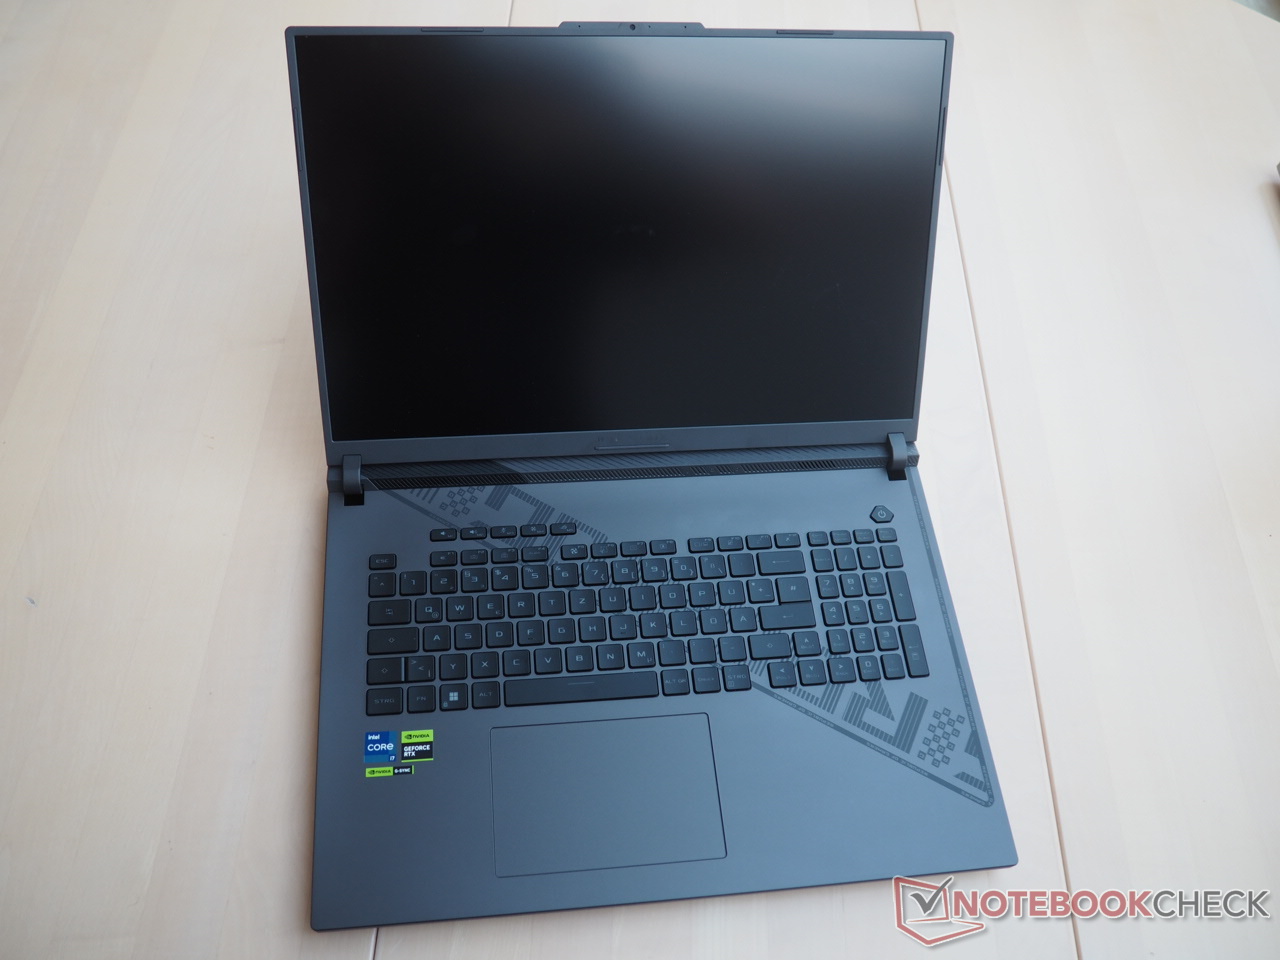
Of course, as an 18-inch laptop, the Strix G18 comes across as rather bulky, but the display's frame is pleasingly slim thanks to the slim bezel design and 16:10 format. Nevertheless, in comparison to the Razer Blade 18, the Asus machine is deeper and, in addition, roughly 1 cm thicker. However, when it comes to weight, the competition isn't much better: 3 kg isn't easy to lug around.
Features
Ports
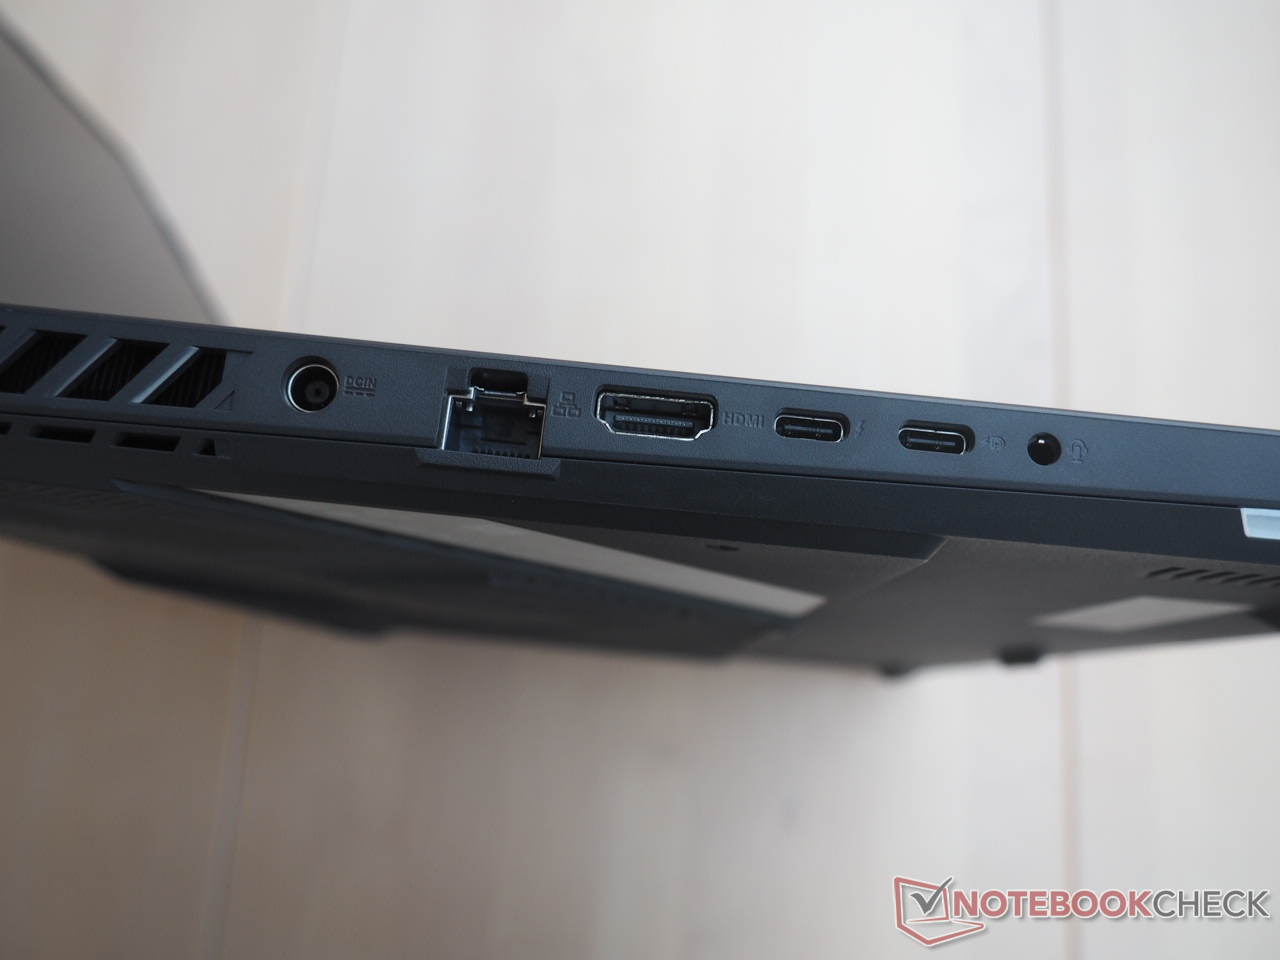
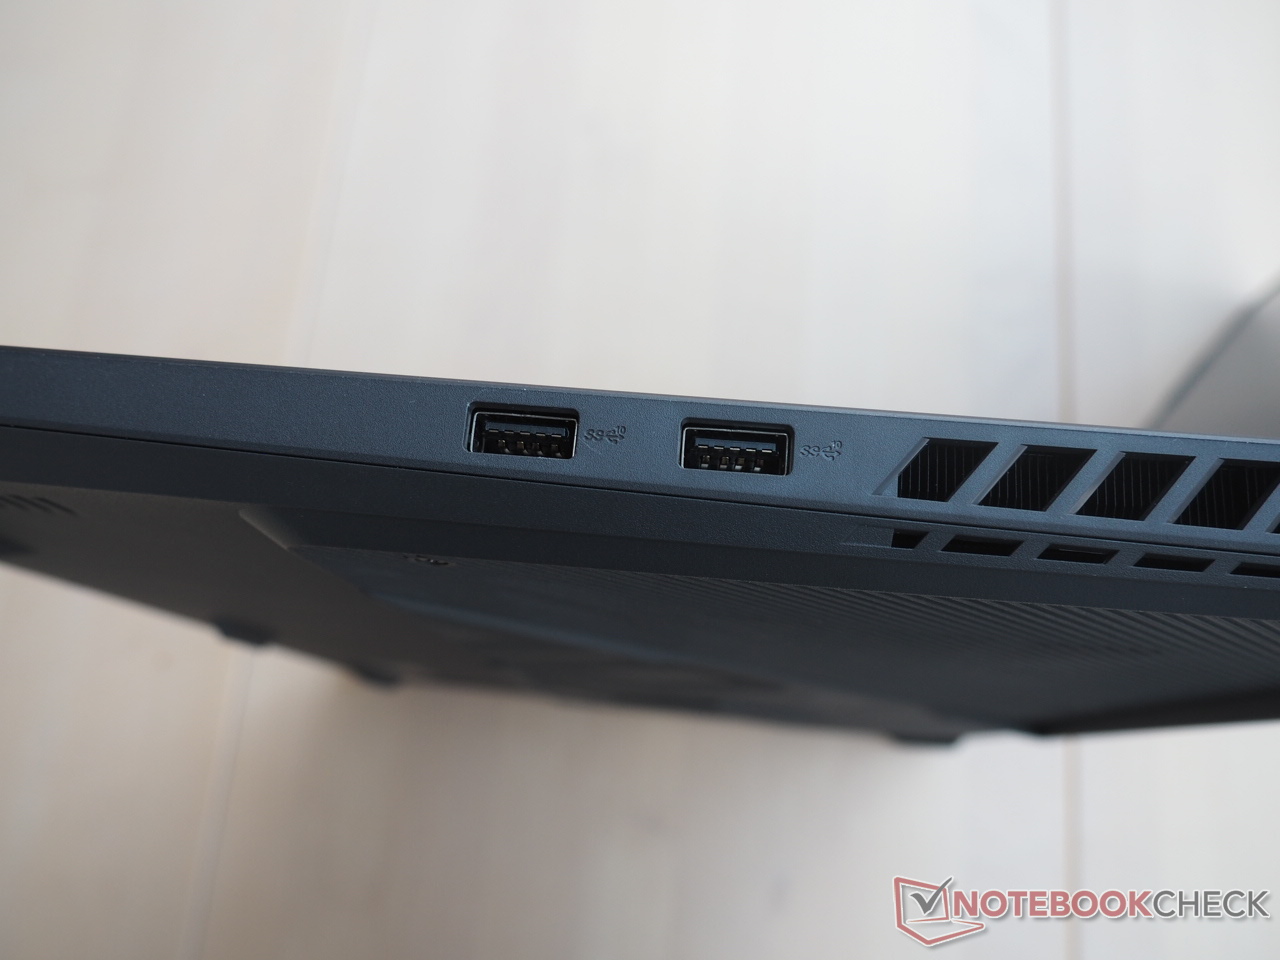
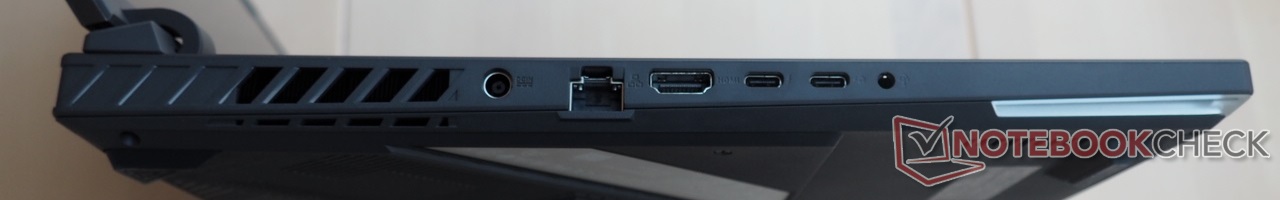
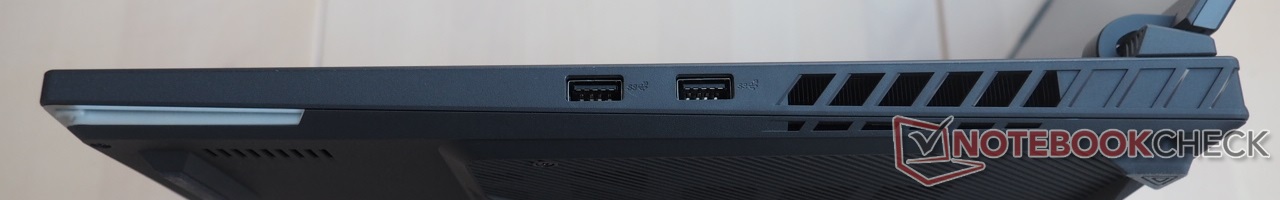
If you disregard the absent card reader, the selection of ports is impressive. Starting with the left-hand side, you can find the power supply socket, an RJ45 port, an HDMI 2.1 out, a combined audio jack, and two USB-C ports (1x USB 3.2 Gen2, 1x USB 4) including Power Delivery and DisplayPort support. On the right side, we have two classic type-A ports which are designed according to the 3.2-Gen2 standard. As the ports are located in the middle area of the side surfaces, this can lead to restricted movement when connected to an external mouse.
Communication
The WiFi performance proves itself to be above average. Our standardized WiFi test was carried out one meter from our reference router and the G18 achieved around 1600 Mbit/s when both sending and receiving data. This represents a good result and beats the Razer Blade 18 – despite an identical WiFi module-Modul (Intel AX211) - by more than 100 Mbit.
Webcam
Webcam quality is only good enough for a mid-table placing. Although image sharpness is a little better than some competitors, it doesn't really manage to impress (the same applies to color space).


Accessories
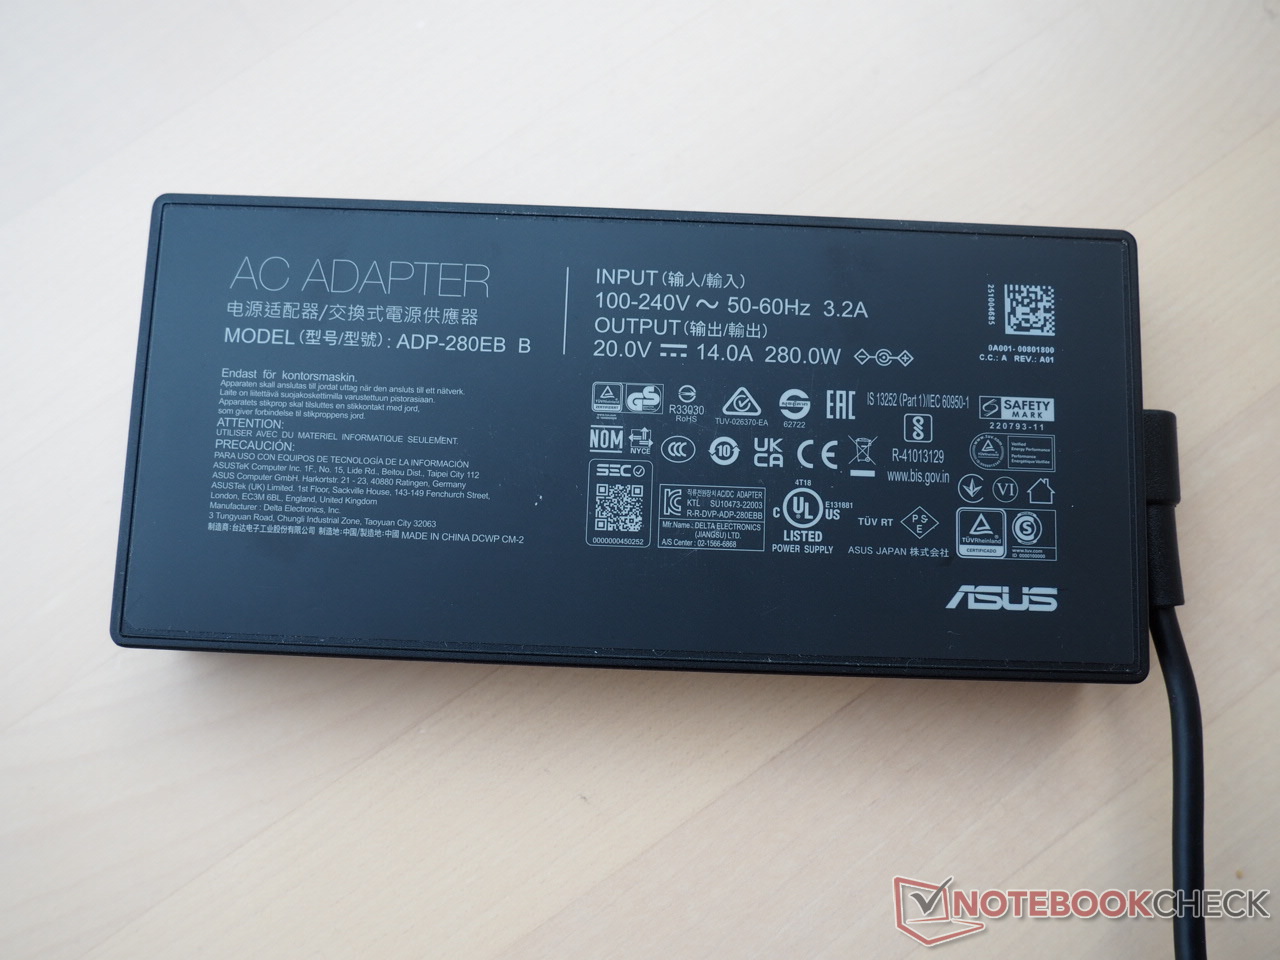
In addition to a few information booklets, the device comes with a 650 gram, 280-watt power supply unit, measuring 18 x 8 x 2.5 cm in size.
Maintenance
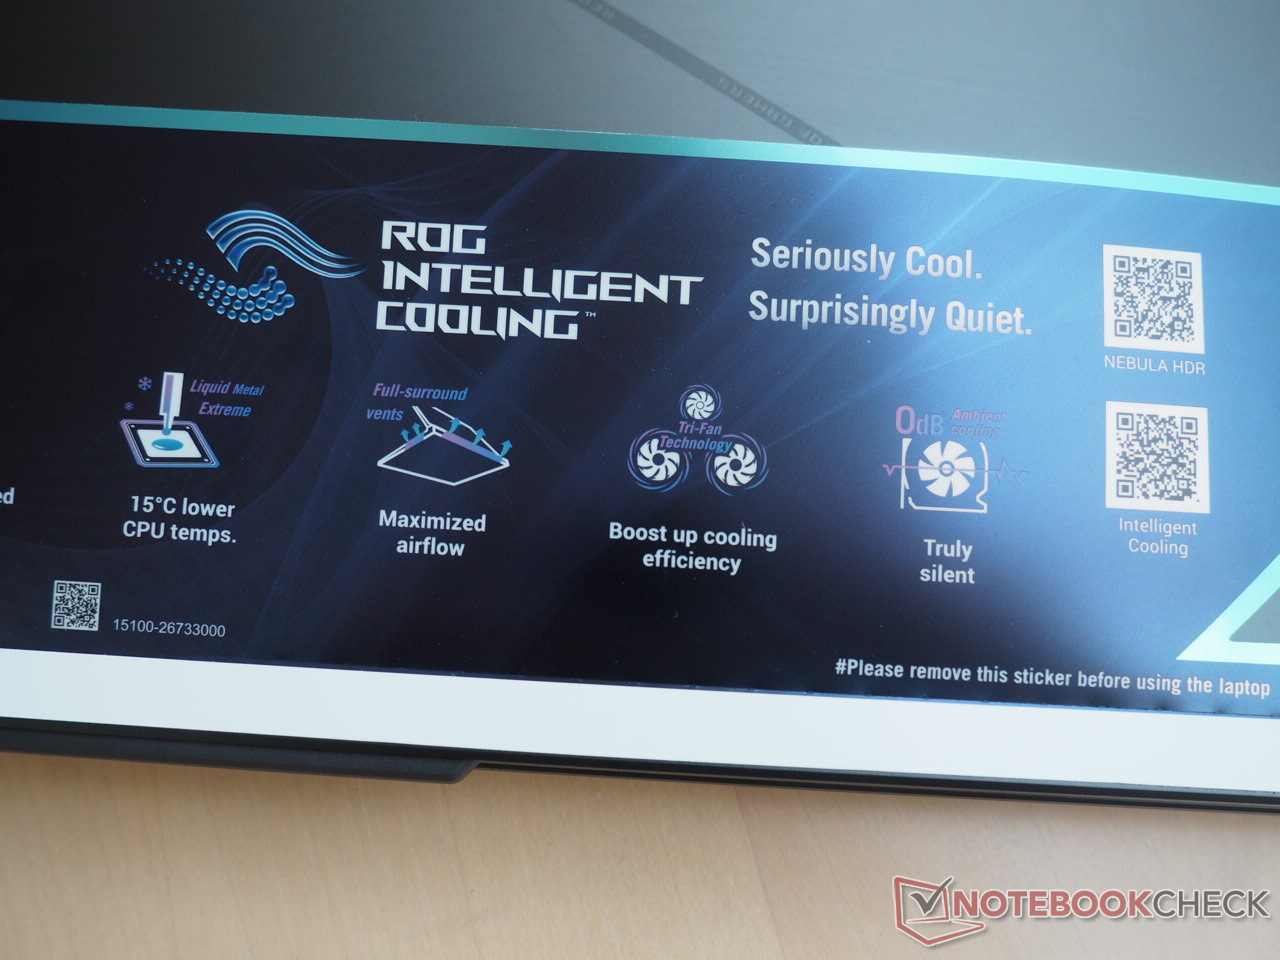
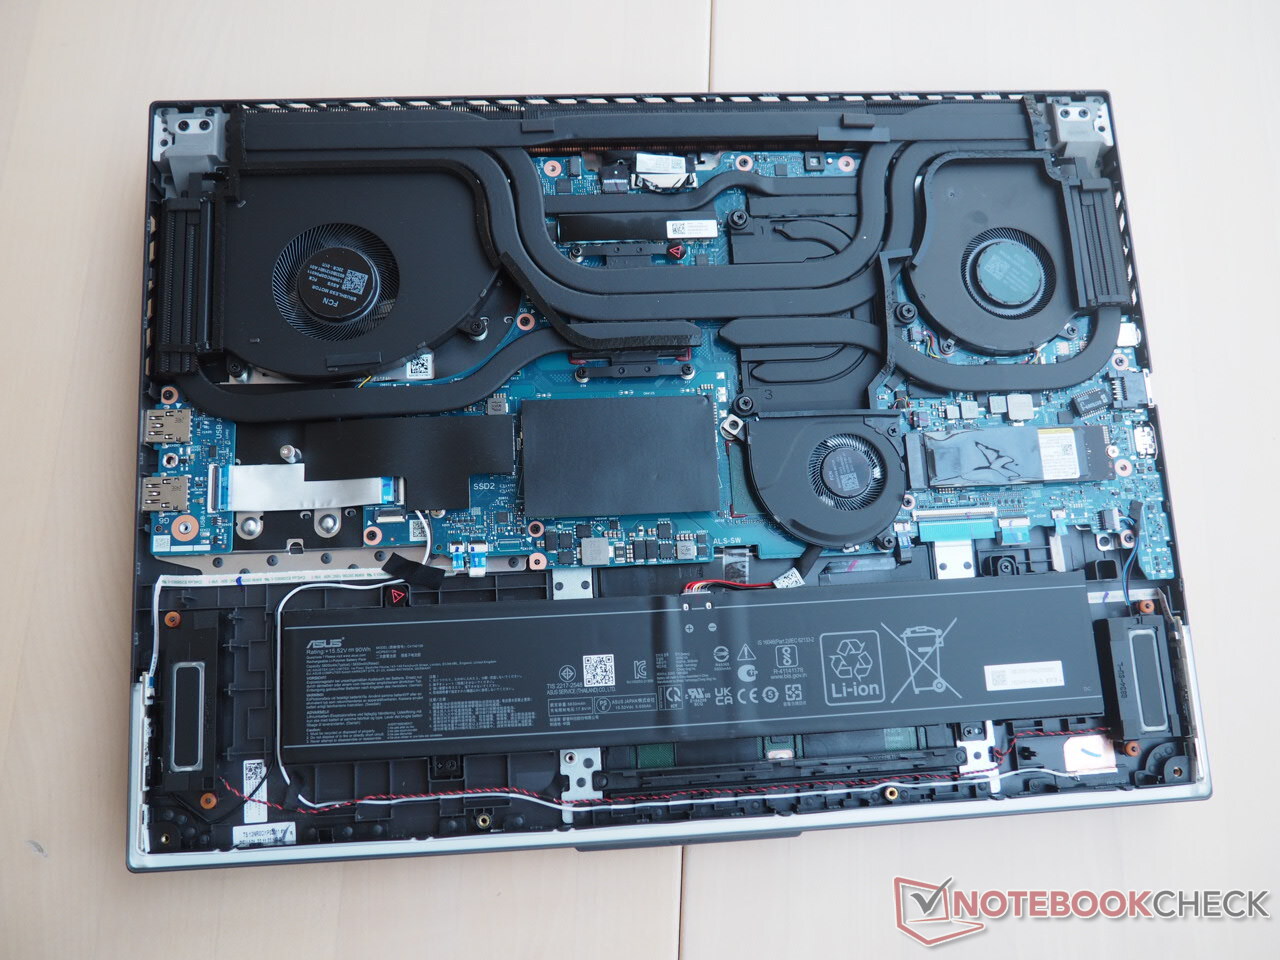
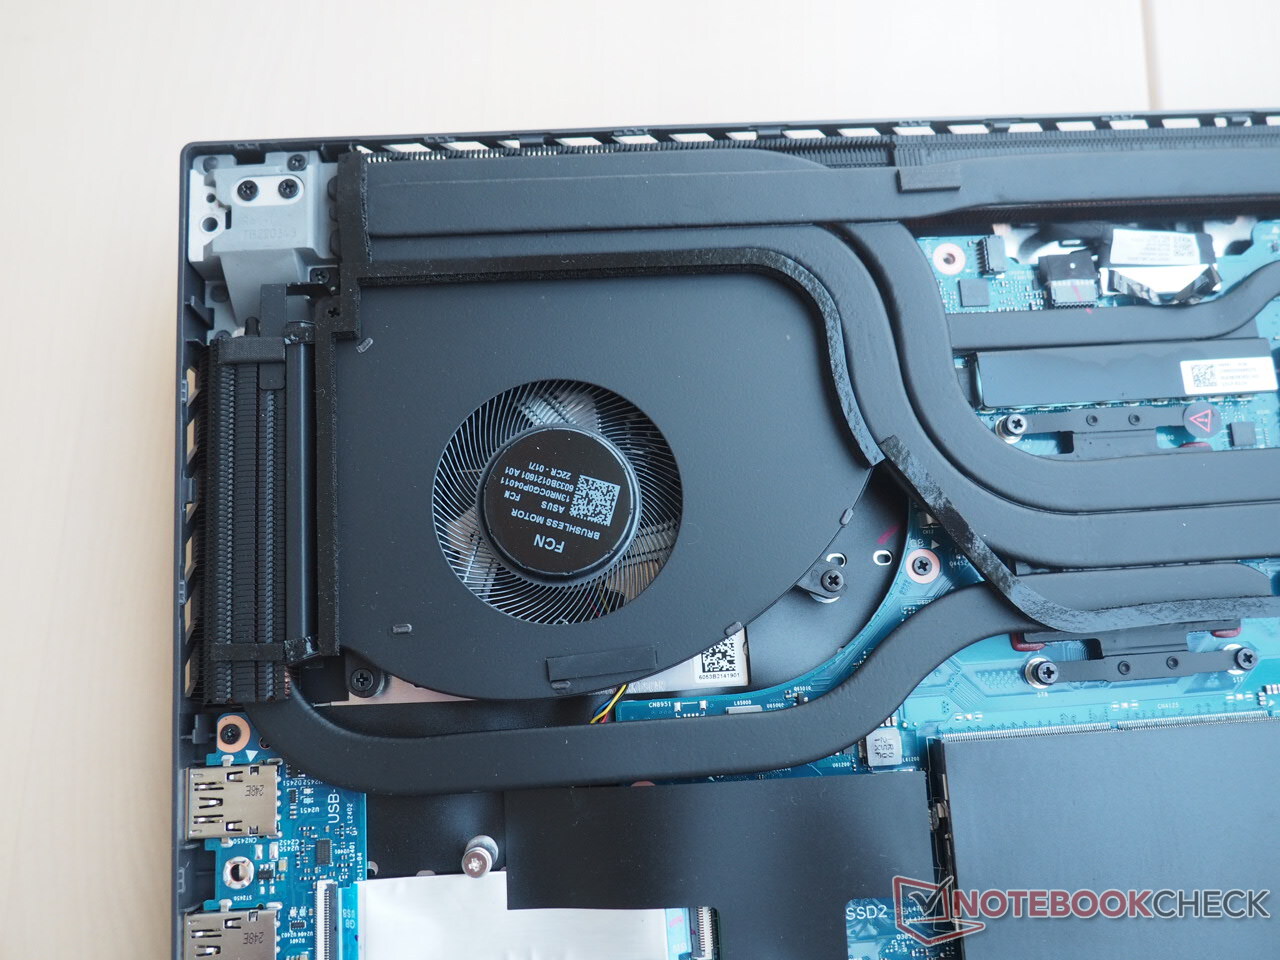
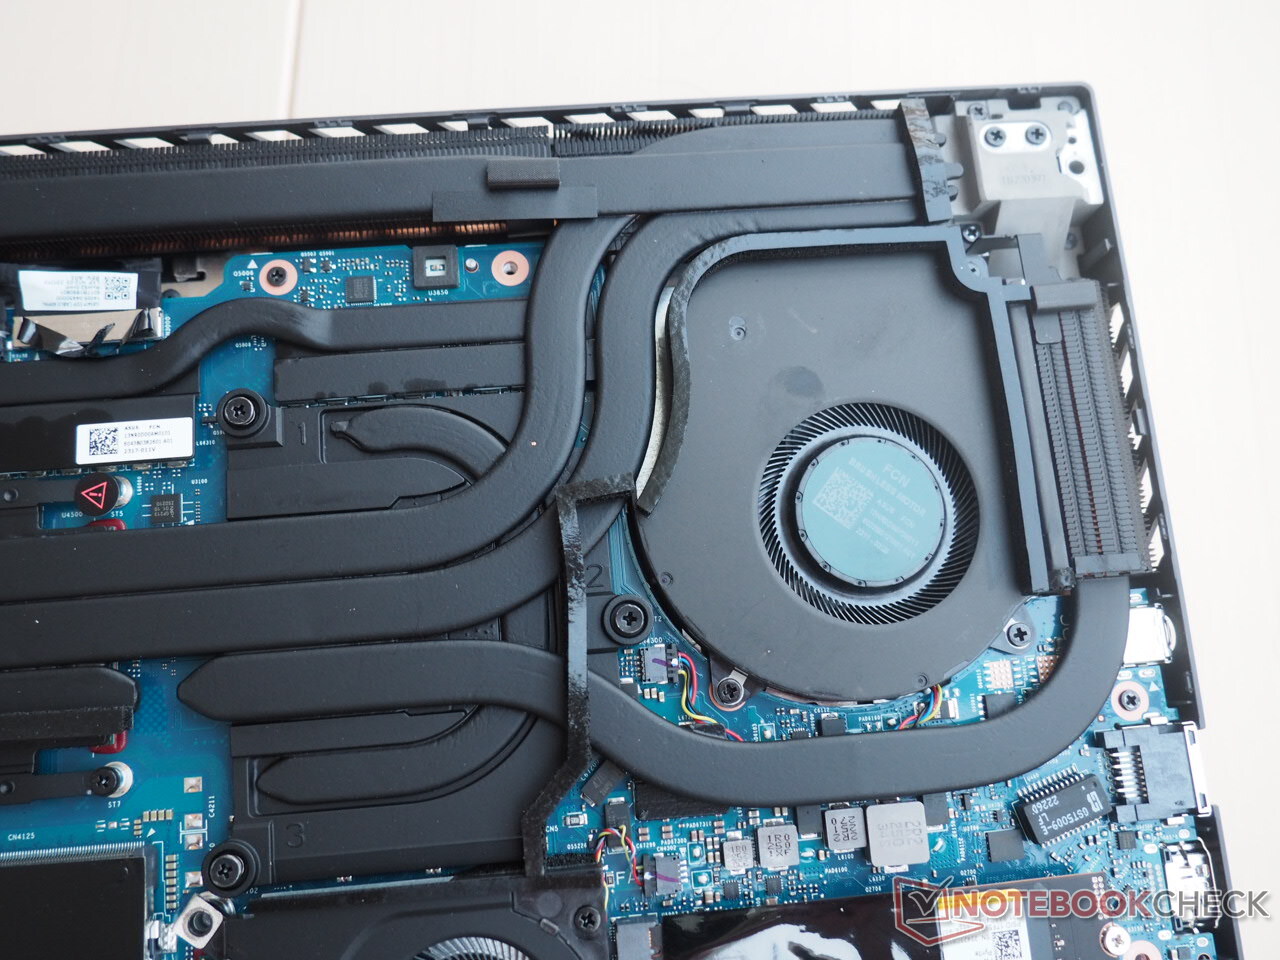
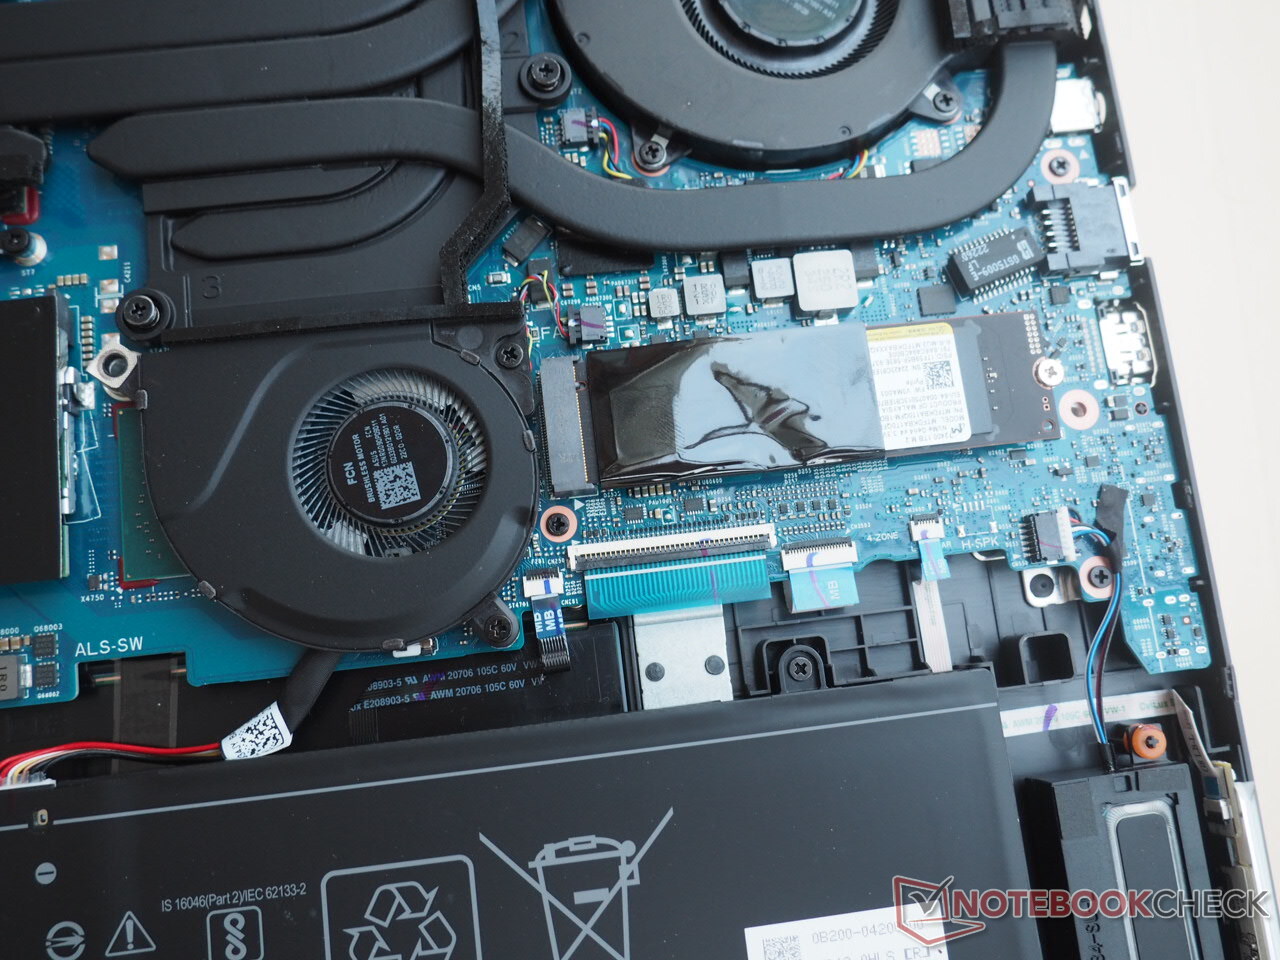
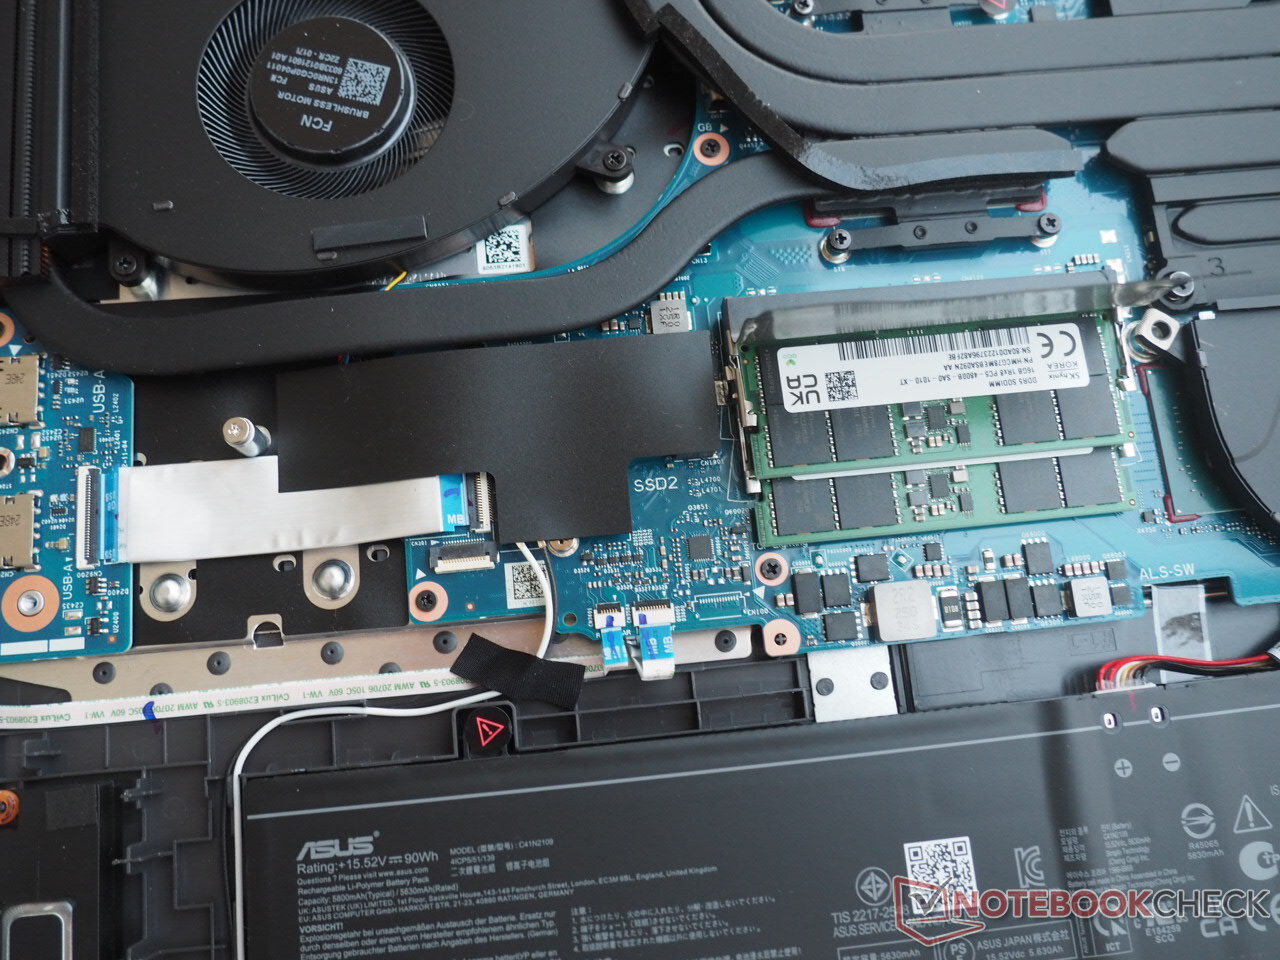
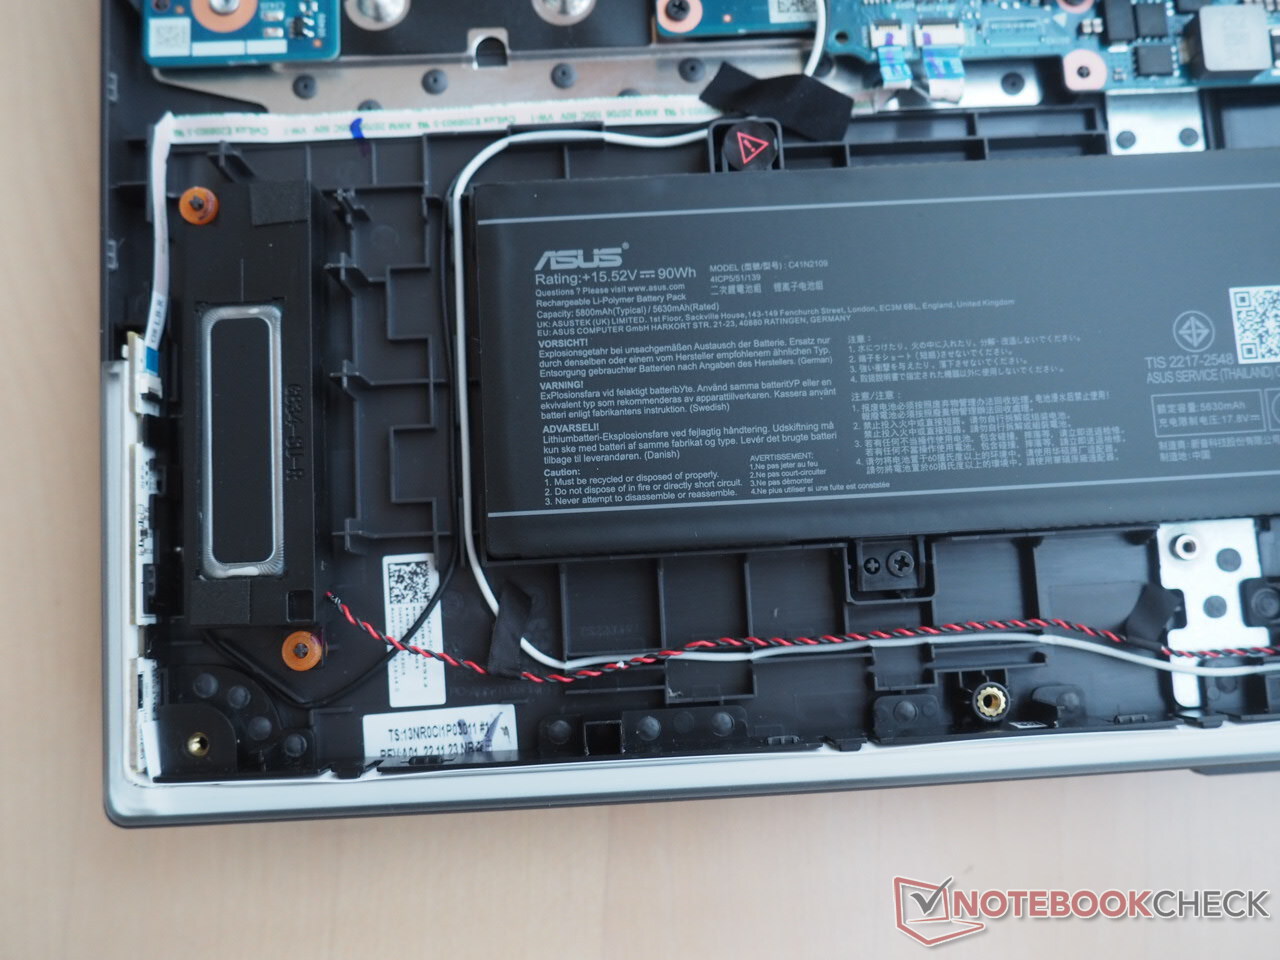
As usual, a number of crosshead screws have to be removed and the base plate has to be levered out of position, in order to gain access to the device's internals. The latter is somewhat easier than many competitors as the removal of one of the corner screws lifts the case slightly, thereby creating a good opening angle. A glance under the hood reveals an extensive cooling system with multiple, complex heat pipes, two large fans and one small fan (Asus also uses liquid metal). In addition, there are two SO-DIMM slots for RAM (occupied) and two M.2 slots for SSDs (1x free). The palm rest area is flanked by a long battery.
Input devices
Keyboard
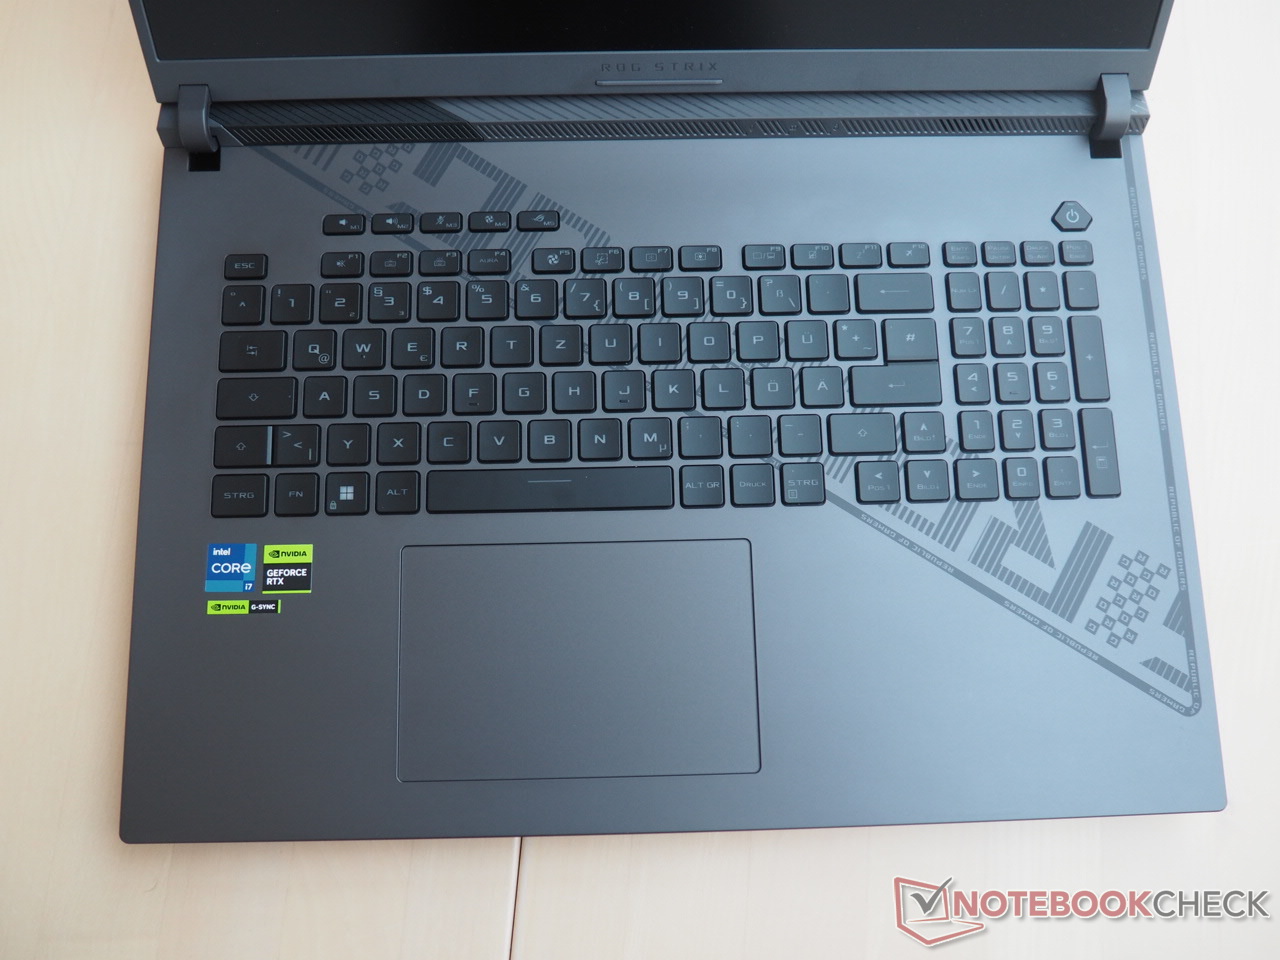
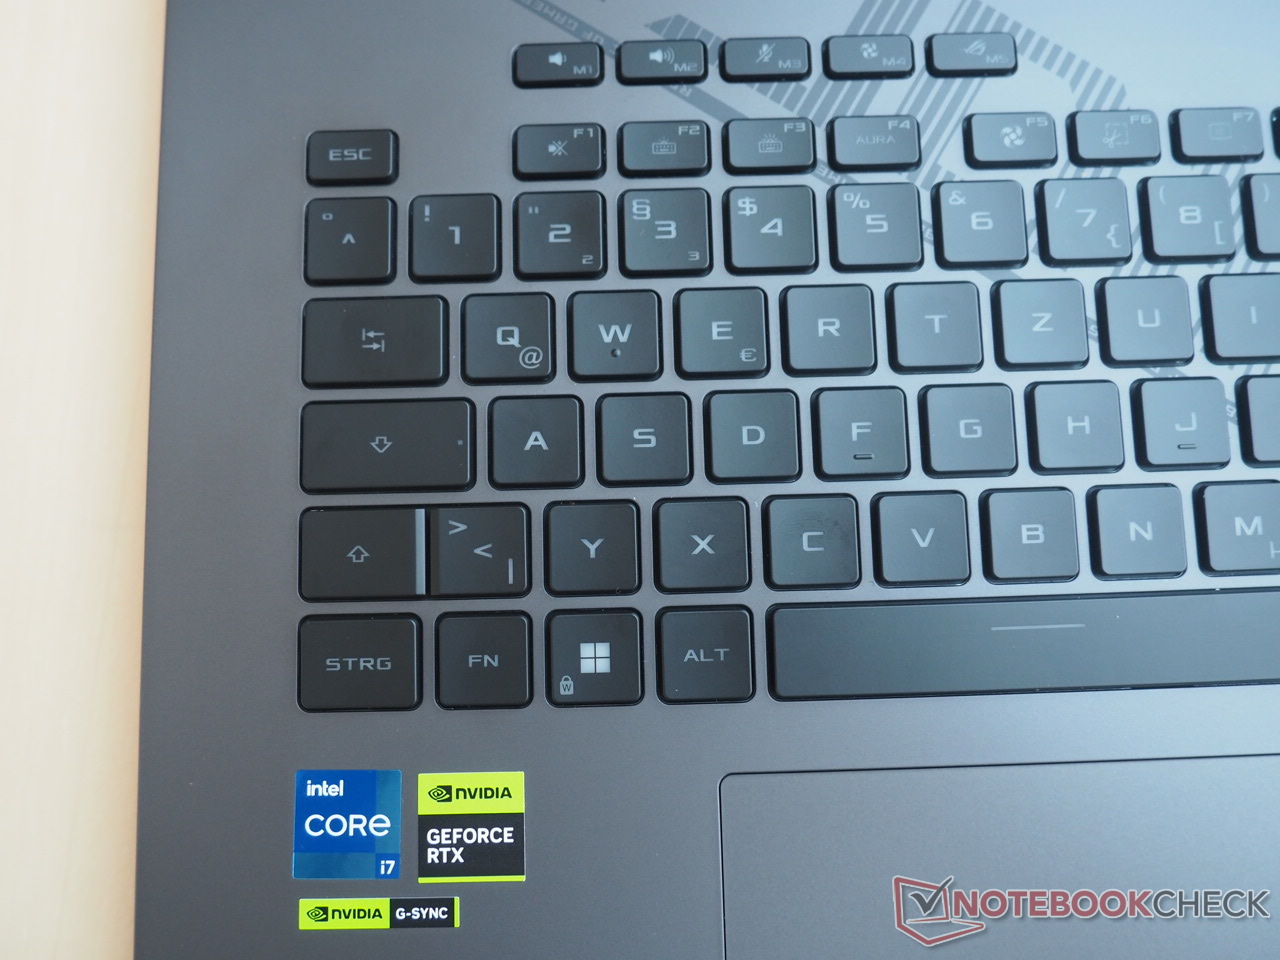
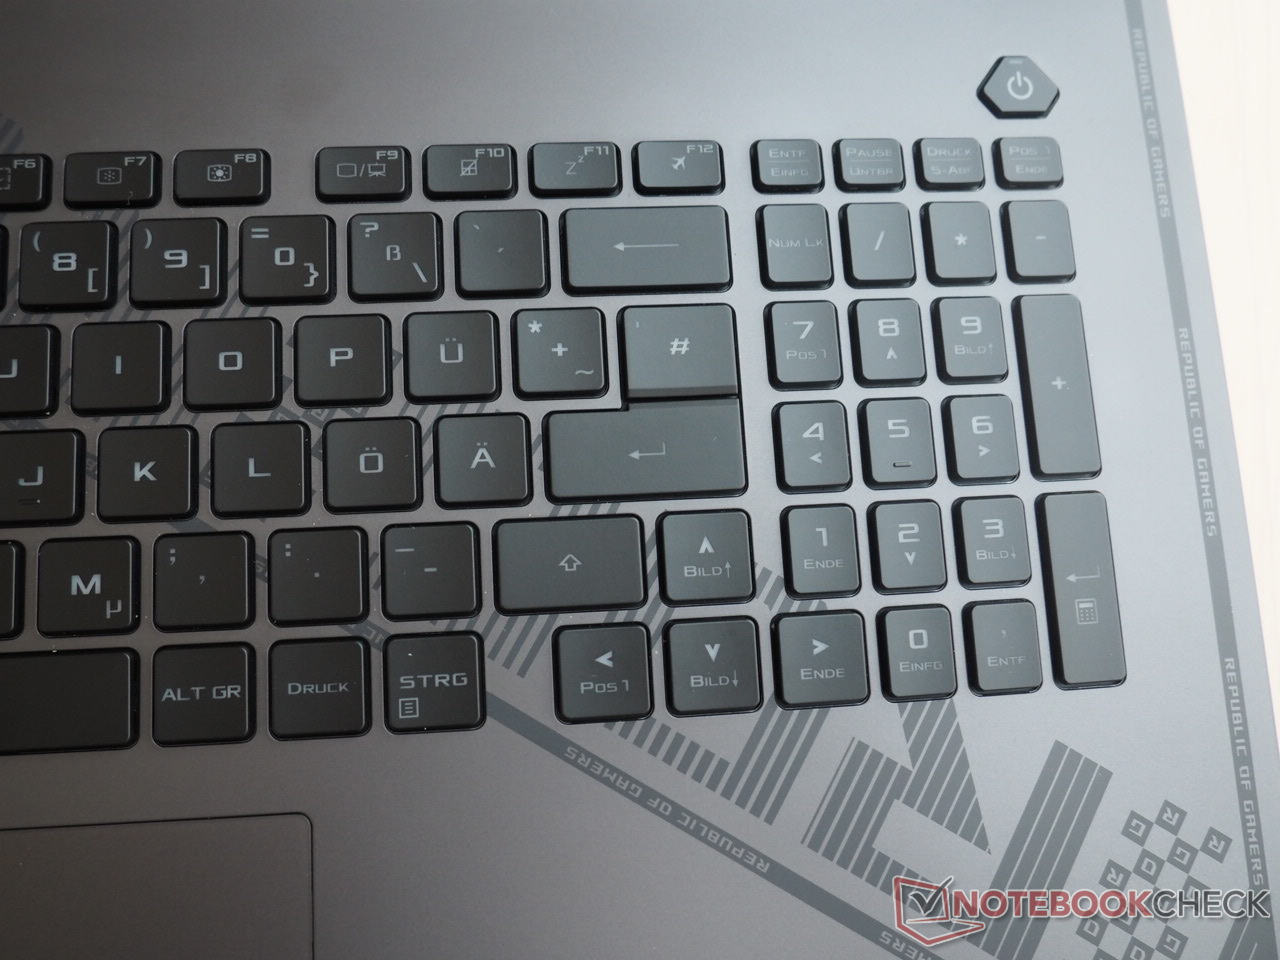
We have mixed feelings concerning the keyboard. While, for example, arrow keys (unlike many other laptops) are a good size, the numerical keypad keys and the F row could be larger considering the 18-inch format. The layout is unlikely to appeal to everyone. For example, German users have to make do with a single-spaced enter key. Some key combinations, such as Del/Insert, are also rather unfavorable.
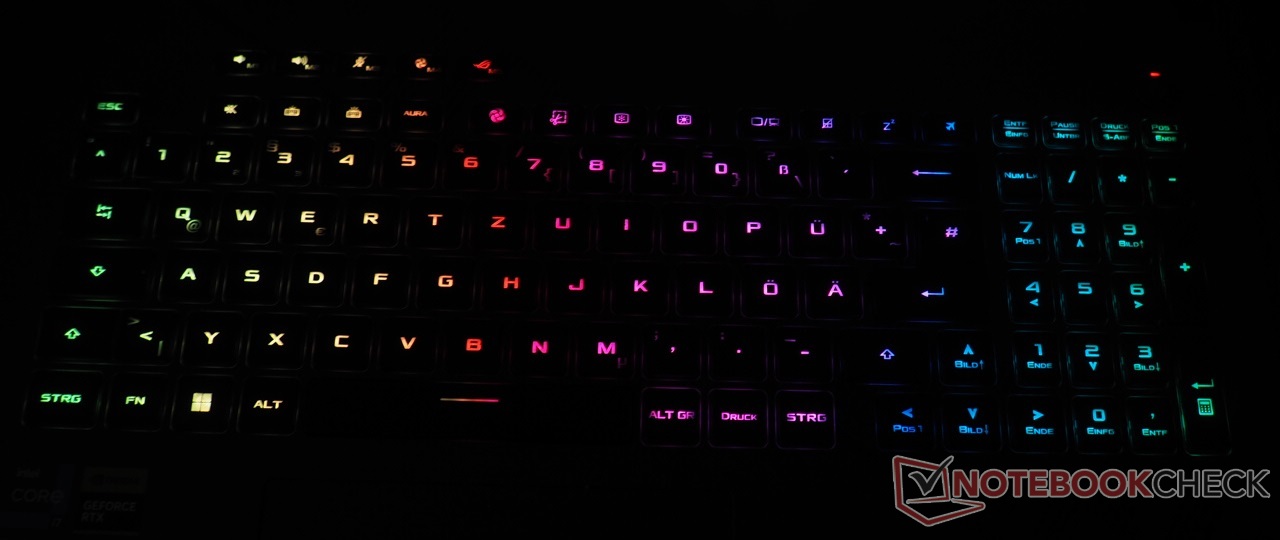
That continues with the typing experience. Although this is mostly acceptable - due to the base unit's decent stability - it could be a little more defined (somewhat mushy feedback), especially in comparison to the kind of mechanical keyboards found in some gaming laptops. Plus points are awarded to the practical special keys and good single-key RGB lighting, which enjoys various modes and multi-level customization.
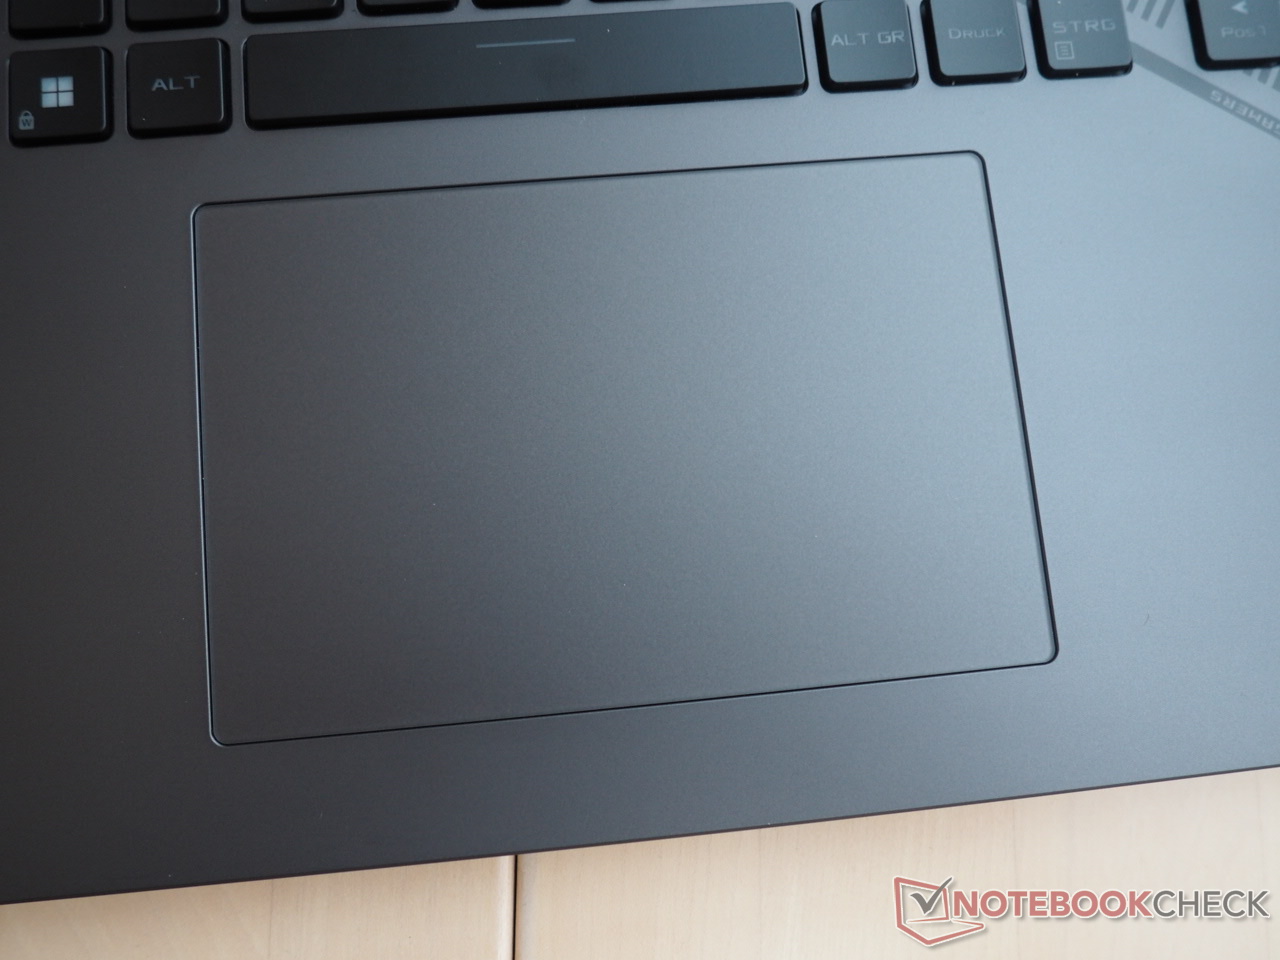
Touchpad
To a certain extent, the touchpad also suffers from sub-optimum case stability. Similar to the chassis, it is sometimes quite creaky which shouldn't be the case at this price point. Apart from that, the replacement mouse made a top-notch impression. With its smooth surface and generous size (13 x 8.5 cm), inputs such as scrolling through a long series of images are easy to handle, especially as precision is on point.
Display
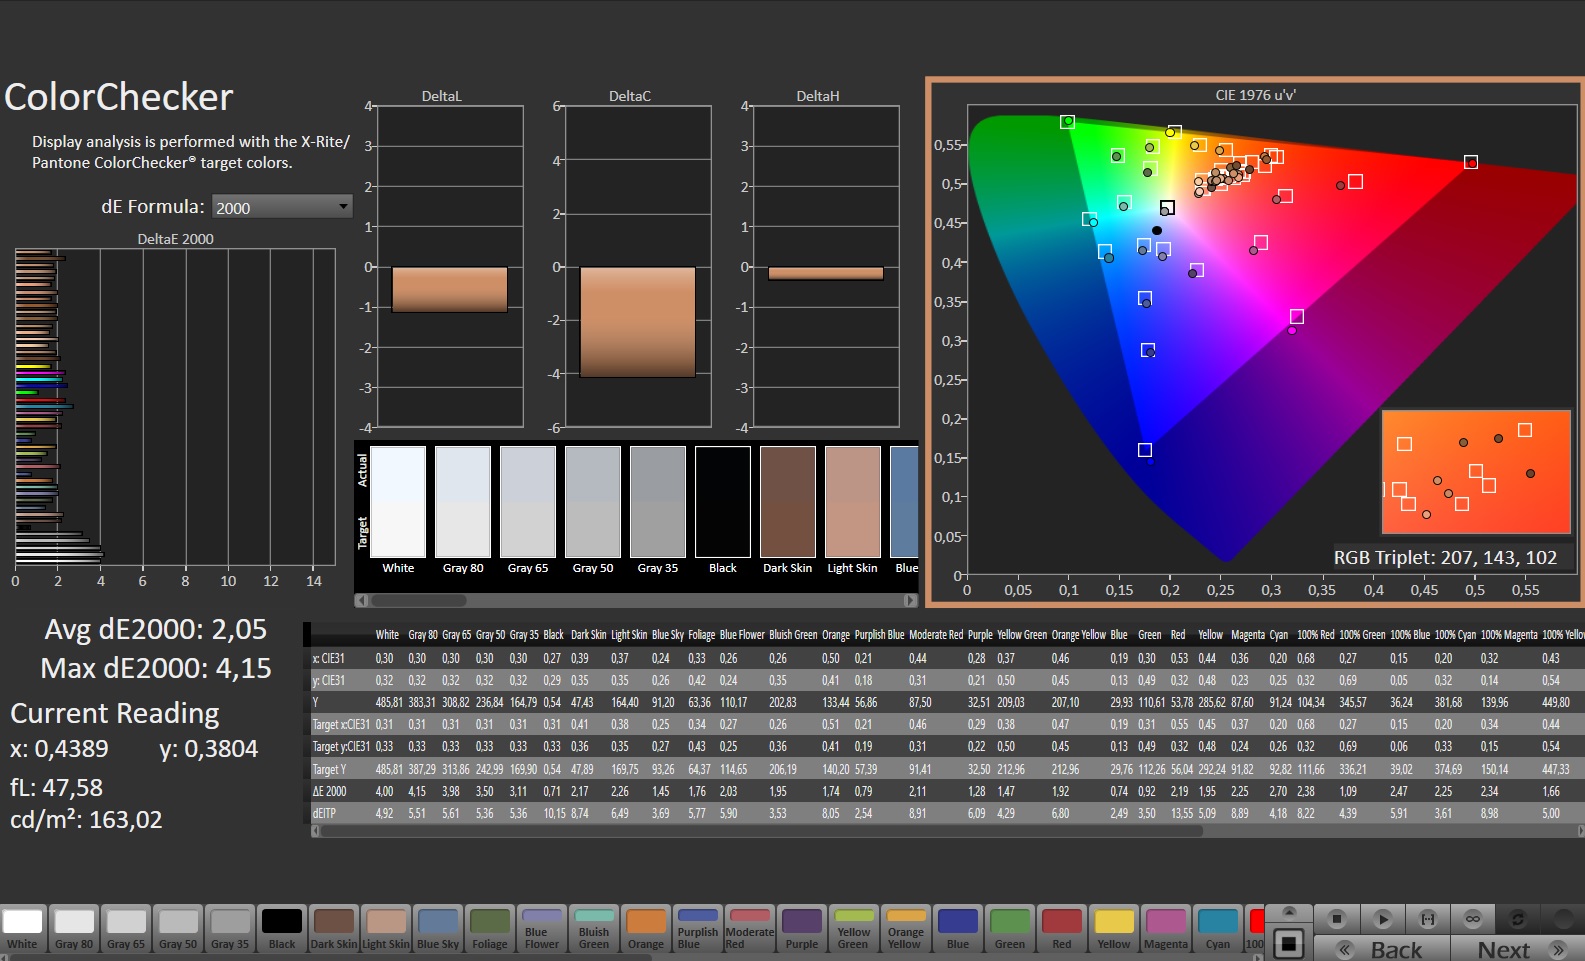
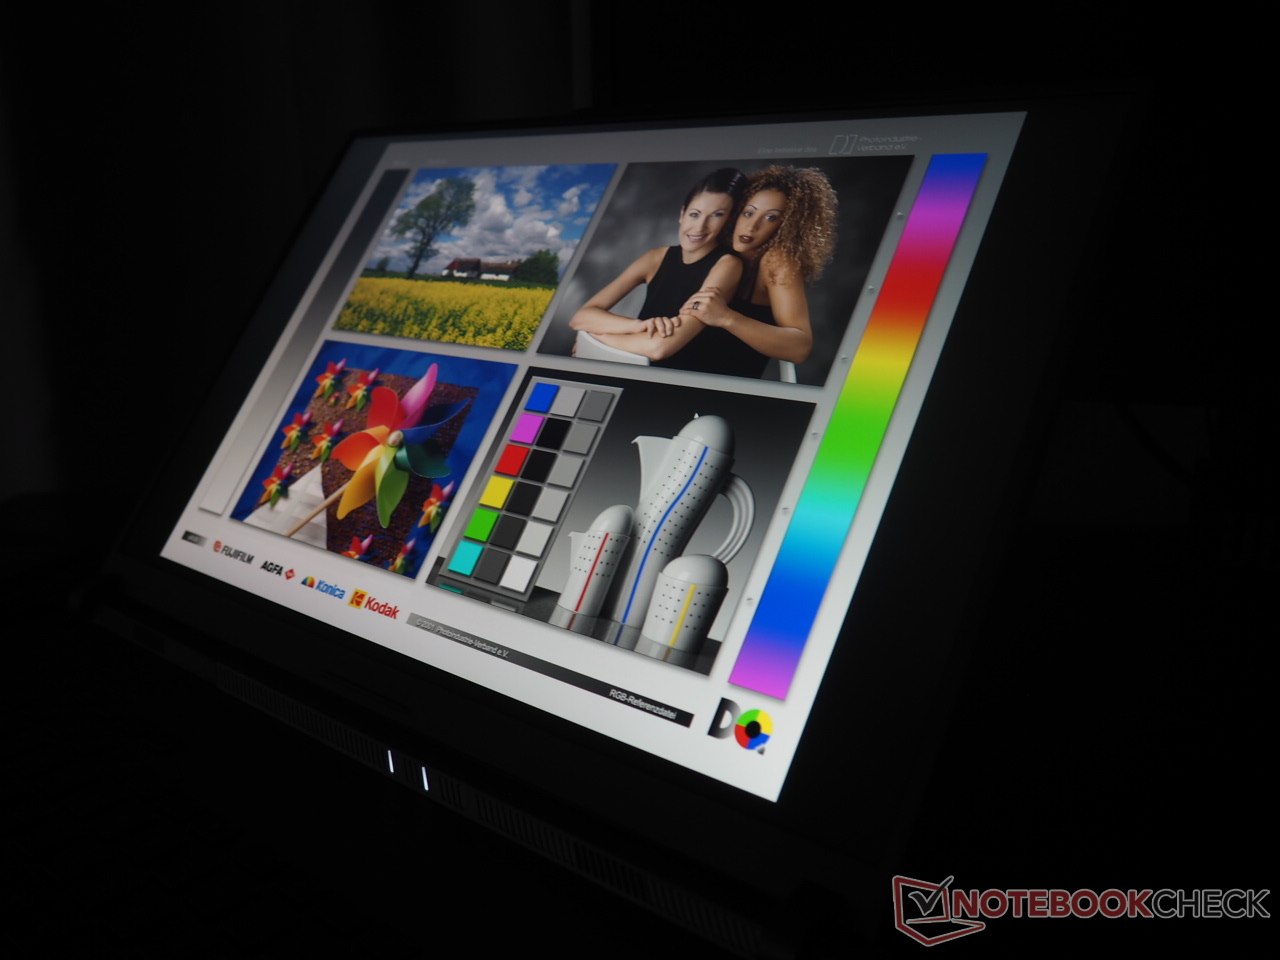
One of the biggest highlights of the G18 is the good display. Although the panel doesn't quite manage the 500 nits advertized by Asus - something which is probably linked to the pre-calibration - an average of 420 cd/m² is still good for an IPs panel and allows for occasional outdoor use.
| |||||||||||||||||||||||||
Brightness Distribution: 83 %
Center on Battery: 471 cd/m²
Contrast: 1002:1 (Black: 0.47 cd/m²)
ΔE ColorChecker Calman: 2.05 | ∀{0.5-29.43 Ø4.71}
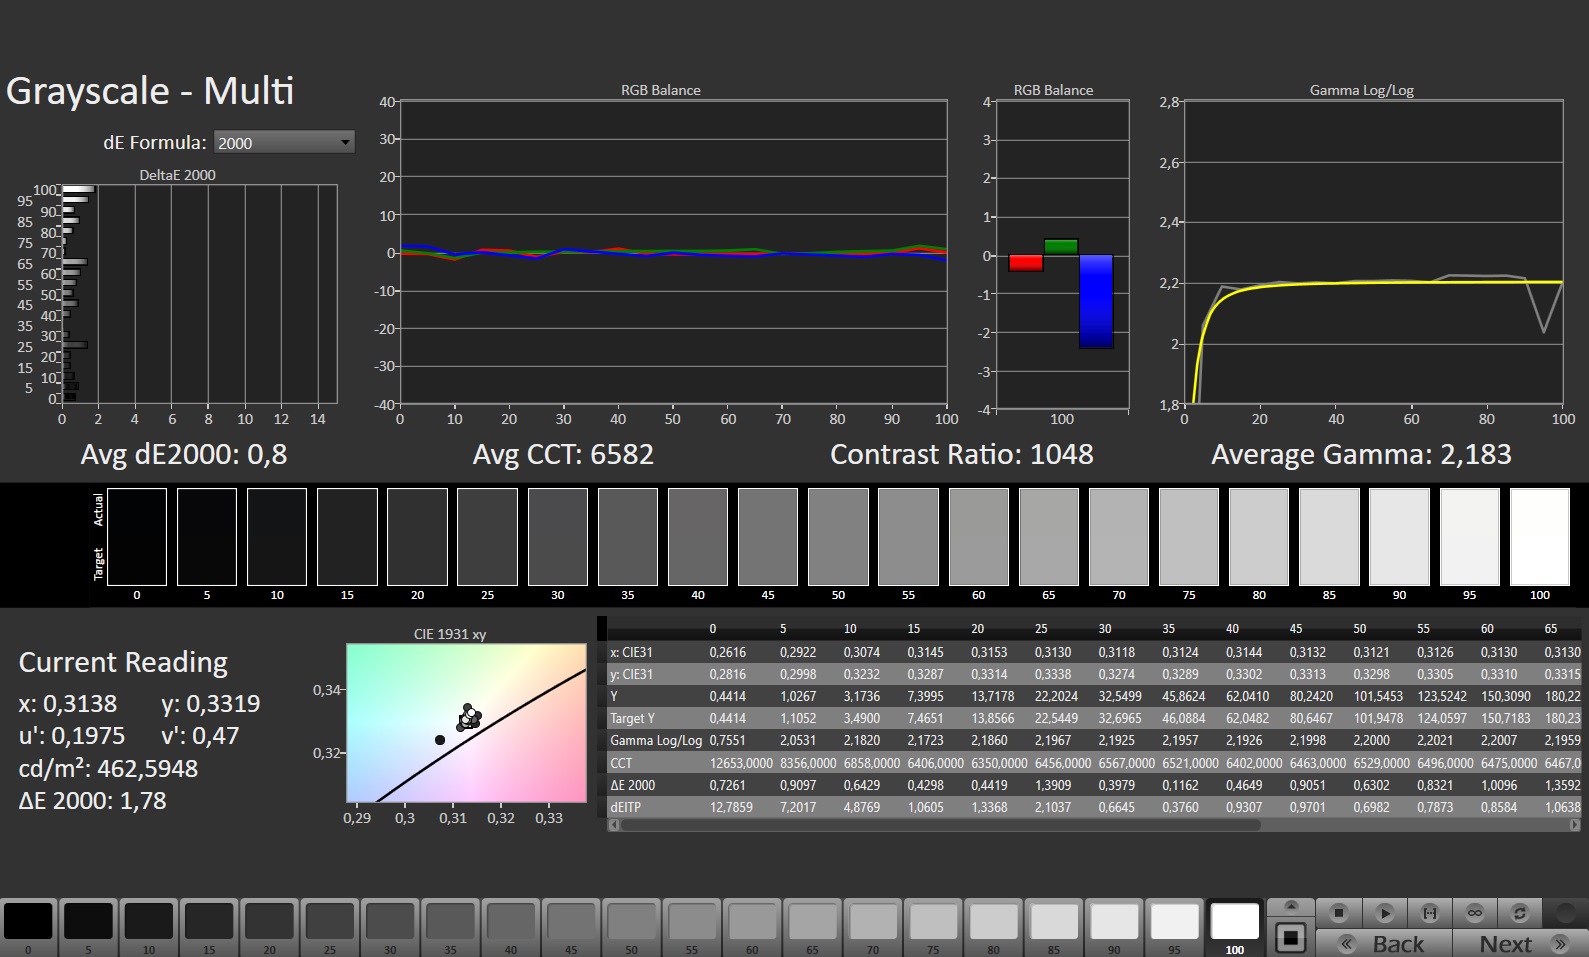
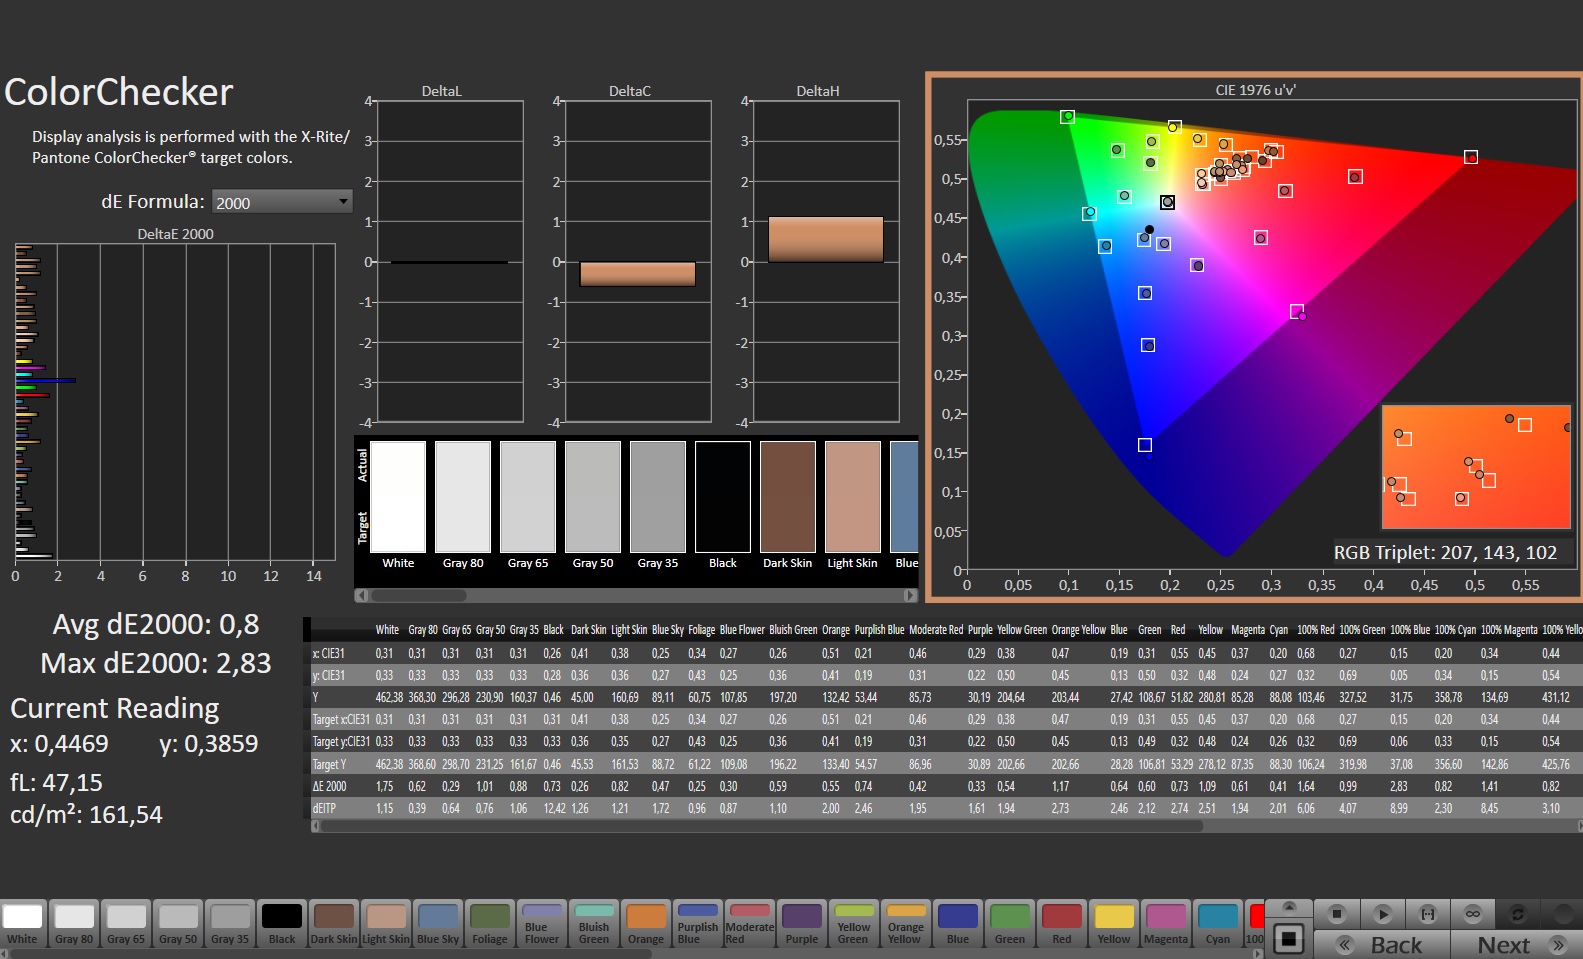
calibrated: 0.8
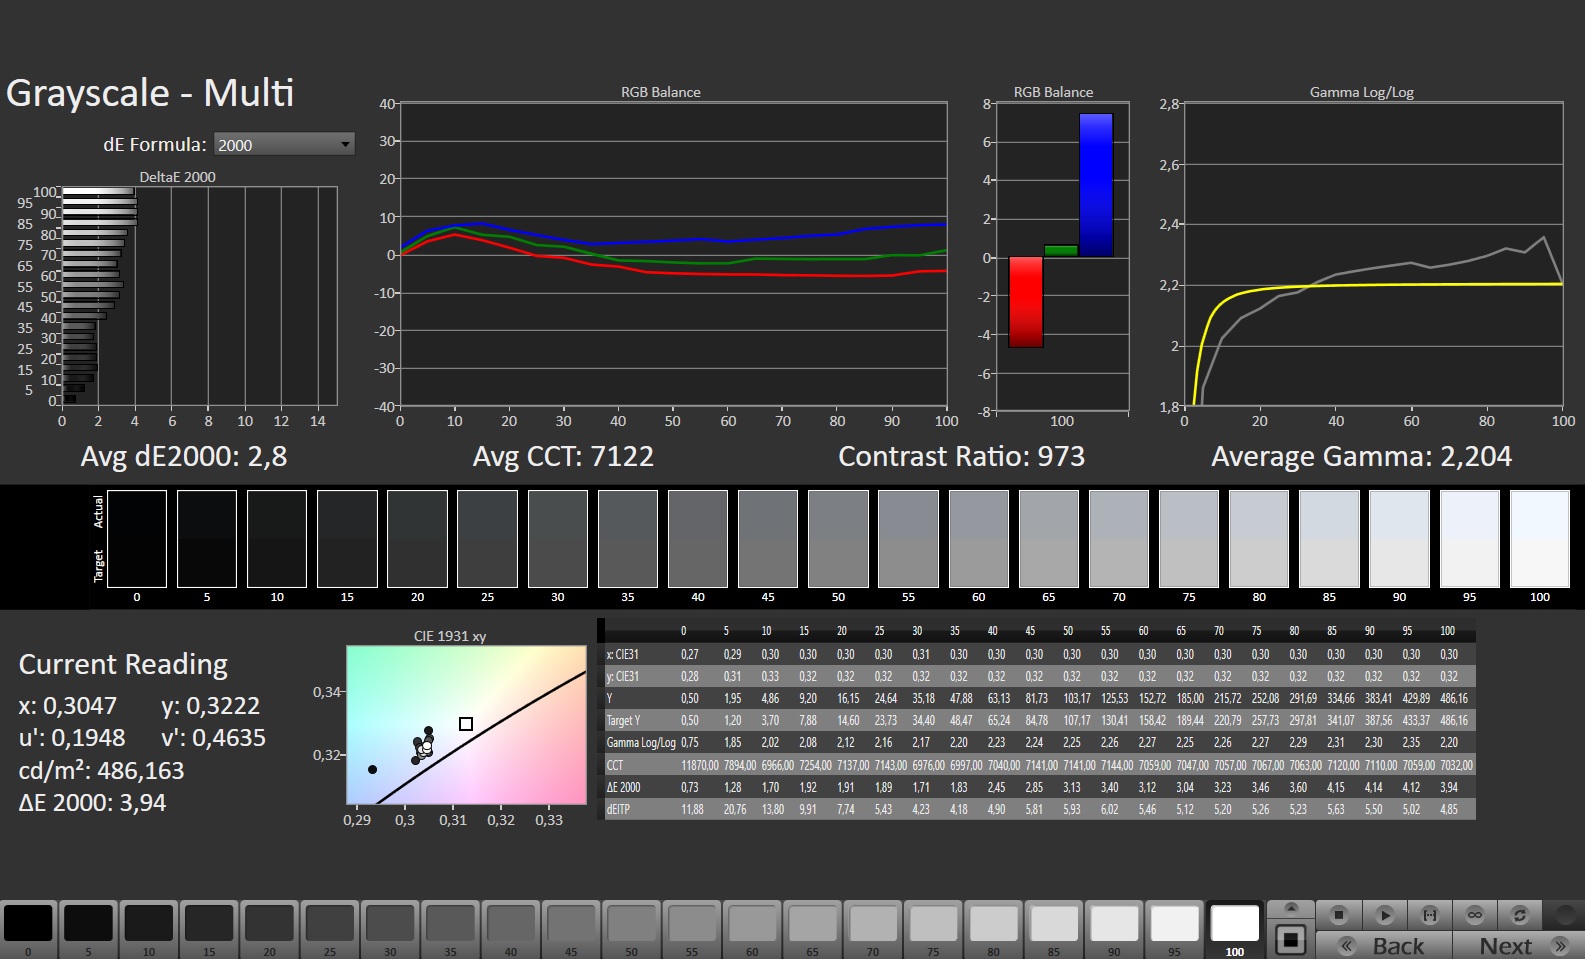
ΔE Greyscale Calman: 2.8 | ∀{0.09-98 Ø4.96}
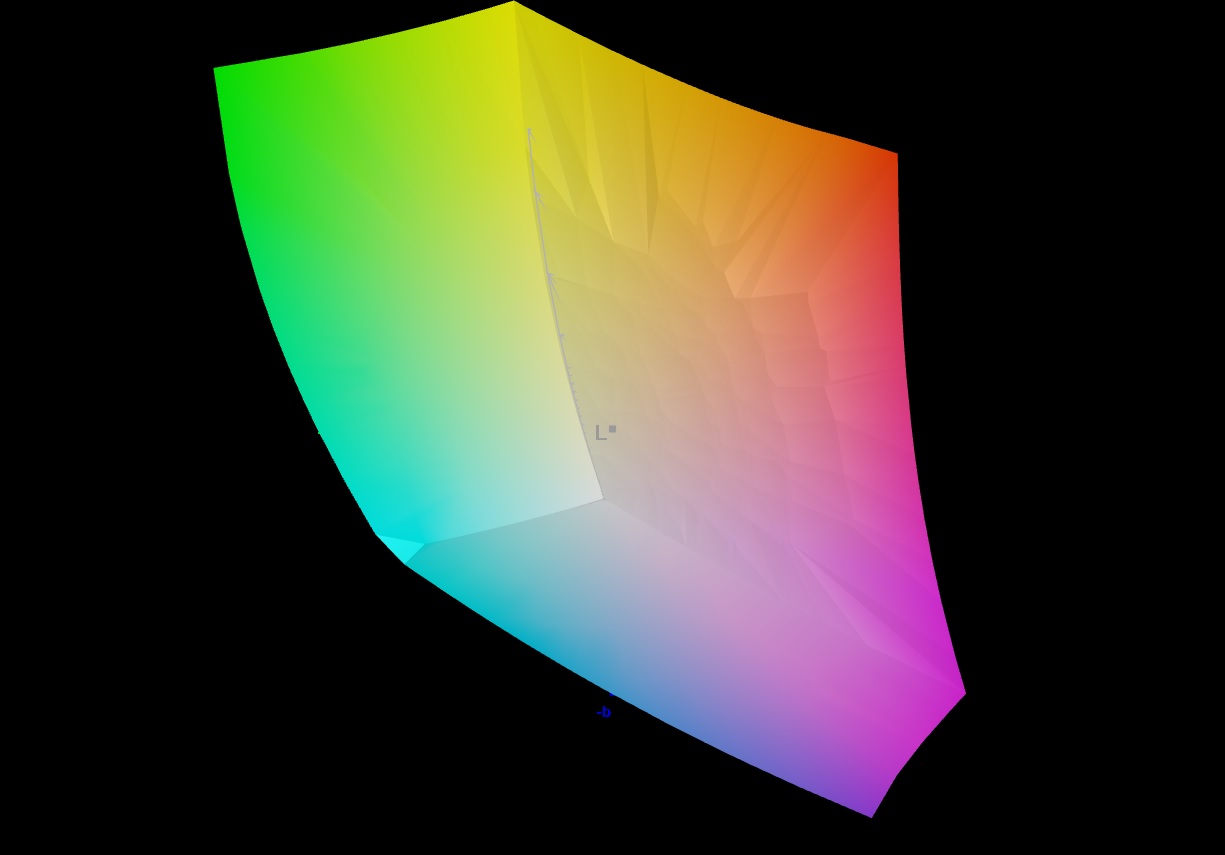
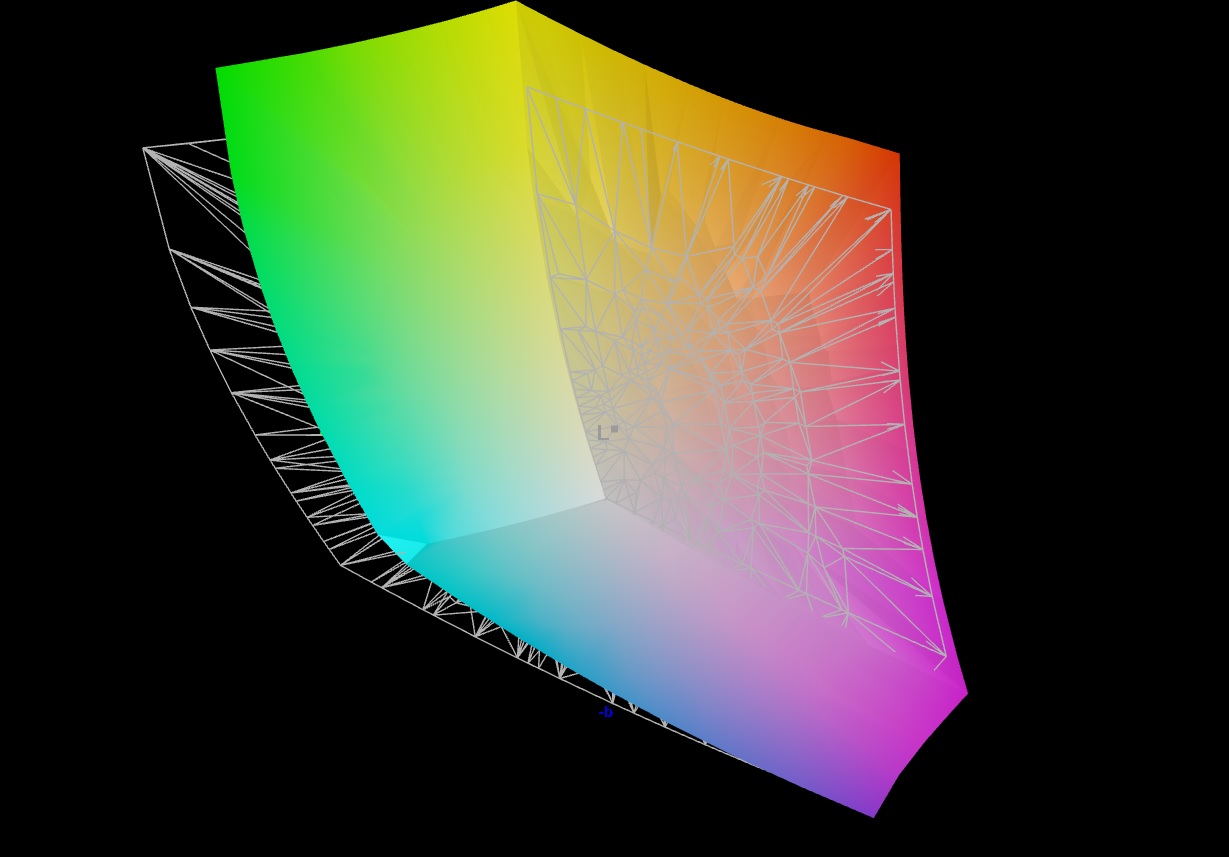
85.6% AdobeRGB 1998 (Argyll 3D)
99.9% sRGB (Argyll 3D)
98.1% Display P3 (Argyll 3D)
Gamma: 2.204
CCT: 7122 K
| Asus ROG Strix G18 G814JI NE180QDM-NZ2 (BOE0B35), IPS, 2560x1600, 18" | Razer Blade 18 RTX 4070 AU Optronics B180QAN01.0, IPS, 2560x1600, 18" | Gigabyte A7 X1 AU Optronics AUO8E8D, IPS, 1920x1080, 17.3" | Lenovo Legion 5 Pro 16ARH7H RTX 3070 Ti BOE CQ NE160QDM-NY1, IPS, 2560x1600, 16" | Alienware x17 RTX 3080 P48E AU Optronics B173ZAN, IPS, 3840x2160, 17.3" | MSI Raider GE77 HX 12UHS AU Optronics B173ZAN06.1, IPS, 3840x2160, 17.3" | |
|---|---|---|---|---|---|---|
| Display | -0% | -24% | -18% | 2% | -1% | |
| Display P3 Coverage (%) | 98.1 | 96.9 -1% | 61.5 -37% | 67.3 -31% | 88.3 -10% | 96.6 -2% |
| sRGB Coverage (%) | 99.9 | 99.8 0% | 90.9 -9% | 96.1 -4% | 100 0% | 99.8 0% |
| AdobeRGB 1998 Coverage (%) | 85.6 | 85.3 0% | 63.2 -26% | 69.5 -19% | 100 17% | 85.8 0% |
| Response Times | 18% | -103% | -91% | -87% | 17% | |
| Response Time Grey 50% / Grey 80% * (ms) | 5.6 ? | 4.2 ? 25% | 16 ? -186% | 14.4 ? -157% | 14.4 ? -157% | 5.8 ? -4% |
| Response Time Black / White * (ms) | 9 ? | 8 ? 11% | 10.8 ? -20% | 11.2 ? -24% | 10.4 ? -16% | 5.6 ? 38% |
| PWM Frequency (Hz) | ||||||
| Screen | -33% | -50% | 1% | -19% | -47% | |
| Brightness middle (cd/m²) | 471 | 549.6 17% | 325 -31% | 522.8 11% | 438.7 -7% | 381 -19% |
| Brightness (cd/m²) | 422 | 524 24% | 318 -25% | 503 19% | 435 3% | 371 -12% |
| Brightness Distribution (%) | 83 | 89 7% | 95 14% | 84 1% | 91 10% | 84 1% |
| Black Level * (cd/m²) | 0.47 | 0.53 -13% | 0.29 38% | 0.41 13% | 0.48 -2% | 0.52 -11% |
| Contrast (:1) | 1002 | 1037 3% | 1121 12% | 1275 27% | 914 -9% | 733 -27% |
| Colorchecker dE 2000 * | 2.05 | 3.32 -62% | 4.33 -111% | 2.47 -20% | 4.34 -112% | |
| Colorchecker dE 2000 max. * | 4.15 | 6.63 -60% | 8.6 -107% | 6.56 -58% | 7.3 -76% | |
| Colorchecker dE 2000 calibrated * | 0.8 | 2.7 -238% | 1.95 -144% | 0.61 24% | 0.72 10% | 2.53 -216% |
| Greyscale dE 2000 * | 2.8 | 2 29% | 5.5 -96% | 3 -7% | 2.4 14% | |
| Gamma | 2.204 100% | 2.29 96% | 2.142 103% | 2.27 97% | 2.09 105% | |
| CCT | 7122 91% | 6319 103% | 7893 82% | 6719 97% | 6413 101% | |
| Total Average (Program / Settings) | -5% /
-18% | -59% /
-52% | -36% /
-16% | -35% /
-24% | -10% /
-23% |
* ... smaller is better
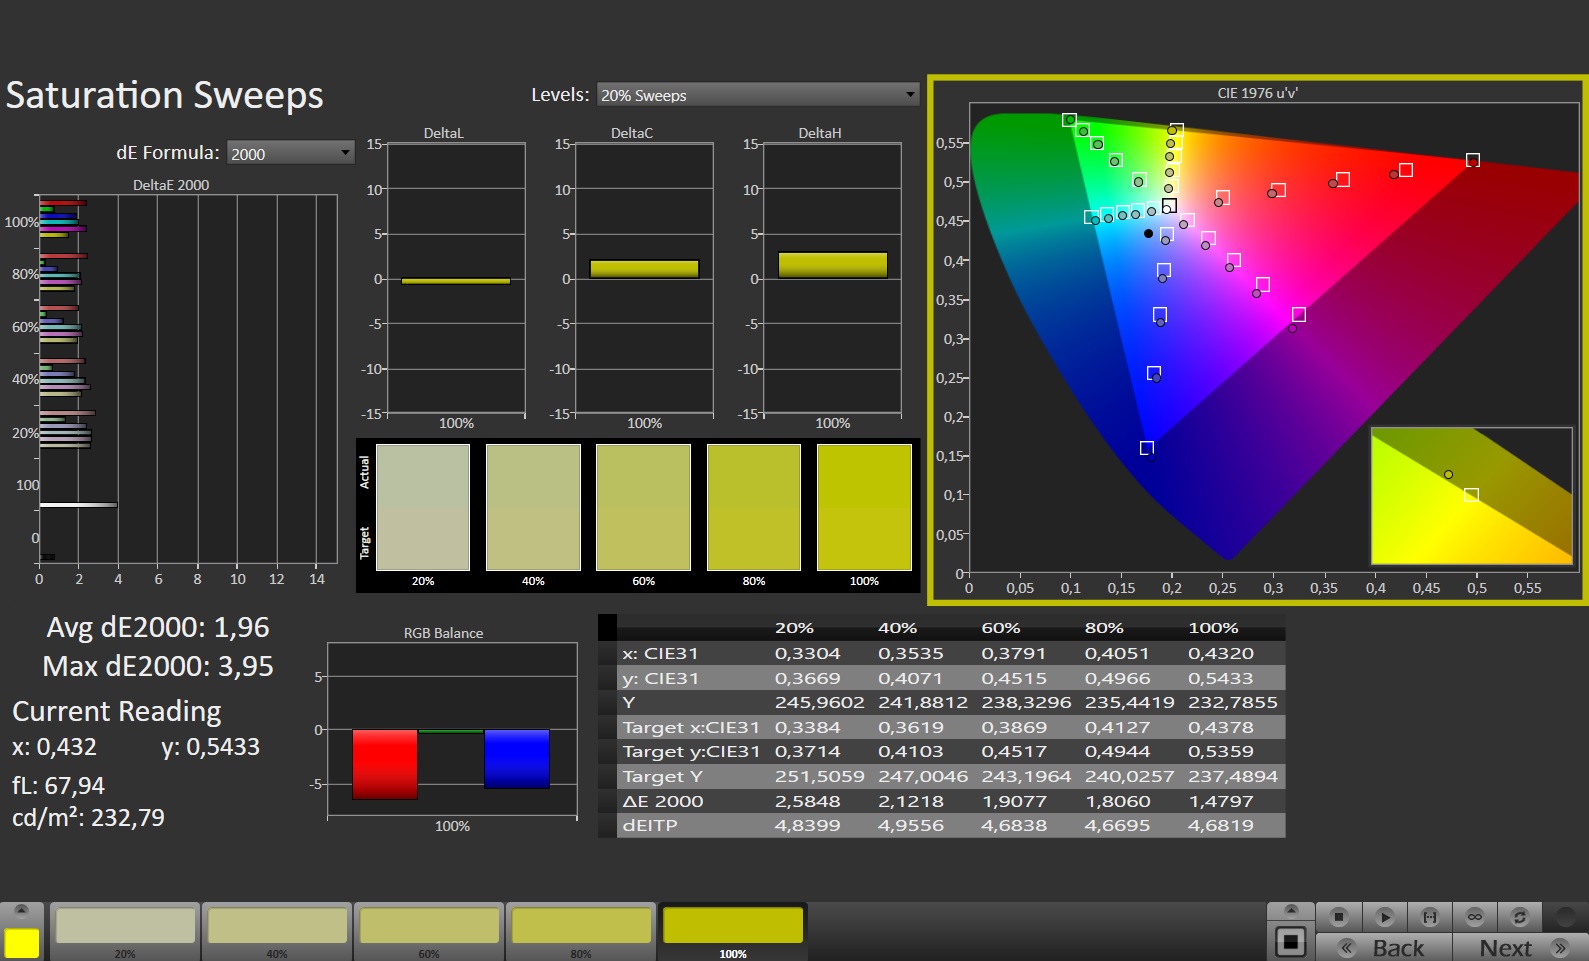
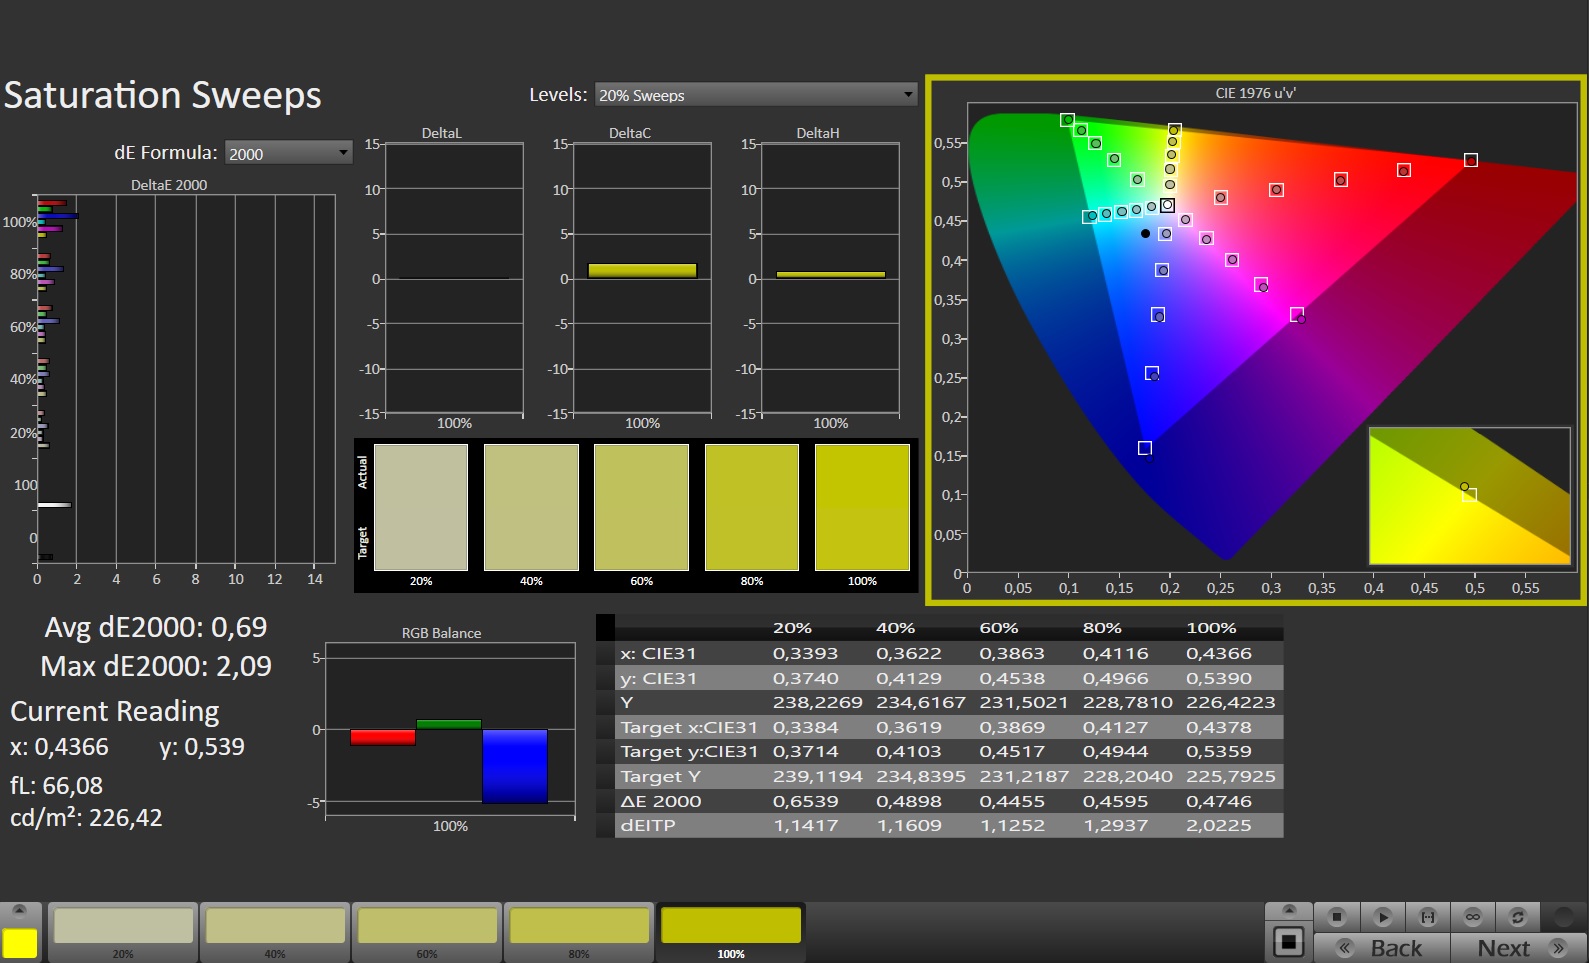
Professional users will be happy about the laptop's color space: According to our measurements, the G18 manages 100 % sRGB, 98 % P3 and 86 % AdobeRGB – all in all, impressive results. There's also hardly any need for criticism in the area of color reproduction. Out-of-the-box, the values are in an ideal range (DeltaE less than 3) thereby ensuring very natural colors.
However, it's not only creators but also gamers who get their money's worth: thanks to the short response time (under 10 ms) the G18 is even well-suited to faster-paced games. We did not detect any display flicker (e.g. PWM).

On the other hand, the review device struggled with screen bleeding, especially in the corners of the panel. However, this is not something that was noticeable in every situation. The contrast (around 1.000:1) and black level (0.47 cd/m²) are also less than perfect with the Blade 18 scoring similarly in this area. By contrast, the viewing angles are pretty good and typical for an IPS panel.
Display Response Times
| ↔ Response Time Black to White | ||
|---|---|---|
| 9 ms ... rise ↗ and fall ↘ combined | ↗ 4 ms rise | 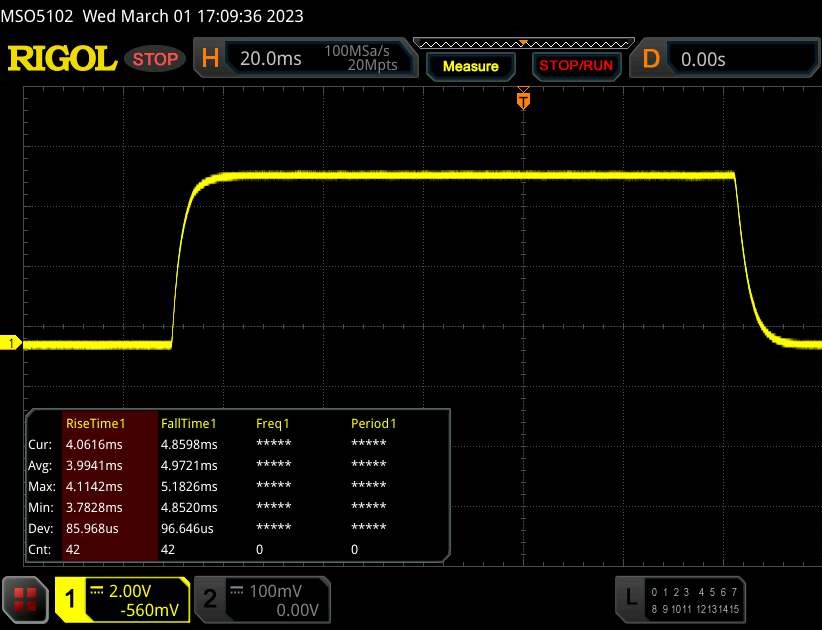 |
| ↘ 5 ms fall | ||
| The screen shows fast response rates in our tests and should be suited for gaming. In comparison, all tested devices range from 0.1 (minimum) to 240 (maximum) ms. » 25 % of all devices are better. This means that the measured response time is better than the average of all tested devices (19.8 ms). | ||
| ↔ Response Time 50% Grey to 80% Grey | ||
| 5.6 ms ... rise ↗ and fall ↘ combined | ↗ 2.7 ms rise | 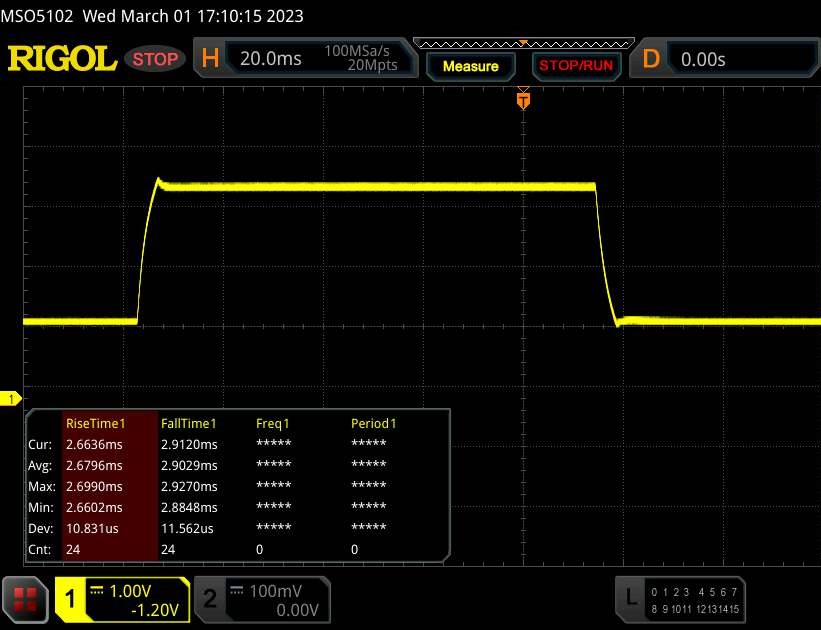 |
| ↘ 2.9 ms fall | ||
| The screen shows very fast response rates in our tests and should be very well suited for fast-paced gaming. In comparison, all tested devices range from 0.165 (minimum) to 636 (maximum) ms. » 18 % of all devices are better. This means that the measured response time is better than the average of all tested devices (31 ms). | ||
Screen Flickering / PWM (Pulse-Width Modulation)
| Screen flickering / PWM not detected | 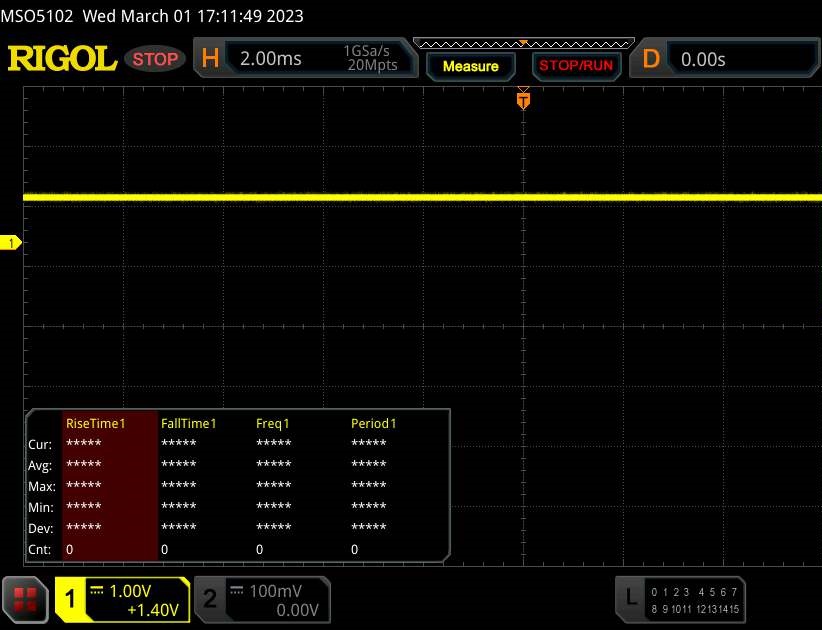 | ||
In comparison: 52 % of all tested devices do not use PWM to dim the display. If PWM was detected, an average of 7747 (minimum: 5 - maximum: 343500) Hz was measured. | |||
Performance
Depending on the specifications, the Strix G18 can be viewed as a middle-of-the-pack or lower high-end laptop with 32 GB of RAM probably being sufficient for the coming year. In the event of the SSD's storage capacity falling short of requirements, the device can be easily upgraded with a second M.2 drive.
Test conditions
Many parameters can be set in the powerful but also rather cluttered and confusing Armoury Crate. Our measurements were made using the GPU's "Standard“ (active graphics switching) and "Performance“ modes. Strange: Using "Quiet“ or "Turbo“ modes, fan behavior changes but performance in The Witcher 3 test remained unchanged. This would suggest there are problems or an error here.
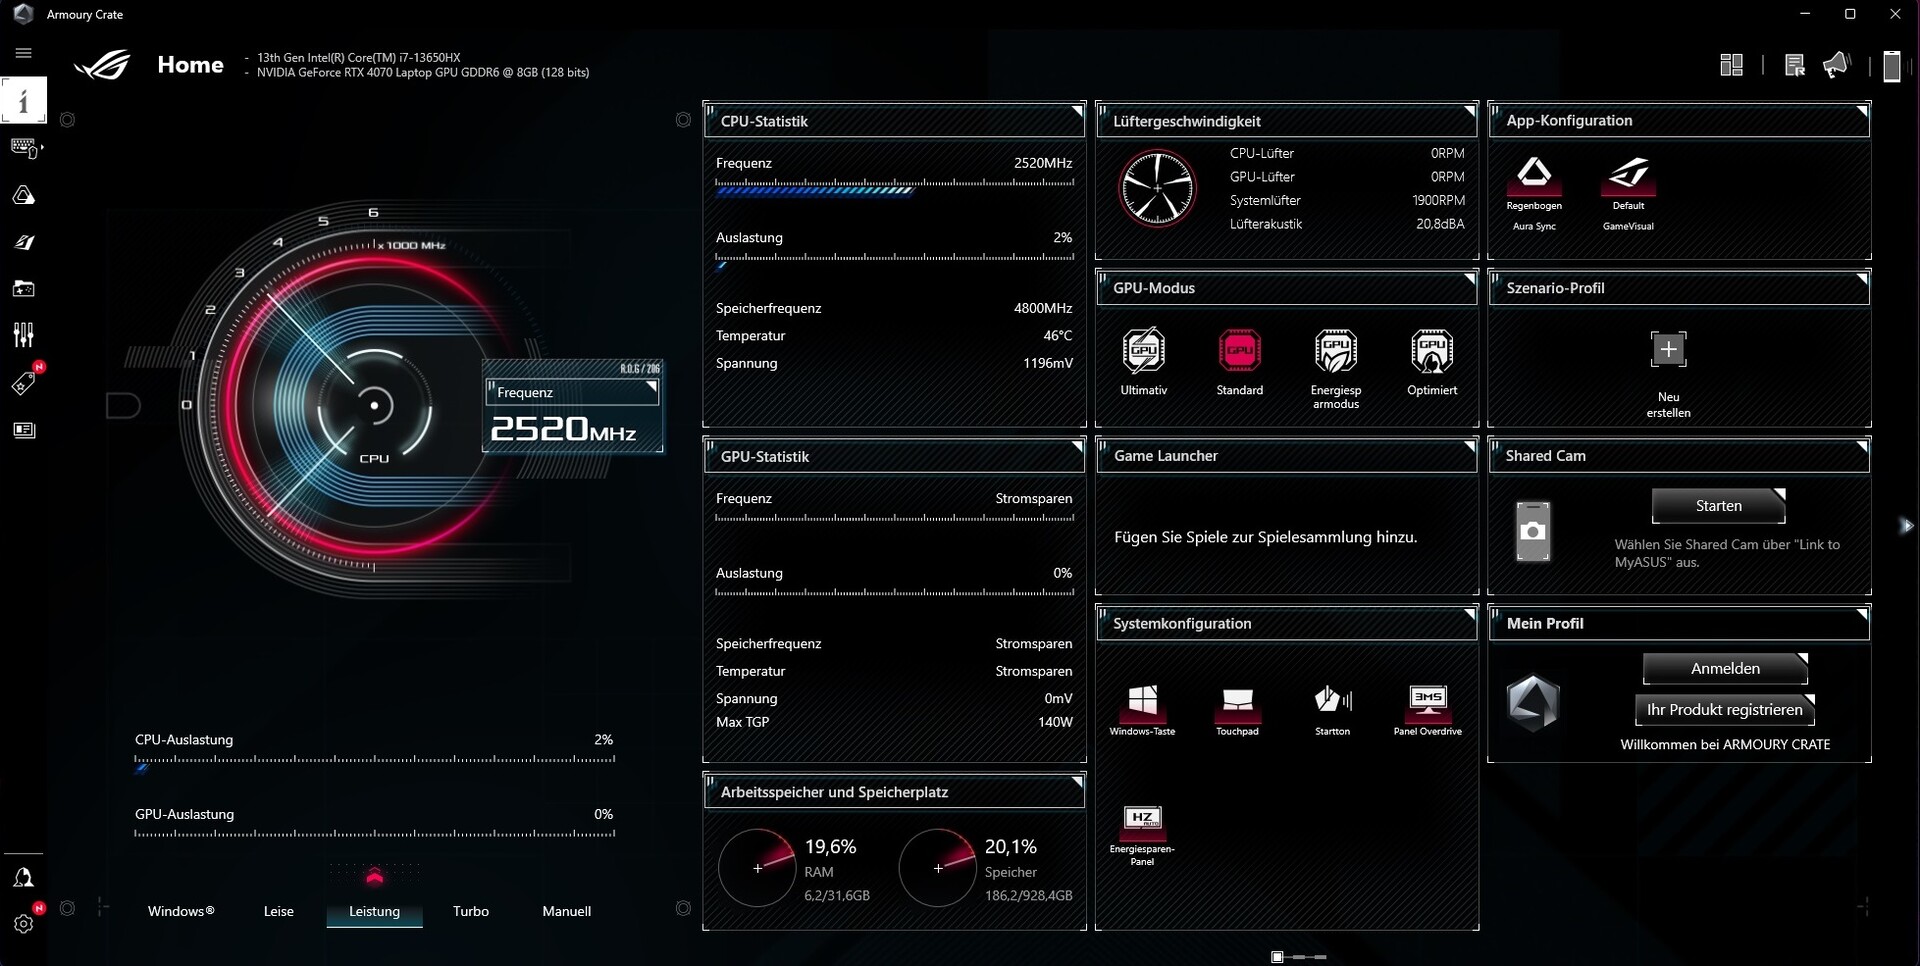
| Silent Mode | Performance Mode | Turbo Mode | |
| CPU PL1 (HWiNFO) | 80 W | 110 W | 170 W |
| CPU PL2 (HWiNFO) | 100 W | 120 W | 175 W |
| Noise (Witcher 3) | 38 - 40 dB(A) | 42 - 44 dB(A) | 51 dB(A) |
| Performance (Witcher 3) | ~120 FPS | ~120 FPS | ~120 FPS |
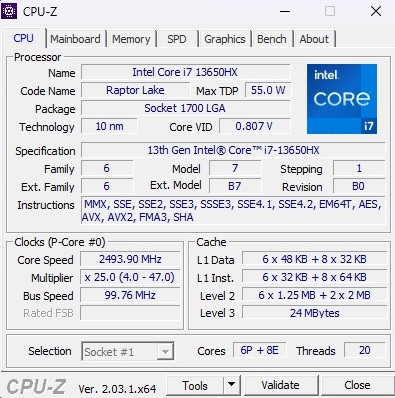
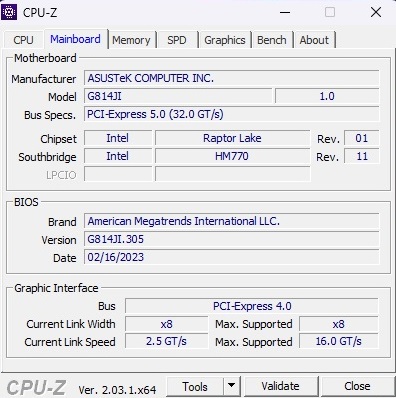
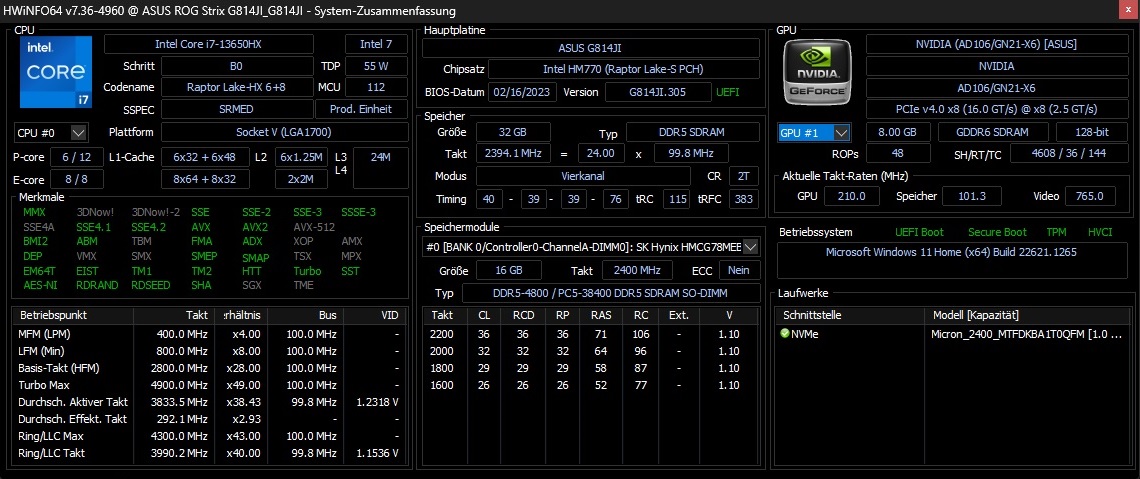
Processor
The Core i7-13650HX comes from Intel's brand-new Raptor Lake series and has a base TDP of 55 watts. The 14 available cores are divided into 6 performance cores including hyper-threading and 8 efficiency cores without HT making a total of 20 threads possible. Depending on the type of core, the clock speed can vary greatly with performance variants it goes up to 4.9 GHz.
Although the i7-13650HX's performance is around 10 % less powerful than the Core i7-12900HX and roughly 20 % lower than the Core i9-13950HX in the benchmark test course, these support up to 24 threads. The often significantly older CPUs found in competing laptops - (Ryzen 7 6800H, Ryzen 9 5900HX & Core i7-11800H) - are usually left behind.
Cinebench R15 Multi Continuous Test
* ... smaller is better
AIDA64: FP32 Ray-Trace | FPU Julia | CPU SHA3 | CPU Queen | FPU SinJulia | FPU Mandel | CPU AES | CPU ZLib | FP64 Ray-Trace | CPU PhotoWorxx
| Performance rating | |
| Average of class Gaming | |
| Razer Blade 18 RTX 4070 | |
| MSI Raider GE77 HX 12UHS | |
| Asus ROG Strix G18 G814JI | |
| Lenovo Legion 5 Pro 16ARH7H RTX 3070 Ti | |
| Average Intel Core i7-13650HX | |
| Gigabyte A7 X1 | |
| Alienware x17 RTX 3080 P48E -9! | |
| AIDA64 / FP32 Ray-Trace | |
| Average of class Gaming (10227 - 85542, n=105, last 2 years) | |
| Razer Blade 18 RTX 4070 | |
| Asus ROG Strix G18 G814JI | |
| MSI Raider GE77 HX 12UHS | |
| Average Intel Core i7-13650HX (13404 - 20012, n=5) | |
| Lenovo Legion 5 Pro 16ARH7H RTX 3070 Ti | |
| Gigabyte A7 X1 | |
| AIDA64 / FPU Julia | |
| Average of class Gaming (51376 - 238426, n=105, last 2 years) | |
| Razer Blade 18 RTX 4070 | |
| MSI Raider GE77 HX 12UHS | |
| Lenovo Legion 5 Pro 16ARH7H RTX 3070 Ti | |
| Asus ROG Strix G18 G814JI | |
| Gigabyte A7 X1 | |
| Average Intel Core i7-13650HX (68241 - 97317, n=5) | |
| AIDA64 / CPU SHA3 | |
| Average of class Gaming (2180 - 10115, n=105, last 2 years) | |
| Razer Blade 18 RTX 4070 | |
| MSI Raider GE77 HX 12UHS | |
| Asus ROG Strix G18 G814JI | |
| Average Intel Core i7-13650HX (3127 - 4487, n=5) | |
| Lenovo Legion 5 Pro 16ARH7H RTX 3070 Ti | |
| Gigabyte A7 X1 | |
| AIDA64 / CPU Queen | |
| Razer Blade 18 RTX 4070 | |
| Average of class Gaming (49785 - 173351, n=90, last 2 years) | |
| Asus ROG Strix G18 G814JI | |
| Average Intel Core i7-13650HX (108627 - 110589, n=5) | |
| Lenovo Legion 5 Pro 16ARH7H RTX 3070 Ti | |
| MSI Raider GE77 HX 12UHS | |
| Gigabyte A7 X1 | |
| AIDA64 / FPU SinJulia | |
| Razer Blade 18 RTX 4070 | |
| Average of class Gaming (4424 - 33636, n=105, last 2 years) | |
| MSI Raider GE77 HX 12UHS | |
| Lenovo Legion 5 Pro 16ARH7H RTX 3070 Ti | |
| Gigabyte A7 X1 | |
| Asus ROG Strix G18 G814JI | |
| Average Intel Core i7-13650HX (9134 - 10887, n=5) | |
| AIDA64 / FPU Mandel | |
| Average of class Gaming (25115 - 128721, n=105, last 2 years) | |
| Razer Blade 18 RTX 4070 | |
| Lenovo Legion 5 Pro 16ARH7H RTX 3070 Ti | |
| MSI Raider GE77 HX 12UHS | |
| Gigabyte A7 X1 | |
| Asus ROG Strix G18 G814JI | |
| Average Intel Core i7-13650HX (33391 - 48323, n=5) | |
| AIDA64 / CPU AES | |
| MSI Raider GE77 HX 12UHS | |
| Lenovo Legion 5 Pro 16ARH7H RTX 3070 Ti | |
| Gigabyte A7 X1 | |
| Razer Blade 18 RTX 4070 | |
| Average of class Gaming (39258 - 247074, n=105, last 2 years) | |
| Asus ROG Strix G18 G814JI | |
| Average Intel Core i7-13650HX (64436 - 85343, n=5) | |
| AIDA64 / CPU ZLib | |
| Razer Blade 18 RTX 4070 | |
| Average of class Gaming (574 - 2531, n=105, last 2 years) | |
| MSI Raider GE77 HX 12UHS | |
| Asus ROG Strix G18 G814JI | |
| Average Intel Core i7-13650HX (1136 - 1285, n=5) | |
| Lenovo Legion 5 Pro 16ARH7H RTX 3070 Ti | |
| Gigabyte A7 X1 | |
| Alienware x17 RTX 3080 P48E | |
| AIDA64 / FP64 Ray-Trace | |
| Average of class Gaming (5509 - 45446, n=105, last 2 years) | |
| Razer Blade 18 RTX 4070 | |
| Asus ROG Strix G18 G814JI | |
| MSI Raider GE77 HX 12UHS | |
| Average Intel Core i7-13650HX (7270 - 10900, n=5) | |
| Lenovo Legion 5 Pro 16ARH7H RTX 3070 Ti | |
| Gigabyte A7 X1 | |
| AIDA64 / CPU PhotoWorxx | |
| Razer Blade 18 RTX 4070 | |
| MSI Raider GE77 HX 12UHS | |
| Average of class Gaming (12271 - 89891, n=105, last 2 years) | |
| Asus ROG Strix G18 G814JI | |
| Average Intel Core i7-13650HX (36170 - 43289, n=5) | |
| Lenovo Legion 5 Pro 16ARH7H RTX 3070 Ti | |
| Gigabyte A7 X1 | |
System Performance
Asus ought to work on the system performance. Similar to the recently reviewed TUF Gaming A16, when opening programs, graphics switching results in annoying freezes which sometimes last for a few seconds. As SSD performance also can't quite keep up with the competition, the PCMark 10 benchmark could only secure last place. The Razer Blade 18 has its nose in front by almost 20 %.
CrossMark: Overall | Productivity | Creativity | Responsiveness
| PCMark 10 / Score | |
| Average of class Gaming (5828 - 12414, n=93, last 2 years) | |
| Razer Blade 18 RTX 4070 | |
| Lenovo Legion 5 Pro 16ARH7H RTX 3070 Ti | |
| Alienware x17 RTX 3080 P48E | |
| MSI Raider GE77 HX 12UHS | |
| Gigabyte A7 X1 | |
| Asus ROG Strix G18 G814JI | |
| Average Intel Core i7-13650HX, NVIDIA GeForce RTX 4070 Laptop GPU (n=1) | |
| PCMark 10 / Essentials | |
| Razer Blade 18 RTX 4070 | |
| Average of class Gaming (8810 - 11935, n=97, last 2 years) | |
| Lenovo Legion 5 Pro 16ARH7H RTX 3070 Ti | |
| Alienware x17 RTX 3080 P48E | |
| Gigabyte A7 X1 | |
| Asus ROG Strix G18 G814JI | |
| Average Intel Core i7-13650HX, NVIDIA GeForce RTX 4070 Laptop GPU (n=1) | |
| MSI Raider GE77 HX 12UHS | |
| PCMark 10 / Productivity | |
| Average of class Gaming (6845 - 25323, n=95, last 2 years) | |
| Alienware x17 RTX 3080 P48E | |
| MSI Raider GE77 HX 12UHS | |
| Razer Blade 18 RTX 4070 | |
| Lenovo Legion 5 Pro 16ARH7H RTX 3070 Ti | |
| Gigabyte A7 X1 | |
| Asus ROG Strix G18 G814JI | |
| Average Intel Core i7-13650HX, NVIDIA GeForce RTX 4070 Laptop GPU (n=1) | |
| PCMark 10 / Digital Content Creation | |
| Average of class Gaming (7602 - 19954, n=95, last 2 years) | |
| Lenovo Legion 5 Pro 16ARH7H RTX 3070 Ti | |
| Alienware x17 RTX 3080 P48E | |
| Razer Blade 18 RTX 4070 | |
| MSI Raider GE77 HX 12UHS | |
| Gigabyte A7 X1 | |
| Asus ROG Strix G18 G814JI | |
| Average Intel Core i7-13650HX, NVIDIA GeForce RTX 4070 Laptop GPU (n=1) | |
| CrossMark / Overall | |
| MSI Raider GE77 HX 12UHS | |
| Razer Blade 18 RTX 4070 | |
| Average of class Gaming (1366 - 2409, n=94, last 2 years) | |
| Lenovo Legion 5 Pro 16ARH7H RTX 3070 Ti | |
| CrossMark / Productivity | |
| MSI Raider GE77 HX 12UHS | |
| Razer Blade 18 RTX 4070 | |
| Average of class Gaming (1386 - 2254, n=94, last 2 years) | |
| Lenovo Legion 5 Pro 16ARH7H RTX 3070 Ti | |
| CrossMark / Creativity | |
| Razer Blade 18 RTX 4070 | |
| MSI Raider GE77 HX 12UHS | |
| Average of class Gaming (1343 - 2786, n=94, last 2 years) | |
| Lenovo Legion 5 Pro 16ARH7H RTX 3070 Ti | |
| CrossMark / Responsiveness | |
| MSI Raider GE77 HX 12UHS | |
| Razer Blade 18 RTX 4070 | |
| Average of class Gaming (1226 - 2334, n=94, last 2 years) | |
| Lenovo Legion 5 Pro 16ARH7H RTX 3070 Ti | |
| PCMark 10 Score | 6404 points | |
Help | ||
| AIDA64 / Memory Copy | |
| Razer Blade 18 RTX 4070 | |
| Average of class Gaming (21750 - 129946, n=105, last 2 years) | |
| MSI Raider GE77 HX 12UHS | |
| Asus ROG Strix G18 G814JI | |
| Average Intel Core i7-13650HX (59266 - 66372, n=5) | |
| Lenovo Legion 5 Pro 16ARH7H RTX 3070 Ti | |
| Gigabyte A7 X1 | |
| AIDA64 / Memory Read | |
| Razer Blade 18 RTX 4070 | |
| Average of class Gaming (22956 - 118858, n=105, last 2 years) | |
| MSI Raider GE77 HX 12UHS | |
| Average Intel Core i7-13650HX (67305 - 71022, n=5) | |
| Asus ROG Strix G18 G814JI | |
| Lenovo Legion 5 Pro 16ARH7H RTX 3070 Ti | |
| Gigabyte A7 X1 | |
| AIDA64 / Memory Write | |
| Average of class Gaming (22297 - 135096, n=105, last 2 years) | |
| Razer Blade 18 RTX 4070 | |
| MSI Raider GE77 HX 12UHS | |
| Average Intel Core i7-13650HX (58028 - 68225, n=5) | |
| Asus ROG Strix G18 G814JI | |
| Lenovo Legion 5 Pro 16ARH7H RTX 3070 Ti | |
| Gigabyte A7 X1 | |
| AIDA64 / Memory Latency | |
| Average of class Gaming (75.3 - 259, n=105, last 2 years) | |
| Average Intel Core i7-13650HX (83.7 - 90.8, n=5) | |
| Lenovo Legion 5 Pro 16ARH7H RTX 3070 Ti | |
| Razer Blade 18 RTX 4070 | |
| MSI Raider GE77 HX 12UHS | |
| Asus ROG Strix G18 G814JI | |
| Gigabyte A7 X1 | |
| Alienware x17 RTX 3080 P48E | |
* ... smaller is better
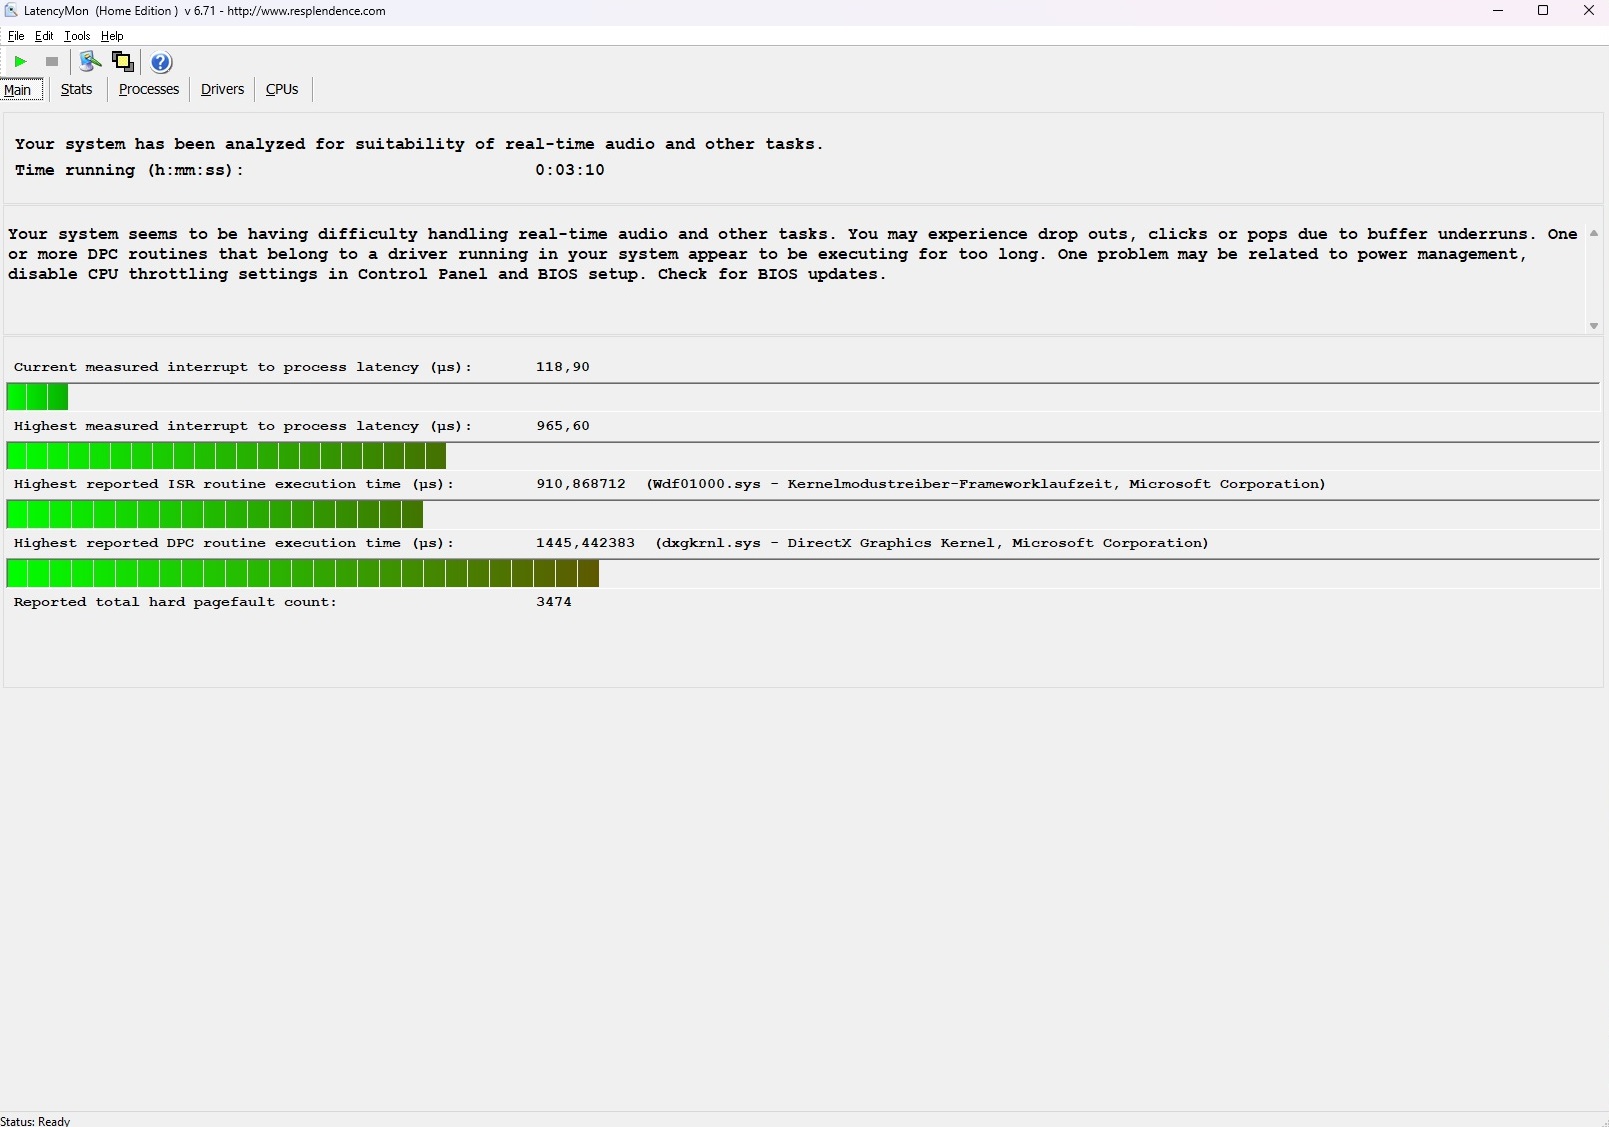
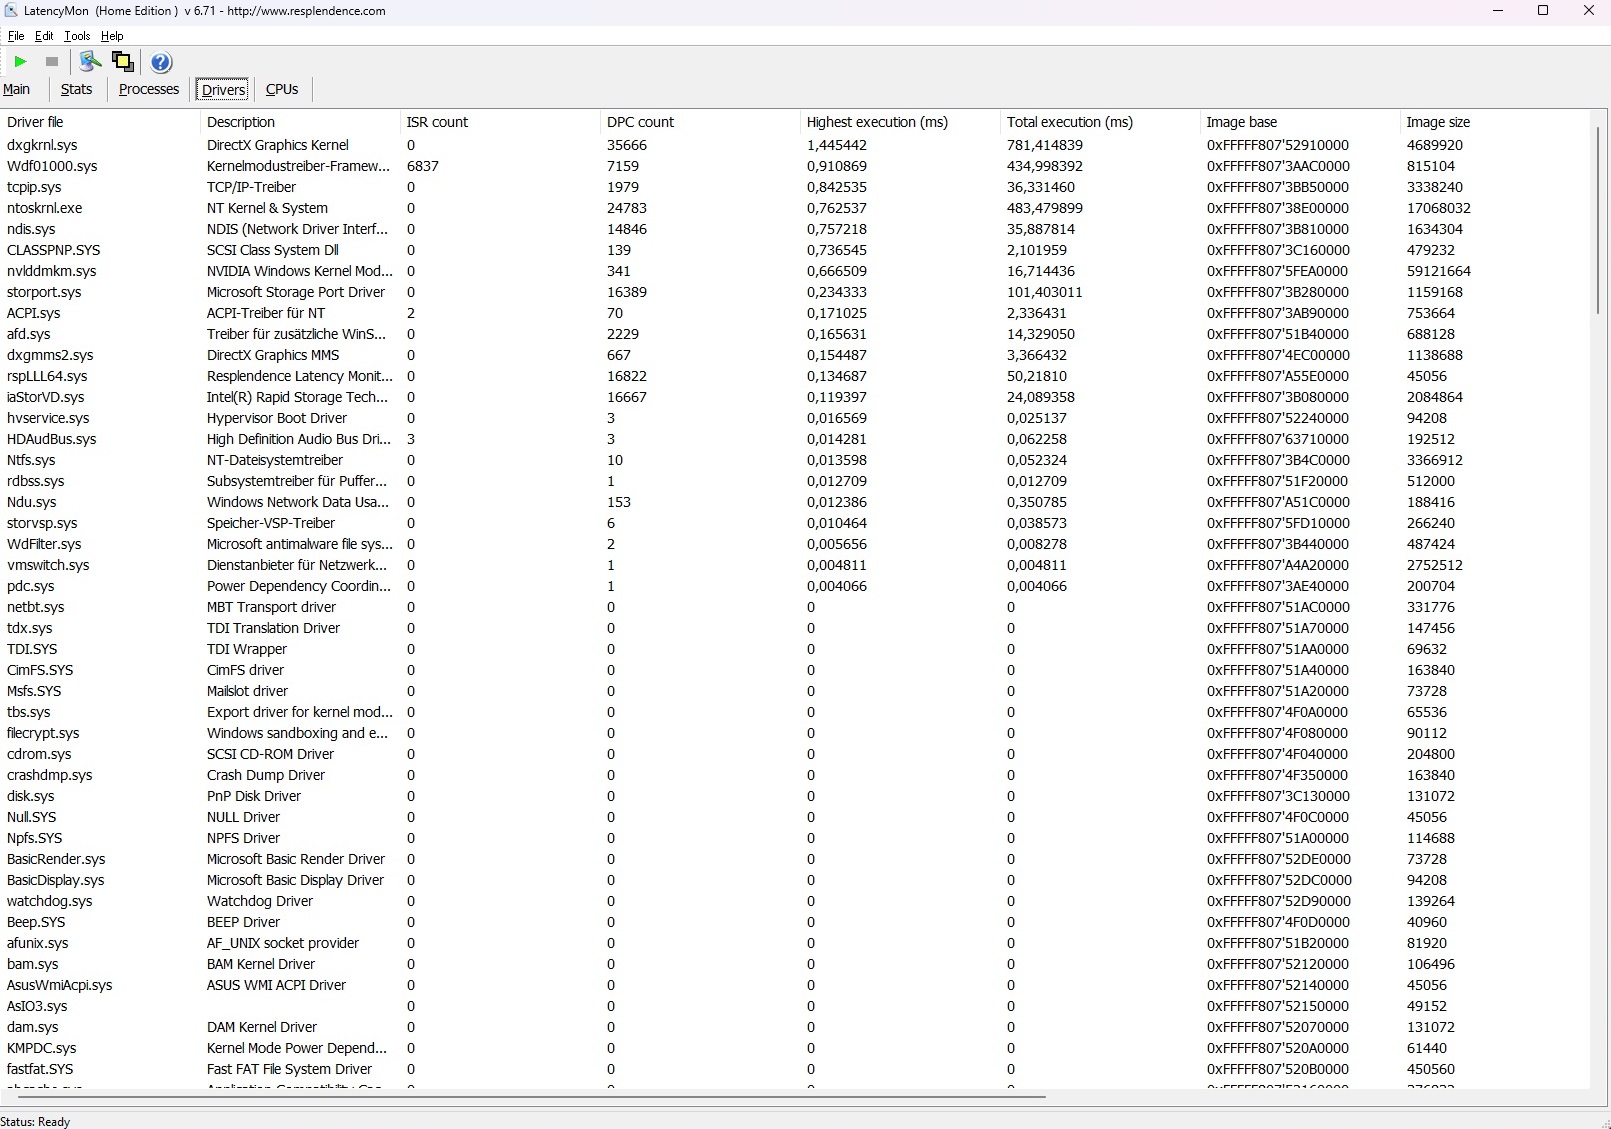
DPC latencies
Regarding latencies, the G18 comfortably manages a mid-table place. Despite the solid result, the LatencyMon tool indicates possible problems during the real-time processing of, for example, audio content. This is something which affects many laptops but is only relevant to specific user groups.
| DPC Latencies / LatencyMon - interrupt to process latency (max), Web, Youtube, Prime95 | |
| Alienware x17 RTX 3080 P48E | |
| MSI Raider GE77 HX 12UHS | |
| Razer Blade 18 RTX 4070 | |
| Asus ROG Strix G18 G814JI | |
| Gigabyte A7 X1 | |
| Lenovo Legion 5 Pro 16ARH7H RTX 3070 Ti | |
* ... smaller is better
Mass storage
The review configuration is driven by a 1 TB Micron SSD. Although the performance on offer (around 3800 MB/s read & 2300 MB/s write speed in the AS SSD benchmark) is on no account poor, competing SSDs mostly have the edge. Only the Gigabyte A7 X1 is just able to set itself apart from the G18 in this discipline.

* ... smaller is better
Continuous Performance Read: DiskSpd Read Loop, Queue Depth 8
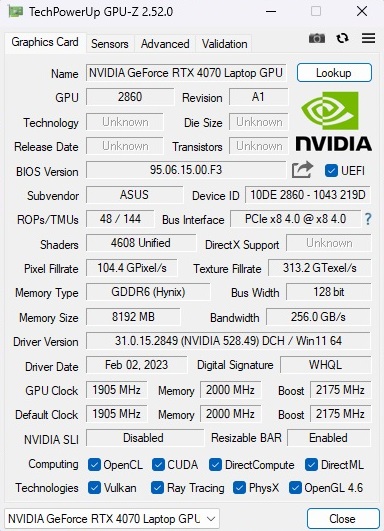
Graphics card
After the GeForce RTX 4070 Ti had to put up with a lot of criticism in the desktop segment (too expensive and with questionable specs for the performance on offer), the mobile GeForce RTX 4070 was hotly anticipated.
To get straight to the point: Once more, Nvidia hasn't made the best of decisions. The name RTX 4070 sounds like proper high-end but with systems of that kind being expensive the specifications tend toward only being sufficient for a typical mid-range device. Likewise, in the year 2023, 8 GB of VRAM is just as meagre as a 128-bit memory interface. In addition, 4608 shader units are more akin to an RTX 4060 (3072) than the RTX 4080 (7424) which is a considerable gap in comparison to more powerful models. When it comes to 3DMark GPU scores, the RTX 4070 is barely faster than an RTX 3070 and sometimes even slower than an RTX 3070 Ti. All in all, it is on a comparable level to the RTX 3080 (also applies to the Blade 18).
| 3DMark 06 Standard Score | 54916 points | |
| 3DMark 11 Performance | 34117 points | |
| 3DMark Cloud Gate Standard Score | 65577 points | |
| 3DMark Fire Strike Score | 25633 points | |
| 3DMark Time Spy Score | 12364 points | |
Help | ||
* ... smaller is better
Gaming Performance
The situation looks better in everyday gaming. Our performance rating (FHD/Ultra with many standard games) shows a gap of almost 30 % to the RTX 3070 and an advantage of nearly 10 % over the RTX 3070 Ti. In gaming, the RTX 4070 is placed somewhere between an RTX 3080 and an RTX 3080 Ti. You can see how the device performs at higher resolutions (QHD/UHD) and with ray tracing activated in the second table, where three examples of newer titles are listed. For a more detailed comparison, take a look at our games list.
| The Witcher 3 - 1920x1080 Ultra Graphics & Postprocessing (HBAO+) | |
| Average of class Gaming (104.7 - 240, n=6, last 2 years) | |
| MSI Raider GE77 HX 12UHS | |
| Asus ROG Strix G18 G814JI | |
| Lenovo Legion 5 Pro 16ARH7H RTX 3070 Ti | |
| Razer Blade 18 RTX 4070 | |
| Alienware x17 RTX 3080 P48E | |
| Gigabyte A7 X1 | |
| Final Fantasy XV Benchmark - 1920x1080 High Quality | |
| Average of class Gaming (41 - 215, n=95, last 2 years) | |
| MSI Raider GE77 HX 12UHS | |
| Lenovo Legion 5 Pro 16ARH7H RTX 3070 Ti | |
| Asus ROG Strix G18 G814JI | |
| Razer Blade 18 RTX 4070 | |
| Alienware x17 RTX 3080 P48E | |
| Strange Brigade - 1920x1080 ultra AA:ultra AF:16 | |
| Average of class Gaming (76.3 - 456, n=86, last 2 years) | |
| Lenovo Legion 5 Pro 16ARH7H RTX 3070 Ti | |
| MSI Raider GE77 HX 12UHS | |
| Asus ROG Strix G18 G814JI | |
| Razer Blade 18 RTX 4070 | |
| Alienware x17 RTX 3080 P48E | |
| Gigabyte A7 X1 | |
| Dota 2 Reborn - 1920x1080 ultra (3/3) best looking | |
| Razer Blade 18 RTX 4070 | |
| MSI Raider GE77 HX 12UHS | |
| Asus ROG Strix G18 G814JI | |
| Average of class Gaming (84.8 - 248, n=107, last 2 years) | |
| Alienware x17 RTX 3080 P48E | |
| Lenovo Legion 5 Pro 16ARH7H RTX 3070 Ti | |
| Gigabyte A7 X1 | |
| Resident Evil Village | |
| 1920x1080 Ray Tracing Preset | |
| MSI GE76 Raider | |
| Asus ROG Strix G18 G814JI | |
| Lenovo Legion 7 16ACHg6 | |
| Medion Erazer Beast X20 | |
| 2560x1440 Max Preset | |
| MSI GE76 Raider | |
| Asus ROG Strix G18 G814JI | |
| Lenovo Legion 7 16ACHg6 | |
| Medion Erazer Beast X20 | |
| 3840x2160 Max Preset | |
| MSI GE76 Raider | |
| Asus ROG Strix G18 G814JI | |
| Guardians of the Galaxy | |
| 1920x1080 Ultra Preset + Ultra Ray-Tracing | |
| MSI GE76 Raider | |
| XMG Neo 15 @165 W TGP | |
| Asus ROG Strix G18 G814JI | |
| XMG Neo 17 @140 W TGP | |
| 2560x1440 Ultra Preset | |
| MSI GE76 Raider | |
| XMG Neo 15 @165 W TGP | |
| Asus ROG Strix G18 G814JI | |
| XMG Neo 17 @140 W TGP | |
| 3840x2160 Ultra Preset | |
| MSI GE76 Raider | |
| XMG Neo 15 @165 W TGP | |
| Asus ROG Strix G18 G814JI | |
| XMG Neo 17 @140 W TGP | |
| Ghostwire Tokyo | |
| 1920x1080 Highest Settings + Maximum Ray Tracing | |
| Asus ROG Strix G18 G814JI | |
| Medion Erazer Beast X30 | |
| XMG Neo 15 @165 W TGP | |
| XMG Neo 17 @140 W TGP | |
| 2560x1440 Highest Settings | |
| Asus ROG Strix G18 G814JI | |
| Medion Erazer Beast X30 | |
| XMG Neo 15 @165 W TGP | |
| XMG Neo 17 @140 W TGP | |
| 3840x2160 Highest Settings | |
| Asus ROG Strix G18 G814JI | |
| XMG Neo 15 @165 W TGP | |
| XMG Neo 17 @140 W TGP | |
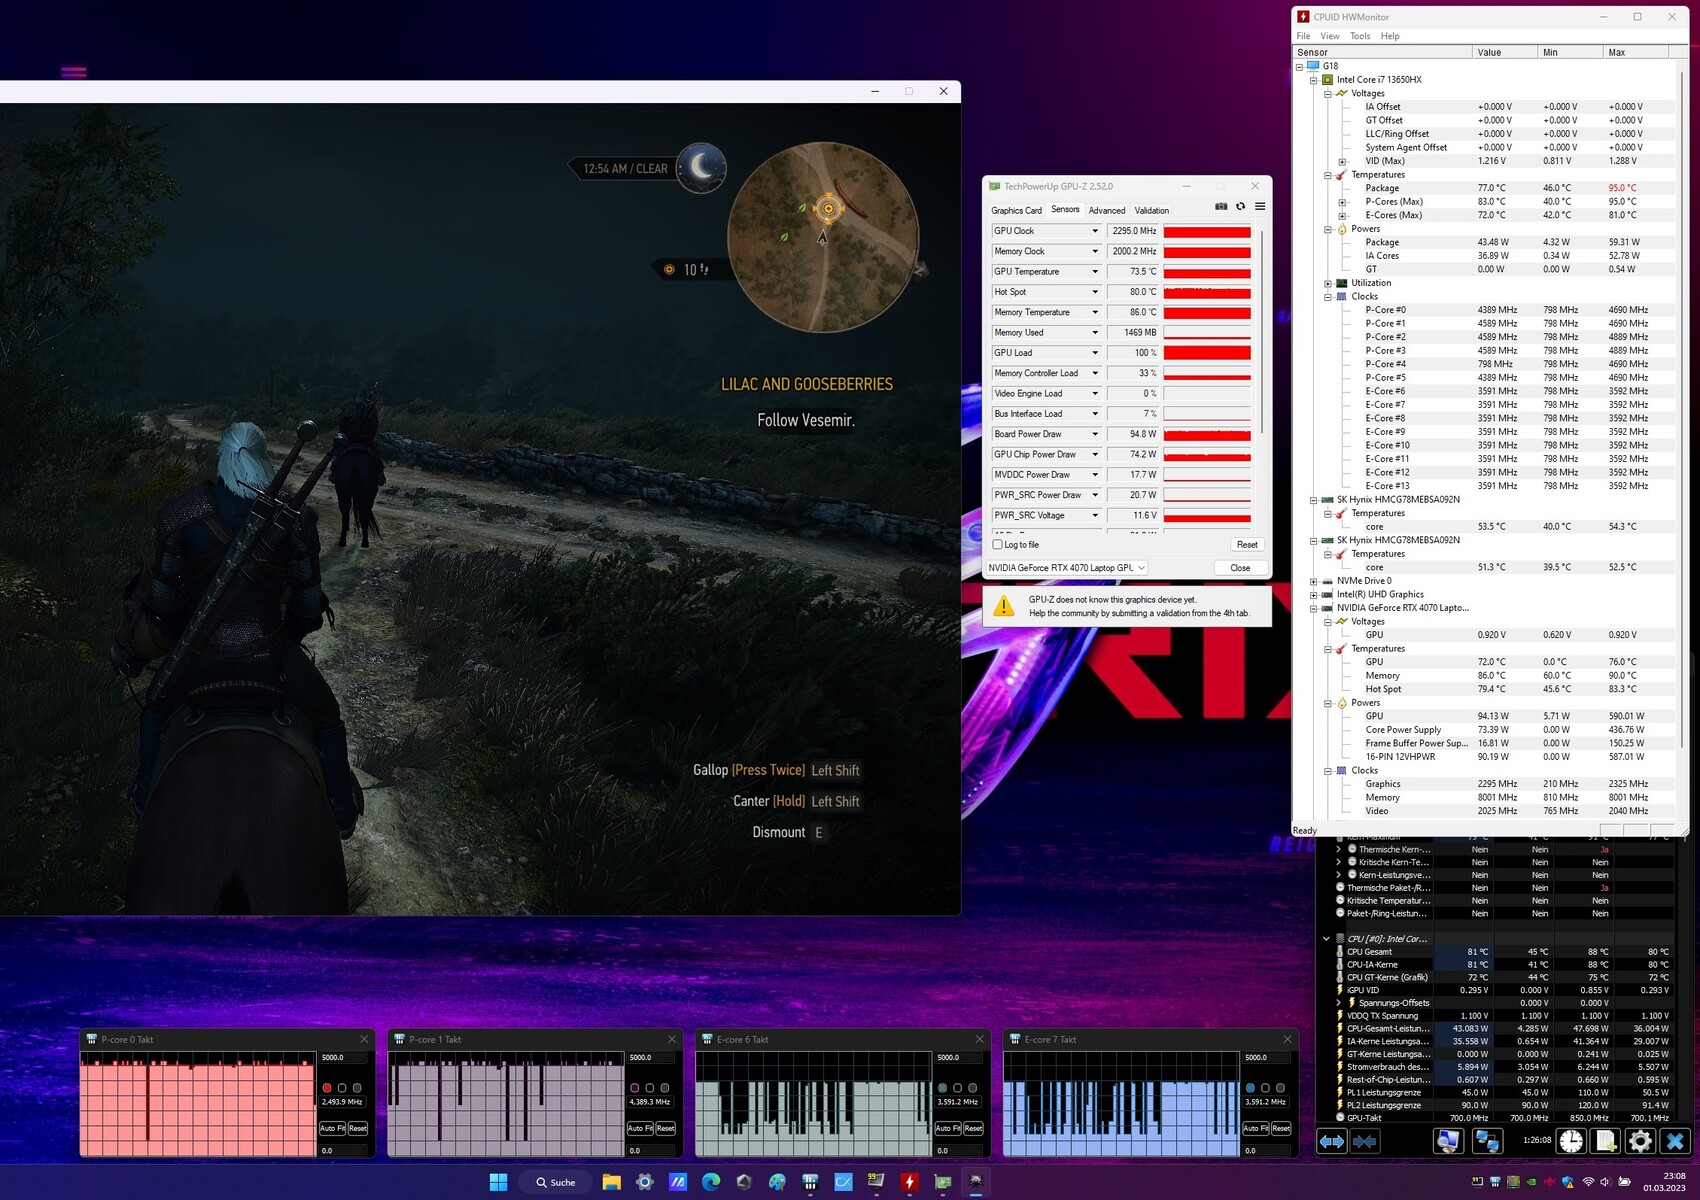
Basically, the GeForce RTX 4070 is a very good graphics card for QHD laptops. Set to 2560 x 1440 pixels (the G18 also manages the native 2560 x 1600 pixels excellently) the Ada Lovelace GPU usually achieves over 60fps, even at maximum settings. Only poorly optimized games such as A Plague Tale Requiem drop below this level. By contrast, at 4K, the RTX 4070 (without DLSS) only offers limited suitability. In more demanding titles, more than 60 fps is the exception rather than the rule.
In order to see if the graphics performance could remain stable even over longer periods of time, we tested The Witcher 3 for 60 minutes. The result: As seen in Cinebench loop for the CPU, performance was relatively stable.
Witcher 3 FPS Diagram
| low | med. | high | ultra | QHD | 4K | |
|---|---|---|---|---|---|---|
| GTA V (2015) | 182.5 | 178.3 | 117.2 | |||
| The Witcher 3 (2015) | 379 | 237 | 119 | |||
| Dota 2 Reborn (2015) | 173.2 | 164.4 | 154.7 | |||
| Final Fantasy XV Benchmark (2018) | 162.3 | 115.5 | ||||
| X-Plane 11.11 (2018) | 145.8 | 112.6 | ||||
| Far Cry 5 (2018) | 163 | 154 | 144 | |||
| Strange Brigade (2018) | 309 | 245 | 209 | |||
| Outriders (2021) | 165.3 | 145.2 | 129.4 | 90 | 46.3 | |
| Resident Evil Village (2021) | 220 | 212 | 189.7 | 128.6 | 62.7 | |
| Days Gone (2021) | 173.2 | 154.7 | 119.2 | 83.8 | 45 | |
| Deathloop (2021) | 139.9 | 129.8 | 106.3 | 65.4 | 37.4 | |
| Back 4 Blood (2021) | 252 | 221 | 209 | 129.4 | 73.7 | |
| Guardians of the Galaxy (2021) | 148 | 147 | 144 | 108 | 60 | |
| Riders Republic (2021) | 160 | 135 | 121 | 87 | 49 | |
| Farming Simulator 22 (2021) | 203 | 148.2 | 138.9 | 137 | 94.1 | |
| Halo Infinite (2021) | 172.7 | 149.1 | 140.6 | 102.5 | 57.5 | |
| Elden Ring (2022) | 59.6 | 59.5 | 59.5 | 59.5 | 45 | |
| Elex 2 (2022) | 118.7 | 118.2 | 112.9 | 78.9 | 40 | |
| Ghostwire Tokyo (2022) | 172.7 | 171.7 | 165.9 | 108.7 | 52.3 | |
| Vampire Bloodhunt (2022) | 212 | 199.9 | 195.7 | 148.6 | 78.5 | |
| The Quarry (2022) | 146 | 122.1 | 98 | 68.2 | 28.7 | |
| A Plague Tale Requiem (2022) | 74.6 | 65.6 | 57.5 | 40.9 | 23 | |
| Need for Speed Unbound (2022) | 131.1 | 110.1 | 97.2 | 67.7 | 36.2 | |
| High On Life (2023) | 178 | 131.6 | 108.5 | 64.5 | 25.7 | |
| Hogwarts Legacy (2023) | 142.7 | 121.2 | 101.2 | 71 | 27.7 | |
| Returnal (2023) | 115 | 104 | 88 | 66 | 39 | |
| Company of Heroes 3 (2023) | 186 | 155 | 150 | 107 | 63 |
Emissions
Noise emissions
Noise emission depends greatly on the selected mode in Armoury Crate. In Witcher 3, our measuring device registered between 8 and 40 dB(A) in "Quiet" mode and 42 to 44 dB(A) in "Performance" mode - acceptable levels for a gaming laptop. Things get loud in "Turbo" mode, with the fans belting out 51 dB(A) while gaming. In idle operation, the fans are either completely off or run at a fairly decent level of almost 30 dB(A).
Annoying: The Strix G18 has to deal with coil whine across almost all load ranges. Many other laptops also display this issue but not at this level of intensity or frequency.
Noise level
| Idle |
| 26 / 28 / 29 dB(A) |
| Load |
| 41 / 46 dB(A) |
 | ||
30 dB silent 40 dB(A) audible 50 dB(A) loud |
||
min: | ||
| Asus ROG Strix G18 G814JI i7-13650HX, GeForce RTX 4070 Laptop GPU | Razer Blade 18 RTX 4070 i9-13950HX, GeForce RTX 4070 Laptop GPU | Gigabyte A7 X1 R9 5900HX, GeForce RTX 3070 Laptop GPU | Lenovo Legion 5 Pro 16ARH7H RTX 3070 Ti R7 6800H, GeForce RTX 3070 Ti Laptop GPU | Alienware x17 RTX 3080 P48E i7-11800H, GeForce RTX 3080 Laptop GPU | MSI Raider GE77 HX 12UHS i9-12900HX, GeForce RTX 3080 Ti Laptop GPU | |
|---|---|---|---|---|---|---|
| Noise | 3% | -17% | -6% | 1% | -22% | |
| off / environment * (dB) | 25 | 23.5 6% | 24 4% | 23.5 6% | 24.9 -0% | 26 -4% |
| Idle Minimum * (dB) | 26 | 23.8 8% | 25 4% | 23.7 9% | 24.9 4% | 26 -0% |
| Idle Average * (dB) | 28 | 23.8 15% | 29 -4% | 31.1 -11% | 24.9 11% | 34 -21% |
| Idle Maximum * (dB) | 29 | 26.8 8% | 35 -21% | 32.2 -11% | 29.6 -2% | 46 -59% |
| Load Average * (dB) | 41 | 37.3 9% | 58 -41% | 38.4 6% | 31.1 24% | 50 -22% |
| Witcher 3 ultra * (dB) | 44 | 48 -9% | 57 -30% | 54.8 -25% | 49.7 -13% | 55 -25% |
| Load Maximum * (dB) | 46 | 53.5 -16% | 59 -28% | 54.8 -19% | 54.8 -19% | 57 -24% |
* ... smaller is better
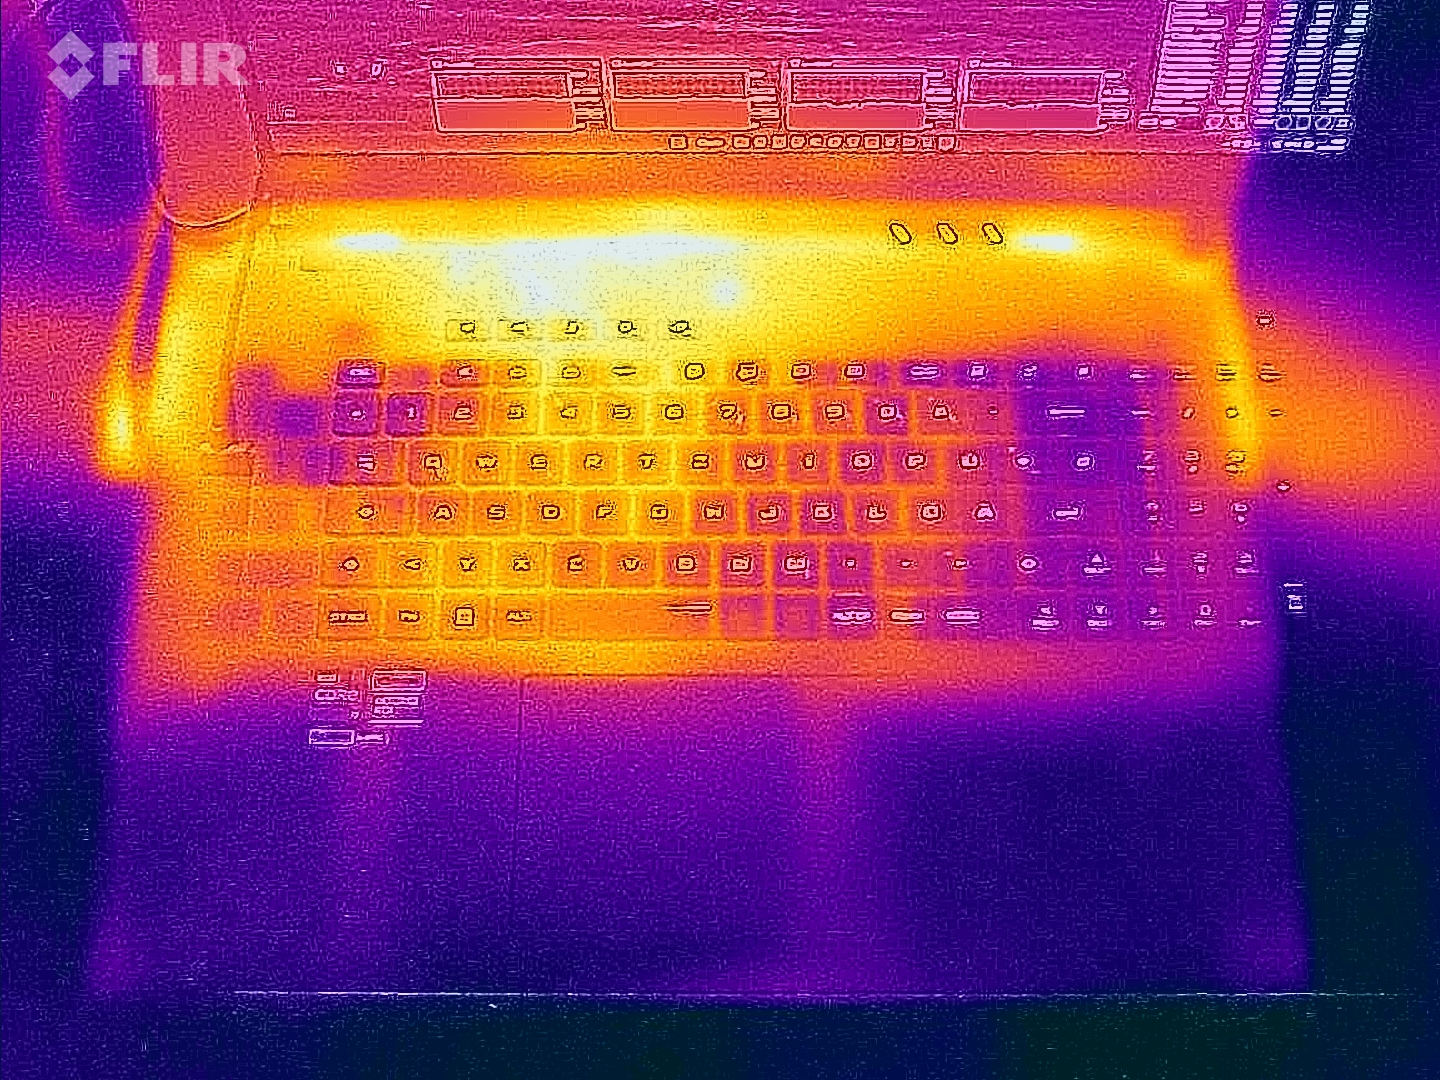
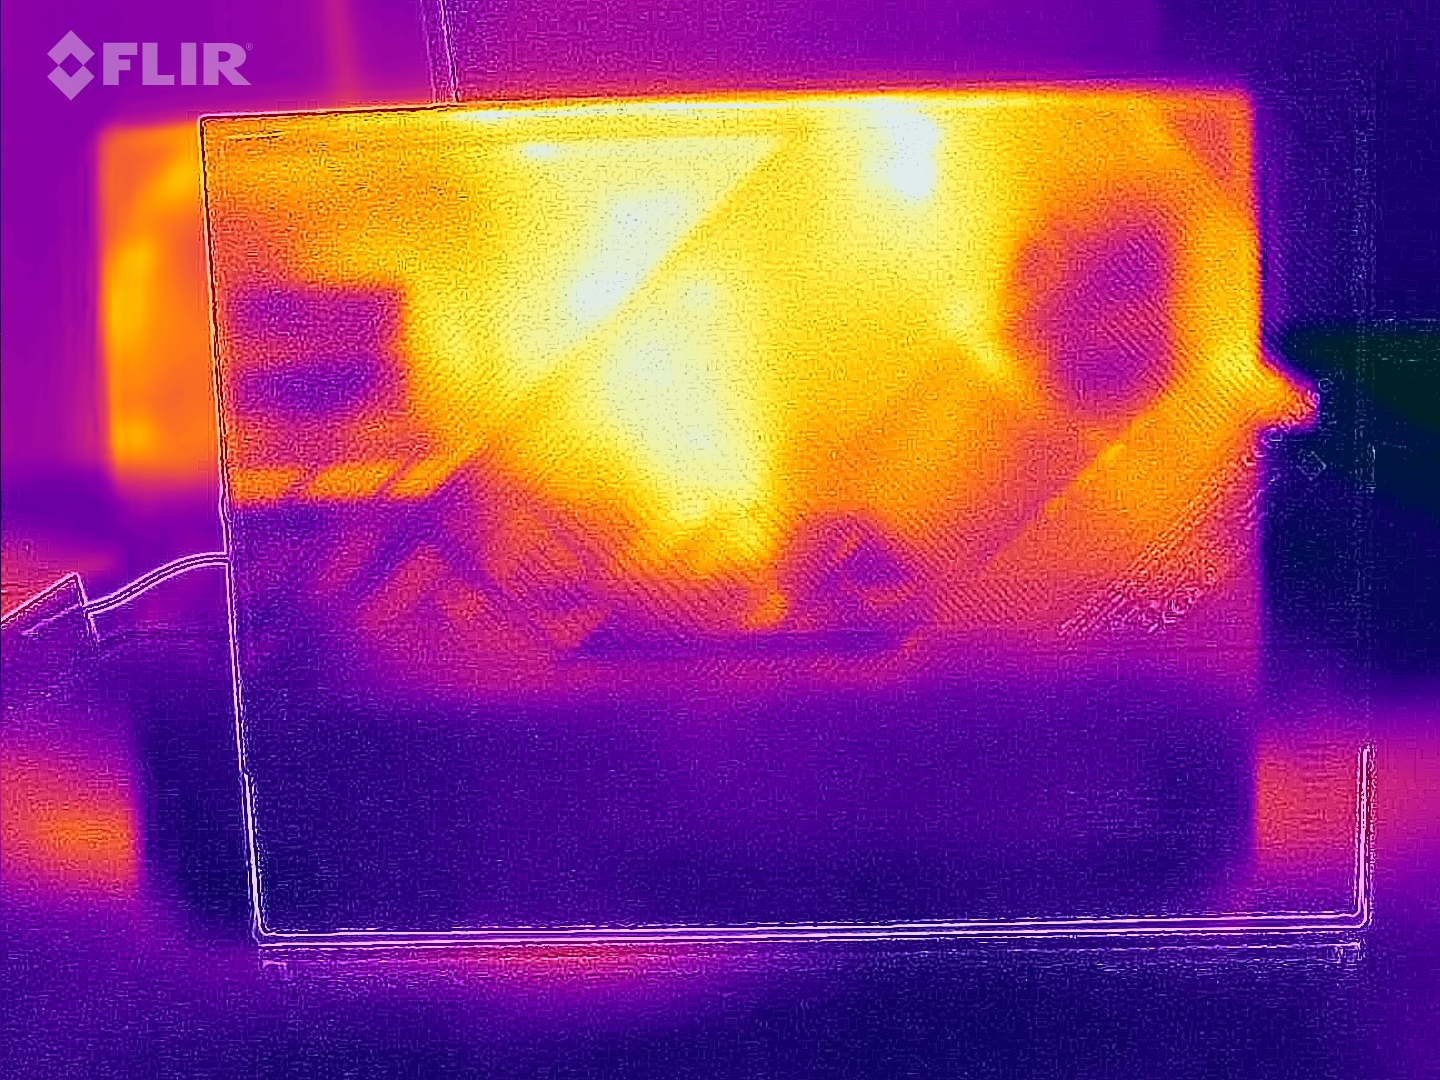
Temperature
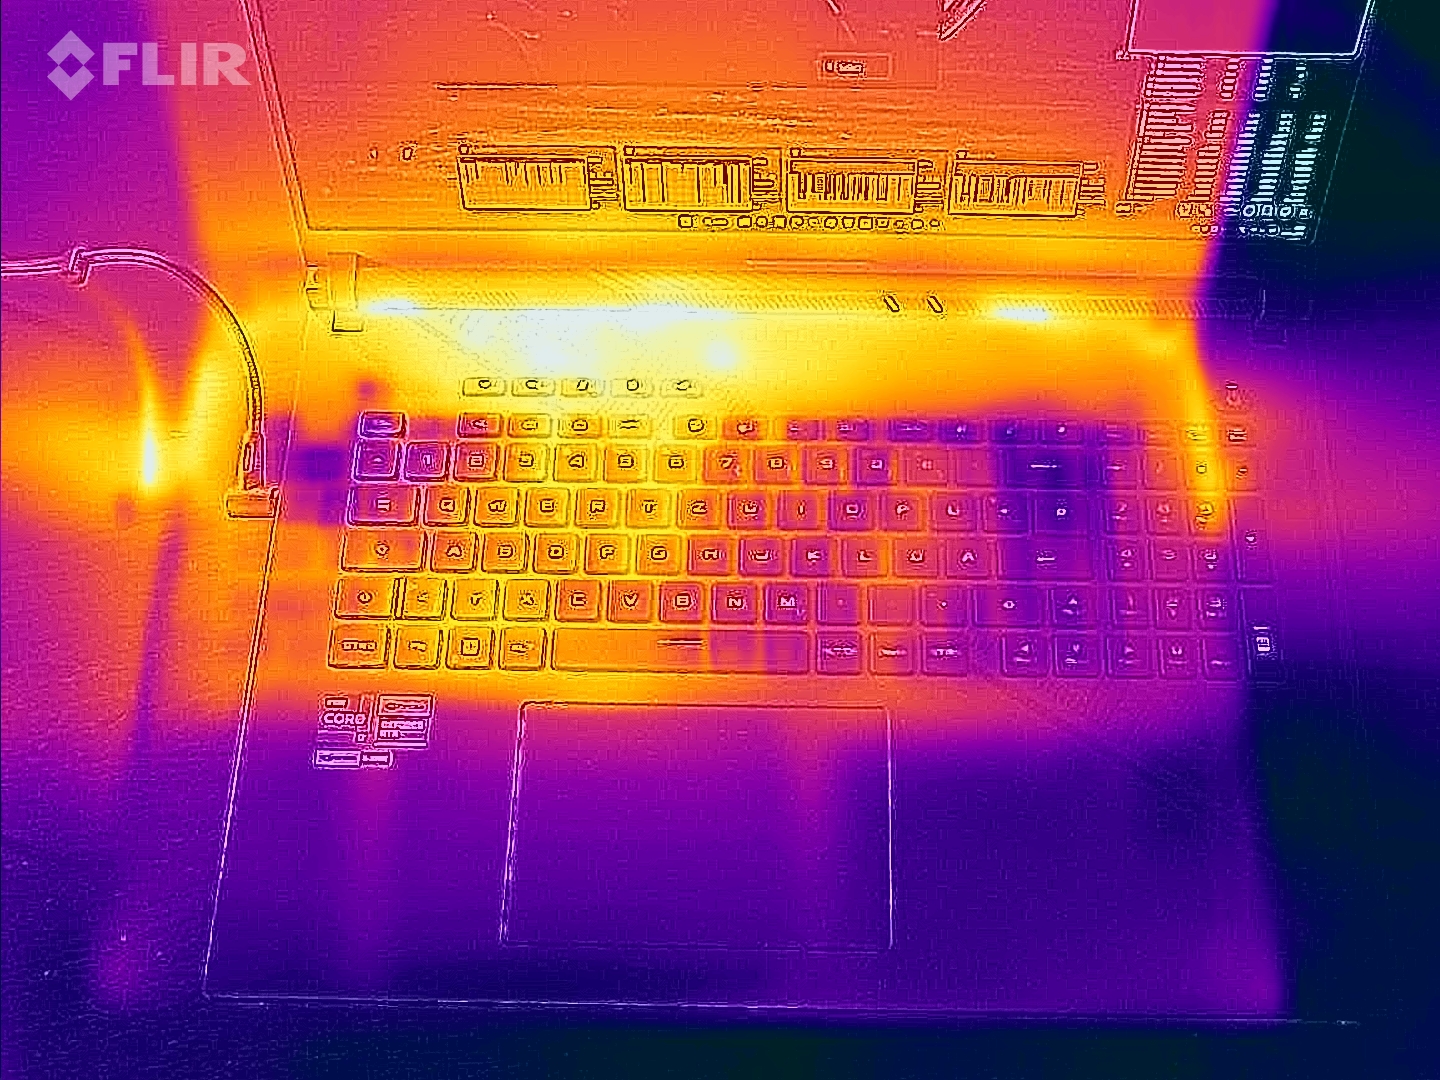
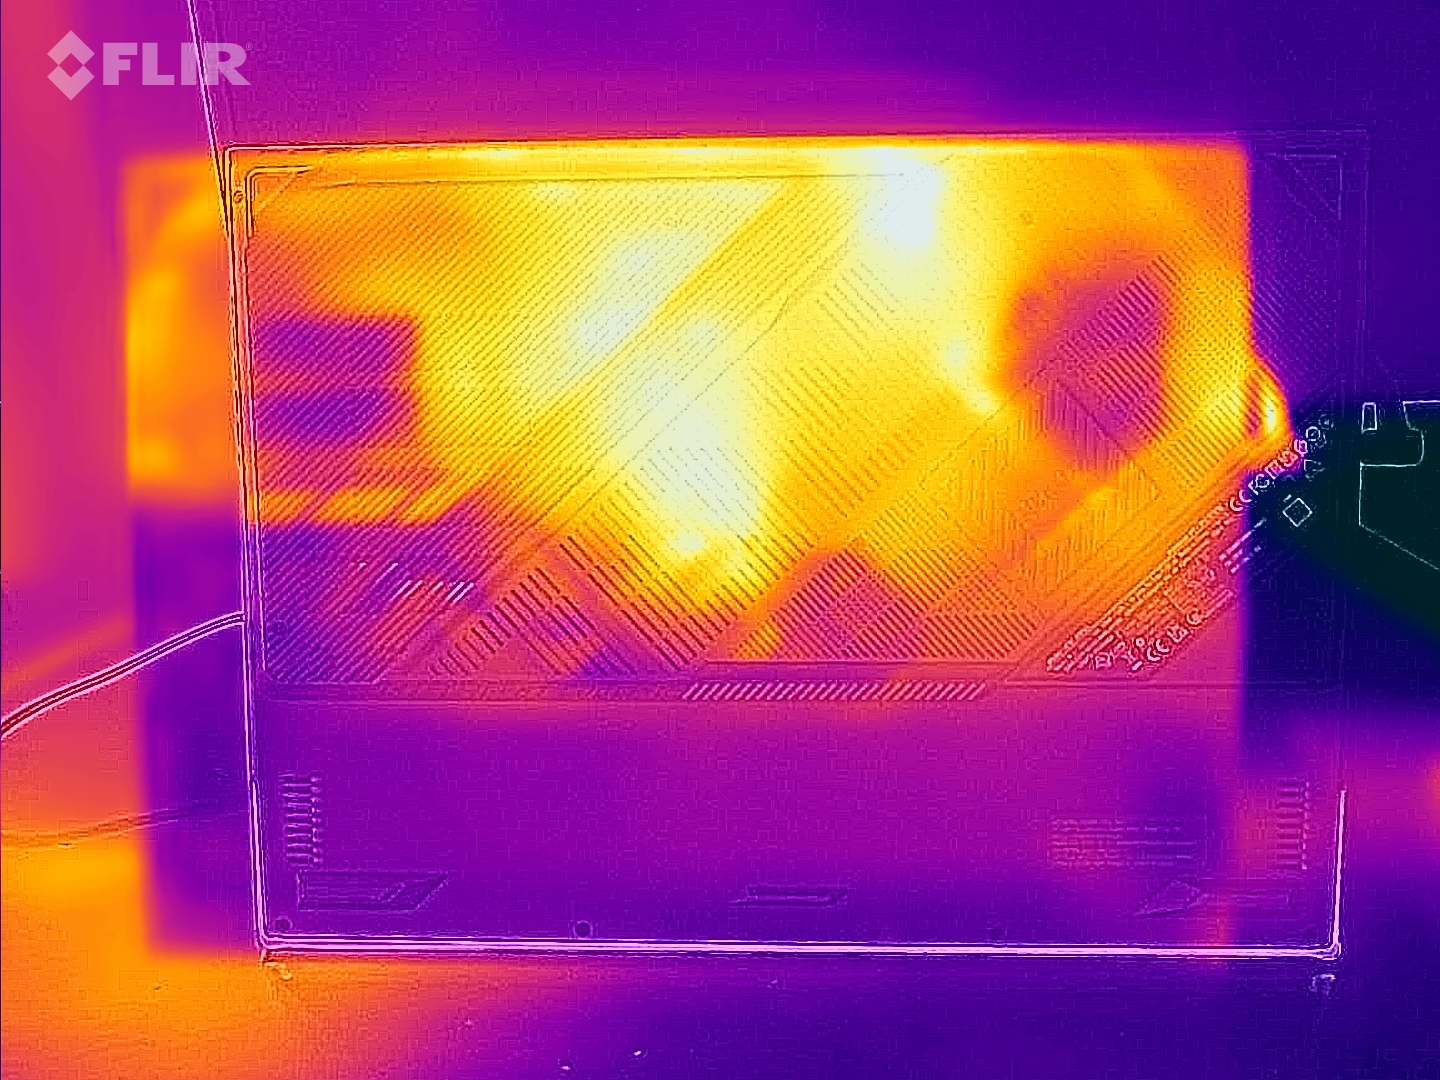
When it comes to temperature, there are no outliers. While the G18 is slightly cooler than the Blade 18 in idle use, it gets somewhat warmer under load. Maximum temperatures of 45 °C on the top of the unit and up to 47 °C on the base, are acceptable.
(±) The maximum temperature on the upper side is 45 °C / 113 F, compared to the average of 40.4 °C / 105 F, ranging from 21.2 to 68.8 °C for the class Gaming.
(-) The bottom heats up to a maximum of 47 °C / 117 F, compared to the average of 43.2 °C / 110 F
(+) In idle usage, the average temperature for the upper side is 27 °C / 81 F, compared to the device average of 33.9 °C / 93 F.
(±) Playing The Witcher 3, the average temperature for the upper side is 36.8 °C / 98 F, compared to the device average of 33.9 °C / 93 F.
(+) The palmrests and touchpad are reaching skin temperature as a maximum (32 °C / 89.6 F) and are therefore not hot.
(-) The average temperature of the palmrest area of similar devices was 28.8 °C / 83.8 F (-3.2 °C / -5.8 F).
| Asus ROG Strix G18 G814JI i7-13650HX, GeForce RTX 4070 Laptop GPU | Razer Blade 18 RTX 4070 i9-13950HX, GeForce RTX 4070 Laptop GPU | Gigabyte A7 X1 R9 5900HX, GeForce RTX 3070 Laptop GPU | Lenovo Legion 5 Pro 16ARH7H RTX 3070 Ti R7 6800H, GeForce RTX 3070 Ti Laptop GPU | Alienware x17 RTX 3080 P48E i7-11800H, GeForce RTX 3080 Laptop GPU | MSI Raider GE77 HX 12UHS i9-12900HX, GeForce RTX 3080 Ti Laptop GPU | |
|---|---|---|---|---|---|---|
| Heat | 4% | 1% | -5% | -17% | -29% | |
| Maximum Upper Side * (°C) | 45 | 39.2 13% | 44 2% | 43.8 3% | 58.4 -30% | 53 -18% |
| Maximum Bottom * (°C) | 47 | 35.6 24% | 49 -4% | 53 -13% | 49 -4% | 58 -23% |
| Idle Upper Side * (°C) | 28 | 31.8 -14% | 27 4% | 30 -7% | 33.6 -20% | 38 -36% |
| Idle Bottom * (°C) | 31 | 33.2 -7% | 30 3% | 31.8 -3% | 34.6 -12% | 43 -39% |
* ... smaller is better
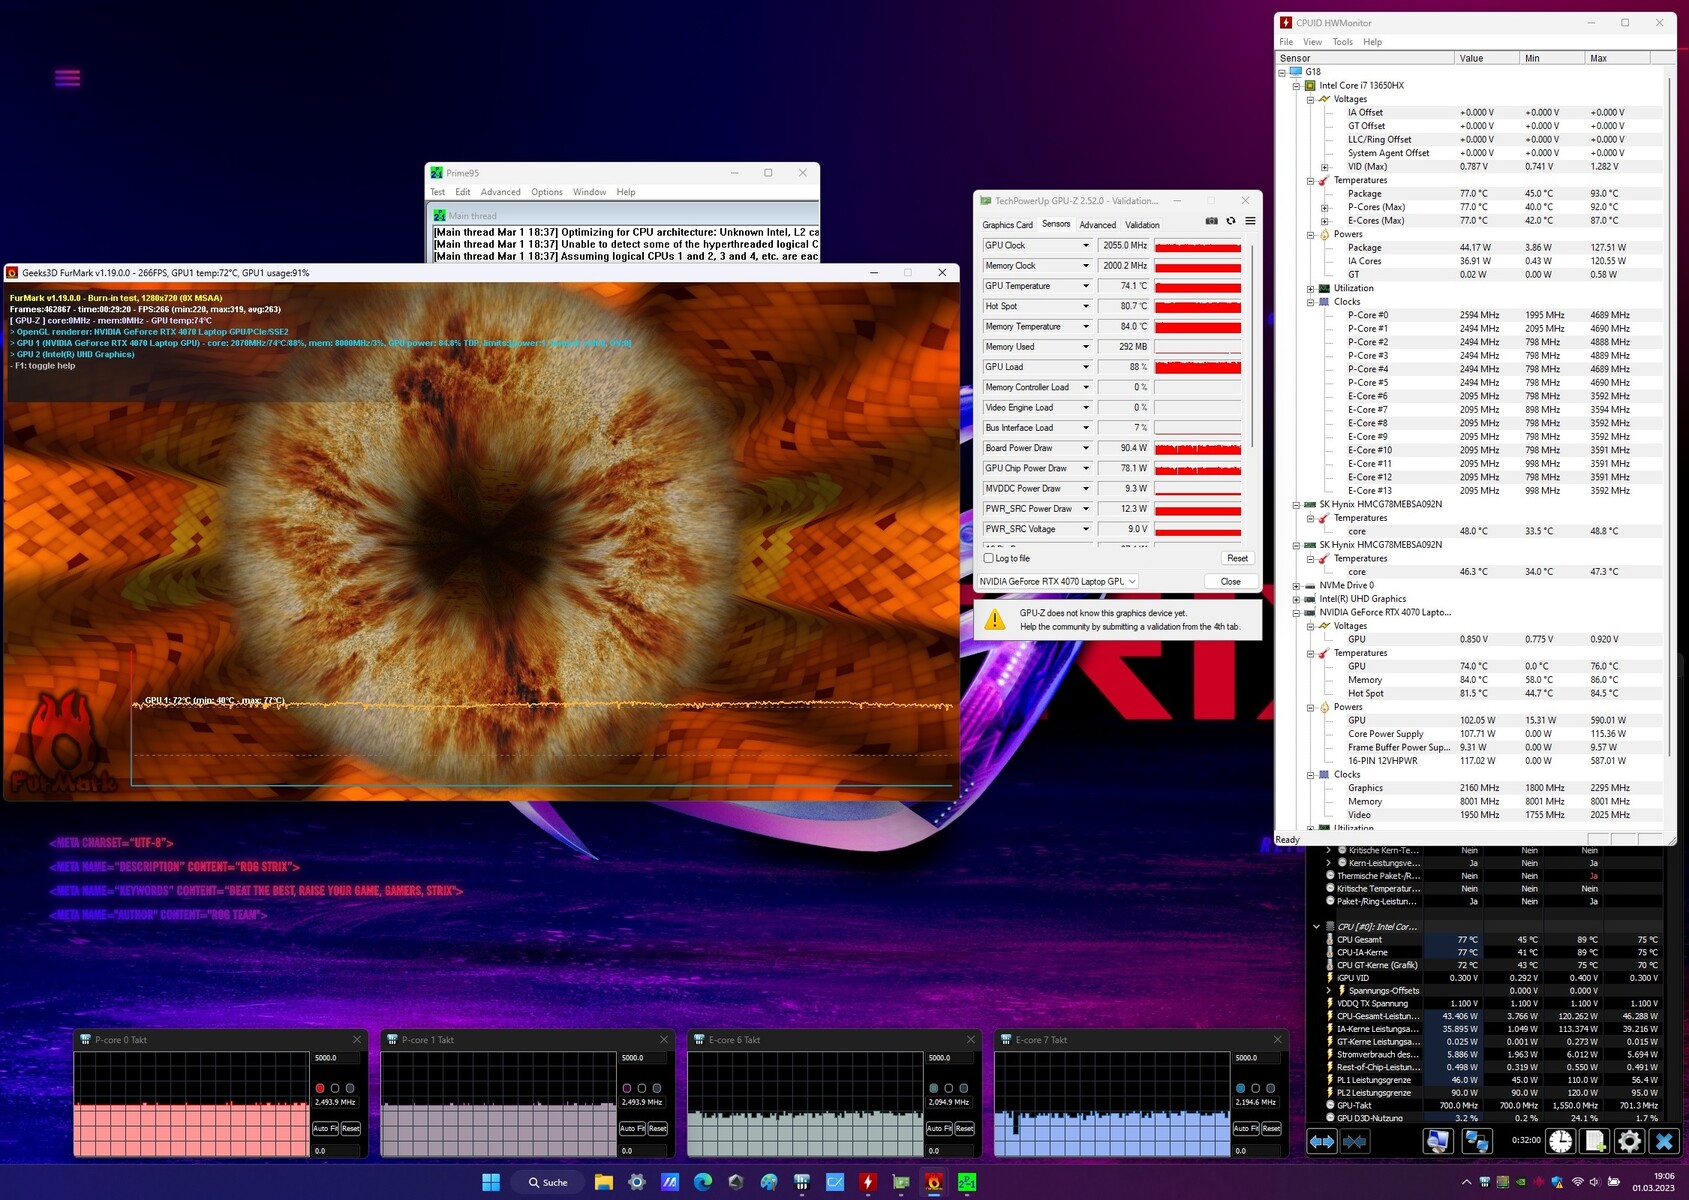
Stress test
None of the components are overly taxed when the "Performance" mode is selected. In the stress test, using the Furmark and Prime95 tools as well as The Witcher 3, the Core i7-13650HX reached an average of 77 °C – a moderate value. The RTX 4070 reached around 74 °C.
Speakers
The sound quality is quite impressive. The 2.0 system didn't show any glaring weaknesses regardless of the frequency range although the Razer Blade 18 sounded slightly better in our audio analysis. In return, the G18 offers a marginally higher maximum volume of up to 88 dB(A). In this way, larger rooms can be filled with sound without the need for external speakers.
Asus ROG Strix G18 G814JI audio analysis
(+) | speakers can play relatively loud (88 dB)
Bass 100 - 315 Hz
(±) | reduced bass - on average 10.2% lower than median
(+) | bass is linear (5.6% delta to prev. frequency)
Mids 400 - 2000 Hz
(+) | balanced mids - only 3.8% away from median
(+) | mids are linear (4% delta to prev. frequency)
Highs 2 - 16 kHz
(+) | balanced highs - only 2.8% away from median
(±) | linearity of highs is average (7% delta to prev. frequency)
Overall 100 - 16.000 Hz
(+) | overall sound is linear (11.5% difference to median)
Compared to same class
» 10% of all tested devices in this class were better, 3% similar, 87% worse
» The best had a delta of 6%, average was 18%, worst was 132%
Compared to all devices tested
» 8% of all tested devices were better, 2% similar, 90% worse
» The best had a delta of 4%, average was 23%, worst was 134%
Razer Blade 18 RTX 4070 audio analysis
(+) | speakers can play relatively loud (85.7 dB)
Bass 100 - 315 Hz
(±) | reduced bass - on average 7.5% lower than median
(±) | linearity of bass is average (9.2% delta to prev. frequency)
Mids 400 - 2000 Hz
(+) | balanced mids - only 3.5% away from median
(+) | mids are linear (4.1% delta to prev. frequency)
Highs 2 - 16 kHz
(+) | balanced highs - only 4.8% away from median
(+) | highs are linear (3.8% delta to prev. frequency)
Overall 100 - 16.000 Hz
(+) | overall sound is linear (9.2% difference to median)
Compared to same class
» 3% of all tested devices in this class were better, 1% similar, 96% worse
» The best had a delta of 6%, average was 18%, worst was 132%
Compared to all devices tested
» 3% of all tested devices were better, 1% similar, 96% worse
» The best had a delta of 4%, average was 23%, worst was 134%
Energy management
Power consumption
In idle operation with the graphics switch active, the 18-inch laptop consumes very little power. Levels of 8 to 26 watts are completely acceptable for a gaming laptop. Under load, this consumption figure climbs from 102 (average score on 3DMark 06) to 267 watts (maximum stress test value). The provided 280-watt power supply unit is also a good size. When gaming, you can reckon with roughly 180 watts which is somewhat less than the Blade 18, despite comparable 3D performance (with a Core i9-13950HX, the Razer machine has a more powerful, hungrier CPU).
| Off / Standby | |
| Idle | |
| Load |
|
Key:
min: | |
| Asus ROG Strix G18 G814JI i7-13650HX, GeForce RTX 4070 Laptop GPU | Razer Blade 18 RTX 4070 i9-13950HX, GeForce RTX 4070 Laptop GPU | Gigabyte A7 X1 R9 5900HX, GeForce RTX 3070 Laptop GPU | Lenovo Legion 5 Pro 16ARH7H RTX 3070 Ti R7 6800H, GeForce RTX 3070 Ti Laptop GPU | Alienware x17 RTX 3080 P48E i7-11800H, GeForce RTX 3080 Laptop GPU | MSI Raider GE77 HX 12UHS i9-12900HX, GeForce RTX 3080 Ti Laptop GPU | Average of class Gaming | |
|---|---|---|---|---|---|---|---|
| Power Consumption | -77% | -6% | -17% | -35% | -35% | -17% | |
| Idle Minimum * (Watt) | 8 | 24.5 -206% | 12 -50% | 9.7 -21% | 10.2 -27% | 13 -63% | 13 ? -63% |
| Idle Average * (Watt) | 15 | 34.1 -127% | 14 7% | 14.8 1% | 21.2 -41% | 19 -27% | 18.7 ? -25% |
| Idle Maximum * (Watt) | 26 | 47.7 -83% | 19 27% | 45.8 -76% | 48.4 -86% | 29 -12% | 24.3 ? 7% |
| Load Average * (Watt) | 102 | 140 -37% | 118 -16% | 87.2 15% | 118.7 -16% | 143 -40% | 110.2 ? -8% |
| Witcher 3 ultra * (Watt) | 178.6 | 202 -13% | 205 -15% | 209 -17% | 249 -39% | 247 -38% | |
| Load Maximum * (Watt) | 267 | 261 2% | 229 14% | 275.3 -3% | 262 2% | 352 -32% | 258 ? 3% |
* ... smaller is better
Power consumption Witcher 3 / stress test
Power consumption with an external monitor
Battery life
As long as you don't ask the G18 to run 3D applications, battery life is surprisingly good for a gaming laptop. With almost 12 hours of idle use at minimum brightness and around 8 hours of internet surfing at a reduced display brightness of 150 cd/m², the G18 leaves the competition behind despite them mostly offering batteries of between 80 and 100 Wh (the G18 possesses 90 Wh).
| Asus ROG Strix G18 G814JI i7-13650HX, GeForce RTX 4070 Laptop GPU, 90 Wh | Razer Blade 18 RTX 4070 i9-13950HX, GeForce RTX 4070 Laptop GPU, 91.7 Wh | Gigabyte A7 X1 R9 5900HX, GeForce RTX 3070 Laptop GPU, 48.96 Wh | Lenovo Legion 5 Pro 16ARH7H RTX 3070 Ti R7 6800H, GeForce RTX 3070 Ti Laptop GPU, 80 Wh | Alienware x17 RTX 3080 P48E i7-11800H, GeForce RTX 3080 Laptop GPU, 87 Wh | MSI Raider GE77 HX 12UHS i9-12900HX, GeForce RTX 3080 Ti Laptop GPU, 99.99 Wh | Average of class Gaming | |
|---|---|---|---|---|---|---|---|
| Battery runtime | -28% | -21% | -46% | -33% | 6% | -4% | |
| Reader / Idle (h) | 11.7 | 7 -40% | 7 -40% | 9.8 -16% | 8.71 ? -26% | ||
| WiFi v1.3 (h) | 8.1 | 4 -51% | 4.7 -42% | 4.4 -46% | 5.9 -27% | 5.4 -33% | 7.11 ? -12% |
| Load (h) | 1.2 | 1.3 8% | 1.2 0% | 0.8 -33% | 2 67% | 1.502 ? 25% | |
| H.264 (h) | 6.5 | 8.64 ? |
Pros
Cons
Verdict
With the ROG Strix G18 G814JI, Asus has made an almost consistently good debut in the still quite new 18-inch laptop segment.
The base unit case shows a few signs of weakness in the area of stability and is something which has an effect on the perceived quality of the input devices (the chassis tends to rattle a bit). Nevertheless, thanks to generous port features (incl. Thunderbolt 4), a striking design, and extensive lighting (keyboard, LED strip on the front), gamers get a fitting gaming platform.
Even though Asus has decided against a Mini LED or OLED display, (the latter technology also has its disadvantages), we like the image quality. Brightness and response times, as well as color space and color accuracy, have no reason to hide from the competition. In addition, the G18 also deserves praise for its relatively long battery life.
The verdict on (3D) performance is somewhat divided. While the Core i7-13650HX makes a successful debut, the graphics card raises a few questions.
It's not entirely possible to understand what Nvidia was thinking with the mobile version of the RTX 4070. The specifications (8 GB VRAM, 128 Bit interface, ...) are neither up-to-date nor do they do justice to the purchase price. Not only is its lead over the older generation often small but costs to the end user have increased dramatically (compare, for example, RTX 3070 Ti laptops).
Accordingly, gamers on the lookout for a laptop should maybe look to the previous generation or even treat themselves to a device with an RTX 4080.
If it absolutely has to be an 18-inch machine, a better alternative would be a device referred to many times in the review, the Razer Blade 18.
Price and availability
The Asus ROG Strix G18 G814JI-N6051W with a Core i7-13650HX, GeForce RTX 4070 and WQXGA display, is currently not yet unavailable in various online stores.
Asus ROG Strix G18 G814JI
- 03/07/2023 v7 (old)
Florian Glaser
Transparency
The selection of devices to be reviewed is made by our editorial team. The test sample was provided to the author as a loan by the manufacturer or retailer for the purpose of this review. The lender had no influence on this review, nor did the manufacturer receive a copy of this review before publication. There was no obligation to publish this review. As an independent media company, Notebookcheck is not subjected to the authority of manufacturers, retailers or publishers.
This is how Notebookcheck is testing
Every year, Notebookcheck independently reviews hundreds of laptops and smartphones using standardized procedures to ensure that all results are comparable. We have continuously developed our test methods for around 20 years and set industry standards in the process. In our test labs, high-quality measuring equipment is utilized by experienced technicians and editors. These tests involve a multi-stage validation process. Our complex rating system is based on hundreds of well-founded measurements and benchmarks, which maintains objectivity. Further information on our test methods can be found here.
Price comparison

