Reviews for the Intel Core i9-13950HX processor
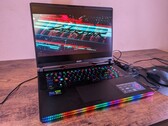
MSI Raider GE68 HX 13VF laptop review: A complete design change
MSI is doubling down on the design of the 17-inch GE78 for the smaller 16-inch GE68. The new look may not be for everyone, but performance is admirable with some of the fastest CPU and GPU options currently available on any gaming laptop this year.
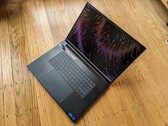
Intel Core i9-13950HX, NVIDIA GeForce RTX 4060 Laptop GPU, 16", 2.7 kgHP ZBook Fury 16 G10 mobile workstation review: 100 W Nvidia RTX 5000 Ada
Not much has changed from the outside, but the Raptor Lake-HX and Nvidia RTX Ada upgrades inside are significant and well worth the time for any power users looking to upgrade in the near future.
Intel Core i9-13950HX, NVIDIA RTX 5000 Ada Generation Laptop, 16", 2.6 kgRazer Blade 16 Early 2023 RTX 4090 Review: Core i9-13950HX beast with world's first dual-mode mini-LED UHD+ display
The Razer Blade 16 Early 2023 is a new offering for gamers interested in a flagship 16:10 16-inch gaming laptop. Featuring a desktop-class Intel Raptor Lake-HX Core i9-13950HX, a 175 W Nvidia GeForce RTX 4090 Laptop GPU, and the world's first dual-mode mini-LED display, the Blade 16 seeks to take on some of the most powerful juggernauts this year. We explore Razer's ambitions with the Blade 16 and see whether it is worth the additional US$700 over the Blade 16 RTX 4080.
Intel Core i9-13950HX, NVIDIA GeForce RTX 4090 Laptop GPU, 16", 2.5 kgMSI Raider GE78 HX 13VH laptop review: 13th gen Core i9-13950HX and GeForce RTX 4080 upgrades
Are you growing tired of all the minimalistic notebook designs these days? MSI is trying something new with its latest GE78 by mixing retro aesthetics with the latest technology for a more eye-catching chassis.
Intel Core i9-13950HX, NVIDIA GeForce RTX 4080 Laptop GPU, 17", 3 kgRazer Blade 18 laptop review: Smaller than many 17-inch gaming laptops
The spacious 18-inch Blade 18 is marketed as a desktop replacement without the desktop form factor. You'll have to really value the large screen, however, as performance and features are otherwise almost indistinguishable from the smaller and more portable Blade 16.
Intel Core i9-13950HX, NVIDIA GeForce RTX 4070 Laptop GPU, 18", 3 kgMSI Titan GT77 HX 13VI: NVIDIA GeForce RTX 4090 Laptop GPU, 17.30", 3.5 kg
Review » Nvidia Ada RTX 40 Laptop GPU analysis: 175 W RTX 4090 Laptop GPU surpasses a 350 W RTX 3090 in performance and power efficiency
Razer Blade 16 Early 2023: NVIDIA GeForce RTX 4080 Laptop GPU, 16.00", 2.4 kg
Review » Nvidia Ada RTX 40 Laptop GPU analysis: 175 W RTX 4090 Laptop GPU surpasses a 350 W RTX 3090 in performance and power efficiency
MSI Titan GT77 HX 13VI: NVIDIA GeForce RTX 4090 Laptop GPU, 17.30", 3.5 kg
Review » MSI Titan GT77 HX 13V Review - Ultimate Gaming Laptop with RTX 4090 & Core i9-13950HX
Razer Blade 16 Early 2023: NVIDIA GeForce RTX 4080 Laptop GPU, 16.00", 2.4 kg
Review » Mobile GeForce RTX 4080 debut: Razer Blade 16 Early 2023 laptop review
HP ZBook Fury 16 G10: NVIDIA RTX 5000 Ada Generation Laptop, 16.00", 2.6 kg
External Review » HP ZBook Fury 16 G10
MSI Vector GP68 HX 13VH: NVIDIA GeForce RTX 4080 Laptop GPU, 16.00", 2.7 kg
External Review » MSI Vector GP68 HX 13VH
MSI Raider GE68 HX 13VF: NVIDIA GeForce RTX 4060 Laptop GPU, 16.00", 2.7 kg
External Review » MSI Raider GE68 HX 13VF
Razer Blade 16 Early 2023 RTX 4060: NVIDIA GeForce RTX 4060, 16.00", 2.5 kg
External Review » Razer Blade 16 Early 2023 RTX 4060
MSI Creator Z17 HX Studio A13VGT: NVIDIA GeForce RTX 4070 Laptop GPU, 17.00", 2.5 kg
External Review » MSI Creator Z17 HX Studio A13VGT
Razer Blade 18 2023 RTX 4060: NVIDIA GeForce RTX 4060 Laptop GPU, 18.00", 3.2 kg
External Review » Razer Blade 18 2023 RTX 4060
Razer Blade 16 Early 2023 RTX 4070: NVIDIA GeForce RTX 4070 Laptop GPU, 16.00", 2.5 kg
External Review » Razer Blade 16 Early 2023 RTX 4070
MSI Raider GE68 HX 13VG: NVIDIA GeForce RTX 4070 Laptop GPU, 15.60", 2.7 kg
External Review » MSI Raider GE68 HX 13VG
MSI GE78HX 13VH-070US: NVIDIA GeForce RTX 4080 Laptop GPU, 17.00", 3 kg
External Review » MSI GE78HX 13VH-070US
Razer Blade 18 2023, RTX 4080: NVIDIA GeForce RTX 4080 Laptop GPU, 18.00", 3.2 kg
External Review » Razer Blade 18 2023, RTX 4080
Razer Blade 18 2023, RTX 4090: NVIDIA GeForce RTX 4090 Laptop GPU, 18.00", 3.2 kg
External Review » Razer Blade 18 2023, RTX 4090
MSI Titan GT77 HX 13VI: NVIDIA GeForce RTX 4090 Laptop GPU, 17.30", 3.5 kg
External Review » MSI Titan GT77 HX 13VI
Razer Blade 16 Early 2023 RTX 4090: NVIDIA GeForce RTX 4090 Laptop GPU, 16.00", 2.5 kg
External Review » Razer Blade 16 Early 2023 RTX 4090
Razer Blade 18 RTX 4070: NVIDIA GeForce RTX 4070 Laptop GPU, 18.00", 3 kg
External Review » Razer Blade 18 RTX 4070
Razer Blade 16 Early 2023: NVIDIA GeForce RTX 4080 Laptop GPU, 16.00", 2.4 kg
External Review » Razer Blade 16 Early 2023
MSI GE78HX 13VH-070US: NVIDIA GeForce RTX 4080 Laptop GPU, 17.00", 3 kg
» MSI Raider GE78 HX now available to be one of the first laptops with PCIe5 SSD support for read rates of over 15 GB/s
Razer Blade 18 RTX 4070: NVIDIA GeForce RTX 4070 Laptop GPU, 18.00", 3 kg
» Nvidia driver 528.49 is borked on the Blade 18 RTX 4070, Razer says a fix should be coming soon
Razer Blade 16 Early 2023: NVIDIA GeForce RTX 4080 Laptop GPU, 16.00", 2.4 kg
» The mobile GeForce RTX 4080 is 35 percent slower than the desktop RTX 4080 and that can be problematic for consumers