Reviews for the Intel Core i5-11400H processor
Blackview MP200 Mini PC review - Small desktop PC with Intel Core i5-11400H in an attractive case
We already know Blackview from the smartphone and tablet segment, but at this point, the manufacturer also includes several Mini PCs in its portfolio. With the MP200, we take a look at a visually attractive compact PC for everyday office work. However, the processor isn't one of the youngest anymore. Find out in this review, what the Tiger Lake SoC in the Blackview MP200 is able to achieve.
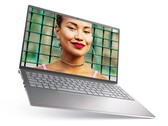
Intel Core i5-11400H, UHD Graphics Xe 16EUs, 678 gDell Inspiron 15 Plus laptop review: Close to being the perfect all-rounder
With the Inspiron 15 Plus, Dell offers a sleek and compact multimedia laptop that is suitable for all kinds of purposes. We took a detailed look at the 15-inch laptop.
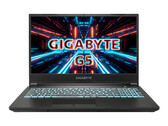
Intel Core i5-11400H, NVIDIA GeForce RTX 3050 4GB Laptop GPU, 15.6", 1.9 kgGigabyte G5 GD in review: Affordable gaming laptop without Windows
For just under 750 Euros (~$848), you can get the G5 GD, a gaming laptop equipped with a Tiger Lake hexa-core processor and a GeForce RTX 3050 laptop GPU. The laptop offers space for up to three storage drives.
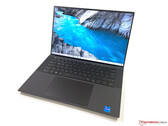
Intel Core i5-11400H, NVIDIA GeForce RTX 3050 4GB Laptop GPU, 15.6", 2.1 kgDell XPS 15 9510 Core i5 laptop review: Basic model with the brakes engaged
The Dell XPS 15 continues to be one of the few high-end multimedia laptops that is optionally also offered without a dedicated graphics card. So while those who are looking only for a fast processor should really be at the right place here, Dell also limits the CPU performance unnecessarily.
Intel Core i5-11400H, UHD Graphics Xe 16EUs, 15.6", 1.8 kgAcer Nitro 5 AN515-57, GTX 1650: NVIDIA GeForce GTX 1650 Mobile, 15.60", 2.3 kg
External Review » Acer Nitro 5 AN515-57, GTX 1650
Asus TUF Gaming F17 FX706HF: NVIDIA GeForce RTX 2050 Mobile, 17.30", 2.6 kg
External Review » Asus TUF Gaming F17 FX706HF
Asus TUF Gaming F15 FX506HF: NVIDIA GeForce RTX 2050 Mobile, 15.60", 2.3 kg
External Review » Asus TUF Gaming FX506HF
MSI GF63 Thin 11UC-680NL: NVIDIA GeForce RTX 3050 4GB Laptop GPU, 15.60", 1.9 kg
External Review » MSI GF63 Thin 11UC-680NL
HP Victus 16-d0019ns: NVIDIA GeForce GTX 1650 Mobile, 16.10", 2.5 kg
External Review » HP Victus 16-d0019ns
Asus TUF Gaming F17 FX706HC-HX007W: NVIDIA GeForce RTX 3050 4GB Laptop GPU, 17.30", 2.6 kg
External Review » Asus TUF Gaming F17 FX706HC-HX007W
Asus TUF Gaming F15 FX506HC-HN004: NVIDIA GeForce RTX 3050 4GB Laptop GPU, 15.60", 2.3 kg
External Review » Asus TUF Gaming F15 FX506HC-HN004
MSI GF63 Thin 11SC: NVIDIA GeForce GTX 1650 Mobile, 15.60", 1.9 kg
External Review » MSI GF63 Thin 11SC
MSI GV15 Thin 11SC-633: NVIDIA GeForce GTX 1650 Max-Q, 15.60", 1.9 kg
External Review » MSI GV15 Thin 11SC-633
Acer Predator Triton 300 PT315-53-54XN: NVIDIA GeForce RTX 3050 Ti Laptop GPU, 15.60", 2.1 kg
External Review » Acer Predator Triton 300 PT315-53-54XN
Acer Nitro 5 AN515-57-505V: NVIDIA GeForce RTX 3050 Ti Laptop GPU, 15.60", 2.2 kg
External Review » Acer Nitro 5 AN515-57-505V
Gigabyte G7 GD: NVIDIA GeForce RTX 3050 4GB Laptop GPU, 17.30", 2.4 kg
External Review » Gigabyte G7 GD
Acer Predator Helios 300 PH315-54 NH.QC5EP.00A: NVIDIA GeForce RTX 3050 Ti Laptop GPU, 15.60", 2.2 kg
External Review » Acer Predator Helios 300 PH315-54 NH.QC5EP.00A
Acer Predator Helios 300 PH315-54-582Q: NVIDIA GeForce RTX 3050 Ti Laptop GPU, 15.60", 2.9 kg
External Review » Acer Predator Helios 300 PH315-54-582Q
Asus TUF Gaming F15 FX506HE-HN012: NVIDIA GeForce RTX 3050 Ti Laptop GPU, 15.60", 2.3 kg
External Review » Asus TUF Gaming F15 FX506HE-HN012
MSI GF63 Thin 11UC-447XES: NVIDIA GeForce RTX 3050 4GB Laptop GPU, 15.60", 1.9 kg
External Review » MSI GF63 Thin 11UC-447XES
MSI Katana GF66 11UD-1222PL: NVIDIA GeForce RTX 3050 Ti Laptop GPU, 15.60", 2.1 kg
External Review » MSI Katana GF66 11UD-1222PL
HP Envy 15-ep1008ns: NVIDIA GeForce RTX 3050 4GB Laptop GPU, 15.60", 2.2 kg
External Review » HP Envy 15-ep1008ns
MSI Katana GF66 11UD-480XUA: NVIDIA GeForce RTX 3050 Ti Laptop GPU, 15.60", 2.1 kg
External Review » MSI Katana GF66 11UD-480XUA
Asus TUF Gaming F15 FX506HCB-HN256T: NVIDIA GeForce RTX 3050 4GB Laptop GPU, 15.60", 2.3 kg
External Review » Asus TUF Gaming F15 FX506HCB-HN256T
Gigabyte G5 KD-52DE123SD: NVIDIA GeForce RTX 3060 Laptop GPU, 15.60", 2 kg
External Review » Gigabyte G5 KD-52DE123SD
Dell Vostro 15 7510, i5-11400H RTX 3050: NVIDIA GeForce RTX 3050 4GB Laptop GPU, 15.60", 1.9 kg
External Review » Dell Vostro 15 7510, i5-11400H RTX 3050
HP Victus 16-d0206nf: NVIDIA GeForce RTX 3060 Laptop GPU, 16.10", 2.5 kg
External Review » HP Victus 16-d0206nf
HP Victus 16-d0655ng: NVIDIA GeForce RTX 3060 Laptop GPU, 16.10", 2.5 kg
External Review » HP Victus 16-d0655ng
Dell XPS 15 9510 i5 11400H FHD: Intel UHD Graphics Xe 16EUs, 15.60", 1.8 kg
External Review » Dell XPS 15 9510 i5 11400H FHD
Asus TUF Gaming F15 FX506HM-HN016: NVIDIA GeForce RTX 3060 Laptop GPU, 15.60", 2.3 kg
External Review » Asus TUF Gaming F15 FX506HM-HN016
Asus TUF Gaming F15 FX506HCB-HN243T: NVIDIA GeForce RTX 3050 Ti Laptop GPU, 15.60", 2.3 kg
External Review » Asus TUF Gaming F15 FX506HCB-HN243T
Lenovo Legion 5 17ITH6H-82JM000FGE: NVIDIA GeForce RTX 3060 Laptop GPU, 17.30", 3 kg
External Review » Lenovo Legion 5 17ITH6H-82JM000FGE
Gigabyte G5 GD: NVIDIA GeForce RTX 3050 4GB Laptop GPU, 15.60", 2.1 kg
External Review » Gigabyte G5 GD
HP Victus 16-d0367ng: NVIDIA GeForce RTX 3050 Ti Laptop GPU, 16.10", 2.5 kg
External Review » HP Victus 16-d0367ng
Asus TUF Gaming F15 FX506HM-HN184: NVIDIA GeForce RTX 3060 Laptop GPU, 15.60", 2.3 kg
External Review » Asus TUF Gaming F15 FX506HM-HN184
Gigabyte G5 MD-51US123SH: NVIDIA GeForce RTX 3050 Ti Laptop GPU, 15.60", 2.2 kg
External Review » Gigabyte G5 MD-51US123SH
MSI Katana GF66 11UD-836XFR: NVIDIA GeForce RTX 3050 Ti Laptop GPU, 15.60", 2.1 kg
External Review » MSI Katana GF66 11UD-836XFR
Acer Nitro 5 AN515-57-56HH: NVIDIA GeForce RTX 3050 4GB Laptop GPU, 15.60", 2.3 kg
External Review » Acer Nitro 5 AN515-57-56HH
HP Victus 16-d0146ng: NVIDIA GeForce RTX 3050 4GB Laptop GPU, 16.10", 2.5 kg
External Review » HP Victus 16-d0146ng
MSI Sword 15 A11UE: NVIDIA GeForce RTX 3060 Laptop GPU, 15.60", 2.3 kg
External Review » MSI Sword 15 A11UE
HP Victus 16-d0057ng: NVIDIA GeForce RTX 3050 4GB Laptop GPU, 16.10", 2.5 kg
External Review » HP Victus 16-d0057ng
Acer Nitro 5 AN515-57-545N: NVIDIA GeForce RTX 3060 Laptop GPU, 15.60", 2.3 kg
External Review » Acer Nitro 5 AN515-57-545N
MSI Katana GF66 11UC-093: NVIDIA GeForce RTX 3050 4GB Laptop GPU, 15.60", 2.1 kg
External Review » MSI Katana GF66 11UC-093
Blackview MP200: Intel UHD Graphics Xe 16EUs, 0.7 kg
» Blackview MP200 Mini PC is a visual highlight on the desk
Gigabyte G5 GD: NVIDIA GeForce RTX 3050 4GB Laptop GPU, 15.60", 2.1 kg
» 1st place for the GeForce RTX 3050 laptop GPU in the Gigabyte G5 GD
Dell XPS 15 9510 i5 11400H FHD: Intel UHD Graphics Xe 16EUs, 15.60", 1.8 kg
» The basic model of the Dell XPS 15 with the Core i5 is simply too expensive