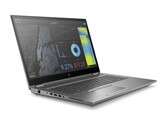
Intel Core i9-10885H
The Intel Core i9-10885H is a high-end processor for laptops with eight cores based on the Comet Lake architecture (CML-H, 4th generation of Skylake). The processor clocks at between 2.4 and 5.3 GHz and can execute up to sixteen threads simultaneously thanks to Hyper-Threading. The processor is still manufactured in the old 14nm (14nm++) process.
The Comet Lake architecture is similar to Coffee Lake and offers the same features and is produced in the same 14nm process. Other than the improved clock rates, the memory controller now also supports faster DDR4-2933 RAM. More information on Comet Lake and all the models and articles on it can be found here .
The Core i9-10855H supports the management features vPro, TXT and SIPP.
Performance
The performance of the Core i9-10885H should be slightly above the older Core i9-9980HK top model, thanks to the potential higher single core turbo. Thanks to the 8 cores and high Turbo speeds, even demanding applications should run very good on the CPU. However, long term performance is always depending on the laptop cooling system and system configuration. At the time of announcement, the i9-10885H is the second fastest Comet Lake-H CPU behind the Core i9-10980HK.
Graphics
The integrated Intel UHD Graphics 630 iGPU is supposed to offer a similar performance as the UHD630 in the Core i7-9880H. As a low-end solution it will only run current games smoothly at reduced details - if at all.
Power Consumption
Intel specifies the TDP with 45 watts and therefore the i9 is only suited for big laptops with good cooling solutions. Using cTDP-down, the CPU can also be configured to 35 Watt resulting in a reduced performance.
Series Intel Comet Lake Codename Comet Lake-H Series: Comet Lake Comet Lake-H Clock Rate 2400 - 5300 MHz Level 1 Cache 512 KB Level 2 Cache 2 MB Level 3 Cache 16 MB Number of Cores / Threads 8 / 16 Power Consumption (TDP = Thermal Design Power) 45 Watt Manufacturing Technology 14 nm Max. Temperature 100 °C Socket FCBGA1440 Features Dual-Channel DDR4 Memory Controller, HyperThreading, AVX, AVX2, Quick Sync, Virtualization, AES-NI GPU Intel UHD Graphics 630 (350 - 1200 MHz)64 Bit 64 Bit support Architecture x86 Starting Price $556 U.S. Announcement Date 04/02/2020 Product Link (external) Intel Comet Lake i9-10885H
Benchmarks Performance Rating - CB R15 + R20 + 7-Zip + X265 + Blender + 3DM11 CPU
45.4 pt (51%)
...
...
Cinebench R23 - Cinebench R23 Multi Core
min: 8802 avg: 9438 median: 9438 (15%) max: 10074 Points
CPU TDP 70 W TDP 74 W 100% 87%
...
...
Cinebench R23 - Cinebench R23 Single Core
min: 1284 avg: 1290 median: 1289.5 (57%) max: 1295 Points
CPU TDP 70 W TDP 74 W 100% 99%
...
...
Cinebench R20 - Cinebench R20 CPU (Single Core)
min: 460 avg: 487.3 median: 489 (56%) max: 513 Points
CPU TDP ? TDP 70 W TDP 74 W 90% 100% 95%
...
...
Cinebench R20 - Cinebench R20 CPU (Multi Core)
min: 2798 avg: 3400 median: 3639 (15%) max: 3762 Points
CPU TDP ? TDP 70 W TDP 74 W 74% 100% 97%
...
...
Cinebench R15 - Cinebench R15 CPU Multi 64 Bit
min: 1264 avg: 1502 median: 1517 (16%) max: 1726 Points
CPU TDP ? TDP 70 W TDP 74 W 73% 100% 88%
...
...
0 90 180 270 360 450 540 630 720 810 900 990 1080 1170 1260 1350 1440 1530 1620 1710 Tooltip Dell Precision 3000 3551: Ø1152 (1113.77-1263.86)
HP ZBook Fury 17 G7 119W5EA: Ø1456 (1429.34-1516.82)
HP ZBook Studio G7: Ø1601 (1574.8-1726.44)
Cinebench R15 - Cinebench R15 CPU Single 64 Bit
min: 197 avg: 206.7 median: 211 (64%) max: 212 Points
CPU TDP ? TDP 70 W TDP 74 W 93% 100% 100%
...
...
wPrime 2.10 - wPrime 2.0 1024m *
131.2 s (2%)
...
...
VIA C3-M C3-M-1200 6348%
wPrime 2.10 - wPrime 2.0 32m *
3.9 s (1%)
...
...
6420 points (37%)
...
...
7-Zip 18.03 - 7-Zip 18.03 Multli Thread 4 runs
min: 36740 avg: 40519 median: 41823 (26%) max: 42993 MIPS
CPU TDP ? TDP 70 W TDP 74 W 85% 100% 97%
...
...
7-Zip 18.03 - 7-Zip 18.03 Single Thread 4 runs
min: 5397 avg: 5551 median: 5589 (67%) max: 5668 MIPS
CPU TDP ? TDP 70 W TDP 74 W 95% 100% 99%
...
...
X264 HD Benchmark 4.0 - x264 Pass 2
80.5 fps (29%)
...
...
X264 HD Benchmark 4.0 - x264 Pass 1
217.8 fps (51%)
...
...
HWBOT x265 Benchmark v2.2 - HWBOT x265 4k Preset
min: 10.6 avg: 11.5 median: 11.3 (24%) max: 12.5 fps
CPU TDP ? TDP 70 W TDP 74 W 85% 100% 90%
...
...
0 5 10 15 20 Tooltip Dell Precision 3000 3551: Ø12 (1.25-21.9)
HP ZBook Fury 17 G7 119W5EA: Ø11.5 (0.87-16.2)
HP ZBook Studio G7: Ø13 (1.15-20.8)
TrueCrypt - TrueCrypt Serpent
1 GB/s (0%)
...
...
TrueCrypt - TrueCrypt Twofish
1.8 GB/s (0%)
...
...
TrueCrypt - TrueCrypt AES
9.9 GB/s (0%)
...
...
Blender - Blender 2.79 BMW27 CPU *
min: 283 avg: 311 median: 302 (2%) max: 348 Seconds
CPU TDP ? TDP 70 W TDP 74 W 100% 100% 100%
...
...
R Benchmark 2.5 - R Benchmark 2.5 *
min: 0.564 avg: 0.6 median: 0.6 (12%) max: 0.572 sec
CPU TDP ? TDP 70 W TDP 74 W 100% 100% 100%
...
...
3DMark 06 - CPU - 3DMark 06 - CPU
12101 Points (26%)
...
...
Super Pi mod 1.5 XS 1M - Super Pi mod 1.5 XS 1M *
7.3 s (2%)
...
...
VIA C3-M C3-M-1200 6215%
Super Pi mod 1.5 XS 2M - Super Pi mod 1.5 XS 2M *
16.3 s (1%)
...
...
Super Pi Mod 1.5 XS 32M - Super Pi mod 1.5 XS 32M *
433.9 s (2%)
...
...
VIA C3-M C3-M-1200 5089%
3DMark 11 - 3DM11 Performance Physics
min: 12279 avg: 14604 median: 14291 (39%) max: 17242 Points
CPU TDP ? TDP 70 W TDP 74 W 100% 83% 71%
...
...
3DMark - 3DMark Ice Storm Physics
31296 Points (20%)
...
...
3DMark - 3DMark Ice Storm Extreme Physics
30997 Points (26%)
...
...
3DMark - 3DMark Cloud Gate Physics
min: 11176 avg: 12814 median: 12814 (32%) max: 14452 Points
CPU TDP ? TDP 74 W 100% 77%
...
...
3DMark - 3DMark Fire Strike Standard Physics
min: 17249 avg: 19483 median: 20594 (38%) max: 20606 Points
CPU TDP ? TDP 70 W TDP 74 W 100% 100% 84%
...
...
3DMark - 3DMark Time Spy CPU
min: 6510 avg: 7798 median: 8203 (40%) max: 8682 Points
CPU TDP ? TDP 70 W TDP 74 W 100% 94% 75%
...
...
Geekbench 5.4 - Geekbench 5.1 - 5.4 64 Bit Single-Core
min: 1216 avg: 1303 median: 1317 (57%) max: 1376 points
CPU TDP ? TDP 70 W TDP 74 W 88% 100% 96%
...
...
Geekbench 5.4 - Geekbench 5.1 - 5.4 64 Bit Multi-Core
min: 6529 avg: 7045 median: 6914 (24%) max: 7693 points
CPU TDP ? TDP 70 W TDP 74 W 90% 100% 85%
...
...
Geekbench 5.0 - Geekbench 5.0 64 Bit Single-Core
min: 1234 avg: 1281 median: 1280.5 (6%) max: 1327 points
CPU TDP ? TDP 74 W 93% 100%
...
...
Geekbench 5.0 - Geekbench 5.0 64 Bit Multi-Core
min: 6598 avg: 7172 median: 7172 (23%) max: 7746 points
CPU TDP ? TDP 74 W 100% 85%
...
...
Geekbench 4.1 - 4.4 - Geekbench 4.1 - 4.4 64 Bit Single-Core
min: 5672 avg: 5676 median: 5675.5 (59%) max: 5679 points
CPU TDP ? TDP 74 W 100% 100%
...
...
Geekbench 4.1 - 4.4 - Geekbench 4.1 - 4.4 64 Bit Multi-Core
min: 26114 avg: 29009 median: 29009 (32%) max: 31904 points
CPU TDP ? TDP 74 W 100% 82%
...
...
Mozilla Kraken 1.1 - Kraken 1.1 Total Score *
min: 730 avg: 738 median: 734 (1%) max: 749 ms
CPU TDP ? TDP 70 W TDP 74 W 100% 100% 100%
...
...
Octane V2 - Octane V2 Total Score
58398 Points (60%)
...
...
WebXPRT 3 - WebXPRT 3 Score
min: 233 avg: 234.3 median: 234 (57%) max: 236 Points
CPU TDP ? TDP 70 W TDP 74 W 99% 100% 99%
...
...
Power Consumption - Prime95 Power Consumption - external Monitor *
min: 78.1 avg: 103.7 median: 116.4 (20%) max: 116.6 Watt
CPU TDP ? TDP 70 W TDP 74 W 108% 100% 100%
...
...
Power Consumption - Cinebench R15 Multi Power Consumption - external Monitor *
min: 125.2 avg: 131.2 median: 126 (26%) max: 142.4 Watt
CPU TDP ? TDP 70 W TDP 74 W 105% 105% 100%
...
...
Power Consumption - Cinebench R15 Multi Power Efficiency - external Monitor
min: 10.1 avg: 11.5 median: 10.7 (12%) max: 13.7 Points per Watt
CPU TDP ? TDP 70 W TDP 74 W 74% 100% 78%
...
...
- Range of benchmark values for this graphics card
- Average benchmark values for this graphics card
* Smaller numbers mean a higher performance