HP ZBook Fury 17 G7 review: A lot of power and a great 4K display in a more compact package

In the current G7 generation of the ZBook Fury workstation, HP uses faster hardware in a smaller case. We already made a similar observation in the test of the smaller HP ZBook Fury 15 G7, and now we are also seeing it in the large ZBook Fury 17 G7. With the 119W5EA model, we are testing one of the top configurations with an Intel Core i9-10885H, Nvidia Quadro RTX 4000 Max-Q, and 32 GB of DDR4 RAM. All this is packaged in a case that is almost 30% smaller and also weighs less than its comparable competitors.
Possible Competitors in Comparison
Rating | Date | Model | Weight | Height | Size | Resolution | Price |
|---|---|---|---|---|---|---|---|
| 89.8 % v7 (old) | 04 / 2021 | HP ZBook Fury 17 G7 119W5EA i9-10885H, Quadro RTX 4000 Max-Q | 2.9 kg | 26.9 mm | 17.30" | 3840x2160 | |
| 88.2 % v7 (old) | 01 / 2021 | Lenovo ThinkPad P73-20QR0030GE i9-9880H, Quadro RTX 4000 (Laptop) | 3.5 kg | 31 mm | 17.30" | 3840x2160 | |
| 90.2 % v7 (old) | 01 / 2021 | HP ZBook Fury 15 G7 W-10885M, Quadro RTX 5000 Max-Q | 2.4 kg | 25.9 mm | 15.60" | 3840x2160 | |
| 88.4 % v7 (old) | 11 / 2020 | Asus StudioBook Pro X W730G5T-H8050T E-2276M, Quadro RTX 5000 (Laptop) | 2.9 kg | 28.2 mm | 17.00" | 1920x1200 | |
| 87.8 % v7 (old) | 08 / 2020 | Dell Precision 7550 W-10885M, Quadro RTX 5000 Max-Q | 2.8 kg | 27.36 mm | 15.60" | 3840x2160 |
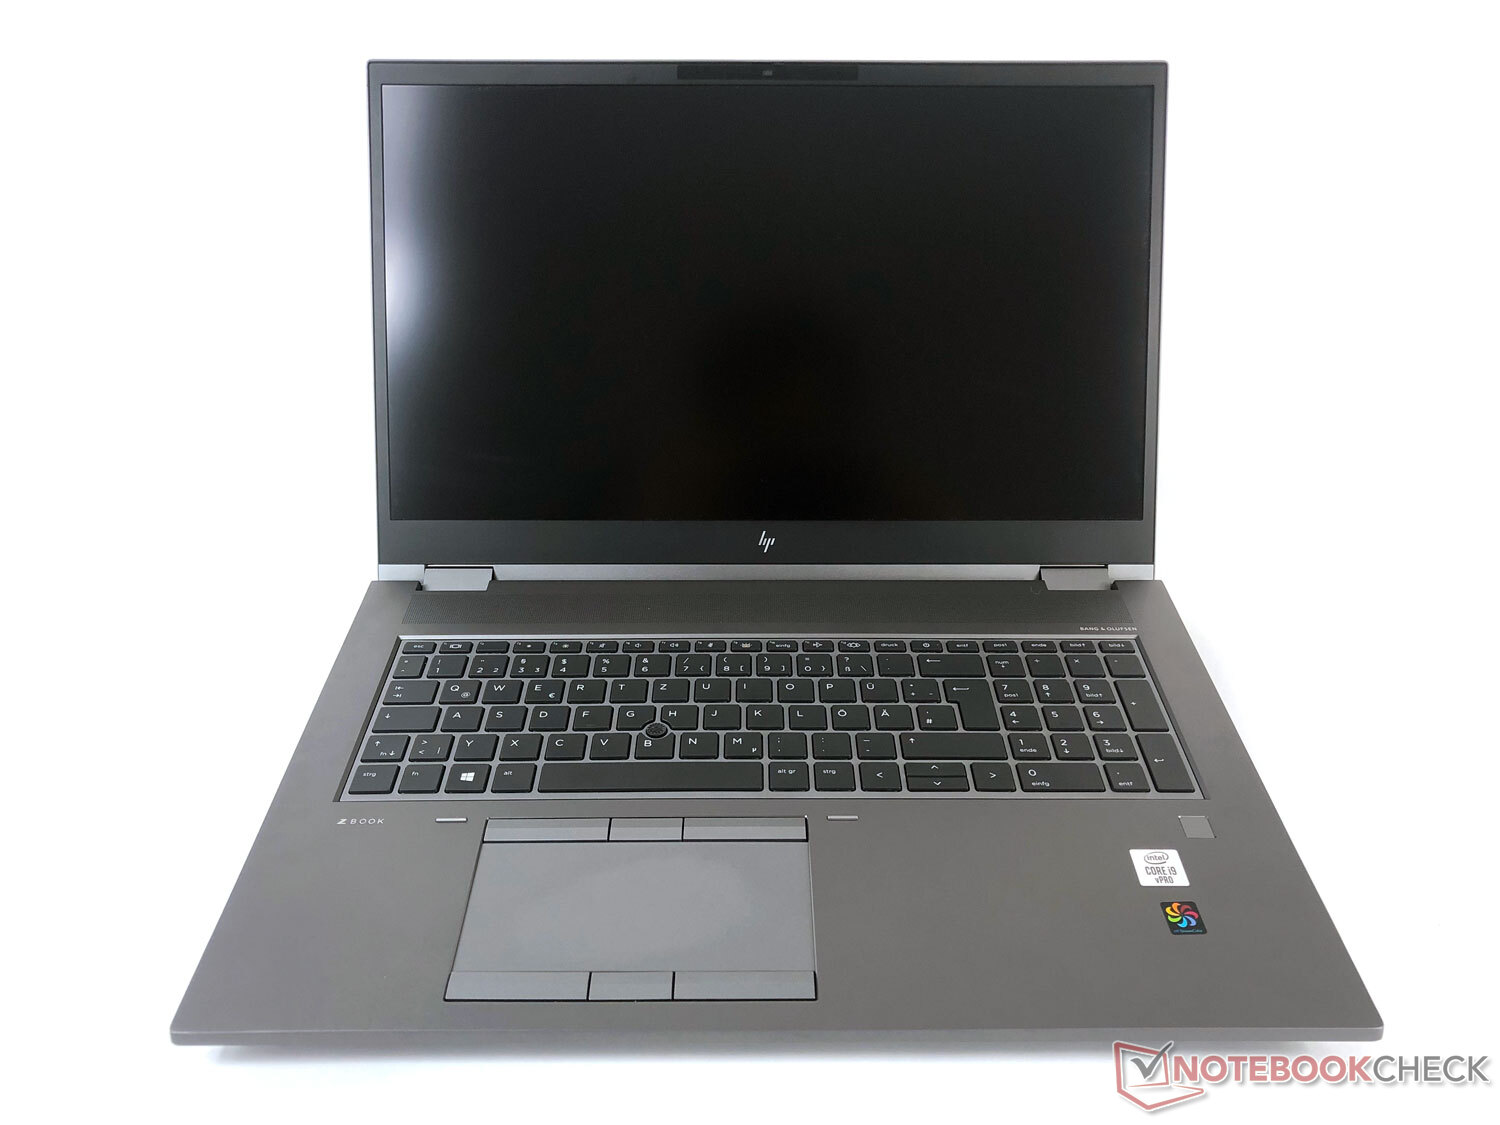
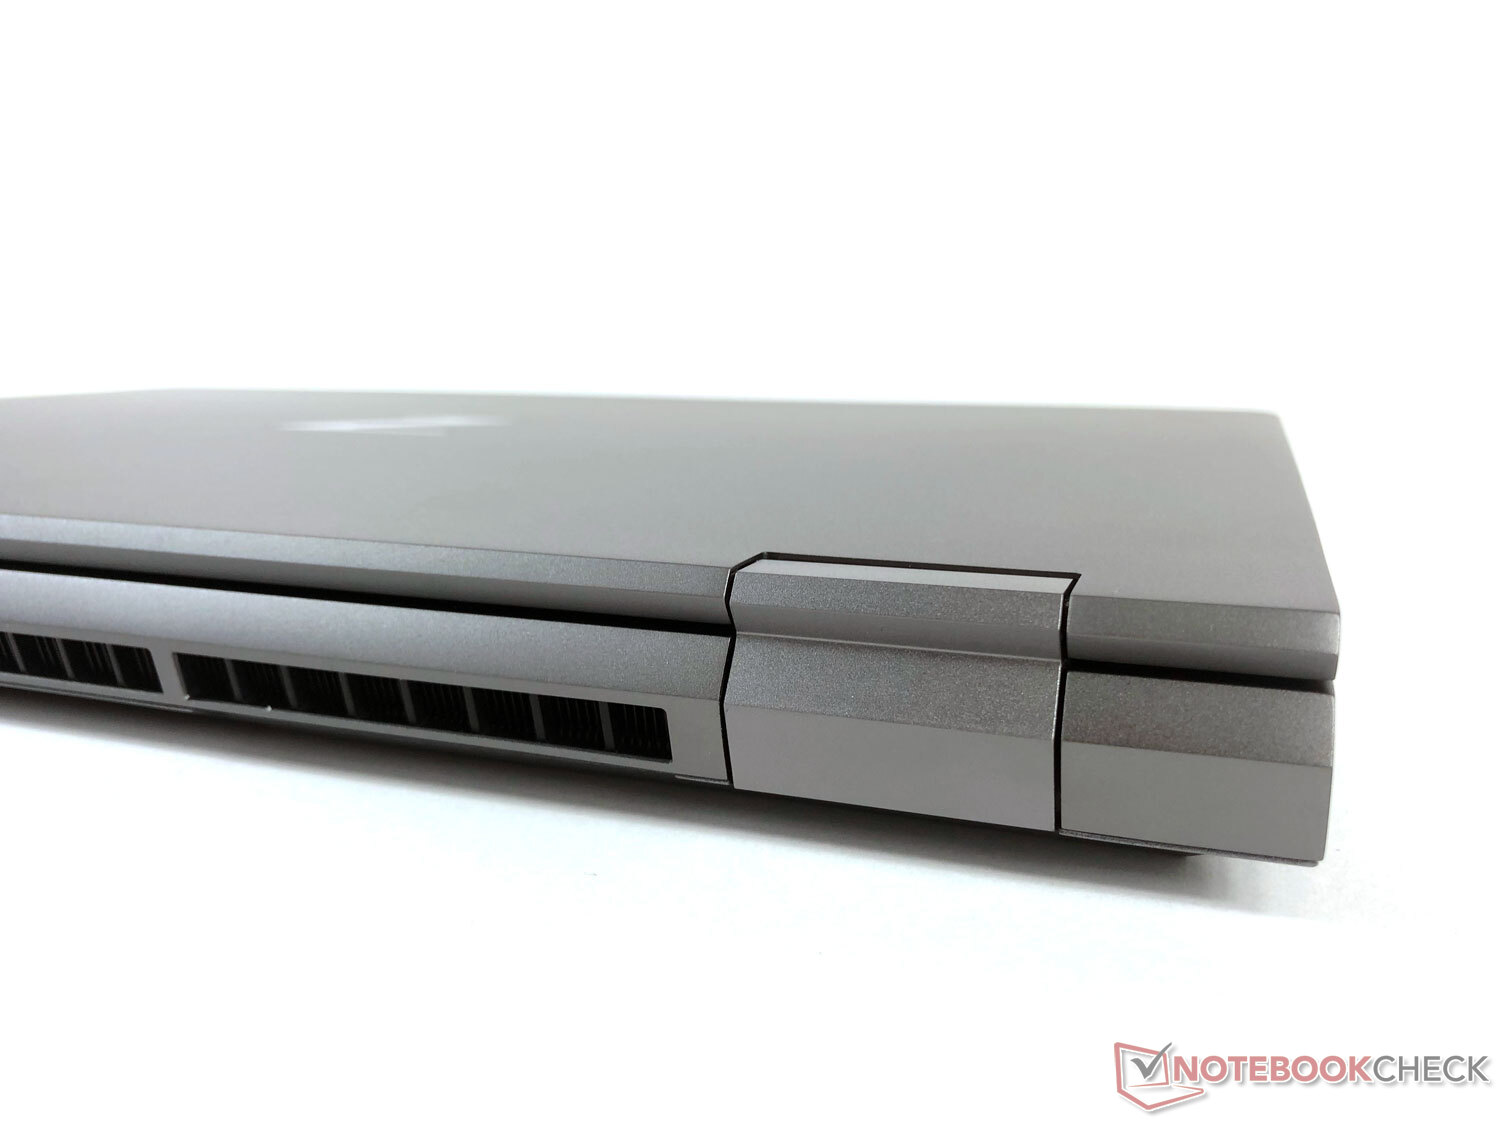
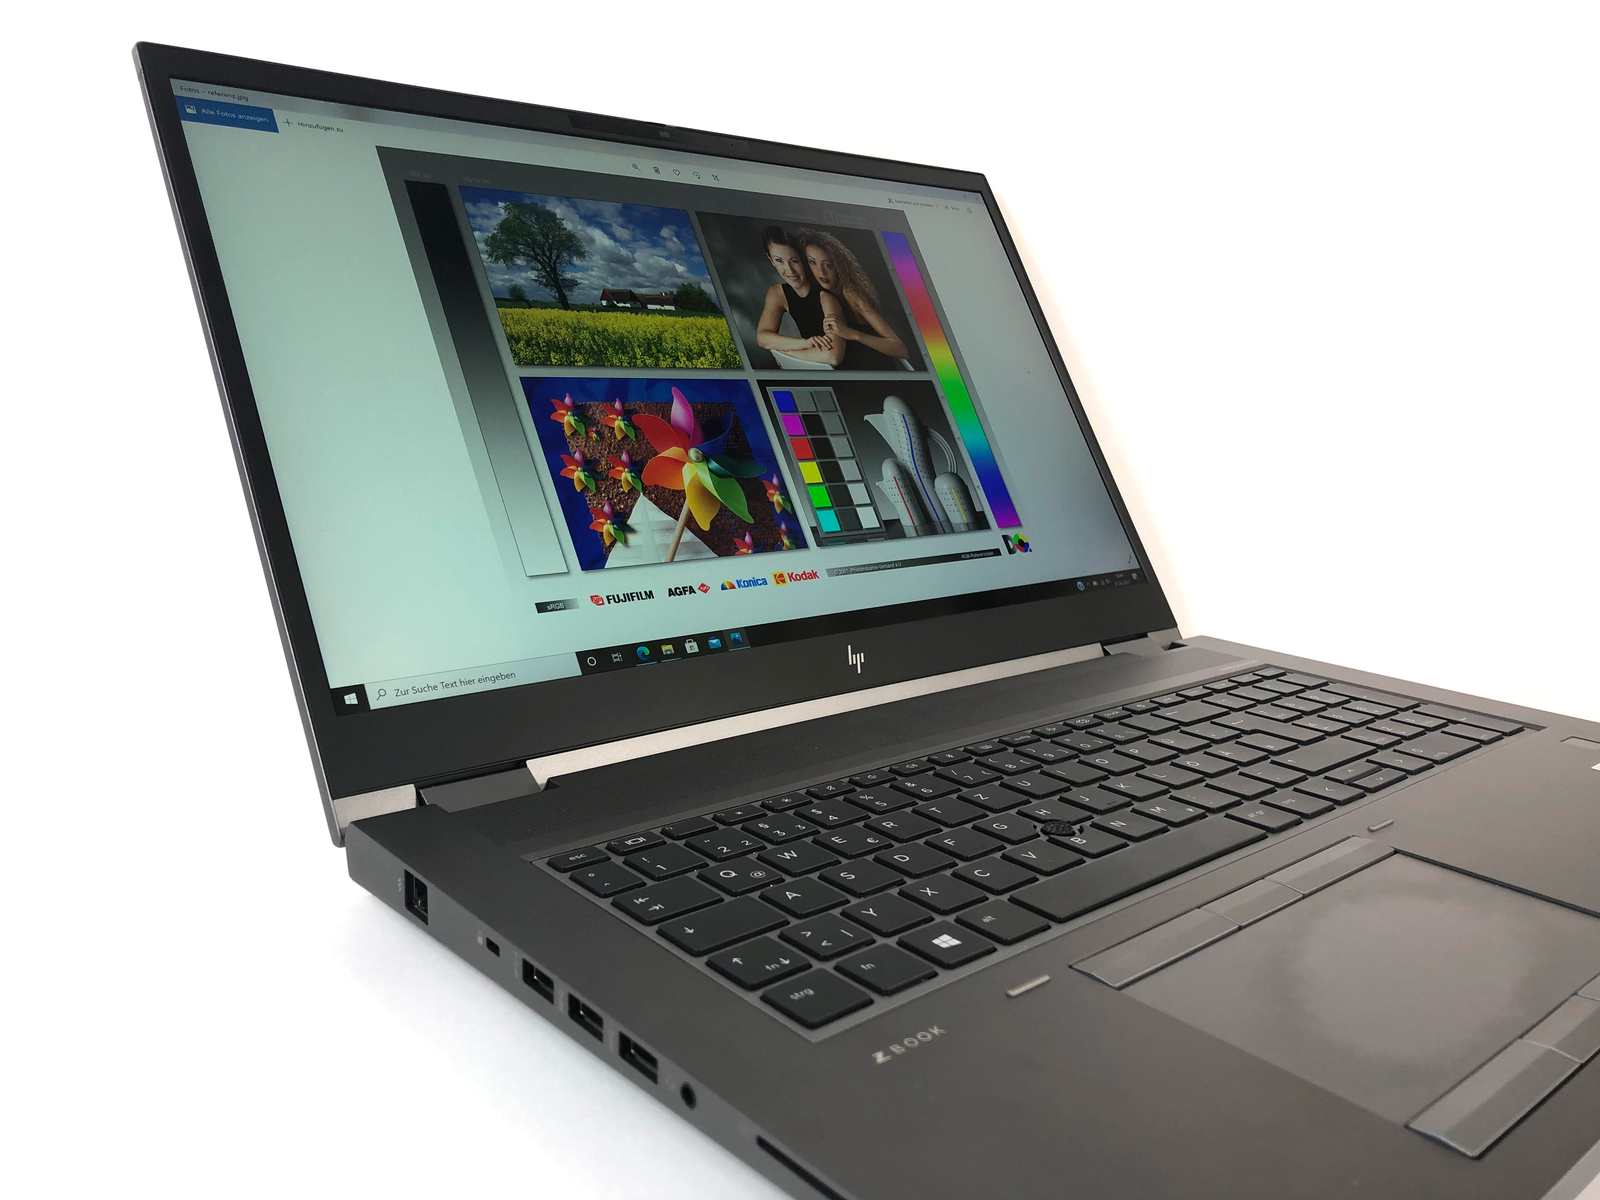
Case: Angular and high-quality
As you would expect in this price class, the HP ZBook Fury 17 G7 shows a flawless quality. The even clearances are evidence of accurate workmanship. The angular case not only looks elegant and offers a high-quality feel, but it is also robust (conforming to MIL STD 810H).
The hinge offers ample resistance that is high enough to create a stable position, but also not too high, allowing you to open the laptop with one hand. In this, the heavy base of the case also plays a role. The thickness of the case stiffens it, making it resistant to attempts of warping and allowing you to hold it up by a single corner.
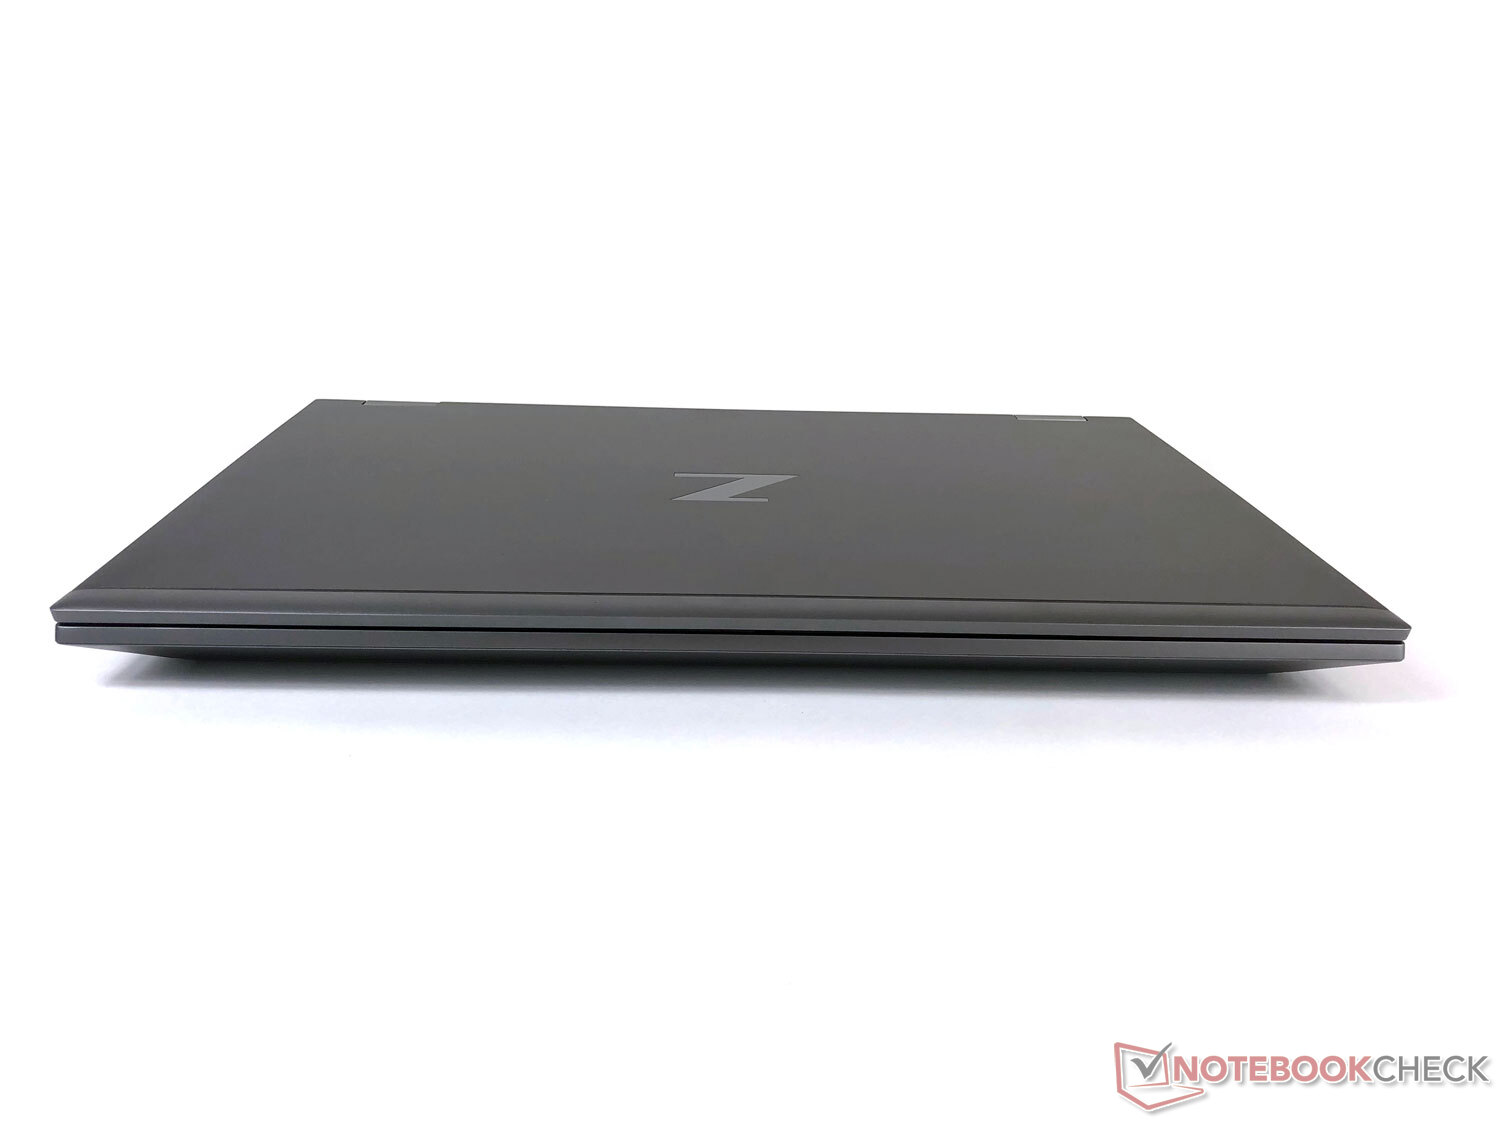

HP specifies that the new HP ZBook Fury 17 G7 is 29% more compact than its predecessor, while still being more powerful. However, even if the device just went through a slimming diet, it is still fairly thick (as expected). But if you look at other 17.3-inch workstations such as the Lenovo ThinkPad P73, this is all relative: at a height of almost 2.7 cm (~1.1 in) and width and depth of 40 x 26.7 cm (~15.7 x 10.5 in), HP's new workstation is significantly more compact. And at 2.9 kg (~6.4 lb), it also weighs more than half a kg less (~1.1 lb).
But of course, 2.9 kg (~6.4 lb) still is a significant weight and not comparable to "regular" 17-inch laptops such as the Acer Aspire 5 we recently tested. However, in contrast to its slim peers, the device is not designed primarily for mobile usage but for stationary use instead. To place it on your lap for streaming in the evening or take it with you on a trip requires some effort. But those who are interested in a powerful workstation would know this anyways.
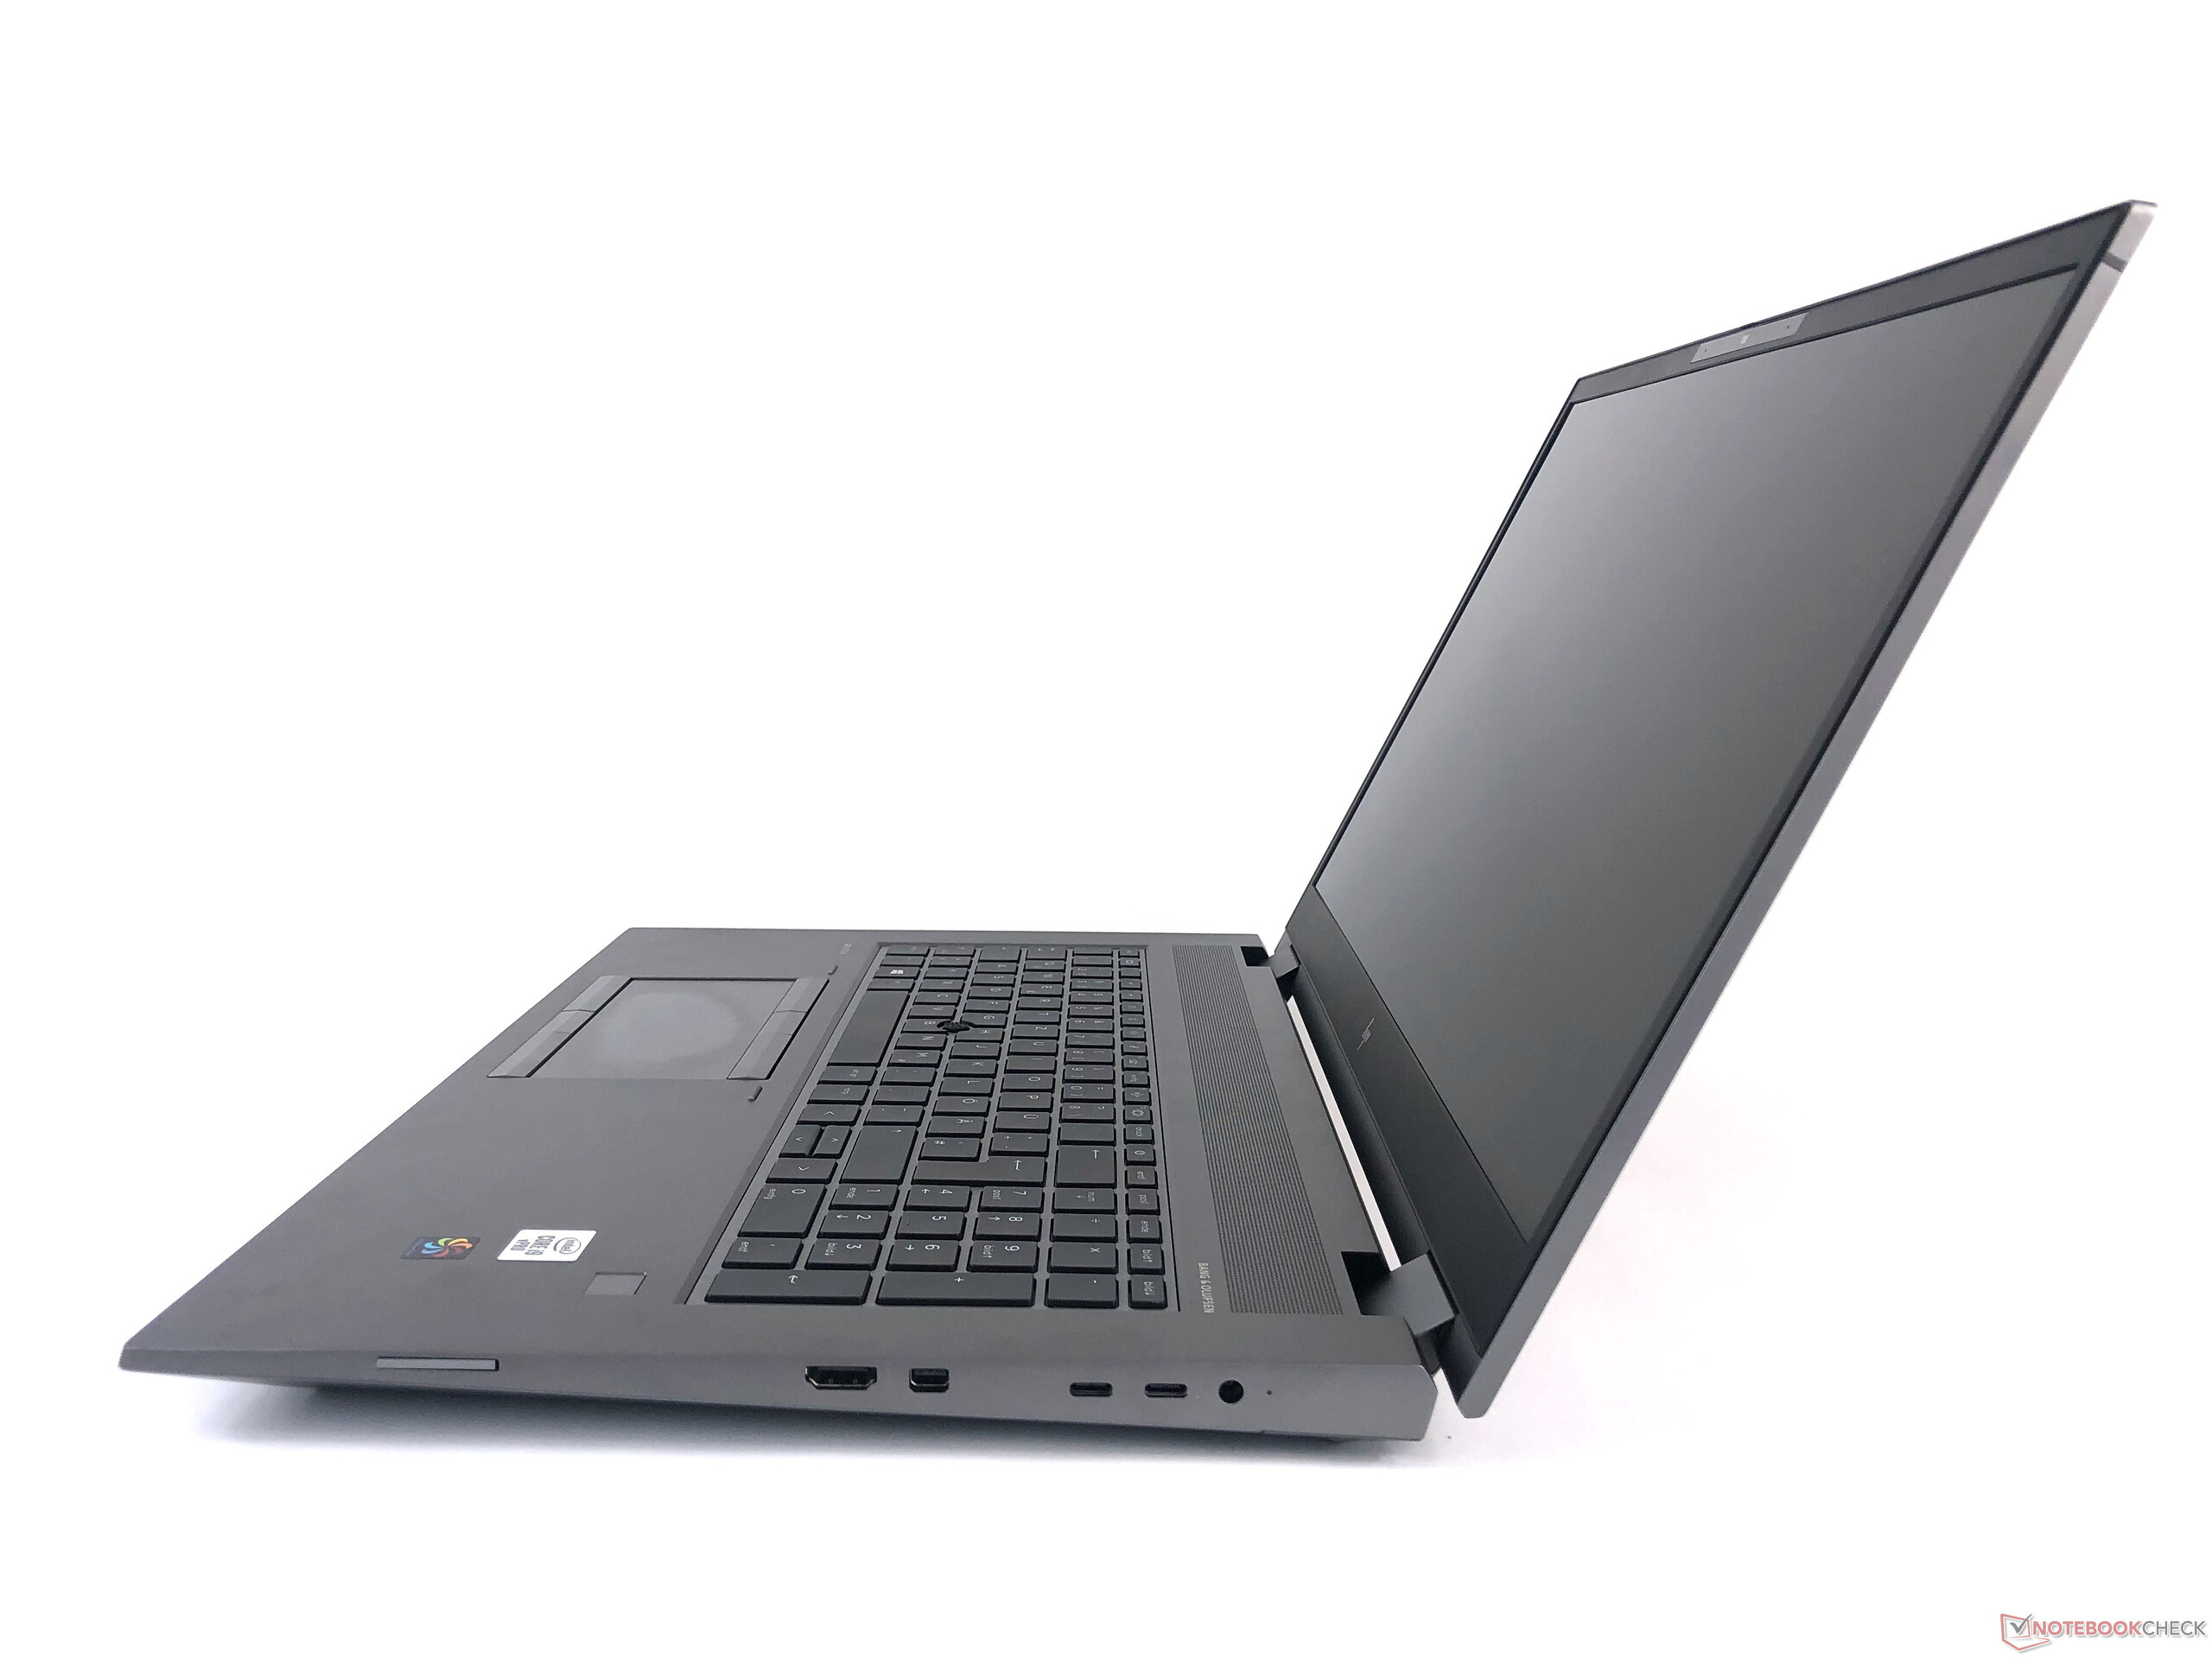
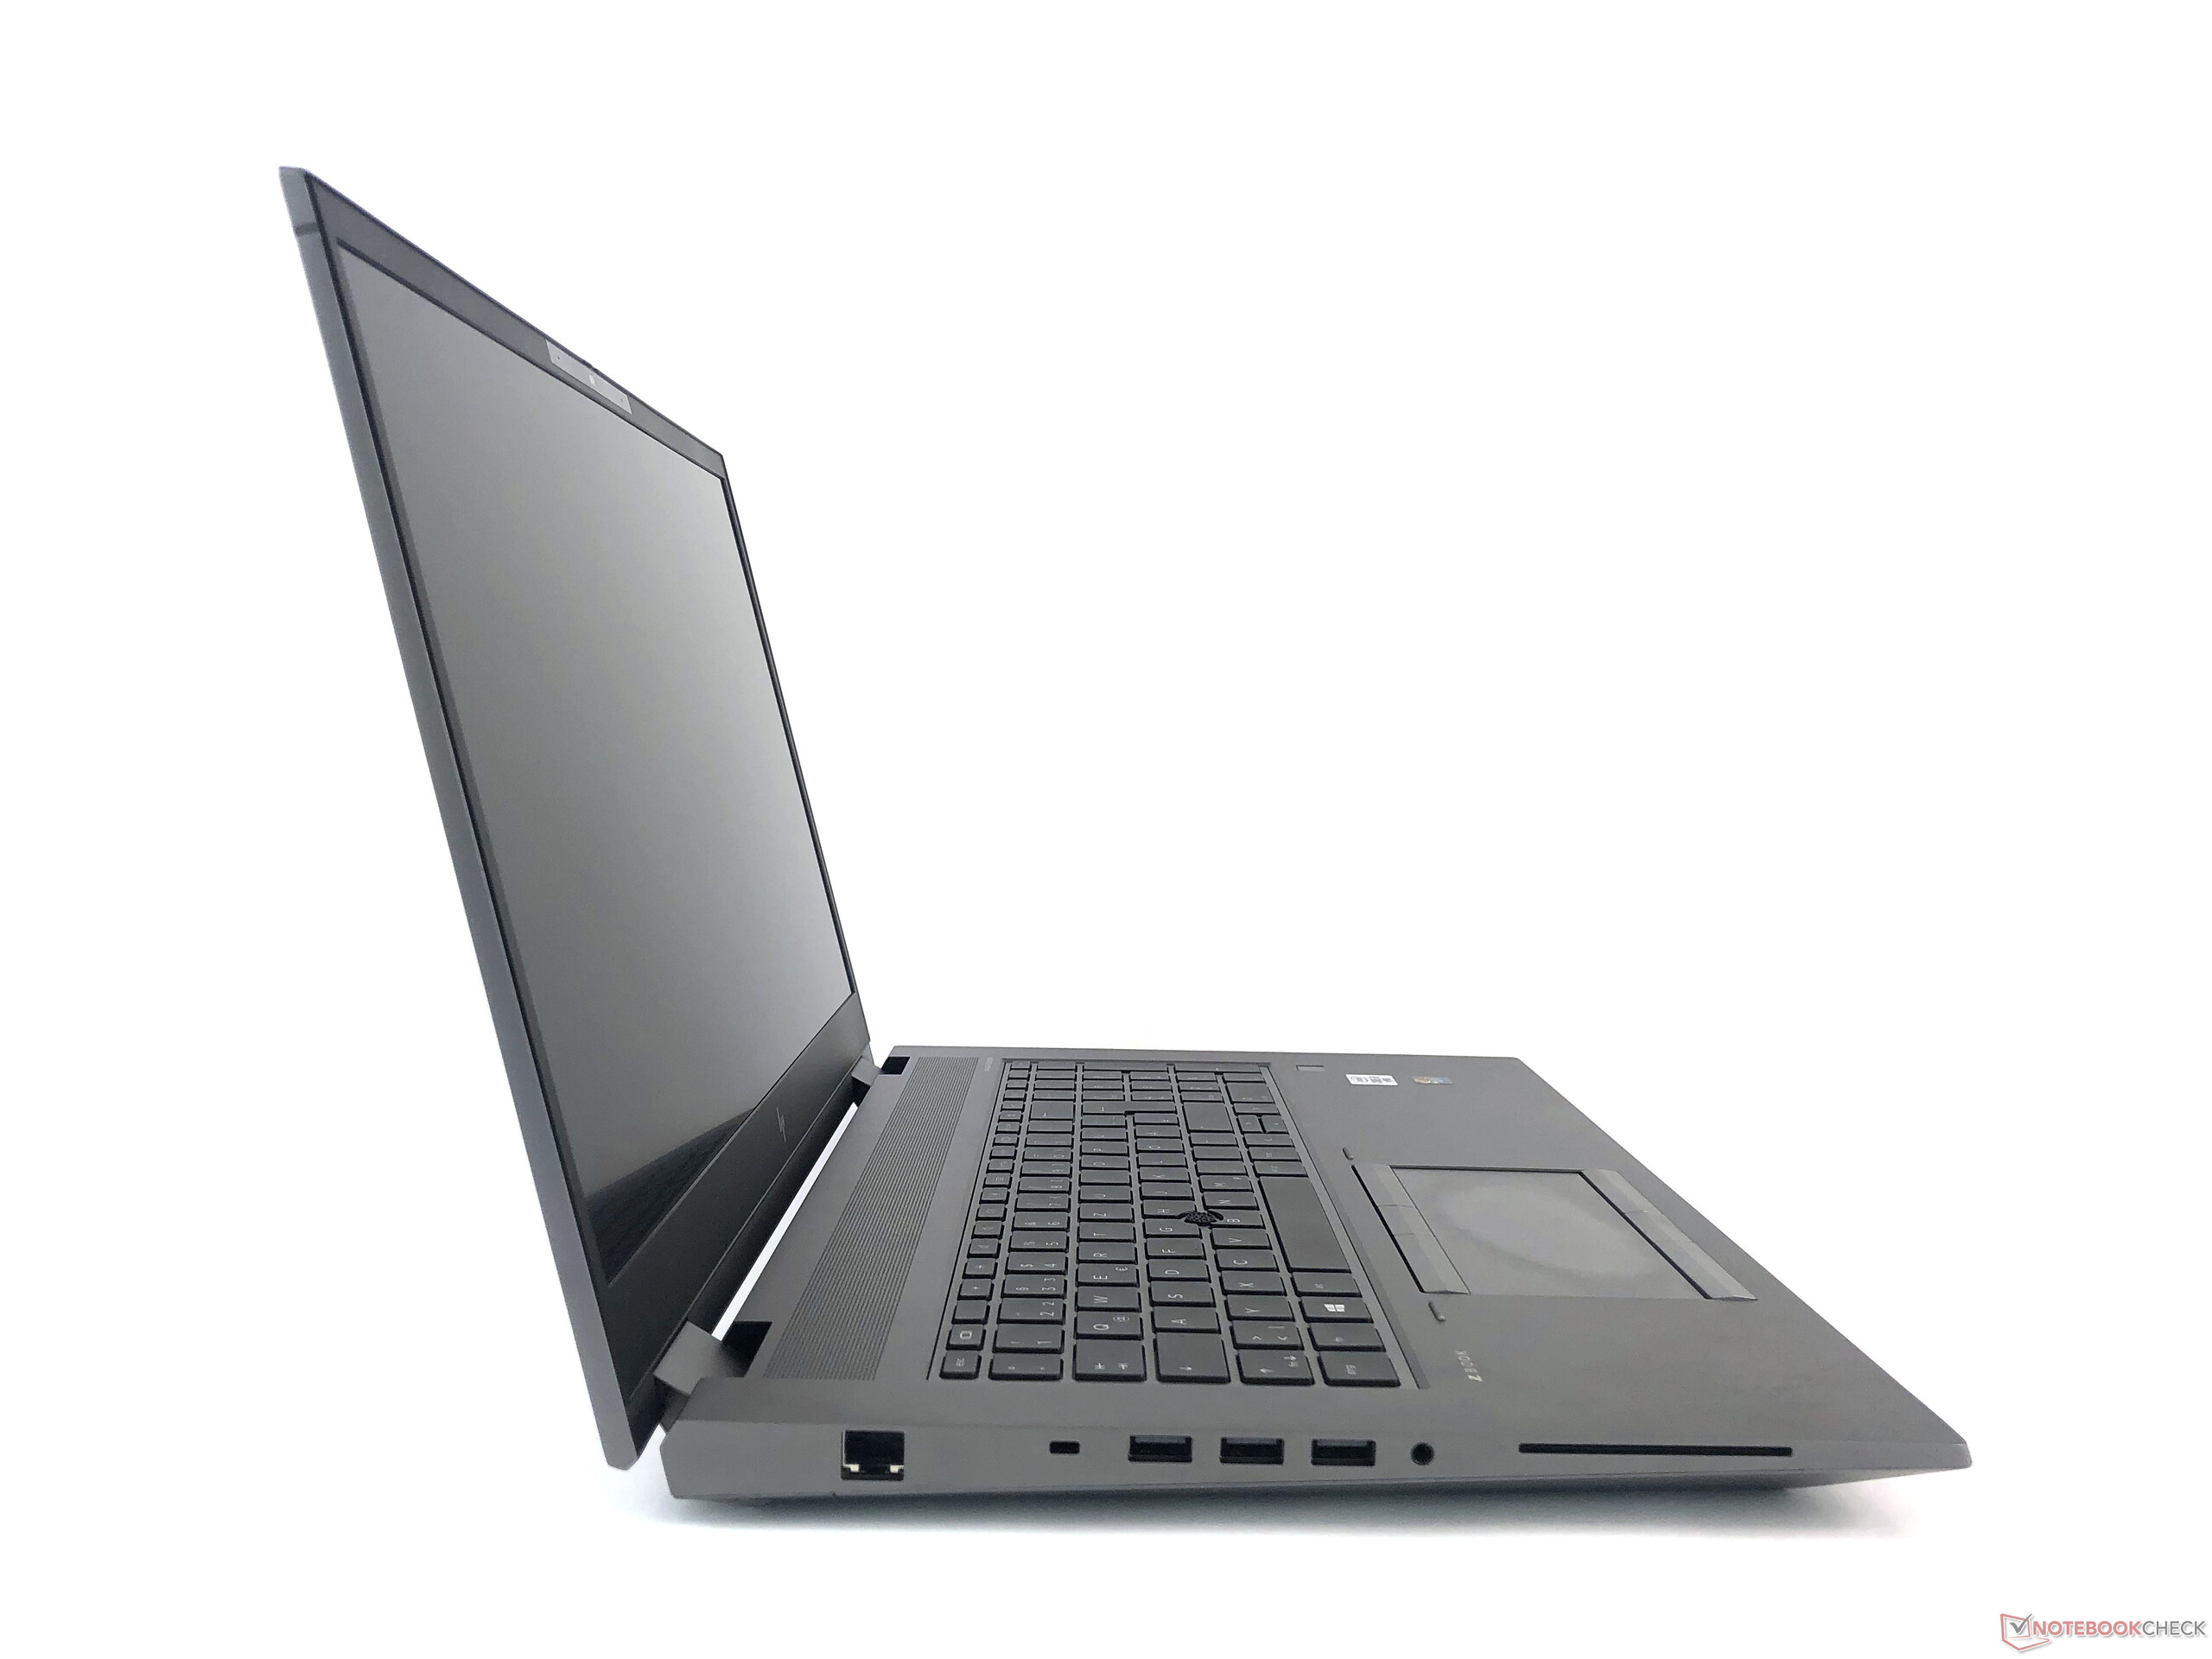
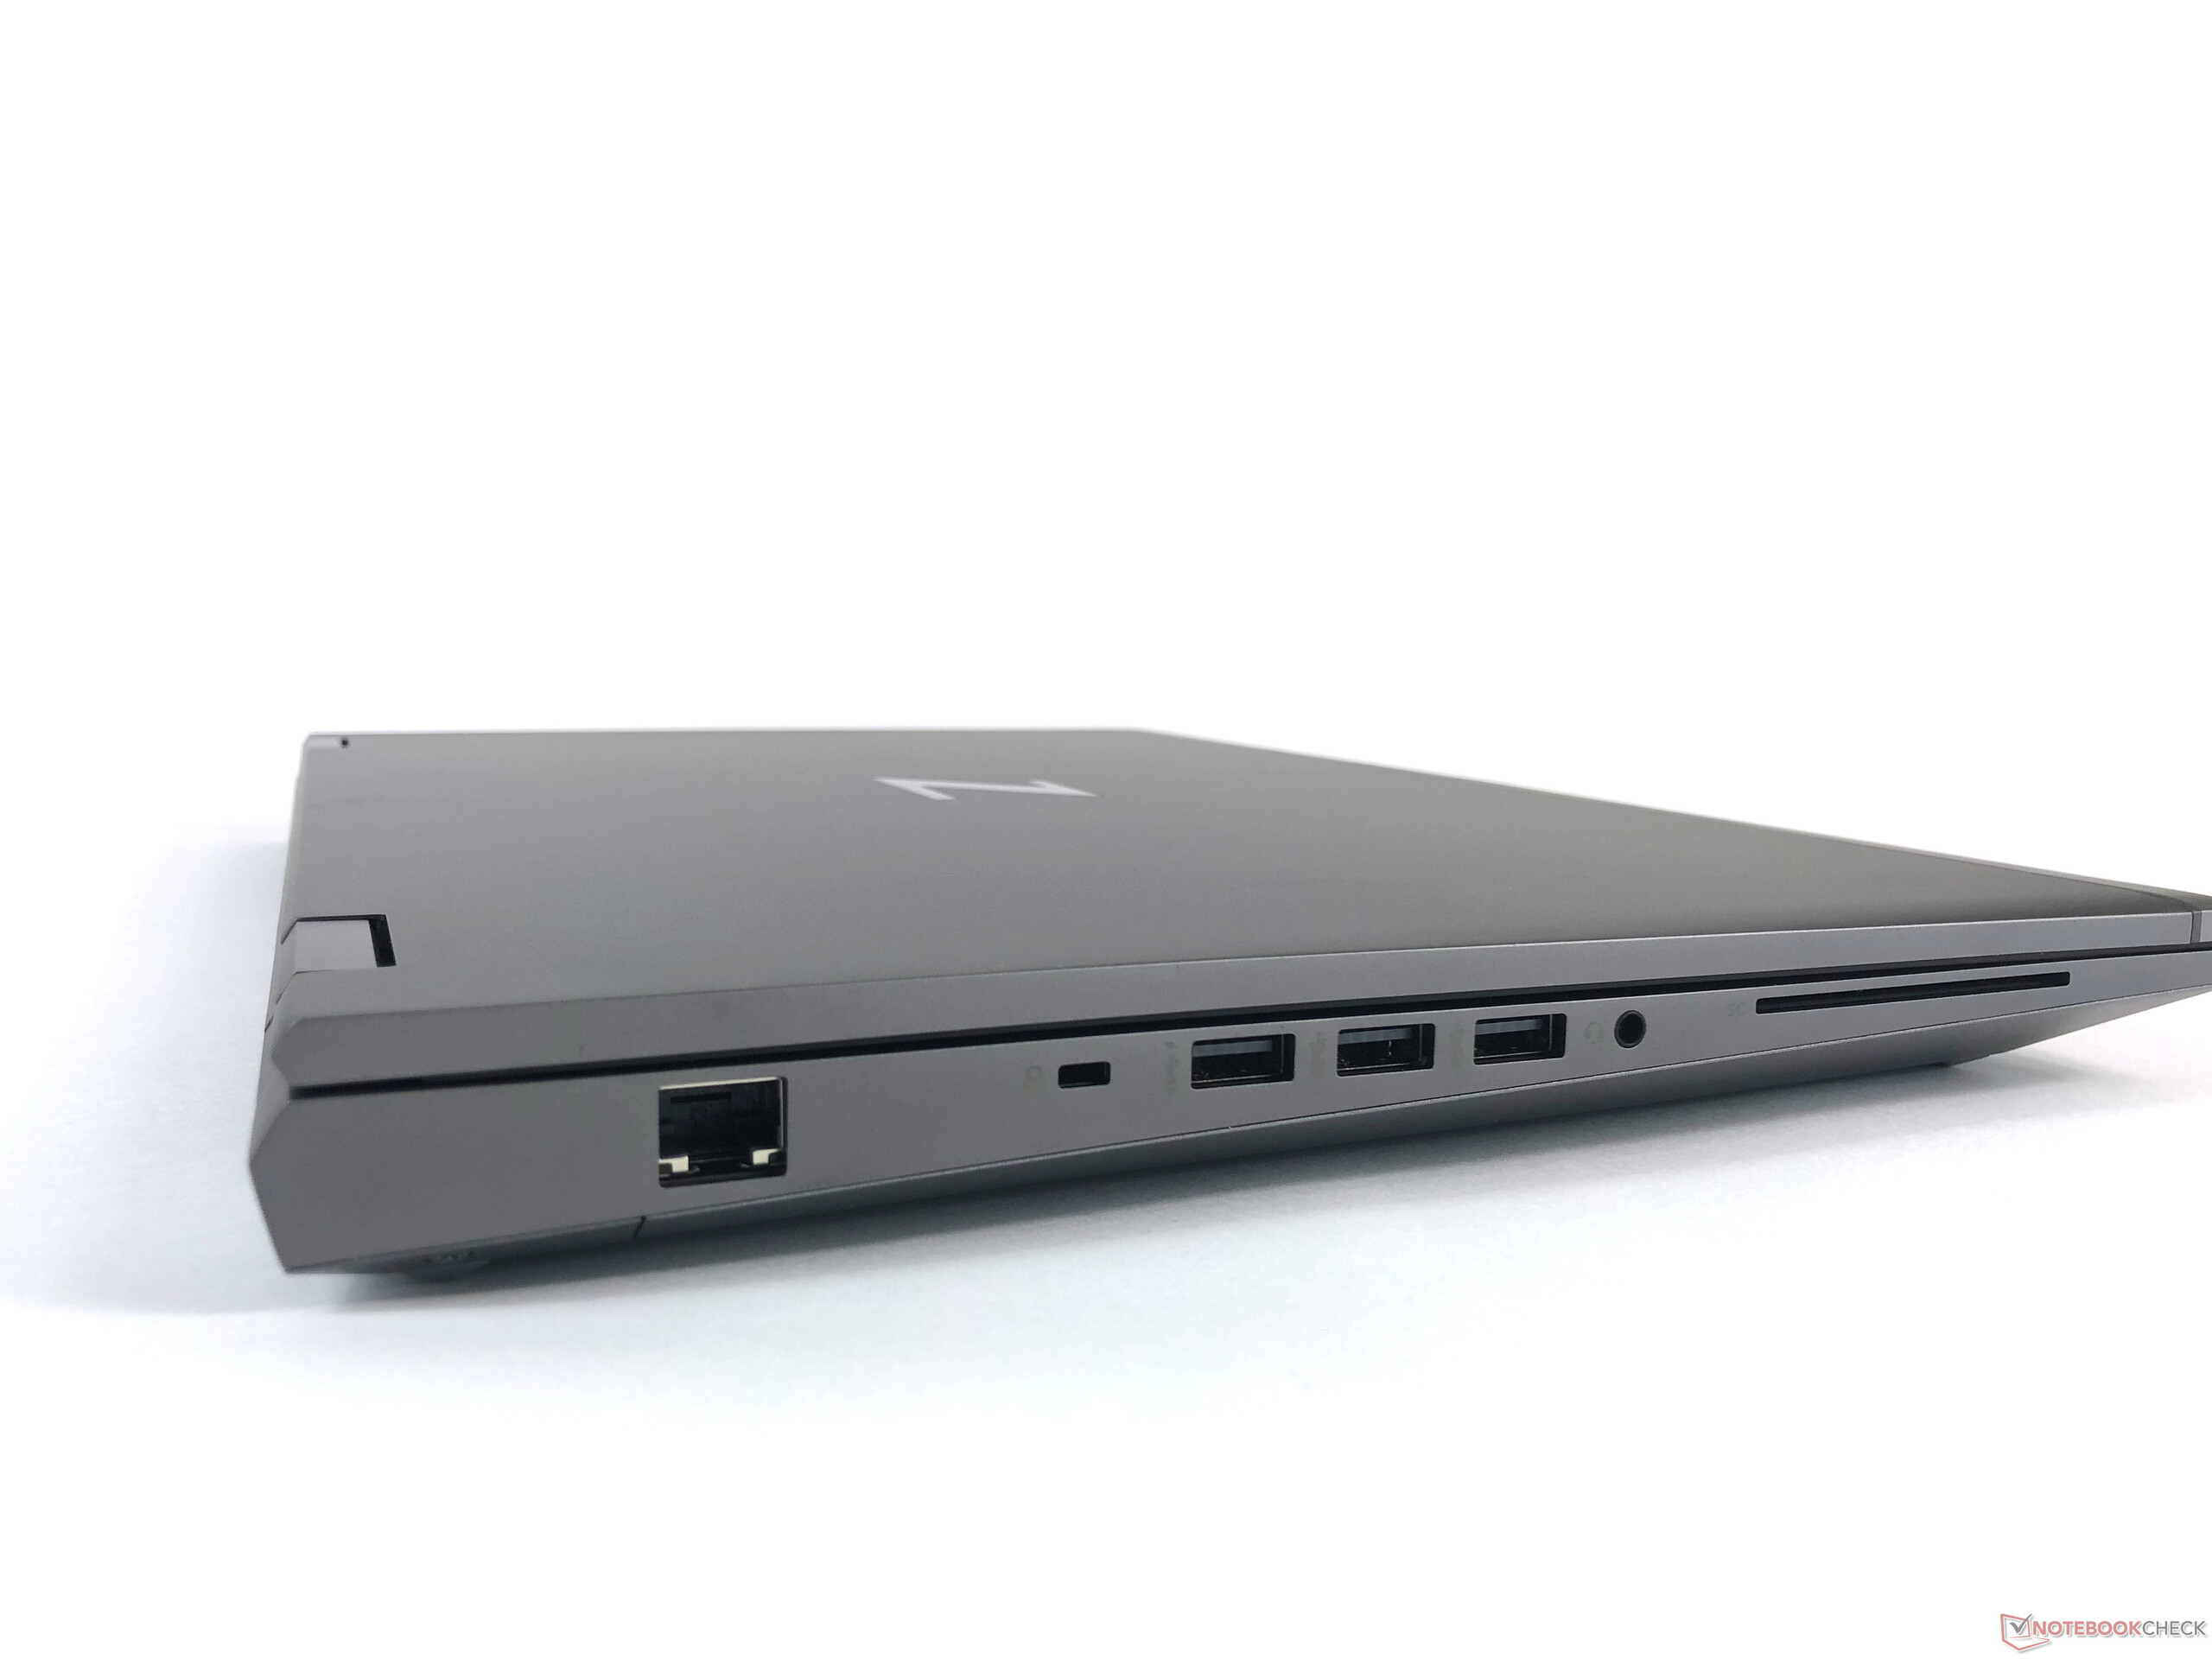
Equipment: More would hardly be possible
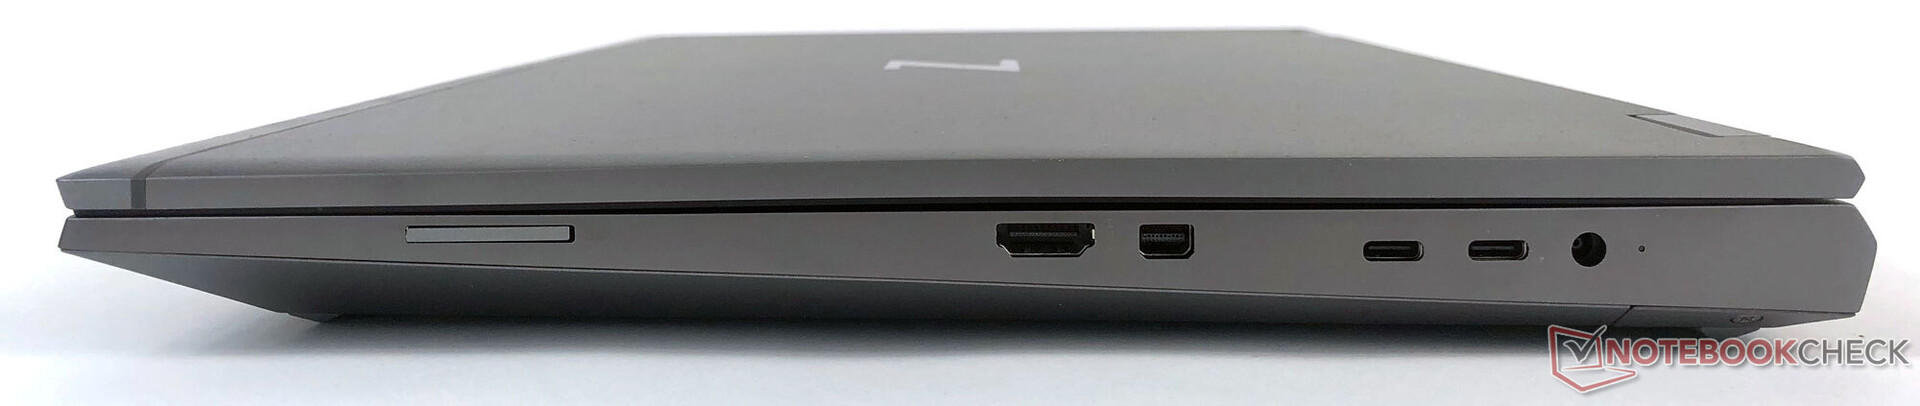
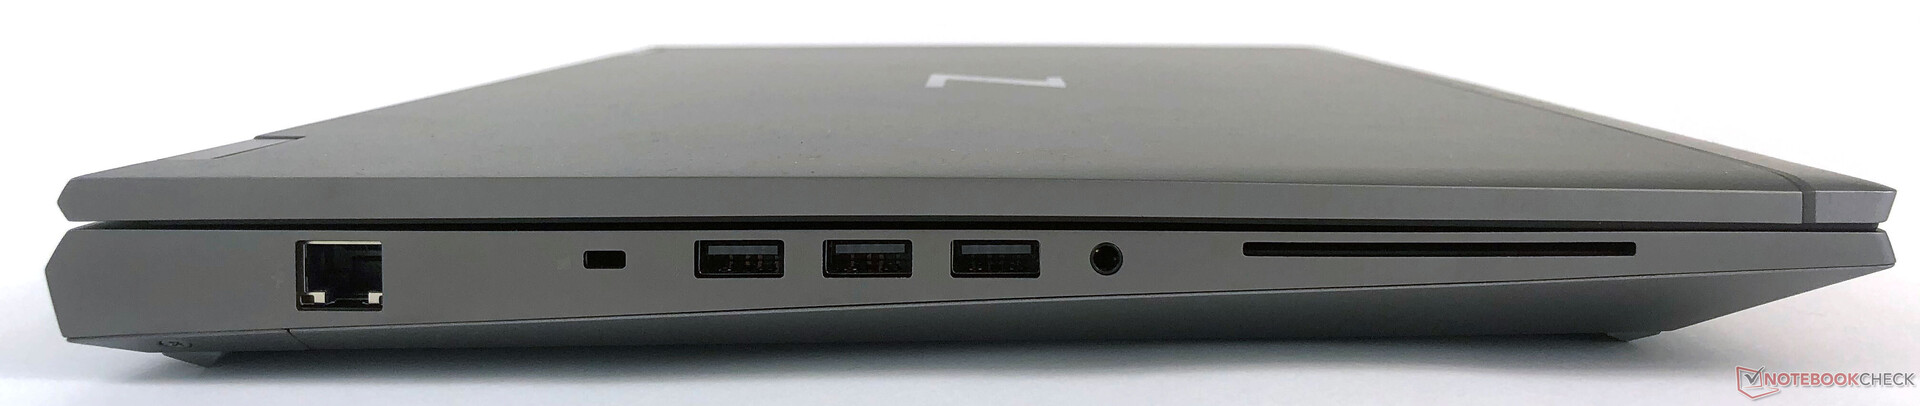
The numerous connections of the HP ZBook Fury 17 G7 are spread across the left and right side of the case, as is typical for laptops. Only very few users should miss anything here, since all the important connections such as USB-C including Thunderbolt 3 are available. In addition, there is another Mini DisplayPort 1.4 and an HDMI 2.0b port for connecting external monitors. All the connections are easily accessible and placed with sufficient distance in between.
SD Card Reader
The integrated card reader for SD storage cards performs slightly slower than the competitors in our test with an AV Pro 60 storage card. But overall, the performance is slightly above the average of workstations in this class, so it is good.
| SD Card Reader | |
| average JPG Copy Test (av. of 3 runs) | |
| Dell Precision 7550 (Toshiba Exceria Pro SDXC 64 GB UHS-II) | |
| Lenovo ThinkPad P73-20QR0030GE (Toshiba Exceria Pro SDXC 64 GB UHS-II) | |
| Asus StudioBook Pro X W730G5T-H8050T (Toshiba Exceria Pro SDXC 64 GB UHS-II) | |
| HP ZBook Fury 15 G7 (Toshiba Exceria Pro SDXC 64 GB UHS-II) | |
| HP ZBook Fury 17 G7 119W5EA (AV Pro 60) | |
| Average of class Workstation (49.6 - 681, n=14, last 2 years) | |
| maximum AS SSD Seq Read Test (1GB) | |
| Asus StudioBook Pro X W730G5T-H8050T (Toshiba Exceria Pro SDXC 64 GB UHS-II) | |
| Average of class Workstation (87.6 - 1455, n=14, last 2 years) | |
| HP ZBook Fury 15 G7 (Toshiba Exceria Pro SDXC 64 GB UHS-II) | |
| Dell Precision 7550 (Toshiba Exceria Pro SDXC 64 GB UHS-II) | |
| Lenovo ThinkPad P73-20QR0030GE (Toshiba Exceria Pro SDXC 64 GB UHS-II) | |
| HP ZBook Fury 17 G7 119W5EA (AV Pro 60) | |
Communication
An even better picture is presented in the WLAN connectivity, where our test unit performs extraordinarily well and is only surpassed by the Lenovo ThinkPad P73. The values are above those of the other comparison devices and above the average of other laptops that are equipped with the Intel Wi-Fi 6 AX201. So HP gets a lot of performance from the WLAN module with Wi-Fi 6, and the HP ZBook Fury 15 G7, which is equipped with the same model, only achieves data rates that are half as high.
Webcam
HP has placed a 720p webcam in the center above the display. While it does its job and is sufficient for video conferencing, we would have liked a better quality in a device of this price class. A positive aspect is that the camera can be locked behind a physical slider.


Security
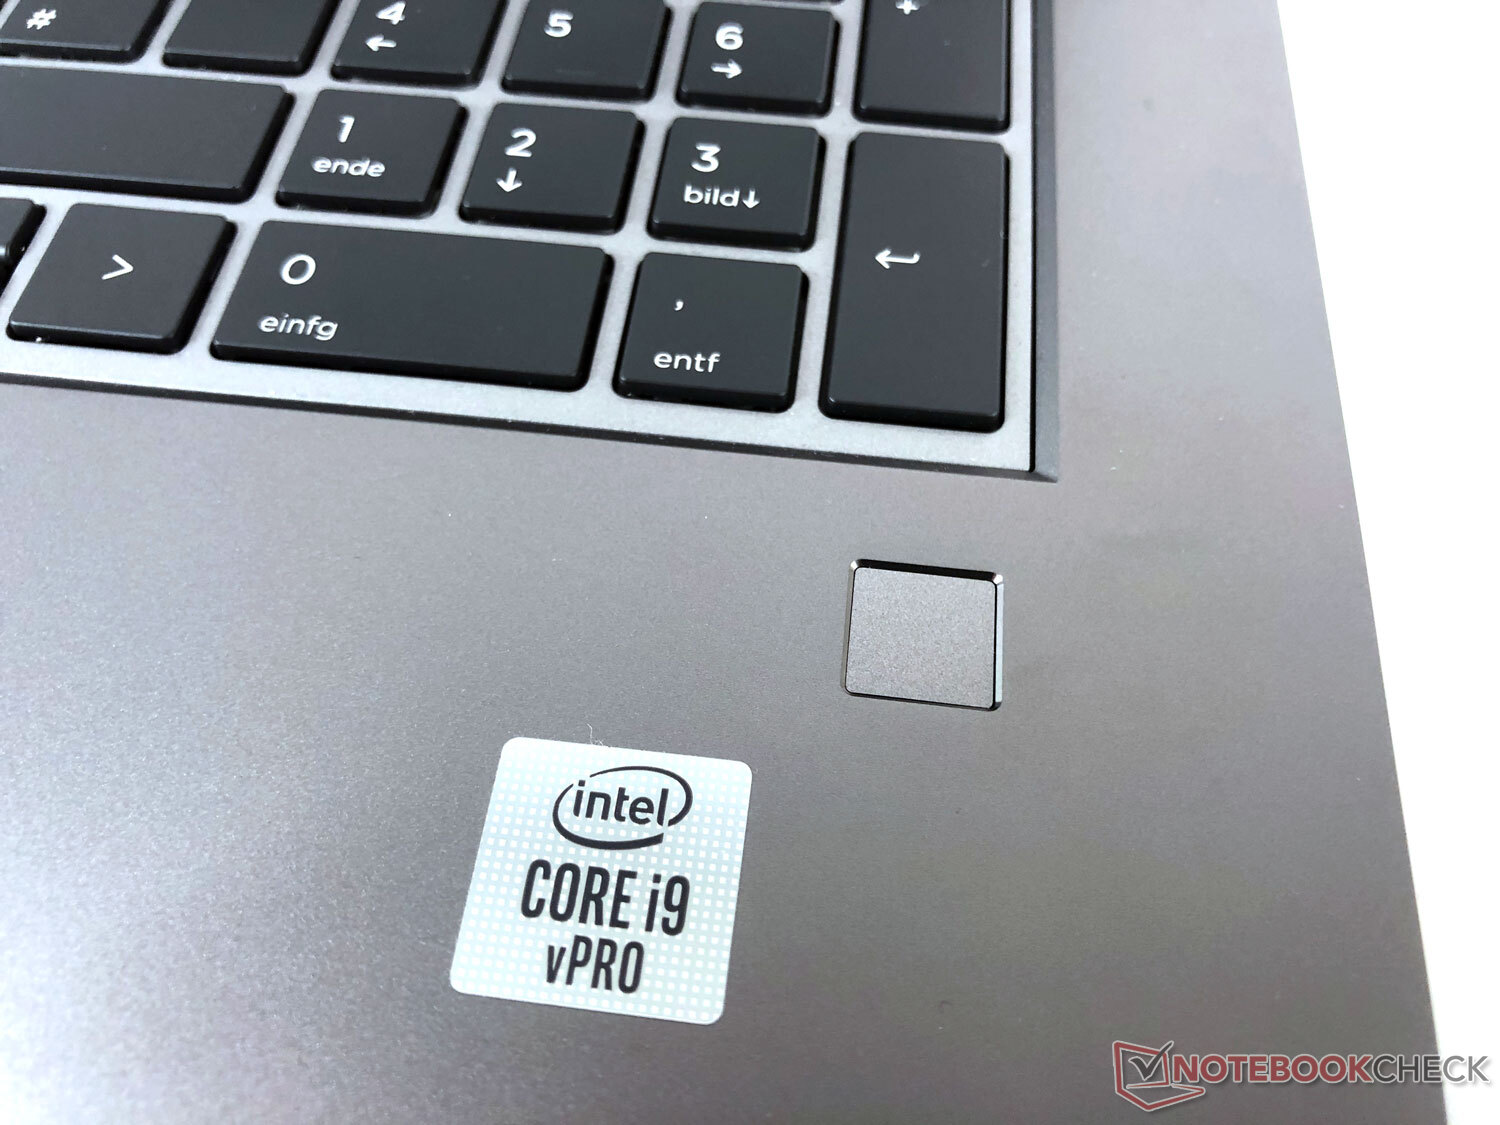
In addition to a whole suite of security management software, the workstation also offers a Kensington Lock as well as a fingerprint sensor below the number block on the right.
Accessories
In addition to the usual paperwork, the box includes a slim smart charger that offers 200 watts, weighs 600 g (~1.3 lb), and has a cable that is surrounded by fabric. HP also offers numerous optional accessories.
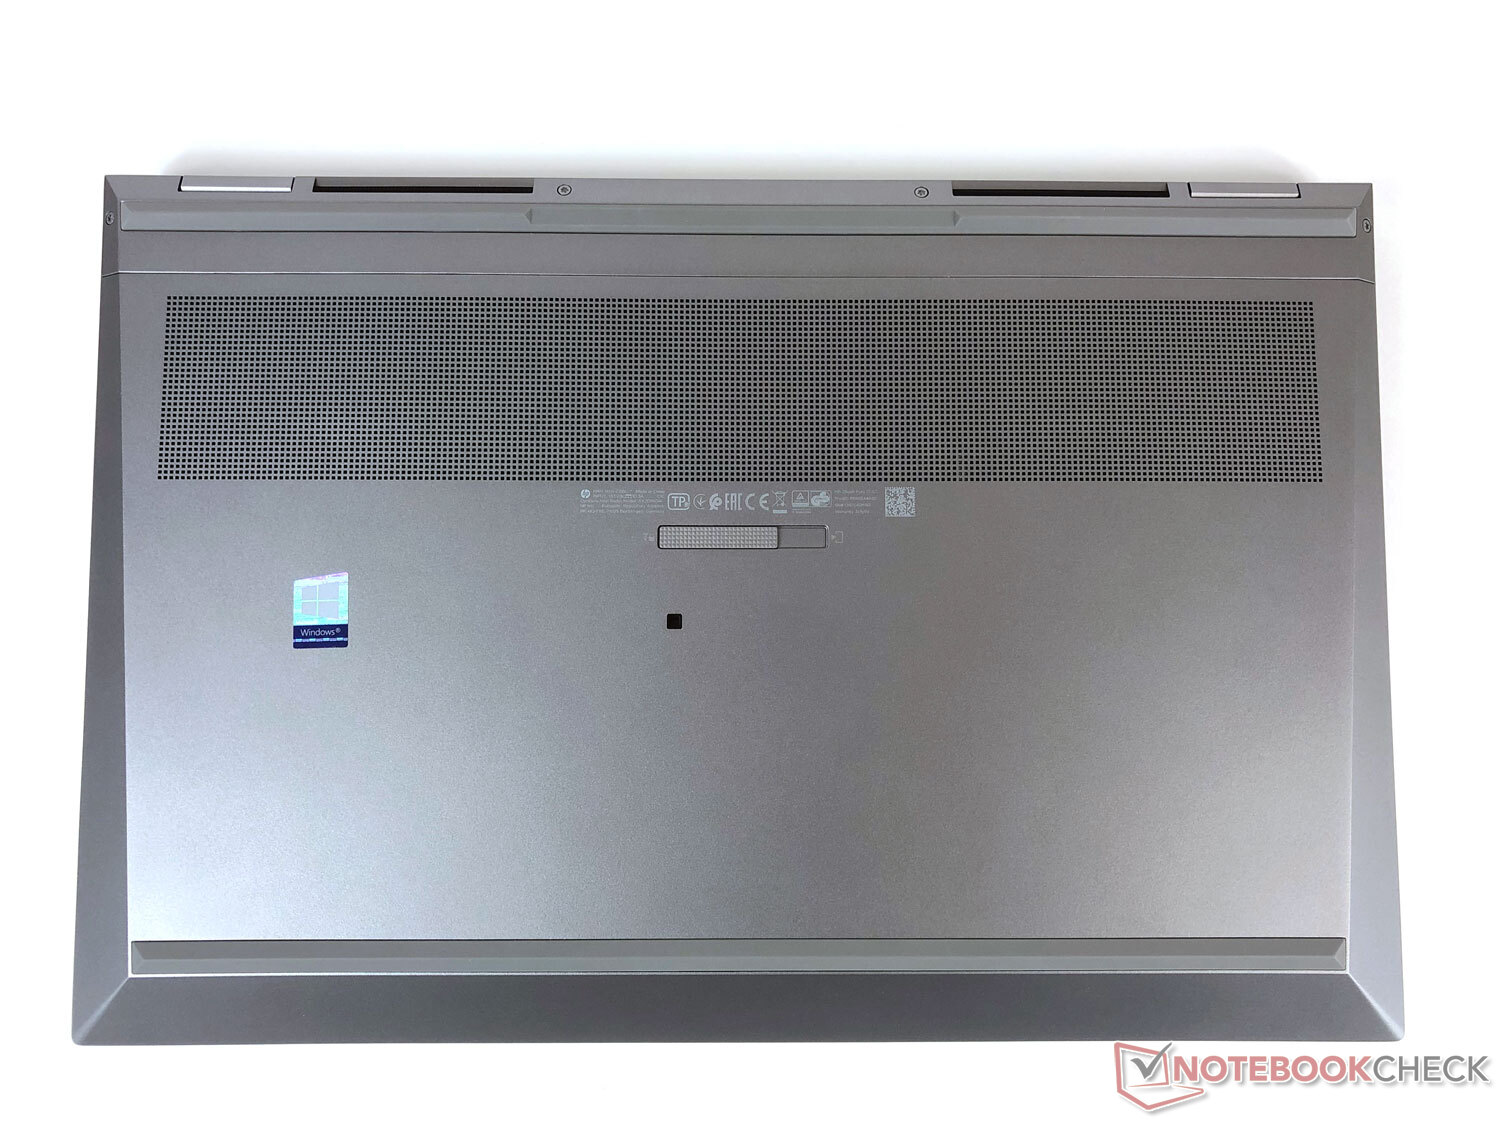
Maintenance
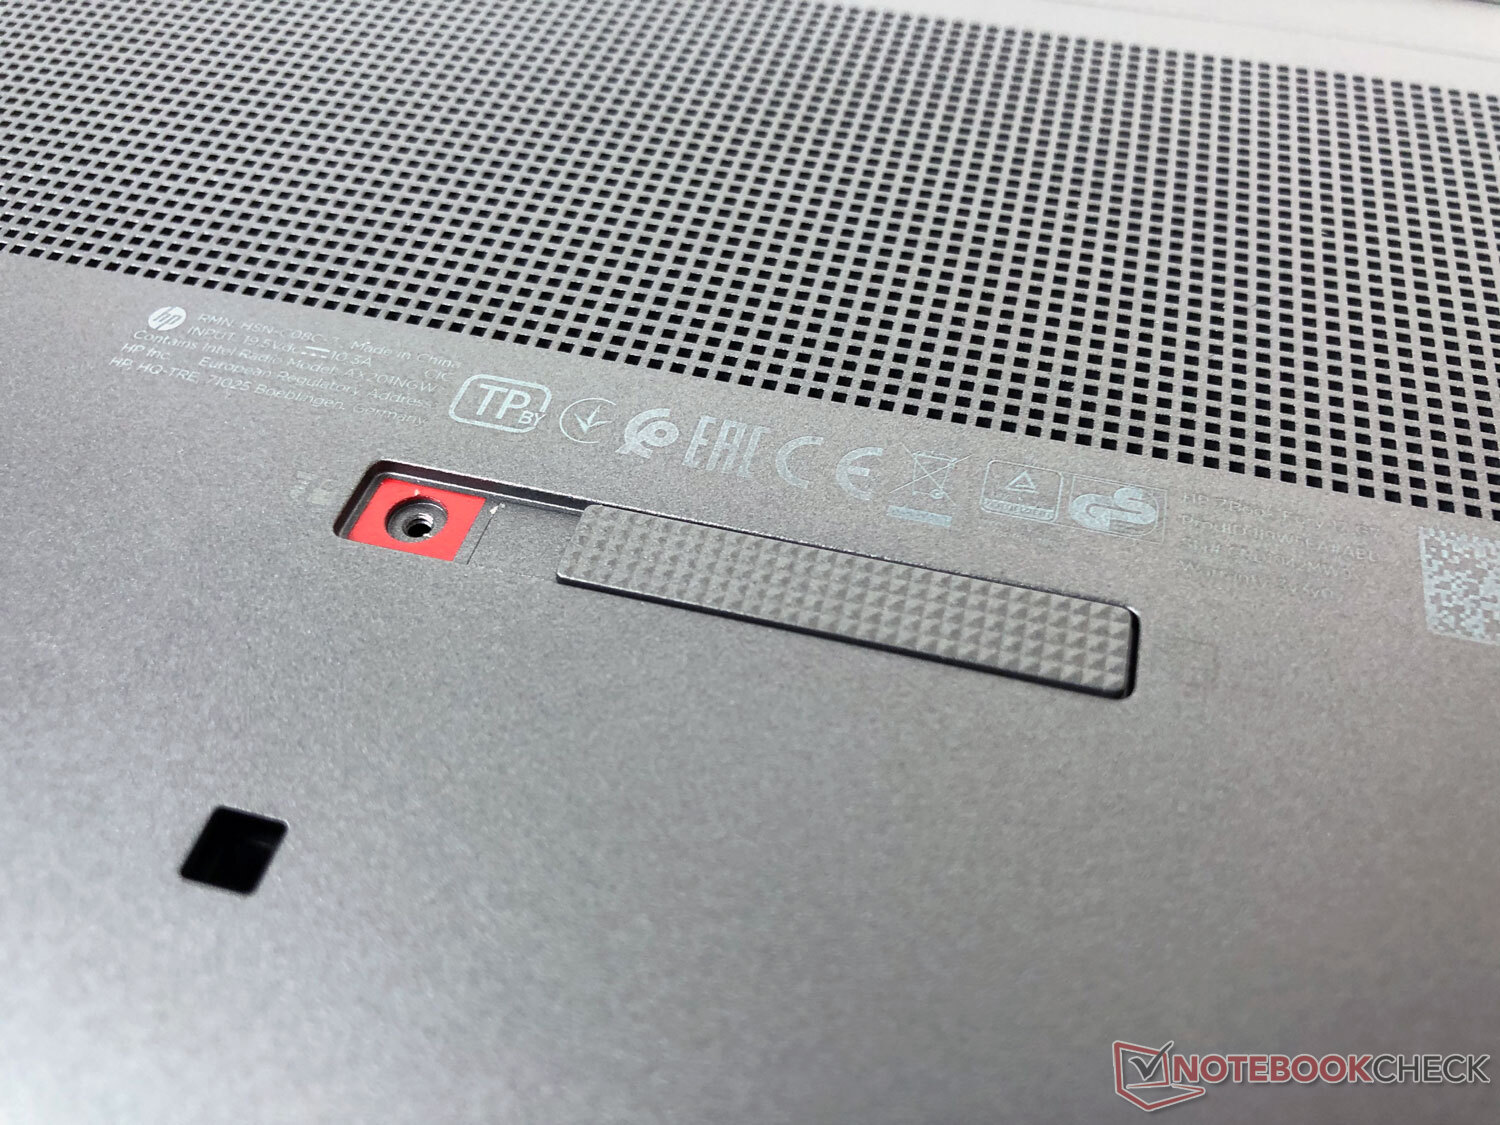
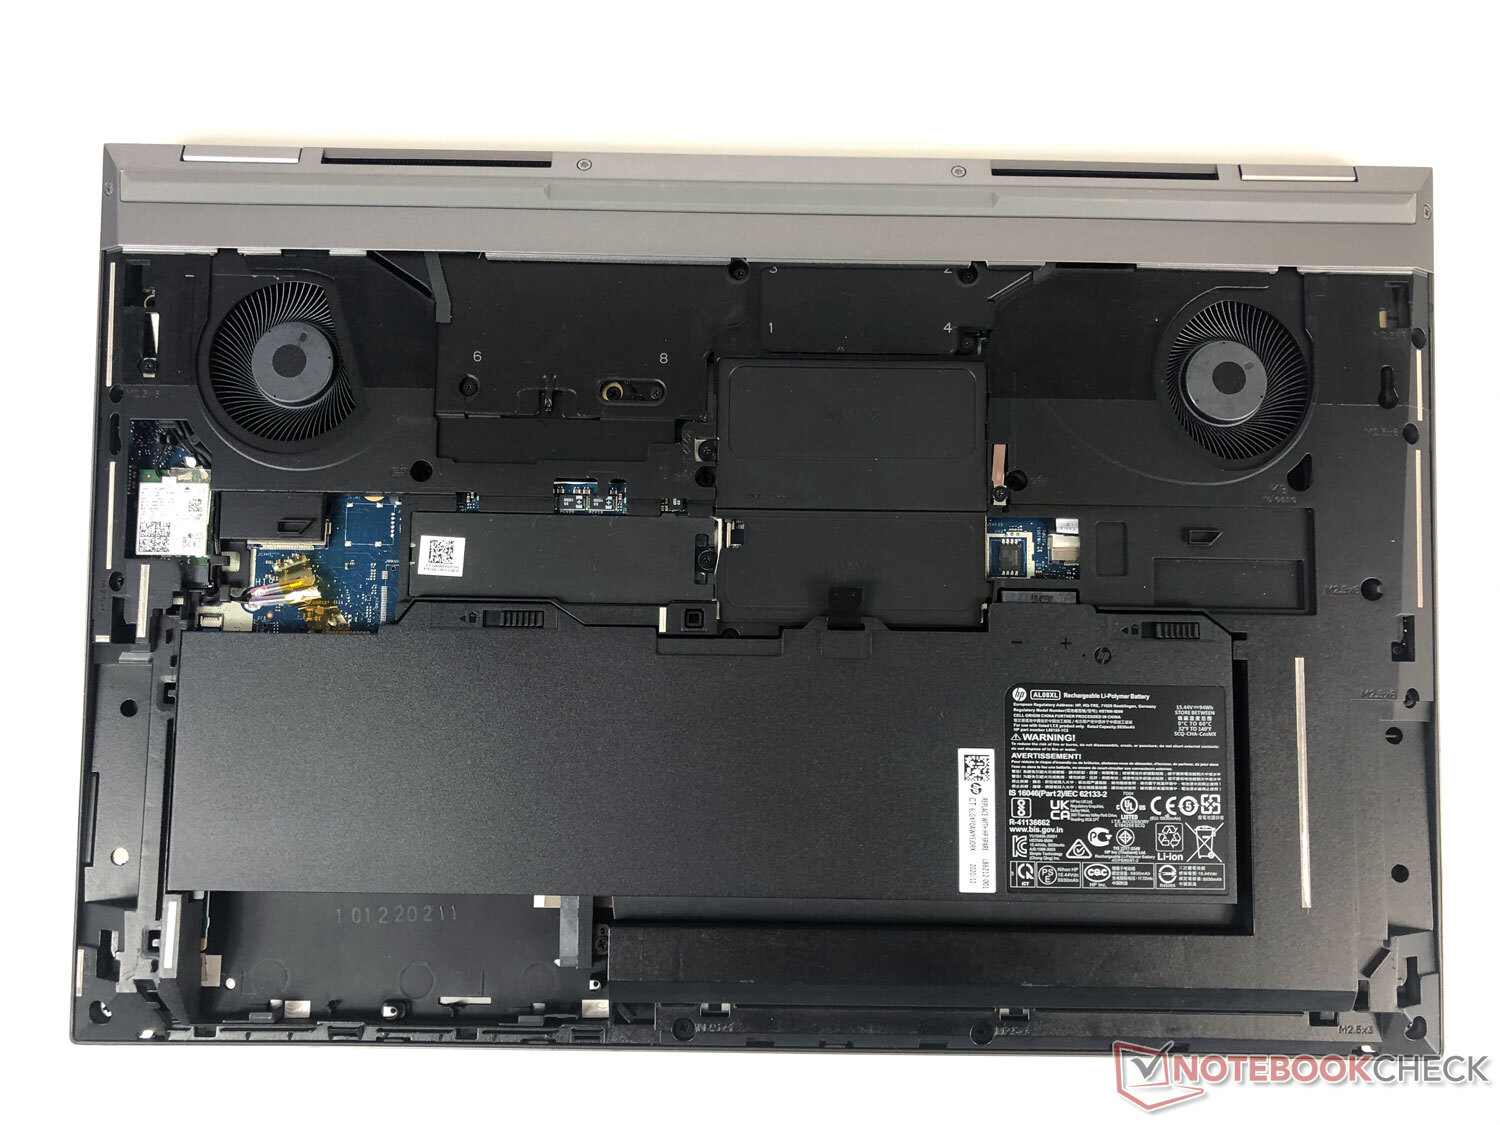
You can unlock the bottom of the case using a slider and then simply remove it. In this way, not only do you get access to the two large fans, but the SSD and RAM can also be replaced. However, you will need a screwdriver to do that. The battery can also be replaced simply.

Warranty
HP offers a limited three-year warranty on parts and labor for the HP ZBook Fury 17 G7 mobile workstation. You can also purchase additional warranty upgrades.
Input Devices: The keyboard feels almost like a PC keyboard
Keyboard
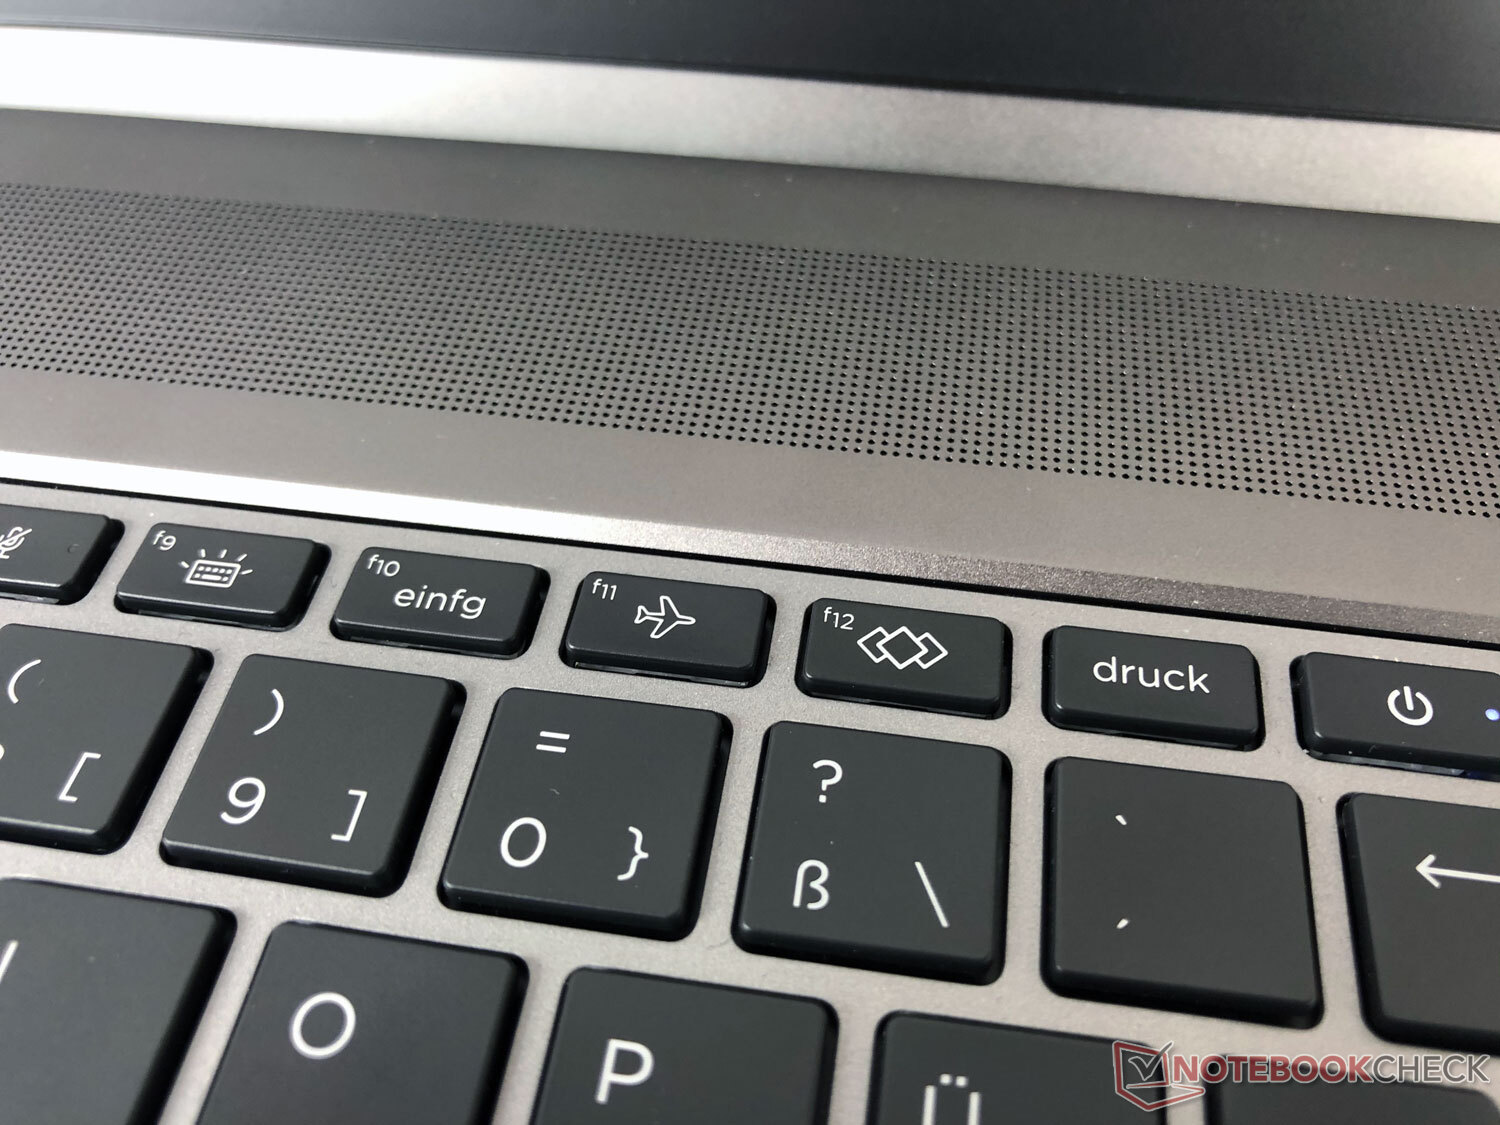
In a workstation, the keyboard is very important, and those who do a lot of typing on a mobile workstation will make a good choice with this model. In our test, the keyboard of the HP ZBook Fury 17 G7 with its number block makes an excellent impression. With its large keystroke, typing feels almost like on a regular PC keyboard, and there is no comparison to the many ultra-slim models in the market. A good typing experience and smooth typing will quickly manifest. The labeling on the keys is easily visible, which is also due to the even background illumination. Except for the space key, which is a little louder, the noise level when typing definitely remains within limits.
The F12 key, which can be individually configured to start programs and more, is something special. On the other hand, the power button, which is "hidden" above the backspace key, is a bit unusual and takes some getting used to.
Touchpad
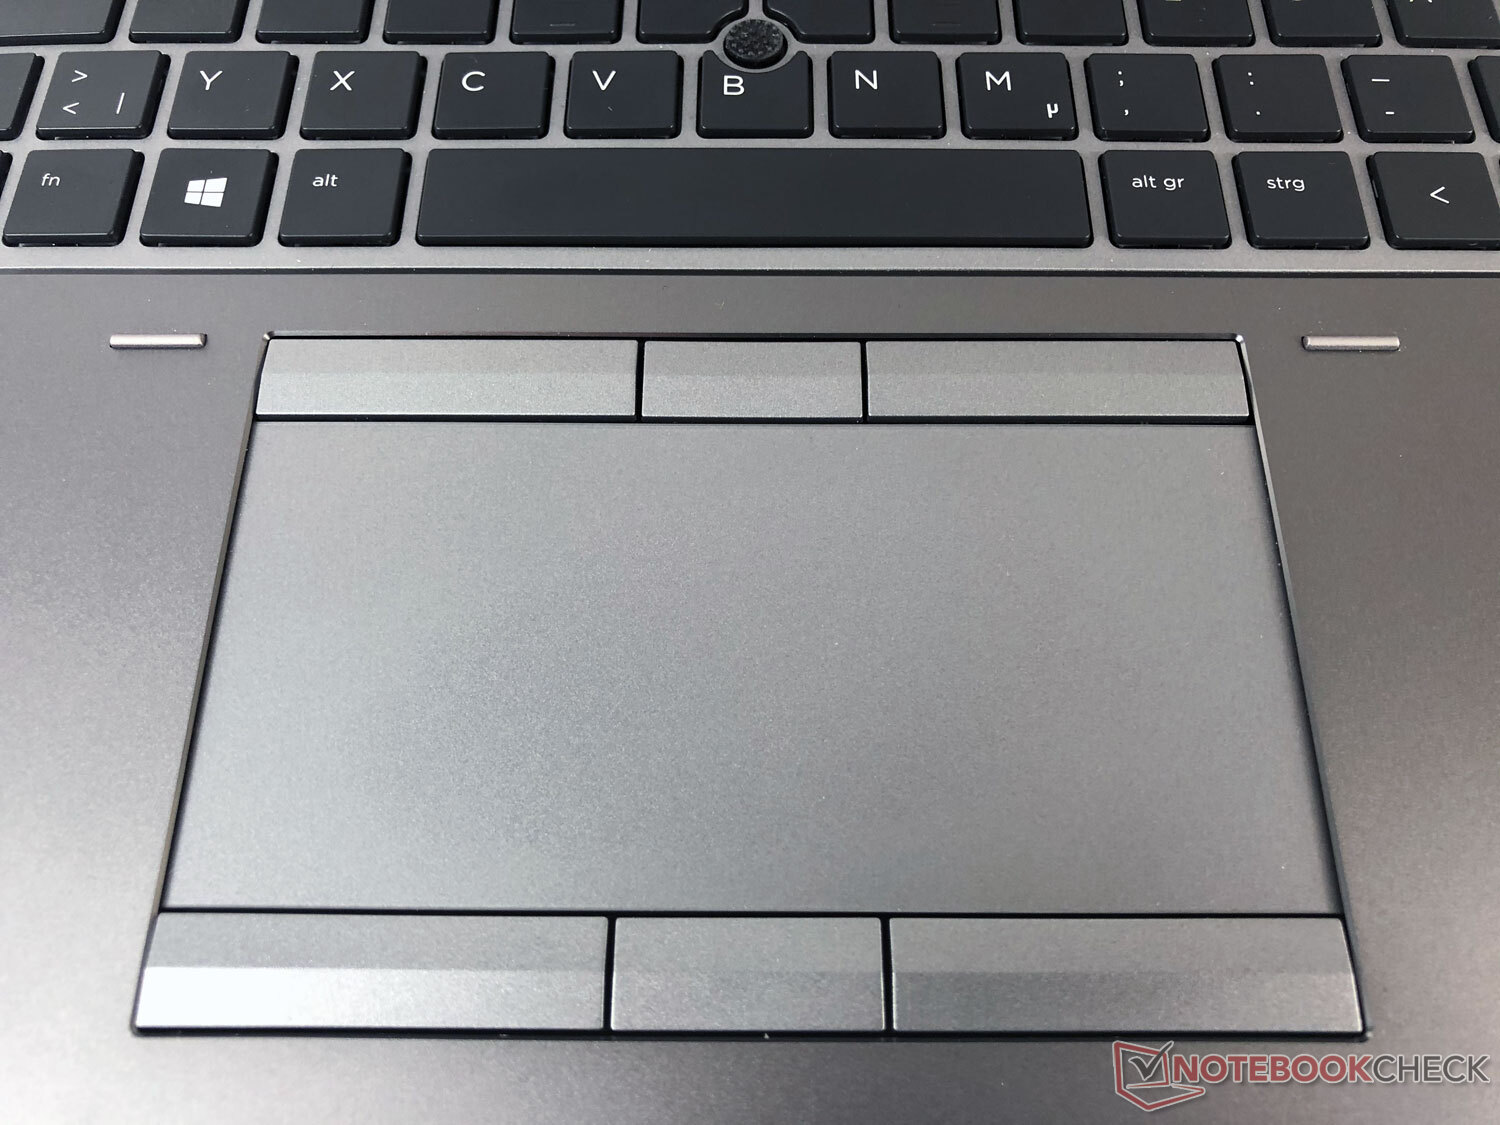
The touchpad is placed below the center of the space key, which means that it is shifted toward the left of the center. The width of 12.5 cm (~4.9 in) offers ample space, but the depth of 6 cm (~2.4 in) is significantly more compact, which is due to the keys for the pointer stick above. The touchpad itself offers comfortable sliding characteristics, and the usual multi-touch gestures are supported. Not only can the three keys above and below be felt easily, but they also offer a significant stroke, which ensures a better feedback without creating an acoustic annoyance.
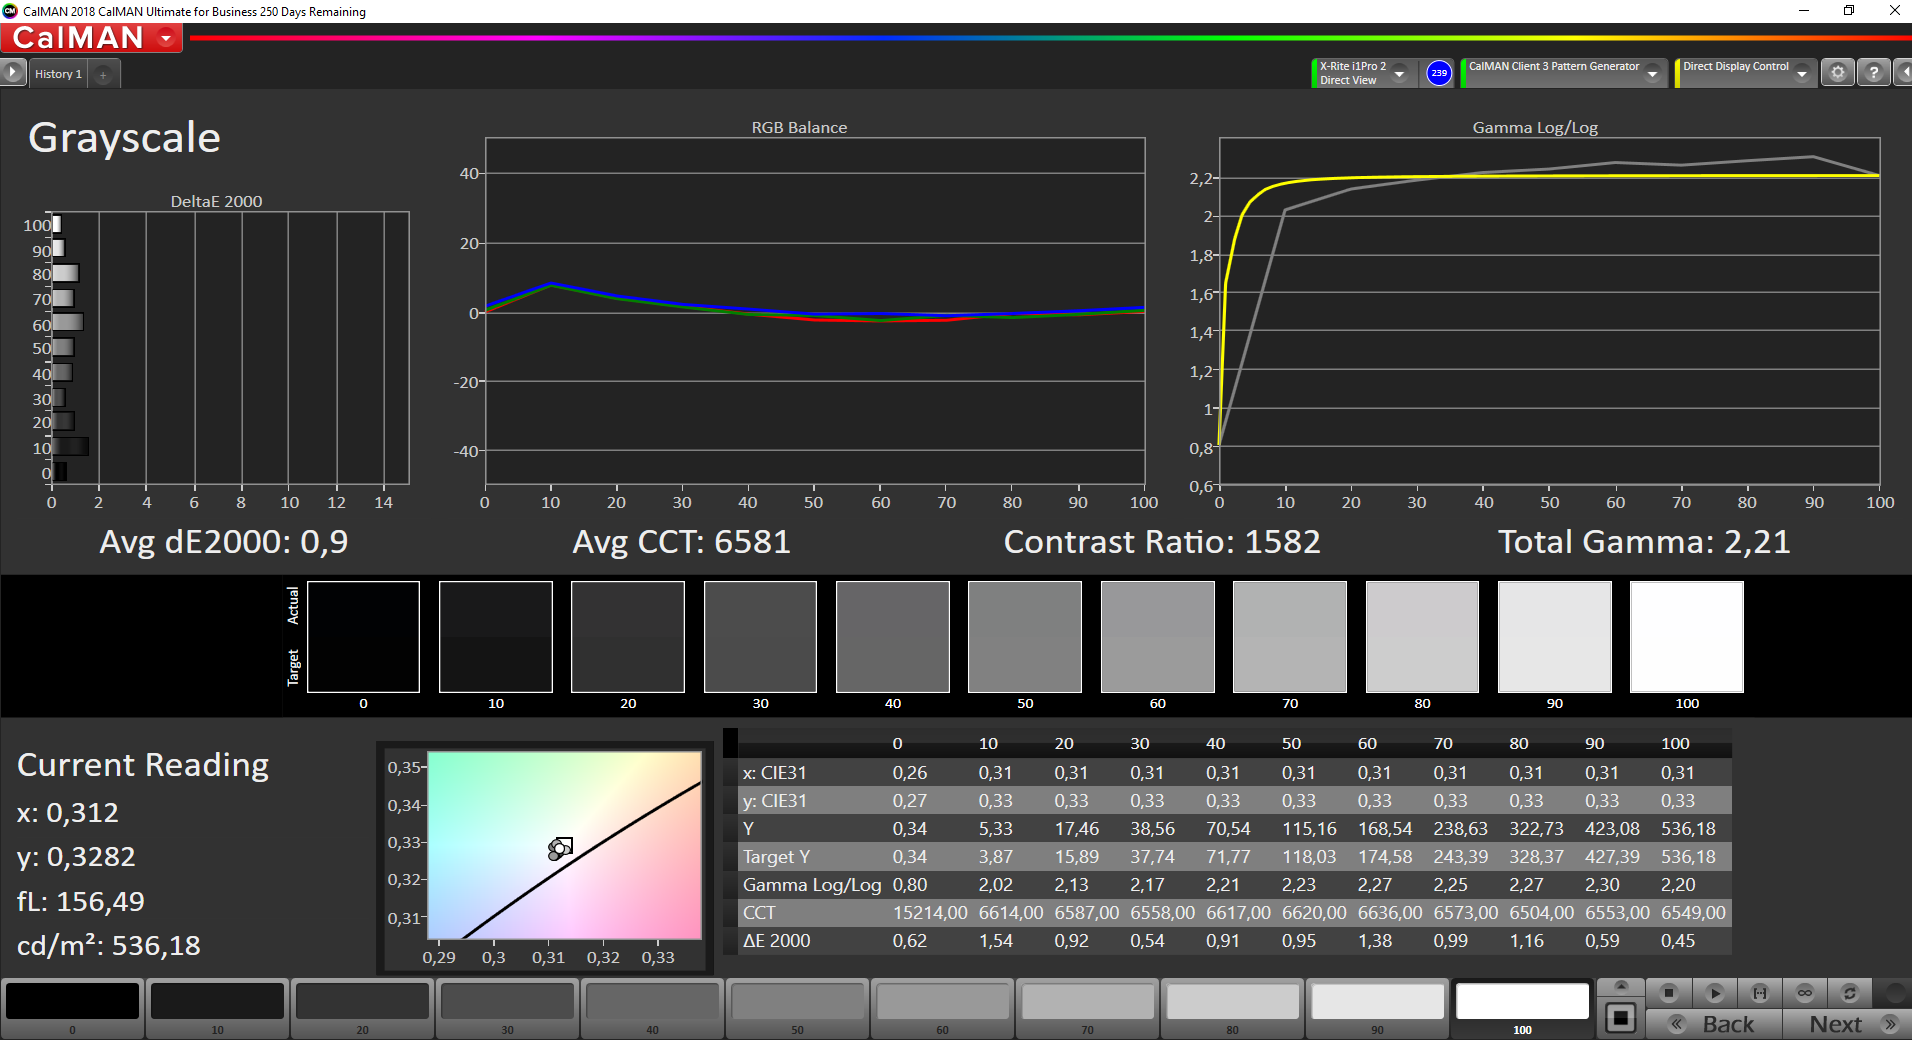
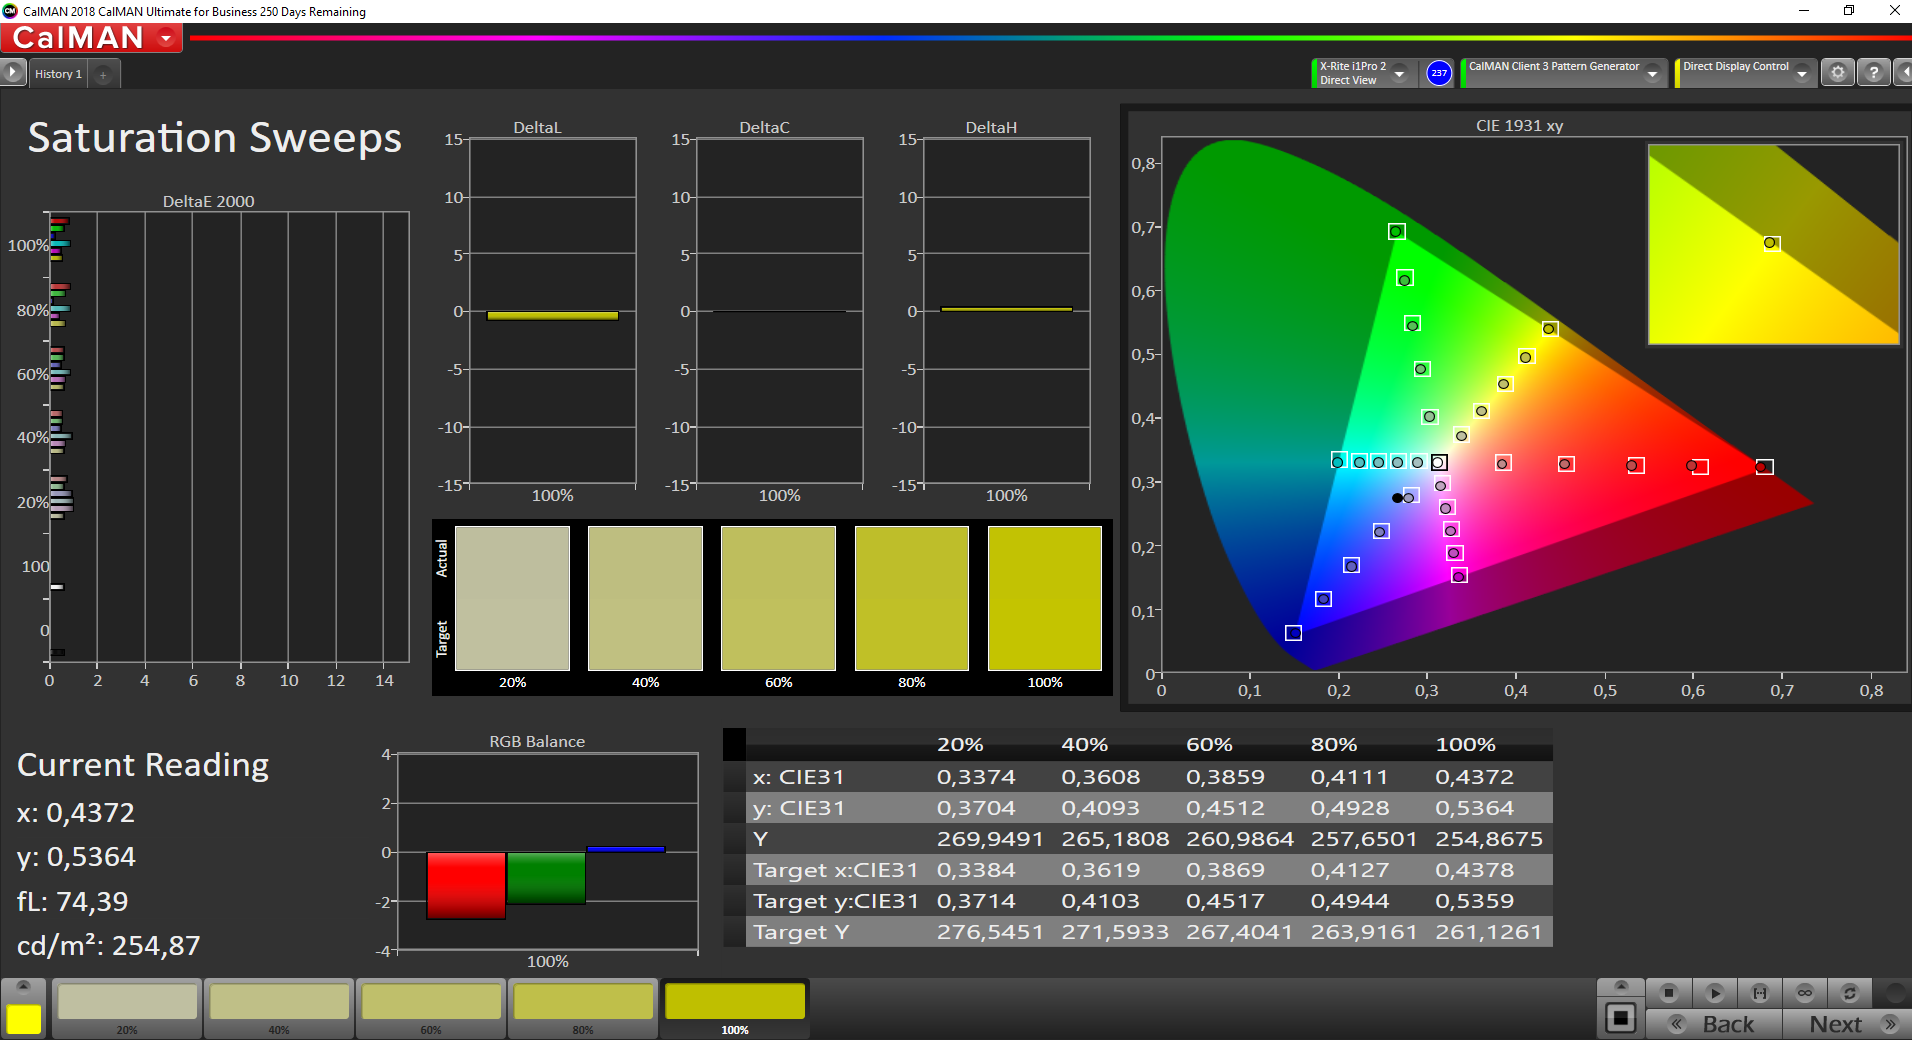
The 4K Display: One of the highlights in the test
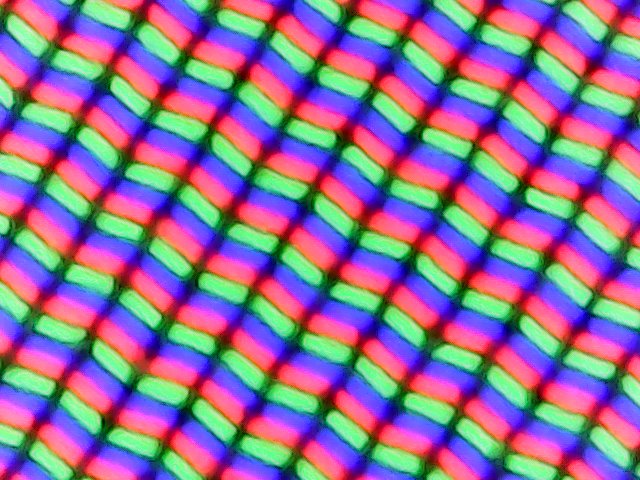
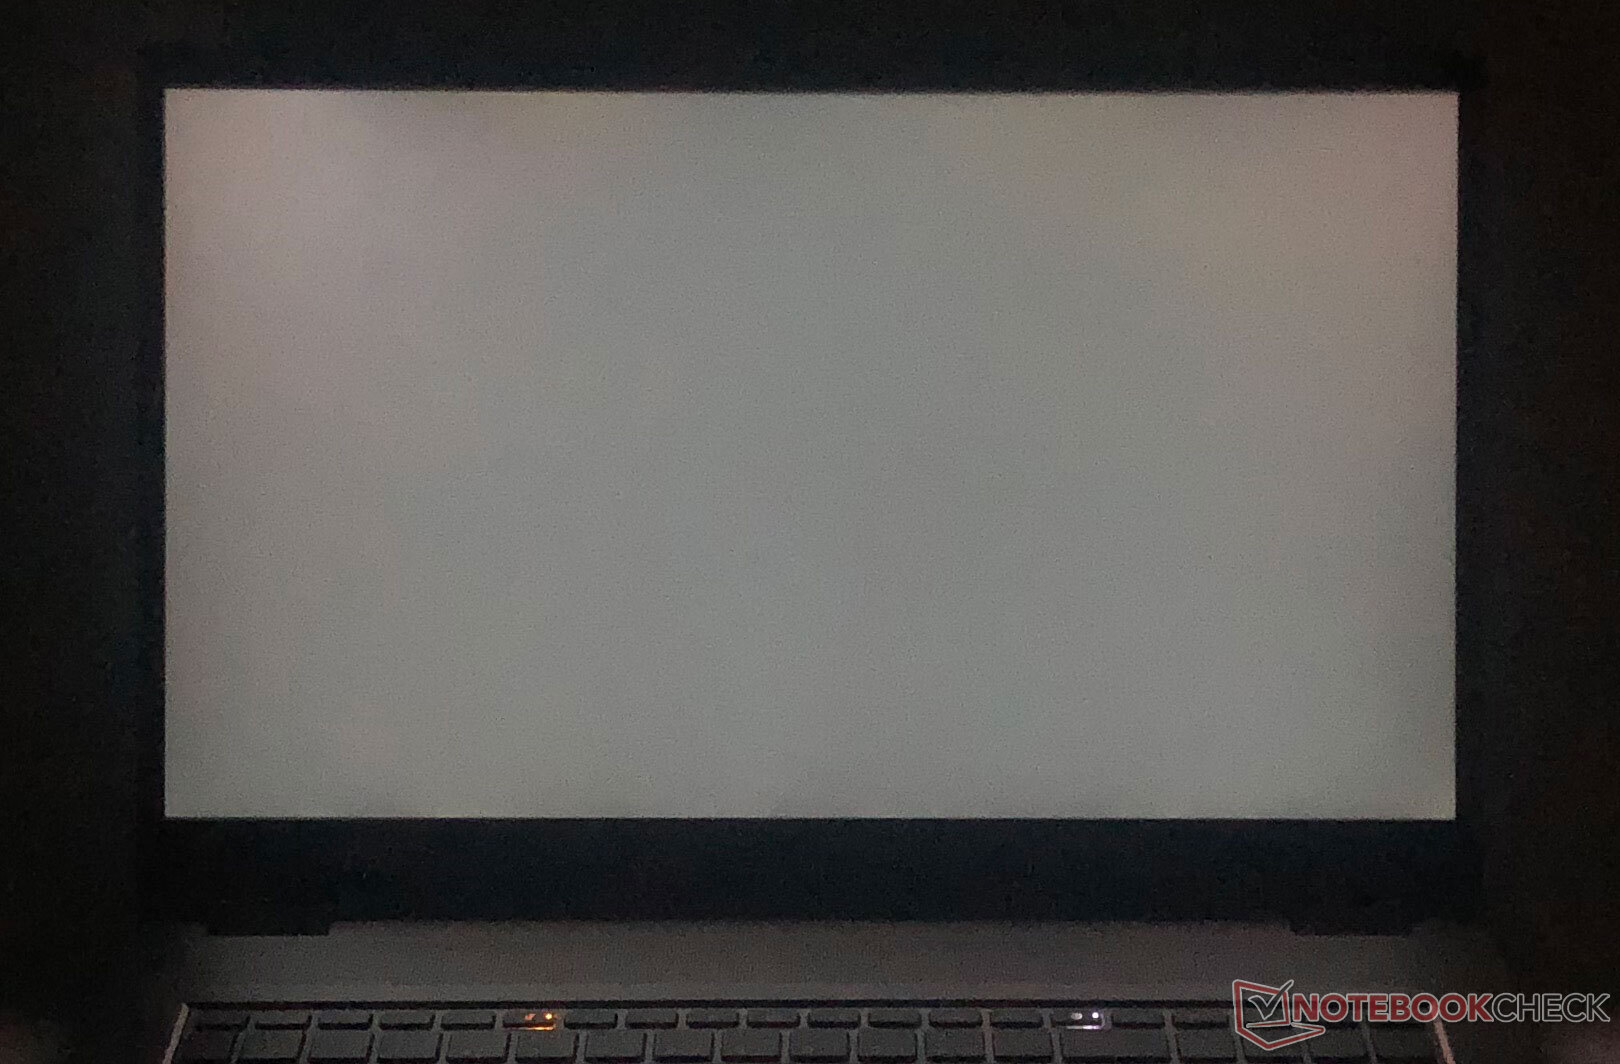
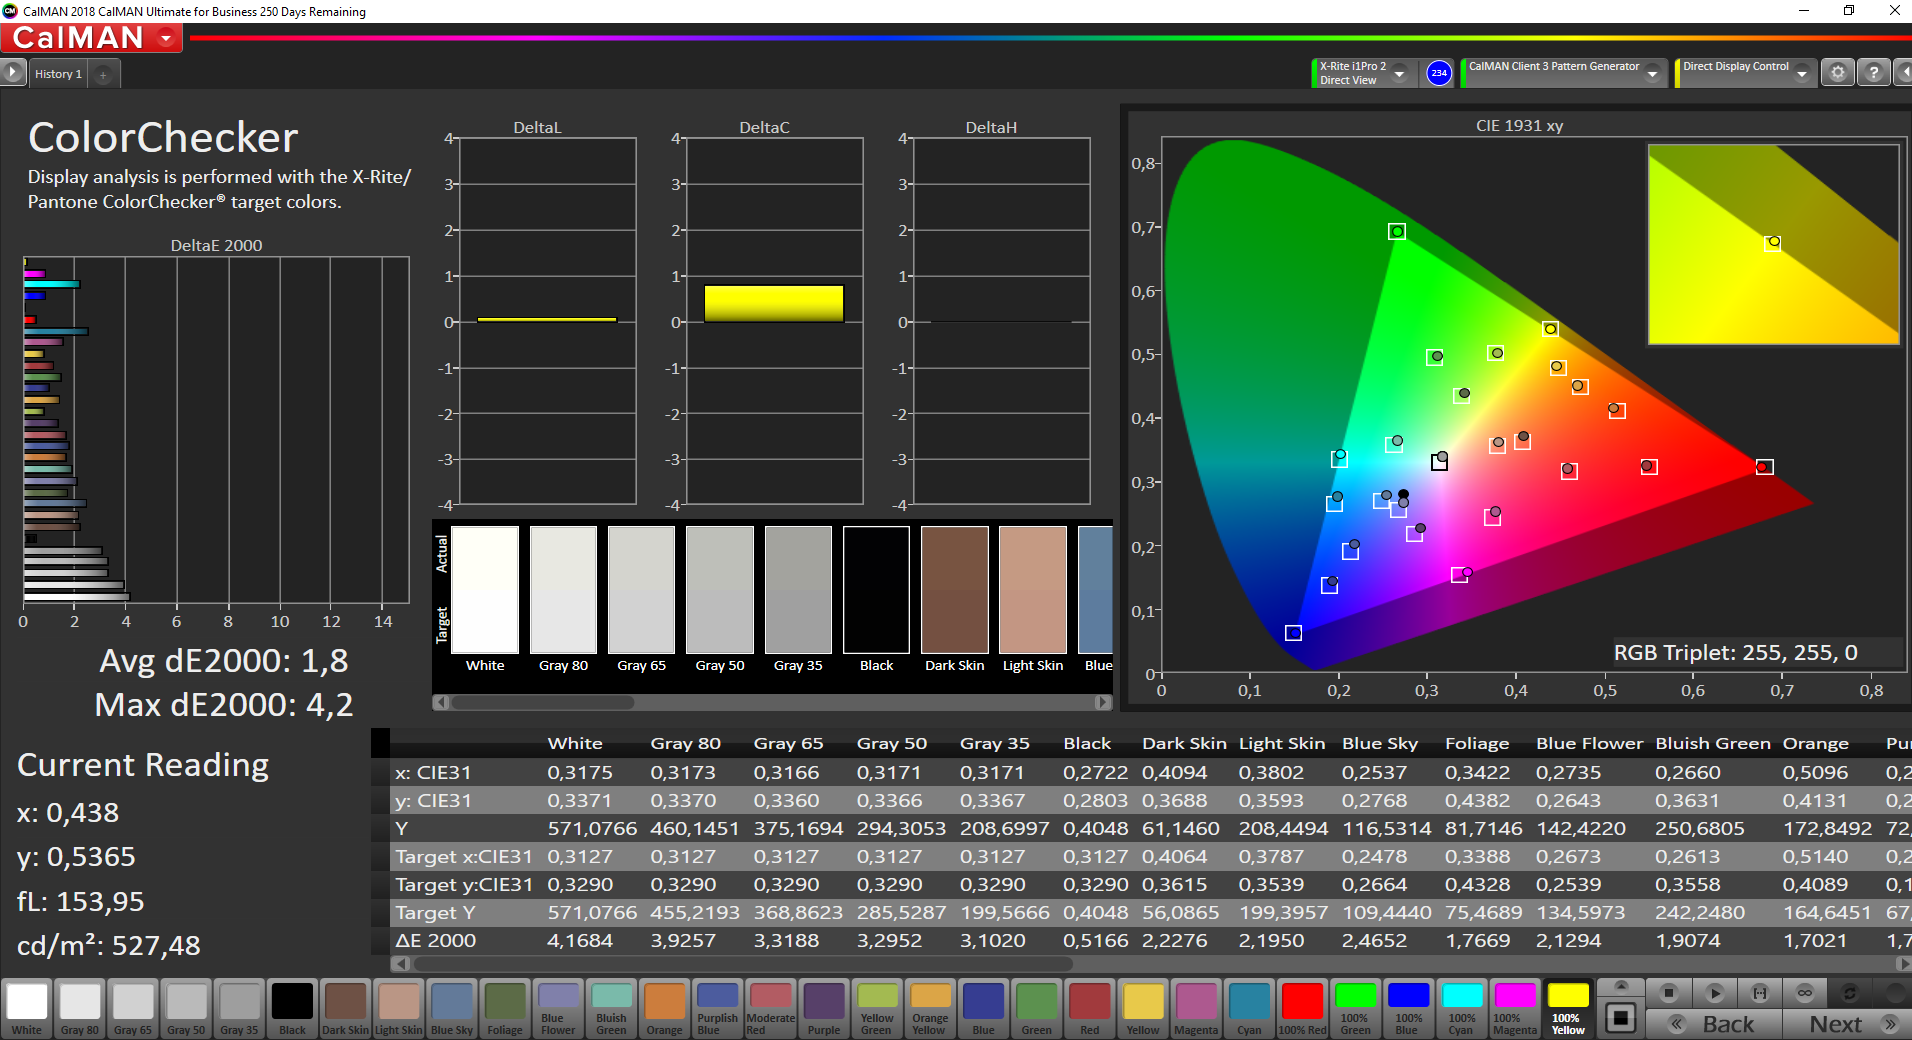
Our test unit is equipped with a DreamColor display with a 4K resolution (3840 x 2160 pixels). This is one of the best that HP has to offer, but compared to the predecessor, the new generation brings two changes.
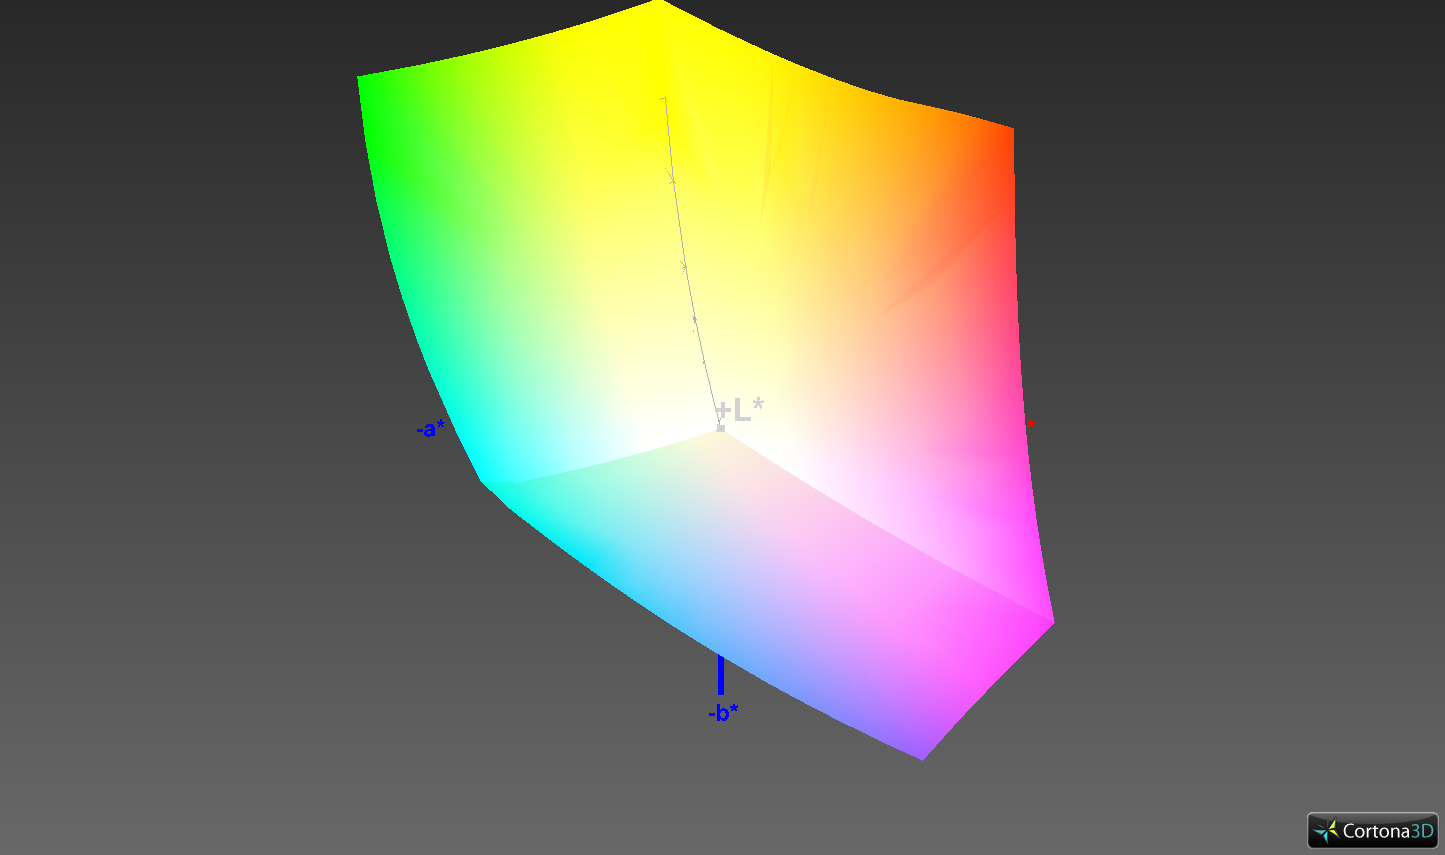
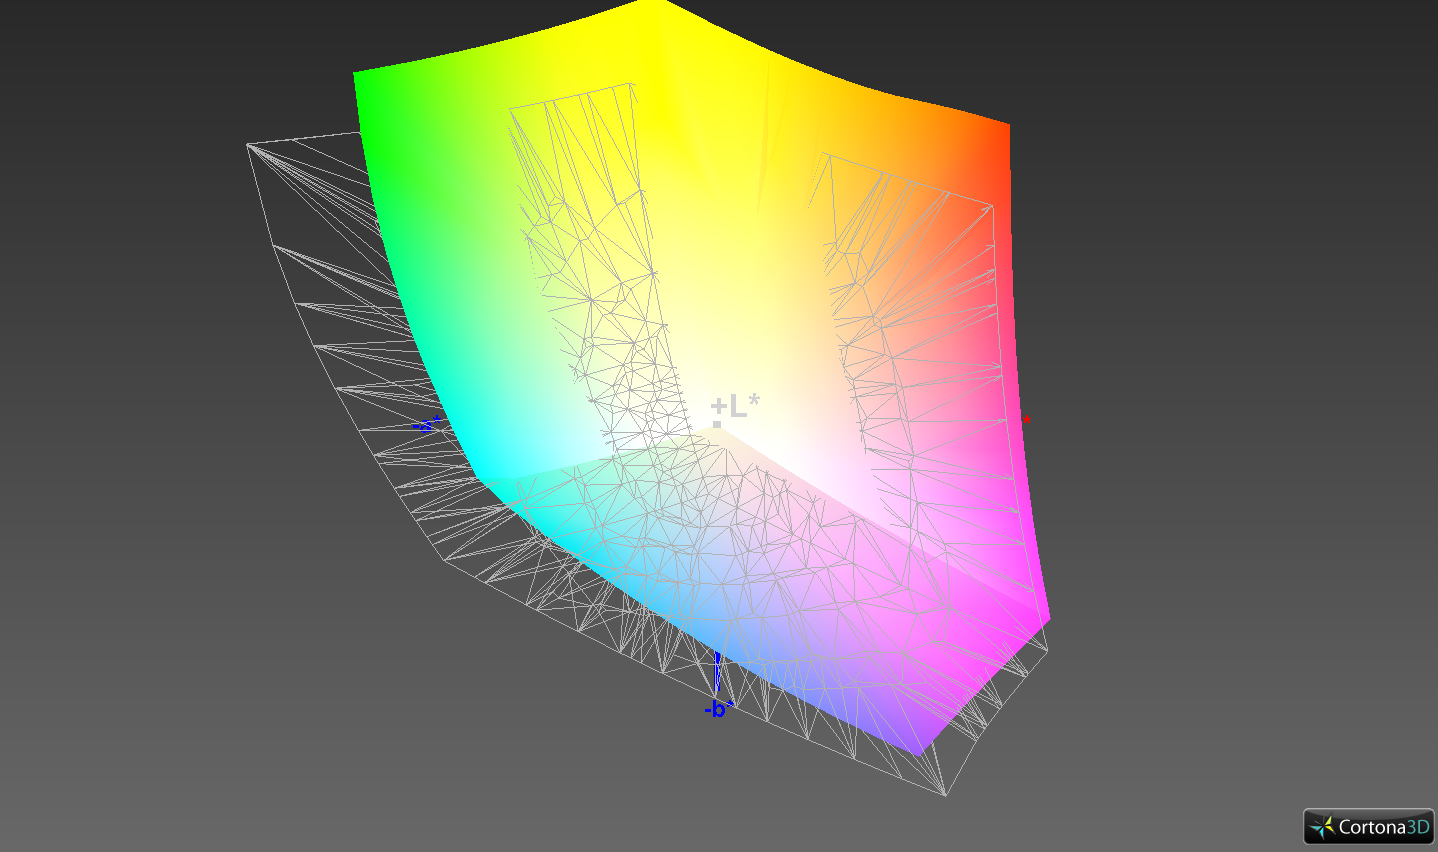
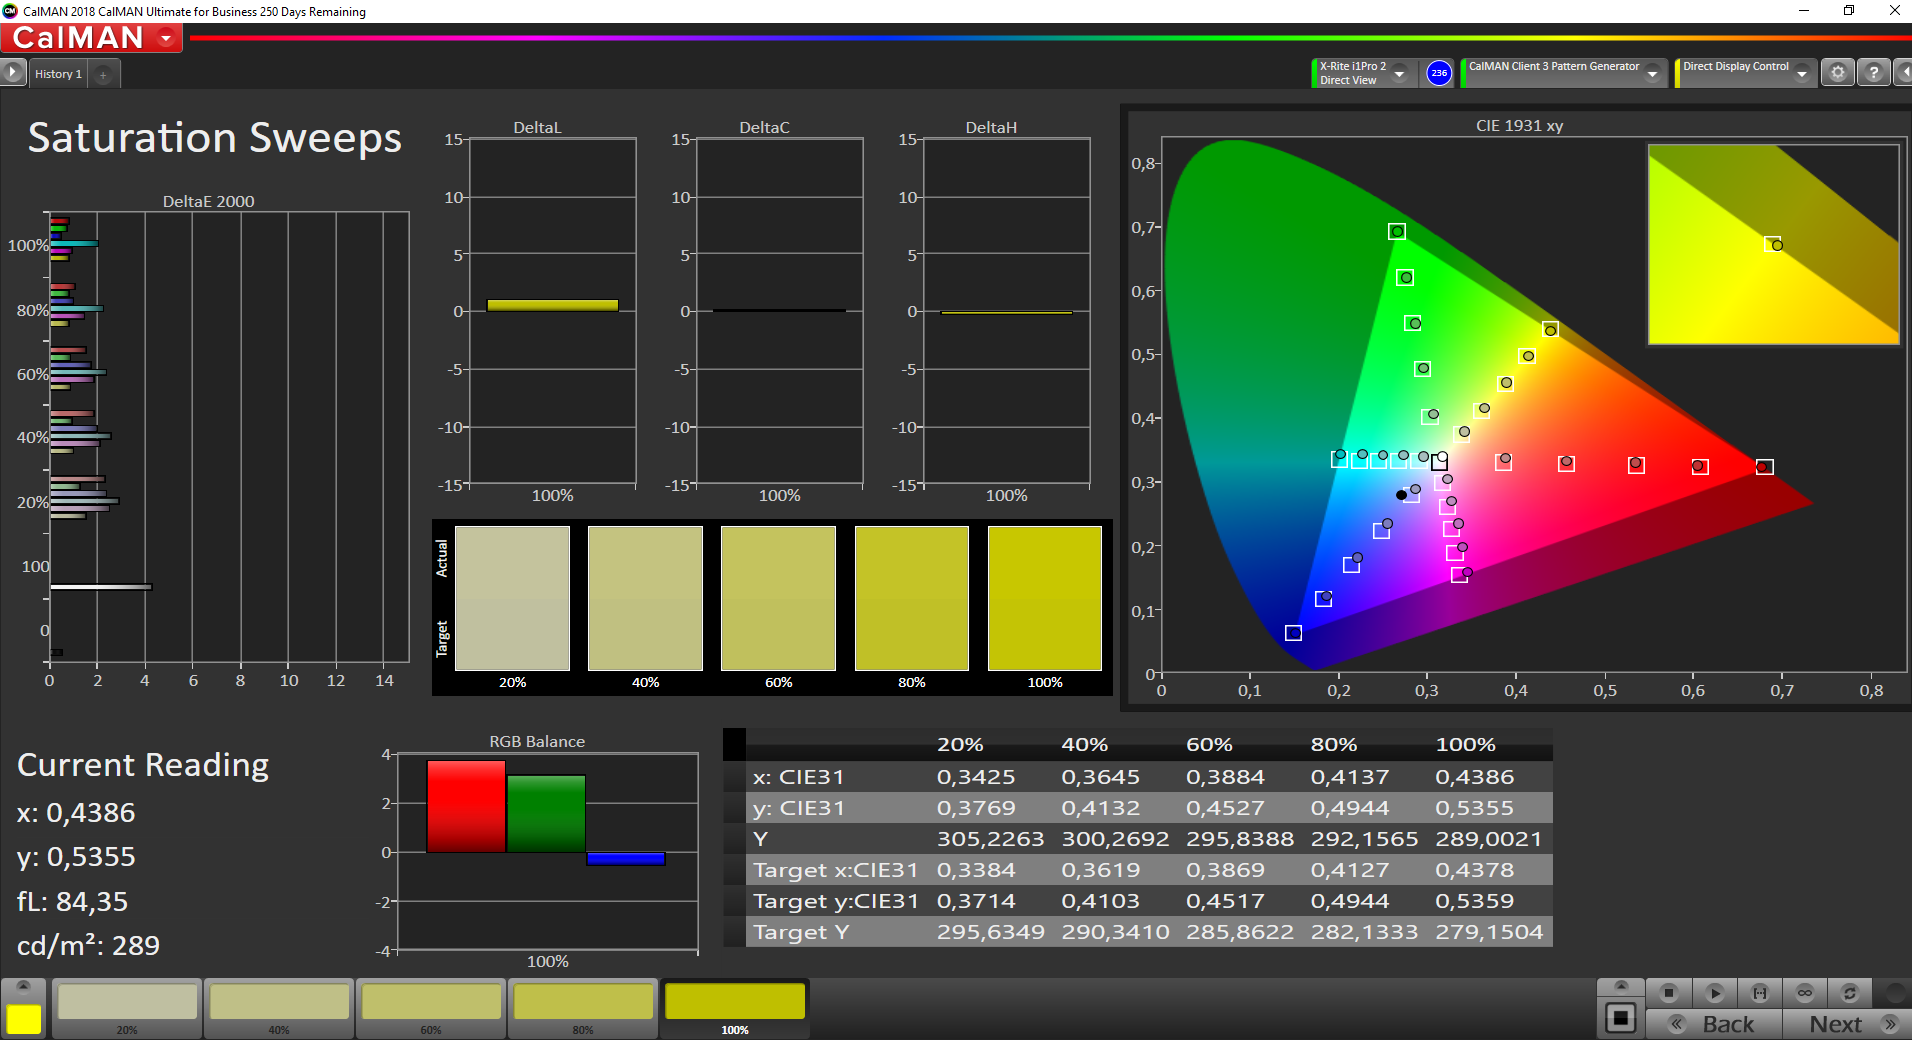
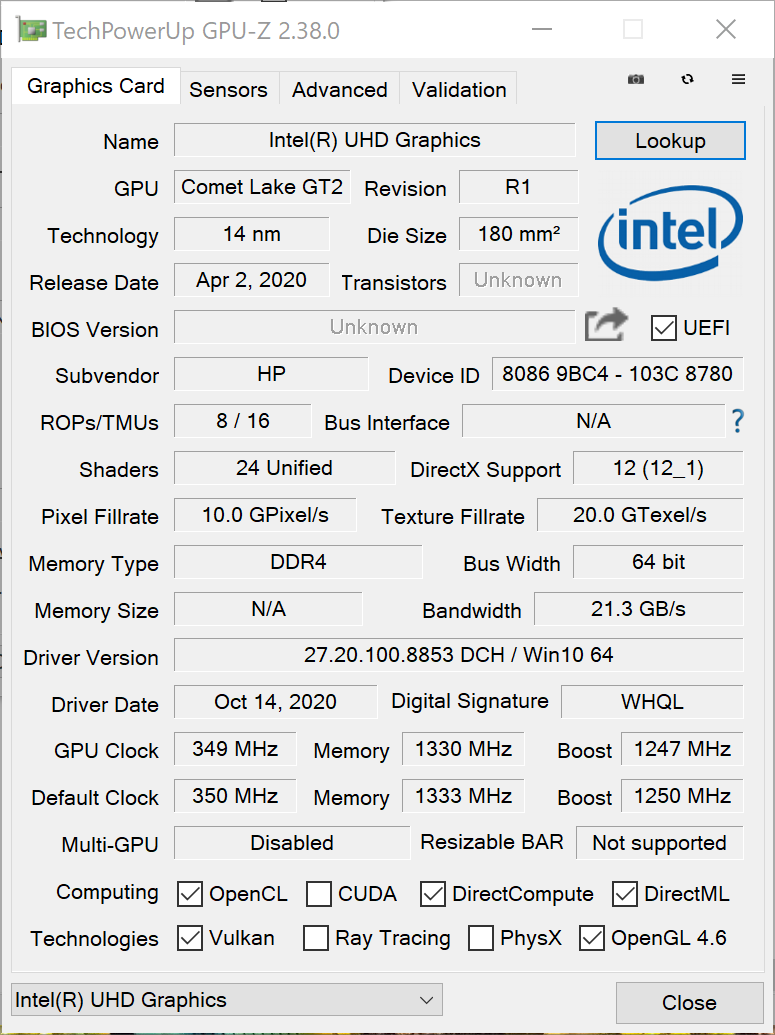
The AdobeRGB color space is not covered completely up to 100% but only to 77.6%, and complete coverage is only achieved for DCI-P3 and sRGB. This is a disadvantage mainly for professional graphics processing. On the other hand, it brings the advantage that the graphics computations under low load are now handled by the iGPU. Before, the dedicated graphics card was always involved, which had a negative effect on the battery life.
At 600 cd/m², the display offers a pleasant brightness and fairly even brightness distribution.
| |||||||||||||||||||||||||
Brightness Distribution: 91 %
Center on Battery: 574 cd/m²
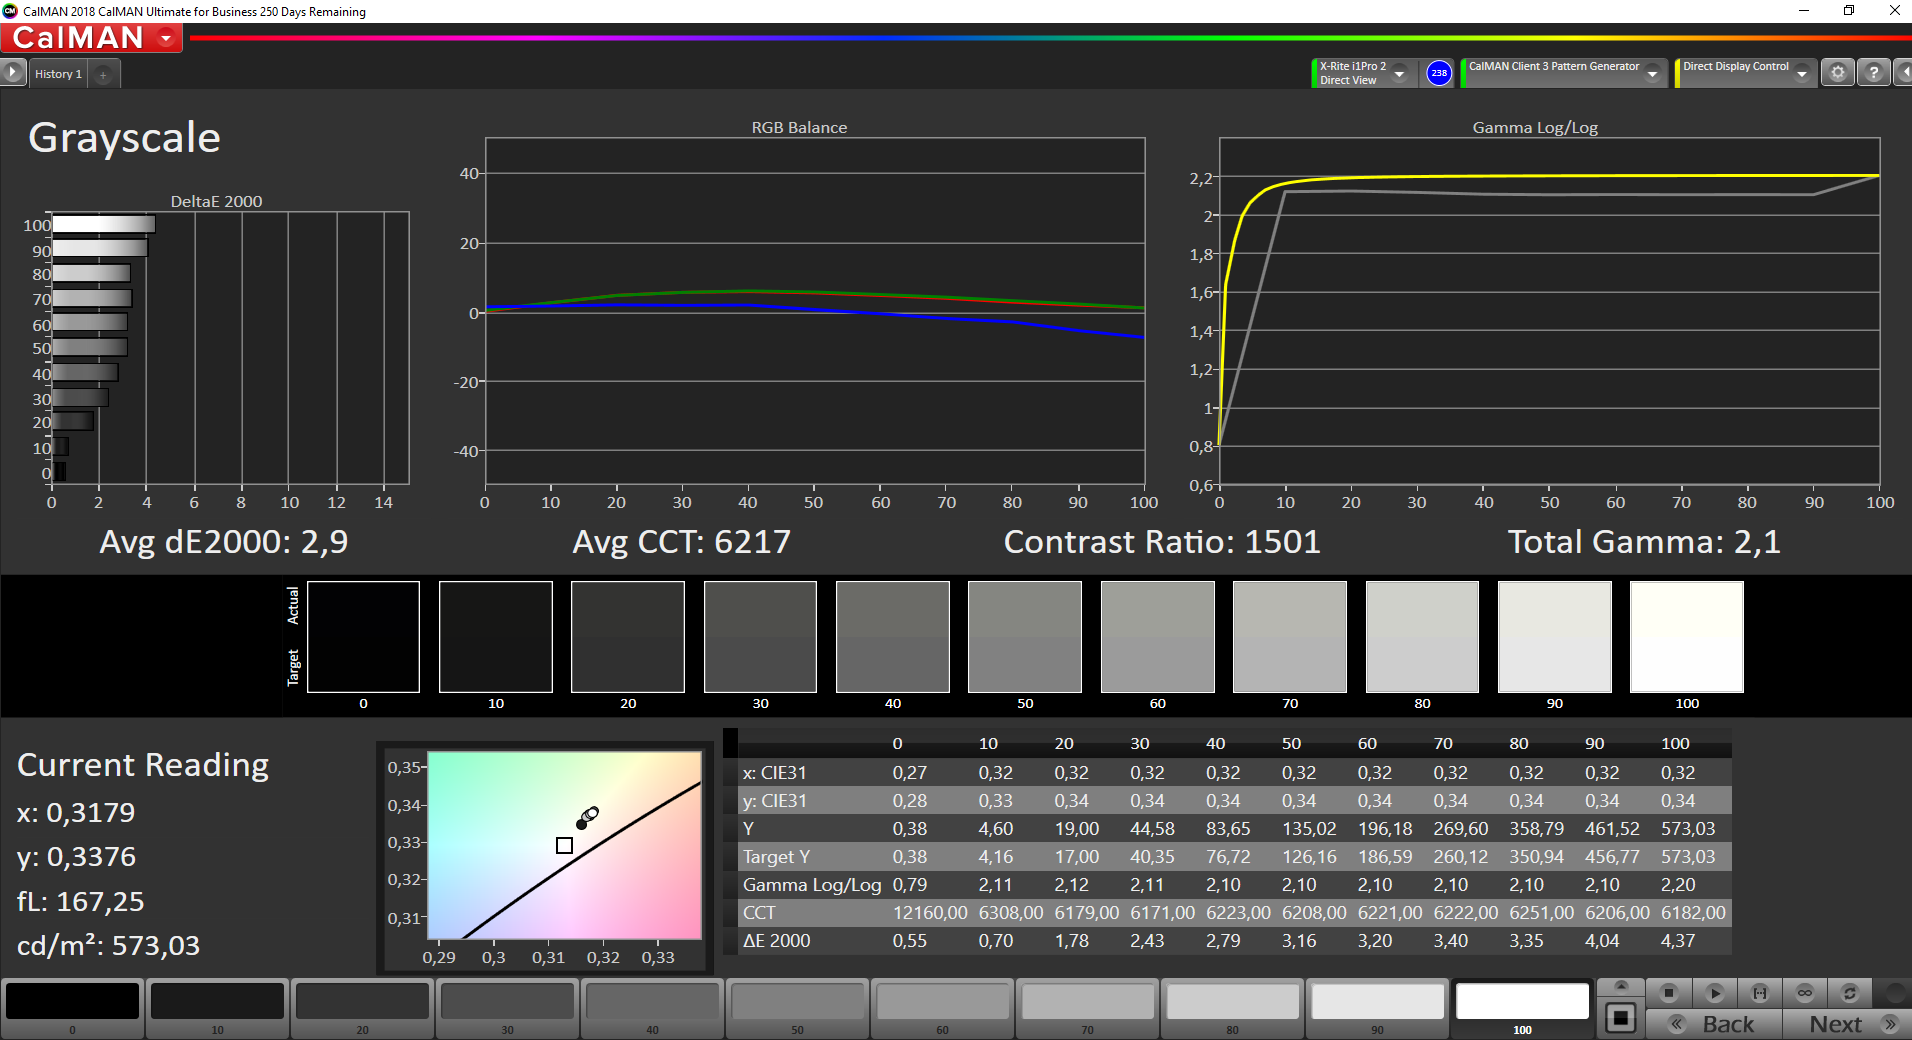
Contrast: 1508:1 (Black: 0.38 cd/m²)
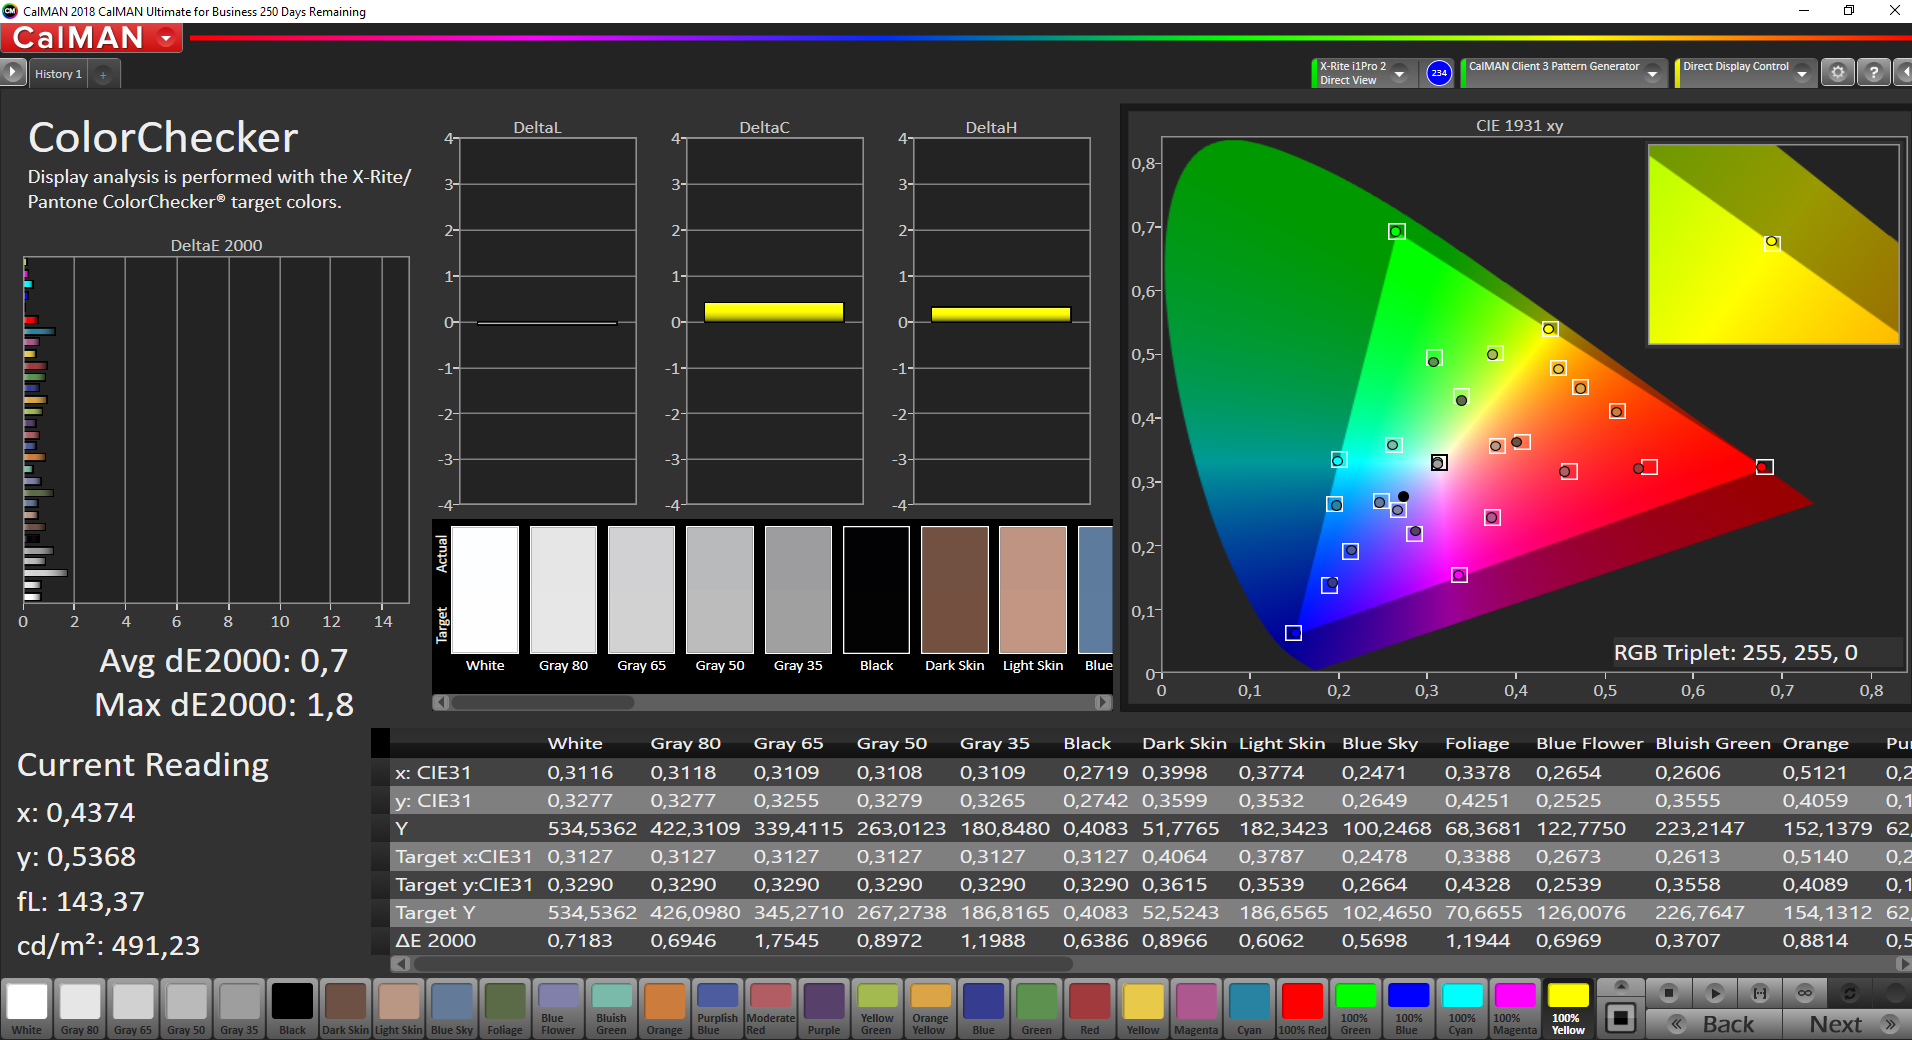
ΔE ColorChecker Calman: 1.9 | ∀{0.5-29.43 Ø4.72}
calibrated: 0.7
ΔE Greyscale Calman: 2.9 | ∀{0.09-98 Ø4.97}
100% sRGB (Argyll 1.6.3 3D)
77.6% AdobeRGB 1998 (Argyll 1.6.3 3D)
86.9% AdobeRGB 1998 (Argyll 3D)
99.9% sRGB (Argyll 3D)
99.3% Display P3 (Argyll 3D)
Gamma: 2.1
CCT: 6217 K
| HP ZBook Fury 17 G7 119W5EA AUOCD8C, , 3840x2160, 17.3" | Lenovo ThinkPad P73-20QR0030GE B173ZAN01.0, IPS, 3840x2160, 17.3" | HP ZBook Fury 15 G7 LG Philips LGD0661, IPS, 3840x2160, 15.6" | Asus StudioBook Pro X W730G5T-H8050T 17PUW1-B00, IPS LED, 1920x1200, 17" | Dell Precision 7550 AU Optronics B156ZAN, IPS, 3840x2160, 15.6" | |
|---|---|---|---|---|---|
| Display | 0% | -2% | -2% | -2% | |
| Display P3 Coverage (%) | 99.3 | 86.8 -13% | 95.6 -4% | 96 -3% | 82.1 -17% |
| sRGB Coverage (%) | 99.9 | 100 0% | 99.8 0% | 99.8 0% | 99.6 0% |
| AdobeRGB 1998 Coverage (%) | 86.9 | 98.8 14% | 84.5 -3% | 84.5 -3% | 96.8 11% |
| Response Times | 28% | 5% | 25% | 12% | |
| Response Time Grey 50% / Grey 80% * (ms) | 56 ? | 44 ? 21% | 56 ? -0% | 41.6 ? 26% | 51.2 ? 9% |
| Response Time Black / White * (ms) | 40 ? | 26.4 ? 34% | 36 ? 10% | 30.8 ? 23% | 34 ? 15% |
| PWM Frequency (Hz) | |||||
| Screen | -41% | -51% | -8% | -74% | |
| Brightness middle (cd/m²) | 573 | 366 -36% | 672.8 17% | 341 -40% | 473.5 -17% |
| Brightness (cd/m²) | 586 | 349 -40% | 674 15% | 319 -46% | 461 -21% |
| Brightness Distribution (%) | 91 | 88 -3% | 89 -2% | 80 -12% | 90 -1% |
| Black Level * (cd/m²) | 0.38 | 0.38 -0% | 0.5 -32% | 0.43 -13% | 0.55 -45% |
| Contrast (:1) | 1508 | 963 -36% | 1346 -11% | 793 -47% | 861 -43% |
| Colorchecker dE 2000 * | 1.9 | 4.3 -126% | 3.48 -83% | 1.5 21% | 4.8 -153% |
| Colorchecker dE 2000 max. * | 4.2 | 7.1 -69% | 9.44 -125% | 2.8 33% | 8.73 -108% |
| Colorchecker dE 2000 calibrated * | 0.7 | 1.1 -57% | 3.03 -333% | 0.8 -14% | 3.08 -340% |
| Greyscale dE 2000 * | 2.9 | 5.5 -90% | 3.1 -7% | 2.1 28% | 5.6 -93% |
| Gamma | 2.1 105% | 2.47 89% | 2.04 108% | 2.27 97% | 2.34 94% |
| CCT | 6217 105% | 6281 103% | 6380 102% | 6281 103% | 7549 86% |
| Color Space (Percent of AdobeRGB 1998) (%) | 77.6 | 86 11% | 75.2 -3% | 75.6 -3% | 86.4 11% |
| Color Space (Percent of sRGB) (%) | 100 | 100 0% | 100 0% | 99.8 0% | 99.7 0% |
| Total Average (Program / Settings) | -4% /
-24% | -16% /
-35% | 5% /
-3% | -21% /
-50% |
* ... smaller is better
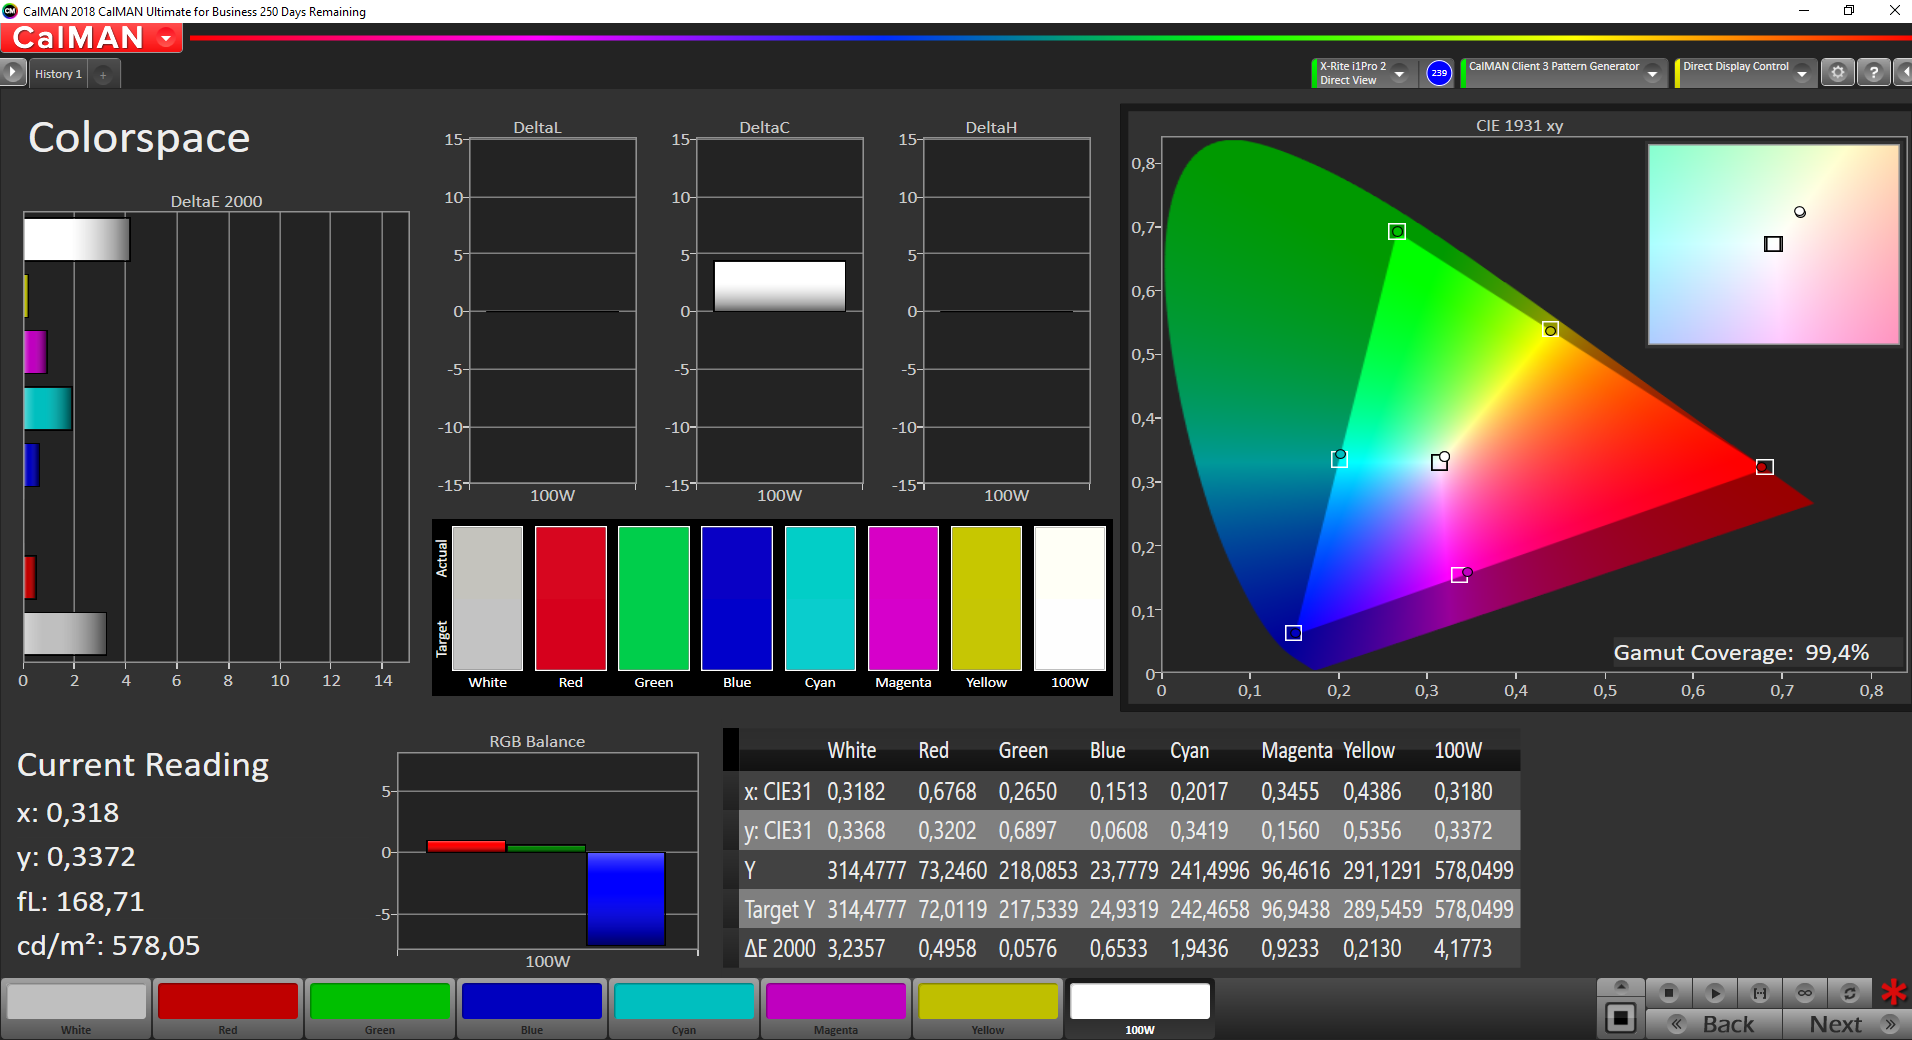
The panel offers a balanced image already in the state of delivery, but it can still be further optimized with a calibration. Visually, the display creates an excellent impression, offering vibrant colors and a good contrast of 1508:1.
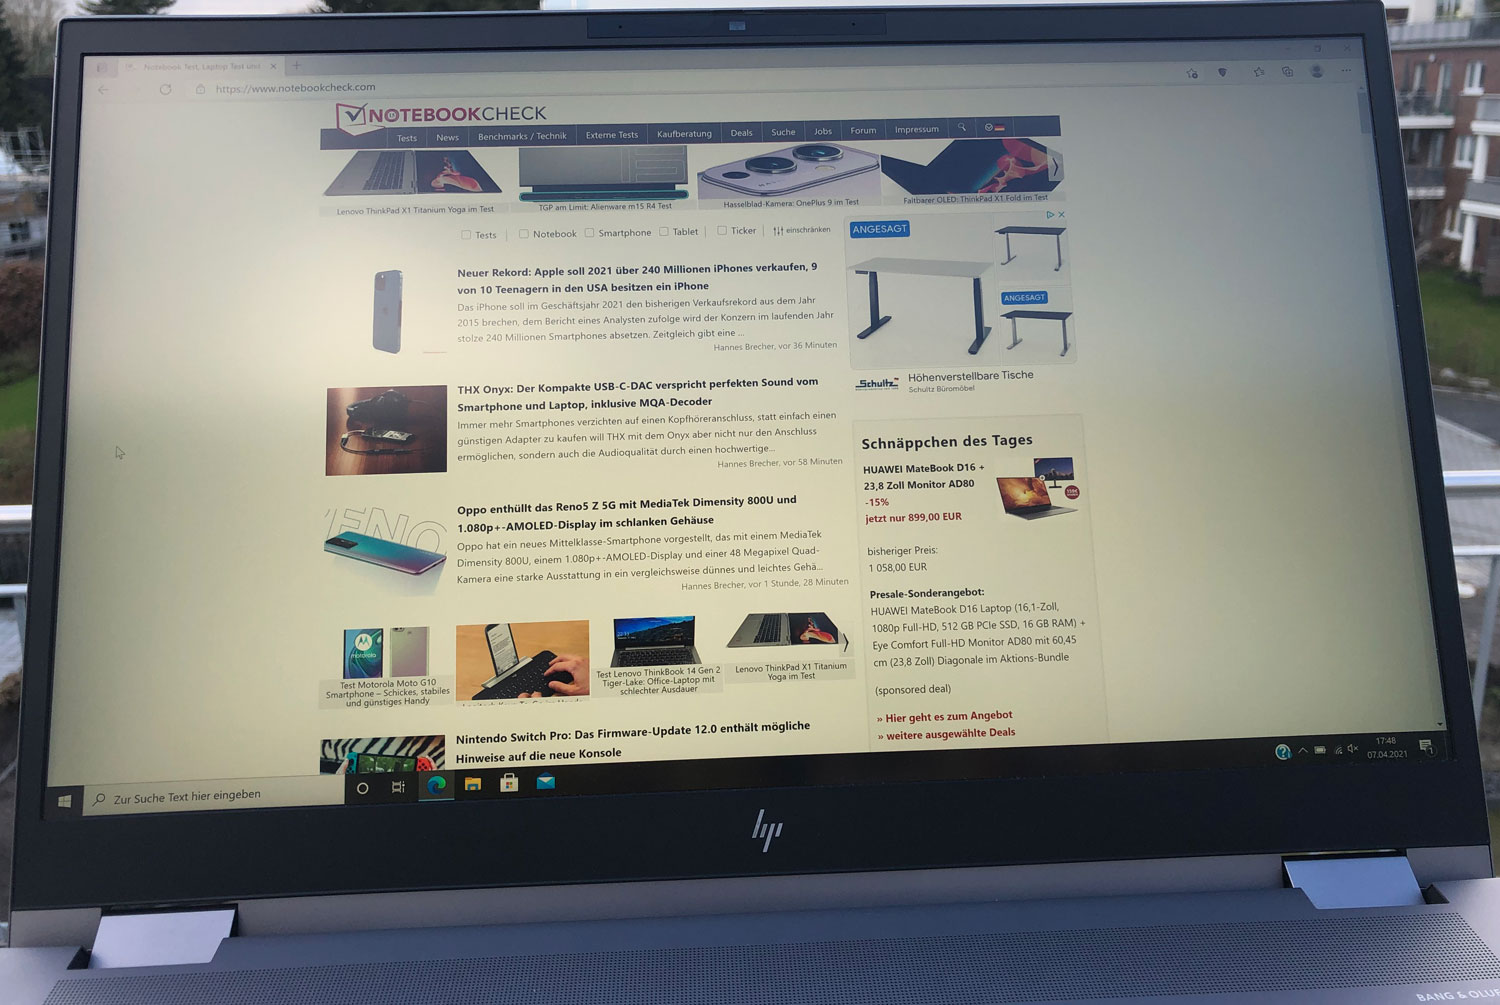
While with its weight, the mobile HP workstation is not the ideal partner outdoors, the display almost invites you to use the ZBook Fury 17 G7 outdoors. Thanks to the high brightness and matte non-glare screen, you can also work in the sun.
Display Response Times
| ↔ Response Time Black to White | ||
|---|---|---|
| 40 ms ... rise ↗ and fall ↘ combined | ↗ 22 ms rise | 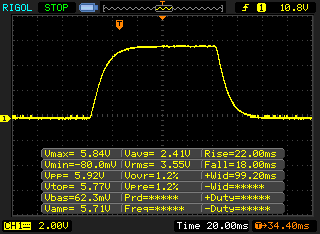 |
| ↘ 18 ms fall | ||
| The screen shows slow response rates in our tests and will be unsatisfactory for gamers. In comparison, all tested devices range from 0.1 (minimum) to 240 (maximum) ms. » 97 % of all devices are better. This means that the measured response time is worse than the average of all tested devices (19.8 ms). | ||
| ↔ Response Time 50% Grey to 80% Grey | ||
| 56 ms ... rise ↗ and fall ↘ combined | ↗ 26 ms rise | 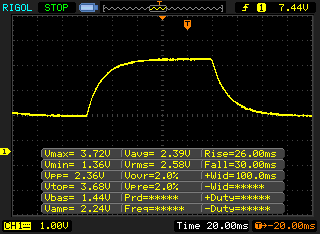 |
| ↘ 30 ms fall | ||
| The screen shows slow response rates in our tests and will be unsatisfactory for gamers. In comparison, all tested devices range from 0.165 (minimum) to 636 (maximum) ms. » 93 % of all devices are better. This means that the measured response time is worse than the average of all tested devices (31 ms). | ||
Screen Flickering / PWM (Pulse-Width Modulation)
| Screen flickering / PWM not detected | 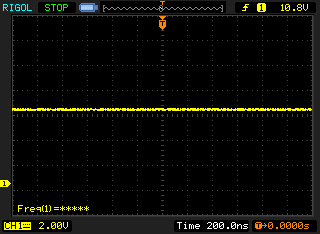 | ||
In comparison: 52 % of all tested devices do not use PWM to dim the display. If PWM was detected, an average of 7747 (minimum: 5 - maximum: 343500) Hz was measured. | |||
The viewing angle stability of the panel is exemplary, allowing you to read the contents clearly even from steep viewing angles.
Performance: Sufficient for any task
HP offers its ZBook Fury 17 G7 mobile workstation in various equipment configurations. The 119W5EA model in our test, which costs almost 4800 Euros (~$5749) with an Intel Core i9-10885H and Nvidia Quadro RTX 4000 Max-Q, is one of the high-end models of the 17-inch laptop. Above that are only the Xeon W-10855M CPU and the Quadro RTX 5000 Max-Q, and below that are a whole series of models, starting from the i7-10750H and NVIDIA Quadro T1000 model that costs 2300 Euros (~$2754).
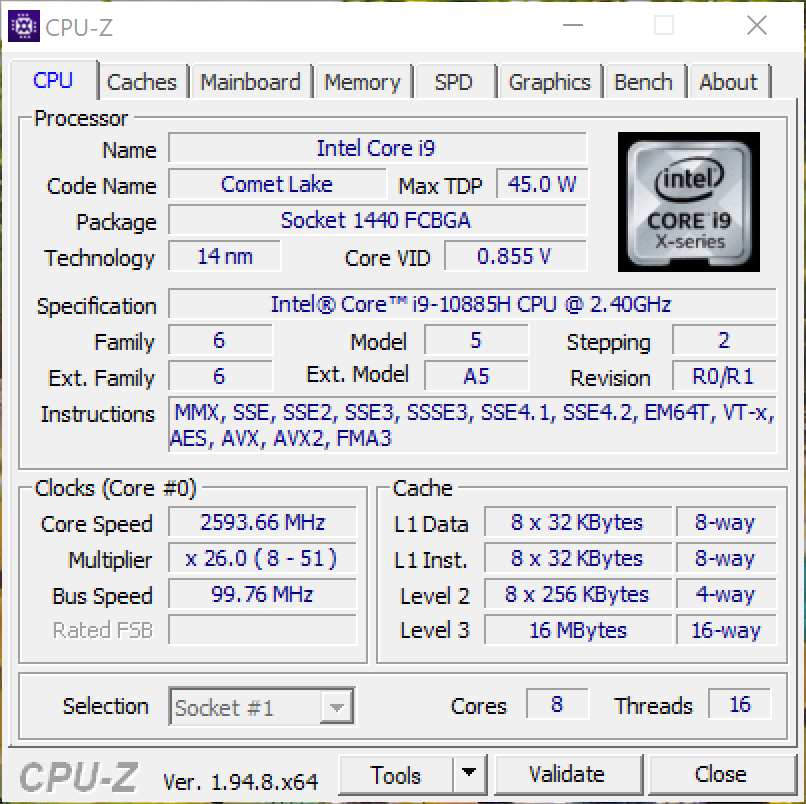
Processor
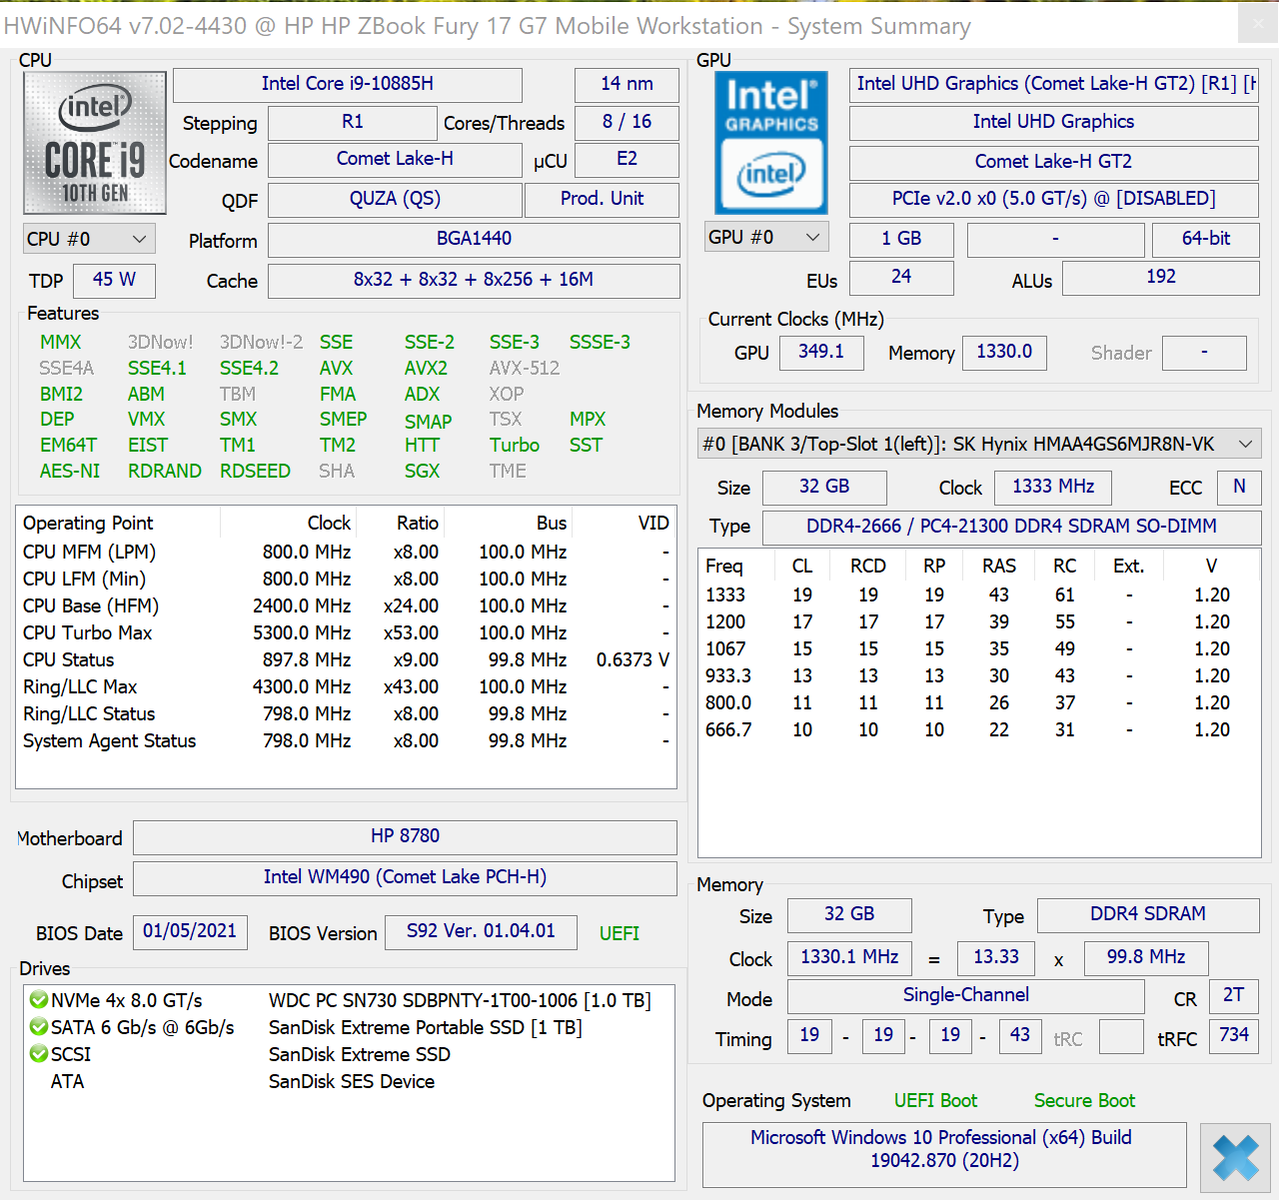
In our version of the mobile workstation, HP trusts the computing performance of the Intel Core i9-10885H. The chip is still based on the known Comet Lake architecture. The regular clock speed is 2.4 GHz and the maximum up to 5.3 GHz or 4.4 GHz with all 8 active cores. With a maximum of 125 watts, HP has configured a generous TDP limit, even if the top value is only reached for a short time due to the high temperature development. The constant value levels out at around 74 watts. In battery operation, the value drops to about 40 watts.
After a slight drop in the beginning, the CPU is able to maintain its performance over time, placing at about the level of the Intel Xeon W-10885M in various benchmarks. Compared to other laptops with the same CPU, the HP ZBook Fury 17 G7 performs just above average in most benchmarks.
Cinebench R15: CPU Single 64Bit | CPU Multi 64Bit
Blender: v2.79 BMW27 CPU
7-Zip 18.03: 7z b 4 -mmt1 | 7z b 4
Geekbench 5.5: Single-Core | Multi-Core
HWBOT x265 Benchmark v2.2: 4k Preset
LibreOffice : 20 Documents To PDF
R Benchmark 2.5: Overall mean
| Cinebench R20 / CPU (Single Core) | |
| Average of class Workstation (671 - 857, n=23, last 2 years) | |
| HP ZBook Fury 15 G7 | |
| HP ZBook Fury 15 G7 | |
| HP ZBook Fury 17 G7 119W5EA | |
| Dell Precision 7550 | |
| Average Intel Core i9-10885H (460 - 513, n=3) | |
| Asus StudioBook Pro X W730G5T-H8050T | |
| Lenovo ThinkPad P73-20QR0030GE | |
| Cinebench R20 / CPU (Multi Core) | |
| Average of class Workstation (5760 - 15043, n=23, last 2 years) | |
| Dell Precision 7550 | |
| HP ZBook Fury 15 G7 | |
| HP ZBook Fury 15 G7 | |
| HP ZBook Fury 17 G7 119W5EA | |
| Average Intel Core i9-10885H (2798 - 3762, n=3) | |
| Lenovo ThinkPad P73-20QR0030GE | |
| Asus StudioBook Pro X W730G5T-H8050T | |
| Cinebench R15 / CPU Single 64Bit | |
| Average of class Workstation (191.4 - 328, n=23, last 2 years) | |
| HP ZBook Fury 15 G7 | |
| HP ZBook Fury 15 G7 | |
| HP ZBook Fury 17 G7 119W5EA | |
| Dell Precision 7550 | |
| Average Intel Core i9-10885H (197 - 212, n=3) | |
| Asus StudioBook Pro X W730G5T-H8050T | |
| Lenovo ThinkPad P73-20QR0030GE | |
| Cinebench R15 / CPU Multi 64Bit | |
| Average of class Workstation (2489 - 5810, n=23, last 2 years) | |
| Dell Precision 7550 | |
| HP ZBook Fury 15 G7 | |
| HP ZBook Fury 15 G7 | |
| HP ZBook Fury 17 G7 119W5EA | |
| Lenovo ThinkPad P73-20QR0030GE | |
| Average Intel Core i9-10885H (1264 - 1726, n=3) | |
| Asus StudioBook Pro X W730G5T-H8050T | |
| Blender / v2.79 BMW27 CPU | |
| HP ZBook Fury 15 G7 | |
| Asus StudioBook Pro X W730G5T-H8050T | |
| Lenovo ThinkPad P73-20QR0030GE | |
| Average Intel Core i9-10885H (283 - 348, n=3) | |
| HP ZBook Fury 17 G7 119W5EA | |
| Dell Precision 7550 | |
| Average of class Workstation (91 - 222, n=23, last 2 years) | |
| 7-Zip 18.03 / 7z b 4 -mmt1 | |
| Average of class Workstation (5126 - 6960, n=23, last 2 years) | |
| HP ZBook Fury 15 G7 | |
| HP ZBook Fury 17 G7 119W5EA | |
| Average Intel Core i9-10885H (5397 - 5668, n=3) | |
| Dell Precision 7550 | |
| Asus StudioBook Pro X W730G5T-H8050T | |
| Lenovo ThinkPad P73-20QR0030GE | |
| 7-Zip 18.03 / 7z b 4 | |
| Average of class Workstation (60489 - 116969, n=23, last 2 years) | |
| Dell Precision 7550 | |
| Lenovo ThinkPad P73-20QR0030GE | |
| HP ZBook Fury 17 G7 119W5EA | |
| Average Intel Core i9-10885H (36740 - 42993, n=3) | |
| HP ZBook Fury 15 G7 | |
| Asus StudioBook Pro X W730G5T-H8050T | |
| Geekbench 5.5 / Single-Core | |
| Average of class Workstation (1783 - 2183, n=23, last 2 years) | |
| HP ZBook Fury 15 G7 | |
| Dell Precision 7550 | |
| HP ZBook Fury 17 G7 119W5EA | |
| Asus StudioBook Pro X W730G5T-H8050T | |
| Average Intel Core i9-10885H (1216 - 1376, n=3) | |
| Lenovo ThinkPad P73-20QR0030GE | |
| Geekbench 5.5 / Multi-Core | |
| Average of class Workstation (11542 - 25554, n=23, last 2 years) | |
| Dell Precision 7550 | |
| Lenovo ThinkPad P73-20QR0030GE | |
| Average Intel Core i9-10885H (6529 - 7693, n=3) | |
| HP ZBook Fury 15 G7 | |
| Asus StudioBook Pro X W730G5T-H8050T | |
| HP ZBook Fury 17 G7 119W5EA | |
| HWBOT x265 Benchmark v2.2 / 4k Preset | |
| Average of class Workstation (17.8 - 40.5, n=23, last 2 years) | |
| Dell Precision 7550 | |
| Average Intel Core i9-10885H (10.6 - 12.5, n=3) | |
| HP ZBook Fury 17 G7 119W5EA | |
| Lenovo ThinkPad P73-20QR0030GE | |
| Asus StudioBook Pro X W730G5T-H8050T | |
| HP ZBook Fury 15 G7 | |
| LibreOffice / 20 Documents To PDF | |
| HP ZBook Fury 15 G7 | |
| HP ZBook Fury 17 G7 119W5EA | |
| Average Intel Core i9-10885H (45.9 - 59.6, n=3) | |
| Asus StudioBook Pro X W730G5T-H8050T | |
| Lenovo ThinkPad P73-20QR0030GE | |
| Average of class Workstation (37.1 - 74.7, n=23, last 2 years) | |
| Dell Precision 7550 | |
| R Benchmark 2.5 / Overall mean | |
| Lenovo ThinkPad P73-20QR0030GE | |
| Asus StudioBook Pro X W730G5T-H8050T | |
| HP ZBook Fury 17 G7 119W5EA | |
| Dell Precision 7550 | |
| Average Intel Core i9-10885H (0.564 - 0.572, n=3) | |
| HP ZBook Fury 15 G7 | |
| Average of class Workstation (0.3825 - 0.603, n=23, last 2 years) | |
* ... smaller is better
System Performance
In the benchmarks on the system performance, our test unit measures well, keeping up with the competitors that are in part equipped with more powerful hardware. The differences between the comparison models can only be seen at the limits at most. The power is easily sufficient for all the usual demands on a mobile workstation. Everyday operation is smooth and without any conspicuous behavior.
| PCMark 8 Home Score Accelerated v2 | 3750 points | |
| PCMark 8 Creative Score Accelerated v2 | 7727 points | |
| PCMark 8 Work Score Accelerated v2 | 4397 points | |
| PCMark 10 Score | 5363 points | |
Help | ||
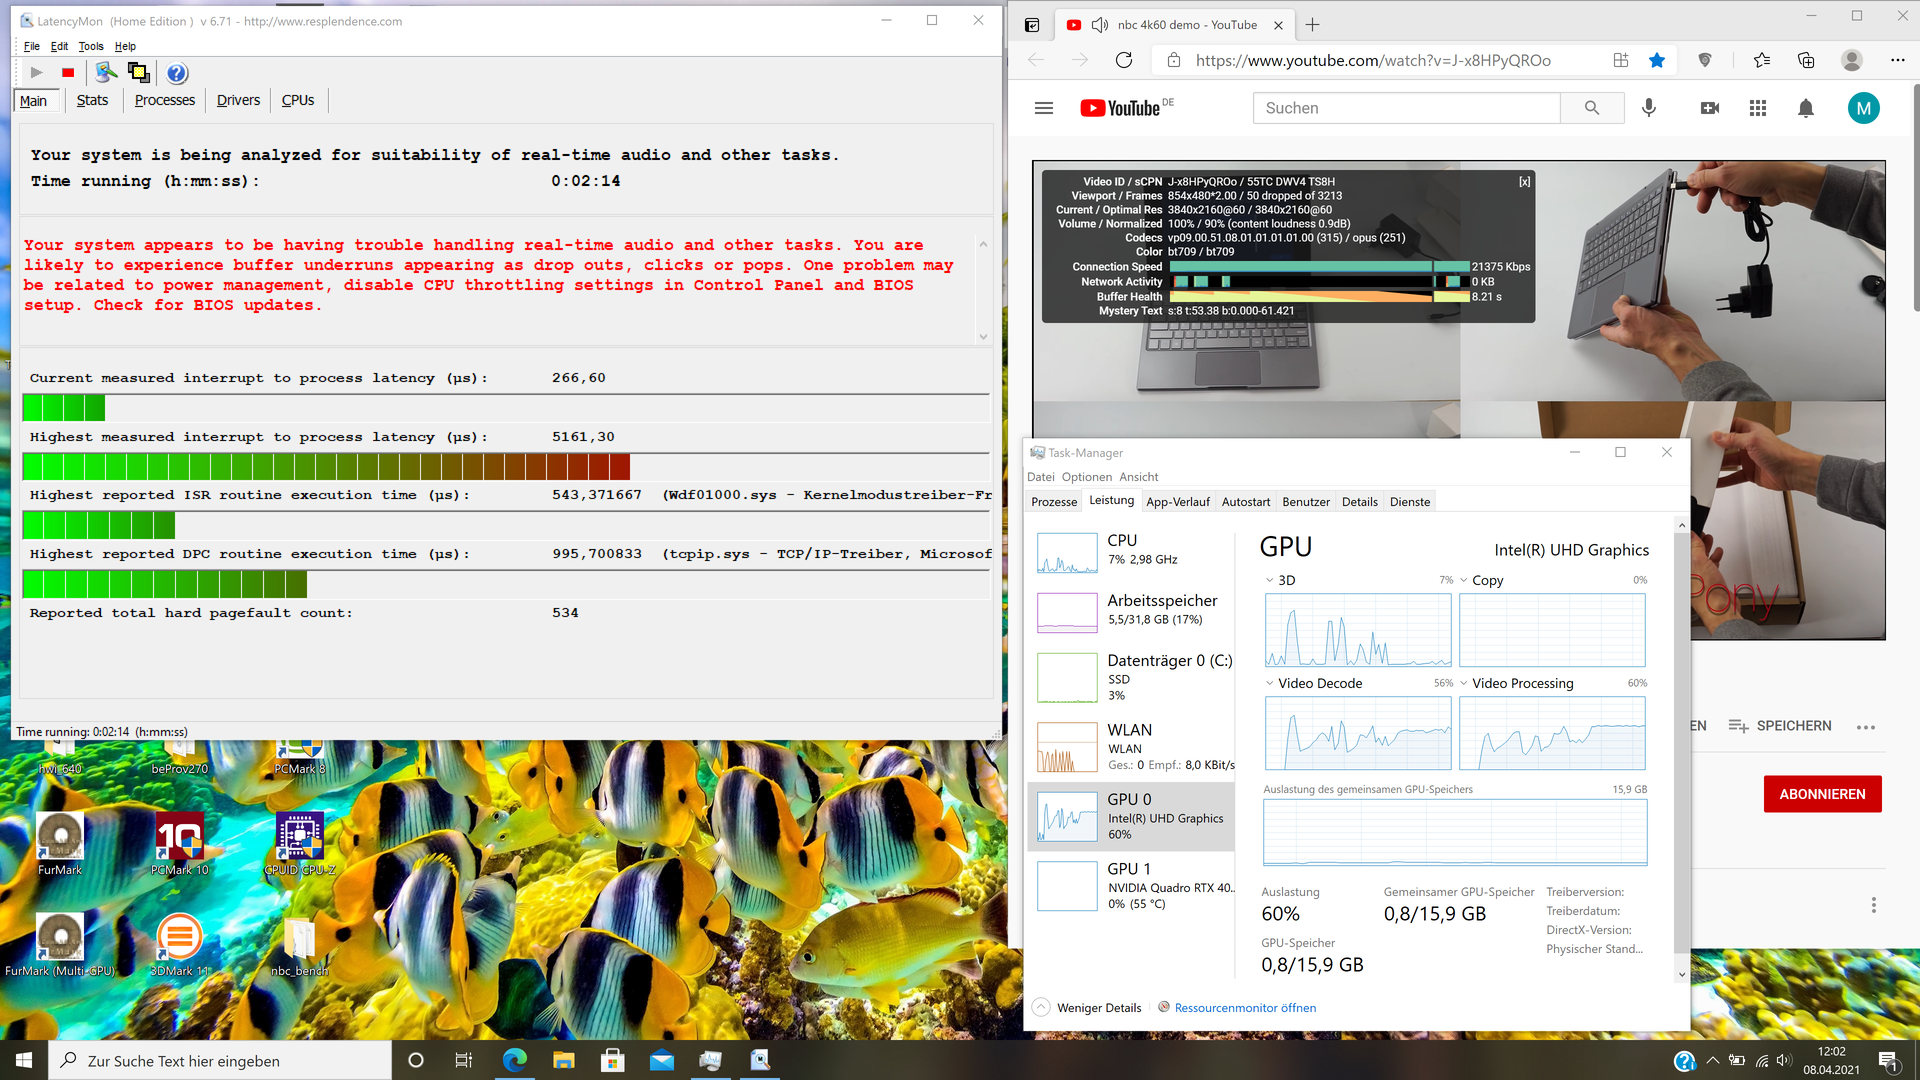
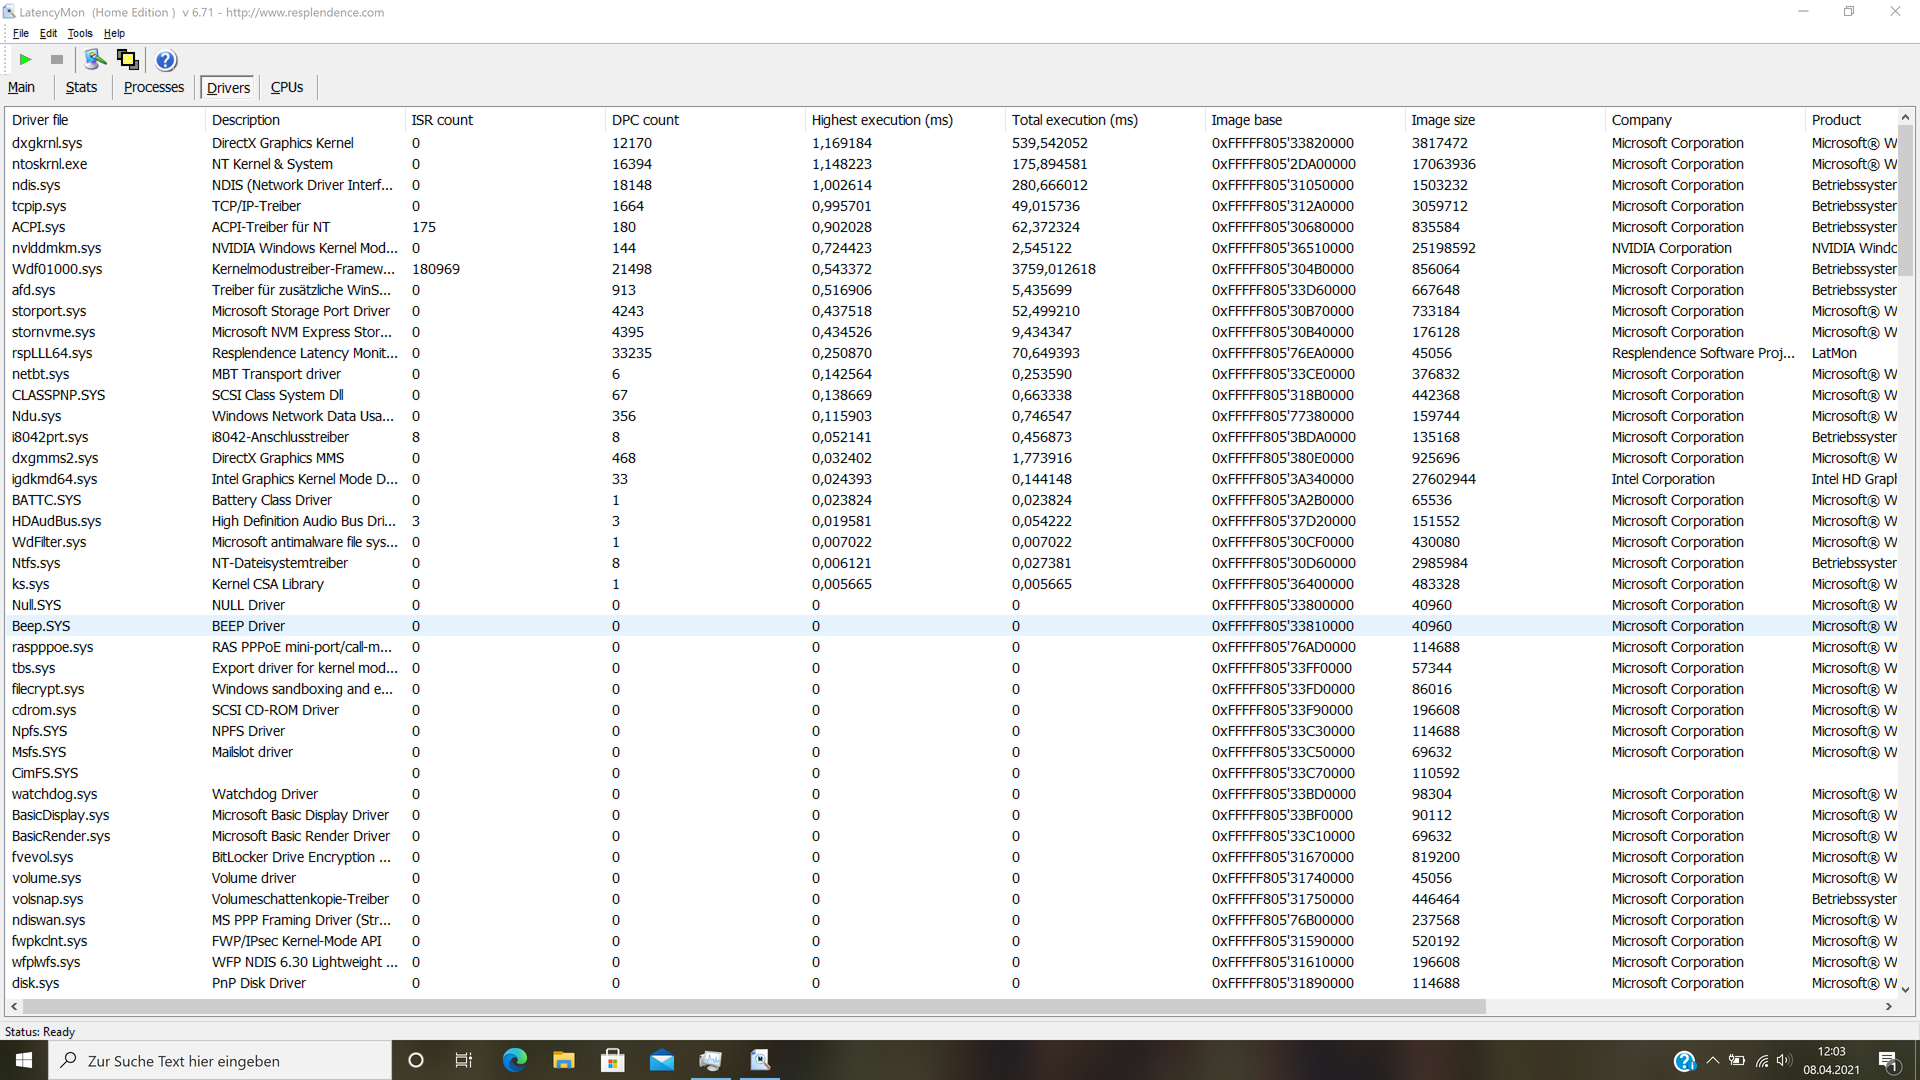
DPC Latencies
In the test, the device showed relatively high latencies that did not improve even in several repetitions.
| DPC Latencies / LatencyMon - interrupt to process latency (max), Web, Youtube, Prime95 | |
| Dell Precision 7550 | |
| HP ZBook Fury 17 G7 119W5EA | |
| HP ZBook Fury 15 G7 | |
| Asus StudioBook Pro X W730G5T-H8050T | |
| Lenovo ThinkPad P73-20QR0030GE | |
* ... smaller is better
Storage Solution
The built in 1-TB storage solution (about 890 GB available in the state of delivery) delivers a good performance in most of the tests that is in parts significantly above the average of other workstations, depending on the benchmark.
| HP ZBook Fury 17 G7 119W5EA WDC PC SN730 SDBPNTY-1T00 | Lenovo ThinkPad P73-20QR0030GE Samsung PM981a MZVLB1T0HBLR | HP ZBook Fury 15 G7 Samsung PM981a MZVLB1T0HBLR | Asus StudioBook Pro X W730G5T-H8050T Intel SSD 760p SSDPEKKW010T8 | Dell Precision 7550 SK Hynix PC601A NVMe 1TB | Average WDC PC SN730 SDBPNTY-1T00 | |
|---|---|---|---|---|---|---|
| CrystalDiskMark 5.2 / 6 | -3% | 3% | 12% | -8% | 2% | |
| Write 4K (MB/s) | 116.3 | 150.1 29% | 114.1 -2% | 228.9 97% | 121 4% | 139.9 ? 20% |
| Read 4K (MB/s) | 44.68 | 48.48 9% | 57.2 28% | 74.1 66% | 42.16 -6% | 44.5 ? 0% |
| Write Seq (MB/s) | 2357 | 1414 -40% | 2580 9% | 1510 -36% | 2150 -9% | 2346 ? 0% |
| Read Seq (MB/s) | 2159 | 1262 -42% | 2527 17% | 2340 8% | 1755 -19% | 2102 ? -3% |
| Write 4K Q32T1 (MB/s) | 543 | 430.7 -21% | 480.2 -12% | 447.1 -18% | 395.3 -27% | 442 ? -19% |
| Read 4K Q32T1 (MB/s) | 390.1 | 539 38% | 387.6 -1% | 552 42% | 381.8 -2% | 460 ? 18% |
| Write Seq Q32T1 (MB/s) | 2938 | 2983 2% | 2996 2% | 1198 -59% | 2730 -7% | 3049 ? 4% |
| Read Seq Q32T1 (MB/s) | 3399 | 3549 4% | 2853 -16% | 3204 -6% | 3468 2% | 3285 ? -3% |
| AS SSD | 67% | -9% | -1% | 27% | 41% | |
| Seq Read (MB/s) | 2423 | 2627 8% | 2127 -12% | 2558 6% | 2028 -16% | 2606 ? 8% |
| Seq Write (MB/s) | 1203 | 2375 97% | 1296 8% | 1035 -14% | 1193 -1% | 1935 ? 61% |
| 4K Read (MB/s) | 42.24 | 53.5 27% | 54.8 30% | 69.6 65% | 42.31 0% | 42.9 ? 2% |
| 4K Write (MB/s) | 115.5 | 139.4 21% | 110.8 -4% | 201.5 74% | 105.5 -9% | 129.1 ? 12% |
| 4K-64 Read (MB/s) | 1630 | 1779 9% | 1420 -13% | 927 -43% | 1128 -31% | 1361 ? -17% |
| 4K-64 Write (MB/s) | 1979 | 1955 -1% | 2012 2% | 898 -55% | 1537 -22% | 1920 ? -3% |
| Access Time Read * (ms) | 0.057 | 0.055 4% | 0.046 19% | 0.038 33% | 0.069 -21% | 0.0689 ? -21% |
| Access Time Write * (ms) | 0.033 | 0.027 18% | 0.099 -200% | 0.019 42% | 0.106 -221% | 0.06215 ? -88% |
| Score Read (Points) | 1915 | 2095 9% | 1687 -12% | 1252 -35% | 1373 -28% | 1664 ? -13% |
| Score Write (Points) | 2215 | 2332 5% | 2253 2% | 1203 -46% | 1762 -20% | 2242 ? 1% |
| Score Total (Points) | 5047 | 5489 9% | 4770 -5% | 3040 -40% | 3801 -25% | 4726 ? -6% |
| Copy ISO MB/s (MB/s) | 2387 | 2932 23% | 2779 16% | 1768 -26% | 2041 ? -14% | |
| Copy Program MB/s (MB/s) | 106.4 | 595 459% | 123.3 16% | 627 489% | 552 ? 419% | |
| Copy Game MB/s (MB/s) | 356.5 | 1264 255% | 440.8 24% | 1477 314% | 1183 ? 232% | |
| Total Average (Program / Settings) | 32% /
42% | -3% /
-5% | 6% /
4% | 10% /
15% | 22% /
27% |
* ... smaller is better

Constant Performance Reads: DiskSpd Read Loop, Queue Depth 8
Graphics Card
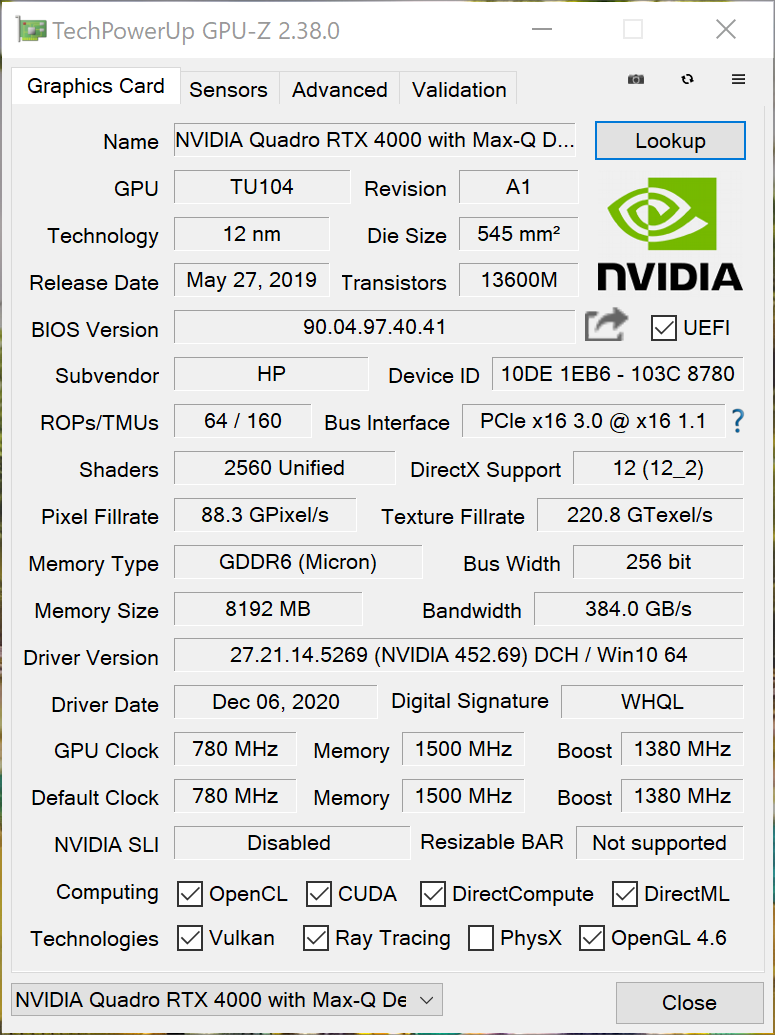
In our test configuration, HP uses the Nvidia Quadro RTX 4000 Max-Q graphics card, which is the Max-Q version of the Quadro RTX 4000 that is trimmed for efficiency. It is based on the same chip as the GeForce RTX 2080 (TU104), but equipped with less shaders. It runs at a 780 Watt basic clock speed and up to 1560 MHz boost.
As expected, the device remains behind the comparison models with the even higher-rated NVIDIA Quadro RTX 5000 Max-Q in the test, but it still convinces with a lot of power and an evaluation that is significantly above the workstation average. In less demanding tasks, the dedicated GPU is not used, and the Intel UHD graphics takes over to the delight of the battery. In battery operation, the device achieves values that are about 50% lower in 3DMark 11, so the full performance is only available in mains operation.
| 3DMark 11 Performance | 19079 points | |
| 3DMark Ice Storm Standard Score | 34399 points | |
| 3DMark Cloud Gate Standard Score | 23809 points | |
| 3DMark Fire Strike Score | 15010 points | |
| 3DMark Time Spy Score | 6724 points | |
Help | ||
Gaming Performance
This power house has no trouble with a game such as "The Witcher 3," even at the highest graphics level. In the other games, the frame rates also remain within very playable ranges even in 4K resolution. Over time, the frame rate drops slightly, as a 3DMark stress test with 91% frame rate stability shows. So the workstation is also suitable as a gaming laptop, even if most buyers will probably appreciate its work performance more than the gaming performance.
| low | med. | high | ultra | QHD | 4K | |
|---|---|---|---|---|---|---|
| The Witcher 3 (2015) | 221 | 178 | 115 | 62.6 | 36 | |
| Dota 2 Reborn (2015) | 131 | 116 | 107 | 101 | 65 | |
| Final Fantasy XV Benchmark (2018) | 118 | 86.5 | 68.3 | 46.3 | 29.7 | |
| X-Plane 11.11 (2018) | 93.3 | 78.8 | 66.2 | 45.3 |
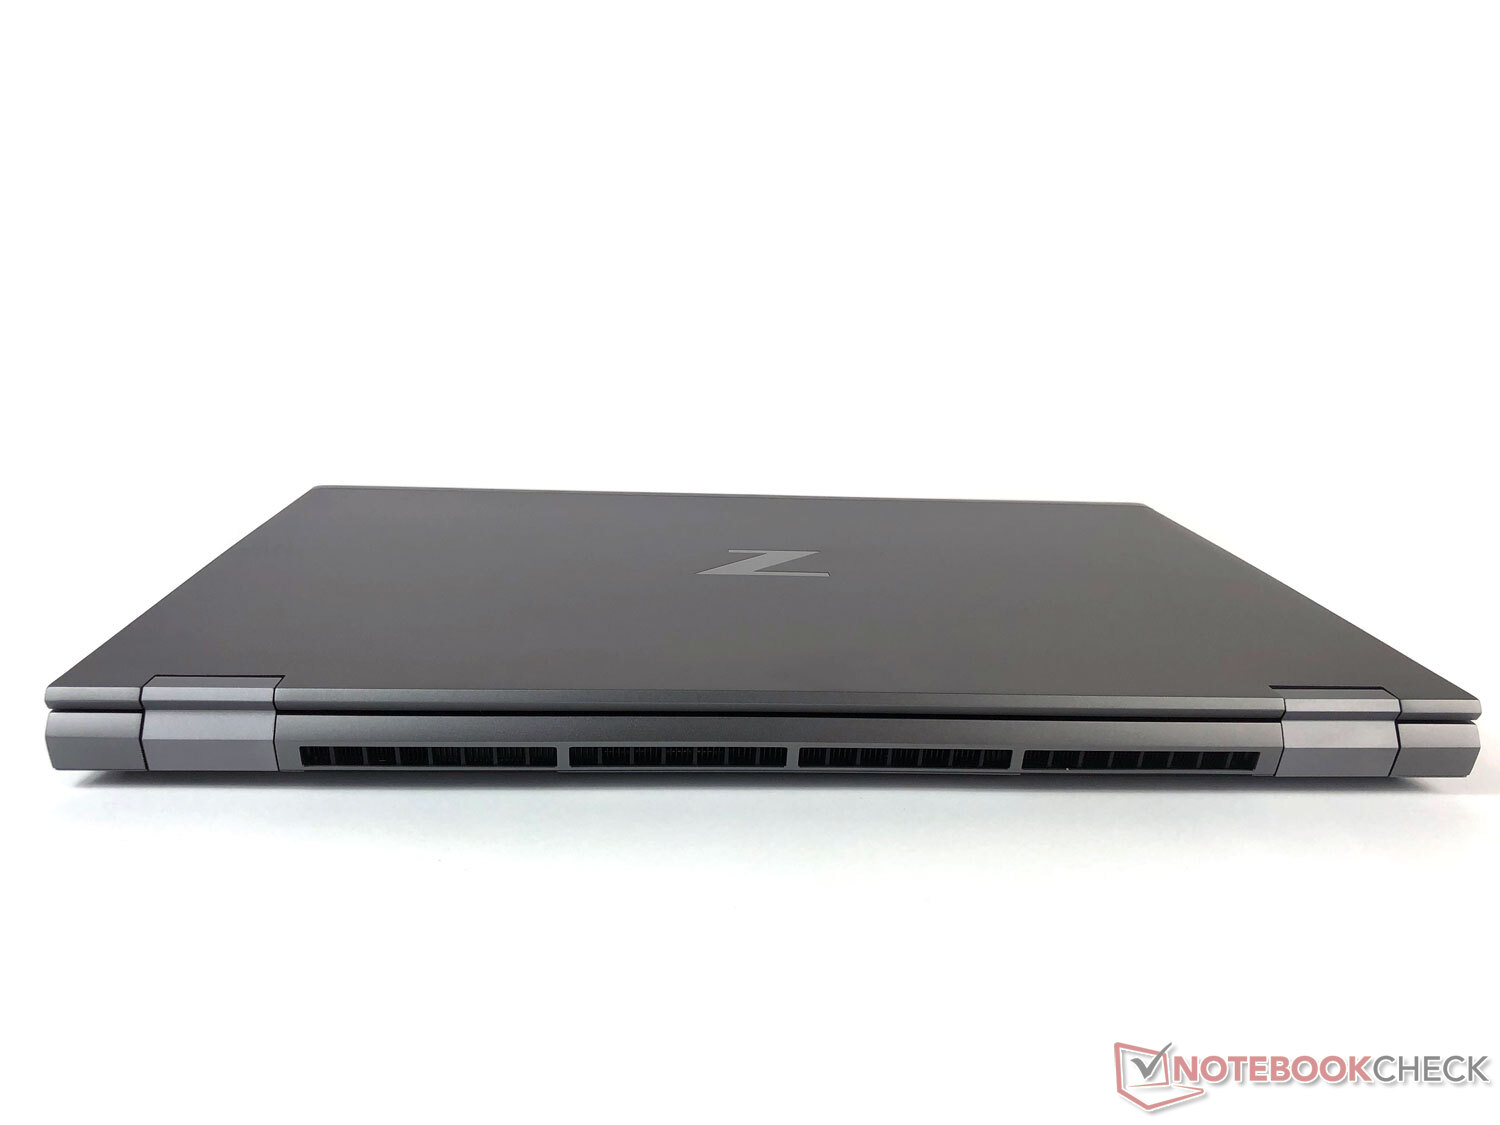
Emissions: Annoying fans under load
Noise Emissions
As in the smaller ZBook Fury 15, HP also uses vapor chamber cooling here, so there are no traditional heat pipes. While in idle operation or under low load, the HP ZBook Fury 17 G7 is not audible, this changes under load. At just below 50 dB(A), the maximum noise level still remains within limits, but the fans constant changing between 45 and 48 dB(A) created a very noticeable annoyance in the test. Although the attempt to run the fans as quietly as possible is commendable in principle, a constant fan speed would be significantly less annoying. In addition, our test unit sometimes produced a quiet squeaking noise (coil whine) under load.
Noise level
| Idle |
| 24.4 / 26.6 / 29 dB(A) |
| Load |
| 40.2 / 48 dB(A) |
 | ||
30 dB silent 40 dB(A) audible 50 dB(A) loud |
||
min: | ||
Temperature
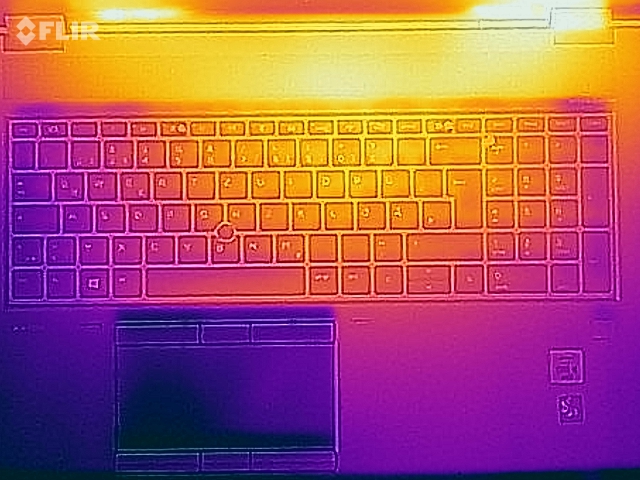
The powerful hardware equipment of the HP ZBook Fury 17 G7 produces a lot of heat under load. This is not only noticeable in the usage of the fan but also the heat development of the case. While the laptop remains comfortably cool during idle operation, particularly the area in front of the screen warms up significantly under load.
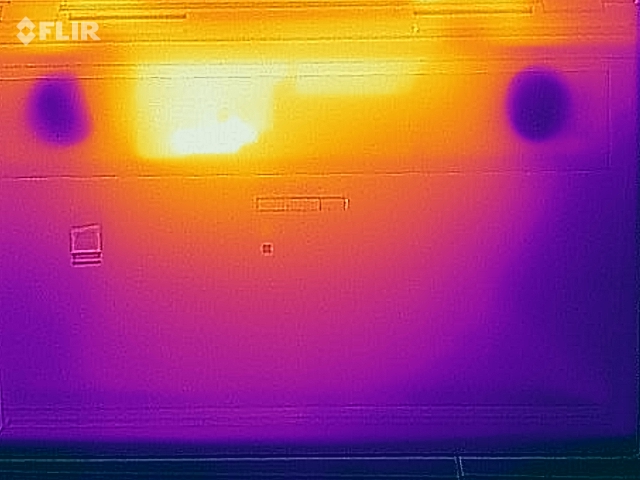
This is not surprising, since this is where the large fan vents are placed. We measured temperatures above 55 °C (131 °F). The bottom of the case also heats up considerably, making a table top a better placement for the device than your lap. On the other hand, the fact that the area in front remains significantly cooler is a positive point.
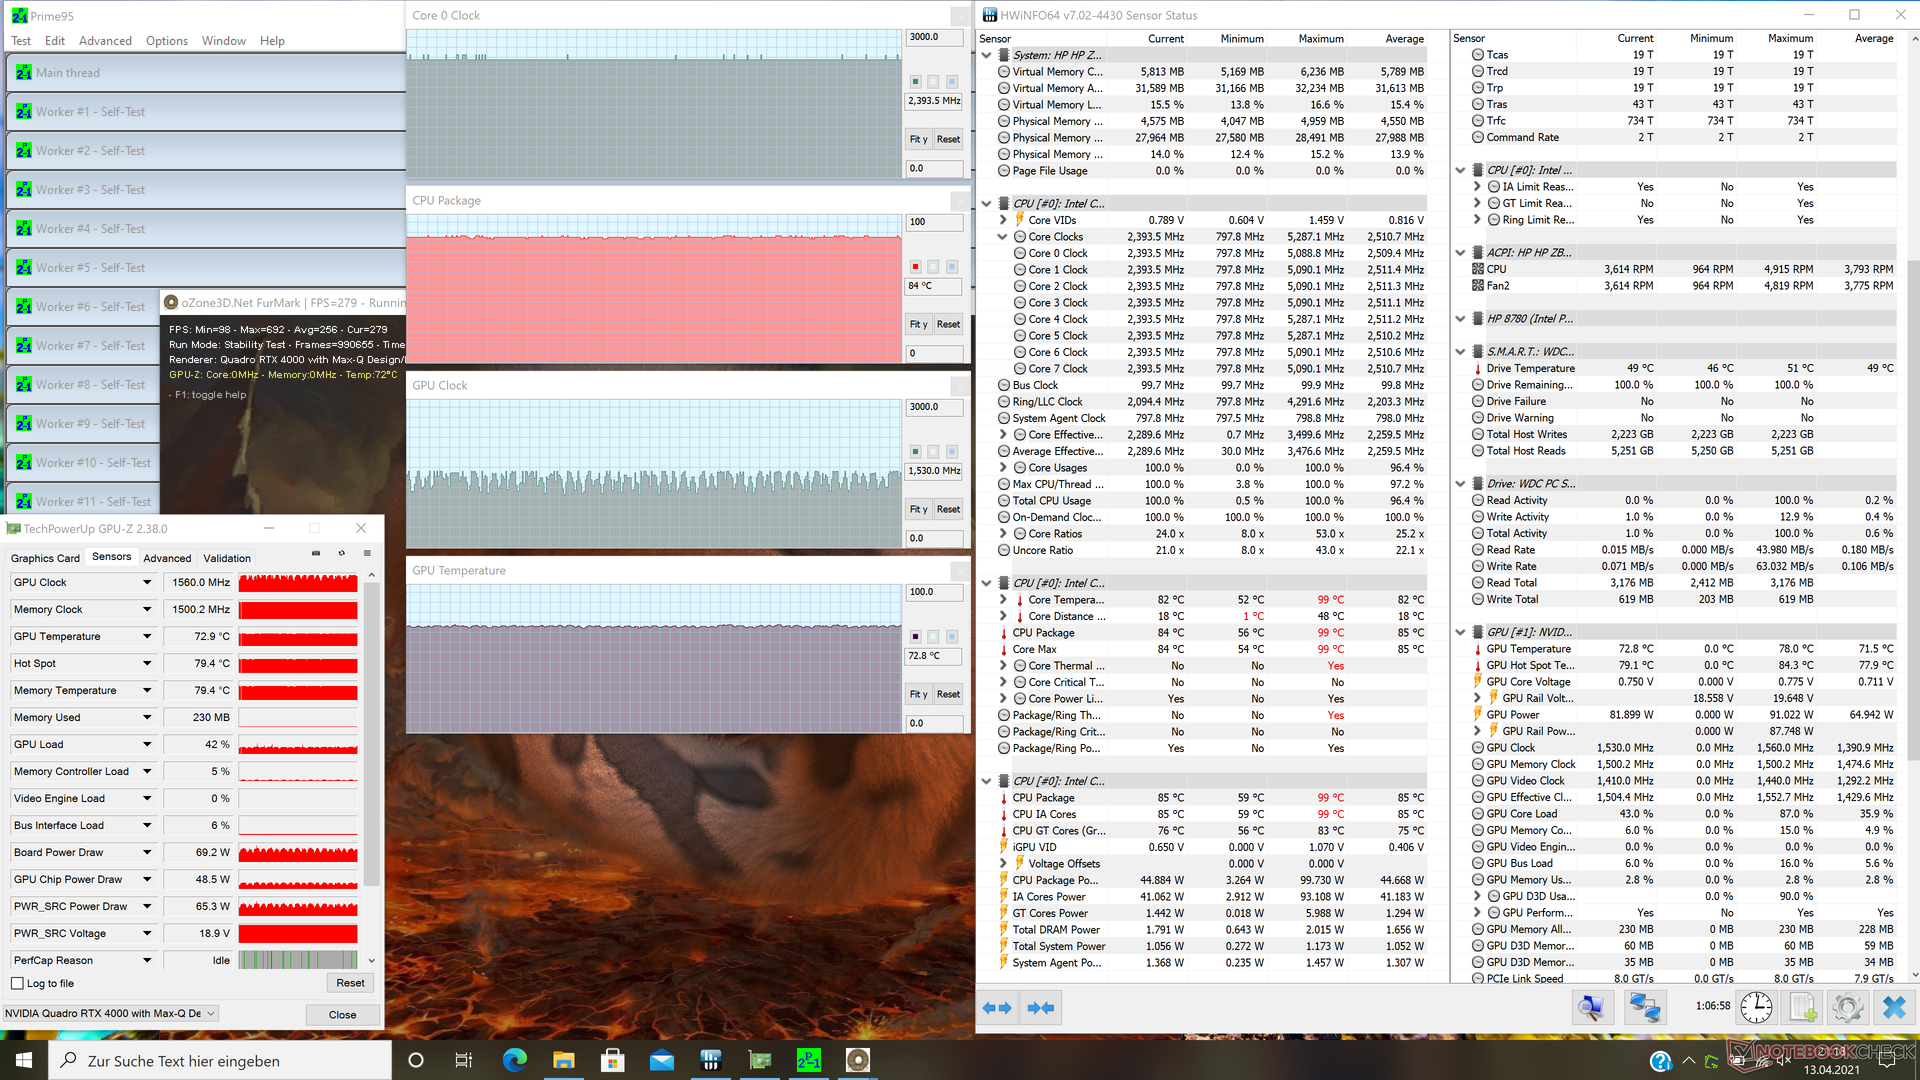
The system remains stable in our stress test with full load from Furmark and Prime95 on the CPU and GPU. After an initial performance peak, the CPU levels out at around 2400 MHz and 85 °C (185 °F) and the GPU on average at about 1250 MHz and 73 °C (163 °F). When running a 3DMark benchmark right after the stress test, the score was not conspicuously lower.
(-) The maximum temperature on the upper side is 46.1 °C / 115 F, compared to the average of 38.2 °C / 101 F, ranging from 22.2 to 69.8 °C for the class Workstation.
(-) The bottom heats up to a maximum of 57.6 °C / 136 F, compared to the average of 41.1 °C / 106 F
(+) In idle usage, the average temperature for the upper side is 22.7 °C / 73 F, compared to the device average of 32 °C / 90 F.
(±) Playing The Witcher 3, the average temperature for the upper side is 36.9 °C / 98 F, compared to the device average of 32 °C / 90 F.
(+) The palmrests and touchpad are cooler than skin temperature with a maximum of 30.9 °C / 87.6 F and are therefore cool to the touch.
(-) The average temperature of the palmrest area of similar devices was 27.8 °C / 82 F (-3.1 °C / -5.6 F).
Speakers
HP uses Bang & Olufsen speakers, leaving a relatively large space in the case for them. The manufacturer is making good use of this, equipping the laptop with good stereo speakers that produce a solid maximum volume. While there is still some room for improvement in terms of the bass reproduction, the mids and highs are pleasing with a good balance and linearity in the test. So you don't absolutely need to use external speakers.
HP ZBook Fury 17 G7 119W5EA audio analysis
(±) | speaker loudness is average but good (78.6 dB)
Bass 100 - 315 Hz
(±) | reduced bass - on average 7.9% lower than median
(±) | linearity of bass is average (11.1% delta to prev. frequency)
Mids 400 - 2000 Hz
(+) | balanced mids - only 2.8% away from median
(+) | mids are linear (3.9% delta to prev. frequency)
Highs 2 - 16 kHz
(+) | balanced highs - only 2.7% away from median
(+) | highs are linear (4.8% delta to prev. frequency)
Overall 100 - 16.000 Hz
(+) | overall sound is linear (10.9% difference to median)
Compared to same class
» 11% of all tested devices in this class were better, 4% similar, 85% worse
» The best had a delta of 7%, average was 17%, worst was 35%
Compared to all devices tested
» 6% of all tested devices were better, 2% similar, 92% worse
» The best had a delta of 4%, average was 23%, worst was 134%
HP ZBook Fury 15 G7 audio analysis
(±) | speaker loudness is average but good (80.1 dB)
Bass 100 - 315 Hz
(±) | reduced bass - on average 8% lower than median
(±) | linearity of bass is average (9.5% delta to prev. frequency)
Mids 400 - 2000 Hz
(+) | balanced mids - only 3.3% away from median
(+) | mids are linear (4.8% delta to prev. frequency)
Highs 2 - 16 kHz
(+) | balanced highs - only 2.2% away from median
(+) | highs are linear (3.5% delta to prev. frequency)
Overall 100 - 16.000 Hz
(+) | overall sound is linear (10.1% difference to median)
Compared to same class
» 6% of all tested devices in this class were better, 4% similar, 90% worse
» The best had a delta of 7%, average was 17%, worst was 35%
Compared to all devices tested
» 5% of all tested devices were better, 1% similar, 94% worse
» The best had a delta of 4%, average was 23%, worst was 134%
Power Management: Surprisingly efficient
Power Consumption
Compared to the competitors in this test, the ZBook Fury 17 G7 shows itself to be more efficient in terms of the power consumption. Other 17-inch workstations use considerably more power, particularly during idle operation. Our test unit uses the onboard graphics here, and under load the device is also fairly efficient.
During the stress test, the maximum power consumption was 199.8 watts, but this might also be limited by the 200-Watt power supply. Over time, the consumption levels out at about 164 watts, so that the power supply still has some additional capacity to charge the battery.
| Off / Standby | |
| Idle | |
| Load |
|
Key:
min: | |
| HP ZBook Fury 17 G7 119W5EA i9-10885H, Quadro RTX 4000 Max-Q, WDC PC SN730 SDBPNTY-1T00, , 3840x2160, 17.3" | Lenovo ThinkPad P73-20QR0030GE i9-9880H, Quadro RTX 4000 (Laptop), Samsung PM981a MZVLB1T0HBLR, IPS, 3840x2160, 17.3" | HP ZBook Fury 15 G7 W-10885M, Quadro RTX 5000 Max-Q, Samsung PM981a MZVLB1T0HBLR, IPS, 3840x2160, 15.6" | Asus StudioBook Pro X W730G5T-H8050T E-2276M, Quadro RTX 5000 (Laptop), Intel SSD 760p SSDPEKKW010T8, IPS LED, 1920x1200, 17" | Dell Precision 7550 W-10885M, Quadro RTX 5000 Max-Q, SK Hynix PC601A NVMe 1TB, IPS, 3840x2160, 15.6" | Average NVIDIA Quadro RTX 4000 Max-Q | Average of class Workstation | |
|---|---|---|---|---|---|---|---|
| Power Consumption | -81% | 3% | -42% | -17% | 0% | -5% | |
| Idle Minimum * (Watt) | 5.8 | 21 -262% | 4.6 21% | 14.3 -147% | 8.2 -41% | 5.8 ? -0% | 9.11 ? -57% |
| Idle Average * (Watt) | 14.8 | 30.4 -105% | 13.6 8% | 19.2 -30% | 16.8 -14% | 14.8 ? -0% | 13.8 ? 7% |
| Idle Maximum * (Watt) | 17 | 35.8 -111% | 21.5 -26% | 24.6 -45% | 24.4 -44% | 17 ? -0% | 17.9 ? -5% |
| Load Average * (Watt) | 120.4 | 110 9% | 113.1 6% | 133 -10% | 131 -9% | 120.4 ? -0% | 96 ? 20% |
| Witcher 3 ultra * (Watt) | 168.4 | 182 -8% | 157.5 6% | 181 -7% | 156.6 7% | ||
| Load Maximum * (Watt) | 199.8 | 215.4 -8% | 199 -0% | 223 -12% | 201.8 -1% | 199.8 ? -0% | 180.3 ? 10% |
* ... smaller is better
Battery Life
HP has equipped the ZBook Fury 17 G7 with a 94 Wh battery. This is identical to that of the HP ZBook Fury 15 G7, which we also tested, meaning that HP does not use the additional space for a larger battery. The result is that in combination with its larger display, it remains behind the smaller sibling in the WLAN test. However, the battery life under load turns out better, but this might also be due to the more powerful hardware (Quadro RTX 5000 Max-Q instead of Quadro RTX 4000 Max-Q) in the smaller model.
Compared to the Lenovo ThinkPad P73-20QR0030GE, which only uses the dedicated graphics card, the battery life of the HP workstation turns out significantly better despite its slightly smaller battery, and it also delivers better results than the Asus StudioBook Pro X W730G5T-H8050T in most measurements. Overall, the device places well at the average of all the workstation we tested so far. A completely empty battery will fully recharge in less than 2 hours.
| HP ZBook Fury 17 G7 119W5EA i9-10885H, Quadro RTX 4000 Max-Q, 94 Wh | Lenovo ThinkPad P73-20QR0030GE i9-9880H, Quadro RTX 4000 (Laptop), 99 Wh | HP ZBook Fury 15 G7 W-10885M, Quadro RTX 5000 Max-Q, 94 Wh | Asus StudioBook Pro X W730G5T-H8050T E-2276M, Quadro RTX 5000 (Laptop), 95 Wh | Dell Precision 7550 W-10885M, Quadro RTX 5000 Max-Q, 95 Wh | Average of class Workstation | |
|---|---|---|---|---|---|---|
| Battery runtime | -46% | -6% | -6% | -12% | -1% | |
| H.264 (h) | 10.3 | 4.1 -60% | 9.1 -12% | 10.1 ? -2% | ||
| WiFi v1.3 (h) | 7.6 | 3.9 -49% | 8.6 13% | 8.5 12% | 8.9 17% | 8.55 ? 13% |
| Load (h) | 1.7 | 1.2 -29% | 1.3 -24% | 1.4 -18% | 1 -41% | 1.441 ? -15% |
| Reader / Idle (h) | 13.2 | 11.1 | 26.1 ? |
Pros
Cons
Verdict on the HP ZBook Fury 17 G7 Test

The HP ZBook Fury 17 G7 mobile workstation knows how to convince in many areas of the test, including the great 4K display, the keyboard that allows comfortable typing, and the high performance capabilities.
HP equips the G7 generation with more performance, while still making the device more compact. Overall, the HP ZBook Fury 17 G7 119W5EA offers an admirable performance in the test.
The matte DreamColor display is also convincing, even if it is slimmed down compared to the predecessor generation, not covering the complete AdobeRGB color space anymore. The amount of connections is extensive. On the other hand, the partially annoying fans and the high temperatures (that were due to the performance) stood out negatively.
In total, the HP ZBook Fury 17 G7 offers a very good overall package that also costs a quite hefty price. Good quality and performance have their price that is worthwhile in this case, and also still remains significantly below that of the Asus StudioBook Pro X W730G5T-H8050T. The device fulfills the professional demands for work, but can also be used for gaming during breaks.
Price and Availability
At the time of our testing, the HP ZBook Fury 17 G7 in the tested 119W5EA configuration (Core i9-10885H, Quadro RTX 4000 Max-Q , 32 GB RAM, 1-TB SSD) is available for 4326 Euros (~$5181) at Notebooksbilliger.de in Germany. In addition, various other models are also available, the most affordable of which only cost about half of our test unit. On HP's US site, prices range between $1916 and $3899, and Amazon offers a model for $2286.
HP ZBook Fury 17 G7 119W5EA
- 04/13/2021 v7 (old)
Marcus Schwarten
Price comparison

