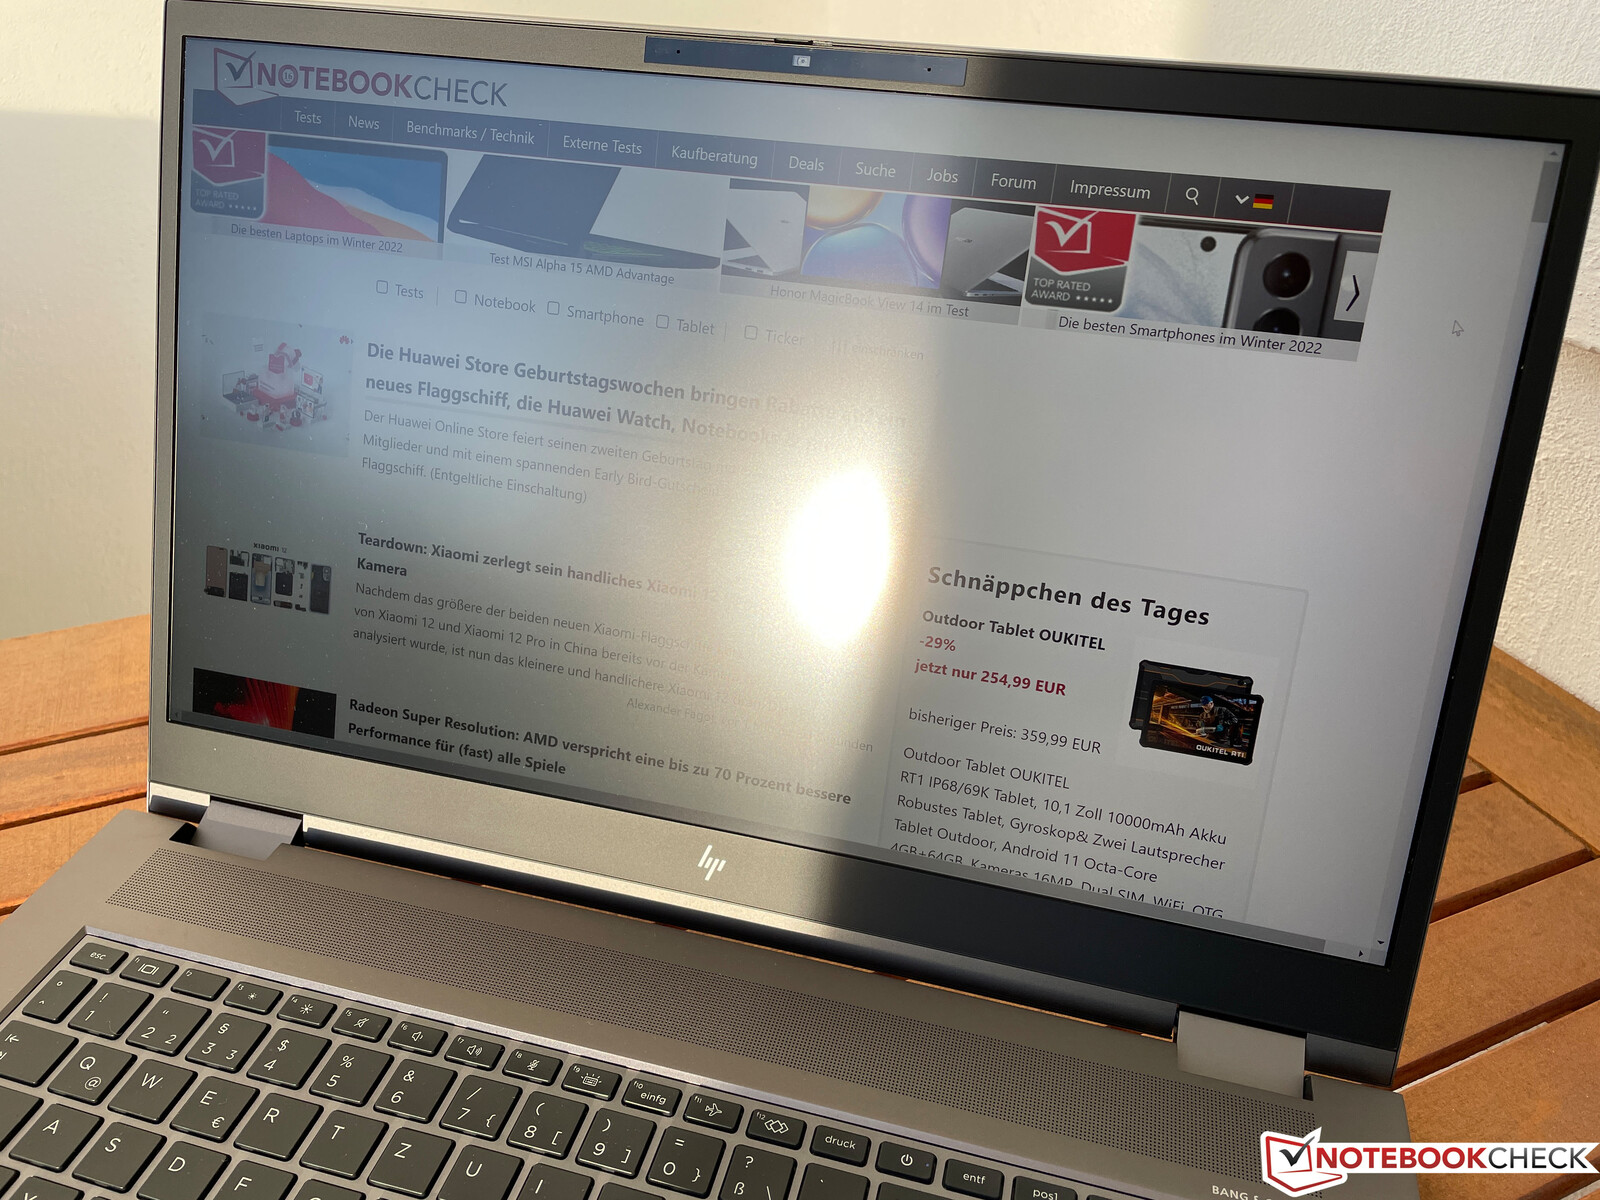
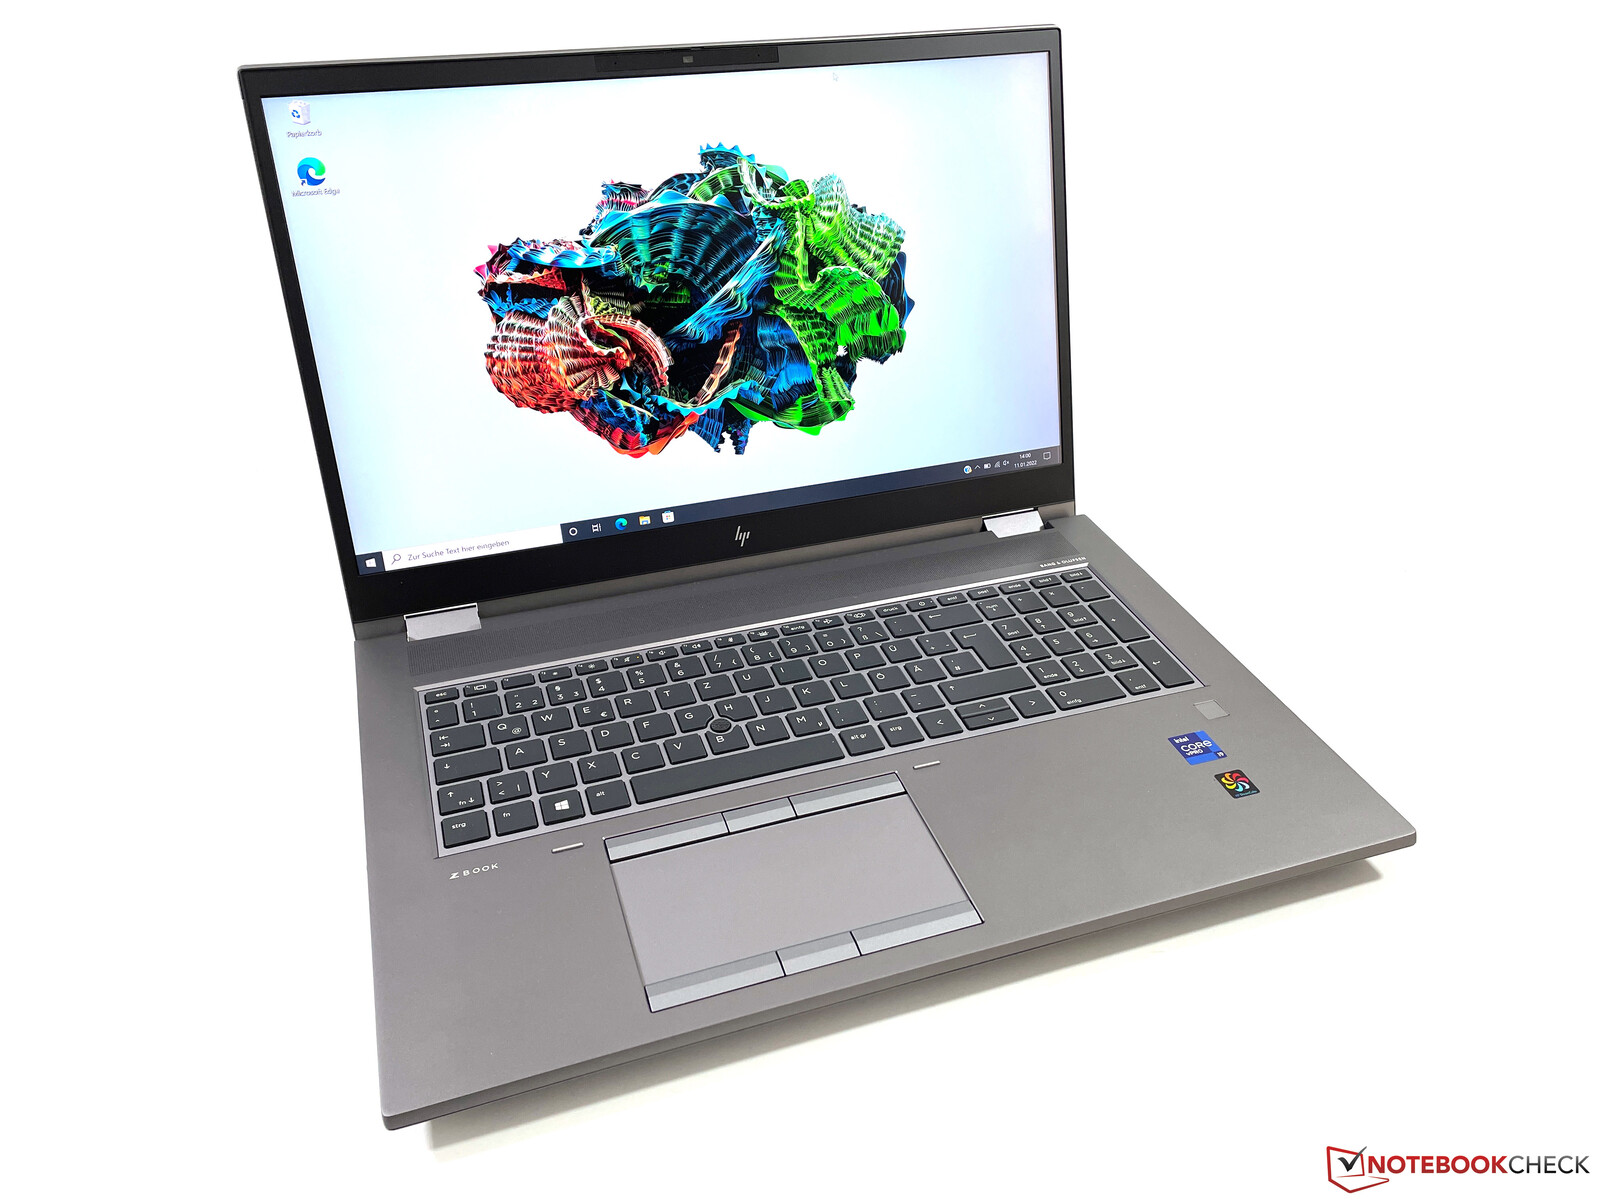
HP ZBook Fury 17 G8 Review - Mobile Workstation with 4K DreamColor Display
The HP ZBook Fury 17 G8 is a classic mobile workstation with a focus on aspects like performance, port variety as well as maintenance options. These product category does not follow the current trend towards slimmer and slimmer devices, which means you have to make compromises. You can also tailor the configuration very well to your requirements with a wide choice of CPU/GPU combinations.
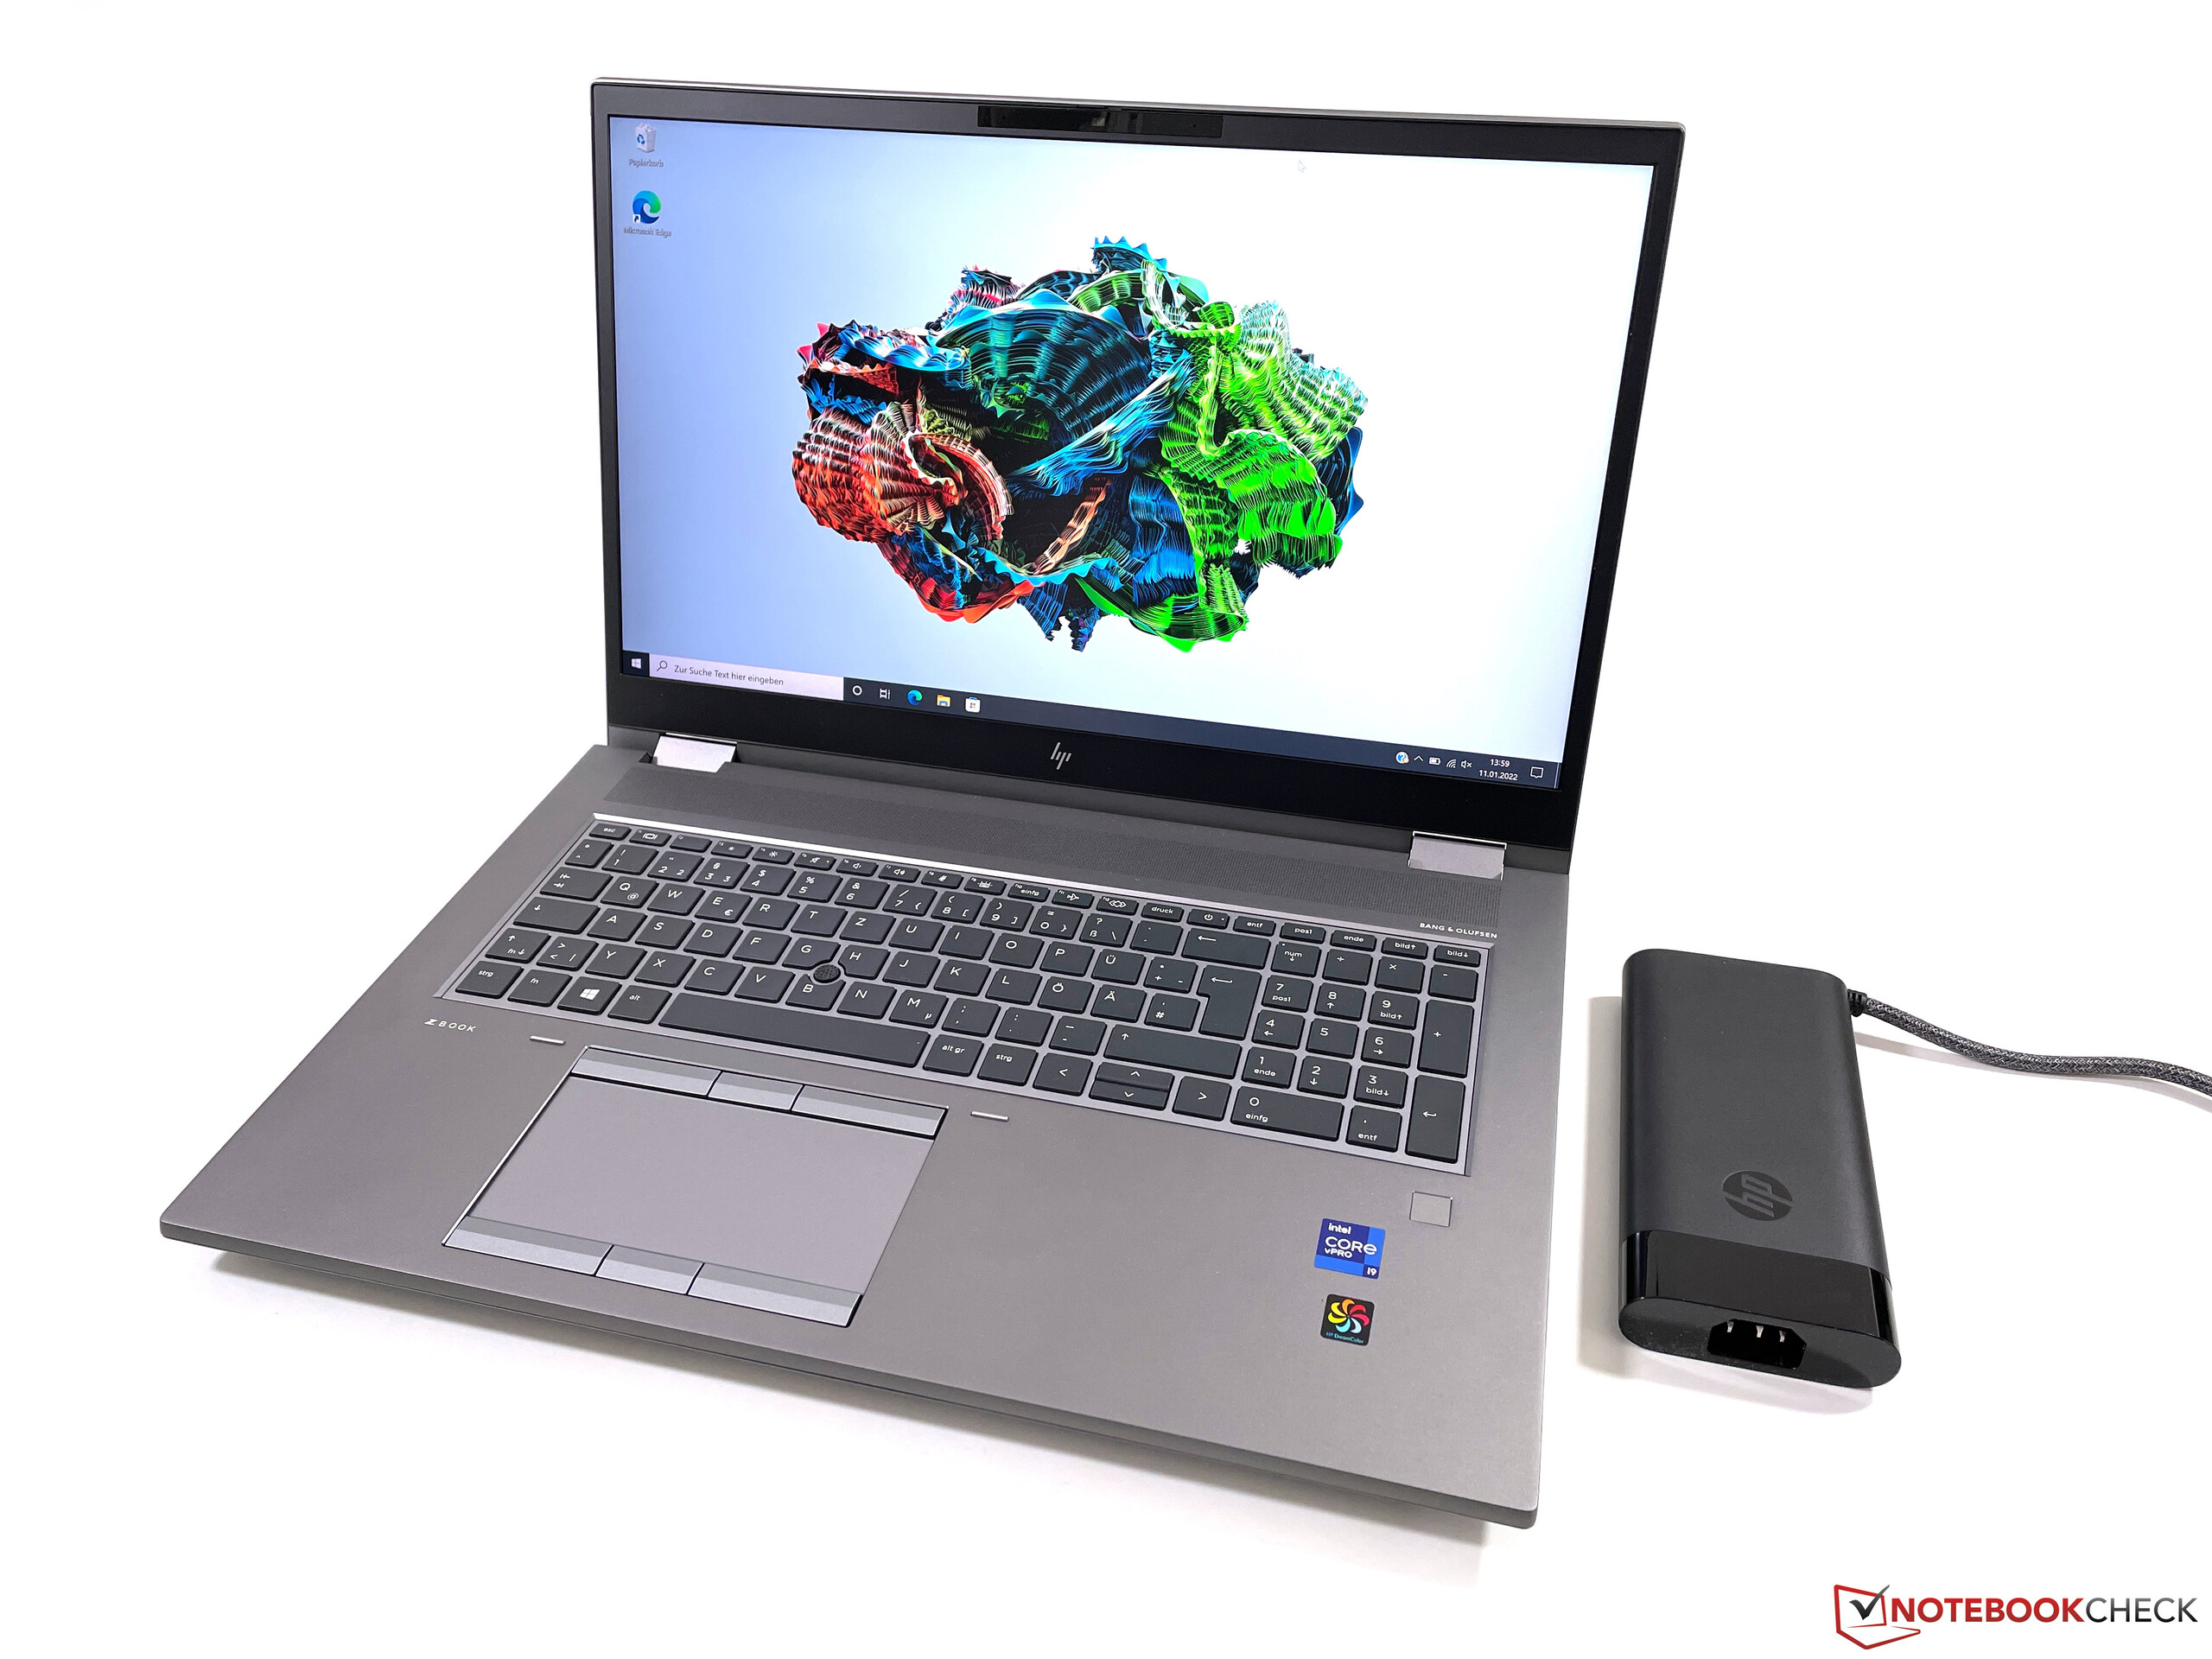
Our review unit is a rather powerful unit with a Core i9 processor and the Nvidia RTX A3000 GPU (previously known as Quadro), but there are even more powerful GPUs available (all the way up to the RTX A5000). You also get 32 GB RAM, a 1 TB NVMe SSD as well as the 4K Dream Color display, which bumps the price of the ZBook Fury 17 G8 to around 3800 Euros.
Potential competitors in comparison
Rating | Date | Model | Weight | Height | Size | Resolution | Price |
|---|---|---|---|---|---|---|---|
| 89.7 % v7 (old) | 02 / 2022 | HP ZBook Fury 17 G8-4A6A9EA i9-11950H, RTX A3000 Laptop GPU | 2.9 kg | 27 mm | 17.30" | 3840x2160 | |
| 87.8 % v7 (old) | 10 / 2021 | Lenovo ThinkPad P17 G2-20YU0025G i7-11800H, RTX A2000 Laptop GPU | 3.6 kg | 28.38 mm | 17.30" | 1920x1080 | |
| 88.6 % v7 (old) | 12 / 2021 | MSI WE76 11UM-456 i9-11980HK, RTX A5000 Laptop GPU | 2.9 kg | 25.9 mm | 17.30" | 3840x2160 | |
v (old) | 12 / 2021 | Asus ProArt StudioBook 16 W7600H5A-2BL2 W-11955M, RTX A5000 Laptop GPU | 2.4 kg | 21.4 mm | 16.00" | 3840x2400 | |
| 89.8 % v7 (old) | 04 / 2021 | HP ZBook Fury 17 G7 119W5EA i9-10885H, Quadro RTX 4000 Max-Q | 2.9 kg | 26.9 mm | 17.30" | 3840x2160 | |
| 92.5 % v7 (old) | 11 / 2021 | Apple MacBook Pro 16 2021 M1 Max M1 Max, M1 Max 32-Core GPU | 2.2 kg | 16.8 mm | 16.20" | 3456x2234 |
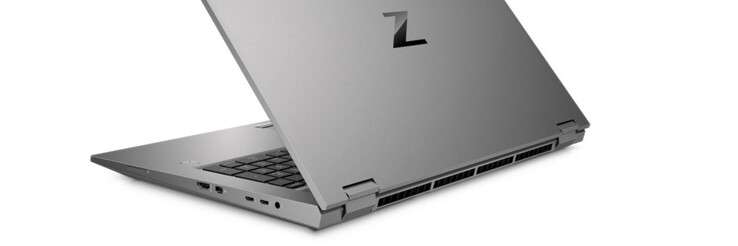
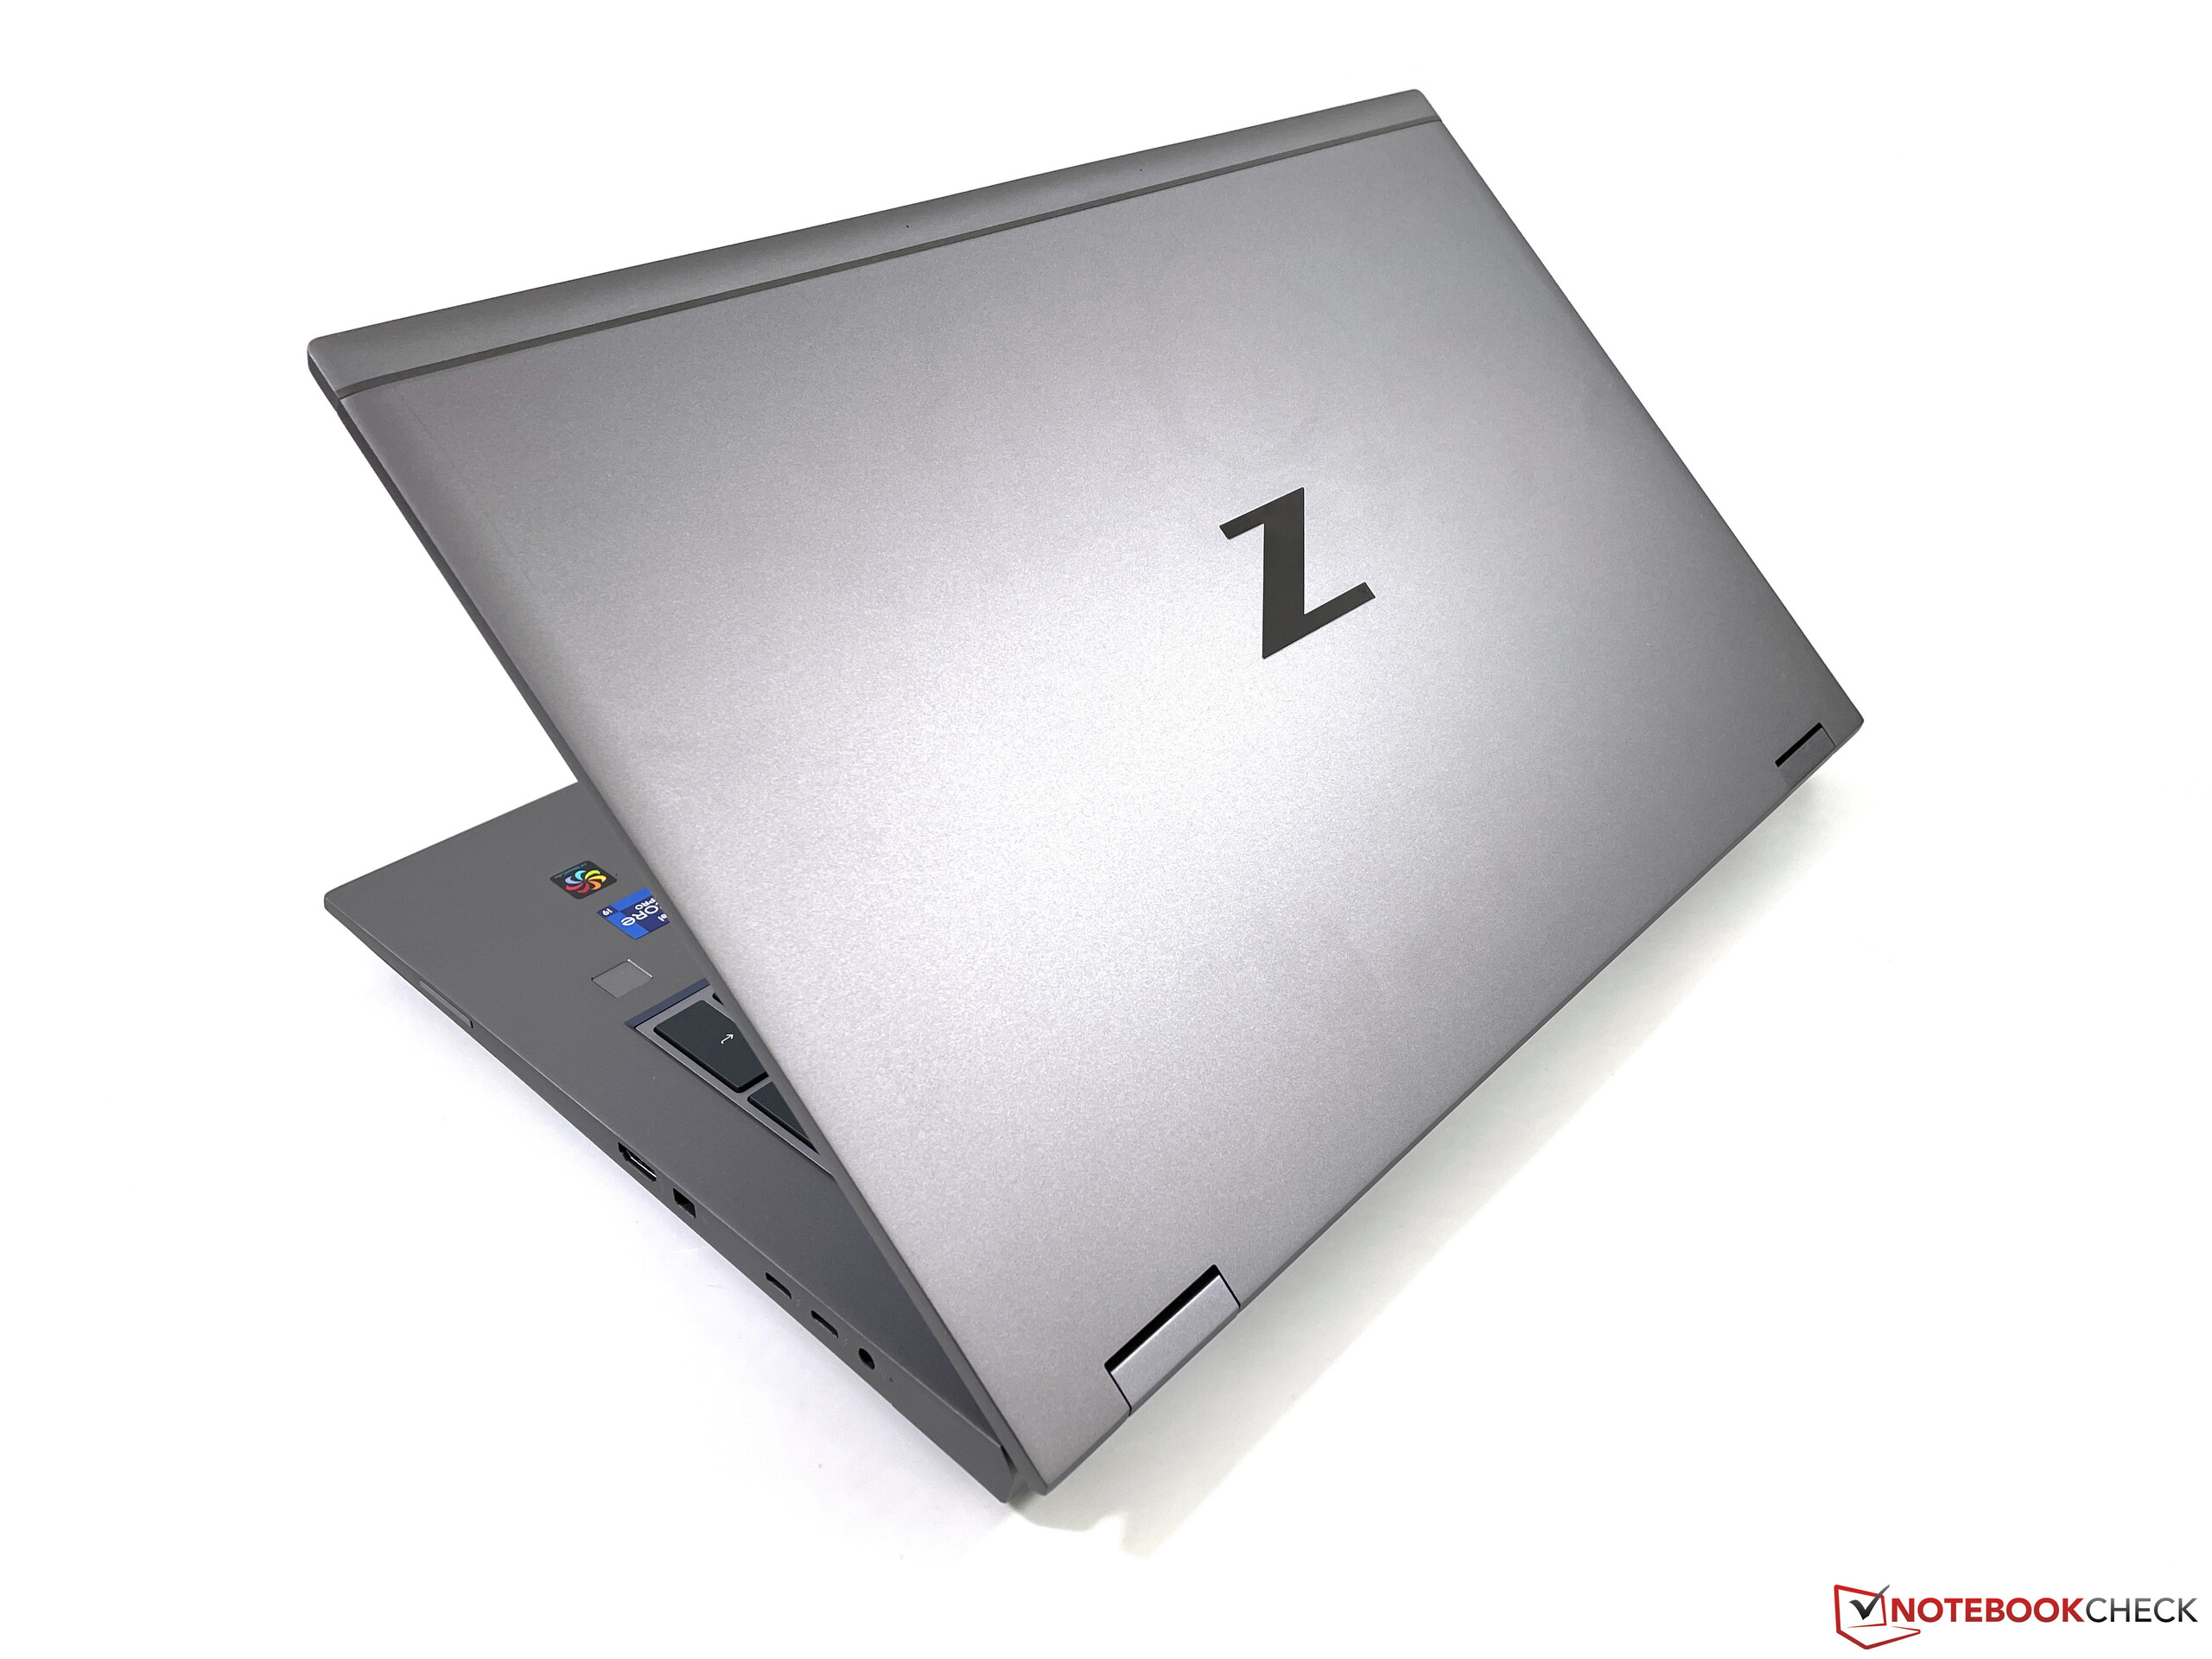
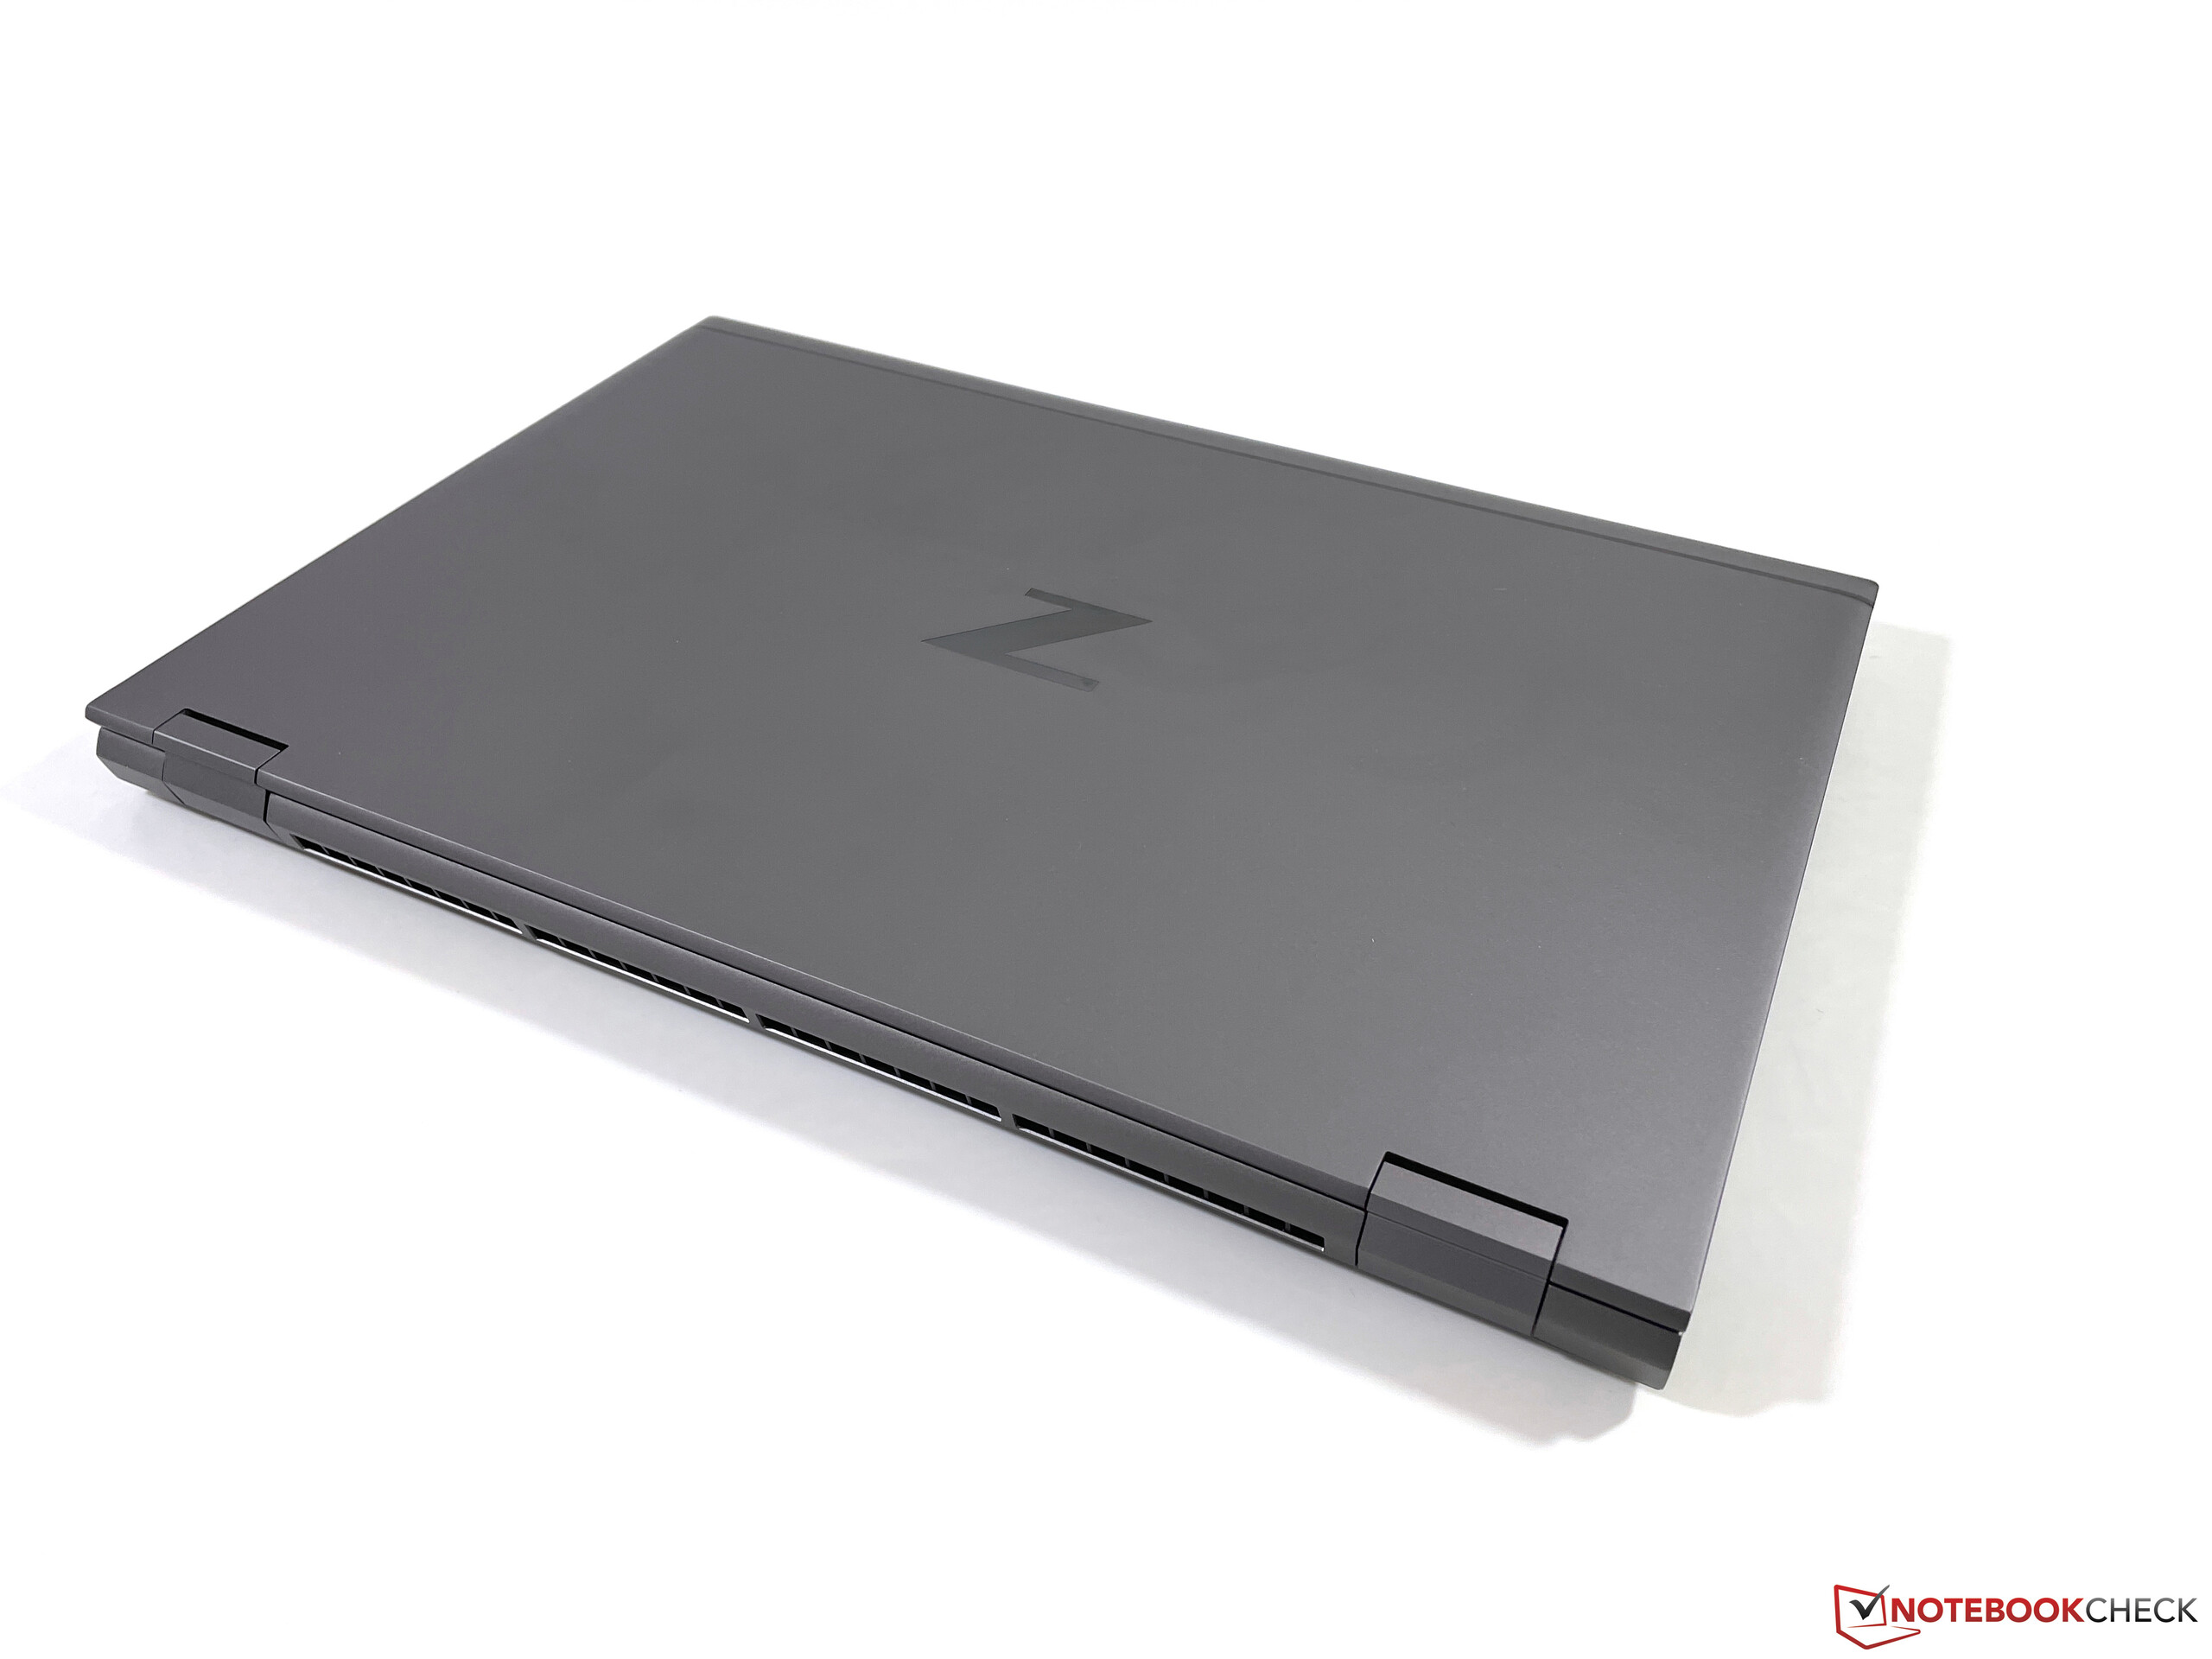
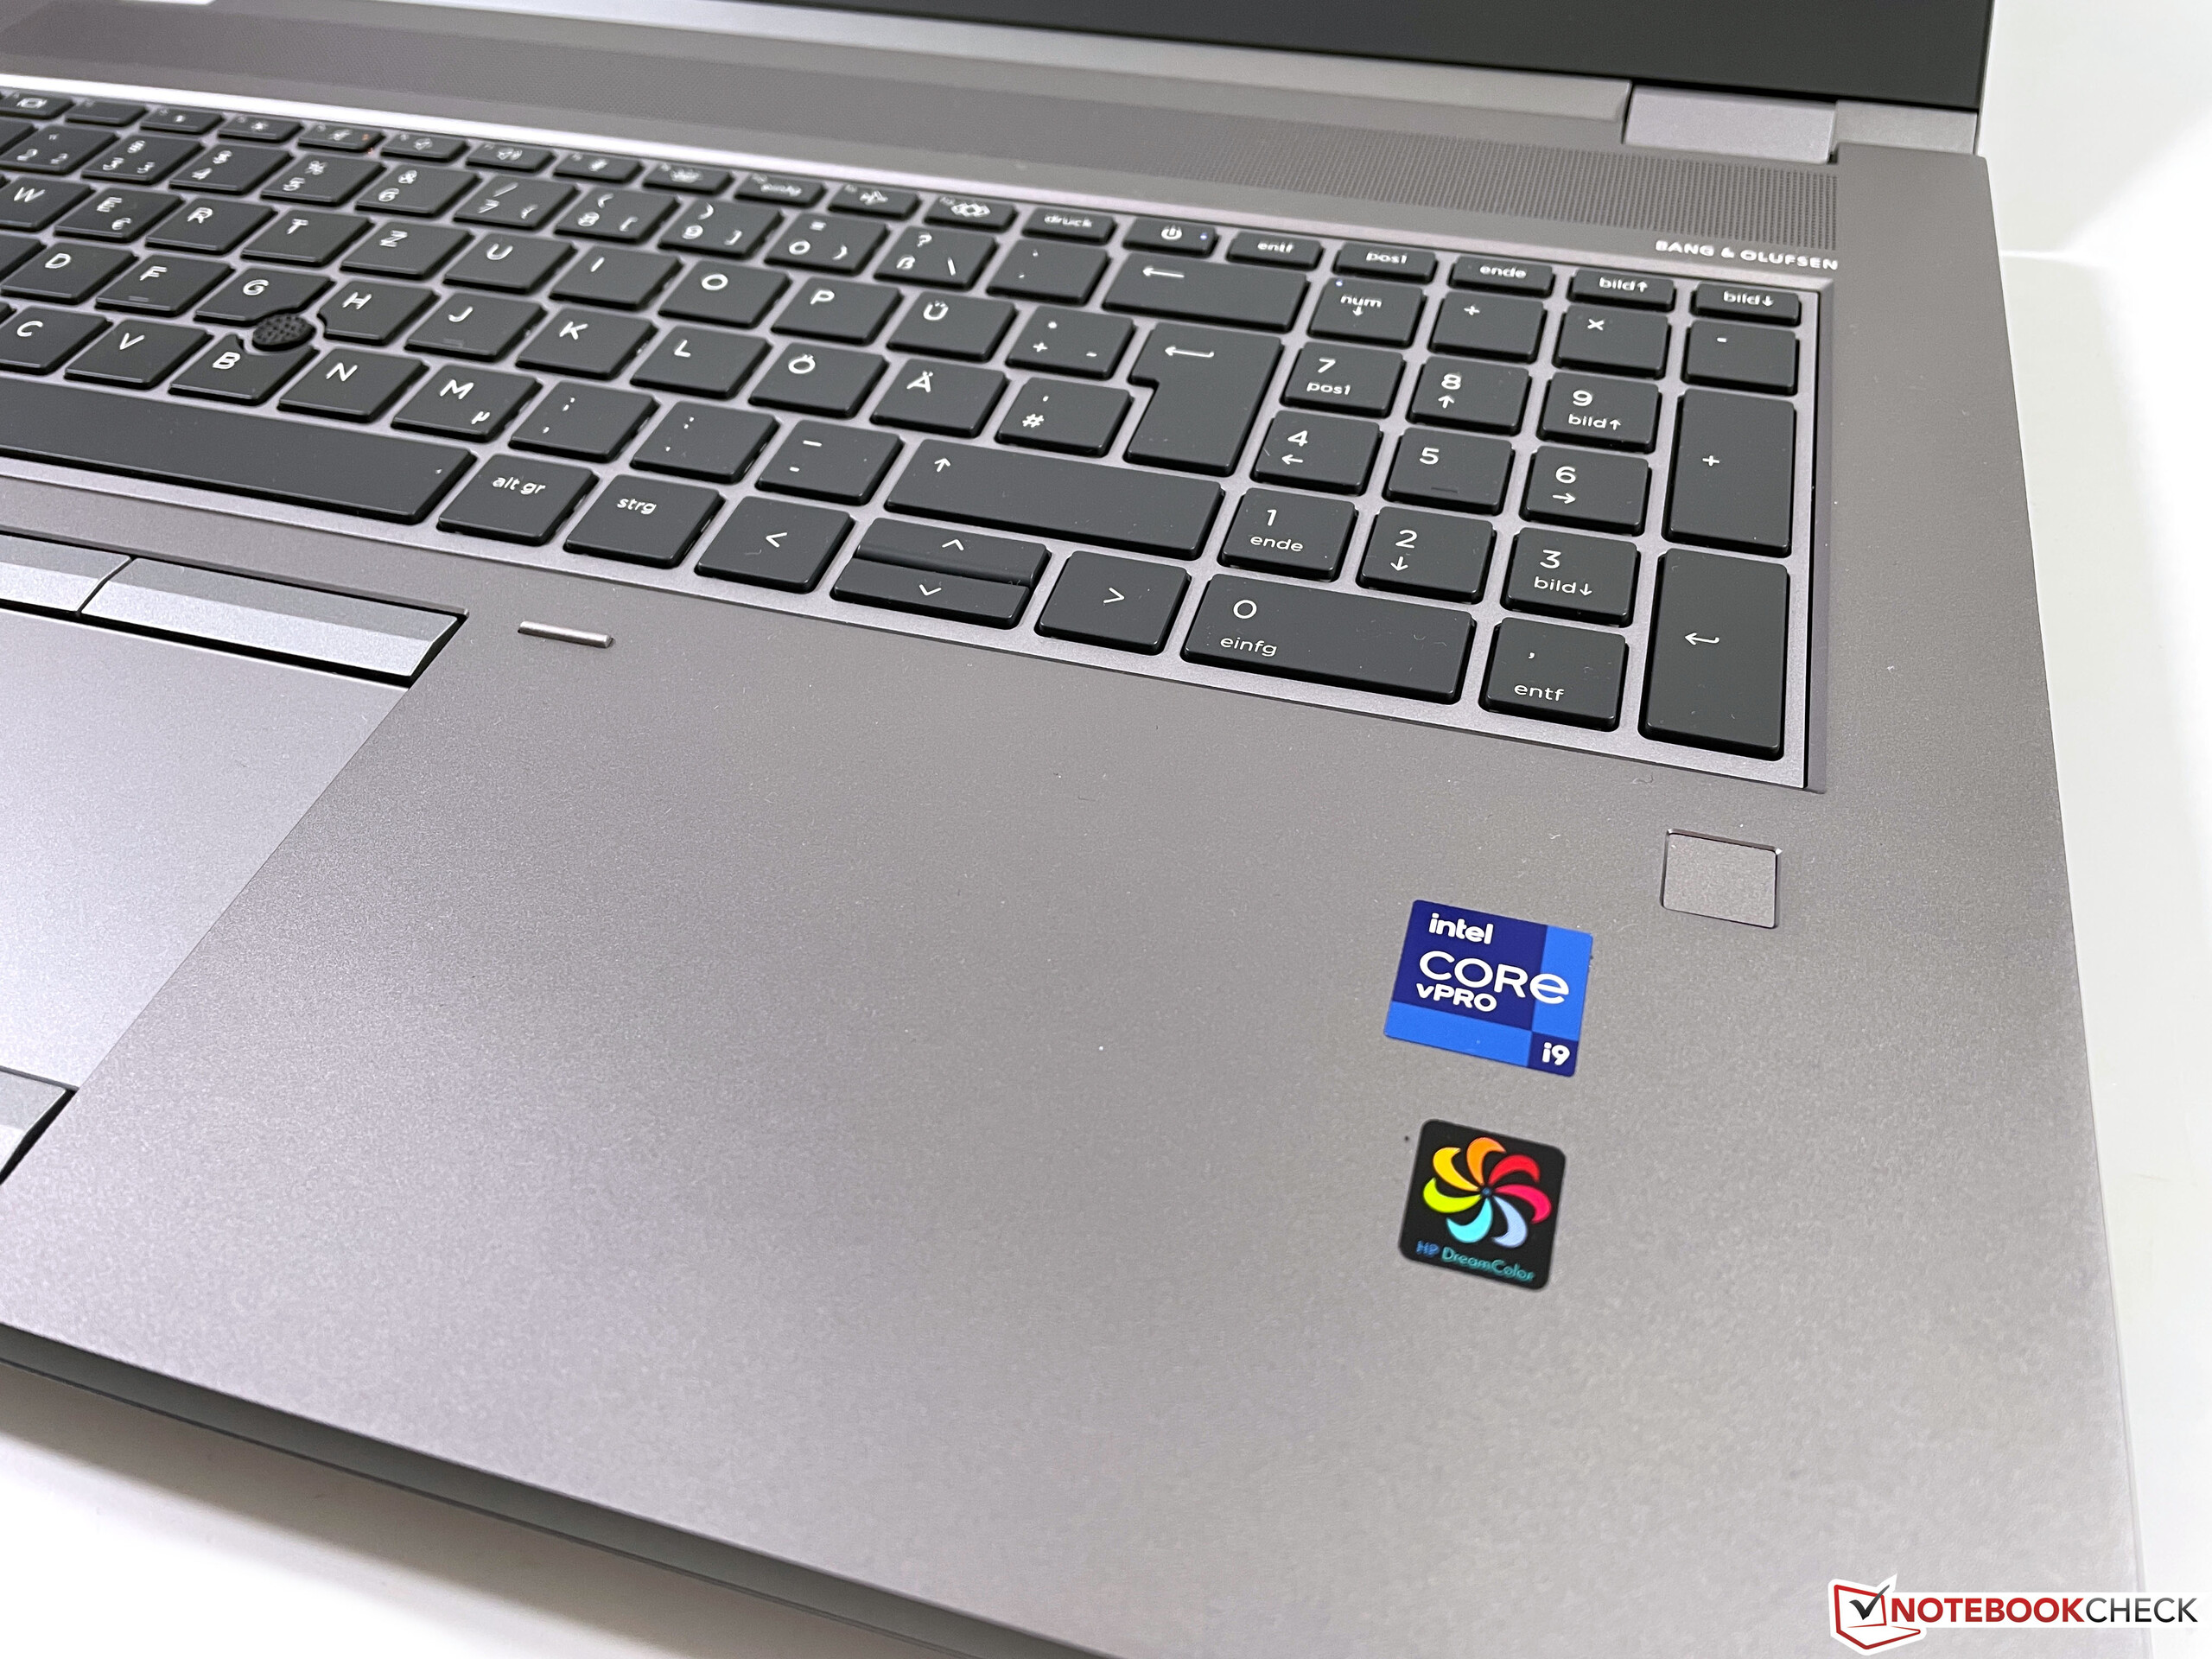
Case - ZBook with unusual quality issues
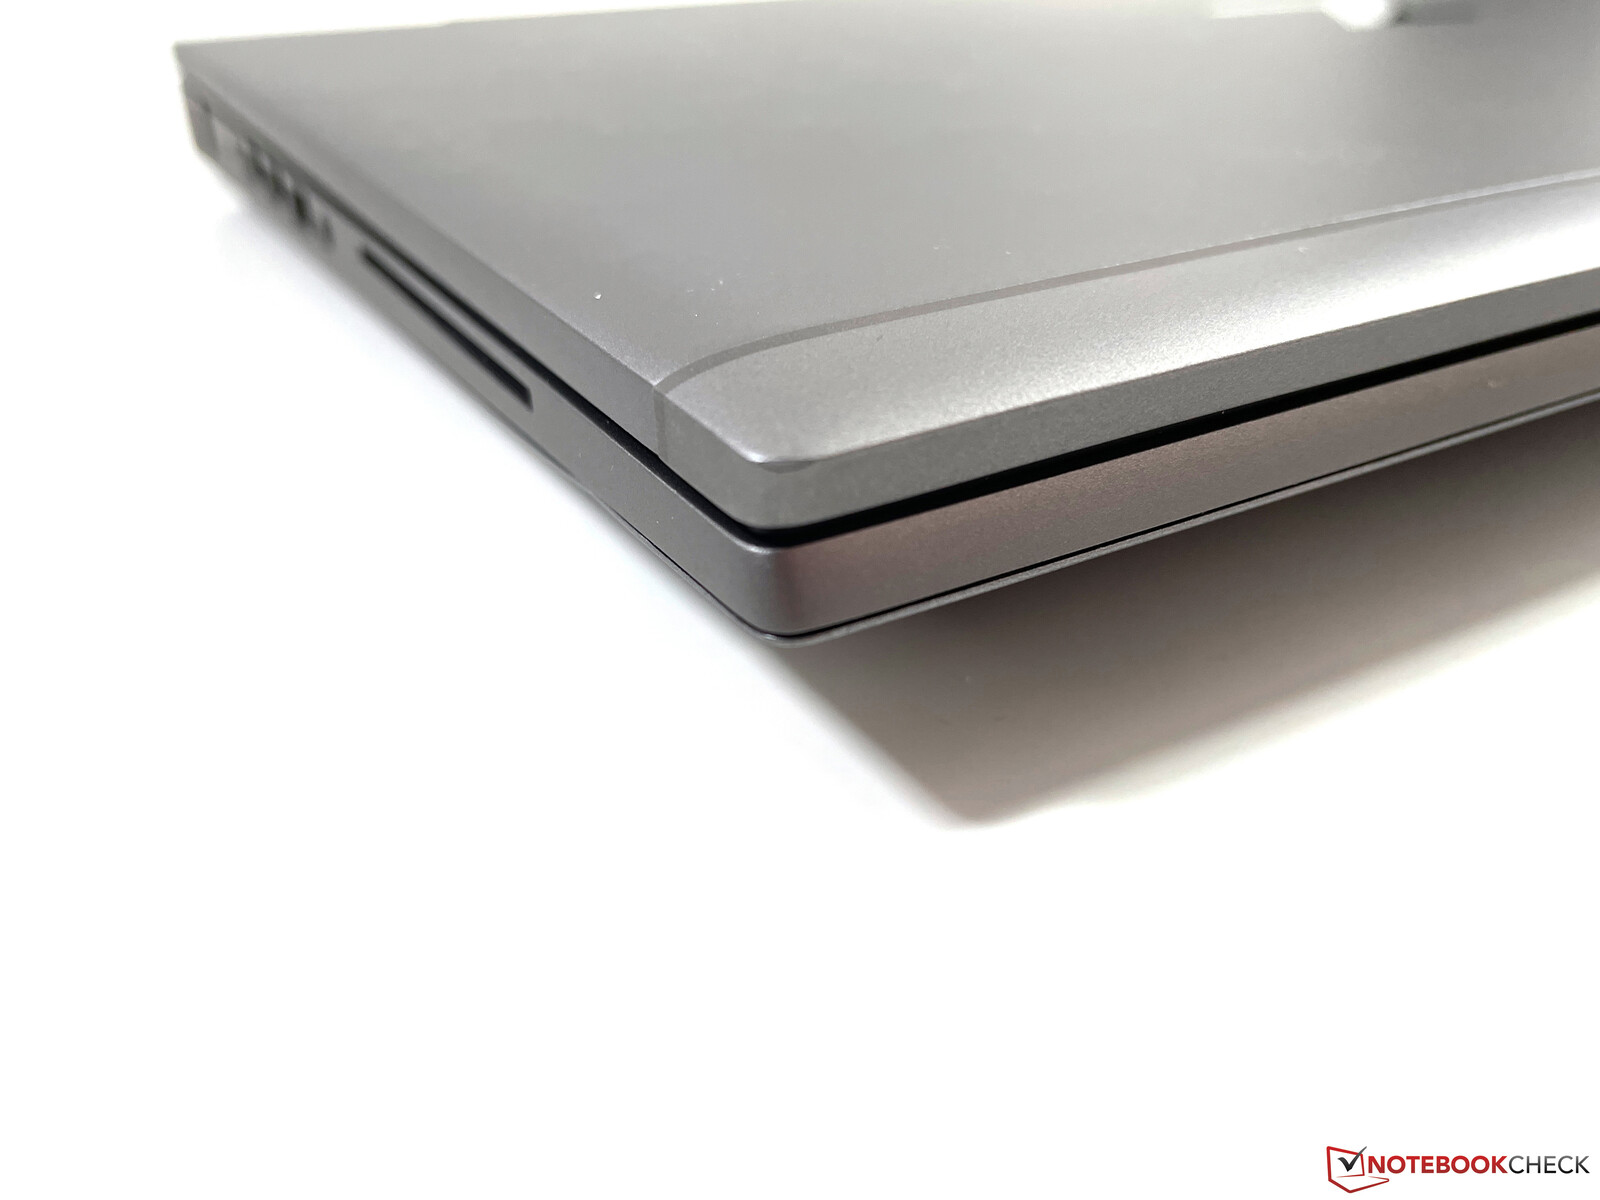
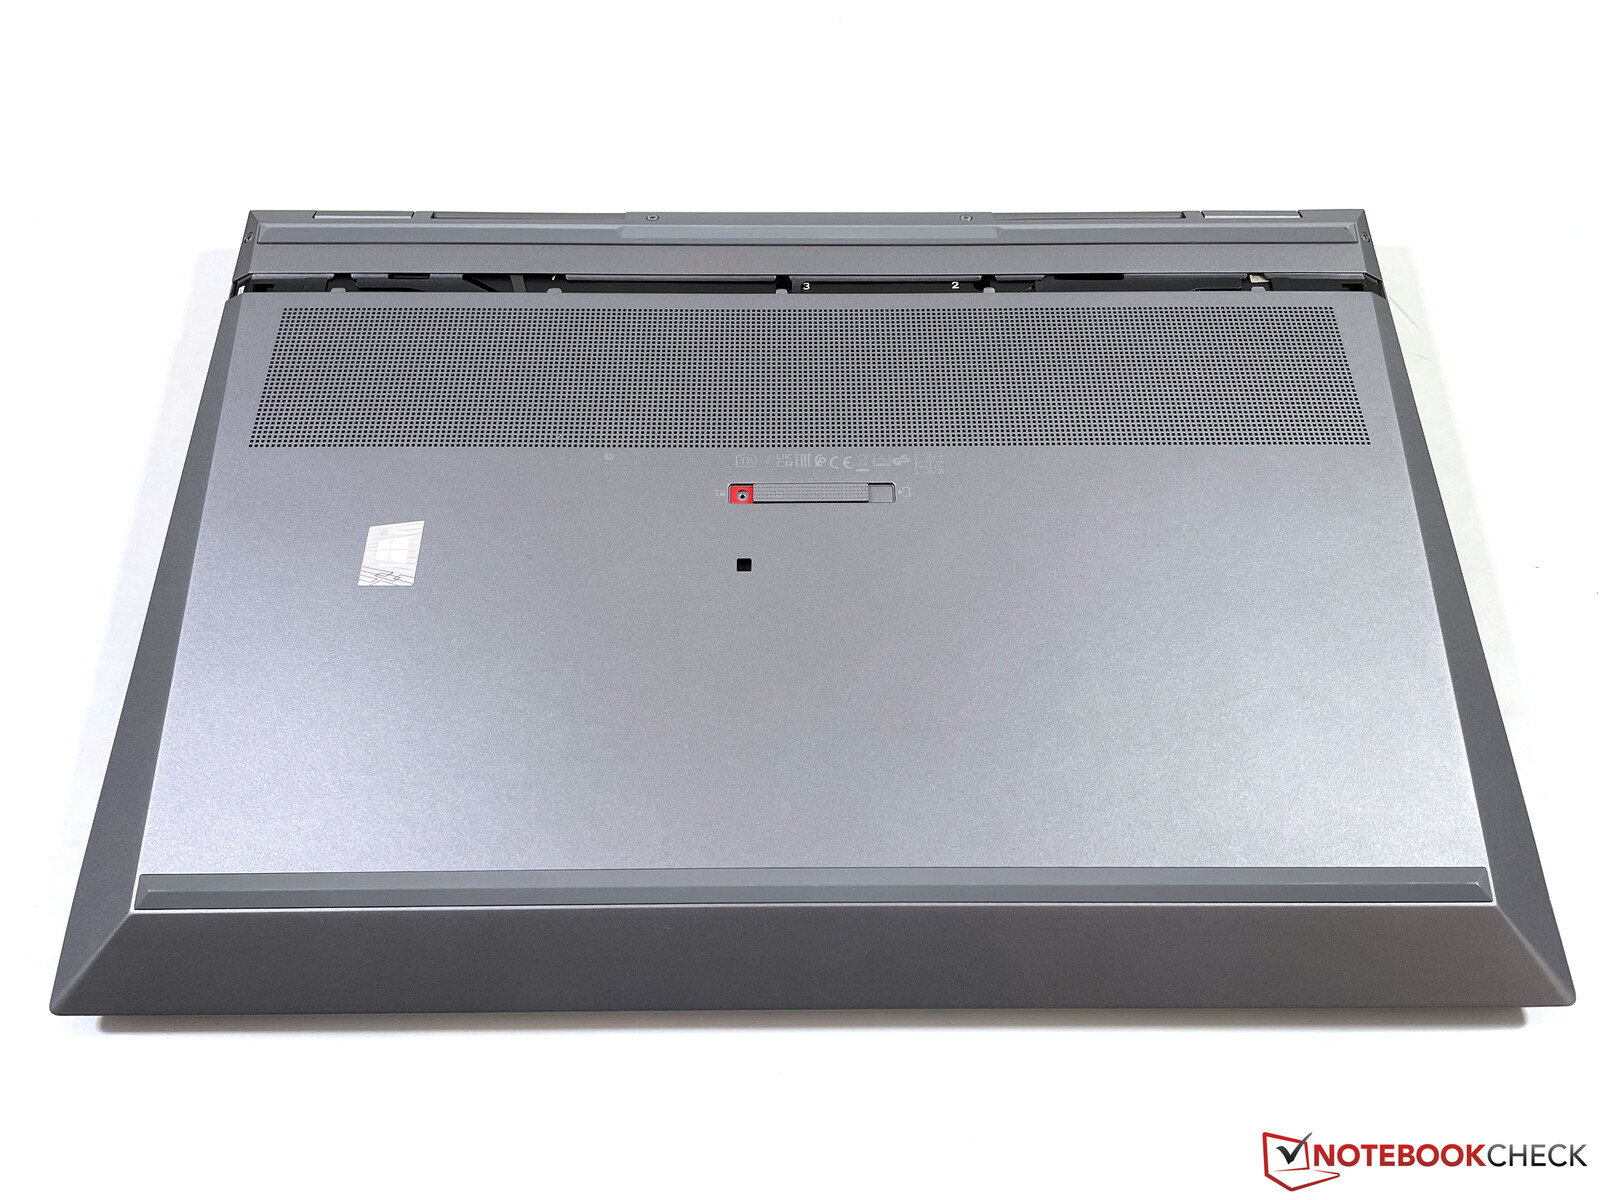
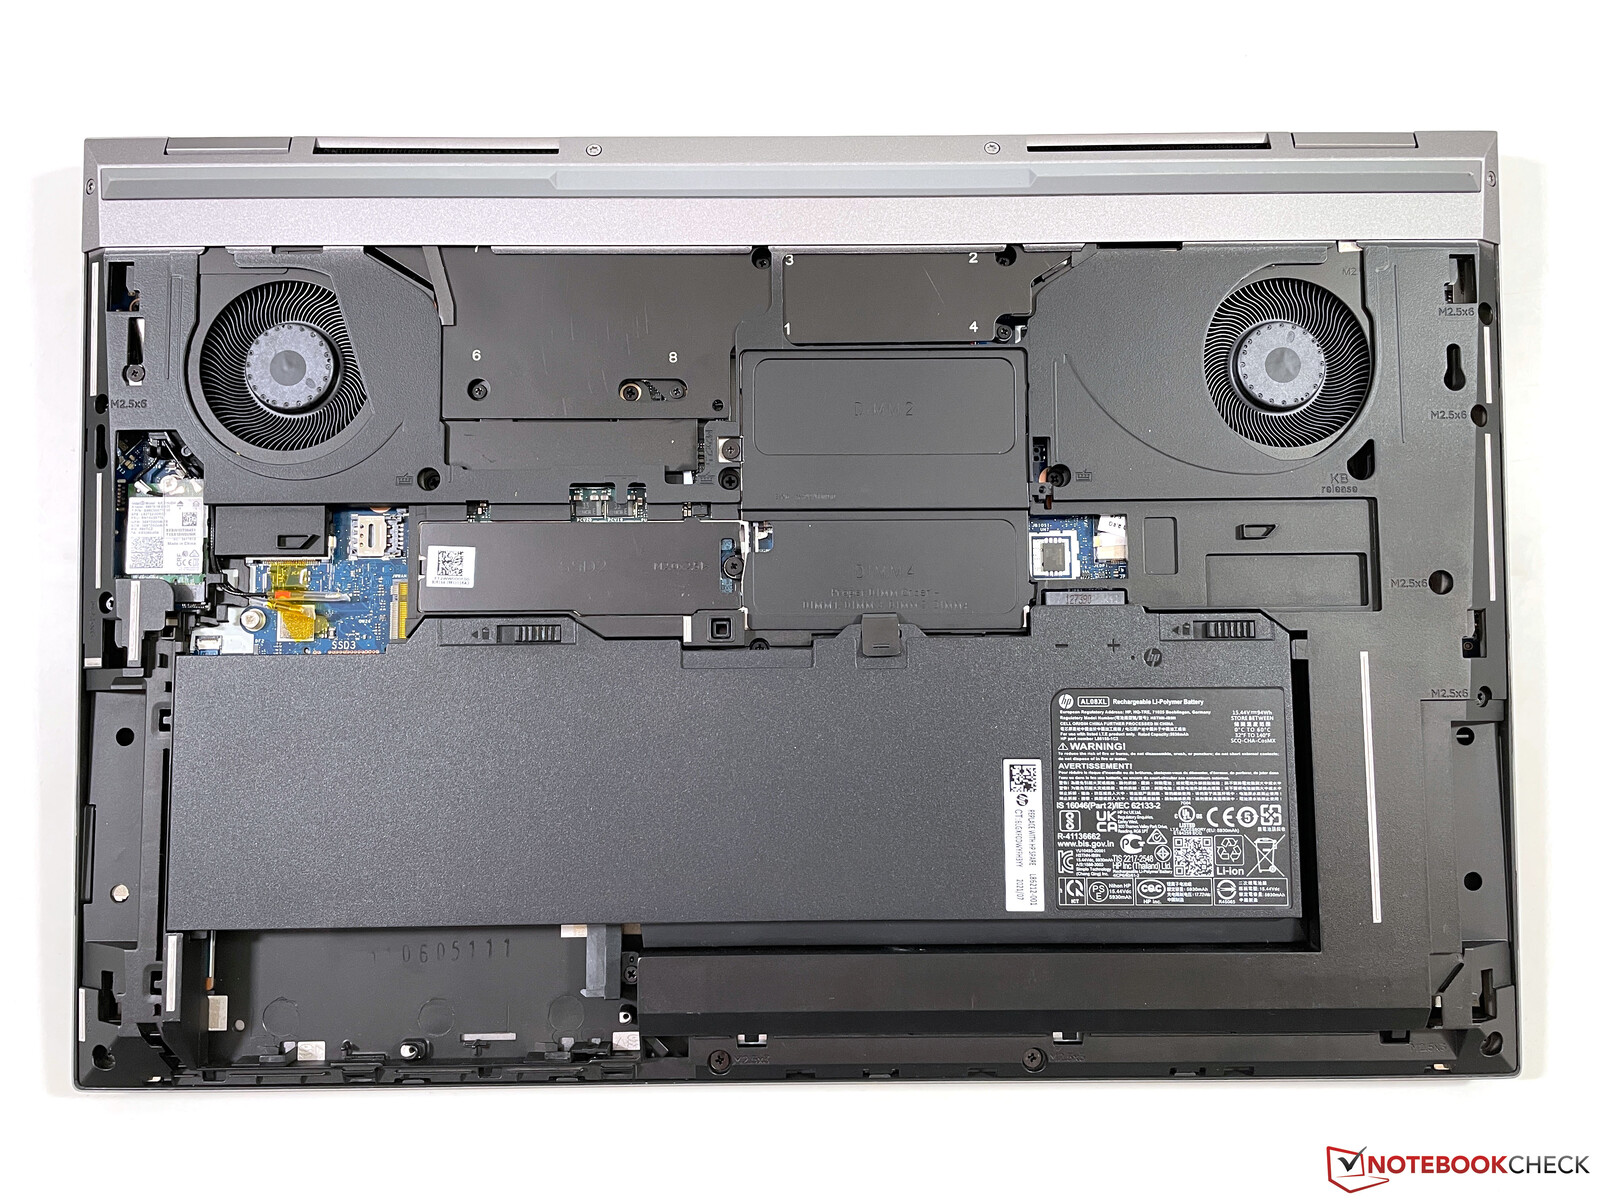
We are already familiar with the chassis design from the predecessor ZBook Fury 17 G7 and the dark gray chassis works well in professional environments. The stability is good for both the chassis as well as the lid and the overall quality is very high, but we noticed an issue with the fitting of the bottom panel. It is only secured by a lever and a central screw, so it is very easy to remove, but the panel is not perfectly aligned with the rest of the chassis and there are visible discrepancies. This does not really fit the high retail price and it affects the visual appearance. Although it is easy to remove the panel, we would have preferred a sturdier solution with more screws.
HP still uses 16:9 panels and the bezels are pretty wide, especially below the screen. While many modern 15 and 16-inch laptops are going back to 16:10 panels, it seems there are just no suitable 17.3-inch panels right now. Only the Lenovo ThinkPad P17 is bulkier and heaver, but all the other comparison devices are more compact than the ZBook.
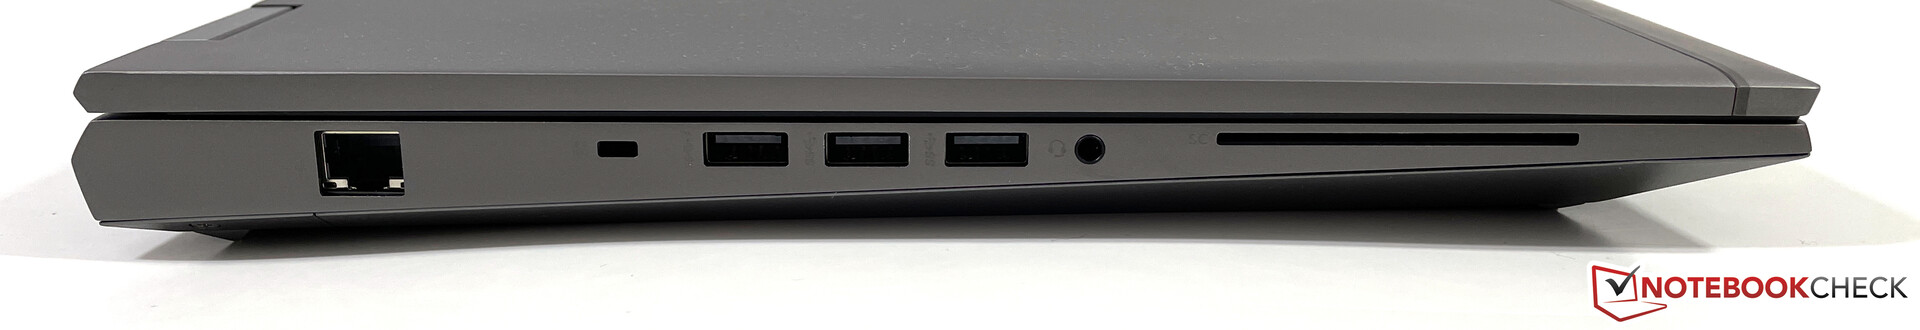
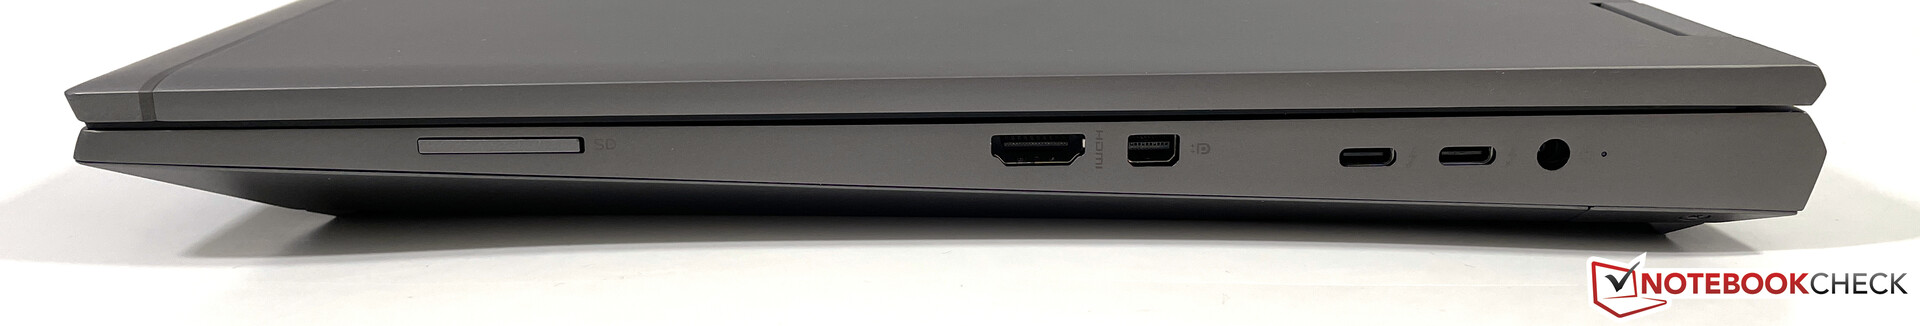
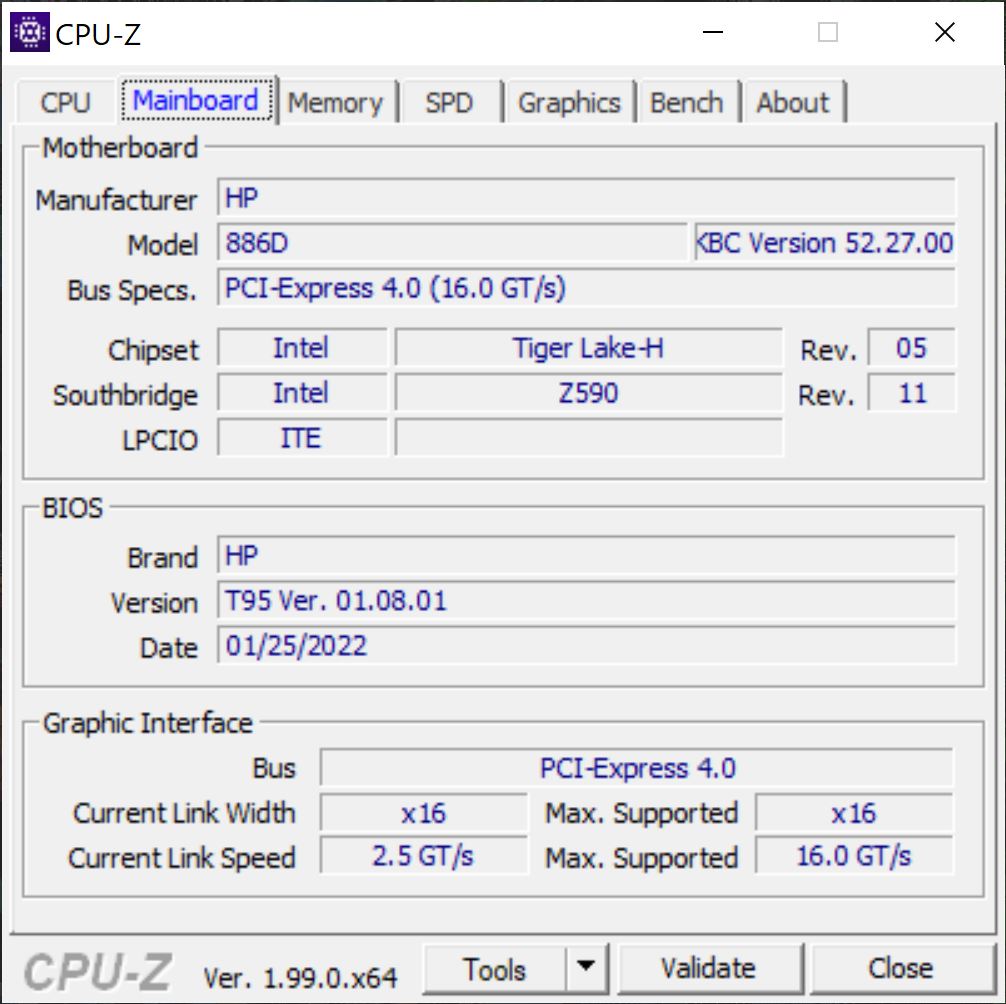
Connectivity - Thunderbolt 4, but slow SD-card reader
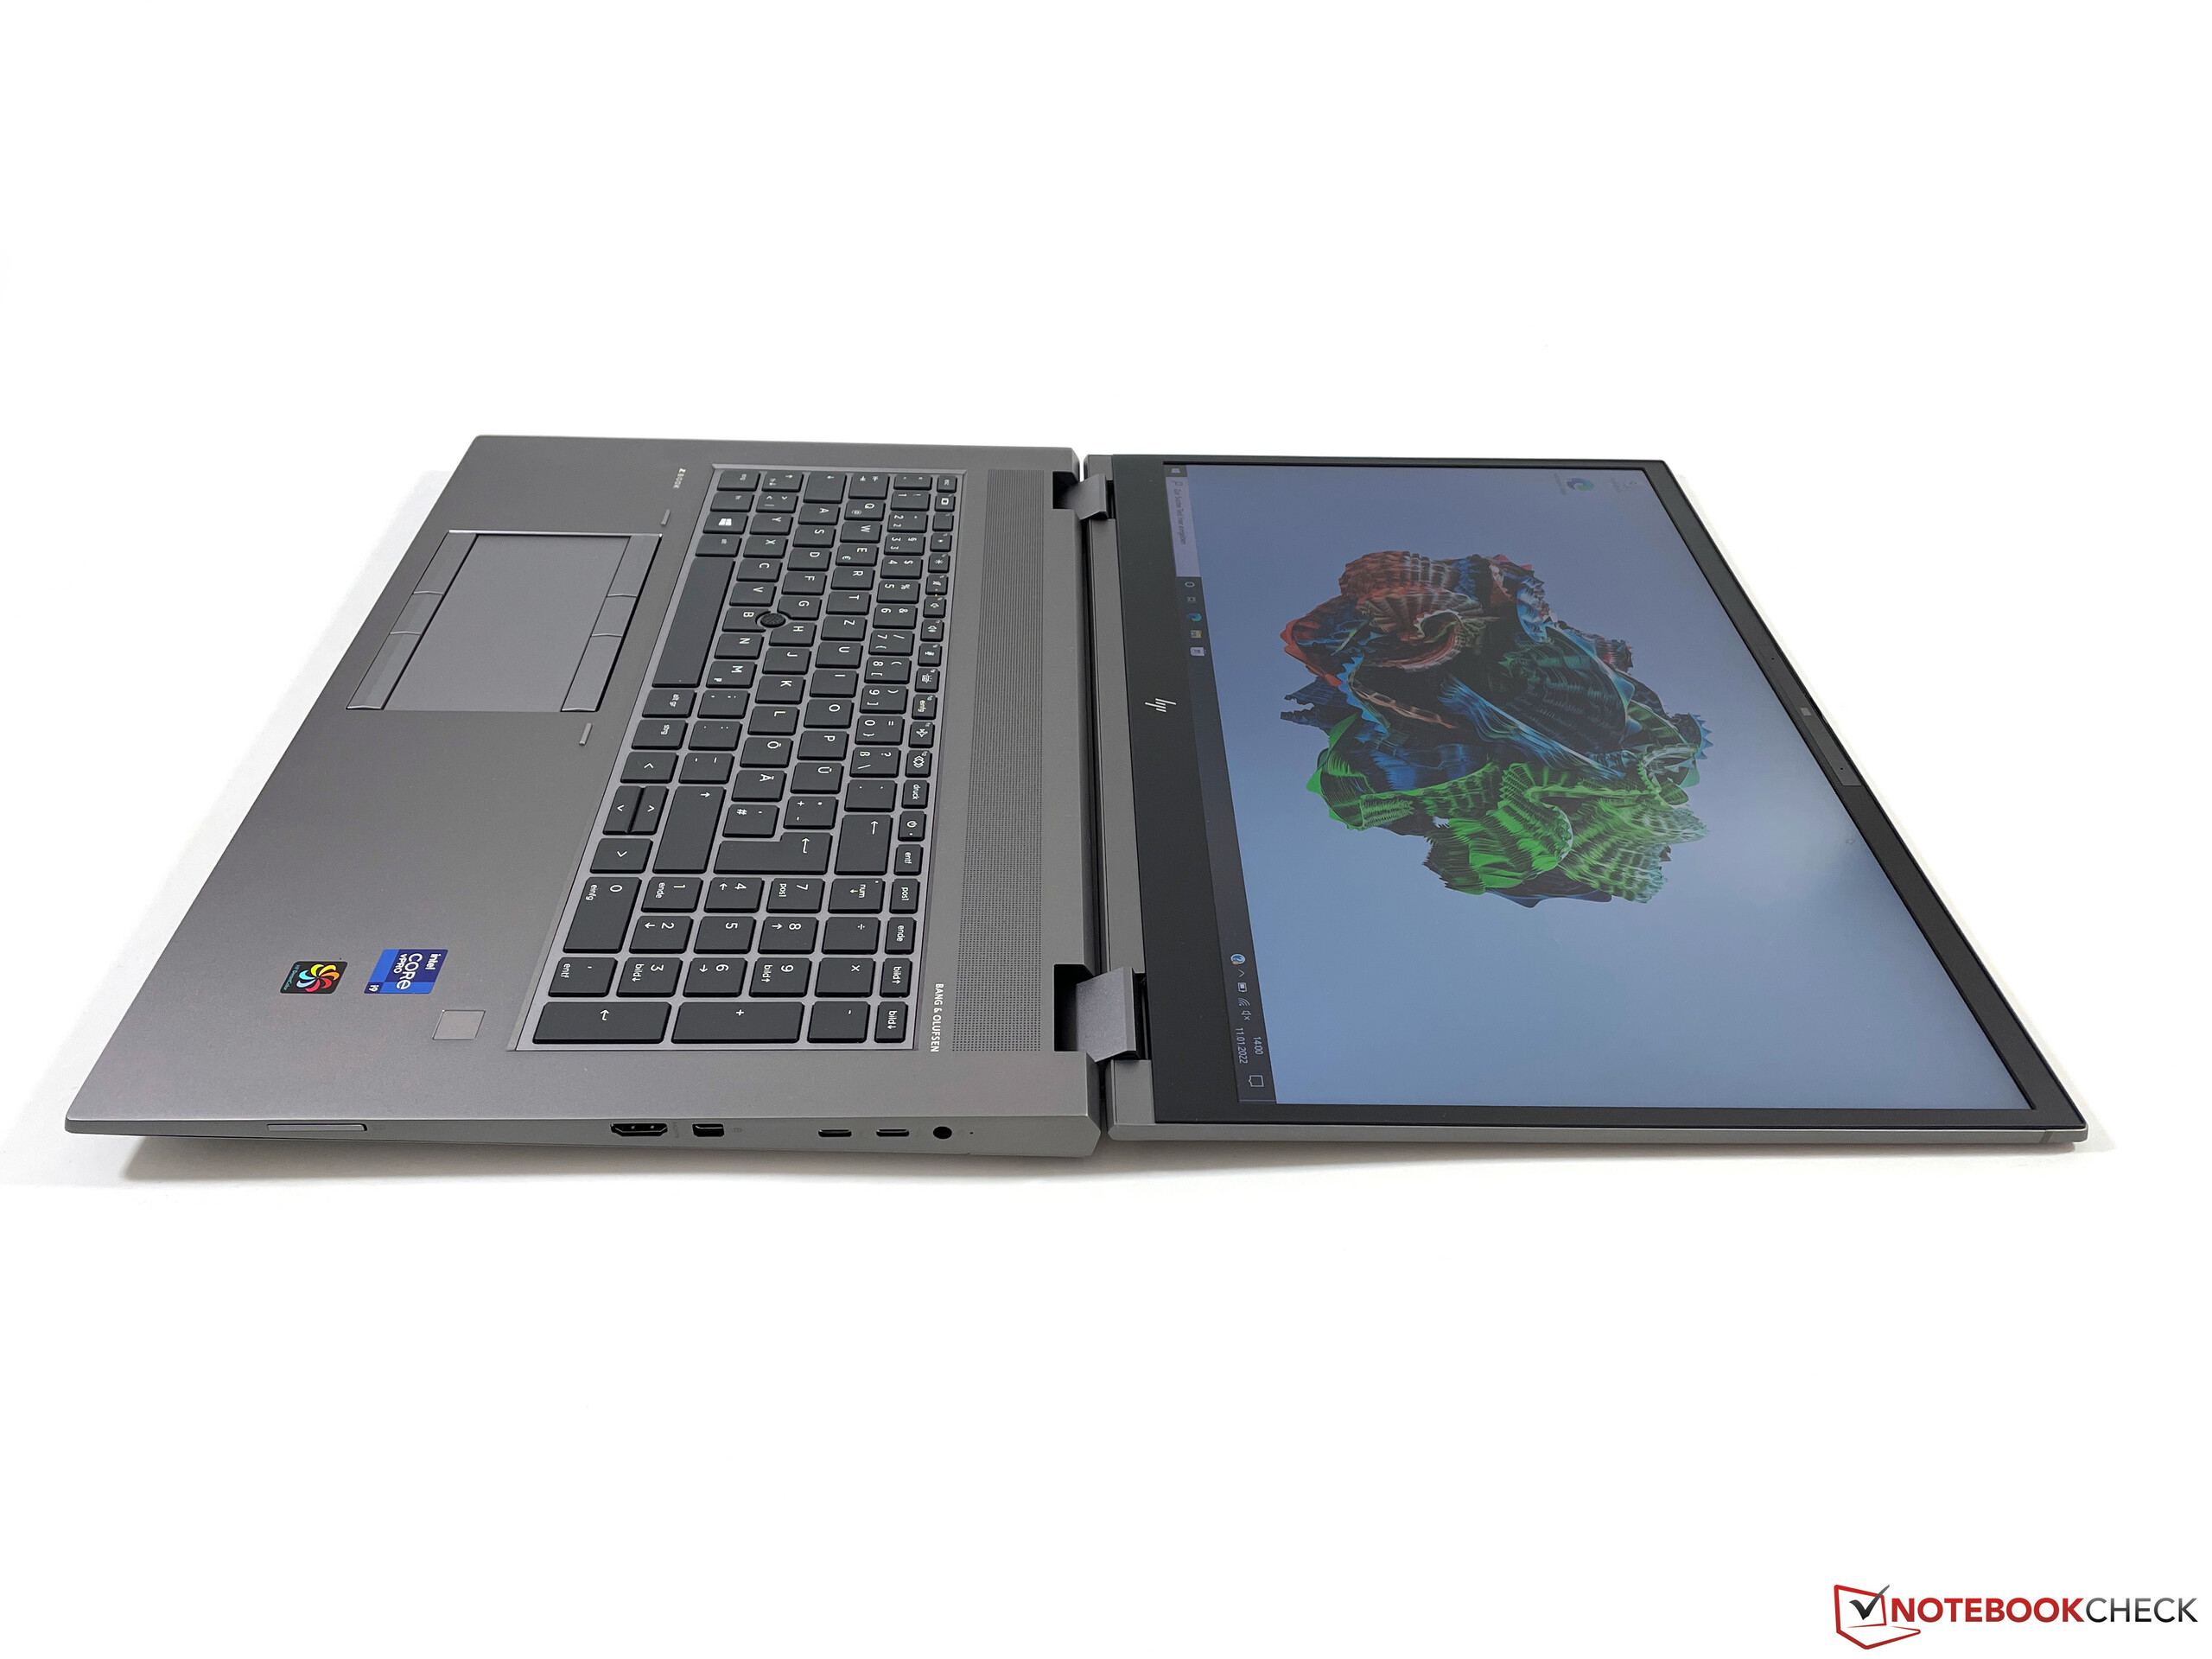
You get all the important ports including Thunderbolt/USB-C, regular USB-A ports, Ethernet, HDMI, and Mini-DisplayPort. The ZBook can drive a total of four screens. The space at the rear is occupied by the fan exhausts, so all the ports are distributed across both sides.
SD Card Reader
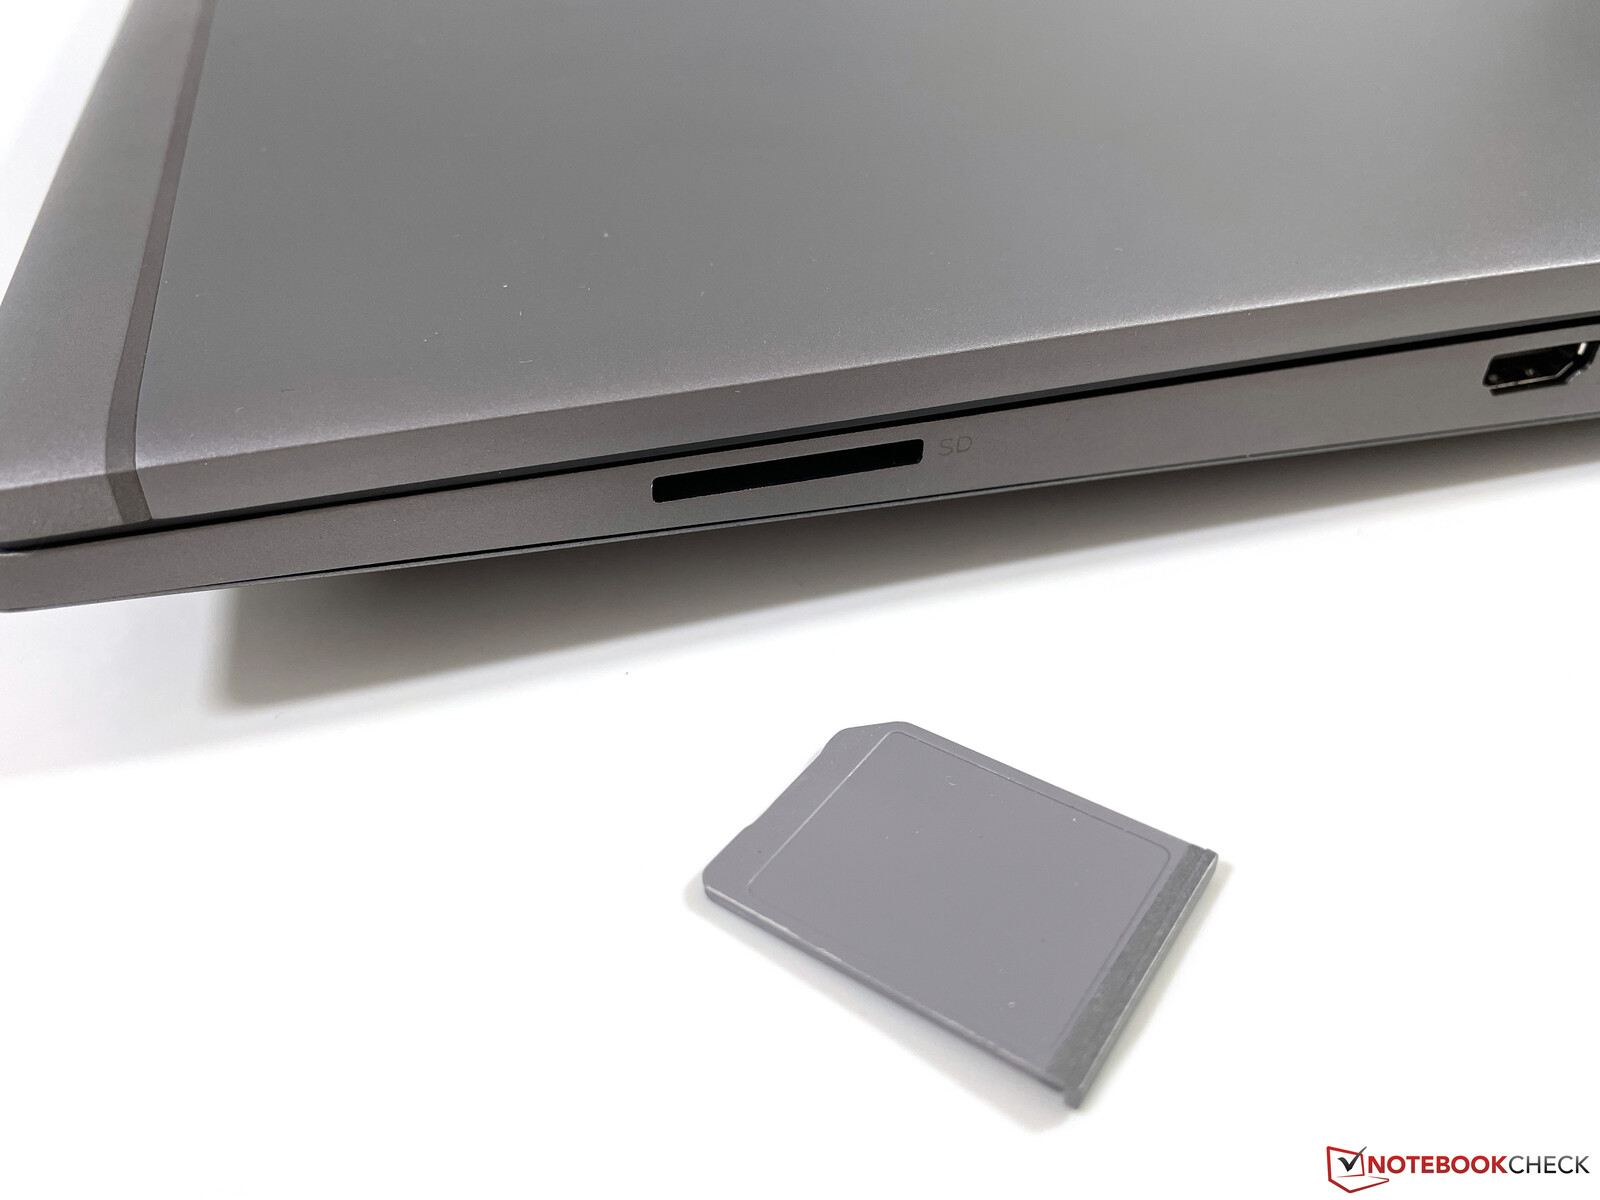
HP still uses a full-size SD-card reader on the right side, and the SD card is fully inserted. Compared to the previous model, however, the performance is much lower and we can only get up to 90 MB/s in the benchmarks, while the ZBook Fury 17 G7 still managed 170 MB/s. In addition to our current reference card (Angelbird AV Pro V60), we also checked our previous card from Toshiba to rule out any compatibility issues, but the results were almost identical.
| SD Card Reader | |
| average JPG Copy Test (av. of 3 runs) | |
| Lenovo ThinkPad P17 G2-20YU0025G (Toshiba Exceria Pro SDXC 64 GB UHS-II) | |
| HP ZBook Fury 17 G7 119W5EA (AV Pro 60) | |
| Average of class Workstation (49.6 - 681, n=14, last 2 years) | |
| MSI WE76 11UM-456 (AV Pro V60) | |
| HP ZBook Fury 17 G8-4A6A9EA (Angelbird AV Pro V60) | |
| Asus ProArt StudioBook 16 W7600H5A-2BL2 (AV Pro SD microSD 128 GB V60) | |
| maximum AS SSD Seq Read Test (1GB) | |
| Average of class Workstation (87.6 - 1455, n=14, last 2 years) | |
| Lenovo ThinkPad P17 G2-20YU0025G (Toshiba Exceria Pro SDXC 64 GB UHS-II) | |
| HP ZBook Fury 17 G7 119W5EA (AV Pro 60) | |
| MSI WE76 11UM-456 (AV Pro V60) | |
| HP ZBook Fury 17 G8-4A6A9EA (Angelbird AV Pro V60) | |
| Asus ProArt StudioBook 16 W7600H5A-2BL2 (AV Pro SD microSD 128 GB V60) | |
Communication
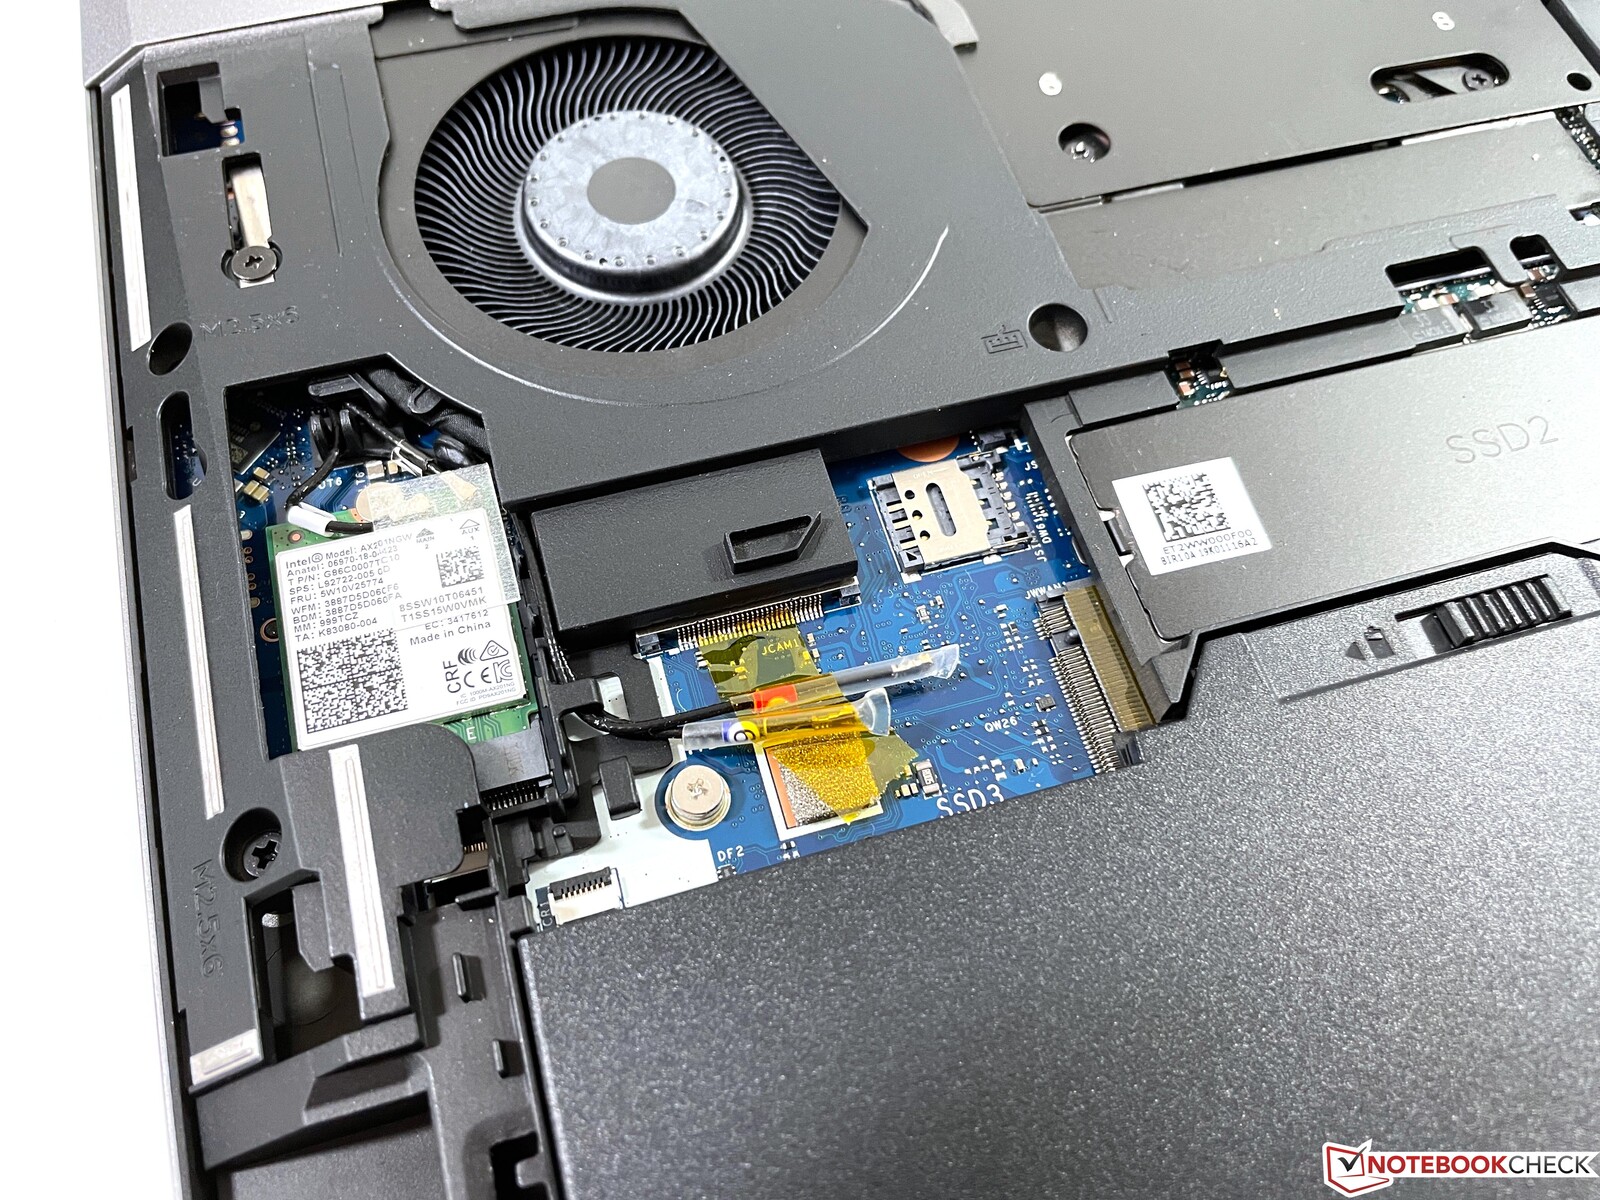
In addition to the Gigabit Ethernet port, you also get a Wi-Fi 6 module from Intel as well as the possibility to add a WWAN module (4G/LTE) since all the necessary antennas are already included. However, HP does not use the latest standards and there are already more modern Wi-Fi 6E modules and a 5G modem would be nice in 2022 as well. The performance of the Wi-Fi module is still very good and we were able to measure transfer rates of more than 1 Gbps. We did not experience any issues with the stability in combination with the Wi-Fi 6 router from Netgear, or the AVM FritzBox 7490 (Wi-Fi 5).
Webcam
The ZBook Fury 17 G8 still uses a 720p webcam. It does its job, but the picture quality is not good even in decent lighting conditions.


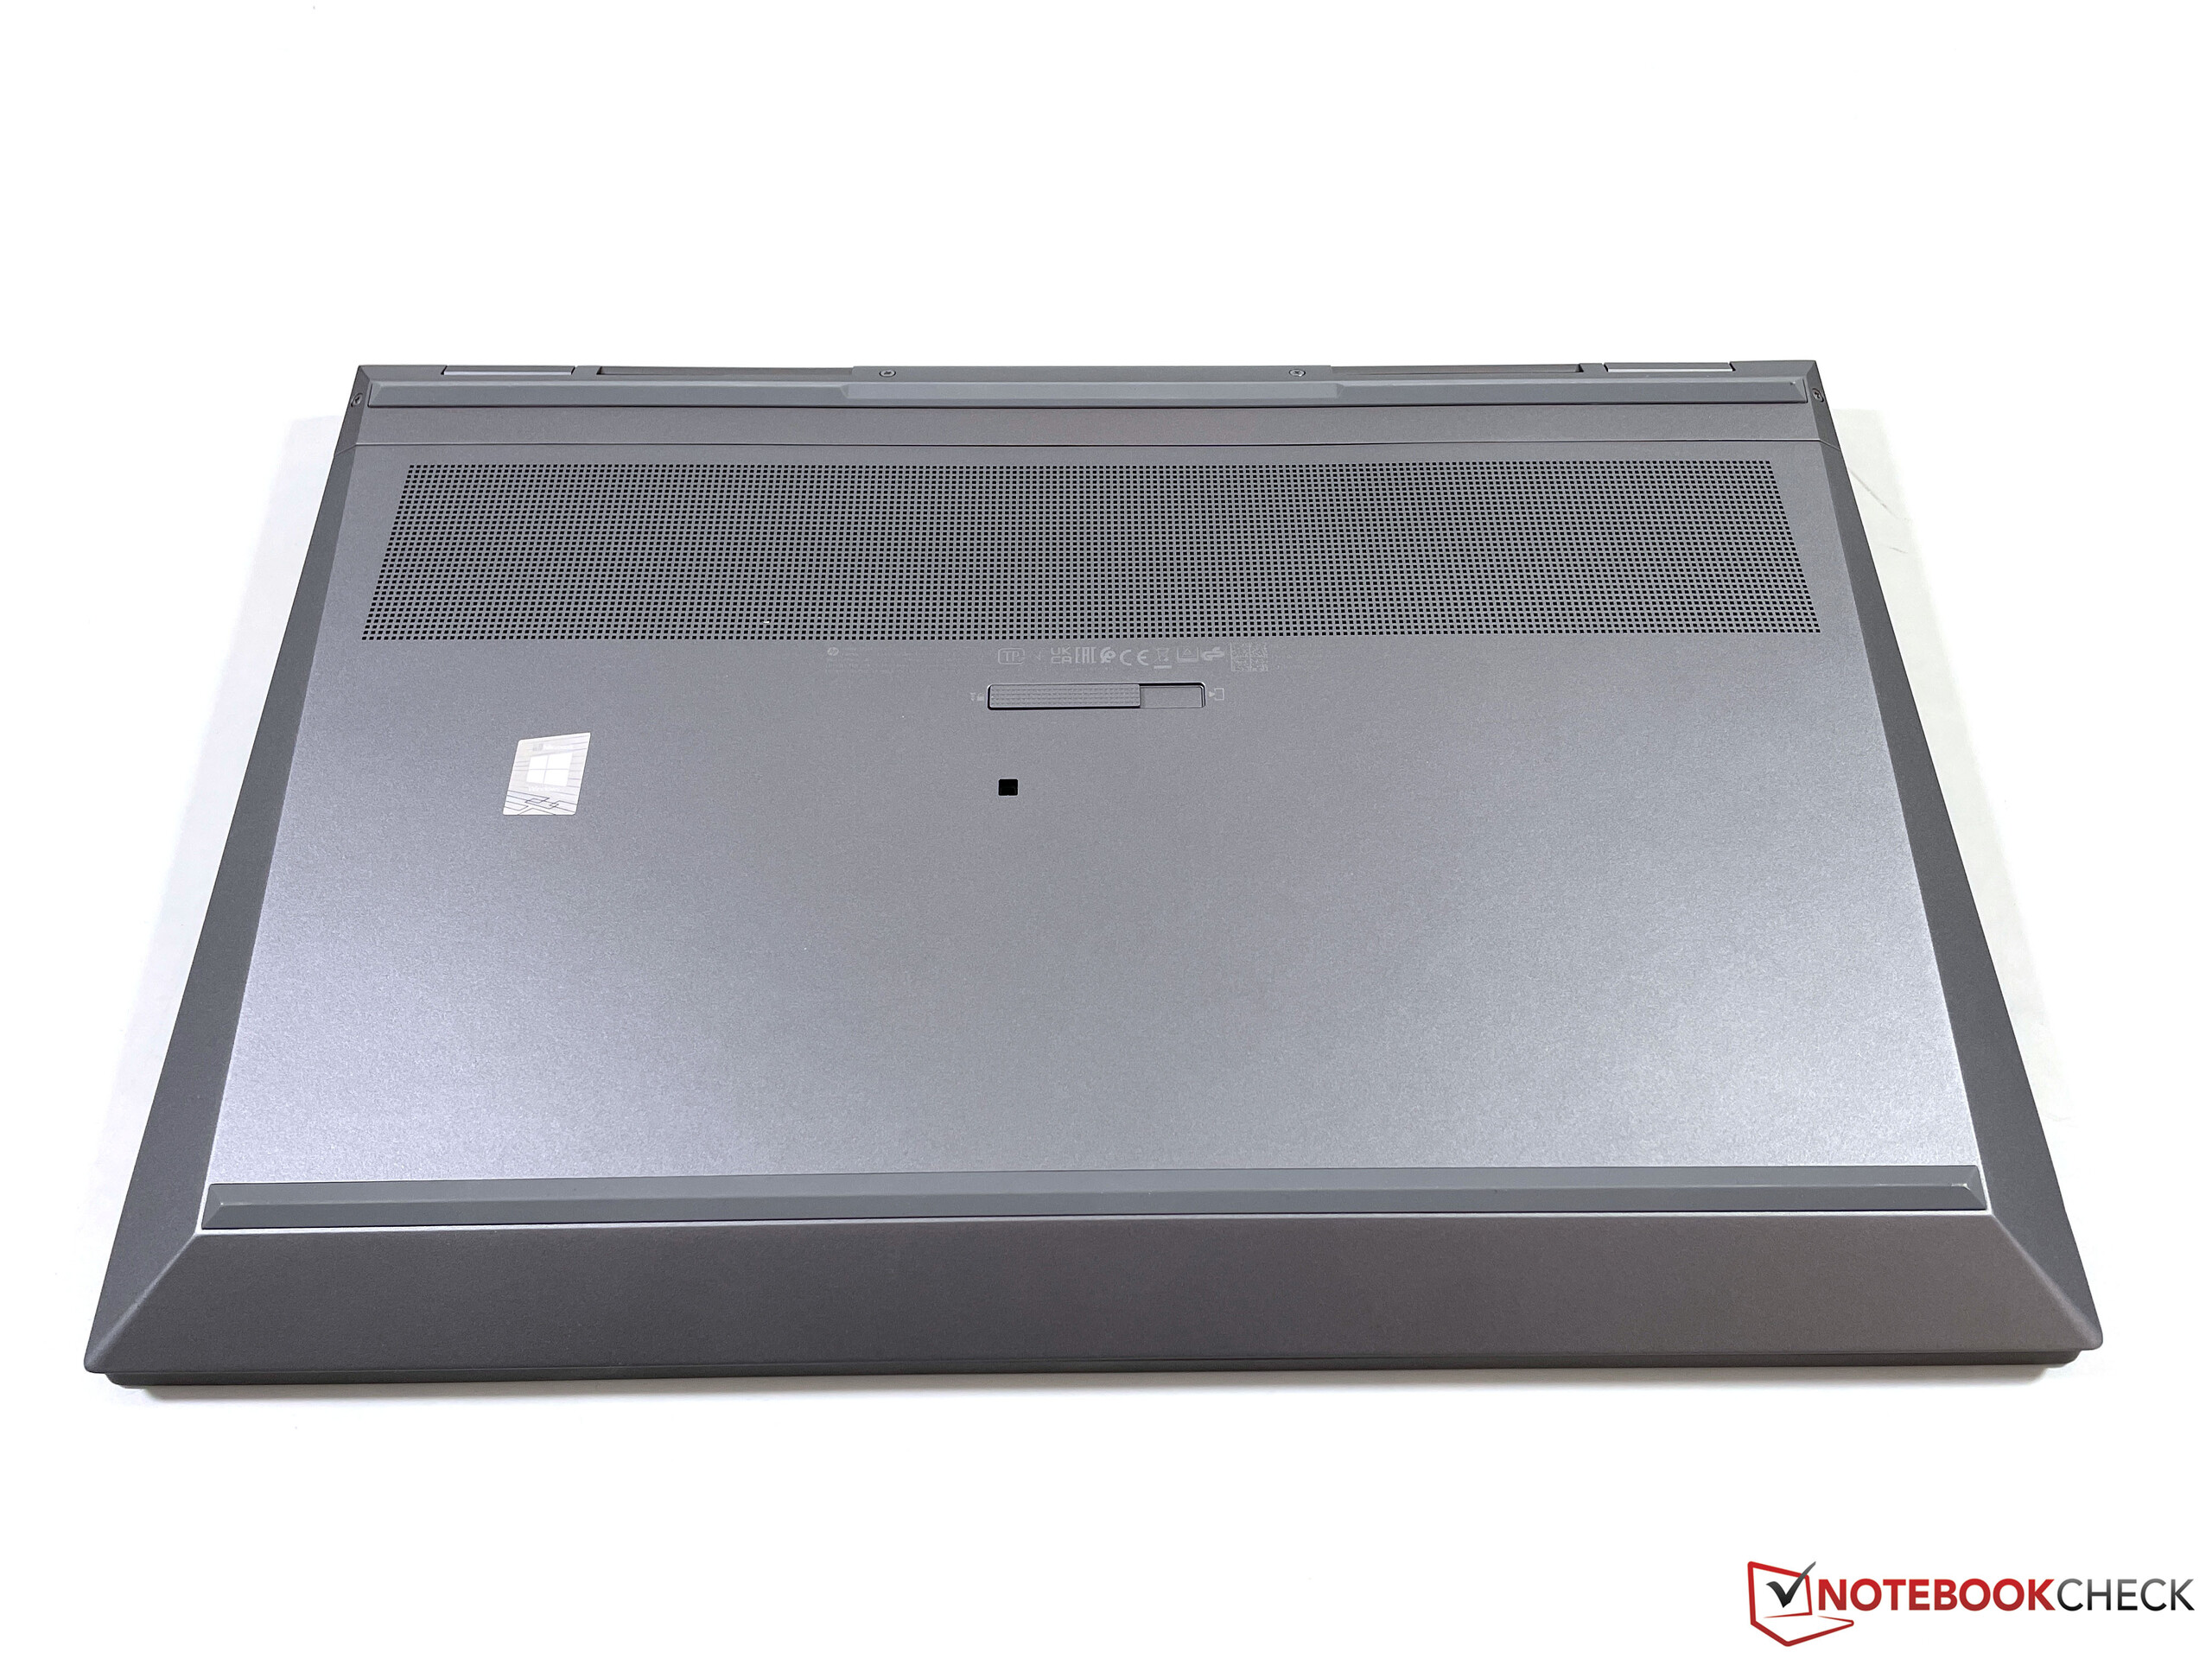
Maintenance
As mentioned before, it is very easy to remove the bottom panel. You only have to remove the central screw that secures the lever and then you can just remove it. Once inside, however, you will find many additional covers, so the access to the actual components requires a bit more tinkering after all. Two of the four RAM slots are also located underneath the keyboard. There is also room for a 2.5-inch drive underneath the battery and the necessary mounting tools are in the box.
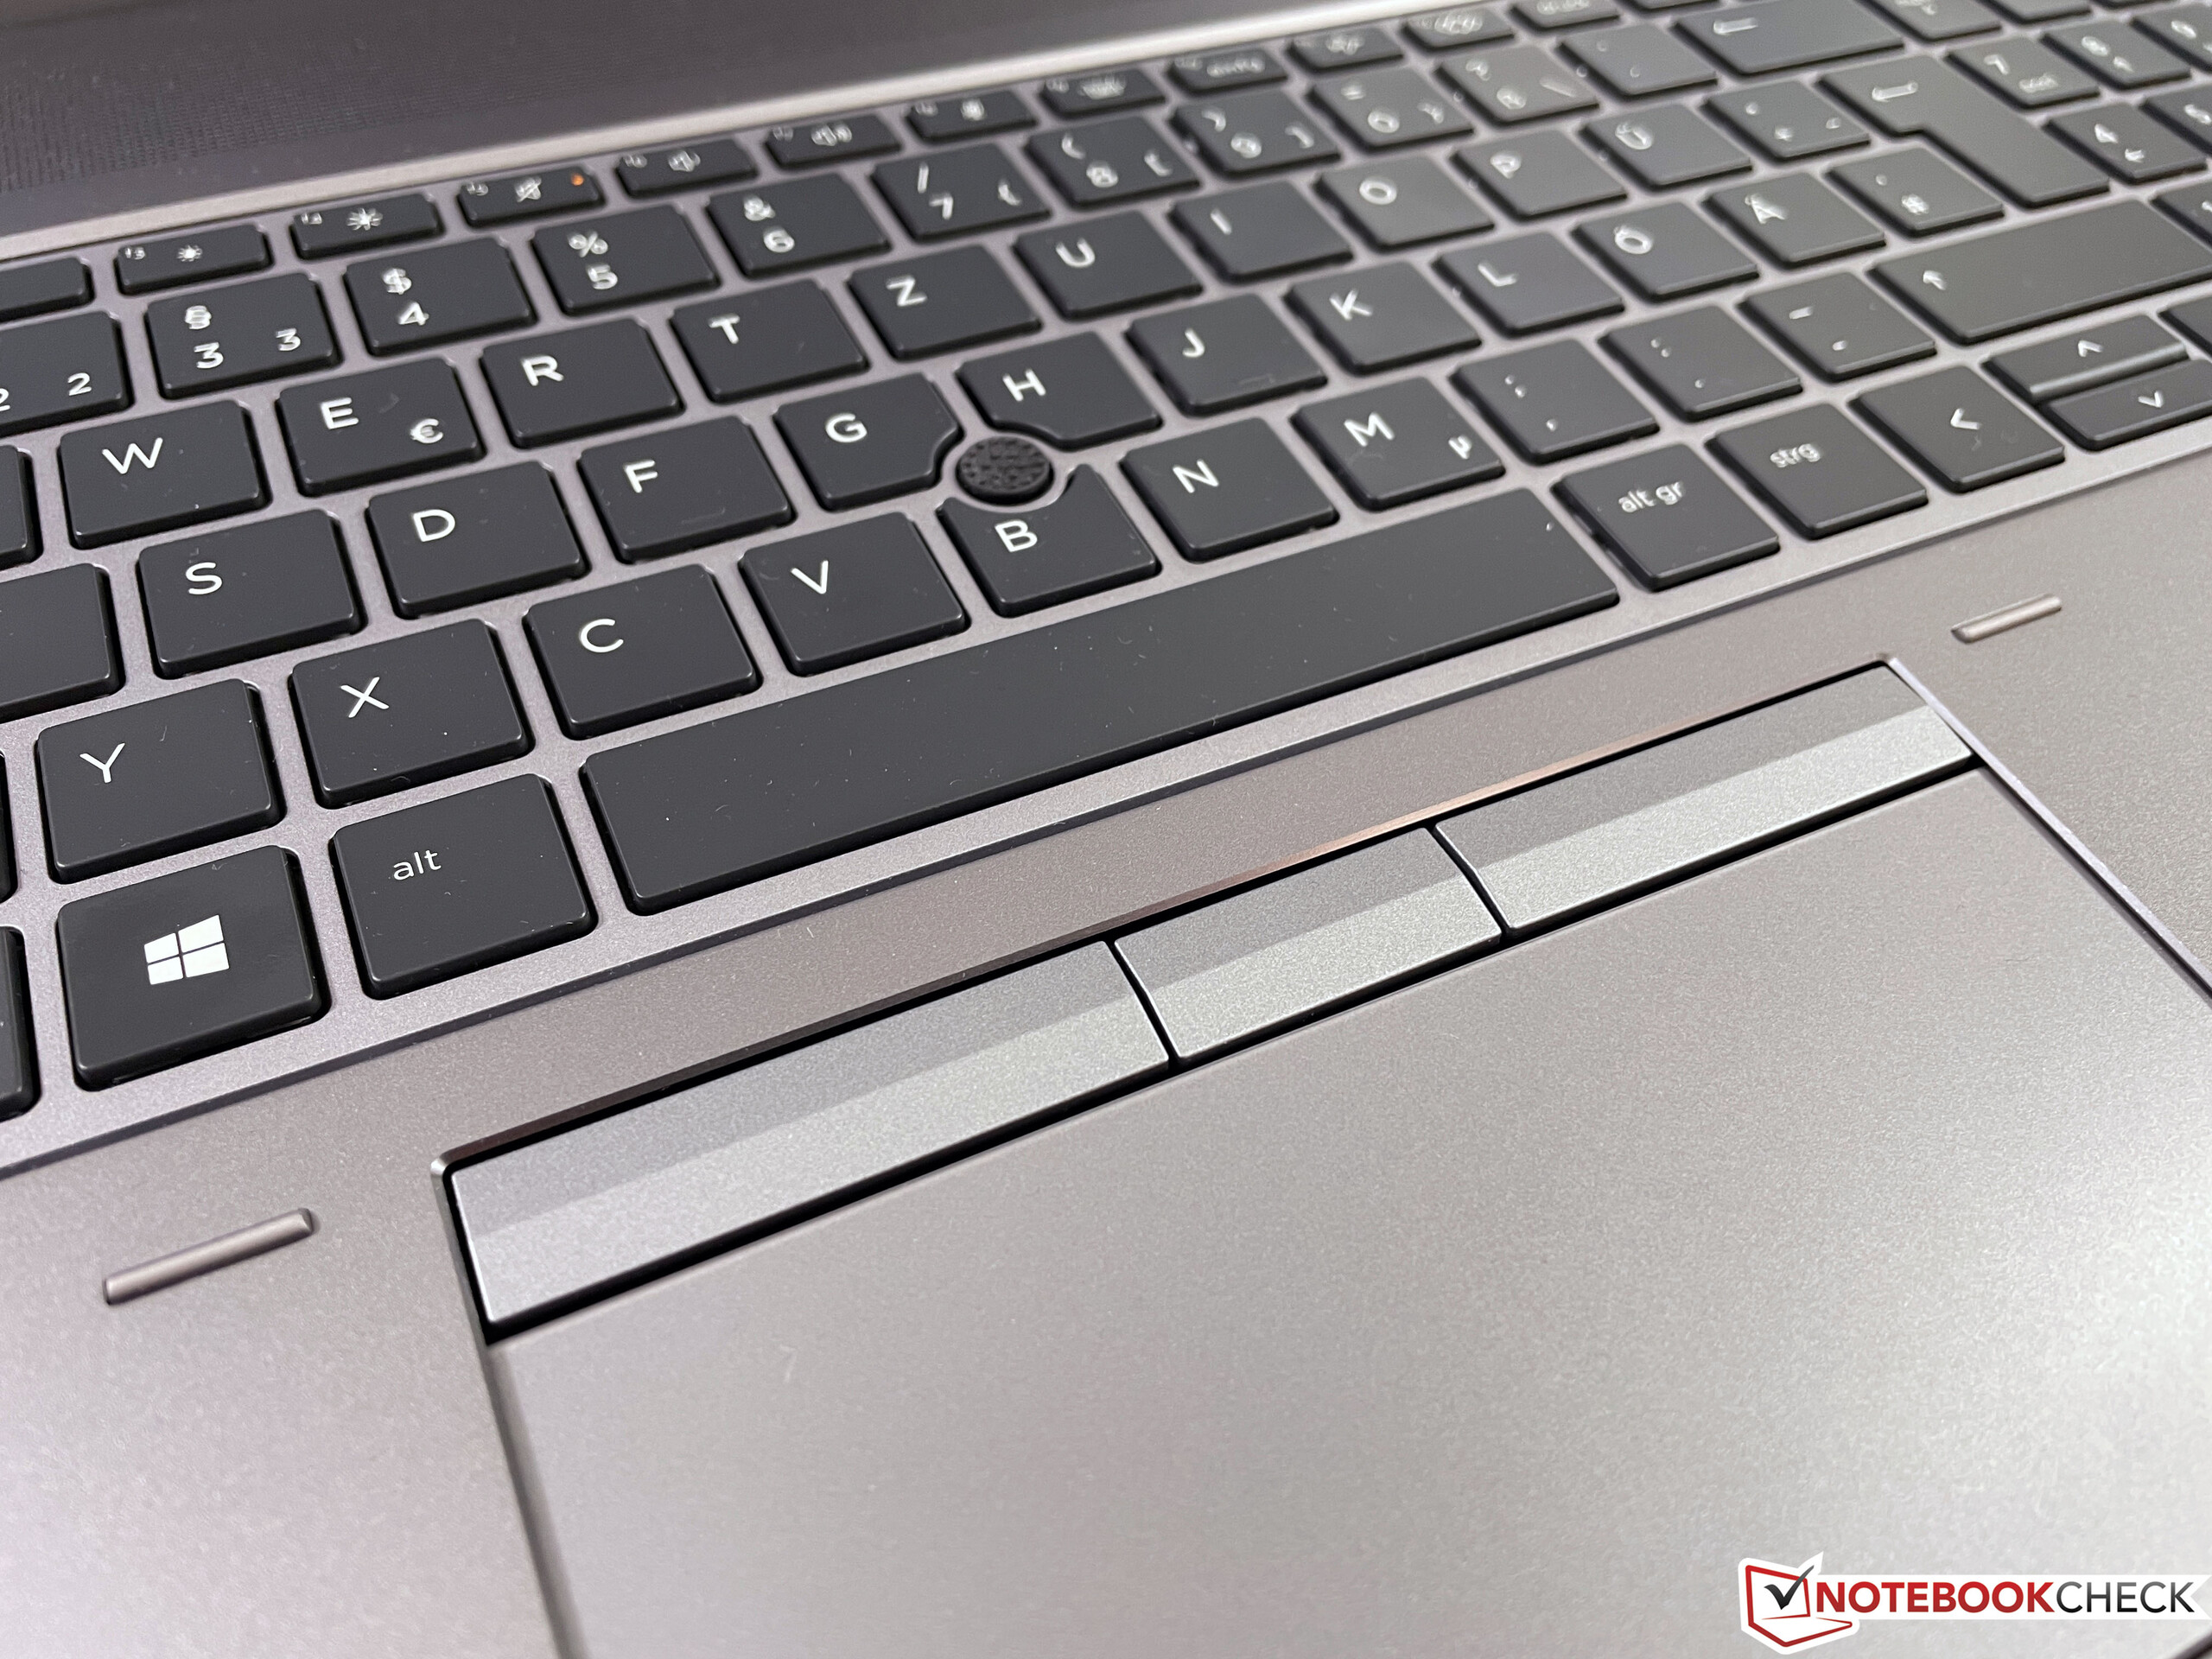
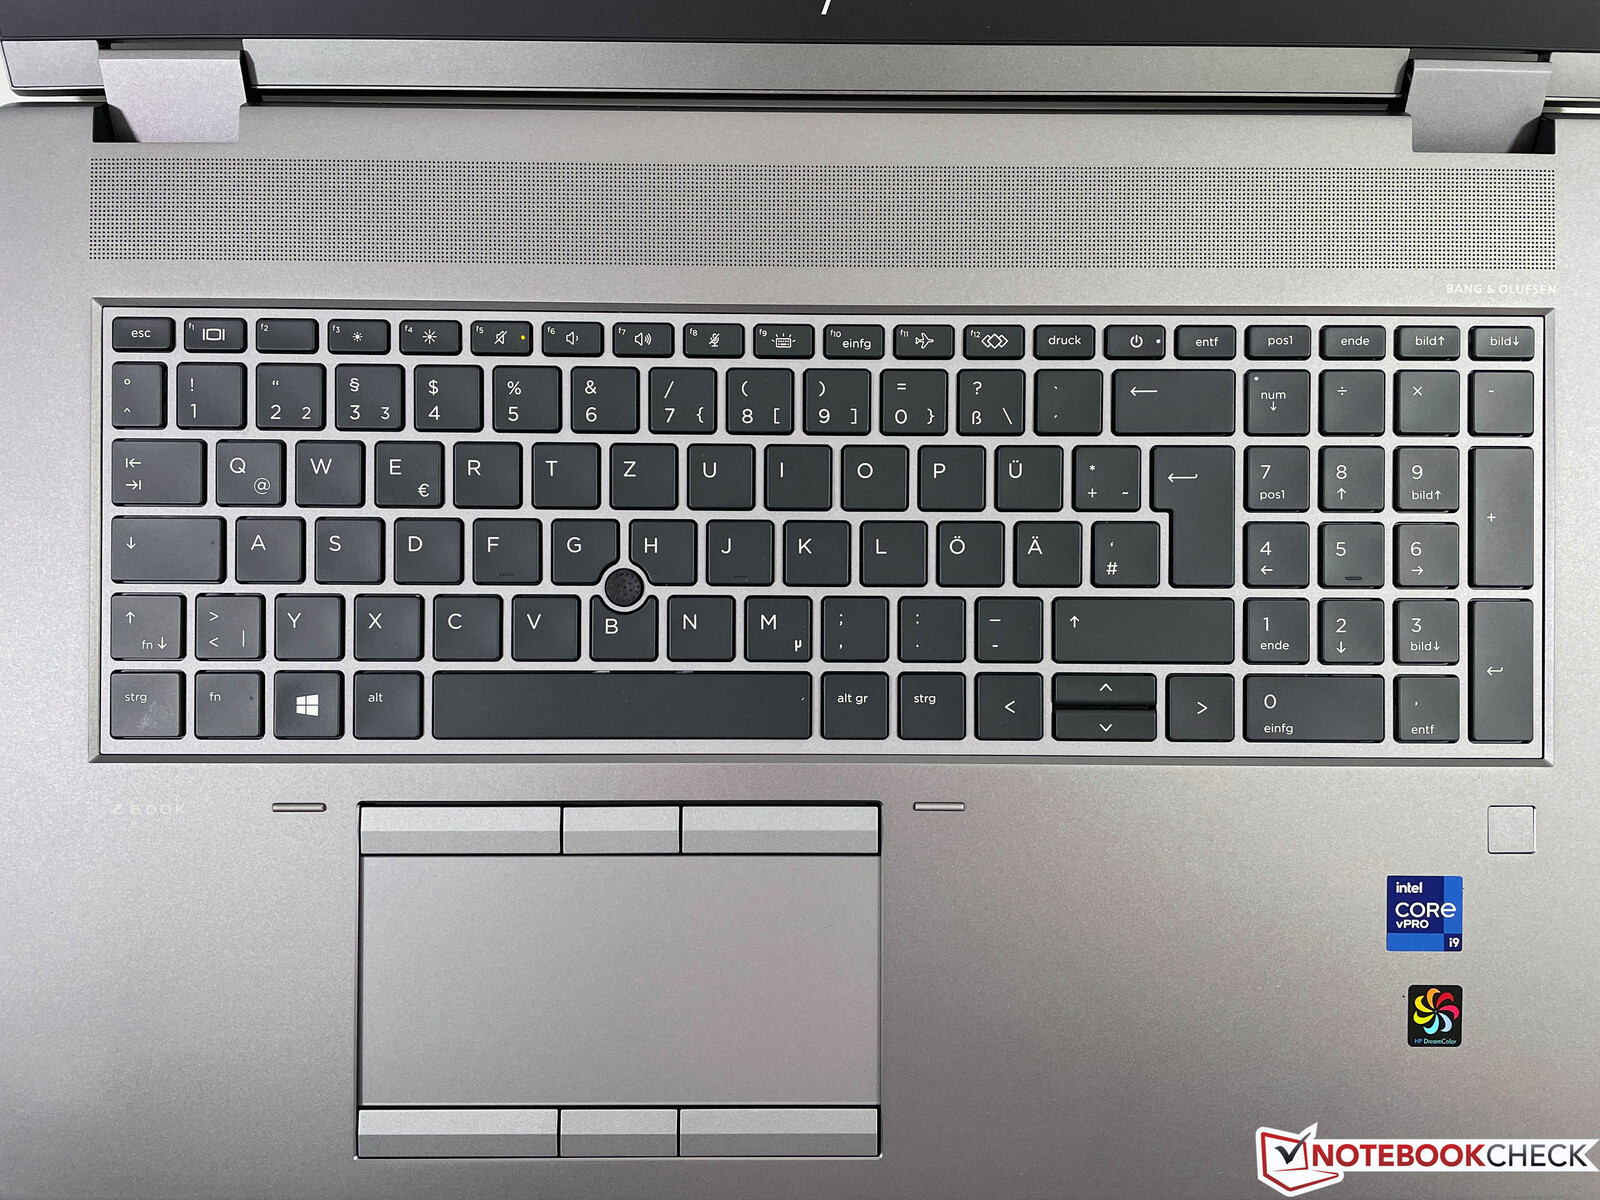
Input Devices - Mobile Workstation still with PointStick
The input devices did not change compared to the previous model. The black keyboard is very sturdy (does not flex) and convinces with a very crisp pressure point as well as sufficient travel. Besides the ThinkPad workstations (like the ThinkPad P17 G2), HP certainly offers one of the best mobile keyboards on the market. In addition to the full-size numpad you also get a two-stage white illumination and the keyboard is spill-water proof. We think the small vertical size of the arrow keys is the only real drawback of the keyboard and you have to get used to it.
Contrary to its EliteBook-series, HP still equips the ZBook with a PointStick in addition to the touchpad. Both input methods get their own set of dedicated mouse buttons and they both work well.
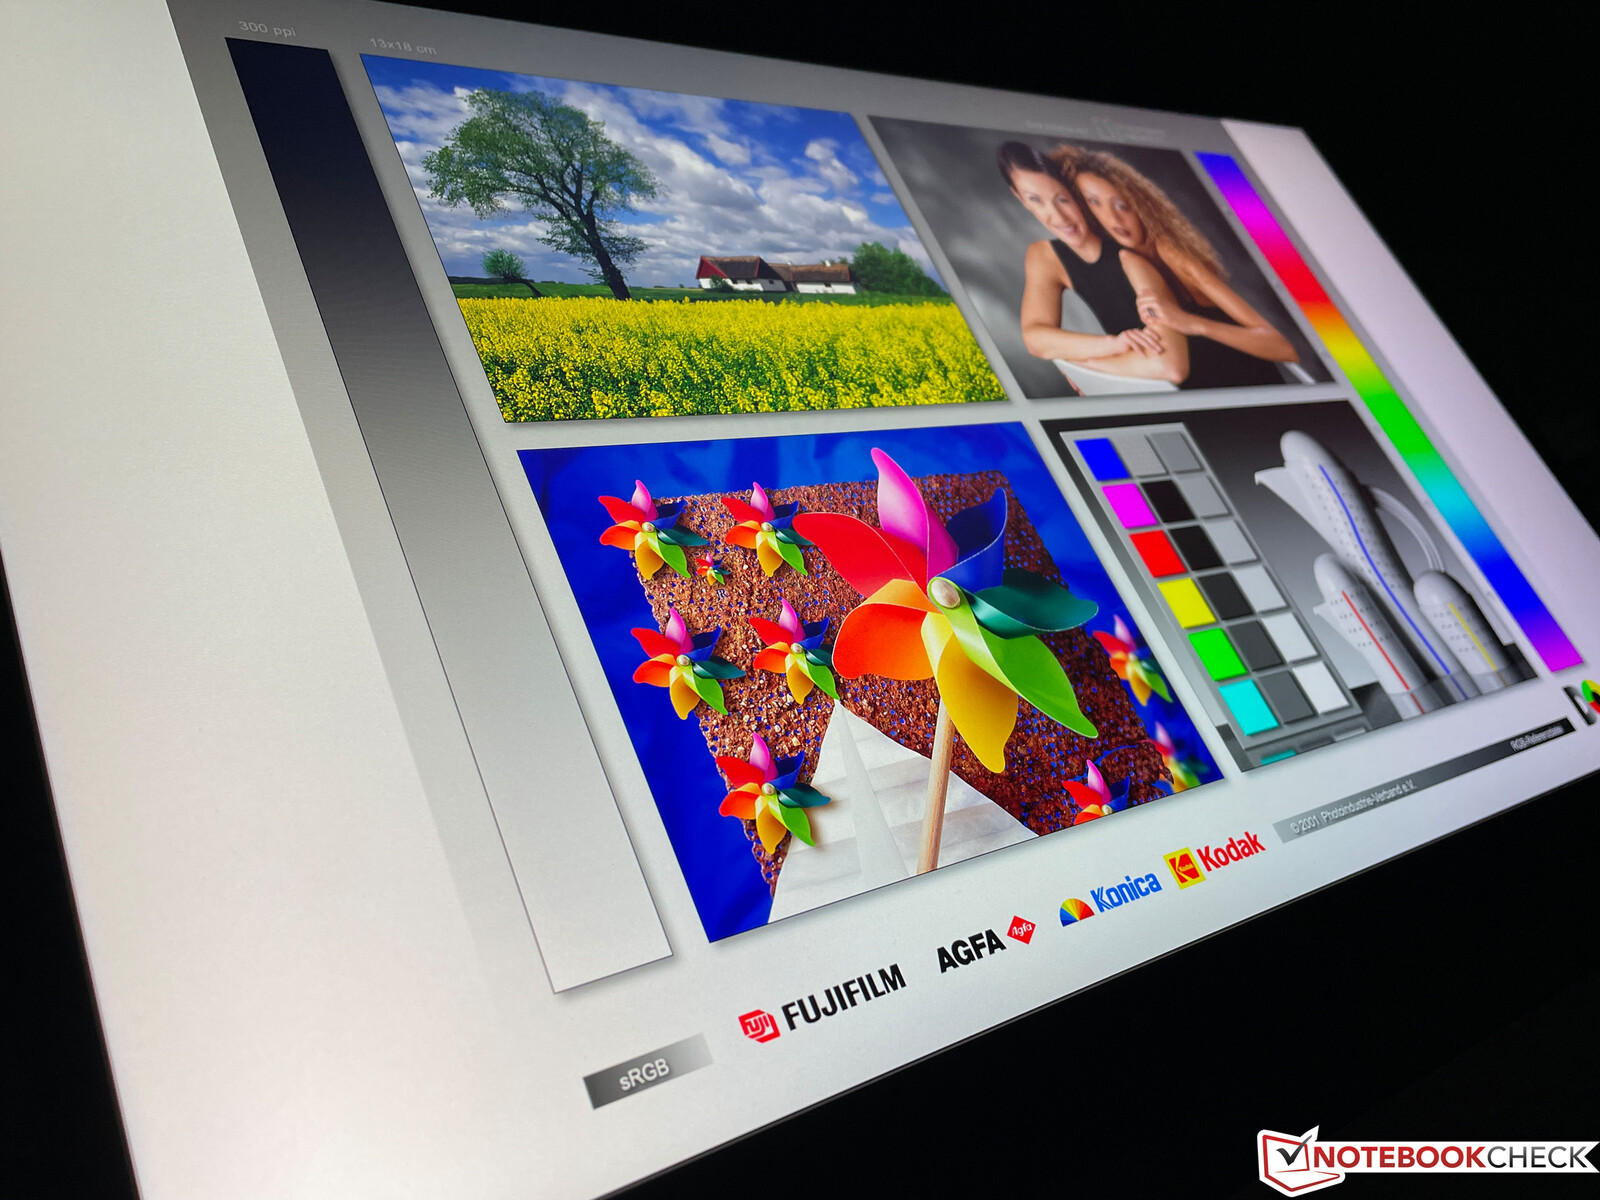
Display - DreamColor now with DCI-P3
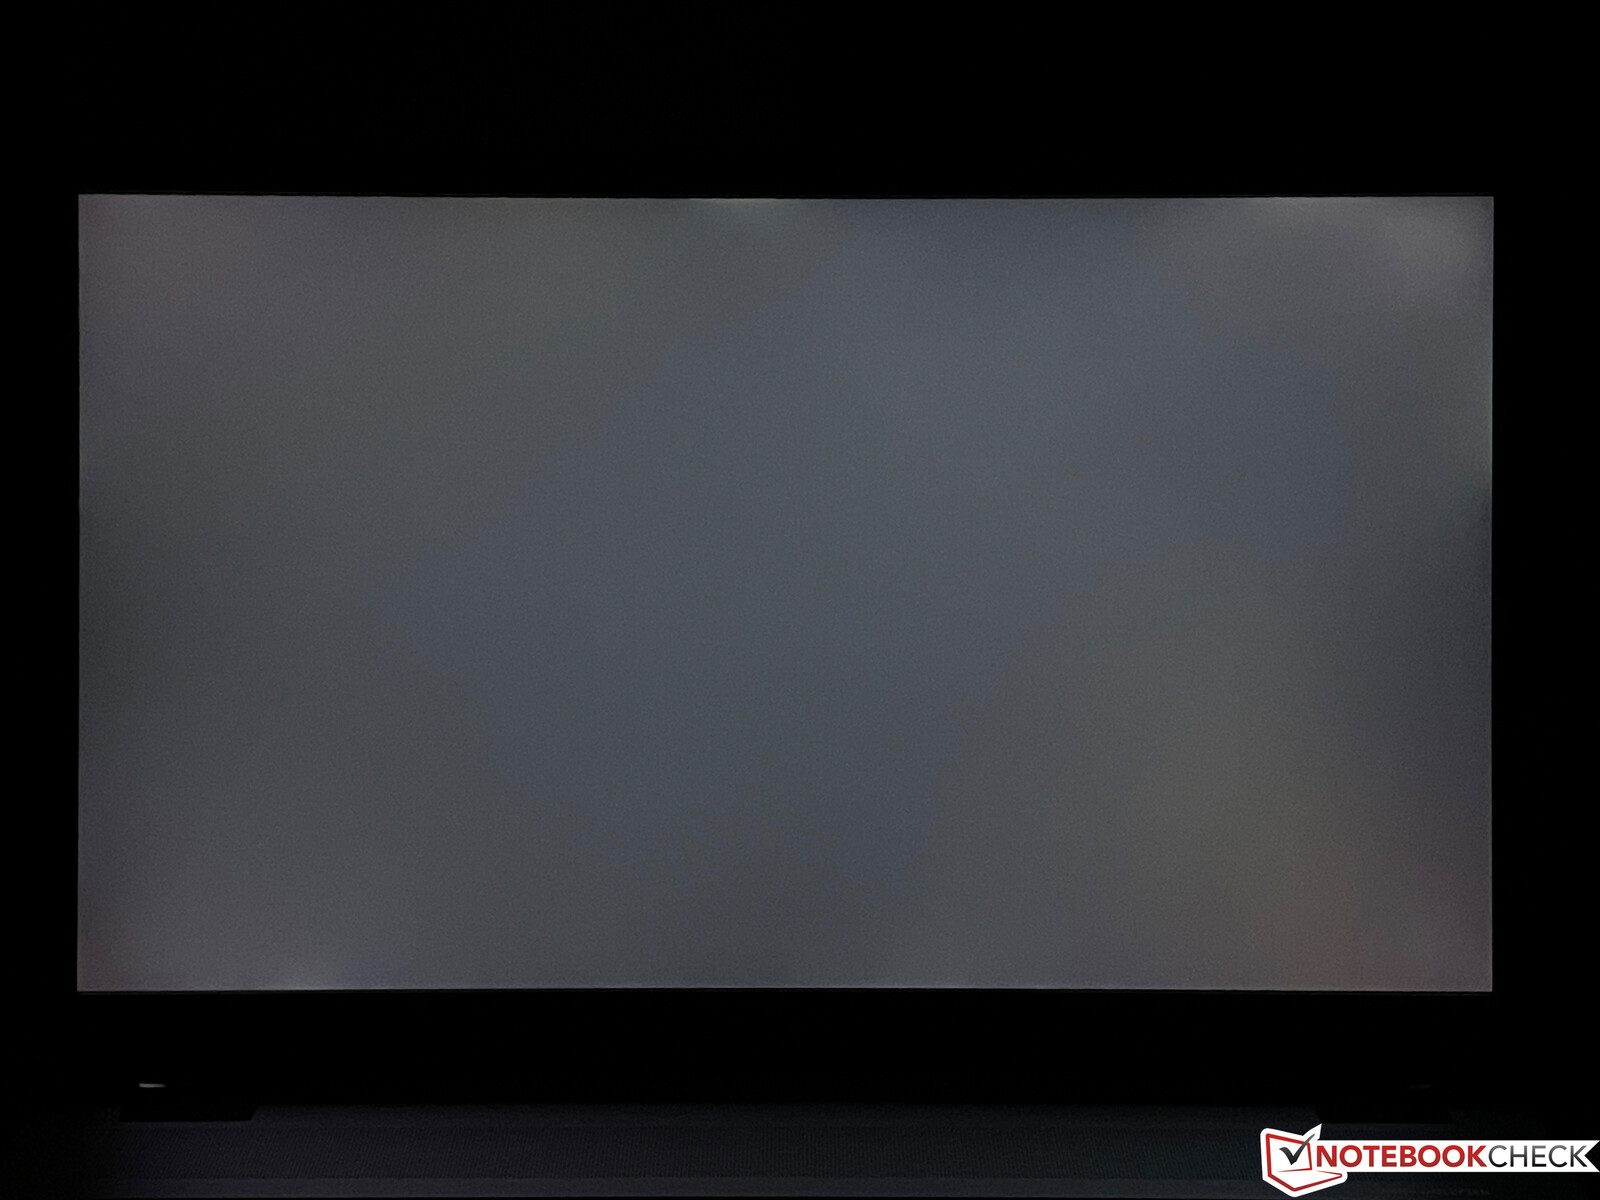
Our review unit is equipped with the matte 4K DreamColor display, which still has the 16:9 aspect ratio. Compared to previous iterations of the DreamColor display, where the AdobeRGB color space was covered. The new version “only” targets the smaller DCI-P3 color space just like the Apple MacBook Pro models. The subjective picture impression is still very good, only bright surfaces appear a bit grainy.
HP advertises an average brightness of 550 cd/m² and we can confirm this value after our measurements. The black value is also decent at 0.33 cd/m² considering the high brightness, which results in a very high contrast ratio of more than 1700:1. You can only see minor backlight bleeding along the edges even at the maximum brightness on a dark background, but they are no problem in practice. There is no PWM, only the response times are pretty slow, which results in visible ghosting.
| |||||||||||||||||||||||||
Brightness Distribution: 88 %
Center on Battery: 569 cd/m²
Contrast: 1721:1 (Black: 0.33 cd/m²)
ΔE ColorChecker Calman: 1 | ∀{0.5-29.43 Ø4.72}
calibrated: 0.5
ΔE Greyscale Calman: 1.7 | ∀{0.09-98 Ø4.97}
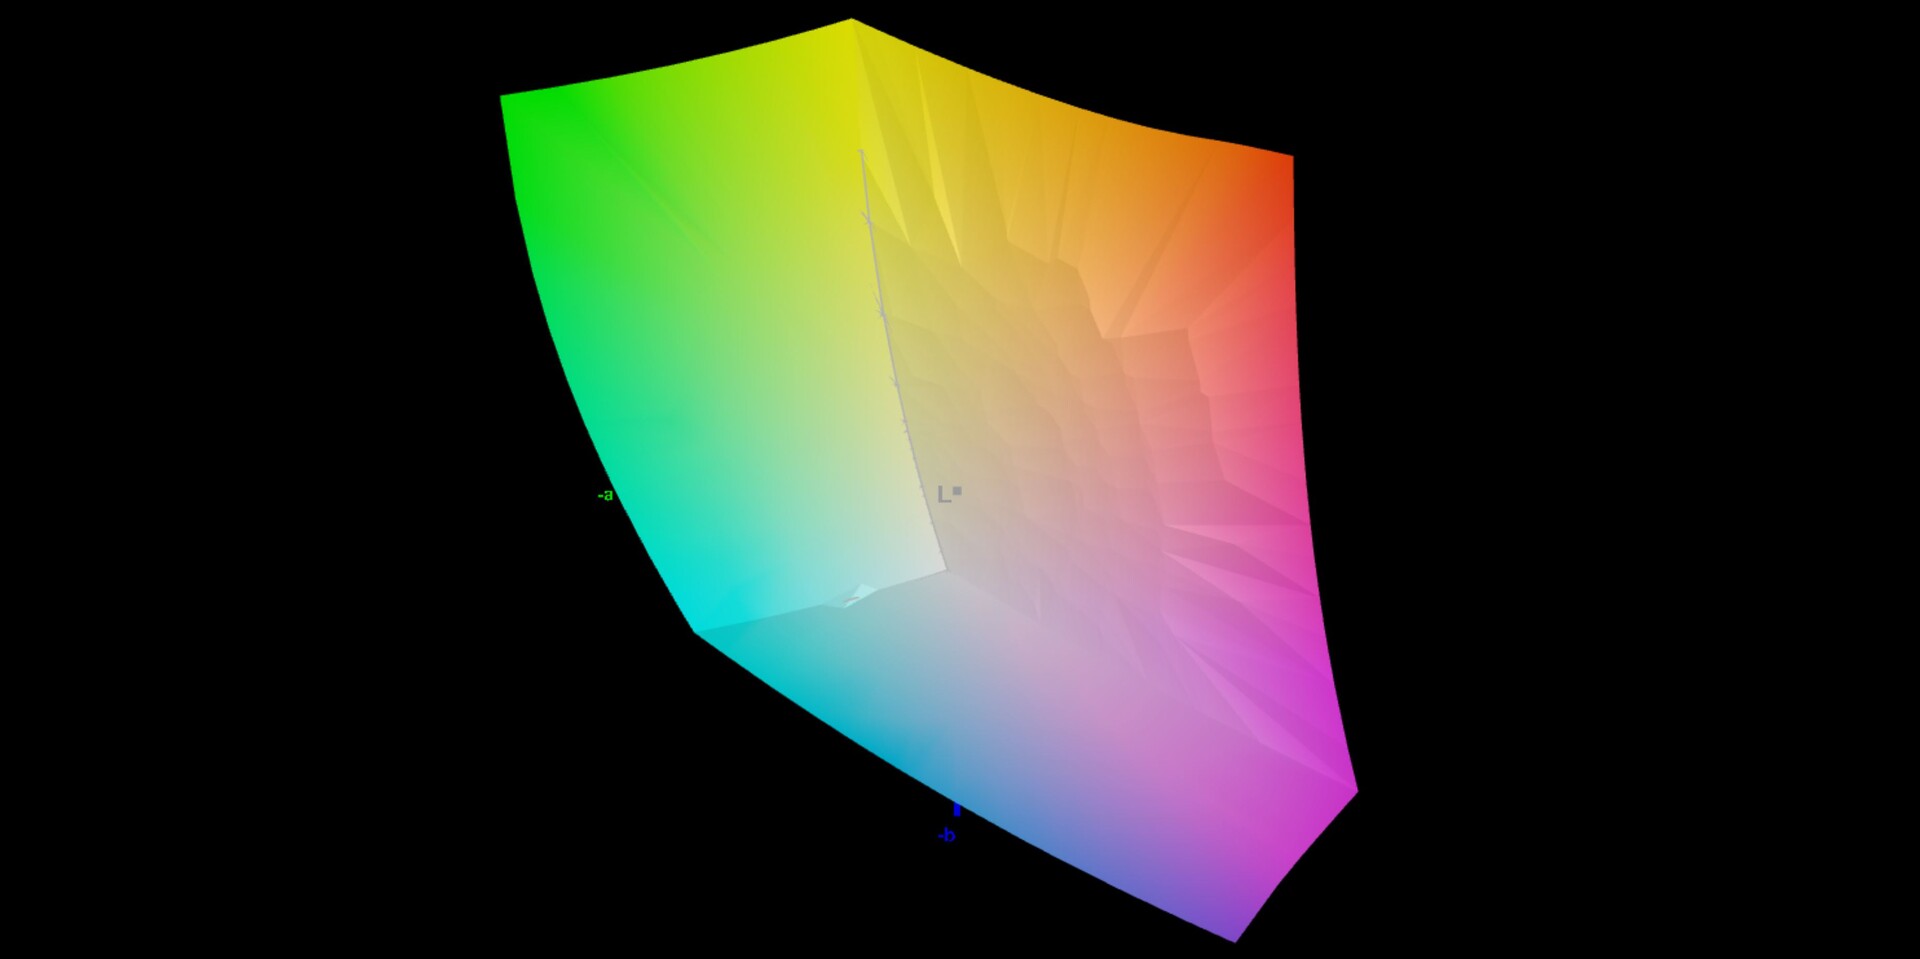
86.8% AdobeRGB 1998 (Argyll 3D)
100% sRGB (Argyll 3D)
99.1% Display P3 (Argyll 3D)
Gamma: 2.18
CCT: 6461 K
| HP ZBook Fury 17 G8-4A6A9EA AUOCD8C, IPS, 3840x2160, 17.3" | Lenovo ThinkPad P17 G2-20YU0025G LP173WF4-SPF7, IPS LED, 1920x1080, 17.3" | MSI WE76 11UM-456 B173ZAN03.3, IPS, 3840x2160, 17.3" | Asus ProArt StudioBook 16 W7600H5A-2BL2 ATNA60YV02-0, OLED, 3840x2400, 16" | HP ZBook Fury 17 G7 119W5EA AUOCD8C, , 3840x2160, 17.3" | Apple MacBook Pro 16 2021 M1 Max Mini-LED, 3456x2234, 16.2" | |
|---|---|---|---|---|---|---|
| Display | -23% | -2% | 5% | 0% | ||
| Display P3 Coverage (%) | 99.1 | 67.9 -31% | 82.1 -17% | 99.9 1% | 99.3 0% | |
| sRGB Coverage (%) | 100 | 87.3 -13% | 99.3 -1% | 100 0% | 99.9 0% | |
| AdobeRGB 1998 Coverage (%) | 86.8 | 63.9 -26% | 96 11% | 98.6 14% | 86.9 0% | |
| Response Times | 29% | 67% | 95% | -16% | ||
| Response Time Grey 50% / Grey 80% * (ms) | 67.6 ? | 39.2 ? 42% | 17.6 ? 74% | 2 ? 97% | 56 ? 17% | |
| Response Time Black / White * (ms) | 26.8 ? | 22.4 ? 16% | 10.8 ? 60% | 2 ? 93% | 40 ? -49% | |
| PWM Frequency (Hz) | 240 ? | |||||
| Screen | -189% | -36% | -104% | -33% | 170% | |
| Brightness middle (cd/m²) | 568 | 361 -36% | 419 -26% | 353 -38% | 573 1% | 507 -11% |
| Brightness (cd/m²) | 564 | 334 -41% | 416 -26% | 360 -36% | 586 4% | 494 -12% |
| Brightness Distribution (%) | 88 | 87 -1% | 93 6% | 96 9% | 91 3% | 96 9% |
| Black Level * (cd/m²) | 0.33 | 0.35 -6% | 0.34 -3% | 0.38 -15% | 0.02 94% | |
| Contrast (:1) | 1721 | 1031 -40% | 1232 -28% | 1508 -12% | 25350 1373% | |
| Colorchecker dE 2000 * | 1 | 5.4 -440% | 1.5 -50% | 2.45 -145% | 1.9 -90% | 1.4 -40% |
| Colorchecker dE 2000 max. * | 2.4 | 9.9 -313% | 4.7 -96% | 3.75 -56% | 4.2 -75% | 2.8 -17% |
| Colorchecker dE 2000 calibrated * | 0.5 | 3.2 -540% | 0.9 -80% | 2.77 -454% | 0.7 -40% | |
| Greyscale dE 2000 * | 1.7 | 6.5 -282% | 2 -18% | 1.88 -11% | 2.9 -71% | 2.3 -35% |
| Gamma | 2.18 101% | 2.23 99% | 2.17 101% | 2.31 95% | 2.1 105% | 2.27 97% |
| CCT | 6461 101% | 7351 88% | 6629 98% | 6441 101% | 6217 105% | 6792 96% |
| Color Space (Percent of AdobeRGB 1998) (%) | 77.6 | |||||
| Color Space (Percent of sRGB) (%) | 100 | |||||
| Total Average (Program / Settings) | -61% /
-122% | 10% /
-14% | -1% /
-44% | -16% /
-23% | 170% /
170% |
* ... smaller is better
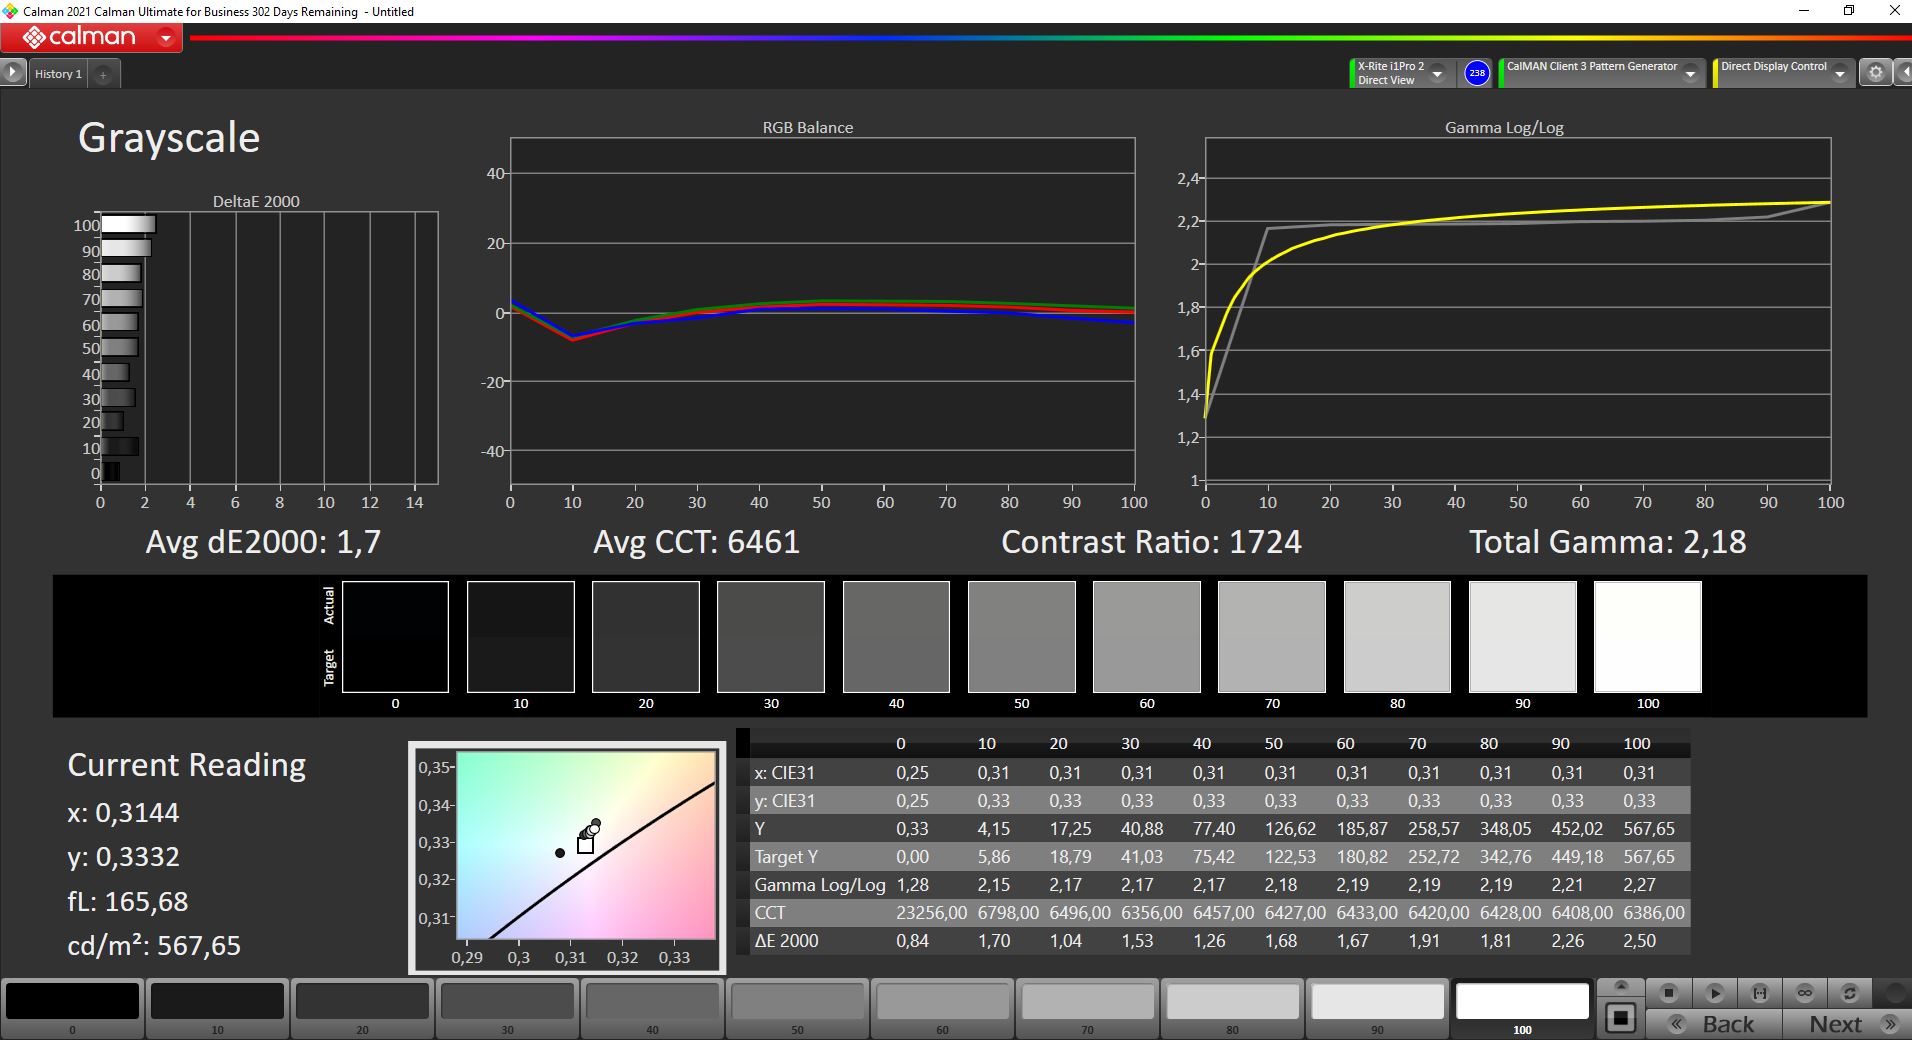

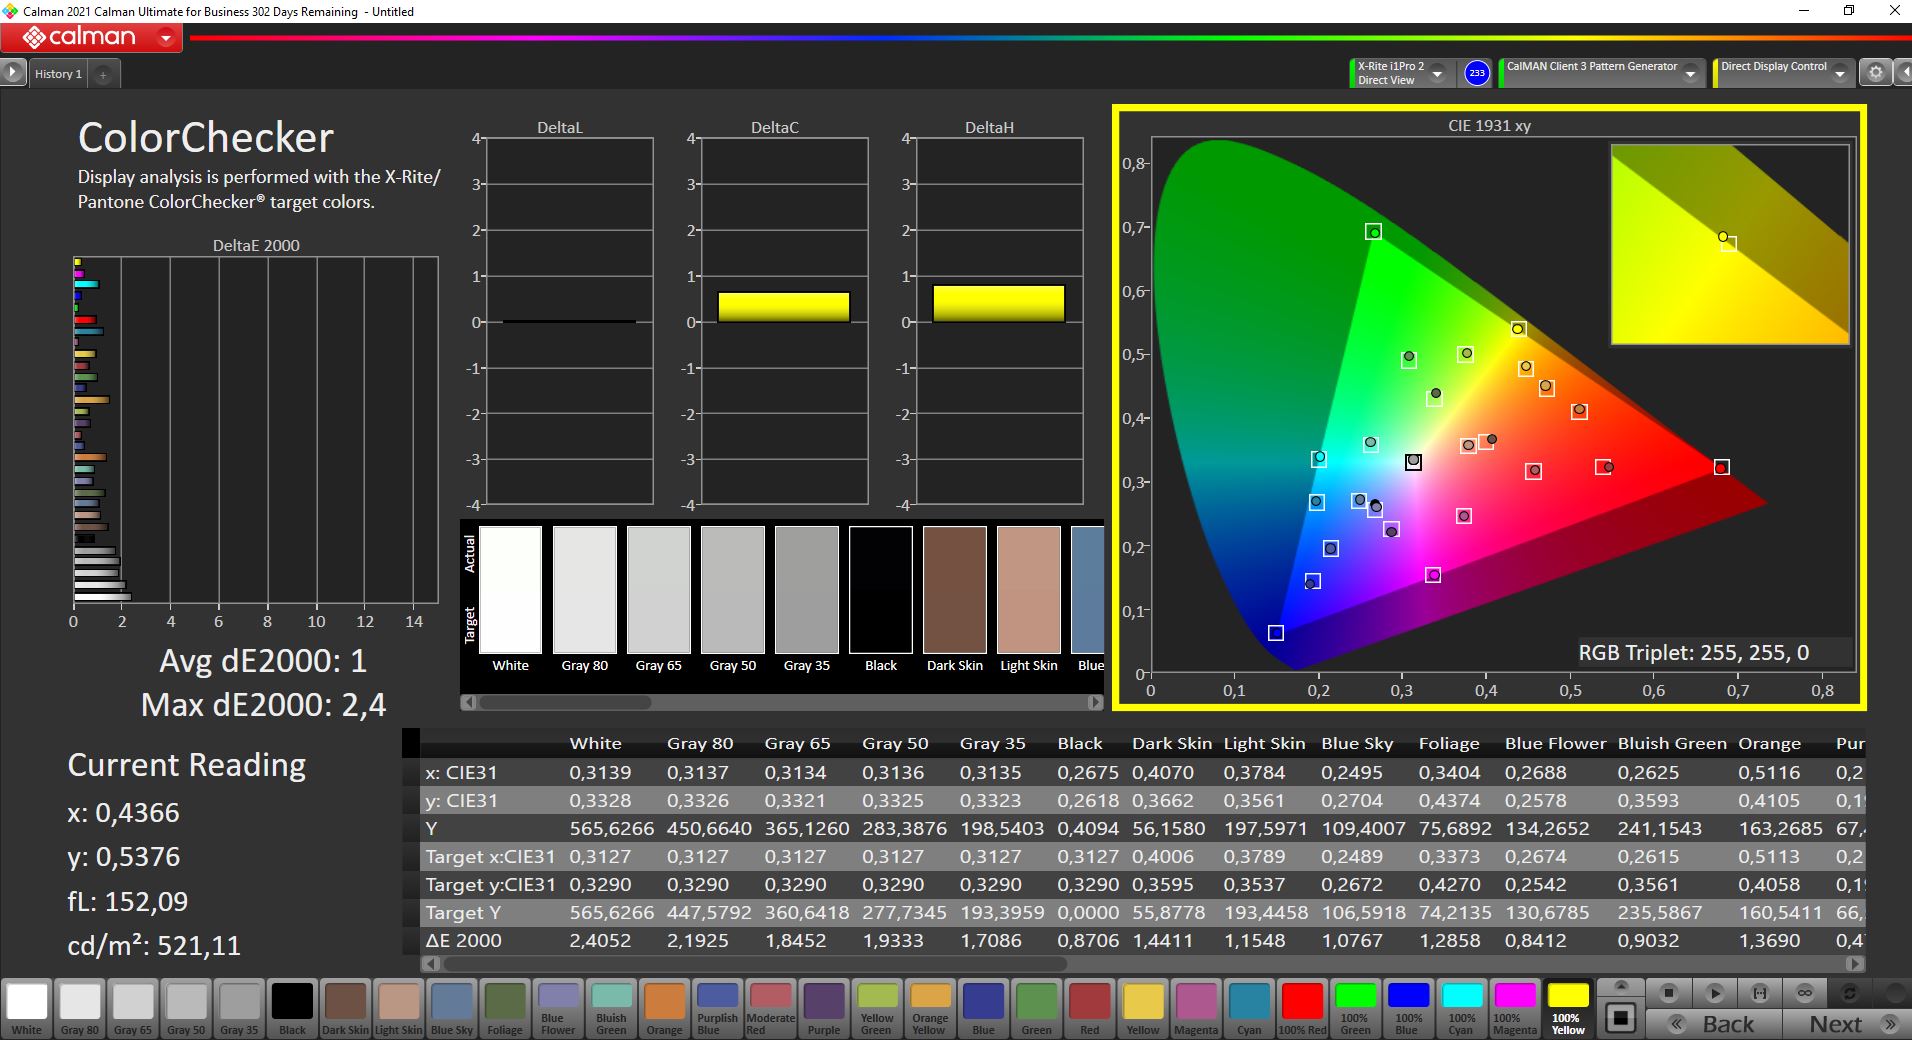

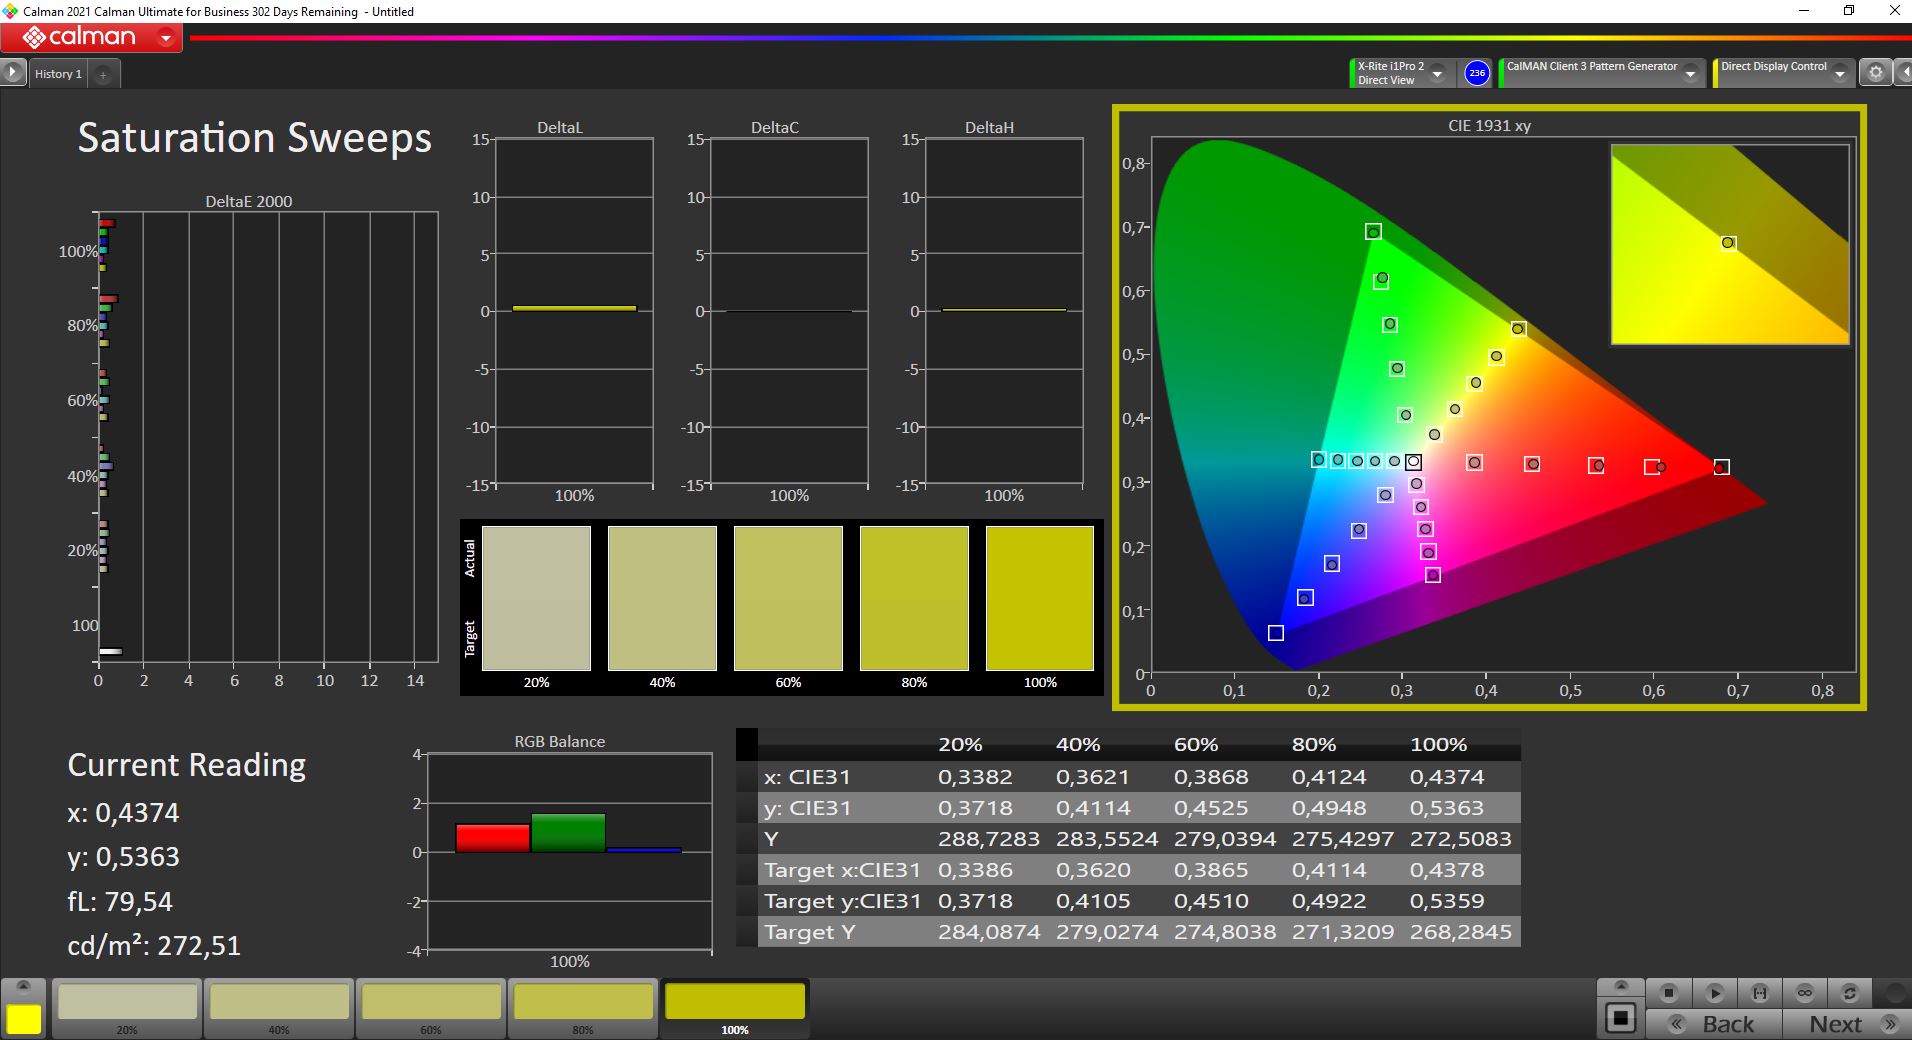
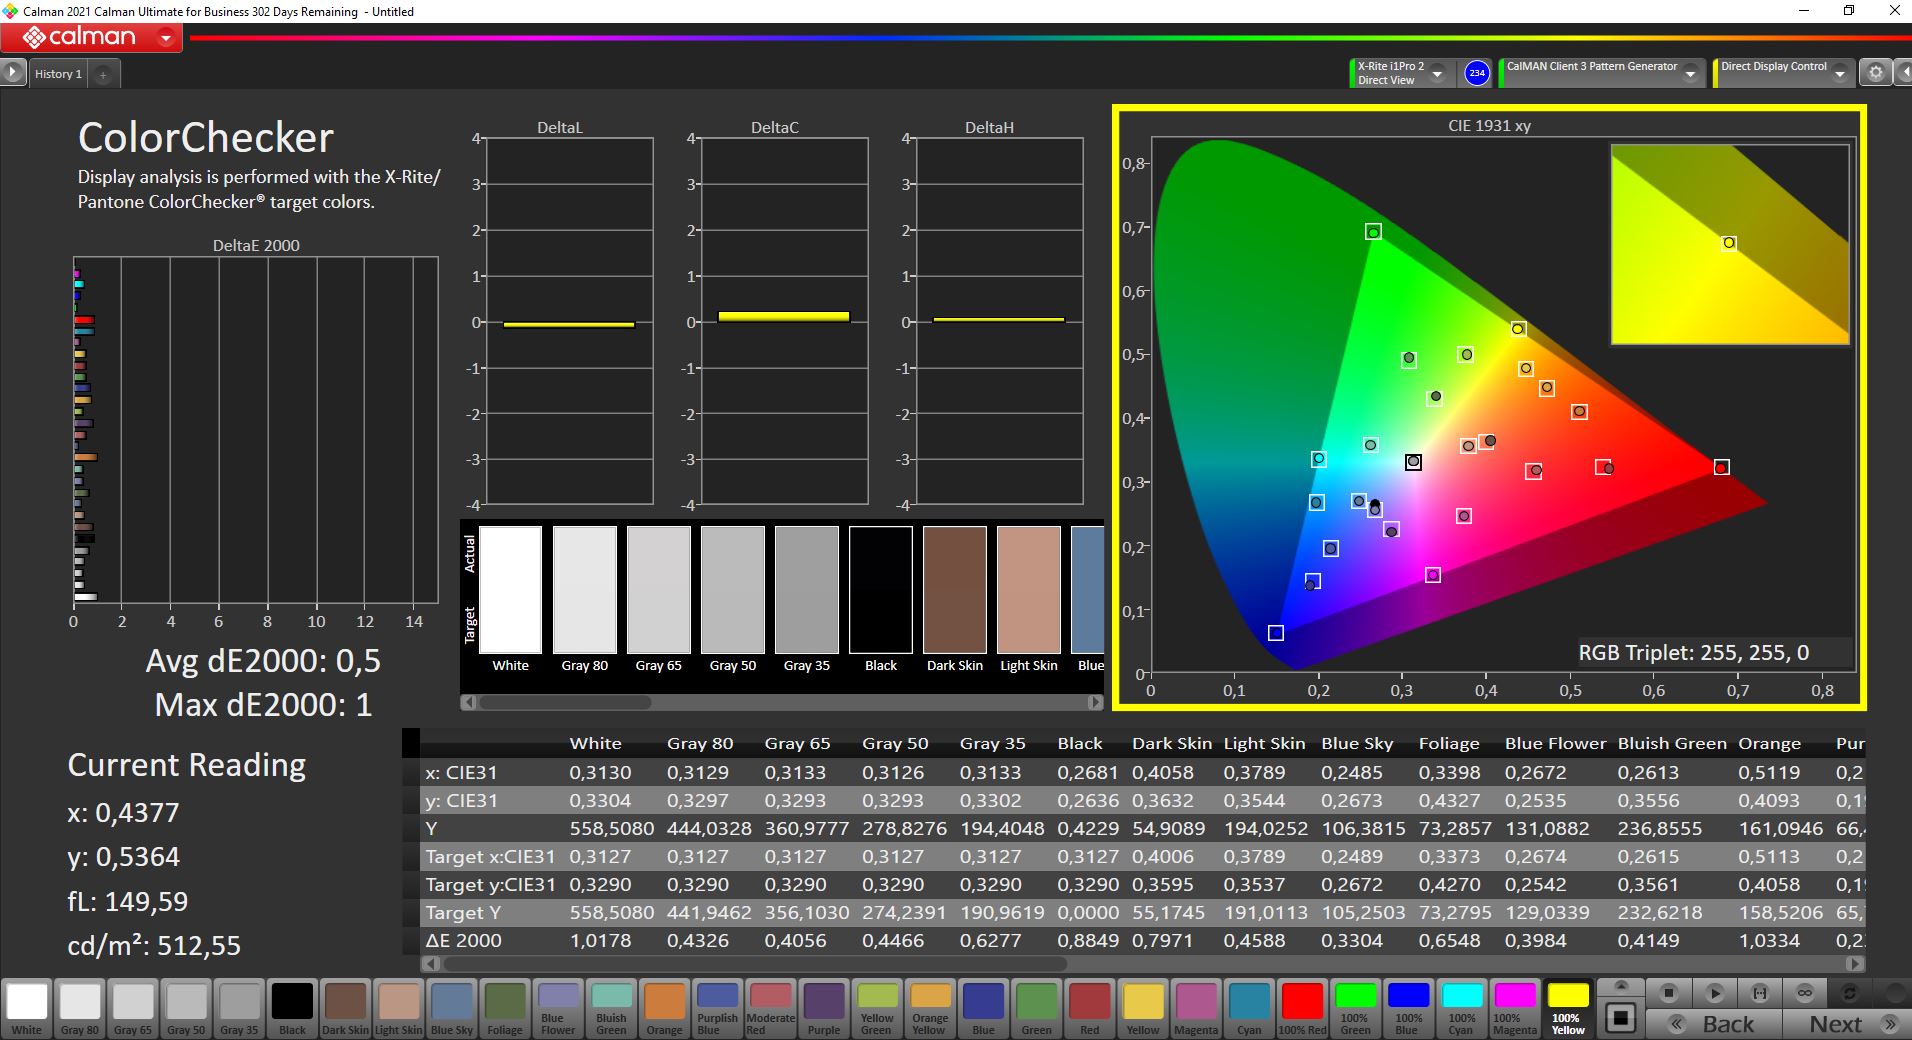
Another difference compared to previous ZBooks with optional DreamColor displays is that there is no more preloaded DreamColor software, which means you cannot switch the color space anymore. We analyzed the panel with the professional CalMAN software and the X-Rite i1 Pro 2 spectrophotometer. The deviations of the grayscale as well as the colors compared to the P3 reference are already very low out of the box and a calibration by the user is not really necessary. Our own calibration (profile can be downloaded for free in the box above) does reduce the deviations a bit further, but the difference is not big. According to our measurements, the P3 color space is covered by 99.1 percent.
Display Response Times
| ↔ Response Time Black to White | ||
|---|---|---|
| 26.8 ms ... rise ↗ and fall ↘ combined | ↗ 9.2 ms rise |  |
| ↘ 17.6 ms fall | ||
| The screen shows relatively slow response rates in our tests and may be too slow for gamers. In comparison, all tested devices range from 0.1 (minimum) to 240 (maximum) ms. » 67 % of all devices are better. This means that the measured response time is worse than the average of all tested devices (19.8 ms). | ||
| ↔ Response Time 50% Grey to 80% Grey | ||
| 67.6 ms ... rise ↗ and fall ↘ combined | ↗ 31.6 ms rise |  |
| ↘ 36 ms fall | ||
| The screen shows slow response rates in our tests and will be unsatisfactory for gamers. In comparison, all tested devices range from 0.165 (minimum) to 636 (maximum) ms. » 98 % of all devices are better. This means that the measured response time is worse than the average of all tested devices (31 ms). | ||
Screen Flickering / PWM (Pulse-Width Modulation)
| Screen flickering / PWM not detected |  | ||
In comparison: 52 % of all tested devices do not use PWM to dim the display. If PWM was detected, an average of 7747 (minimum: 5 - maximum: 343500) Hz was measured. | |||
The large 17-inch device is certainly not the most mobile unit, but the matte and bright display works well outdoors. There is no criticism for the viewing angle stability of the IPS panel, either.
Performance - ZBook with Core i9 and RTX A3000
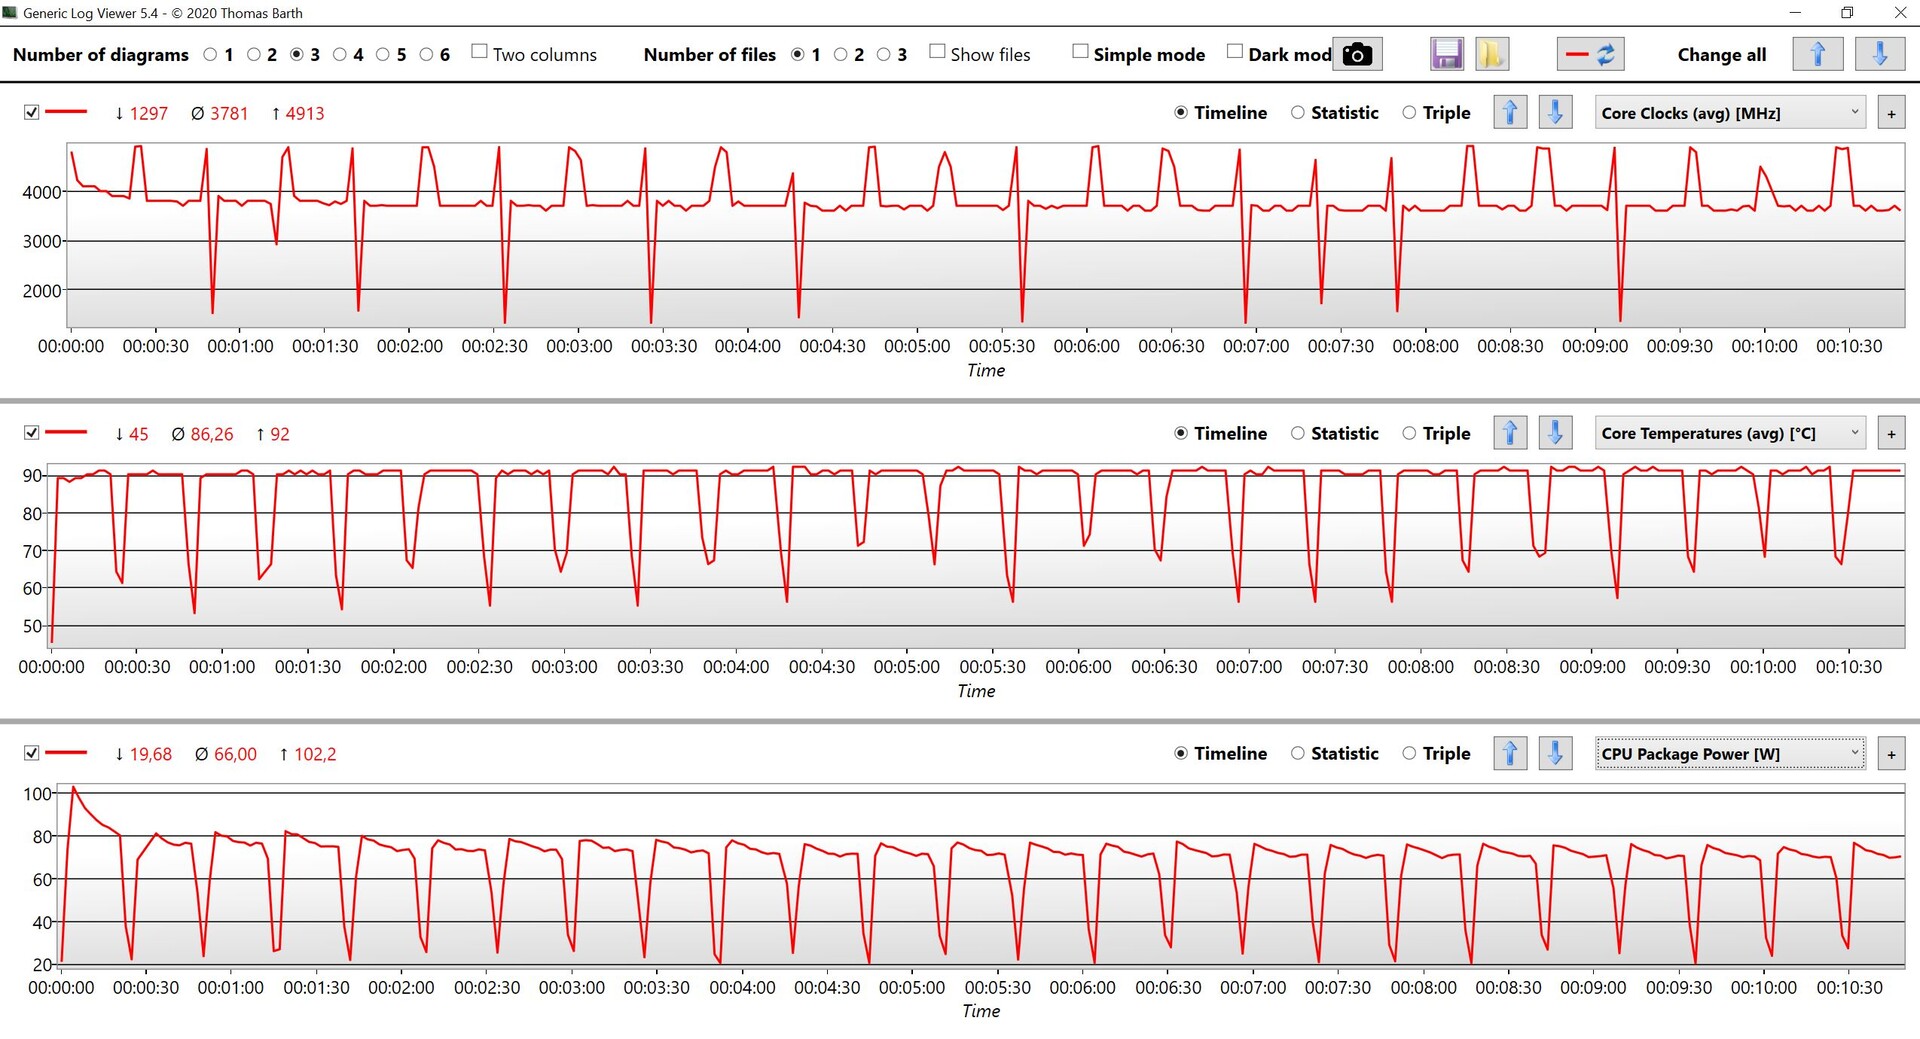
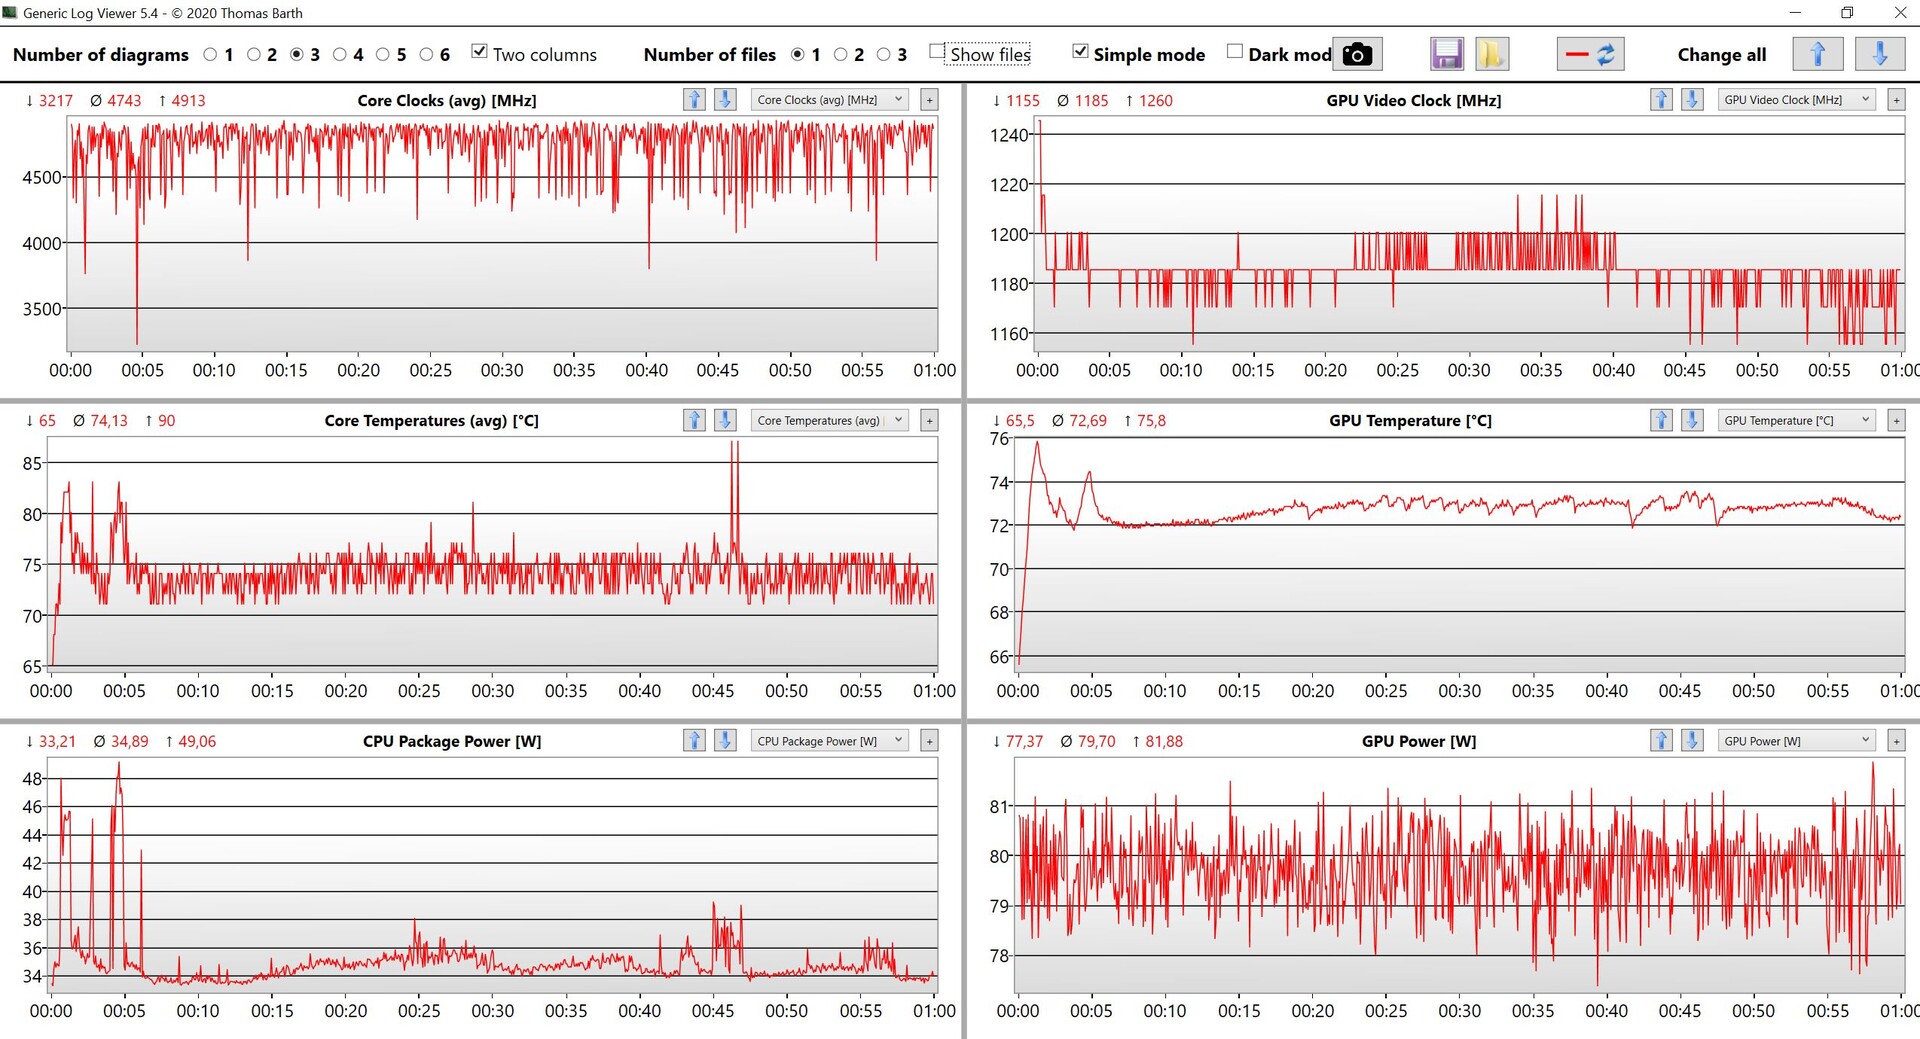
HP offers a wide variety of components for the ZBook Fury 17 G8and you can even get models without dedicated GPUs. You can choose between different Intel CPUs (11th generation) including Xeon chips and professional graphics cards from AMD or Nvidia. The TGP of our RTX A3000 is set at 80 Watts and the device already surpasses the 200W limitation of the power adapter during the stress test (the 200W unit is the most powerful according to the spec sheet), so we believe the optional RTX A4000 and RTX A5000 are also limited to 80W. Basically, we are dealing with the slower Max-Q versions, even though this designation is not officially used anymore.
Test Settings
HP does not implement any custom power profiles or additional performance settings and only uses the regular Windows power settings.
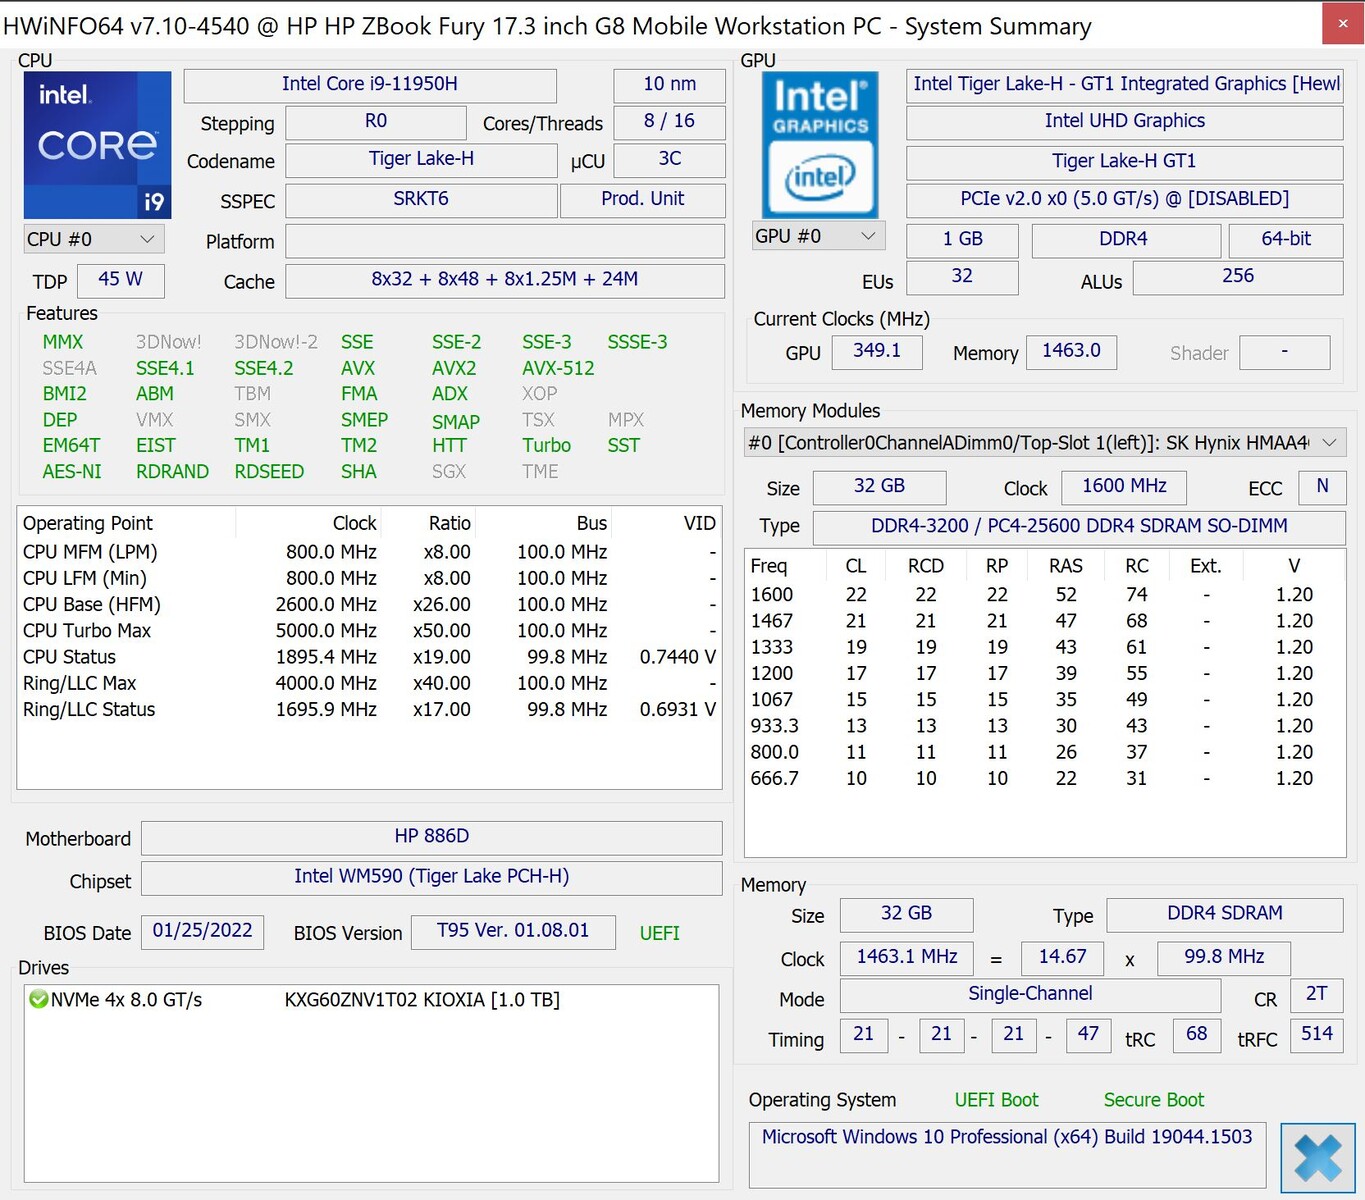
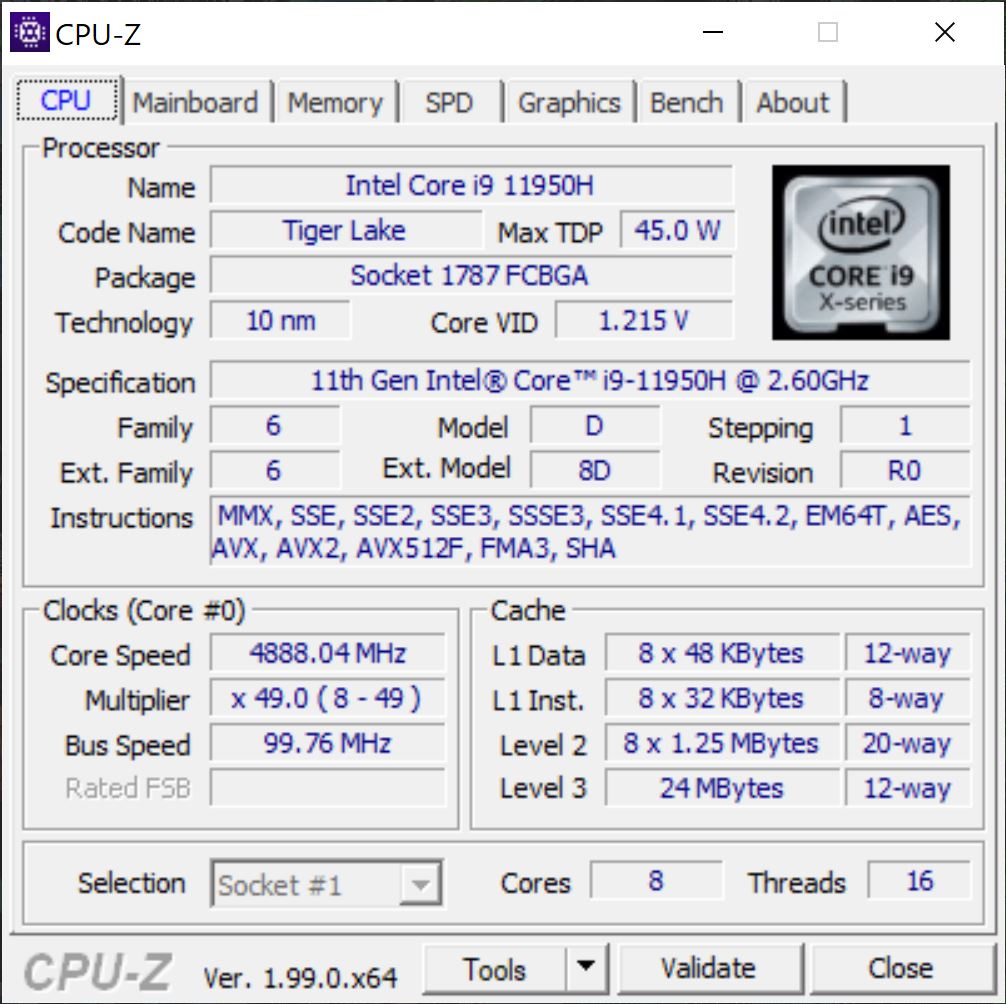
Processor - Core i9-11950H
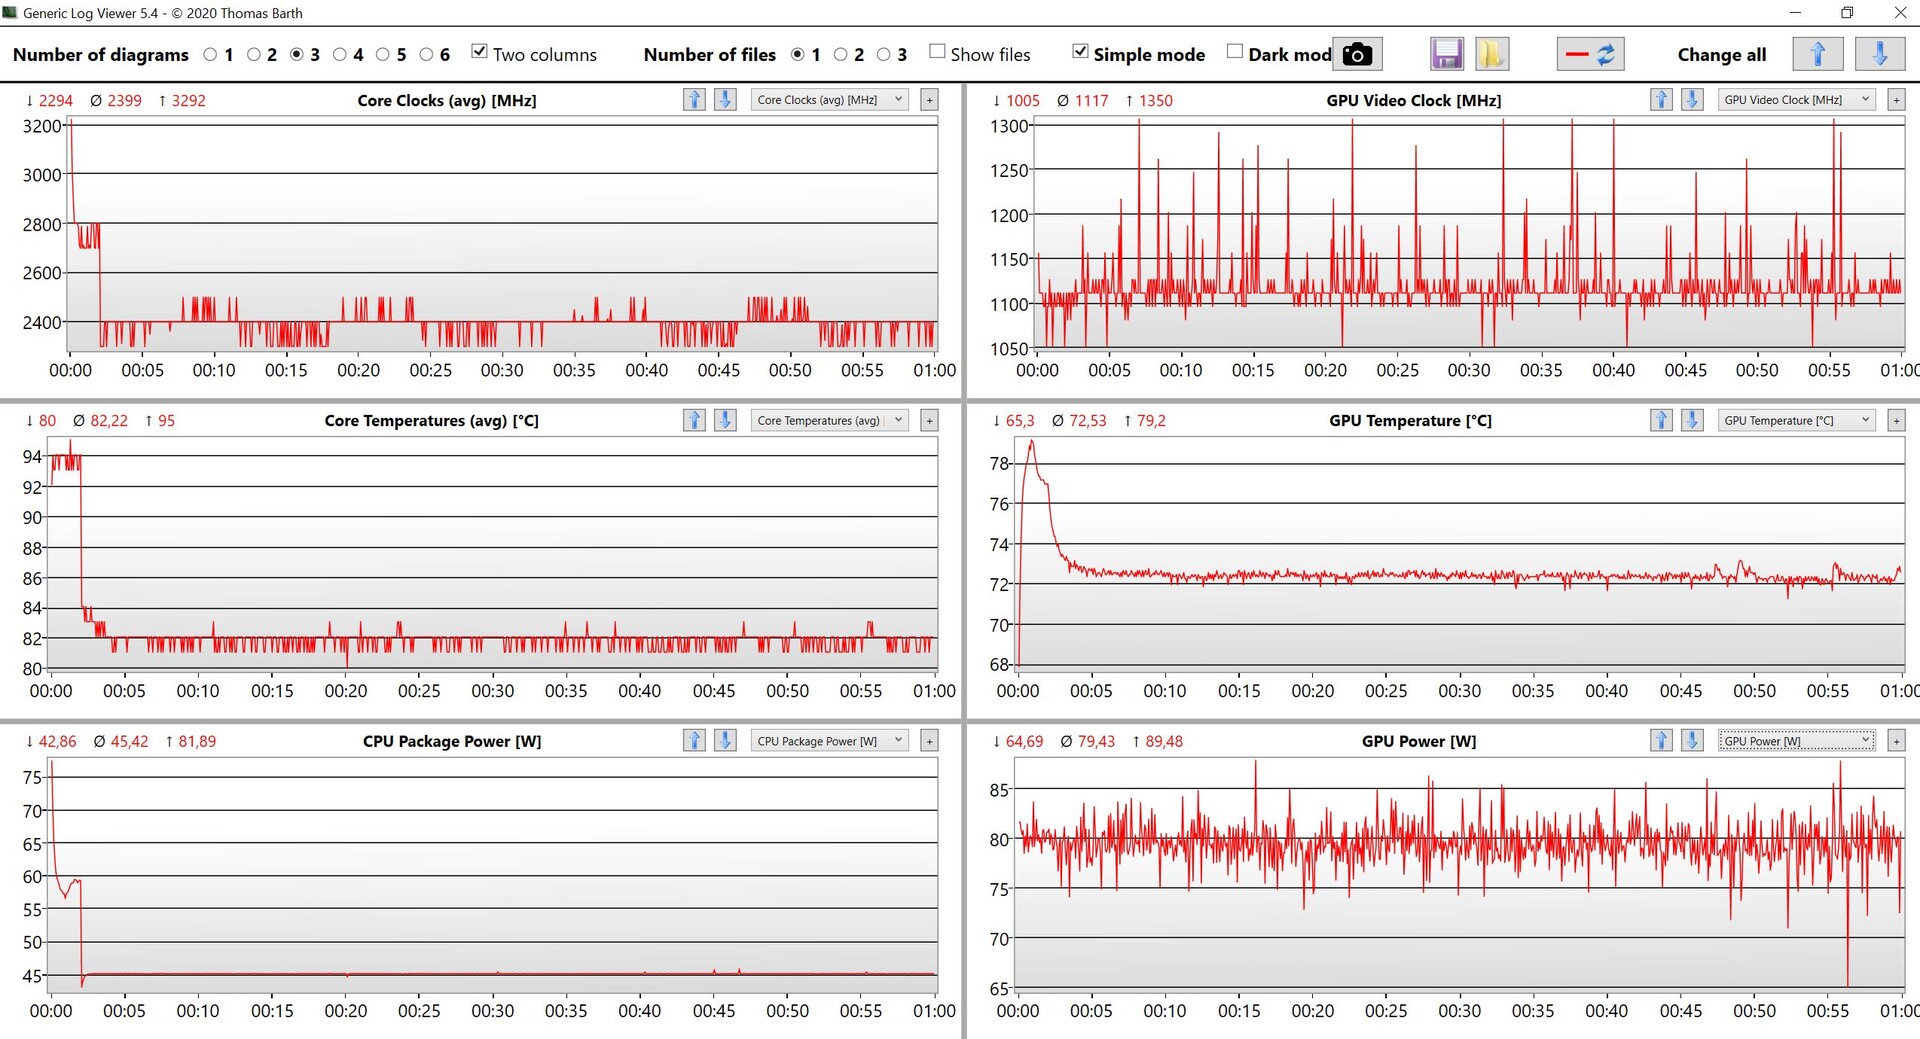
Our test unit is equipped with the Core i9-11950H, which is the business version of the Core i9-11980HK. There is no unlocked multiplier, but in return the chip supports vPro. The 8 cores can reach up to 5 GHz (or 4.5 GHz when all cores are stressed simultaneously), so this is one of the fastest mobile Tiger Lake chips. The CPU can consume more than 100 Watts for a brief period and levels off at around 70 Watts under sustained workloads, which are good values.
This means the CPU performance of the ZBook is on par with the workstation competition, but Intel’s brand-new Alder Lake processors, which use much more cores, will provide a massive multi-core performance advantage in the next model generation. AMDs current mobile processors provide more performance at comparable TDP settings as well.
The power consumption is limited to 65 Watts on battery power, which results in a performance deficit of around 15% in multi-core scenarios. More CPU benchmarks are available in our Tech section.
Cinebench R15 Multi Loop
Cinebench R23: Multi Core | Single Core
Cinebench R20: CPU (Multi Core) | CPU (Single Core)
Cinebench R15: CPU Multi 64Bit | CPU Single 64Bit
Blender: v2.79 BMW27 CPU
7-Zip 18.03: 7z b 4 | 7z b 4 -mmt1
Geekbench 5.5: Multi-Core | Single-Core
HWBOT x265 Benchmark v2.2: 4k Preset
LibreOffice : 20 Documents To PDF
R Benchmark 2.5: Overall mean
| CPU Performance rating | |
| Average of class Workstation | |
| MSI WE76 11UM-456 -1! | |
| Apple MacBook Pro 16 2021 M1 Max -5! | |
| HP ZBook Fury 17 G8-4A6A9EA | |
| Average Intel Core i9-11950H | |
| Asus ProArt StudioBook 16 W7600H5A-2BL2 | |
| Lenovo ThinkPad P17 G2-20YU0025G | |
| HP ZBook Fury 17 G7 119W5EA | |
| Cinebench R23 / Multi Core | |
| Average of class Workstation (14621 - 38520, n=23, last 2 years) | |
| MSI WE76 11UM-456 | |
| HP ZBook Fury 17 G8-4A6A9EA | |
| Lenovo ThinkPad P17 G2-20YU0025G | |
| Average Intel Core i9-11950H (12048 - 13113, n=4) | |
| Apple MacBook Pro 16 2021 M1 Max | |
| Asus ProArt StudioBook 16 W7600H5A-2BL2 | |
| HP ZBook Fury 17 G7 119W5EA | |
| Cinebench R23 / Single Core | |
| Average of class Workstation (1712 - 2228, n=23, last 2 years) | |
| HP ZBook Fury 17 G8-4A6A9EA | |
| MSI WE76 11UM-456 | |
| Average Intel Core i9-11950H (1569 - 1633, n=4) | |
| Apple MacBook Pro 16 2021 M1 Max | |
| Lenovo ThinkPad P17 G2-20YU0025G | |
| Asus ProArt StudioBook 16 W7600H5A-2BL2 | |
| HP ZBook Fury 17 G7 119W5EA | |
| Cinebench R20 / CPU (Multi Core) | |
| Average of class Workstation (5760 - 15043, n=23, last 2 years) | |
| Lenovo ThinkPad P17 G2-20YU0025G | |
| HP ZBook Fury 17 G8-4A6A9EA | |
| Average Intel Core i9-11950H (4471 - 5000, n=4) | |
| MSI WE76 11UM-456 | |
| Asus ProArt StudioBook 16 W7600H5A-2BL2 | |
| HP ZBook Fury 17 G7 119W5EA | |
| Apple MacBook Pro 16 2021 M1 Max | |
| Cinebench R20 / CPU (Single Core) | |
| Average of class Workstation (671 - 857, n=23, last 2 years) | |
| HP ZBook Fury 17 G8-4A6A9EA | |
| MSI WE76 11UM-456 | |
| Average Intel Core i9-11950H (610 - 632, n=4) | |
| Lenovo ThinkPad P17 G2-20YU0025G | |
| Asus ProArt StudioBook 16 W7600H5A-2BL2 | |
| HP ZBook Fury 17 G7 119W5EA | |
| Apple MacBook Pro 16 2021 M1 Max | |
| Cinebench R15 / CPU Multi 64Bit | |
| Average of class Workstation (2489 - 5810, n=23, last 2 years) | |
| MSI WE76 11UM-456 | |
| Lenovo ThinkPad P17 G2-20YU0025G | |
| HP ZBook Fury 17 G8-4A6A9EA | |
| Average Intel Core i9-11950H (1827 - 2130, n=5) | |
| Asus ProArt StudioBook 16 W7600H5A-2BL2 | |
| Apple MacBook Pro 16 2021 M1 Max | |
| HP ZBook Fury 17 G7 119W5EA | |
| Cinebench R15 / CPU Single 64Bit | |
| Average of class Workstation (191.4 - 328, n=23, last 2 years) | |
| HP ZBook Fury 17 G8-4A6A9EA | |
| MSI WE76 11UM-456 | |
| Average Intel Core i9-11950H (236 - 249, n=4) | |
| Lenovo ThinkPad P17 G2-20YU0025G | |
| Asus ProArt StudioBook 16 W7600H5A-2BL2 | |
| HP ZBook Fury 17 G7 119W5EA | |
| Apple MacBook Pro 16 2021 M1 Max | |
| Blender / v2.79 BMW27 CPU | |
| HP ZBook Fury 17 G7 119W5EA | |
| Asus ProArt StudioBook 16 W7600H5A-2BL2 | |
| Average Intel Core i9-11950H (244 - 261, n=3) | |
| Lenovo ThinkPad P17 G2-20YU0025G | |
| HP ZBook Fury 17 G8-4A6A9EA | |
| Apple MacBook Pro 16 2021 M1 Max | |
| Average of class Workstation (91 - 222, n=23, last 2 years) | |
| 7-Zip 18.03 / 7z b 4 | |
| Average of class Workstation (60489 - 116969, n=23, last 2 years) | |
| MSI WE76 11UM-456 | |
| HP ZBook Fury 17 G8-4A6A9EA | |
| Average Intel Core i9-11950H (50050 - 51402, n=3) | |
| Lenovo ThinkPad P17 G2-20YU0025G | |
| Asus ProArt StudioBook 16 W7600H5A-2BL2 | |
| HP ZBook Fury 17 G7 119W5EA | |
| 7-Zip 18.03 / 7z b 4 -mmt1 | |
| Average of class Workstation (5126 - 6960, n=23, last 2 years) | |
| HP ZBook Fury 17 G8-4A6A9EA | |
| Average Intel Core i9-11950H (5755 - 5919, n=3) | |
| MSI WE76 11UM-456 | |
| HP ZBook Fury 17 G7 119W5EA | |
| Lenovo ThinkPad P17 G2-20YU0025G | |
| Asus ProArt StudioBook 16 W7600H5A-2BL2 | |
| Geekbench 5.5 / Multi-Core | |
| Average of class Workstation (11542 - 25554, n=23, last 2 years) | |
| Apple MacBook Pro 16 2021 M1 Max | |
| MSI WE76 11UM-456 | |
| Asus ProArt StudioBook 16 W7600H5A-2BL2 | |
| HP ZBook Fury 17 G8-4A6A9EA | |
| Lenovo ThinkPad P17 G2-20YU0025G | |
| Average Intel Core i9-11950H (7286 - 8152, n=3) | |
| HP ZBook Fury 17 G7 119W5EA | |
| Geekbench 5.5 / Single-Core | |
| Average of class Workstation (1783 - 2183, n=23, last 2 years) | |
| Apple MacBook Pro 16 2021 M1 Max | |
| MSI WE76 11UM-456 | |
| Average Intel Core i9-11950H (1623 - 1702, n=3) | |
| HP ZBook Fury 17 G8-4A6A9EA | |
| Lenovo ThinkPad P17 G2-20YU0025G | |
| Asus ProArt StudioBook 16 W7600H5A-2BL2 | |
| HP ZBook Fury 17 G7 119W5EA | |
| HWBOT x265 Benchmark v2.2 / 4k Preset | |
| Average of class Workstation (17.8 - 40.5, n=23, last 2 years) | |
| MSI WE76 11UM-456 | |
| Lenovo ThinkPad P17 G2-20YU0025G | |
| HP ZBook Fury 17 G8-4A6A9EA | |
| Average Intel Core i9-11950H (13.8 - 14.5, n=4) | |
| Asus ProArt StudioBook 16 W7600H5A-2BL2 | |
| HP ZBook Fury 17 G7 119W5EA | |
| LibreOffice / 20 Documents To PDF | |
| HP ZBook Fury 17 G7 119W5EA | |
| HP ZBook Fury 17 G8-4A6A9EA | |
| Lenovo ThinkPad P17 G2-20YU0025G | |
| Average Intel Core i9-11950H (38.6 - 53.2, n=4) | |
| Average of class Workstation (37.1 - 74.7, n=23, last 2 years) | |
| MSI WE76 11UM-456 | |
| Asus ProArt StudioBook 16 W7600H5A-2BL2 | |
| R Benchmark 2.5 / Overall mean | |
| HP ZBook Fury 17 G7 119W5EA | |
| Asus ProArt StudioBook 16 W7600H5A-2BL2 | |
| Lenovo ThinkPad P17 G2-20YU0025G | |
| MSI WE76 11UM-456 | |
| Average Intel Core i9-11950H (0.521 - 0.551, n=4) | |
| HP ZBook Fury 17 G8-4A6A9EA | |
| Average of class Workstation (0.3825 - 0.603, n=23, last 2 years) | |
* ... smaller is better
AIDA64: FP32 Ray-Trace | FPU Julia | CPU SHA3 | CPU Queen | FPU SinJulia | FPU Mandel | CPU AES | CPU ZLib | FP64 Ray-Trace | CPU PhotoWorxx
| Performance rating | |
| Average of class Workstation | |
| MSI WE76 11UM-456 | |
| Average Intel Core i9-11950H | |
| HP ZBook Fury 17 G8-4A6A9EA | |
| HP ZBook Fury 17 G7 119W5EA | |
| Lenovo ThinkPad P17 G2-20YU0025G -9! | |
| Asus ProArt StudioBook 16 W7600H5A-2BL2 -9! | |
| AIDA64 / FP32 Ray-Trace | |
| Average of class Workstation (16730 - 61611, n=23, last 2 years) | |
| MSI WE76 11UM-456 | |
| HP ZBook Fury 17 G8-4A6A9EA | |
| Average Intel Core i9-11950H (14407 - 15655, n=4) | |
| HP ZBook Fury 17 G7 119W5EA | |
| AIDA64 / FPU Julia | |
| Average of class Workstation (89597 - 186971, n=23, last 2 years) | |
| MSI WE76 11UM-456 | |
| HP ZBook Fury 17 G8-4A6A9EA | |
| Average Intel Core i9-11950H (60286 - 63537, n=4) | |
| HP ZBook Fury 17 G7 119W5EA | |
| AIDA64 / CPU SHA3 | |
| Average of class Workstation (4178 - 8975, n=23, last 2 years) | |
| MSI WE76 11UM-456 | |
| HP ZBook Fury 17 G8-4A6A9EA | |
| Average Intel Core i9-11950H (4003 - 4254, n=4) | |
| HP ZBook Fury 17 G7 119W5EA | |
| AIDA64 / CPU Queen | |
| Average of class Workstation (60778 - 144411, n=23, last 2 years) | |
| MSI WE76 11UM-456 | |
| HP ZBook Fury 17 G8-4A6A9EA | |
| Average Intel Core i9-11950H (97840 - 98772, n=4) | |
| HP ZBook Fury 17 G7 119W5EA | |
| AIDA64 / FPU SinJulia | |
| Average of class Workstation (8165 - 29343, n=23, last 2 years) | |
| MSI WE76 11UM-456 | |
| HP ZBook Fury 17 G8-4A6A9EA | |
| Average Intel Core i9-11950H (9828 - 10462, n=4) | |
| HP ZBook Fury 17 G7 119W5EA | |
| AIDA64 / FPU Mandel | |
| Average of class Workstation (44497 - 98153, n=23, last 2 years) | |
| MSI WE76 11UM-456 | |
| HP ZBook Fury 17 G8-4A6A9EA | |
| Average Intel Core i9-11950H (35735 - 38450, n=4) | |
| HP ZBook Fury 17 G7 119W5EA | |
| AIDA64 / CPU AES | |
| Average of class Workstation (73133 - 187841, n=23, last 2 years) | |
| Average Intel Core i9-11950H (83095 - 147249, n=4) | |
| MSI WE76 11UM-456 | |
| HP ZBook Fury 17 G8-4A6A9EA | |
| HP ZBook Fury 17 G7 119W5EA | |
| AIDA64 / CPU ZLib | |
| Average of class Workstation (929 - 2148, n=23, last 2 years) | |
| MSI WE76 11UM-456 | |
| HP ZBook Fury 17 G8-4A6A9EA | |
| Average Intel Core i9-11950H (756 - 820, n=4) | |
| HP ZBook Fury 17 G7 119W5EA | |
| Lenovo ThinkPad P17 G2-20YU0025G | |
| Asus ProArt StudioBook 16 W7600H5A-2BL2 | |
| Asus ProArt StudioBook 16 W7600H5A-2BL2 | |
| AIDA64 / FP64 Ray-Trace | |
| Average of class Workstation (8545 - 32891, n=23, last 2 years) | |
| MSI WE76 11UM-456 | |
| HP ZBook Fury 17 G8-4A6A9EA | |
| Average Intel Core i9-11950H (7871 - 8549, n=4) | |
| HP ZBook Fury 17 G7 119W5EA | |
| AIDA64 / CPU PhotoWorxx | |
| Average of class Workstation (37151 - 93684, n=23, last 2 years) | |
| MSI WE76 11UM-456 | |
| Average Intel Core i9-11950H (12933 - 26370, n=4) | |
| HP ZBook Fury 17 G8-4A6A9EA | |
| HP ZBook Fury 17 G7 119W5EA | |
System Performance
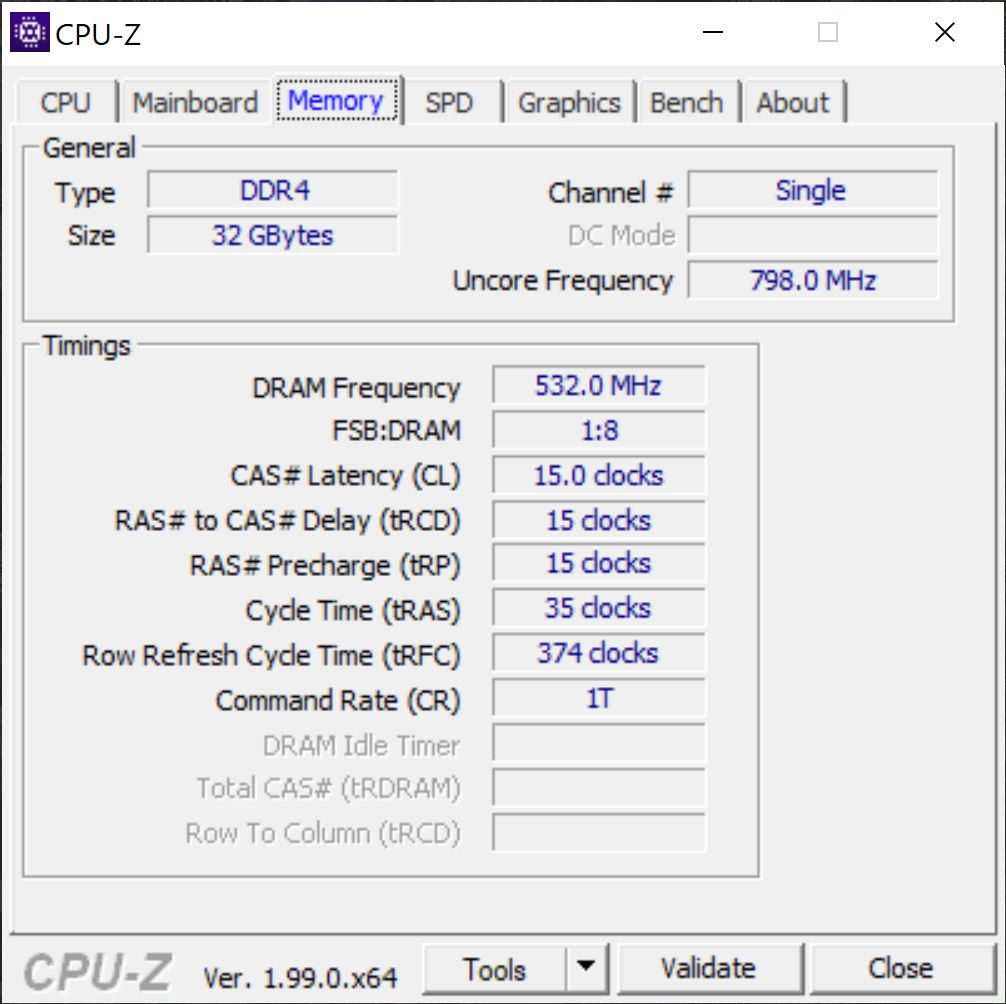
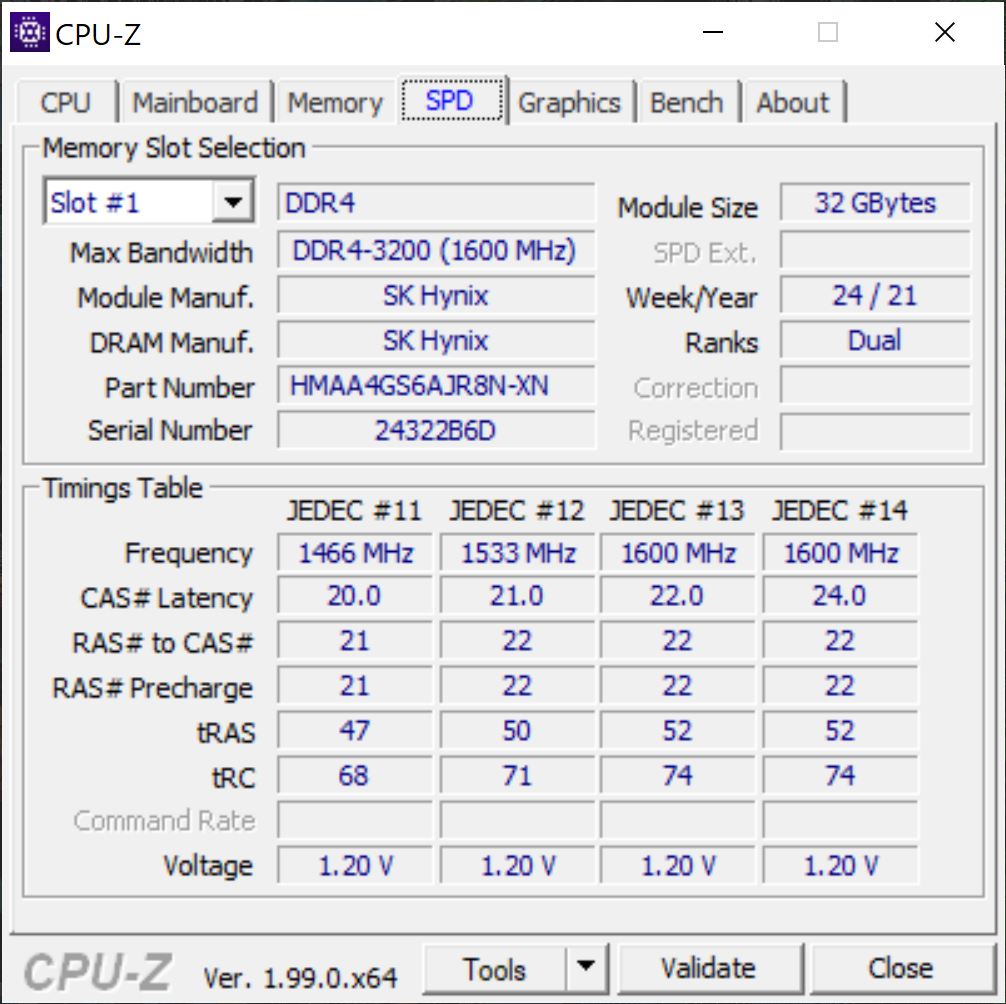
The subjective performance impression of the ZBook Fury 17 G8 is, as expected, very good, which is also confirmed by the benchmark results. We are, however, a bit surprised by the single-channel memory configuration of our unit with just one 32 GB module. There are four slots in total, so a dual-channel configuration with two 16 GB modules would have been the better solution for the majority of users.
CrossMark: Overall | Productivity | Creativity | Responsiveness
| PCMark 10 / Score | |
| Average of class Workstation (6563 - 10409, n=19, last 2 years) | |
| MSI WE76 11UM-456 | |
| Asus ProArt StudioBook 16 W7600H5A-2BL2 | |
| Lenovo ThinkPad P17 G2-20YU0025G | |
| HP ZBook Fury 17 G8-4A6A9EA | |
| Average Intel Core i9-11950H, NVIDIA RTX A3000 Laptop GPU (n=1) | |
| HP ZBook Fury 17 G7 119W5EA | |
| PCMark 10 / Essentials | |
| Average of class Workstation (9622 - 11157, n=19, last 2 years) | |
| Asus ProArt StudioBook 16 W7600H5A-2BL2 | |
| Lenovo ThinkPad P17 G2-20YU0025G | |
| MSI WE76 11UM-456 | |
| HP ZBook Fury 17 G8-4A6A9EA | |
| Average Intel Core i9-11950H, NVIDIA RTX A3000 Laptop GPU (n=1) | |
| HP ZBook Fury 17 G7 119W5EA | |
| PCMark 10 / Productivity | |
| Average of class Workstation (8789 - 20616, n=19, last 2 years) | |
| MSI WE76 11UM-456 | |
| Asus ProArt StudioBook 16 W7600H5A-2BL2 | |
| Lenovo ThinkPad P17 G2-20YU0025G | |
| HP ZBook Fury 17 G8-4A6A9EA | |
| Average Intel Core i9-11950H, NVIDIA RTX A3000 Laptop GPU (n=1) | |
| HP ZBook Fury 17 G7 119W5EA | |
| PCMark 10 / Digital Content Creation | |
| Average of class Workstation (8108 - 15631, n=19, last 2 years) | |
| MSI WE76 11UM-456 | |
| Asus ProArt StudioBook 16 W7600H5A-2BL2 | |
| HP ZBook Fury 17 G8-4A6A9EA | |
| Average Intel Core i9-11950H, NVIDIA RTX A3000 Laptop GPU (n=1) | |
| Lenovo ThinkPad P17 G2-20YU0025G | |
| HP ZBook Fury 17 G7 119W5EA | |
| CrossMark / Overall | |
| Average of class Workstation (1307 - 2267, n=22, last 2 years) | |
| MSI WE76 11UM-456 | |
| Apple MacBook Pro 16 2021 M1 Max | |
| HP ZBook Fury 17 G8-4A6A9EA | |
| Average Intel Core i9-11950H, NVIDIA RTX A3000 Laptop GPU (n=1) | |
| CrossMark / Productivity | |
| Average of class Workstation (1130 - 2122, n=22, last 2 years) | |
| MSI WE76 11UM-456 | |
| HP ZBook Fury 17 G8-4A6A9EA | |
| Average Intel Core i9-11950H, NVIDIA RTX A3000 Laptop GPU (n=1) | |
| Apple MacBook Pro 16 2021 M1 Max | |
| CrossMark / Creativity | |
| Average of class Workstation (1657 - 2725, n=22, last 2 years) | |
| Apple MacBook Pro 16 2021 M1 Max | |
| MSI WE76 11UM-456 | |
| HP ZBook Fury 17 G8-4A6A9EA | |
| Average Intel Core i9-11950H, NVIDIA RTX A3000 Laptop GPU (n=1) | |
| CrossMark / Responsiveness | |
| Average of class Workstation (993 - 2096, n=22, last 2 years) | |
| MSI WE76 11UM-456 | |
| HP ZBook Fury 17 G8-4A6A9EA | |
| Average Intel Core i9-11950H, NVIDIA RTX A3000 Laptop GPU (n=1) | |
| Apple MacBook Pro 16 2021 M1 Max | |
| PCMark 10 Score | 6212 points | |
Help | ||
| AIDA64 / Memory Copy | |
| Average of class Workstation (56003 - 164795, n=23, last 2 years) | |
| MSI WE76 11UM-456 | |
| Average Intel Core i9-11950H (25952 - 48565, n=4) | |
| HP ZBook Fury 17 G8-4A6A9EA | |
| HP ZBook Fury 17 G7 119W5EA | |
| AIDA64 / Memory Read | |
| Average of class Workstation (55795 - 121563, n=23, last 2 years) | |
| MSI WE76 11UM-456 | |
| Average Intel Core i9-11950H (26064 - 47921, n=4) | |
| HP ZBook Fury 17 G8-4A6A9EA | |
| HP ZBook Fury 17 G7 119W5EA | |
| AIDA64 / Memory Write | |
| Average of class Workstation (55663 - 214520, n=23, last 2 years) | |
| MSI WE76 11UM-456 | |
| Average Intel Core i9-11950H (22302 - 46818, n=4) | |
| HP ZBook Fury 17 G8-4A6A9EA | |
| HP ZBook Fury 17 G7 119W5EA | |
| AIDA64 / Memory Latency | |
| Average of class Workstation (84.5 - 165.2, n=23, last 2 years) | |
| MSI WE76 11UM-456 | |
| Average Intel Core i9-11950H (82.6 - 88.6, n=4) | |
| HP ZBook Fury 17 G8-4A6A9EA | |
| HP ZBook Fury 17 G7 119W5EA | |
| Lenovo ThinkPad P17 G2-20YU0025G | |
| Asus ProArt StudioBook 16 W7600H5A-2BL2 | |
| Asus ProArt StudioBook 16 W7600H5A-2BL2 | |
* ... smaller is better
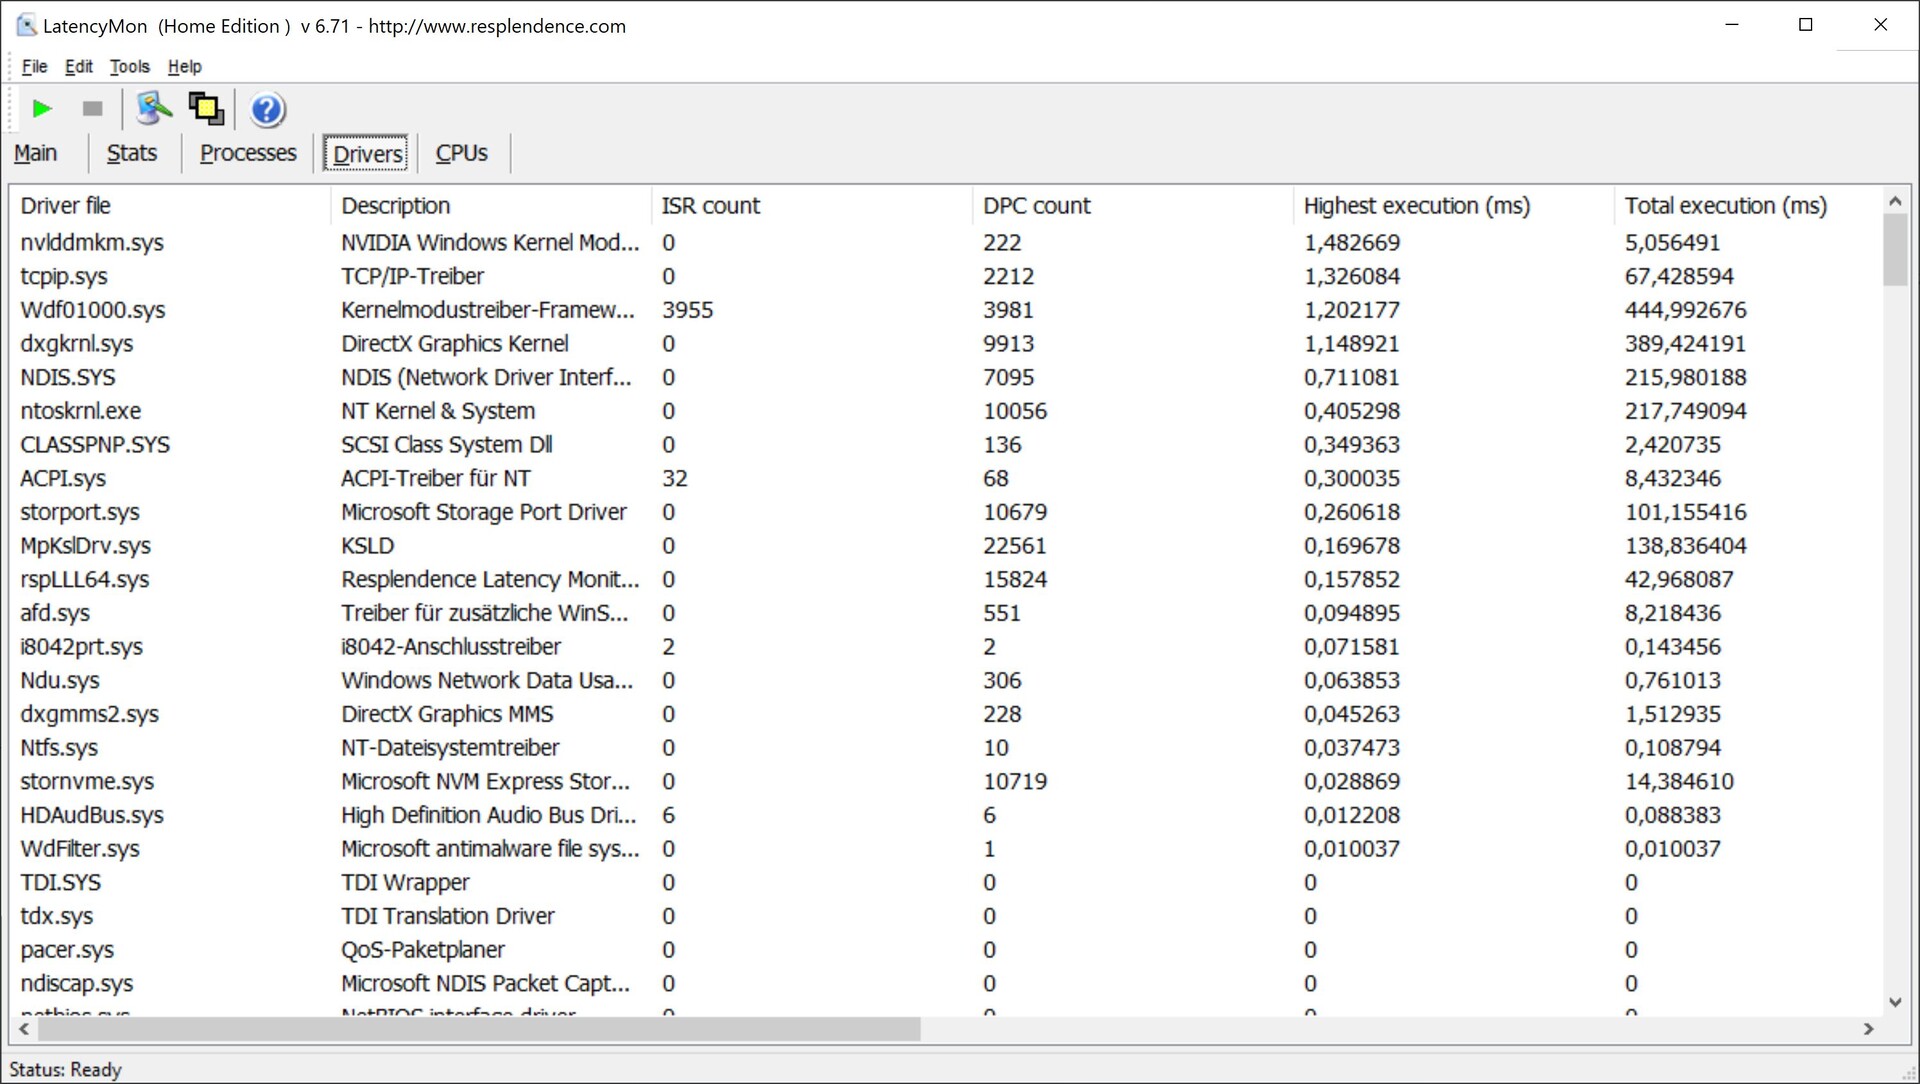
DPC Latency
Our standardized latency test shows slightly increased latencies with the current BIOS version and is therefore not perfectly suited for real-time audio applications.
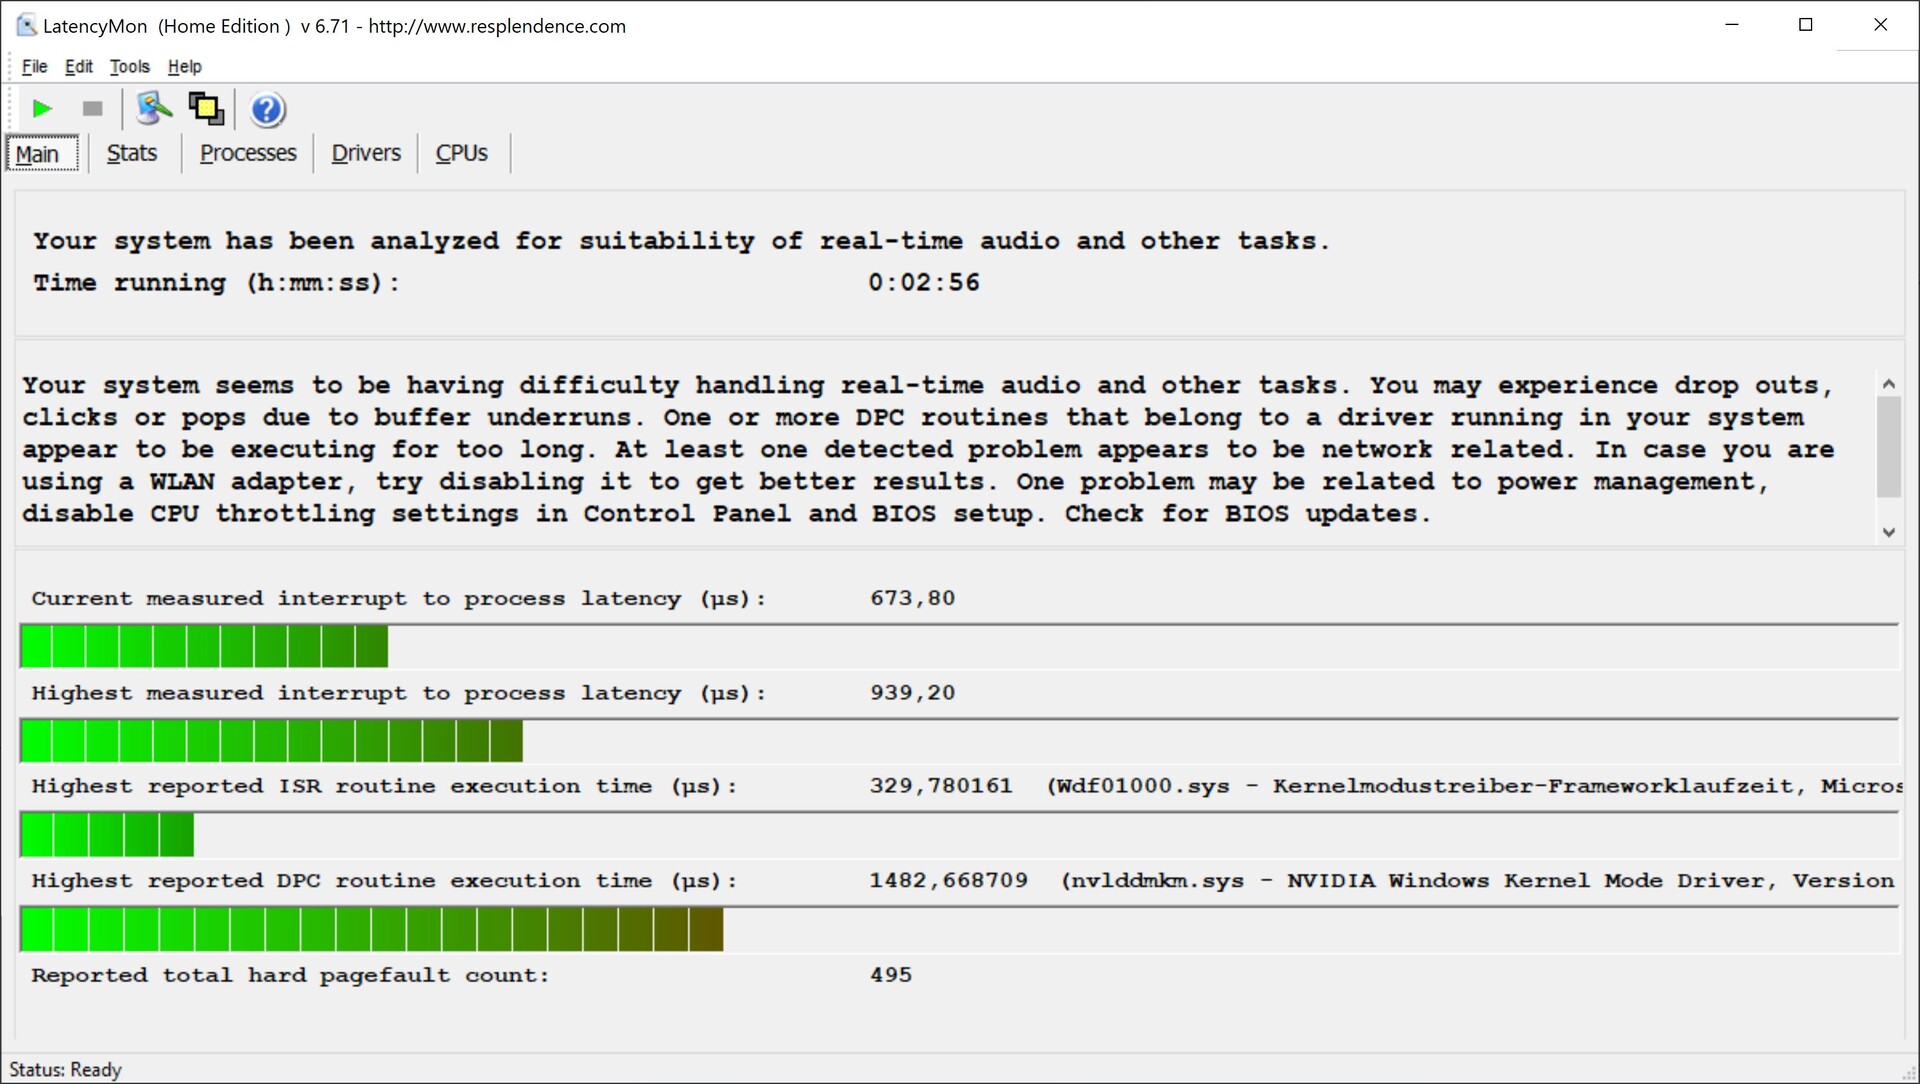
| DPC Latencies / LatencyMon - interrupt to process latency (max), Web, Youtube, Prime95 | |
| Lenovo ThinkPad P17 G2-20YU0025G | |
| HP ZBook Fury 17 G7 119W5EA | |
| Asus ProArt StudioBook 16 W7600H5A-2BL2 | |
| MSI WE76 11UM-456 | |
| HP ZBook Fury 17 G8-4A6A9EA | |
* ... smaller is better
Storage Devices
The two M.2-2280 slots do not support the latest PCIe 4.0 standard, but the 1 TB SSD from Toshiba (885 GB are available for the user after the initial setup) still manages high transfer rates of more than 3 GB/s despite the PCIe 3.0 interface. Still, many of the rivals are superior in this respect. The additional slot for a 2.5-inch drive (SATA) appears rather outdated, but HP at least ships the necessary mounting kit. More SSD benchmarks are available here.

* ... smaller is better
Disk Throttling: DiskSpd Read Loop, Queue Depth 8
GPU Performance
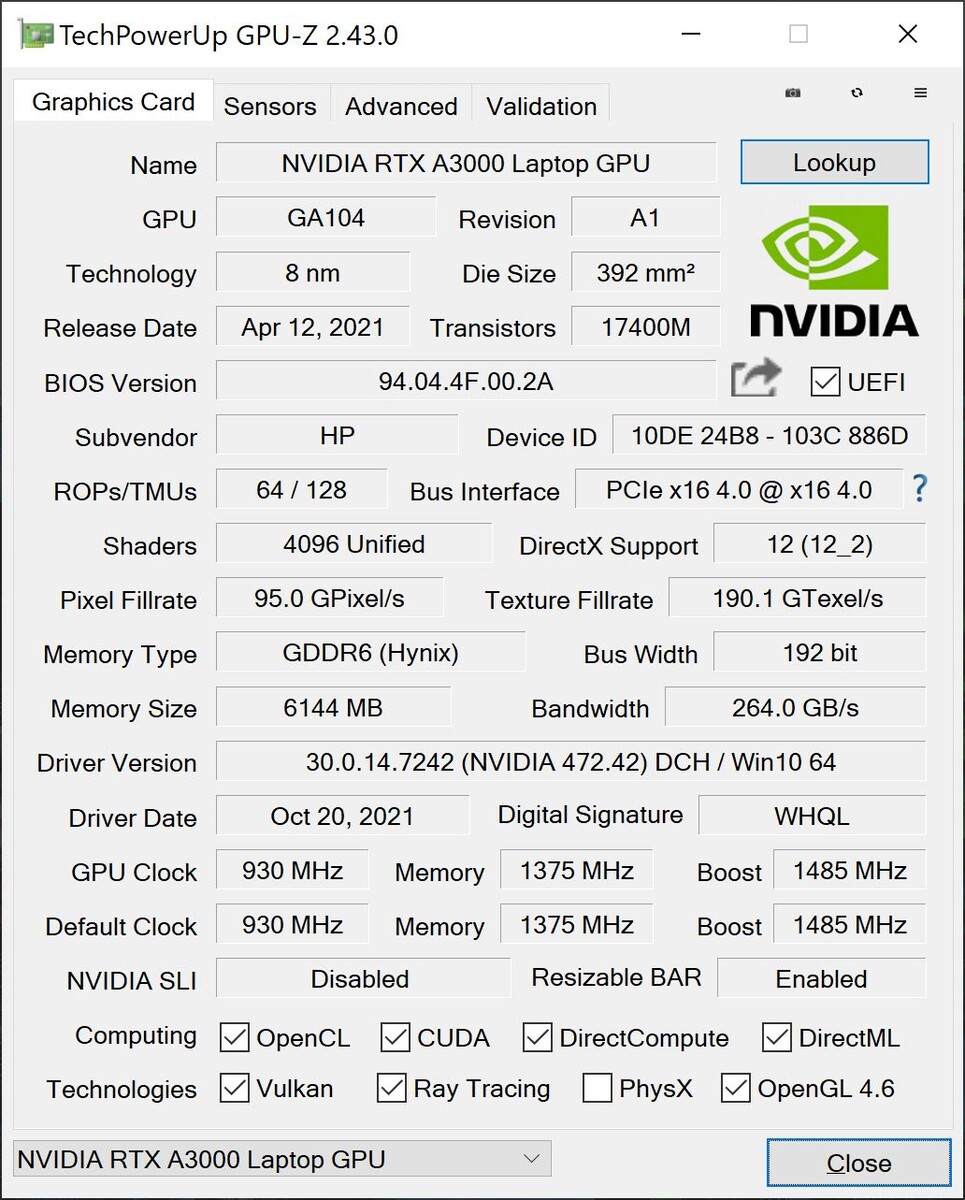
Nvidia’s RTX A3000 is a professional upper mainstream mobile graphics card and the performance is comparable to the consumer version GeForce RTX 3060. Thanks to special drivers, the performance can be much higher in some applications, which is also supported by the SPECviewperf benchmark results. With a TGP of 80W, this is one of the slower versions of the GPU (it would have carried the Max-Q designation in previous generations), which is a bit disappointing considering the bulky chassis. The maximum power consumption of the optional RTX A4000 and RTX A5000 GPUs should also be set at 80W due to the limitation of the 200W power adapter.
Looking at the performance, the RTX A3000 is pretty much on par with the old Quadro RTX 4000 Max-Q in the predecessor ZBook Fury 17 G7 in most benchmarks and slightly lower than the average scores for the RTX A3000 we have in our database. There is definitely room for improvements here, but the performance is at least stable under sustained workloads; the demanding 3DMark Time Spy stress test is easily passed.
The TGP is limited to 55 Watts on battery power, which results in a performance deficit of around 25 percent (5000 vs. 6580 points @Time Spy Graphics). More GPU benchmarks are listed here.
| 3DMark 11 Performance | 20760 points | |
| 3DMark Cloud Gate Standard Score | 24449 points | |
| 3DMark Fire Strike Score | 15711 points | |
| 3DMark Time Spy Score | 6490 points | |
Help | ||
Gaming Performance
Nvidia’s professional GPUs are also well-suited for gaming and the performance of the RTX A3000 is often even sufficient for the native 4K resolution, only very demanding titles like Cyberpunk 2077 will require a reduction of the details and/or the resolution. The performance is stable in longer gaming sessions, but there is once again a small deficit on battery power; Witcher 3 Ultra on battery results in 43 fps vs. 61 fps on mains. Please see our Tech section for more gaming benchmarks.
Witcher 3 FPS Diagram
| low | med. | high | ultra | QHD | 4K | |
|---|---|---|---|---|---|---|
| GTA V (2015) | 163 | 150 | 101 | 64.3 | 53.5 | 49.2 |
| The Witcher 3 (2015) | 263 | 176 | 112 | 61.1 | 45 | |
| Dota 2 Reborn (2015) | 156 | 131 | 119 | 108 | 77.1 | |
| Final Fantasy XV Benchmark (2018) | 130 | 86.7 | 67 | 50.7 | 28.8 | |
| X-Plane 11.11 (2018) | 103 | 82.1 | 66.7 | 40.5 | ||
| Far Cry 5 (2018) | 113 | 84 | 81 | 77 | 62 | 36 |
| Strange Brigade (2018) | 324 | 164 | 134 | 118 | 87 | 51 |
| Cyberpunk 2077 1.0 (2020) | 78 | 64 | 52 | 45 | 28 | 14 |
| F1 2021 (2021) | 202 | 131 | 114 | 75 | 56.7 | 26.9 |
Emissions - ZBook stays cool
System Noise
The ZBook Fury 17 G8 is usually a very quiet companion during everyday tasks and the fan murmur is still tolerable at around 40 dB(A) during more challenging workloads since there is no high-pitched noise. We measured up to 47 dB(A) under maximum load, which is very audible, but we did not notice any other electronic noises like coil whine, for instance.
Noise level
| Idle |
| 24.5 / 24.5 / 26.8 dB(A) |
| Load |
| 41.8 / 47.1 dB(A) |
 | ||
30 dB silent 40 dB(A) audible 50 dB(A) loud |
||
min: | ||
| HP ZBook Fury 17 G8-4A6A9EA RTX A3000 Laptop GPU, i9-11950H, Toshiba XG6 KXG60ZNV1T02 | Lenovo ThinkPad P17 G2-20YU0025G RTX A2000 Laptop GPU, i7-11800H, Kioxia XG7 KXG7AZNV512G | MSI WE76 11UM-456 RTX A5000 Laptop GPU, i9-11980HK, Samsung PM9A1 MZVL22T0HBLB | Asus ProArt StudioBook 16 W7600H5A-2BL2 RTX A5000 Laptop GPU, W-11955M, 2x Micron 2300 2TB MTFDHBA2T0TDV (RAID 0) | HP ZBook Fury 17 G7 119W5EA Quadro RTX 4000 Max-Q, i9-10885H, WDC PC SN730 SDBPNTY-1T00 | Apple MacBook Pro 16 2021 M1 Max M1 Max 32-Core GPU, M1 Max, Apple SSD AP2048R | |
|---|---|---|---|---|---|---|
| Noise | 1% | -2% | -1% | -3% | 4% | |
| off / environment * (dB) | 24.5 | 26.4 -8% | 24.7 -1% | 26 -6% | 24.4 -0% | 24.2 1% |
| Idle Minimum * (dB) | 24.5 | 26.4 -8% | 24.7 -1% | 26 -6% | 24.4 -0% | 24.2 1% |
| Idle Average * (dB) | 24.5 | 26.4 -8% | 24.7 -1% | 26 -6% | 26.6 -9% | 24.2 1% |
| Idle Maximum * (dB) | 26.8 | 26.4 1% | 27.5 -3% | 26.5 1% | 29 -8% | 24.2 10% |
| Load Average * (dB) | 41.8 | 38.1 9% | 43.7 -5% | 42 -0% | 40.2 4% | 42.9 -3% |
| Witcher 3 ultra * (dB) | 44.9 | 38.1 15% | 46.6 -4% | 48 -7% | 39.5 12% | |
| Load Maximum * (dB) | 47.1 | 45 4% | 47.7 -1% | 43 9% | 48 -2% | 42.9 9% |
* ... smaller is better
Temperature
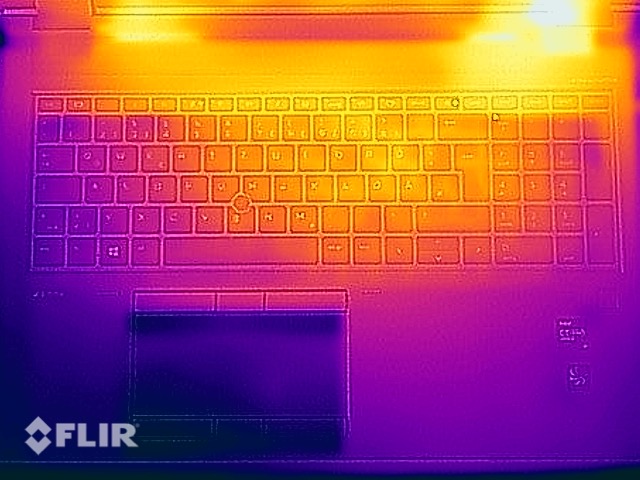
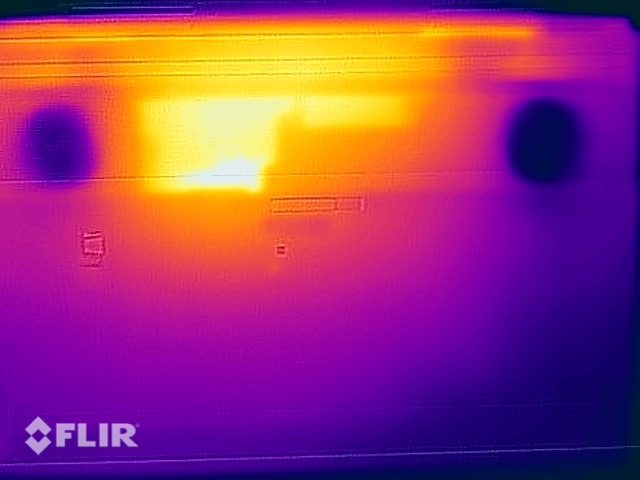
The surface temperatures are completely uncritical even in our stress test where we can only measure slightly more than 50 °C at a few spots on the bottom of the chassis. The top of the base unit including the keyboard deck is much cooler and does not scratch the 40 °C mark, so there are absolutely no limitations. The unit does not really warm up at all under light workloads.
The performance is not disappointing during the stress test, but that should be expected from a large mobile workstation. The processor performance is limited to the nominal 45 Watts after a few minutes while the dedicated graphics card can maintain 80 Watts. Therefore, there is no performance deficit immediately after the stress test.
(±) The maximum temperature on the upper side is 41.9 °C / 107 F, compared to the average of 38.2 °C / 101 F, ranging from 22.2 to 69.8 °C for the class Workstation.
(-) The bottom heats up to a maximum of 52.9 °C / 127 F, compared to the average of 41.1 °C / 106 F
(+) In idle usage, the average temperature for the upper side is 26.6 °C / 80 F, compared to the device average of 32 °C / 90 F.
(±) Playing The Witcher 3, the average temperature for the upper side is 34.6 °C / 94 F, compared to the device average of 32 °C / 90 F.
(+) The palmrests and touchpad are cooler than skin temperature with a maximum of 28.6 °C / 83.5 F and are therefore cool to the touch.
(±) The average temperature of the palmrest area of similar devices was 27.8 °C / 82 F (-0.8 °C / -1.5 F).
| HP ZBook Fury 17 G8-4A6A9EA Intel Core i9-11950H, NVIDIA RTX A3000 Laptop GPU | Lenovo ThinkPad P17 G2-20YU0025G Intel Core i7-11800H, NVIDIA RTX A2000 Laptop GPU | MSI WE76 11UM-456 Intel Core i9-11980HK, NVIDIA RTX A5000 Laptop GPU | Asus ProArt StudioBook 16 W7600H5A-2BL2 Intel Xeon W-11955M, NVIDIA RTX A5000 Laptop GPU | HP ZBook Fury 17 G7 119W5EA Intel Core i9-10885H, NVIDIA Quadro RTX 4000 Max-Q | Apple MacBook Pro 16 2021 M1 Max Apple M1 Max, Apple M1 Max 32-Core GPU | |
|---|---|---|---|---|---|---|
| Heat | 1% | -7% | -9% | 6% | 14% | |
| Maximum Upper Side * (°C) | 41.9 | 49.6 -18% | 48.4 -16% | 45.7 -9% | 46.1 -10% | 42.3 -1% |
| Maximum Bottom * (°C) | 52.9 | 52.1 2% | 56.2 -6% | 48.3 9% | 57.6 -9% | 41.7 21% |
| Idle Upper Side * (°C) | 28.2 | 26 8% | 28.6 -1% | 35.3 -25% | 23.4 17% | 23.9 15% |
| Idle Bottom * (°C) | 30.7 | 27.6 10% | 31.8 -4% | 34.4 -12% | 23.4 24% | 23.9 22% |
* ... smaller is better
Speakers
The stereo speakers of the ZBook offer good sound quality; they are sufficiently loud and rich. It cannot match the audio performance of the MacBook Pro 16, but the integrated modules are not bad by any means. The microphones also left a good impression during our review and voice recordings were very clear without major distortions.
HP ZBook Fury 17 G8-4A6A9EA audio analysis
(±) | speaker loudness is average but good (81.1 dB)
Bass 100 - 315 Hz
(±) | reduced bass - on average 9.5% lower than median
(±) | linearity of bass is average (7.8% delta to prev. frequency)
Mids 400 - 2000 Hz
(+) | balanced mids - only 4.6% away from median
(+) | mids are linear (4.9% delta to prev. frequency)
Highs 2 - 16 kHz
(+) | balanced highs - only 4% away from median
(+) | highs are linear (3.9% delta to prev. frequency)
Overall 100 - 16.000 Hz
(+) | overall sound is linear (13.7% difference to median)
Compared to same class
» 28% of all tested devices in this class were better, 3% similar, 70% worse
» The best had a delta of 7%, average was 17%, worst was 35%
Compared to all devices tested
» 15% of all tested devices were better, 4% similar, 81% worse
» The best had a delta of 4%, average was 23%, worst was 134%
Lenovo ThinkPad P17 G2-20YU0025G audio analysis
(±) | speaker loudness is average but good (76.6 dB)
Bass 100 - 315 Hz
(±) | reduced bass - on average 14.5% lower than median
(±) | linearity of bass is average (9.6% delta to prev. frequency)
Mids 400 - 2000 Hz
(±) | higher mids - on average 6.9% higher than median
(±) | linearity of mids is average (7.7% delta to prev. frequency)
Highs 2 - 16 kHz
(+) | balanced highs - only 2.6% away from median
(+) | highs are linear (6.6% delta to prev. frequency)
Overall 100 - 16.000 Hz
(±) | linearity of overall sound is average (20.1% difference to median)
Compared to same class
» 71% of all tested devices in this class were better, 6% similar, 23% worse
» The best had a delta of 7%, average was 17%, worst was 35%
Compared to all devices tested
» 52% of all tested devices were better, 8% similar, 40% worse
» The best had a delta of 4%, average was 23%, worst was 134%
Apple MacBook Pro 16 2021 M1 Pro audio analysis
(+) | speakers can play relatively loud (84.7 dB)
Bass 100 - 315 Hz
(+) | good bass - only 3.8% away from median
(+) | bass is linear (5.2% delta to prev. frequency)
Mids 400 - 2000 Hz
(+) | balanced mids - only 1.3% away from median
(+) | mids are linear (2.1% delta to prev. frequency)
Highs 2 - 16 kHz
(+) | balanced highs - only 1.9% away from median
(+) | highs are linear (2.7% delta to prev. frequency)
Overall 100 - 16.000 Hz
(+) | overall sound is linear (4.6% difference to median)
Compared to same class
» 0% of all tested devices in this class were better, 0% similar, 100% worse
» The best had a delta of 5%, average was 17%, worst was 45%
Compared to all devices tested
» 0% of all tested devices were better, 0% similar, 100% worse
» The best had a delta of 4%, average was 23%, worst was 134%
Energy Management - Decent Stamina
Power Consumption
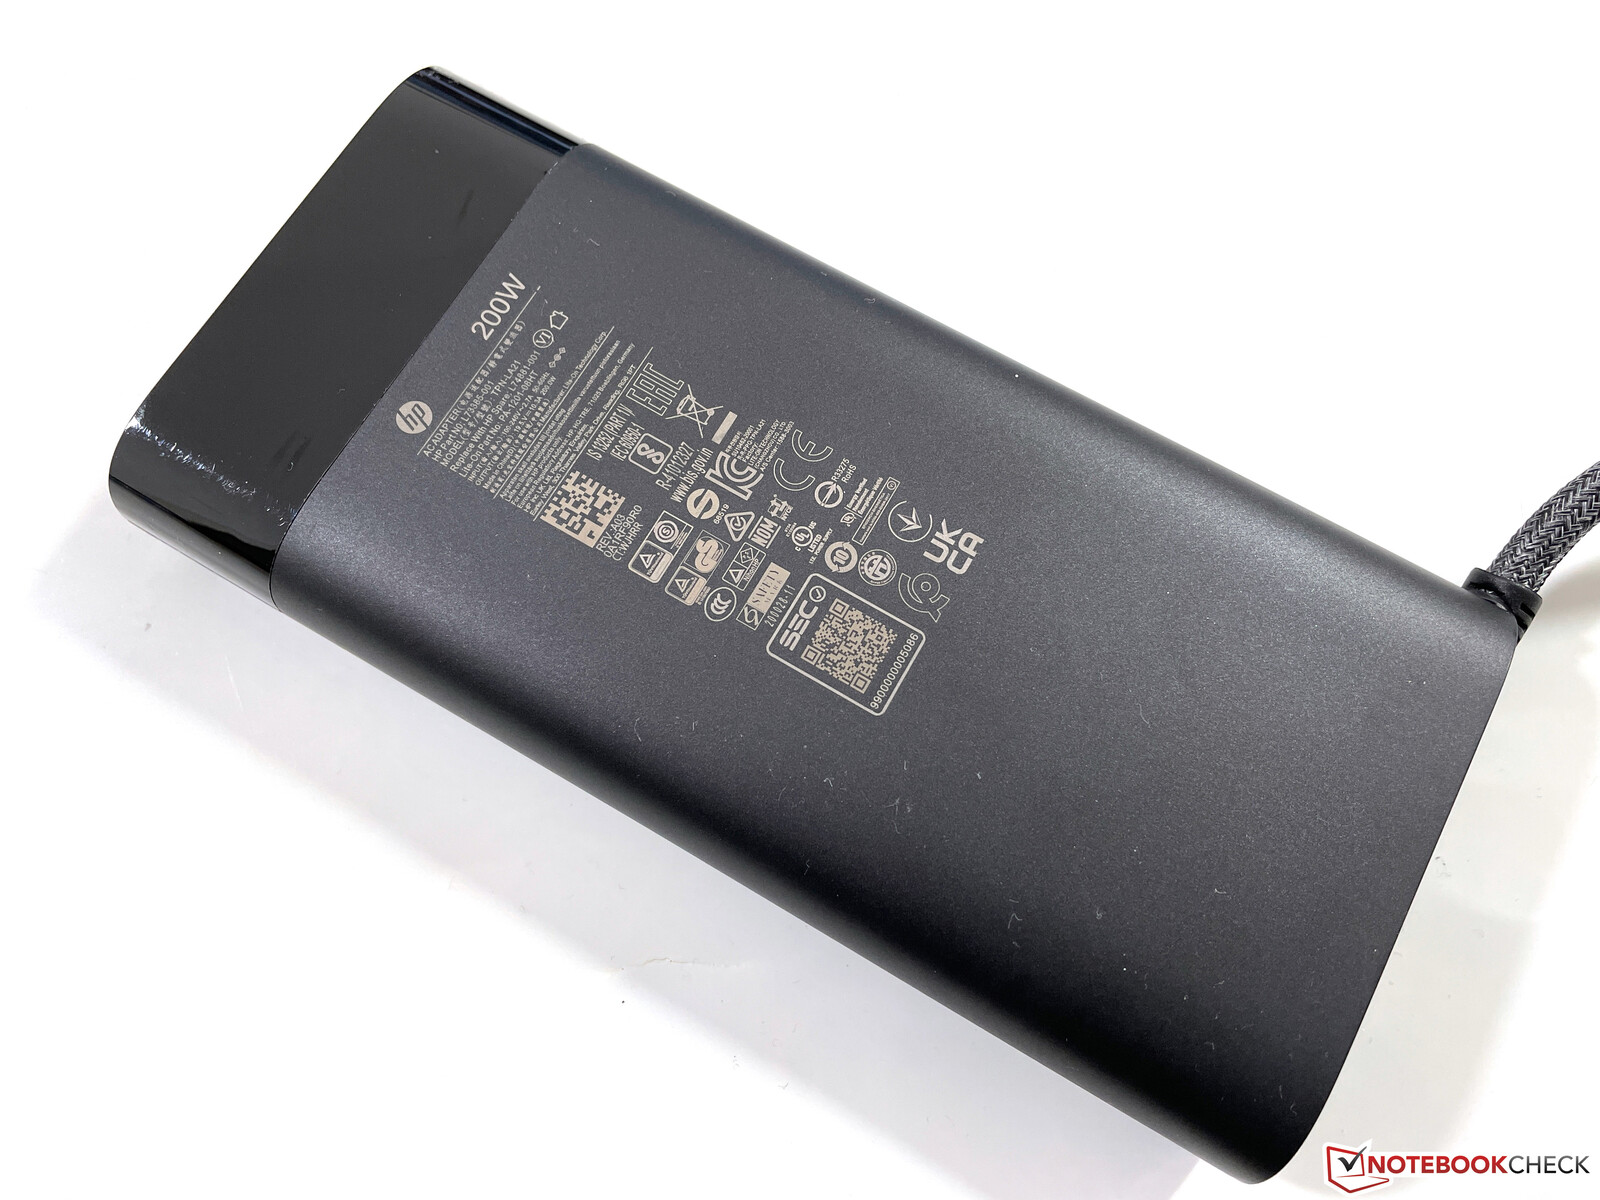
The power consumption is roughly comparable to the previous model. We can measure slightly more than 200 Watts under load, so the unit is limited by the power adapter. We are a bit surprised about this limitation, powerful mobile workstations used to be shipped with 230W units. According to the official spec sheet, the 200W module is the most powerful version.
The consumption will level off at around 160W during the stress test, so this is not a big deal, but HP could have used more powerful GPU models (with higher TGP values) with more powerful PSUs.
| Off / Standby | |
| Idle | |
| Load |
|
Key:
min: | |
| HP ZBook Fury 17 G8-4A6A9EA i9-11950H, RTX A3000 Laptop GPU, Toshiba XG6 KXG60ZNV1T02, IPS, 3840x2160, 17.3" | Lenovo ThinkPad P17 G2-20YU0025G i7-11800H, RTX A2000 Laptop GPU, Kioxia XG7 KXG7AZNV512G, IPS LED, 1920x1080, 17.3" | MSI WE76 11UM-456 i9-11980HK, RTX A5000 Laptop GPU, Samsung PM9A1 MZVL22T0HBLB, IPS, 3840x2160, 17.3" | Asus ProArt StudioBook 16 W7600H5A-2BL2 W-11955M, RTX A5000 Laptop GPU, 2x Micron 2300 2TB MTFDHBA2T0TDV (RAID 0), OLED, 3840x2400, 16" | HP ZBook Fury 17 G7 119W5EA i9-10885H, Quadro RTX 4000 Max-Q, WDC PC SN730 SDBPNTY-1T00, , 3840x2160, 17.3" | Apple MacBook Pro 16 2021 M1 Max M1 Max, M1 Max 32-Core GPU, Apple SSD AP2048R, Mini-LED, 3456x2234, 16.2" | Average NVIDIA RTX A3000 Laptop GPU | Average of class Workstation | |
|---|---|---|---|---|---|---|---|---|
| Power Consumption | 21% | -28% | -12% | 4% | 20% | 6% | 5% | |
| Idle Minimum * (Watt) | 7.6 | 6.1 20% | 10.5 -38% | 12.4 -63% | 5.8 24% | 5.4 29% | 8.23 ? -8% | 9.11 ? -20% |
| Idle Average * (Watt) | 16.7 | 10.9 35% | 18.6 -11% | 16.5 1% | 14.8 11% | 16.4 2% | 14.6 ? 13% | 13.8 ? 17% |
| Idle Maximum * (Watt) | 17.5 | 12.3 30% | 20 -14% | 25 -43% | 17 3% | 16.7 5% | 15.3 ? 13% | 17.9 ? -2% |
| Load Average * (Watt) | 117 | 106.3 9% | 132.4 -13% | 132 -13% | 120.4 -3% | 94 20% | 109.3 ? 7% | 96 ? 18% |
| Witcher 3 ultra * (Watt) | 150 | 124 17% | 232 -55% | 132 12% | 168.4 -12% | 104 31% | ||
| Load Maximum * (Watt) | 202 | 168.9 16% | 281.6 -39% | 134 34% | 199.8 1% | 135 33% | 196.5 ? 3% | 180.3 ? 11% |
* ... smaller is better
Energieaufnahme Witcher 3 / Stresstest
Power Consumption external screen
Battery Runtime
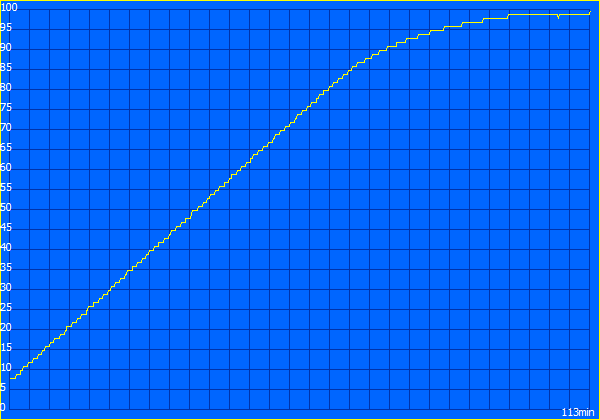
Despite the 4K panel, the 94 Wh battery manages decent runtimes. At an adjusted brightness of 150 nits (44 % in the case of our test unit) our video test runs for 8.5 hours and our Wi-Fi test for 7.5 hours. The Wi-Fi runtime drops to little more than 5 hours when we repeat the test with the maximum display brightness.
The battery is empty after about 2 hours when you really stress the device and a full charge takes 113 minutes when the device is turned on. 50% of the capacity is recharged after about 35 minutes.
| HP ZBook Fury 17 G8-4A6A9EA i9-11950H, RTX A3000 Laptop GPU, 94 Wh | Lenovo ThinkPad P17 G2-20YU0025G i7-11800H, RTX A2000 Laptop GPU, 94 Wh | MSI WE76 11UM-456 i9-11980HK, RTX A5000 Laptop GPU, 99.9 Wh | Asus ProArt StudioBook 16 W7600H5A-2BL2 W-11955M, RTX A5000 Laptop GPU, 90 Wh | HP ZBook Fury 17 G7 119W5EA i9-10885H, Quadro RTX 4000 Max-Q, 94 Wh | Apple MacBook Pro 16 2021 M1 Max M1 Max, M1 Max 32-Core GPU, 99.6 Wh | Average of class Workstation | |
|---|---|---|---|---|---|---|---|
| Battery runtime | 5% | -23% | -56% | 3% | 52% | 2% | |
| H.264 (h) | 8.5 | 9.5 12% | 6.9 -19% | 1.8 -79% | 10.3 21% | 17 100% | 10.1 ? 19% |
| WiFi v1.3 (h) | 7.4 | 9.8 32% | 6.3 -15% | 5 -32% | 7.6 3% | 14.9 101% | 8.55 ? 16% |
| Load (h) | 2 | 1.4 -30% | 1.3 -35% | 1.7 -15% | 1.1 -45% | 1.441 ? -28% | |
| Witcher 3 ultra (h) | 1.6 |
Pros
Cons
Verdict - The ZBook Fury 17 needs a refresh
The ZBook Fury 17 G8 appear slightly dated at some points. You get modern CPUs and GPUs, but a 2.5-inch slot for hard drives is pretty rare these days. You do not get the latest communication modules, either (no Wi-Fi 6E, no 5G) and there is still a 720p webcam as well as the 16:9 aspect ratio including wide bezels.
We are also a bit surprised that the components do not offer more performance. If you get such a “classic” mobile workstation with a comparatively heavy and bulky chassis, you usually want the highest performance possible. Due to the limitation to the 200W power adapter, however, the manufacturer limits itself unnecessarily and the cooling solution could certainly handle more. The performance is at least stable. If you need more CPU performance, we recommend you wait for the next generation with promises a major leap thanks to Intel’s new Alder Lake chips with much more CPU cores.
Decent performance utilization and moderate emissions: The ZBook Fury 17 G8 is a solid mobile workstation, but HP is pretty conservative in terms of the GPU performance. Considering the bulky chassis, there could be more powerful GPU versions.
The current DreamColor versions still offer very good picture quality. They do not cover AdobeRGB anymore, but “only” the DCI-P3 reference similar to the MacBook Pro models from Apple. If you work with a lot of HDR contents, you should consider the current MacBooks since they manage much higher peak brightness thanks to the Mini-LED technology.
The idea with the large maintenance cover is good, but the mechanism should not affect the quality impression, which is the case on our test unit. You should be able to expect flawless build quality and even gaps for a price of almost 4000 Euros. The easy access to the components is also affected by the additional covers for the individual components.
If you are not willing to make compromises in terms of GPU performance, you should have a look at the MSI WE76 (155W TGP), while the ThinkPad P17 G2 is very comparable to the ZBook in many respects, but still has the slight edge in terms of keyboard quality. Looking at the development of other ThinkPad keyboard, however, this might change soon.
Price and Availability
You can customize the ZBook Fury 17 G8 on HP's website. A configuration similar to our test unit is available for $4942 with a shipping date in May.
HP ZBook Fury 17 G8-4A6A9EA
- 02/16/2022 v7 (old)
Andreas Osthoff
Price comparison
