HP ZBook Fury 15 G8 workstation review: The Quadro RTX A5000 is a beast
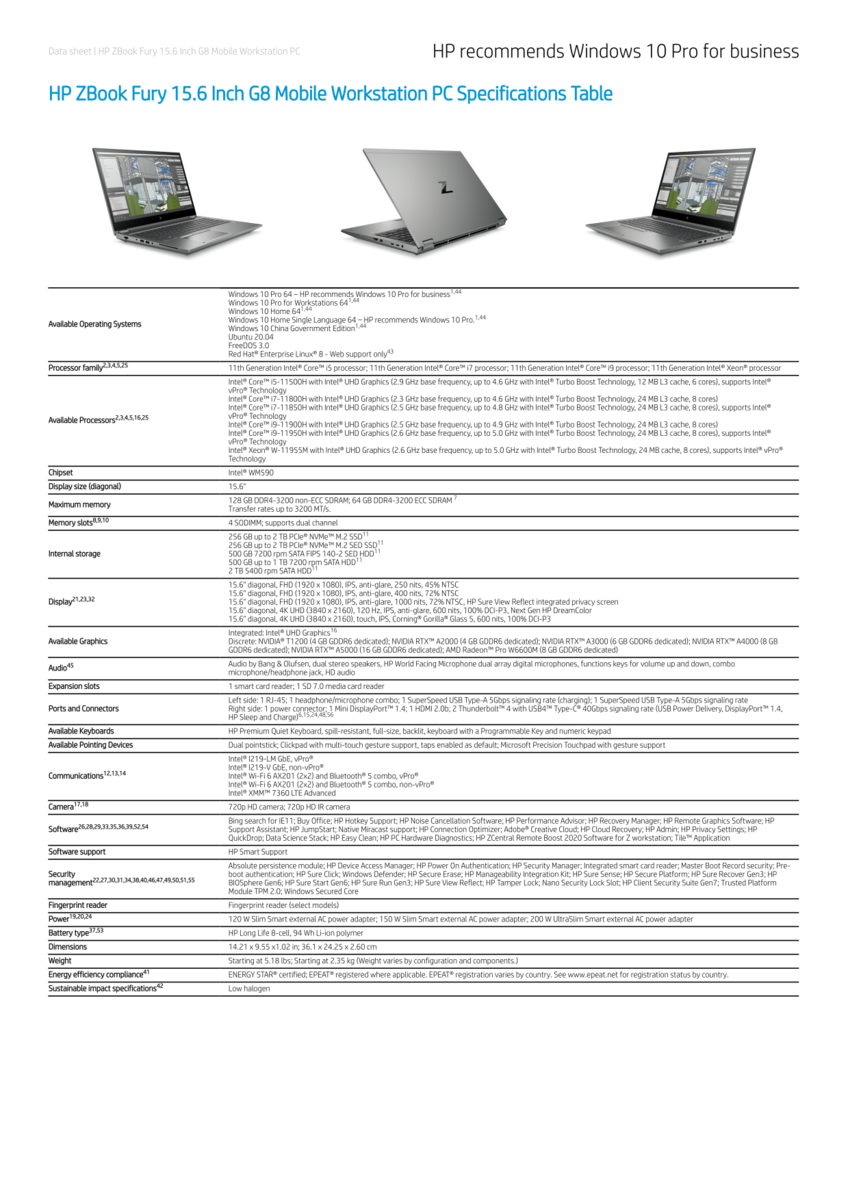
While the ZBook Fury 15 G7 represented a massive overhaul over the ZBook Fury 15 G6, the latest ZBook Fury 15 G8 is a relatively minor update overall. The newer model comes with Tiger Lake-H CPUs and Nvidia Ampere GPUs to replace last year's Comet Lake-H and Nvidia Turing options. Its display has also been upgraded from 4K 60 Hz to 4K 120 Hz to be one of the very few 15-inch laptops with such a panel option.
SKUs range from the Core i5-11500H CPU with integrated graphics and 45 percent NTSC 1080p display for approximately $2000 USD up to the Xeon W-11955M vPro CPU with Quadro RTX A5000 graphics and 4K UHD 100 percent DCI-P3 glossy touchscreen for over $6000. Our test unit an upper-range configuration with the Core i9-11950H, RTX A5000, and 4K120 matte display for about $5000.
Competitors in this space include other traditional 15.6-inch workstations like the Dell Precision 7550, Lenovo ThinkPad P15 Gen 2, and the Fujitsu Celsius series. We recommend checking out our existing review on the ZBook Fury 15 G7 for more information on the chassis and its features since the Fury 15 G8 utilizes the same skeleton.
More HP reviews:
potential competitors in comparison
Rating | Date | Model | Weight | Height | Size | Resolution | Price |
|---|---|---|---|---|---|---|---|
| 90.3 % v7 (old) | 10 / 2021 | HP ZBook Fury 15 G8 i9-11950H, RTX A5000 Laptop GPU | 2.5 kg | 25.9 mm | 15.60" | 3840x2160 | |
| 90.2 % v7 (old) | 01 / 2021 | HP ZBook Fury 15 G7 W-10885M, Quadro RTX 5000 Max-Q | 2.4 kg | 25.9 mm | 15.60" | 3840x2160 | |
| 88.3 % v7 (old) | 10 / 2021 | Dell Precision 5000 5560 i7-11850H, RTX A2000 Laptop GPU | 2 kg | 18 mm | 15.60" | 3840x2400 | |
| 87.8 % v7 (old) | 08 / 2021 | HP ZBook Studio 15 G8 i9-11950H, GeForce RTX 3070 Laptop GPU | 1.9 kg | 18 mm | 15.60" | 3840x2160 | |
| 85.3 % v7 (old) | 06 / 2021 | Lenovo ThinkPad P15s Gen2-20W6000GGE i7-1165G7, T500 Laptop GPU | 1.9 kg | 19.1 mm | 15.60" | 3840x2160 | |
| 82.7 % v7 (old) | 10 / 2020 | HP ZBook Firefly 15 G7 i7-10610U, Quadro P520 | 1.8 kg | 19.2 mm | 15.60" | 3840x2160 |
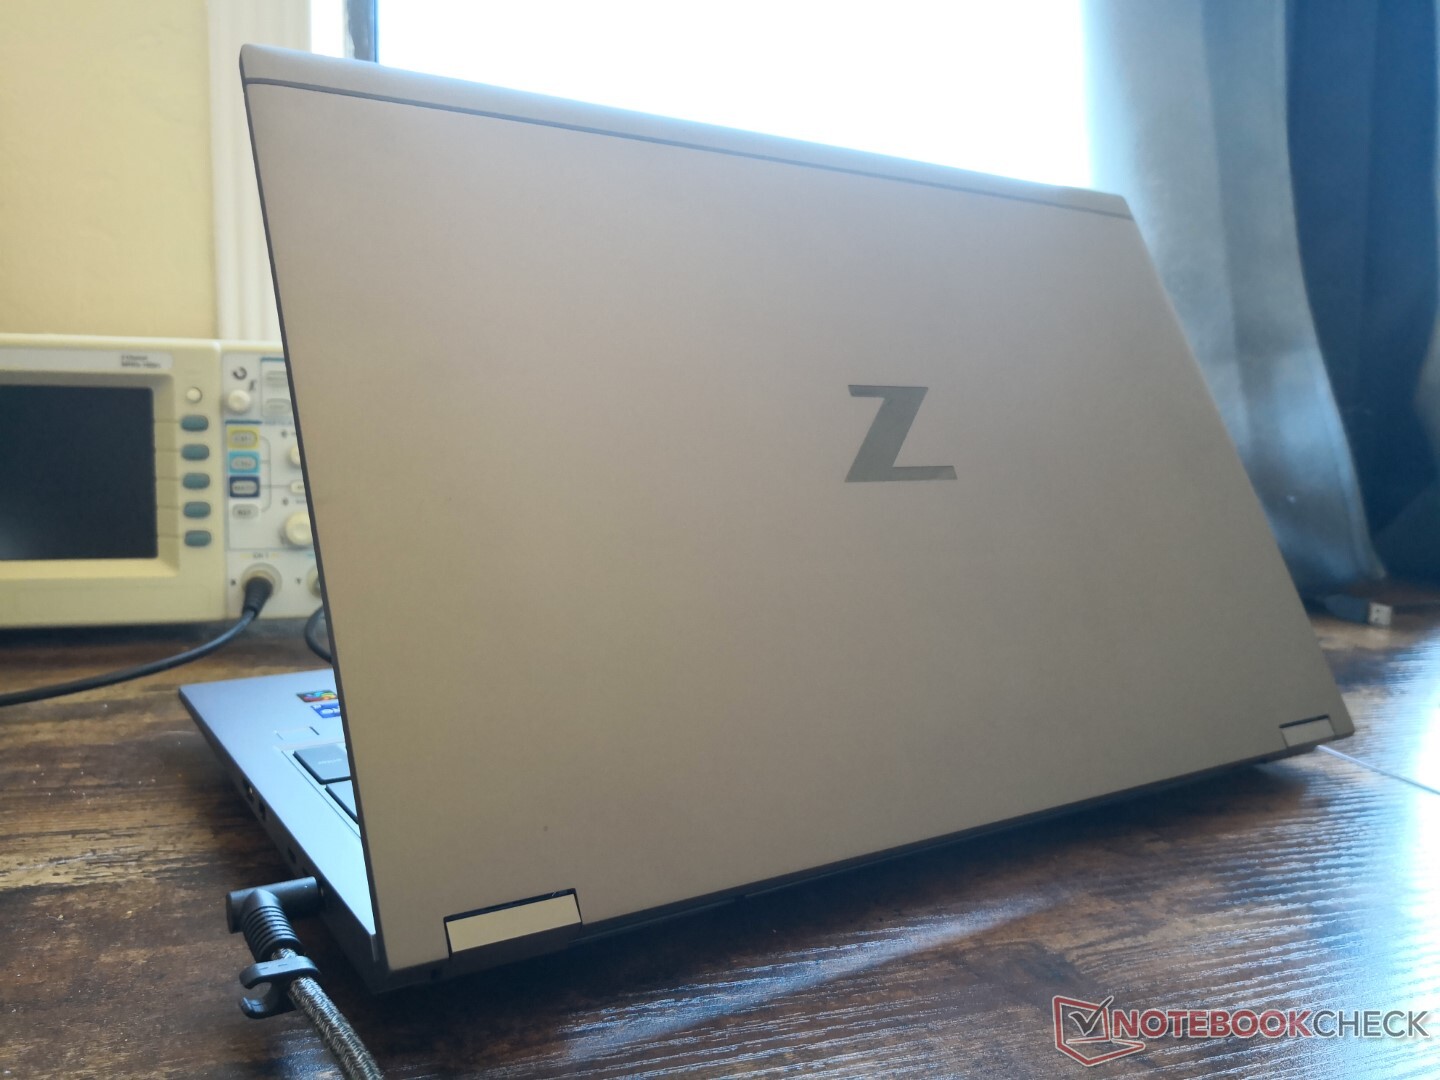
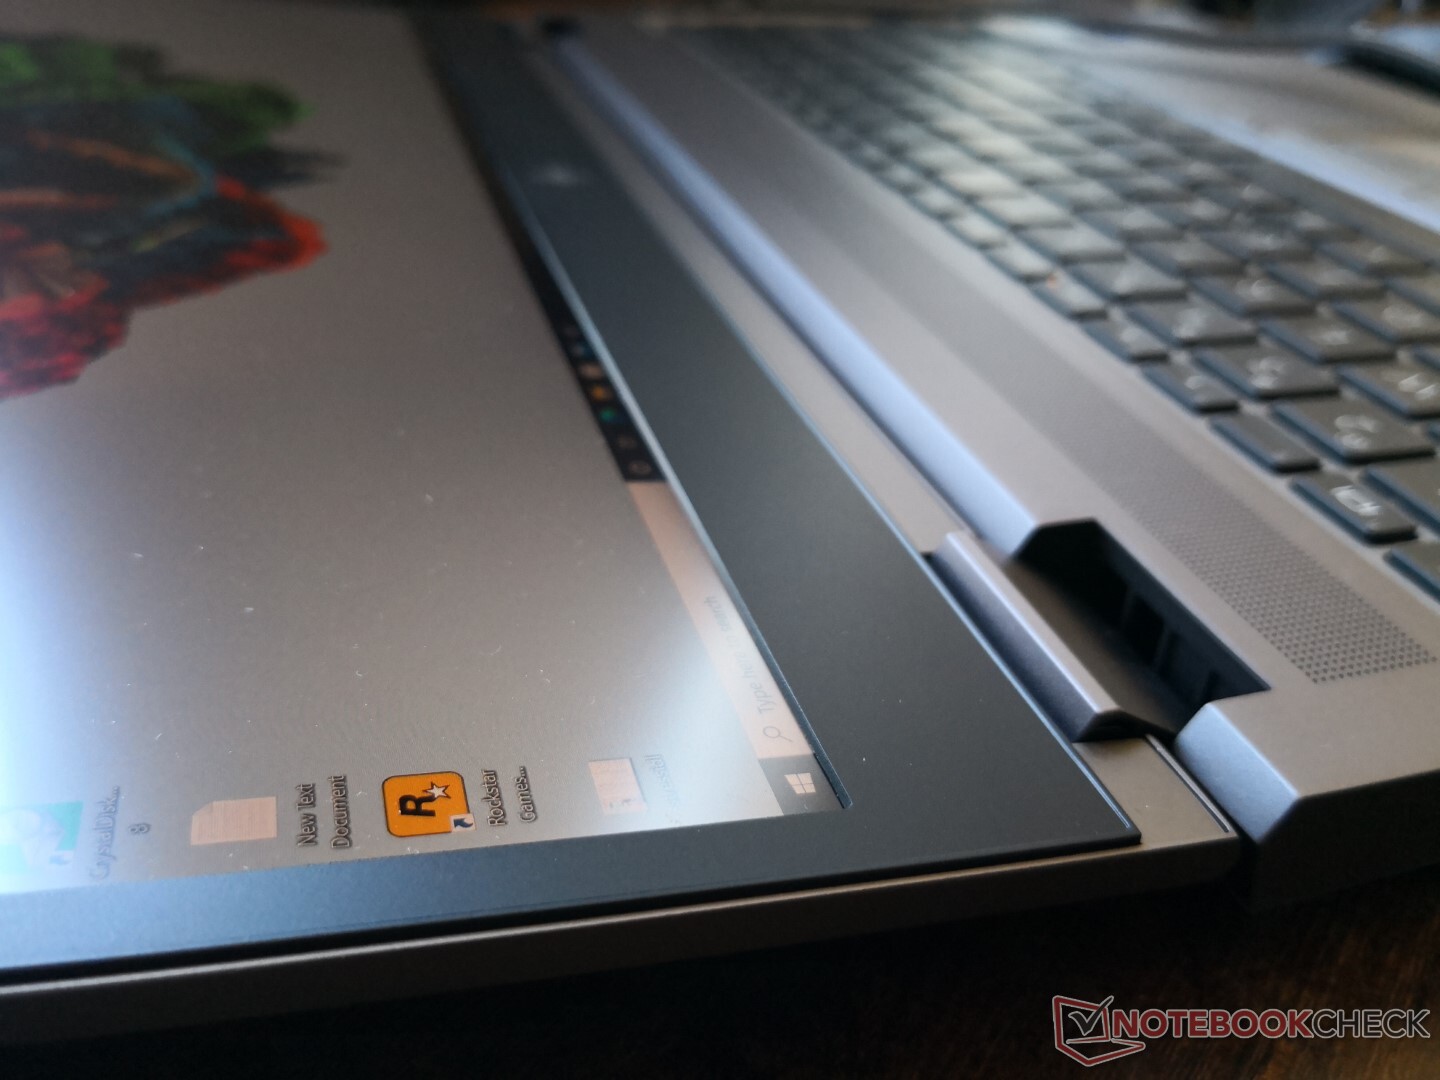
Case — Identical to the ZBook Fury 15 G7
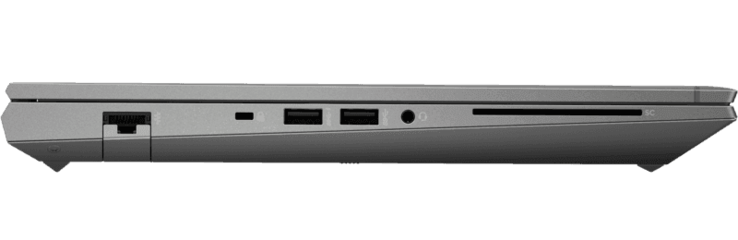
Connectivity
Thunderbolt 4 is supported instead of "only" Thunderbolt 3 on the Fury 15 G7. Otherwise, the ports remain identical year-over-year.
SD Card Reader
| SD Card Reader | |
| average JPG Copy Test (av. of 3 runs) | |
| Dell Precision 5000 5560 (AV Pro V60) | |
| HP ZBook Fury 15 G7 (Toshiba Exceria Pro SDXC 64 GB UHS-II) | |
| HP ZBook Fury 15 G8 (AV Pro V60) | |
| HP ZBook Studio 15 G8 (AV Pro V60) | |
| Lenovo ThinkPad P15s Gen2-20W6000GGE (AV Pro V60) | |
| maximum AS SSD Seq Read Test (1GB) | |
| HP ZBook Fury 15 G7 (Toshiba Exceria Pro SDXC 64 GB UHS-II) | |
| Dell Precision 5000 5560 (AV Pro V60) | |
| Lenovo ThinkPad P15s Gen2-20W6000GGE (AV Pro V60) | |
| HP ZBook Studio 15 G8 (AV Pro V60) | |
| HP ZBook Fury 15 G8 (AV Pro V60) | |
Communication
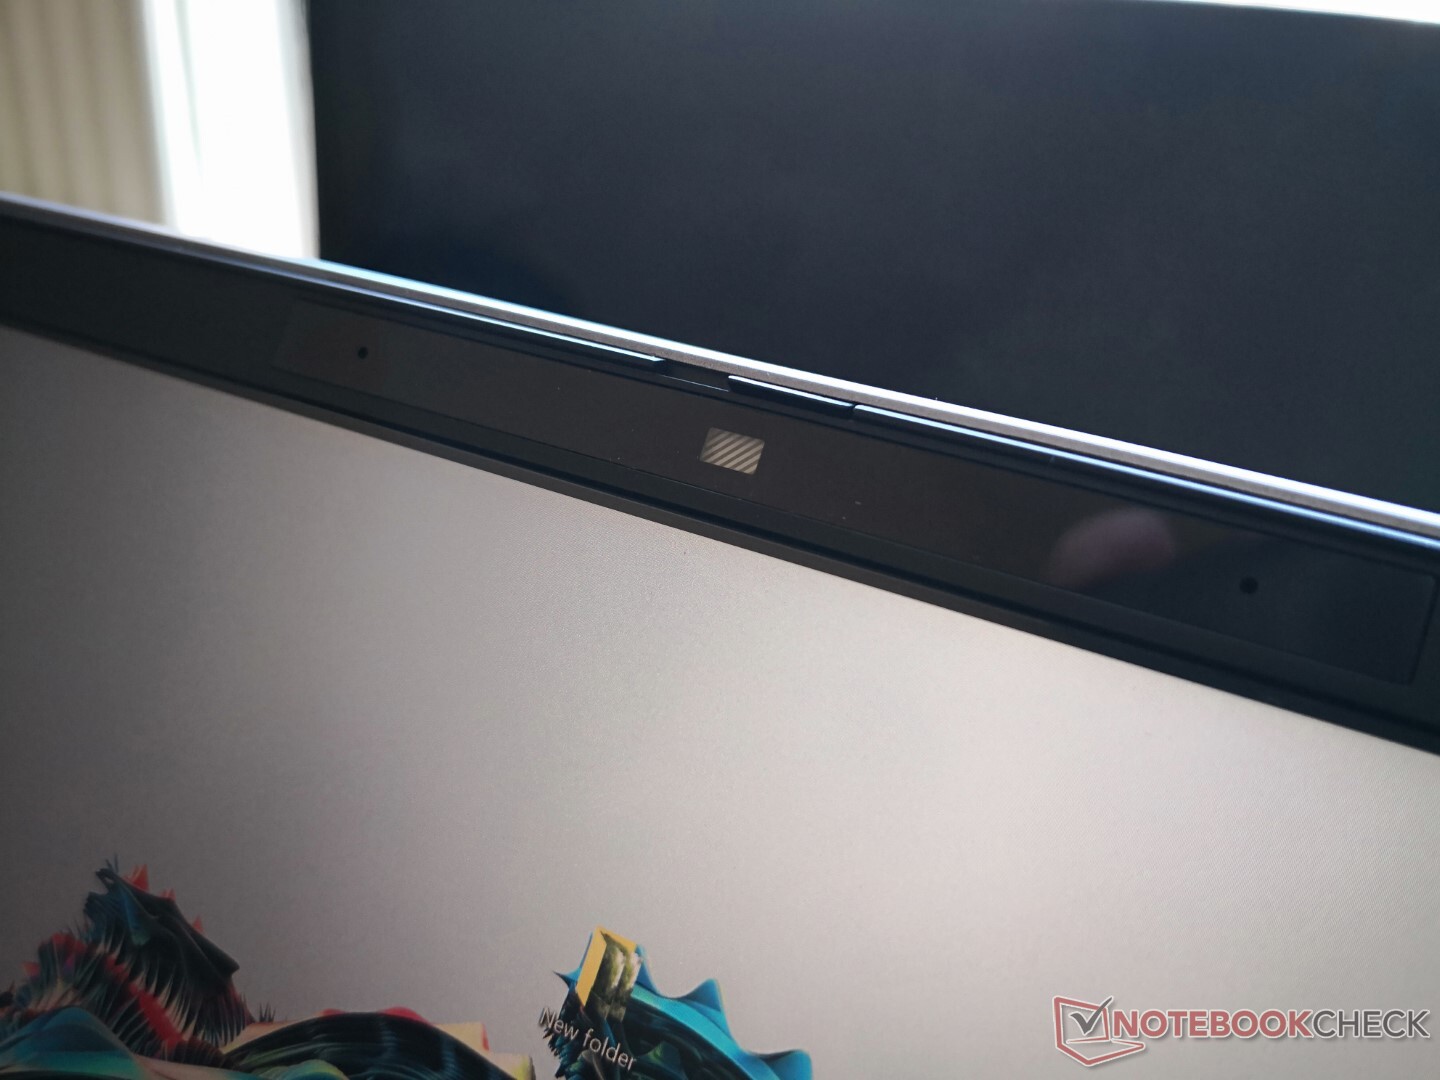
Webcam — Still 720p
Camera quality remains poor at only 720p. Some manufacturers like Razer have since upgraded their integrated webcams from 720p to 1080p.


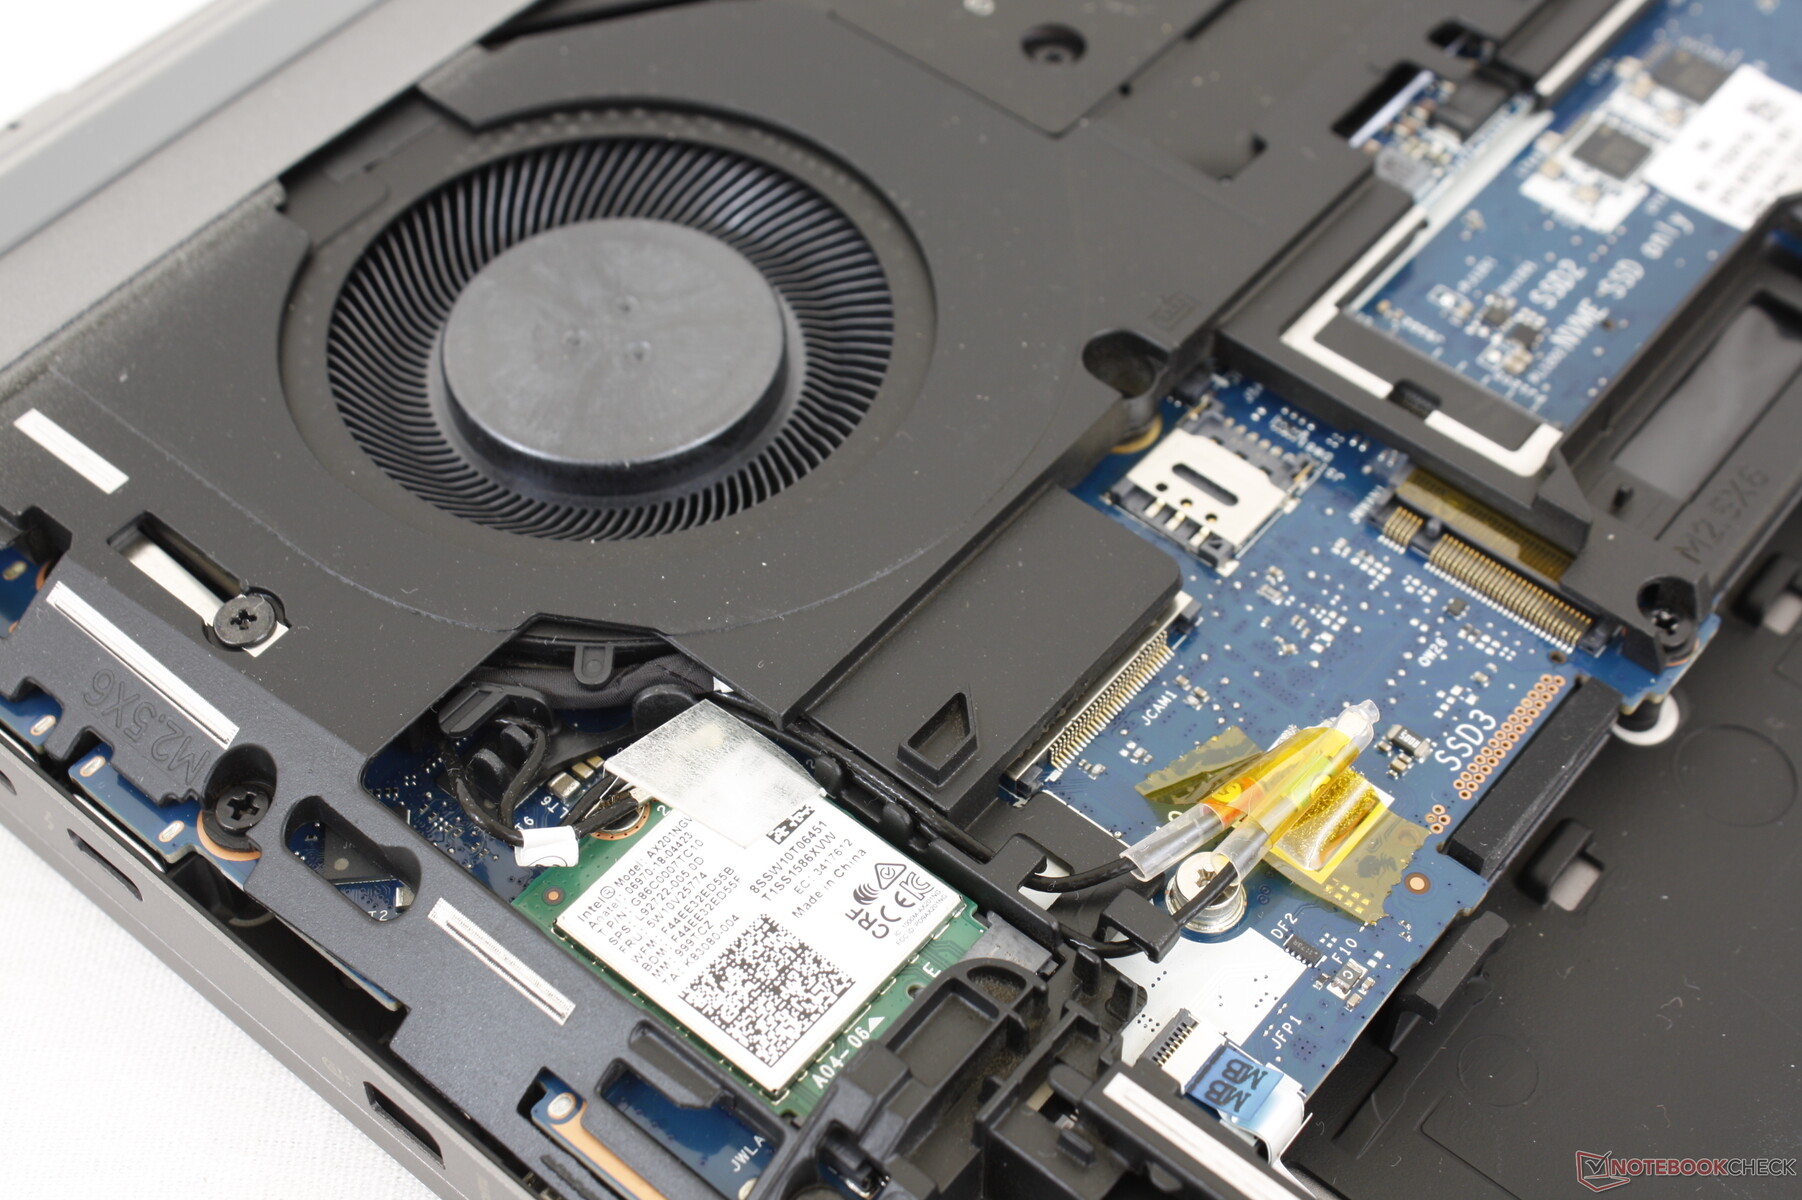
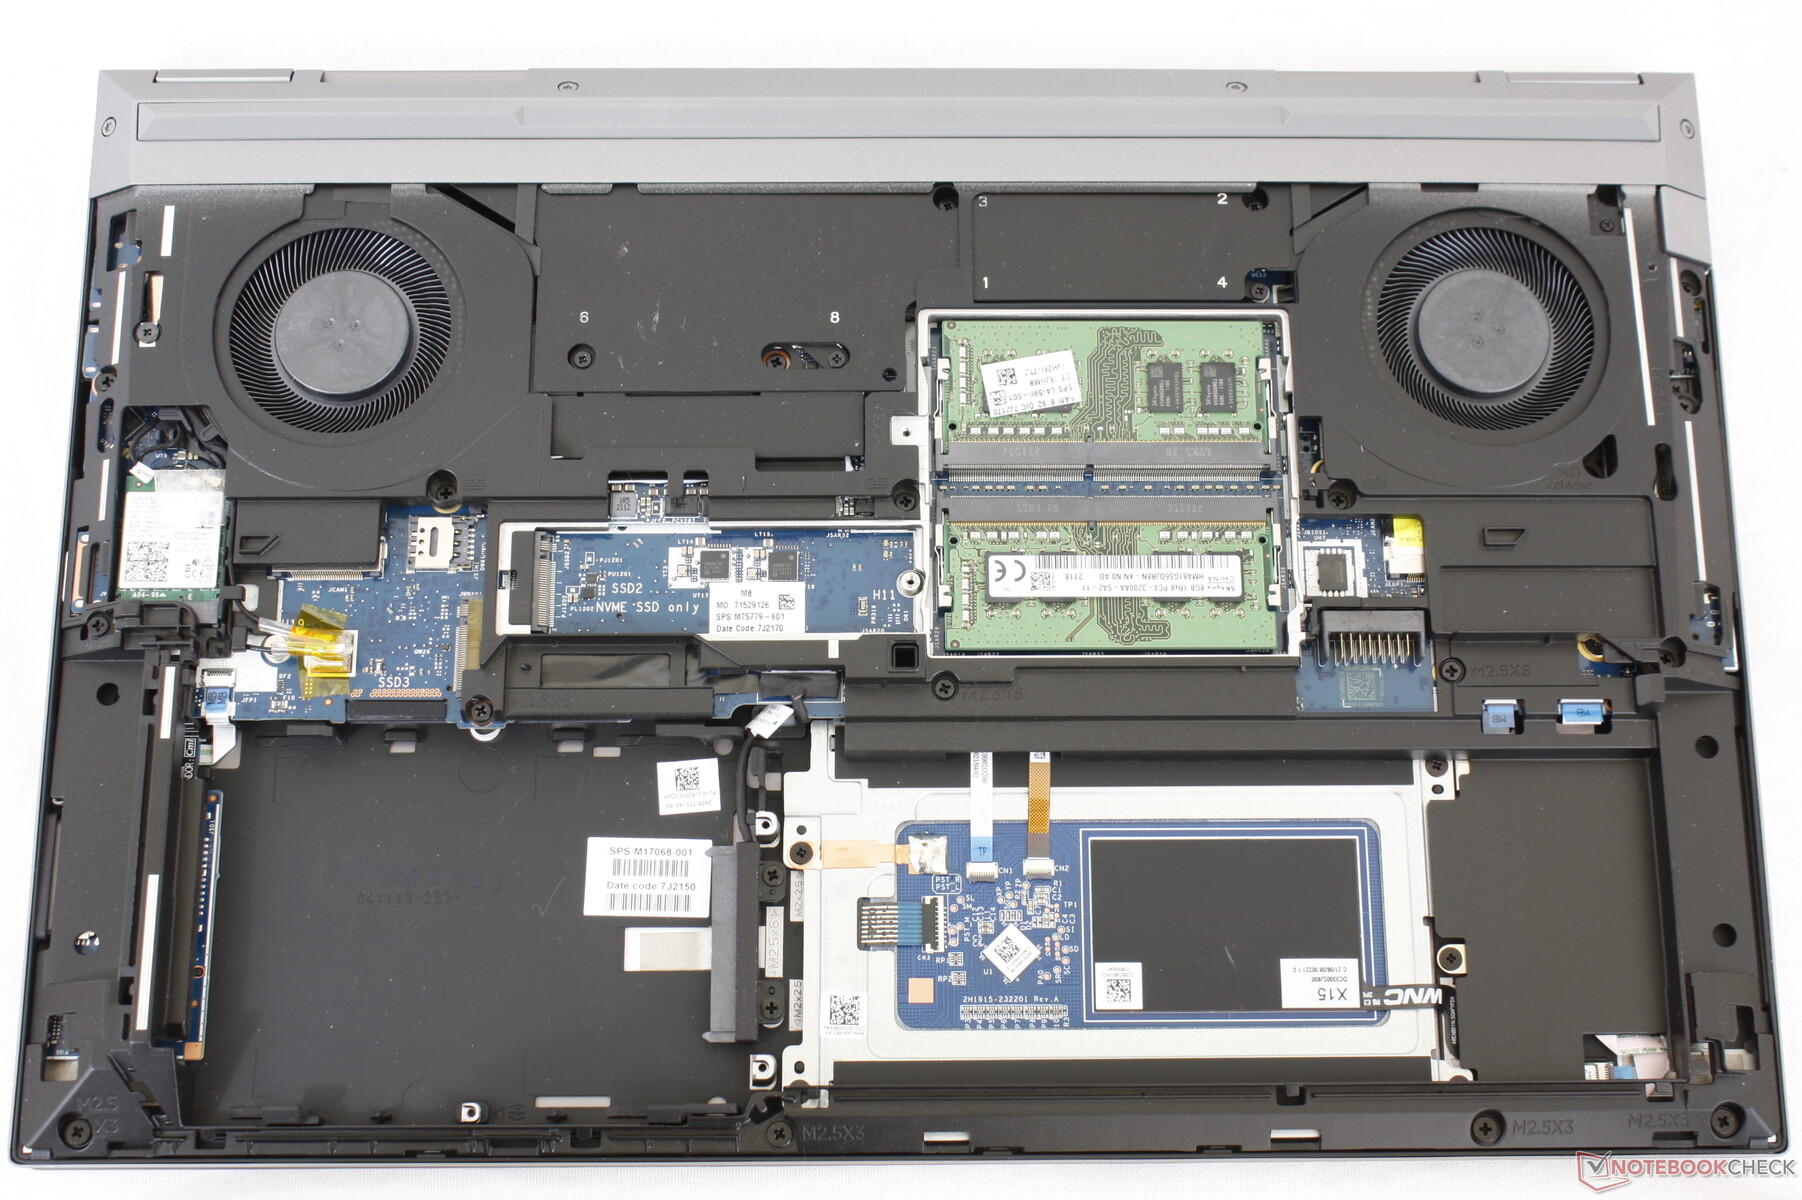
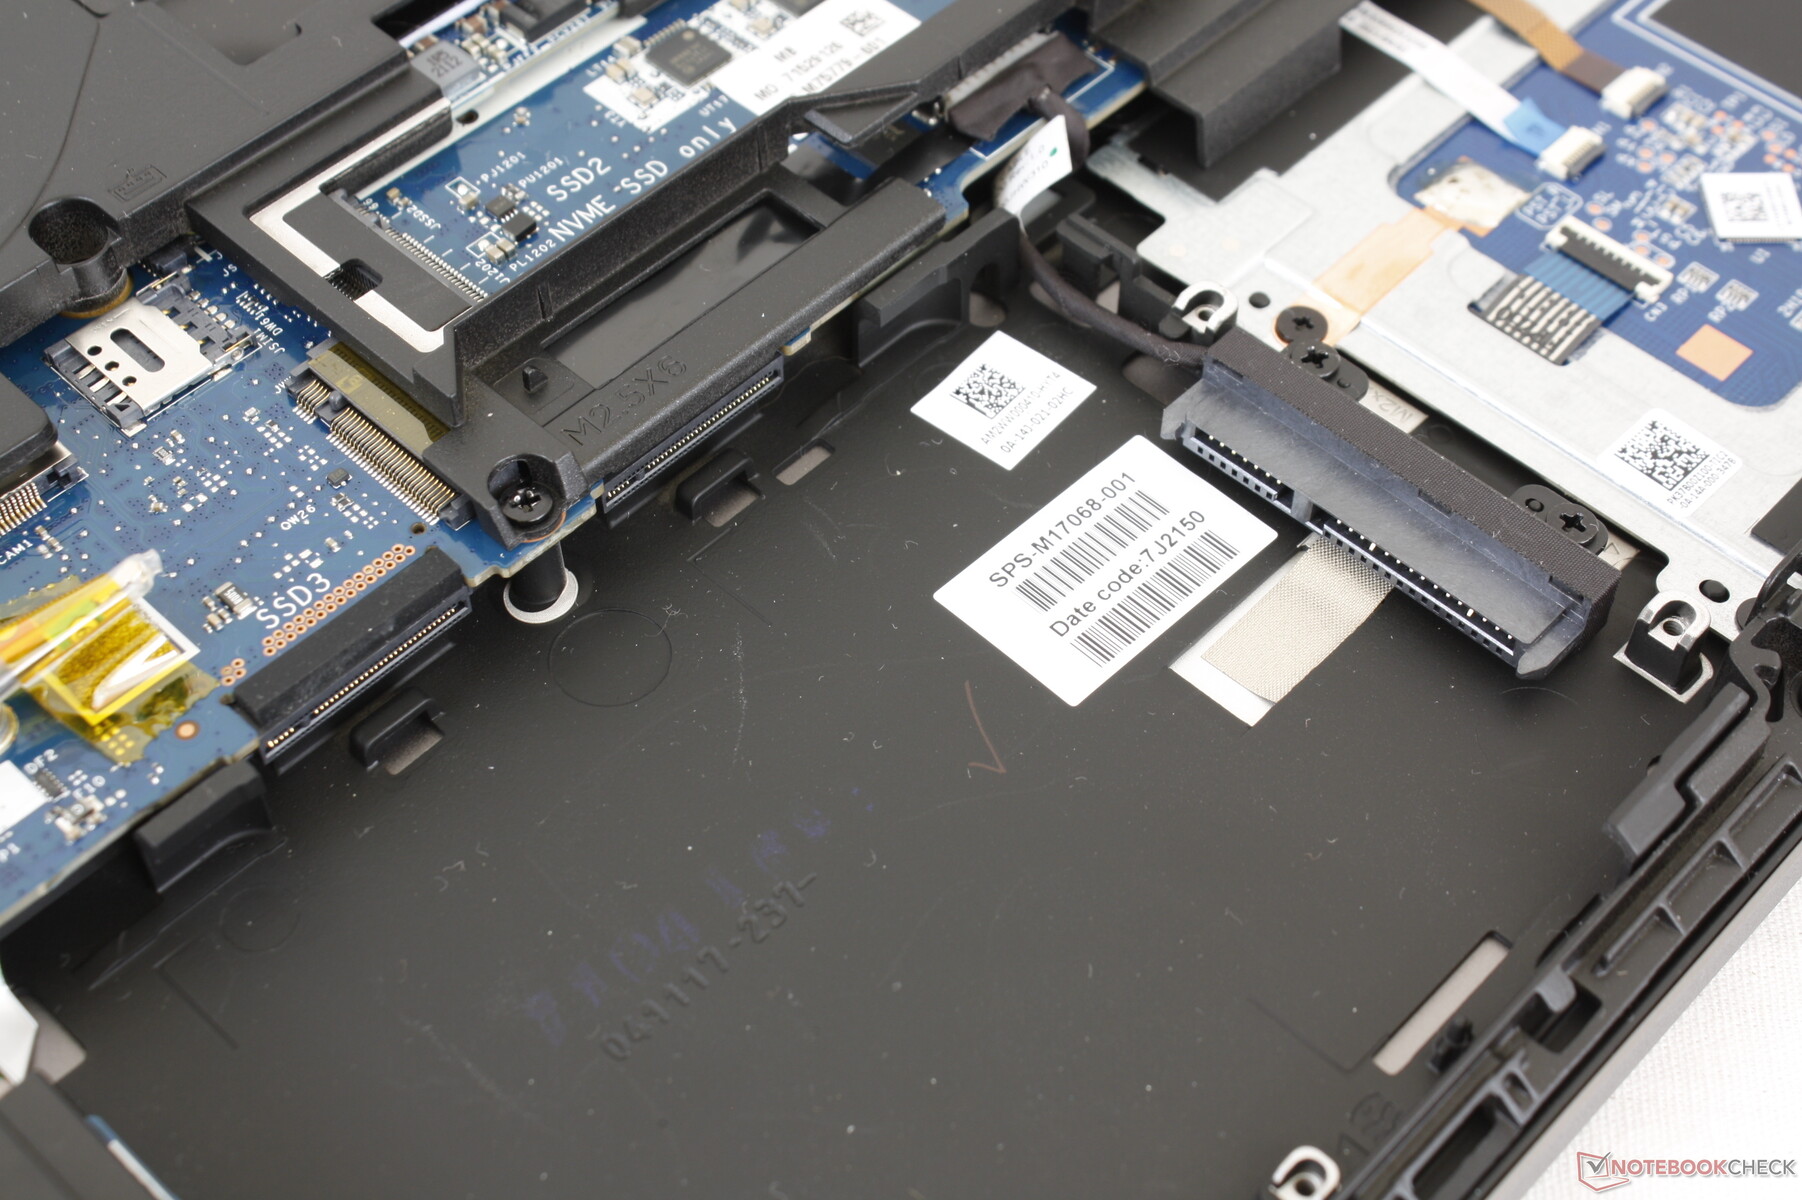
Maintenance — Have a Screwdriver Ready
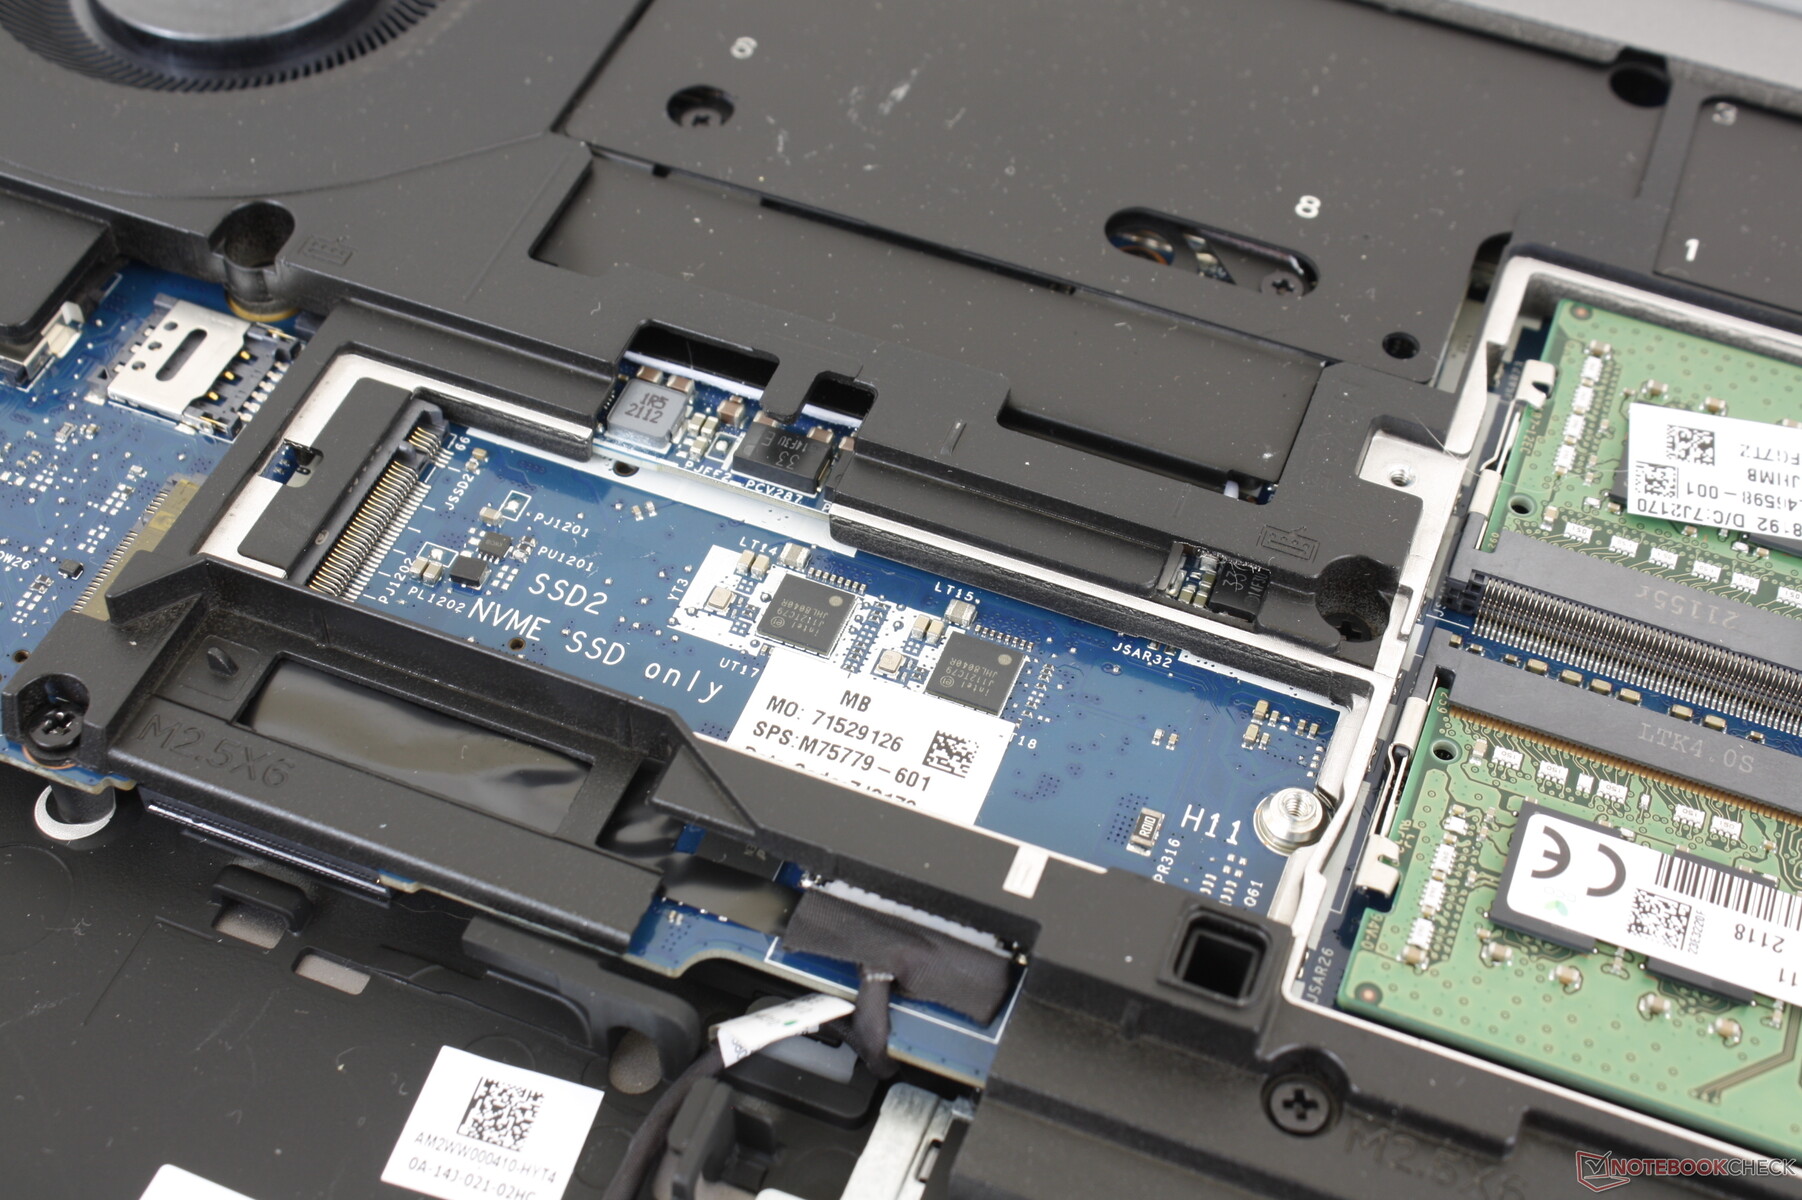
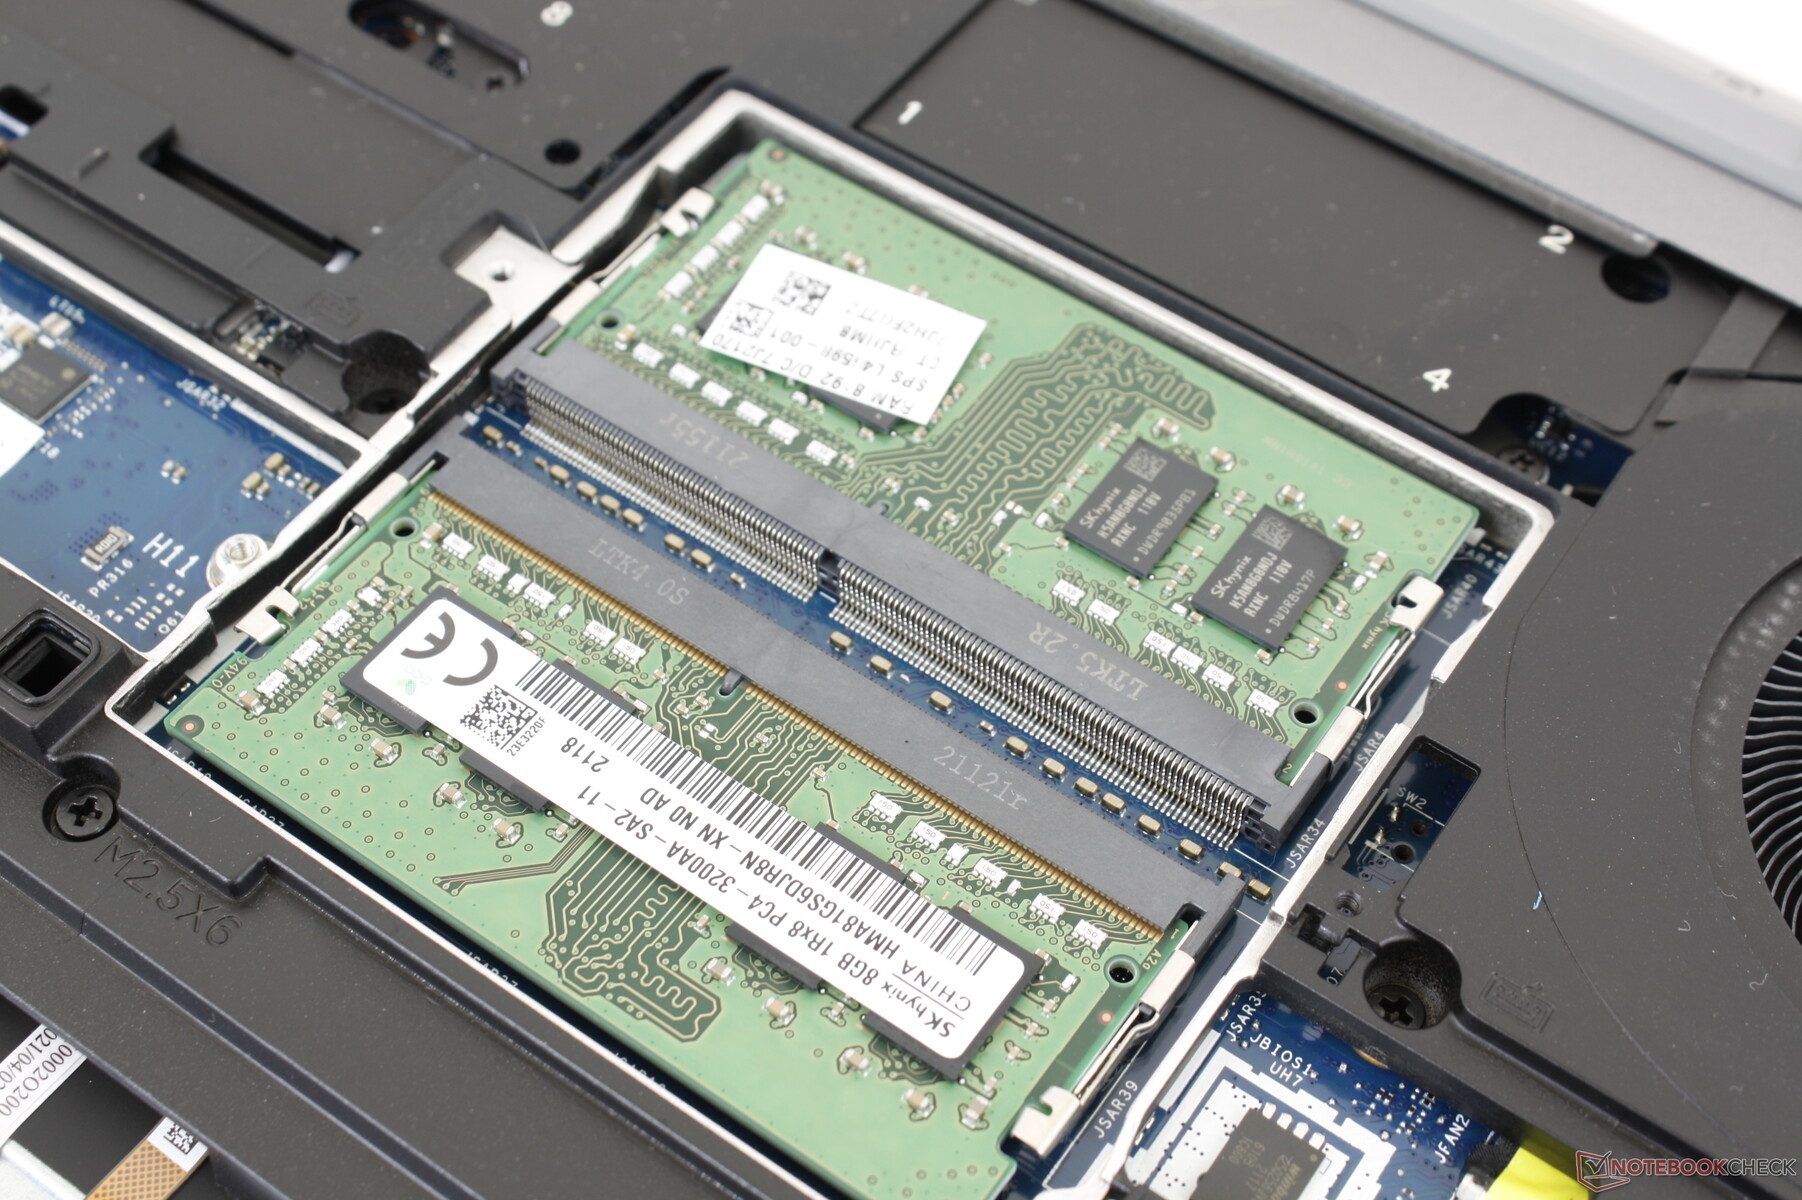
The bottom panel slides off easily — no tools or screwdrivers required. Once inside, however, most components are underneath metal plates anyway which require a Philips screwdriver to remove. Additional RAM and storage components are on the other side of the motherboard and so they are not as easily accessible.
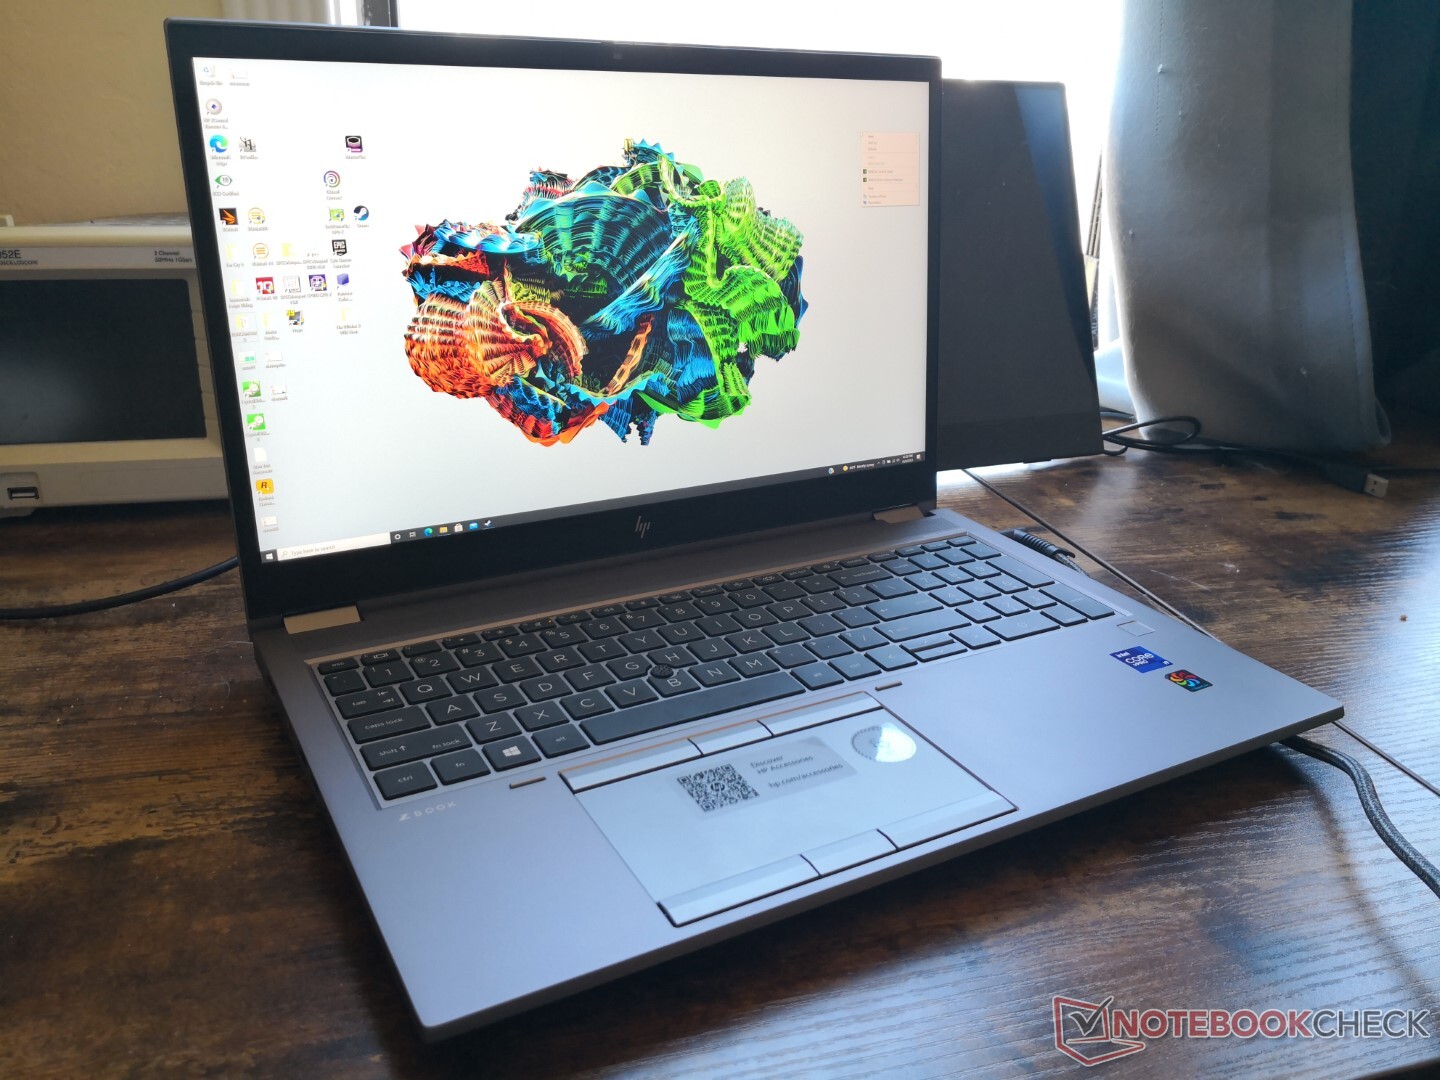
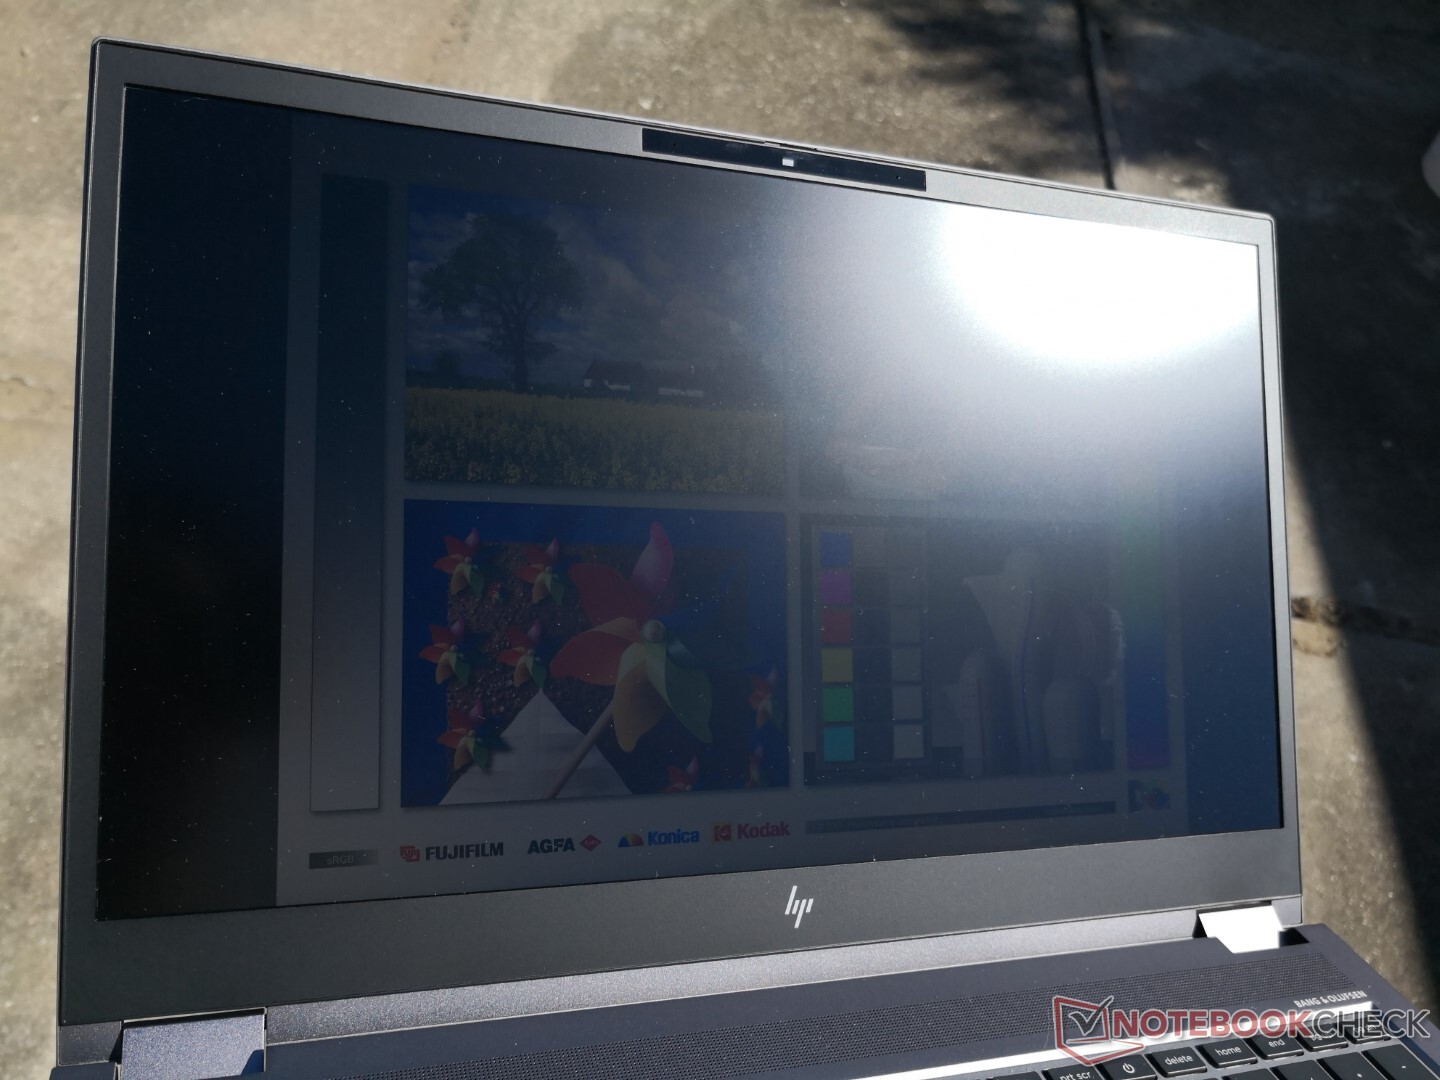
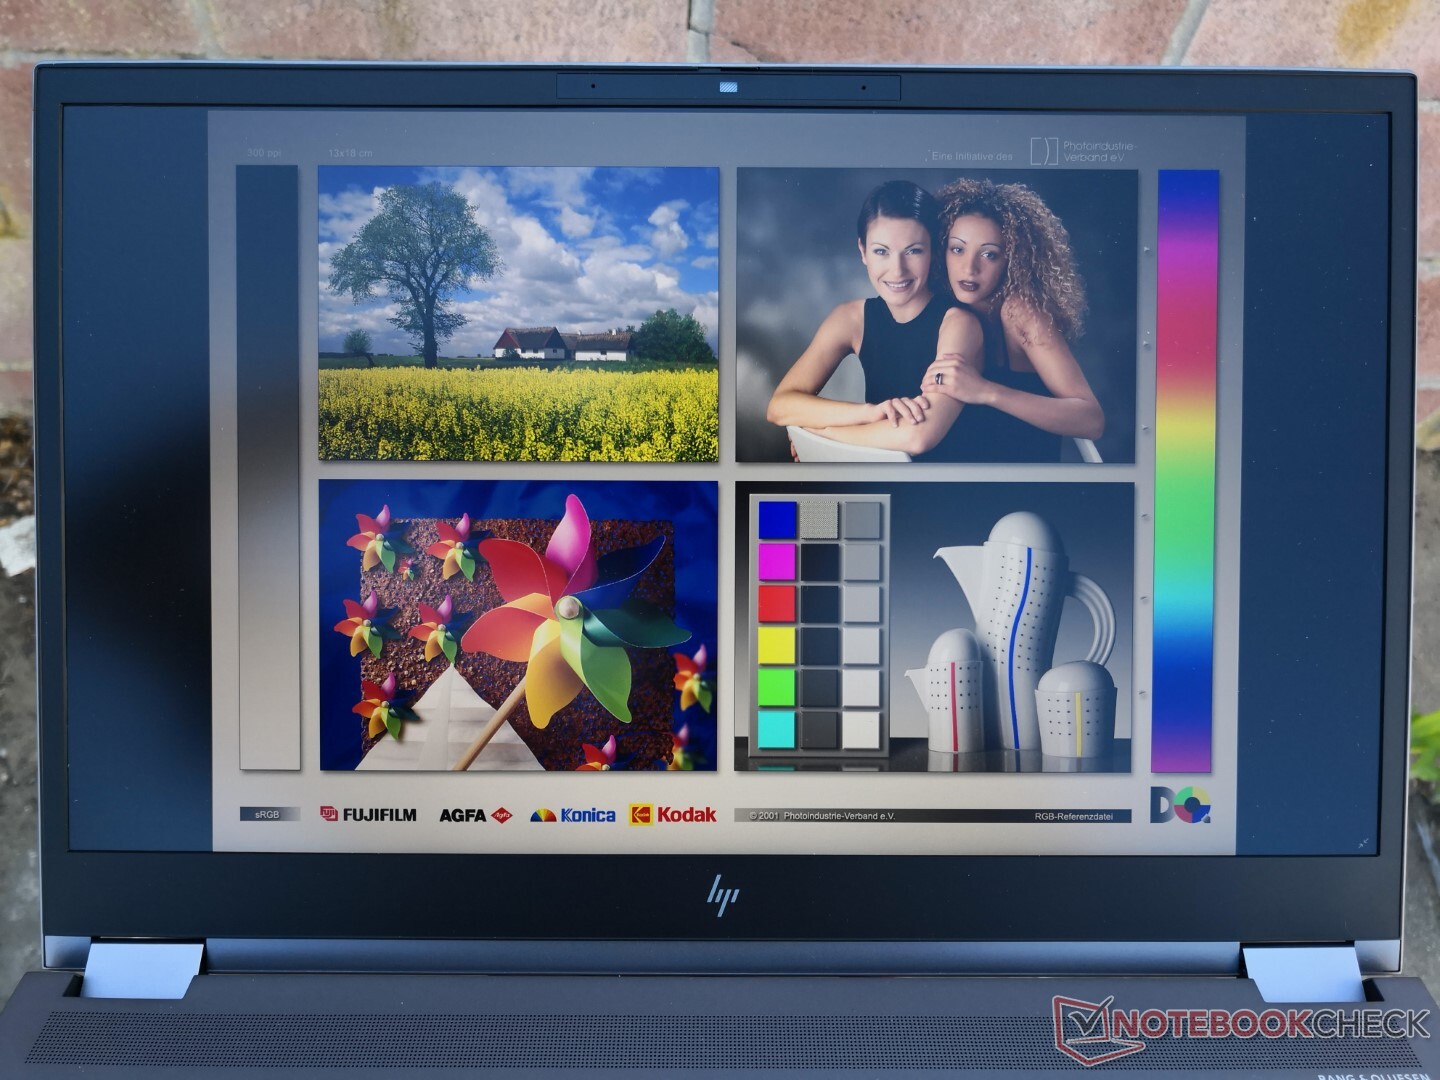
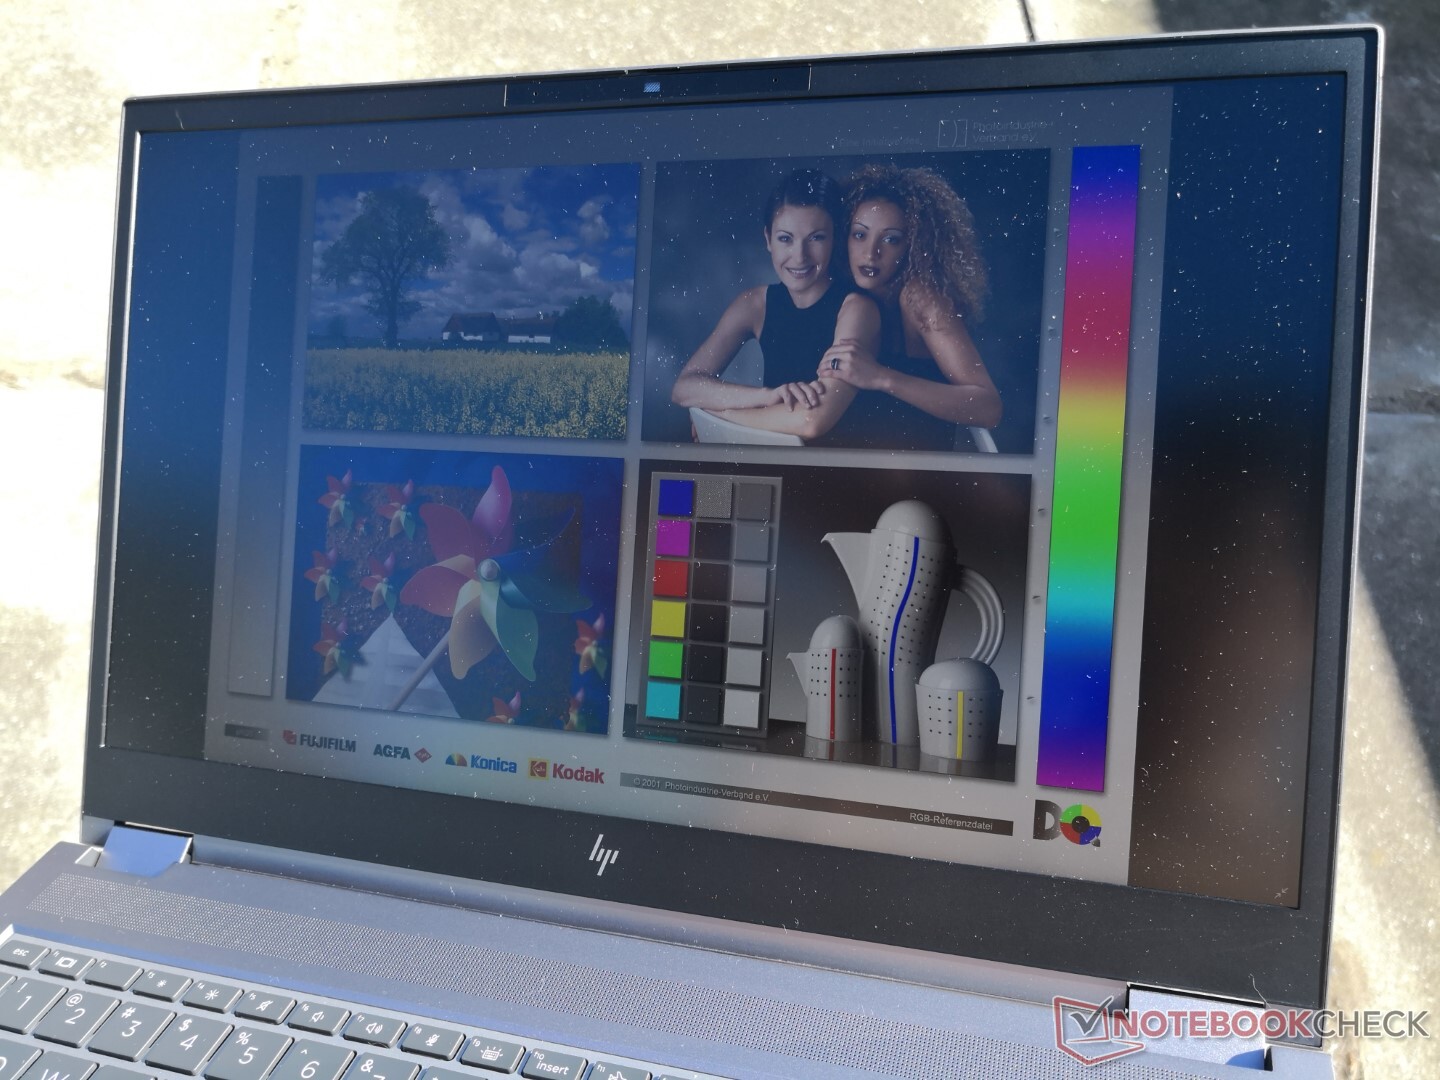
Display — 120 Hz Makes all the Difference
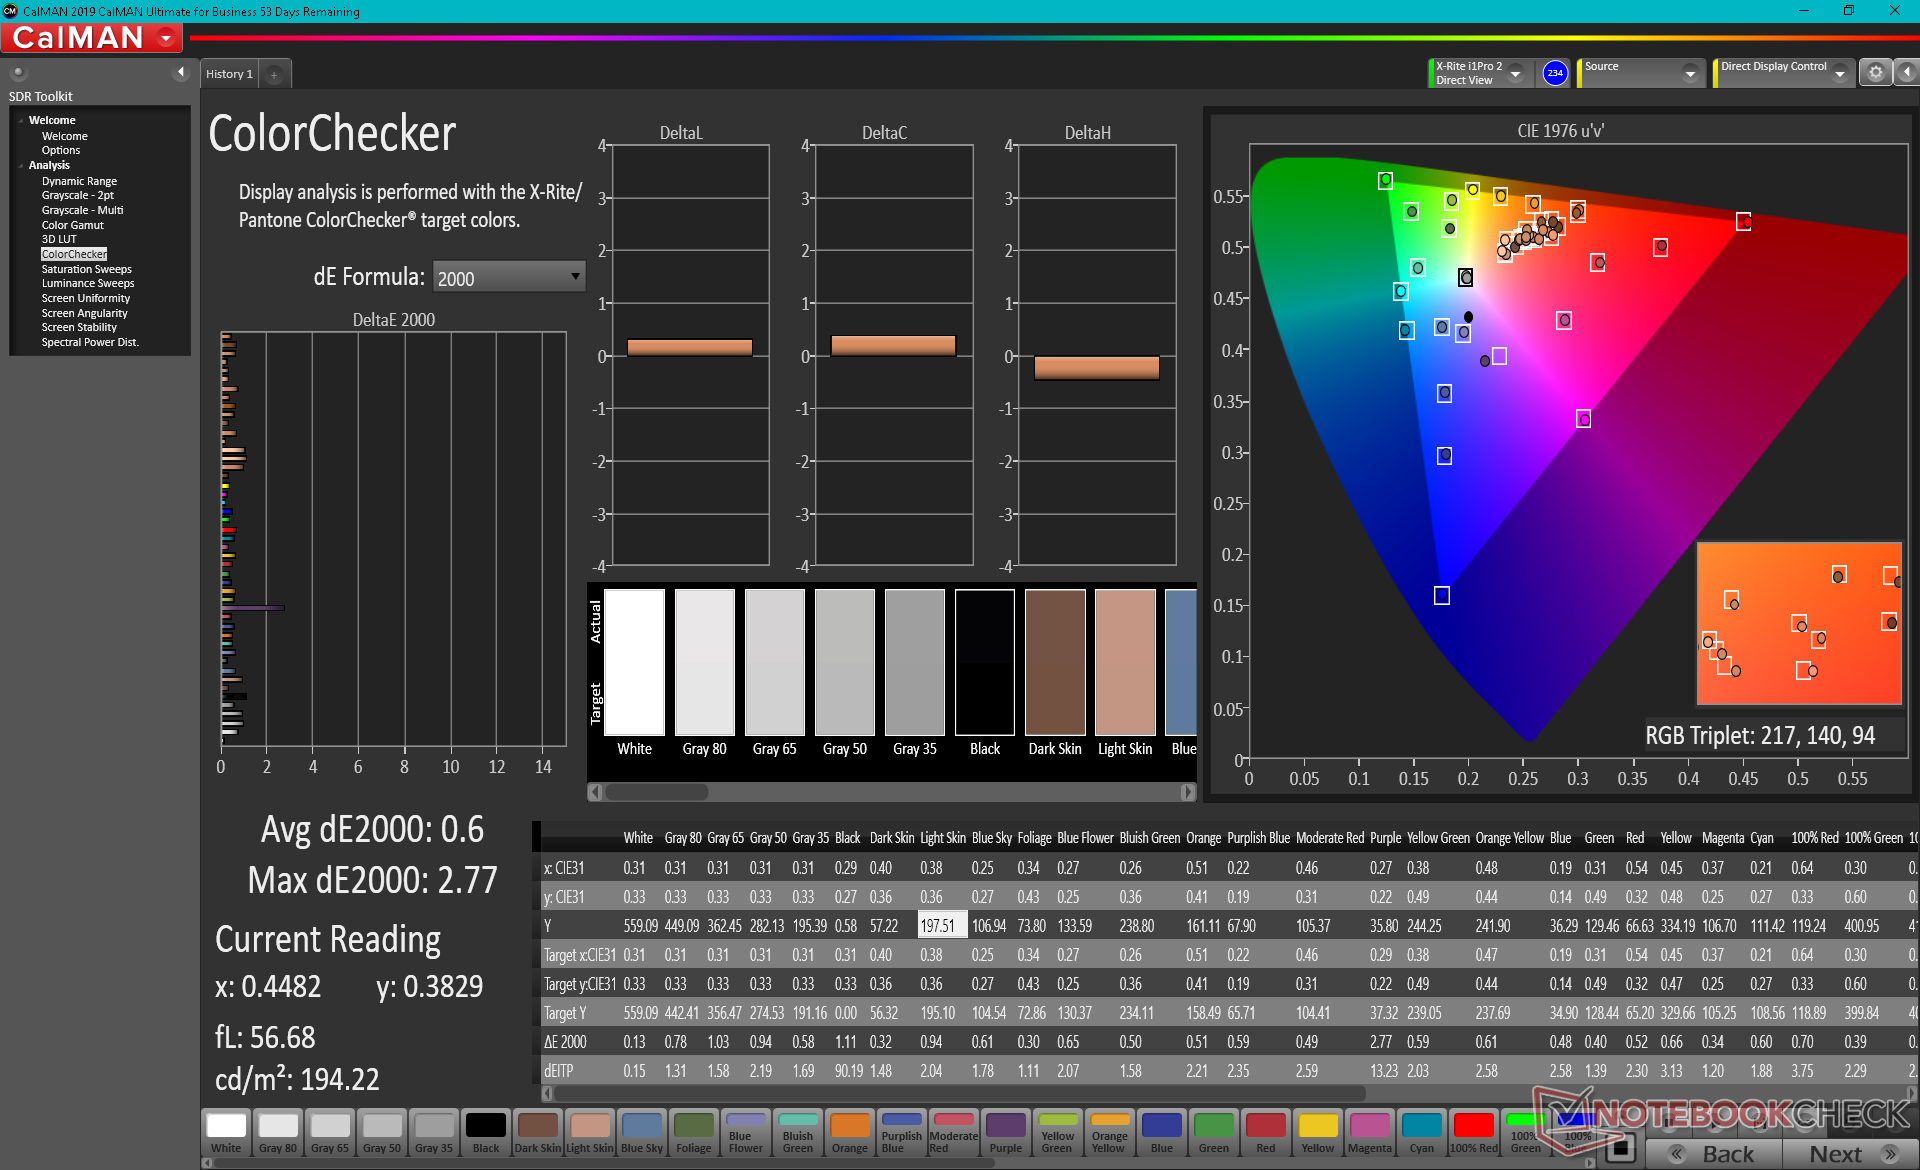
The new 4K 120 Hz panel on the Fury 15 G8 is a significant improvement over the 4K 60 Hz panel on the Fury 15 G7 despite having the same high native resolution and wide color coverage. Aside from the obvious benefits of moving from 60 Hz to 120 Hz, the newer panel offers much faster black-white and gray-gray response times by almost 4x for less noticeable ghosting especially when dealing with fast-moving graphics. Both brightness and contrast remain high as well at ~600:1 and >1000:1, respectively.
Perhaps the single biggest drawback to the 4K panel is that it suffers from a bit of graininess due to the matte overlay and so texts and images don't appear as sharp as they could have been despite the very high PPI. HP offers glossy options to overcome this specific drawback.

| |||||||||||||||||||||||||
Brightness Distribution: 87 %
Center on Battery: 626 cd/m²
Contrast: 1079:1 (Black: 0.58 cd/m²)
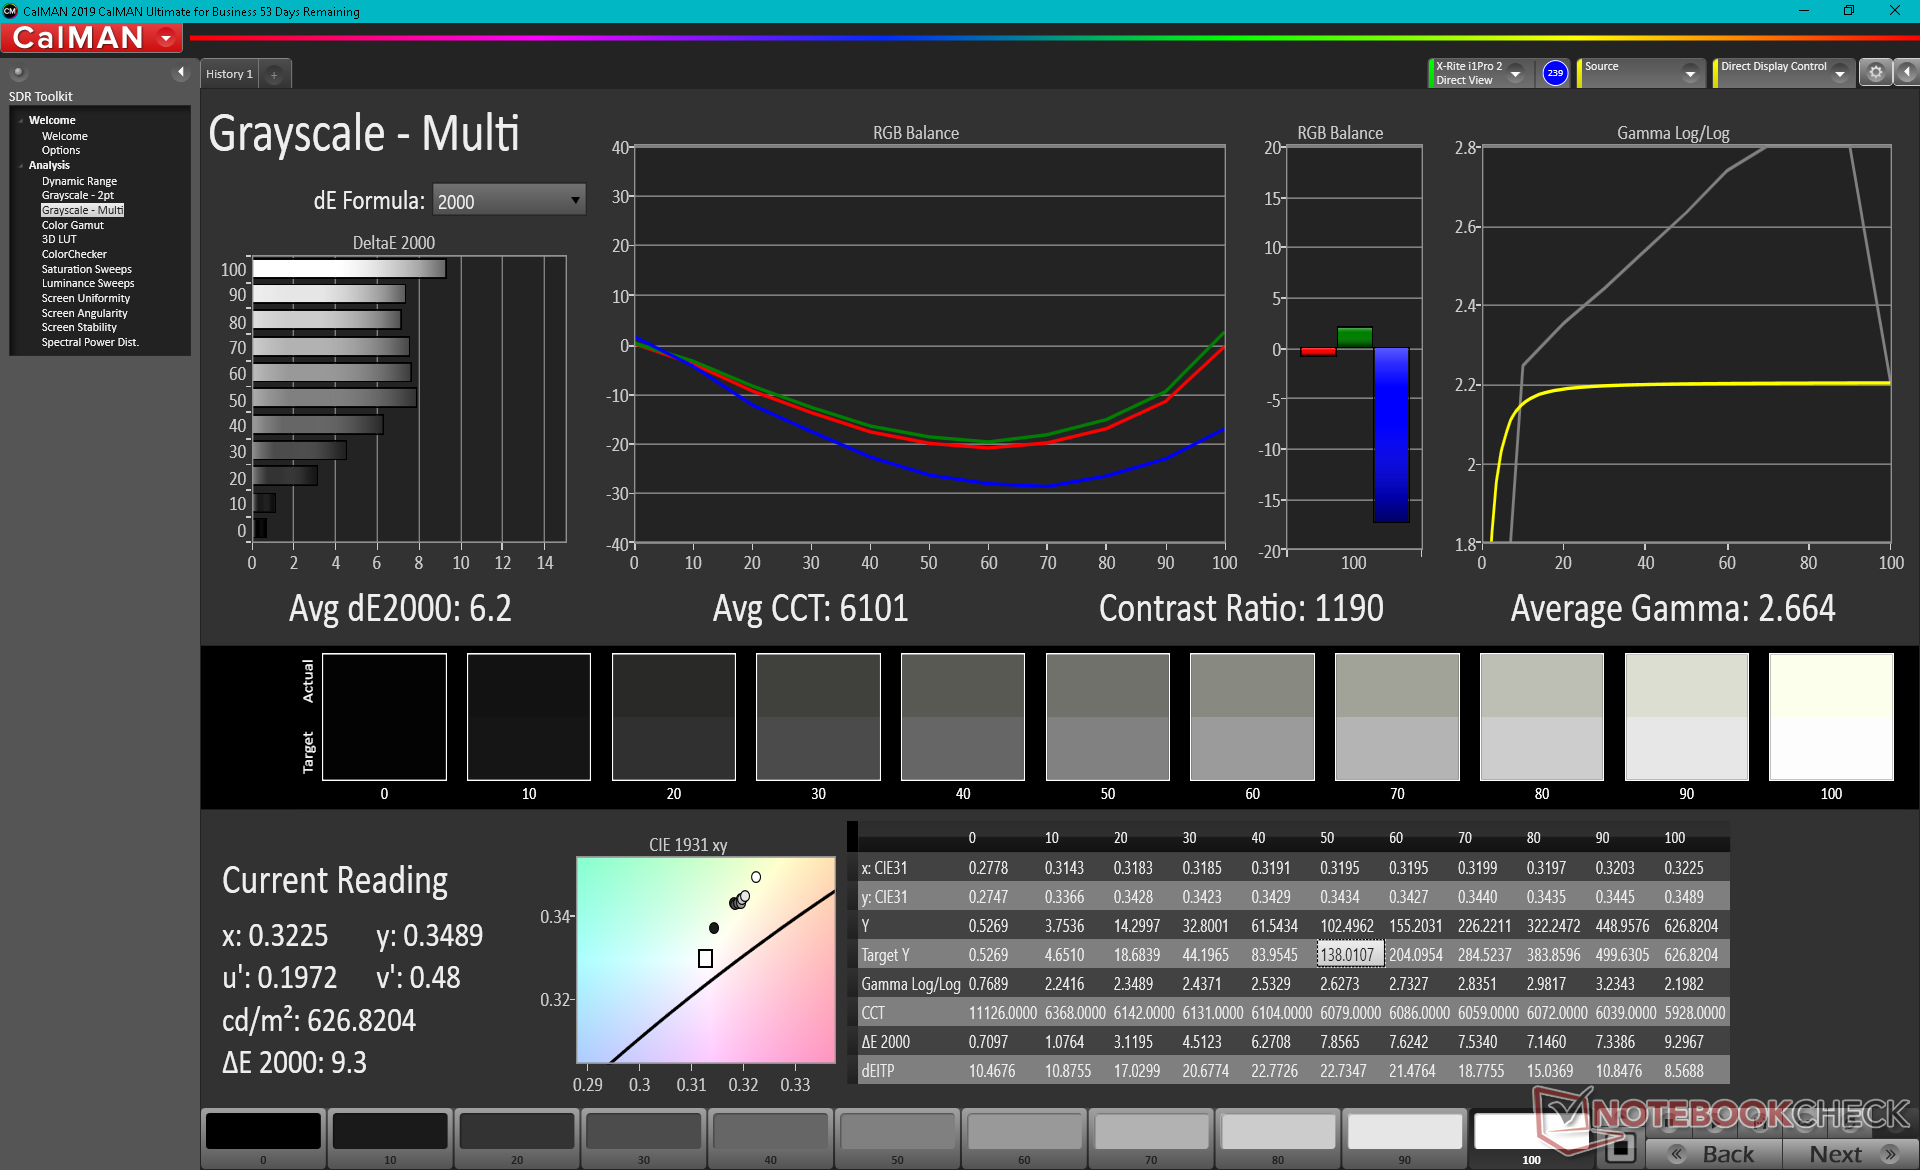
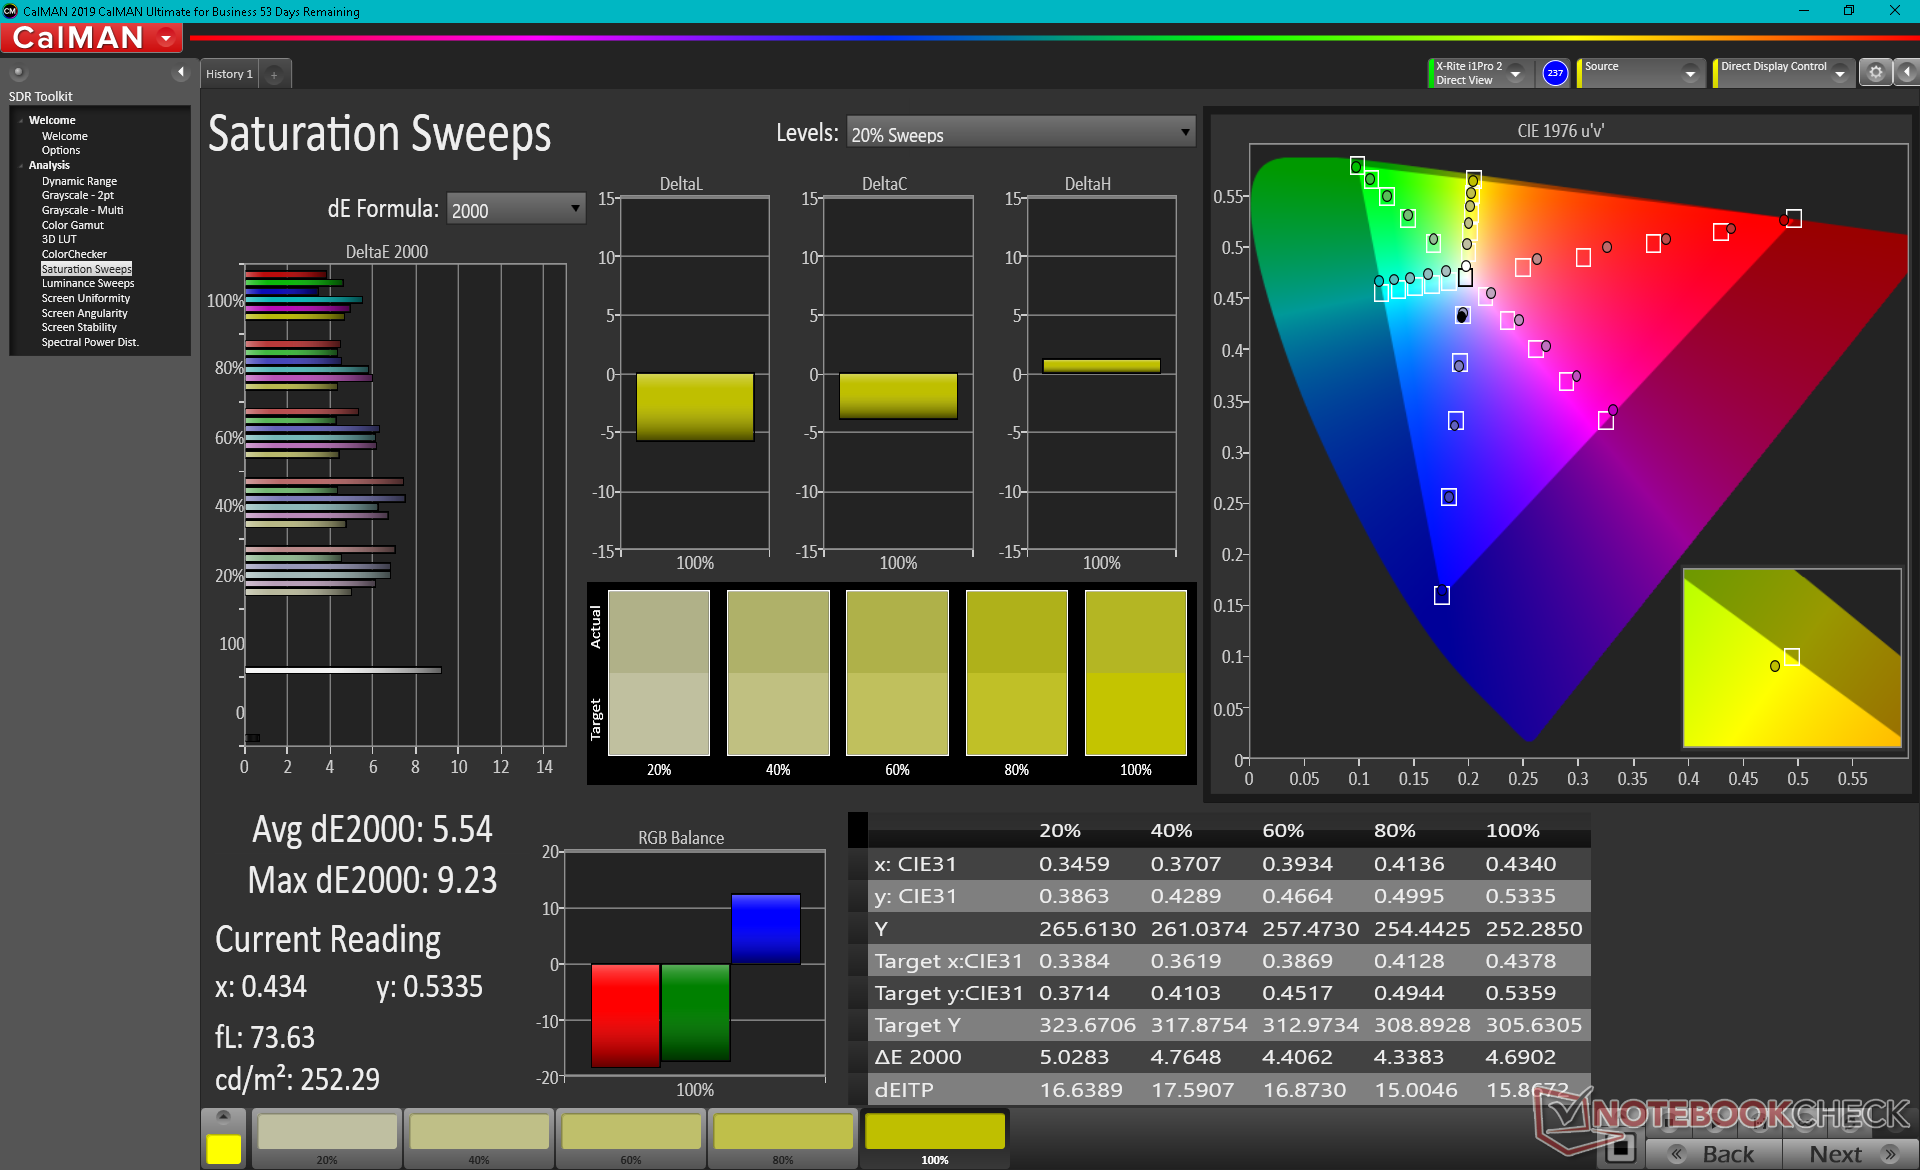
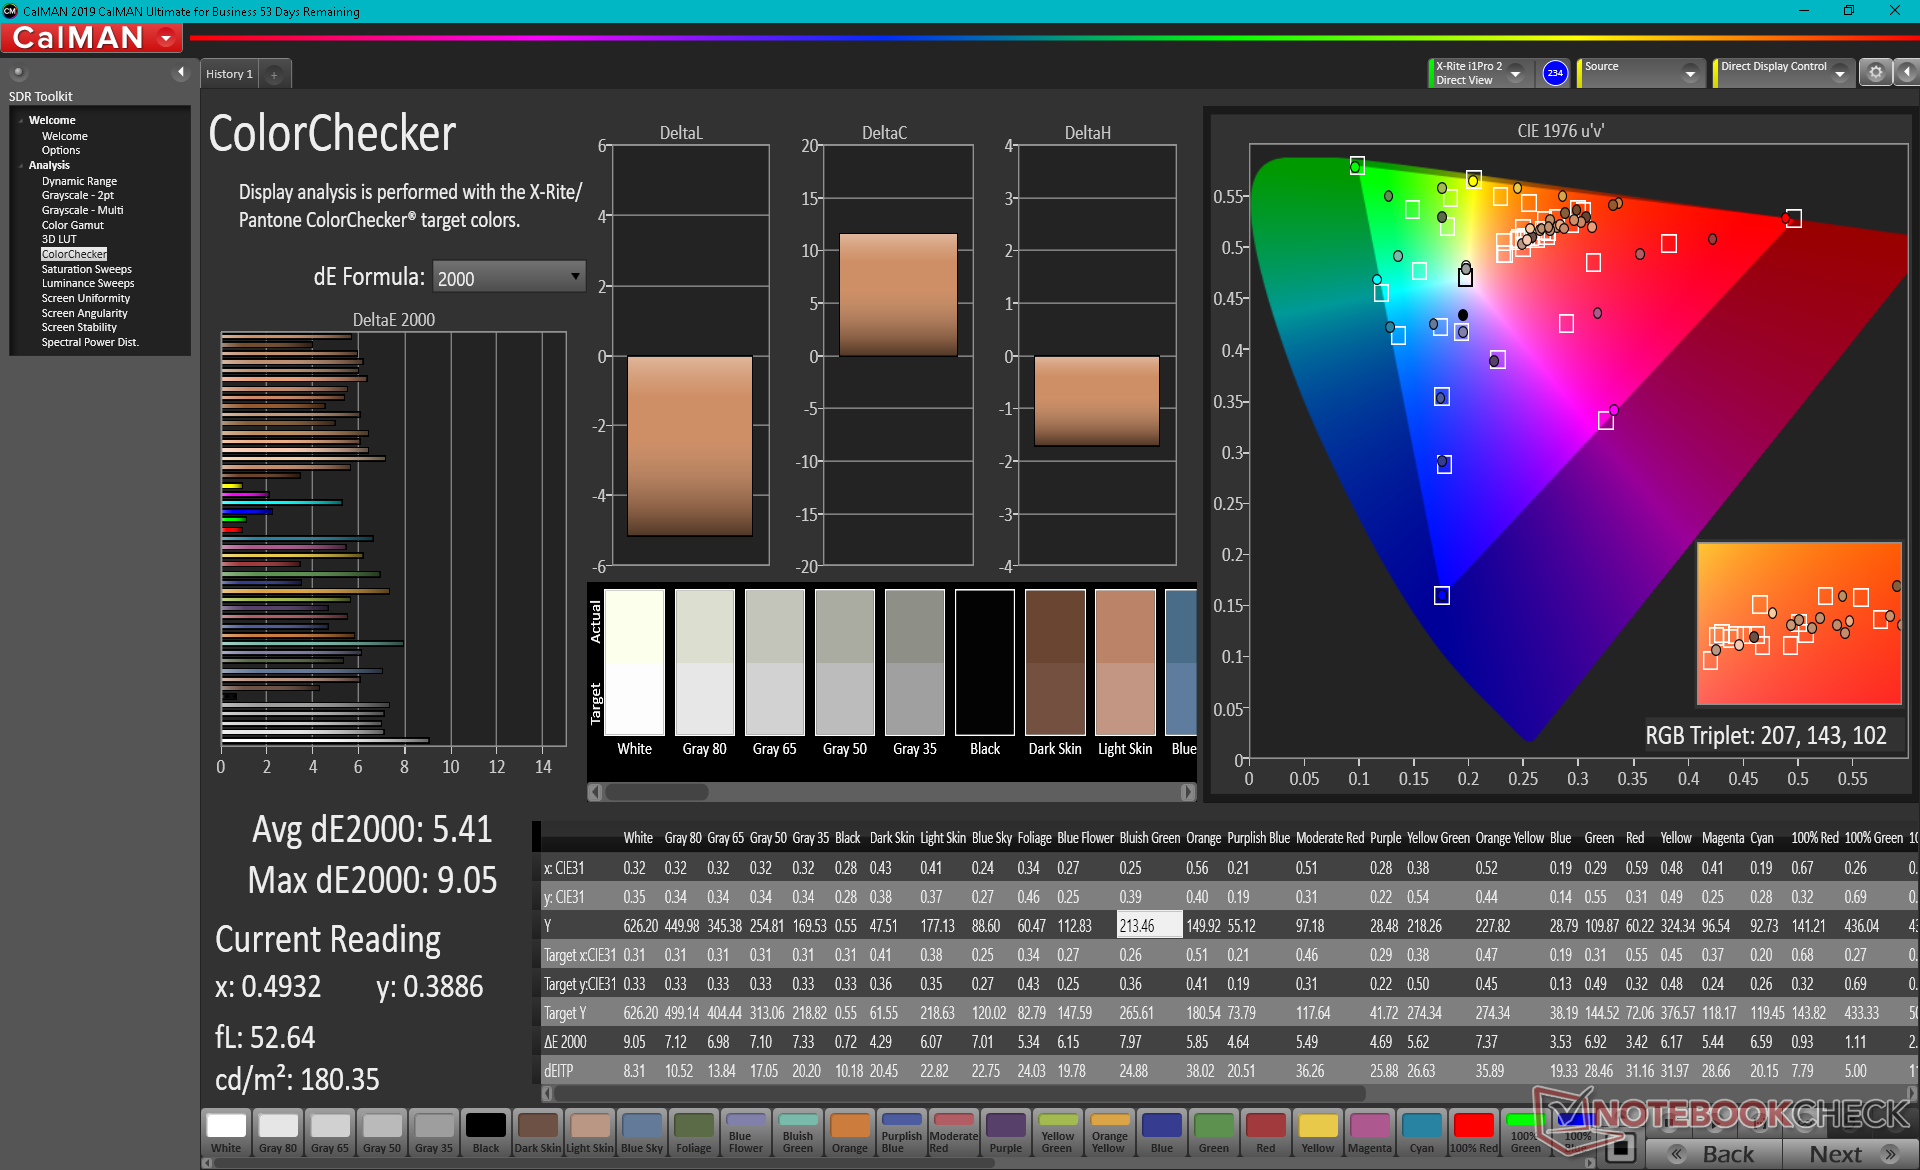
ΔE ColorChecker Calman: 5.41 | ∀{0.5-29.43 Ø4.72}
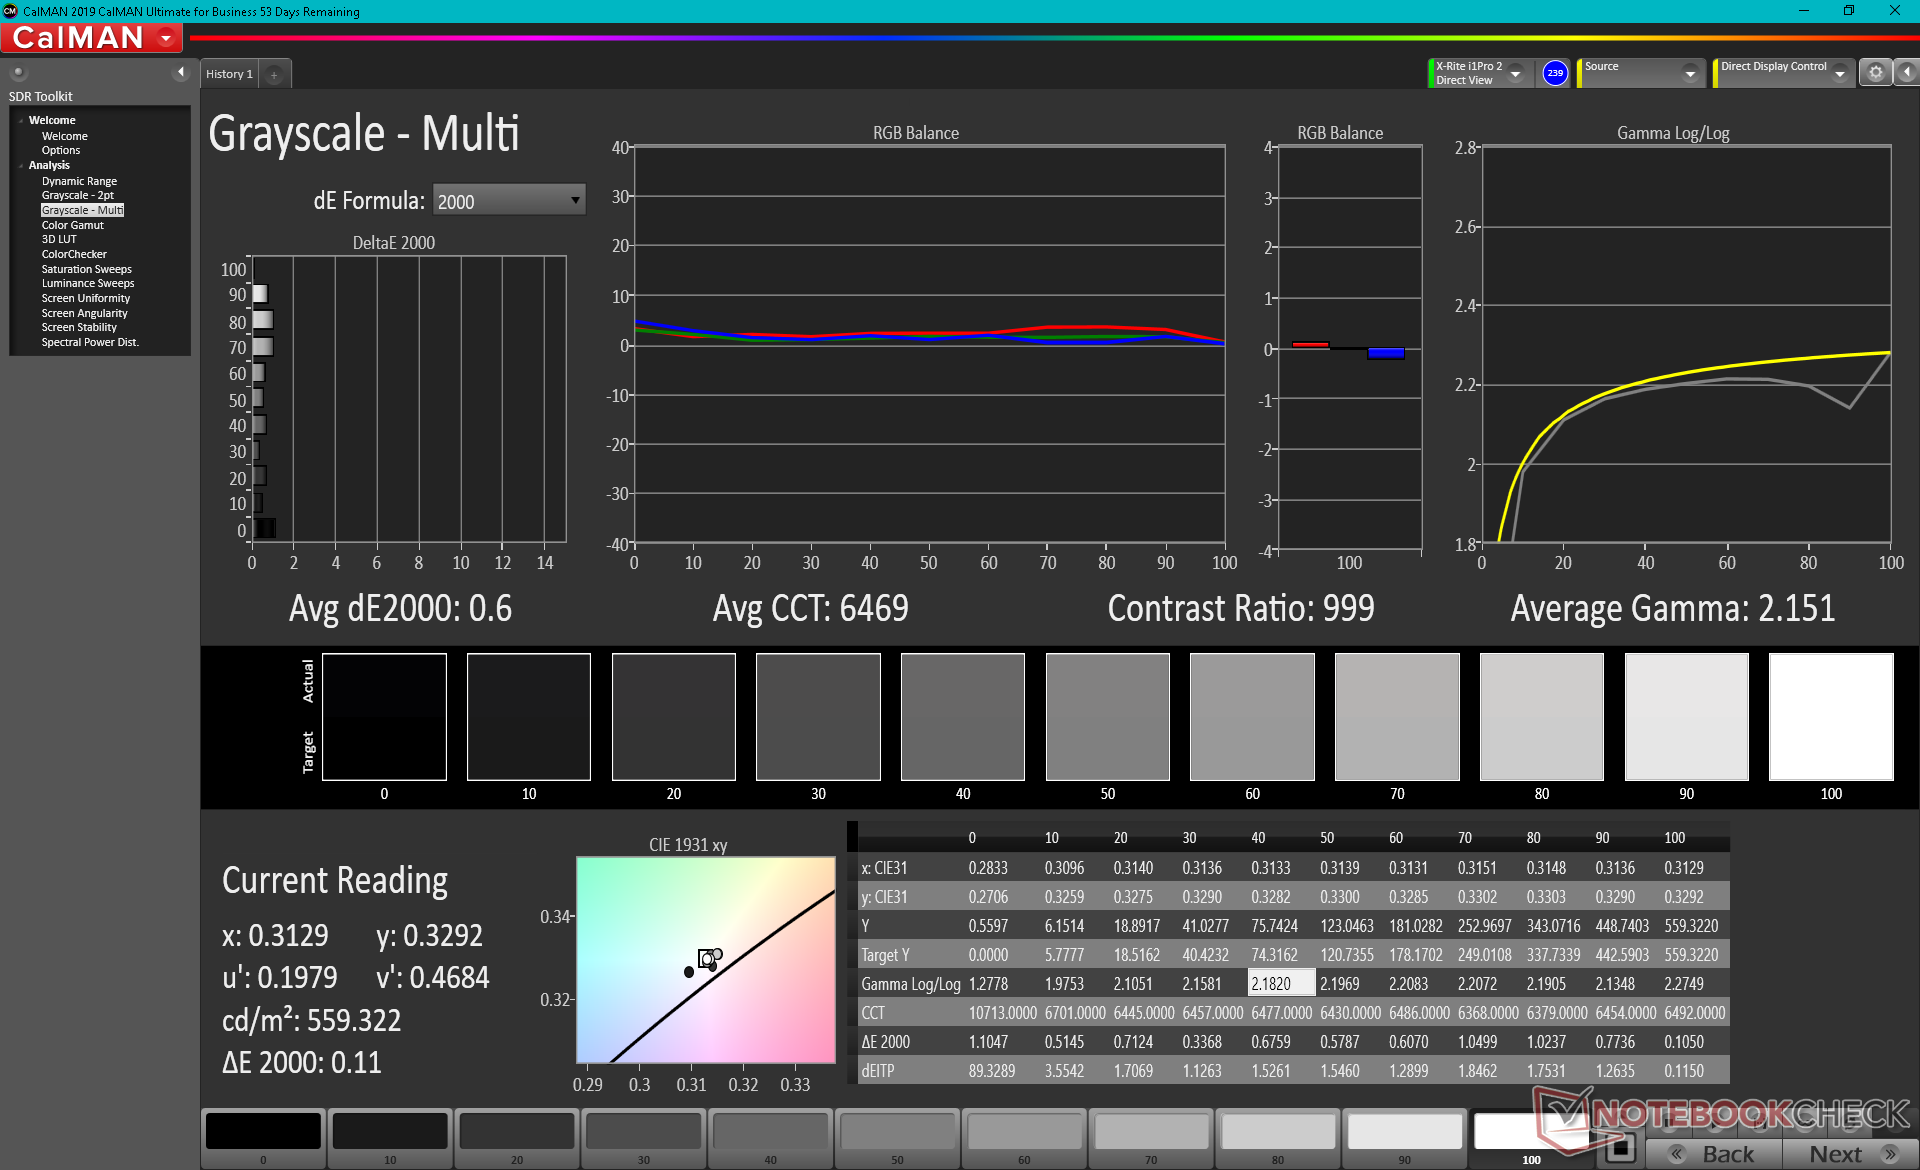
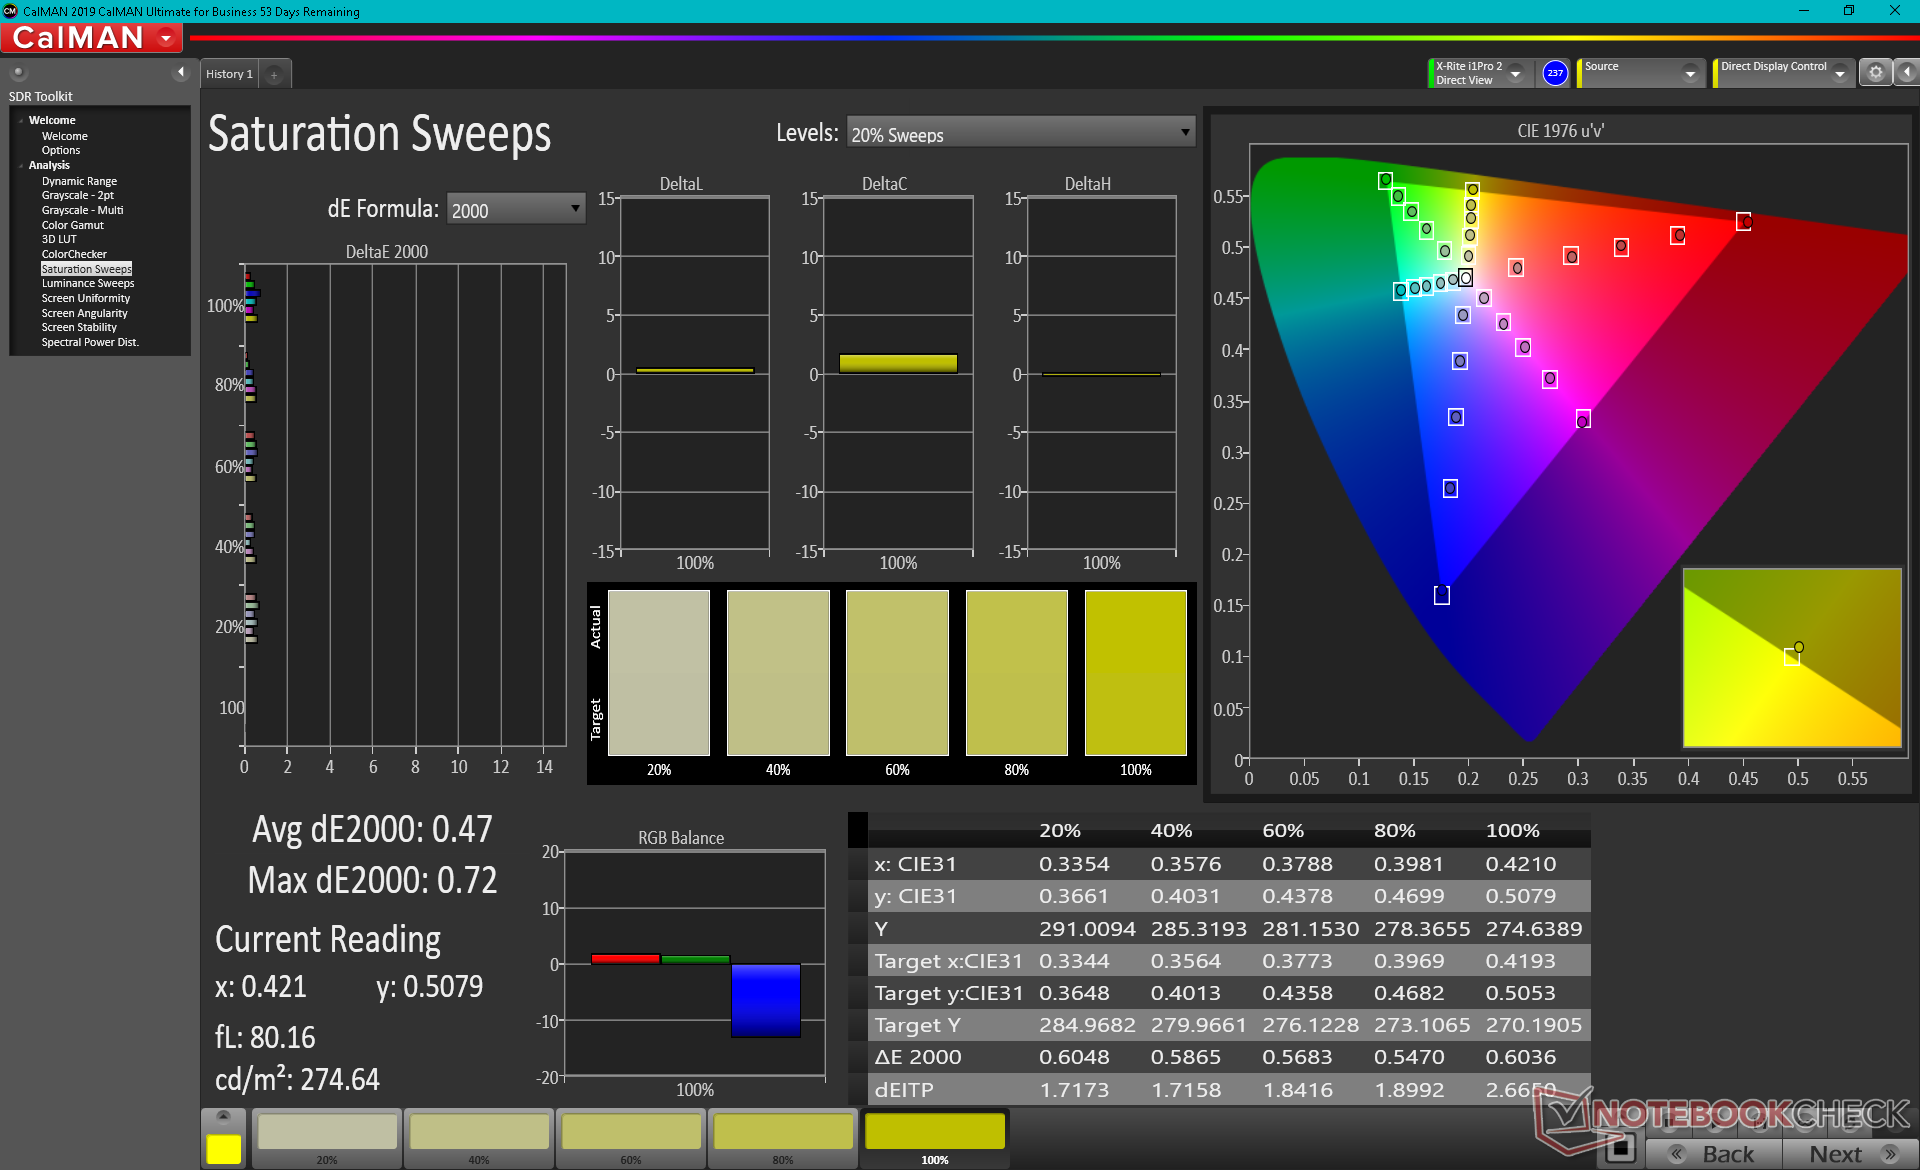
calibrated: 0.6
ΔE Greyscale Calman: 6.2 | ∀{0.09-98 Ø4.97}
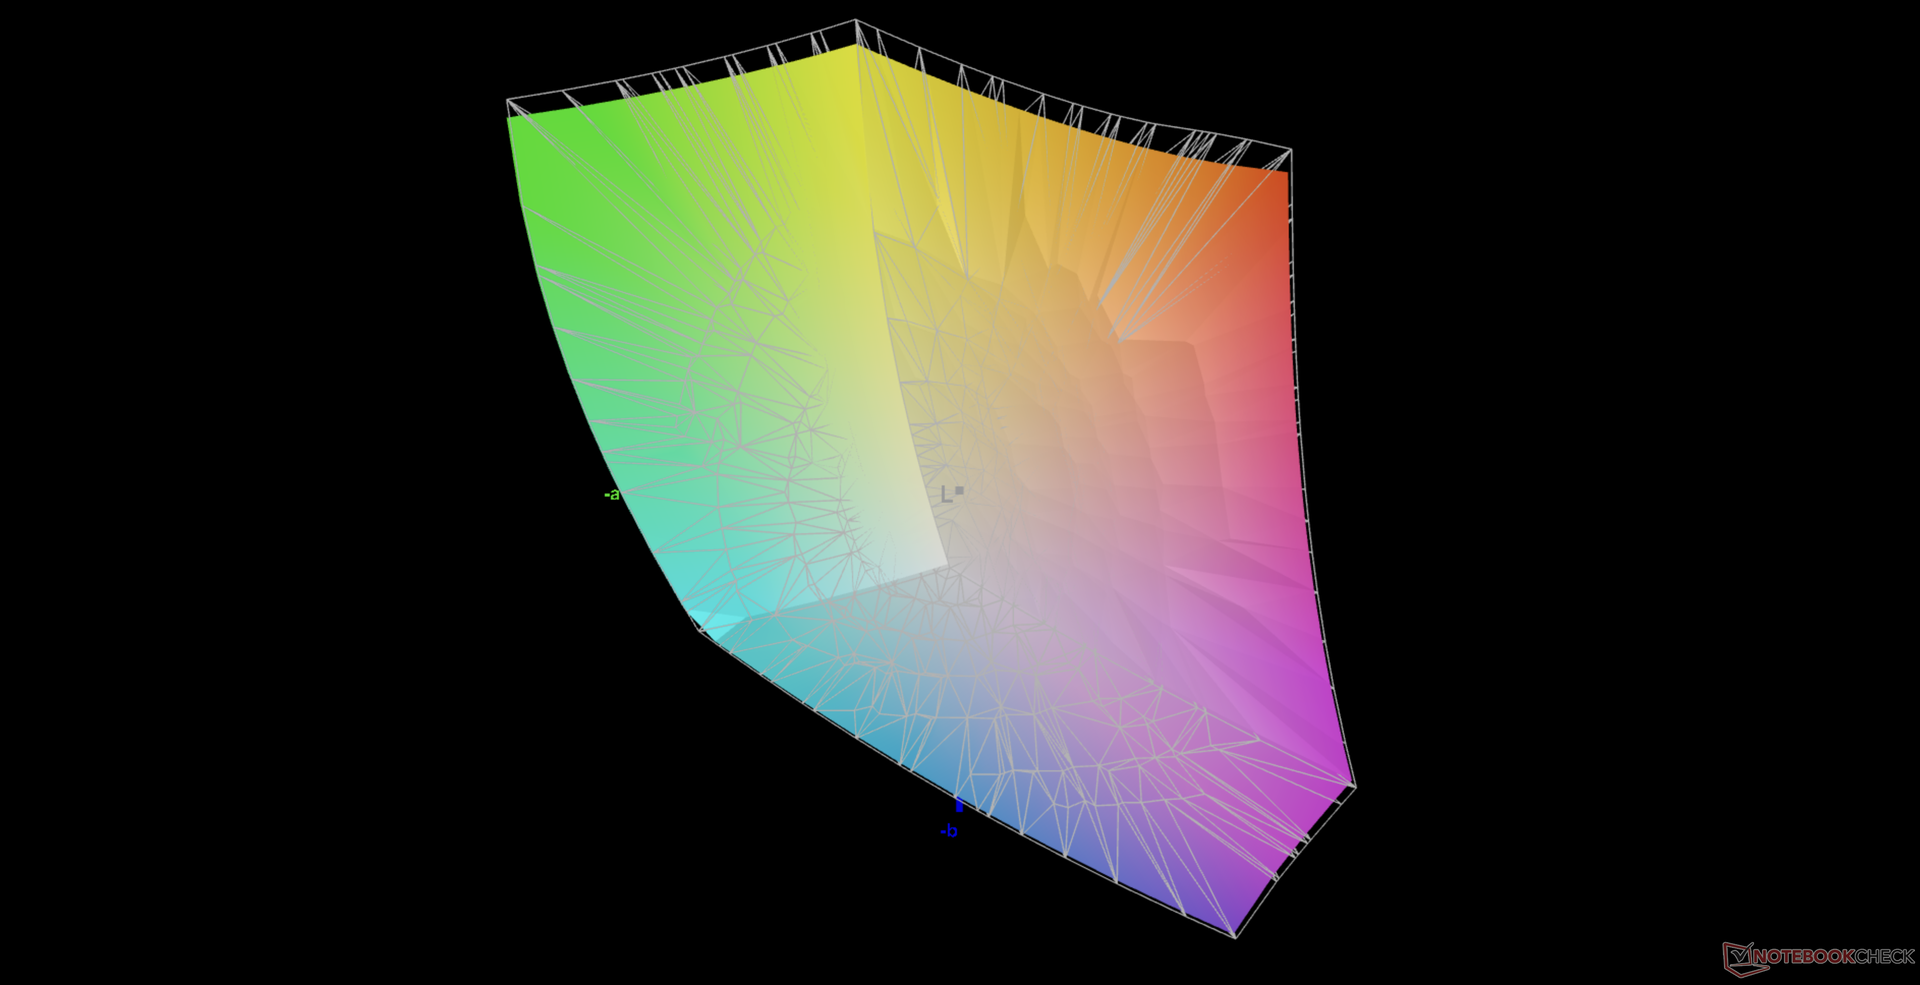
87.3% AdobeRGB 1998 (Argyll 3D)
100% sRGB (Argyll 3D)
95.9% Display P3 (Argyll 3D)
Gamma: 2.66
CCT: 6101 K
| HP ZBook Fury 15 G8 BOE0969, IPS, 15.6", 3840x2160 | HP ZBook Fury 15 G7 LG Philips LGD0661, IPS, 15.6", 3840x2160 | Dell Precision 5000 5560 Sharp LQ156R1, IPS, 15.6", 3840x2400 | HP ZBook Studio 15 G8 SDC4145, OLED, 15.6", 3840x2160 | Lenovo ThinkPad P15s Gen2-20W6000GGE MNF601EA1-1, IPS LED, 15.6", 3840x2160 | HP ZBook Firefly 15 G7 LGD064F, IPS LED, 15.6", 3840x2160 | |
|---|---|---|---|---|---|---|
| Display | -1% | 5% | 4% | -0% | -17% | |
| Display P3 Coverage (%) | 95.9 | 95.6 0% | 94.9 -1% | 99.9 4% | 84.5 -12% | 68.8 -28% |
| sRGB Coverage (%) | 100 | 99.8 0% | 100 0% | 100 0% | 98.7 -1% | 97.7 -2% |
| AdobeRGB 1998 Coverage (%) | 87.3 | 84.5 -3% | 100 15% | 95.3 9% | 97.8 12% | 69.8 -20% |
| Response Times | -253% | -198% | 81% | -141% | -189% | |
| Response Time Grey 50% / Grey 80% * (ms) | 14.8 ? | 56 ? -278% | 47.2 ? -219% | 2.4 ? 84% | 40 ? -170% | 44 ? -197% |
| Response Time Black / White * (ms) | 11 ? | 36 ? -227% | 30.4 ? -176% | 2.4 ? 78% | 23.2 ? -111% | 30.8 ? -180% |
| PWM Frequency (Hz) | 240.4 ? | |||||
| Screen | -29% | 7% | -58% | 35% | 5% | |
| Brightness middle (cd/m²) | 626 | 672.8 7% | 501.5 -20% | 379.6 -39% | 604 -4% | 381 -39% |
| Brightness (cd/m²) | 589 | 674 14% | 467 -21% | 380 -35% | 609 3% | 382 -35% |
| Brightness Distribution (%) | 87 | 89 2% | 83 -5% | 95 9% | 91 5% | 92 6% |
| Black Level * (cd/m²) | 0.58 | 0.5 14% | 0.44 24% | 0.34 41% | 0.21 64% | |
| Contrast (:1) | 1079 | 1346 25% | 1140 6% | 1776 65% | 1814 68% | |
| Colorchecker dE 2000 * | 5.41 | 3.48 36% | 4.73 13% | 5.15 5% | 0.9 83% | 3 45% |
| Colorchecker dE 2000 max. * | 9.05 | 9.44 -4% | 8.45 7% | 7.79 14% | 2.6 71% | 5.2 43% |
| Colorchecker dE 2000 calibrated * | 0.6 | 3.03 -405% | 0.51 15% | 3.1 -417% | 0.8 -33% | 1.5 -150% |
| Greyscale dE 2000 * | 6.2 | 3.1 50% | 3.6 42% | 2.6 58% | 1.1 82% | 3.5 44% |
| Gamma | 2.66 83% | 2.04 108% | 2.08 106% | 1.99 111% | 2.15 102% | 2.26 97% |
| CCT | 6101 107% | 6380 102% | 6447 101% | 6166 105% | 6656 98% | 7254 90% |
| Color Space (Percent of AdobeRGB 1998) (%) | 75.2 | 84.5 | 64.3 | |||
| Color Space (Percent of sRGB) (%) | 100 | 98.6 | 97.5 | |||
| Total Average (Program / Settings) | -94% /
-55% | -62% /
-23% | 9% /
-19% | -35% /
2% | -67% /
-27% |
* ... smaller is better
Our X-Rite colorimeter shows a 96 percent DCI-P3 coverage versus the 100 percent claim by HP. Combine the wide colors with the very fast response times and you have a 4K panel that works extremely well for both professional graphics editing and gaming applications.
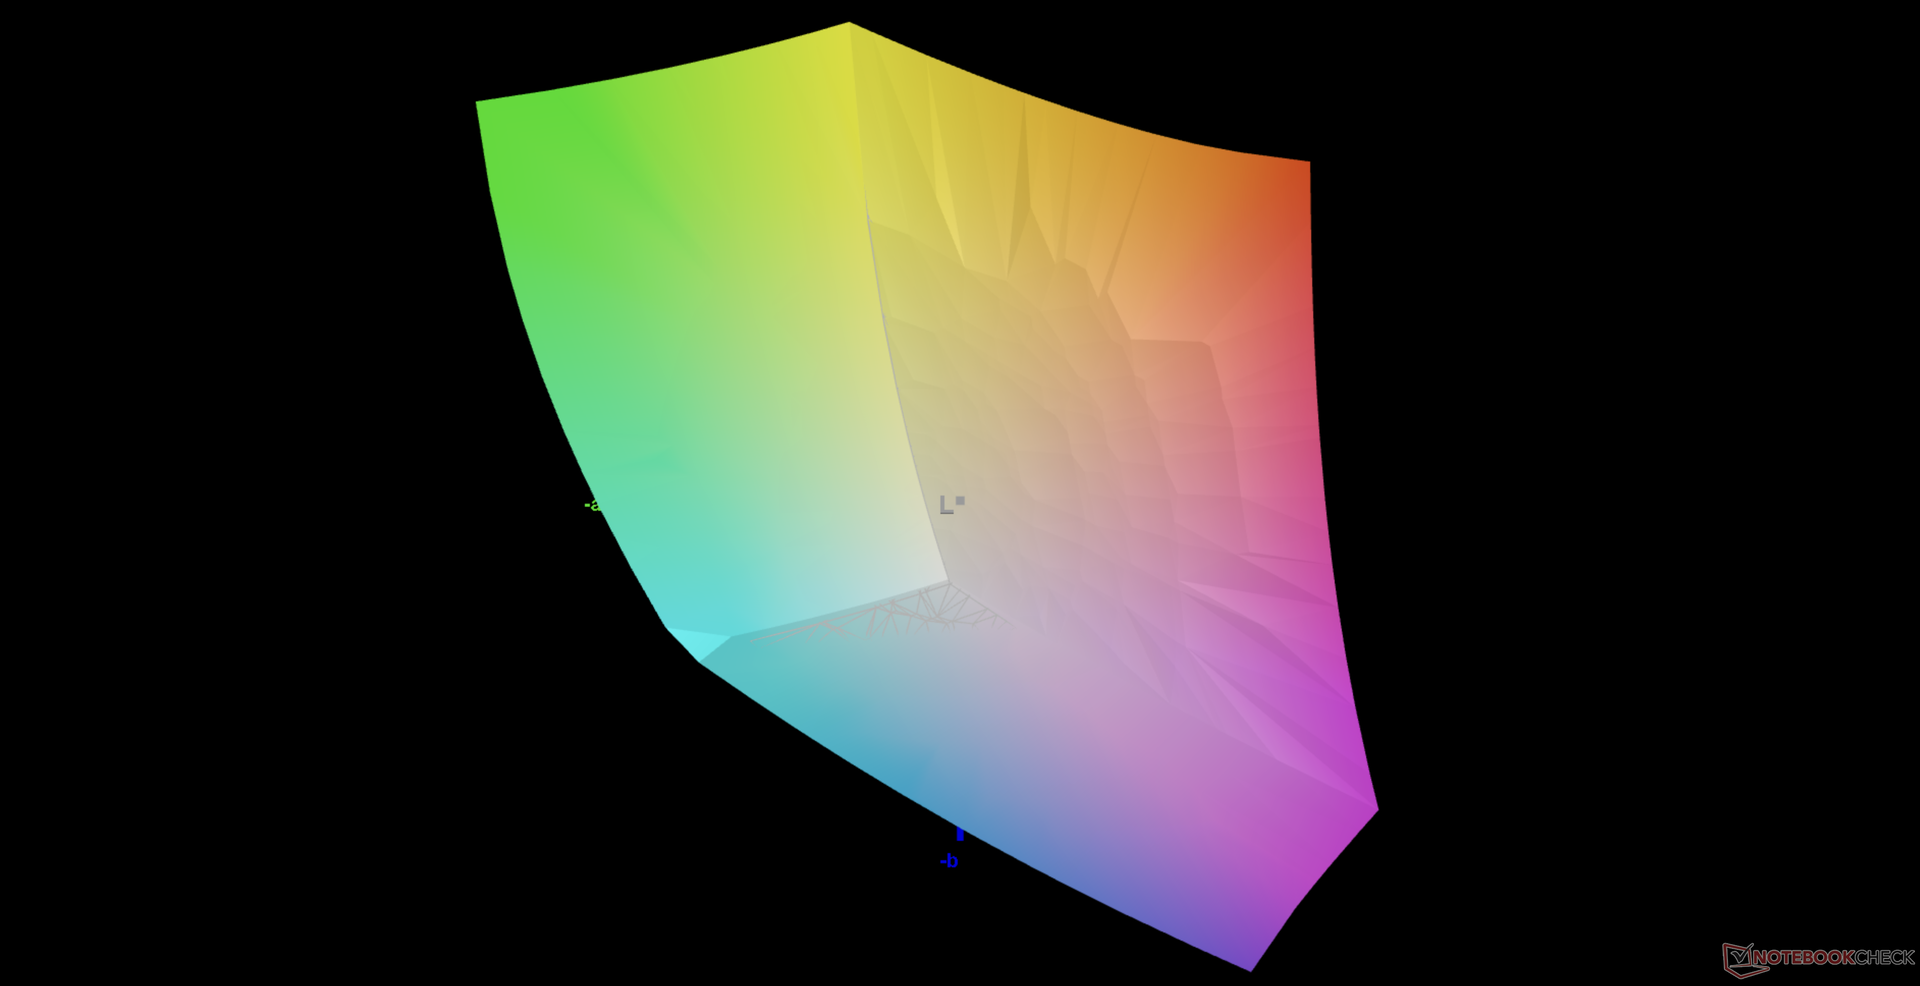
The display could have been better calibrated out of the box against the DCI-P3 standard. Average grayscale and color deltaE values out of the box are at 6.2 and 5.41, respectively, with an ovely warm color temperature of 6100. Calibrating the panel ourselves with an X-Rite colorimeter addresses these shortcomings.
Display Response Times
| ↔ Response Time Black to White | ||
|---|---|---|
| 11 ms ... rise ↗ and fall ↘ combined | ↗ 7.6 ms rise | 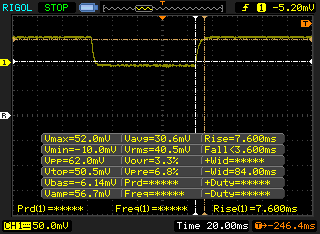 |
| ↘ 3.4 ms fall | ||
| The screen shows good response rates in our tests, but may be too slow for competitive gamers. In comparison, all tested devices range from 0.1 (minimum) to 240 (maximum) ms. » 30 % of all devices are better. This means that the measured response time is better than the average of all tested devices (19.8 ms). | ||
| ↔ Response Time 50% Grey to 80% Grey | ||
| 14.8 ms ... rise ↗ and fall ↘ combined | ↗ 7.6 ms rise | 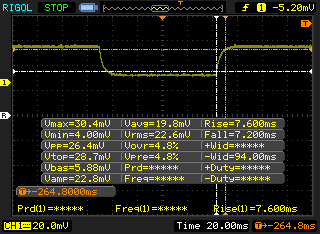 |
| ↘ 7.2 ms fall | ||
| The screen shows good response rates in our tests, but may be too slow for competitive gamers. In comparison, all tested devices range from 0.165 (minimum) to 636 (maximum) ms. » 29 % of all devices are better. This means that the measured response time is better than the average of all tested devices (31 ms). | ||
Screen Flickering / PWM (Pulse-Width Modulation)
| Screen flickering / PWM not detected | 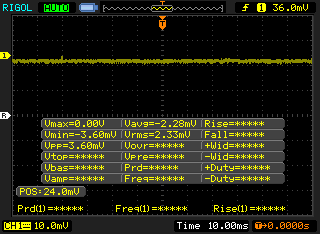 | ||
In comparison: 52 % of all tested devices do not use PWM to dim the display. If PWM was detected, an average of 7747 (minimum: 5 - maximum: 343500) Hz was measured. | |||
Outdoor visibility is better than on many other workstations due to the extra-bright 600 nit backlight. Even HP's own ZBook Studio 15 G8 or Firefly 15 G7 don't approach 400 nits each at their respective maximum brightness settings. Nonetheless, you'll still want to scale the font appropriately and work under shade to maximize viewability.

Performance — Intel 11th Gen
CPU options encompass Tiger Lake-H CPUs and both Nvidia T1200 and RTX A series GPUs up to the RTX A5000. Xeon and even Radeon Pro W6600M options are also available for a very wide range of configurable options. The higher-end options in particular are some of the fastest mobile workstation-class processors you can find on any laptop.
Resizable Bar and Dynamic Boost 2.0 are supported while Advanced Optimus and WhisperMode 2.0 are not. There is unfortunately no manual graphics switch, either.
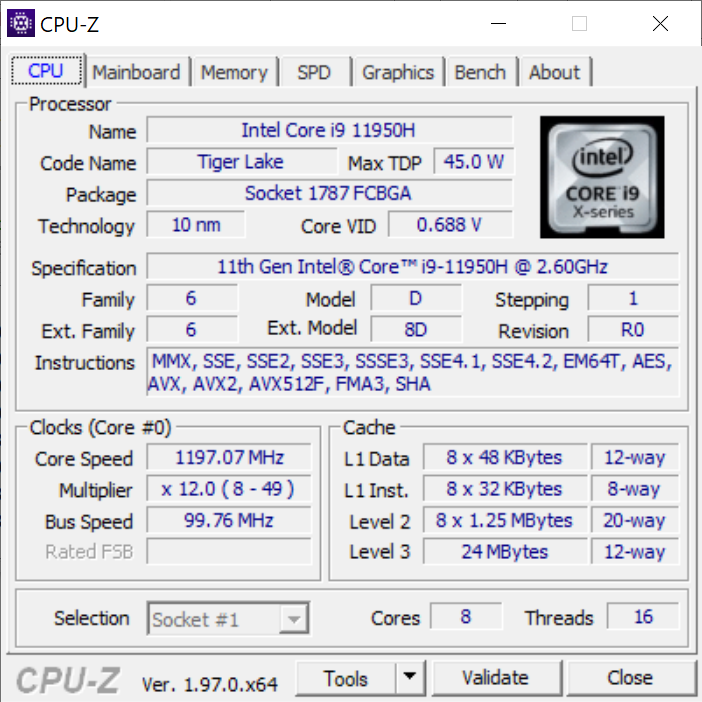
Processor
Multi-thread CPU performance is a few percentage points short of the Core i9-11900H as found in the MSI GS76 despite the fact that the Core i7-11950H is rated at slightly faster clock rates. Core i9-11950H single-thread performance, however, remains excellent and on par with its non-vPro counterpart. Overall multi-thread performance is about 15 percent higher than the Xeon W-10885M in last year's ZBook Fury 15 G7 but without any support for ECC RAM, of course.
Cinebench R15 Multi Loop
Cinebench R23: Multi Core | Single Core
Cinebench R15: CPU Multi 64Bit | CPU Single 64Bit
Blender: v2.79 BMW27 CPU
7-Zip 18.03: 7z b 4 -mmt1 | 7z b 4
Geekbench 5.5: Single-Core | Multi-Core
HWBOT x265 Benchmark v2.2: 4k Preset
LibreOffice : 20 Documents To PDF
R Benchmark 2.5: Overall mean
| Cinebench R23 / Multi Core | |
| Lenovo Legion 5 15ACH-82JU00C6GE-FL | |
| MSI GS76 Stealth 11UH | |
| Average Intel Core i9-11950H (12048 - 13113, n=4) | |
| HP ZBook Fury 15 G8 | |
| Lenovo ThinkPad P15 G2-20YQ001JGE | |
| Dell Precision 5000 5560 | |
| Gigabyte Aero 15 OLED XC | |
| HP ZBook Fury 15 G7 | |
| Cinebench R23 / Single Core | |
| HP ZBook Fury 15 G8 | |
| Average Intel Core i9-11950H (1569 - 1633, n=4) | |
| MSI GS76 Stealth 11UH | |
| Dell Precision 5000 5560 | |
| Lenovo ThinkPad P15 G2-20YQ001JGE | |
| Lenovo Legion 5 15ACH-82JU00C6GE-FL | |
| HP ZBook Fury 15 G7 | |
| Gigabyte Aero 15 OLED XC | |
| Geekbench 5.5 / Single-Core | |
| Average Intel Core i9-11950H (1623 - 1702, n=3) | |
| MSI GS76 Stealth 11UH | |
| Lenovo ThinkPad P15 G2-20YQ001JGE | |
| Lenovo Legion 5 15ACH-82JU00C6GE-FL | |
| Acer Nitro 5 AN515-45-R05E | |
| HP ZBook Fury 15 G7 | |
| Dell Precision 5550 P91F | |
| Gigabyte Aero 15 OLED XC | |
| Geekbench 5.5 / Multi-Core | |
| MSI GS76 Stealth 11UH | |
| Lenovo ThinkPad P15 G2-20YQ001JGE | |
| Dell Precision 5550 P91F | |
| Average Intel Core i9-11950H (7286 - 8152, n=3) | |
| Gigabyte Aero 15 OLED XC | |
| Lenovo Legion 5 15ACH-82JU00C6GE-FL | |
| HP ZBook Fury 15 G7 | |
| Acer Nitro 5 AN515-45-R05E | |
| HWBOT x265 Benchmark v2.2 / 4k Preset | |
| Lenovo Legion 5 15ACH-82JU00C6GE-FL | |
| MSI GS76 Stealth 11UH | |
| HP ZBook Fury 15 G8 | |
| Average Intel Core i9-11950H (13.8 - 14.5, n=4) | |
| Lenovo ThinkPad P15 G2-20YQ001JGE | |
| Dell Precision 5000 5560 | |
| Gigabyte Aero 15 OLED XC | |
| Acer Nitro 5 AN515-45-R05E | |
| Dell Precision 5550 P91F | |
| HP ZBook Fury 15 G7 | |
| LibreOffice / 20 Documents To PDF | |
| Lenovo Legion 5 15ACH-82JU00C6GE-FL | |
| Gigabyte Aero 15 OLED XC | |
| HP ZBook Fury 15 G7 | |
| Acer Nitro 5 AN515-45-R05E | |
| HP ZBook Fury 15 G8 | |
| MSI GS76 Stealth 11UH | |
| Lenovo ThinkPad P15 G2-20YQ001JGE | |
| Average Intel Core i9-11950H (38.6 - 53.2, n=4) | |
| Dell Precision 5000 5560 | |
| Dell Precision 5550 P91F | |
| R Benchmark 2.5 / Overall mean | |
| Dell Precision 5550 P91F | |
| Gigabyte Aero 15 OLED XC | |
| Lenovo ThinkPad P15 G2-20YQ001JGE | |
| HP ZBook Fury 15 G7 | |
| HP ZBook Fury 15 G8 | |
| Dell Precision 5000 5560 | |
| Acer Nitro 5 AN515-45-R05E | |
| Average Intel Core i9-11950H (0.521 - 0.551, n=4) | |
| Lenovo Legion 5 15ACH-82JU00C6GE-FL | |
| MSI GS76 Stealth 11UH | |
* ... smaller is better
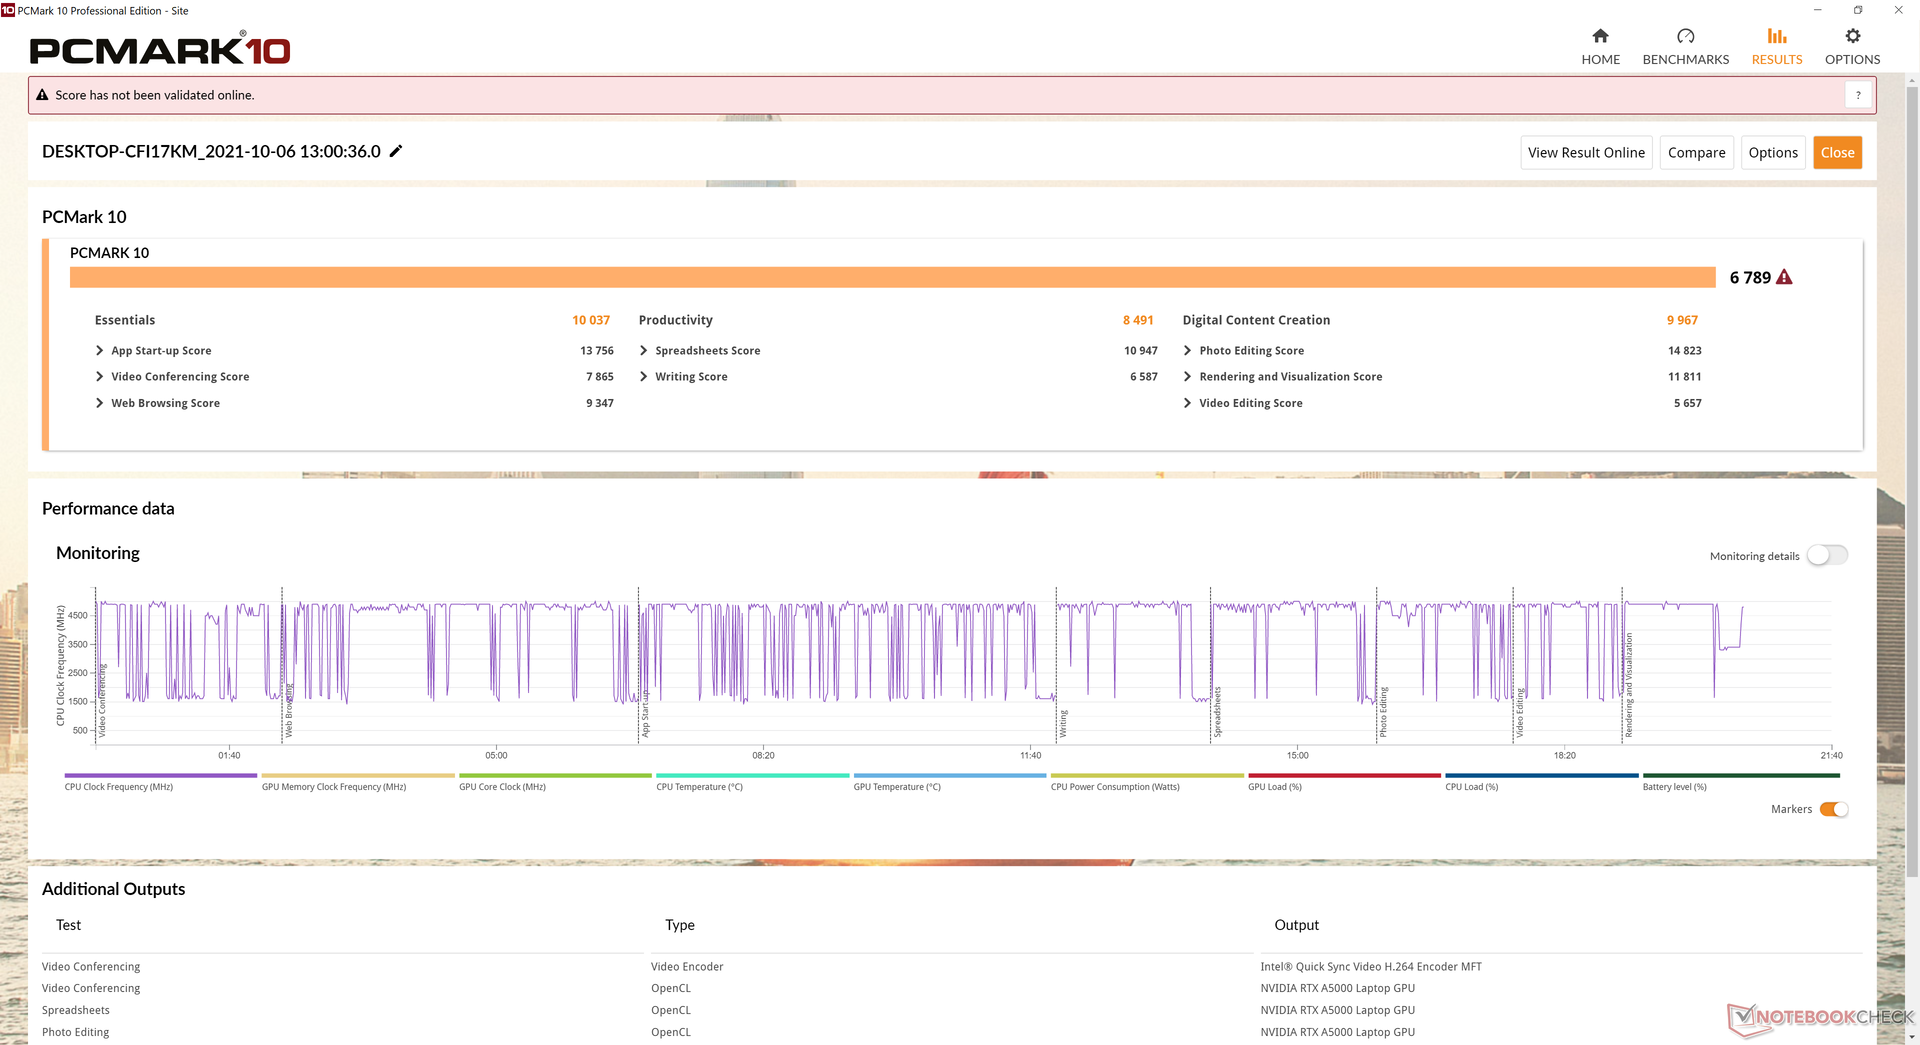
System Performance
PCMark scores are consistently higher than that we recorded on the Fury 15 G7 while being nearly identical to what we recorded on the thicker Studio 15 G8 with RTX 3070 graphics.
| PCMark 10 / Score | |
| HP ZBook Fury 15 G8 | |
| Average Intel Core i9-11950H, NVIDIA RTX A5000 Laptop GPU (n=1) | |
| HP ZBook Studio 15 G8 | |
| Dell Precision 5000 5560 | |
| HP ZBook Fury 15 G7 | |
| Lenovo ThinkPad P15s Gen2-20W6000GGE | |
| HP ZBook Firefly 15 G7 | |
| PCMark 10 / Essentials | |
| Dell Precision 5000 5560 | |
| HP ZBook Fury 15 G8 | |
| Average Intel Core i9-11950H, NVIDIA RTX A5000 Laptop GPU (n=1) | |
| HP ZBook Studio 15 G8 | |
| Lenovo ThinkPad P15s Gen2-20W6000GGE | |
| HP ZBook Fury 15 G7 | |
| HP ZBook Firefly 15 G7 | |
| PCMark 10 / Productivity | |
| Lenovo ThinkPad P15s Gen2-20W6000GGE | |
| Dell Precision 5000 5560 | |
| HP ZBook Fury 15 G8 | |
| Average Intel Core i9-11950H, NVIDIA RTX A5000 Laptop GPU (n=1) | |
| HP ZBook Studio 15 G8 | |
| HP ZBook Fury 15 G7 | |
| HP ZBook Firefly 15 G7 | |
| PCMark 10 / Digital Content Creation | |
| HP ZBook Fury 15 G8 | |
| Average Intel Core i9-11950H, NVIDIA RTX A5000 Laptop GPU (n=1) | |
| HP ZBook Studio 15 G8 | |
| Dell Precision 5000 5560 | |
| HP ZBook Fury 15 G7 | |
| Lenovo ThinkPad P15s Gen2-20W6000GGE | |
| HP ZBook Firefly 15 G7 | |
| PCMark 10 Score | 6789 points | |
Help | ||
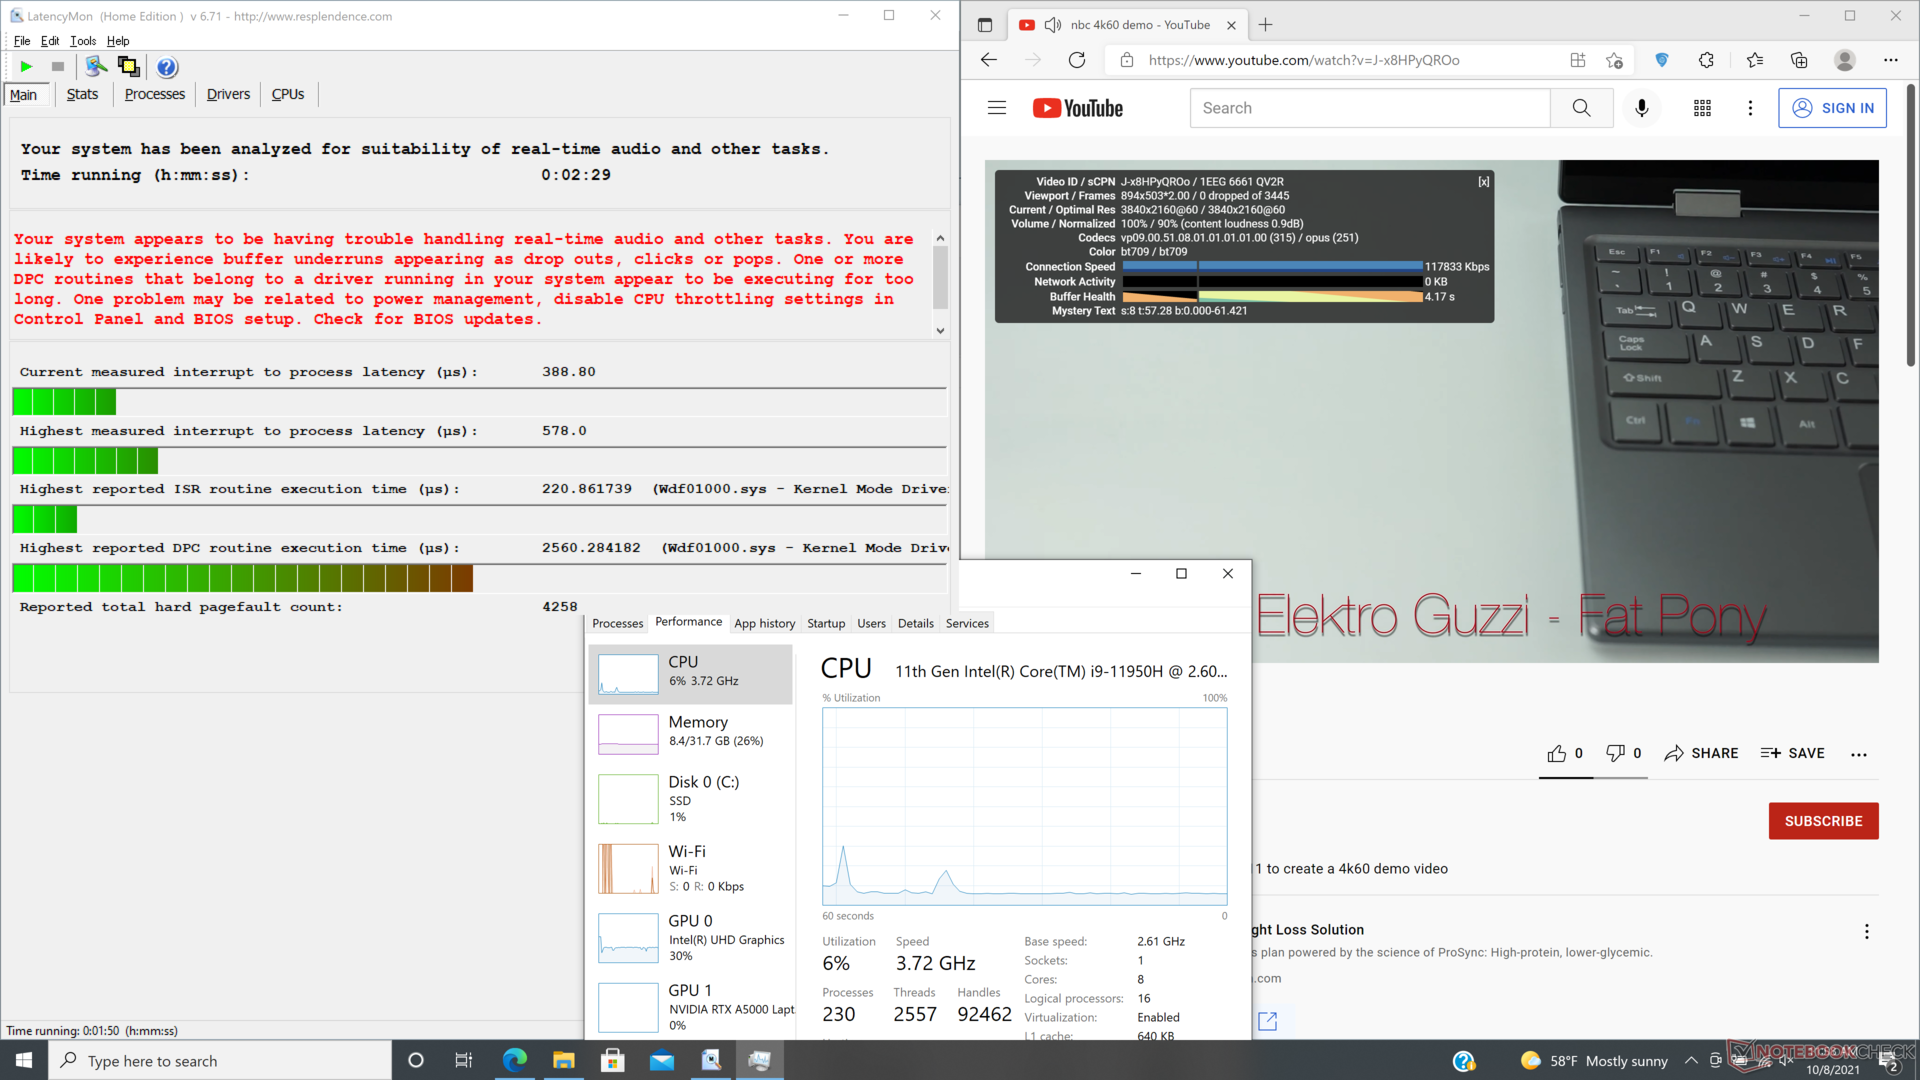
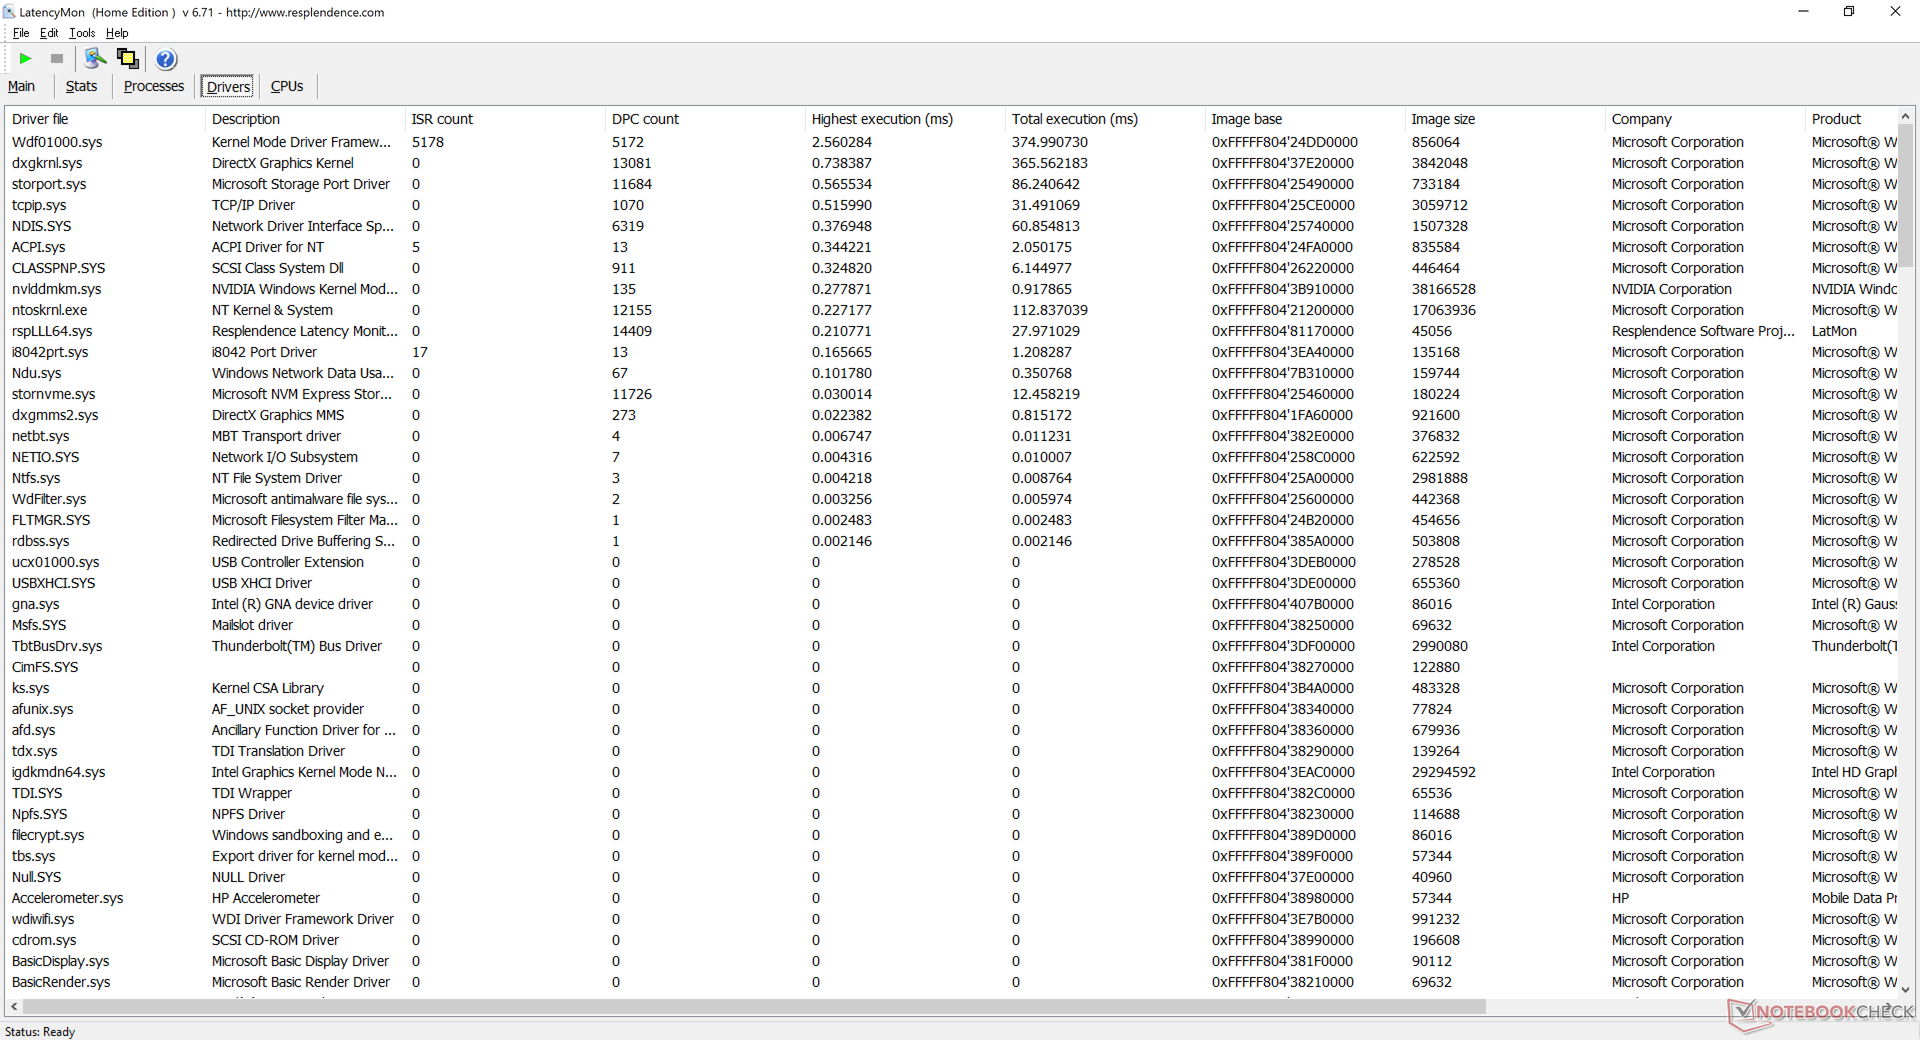
DPC Latency
LatencyMon reveals no major latency interrupts when opening multiple browsers tabs on our homepage or when running Prime95 stress. DPC routine times, however, would spike much like what we observed on last year's Fury 15 G7. 4K video playback at 60 FPS is otherwise smooth and with no dropped frames.
| DPC Latencies / LatencyMon - interrupt to process latency (max), Web, Youtube, Prime95 | |
| Lenovo ThinkPad P15s Gen2-20W6000GGE | |
| HP ZBook Firefly 15 G7 | |
| HP ZBook Fury 15 G7 | |
| HP ZBook Studio 15 G8 | |
| Dell Precision 5000 5560 | |
| HP ZBook Fury 15 G8 | |
* ... smaller is better
Storage Devices — Lots of Options
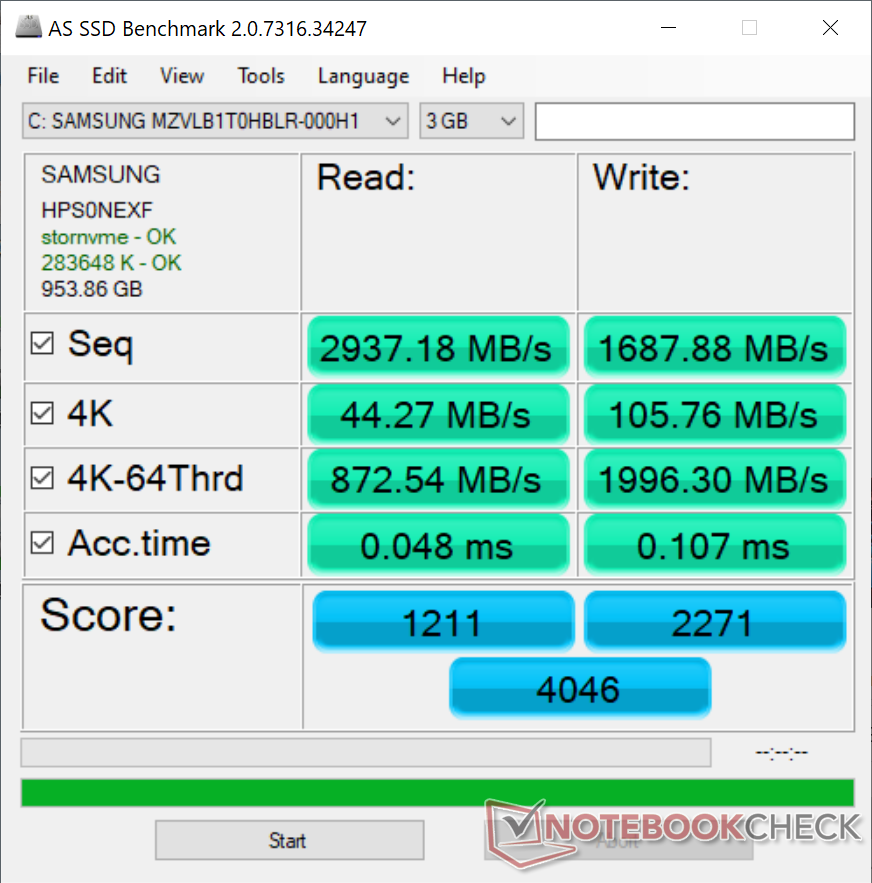
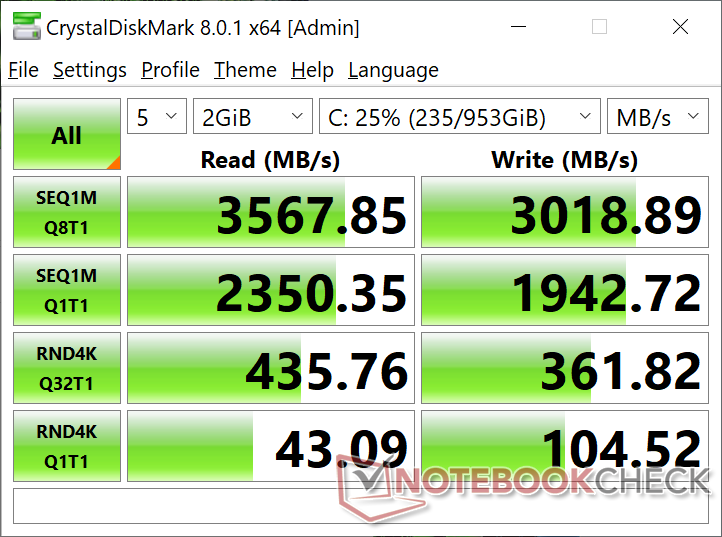
Our unit can support up to four internal storage drives (2x M.2 2280, 1x M.2 2242, 1x 2.5-inch SATA III). Interestingly, HP is not offering any PCIe4 options as all current SKUs come with PCIe3 SSDs instead such as the familiar Samsung PM981a. We've reached out to HP to try and confirm if PCIe4 NVMe speeds are supported and we'll update this page accordingly.
| HP ZBook Fury 15 G8 Samsung PM981a MZVLB1T0HBLR | HP ZBook Fury 15 G7 Samsung PM981a MZVLB1T0HBLR | Dell Precision 5000 5560 Samsung PM9A1 MZVL22T0HBLB | HP ZBook Studio 15 G8 Samsung PM981a MZVLB2T0HALB | Lenovo ThinkPad P15s Gen2-20W6000GGE WDC PC SN720 SDAQNTW-1T00 | HP ZBook Firefly 15 G7 Toshiba XG6 KXG60ZNV1T02 | |
|---|---|---|---|---|---|---|
| AS SSD | 24% | 93% | 104% | 19% | -1% | |
| Seq Read (MB/s) | 2937 | 2127 -28% | 5169 76% | 2953 1% | 2796 -5% | 2666 -9% |
| Seq Write (MB/s) | 1688 | 1296 -23% | 1986 18% | 1691 0% | 2525 50% | 1257 -26% |
| 4K Read (MB/s) | 44.27 | 54.8 24% | 78 76% | 43.98 -1% | 50.9 15% | 48.04 9% |
| 4K Write (MB/s) | 105.8 | 110.8 5% | 214.6 103% | 105.4 0% | 211.9 100% | 137.5 30% |
| 4K-64 Read (MB/s) | 873 | 1420 63% | 1232 41% | 1065 22% | 1505 72% | 977 12% |
| 4K-64 Write (MB/s) | 1996 | 2012 1% | 2719 36% | 1957 -2% | 949 -52% | 1142 -43% |
| Access Time Read * (ms) | 0.048 | 0.046 4% | 0.024 50% | 0.04 17% | 0.081 -69% | 0.053 -10% |
| Access Time Write * (ms) | 0.107 | 0.099 7% | 0.059 45% | 0.105 2% | 0.019 82% | 0.03 72% |
| Score Read (Points) | 1211 | 1687 39% | 1827 51% | 1404 16% | 1835 52% | 1292 7% |
| Score Write (Points) | 2271 | 2253 -1% | 3133 38% | 2232 -2% | 1413 -38% | 1406 -38% |
| Score Total (Points) | 4046 | 4770 18% | 5753 42% | 4297 6% | 4177 3% | 3297 -19% |
| Copy ISO MB/s (MB/s) | 901 | 2779 208% | 3201 255% | 2474 175% | ||
| Copy Program MB/s (MB/s) | 118.7 | 123.3 4% | 415.8 250% | 1074 805% | ||
| Copy Game MB/s (MB/s) | 372 | 440.8 18% | 1212 226% | 1929 419% | ||
| CrystalDiskMark 5.2 / 6 | 10% | 54% | 7% | 31% | 7% | |
| Write 4K (MB/s) | 96.3 | 114.1 18% | 172.4 79% | 110.5 15% | 237.6 147% | 133.1 38% |
| Read 4K (MB/s) | 51.5 | 57.2 11% | 78.8 53% | 51.8 1% | 54.7 6% | 51.6 0% |
| Write Seq (MB/s) | 1942 | 2580 33% | 2991 54% | 2071 7% | 2603 34% | 1986 2% |
| Read Seq (MB/s) | 2504 | 2527 1% | 3351 34% | 2505 0% | 1889 -25% | 2208 -12% |
| Write 4K Q32T1 (MB/s) | 346.6 | 480.2 39% | 459.2 32% | 429.8 24% | 505 46% | 462.3 33% |
| Read 4K Q32T1 (MB/s) | 408 | 387.6 -5% | 484.3 19% | 418.3 3% | 606 49% | 400.2 -2% |
| Write Seq Q32T1 (MB/s) | 3019 | 2996 -1% | 4761 58% | 3060 1% | 2795 -7% | 3074 2% |
| Read Seq Q32T1 (MB/s) | 3514 | 2853 -19% | 7071 101% | 3539 1% | 3448 -2% | 3268 -7% |
| Total Average (Program / Settings) | 17% /
19% | 74% /
79% | 56% /
69% | 25% /
24% | 3% /
2% |
* ... smaller is better

Disk Throttling: DiskSpd Read Loop, Queue Depth 8
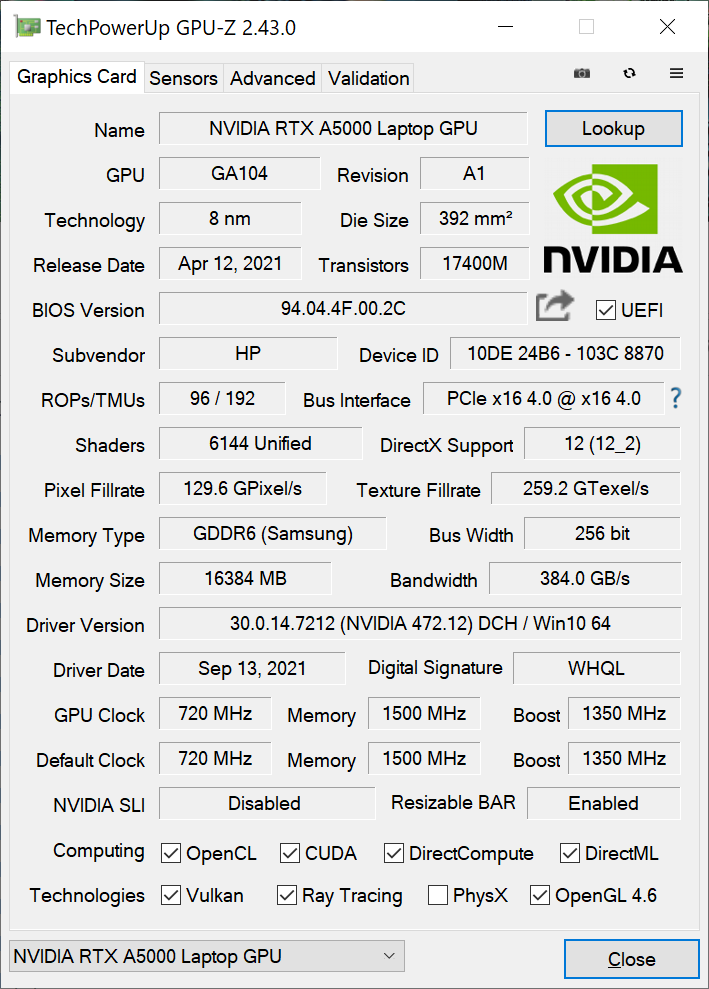
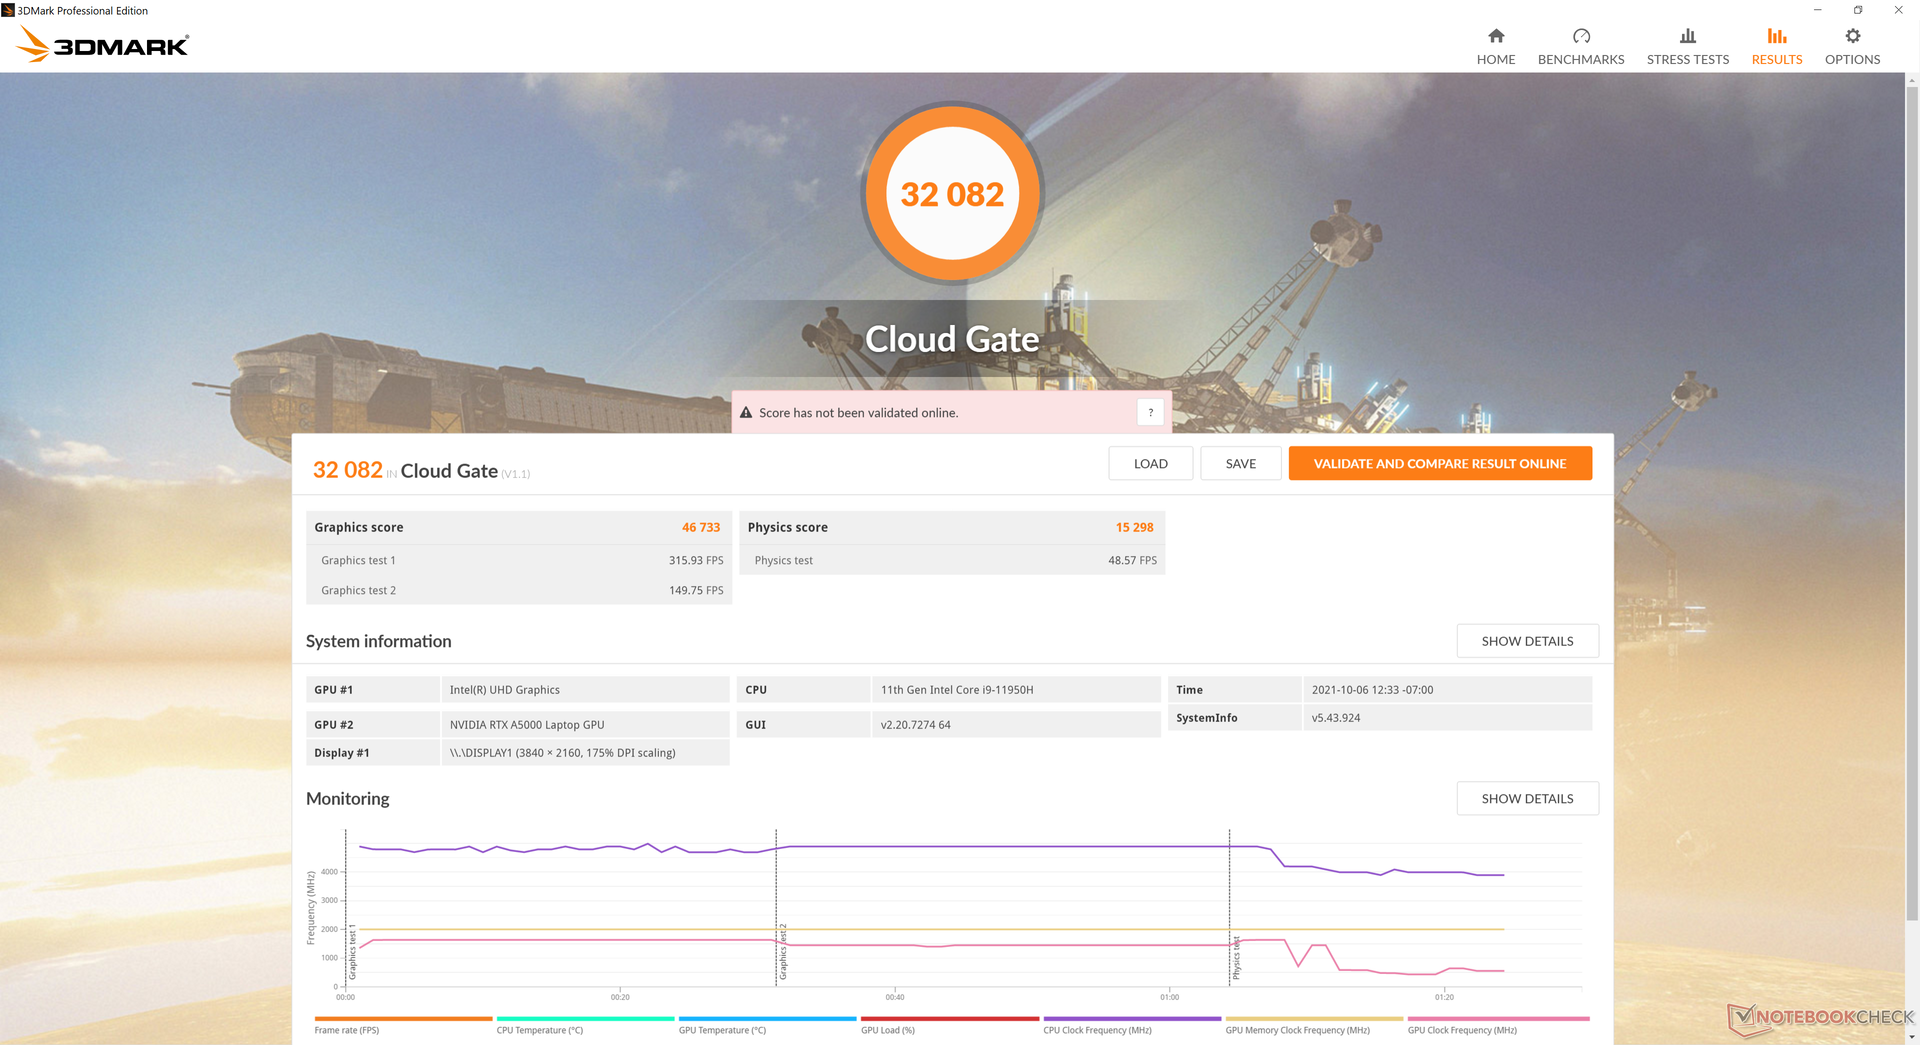
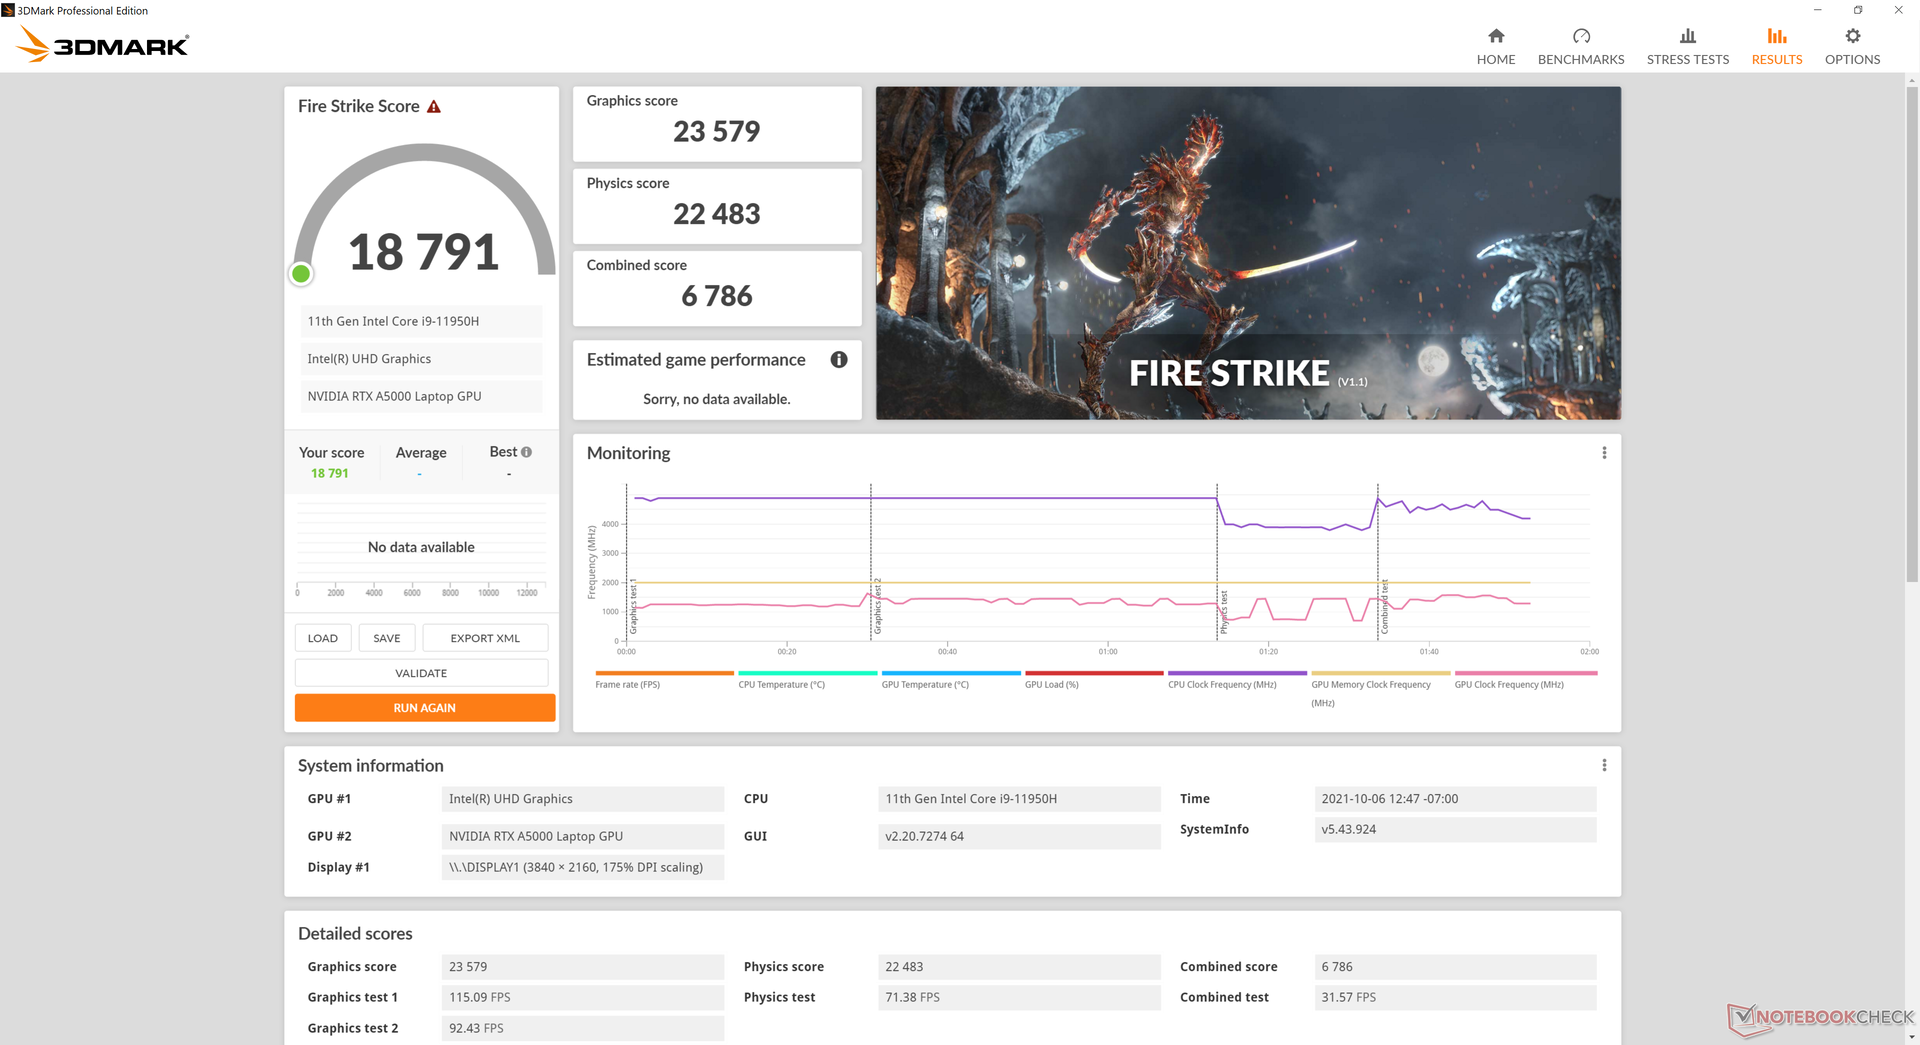
GPU Performance — Quadro RTX A5000 Powerhouse
Raw graphics performance lies in between the mobile GeForce RTX 3060 and mobile RTX 3070 to be about 10 to 20 percent faster than the Quadro RTX 5000 Max-Q in the older Fury 15 G7. Certain sub-benchmarks within SpecViewPerf can even see a 40 to 50 percent improvement.
Though not optimized for gaming, the system can definitely power through even the most demanding titles at QHD resolution. Overall gaming performance is similar to the mobile GeForce RTX 3060 in most cases.
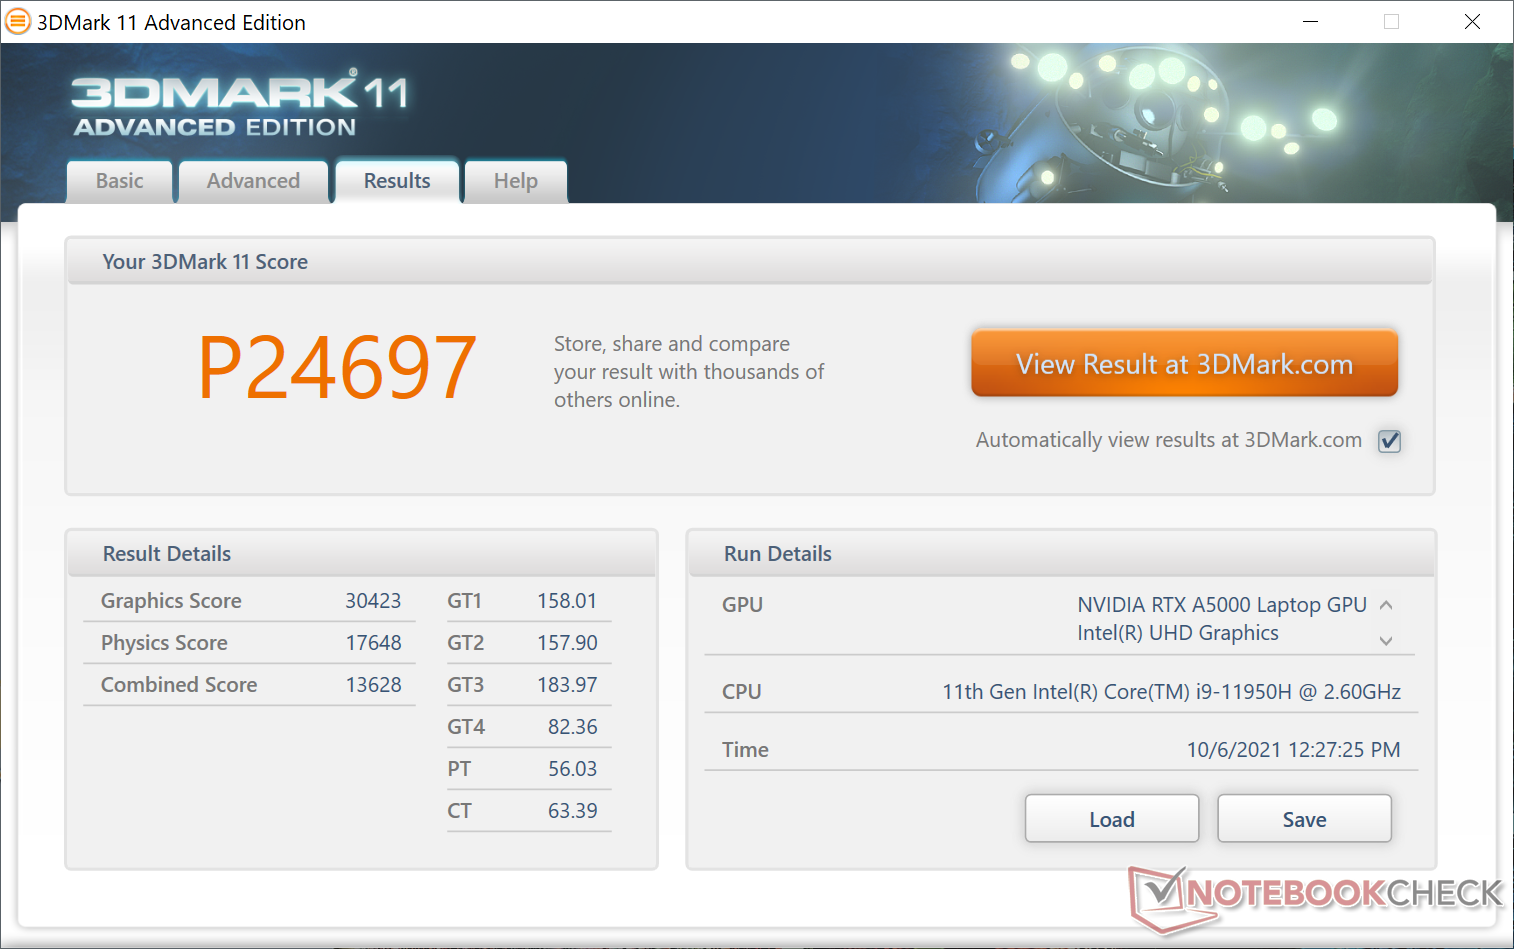
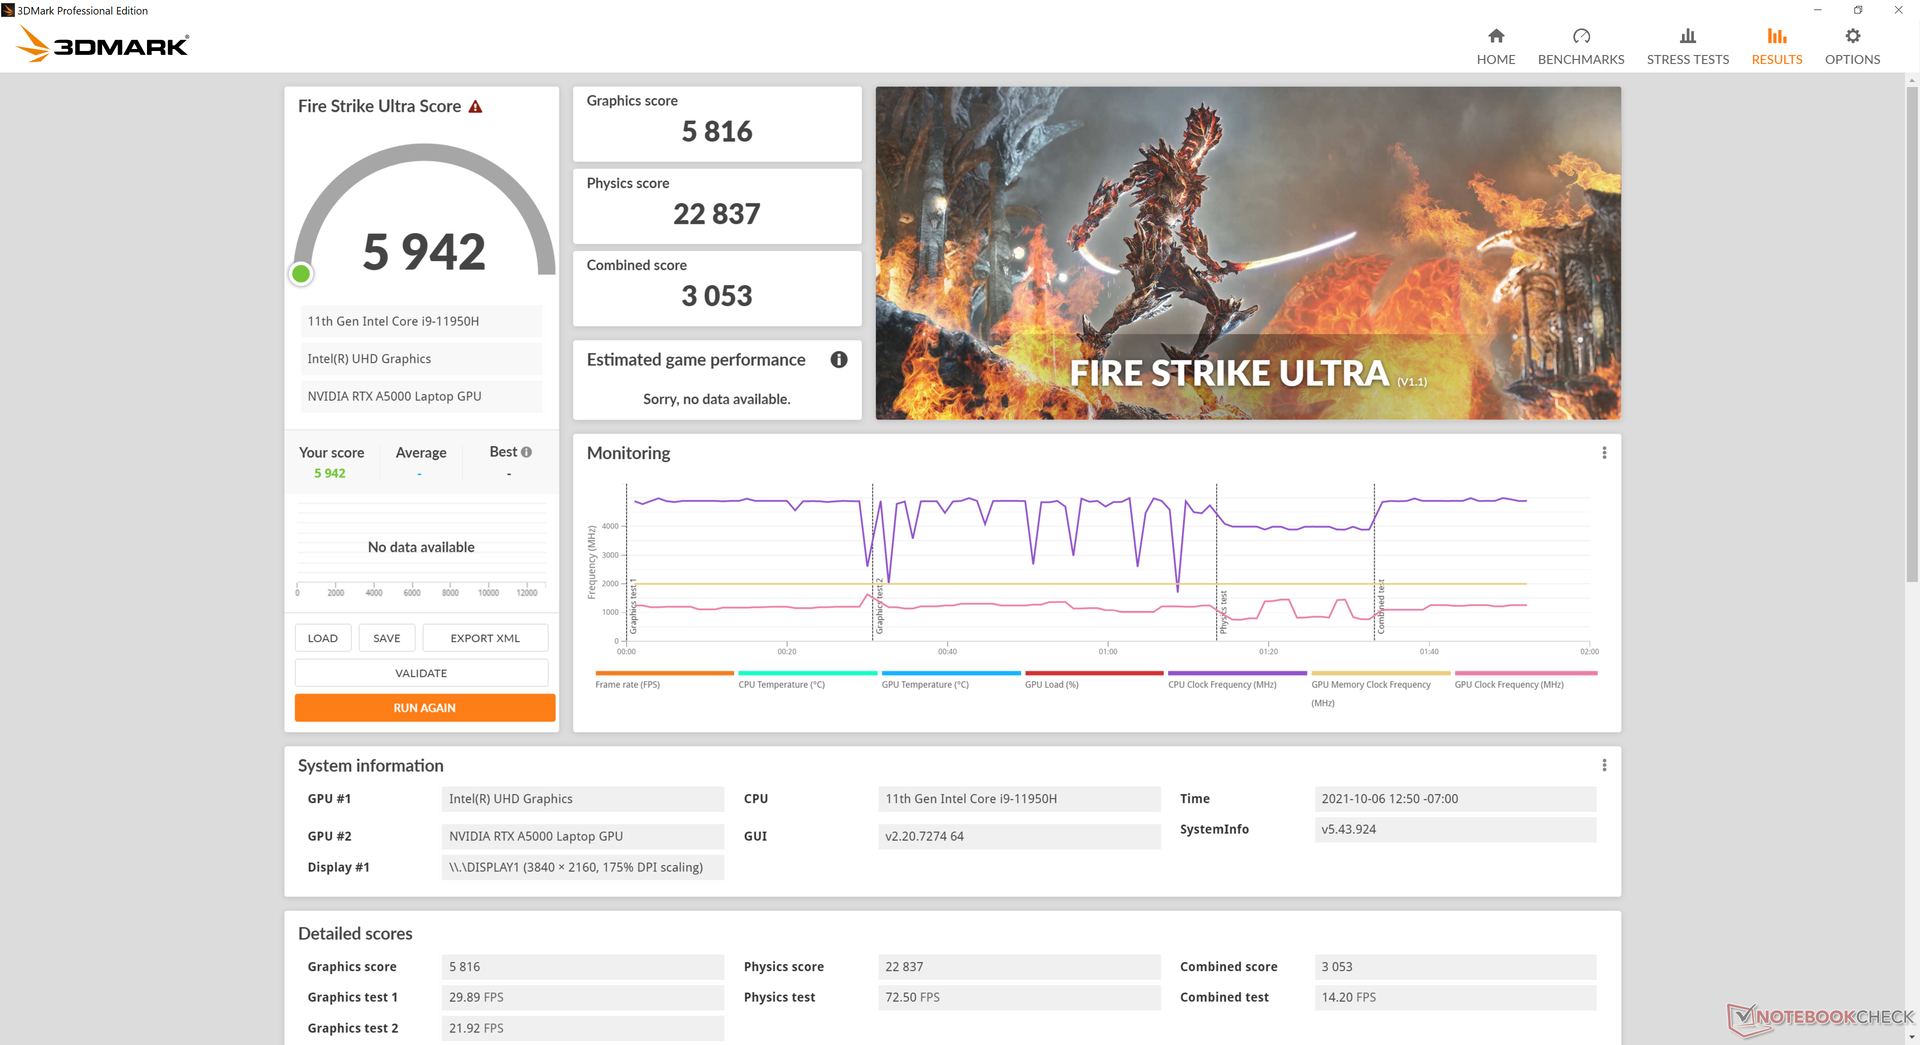
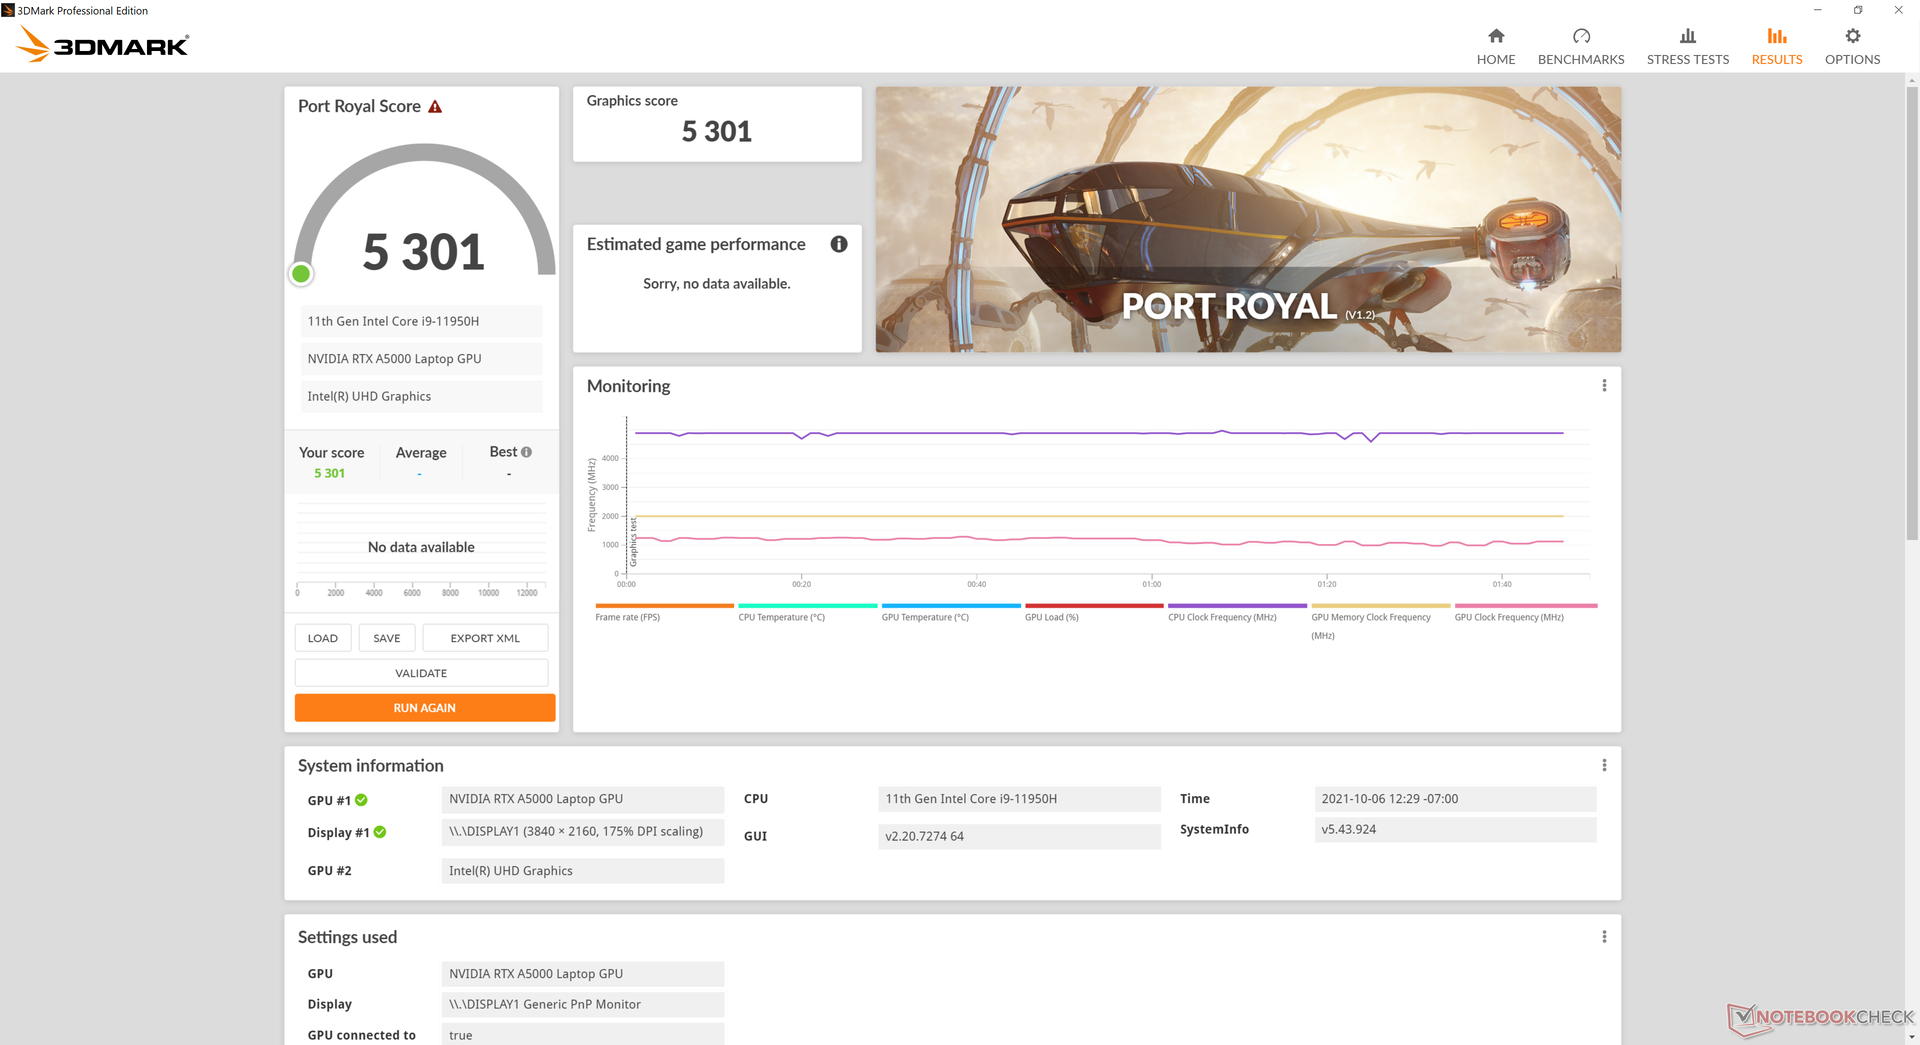
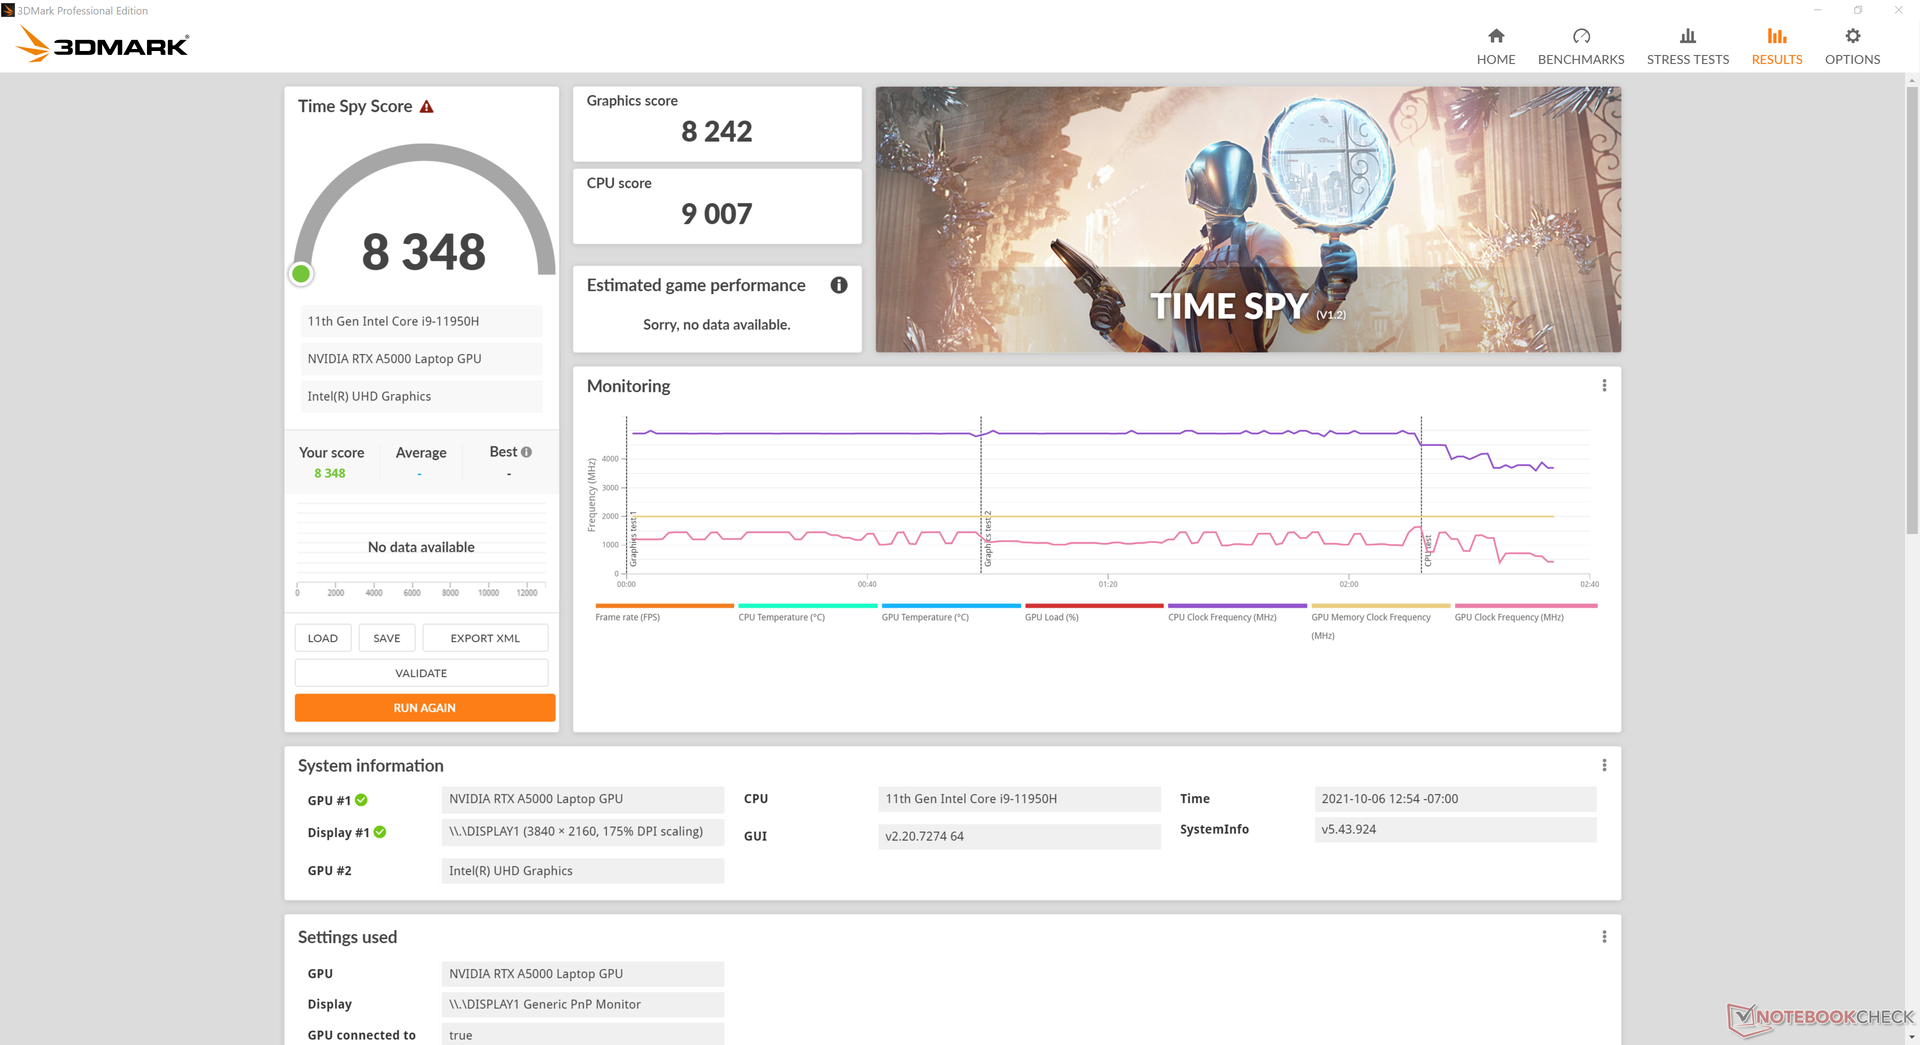
| 3DMark 11 Performance | 24697 points | |
| 3DMark Cloud Gate Standard Score | 32082 points | |
| 3DMark Fire Strike Score | 18791 points | |
| 3DMark Time Spy Score | 8348 points | |
Help | ||
Witcher 3 FPS Chart
| low | med. | high | ultra | QHD | 4K | |
|---|---|---|---|---|---|---|
| GTA V (2015) | 175 | 169 | 131 | 76.1 | 70.4 | 75.5 |
| The Witcher 3 (2015) | 335.1 | 227.4 | 149.5 | 81.7 | 57.5 | |
| Dota 2 Reborn (2015) | 164 | 148 | 140 | 131 | 95 | |
| Final Fantasy XV Benchmark (2018) | 155 | 110 | 81.1 | 62.6 | 35.4 | |
| X-Plane 11.11 (2018) | 108 | 90.8 | 76.5 | 48.6 | ||
| Far Cry 5 (2018) | 137 | 93 | 90 | 85 | 79 | 44 |
| Strange Brigade (2018) | 337 | 195 | 165 | 147 | 108 | 64 |
| Shadow of the Tomb Raider (2018) | 128 | 109 | 106 | 94 | 71 | 38 |
| Far Cry New Dawn (2019) | 105 | 85 | 78 | 71 | 62 | 43 |
| Metro Exodus (2019) | 154 | 94.8 | 74.5 | 59.8 | 46.3 | 28.5 |
| Borderlands 3 (2019) | 159.6 | 121.6 | 85.9 | 67.1 | 46.8 | 25.6 |
| Gears Tactics (2020) | 145.8 | 181.2 | 120.3 | 94.7 | 66.6 | 34.9 |
| Horizon Zero Dawn (2020) | 133 | 109 | 101 | 91 | 73 | 40 |
| Watch Dogs Legion (2020) | 69 | 64 | 60 | 45 | 43 | 26 |
| Dirt 5 (2020) | 178.1 | 115.2 | 91.7 | 74.8 | 59.5 | 39 |
| Assassin´s Creed Valhalla (2020) | 113 | 76 | 64 | 55 | 44 | 29 |
| Immortals Fenyx Rising (2020) | 123 | 90 | 84 | 80 | 59 | 38 |
| Hitman 3 (2021) | 206.6 | 147.3 | 138.1 | 125.8 | 87.1 | 47.1 |
| F1 2021 (2021) | 164 | 136 | 122 | 85 | 59 | 38 |
Emissions
System Noise
The two ~50 mm fans in the Fury 15 G8 tend to ramp up in RPM sooner than on the Fury 15 G7 when stressful loads are introduced. For example, we're able to record a high a 37.8 dB(A) when running the first benchmark scene of 3DMark 06 compared to only 31.7 dB(A) on the older model. Overall fan noise remains quieter than on the ZBook Studio 15 G8 but much louder than on the slower ZBook Firefly 15 G7.
| HP ZBook Fury 15 G8 RTX A5000 Laptop GPU, i9-11950H, Samsung PM981a MZVLB1T0HBLR | HP ZBook Fury 15 G7 Quadro RTX 5000 Max-Q, W-10885M, Samsung PM981a MZVLB1T0HBLR | Dell Precision 5000 5560 RTX A2000 Laptop GPU, i7-11850H, Samsung PM9A1 MZVL22T0HBLB | HP ZBook Studio 15 G8 GeForce RTX 3070 Laptop GPU, i9-11950H, Samsung PM981a MZVLB2T0HALB | Lenovo ThinkPad P15s Gen2-20W6000GGE T500 Laptop GPU, i7-1165G7, WDC PC SN720 SDAQNTW-1T00 | HP ZBook Firefly 15 G7 Quadro P520, i7-10610U, Toshiba XG6 KXG60ZNV1T02 | |
|---|---|---|---|---|---|---|
| Noise | -5% | 8% | -6% | 2% | -3% | |
| off / environment * (dB) | 24.1 | 26.4 -10% | 23.4 3% | 23.5 2% | 24.3 -1% | 29.3 -22% |
| Idle Minimum * (dB) | 24.1 | 26.4 -10% | 23.6 2% | 25.3 -5% | 25.5 -6% | 29.3 -22% |
| Idle Average * (dB) | 24.1 | 26.4 -10% | 23.6 2% | 25.3 -5% | 25.5 -6% | 29.3 -22% |
| Idle Maximum * (dB) | 24.8 | 26.4 -6% | 23.6 5% | 25.3 -2% | 25.5 -3% | 30 -21% |
| Load Average * (dB) | 37.8 | 31.7 16% | 25.8 32% | 41.2 -9% | 35.65 6% | 32.8 13% |
| Witcher 3 ultra * (dB) | 44.2 | 47 -6% | 40.1 9% | 49.4 -12% | 32.8 26% | |
| Load Maximum * (dB) | 44.2 | 47 -6% | 41.4 6% | 49.4 -12% | 35.65 19% | 32.8 26% |
* ... smaller is better
Noise level
| Idle |
| 24.1 / 24.1 / 24.8 dB(A) |
| Load |
| 37.8 / 44.2 dB(A) |
 | ||
30 dB silent 40 dB(A) audible 50 dB(A) loud |
||
min: | ||
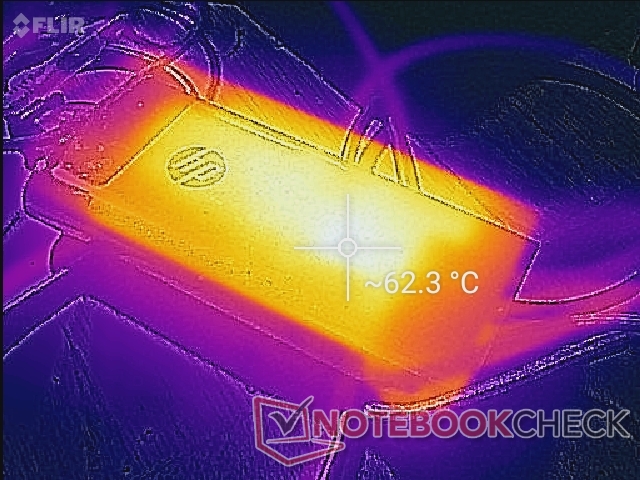
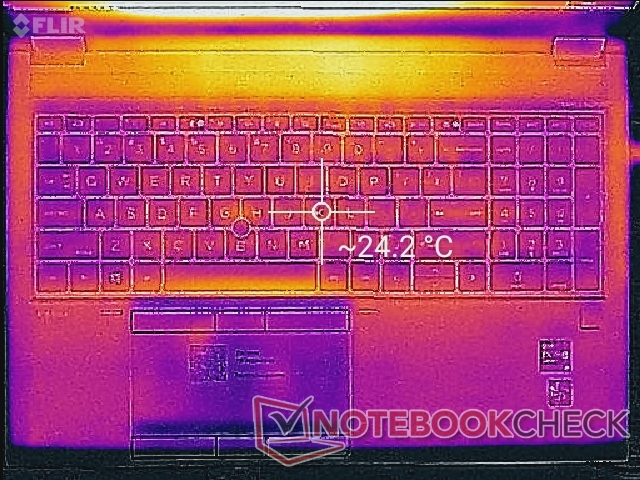
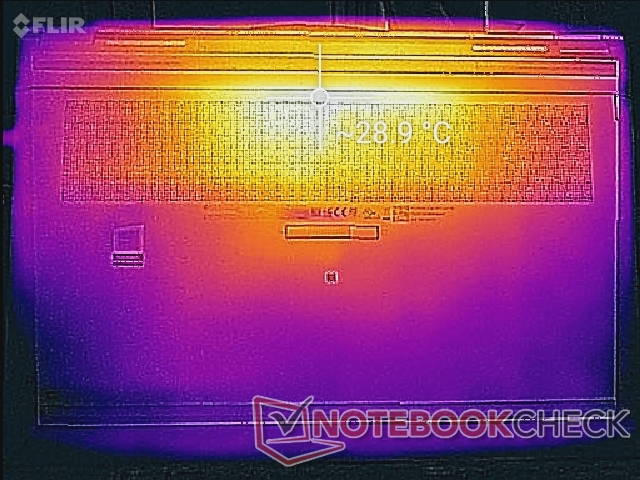
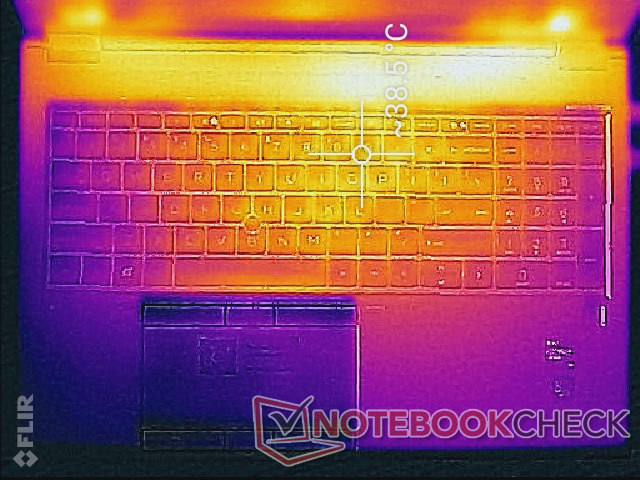
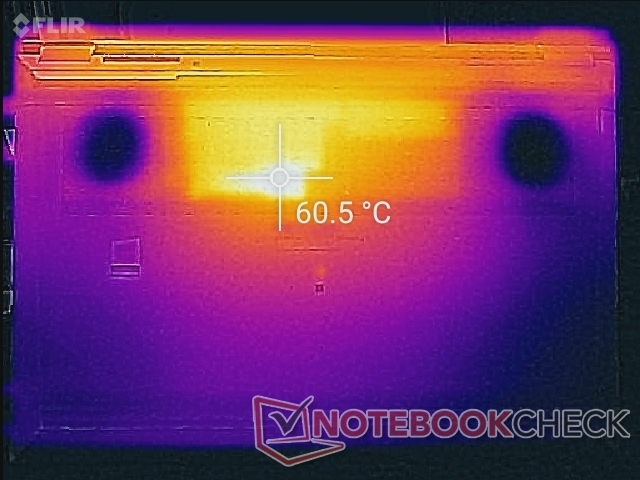
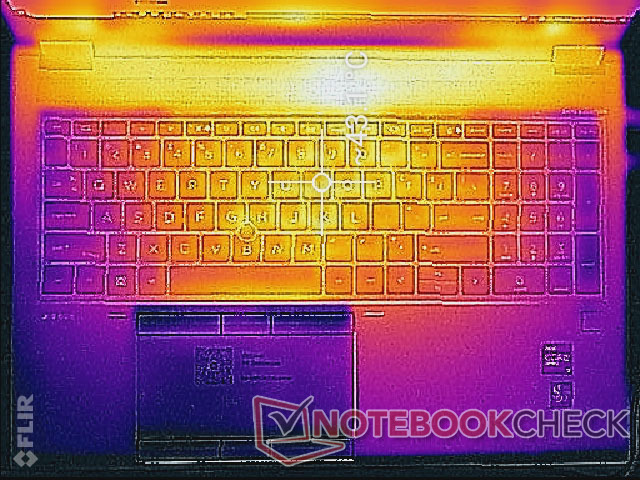
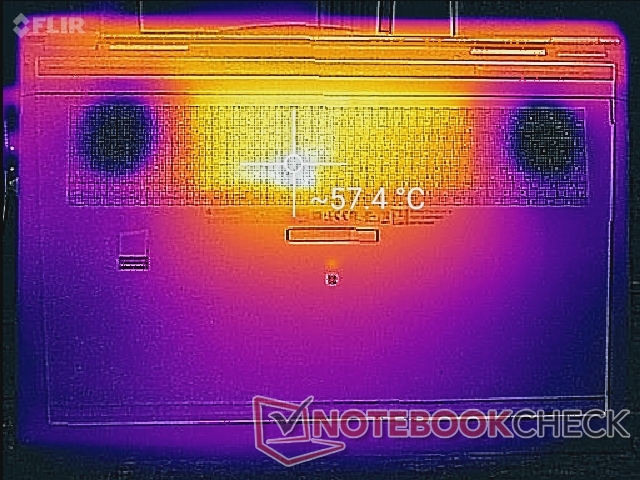
Temperature — Vapor Chamber Cooling
Surface temperatures can reach up to 43 C and 60 C on the top and bottom, respectively, compared to 49 C to 53 C on the Precision 7550 when running demanding loads for extended periods. In other words, the HP is cooler on top at the expense of a warmer bottom while the Dell is cooler on the bottom at the expense of warmer keyboard keys.
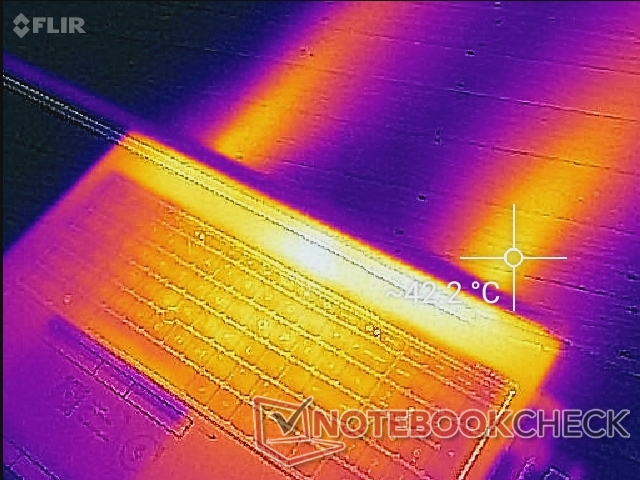
(-) The maximum temperature on the upper side is 45.6 °C / 114 F, compared to the average of 38.2 °C / 101 F, ranging from 22.2 to 69.8 °C for the class Workstation.
(-) The bottom heats up to a maximum of 57.6 °C / 136 F, compared to the average of 41.1 °C / 106 F
(+) In idle usage, the average temperature for the upper side is 24.4 °C / 76 F, compared to the device average of 32 °C / 90 F.
(±) Playing The Witcher 3, the average temperature for the upper side is 34 °C / 93 F, compared to the device average of 32 °C / 90 F.
(+) The palmrests and touchpad are reaching skin temperature as a maximum (33 °C / 91.4 F) and are therefore not hot.
(-) The average temperature of the palmrest area of similar devices was 27.8 °C / 82 F (-5.2 °C / -9.4 F).
Stress Test
When stressed with Prime95, the CPU would boost to 3.6 GHz for the first couple of seconds until hitting a core temperature of 96 C. Clock rates would then stabilize in the 3.0 to 3.5 GHz range while maintaining 96 C. Results are similar to what we observed on both the Dell Precision 7550 and older Fury 15 G7 to show that these high-performance workstations are prioritizing CPU performance even if it means much warmer core temperatures overall.
When running Witcher 3, CPU and GPU temperatures would stabilize at 94 C and 75 C, respectively, compared to 85 C and 70 C on the Fury 15 G7. Thus, the boost in performance year-over-year entails slight temperatures increases. The processors in our Precision 7550 would stabilize at cooler temperatures by relatively wide margins between 10 to 20 C when running the same game.
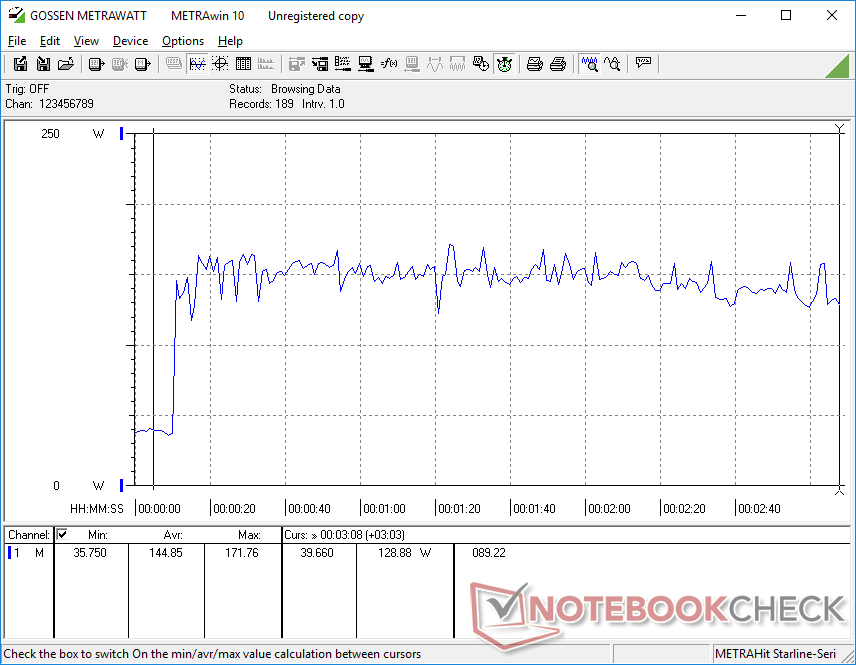
GPU board power draw would stabilize at 78 W when running gaming loads compared to its 90 W TGP target. We're able to attain a draw of 93 W albeit only for a short period during the start of the test.
Running on batteries will limit performance. A 3DMark Fire Strike test on battery power would return Physics and Graphics scores of 17779 and 6244 points, respectively, compared to 22483 and 23579 points when on mains.
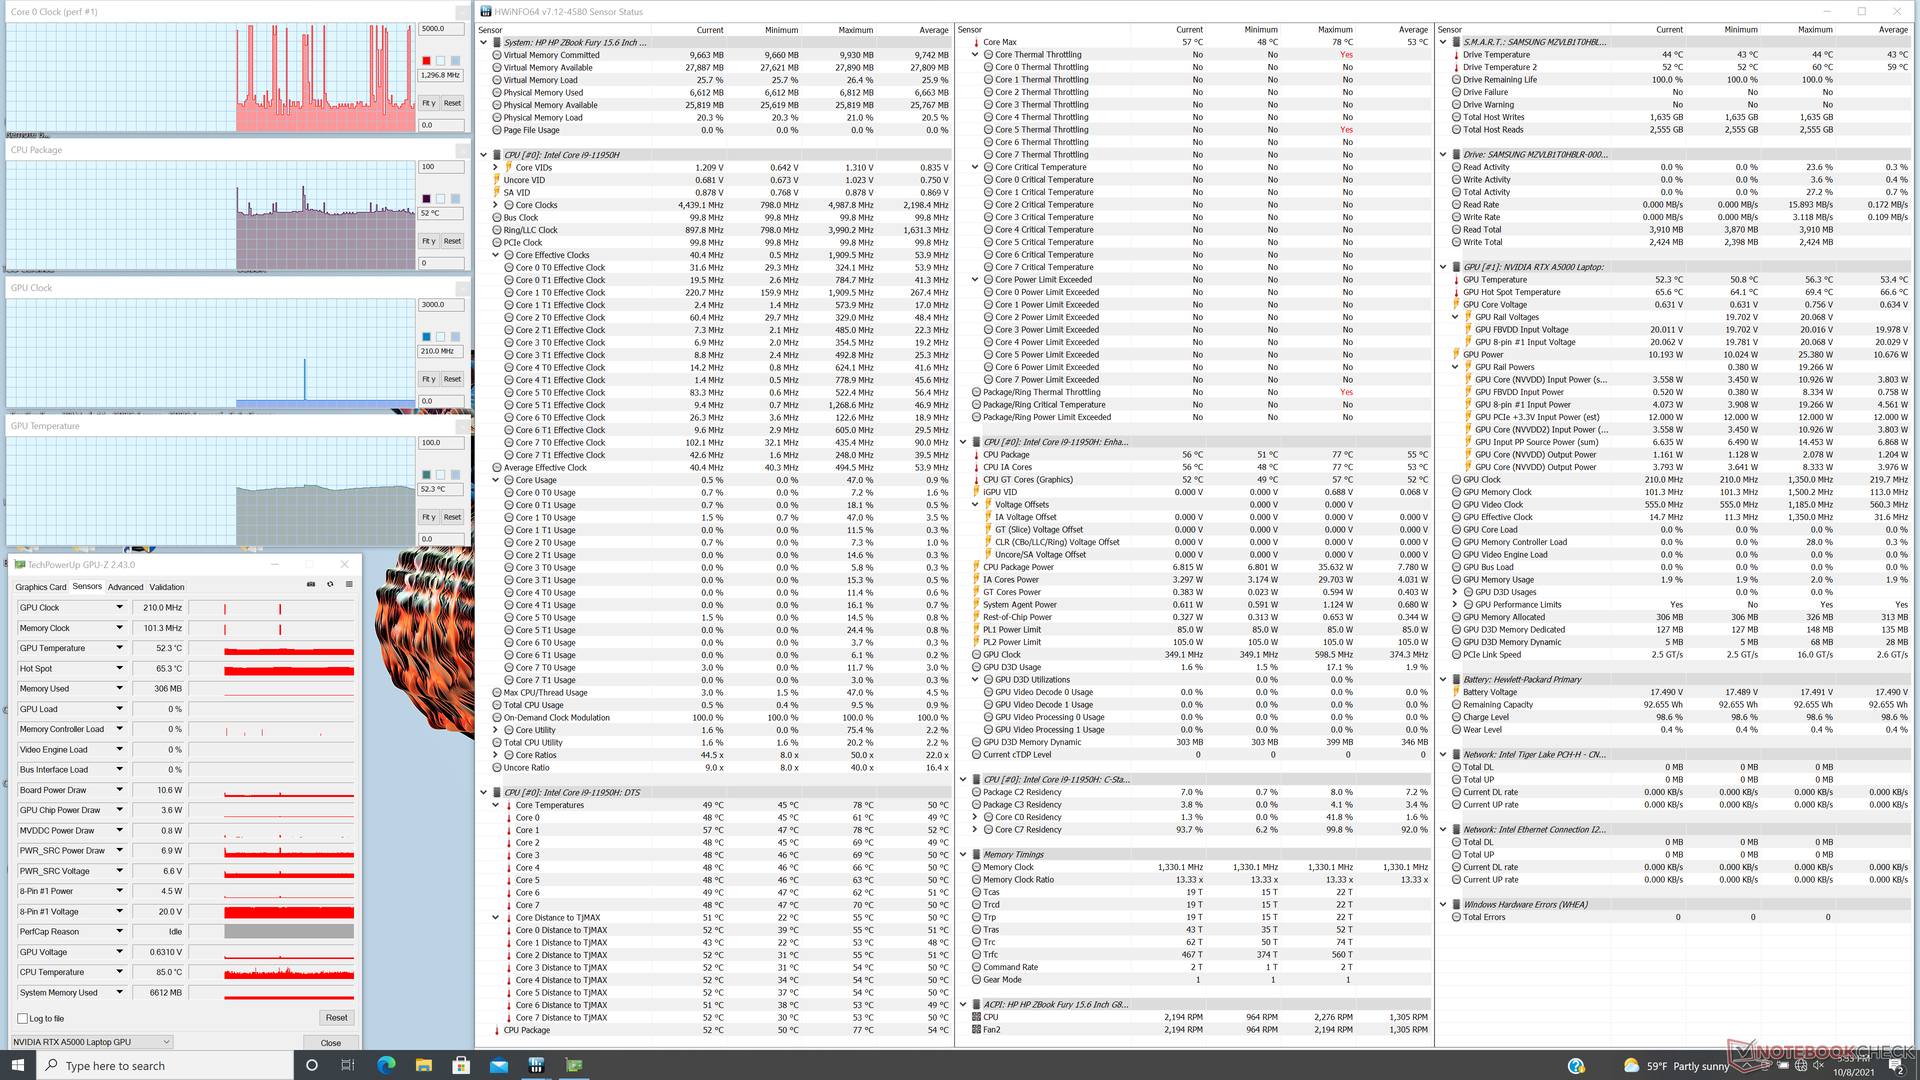
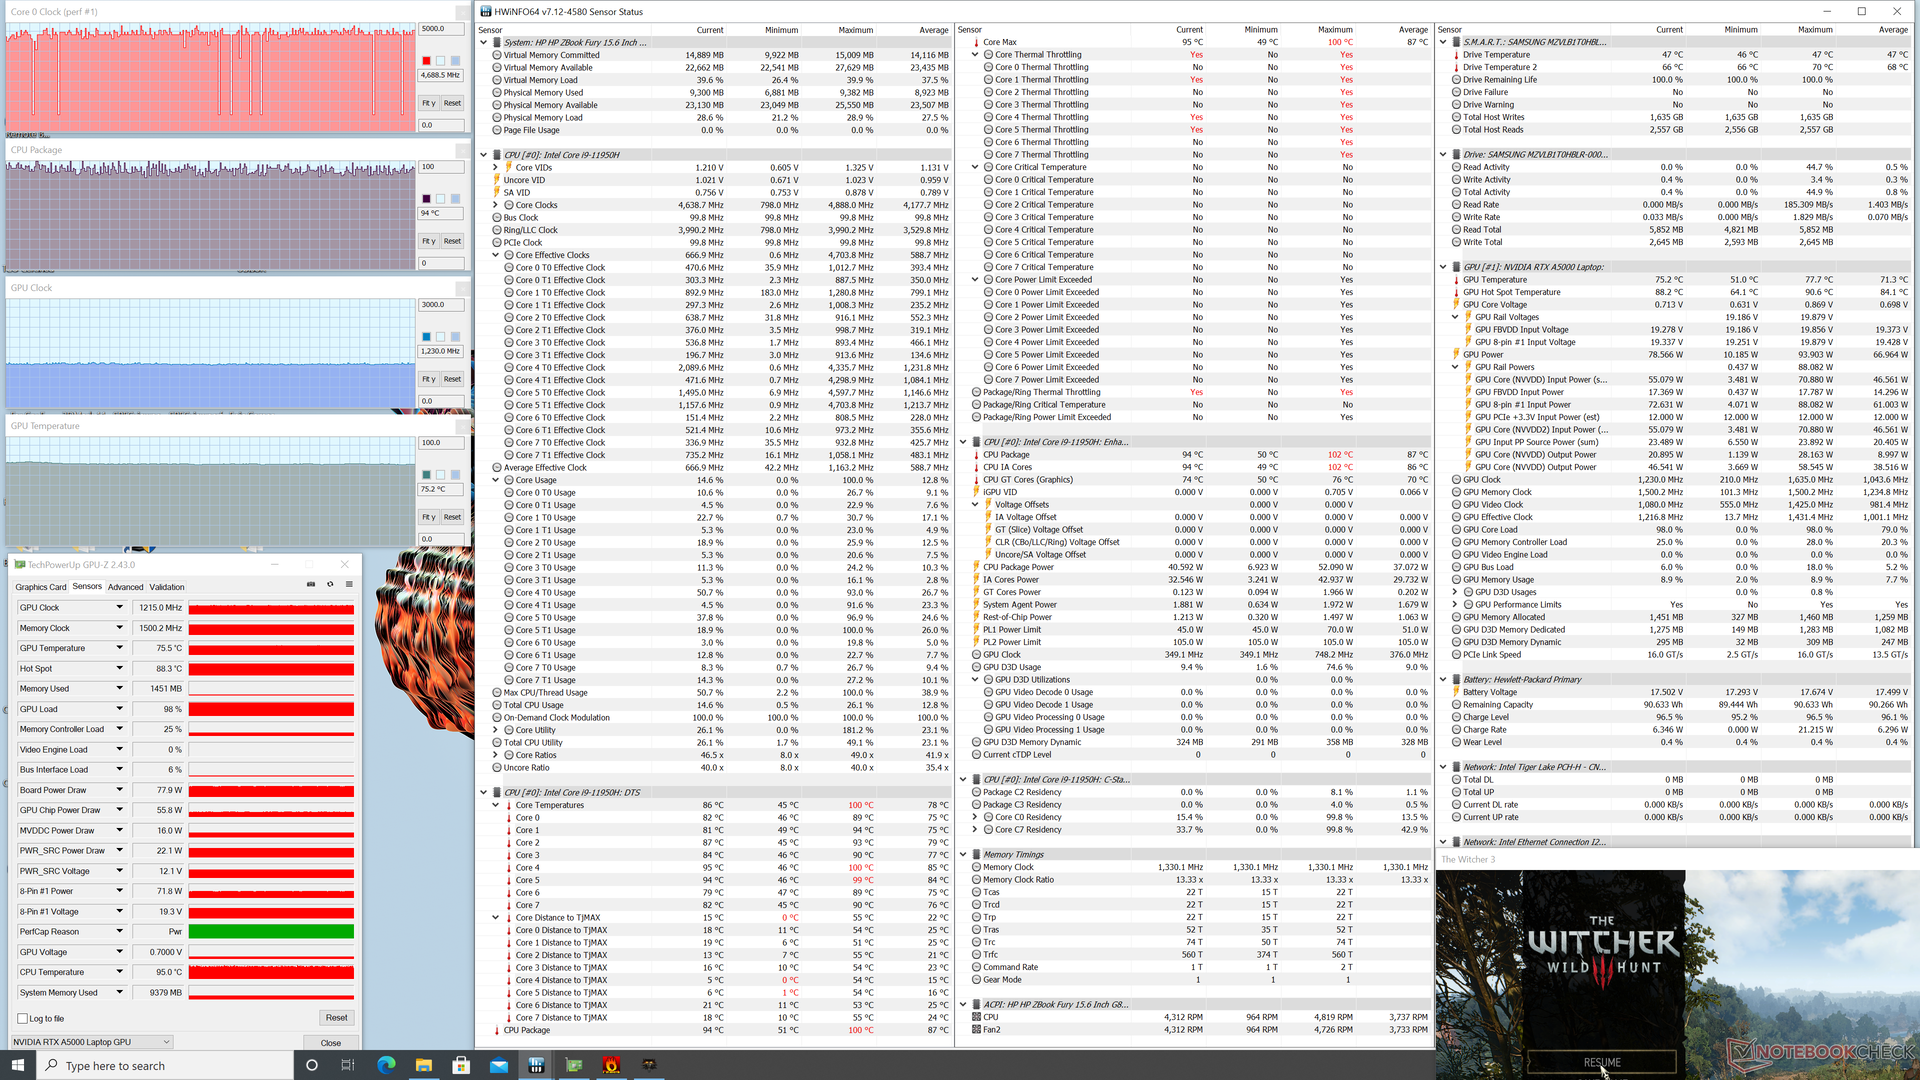
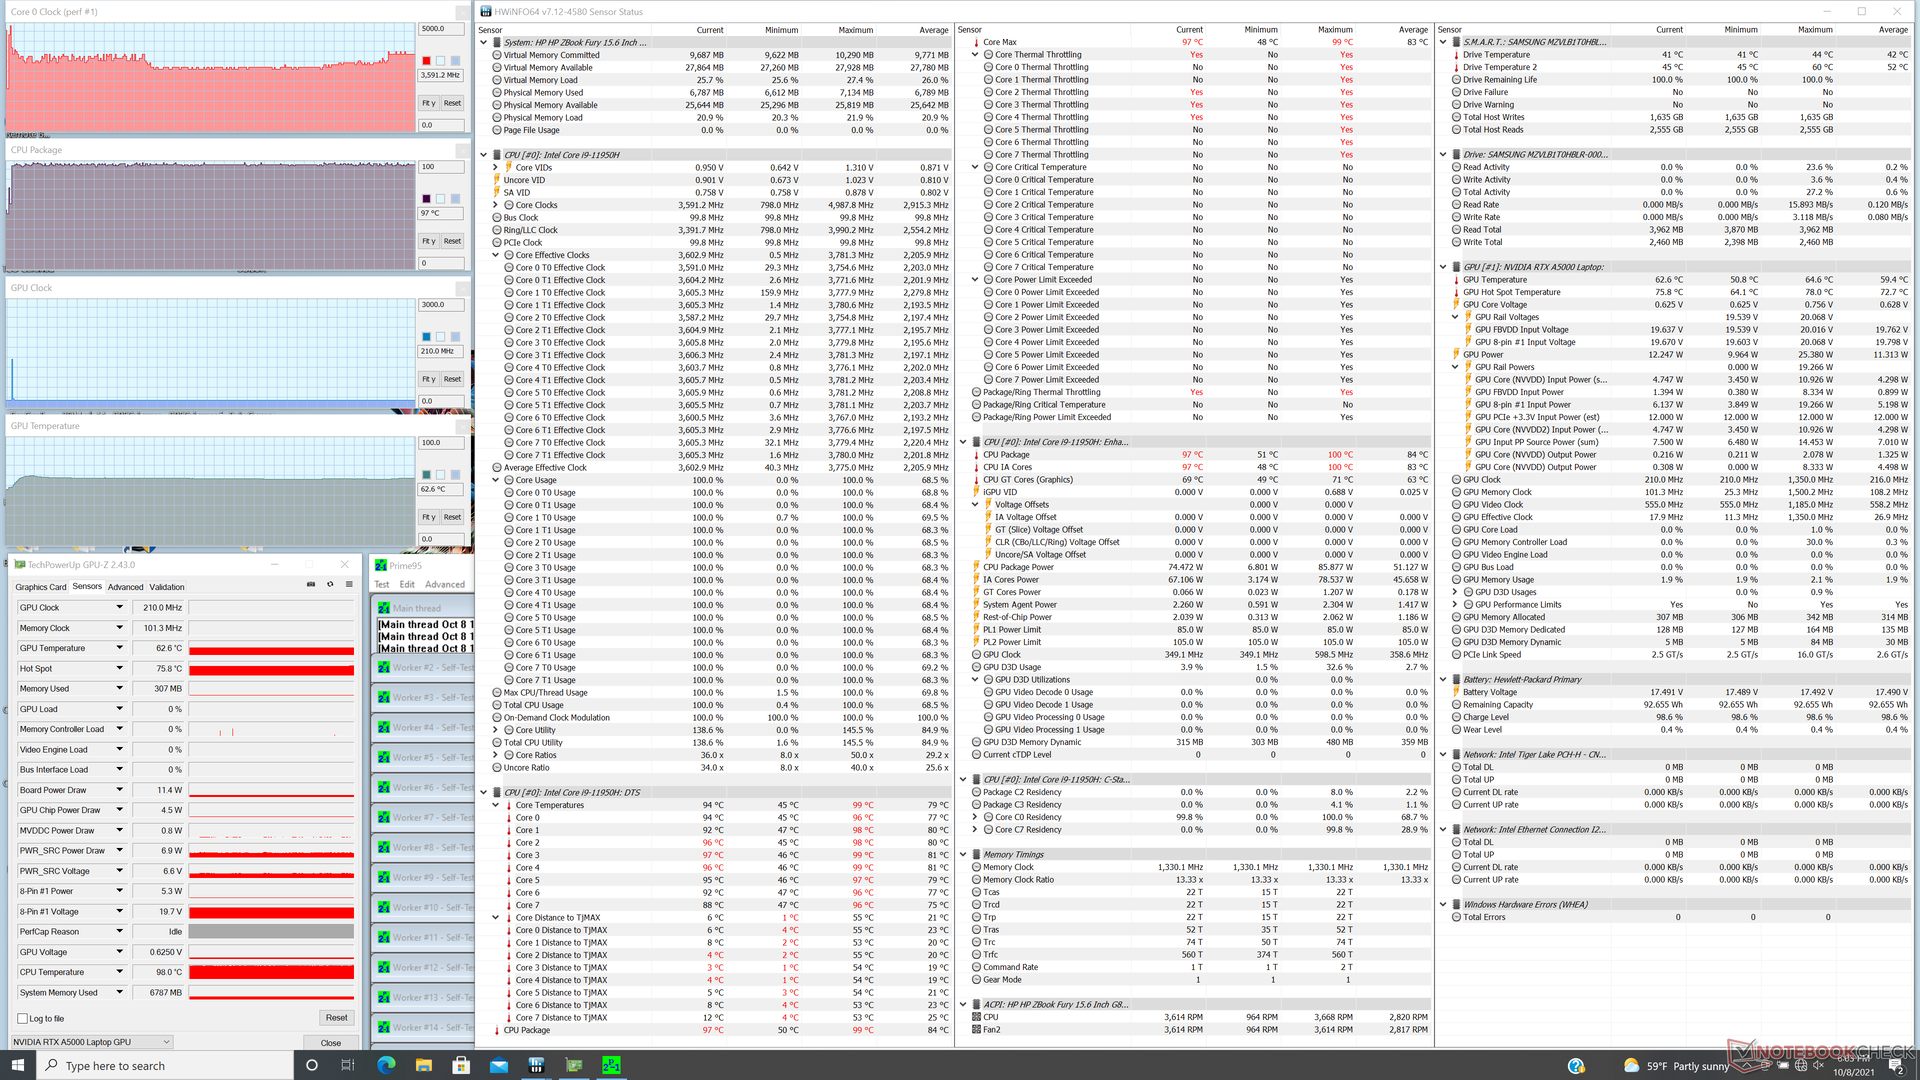
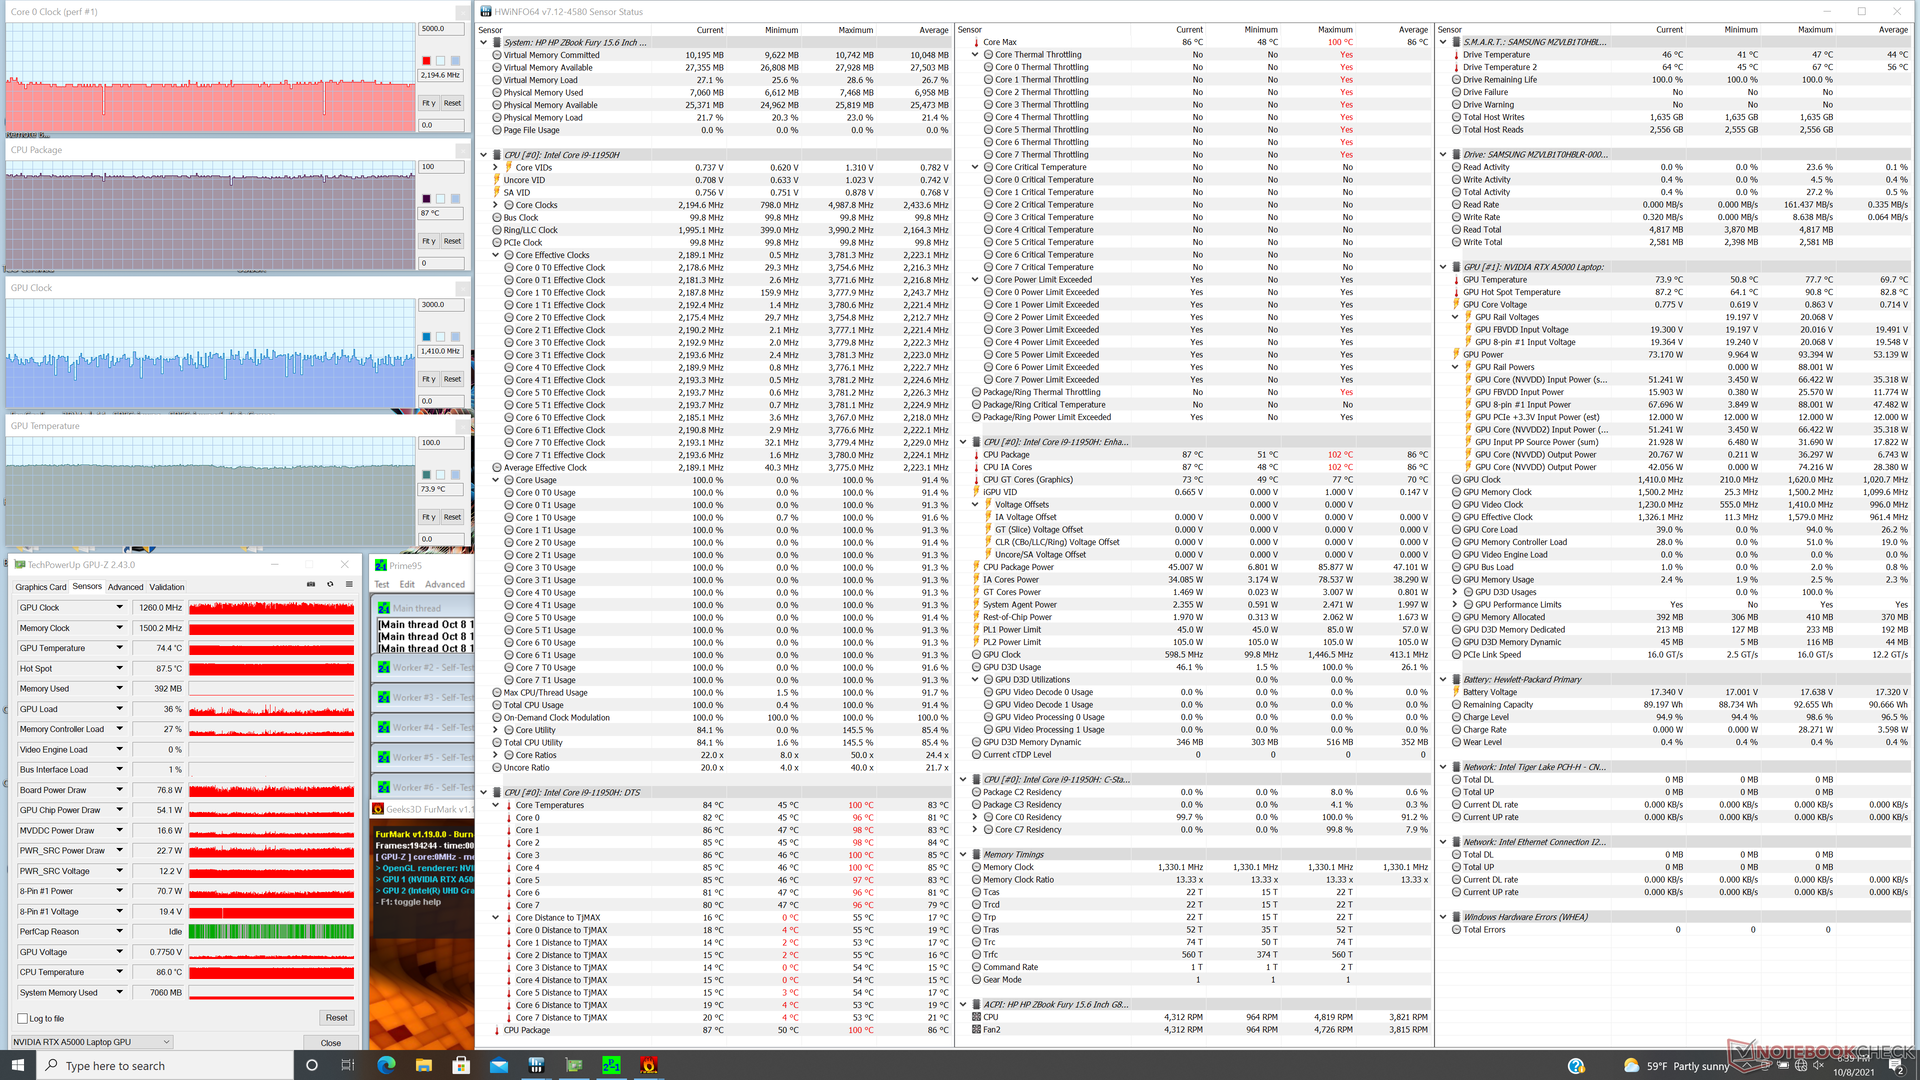
| CPU Clock (GHz) | GPU Clock (MHz) | Average CPU Temperature (°C) | Average GPU Temperature (°C) | |
| System Idle | -- | -- | 52 | 52 |
| Prime95 Stress | 3.0 - 3.5 | -- | 97 | 63 |
| Prime95 + FurMark Stress | 2.2 | ~1260 | 87 | 74 |
| Witcher 3 Stress | ~4.7 | 1215 | ~94 | 75 |
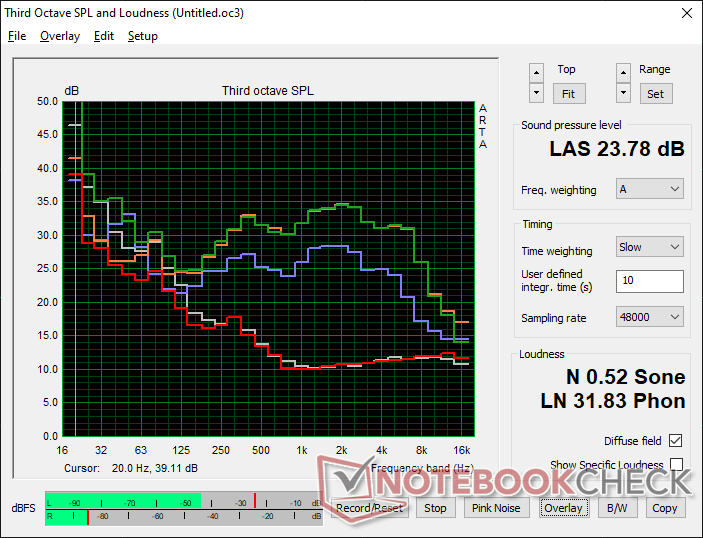
Speakers

HP ZBook Fury 15 G8 audio analysis
(±) | speaker loudness is average but good (79.8 dB)
Bass 100 - 315 Hz
(±) | reduced bass - on average 10.6% lower than median
(±) | linearity of bass is average (8.8% delta to prev. frequency)
Mids 400 - 2000 Hz
(+) | balanced mids - only 3.9% away from median
(+) | mids are linear (4.8% delta to prev. frequency)
Highs 2 - 16 kHz
(+) | balanced highs - only 2.9% away from median
(+) | highs are linear (5.3% delta to prev. frequency)
Overall 100 - 16.000 Hz
(+) | overall sound is linear (11.9% difference to median)
Compared to same class
» 17% of all tested devices in this class were better, 4% similar, 79% worse
» The best had a delta of 7%, average was 17%, worst was 35%
Compared to all devices tested
» 9% of all tested devices were better, 2% similar, 89% worse
» The best had a delta of 4%, average was 23%, worst was 134%
Apple MacBook 12 (Early 2016) 1.1 GHz audio analysis
(+) | speakers can play relatively loud (83.6 dB)
Bass 100 - 315 Hz
(±) | reduced bass - on average 11.3% lower than median
(±) | linearity of bass is average (14.2% delta to prev. frequency)
Mids 400 - 2000 Hz
(+) | balanced mids - only 2.4% away from median
(+) | mids are linear (5.5% delta to prev. frequency)
Highs 2 - 16 kHz
(+) | balanced highs - only 2% away from median
(+) | highs are linear (4.5% delta to prev. frequency)
Overall 100 - 16.000 Hz
(+) | overall sound is linear (10.2% difference to median)
Compared to same class
» 7% of all tested devices in this class were better, 2% similar, 90% worse
» The best had a delta of 5%, average was 18%, worst was 53%
Compared to all devices tested
» 5% of all tested devices were better, 1% similar, 94% worse
» The best had a delta of 4%, average was 23%, worst was 134%
Energy Management
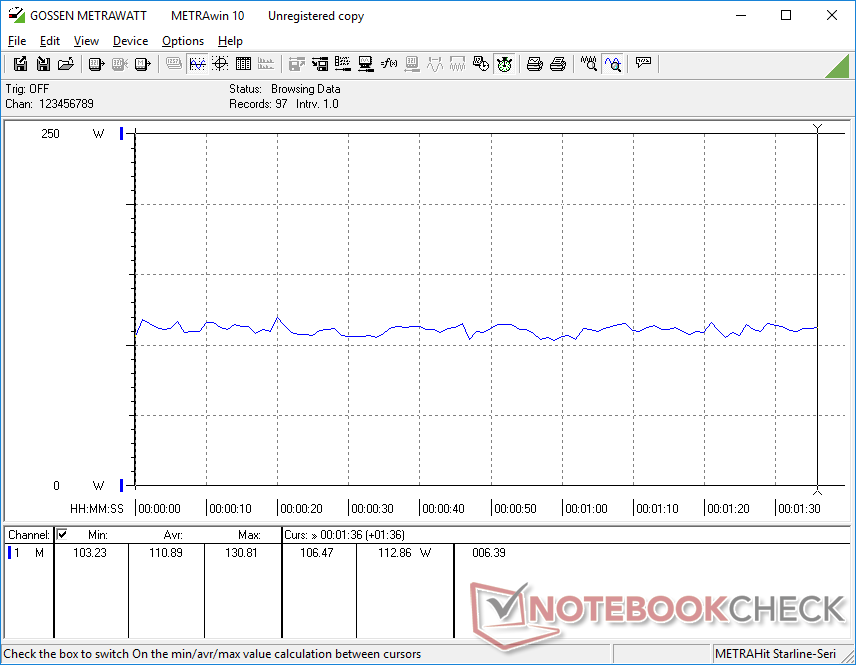
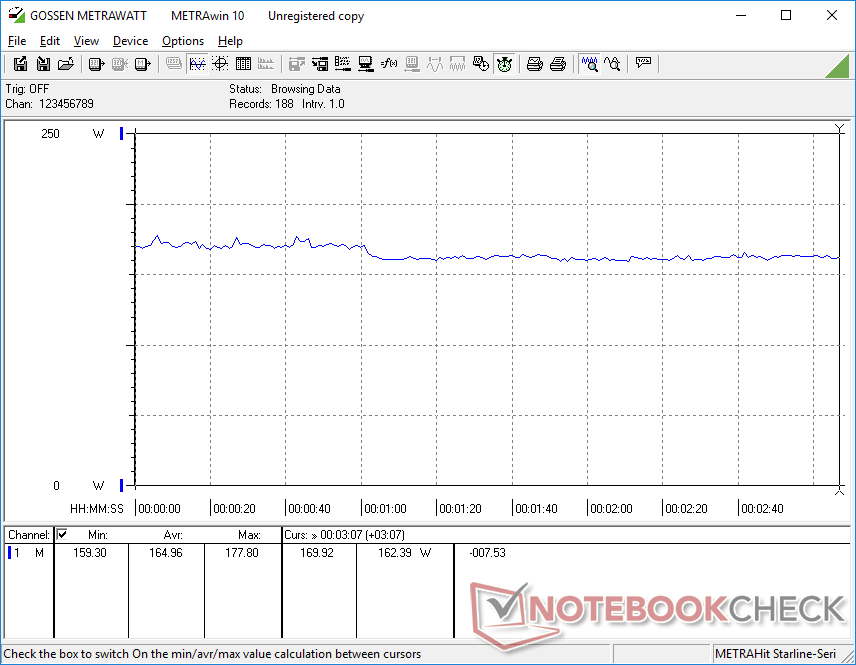
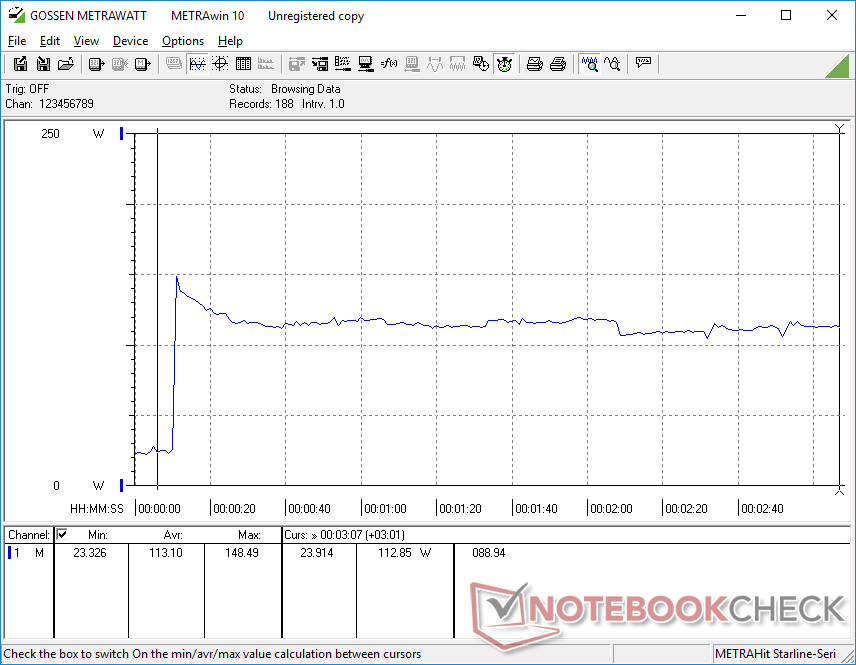
Power Consumption — Power-Hungry Display
The system draws slightly more power than its immediate Fury 15 G7 predecessor particularly when under low processing loads. Our unit would settle at slightly higher ranges from 8 W to 20 W compared to 4 W to 14 W on the older model. Power consumption is otherwise very close between the two models when running demanding loads.
Running extreme loads (Prime95+FurMark) would cause power consumption to spike to as high as 172 W from the medium-sized (~15.2 x 7.2 x 2.4 cm) 200 W AC adapter. The system will continue to recharge even when running high loads albeit at a slower rate.
Jumping from the minimum to maximum brightness setting would consume about 11 W more compared to around half that on most Ultrabooks due to the extra-bright panel on our HP.
| Off / Standby | |
| Idle | |
| Load |
|
Key:
min: | |
| HP ZBook Fury 15 G8 i9-11950H, RTX A5000 Laptop GPU, Samsung PM981a MZVLB1T0HBLR, IPS, 3840x2160, 15.6" | HP ZBook Fury 15 G7 W-10885M, Quadro RTX 5000 Max-Q, Samsung PM981a MZVLB1T0HBLR, IPS, 3840x2160, 15.6" | Dell Precision 5000 5560 i7-11850H, RTX A2000 Laptop GPU, Samsung PM9A1 MZVL22T0HBLB, IPS, 3840x2400, 15.6" | HP ZBook Studio 15 G8 i9-11950H, GeForce RTX 3070 Laptop GPU, Samsung PM981a MZVLB2T0HALB, OLED, 3840x2160, 15.6" | Lenovo ThinkPad P15s Gen2-20W6000GGE i7-1165G7, T500 Laptop GPU, WDC PC SN720 SDAQNTW-1T00, IPS LED, 3840x2160, 15.6" | HP ZBook Firefly 15 G7 i7-10610U, Quadro P520, Toshiba XG6 KXG60ZNV1T02, IPS LED, 3840x2160, 15.6" | |
|---|---|---|---|---|---|---|
| Power Consumption | 11% | 22% | -10% | 49% | 59% | |
| Idle Minimum * (Watt) | 8.3 | 4.6 45% | 6.2 25% | 11 -33% | 5.8 30% | 3.5 58% |
| Idle Average * (Watt) | 19.9 | 13.6 32% | 13.9 30% | 18.8 6% | 13.3 33% | 6.7 66% |
| Idle Maximum * (Watt) | 21.8 | 21.5 1% | 23.8 -9% | 31.7 -45% | 15.6 28% | 9.6 56% |
| Load Average * (Watt) | 110.9 | 113.1 -2% | 95.7 14% | 105.2 5% | 43.2 61% | 60 46% |
| Witcher 3 ultra * (Watt) | 165 | 157.5 5% | 87 47% | 148 10% | 37.1 78% | 49.3 70% |
| Load Maximum * (Watt) | 171.8 | 199 -16% | 132.6 23% | 171.8 -0% | 67.3 61% | 68.6 60% |
* ... smaller is better
Power Consumption Witcher 3 / Stresstest
Battery Life
WLAN runtimes are a couple hours shorter on the Fury 15 G8 when compared to the Fury 15 G7 even when set to the same balanced profile, display brightness, and integrated graphics settings. We suspect that the higher native refresh rate or potential automatic background activity may have been partly responsible for the noticeably shorter battery life.
Charging from empty to full capacity takes about 90 minutes. Most USB-C chargers will work on the system as well so long as the power output is high enough.
| HP ZBook Fury 15 G8 i9-11950H, RTX A5000 Laptop GPU, 94 Wh | HP ZBook Fury 15 G7 W-10885M, Quadro RTX 5000 Max-Q, 94 Wh | Dell Precision 5000 5560 i7-11850H, RTX A2000 Laptop GPU, 86 Wh | HP ZBook Studio 15 G8 i9-11950H, GeForce RTX 3070 Laptop GPU, 83 Wh | Lenovo ThinkPad P15s Gen2-20W6000GGE i7-1165G7, T500 Laptop GPU, 57 Wh | HP ZBook Firefly 15 G7 i7-10610U, Quadro P520, 53 Wh | |
|---|---|---|---|---|---|---|
| Battery runtime | 39% | 2% | 0% | 24% | 47% | |
| WiFi v1.3 (h) | 6.2 | 8.6 39% | 6.3 2% | 6.2 0% | 7.7 24% | 9.1 47% |
| Reader / Idle (h) | 13.2 | 12 | 12.9 | |||
| Load (h) | 1.3 | 1.8 | 1.8 | 1.9 | 2 |
Pros
Cons
Verdict — Fury-ous Performance
The ZBook Fury 15 G8 squeezes more performance from the same Fury 15 G7 chassis that we're already familiar with. Users will see marginal-to-moderate gains from both the latest generation CPU and GPU while maintaining the same AC adapter and physical features. It would be unrealistic to expect a full top-down redesign from the Fury 15 G8 when the jump from the Fury 15 G6 to the Fury 15 G7 was already so significant for the series. Power users may want to consider the Fury 15 G8 if the performance gains are relevant to their workloads. Otherwise, the Fury 15 G7 can offer essentially the same experience for less.
The new 120 Hz 4K panel option deserves praise perhaps even more so than the processor upgrades since the smoother motion and reduced ghosting are much more noticeable. This is definitely a panel we would love to see on more laptops outside of the ZBook series.
The Fury 15 series in general remains an excellent alternative to workstations like the MSI WS66, Razer Blade Studio, ZBook Firefly, or Lenovo ThinkPad P1 which sacrifice features and options just for the thinner and sleeker look.
Price and availability
The ZBook Fury 15 G8 is not widely available through third party retailers as of this writing. At least one SKU can be found on Walmart, but users should purchase directly from HP instead for significantly more configurable options.
HP ZBook Fury 15 G8
- 10/13/2021 v7 (old)
Allen Ngo
