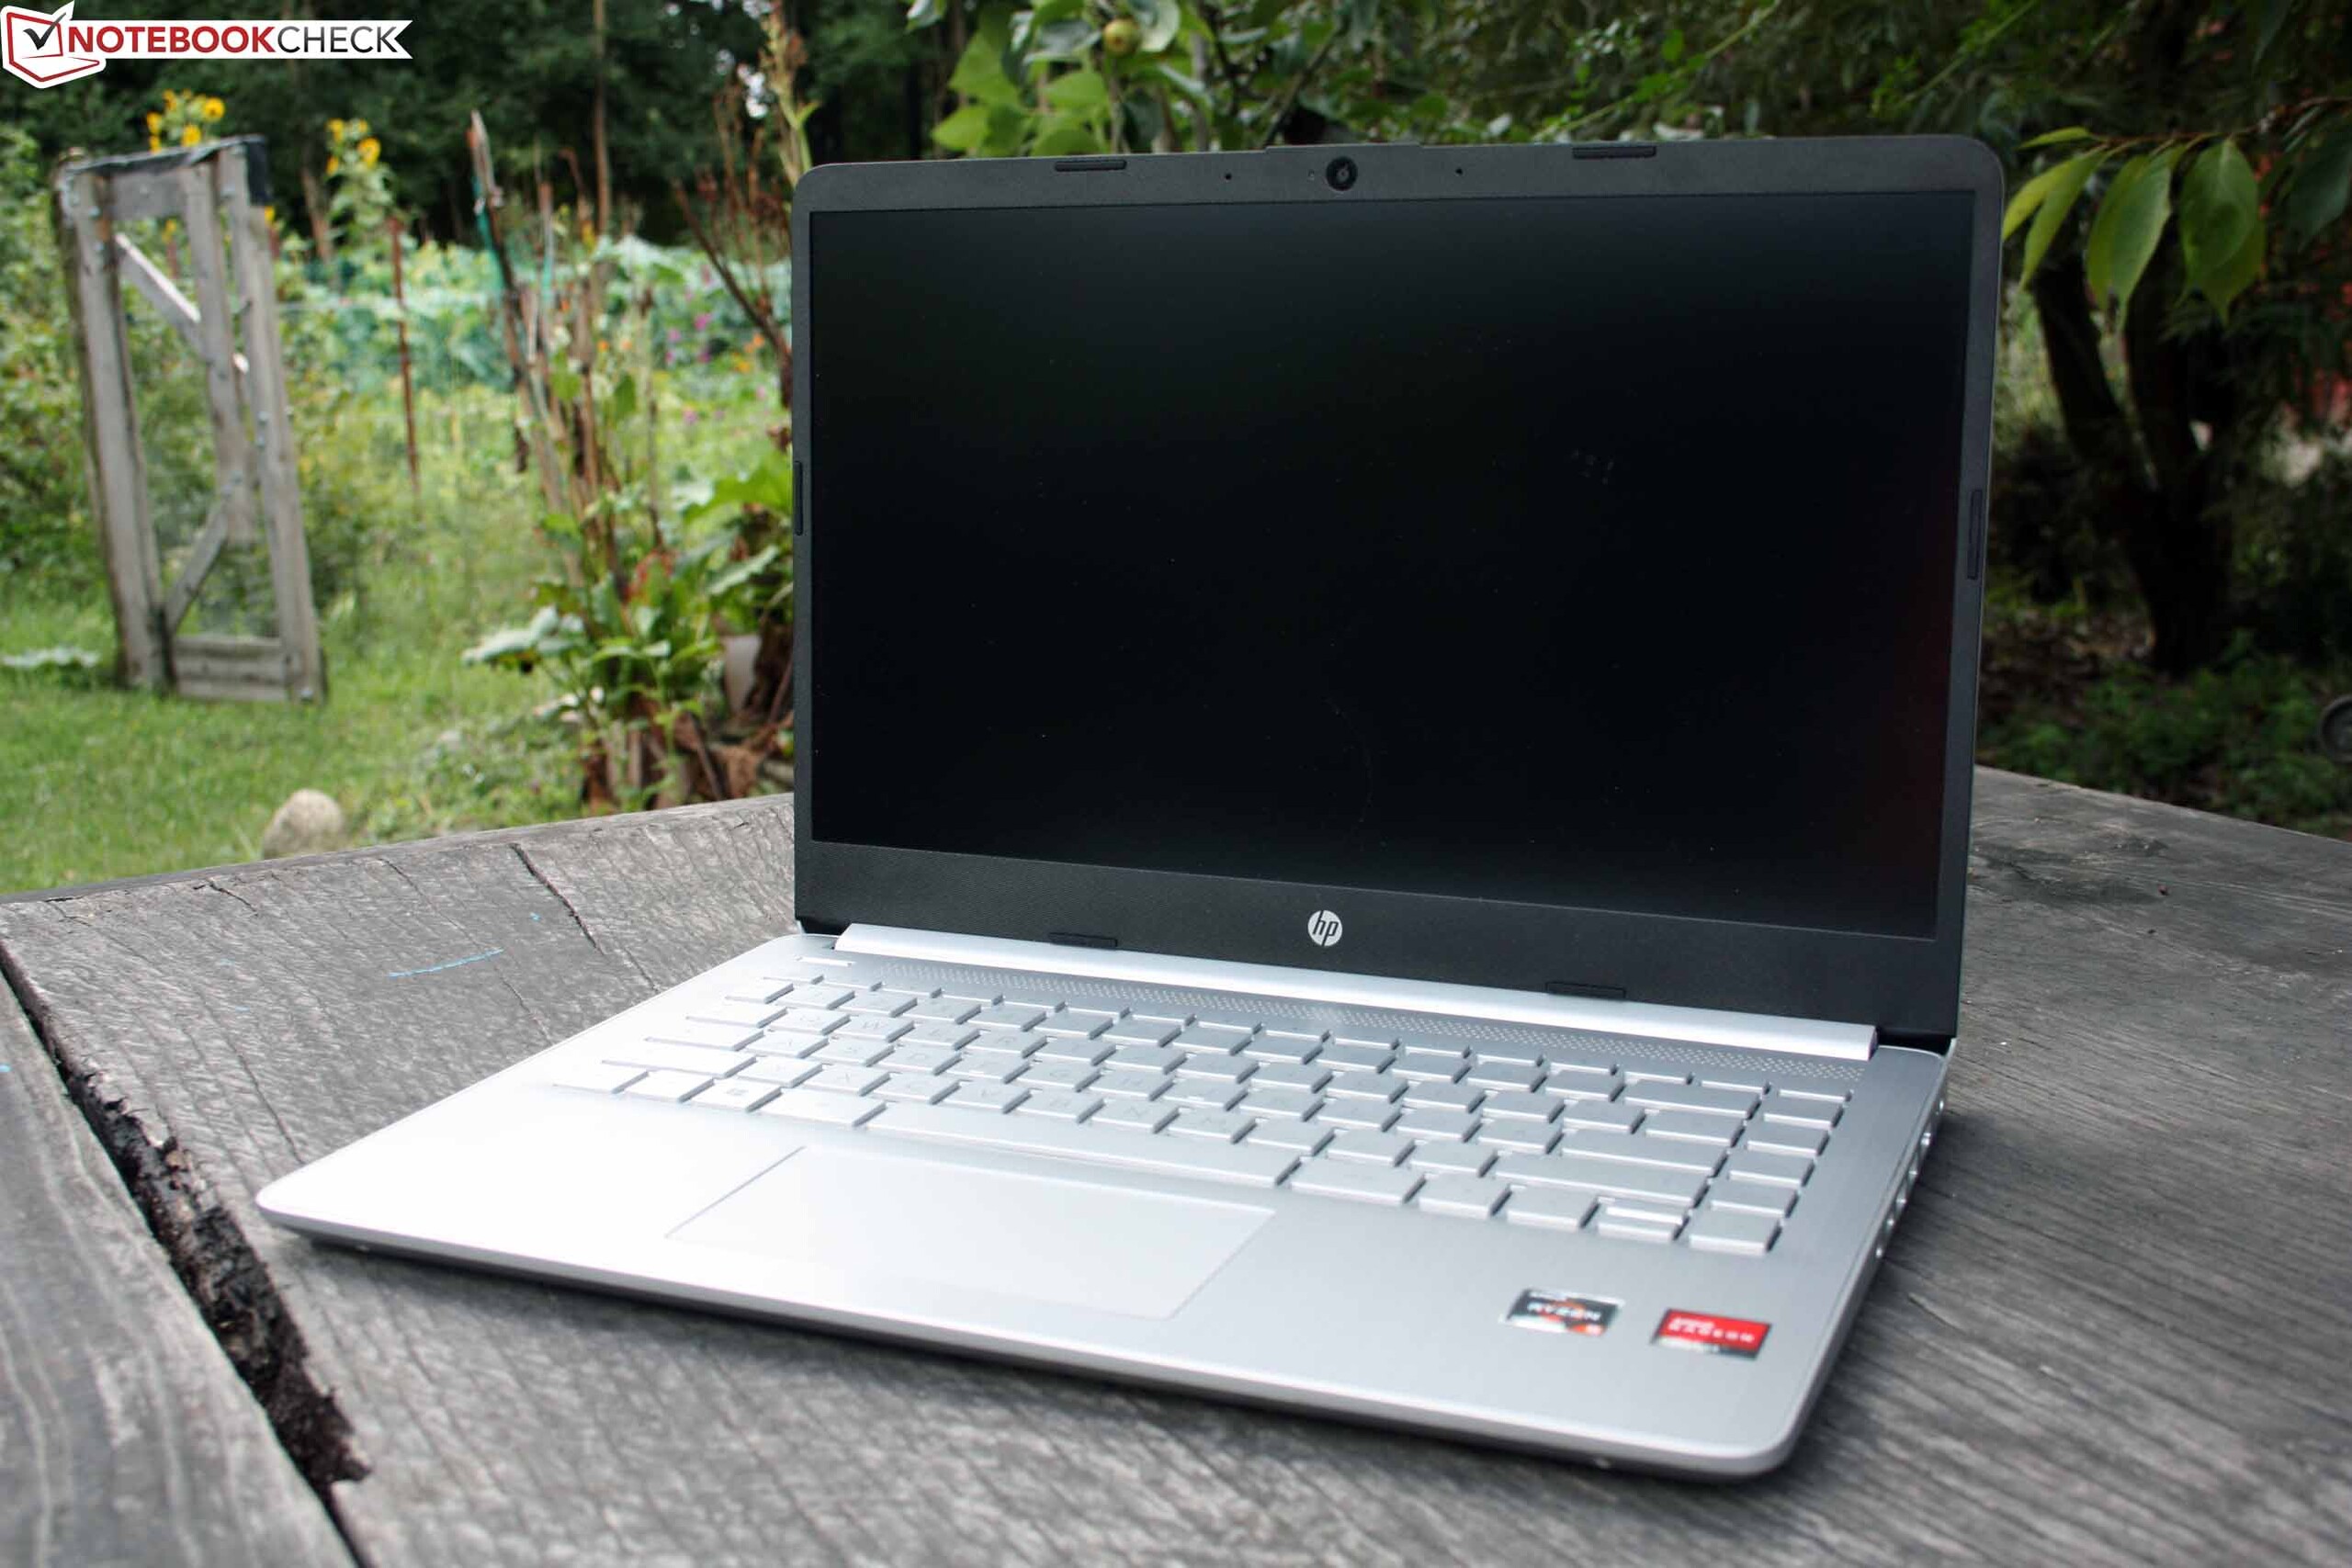
HP 14s with Ryzen in review: Cheap laptop gives away potential

As a mainstream platform, the HP 14s is equipped with hardware in all conceivable variants by the manufacturer: Whether Intel or AMD chips, large and small hard drives, minimal or generous working memory configurations. Thus, there is something for everyone, from 280 Euros (~$333, without Windows) to almost 850 Euros (~$1010, Intel High End).
Our test model is in the lower midfield at 530 Euros (~$630, without Windows), but can theoretically keep up with the Intel variants at the top with its Ryzen 5000 SoC. You can find out why we do not recommend the model in the review.
Possible competitors in comparison
Rating | Date | Model | Weight | Height | Size | Resolution | Price |
|---|---|---|---|---|---|---|---|
| 76.9 % v7 (old) | 09 / 2021 | HP 14s-fq1357ng R5 5500U, Vega 7 | 1.5 kg | 17.9 mm | 14.00" | 1920x1080 | |
| 79.1 % v7 (old) | 06 / 2020 | HP 14s-dq1431ng i5-1035G1, UHD Graphics G1 (Ice Lake 32 EU) | 1.5 kg | 18 mm | 14.00" | 1920x1080 | |
| 86.3 % v7 (old) | 05 / 2021 | Lenovo IdeaPad 5 14ALC05 82LM005YGE R5 5500U, Vega 7 | 1.4 kg | 19.1 mm | 14.00" | 1920x1080 | |
| 84.9 % v7 (old) | 05 / 2021 | Honor Magicbook 14 i7-1165G7 i7-1165G7, Iris Xe G7 96EUs | 1.4 kg | 15.9 mm | 14.00" | 1920x1080 | |
| 86.7 % v7 (old) | 07 / 2021 | Lenovo ThinkPad E14 G3-20Y7003SGE R5 5500U, Vega 7 | 1.6 kg | 17.9 mm | 14.00" | 1920x1080 |
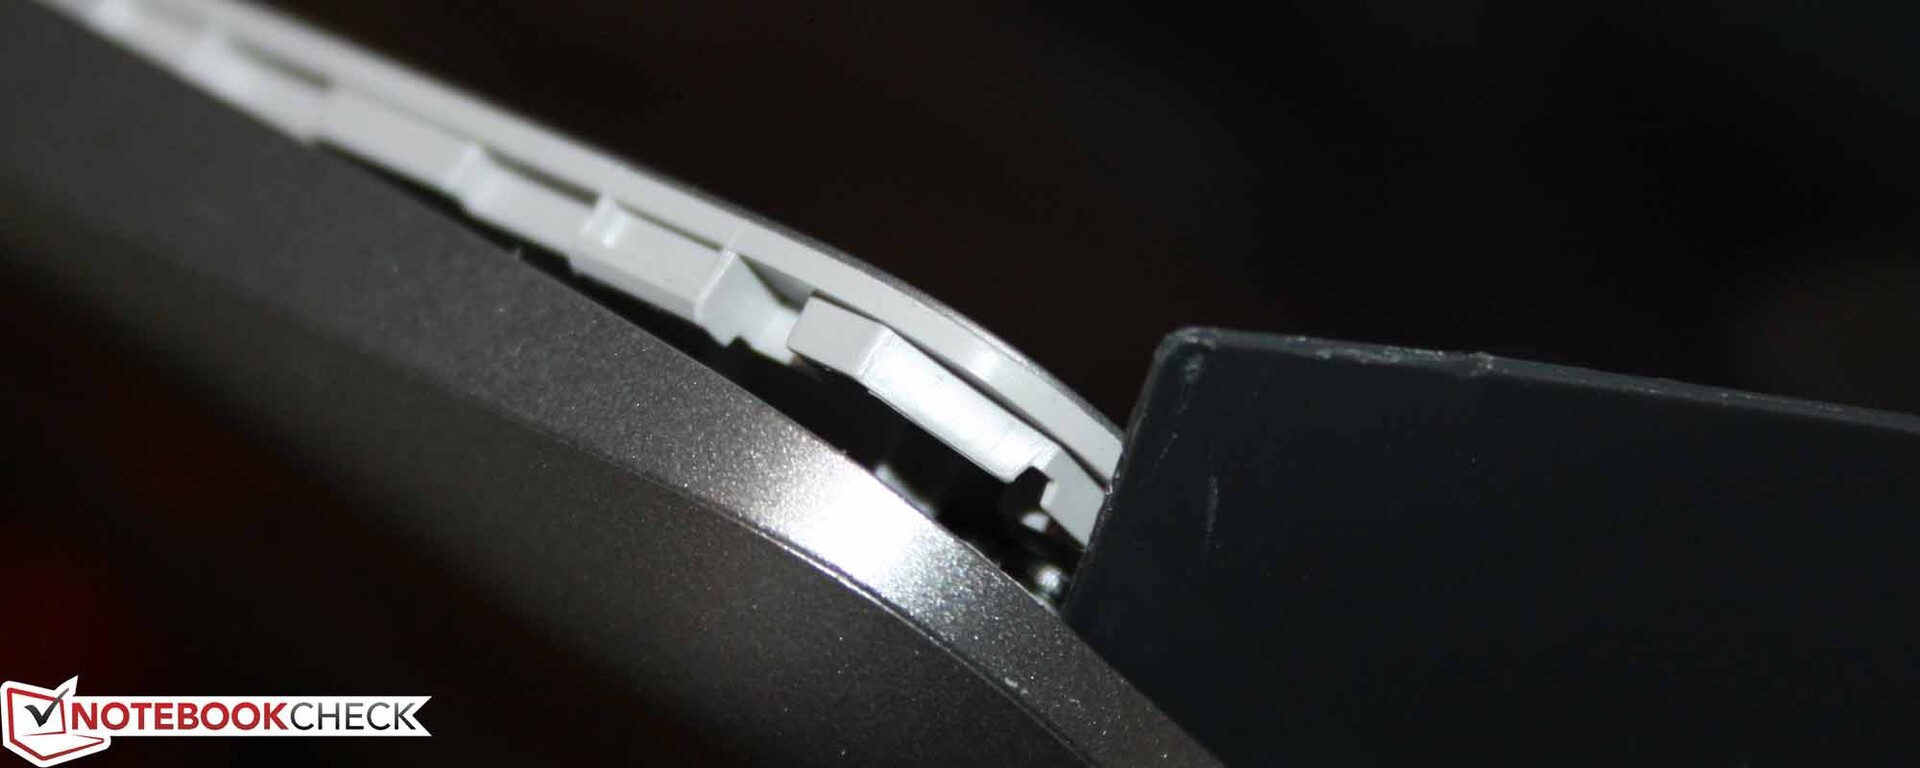
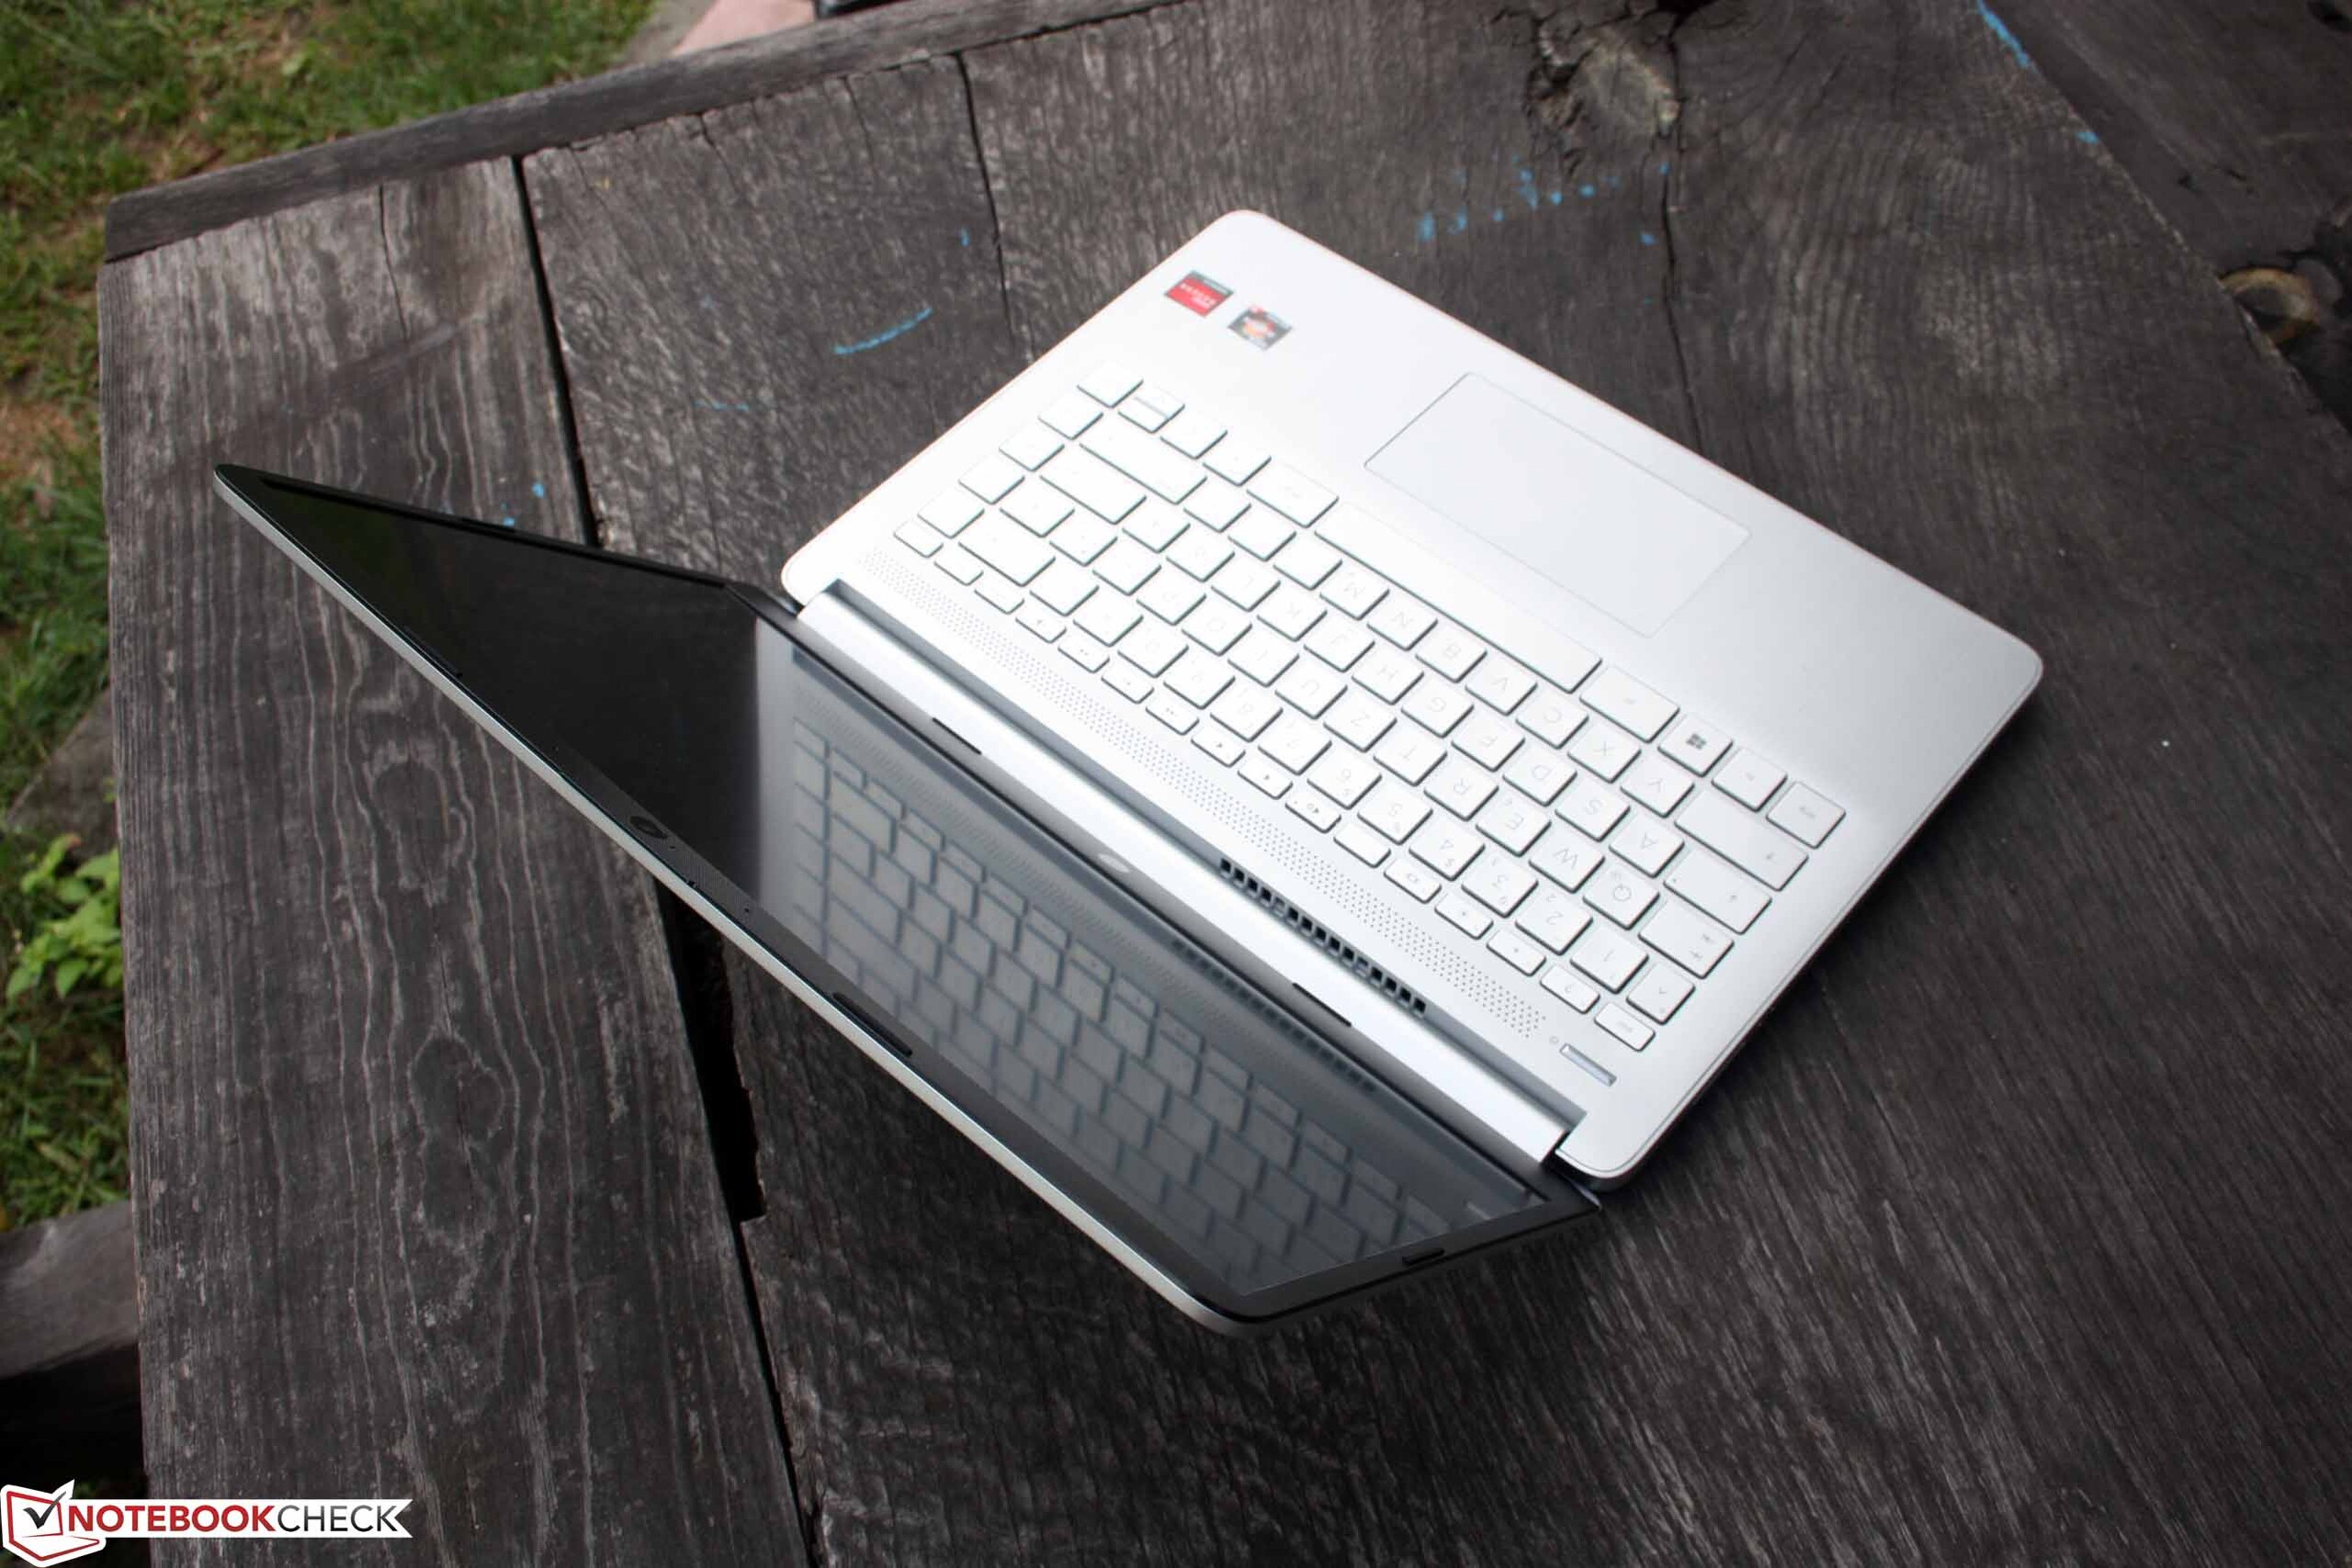
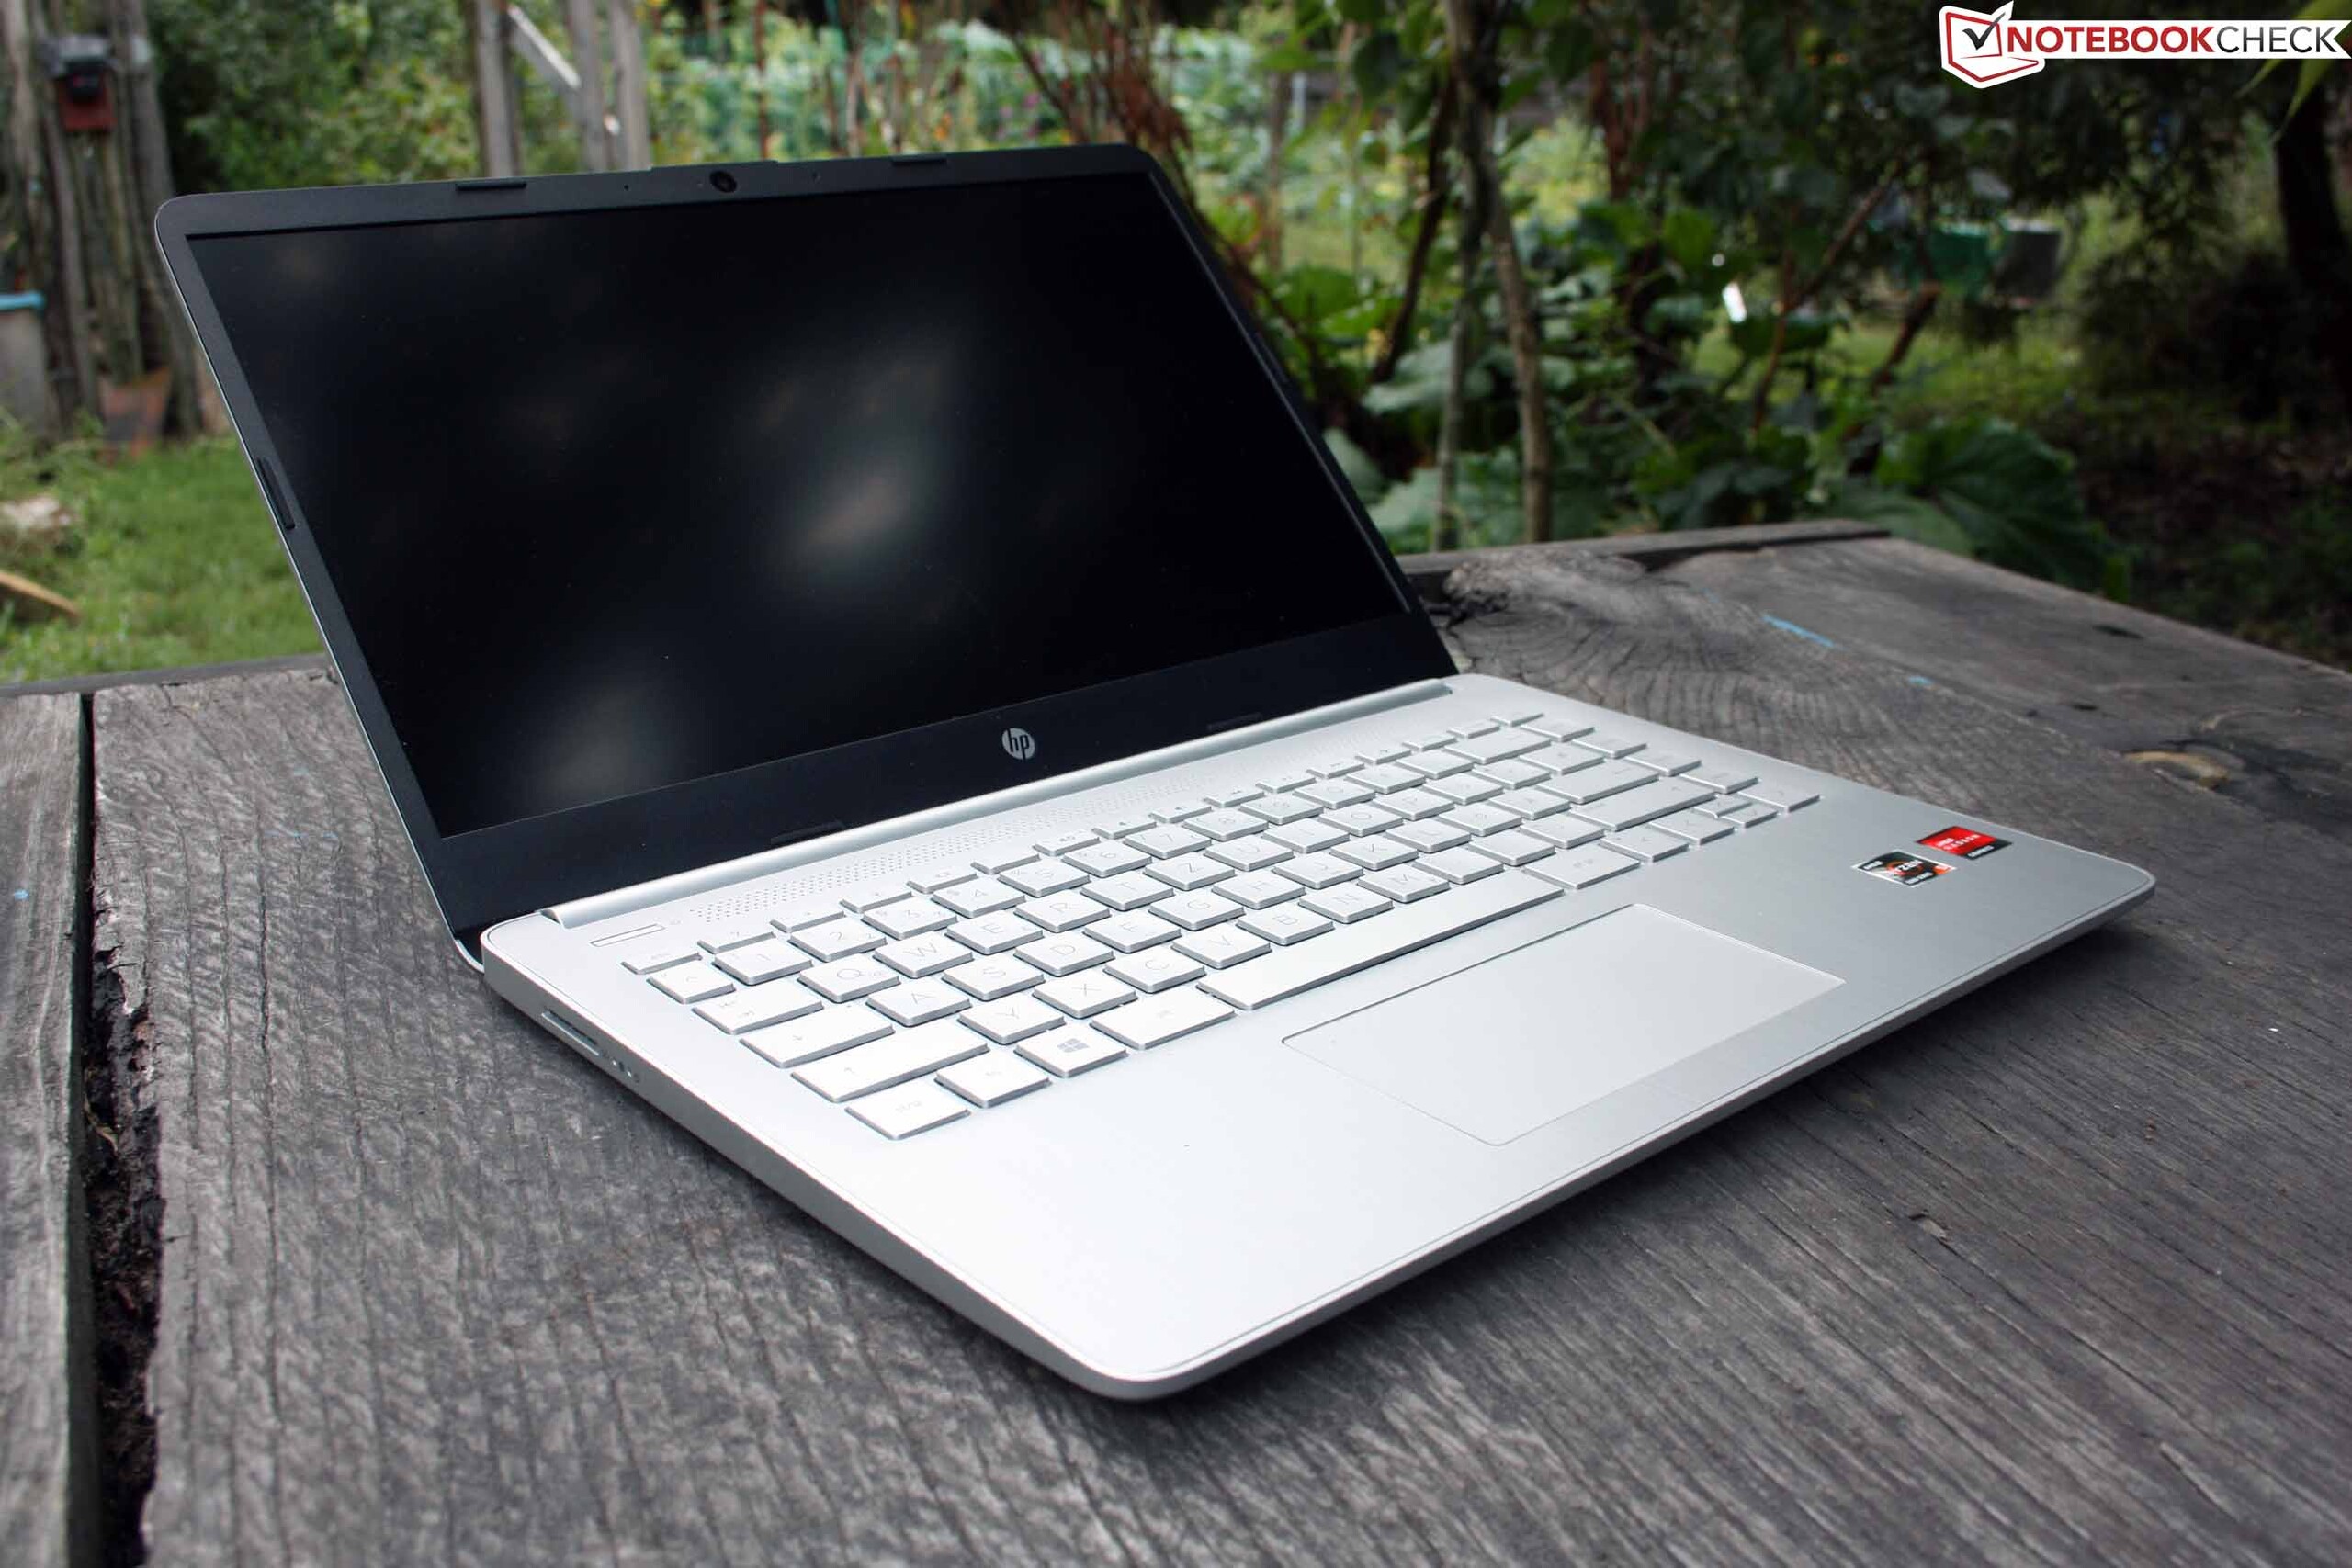
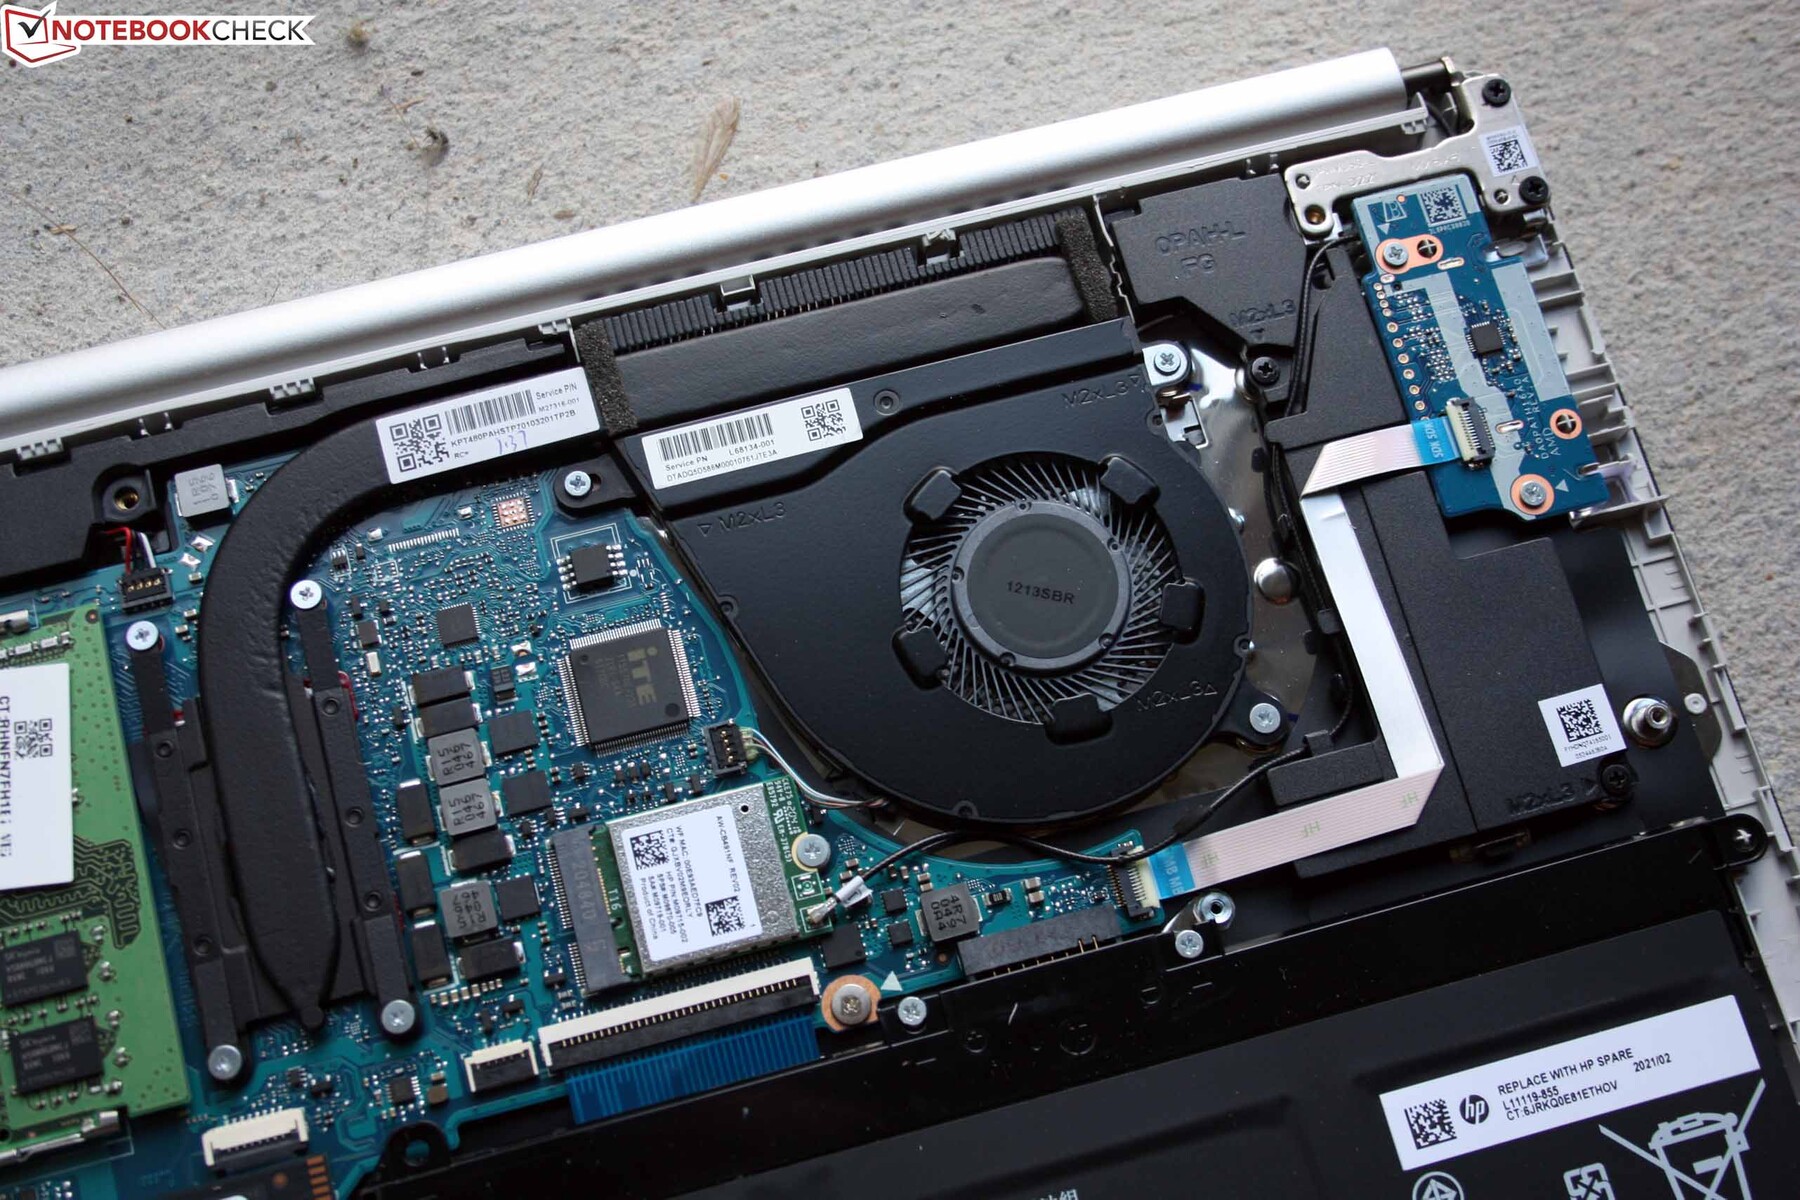
Case & features: Upgradeable subnotebook
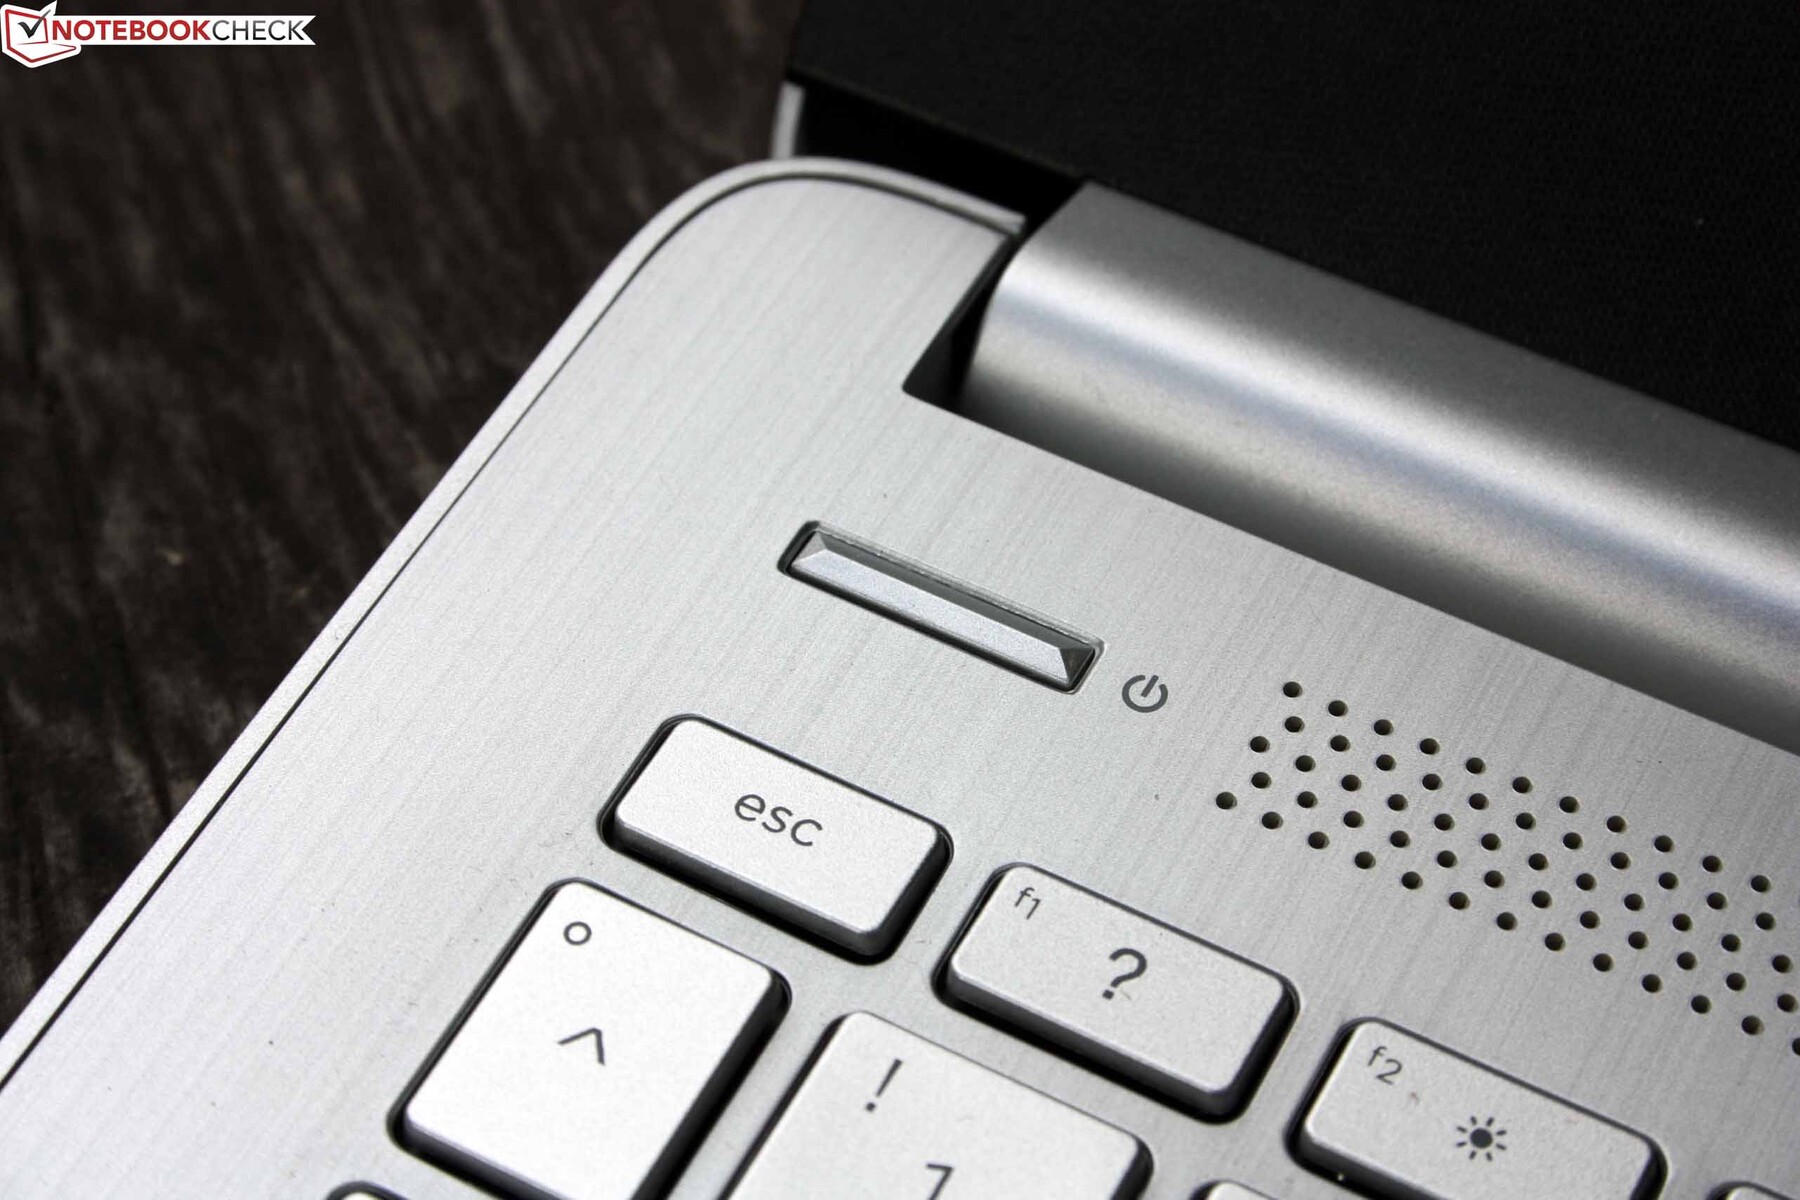
The plastic chassis looks pleasing due to the thin aluminum plate on the base, but this does not help the stability: The light chassis is only fairly torsion-resistant, and movements on the hinge warp the adjacent area of the construction. The keyboard yields considerably and the base can be bent to a limited extent from below. Pressure on the display leads to changes in brightness (recognizable in the black image).
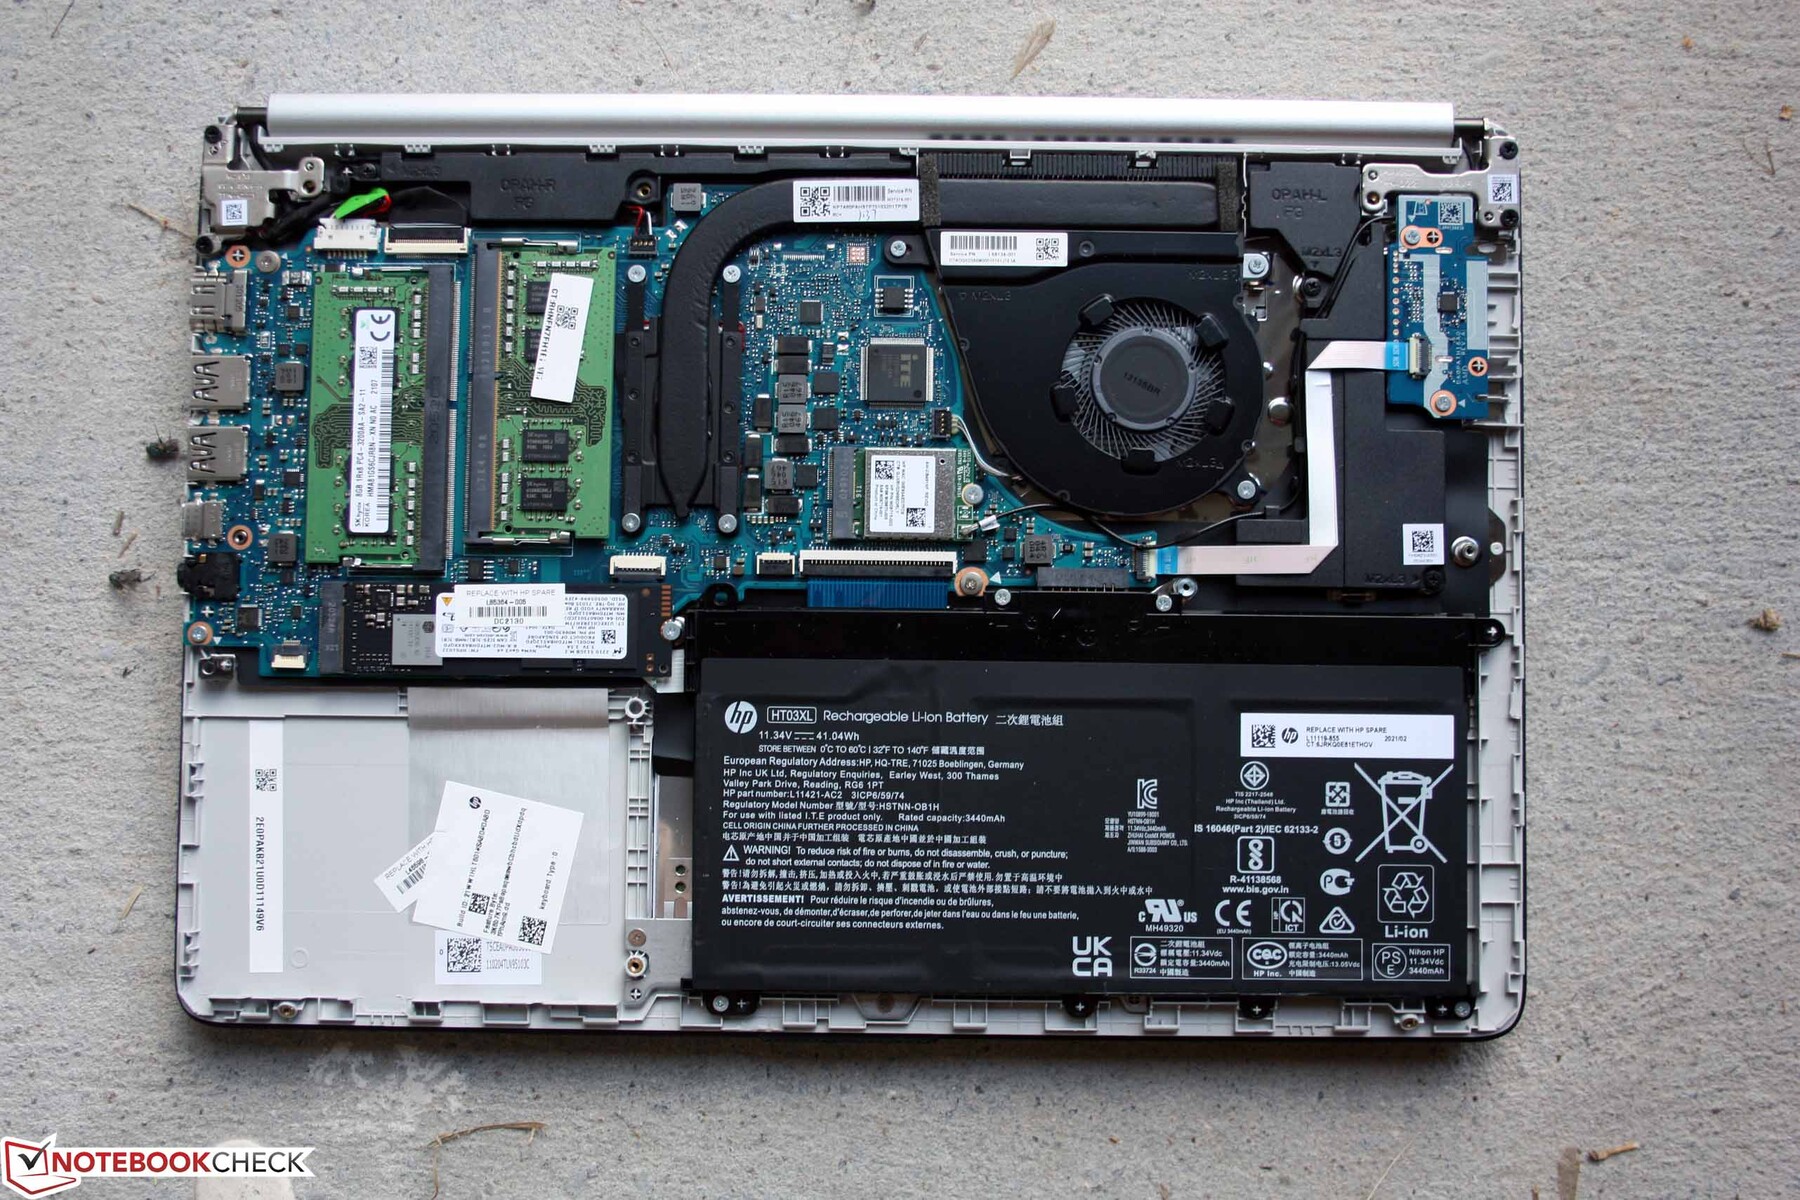
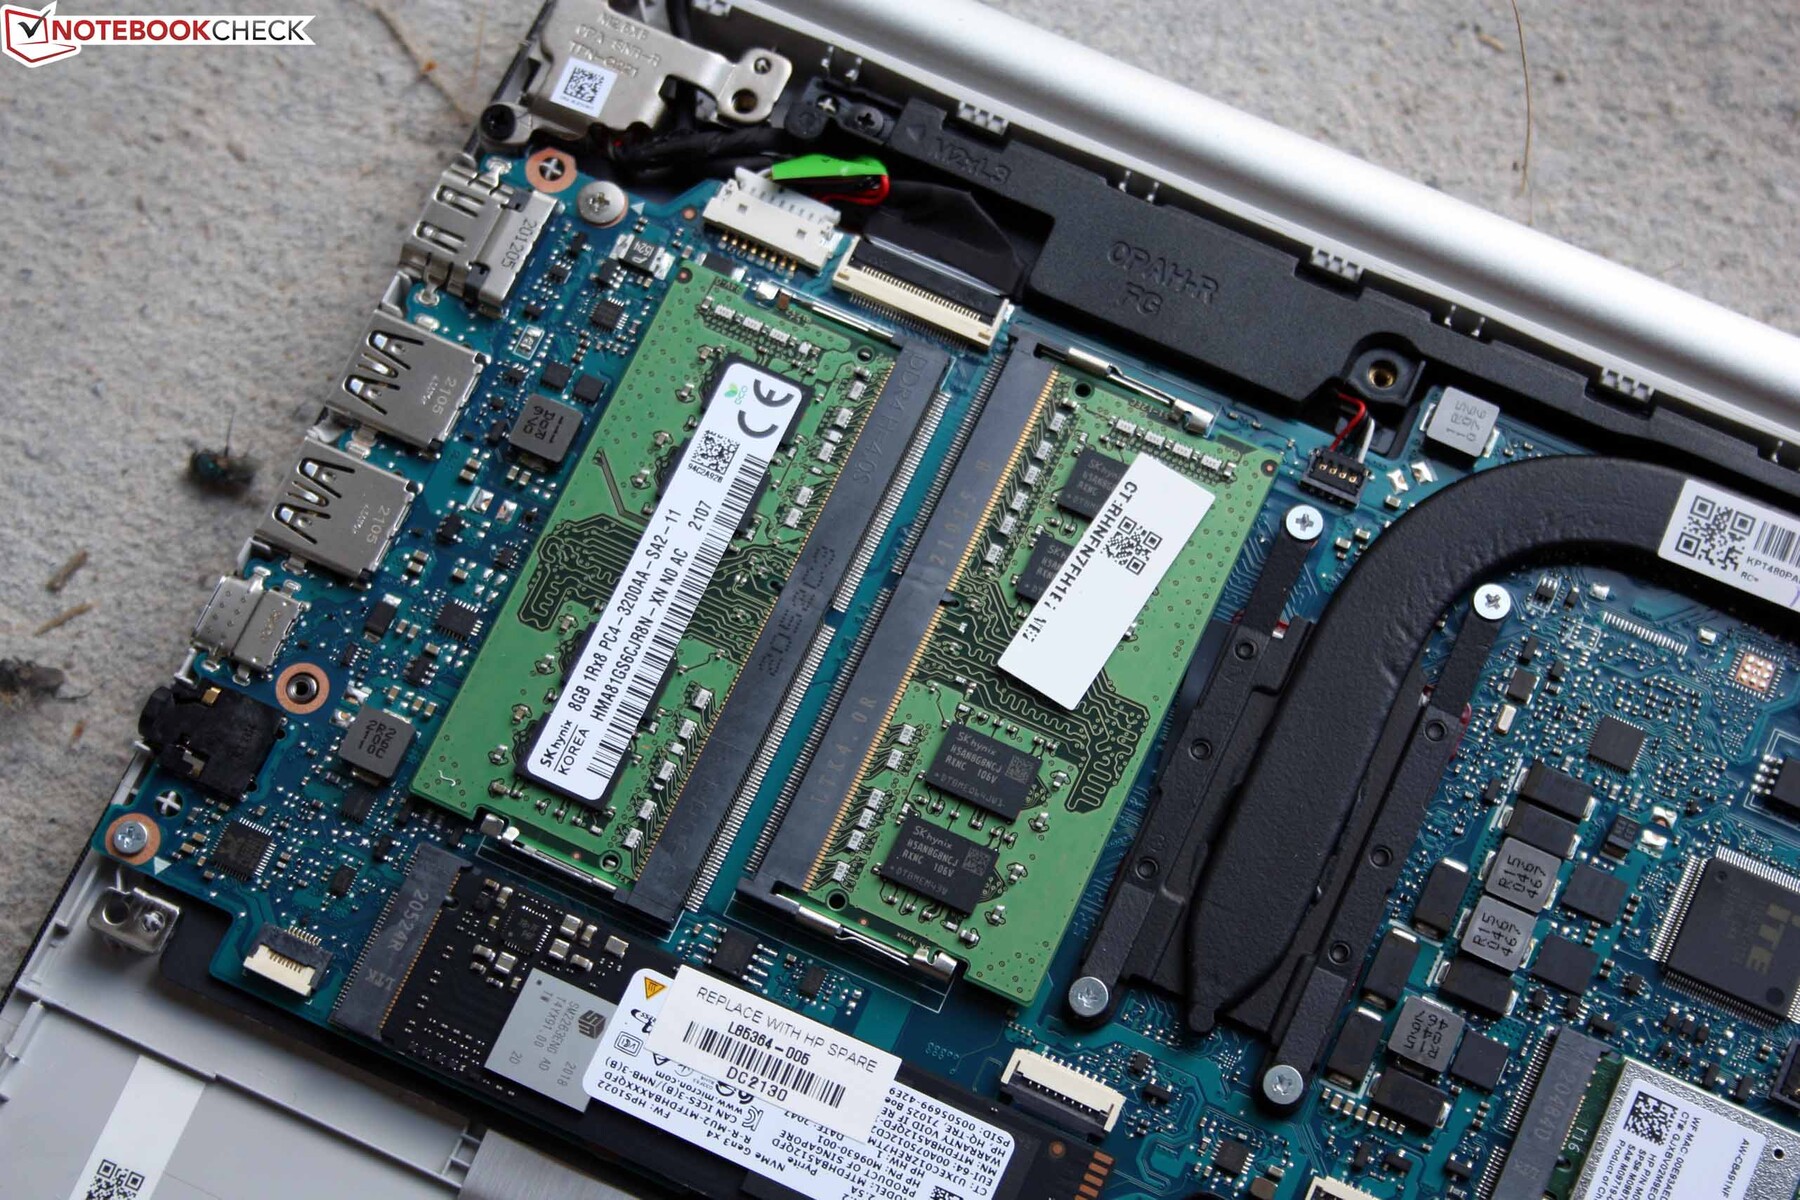
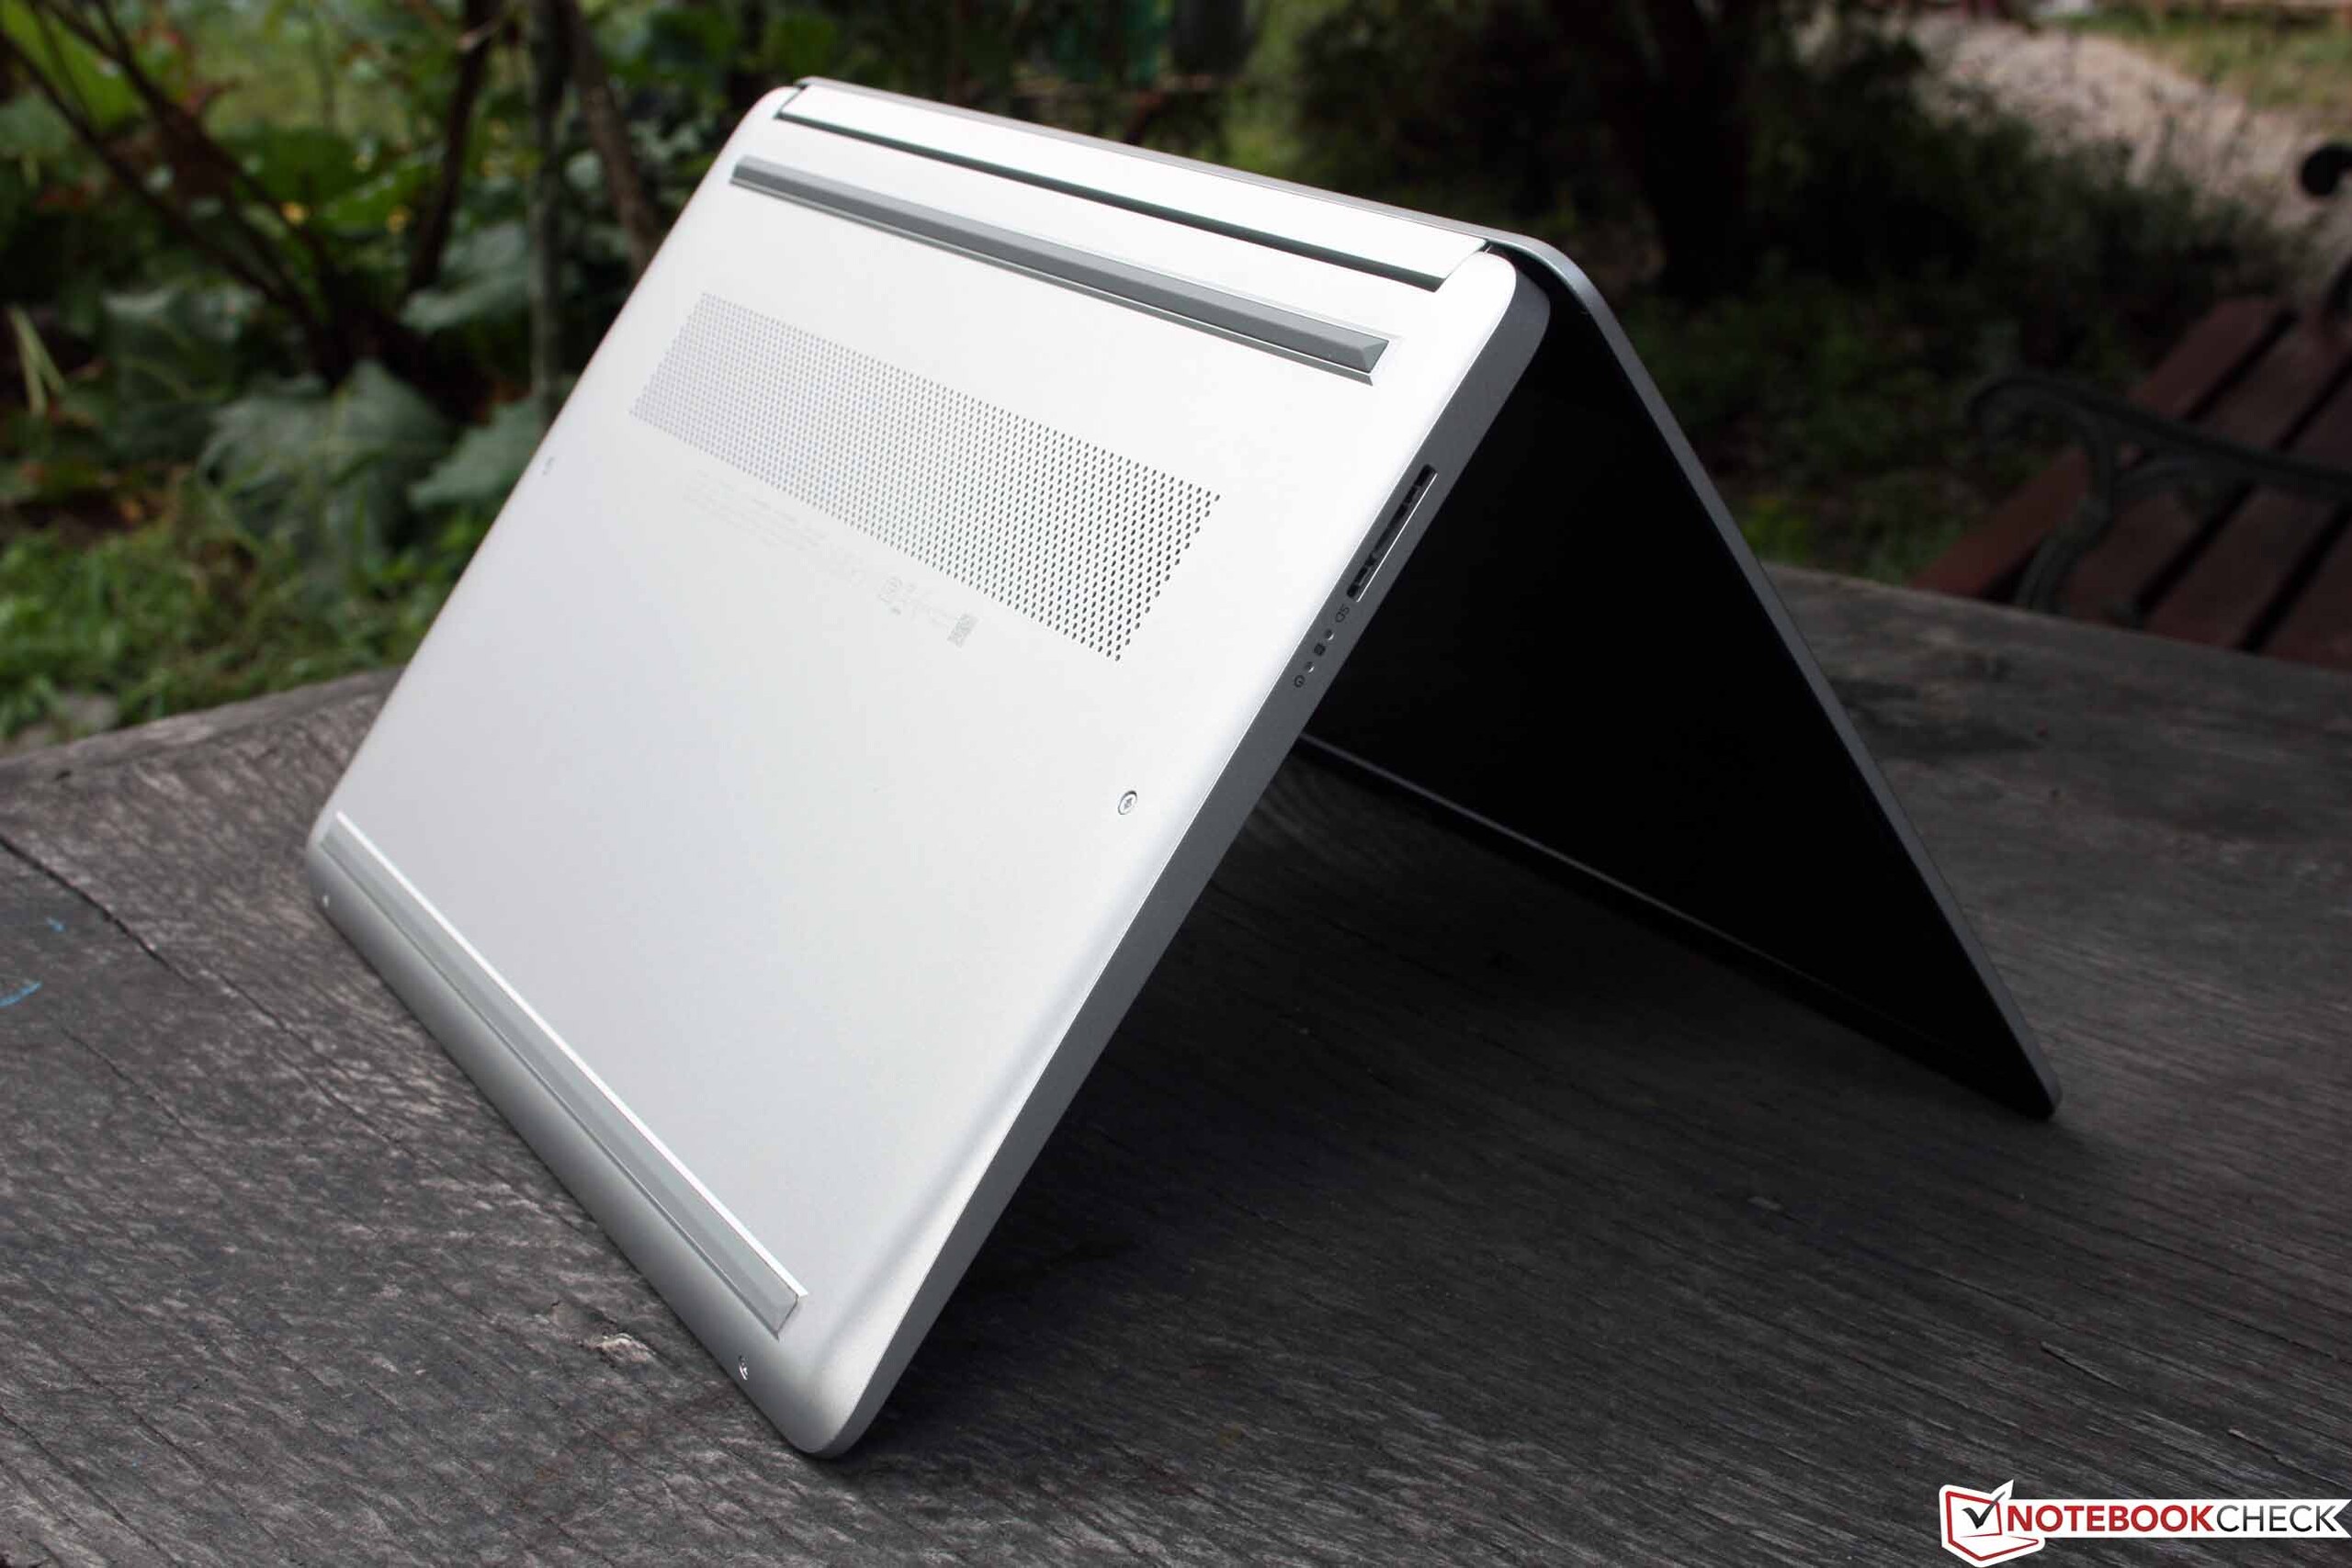
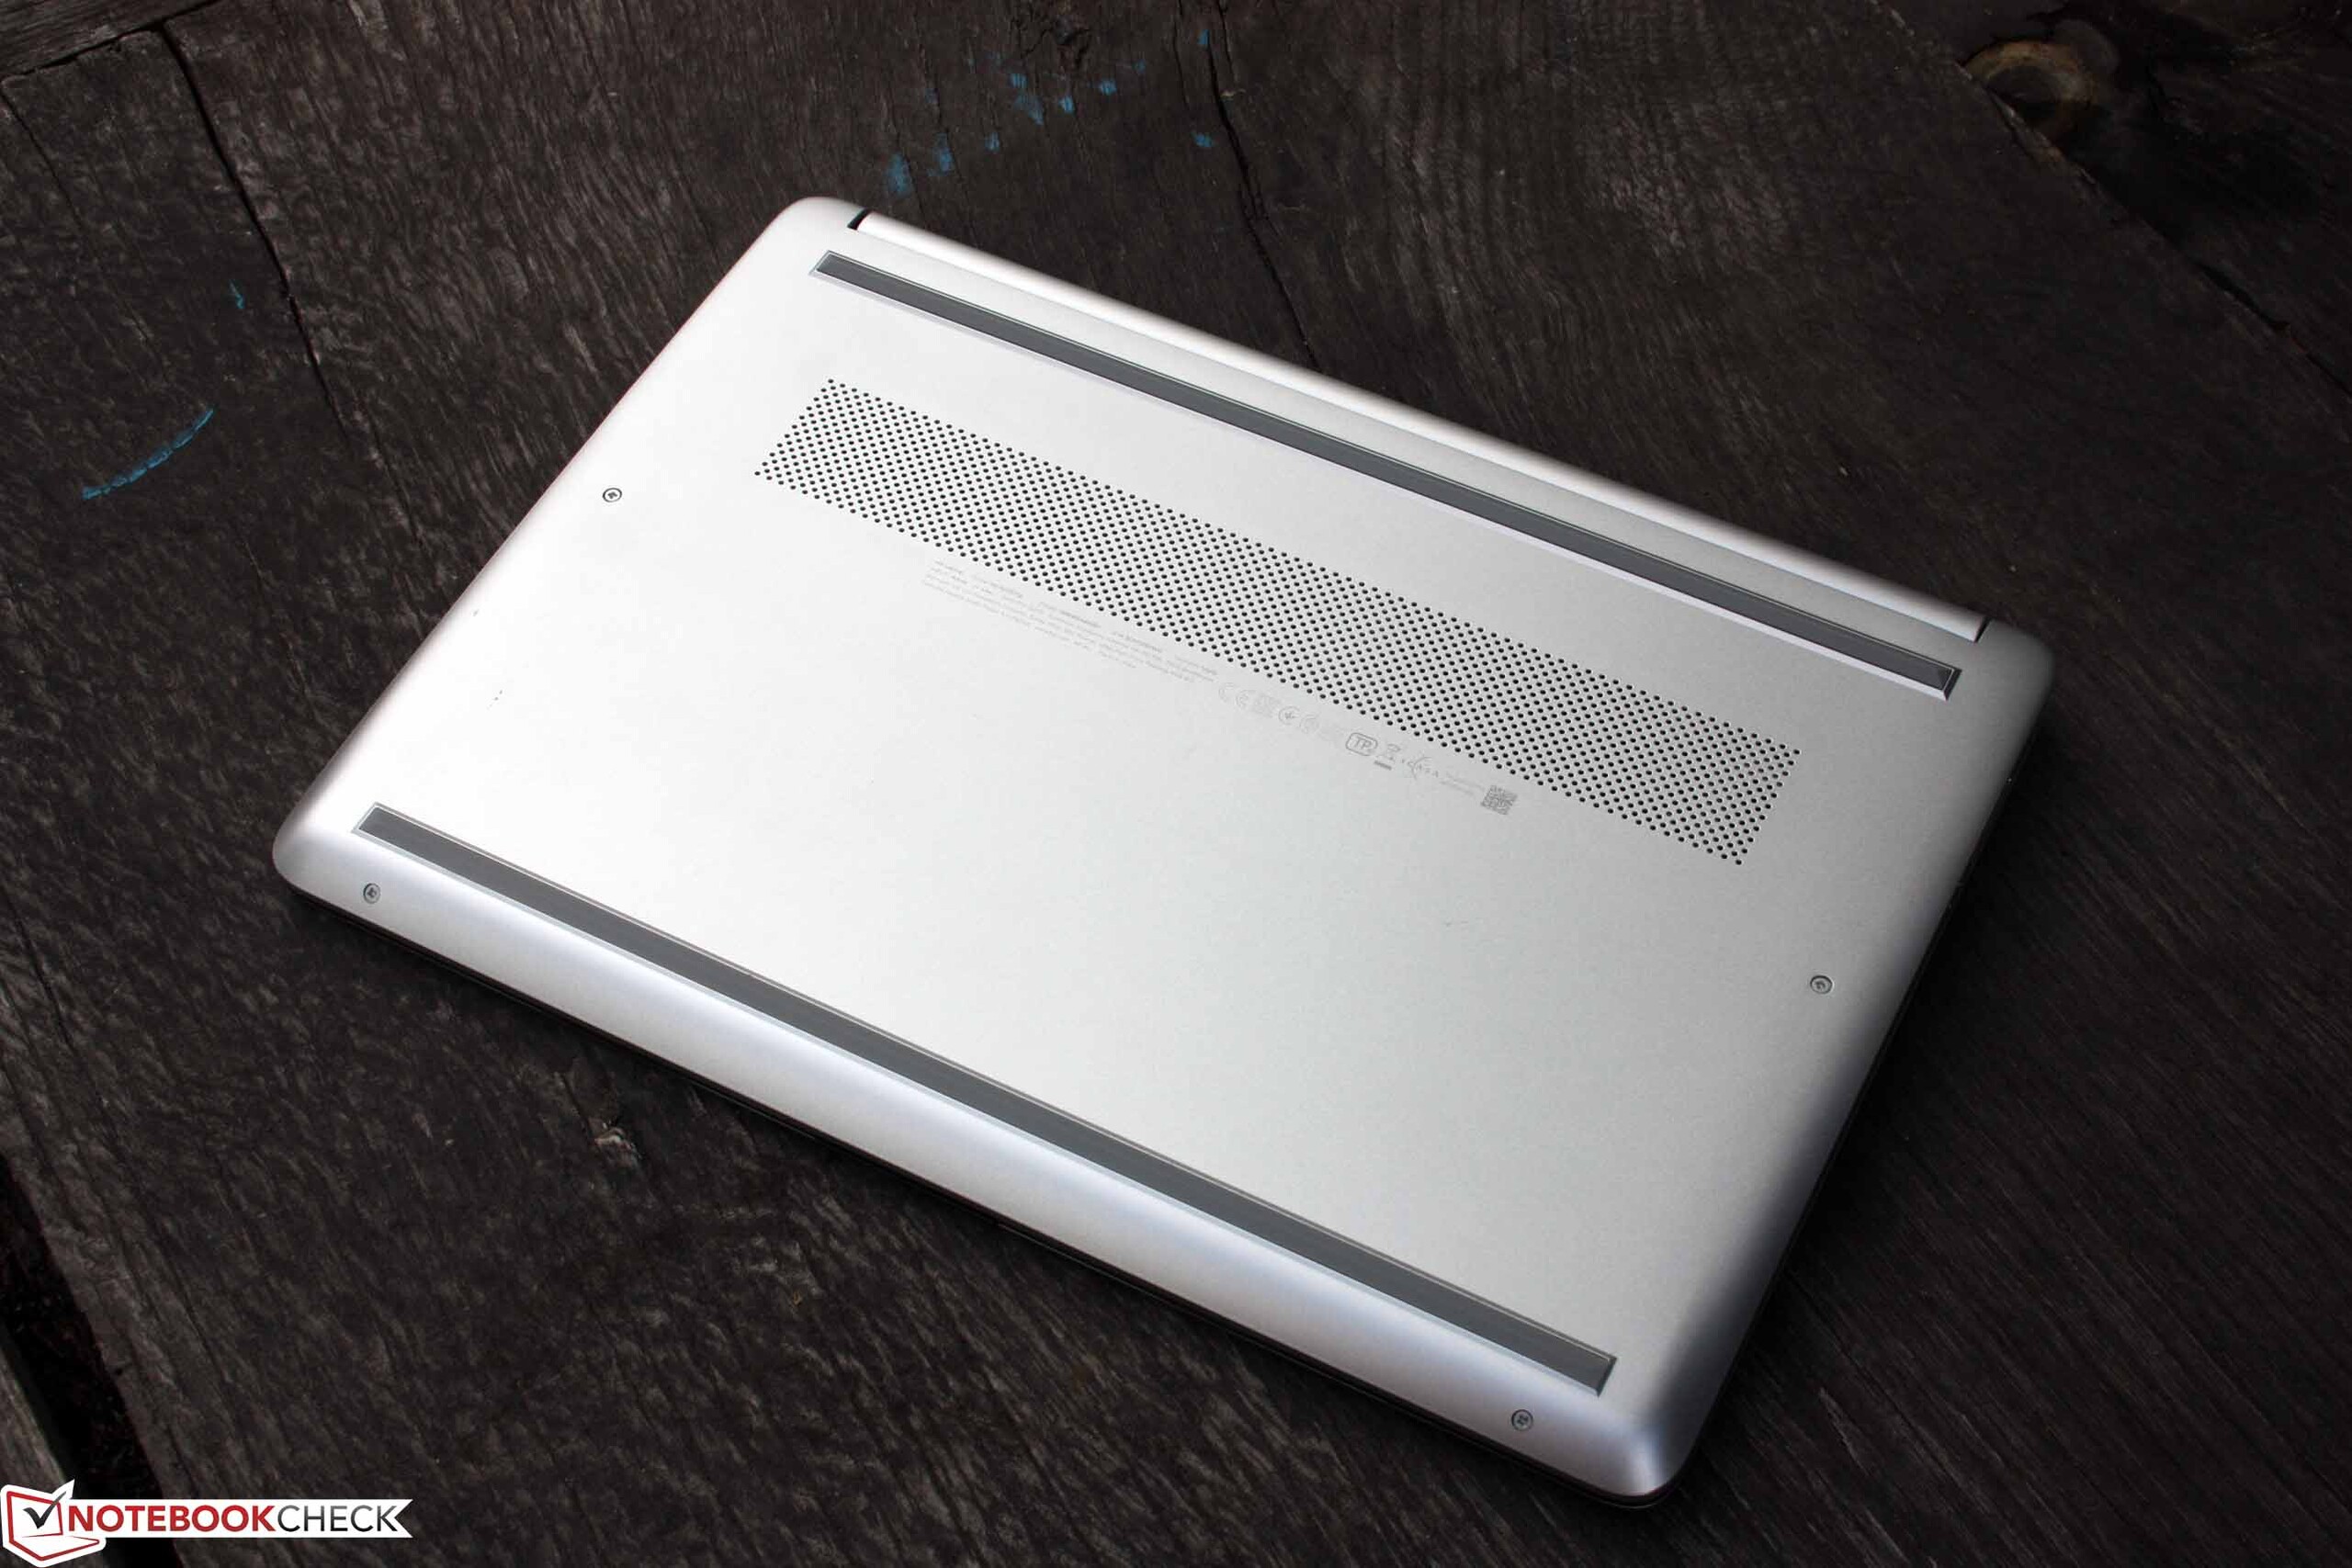
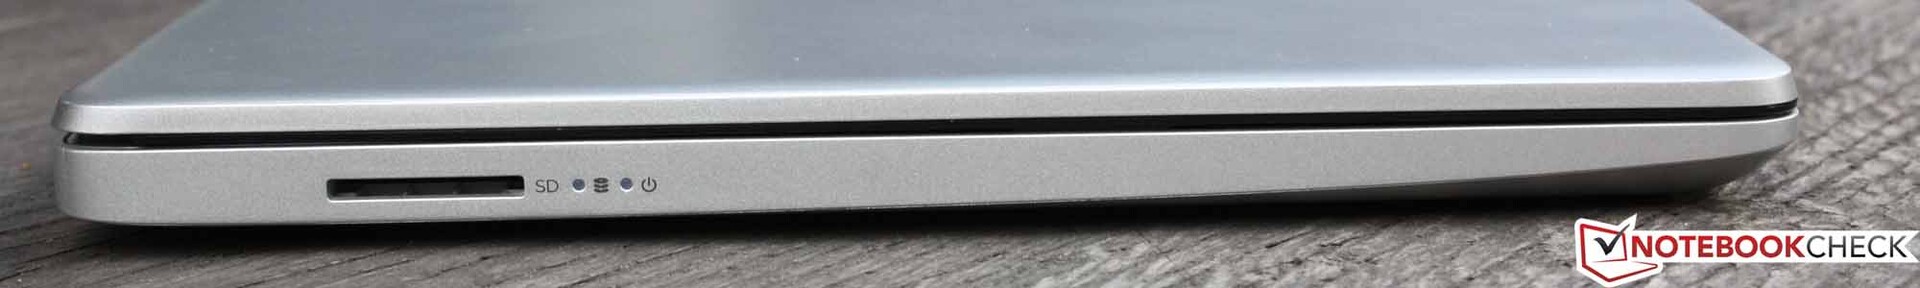
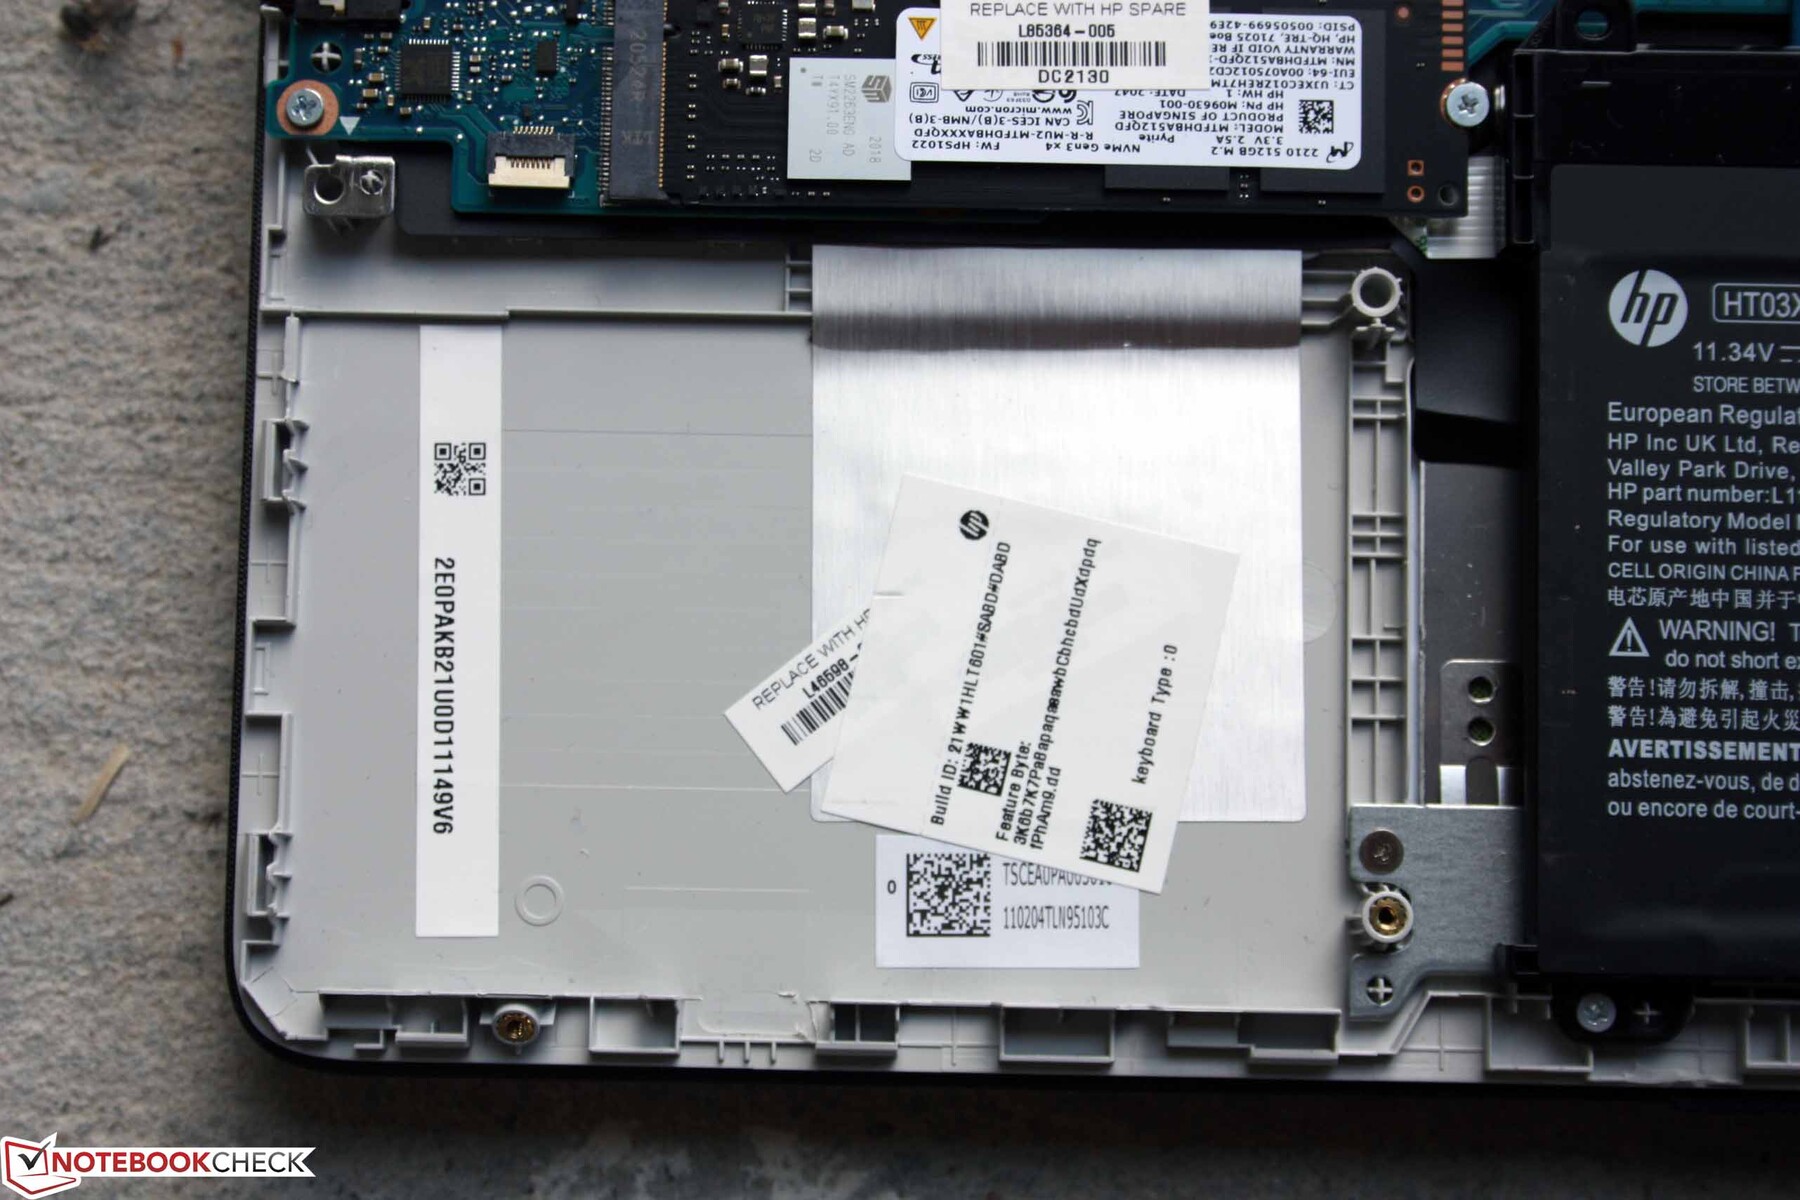
The model can be upgraded, there are two RAM sockets, an M.2 2280 slot for the SSD and an M.2 2230 for the WiFi chip. We would throw the latter out first due to the poor result in the test. The slow SD card reader as well, but fortunately you do not need it that often. The missing eject mechanism is annoying: The SD card is simply stuck in the slot and we have to struggle with our fingertips on the card that only sticks out 4 mm.
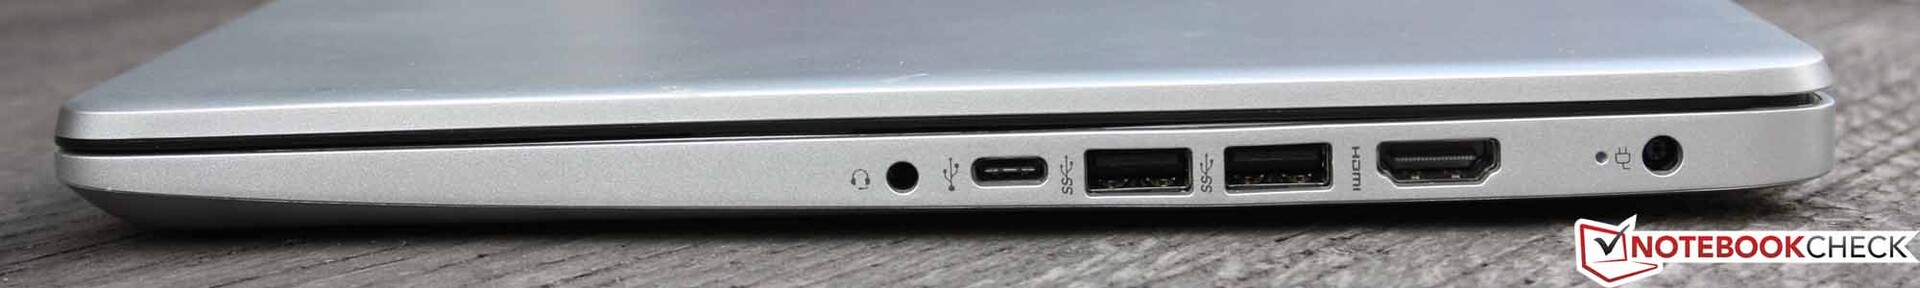
At least the weight of 1.4 kg (~3.1 lb) is respectable, the Lenovo competition is heavier and thicker. The ports are on the right and close together, which could cause problems with USB dongles, for example for Ethernet. The Type-C USB cannot be used for charging and it is not suitable as a DisplayPort output - at least it refused to work with our Type-C to HDMI cable.
Connection equipment
| SD Card Reader | |
| average JPG Copy Test (av. of 3 runs) | |
| Lenovo IdeaPad 5 14ALC05 82LM005YGE | |
| Average of class Subnotebook (23.7 - 188, n=9, last 2 years) | |
| HP 14s-dq1431ng (Toshiba Exceria Pro SDXC 64 GB UHS-II) | |
| HP 14s-fq1357ng (AV Pro SD microSD 128 GB V60) | |
| maximum AS SSD Seq Read Test (1GB) | |
| Average of class Subnotebook (24.9 - 195, n=8, last 2 years) | |
| Lenovo IdeaPad 5 14ALC05 82LM005YGE | |
| HP 14s-dq1431ng (Toshiba Exceria Pro SDXC 64 GB UHS-II) | |
| HP 14s-fq1357ng (AV Pro SD microSD 128 GB V60) | |


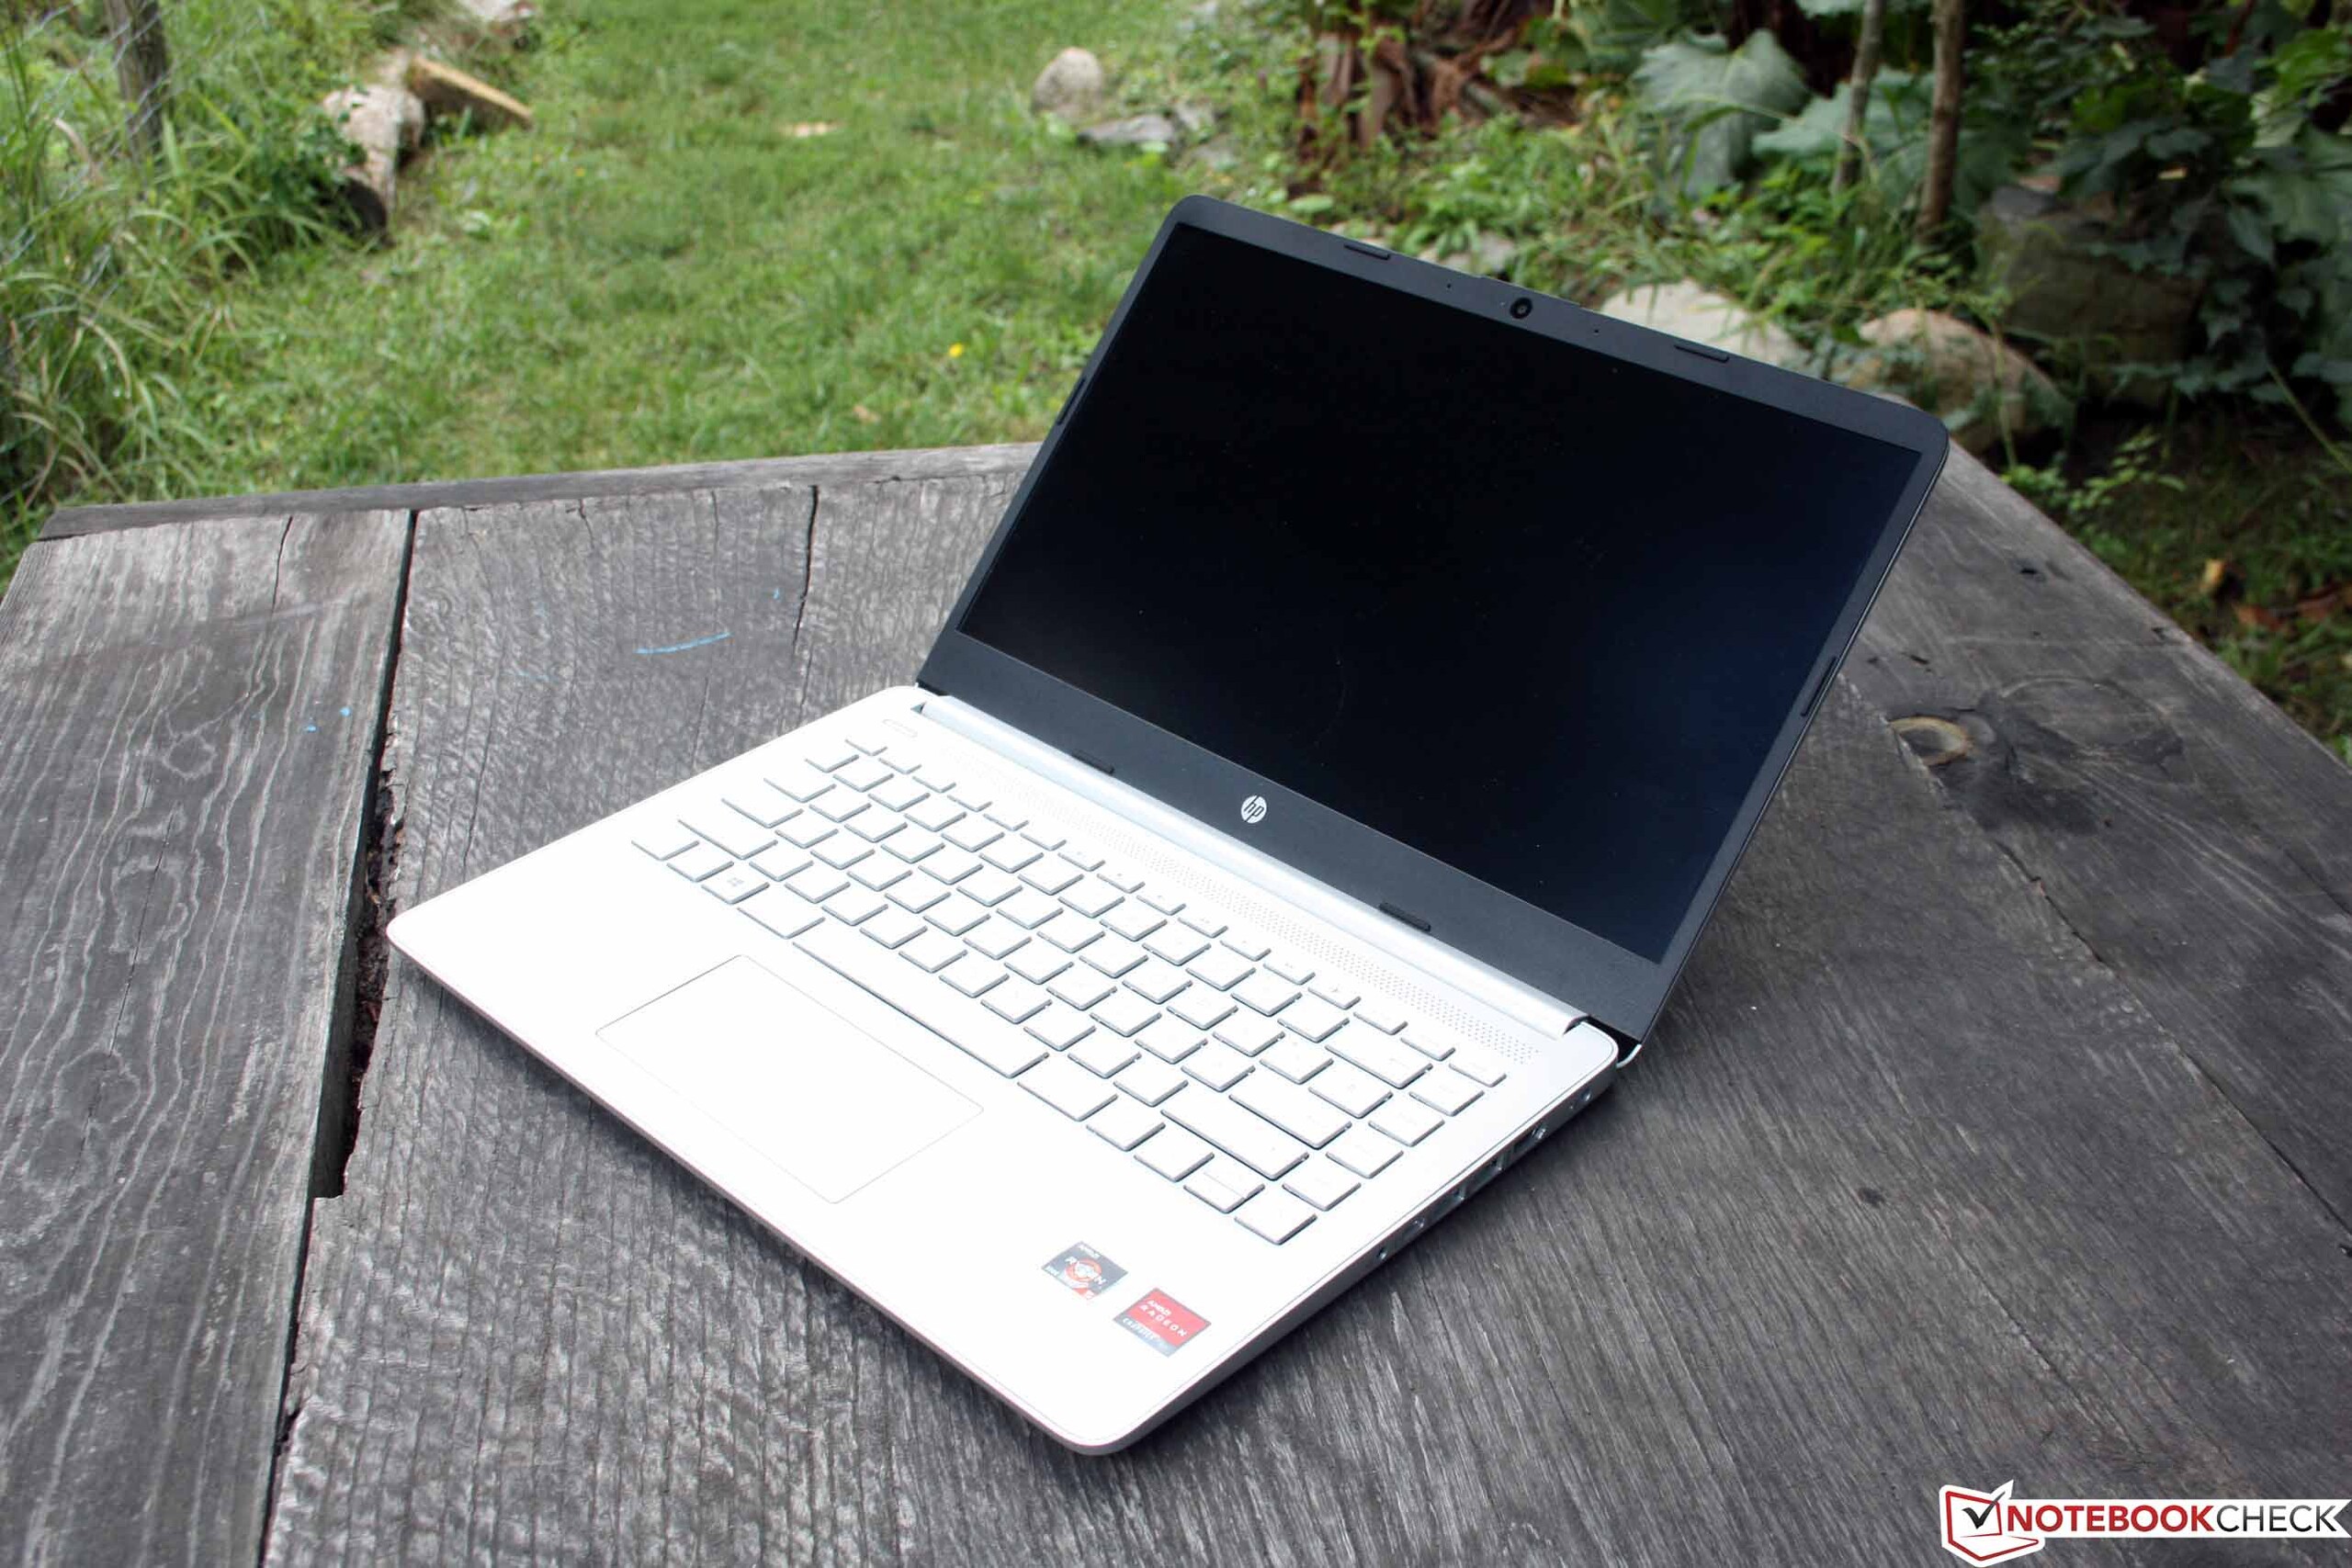
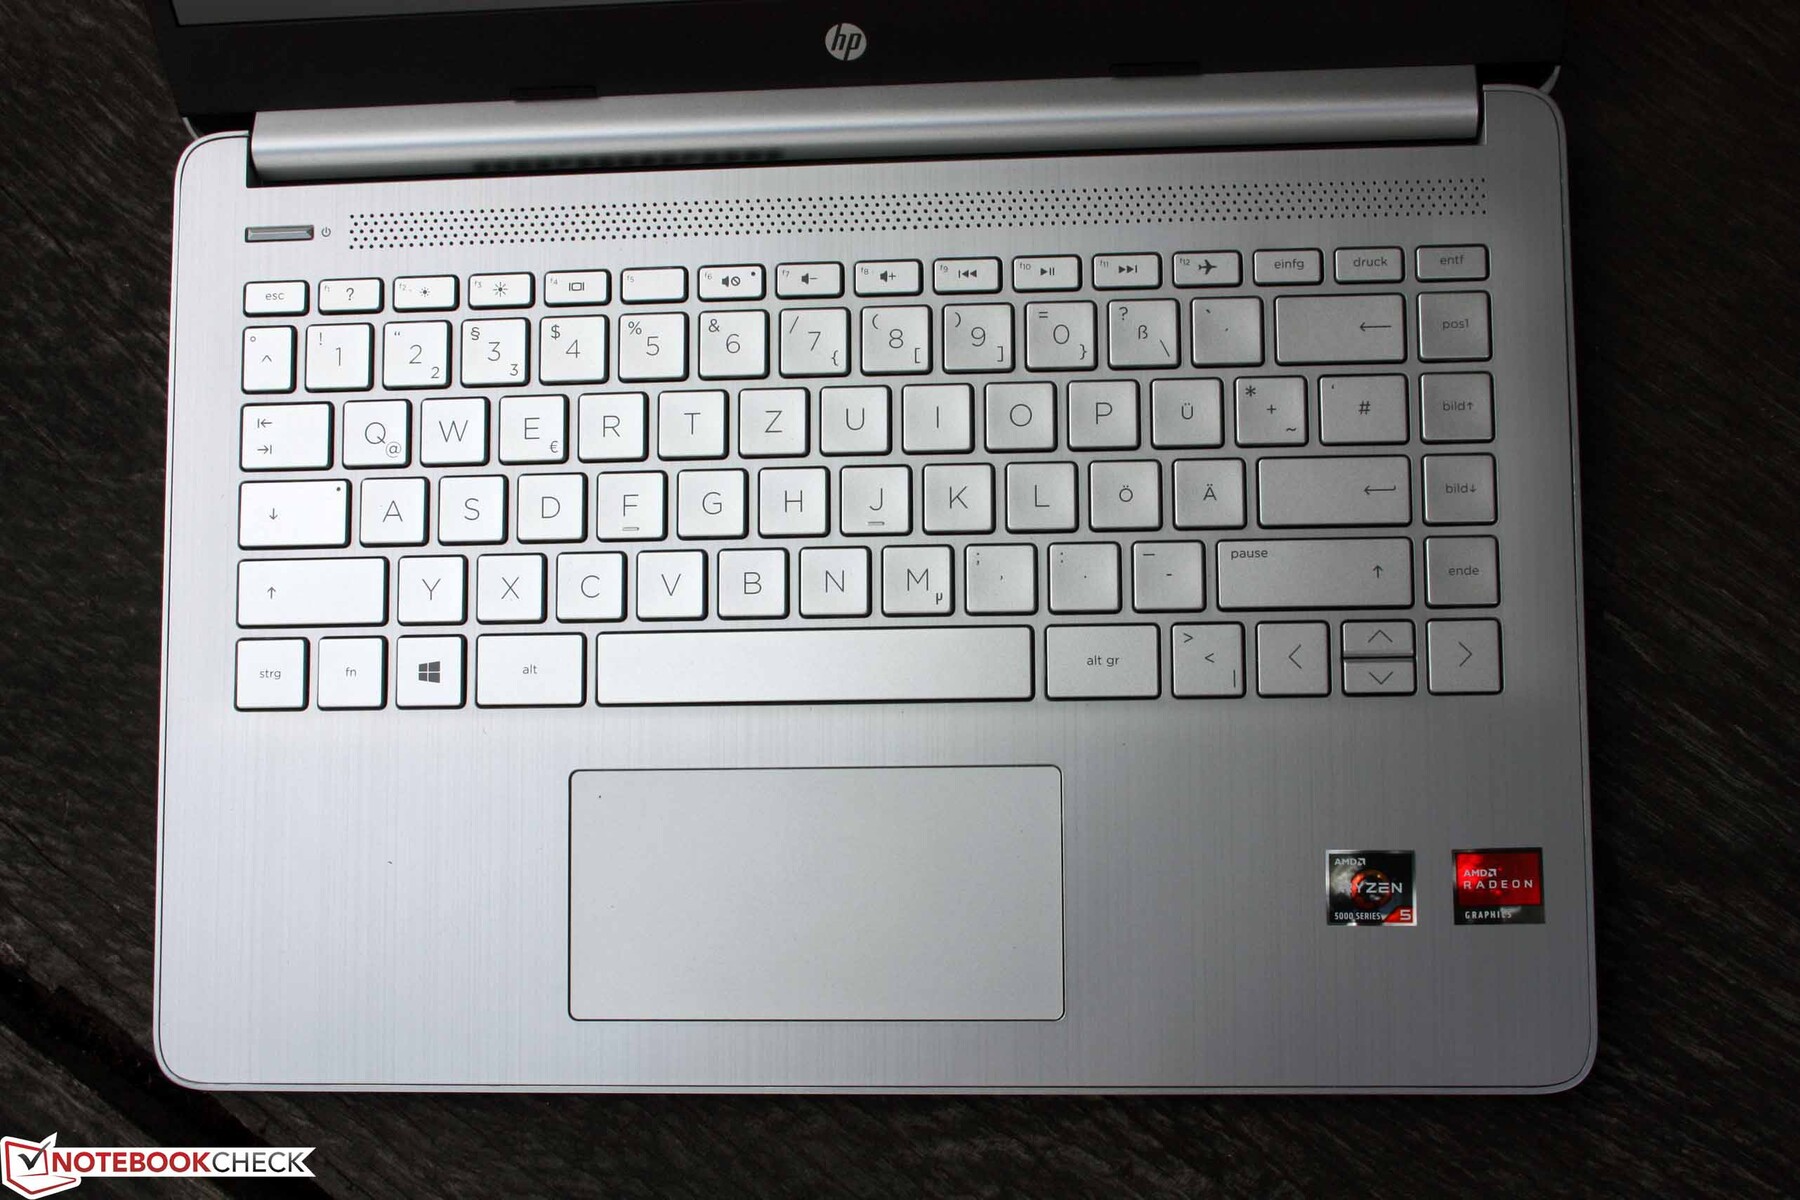
Input devices: HP laptop proves to be weak
The input suffers from its yielding substructure. The keys yield when typing, resulting in a spongy typing feel that is not much fun. The smooth keys have a clear stroke and are quiet. There is no illumination, and the lettering could have been stronger to our taste. The rarely needed F-keys are designed as Fn secondary keys.
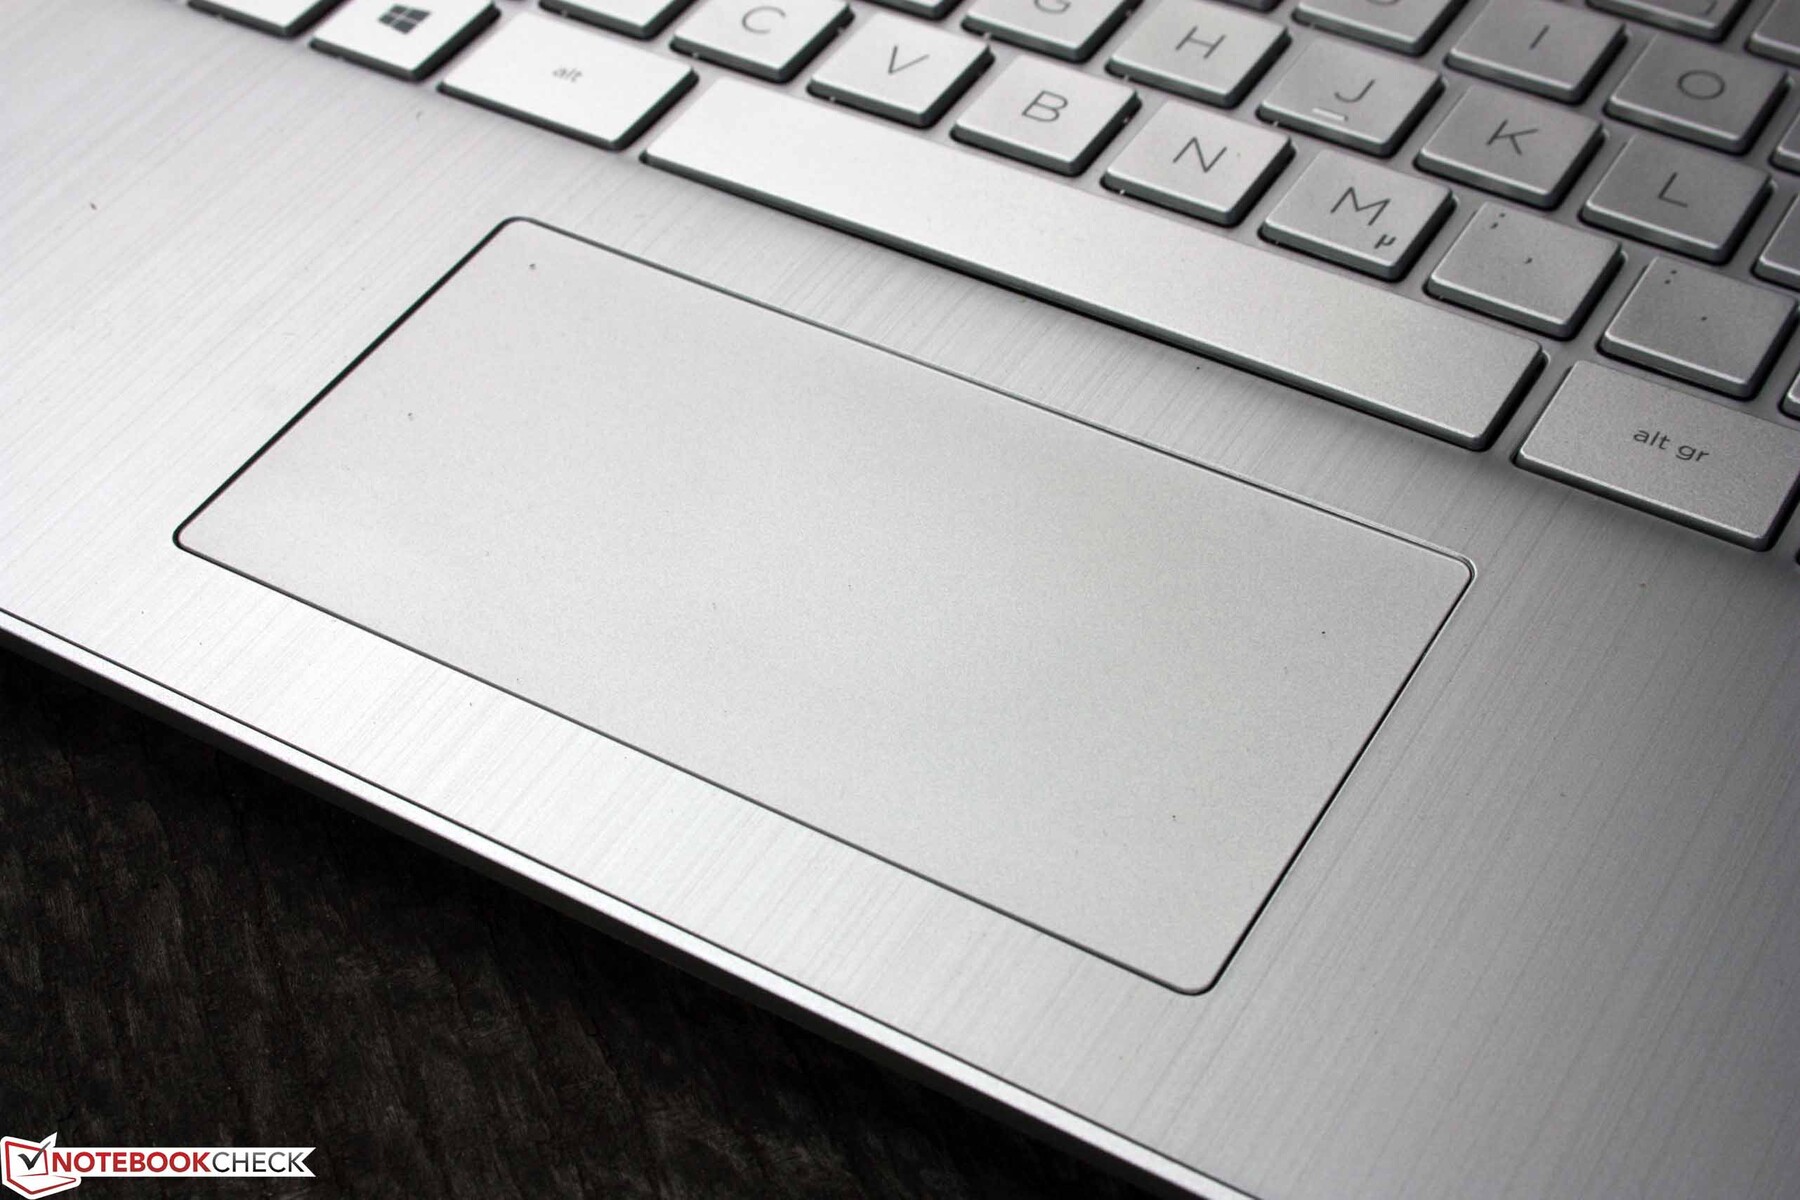
The wide clickpad is sensitive up to the edges, is only slightly lower than the palm rest and has a clear pressure point. However, the stroke is small. The penetratingly loud click noise proved to be annoying.
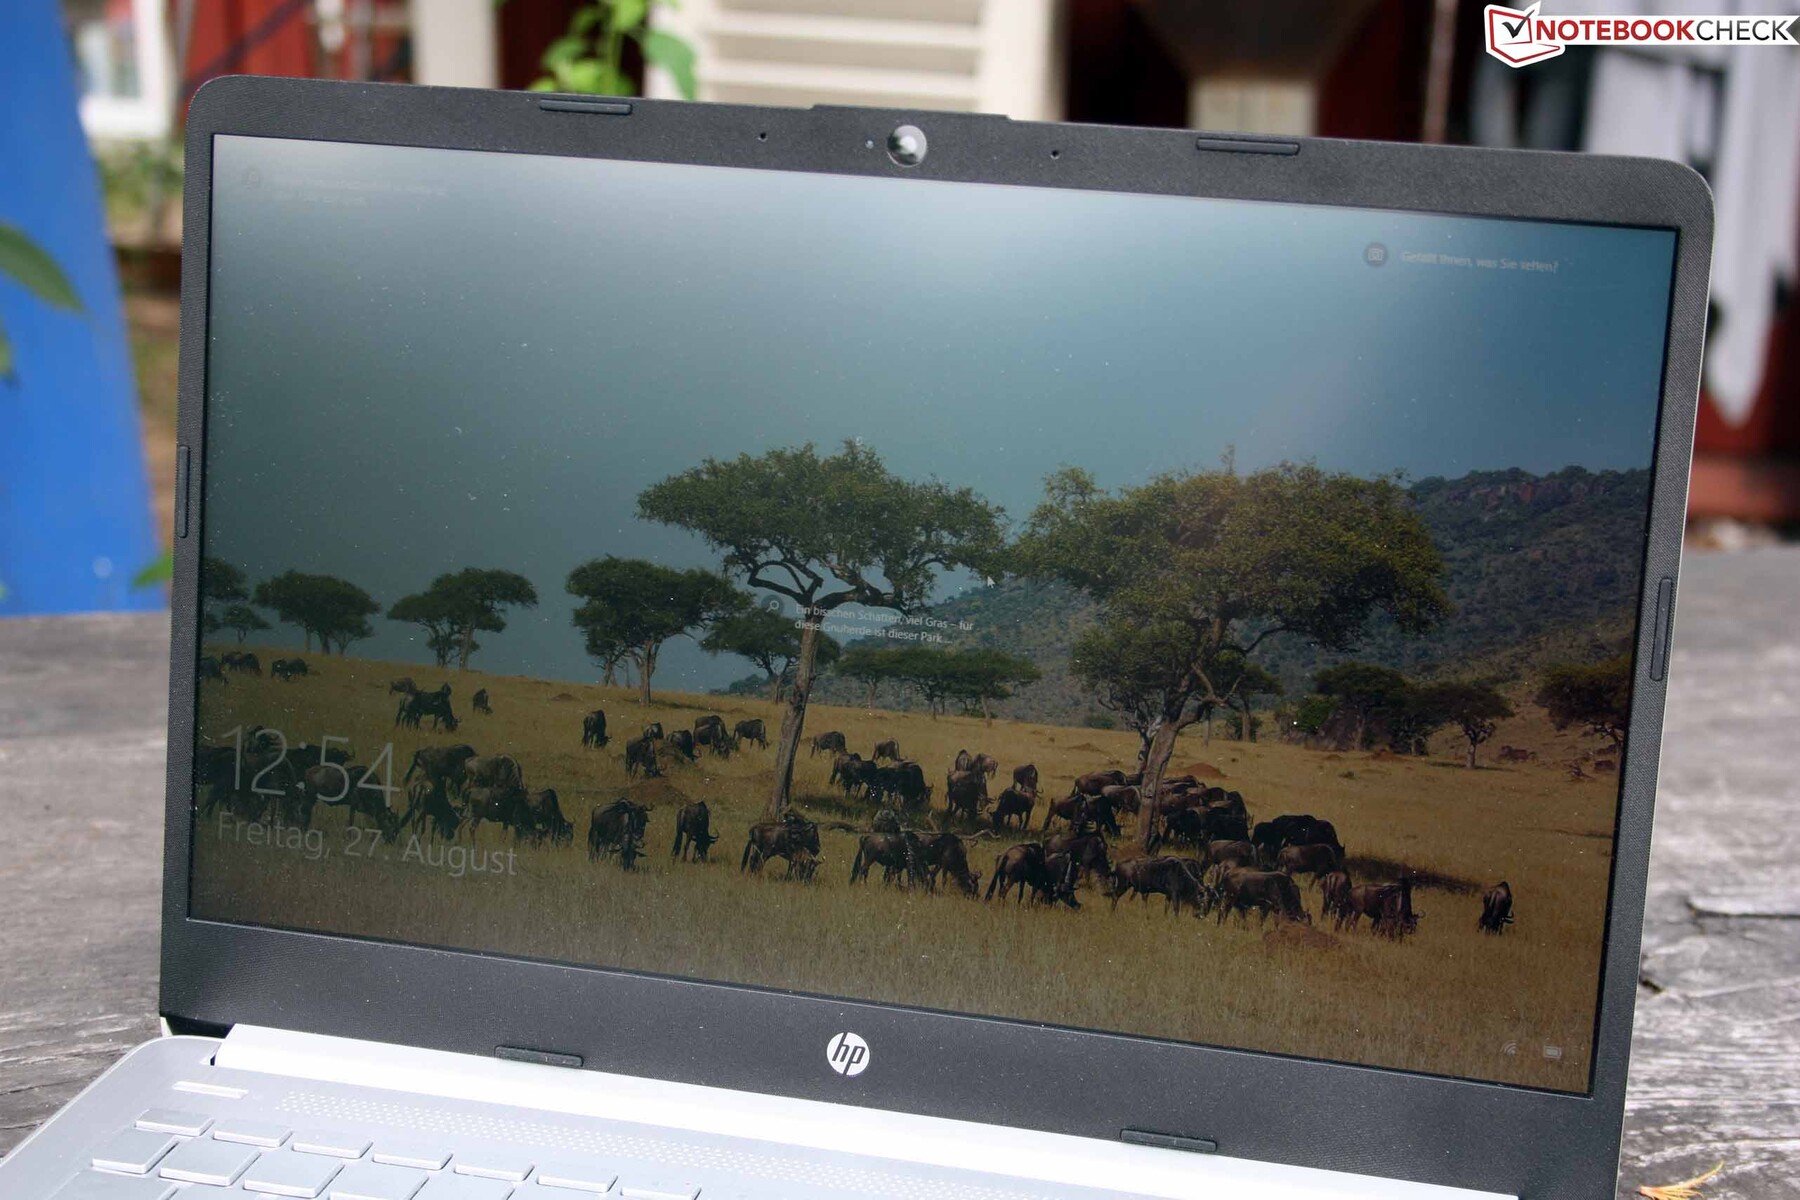
Display: not an optimal notebook display
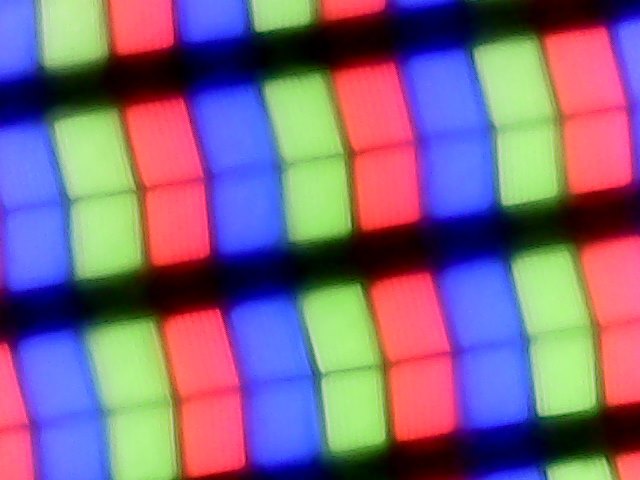
The AUO display comes with 1920 x 1080 pixels and is weakly anti-reflective, which means a certain silky gloss is present and that is also annoying in sunlight. The brightness of 223 cd/m² on average cannot do much about that.
The contrast is 978:1, a value that is almost twice as high for the Intel sister, although it is the same AUO panel type according to the nomenclature. The reason is a slightly lower black value (0.22 instead of 0.16) and a higher brightness in the Intel sister. AMD Vari Bright was not active, the device does not work with the corresponding Radeon software as usual for AMD laptops.
| |||||||||||||||||||||||||
Brightness Distribution: 85 %
Center on Battery: 220 cd/m²
Contrast: 978:1 (Black: 0.225 cd/m²)
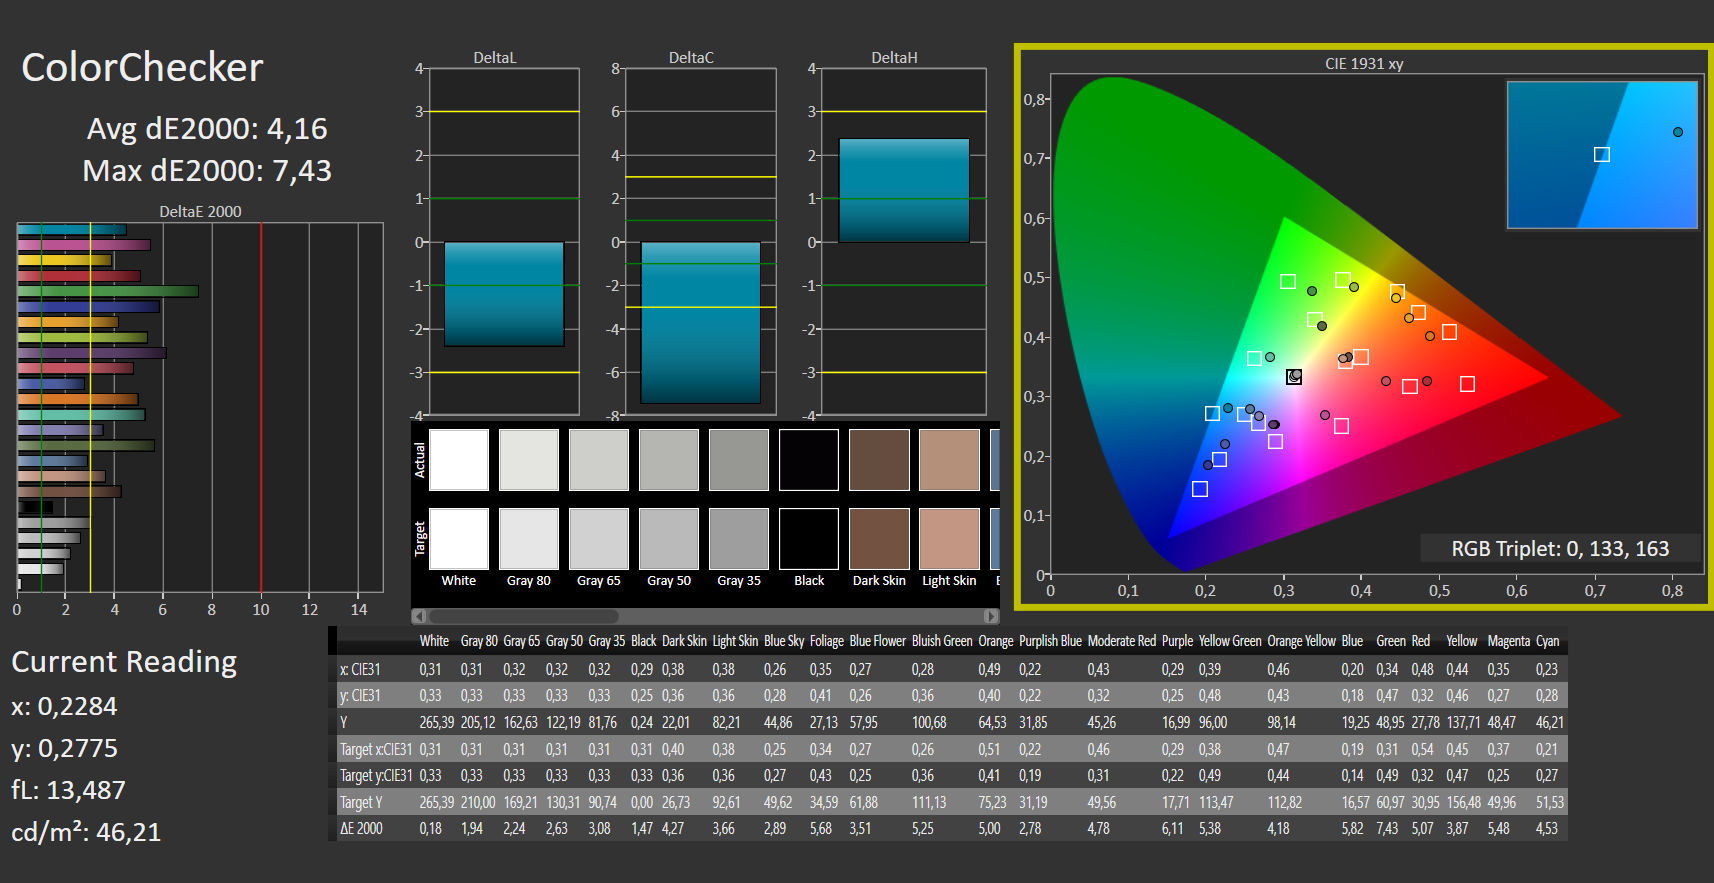
ΔE ColorChecker Calman: 4.16 | ∀{0.5-29.43 Ø4.71}
ΔE Greyscale Calman: 2.35 | ∀{0.09-98 Ø4.96}
39.37% AdobeRGB 1998 (Argyll 3D)
57% sRGB (Argyll 3D)
38.11% Display P3 (Argyll 3D)
Gamma: 2.62
CCT: 6389 K
| HP 14s-fq1357ng AUO403D, IPS, 1920x1080, 14" | Lenovo IdeaPad 5 14ALC05 82LM005YGE AU Optronics B140HAN04.E, IPS, 1920x1080, 14" | Honor Magicbook 14 i7-1165G7 BOE092E, IPS, 1920x1080, 14" | Lenovo ThinkPad E14 G3-20Y7003SGE NVM140FHM-N4V, IPS, 1920x1080, 14" | HP 14s-dq1431ng AUO403D, IPS, 1920x1080, 14" | |
|---|---|---|---|---|---|
| Display | -2% | 69% | 5% | 1% | |
| Display P3 Coverage (%) | 38.11 | 37.47 -2% | 64.8 70% | 40.3 6% | 38.42 1% |
| sRGB Coverage (%) | 57 | 56 -2% | 96.3 69% | 59.5 4% | 57.7 1% |
| AdobeRGB 1998 Coverage (%) | 39.37 | 38.71 -2% | 66.1 68% | 41.7 6% | 39.71 1% |
| Response Times | -2% | 27% | 17% | 4% | |
| Response Time Grey 50% / Grey 80% * (ms) | 41 ? | 41 ? -0% | 31.2 ? 24% | 35.2 ? 14% | 41 ? -0% |
| Response Time Black / White * (ms) | 27 ? | 28 ? -4% | 19.2 ? 29% | 21.6 ? 20% | 25 ? 7% |
| PWM Frequency (Hz) | 29800 | ||||
| Screen | -7% | 20% | -3% | -8% | |
| Brightness middle (cd/m²) | 220 | 357 62% | 341 55% | 341 55% | 305 39% |
| Brightness (cd/m²) | 223 | 315 41% | 313 40% | 327 47% | 264 18% |
| Brightness Distribution (%) | 85 | 82 -4% | 87 2% | 90 6% | 81 -5% |
| Black Level * (cd/m²) | 0.225 | 0.455 -102% | 0.27 -20% | 0.26 -16% | 0.16 29% |
| Contrast (:1) | 978 | 785 -20% | 1263 29% | 1312 34% | 1906 95% |
| Colorchecker dE 2000 * | 4.16 | 3.98 4% | 1.76 58% | 5.1 -23% | 5.44 -31% |
| Colorchecker dE 2000 max. * | 7.43 | 6.92 7% | 4.85 35% | 17.6 -137% | 20.42 -175% |
| Greyscale dE 2000 * | 2.35 | 3.33 -42% | 3.3 -40% | 2.1 11% | 3.23 -37% |
| Gamma | 2.62 84% | 2.47 89% | 2.26 97% | 2.11 104% | 2.45 90% |
| CCT | 6389 102% | 6138 106% | 7233 90% | 6755 96% | 7035 92% |
| Color Space (Percent of AdobeRGB 1998) (%) | 36 | 66 | 37 | ||
| Color Space (Percent of sRGB) (%) | 56 | 89 | 58 | ||
| Colorchecker dE 2000 calibrated * | 1.01 | 4.4 | 4.72 | ||
| Total Average (Program / Settings) | -4% /
-5% | 39% /
32% | 6% /
2% | -1% /
-4% |
* ... smaller is better
Display Response Times
| ↔ Response Time Black to White | ||
|---|---|---|
| 27 ms ... rise ↗ and fall ↘ combined | ↗ 15 ms rise |  |
| ↘ 12 ms fall | ||
| The screen shows relatively slow response rates in our tests and may be too slow for gamers. In comparison, all tested devices range from 0.1 (minimum) to 240 (maximum) ms. » 68 % of all devices are better. This means that the measured response time is worse than the average of all tested devices (19.8 ms). | ||
| ↔ Response Time 50% Grey to 80% Grey | ||
| 41 ms ... rise ↗ and fall ↘ combined | ↗ 19 ms rise |  |
| ↘ 22 ms fall | ||
| The screen shows slow response rates in our tests and will be unsatisfactory for gamers. In comparison, all tested devices range from 0.165 (minimum) to 636 (maximum) ms. » 65 % of all devices are better. This means that the measured response time is worse than the average of all tested devices (30.9 ms). | ||
Screen Flickering / PWM (Pulse-Width Modulation)
| Screen flickering / PWM not detected |  | ||
In comparison: 52 % of all tested devices do not use PWM to dim the display. If PWM was detected, an average of 7741 (minimum: 5 - maximum: 343500) Hz was measured. | |||
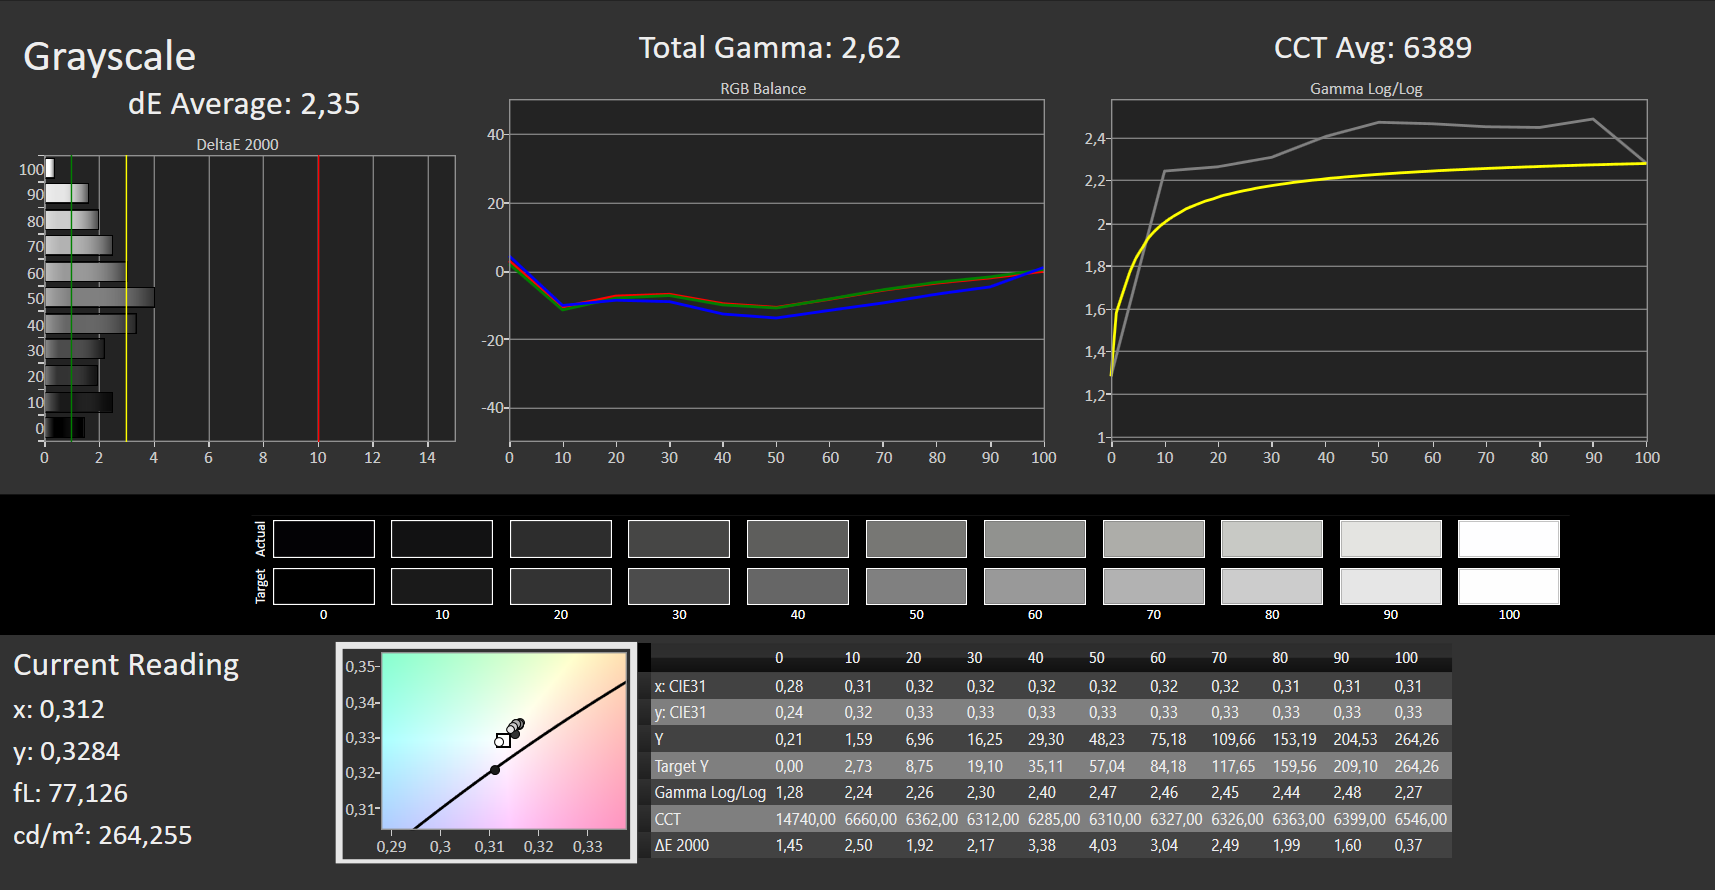
The colors do not give the 14s a boost either; sRGB is only covered by 57%. If you are looking for a really good display in this price range, you are better off with the Honor Magicbook 14 i7-1165G7 which covers 96% of sRGB and is much brighter. At least the grayscale is reproduced quite well (no visible blue cast) and there is no PWM when reducing the brightness.


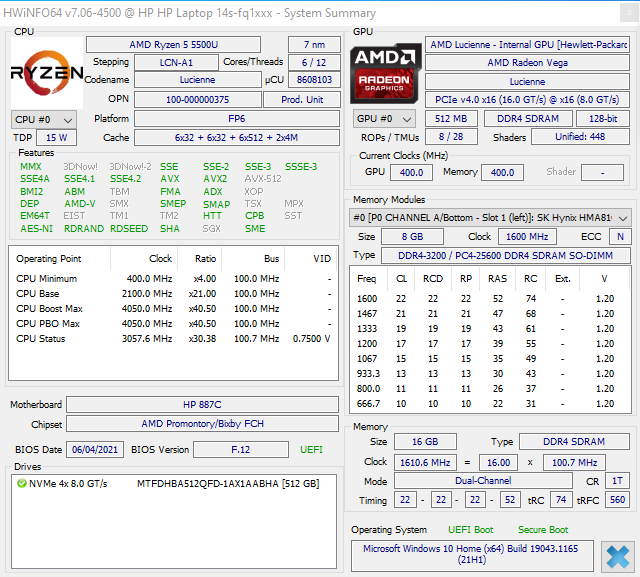
Performance: AMD's laptop processor is not maxed out
Ryzen 5 5500U, 5700U and 3500U are the possible AMD configurations on the market, Athlon variants might also be offered (not in Germany). The Intel sisters start with Celeron N4500, go over Core i3-1115G4 and end with i7-1165G7. The AMD models are mostly offered with 16 GB of RAM, the Intel with 8 GB.
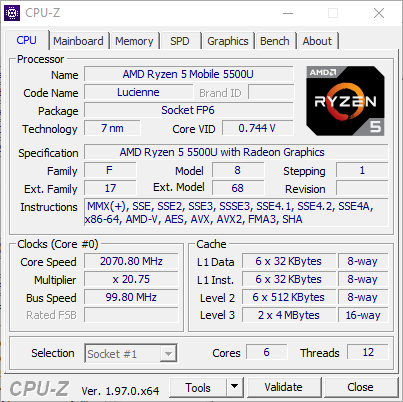
Processor
The Ryzen 5 5500U has a Turbo up to 4 GHz and a base clock of 2.1 GHz. Six Zen cores work in the chip, and a Radeon RX Vega graphics unit with a maximum of 1800 MHz is added. Both the graphics and processor parts of the APU change their clock according to the thermal conditions: If it gets too hot on the SoC, it throttles the clock until the waste heat settles below a certain limit. This is just over 60 degrees in the HP 14s.

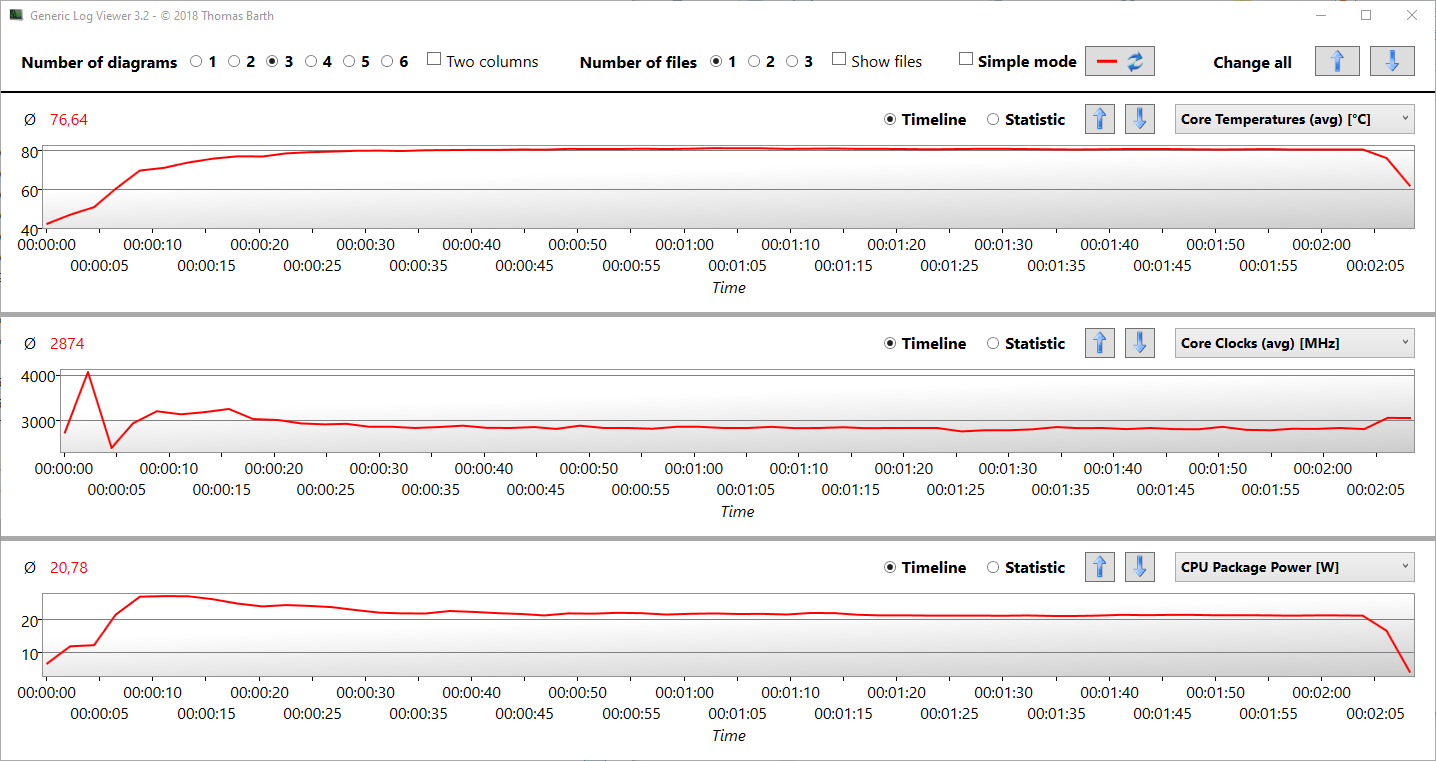
Cinebench R15 Multi Endurance test
The Ryzen 5 5500U cannot run its 4000 MHz Turbo permanently, but only for a few seconds. In R15, the clock is already back to 2500 MHz after 4 seconds and then settles at just under 3000 MHz. Therefore, the scores drop leisurely in the first seven runs, but then give way a bit and remain at a level of 950 points. A Lenovo ThinkPad E14 G3 with an identical SoC shows that 1160 points are possible in permanent use. Our Ryzen 5 5500U is weaker at startup (-11%) and during load (-19%). The base clock of 2100 MHz is not undercut.
Cinebench R20: CPU (Single Core) | CPU (Multi Core)
Cinebench R15: CPU Single 64Bit | CPU Multi 64Bit
Blender: v2.79 BMW27 CPU
7-Zip 18.03: 7z b 4 -mmt1 | 7z b 4
Geekbench 5.5: Single-Core | Multi-Core
HWBOT x265 Benchmark v2.2: 4k Preset
LibreOffice : 20 Documents To PDF
R Benchmark 2.5: Overall mean
| Cinebench R23 / Single Core | |
| Average of class Subnotebook (358 - 2213, n=60, last 2 years) | |
| Lenovo IdeaPad 5 14ALC05 82LM005YGE | |
| Lenovo ThinkPad E14 G3-20Y7003SGE | |
| Average AMD Ryzen 5 5500U (1149 - 1183, n=18) | |
| HP 14s-fq1357ng | |
| Cinebench R23 / Multi Core | |
| Average of class Subnotebook (1555 - 21812, n=59, last 2 years) | |
| Lenovo ThinkPad E14 G3-20Y7003SGE | |
| Average AMD Ryzen 5 5500U (6030 - 8565, n=19) | |
| Lenovo IdeaPad 5 14ALC05 82LM005YGE | |
| HP 14s-fq1357ng | |
| Cinebench R20 / CPU (Single Core) | |
| Average of class Subnotebook (128 - 832, n=56, last 2 years) | |
| Honor Magicbook 14 i7-1165G7 | |
| Lenovo IdeaPad 5 14ALC05 82LM005YGE | |
| Lenovo ThinkPad E14 G3-20Y7003SGE | |
| Average AMD Ryzen 5 5500U (449 - 461, n=19) | |
| HP 14s-fq1357ng | |
| HP 14s-dq1431ng | |
| HP 14s-dq1431ng | |
| Cinebench R20 / CPU (Multi Core) | |
| Average of class Subnotebook (579 - 8541, n=56, last 2 years) | |
| Lenovo ThinkPad E14 G3-20Y7003SGE | |
| Average AMD Ryzen 5 5500U (2223 - 3316, n=20) | |
| Lenovo IdeaPad 5 14ALC05 82LM005YGE | |
| Honor Magicbook 14 i7-1165G7 | |
| HP 14s-fq1357ng | |
| HP 14s-dq1431ng | |
| HP 14s-dq1431ng | |
| Cinebench R15 / CPU Single 64Bit | |
| Average of class Subnotebook (72.4 - 322, n=56, last 2 years) | |
| Honor Magicbook 14 i7-1165G7 | |
| HP 14s-fq1357ng | |
| Lenovo ThinkPad E14 G3-20Y7003SGE | |
| Average AMD Ryzen 5 5500U (170 - 179, n=18) | |
| Lenovo IdeaPad 5 14ALC05 82LM005YGE | |
| HP 14s-dq1431ng | |
| Cinebench R15 / CPU Multi 64Bit | |
| Average of class Subnotebook (327 - 3345, n=56, last 2 years) | |
| Lenovo IdeaPad 5 14ALC05 82LM005YGE | |
| Lenovo ThinkPad E14 G3-20Y7003SGE | |
| Average AMD Ryzen 5 5500U (995 - 1412, n=20) | |
| HP 14s-fq1357ng | |
| Honor Magicbook 14 i7-1165G7 | |
| HP 14s-dq1431ng | |
| Blender / v2.79 BMW27 CPU | |
| HP 14s-dq1431ng | |
| HP 14s-dq1431ng | |
| Honor Magicbook 14 i7-1165G7 | |
| HP 14s-fq1357ng | |
| Lenovo IdeaPad 5 14ALC05 82LM005YGE | |
| Average AMD Ryzen 5 5500U (358 - 490, n=18) | |
| Lenovo ThinkPad E14 G3-20Y7003SGE | |
| Average of class Subnotebook (159 - 2271, n=57, last 2 years) | |
| 7-Zip 18.03 / 7z b 4 -mmt1 | |
| Average of class Subnotebook (2643 - 6699, n=58, last 2 years) | |
| Honor Magicbook 14 i7-1165G7 | |
| Lenovo IdeaPad 5 14ALC05 82LM005YGE | |
| Average AMD Ryzen 5 5500U (4174 - 4378, n=19) | |
| Lenovo ThinkPad E14 G3-20Y7003SGE | |
| HP 14s-fq1357ng | |
| HP 14s-dq1431ng | |
| HP 14s-dq1431ng | |
| 7-Zip 18.03 / 7z b 4 | |
| Average of class Subnotebook (11668 - 77867, n=56, last 2 years) | |
| Lenovo ThinkPad E14 G3-20Y7003SGE | |
| Average AMD Ryzen 5 5500U (29585 - 36896, n=18) | |
| Lenovo IdeaPad 5 14ALC05 82LM005YGE | |
| HP 14s-fq1357ng | |
| Honor Magicbook 14 i7-1165G7 | |
| HP 14s-dq1431ng | |
| HP 14s-dq1431ng | |
| Geekbench 5.5 / Single-Core | |
| Average of class Subnotebook (726 - 2224, n=49, last 2 years) | |
| Honor Magicbook 14 i7-1165G7 | |
| HP 14s-dq1431ng | |
| HP 14s-dq1431ng | |
| HP 14s-fq1357ng | |
| Lenovo IdeaPad 5 14ALC05 82LM005YGE | |
| Lenovo ThinkPad E14 G3-20Y7003SGE | |
| Average AMD Ryzen 5 5500U (1070 - 1126, n=20) | |
| Geekbench 5.5 / Multi-Core | |
| Average of class Subnotebook (2557 - 17218, n=49, last 2 years) | |
| HP 14s-fq1357ng | |
| Lenovo IdeaPad 5 14ALC05 82LM005YGE | |
| Lenovo ThinkPad E14 G3-20Y7003SGE | |
| Average AMD Ryzen 5 5500U (4063 - 5917, n=20) | |
| Honor Magicbook 14 i7-1165G7 | |
| HP 14s-dq1431ng | |
| HP 14s-dq1431ng | |
| HWBOT x265 Benchmark v2.2 / 4k Preset | |
| Average of class Subnotebook (0.97 - 25.1, n=56, last 2 years) | |
| Lenovo ThinkPad E14 G3-20Y7003SGE | |
| Average AMD Ryzen 5 5500U (6.7 - 9.74, n=20) | |
| Lenovo IdeaPad 5 14ALC05 82LM005YGE | |
| HP 14s-fq1357ng | |
| Honor Magicbook 14 i7-1165G7 | |
| HP 14s-dq1431ng | |
| HP 14s-dq1431ng | |
| LibreOffice / 20 Documents To PDF | |
| HP 14s-dq1431ng | |
| HP 14s-dq1431ng | |
| HP 14s-fq1357ng | |
| Average AMD Ryzen 5 5500U (60 - 80.7, n=17) | |
| Lenovo ThinkPad E14 G3-20Y7003SGE | |
| Lenovo IdeaPad 5 14ALC05 82LM005YGE | |
| Average of class Subnotebook (39.9 - 220, n=55, last 2 years) | |
| Honor Magicbook 14 i7-1165G7 | |
| R Benchmark 2.5 / Overall mean | |
| HP 14s-dq1431ng | |
| HP 14s-dq1431ng | |
| Average AMD Ryzen 5 5500U (0.607 - 0.67, n=19) | |
| Lenovo ThinkPad E14 G3-20Y7003SGE | |
| HP 14s-fq1357ng | |
| Lenovo IdeaPad 5 14ALC05 82LM005YGE | |
| Honor Magicbook 14 i7-1165G7 | |
| Average of class Subnotebook (0.4024 - 1.456, n=57, last 2 years) | |
* ... smaller is better
System performance
PCMark is below average in all disciplines, but -5 to -15% should not be overestimated. The system works smoothly at all times, 20 browser tabs and several programs do not immediately bring the HP 14s to its knees.
| PCMark 10 / Score | |
| Average of class Subnotebook (4920 - 9939, n=46, last 2 years) | |
| Lenovo IdeaPad 5 14ALC05 82LM005YGE | |
| Lenovo ThinkPad E14 G3-20Y7003SGE | |
| Average AMD Ryzen 5 5500U, AMD Radeon RX Vega 7 (4626 - 5301, n=13) | |
| Honor Magicbook 14 i7-1165G7 | |
| HP 14s-fq1357ng | |
| HP 14s-dq1431ng | |
| PCMark 10 / Essentials | |
| Average of class Subnotebook (8552 - 11646, n=46, last 2 years) | |
| Honor Magicbook 14 i7-1165G7 | |
| Lenovo IdeaPad 5 14ALC05 82LM005YGE | |
| HP 14s-fq1357ng | |
| Lenovo ThinkPad E14 G3-20Y7003SGE | |
| Average AMD Ryzen 5 5500U, AMD Radeon RX Vega 7 (8390 - 9789, n=13) | |
| HP 14s-dq1431ng | |
| PCMark 10 / Productivity | |
| Average of class Subnotebook (5435 - 16606, n=46, last 2 years) | |
| Lenovo ThinkPad E14 G3-20Y7003SGE | |
| Lenovo IdeaPad 5 14ALC05 82LM005YGE | |
| Average AMD Ryzen 5 5500U, AMD Radeon RX Vega 7 (6262 - 7958, n=13) | |
| Honor Magicbook 14 i7-1165G7 | |
| HP 14s-fq1357ng | |
| HP 14s-dq1431ng | |
| PCMark 10 / Digital Content Creation | |
| Average of class Subnotebook (5722 - 13779, n=46, last 2 years) | |
| Lenovo IdeaPad 5 14ALC05 82LM005YGE | |
| Average AMD Ryzen 5 5500U, AMD Radeon RX Vega 7 (4513 - 5540, n=13) | |
| Honor Magicbook 14 i7-1165G7 | |
| Lenovo ThinkPad E14 G3-20Y7003SGE | |
| HP 14s-fq1357ng | |
| HP 14s-dq1431ng | |
| PCMark 10 Score | 4809 points | |
Help | ||
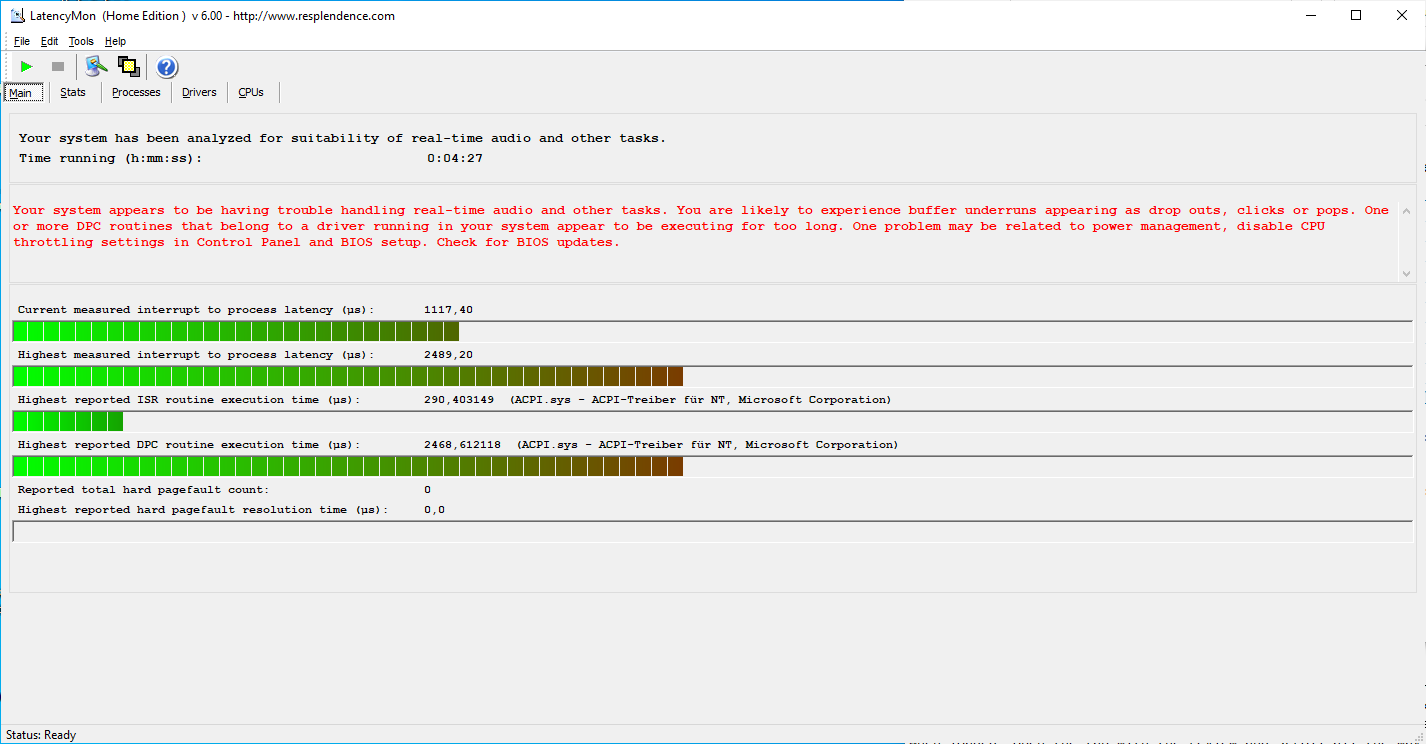
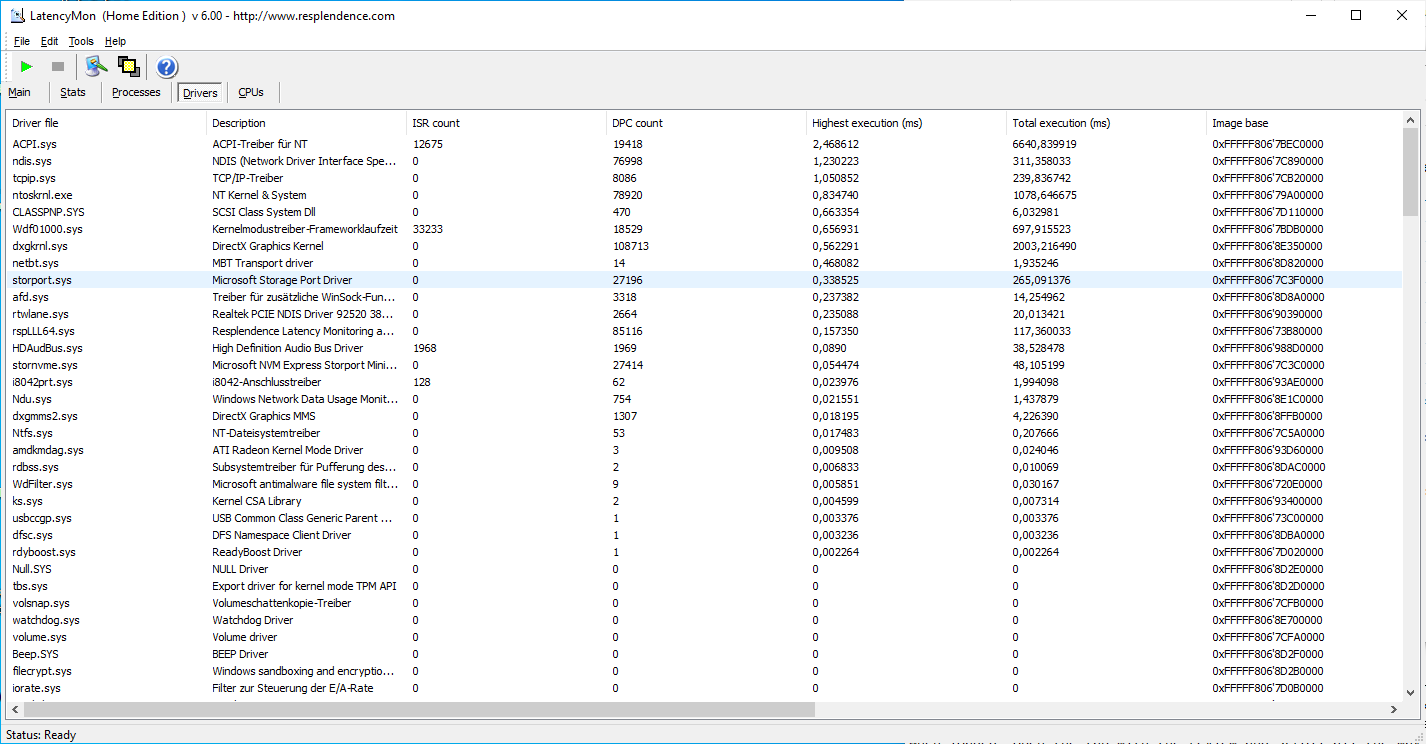
DPC latencies
In the test with LatencyMon, the HP 14s shows increased interruption times, with ACPI and network drivers causing the highest latencies. Thus, our test configuration is not suitable for real-time applications or similar, but this might change with future updates.
| DPC Latencies / LatencyMon - interrupt to process latency (max), Web, Youtube, Prime95 | |
| HP 14s-fq1357ng | |
| Lenovo ThinkPad E14 G3-20Y7003SGE | |
| HP 14s-dq1431ng | |
| Honor Magicbook 14 i7-1165G7 | |
| Lenovo IdeaPad 5 14ALC05 82LM005YGE | |
* ... smaller is better
Mass storage
The PCIe SSD Micron 2210 (M.2 2280) with a capacity of 512 GB installed here achieves below-average write and read rates in the storage benchmarks. The rivals with WDC, Samsung and SK Hynix are faster here. However, the sister HP 14s-dq1431ng (Intel) with Intel Optane memory is easily beaten.
| HP 14s-fq1357ng Micron 2210 MTFDHBA512QFD | Lenovo IdeaPad 5 14ALC05 82LM005YGE Samsung SSD PM981a MZVLB512HBJQ | Honor Magicbook 14 i7-1165G7 WDC PC SN730 SDBPNTY-512G | Lenovo ThinkPad E14 G3-20Y7003SGE SK Hynix BC711 HFM512GD3HX015N | HP 14s-dq1431ng Intel Optane Memory H10 with Solid State Storage 16GB + 256GB HBRPEKNX0101AH | Average Micron 2210 MTFDHBA512QFD | Average of class Subnotebook | |
|---|---|---|---|---|---|---|---|
| CrystalDiskMark 5.2 / 6 | 57% | 89% | 37% | 20% | 17% | 113% | |
| Write 4K (MB/s) | 94.8 | 93.3 -2% | 223.7 136% | 83.3 -12% | 142.8 51% | 153.1 ? 61% | 151.2 ? 59% |
| Read 4K (MB/s) | 48.93 | 38.87 -21% | 51.2 5% | 46.84 -4% | 167.4 242% | 64.6 ? 32% | 63.9 ? 31% |
| Write Seq (MB/s) | 1059 | 2834 168% | 2579 144% | 2195 107% | 232.1 -78% | 1125 ? 6% | 2839 ? 168% |
| Read Seq (MB/s) | 1620 | 2452 51% | 2553 58% | 2112 30% | 1128 -30% | 1808 ? 12% | 3290 ? 103% |
| Write 4K Q32T1 (MB/s) | 400 | 386.6 -3% | 671 68% | 439.7 10% | 438 10% | 367 ? -8% | 433 ? 8% |
| Read 4K Q32T1 (MB/s) | 377.2 | 495.5 31% | 761 102% | 391.1 4% | 491.2 30% | 507 ? 34% | 501 ? 33% |
| Write Seq Q32T1 (MB/s) | 1136 | 2981 162% | 2721 140% | 2484 119% | 622 -45% | 1138 ? 0% | 4721 ? 316% |
| Read Seq Q32T1 (MB/s) | 2073 | 3566 72% | 3358 62% | 2995 44% | 1566 -24% | 1997 ? -4% | 5886 ? 184% |
| AS SSD | 58% | 79% | 46% | -49% | -3% | 72% | |
| Seq Read (MB/s) | 1784 | 2645 48% | 3021 69% | 2596 46% | 677 -62% | 1885 ? 6% | 4536 ? 154% |
| Seq Write (MB/s) | 742 | 2627 254% | 2341 215% | 1460 97% | 194.7 -74% | 998 ? 35% | 2962 ? 299% |
| 4K Read (MB/s) | 58.3 | 55.2 -5% | 47.9 -18% | 48.62 -17% | 58.1 0% | 62.2 ? 7% | 59.3 ? 2% |
| 4K Write (MB/s) | 141.9 | 119.4 -16% | 186.7 32% | 113.4 -20% | 124.1 -13% | 162 ? 14% | 163.9 ? 16% |
| 4K-64 Read (MB/s) | 582 | 1308 125% | 1472 153% | 1419 144% | 219.6 -62% | 585 ? 1% | 866 ? 49% |
| 4K-64 Write (MB/s) | 1047 | 1816 73% | 1829 75% | 1840 76% | 638 -39% | 863 ? -18% | 1713 ? 64% |
| Access Time Read * (ms) | 0.052 | 0.057 -10% | 0.06 -15% | 0.049 6% | 0.109 -110% | 0.07329 ? -41% | 0.06724 ? -29% |
| Access Time Write * (ms) | 0.046 | 0.031 33% | 0.021 54% | 0.032 30% | 0.065 -41% | 0.04957 ? -8% | 0.05165 ? -12% |
| Score Read (Points) | 819 | 1628 99% | 1822 122% | 1727 111% | 345 -58% | 836 ? 2% | 1378 ? 68% |
| Score Write (Points) | 1263 | 2198 74% | 2249 78% | 2099 66% | 782 -38% | 1125 ? -11% | 2173 ? 72% |
| Score Total (Points) | 2469 | 4667 89% | 4973 101% | 4658 89% | 1305 -47% | 2366 ? -4% | 4191 ? 70% |
| Copy ISO MB/s (MB/s) | 1067 | 1476 38% | 1168 9% | 1191 ? 12% | 2596 ? 143% | ||
| Copy Program MB/s (MB/s) | 597 | 538 -10% | 590 -1% | 477 ? -20% | 805 ? 35% | ||
| Copy Game MB/s (MB/s) | 1019 | 1185 16% | 1148 13% | 857 ? -16% | 1779 ? 75% | ||
| Total Average (Program / Settings) | 58% /
58% | 84% /
83% | 42% /
43% | -15% /
-20% | 7% /
4% | 93% /
87% |
* ... smaller is better

Continuous power reading: DiskSpd Read Loop, Queue Depth 8
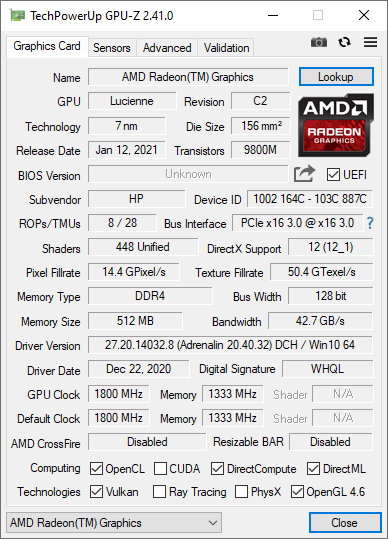
Graphics card
With the integrated Radeon RX Vega 7 SoC graphics, the HP 14s has its limits; the 14-incher is not designed for gaming. Our games table immediately shows that: The games there are 3-5 years old and can be played in medium settings at best. If you are seriously thinking about current games, you should look for an alternative
| 3DMark 11 Performance | 5982 points | |
| 3DMark Fire Strike Score | 3073 points | |
| 3DMark Time Spy Score | 1203 points | |
Help | ||
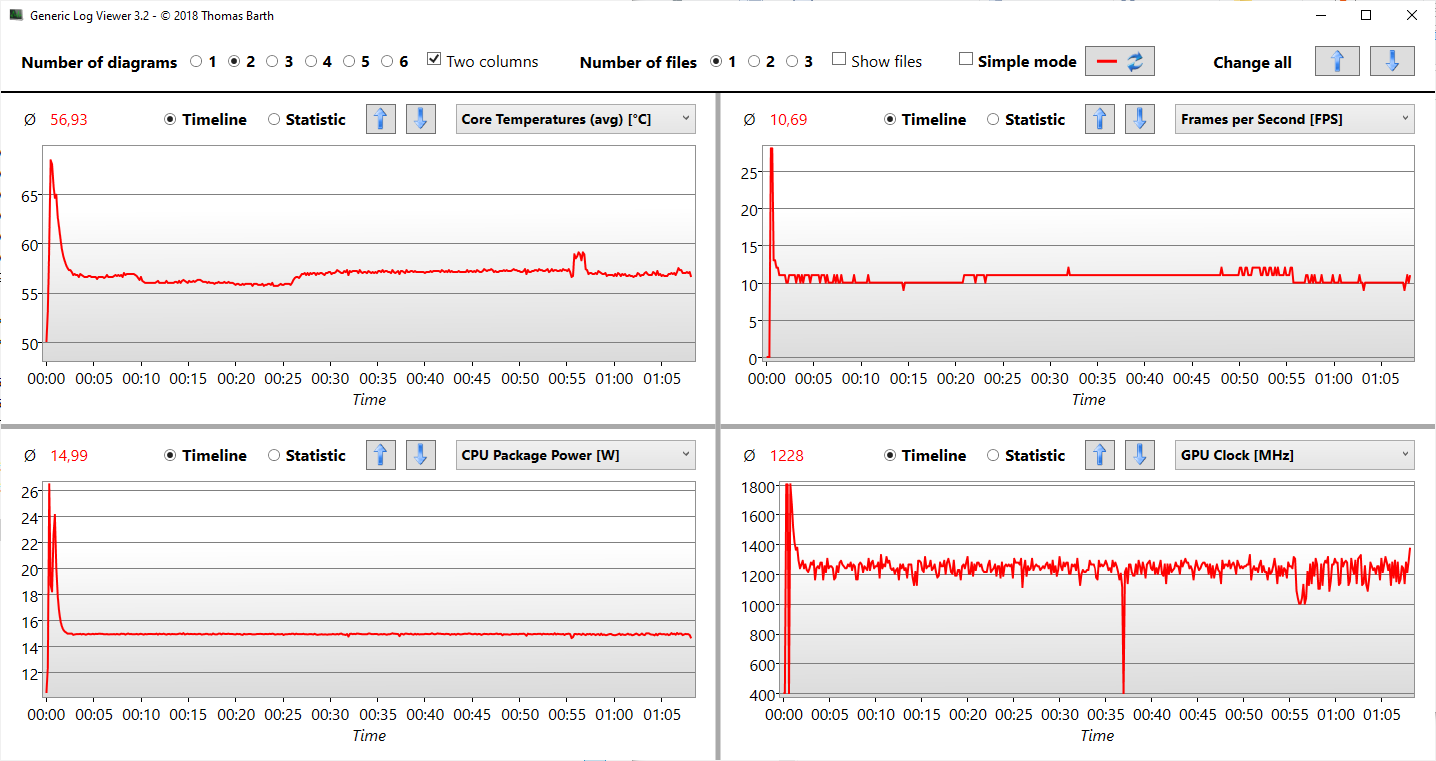
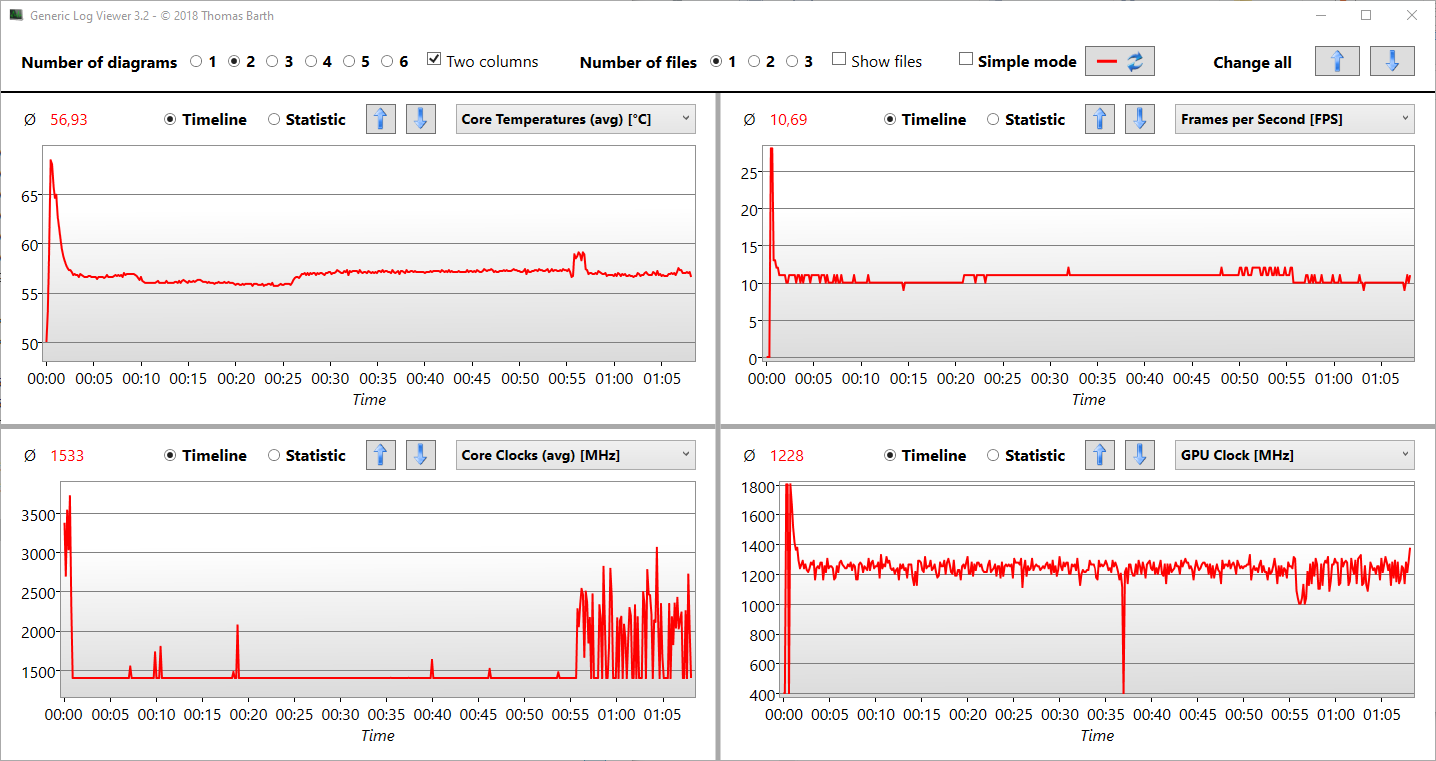
Gaming performance
If you push the graphics with Ultra settings, you will experience thermal limitations, as our test with Witcher 3 Ultra shows: FPS hold at 25 for a few minutes, then drop to 10-11 along with the CPU and GPU clock. Here the GPU clock drops from 1800 to 1200 MHz, the CPU clock from 3500 to 1500 MHz. This all happens to keep the temperature in the SoC below 60 degrees Celsius (140 degrees Fahrenheit). This is good for low waste heat, but gives away performance of the Radeon Vega RX, which is then below average.
Moderately hardware-intensive games and the 3DMarks were not affected by this in the test. The HP 14s is not bad compared to the competition, and it even takes the lead over other Vega RX 7s in some cases. The Intel competition with an iGPU Iris Xe is mostly beaten, even with a strong Core i7 (Honor Magicbook 14 i7).
Witcher 3 FPS-Diagram
Which games are playable with the AMD Radeon RX Vega 7? You can find the answer in our gaming overview or on the GPU page.
| GTA V | |
| 1024x768 Lowest Settings possible | |
| Average of class Subnotebook (87.5 - 181.8, n=55, last 2 years) | |
| Average AMD Radeon RX Vega 7 (43.1 - 140.7, n=39) | |
| Lenovo ThinkPad E14 G3-20Y7003SGE | |
| HP 14s-fq1357ng | |
| 1920x1080 Lowest Settings possible | |
| Average of class Subnotebook (89.6 - 177.3, n=25, last 2 years) | |
| Lenovo ThinkPad E14 G3-20Y7003SGE | |
| Average AMD Radeon RX Vega 7 (25.1 - 81.3, n=31) | |
| 1366x768 Normal/Off AF:4x | |
| Average of class Subnotebook (81.2 - 176.9, n=53, last 2 years) | |
| Lenovo ThinkPad E14 G3-20Y7003SGE | |
| Average AMD Radeon RX Vega 7 (38 - 123, n=36) | |
| HP 14s-fq1357ng | |
| 1920x1080 Normal/Off AF:4x | |
| Average of class Subnotebook (81.2 - 170.7, n=24, last 2 years) | |
| Lenovo ThinkPad E14 G3-20Y7003SGE | |
| Average AMD Radeon RX Vega 7 (26.3 - 82.7, n=32) | |
| 1920x1080 High/On (Advanced Graphics Off) AA:2xMSAA + FX AF:8x | |
| Average of class Subnotebook (25.8 - 99.6, n=54, last 2 years) | |
| Lenovo ThinkPad E14 G3-20Y7003SGE | |
| Average AMD Radeon RX Vega 7 (11.3 - 32.2, n=40) | |
| HP 14s-fq1357ng | |
| low | med. | high | ultra | |
|---|---|---|---|---|
| GTA V (2015) | 82 | 74 | 22 | |
| The Witcher 3 (2015) | 52 | 29 | 14.7 | 10 |
| Dota 2 Reborn (2015) | 98.7 | 84.5 | 47.2 | 43.7 |
| Final Fantasy XV Benchmark (2018) | 34.8 | 16.9 | ||
| X-Plane 11.11 (2018) | 38.8 | 29.7 | 26.4 | |
| Strange Brigade (2018) | 76.6 | 30.5 | 25.3 |
Emissions & Energy: Cool HP Notebook
Noise emissions
The overall noise level is low. The fans consistently stay off in idle mode. Under load, they start up abruptly; a slow ramp-up would be more pleasant here. The fans only know one speed during load, regardless of whether it is the stress test or high load via Witcher 3 Ultra. We measured 41 dB(A) in both cases. The competitors are not so different in this respect: It is common for current Intel and AMD chipsets in the performance class that the fans do not have to work continuously.
Noise level
| Idle |
| 26 / 26 / 31.6 dB(A) |
| Load |
| 41 / 41 dB(A) |
 | ||
30 dB silent 40 dB(A) audible 50 dB(A) loud |
||
min: | ||
Temperature
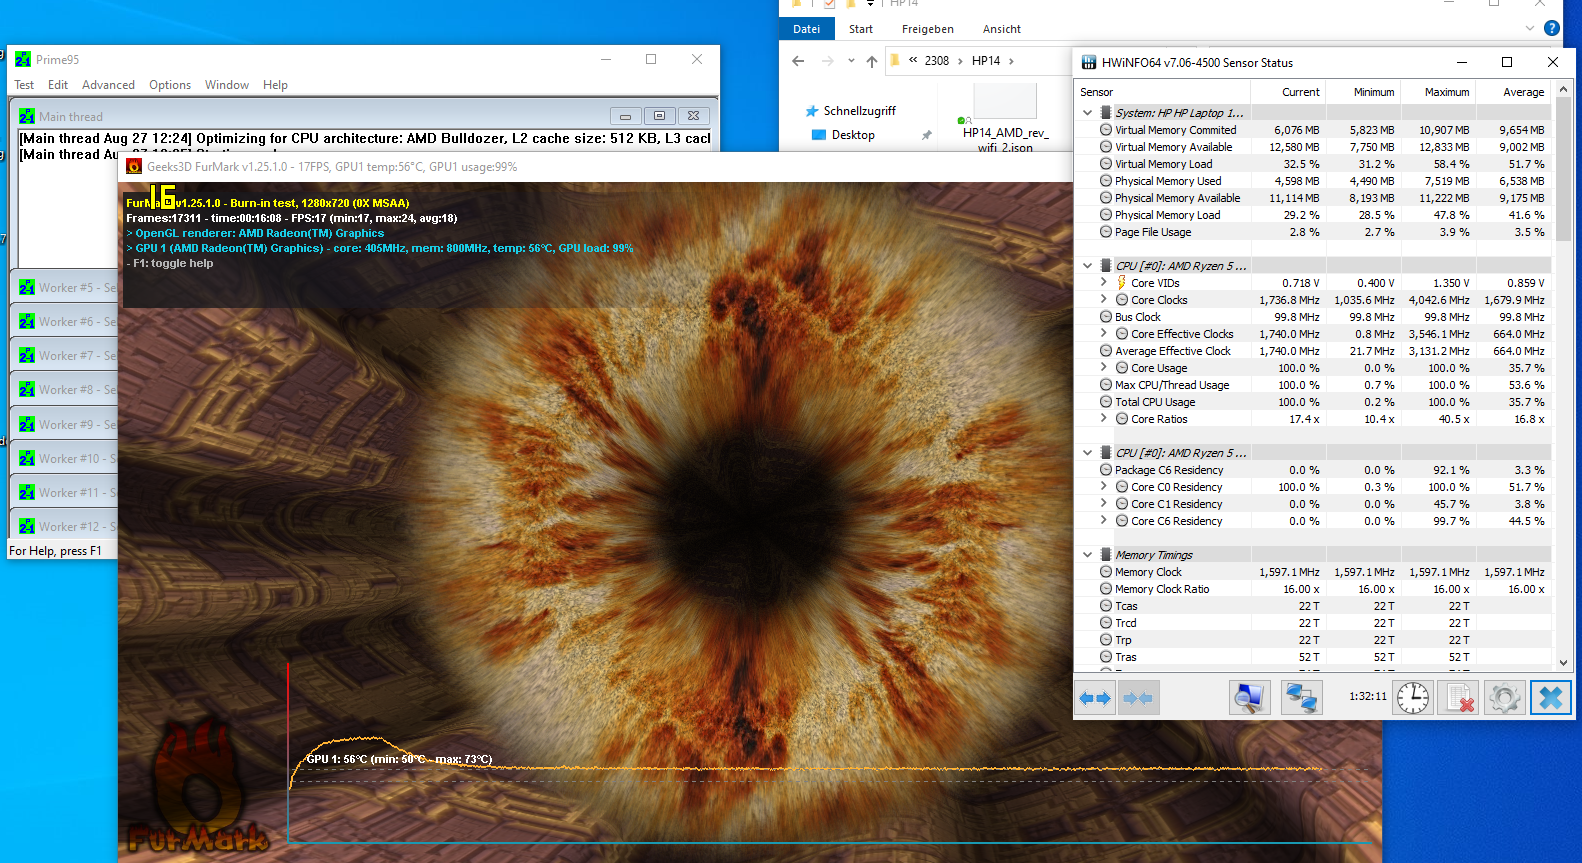
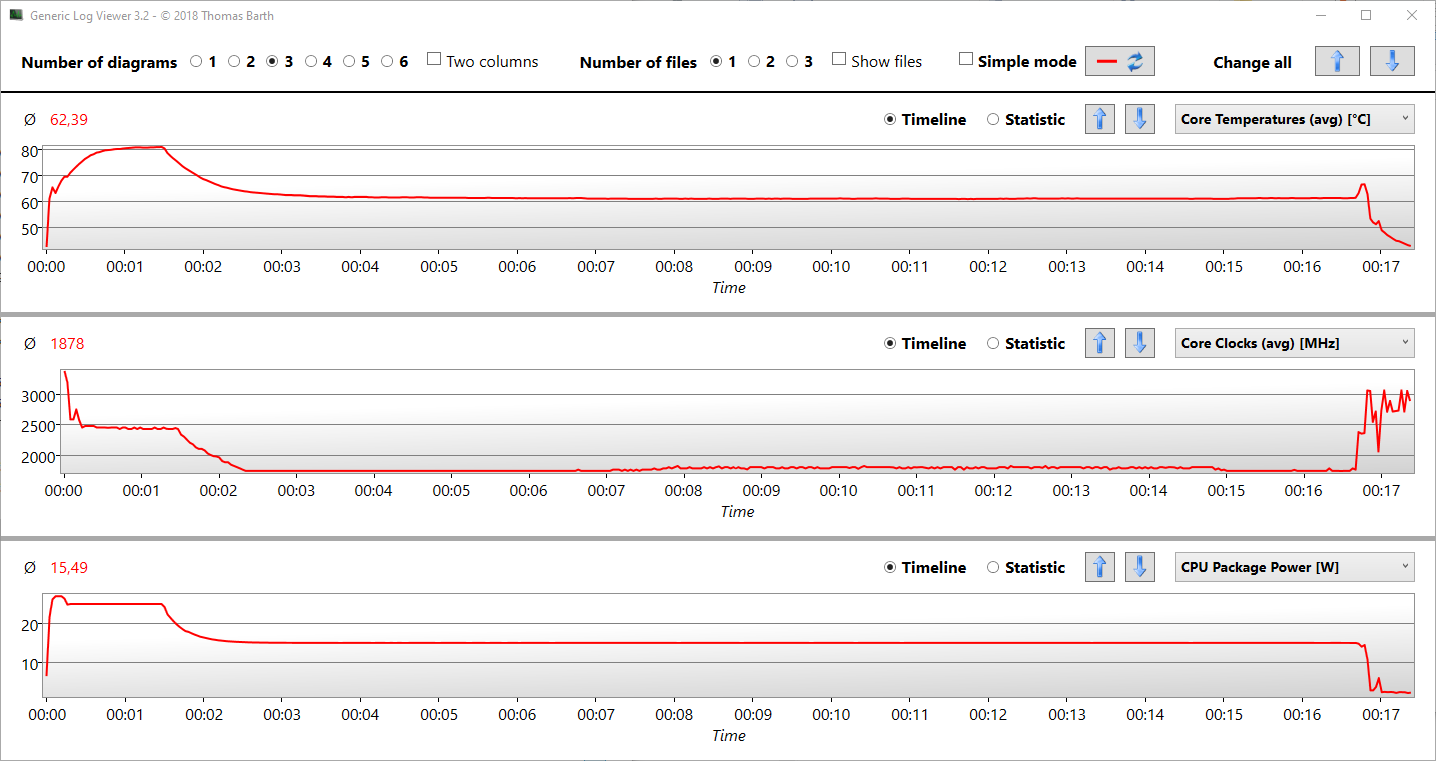
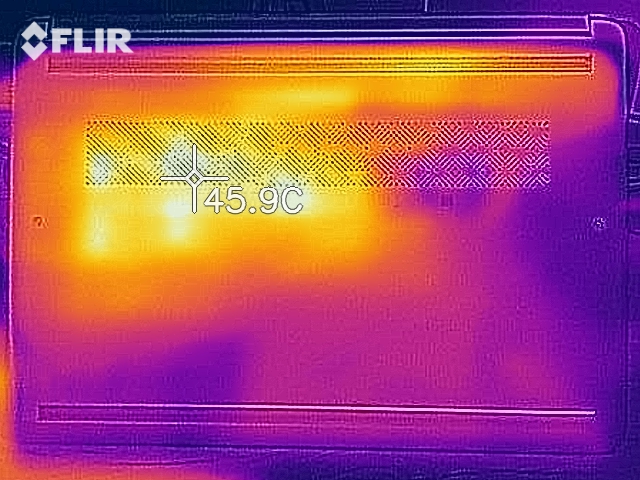
The stress test shows how the cooling system handles high permanent load. As soon as the temperatures on the SoC exceed 81 degrees (~178 degrees Fahrenheit) - which is the case after about 1:30 minutes - the clock is gradually reduced from 2500 down to 1600 MHz. The package power is also reduced from an initial 25 watts to 15 watts.
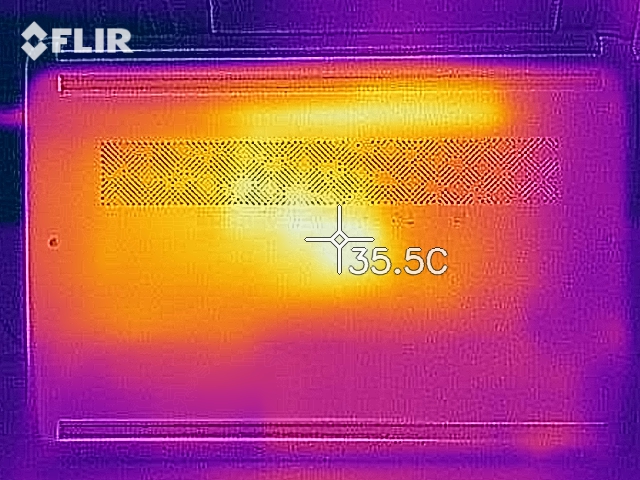
Consequently, the HP 14s favors low surface temperatures. It is only just over 60 degrees (~140 degrees Fahrenheit) on the chip permanently, which means we measured a maximum of 45 degrees (~113 degrees Fahrenheit) on the bottom, whereas the average of 30 degrees (~86 degrees Fahrenheit) is considerably lower.
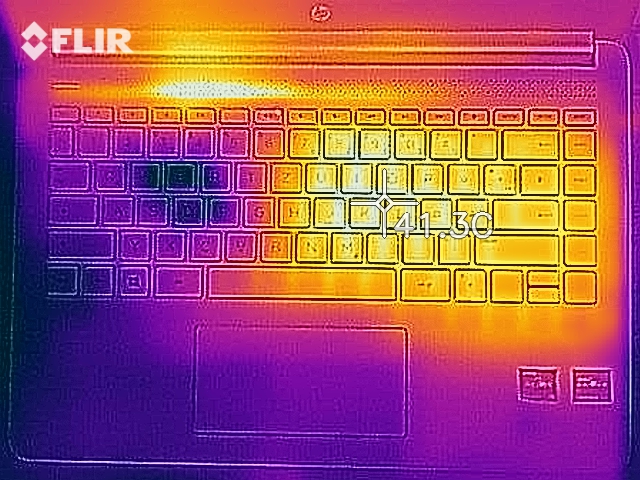
(+) The maximum temperature on the upper side is 37.7 °C / 100 F, compared to the average of 35.9 °C / 97 F, ranging from 21.4 to 59 °C for the class Subnotebook.
(-) The bottom heats up to a maximum of 45.6 °C / 114 F, compared to the average of 39.2 °C / 103 F
(+) In idle usage, the average temperature for the upper side is 25.9 °C / 79 F, compared to the device average of 30.8 °C / 87 F.
(+) The palmrests and touchpad are cooler than skin temperature with a maximum of 26.4 °C / 79.5 F and are therefore cool to the touch.
(±) The average temperature of the palmrest area of similar devices was 28.2 °C / 82.8 F (+1.8 °C / 3.3 F).

Speaker
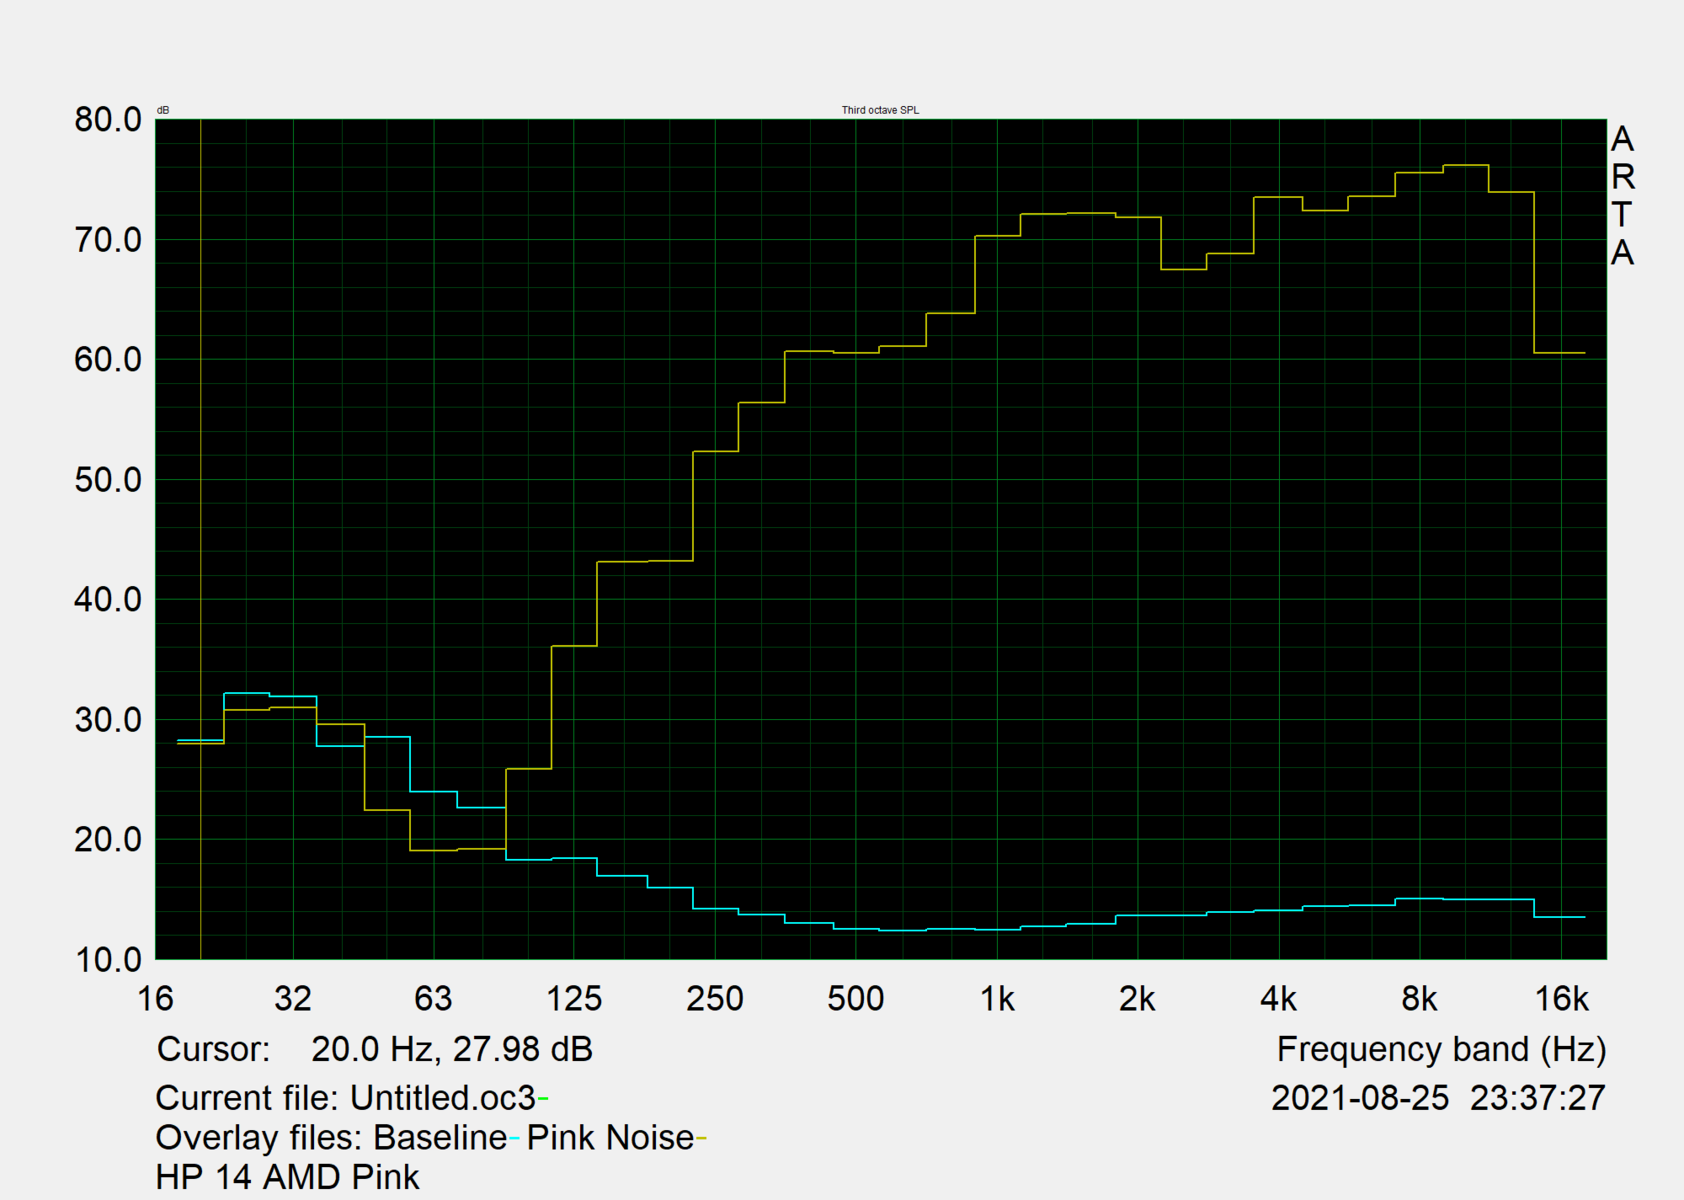
The speakers are located under the perforated plate above the keyboard, which ensures a consistent sound even when the device is lying on the bedspread. The sound emphasizes the mids very strongly, there are almost no lows. The competition can't do any better, like the Honor Magicbook 14 shows. The dual microphone is of inferior quality; recordings are accompanied by moderate noise.
HP 14s-fq1357ng audio analysis
(±) | speaker loudness is average but good (76.1 dB)
Bass 100 - 315 Hz
(-) | nearly no bass - on average 24.6% lower than median
(±) | linearity of bass is average (11.6% delta to prev. frequency)
Mids 400 - 2000 Hz
(±) | reduced mids - on average 5% lower than median
(+) | mids are linear (3.8% delta to prev. frequency)
Highs 2 - 16 kHz
(±) | higher highs - on average 5% higher than median
(+) | highs are linear (4.1% delta to prev. frequency)
Overall 100 - 16.000 Hz
(±) | linearity of overall sound is average (19.7% difference to median)
Compared to same class
» 62% of all tested devices in this class were better, 7% similar, 31% worse
» The best had a delta of 5%, average was 18%, worst was 53%
Compared to all devices tested
» 50% of all tested devices were better, 7% similar, 43% worse
» The best had a delta of 4%, average was 23%, worst was 134%
Honor Magicbook 14 i7-1165G7 audio analysis
(+) | speakers can play relatively loud (82 dB)
Bass 100 - 315 Hz
(-) | nearly no bass - on average 26.5% lower than median
(±) | linearity of bass is average (13.5% delta to prev. frequency)
Mids 400 - 2000 Hz
(+) | balanced mids - only 3.5% away from median
(+) | mids are linear (5.4% delta to prev. frequency)
Highs 2 - 16 kHz
(+) | balanced highs - only 3.2% away from median
(+) | highs are linear (3.4% delta to prev. frequency)
Overall 100 - 16.000 Hz
(±) | linearity of overall sound is average (18.9% difference to median)
Compared to same class
» 36% of all tested devices in this class were better, 7% similar, 57% worse
» The best had a delta of 7%, average was 21%, worst was 53%
Compared to all devices tested
» 44% of all tested devices were better, 8% similar, 48% worse
» The best had a delta of 4%, average was 23%, worst was 134%
Energy consumption
Ryzen 5 is frugal, which is once again evident with an idle power consumption of 4 to 7 watts. It increases to between 28 and 42 watts during permanent load, and short load phases can be higher. Either way, the 65 watt power supply is suitably rated. The Witcher 3 energy consumption shows how differently cooling systems can affect the performance of an R5 5500U intercept: While our HP 14s throttles the clock to keep waste heat and noise in check, a Lenovo IdeaPad 5 14ALC05 continues unabated and remains at its already higher level.
| Off / Standby | |
| Idle | |
| Load |
|
Key:
min: | |
Energy consumption Witcher 3 / stress test
Battery life
We determined the runtime relevant for practice with the Wi-Fi test. The browser goes off after 8:27 hours, an impressive performance for the small 41 Wh battery. However, the competition with 56-57 Wh lasts up to 30% longer. If you are looking for a longer battery life, you should check out the Lenovo IdeaPad 5 14ALC05 more closely.
| HP 14s-fq1357ng R5 5500U, Vega 7, 41 Wh | Lenovo IdeaPad 5 14ALC05 82LM005YGE R5 5500U, Vega 7, 56.5 Wh | Honor Magicbook 14 i7-1165G7 i7-1165G7, Iris Xe G7 96EUs, 56 Wh | Lenovo ThinkPad E14 G3-20Y7003SGE R5 5500U, Vega 7, 57 Wh | HP 14s-dq1431ng i5-1035G1, UHD Graphics G1 (Ice Lake 32 EU), 41 Wh | Average of class Subnotebook | |
|---|---|---|---|---|---|---|
| Battery Runtime | 27% | 14% | 33% | -34% | 64% | |
| WiFi Websurfing (h) | 8.5 | 10.8 27% | 9.7 14% | 11.3 33% | 5.6 -34% | 13.9 ? 64% |
| 1920x1080 Witcher 3 ultra 150cd (h) | 1.5 | |||||
| Battery runtime | ||||||
| Reader / Idle (h) | 11.3 | 19.7 74% | 12.1 7% | 26.4 ? 134% | ||
| Total Average (Program / Settings) | 51% /
51% | 14% /
14% | 33% /
33% | -14% /
-14% | 99% /
99% |
Pros
Cons
Verdict: HP's 14-incher has too many weaknesses
The HP 14s caters to the price-sensitive low-budget customer as well as the price- and performance-conscious mainstream buyer. Cheap to mid-priced AMD and Intel configurations are used in a dignified but unfortunately also below average stable case. Our test device hardware includes the Ryzen 5 5500U, 16 GB RAM, 512 GB SSD and IPS Full HD, a very attractive price-performance ratio.
However, if you take into account the less stable chassis, the input devices that suffer from it, the weak display, the difficult maintenance, the slow WLAN and the few ports, there is not much that we can recommend about the HP 14s.
Sure, the Ryzen 5 5500U does a good job here and puts the Intel rivals in its pocket. However, the chip performs below average under selective and permanent load. Here, models with the same SoC get more performance out of Ryzen 5, see Lenovo ThinkPad E14 G3 and Lenovo IdeaPad 5 14ALC05.
If you are looking for runtime and a very good price/performance ratio, you should take a look at the Lenovo IdeaPad 5 14ALC05 more closely.
Price and availability
The test configuration HP 14s-fq1357ng is not offered at the time of publishing this test, the device was provided to us by HP Germany. The identical HP 14s-fq1158ng (without Windows) is currently available for €533 (~$635) at Notebooksbilliger.
HP 14s-fq1357ng
- 08/31/2021 v7 (old)
Sebastian Jentsch
Price comparison

