HP ZBook Fury 15 G7 Workstation Review: Vapor Chamber for Maximum Performance
The HP ZBook Fury 15 G7 is is the company's flagship 15.6-inch mobile workstation designed for high-performance CAD users and professionals. Unlike the thinner ZBook 15u or Firefly series, the ZBook Fury 15 utilizes much faster Intel H-series CPUs with higher-end GeForce RTX GPU options instead of the slower Intel U-series with Quadro P GPUs.
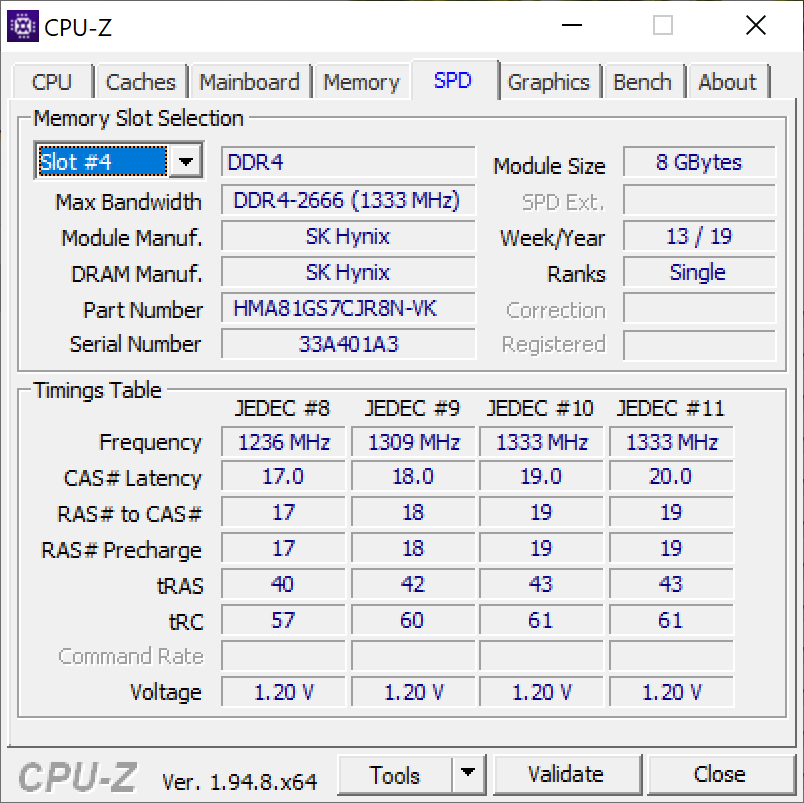
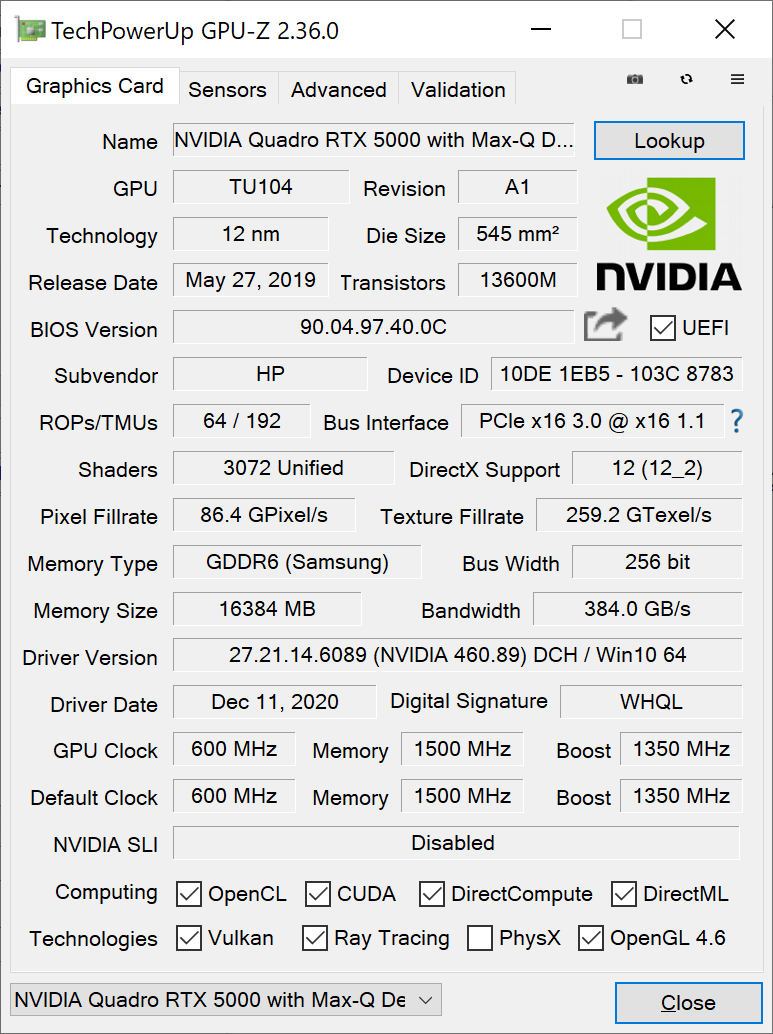
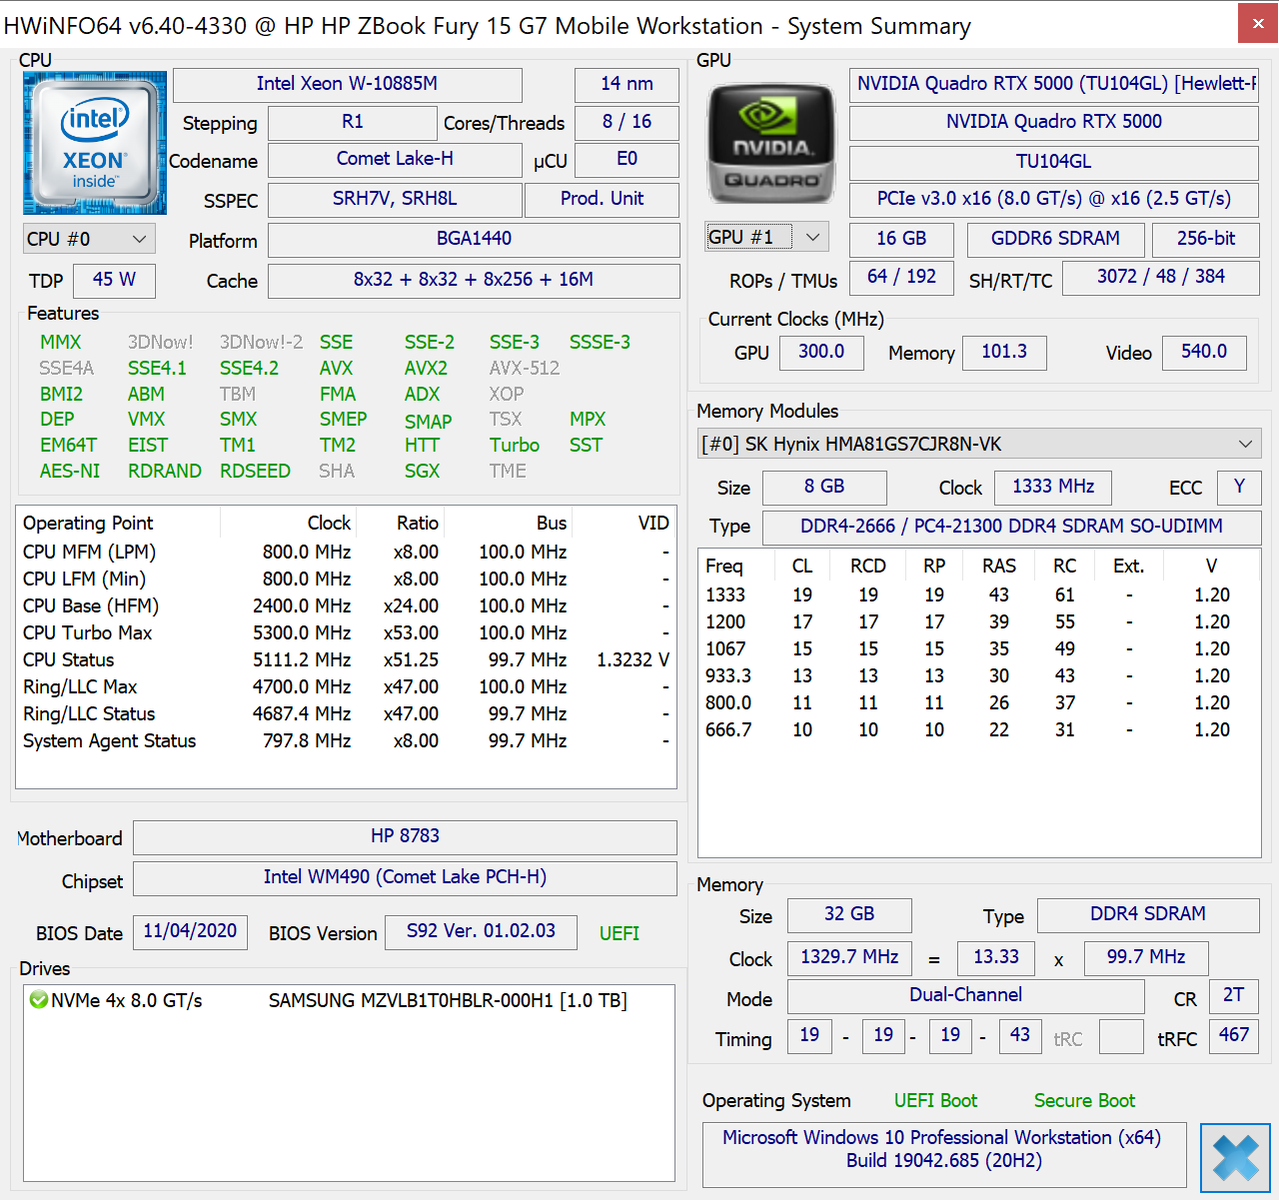
A wide range of configurations are available ranging from the Core i5-10300H CPU up to the Xeon W-10885M, 16 GB of RAM up to 128 GB, 1080p 250 nit display up to 4K UHD 600 nits, and the Quadro T2000 Max-Q GPU up to the RTX 5000 Max-Q. The full specifications list can be found on HP's official datasheet here. The unit we have on hand in a higher-end configuration with the Xeon CPU, 4K display, and Quadr RTX 5000 Max-Q GPU for approximately $6100 USD.
Alternatives to the ZBook Fury 15 G7 include other high-end 15.6-inch workstations like the Dell Precision 7550, Lenovo ThinkPad P series, Asus ProArt StudioBook Pro 15, or the MSI WS66.
More HP reviews:
potential competitors in comparison
Rating | Date | Model | Weight | Height | Size | Resolution | Price |
|---|---|---|---|---|---|---|---|
| 90.2 % v7 (old) | 01 / 2021 | HP ZBook Fury 15 G7 W-10885M, Quadro RTX 5000 Max-Q | 2.4 kg | 25.9 mm | 15.60" | 3840x2160 | |
| 83.1 % v7 (old) | 11 / 2020 | Asus ProArt StudioBook Pro 15 W500G5T i7-9750H, Quadro RTX 5000 Max-Q | 2 kg | 18.9 mm | 15.60" | 3840x2160 | |
| 83.4 % v7 (old) | 08 / 2020 | MSI WS66 10TMT-207US i9-10980HK, Quadro RTX 5000 Max-Q | 2.3 kg | 19.8 mm | 15.60" | 1920x1080 | |
| 87.8 % v7 (old) | 08 / 2020 | Dell Precision 7550 W-10885M, Quadro RTX 5000 Max-Q | 2.8 kg | 27.36 mm | 15.60" | 3840x2160 | |
| 87 % v7 (old) | 08 / 2020 | Razer Blade 15 Studio Edition 2020 i7-10875H, Quadro RTX 5000 Max-Q | 2.2 kg | 13.98 mm | 15.60" | 3840x2160 | |
| 87.8 % v7 (old) | 08 / 2019 | Lenovo ThinkPad P1 2019-20QT000RGE i7-9850H, Quadro T1000 (Laptop) | 1.7 kg | 18.4 mm | 15.60" | 1920x1080 |
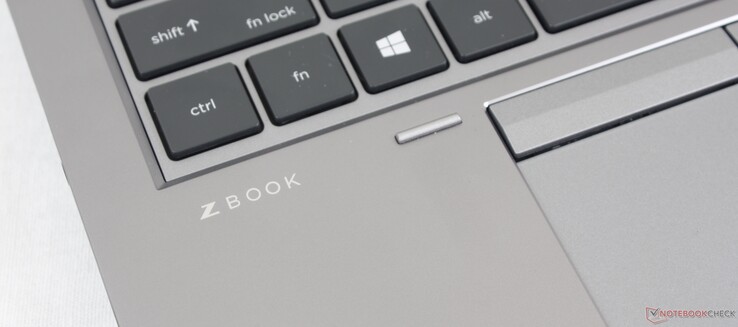
Case
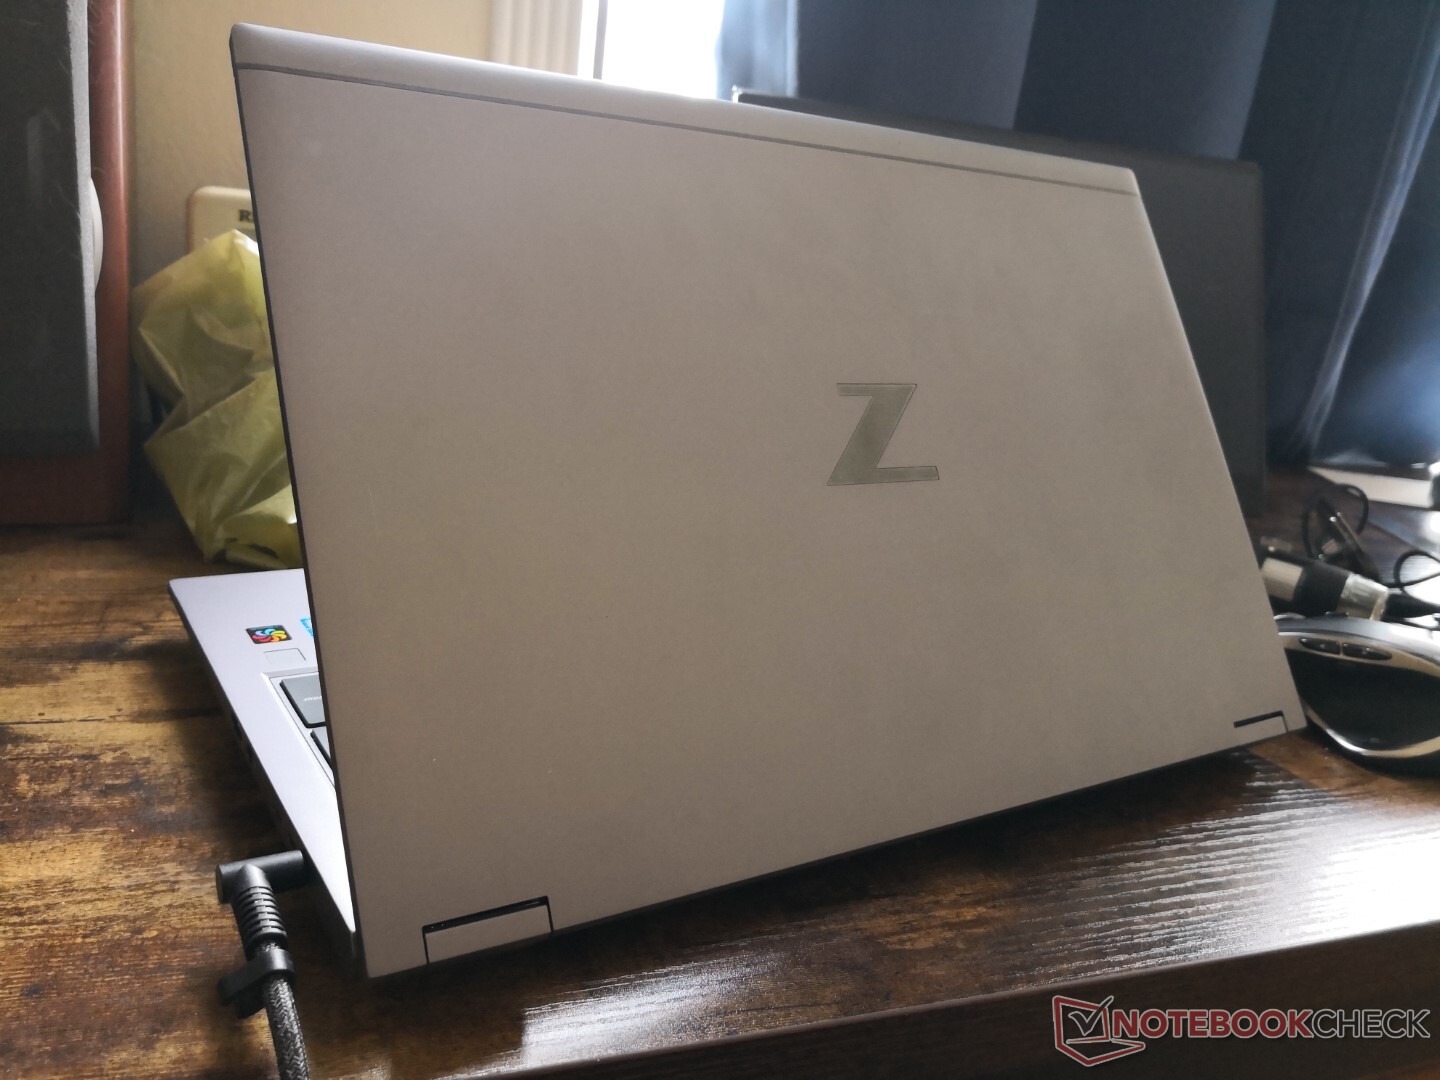
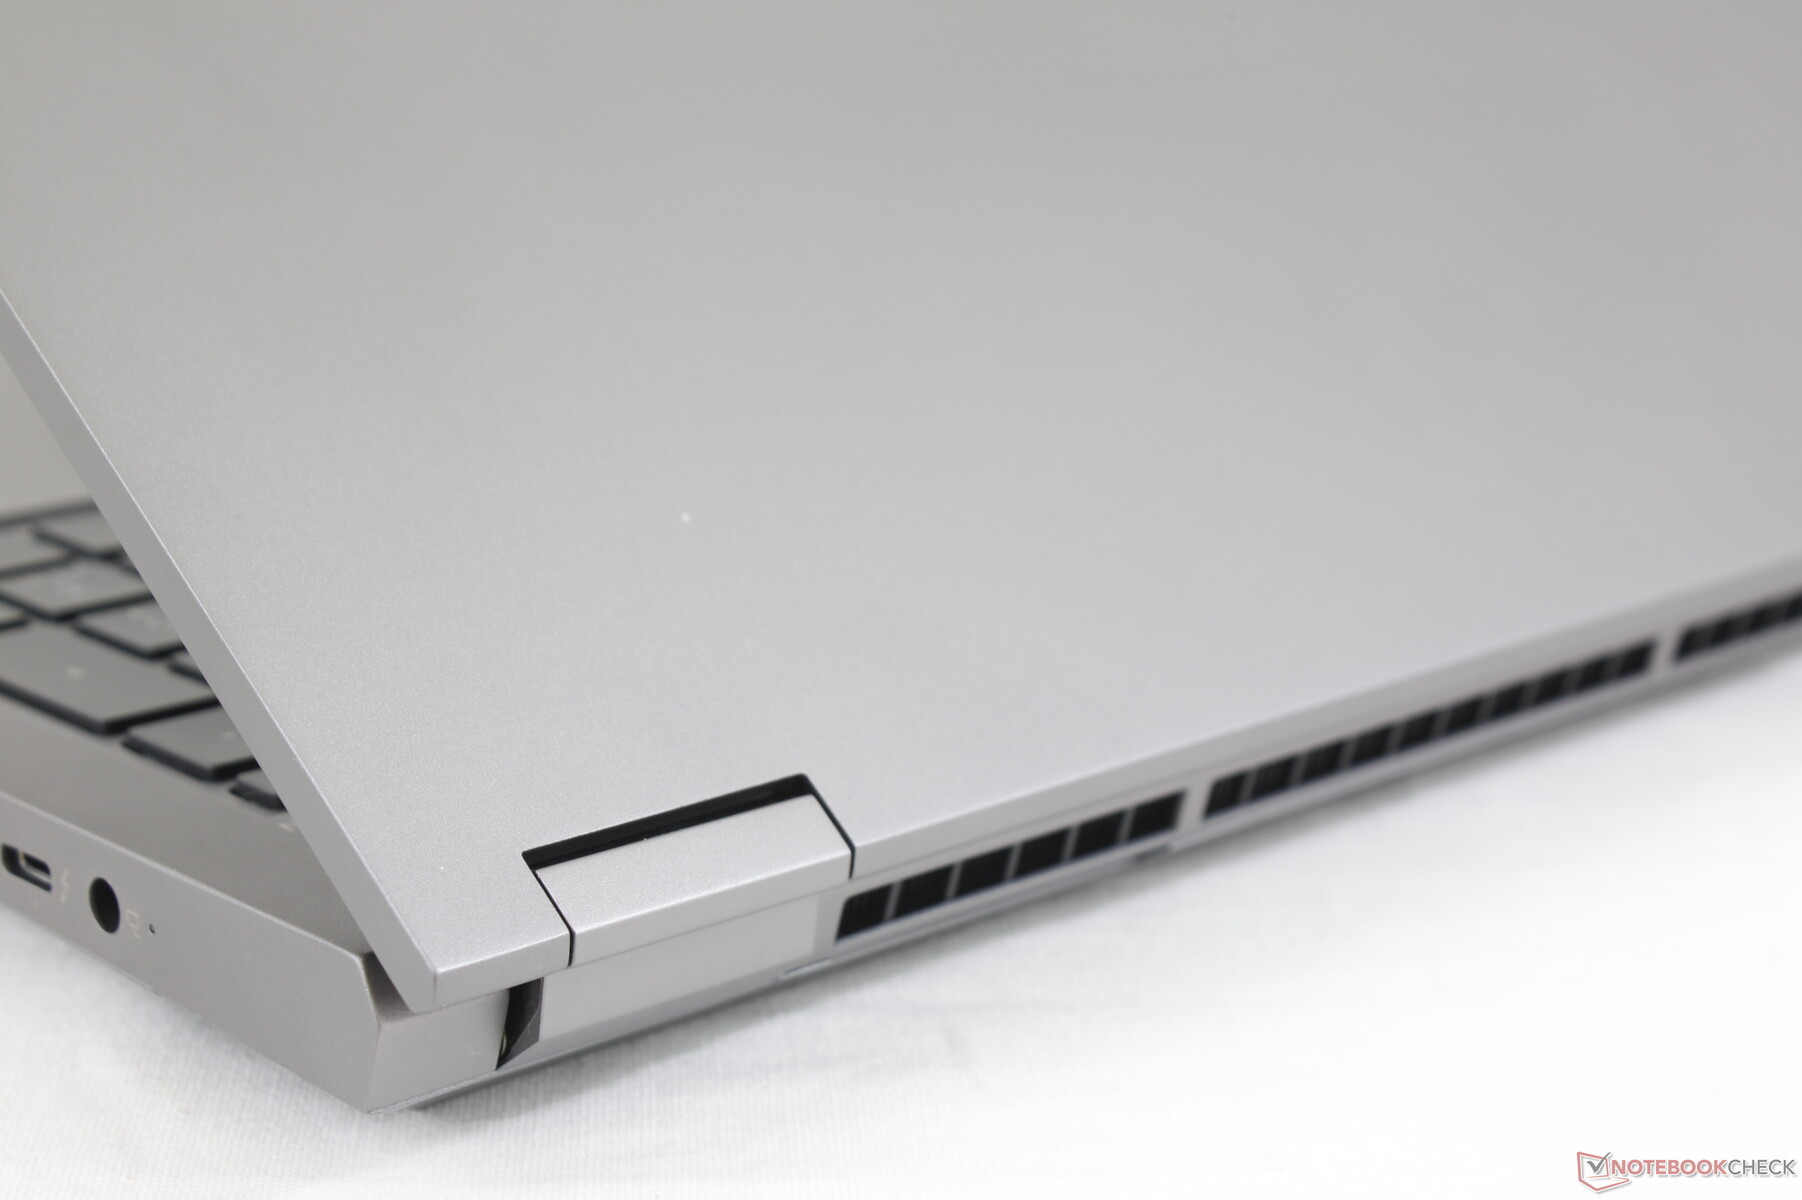
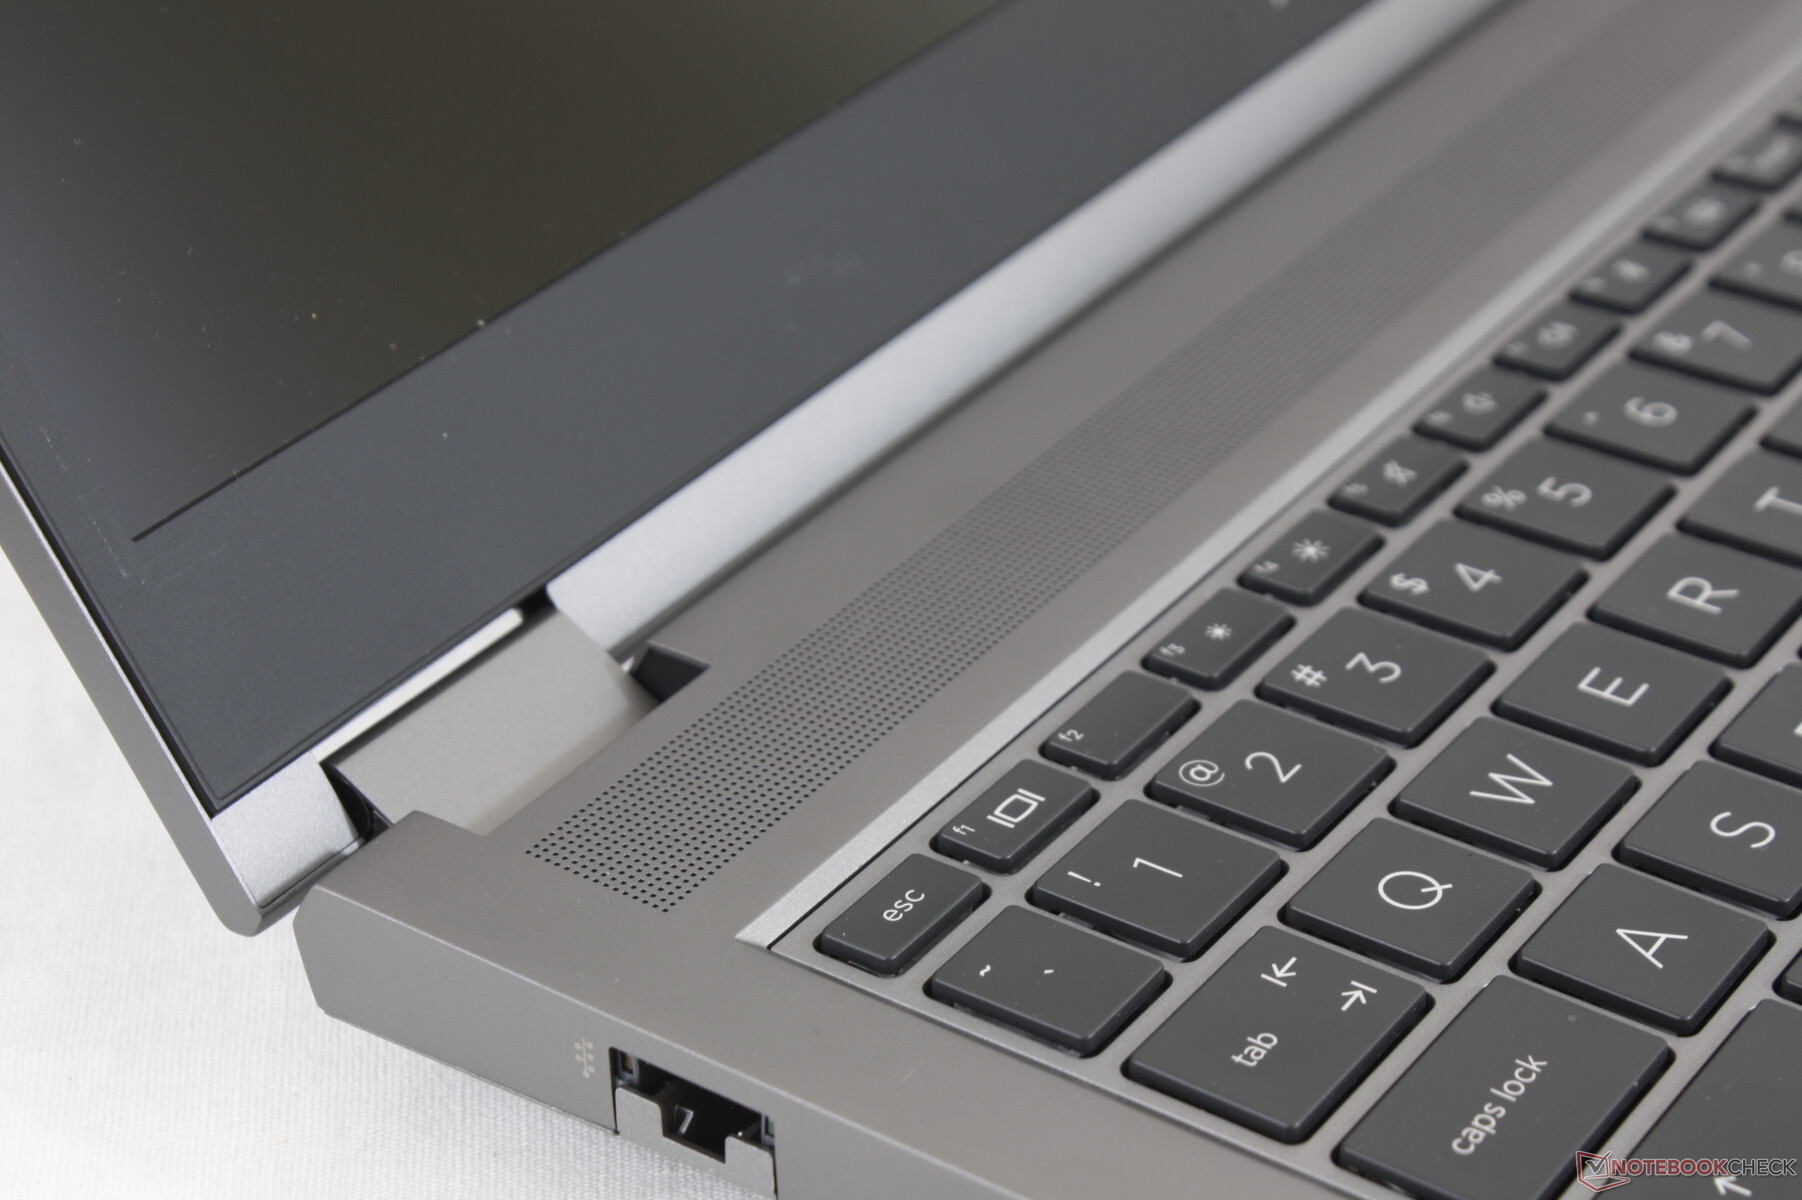
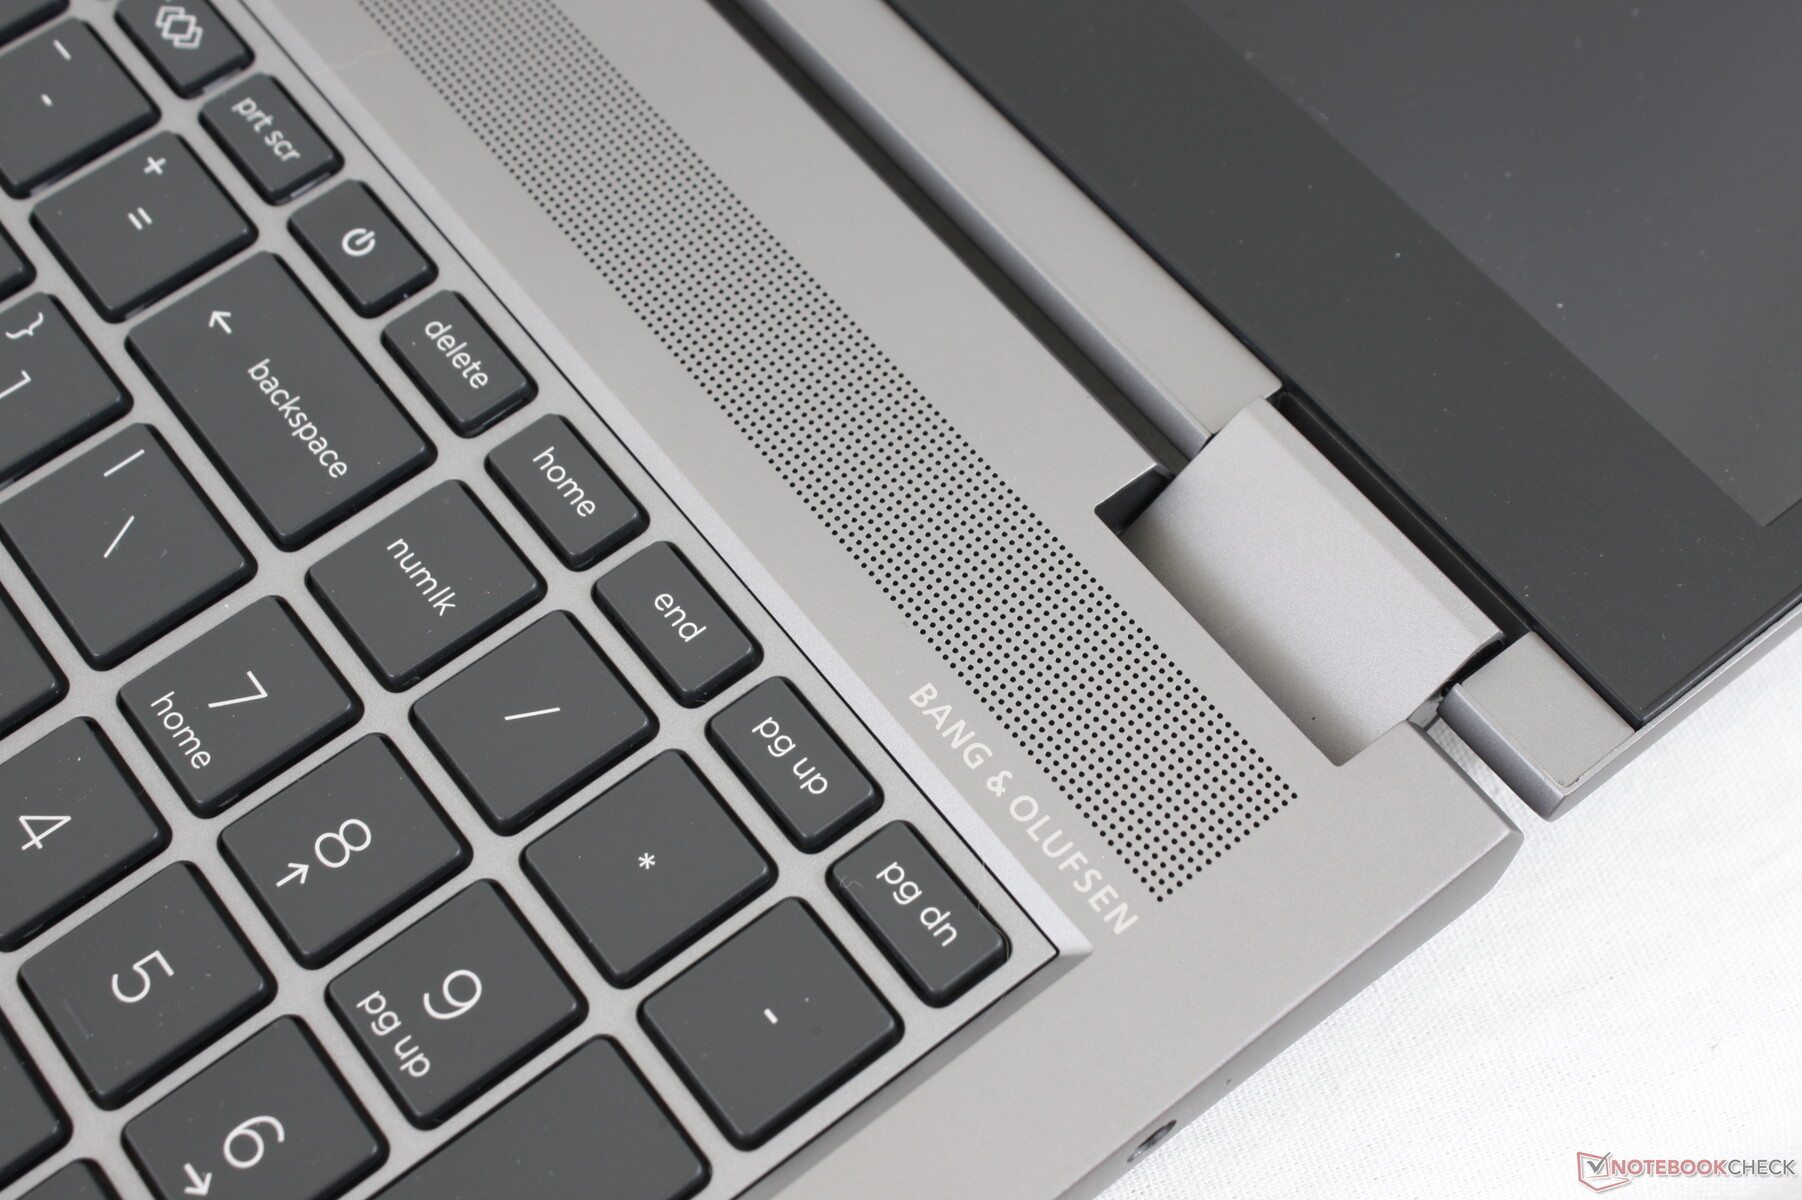
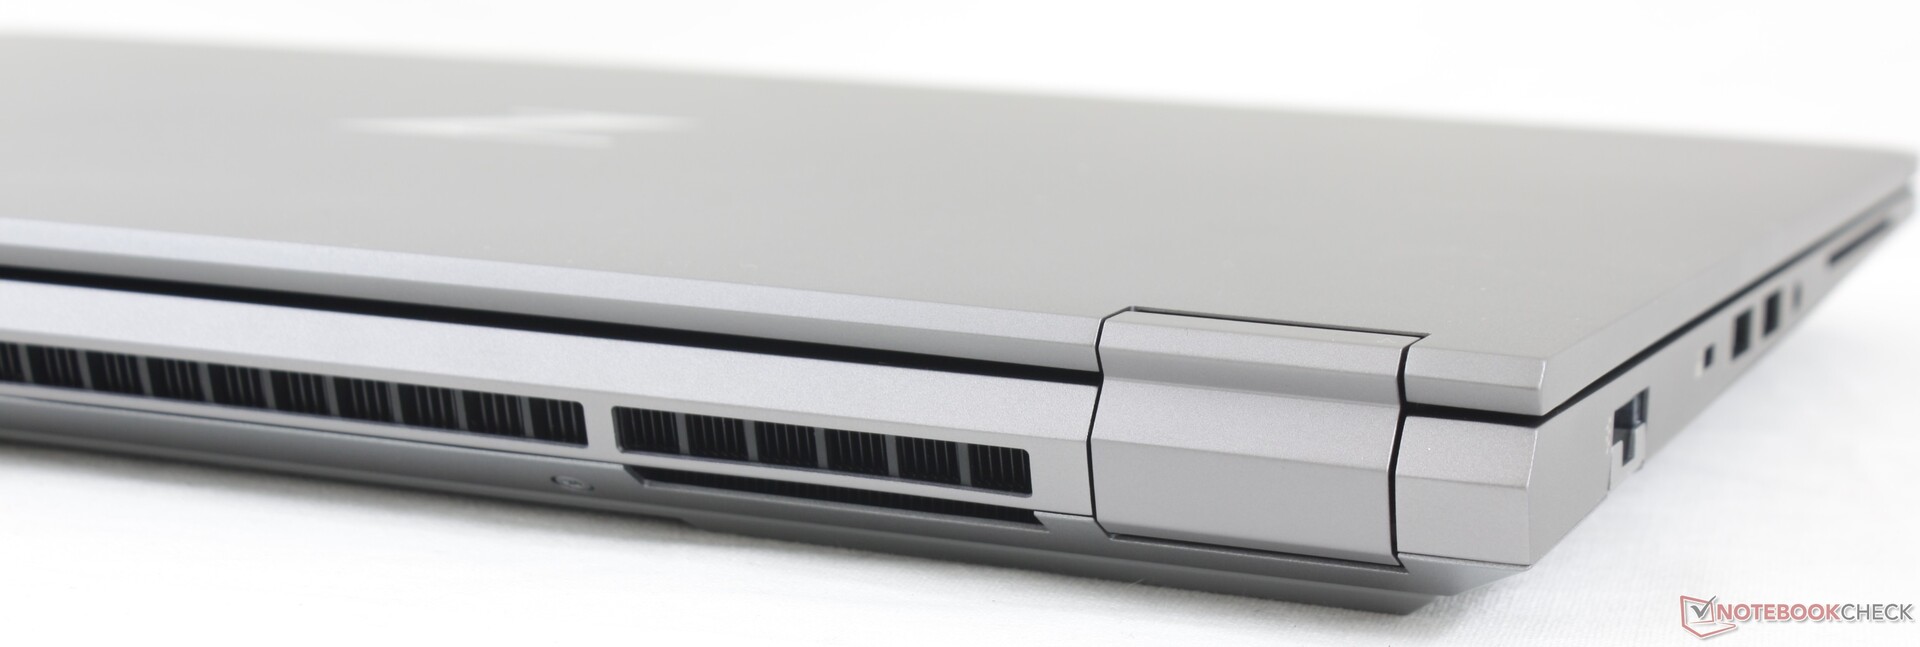
It's been a few years since we last checked out a full-size ZBook 15 and a lot has changed. HP has redesigned the chassis from head to toe with sharper looks without sacrificing a lot of the features that thinner workstations tend to omit like smart card readers, pointing stick nub, and dedicated mouse buttons. HP says the top, side, and bottom bezels are 59.7 percent, 53.1 percent, and 10.6 percent smaller, respectively, than the outgoing ZBook 15 G6. The base is firm with little to no warping or creaking including the keyboard center which is where most laptops are weakest. The lid flexes a little bit more but not enough to be of any concern.
The HP is noticeably lighter than the Precision 7550 by about 400 g despite their similar dimensions. The Dell system feels sounder, however, likely due to its more massive weight. There are plenty of ultrathin Nvidia Studio workstations like the Razer Blade or MSI WS66 that are designed to be even thinner and lighter if users want something more portable.
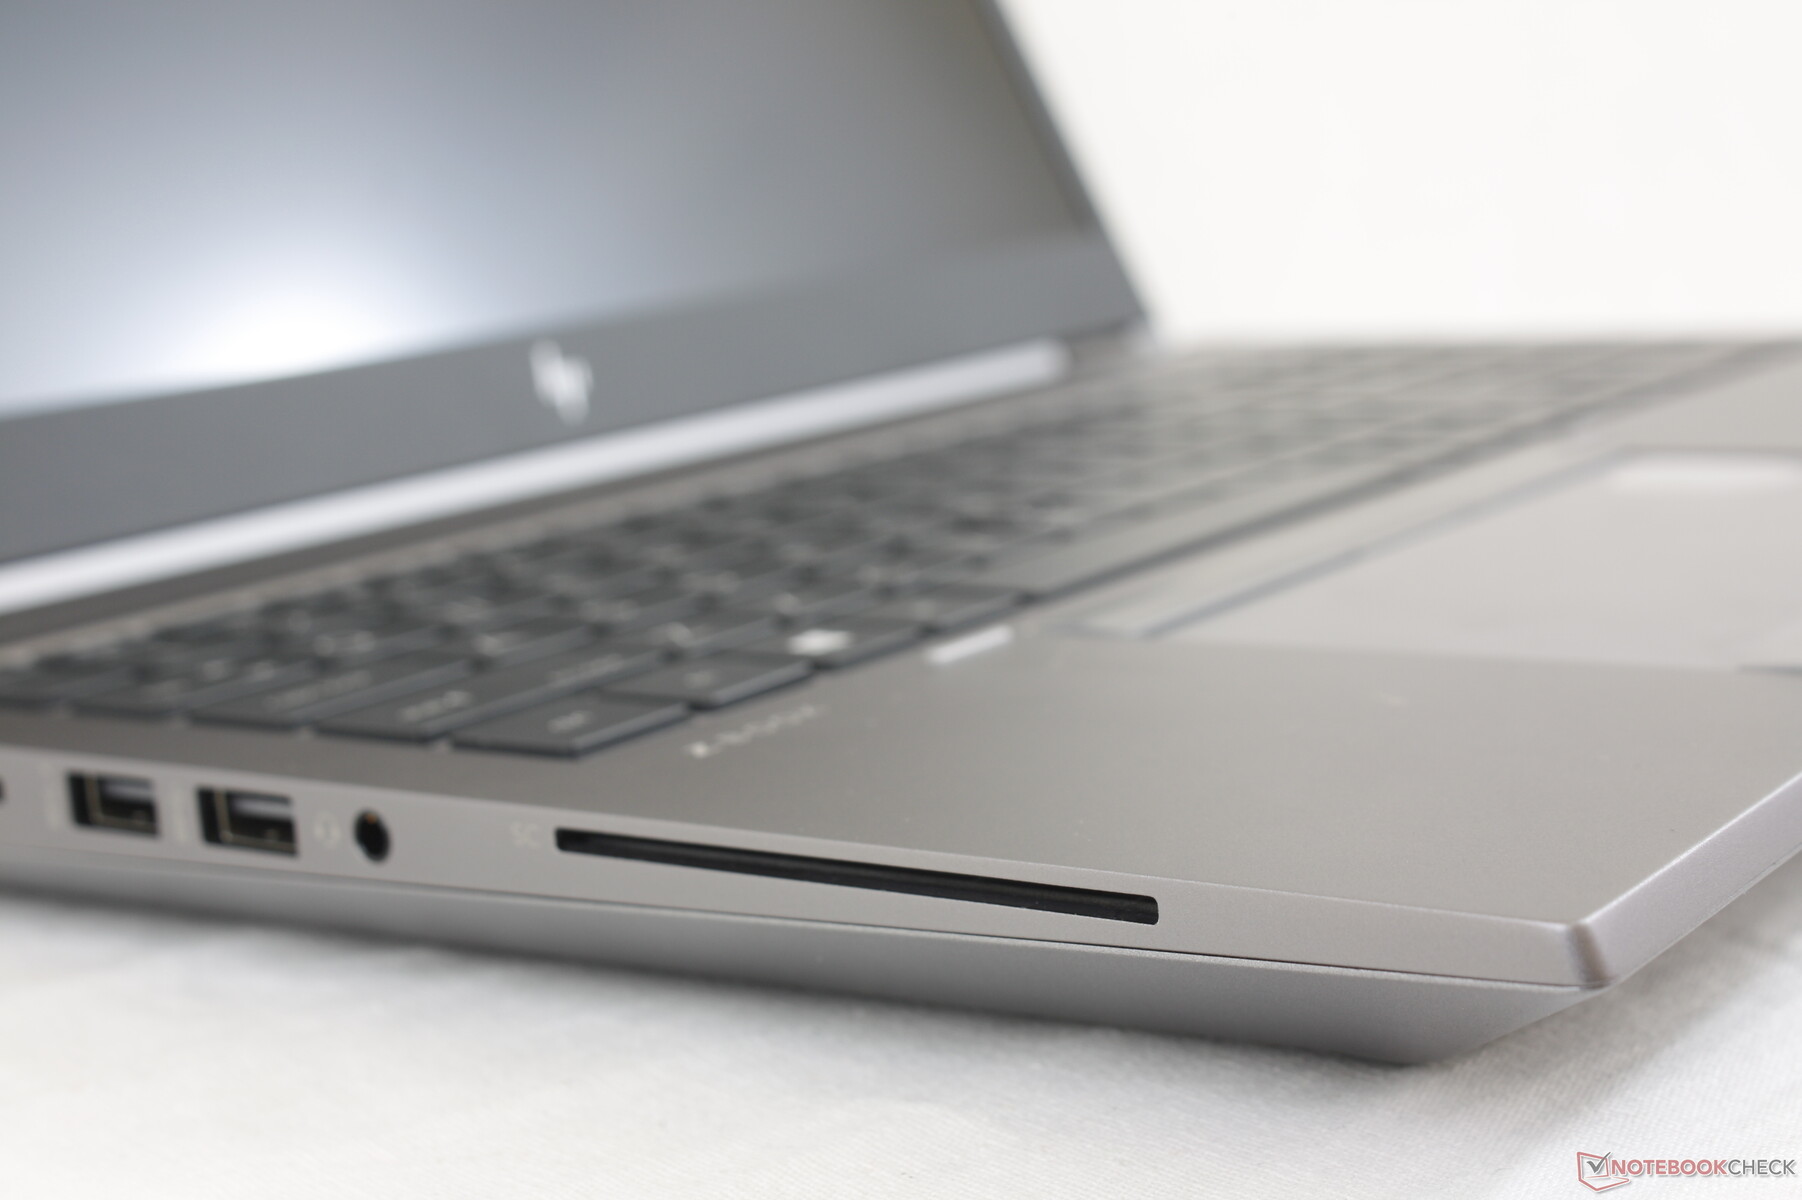
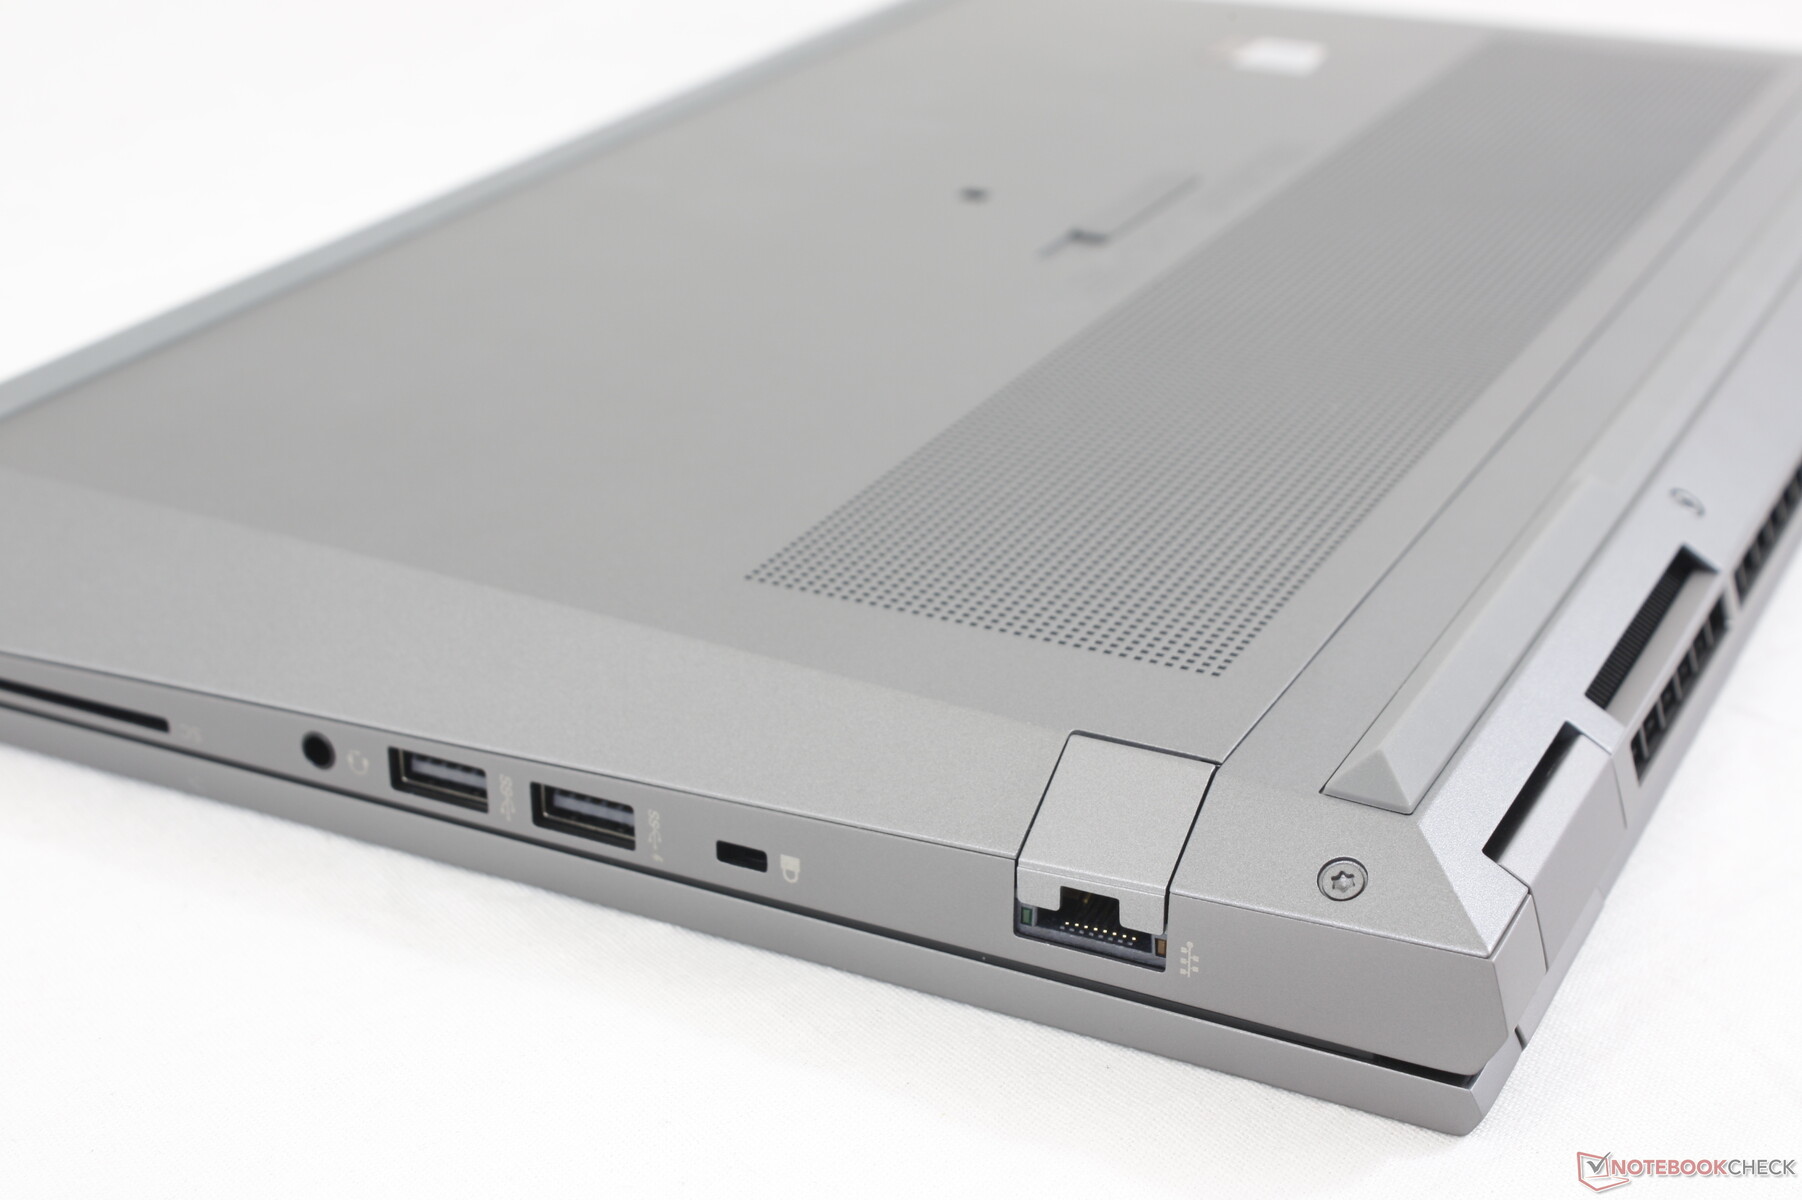
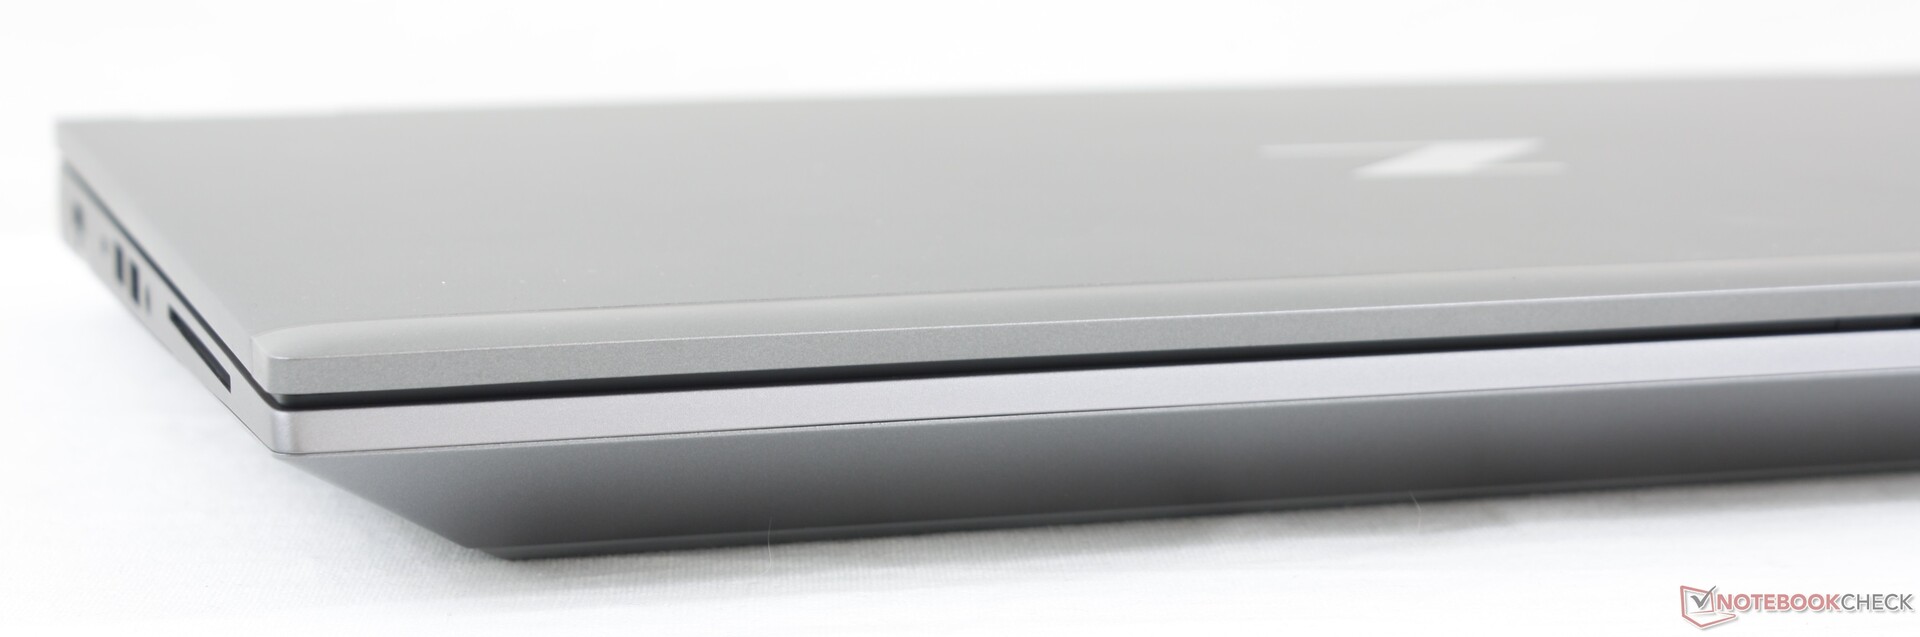
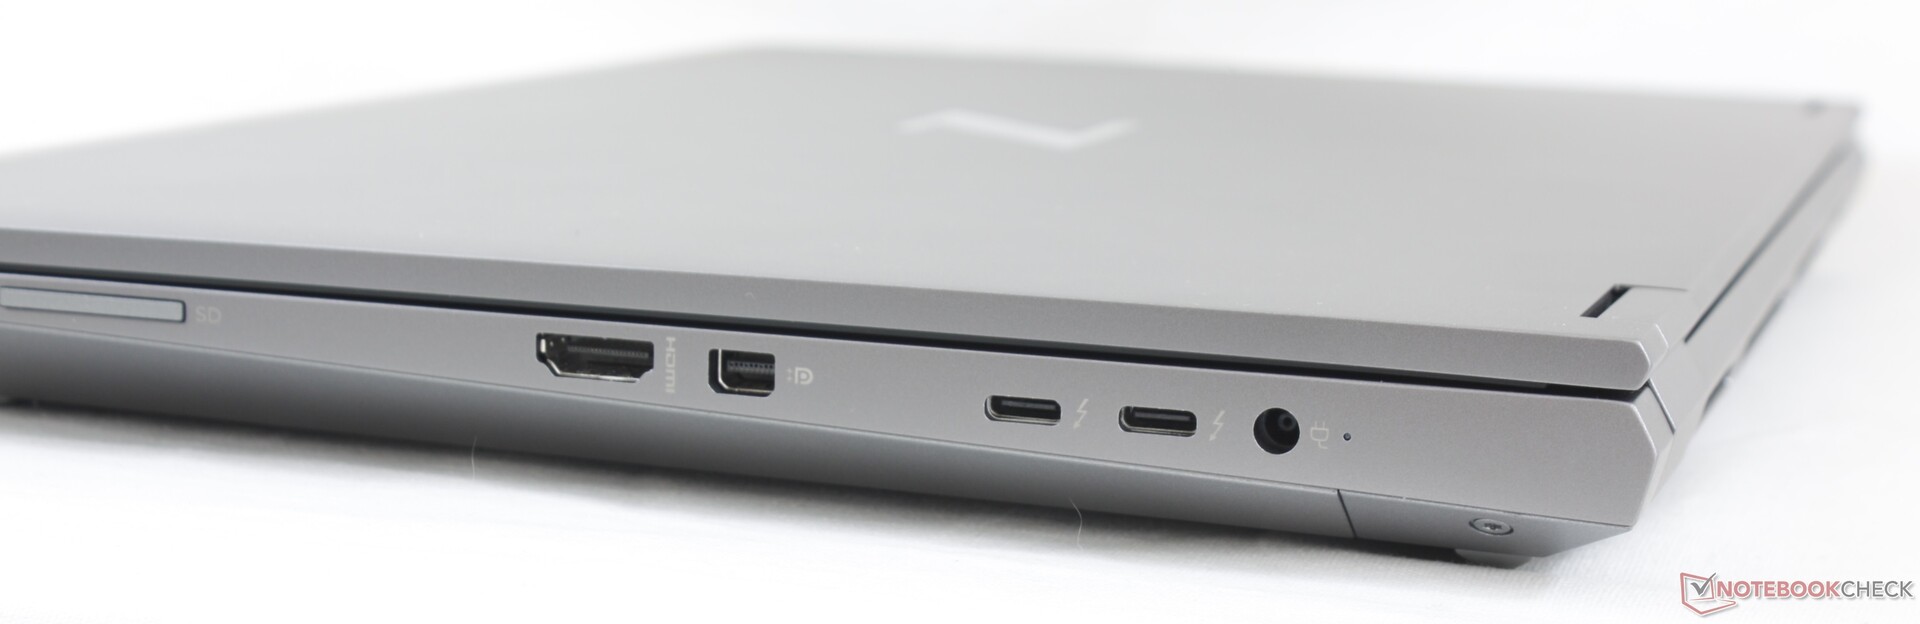
Connectivity
Port options are plentiful and identical to the Dell Precision 7550. Port positioning is more accessible on the HP since there are none along the rear edge.
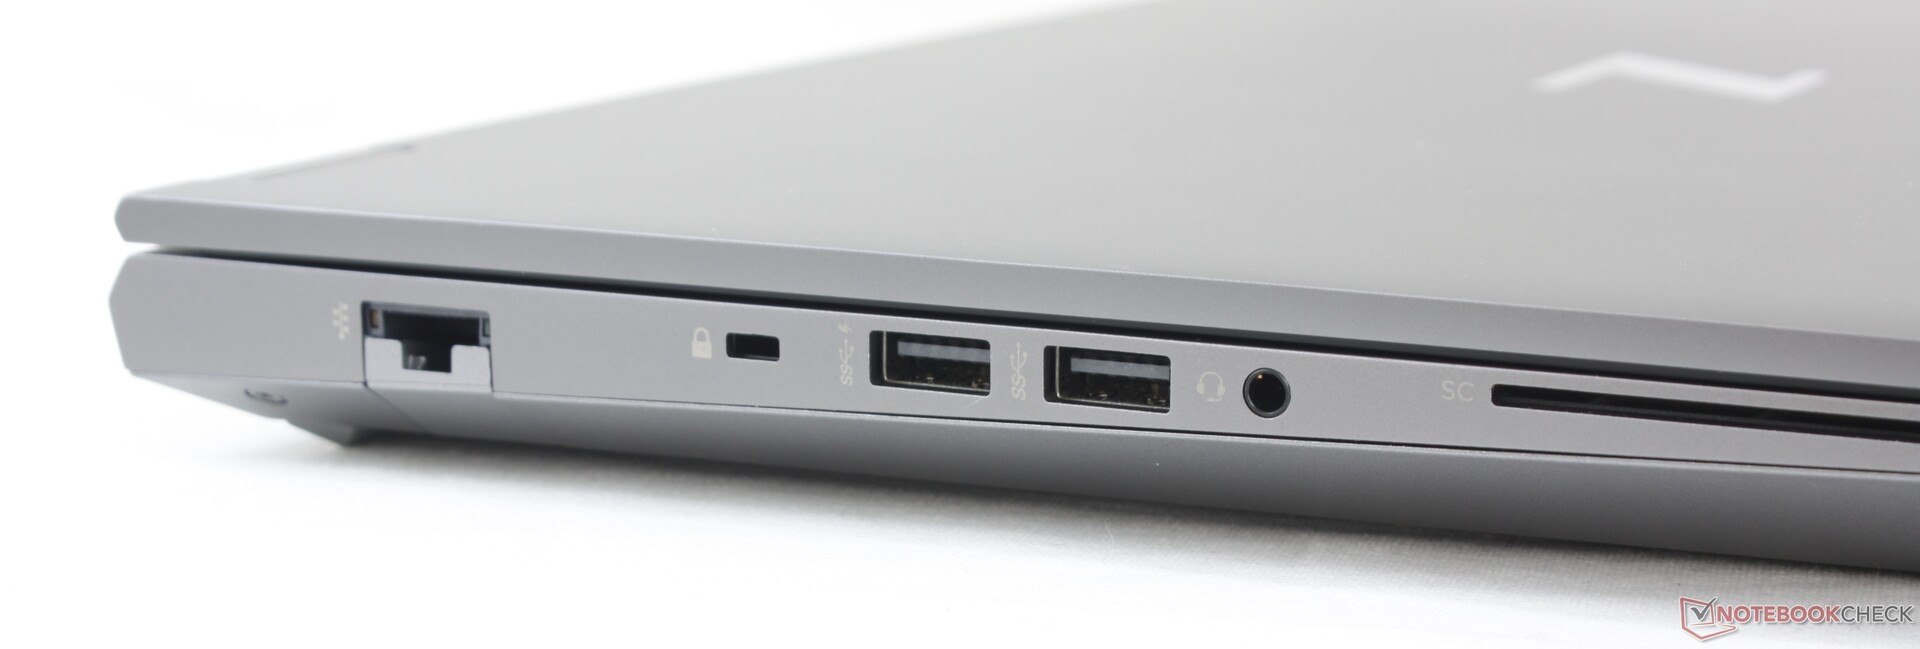
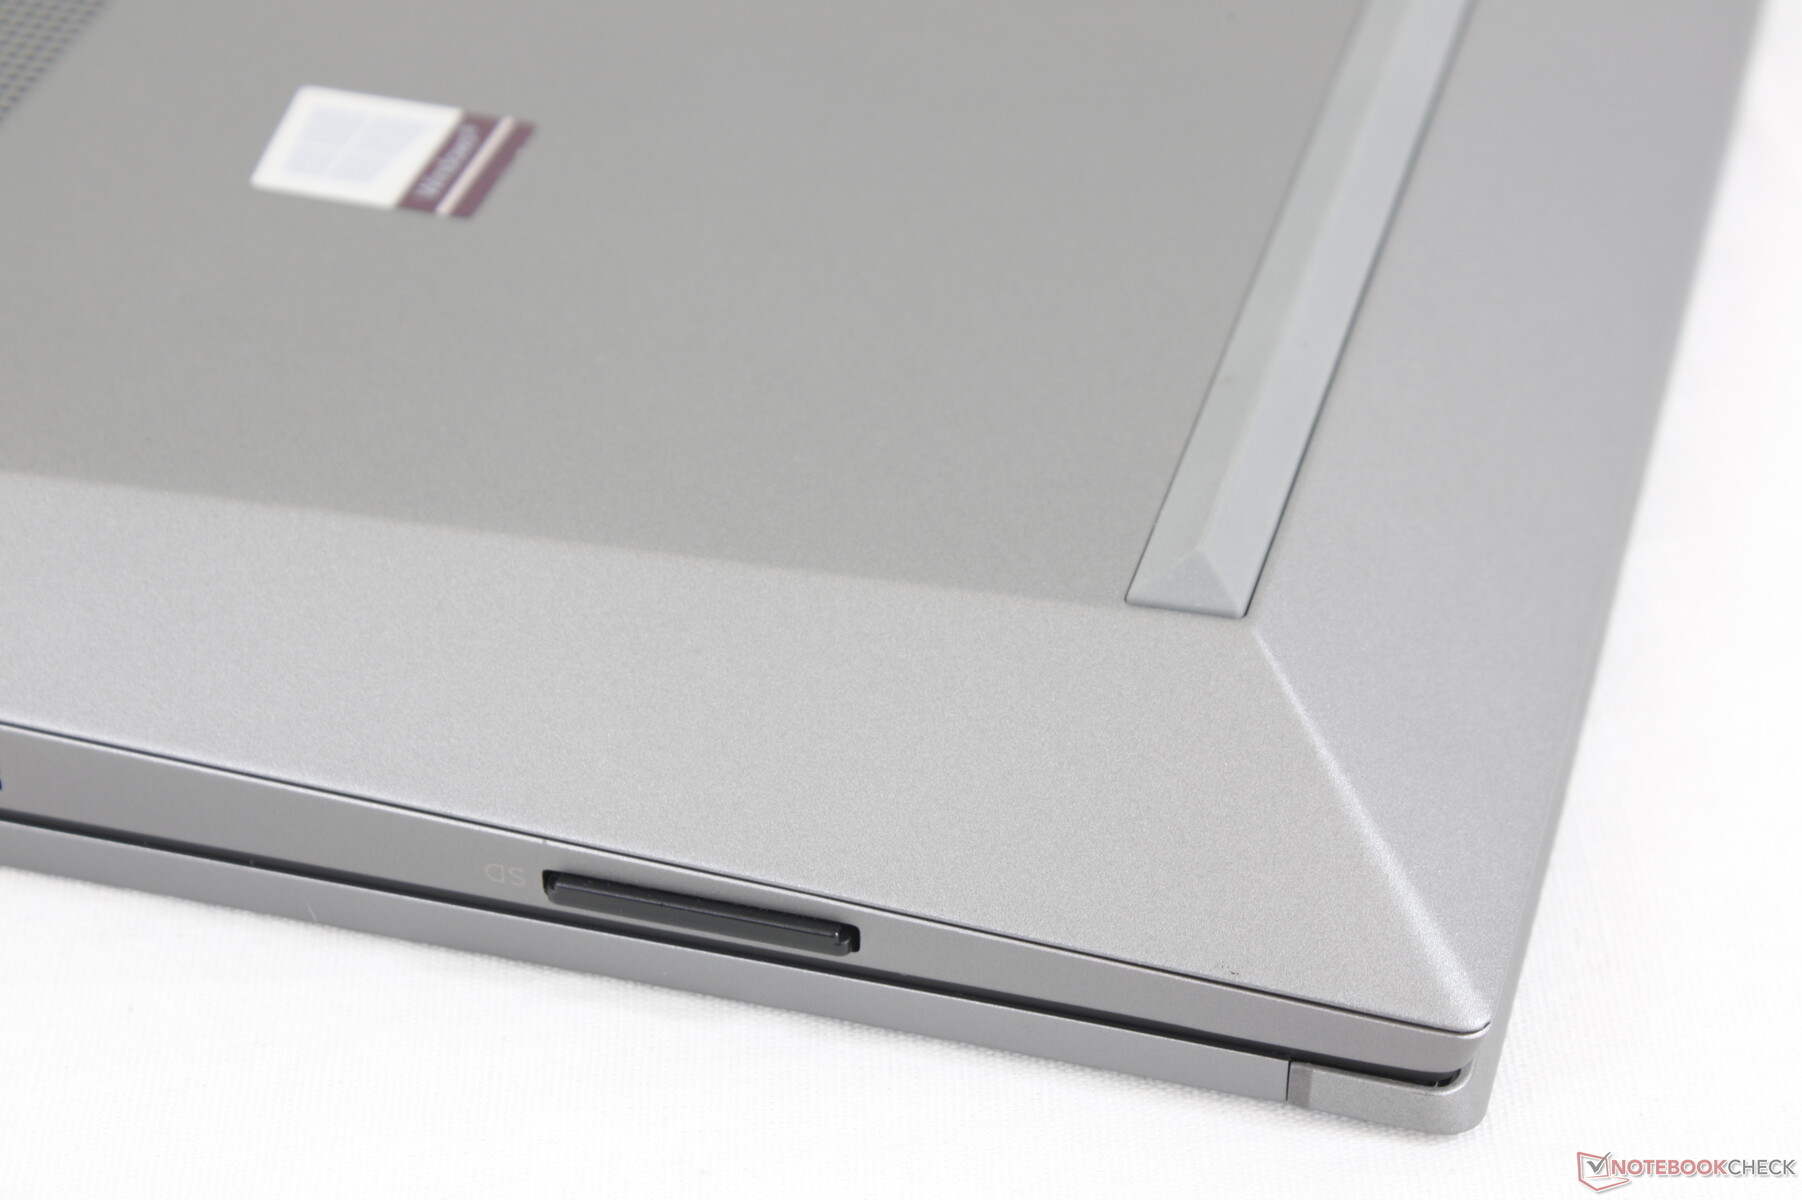
SD Card Reader
The integrated SD card reader offers fast transfer rates. Moving 1 GB of images from our UHS-II card to desktop takes about 6 seconds to be in line with most other high-end workstations.
| SD Card Reader | |
| average JPG Copy Test (av. of 3 runs) | |
| MSI WS66 10TMT-207US (Toshiba Exceria Pro SDXC 64 GB UHS-II) | |
| Dell Precision 7550 (Toshiba Exceria Pro SDXC 64 GB UHS-II) | |
| Lenovo ThinkPad P1 2019-20QT000RGE (Toshiba Exceria Pro SDXC 64 GB UHS-II) | |
| HP ZBook Fury 15 G7 (Toshiba Exceria Pro SDXC 64 GB UHS-II) | |
| Razer Blade 15 Studio Edition 2020 (Toshiba Exceria Pro SDXC 64 GB UHS-II) | |
| maximum AS SSD Seq Read Test (1GB) | |
| MSI WS66 10TMT-207US (Toshiba Exceria Pro SDXC 64 GB UHS-II) | |
| HP ZBook Fury 15 G7 (Toshiba Exceria Pro SDXC 64 GB UHS-II) | |
| Lenovo ThinkPad P1 2019-20QT000RGE (Toshiba Exceria Pro SDXC 64 GB UHS-II) | |
| Dell Precision 7550 (Toshiba Exceria Pro SDXC 64 GB UHS-II) | |
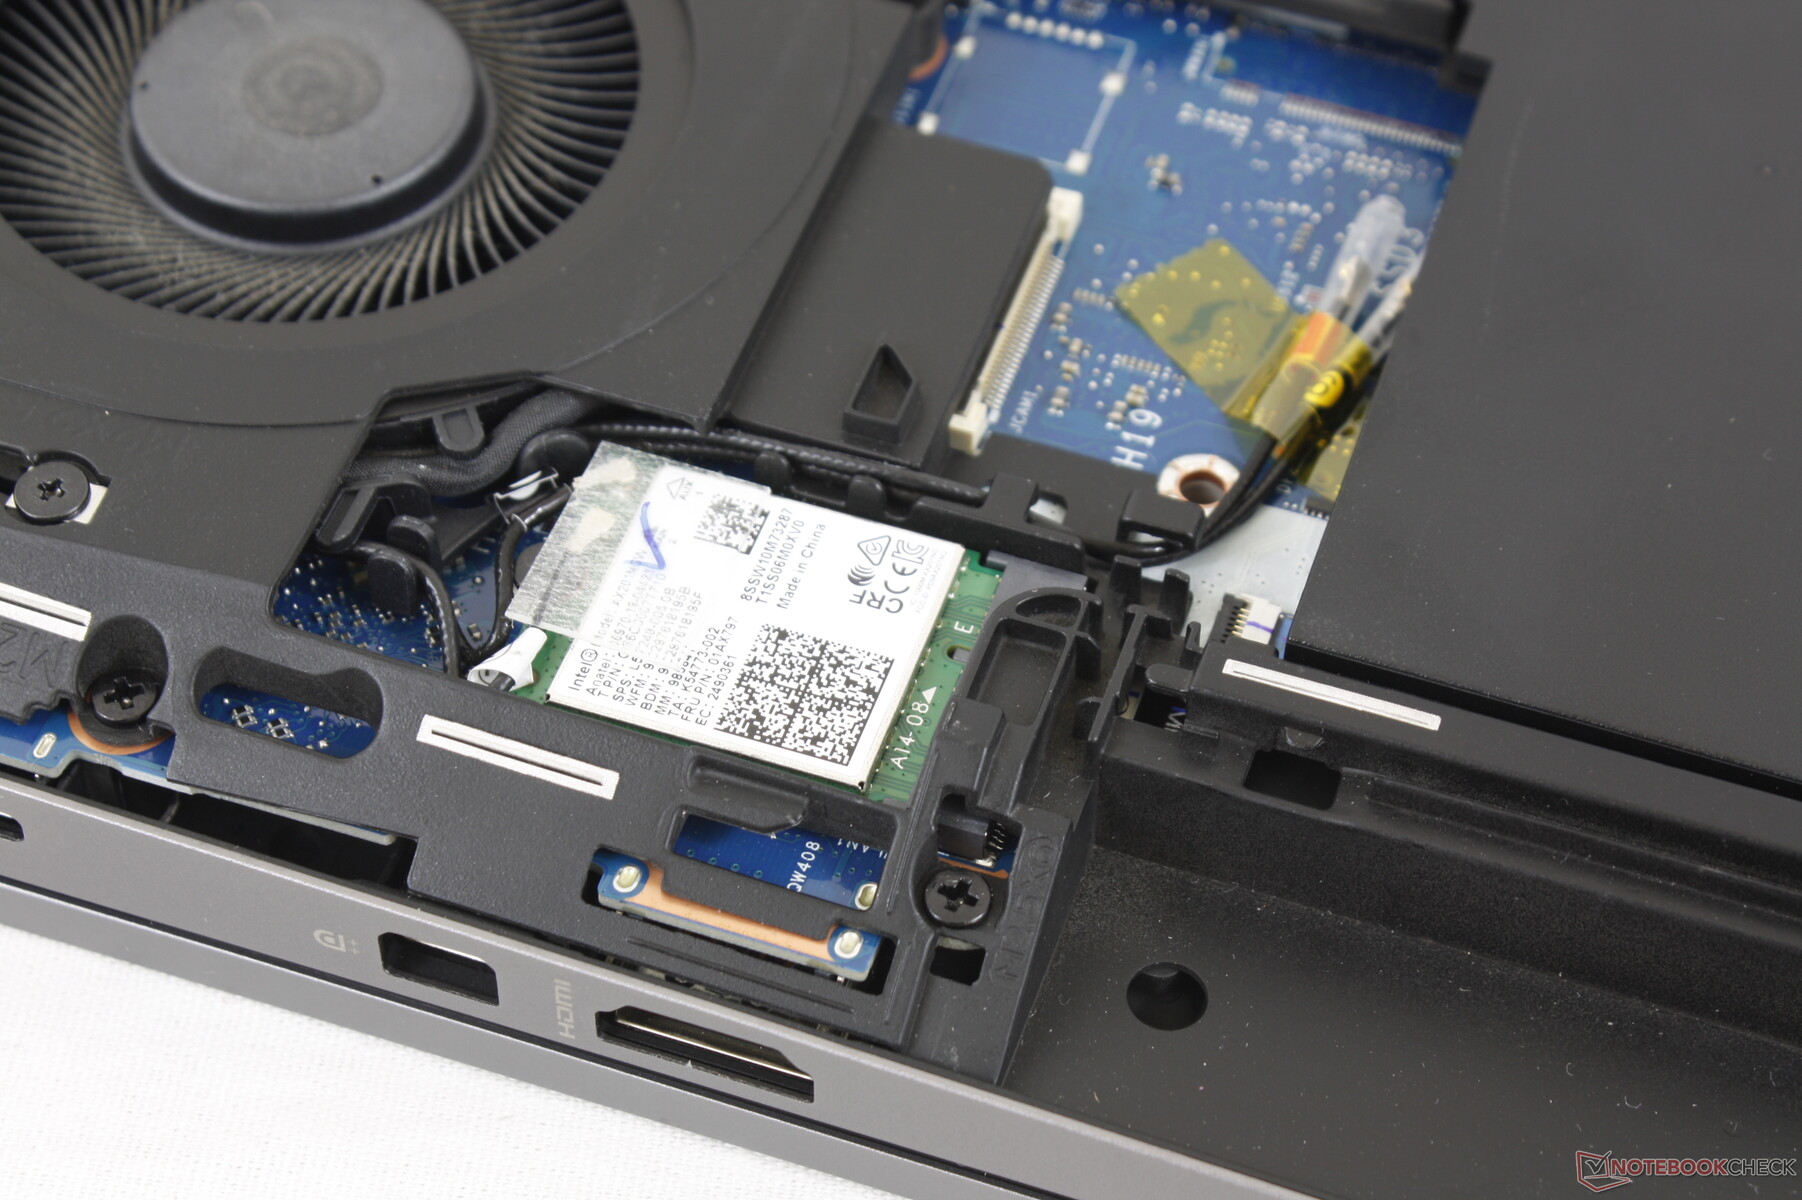
Communication
The Intel AX201 comes standard for Wi-Fi 6 and Bluetooth 5.1 connectivity. We experienced no issues when paired to our Netgear RAX200 test router. Average transfer rates will vary depending on the environment.
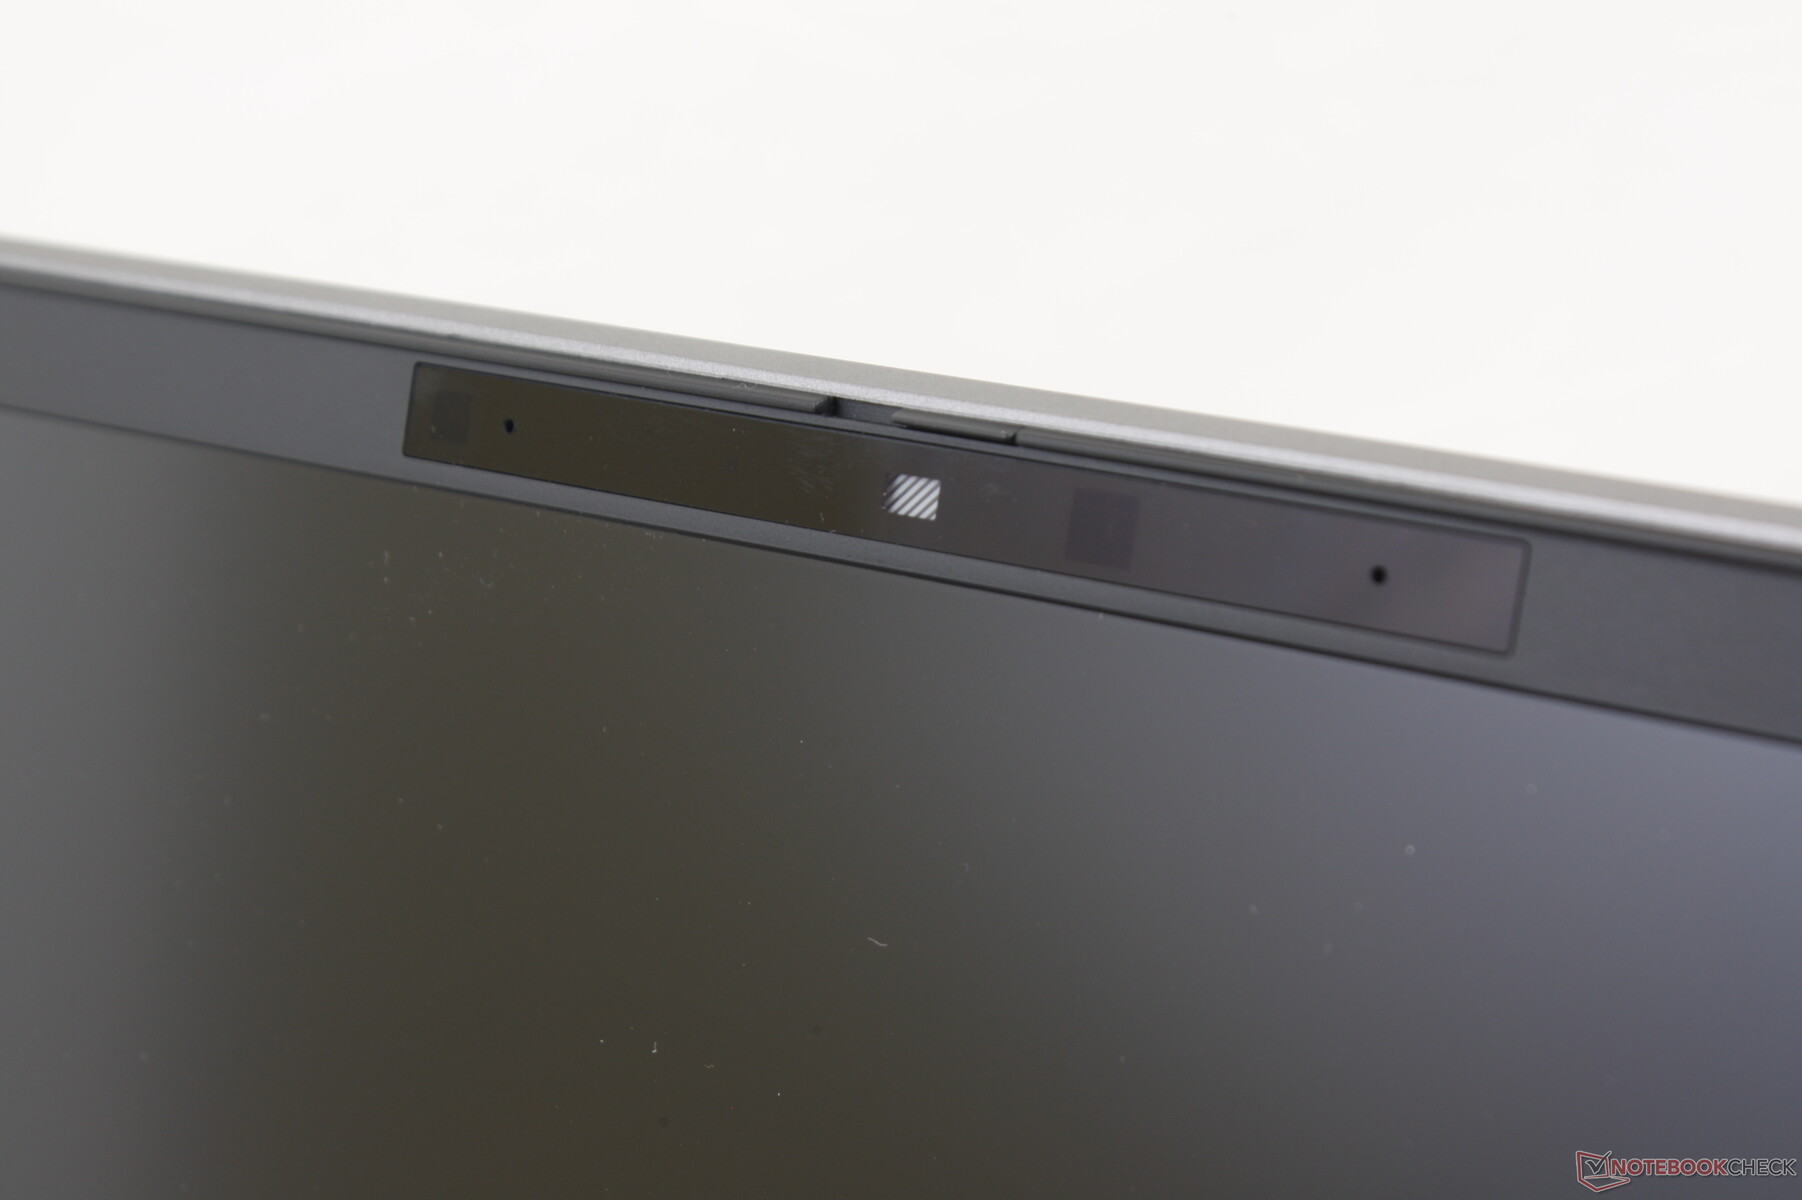
Webcam


Maintenance
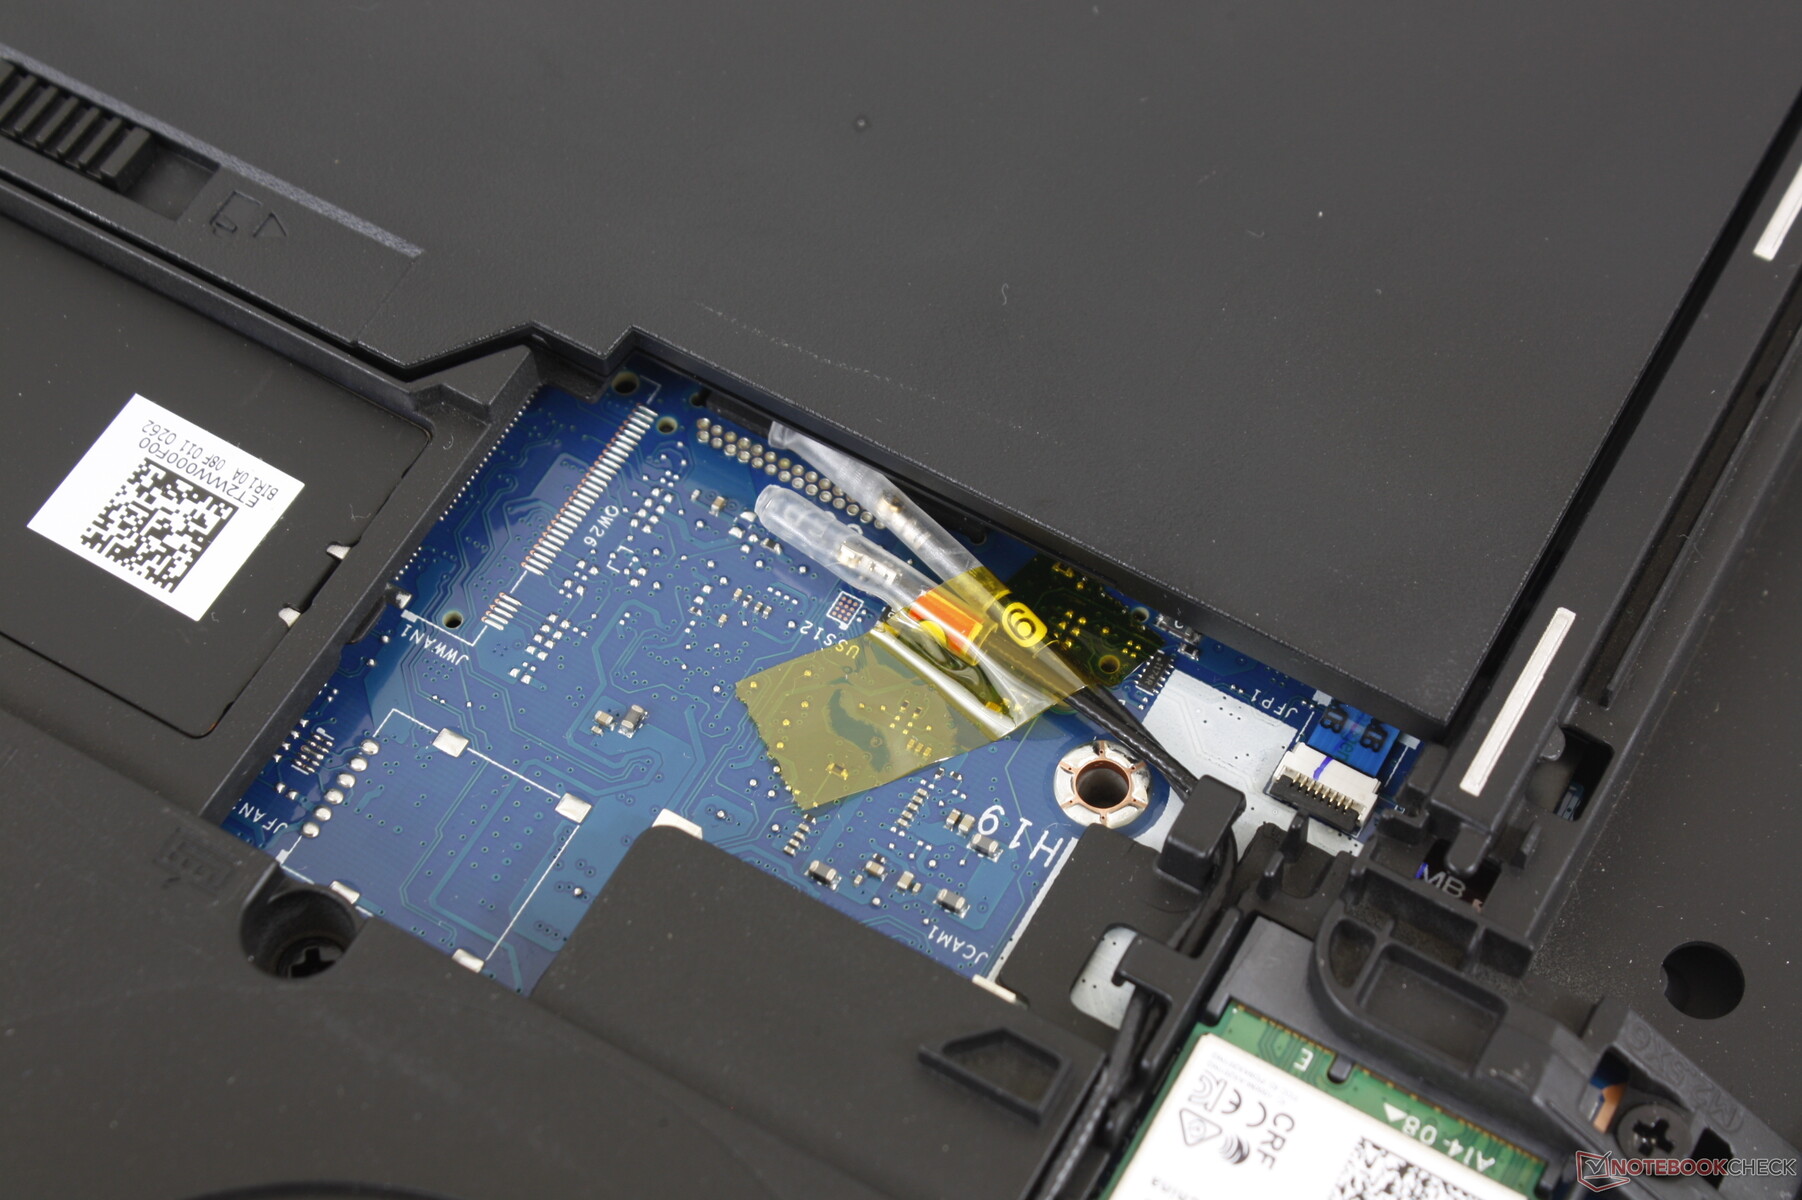
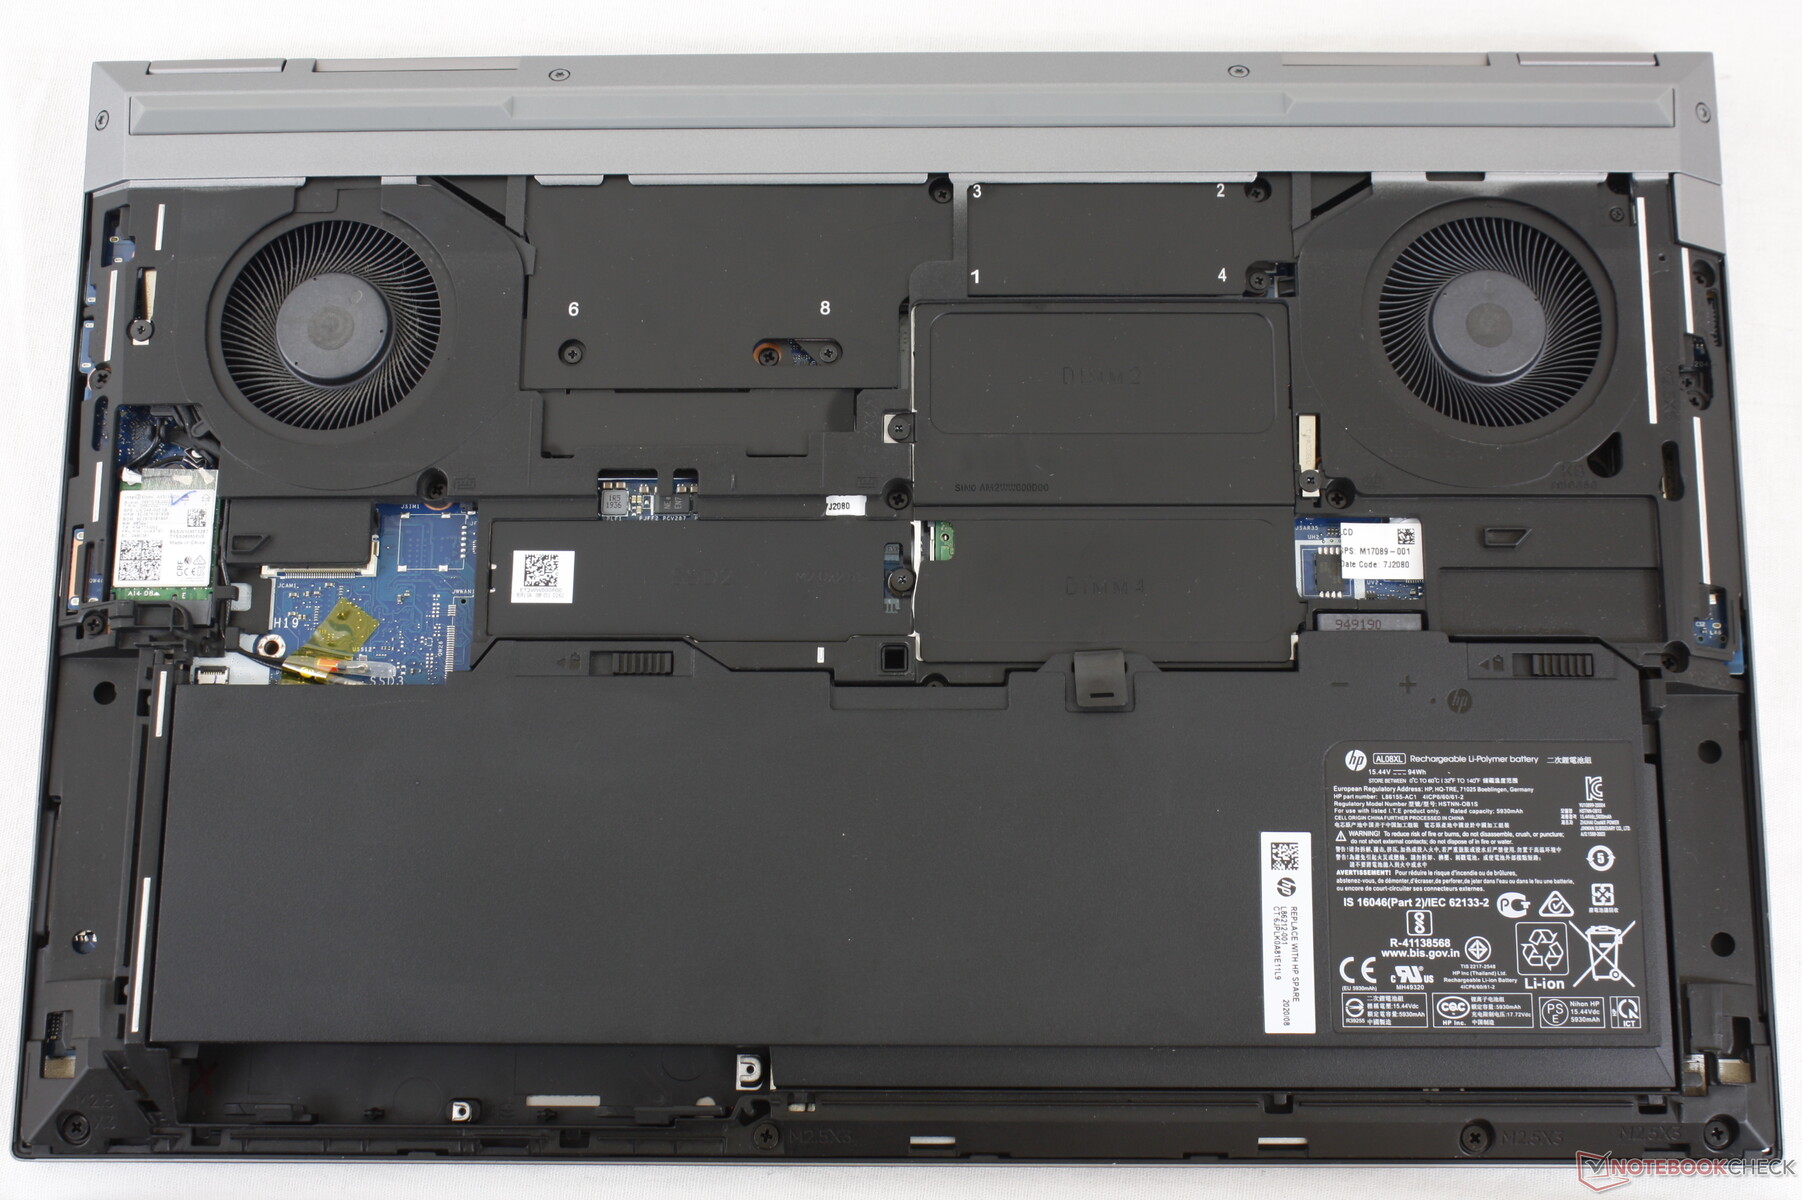
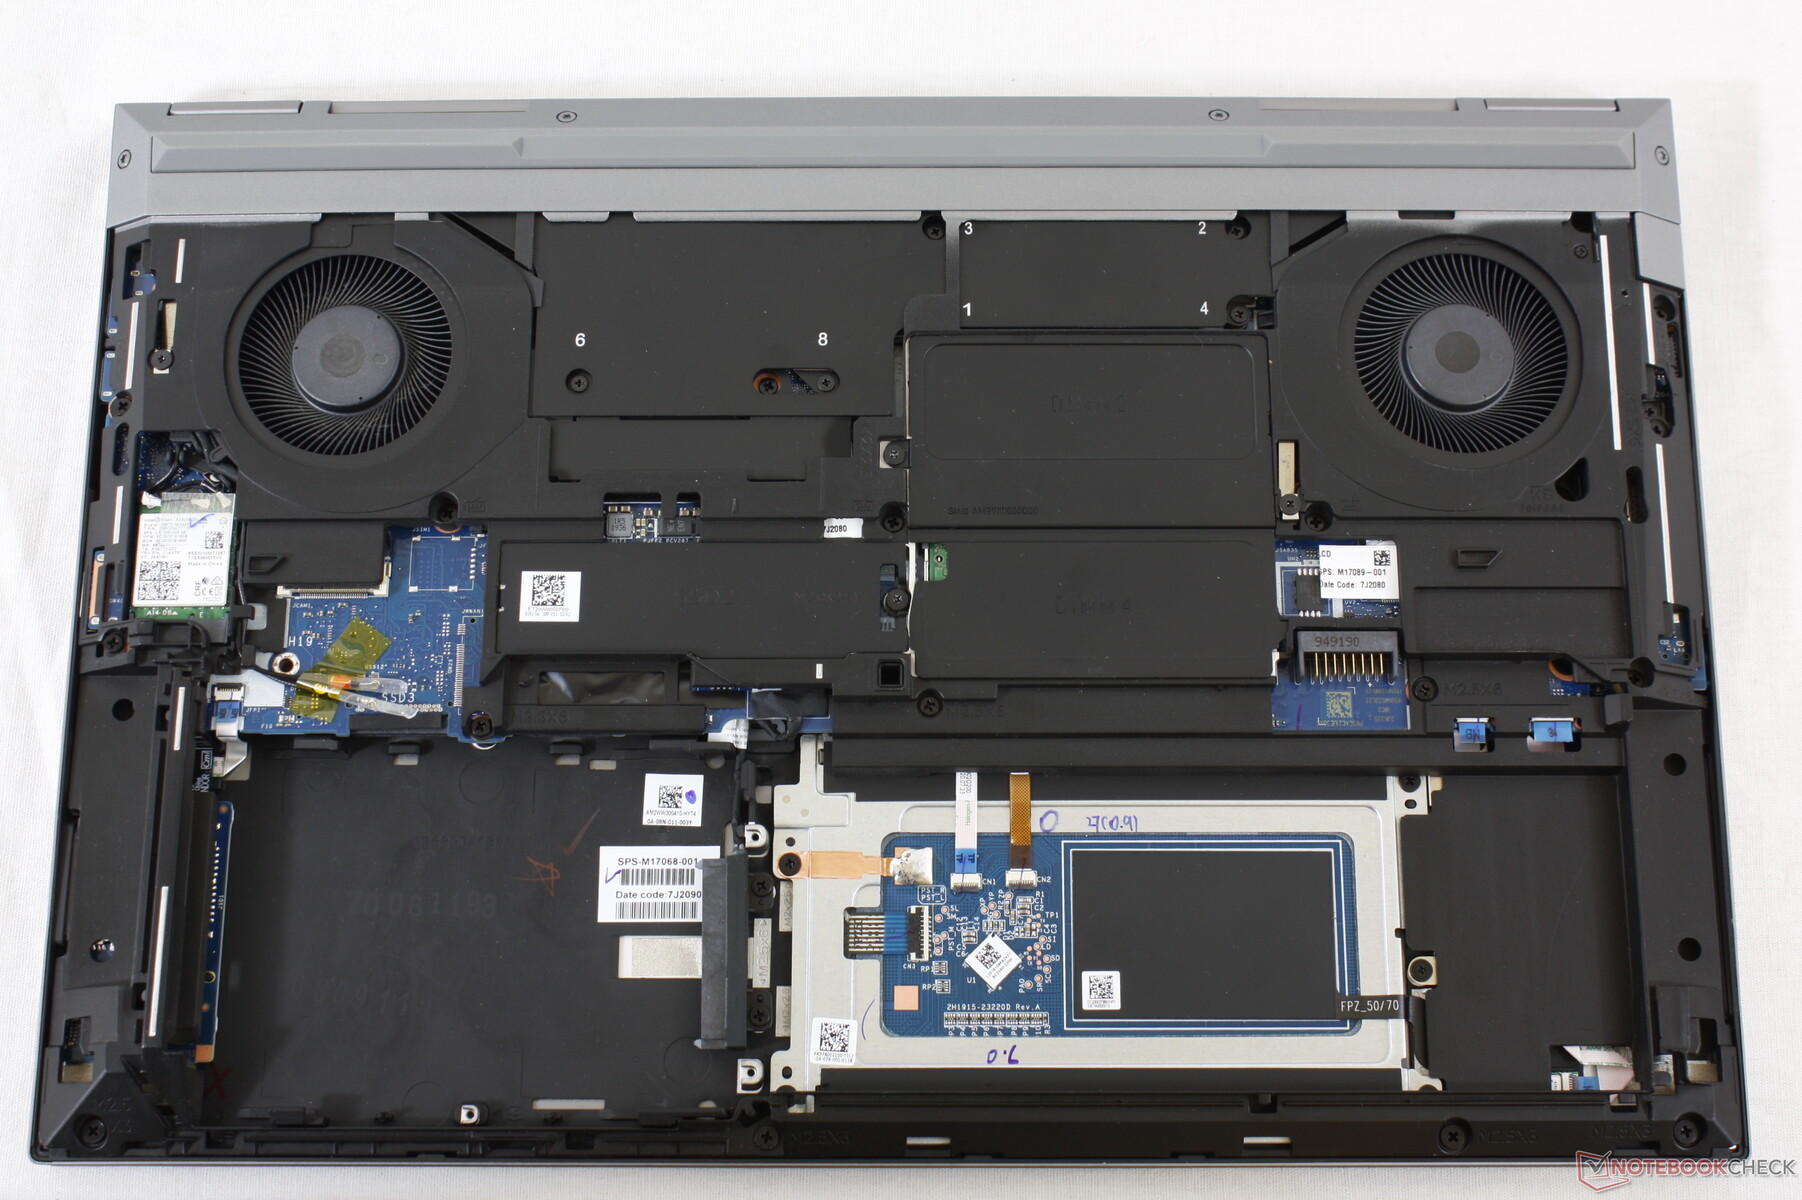
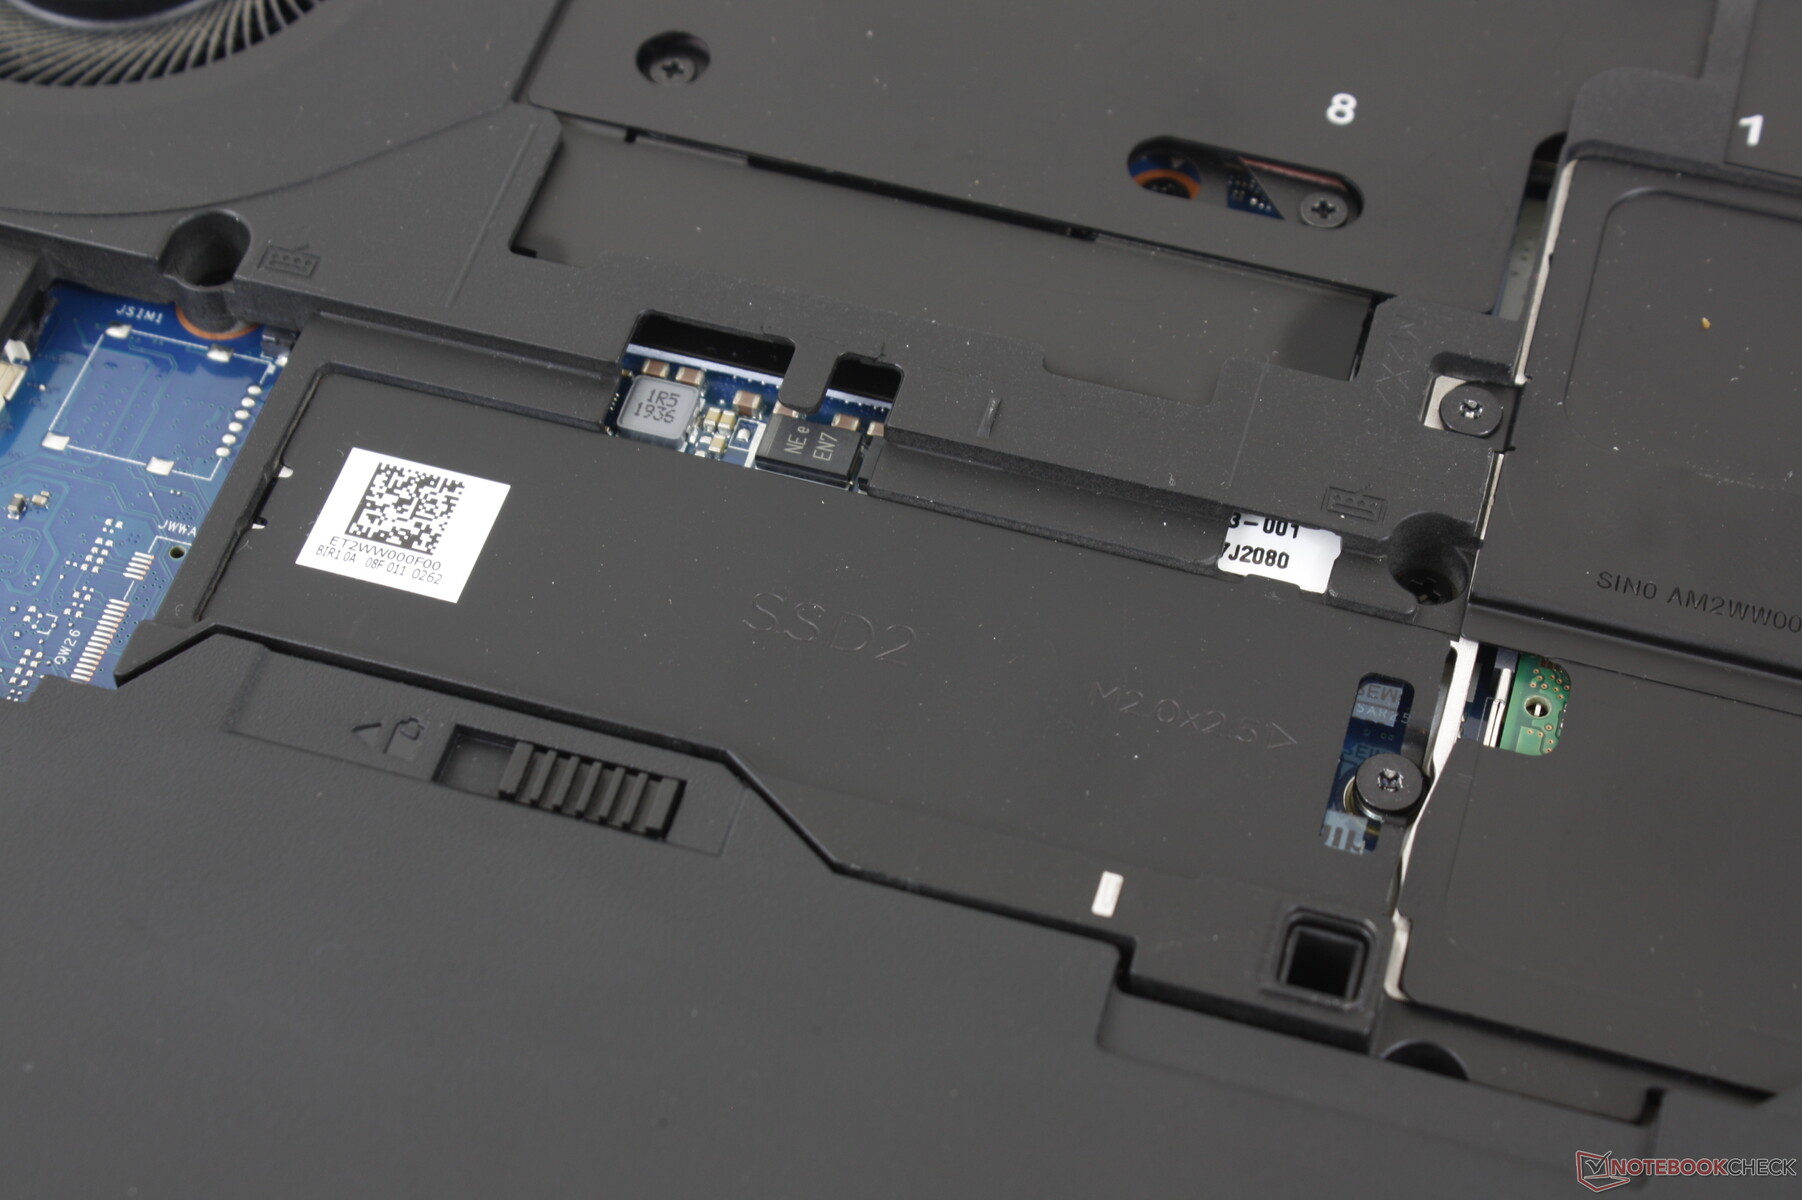
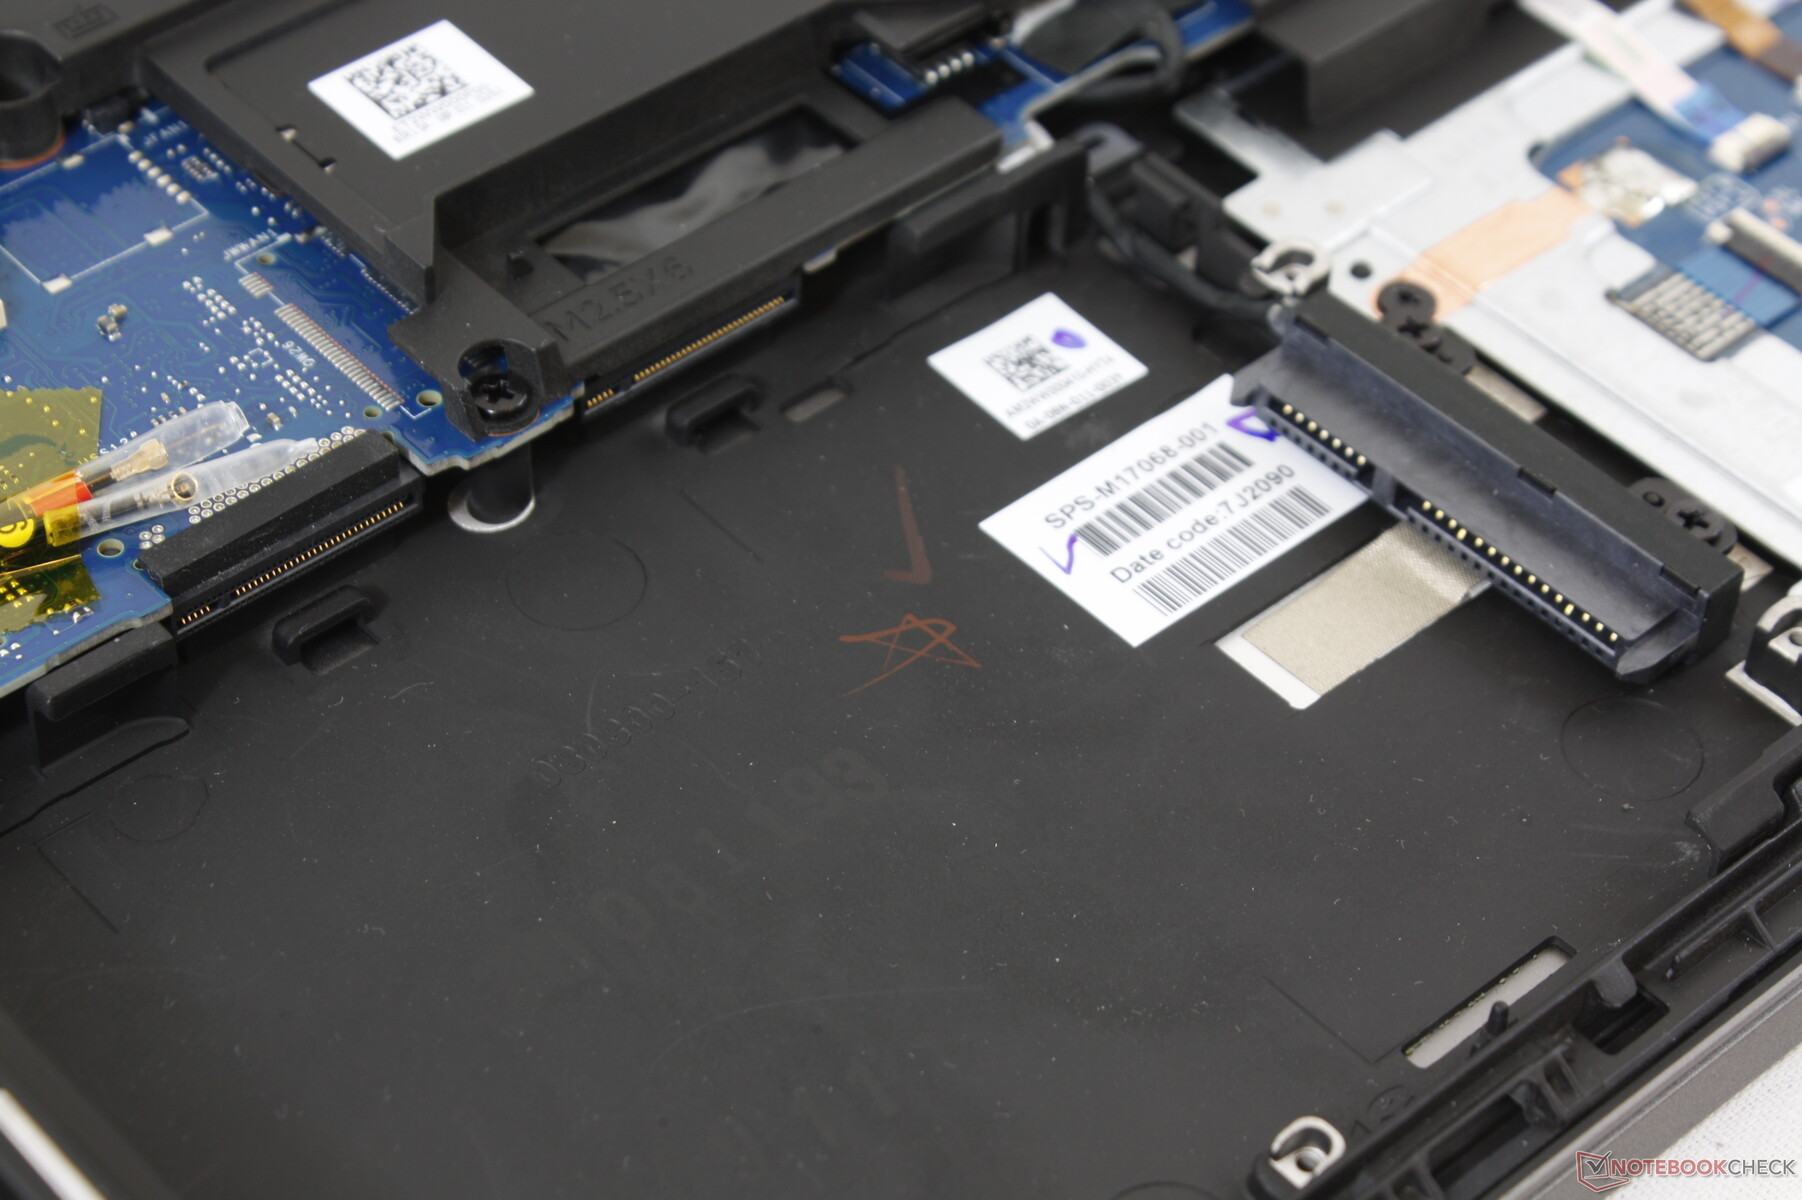
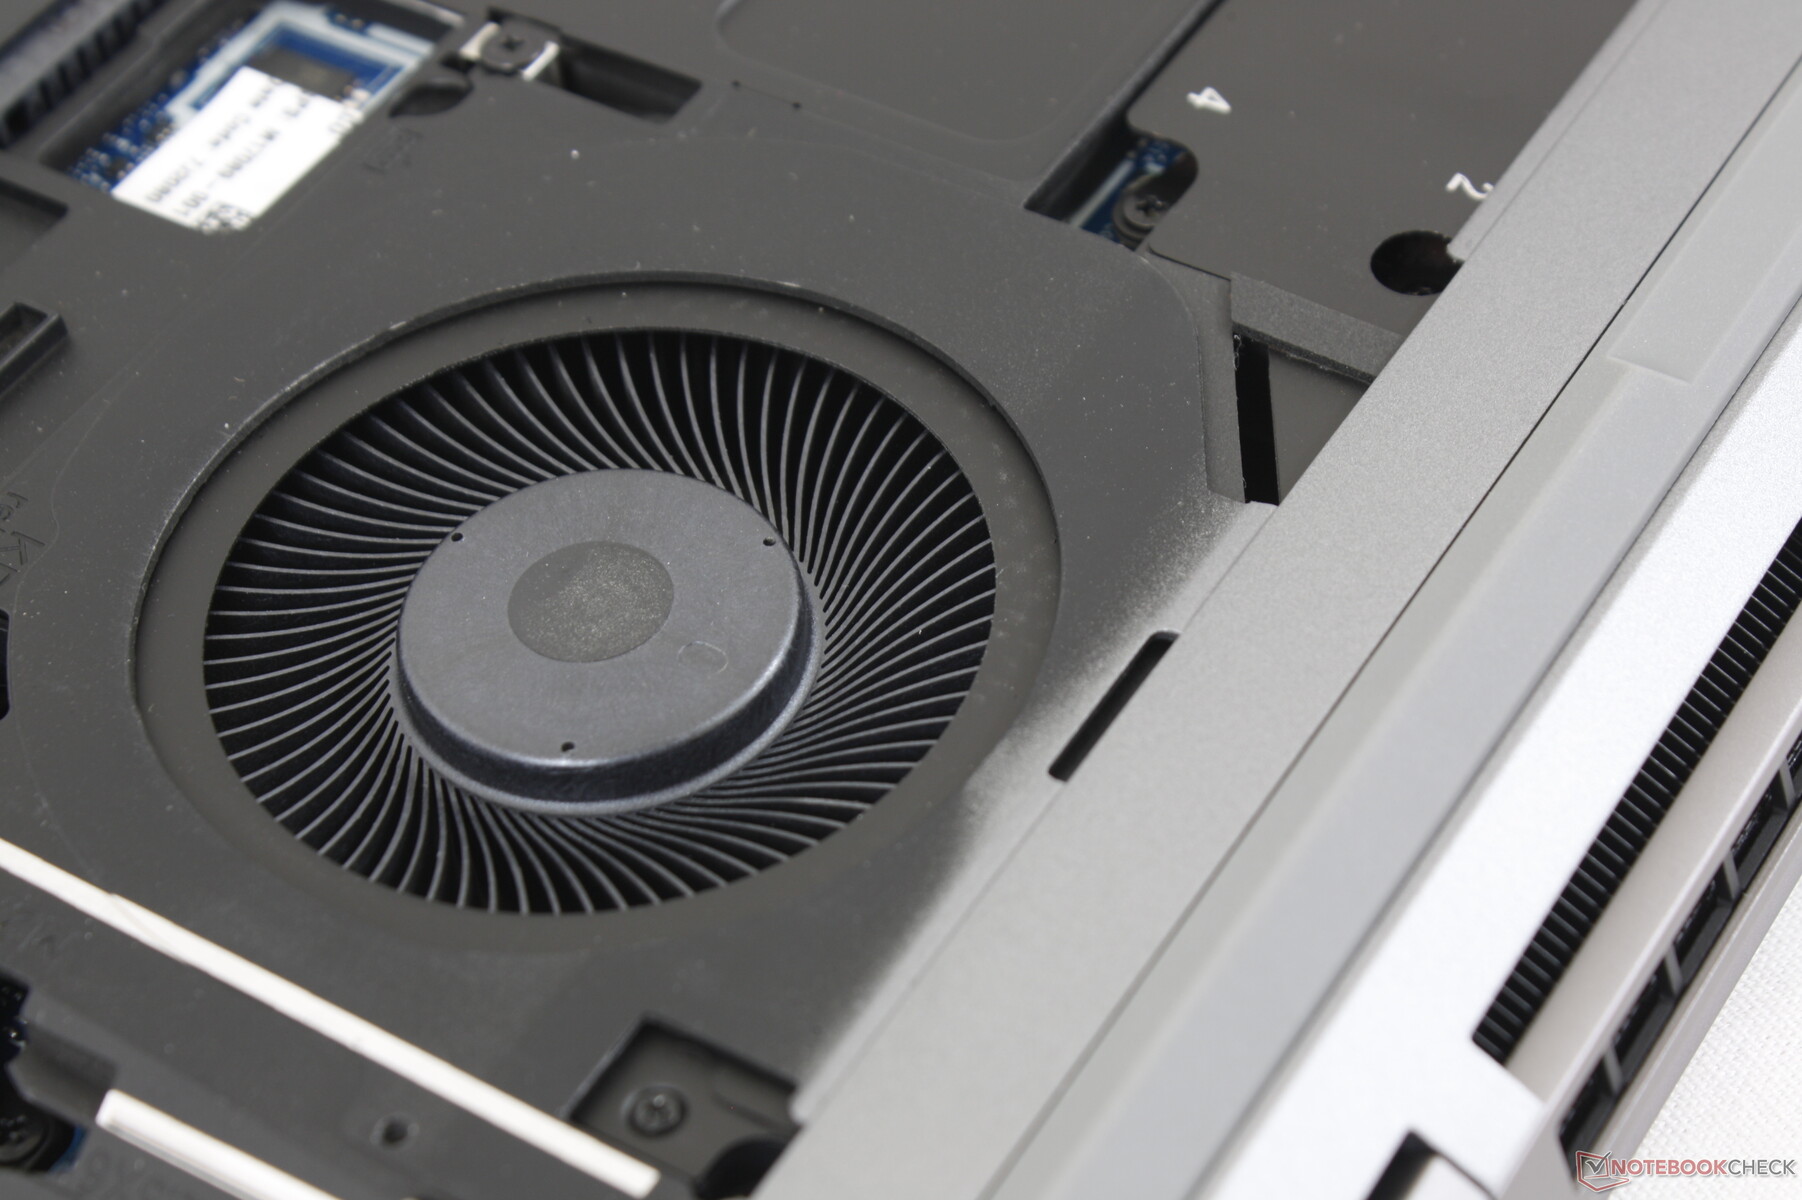
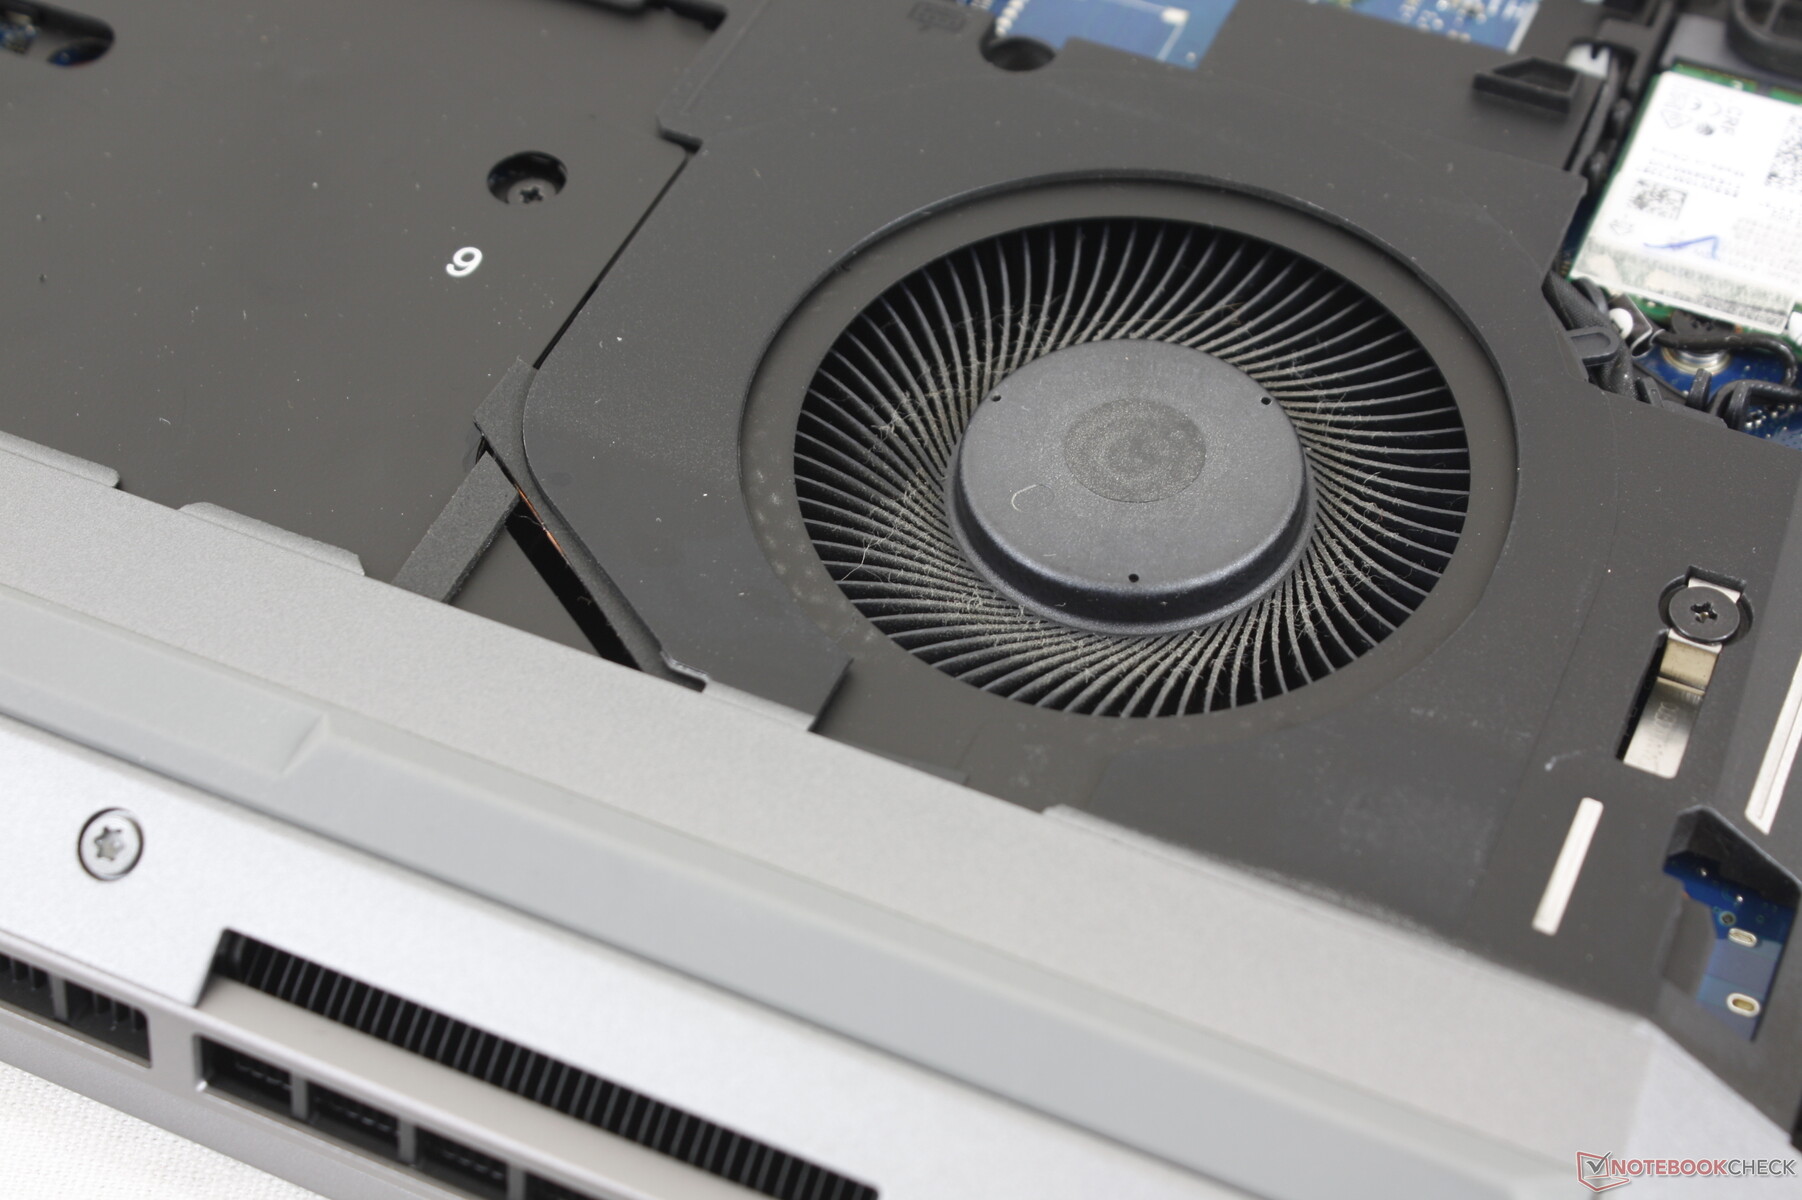
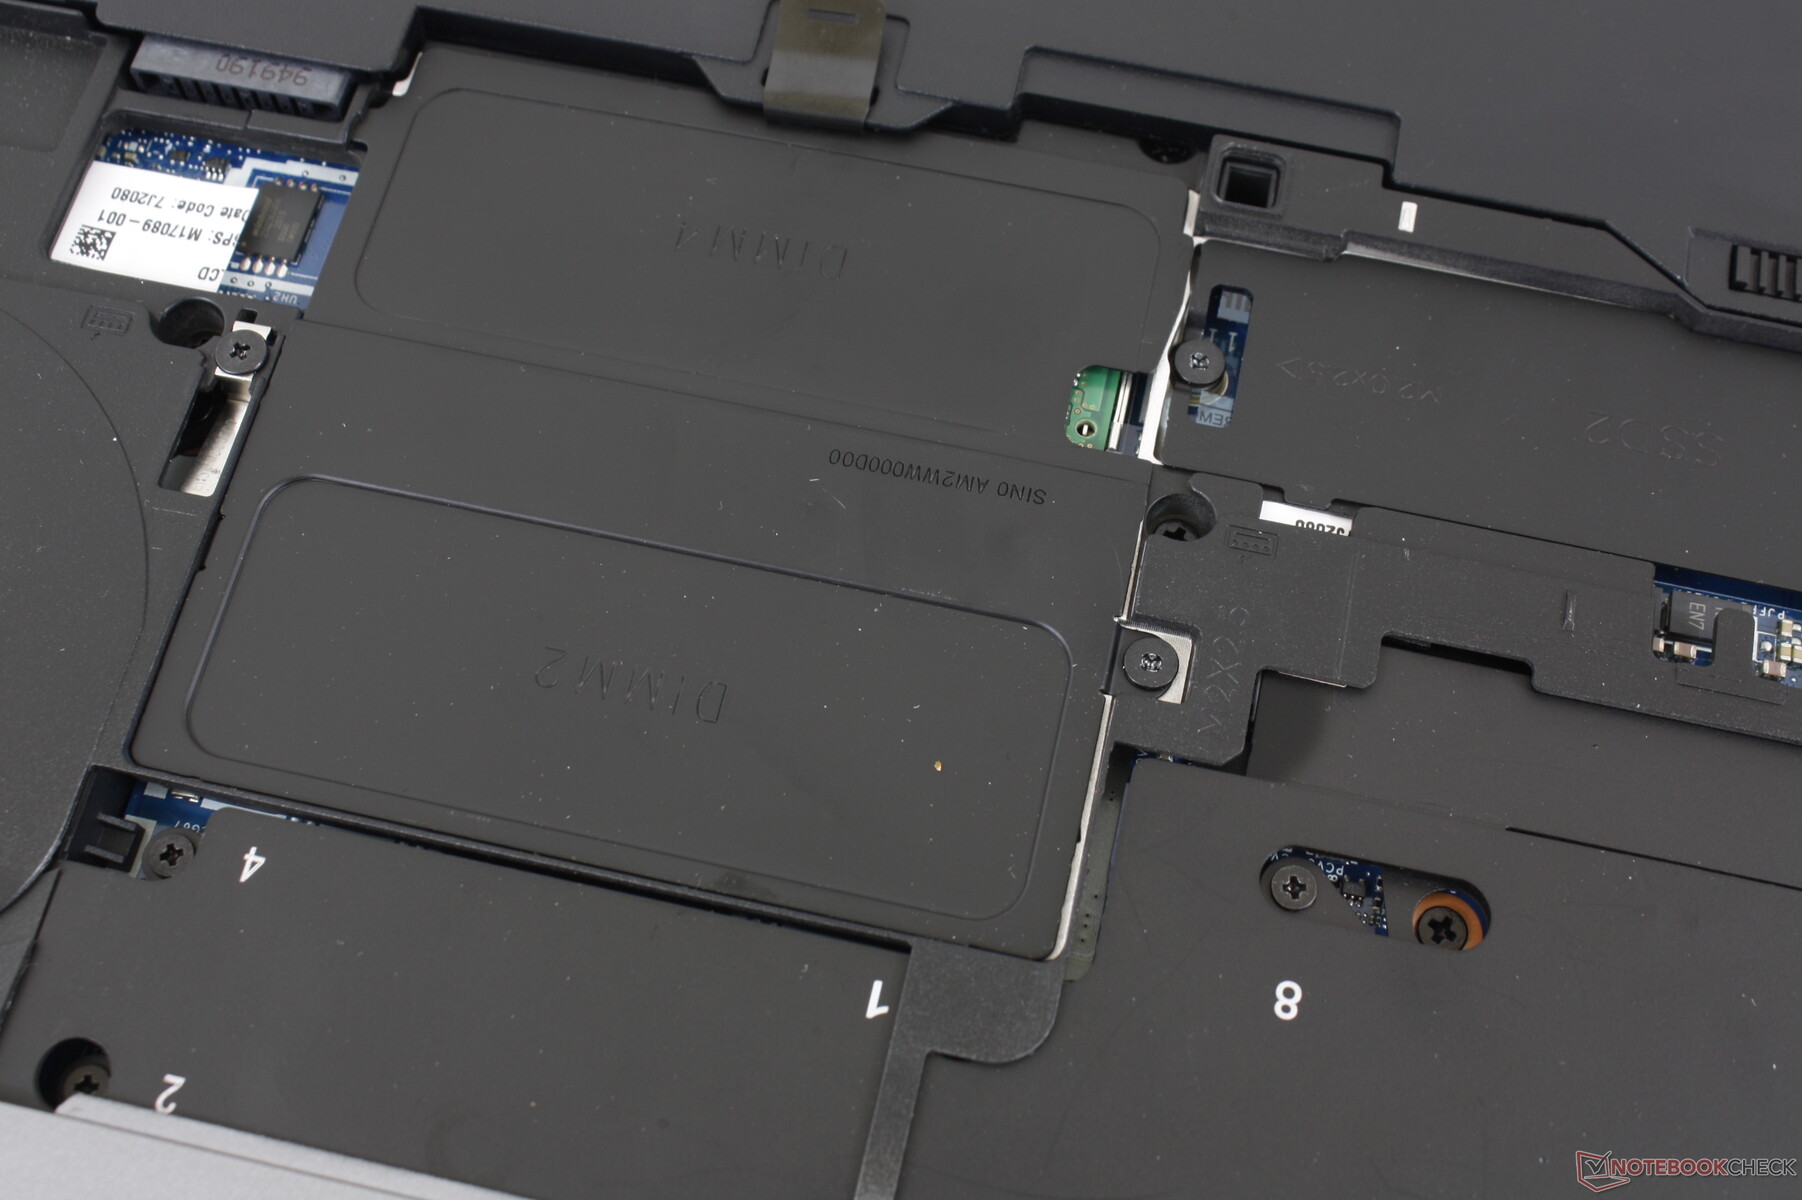
HP advertises "tool-less" servicing because the bottom panel and main battery can be easily removed by disengaging a couple of latches. We absolutely love this approach and we think more OEMs should implement something similar for their professional laptops. Unfortunately, there is one big caveat: a screwdriver is still required to actually access almost anything else. RAM and storage are behind additional shielding meaning the "tool-less" design is not entirely accurate.
Furthermore, the screws securing the RAM and SSD slots are tight and soft meaning they can cam out more easily. We've disassembled plenty of laptops in our labs and the screws on this HP are more difficult to remove.
Accessories and Warranty
There are no extras in the box other than the usual paperwork and AC adapter. Nonetheless, there are plenty of optional docking stations and accessories including the HP Thunderbolt Dock.
A three-year limited warranty comes standard with extension options if ordered directly from HP.
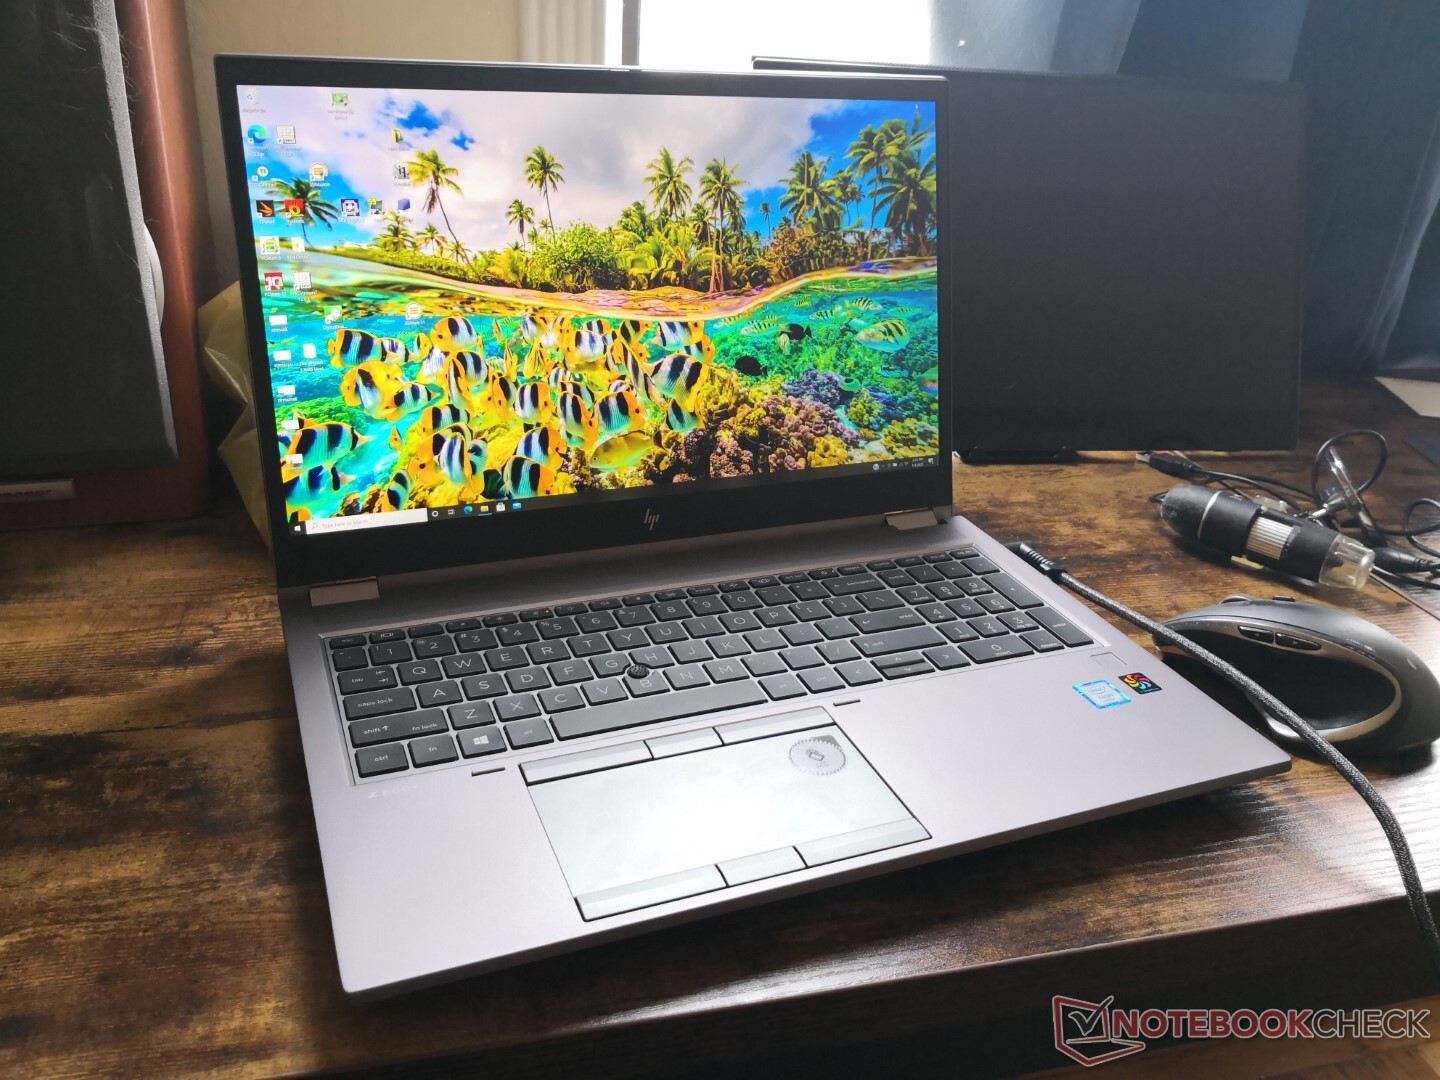
Input Devices
Keyboard
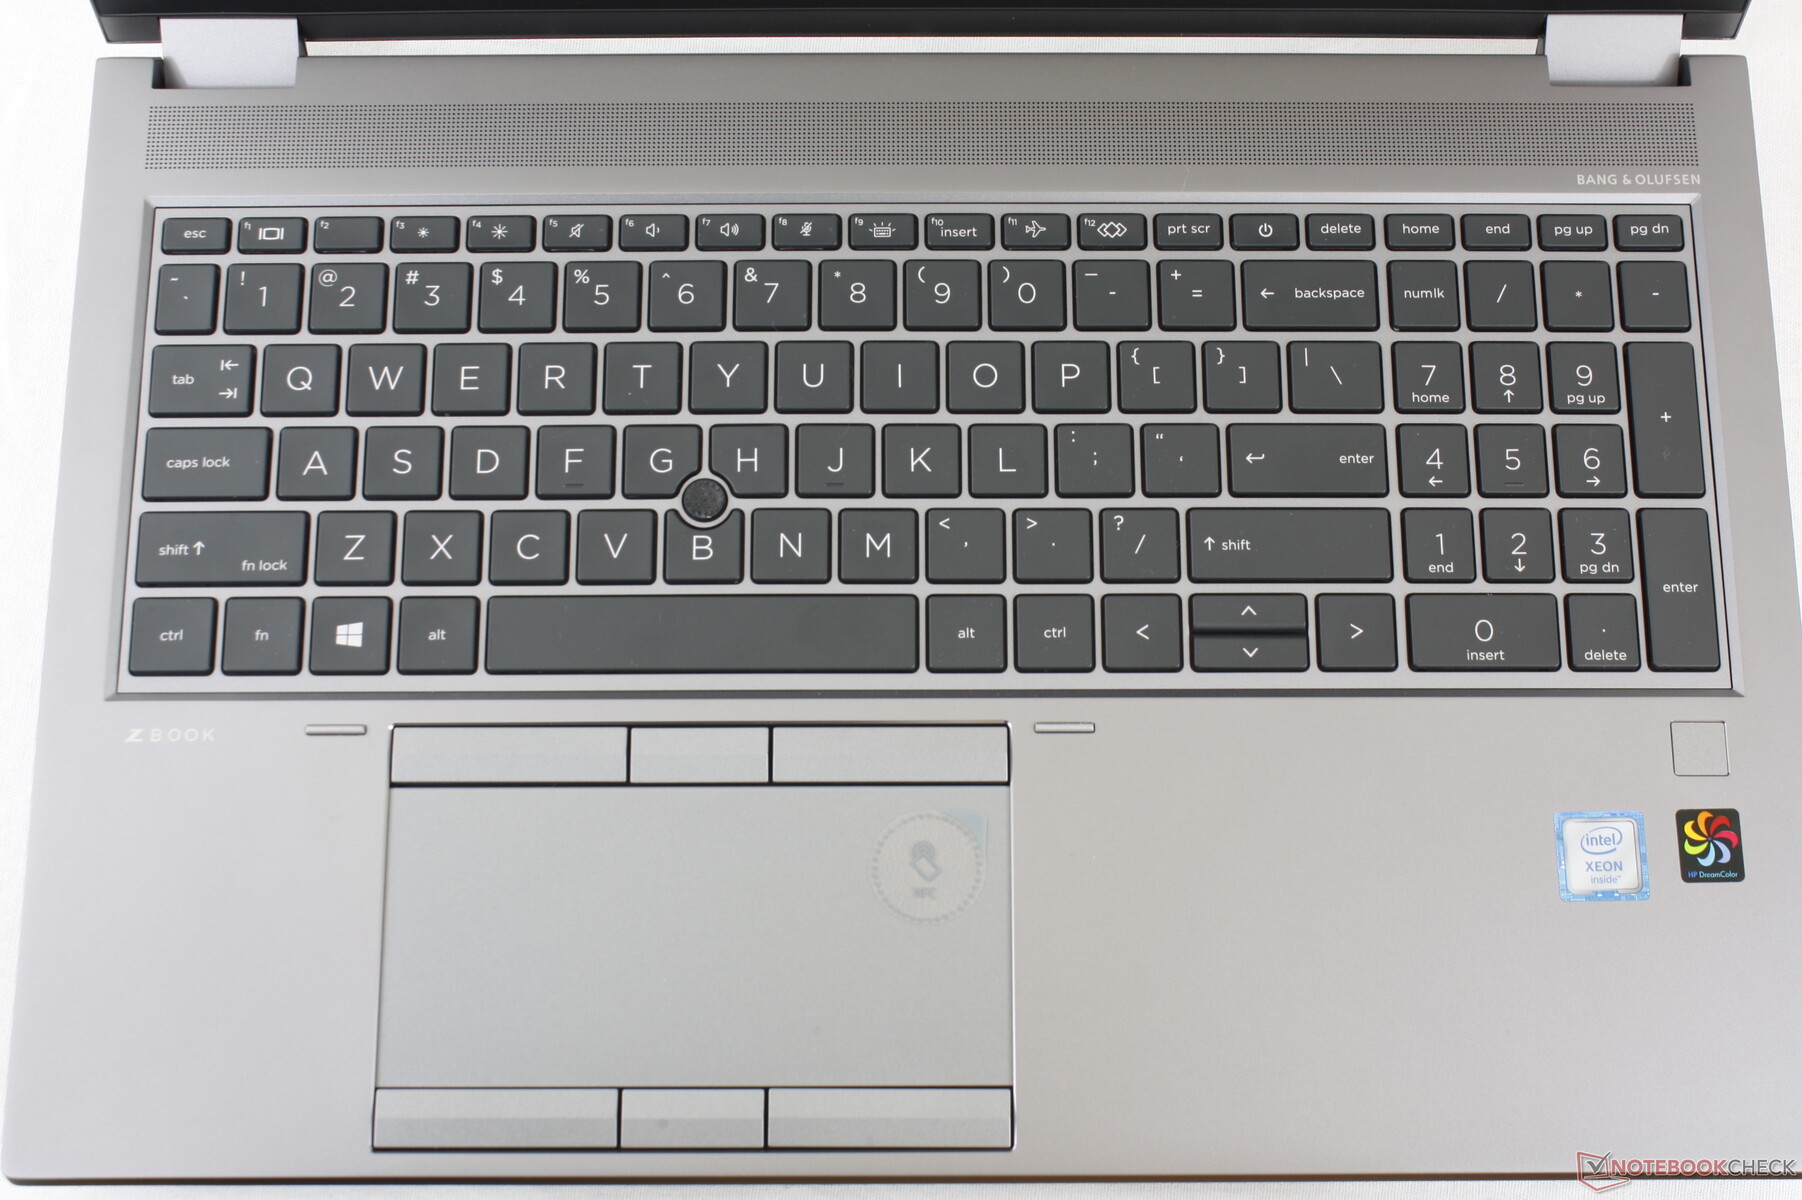
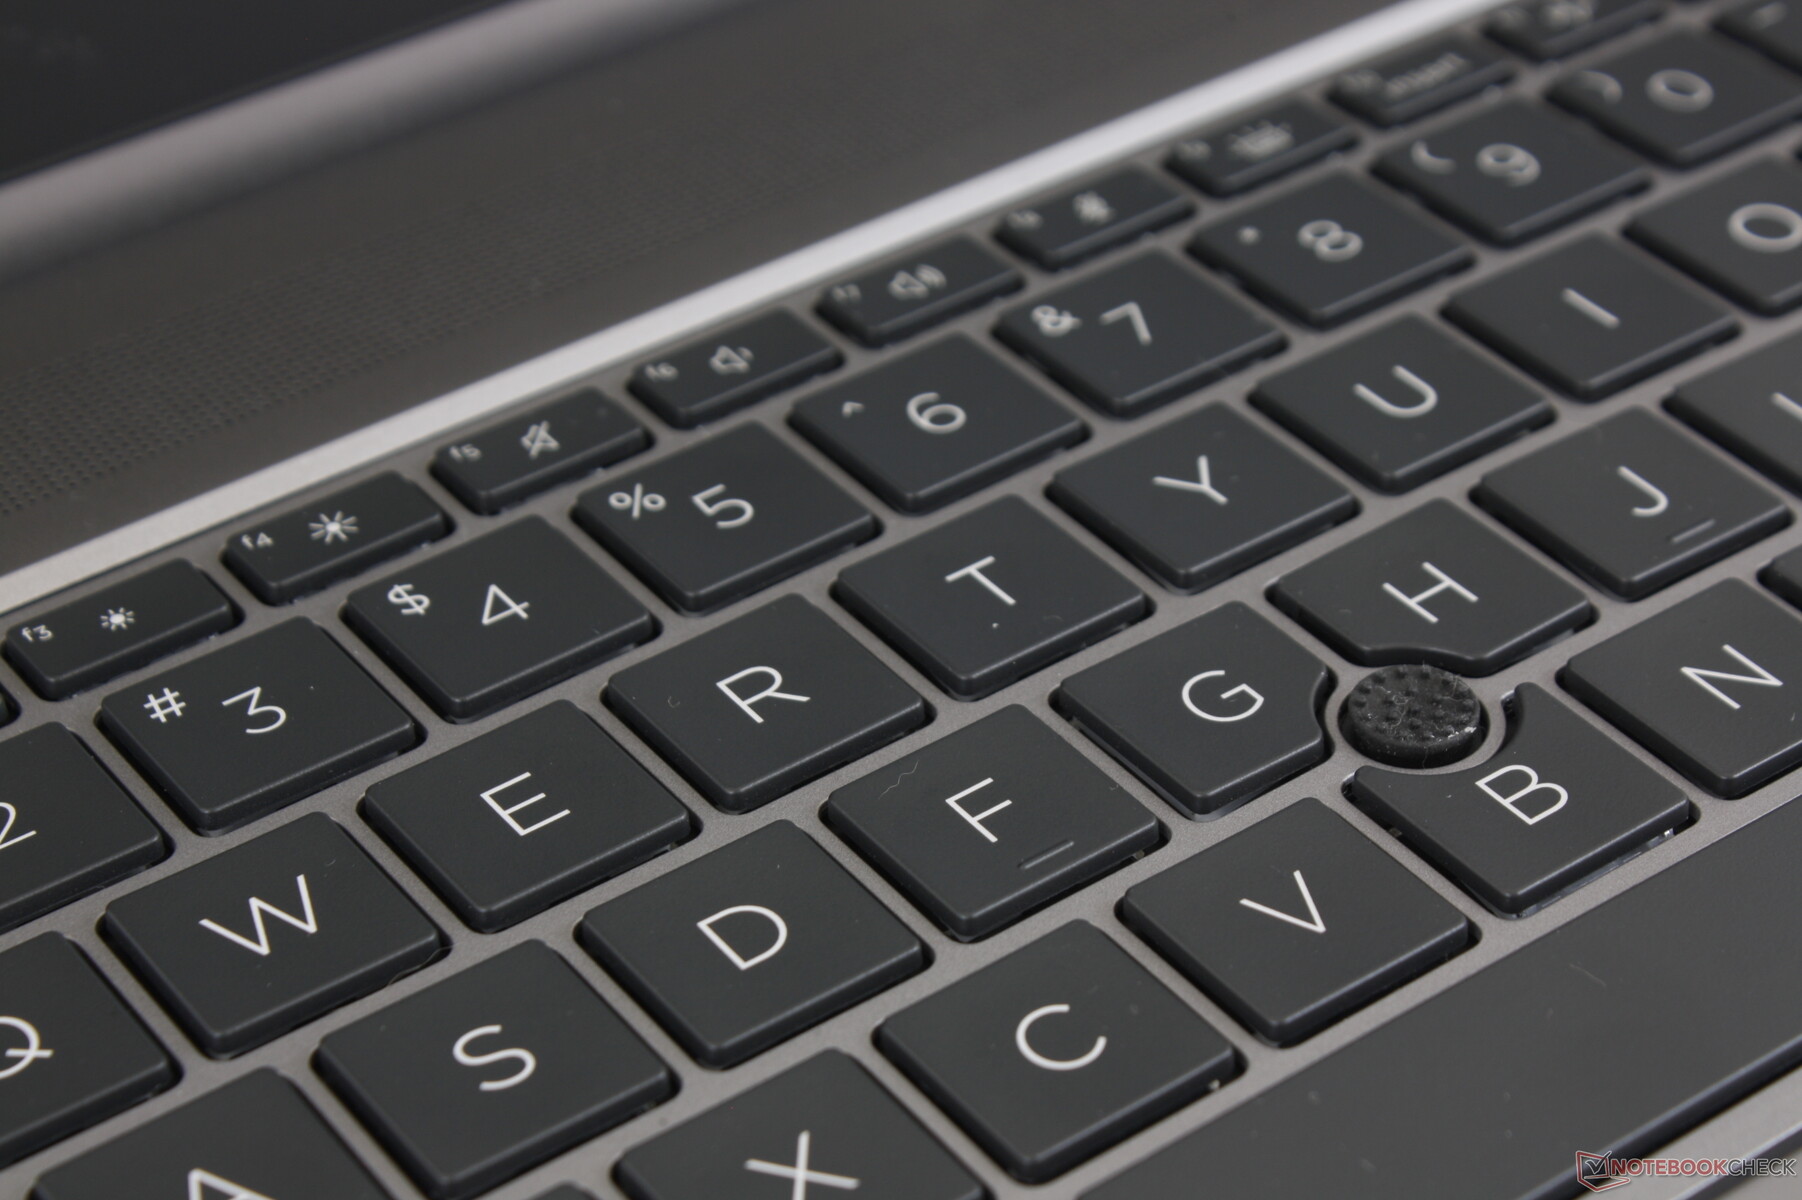
The keyboards on HP Spectre, EliteBook, and ZBook laptops are some of the best in their respective categories. Feedback is crisp with relatively deep travel so it doesn't feel like you're typing on a thin Ultrabook with shallow keys. Clatter is also relatively quiet save for the louder Space key. The fact that the base is so dense helps each key feel uniform from corner to corner.
A new feature of the keyboard is its customizable F12 key which can also be found on the latest Envy and Spectre laptops. Users can set the key to quickly launch programs, files, folders, or websites. It does not, however, support macros which we think is a huge oversight.
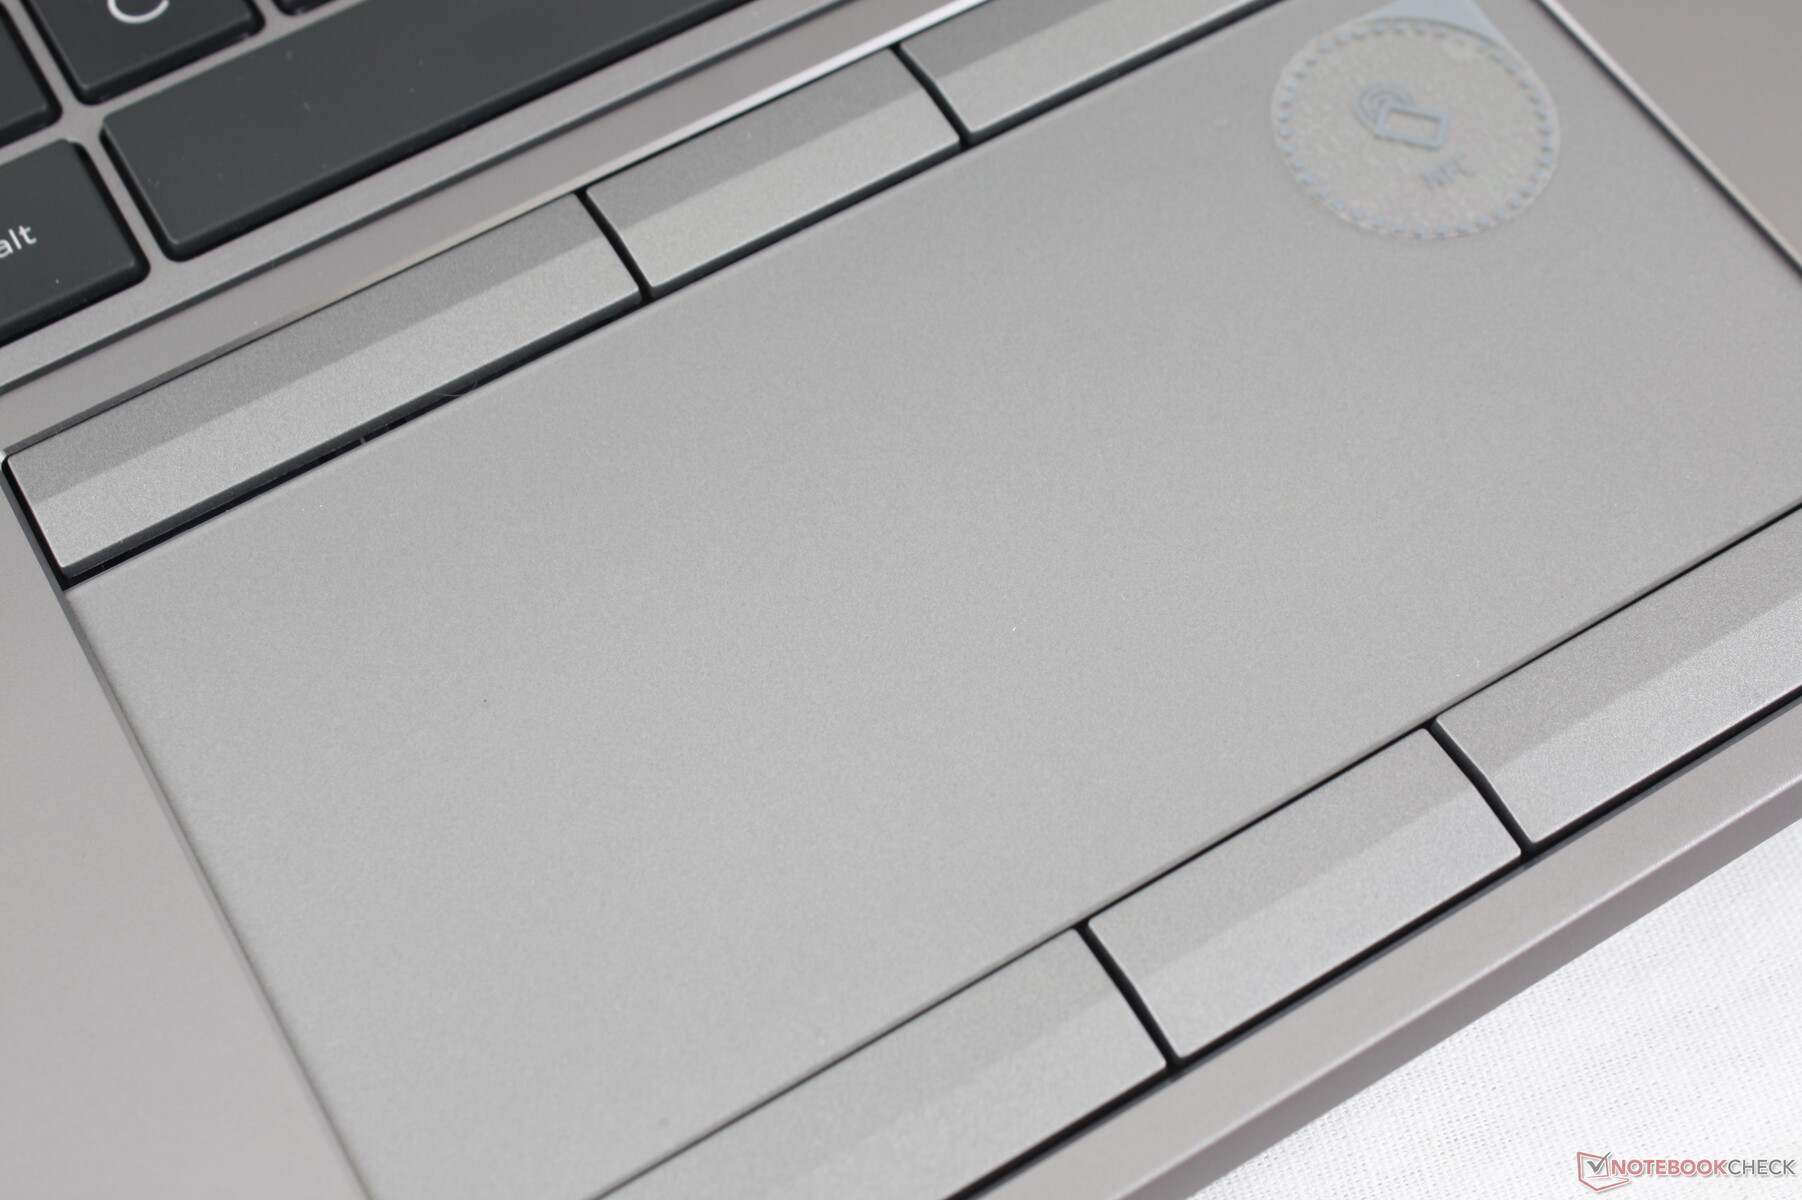
Touchpad
The touchpad here is one of the best we've used on any 15.6-inch workstation. It's firm with smooth gliding properties and only a bit of sticking at slower speeds. Surface area is also larger than on the Precision 7550 (12.5 x 6 cm vs. 10 x 6.5 cm) while offering more dedicated mouse buttons.
Feedback from the dedicated buttons is also satisfying with deeper travel than on most laptops. Clatter is moderate but not loud enough to be annoying. Feedback doesn't feel uniform between each key, however, as the bottom right key feels a bit softer than the rest of the keys.
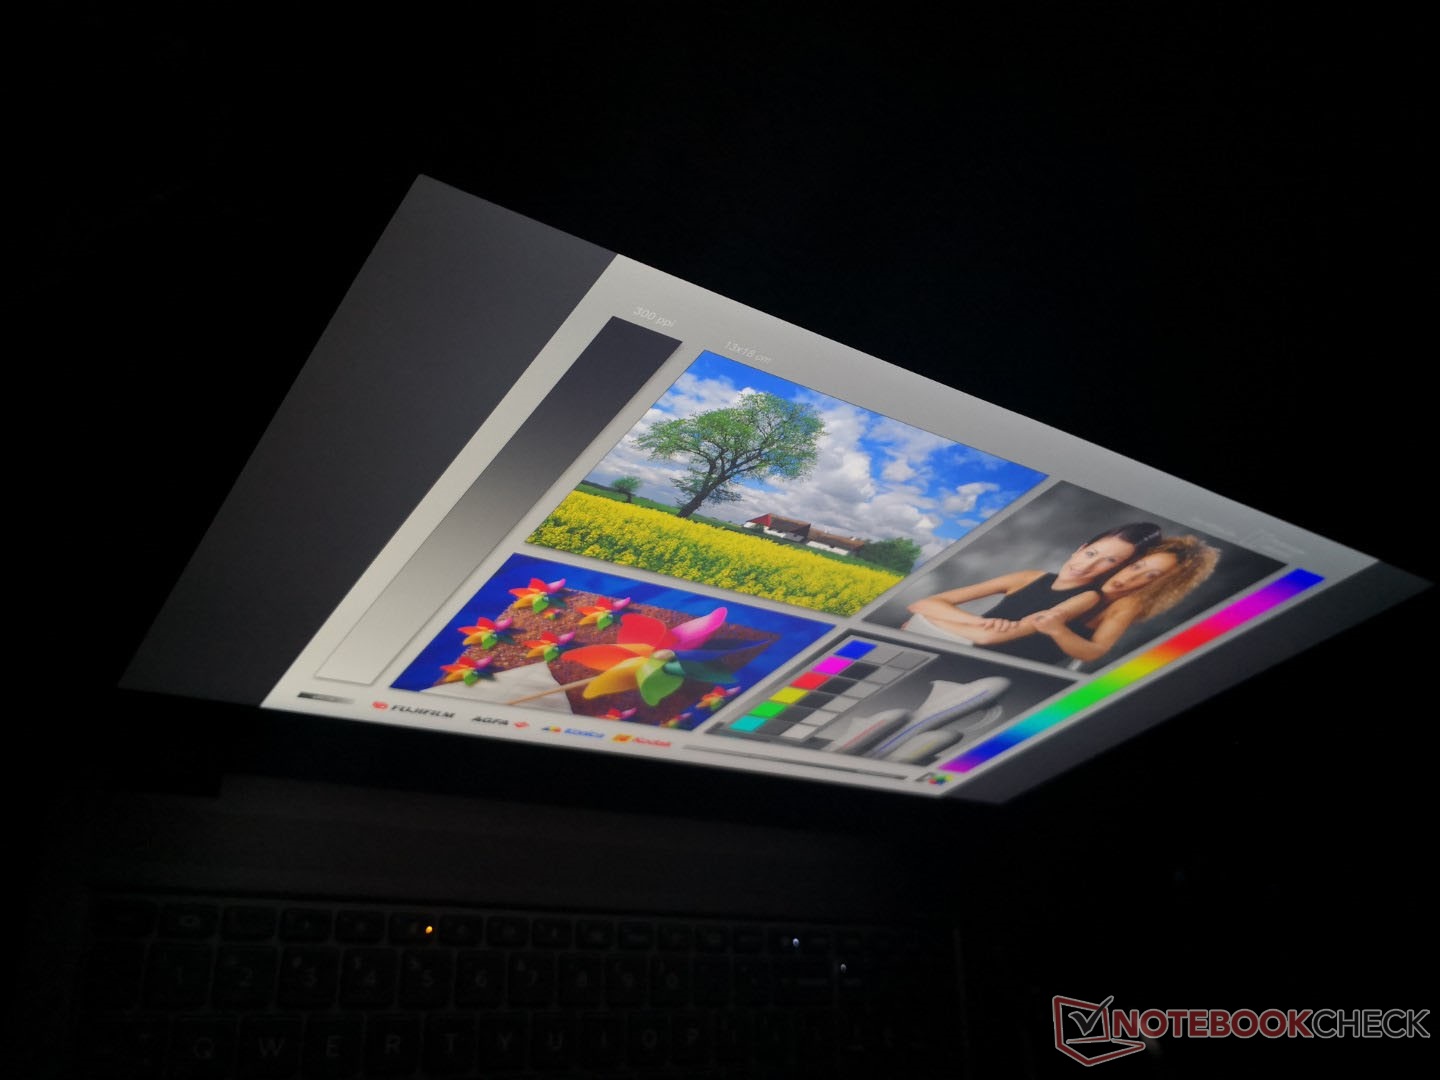
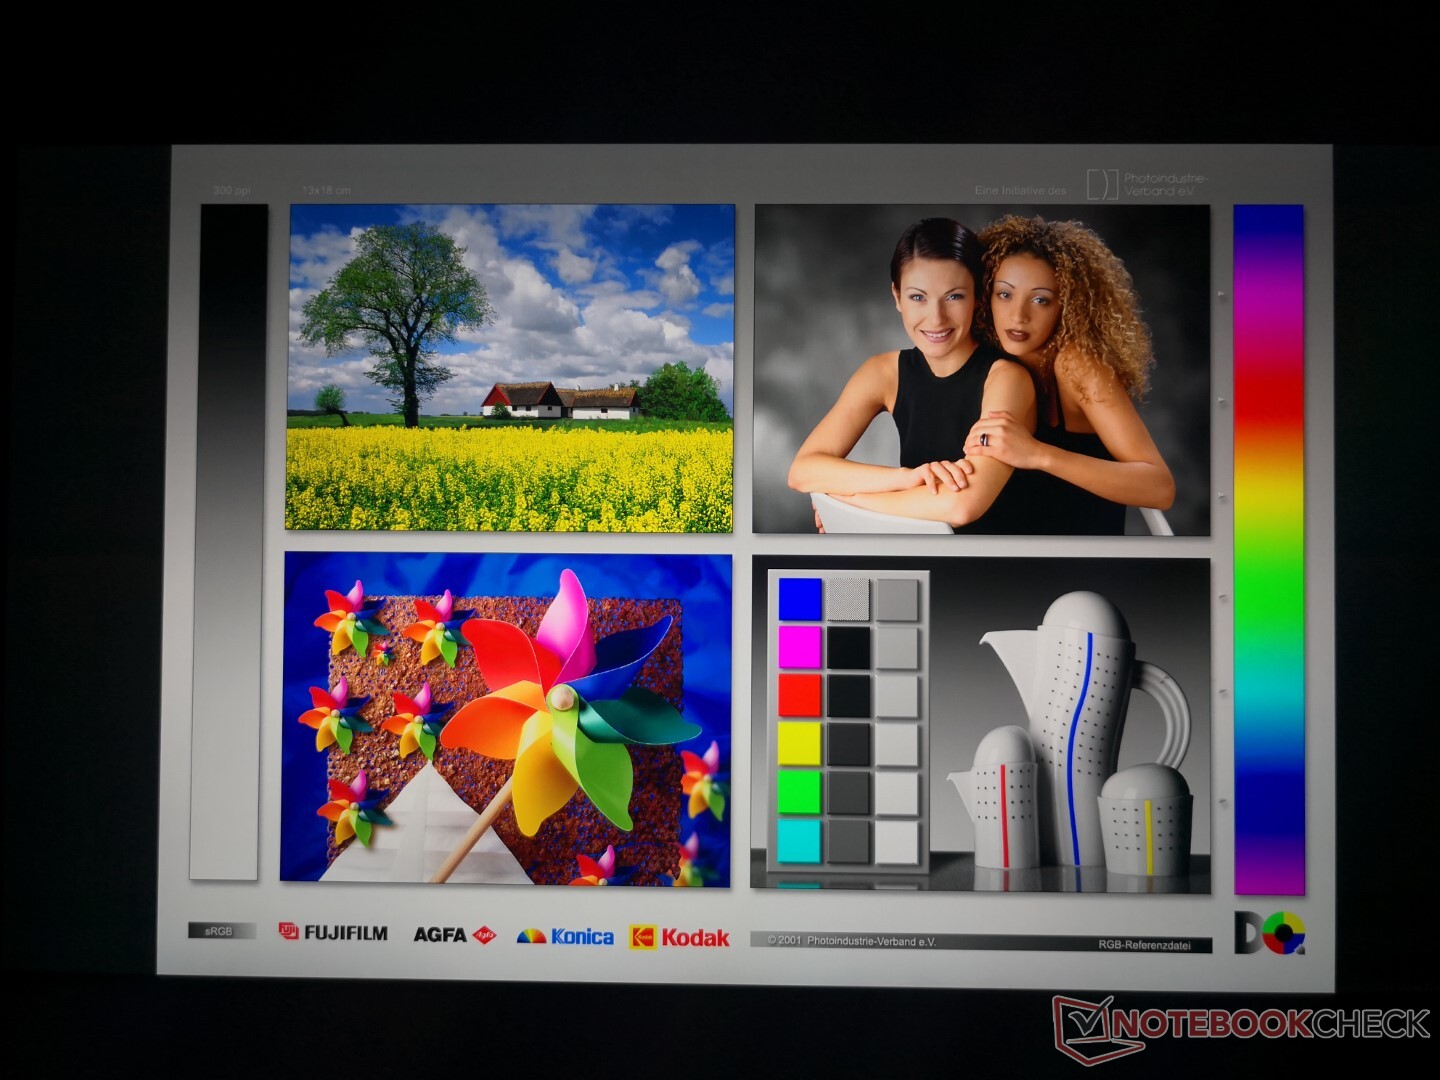
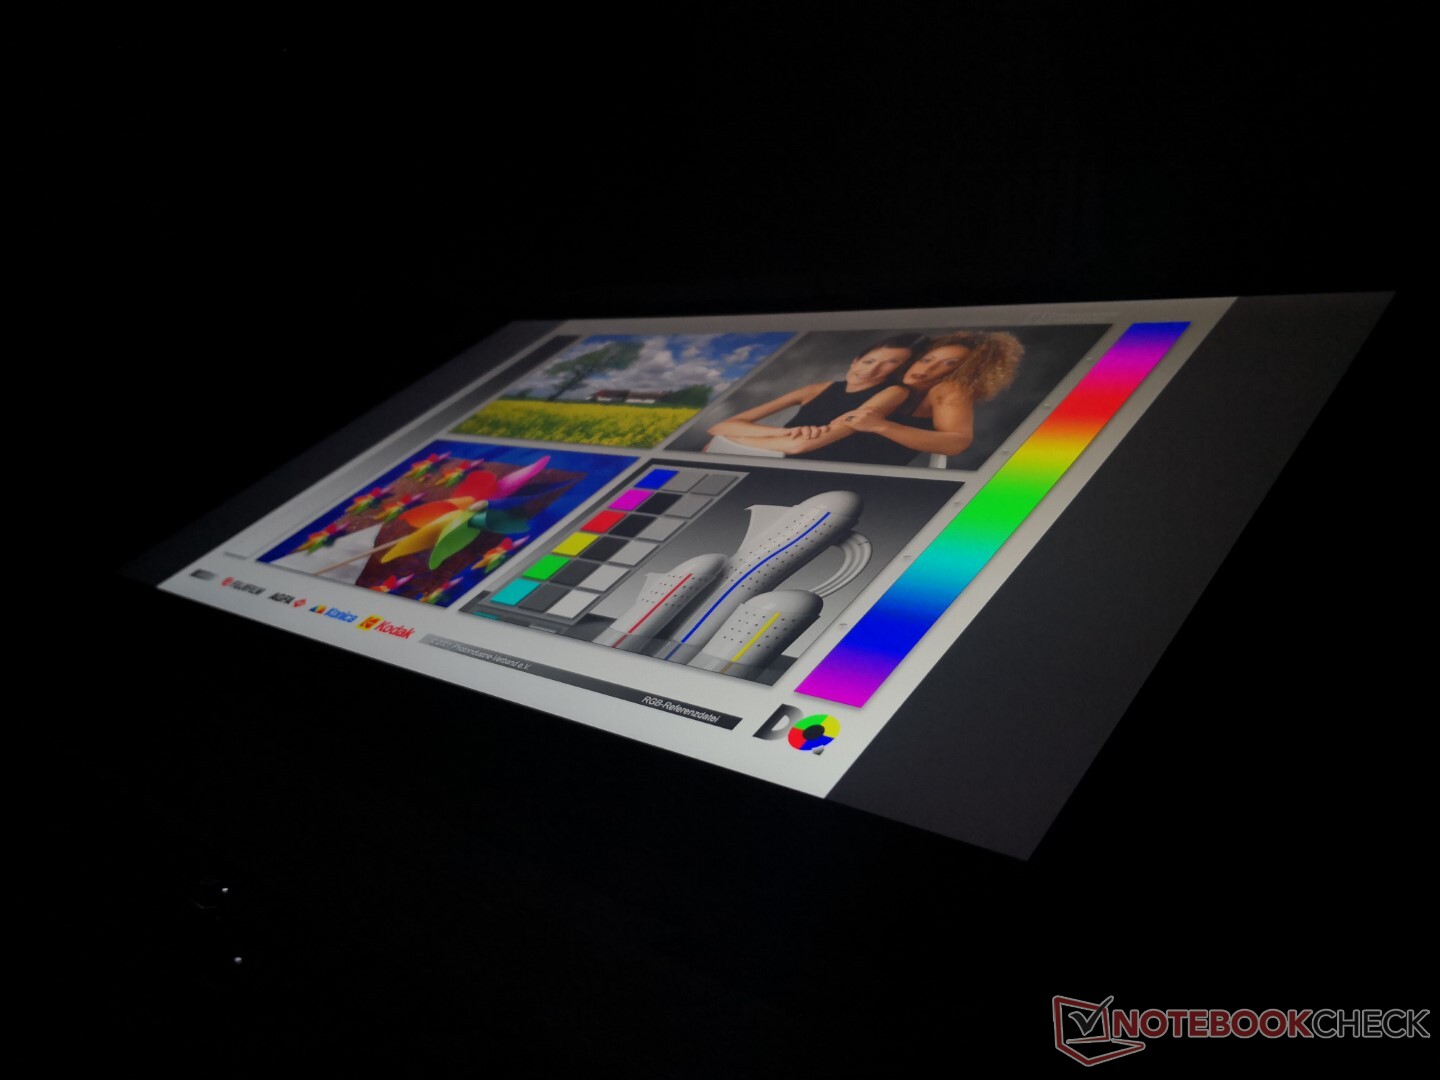
Display
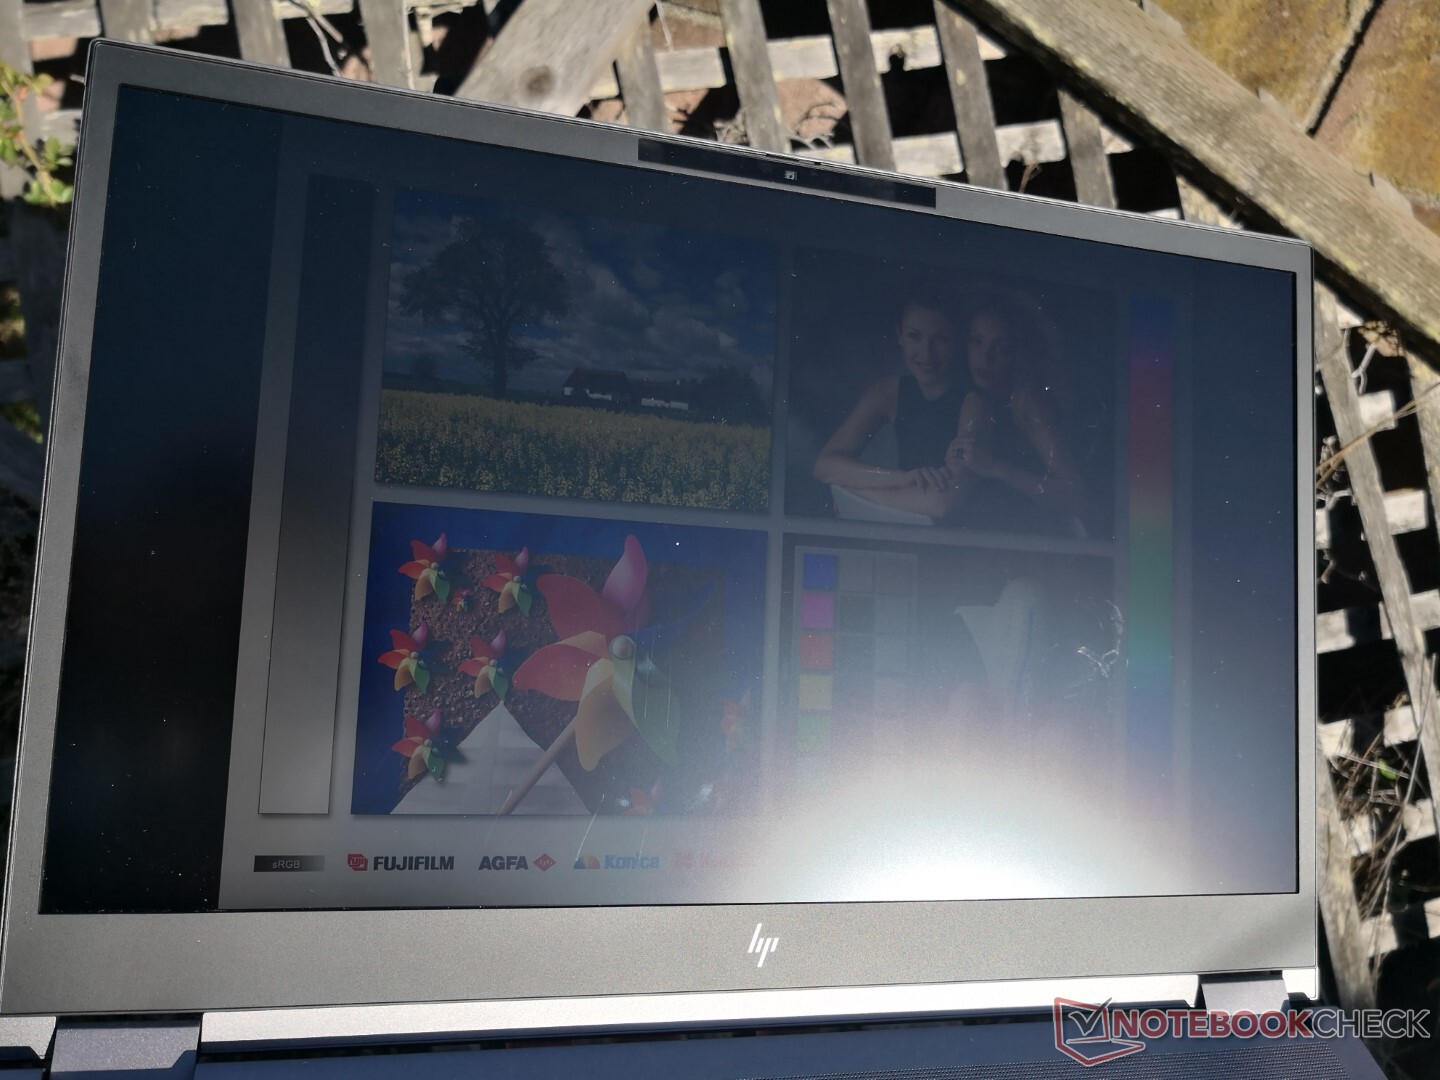
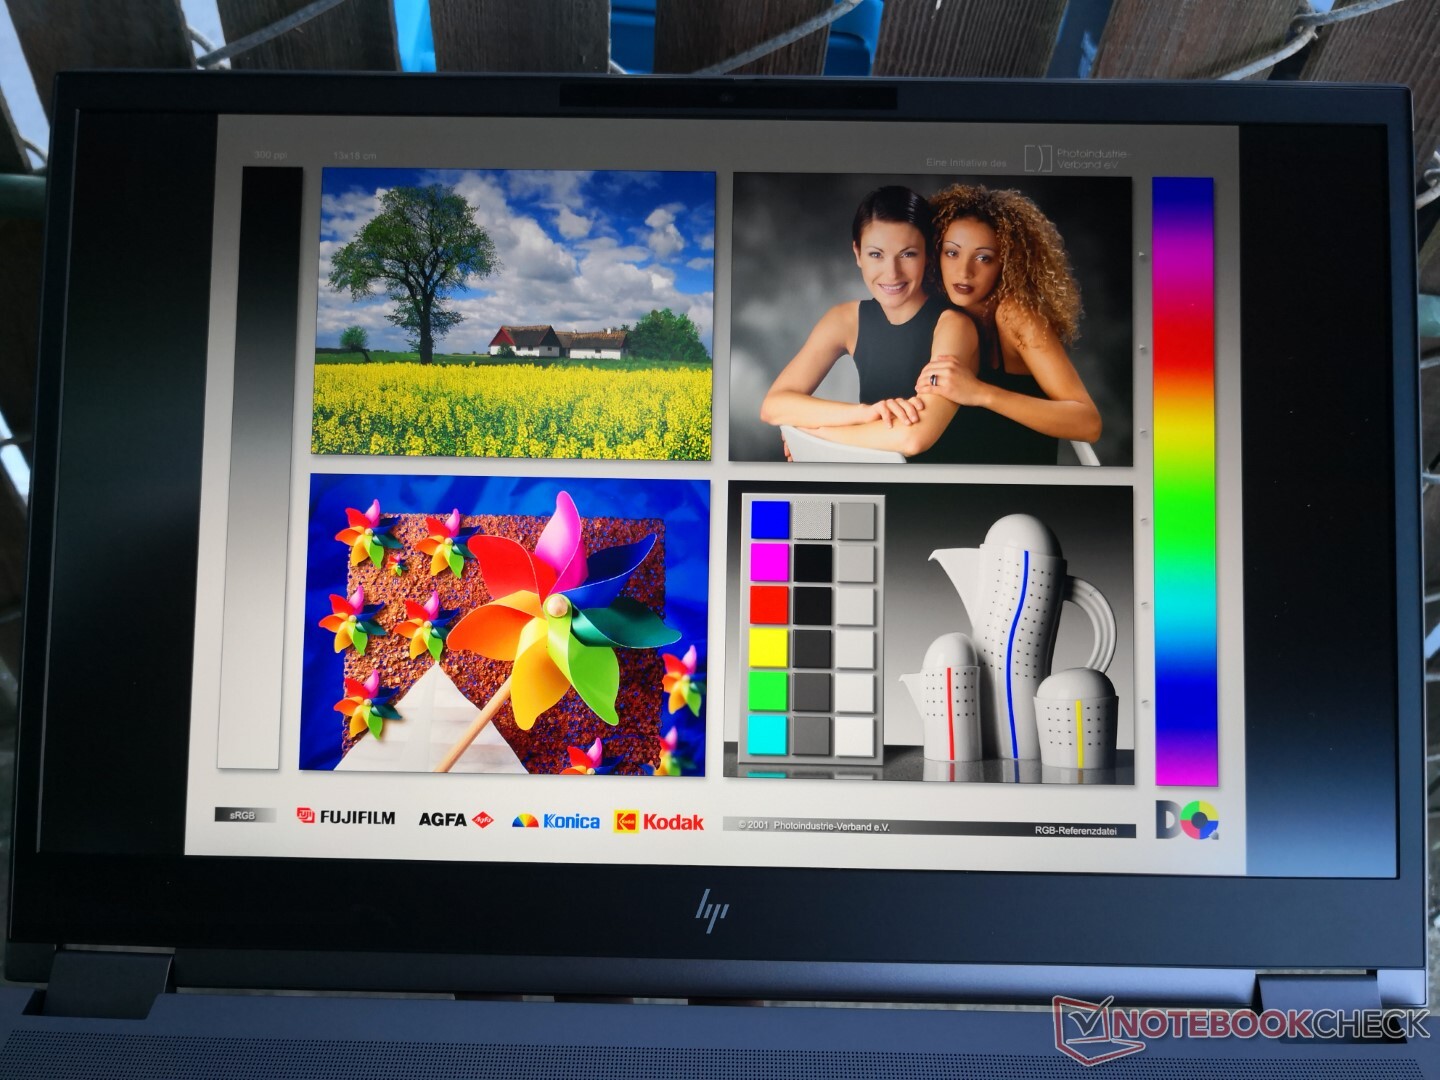
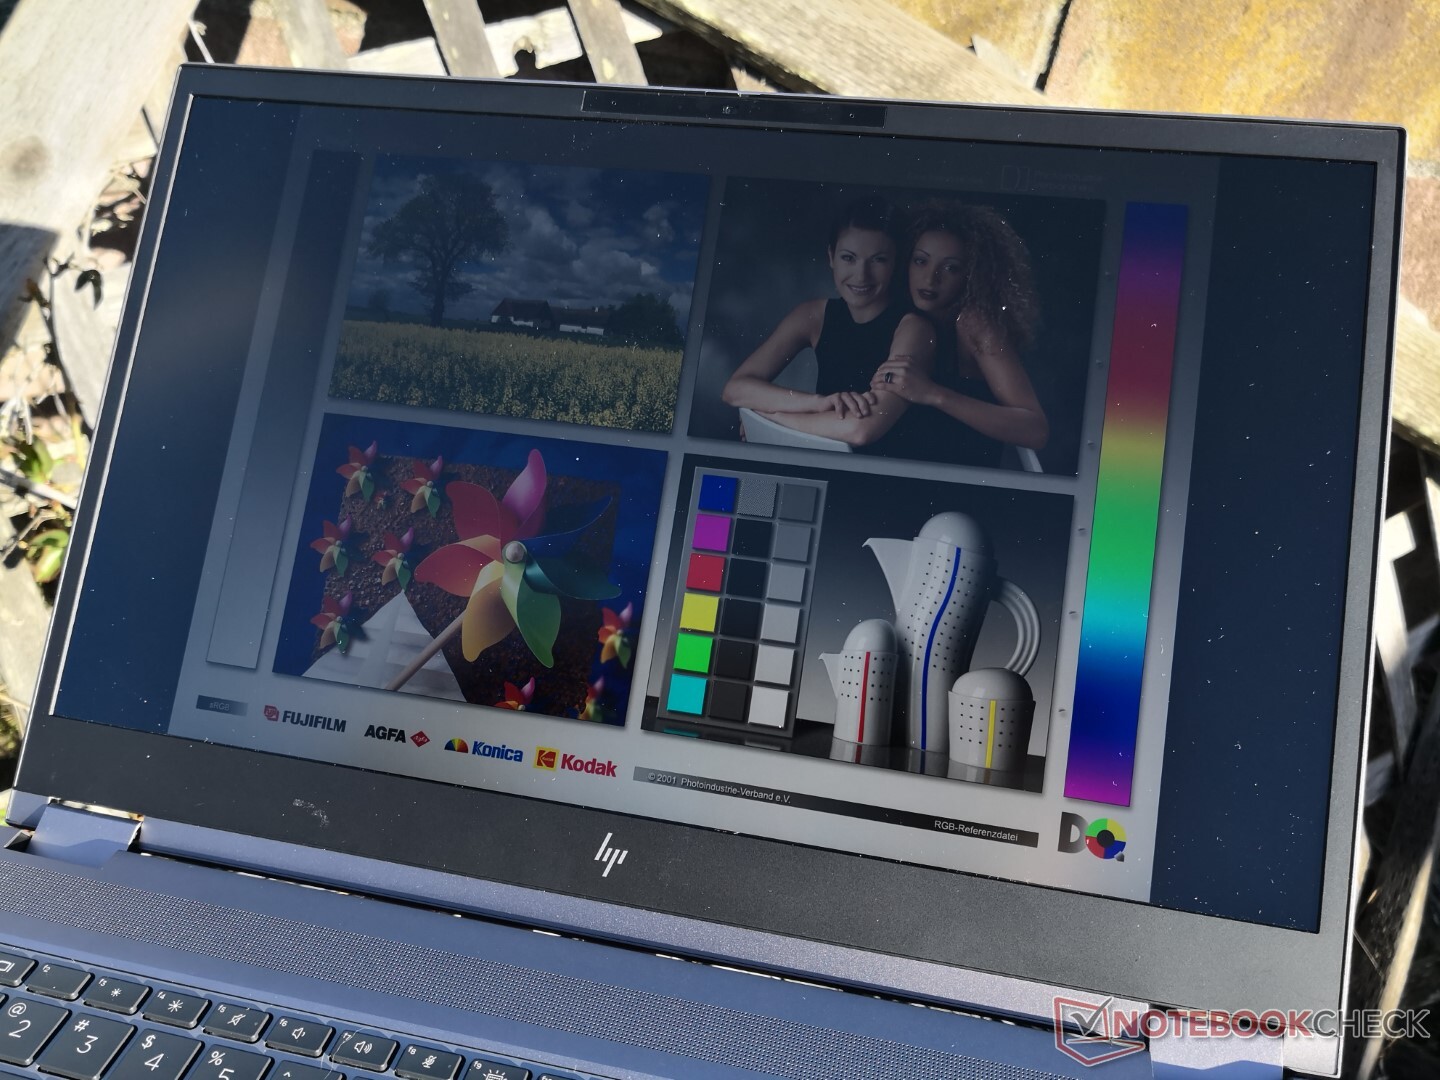
HP offers a deluge of display options — 13, in fact — ranging from FHD to 4K, 250 nits to 1000 nits, touchscreen and no touchscreen, and everything in between. Our measurements and impressions below reflect only the 4K UHD HDR400 DreamColor non-touch panel as the other panels will almost surely have different attributes.
HWiNFO is unable to to pull the exact panel name of our unit and can only return the LG Philips LGD0661 controller. Nonetheless, we can confirm the high contrast ratio and 600 nit display to be brighter than most other workstations.
| |||||||||||||||||||||||||
Brightness Distribution: 89 %
Center on Battery: 672.8 cd/m²
Contrast: 1346:1 (Black: 0.5 cd/m²)
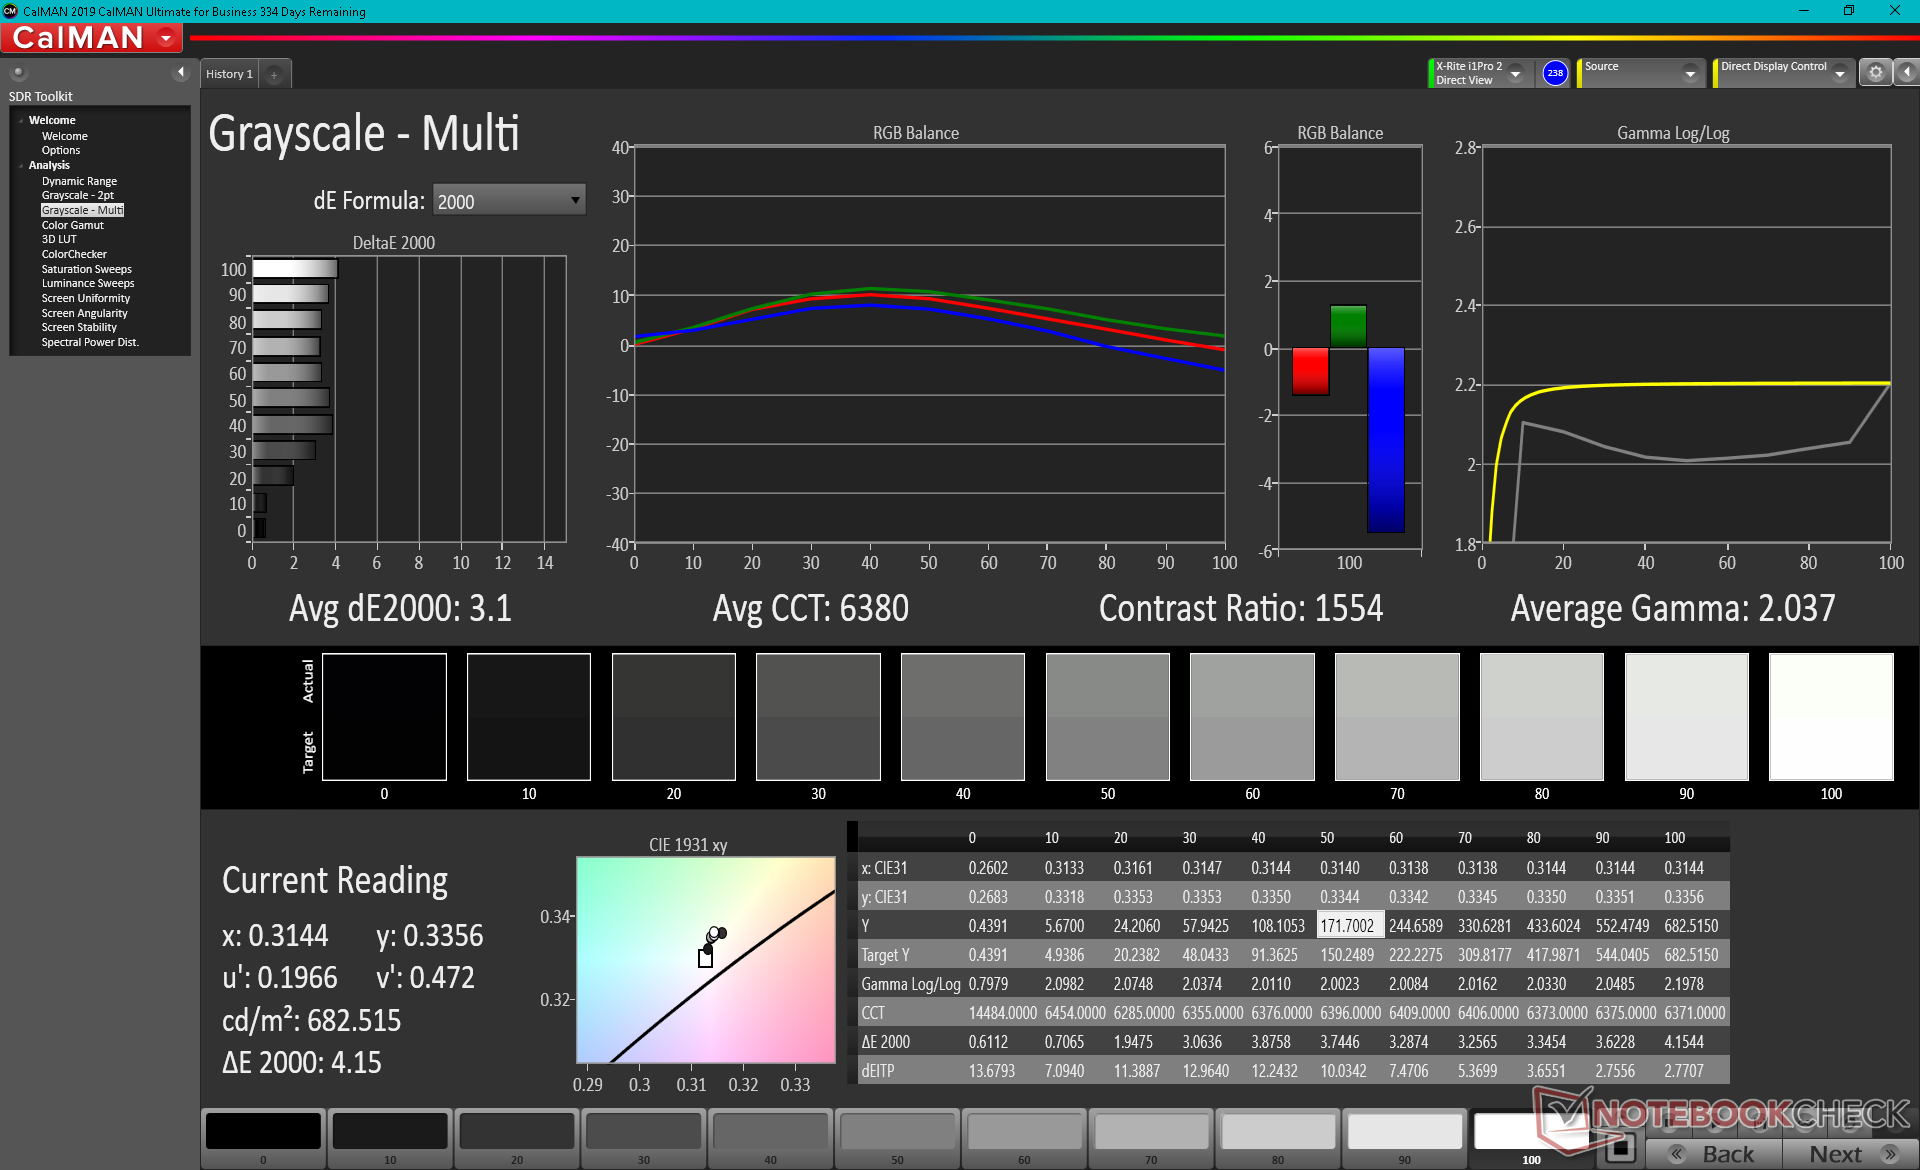
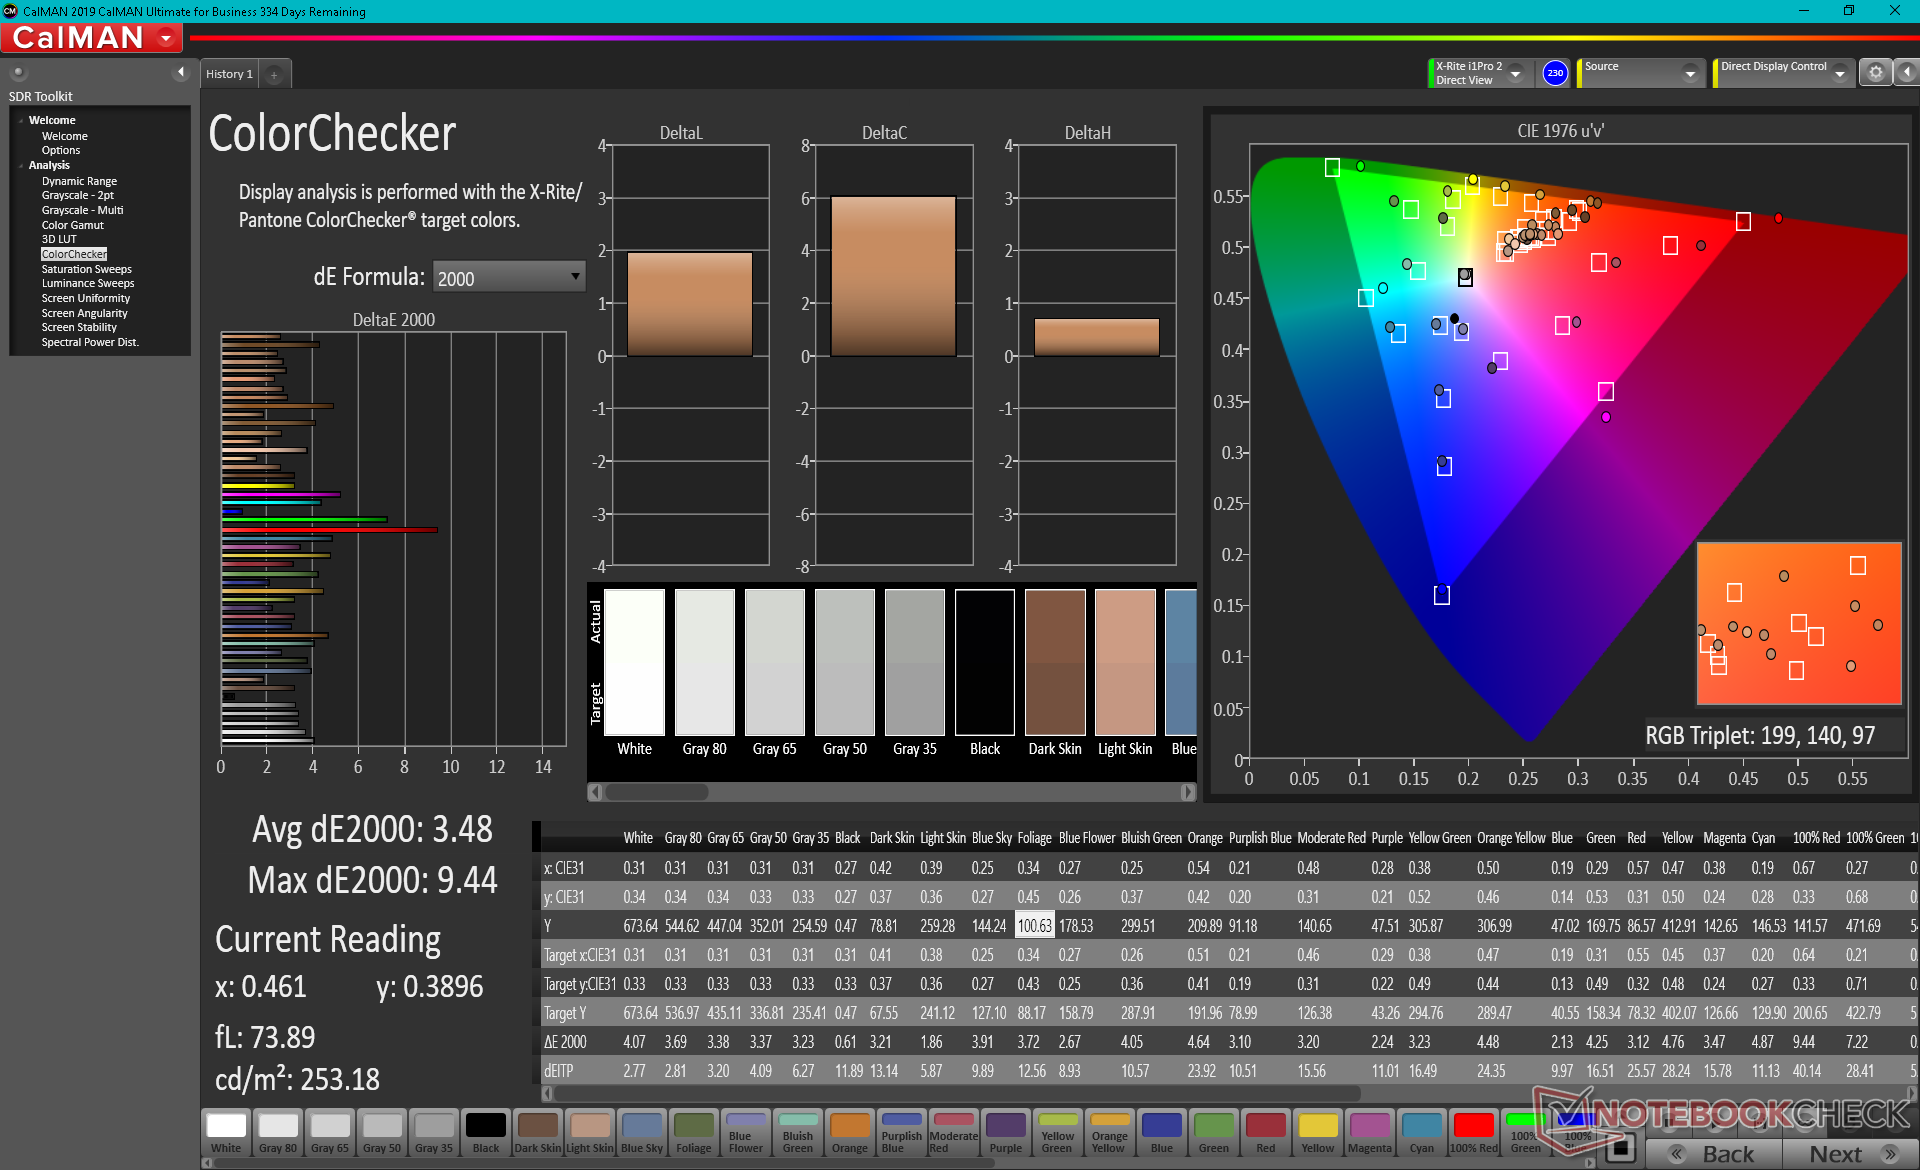
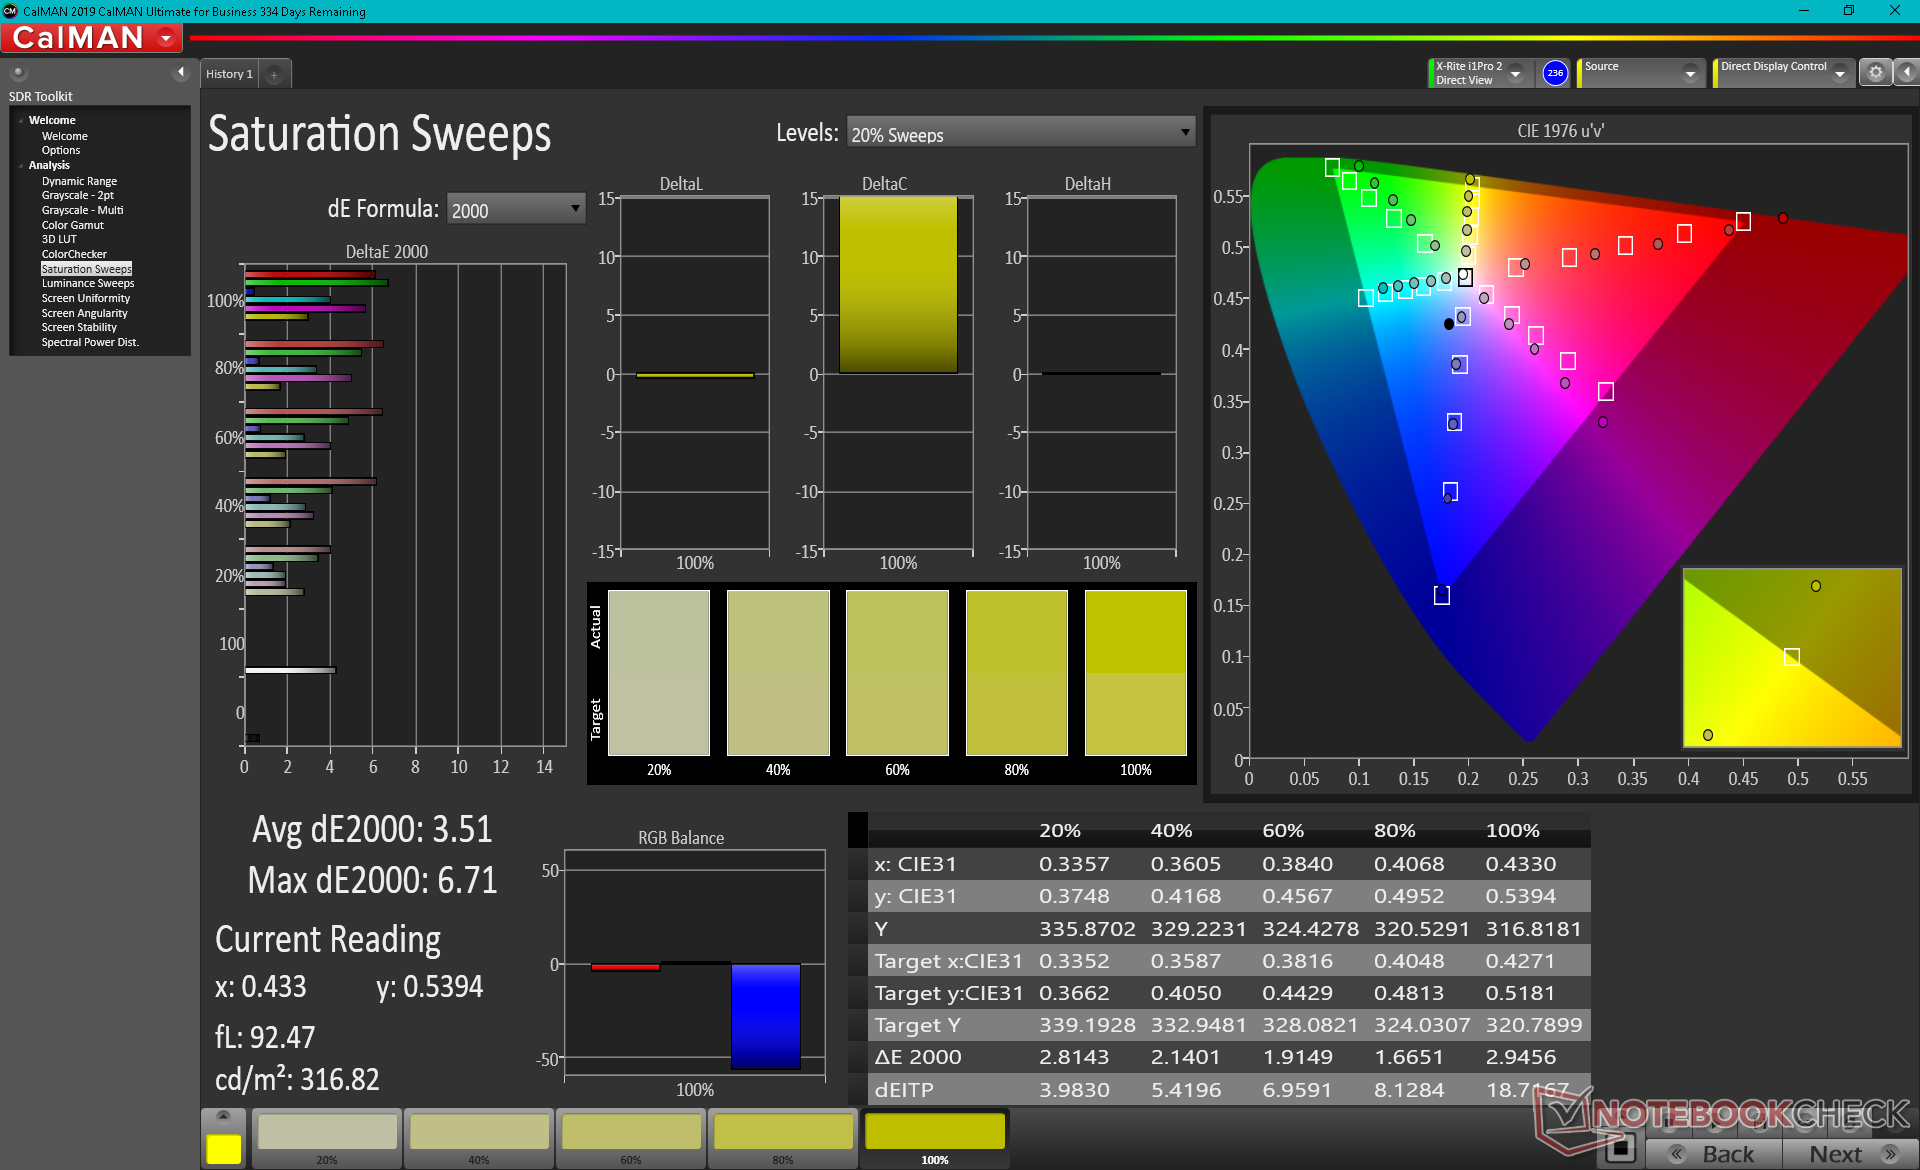
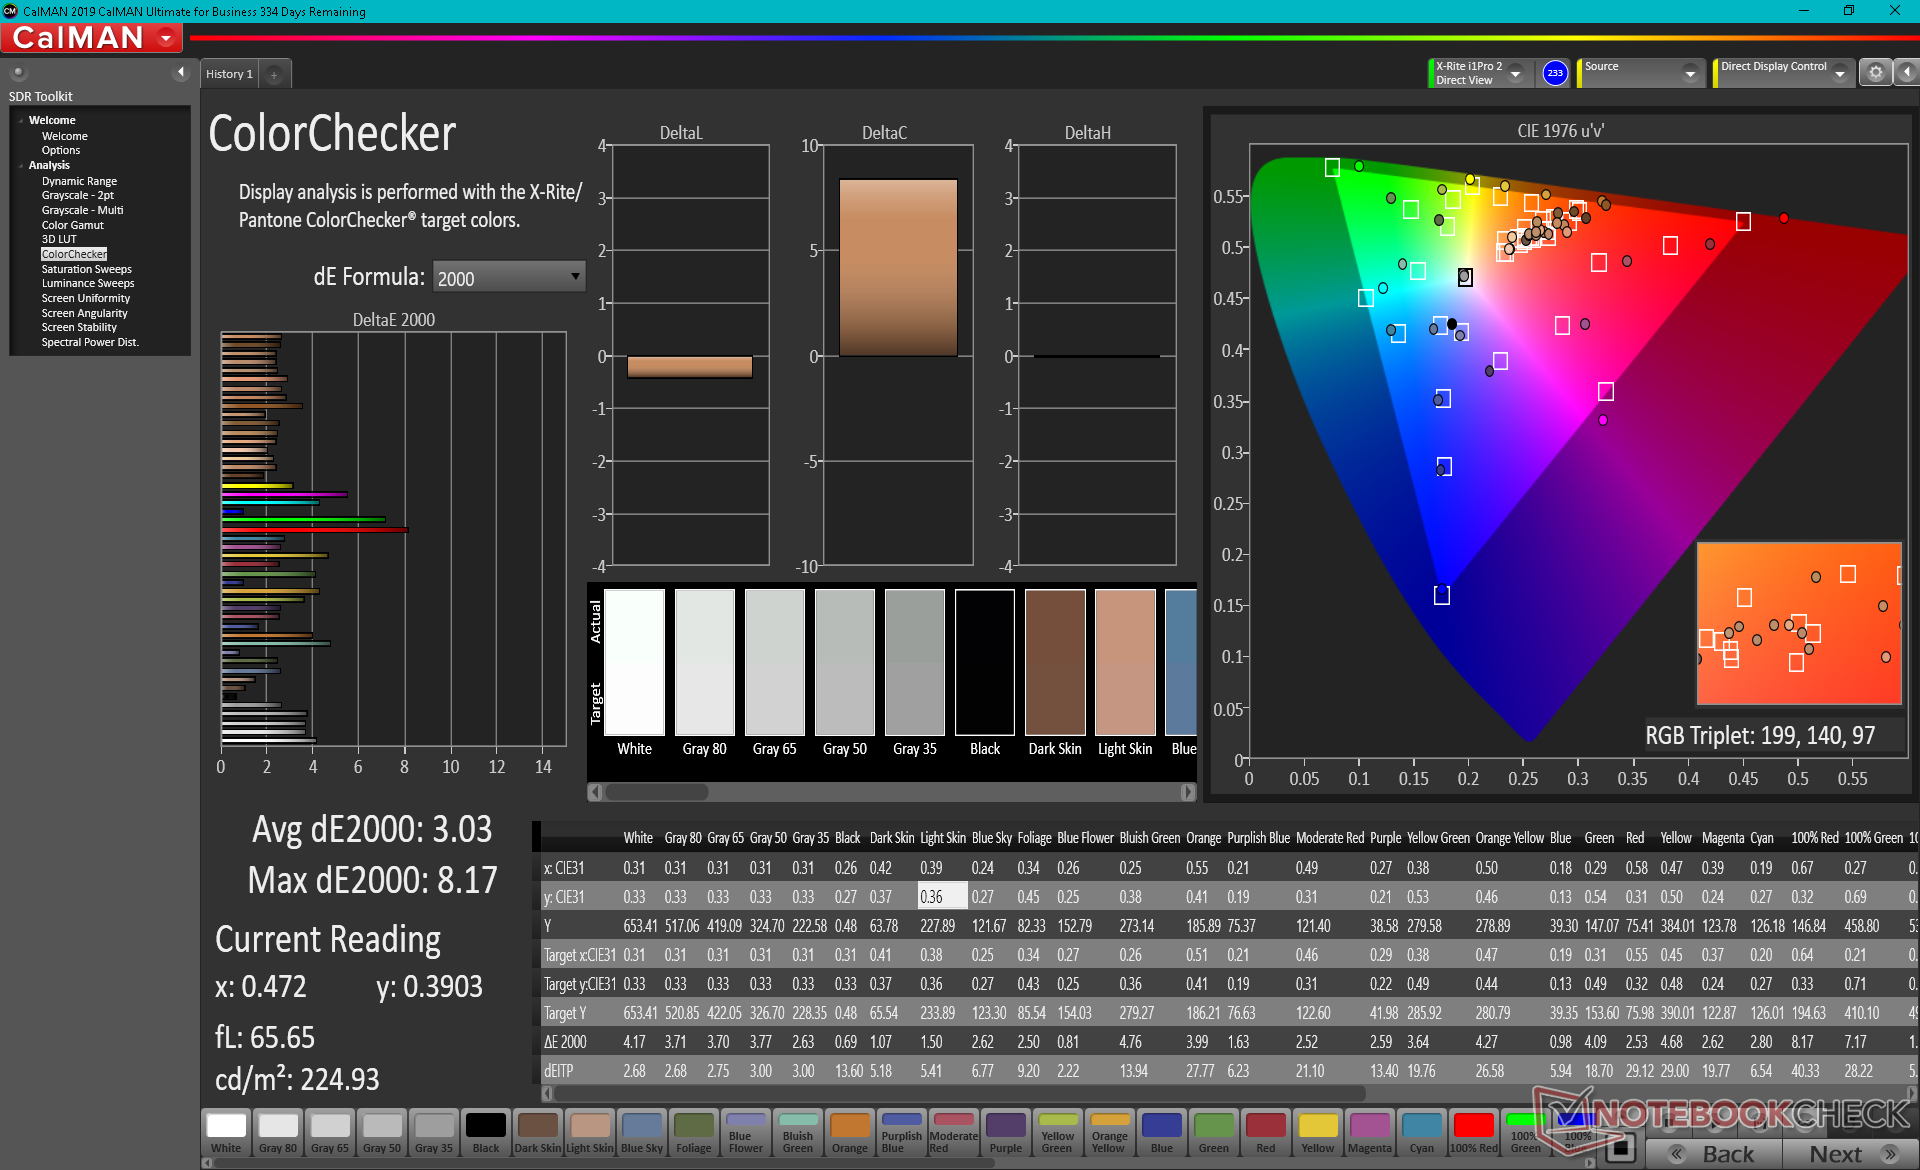
ΔE ColorChecker Calman: 3.48 | ∀{0.5-29.43 Ø4.72}
calibrated: 3.03
ΔE Greyscale Calman: 3.1 | ∀{0.09-98 Ø4.97}
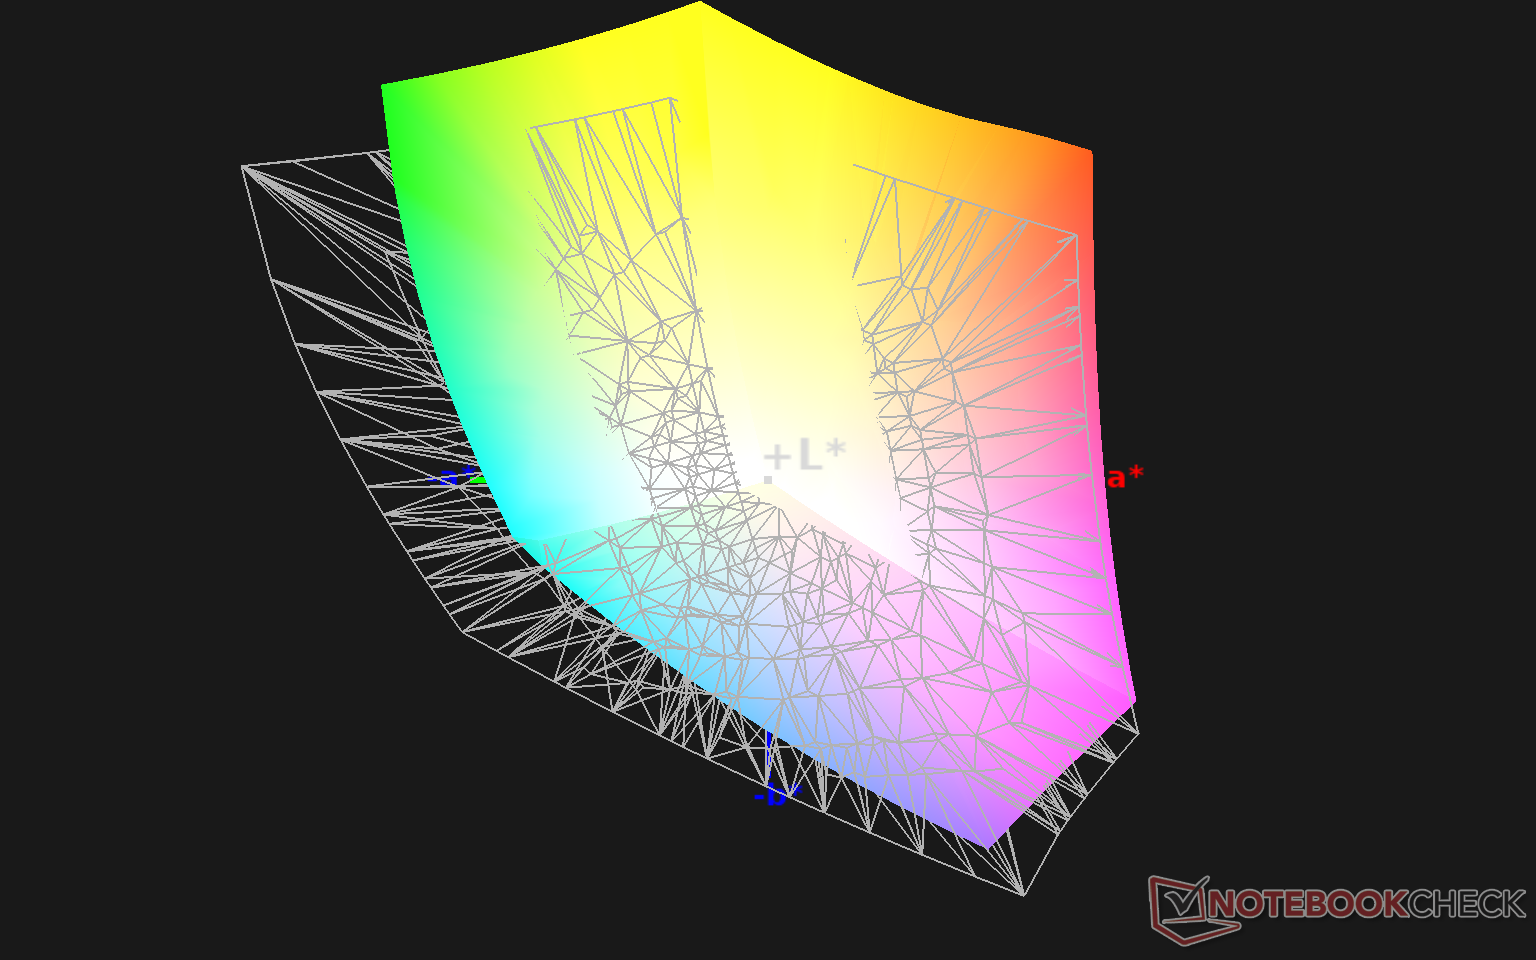
100% sRGB (Argyll 1.6.3 3D)
75.2% AdobeRGB 1998 (Argyll 1.6.3 3D)
84.5% AdobeRGB 1998 (Argyll 3D)
99.8% sRGB (Argyll 3D)
95.6% Display P3 (Argyll 3D)
Gamma: 2.04
CCT: 6380 K
| HP ZBook Fury 15 G7 LG Philips LGD0661, IPS, 15.6", 3840x2160 | Asus ProArt StudioBook Pro 15 W500G5T AU Optronics B156ZAN03.1, IPS, 15.6", 3840x2160 | MSI WS66 10TMT-207US AU Optronics B156HAB03.0, IPS, 15.6", 1920x1080 | Dell Precision 7550 AU Optronics B156ZAN, IPS, 15.6", 3840x2160 | Razer Blade 15 Studio Edition 2020 Samsung SDCA029, OLED, 15.6", 3840x2160 | Lenovo ThinkPad P1 2019-20QT000RGE N156HCE-GN1, IPS LED, 15.6", 1920x1080 | |
|---|---|---|---|---|---|---|
| Display | -1% | -24% | 0% | 6% | -23% | |
| Display P3 Coverage (%) | 95.6 | 82.1 -14% | 62.8 -34% | 82.1 -14% | 99.9 4% | 62.4 -35% |
| sRGB Coverage (%) | 99.8 | 97.6 -2% | 86.9 -13% | 99.6 0% | 100 0% | 91.5 -8% |
| AdobeRGB 1998 Coverage (%) | 84.5 | 95 12% | 63.6 -25% | 96.8 15% | 97.3 15% | 63.4 -25% |
| Response Times | -1% | 20% | 8% | 91% | 50% | |
| Response Time Grey 50% / Grey 80% * (ms) | 56 ? | 58 ? -4% | 44.8 ? 20% | 51.2 ? 9% | 4 ? 93% | 34.4 ? 39% |
| Response Time Black / White * (ms) | 36 ? | 35 ? 3% | 28.8 ? 20% | 34 ? 6% | 4 ? 89% | 14 ? 61% |
| PWM Frequency (Hz) | 26040 ? | |||||
| Screen | 1% | -16% | -19% | 126% | -4% | |
| Brightness middle (cd/m²) | 672.8 | 344 -49% | 374.5 -44% | 473.5 -30% | 380 -44% | 542 -19% |
| Brightness (cd/m²) | 674 | 335 -50% | 363 -46% | 461 -32% | 388 -42% | 528 -22% |
| Brightness Distribution (%) | 89 | 93 4% | 91 2% | 90 1% | 93 4% | 84 -6% |
| Black Level * (cd/m²) | 0.5 | 0.37 26% | 0.42 16% | 0.55 -10% | 0.018 96% | 0.41 18% |
| Contrast (:1) | 1346 | 930 -31% | 892 -34% | 861 -36% | 21111 1468% | 1322 -2% |
| Colorchecker dE 2000 * | 3.48 | 1.76 49% | 4.05 -16% | 4.8 -38% | 5.47 -57% | 3.5 -1% |
| Colorchecker dE 2000 max. * | 9.44 | 4.31 54% | 8.17 13% | 8.73 8% | 8.19 13% | 7.8 17% |
| Colorchecker dE 2000 calibrated * | 3.03 | 4.36 -44% | 3.08 -2% | 3.04 -0% | 1.3 57% | |
| Greyscale dE 2000 * | 3.1 | 3.12 -1% | 2.6 16% | 5.6 -81% | 5.3 -71% | 4.8 -55% |
| Gamma | 2.04 108% | 2.2 100% | 2.21 100% | 2.34 94% | 2.15 102% | 2.33 94% |
| CCT | 6380 102% | 6563 99% | 7027 93% | 7549 86% | 6128 106% | 7690 85% |
| Color Space (Percent of AdobeRGB 1998) (%) | 75.2 | 85 13% | 56.4 -25% | 86.4 15% | 86 14% | 58.8 -22% |
| Color Space (Percent of sRGB) (%) | 100 | 98 -2% | 86.3 -14% | 99.7 0% | 100 0% | 91.1 -9% |
| Total Average (Program / Settings) | -0% /
1% | -7% /
-13% | -4% /
-12% | 74% /
99% | 8% /
-1% |
* ... smaller is better
Color space covers all of sRGB and DCI-P3. When compared to AdobeRGB, DCI-P3 covers more yellow and reds which our images below can confirm for our ZBook.
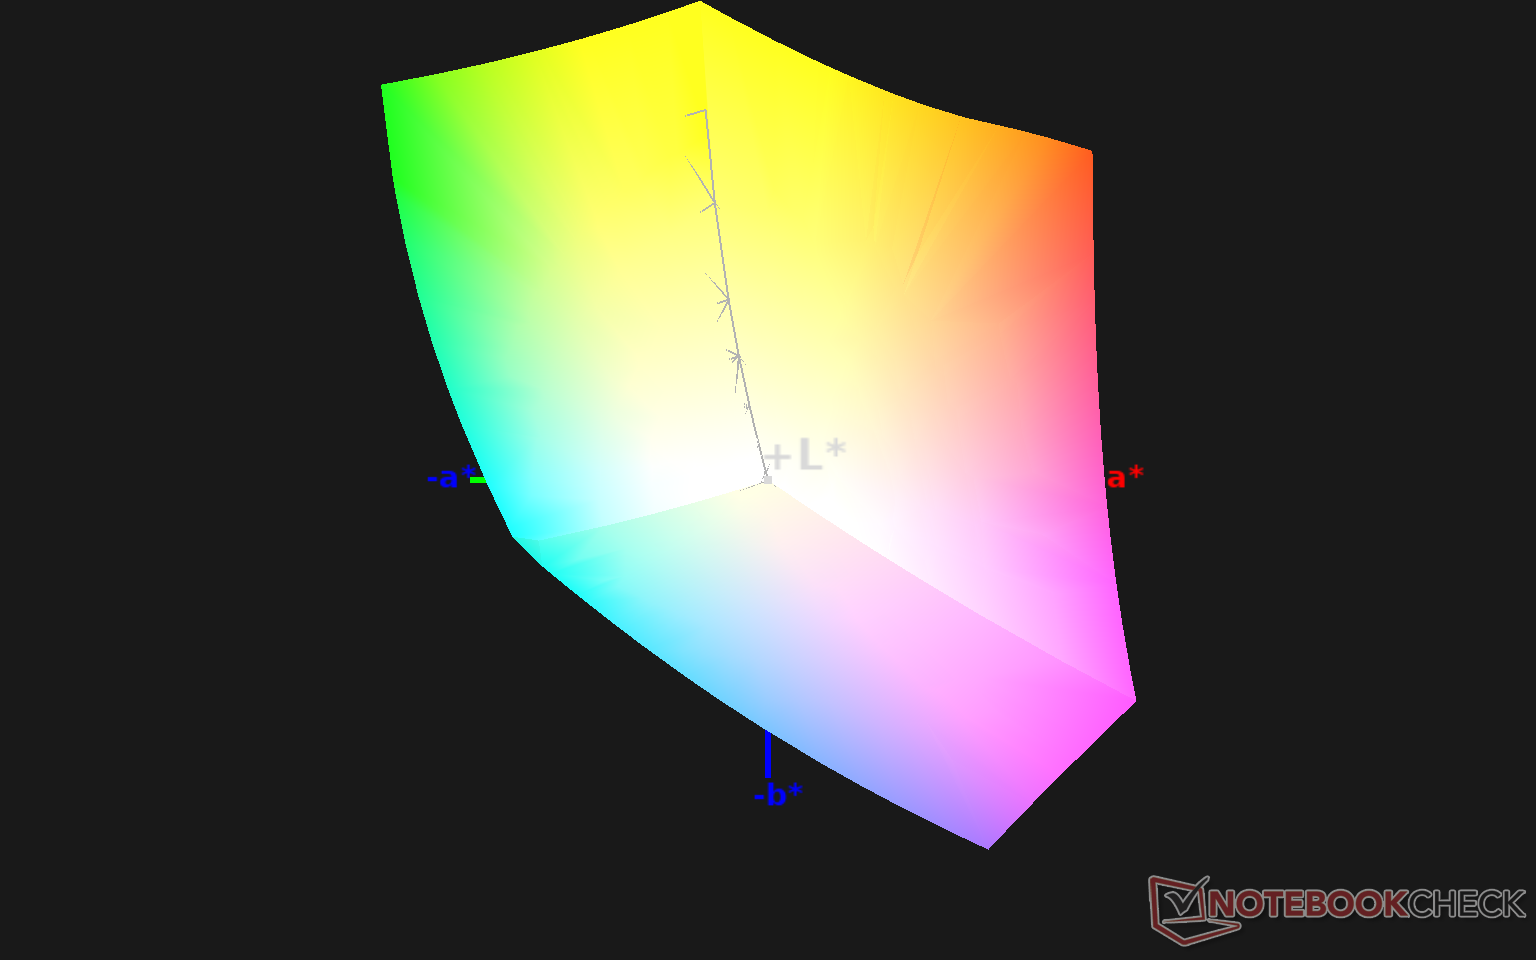
X-Rite colorimeter measurements show color temperature to be slightly on the warm side. Calibrating the display ourselves addresses the small issue for flatter RGB balance and gamma curves. HP offers no pre-installed color management software unlike Dell and its Premier Color software.

Display Response Times
| ↔ Response Time Black to White | ||
|---|---|---|
| 36 ms ... rise ↗ and fall ↘ combined | ↗ 20.4 ms rise | 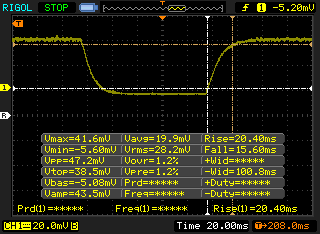 |
| ↘ 15.6 ms fall | ||
| The screen shows slow response rates in our tests and will be unsatisfactory for gamers. In comparison, all tested devices range from 0.1 (minimum) to 240 (maximum) ms. » 94 % of all devices are better. This means that the measured response time is worse than the average of all tested devices (19.8 ms). | ||
| ↔ Response Time 50% Grey to 80% Grey | ||
| 56 ms ... rise ↗ and fall ↘ combined | ↗ 27.6 ms rise | 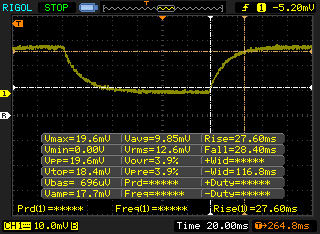 |
| ↘ 28.4 ms fall | ||
| The screen shows slow response rates in our tests and will be unsatisfactory for gamers. In comparison, all tested devices range from 0.165 (minimum) to 636 (maximum) ms. » 93 % of all devices are better. This means that the measured response time is worse than the average of all tested devices (31 ms). | ||
Screen Flickering / PWM (Pulse-Width Modulation)
| Screen flickering / PWM not detected | 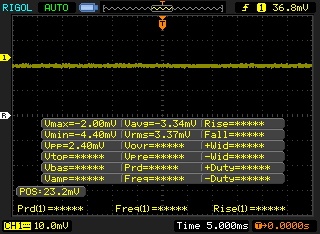 | ||
In comparison: 52 % of all tested devices do not use PWM to dim the display. If PWM was detected, an average of 7750 (minimum: 5 - maximum: 343500) Hz was measured. | |||
Outdoor visibility is good if under shade especially because the display is significantly brighter than the average 15.6-inch laptop or workstation. Direct sunlight will still wash out the screen, however.
Performance
As a fully featured mobile workstation, the ZBook Fury 15 can be equipped with the Core i9-10885H or Xeon W-10885M for ECC RAM support. It's worth noting that users can configure up to 128 GB of non-ECC RAM while ECC will be limited to 64 GB. Professionals who aren't power users may prefer the smaller and more portable HP ZBook Firefly instead.
Our unit was set to High Performance mode via Windows prior to running all benchmarks benchmarks below for the highest possible scores.
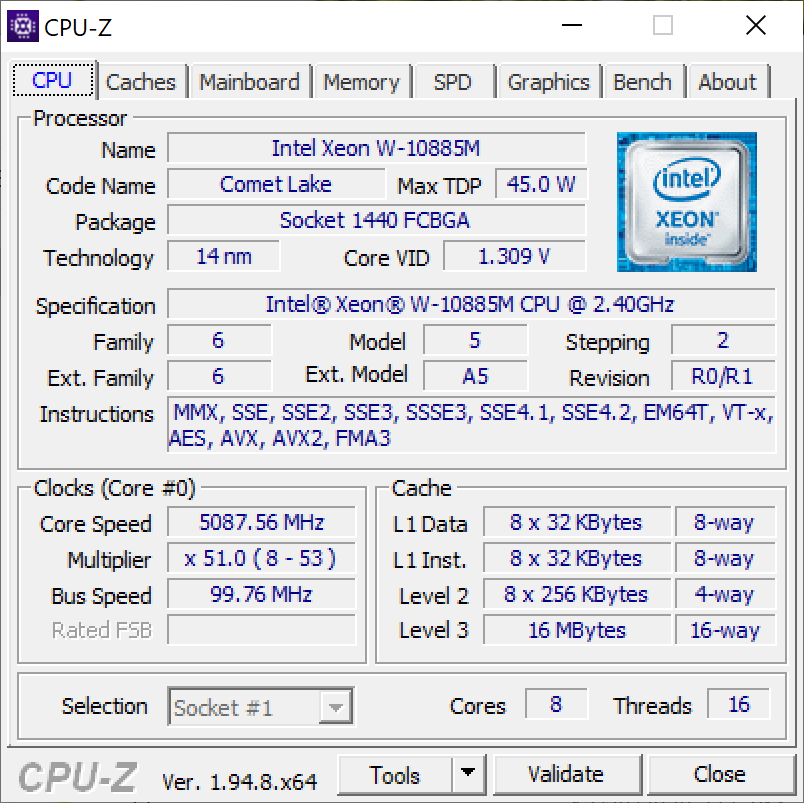
Processor
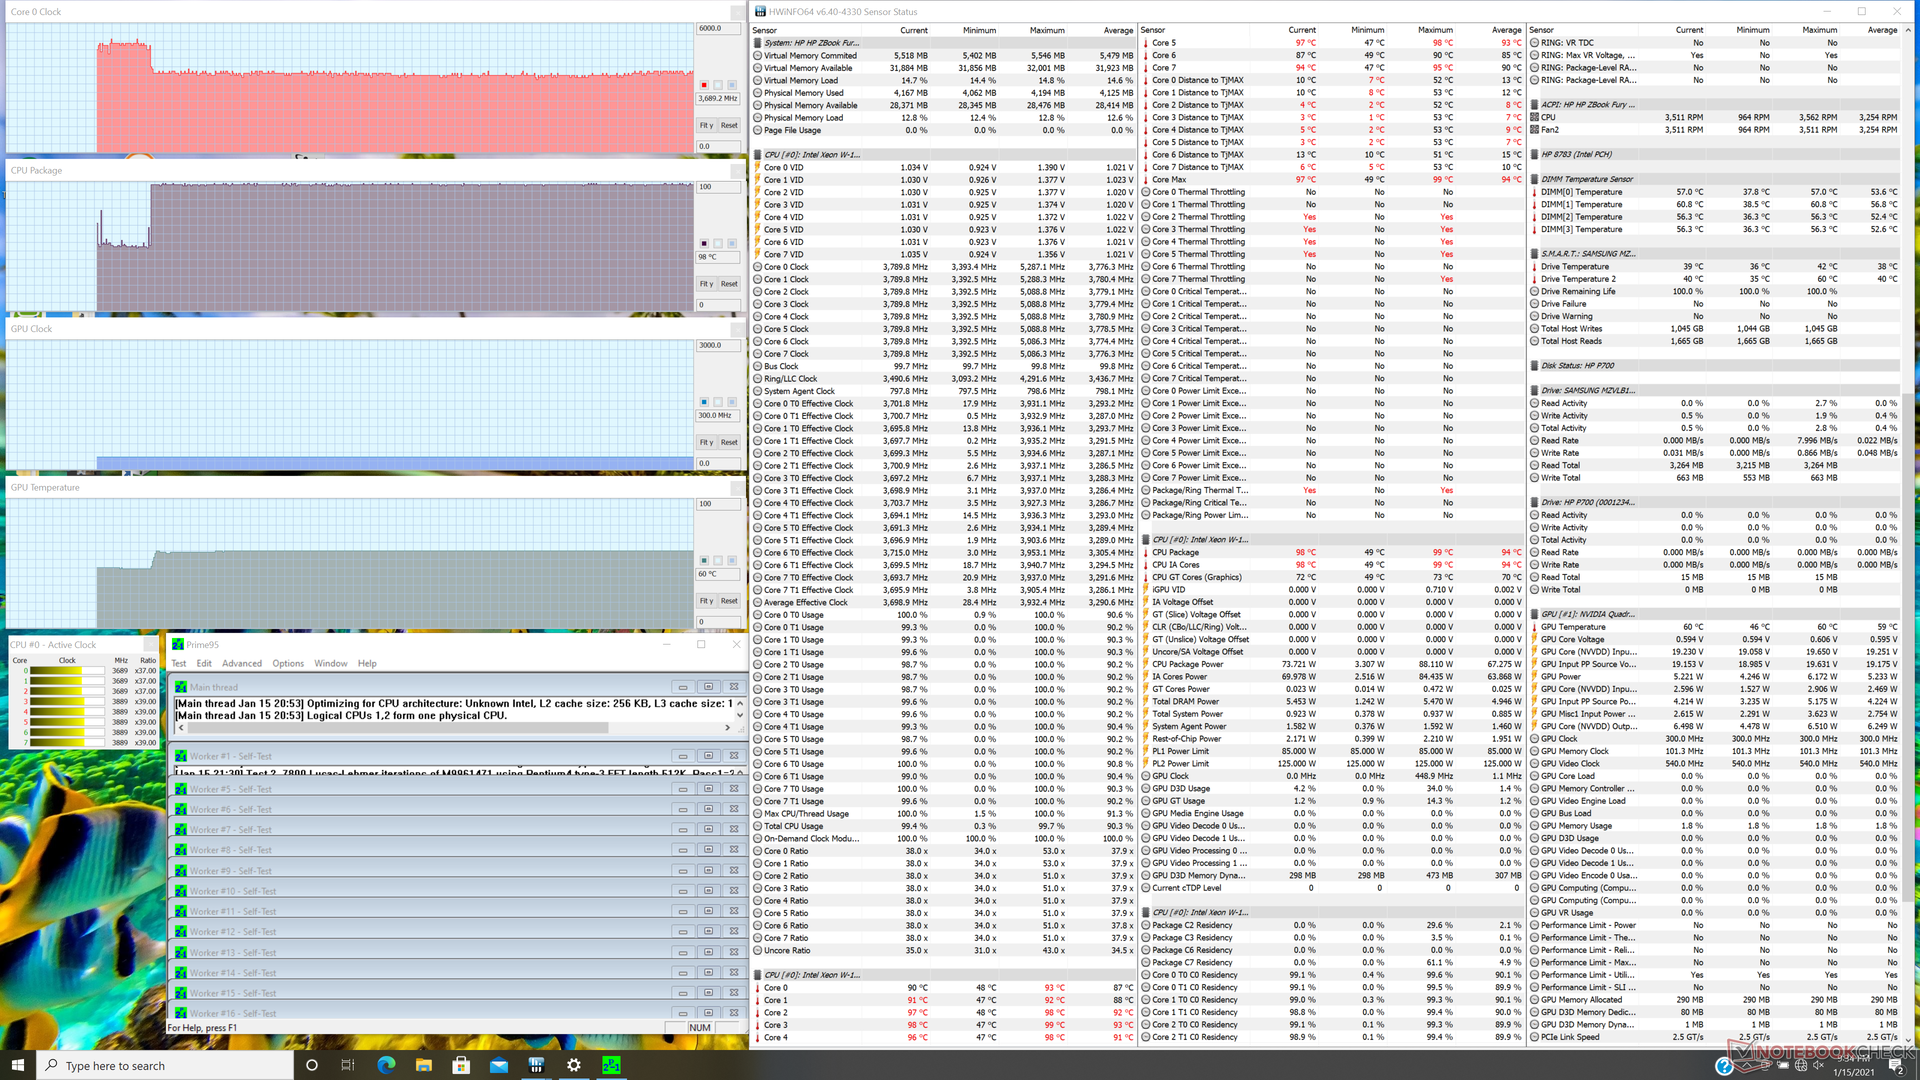
Raw multi-thread performance is slower than expected at about 30 percent slower than the Precision 7550 equipped with the same Xeon CPU. Turbo Boost benefits are minimal as shown by our CineBench R15 xT loop test results below.
Performance improves significantly after updating the BIOS to 1.04.01 likely due to a bug with our older BIOS version. Raw multi-thread performance would jump by almost 50 percent to be more in line with the aforementioned Dell. This comes at a cost, however, which our Stress Test section below will detail.
Cinebench R15: CPU Multi 64Bit | CPU Single 64Bit
Blender: v2.79 BMW27 CPU
7-Zip 18.03: 7z b 4 -mmt1 | 7z b 4
Geekbench 5.5: Single-Core | Multi-Core
HWBOT x265 Benchmark v2.2: 4k Preset
LibreOffice : 20 Documents To PDF
R Benchmark 2.5: Overall mean
| Cinebench R20 / CPU (Multi Core) | |
| MSI WS66 10TMT-207US | |
| HP ZBook Fury 15 G7 | |
| HP ZBook Fury 15 G7 | |
| Average Intel Xeon W-10885M (2727 - 4065, n=4) | |
| Dell Precision 5550 P91F | |
| Acer Nitro 5 AN515-44-R5FT | |
| Asus ProArt StudioBook Pro 15 W500G5T | |
| Lenovo ThinkPad X1 Extreme Gen3-20TLS0UV00 | |
| Dell Precision 3000 3551 | |
| Dell XPS 15 9500 Core i5 | |
| Cinebench R20 / CPU (Single Core) | |
| HP ZBook Fury 15 G7 | |
| HP ZBook Fury 15 G7 | |
| MSI WS66 10TMT-207US | |
| Average Intel Xeon W-10885M (488 - 502, n=4) | |
| Dell Precision 5550 P91F | |
| Lenovo ThinkPad X1 Extreme Gen3-20TLS0UV00 | |
| Asus ProArt StudioBook Pro 15 W500G5T | |
| Dell Precision 3000 3551 | |
| Dell XPS 15 9500 Core i5 | |
| Acer Nitro 5 AN515-44-R5FT | |
| Geekbench 5.5 / Single-Core | |
| MSI WS66 10TMT-207US | |
| HP ZBook Fury 15 G7 | |
| Average Intel Xeon W-10885M (1331 - 1347, n=3) | |
| Dell Precision 5550 P91F | |
| Lenovo ThinkPad X1 Extreme Gen3-20TLS0UV00 | |
| Dell Precision 3000 3551 | |
| Asus ProArt StudioBook Pro 15 W500G5T | |
| Dell XPS 15 9500 Core i5 | |
| Acer Nitro 5 AN515-44-R5FT | |
| HWBOT x265 Benchmark v2.2 / 4k Preset | |
| MSI WS66 10TMT-207US | |
| Average Intel Xeon W-10885M (8.89 - 13.6, n=3) | |
| Dell Precision 5540 | |
| Dell Precision 3000 3551 | |
| Dell Precision 5550 P91F | |
| Lenovo ThinkPad X1 Extreme Gen3-20TLS0UV00 | |
| Acer Nitro 5 AN515-44-R5FT | |
| HP ZBook Fury 15 G7 | |
| Asus ProArt StudioBook Pro 15 W500G5T | |
| Dell XPS 15 9500 Core i5 | |
| LibreOffice / 20 Documents To PDF | |
| Acer Nitro 5 AN515-44-R5FT | |
| Dell XPS 15 9500 Core i5 | |
| Asus ProArt StudioBook Pro 15 W500G5T | |
| HP ZBook Fury 15 G7 | |
| Average Intel Xeon W-10885M (44.4 - 58.1, n=3) | |
| Lenovo ThinkPad X1 Extreme Gen3-20TLS0UV00 | |
| Dell Precision 3000 3551 | |
| MSI WS66 10TMT-207US | |
| Dell Precision 5550 P91F | |
| R Benchmark 2.5 / Overall mean | |
| Dell XPS 15 9500 Core i5 | |
| Asus ProArt StudioBook Pro 15 W500G5T | |
| Acer Nitro 5 AN515-44-R5FT | |
| Lenovo ThinkPad X1 Extreme Gen3-20TLS0UV00 | |
| Dell Precision 5550 P91F | |
| MSI WS66 10TMT-207US | |
| Dell Precision 3000 3551 | |
| Average Intel Xeon W-10885M (0.551 - 0.57, n=3) | |
| HP ZBook Fury 15 G7 | |
* ... smaller is better
System Performance
PCMark benchmarks are where we expect them to be relative to other mobile workstations. The Precision 7550, which comes with the exact same CPU and GPU as our HP, is able to edge out our system by mere percentage points.
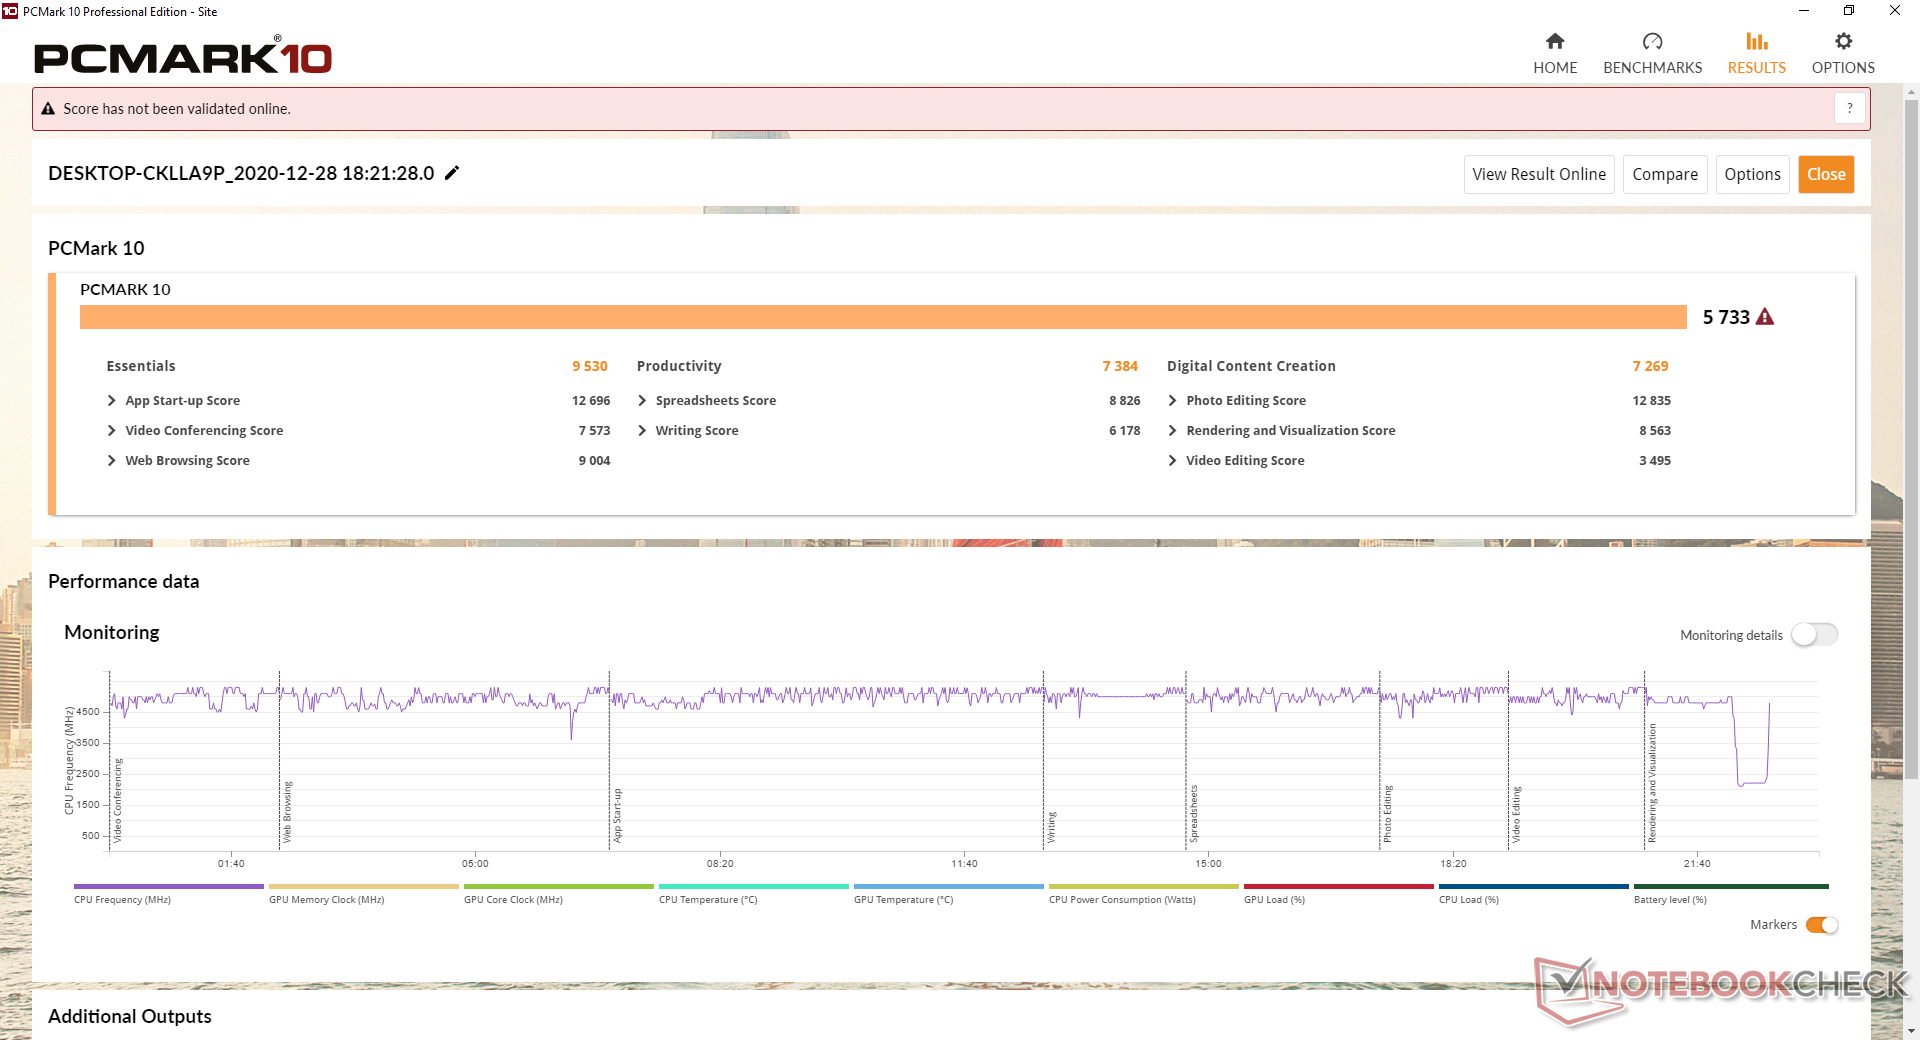
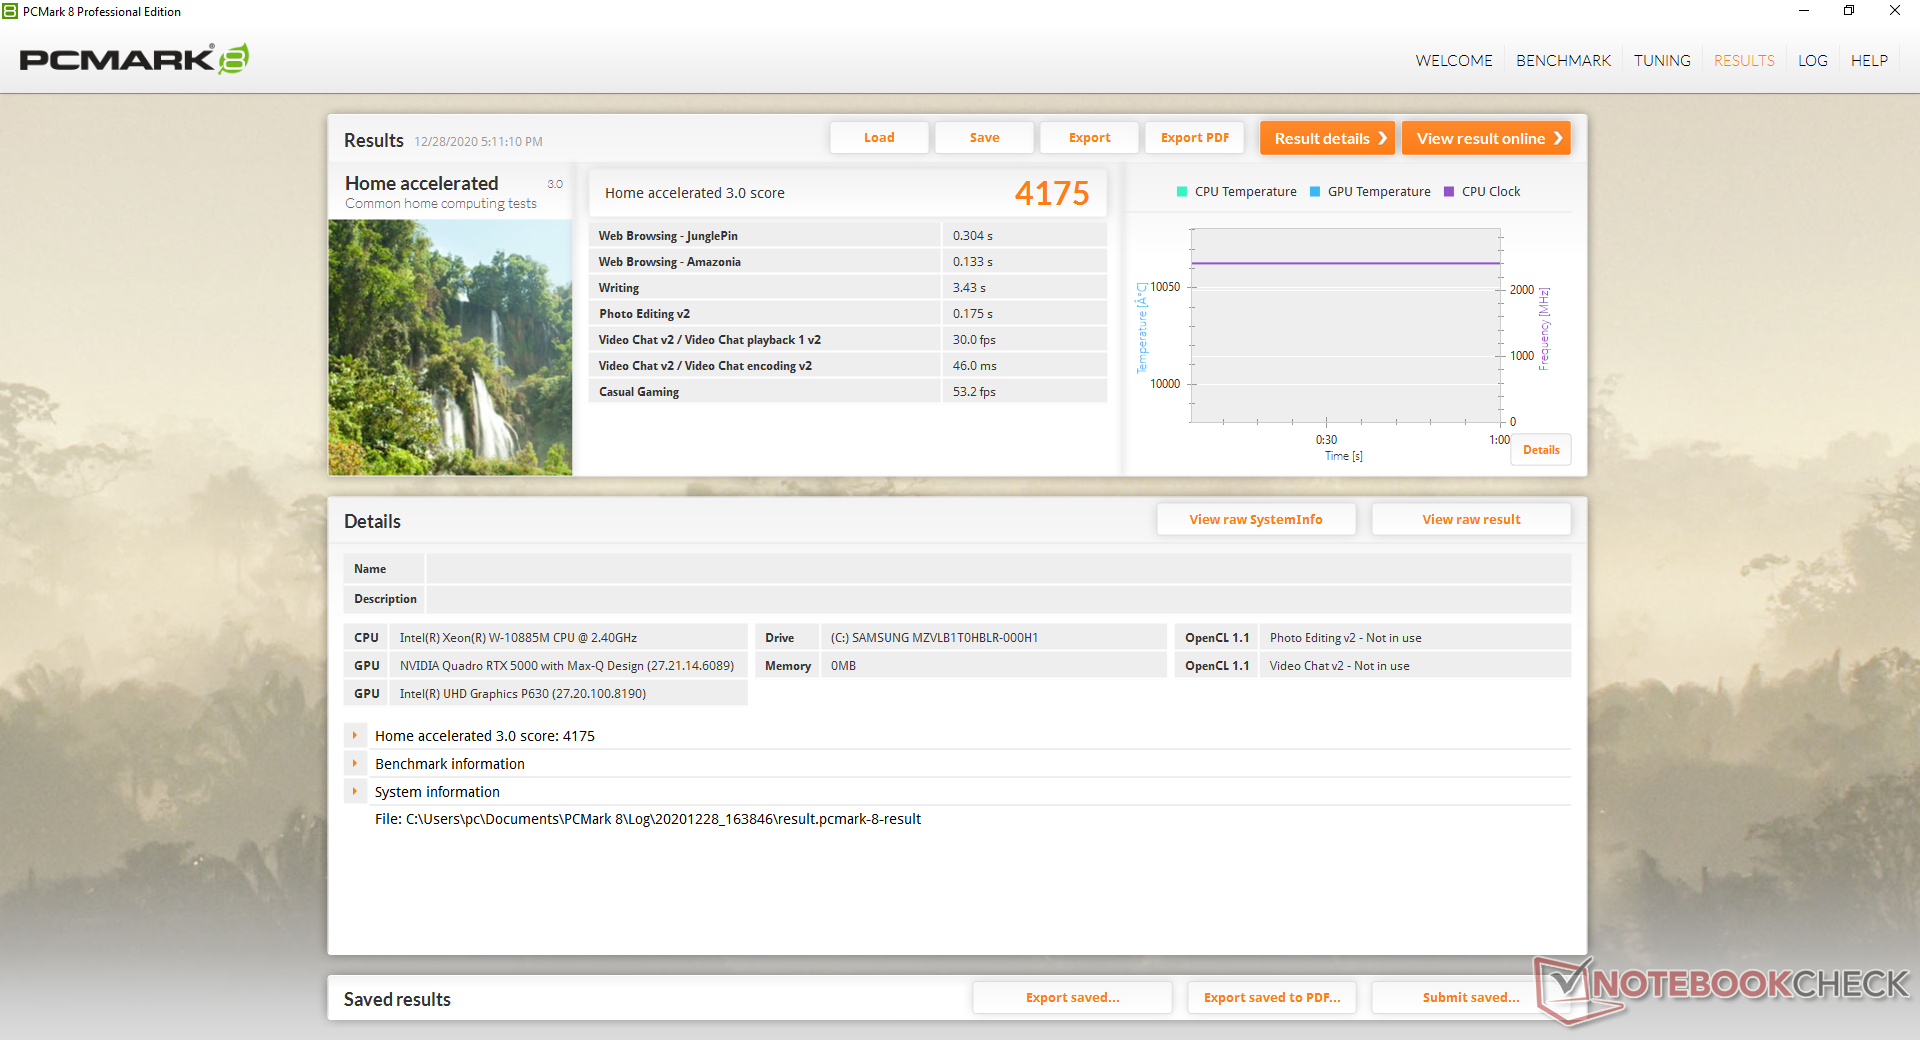
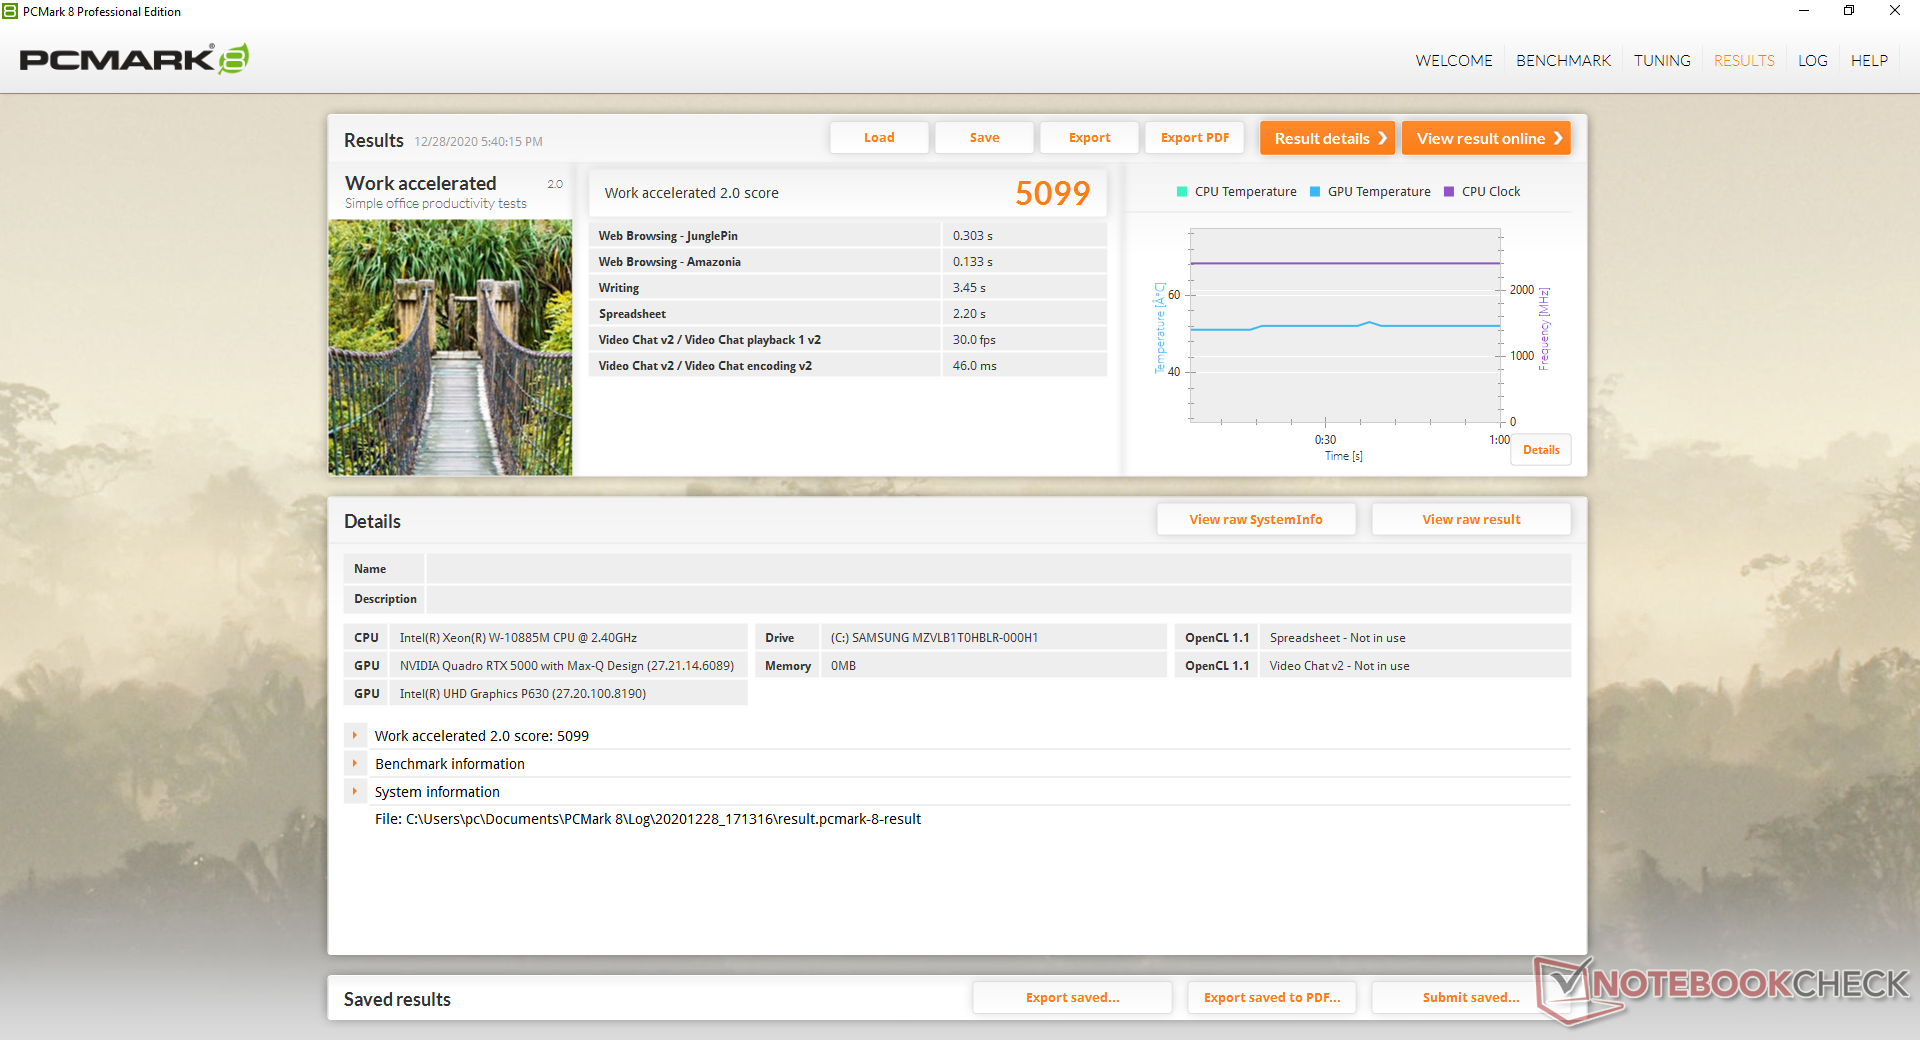
| PCMark 8 Home Score Accelerated v2 | 4175 points | |
| PCMark 8 Work Score Accelerated v2 | 5099 points | |
| PCMark 10 Score | 5733 points | |
Help | ||
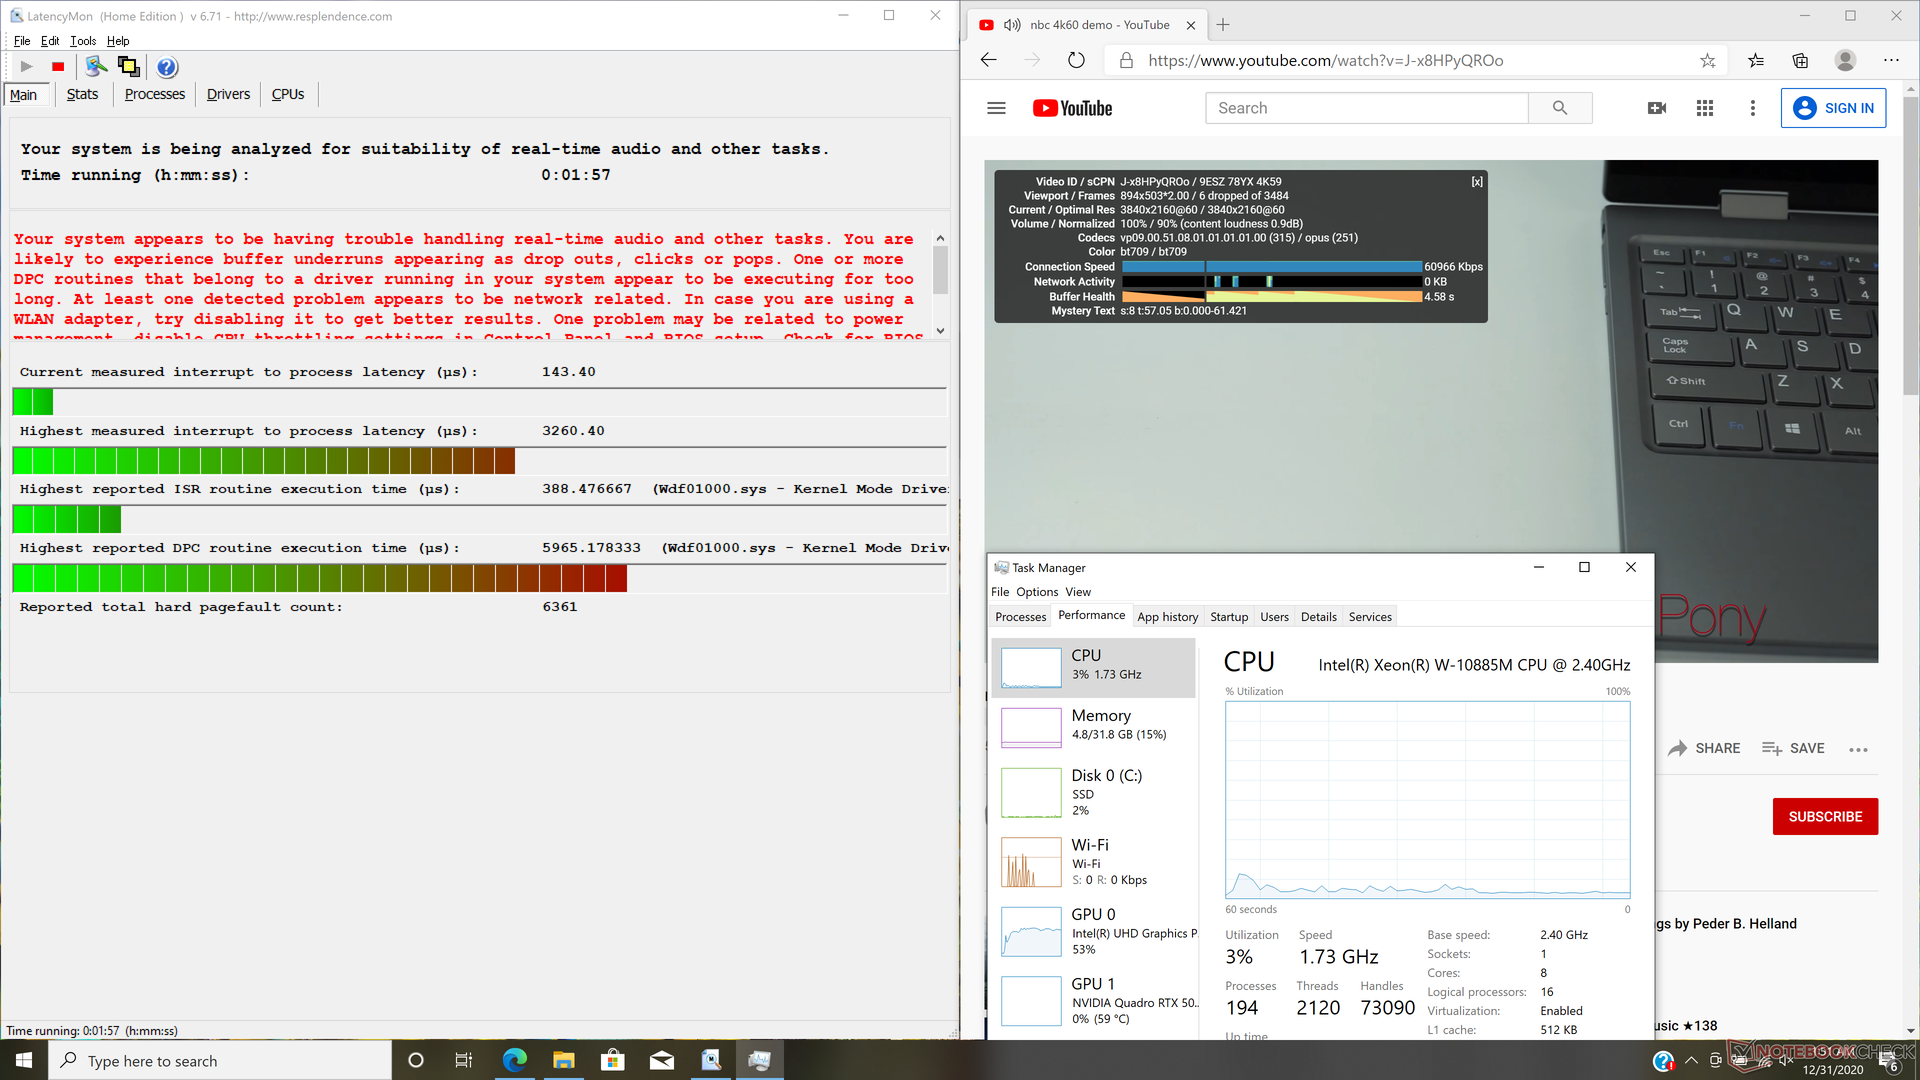
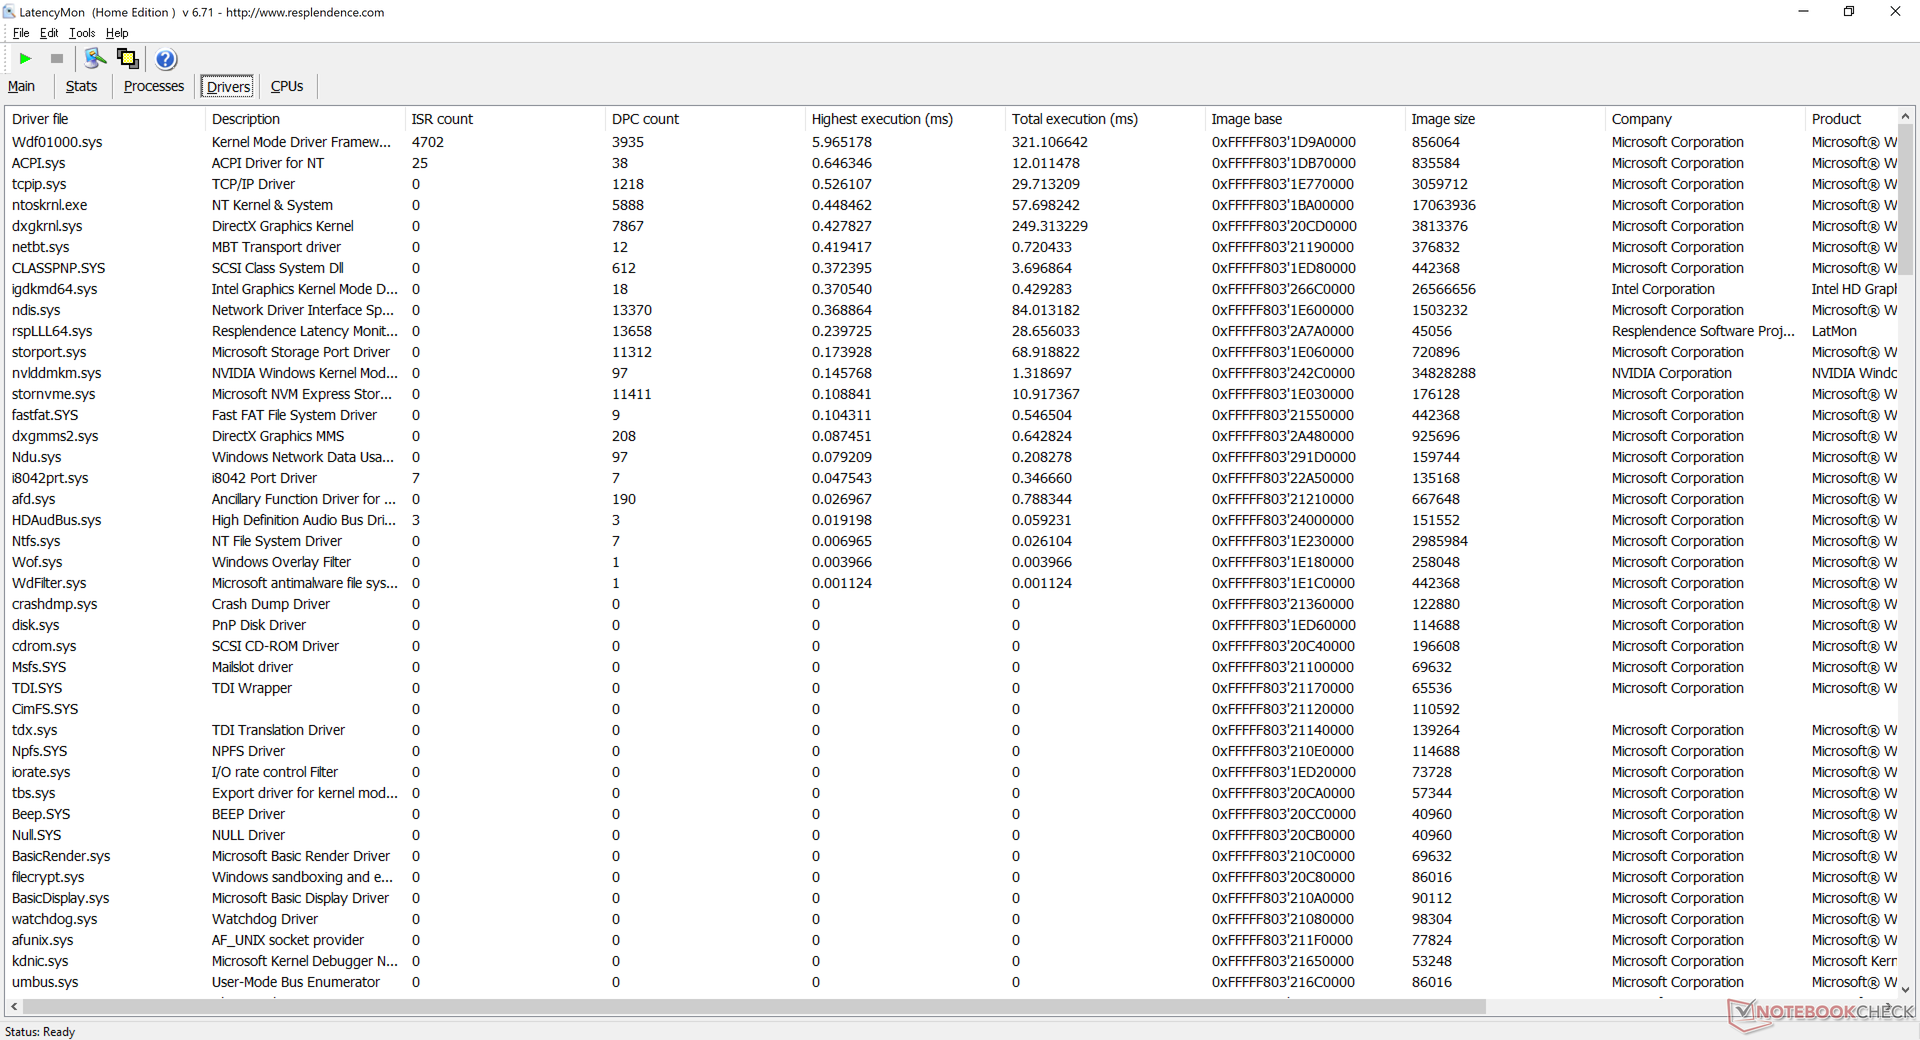
DPC Latency
LatencyMon reveals DPC latency issues when opening multiple browser tabs of our homepage even after several repeat tests. 4K video playback at 60 FPS is smooth but not perfect as we recorded 6 dropped frames during a minute-long YouTube video.
| DPC Latencies / LatencyMon - interrupt to process latency (max), Web, Youtube, Prime95 | |
| Dell Precision 7550 | |
| MSI WS66 10TMT-207US | |
| HP ZBook Fury 15 G7 | |
| Asus ProArt StudioBook Pro 15 W500G5T | |
| Razer Blade 15 Studio Edition 2020 | |
* ... smaller is better
Storage Devices
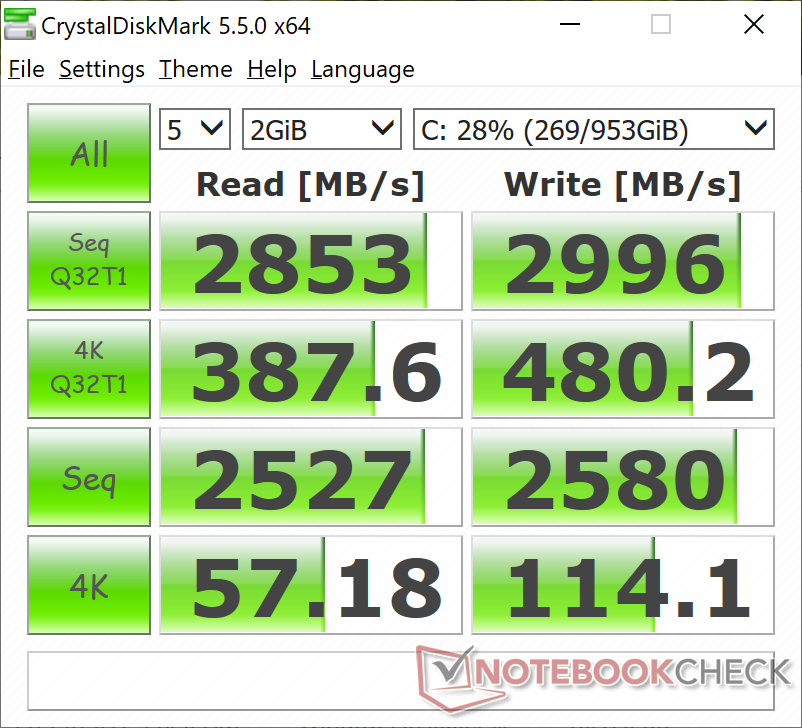
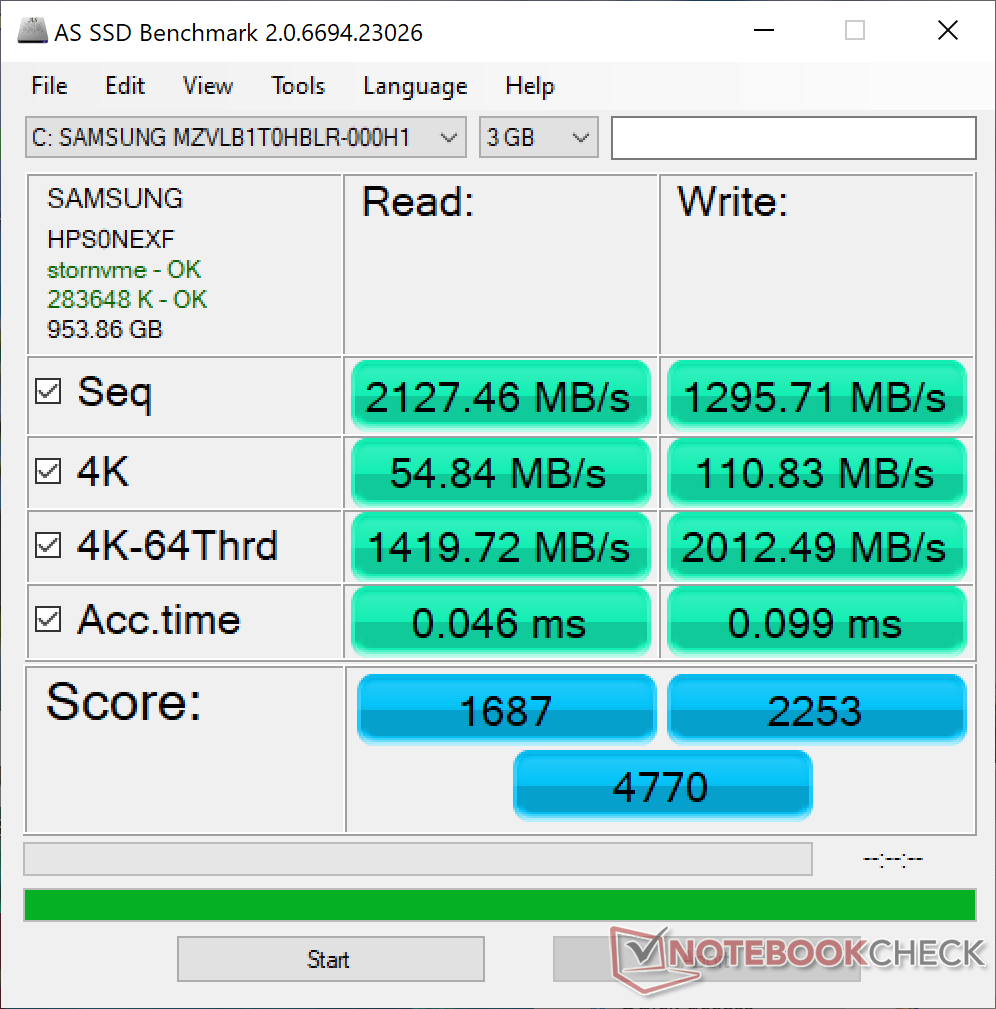
Our test unit comes with a 1 TB Samsung PM981a which is one of the fastest consumer-oriented PCIe 3 x4 NVMe SSDs available. Users can configure with other sizes or models with SED security if desired.
A total of four storage slots are available (3x M.2 2280 + 1x 2.5-inch SATA III). However, the 2.5-inch bay shares the same space as two of the M.2 slots meaning there is not enough room to install four drives. Users can install up to three M.2 drives or one M.2 drive plus one 2.5-inch drive.
Certain SKUs omit the 2.5-inch connector for an additional M.2 slot to support up to four M.2 drives simultaneously.
| HP ZBook Fury 15 G7 Samsung PM981a MZVLB1T0HBLR | MSI WS66 10TMT-207US WDC PC SN730 SDBPNTY-1T00 | Dell Precision 7550 SK Hynix PC601A NVMe 1TB | Razer Blade 15 Studio Edition 2020 Samsung PM981a MZVLB1T0HBLR | Lenovo ThinkPad P1 2019-20QT000RGE WDC PC SN720 SDAQNTW-512G | |
|---|---|---|---|---|---|
| AS SSD | 74% | 29% | 31% | 49% | |
| Seq Read (MB/s) | 2127 | 2321 9% | 2028 -5% | 1982 -7% | 2980 40% |
| Seq Write (MB/s) | 1296 | 2620 102% | 1193 -8% | 2252 74% | 2094 62% |
| 4K Read (MB/s) | 54.8 | 48.57 -11% | 42.31 -23% | 47.13 -14% | 45.05 -18% |
| 4K Write (MB/s) | 110.8 | 165.1 49% | 105.5 -5% | 88.2 -20% | 155.4 40% |
| 4K-64 Read (MB/s) | 1420 | 1712 21% | 1128 -21% | 1481 4% | 1291 -9% |
| 4K-64 Write (MB/s) | 2012 | 2174 8% | 1537 -24% | 1842 -8% | 1506 -25% |
| Access Time Read * (ms) | 0.046 | 0.057 -24% | 0.069 -50% | 0.087 -89% | 0.064 -39% |
| Access Time Write * (ms) | 0.099 | 0.068 31% | 0.106 -7% | 0.04 60% | 0.024 76% |
| Score Read (Points) | 1687 | 1993 18% | 1373 -19% | 1726 2% | 1634 -3% |
| Score Write (Points) | 2253 | 2601 15% | 1762 -22% | 2155 -4% | 1871 -17% |
| Score Total (Points) | 4770 | 5630 18% | 3801 -20% | 4781 0% | 4300 -10% |
| Copy ISO MB/s (MB/s) | 2779 | 2589 -7% | 1768 -36% | 1982 -29% | 2015 -27% |
| Copy Program MB/s (MB/s) | 123.3 | 791 542% | 627 409% | 501 306% | 597 384% |
| Copy Game MB/s (MB/s) | 440.8 | 1625 269% | 1477 235% | 1140 159% | 1449 229% |
| CrystalDiskMark 5.2 / 6 | 12% | -9% | 2% | 1% | |
| Write 4K (MB/s) | 114.1 | 185.8 63% | 121 6% | 132.9 16% | 162.2 42% |
| Read 4K (MB/s) | 57.2 | 47.21 -17% | 42.16 -26% | 46.73 -18% | 43.71 -24% |
| Write Seq (MB/s) | 2580 | 2874 11% | 2150 -17% | 2214 -14% | 2441 -5% |
| Read Seq (MB/s) | 2527 | 1786 -29% | 1755 -31% | 2018 -20% | 1753 -31% |
| Write 4K Q32T1 (MB/s) | 480.2 | 466.8 -3% | 395.3 -18% | 478.9 0% | 397.6 -17% |
| Read 4K Q32T1 (MB/s) | 387.6 | 563 45% | 381.8 -1% | 540 39% | 520 34% |
| Write Seq Q32T1 (MB/s) | 2996 | 3091 3% | 2730 -9% | 2975 -1% | 2519 -16% |
| Read Seq Q32T1 (MB/s) | 2853 | 3395 19% | 3468 22% | 3195 12% | 3448 21% |
| Write 4K Q8T8 (MB/s) | 1381 | ||||
| Read 4K Q8T8 (MB/s) | 1371 | ||||
| Total Average (Program / Settings) | 43% /
51% | 10% /
15% | 17% /
20% | 25% /
31% |
* ... smaller is better

Disk Throttling: DiskSpd Read Loop, Queue Depth 8
GPU Performance
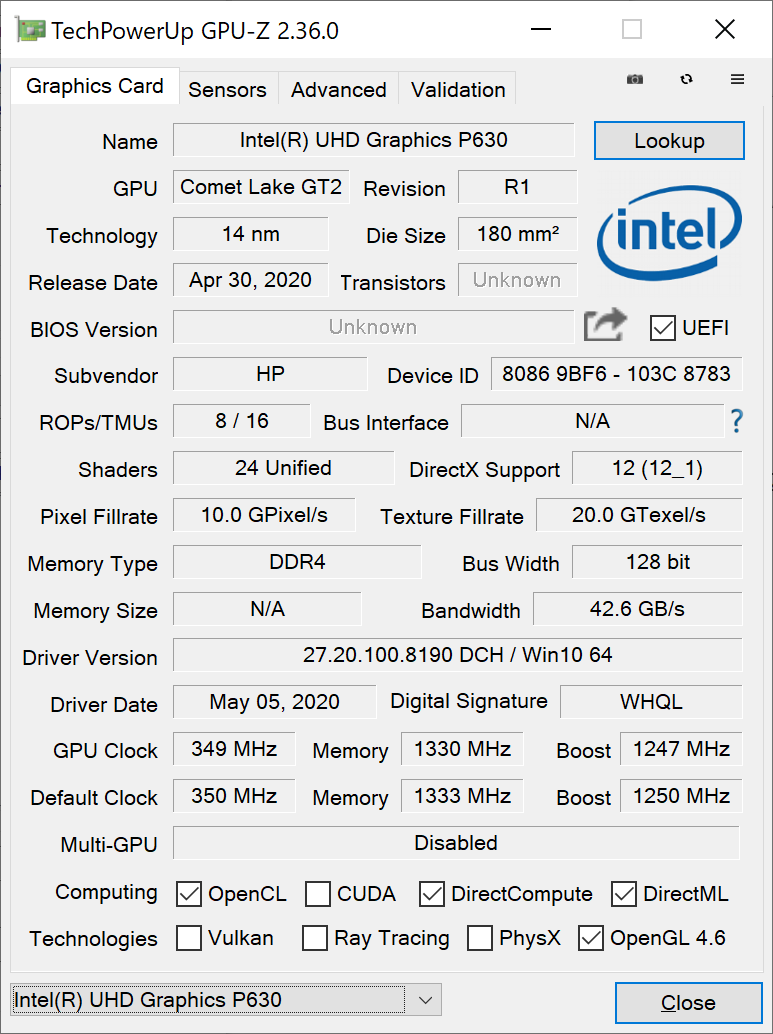
The system utilizes a Quadro RTX 5000 Max-Q GPU instead of the faster Quadro RTX 5000 Max-P which is able to offer up to 30 to 35 percent more performance than our Max-Q variant. Users who want maximum RTX 5000 performance should look into the larger Acer ConceptD 9 Pro instead.
Raw graphics performance is still excellent with benchmark results just shy of a Quadro RTX 4000 Max-P.
| 3DMark 11 Performance | 20890 points | |
| 3DMark Cloud Gate Standard Score | 30434 points | |
| 3DMark Fire Strike Score | 16005 points | |
| 3DMark Time Spy Score | 7276 points | |
Help | ||
| low | med. | high | ultra | QHD | 4K | |
|---|---|---|---|---|---|---|
| The Witcher 3 (2015) | 298.9 | 235.8 | 149.8 | 79.5 | 55.4 | |
| Dota 2 Reborn (2015) | 142 | 126 | 119 | 112 | 96.7 | |
| Final Fantasy XV Benchmark (2018) | 132 | 101 | 79.4 | 58.4 | 33.9 | |
| X-Plane 11.11 (2018) | 96.1 | 86.9 | 73.4 | 60.6 |
Emissions
System Noise
Fan noise is never an issue when running low to low-medium loads. The first 90-second benchmark scene of 3DMark 06, for example, induces a fan noise of just 31.7 dB(A) to be much quieter than what we've observed on the Precision 7550 or MSI WS66. Fan noise tops out at 47 dB(A) when running higher loads.
We can notice no electronic noise or coil whine from our test unit.
| HP ZBook Fury 15 G7 Quadro RTX 5000 Max-Q, W-10885M, Samsung PM981a MZVLB1T0HBLR | Asus ProArt StudioBook Pro 15 W500G5T Quadro RTX 5000 Max-Q, i7-9750H, Samsung SSD PM981 MZVLB1T0HALR | MSI WS66 10TMT-207US Quadro RTX 5000 Max-Q, i9-10980HK, WDC PC SN730 SDBPNTY-1T00 | Dell Precision 7550 Quadro RTX 5000 Max-Q, W-10885M, SK Hynix PC601A NVMe 1TB | Razer Blade 15 Studio Edition 2020 Quadro RTX 5000 Max-Q, i7-10875H, Samsung PM981a MZVLB1T0HBLR | Lenovo ThinkPad P1 2019-20QT000RGE Quadro T1000 (Laptop), i7-9850H, WDC PC SN720 SDAQNTW-512G | |
|---|---|---|---|---|---|---|
| Noise | -10% | -17% | -11% | -12% | -5% | |
| off / environment * (dB) | 26.4 | 25.2 5% | 26 2% | 25.8 2% | 30.1 -14% | 28.8 -9% |
| Idle Minimum * (dB) | 26.4 | 27.9 -6% | 32 -21% | 25.8 2% | 30.1 -14% | 28.8 -9% |
| Idle Average * (dB) | 26.4 | 27.9 -6% | 32 -21% | 25.8 2% | 30.1 -14% | 28.8 -9% |
| Idle Maximum * (dB) | 26.4 | 27.9 -6% | 32 -21% | 25.9 2% | 30.1 -14% | 28.8 -9% |
| Load Average * (dB) | 31.7 | 47 -48% | 42 -32% | 51.2 -62% | 42.3 -33% | 36.1 -14% |
| Witcher 3 ultra * (dB) | 47 | 47.4 -1% | 51.9 -10% | 48.2 -3% | ||
| Load Maximum * (dB) | 47 | 46.9 -0% | 59.7 -27% | 51.9 -10% | 42.1 10% | 36.7 22% |
* ... smaller is better
Noise level
| Idle |
| 26.4 / 26.4 / 26.4 dB(A) |
| Load |
| 31.7 / 47 dB(A) |
 | ||
30 dB silent 40 dB(A) audible 50 dB(A) loud |
||
min: | ||
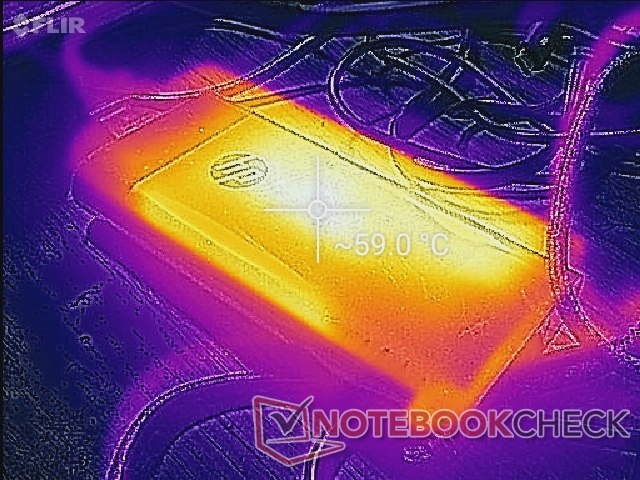
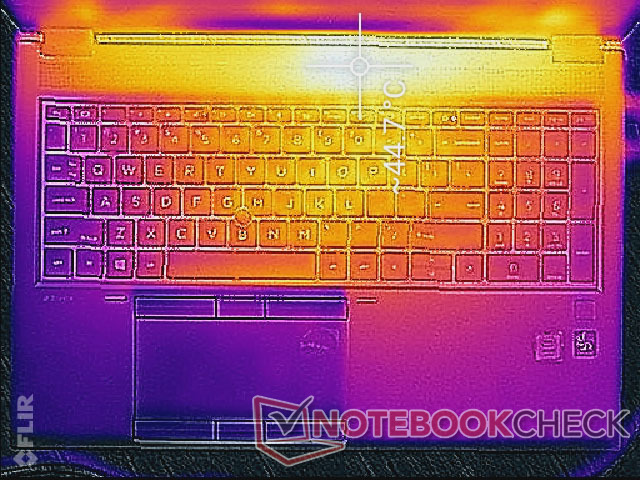
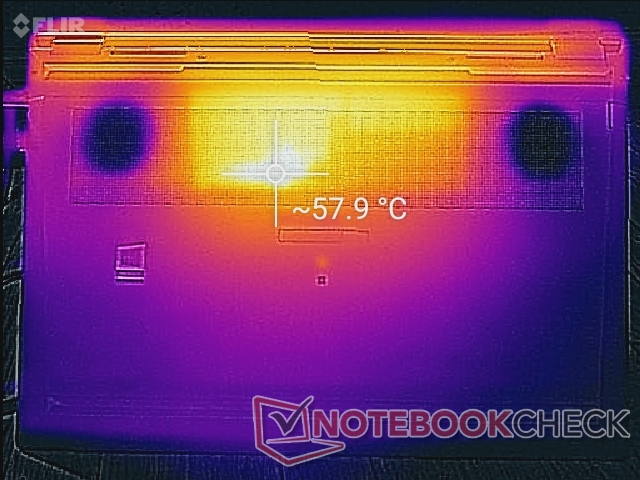
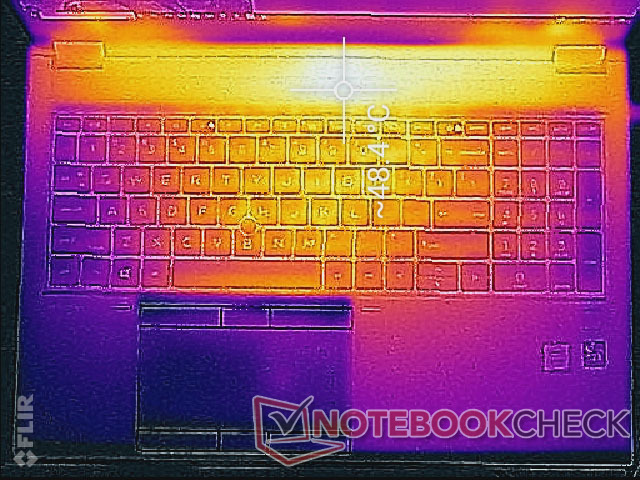
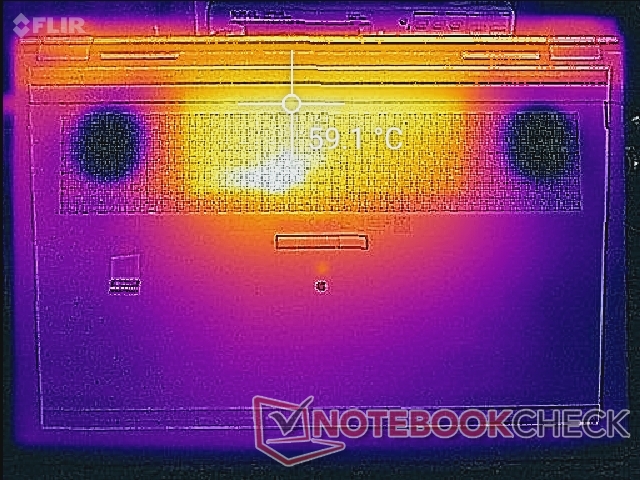
Temperature
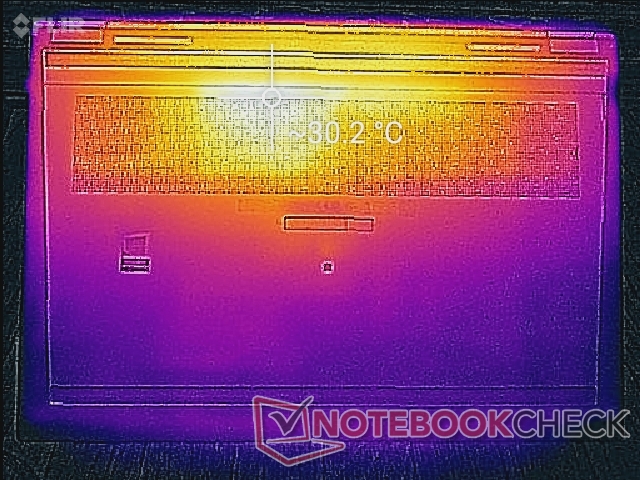
Hot spots can become as warm as 49 C to 60 C on the top and bottom sides of the laptop, respectively. Thankfully, these areas are toward the rear of the laptop where users are less likely to touch. The Asus ProArt StudioBook Pro 15, which comes with the same RTX 5000 Max-Q GPU, runs even warmer at up to 66 C when under similar conditions.
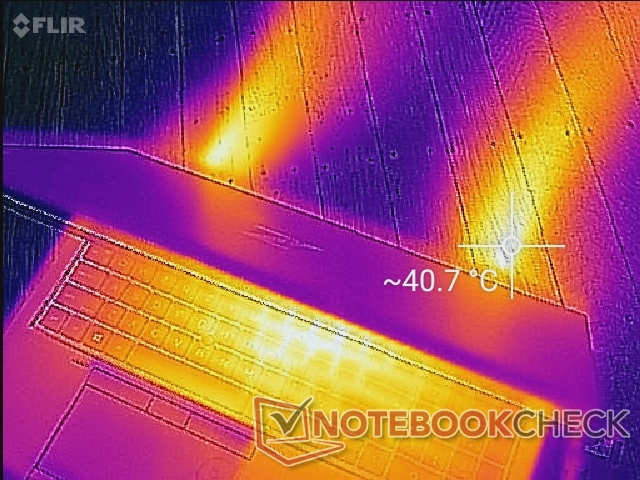
(-) The maximum temperature on the upper side is 48.8 °C / 120 F, compared to the average of 38.2 °C / 101 F, ranging from 22.2 to 69.8 °C for the class Workstation.
(-) The bottom heats up to a maximum of 62.6 °C / 145 F, compared to the average of 41.1 °C / 106 F
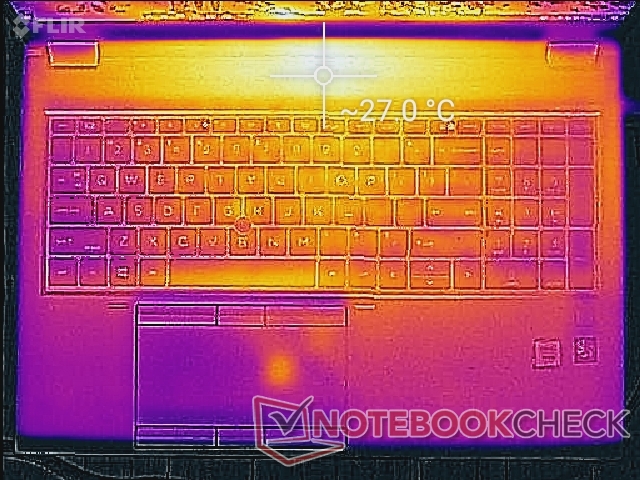
(+) In idle usage, the average temperature for the upper side is 24.5 °C / 76 F, compared to the device average of 32 °C / 90 F.
(±) Playing The Witcher 3, the average temperature for the upper side is 33.9 °C / 93 F, compared to the device average of 32 °C / 90 F.
(+) The palmrests and touchpad are reaching skin temperature as a maximum (33 °C / 91.4 F) and are therefore not hot.
(-) The average temperature of the palmrest area of similar devices was 27.8 °C / 82 F (-5.2 °C / -9.4 F).
Stress Test
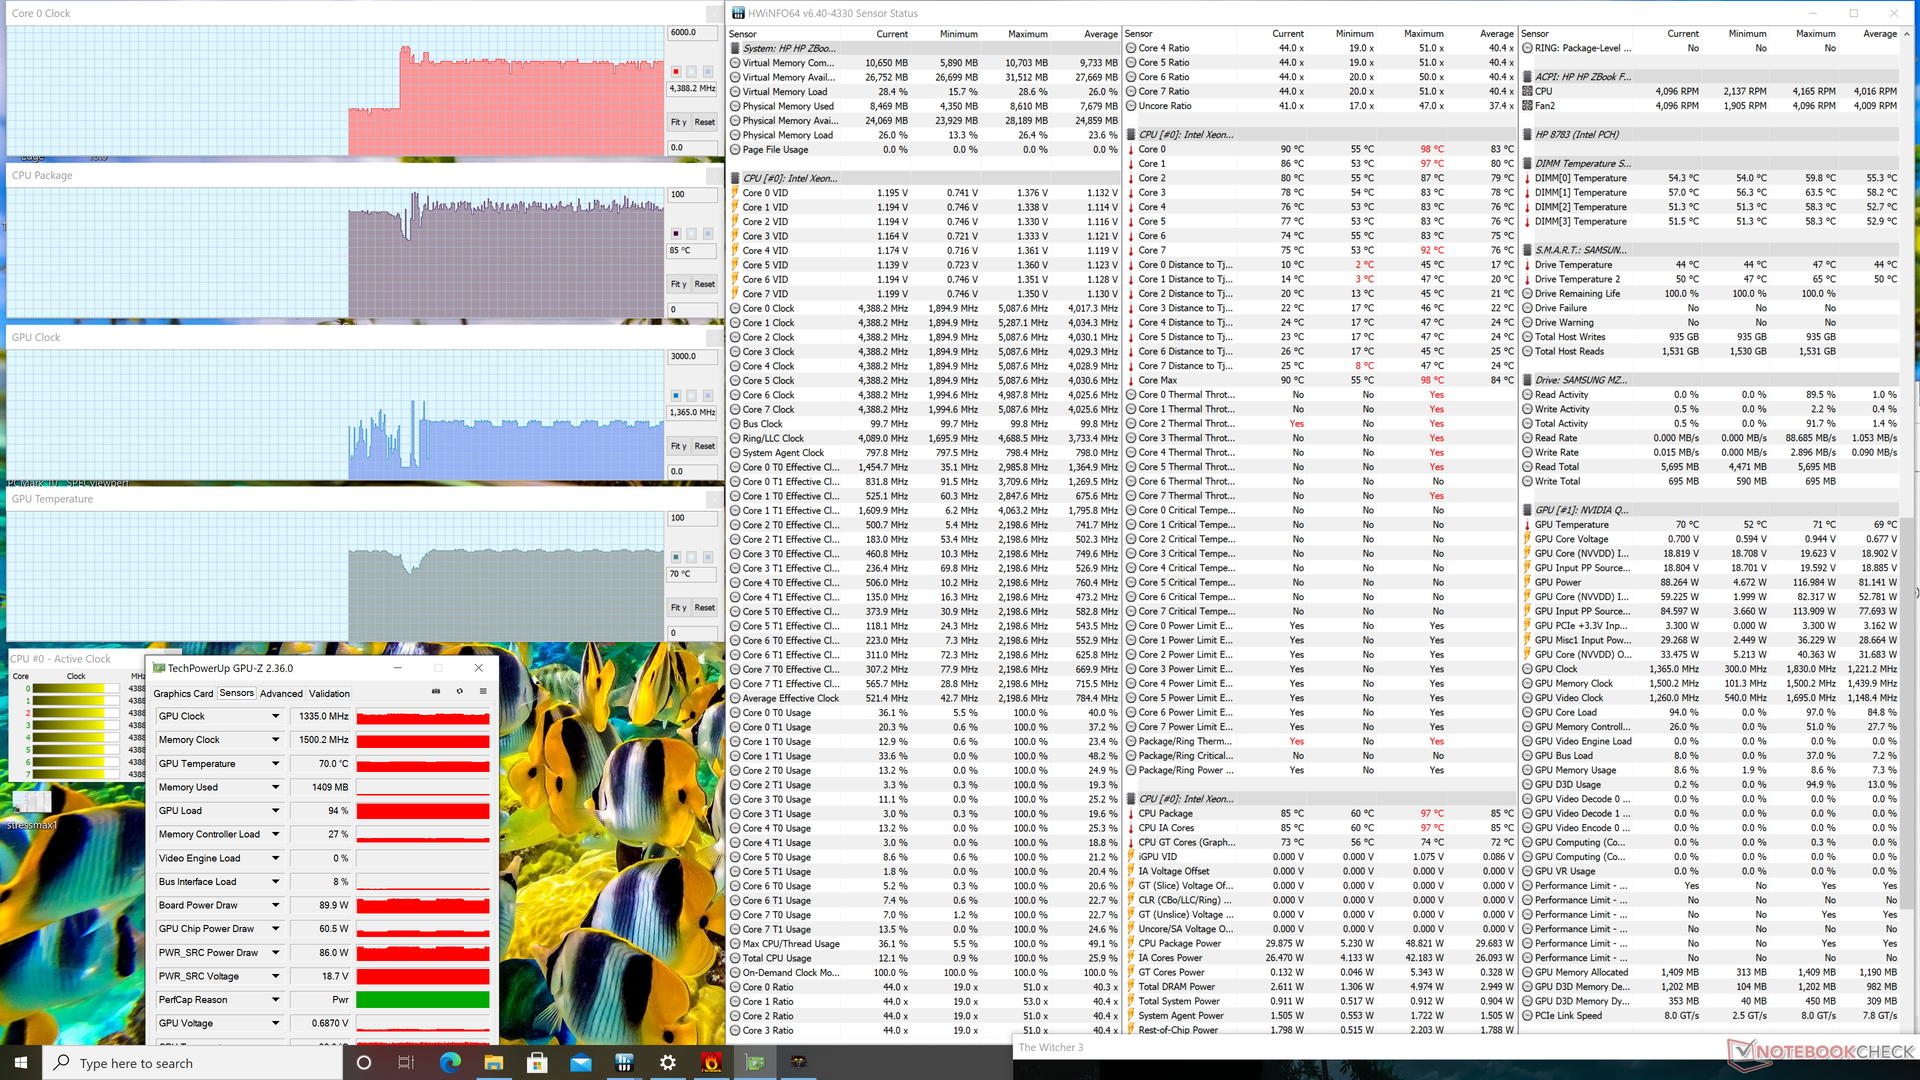
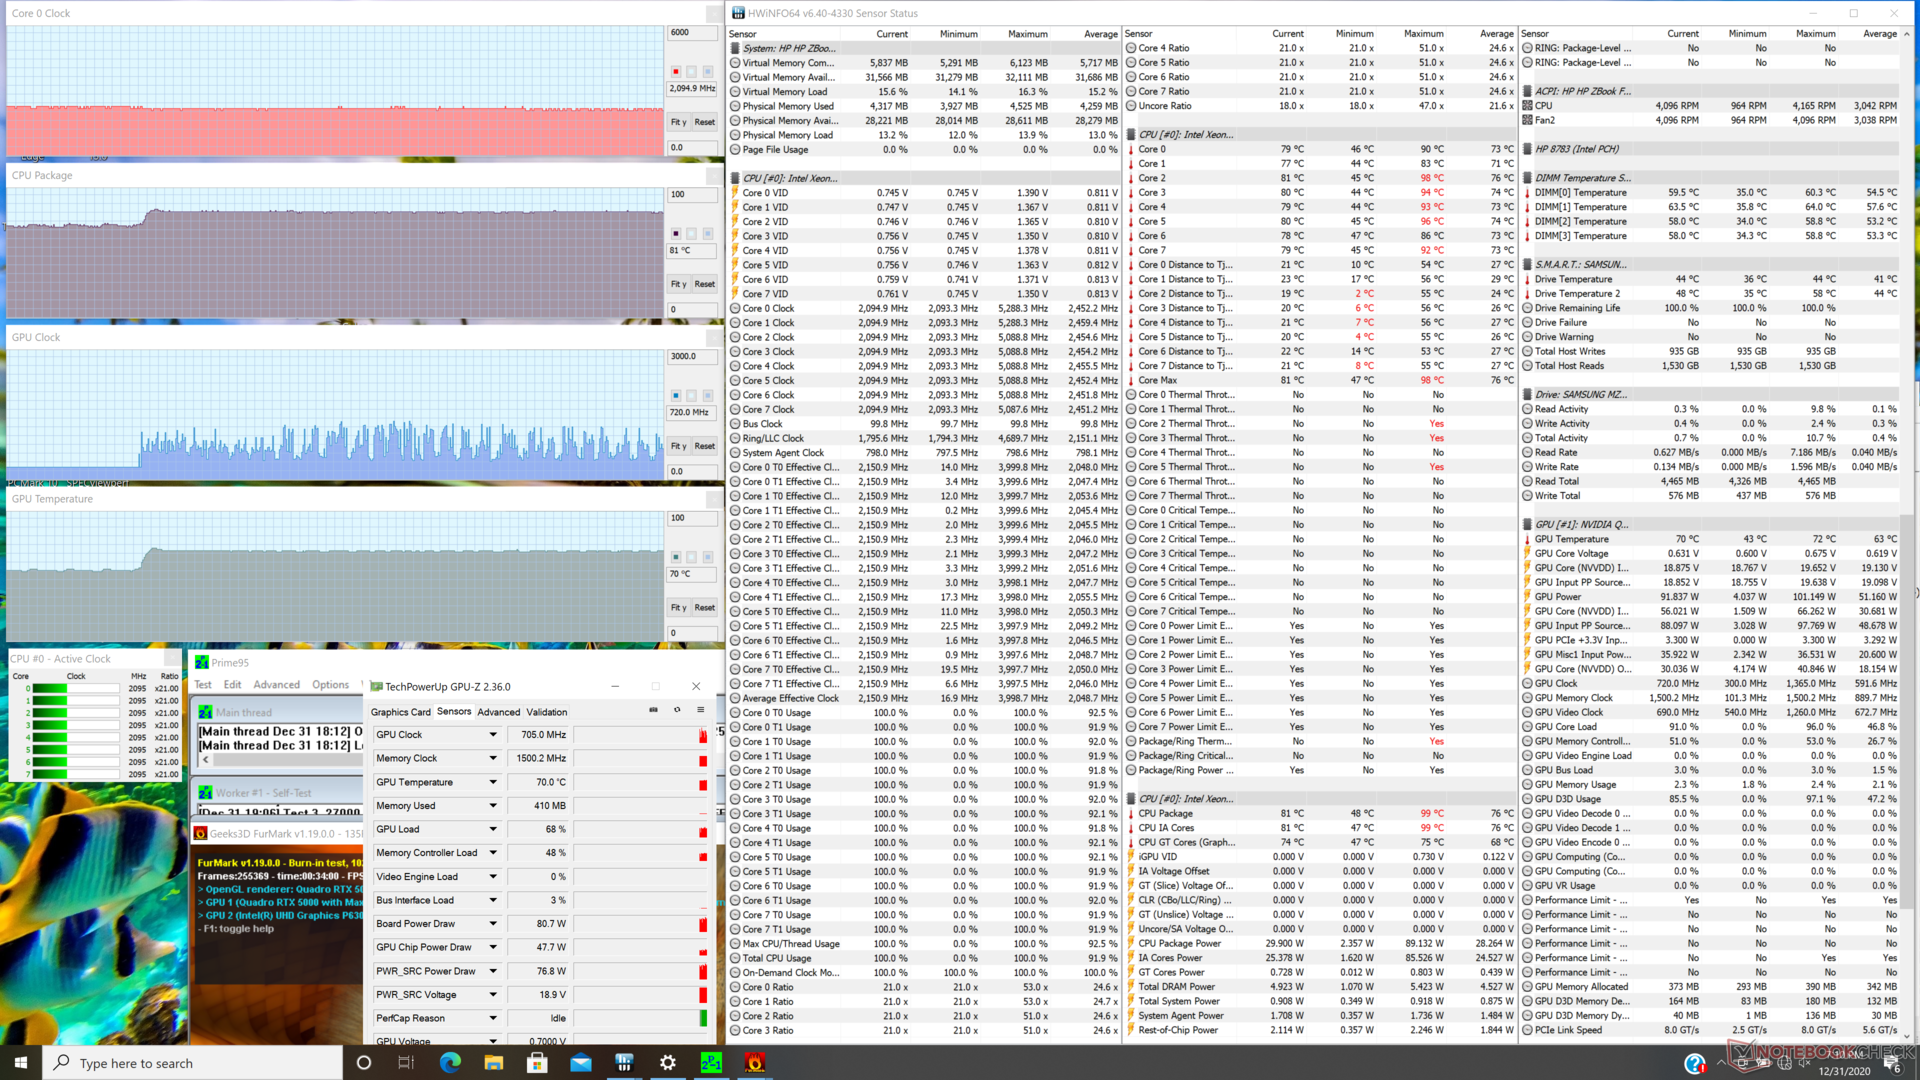
We stress the system with synthetic loads to identify for any potential throttling or stability issues. When running Prime95, the CPU would boost up to the 3.6 to 4 GHz range for just a few seconds and at a core temperature of 99 C. It would then immediately drop to just 2.3 GHz for a much cooler core temperature of 72 C. After updating our BIOS, however, the CPU would instead stabilize at about 3.6 GHz and 98 C for dramatically faster performance albeit at the cost of much warmer core temperatures. Overall results after updating are similar to what we observed on the Precision 7550.
Running on battery impacts graphics performance. A Fire Strike run on batteries would result in Physics and Graphics scores of 15724 and 9428 points, respectively, compared to 15118 and 19759 points when on mains.
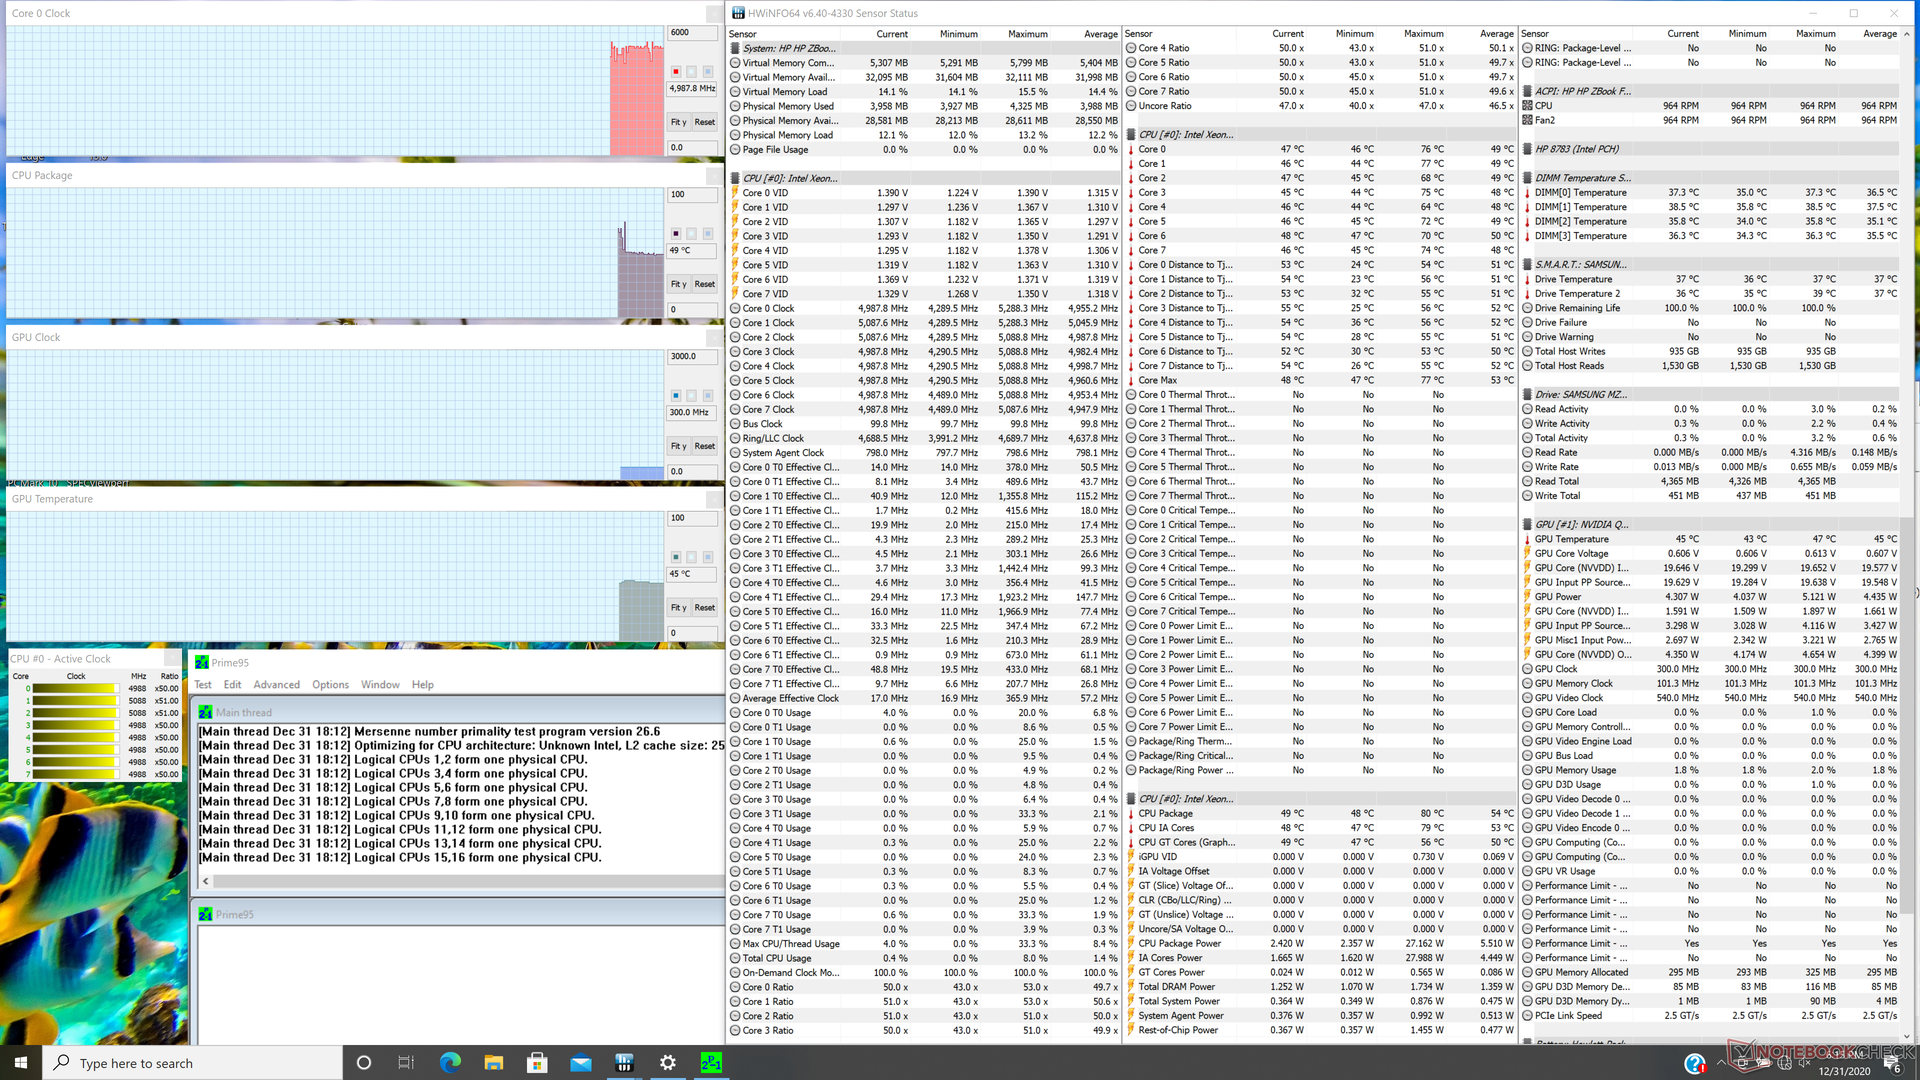
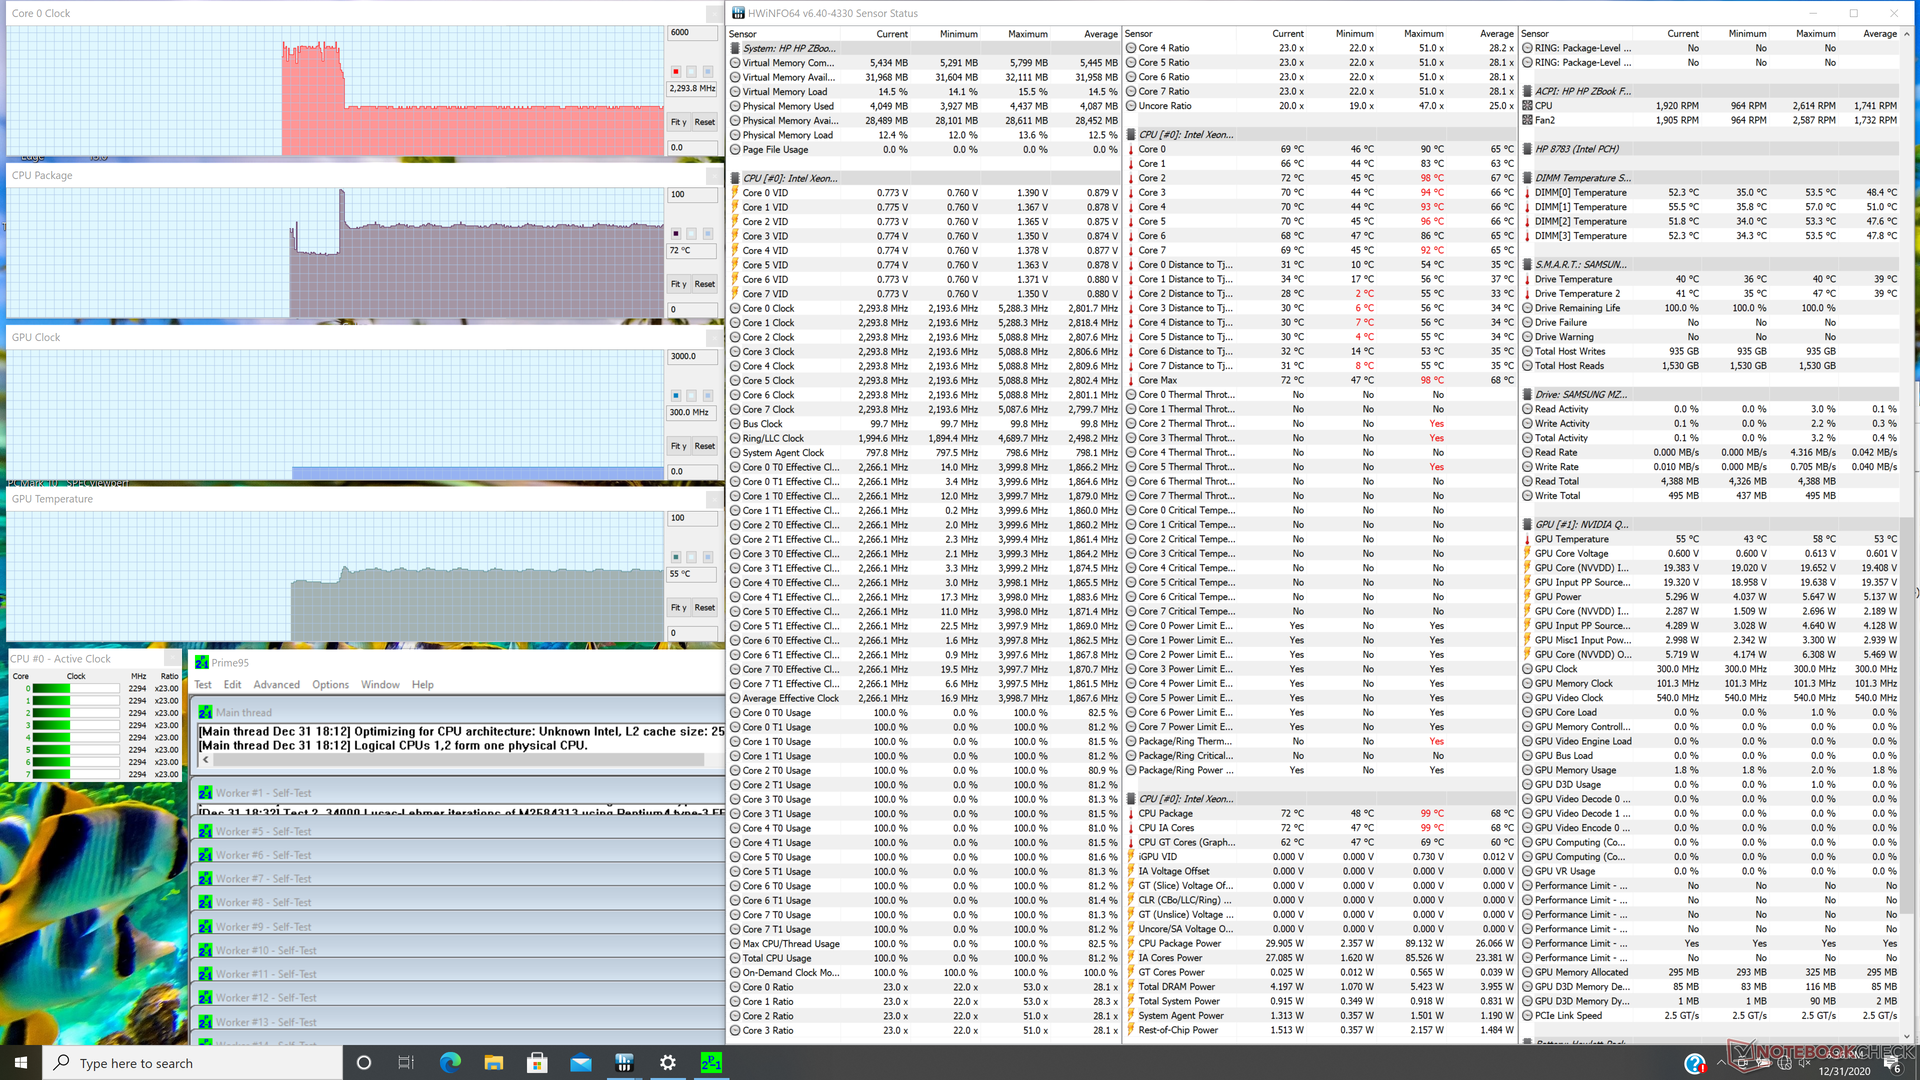
| CPU Clock (GHz) | GPU Clock (MHz) | Average CPU Temperature (°C) | Average GPU Temperature (°C) | |
| System Idle | -- | -- | 48 | 45 |
| Prime95 Stress | 2.2 - 2.3 | -- | 72 | 55 |
| Prime95 Stress (BIOS 1.04.01) | 3.5 - 3.6 | -- | 98 | 60 |
| Prime95 + FurMark Stress | 2.0 - 2.1 | ~510 - 1575 | 81 | 70 |
| Prime95 + FurMark Stress (BIOS 1.04.01) | 2.9 - 3.5 | ~510 - 1575 | 88 - 98 | 71 |
| Witcher 3 Stress | ~4.4 | 1230 - 1380 | 85 | 70 |
Speakers

HP ZBook Fury 15 G7 audio analysis
(±) | speaker loudness is average but good (80.1 dB)
Bass 100 - 315 Hz
(±) | reduced bass - on average 8% lower than median
(±) | linearity of bass is average (9.5% delta to prev. frequency)
Mids 400 - 2000 Hz
(+) | balanced mids - only 3.3% away from median
(+) | mids are linear (4.8% delta to prev. frequency)
Highs 2 - 16 kHz
(+) | balanced highs - only 2.2% away from median
(+) | highs are linear (3.5% delta to prev. frequency)
Overall 100 - 16.000 Hz
(+) | overall sound is linear (10.1% difference to median)
Compared to same class
» 6% of all tested devices in this class were better, 4% similar, 90% worse
» The best had a delta of 7%, average was 17%, worst was 35%
Compared to all devices tested
» 5% of all tested devices were better, 1% similar, 94% worse
» The best had a delta of 4%, average was 23%, worst was 134%
Apple MacBook 12 (Early 2016) 1.1 GHz audio analysis
(+) | speakers can play relatively loud (83.6 dB)
Bass 100 - 315 Hz
(±) | reduced bass - on average 11.3% lower than median
(±) | linearity of bass is average (14.2% delta to prev. frequency)
Mids 400 - 2000 Hz
(+) | balanced mids - only 2.4% away from median
(+) | mids are linear (5.5% delta to prev. frequency)
Highs 2 - 16 kHz
(+) | balanced highs - only 2% away from median
(+) | highs are linear (4.5% delta to prev. frequency)
Overall 100 - 16.000 Hz
(+) | overall sound is linear (10.2% difference to median)
Compared to same class
» 7% of all tested devices in this class were better, 2% similar, 91% worse
» The best had a delta of 5%, average was 18%, worst was 53%
Compared to all devices tested
» 5% of all tested devices were better, 1% similar, 94% worse
» The best had a delta of 4%, average was 23%, worst was 134%
Energy Management
Power Consumption
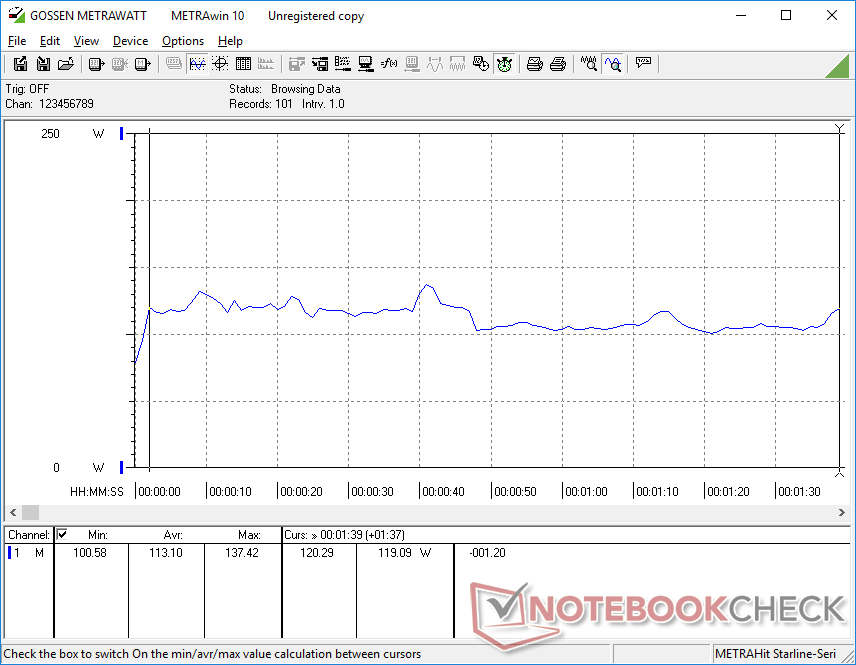
Idling on desktop demands between 4 W and 22 W depending on the brightness level and if the discrete GPU is active. The difference between minimum and maximum brightness is as high as 9 W since the display is brighter than most other laptops.
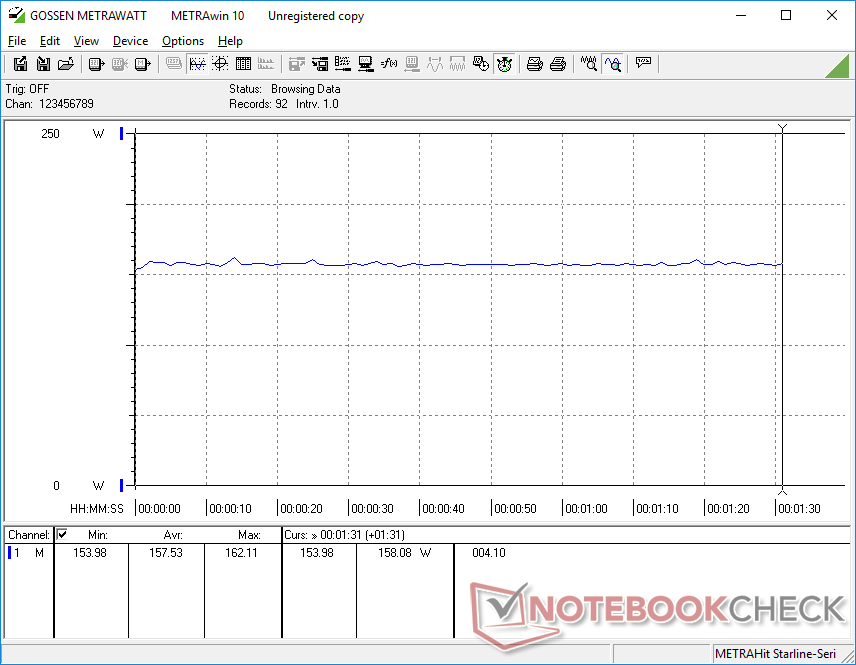
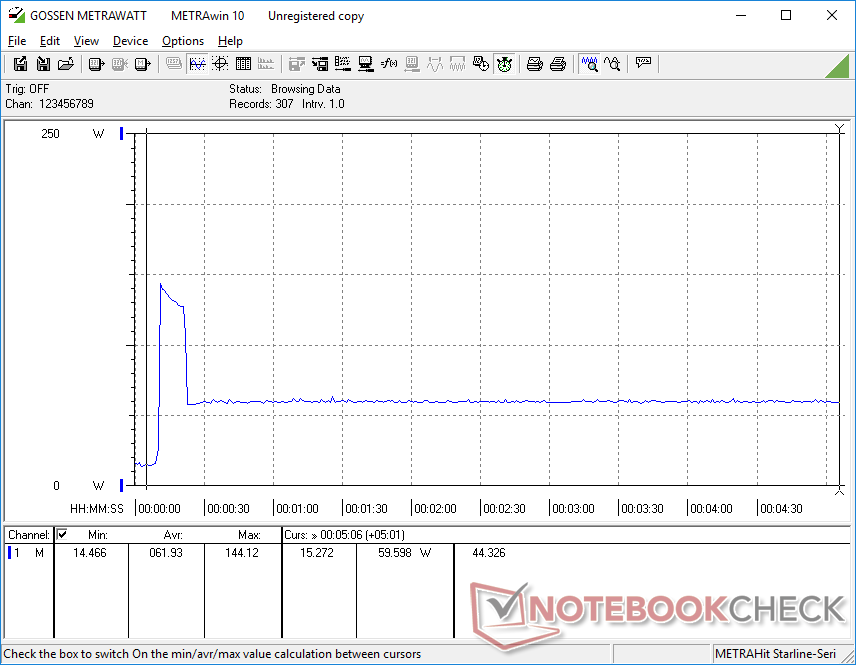
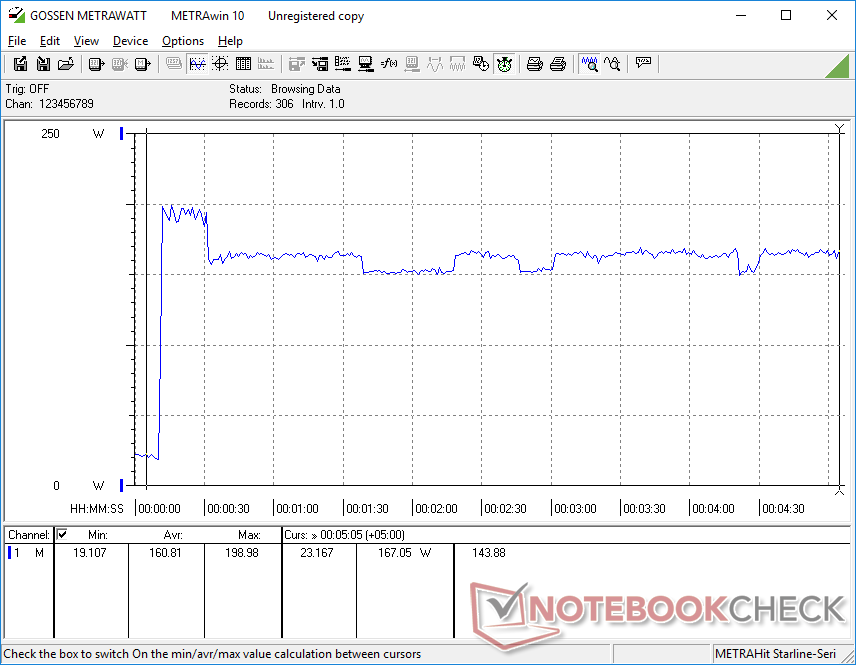
Higher loads equivalent to games can draw between 113 W to 158 W which is almost exactly what we measured on the Precision 7550 or MSI WS66 as well each equipped with the same CPU and GPU. However, a major difference can be observed when running Prime95. Power consumption would stabilize at just 59.6 W on our HP compared to 135.3 W on our Dell. This would also explain the noticeable performance deficit of our HP during the CineBench loop test and Stress Test sections above.
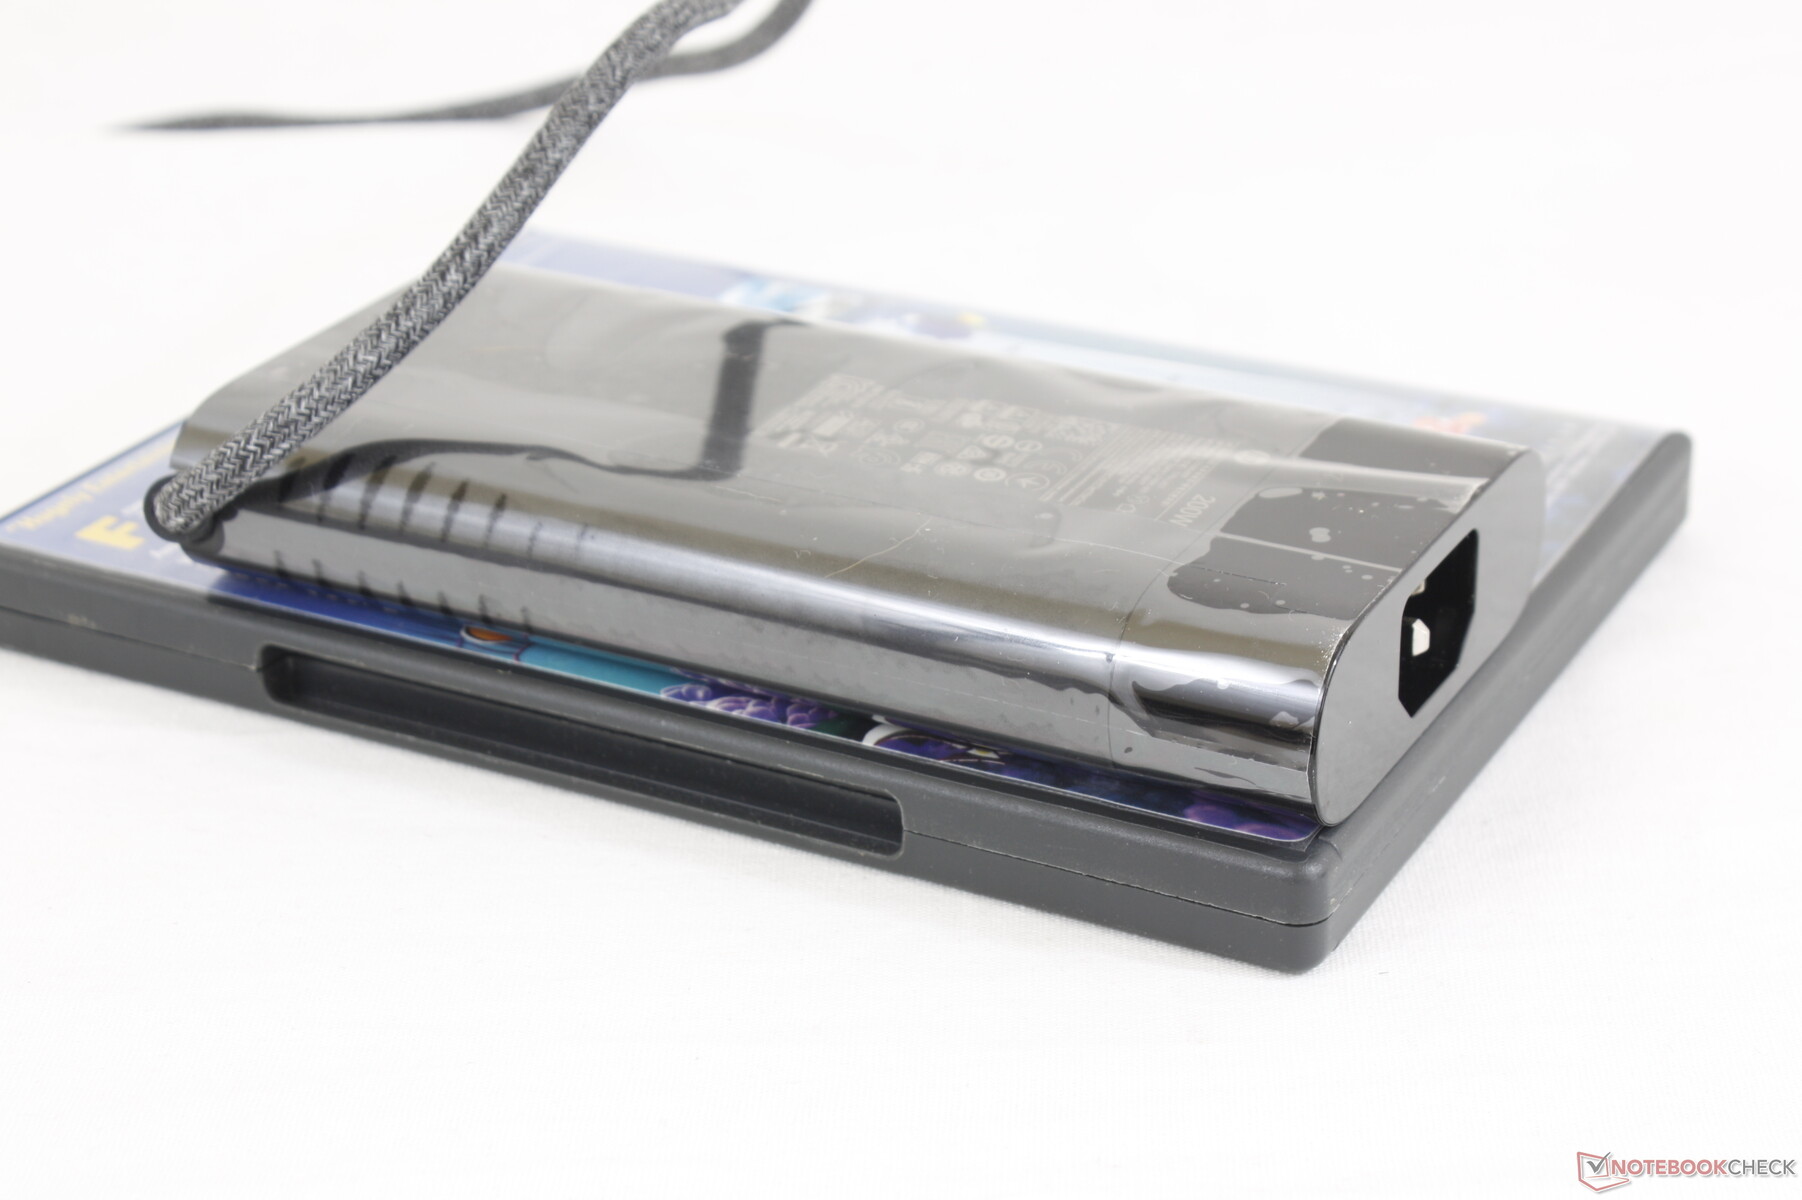
We're able to record a maximum draw of 199 W from the medium-sized (~15 x 7.2 x 2.4 cm) 200 W AC adapter. This rate is only temporary as shown by our graphs below likely due to thermal reasons. Running extreme loads will slow the charging rate but it will not drain the battery unlike on some early Dell Precision models.
| Off / Standby | |
| Idle | |
| Load |
|
Key:
min: | |
| HP ZBook Fury 15 G7 W-10885M, Quadro RTX 5000 Max-Q, Samsung PM981a MZVLB1T0HBLR, IPS, 3840x2160, 15.6" | Asus ProArt StudioBook Pro 15 W500G5T i7-9750H, Quadro RTX 5000 Max-Q, Samsung SSD PM981 MZVLB1T0HALR, IPS, 3840x2160, 15.6" | MSI WS66 10TMT-207US i9-10980HK, Quadro RTX 5000 Max-Q, WDC PC SN730 SDBPNTY-1T00, IPS, 1920x1080, 15.6" | Dell Precision 7550 W-10885M, Quadro RTX 5000 Max-Q, SK Hynix PC601A NVMe 1TB, IPS, 3840x2160, 15.6" | Razer Blade 15 Studio Edition 2020 i7-10875H, Quadro RTX 5000 Max-Q, Samsung PM981a MZVLB1T0HBLR, OLED, 3840x2160, 15.6" | Lenovo ThinkPad P1 2019-20QT000RGE i7-9850H, Quadro T1000 (Laptop), WDC PC SN720 SDAQNTW-512G, IPS LED, 1920x1080, 15.6" | |
|---|---|---|---|---|---|---|
| Power Consumption | -33% | -56% | -22% | -37% | -31% | |
| Idle Minimum * (Watt) | 4.6 | 11.6 -152% | 13.8 -200% | 8.2 -78% | 13.4 -191% | 13.7 -198% |
| Idle Average * (Watt) | 13.6 | 19 -40% | 18.4 -35% | 16.8 -24% | 18 -32% | 17.5 -29% |
| Idle Maximum * (Watt) | 21.5 | 20.6 4% | 41.5 -93% | 24.4 -13% | 26.1 -21% | 20.9 3% |
| Load Average * (Watt) | 113.1 | 102 10% | 110.5 2% | 131 -16% | 115 -2% | 77.2 32% |
| Witcher 3 ultra * (Watt) | 157.5 | 151.6 4% | 156.6 1% | 145 8% | ||
| Load Maximum * (Watt) | 199 | 178 11% | 227.1 -14% | 201.8 -1% | 165 17% | 123.7 38% |
* ... smaller is better
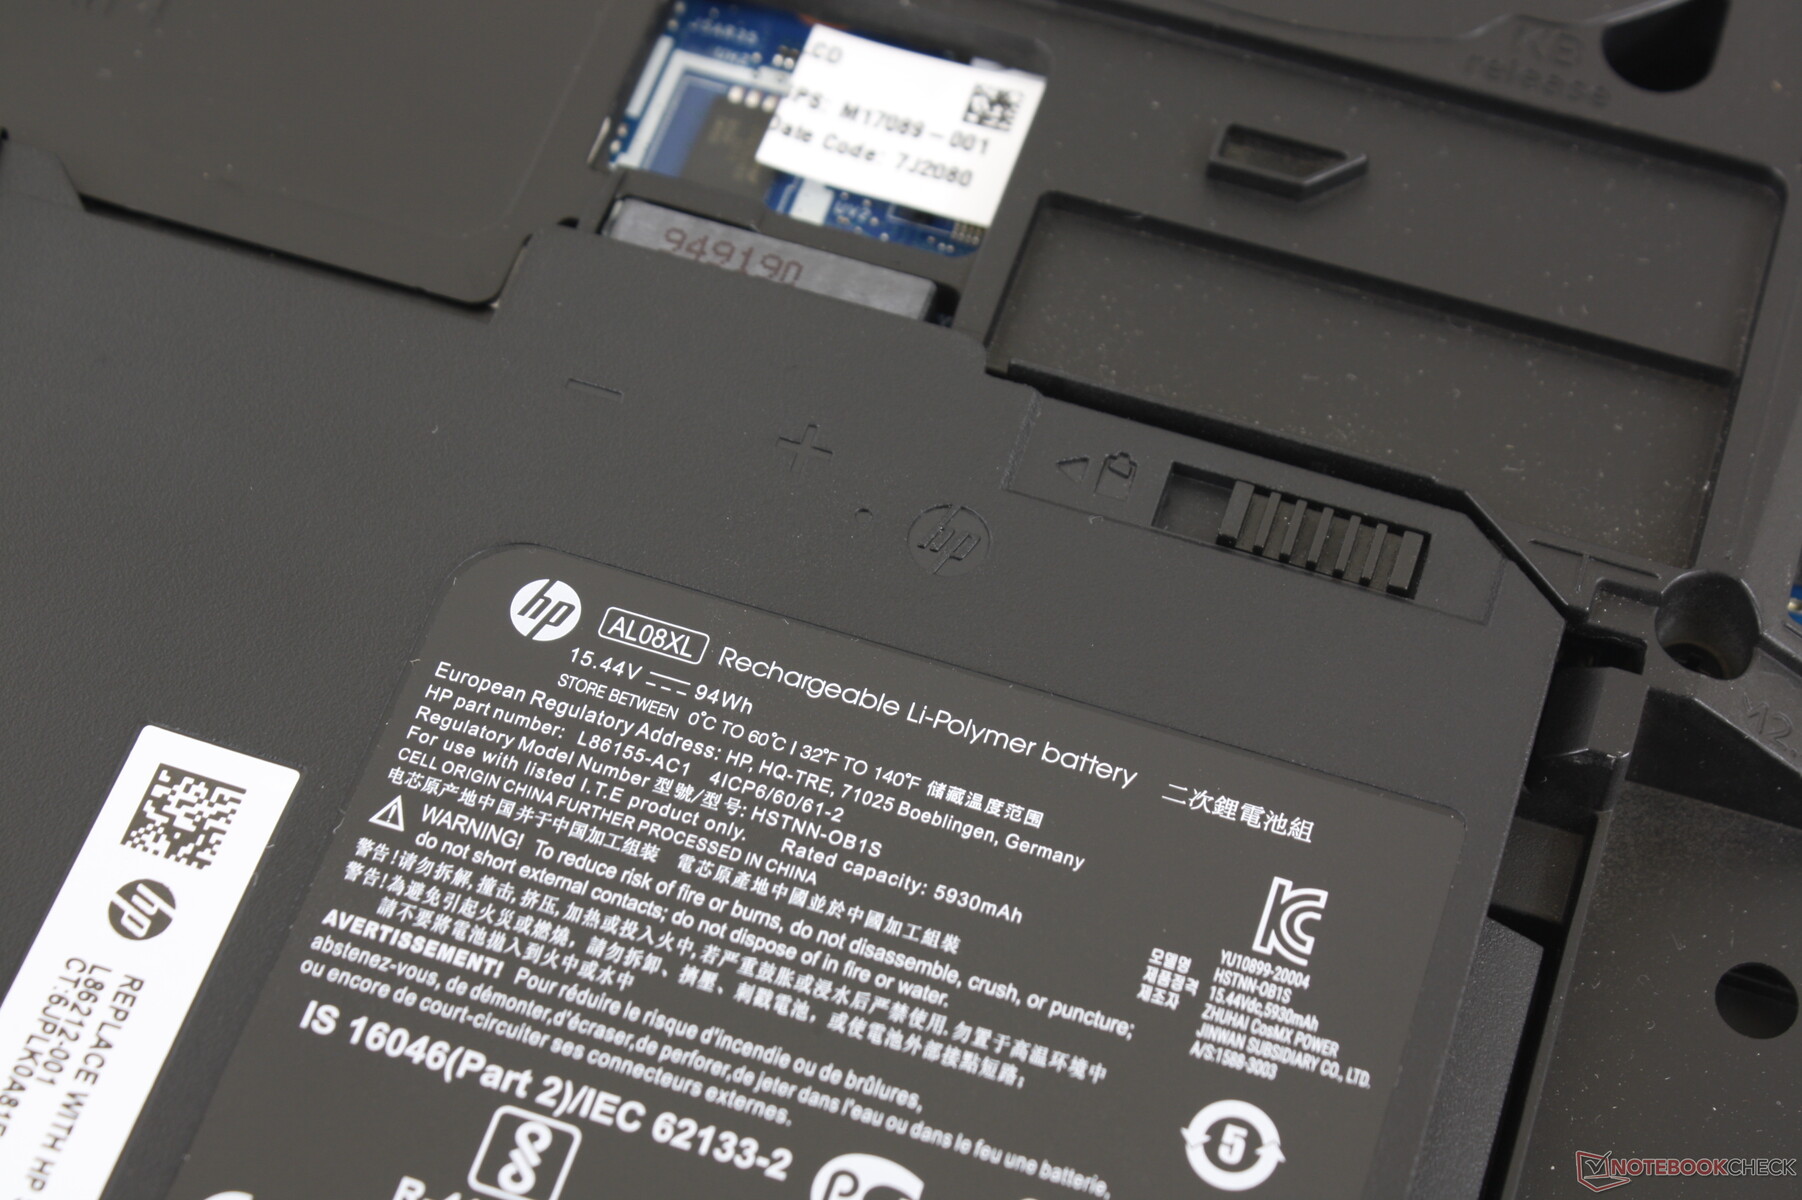
Battery Life
Expect 8.5 hours of real-world WLAN use. Charging from empty to full is also fast despite the large 94 Wh battery capacity. The system can be charged via USB-C albeit at a slower rate.
| HP ZBook Fury 15 G7 W-10885M, Quadro RTX 5000 Max-Q, 94 Wh | Asus ProArt StudioBook Pro 15 W500G5T i7-9750H, Quadro RTX 5000 Max-Q, 76 Wh | MSI WS66 10TMT-207US i9-10980HK, Quadro RTX 5000 Max-Q, 99.99 Wh | Dell Precision 7550 W-10885M, Quadro RTX 5000 Max-Q, 95 Wh | Razer Blade 15 Studio Edition 2020 i7-10875H, Quadro RTX 5000 Max-Q, 80 Wh | Lenovo ThinkPad P1 2019-20QT000RGE i7-9850H, Quadro T1000 (Laptop), 80 Wh | |
|---|---|---|---|---|---|---|
| Battery runtime | -45% | -18% | -12% | -4% | 2% | |
| Reader / Idle (h) | 13.2 | 8.3 -37% | 11.1 -16% | 8.8 -33% | ||
| WiFi v1.3 (h) | 8.6 | 4.7 -45% | 7.8 -9% | 8.9 3% | 5.7 -34% | 8.9 3% |
| Load (h) | 1.3 | 1.2 -8% | 1 -23% | 2 54% | 1.3 0% |
Pros
Cons
Verdict
The most notable aspect of the ZBook Fury 15 is its ability to offer essentially all the features and performance options of the Dell Precision 7550 but in a noticeably lighter package. This makes the HP a good middle-ground solution for users who want a mobile workstation without sacrificing many of the auxiliary features that thinner and lighter models like the Razer Blade Studio, MSI WS66, or Asus ProArt frequently omit. It's also one of the very few workstations to include 1000-nit panel options for the occasional outdoor scenarios.
Expandable and comfortable with plenty of configuration options to choose from. The ZBook Fury 15 manages to cram a lot of classic workstation features despite its moderate weight.
The typing and trackpad experience deserves praise for being one of the most comfortable we've experienced on a mobile workstation. It's great that HP didn't find the need to "dumb down" the keyboard or touchpad to fit current trends of ultra-thin laptops or minimalist designs. This is a system designed from the ground up for professionals and not just a recolored gaming laptop.
Power users will not like the fact that the processor will stabilize at 98 C when under full load and that the Quadro RTX 5000 GPU is of the Max-Q variety. WAN and certain storage options may be excluded depending on the SKU meaning you can't just purchase a cheaper configuration and then upgrade certain components yourself because the connectors will be missing. Firmer hinges to minimize teetering when adjusting angles would make the chassis feel even better.
Price and availability
HP ZBook Fury 15 G7
- 01/16/2021 v7 (old)
Allen Ngo
Price comparison
