Verdict — Balanced Performance And Portability
The ZBook X G1i 16 sits comfortably in the middle between the slower ZBook 8 series and faster but heavier ZBook Fury series. Externally, almost nothing has changed from last year's ZBook Power 16 G11 and so the user experience remains identical including the feature-rich ports and comfortable keys. Both battery life and performance have improved, but power consumption is slightly higher as well when running demanding loads.
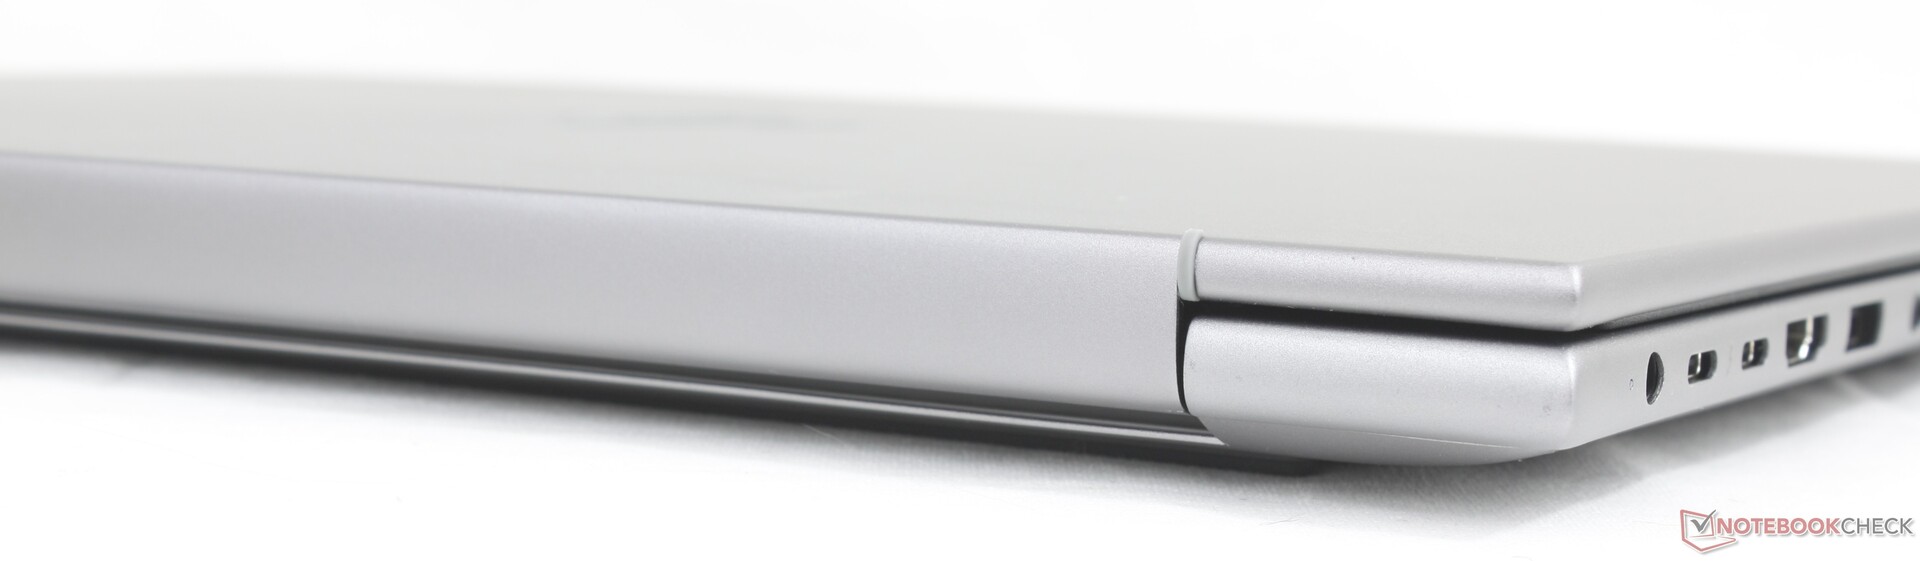
Some features remain missing on the machine. While higher-end CPU and GPU options are out of reach as to be expected, the model lacks OLED, HDR, and ECC RAM support which may irk a small subset of users. Ports feel crowded along the left edge especially since there are no USB-C ports along the right edge. Users who like to stress the CPU and GPU will also find that the system will not run any quieter than its last generation counterpart.
For future models, we would like to see the ZBook X series move away from proprietary AC barrel charging while offering better CPU Turbo Boost performance. The processor would reach over 100 C quite quickly when stressed which suggests that a stronger cooling solution could be beneficial.
Pros
Cons
Price and Availability
The configuration as reviewed is now shipping on HP.com for $2900 alongside many other options. The Core Ultra 9 and 2400p configuration is available on Amazon for $3500.
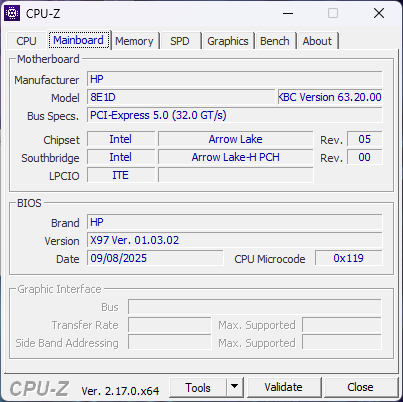
The HP ZBook X G1i 16 is an ultrathin mobile workstation with midrange Arrow Lake-H processors and Nvidia RTX Pro Blackwell GPU graphics. It tops out at the Core Ultra 9 285H CPU and RTX Pro 2000 GPU whereas the thicker ZBook Fury G1i 16 can be equipped with faster Arrow Lake-HX and RTX Pro 5000 graphics.
Our test unit is the middle configuration with the Core Ultra 7 265H, 2K 1600p120 display, and RTX Pro 2000 GPU for approximately $2700 USD. A full list of available configurations can be seen here.
Alternatives to the ZBook X G1i 16 include other ultrathin 16-inch workstations like the Dell Precision 5690, Lenovo ThinkPad P16s G2, or the MSI CreatorPro series. The ZBook X G1i 16 should not be confused with the ZBook 8 G1i 16 which is a lower-end version that tops out at the slower RTX Pro 500 GPU.
More HP reviews:
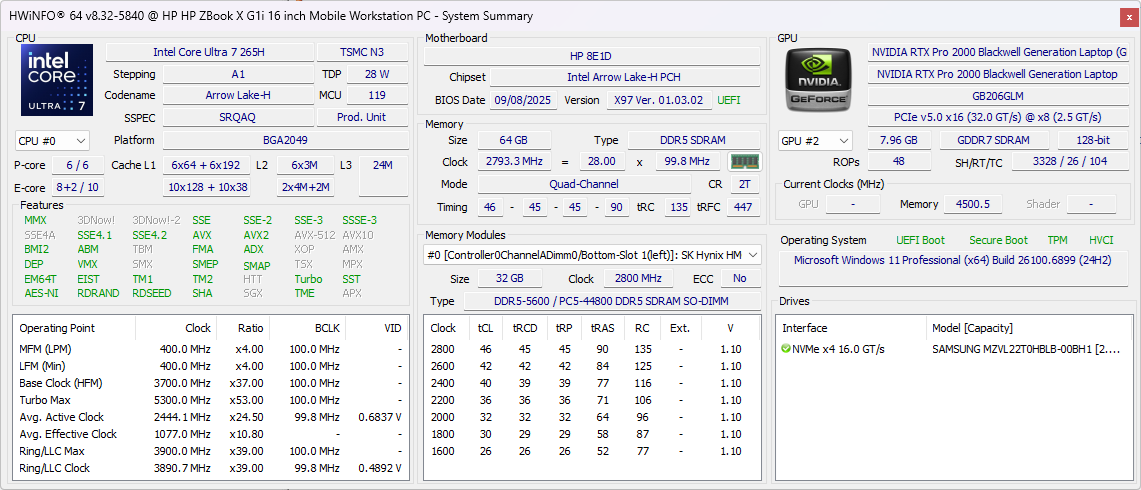
Specifications
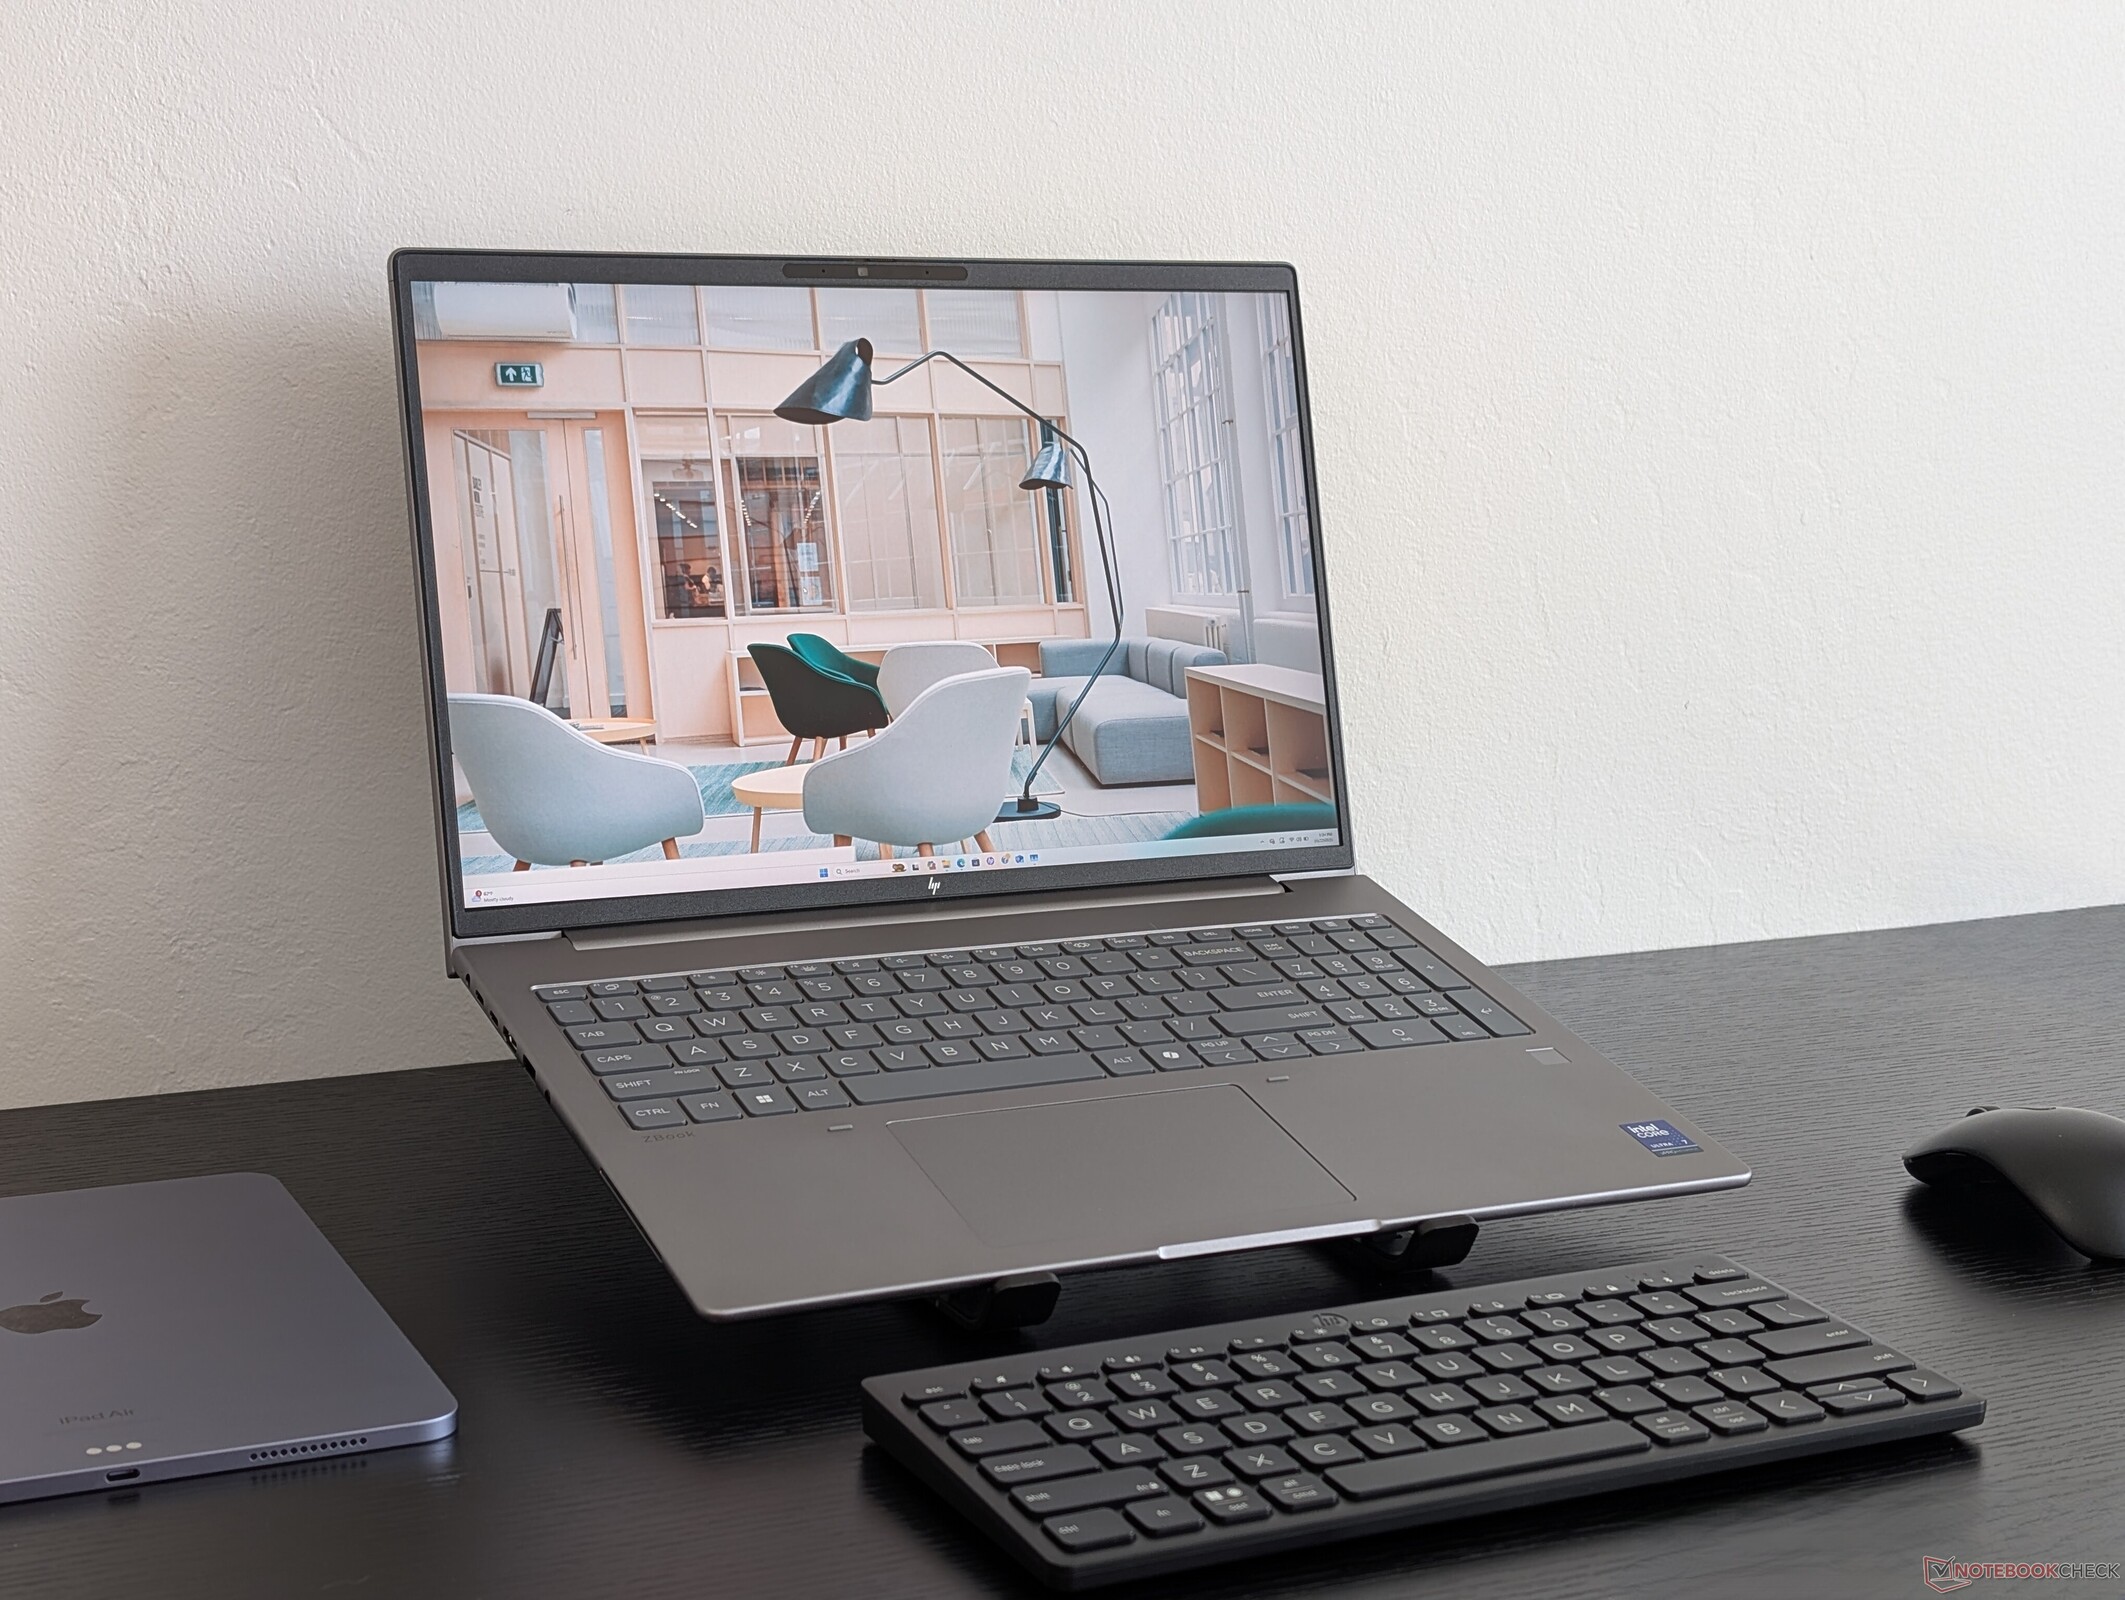
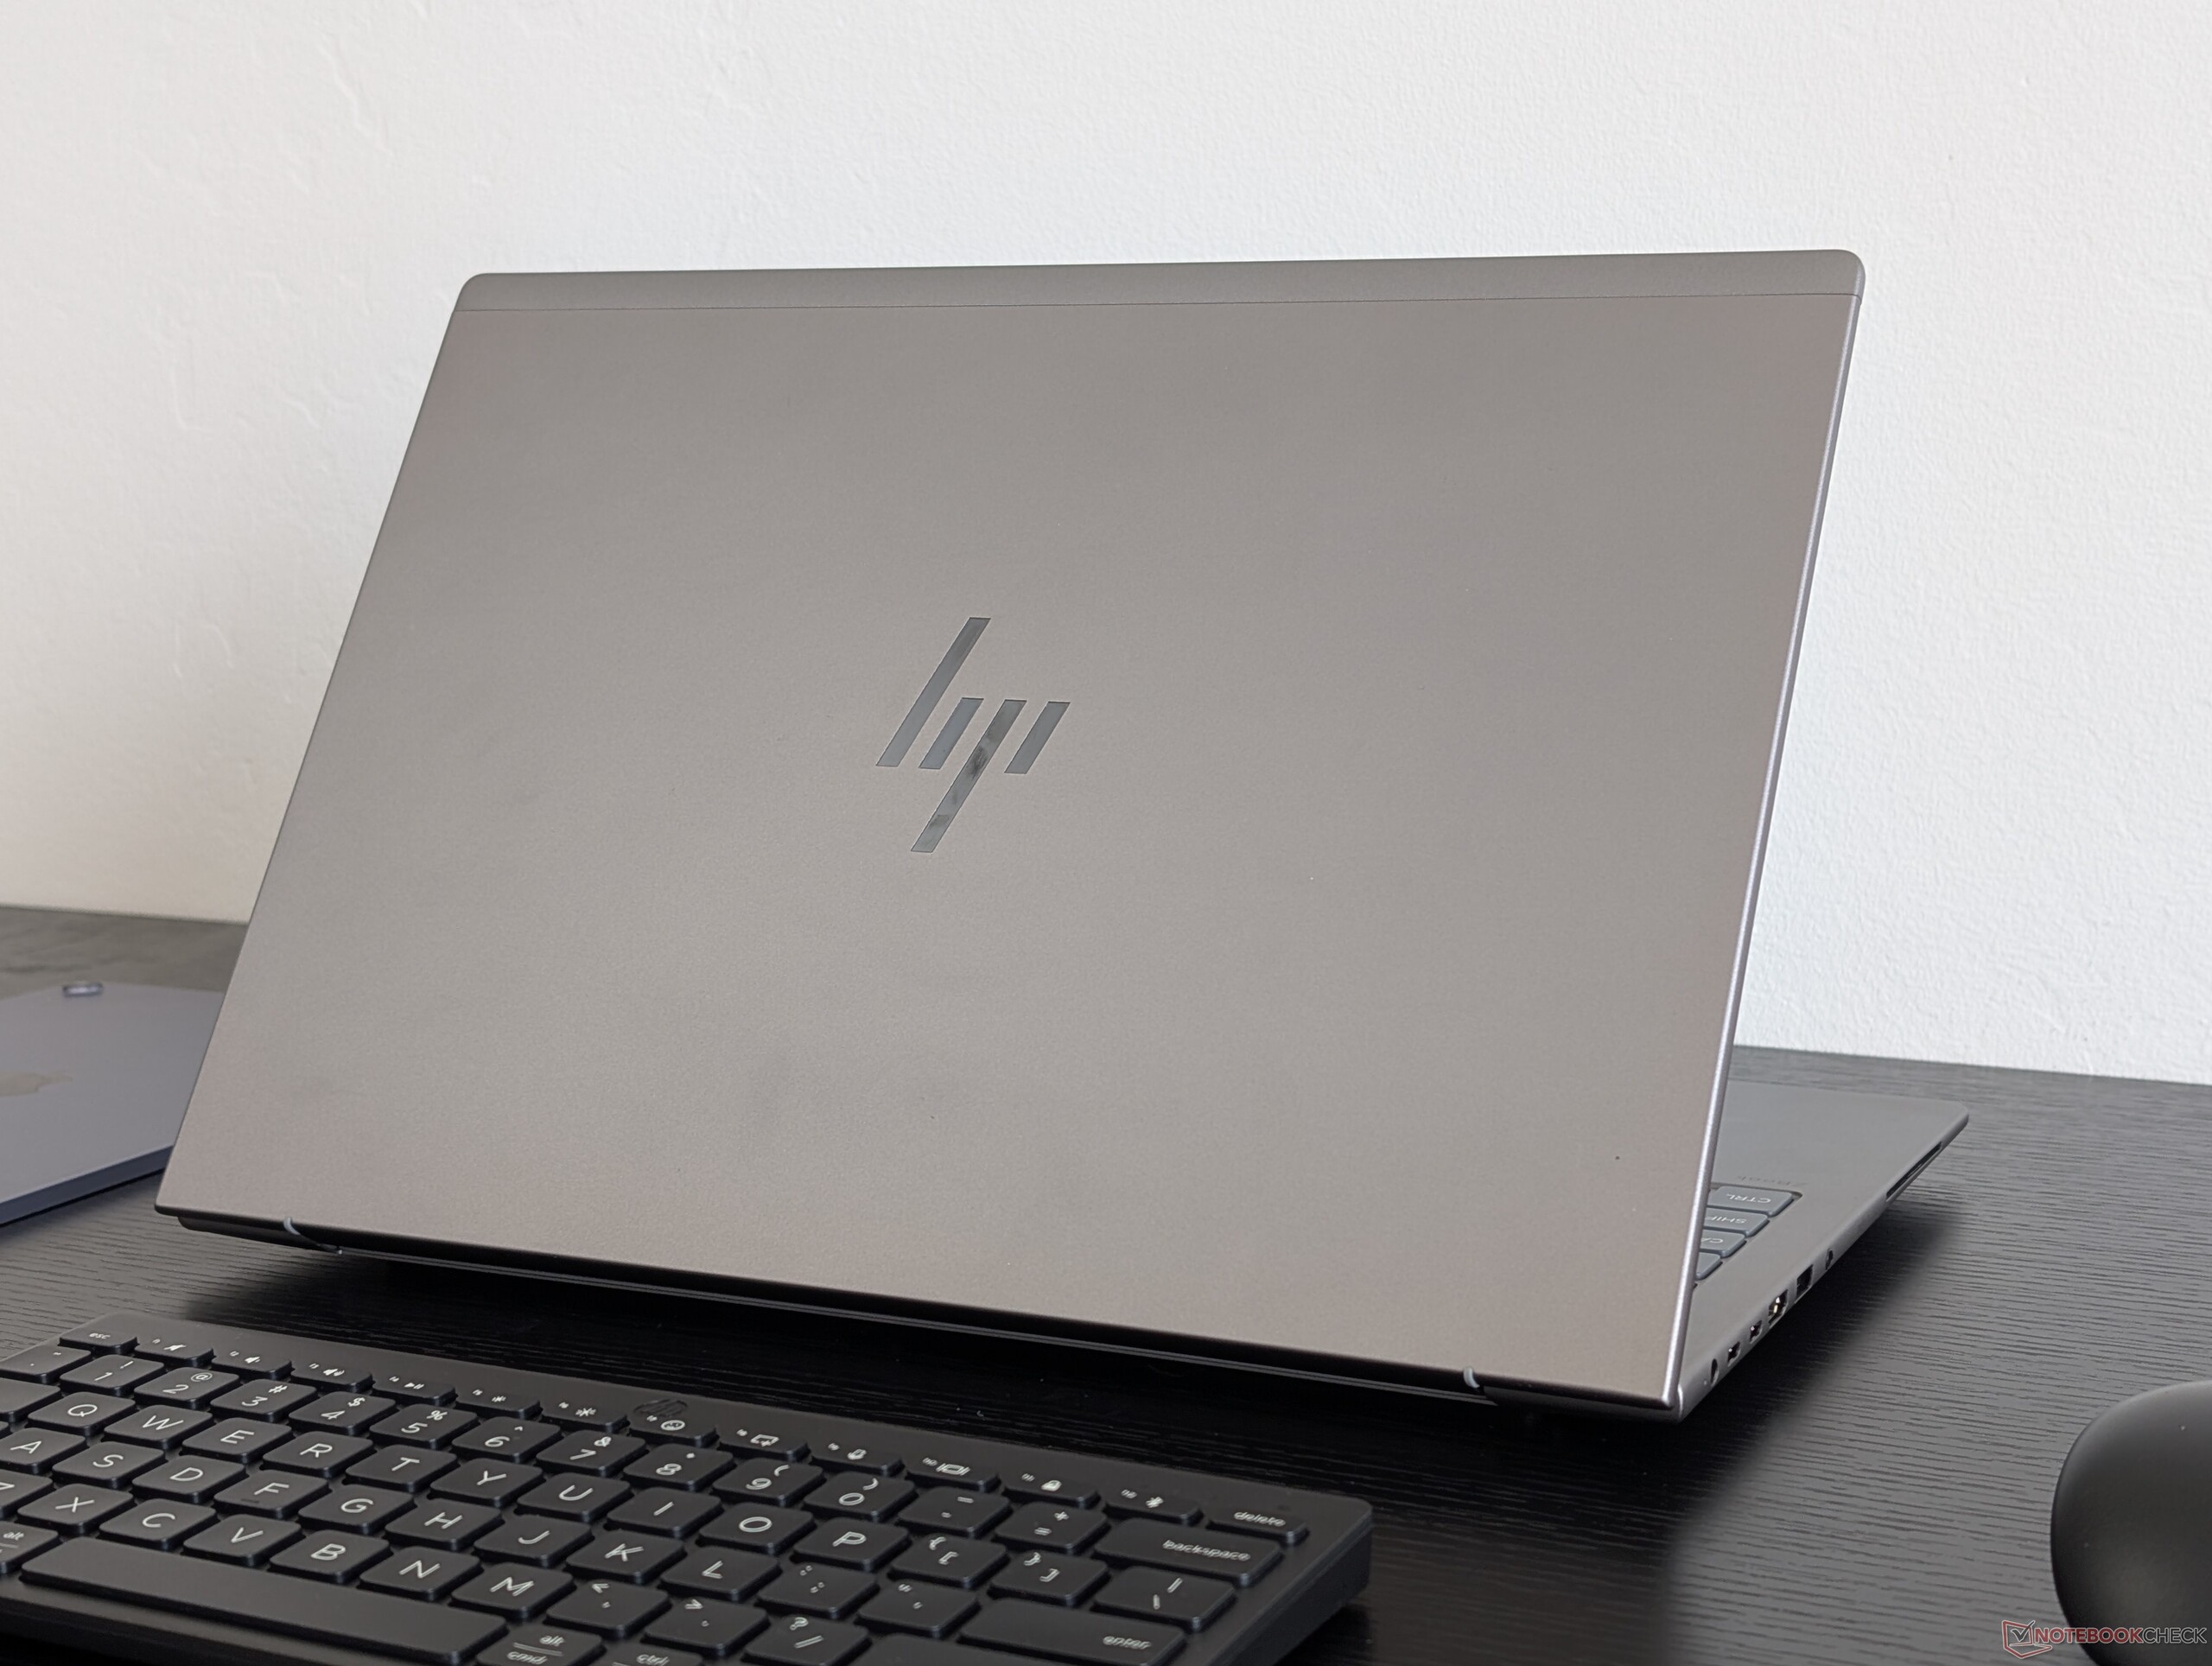
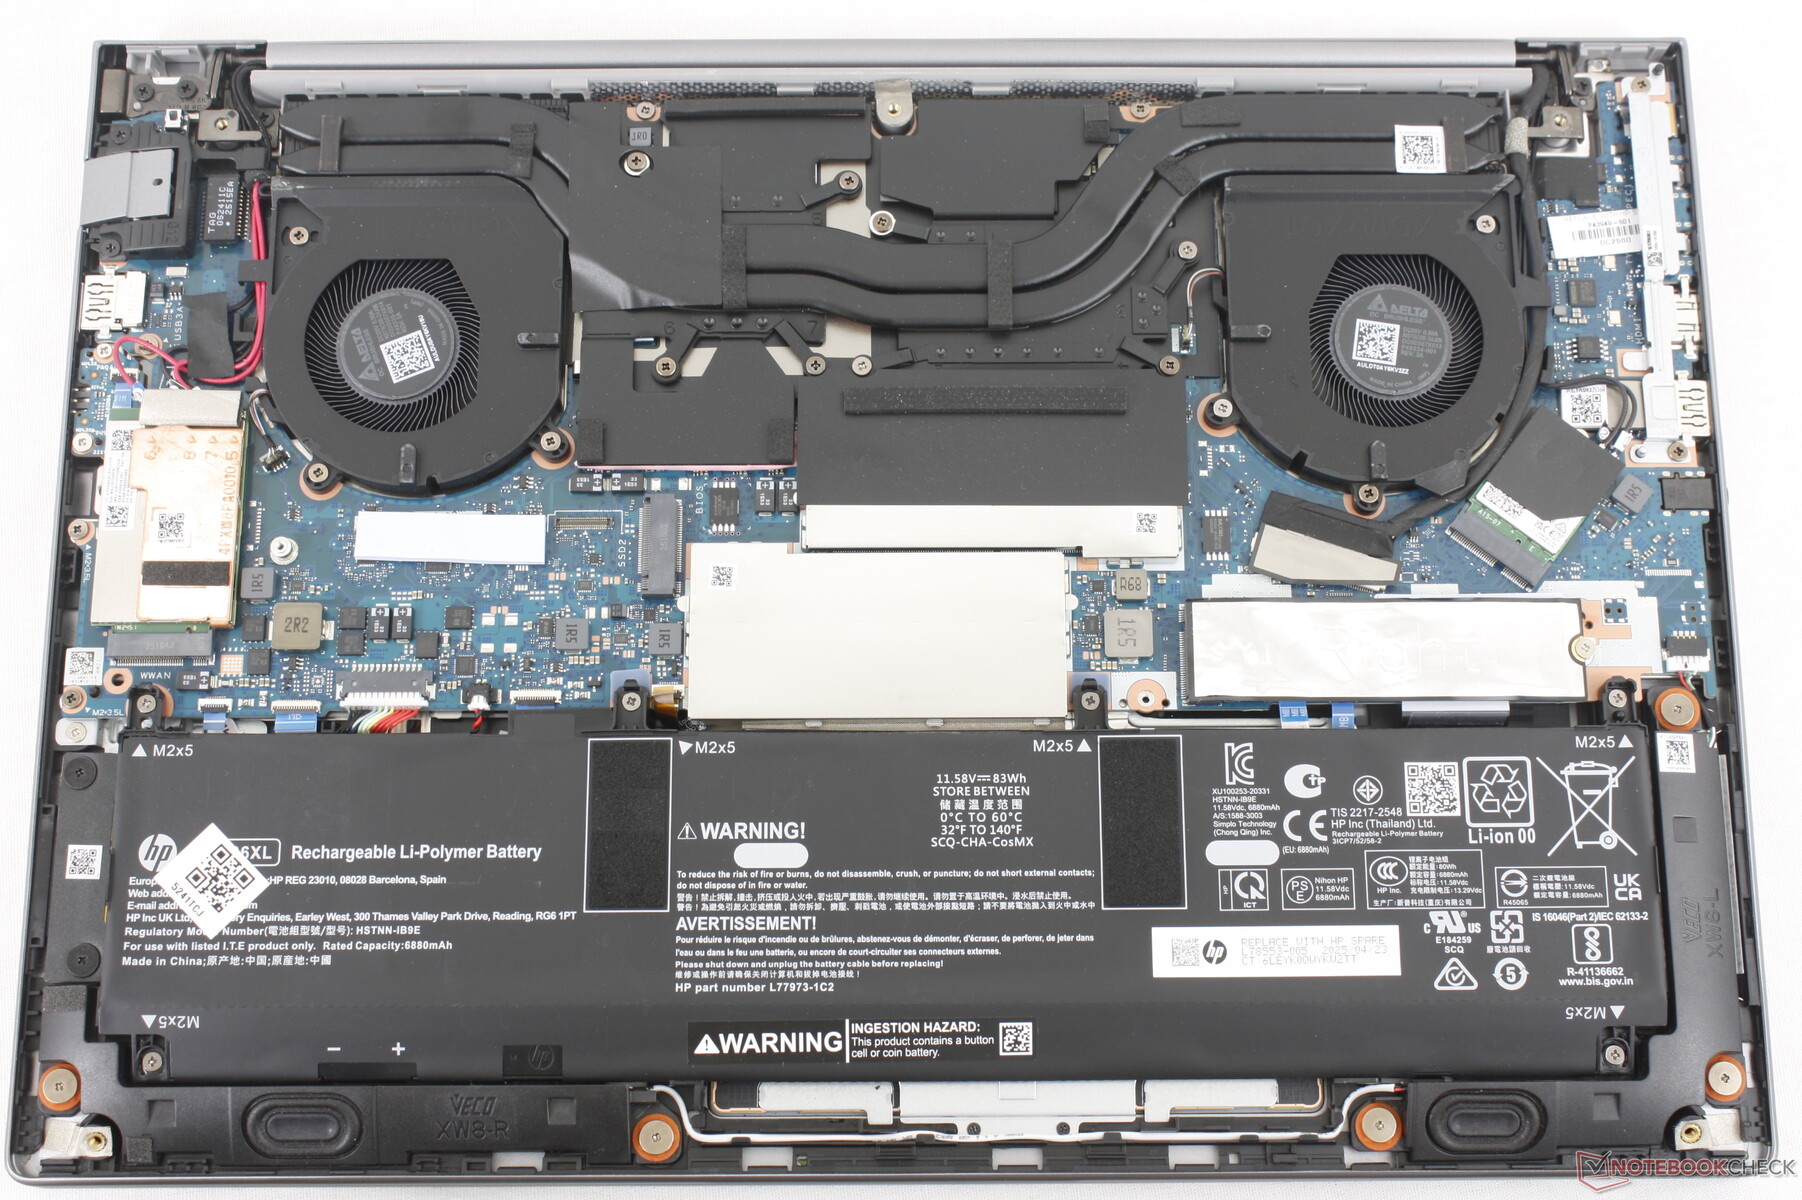
Case
The ZBook X G1i 16 directly replaces last year's ZBook Power 16 G11 and, despite the name change, the two models are otherwise almost visually identical. Physical features remain nearly the same including the weight, dimensions, and ports and so our comments about the ZBook Power 16 G11 still apply here for the ZBook X G1i 16.
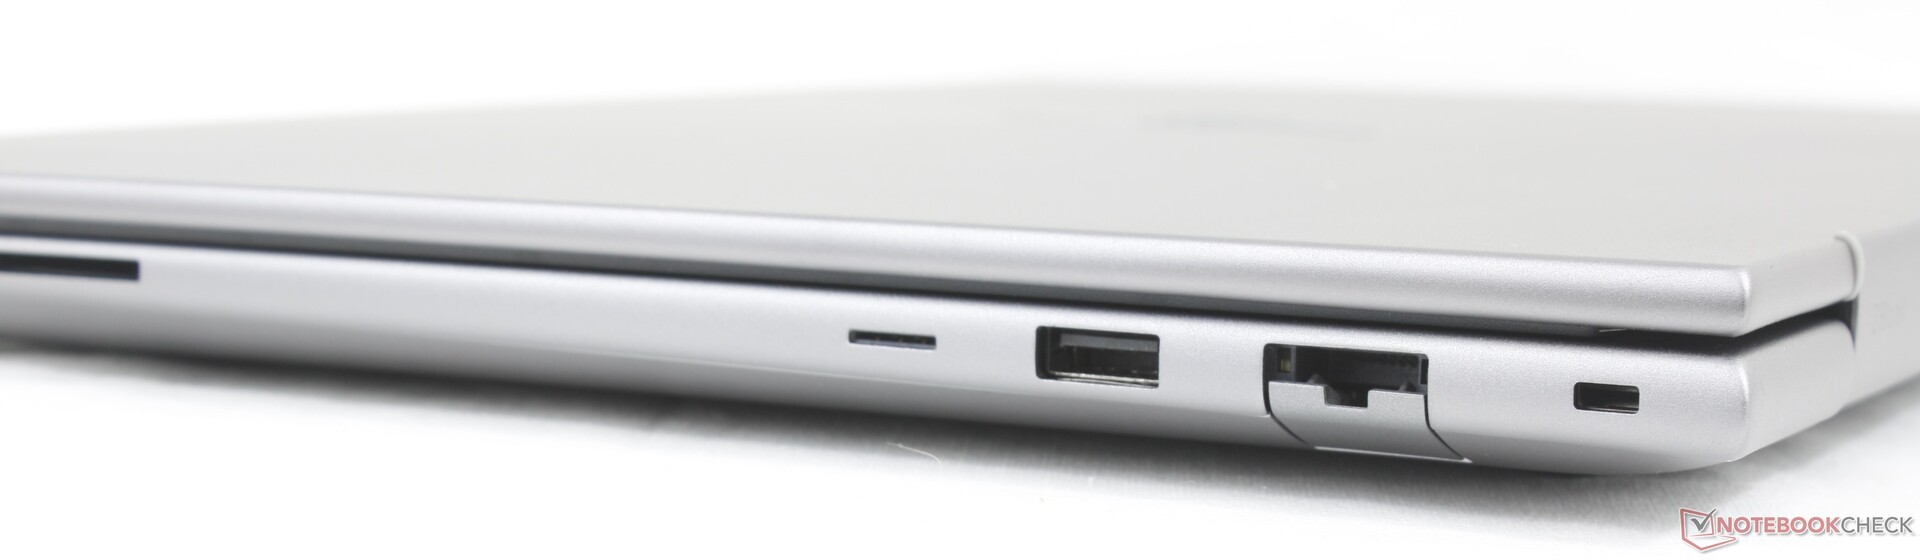
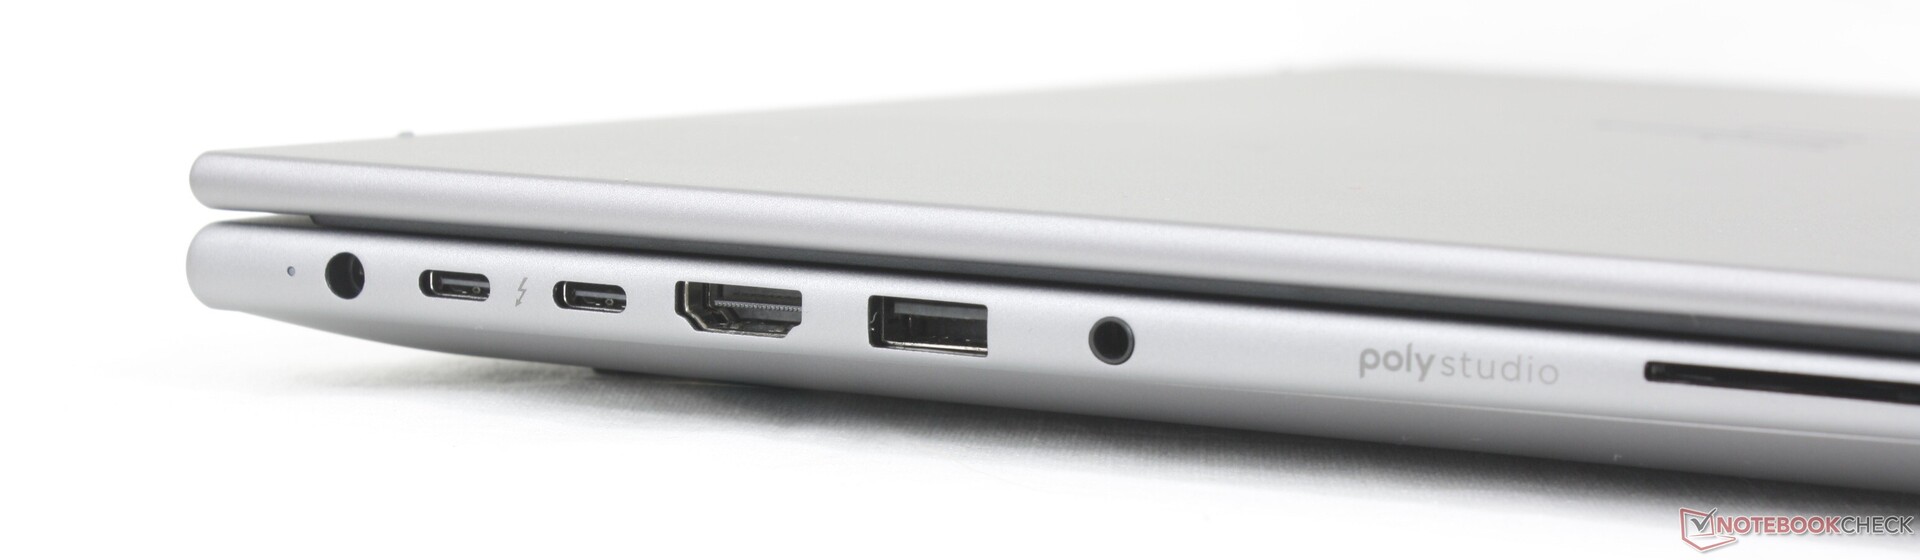
Connectivity
When compared to the ZBook Studio 16 G11, the ZBook X G1i 16 includes additional ports like RJ-45, HDMI, and more USB-A ports. However, it features no USB-C ports along the right edge.

SD Card Reader
| SD Card Reader | |
| average JPG Copy Test (av. of 3 runs) | |
| HP ZBook X G1i 16 (Toshiba Exceria Pro SDXC 64 GB UHS-II) | |
| HP ZBook Power 16 G11 A (Toshiba Exceria Pro SDXC 64 GB UHS-II) | |
| Lenovo ThinkPad P16 Gen 2 (Toshiba Exceria Pro SDXC 64 GB UHS-II) | |
| Dell Pro Max 16 Plus (Toshiba Exceria Pro SDXC 64 GB UHS-II) | |
| maximum AS SSD Seq Read Test (1GB) | |
| HP ZBook Power 16 G11 A (Toshiba Exceria Pro SDXC 64 GB UHS-II) | |
| HP ZBook X G1i 16 (Toshiba Exceria Pro SDXC 64 GB UHS-II) | |
| Dell Pro Max 16 Plus (Toshiba Exceria Pro SDXC 64 GB UHS-II) | |
| Lenovo ThinkPad P16 Gen 2 (Toshiba Exceria Pro SDXC 64 GB UHS-II) | |
Communication
Webcam
Webcam options include 2 MP or 5 MP with IR and a physical shutter.


Maintenance
HP provides disassembly videos and written guides for servicing the ZBook X G1i 16.
Sustainability
All HP Z workstations are certified EPEAT Gold or Silver and incorporate ocean-bound and recycled plastics or metals during the manufacturing process.
Accessories And Warranty
There are no extras in the box other than the AC adapter and paperwork. A three-year limited warranty comes standard if purchased through the manufacturer website.
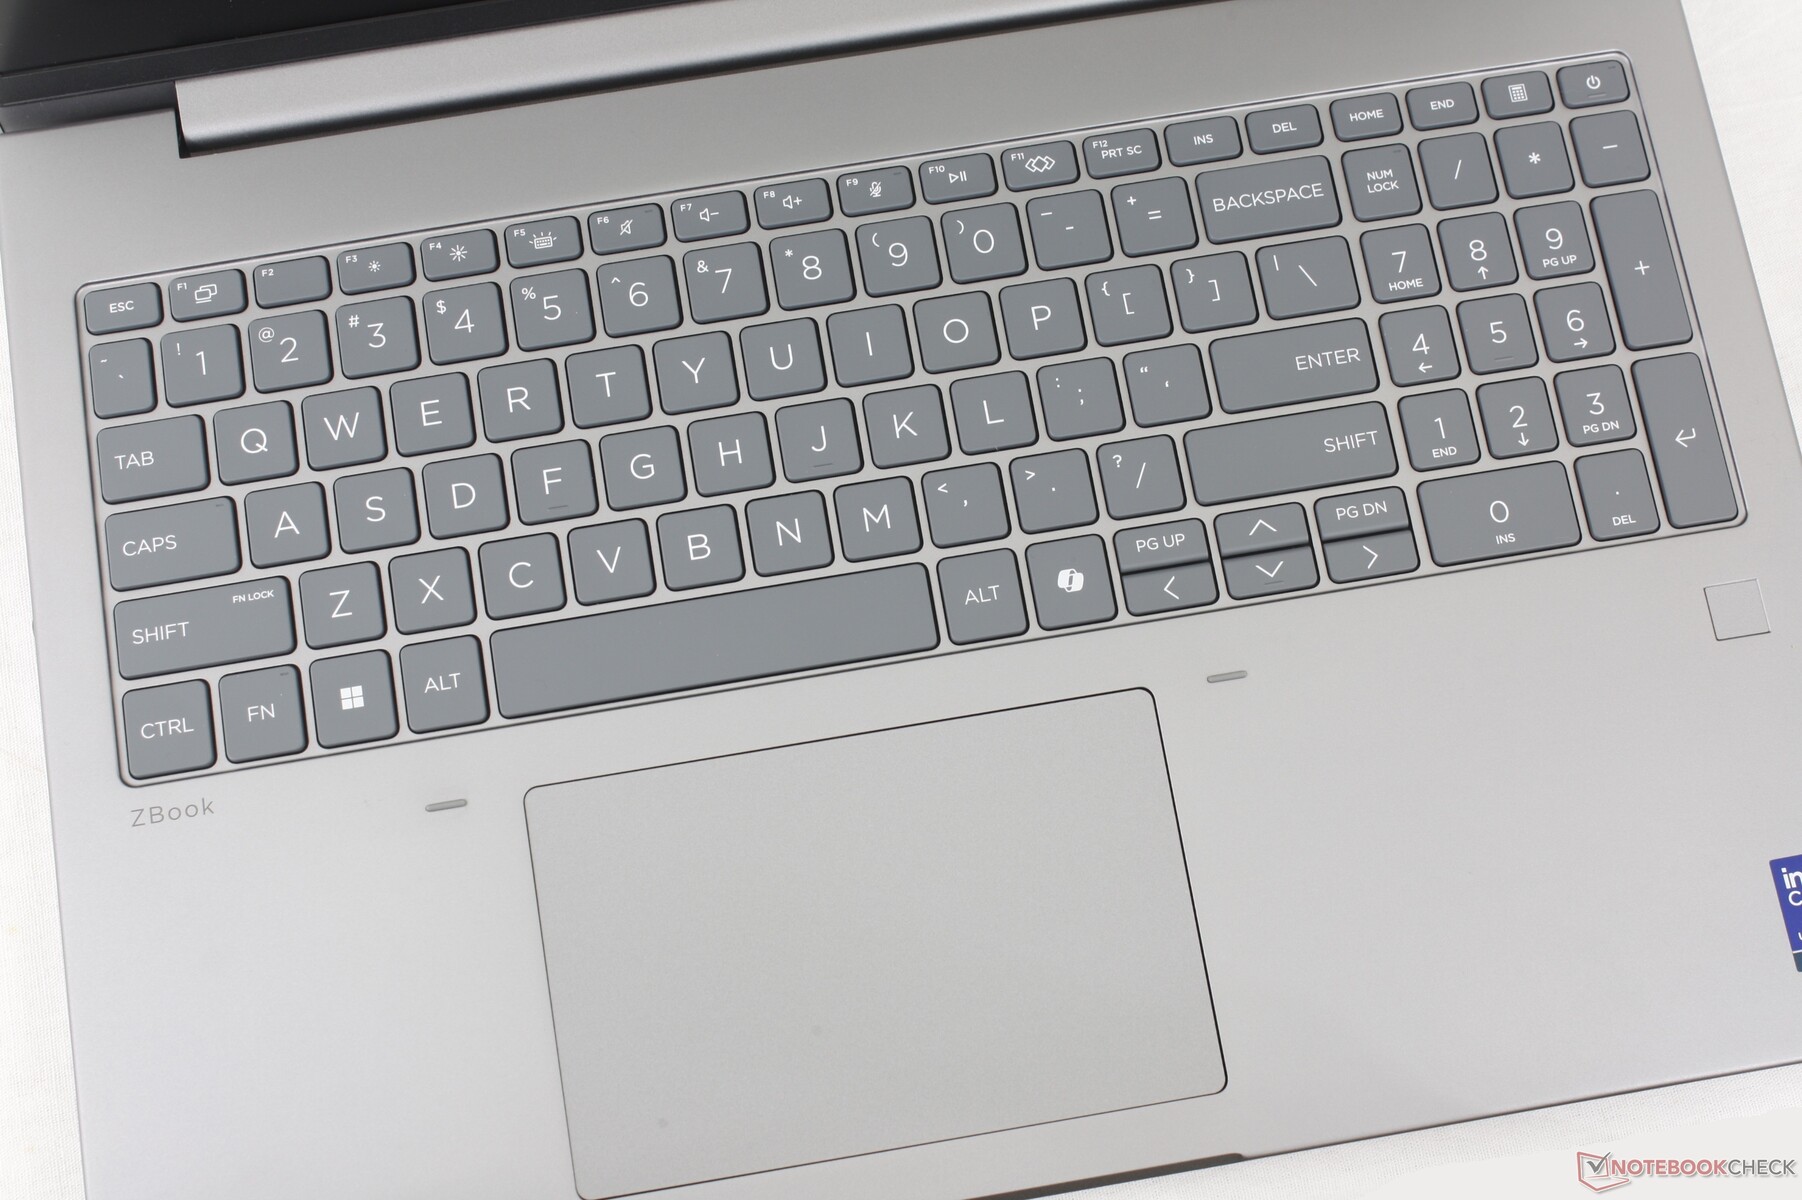
Input Devices
The typing experience is similar to the older ZBook Fury 16 G9 as keyboard layout has changed little across the ZBook generations. On the ZBook X G1i 16, however, HP has removed the dedicated mouse buttons without increasing surface area (12 x 8 cm vs. 12.4 x 8.3 cm on the ZBook Fury 16 G9).
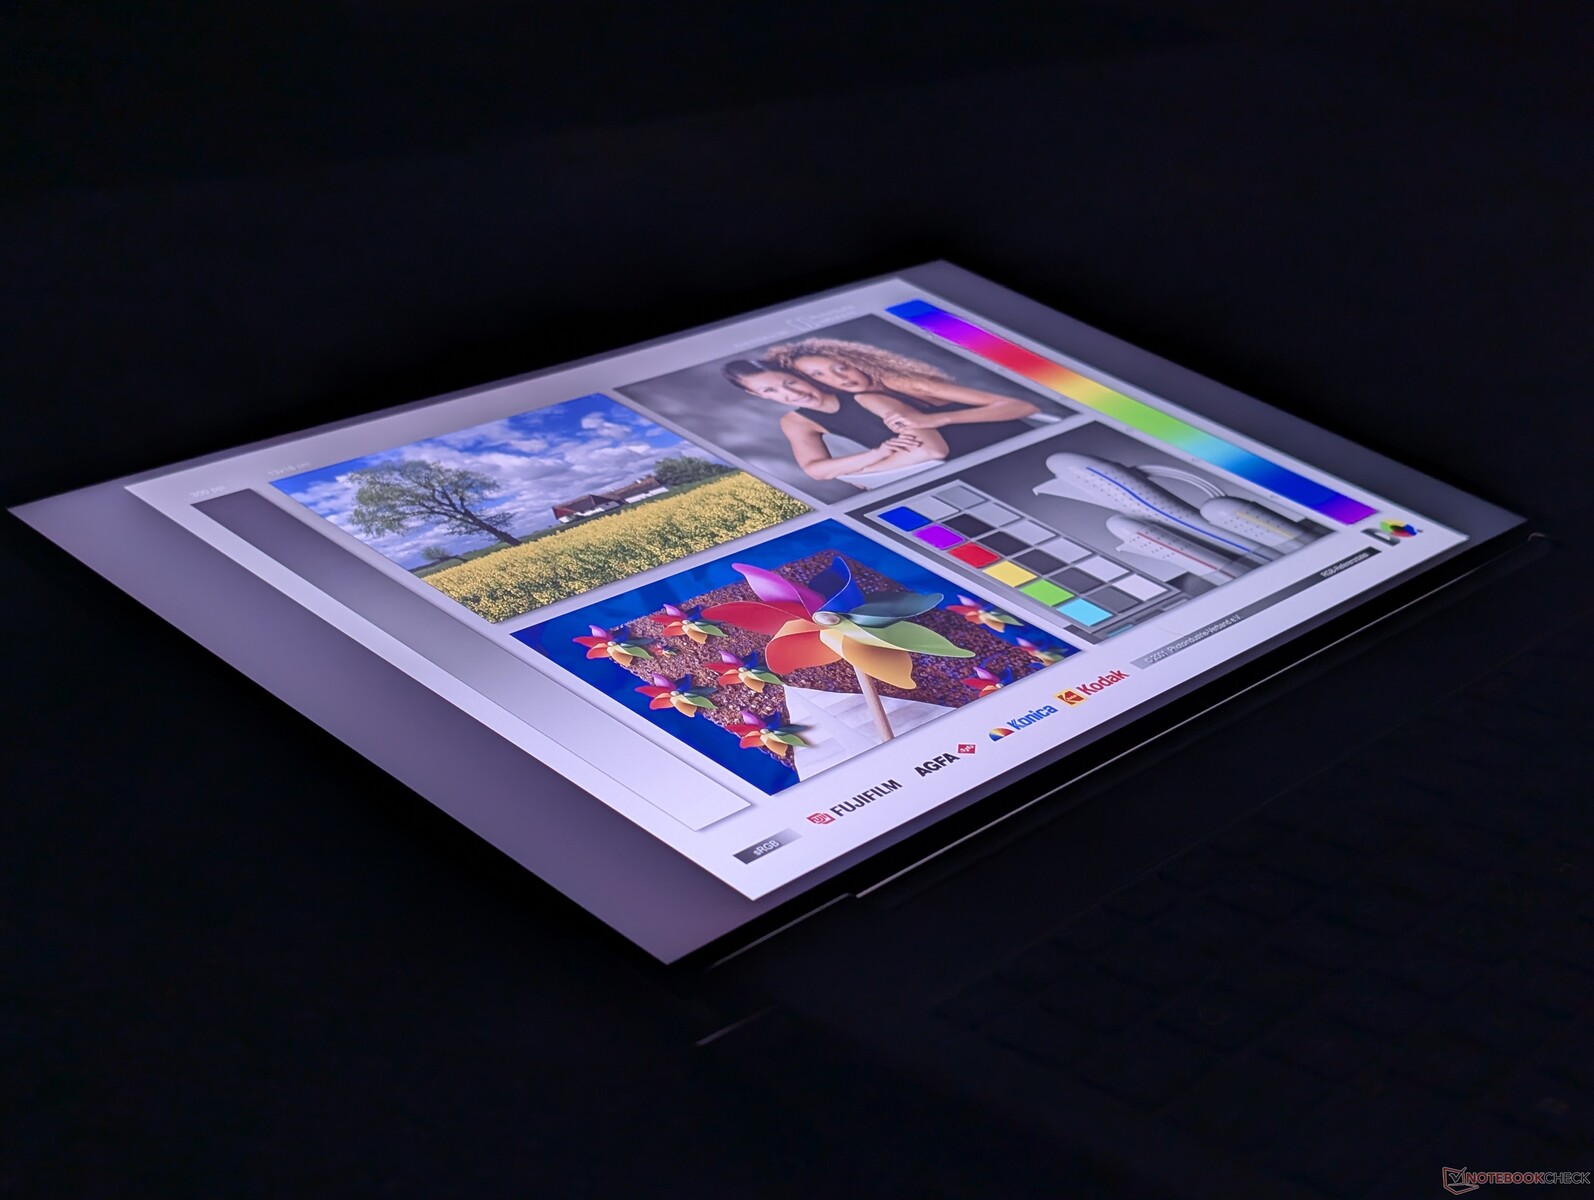
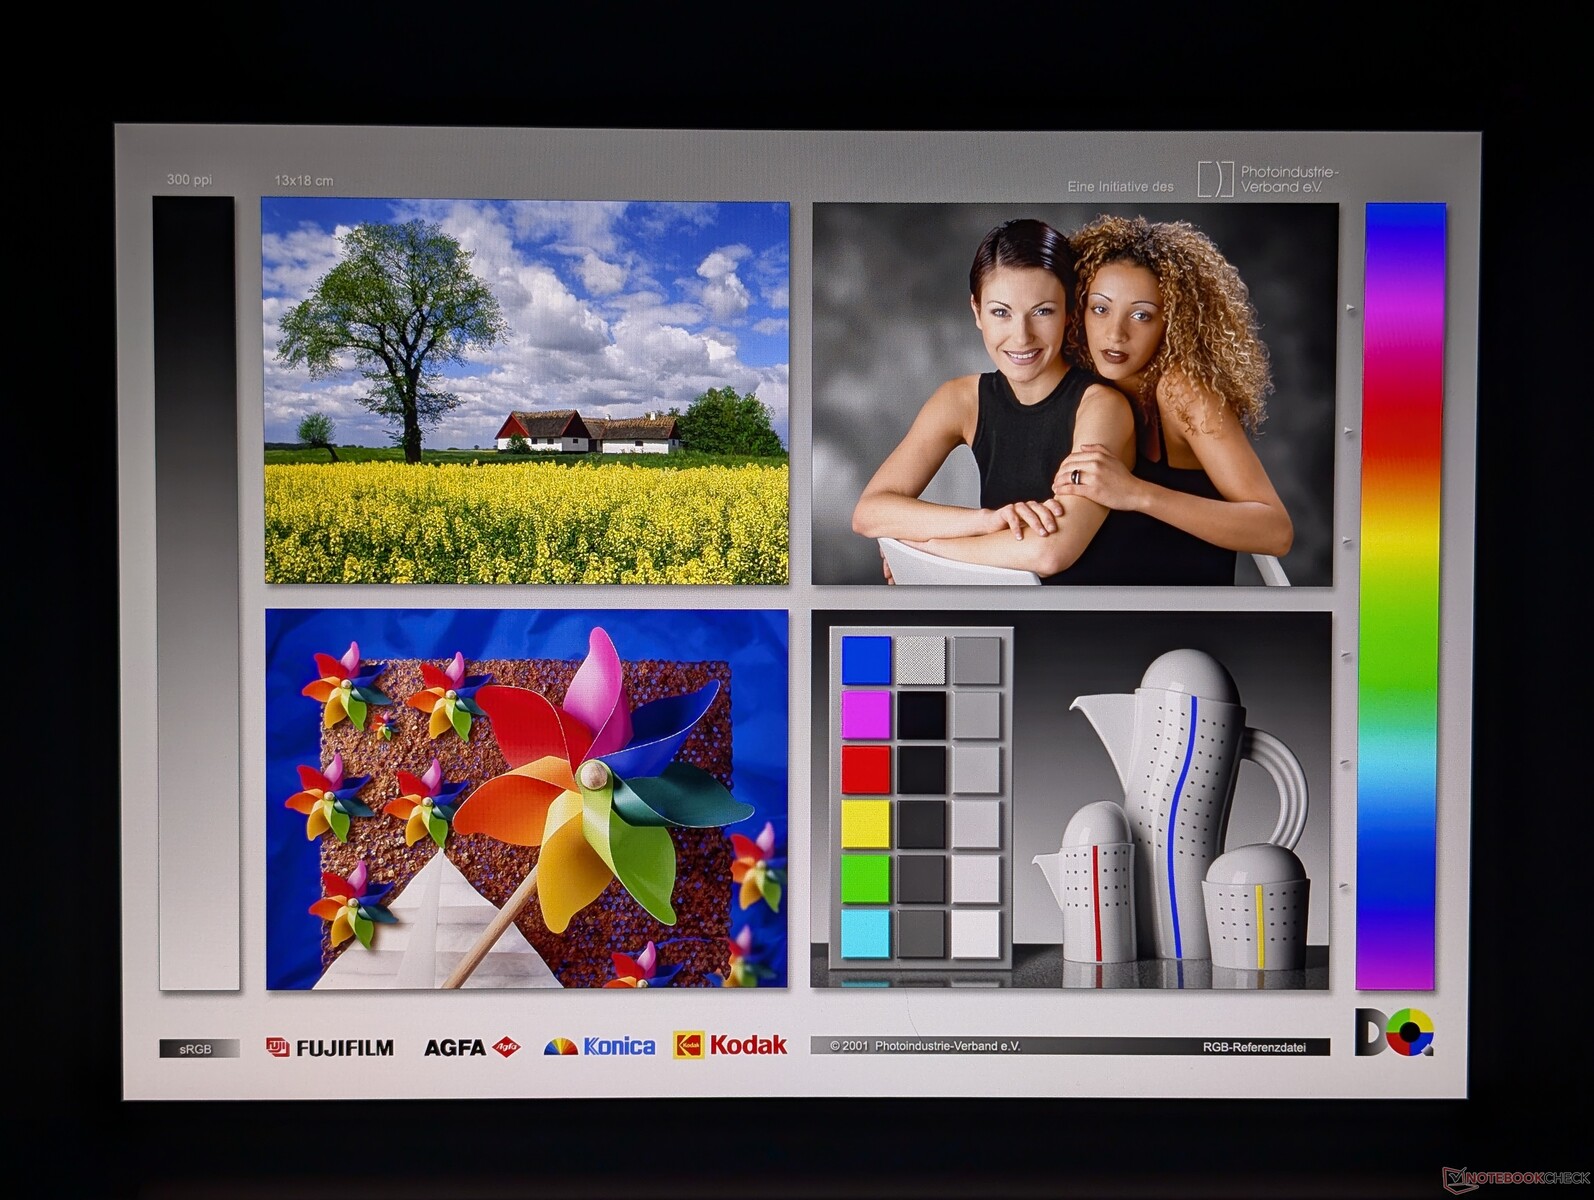
Display
There are six IPS display options available ranging from 1200p60 and 300 nits up to 2400p120 and 500 nits with full DCI-P3 colors. Our test unit ships with the middle 1600p 120 Hz matte option which still offers P3 colors but no touchscreen or Sure View capabilities. In fact, the latter is only available on the 1200p non-touch panel.
Note that there are no OLED options or HDR support for this model. If color accuracy is important, then we recommend avoiding some lower-end 1200p options as they offer only ~60% of sRGB colors.

| |||||||||||||||||||||||||
Brightness Distribution: 88 %
Center on Battery: 461.8 cd/m²
Contrast: 1004:1 (Black: 0.46 cd/m²)
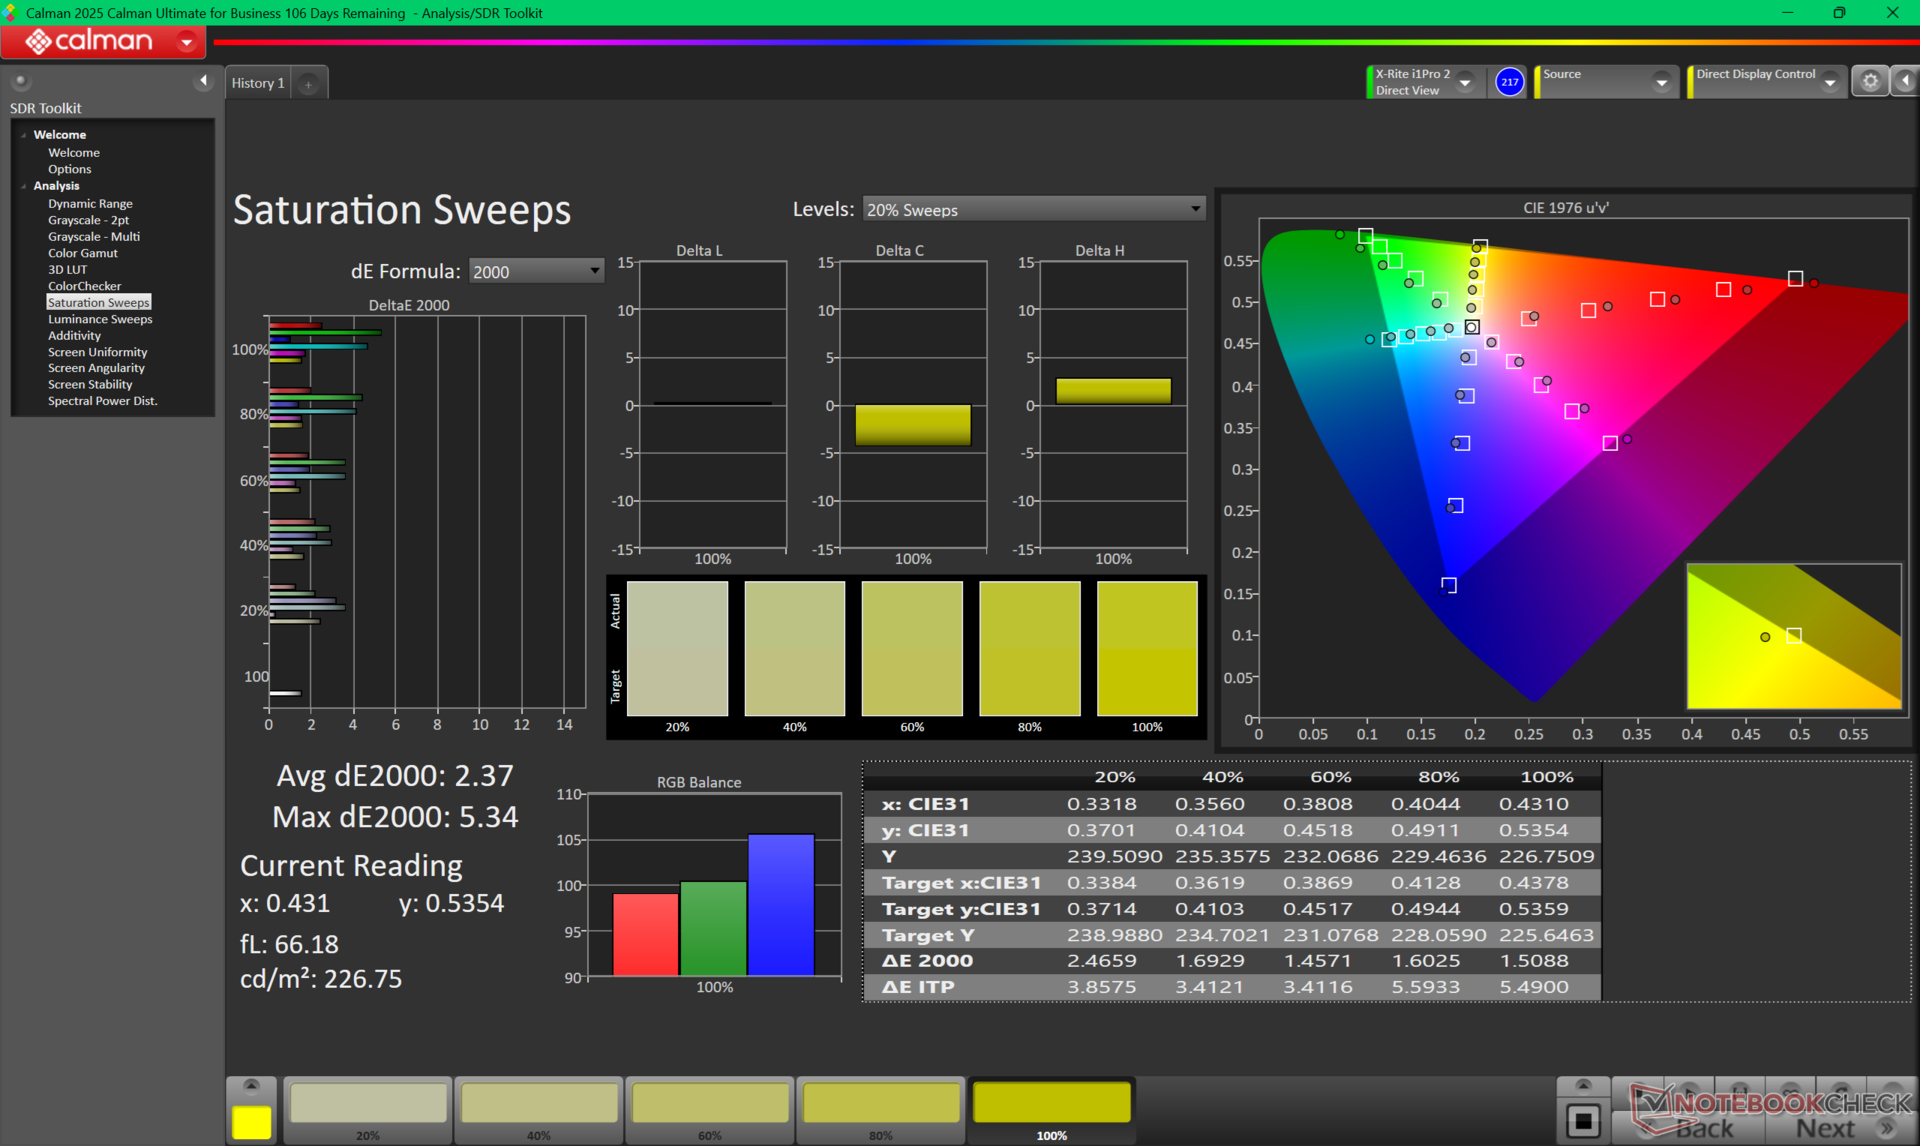
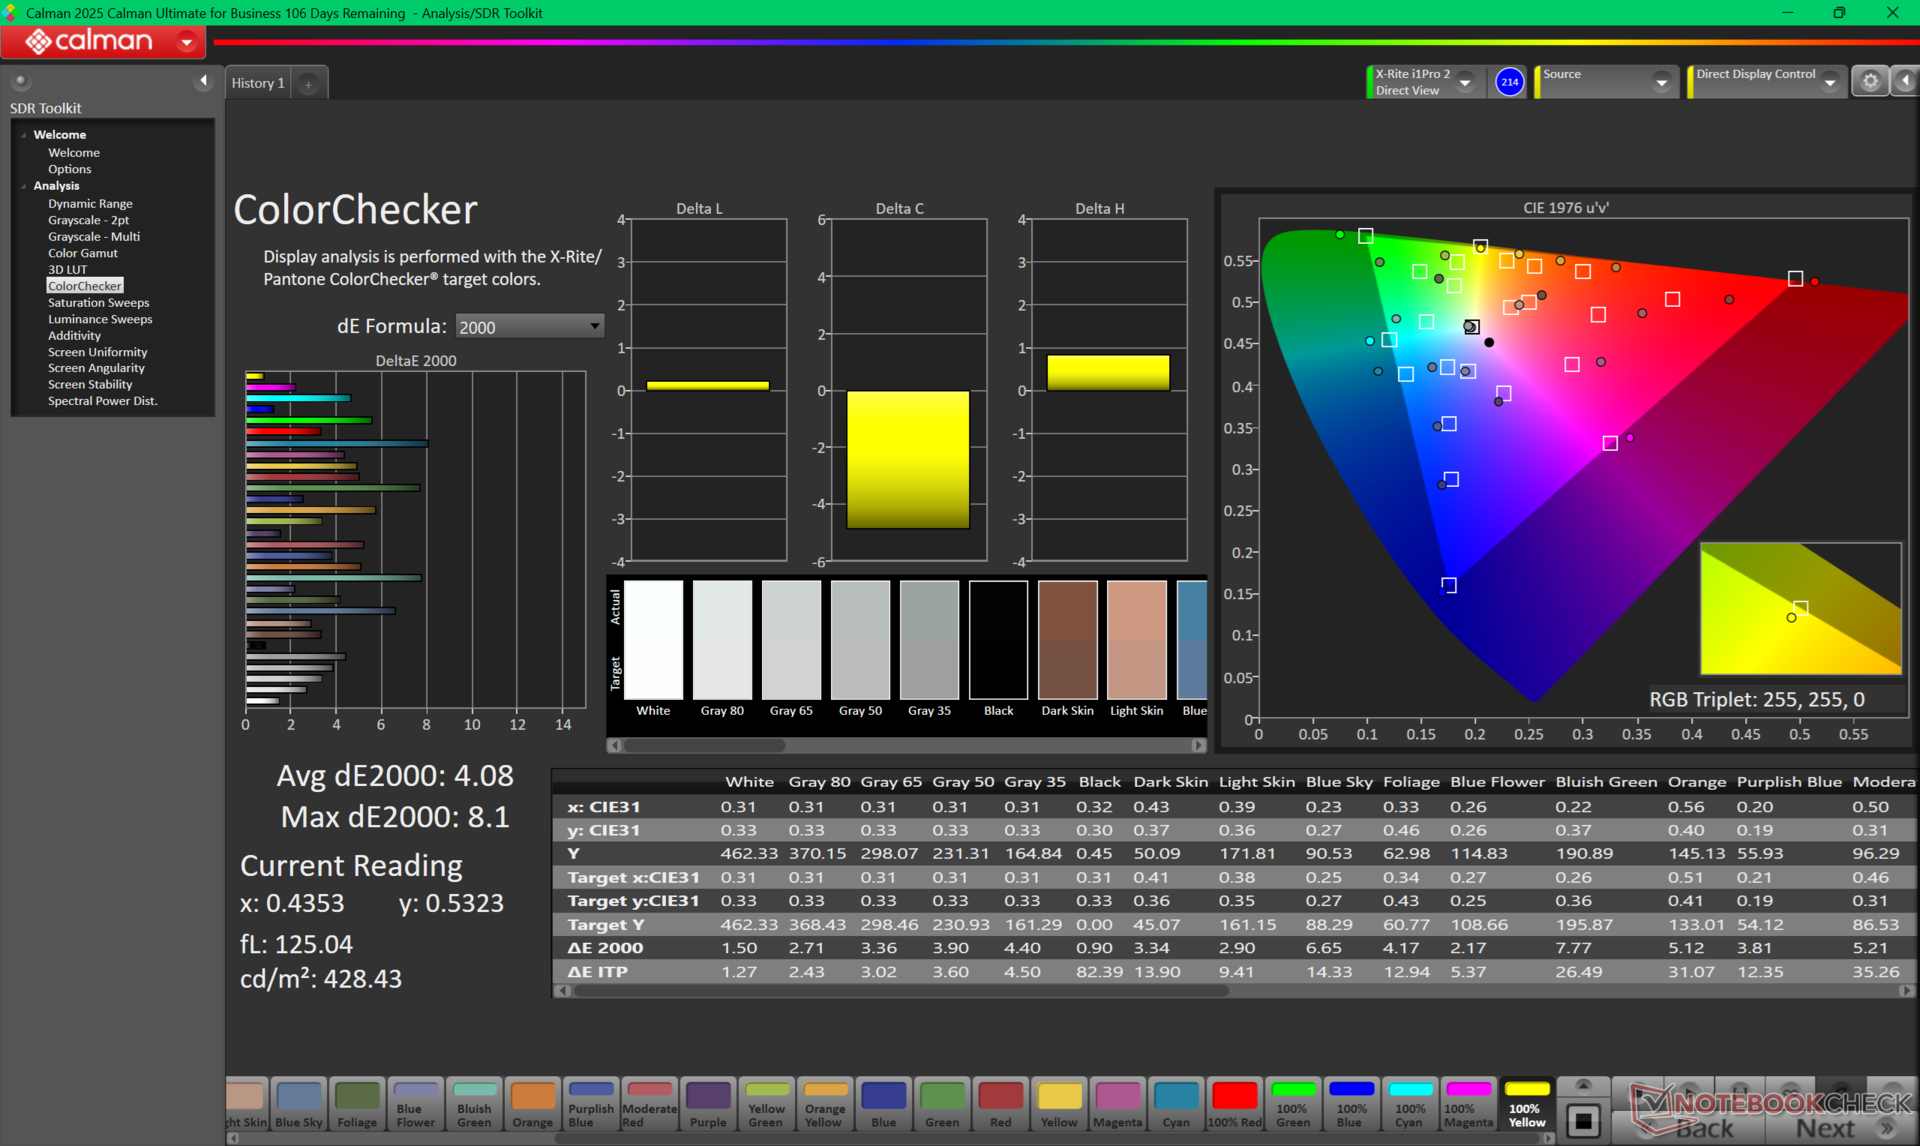
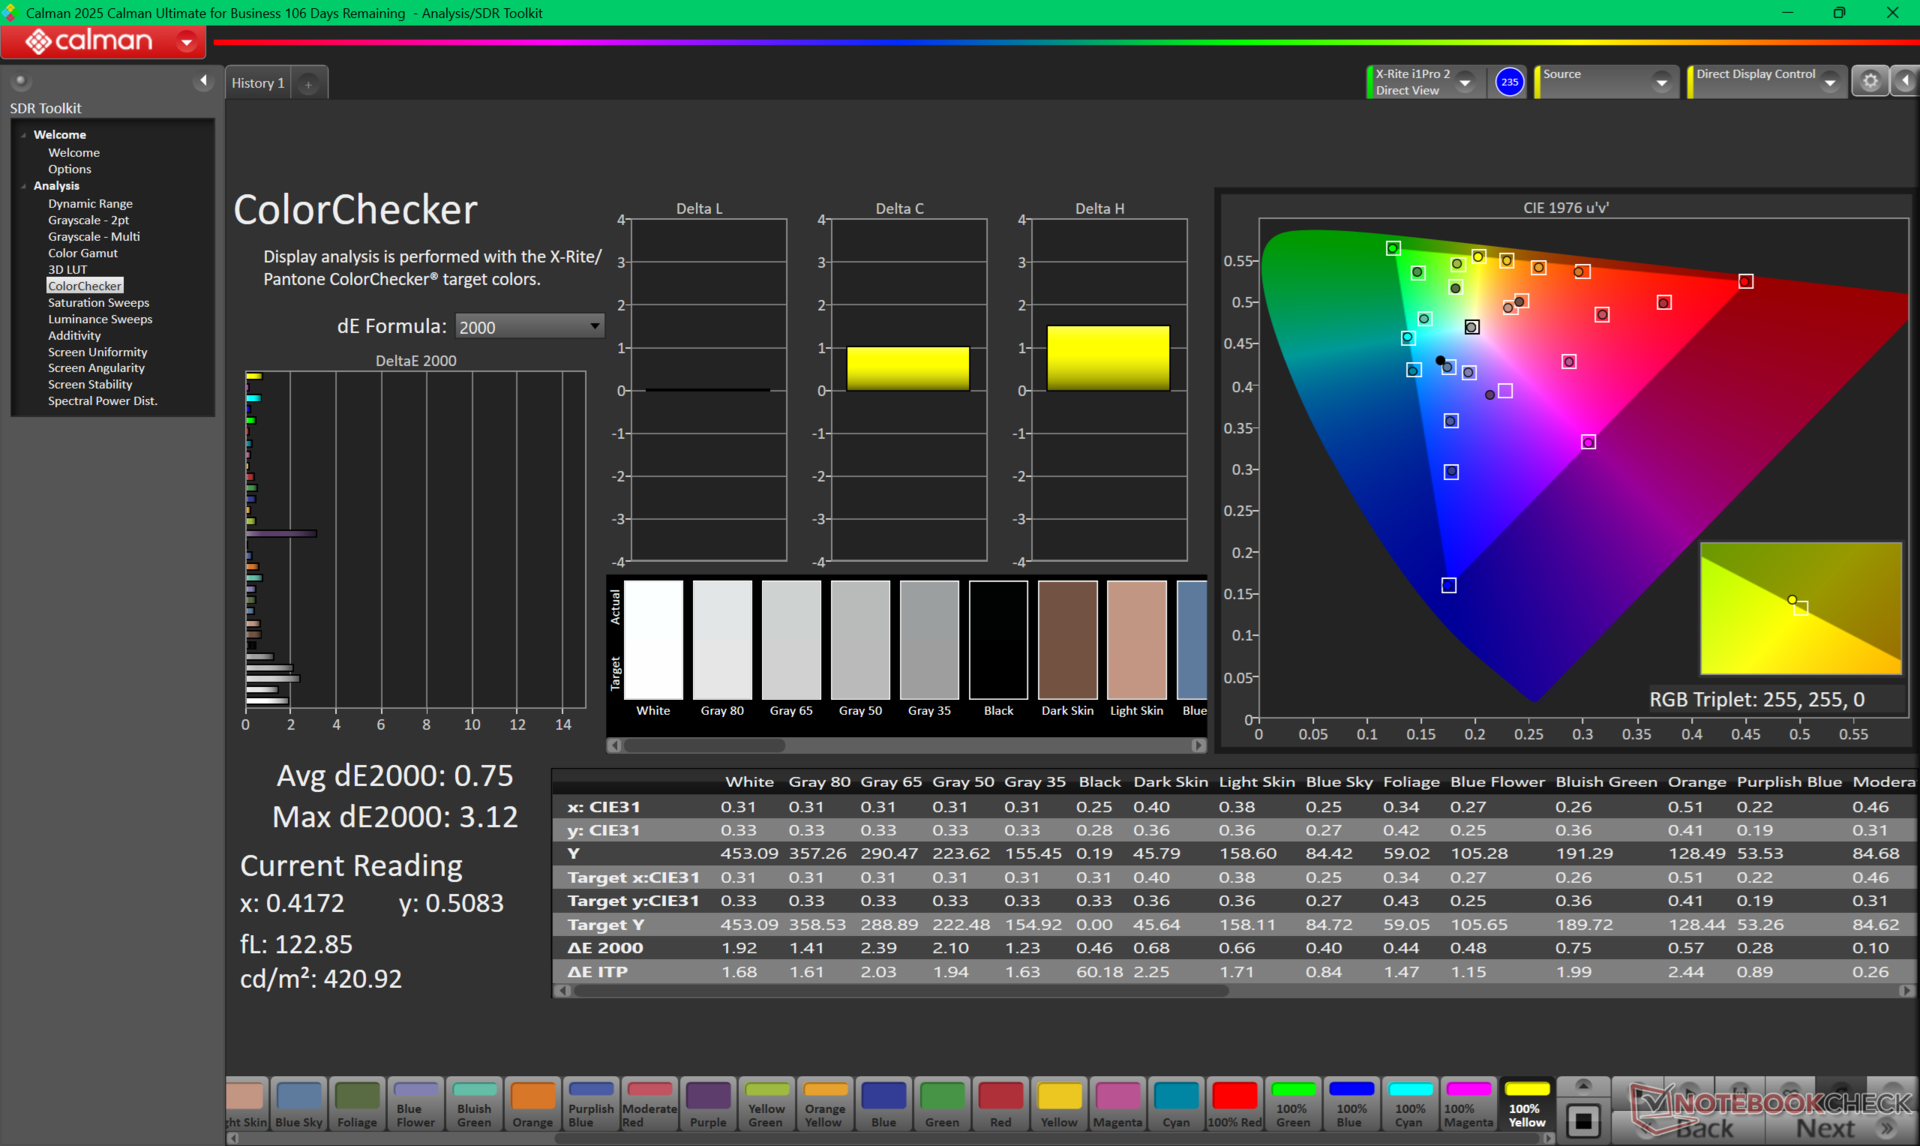
ΔE ColorChecker Calman: 4.08 | ∀{0.5-29.43 Ø4.72}
calibrated: 0.75
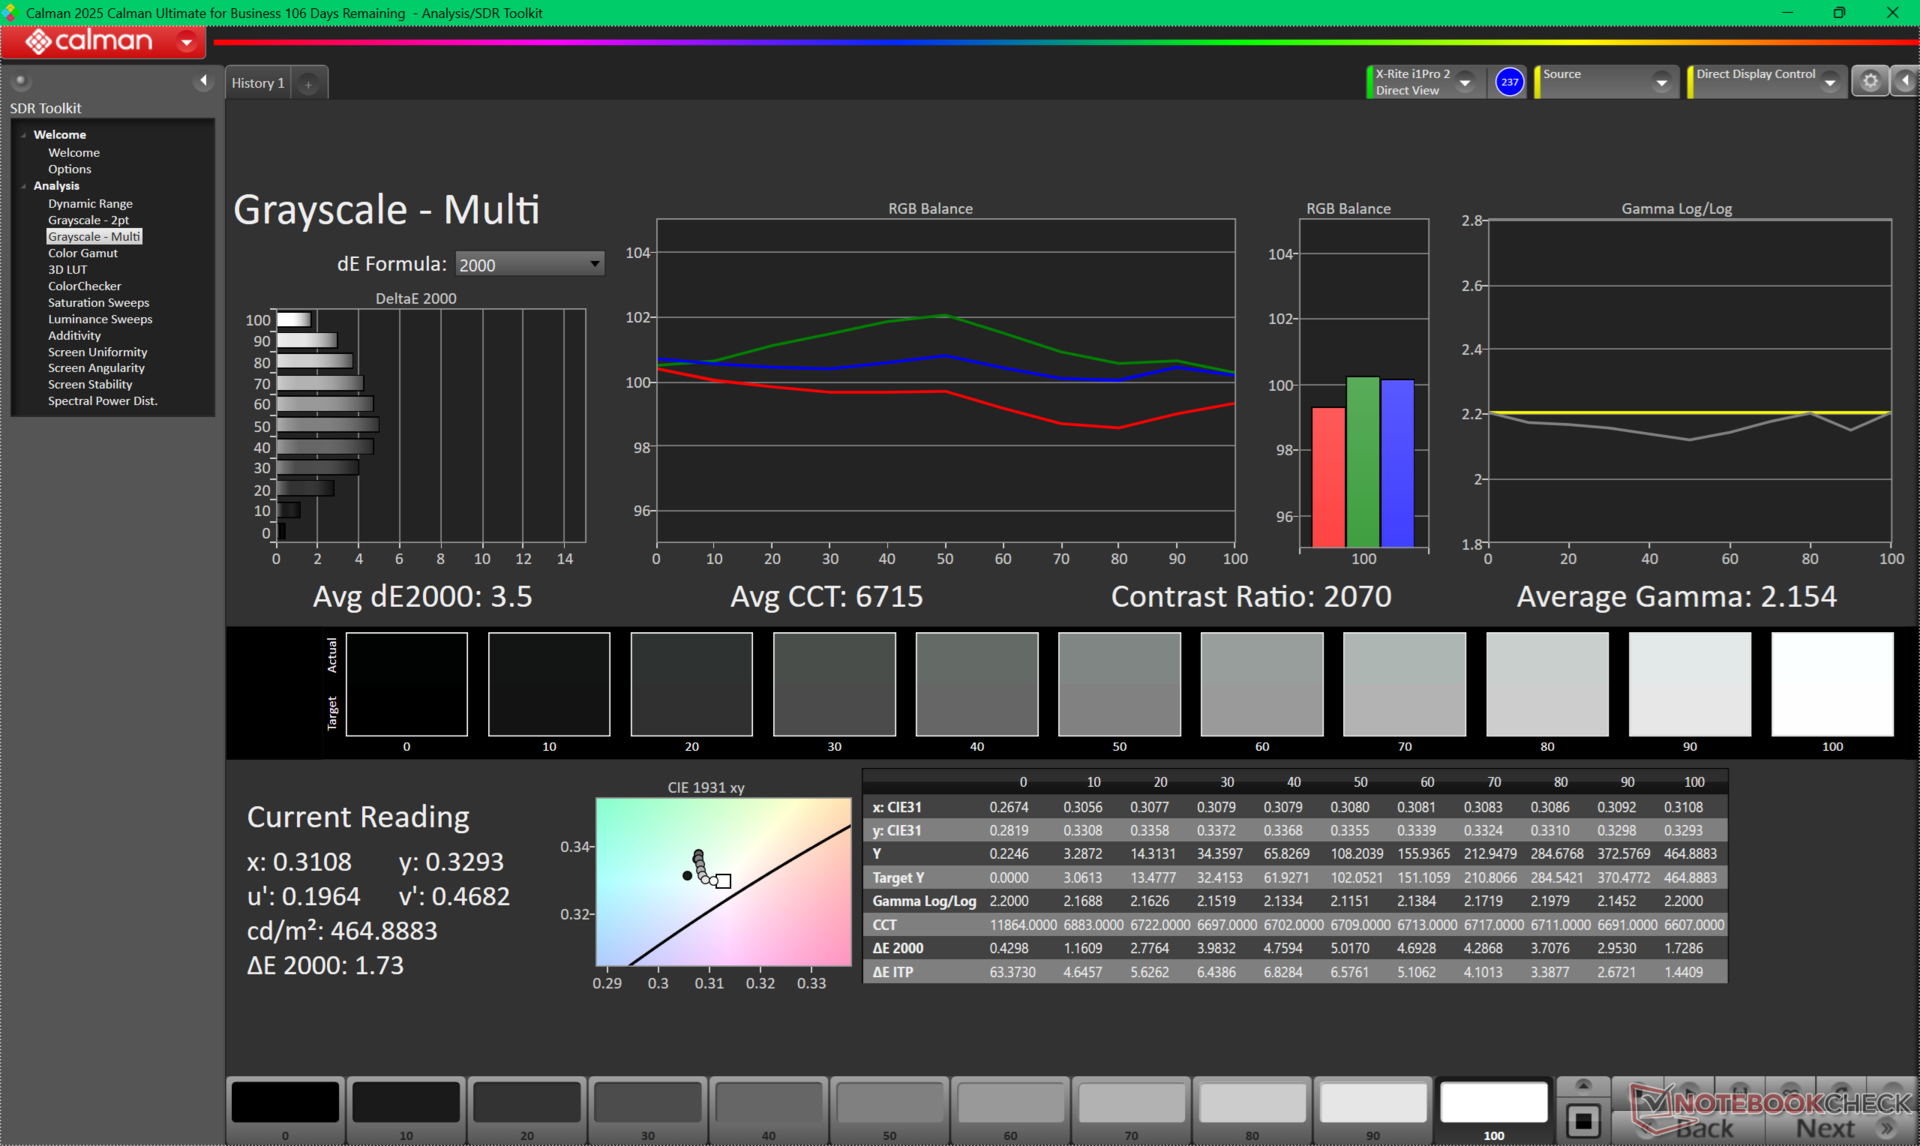
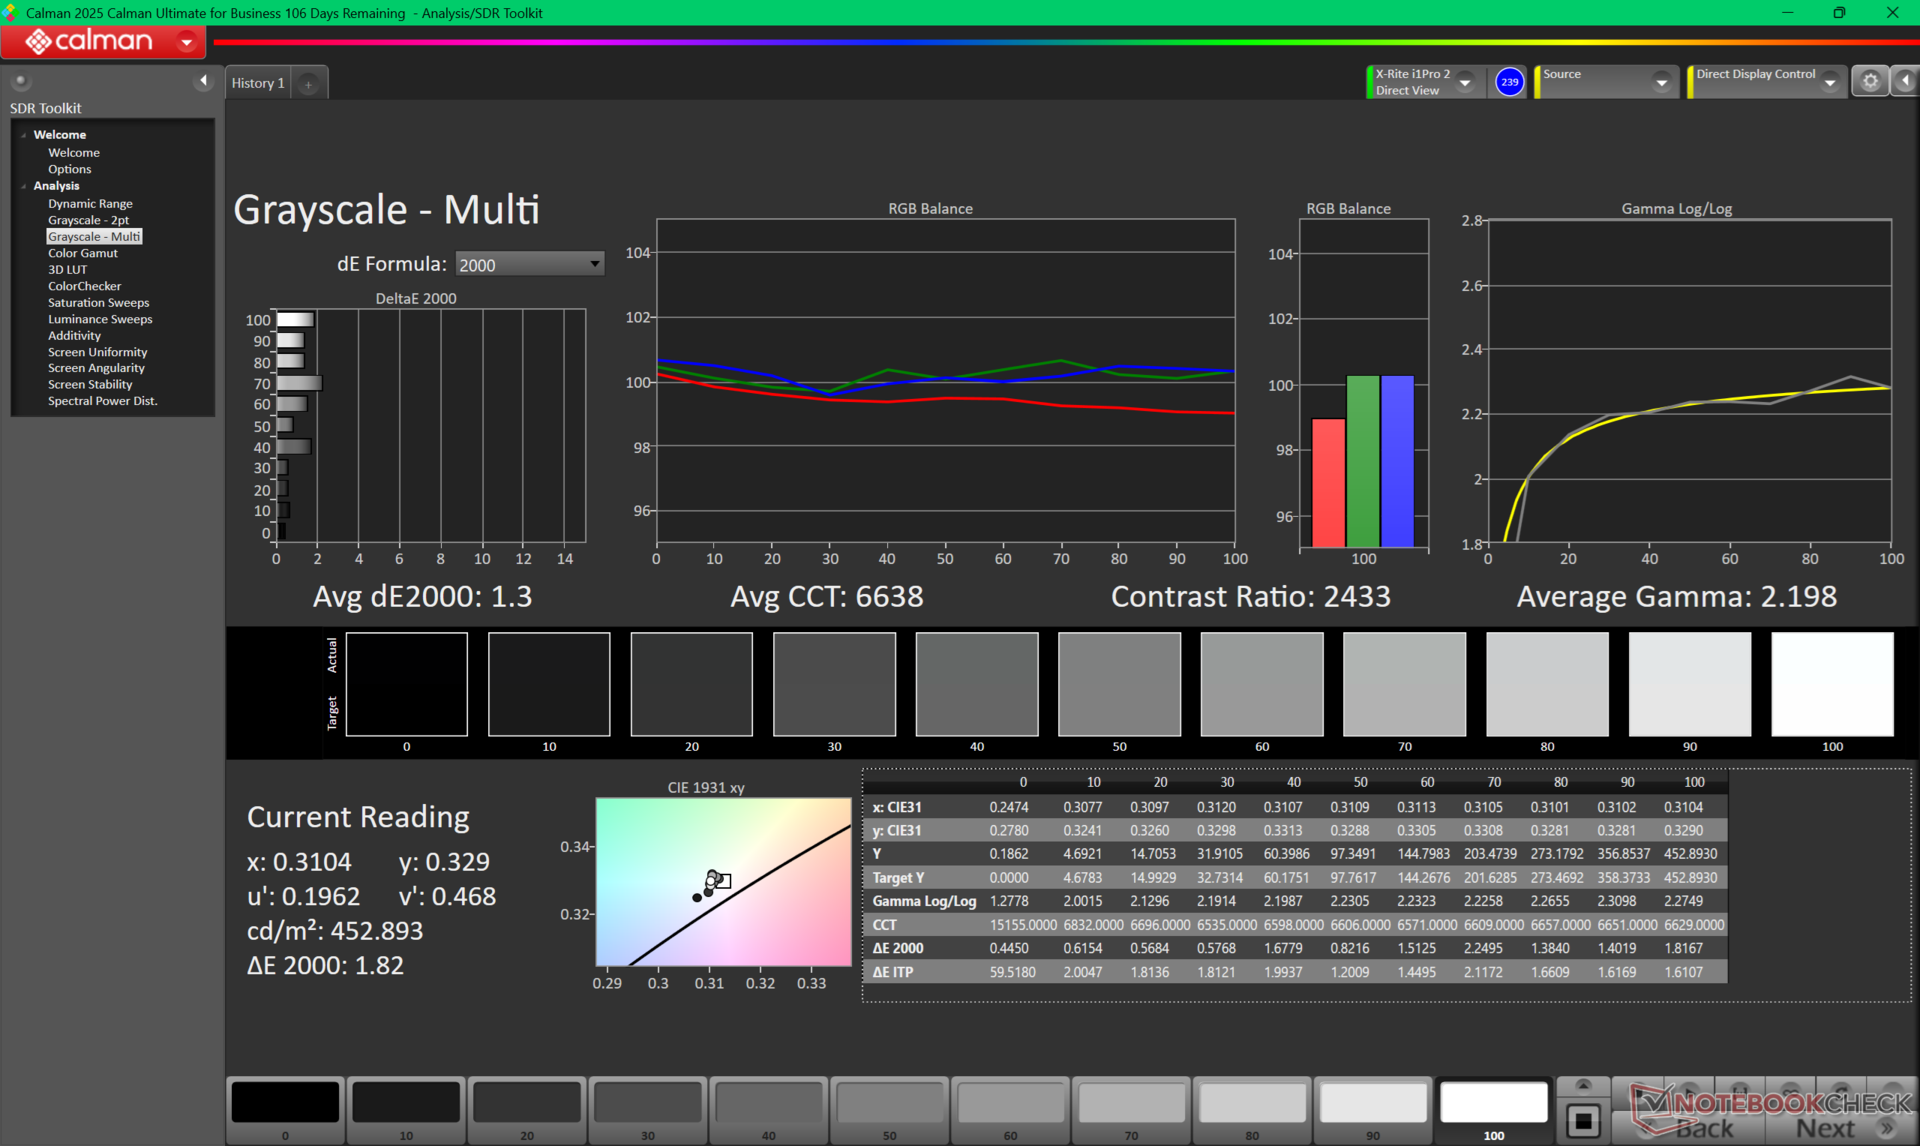
ΔE Greyscale Calman: 3.5 | ∀{0.09-98 Ø4.97}
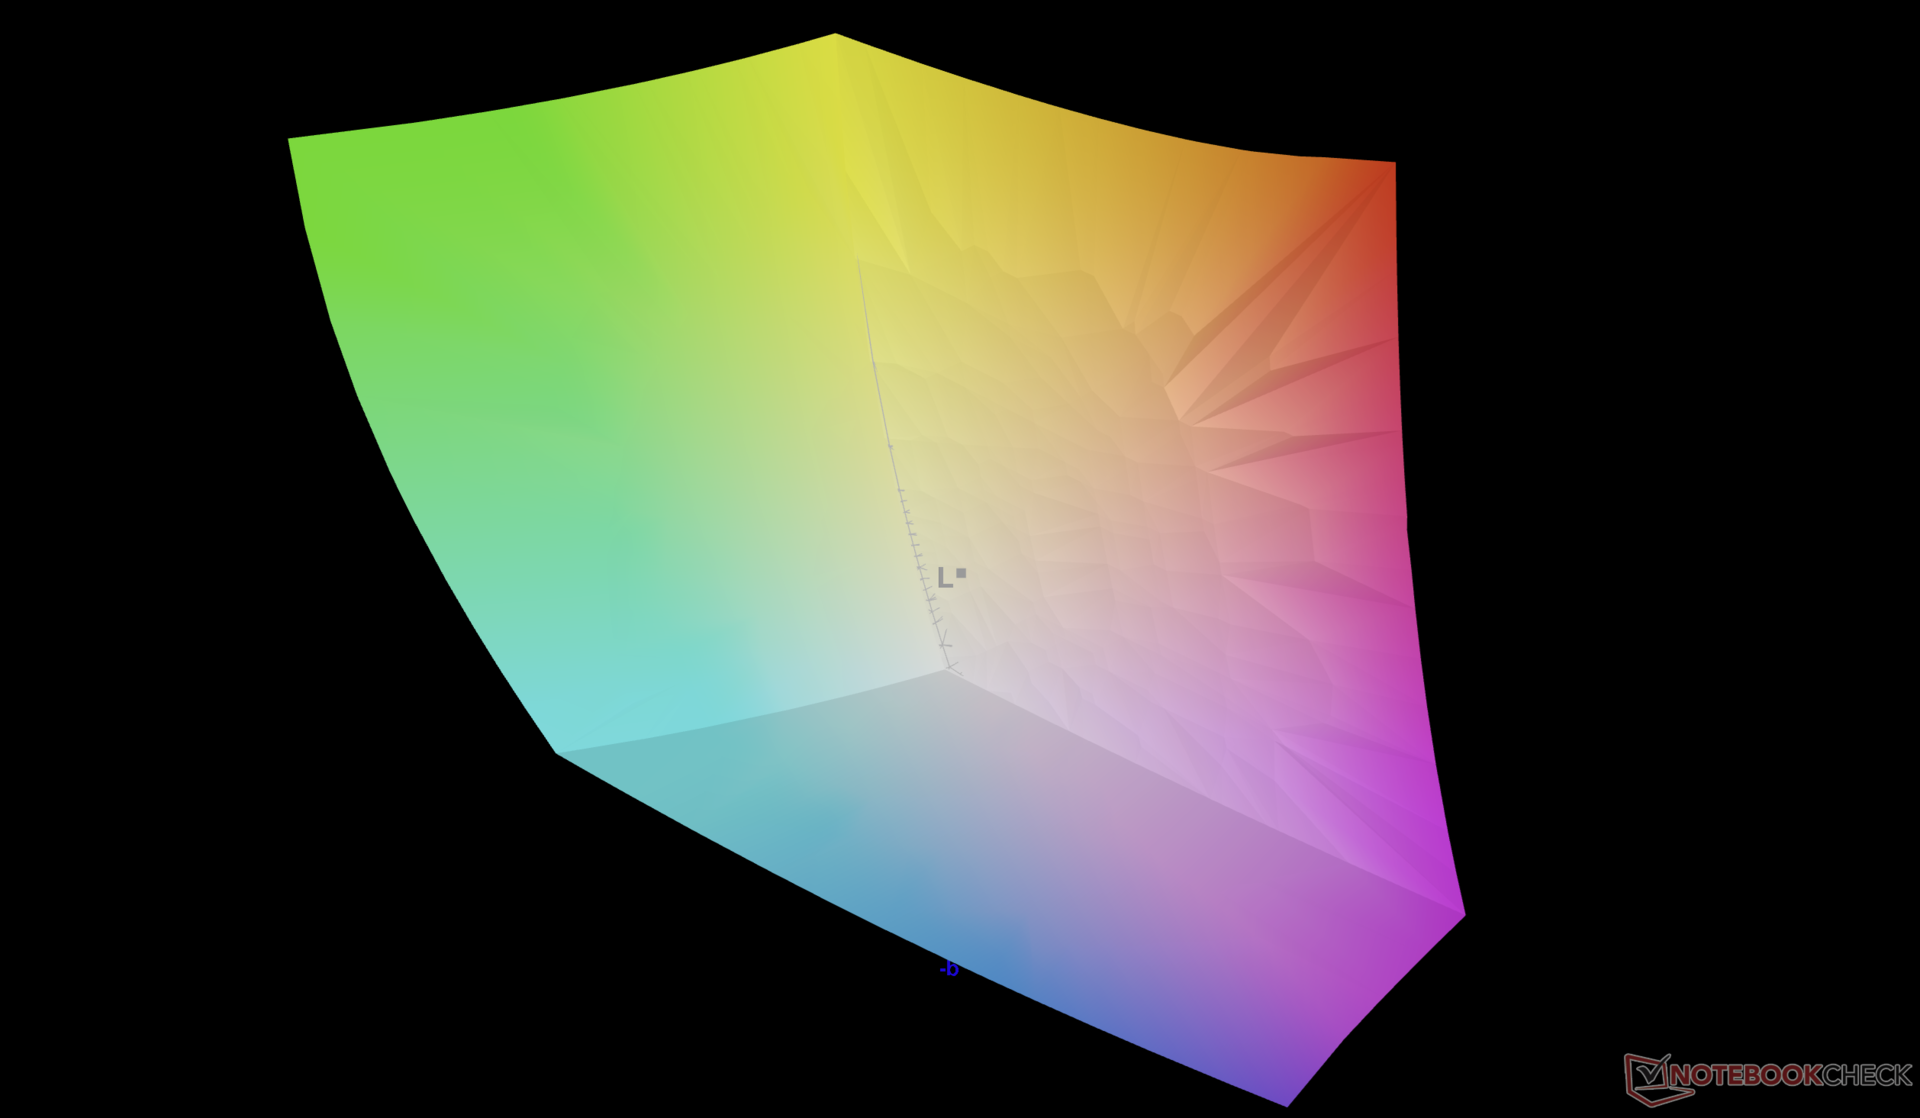
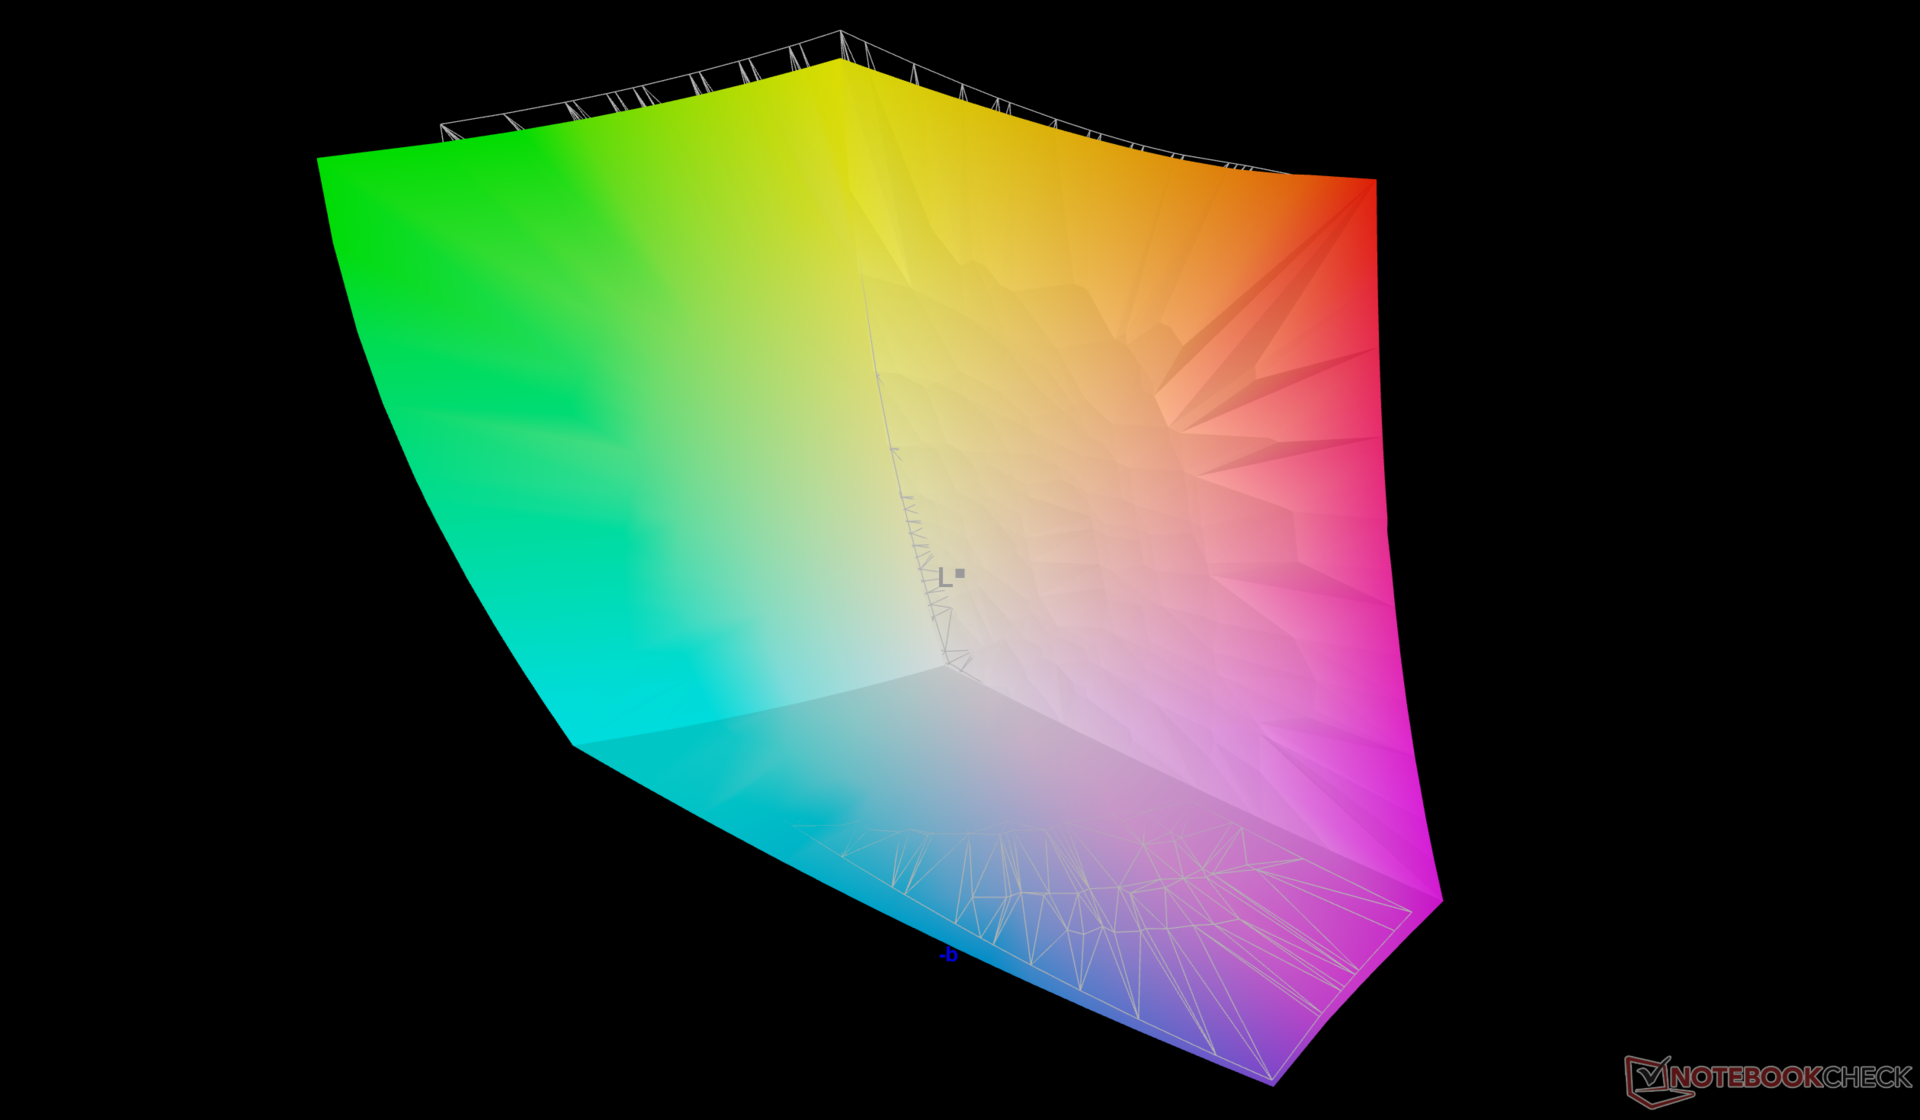
99.9% AdobeRGB 1998 (Argyll 3D)
100% sRGB (Argyll 3D)
97.2% Display P3 (Argyll 3D)
Gamma: 2.15
CCT: 6715 K
| HP ZBook X G1i 16 LG Philips LGD07B3, IPS, 2560x1600, 16", 120 Hz | HP ZBook Power 16 G11 A AUOA0A9, IPS, 2560x1600, 16", 120 Hz | HP ZBook Studio 16 G11 AUO87A8, IPS, 3840x2400, 16", 120 Hz | Lenovo ThinkPad P16 Gen 2 NE160QDM-NY1, IPS, 2560x1600, 16", 165 Hz | Dell Pro Max 16 Plus Samsung 160HC01, OLED, 3840x2400, 16", 120 Hz | Dell Precision 5690 Samsung 160YV03, OLED, 3840x2400, 16", 60 Hz | |
|---|---|---|---|---|---|---|
| Display | -20% | -4% | -21% | -4% | 0% | |
| Display P3 Coverage (%) | 97.2 | 69.1 -29% | 97.7 1% | 68.4 -30% | 97.3 0% | 99.8 3% |
| sRGB Coverage (%) | 100 | 97.7 -2% | 99.9 0% | 96.9 -3% | 100 0% | 100 0% |
| AdobeRGB 1998 Coverage (%) | 99.9 | 71 -29% | 85.7 -14% | 70.6 -29% | 88.8 -11% | 96.6 -3% |
| Response Times | 69% | 64% | 66% | 79% | 95% | |
| Response Time Grey 50% / Grey 80% * (ms) | 45.5 ? | 13.6 ? 70% | 14.2 ? 69% | 14.1 ? 69% | 0.63 ? 99% | 1.7 ? 96% |
| Response Time Black / White * (ms) | 26.1 ? | 8.4 ? 68% | 10.6 ? 59% | 9.9 ? 62% | 0.89 ? 97% | 1.7 ? 93% |
| PWM Frequency (Hz) | 26536 ? | 479.9 ? | 60 ? | |||
| PWM Amplitude * (%) | 47 | 28 40% | ||||
| Screen | -4% | 11% | 31% | 29% | 1% | |
| Brightness middle (cd/m²) | 461.8 | 470.7 2% | 404.3 -12% | 531.5 15% | 530.9 15% | 348.1 -25% |
| Brightness (cd/m²) | 427 | 431 1% | 405 -5% | 499 17% | 540 26% | 351 -18% |
| Brightness Distribution (%) | 88 | 88 0% | 92 5% | 89 1% | 95 8% | 97 10% |
| Black Level * (cd/m²) | 0.46 | 0.57 -24% | 0.28 39% | 0.38 17% | ||
| Contrast (:1) | 1004 | 826 -18% | 1444 44% | 1399 39% | ||
| Colorchecker dE 2000 * | 4.08 | 2.16 47% | 2.63 36% | 1.82 55% | 2.42 41% | 4.18 -2% |
| Colorchecker dE 2000 max. * | 8.1 | 4.39 46% | 4.48 45% | 4.1 49% | 5.76 29% | 6.68 18% |
| Colorchecker dE 2000 calibrated * | 0.75 | 1.37 -83% | 1.46 -95% | 0.63 16% | 0.7 7% | 0.97 -29% |
| Greyscale dE 2000 * | 3.5 | 3.7 -6% | 2.1 40% | 1.2 66% | 0.8 77% | 1.7 51% |
| Gamma | 2.15 102% | 2.38 92% | 2.3 96% | 2.15 102% | 2.23 99% | 2.2 100% |
| CCT | 6715 97% | 6765 96% | 6810 95% | 6484 100% | 6488 100% | 6198 105% |
| Total Average (Program / Settings) | 15% /
3% | 24% /
15% | 25% /
25% | 35% /
33% | 32% /
16% |
* ... smaller is better
Display Response Times
| ↔ Response Time Black to White | ||
|---|---|---|
| 26.1 ms ... rise ↗ and fall ↘ combined | ↗ 11.8 ms rise | 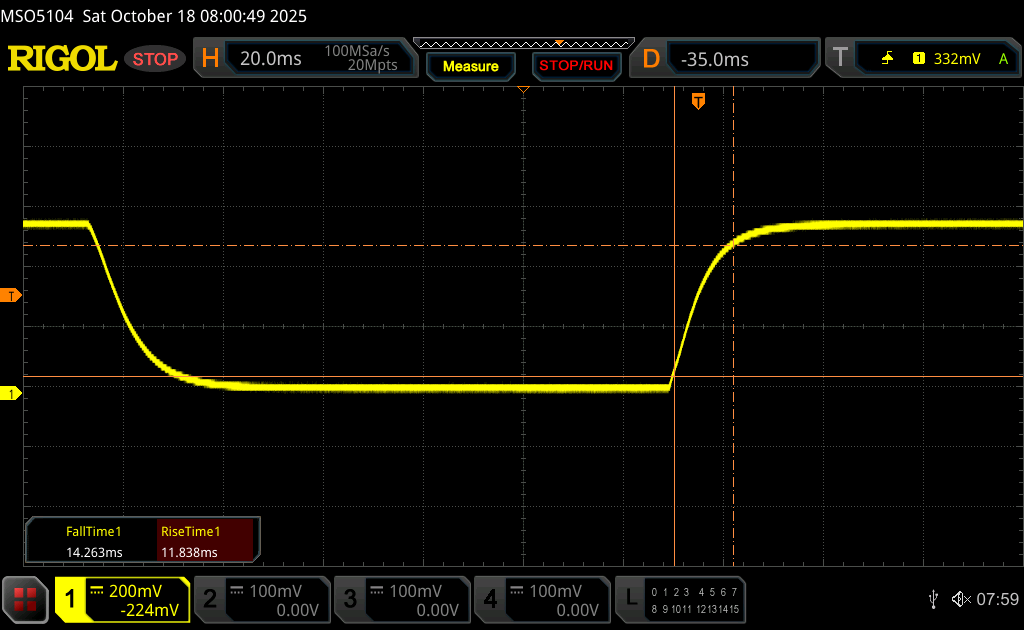 |
| ↘ 14.3 ms fall | ||
| The screen shows relatively slow response rates in our tests and may be too slow for gamers. In comparison, all tested devices range from 0.1 (minimum) to 240 (maximum) ms. » 65 % of all devices are better. This means that the measured response time is worse than the average of all tested devices (19.8 ms). | ||
| ↔ Response Time 50% Grey to 80% Grey | ||
| 45.5 ms ... rise ↗ and fall ↘ combined | ↗ 21.1 ms rise | 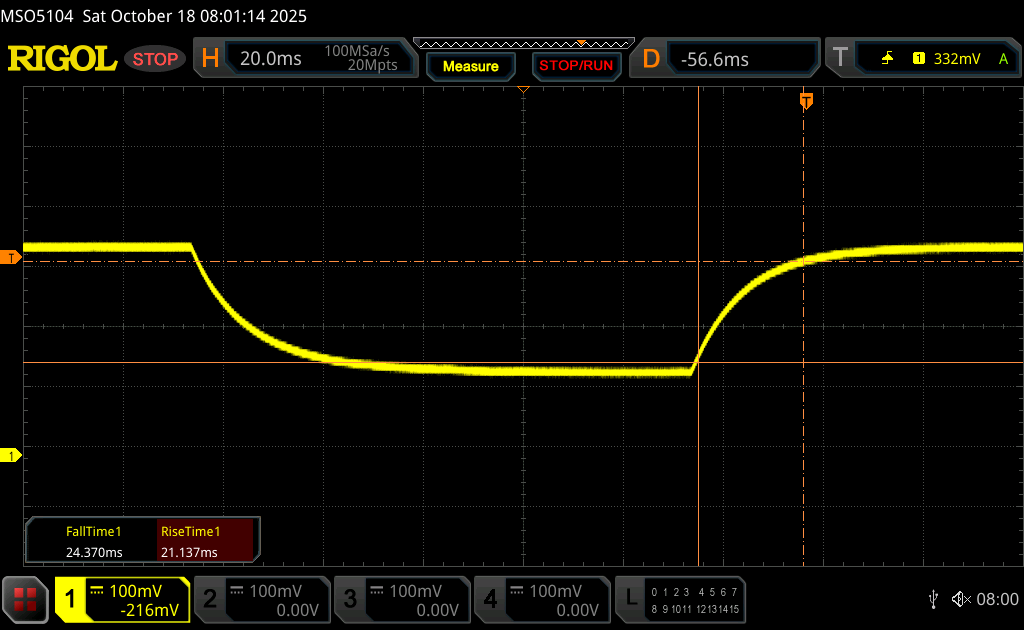 |
| ↘ 24.4 ms fall | ||
| The screen shows slow response rates in our tests and will be unsatisfactory for gamers. In comparison, all tested devices range from 0.165 (minimum) to 636 (maximum) ms. » 78 % of all devices are better. This means that the measured response time is worse than the average of all tested devices (31 ms). | ||
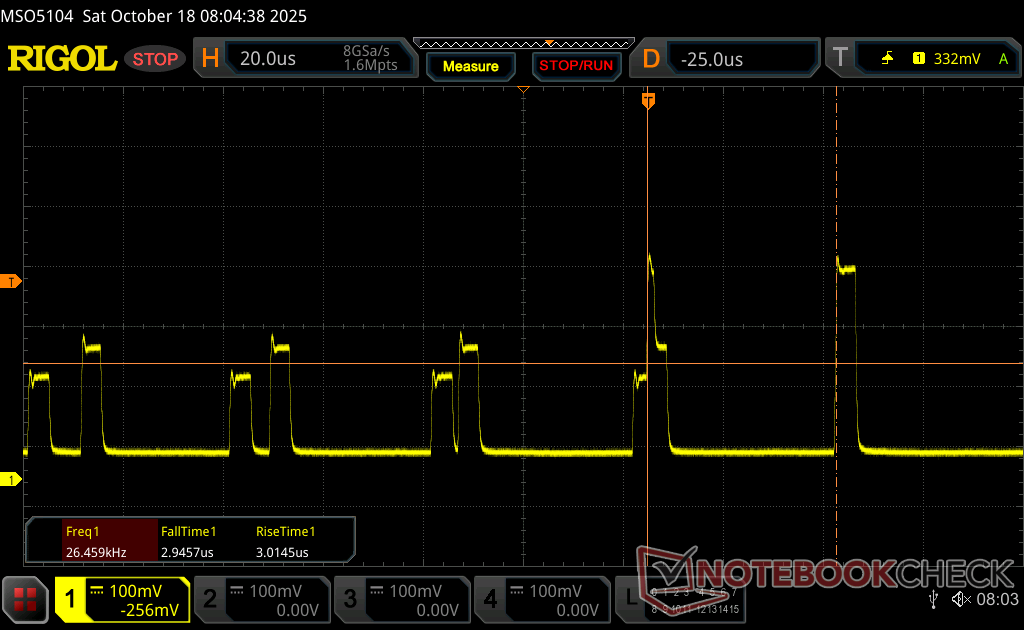
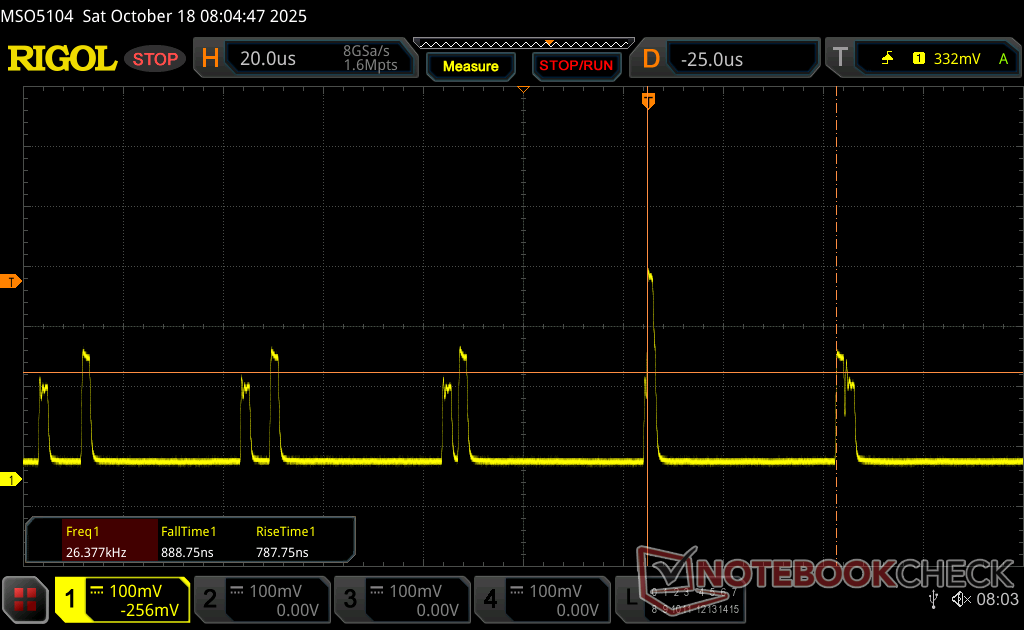
Screen Flickering / PWM (Pulse-Width Modulation)
| Screen flickering / PWM detected | 26536 Hz Amplitude: 47 % | ≤ 74 % brightness setting | 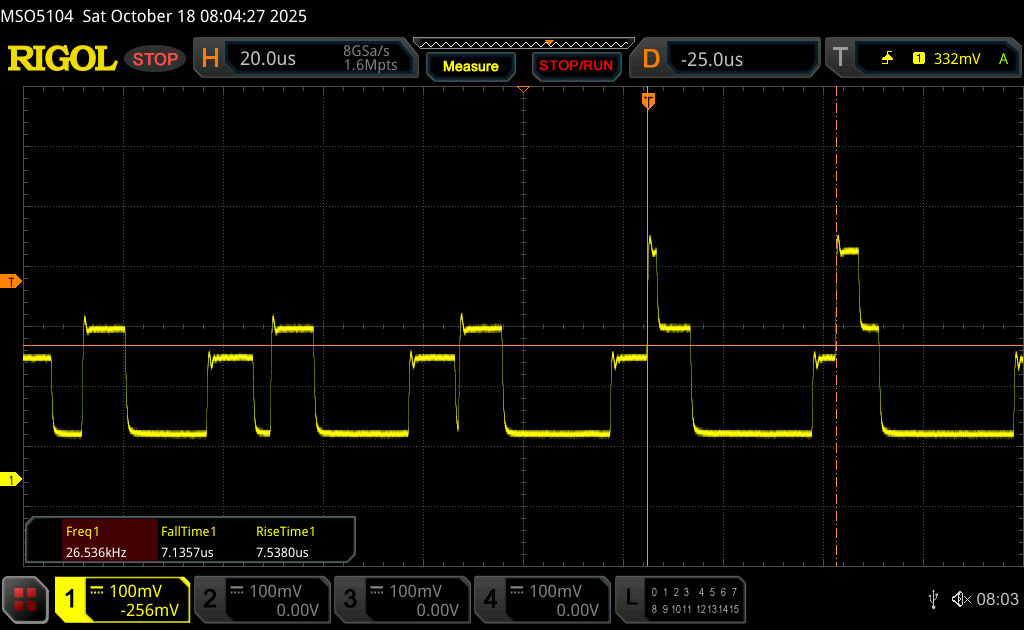 |
The display backlight flickers at 26536 Hz (worst case, e.g., utilizing PWM) Flickering detected at a brightness setting of 74 % and below. There should be no flickering or PWM above this brightness setting. The frequency of 26536 Hz is quite high, so most users sensitive to PWM should not notice any flickering. In comparison: 52 % of all tested devices do not use PWM to dim the display. If PWM was detected, an average of 7747 (minimum: 5 - maximum: 343500) Hz was measured. | |||


Performance
Testing Conditions
We set Windows to Performance mode prior to running the benchmarks below.
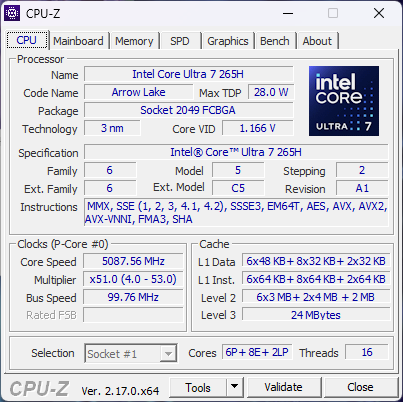
Processor
The Core Ultra 7 265H offers only a relatively minor bump in performance over last year's Core Ultra 7 155H by about 15 percent. Users upgrading from a much older model like the HP ZBook Studio 16 G9 will see a more significant boost of about 30 percent.
Performance drops by about 10 percent when running our looping CineBench R15 xT stress test due to Turbo Boost limitations as detailed in our Stress Test section below.
Cinebench R15 Multi Loop
Cinebench R23: Multi Core | Single Core
Cinebench R20: CPU (Multi Core) | CPU (Single Core)
Cinebench R15: CPU Multi 64Bit | CPU Single 64Bit
Blender: v2.79 BMW27 CPU
7-Zip 18.03: 7z b 4 | 7z b 4 -mmt1
Geekbench 6.7: Multi-Core | Single-Core
Geekbench 5.5: Multi-Core | Single-Core
HWBOT x265 Benchmark v2.2: 4k Preset
LibreOffice : 20 Documents To PDF
R Benchmark 2.5: Overall mean
* ... smaller is better
System Performance
A small handful of benchmarks would crash or fail to complete on our test unit including PCMark 10, SpecViewPerf 13 Maya, and AIDA64 Engineer.
CrossMark: Overall | Productivity | Creativity | Responsiveness
WebXPRT 3: Overall
WebXPRT 4: Overall
Mozilla Kraken 1.1: Total
| Performance rating | |
| Dell Pro Max 16 Plus | |
| Lenovo ThinkPad P16 Gen 2 | |
| HP ZBook X G1i 16 | |
| Average Intel Core Ultra 7 265H, NVIDIA RTX PRO 2000 Blackwell Generation Laptop | |
| Dell Precision 5690 | |
| HP ZBook Studio 16 G11 | |
| HP ZBook Power 16 G11 A | |
| CrossMark / Overall | |
| Dell Pro Max 16 Plus | |
| Lenovo ThinkPad P16 Gen 2 | |
| HP ZBook X G1i 16 | |
| Average Intel Core Ultra 7 265H, NVIDIA RTX PRO 2000 Blackwell Generation Laptop (n=1) | |
| Dell Precision 5690 | |
| HP ZBook Power 16 G11 A | |
| HP ZBook Studio 16 G11 | |
| CrossMark / Productivity | |
| Dell Pro Max 16 Plus | |
| HP ZBook X G1i 16 | |
| Average Intel Core Ultra 7 265H, NVIDIA RTX PRO 2000 Blackwell Generation Laptop (n=1) | |
| Lenovo ThinkPad P16 Gen 2 | |
| Dell Precision 5690 | |
| HP ZBook Power 16 G11 A | |
| HP ZBook Studio 16 G11 | |
| CrossMark / Creativity | |
| Dell Pro Max 16 Plus | |
| Lenovo ThinkPad P16 Gen 2 | |
| HP ZBook X G1i 16 | |
| Average Intel Core Ultra 7 265H, NVIDIA RTX PRO 2000 Blackwell Generation Laptop (n=1) | |
| HP ZBook Power 16 G11 A | |
| Dell Precision 5690 | |
| HP ZBook Studio 16 G11 | |
| CrossMark / Responsiveness | |
| Dell Pro Max 16 Plus | |
| Lenovo ThinkPad P16 Gen 2 | |
| Dell Precision 5690 | |
| HP ZBook X G1i 16 | |
| Average Intel Core Ultra 7 265H, NVIDIA RTX PRO 2000 Blackwell Generation Laptop (n=1) | |
| HP ZBook Studio 16 G11 | |
| HP ZBook Power 16 G11 A | |
| WebXPRT 3 / Overall | |
| Lenovo ThinkPad P16 Gen 2 | |
| Dell Pro Max 16 Plus | |
| HP ZBook X G1i 16 | |
| Average Intel Core Ultra 7 265H, NVIDIA RTX PRO 2000 Blackwell Generation Laptop (n=1) | |
| HP ZBook Power 16 G11 A | |
| HP ZBook Studio 16 G11 | |
| Dell Precision 5690 | |
| WebXPRT 4 / Overall | |
| Dell Pro Max 16 Plus | |
| Lenovo ThinkPad P16 Gen 2 | |
| HP ZBook X G1i 16 | |
| Average Intel Core Ultra 7 265H, NVIDIA RTX PRO 2000 Blackwell Generation Laptop (n=1) | |
| Dell Precision 5690 | |
| HP ZBook Studio 16 G11 | |
| HP ZBook Power 16 G11 A | |
| Mozilla Kraken 1.1 / Total | |
| HP ZBook Power 16 G11 A | |
| HP ZBook Studio 16 G11 | |
| Dell Precision 5690 | |
| HP ZBook X G1i 16 | |
| Average Intel Core Ultra 7 265H, NVIDIA RTX PRO 2000 Blackwell Generation Laptop (n=1) | |
| Lenovo ThinkPad P16 Gen 2 | |
| Dell Pro Max 16 Plus | |
* ... smaller is better
» No benchmarks for this notebook found!
DPC Latency
| DPC Latencies / LatencyMon - interrupt to process latency (max), Web, Youtube, Prime95 | |
| HP ZBook Power 16 G11 A | |
| Dell Pro Max 16 Plus | |
| HP ZBook Studio 16 G11 | |
| Lenovo ThinkPad P16 Gen 2 | |
| HP ZBook X G1i 16 | |
| Dell Precision 5690 | |
* ... smaller is better
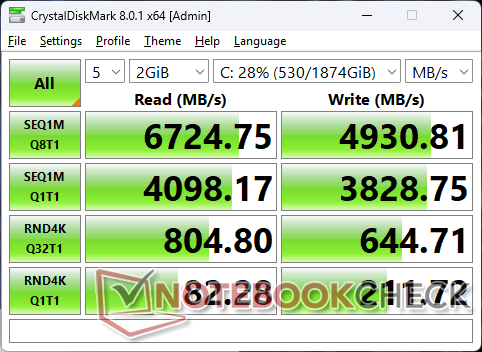
Storage Devices
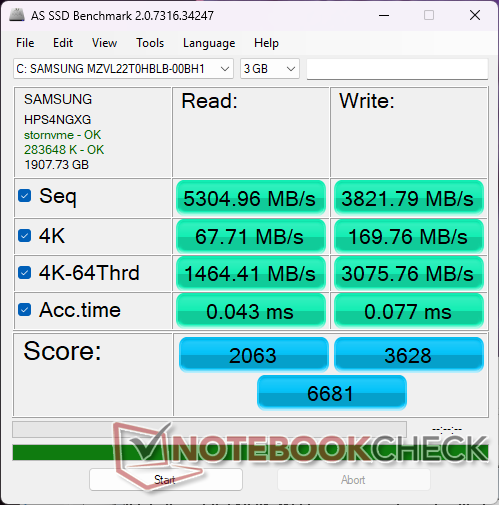

| Drive Performance rating - Percent | |
| HP ZBook X G1i 16 | |
| Dell Pro Max 16 Plus | |
| Dell Precision 5690 | |
| Lenovo ThinkPad P16 Gen 2 | |
| HP ZBook Power 16 G11 A | |
| HP ZBook Studio 16 G11 | |
* ... smaller is better
Disk Throttling: DiskSpd Read Loop, Queue Depth 8
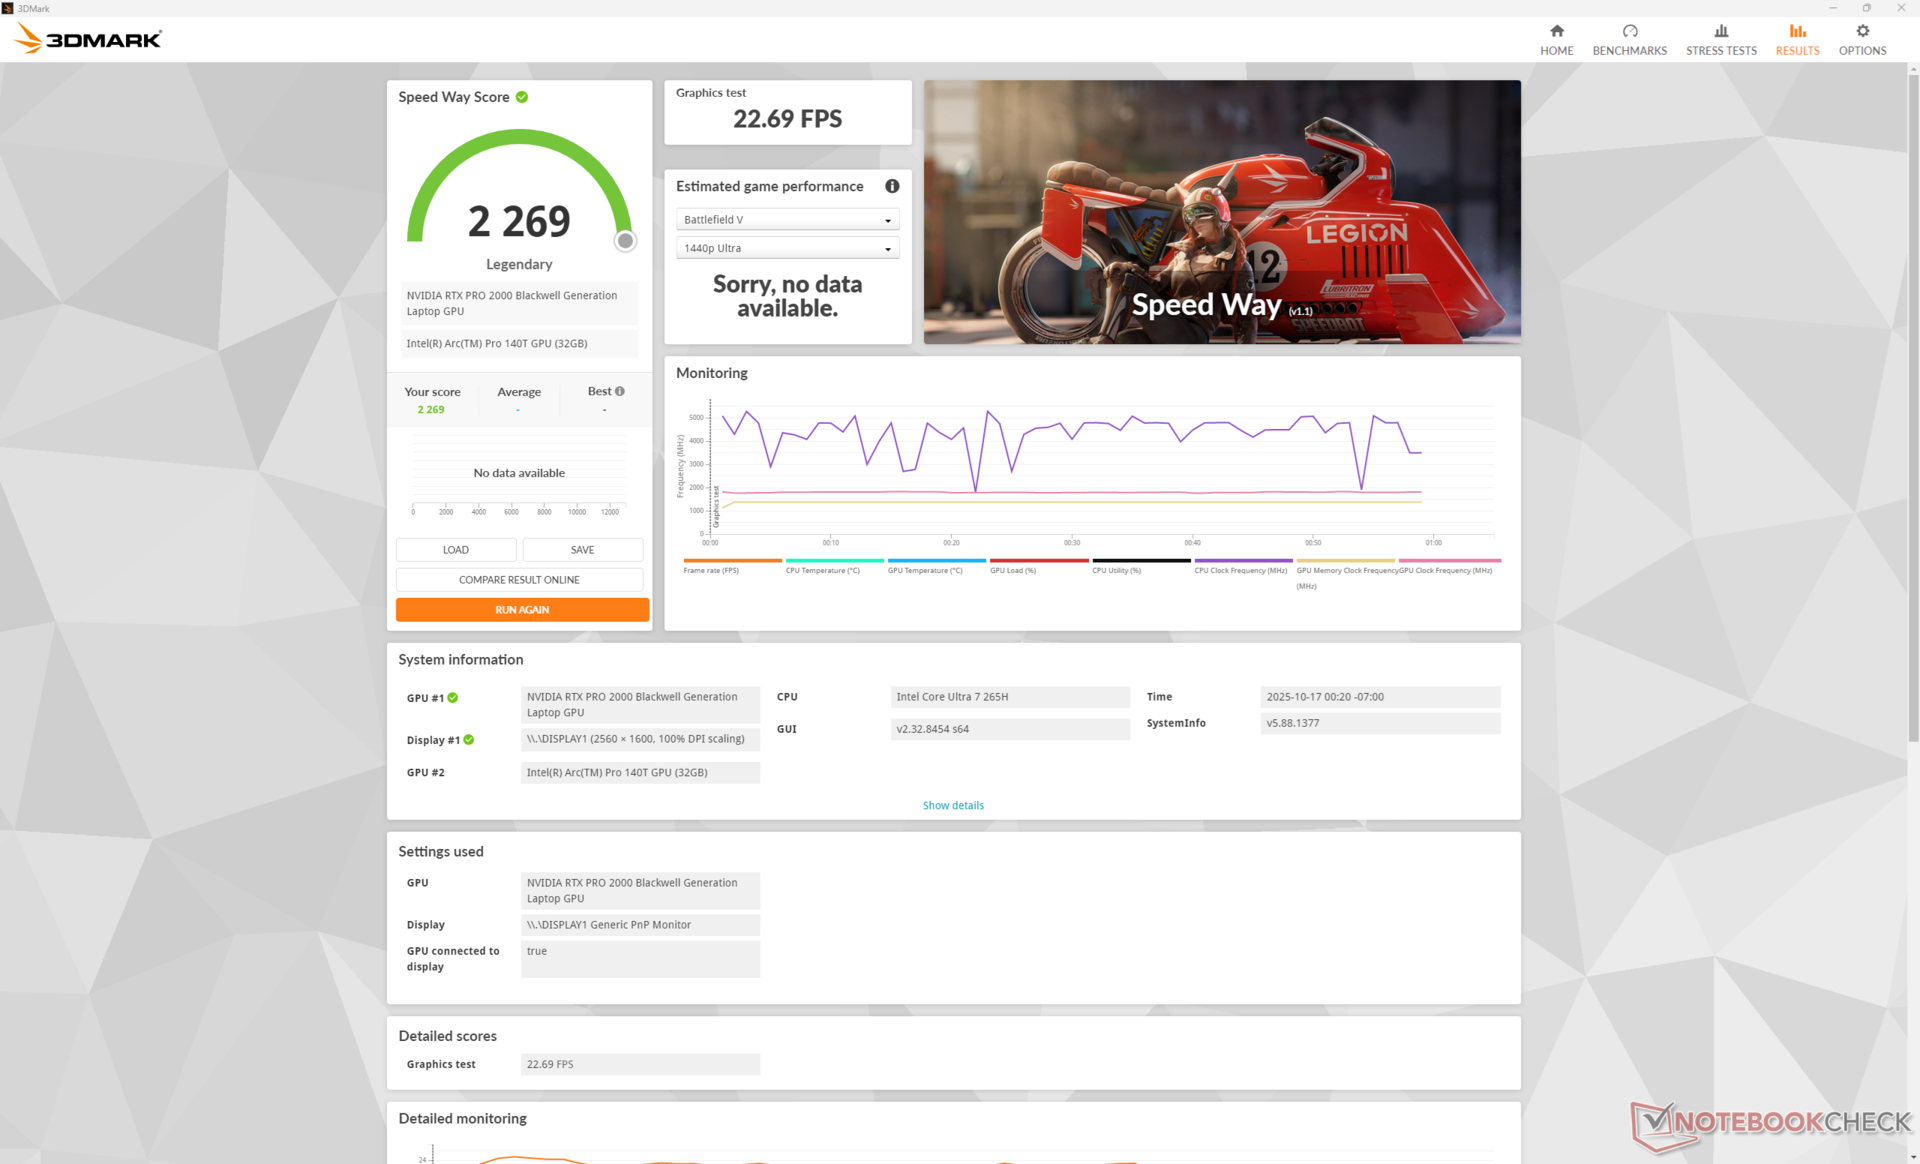
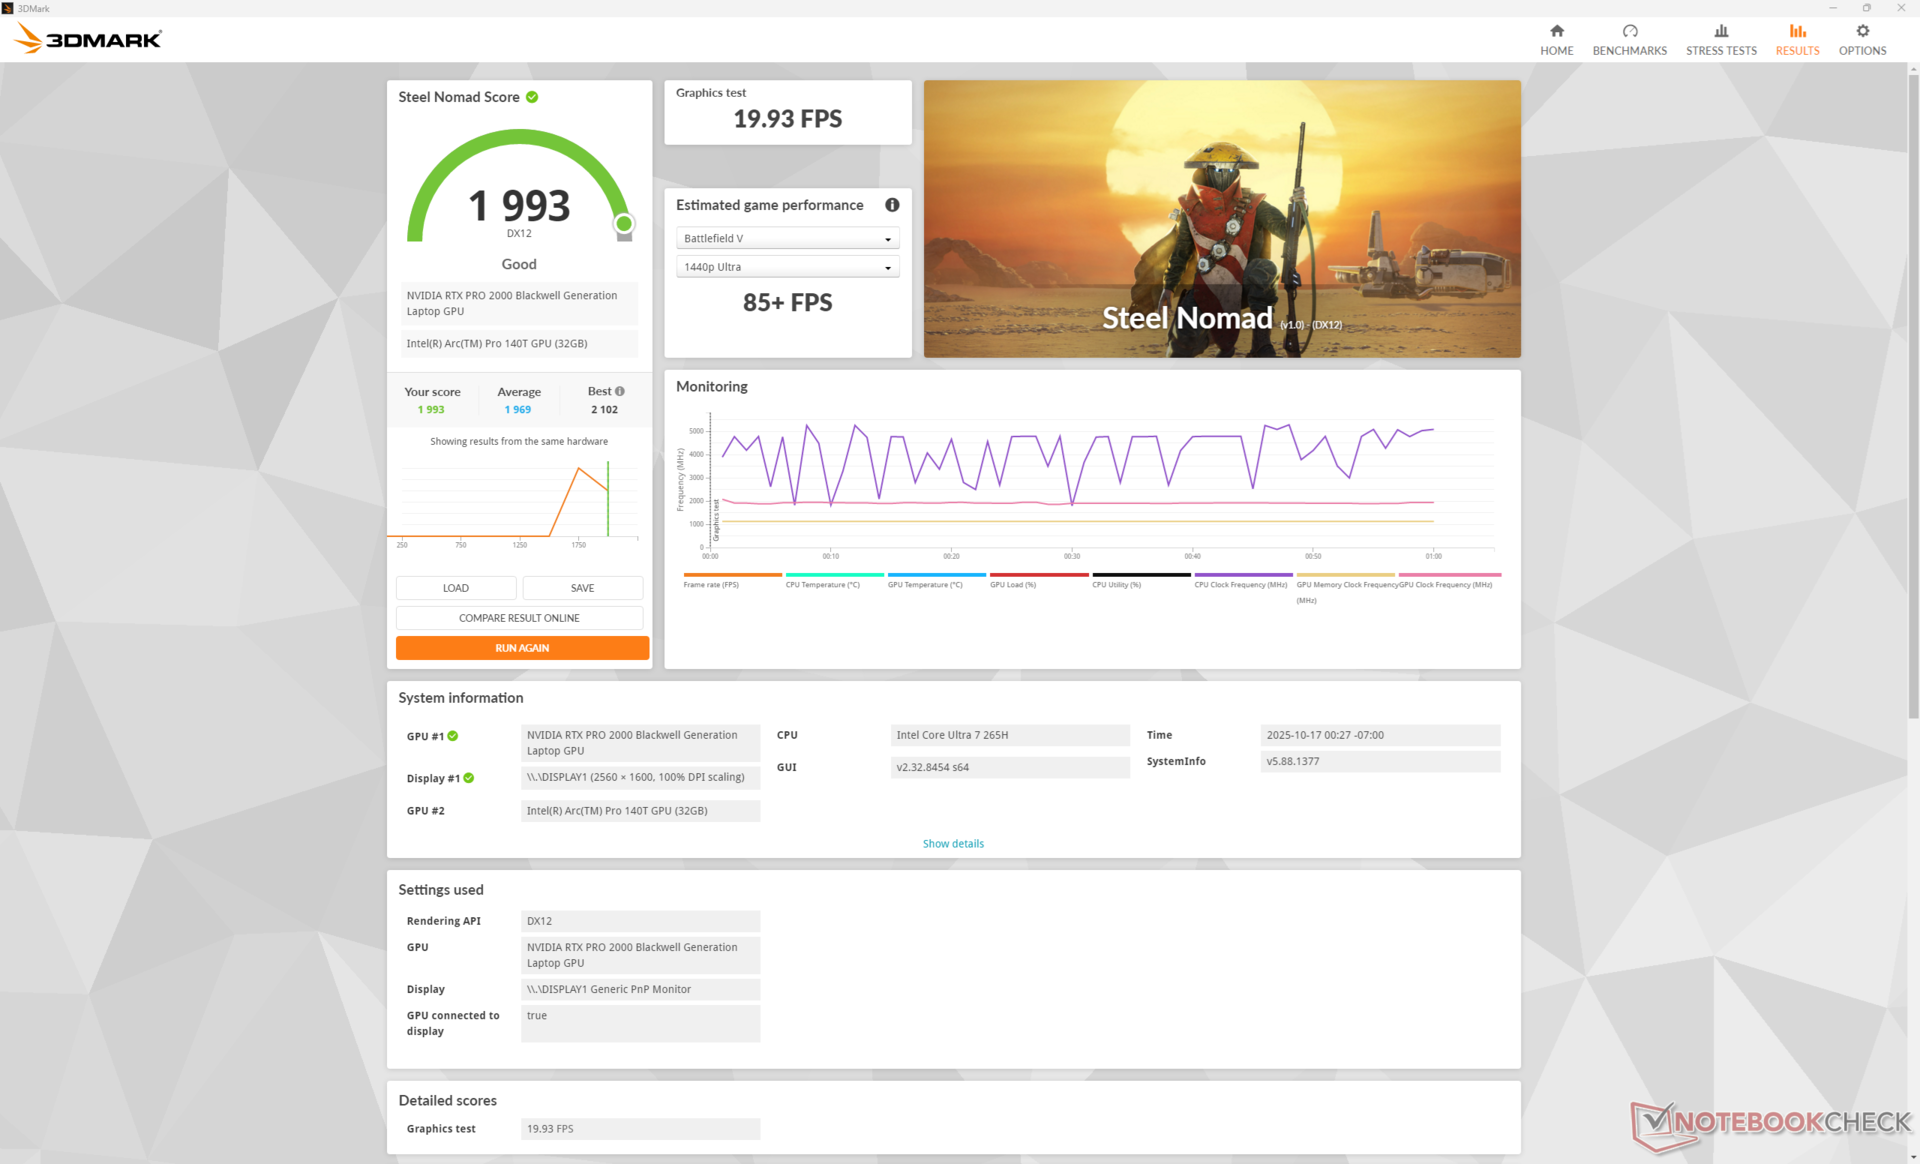
GPU Performance
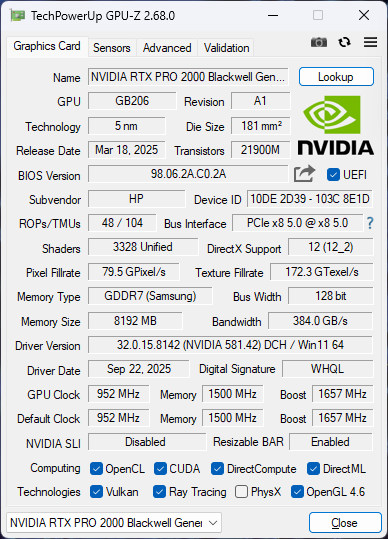
The RTX Pro 2000 Blackwell in the HP targets 60 W for a raw performance level just slightly higher than the last generation RTX 2000 Ada Lovelace. Meanwhile, users upgrading from the much older RTX A2000 on models like the 2022 ZBook Studio 16 G9 will see more significant boosts of 1.5x to 1.9x.
Running on Balanced mode instead of Performance mode would impact graphics performance by about 5 percent as shown by our Fire Strike results table below. If gaming, the RTX Pro 2000 performs most similarly to the mobile GeForce RTX 4060 or 5060.
| Power Profile | Graphics Score | Physics Score | Combined Score |
| Performance Mode | 25085 | 33858 | 11010 |
| Balanced Mode | 23771 (-5%) | 35309 (+4%) | 9366 (-15%) |
| Battery Power | 18195 (-27%) | 25739 (-24%) | 5646 (-49%) |
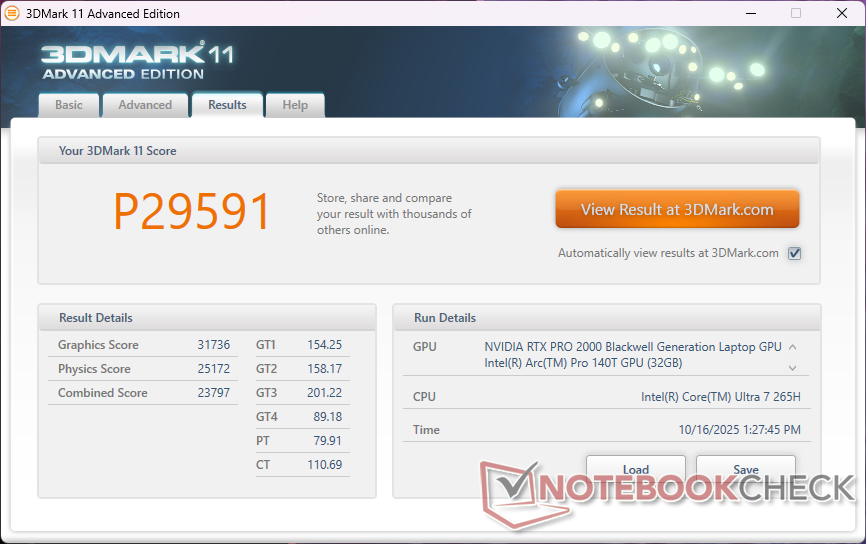

| 3DMark 11 Performance | 29591 points | |
| 3DMark Cloud Gate Standard Score | 60675 points | |
| 3DMark Fire Strike Score | 23035 points | |
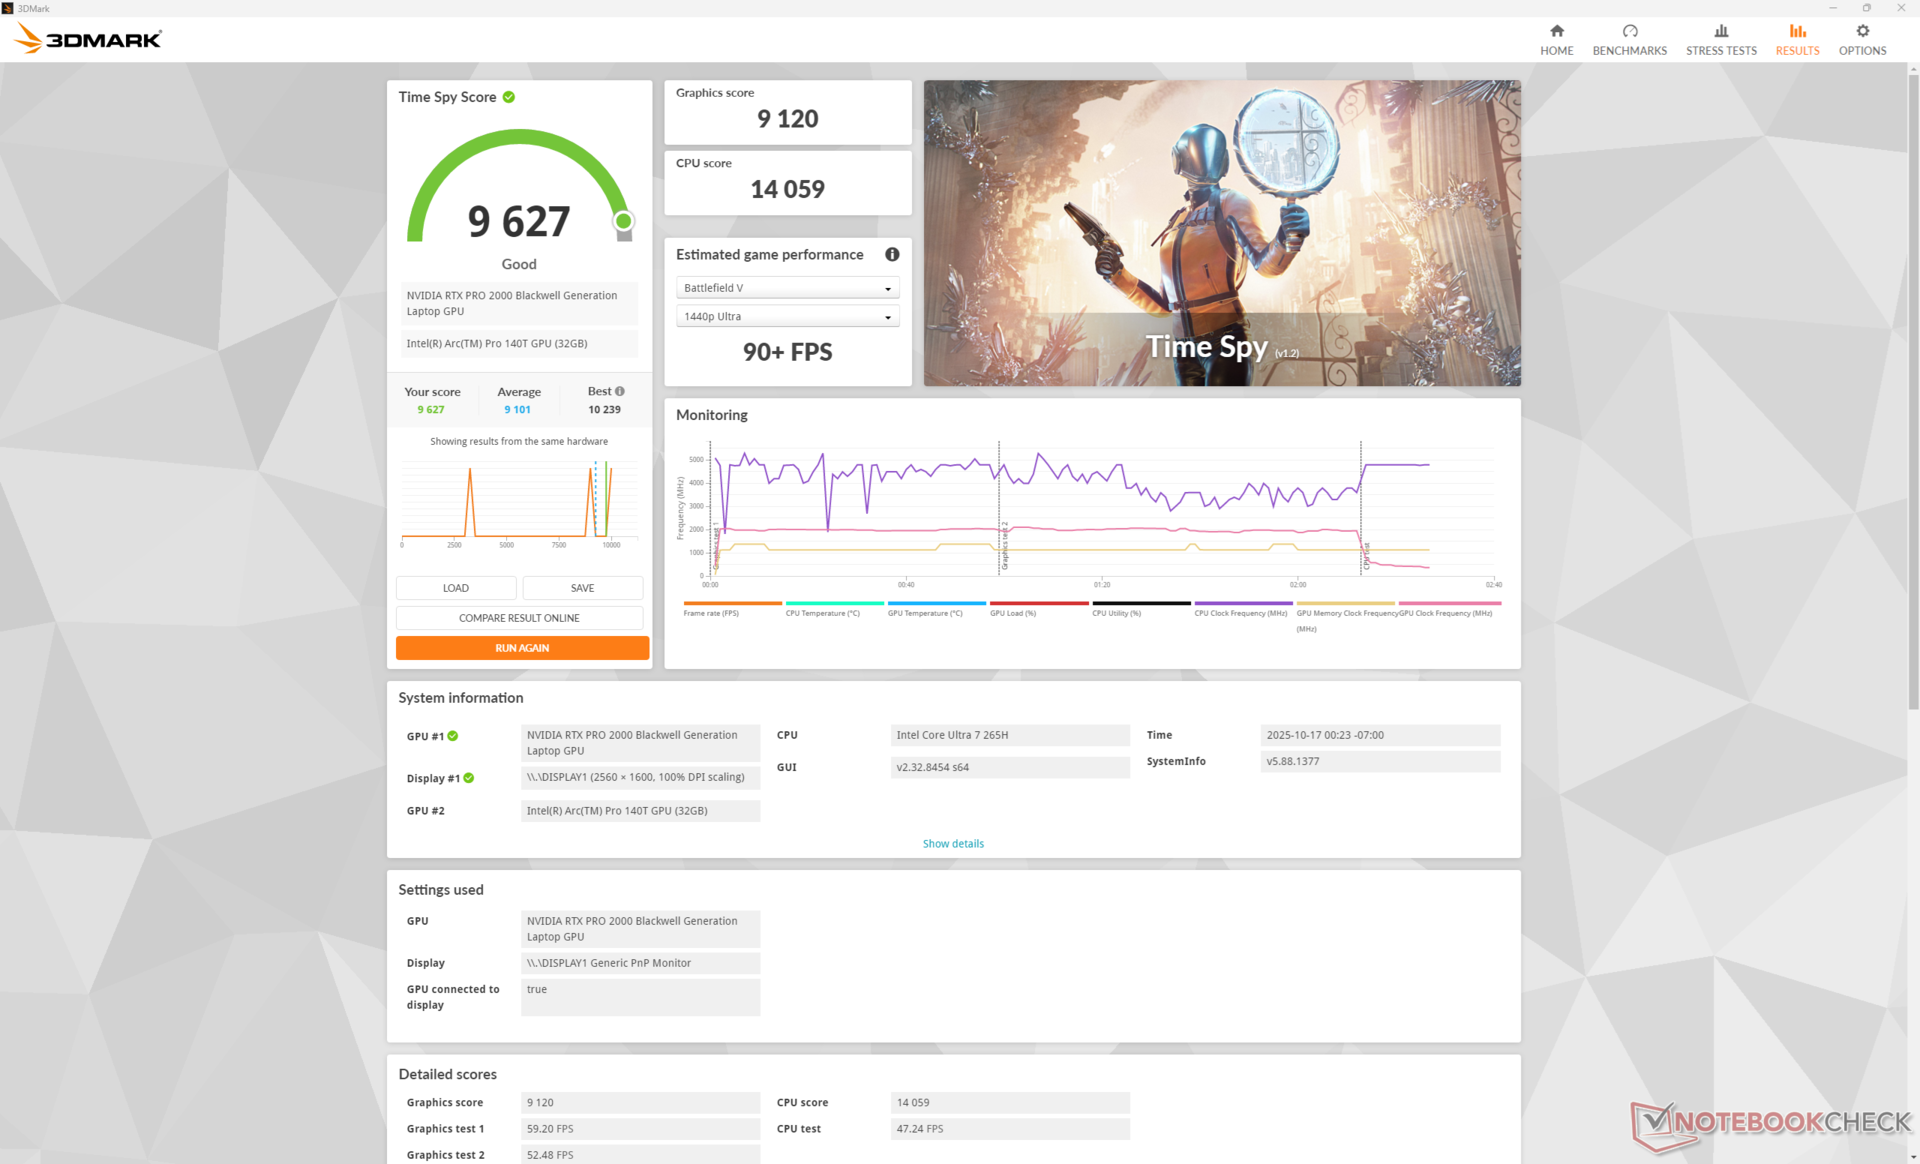
| 3DMark Time Spy Score | 9627 points | |
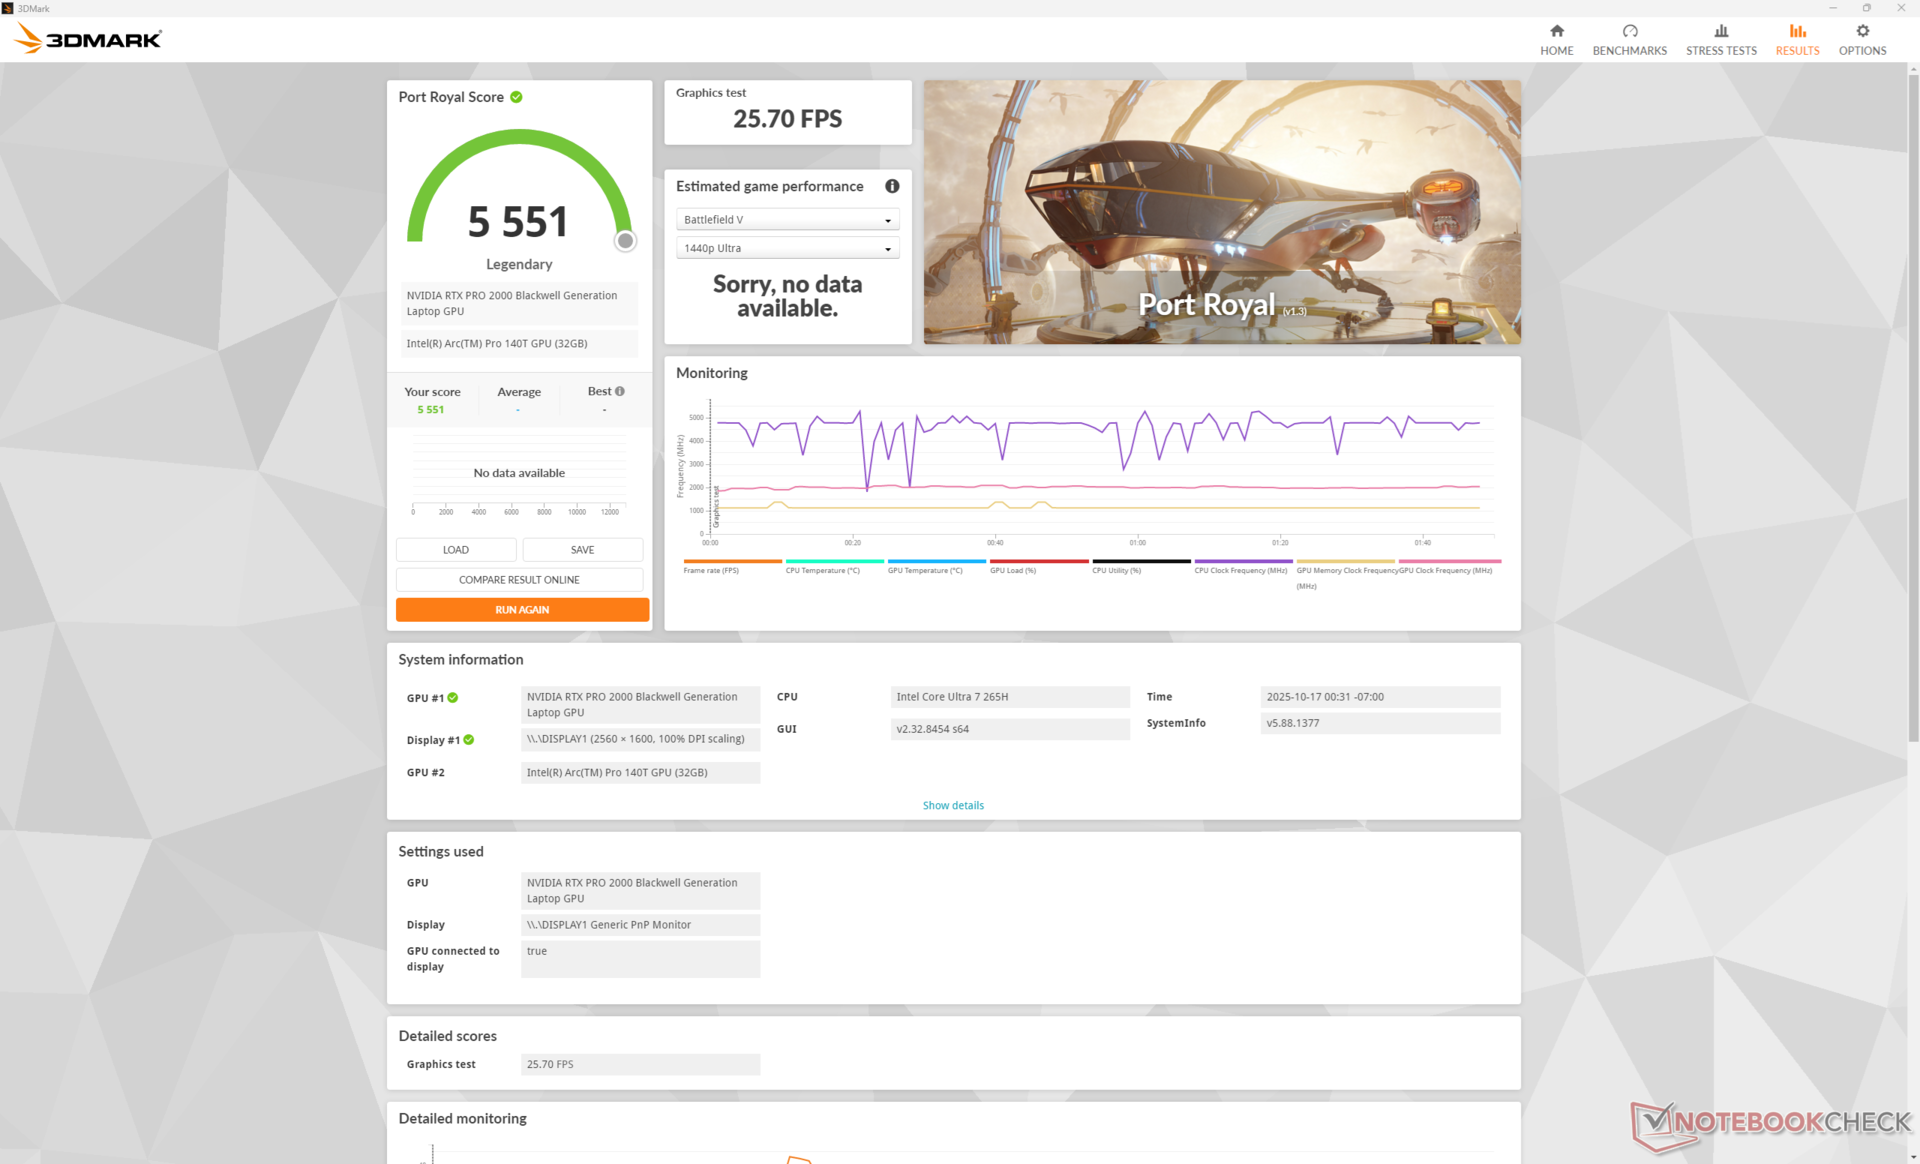
| 3DMark Steel Nomad Score | 1993 points | |
Help | ||
* ... smaller is better
| Performance rating - Percent | |
| Dell Pro Max 16 Plus | |
| Lenovo ThinkPad P16 Gen 2 | |
| Dell Precision 5690 -1! | |
| HP ZBook X G1i 16 | |
| HP ZBook Studio 16 G11 | |
| HP ZBook Power 16 G11 A | |
| Cyberpunk 2077 - 1920x1080 Ultra Preset (FSR off) | |
| Dell Pro Max 16 Plus | |
| Dell Precision 5690 | |
| Lenovo ThinkPad P16 Gen 2 | |
| HP ZBook X G1i 16 | |
| HP ZBook Studio 16 G11 | |
| HP ZBook Power 16 G11 A | |
| Baldur's Gate 3 - 1920x1080 Ultra Preset AA:T | |
| Dell Pro Max 16 Plus | |
| Lenovo ThinkPad P16 Gen 2 | |
| Dell Precision 5690 | |
| HP ZBook Studio 16 G11 | |
| HP ZBook X G1i 16 | |
| HP ZBook Power 16 G11 A | |
| GTA V - 1920x1080 Highest AA:4xMSAA + FX AF:16x | |
| Dell Pro Max 16 Plus | |
| Lenovo ThinkPad P16 Gen 2 | |
| HP ZBook X G1i 16 | |
| HP ZBook Studio 16 G11 | |
| HP ZBook Power 16 G11 A | |
| Final Fantasy XV Benchmark - 1920x1080 High Quality | |
| Dell Pro Max 16 Plus | |
| Lenovo ThinkPad P16 Gen 2 | |
| Dell Precision 5690 | |
| HP ZBook X G1i 16 | |
| HP ZBook Studio 16 G11 | |
| HP ZBook Power 16 G11 A | |
| Strange Brigade - 1920x1080 ultra AA:ultra AF:16 | |
| Lenovo ThinkPad P16 Gen 2 | |
| Dell Pro Max 16 Plus | |
| Dell Precision 5690 | |
| HP ZBook Studio 16 G11 | |
| HP ZBook X G1i 16 | |
| HP ZBook Power 16 G11 A | |
| Dota 2 Reborn - 1920x1080 ultra (3/3) best looking | |
| Dell Pro Max 16 Plus | |
| Lenovo ThinkPad P16 Gen 2 | |
| HP ZBook Studio 16 G11 | |
| HP ZBook X G1i 16 | |
| Dell Precision 5690 | |
| HP ZBook Power 16 G11 A | |
| X-Plane 11.11 - 1920x1080 high (fps_test=3) | |
| Lenovo ThinkPad P16 Gen 2 | |
| Dell Pro Max 16 Plus | |
| Dell Precision 5690 | |
| HP ZBook Studio 16 G11 | |
| HP ZBook X G1i 16 | |
| HP ZBook Power 16 G11 A | |
Cyberpunk 2077 ultra FPS Chart
| low | med. | high | ultra | QHD DLSS | QHD | |
|---|---|---|---|---|---|---|
| GTA V (2015) | 186.2 | 183.1 | 177.8 | 112.7 | 88.4 | |
| Dota 2 Reborn (2015) | 170.1 | 158.1 | 151.1 | 141.8 | ||
| Final Fantasy XV Benchmark (2018) | 206 | 129.5 | 100.2 | 71 | ||
| X-Plane 11.11 (2018) | 102 | 92.2 | 80.6 | |||
| Strange Brigade (2018) | 480 | 252 | 198.7 | 171.3 | 119.2 | |
| Baldur's Gate 3 (2023) | 116.1 | 99.7 | 89.6 | 89.5 | 90 | 60.4 |
| Cyberpunk 2077 (2023) | 112.5 | 93.5 | 80 | 72.1 | 52.4 | 43.6 |
| F1 24 (2024) | 214 | 205 | 161.4 | 48.2 | 48.8 | 32.2 |
Emissions
System Noise
The fans are lethargic when running undemanding loads but they can get quite loud at just over 50 dB(A) when running more demanding loads for extended periods like Cyberpunk 2077.
Noise level
| Idle |
| 23.7 / 23.7 / 23.7 dB(A) |
| Load |
| 32.7 / 48 dB(A) |
 | ||
30 dB silent 40 dB(A) audible 50 dB(A) loud |
||
min: | ||
| HP ZBook X G1i 16 RTX PRO 2000 Blackwell Generation Laptop, Ultra 7 265H, Samsung PM9A1 MZVL22T0HBLB | HP ZBook Power 16 G11 A RTX 2000 Ada Generation Laptop, R7 8845HS, Samsung PM9A1 MZVL22T0HBLB | HP ZBook Studio 16 G11 RTX 3000 Ada Generation Laptop, Ultra 9 185H, Kioxia XG8 KXG80ZNV1T02 | Lenovo ThinkPad P16 Gen 2 RTX 4000 Ada Generation Laptop, i7-14700HX, SK hynix PC801 HFS001TEJ9X162N | Dell Pro Max 16 Plus RTX PRO 5000 Blackwell Generation Laptop, Ultra 9 285HX, SK hynix PCB01 HFS001TFM9X186N | Dell Precision 5690 RTX 5000 Ada Generation Laptop, Ultra 9 185H, 2x Samsung PM9A1 1TB (RAID 0) | |
|---|---|---|---|---|---|---|
| Noise | 6% | -4% | -16% | -18% | -11% | |
| off / environment * (dB) | 23.7 | 23.5 1% | 23.8 -0% | 23.9 -1% | 23.2 2% | 23.4 1% |
| Idle Minimum * (dB) | 23.7 | 23.8 -0% | 23.8 -0% | 29.1 -23% | 26.7 -13% | 23.6 -0% |
| Idle Average * (dB) | 23.7 | 24.2 -2% | 26.4 -11% | 29.1 -23% | 30.5 -29% | 24.9 -5% |
| Idle Maximum * (dB) | 23.7 | 24.2 -2% | 26.4 -11% | 29.1 -23% | 34 -43% | 30.9 -30% |
| Load Average * (dB) | 32.7 | 25.4 22% | 33.7 -3% | 41 -25% | 39.8 -22% | 40.4 -24% |
| Cyberpunk 2077 ultra * (dB) | 50.9 | 43 16% | 46.1 9% | 52.8 -4% | 54.3 -7% | |
| Load Maximum * (dB) | 48 | 45 6% | 53.2 -11% | 52.9 -10% | 54.3 -13% | 51.9 -8% |
| Witcher 3 ultra * (dB) | 48.3 |
* ... smaller is better
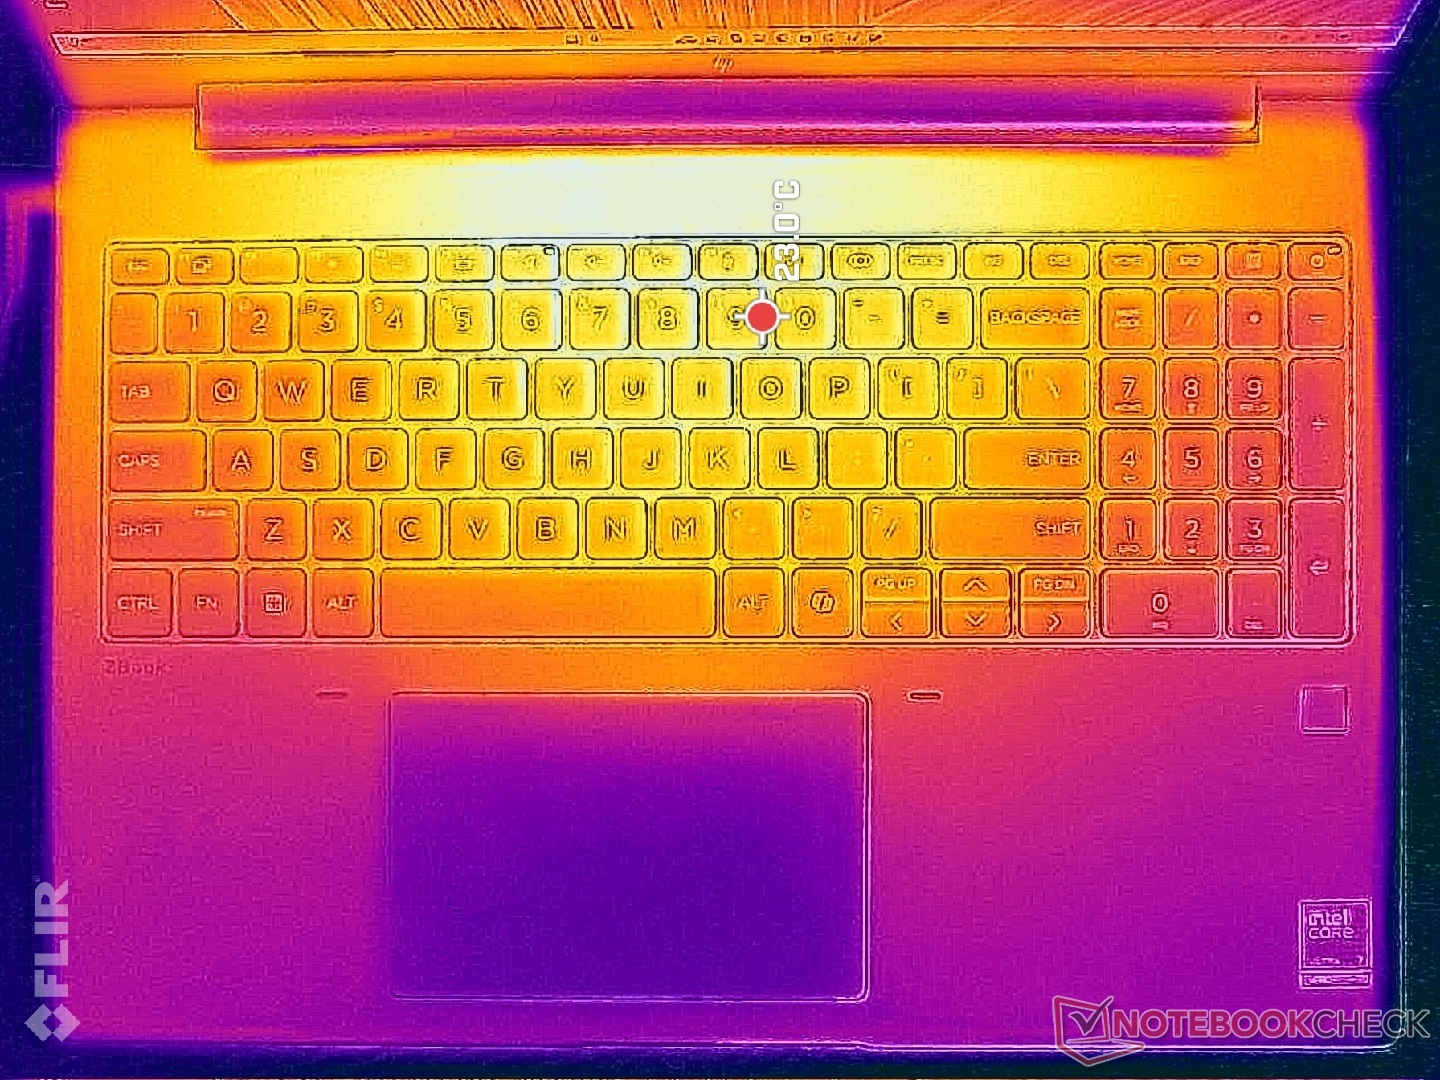
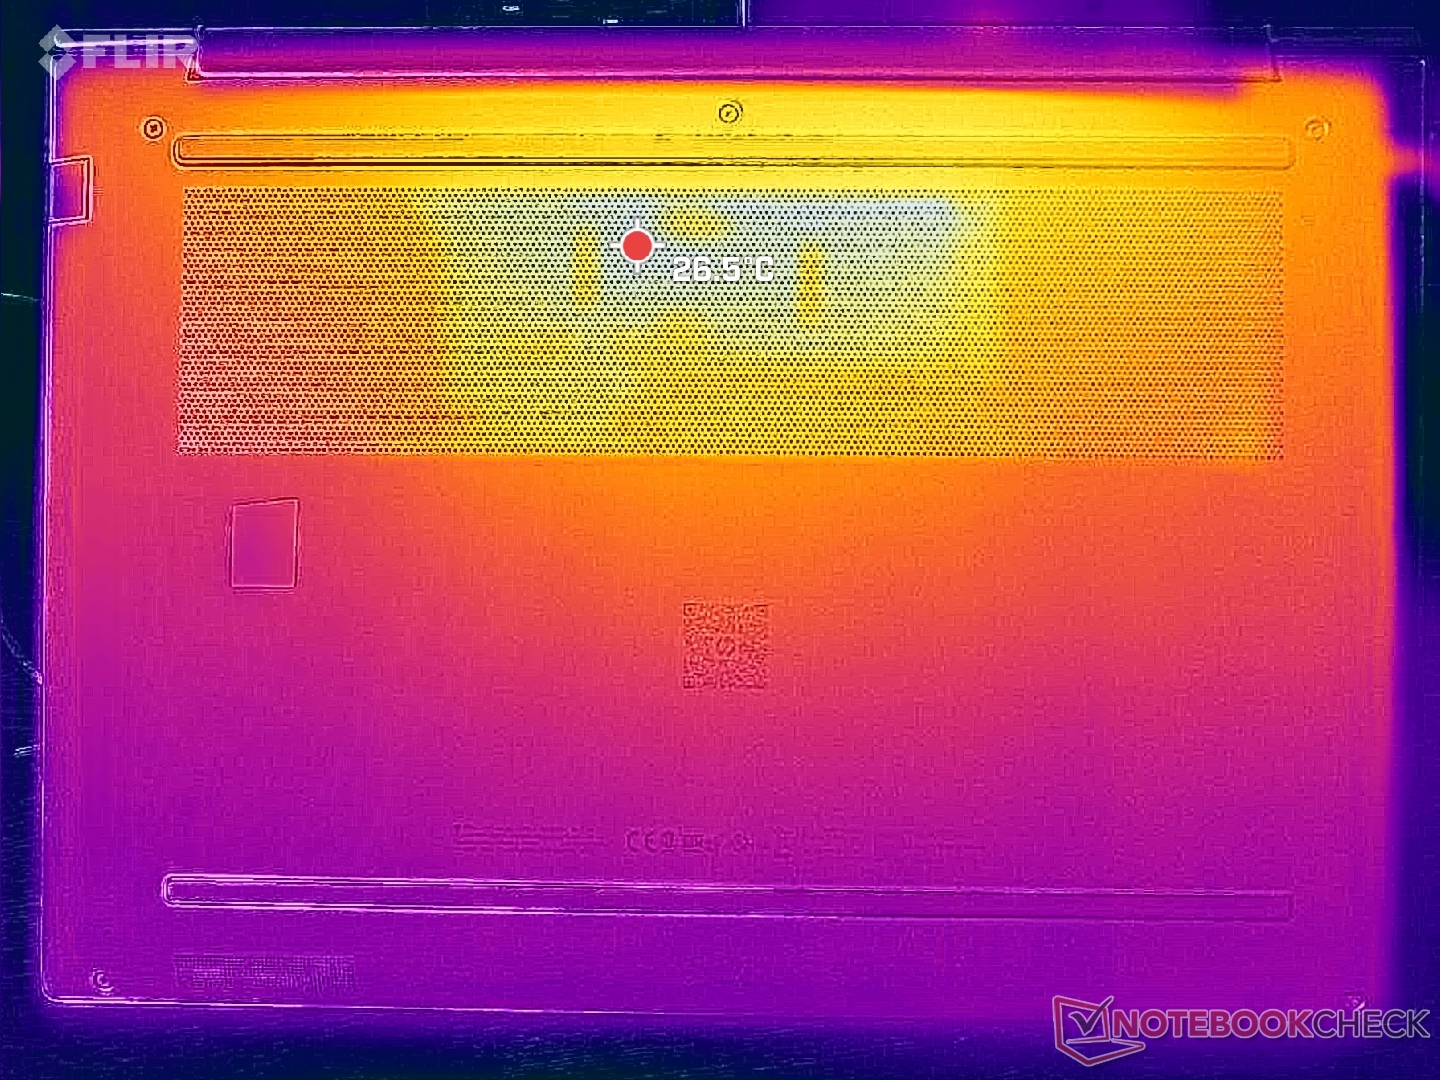
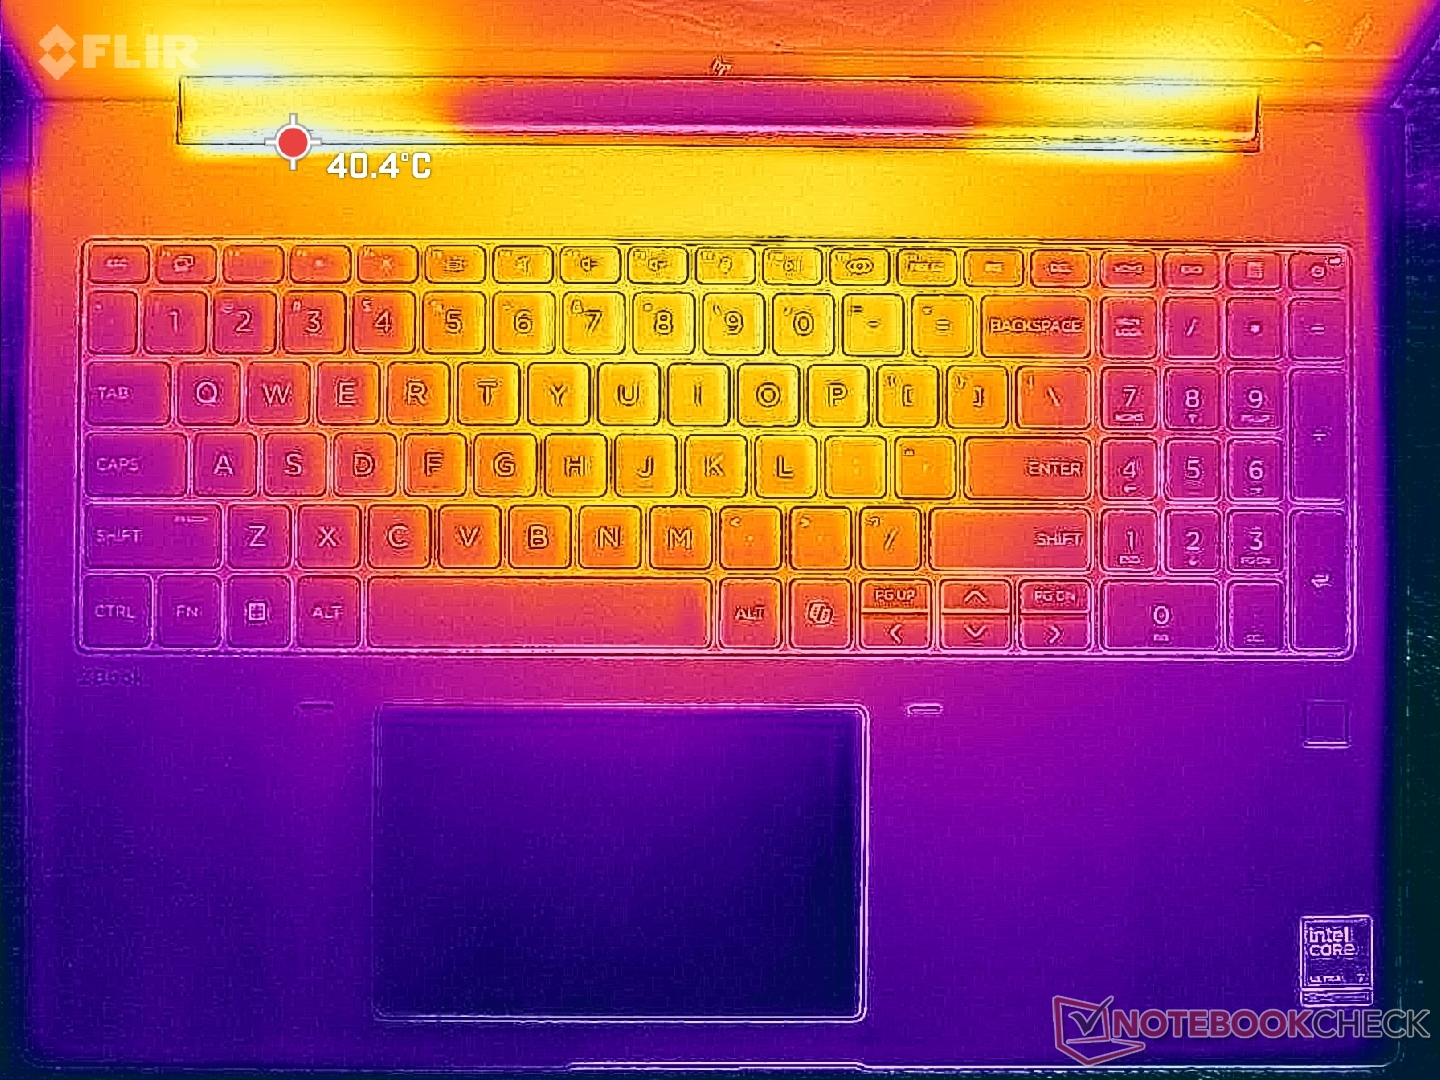
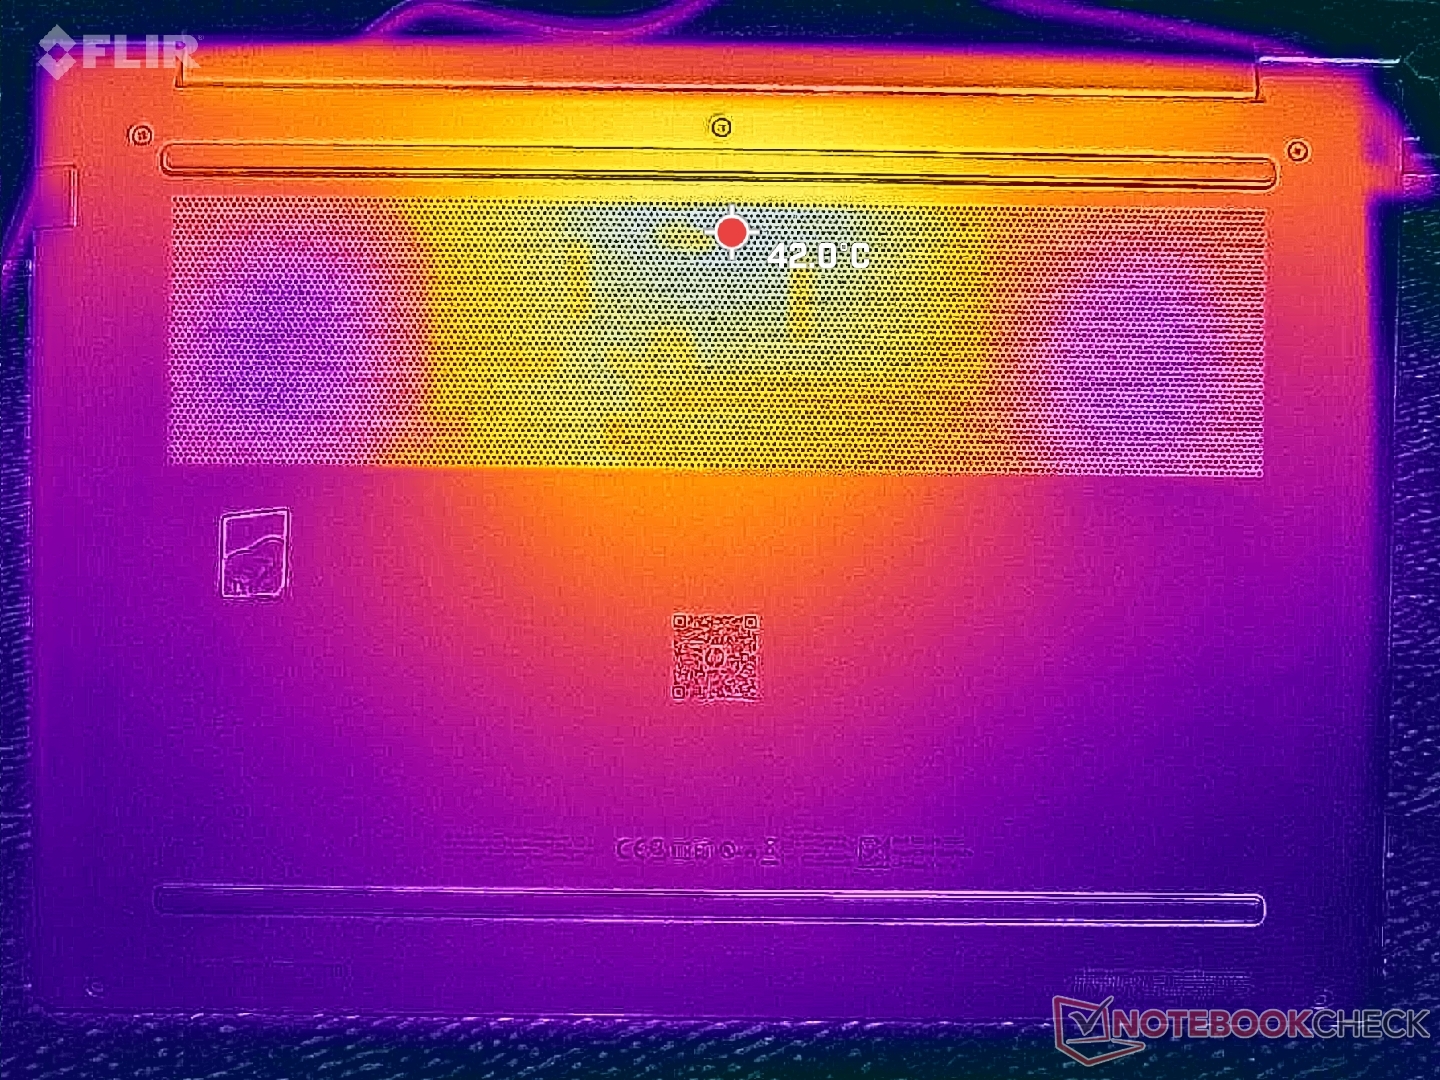
Temperature
Surface temperature development is warmest towards the center where it can reach over 36 C when running demanding loads which is signicantly cooler than what we recorded on the ThinkPad P16 Gen 2 or Dell Precision 5690.
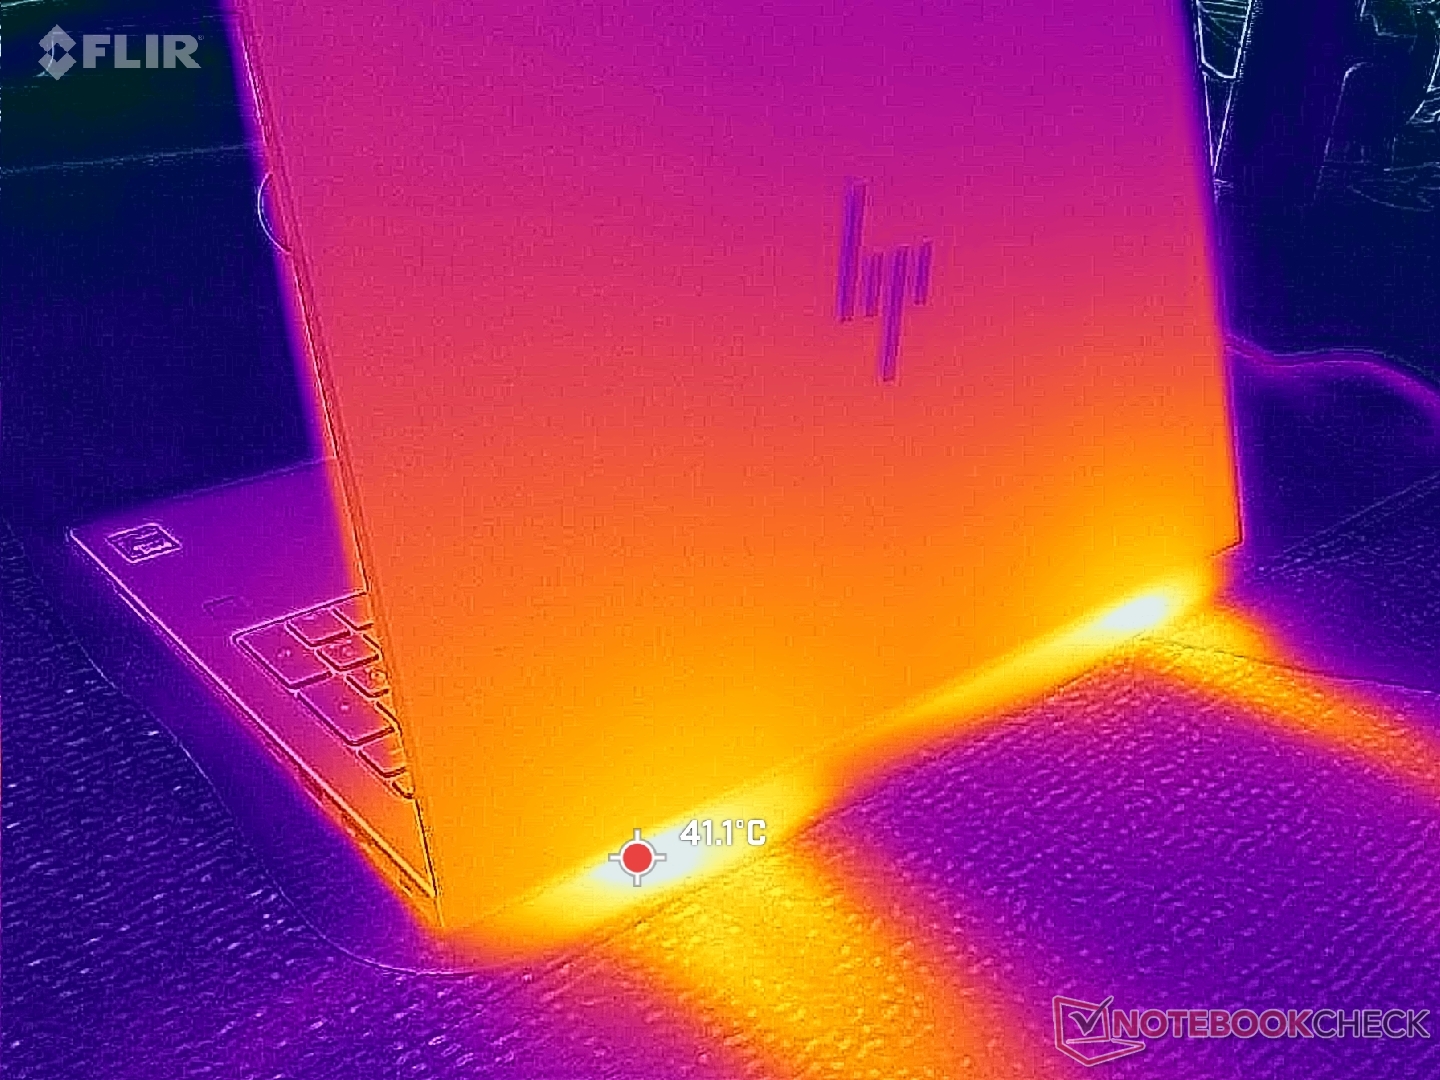
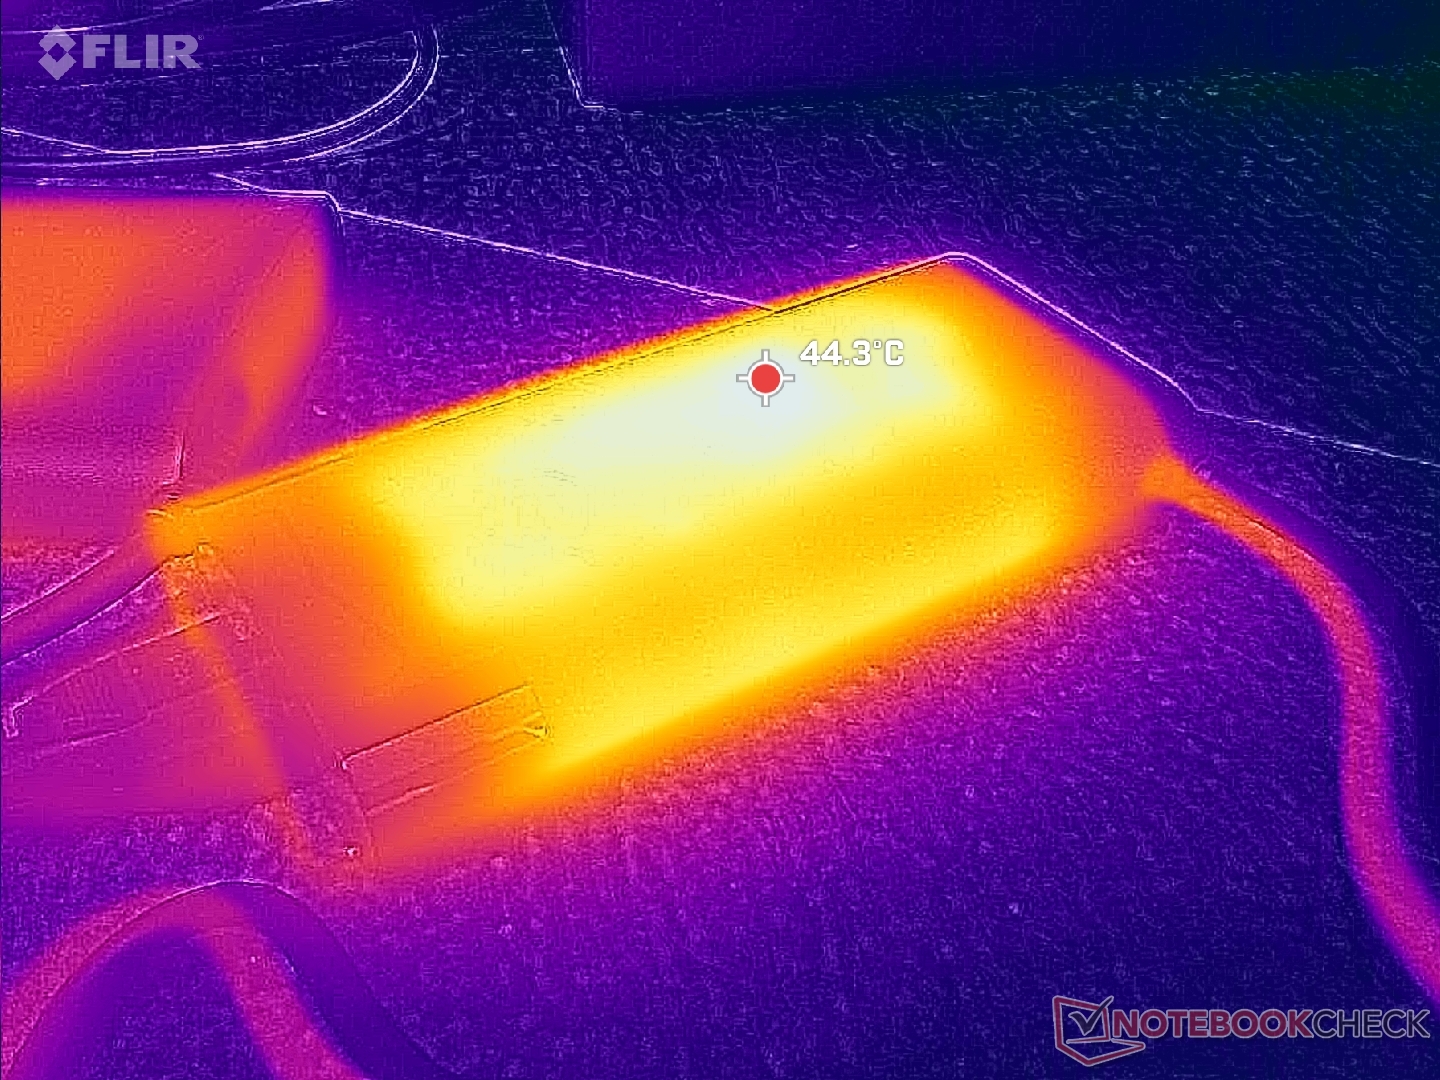
(+) The maximum temperature on the upper side is 36 °C / 97 F, compared to the average of 38.2 °C / 101 F, ranging from 22.2 to 69.8 °C for the class Workstation.
(+) The bottom heats up to a maximum of 39.4 °C / 103 F, compared to the average of 41.1 °C / 106 F
(+) In idle usage, the average temperature for the upper side is 26.9 °C / 80 F, compared to the device average of 32 °C / 90 F.
(+) The palmrests and touchpad are cooler than skin temperature with a maximum of 24.2 °C / 75.6 F and are therefore cool to the touch.
(+) The average temperature of the palmrest area of similar devices was 27.8 °C / 82 F (+3.6 °C / 6.4 F).
| HP ZBook X G1i 16 Intel Core Ultra 7 265H, NVIDIA RTX PRO 2000 Blackwell Generation Laptop | HP ZBook Power 16 G11 A AMD Ryzen 7 8845HS, NVIDIA RTX 2000 Ada Generation Laptop | HP ZBook Studio 16 G11 Intel Core Ultra 9 185H, NVIDIA RTX 3000 Ada Generation Laptop | Lenovo ThinkPad P16 Gen 2 Intel Core i7-14700HX, NVIDIA RTX 4000 Ada Generation Laptop | Dell Pro Max 16 Plus Intel Core Ultra 9 285HX, NVIDIA RTX PRO 5000 Blackwell Generation Laptop | Dell Precision 5690 Intel Core Ultra 9 185H, NVIDIA RTX 5000 Ada Generation Laptop | |
|---|---|---|---|---|---|---|
| Heat | 4% | -10% | -5% | -10% | -3% | |
| Maximum Upper Side * (°C) | 36 | 40.6 -13% | 36.6 -2% | 46.6 -29% | 40.4 -12% | 46.6 -29% |
| Maximum Bottom * (°C) | 39.4 | 40.6 -3% | 47.8 -21% | 51 -29% | 45.6 -16% | 33 16% |
| Idle Upper Side * (°C) | 30.4 | 26 14% | 31.4 -3% | 24.8 18% | 32.8 -8% | 32.4 -7% |
| Idle Bottom * (°C) | 31.8 | 26.6 16% | 35.6 -12% | 25.6 19% | 33 -4% | 29.4 8% |
* ... smaller is better
Stress Test
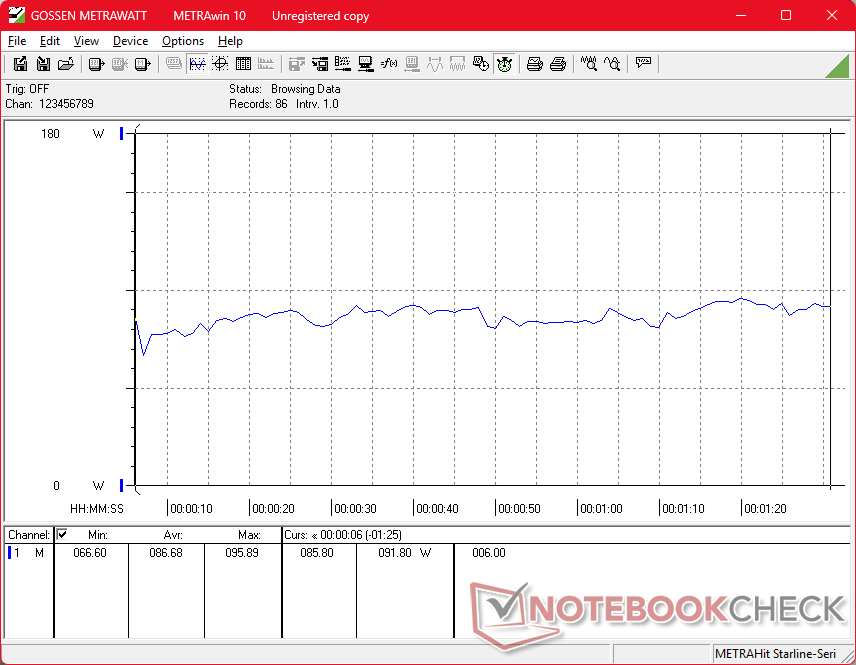
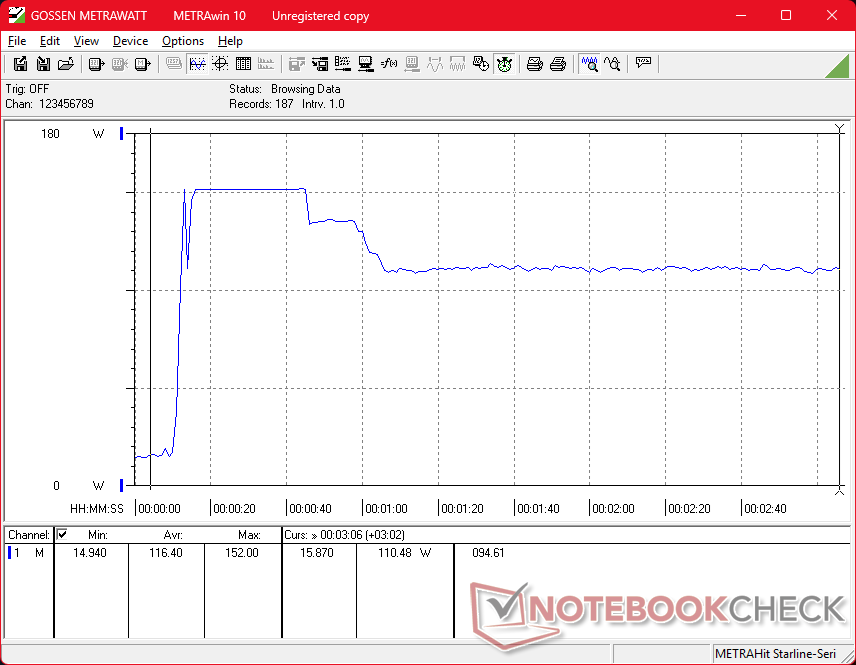
The CPU would boost to 3.6 GHz, 108 W, and a toasty 104 C when initiating Prime95 stress before falling and stabilizing at 3.0 GHz, 62 W, and 88 C just a few moments later to represent limited maximum Turbo Boost sustainability. Interestingly, CPU clock rates would cycle while GPU clock rates would remain constant when running Prime95 and FurMark simultaneously.
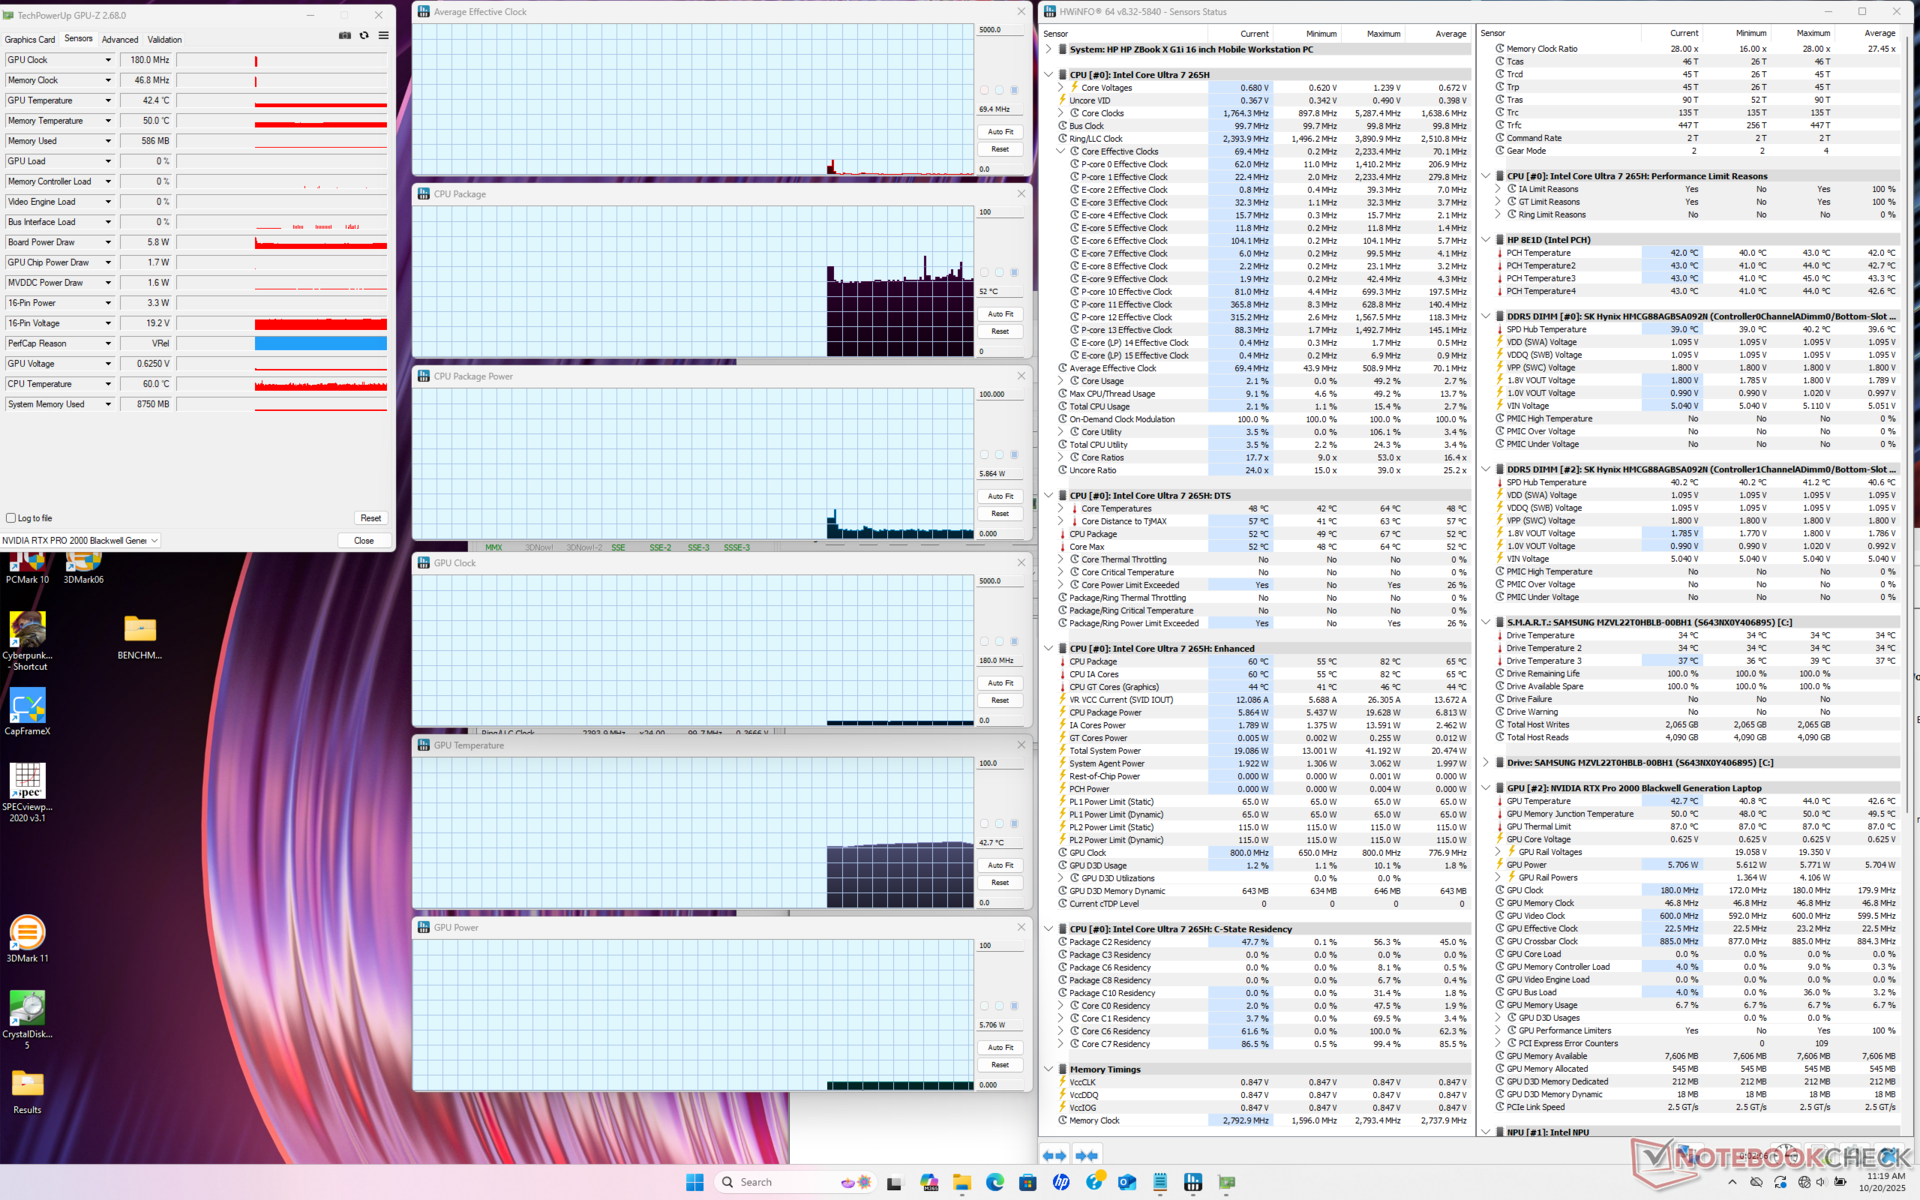
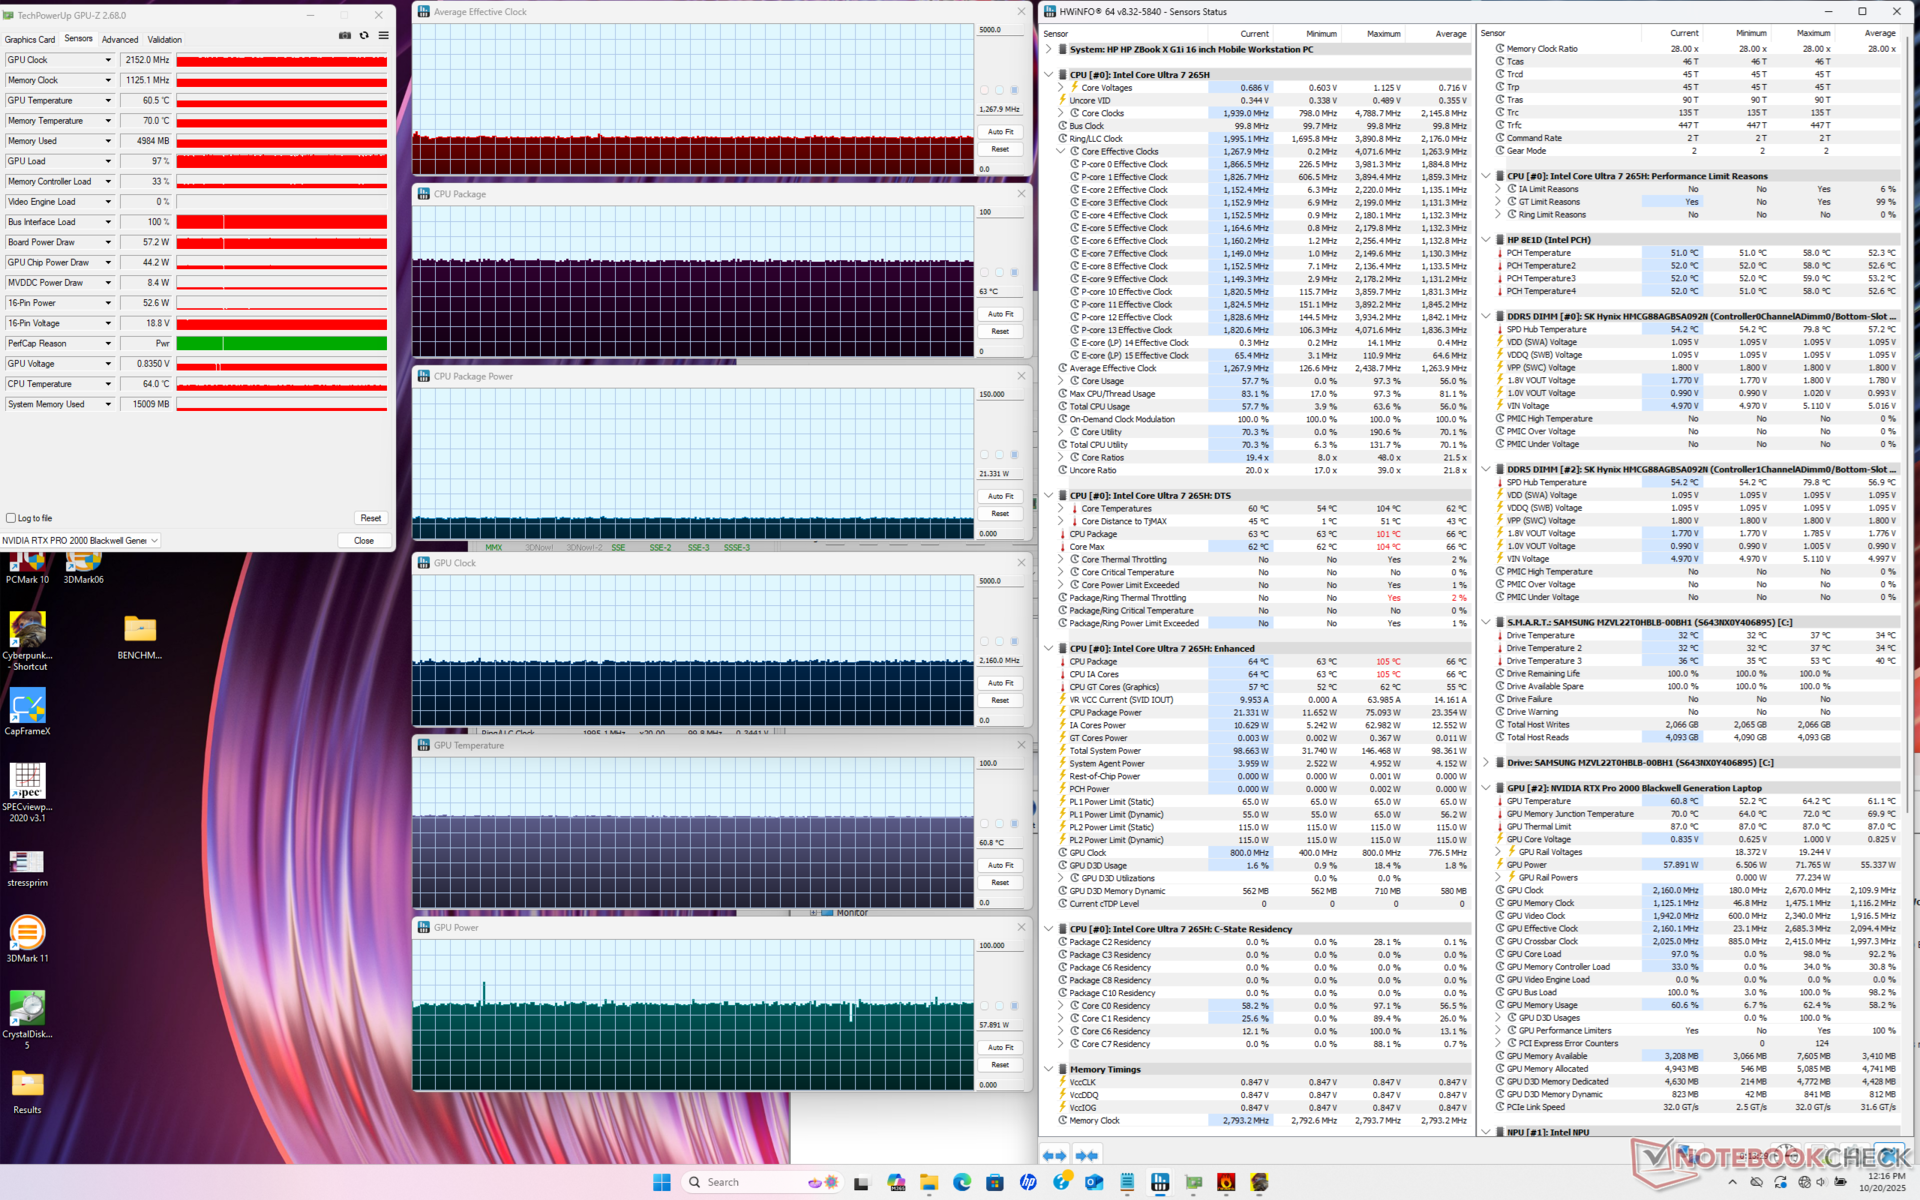
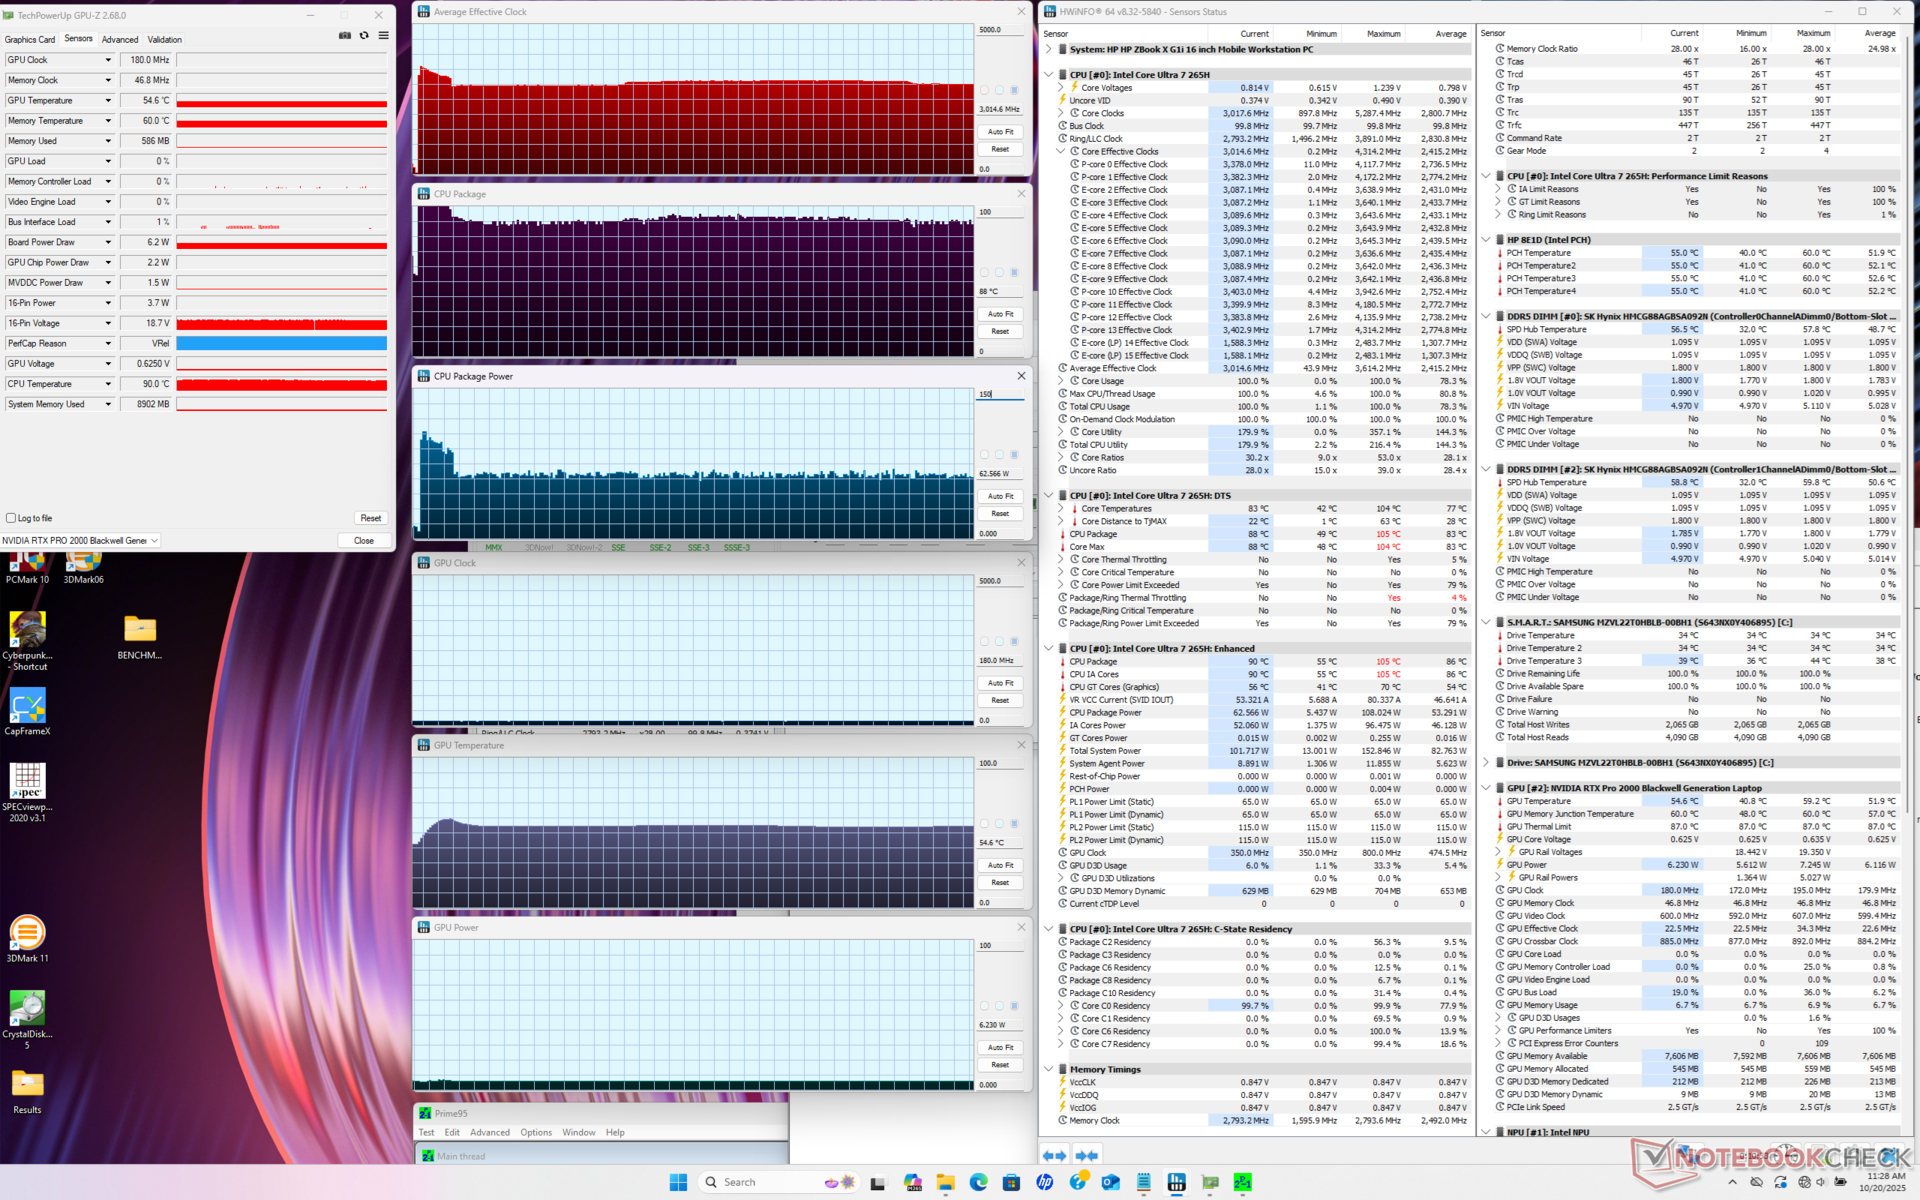

| Average CPU Clock (GHz) | GPU Clock (MHz) | Average CPU Temperature (°C) | Average GPU Temperature (°C) | |
| System Idle | -- | -- | 52 | 43 |
| Prime95 Stress | 3.0 | -- | 88 | 55 |
| Prime95 + FurMark Stress | 2.5 - 2.9 | 1215 | 83 - 91 | 65 |
| Cyberpunk 2077 Stress | 1.3 | 2160 | 63 | 61 |
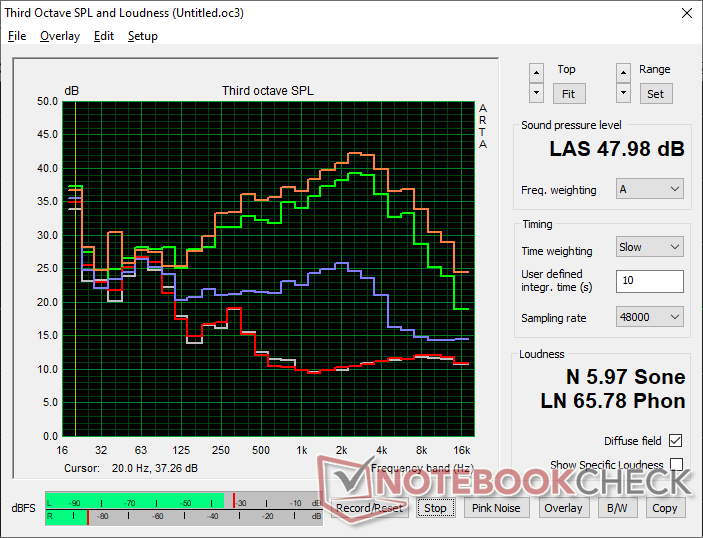
Speakers
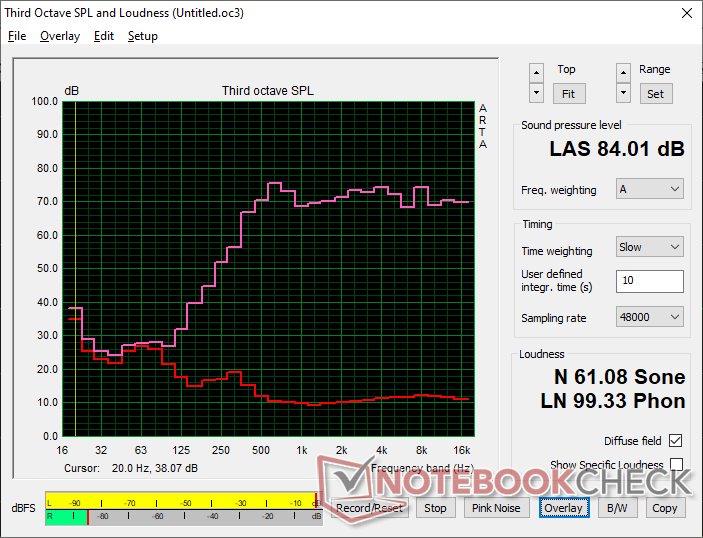
HP ZBook X G1i 16 audio analysis
(+) | speakers can play relatively loud (84 dB)
Bass 100 - 315 Hz
(-) | nearly no bass - on average 28% lower than median
(±) | linearity of bass is average (8.8% delta to prev. frequency)
Mids 400 - 2000 Hz
(+) | balanced mids - only 1.9% away from median
(+) | mids are linear (6.1% delta to prev. frequency)
Highs 2 - 16 kHz
(+) | balanced highs - only 2.9% away from median
(+) | highs are linear (5.1% delta to prev. frequency)
Overall 100 - 16.000 Hz
(±) | linearity of overall sound is average (15.6% difference to median)
Compared to same class
» 35% of all tested devices in this class were better, 11% similar, 54% worse
» The best had a delta of 7%, average was 17%, worst was 35%
Compared to all devices tested
» 23% of all tested devices were better, 5% similar, 72% worse
» The best had a delta of 4%, average was 23%, worst was 134%
Apple MacBook Pro 16 2021 M1 Pro audio analysis
(+) | speakers can play relatively loud (84.7 dB)
Bass 100 - 315 Hz
(+) | good bass - only 3.8% away from median
(+) | bass is linear (5.2% delta to prev. frequency)
Mids 400 - 2000 Hz
(+) | balanced mids - only 1.3% away from median
(+) | mids are linear (2.1% delta to prev. frequency)
Highs 2 - 16 kHz
(+) | balanced highs - only 1.9% away from median
(+) | highs are linear (2.7% delta to prev. frequency)
Overall 100 - 16.000 Hz
(+) | overall sound is linear (4.6% difference to median)
Compared to same class
» 0% of all tested devices in this class were better, 0% similar, 100% worse
» The best had a delta of 5%, average was 17%, worst was 45%
Compared to all devices tested
» 0% of all tested devices were better, 0% similar, 100% worse
» The best had a delta of 4%, average was 23%, worst was 134%
Energy Management
Power Consumption
Consumption when under load is slightly higher on average than what we recorded on the older AMD-powered ZBook Power 16 G11 A. However, our ZBook X G1i 16 is also the faster and leaner machine and so the high performance-per-watt is preserved.
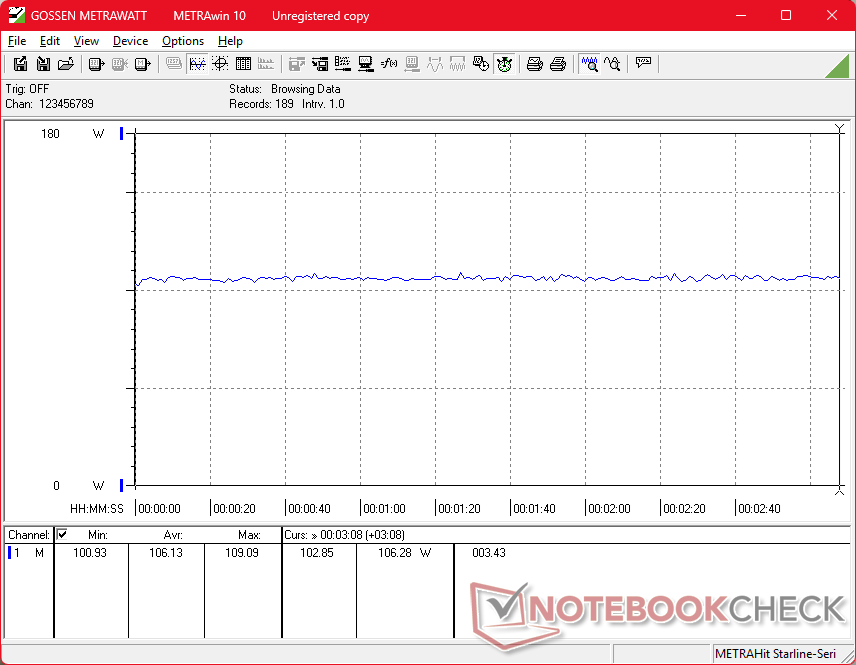
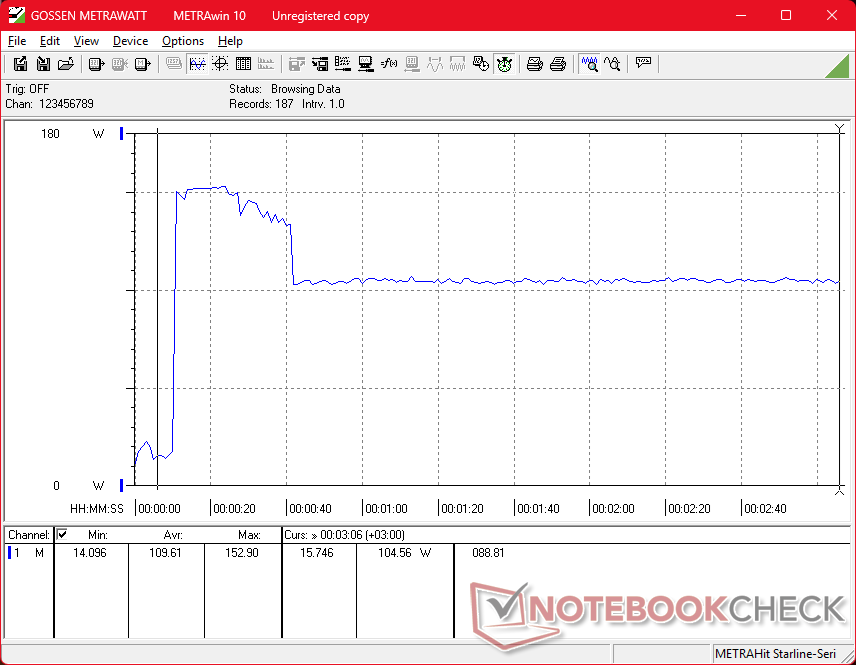
We're able to measure a temporary maximum draw of 153 W from the small (~13.8 x 6.5 x 2.2 cm) 150 W AC adapter when the CPU and GPU are fully stressed.
| Off / Standby | |
| Idle | |
| Load |
|
Key:
min: | |
| HP ZBook X G1i 16 Ultra 7 265H, RTX PRO 2000 Blackwell Generation Laptop, Samsung PM9A1 MZVL22T0HBLB, IPS, 2560x1600, 16" | HP ZBook Power 16 G11 A R7 8845HS, RTX 2000 Ada Generation Laptop, Samsung PM9A1 MZVL22T0HBLB, IPS, 2560x1600, 16" | HP ZBook Studio 16 G11 Ultra 9 185H, RTX 3000 Ada Generation Laptop, Kioxia XG8 KXG80ZNV1T02, IPS, 3840x2400, 16" | Lenovo ThinkPad P16 Gen 2 i7-14700HX, RTX 4000 Ada Generation Laptop, SK hynix PC801 HFS001TEJ9X162N, IPS, 2560x1600, 16" | Dell Pro Max 16 Plus Ultra 9 285HX, RTX PRO 5000 Blackwell Generation Laptop, SK hynix PCB01 HFS001TFM9X186N, OLED, 3840x2400, 16" | Dell Precision 5690 Ultra 9 185H, RTX 5000 Ada Generation Laptop, 2x Samsung PM9A1 1TB (RAID 0), OLED, 3840x2400, 16" | |
|---|---|---|---|---|---|---|
| Power Consumption | 2% | -85% | -90% | -279% | -72% | |
| Idle Minimum * (Watt) | 4.1 | 4.6 -12% | 14 -241% | 7.9 -93% | 35.1 -756% | 7.9 -93% |
| Idle Average * (Watt) | 9 | 10 -11% | 22.4 -149% | 13.1 -46% | 39.2 -336% | 12 -33% |
| Idle Maximum * (Watt) | 9.4 | 10.6 -13% | 25.7 -173% | 24.2 -157% | 56 -496% | 28.6 -204% |
| Load Average * (Watt) | 86.7 | 60.9 30% | 90.2 -4% | 127.4 -47% | 130.2 -50% | 98.8 -14% |
| Cyberpunk 2077 ultra external monitor * (Watt) | 102 | 92.8 9% | 120.3 -18% | 219 -115% | 213 -109% | |
| Cyberpunk 2077 ultra * (Watt) | 106.1 | 96.8 9% | 125.4 -18% | 225 -112% | 229 -116% | |
| Load Maximum * (Watt) | 152.9 | 154.8 -1% | 142 7% | 248.5 -63% | 285.2 -87% | 174.8 -14% |
| Witcher 3 ultra * (Watt) | 144.5 |
* ... smaller is better
Power Consumption Cyberpunk / Stress Test
Power Consumption external Monitor
Battery Life
WLAN runtime is excellent at 12.5 hours to outlast the last generation Precision 5690 or ZBook Power 16 G11 A by a few hours each.
| HP ZBook X G1i 16 Ultra 7 265H, RTX PRO 2000 Blackwell Generation Laptop, 83 Wh | HP ZBook Power 16 G11 A R7 8845HS, RTX 2000 Ada Generation Laptop, 83 Wh | HP ZBook Studio 16 G11 Ultra 9 185H, RTX 3000 Ada Generation Laptop, 86 Wh | Lenovo ThinkPad P16 Gen 2 i7-14700HX, RTX 4000 Ada Generation Laptop, 94 Wh | Dell Pro Max 16 Plus Ultra 9 285HX, RTX PRO 5000 Blackwell Generation Laptop, 96 Wh | Dell Precision 5690 Ultra 9 185H, RTX 5000 Ada Generation Laptop, 98 Wh | |
|---|---|---|---|---|---|---|
| Battery runtime | -22% | -62% | -80% | -71% | -26% | |
| WiFi v1.3 (h) | 12.5 | 9.7 -22% | 4.8 -62% | 2.5 -80% | 3.6 -71% | 9.2 -26% |
| Reader / Idle (h) | 26.1 | |||||
| Load (h) | 1.7 |
Notebookcheck Rating
High quality and lean mobile workstation with midrange performance.
HP ZBook X G1i 16
- 10/22/2025 v8
Allen Ngo
 Total Sustainability Score:
 Potential Competitors in Comparison
Image | Model / Review | Price | Weight | Height | Display |
|---|---|---|---|---|---|
1. 87.4%  | HP ZBook X G1i 16 Intel Core Ultra 7 265H ⎘ NVIDIA RTX PRO 2000 Blackwell Generation Laptop ⎘ 64 GB Memory, 2048 GB SSD | Amazon: List Price: 2700 USD | 2.2 kg | 23 mm | 16.00" 2560x1600 189 PPI IPS |
2. 85.4%  | HP ZBook Power 16 G11 A AMD Ryzen 7 8845HS ⎘ NVIDIA RTX 2000 Ada Generation Laptop ⎘ 64 GB Memory, 2048 GB SSD | Amazon: List Price: 2100 USD | 2.2 kg | 22.9 mm | 16.00" 2560x1600 189 PPI IPS |
3. 84.2%  | HP ZBook Studio 16 G11 Intel Core Ultra 9 185H ⎘ NVIDIA RTX 3000 Ada Generation Laptop ⎘ 64 GB Memory, 1024 GB SSD | Amazon: List Price: 4300 USD | 1.8 kg | 19 mm | 16.00" 3840x2400 283 PPI IPS |
4. 85.9%  | Lenovo ThinkPad P16 Gen 2 Intel Core i7-14700HX ⎘ NVIDIA RTX 4000 Ada Generation Laptop ⎘ 32 GB Memory, 1024 GB SSD | Amazon: List Price: 3500 USD | 3.1 kg | 30.23 mm | 16.00" 2560x1600 189 PPI IPS |
5. 88.4%  | Dell Pro Max 16 Plus Intel Core Ultra 9 285HX ⎘ NVIDIA RTX PRO 5000 Blackwell Generation Laptop ⎘ 128 GB Memory, SSD | Amazon: List Price: 5000 USD | 2.8 kg | 30.9 mm | 16.00" 3840x2400 283 PPI OLED |
6. 88.3% v7 (old)  | Dell Precision 5690 Intel Core Ultra 9 185H ⎘ NVIDIA RTX 5000 Ada Generation Laptop ⎘ 32 GB Memory, 2048 GB SSD | Amazon: List Price: 5900 USD | 2.3 kg | 22.17 mm | 16.00" 3840x2400 283 PPI OLED |
Transparency
The selection of devices to be reviewed is made by our editorial team. The test sample was provided to the author as a loan by the manufacturer or retailer for the purpose of this review. The lender had no influence on this review, nor did the manufacturer receive a copy of this review before publication. There was no obligation to publish this review. As an independent media company, Notebookcheck is not subjected to the authority of manufacturers, retailers or publishers.
This is how Notebookcheck is testing
Every year, Notebookcheck independently reviews hundreds of laptops and smartphones using standardized procedures to ensure that all results are comparable. We have continuously developed our test methods for around 20 years and set industry standards in the process. In our test labs, high-quality measuring equipment is utilized by experienced technicians and editors. These tests involve a multi-stage validation process. Our complex rating system is based on hundreds of well-founded measurements and benchmarks, which maintains objectivity. Further information on our test methods can be found here.
