HP ZBook Power 16 G11 A review: Powerful workstation with AMD Zen 4

The ZBook Power 16 G11 succeeds the older ZBook Power 15 G10 with both new internal processors and new external changes. As its name implies, the ZBook Power 16 G11 modernizes the series by dropping the old 15.6-inch form factor for a 16-inch design. It sits in between the lower-end ZBook Firefly and higher-end ZBook Fury when it comes to performance. Users can configure with either Meteor Lake Intel Core Ultra CPUs or AMD Ryzen Zen 4 CPUs and Nvidia RTX graphics.
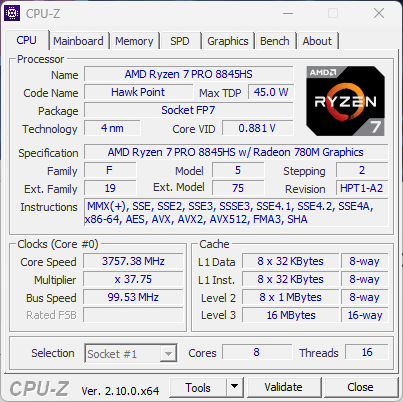
Our unit in review is a higher-end AMD configuration (ZBook Power 16 G11 A) with the Ryzen 7 8845HS CPU, RTX 2000 Ada GPU, and 120Hz 2560 x 1600p IPS display for approximately $2100. Options are very wide ranging from the Ryzen 5 8645HS up to the Ryzen 9 8945HS with 1200p display and RTX 1000, RTX 2000, or RTX 3000 graphics. Users can also opt for no discrete graphics at all.
Competitors in this space include other 16-inch workstations like the Dell Precision 5690, MSI CreatorPro Z16P, or the Lenovo ThinkPad P16s G2.
More HP reviews:
Potential Competitors in Comparison
Rating | Version | Date | Model | Weight | Height | Size | Resolution | Price |
|---|---|---|---|---|---|---|---|---|
| 85.4 % | v8 | 10 / 2024 | HP ZBook Power 16 G11 A R7 8845HS, RTX 2000 Ada Generation Laptop | 2.2 kg | 22.9 mm | 16.00" | 2560x1600 | |
| 88.9 % v7 (old) | v7 (old) | 12 / 2023 | HP ZBook Power 15 G10 R7 PRO 7840HS, RTX 2000 Ada Generation Laptop | 2 kg | 22.9 mm | 15.60" | 2560x1440 | |
| 85.9 % | v8 | 08 / 2024 | HP ZBook Fury 16 G11 i9-14900HX, RTX 3500 Ada Generation Laptop | 2.6 kg | 28.5 mm | 16.00" | 3840x2400 | |
| 83.5 % | v8 | 10 / 2024 | Lenovo ThinkPad P1 Gen 7 21KV001SGE Ultra 7 155H, GeForce RTX 4060 Laptop GPU | 2 kg | 20.5 mm | 16.00" | 2560x1600 | |
| 88.6 % v7 (old) | v7 (old) | 01 / 2024 | Lenovo ThinkPad P16s G2 21K9000CGE R7 PRO 7840U, Radeon 780M | 1.8 kg | 24.4 mm | 16.00" | 3840x2400 | |
| 88.3 % v7 (old) | v7 (old) | 05 / 2024 | Dell Precision 5690 Ultra 9 185H, RTX 5000 Ada Generation Laptop | 2.3 kg | 22.17 mm | 16.00" | 3840x2400 |
Note: We have recently updated our rating system and the results of version 8 are not comparable with the results of version 7. More information is available here .
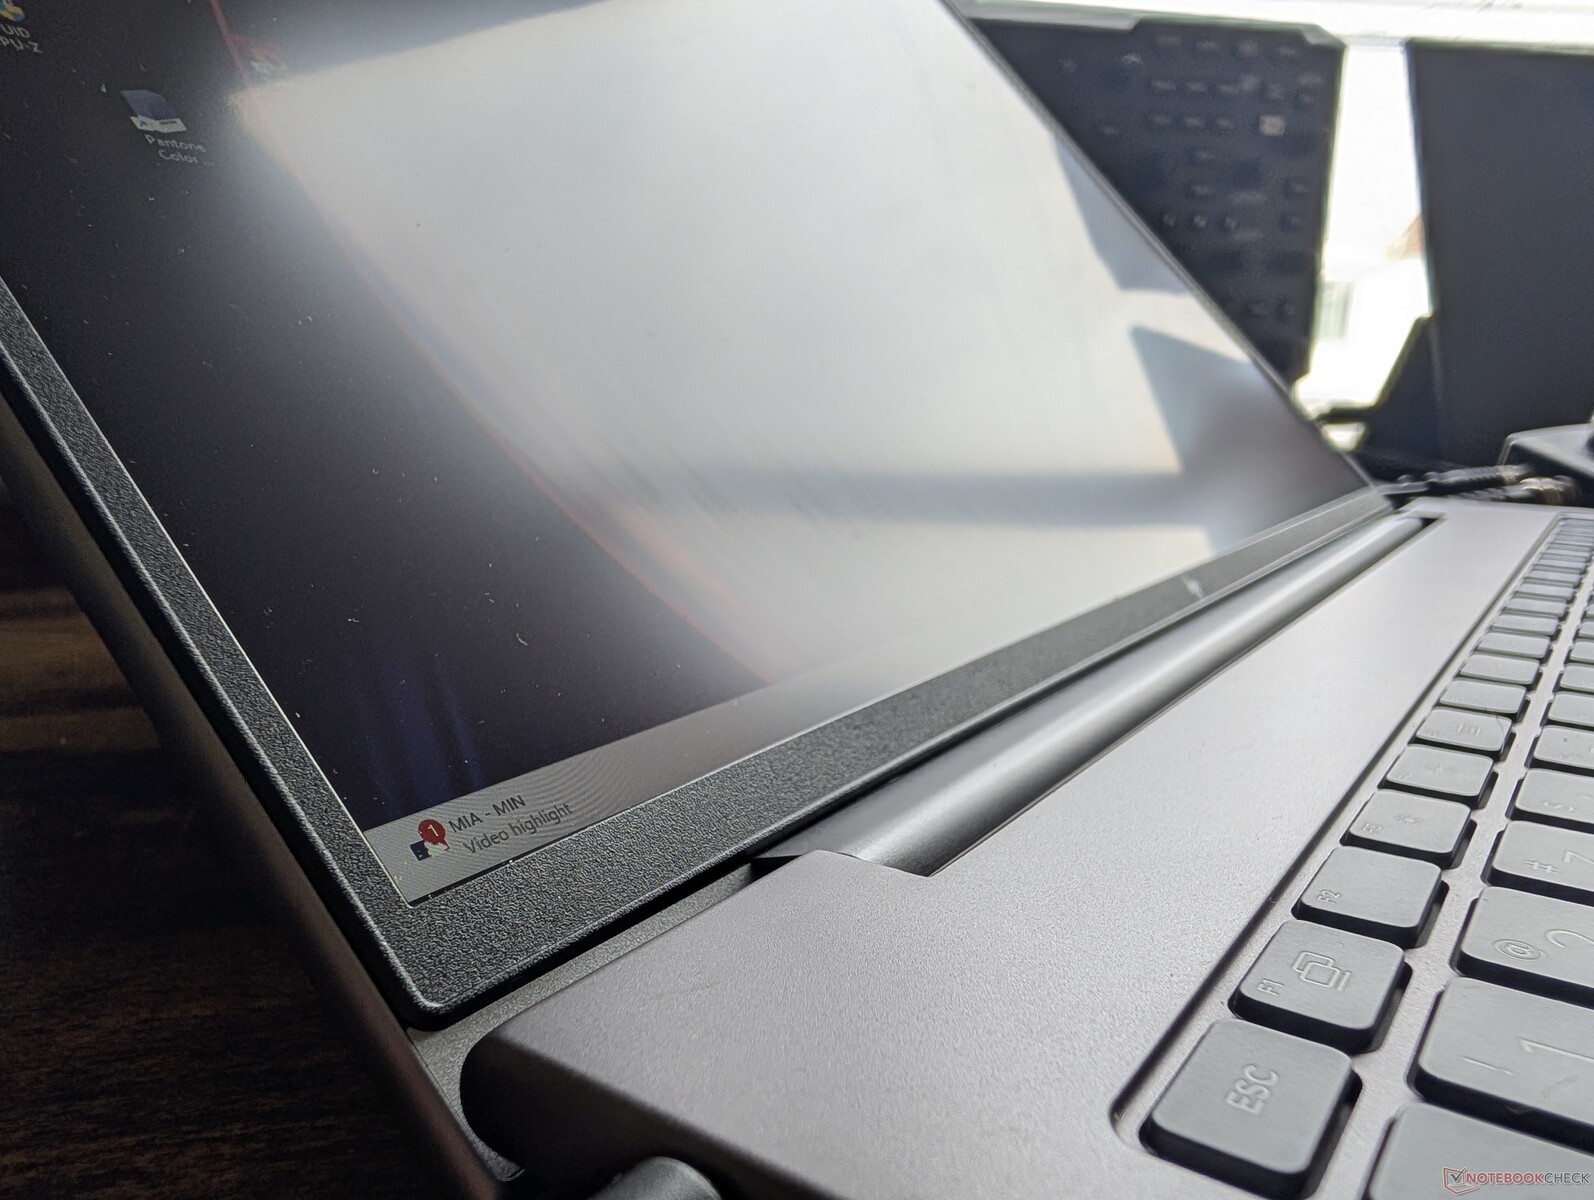
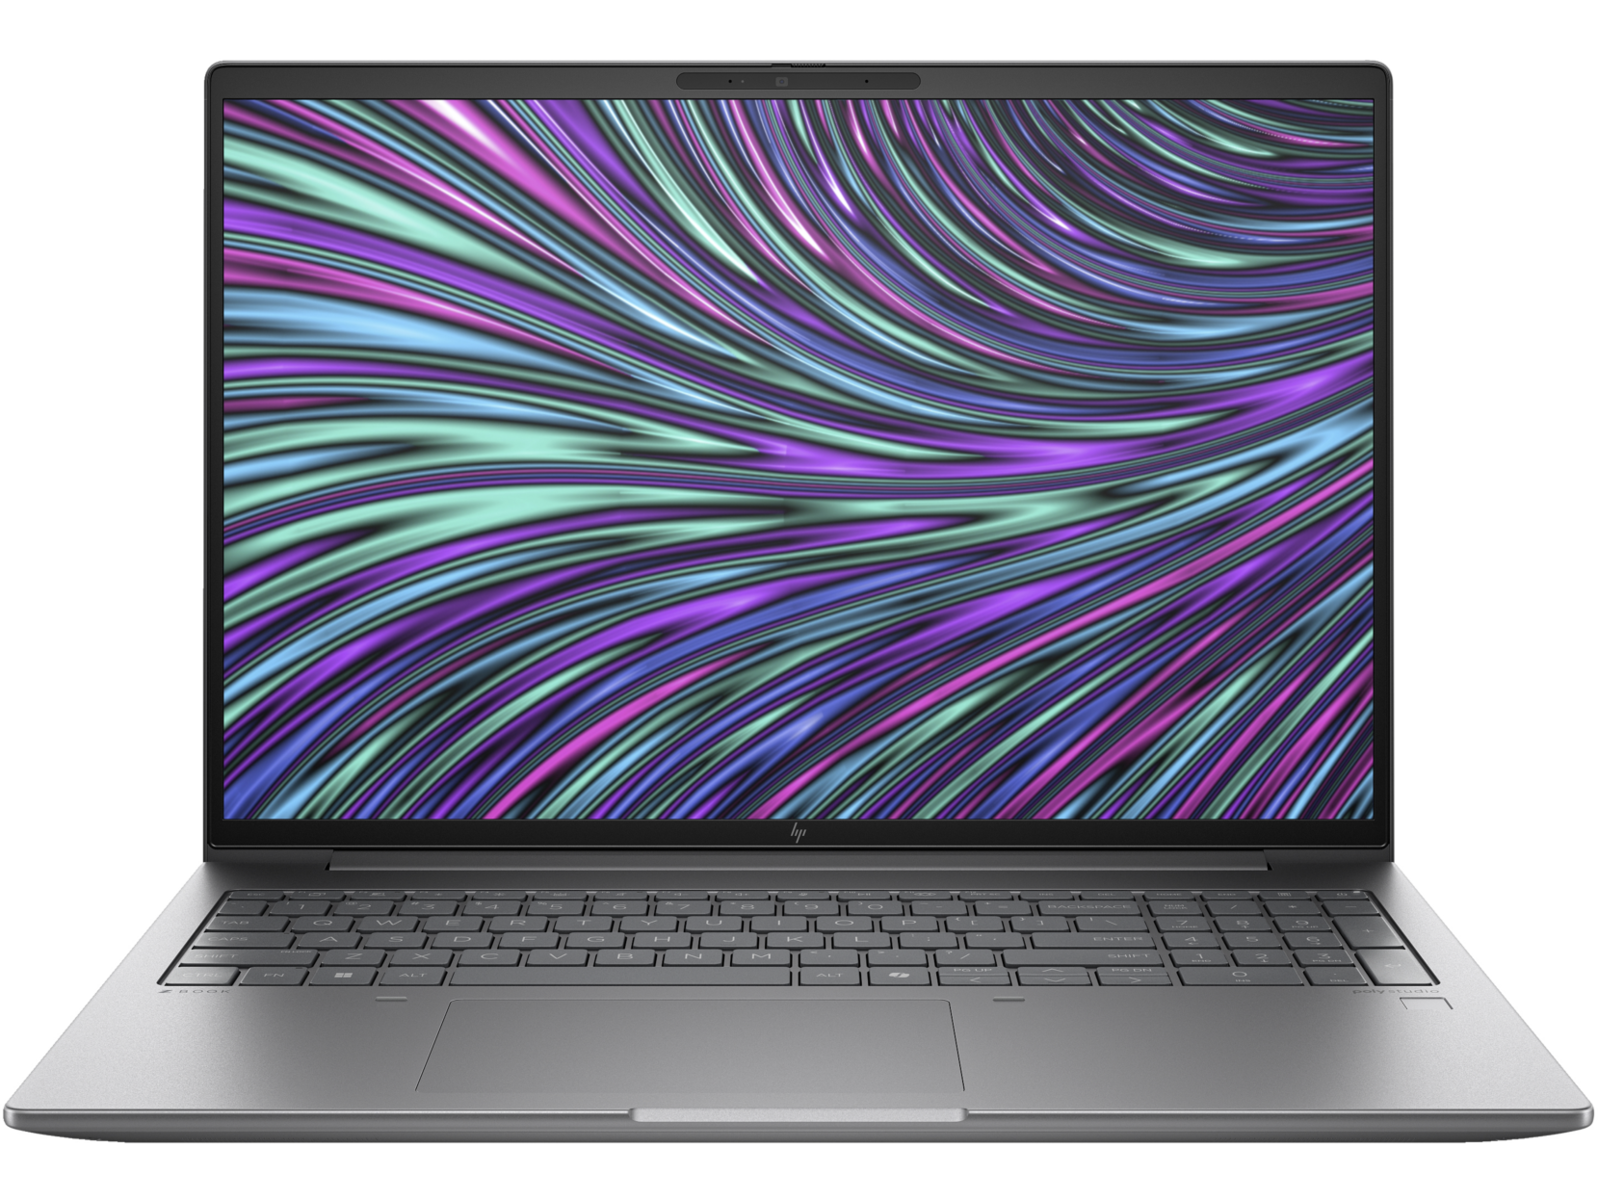
Case — MIL-STD 810 Certified
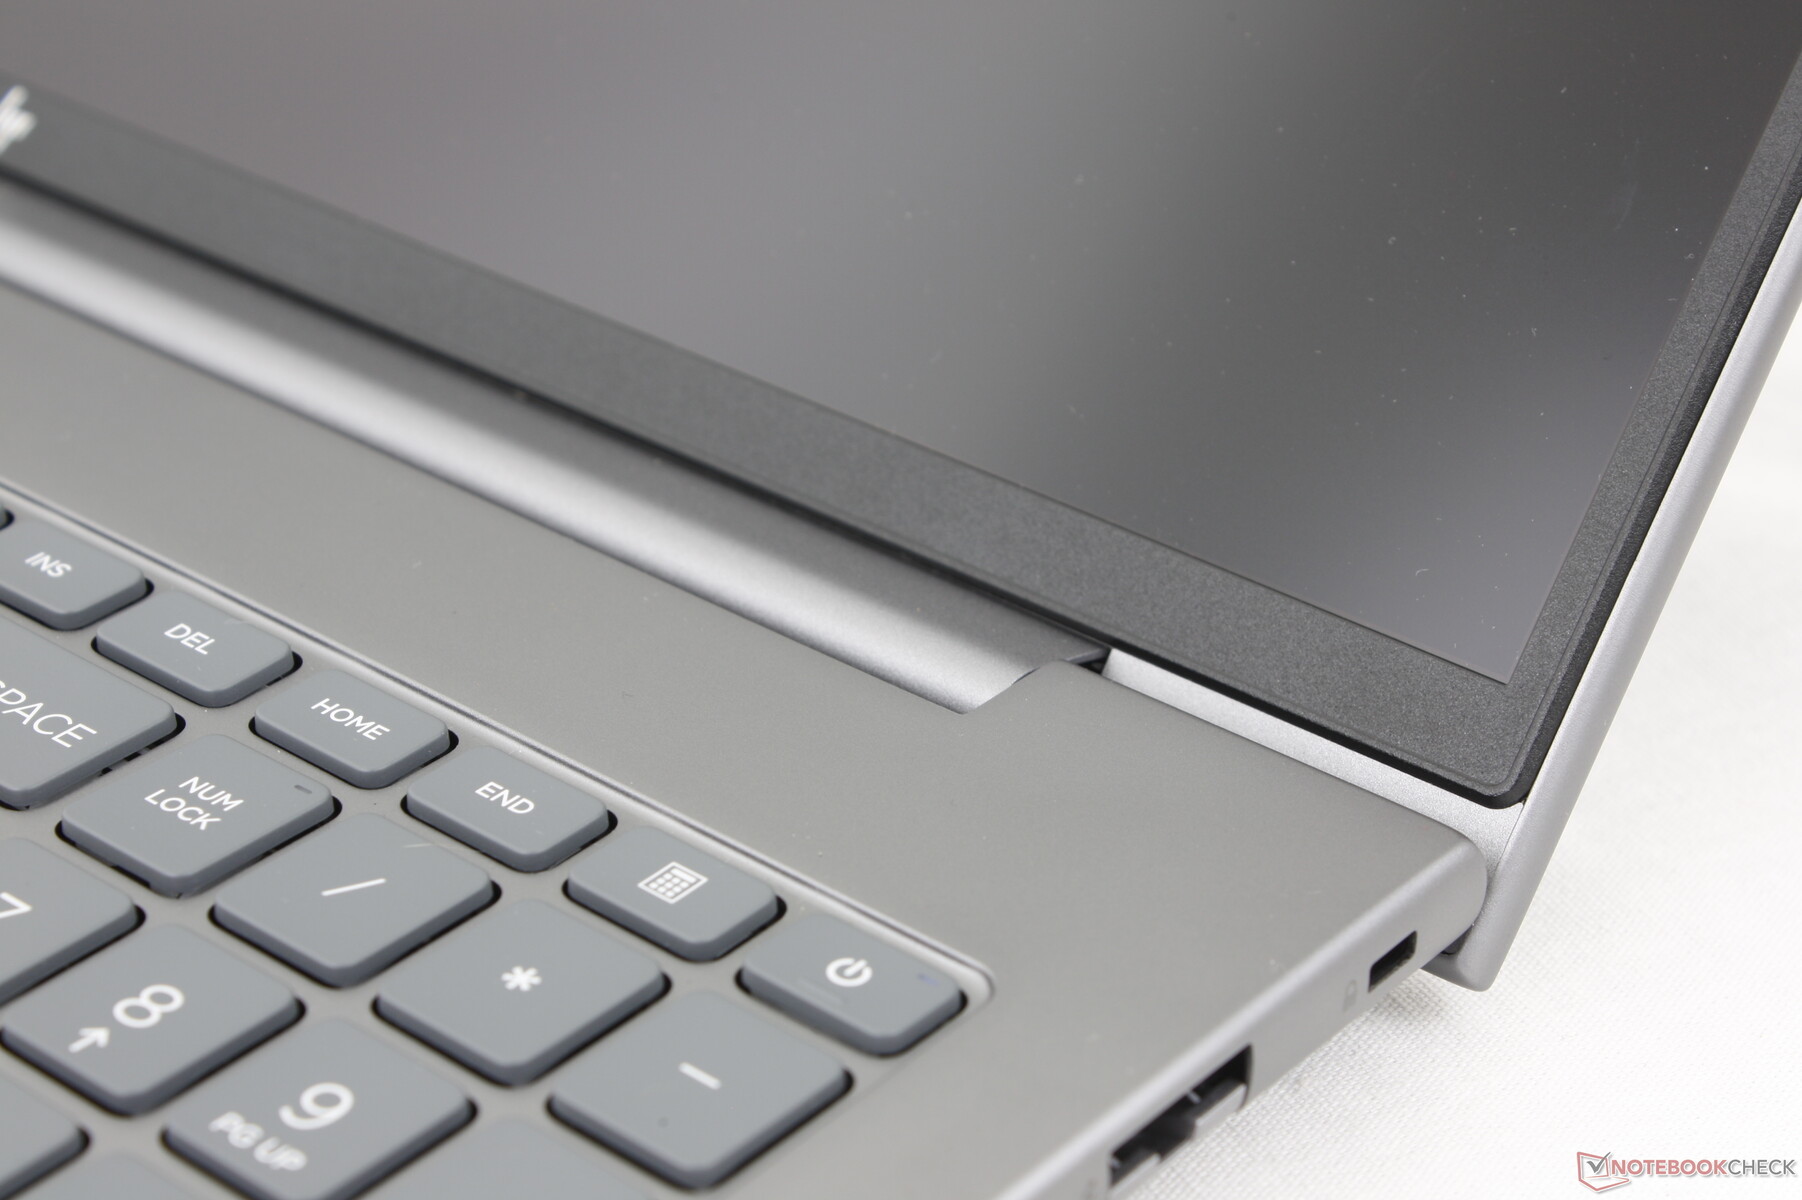
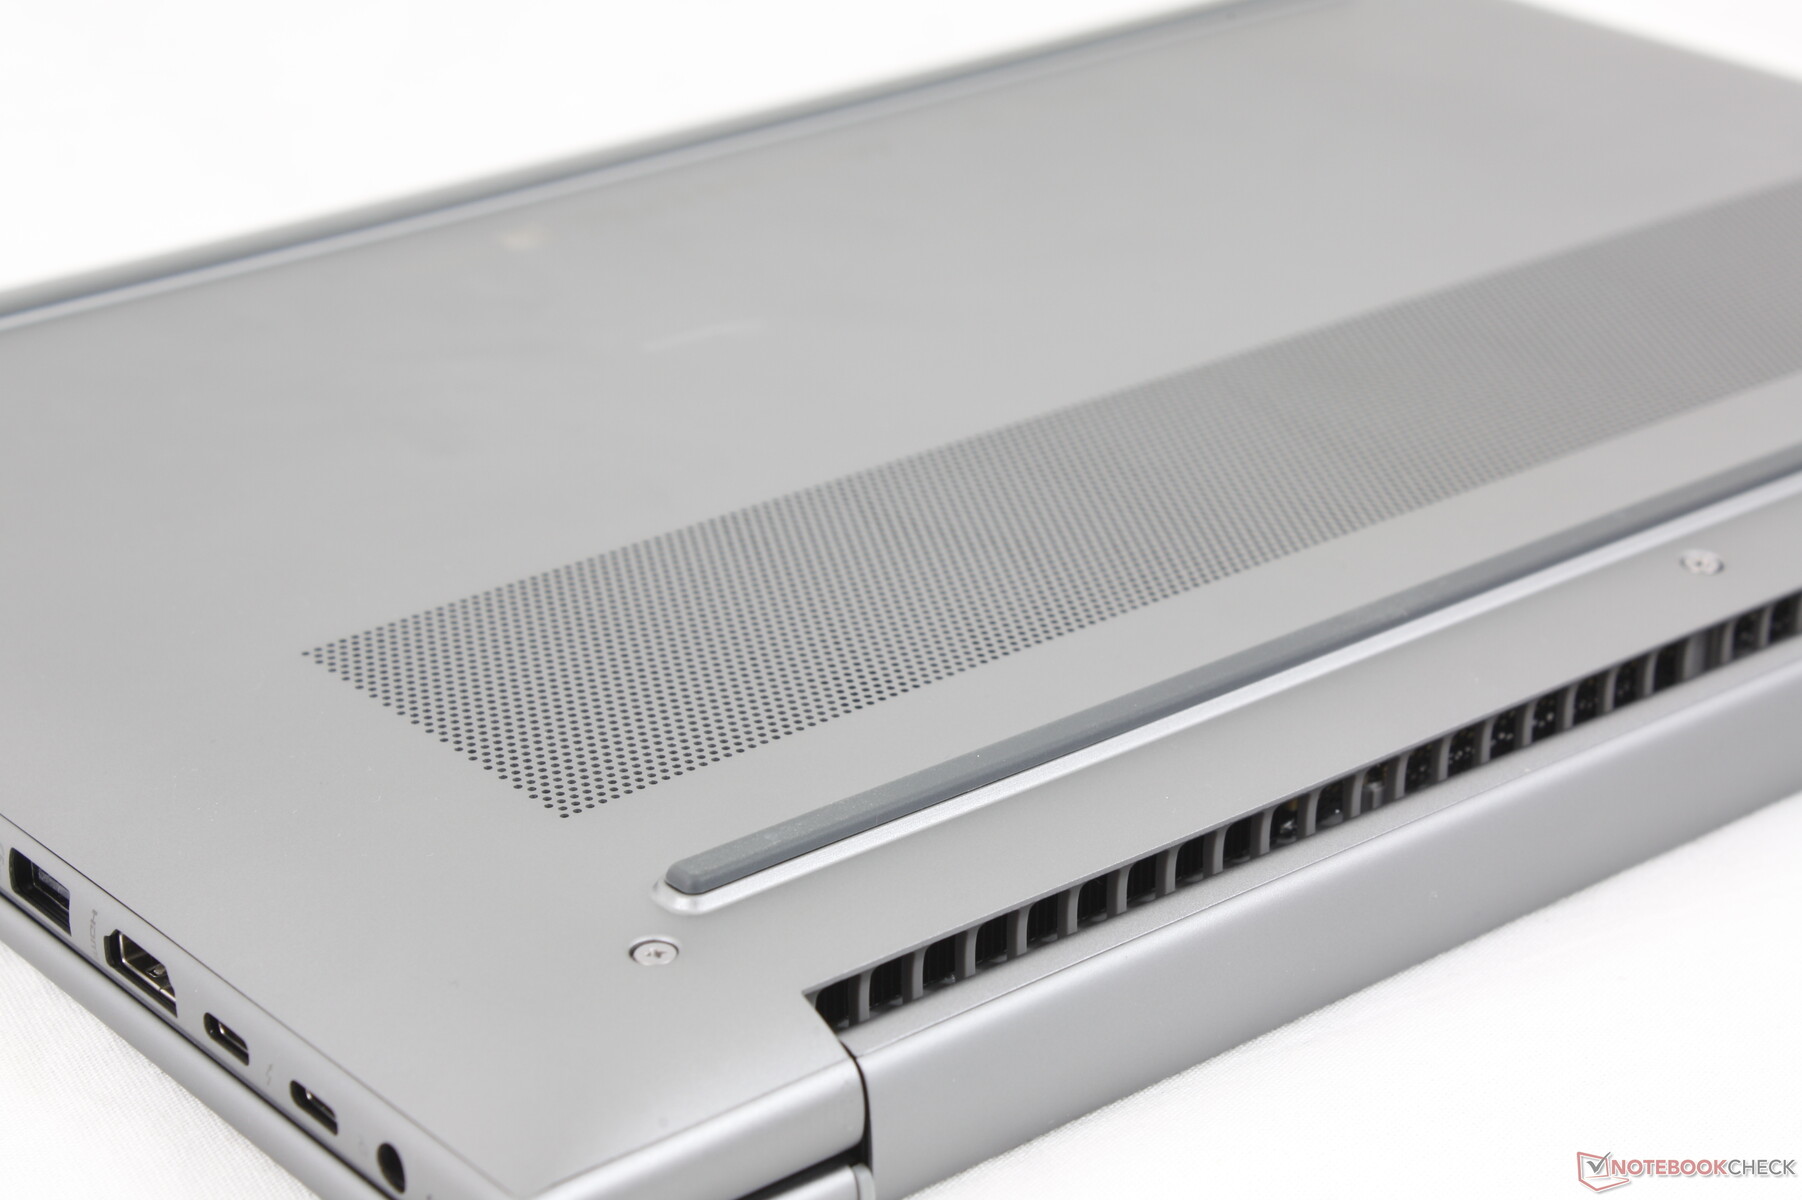
HP utilizes similar gray aluminum alloy materials for almost all of its ZBook models for a sense of consistency across the family. In this case, the ZBook Power 16 G11 sports the same smooth matte metal texture as the ZBook Power 15 G10 but with superficial changes to the keyboard borders, outer lid trim, and bottom panel.
Chassis rigidity is excellent with minimal bending and depressions when trying to twist the base. However, the hinges and lid could have been stiffer especially since the lid can open almost the full 180 degrees unlike on the Precision 5690.
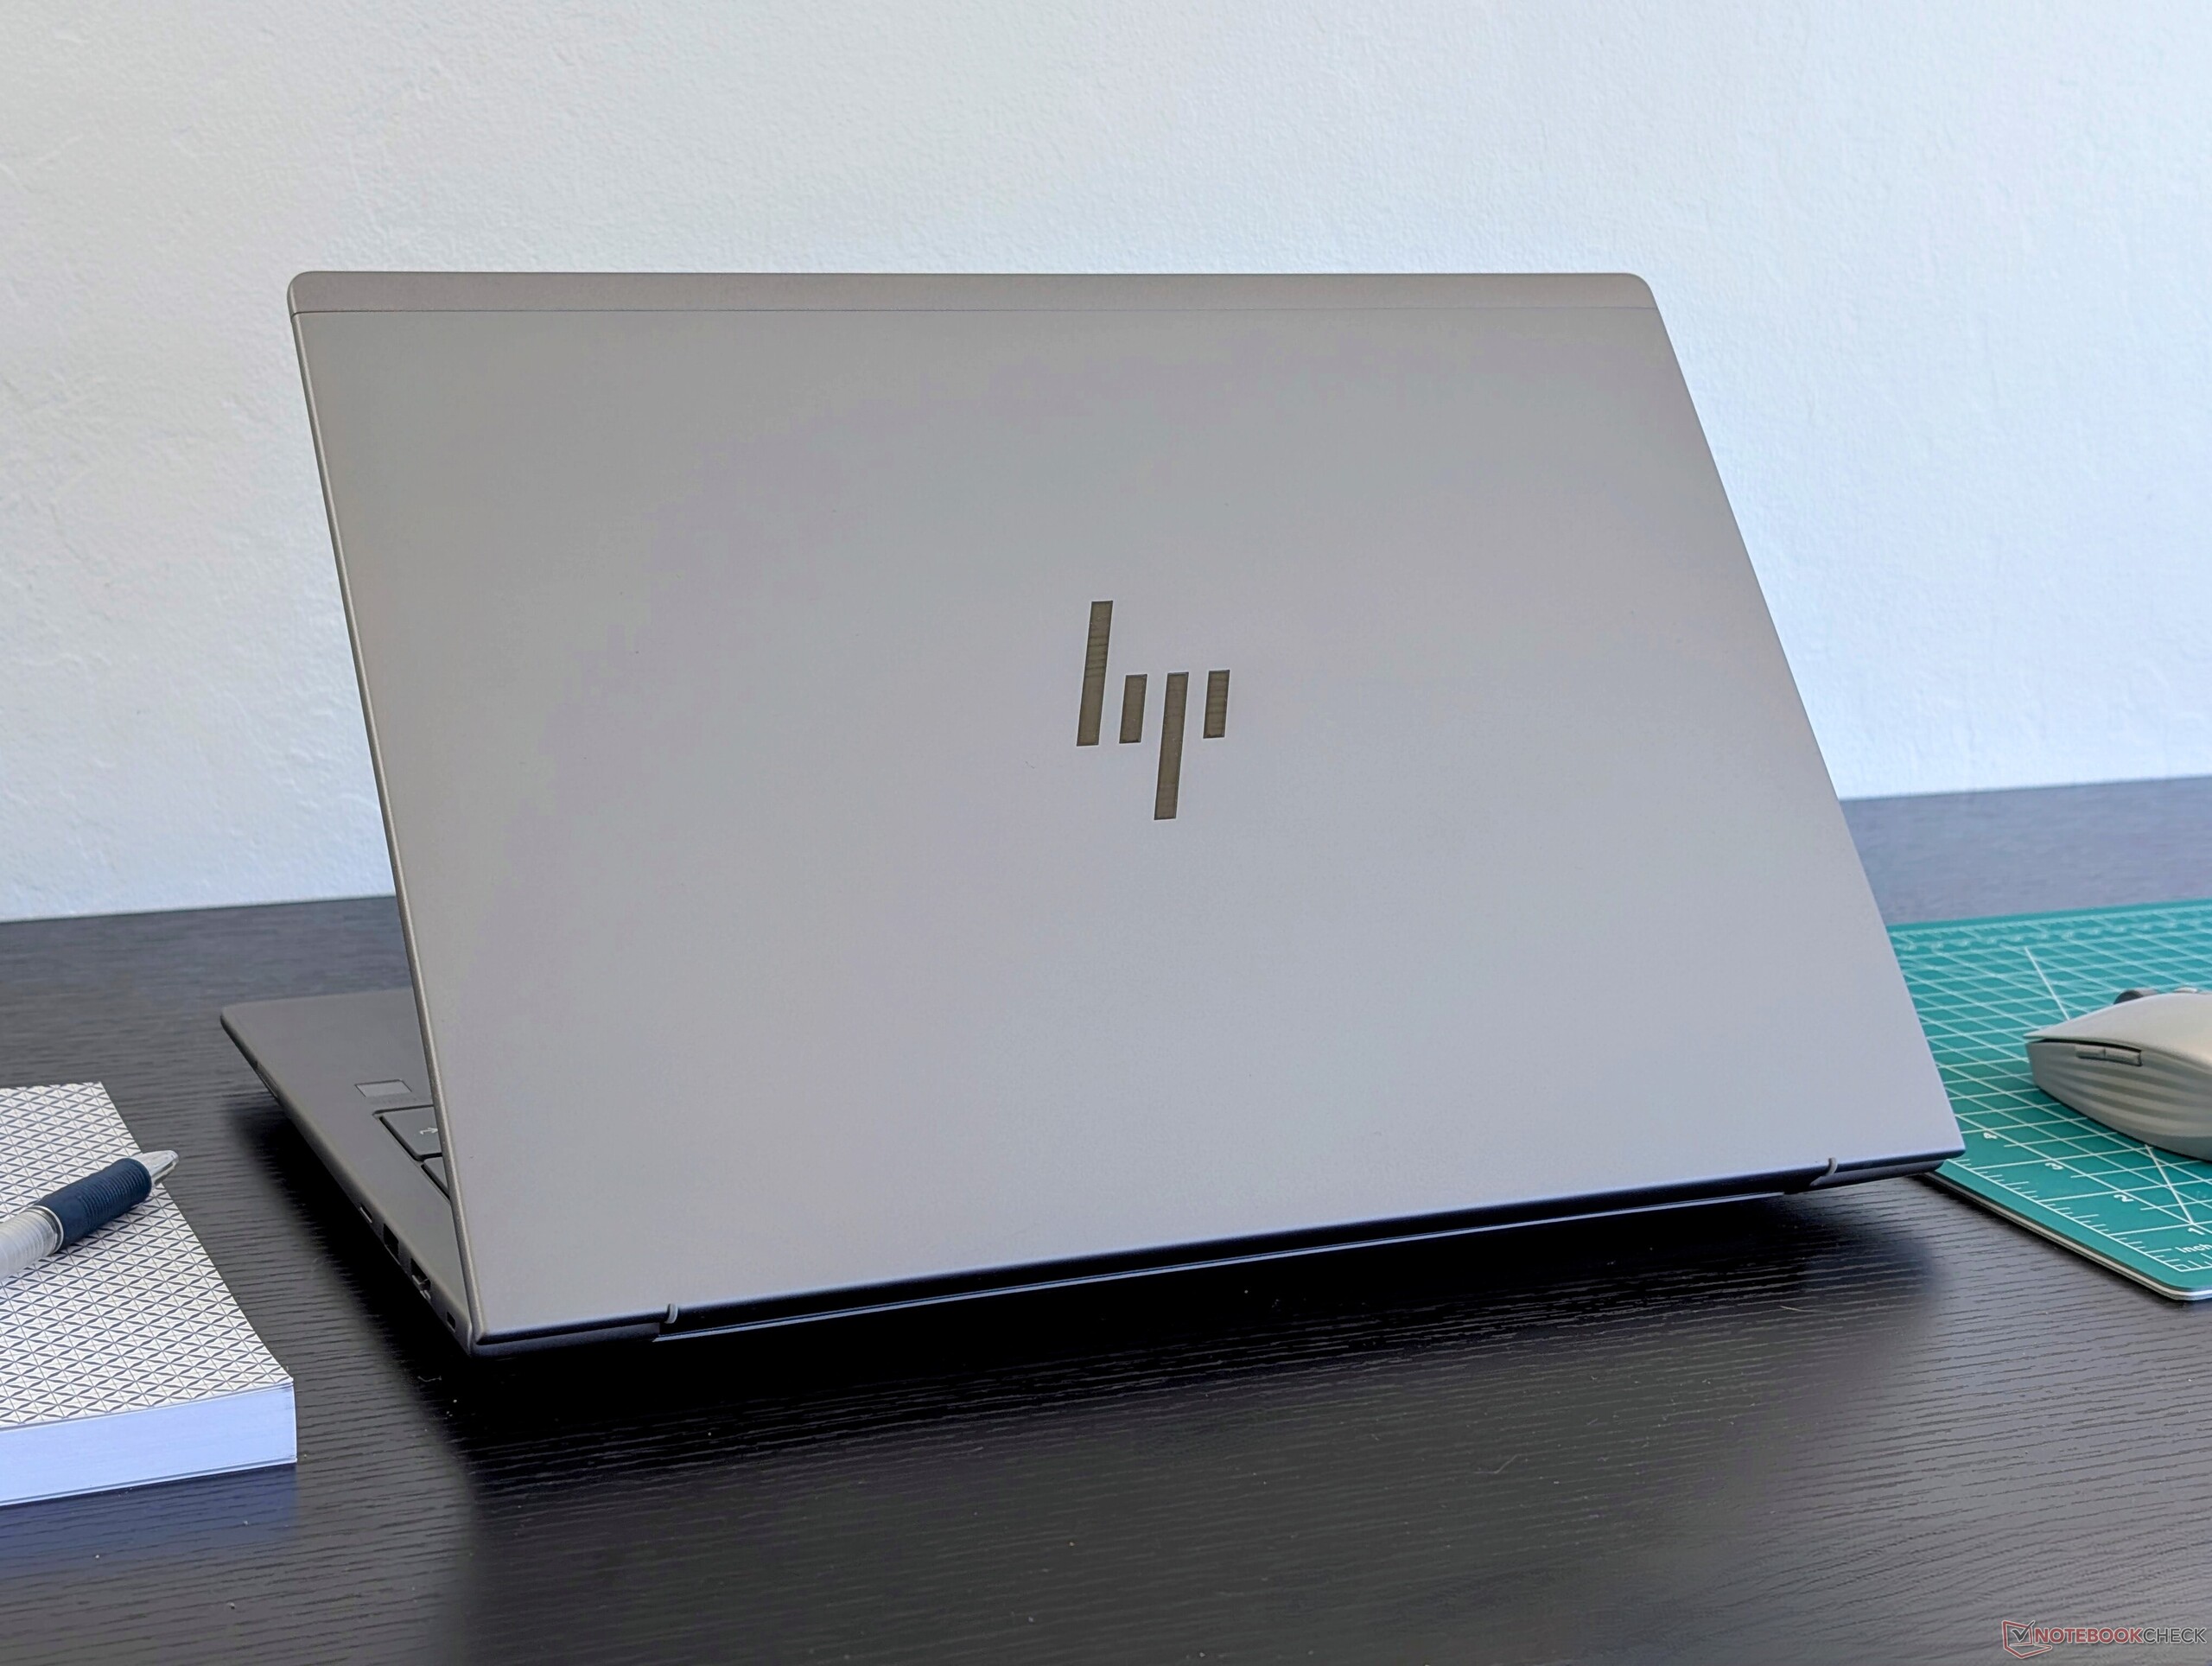
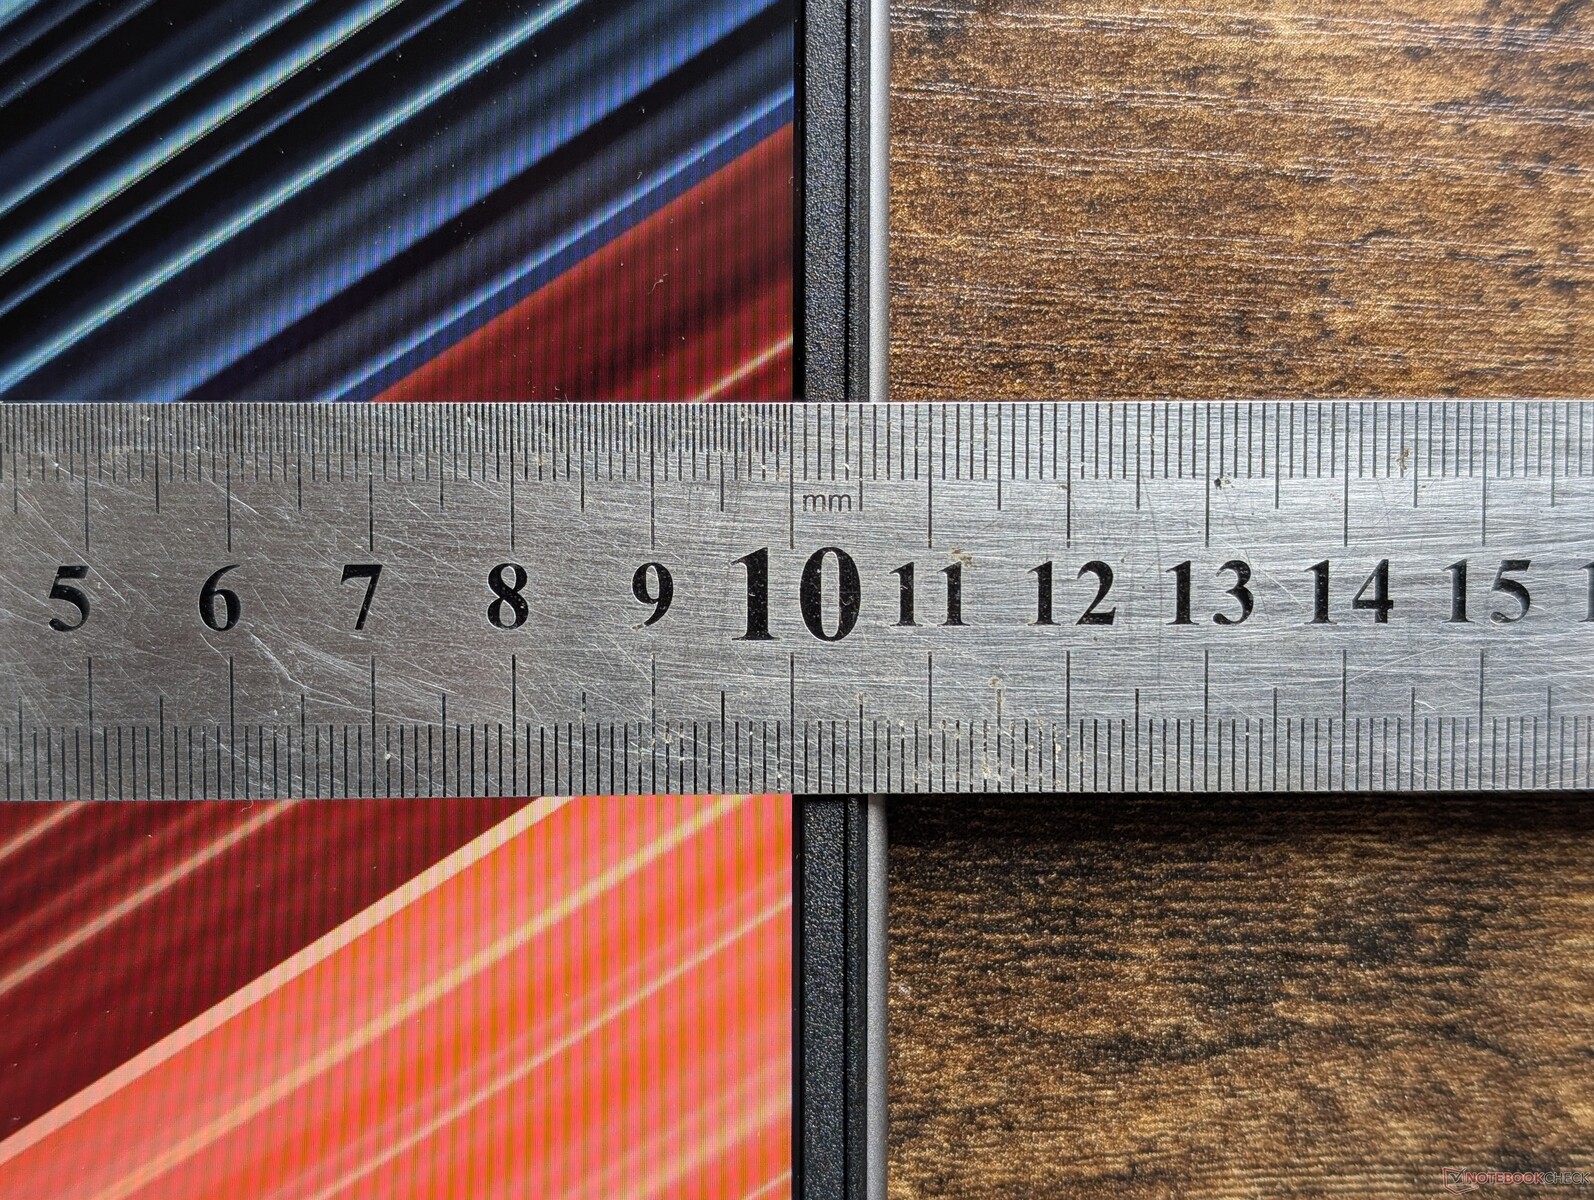
The new 16-inch design is about 10 percent heavier and 7 percent larger than the outgoing 15-inch model. It's notably not any thinner which is a bummer as it's already thicker than some competitors like the ThinkPad P1 Gen 7. The ZBook Fury 16 G11 is even heavier and thicker still but with faster CPU and GPU options to compensate. HP offers the slimmer ZBook Firefly 16 series should users want a more portable option.
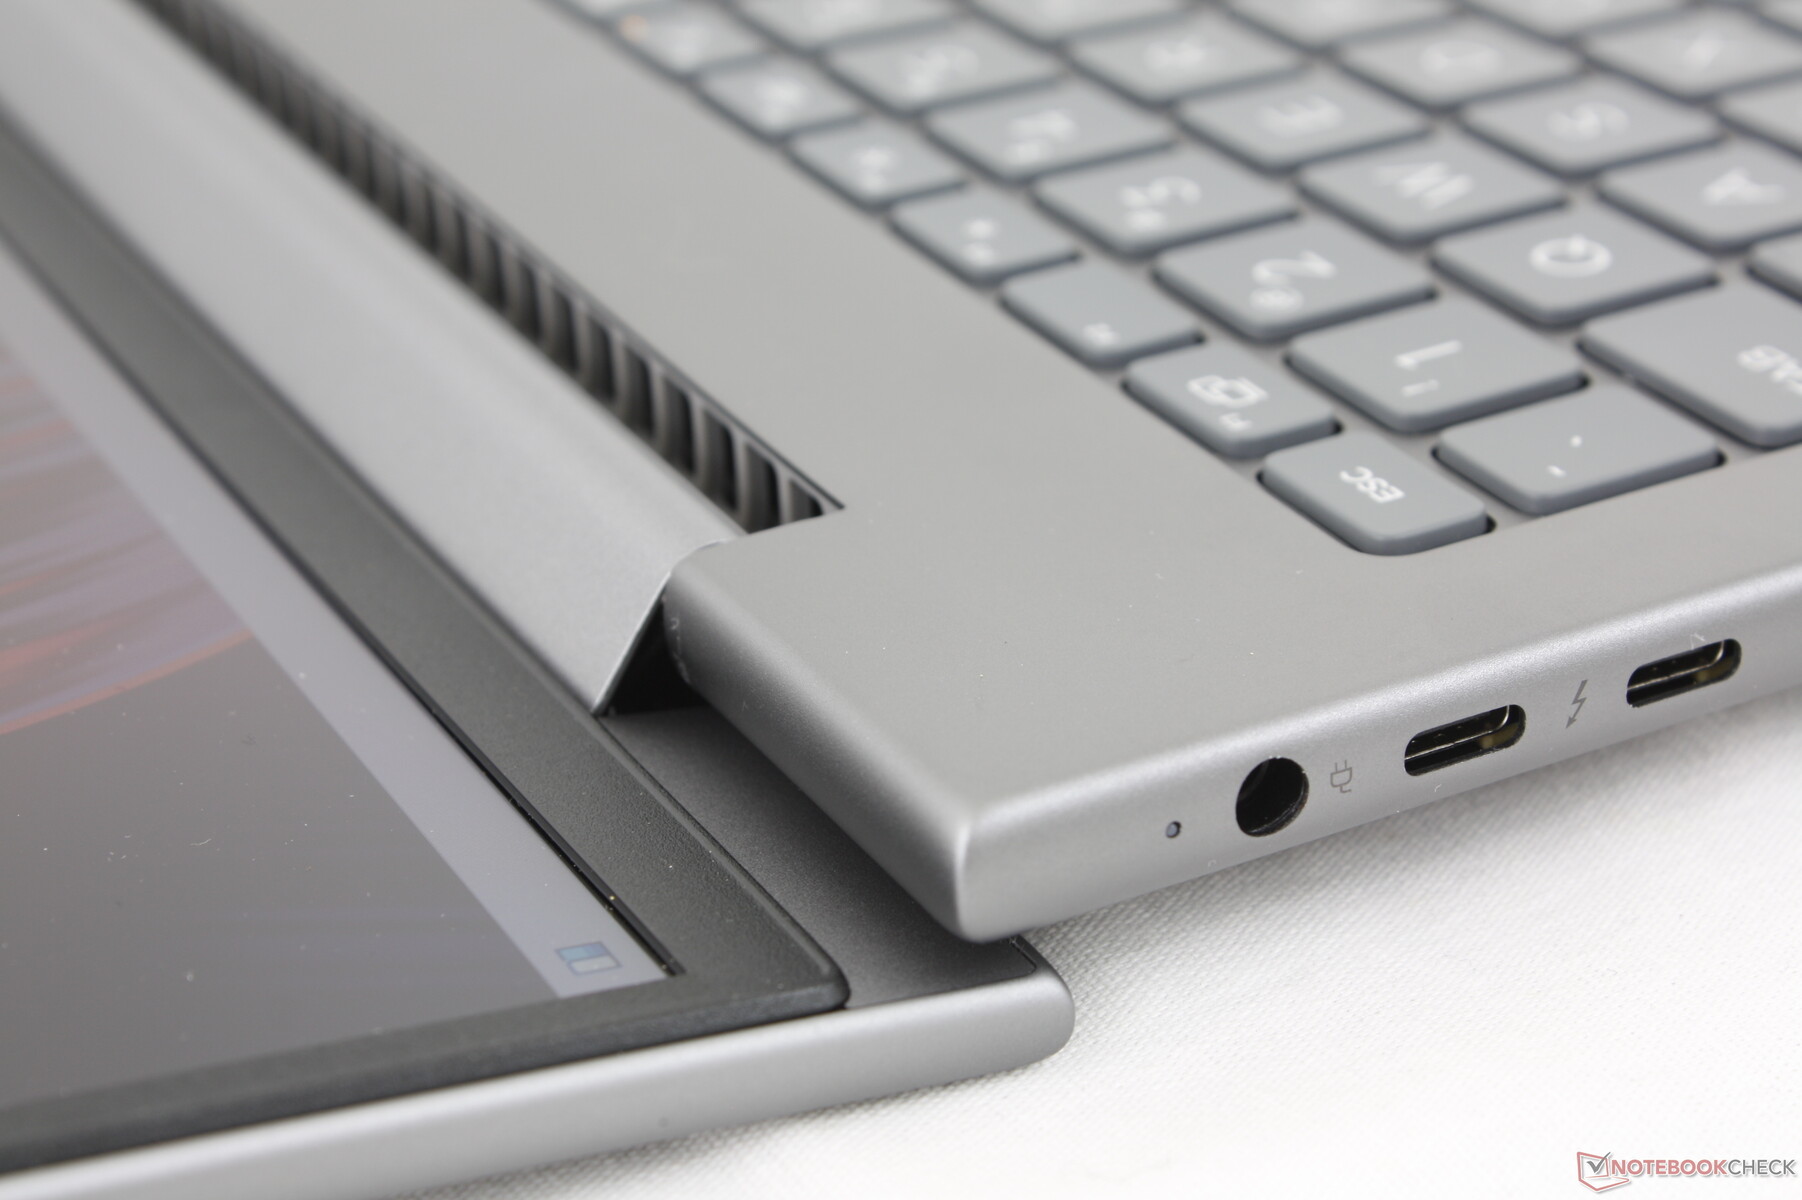
Connectivity — Thunderbolt 4 Ports
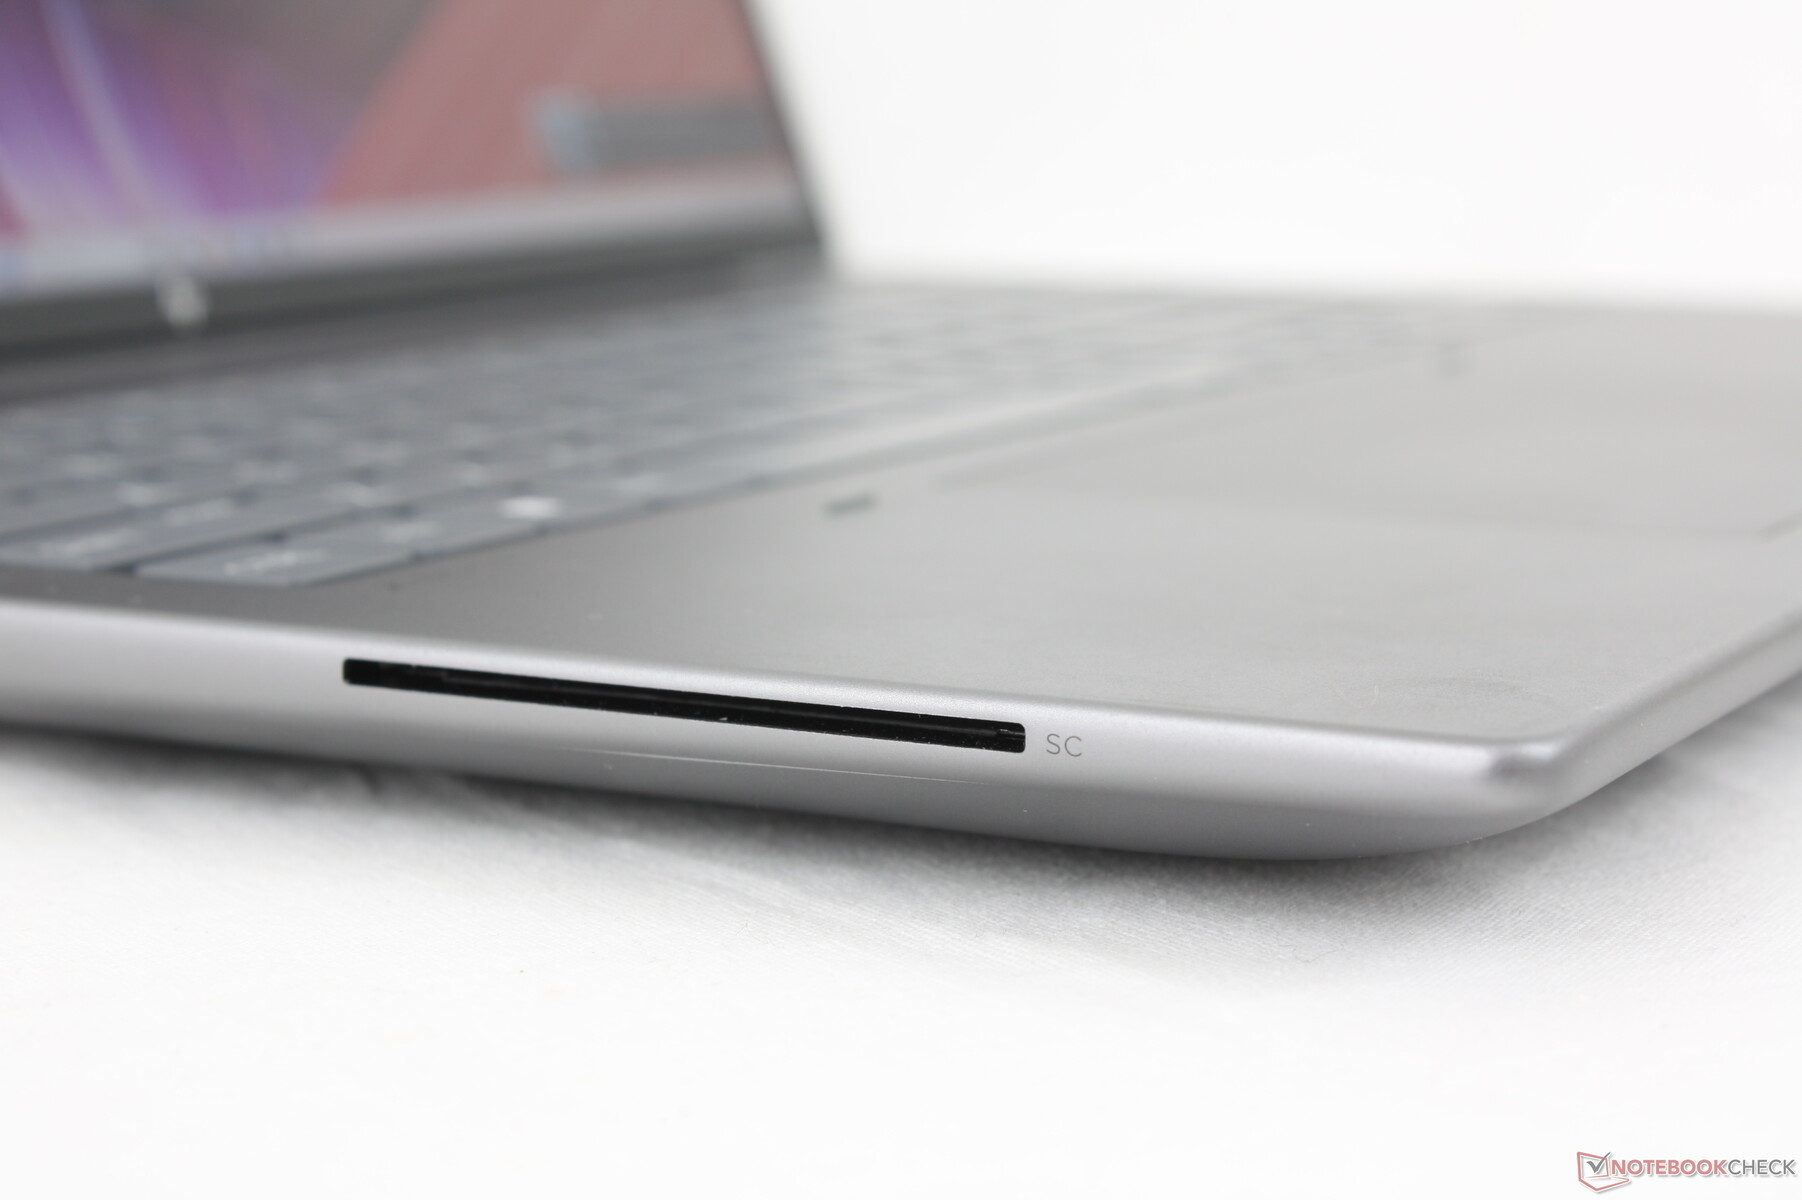
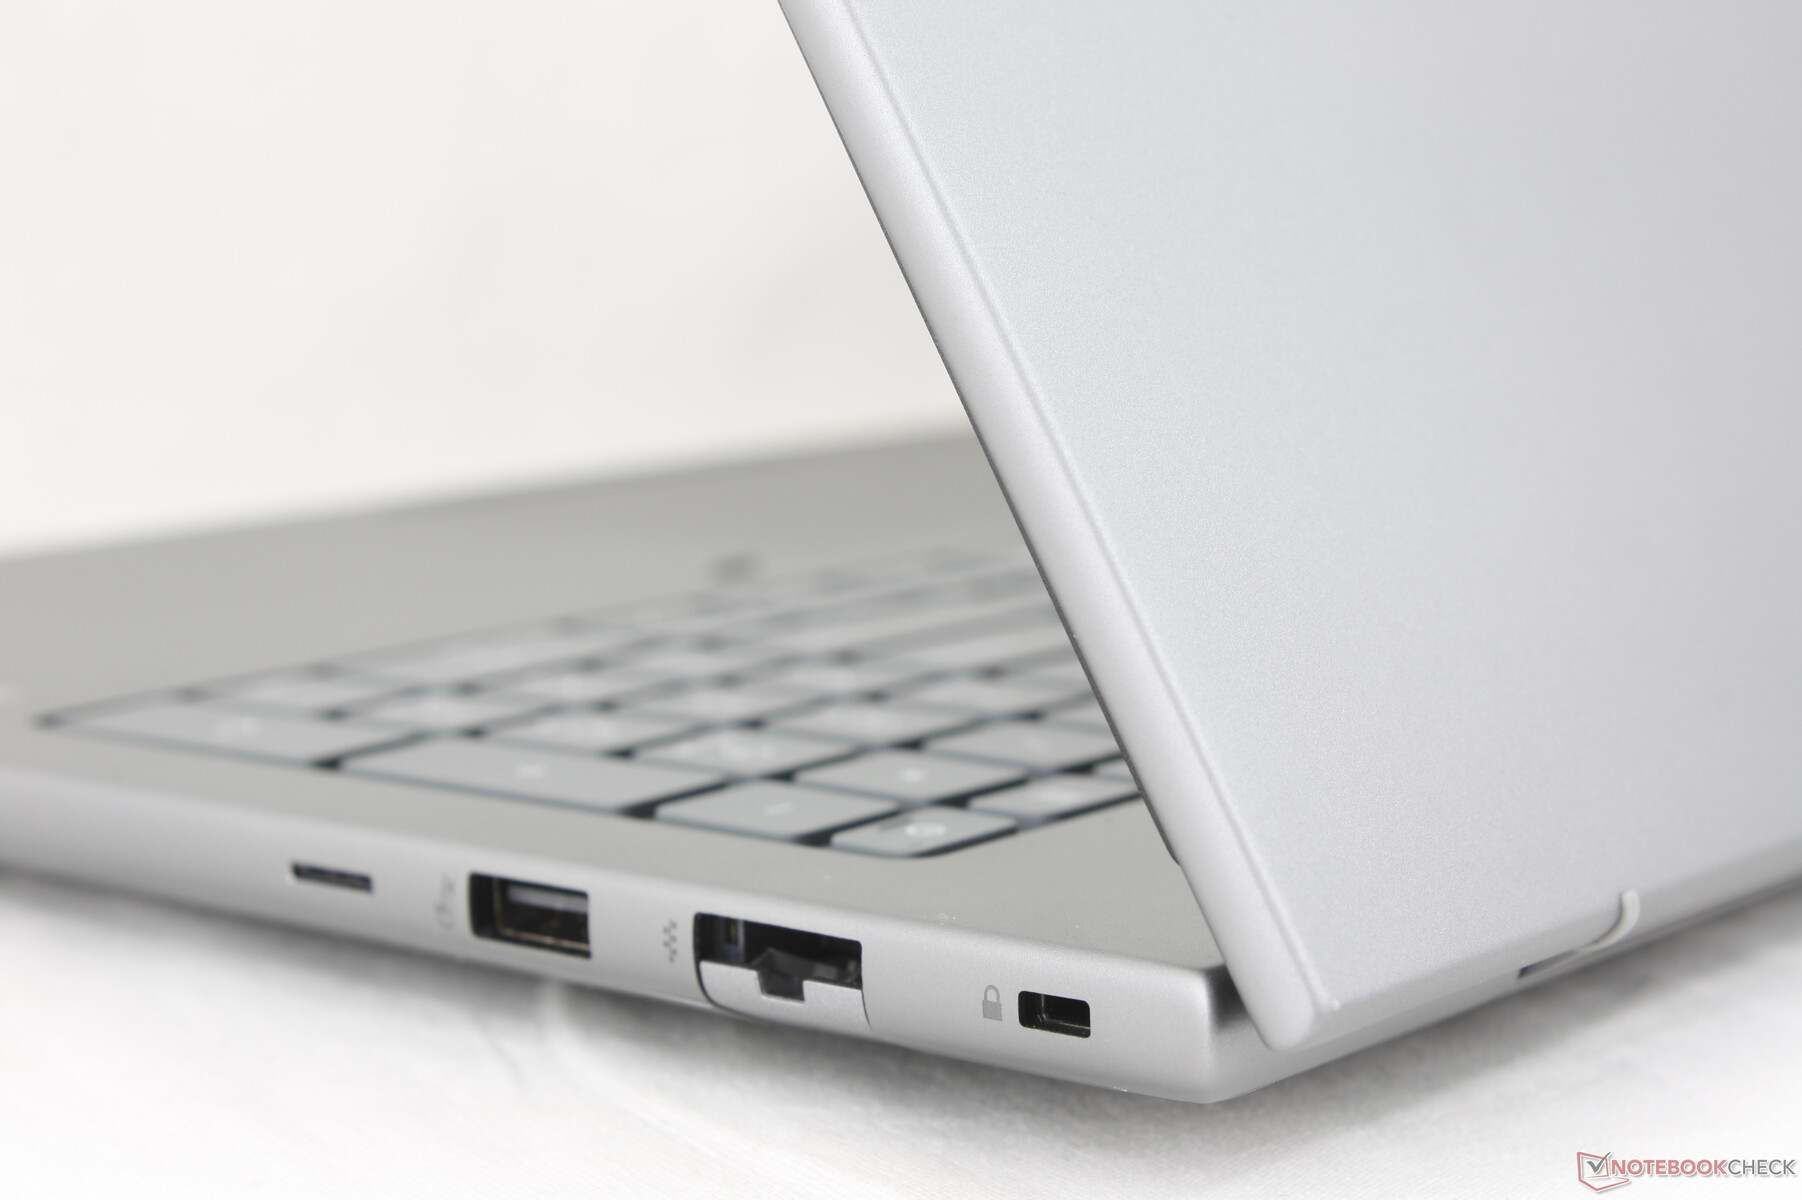
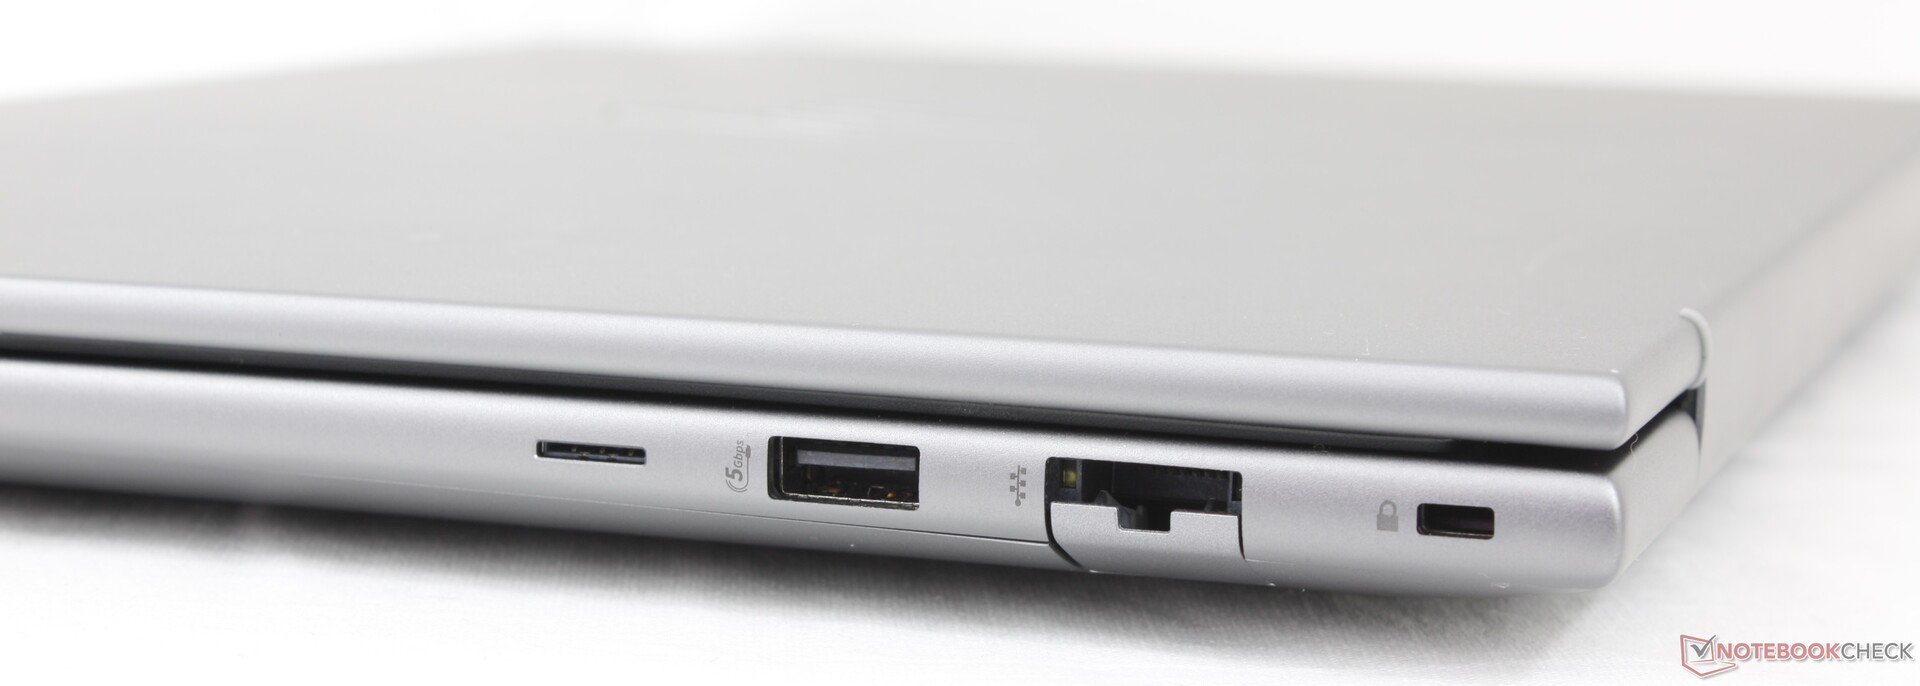
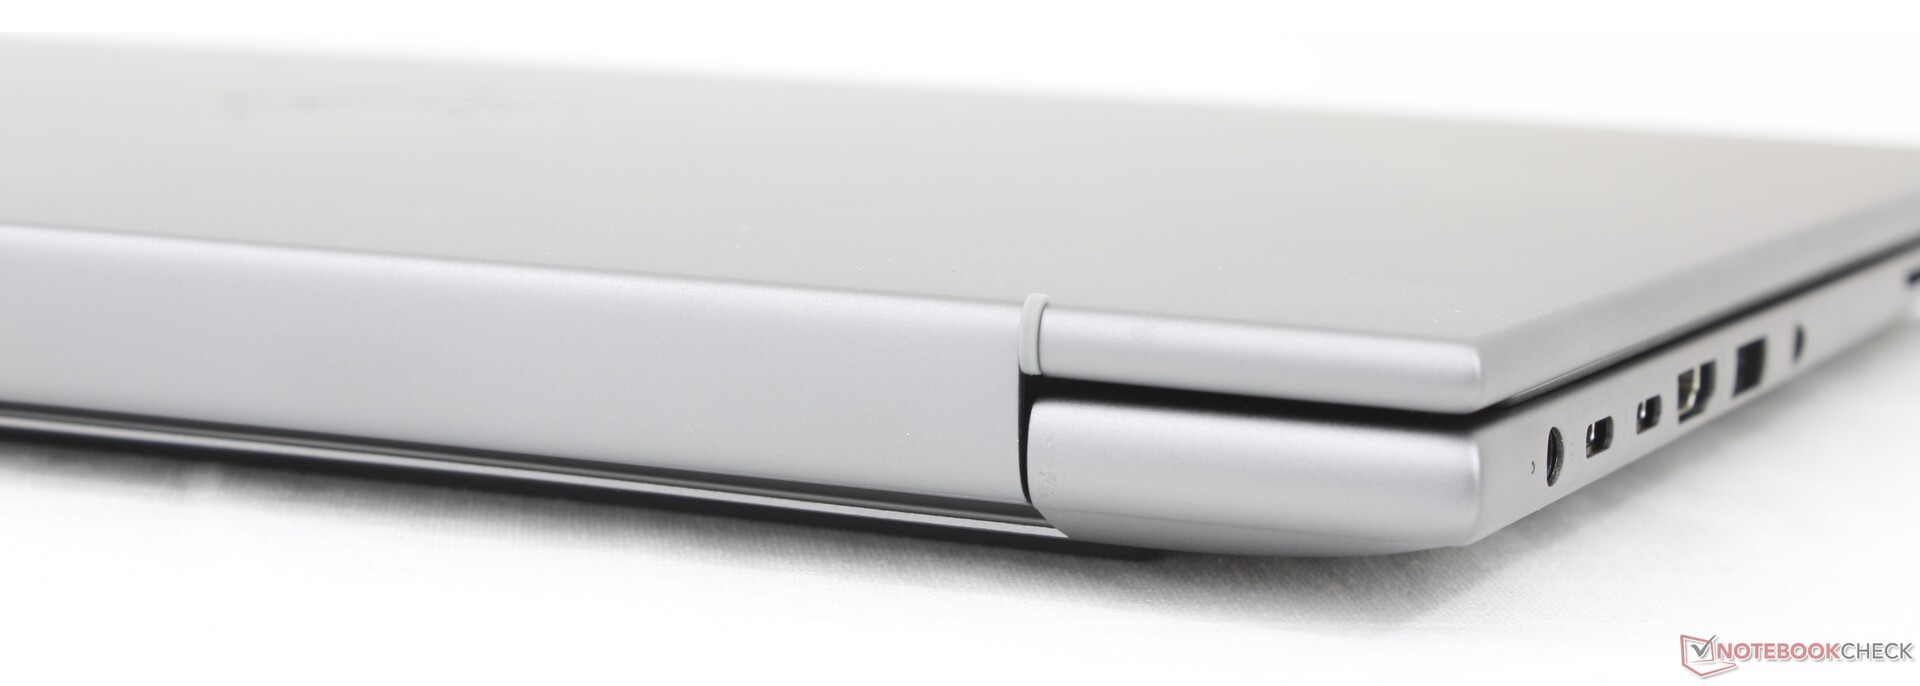
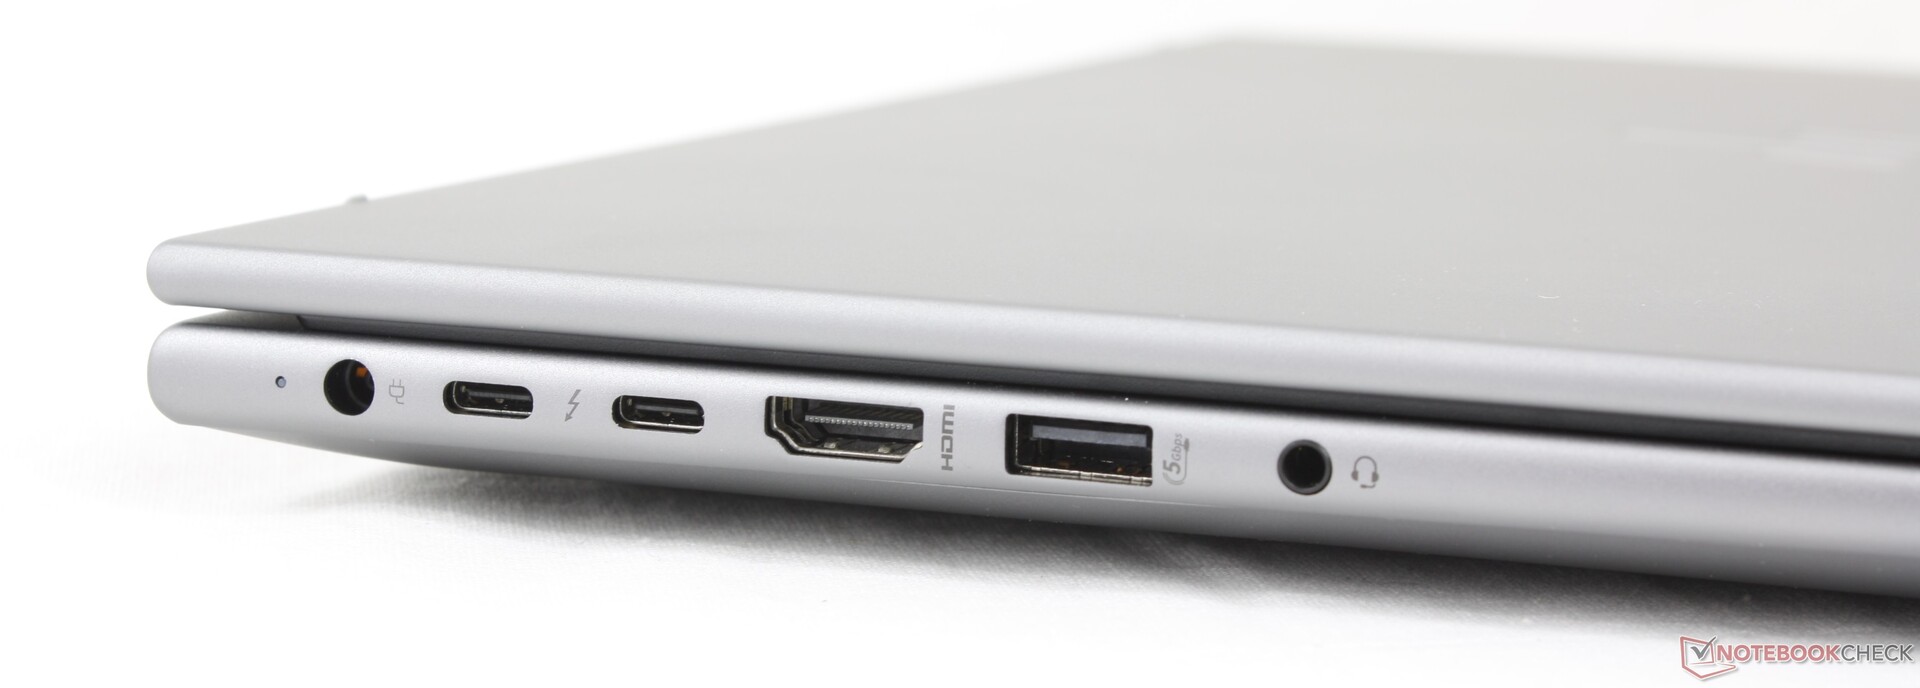
The model includes fewer USB-A ports than on last year's ZBook Power 15 G10. Everything else has returned including the Smart Card reader and dual USB-C Thunderbolt 4 ports albeit rearranged. The ports along the left edge in particular are far too crowded and could have been spread out a bit more.
SD Card Reader
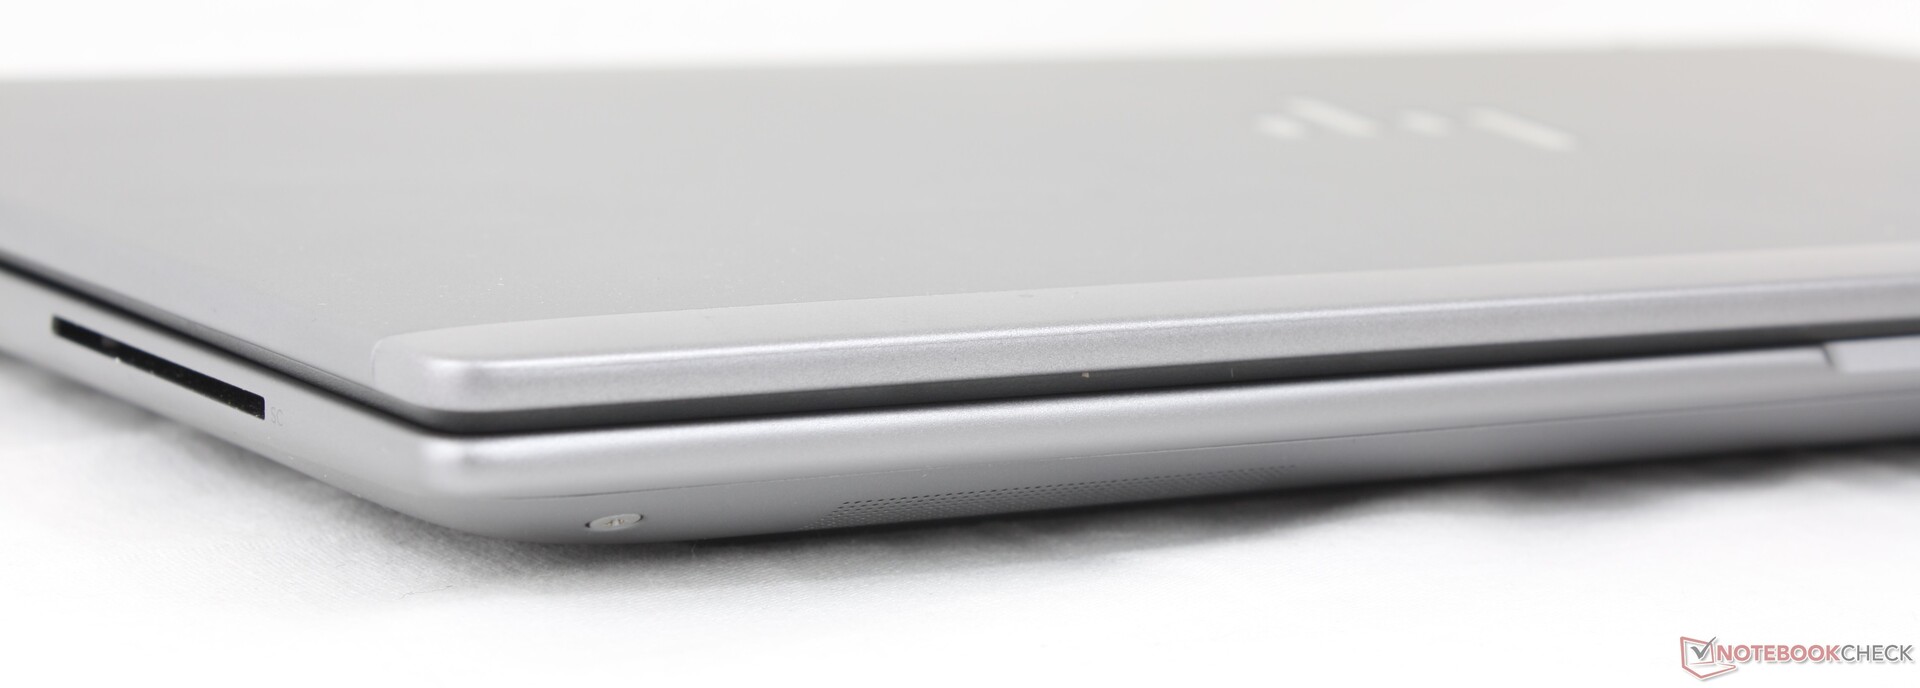
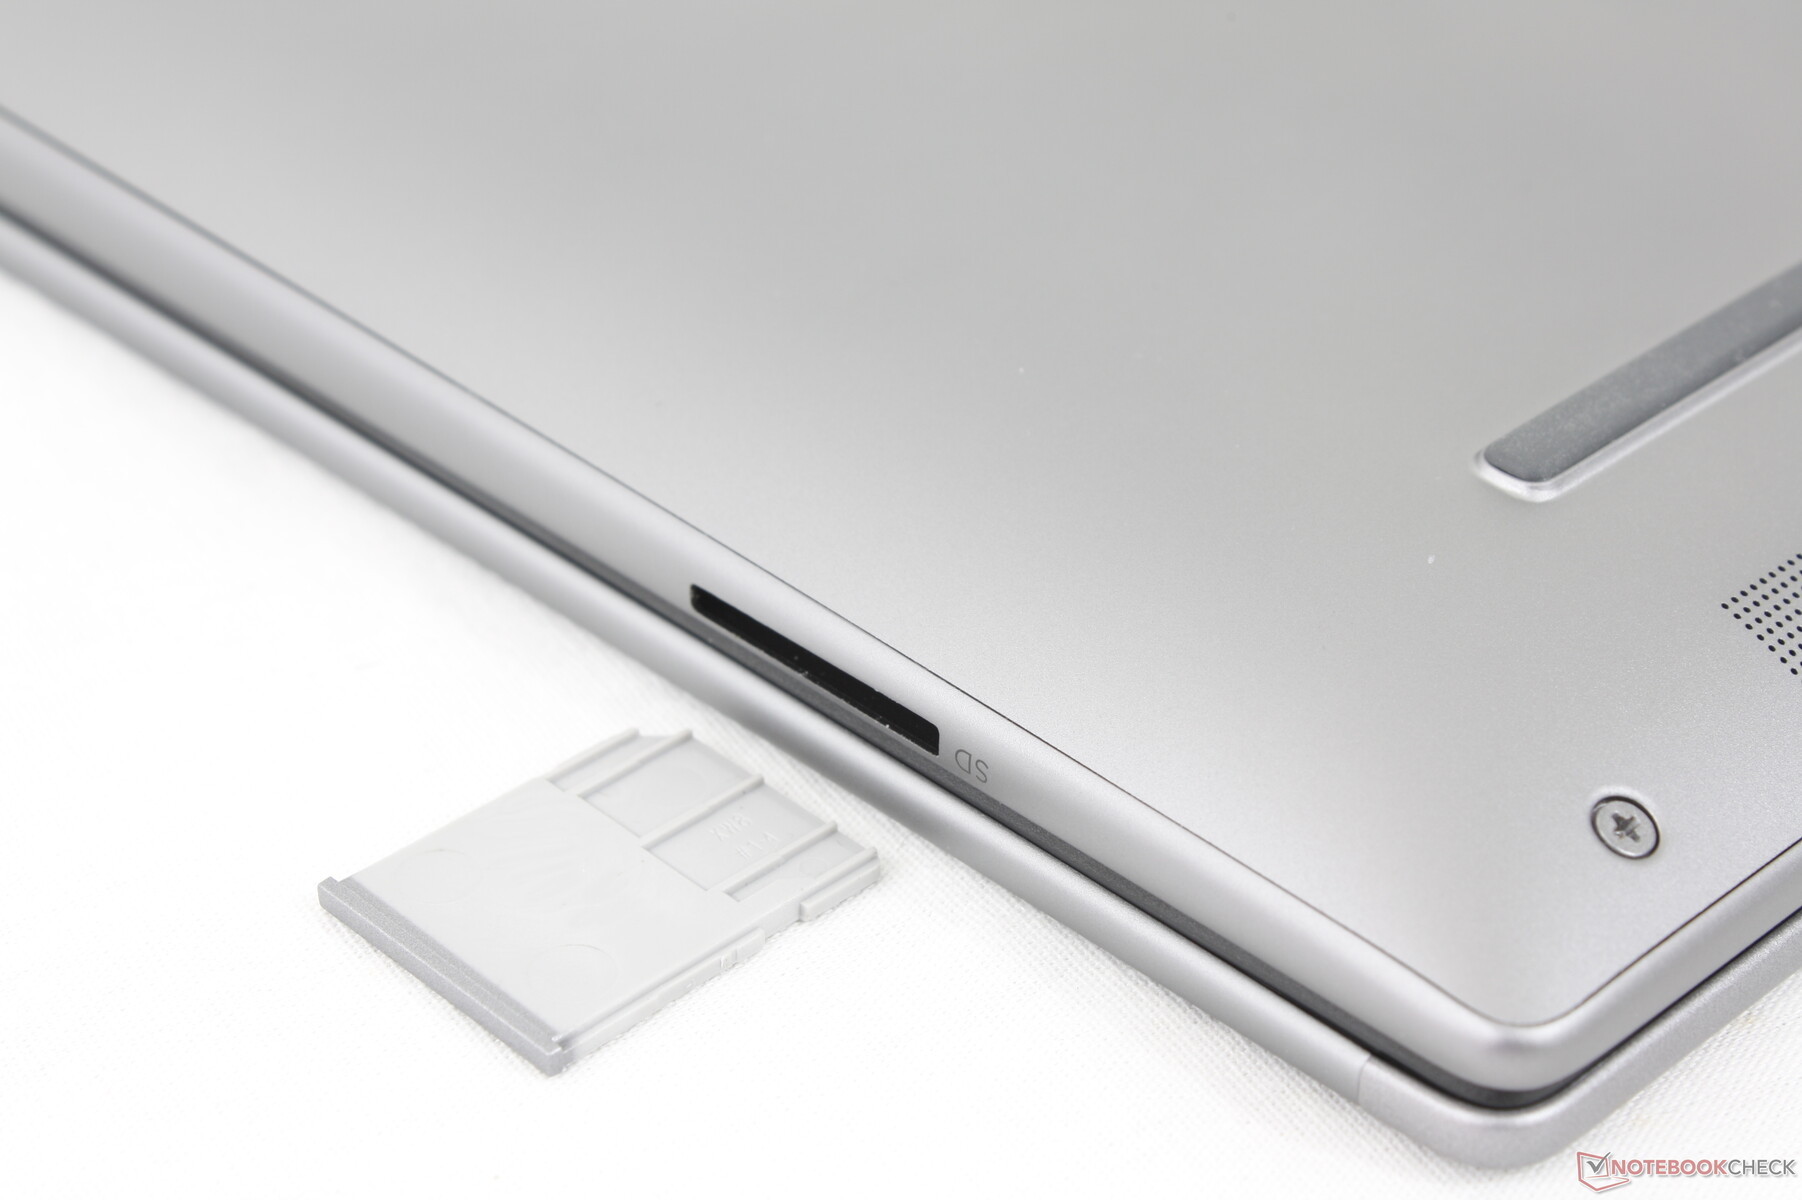
The model integrates a MicroSD card reader whereas the feature was missing on the ZBook Power 15 G10. Transfer rates are very fast; moving 1 GB of pictures from our UHS-II test card takes less than 6 seconds compared to 12 seconds on the ZBook Fury 16 G11 or ThinkPad P1 Gen 7.
| SD Card Reader | |
| average JPG Copy Test (av. of 3 runs) | |
| HP ZBook Power 16 G11 A (Toshiba Exceria Pro SDXC 64 GB UHS-II) | |
| HP ZBook Fury 16 G11 (Toshiba Exceria Pro SDXC 64 GB UHS-II) | |
| Lenovo ThinkPad P1 Gen 7 21KV001SGE (AV Pro V60) | |
| maximum AS SSD Seq Read Test (1GB) | |
| HP ZBook Power 16 G11 A (Toshiba Exceria Pro SDXC 64 GB UHS-II) | |
| HP ZBook Fury 16 G11 (Toshiba Exceria Pro SDXC 64 GB UHS-II) | |
| Lenovo ThinkPad P1 Gen 7 21KV001SGE (AV Pro V60) | |
Communication
The MediaTek MT7922 comes standard for Wi-Fi 6E and Bluetooth 5.2 connectivity. Realtek options are also available as well as the HP 4000 or Qualcomm 9205 for WAN connectivity.
Webcam
A 5 MP webcam comes standard alongside IR and a physical shutter slider similar to the ThinkPad P16s G2. The Precision 5690 comes with a much lower resolution 2 MP webcam.


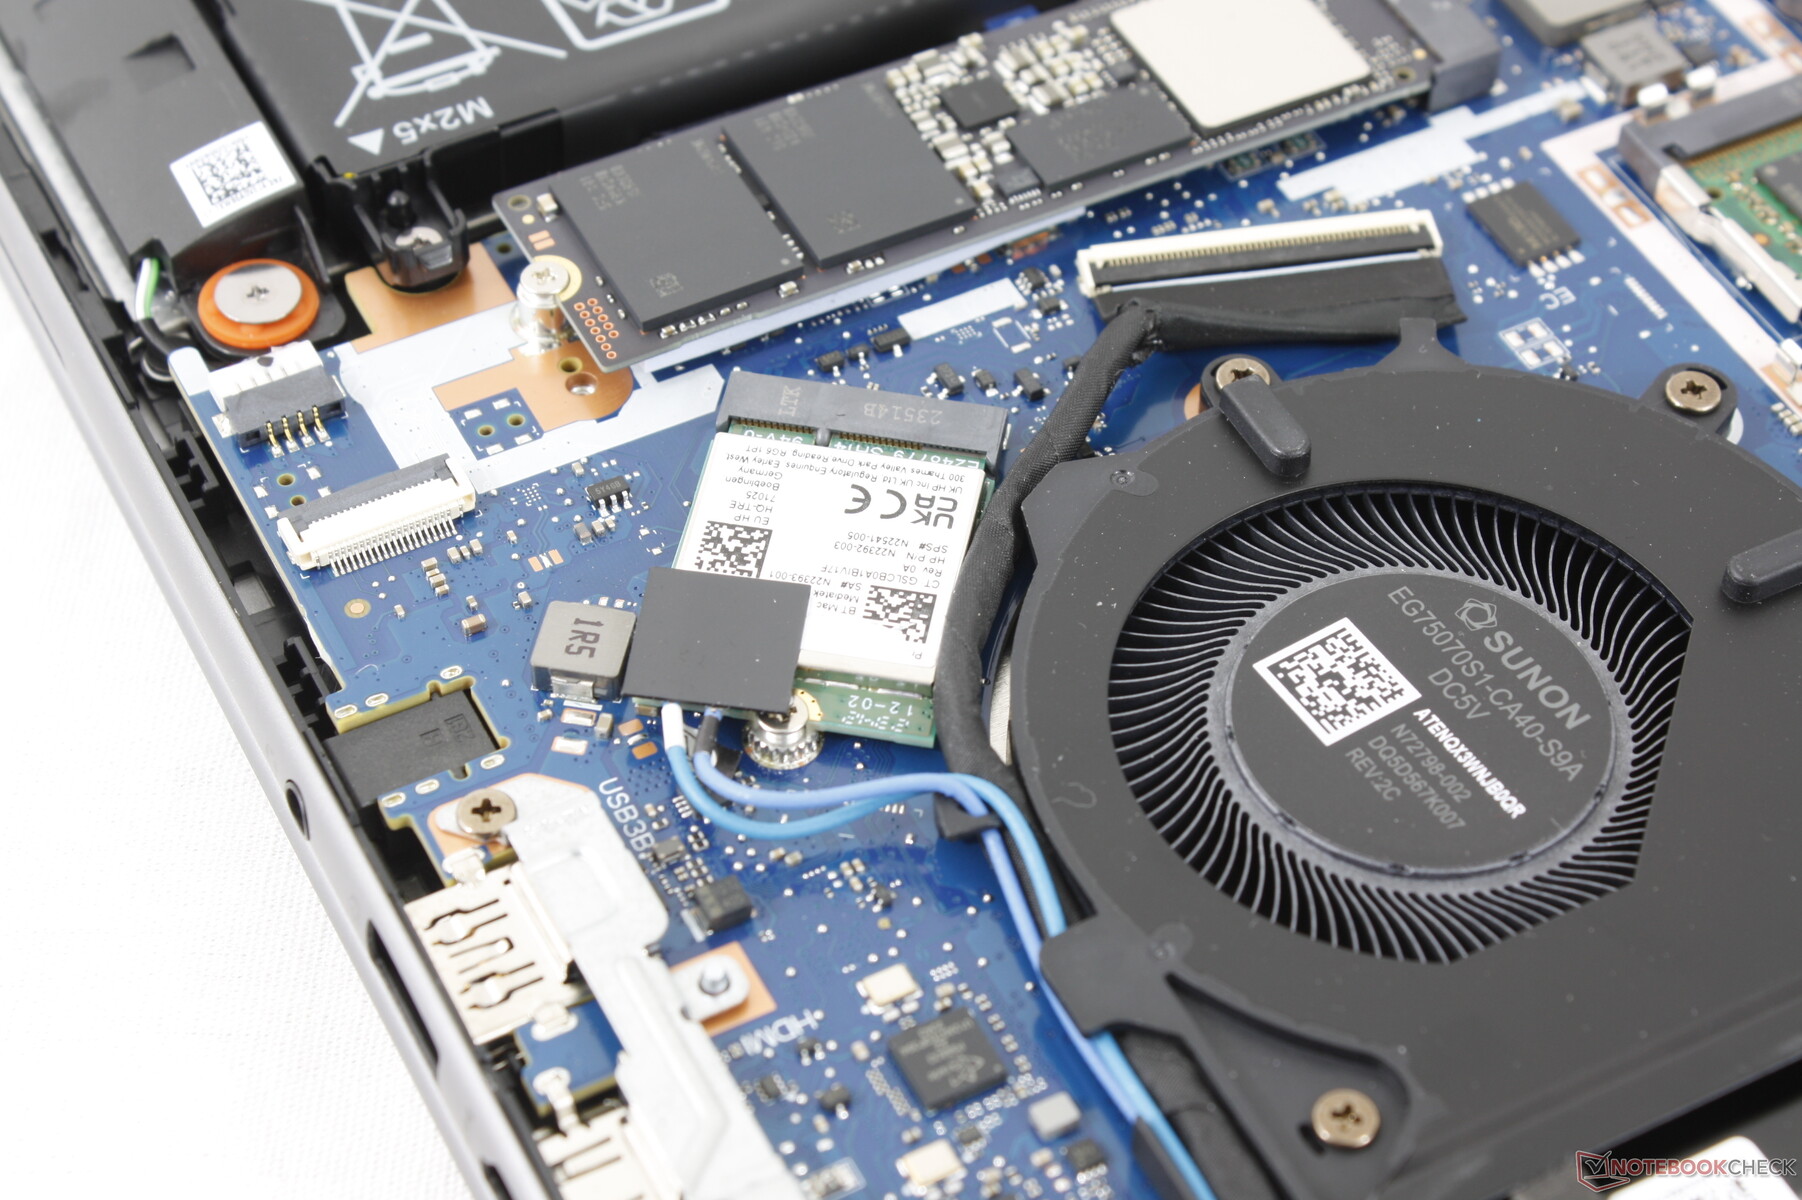
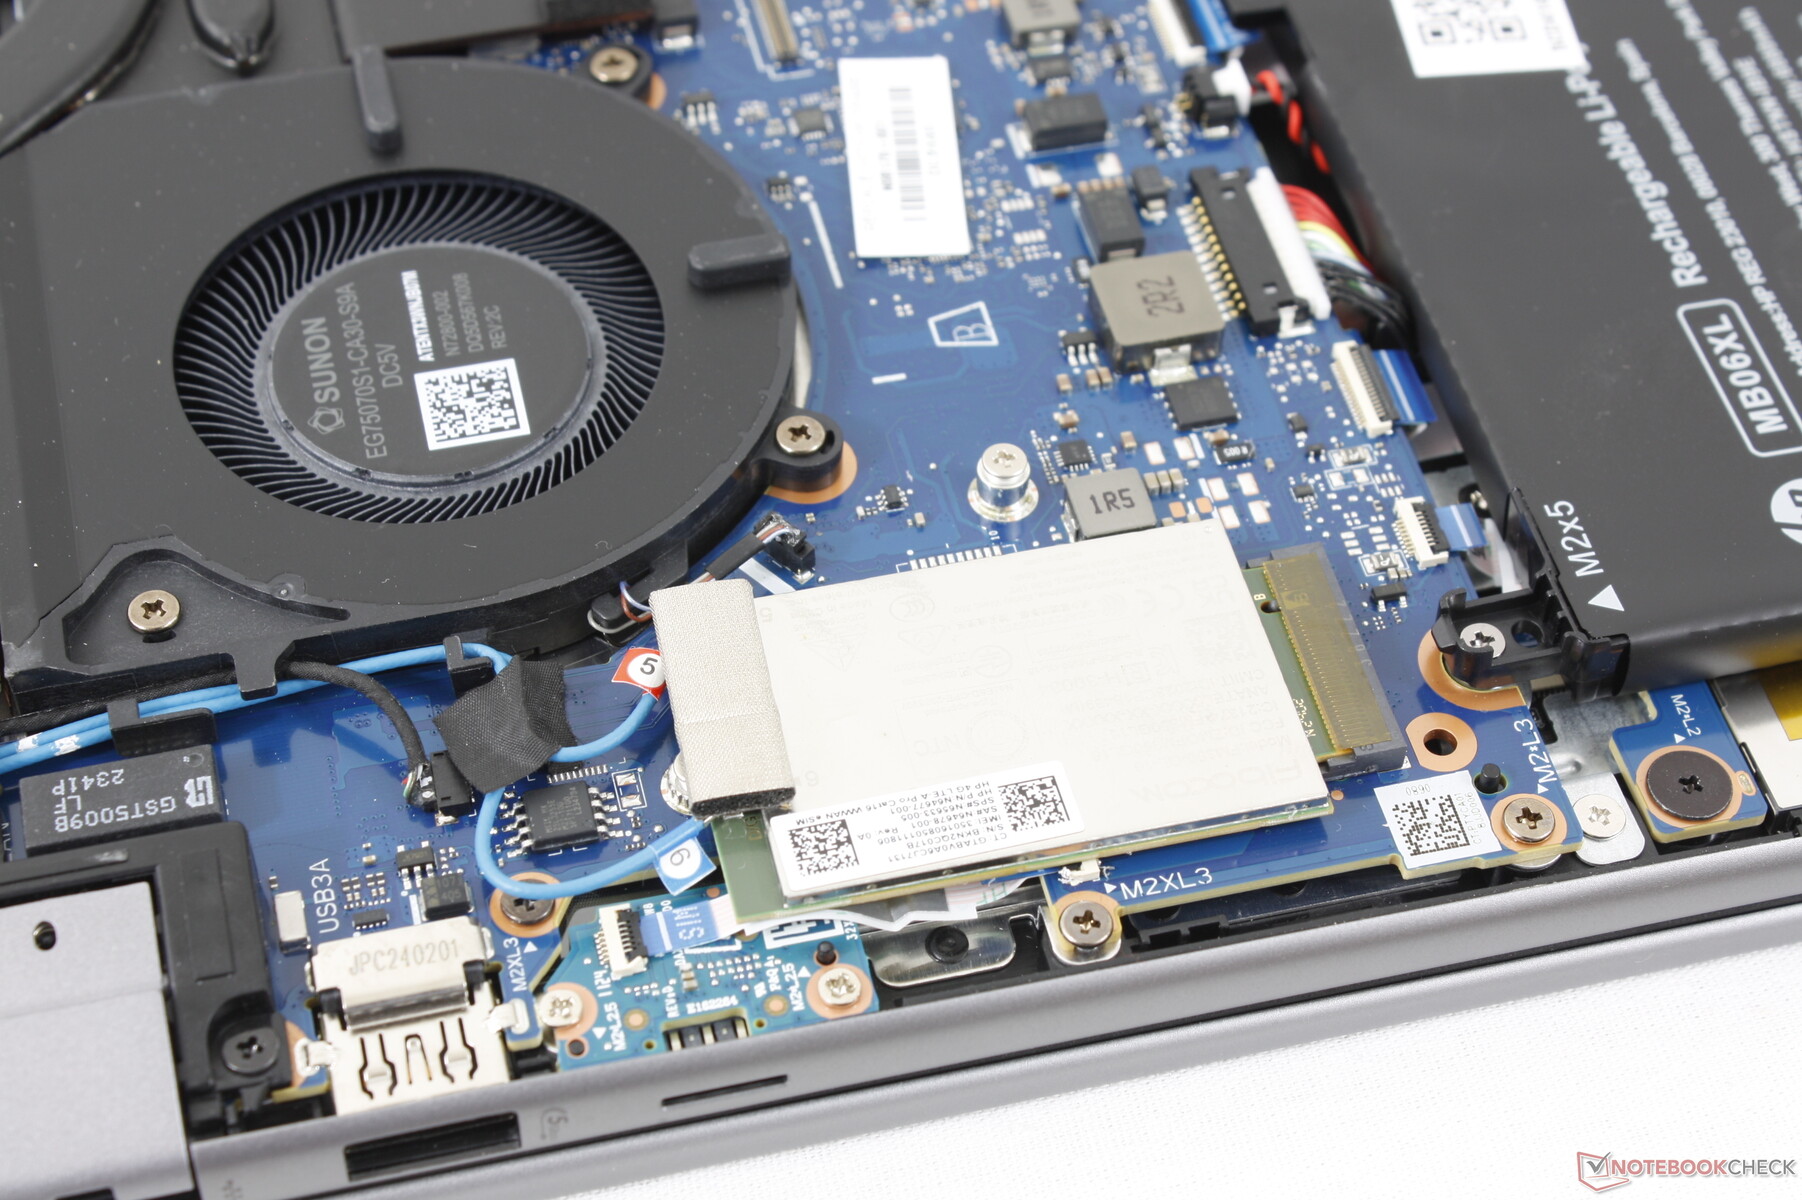
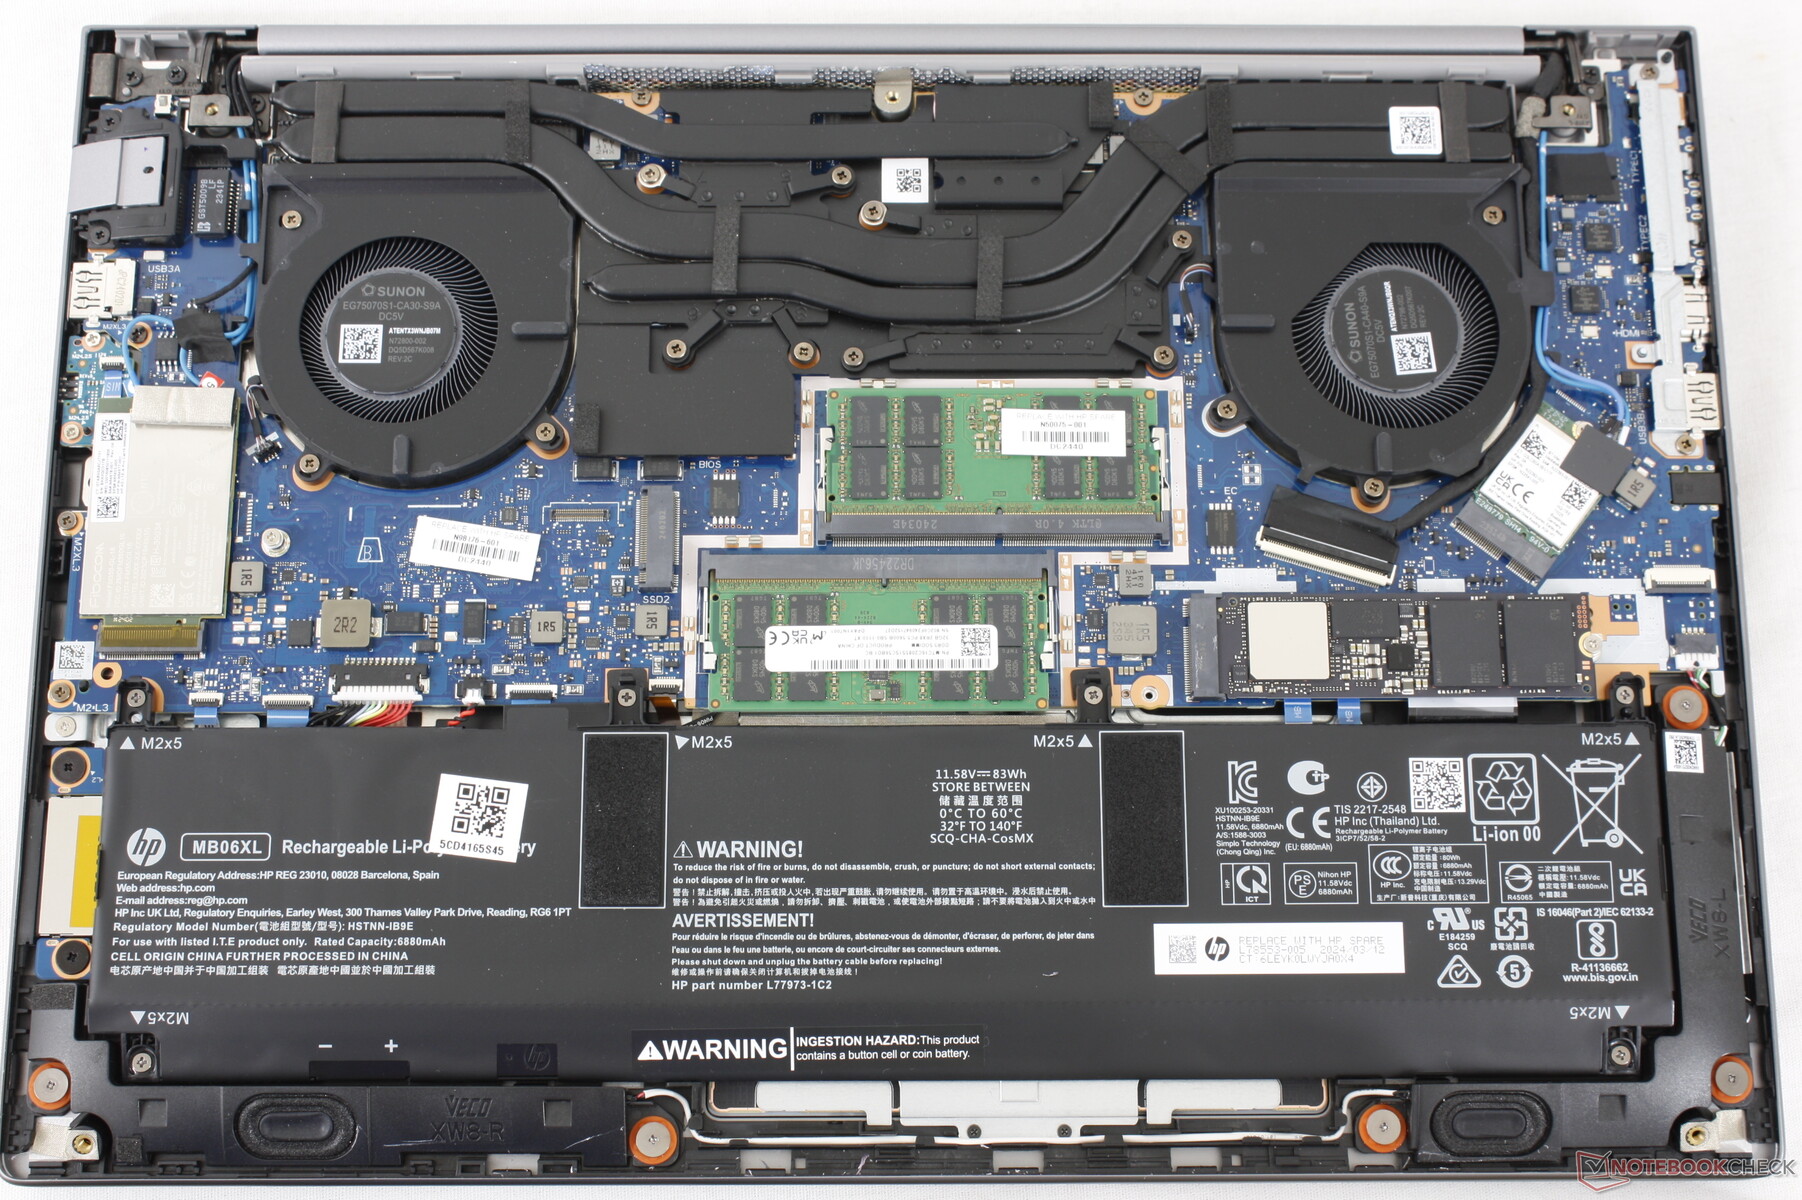
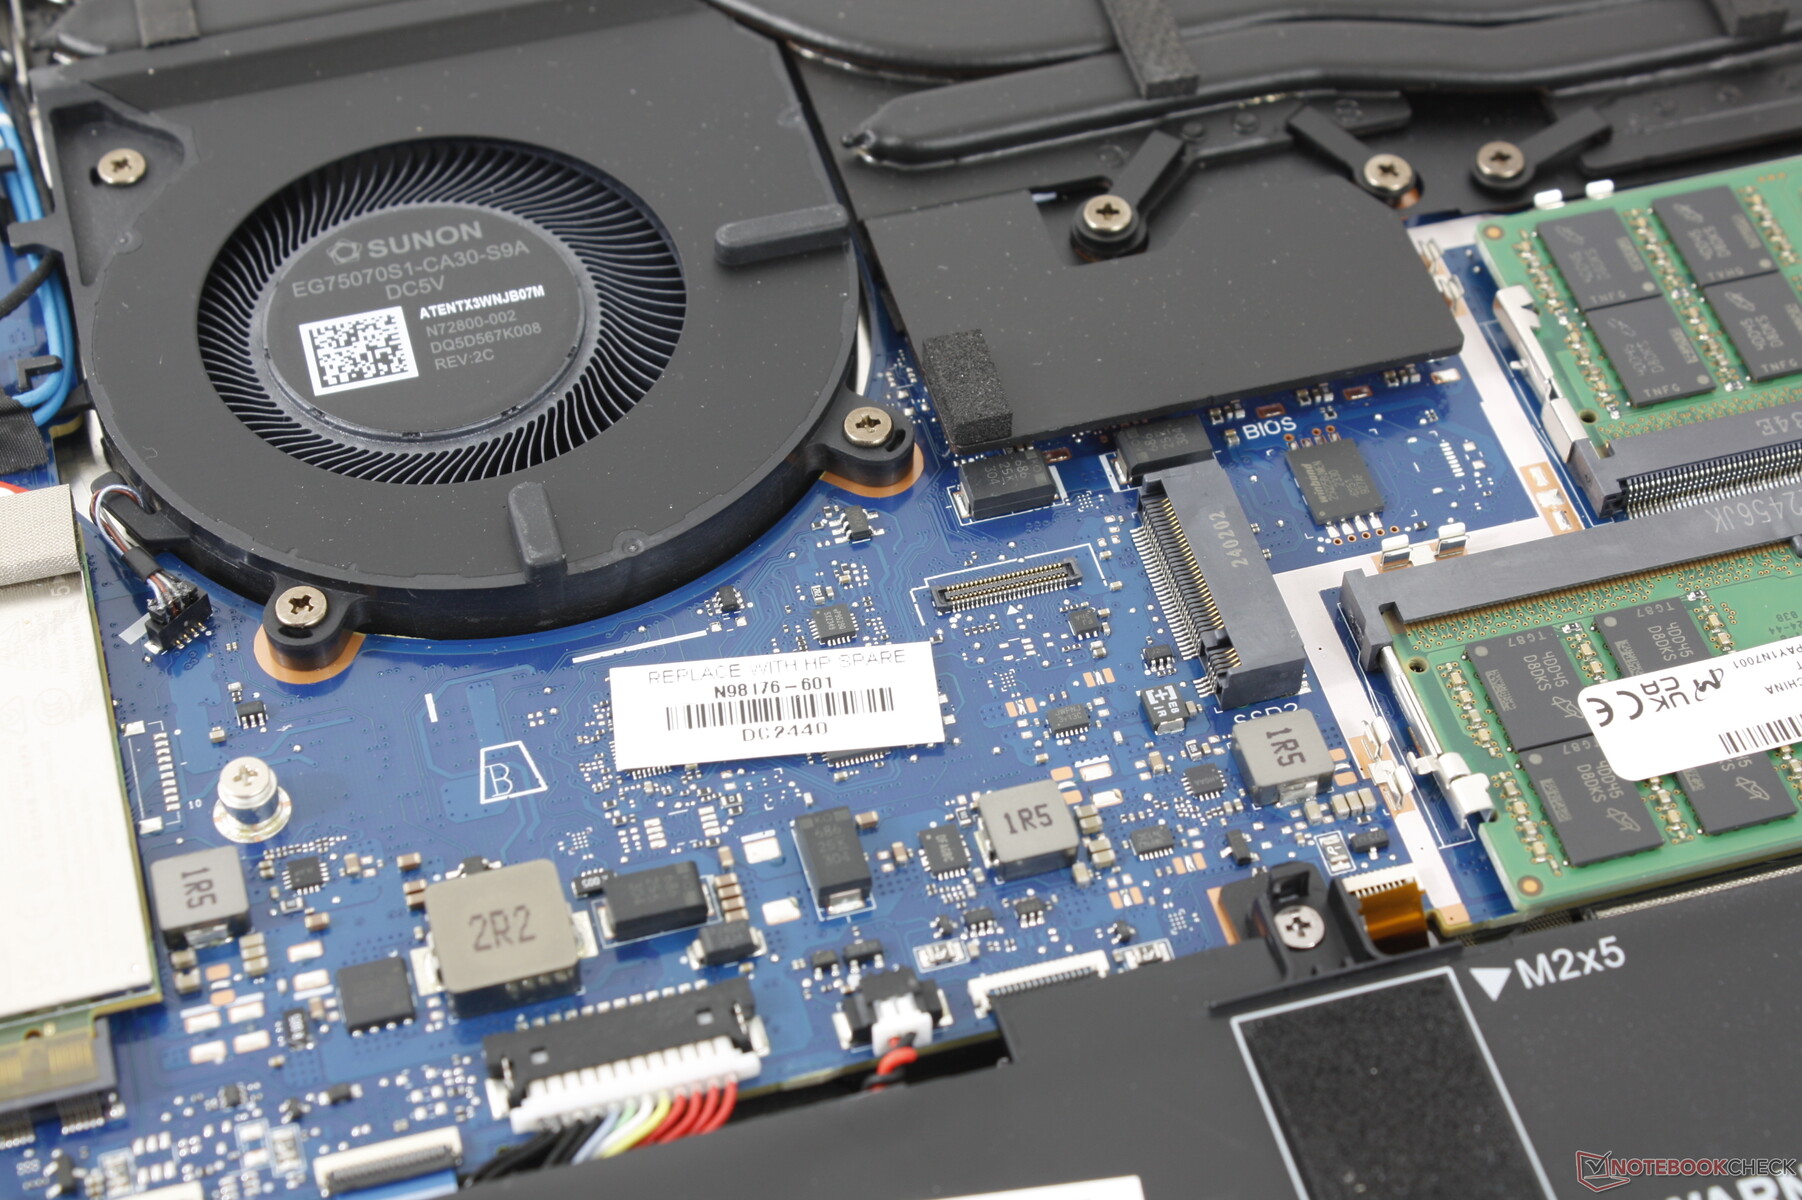
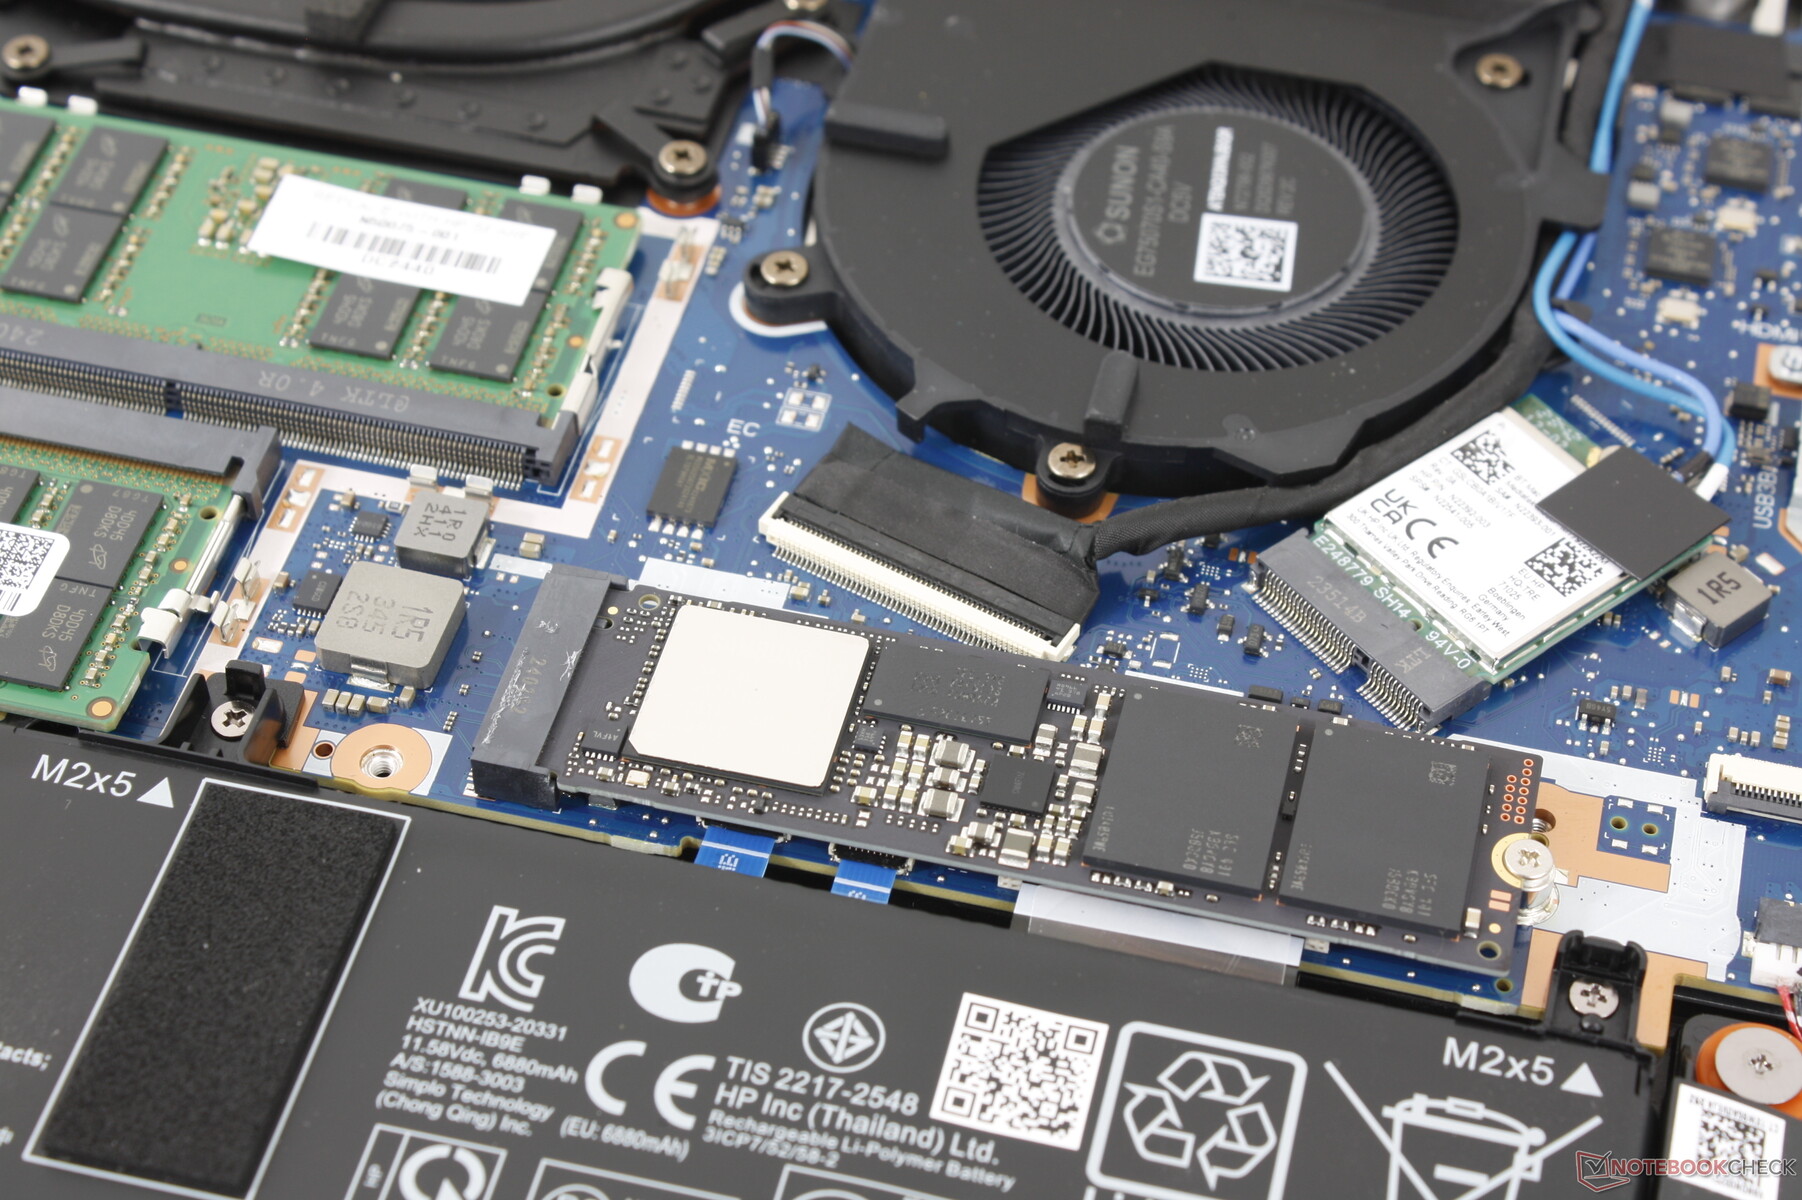
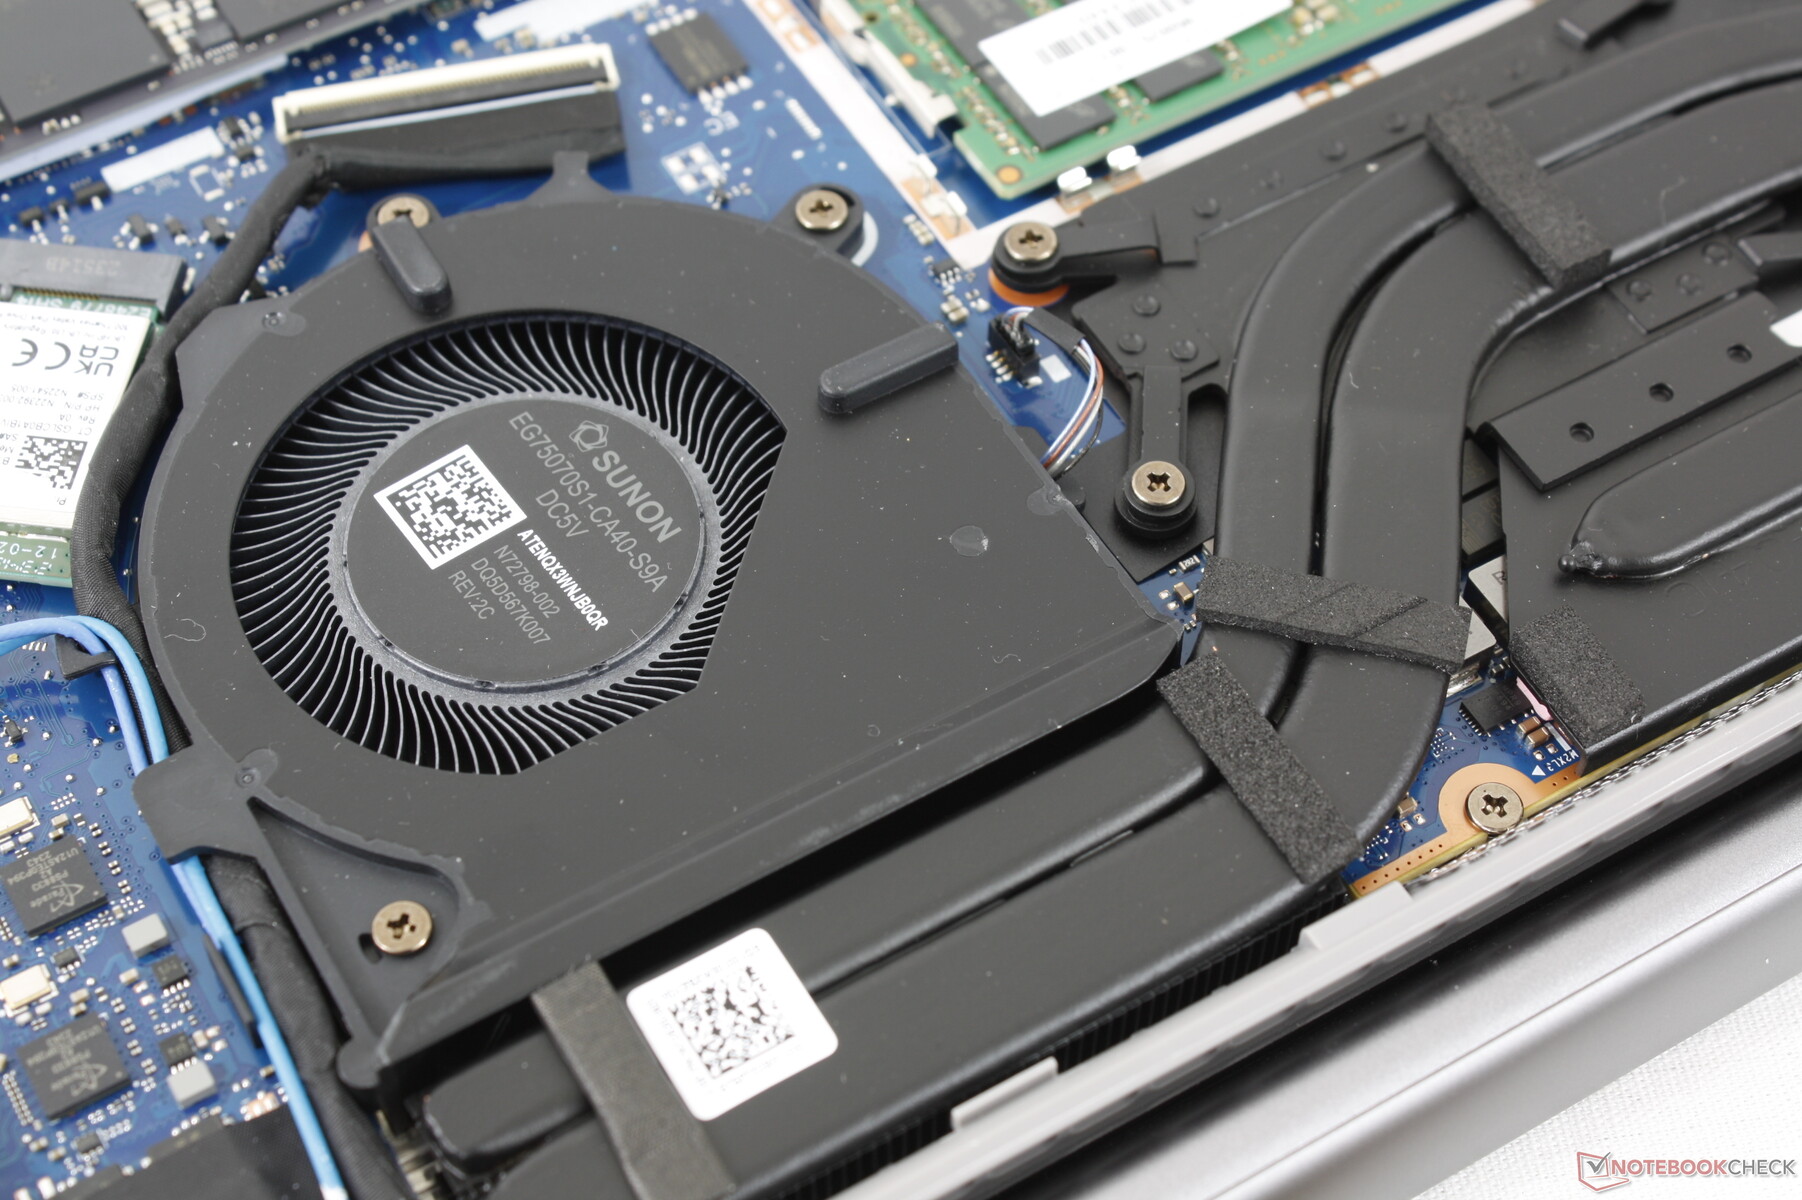
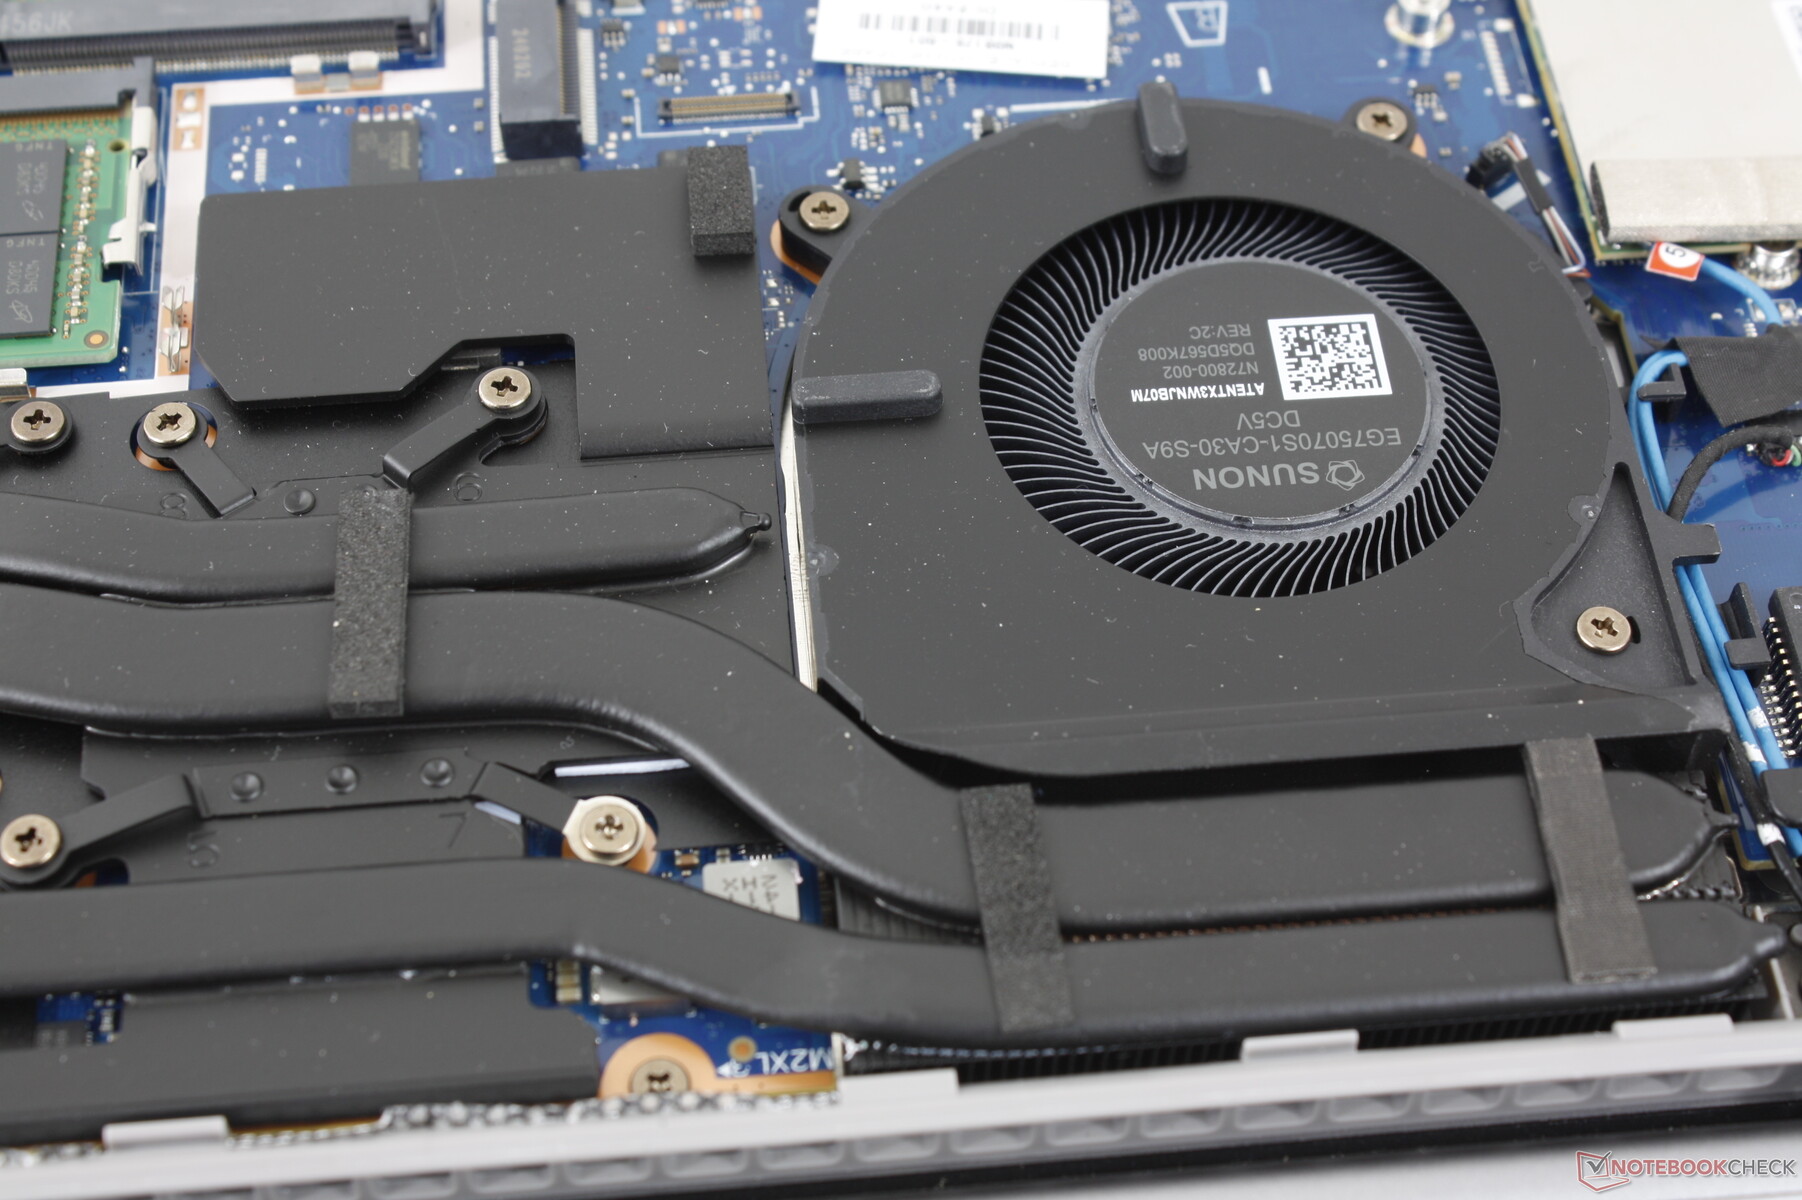
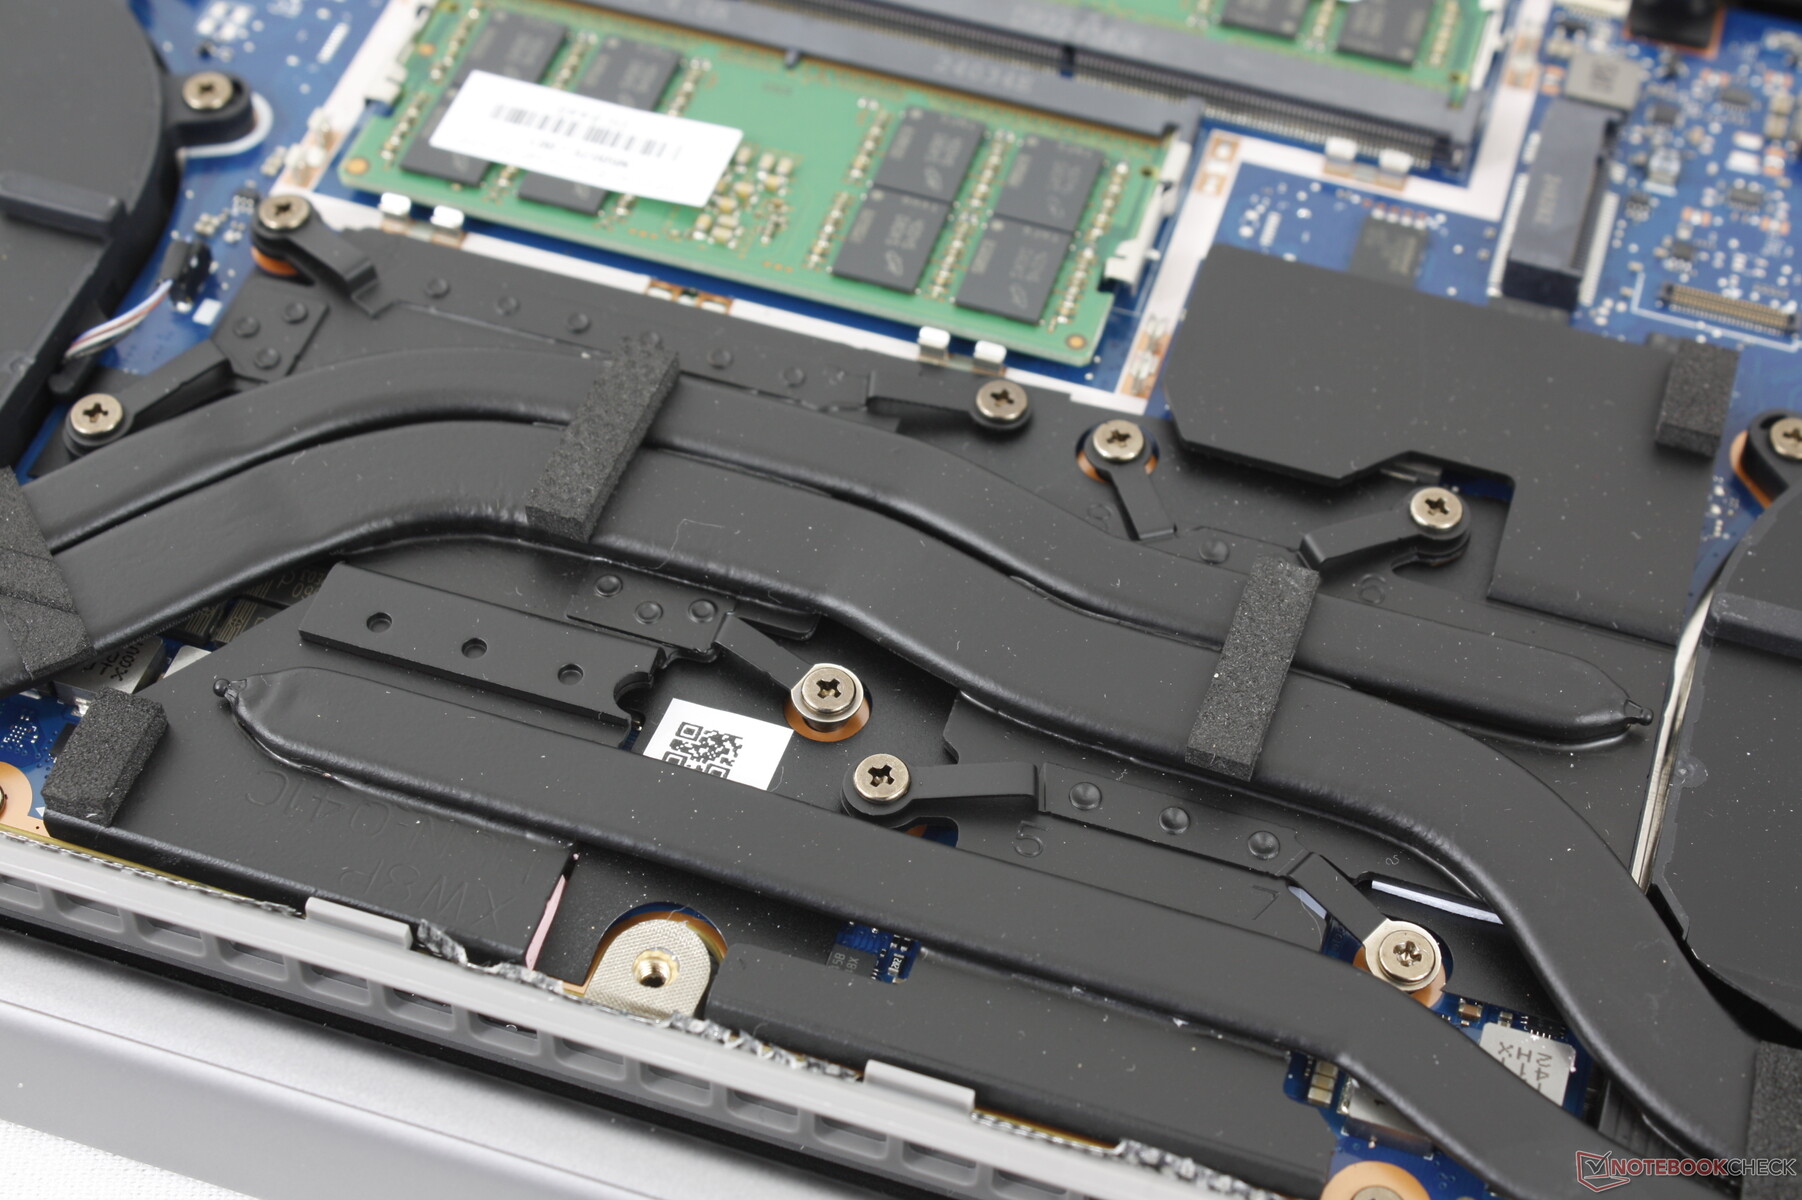
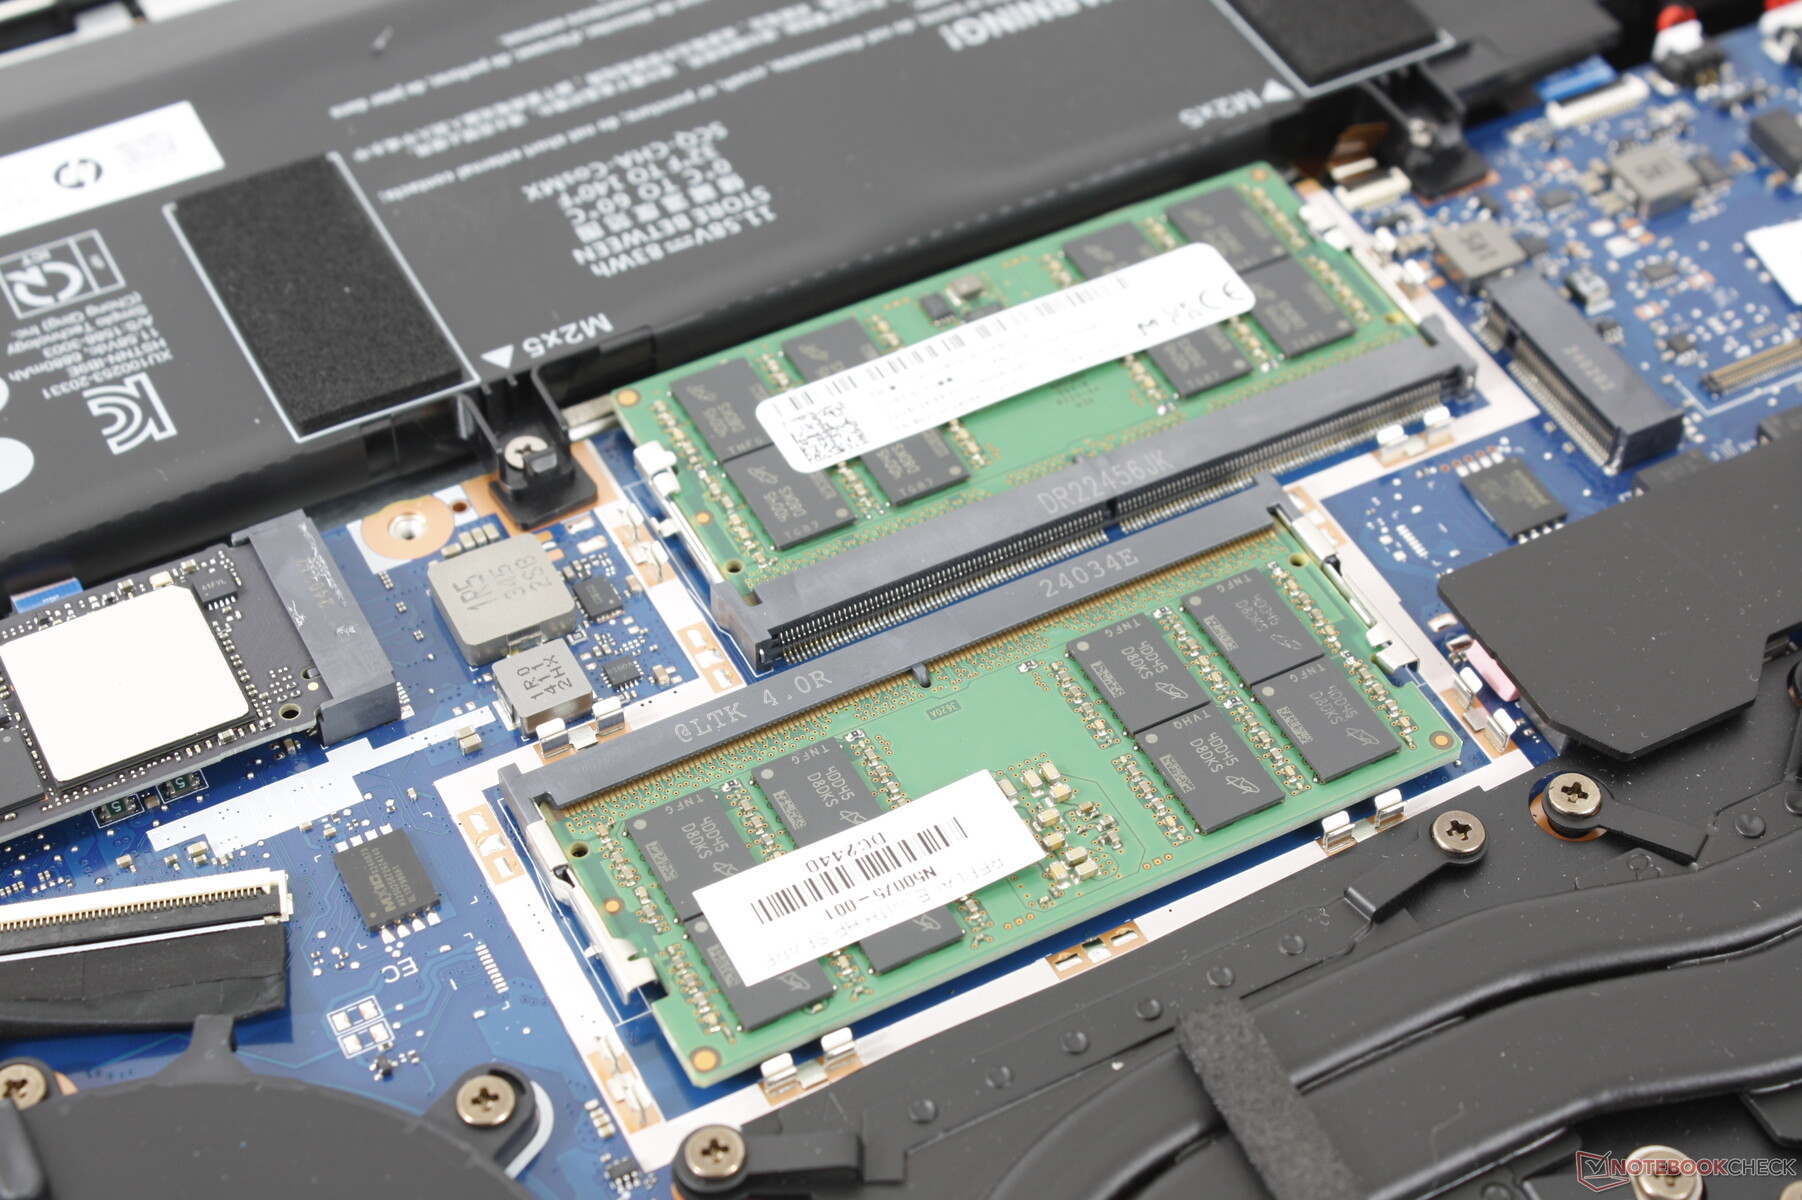
Maintenance
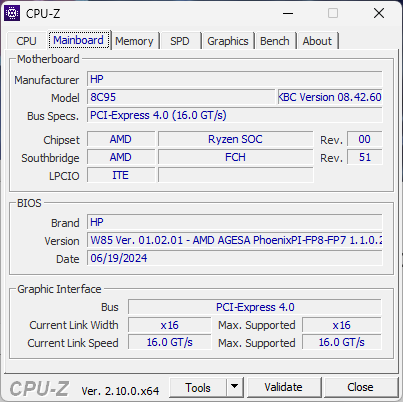
The bottom panel pops off relatively easily with just a Phillips screwdriver and sharp edge. The internals have been completely redesigned when compared to the ZBook Power 15 G10 while retaining the same upgradeable options like the 2x SODIMM slots, 2x PCIe4 x4 NVMe SSD slots, and removable WLAN module. WAN is an added option this time around.
Sustainability
The manufacturing utilizes low halogen while the packaging consists of molded paper pulp and recycled plastics made from 100 percent sustainable sources and 60 percent post-consumer sources, respectively.
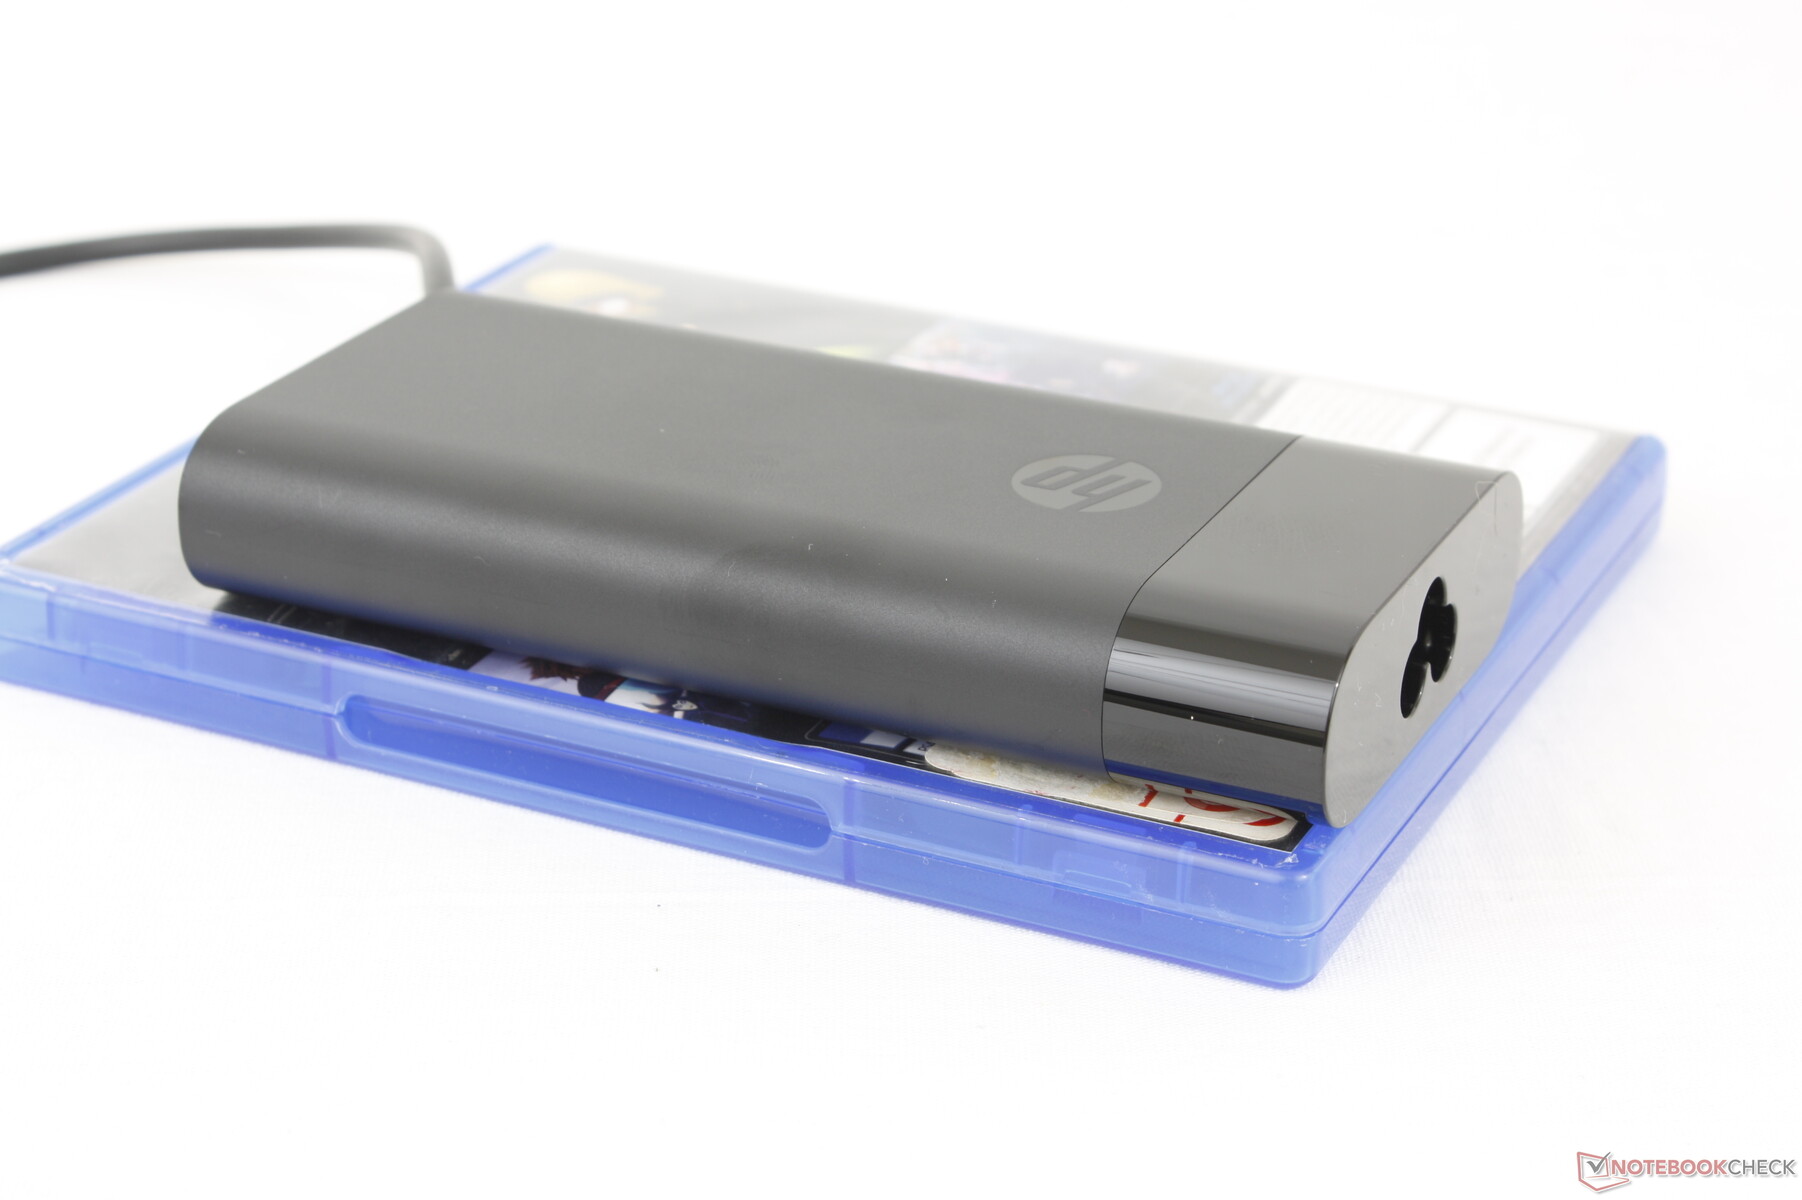
Accessories And Warranty
There are no extras in the box to accompany the AC adapter and paperwork. Disappointingly, the standard limited warranty is only one year if purchased in the US whereas the ZBook Fury comes with three years as standard.
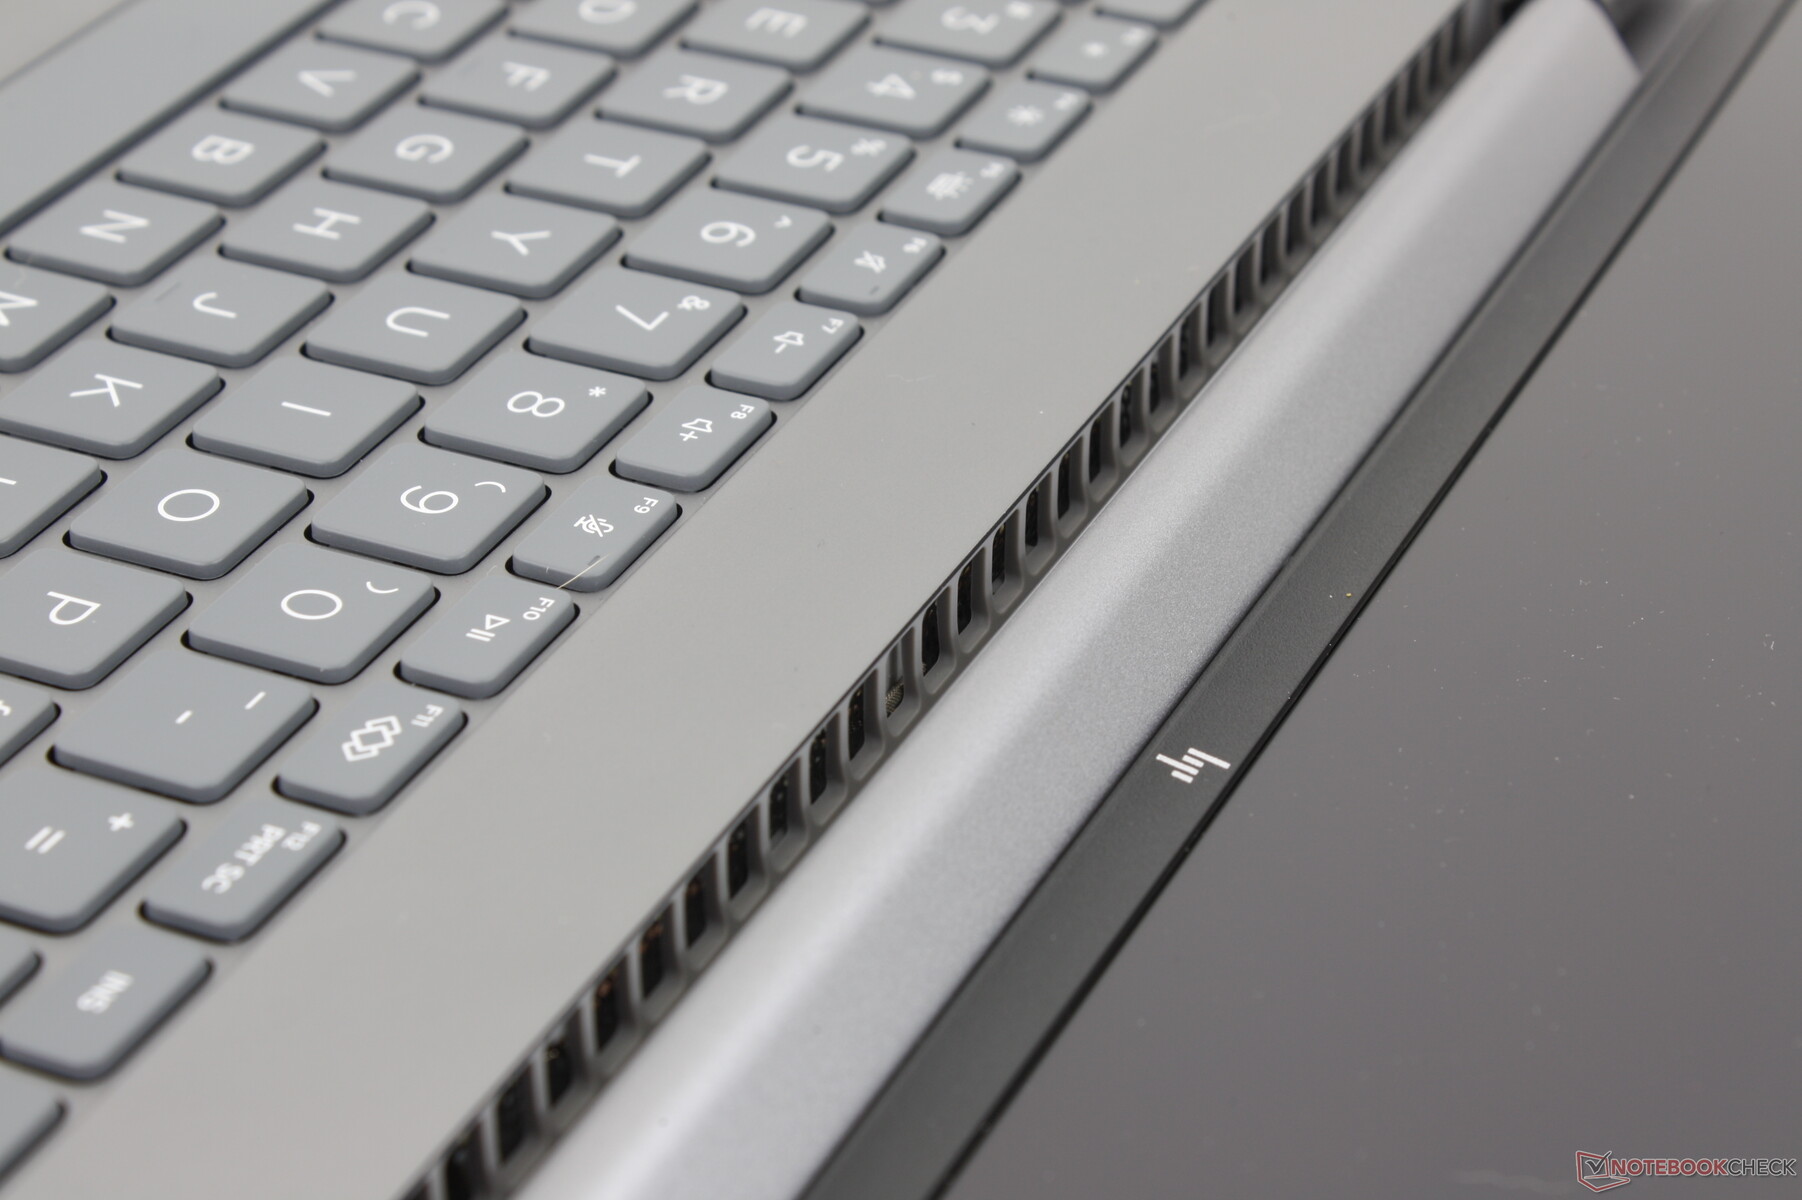
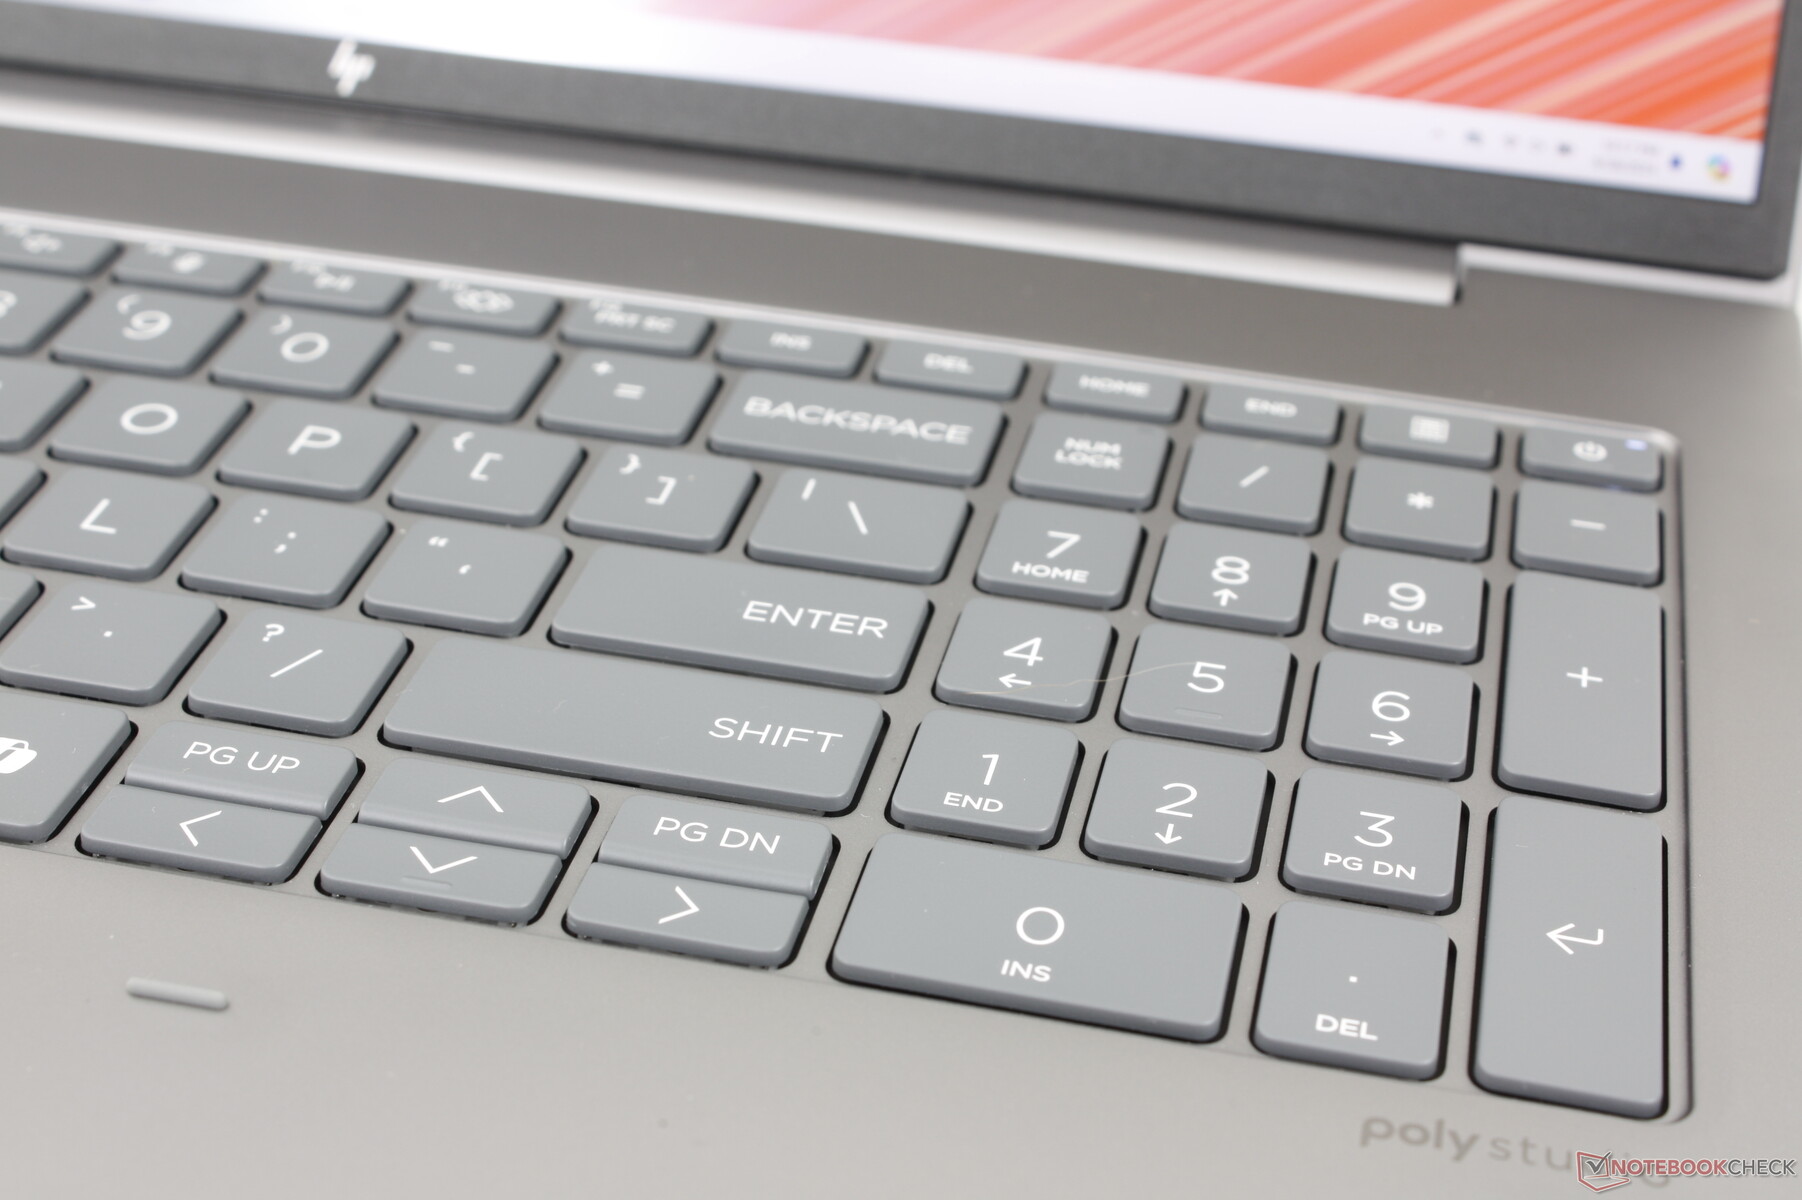
Input Devices — Spacious Keys
Keyboard
The typing experience is similar to a Spectre x360 16 in that the keys are firm with relatively sharp feedback to be comfortable for typing. Key travel in particular feels deeper than on most Ultrabooks to avoid the typical shallow or spongy feedback.
The numpad has returned whereas it is missing on the competing Precision 5690. Its keys are slightly narrower than the main QWERTY keys, however, and so feedback is noticeably softer when pressed.
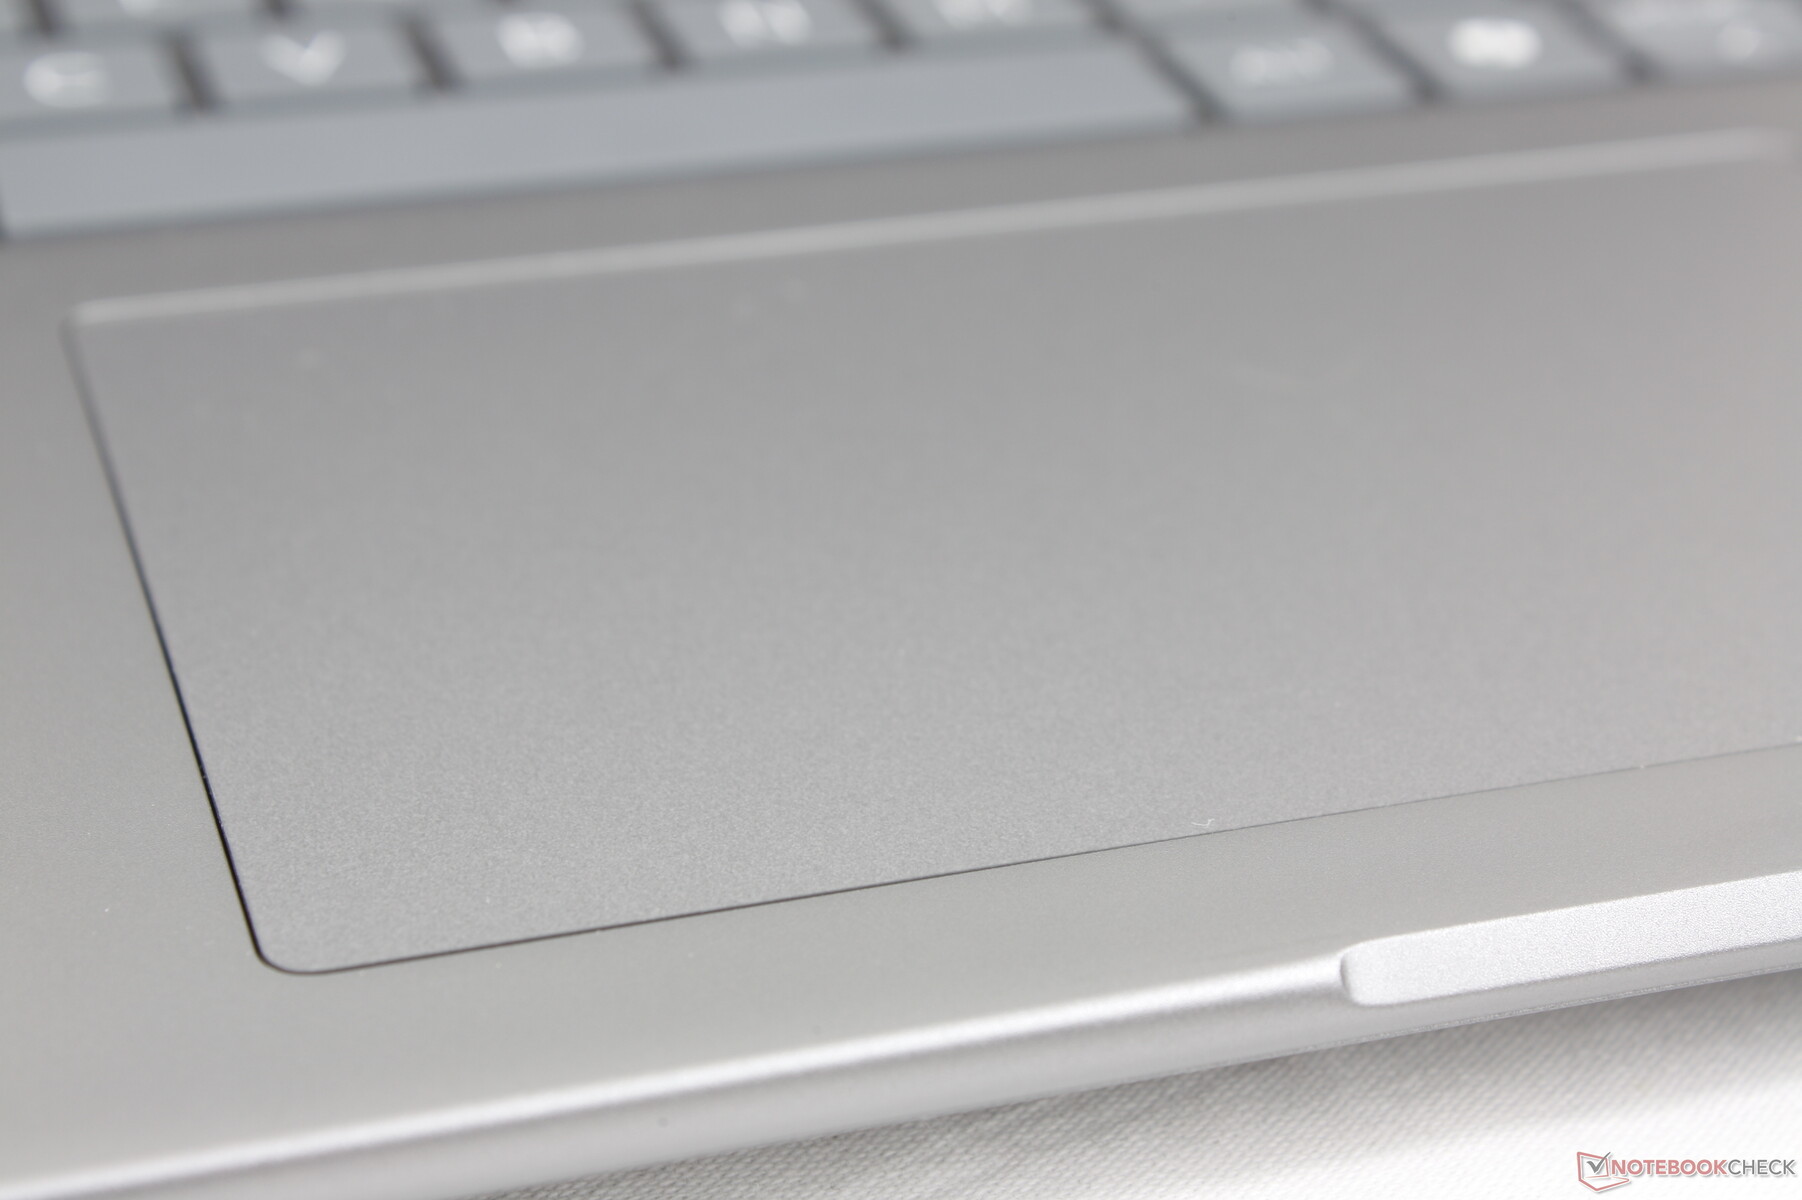
Touchpad
The clickpad is larger than before (12.5 x 8 cm vs. 11.5 × 7 cm) to take advantage of the larger 16-inch form factor. Dedicated keys are still missing and are instead available on the pricier ZBook Fury series. Traction and feedback are nonetheless smooth and clicky, respectively, to be more reliable than the normally spongier clickpads on most consumer laptops.


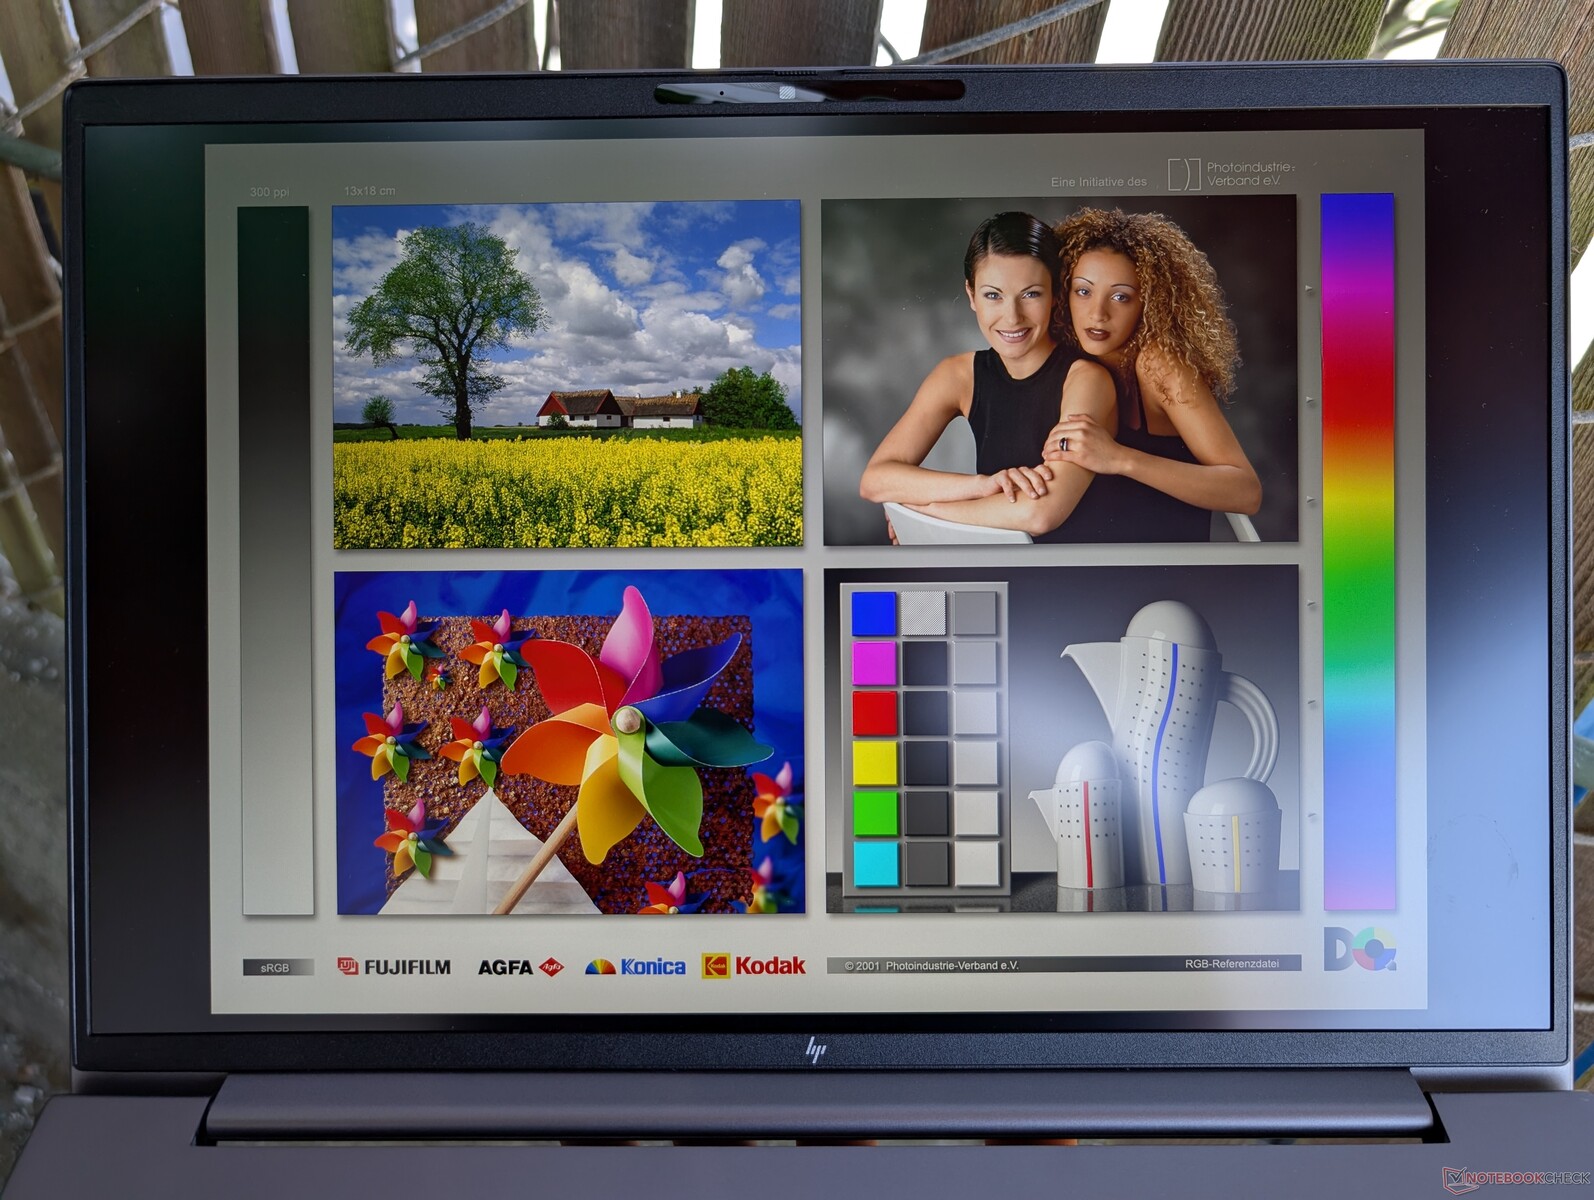
Display — IPS Across The Board
A total of five display options are available as follows all of which are IPS only. Our configuration ships with the bolded option.
- 1920 x 1200, non-touch, matte, 250 nits, 45 percent NTSC, 60 Hz
- 1920 x 1200, touch, matte, 250 nits, 45 percent NTSC, 60 Hz
- 1920 x 1200, non-touch, matte, 400 nits, 100 percent sRGB, 60 Hz
- 1920 x 1200, non-touch, matte, 1000 nits, 100 percent sRGB, HP Sure View, 60 Hz
- 2560 x 1600, non-touch, matte, 400 nits, 100 percent sRGB, 120 Hz
If image quality is a concern, users should skip the lower-end first two options as color coverage would only be about 60 percent of sRGB. The super-bright 1000 nit panel is noteworthy since many other workstations do not offer this feature, but the option is unfortunately tied to Sure View which severely limits viewing angles for increased privacy. There are no OLED, HDR, or P3 options to speak of which is somewhat disappointing for a performance workstation. Users would have to upgrade to the HP ZBook Fury 16 G11 or consider the ThinkPad P16s G2 for such features.


| |||||||||||||||||||||||||
Brightness Distribution: 88 %
Center on Battery: 470.7 cd/m²
Contrast: 826:1 (Black: 0.57 cd/m²)
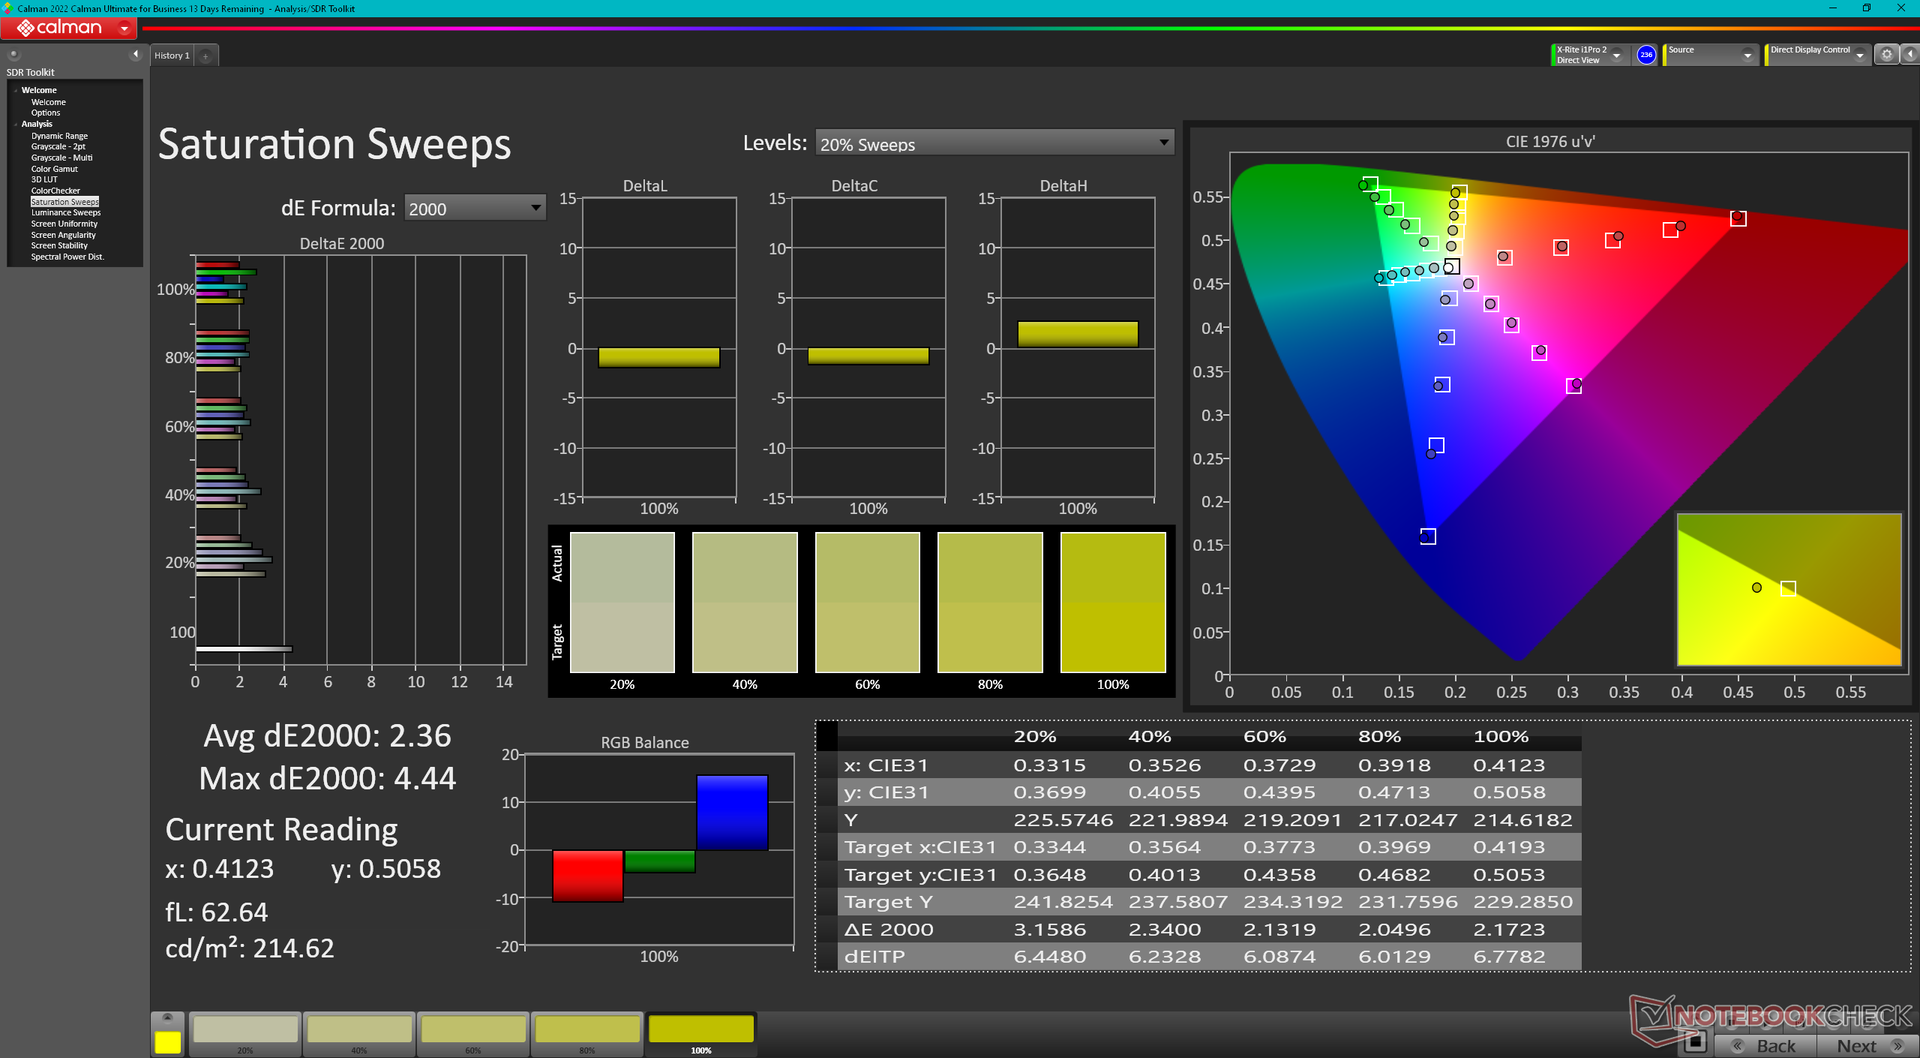
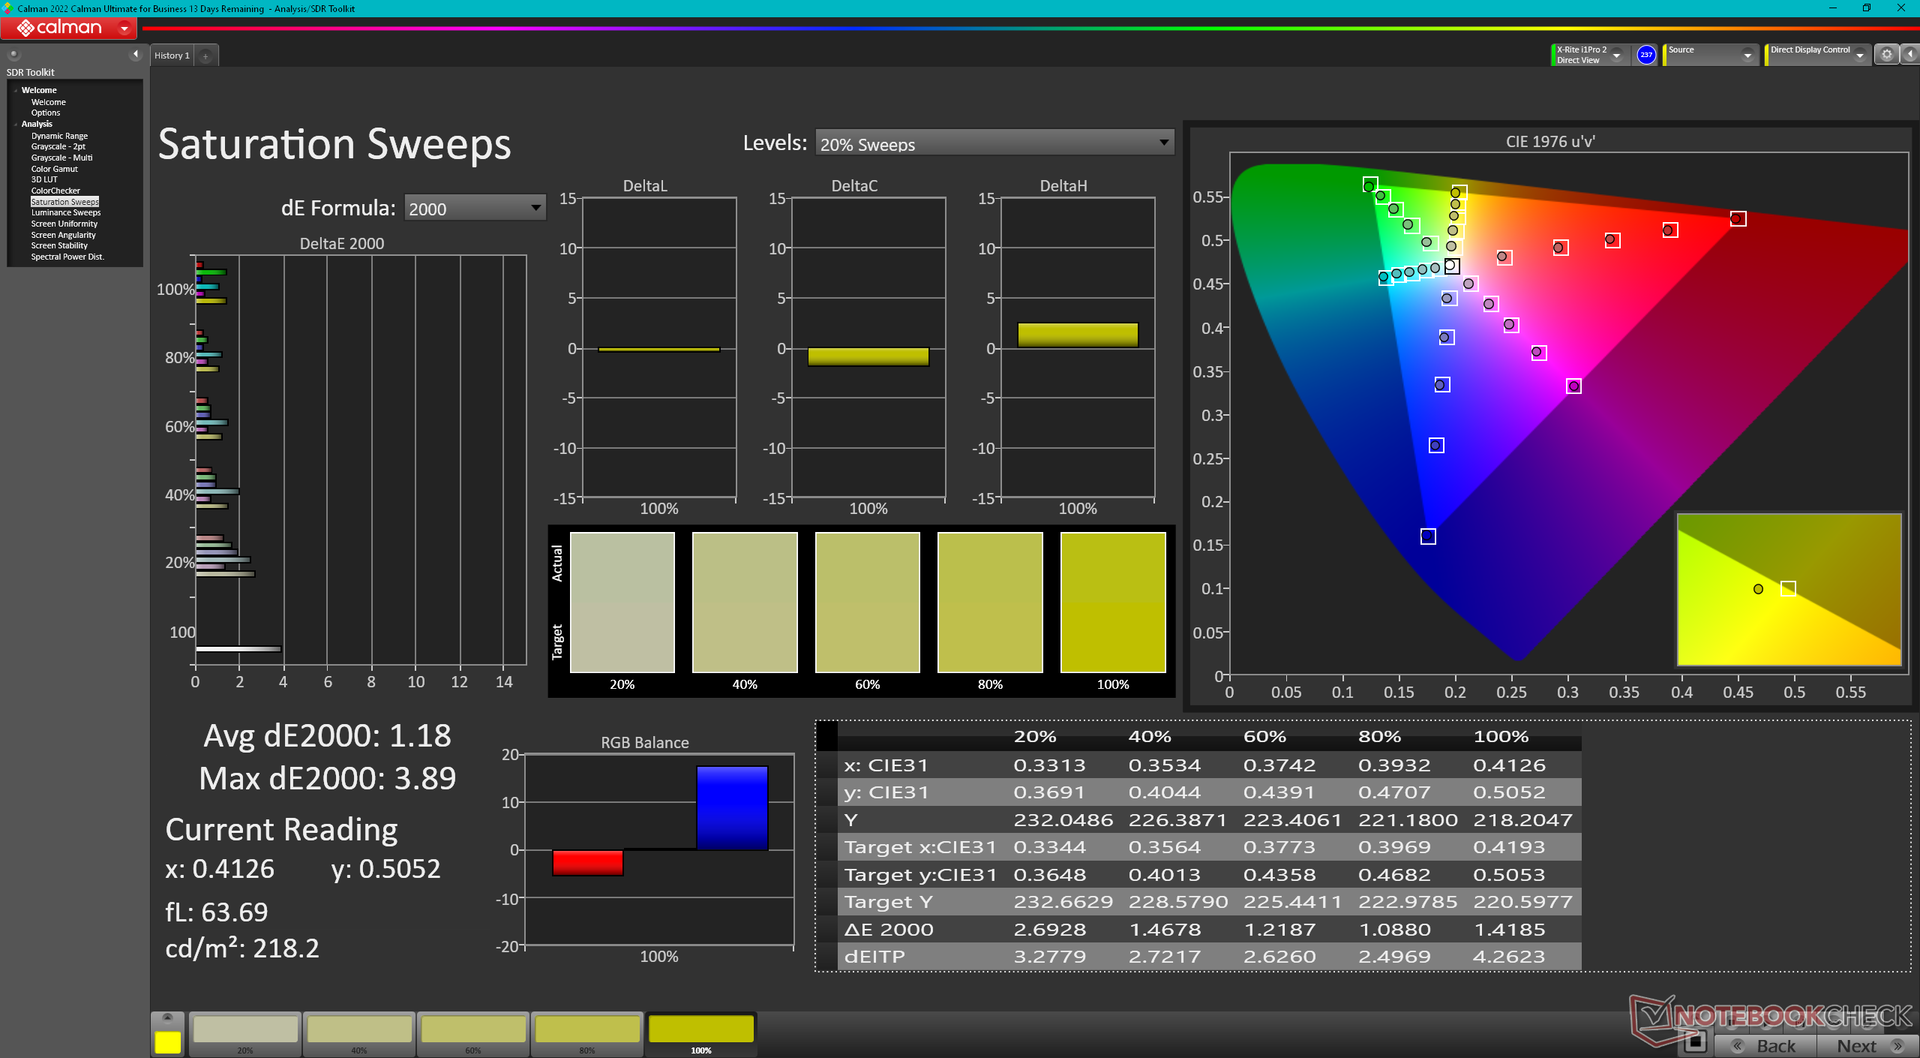
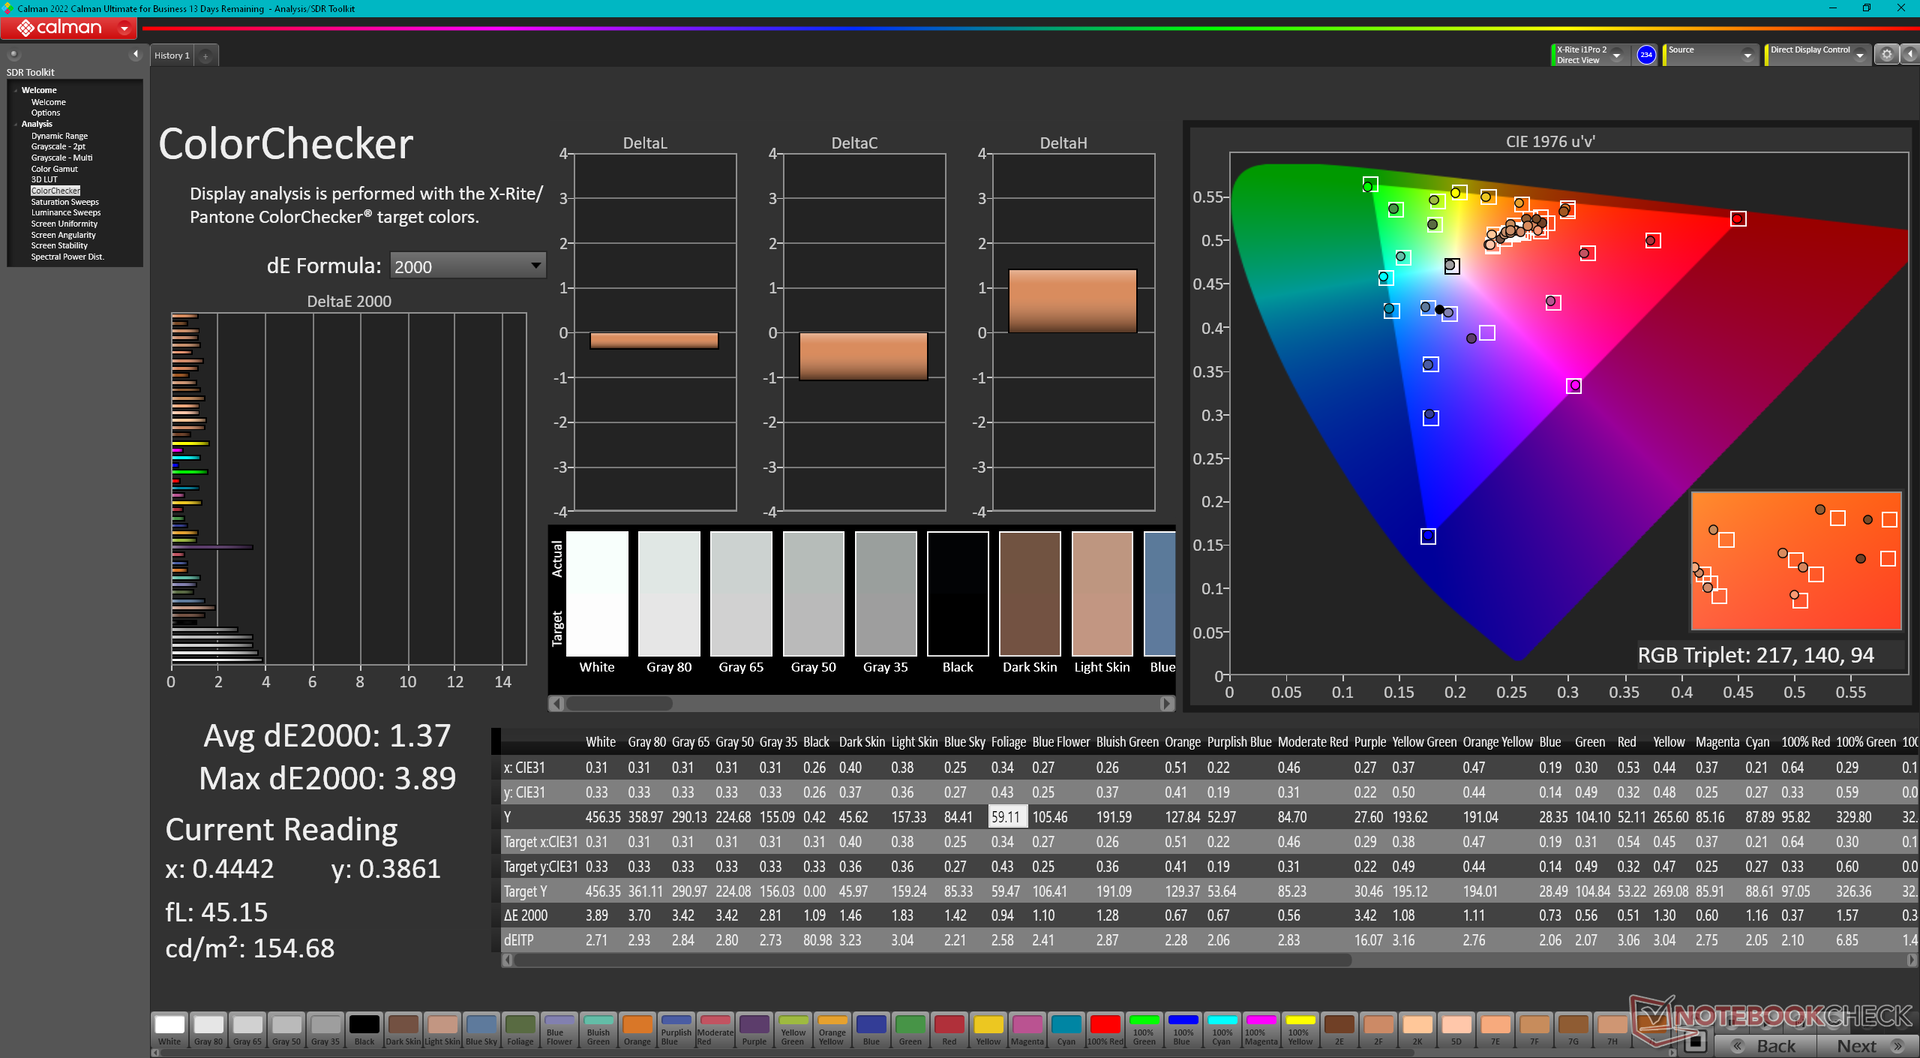
ΔE ColorChecker Calman: 2.16 | ∀{0.5-29.43 Ø4.72}
calibrated: 1.37
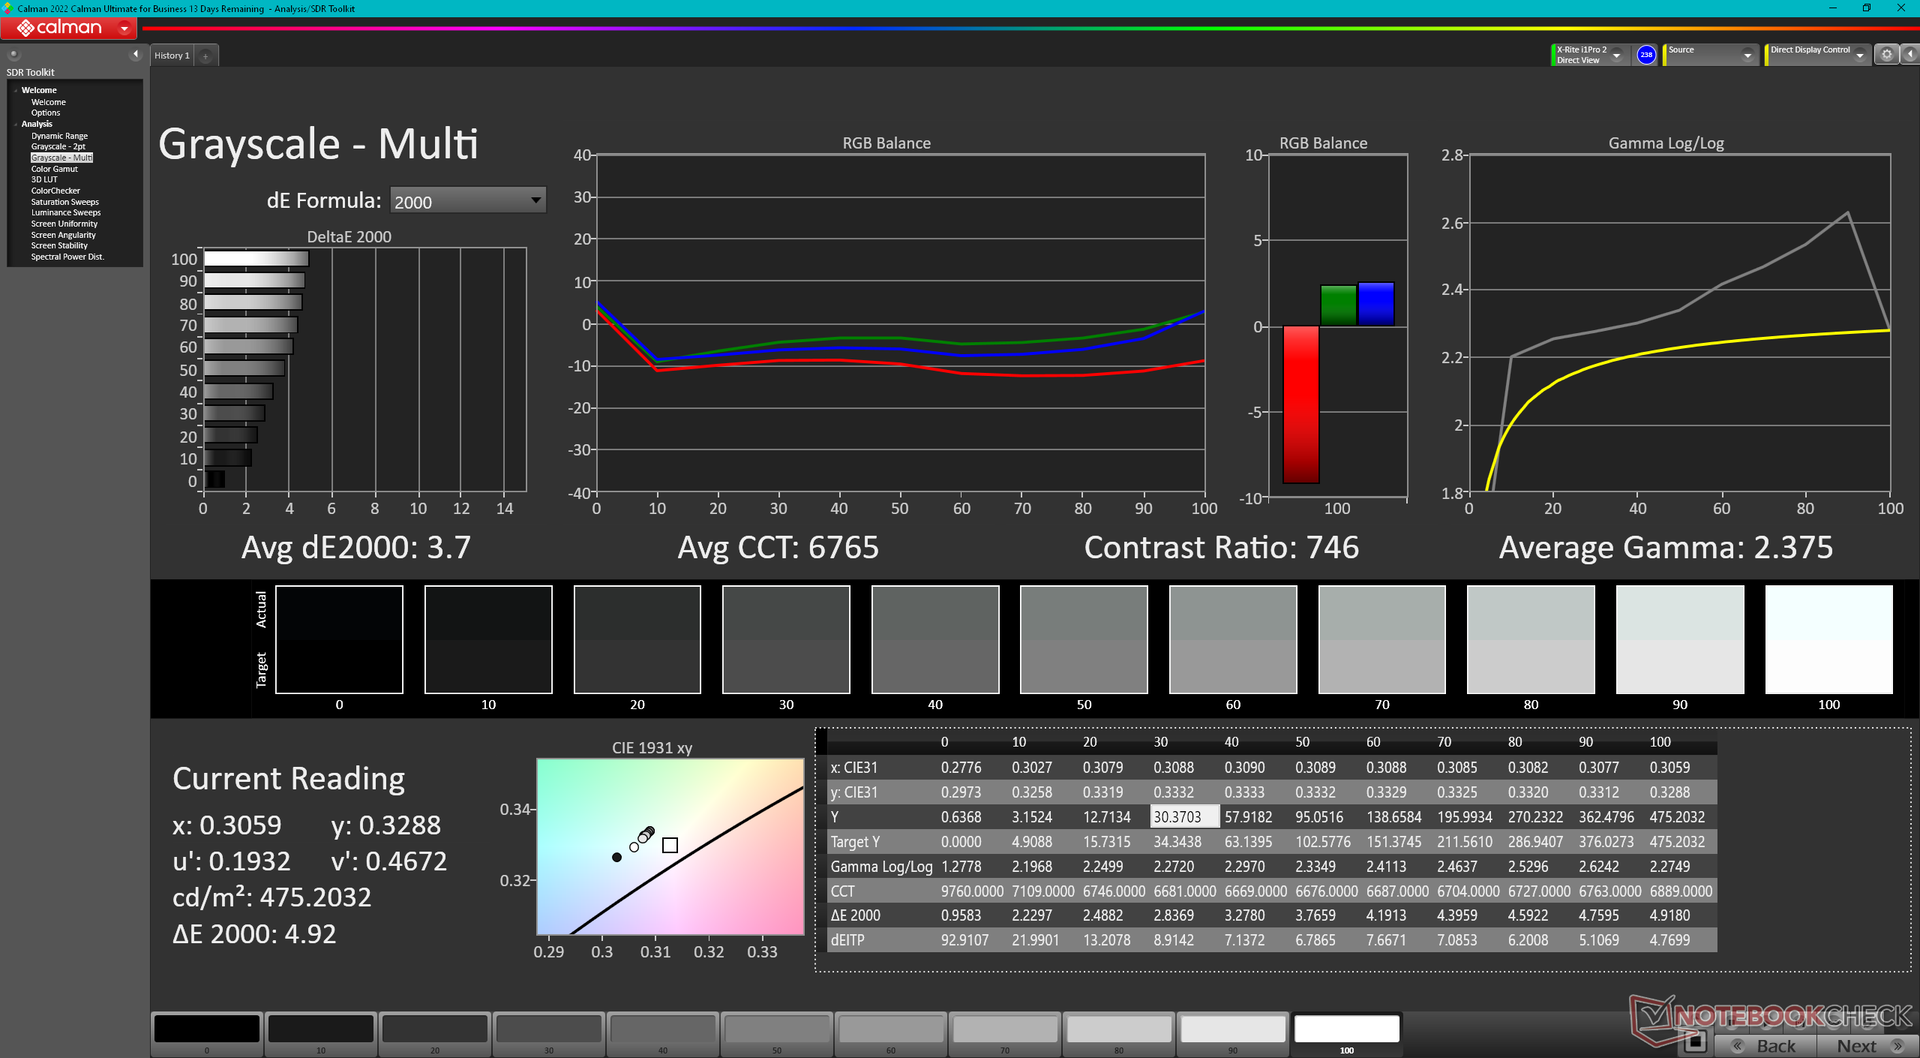
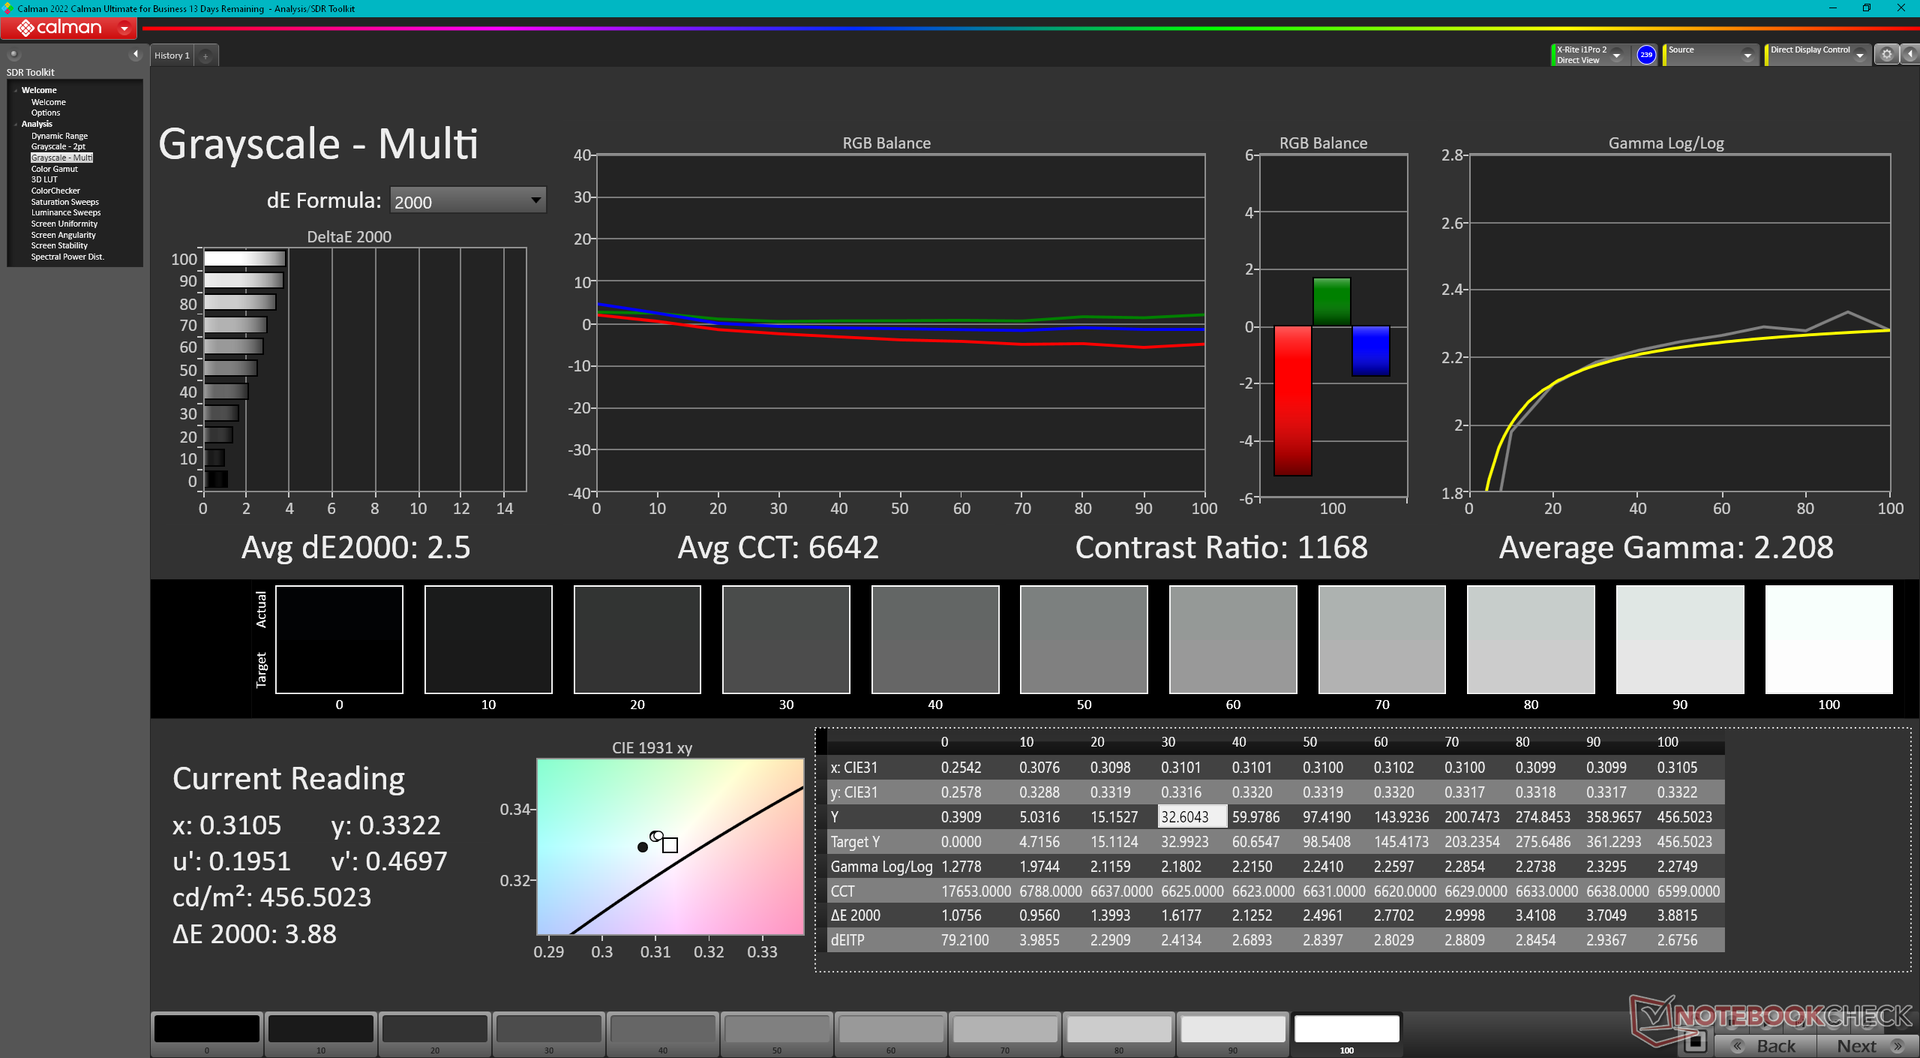
ΔE Greyscale Calman: 3.7 | ∀{0.09-98 Ø4.97}
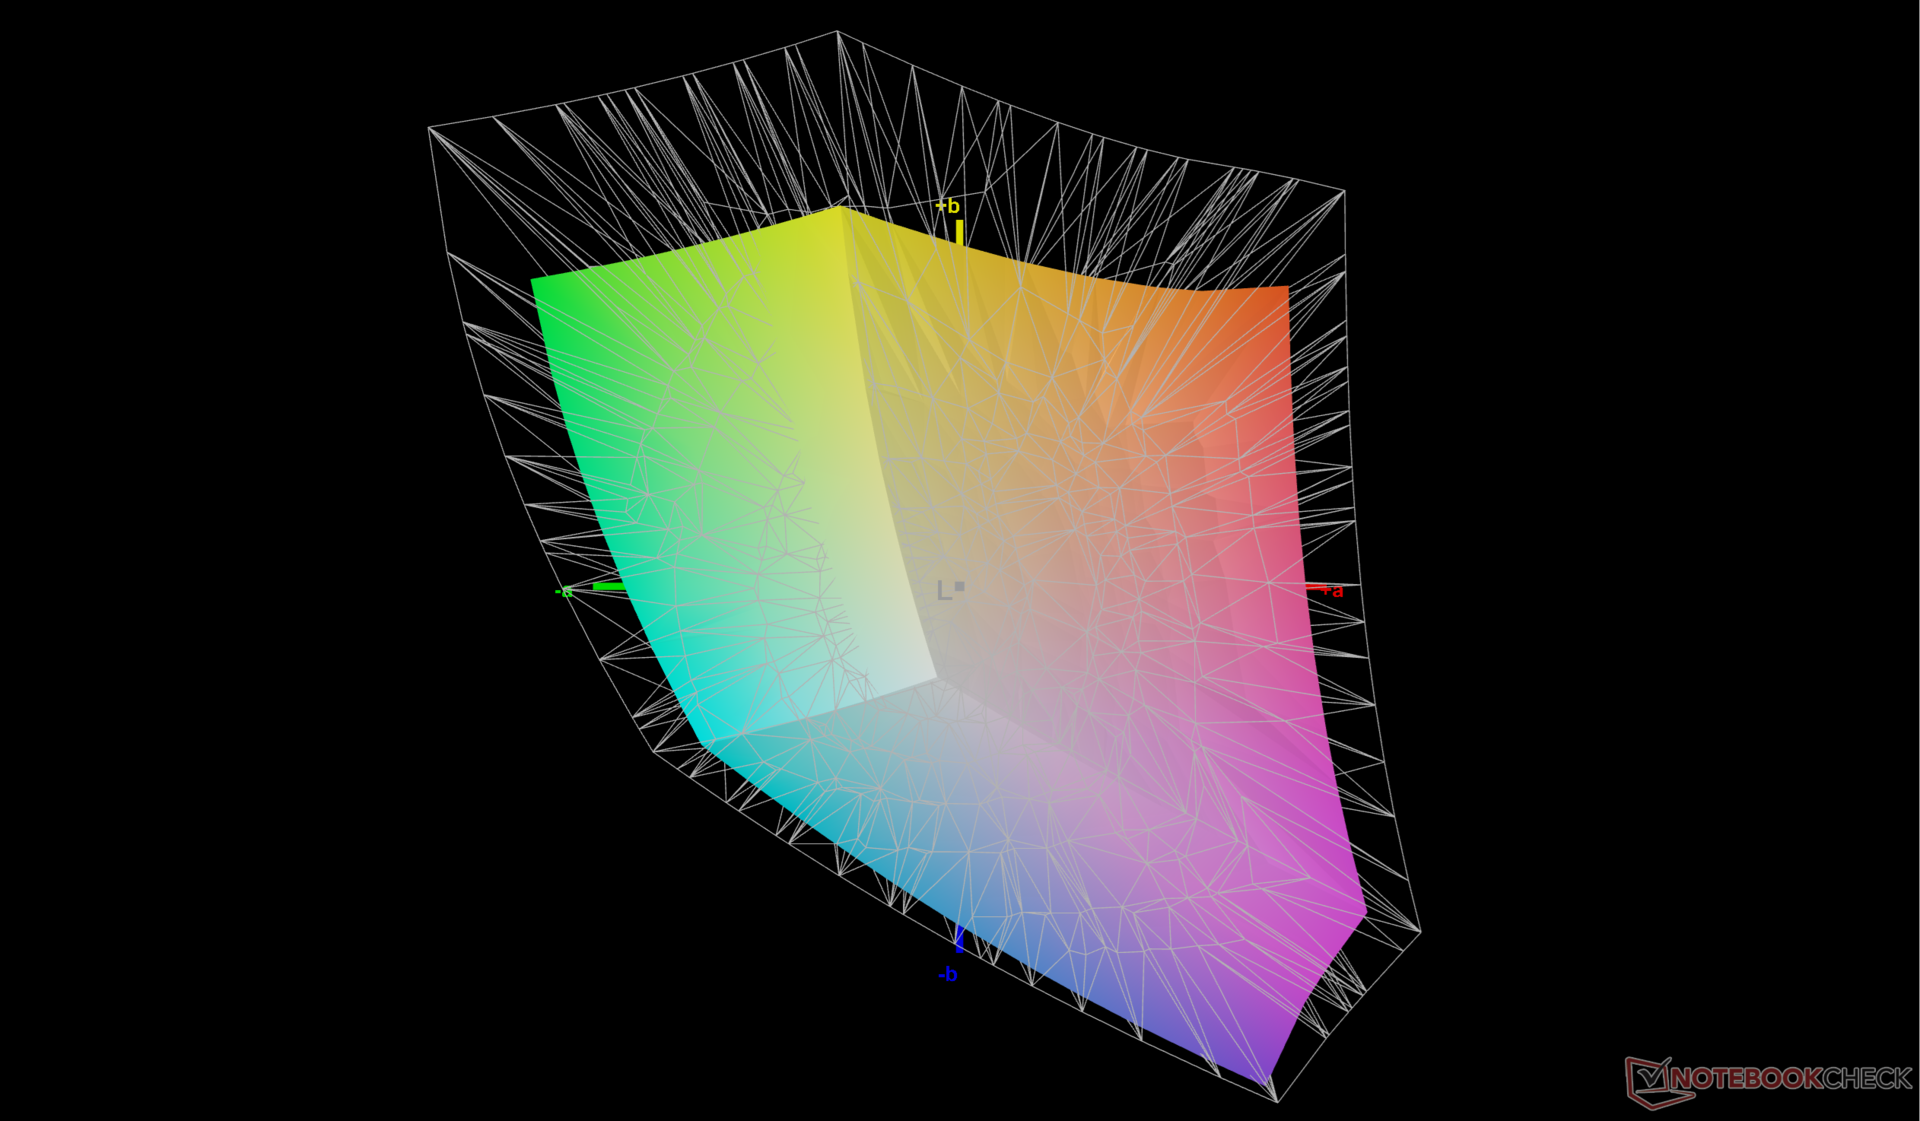
71% AdobeRGB 1998 (Argyll 3D)
97.7% sRGB (Argyll 3D)
69.1% Display P3 (Argyll 3D)
Gamma: 2.38
CCT: 6765 K
| HP ZBook Power 16 G11 A AUOA0A9, IPS, 2560x1600, 16", 120 Hz | HP ZBook Power 15 G10 BOE0B6A, IPS, 2560x1440, 15.6", 120 Hz | HP ZBook Fury 16 G11 AUO87A8, IPS, 3840x2400, 16", 120 Hz | Lenovo ThinkPad P1 Gen 7 21KV001SGE MNG007DA1-9 , IPS LED, 2560x1600, 16", 165 Hz | Lenovo ThinkPad P16s G2 21K9000CGE ATNA60YV04-0, OLED, 3840x2400, 16", 60 Hz | Dell Precision 5690 Samsung 160YV03, OLED, 3840x2400, 16", 60 Hz | |
|---|---|---|---|---|---|---|
| Display | -1% | 22% | 0% | 28% | 27% | |
| Display P3 Coverage (%) | 69.1 | 68.2 -1% | 98.4 42% | 69.4 0% | 99.9 45% | 99.8 44% |
| sRGB Coverage (%) | 97.7 | 95.6 -2% | 99.9 2% | 97.6 0% | 100 2% | 100 2% |
| AdobeRGB 1998 Coverage (%) | 71 | 70.5 -1% | 86 21% | 71.8 1% | 96.9 36% | 96.6 36% |
| Response Times | -10% | 8% | -4% | 87% | 84% | |
| Response Time Grey 50% / Grey 80% * (ms) | 13.6 ? | 13 ? 4% | 11.4 ? 16% | 11.2 ? 18% | 1.5 ? 89% | 1.7 ? 87% |
| Response Time Black / White * (ms) | 8.4 ? | 10.4 ? -24% | 8.4 ? -0% | 10.6 ? -26% | 1.3 ? 85% | 1.7 ? 80% |
| PWM Frequency (Hz) | 60 | 60 ? | ||||
| Screen | -13% | 5% | -10% | 2% | -14% | |
| Brightness middle (cd/m²) | 470.7 | 313.8 -33% | 457.6 -3% | 516 10% | 416 -12% | 348.1 -26% |
| Brightness (cd/m²) | 431 | 302 -30% | 466 8% | 505 17% | 421 -2% | 351 -19% |
| Brightness Distribution (%) | 88 | 83 -6% | 83 -6% | 89 1% | 98 11% | 97 10% |
| Black Level * (cd/m²) | 0.57 | 0.29 49% | 0.43 25% | 0.41 28% | ||
| Contrast (:1) | 826 | 1082 31% | 1064 29% | 1259 52% | ||
| Colorchecker dE 2000 * | 2.16 | 3.27 -51% | 2.78 -29% | 3.5 -62% | 1.3 40% | 4.18 -94% |
| Colorchecker dE 2000 max. * | 4.39 | 7.81 -78% | 5.53 -26% | 8.8 -100% | 2.8 36% | 6.68 -52% |
| Colorchecker dE 2000 calibrated * | 1.37 | 0.56 59% | 1.37 -0% | 1.2 12% | 2.9 -112% | 0.97 29% |
| Greyscale dE 2000 * | 3.7 | 5.9 -59% | 2 46% | 5.6 -51% | 1.8 51% | 1.7 54% |
| Gamma | 2.38 92% | 2.18 101% | 2.28 96% | 2.27 97% | 2.25 98% | 2.2 100% |
| CCT | 6765 96% | 6323 103% | 6806 96% | 6071 107% | 6574 99% | 6198 105% |
| Total Average (Program / Settings) | -8% /
-10% | 12% /
9% | -5% /
-7% | 39% /
22% | 32% /
13% |
* ... smaller is better
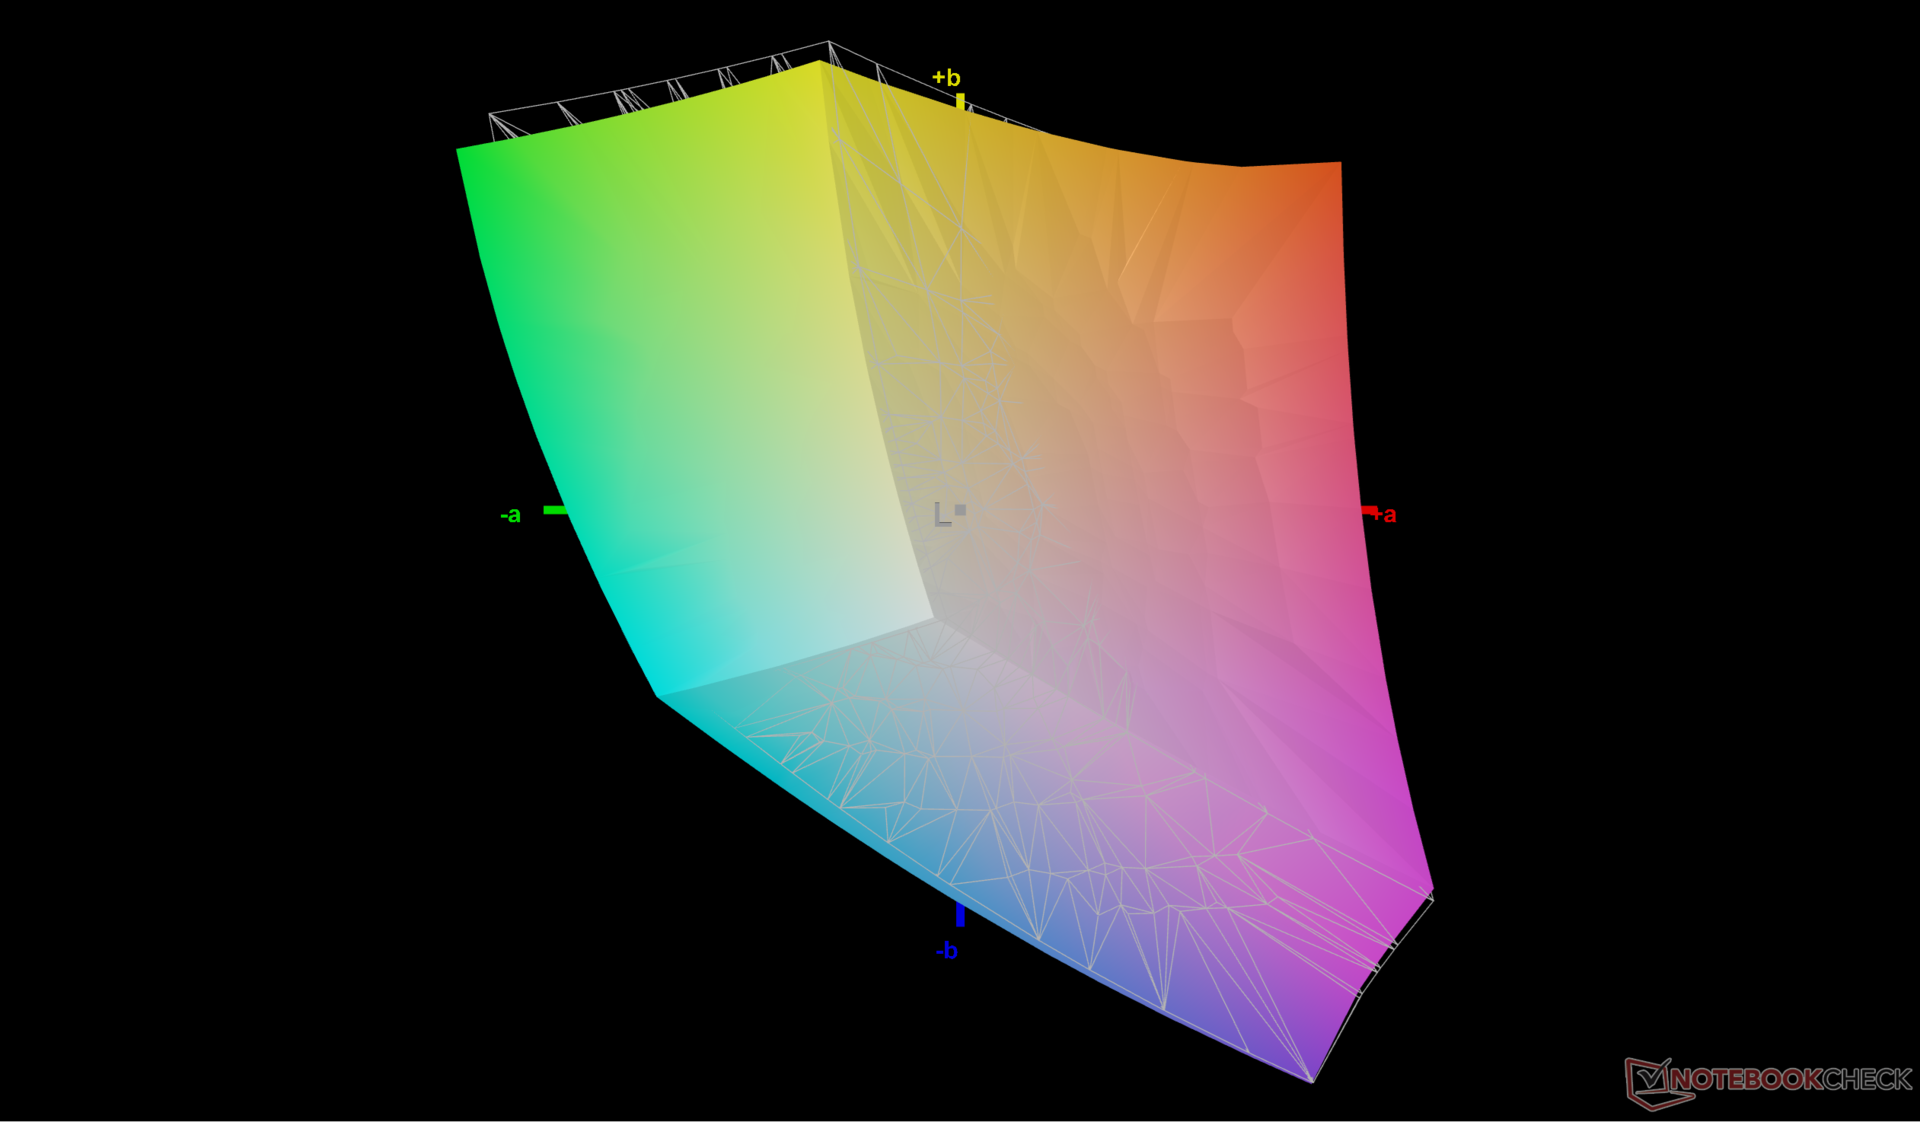
The display is decently calibrated out of the box against the sRGB standard. Calibrating the panel with our X-Rite colorimeter would improve average grayscale and color deltaE values even further from 3.7 and 2.16 to just 2.5 and 1.37, respectively. Our calibrated ICM profile is available to download above for free.

Display Response Times
| ↔ Response Time Black to White | ||
|---|---|---|
| 8.4 ms ... rise ↗ and fall ↘ combined | ↗ 4.5 ms rise | 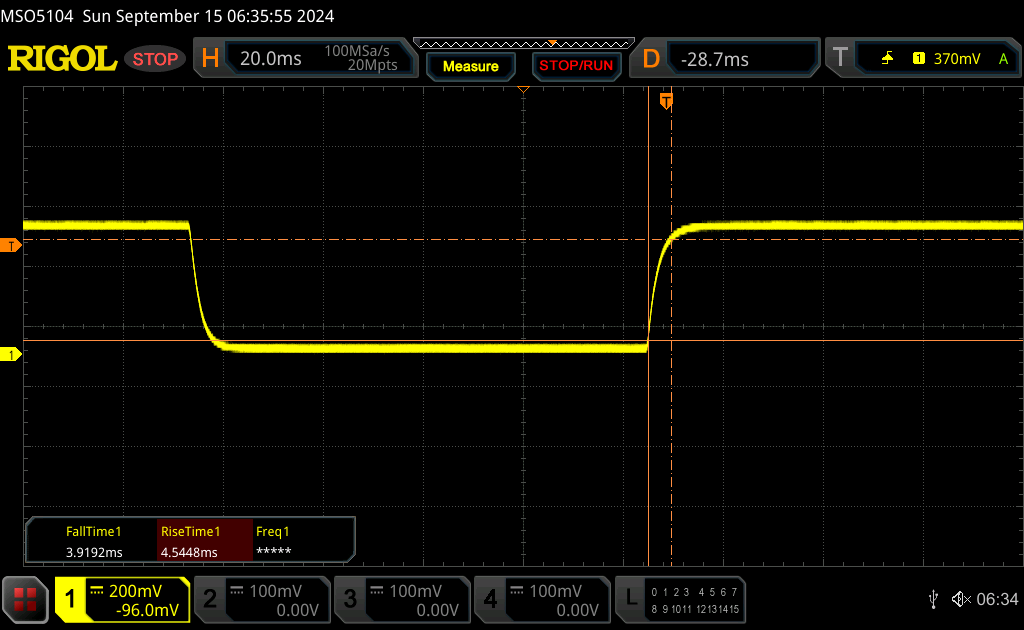 |
| ↘ 3.9 ms fall | ||
| The screen shows fast response rates in our tests and should be suited for gaming. In comparison, all tested devices range from 0.1 (minimum) to 240 (maximum) ms. » 24 % of all devices are better. This means that the measured response time is better than the average of all tested devices (19.8 ms). | ||
| ↔ Response Time 50% Grey to 80% Grey | ||
| 13.6 ms ... rise ↗ and fall ↘ combined | ↗ 7.2 ms rise | 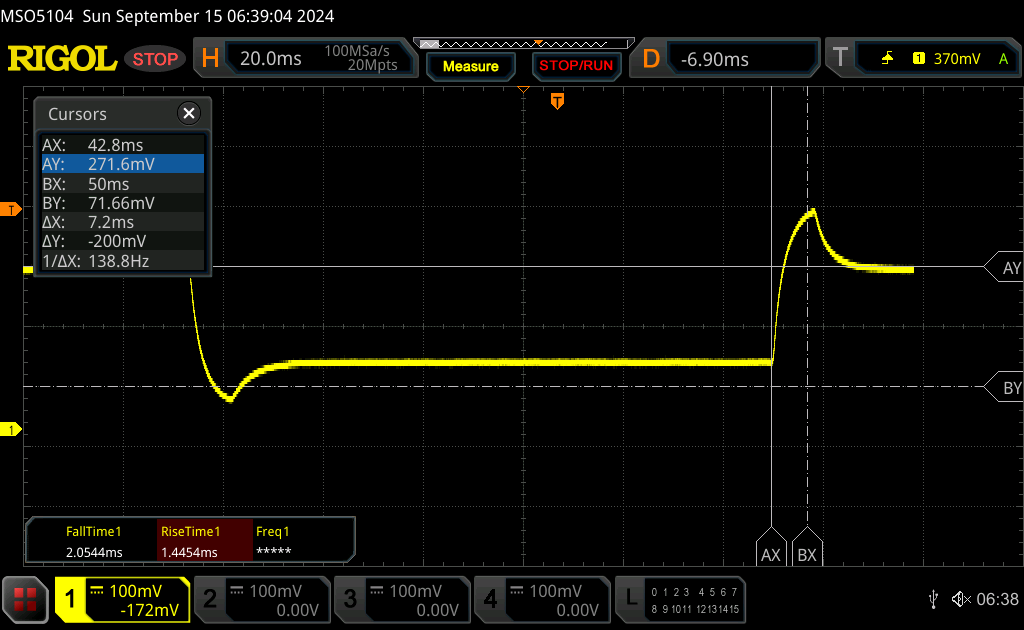 |
| ↘ 6.4 ms fall | ||
| The screen shows good response rates in our tests, but may be too slow for competitive gamers. In comparison, all tested devices range from 0.165 (minimum) to 636 (maximum) ms. » 27 % of all devices are better. This means that the measured response time is better than the average of all tested devices (31 ms). | ||
Screen Flickering / PWM (Pulse-Width Modulation)
| Screen flickering / PWM not detected | 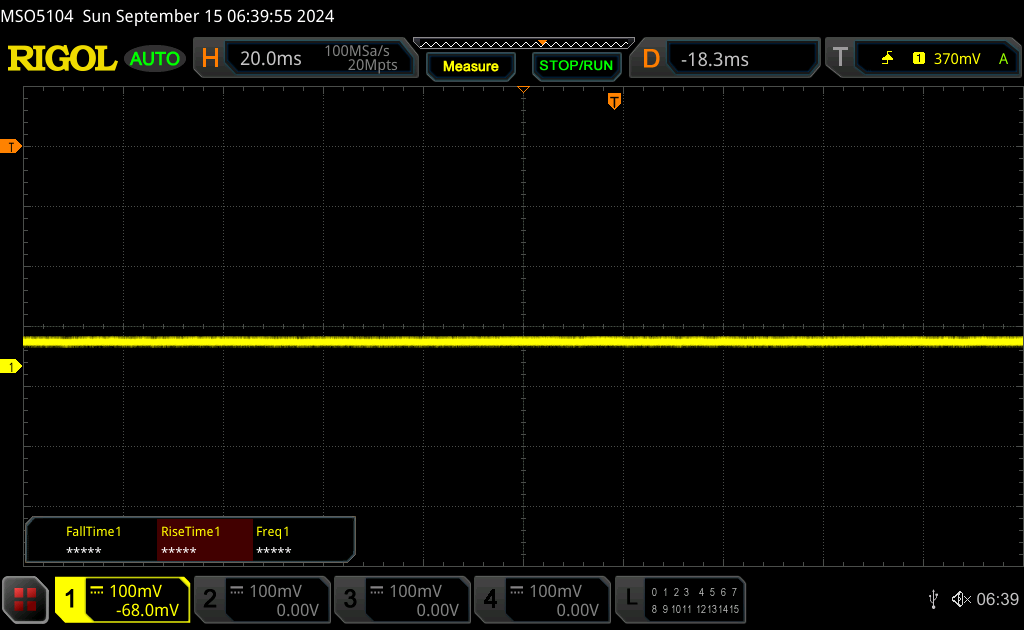 | ||
In comparison: 52 % of all tested devices do not use PWM to dim the display. If PWM was detected, an average of 7750 (minimum: 5 - maximum: 343500) Hz was measured. | |||
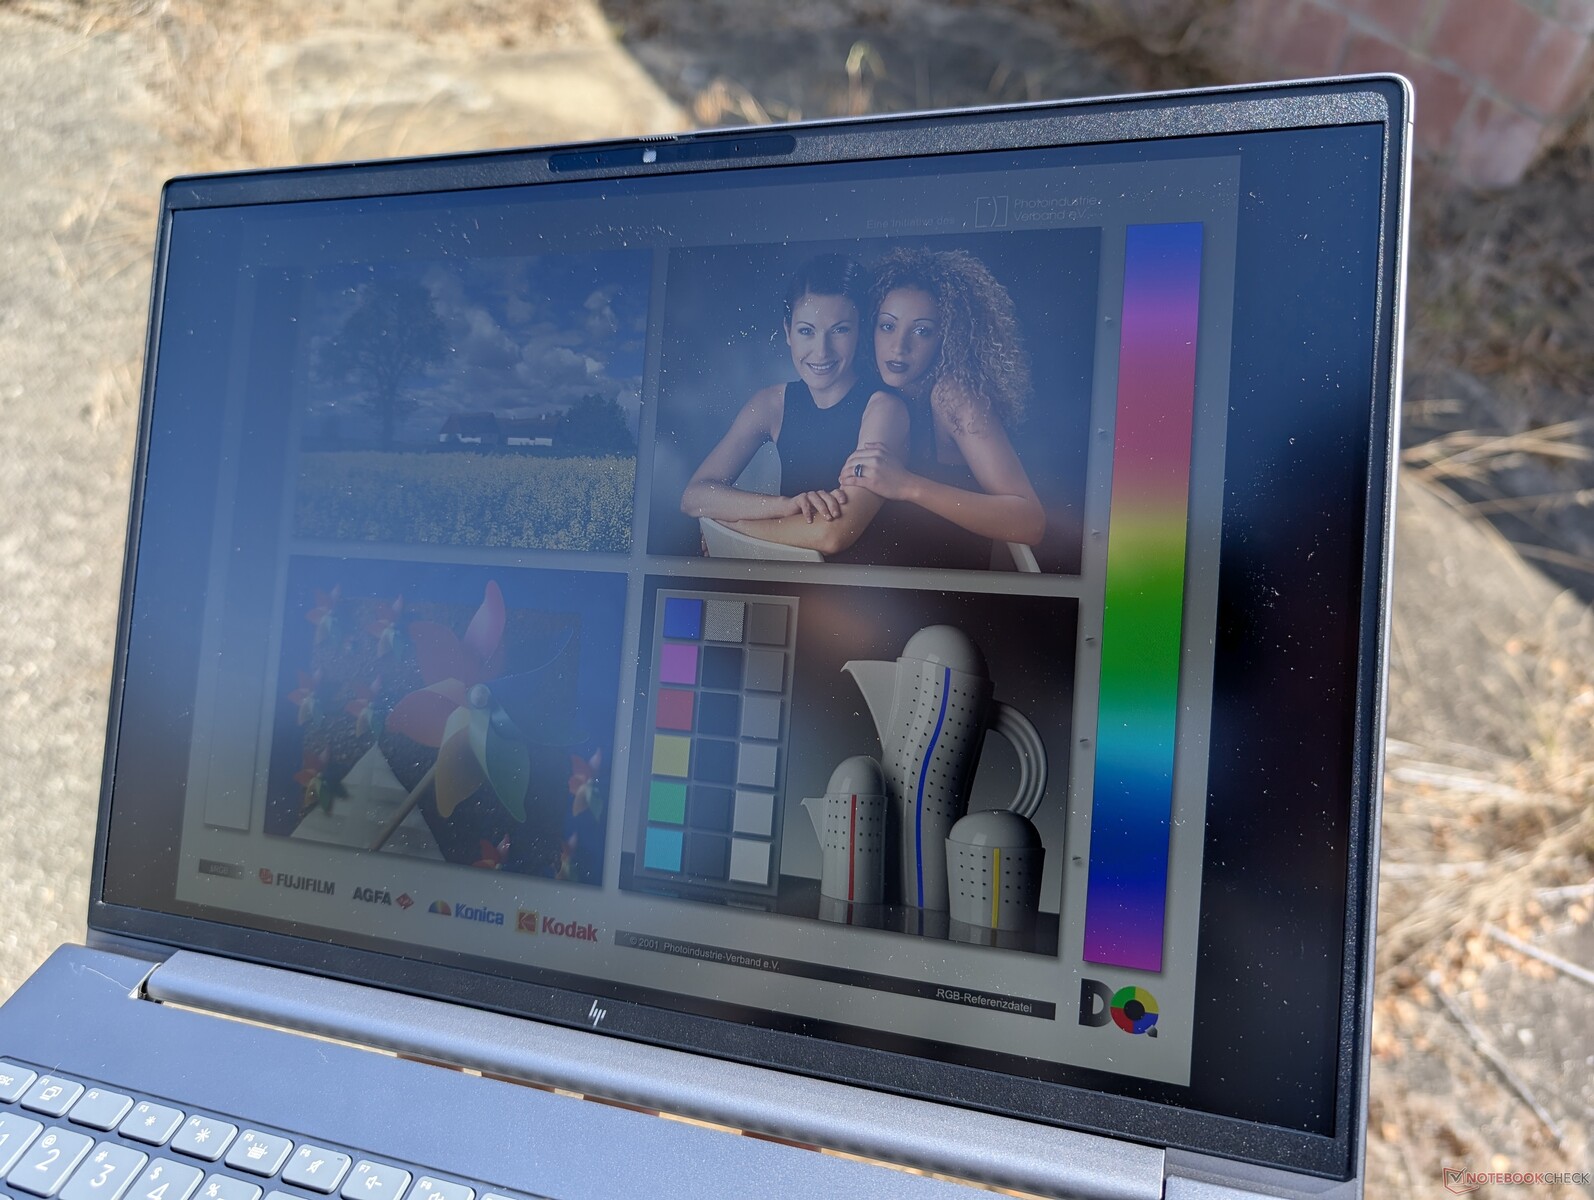
Outdoor visibility is decent when under shade with our 1600p panel, but lower-end options will be dimmer and more prone to glare. The 1000-nit option should be considered if frequently outdoors.

Performance — New Zen 4, Same Zen 4 Performance
Testing Conditions
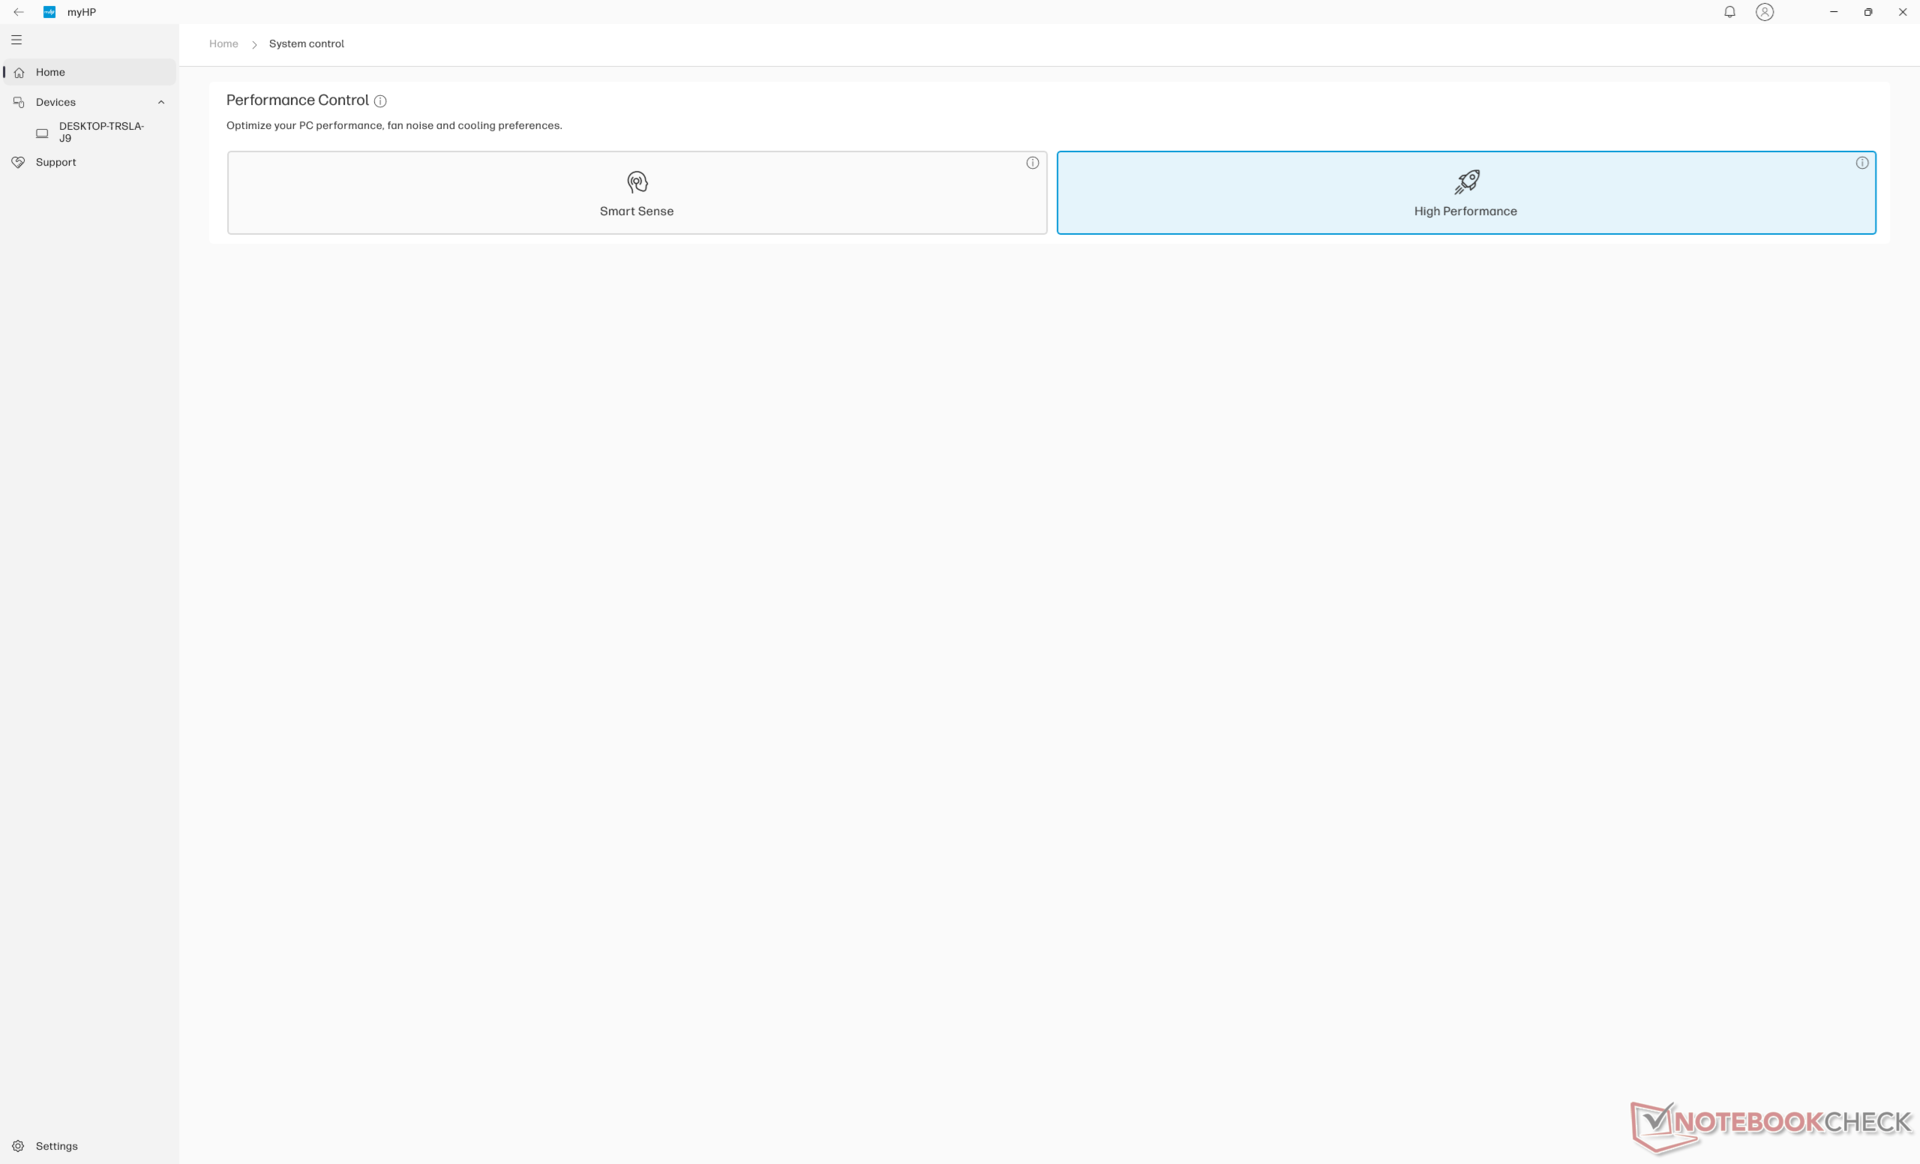
We set both Windows and MyHP to Performance mode prior to running the benchmarks below. Optimus 1.0 is supported.
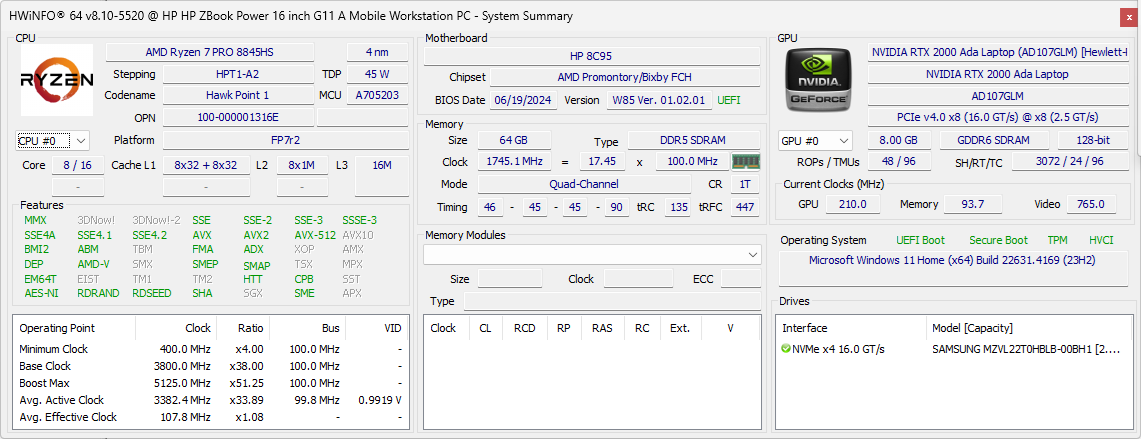
Processor
The Ryzen 7 8845HS doesn't offer much over the Ryzen 7 7840HS that it replaces in last year's ZBook Power 15 G10. In fact, benchmarks put both processors neck-to-neck by just a few percentage points to be essentially identical. This may be disappointing to power users who were expecting more significant performance upgrades in the transition from 15-inch to 16-inch. Faster Raptor Lake-HX options are available only on HP's thicker ZBook Fury series.
The main advantage that the Ryzen 7 8845HS holds over the Ryzen 7 7840HS is AI acceleration due to its integrated NPU. However, Co-Pilot+ is incompatible with Hawk Point CPUs and so the practicality of the NPU is very limited on this machine.
Downgrading to the Ryzen 5 8645HS is expected to reduce performance by 25 to 30 percent while upgrading to the Ryzen 9 8945HS is expected to improve performance by just 5 percent.
Cinebench R15 Multi Loop
Cinebench R23: Multi Core | Single Core
Cinebench R20: CPU (Multi Core) | CPU (Single Core)
Cinebench R15: CPU Multi 64Bit | CPU Single 64Bit
Blender: v2.79 BMW27 CPU
7-Zip 18.03: 7z b 4 | 7z b 4 -mmt1
Geekbench 6.7: Multi-Core | Single-Core
Geekbench 5.5: Multi-Core | Single-Core
HWBOT x265 Benchmark v2.2: 4k Preset
LibreOffice : 20 Documents To PDF
R Benchmark 2.5: Overall mean
| Geekbench 6.7 / Multi-Core | |
| HP ZBook Fury 16 G11 | |
| Dell Precision 5690 | |
| Dell Precision 5000 5490 | |
| HP ZBook Power 15 G10 | |
| Average AMD Ryzen 7 8845HS (11073 - 14014, n=18) | |
| HP ZBook Power 16 G11 A | |
| Lenovo ThinkPad P16s G2 21K9000CGE | |
| Lenovo ThinkPad P16v G1 AMD | |
| Geekbench 6.7 / Single-Core | |
| HP ZBook Fury 16 G11 | |
| HP ZBook Power 15 G10 | |
| Average AMD Ryzen 7 8845HS (2510 - 2698, n=16) | |
| HP ZBook Power 16 G11 A | |
| Lenovo ThinkPad P16v G1 AMD | |
| Dell Precision 5690 | |
| Lenovo ThinkPad P16s G2 21K9000CGE | |
| Dell Precision 5000 5490 | |
Cinebench R23: Multi Core | Single Core
Cinebench R20: CPU (Multi Core) | CPU (Single Core)
Cinebench R15: CPU Multi 64Bit | CPU Single 64Bit
Blender: v2.79 BMW27 CPU
7-Zip 18.03: 7z b 4 | 7z b 4 -mmt1
Geekbench 6.7: Multi-Core | Single-Core
Geekbench 5.5: Multi-Core | Single-Core
HWBOT x265 Benchmark v2.2: 4k Preset
LibreOffice : 20 Documents To PDF
R Benchmark 2.5: Overall mean
* ... smaller is better
AIDA64: FP32 Ray-Trace | FPU Julia | CPU SHA3 | CPU Queen | FPU SinJulia | FPU Mandel | CPU AES | CPU ZLib | FP64 Ray-Trace | CPU PhotoWorxx
| Performance rating | |
| Average AMD Ryzen 7 8845HS | |
| HP ZBook Power 15 G10 | |
| HP ZBook Power 16 G11 A | |
| HP ZBook Fury 16 G11 | |
| Lenovo ThinkPad P16s G2 21K9000CGE | |
| Dell Precision 5690 | |
| Lenovo ThinkPad P1 Gen 7 21KV001SGE | |
| AIDA64 / FP32 Ray-Trace | |
| Average AMD Ryzen 7 8845HS (23708 - 29544, n=13) | |
| HP ZBook Power 15 G10 | |
| HP ZBook Power 16 G11 A | |
| Lenovo ThinkPad P16s G2 21K9000CGE | |
| HP ZBook Fury 16 G11 | |
| Dell Precision 5690 | |
| Lenovo ThinkPad P1 Gen 7 21KV001SGE | |
| AIDA64 / FPU Julia | |
| HP ZBook Power 16 G11 A | |
| Average AMD Ryzen 7 8845HS (99659 - 125873, n=13) | |
| HP ZBook Power 15 G10 | |
| HP ZBook Fury 16 G11 | |
| Lenovo ThinkPad P16s G2 21K9000CGE | |
| Dell Precision 5690 | |
| Lenovo ThinkPad P1 Gen 7 21KV001SGE | |
| AIDA64 / CPU SHA3 | |
| HP ZBook Fury 16 G11 | |
| HP ZBook Power 16 G11 A | |
| Average AMD Ryzen 7 8845HS (4332 - 5180, n=13) | |
| HP ZBook Power 15 G10 | |
| Lenovo ThinkPad P16s G2 21K9000CGE | |
| Dell Precision 5690 | |
| Lenovo ThinkPad P1 Gen 7 21KV001SGE | |
| AIDA64 / CPU Queen | |
| HP ZBook Fury 16 G11 | |
| HP ZBook Power 16 G11 A | |
| Average AMD Ryzen 7 8845HS (109458 - 124695, n=13) | |
| HP ZBook Power 15 G10 | |
| Lenovo ThinkPad P16s G2 21K9000CGE | |
| Dell Precision 5690 | |
| Lenovo ThinkPad P1 Gen 7 21KV001SGE | |
| AIDA64 / FPU SinJulia | |
| Average AMD Ryzen 7 8845HS (14062 - 15519, n=13) | |
| HP ZBook Power 15 G10 | |
| HP ZBook Power 16 G11 A | |
| Lenovo ThinkPad P16s G2 21K9000CGE | |
| HP ZBook Fury 16 G11 | |
| Dell Precision 5690 | |
| Lenovo ThinkPad P1 Gen 7 21KV001SGE | |
| AIDA64 / FPU Mandel | |
| Average AMD Ryzen 7 8845HS (53436 - 67367, n=13) | |
| HP ZBook Power 15 G10 | |
| HP ZBook Power 16 G11 A | |
| Lenovo ThinkPad P16s G2 21K9000CGE | |
| HP ZBook Fury 16 G11 | |
| Dell Precision 5690 | |
| Lenovo ThinkPad P1 Gen 7 21KV001SGE | |
| AIDA64 / CPU AES | |
| HP ZBook Fury 16 G11 | |
| Average AMD Ryzen 7 8845HS (64515 - 172642, n=13) | |
| Dell Precision 5690 | |
| HP ZBook Power 15 G10 | |
| Lenovo ThinkPad P1 Gen 7 21KV001SGE | |
| HP ZBook Power 16 G11 A | |
| Lenovo ThinkPad P16s G2 21K9000CGE | |
| AIDA64 / CPU ZLib | |
| HP ZBook Fury 16 G11 | |
| Dell Precision 5690 | |
| Lenovo ThinkPad P1 Gen 7 21KV001SGE | |
| HP ZBook Power 16 G11 A | |
| HP ZBook Power 15 G10 | |
| Lenovo ThinkPad P16s G2 21K9000CGE | |
| Average AMD Ryzen 7 8845HS (627 - 1080, n=13) | |
| AIDA64 / FP64 Ray-Trace | |
| HP ZBook Power 15 G10 | |
| Average AMD Ryzen 7 8845HS (12361 - 15911, n=13) | |
| HP ZBook Power 16 G11 A | |
| Lenovo ThinkPad P16s G2 21K9000CGE | |
| HP ZBook Fury 16 G11 | |
| Dell Precision 5690 | |
| Lenovo ThinkPad P1 Gen 7 21KV001SGE | |
| AIDA64 / CPU PhotoWorxx | |
| Dell Precision 5690 | |
| HP ZBook Power 15 G10 | |
| Lenovo ThinkPad P1 Gen 7 21KV001SGE | |
| HP ZBook Power 16 G11 A | |
| Average AMD Ryzen 7 8845HS (33192 - 41668, n=13) | |
| Lenovo ThinkPad P16s G2 21K9000CGE | |
| HP ZBook Fury 16 G11 | |
Stress Test
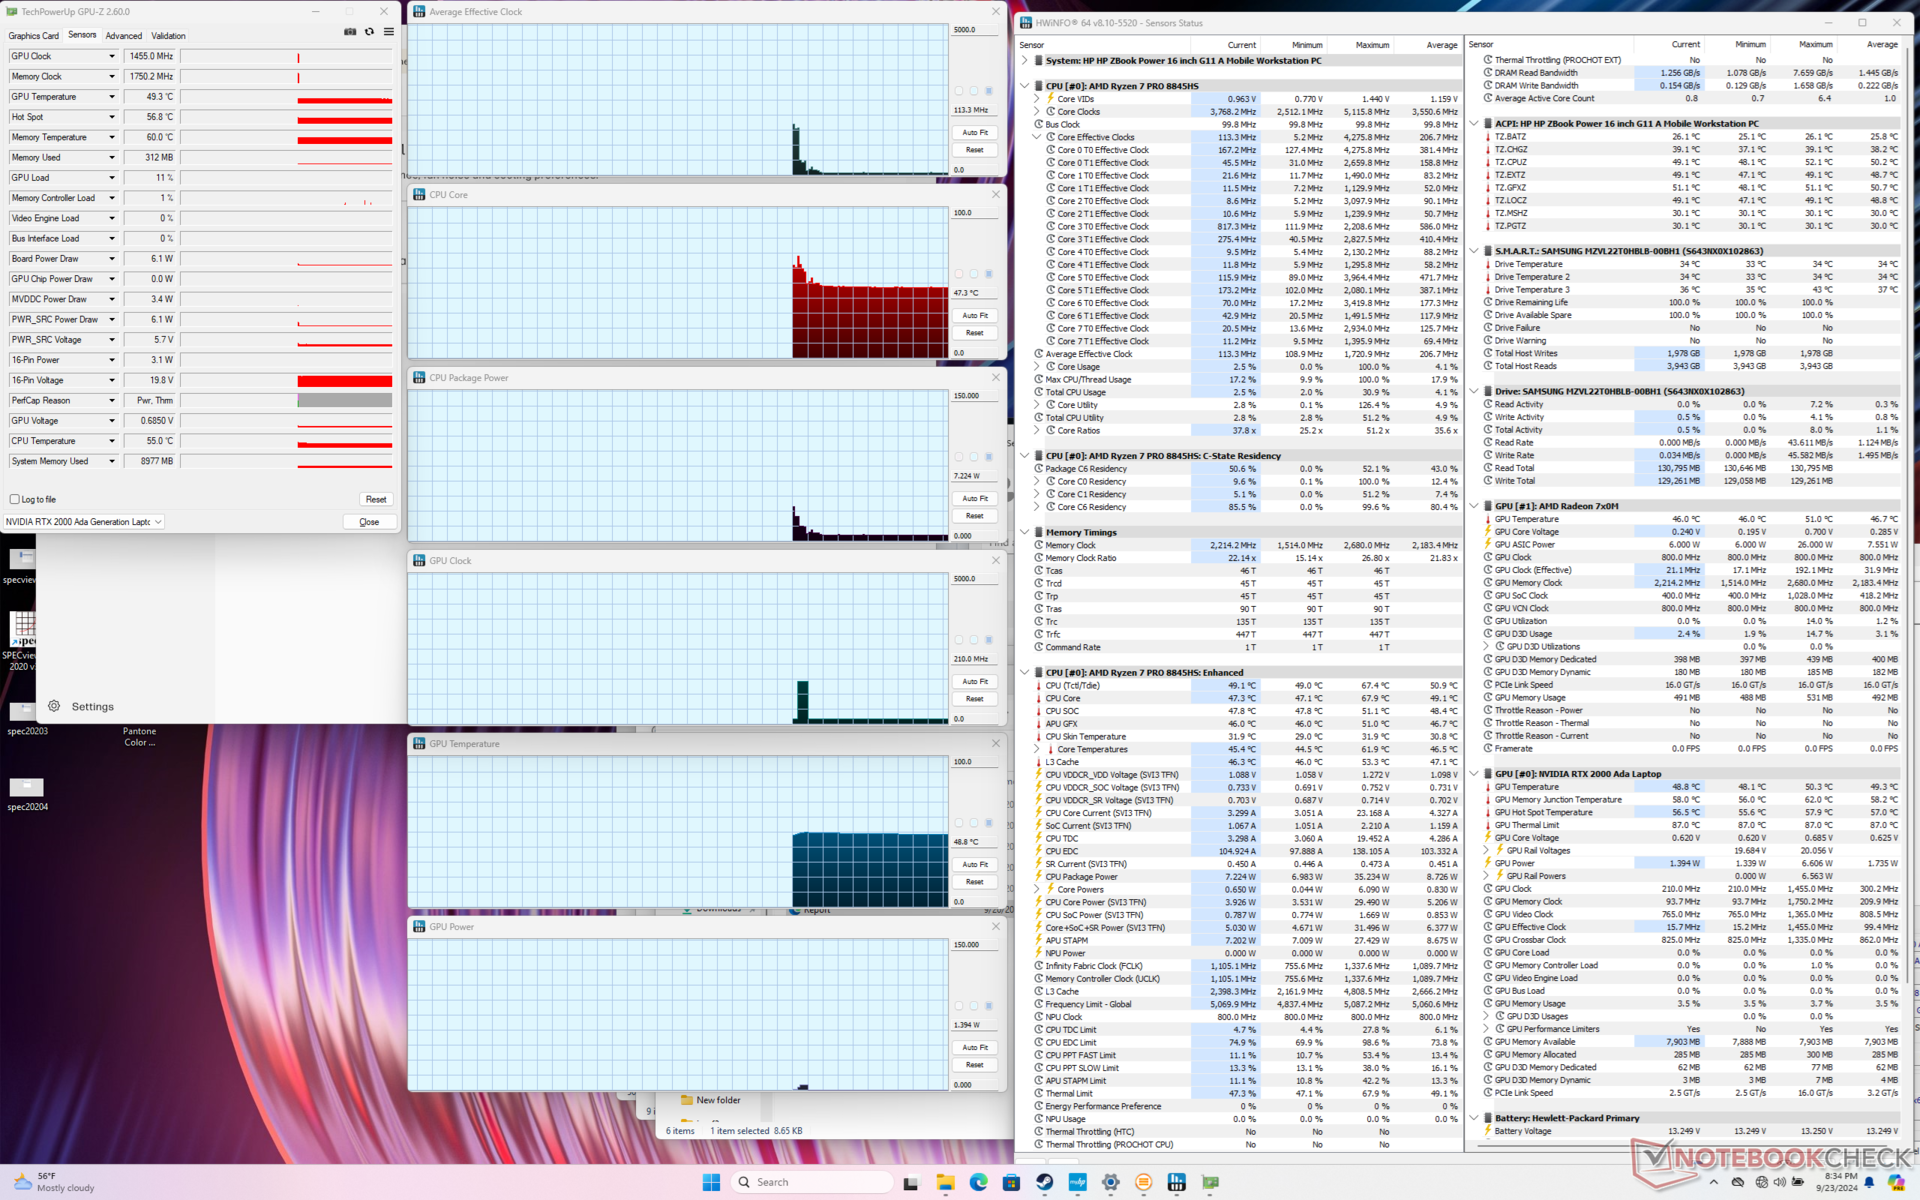
The CPU would boost to 4.3 GHz, 65 W, and 90 C when initiating Prime95 stress before quickly falling and stabilizing at 3.8 GHz and 50 W to prevent higher core temperatures. Results are close to what we observed on the ZBook Power 15 G10 if not slightly warmer by a few degrees.
Interestingly, the CPU throttles more heavily to just 2.8 GHz when running both Prime95 and FurMark simultaneously instead of 3.8 GHz as on last year's model. This change was likely to improve core temperatures; the CPU now stabilizes at a more comfortable 66 C instead of the 99 C on the ZBook Power 15 G10.
Running Cyberpunk 2077 on Balanced mode instead of Performance mode results in both slightly cooler core temperatures and slightly slower average clock rates as shown below. GPU board power draw would also drop from 35 W to 30 W against the advertised maximum of 50 W.
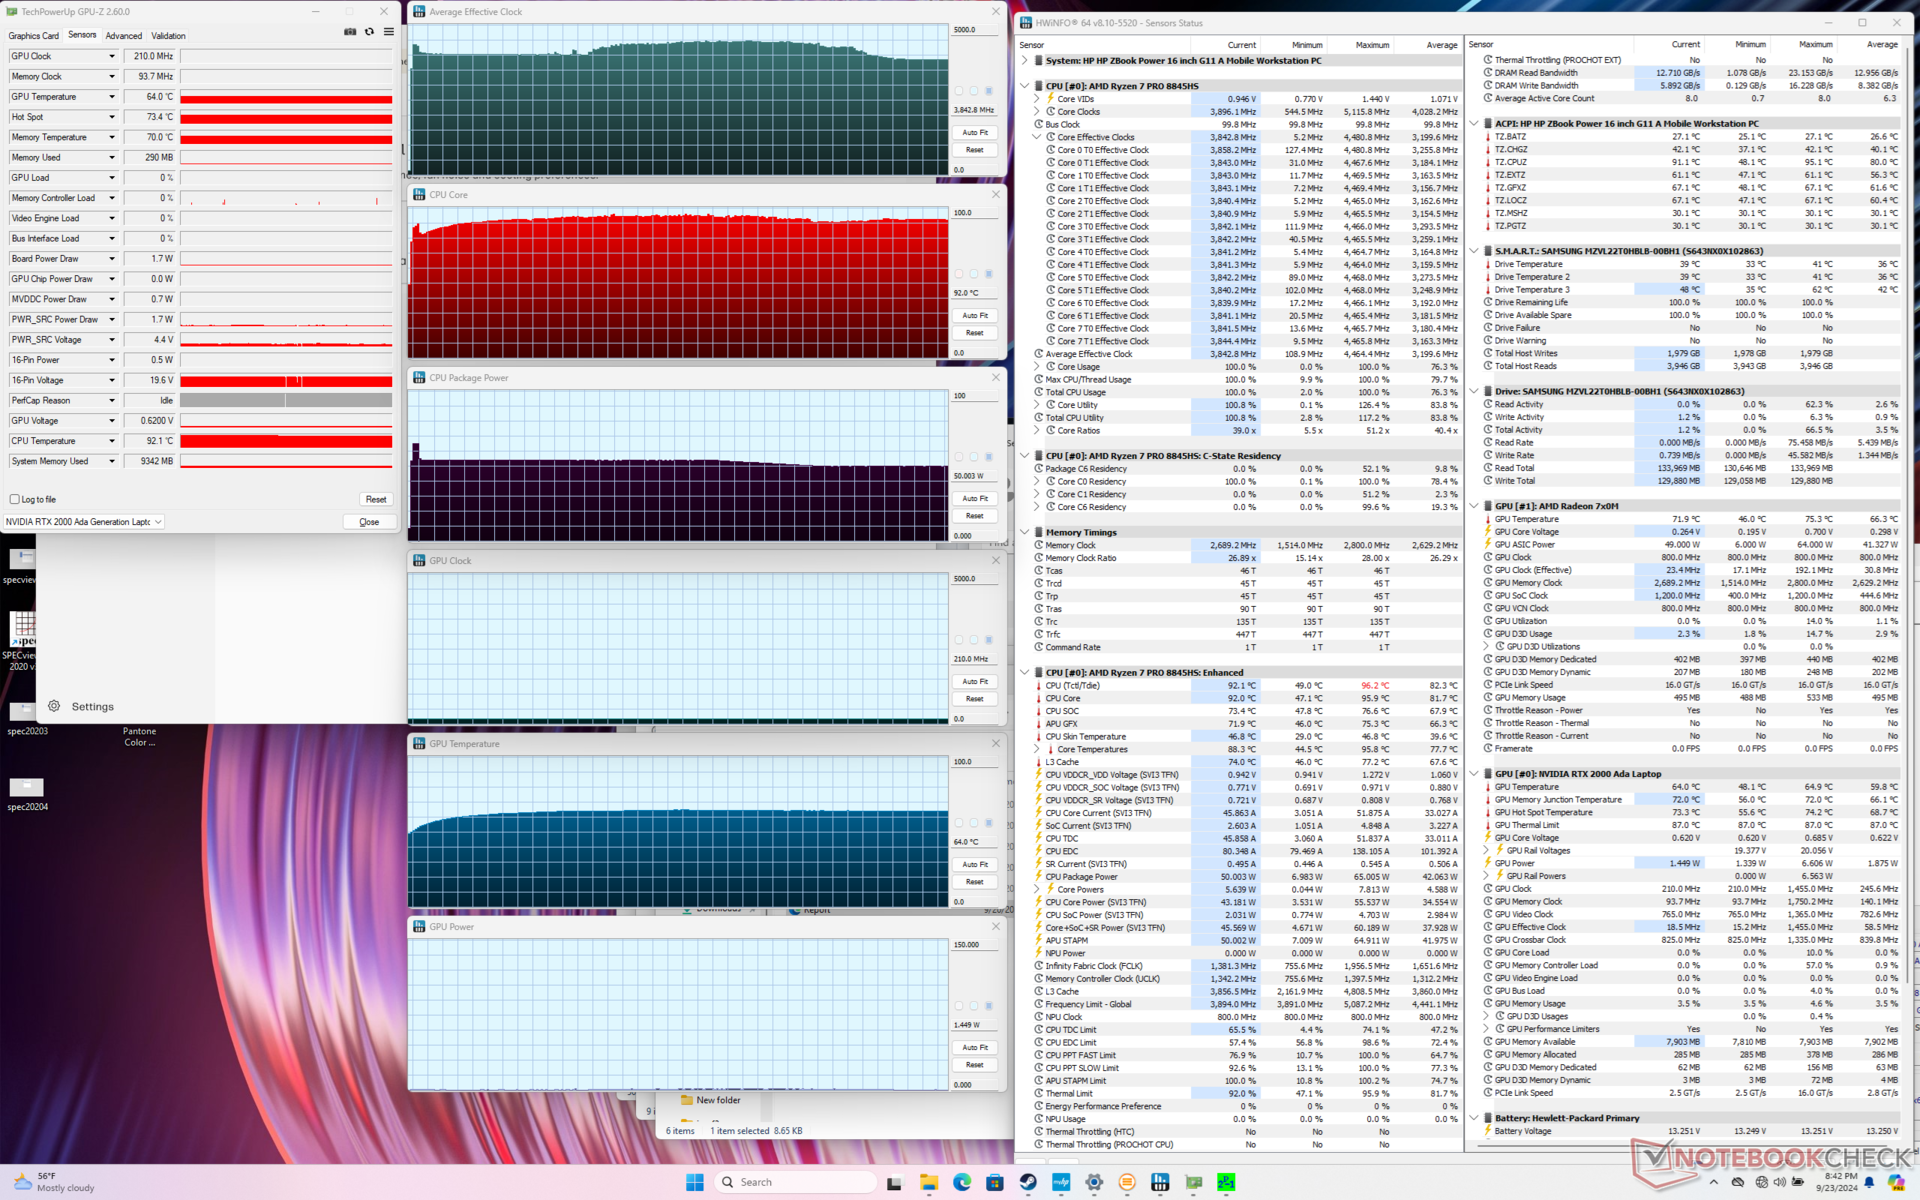
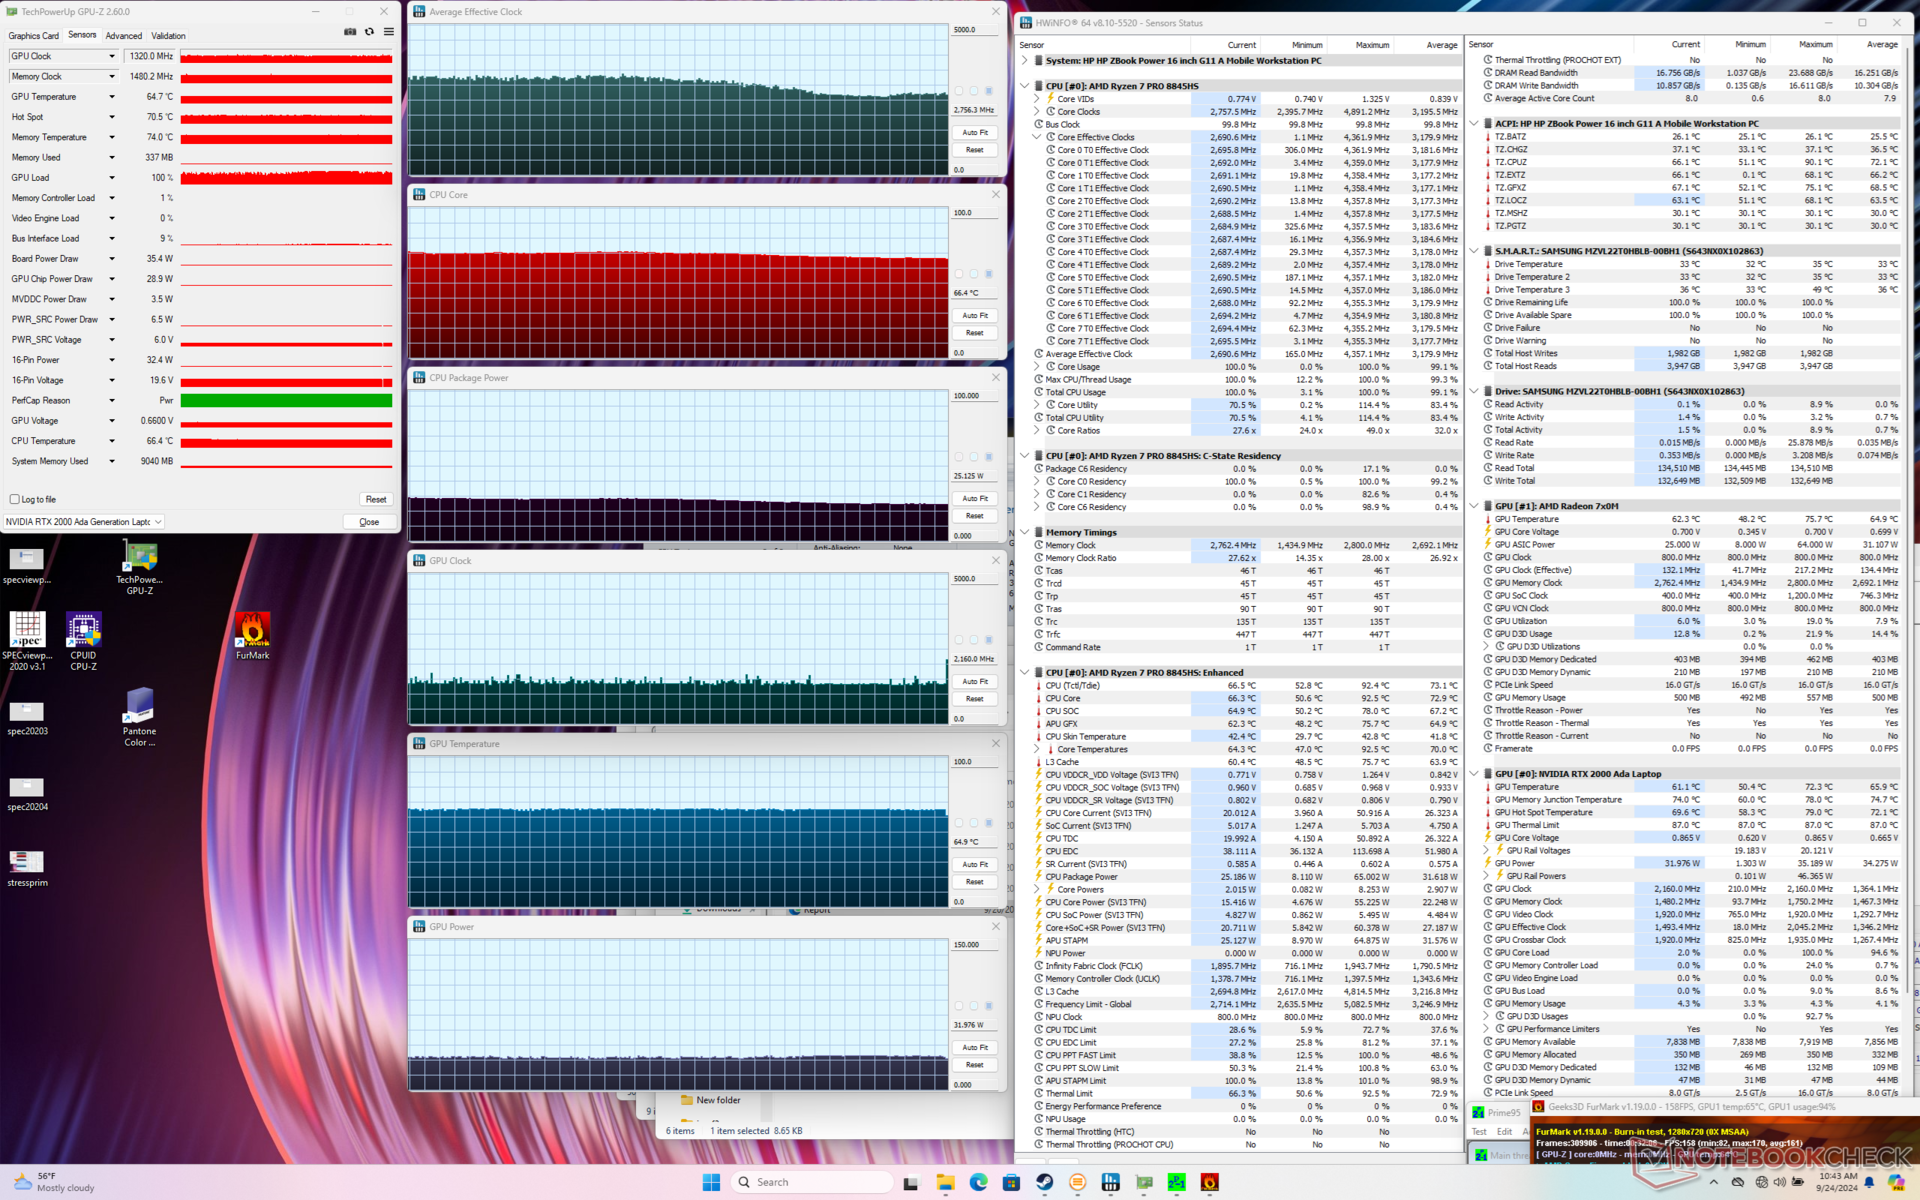
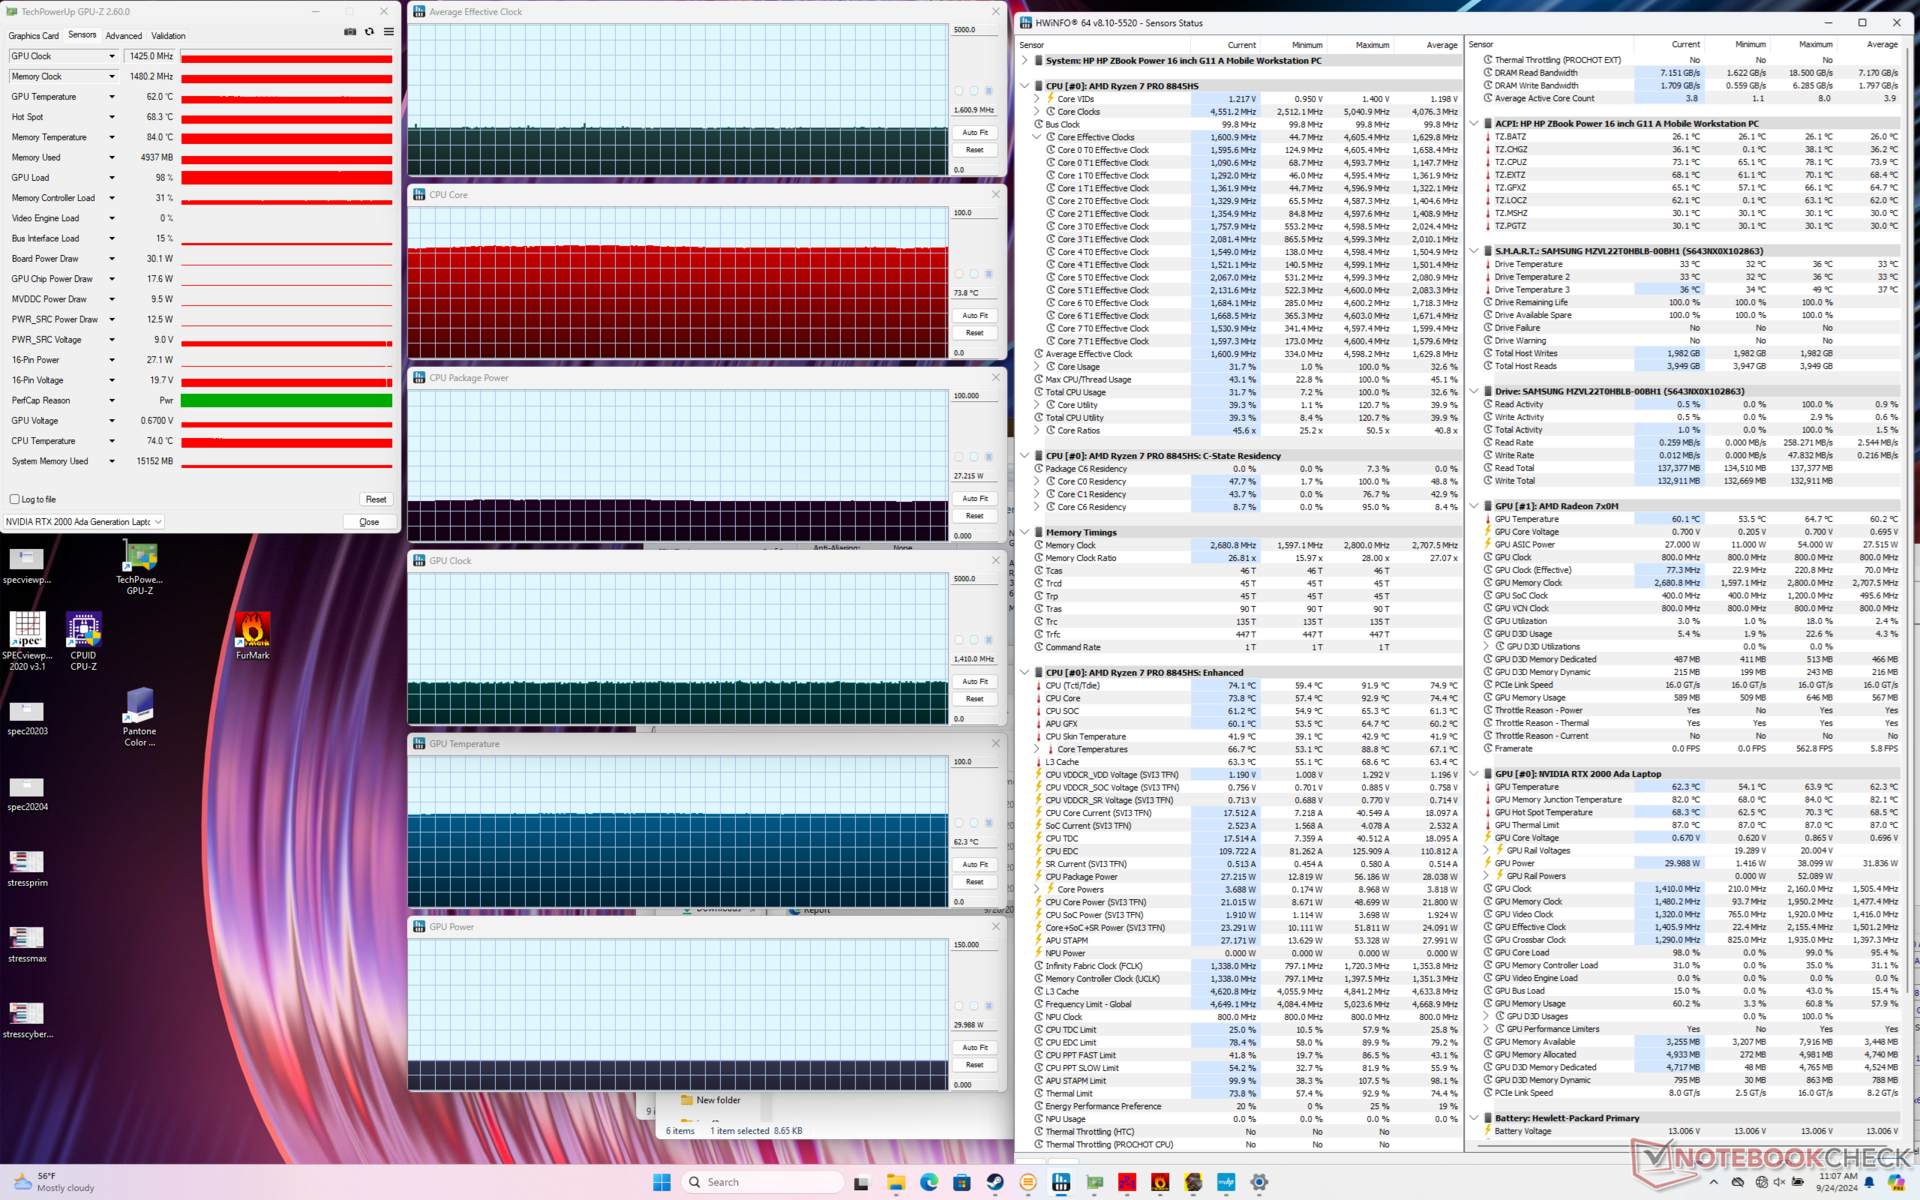
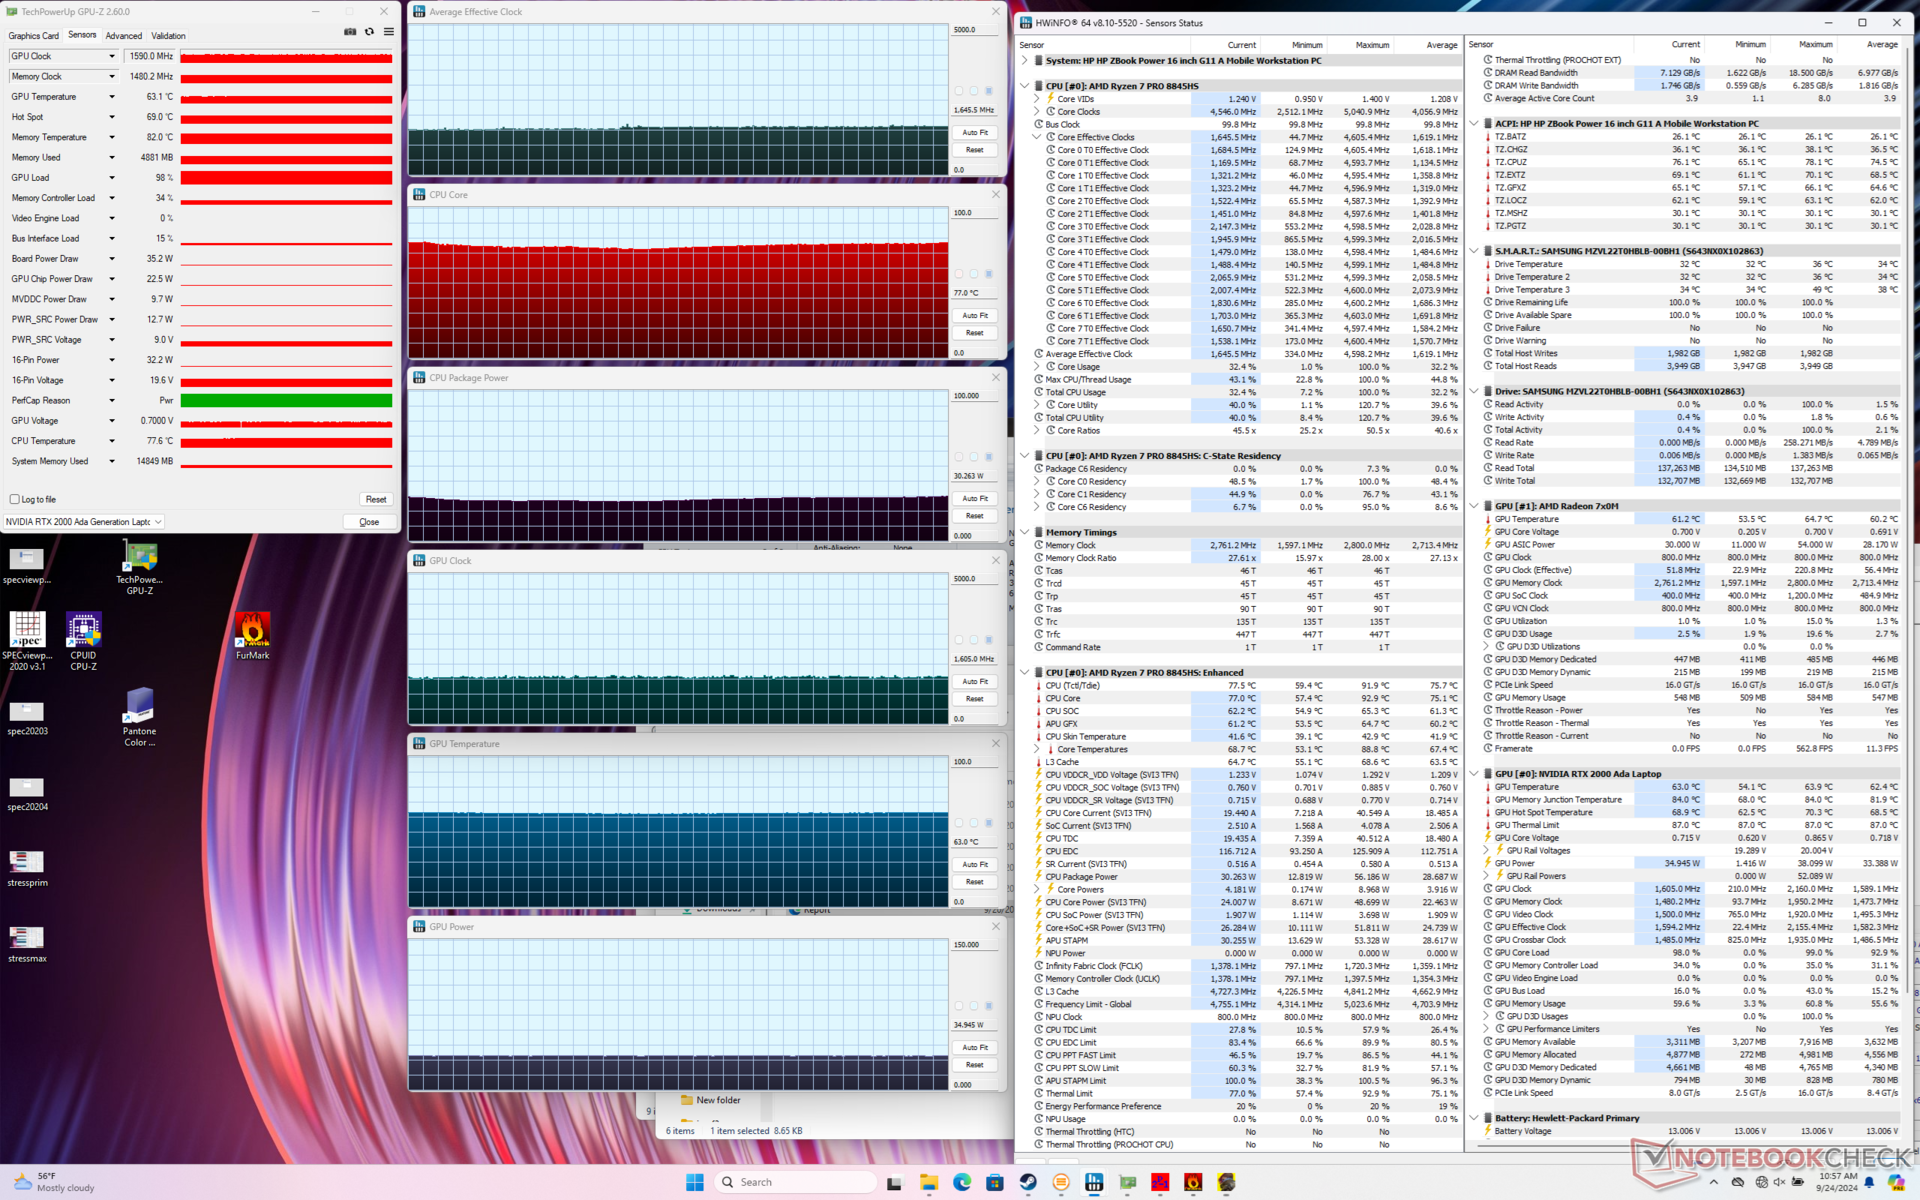
| Average CPU Clock (GHz) | GPU Clock (MHz) | Average CPU Temperature (°C) | Average GPU Temperature (°C) | |
| System Idle | -- | -- | 47 | 49 |
| Prime95 Stress | 3.9 | -- | 92 | 64 |
| Prime95 + FurMark Stress | 2.8 | 1320 | 66 | 65 |
| Cyberpunk 2077 Stress (Balanced mode) | 1.6 | 1425 | 74 | 62 |
| Cyberpunk 2077 Stress (Performance mode) | 1.7 | 1590 | 77 | 63 |
System Performance
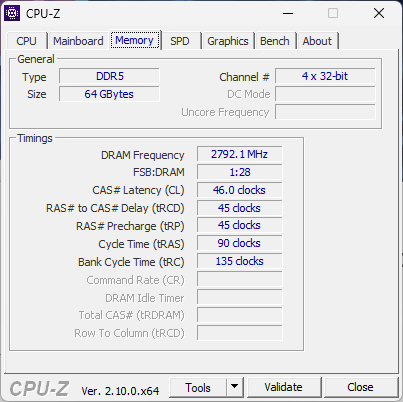
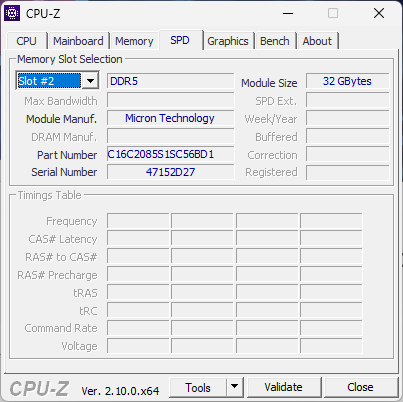
PCMark results are nearly identical to what we recorded on last year's ZBook Power 15 G10. This means that traditional day-to-day loads like browsing or editing aren't noticeably faster on our newer model. RAM performance has not improved as well.
We experienced a wake-from-sleep issue where a hard shutdown was required to return to Windows. We weren't able to reliably replicate the problem, but the fact that it happened at all on a mobile workstation is noteworthy nonetheless.

CrossMark: Overall | Productivity | Creativity | Responsiveness
WebXPRT 3: Overall
WebXPRT 4: Overall
Mozilla Kraken 1.1: Total
| PCMark 10 / Score | |
| Dell Precision 5690 | |
| HP ZBook Fury 16 G11 | |
| HP ZBook Power 15 G10 | |
| HP ZBook Power 16 G11 A | |
| Average AMD Ryzen 7 8845HS, NVIDIA RTX 2000 Ada Generation Laptop (n=1) | |
| Lenovo ThinkPad P1 Gen 7 21KV001SGE | |
| Lenovo ThinkPad P16s G2 21K9000CGE | |
| PCMark 10 / Essentials | |
| Dell Precision 5690 | |
| HP ZBook Power 15 G10 | |
| HP ZBook Power 16 G11 A | |
| Average AMD Ryzen 7 8845HS, NVIDIA RTX 2000 Ada Generation Laptop (n=1) | |
| Lenovo ThinkPad P1 Gen 7 21KV001SGE | |
| Lenovo ThinkPad P16s G2 21K9000CGE | |
| HP ZBook Fury 16 G11 | |
| PCMark 10 / Productivity | |
| Dell Precision 5690 | |
| HP ZBook Power 15 G10 | |
| HP ZBook Power 16 G11 A | |
| Average AMD Ryzen 7 8845HS, NVIDIA RTX 2000 Ada Generation Laptop (n=1) | |
| HP ZBook Fury 16 G11 | |
| Lenovo ThinkPad P1 Gen 7 21KV001SGE | |
| Lenovo ThinkPad P16s G2 21K9000CGE | |
| PCMark 10 / Digital Content Creation | |
| HP ZBook Fury 16 G11 | |
| Dell Precision 5690 | |
| Lenovo ThinkPad P1 Gen 7 21KV001SGE | |
| HP ZBook Power 15 G10 | |
| HP ZBook Power 16 G11 A | |
| Average AMD Ryzen 7 8845HS, NVIDIA RTX 2000 Ada Generation Laptop (n=1) | |
| Lenovo ThinkPad P16s G2 21K9000CGE | |
| CrossMark / Overall | |
| HP ZBook Fury 16 G11 | |
| Dell Precision 5690 | |
| HP ZBook Power 16 G11 A | |
| Average AMD Ryzen 7 8845HS, NVIDIA RTX 2000 Ada Generation Laptop (n=1) | |
| Lenovo ThinkPad P1 Gen 7 21KV001SGE | |
| HP ZBook Power 15 G10 | |
| Lenovo ThinkPad P16s G2 21K9000CGE | |
| CrossMark / Productivity | |
| HP ZBook Fury 16 G11 | |
| Dell Precision 5690 | |
| HP ZBook Power 16 G11 A | |
| Average AMD Ryzen 7 8845HS, NVIDIA RTX 2000 Ada Generation Laptop (n=1) | |
| Lenovo ThinkPad P1 Gen 7 21KV001SGE | |
| HP ZBook Power 15 G10 | |
| Lenovo ThinkPad P16s G2 21K9000CGE | |
| CrossMark / Creativity | |
| HP ZBook Fury 16 G11 | |
| HP ZBook Power 16 G11 A | |
| Average AMD Ryzen 7 8845HS, NVIDIA RTX 2000 Ada Generation Laptop (n=1) | |
| Dell Precision 5690 | |
| Lenovo ThinkPad P1 Gen 7 21KV001SGE | |
| HP ZBook Power 15 G10 | |
| Lenovo ThinkPad P16s G2 21K9000CGE | |
| CrossMark / Responsiveness | |
| HP ZBook Fury 16 G11 | |
| Dell Precision 5690 | |
| HP ZBook Power 16 G11 A | |
| Average AMD Ryzen 7 8845HS, NVIDIA RTX 2000 Ada Generation Laptop (n=1) | |
| Lenovo ThinkPad P1 Gen 7 21KV001SGE | |
| Lenovo ThinkPad P16s G2 21K9000CGE | |
| HP ZBook Power 15 G10 | |
| WebXPRT 3 / Overall | |
| HP ZBook Fury 16 G11 | |
| HP ZBook Power 15 G10 | |
| HP ZBook Power 16 G11 A | |
| Average AMD Ryzen 7 8845HS, NVIDIA RTX 2000 Ada Generation Laptop (n=1) | |
| Dell Precision 5690 | |
| Lenovo ThinkPad P1 Gen 7 21KV001SGE | |
| Lenovo ThinkPad P16s G2 21K9000CGE | |
| WebXPRT 4 / Overall | |
| HP ZBook Fury 16 G11 | |
| Dell Precision 5690 | |
| Lenovo ThinkPad P1 Gen 7 21KV001SGE | |
| HP ZBook Power 16 G11 A | |
| Average AMD Ryzen 7 8845HS, NVIDIA RTX 2000 Ada Generation Laptop (n=1) | |
| HP ZBook Power 15 G10 | |
| Mozilla Kraken 1.1 / Total | |
| Lenovo ThinkPad P16s G2 21K9000CGE | |
| HP ZBook Power 15 G10 | |
| HP ZBook Power 16 G11 A | |
| Average AMD Ryzen 7 8845HS, NVIDIA RTX 2000 Ada Generation Laptop (n=1) | |
| Lenovo ThinkPad P1 Gen 7 21KV001SGE | |
| Dell Precision 5690 | |
| HP ZBook Fury 16 G11 | |
* ... smaller is better
| PCMark 10 Score | 7376 points | |
Help | ||
| AIDA64 / Memory Copy | |
| Dell Precision 5690 | |
| HP ZBook Power 15 G10 | |
| Average AMD Ryzen 7 8845HS (61459 - 71873, n=13) | |
| Lenovo ThinkPad P16s G2 21K9000CGE | |
| Lenovo ThinkPad P1 Gen 7 21KV001SGE | |
| HP ZBook Power 16 G11 A | |
| HP ZBook Fury 16 G11 | |
| AIDA64 / Memory Read | |
| Dell Precision 5690 | |
| Lenovo ThinkPad P1 Gen 7 21KV001SGE | |
| HP ZBook Power 15 G10 | |
| HP ZBook Power 16 G11 A | |
| HP ZBook Fury 16 G11 | |
| Average AMD Ryzen 7 8845HS (49866 - 61976, n=13) | |
| Lenovo ThinkPad P16s G2 21K9000CGE | |
| AIDA64 / Memory Write | |
| Lenovo ThinkPad P16s G2 21K9000CGE | |
| Average AMD Ryzen 7 8845HS (68425 - 93239, n=13) | |
| HP ZBook Power 15 G10 | |
| HP ZBook Power 16 G11 A | |
| Dell Precision 5690 | |
| Lenovo ThinkPad P1 Gen 7 21KV001SGE | |
| HP ZBook Fury 16 G11 | |
| AIDA64 / Memory Latency | |
| Dell Precision 5690 | |
| Lenovo ThinkPad P1 Gen 7 21KV001SGE | |
| Lenovo ThinkPad P16s G2 21K9000CGE | |
| HP ZBook Power 15 G10 | |
| HP ZBook Power 16 G11 A | |
| Average AMD Ryzen 7 8845HS (82.5 - 117, n=13) | |
| HP ZBook Fury 16 G11 | |
* ... smaller is better
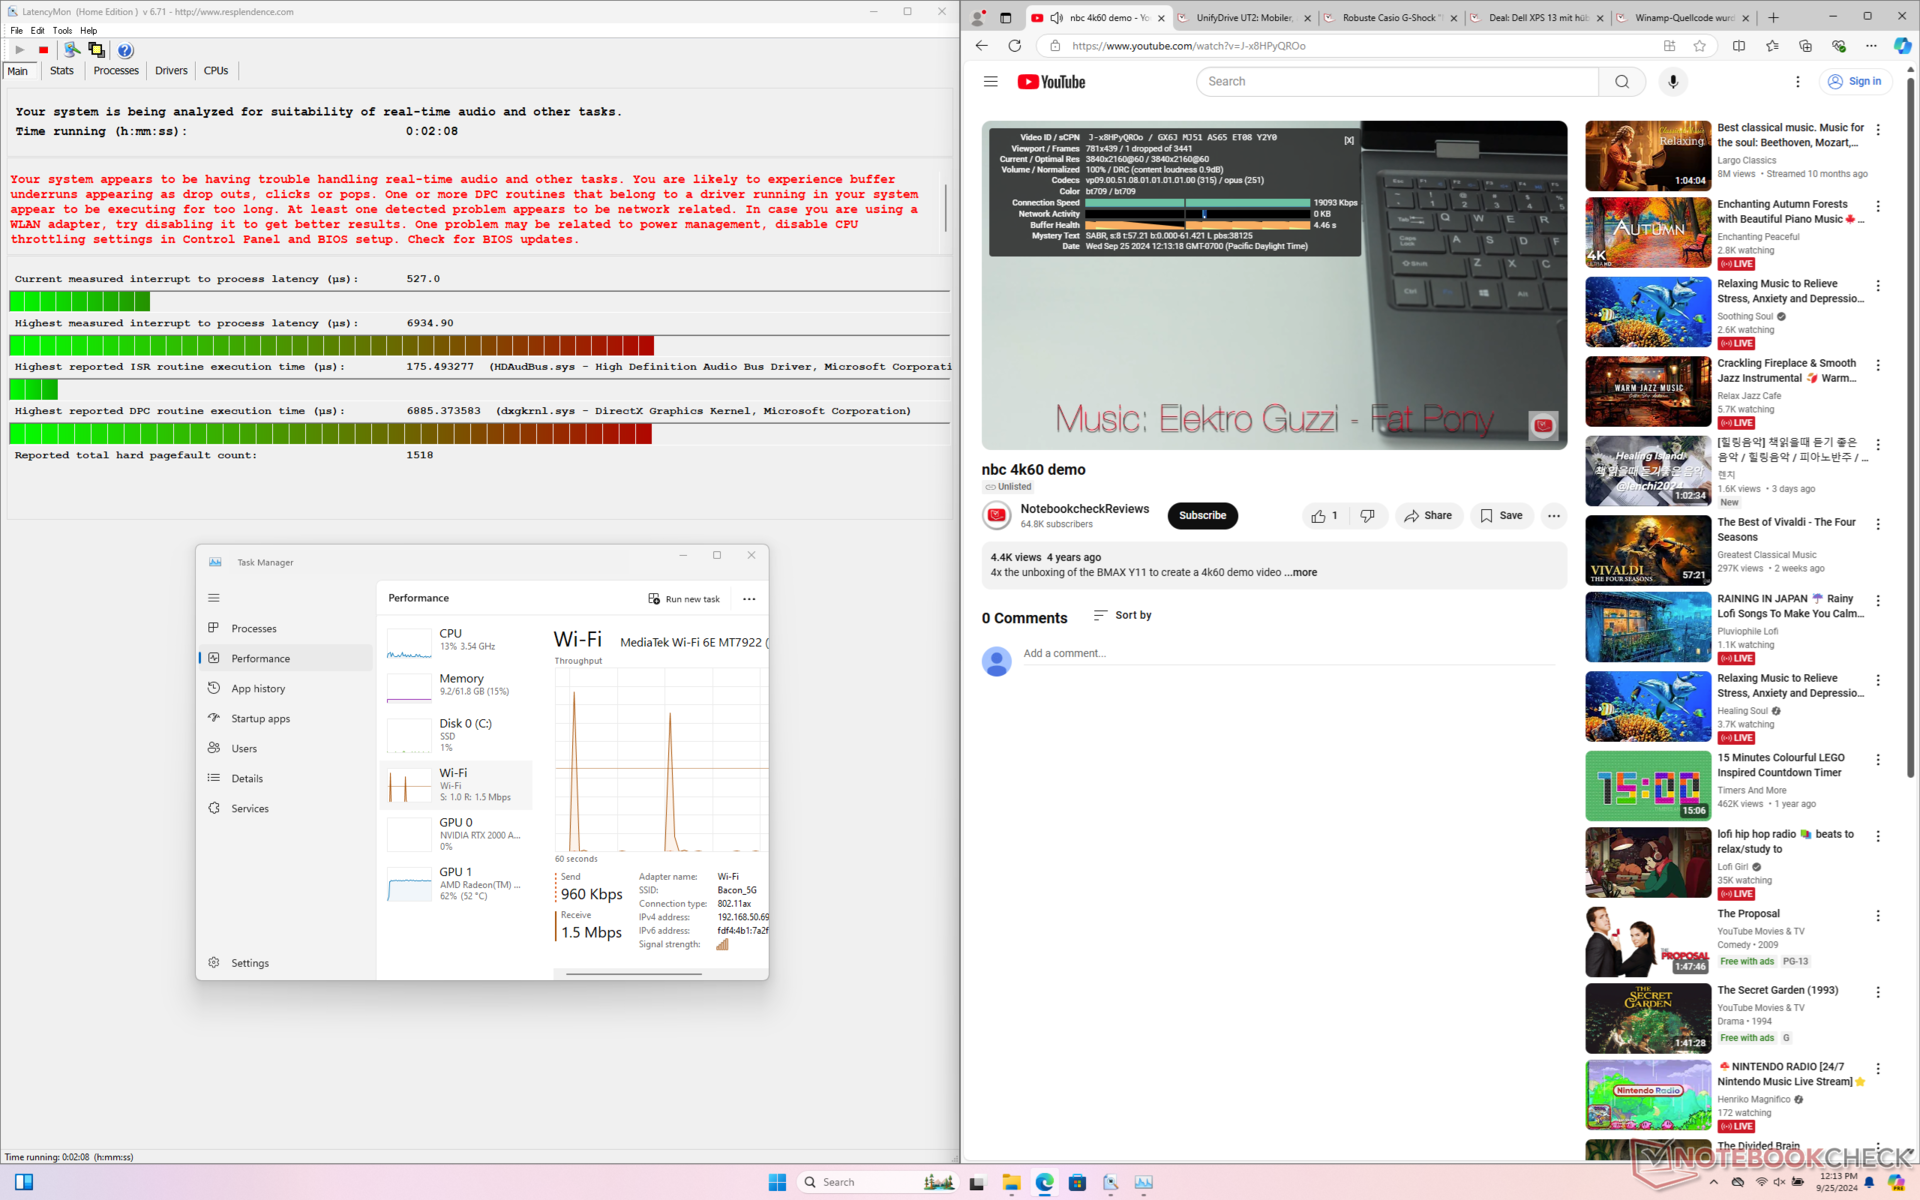
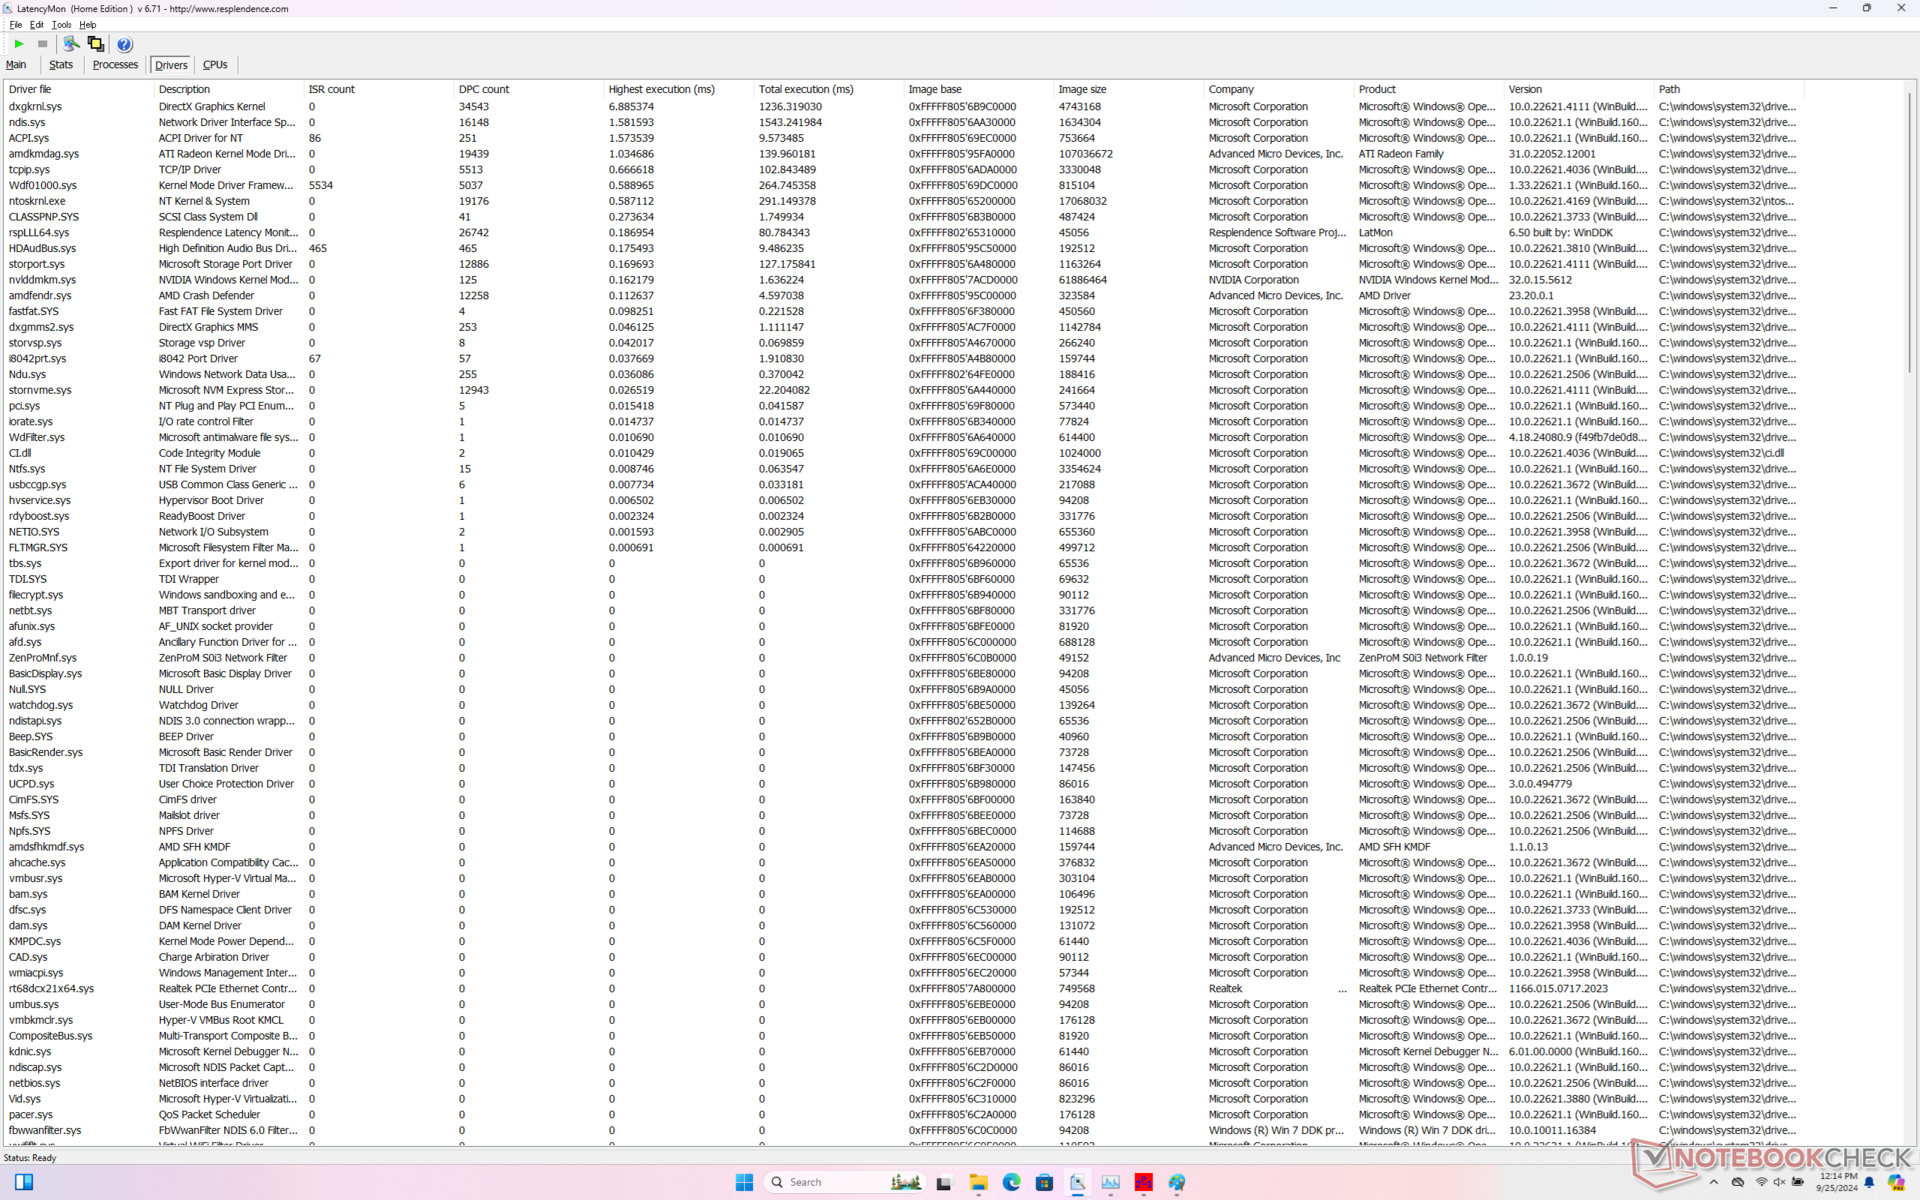
DPC Latency
LatencyMon reveals DPC issues related to HDAudBus.sys even after multiple retests. 4K video playback at 60 FPS is otherwise excellent with just a single dropped frame recorded during a 60-second window.
| DPC Latencies / LatencyMon - interrupt to process latency (max), Web, Youtube, Prime95 | |
| HP ZBook Fury 16 G11 | |
| HP ZBook Power 16 G11 A | |
| HP ZBook Power 15 G10 | |
| Lenovo ThinkPad P1 Gen 7 21KV001SGE | |
| Lenovo ThinkPad P16s G2 21K9000CGE | |
| Dell Precision 5690 | |
* ... smaller is better
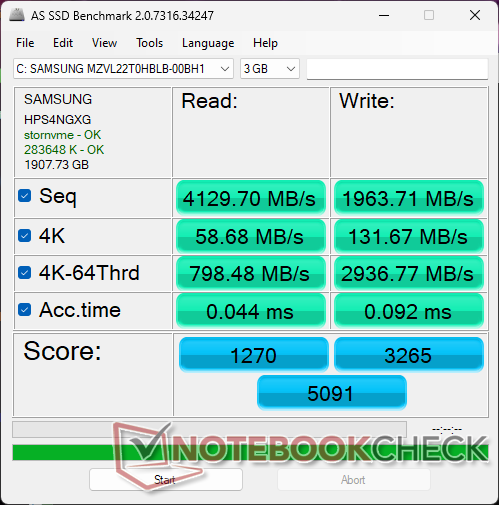
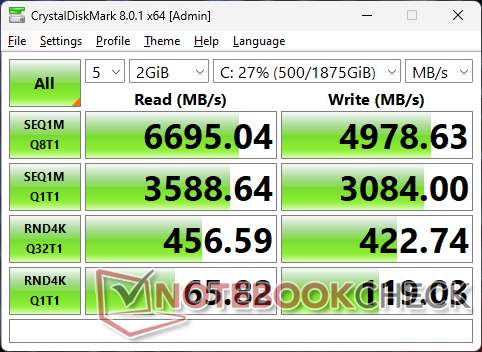
Storage Devices
Our test unit ships with a 2 TB Samsung PM9A1 PCIe4 x4 NVMe SSD for sequential read rates as high as 6700 MB/s. Unfortunately, the drive would quickly throttle down to the low 2000 MB/s range after just a few minutes of stress as shown by our DiskSpd loop test results below. We repeated the test and results would not improve. This is disappointing as the WD drive in the older ZBook Power 15 G10 would not exhibit any throttling issues. A heat spreader would have likely improved performance.

| Drive Performance rating - Percent | |
| HP ZBook Fury 16 G11 | |
| Dell Precision 5690 | |
| Lenovo ThinkPad P16s G2 21K9000CGE | |
| HP ZBook Power 15 G10 | |
| HP ZBook Power 16 G11 A | |
| Lenovo ThinkPad P1 Gen 7 21KV001SGE | |
* ... smaller is better
Disk Throttling: DiskSpd Read Loop, Queue Depth 8
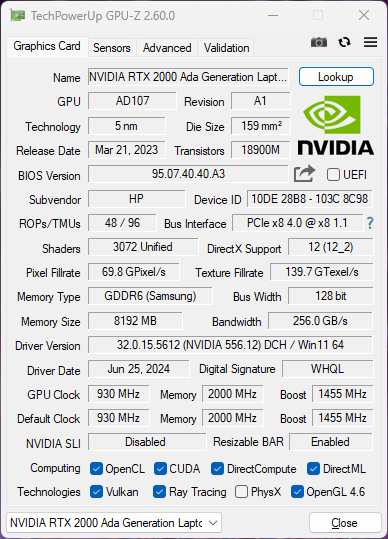
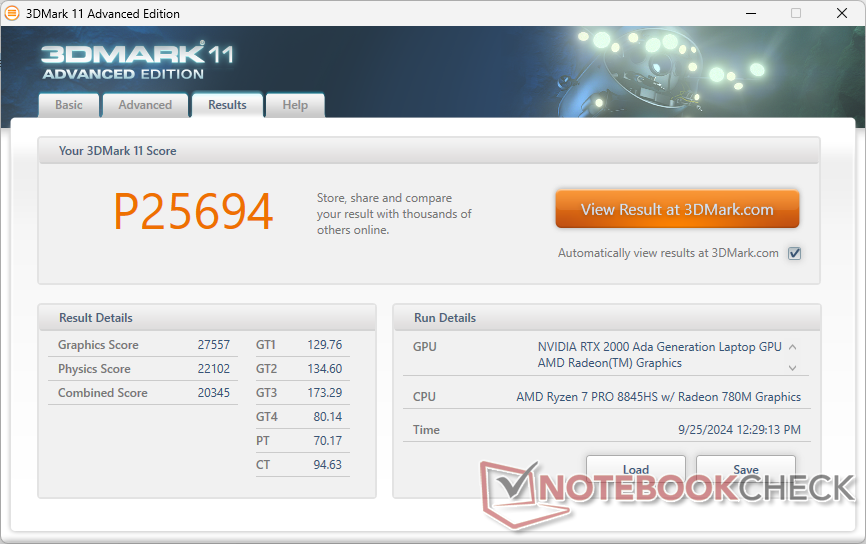
GPU Performance
Discrete GPU options remain identical to the 15-inch ZBook Power 15 G10 as Nvidia has not launched a successor yet to the mobile Ada Lovelace series. Additionally, the cooling solution has not vastly improved during the switch to a 16-inch form factor meaning that the ZBook Power 16 G11 is still limited to the same 50 W TGP ceiling and RTX 1000 Ada, RTX 2000 Ada, and RTX 3000 Ada graphics options as before. Users will have to consider the thicker ZBook Fury 16 series for higher-end RTX Ada options.
Upgrading to the RTX 3000 Ada brings marginal performance boosts at best based on our experience with the Dell Precision 5490.
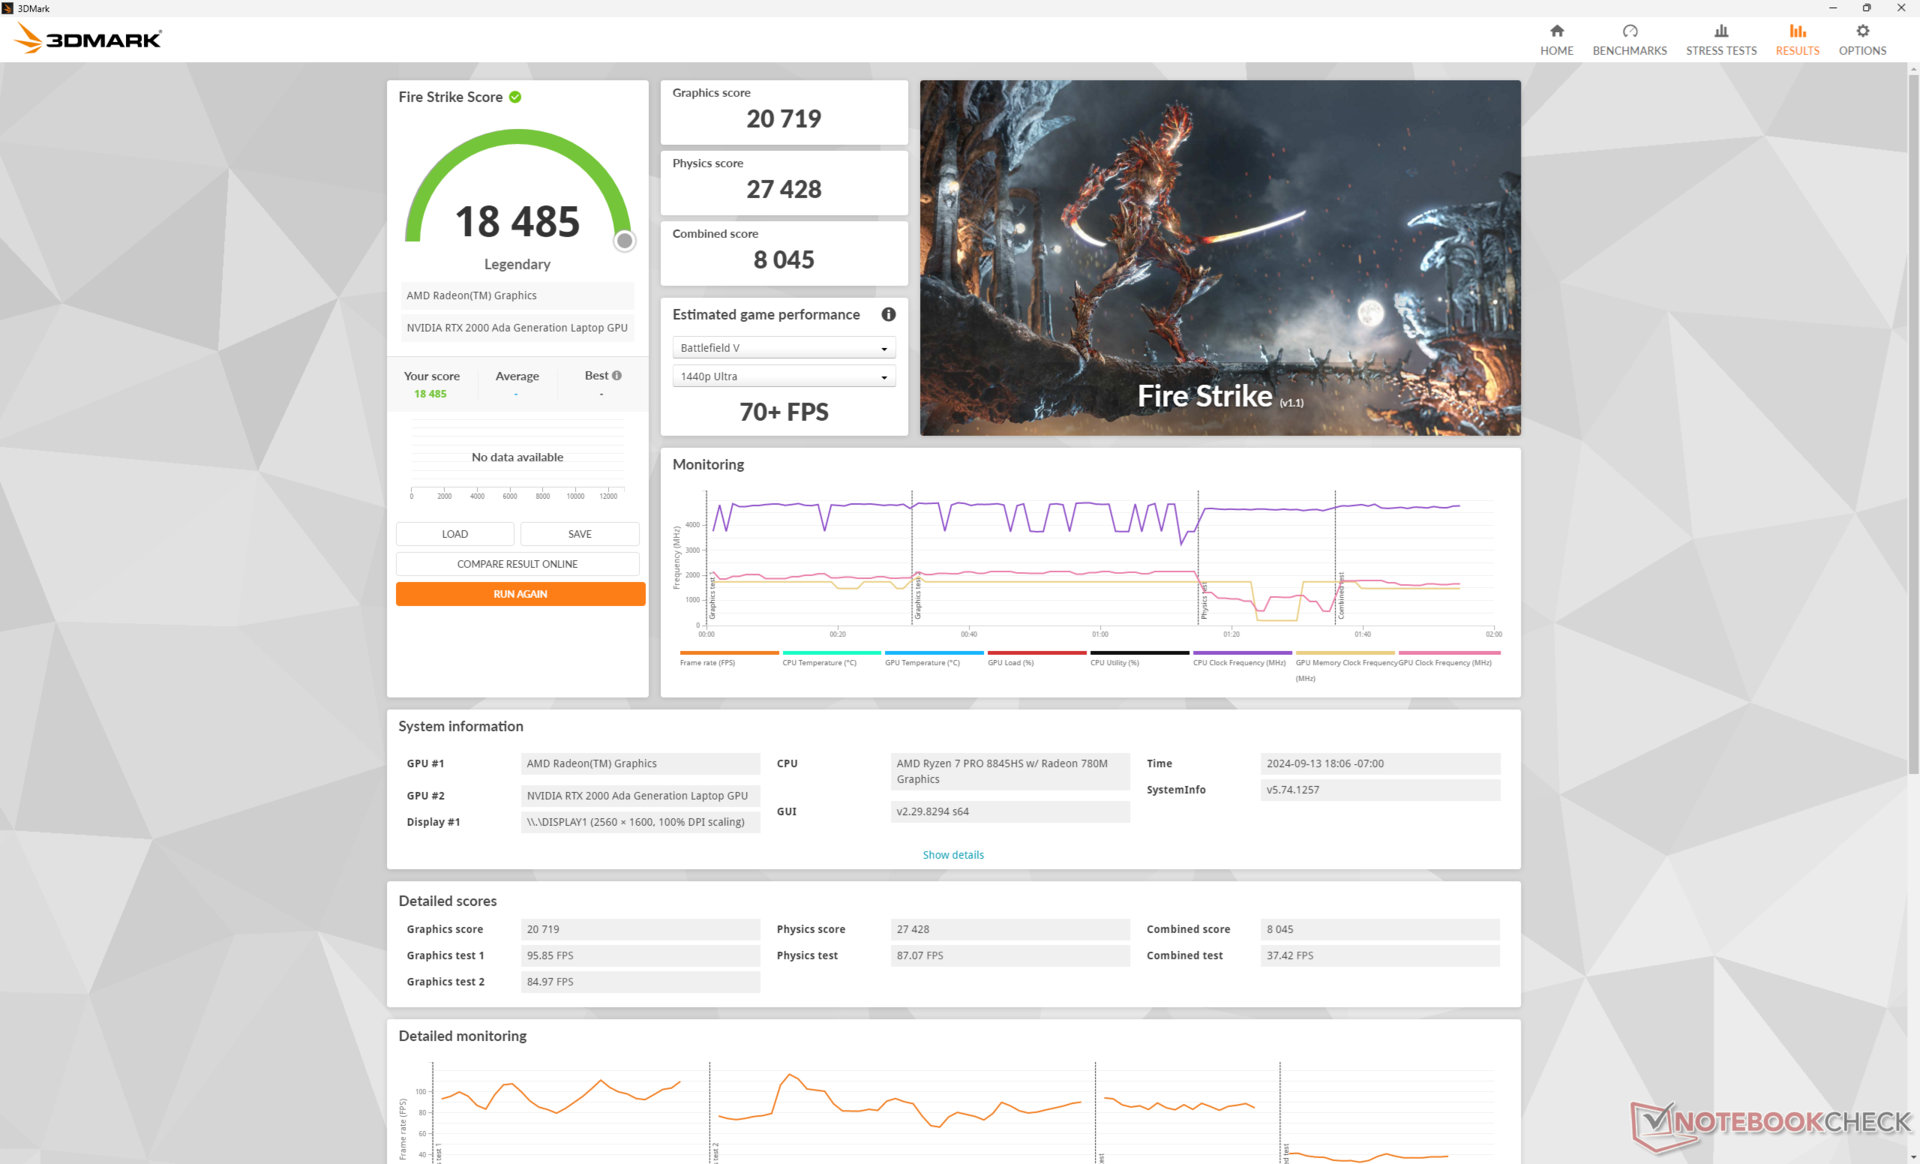
| Power Profile | Graphics Score | Physics Score | Combined Score |
| Performance mode | 20719 | 27428 | 8045 |
| Balanced mode | 19961 (-4%) | 26363 (-4%) | 7633 (-5%) |
| Battery power | 8108 (-61%) | 6149 (-78%) | 1727 (-79%) |
Running on Balanced mode instead of Performance mode impact performance slightly as shown by our Fire Strike results table above. However, both CPU and GPU performance are significantly reduced if running on batteries.
| 3DMark Performance rating - Percent | |
| Dell Precision 5690 -3! | |
| HP ZBook Fury 16 G11 | |
| HP ZBook Fury 16 G9 -3! | |
| HP ZBook Power 16 G11 A | |
| Average NVIDIA RTX 2000 Ada Generation Laptop | |
| Dell Precision 5000 5490 -3! | |
| MSI CreatorPro Z16P B12UKST -19! | |
| HP ZBook Power 15 G10 -11! | |
| Asus ExpertBook B6 Flip B6602FC2 -19! | |
| Lenovo ThinkPad P16v G1 AMD -18! | |
| Lenovo ThinkPad P1 G4-20Y4Z9DVUS -19! | |
| Lenovo ThinkPad P16s G2 21K9000CGE -19! | |
| HP ZBook Firefly 16 G9-6B897EA -19! | |
| 3DMark 11 Performance | 25694 points | |
| 3DMark Cloud Gate Standard Score | 51846 points | |
| 3DMark Fire Strike Score | 18485 points | |
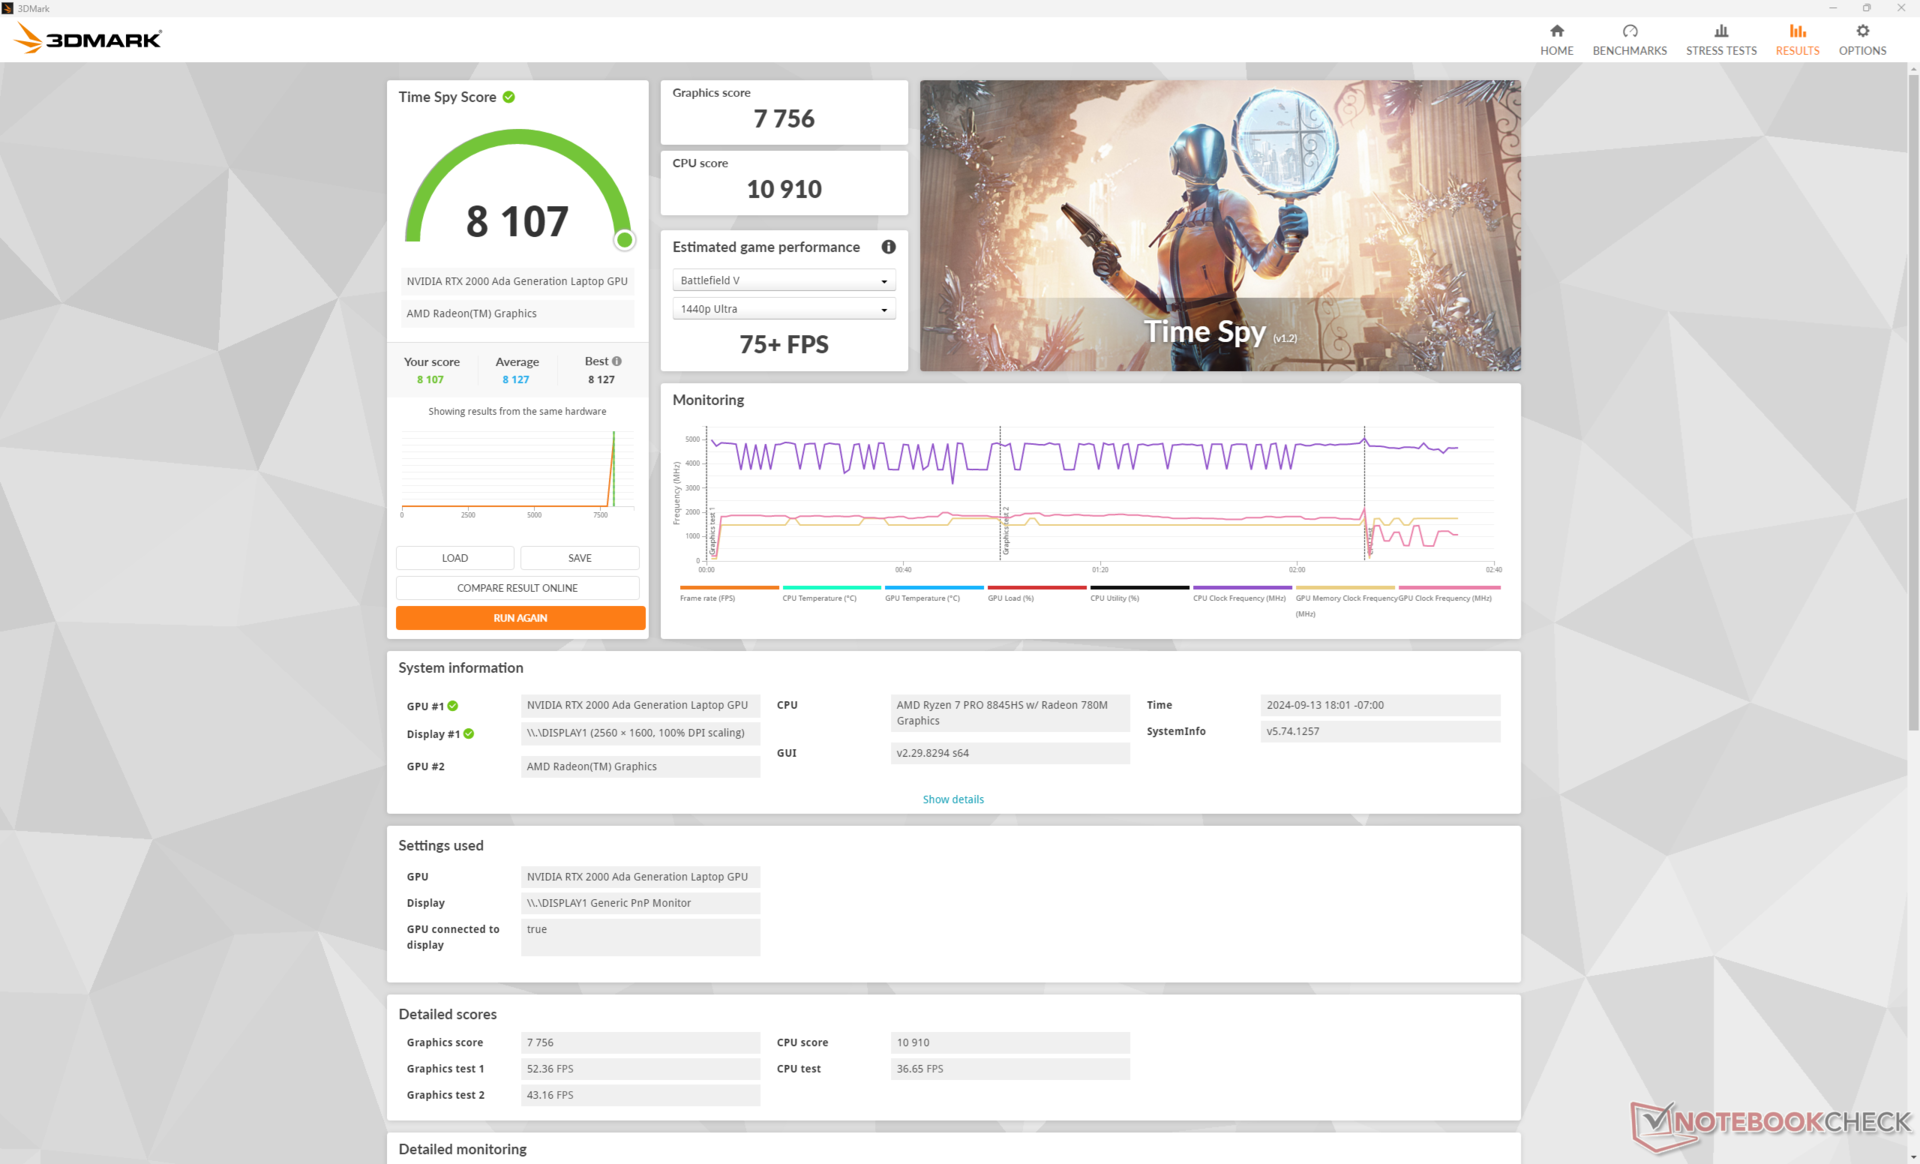
| 3DMark Time Spy Score | 8107 points | |
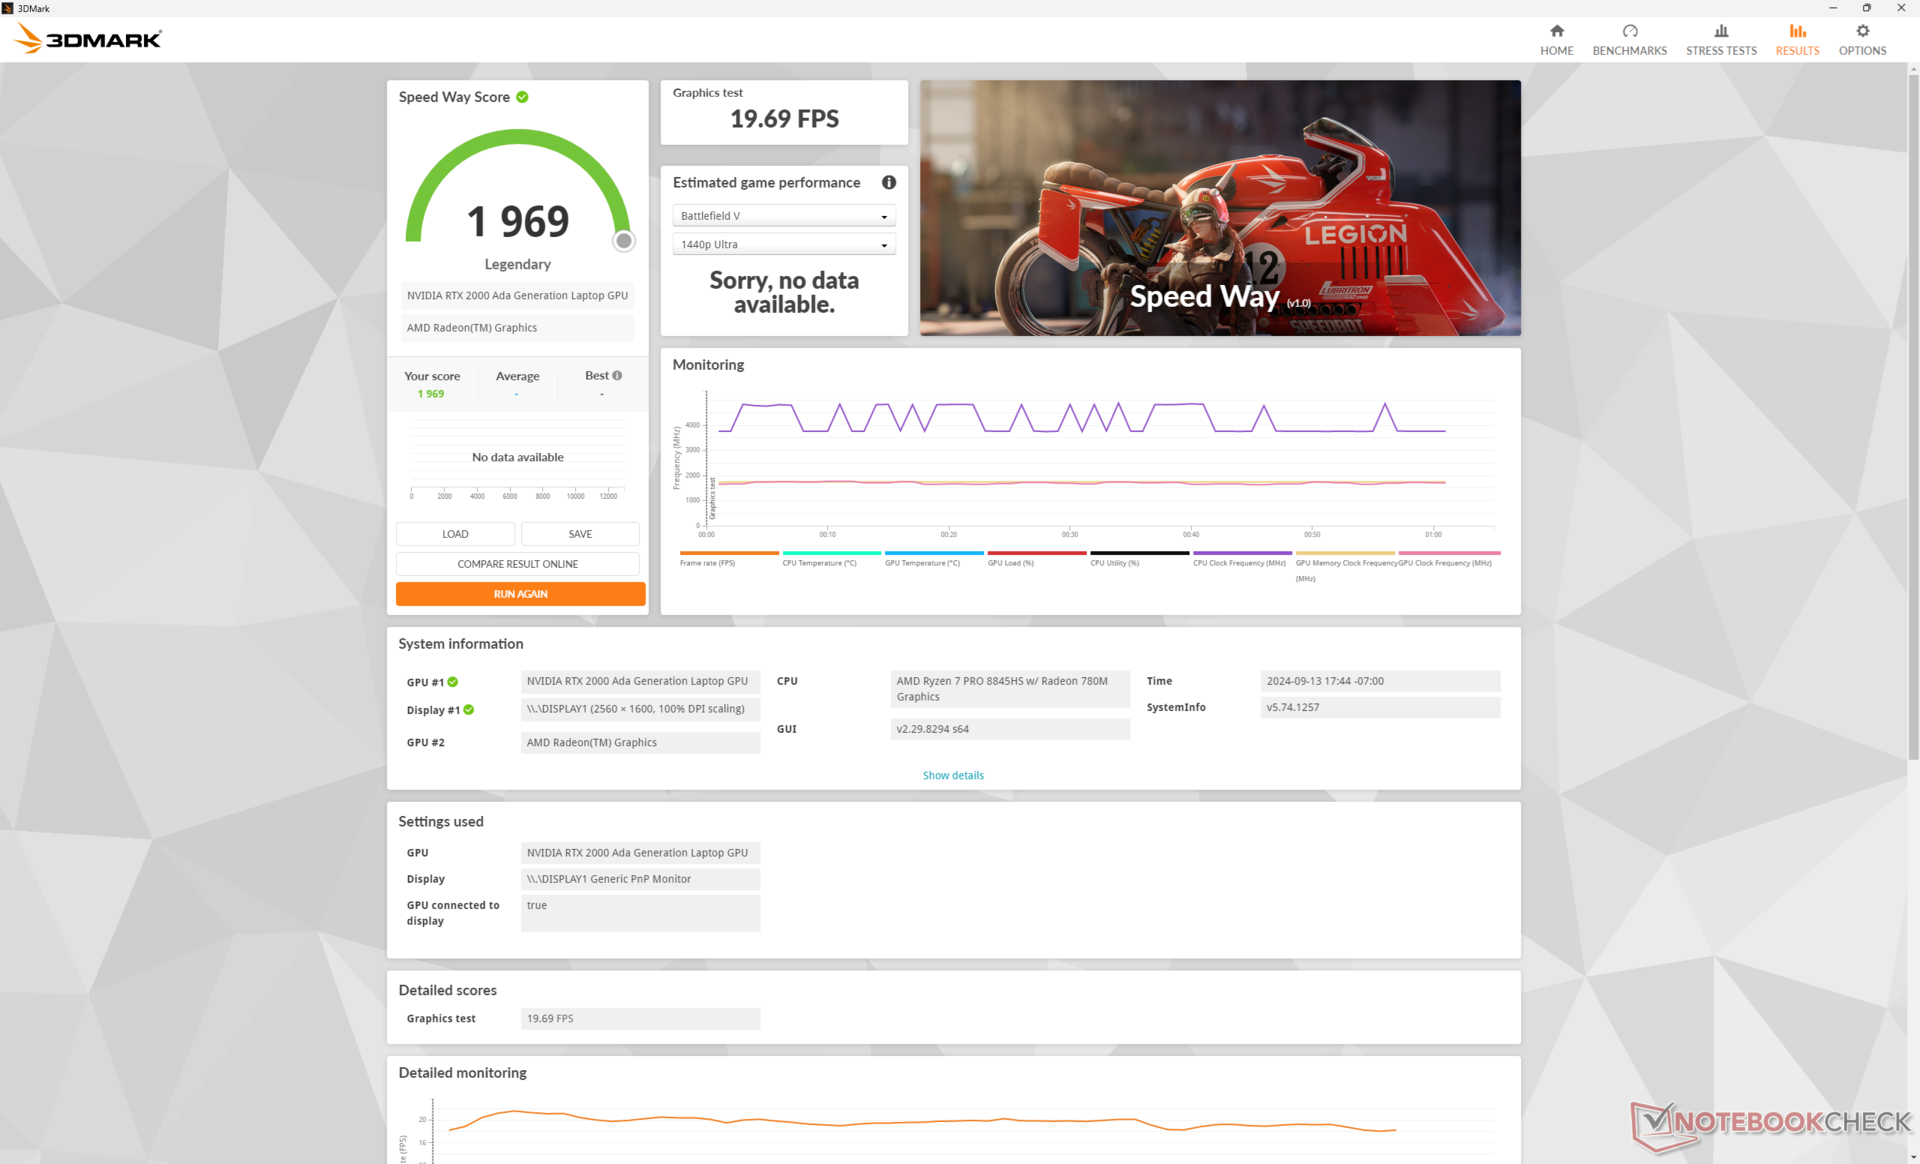
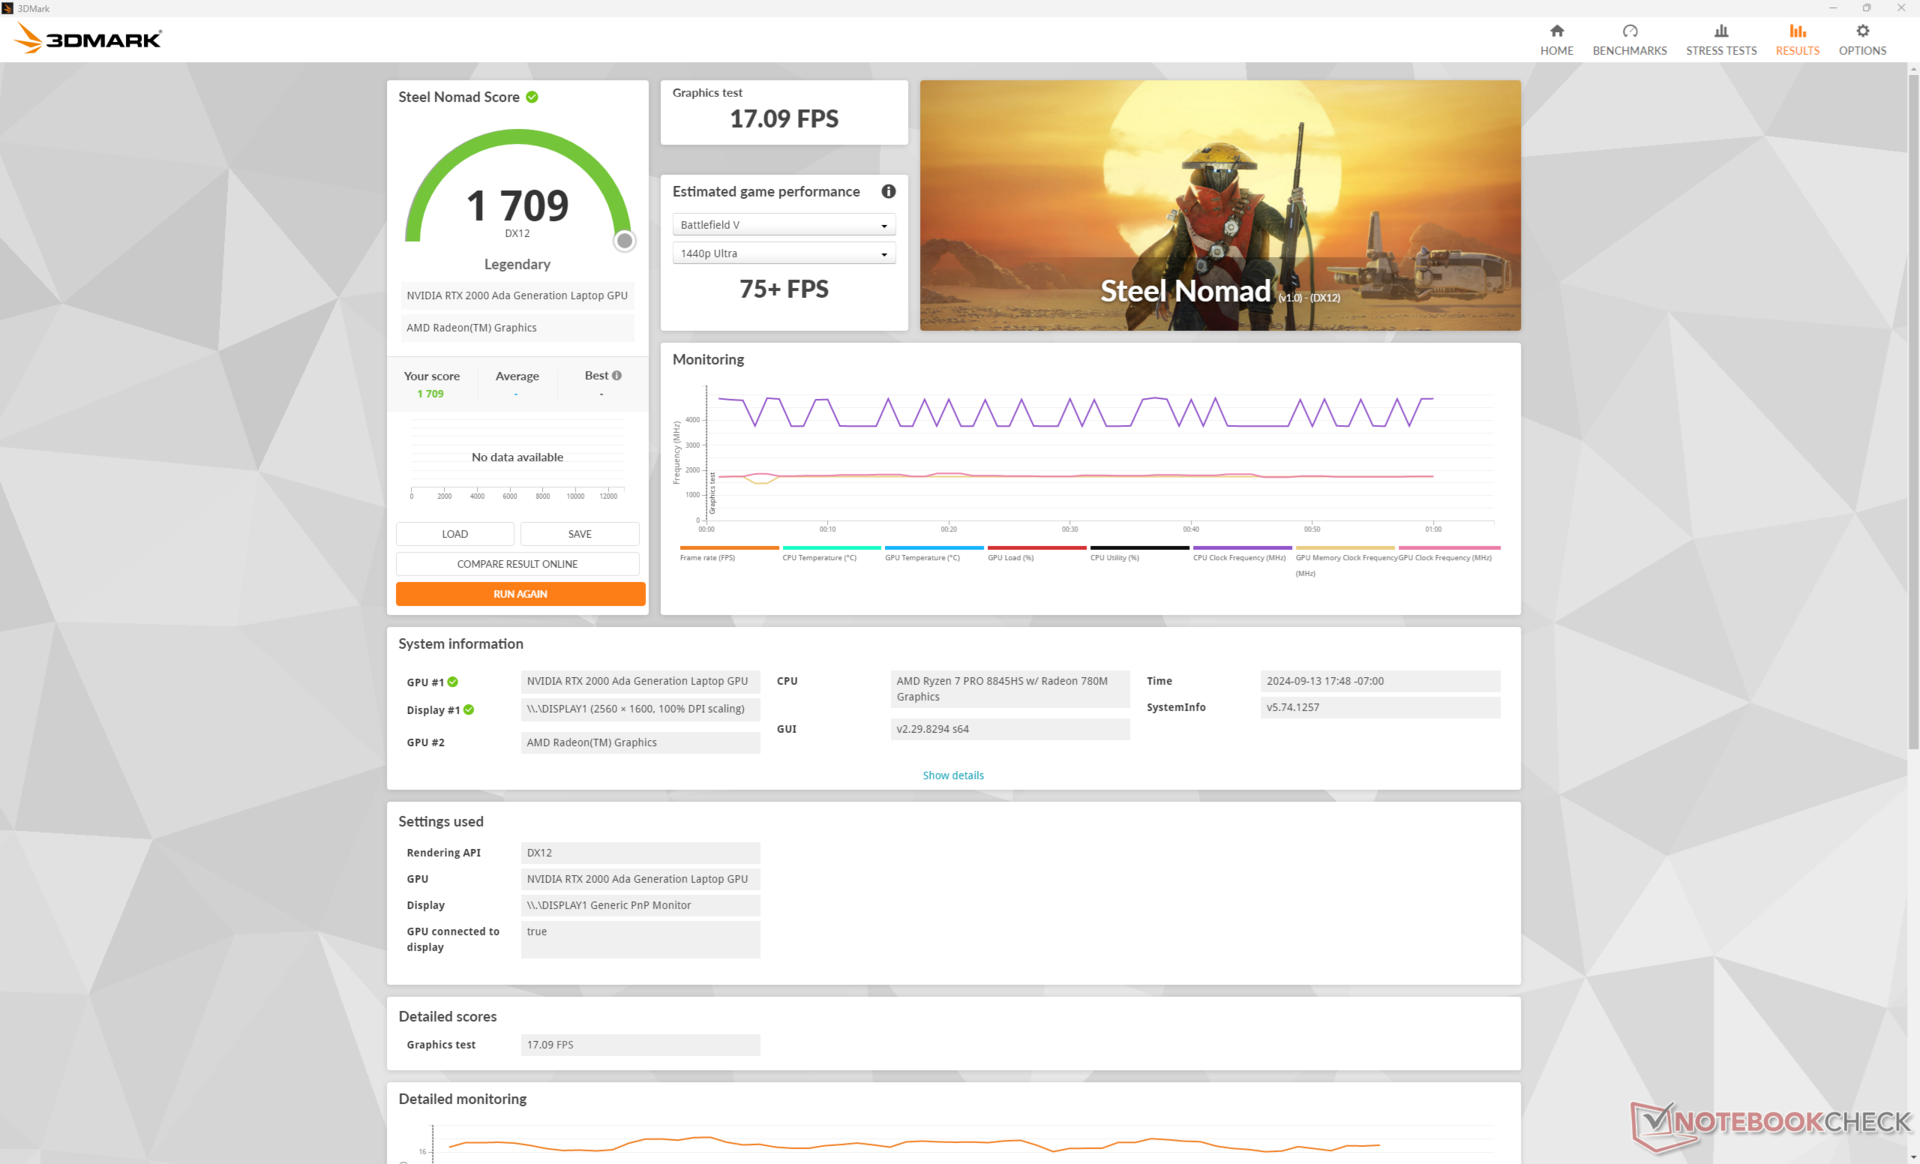
| 3DMark Steel Nomad Score | 1709 points | |
Help | ||
* ... smaller is better
Gaming Performance
Though not optimized for gaming, the RTX 2000 Ada is most similar to laptops running on the GeForce RTX 3060 or RTX 4060.
| Baldur's Gate 3 | |
| 1920x1080 High Preset AA:T | |
| Dell Precision 5690 | |
| HP ZBook Fury 16 G11 | |
| Dell Precision 5000 5490 | |
| HP ZBook Power 16 G11 A | |
| Average NVIDIA RTX 2000 Ada Generation Laptop (n=1) | |
| 1920x1080 Ultra Preset AA:T | |
| Dell Precision 5690 | |
| HP ZBook Fury 16 G11 | |
| Dell Precision 5000 5490 | |
| HP ZBook Power 16 G11 A | |
| Average NVIDIA RTX 2000 Ada Generation Laptop (n=1) | |
| 2560x1440 Ultra Preset AA:T | |
| Dell Precision 5690 | |
| HP ZBook Fury 16 G11 | |
| HP ZBook Power 16 G11 A | |
| Average NVIDIA RTX 2000 Ada Generation Laptop (n=1) | |
Cyberpunk 2077 ultra FPS Chart
| low | med. | high | ultra | QHD | |
|---|---|---|---|---|---|
| GTA V (2015) | 180.6 | 162.7 | 90.3 | 63.4 | |
| Dota 2 Reborn (2015) | 145.2 | 142 | 126.1 | 119.9 | |
| Final Fantasy XV Benchmark (2018) | 166.1 | 89.3 | 66.3 | 49.4 | |
| X-Plane 11.11 (2018) | 83.2 | 72.1 | 60.6 | ||
| Far Cry 5 (2018) | 138 | 111 | 104 | 98 | 67 |
| Strange Brigade (2018) | 329 | 187.8 | 158.1 | 138.5 | 99.5 |
| Tiny Tina's Wonderlands (2022) | 139.1 | 115.1 | 80 | 64.4 | 46.3 |
| F1 22 (2022) | 186.6 | 171.1 | 129.1 | 46.2 | 29.8 |
| Baldur's Gate 3 (2023) | 87.1 | 75.7 | 67.6 | 66.1 | 45.6 |
| Cyberpunk 2077 (2023) | 81.1 | 61.4 | 51.7 | 44.8 | 29.7 |
Emissions
System Noise
Fan noise levels and behavior are similar to what we observed on last year's model. The system remains quiet at just 25.4 dB(A) even after running the first benchmarks scene of 3DMark 06 which is much quieter than competing models like the ThinkPad P16s G2 or Precision 5690 under similar conditions.
Keep in mind that fan noise is noticeably quieter on Balanced mode; running Cyberpunk 2077 on Performance mode can be as loud as 43 dB(A) compared to only 37.5 dB(A) if on Balanced mode.
Noise level
| Idle |
| 23.8 / 24.2 / 24.2 dB(A) |
| Load |
| 25.4 / 45 dB(A) |
 | ||
30 dB silent 40 dB(A) audible 50 dB(A) loud |
||
min: | ||
| HP ZBook Power 16 G11 A RTX 2000 Ada Generation Laptop, R7 8845HS, Samsung PM9A1 MZVL22T0HBLB | HP ZBook Power 15 G10 RTX 2000 Ada Generation Laptop, R7 PRO 7840HS, WDC PC SN810 2TB | HP ZBook Fury 16 G11 RTX 3500 Ada Generation Laptop, i9-14900HX, SK hynix PC801 HFS001TEJ9X101N | Lenovo ThinkPad P1 Gen 7 21KV001SGE GeForce RTX 4060 Laptop GPU, Ultra 7 155H, Kioxia XG8 KXG8AZNV1T02 | Lenovo ThinkPad P16s G2 21K9000CGE Radeon 780M, R7 PRO 7840U, SK hynix PC801 HFS001TEJ9X162N | Dell Precision 5690 RTX 5000 Ada Generation Laptop, Ultra 9 185H, 2x Samsung PM9A1 1TB (RAID 0) | |
|---|---|---|---|---|---|---|
| Noise | -3% | -15% | -18% | -3% | -17% | |
| off / environment * (dB) | 23.5 | 24.2 -3% | 23.2 1% | 24.7 -5% | 22.6 4% | 23.4 -0% |
| Idle Minimum * (dB) | 23.8 | 24.4 -3% | 23.2 3% | 24.7 -4% | 22.6 5% | 23.6 1% |
| Idle Average * (dB) | 24.2 | 24.4 -1% | 23.2 4% | 24.7 -2% | 22.6 7% | 24.9 -3% |
| Idle Maximum * (dB) | 24.2 | 24.4 -1% | 29.5 -22% | 24.7 -2% | 22.6 7% | 30.9 -28% |
| Load Average * (dB) | 25.4 | 27.4 -8% | 43 -69% | 43.7 -72% | 37.8 -49% | 40.4 -59% |
| Cyberpunk 2077 ultra * (dB) | 43 | 48.2 -12% | 53.2 -24% | |||
| Load Maximum * (dB) | 45 | 46.8 -4% | 48.2 -7% | 53.3 -18% | 40.5 10% | 51.9 -15% |
| Witcher 3 ultra * (dB) | 43.3 | 40.3 | 48.3 |
* ... smaller is better
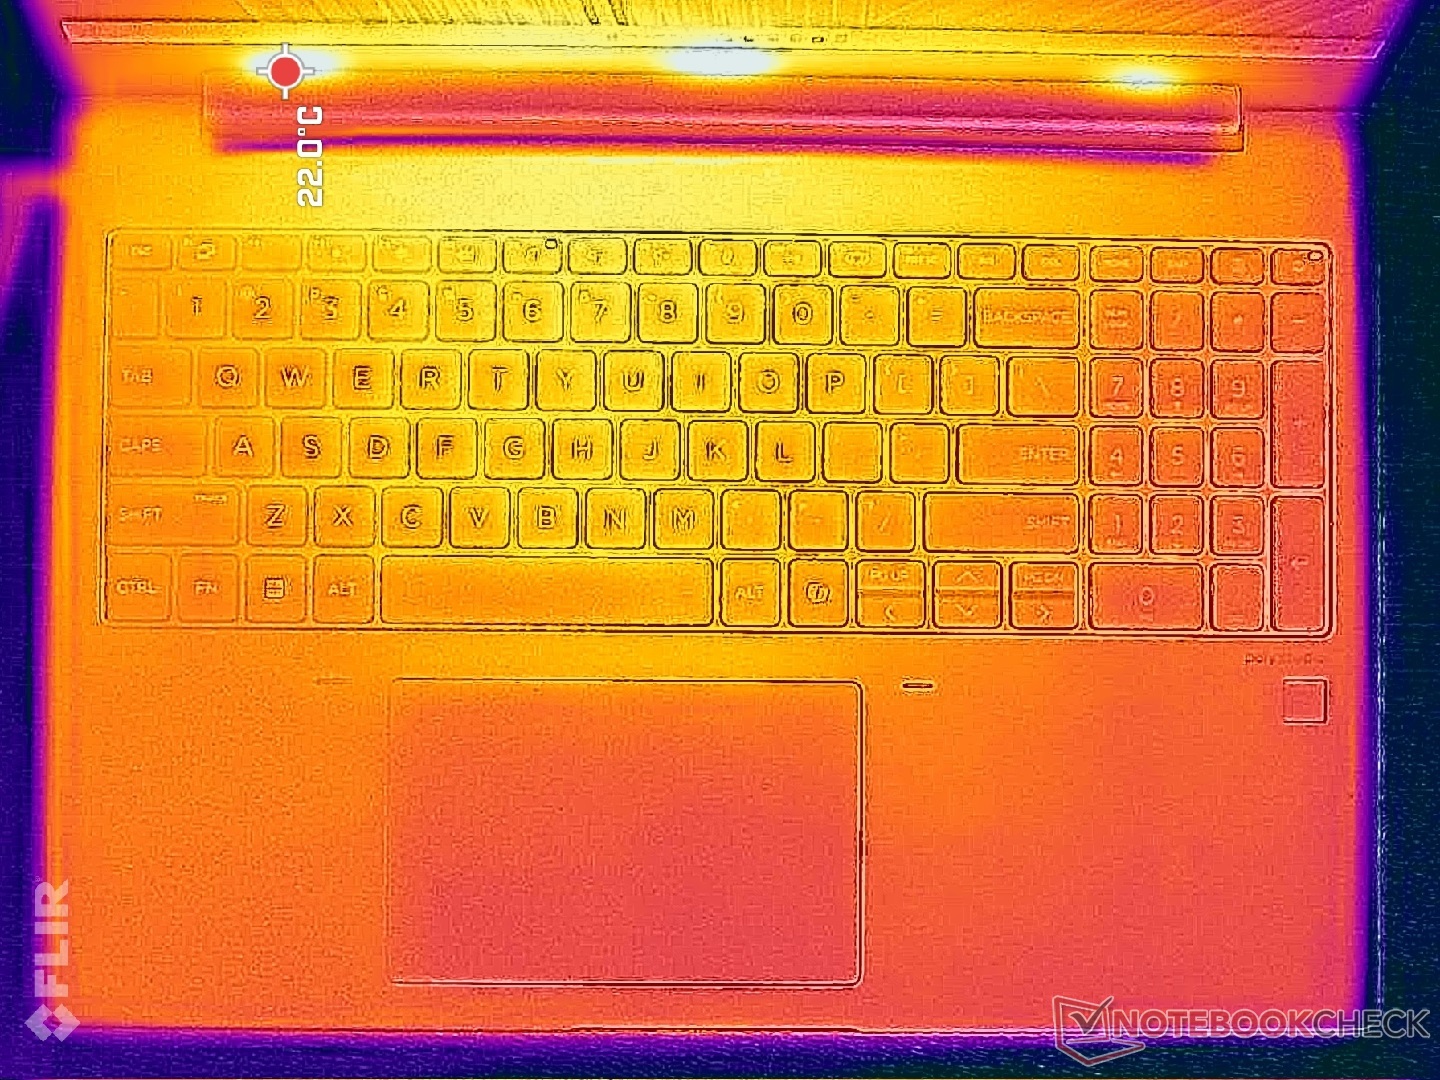
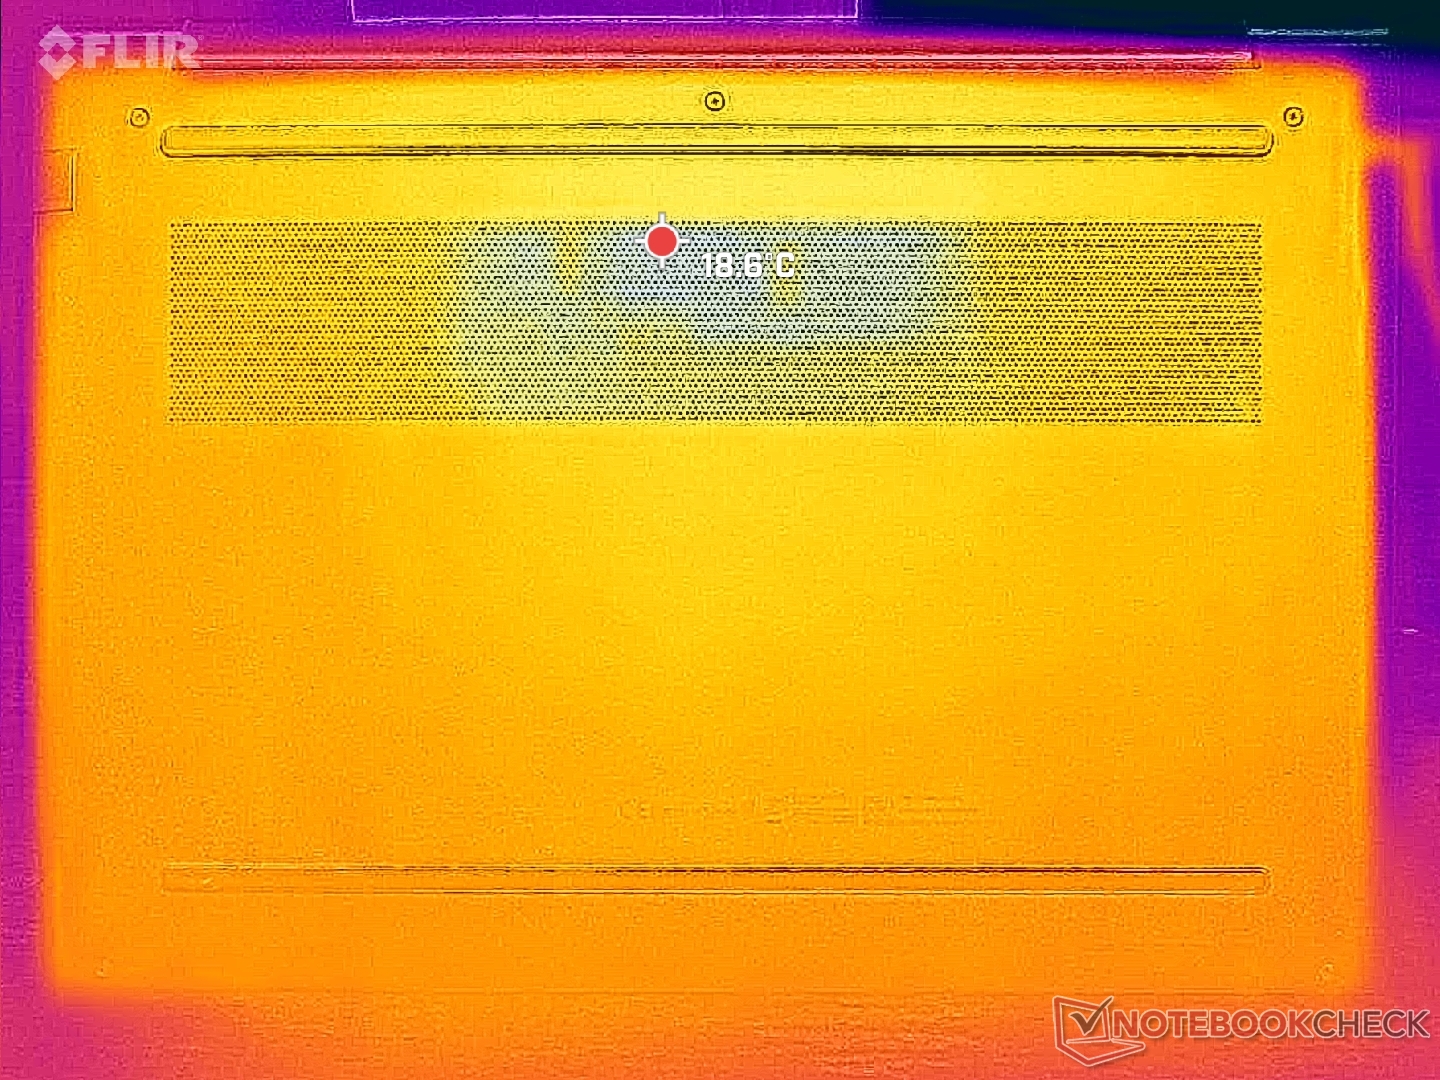
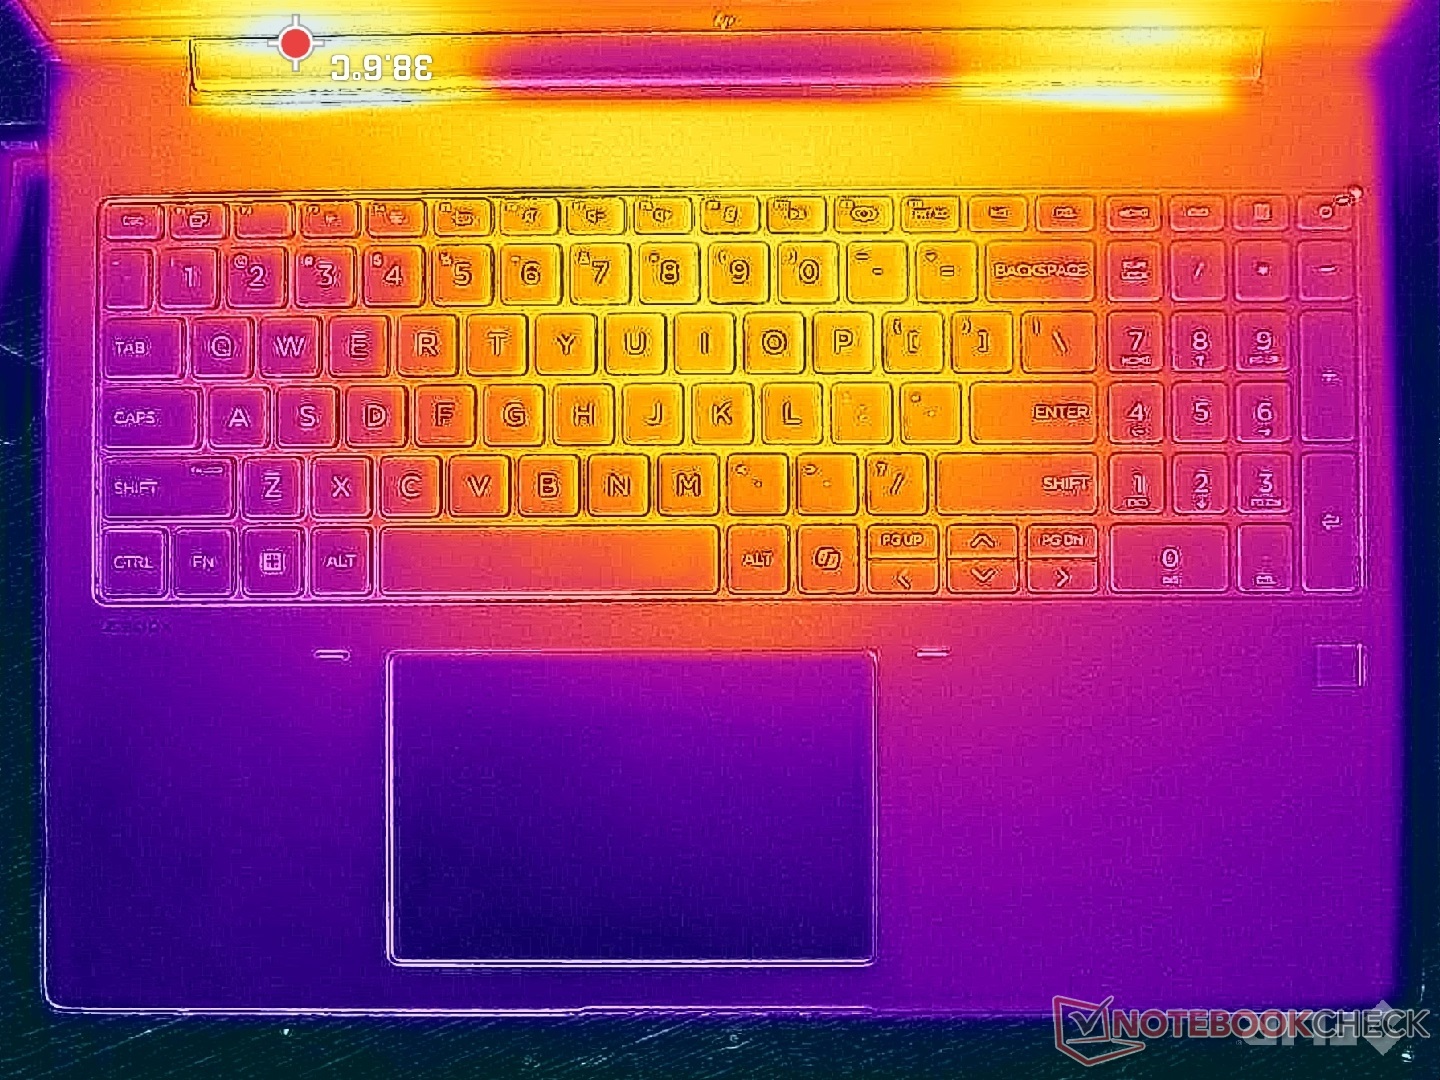
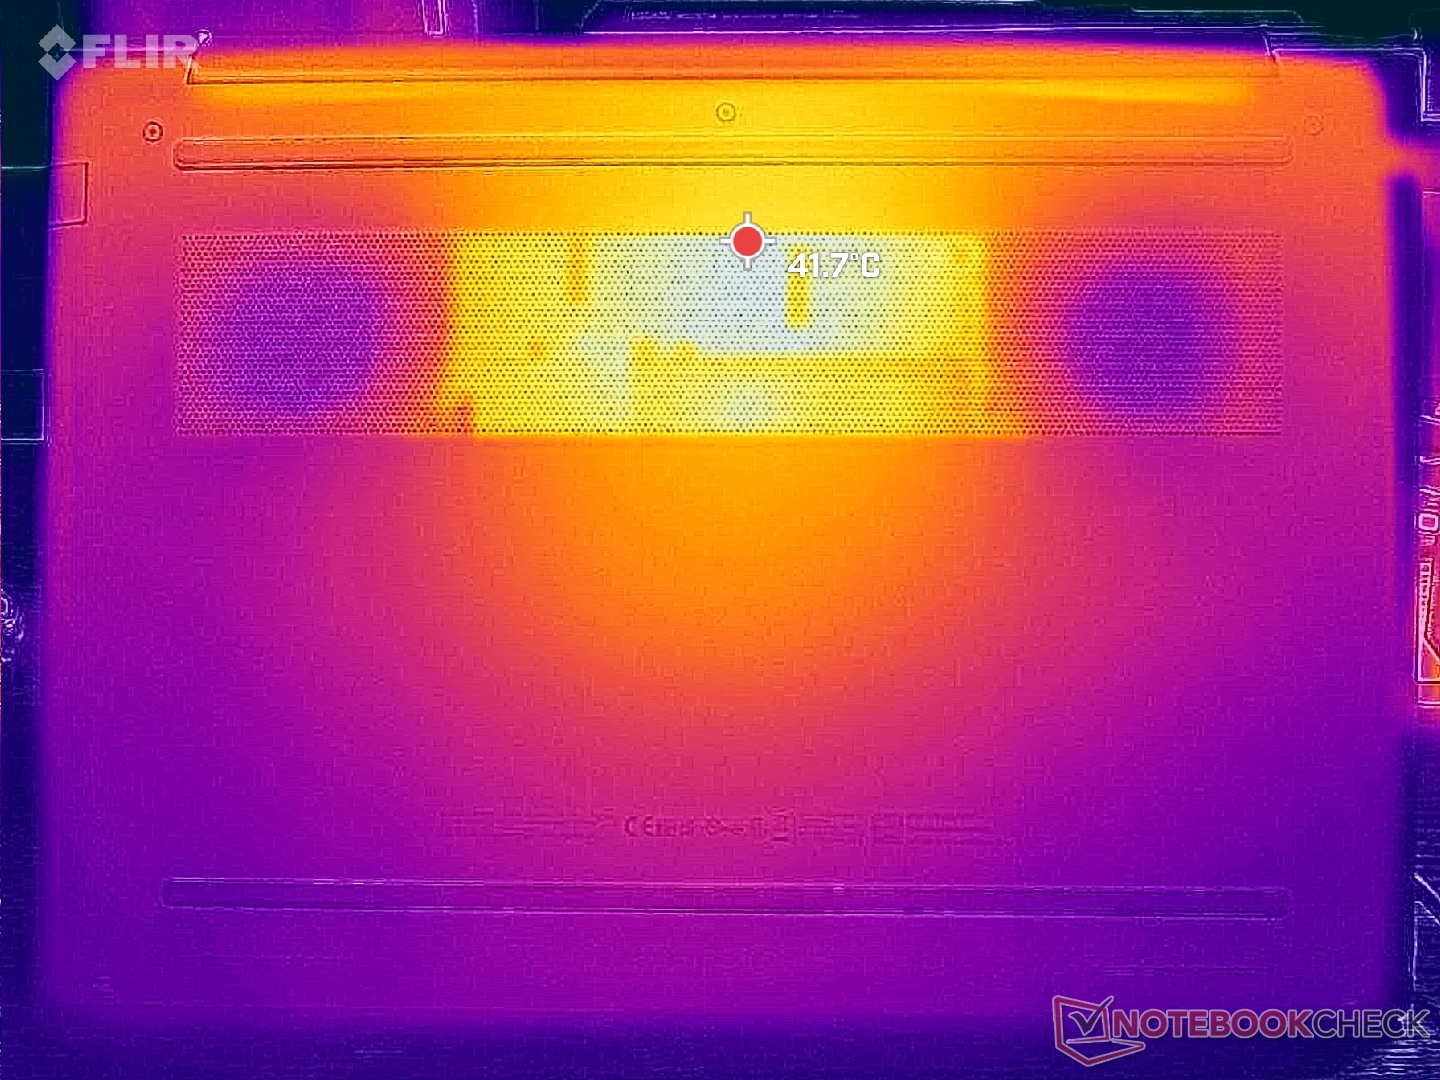
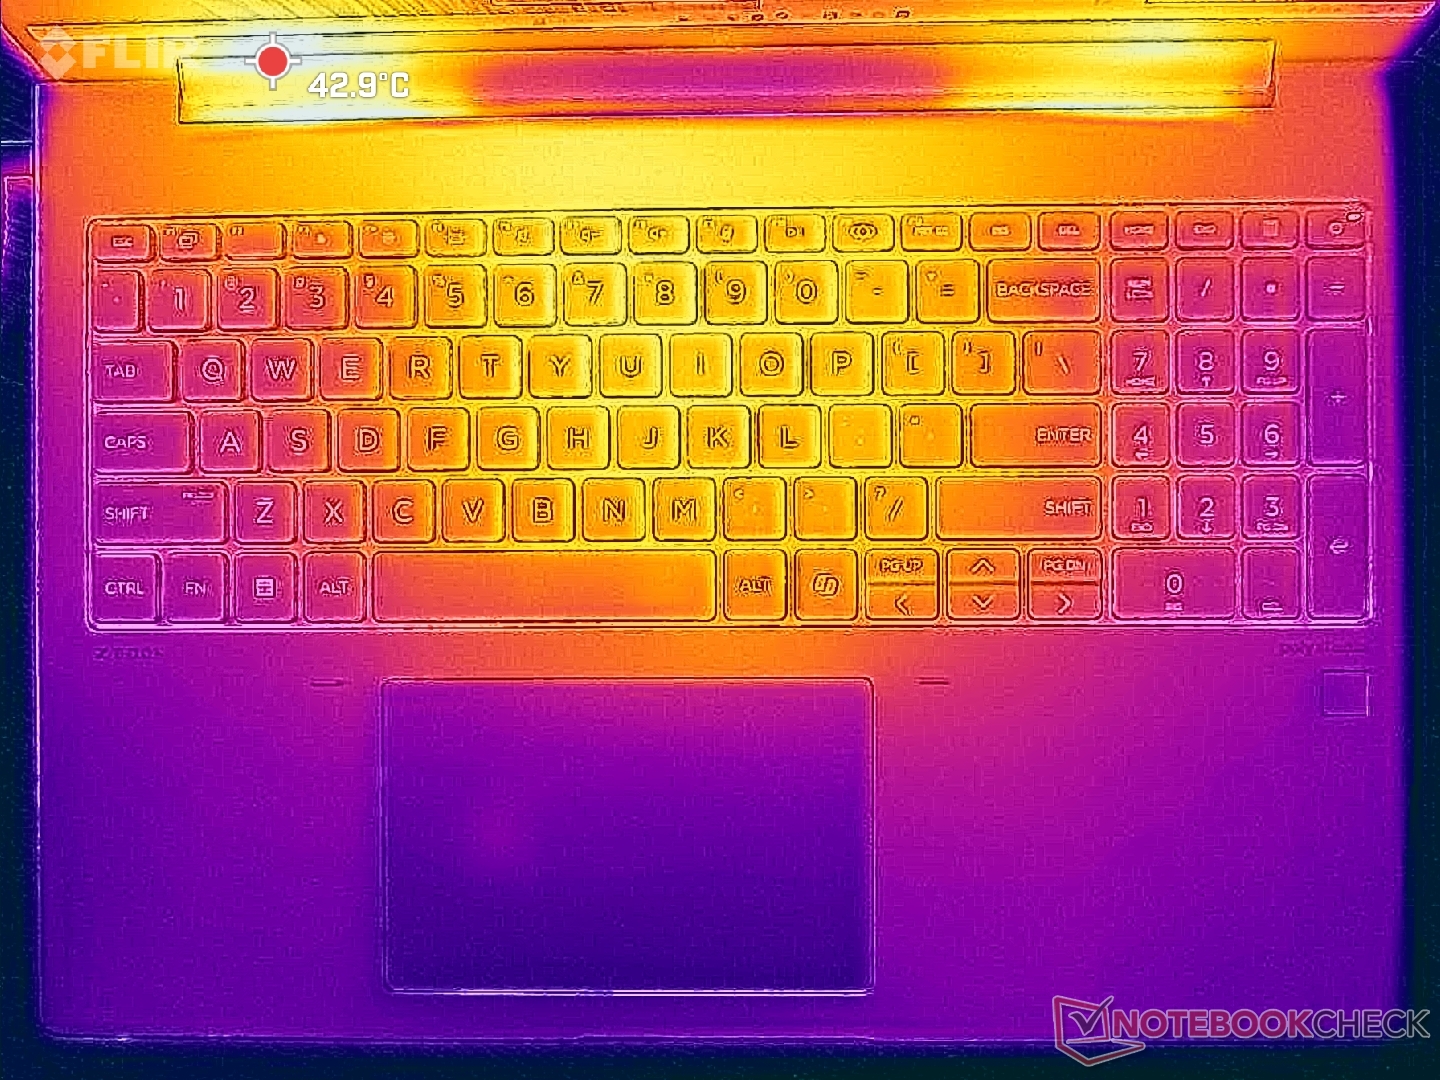
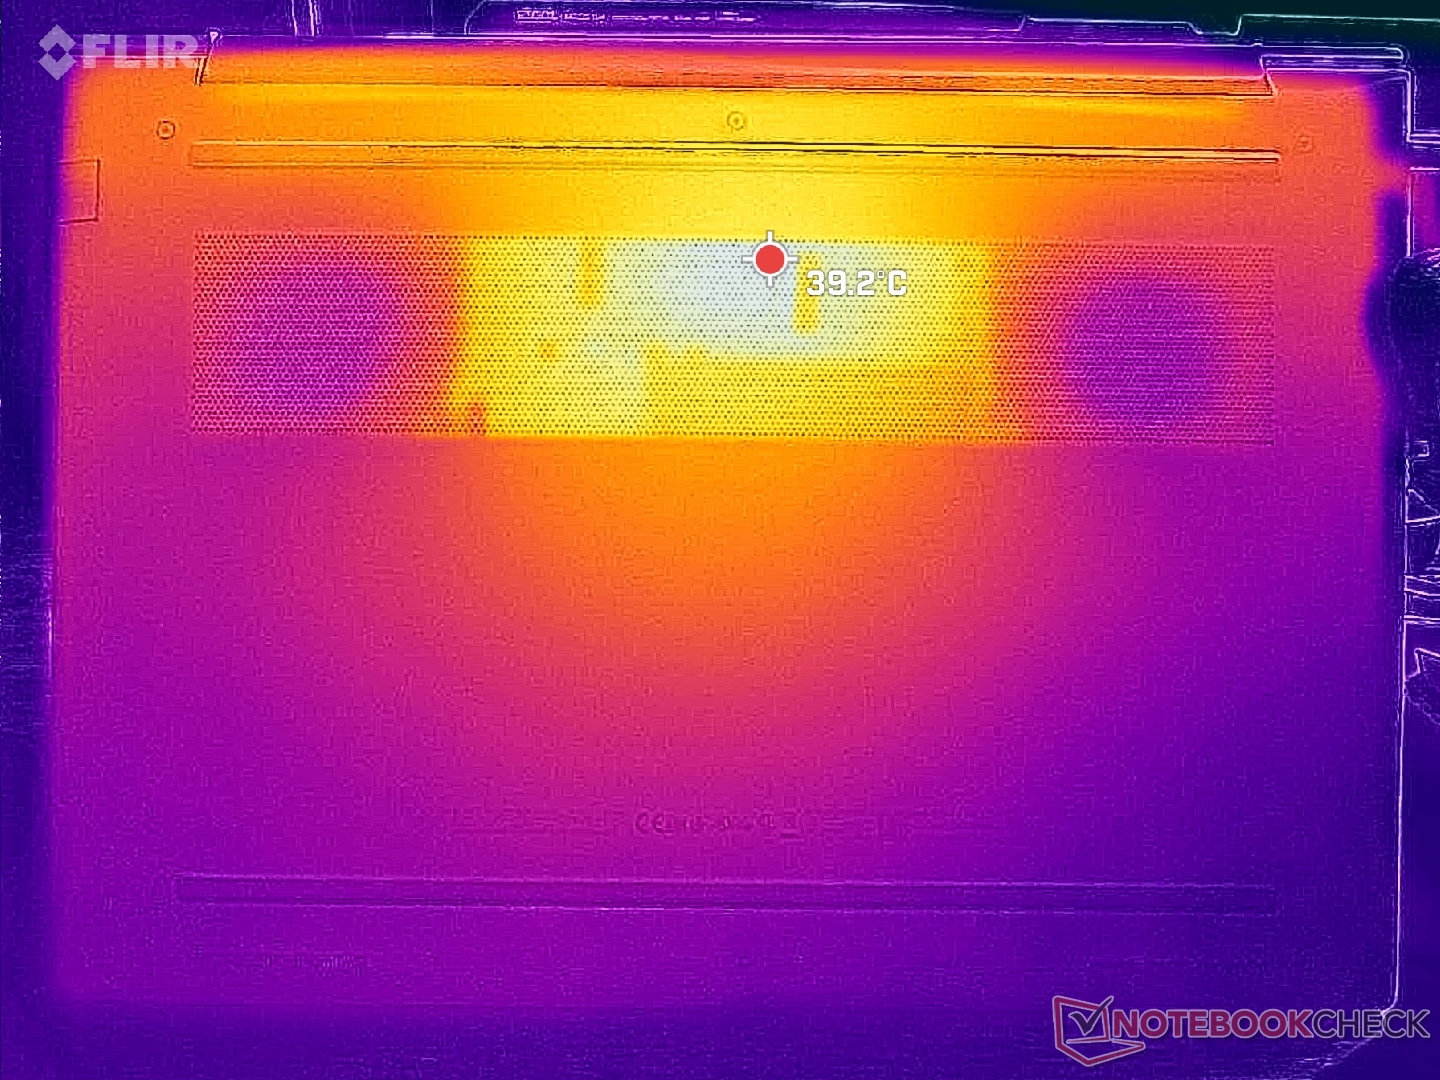
Temperature
Surface temperatures are generally cooler on our new 16-inch form factor especially in regards to the bottom cover. Hot spots on the bottom reach just 41 C when running demanding loads compared to 48 C on the older ZBook Power 15 G10. The hot spot on the keyboard center reaches 41 C as well while the palm rests and sides remain cooler and more comfortable for palms and fingers.
When compared to the more powerful Precision 5690, the Dell unit is even warmer on the keyboard while being cooler on the bottom surface.
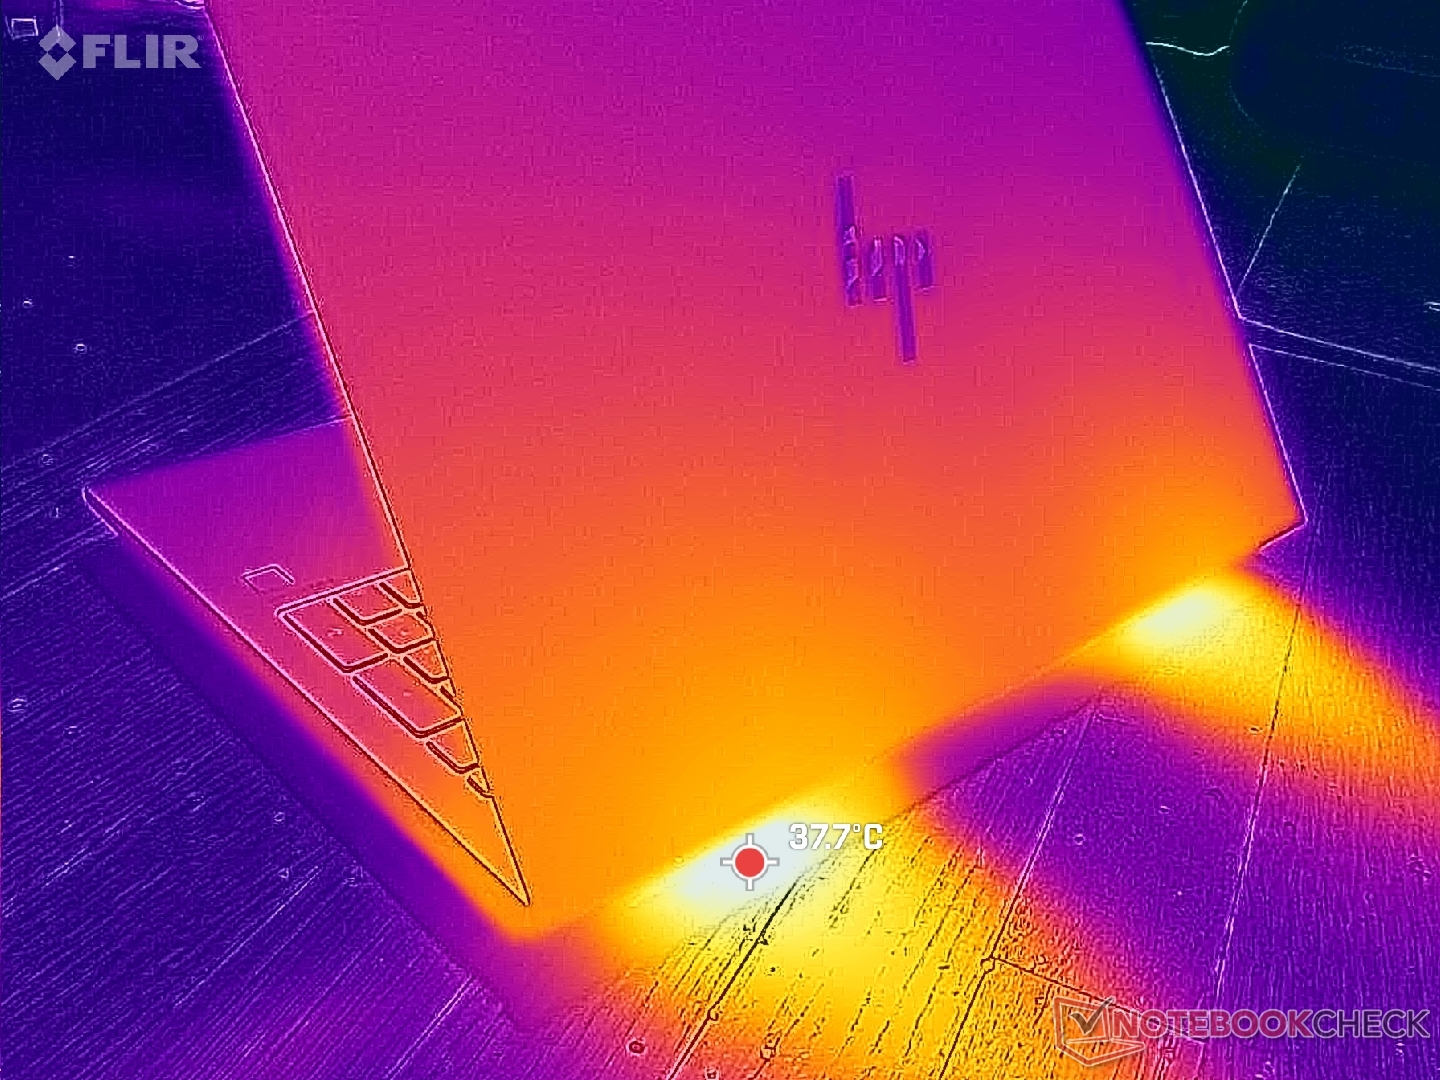
(±) The maximum temperature on the upper side is 40.6 °C / 105 F, compared to the average of 38.2 °C / 101 F, ranging from 22.2 to 69.8 °C for the class Workstation.
(±) The bottom heats up to a maximum of 40.6 °C / 105 F, compared to the average of 41.1 °C / 106 F
(+) In idle usage, the average temperature for the upper side is 24.6 °C / 76 F, compared to the device average of 32 °C / 90 F.
(+) 3: The average temperature for the upper side is 30.1 °C / 86 F, compared to the average of 32 °C / 90 F for the class Workstation.
(+) The palmrests and touchpad are cooler than skin temperature with a maximum of 27.2 °C / 81 F and are therefore cool to the touch.
(±) The average temperature of the palmrest area of similar devices was 27.8 °C / 82 F (+0.6 °C / 1 F).
| HP ZBook Power 16 G11 A AMD Ryzen 7 8845HS, NVIDIA RTX 2000 Ada Generation Laptop | HP ZBook Power 15 G10 AMD Ryzen 7 PRO 7840HS, NVIDIA RTX 2000 Ada Generation Laptop | HP ZBook Fury 16 G11 Intel Core i9-14900HX, NVIDIA RTX 3500 Ada Generation Laptop | Lenovo ThinkPad P1 Gen 7 21KV001SGE Intel Core Ultra 7 155H, NVIDIA GeForce RTX 4060 Laptop GPU | Lenovo ThinkPad P16s G2 21K9000CGE AMD Ryzen 7 PRO 7840U, AMD Radeon 780M | Dell Precision 5690 Intel Core Ultra 9 185H, NVIDIA RTX 5000 Ada Generation Laptop | |
|---|---|---|---|---|---|---|
| Heat | -7% | -26% | -8% | -9% | -8% | |
| Maximum Upper Side * (°C) | 40.6 | 42.4 -4% | 42.2 -4% | 50.3 -24% | 42.7 -5% | 46.6 -15% |
| Maximum Bottom * (°C) | 40.6 | 47.8 -18% | 48 -18% | 38 6% | 47.2 -16% | 33 19% |
| Idle Upper Side * (°C) | 26 | 26.8 -3% | 37 -42% | 28.3 -9% | 27.8 -7% | 32.4 -25% |
| Idle Bottom * (°C) | 26.6 | 27.2 -2% | 36.8 -38% | 27.3 -3% | 28.4 -7% | 29.4 -11% |
* ... smaller is better
Speakers
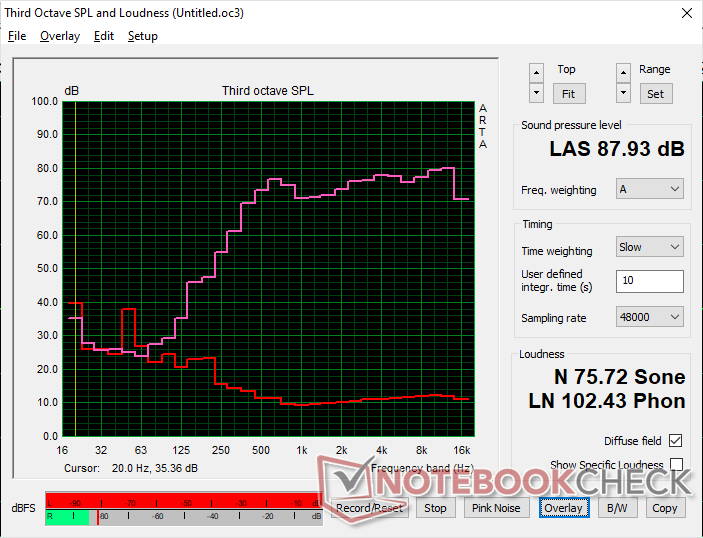
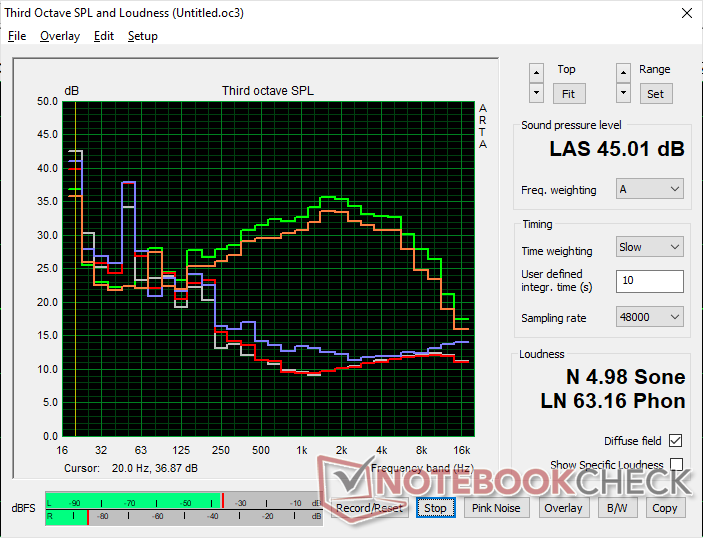
HP ZBook Power 16 G11 A audio analysis
(+) | speakers can play relatively loud (87.9 dB)
Bass 100 - 315 Hz
(-) | nearly no bass - on average 28.1% lower than median
(±) | linearity of bass is average (9% delta to prev. frequency)
Mids 400 - 2000 Hz
(+) | balanced mids - only 1.9% away from median
(+) | mids are linear (4.8% delta to prev. frequency)
Highs 2 - 16 kHz
(+) | balanced highs - only 3.6% away from median
(+) | highs are linear (2.4% delta to prev. frequency)
Overall 100 - 16.000 Hz
(±) | linearity of overall sound is average (15.1% difference to median)
Compared to same class
» 33% of all tested devices in this class were better, 7% similar, 60% worse
» The best had a delta of 7%, average was 17%, worst was 35%
Compared to all devices tested
» 21% of all tested devices were better, 4% similar, 75% worse
» The best had a delta of 4%, average was 23%, worst was 134%
Apple MacBook Pro 16 2021 M1 Pro audio analysis
(+) | speakers can play relatively loud (84.7 dB)
Bass 100 - 315 Hz
(+) | good bass - only 3.8% away from median
(+) | bass is linear (5.2% delta to prev. frequency)
Mids 400 - 2000 Hz
(+) | balanced mids - only 1.3% away from median
(+) | mids are linear (2.1% delta to prev. frequency)
Highs 2 - 16 kHz
(+) | balanced highs - only 1.9% away from median
(+) | highs are linear (2.7% delta to prev. frequency)
Overall 100 - 16.000 Hz
(+) | overall sound is linear (4.6% difference to median)
Compared to same class
» 0% of all tested devices in this class were better, 0% similar, 100% worse
» The best had a delta of 5%, average was 17%, worst was 45%
Compared to all devices tested
» 0% of all tested devices were better, 0% similar, 100% worse
» The best had a delta of 4%, average was 23%, worst was 134%
Energy Management
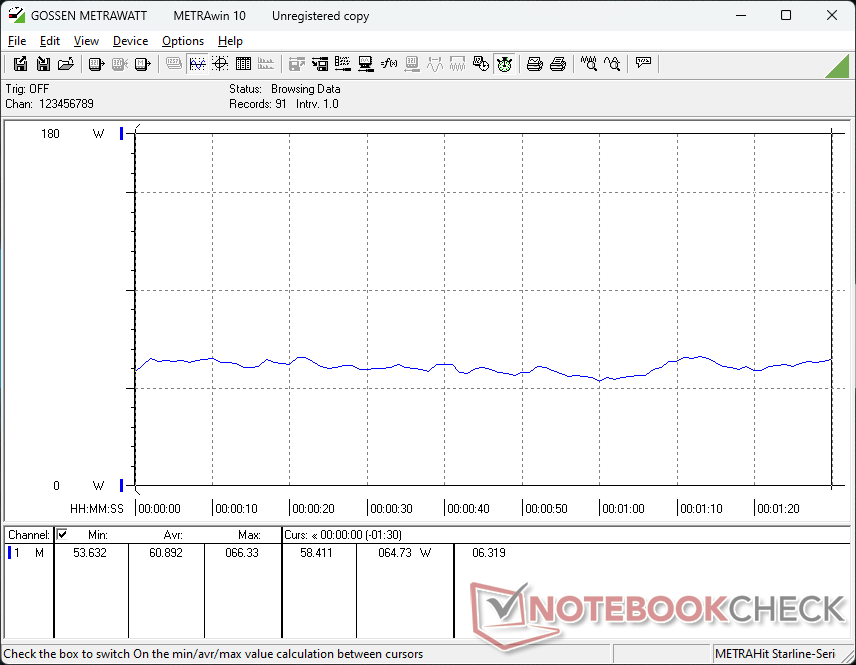
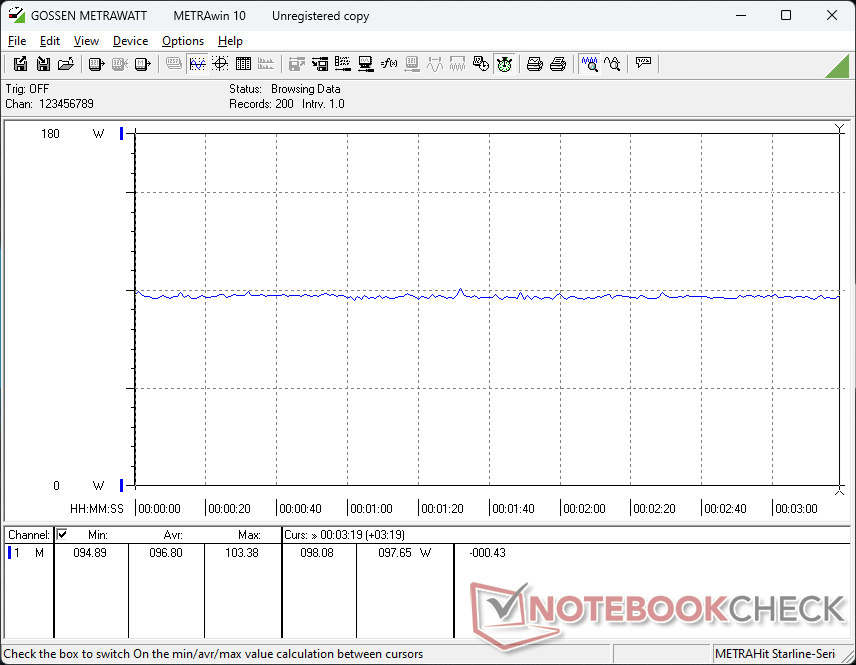
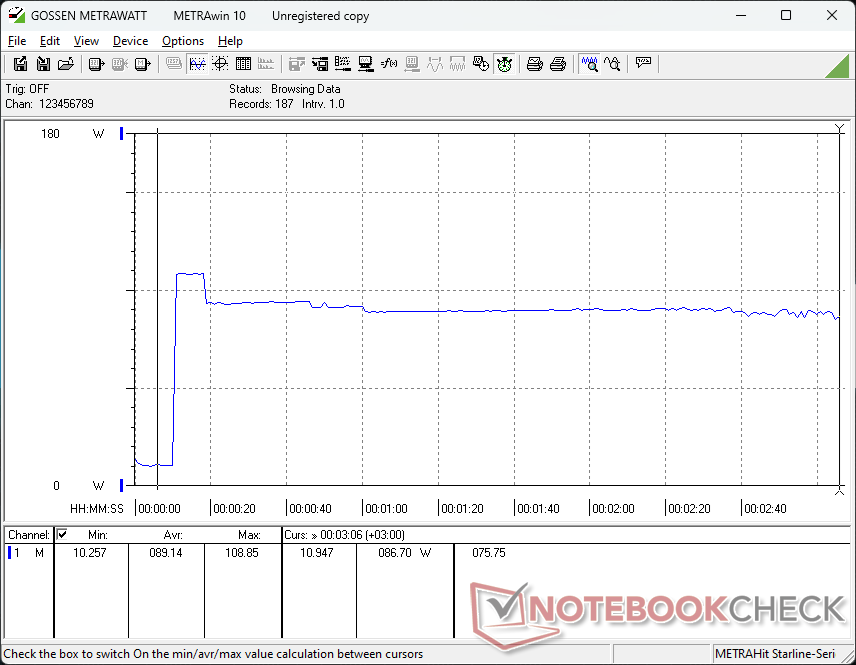
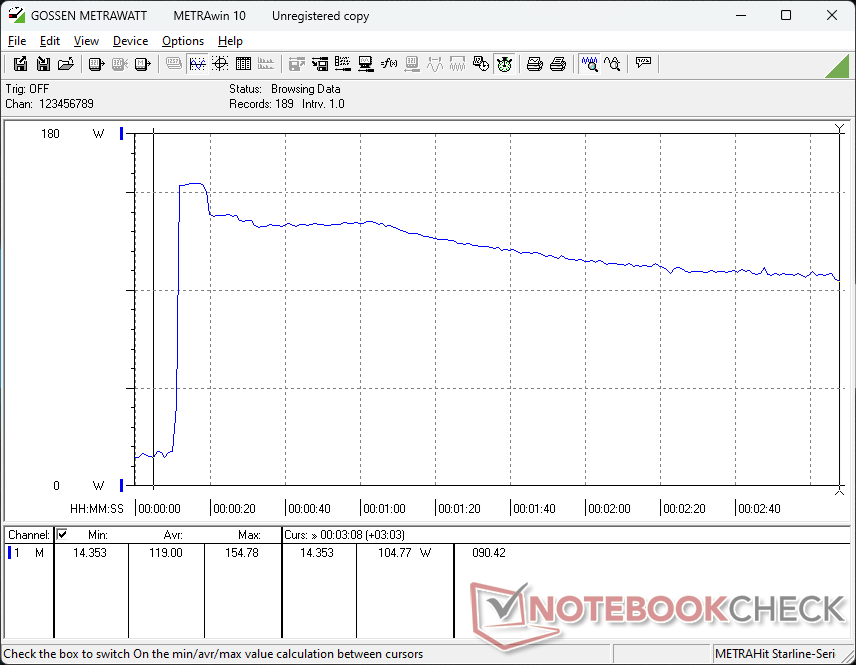
Power Consumption
Consumption levels and behavior are similar to what we observed on the ZBook Power 15 G10 which is unsurprising given that the power envelope remains the same between them. Perhaps the most notable difference relates to the lower consumption of about 25 W when running Prime95 and FurMark simultaneously. This can be attributed to the heavier throttling for cooling core temperatures when running such loads as mentioned in the Stress Test section above.
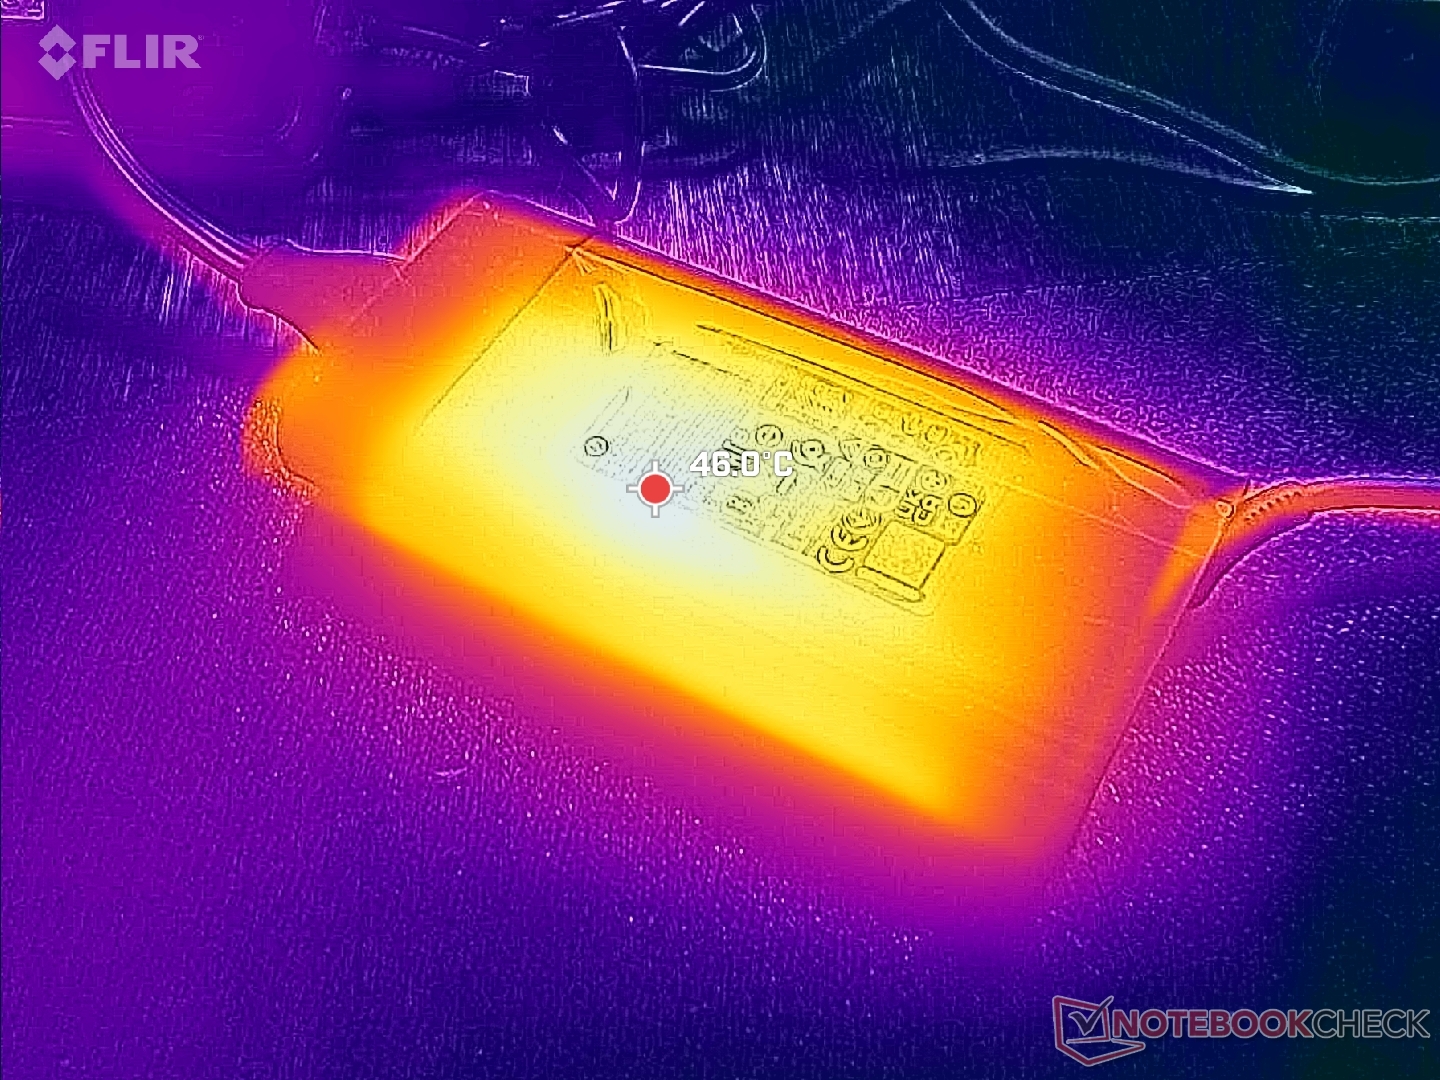
We're able to record a temporary maximum draw of 155 W from the medium-sized (~13.8 x 6.5 x 2.2 cm) 150 W AC adapter.
| Off / Standby | |
| Idle | |
| Load |
|
Key:
min: | |
| HP ZBook Power 16 G11 A R7 8845HS, RTX 2000 Ada Generation Laptop, Samsung PM9A1 MZVL22T0HBLB, IPS, 2560x1600, 16" | HP ZBook Power 15 G10 R7 PRO 7840HS, RTX 2000 Ada Generation Laptop, WDC PC SN810 2TB, IPS, 2560x1440, 15.6" | HP ZBook Fury 16 G11 i9-14900HX, RTX 3500 Ada Generation Laptop, SK hynix PC801 HFS001TEJ9X101N, IPS, 3840x2400, 16" | Lenovo ThinkPad P1 Gen 7 21KV001SGE Ultra 7 155H, GeForce RTX 4060 Laptop GPU, Kioxia XG8 KXG8AZNV1T02, IPS LED, 2560x1600, 16" | Lenovo ThinkPad P16s G2 21K9000CGE R7 PRO 7840U, Radeon 780M, SK hynix PC801 HFS001TEJ9X162N, OLED, 3840x2400, 16" | Dell Precision 5690 Ultra 9 185H, RTX 5000 Ada Generation Laptop, 2x Samsung PM9A1 1TB (RAID 0), OLED, 3840x2400, 16" | |
|---|---|---|---|---|---|---|
| Power Consumption | -13% | -80% | -35% | 20% | -67% | |
| Idle Minimum * (Watt) | 4.6 | 5.3 -15% | 8.6 -87% | 7.3 -59% | 6.1 -33% | 7.9 -72% |
| Idle Average * (Watt) | 10 | 9.9 1% | 14.8 -48% | 12.3 -23% | 6.5 35% | 12 -20% |
| Idle Maximum * (Watt) | 10.6 | 16.7 -58% | 15.7 -48% | 17.9 -69% | 7 34% | 28.6 -170% |
| Load Average * (Watt) | 60.9 | 61.3 -1% | 129.4 -112% | 78.2 -28% | 56.6 7% | 98.8 -62% |
| Cyberpunk 2077 ultra external monitor * (Watt) | 92.8 | 192.6 -108% | 117.7 -27% | |||
| Cyberpunk 2077 ultra * (Watt) | 96.8 | 199.4 -106% | 123.5 -28% | |||
| Load Maximum * (Watt) | 154.8 | 145.3 6% | 236.1 -53% | 167.5 -8% | 68.3 56% | 174.8 -13% |
| Witcher 3 ultra * (Watt) | 87.9 | 61.2 | 144.5 |
* ... smaller is better
Power Consumption Cyberpunk / Stress Test
Power Consumption external Monitor
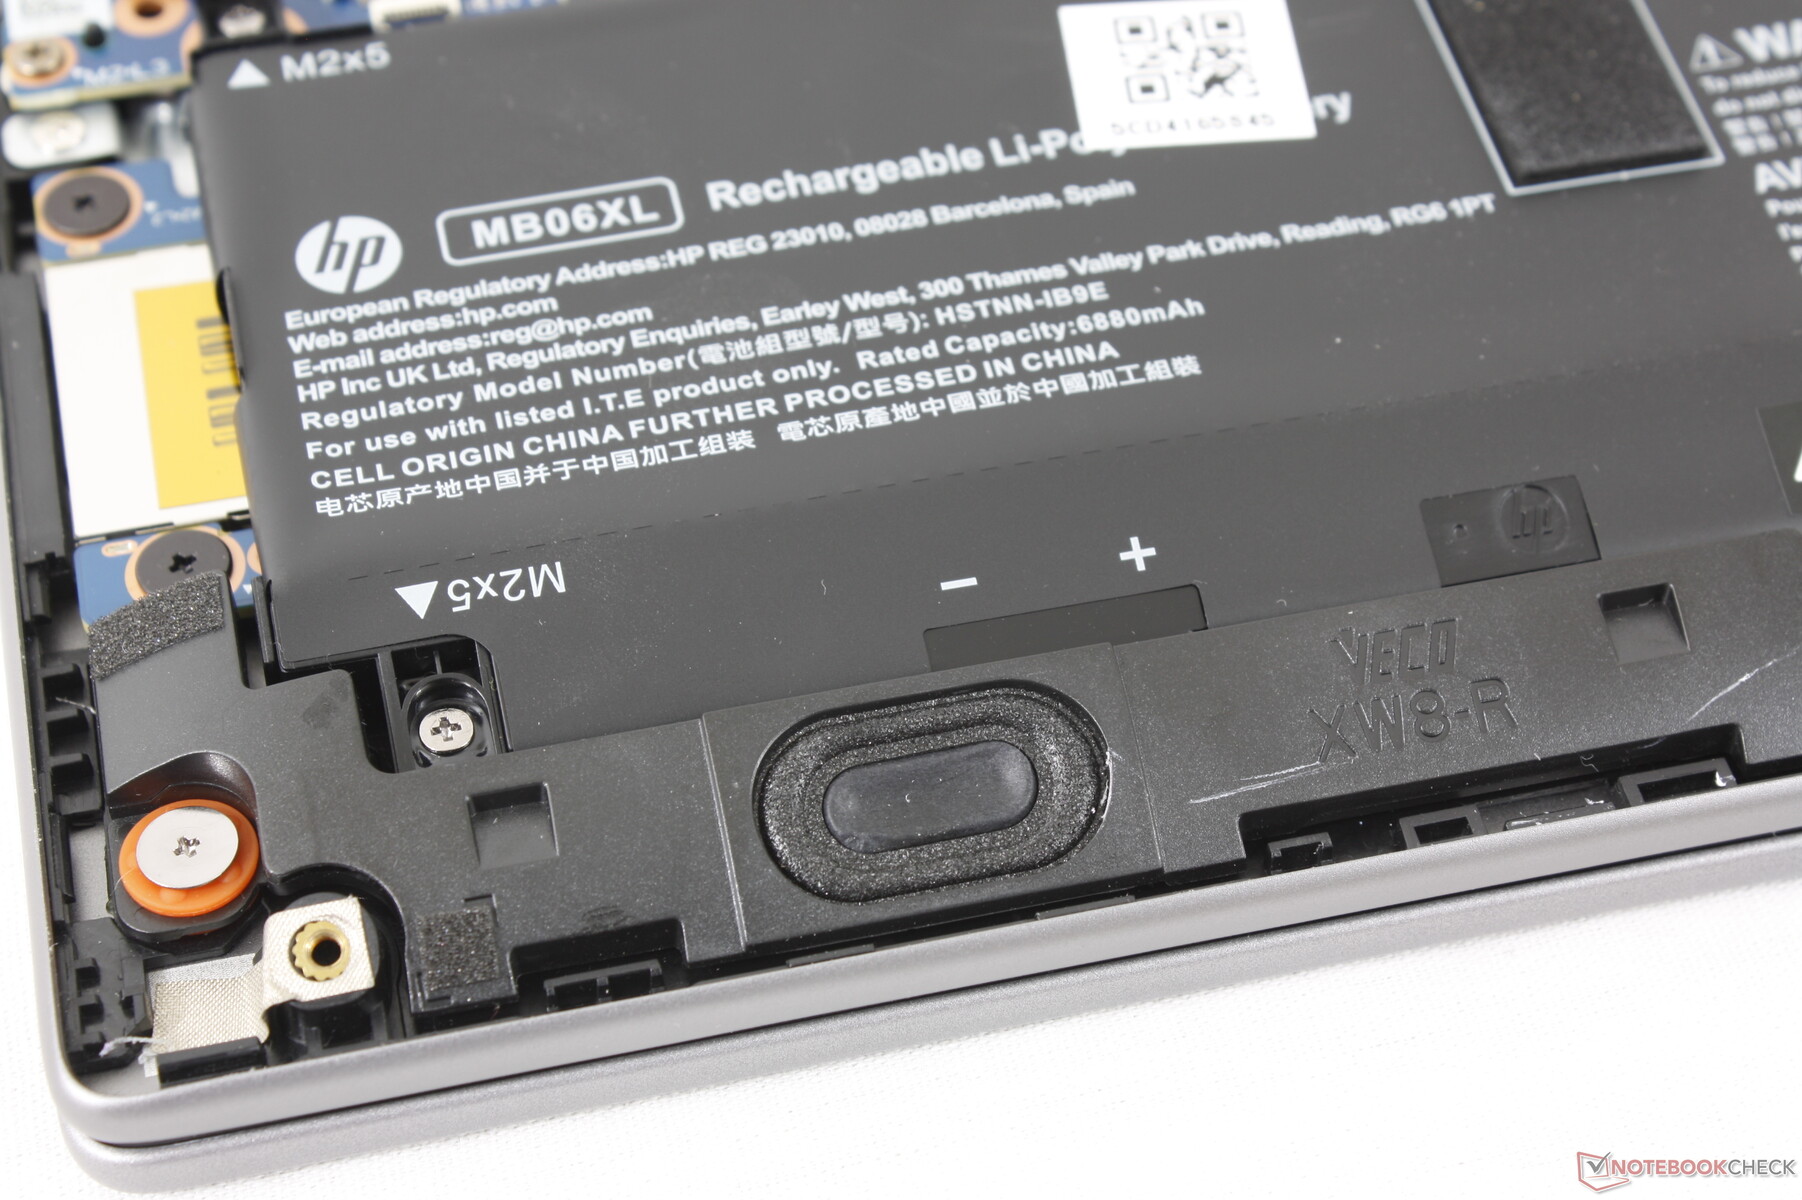
Battery Life
Battery capacity has not changed from last year's ZBook Power 15 G10 despite the form factor updates. Perhaps coincidentally, runtimes remain almost the same at just over 9.5 hours of real-world WLAN browsing before automatic shutdown.
Charging from empty to full capacity is relatively fast at under 70 minutes. Charging via USB-C is supported albeit at slower speeds.
| HP ZBook Power 16 G11 A R7 8845HS, RTX 2000 Ada Generation Laptop, 83 Wh | HP ZBook Power 15 G10 R7 PRO 7840HS, RTX 2000 Ada Generation Laptop, 83 Wh | HP ZBook Fury 16 G11 i9-14900HX, RTX 3500 Ada Generation Laptop, 95 Wh | Lenovo ThinkPad P1 Gen 7 21KV001SGE Ultra 7 155H, GeForce RTX 4060 Laptop GPU, 90 Wh | Lenovo ThinkPad P16s G2 21K9000CGE R7 PRO 7840U, Radeon 780M, 84 Wh | Dell Precision 5690 Ultra 9 185H, RTX 5000 Ada Generation Laptop, 98 Wh | |
|---|---|---|---|---|---|---|
| Battery runtime | 3% | -31% | 7% | -2% | -5% | |
| Reader / Idle (h) | 26.1 | |||||
| WiFi v1.3 (h) | 9.7 | 10 3% | 6.7 -31% | 9.9 2% | 10.6 9% | 9.2 -5% |
| Load (h) | 1.7 | 1.9 12% | 1.5 -12% | |||
| H.264 (h) | 13.3 |
Pros
Cons
Verdict — Bigger Screen But Same Performance
The ZBook Power 16 G11 replaces the ZBook Power 15 series with a larger and heavier 16-inch design. One might assume that the bigger form factor leads to faster performance, but that is unfortunately not the case. The new Hawk Point CPUs don't offer much over last year's Phoenix options while the GPU options are exactly the same down to their TGP ceilings. The chassis redesign was HP's chance to upgrade the cooling solution and squeeze more performance from the processors, but we suppose the manufacturer didn't want to encroach too much into the higher-end ZBook Fury territory.
Display options are also a bit disappointing for a workstation. Other than the unique 1000-nit option, there are no noteworthy features like OLED, P3 colors, or 4K resolution. Such panels would have made the larger screen size much more appealing over the outgoing 15.6-inch version. Instead, users are limited to 2K and IPS.
The ZBook Power 16 G11 doesn't offer much else over its predecessor other than the larger 16-inch screen size. Performance and features are very nearly the same between the two models.
The HP is still a strong midrange workstation despite the lack of performance upgrades and new features. CPU performance is still noticeably faster than the ThinkPad P16s G2 which is limited to Ryzen-U series CPUs while being less expensive than the popular Dell Precision 5690 when configured with the same GPU. If you already own a ZBook Power 15 G10, however, the heavier 16-inch version can feel like a sidestep.
Price and Availability
HP is now shipping the ZBook Power 16 G11 A starting for $1140 at the base Ryzen 5 and iGPU configuration. Our review configuration with the Ryzen 7 CPU, RTX 2000 Ada GPU, and 1600p display retails for around $2000.
Note: We have recently updated our rating system and the results of version 8 are not comparable with the results of version 7. More information is available here .
HP ZBook Power 16 G11 A
- 09/30/2024 v8
Allen Ngo
 Total Sustainability Score:
 Transparency
The selection of devices to be reviewed is made by our editorial team. The test sample was provided to the author as a loan by the manufacturer or retailer for the purpose of this review. The lender had no influence on this review, nor did the manufacturer receive a copy of this review before publication. There was no obligation to publish this review. As an independent media company, Notebookcheck is not subjected to the authority of manufacturers, retailers or publishers.
This is how Notebookcheck is testing
Every year, Notebookcheck independently reviews hundreds of laptops and smartphones using standardized procedures to ensure that all results are comparable. We have continuously developed our test methods for around 20 years and set industry standards in the process. In our test labs, high-quality measuring equipment is utilized by experienced technicians and editors. These tests involve a multi-stage validation process. Our complex rating system is based on hundreds of well-founded measurements and benchmarks, which maintains objectivity. Further information on our test methods can be found here.
Price comparison
