Dell Precision 5490 workstation review: Now with Intel Meteor Lake-H vPro

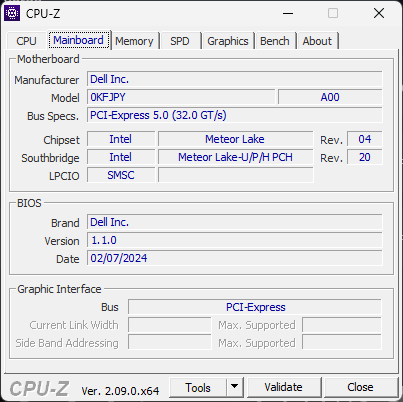
The 2024 Precision 5490 is an update to last year's Precision 5480. The latest model utilizes the same chassis design as both the Precision 5480 and 5470 meaning all our existing comments on the physical features of the Precision 5470 still apply here for the 5490.
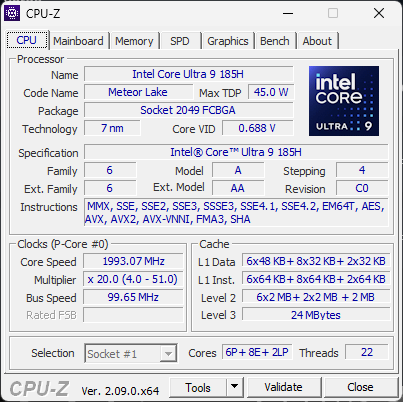
Our test unit is the top-end configuration with the Meteor Lake-H Core Ultra 9 185H CPU to replace last year's Raptor Lake-H options. Otherwise, everything else remains the same including the QHD+ 2560 x 1600 IPS touchscreen and 50 W Nvidia RTX 3000 Ada GPU. Lesser SKUs may ship with the Core Ultra 5 135H, FHD+ 1920 x 1200 display, and only integrated Arc graphics instead.
Direct competitors to the Precision 5490 include other ultraportable 14-inch workstations like the Lenovo ThinkPad P14s or HP ZBook Firefly 14 G10.
More Dell reviews:
Potential Competitors in Comparison
Rating | Date | Model | Weight | Height | Size | Resolution | Price |
|---|---|---|---|---|---|---|---|
| 89.3 % v7 (old) | 04 / 2024 | Dell Precision 5000 5490 Ultra 9 185H, RTX 3000 Ada Generation Laptop | 1.6 kg | 18.95 mm | 14.00" | 2560x1600 | |
| 81 % | 07 / 2024 | Lenovo ThinkPad P14s G4 21HF0017GE i7-1370P, RTX A500 Laptop GPU | 1.5 kg | 22.7 mm | 14.00" | 2880x1800 | |
| 87.4 % v7 (old) | 10 / 2023 | HP ZBook Firefly 14 G10 A R5 PRO 7640HS, Radeon 760M | 1.5 kg | 20 mm | 14.00" | 1920x1200 | |
| 87.4 % v7 (old) | 01 / 2023 | HP ZBook Firefly 14 G9-6B8A2EA i7-1265U, T550 Laptop GPU | 1.5 kg | 19.9 mm | 14.00" | 1920x1200 | |
| 89.6 % v7 (old) | 09 / 2023 | Dell Precision 5480 i9-13900H, RTX 3000 Ada Generation Laptop | 1.6 kg | 18.95 mm | 14.00" | 2560x1600 | |
| 87.6 % v7 (old) | 09 / 2022 | Dell Precision 5000 5470 i9-12900H, RTX A1000 Laptop GPU | 1.6 kg | 18.95 mm | 14.00" | 2560x1600 |
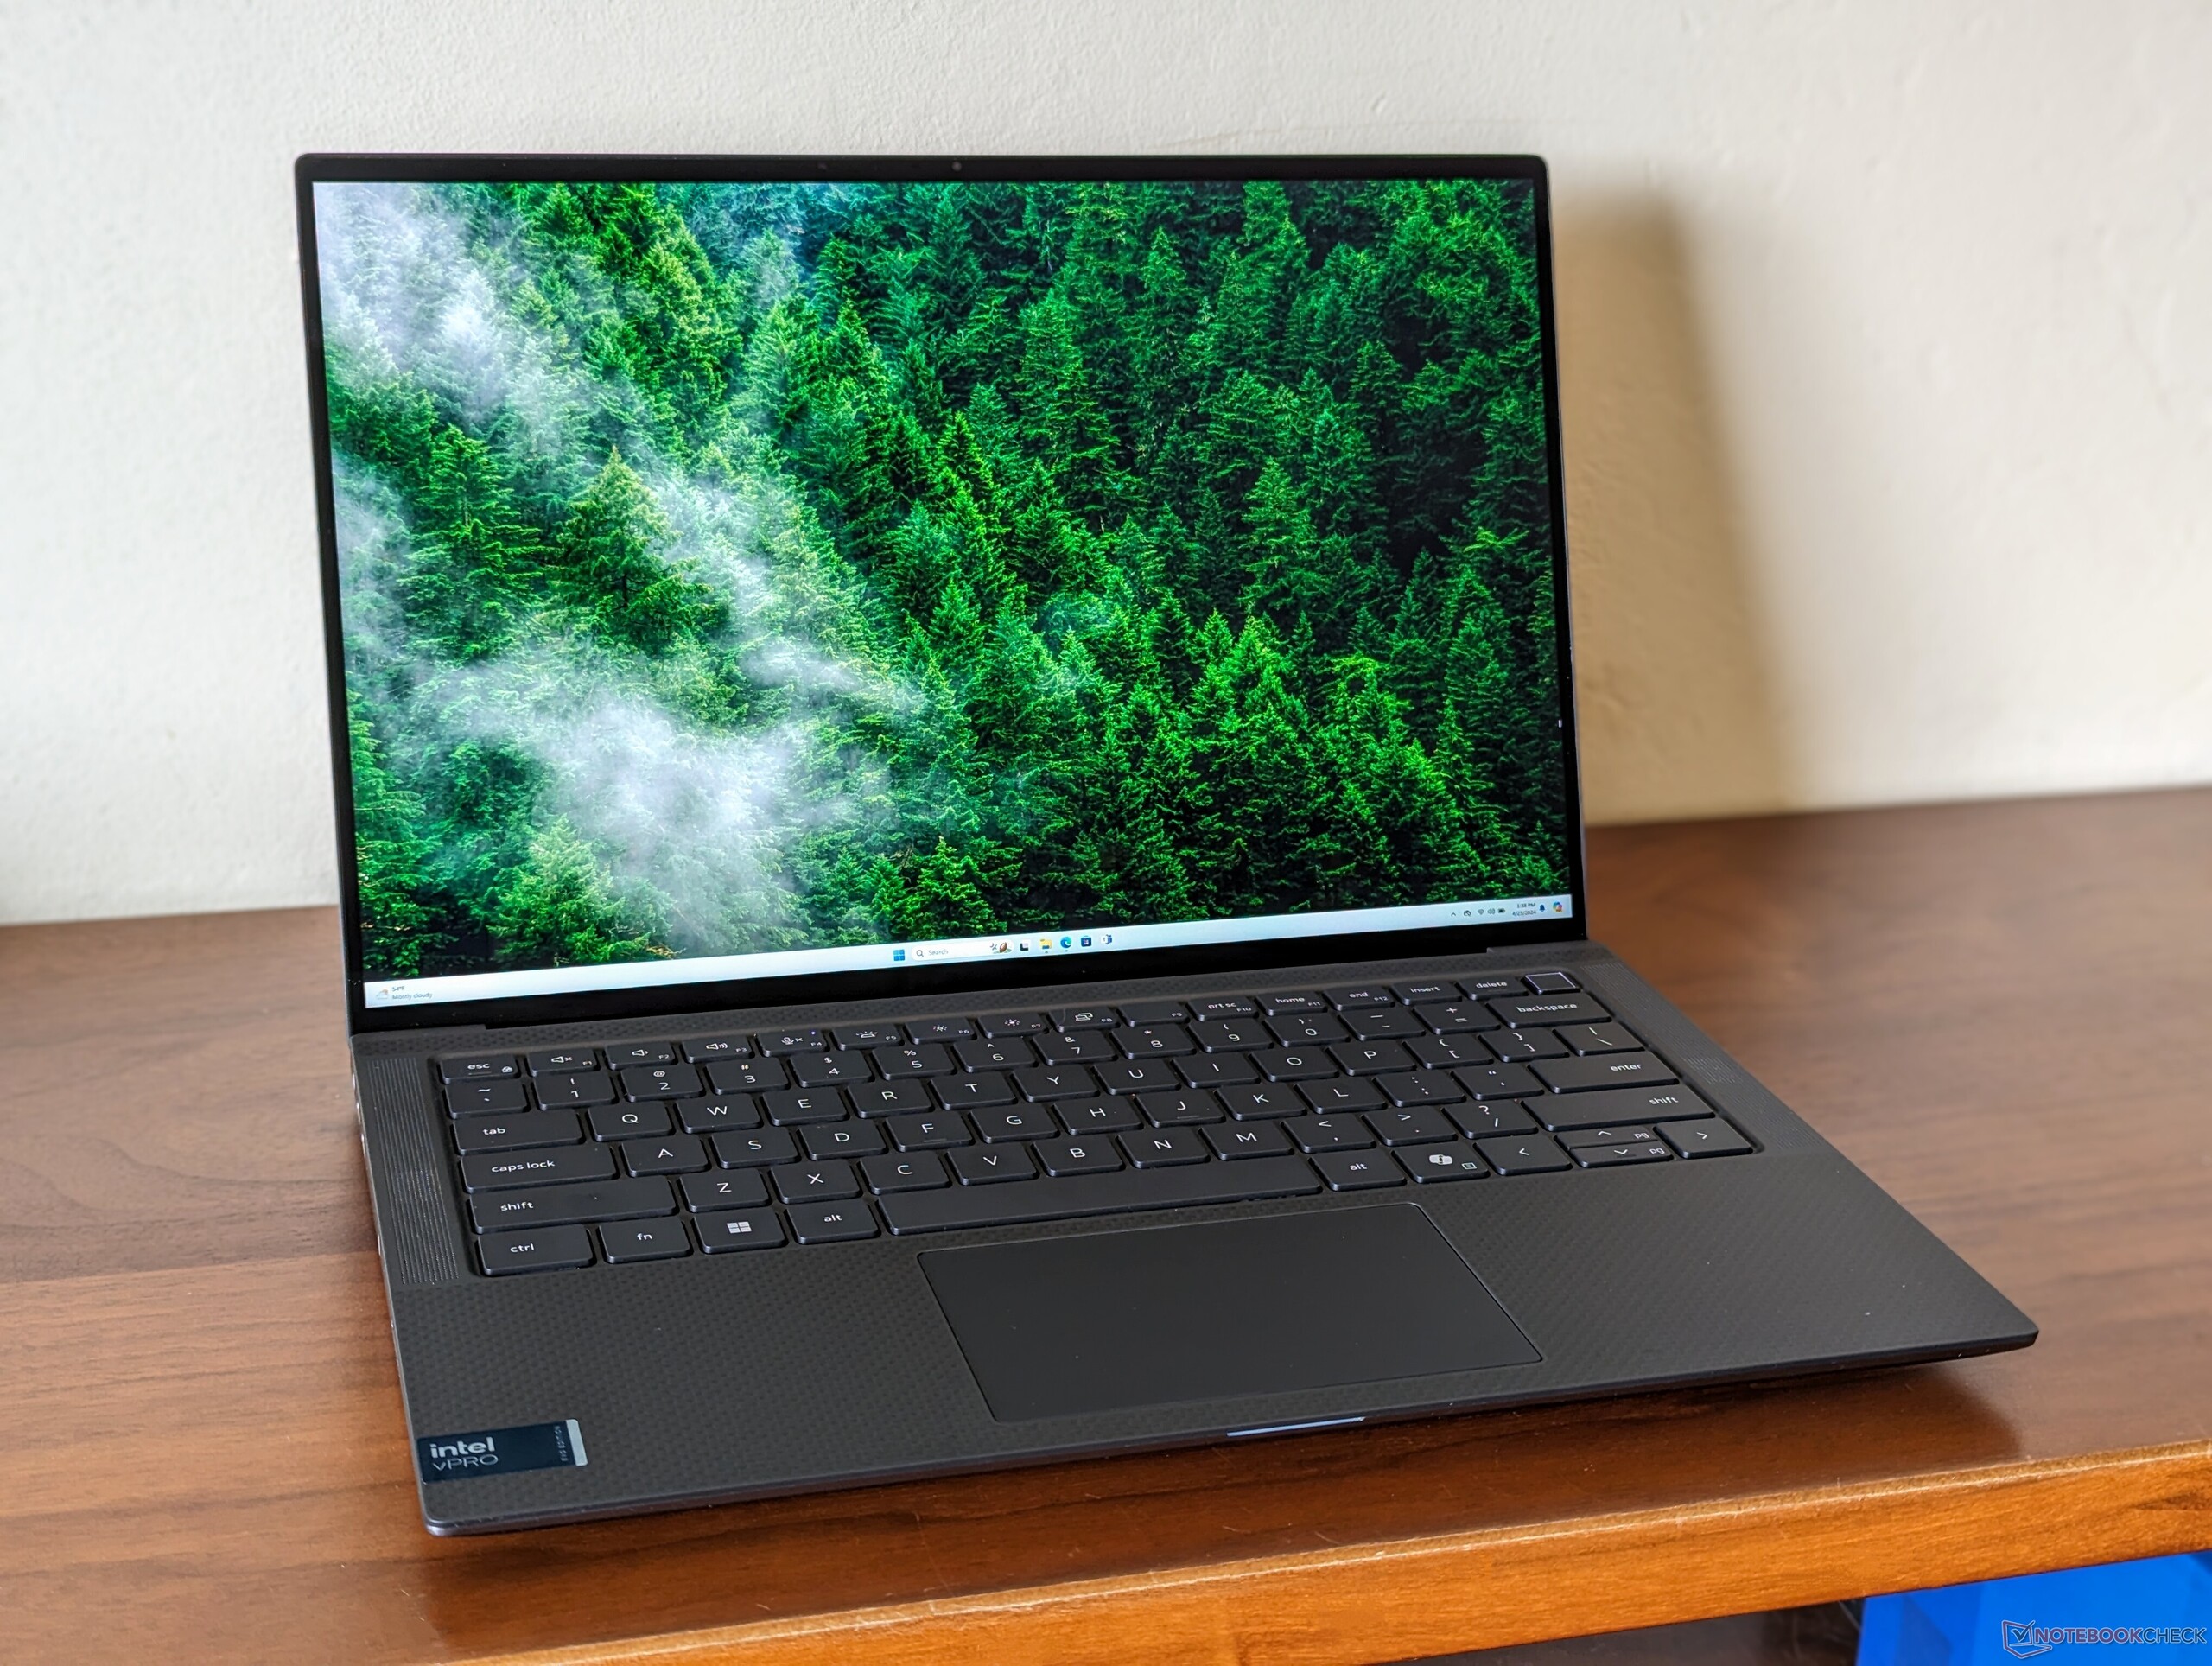
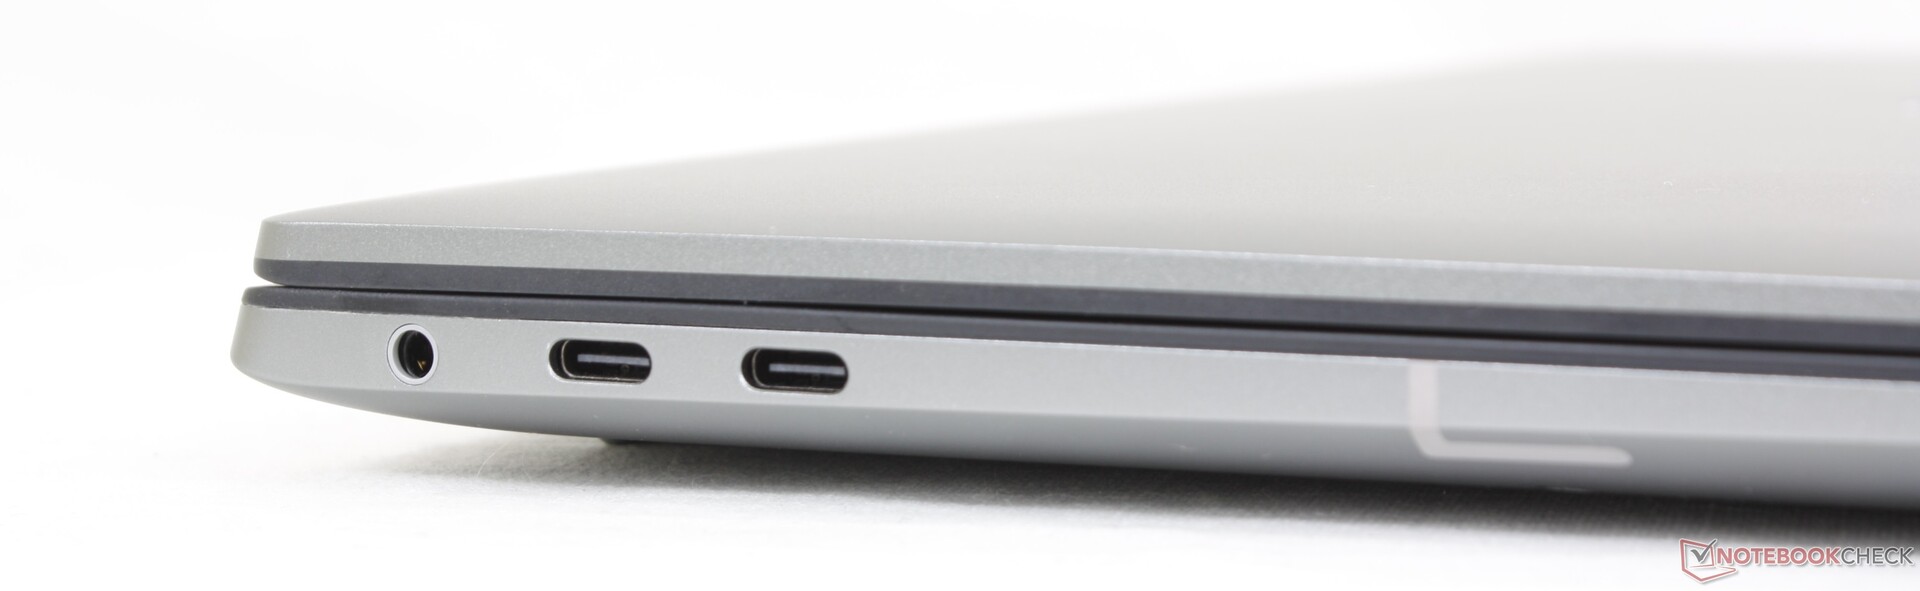
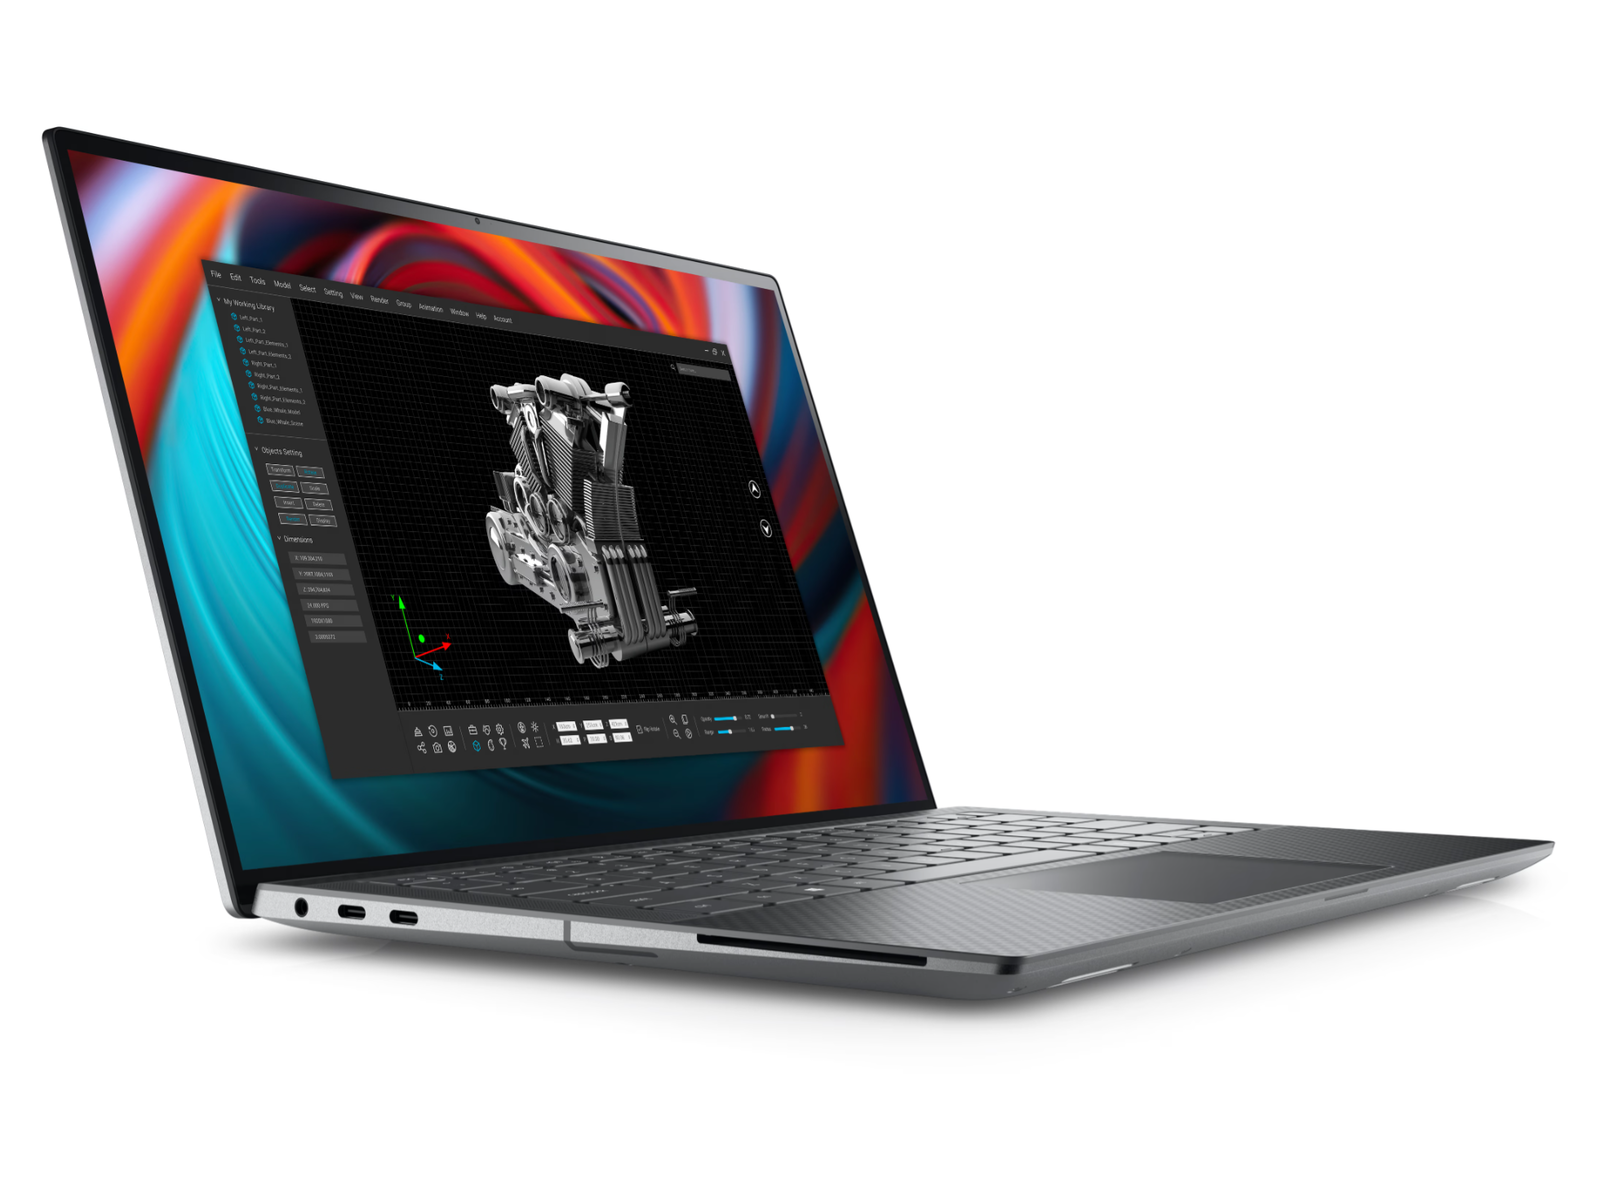
Case — Inspired By XPS
The easiest way to visually distinguish the Precision 5490 from the Precision 5480 or 5470 is to look for the new Co-Pilot key on the keyboard. Microsoft is requiring this dedicated key from all major manufacturers moving forward in order to better support upcoming Windows AI features. Otherwise, there are no other changes to the chassis. We recommend checking out our review on the Precision 5470 for more info.
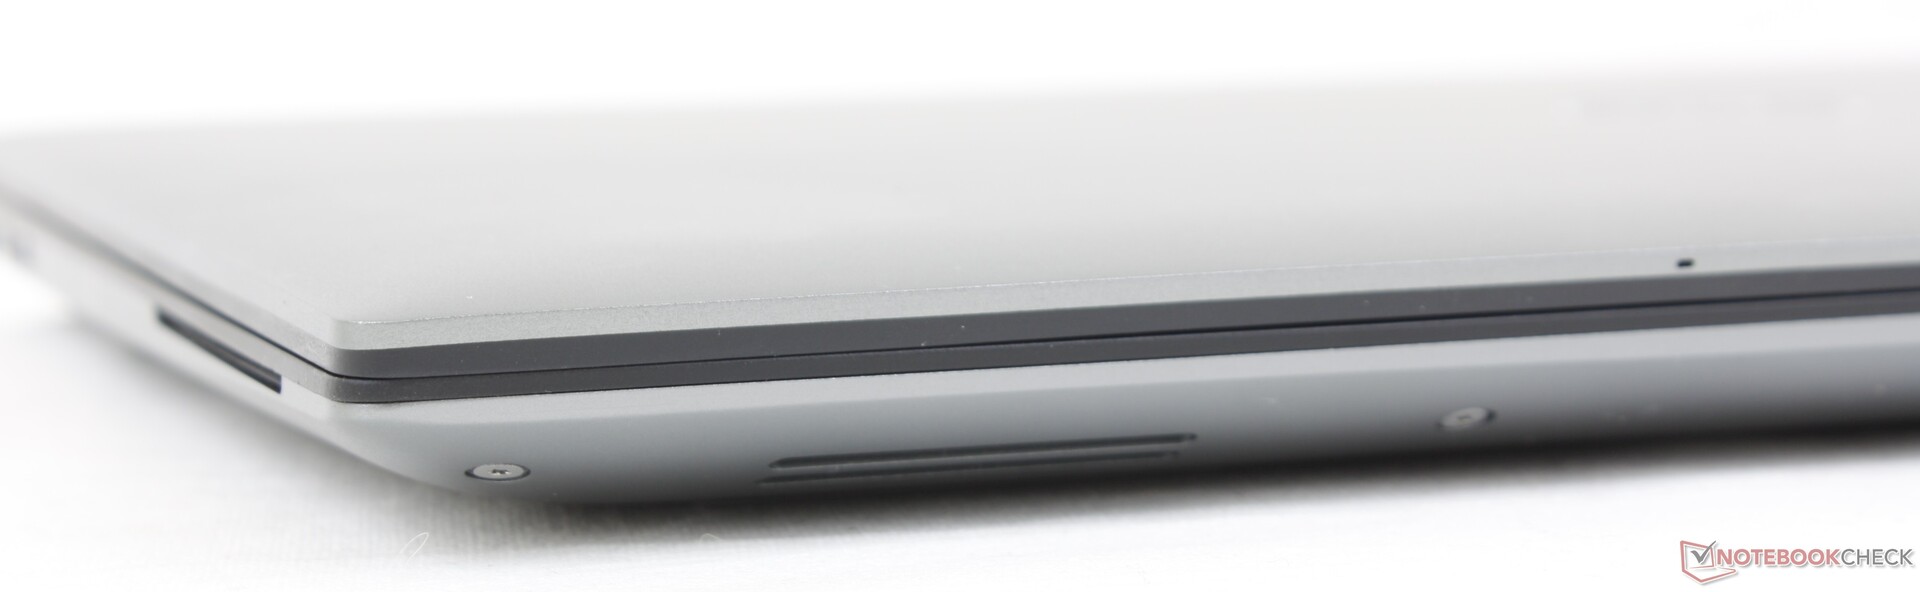
Note that the MicroSD card reader remains optional.
Connectivity
Communication
This year's model includes the Intel BE200 to be Wi-Fi 7 ready.
| Networking | |
| iperf3 transmit AXE11000 | |
| Dell Precision 5480 | |
| Dell Precision 5000 5490 | |
| HP ZBook Firefly 14 G10 A | |
| Lenovo ThinkPad P14s G4 21HF0017GE | |
| iperf3 receive AXE11000 | |
| HP ZBook Firefly 14 G10 A | |
| Lenovo ThinkPad P14s G4 21HF0017GE | |
| Dell Precision 5480 | |
| Dell Precision 5000 5490 | |
| iperf3 transmit AXE11000 6GHz | |
| Dell Precision 5000 5490 | |
| Dell Precision 5480 | |
| Dell Precision 5000 5470 | |
| Lenovo ThinkPad P14s G4 21HF0017GE | |
| iperf3 receive AXE11000 6GHz | |
| Lenovo ThinkPad P14s G4 21HF0017GE | |
| Dell Precision 5000 5490 | |
| Dell Precision 5480 | |
| Dell Precision 5000 5470 | |
Webcam


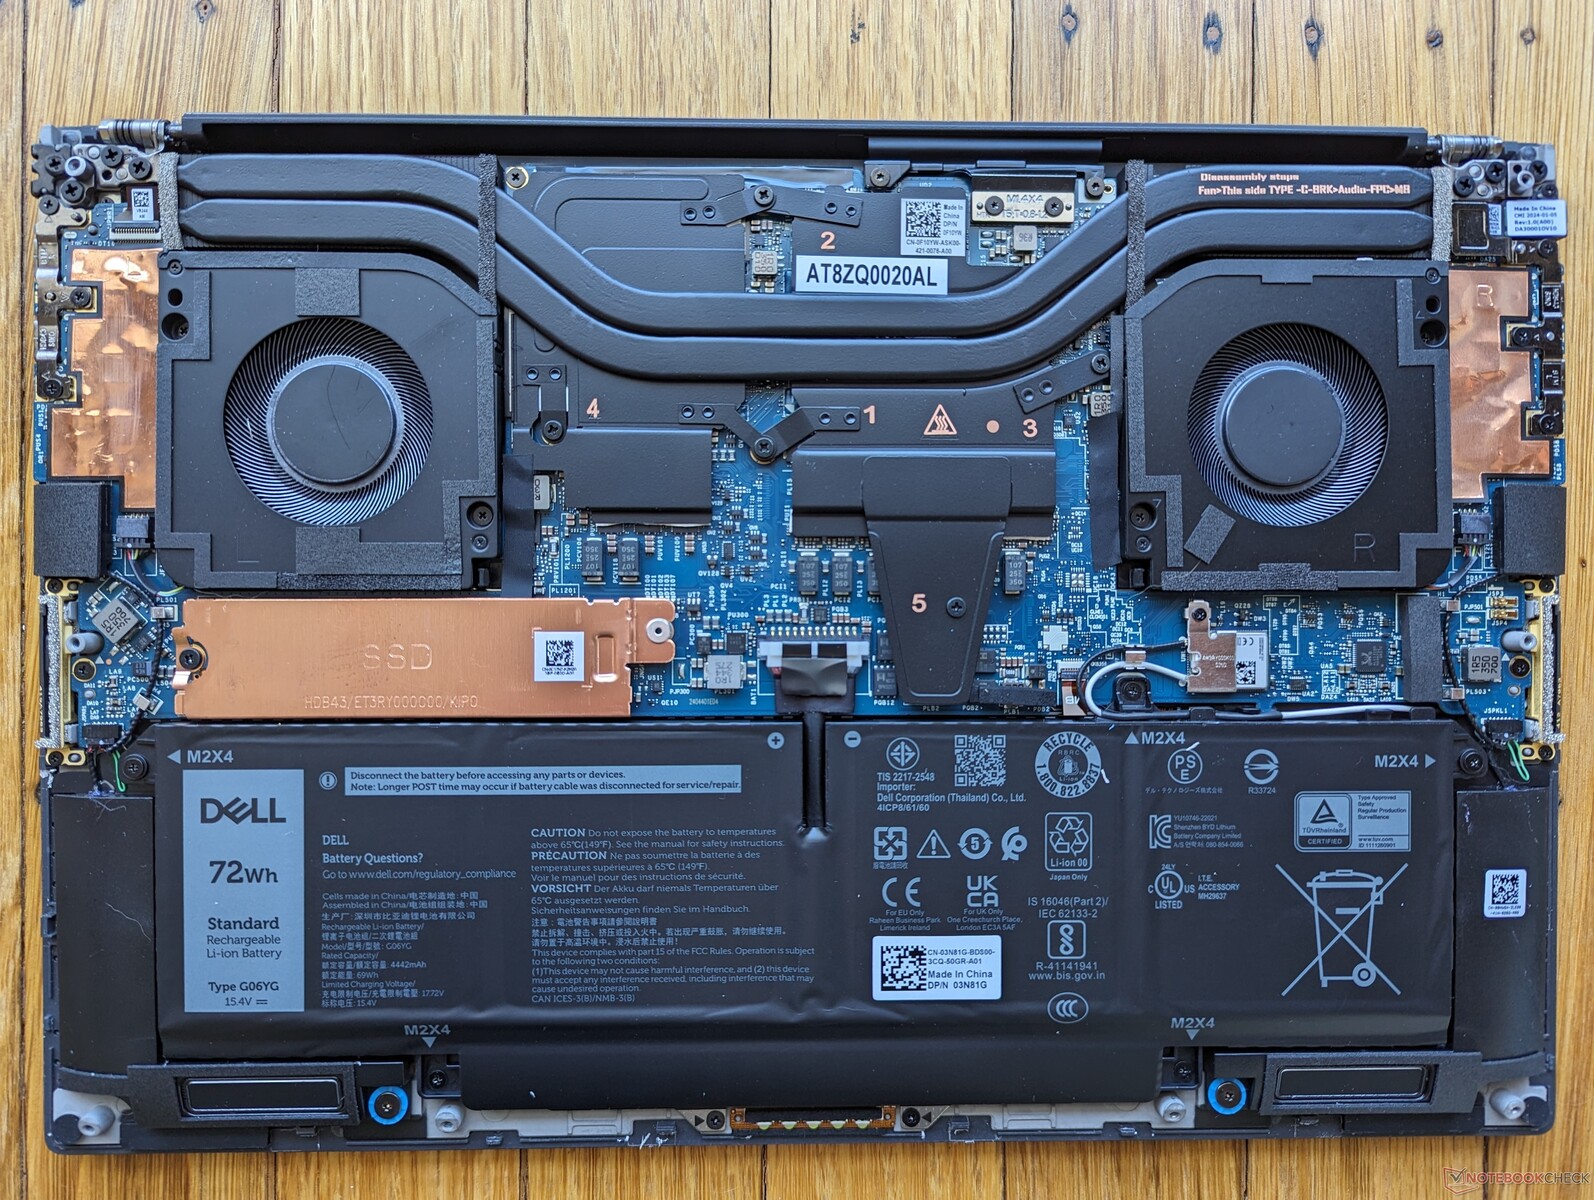
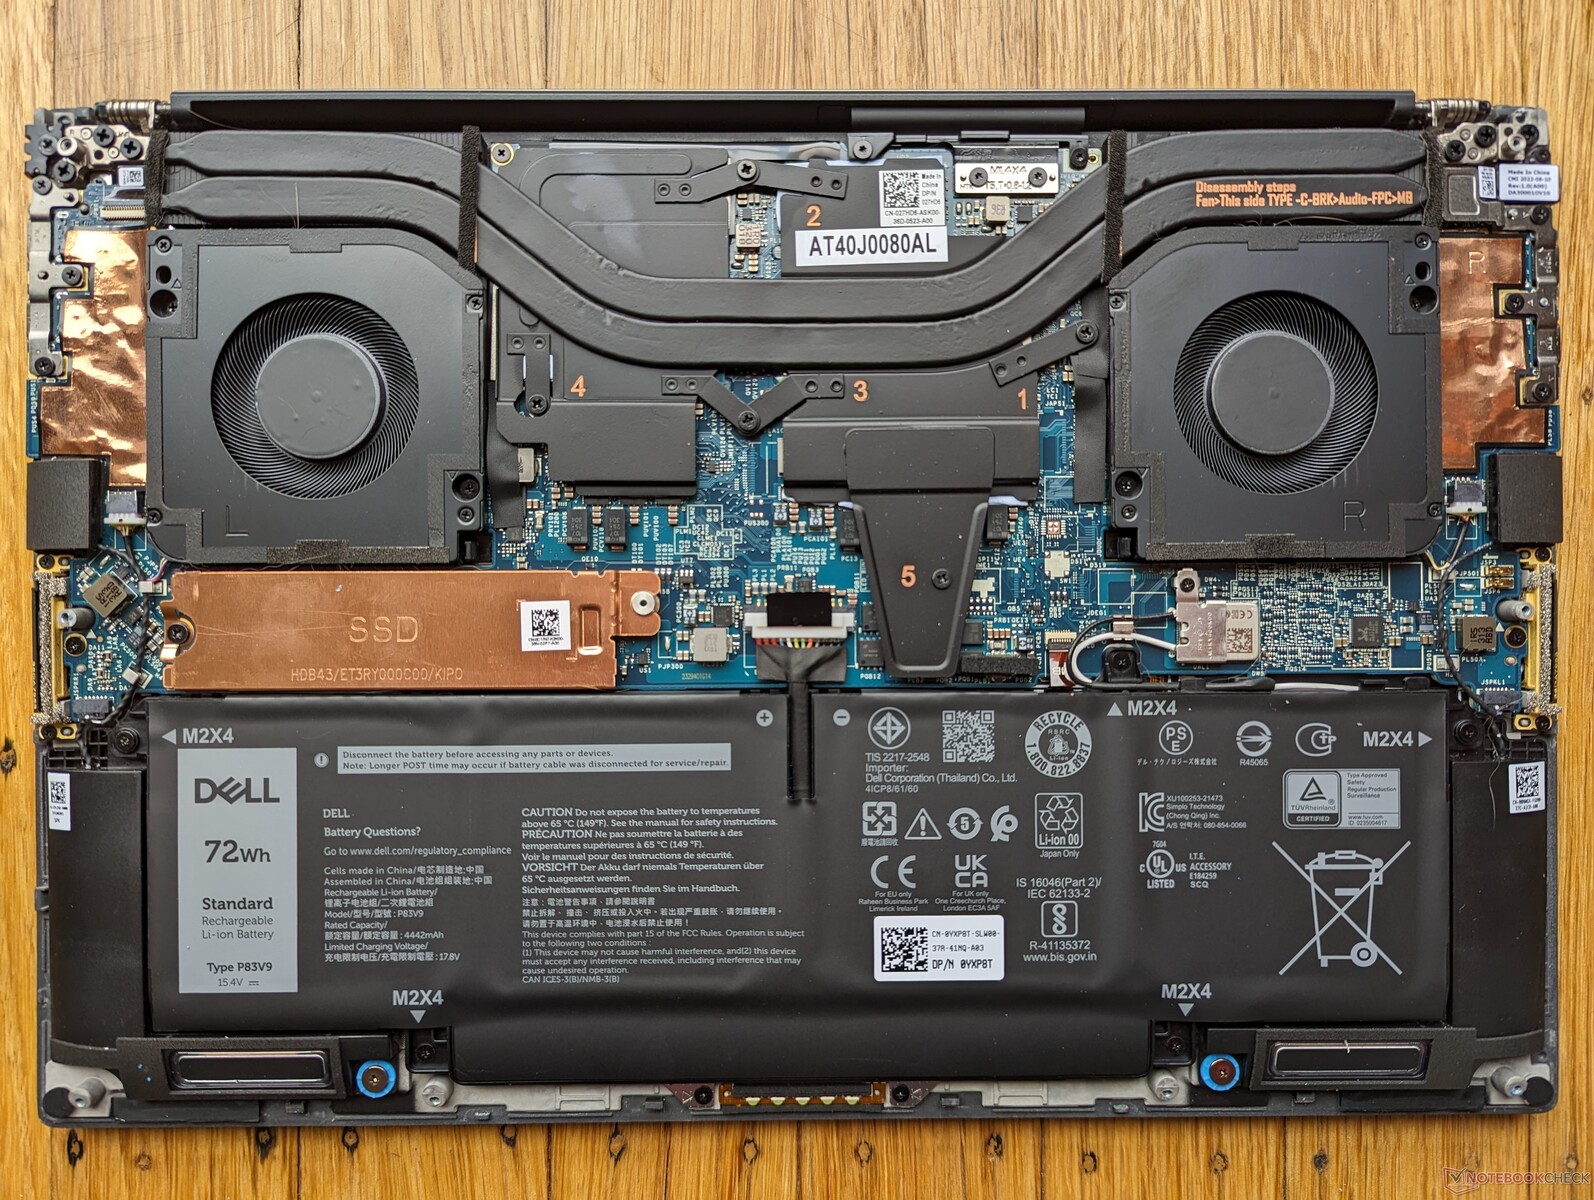
Maintenance
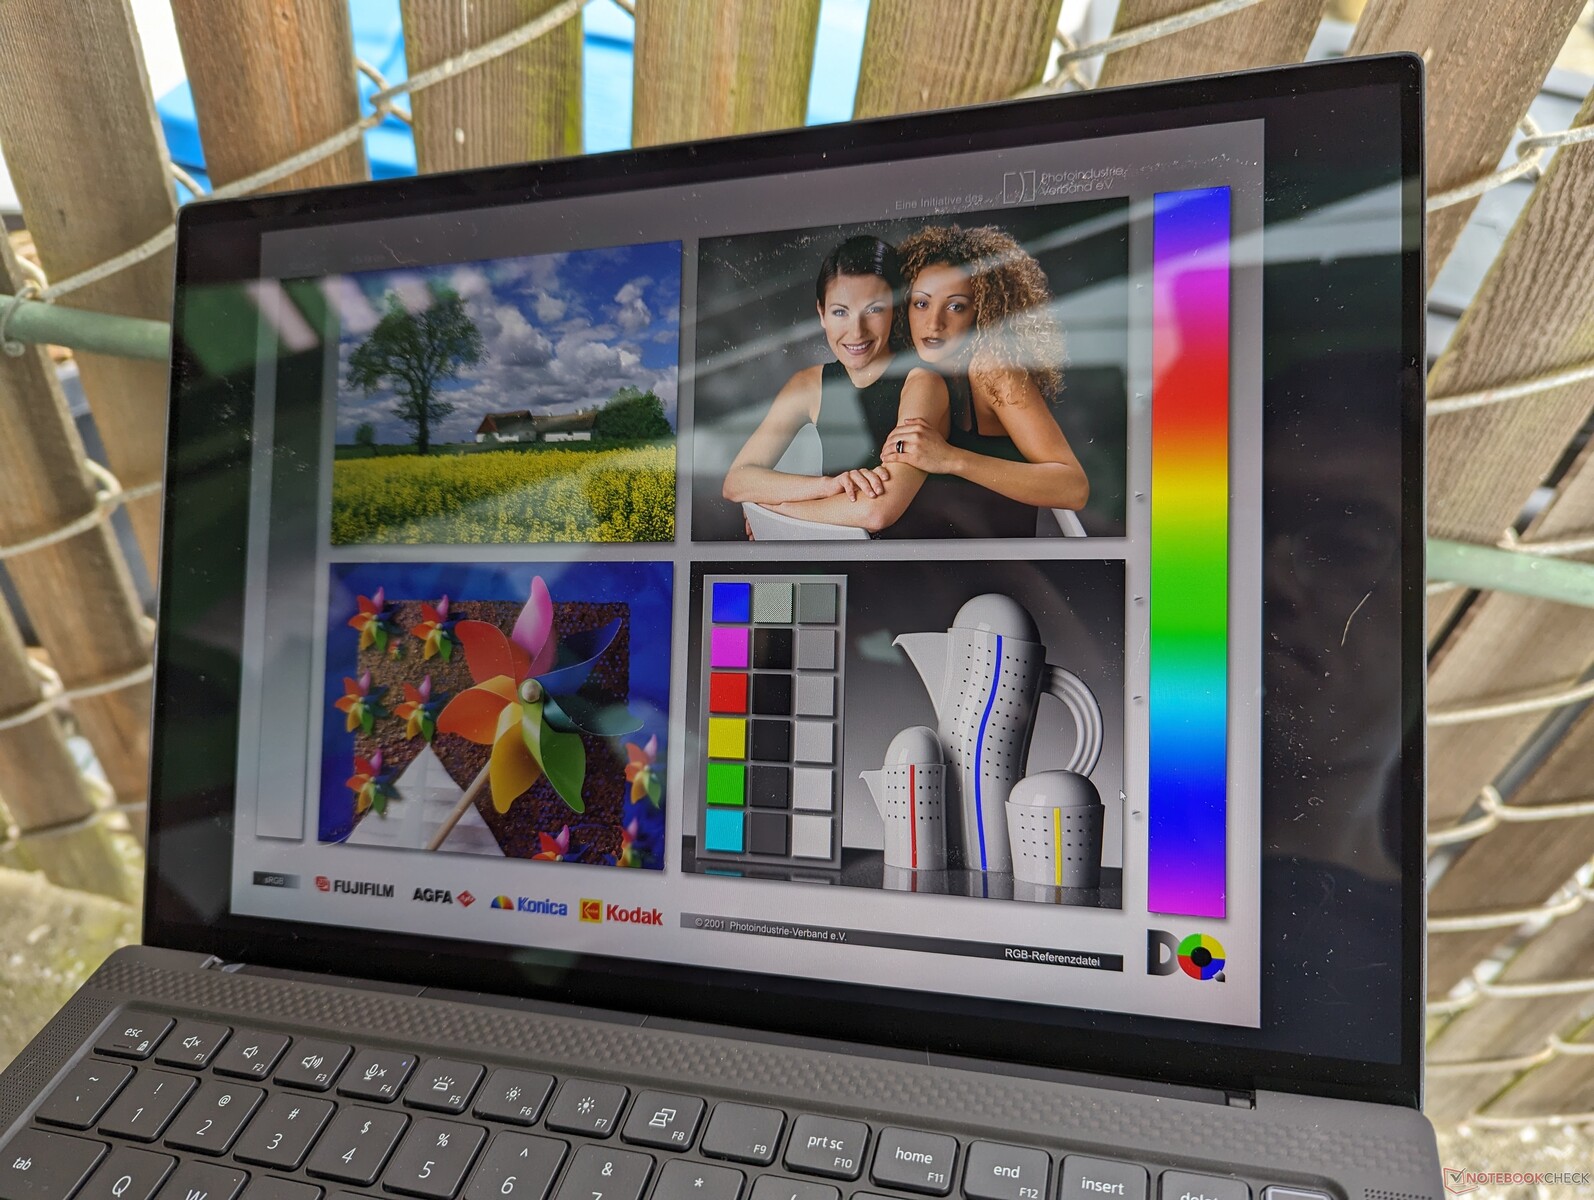
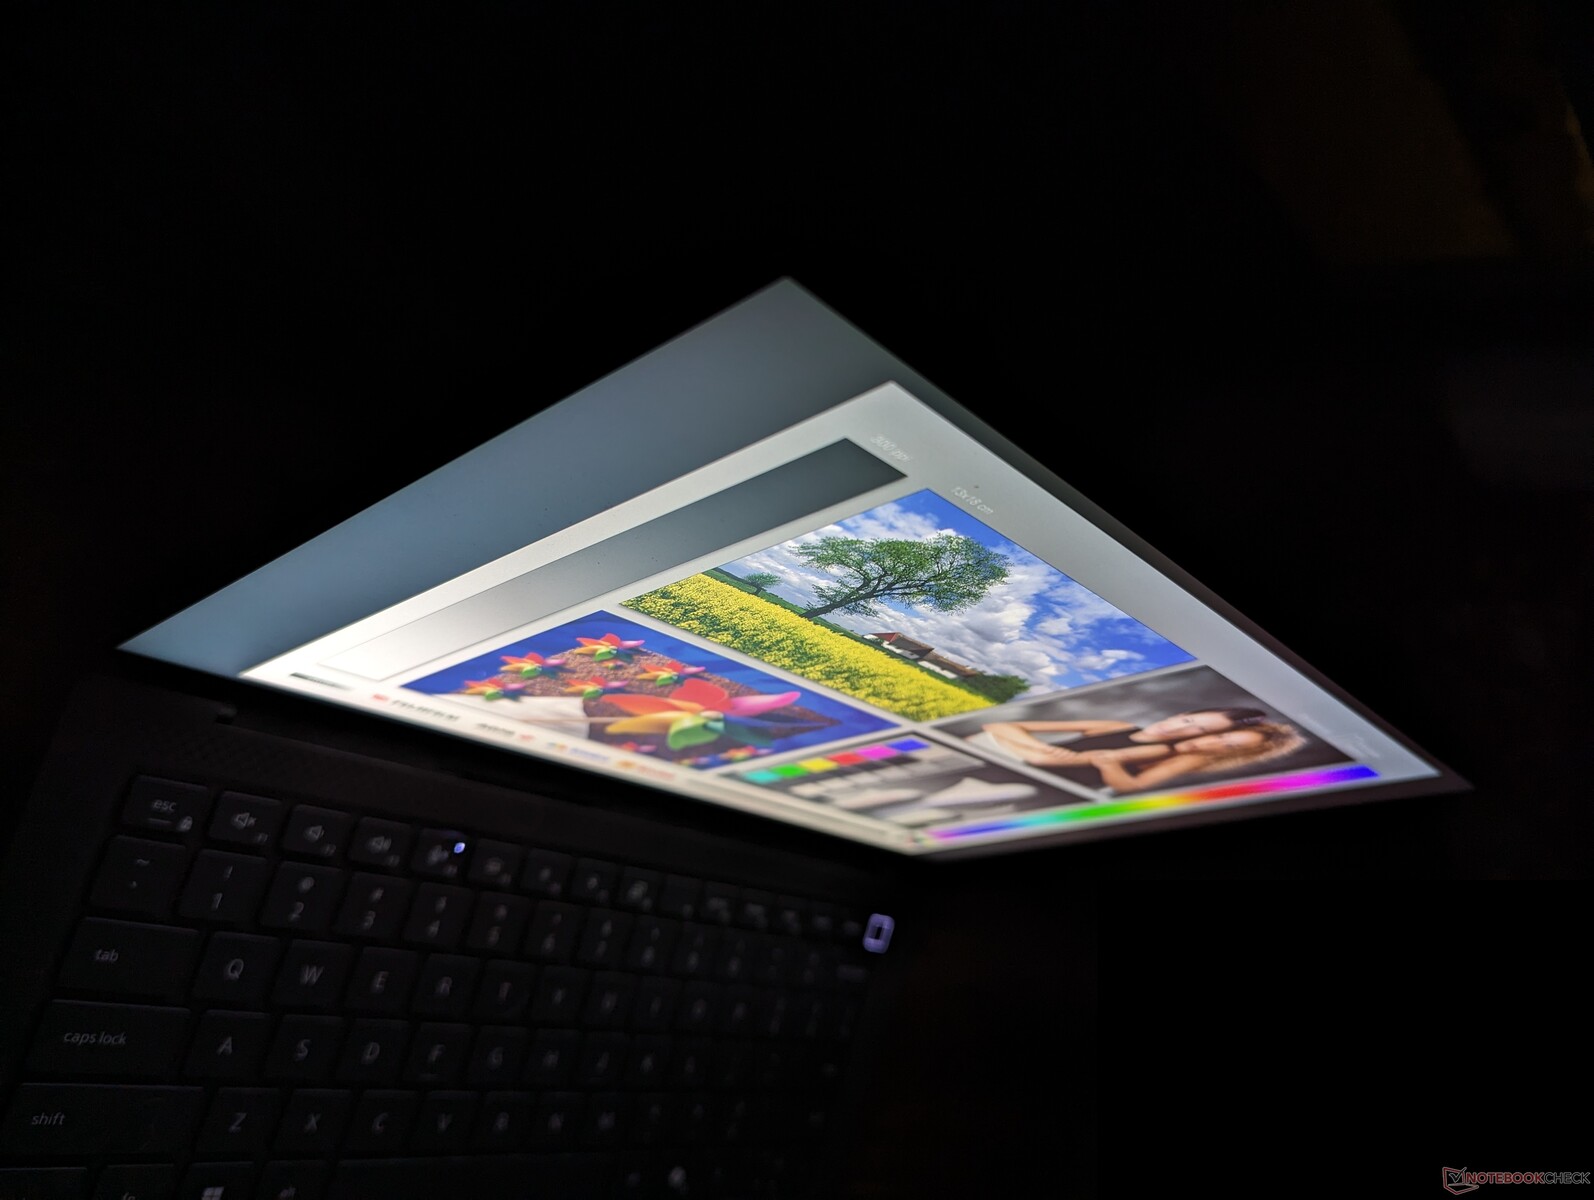
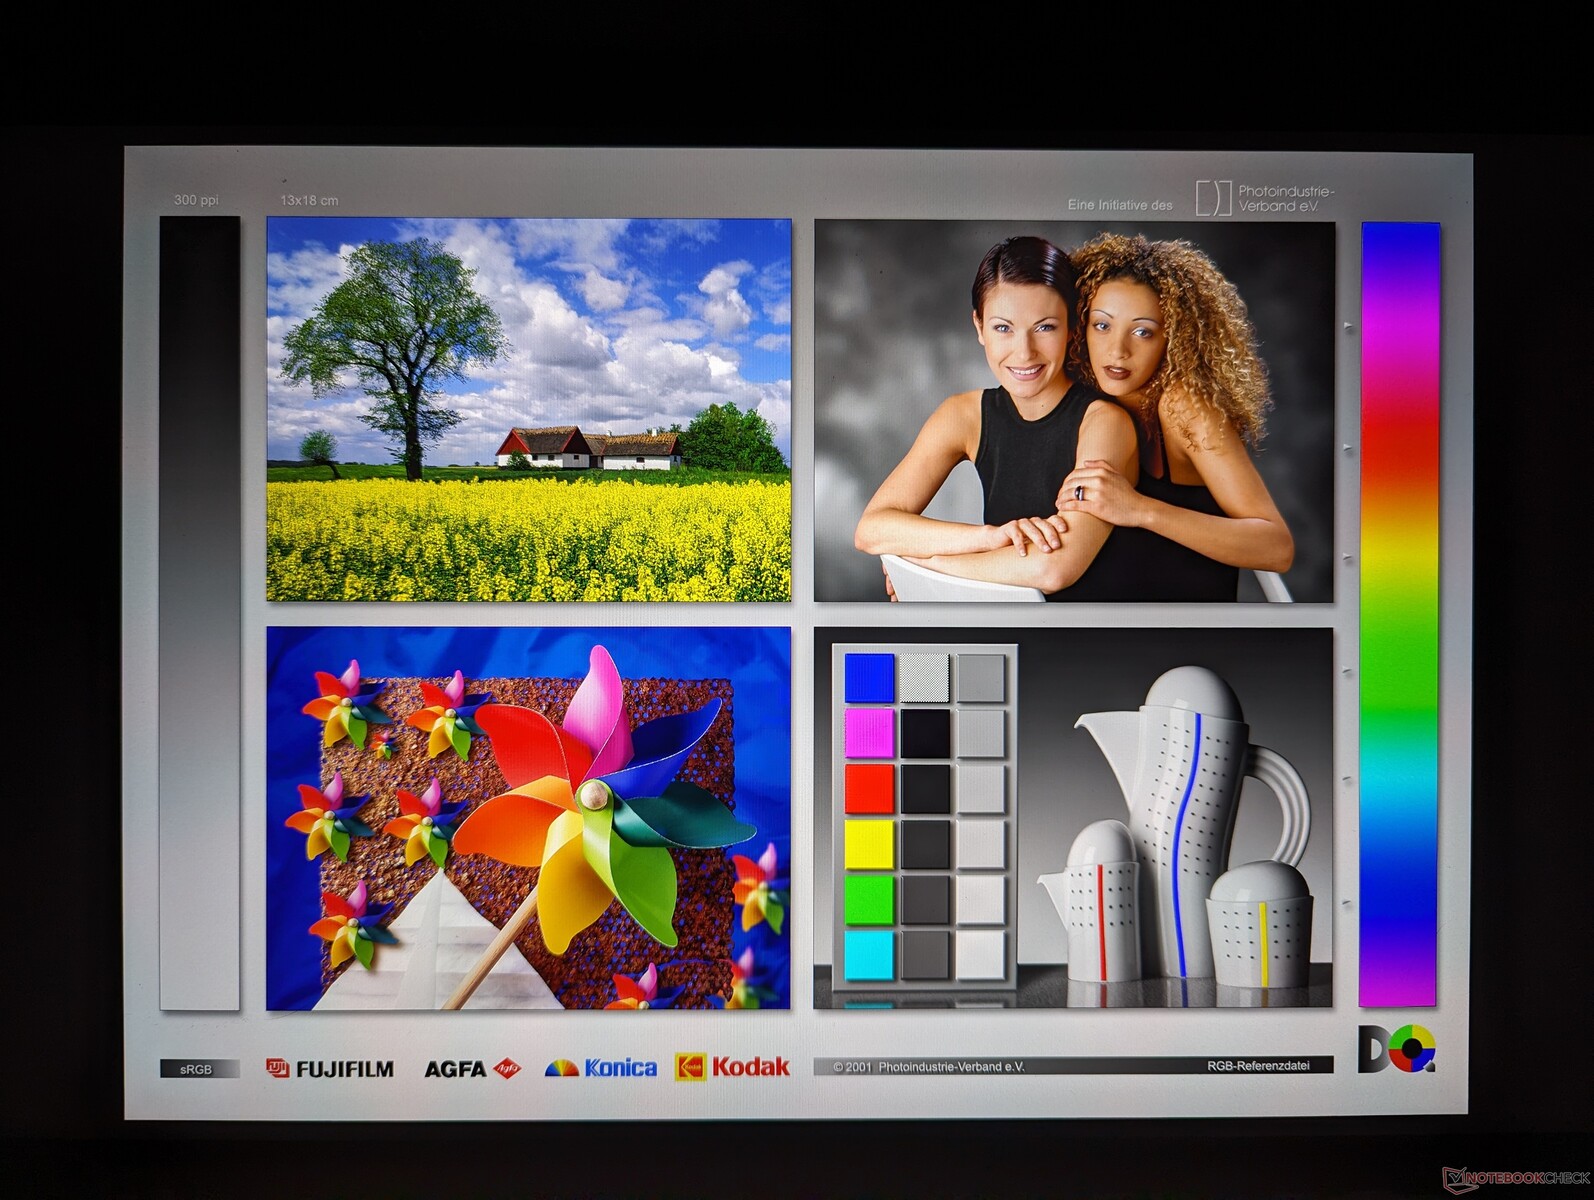
Display — Good Ol' IPS
AU Optronics is once again the supplier for the QHD+ panel for the third year in a row. While it was outstanding when it first launched for the Precision 5470, the panel is now starting to show its age in the face of newer OLED and higher refresh rate alternatives. The Lenovo ThinkPad P14s G4, for example, ships with an 1800p OLED option which is not available on the Precision 5490.

| |||||||||||||||||||||||||
Brightness Distribution: 90 %
Center on Battery: 485.1 cd/m²
Contrast: 1277:1 (Black: 0.38 cd/m²)
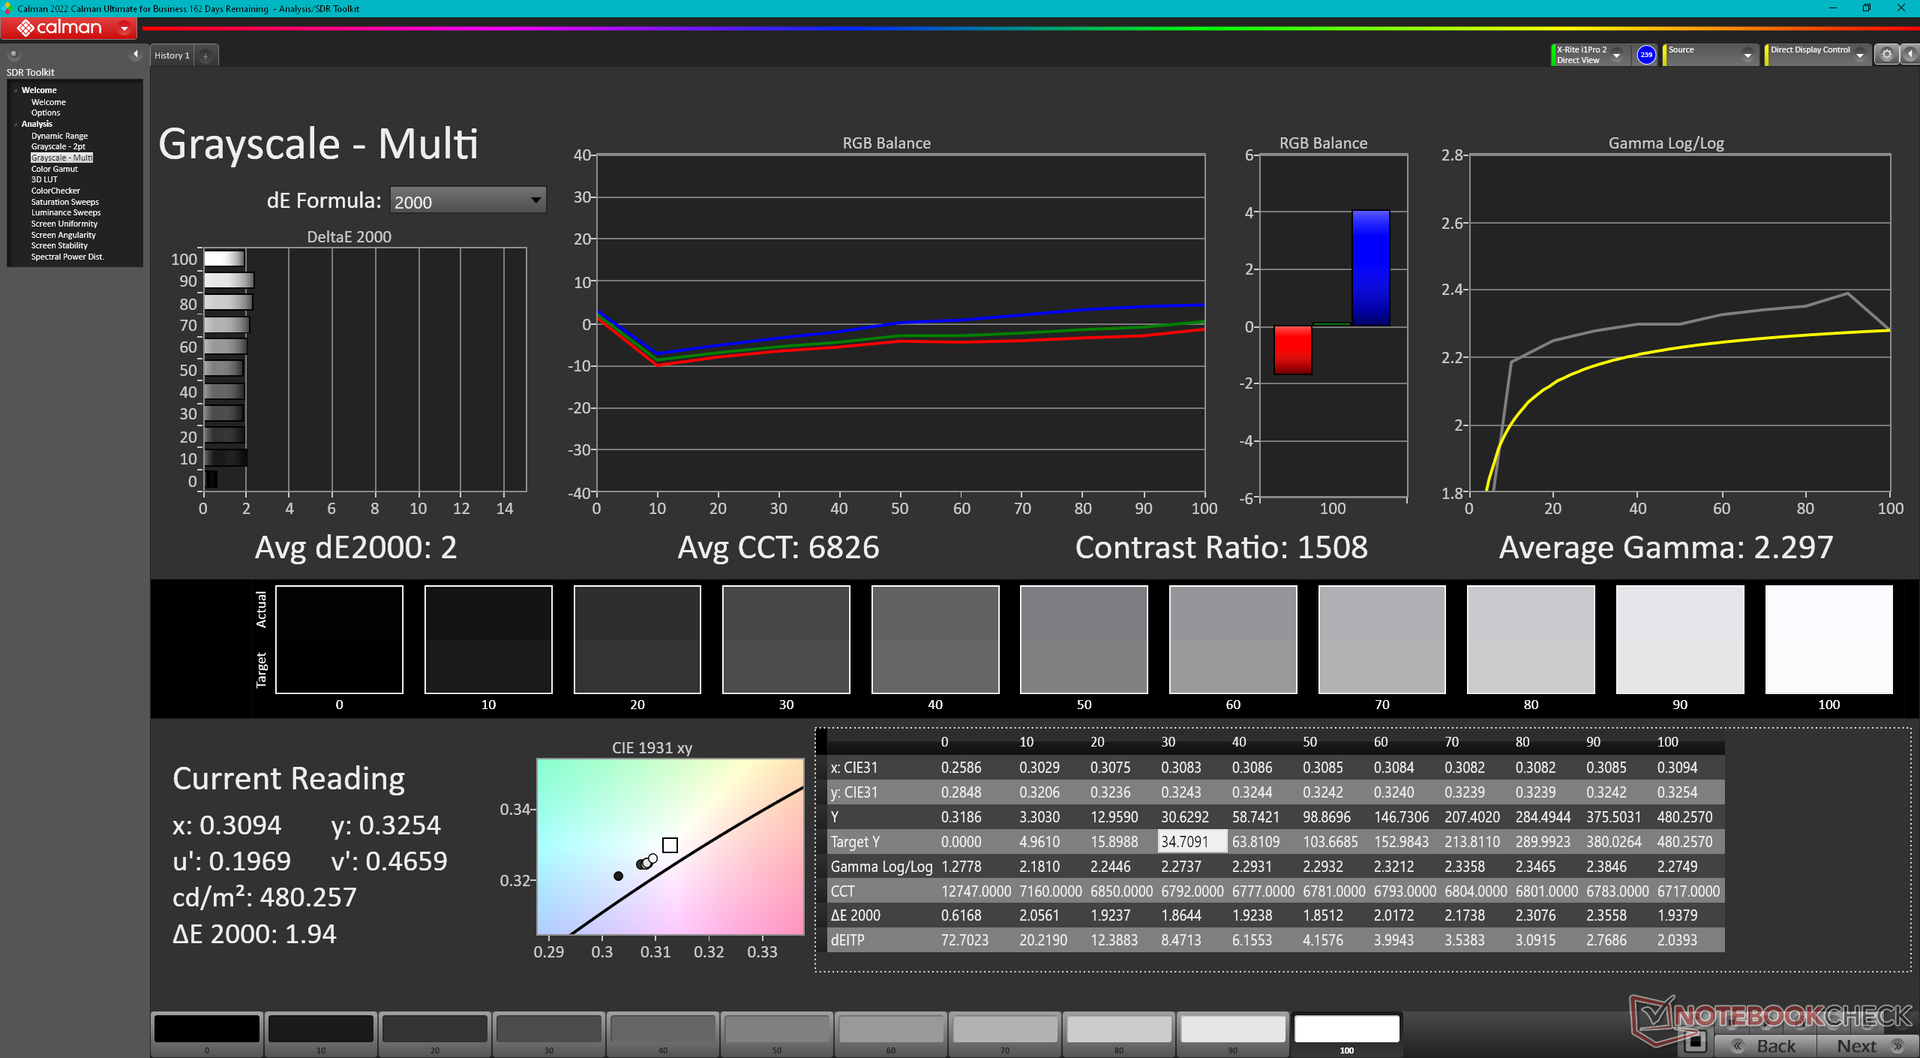
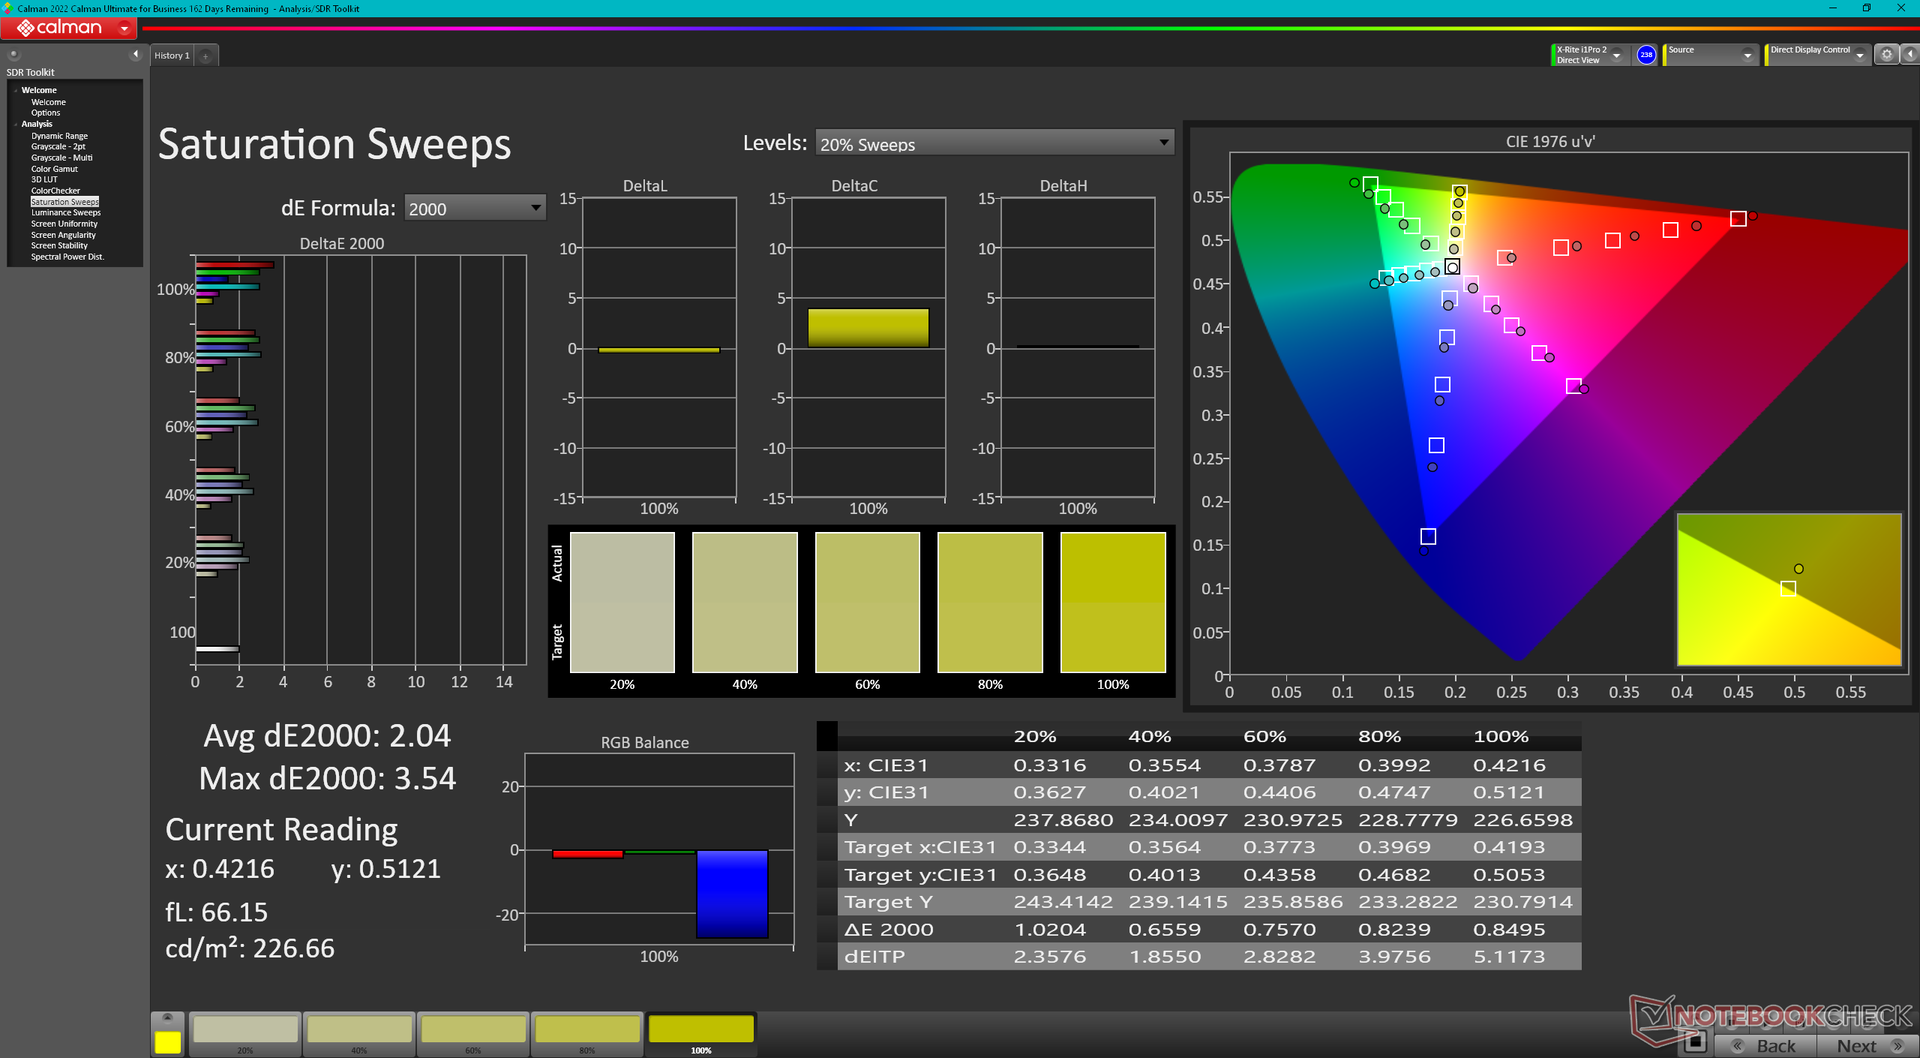
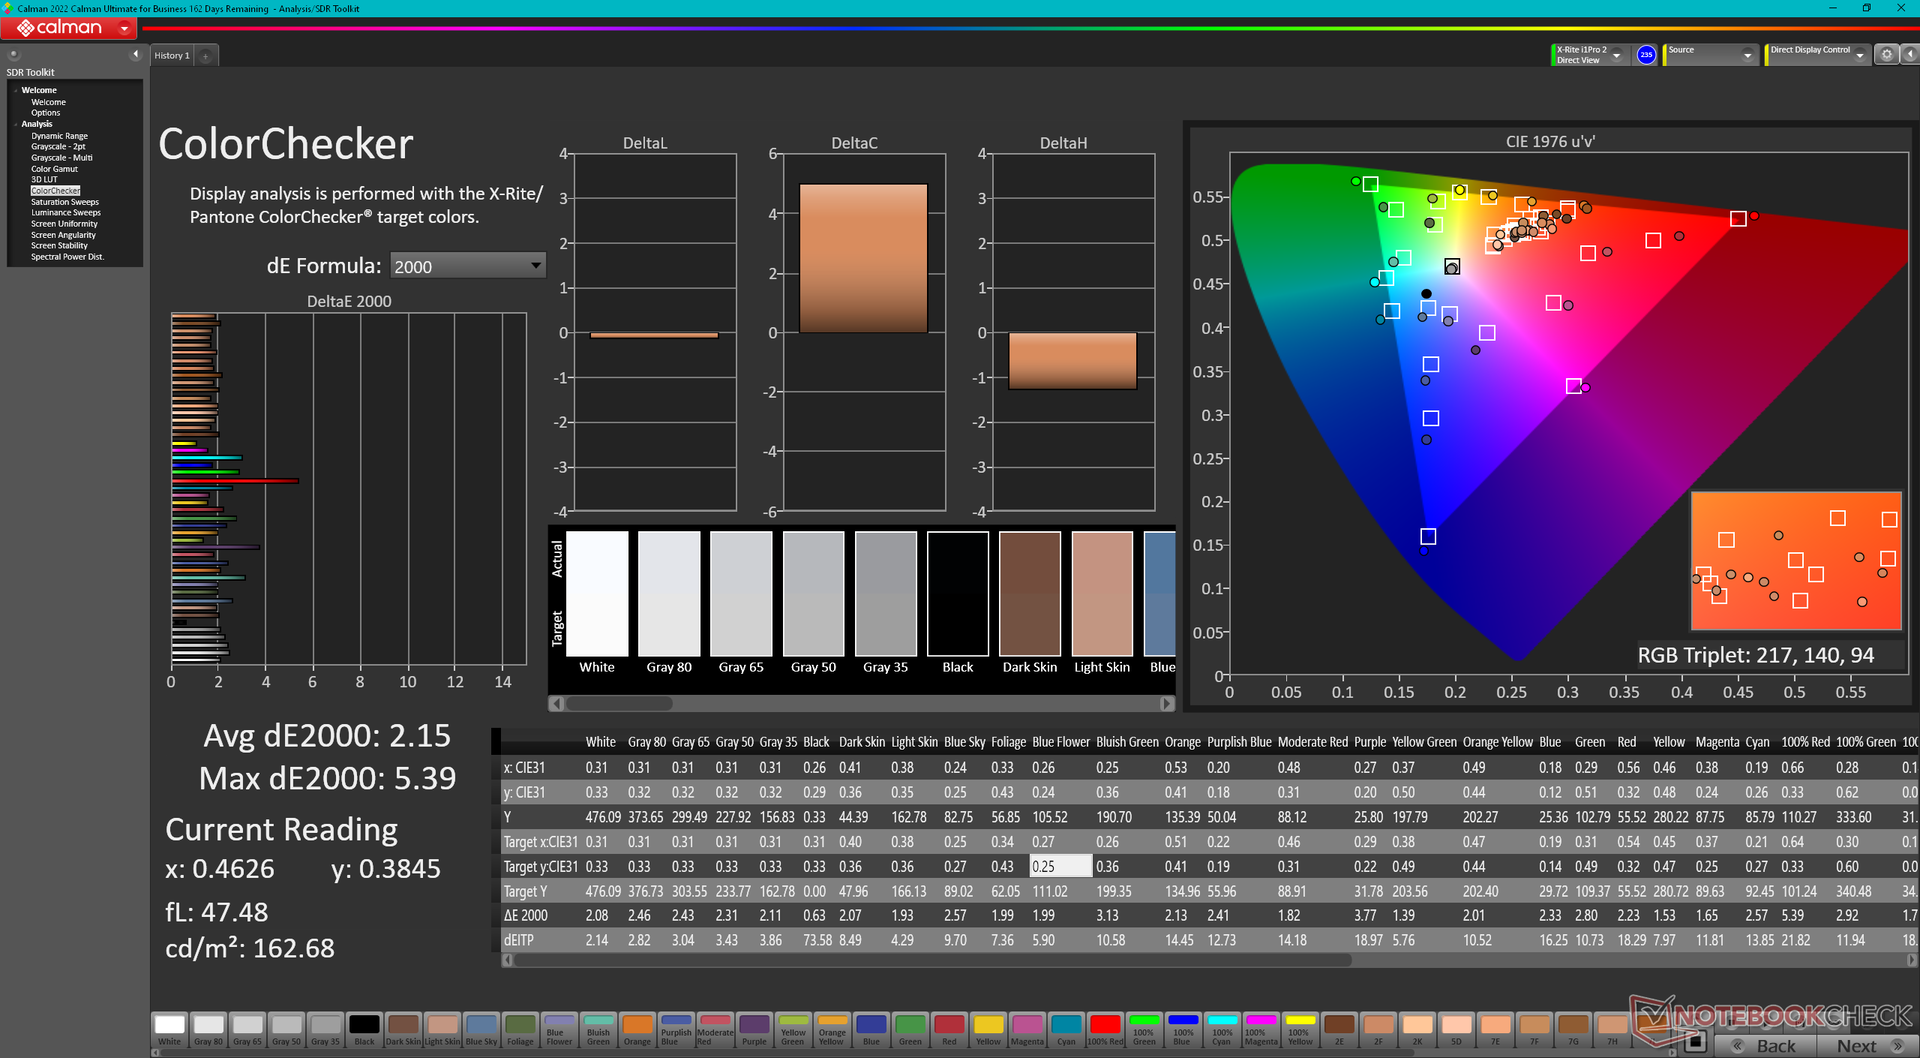
ΔE ColorChecker Calman: 2.15 | ∀{0.5-29.43 Ø4.72}
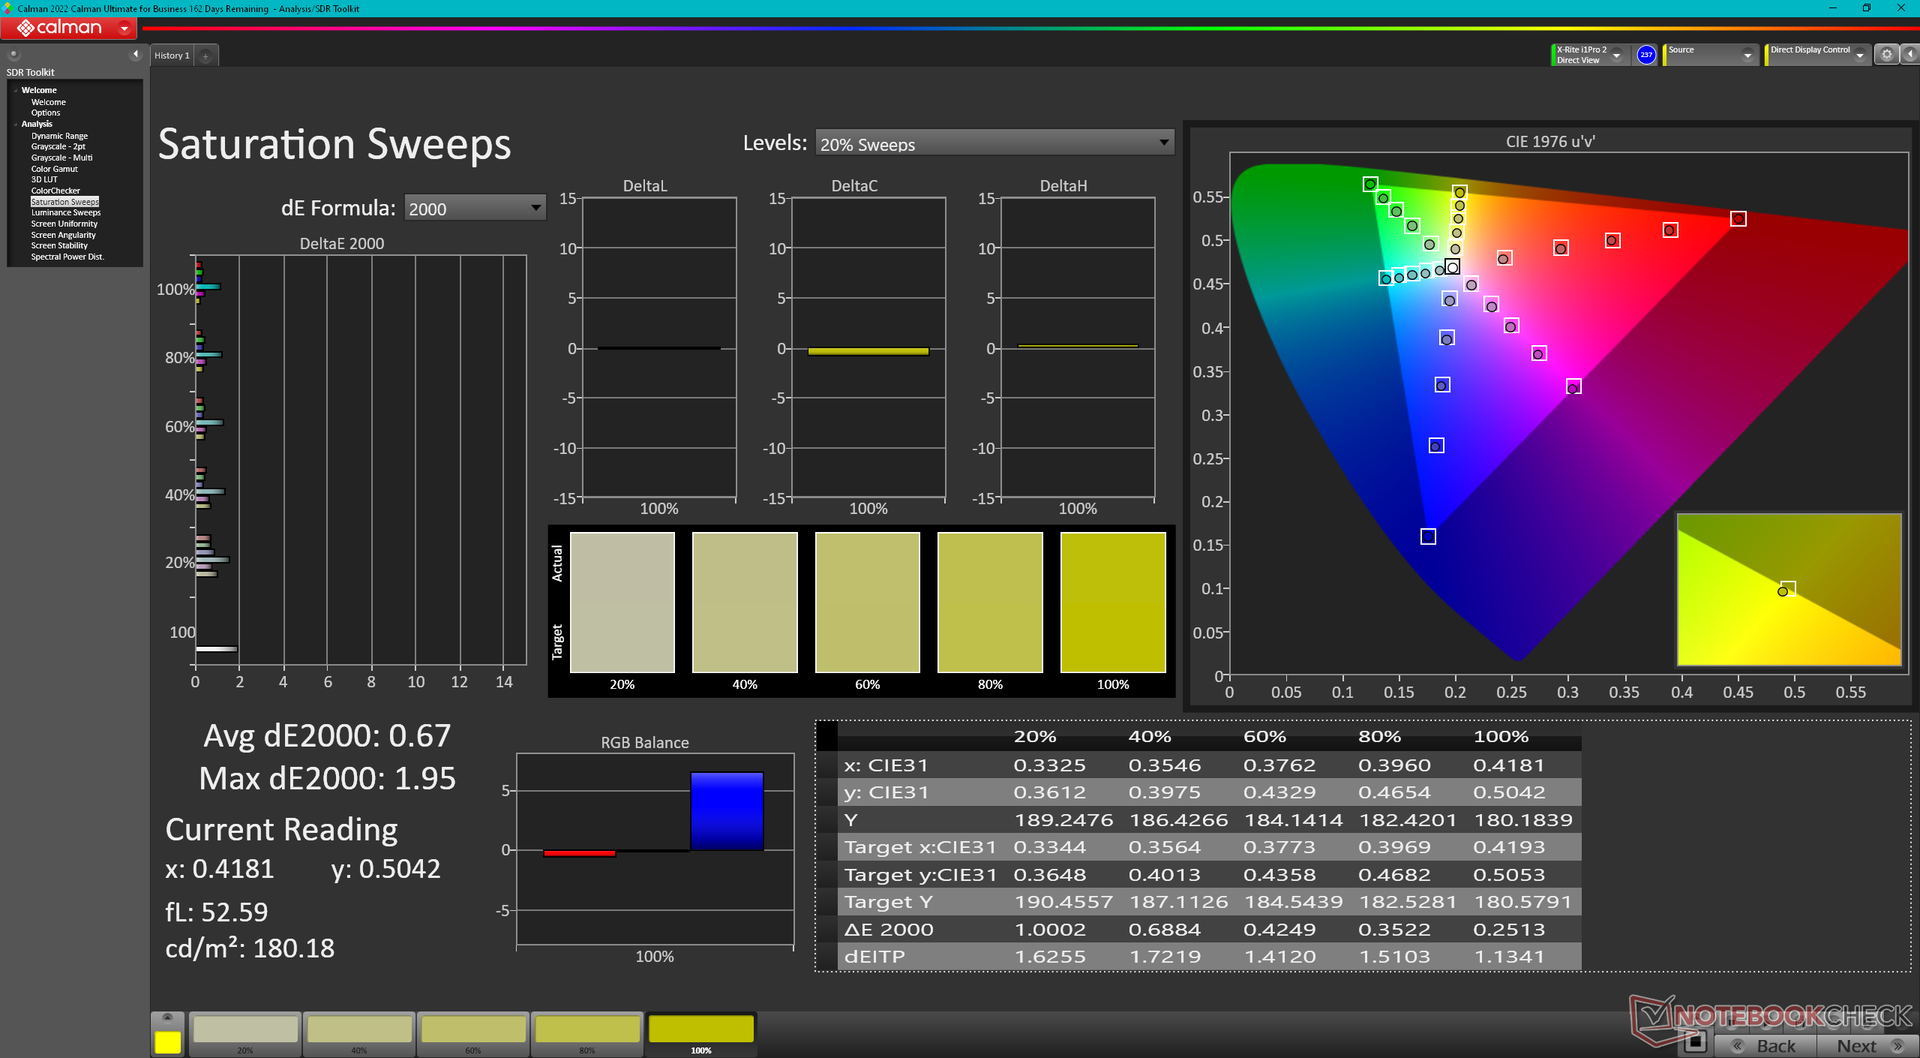
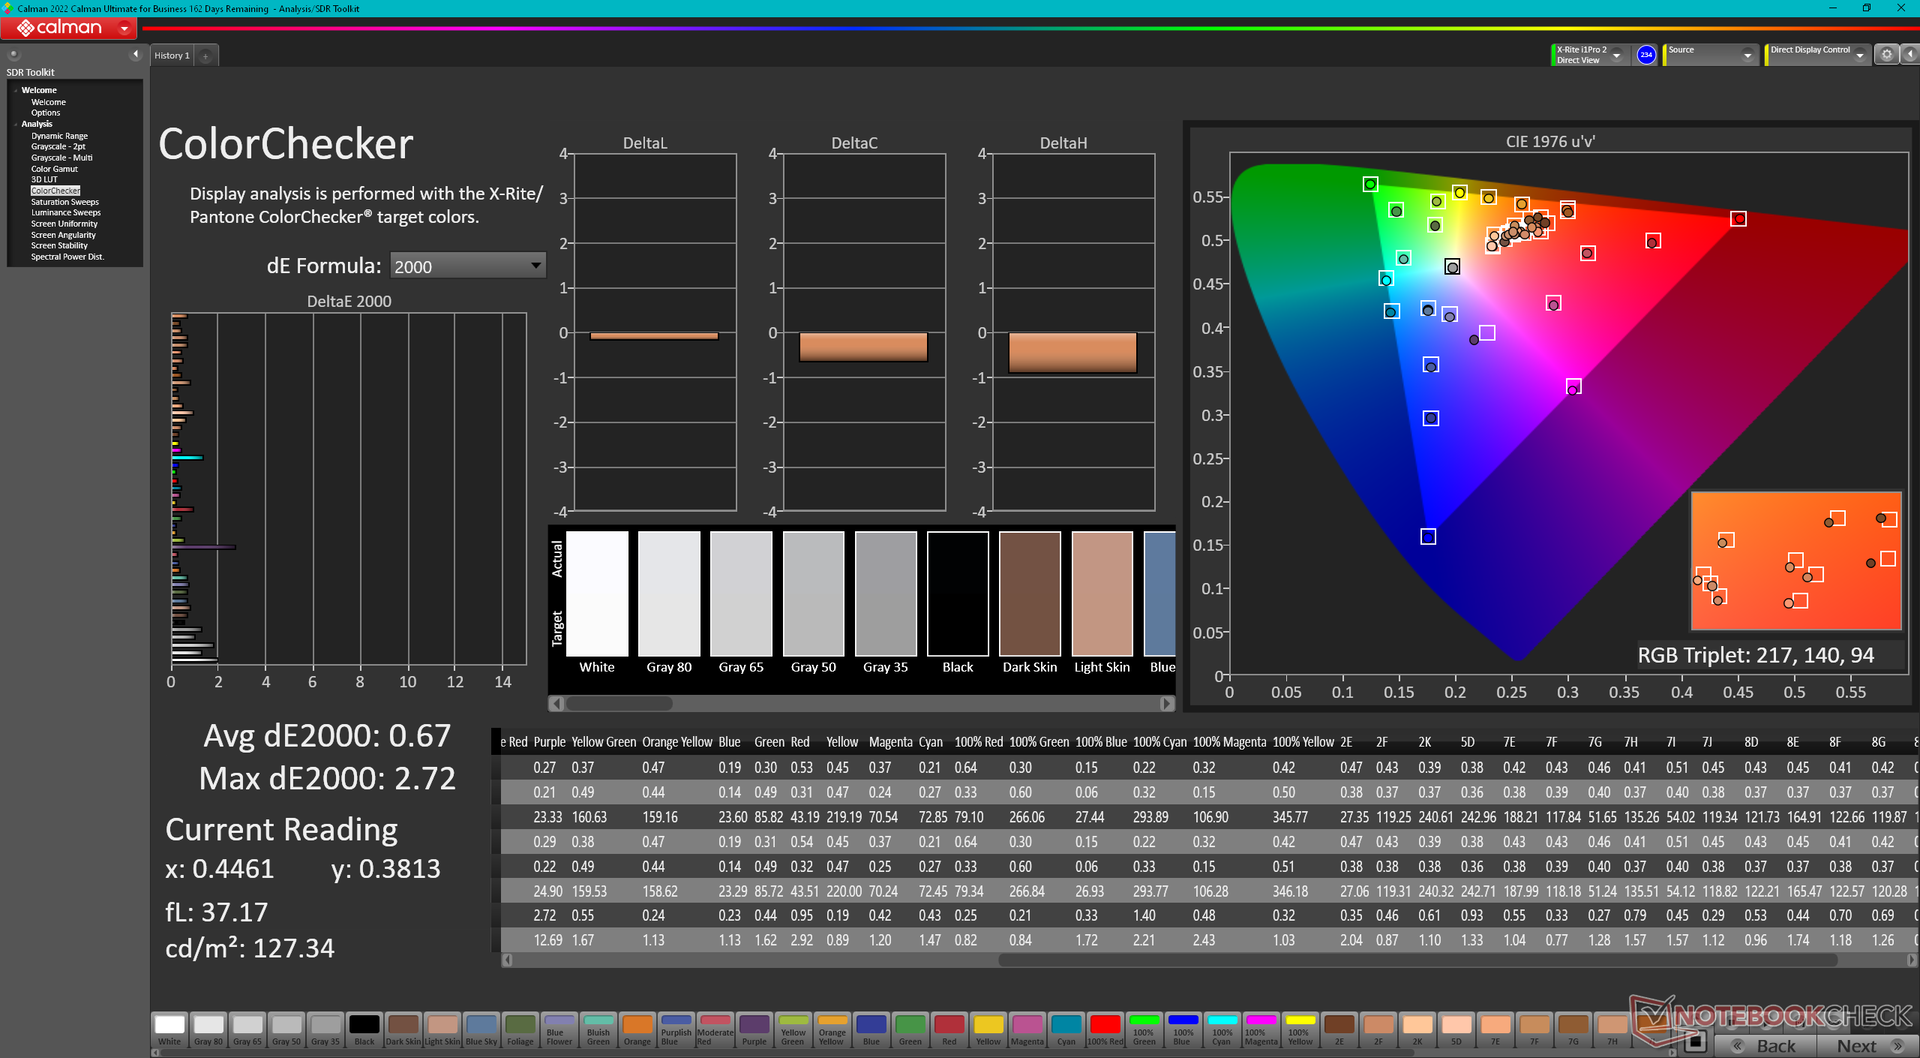
calibrated: 0.67
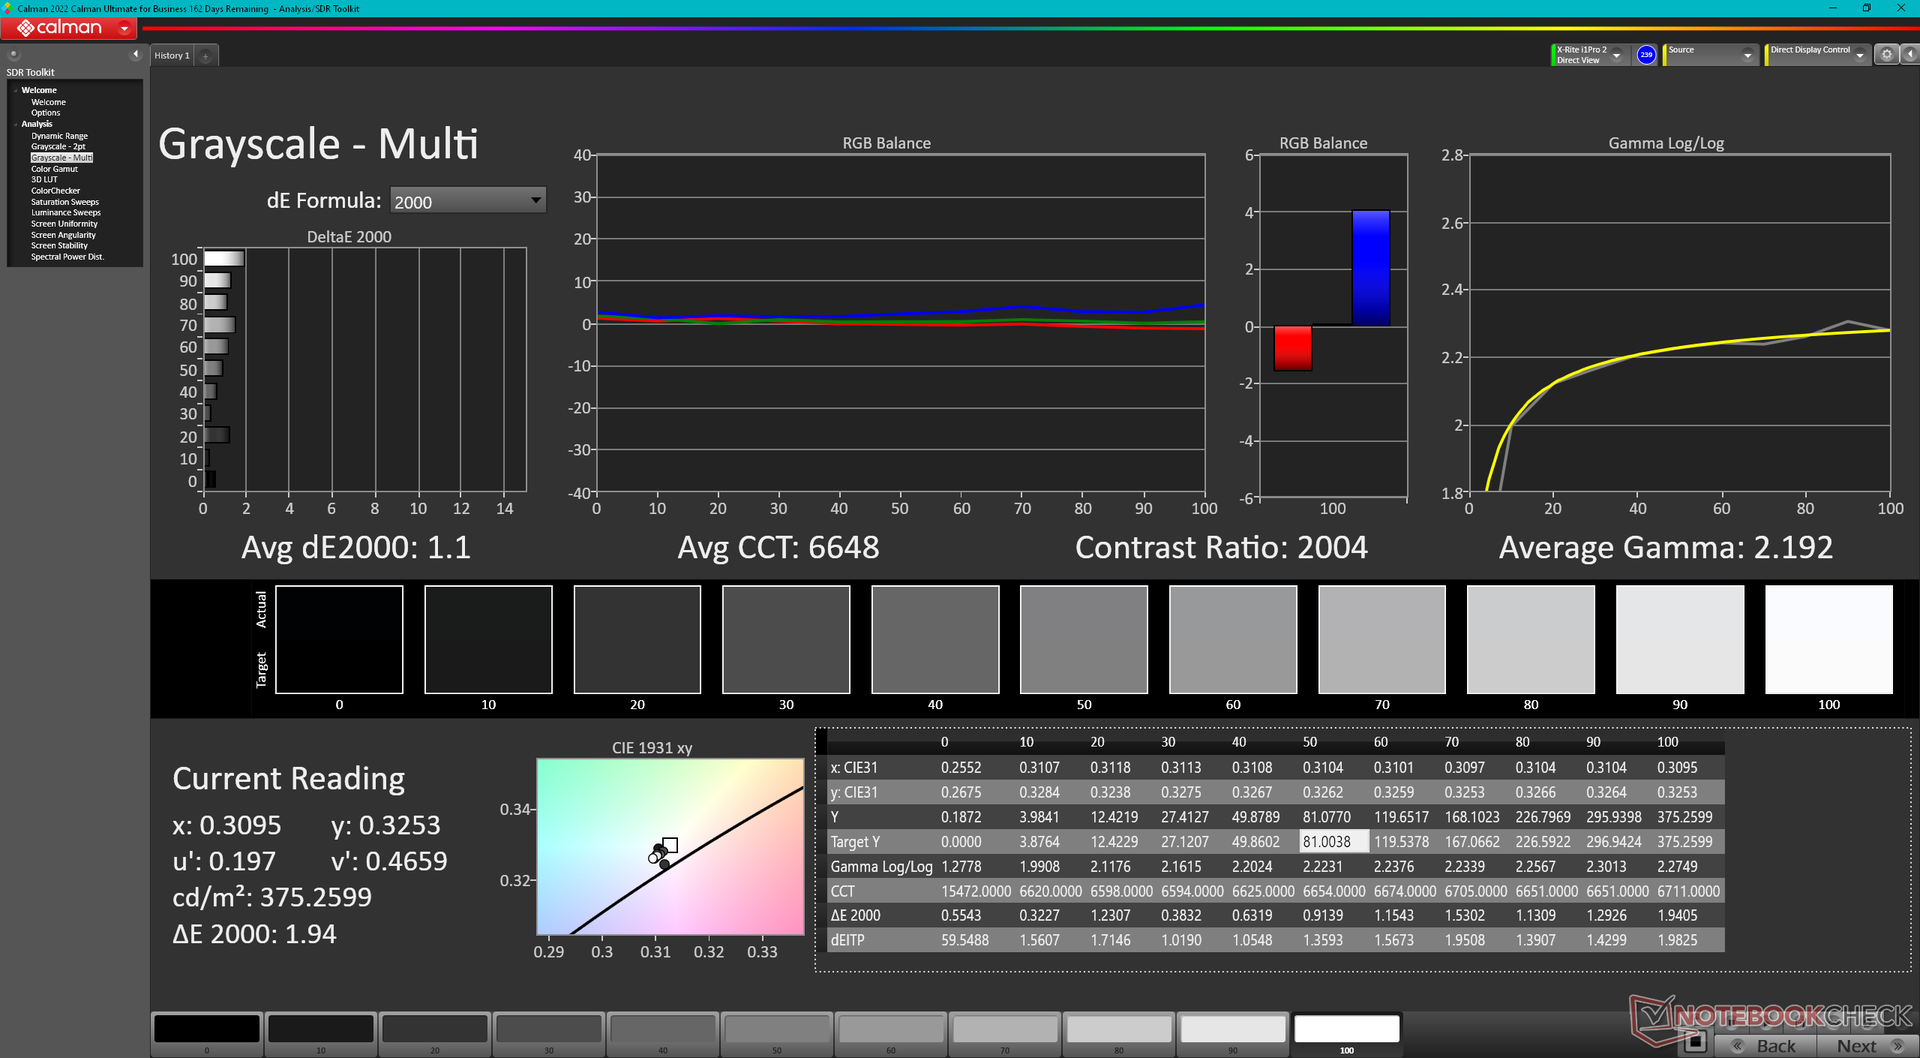
ΔE Greyscale Calman: 2 | ∀{0.09-98 Ø4.97}
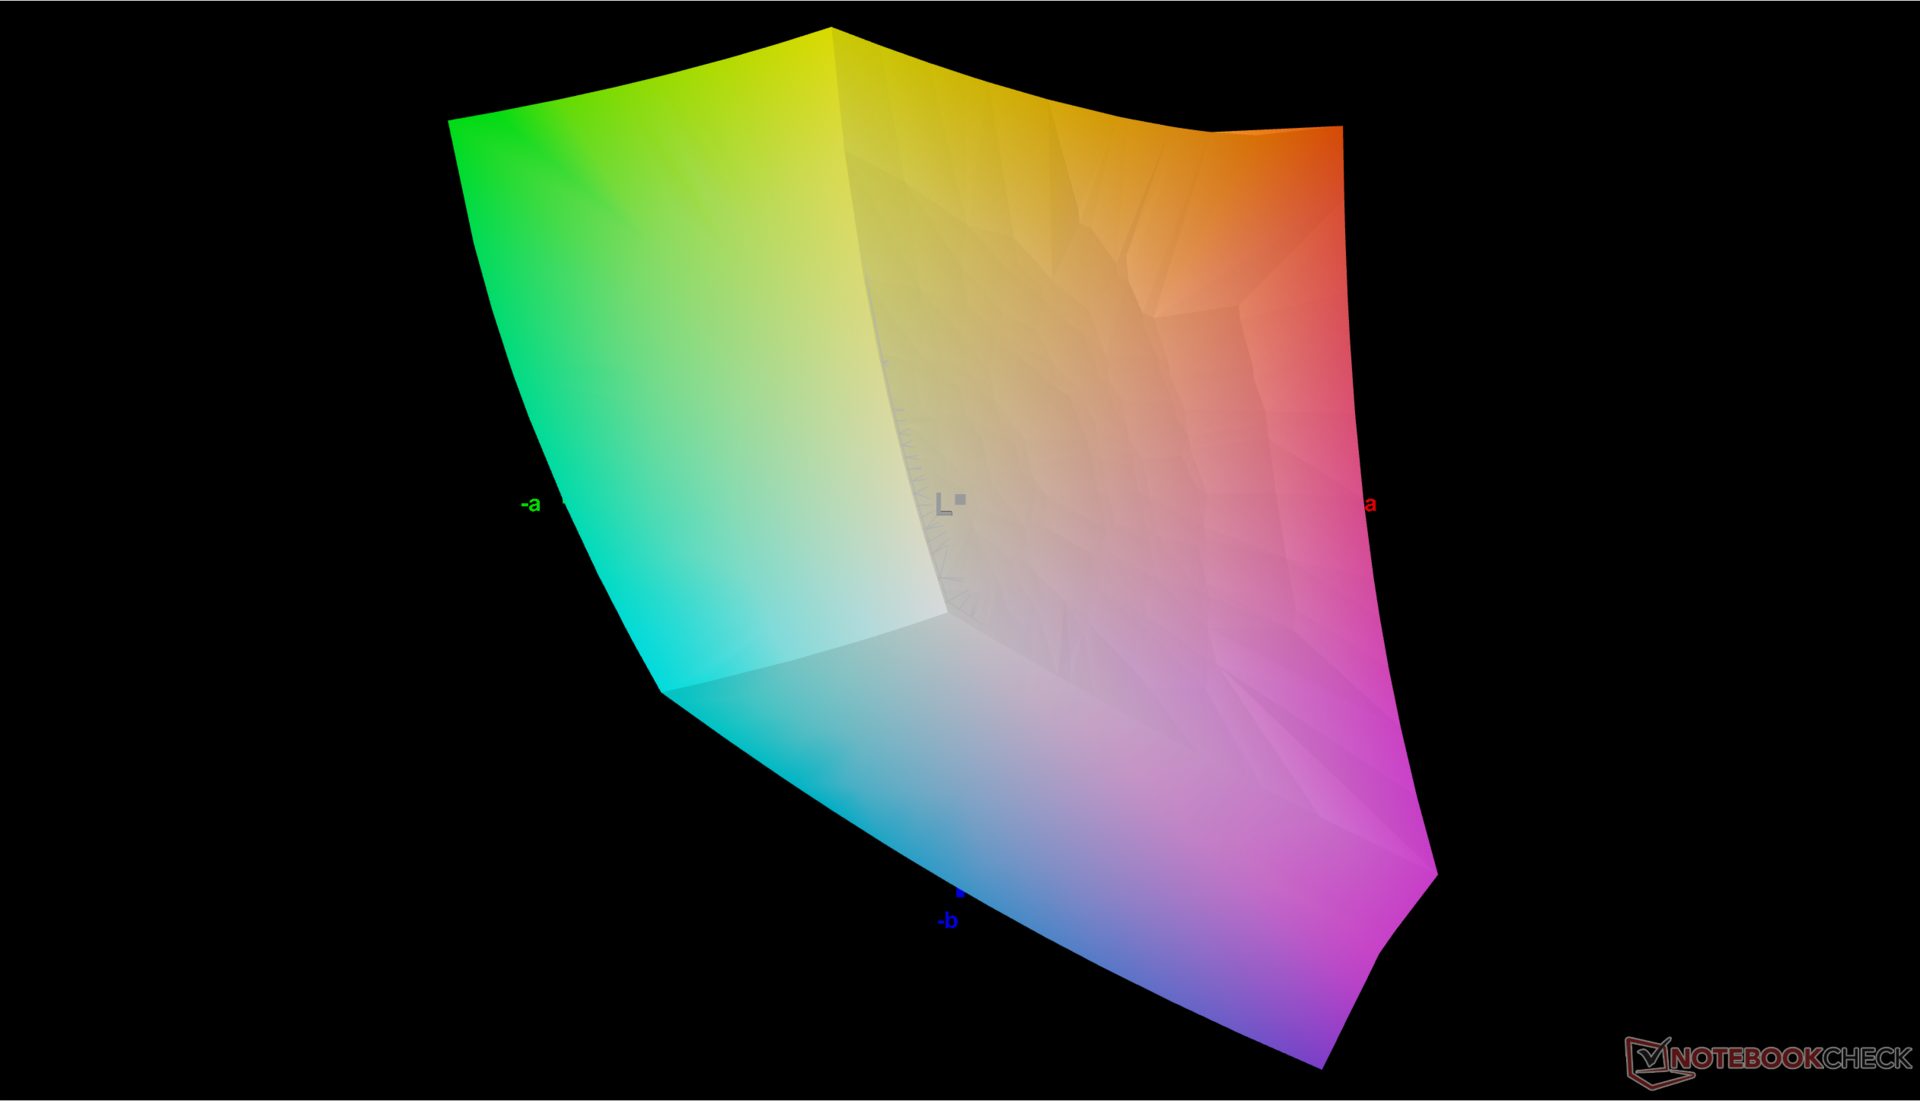
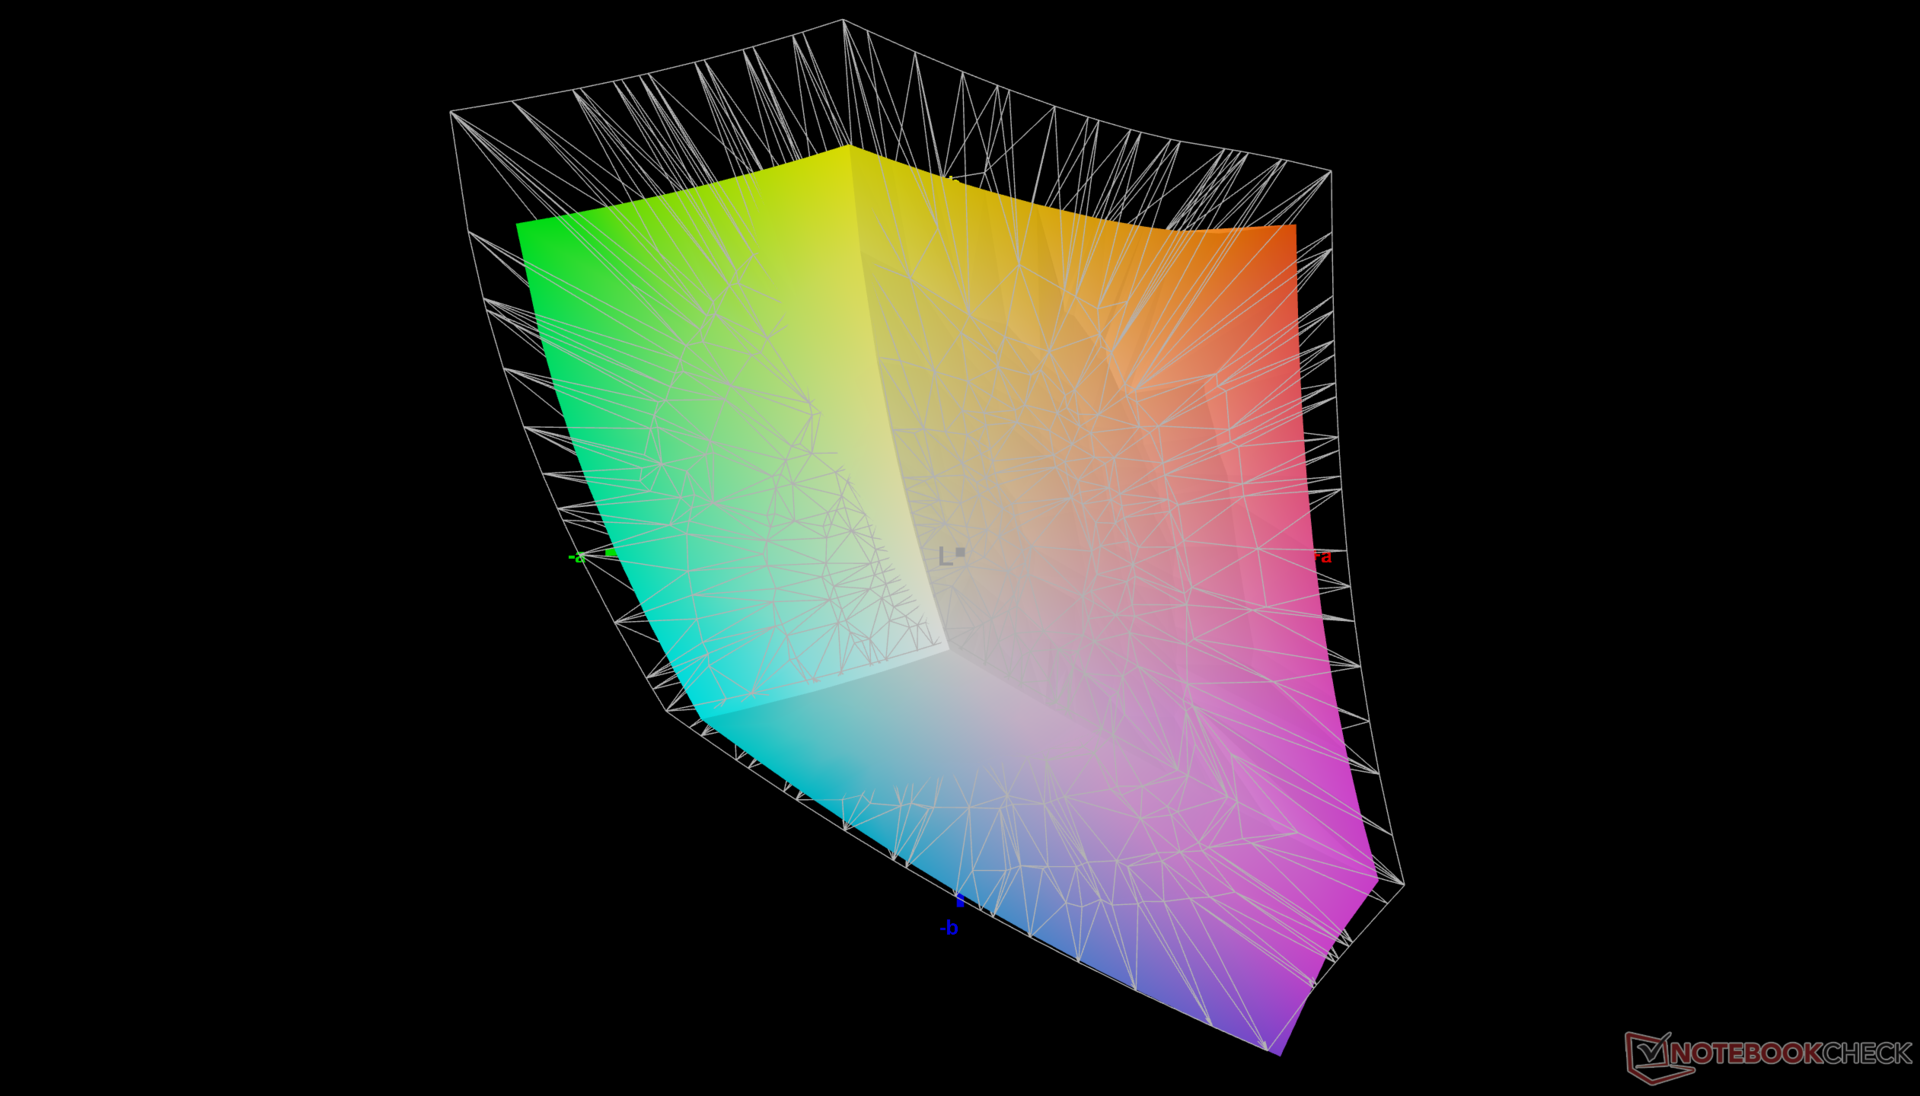
79.5% AdobeRGB 1998 (Argyll 3D)
100% sRGB (Argyll 3D)
79.7% Display P3 (Argyll 3D)
Gamma: 2.3
CCT: 6826 K
| Dell Precision 5000 5490 AU Optronics B140QAN, IPS, 2560x1600, 14" | Lenovo ThinkPad P14s G4 21HF0017GE ATNA40YK15-0, OLED, 2880x1800, 14" | HP ZBook Firefly 14 G10 A CMN1435, IPS, 1920x1200, 14" | HP ZBook Firefly 14 G9-6B8A2EA CMN1435, IPS, 1920x1200, 14" | Dell Precision 5480 AU Optronics B140QAN, IPS, 2560x1600, 14" | Dell Precision 5000 5470 AU Optronics B140QAN, IPS, 2560x1600, 14" | |
|---|---|---|---|---|---|---|
| Display | 16% | -9% | -8% | -2% | -1% | |
| Display P3 Coverage (%) | 79.7 | 99.9 25% | 68.7 -14% | 69.6 -13% | 77.6 -3% | 79.3 -1% |
| sRGB Coverage (%) | 100 | 100 0% | 98.2 -2% | 99.9 0% | 99.8 0% | 100 0% |
| AdobeRGB 1998 Coverage (%) | 79.5 | 97 22% | 70.8 -11% | 71.1 -11% | 78 -2% | 78.7 -1% |
| Response Times | 94% | 9% | 7% | 20% | 2% | |
| Response Time Grey 50% / Grey 80% * (ms) | 52.3 ? | 3 ? 94% | 56.2 ? -7% | 56.3 ? -8% | 43.9 ? 16% | 52.4 ? -0% |
| Response Time Black / White * (ms) | 33.3 ? | 2.2 ? 93% | 25.2 ? 24% | 26.2 ? 21% | 25.3 ? 24% | 32.4 ? 3% |
| PWM Frequency (Hz) | 360 ? | |||||
| PWM Amplitude * (%) | 25 | |||||
| Screen | -121% | -8% | -19% | 4% | -3% | |
| Brightness middle (cd/m²) | 485.1 | 432 -11% | 397 -18% | 432 -11% | 472.8 -3% | 537 11% |
| Brightness (cd/m²) | 471 | 432 -8% | 367 -22% | 407 -14% | 469 0% | 518 10% |
| Brightness Distribution (%) | 90 | 98 9% | 86 -4% | 91 1% | 87 -3% | 94 4% |
| Black Level * (cd/m²) | 0.38 | 0.25 34% | 0.28 26% | 0.35 8% | 0.33 13% | |
| Contrast (:1) | 1277 | 1588 24% | 1543 21% | 1351 6% | 1627 27% | |
| Colorchecker dE 2000 * | 2.15 | 4.8 -123% | 2.35 -9% | 3.1 -44% | 2.1 2% | 2.97 -38% |
| Colorchecker dE 2000 max. * | 5.39 | 9.2 -71% | 4.68 13% | 5.6 -4% | 5.54 -3% | 5.33 1% |
| Colorchecker dE 2000 calibrated * | 0.67 | 4.9 -631% | 1.15 -72% | 0.8 -19% | 0.59 12% | 0.88 -31% |
| Greyscale dE 2000 * | 2 | 2.3 -15% | 2.4 -20% | 4.5 -125% | 1.7 15% | 2.4 -20% |
| Gamma | 2.3 96% | 2.23 99% | 2.067 106% | 2 110% | 2.26 97% | 2.06 107% |
| CCT | 6826 95% | 6391 102% | 6409 101% | 6528 100% | 6493 100% | 6668 97% |
| Total Average (Program / Settings) | -4% /
-51% | -3% /
-6% | -7% /
-13% | 7% /
5% | -1% /
-2% |
* ... smaller is better
The display comes well-calibrated out of the box with average grayscale and color deltaE values of just 2 and 2.15, respectively. Only sRGB is fully supported on all configurations.
Display Response Times
| ↔ Response Time Black to White | ||
|---|---|---|
| 33.3 ms ... rise ↗ and fall ↘ combined | ↗ 16.2 ms rise | 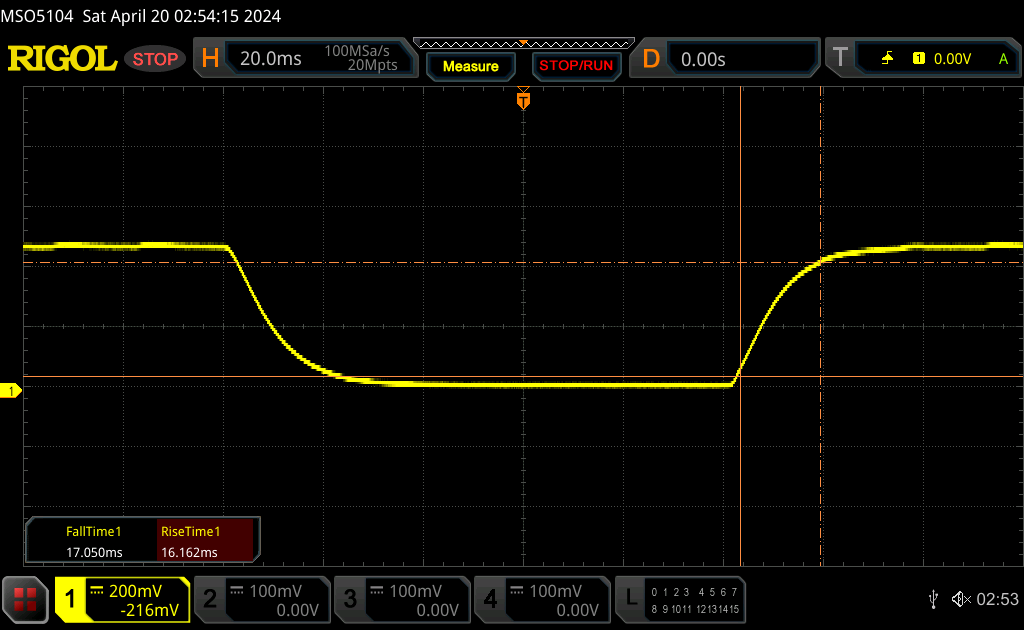 |
| ↘ 17.1 ms fall | ||
| The screen shows slow response rates in our tests and will be unsatisfactory for gamers. In comparison, all tested devices range from 0.1 (minimum) to 240 (maximum) ms. » 90 % of all devices are better. This means that the measured response time is worse than the average of all tested devices (19.8 ms). | ||
| ↔ Response Time 50% Grey to 80% Grey | ||
| 52.3 ms ... rise ↗ and fall ↘ combined | ↗ 23.6 ms rise | 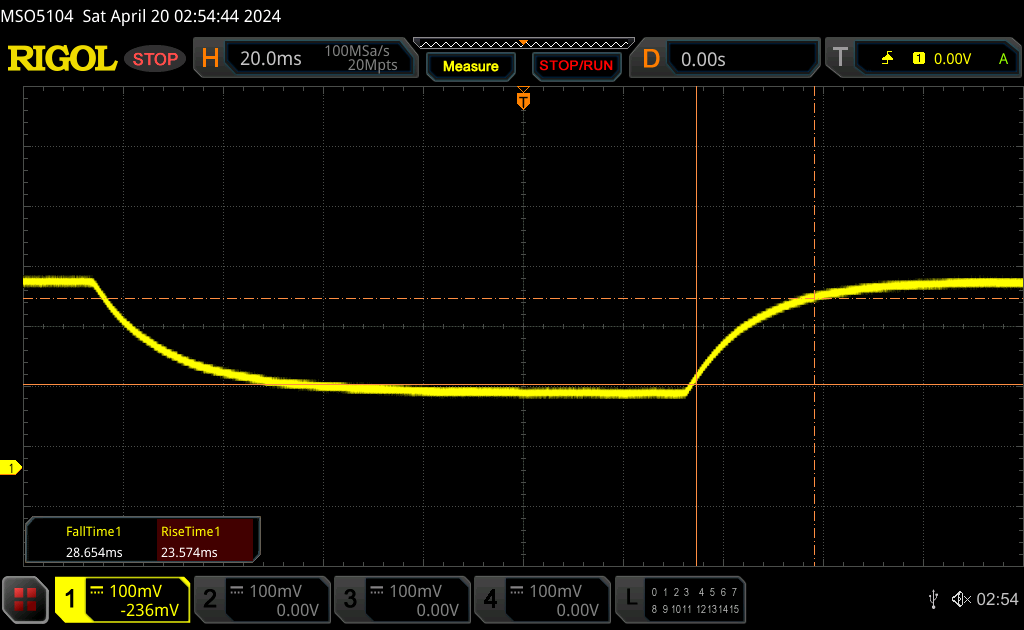 |
| ↘ 28.7 ms fall | ||
| The screen shows slow response rates in our tests and will be unsatisfactory for gamers. In comparison, all tested devices range from 0.165 (minimum) to 636 (maximum) ms. » 89 % of all devices are better. This means that the measured response time is worse than the average of all tested devices (31 ms). | ||
Screen Flickering / PWM (Pulse-Width Modulation)
| Screen flickering / PWM not detected | 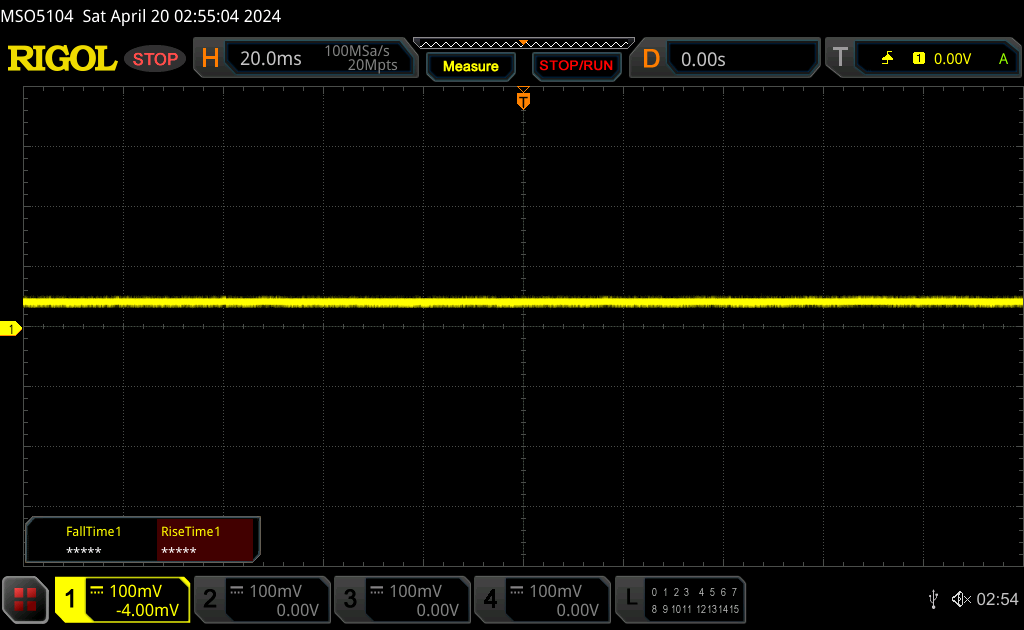 | ||
In comparison: 52 % of all tested devices do not use PWM to dim the display. If PWM was detected, an average of 7763 (minimum: 5 - maximum: 343500) Hz was measured. | |||


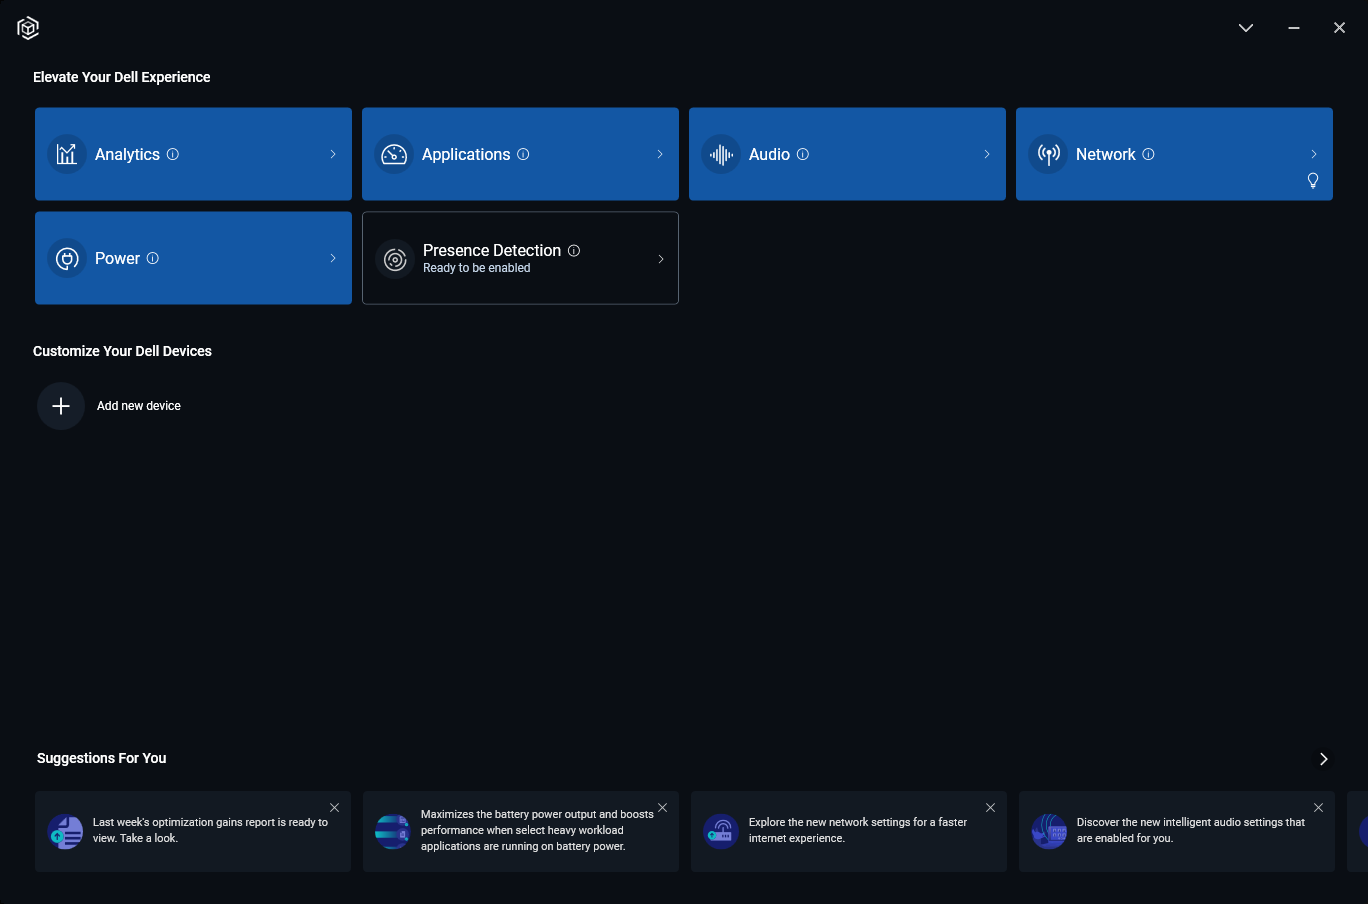
Performance — All About AI
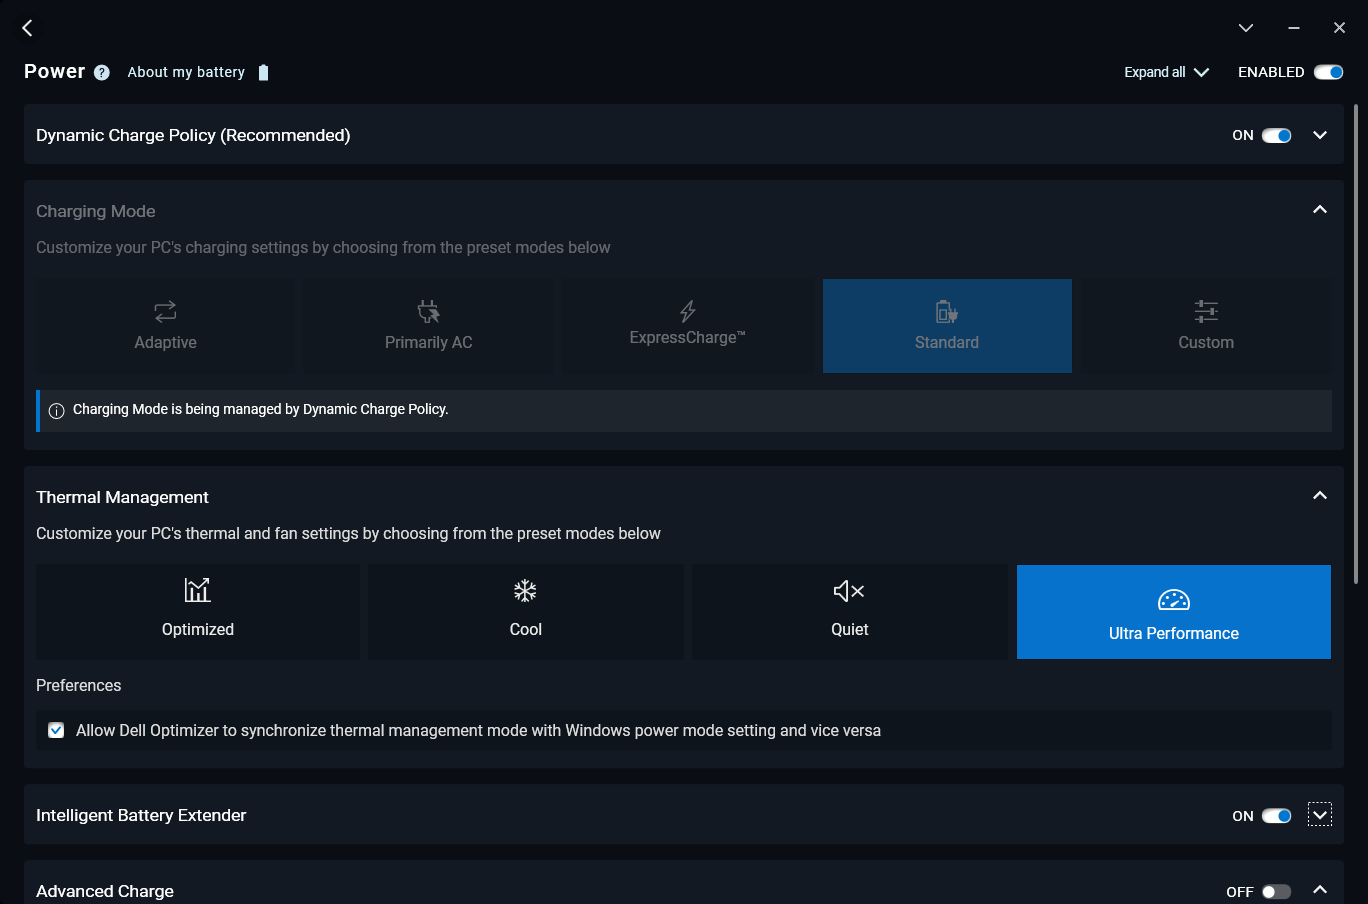
Testing Conditions
We set Dell Optimizer to Ultra Performance mode and the GPU to Nvidia prior to running the benchmarks below.
Processor
Raw CPU performance remains flat when compared to the Core i9-13900H in last year's Precision 5480. Any benefits are marginal at best at up to 5 percent, but even this small delta can shrink once Turbo Boost limitations are accounted for as shown by our CineBench R15 xT loop results below.
If integrated AI features are unimportant, then the less expensive Ryzen 7 Pro 7840HS on competing models like the HP Firefly 14 series can provide essentially the same performance as the newer Core Ultra 9 185H.
Downgrading to the Core Ultra 5 135H configuration is expected to impact processor performance by 15 to 20 percent based on our experience with Core i5-13500H laptops.
Cinebench R15 Multi Loop
Cinebench R23: Multi Core | Single Core
Cinebench R20: CPU (Multi Core) | CPU (Single Core)
Cinebench R15: CPU Multi 64Bit | CPU Single 64Bit
Blender: v2.79 BMW27 CPU
7-Zip 18.03: 7z b 4 | 7z b 4 -mmt1
Geekbench 6.7: Multi-Core | Single-Core
Geekbench 5.5: Multi-Core | Single-Core
HWBOT x265 Benchmark v2.2: 4k Preset
LibreOffice : 20 Documents To PDF
R Benchmark 2.5: Overall mean
| Geekbench 6.7 / Multi-Core | |
| Dell Precision 5480 | |
| Dell Precision 5000 5490 | |
| Average Intel Core Ultra 9 185H (9140 - 14540, n=20) | |
| HP ZBook Power 15 G10 | |
| Lenovo ThinkPad P14s G4 21HF0017GE | |
| Lenovo ThinkPad P14s G4 21K5000LGE | |
| HP ZBook Firefly 14 G10 A | |
| Geekbench 6.7 / Single-Core | |
| Dell Precision 5480 | |
| Lenovo ThinkPad P14s G4 21HF0017GE | |
| HP ZBook Power 15 G10 | |
| Lenovo ThinkPad P14s G4 21K5000LGE | |
| Average Intel Core Ultra 9 185H (1490 - 2573, n=20) | |
| Dell Precision 5000 5490 | |
| HP ZBook Firefly 14 G10 A | |
Cinebench R23: Multi Core | Single Core
Cinebench R20: CPU (Multi Core) | CPU (Single Core)
Cinebench R15: CPU Multi 64Bit | CPU Single 64Bit
Blender: v2.79 BMW27 CPU
7-Zip 18.03: 7z b 4 | 7z b 4 -mmt1
Geekbench 6.7: Multi-Core | Single-Core
Geekbench 5.5: Multi-Core | Single-Core
HWBOT x265 Benchmark v2.2: 4k Preset
LibreOffice : 20 Documents To PDF
R Benchmark 2.5: Overall mean
* ... smaller is better
AIDA64: FP32 Ray-Trace | FPU Julia | CPU SHA3 | CPU Queen | FPU SinJulia | FPU Mandel | CPU AES | CPU ZLib | FP64 Ray-Trace | CPU PhotoWorxx
| Performance rating | |
| Average Intel Core Ultra 9 185H | |
| Dell Precision 5480 | |
| Dell Precision 5000 5490 | |
| HP ZBook Firefly 14 G10 A | |
| Dell Precision 5000 5470 | |
| Lenovo ThinkPad P14s G4 21HF0017GE | |
| HP ZBook Firefly 14 G9-6B8A2EA | |
| AIDA64 / FP32 Ray-Trace | |
| HP ZBook Firefly 14 G10 A | |
| Average Intel Core Ultra 9 185H (9220 - 18676, n=20) | |
| Dell Precision 5480 | |
| Dell Precision 5000 5490 | |
| Dell Precision 5000 5470 | |
| Lenovo ThinkPad P14s G4 21HF0017GE | |
| HP ZBook Firefly 14 G9-6B8A2EA | |
| AIDA64 / FPU Julia | |
| Average Intel Core Ultra 9 185H (48865 - 96463, n=20) | |
| HP ZBook Firefly 14 G10 A | |
| Dell Precision 5000 5490 | |
| Dell Precision 5480 | |
| Dell Precision 5000 5470 | |
| Lenovo ThinkPad P14s G4 21HF0017GE | |
| HP ZBook Firefly 14 G9-6B8A2EA | |
| AIDA64 / CPU SHA3 | |
| Average Intel Core Ultra 9 185H (2394 - 4534, n=20) | |
| Dell Precision 5000 5490 | |
| Dell Precision 5480 | |
| HP ZBook Firefly 14 G10 A | |
| Dell Precision 5000 5470 | |
| Lenovo ThinkPad P14s G4 21HF0017GE | |
| HP ZBook Firefly 14 G9-6B8A2EA | |
| AIDA64 / CPU Queen | |
| Dell Precision 5480 | |
| Dell Precision 5000 5470 | |
| Lenovo ThinkPad P14s G4 21HF0017GE | |
| Dell Precision 5000 5490 | |
| Average Intel Core Ultra 9 185H (66785 - 95241, n=20) | |
| HP ZBook Firefly 14 G10 A | |
| HP ZBook Firefly 14 G9-6B8A2EA | |
| AIDA64 / FPU SinJulia | |
| HP ZBook Firefly 14 G10 A | |
| Average Intel Core Ultra 9 185H (7255 - 11392, n=20) | |
| Dell Precision 5000 5490 | |
| Dell Precision 5480 | |
| Dell Precision 5000 5470 | |
| Lenovo ThinkPad P14s G4 21HF0017GE | |
| HP ZBook Firefly 14 G9-6B8A2EA | |
| AIDA64 / FPU Mandel | |
| HP ZBook Firefly 14 G10 A | |
| Average Intel Core Ultra 9 185H (24004 - 48020, n=20) | |
| Dell Precision 5480 | |
| Dell Precision 5000 5490 | |
| Dell Precision 5000 5470 | |
| Lenovo ThinkPad P14s G4 21HF0017GE | |
| HP ZBook Firefly 14 G9-6B8A2EA | |
| AIDA64 / CPU AES | |
| Average Intel Core Ultra 9 185H (53116 - 154066, n=20) | |
| Dell Precision 5000 5490 | |
| Dell Precision 5480 | |
| HP ZBook Firefly 14 G10 A | |
| Lenovo ThinkPad P14s G4 21HF0017GE | |
| HP ZBook Firefly 14 G9-6B8A2EA | |
| Dell Precision 5000 5470 | |
| AIDA64 / CPU ZLib | |
| Average Intel Core Ultra 9 185H (678 - 1341, n=20) | |
| Dell Precision 5000 5490 | |
| Dell Precision 5480 | |
| Lenovo ThinkPad P14s G4 21HF0017GE | |
| HP ZBook Firefly 14 G10 A | |
| HP ZBook Firefly 14 G9-6B8A2EA | |
| Dell Precision 5000 5470 | |
| AIDA64 / FP64 Ray-Trace | |
| HP ZBook Firefly 14 G10 A | |
| Average Intel Core Ultra 9 185H (4428 - 10078, n=20) | |
| Dell Precision 5480 | |
| Dell Precision 5000 5490 | |
| Dell Precision 5000 5470 | |
| Lenovo ThinkPad P14s G4 21HF0017GE | |
| HP ZBook Firefly 14 G9-6B8A2EA | |
| AIDA64 / CPU PhotoWorxx | |
| Dell Precision 5000 5490 | |
| Average Intel Core Ultra 9 185H (44547 - 53918, n=20) | |
| Dell Precision 5480 | |
| Dell Precision 5000 5470 | |
| HP ZBook Firefly 14 G9-6B8A2EA | |
| Lenovo ThinkPad P14s G4 21HF0017GE | |
| HP ZBook Firefly 14 G10 A | |
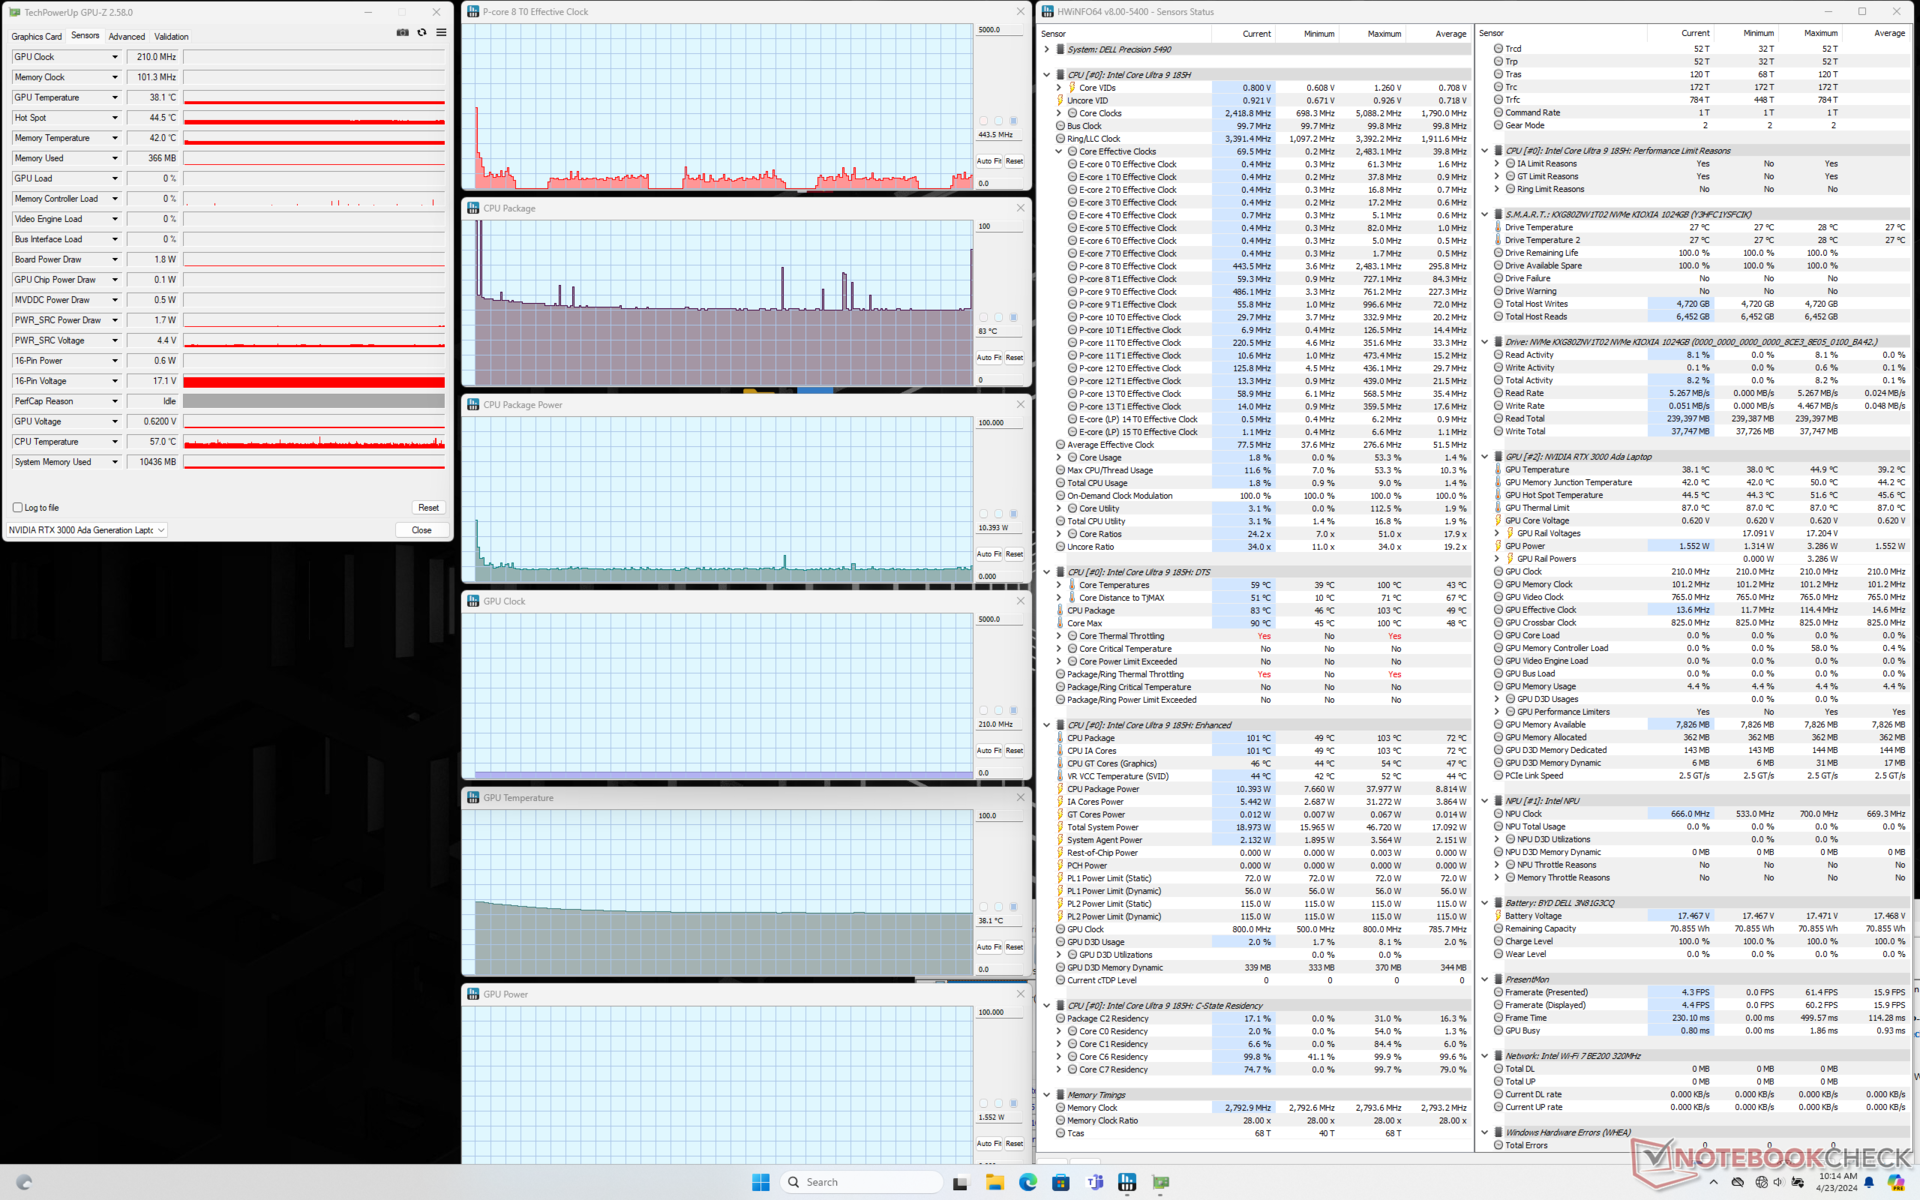
Stress Test
Core clock rate and board power draw would spike to as high as 3.3 GHz and 92 W, respectively, when initiating Prime95 stress. However, this would fall very quickly to 2.2 GHz and 55 W on average to maintain a very high core temperature of 101 C. Results are similar to what we recorded on last year's Precision 5480 if not slightly warmer.
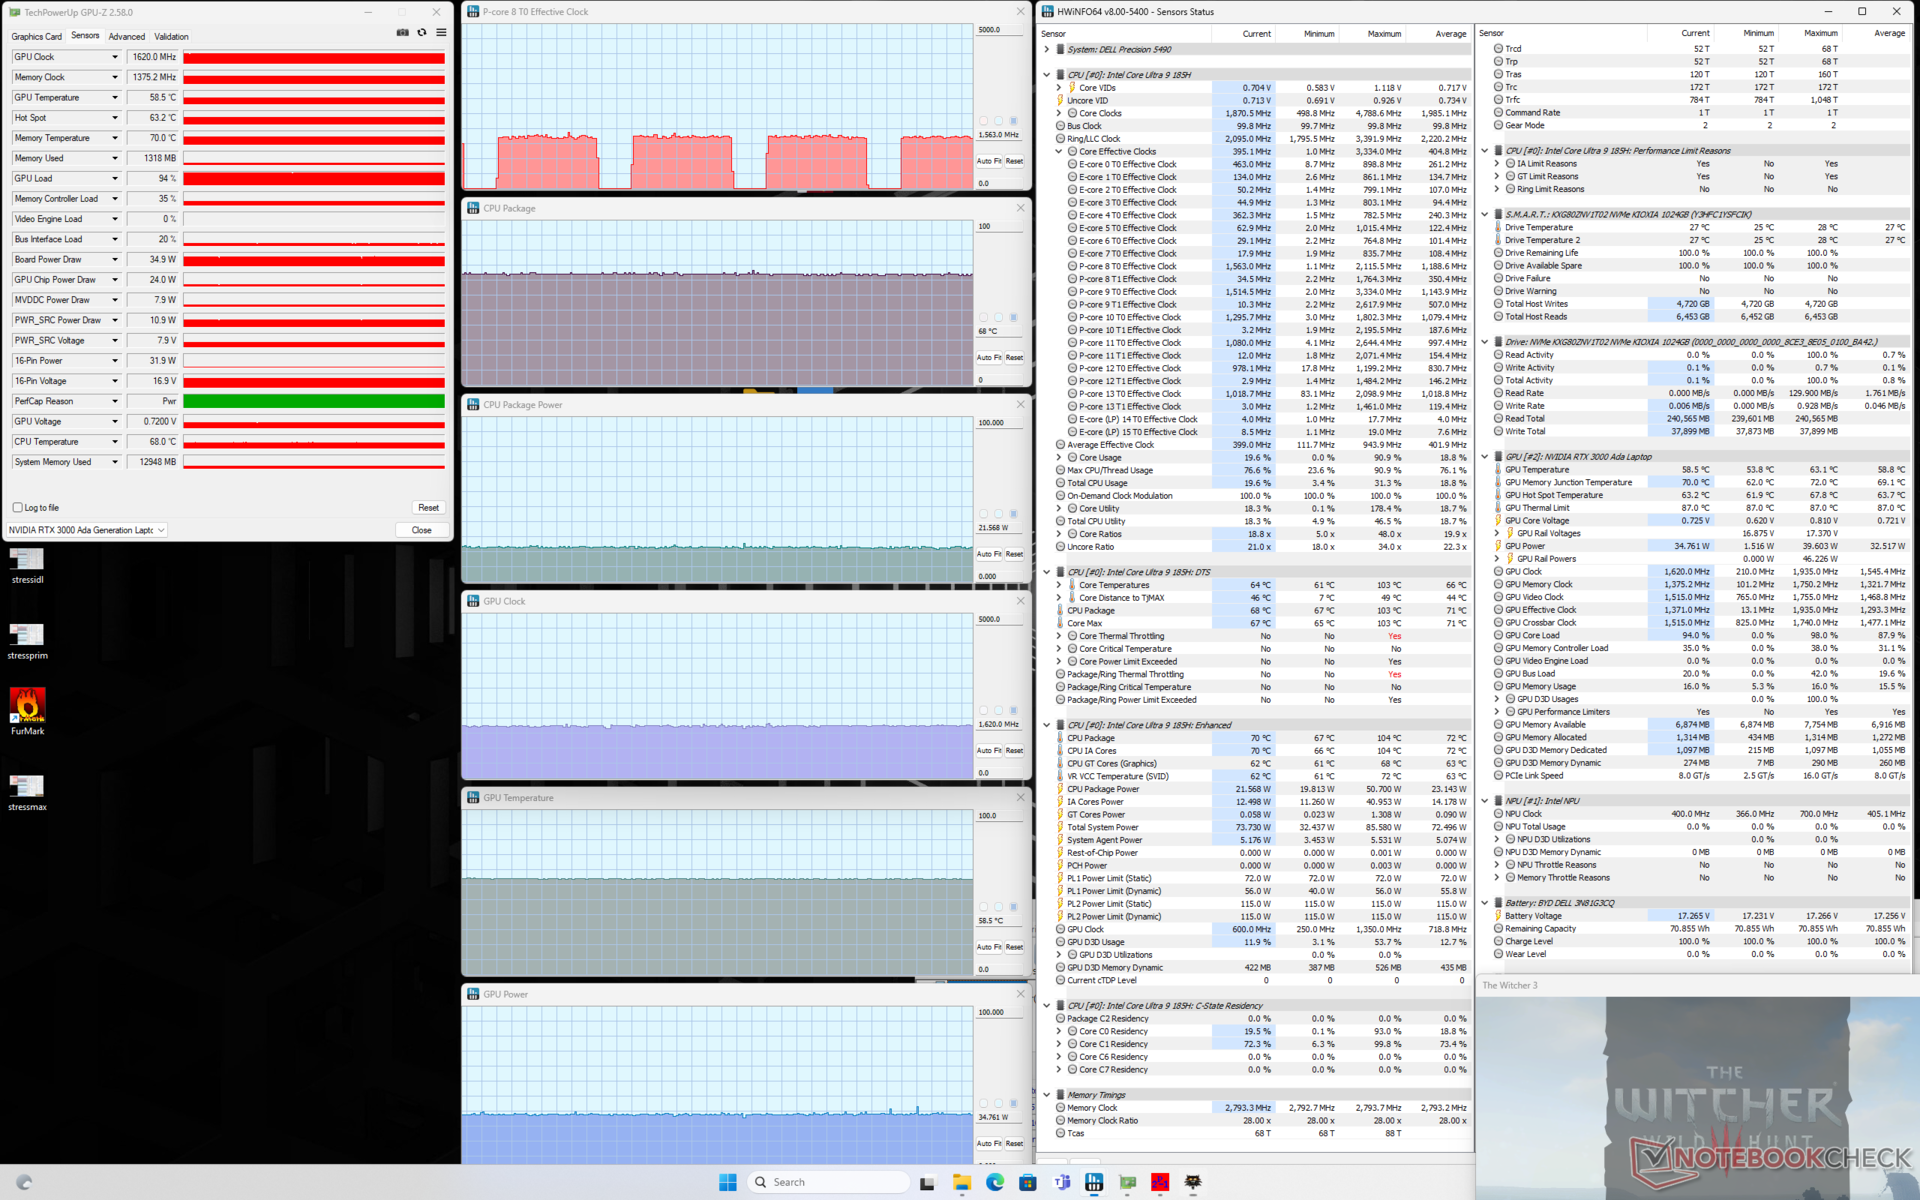
Interestingly, GPU board power draw when running Witcher 3 would stabilize at 35 W whereas the GPU in last year's Precision 5480 would stabilize at 45 W even when set to Ultra Performance mode. The board power draw may partly explain the slightly slower graphics performance in our GPU Performance section below.
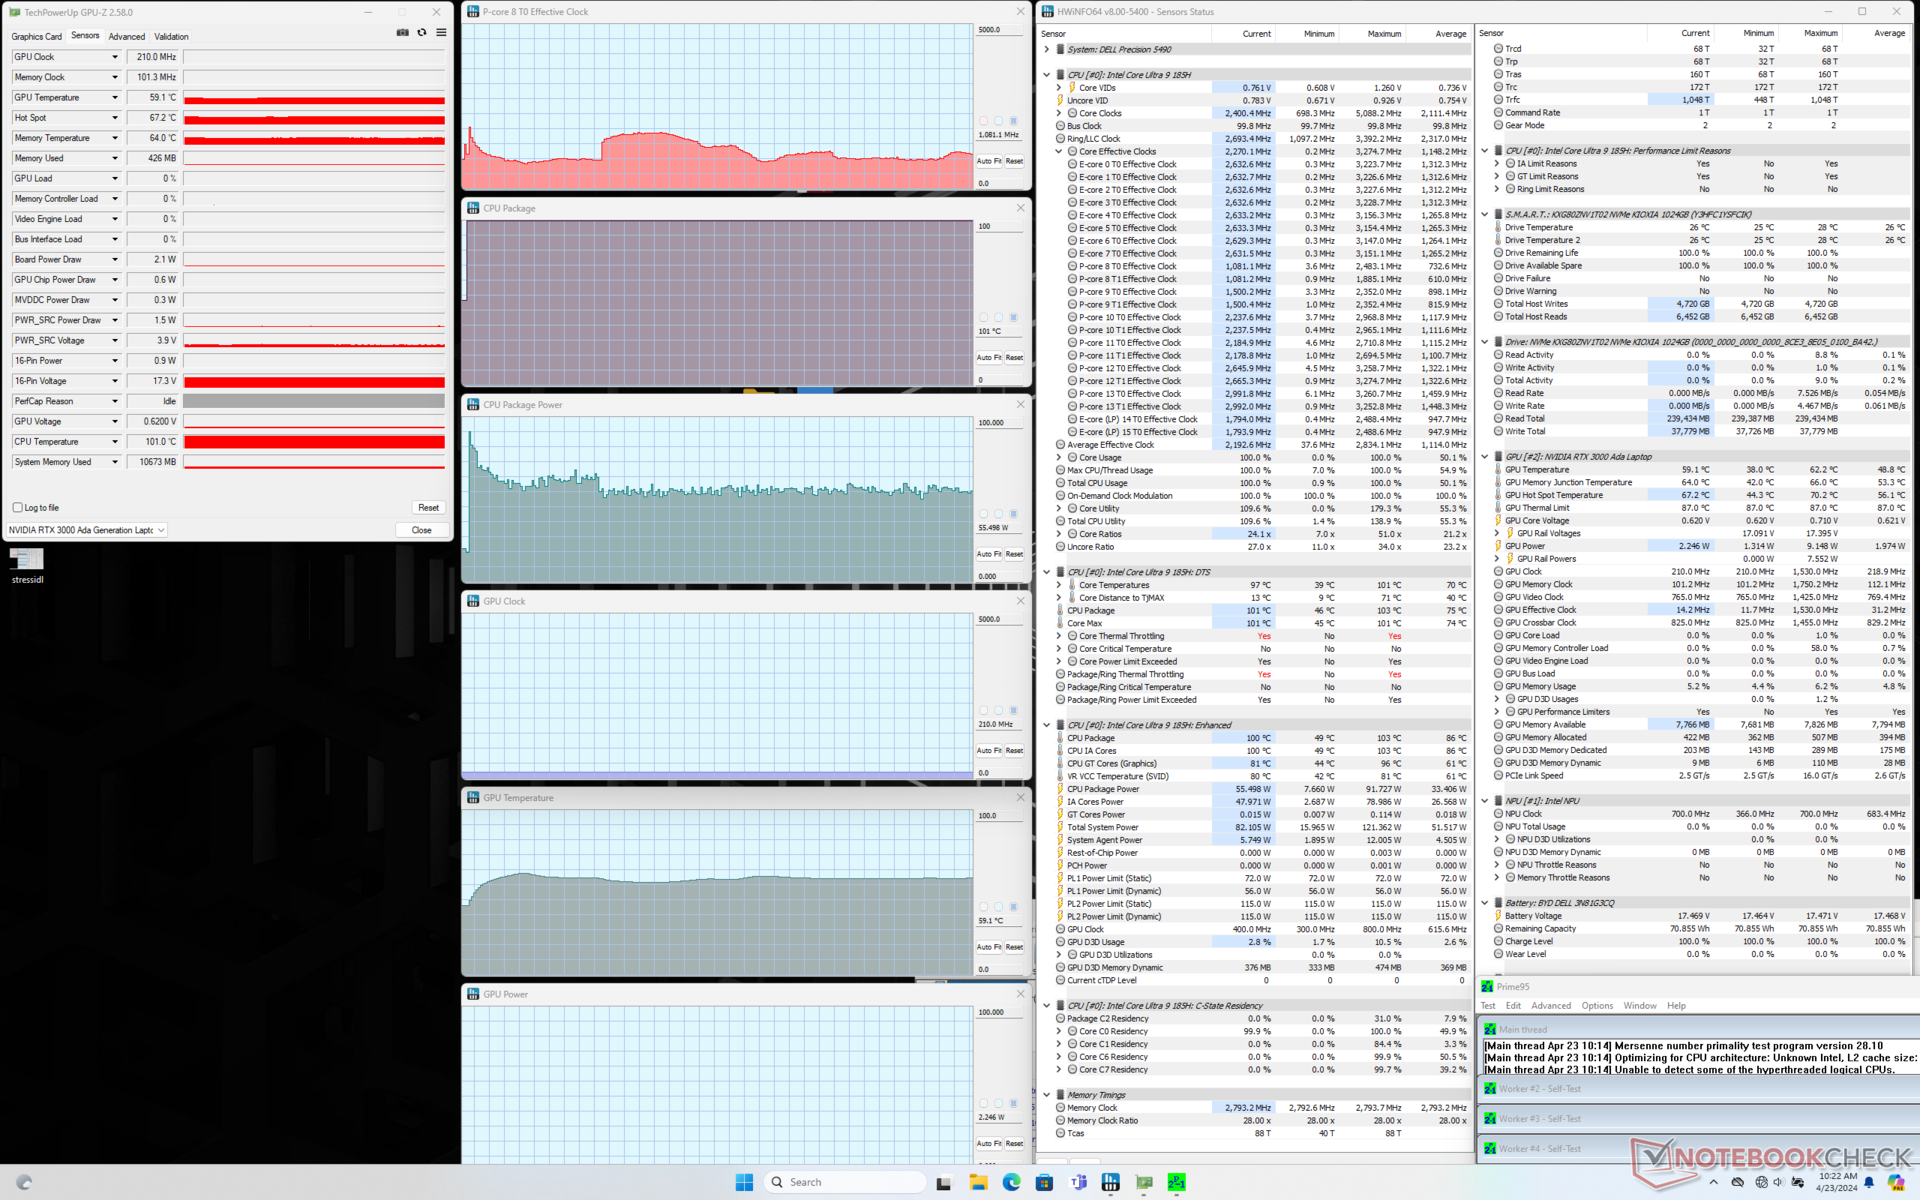
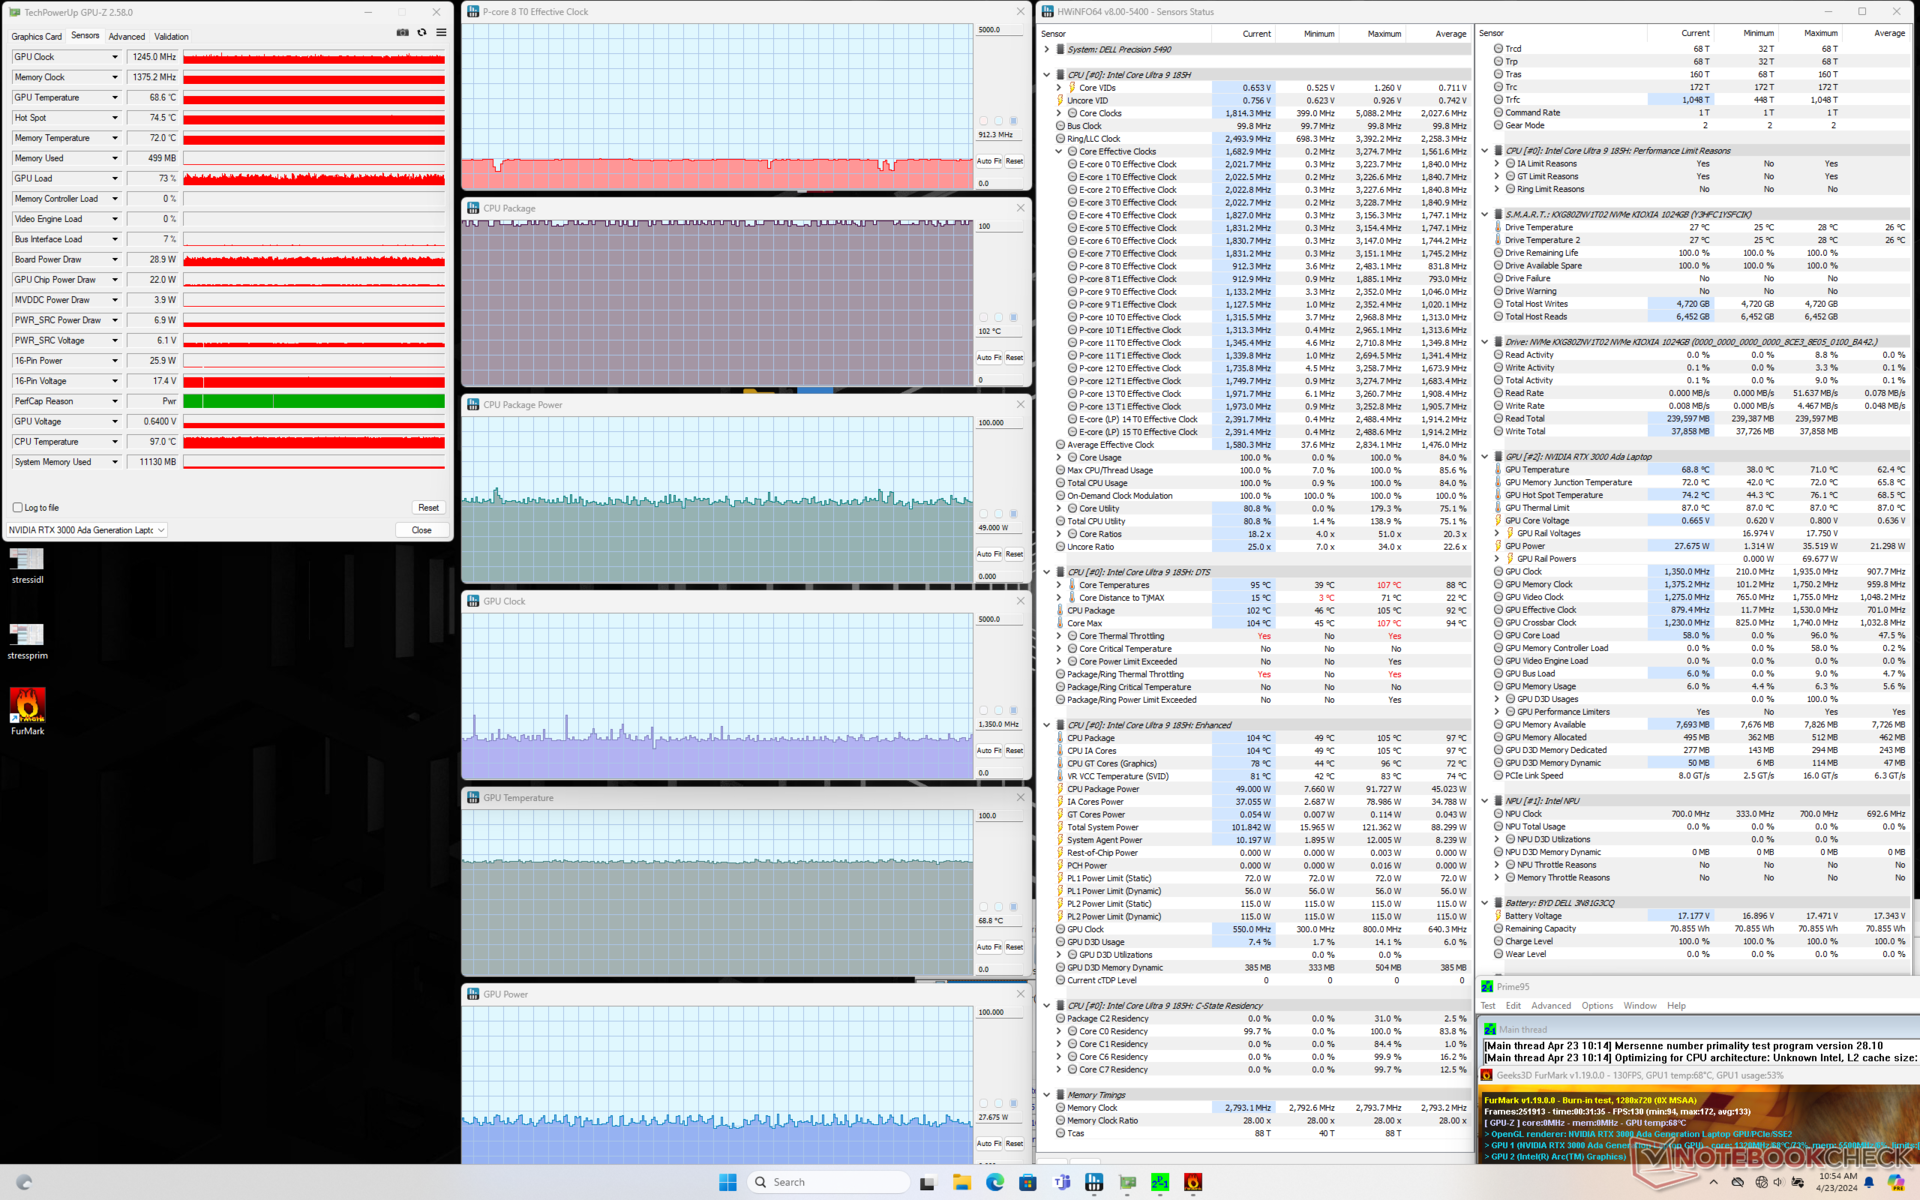
| CPU Clock (GHz) | GPU Clock (MHz) | Average CPU Temperature (°C) | Average GPU Temperature (°C) | |
| System Idle | -- | -- | 45 | 38 |
| Prime95 Stress | 2.2 | -- | 101 | 59 |
| Prime95 + FurMark Stress | 1.6 | ~1350 | 101 | 69 |
| Witcher 3 Stress | 0.4 | 1620 | 68 | 59 |
System Performance
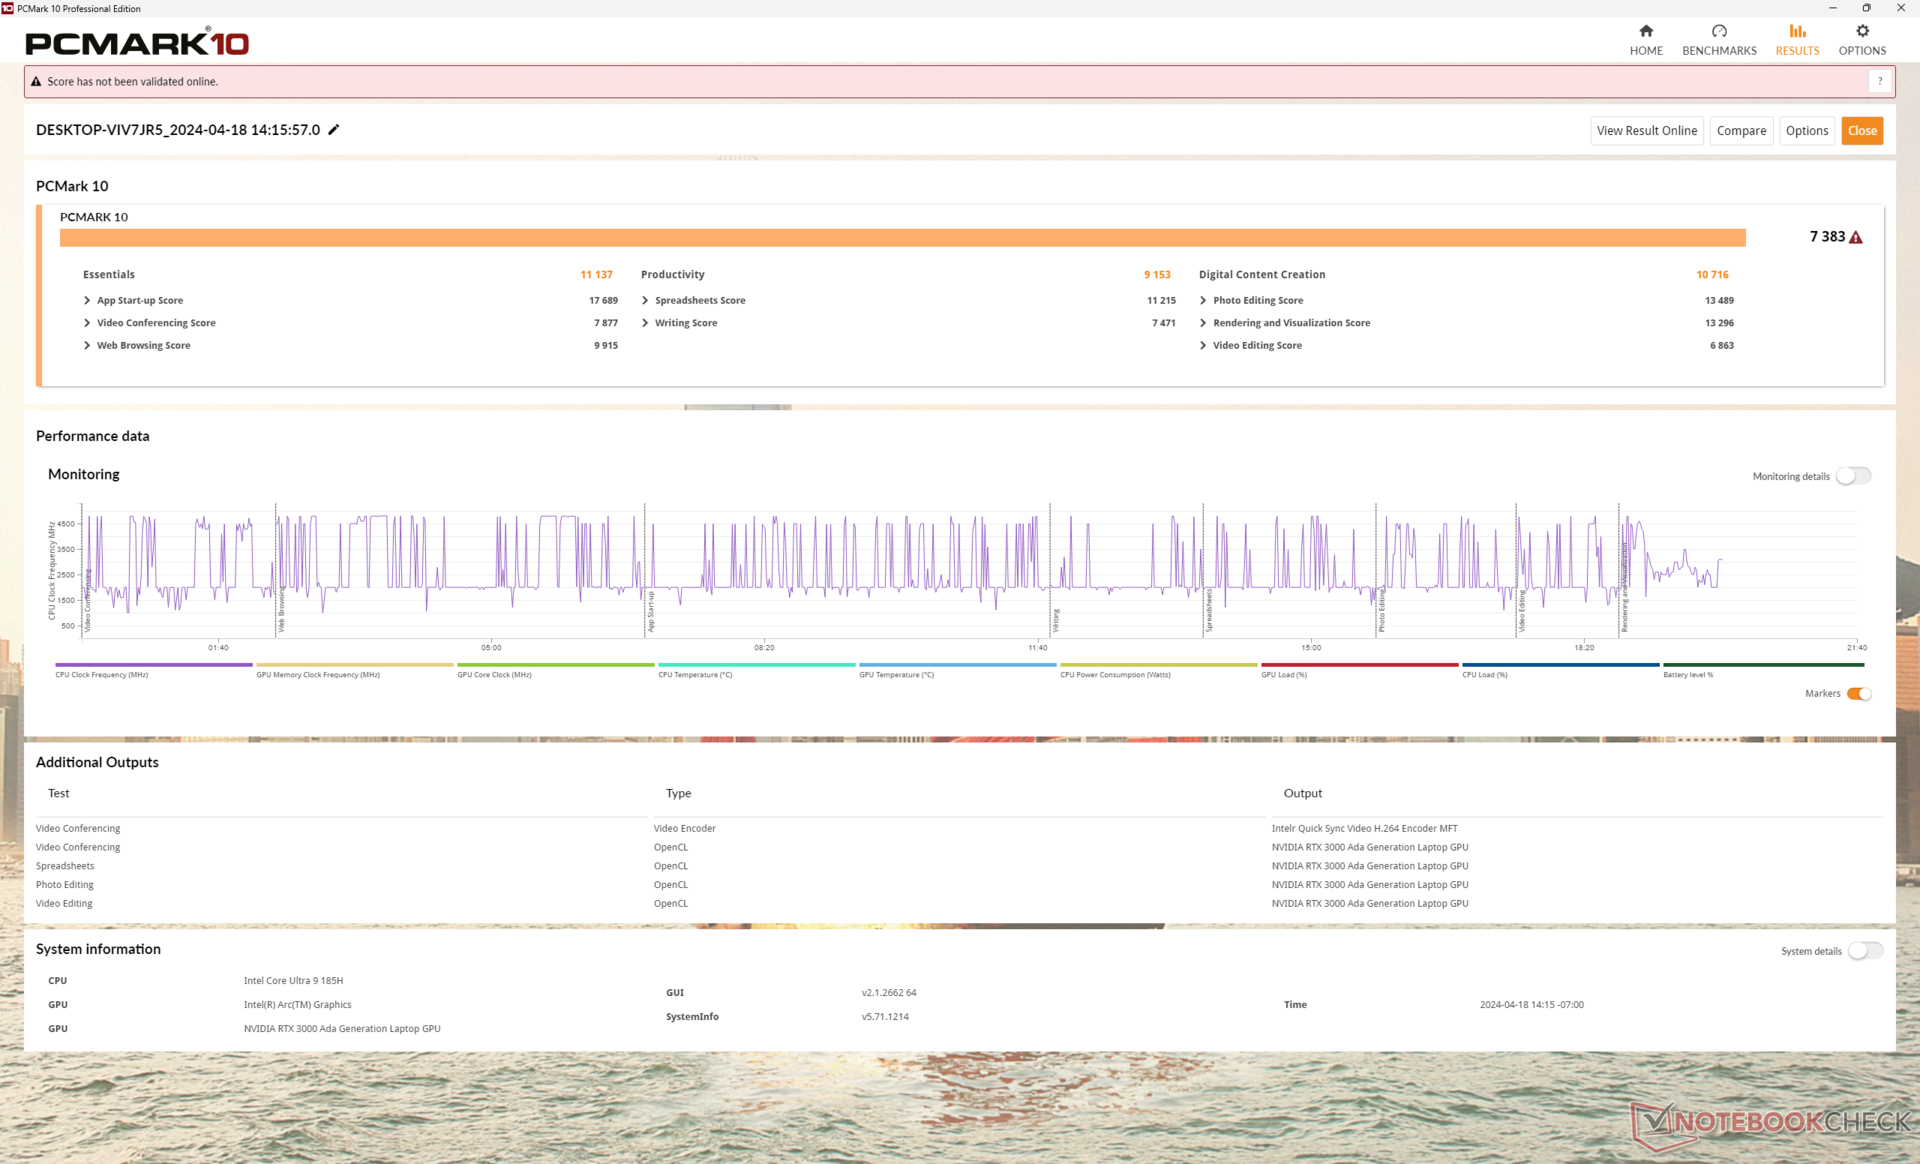
PCMark results are nearly identical to what we recorded on last year's Precision 5480 to suggest no major performance advantages when it comes to general multitasking or video editing tasks. PCMark AI benchmarks, which we do not yet run, can better differentiate laptops with integrated NPUs like our Precision 5490 from older models.
CrossMark: Overall | Productivity | Creativity | Responsiveness
WebXPRT 3: Overall
WebXPRT 4: Overall
Mozilla Kraken 1.1: Total
| PCMark 10 / Score | |
| Dell Precision 5480 | |
| Average Intel Core Ultra 9 185H, NVIDIA RTX 3000 Ada Generation Laptop (7383 - 7537, n=2) | |
| Dell Precision 5000 5490 | |
| Lenovo ThinkPad P14s G4 21HF0017GE | |
| Dell Precision 5000 5470 | |
| HP ZBook Firefly 14 G10 A | |
| HP ZBook Firefly 14 G9-6B8A2EA | |
| PCMark 10 / Essentials | |
| Dell Precision 5480 | |
| Dell Precision 5000 5490 | |
| Dell Precision 5000 5470 | |
| Average Intel Core Ultra 9 185H, NVIDIA RTX 3000 Ada Generation Laptop (10514 - 11137, n=2) | |
| Lenovo ThinkPad P14s G4 21HF0017GE | |
| HP ZBook Firefly 14 G9-6B8A2EA | |
| HP ZBook Firefly 14 G10 A | |
| PCMark 10 / Productivity | |
| Lenovo ThinkPad P14s G4 21HF0017GE | |
| HP ZBook Firefly 14 G9-6B8A2EA | |
| Dell Precision 5480 | |
| Average Intel Core Ultra 9 185H, NVIDIA RTX 3000 Ada Generation Laptop (9153 - 9356, n=2) | |
| HP ZBook Firefly 14 G10 A | |
| Dell Precision 5000 5490 | |
| Dell Precision 5000 5470 | |
| PCMark 10 / Digital Content Creation | |
| Dell Precision 5480 | |
| Average Intel Core Ultra 9 185H, NVIDIA RTX 3000 Ada Generation Laptop (10716 - 11811, n=2) | |
| Dell Precision 5000 5490 | |
| Dell Precision 5000 5470 | |
| Lenovo ThinkPad P14s G4 21HF0017GE | |
| HP ZBook Firefly 14 G10 A | |
| HP ZBook Firefly 14 G9-6B8A2EA | |
| CrossMark / Overall | |
| Dell Precision 5480 | |
| Lenovo ThinkPad P14s G4 21HF0017GE | |
| Dell Precision 5000 5470 | |
| Average Intel Core Ultra 9 185H, NVIDIA RTX 3000 Ada Generation Laptop (1754 - 1770, n=2) | |
| Dell Precision 5000 5490 | |
| HP ZBook Firefly 14 G9-6B8A2EA | |
| CrossMark / Productivity | |
| Dell Precision 5480 | |
| Lenovo ThinkPad P14s G4 21HF0017GE | |
| Dell Precision 5000 5470 | |
| Average Intel Core Ultra 9 185H, NVIDIA RTX 3000 Ada Generation Laptop (1643 - 1686, n=2) | |
| Dell Precision 5000 5490 | |
| HP ZBook Firefly 14 G9-6B8A2EA | |
| CrossMark / Creativity | |
| Dell Precision 5480 | |
| Dell Precision 5000 5470 | |
| Lenovo ThinkPad P14s G4 21HF0017GE | |
| Dell Precision 5000 5490 | |
| Average Intel Core Ultra 9 185H, NVIDIA RTX 3000 Ada Generation Laptop (1981 - 2001, n=2) | |
| HP ZBook Firefly 14 G9-6B8A2EA | |
| CrossMark / Responsiveness | |
| Dell Precision 5480 | |
| Lenovo ThinkPad P14s G4 21HF0017GE | |
| Dell Precision 5000 5470 | |
| Average Intel Core Ultra 9 185H, NVIDIA RTX 3000 Ada Generation Laptop (1438 - 1458, n=2) | |
| Dell Precision 5000 5490 | |
| HP ZBook Firefly 14 G9-6B8A2EA | |
| WebXPRT 3 / Overall | |
| Dell Precision 5480 | |
| Dell Precision 5000 5470 | |
| Lenovo ThinkPad P14s G4 21HF0017GE | |
| Average Intel Core Ultra 9 185H, NVIDIA RTX 3000 Ada Generation Laptop (286 - 295, n=2) | |
| Dell Precision 5000 5490 | |
| HP ZBook Firefly 14 G9-6B8A2EA | |
| HP ZBook Firefly 14 G10 A | |
| HP ZBook Firefly 14 G10 A | |
| WebXPRT 4 / Overall | |
| Dell Precision 5480 | |
| Lenovo ThinkPad P14s G4 21HF0017GE | |
| Lenovo ThinkPad P14s G4 21HF0017GE | |
| Dell Precision 5000 5470 | |
| Dell Precision 5000 5490 | |
| Average Intel Core Ultra 9 185H, NVIDIA RTX 3000 Ada Generation Laptop (261 - 268, n=2) | |
| HP ZBook Firefly 14 G9-6B8A2EA | |
| Mozilla Kraken 1.1 / Total | |
| HP ZBook Firefly 14 G10 A | |
| HP ZBook Firefly 14 G10 A | |
| HP ZBook Firefly 14 G9-6B8A2EA | |
| Dell Precision 5000 5470 | |
| Dell Precision 5000 5490 | |
| Average Intel Core Ultra 9 185H, NVIDIA RTX 3000 Ada Generation Laptop (515 - 522, n=2) | |
| Dell Precision 5480 | |
| Lenovo ThinkPad P14s G4 21HF0017GE | |
* ... smaller is better
| PCMark 10 Score | 7383 points | |
Help | ||
| AIDA64 / Memory Copy | |
| Dell Precision 5000 5490 | |
| Average Intel Core Ultra 9 185H (69929 - 95718, n=20) | |
| Dell Precision 5480 | |
| Dell Precision 5000 5470 | |
| HP ZBook Firefly 14 G10 A | |
| Lenovo ThinkPad P14s G4 21HF0017GE | |
| HP ZBook Firefly 14 G9-6B8A2EA | |
| AIDA64 / Memory Read | |
| Dell Precision 5000 5490 | |
| Average Intel Core Ultra 9 185H (64619 - 87768, n=20) | |
| Dell Precision 5000 5470 | |
| Dell Precision 5480 | |
| HP ZBook Firefly 14 G9-6B8A2EA | |
| HP ZBook Firefly 14 G10 A | |
| Lenovo ThinkPad P14s G4 21HF0017GE | |
| AIDA64 / Memory Write | |
| Dell Precision 5000 5490 | |
| Dell Precision 5480 | |
| HP ZBook Firefly 14 G10 A | |
| Average Intel Core Ultra 9 185H (51114 - 93871, n=20) | |
| Lenovo ThinkPad P14s G4 21HF0017GE | |
| HP ZBook Firefly 14 G9-6B8A2EA | |
| Dell Precision 5000 5470 | |
| AIDA64 / Memory Latency | |
| Average Intel Core Ultra 9 185H (121.4 - 259, n=20) | |
| Dell Precision 5000 5490 | |
| Dell Precision 5000 5470 | |
| HP ZBook Firefly 14 G10 A | |
| Lenovo ThinkPad P14s G4 21HF0017GE | |
| Dell Precision 5480 | |
| HP ZBook Firefly 14 G9-6B8A2EA | |
* ... smaller is better
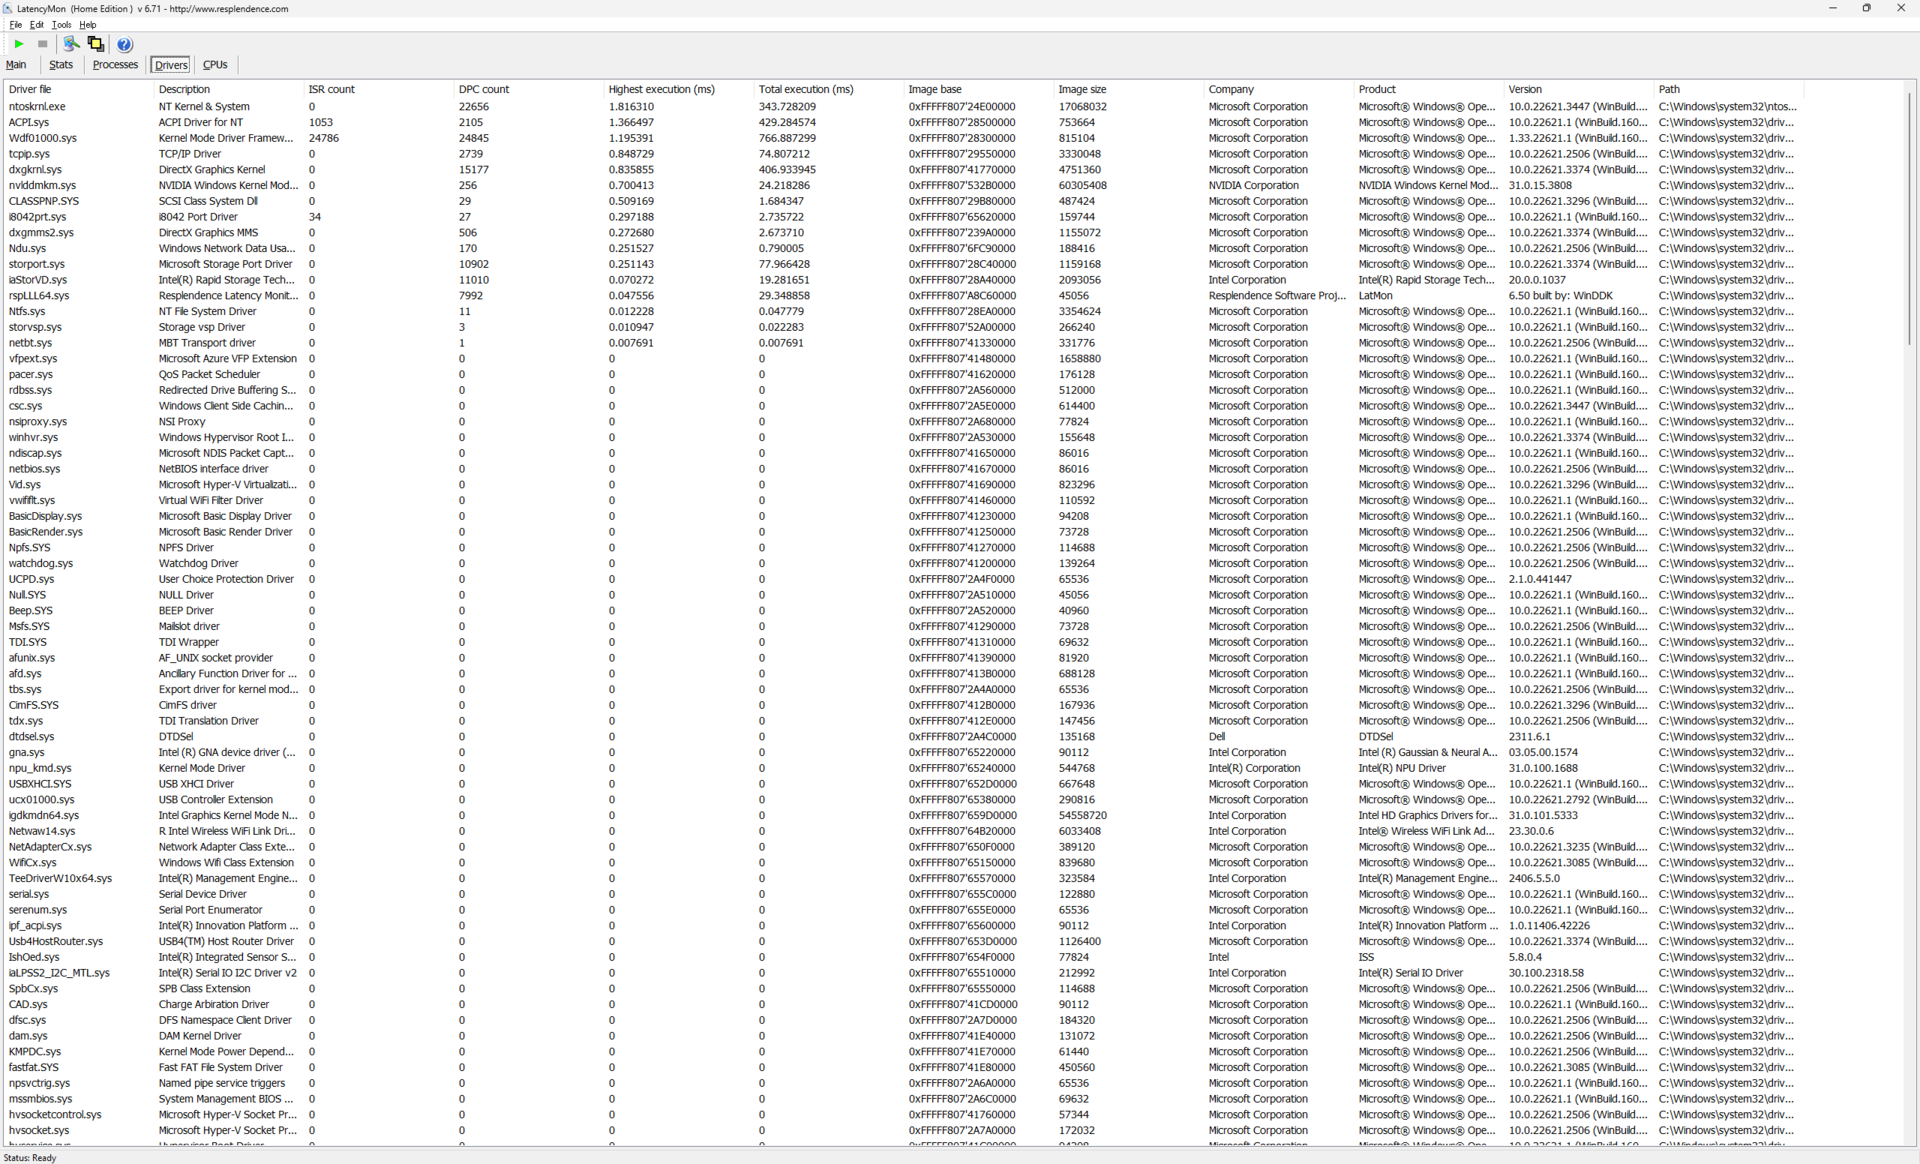
DPC Latency
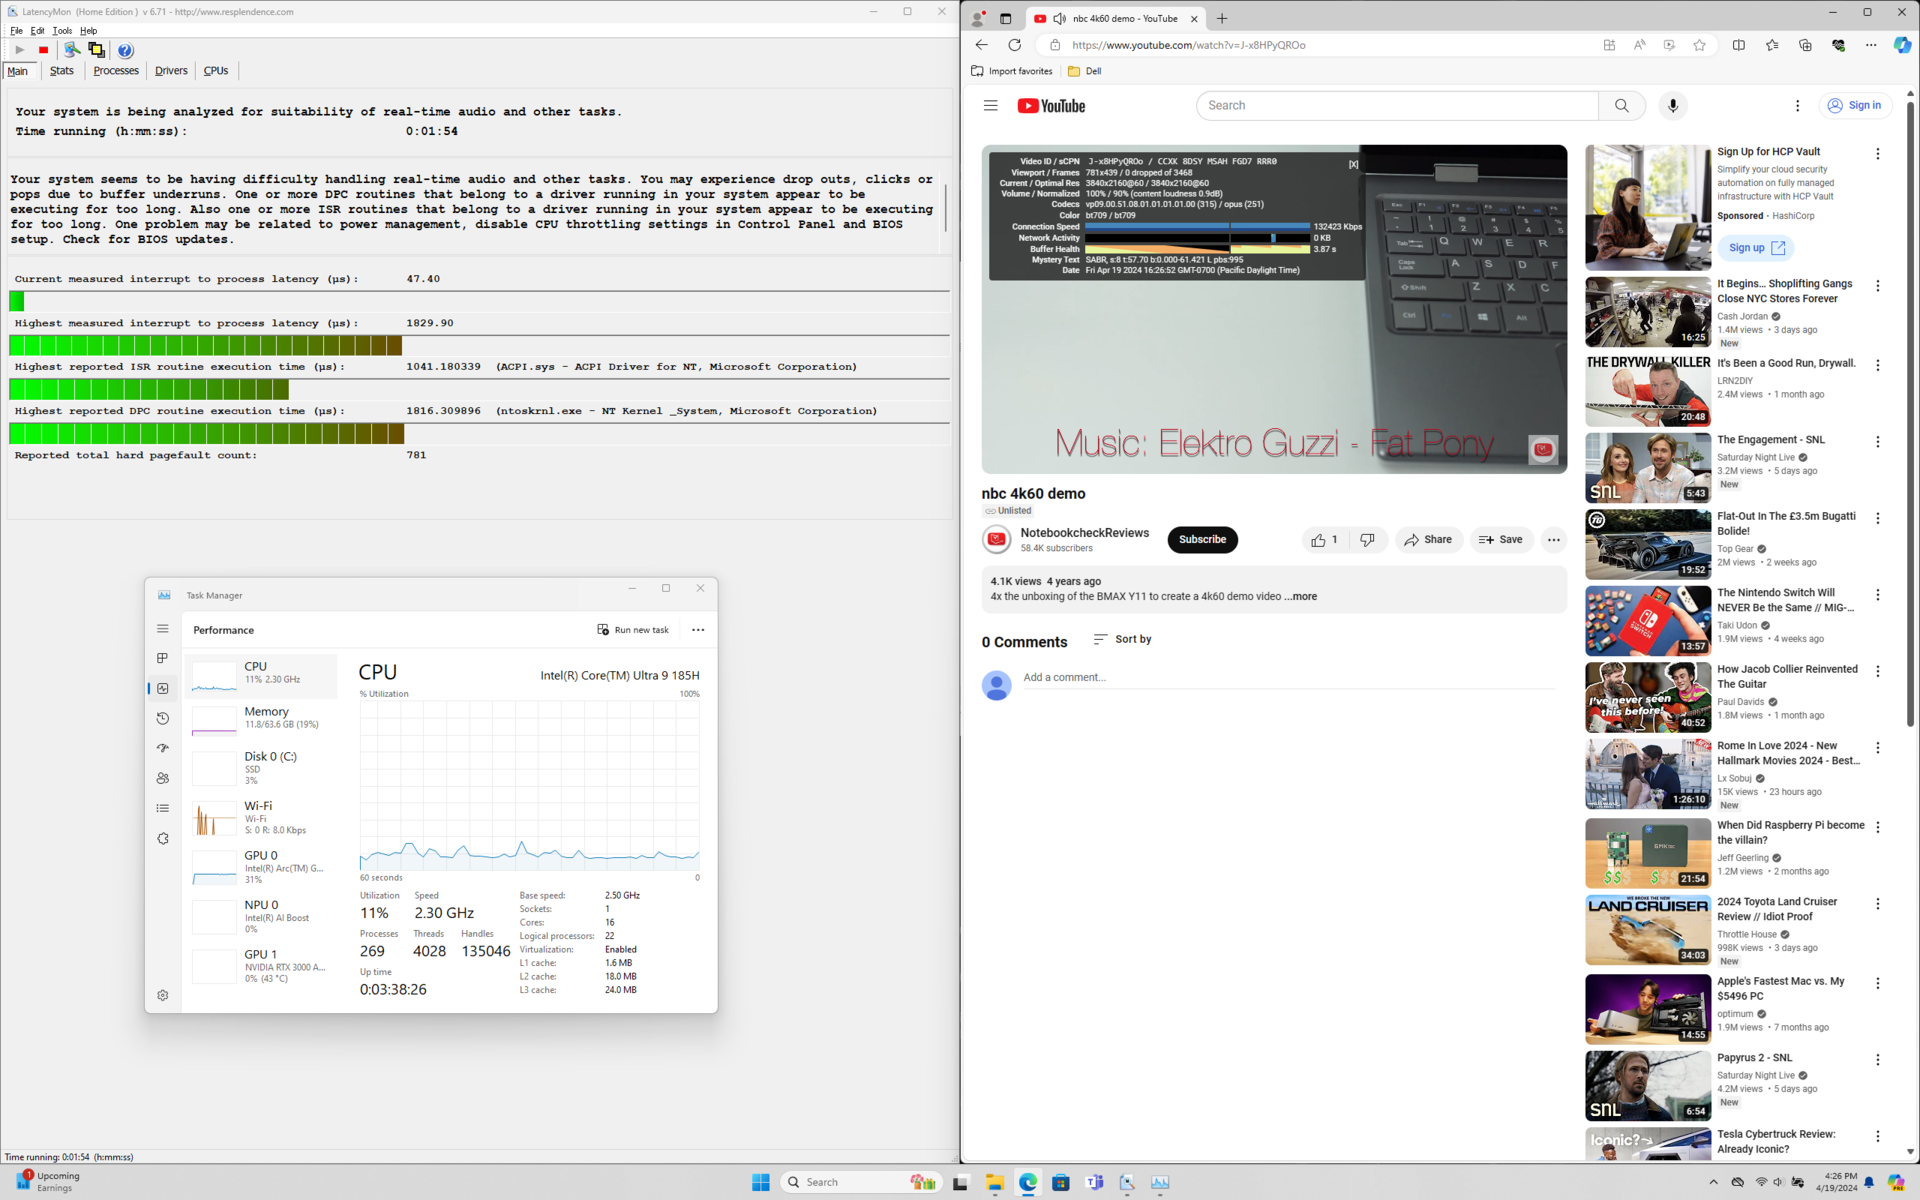
LatencyMon shows just minor DPC issues again when opening multiple tabs of our homepage. 4K video playback at 60 FPS is otherwise perfect with no dropped frames recorded.
| DPC Latencies / LatencyMon - interrupt to process latency (max), Web, Youtube, Prime95 | |
| Dell Precision 5000 5490 | |
| Lenovo ThinkPad P14s G4 21HF0017GE | |
| Dell Precision 5480 | |
| HP ZBook Firefly 14 G10 A | |
| Dell Precision 5000 5470 | |
* ... smaller is better
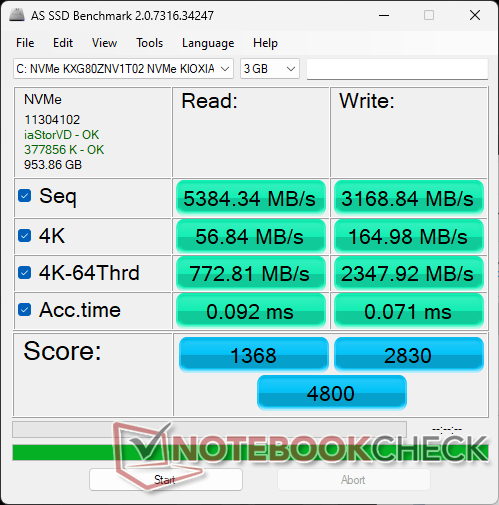
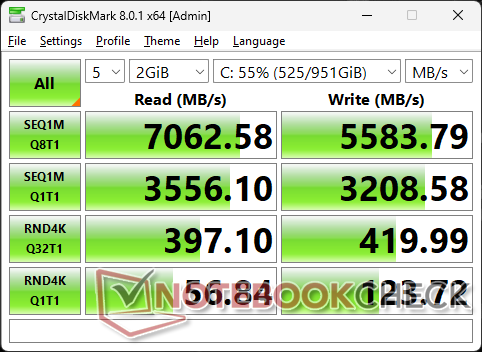
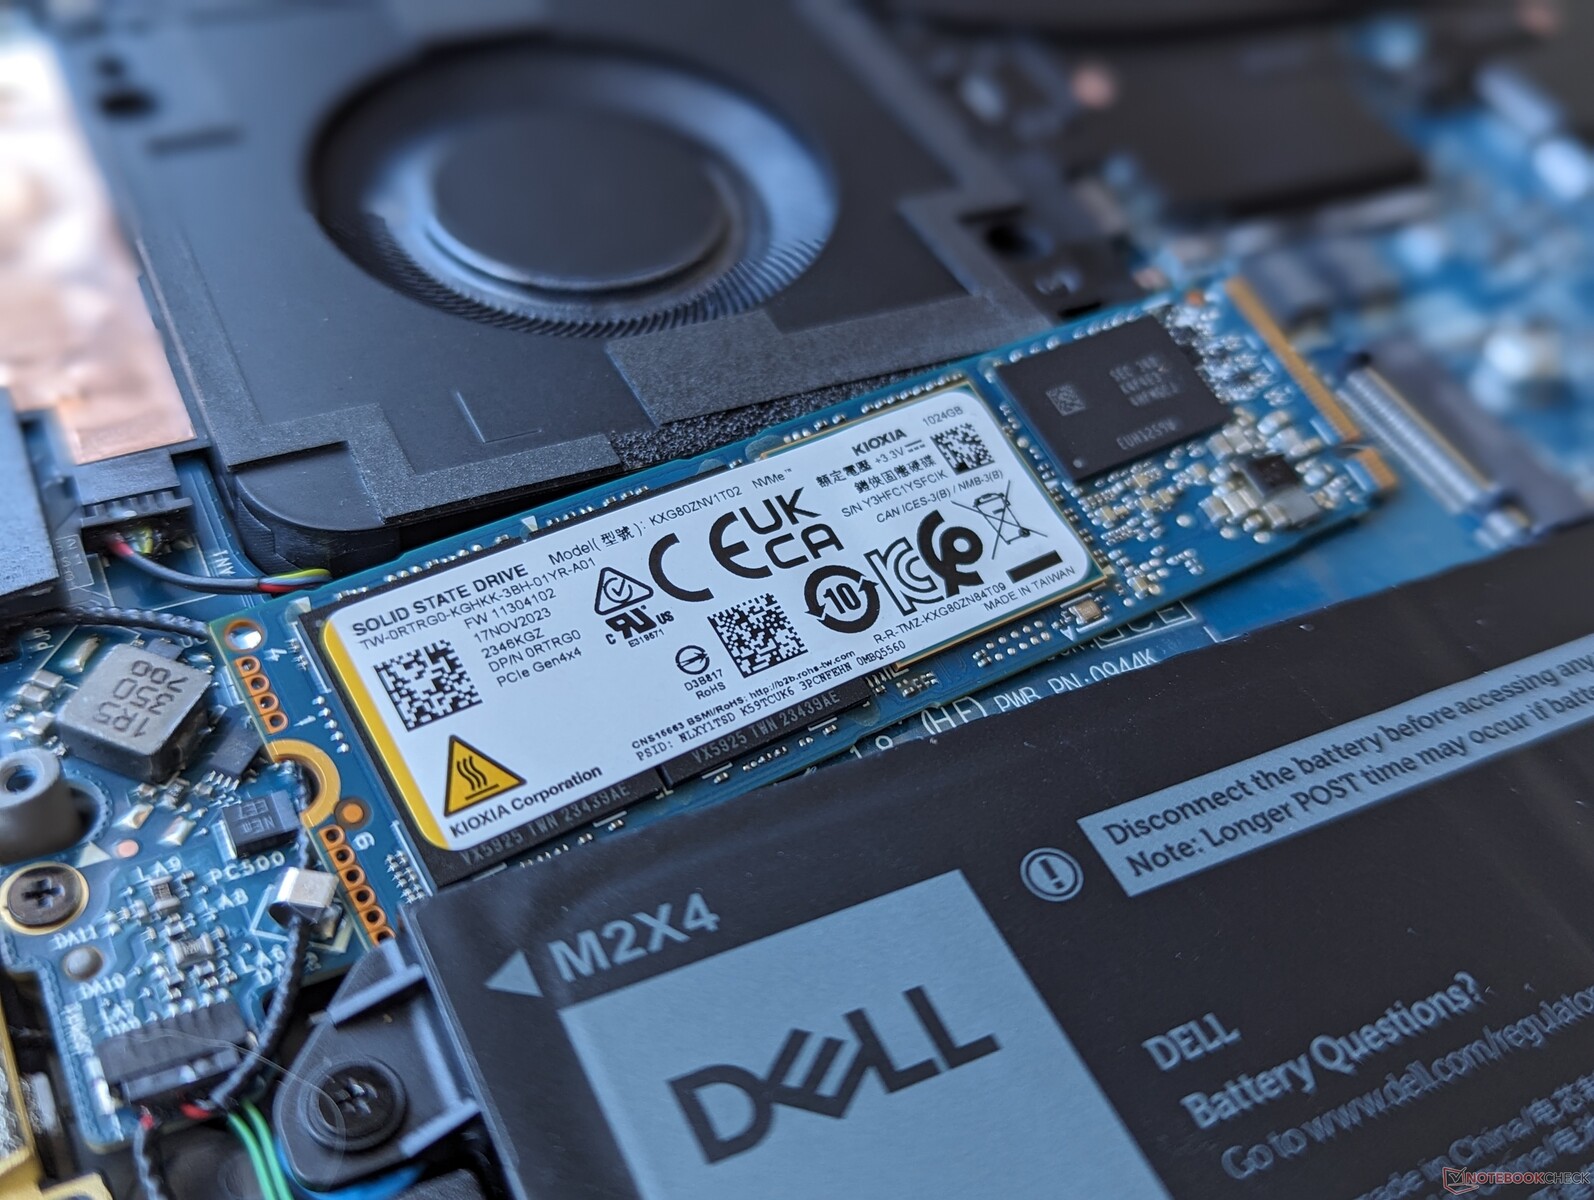
Storage Devices
Our unit ships with the Kioxia KXG80ZNV1T02 instead of the Samsung PM9A1 on last year's model. Overall performance is about the same albeit with slightly slower read rates of smaller 4K blocks.

| Drive Performance rating - Percent | |
| Lenovo ThinkPad P14s G4 21HF0017GE | |
| Dell Precision 5480 | |
| Dell Precision 5000 5470 | |
| HP ZBook Firefly 14 G9-6B8A2EA | |
| Dell Precision 5000 5490 | |
| HP ZBook Firefly 14 G10 A | |
* ... smaller is better
Disk Throttling: DiskSpd Read Loop, Queue Depth 8
GPU Performance — RTX 3000 Ada
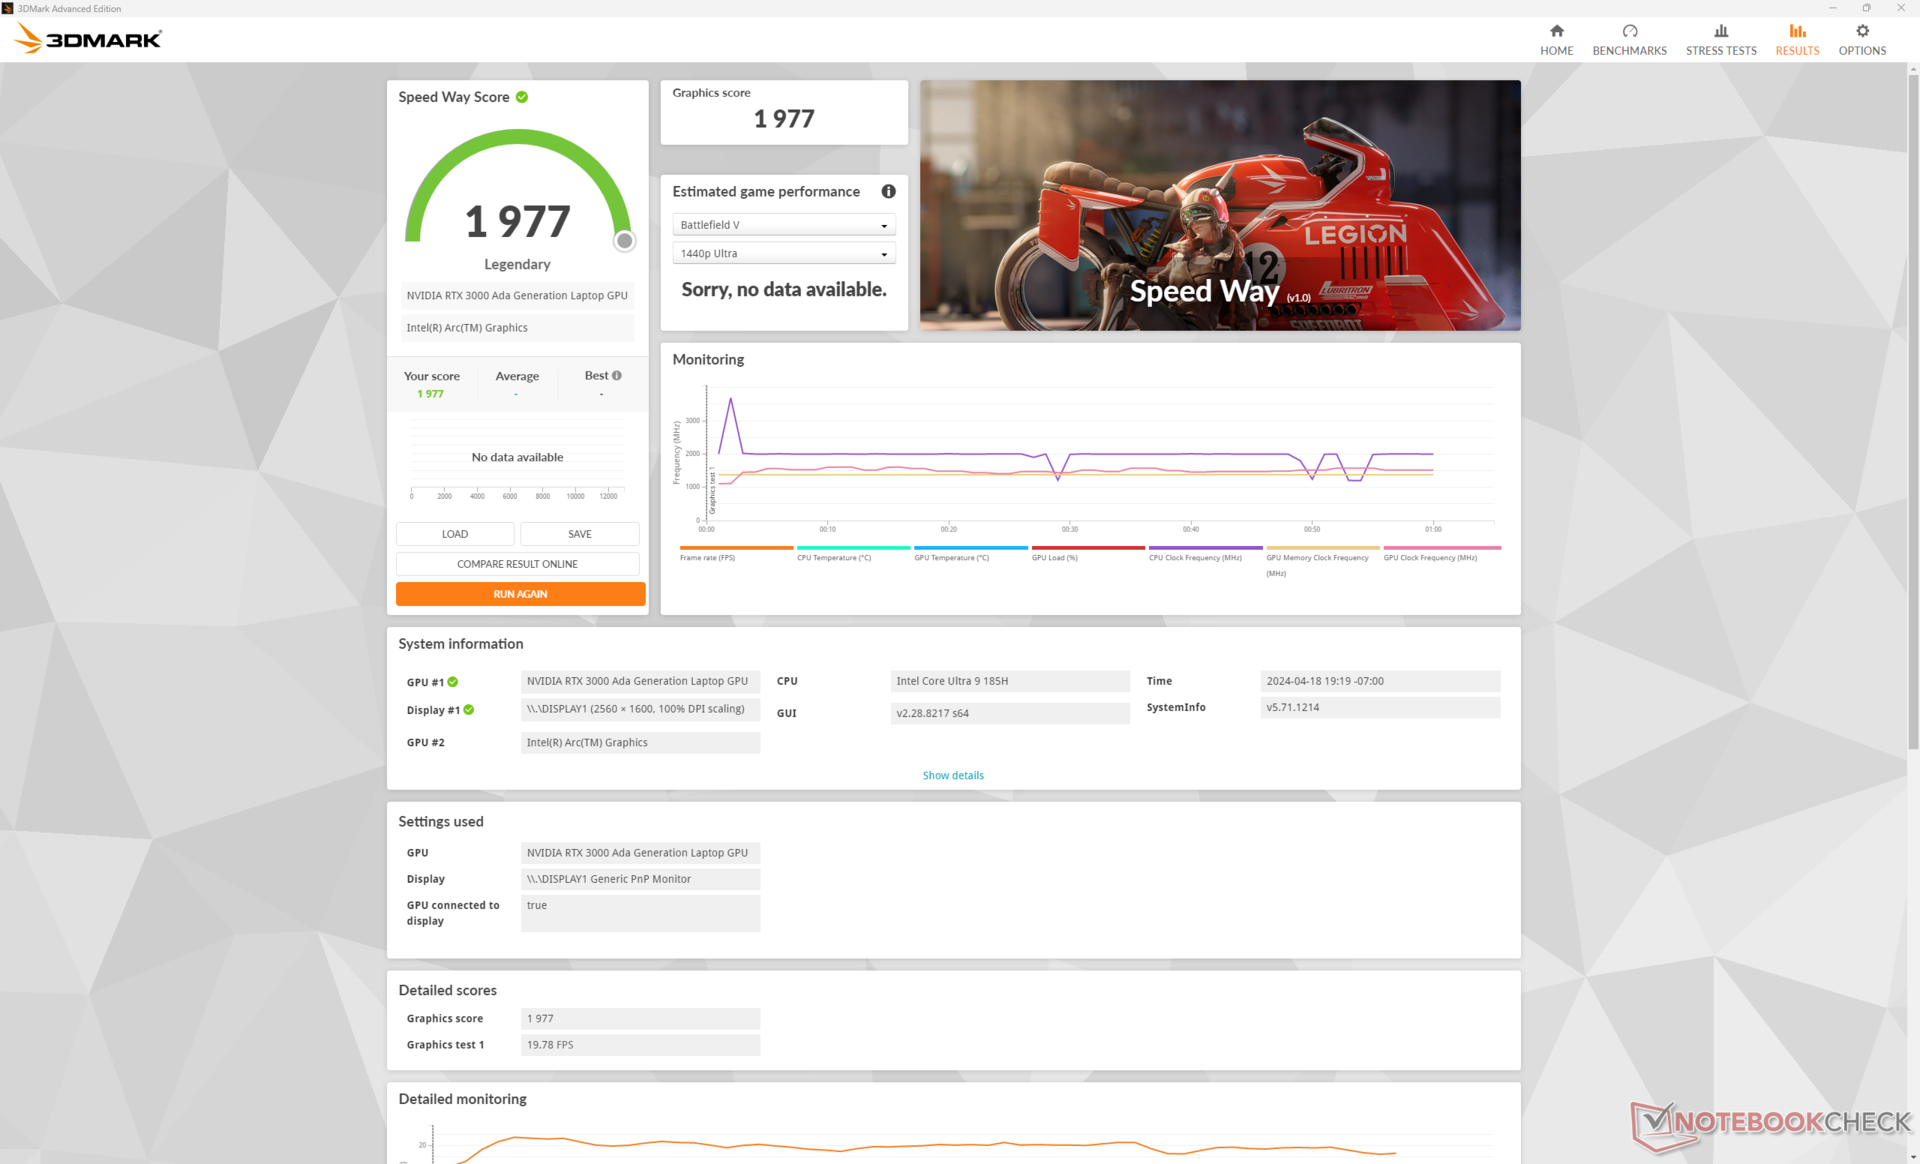
The RTX 3000 Ada has returned with no changes for no performance benefits over the Precision 5480. In fact, average performance may be slightly slower in many cases including certain games and 3DMark benchmarks. Even so, the Precision 5490 remains one of the fastest 14-inch workstations.
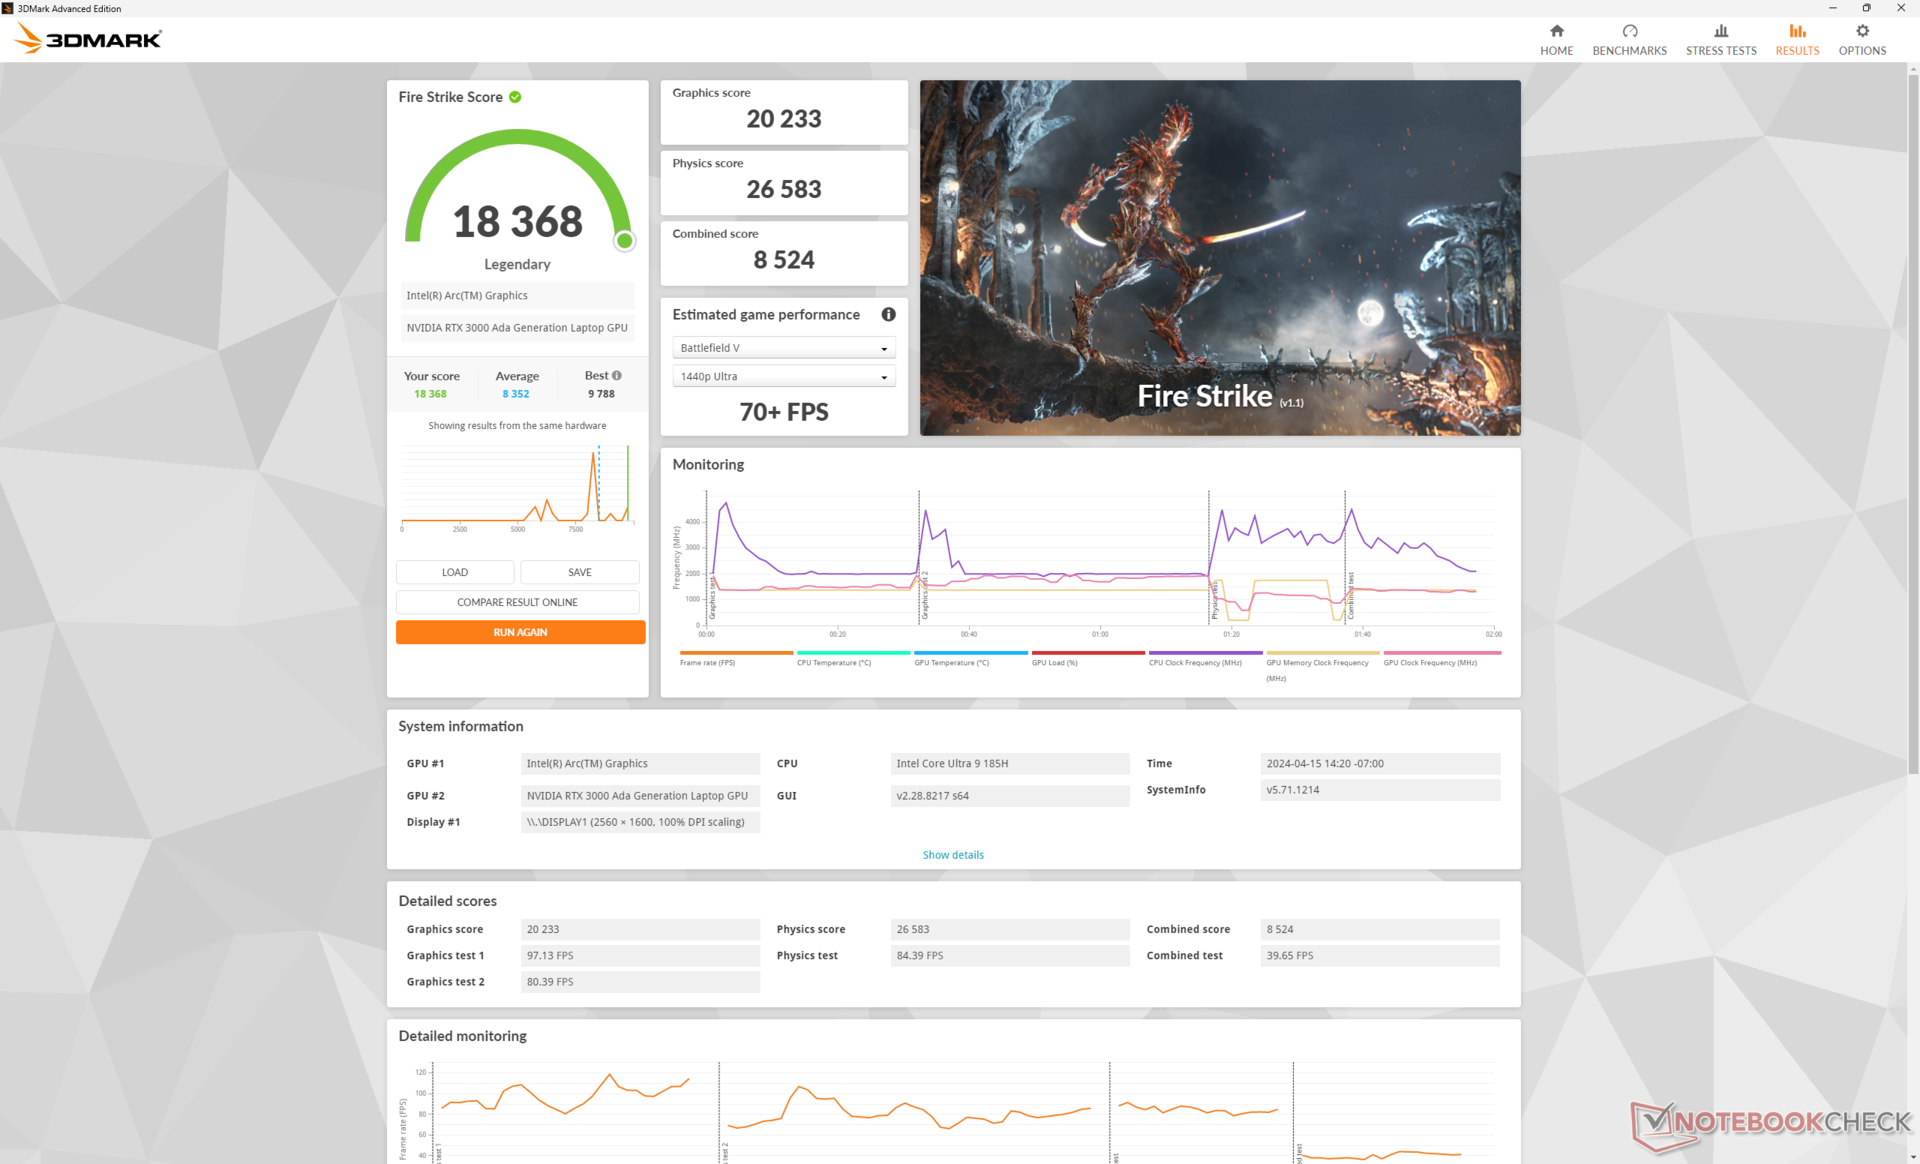
| Power Profile | Graphics Score | Physics Score | Combined Score |
| Performance Mode | 20233 | 26583 | 8524 |
| Balanced Mode | 19308 (-5%) | 25981 (-2%) | 7568 (-11%) |
| Battery Power | 19040 (-6%) | 20532 (-23%) | 7331 (-14%) |
Running on Balanced mode instead of Performance mode impacts performance only marginally as shown by our Fire Strike results above. Battery power reduces processor performance more significantly than graphics performance.
| 3DMark Performance rating - Percent | |
| Average NVIDIA RTX 3000 Ada Generation Laptop -1! | |
| Dell Precision 5000 5490 -3! | |
| Dell Precision 5480 -5! | |
| HP ZBook Power 15 G10 -11! | |
| HP ZBook Power 15 G9 6B8C4EA -18! | |
| Dell Precision 5000 5560 -4! | |
| Dell Precision 5000 5470 -11! | |
| Lenovo ThinkPad P15v G3 21EM001AGE -12! | |
| Lenovo ThinkPad P15v G2 21A9000XGE -19! | |
| Lenovo ThinkPad P14s G4 21HF0017GE -19! | |
| Lenovo ThinkPad P14s G4 21K5000LGE -21! | |
| Lenovo ThinkPad P14s G3 AMD 21J6S05000 -19! | |
| HP ZBook Firefly 14 G9-6B8A2EA -19! | |
| HP ZBook Firefly 14 G10 A -35! | |
| Lenovo ThinkPad P14s Gen1-20Y10002GE -19! | |
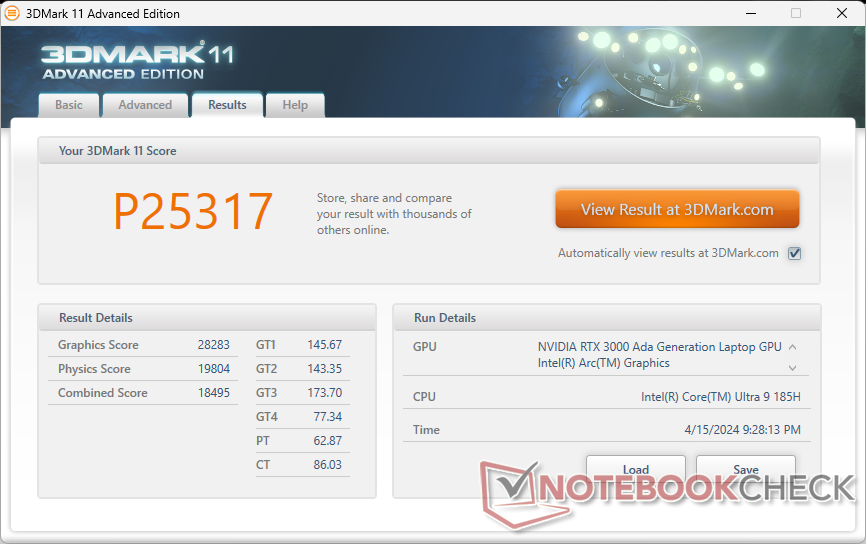
| 3DMark 11 Performance | 25317 points | |
| 3DMark Cloud Gate Standard Score | 45774 points | |
| 3DMark Fire Strike Score | 18368 points | |
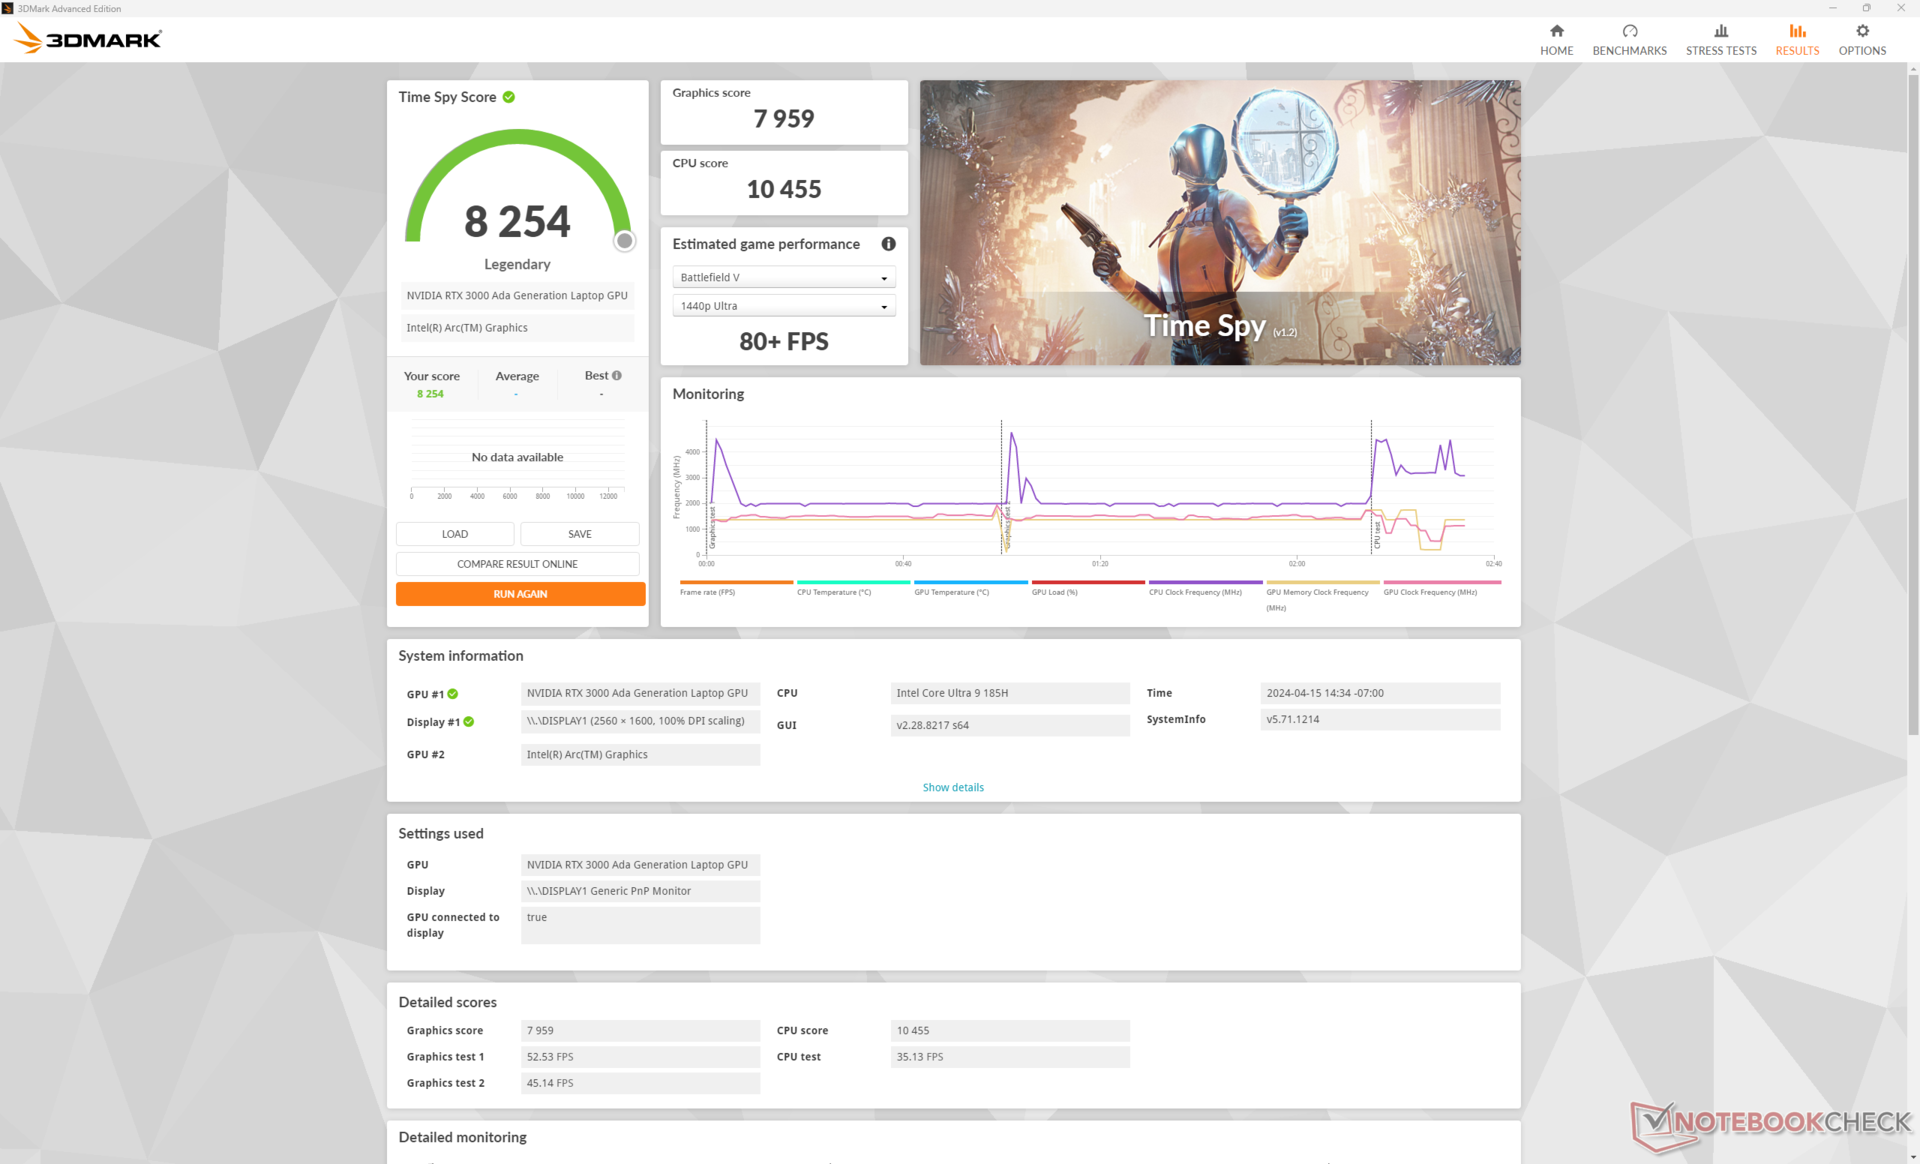
| 3DMark Time Spy Score | 8254 points | |
Help | ||
* ... smaller is better
| Cyberpunk 2077 | |
| 1920x1080 Low Preset (FSR off) | |
| Average NVIDIA RTX 3000 Ada Generation Laptop (87.2 - 104.6, n=2) | |
| Dell Precision 5000 5490 | |
| HP ZBook Power 15 G10 | |
| Lenovo ThinkPad P14s G4 21HF0017GE | |
| 1920x1080 Medium Preset (FSR off) | |
| Average NVIDIA RTX 3000 Ada Generation Laptop (72.7 - 87.9, n=2) | |
| Dell Precision 5000 5490 | |
| HP ZBook Power 15 G10 | |
| Lenovo ThinkPad P14s G4 21HF0017GE | |
| 1920x1080 High Preset (FSR off) | |
| Average NVIDIA RTX 3000 Ada Generation Laptop (60.7 - 74.2, n=2) | |
| Dell Precision 5000 5490 | |
| HP ZBook Power 15 G10 | |
| Lenovo ThinkPad P14s G4 21HF0017GE | |
| 1920x1080 Ultra Preset (FSR off) | |
| Average NVIDIA RTX 3000 Ada Generation Laptop (52.1 - 64.3, n=2) | |
| Dell Precision 5000 5490 | |
| HP ZBook Power 15 G10 | |
| Lenovo ThinkPad P14s G4 21HF0017GE | |
| 1920x1080 Ray Tracing Ultra Preset (DLSS off) | |
| Average NVIDIA RTX 3000 Ada Generation Laptop (26.2 - 33.2, n=2) | |
| Dell Precision 5000 5490 | |
| HP ZBook Power 15 G10 | |
| Lenovo ThinkPad P14s G4 21HF0017GE | |
| Tiny Tina's Wonderlands | |
| 1920x1080 Low Preset (DX12) | |
| Average NVIDIA RTX 3000 Ada Generation Laptop (153.9 - 194, n=3) | |
| Dell Precision 5480 | |
| Dell Precision 5000 5490 | |
| HP ZBook Power 15 G10 | |
| 1920x1080 Medium Preset (DX12) | |
| Average NVIDIA RTX 3000 Ada Generation Laptop (125.4 - 157.7, n=3) | |
| Dell Precision 5480 | |
| Dell Precision 5000 5490 | |
| HP ZBook Power 15 G10 | |
| 1920x1080 High Preset (DX12) | |
| Average NVIDIA RTX 3000 Ada Generation Laptop (88 - 110, n=3) | |
| Dell Precision 5000 5490 | |
| Dell Precision 5480 | |
| HP ZBook Power 15 G10 | |
| 1920x1080 Badass Preset (DX12) | |
| Average NVIDIA RTX 3000 Ada Generation Laptop (69 - 87.9, n=3) | |
| Dell Precision 5000 5490 | |
| Dell Precision 5480 | |
| HP ZBook Power 15 G10 | |
Witcher 3 FPS Chart
| low | med. | high | ultra | |
|---|---|---|---|---|
| The Witcher 3 (2015) | 344 | 249.5 | 145.8 | 79.5 |
| Dota 2 Reborn (2015) | 168 | 151.3 | 136 | 123.3 |
| Final Fantasy XV Benchmark (2018) | 128.8 | 91.9 | 72.9 | |
| X-Plane 11.11 (2018) | 109.9 | 102.1 | 76.7 | |
| Far Cry 5 (2018) | 115 | 105 | 104 | 96 |
| Strange Brigade (2018) | 282 | 182.4 | 151.4 | 132.5 |
| Tiny Tina's Wonderlands (2022) | 153.9 | 125.4 | 88.5 | 70.2 |
| F1 22 (2022) | 183.6 | 168 | 127.5 | 50.4 |
| Baldur's Gate 3 (2023) | 92 | 78.8 | 70.1 | 68.8 |
| Cyberpunk 2077 (2023) | 87.2 | 72.7 | 60.7 | 52.1 |
Emissions
System Noise
Fan noise floor and ceiling are essentially identical to what we recorded on the Precision 5480. The ceiling in particular continues to be higher or louder than other 14-inch workstations mostly due to the faster GPU in the Dell system. For this year, the Precision 5490 can at least run quieter for longer periods before the fans begin to ramp up.
Noise level
| Idle |
| 23.8 / 23.8 / 24.7 dB(A) |
| Load |
| 38.9 / 51.4 dB(A) |
 | ||
30 dB silent 40 dB(A) audible 50 dB(A) loud |
||
min: | ||
| Dell Precision 5000 5490 RTX 3000 Ada Generation Laptop, Ultra 9 185H, Kioxia XG8 KXG80ZNV1T02 | Lenovo ThinkPad P14s G4 21HF0017GE RTX A500 Laptop GPU, i7-1370P, SK Hynix HFS002TEJ9X162N | HP ZBook Firefly 14 G10 A Radeon 760M, R5 PRO 7640HS, Samsung PM9B1 512GB MZVL4512HBLU | HP ZBook Firefly 14 G9-6B8A2EA T550 Laptop GPU, i7-1265U, Micron 3400 1TB MTFDKBA1T0TFH | Dell Precision 5480 RTX 3000 Ada Generation Laptop, i9-13900H, Samsung PM9A1 MZVL21T0HCLR | Dell Precision 5000 5470 RTX A1000 Laptop GPU, i9-12900H, Samsung PM9A1 MZVL21T0HCLR | |
|---|---|---|---|---|---|---|
| Noise | -1% | -4% | 4% | 0% | -2% | |
| off / environment * (dB) | 22.8 | 24.6 -8% | 25 -10% | 23.6 -4% | 23.5 -3% | 23 -1% |
| Idle Minimum * (dB) | 23.8 | 24.6 -3% | 25 -5% | 23.6 1% | 23.5 1% | 23.3 2% |
| Idle Average * (dB) | 23.8 | 24.6 -3% | 26 -9% | 23.6 1% | 23.5 1% | 23.3 2% |
| Idle Maximum * (dB) | 24.7 | 25.9 -5% | 27 -9% | 23.6 4% | 23.5 5% | 23.3 6% |
| Load Average * (dB) | 38.9 | 41.3 -6% | 45 -16% | 42.5 -9% | 39.9 -3% | 48.5 -25% |
| Witcher 3 ultra * (dB) | 49.9 | 46 8% | 45 10% | 42.5 15% | 50.1 -0% | 48.6 3% |
| Load Maximum * (dB) | 51.4 | 46.2 10% | 46 11% | 42.5 17% | 51 1% | 50.4 2% |
| Cyberpunk 2077 ultra * (dB) | 44.2 |
* ... smaller is better
Temperature
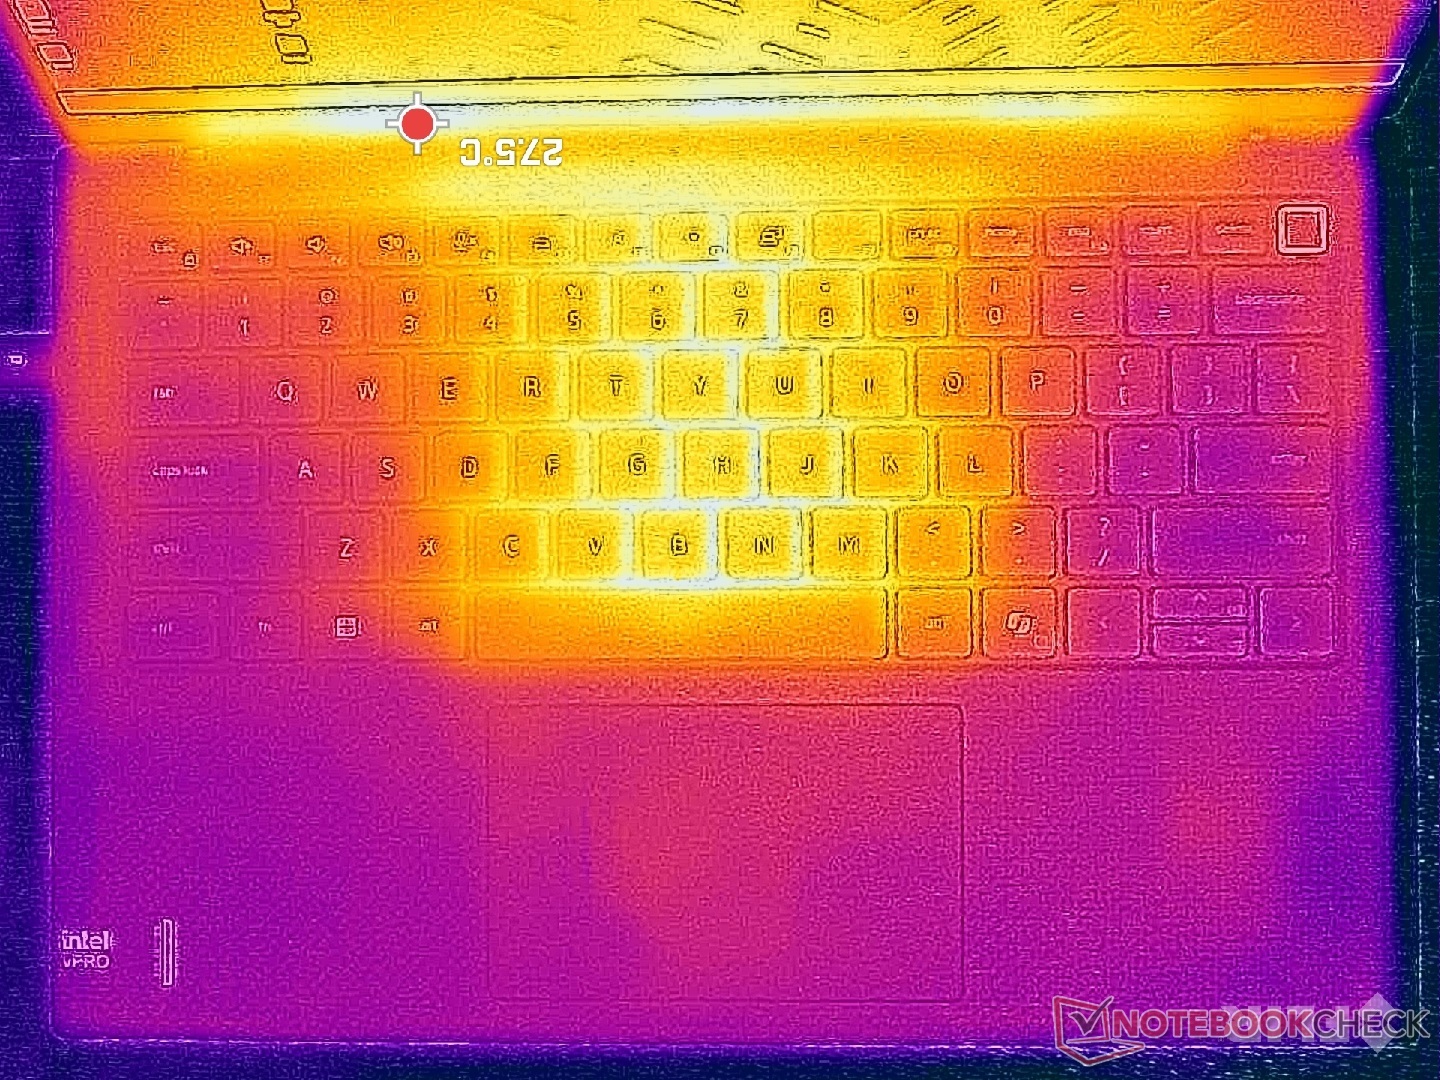
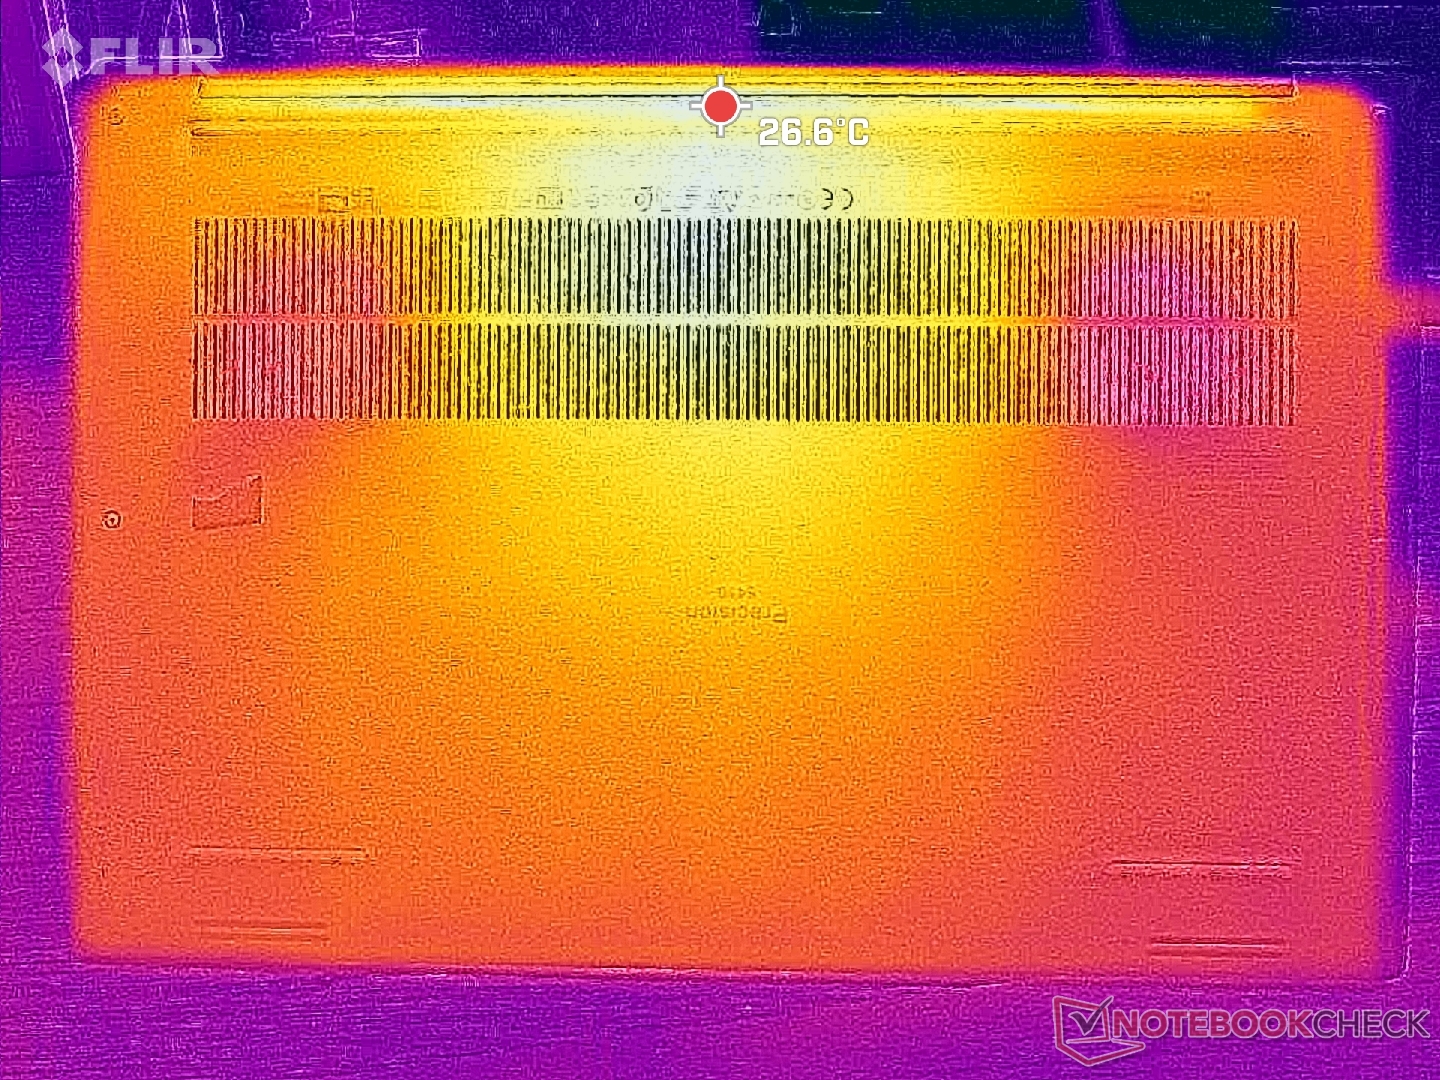
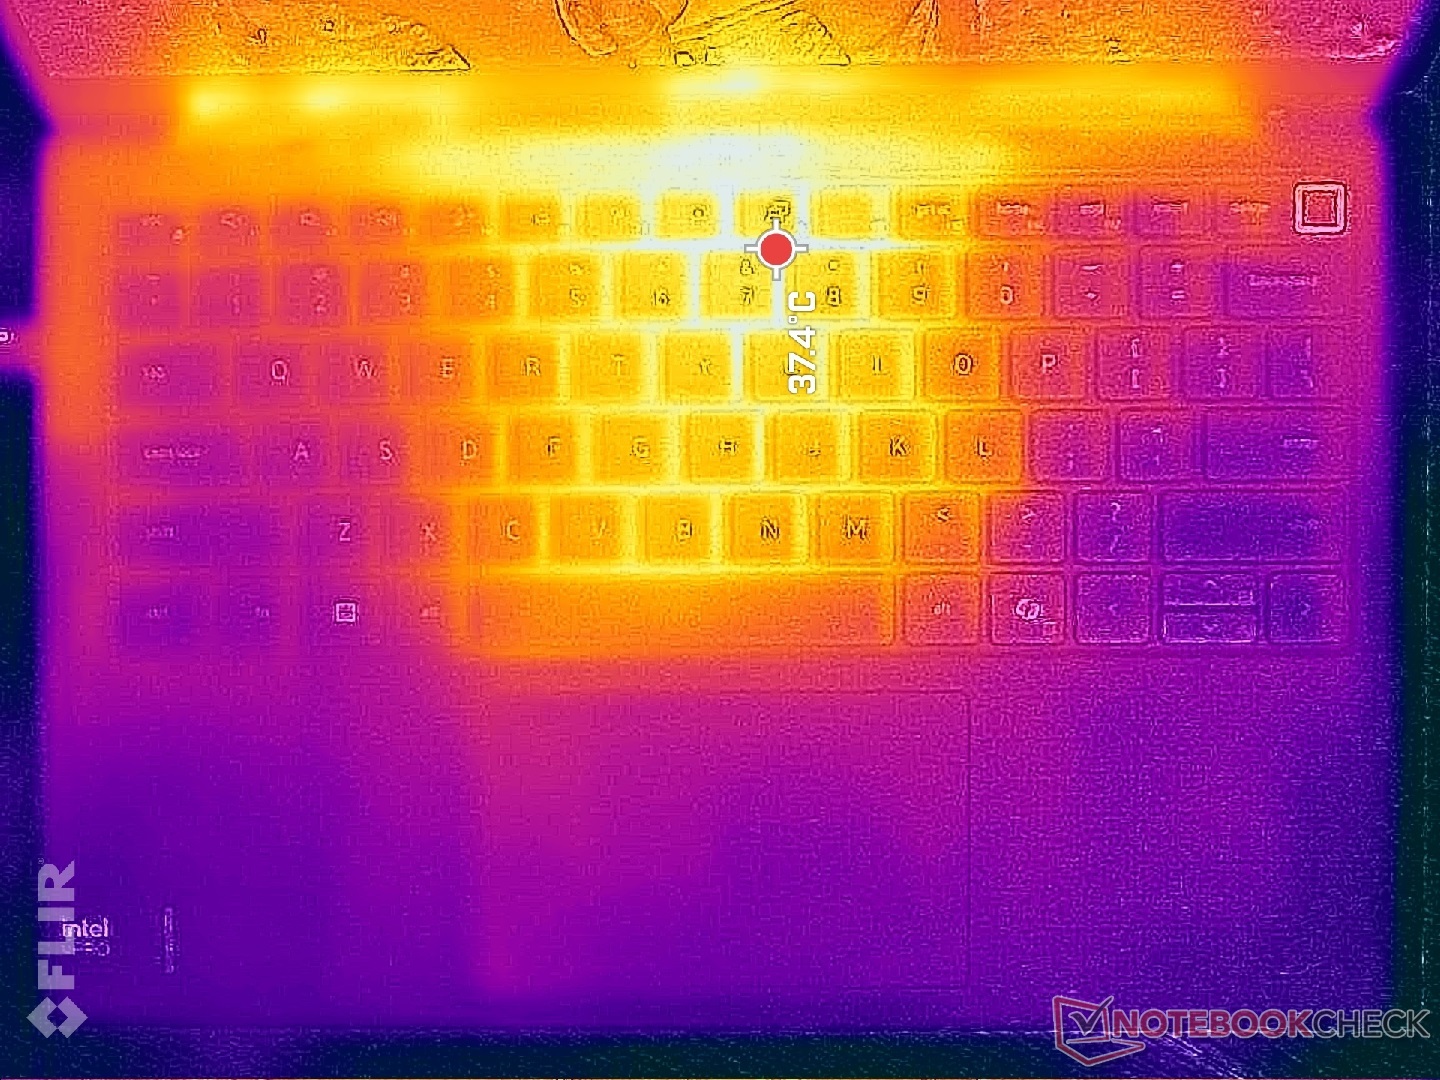
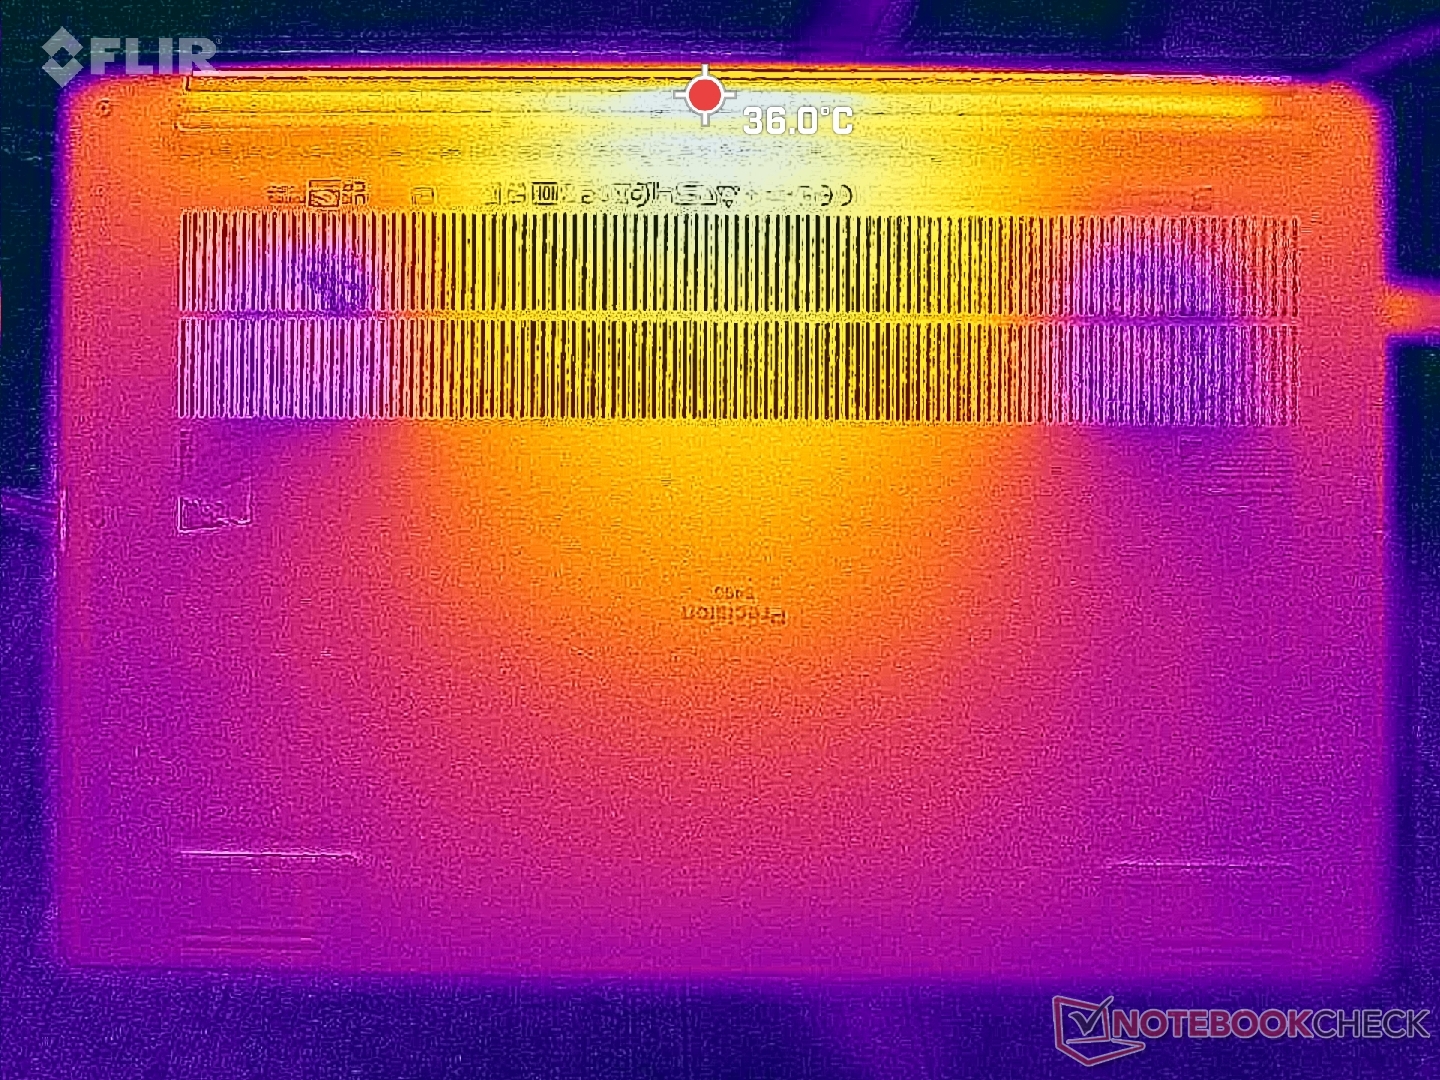
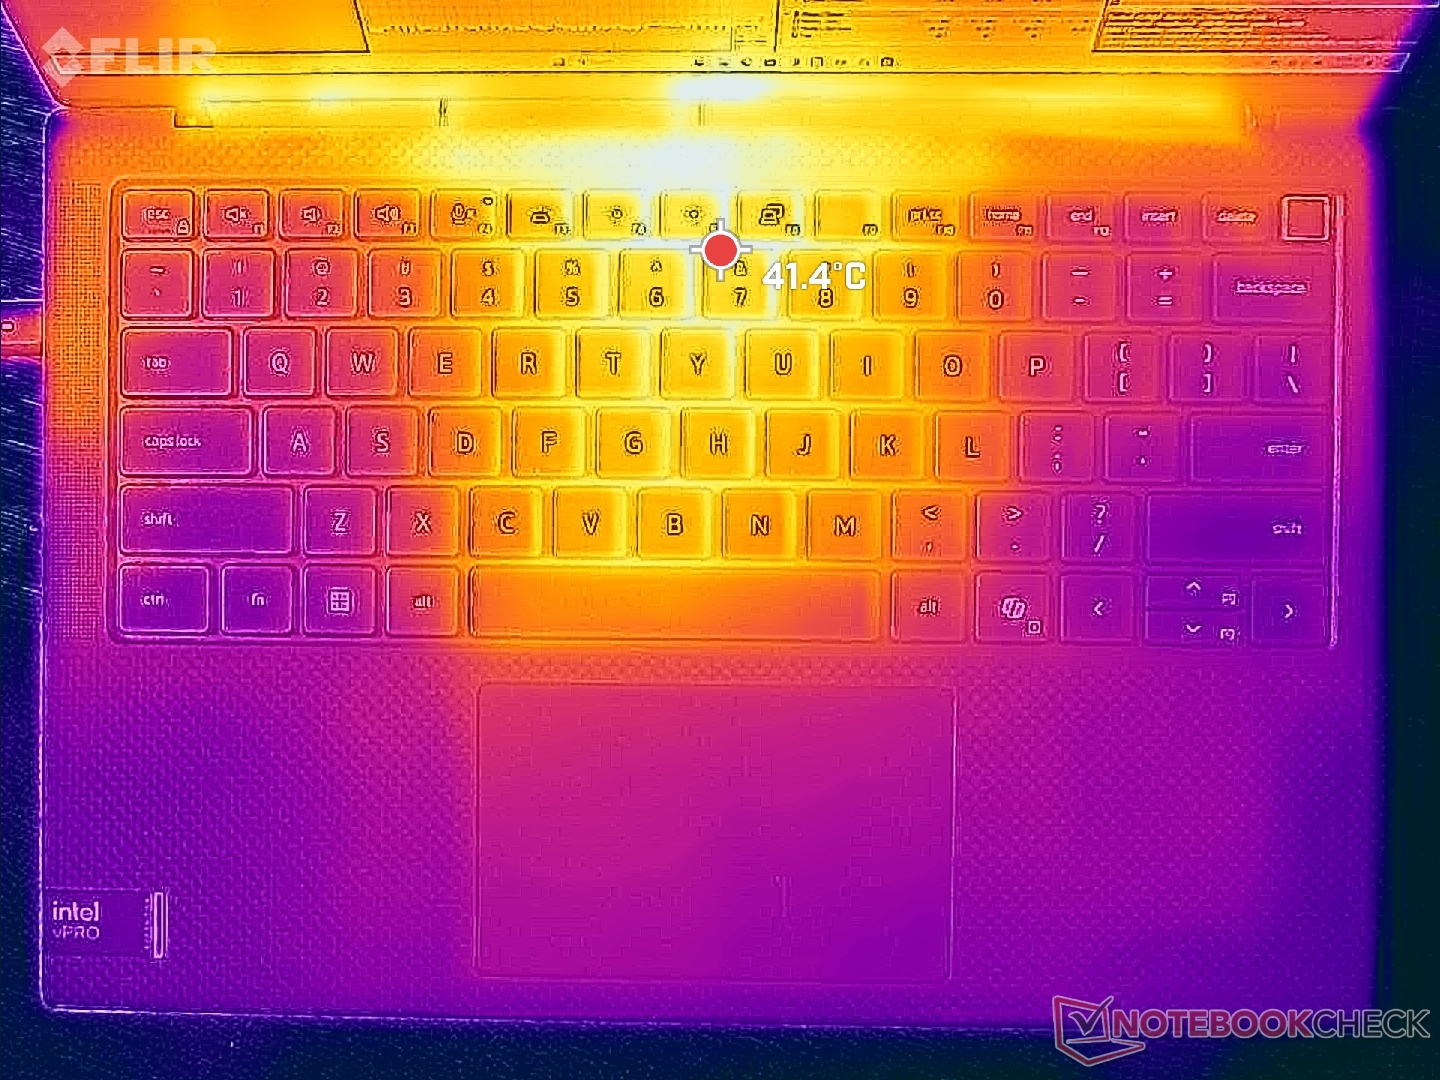
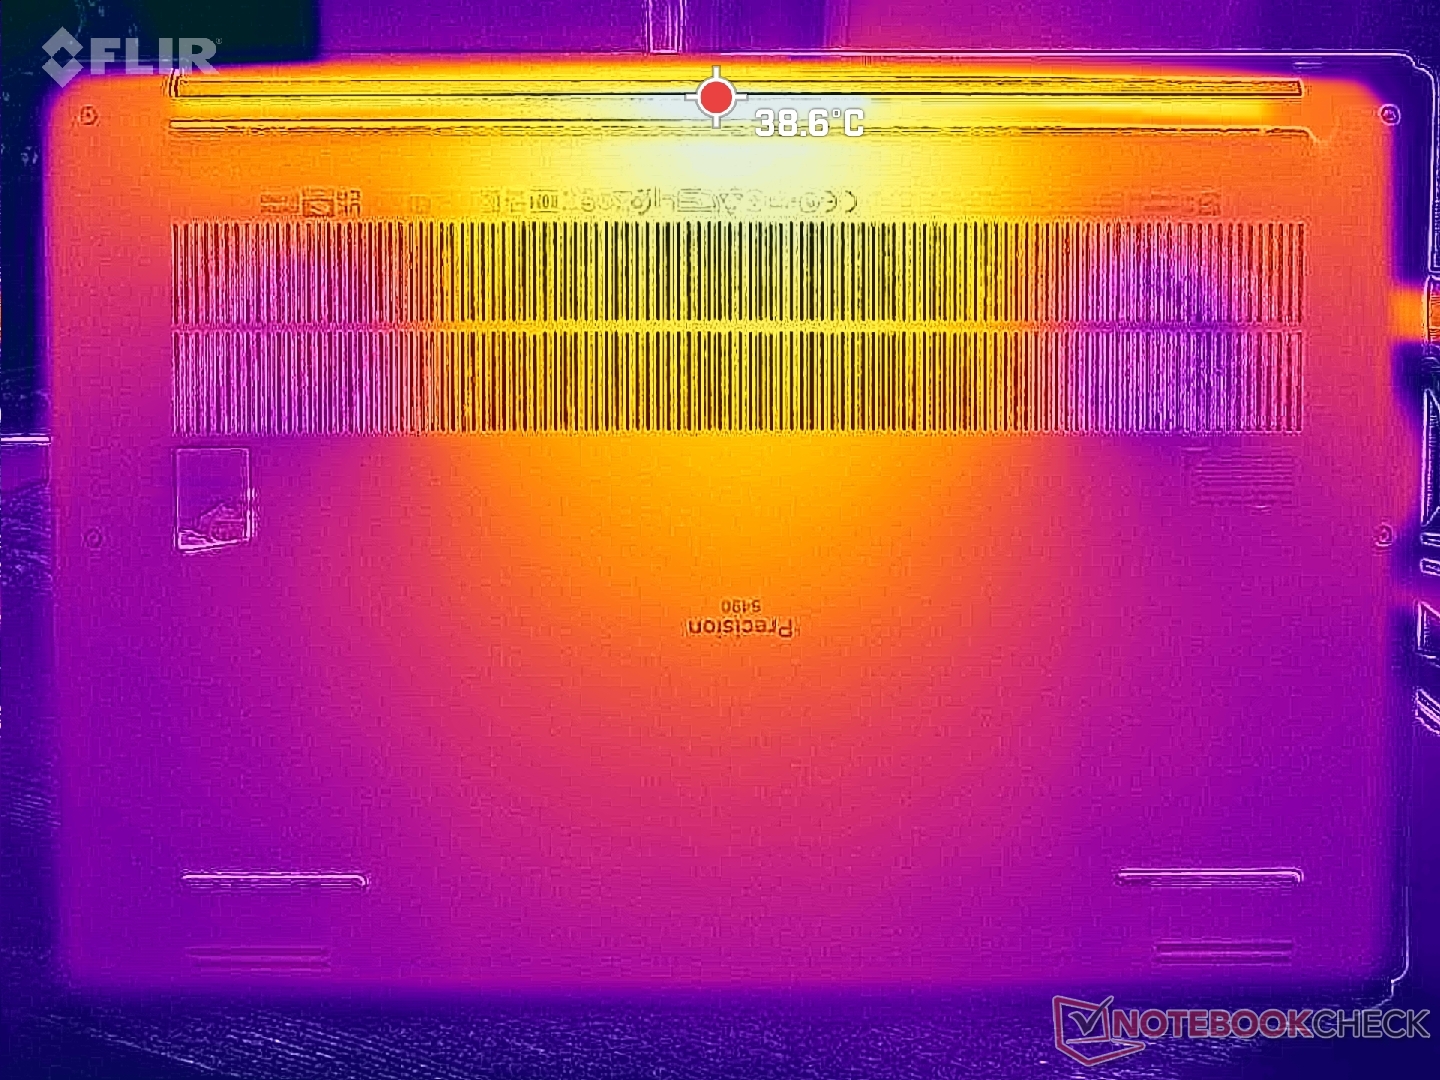
Temperature development is symmetrical and so the hot spots are closest toward the keyboard center while the sides and palm rests are much cooler. Hot spots are nonetheless noticeably cooler than on the HP ZBook Firefly 14 G10 by several degrees C.
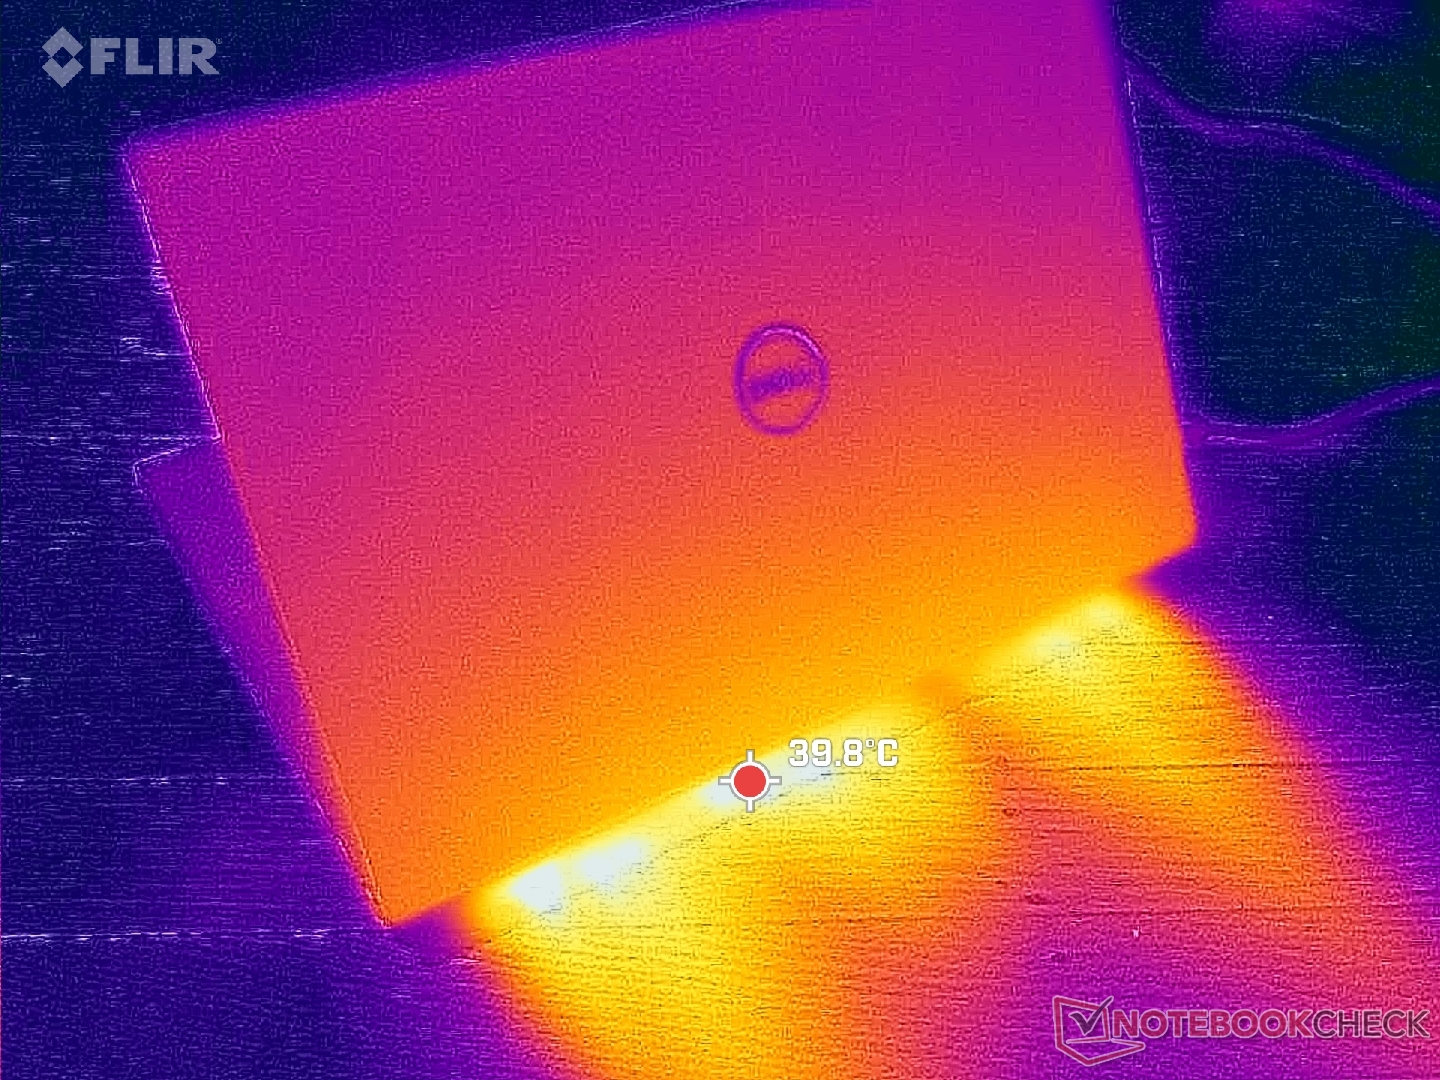
(±) The maximum temperature on the upper side is 43.2 °C / 110 F, compared to the average of 38.2 °C / 101 F, ranging from 22.2 to 69.8 °C for the class Workstation.
(+) The bottom heats up to a maximum of 38.4 °C / 101 F, compared to the average of 41.1 °C / 106 F
(+) In idle usage, the average temperature for the upper side is 29 °C / 84 F, compared to the device average of 32 °C / 90 F.
(+) Playing The Witcher 3, the average temperature for the upper side is 31.7 °C / 89 F, compared to the device average of 32 °C / 90 F.
(+) The palmrests and touchpad are cooler than skin temperature with a maximum of 27.6 °C / 81.7 F and are therefore cool to the touch.
(±) The average temperature of the palmrest area of similar devices was 27.8 °C / 82 F (+0.2 °C / 0.3 F).
| Dell Precision 5000 5490 Intel Core Ultra 9 185H, NVIDIA RTX 3000 Ada Generation Laptop | Lenovo ThinkPad P14s G4 21HF0017GE Intel Core i7-1370P, NVIDIA RTX A500 Laptop GPU | HP ZBook Firefly 14 G10 A AMD Ryzen 5 PRO 7640HS, AMD Radeon 760M | HP ZBook Firefly 14 G9-6B8A2EA Intel Core i7-1265U, NVIDIA T550 Laptop GPU | Dell Precision 5480 Intel Core i9-13900H, NVIDIA RTX 3000 Ada Generation Laptop | Dell Precision 5000 5470 Intel Core i9-12900H, NVIDIA RTX A1000 Laptop GPU | |
|---|---|---|---|---|---|---|
| Heat | -13% | -4% | 2% | -13% | -3% | |
| Maximum Upper Side * (°C) | 43.2 | 55.3 -28% | 50 -16% | 41.2 5% | 44 -2% | 41.8 3% |
| Maximum Bottom * (°C) | 38.4 | 48.7 -27% | 51 -33% | 47.9 -25% | 38.2 1% | 36 6% |
| Idle Upper Side * (°C) | 31.6 | 31 2% | 25 21% | 26.5 16% | 38.8 -23% | 34.6 -9% |
| Idle Bottom * (°C) | 30.6 | 29.9 2% | 27 12% | 27 12% | 38.6 -26% | 33.6 -10% |
* ... smaller is better
Speakers
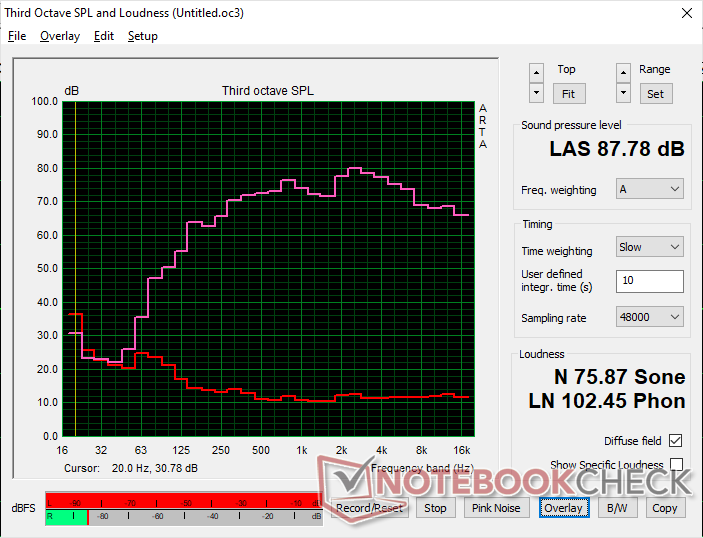
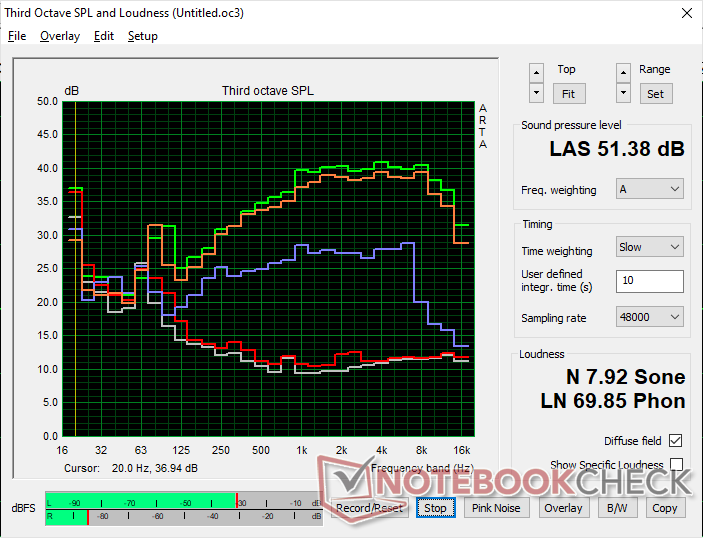
Dell Precision 5000 5490 audio analysis
(+) | speakers can play relatively loud (87.8 dB)
Bass 100 - 315 Hz
(±) | reduced bass - on average 10.9% lower than median
(±) | linearity of bass is average (7.2% delta to prev. frequency)
Mids 400 - 2000 Hz
(+) | balanced mids - only 1.7% away from median
(+) | mids are linear (3.5% delta to prev. frequency)
Highs 2 - 16 kHz
(+) | balanced highs - only 4.4% away from median
(+) | highs are linear (3.4% delta to prev. frequency)
Overall 100 - 16.000 Hz
(+) | overall sound is linear (9.2% difference to median)
Compared to same class
» 4% of all tested devices in this class were better, 2% similar, 94% worse
» The best had a delta of 7%, average was 17%, worst was 35%
Compared to all devices tested
» 3% of all tested devices were better, 1% similar, 96% worse
» The best had a delta of 4%, average was 23%, worst was 134%
Apple MacBook Pro 16 2021 M1 Pro audio analysis
(+) | speakers can play relatively loud (84.7 dB)
Bass 100 - 315 Hz
(+) | good bass - only 3.8% away from median
(+) | bass is linear (5.2% delta to prev. frequency)
Mids 400 - 2000 Hz
(+) | balanced mids - only 1.3% away from median
(+) | mids are linear (2.1% delta to prev. frequency)
Highs 2 - 16 kHz
(+) | balanced highs - only 1.9% away from median
(+) | highs are linear (2.7% delta to prev. frequency)
Overall 100 - 16.000 Hz
(+) | overall sound is linear (4.6% difference to median)
Compared to same class
» 0% of all tested devices in this class were better, 0% similar, 100% worse
» The best had a delta of 5%, average was 17%, worst was 45%
Compared to all devices tested
» 0% of all tested devices were better, 0% similar, 100% worse
» The best had a delta of 4%, average was 23%, worst was 134%
Energy Management
Power Consumption
Running Witcher 3 demands an average of 93 W to be close to what we recorded on the Precision 5480 despite their CPU differences. When compared to other 14-inch workstations, the Precision 5490 is one of the most demanding which aligns with its relatively fast performance.
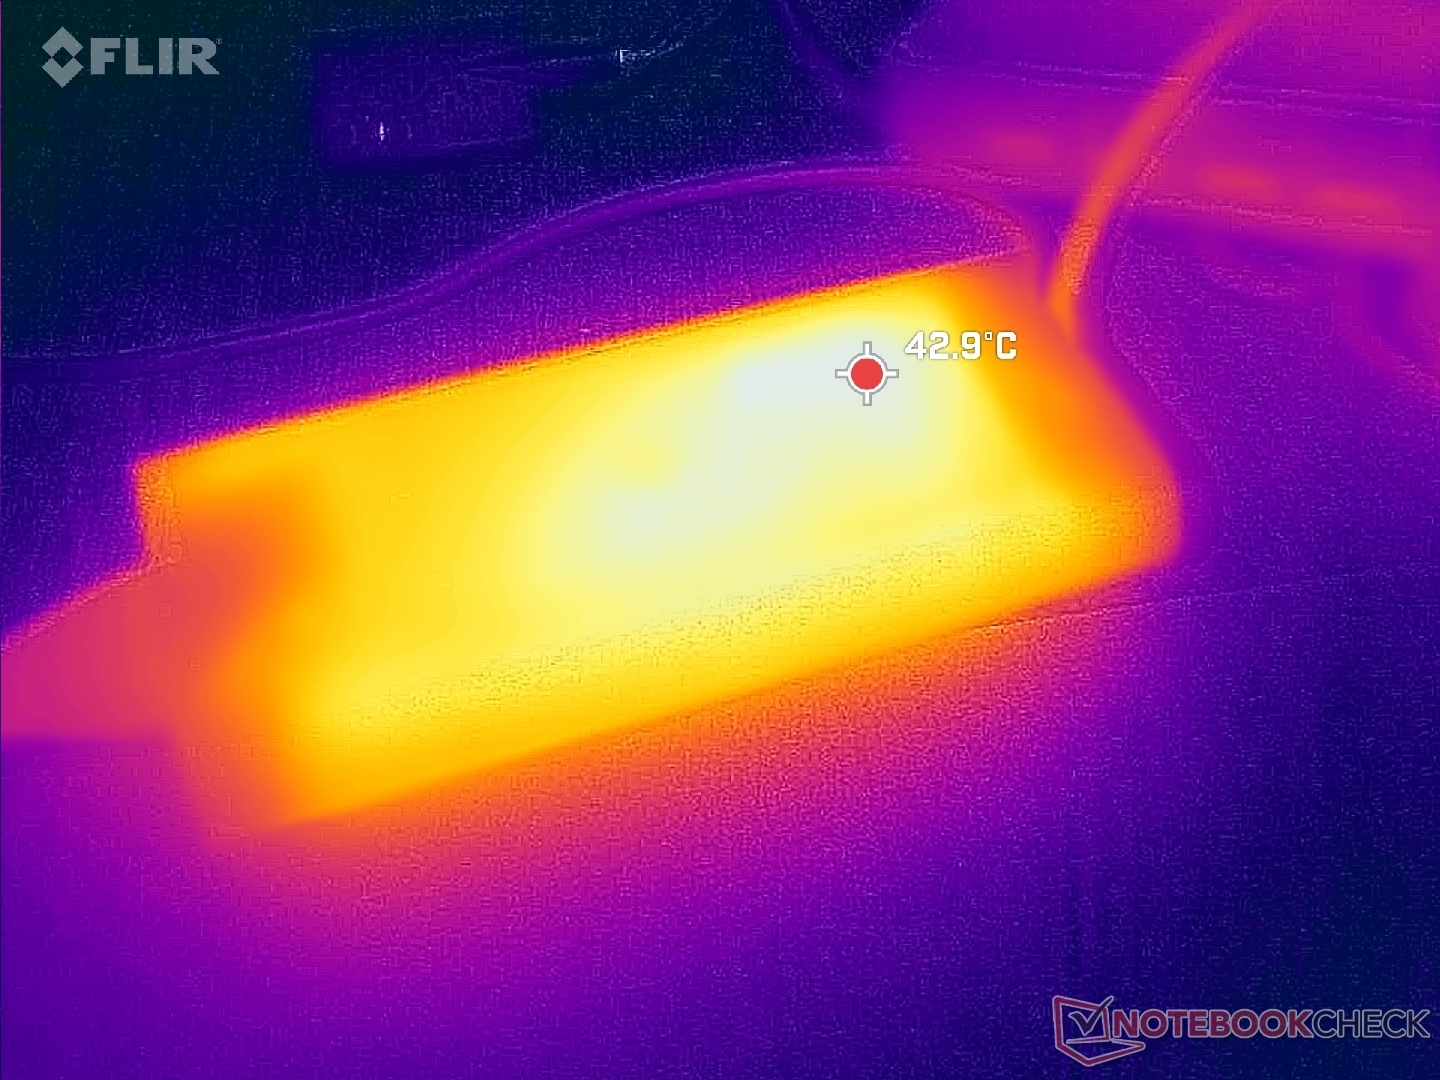
A smaller 100 W USB-C adapter ships with configurations that utilize no discrete graphics. Otherwise, a 130 W USB-C adapter comes standard. We're able to record a temporary maximum draw of 138 W when running Prime95 and FurMark simultaneously, but this would drop to 109 W after just a few seconds.
| Off / Standby | |
| Idle | |
| Load |
|
Key:
min: | |
| Dell Precision 5000 5490 Ultra 9 185H, RTX 3000 Ada Generation Laptop, Kioxia XG8 KXG80ZNV1T02, IPS, 2560x1600, 14" | Lenovo ThinkPad P14s G4 21HF0017GE i7-1370P, RTX A500 Laptop GPU, SK Hynix HFS002TEJ9X162N, OLED, 2880x1800, 14" | HP ZBook Firefly 14 G10 A R5 PRO 7640HS, Radeon 760M, Samsung PM9B1 512GB MZVL4512HBLU, IPS, 1920x1200, 14" | HP ZBook Firefly 14 G9-6B8A2EA i7-1265U, T550 Laptop GPU, Micron 3400 1TB MTFDKBA1T0TFH, IPS, 1920x1200, 14" | Dell Precision 5480 i9-13900H, RTX 3000 Ada Generation Laptop, Samsung PM9A1 MZVL21T0HCLR, IPS, 2560x1600, 14" | Dell Precision 5000 5470 i9-12900H, RTX A1000 Laptop GPU, Samsung PM9A1 MZVL21T0HCLR, IPS, 2560x1600, 14" | |
|---|---|---|---|---|---|---|
| Power Consumption | 32% | 51% | 52% | -24% | 11% | |
| Idle Minimum * (Watt) | 11.1 | 6.3 43% | 3 73% | 4.2 62% | 14.9 -34% | 4.3 61% |
| Idle Average * (Watt) | 14.8 | 7 53% | 4 73% | 6.5 56% | 19.5 -32% | 8.9 40% |
| Idle Maximum * (Watt) | 16.5 | 8.1 51% | 8 52% | 7.2 56% | 27.2 -65% | 18.9 -15% |
| Load Average * (Watt) | 70.1 | 84.6 -21% | 56 20% | 47.7 32% | 81.6 -16% | 94 -34% |
| Witcher 3 ultra * (Watt) | 93.1 | 56.5 39% | 58.2 37% | 42.9 54% | 90.4 3% | 83.2 11% |
| Load Maximum * (Watt) | 137.5 | 98.3 29% | 66 52% | 68.2 50% | 137.8 -0% | 137.5 -0% |
* ... smaller is better
Battery Life
Battery life is nearly identical to what we recorded on the Precision 5480 since the two models share similar components and performance levels.
| Dell Precision 5000 5490 Ultra 9 185H, RTX 3000 Ada Generation Laptop, 72 Wh | Lenovo ThinkPad P14s G4 21HF0017GE i7-1370P, RTX A500 Laptop GPU, 52.5 Wh | HP ZBook Firefly 14 G10 A R5 PRO 7640HS, Radeon 760M, 51 Wh | HP ZBook Firefly 14 G9-6B8A2EA i7-1265U, T550 Laptop GPU, 51 Wh | Dell Precision 5480 i9-13900H, RTX 3000 Ada Generation Laptop, 72 Wh | Dell Precision 5000 5470 i9-12900H, RTX A1000 Laptop GPU, 72 Wh | |
|---|---|---|---|---|---|---|
| Battery runtime | -45% | 18% | -20% | -1% | -13% | |
| WiFi v1.3 (h) | 11 | 6.1 -45% | 13 18% | 8.8 -20% | 10.9 -1% | 9.6 -13% |
| Load (h) | 1 | 0.9 | 1.1 | |||
| Reader / Idle (h) | 14.7 |
Pros
Cons
Verdict — Almost Indistinguishable From The Precision 5480
The Precision 5480 provided a significant GPU boost over the Precision 5470 due to the jump in GPU generation even though their chassis were identical. For the Precision 5490, however, the model introduces no new GPU options and so the RTX 3000 Ada remains the top-end configuration. If GPU performance is priority, then the Precision 5490 will run identically to the Precision 5480.
CPU performance and Graphics performance remain stagnant between the Precision 5490 and Precision 5480. Instead, the latest model focuses on AI acceleration which is still in its infancy at the time of publishing.
Outside of the GPU, the CPU jump from Raptor Lake-H to Meteor Lake-H provides no major raw performance benefits. Its integrated NPU, which is the main selling point of the Precision 5490, has few applications at the time of writing. Buying the Precision 5490 today therefore means investing in local AI acceleration and future Windows AI features.
For future models, we would like to see additional display options especially for applications that demand P3 colors and faster black-white response times. Alternatives like the ThinkPad P14s offer OLED while our Precision is stuck with IPS only.
Price and Availability
Dell is now shipping the Precision 5490 starting at $2250 USD for the base Core Ultra 5, RTX 1000 Ada, and 1200p configuration up to over $3900 for the high-end Core Ultra 9, RTX 3000 Ada, and 1600p configuration.
Dell Precision 5000 5490
- 04/25/2024 v7 (old)
Allen Ngo
Transparency
The selection of devices to be reviewed is made by our editorial team. The test sample was provided to the author as a loan by the manufacturer or retailer for the purpose of this review. The lender had no influence on this review, nor did the manufacturer receive a copy of this review before publication. There was no obligation to publish this review. As an independent media company, Notebookcheck is not subjected to the authority of manufacturers, retailers or publishers.
This is how Notebookcheck is testing
Every year, Notebookcheck independently reviews hundreds of laptops and smartphones using standardized procedures to ensure that all results are comparable. We have continuously developed our test methods for around 20 years and set industry standards in the process. In our test labs, high-quality measuring equipment is utilized by experienced technicians and editors. These tests involve a multi-stage validation process. Our complex rating system is based on hundreds of well-founded measurements and benchmarks, which maintains objectivity. Further information on our test methods can be found here.
Price comparison
