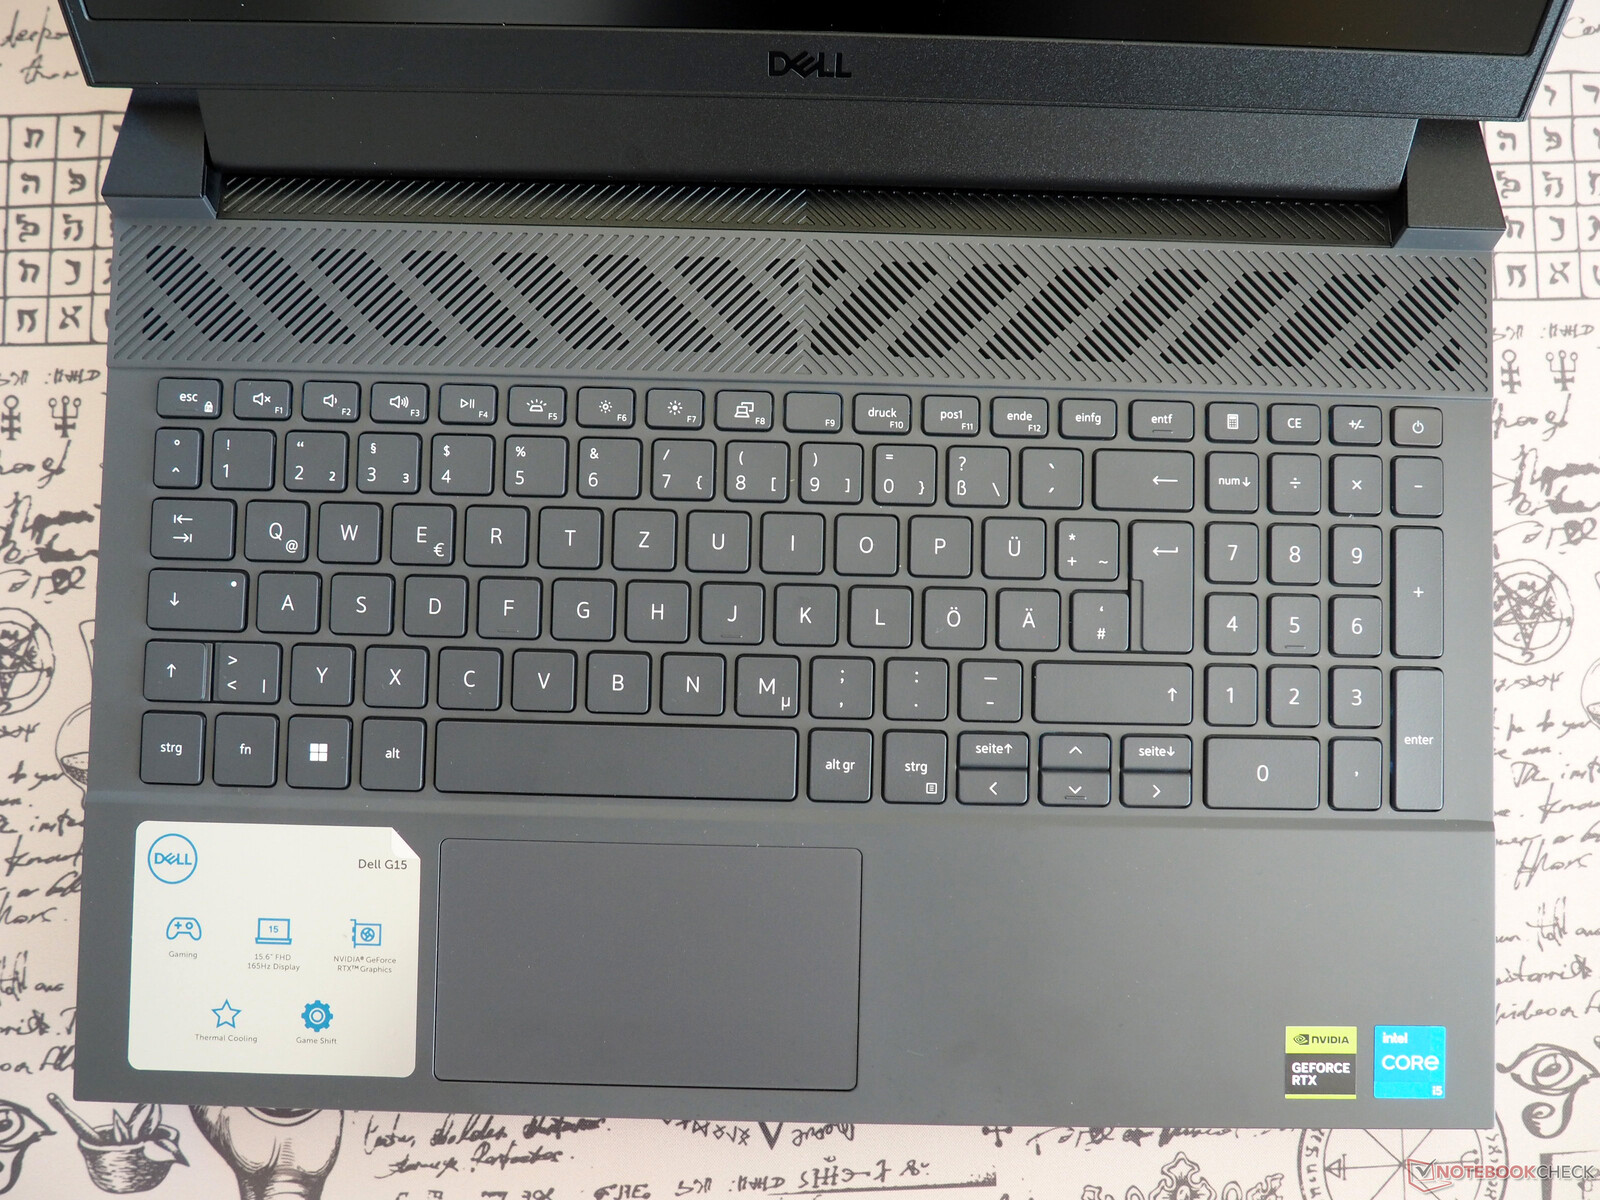
Dell G15 5530 review: RTX 4050 gaming laptop in Dark Shadow Gray

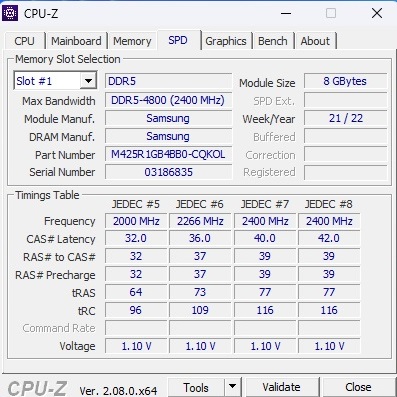
After reviewing the G15 with a Core i7-13650HX and GeForce RTX 4060 a few months back (see article), we're now checking out the lower-cost version (by a few hundred euros) with a Core i5-13450HX und GeForce RTX 4050. This variant is similarly equipped with 16 GB of DDR-4800 RAM, a 512 GB drive and a 165Hz IPS display, though different models are occasionally used for these components. Rounding off the package is the Windows 11 Home 64 Bit operating system.
The G15 is up against other RTX 4050-based 15-inch gaming laptops like the Medion Erazer Crawler E40, the Lenovo LOQ 15IRH8 and the Asus TUF A15 FA507, all of which appear in the tables below for comparison purposes.
Because the chassis is identical to the G15 we previously reviewed apart from its colour scheme (grey instead of white) and keyboard language, we are only going to briefly cover the case, specs and input devices in this article.
Comparison with possible competitors
Rating | Date | Model | Weight | Height | Size | Resolution | Price |
|---|---|---|---|---|---|---|---|
| 84.7 % v7 (old) | 01 / 2024 | Dell G15 5530, i5-13450HX RTX 4050 i5-13450HX, GeForce RTX 4050 Laptop GPU | 2.7 kg | 27 mm | 15.60" | 1920x1080 | |
| 85.4 % v7 (old) | 11 / 2023 | Medion Erazer Crawler E40 - MD 62518 i5-13500H, GeForce RTX 4050 Laptop GPU | 2.3 kg | 28 mm | 15.60" | 1920x1080 | |
| 85.9 % v7 (old) | 10 / 2023 | Lenovo LOQ 15IRH8 Core i7 i7-13620H, GeForce RTX 4050 Laptop GPU | 2.4 kg | 25.2 mm | 15.60" | 2560x1440 | |
| 86.3 % v7 (old) | 06 / 2023 | Asus TUF A15 FA507 R7 7735HS, GeForce RTX 4050 Laptop GPU | 2.2 kg | 24.9 mm | 15.60" | 1920x1080 | |
| 84.2 % v7 (old) | 06 / 2023 | Dell G15 5530 i7-13650HX, GeForce RTX 4060 Laptop GPU | 3 kg | 26.95 mm | 15.60" | 1920x1080 |
Case
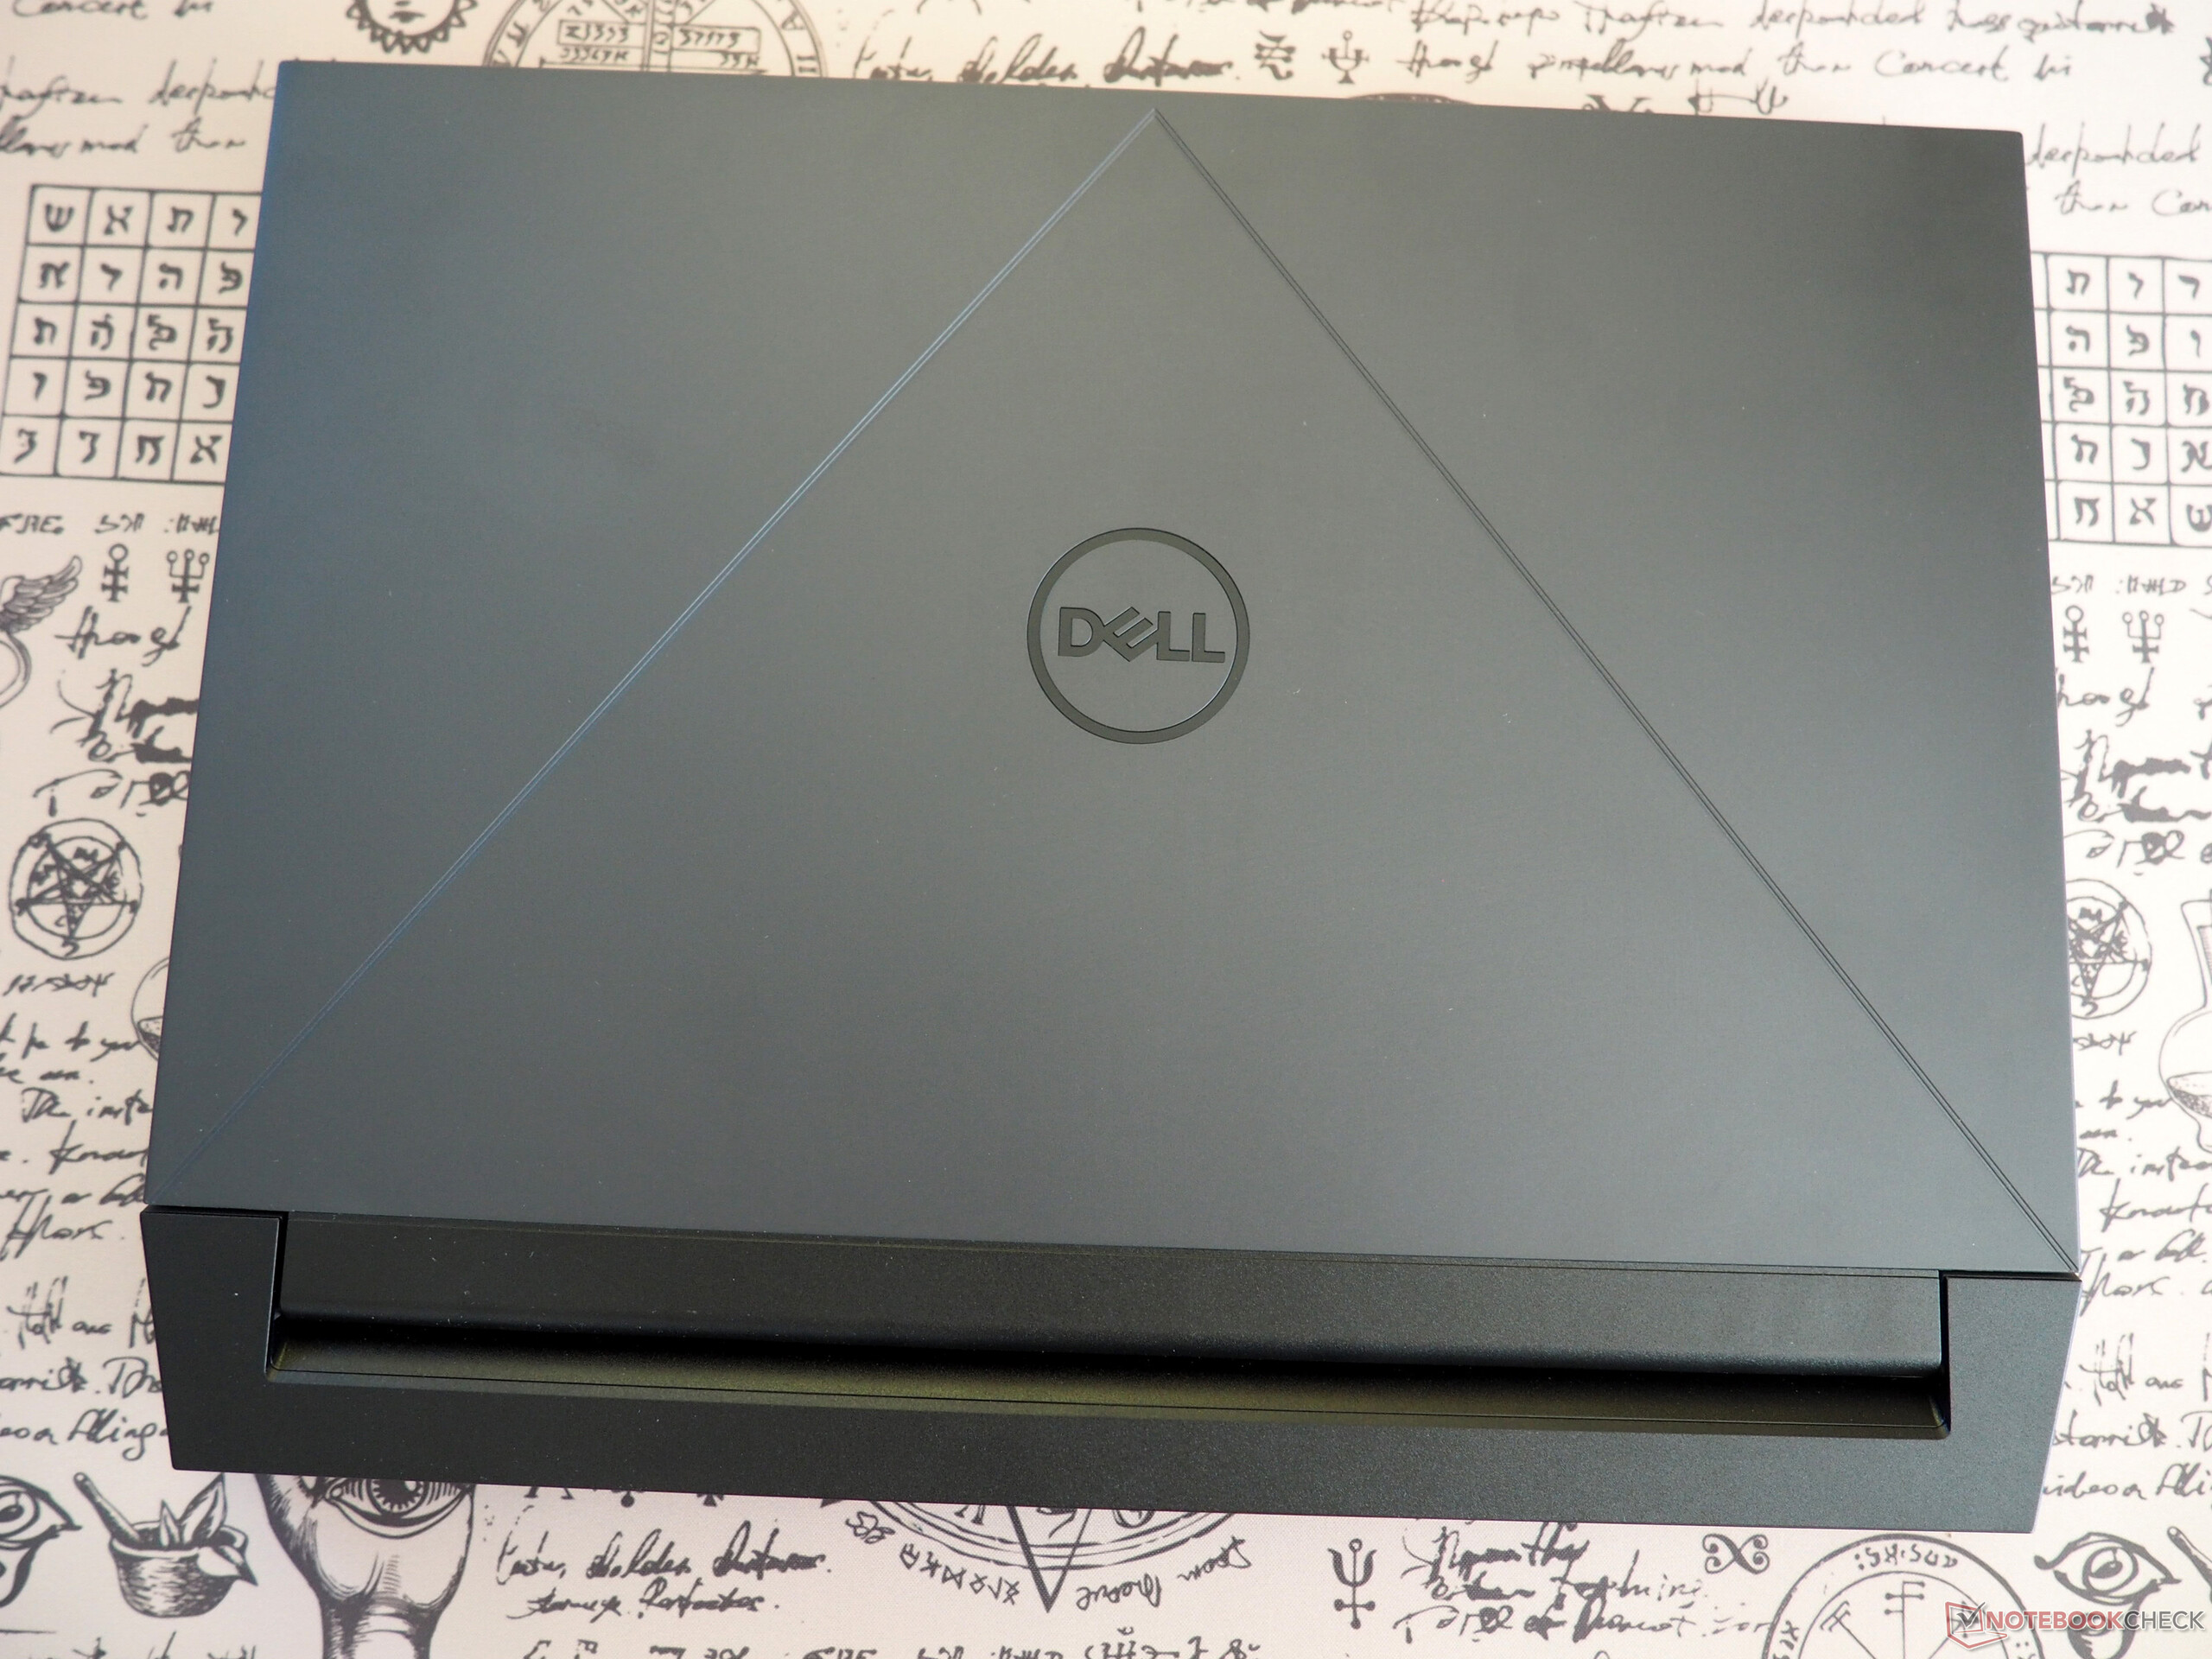
The G15 turns out to be a notebook with a classic build, meaning it's neither very thin (2.7 cm, or 1.06 in) nor especially light (2.7 kg, or 5.95 lb). The competitors offer more modern designs, though this doesn’t always have to be a good thing (keyword: emissions). In terms of aesthetics, the laptop's design is particularly eye-catching, but like what many other manufacturers do in this price bracket, Dell has opted for an all-plastic exterior that has a tendency to rattle in some spots. The quality of the fit and finish is good by contrast. The hinge mechanism does a decent job; the laptop can be easily opened with one hand.
Specifications
Interfaces
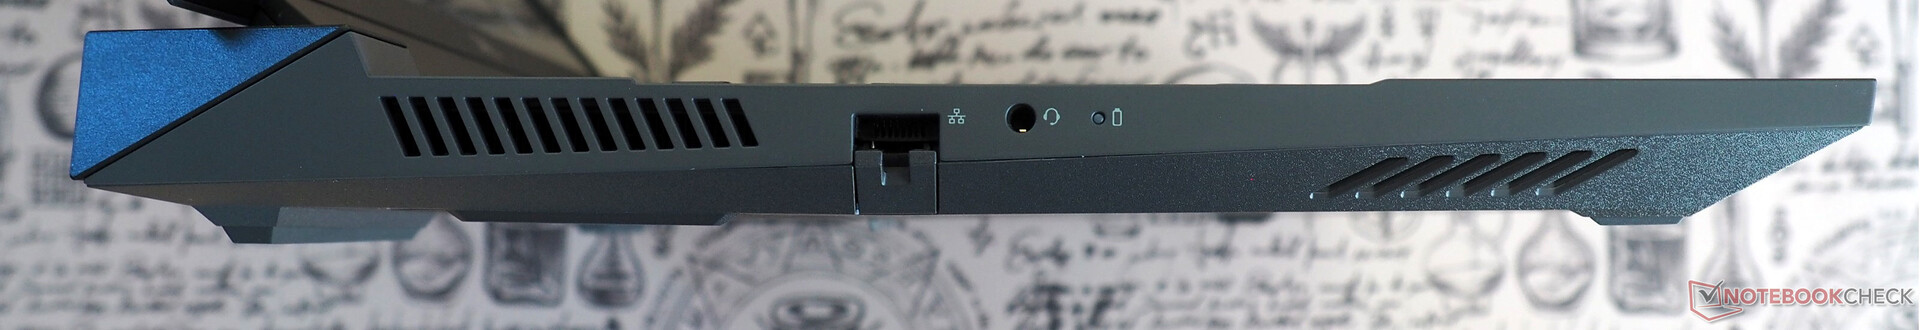
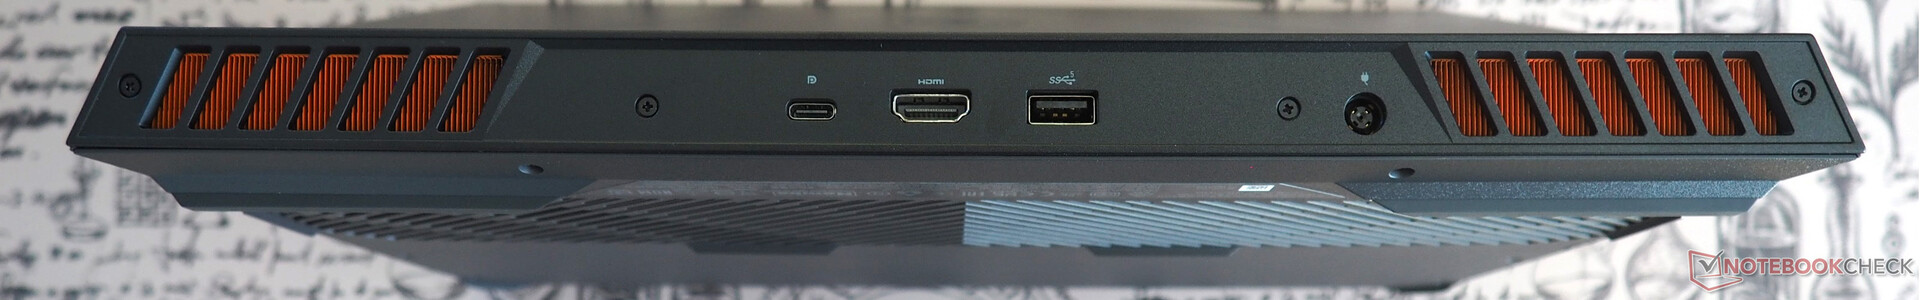
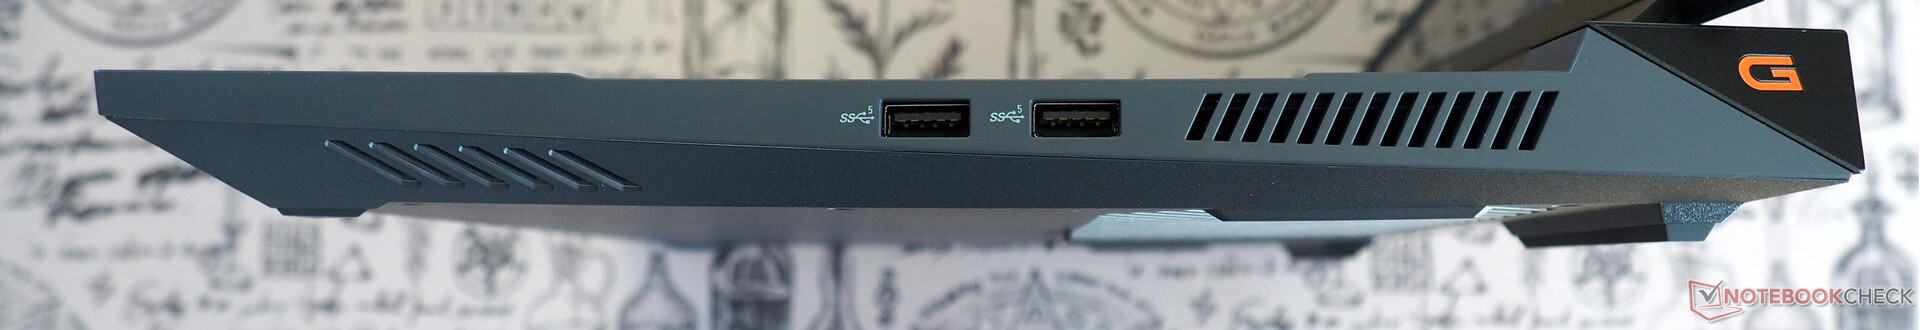
The port selection is pretty outdated and sparse. For instance, you won’t find a single USB4 port on the device. Instead, it only comes with one USB. 3.2 Gen 2 (Type C) and three USB 3.2 Gen 1 (Type A) ports. Users will also have to do without a card reader and a Kensington slot. But at least the device has a HDMI 2.1 output, an Ethernet port and an audio jack.
Connectivity
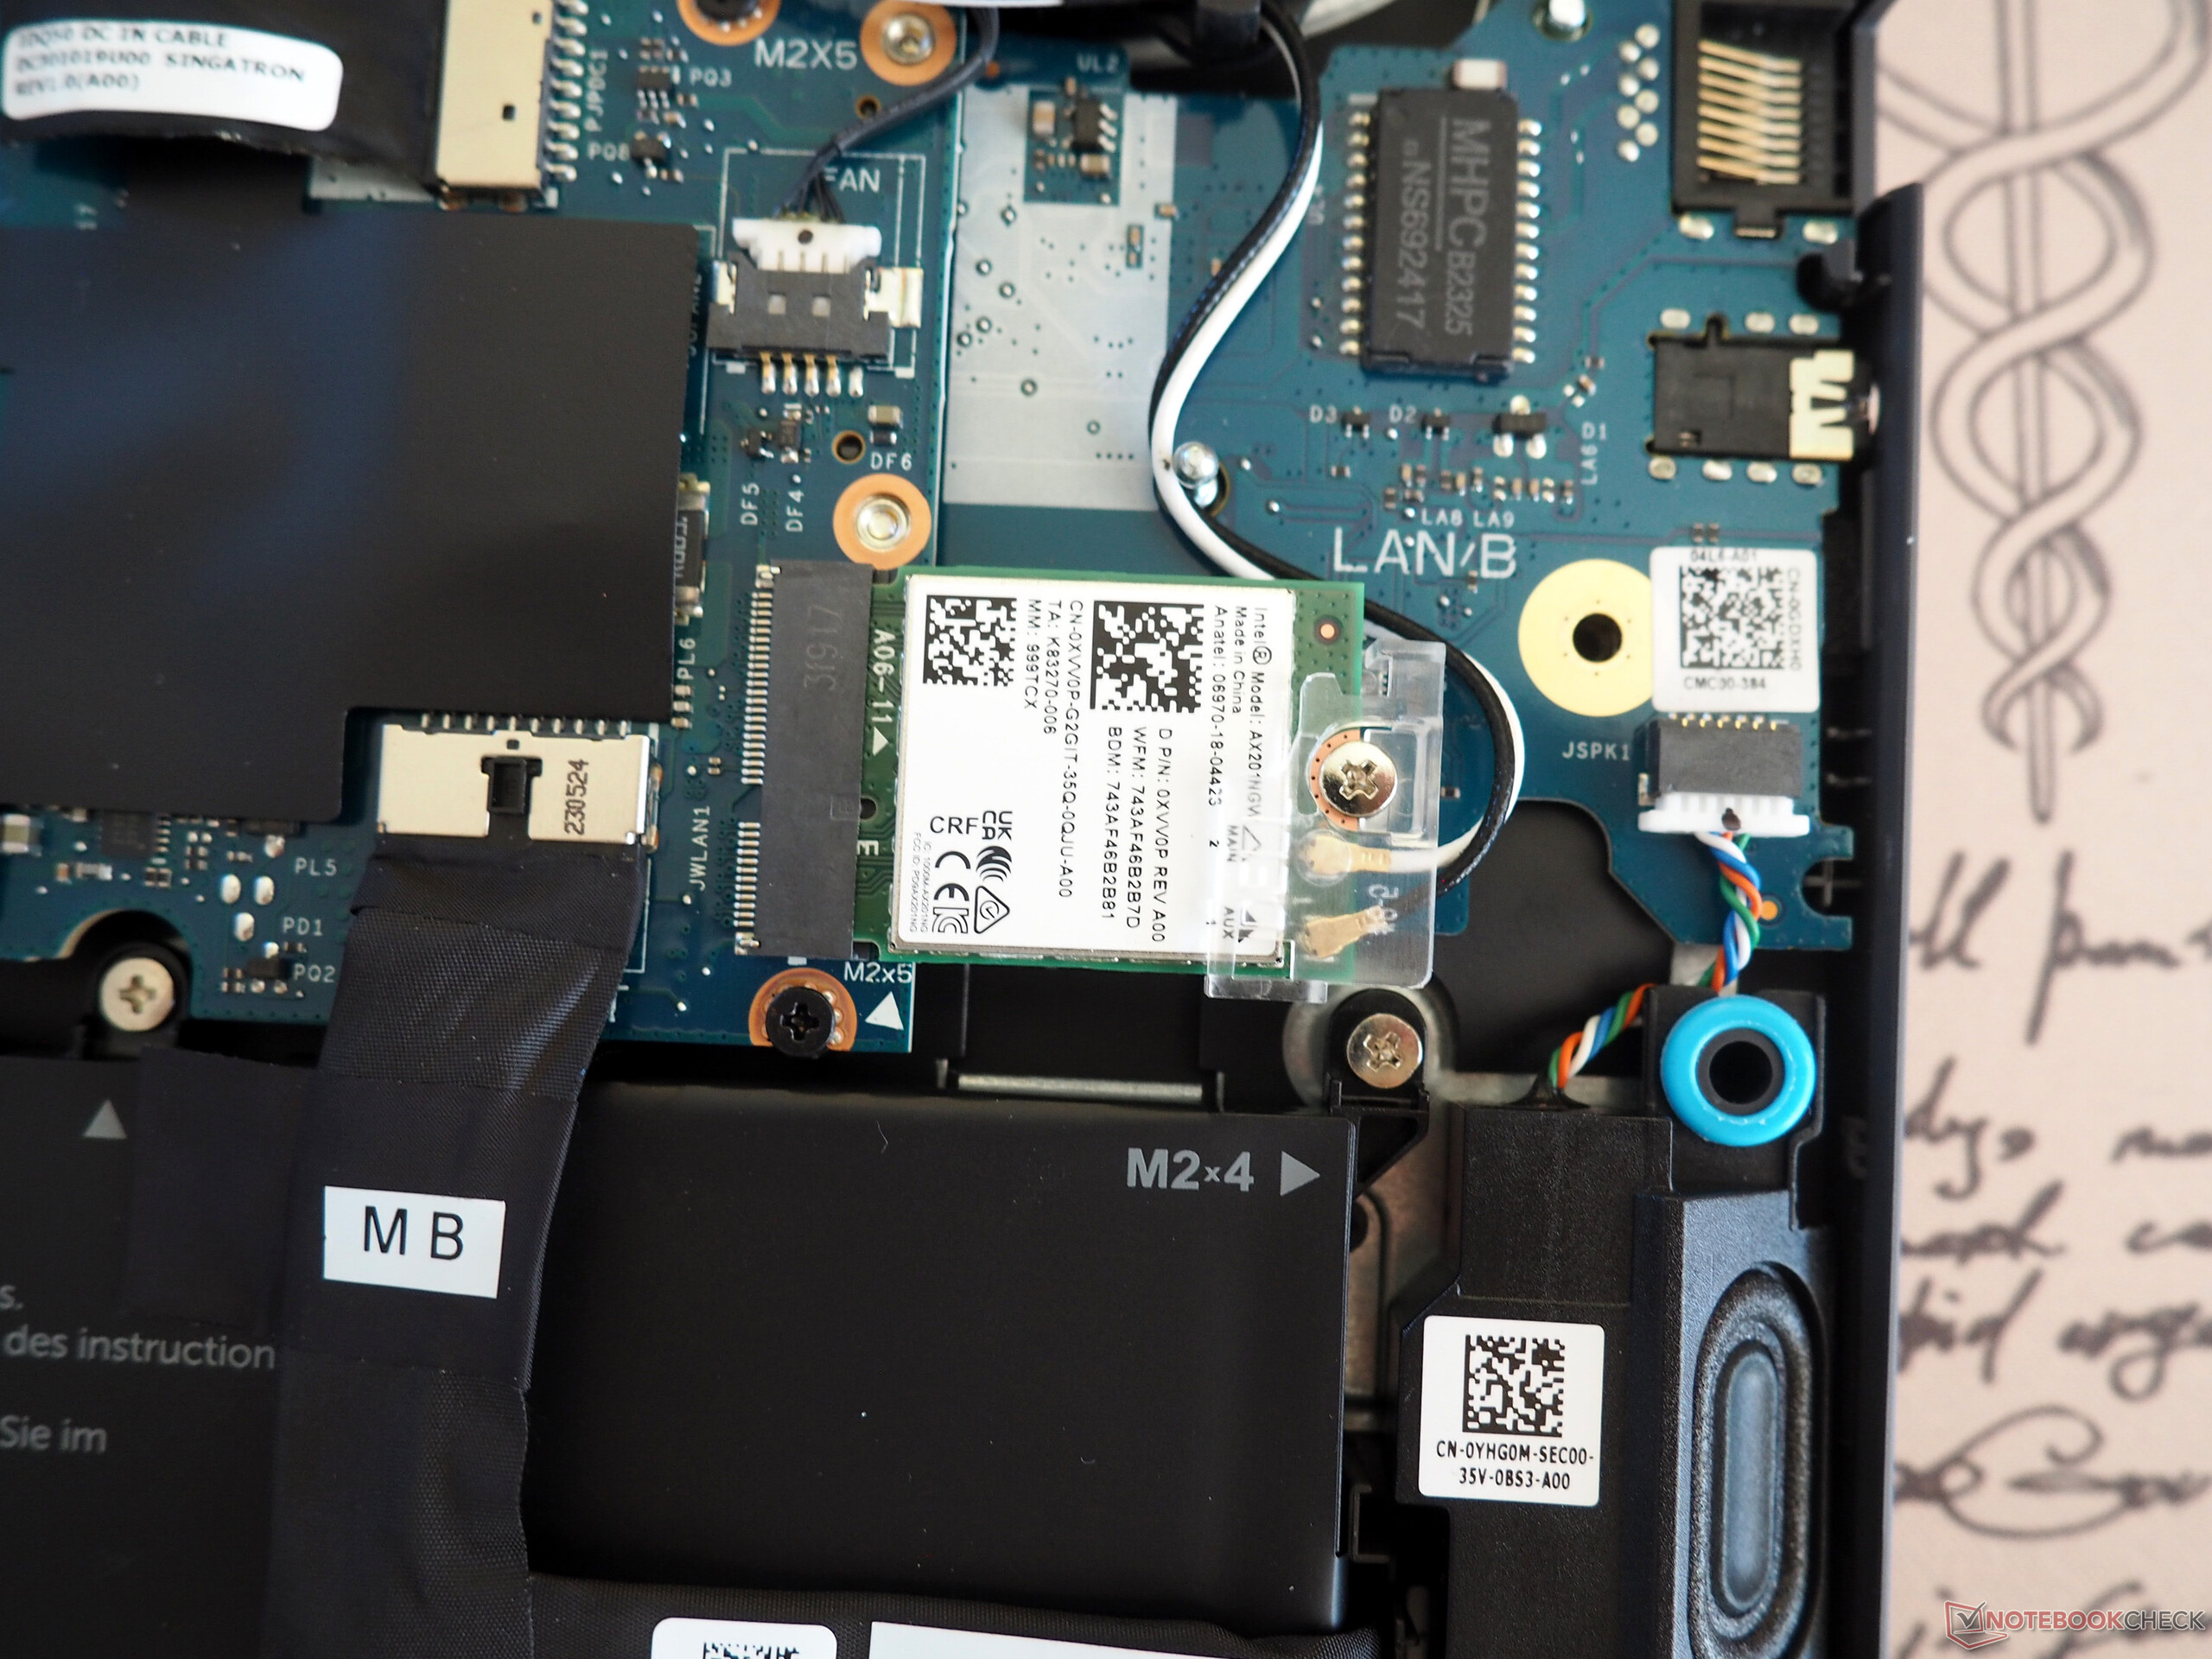
The G15's wireless performance is on par with (send) or higher than (receive) the average we’ve seen so far from this class of laptop. The built-in wireless card is made by Intel (Wi-Fi 6 AX201).
Webcam
The webcam is fairly mediocre quality-wise. There is still room for improvement when it comes to colour accuracy and image sharpness.


Accessories
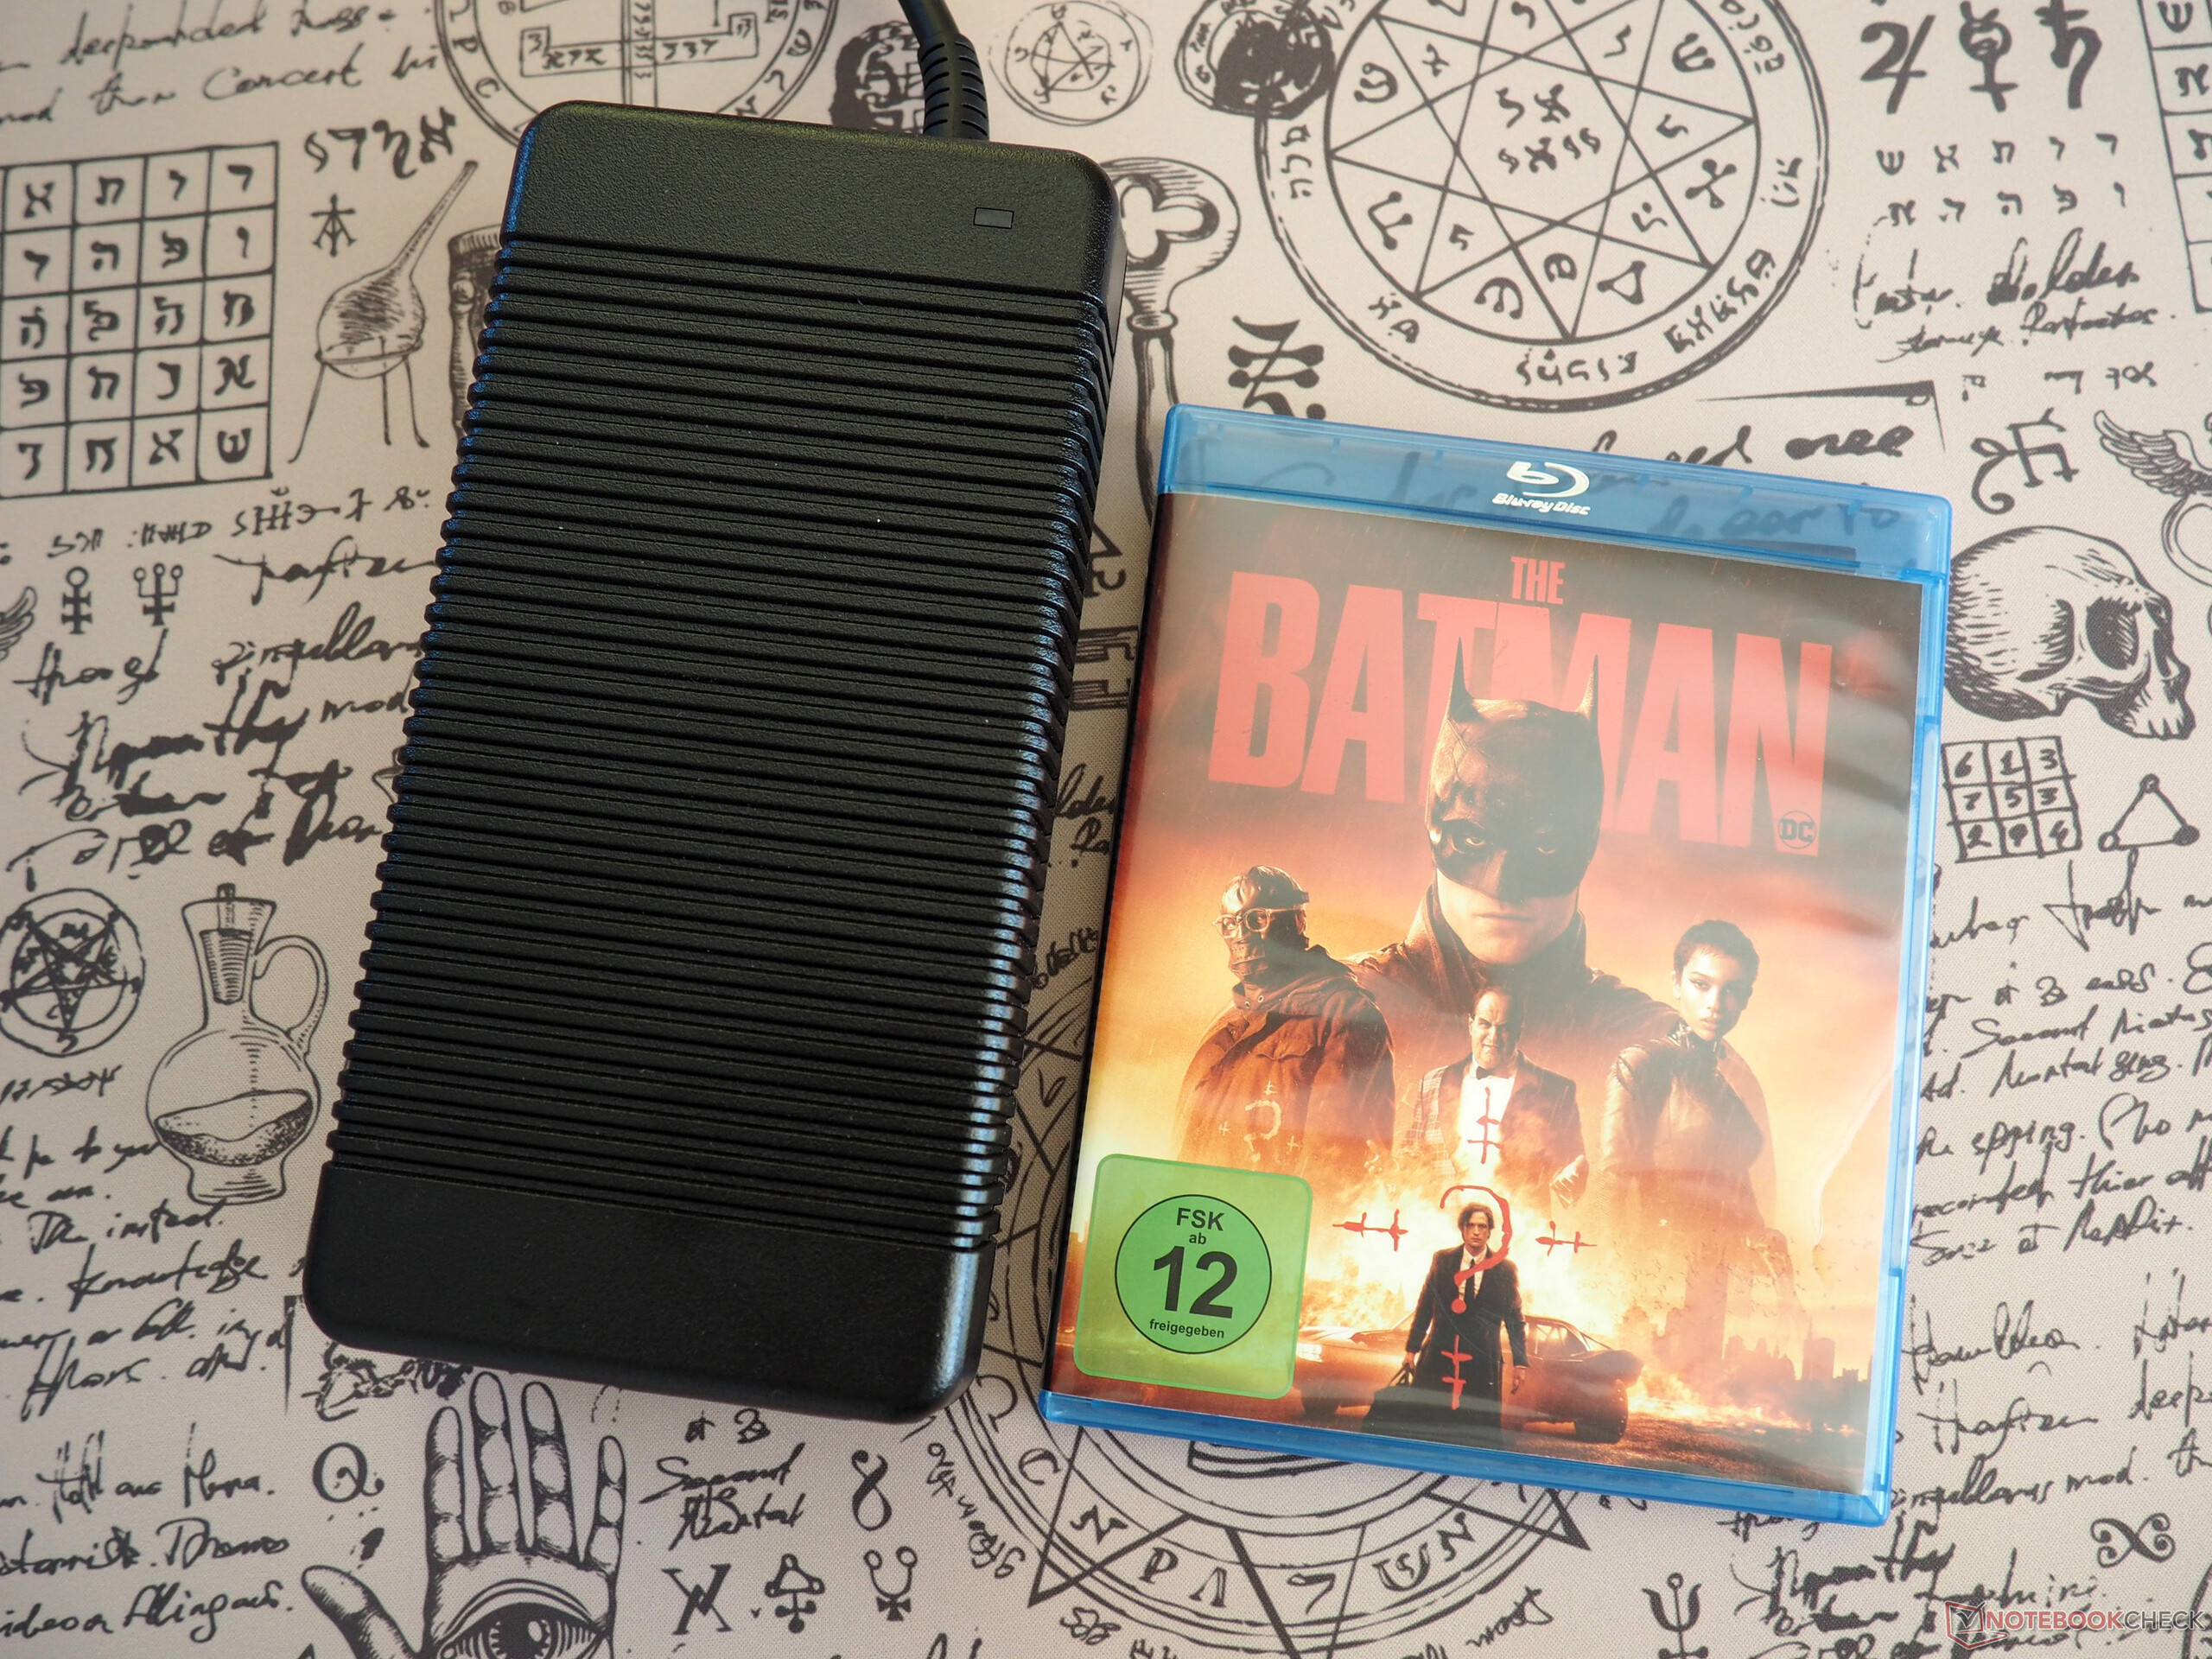
Given the level of performance on offer, the G15 is shipped with an absurdly big and weighty power adapter (incl. cable 1.5 kg, or 3.3 lb).
Maintenance
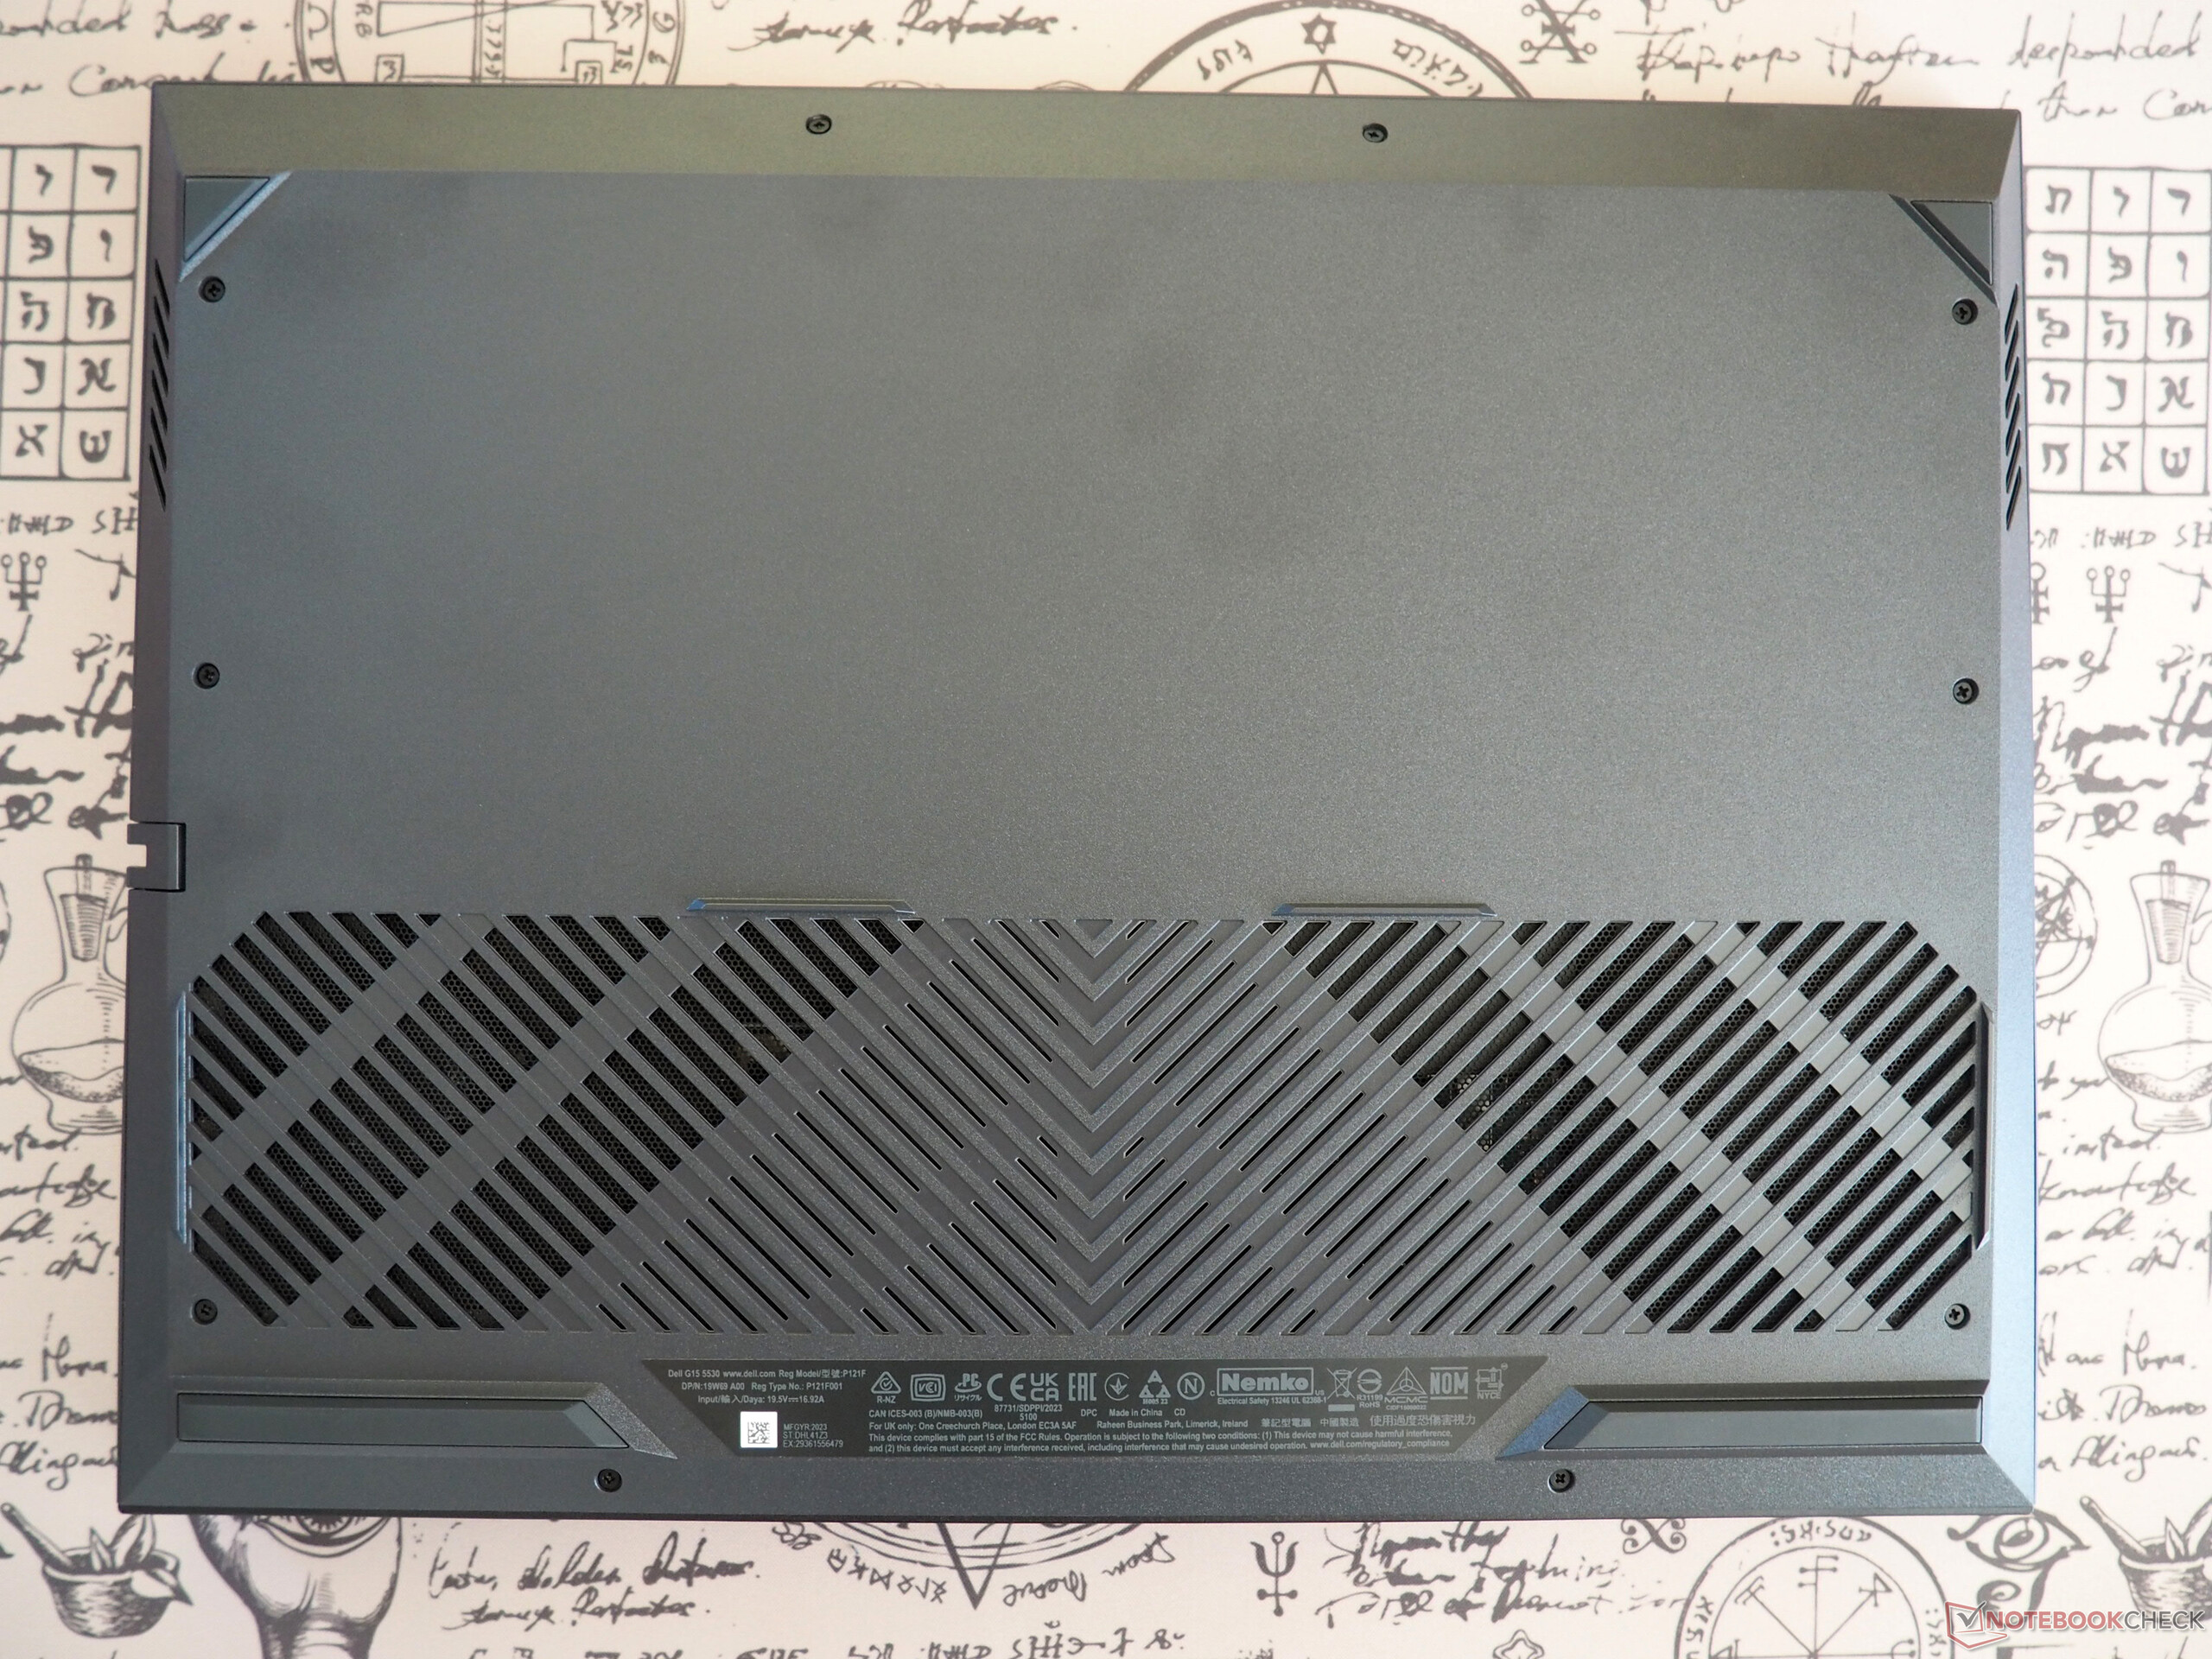
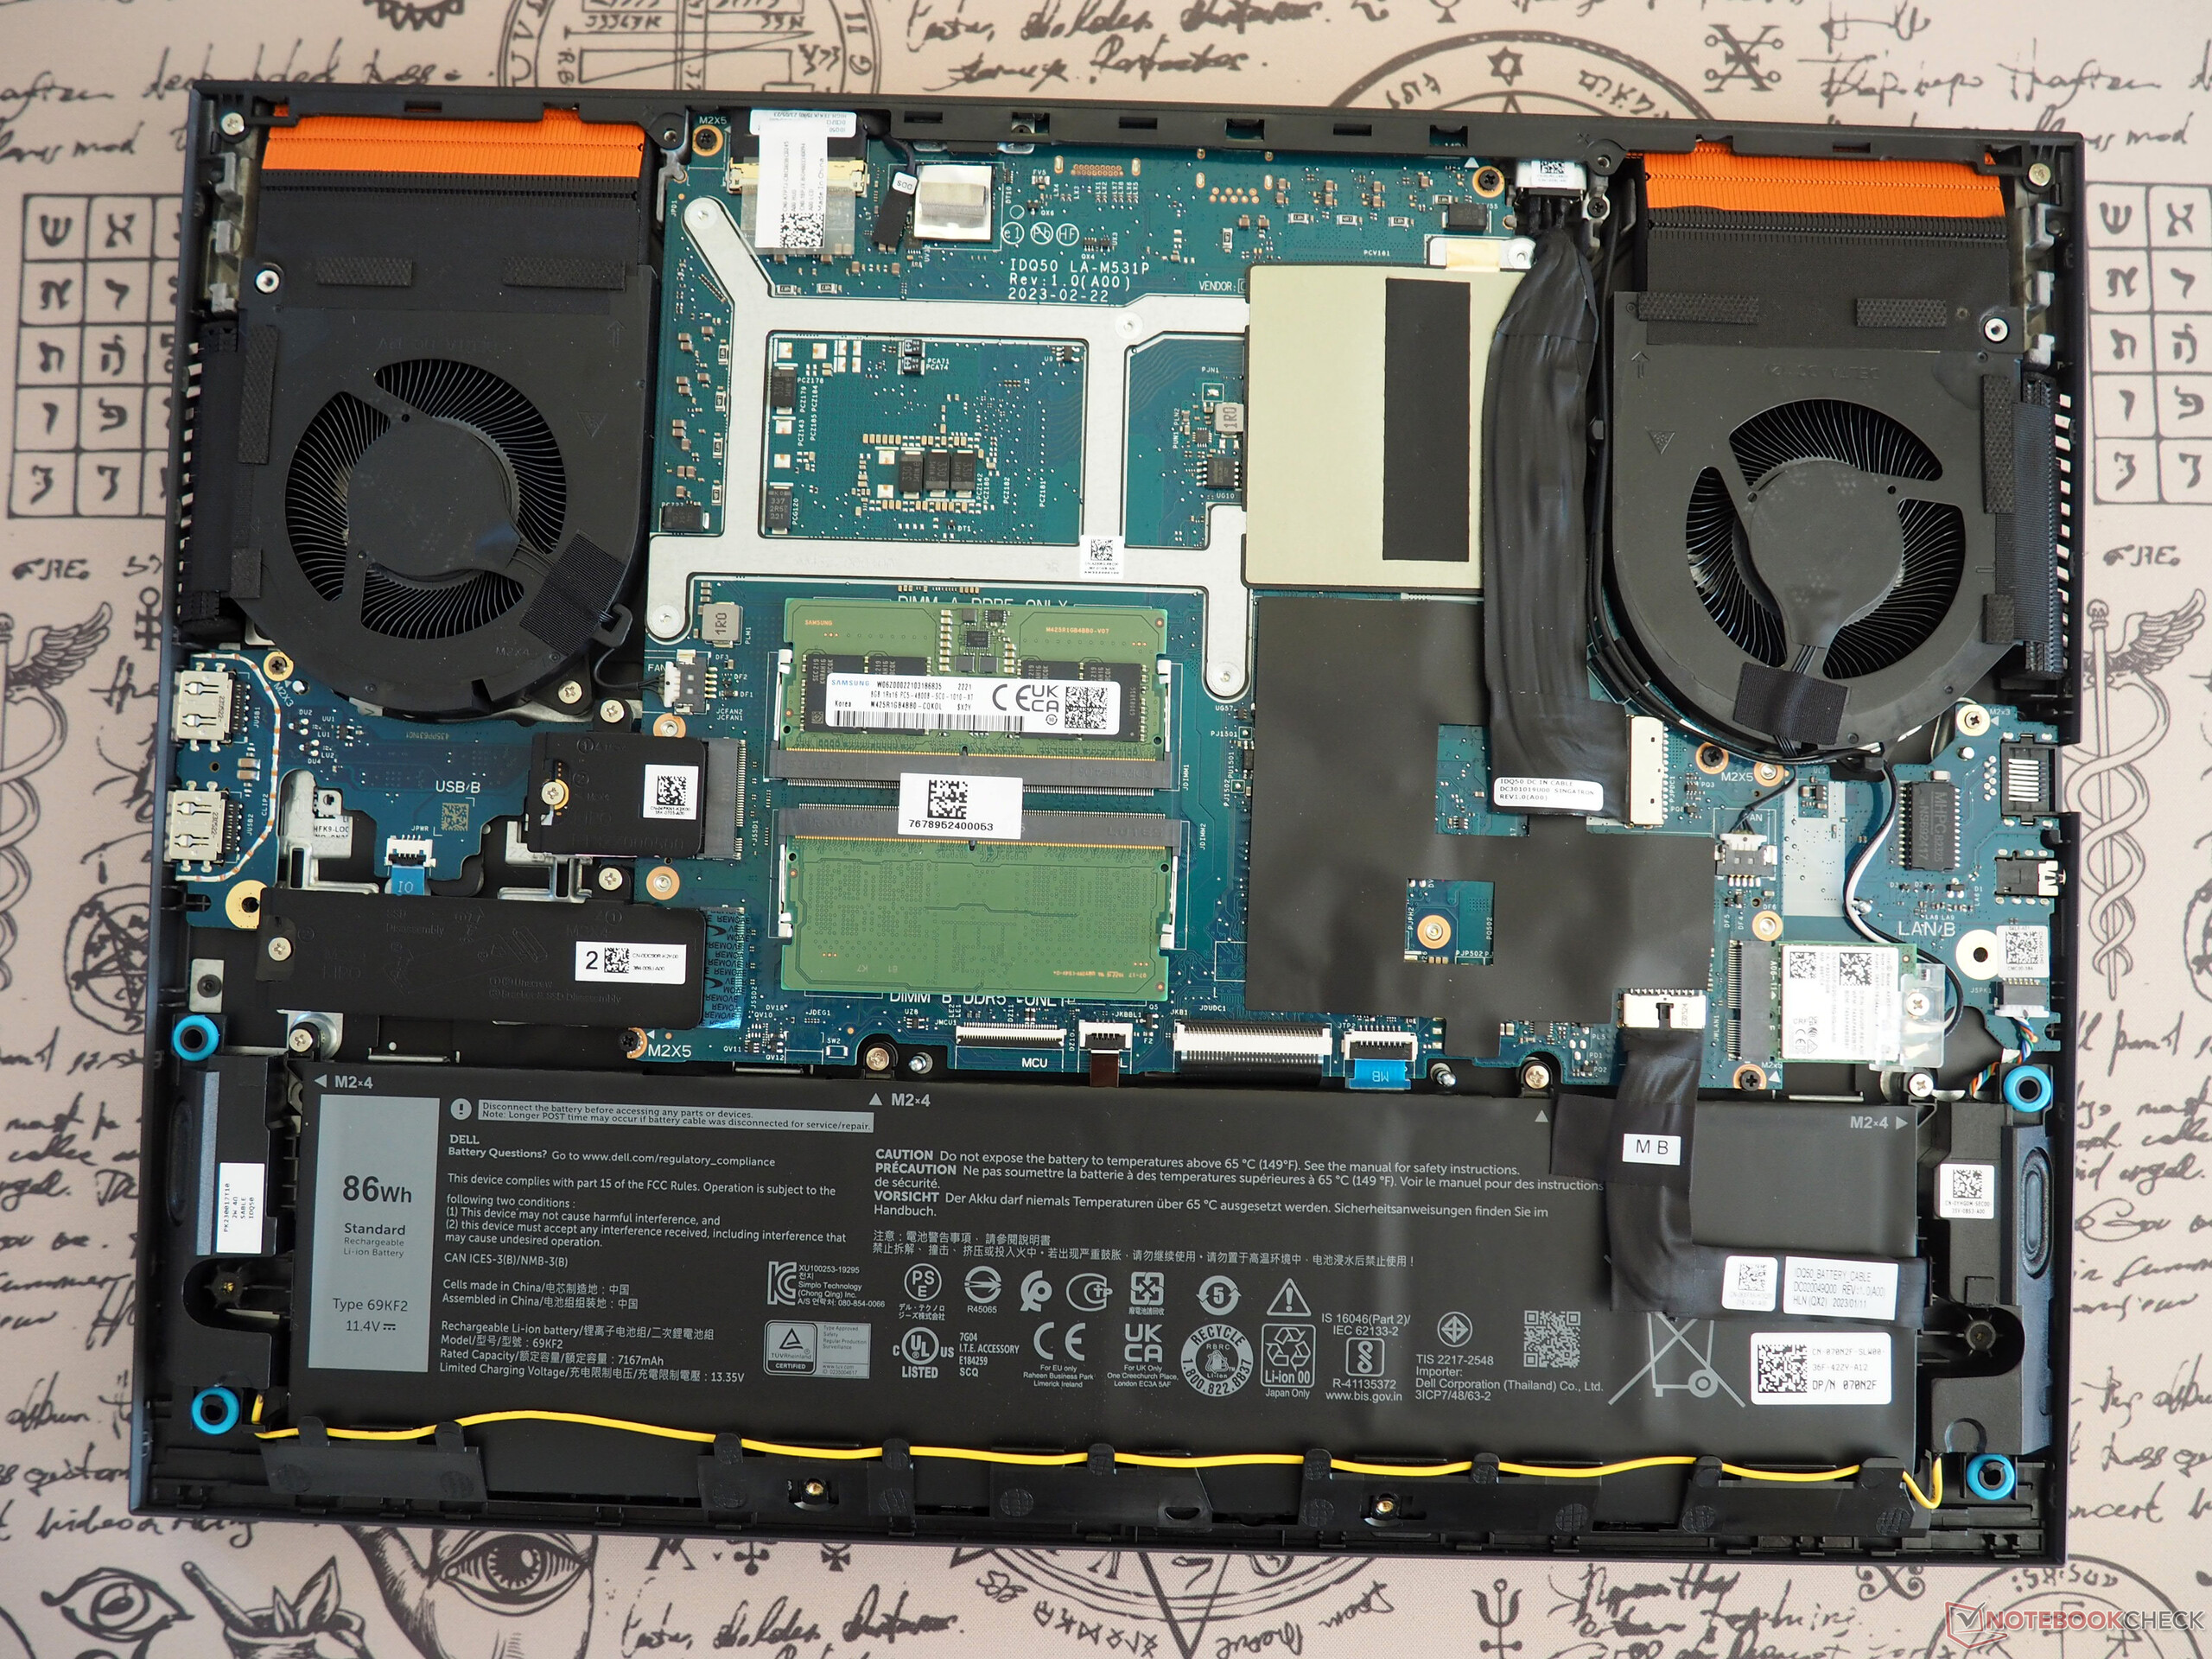
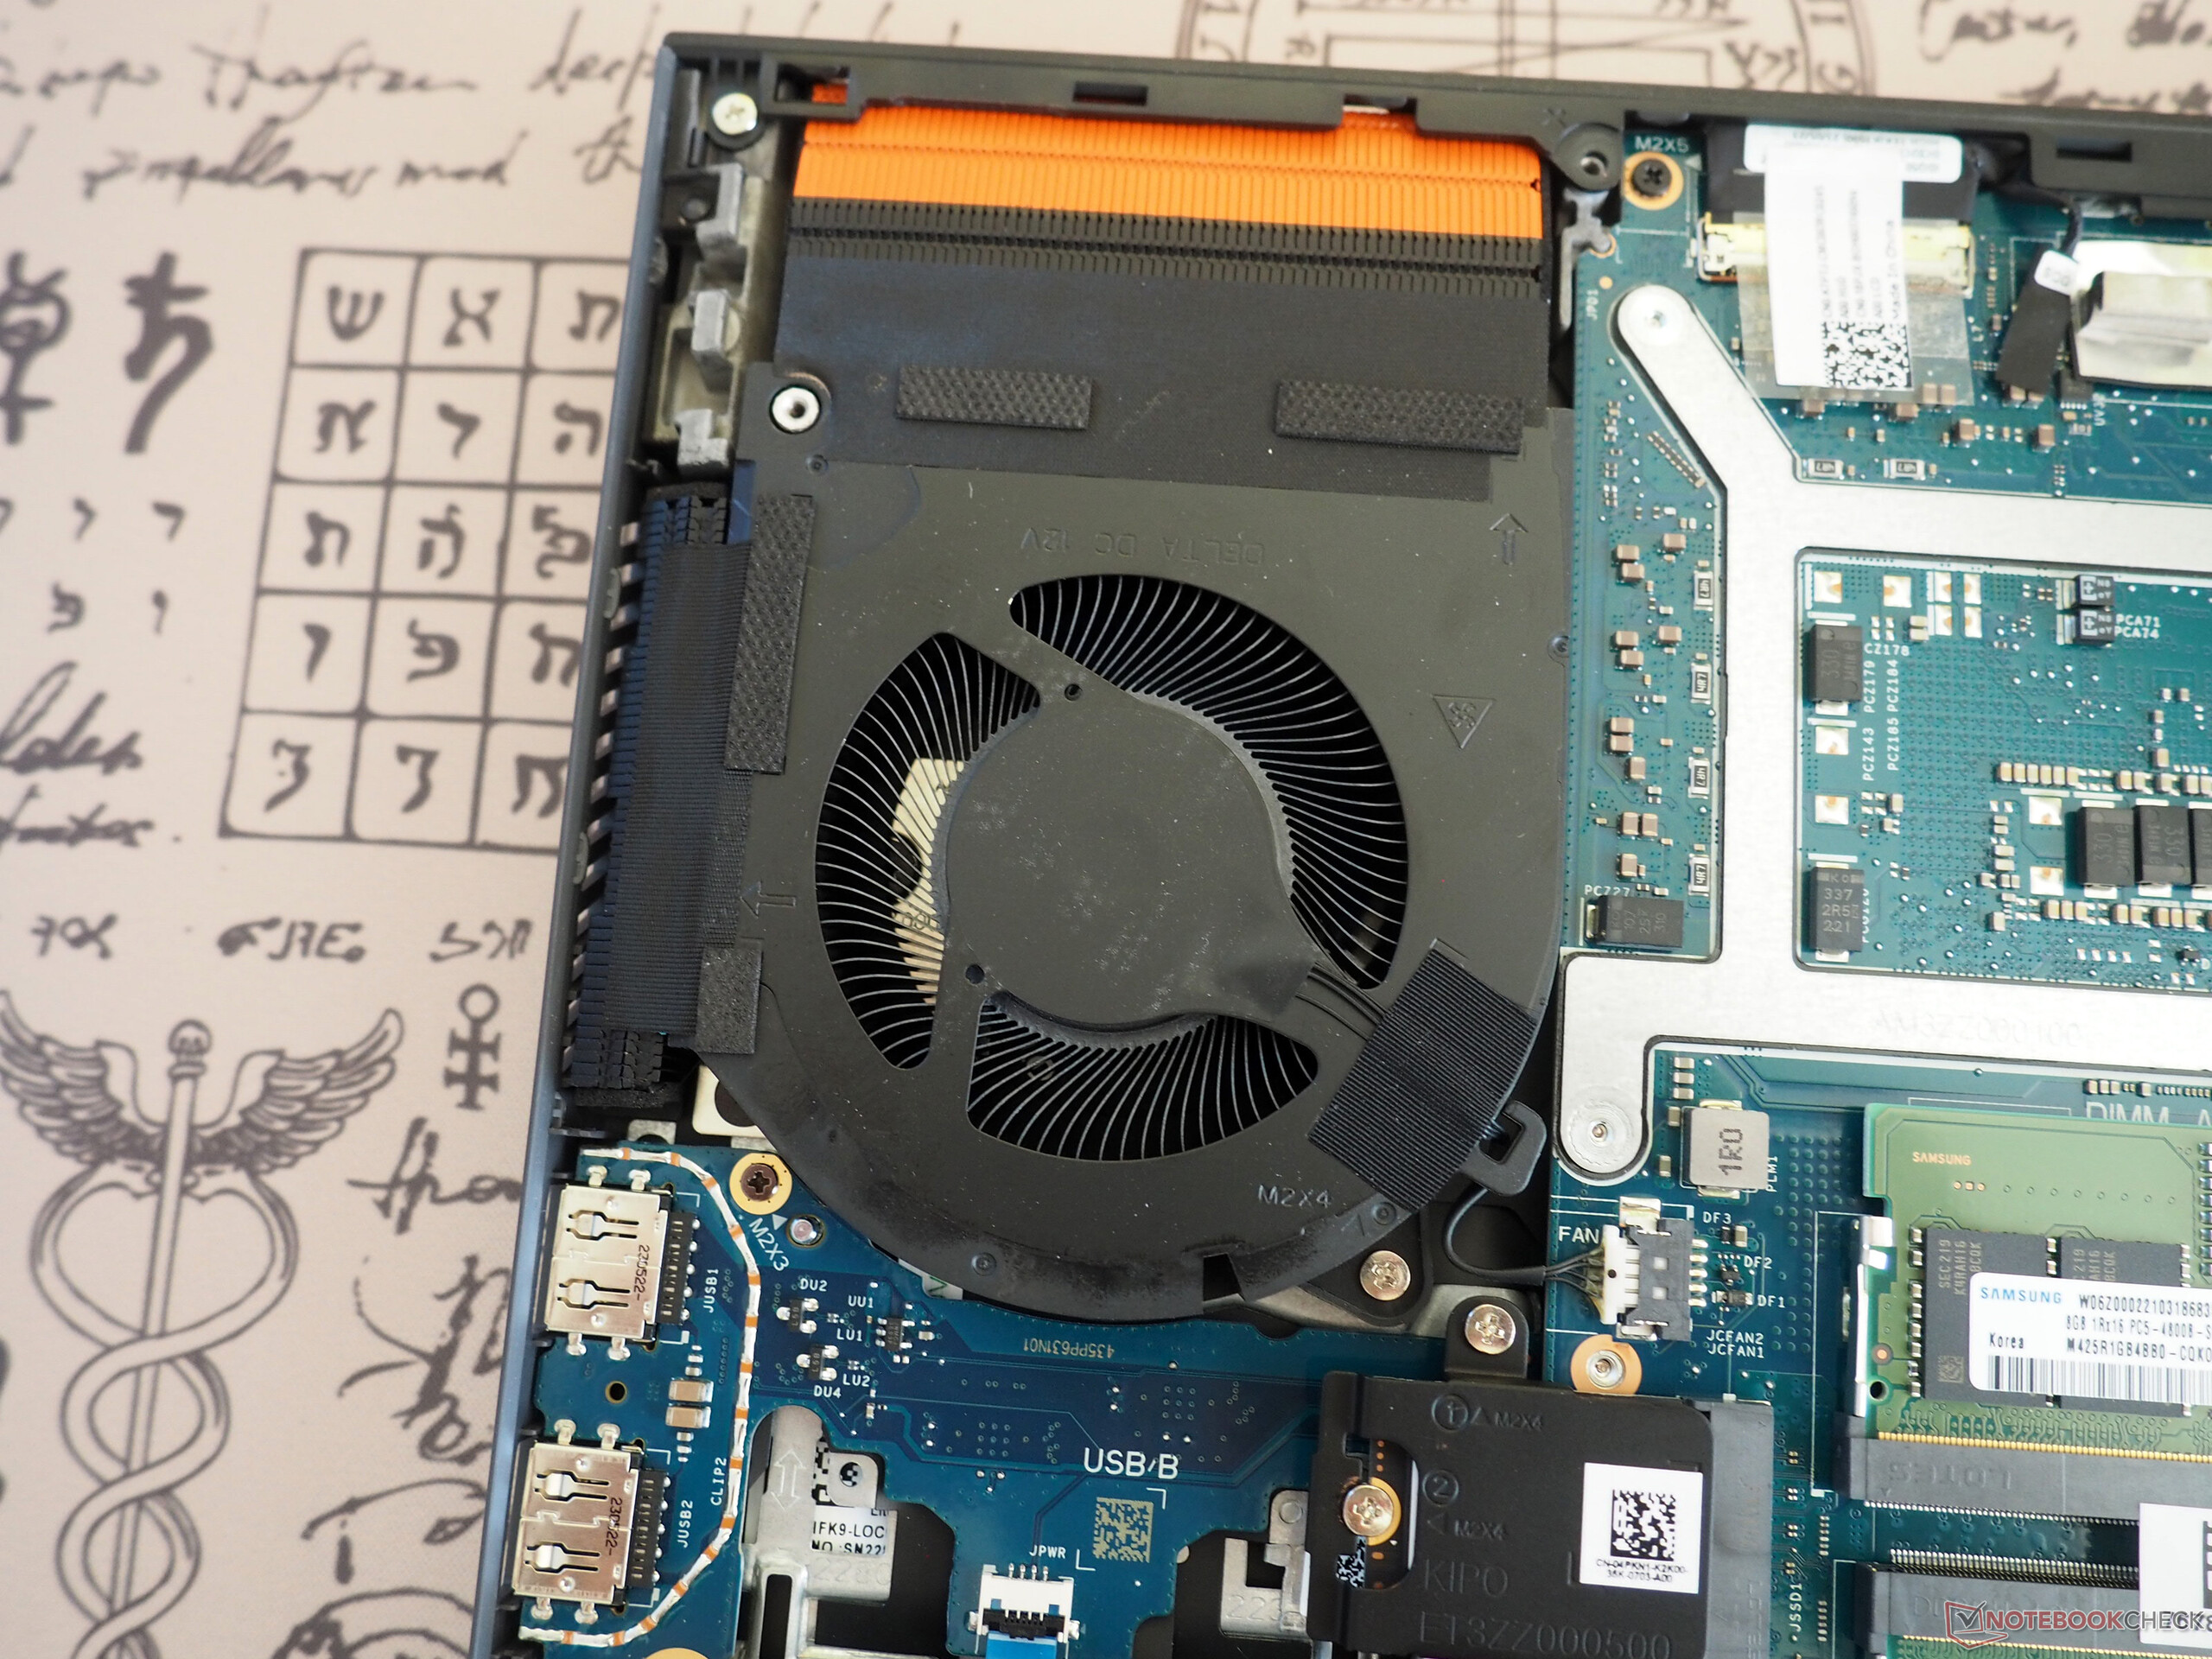
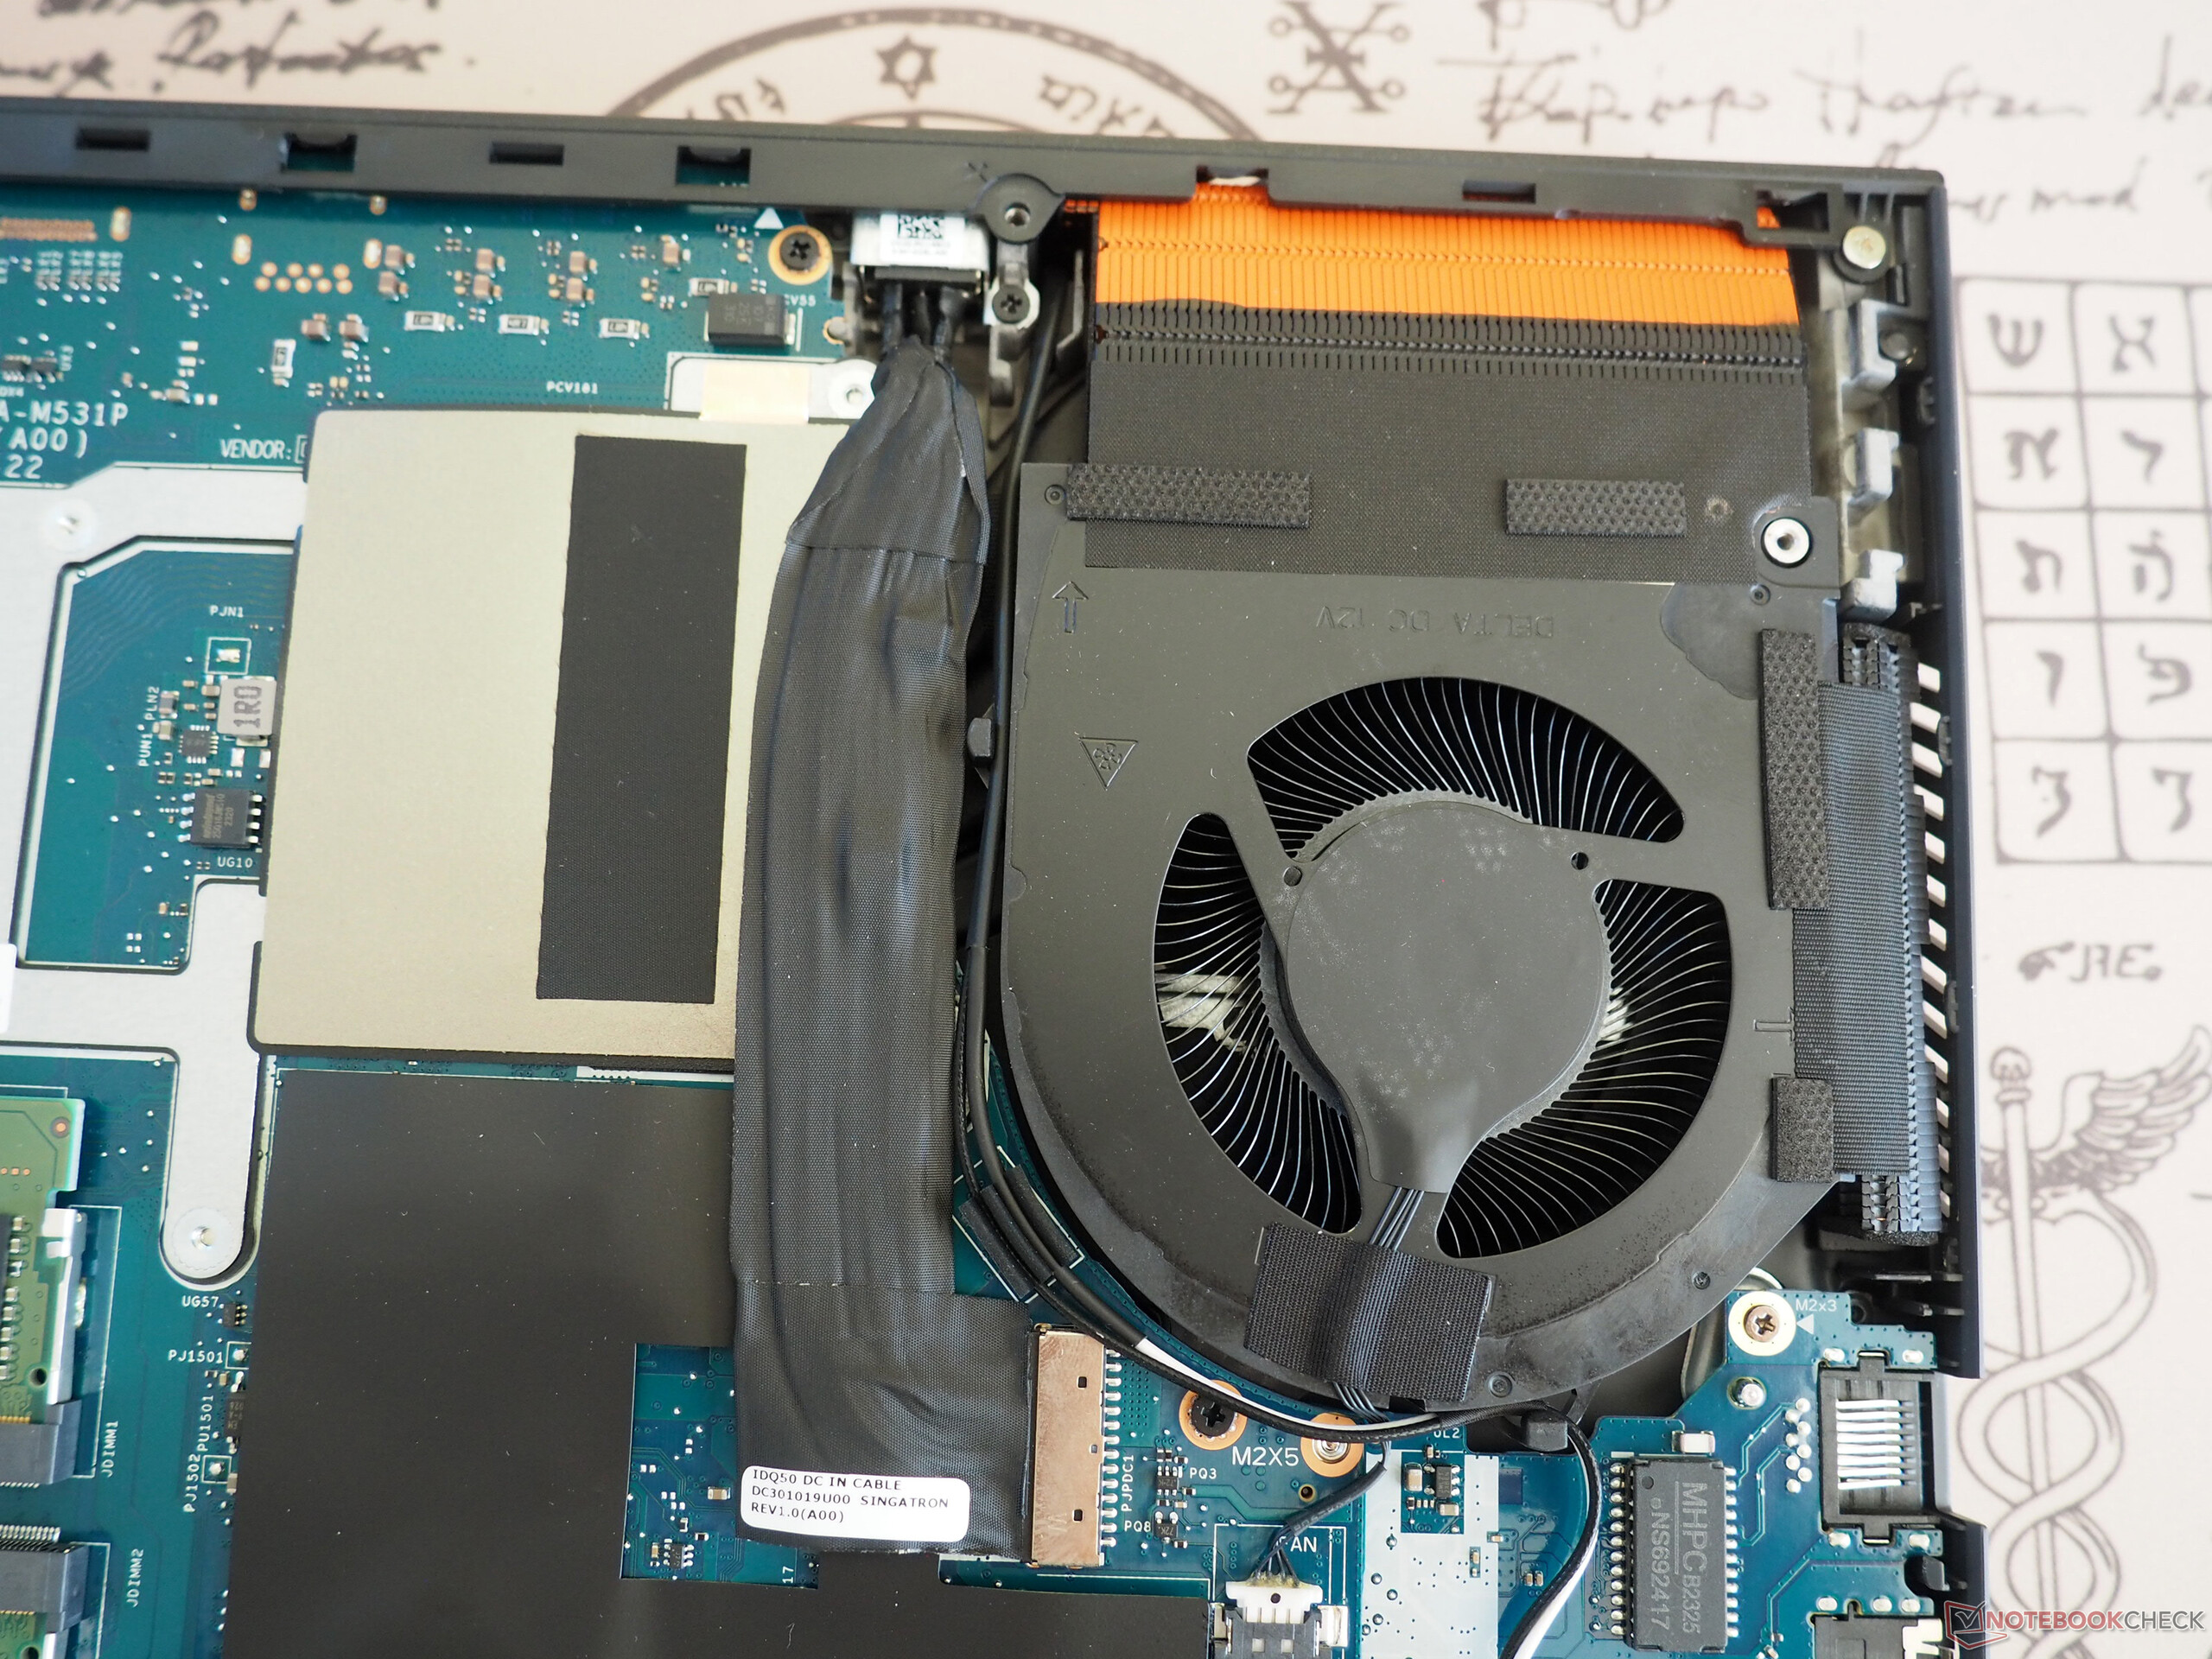
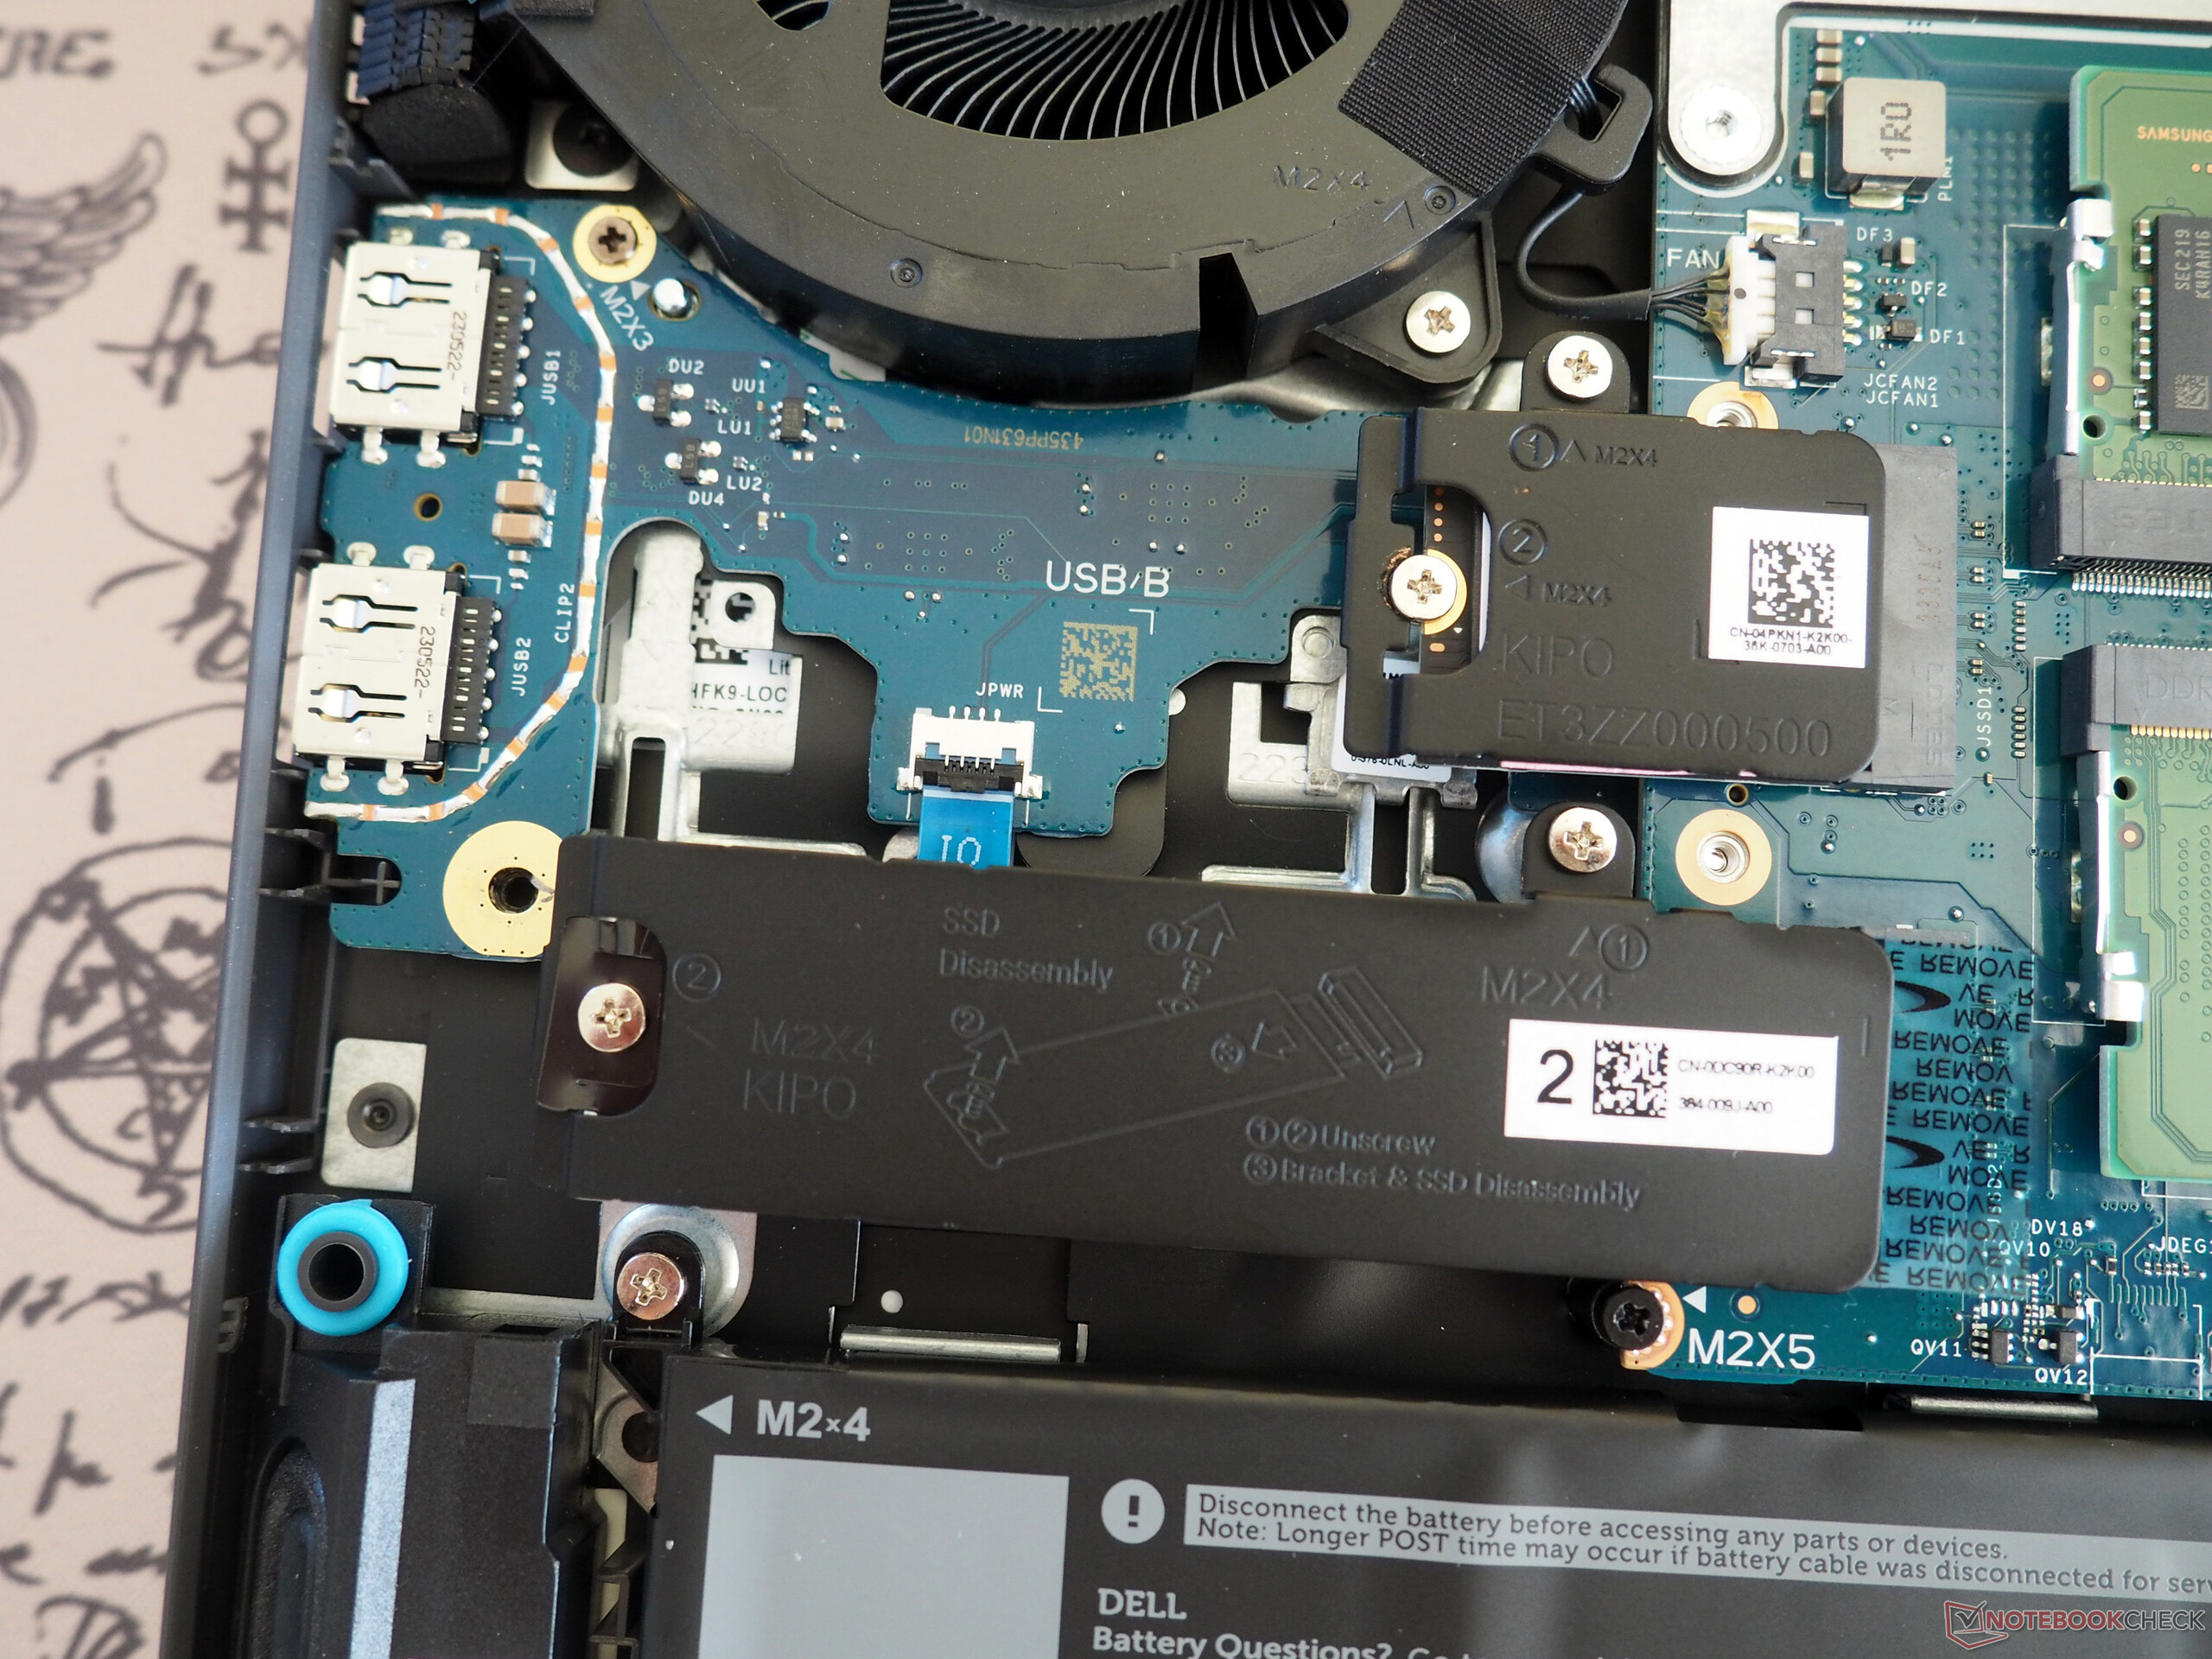
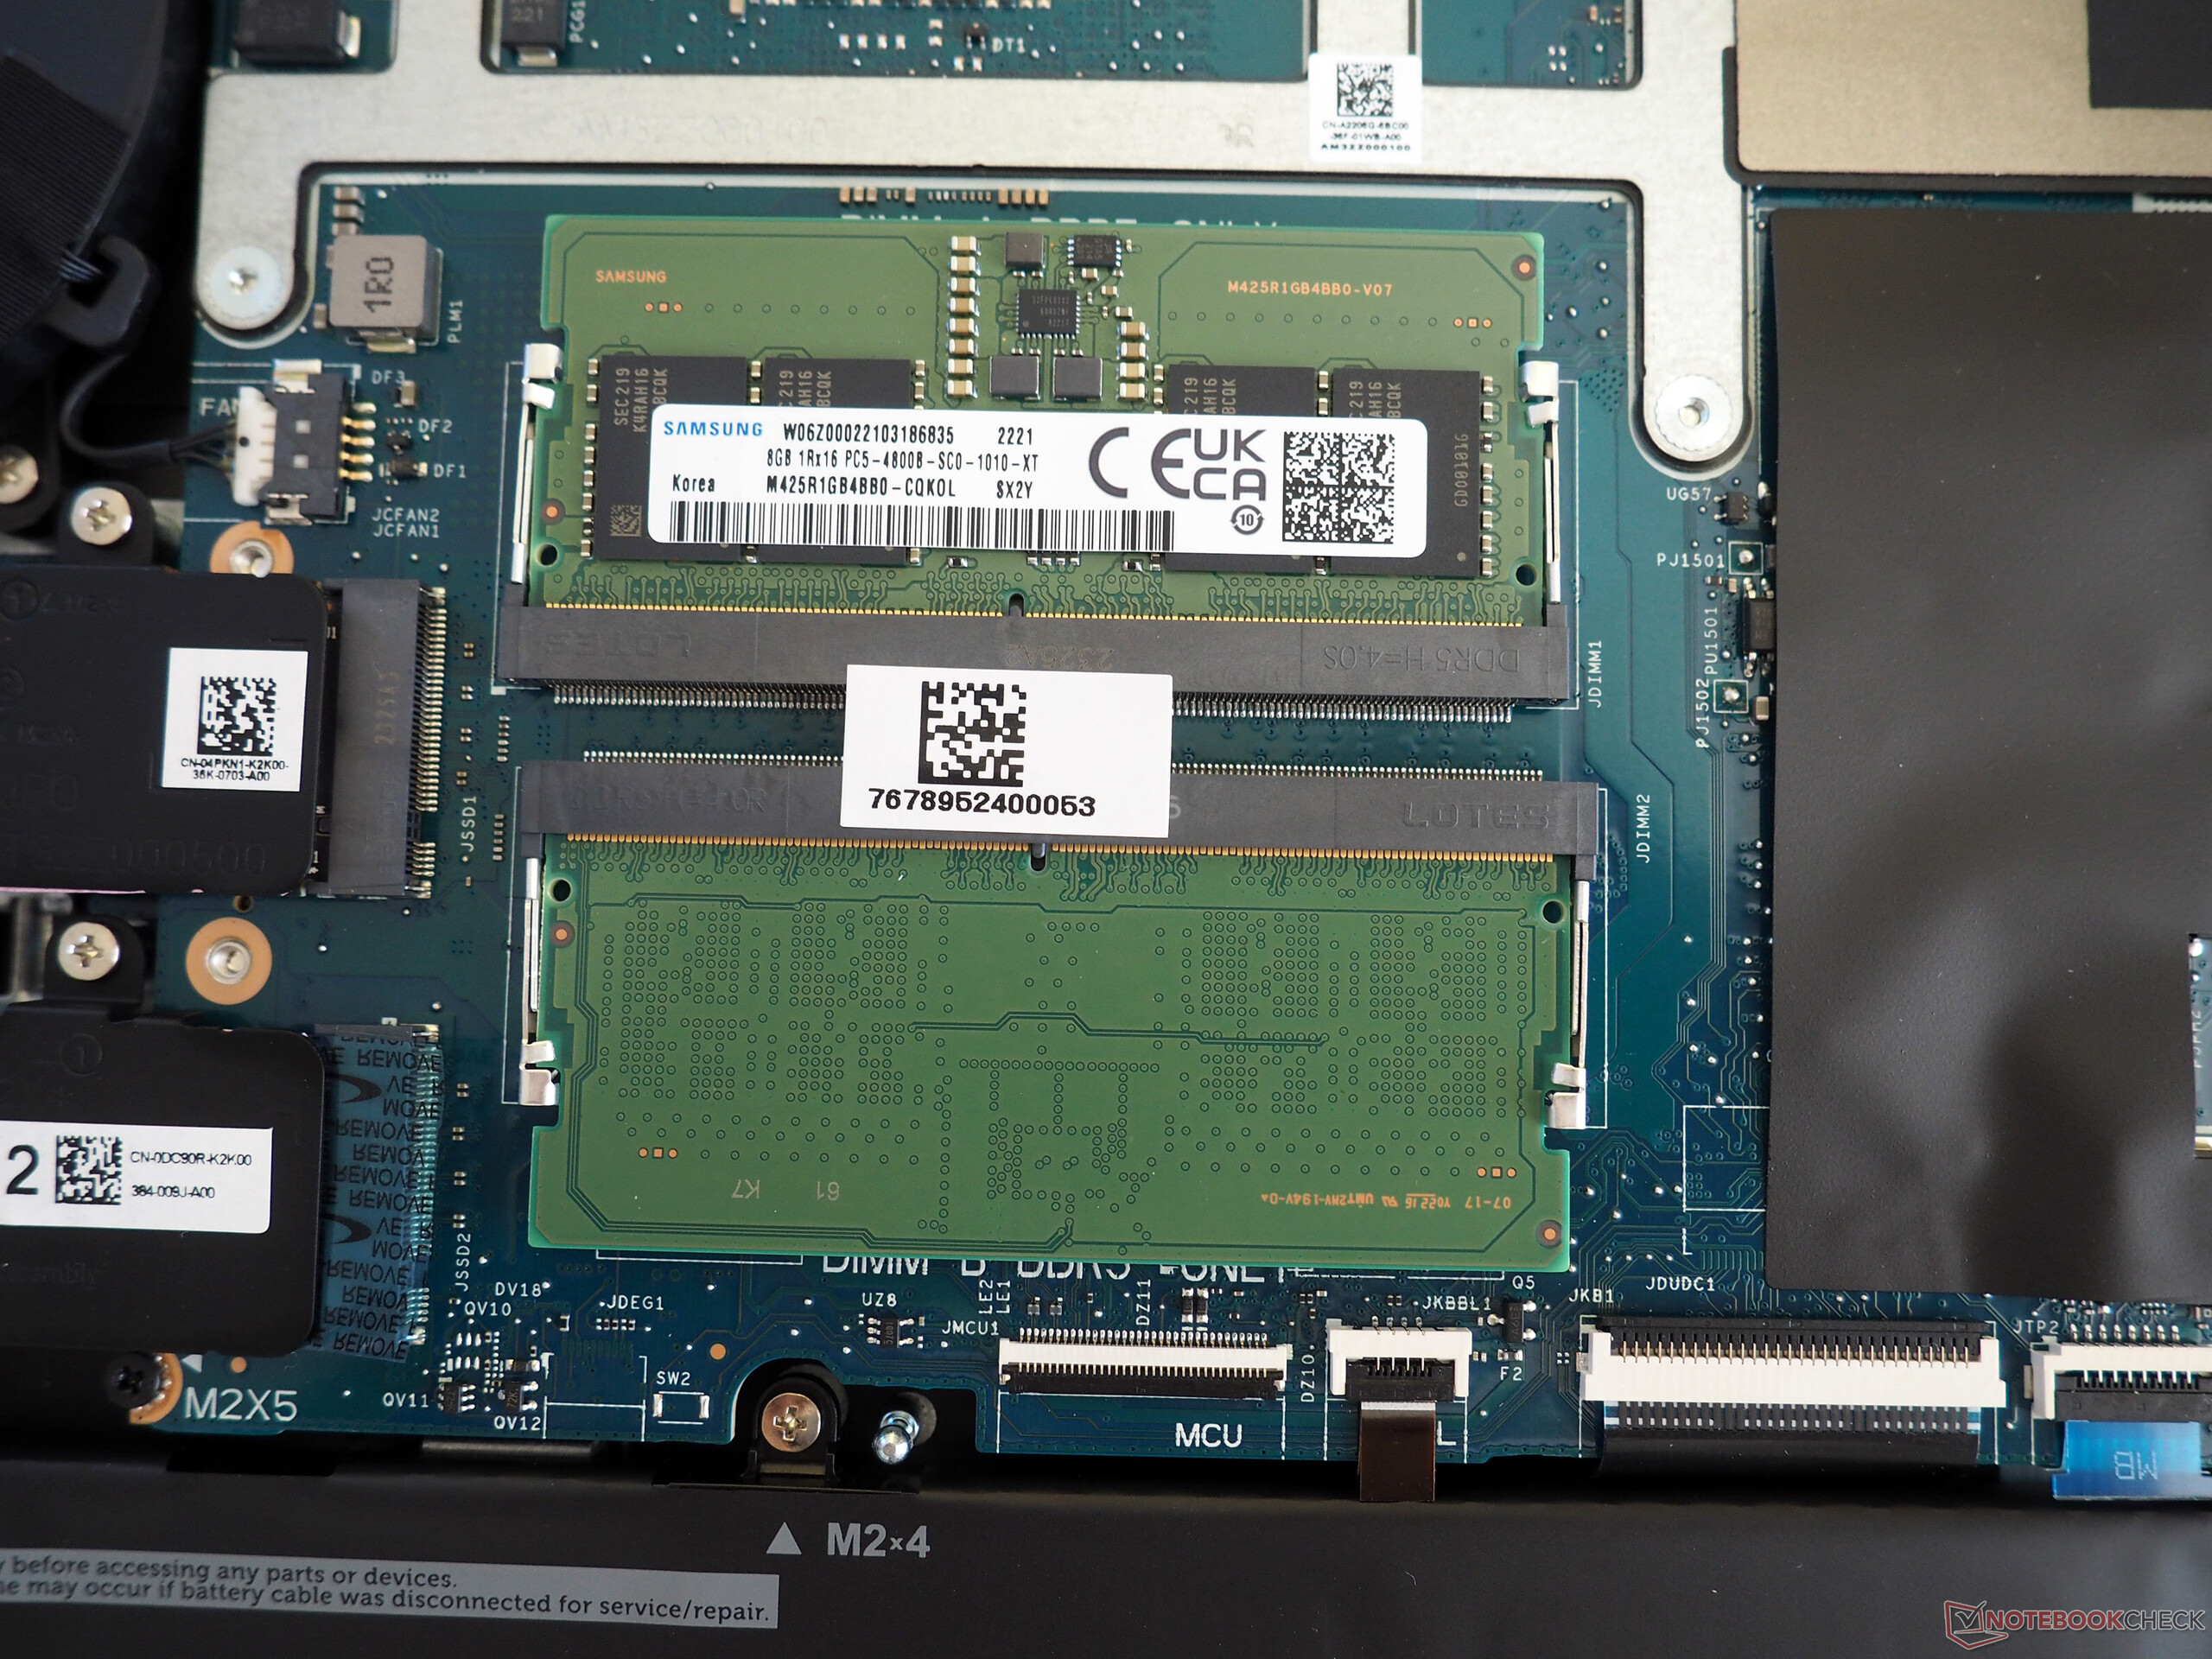
Opening the chassis can definitely be done even by an average user. After removing ten cross-head screws, you’ll be able to lift the bottom panel out of the retainer. Waiting under the hood are the cooling unit, battery, Wi-Fi module, two occupied memory slots, one M.2 2230 slot in use, and one free M.2 2280 slot for storage upgrade.
Warranty
Dell provides only a 12-month warranty by default in Germany. But warranty period may vary depending on region.
Input devices
Keyboard
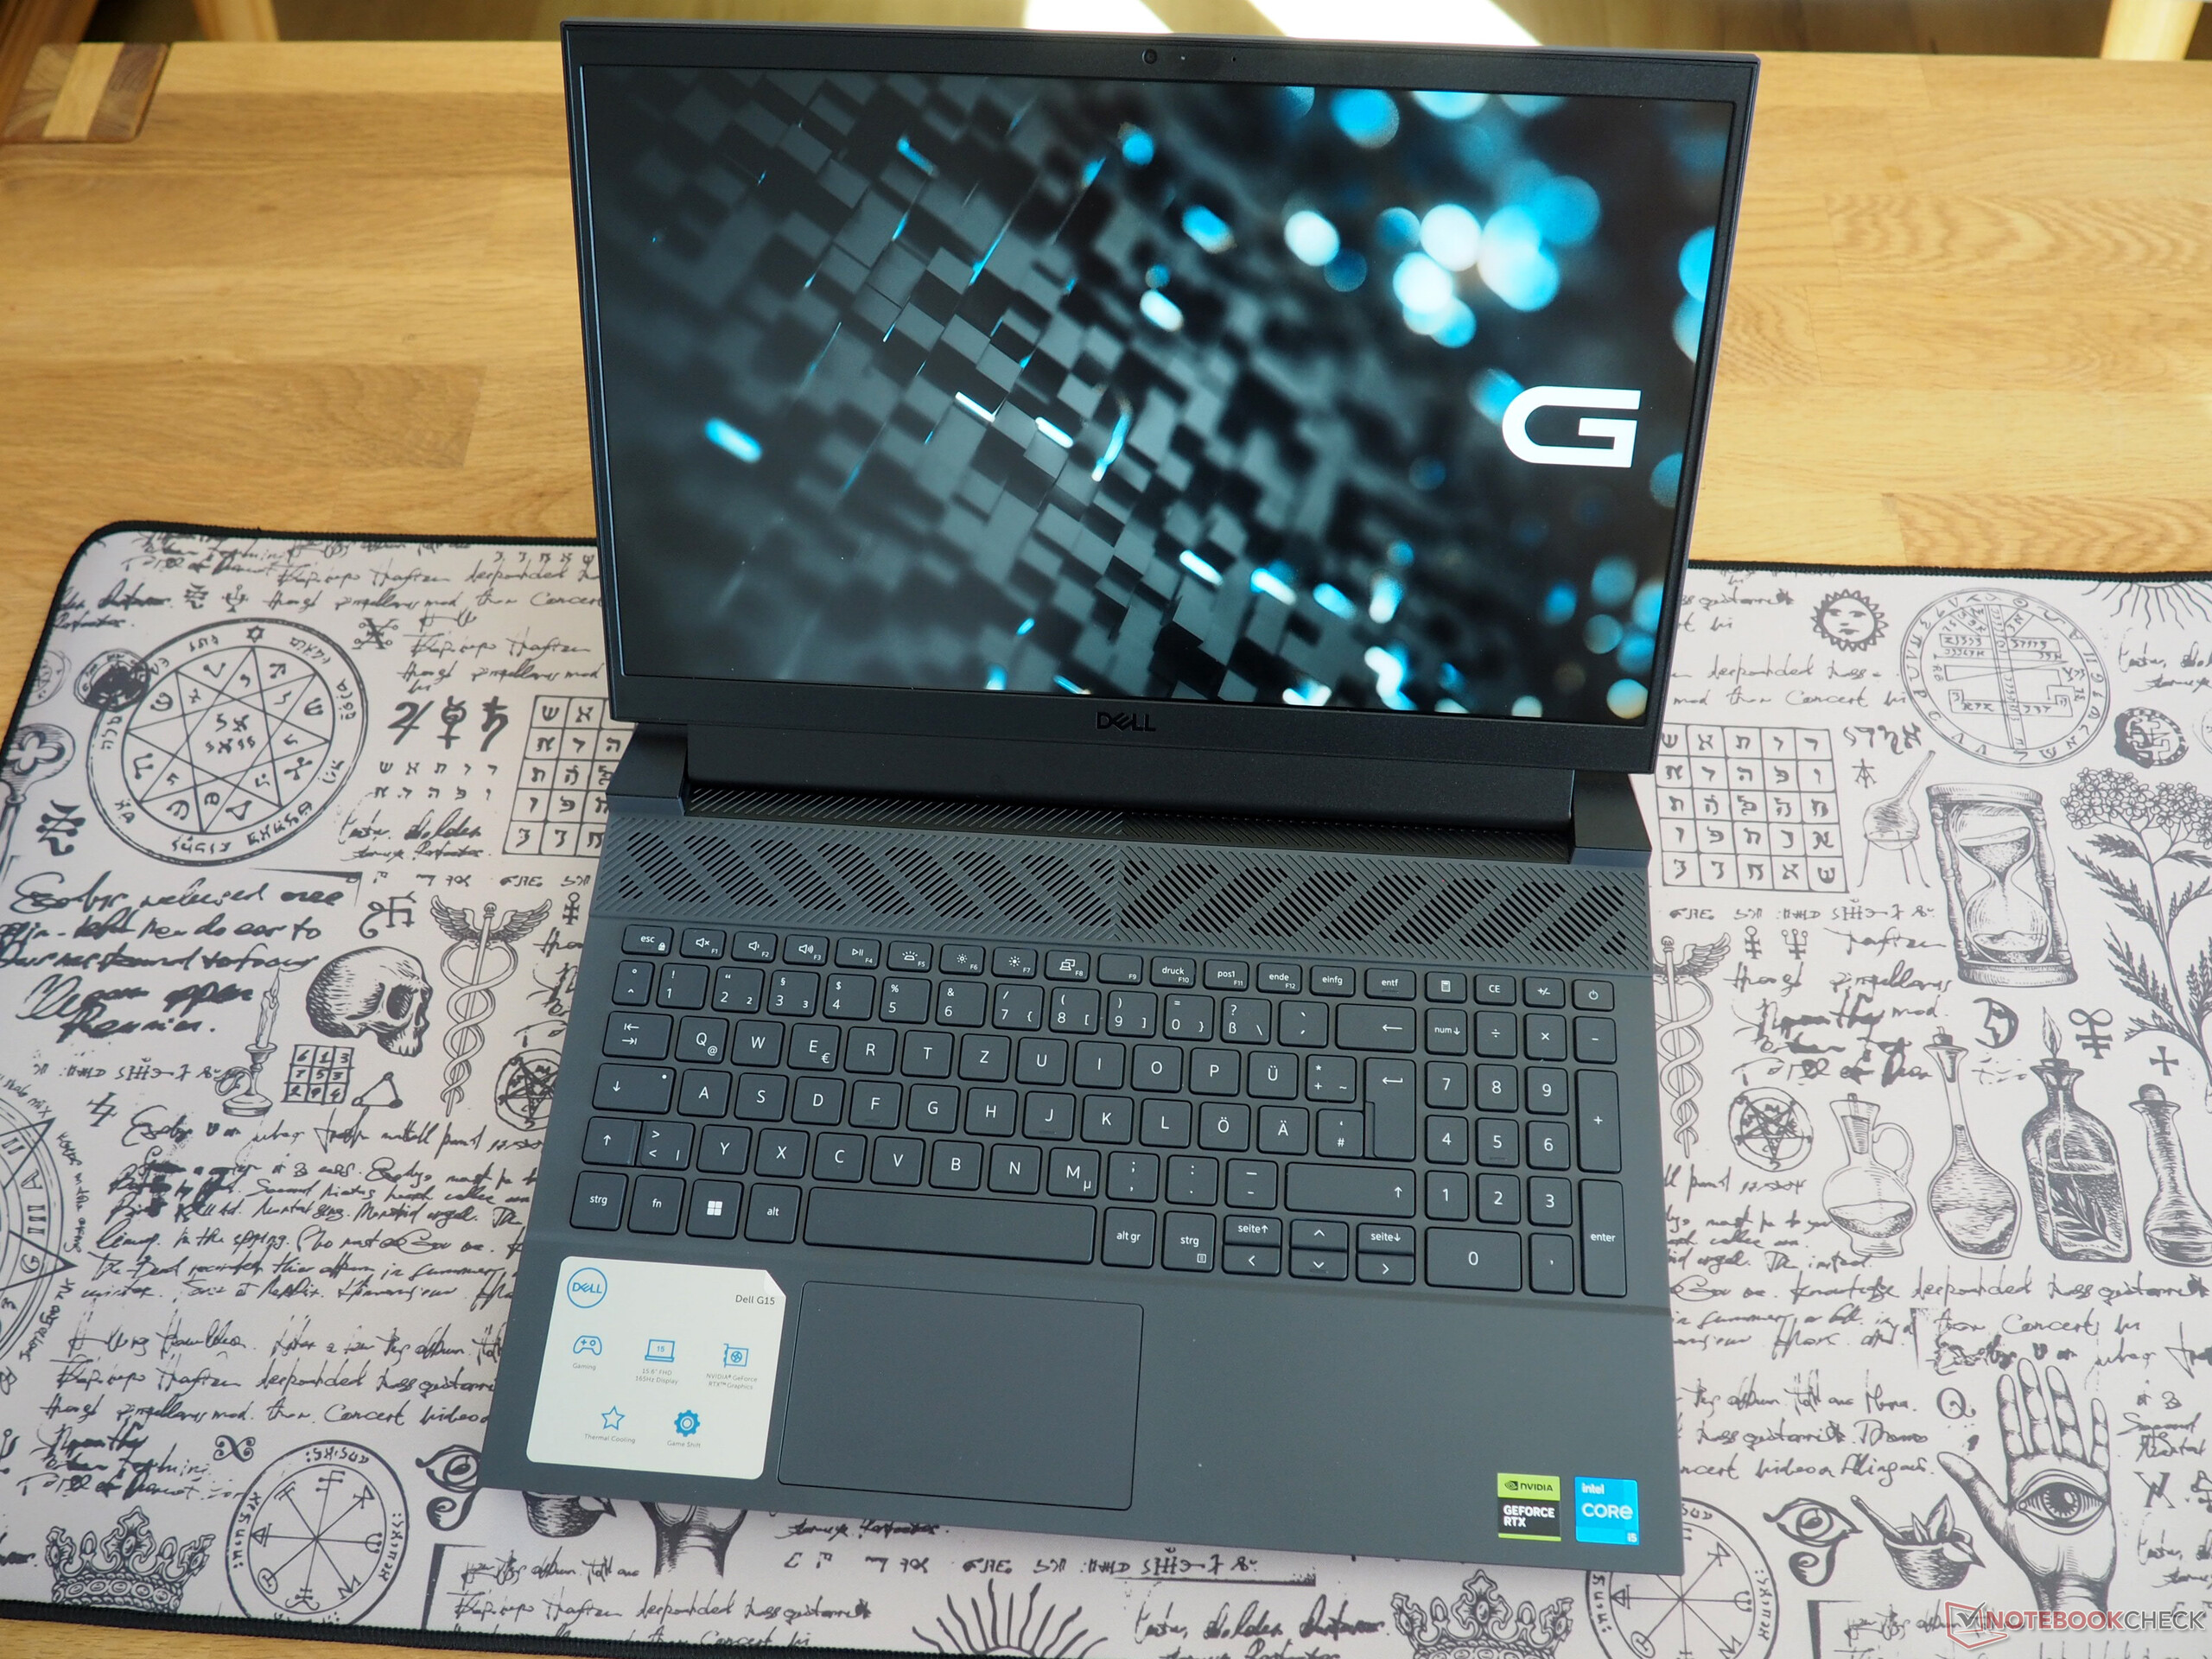
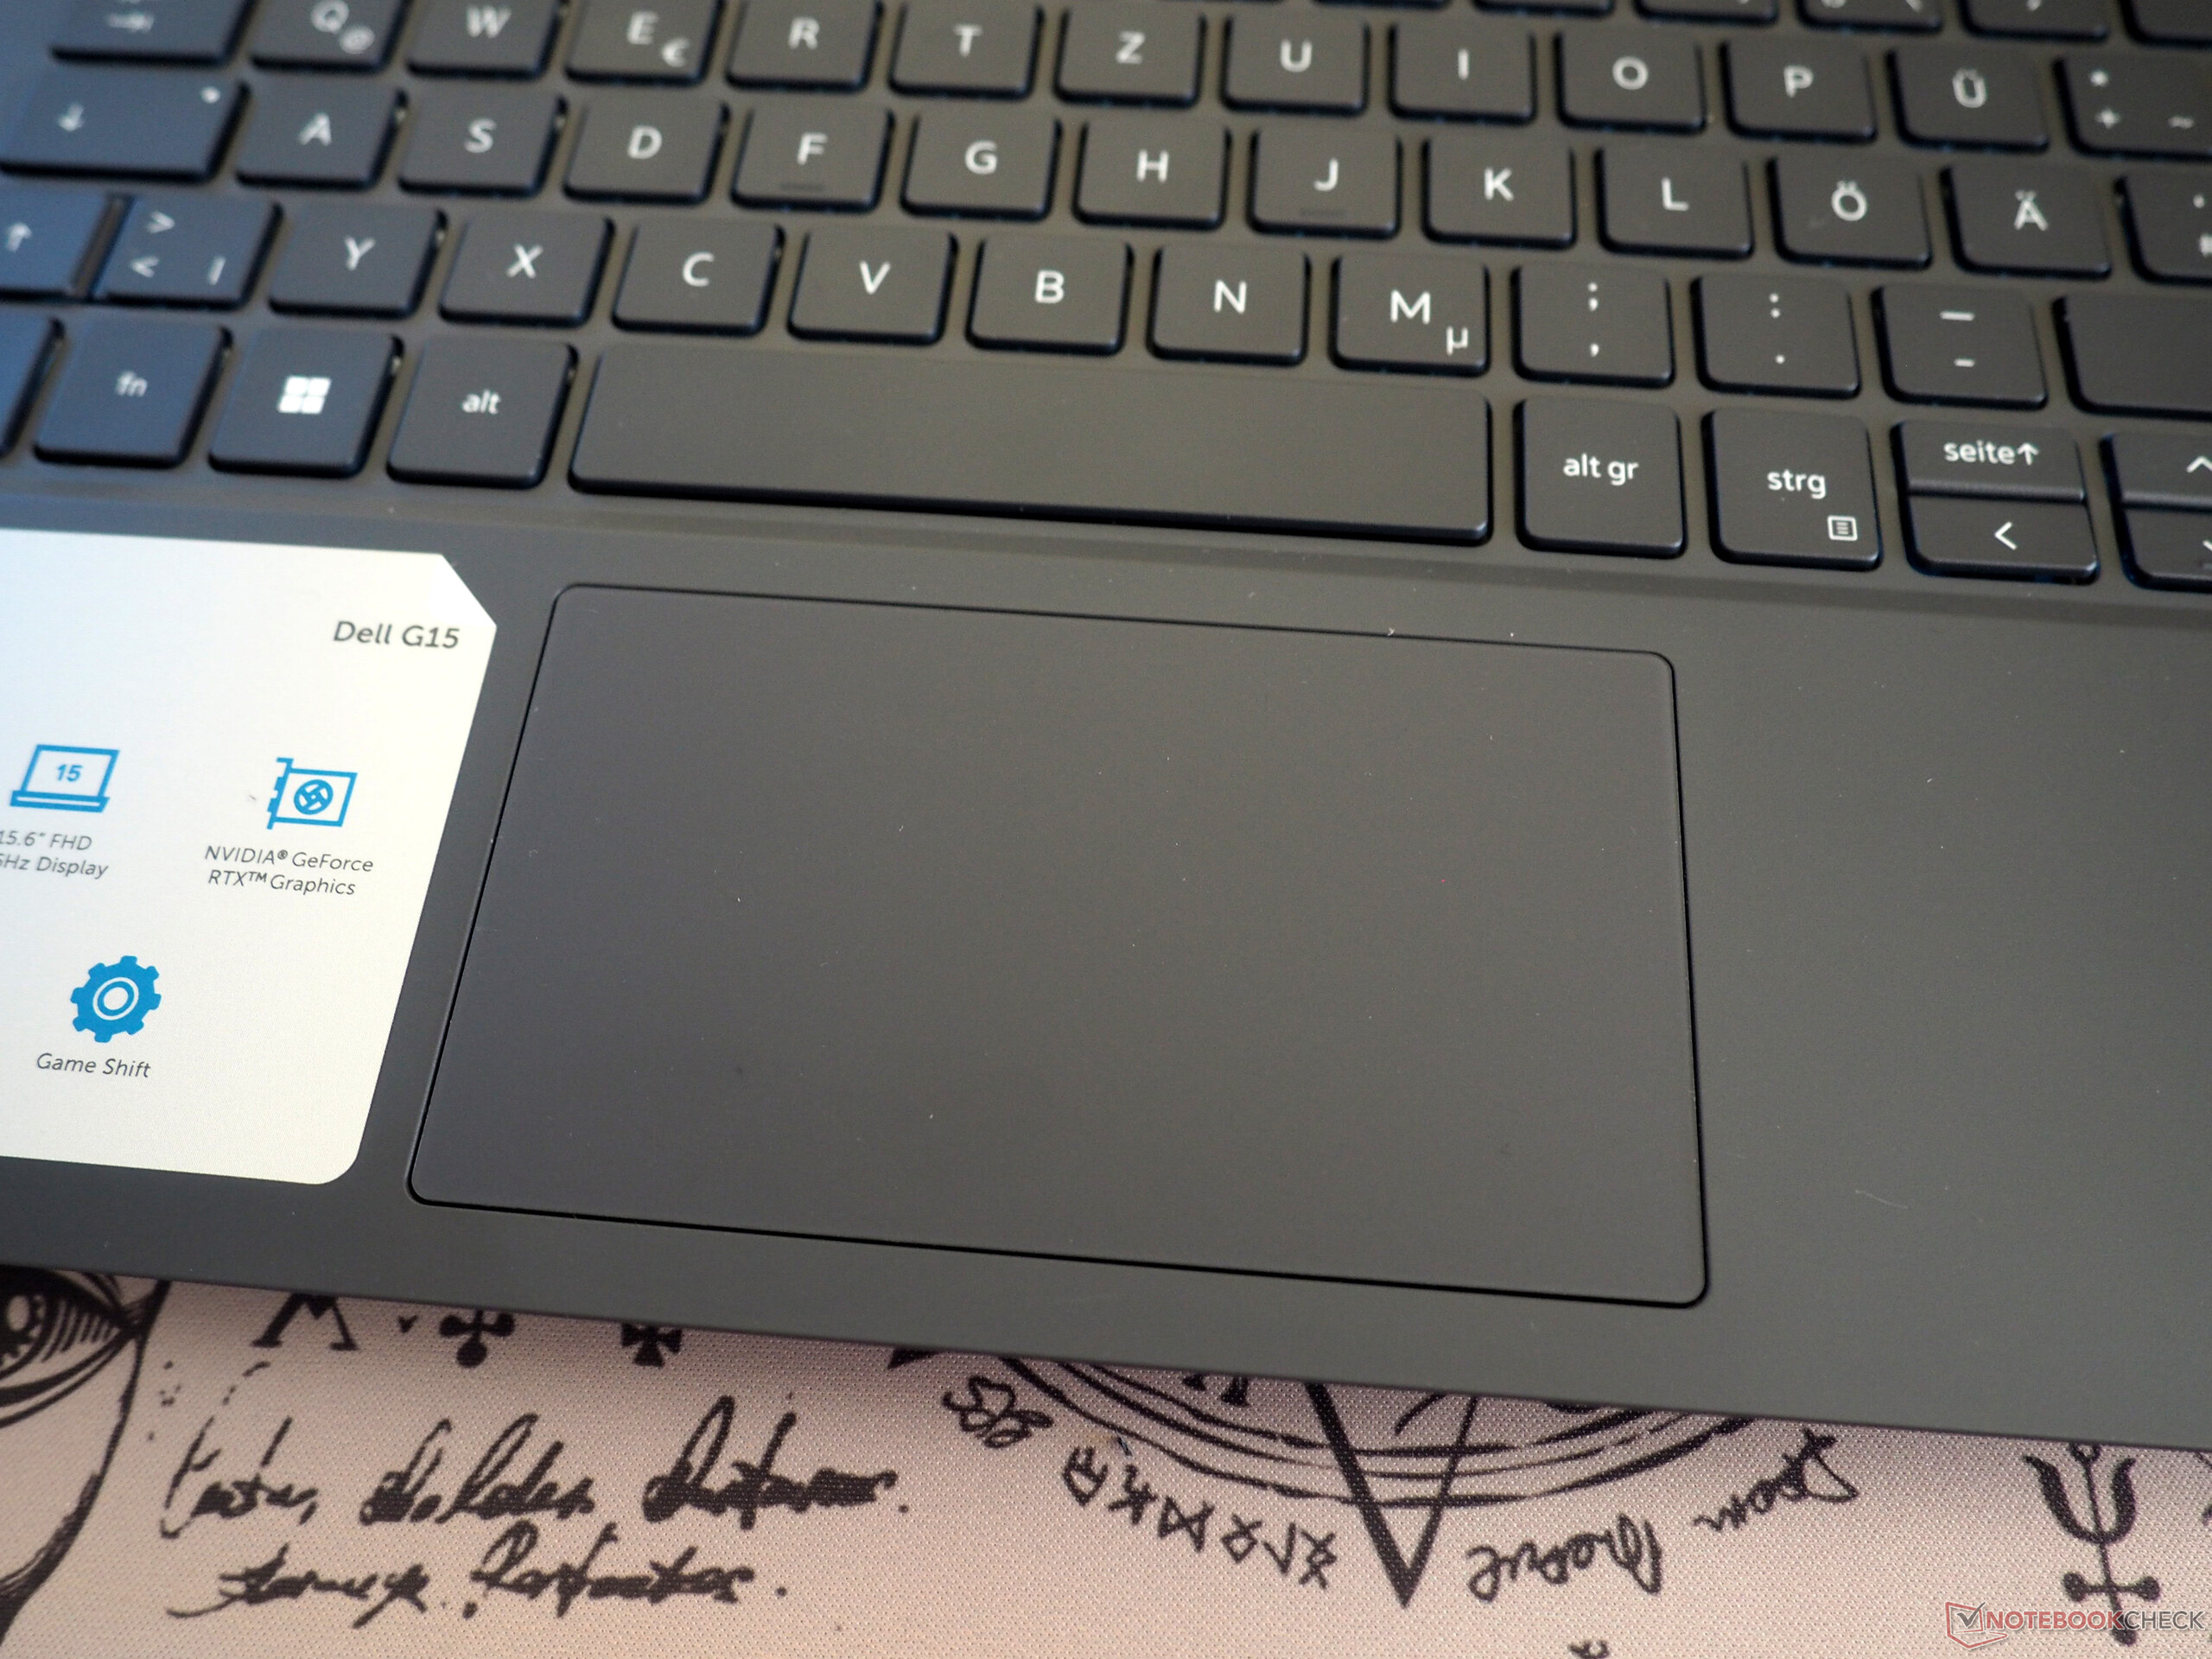
The input devices are solid without really being amazing. The tiny arrow keys notwithstanding, we especially like the layout of the German keyboard, which largely keeps to the standard arrangement and offers a full-size numpad. The typing feel is rather mediocre and could be even firmer in our opinion. The white backlight with two brightness levels facilitates typing in a dark environment.
Touchpad
The touchpad could also use a bit of work from Dell. For instance, besides the somewhat modest size (approx. 10.5 x 6 cm, 4.1 x 2.4 in), we also have gripes about the very loose surface. That said, the touchpad provides an acceptable level of smoothness and precision.
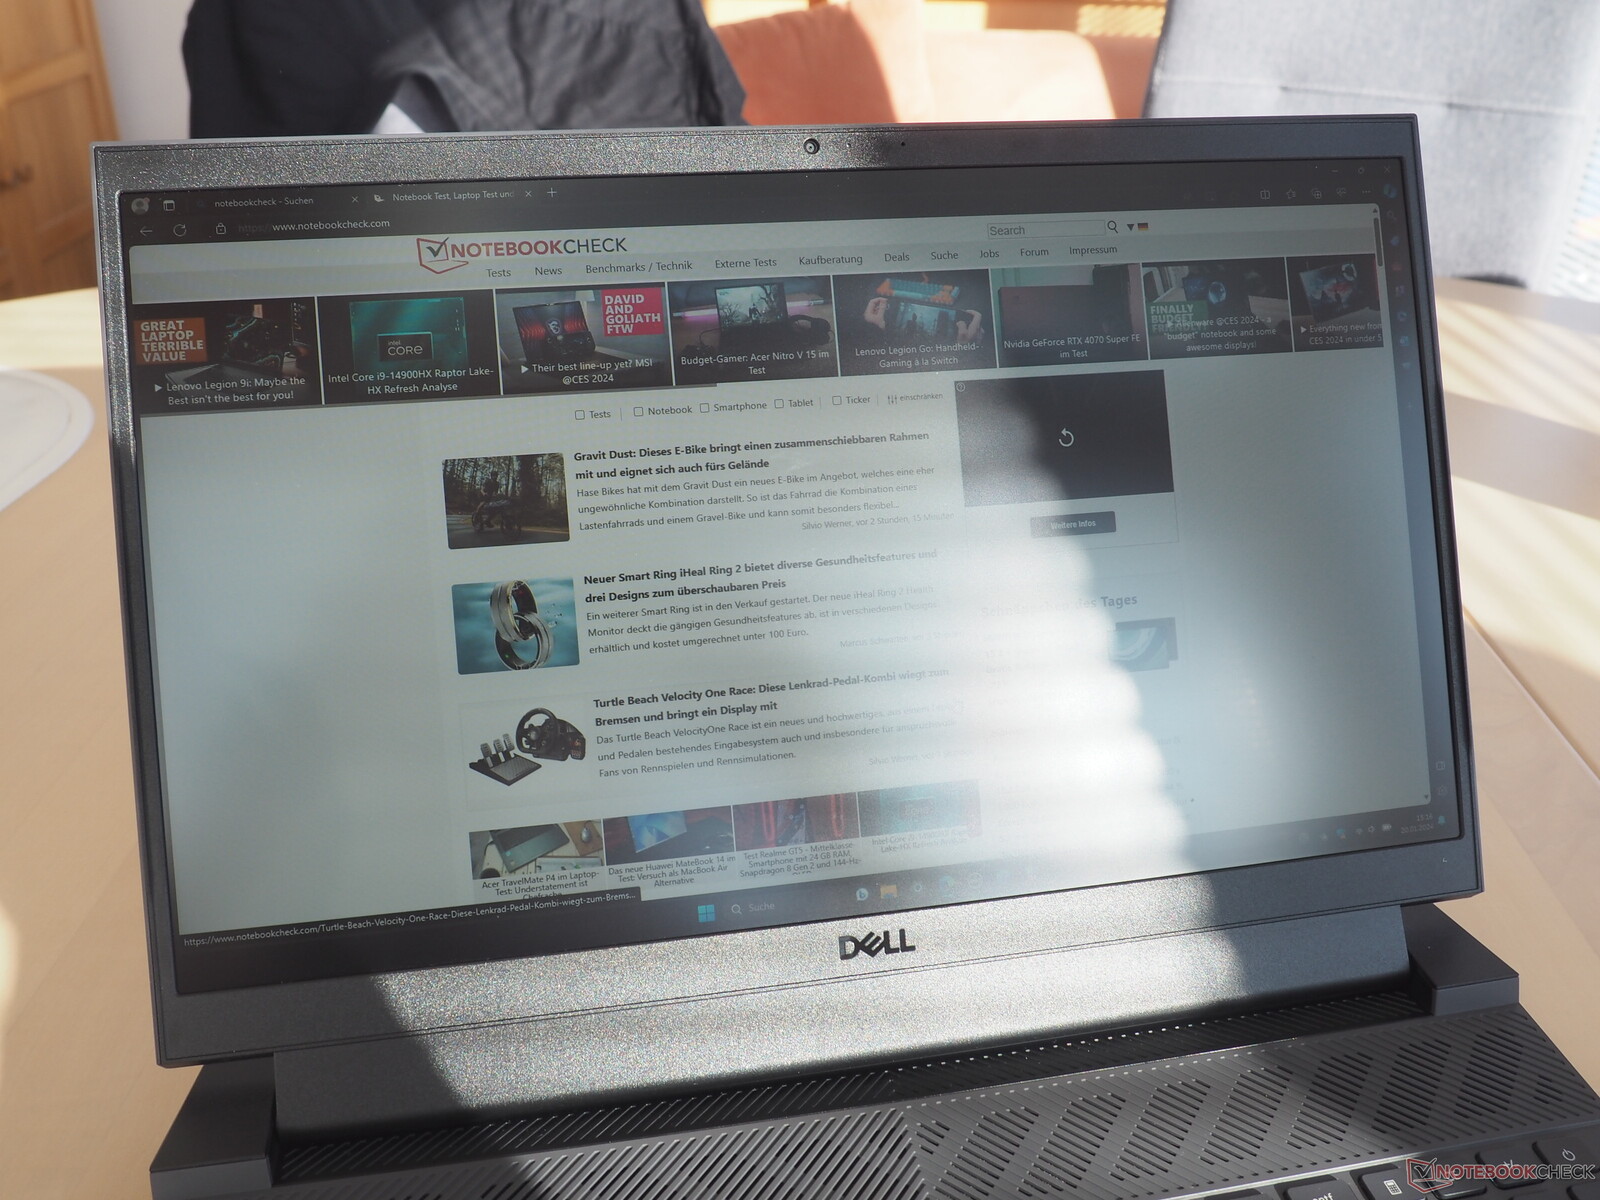
Display
The laptop comes with a 165Hz display as well. However, the panel is different from the one used on the G15 we previously reviewed (see table). This also explains why some of the results obtained for the two displays differ from each other.
| |||||||||||||||||||||||||
Brightness Distribution: 89 %
Center on Battery: 389 cd/m²
Contrast: 1111:1 (Black: 0.35 cd/m²)
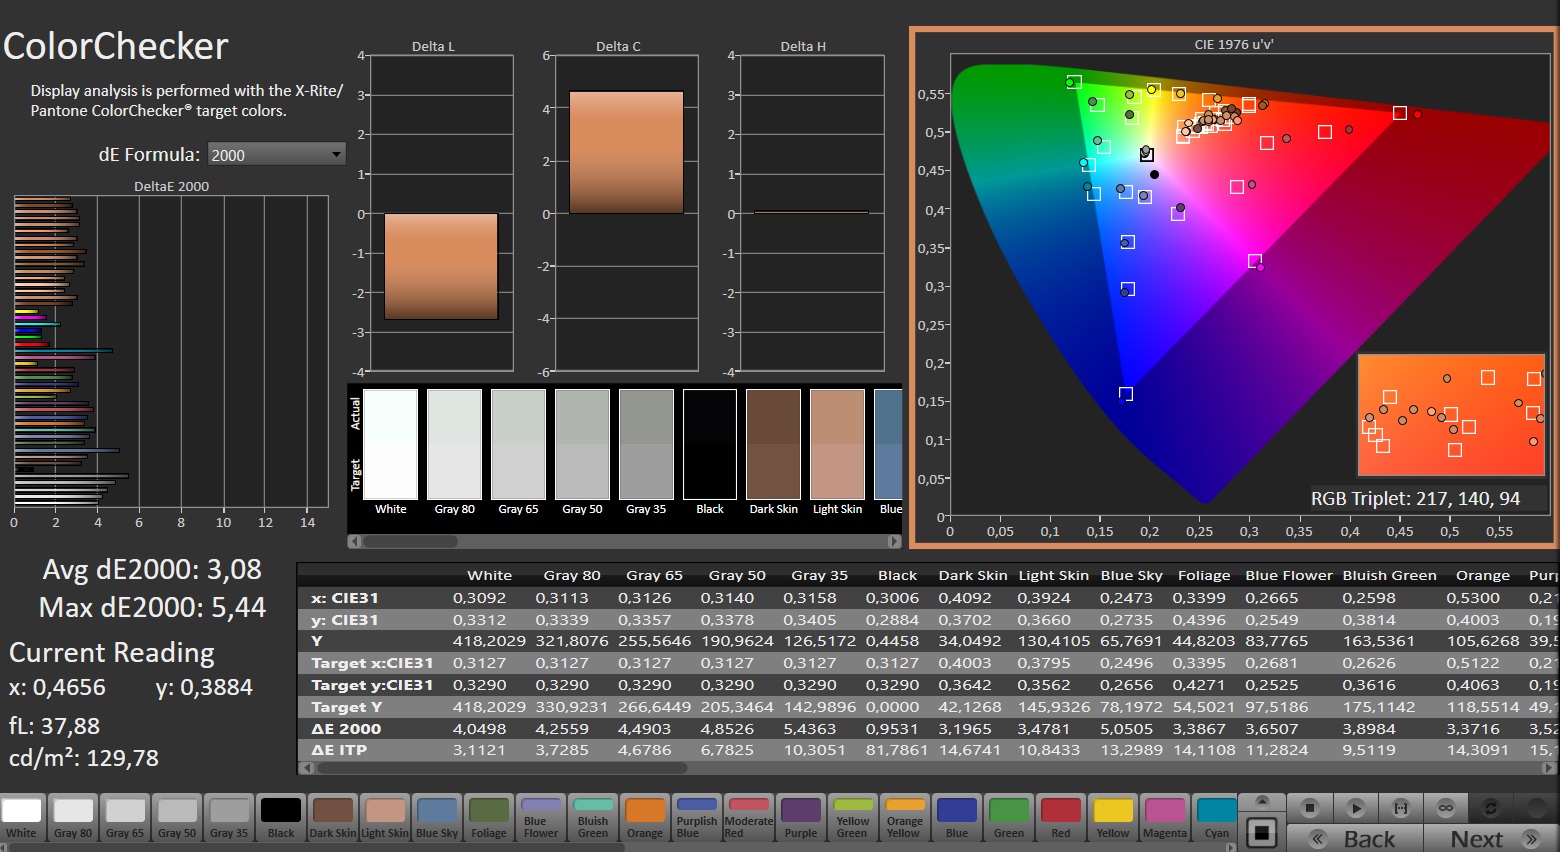
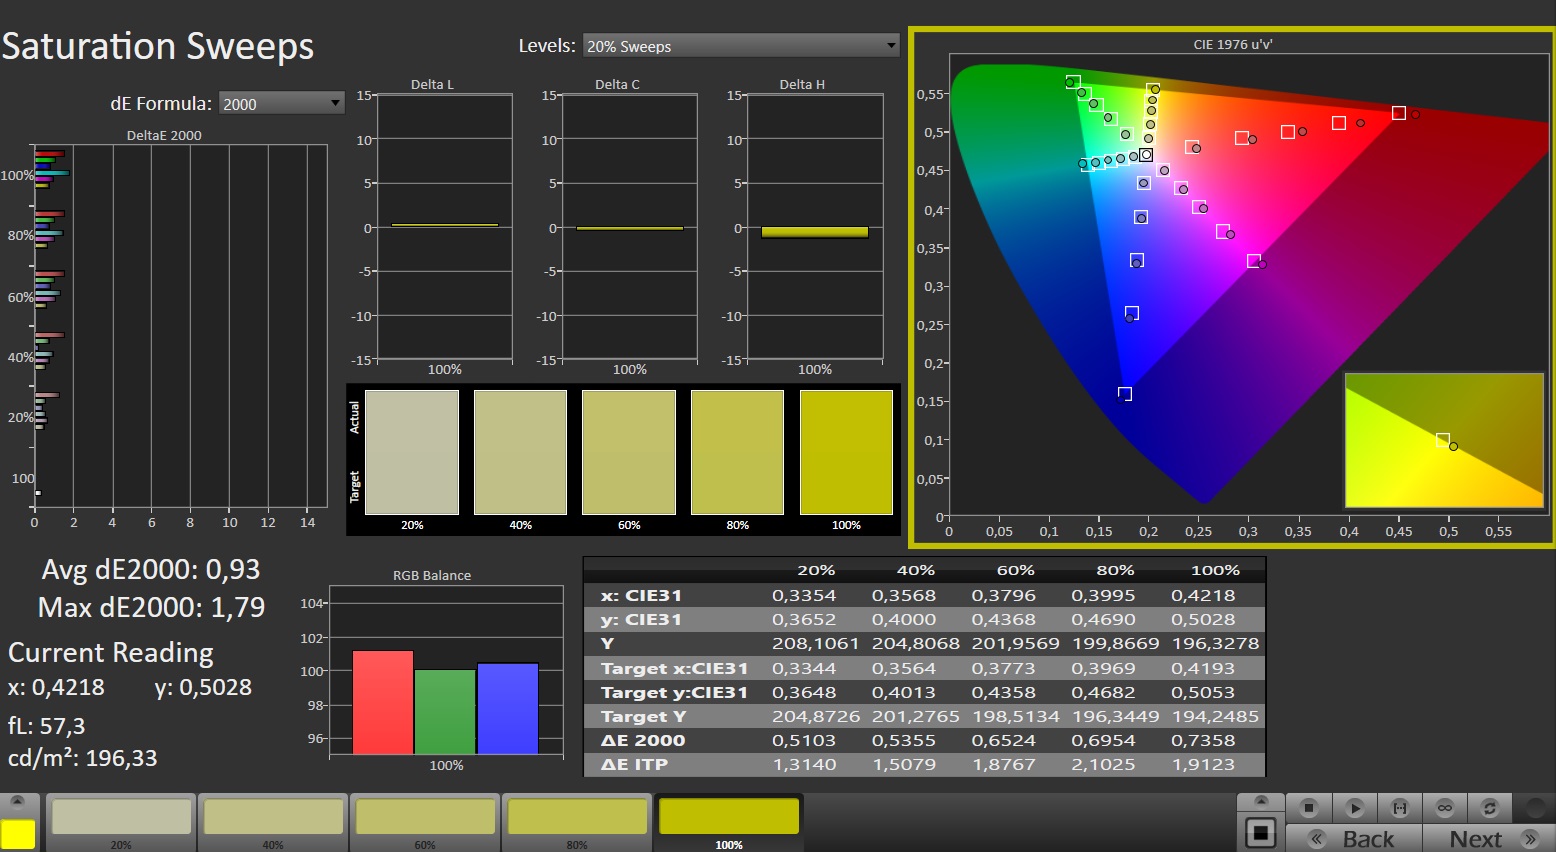
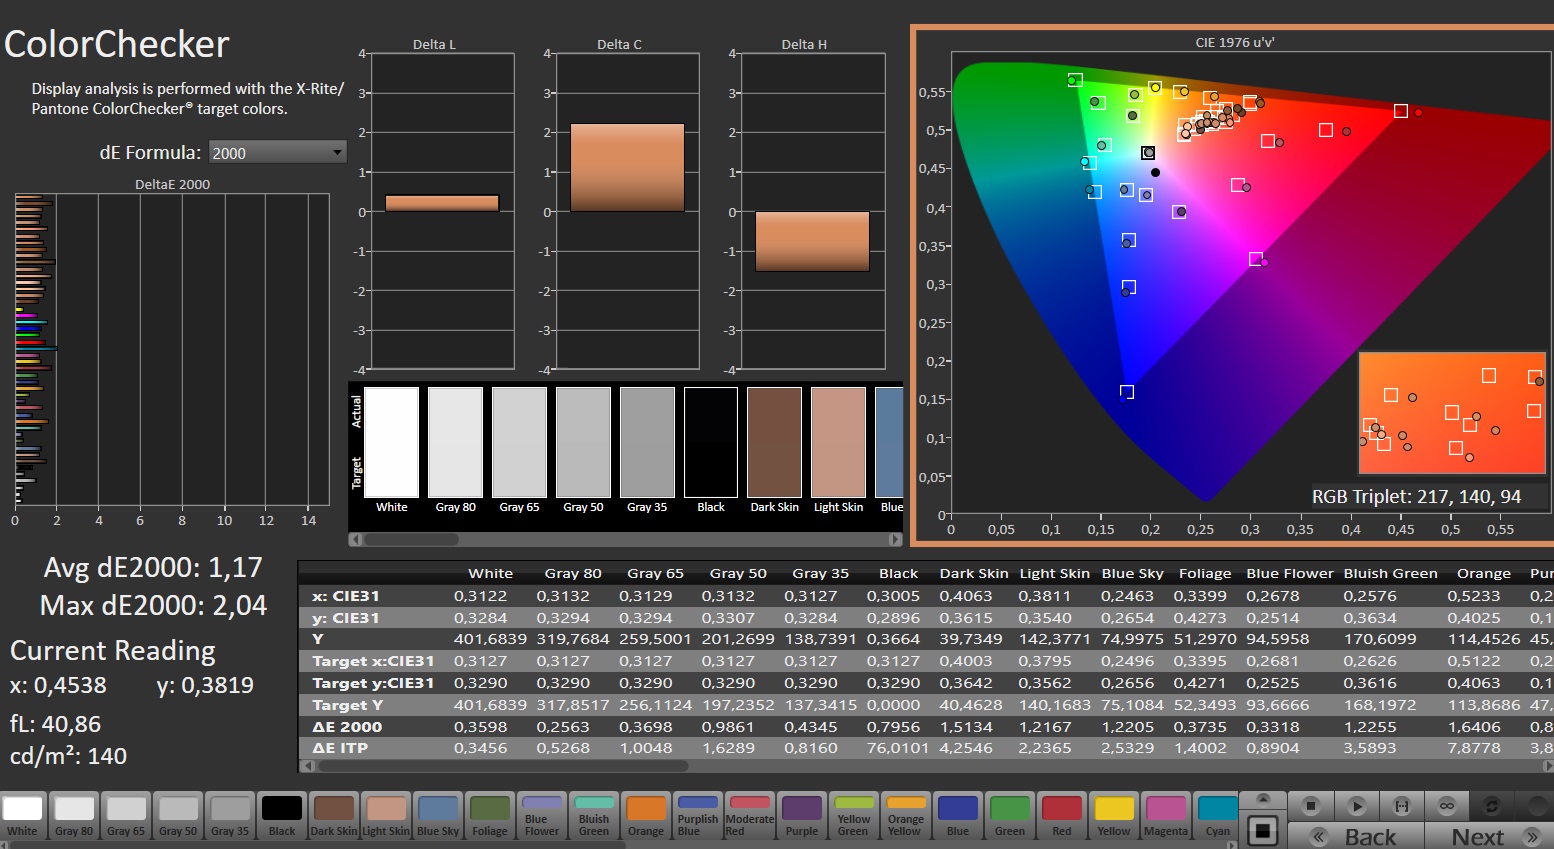
ΔE ColorChecker Calman: 3.08 | ∀{0.5-29.43 Ø4.73}
calibrated: 1.17
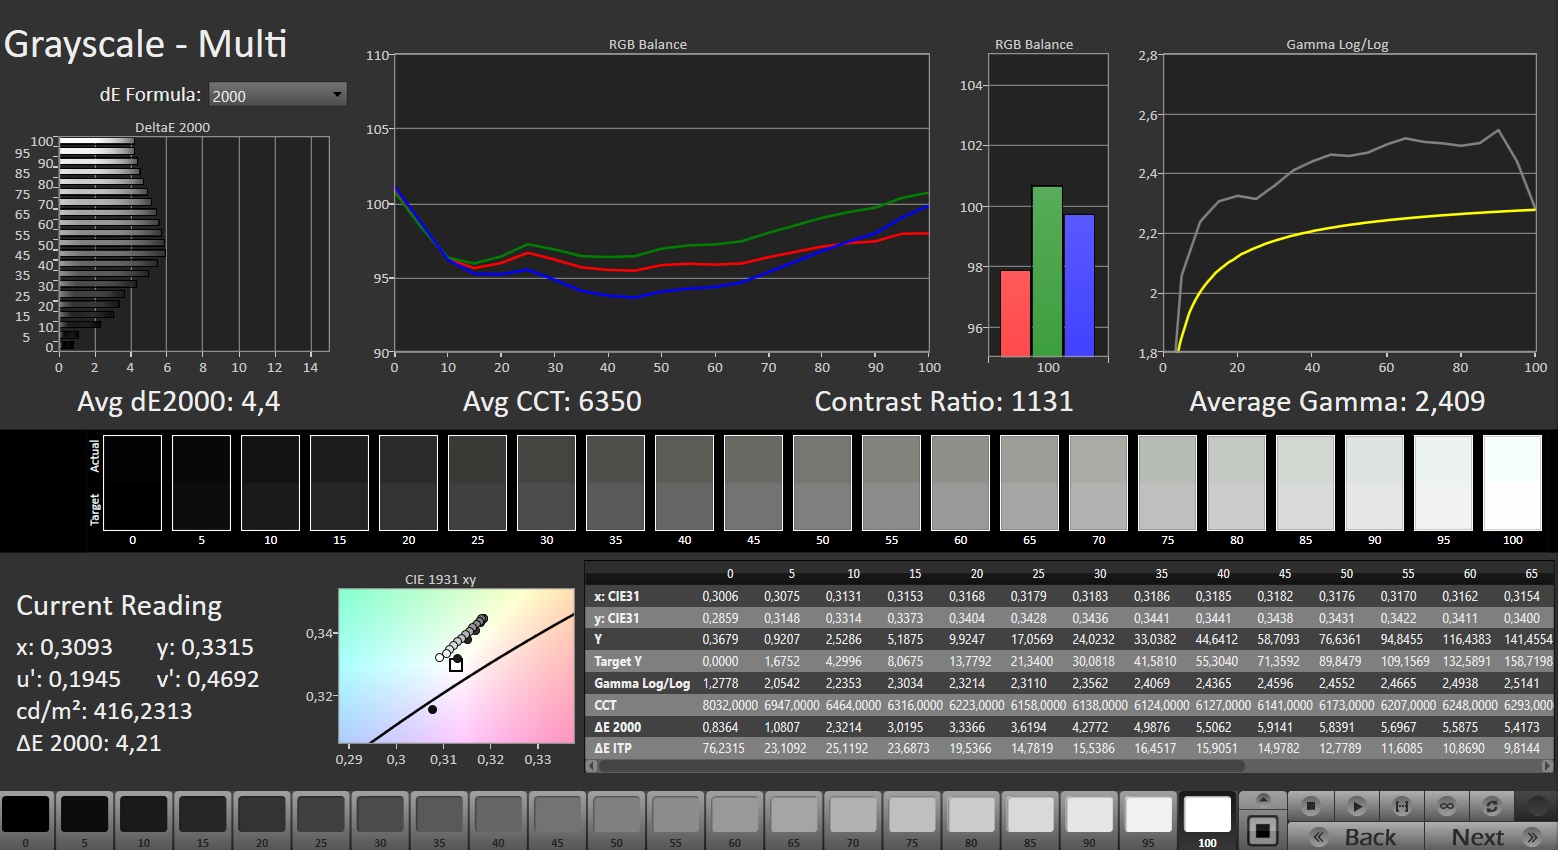
ΔE Greyscale Calman: 4.4 | ∀{0.09-98 Ø4.97}
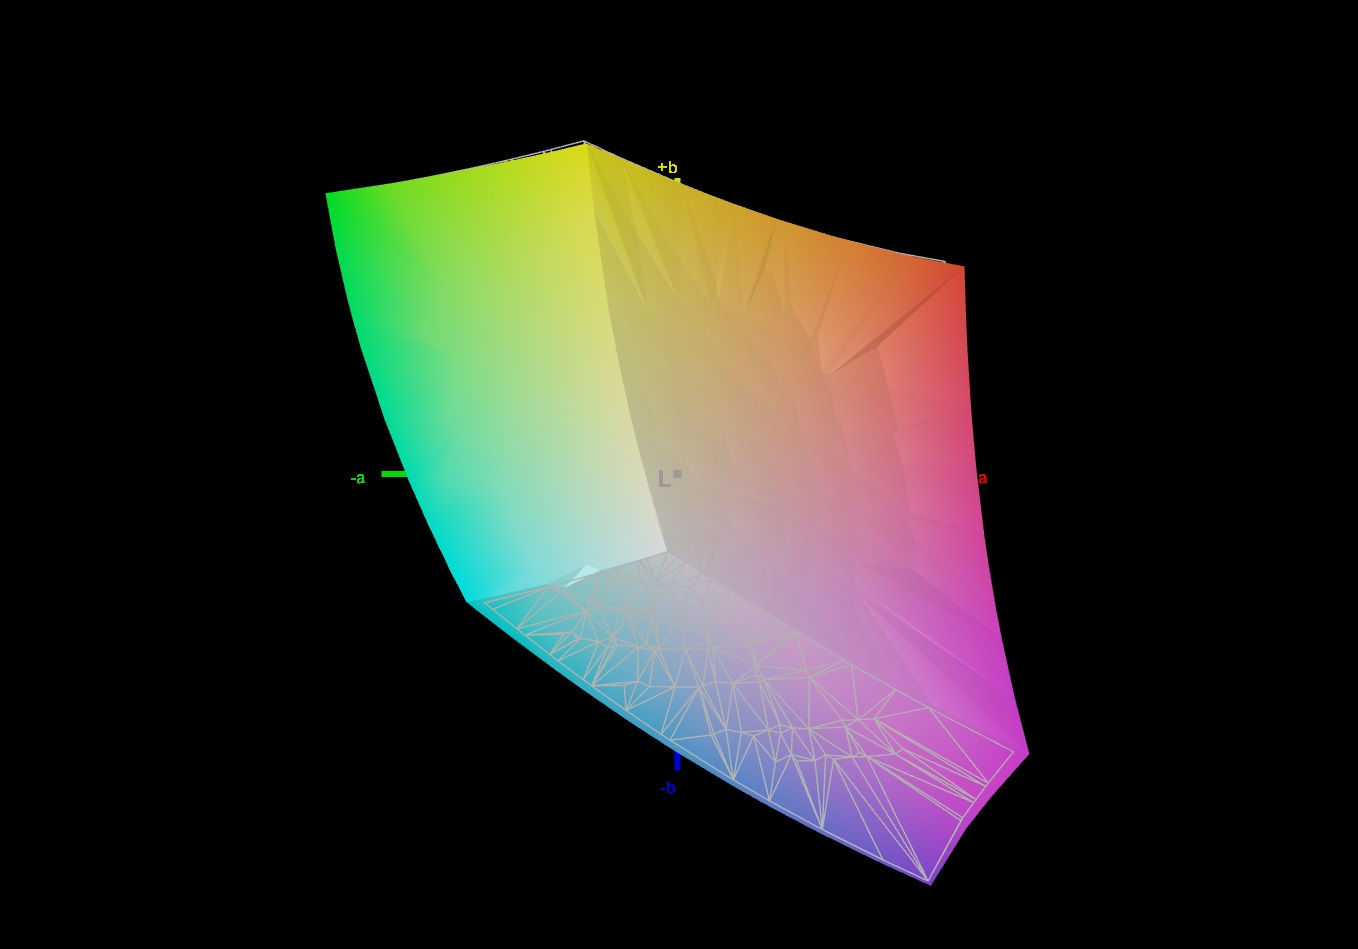
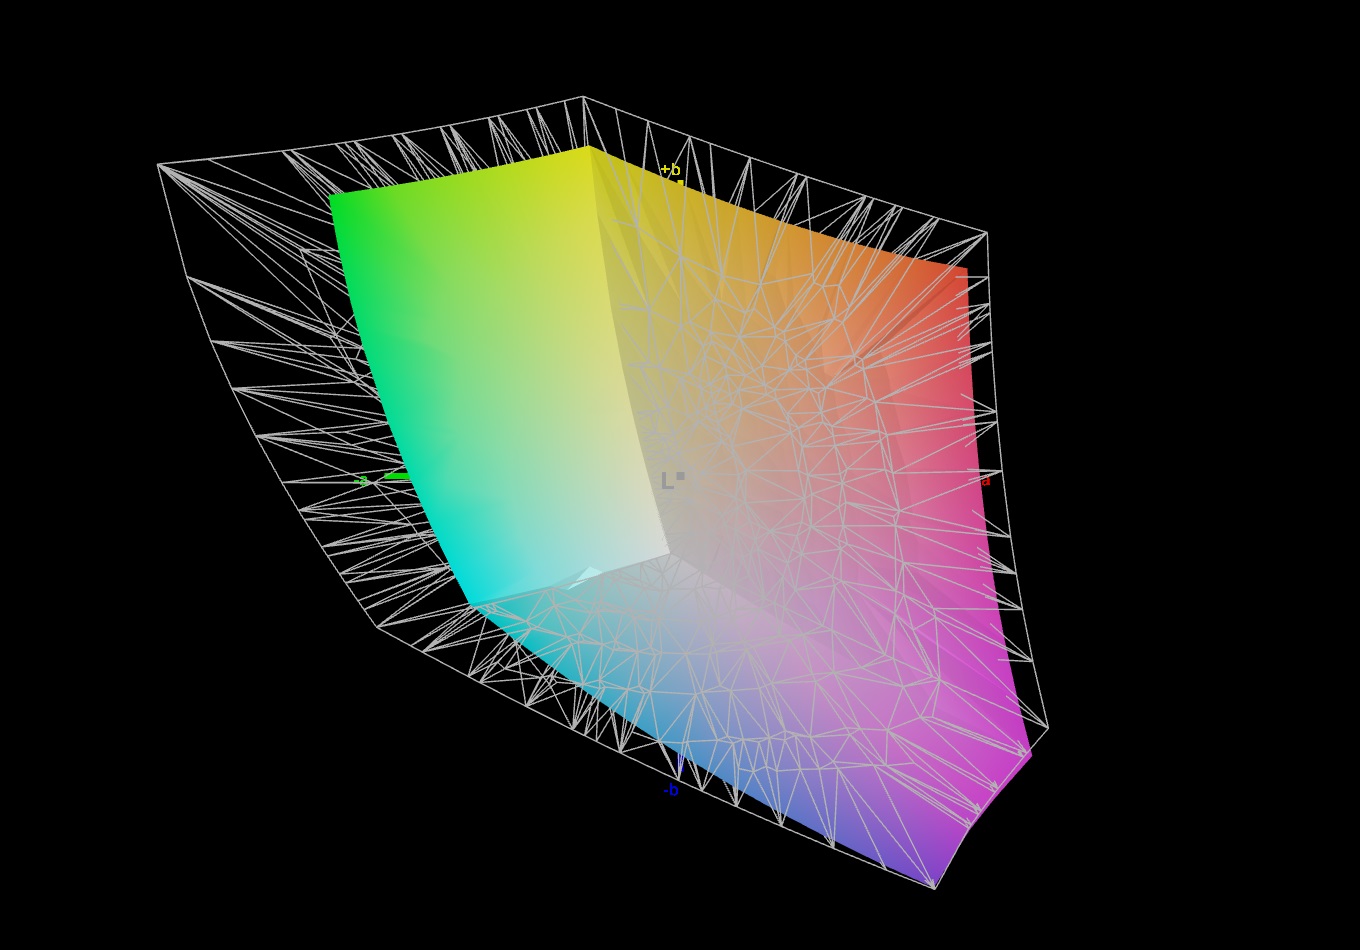
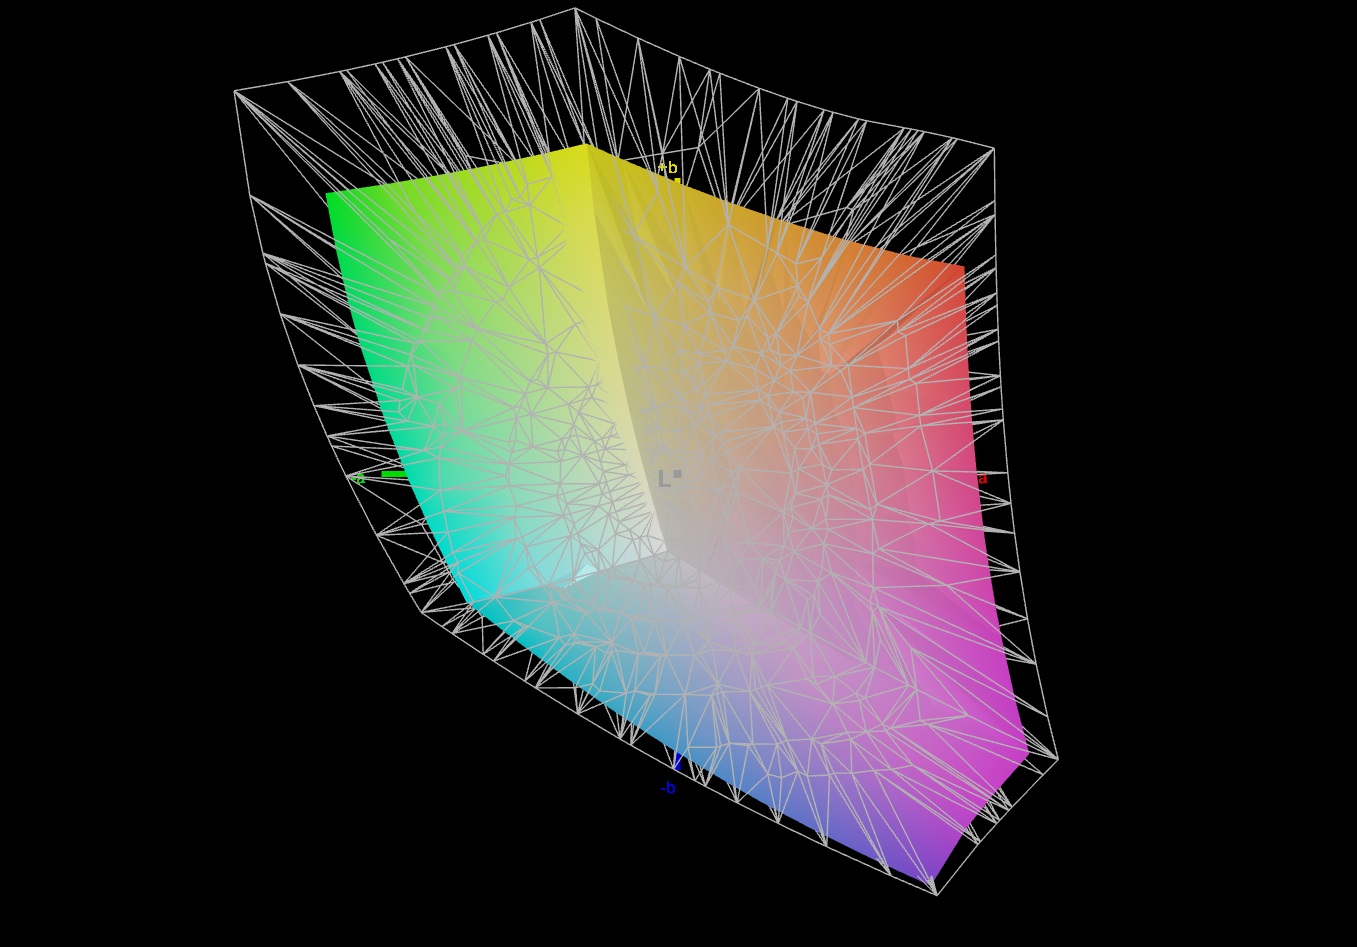
71.4% AdobeRGB 1998 (Argyll 3D)
99.3% sRGB (Argyll 3D)
71.1% Display P3 (Argyll 3D)
Gamma: 2.409
CCT: 6350 K
| Dell G15 5530, i5-13450HX RTX 4050 BOEhydis NV15NY9 (Dell 18PJX), IPS, 1920x1080, 15.6" | Medion Erazer Crawler E40 - MD 62518 BOE HF NV156FHM-N4G, IPS, 1920x1080, 15.6" | Lenovo LOQ 15IRH8 Core i7 BOE CQ NE156QHM-NY4, IPS, 2560x1440, 15.6" | Asus TUF A15 FA507 N156HMA-GA1, IPS, 1920x1080, 15.6" | Dell G15 5530 AUO B156HAN, IPS, 1920x1080, 15.6" | |
|---|---|---|---|---|---|
| Display | -12% | -5% | -6% | 2% | |
| Display P3 Coverage (%) | 71.1 | 61.4 -14% | 66.3 -7% | 64.9 -9% | 73.1 3% |
| sRGB Coverage (%) | 99.3 | 89.7 -10% | 96.6 -3% | 96.5 -3% | 98.4 -1% |
| AdobeRGB 1998 Coverage (%) | 71.4 | 63.2 -11% | 67.7 -5% | 66.6 -7% | 74.4 4% |
| Response Times | -19% | 8% | -234% | 40% | |
| Response Time Grey 50% / Grey 80% * (ms) | 8.5 ? | 8 ? 6% | 5 ? 41% | 30.4 ? -258% | 3.39 ? 60% |
| Response Time Black / White * (ms) | 6.7 ? | 9.6 ? -43% | 8.41 ? -26% | 20.8 ? -210% | 5.35 ? 20% |
| PWM Frequency (Hz) | 21620 ? | ||||
| Screen | -13% | -10% | 21% | -17% | |
| Brightness middle (cd/m²) | 389 | 364 -6% | 373 -4% | 288 -26% | 320 -18% |
| Brightness (cd/m²) | 374 | 351 -6% | 365 -2% | 271 -28% | 316 -16% |
| Brightness Distribution (%) | 89 | 91 2% | 90 1% | 91 2% | 94 6% |
| Black Level * (cd/m²) | 0.35 | 0.43 -23% | 0.33 6% | 0.17 51% | 0.21 40% |
| Contrast (:1) | 1111 | 847 -24% | 1130 2% | 1694 52% | 1524 37% |
| Colorchecker dE 2000 * | 3.08 | 3.98 -29% | 4.19 -36% | 1.9 38% | 4.55 -48% |
| Colorchecker dE 2000 max. * | 5.44 | 6.38 -17% | 8.47 -56% | 3.3 39% | 9.83 -81% |
| Colorchecker dE 2000 calibrated * | 1.17 | 1.36 -16% | 1.07 9% | 0.9 23% | 1.51 -29% |
| Greyscale dE 2000 * | 4.4 | 4.39 -0% | 5 -14% | 2.7 39% | 6.2 -41% |
| Gamma | 2.409 91% | 2.58 85% | 1.93 114% | 2.32 95% | 2.07 106% |
| CCT | 6350 102% | 7316 89% | 7520 86% | 6535 99% | 6479 100% |
| Total Average (Program / Settings) | -15% /
-14% | -2% /
-7% | -73% /
-21% | 8% /
-5% |
* ... smaller is better
Whilst the current panel has a slightly worse black level (0.35 as opposed to 0.21 cd/m²), its average max brightness is a touch higher (374 rather than 316 cd/m²). The other G15 model has better contrast and response time than the review unit. Nonetheless, having a contrast of 1,111:1 and grey-to-grey response time of 8.5 ms is respectable for an IPS panel.
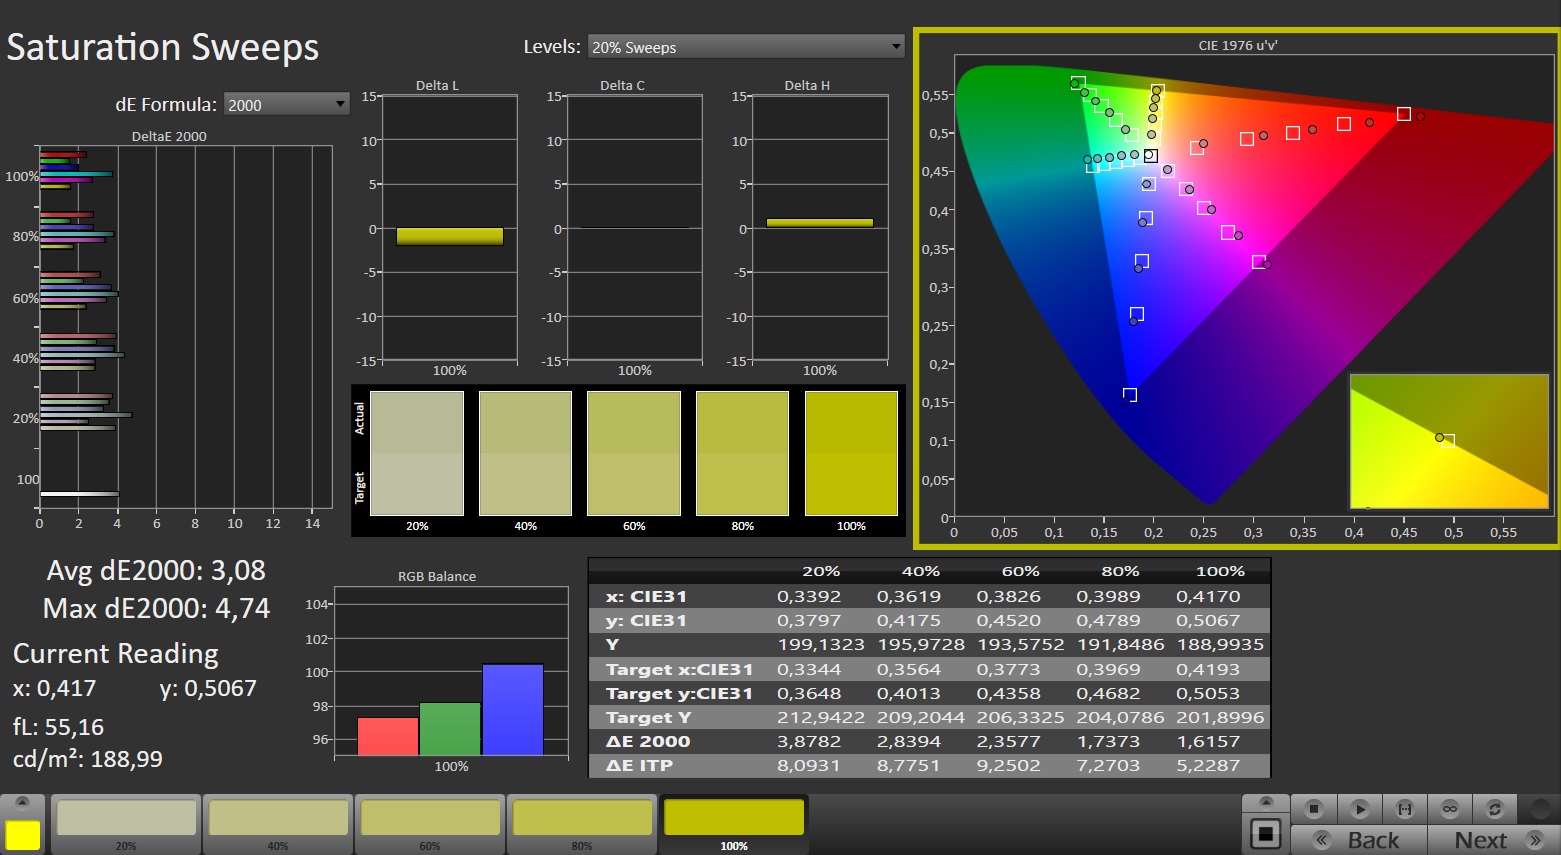
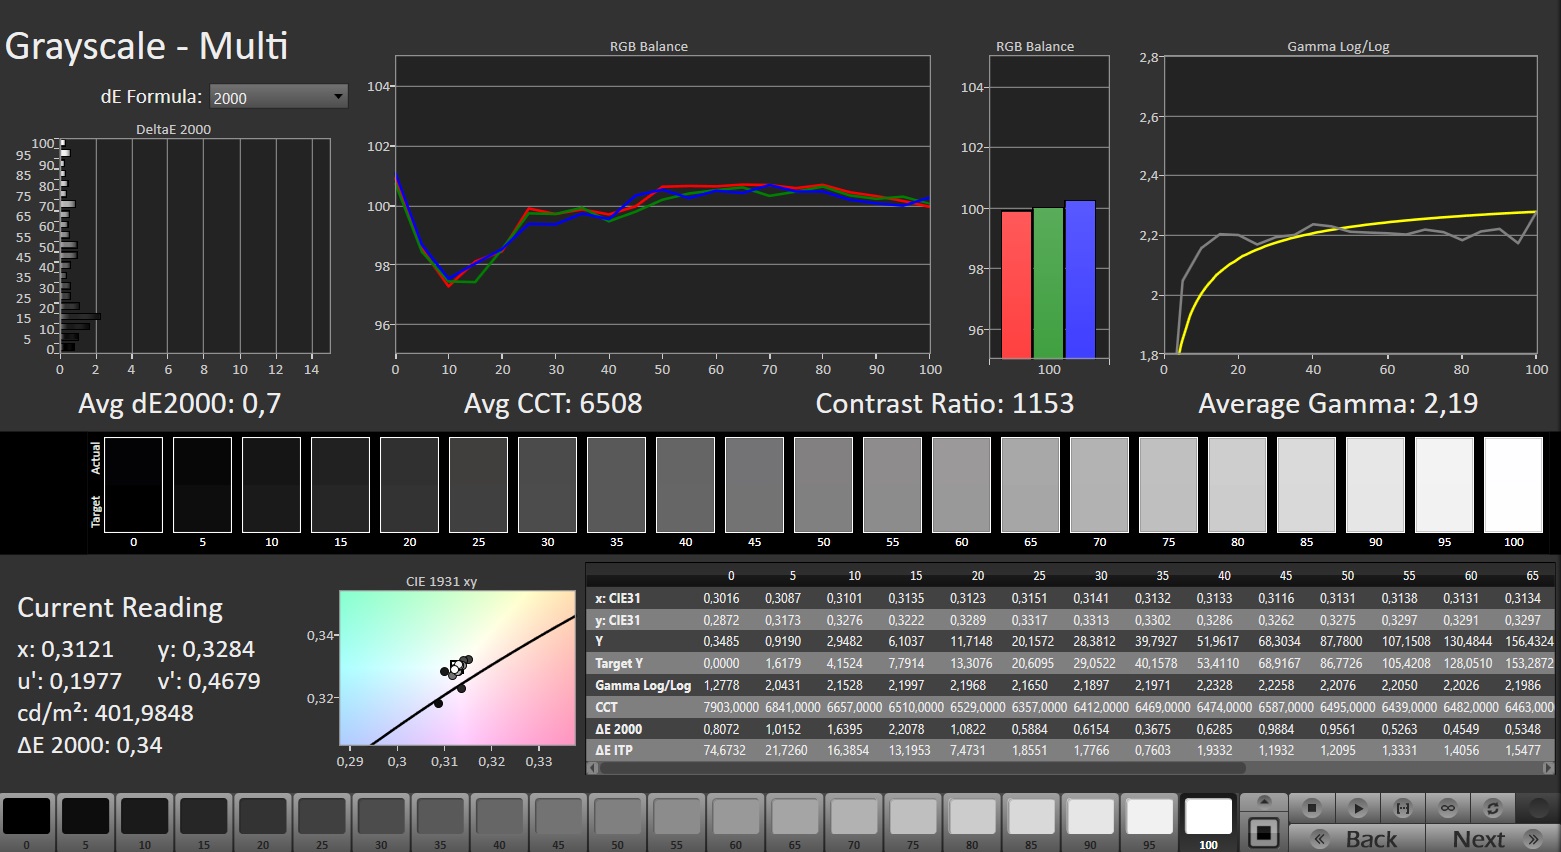
“Respectable” is also an apt description for the colour coverage: even though the 15-inch laptop can’t fully reproduce the DCI-P3 and AdobeRGB colour spaces, having nearly 100% sRGB coverage isn’t a given in the €1,000 (US$1,090) price range, as demonstrated by the Acer Nitro V 15 we recently reviewed, for example.
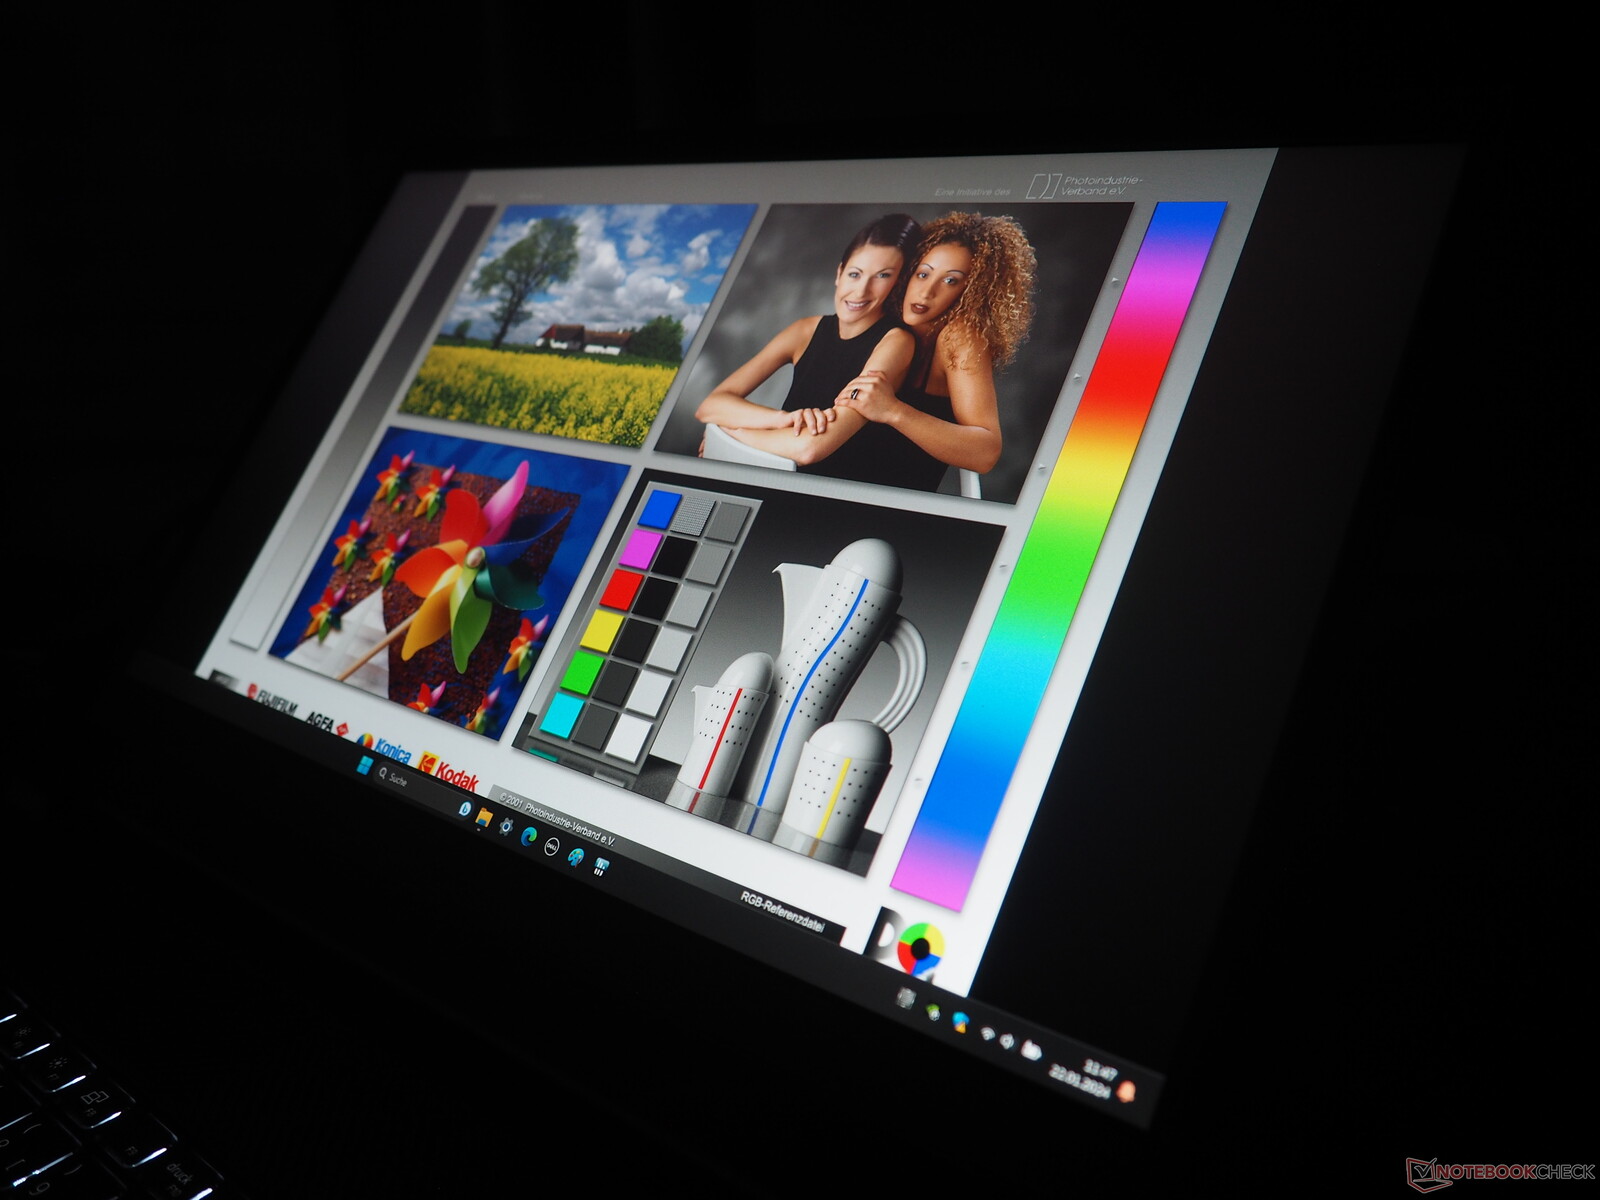
The viewing angle is fairly typical for an IPS display, i.e. pretty good. Most buyers should also be satisfied with the colour accuracy.
Display Response Times
| ↔ Response Time Black to White | ||
|---|---|---|
| 6.7 ms ... rise ↗ and fall ↘ combined | ↗ 3.1 ms rise | 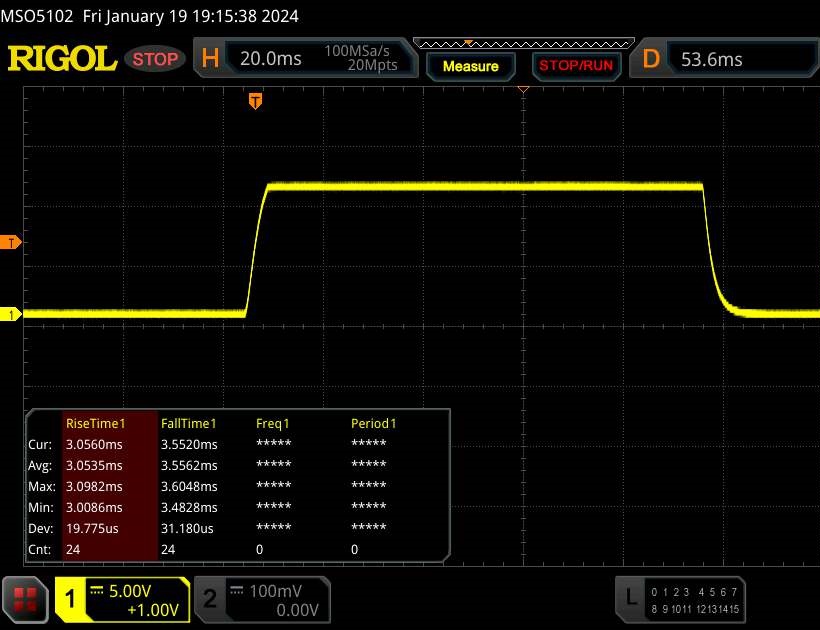 |
| ↘ 3.6 ms fall | ||
| The screen shows very fast response rates in our tests and should be very well suited for fast-paced gaming. In comparison, all tested devices range from 0.1 (minimum) to 240 (maximum) ms. » 21 % of all devices are better. This means that the measured response time is better than the average of all tested devices (19.9 ms). | ||
| ↔ Response Time 50% Grey to 80% Grey | ||
| 8.5 ms ... rise ↗ and fall ↘ combined | ↗ 4.2 ms rise | 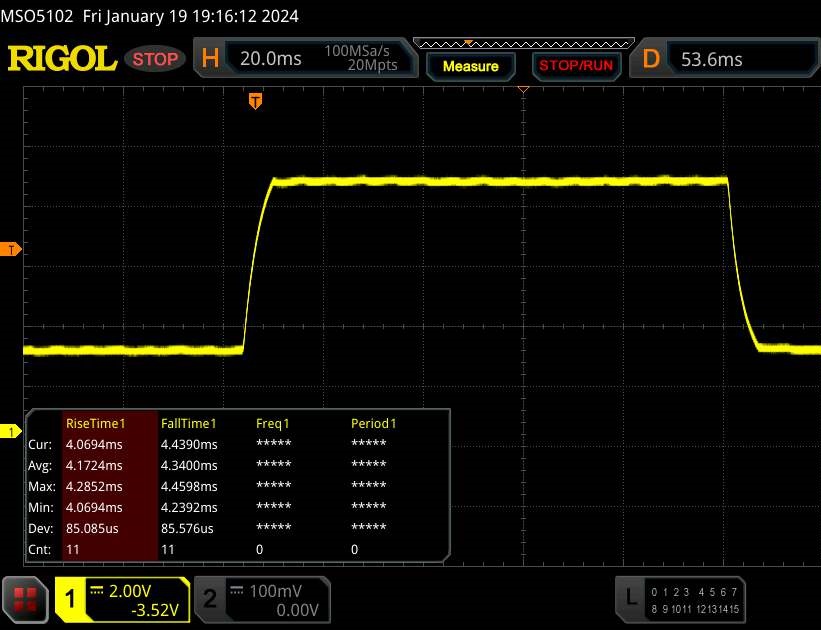 |
| ↘ 4.3 ms fall | ||
| The screen shows fast response rates in our tests and should be suited for gaming. In comparison, all tested devices range from 0.165 (minimum) to 636 (maximum) ms. » 22 % of all devices are better. This means that the measured response time is better than the average of all tested devices (31.1 ms). | ||
Screen Flickering / PWM (Pulse-Width Modulation)
| Screen flickering / PWM not detected | 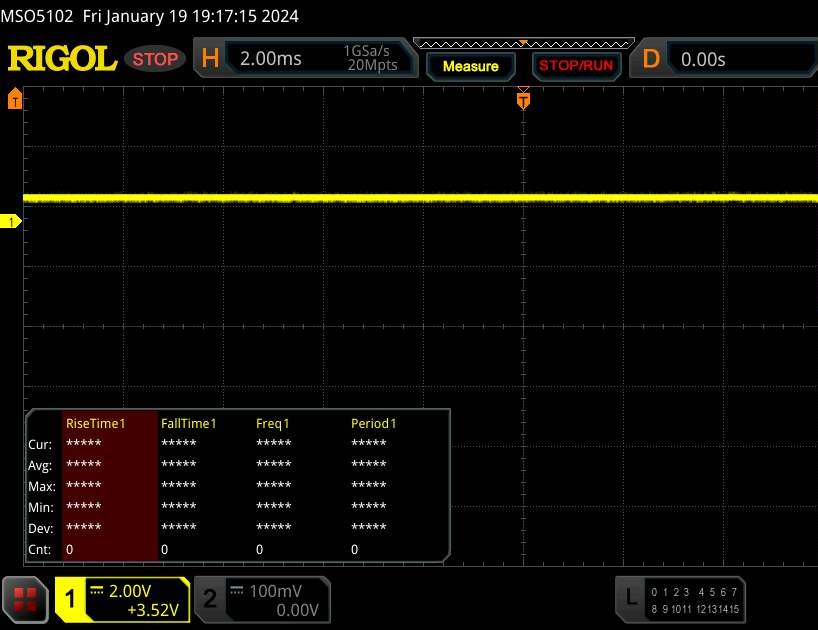 | ||
In comparison: 52 % of all tested devices do not use PWM to dim the display. If PWM was detected, an average of 7797 (minimum: 5 - maximum: 343500) Hz was measured. | |||
Performance
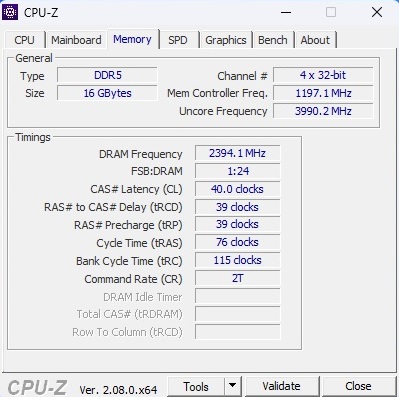
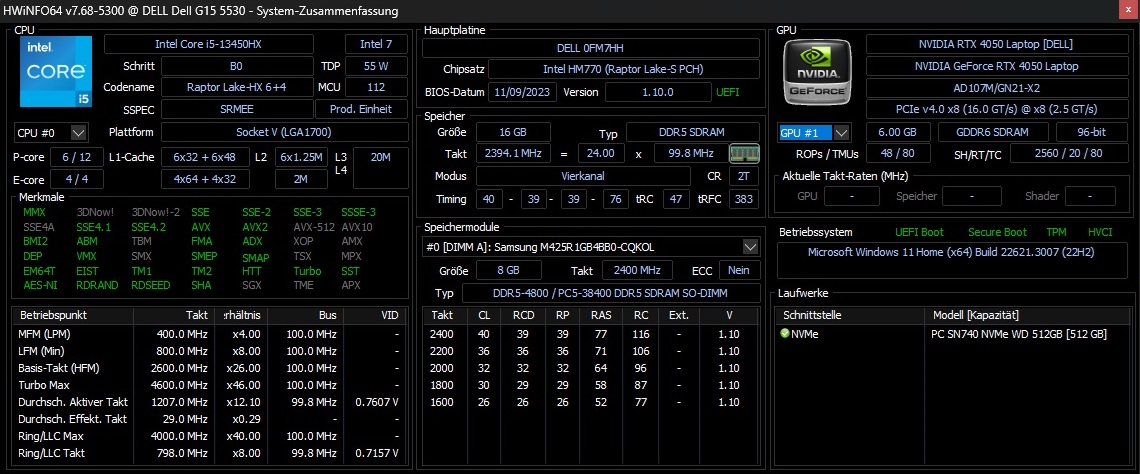
Whether it has an RTX 4050 or RTX 4060 inside, the Dell G15 5530 is still a mid-range gaming laptop. The 16 GB of DDR5 memory is absolutely sufficient for gaming purposes at the moment; as mentioned above, the slightly meagre 512 GB of SSD storage can be expanded by adding a larger M.2 drive.
Test condition
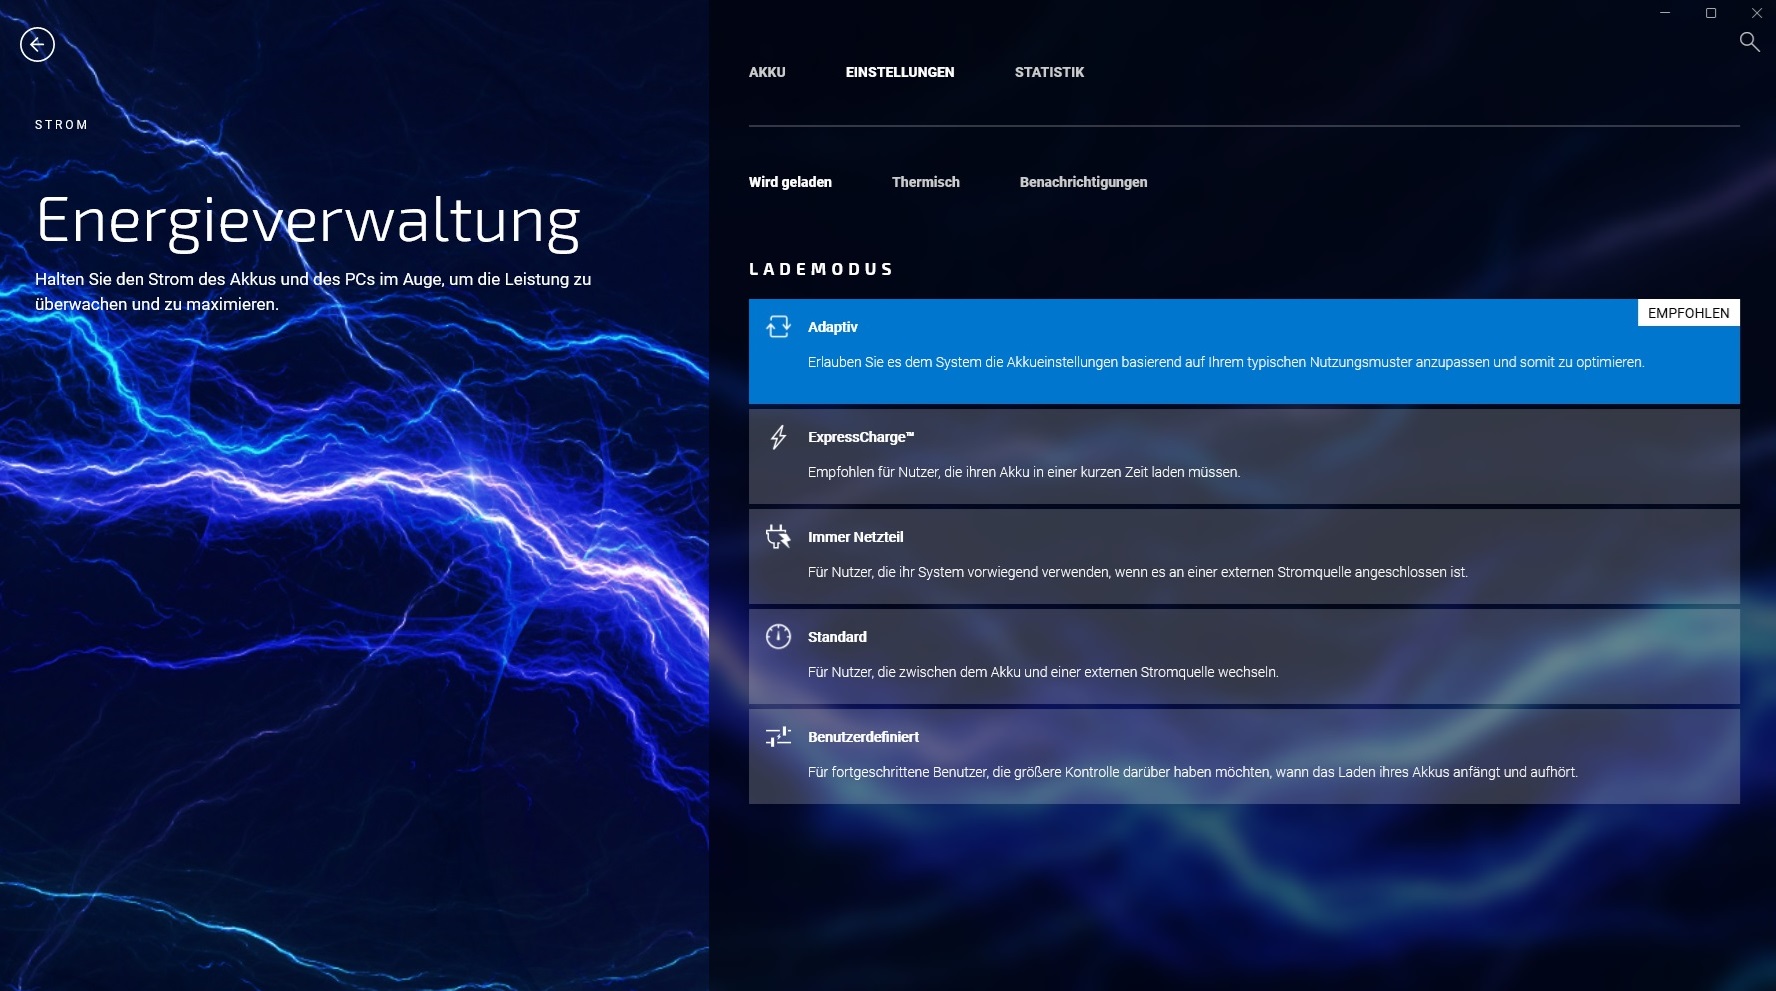
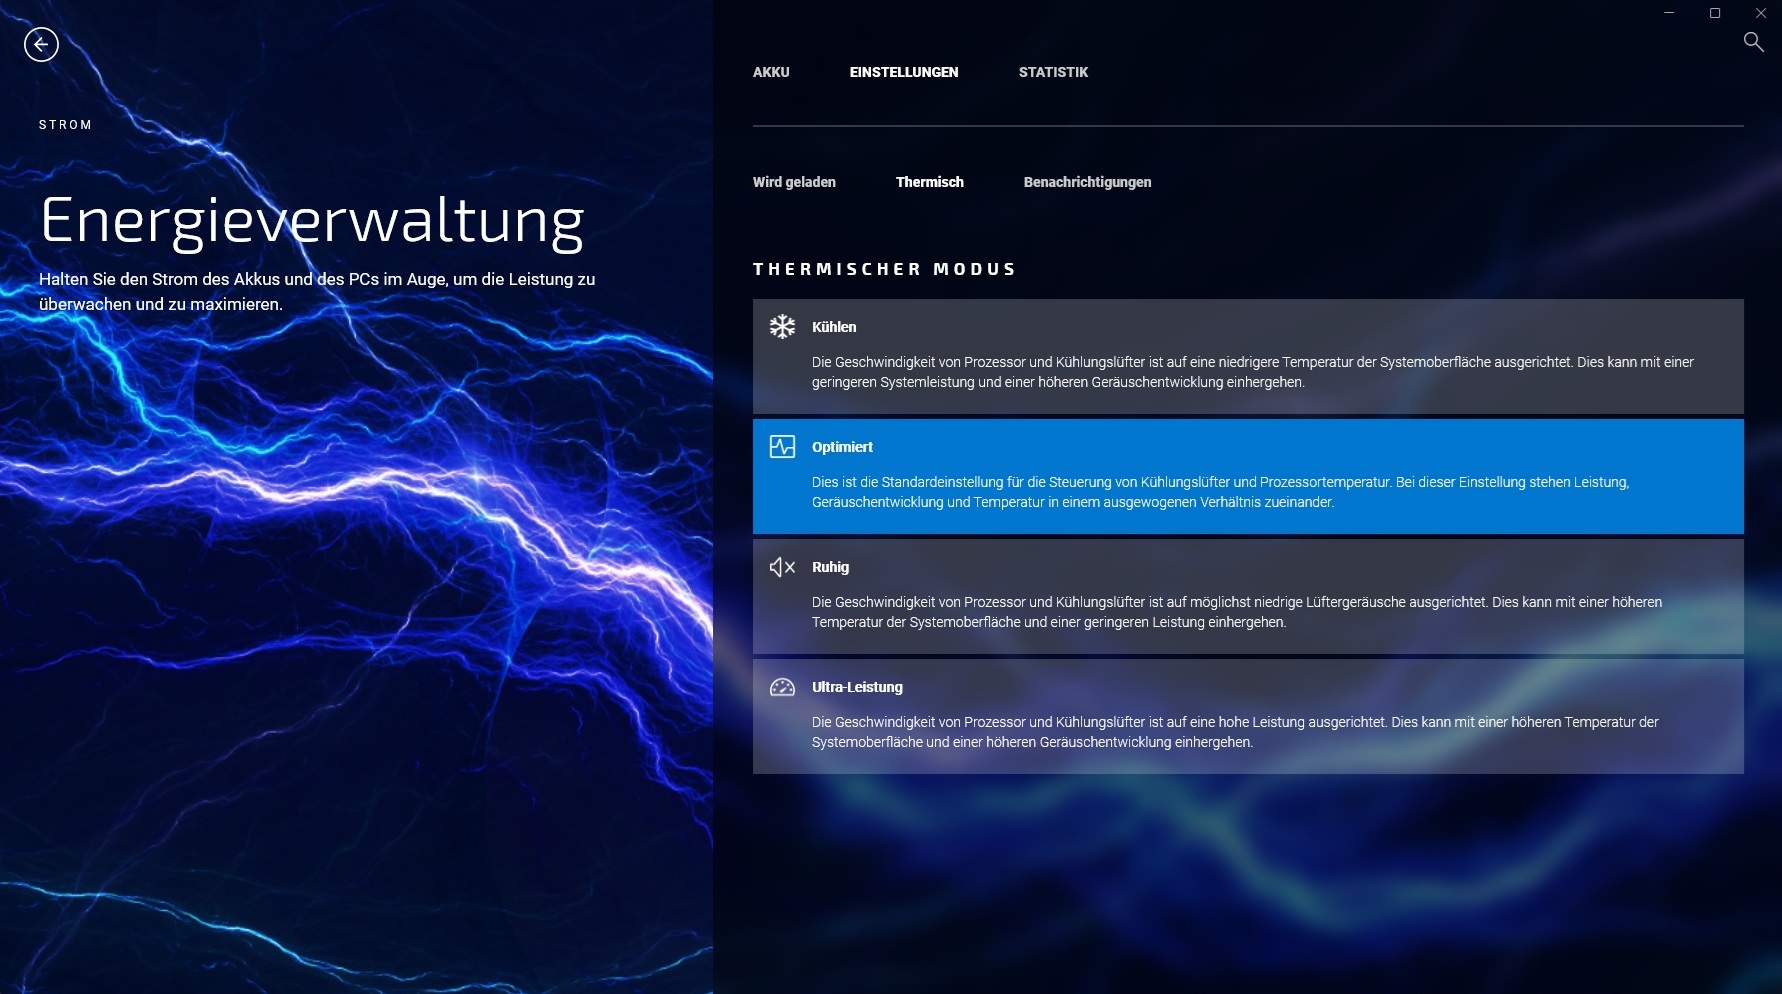
There are several power modes hidden behind various menus in the preinstalled Dell software. According to our measurements, these modes don’t have any impact on 3D performance, but rather mainly affect how loud the laptop runs (see table). All our tests were thus carried out in “Optimised” mode, which is enabled by default right out of the box. Alternatively, the Alienware Command Center also offers a whole host of customisation options.
| Witcher 3 (FHD/Ultra) | Quiet | Optimised | Cooling | Ultra Performance |
| Noise | 40 - 41 dB(A) | 43 - 44 dB(A) | 46 - 47 dB(A) | 49 - 50 dB(A) |
| Performance | 84 fps | 84 fps | 84 fps | 84 fps |
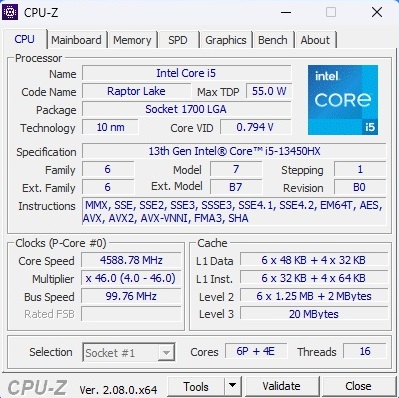
Processor
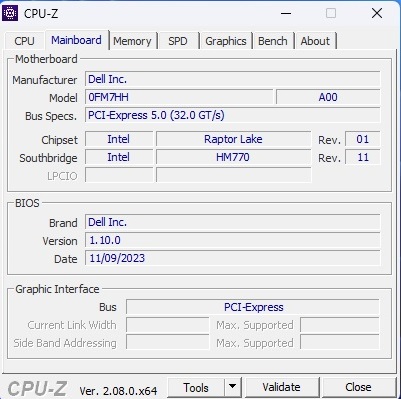
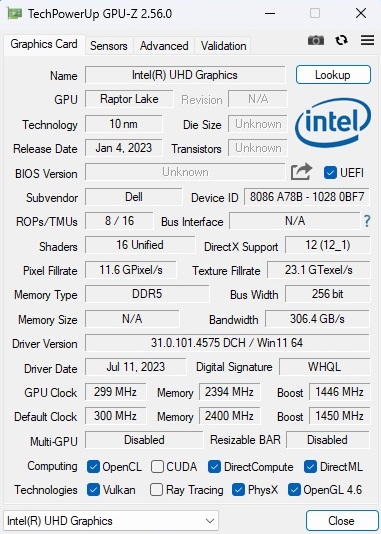
Compared with the Core i7-13650HX, the Core i5-13450HX only has four instead of eight efficiency cores, but the number of performance cores remains the same at six. Both CPUs are from the Raptor Lake generation and fabricated using the improved 10 nm process. Taking all the CPU benchmarks into consideration, the Core i5-13450HX is roughly 15% slower than its more expensive sibling and falls somewhere in between the Core i5-13500H (Medion Erazer Crawler E40) and the Core i7-13620H (Lenovo LOQ 15IRH8). The score decreased slightly over time during our Cinebench loop test, but there weren’t any drastic performance drops.
Cinebench R15 Multi Sustained Load
* ... smaller is better
AIDA64: FP32 Ray-Trace | FPU Julia | CPU SHA3 | CPU Queen | FPU SinJulia | FPU Mandel | CPU AES | CPU ZLib | FP64 Ray-Trace | CPU PhotoWorxx
| Performance rating | |
| Average of class Gaming | |
| Dell G15 5530 | |
| Asus TUF A15 FA507 | |
| Dell G15 5530, i5-13450HX RTX 4050 | |
| Average Intel Core i5-13450HX | |
| Medion Erazer Crawler E40 - MD 62518 | |
| Lenovo LOQ 15IRH8 Core i7 | |
| AIDA64 / FP32 Ray-Trace | |
| Average of class Gaming (10227 - 85542, n=109, last 2 years) | |
| Dell G15 5530 | |
| Dell G15 5530, i5-13450HX RTX 4050 | |
| Asus TUF A15 FA507 | |
| Average Intel Core i5-13450HX (13747 - 17767, n=3) | |
| Medion Erazer Crawler E40 - MD 62518 | |
| Lenovo LOQ 15IRH8 Core i7 | |
| AIDA64 / FPU Julia | |
| Average of class Gaming (51376 - 238426, n=109, last 2 years) | |
| Asus TUF A15 FA507 | |
| Dell G15 5530 | |
| Dell G15 5530, i5-13450HX RTX 4050 | |
| Average Intel Core i5-13450HX (71834 - 83862, n=3) | |
| Medion Erazer Crawler E40 - MD 62518 | |
| Lenovo LOQ 15IRH8 Core i7 | |
| AIDA64 / CPU SHA3 | |
| Average of class Gaming (2180 - 9817, n=109, last 2 years) | |
| Dell G15 5530 | |
| Average Intel Core i5-13450HX (3519 - 3530, n=3) | |
| Dell G15 5530, i5-13450HX RTX 4050 | |
| Medion Erazer Crawler E40 - MD 62518 | |
| Asus TUF A15 FA507 | |
| Lenovo LOQ 15IRH8 Core i7 | |
| AIDA64 / CPU Queen | |
| Average of class Gaming (49785 - 173351, n=100, last 2 years) | |
| Dell G15 5530 | |
| Asus TUF A15 FA507 | |
| Average Intel Core i5-13450HX (85888 - 86148, n=3) | |
| Dell G15 5530, i5-13450HX RTX 4050 | |
| Medion Erazer Crawler E40 - MD 62518 | |
| Lenovo LOQ 15IRH8 Core i7 | |
| AIDA64 / FPU SinJulia | |
| Average of class Gaming (4424 - 33636, n=109, last 2 years) | |
| Asus TUF A15 FA507 | |
| Dell G15 5530 | |
| Average Intel Core i5-13450HX (9325 - 9354, n=3) | |
| Dell G15 5530, i5-13450HX RTX 4050 | |
| Medion Erazer Crawler E40 - MD 62518 | |
| Lenovo LOQ 15IRH8 Core i7 | |
| AIDA64 / FPU Mandel | |
| Average of class Gaming (25115 - 128721, n=109, last 2 years) | |
| Asus TUF A15 FA507 | |
| Dell G15 5530 | |
| Dell G15 5530, i5-13450HX RTX 4050 | |
| Average Intel Core i5-13450HX (34956 - 42825, n=3) | |
| Medion Erazer Crawler E40 - MD 62518 | |
| Lenovo LOQ 15IRH8 Core i7 | |
| AIDA64 / CPU AES | |
| Average of class Gaming (39258 - 247074, n=109, last 2 years) | |
| Dell G15 5530 | |
| Dell G15 5530, i5-13450HX RTX 4050 | |
| Average Intel Core i5-13450HX (70296 - 70680, n=3) | |
| Asus TUF A15 FA507 | |
| Medion Erazer Crawler E40 - MD 62518 | |
| Lenovo LOQ 15IRH8 Core i7 | |
| AIDA64 / CPU ZLib | |
| Average of class Gaming (574 - 2531, n=109, last 2 years) | |
| Dell G15 5530 | |
| Dell G15 5530, i5-13450HX RTX 4050 | |
| Medion Erazer Crawler E40 - MD 62518 | |
| Average Intel Core i5-13450HX (977 - 1002, n=3) | |
| Lenovo LOQ 15IRH8 Core i7 | |
| Asus TUF A15 FA507 | |
| AIDA64 / FP64 Ray-Trace | |
| Average of class Gaming (5509 - 45446, n=109, last 2 years) | |
| Dell G15 5530 | |
| Dell G15 5530, i5-13450HX RTX 4050 | |
| Average Intel Core i5-13450HX (7428 - 9561, n=3) | |
| Asus TUF A15 FA507 | |
| Medion Erazer Crawler E40 - MD 62518 | |
| Lenovo LOQ 15IRH8 Core i7 | |
| AIDA64 / CPU PhotoWorxx | |
| Average of class Gaming (12271 - 89891, n=109, last 2 years) | |
| Dell G15 5530 | |
| Medion Erazer Crawler E40 - MD 62518 | |
| Average Intel Core i5-13450HX (36014 - 36764, n=3) | |
| Dell G15 5530, i5-13450HX RTX 4050 | |
| Lenovo LOQ 15IRH8 Core i7 | |
| Asus TUF A15 FA507 | |
System performance
All the devices in our comparison are fairly close together in terms of system performance. In PCMark 10, the review unit achieved almost the same overall score as the more expensive G15 model.
CrossMark: Overall | Productivity | Creativity | Responsiveness
WebXPRT 3: Overall
WebXPRT 4: Overall
Mozilla Kraken 1.1: Total
| PCMark 10 / Score | |
| Average of class Gaming (5828 - 11574, n=95, last 2 years) | |
| Lenovo LOQ 15IRH8 Core i7 | |
| Medion Erazer Crawler E40 - MD 62518 | |
| Asus TUF A15 FA507 | |
| Dell G15 5530 | |
| Dell G15 5530, i5-13450HX RTX 4050 | |
| Average Intel Core i5-13450HX, NVIDIA GeForce RTX 4050 Laptop GPU (n=1) | |
| PCMark 10 / Essentials | |
| Dell G15 5530 | |
| Lenovo LOQ 15IRH8 Core i7 | |
| Average of class Gaming (8810 - 12600, n=99, last 2 years) | |
| Asus TUF A15 FA507 | |
| Medion Erazer Crawler E40 - MD 62518 | |
| Dell G15 5530, i5-13450HX RTX 4050 | |
| Average Intel Core i5-13450HX, NVIDIA GeForce RTX 4050 Laptop GPU (n=1) | |
| PCMark 10 / Productivity | |
| Average of class Gaming (6845 - 18766, n=97, last 2 years) | |
| Dell G15 5530 | |
| Lenovo LOQ 15IRH8 Core i7 | |
| Asus TUF A15 FA507 | |
| Medion Erazer Crawler E40 - MD 62518 | |
| Dell G15 5530, i5-13450HX RTX 4050 | |
| Average Intel Core i5-13450HX, NVIDIA GeForce RTX 4050 Laptop GPU (n=1) | |
| PCMark 10 / Digital Content Creation | |
| Average of class Gaming (7602 - 19657, n=97, last 2 years) | |
| Lenovo LOQ 15IRH8 Core i7 | |
| Medion Erazer Crawler E40 - MD 62518 | |
| Dell G15 5530, i5-13450HX RTX 4050 | |
| Average Intel Core i5-13450HX, NVIDIA GeForce RTX 4050 Laptop GPU (n=1) | |
| Asus TUF A15 FA507 | |
| Dell G15 5530 | |
| CrossMark / Overall | |
| Average of class Gaming (1366 - 2409, n=97, last 2 years) | |
| Lenovo LOQ 15IRH8 Core i7 | |
| Dell G15 5530 | |
| Medion Erazer Crawler E40 - MD 62518 | |
| Asus TUF A15 FA507 | |
| CrossMark / Productivity | |
| Average of class Gaming (1386 - 2254, n=97, last 2 years) | |
| Lenovo LOQ 15IRH8 Core i7 | |
| Dell G15 5530 | |
| Medion Erazer Crawler E40 - MD 62518 | |
| Asus TUF A15 FA507 | |
| CrossMark / Creativity | |
| Average of class Gaming (1343 - 2729, n=97, last 2 years) | |
| Dell G15 5530 | |
| Lenovo LOQ 15IRH8 Core i7 | |
| Medion Erazer Crawler E40 - MD 62518 | |
| Asus TUF A15 FA507 | |
| CrossMark / Responsiveness | |
| Lenovo LOQ 15IRH8 Core i7 | |
| Medion Erazer Crawler E40 - MD 62518 | |
| Average of class Gaming (1226 - 2334, n=97, last 2 years) | |
| Dell G15 5530 | |
| Asus TUF A15 FA507 | |
| WebXPRT 3 / Overall | |
| Average of class Gaming (242 - 532, n=100, last 2 years) | |
| Dell G15 5530 | |
| Asus TUF A15 FA507 | |
| Lenovo LOQ 15IRH8 Core i7 | |
| Dell G15 5530, i5-13450HX RTX 4050 | |
| Dell G15 5530, i5-13450HX RTX 4050 | |
| Average Intel Core i5-13450HX, NVIDIA GeForce RTX 4050 Laptop GPU (281 - 281, n=2) | |
| Medion Erazer Crawler E40 - MD 62518 | |
| WebXPRT 4 / Overall | |
| Average of class Gaming (176.4 - 354, n=100, last 2 years) | |
| Dell G15 5530 | |
| Lenovo LOQ 15IRH8 Core i7 | |
| Medion Erazer Crawler E40 - MD 62518 | |
| Asus TUF A15 FA507 | |
| Mozilla Kraken 1.1 / Total | |
| Asus TUF A15 FA507 | |
| Dell G15 5530, i5-13450HX RTX 4050 | |
| Dell G15 5530, i5-13450HX RTX 4050 | |
| Average Intel Core i5-13450HX, NVIDIA GeForce RTX 4050 Laptop GPU (531 - 531, n=2) | |
| Medion Erazer Crawler E40 - MD 62518 | |
| Dell G15 5530 | |
| Lenovo LOQ 15IRH8 Core i7 | |
| Average of class Gaming (391 - 590, n=105, last 2 years) | |
* ... smaller is better
| PCMark 10 Score | 6969 points | |
Help | ||
| AIDA64 / Memory Copy | |
| Average of class Gaming (21750 - 129946, n=109, last 2 years) | |
| Dell G15 5530 | |
| Dell G15 5530, i5-13450HX RTX 4050 | |
| Average Intel Core i5-13450HX (58673 - 58861, n=3) | |
| Medion Erazer Crawler E40 - MD 62518 | |
| Lenovo LOQ 15IRH8 Core i7 | |
| Asus TUF A15 FA507 | |
| AIDA64 / Memory Read | |
| Average of class Gaming (22956 - 118858, n=109, last 2 years) | |
| Average Intel Core i5-13450HX (66626 - 69024, n=3) | |
| Dell G15 5530 | |
| Dell G15 5530, i5-13450HX RTX 4050 | |
| Medion Erazer Crawler E40 - MD 62518 | |
| Lenovo LOQ 15IRH8 Core i7 | |
| Asus TUF A15 FA507 | |
| AIDA64 / Memory Write | |
| Average of class Gaming (22297 - 135096, n=109, last 2 years) | |
| Medion Erazer Crawler E40 - MD 62518 | |
| Dell G15 5530, i5-13450HX RTX 4050 | |
| Dell G15 5530 | |
| Average Intel Core i5-13450HX (58540 - 60196, n=3) | |
| Asus TUF A15 FA507 | |
| Lenovo LOQ 15IRH8 Core i7 | |
| AIDA64 / Memory Latency | |
| Lenovo LOQ 15IRH8 Core i7 | |
| Average of class Gaming (75.3 - 259, n=109, last 2 years) | |
| Medion Erazer Crawler E40 - MD 62518 | |
| Dell G15 5530, i5-13450HX RTX 4050 | |
| Average Intel Core i5-13450HX (90 - 94.2, n=3) | |
| Dell G15 5530 | |
| Asus TUF A15 FA507 | |
* ... smaller is better
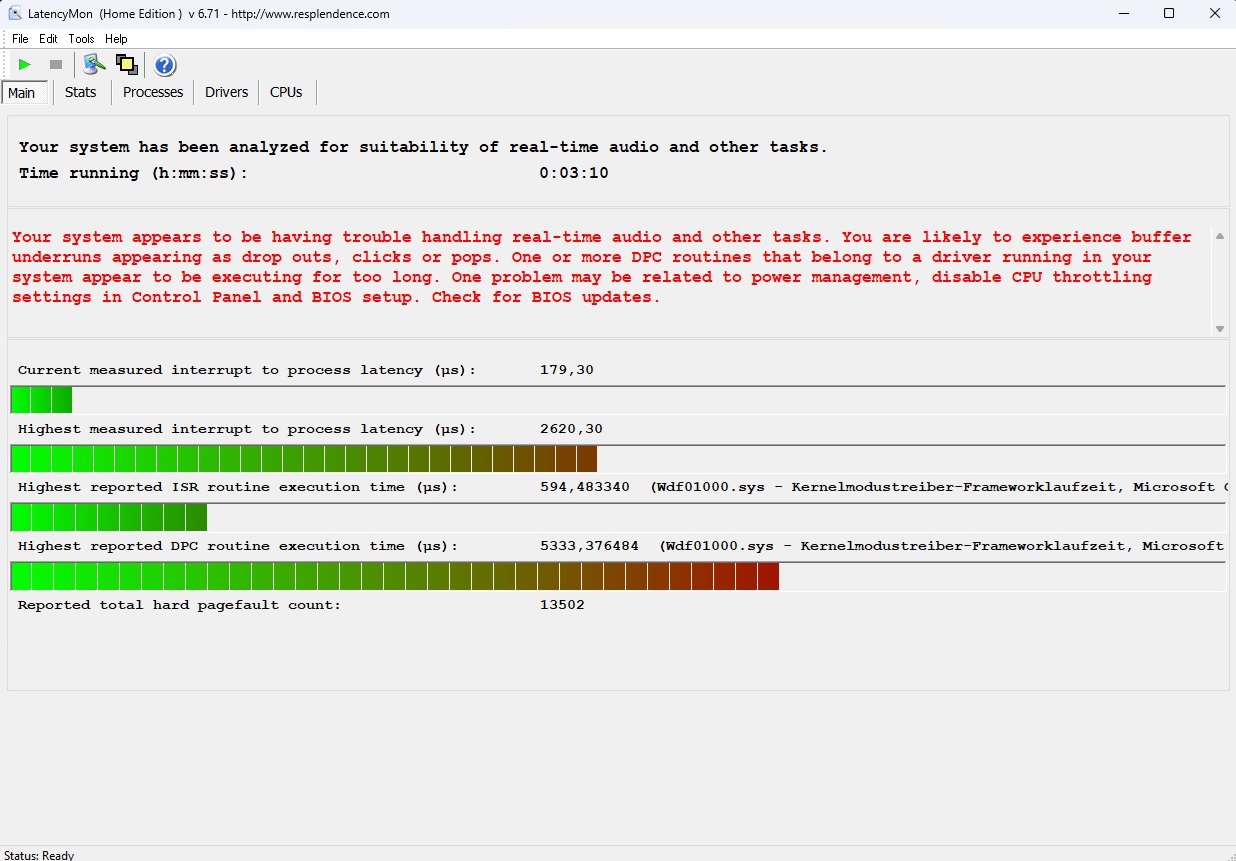
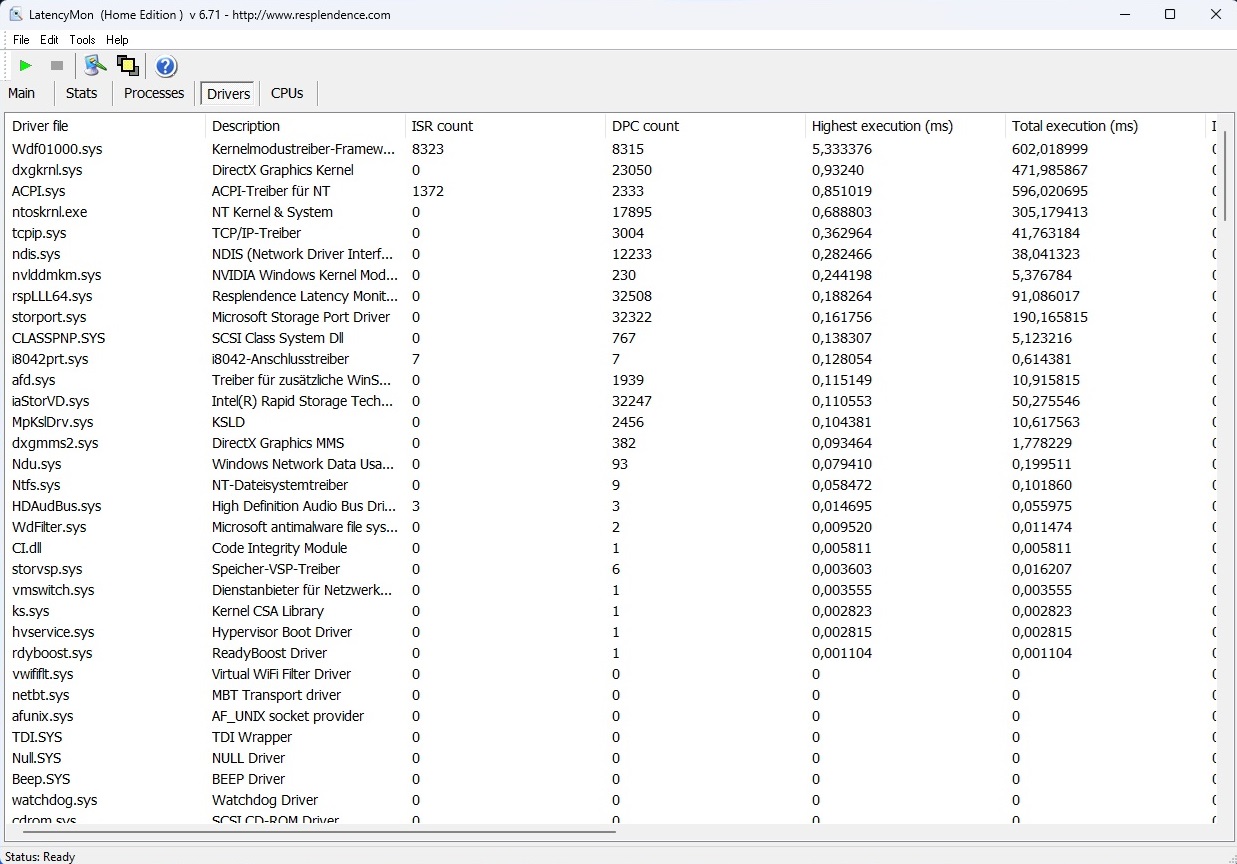
DPC latency
The 15-inch laptop has weaknesses in the area of latency. LatencyMon reported that the laptop – at least right out of the box – appears to have issues handling real-time audio and video processing. That said, this should only affect those who intend to use the laptop for such purposes.
| DPC Latencies / LatencyMon - interrupt to process latency (max), Web, Youtube, Prime95 | |
| Dell G15 5530 | |
| Dell G15 5530, i5-13450HX RTX 4050 | |
| Medion Erazer Crawler E40 - MD 62518 | |
| Lenovo LOQ 15IRH8 Core i7 | |
* ... smaller is better
Mass storage
At first glance, the laptop’s mass storage cuts an excellent figure. Despite its compact size, the 512 GB M.2 2230 drive made by WDC had an extremely good showing in our series of benchmarks. Despite this, our loop test revealed that, under sustained load or stress, the drive sometimes experienced a severe level of throttling not seen in any of the competitors.

* ... smaller is better
Sustained Load Read: DiskSpd Read Loop, Queue Depth 8
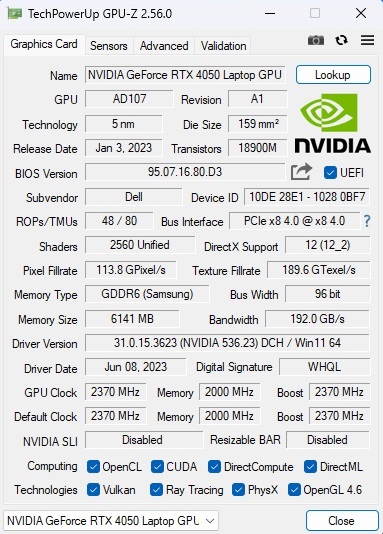
Graphics card
The GeForce RTX 4050 is a popular mid-range GPU from Nvidia’s Ada Lovelace lineup, but the 6 GB of GDDR6 video memory and 96-bit bus are rather tight by today’s standards. The actual performance depends largely on the cooling system and the specified TGP. Dell has decided on a 140-watt TGP for the G15, which corresponds to the maximum allowable for the RTX 4050. It is thus hardly surprising that the 15-inch Dell laptop delivered above-average performance in 3D benchmark, though we must mention that some of the competitors often achieved similar results at lower TGP and are consequently more efficient.
| 3DMark 11 Performance | 28326 points | |
| 3DMark Ice Storm Standard Score | 222203 points | |
| 3DMark Cloud Gate Standard Score | 58346 points | |
| 3DMark Fire Strike Score | 19919 points | |
| 3DMark Time Spy Score | 9091 points | |
Help | ||
* ... smaller is better
Gaming performance
Gaming performance is similar to what we’ve seen in the synthetic benchmarks. The RTX 4050 is generally fast enough to run most modern games smoothly at 1080p and high to max settings. Things only get strained when you’re playing very demanding titles, such as Starfield. We recommend having at least a GeForce RTX 4070 if you want to use higher resolutions (QHD or above).
| The Witcher 3 - 1920x1080 Ultra Graphics & Postprocessing (HBAO+) | |
| Average of class Gaming (95 - 240, n=8, last 2 years) | |
| Dell G15 5530 | |
| Lenovo LOQ 15IRH8 Core i7 | |
| Dell G15 5530, i5-13450HX RTX 4050 | |
| Asus TUF A15 FA507 | |
| Medion Erazer Crawler E40 - MD 62518 | |
| Average NVIDIA GeForce RTX 4050 Laptop GPU (18.5 - 94.7, n=40) | |
| Lies of P - 1920x1080 Best Preset | |
| XMG Focus 15 E23 | |
| Average NVIDIA GeForce RTX 4050 Laptop GPU (101.4 - 105.7, n=3) | |
| Dell G15 5530, i5-13450HX RTX 4050 | |
| The Crew Motorfest - 1920x1080 Ultra Preset | |
| XMG Focus 15 E23 | |
| Dell G15 5530, i5-13450HX RTX 4050 | |
| Average NVIDIA GeForce RTX 4050 Laptop GPU (59 - 59, n=3) | |
| Starfield - 1920x1080 Ultra Preset | |
| Dell G15 5530, i5-13450HX RTX 4050 | |
| Average NVIDIA GeForce RTX 4050 Laptop GPU (35.7 - 37.3, n=3) | |
| XMG Focus 15 E23 | |
| Armored Core 6 - 1920x1080 Maximum Preset | |
| XMG Focus 15 E23 | |
| Average NVIDIA GeForce RTX 4050 Laptop GPU (79 - 87.8, n=3) | |
| Dell G15 5530, i5-13450HX RTX 4050 | |
| Average of class Gaming (n=1last 2 years) | |
| Atlas Fallen - 1920x1080 Very High Preset | |
| Average NVIDIA GeForce RTX 4050 Laptop GPU (81.1 - 94.2, n=3) | |
| Dell G15 5530, i5-13450HX RTX 4050 | |
| XMG Focus 15 E23 | |
| Baldur's Gate 3 - 1920x1080 Ultra Preset AA:T | |
| Average of class Gaming (59.4 - 246, n=106, last 2 years) | |
| XMG Focus 15 E23 | |
| Dell G15 5530, i5-13450HX RTX 4050 | |
| Average NVIDIA GeForce RTX 4050 Laptop GPU (48.3 - 81.3, n=11) | |
| Ratchet & Clank Rift Apart - 1920x1080 Very High Preset AA:T | |
| XMG Focus 15 E23 | |
| Average NVIDIA GeForce RTX 4050 Laptop GPU (32.9 - 45.8, n=3) | |
| Dell G15 5530, i5-13450HX RTX 4050 | |
| Resident Evil 4 Remake - 1920x1080 Max Preset | |
| Dell G15 5530, i5-13450HX RTX 4050 | |
| Average NVIDIA GeForce RTX 4050 Laptop GPU (36.8 - 53.9, n=2) | |
| XMG Focus 15 E23 | |
We used The Witcher 3 (running @ FHD/Ultra for approx. 60 minutes) to find out how each laptop performs in 3D applications over an extended period. The result: frame rates remained fairly consistent on the G15 5530.
Witcher 3 FPS chart
| low | med. | high | ultra | |
|---|---|---|---|---|
| GTA V (2015) | 178 | 168.6 | 96.6 | |
| The Witcher 3 (2015) | 84 | |||
| Dota 2 Reborn (2015) | 170 | 156.1 | 154.1 | 146.8 |
| Final Fantasy XV Benchmark (2018) | 120.3 | 84.1 | ||
| X-Plane 11.11 (2018) | 153.1 | 139.6 | 108.5 | |
| Strange Brigade (2018) | 203 | 171.4 | 145.1 | |
| Company of Heroes 3 (2023) | 127 | 70.2 | 68.7 | |
| Resident Evil 4 Remake (2023) | 88.6 | 80.9 | 53.9 | |
| Ratchet & Clank Rift Apart (2023) | 67.7 | 40.2 | 32.9 | |
| Atlas Fallen (2023) | 114.3 | 104.1 | 83.3 | |
| Armored Core 6 (2023) | 103.8 | 96.7 | 79 | |
| Starfield (2023) | 55.9 | 43.7 | 37.3 | |
| The Crew Motorfest (2023) | 60 | 60 | 59 | |
| Lies of P (2023) | 132.8 | 113.3 | 101.4 | |
| Baldur's Gate 3 (2023) | 84.4 | 71.3 | 69.3 |
Emissions
Noise emissions
The Dell G15 5530 stays mostly nice and quiet at idle. The fans are either completely still or running at a decent noise level. They rev up quite rarely, but this can occur more frequently during everyday tasks such as video playback and web browsing. Nonetheless, at around 44 dB(A), the amount of noise produced when gaming in "Optimised" mode is below average for an RTX 4050 notebook.
Noise level
| Idle |
| 25 / 26 / 30 dB(A) |
| Load |
| 38 / 50 dB(A) |
 | ||
30 dB silent 40 dB(A) audible 50 dB(A) loud |
||
min: | ||
| Dell G15 5530, i5-13450HX RTX 4050 GeForce RTX 4050 Laptop GPU, i5-13450HX | Medion Erazer Crawler E40 - MD 62518 GeForce RTX 4050 Laptop GPU, i5-13500H | Lenovo LOQ 15IRH8 Core i7 GeForce RTX 4050 Laptop GPU, i7-13620H | Asus TUF A15 FA507 GeForce RTX 4050 Laptop GPU, R7 7735HS | Dell G15 5530 GeForce RTX 4060 Laptop GPU, i7-13650HX | |
|---|---|---|---|---|---|
| Noise | -4% | -8% | 12% | 6% | |
| off / environment * (dB) | 25 | 23 8% | 23.69 5% | 23.3 7% | 20.41 18% |
| Idle Minimum * (dB) | 25 | 23 8% | 29.03 -16% | 23.3 7% | 26.85 -7% |
| Idle Average * (dB) | 26 | 23 12% | 29.03 -12% | 23.3 10% | 26.85 -3% |
| Idle Maximum * (dB) | 30 | 28.02 7% | 29.03 3% | 23.3 22% | 26.85 10% |
| Load Average * (dB) | 38 | 50.21 -32% | 48.7 -28% | 29.6 22% | 27.65 27% |
| Witcher 3 ultra * (dB) | 44 | 51.46 -17% | 48.5 -10% | 43 2% | 47.9 -9% |
| Load Maximum * (dB) | 50 | 56.79 -14% | 48.7 3% | 43 14% | 47.86 4% |
* ... smaller is better
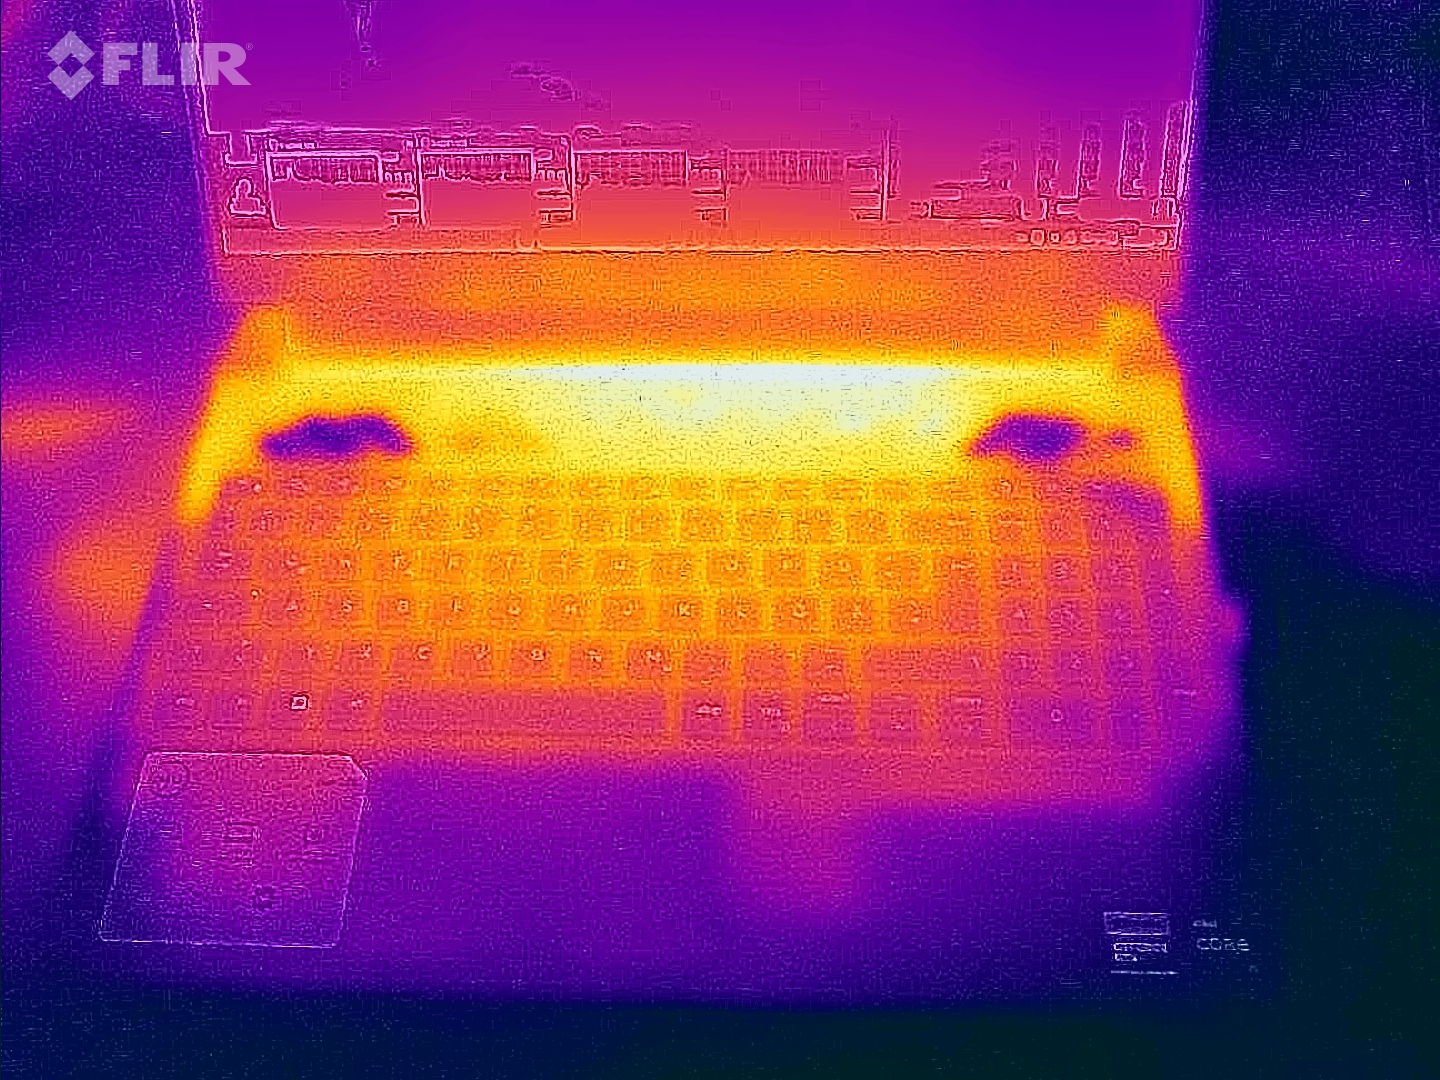
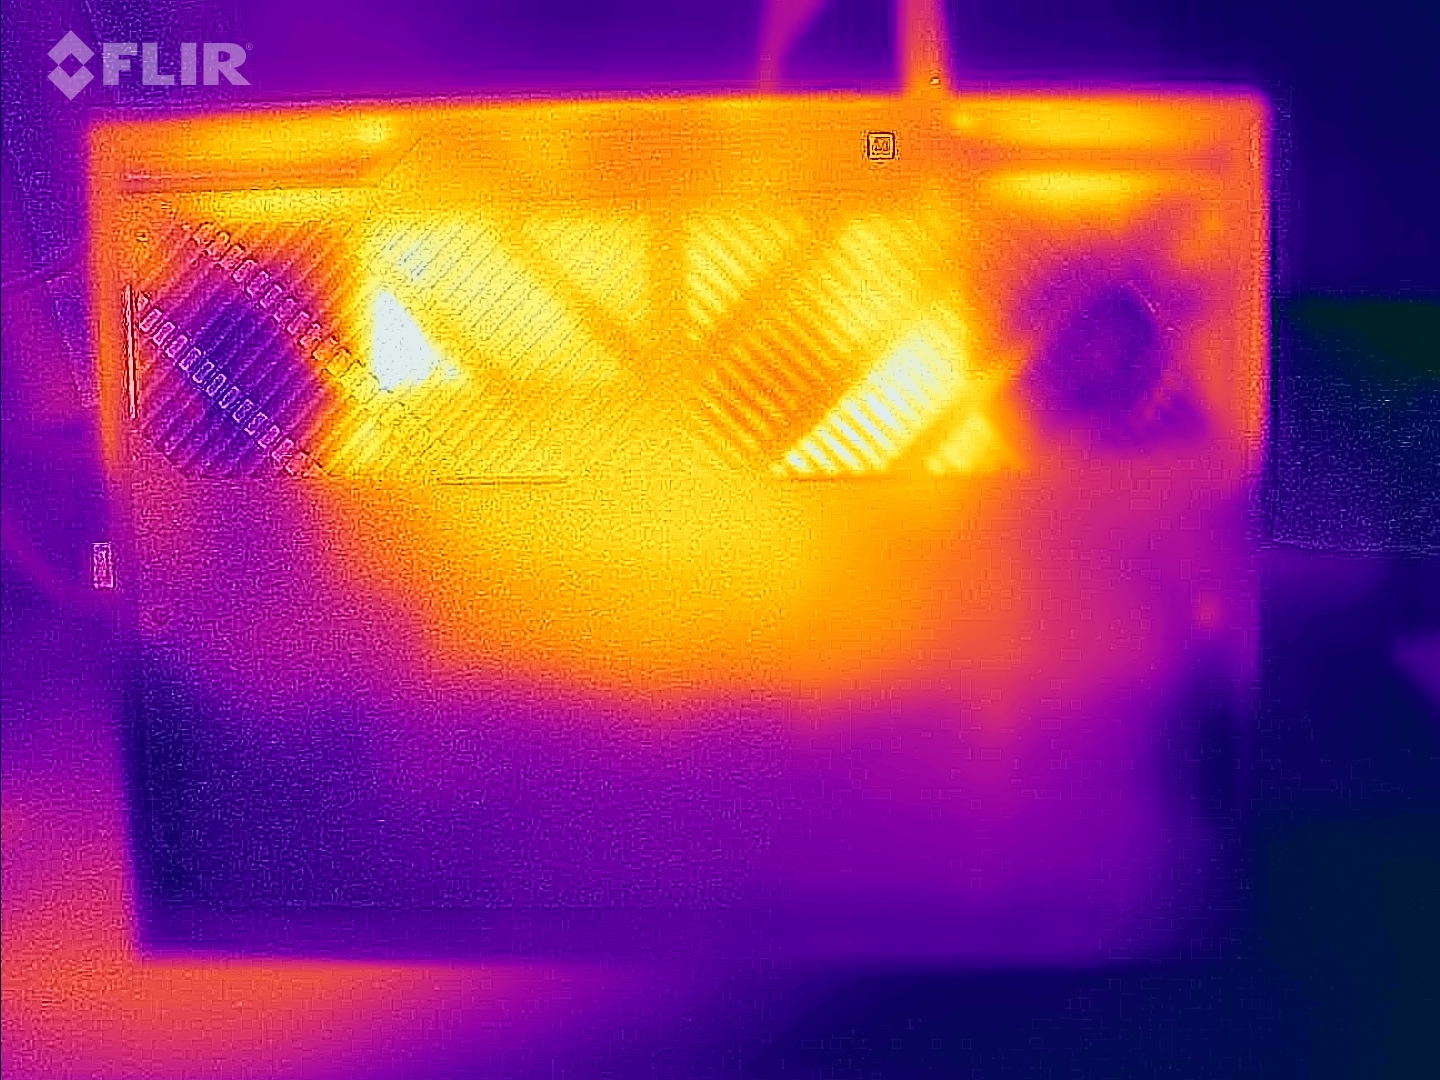
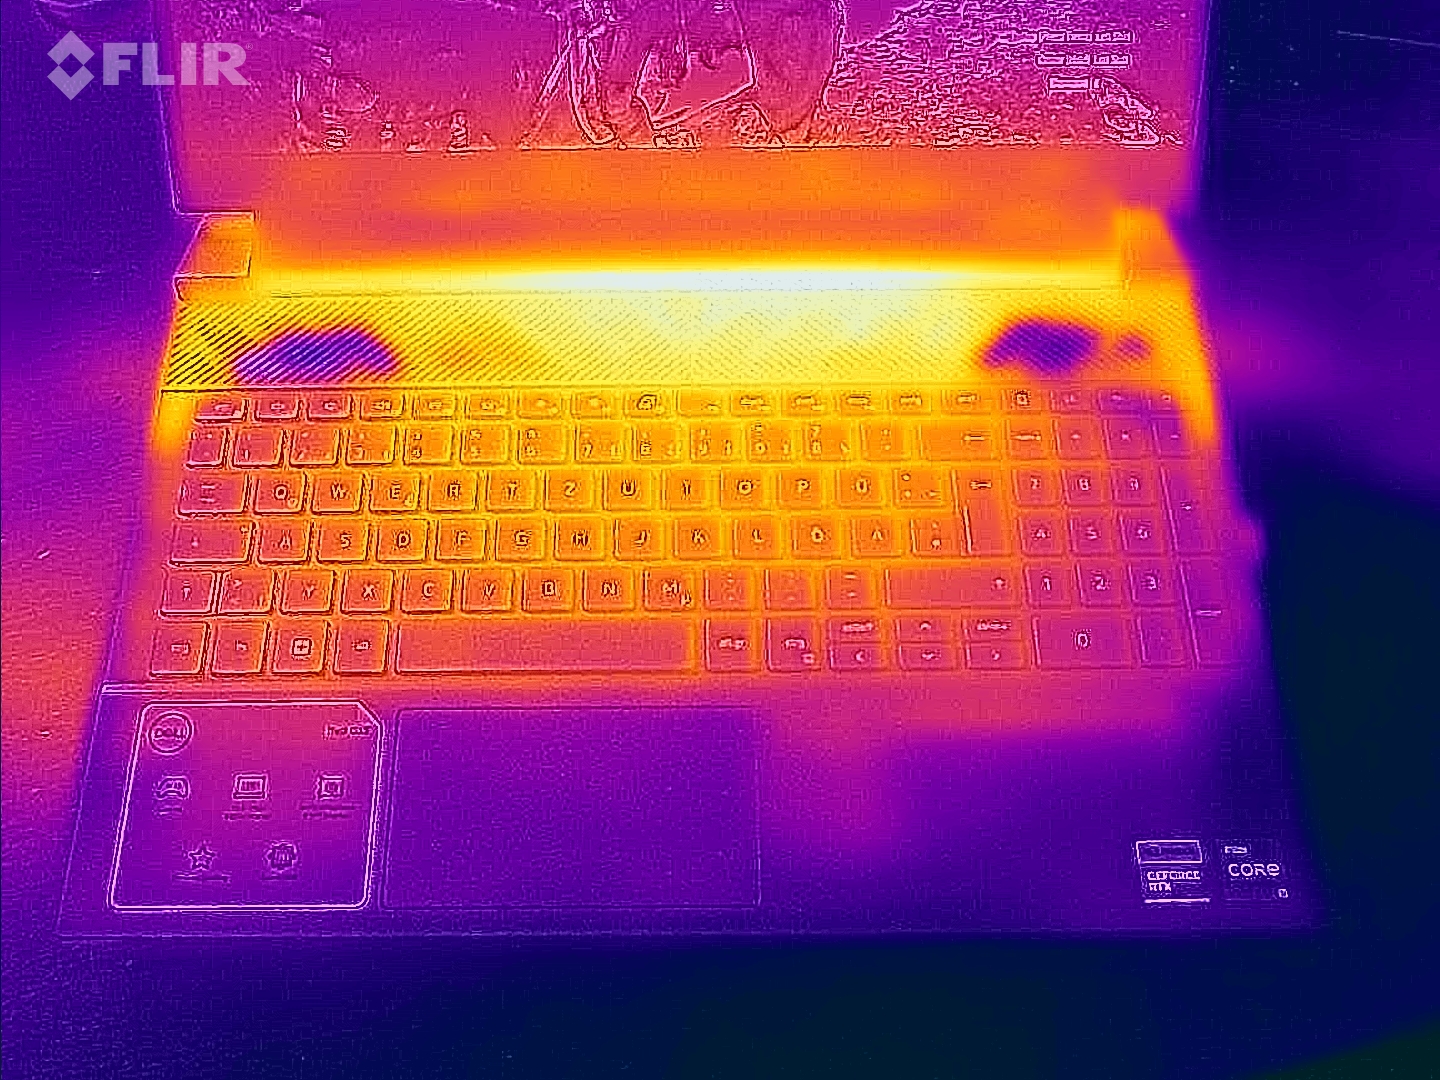
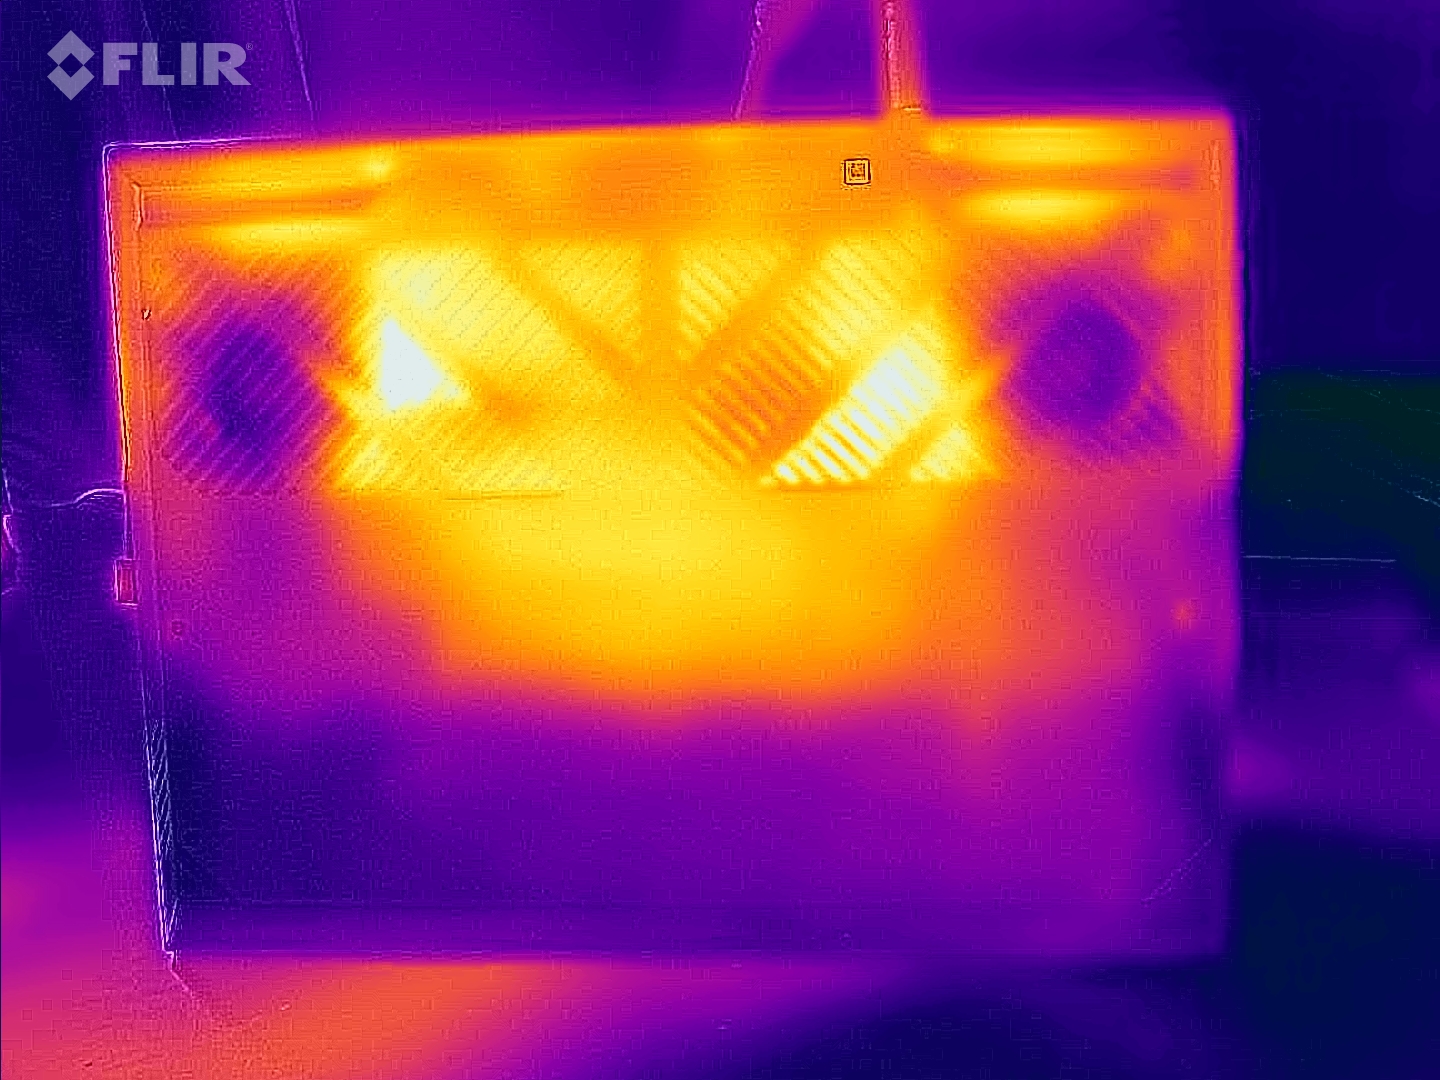
Temperature
On average, chassis temperatures are slightly lower than on the more expensive G15 model. After 60 minutes of running The Witcher 3, the max temperatures measured on the keyboard deck and the bottom panel were 54°C (129.4°F) and 52°C (125.6°F) respectively, which are quite high in theory. However, because the palm rest never got warmer than 32°C (89.6°F), longer gaming sessions shouldn’t be much of a problem, provided you don’t place the device on your lap.
(-) The maximum temperature on the upper side is 58 °C / 136 F, compared to the average of 40.4 °C / 105 F, ranging from 21.2 to 68.8 °C for the class Gaming.
(-) The bottom heats up to a maximum of 57 °C / 135 F, compared to the average of 43.2 °C / 110 F
(+) In idle usage, the average temperature for the upper side is 26 °C / 79 F, compared to the device average of 33.9 °C / 93 F.
(-) Playing The Witcher 3, the average temperature for the upper side is 41.7 °C / 107 F, compared to the device average of 33.9 °C / 93 F.
(+) The palmrests and touchpad are reaching skin temperature as a maximum (32 °C / 89.6 F) and are therefore not hot.
(-) The average temperature of the palmrest area of similar devices was 28.8 °C / 83.8 F (-3.2 °C / -5.8 F).
| Dell G15 5530, i5-13450HX RTX 4050 GeForce RTX 4050 Laptop GPU, i5-13450HX | Medion Erazer Crawler E40 - MD 62518 GeForce RTX 4050 Laptop GPU, i5-13500H | Lenovo LOQ 15IRH8 Core i7 GeForce RTX 4050 Laptop GPU, i7-13620H | Asus TUF A15 FA507 GeForce RTX 4050 Laptop GPU, R7 7735HS | Dell G15 5530 GeForce RTX 4060 Laptop GPU, i7-13650HX | |
|---|---|---|---|---|---|
| Heat | 24% | -6% | 13% | -7% | |
| Maximum Upper Side * (°C) | 58 | 36 38% | 46.4 20% | 48.9 16% | 54 7% |
| Maximum Bottom * (°C) | 57 | 36 37% | 59.2 -4% | 44.6 22% | 62.2 -9% |
| Idle Upper Side * (°C) | 30 | 26 13% | 34.4 -15% | 27.1 10% | 33.4 -11% |
| Idle Bottom * (°C) | 29 | 27 7% | 36.2 -25% | 27.5 5% | 33.4 -15% |
* ... smaller is better
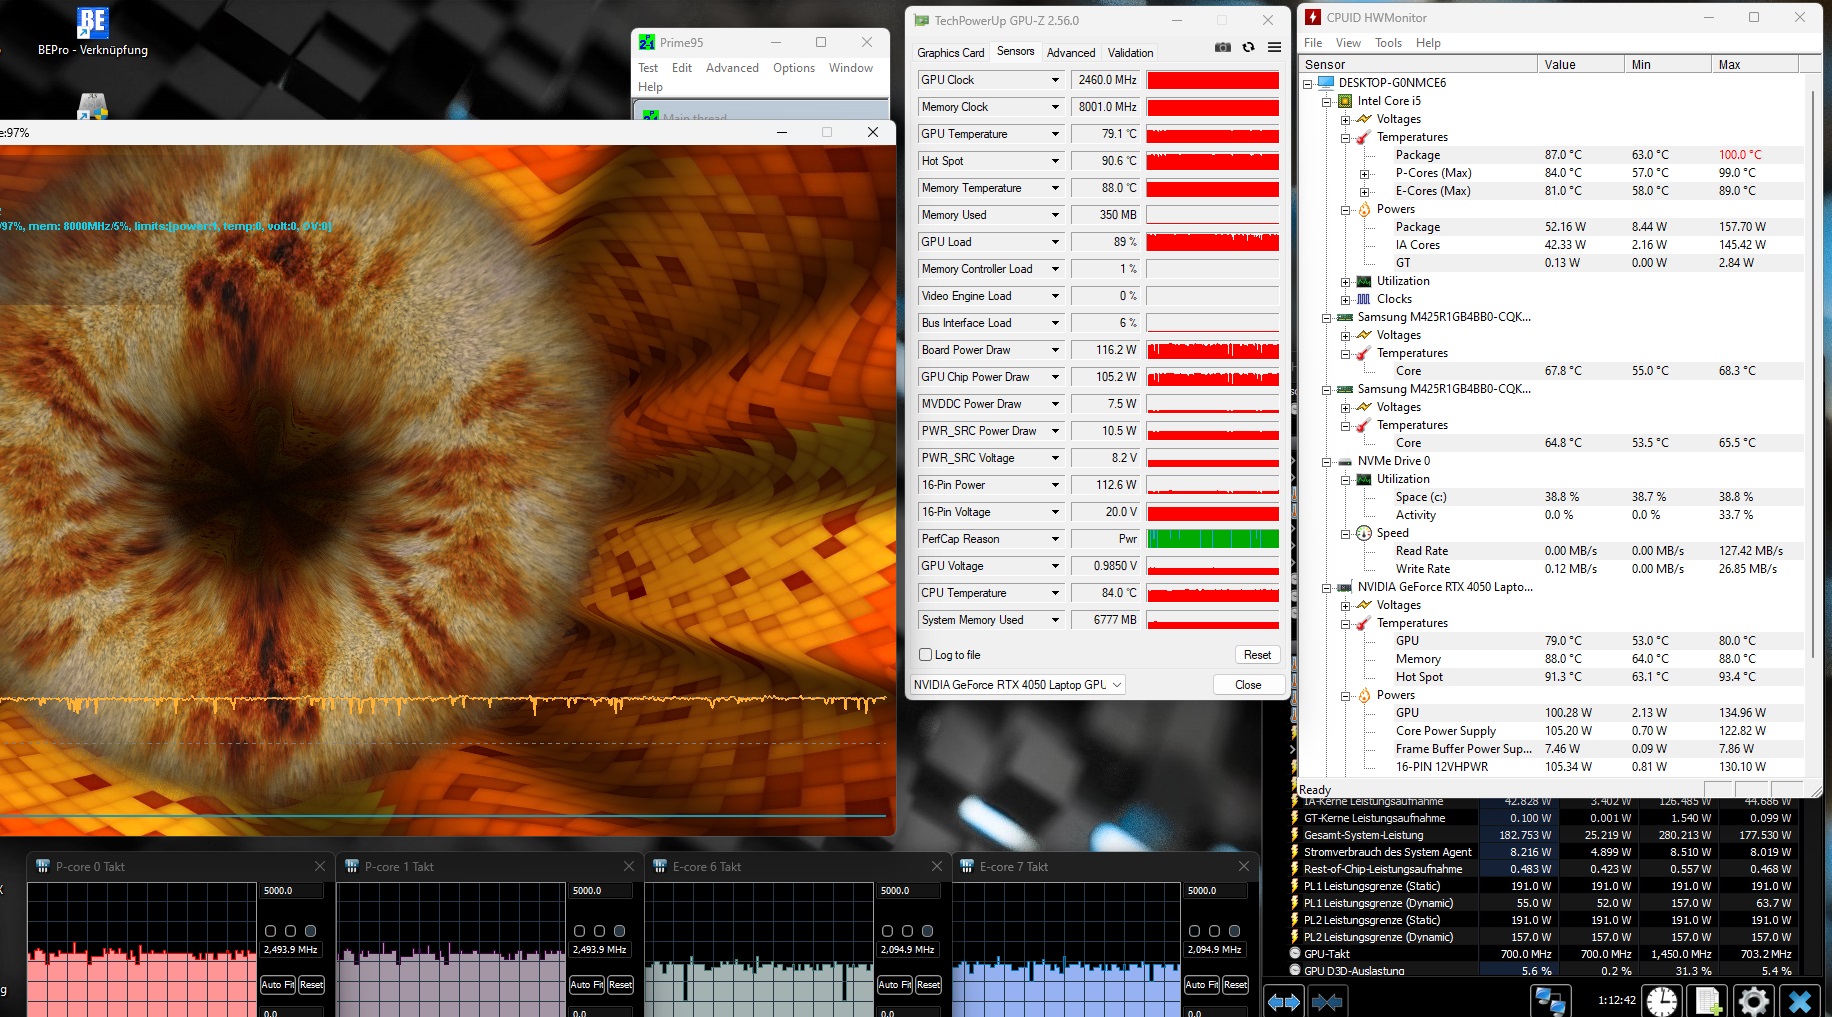
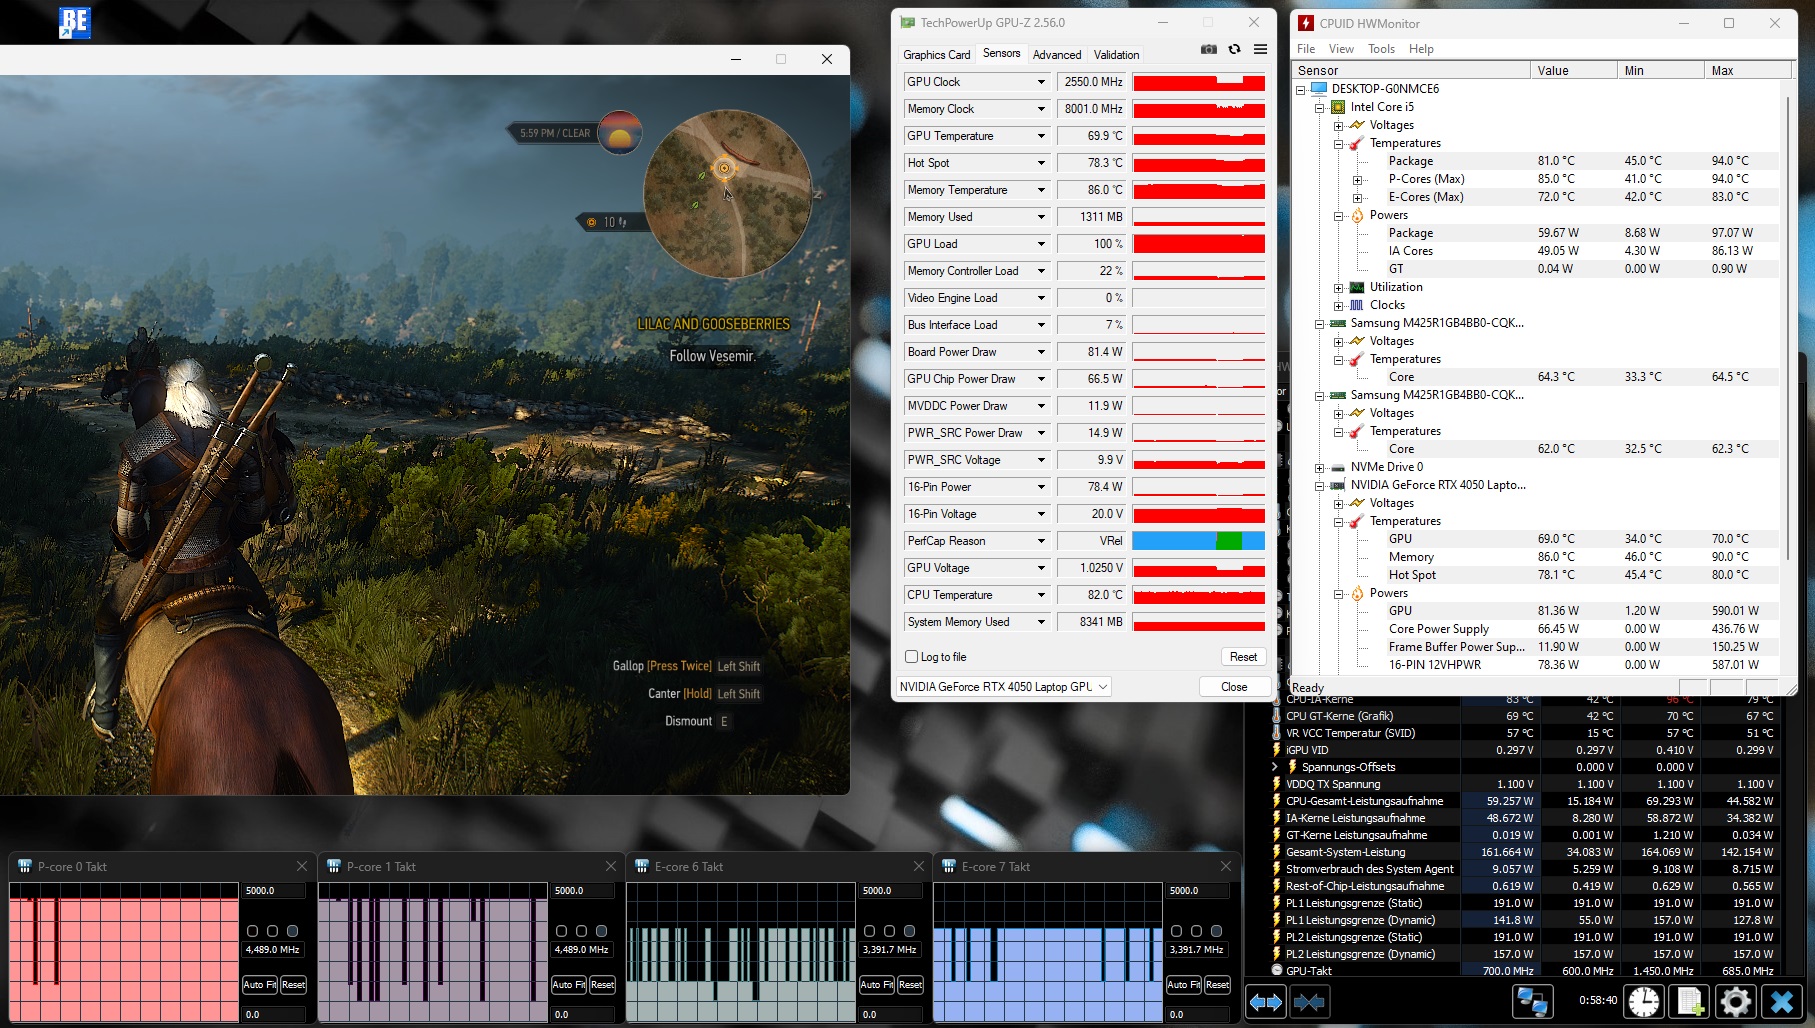
Stress test
The CPU, in particular, struggled during the stress test performed using FurMark & Prime95. After briefly reaching 100°C (212°F), the Core i5-13450HX reduced its the clock speed, causing temperatures to level out at 80 to 90°C (176 to 194°F). The GeForce RTX 4050 got up to “only” 79°C (174.2°F) after one hour, but has a hotspot temp of approx. 91°C (195.8°F).
Speakers
The laptop has average sound quality. The speakers have good max volume but are held back by their weak bass.
Dell G15 5530, i5-13450HX RTX 4050 audio analysis
(+) | speakers can play relatively loud (86 dB)
Bass 100 - 315 Hz
(-) | nearly no bass - on average 32% lower than median
(±) | linearity of bass is average (14% delta to prev. frequency)
Mids 400 - 2000 Hz
(+) | balanced mids - only 3.5% away from median
(+) | mids are linear (4.3% delta to prev. frequency)
Highs 2 - 16 kHz
(+) | balanced highs - only 2.4% away from median
(+) | highs are linear (4.2% delta to prev. frequency)
Overall 100 - 16.000 Hz
(±) | linearity of overall sound is average (18% difference to median)
Compared to same class
» 55% of all tested devices in this class were better, 9% similar, 36% worse
» The best had a delta of 6%, average was 18%, worst was 132%
Compared to all devices tested
» 38% of all tested devices were better, 8% similar, 54% worse
» The best had a delta of 4%, average was 24%, worst was 134%
Medion Erazer Crawler E40 - MD 62518 audio analysis
(±) | speaker loudness is average but good (81.47 dB)
Bass 100 - 315 Hz
(-) | nearly no bass - on average 32.7% lower than median
(±) | linearity of bass is average (11% delta to prev. frequency)
Mids 400 - 2000 Hz
(+) | balanced mids - only 4.6% away from median
(±) | linearity of mids is average (7.1% delta to prev. frequency)
Highs 2 - 16 kHz
(+) | balanced highs - only 3.1% away from median
(+) | highs are linear (5.7% delta to prev. frequency)
Overall 100 - 16.000 Hz
(±) | linearity of overall sound is average (21.8% difference to median)
Compared to same class
» 78% of all tested devices in this class were better, 6% similar, 16% worse
» The best had a delta of 6%, average was 18%, worst was 132%
Compared to all devices tested
» 62% of all tested devices were better, 7% similar, 31% worse
» The best had a delta of 4%, average was 24%, worst was 134%
Power management
Power consumption
Our findings are very divided regarding the laptop’s power consumption. Although the G15 only consumed an average of 12 watts at idle, which is a very small amount for a gaming notebook, the 100 to 262 watts it required under load is immensely high relative to the performance offered.
| Off / Standby | |
| Idle | |
| Load |
|
Key:
min: | |
| Dell G15 5530, i5-13450HX RTX 4050 i5-13450HX, GeForce RTX 4050 Laptop GPU | Medion Erazer Crawler E40 - MD 62518 i5-13500H, GeForce RTX 4050 Laptop GPU | Lenovo LOQ 15IRH8 Core i7 i7-13620H, GeForce RTX 4050 Laptop GPU | Asus TUF A15 FA507 R7 7735HS, GeForce RTX 4050 Laptop GPU | Dell G15 5530 i7-13650HX, GeForce RTX 4060 Laptop GPU | Average of class Gaming | |
|---|---|---|---|---|---|---|
| Power Consumption | -58% | -148% | -30% | -53% | -123% | |
| Idle Minimum * (Watt) | 2 | 10 -400% | 18.52 -826% | 8 -300% | 8.4 -320% | 13.2 ? -560% |
| Idle Average * (Watt) | 12 | 15.3 -28% | 22.54 -88% | 12.1 -1% | 14.98 -25% | 18.9 ? -58% |
| Idle Maximum * (Watt) | 27 | 15.5 43% | 29.79 -10% | 12.5 54% | 15.56 42% | 24.3 ? 10% |
| Load Average * (Watt) | 100 | 88 12% | 94.5 5% | 74.9 25% | 96.8 3% | 108 ? -8% |
| Witcher 3 ultra * (Watt) | 161.9 | 155 4% | 154.4 5% | 136.6 16% | 186 -15% | |
| Load Maximum * (Watt) | 262 | 202.47 23% | 190.4 27% | 185 29% | 271.42 -4% | 254 ? 3% |
* ... smaller is better
Power consumption Witcher 3 / Stresstest
Power consumption with external monitor
Battery life
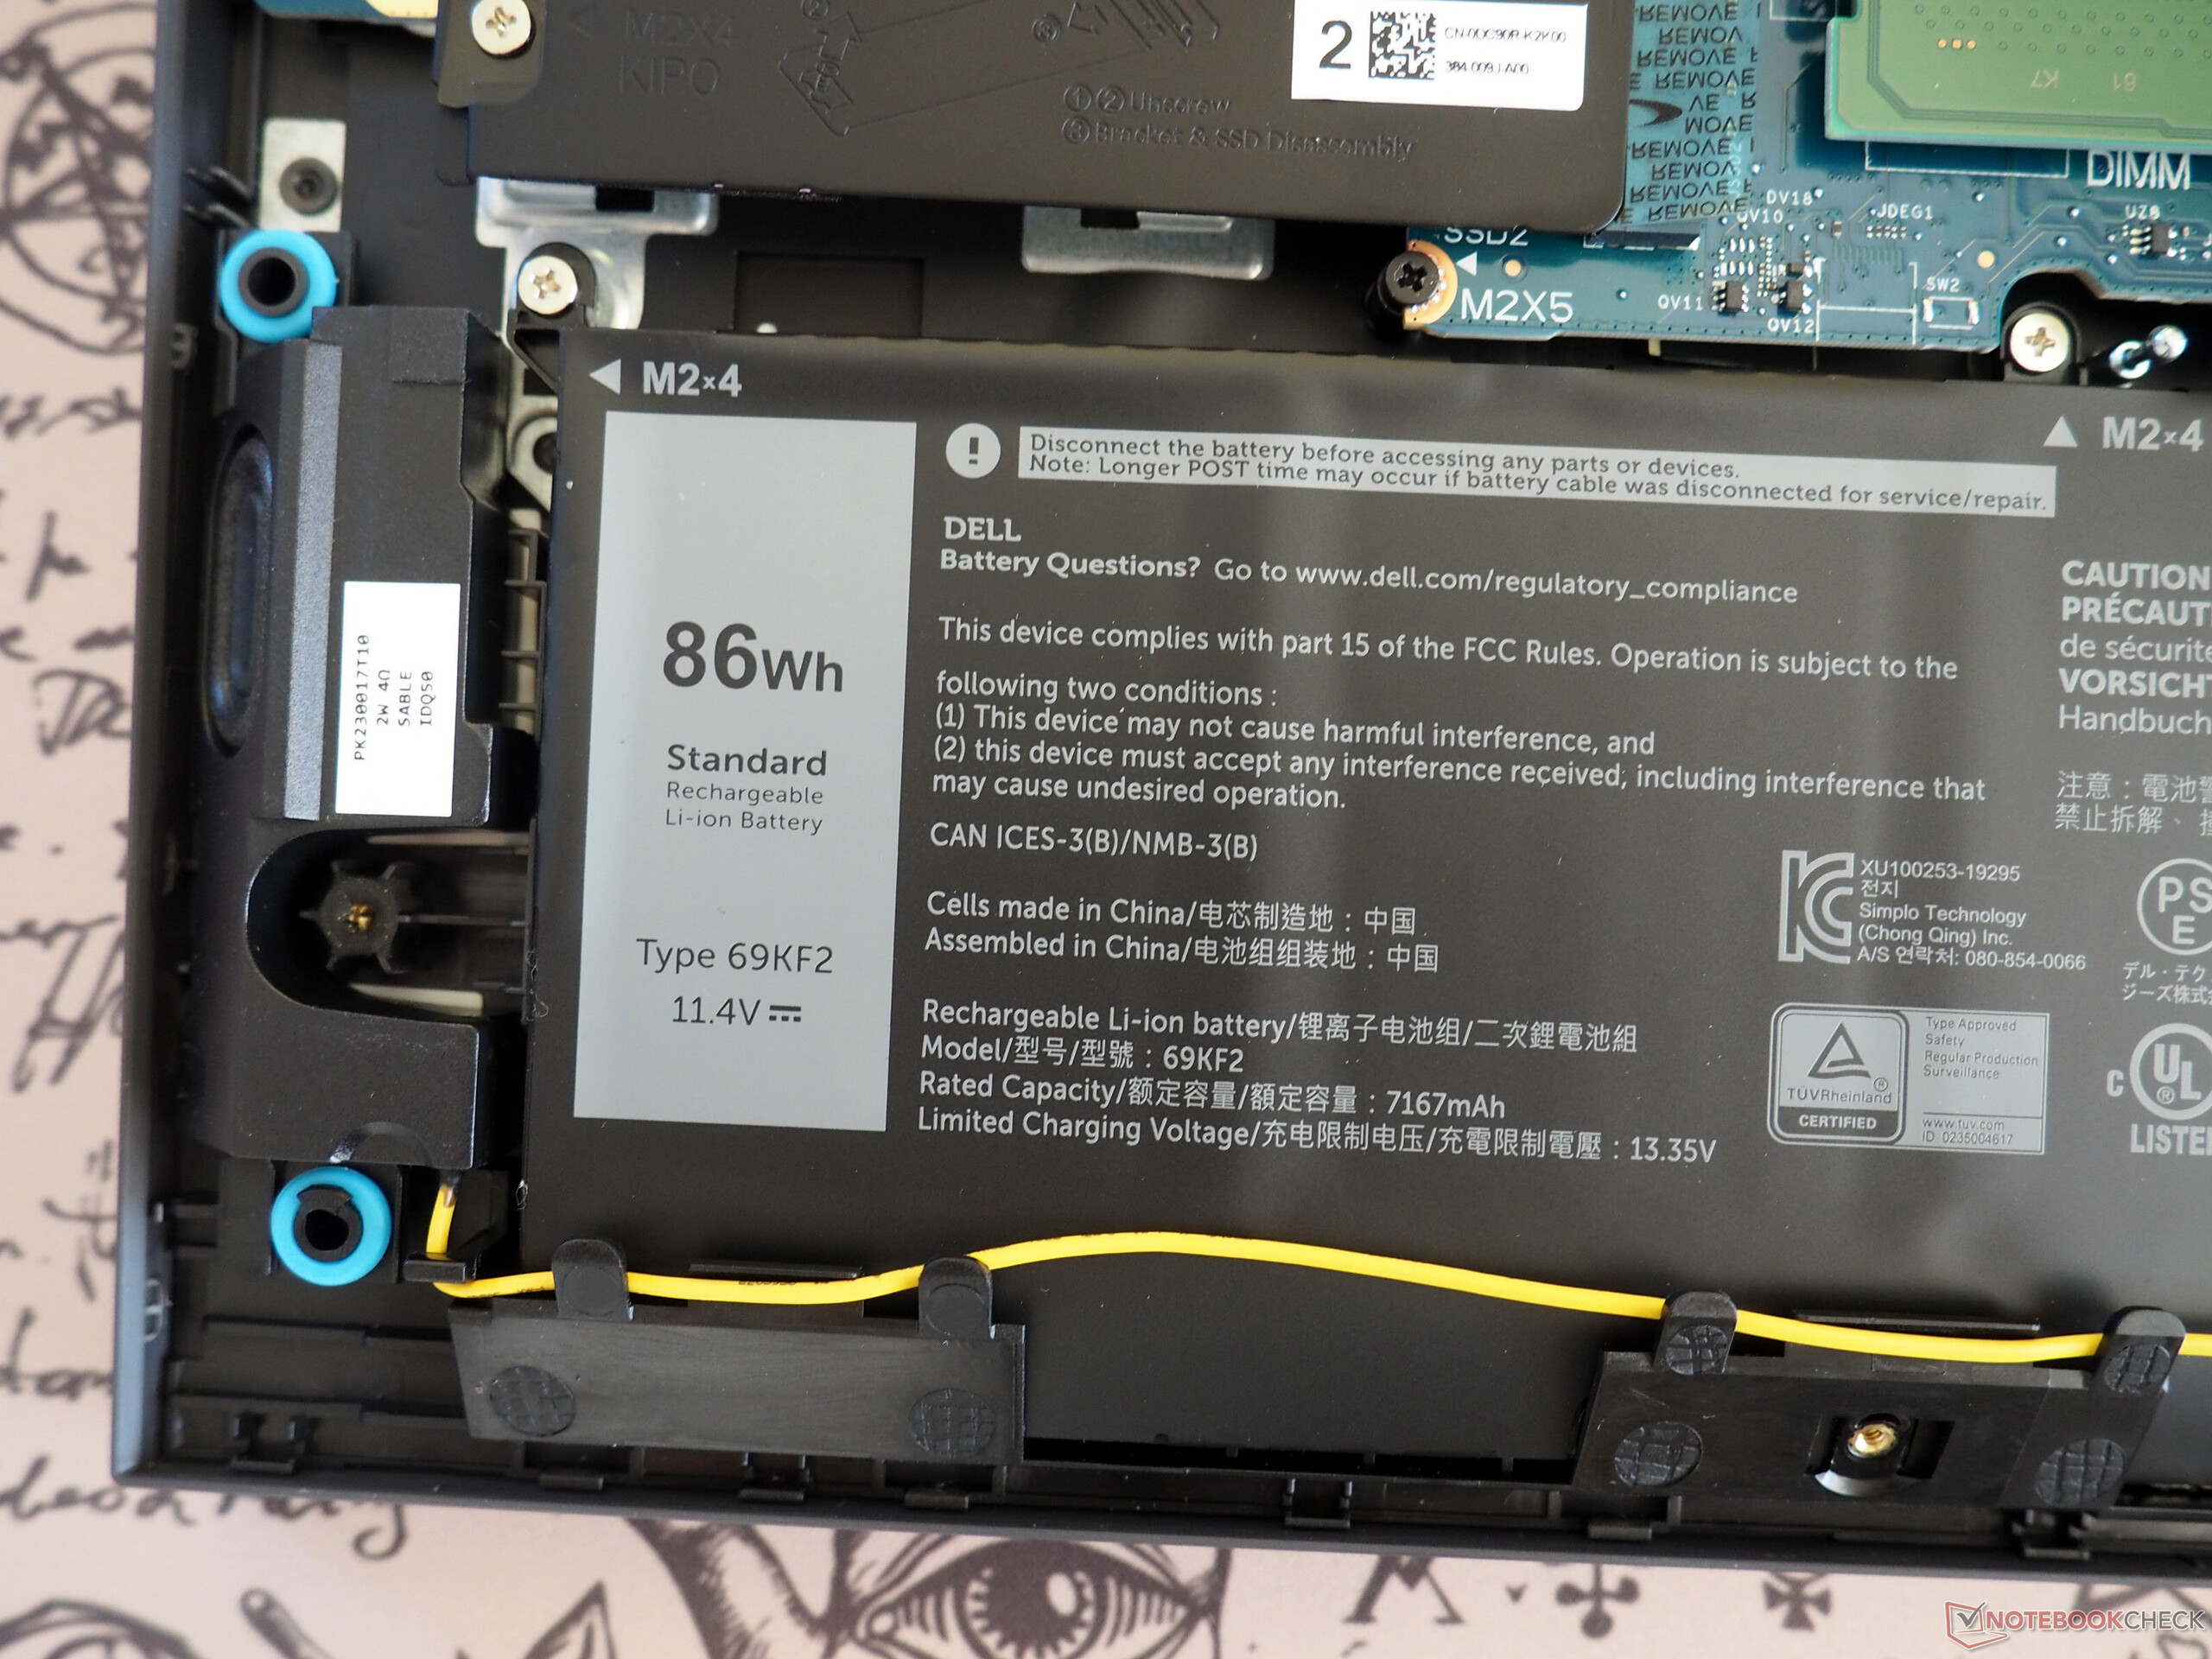
Battery life is more than decent on the G15, not least thanks to graphics switching. In our Wi-Fi test (with screen brightness reduced to 150 cd/m²), we managed to get roughly 7 hours of use from the huge 86 Wh battery.
| Dell G15 5530, i5-13450HX RTX 4050 i5-13450HX, GeForce RTX 4050 Laptop GPU, 86 Wh | Medion Erazer Crawler E40 - MD 62518 i5-13500H, GeForce RTX 4050 Laptop GPU, 54 Wh | Lenovo LOQ 15IRH8 Core i7 i7-13620H, GeForce RTX 4050 Laptop GPU, 60 Wh | Asus TUF A15 FA507 R7 7735HS, GeForce RTX 4050 Laptop GPU, 90 Wh | Dell G15 5530 i7-13650HX, GeForce RTX 4060 Laptop GPU, 86 Wh | Average of class Gaming | |
|---|---|---|---|---|---|---|
| Battery runtime | -42% | -17% | 65% | -8% | -1% | |
| WiFi v1.3 (h) | 7.1 | 4.1 -42% | 5.9 -17% | 11.7 65% | 6.5 -8% | 7.02 ? -1% |
| H.264 (h) | 3.9 | 6.1 | 12.5 | 6.8 | 8.26 ? | |
| Load (h) | 1.2 | 1 | 0.8 | 1.47 ? | ||
| Witcher 3 ultra (h) | 0.8 |
Pros
Cons
Verdict
The Dell G15 5530 with a Core i5-13450HX and GeForce RTX 4050 inherits most of the strengths and weaknesses of its more expensive sibling with an i7-13650HX and RTX 4060. On the plus side, the device has a relatively good display, solid battery life and reasonable value for money going for it, amongst other things.
On the minus side, though, we have a pretty heavy and chunky chassis, a needlessly bulky charger and a lacklustre port selection (no USB4 and card reader). Dell should also work on addressing the massive SSD throttling under sustained stress as well as the power usage under load.
At any rate, the G15 5530 is overall a great option for budget-conscious gamers looking for a suitable gaming machine in the €1,000 (US$1,090) price bracket.
The competitors mentioned in the review (Medion Crawler E40, Asus TUF A15 and Lenovo LOQ 15) largely deliver similar performance, but sometimes present other advantages and drawbacks.
Price and availability
The Dell G15 5530 with a Core i5-13450HX and GeForce RTX 4050 is currently available from Amazon Germany for €950. In the US, you can get a similarly spec'd version directly from Dell for US$900 or the model with a Core i7-13650HX and an RTX 4060 from Amazon US for US$1,200.
Dell G15 5530, i5-13450HX RTX 4050
- 01/23/2024 v7 (old)
Florian Glaser
Transparency
The selection of devices to be reviewed is made by our editorial team. The test sample was provided to the author as a loan by the manufacturer or retailer for the purpose of this review. The lender had no influence on this review, nor did the manufacturer receive a copy of this review before publication. There was no obligation to publish this review. As an independent media company, Notebookcheck is not subjected to the authority of manufacturers, retailers or publishers.
This is how Notebookcheck is testing
Every year, Notebookcheck independently reviews hundreds of laptops and smartphones using standardized procedures to ensure that all results are comparable. We have continuously developed our test methods for around 20 years and set industry standards in the process. In our test labs, high-quality measuring equipment is utilized by experienced technicians and editors. These tests involve a multi-stage validation process. Our complex rating system is based on hundreds of well-founded measurements and benchmarks, which maintains objectivity. Further information on our test methods can be found here.
Price comparison

