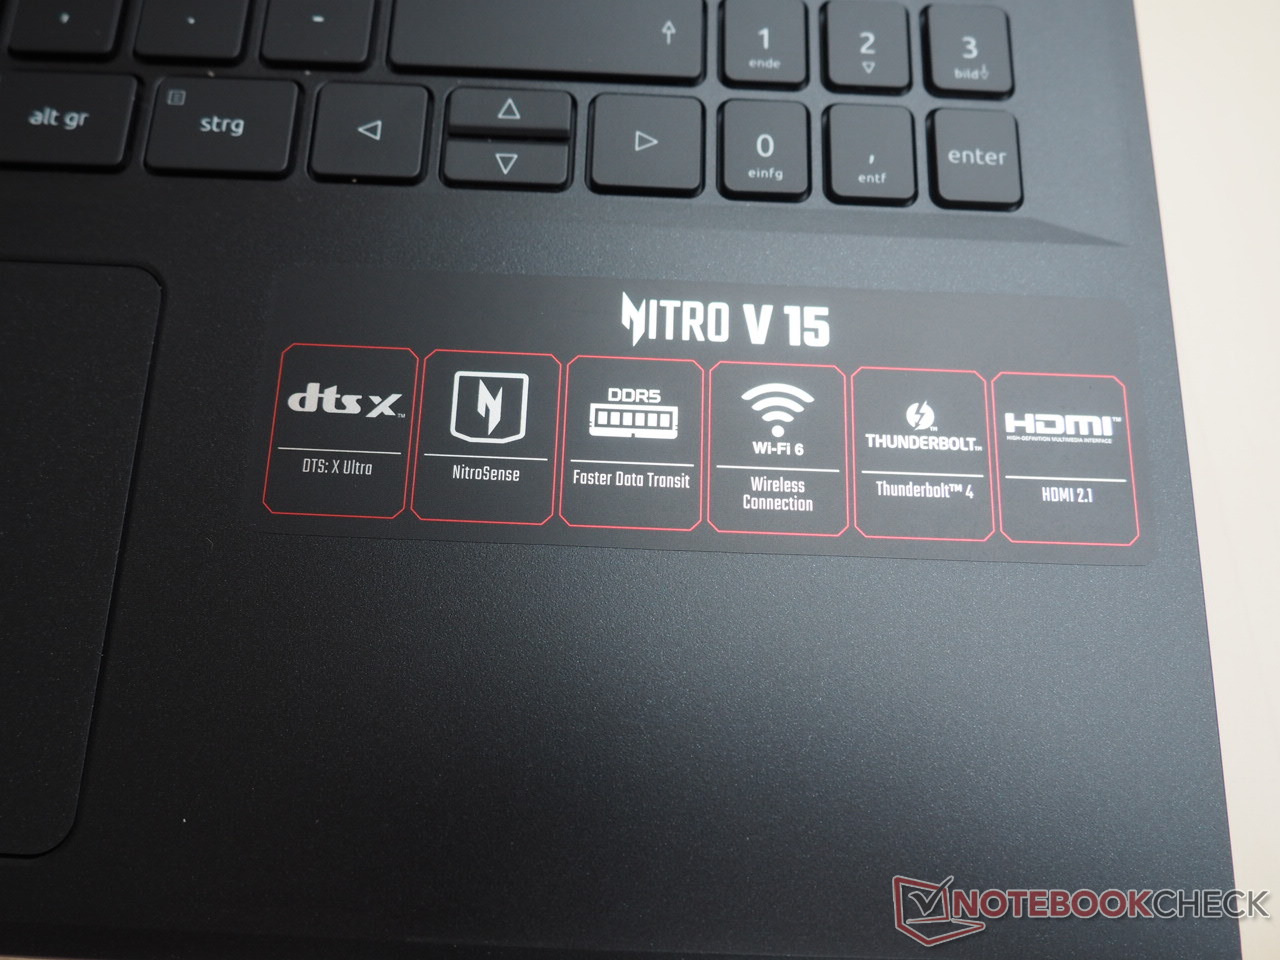
Acer Nitro V 15 ANV15-51 review: Budget gaming laptop with RTX 4050
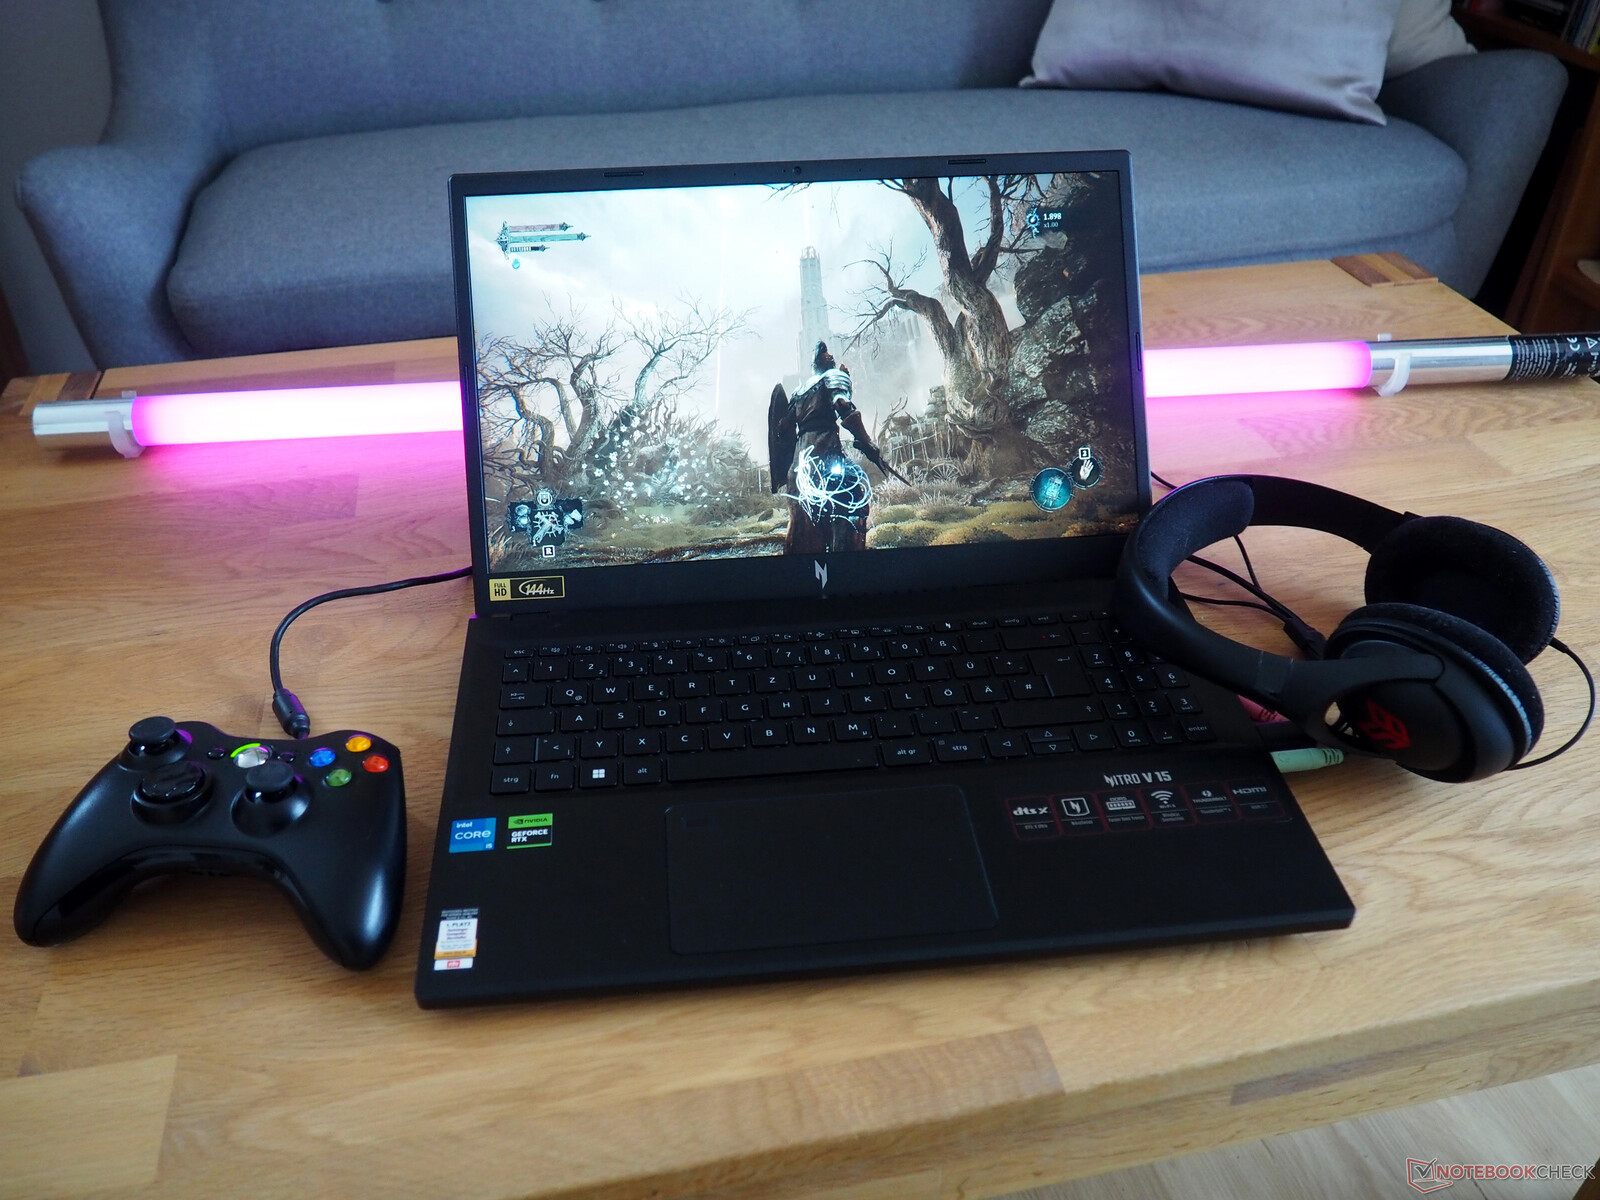
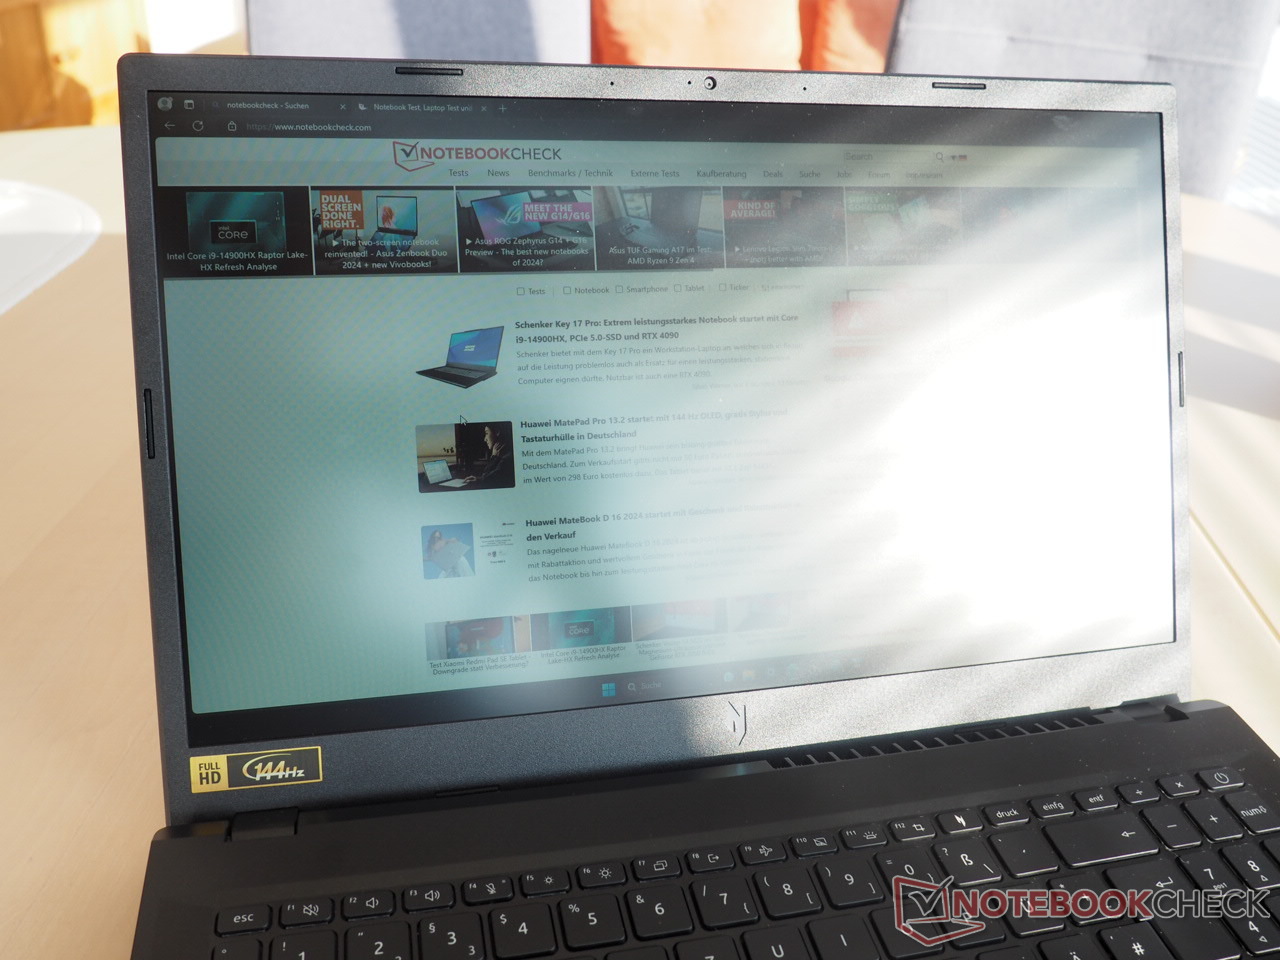
Two main variants of the Nitro V 15 are available in Germany right now. Whilst the base model featured in this review costs around €900 (US$980) and comes with a Core i5-13420H (12 threads) and a 512 GB SSD, the more expensive model will set you back roughly €200 (US$218) more and boasts a Core i7-13620H (16 threads) and a 1 TB drive. Both variants are configured with the same 16 GB of DDR5 RAM and a dedicated GeForce RTX 4050. They also use a matt IPS display with the usual Full HD resolution (1,920 x 1,080) and 144Hz capability.
The Nitro V 15 is competing with other 15-inch budget gaming laptops with a GeForce RTX 4050, such as the Medion Erazer Crawler E40, the Lenovo LOQ 15IRH8, the Asus TUF A15 FA507 and the Schenker XMG Apex 15 Late 23, all of which are listed in the tables below for comparison purposes.
Comparison with possible competitors
Rating | Date | Model | Weight | Height | Size | Resolution | Price |
|---|---|---|---|---|---|---|---|
| 82.8 % v7 (old) | 01 / 2024 | Acer Nitro V 15 ANV15-51-582S i5-13420H, GeForce RTX 4050 Laptop GPU | 2.1 kg | 23.5 mm | 15.60" | 1920x1080 | |
| 85.4 % v7 (old) | 11 / 2023 | Medion Erazer Crawler E40 - MD 62518 i5-13500H, GeForce RTX 4050 Laptop GPU | 2.3 kg | 28 mm | 15.60" | 1920x1080 | |
| 85.9 % v7 (old) | 10 / 2023 | Lenovo LOQ 15IRH8 Core i7 i7-13620H, GeForce RTX 4050 Laptop GPU | 2.4 kg | 25.2 mm | 15.60" | 2560x1440 | |
| 86.3 % v7 (old) | 06 / 2023 | Asus TUF A15 FA507 R7 7735HS, GeForce RTX 4050 Laptop GPU | 2.2 kg | 24.9 mm | 15.60" | 1920x1080 | |
| 86.2 % v7 (old) | 10 / 2023 | Schenker XMG Apex 15 (Late 23) R7 7840HS, GeForce RTX 4050 Laptop GPU | 2.2 kg | 26.7 mm | 15.60" | 2560x1440 |
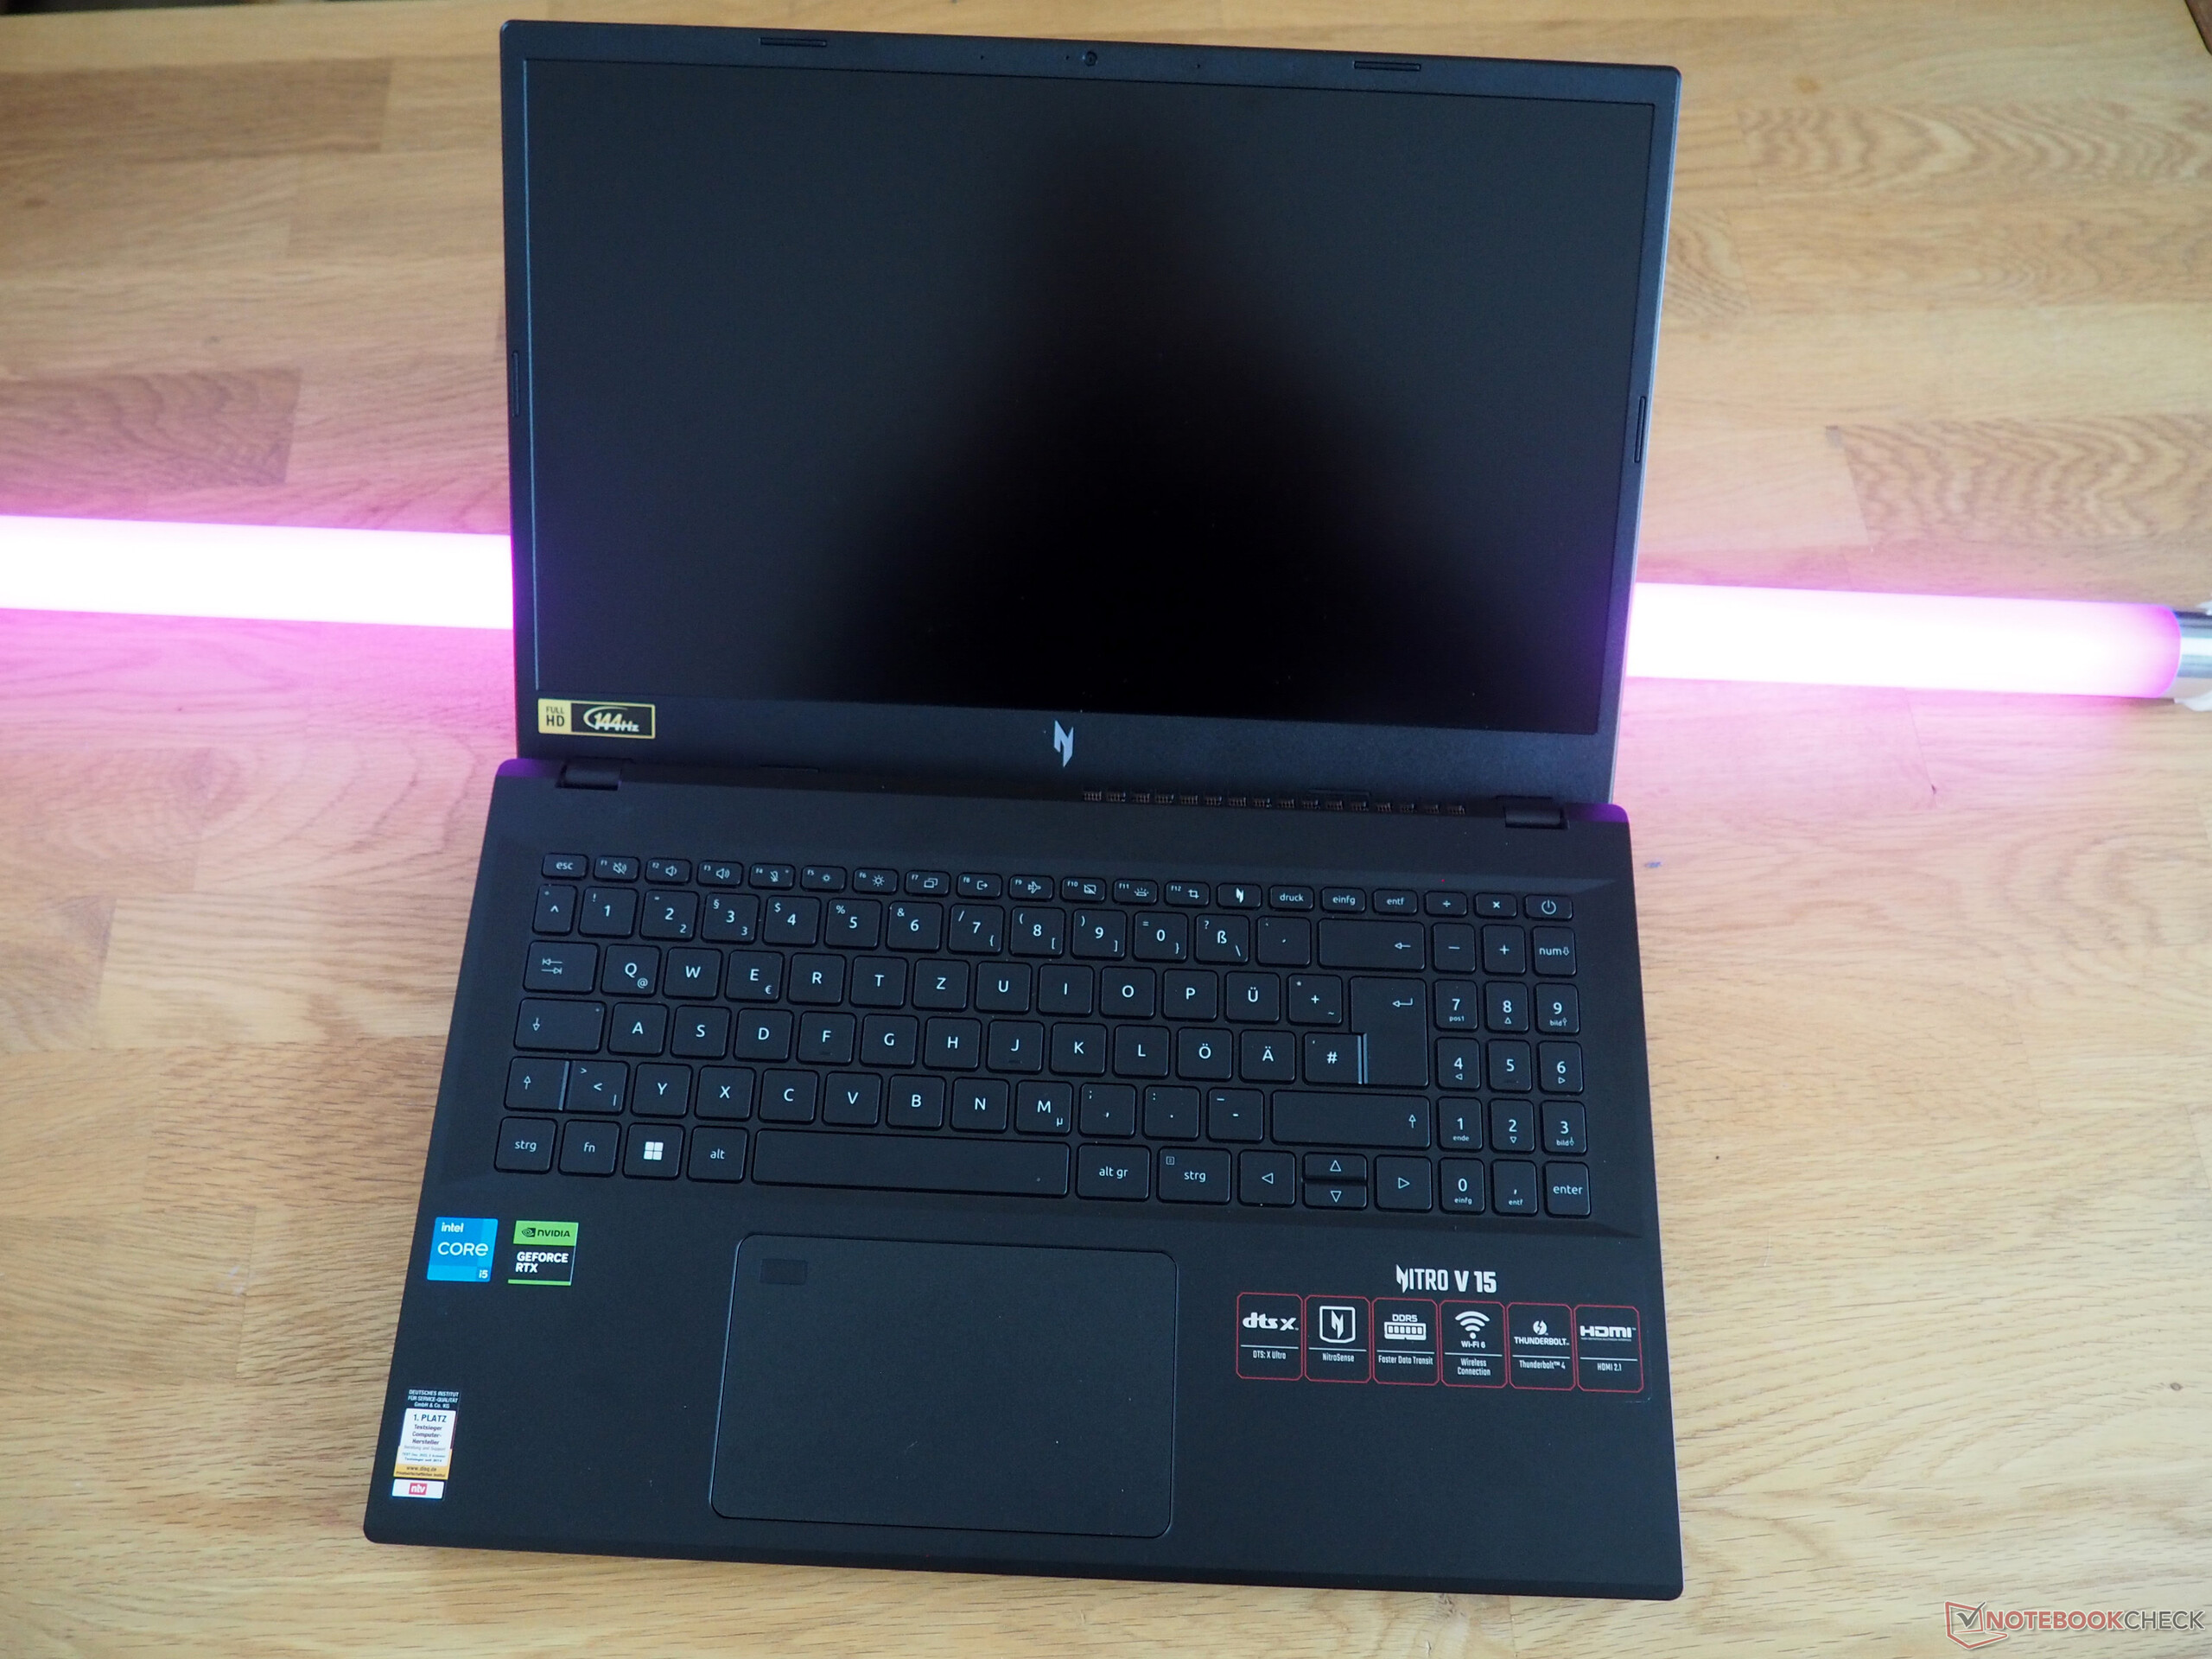
Case
The V 15 is aesthetically pleasing. The grey-blue design on the lid, in particular, provides a breath of fresh air. However, you shouldn't expect too much from the chassis in terms of quality. Like many other devices in this price range, buyers have to settle for a slightly flimsy and not-very-sturdy plastic chassis. At least the 15-inch laptop has a clean fit and finish as well as a solid max opening angle (approx. 140°), though its hinges could be somewhat stiffer and less "wobbly".
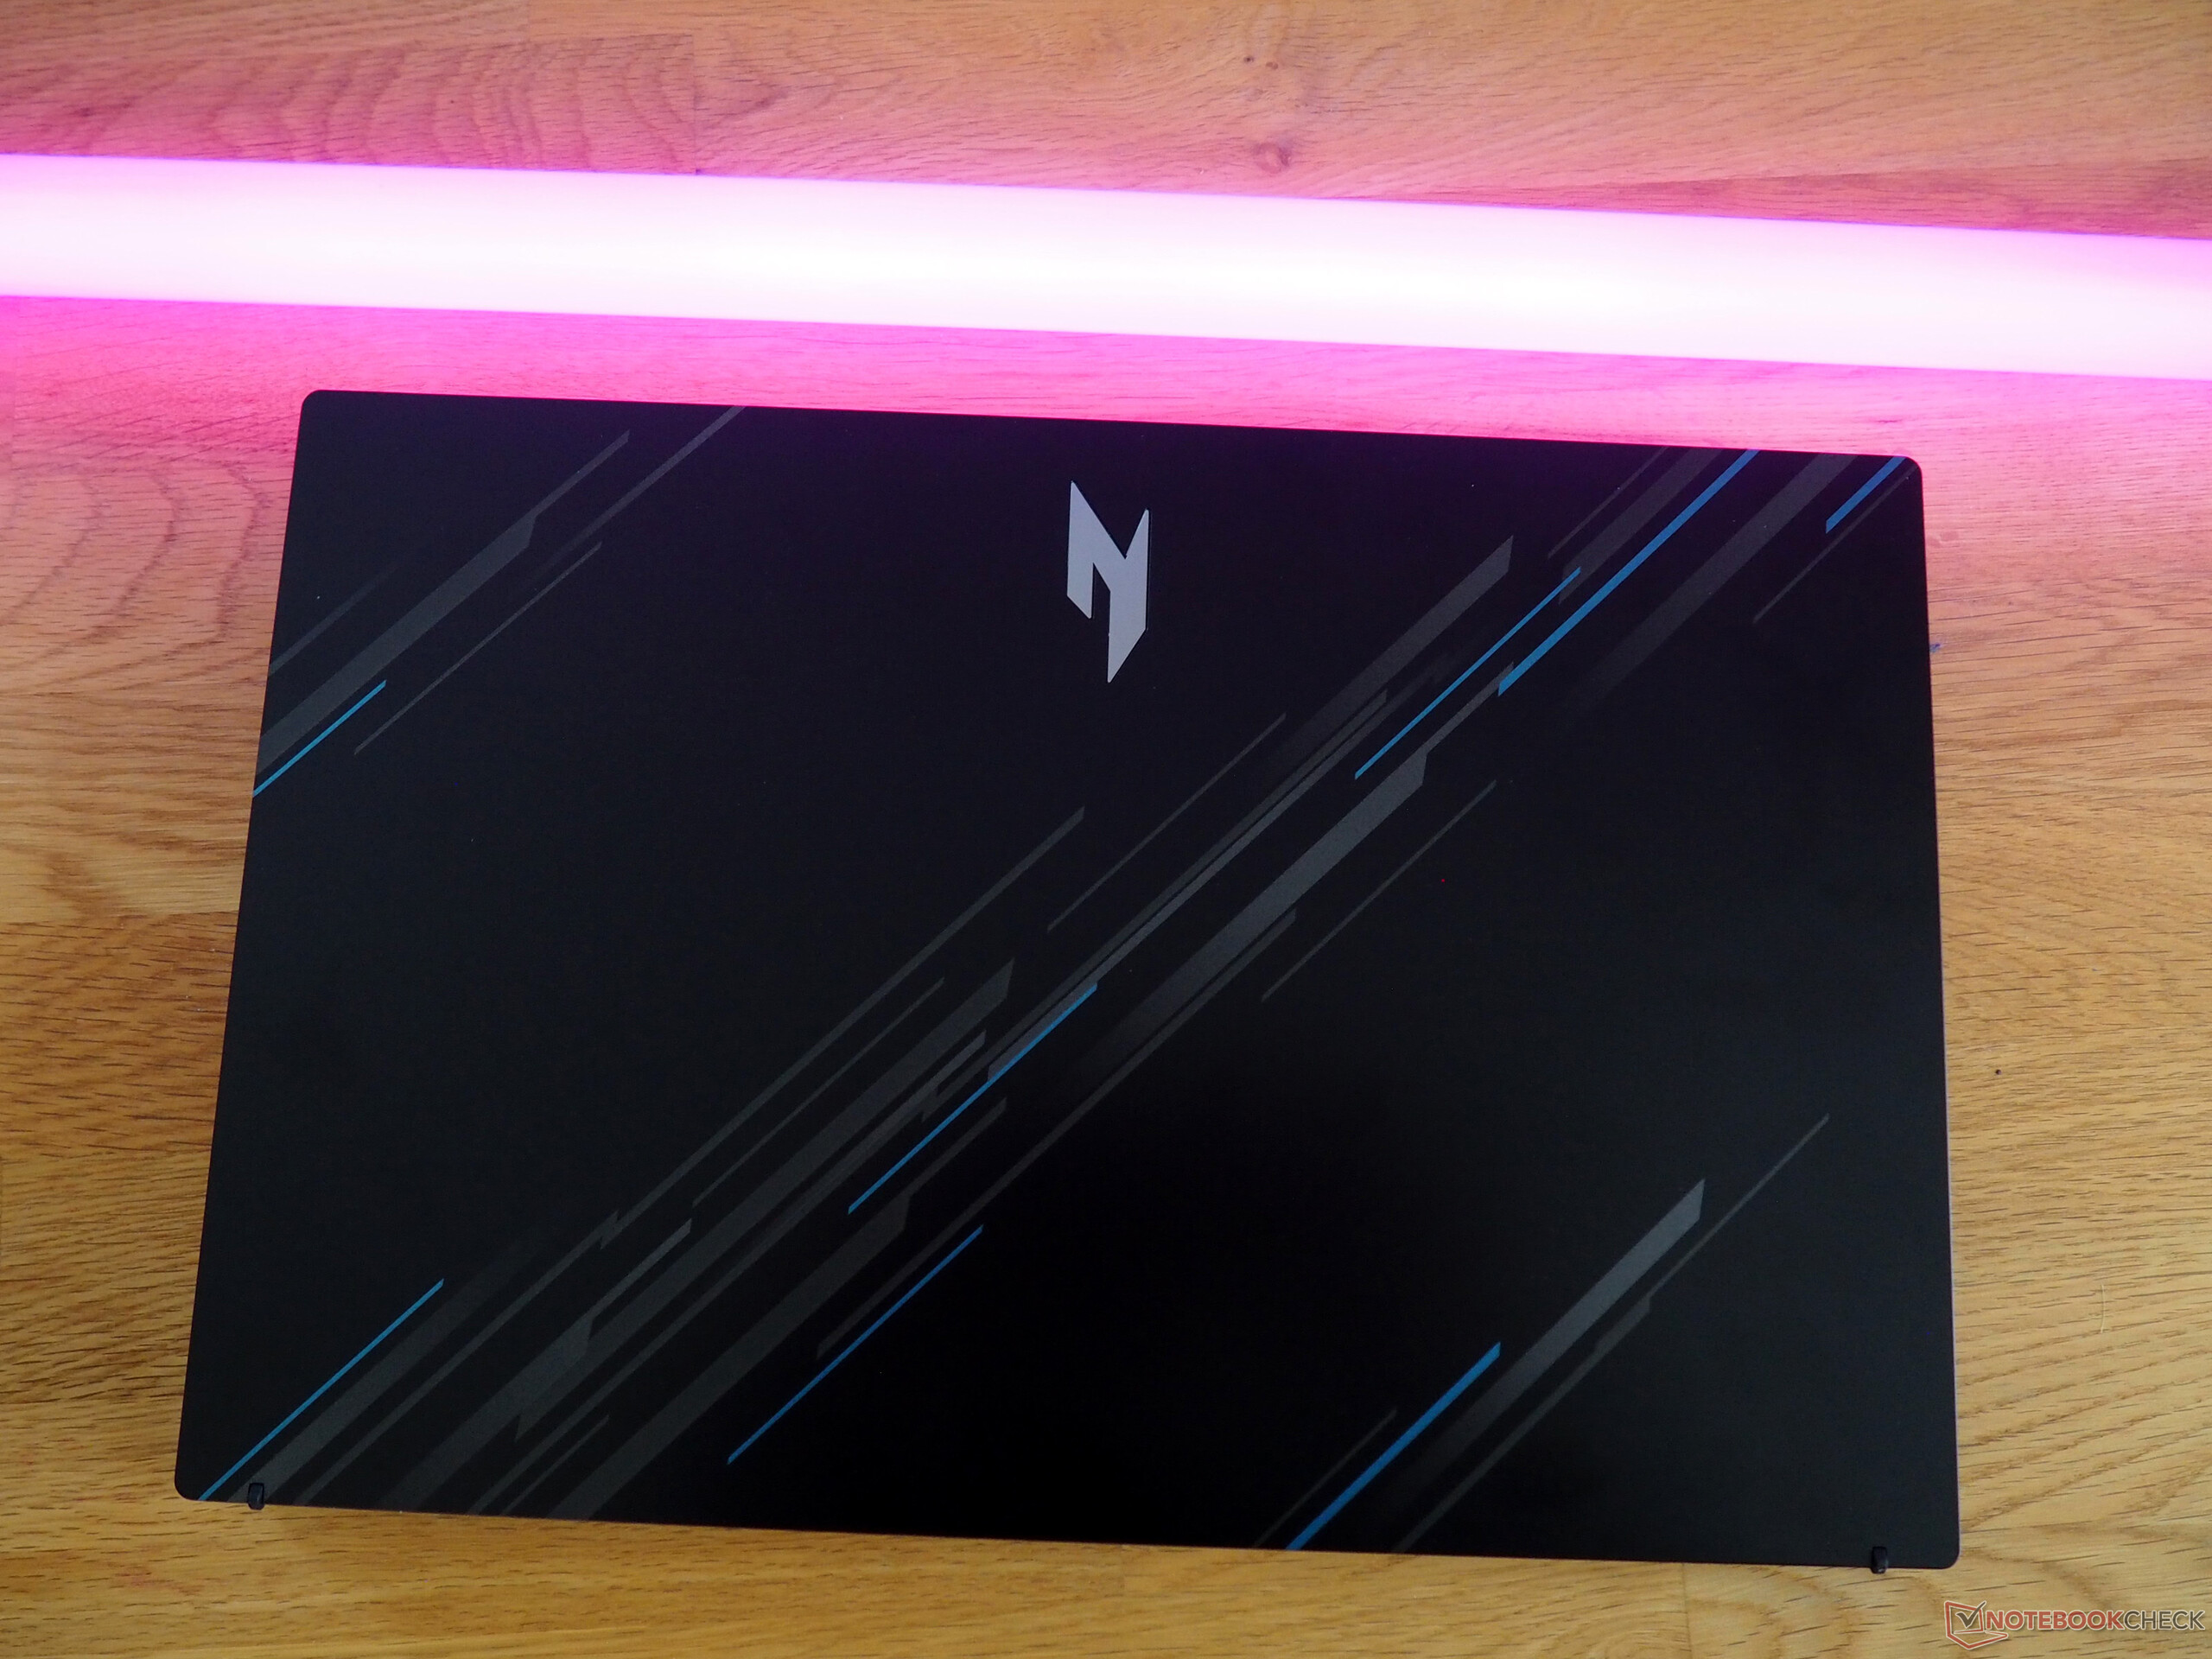
One of the Nitro’s biggest strengths is its moderate weight: at about 2.1 kg (4.6 lb), it is the lightest device in our comparison (the competitors weigh between 2.2 and 2.4 kg, or 4.8 and 6.2 lb). The device also doesn’t look bulky thanks to its svelte silhouette.
Specifications
Interfaces
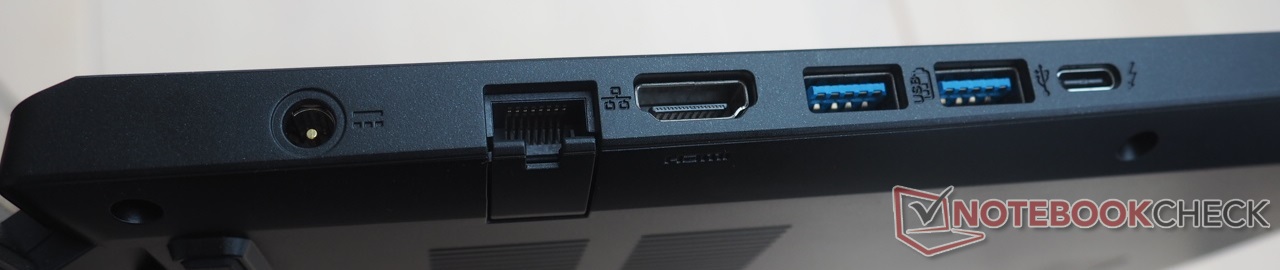
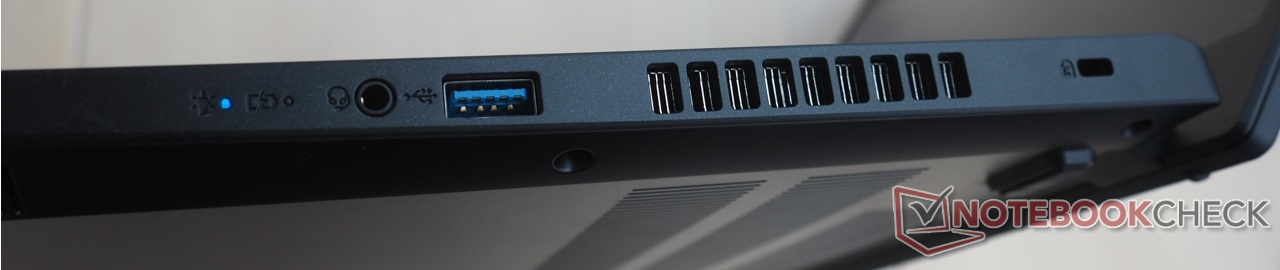
If you ignore the lack of a card reader, the port selection can be described as adequate. Although we would have liked to see one more USB-C port, the three USB-A 3.0 and one Thunderbolt 4 port are still decent for a budget gaming laptop. The Nitro V 15 also sports a fold-out Ethernet port, a HDMI 2.1 output, an audio jack and a Kensington slot. The interfaces are fairly well distributed across the device. That said, some of the ports could have been placed slightly further back to make using a mouse easier.
Connectivity
The Wi-Fi performance is mediocre at best. The built-in Intel wireless module (Wi-Fi 6 AX203) doesn’t deliver top-notch performance when sending and receiving data, but the speeds we obtained are fairly stable.
Webcam
Similarly, you will only get an unremarkable, standard webcam with the laptop. As is so often the case with laptop webcams, the images lack sharpness and colour accuracy.


Accessories
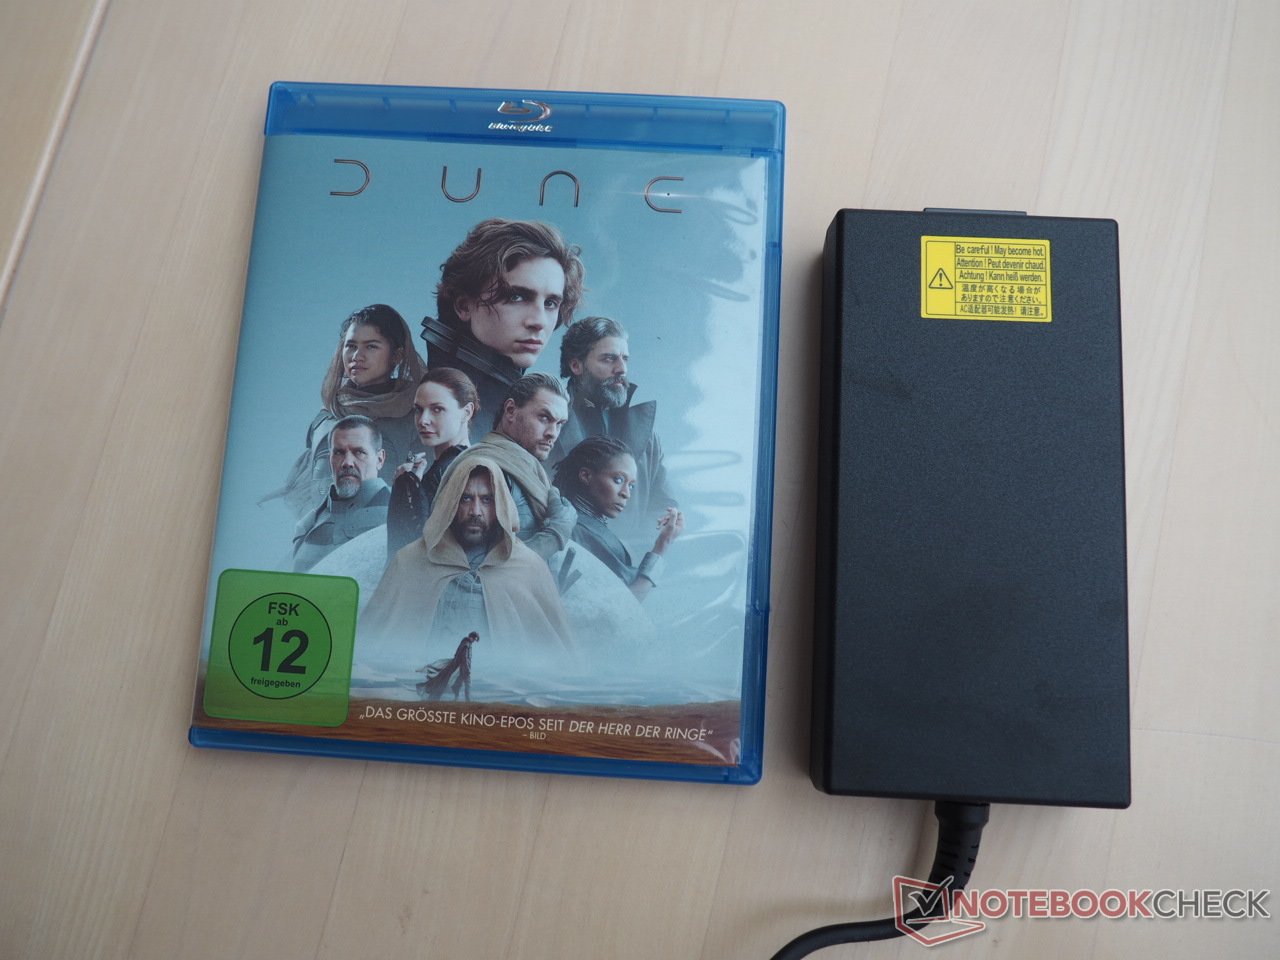
Besides a bunch of documents, you'll also find a pleasantly compact and light 135-watt AC adapter in the box.
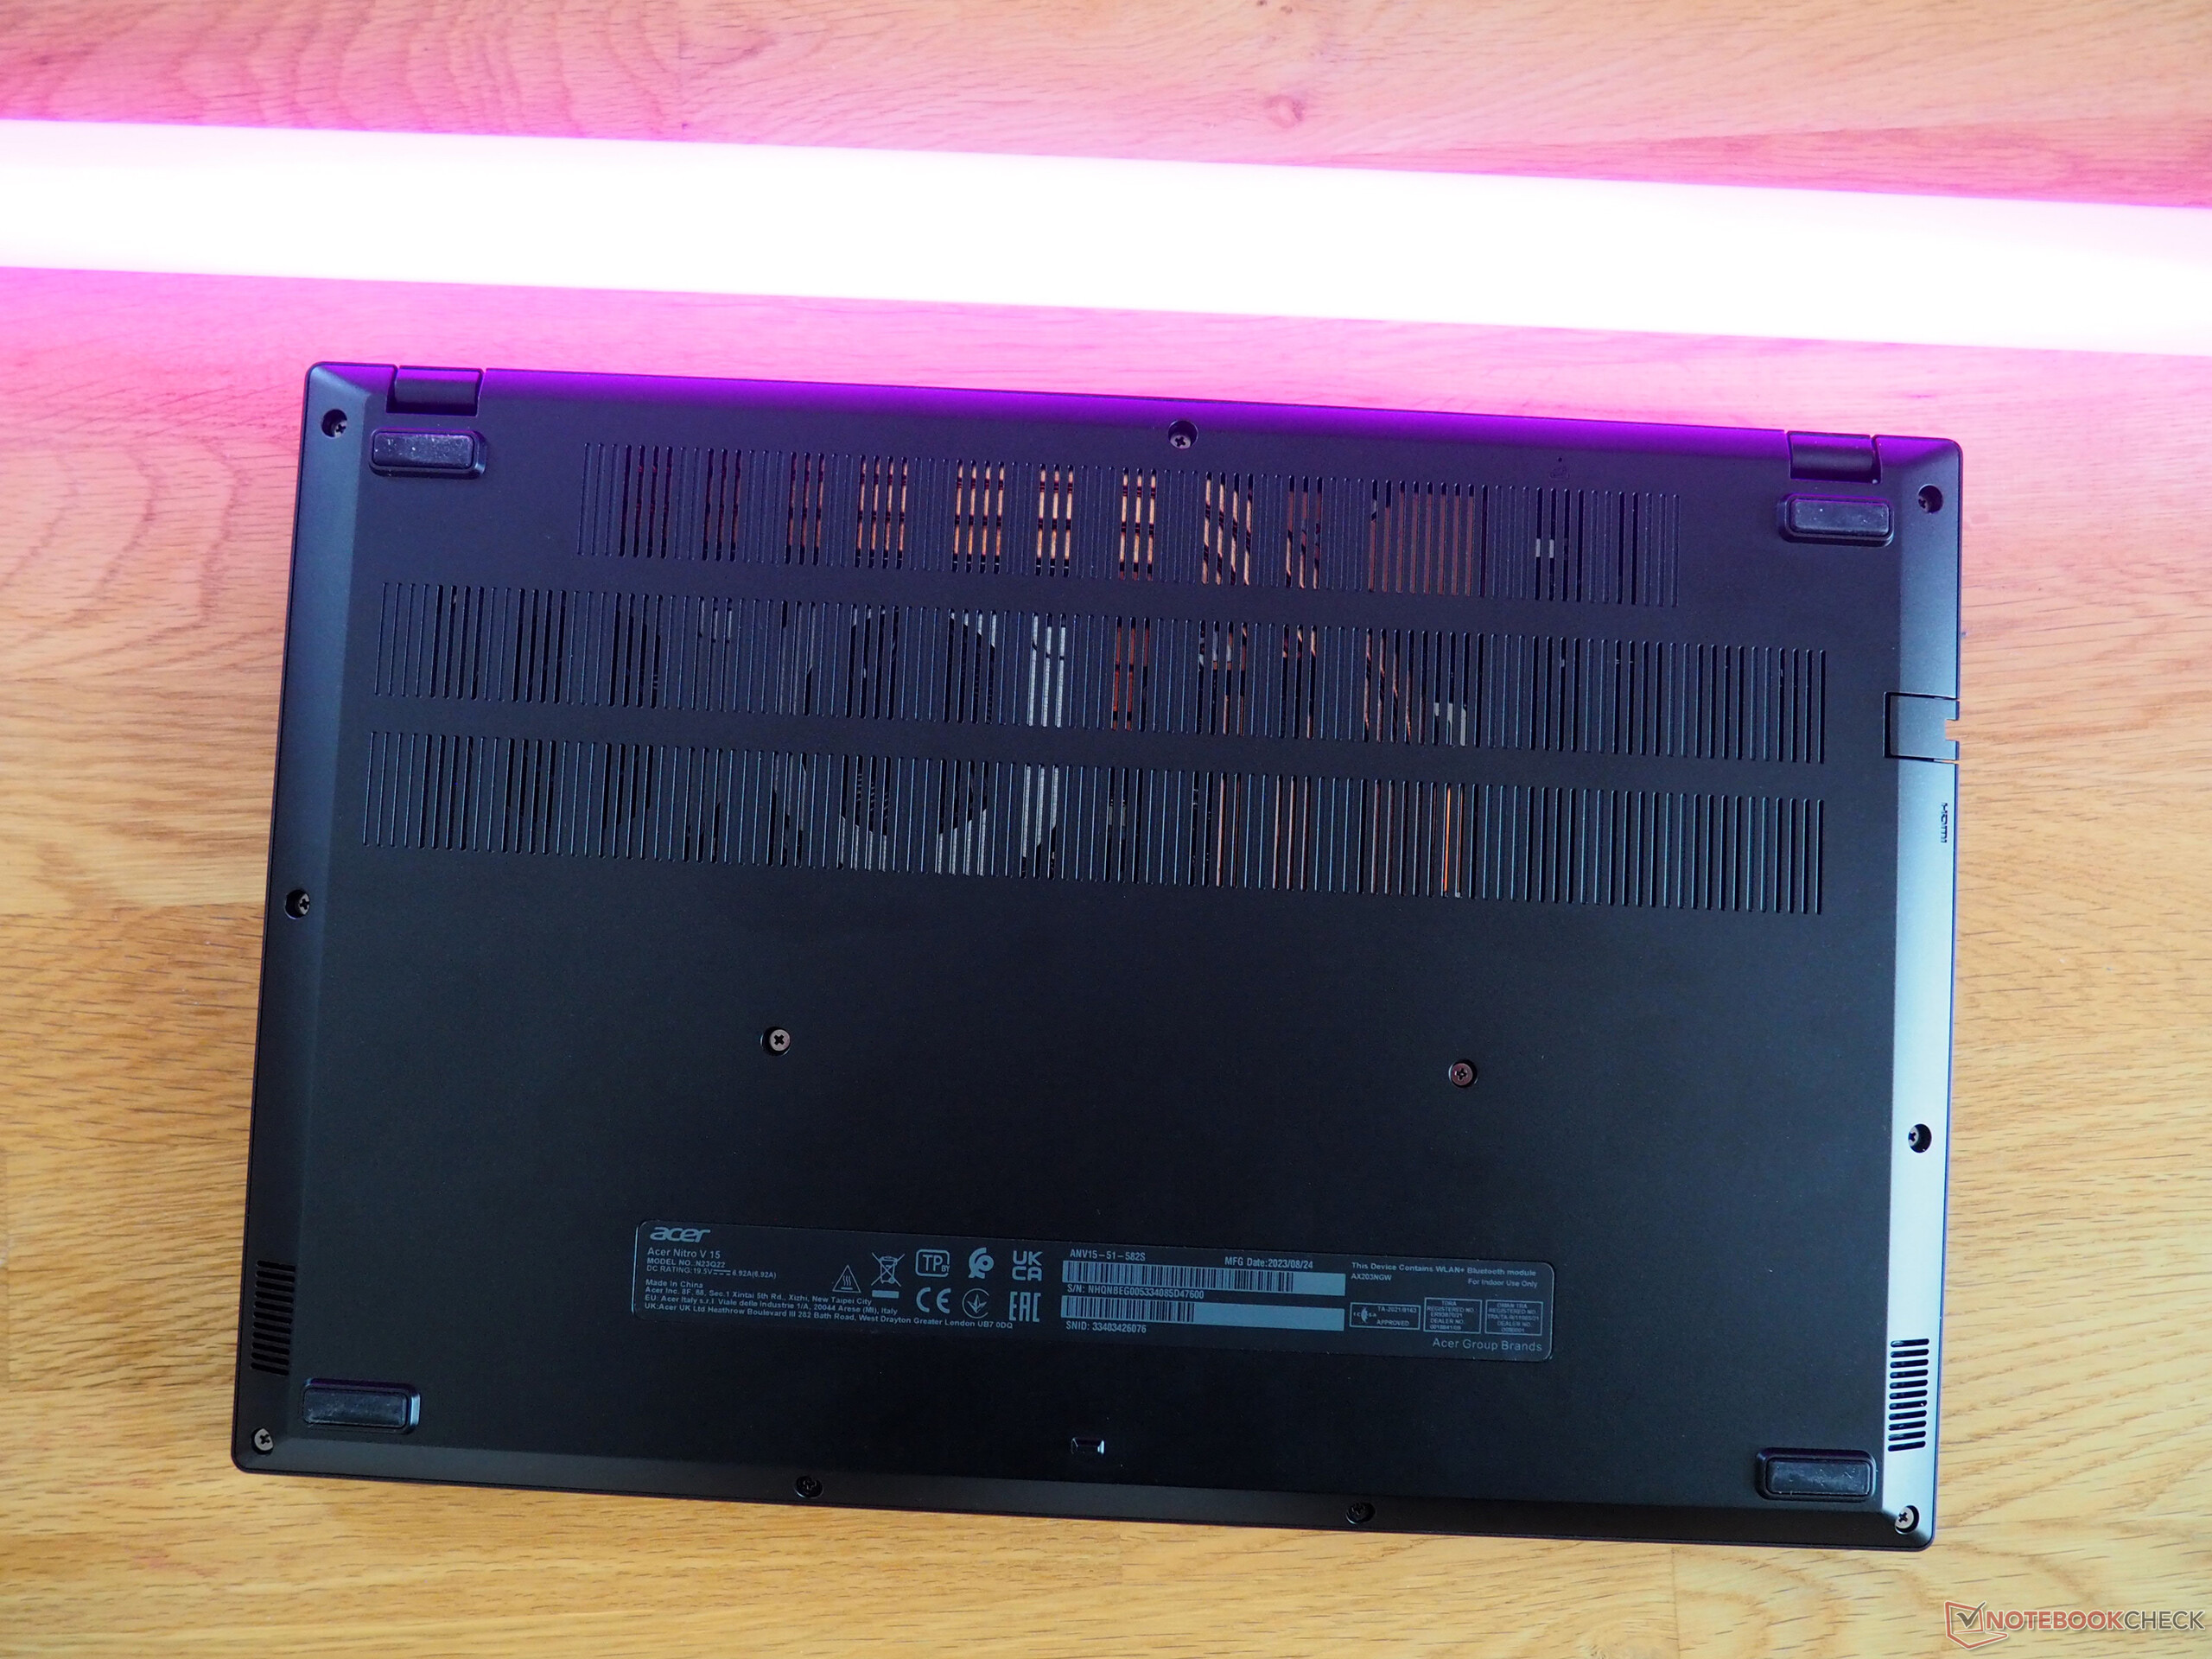
Maintenance
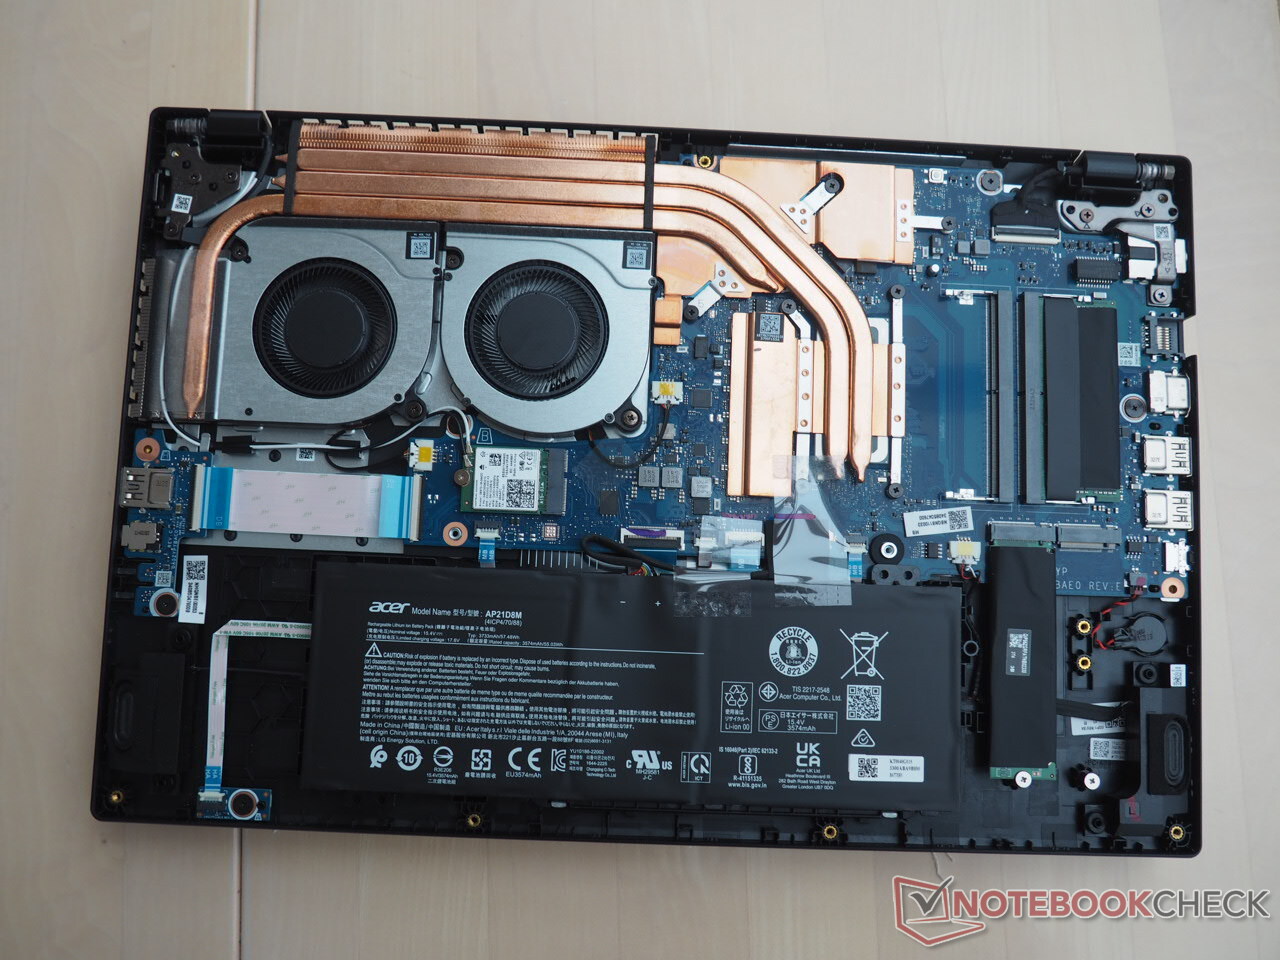
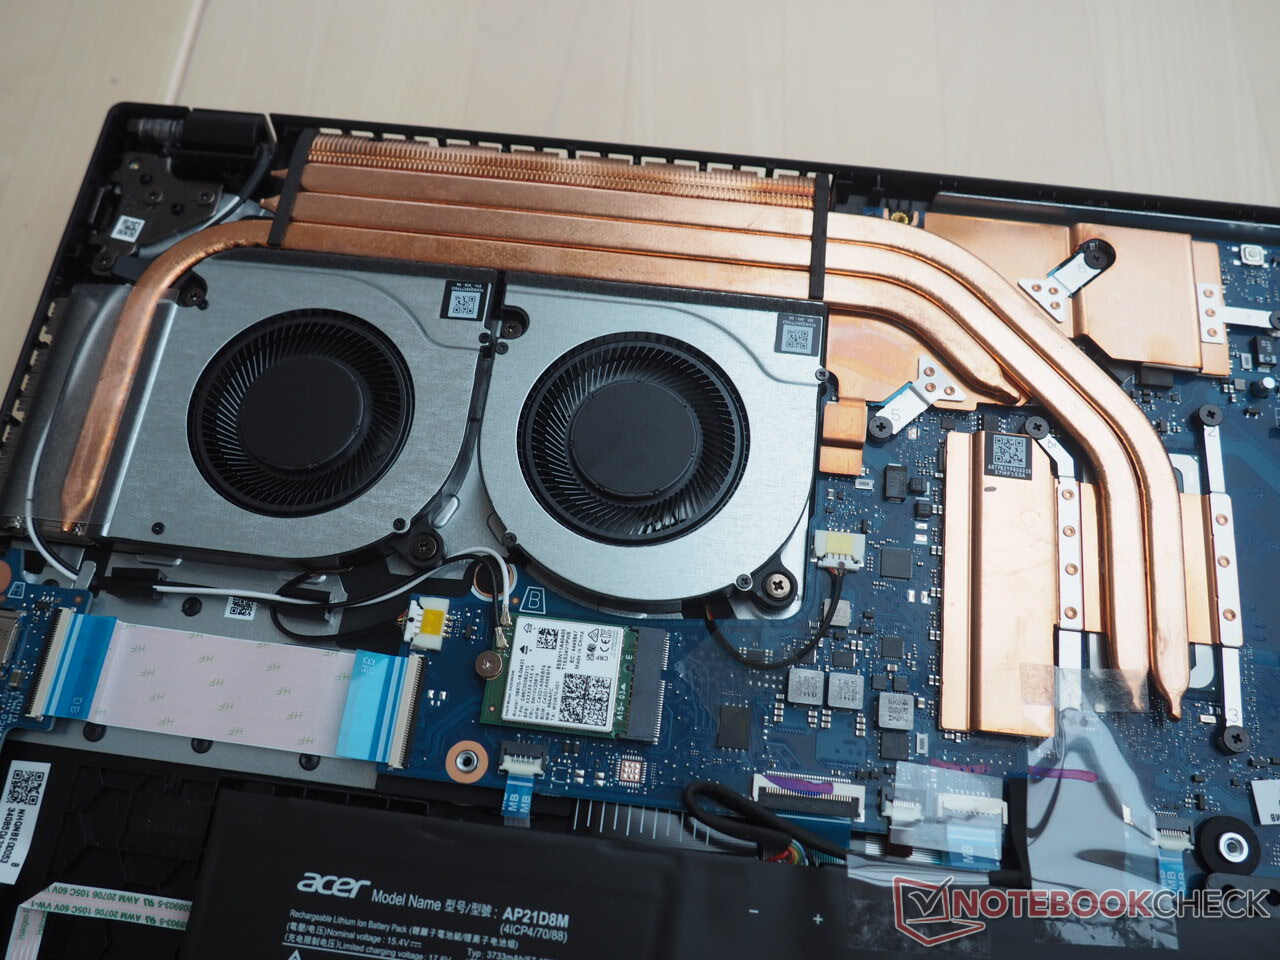
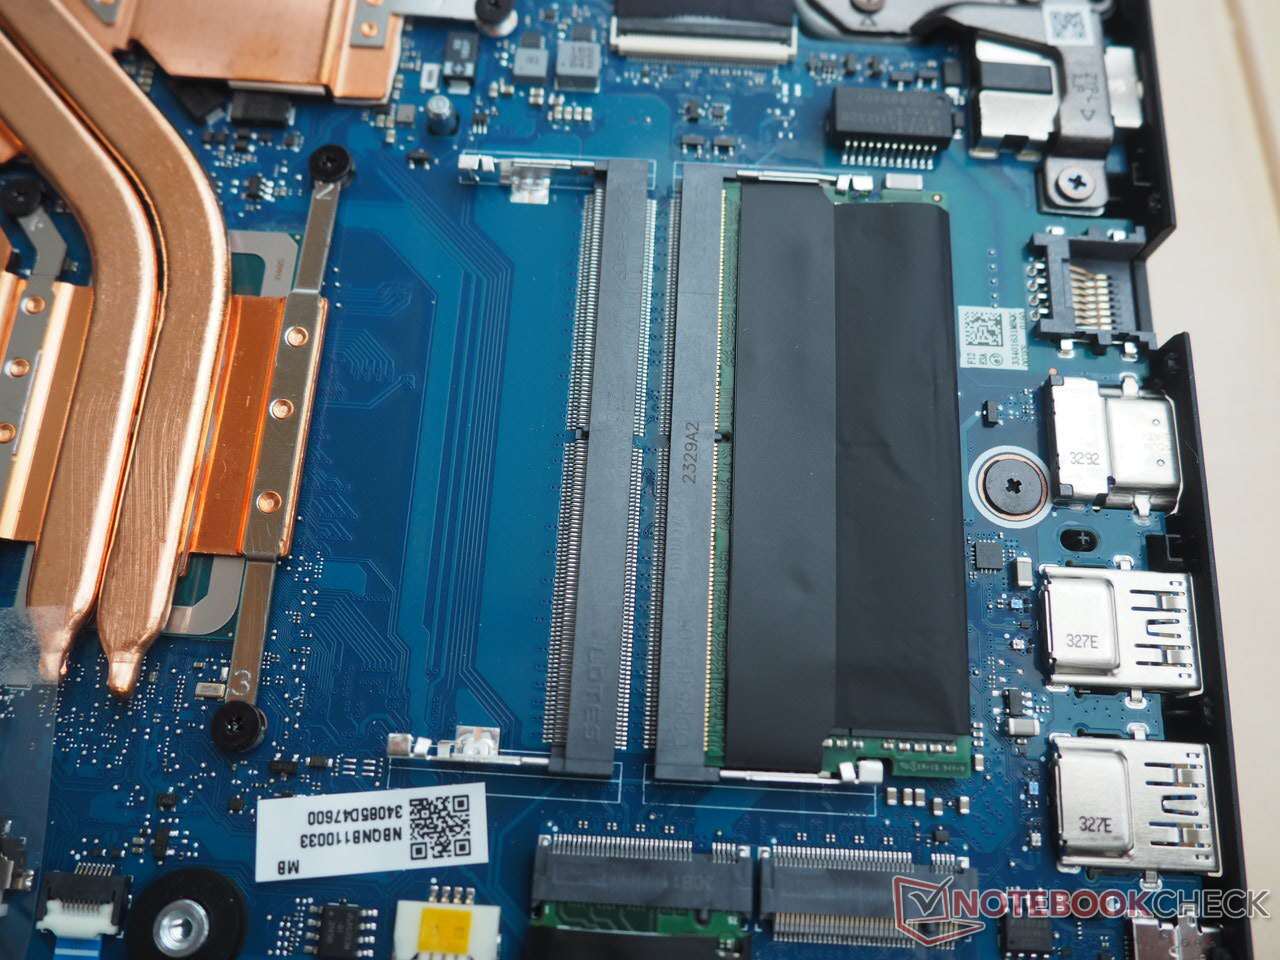
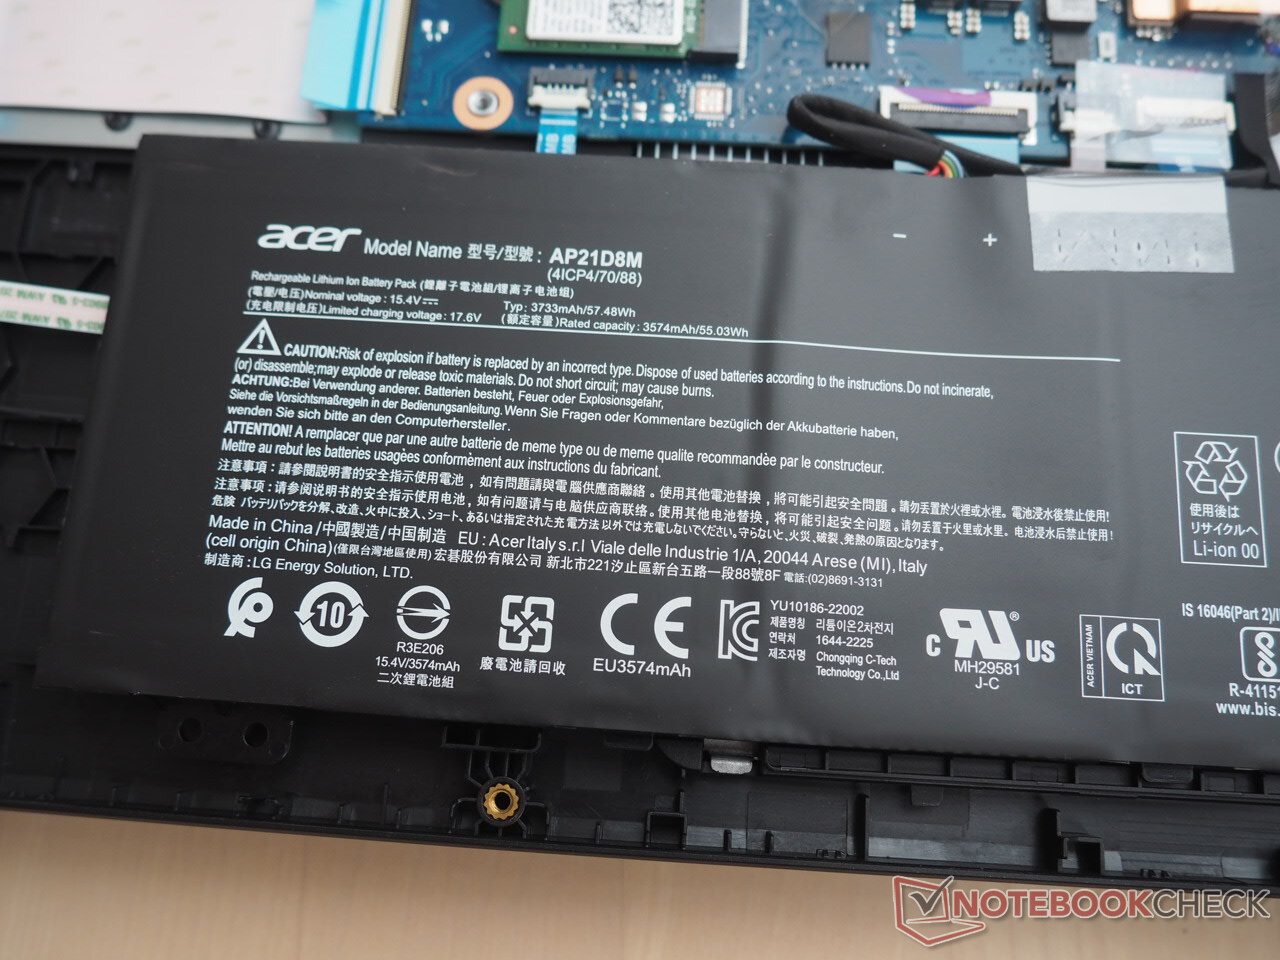
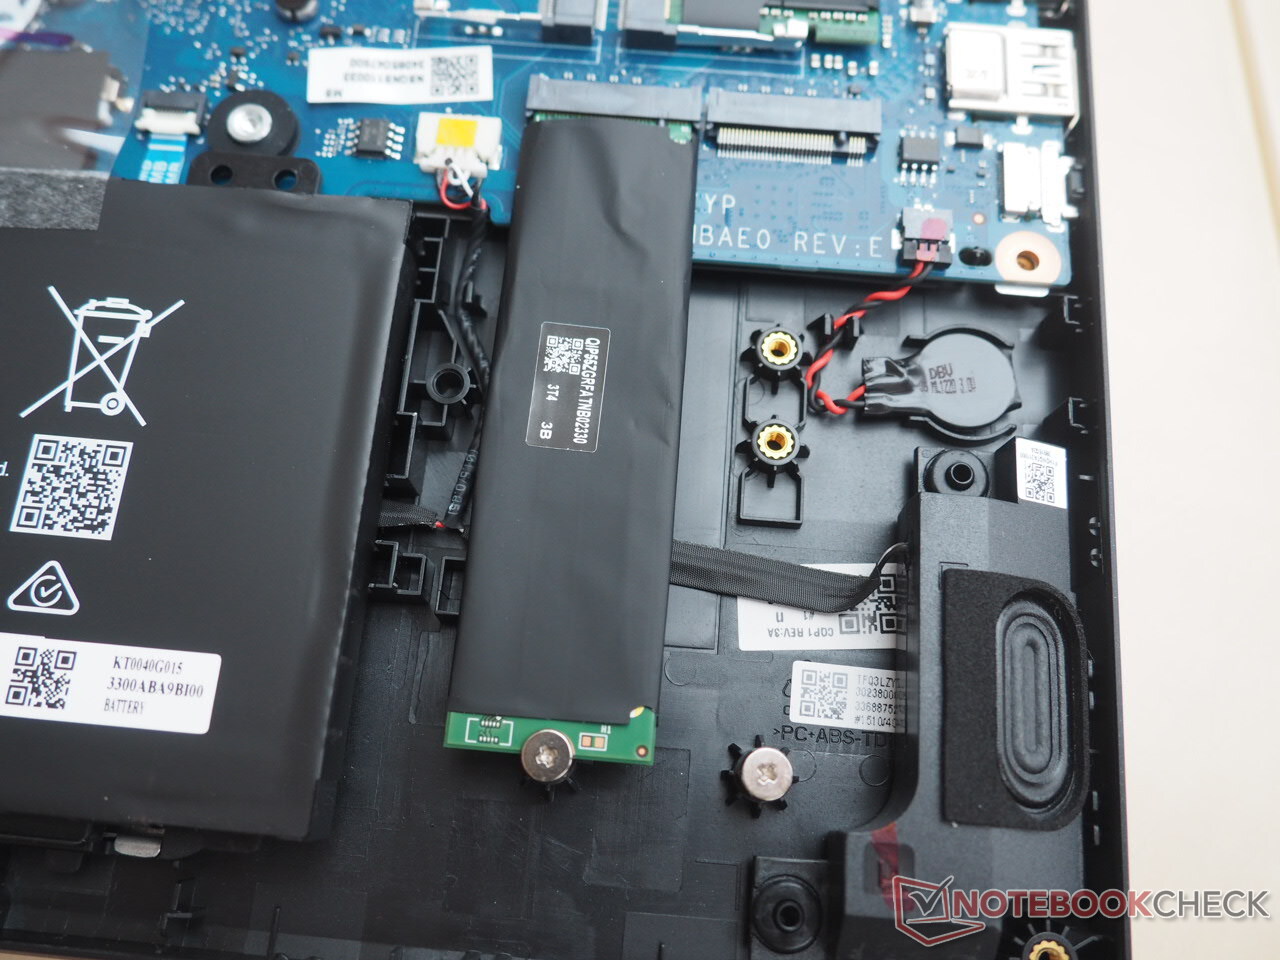
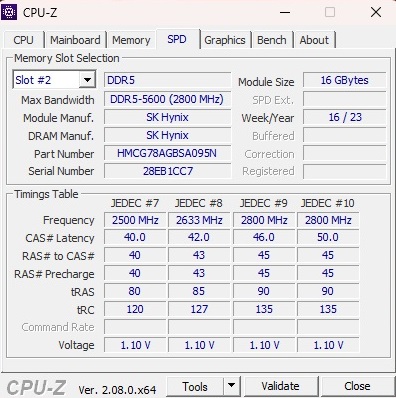
One advantage of the Nitro is its serviceability. Despite the fact that the bottom cover is held on quite firmly even after the eleven case screws have been removed, once you get inside the 15-inch laptop, you’ll have access to a free M.2 slot and an empty RAM slot (see photos). Though the single-RAM configuration in our review unit can negatively impact performance in some situations. One thing to take note: the battery isn’t screwed down and can theoretically fall out of the chassis when you’re opening up the laptop.
Warranty
Acer provides a two-year warranty on the Nitro V 15 in Germany. However, warranty period may vary depending on region.
Input devices
Keyboard
The input devices are neither awful nor superb. Similar to most laptops with conventional keyboards, typing on the Nitro feels a bit mushy due to a lack of tactile feedback. Acer could also have done better with the layout. For instance, there is enough space for a standard four-column numpad rather than a three-column one. It's likewise a shame that the arrow keys are not great and barely suitable for gaming and that the power button isn’t located separately. The function keys being almost puny doesn't help either. Positive aspects worth mentioning include the white backlight with adjustable brightness and the dedicated button to open the tuning software (NitroSense).
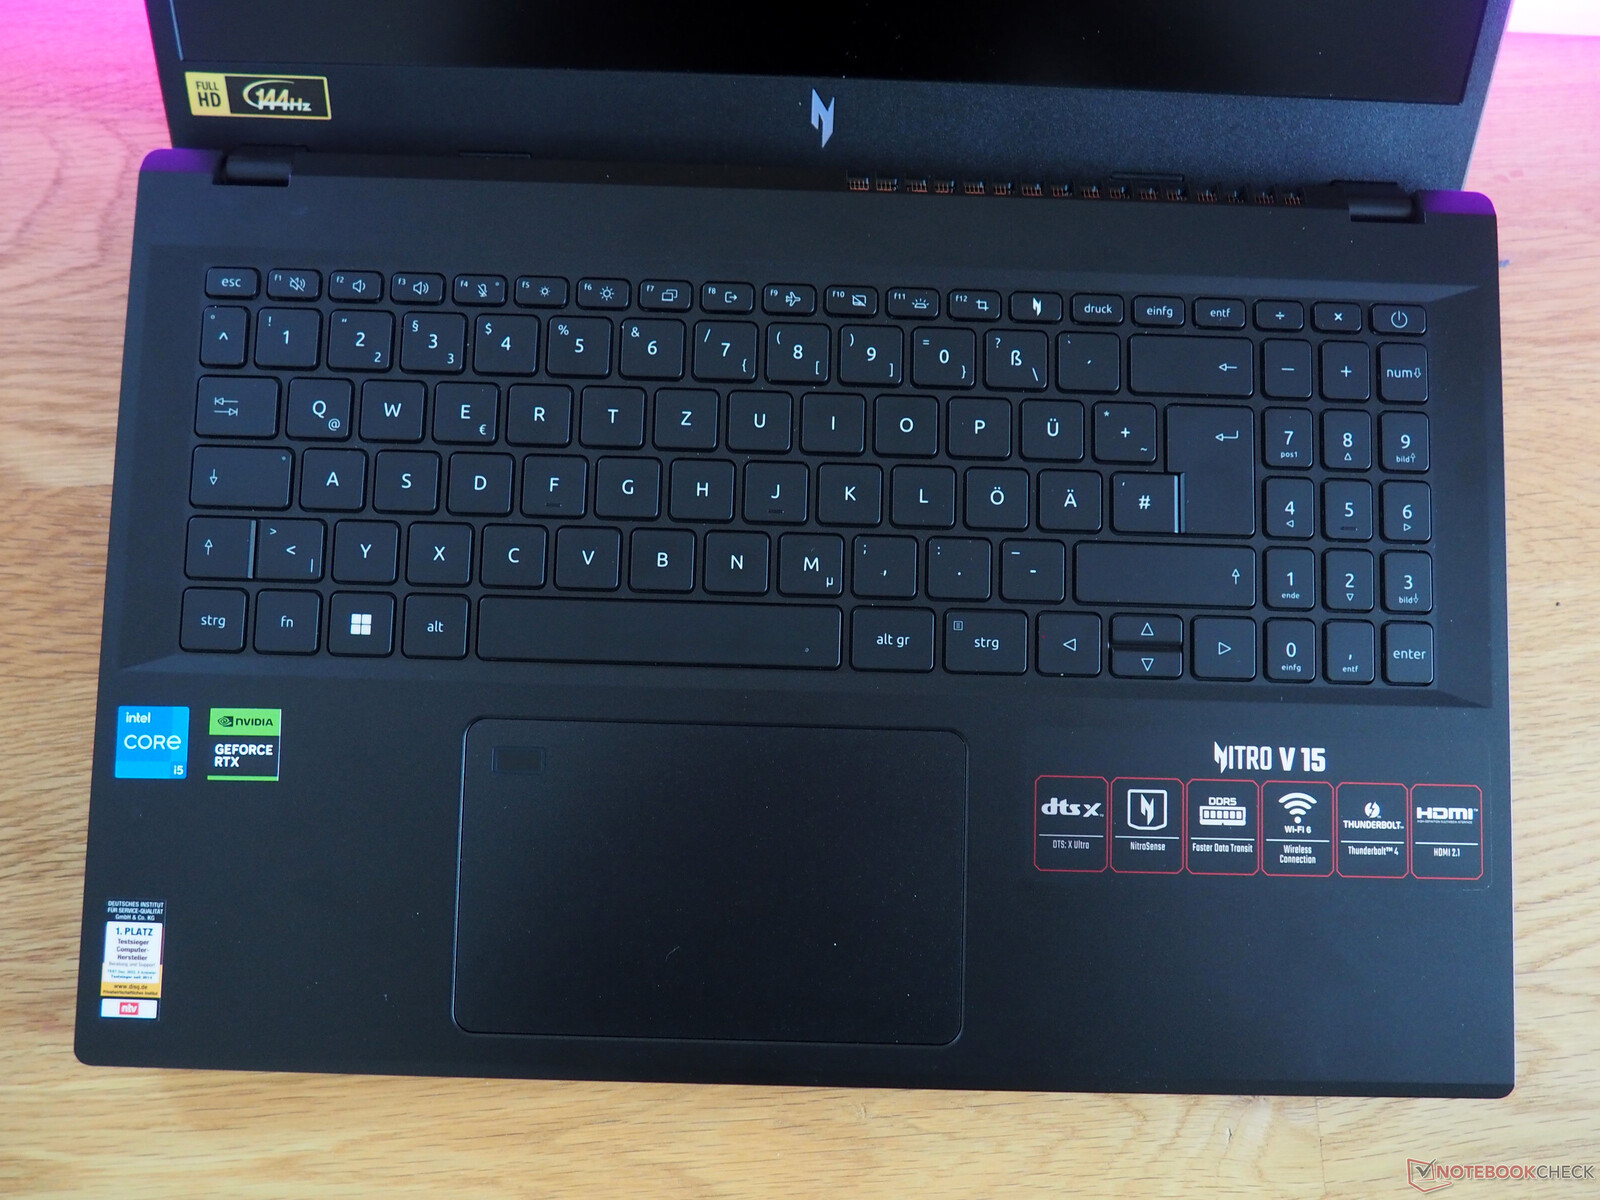
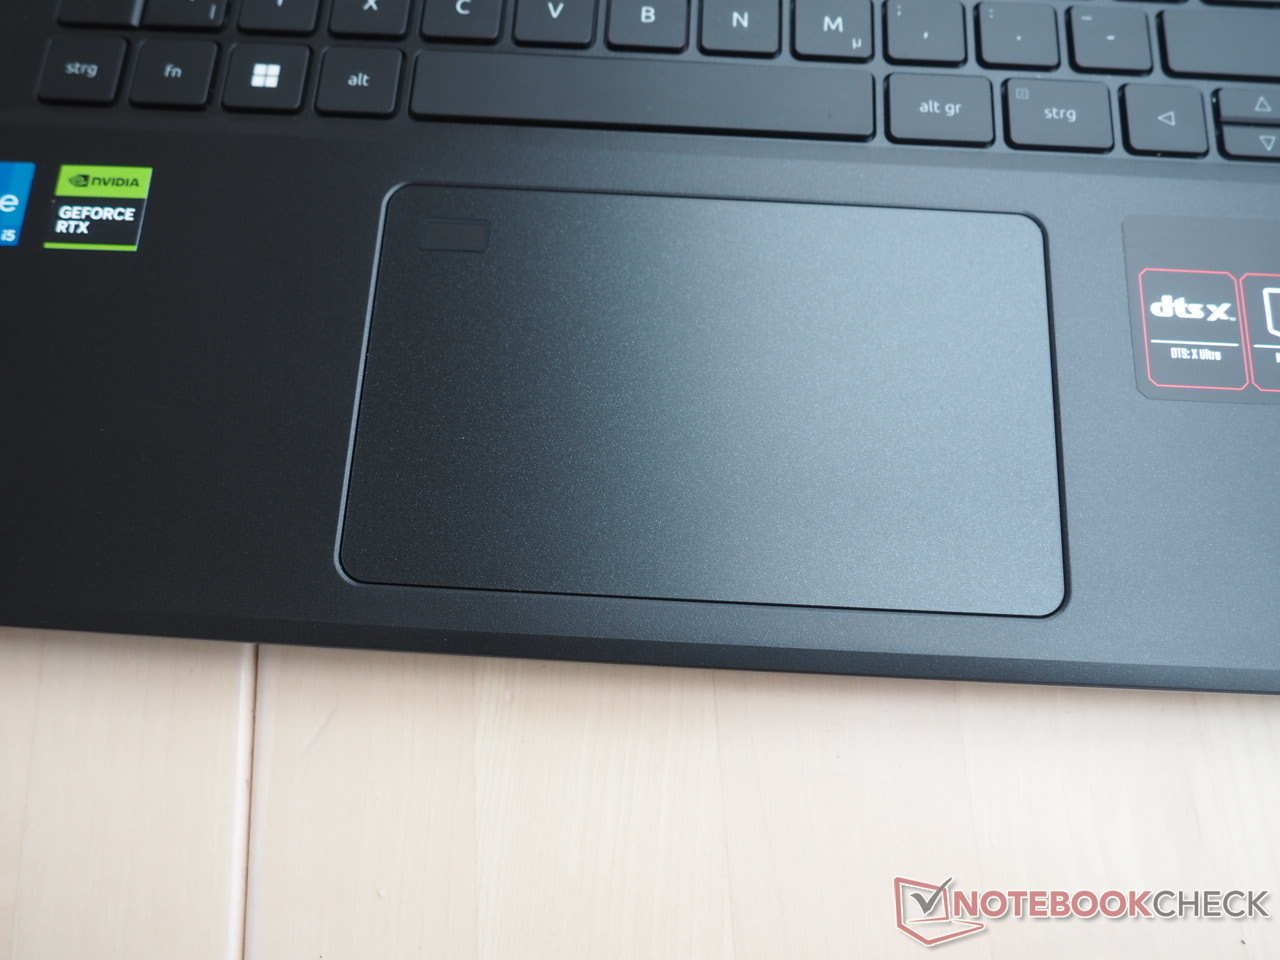
Touchpad
The touchpad mostly stands out with the built-in fingerprint scanner at its top left corner. The mouse replacement is other rather average in terms of quality. The level of precision and smoothness is reasonable without being mind-blowing. The situation is similar with the multi-touch support and feel of the click surfaces. Depending on how hard you press the touchpad, it unfortunately has a tendency to rattle.
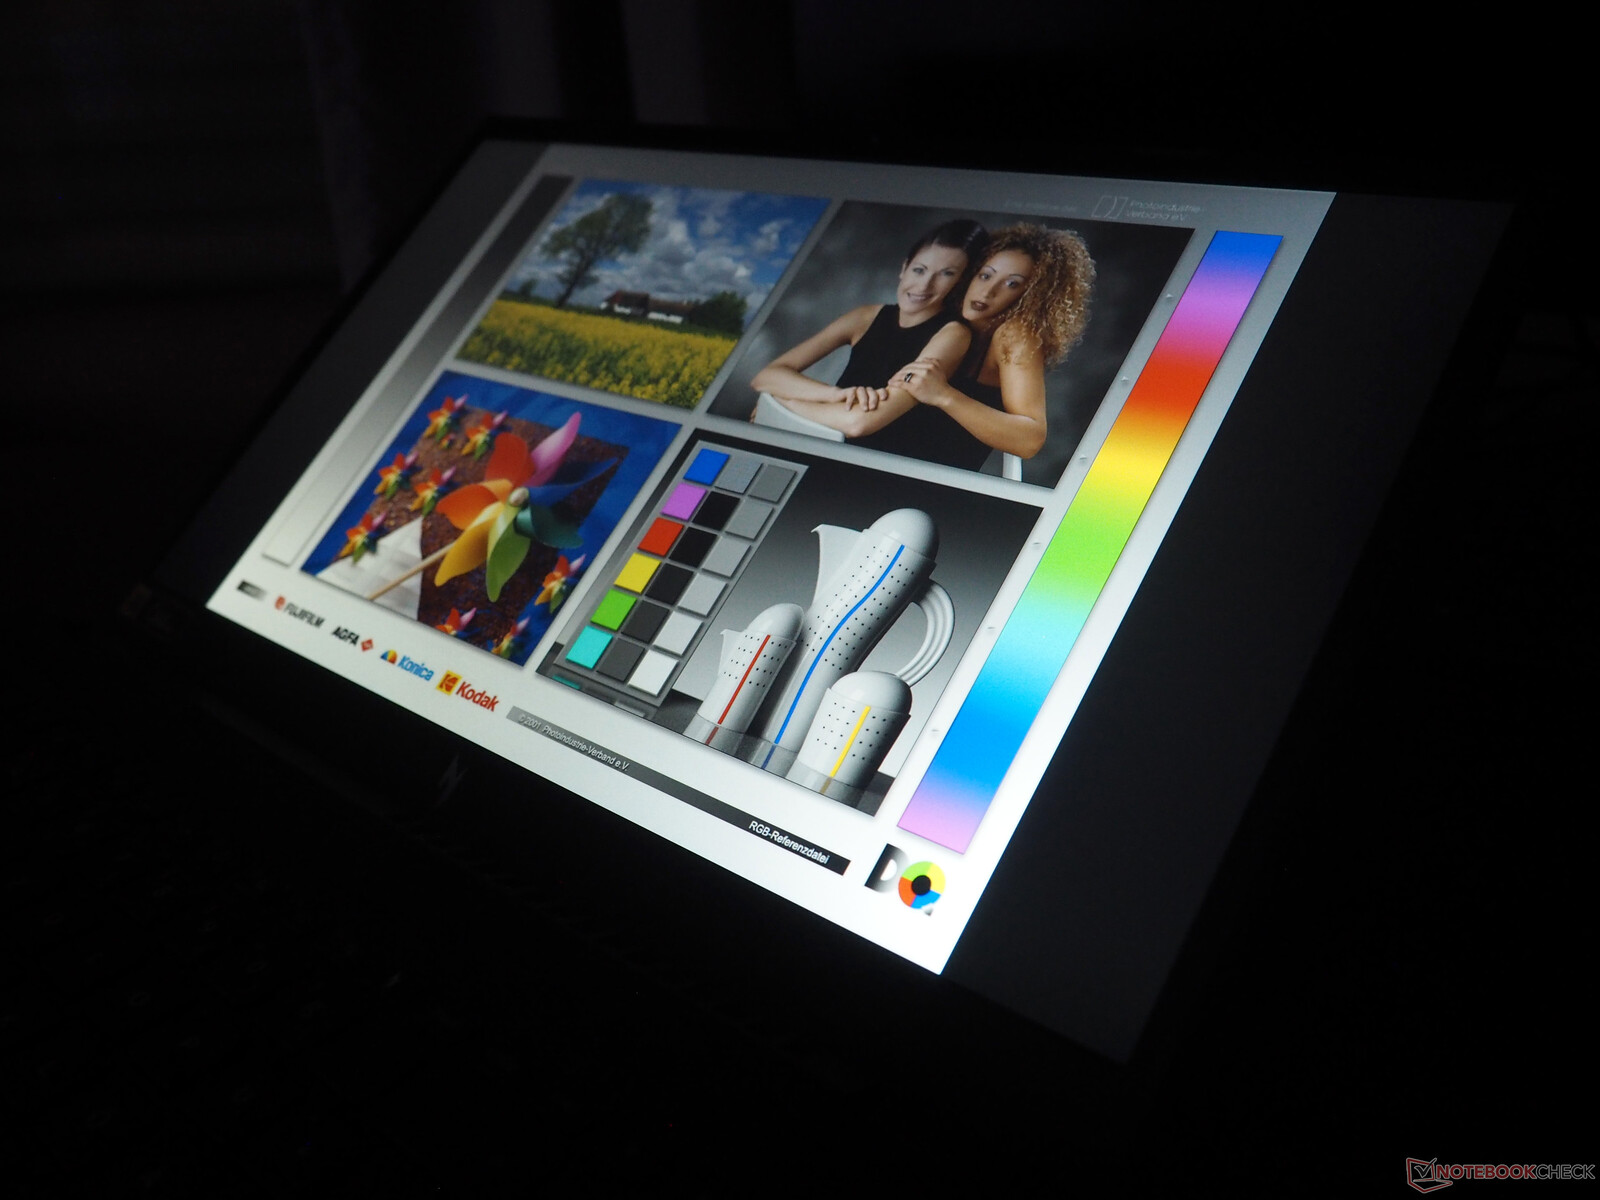
Display
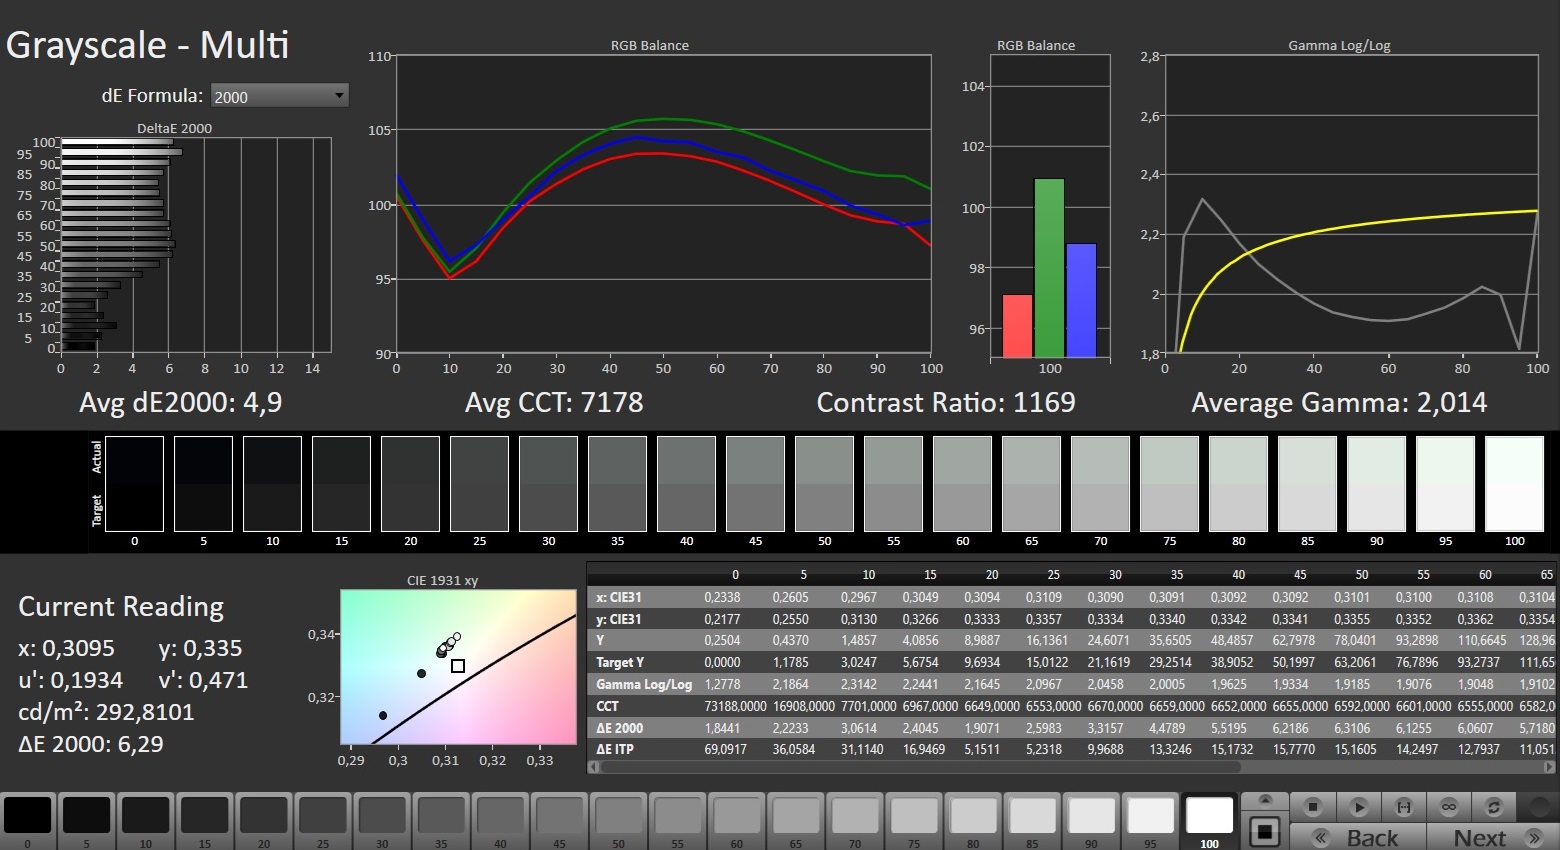
The Nitro V 15’s low-quality display is one of its biggest weaknesses. At first glance, the results obtained don’t seem all too disappointing: the black level of 0.25 cd/m² and contrast ratio of 1168:1 are similar to what can you get from the competitors or a typical IPS panel. This also applies to the viewing angle.
| |||||||||||||||||||||||||
Brightness Distribution: 80 %
Center on Battery: 292 cd/m²
Contrast: 1168:1 (Black: 0.25 cd/m²)
ΔE ColorChecker Calman: 7.15 | ∀{0.5-29.43 Ø4.73}
calibrated: 4.13
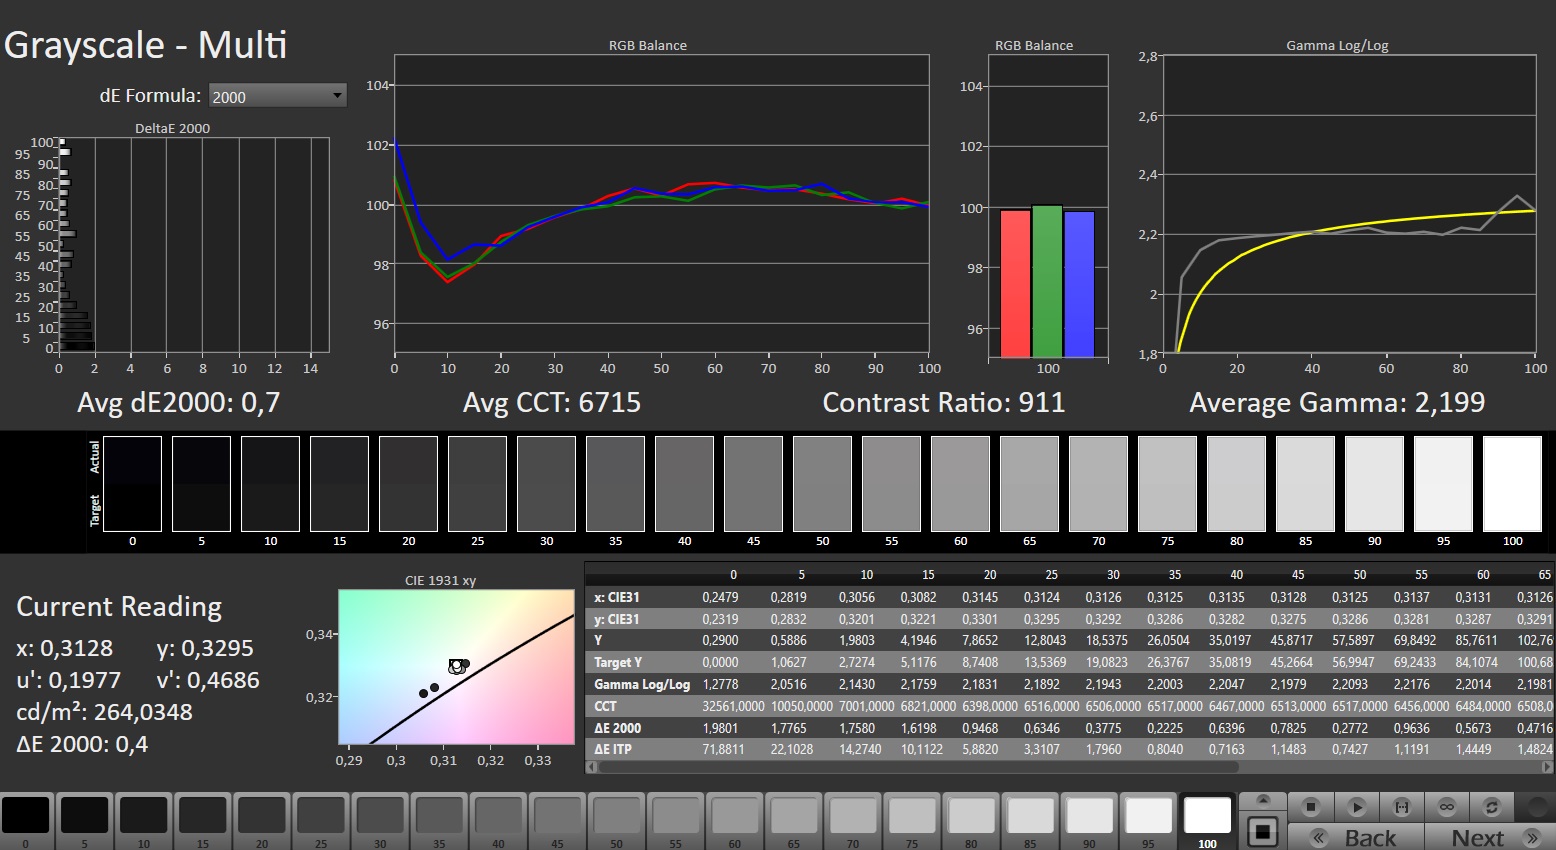
ΔE Greyscale Calman: 4.9 | ∀{0.09-98 Ø4.97}
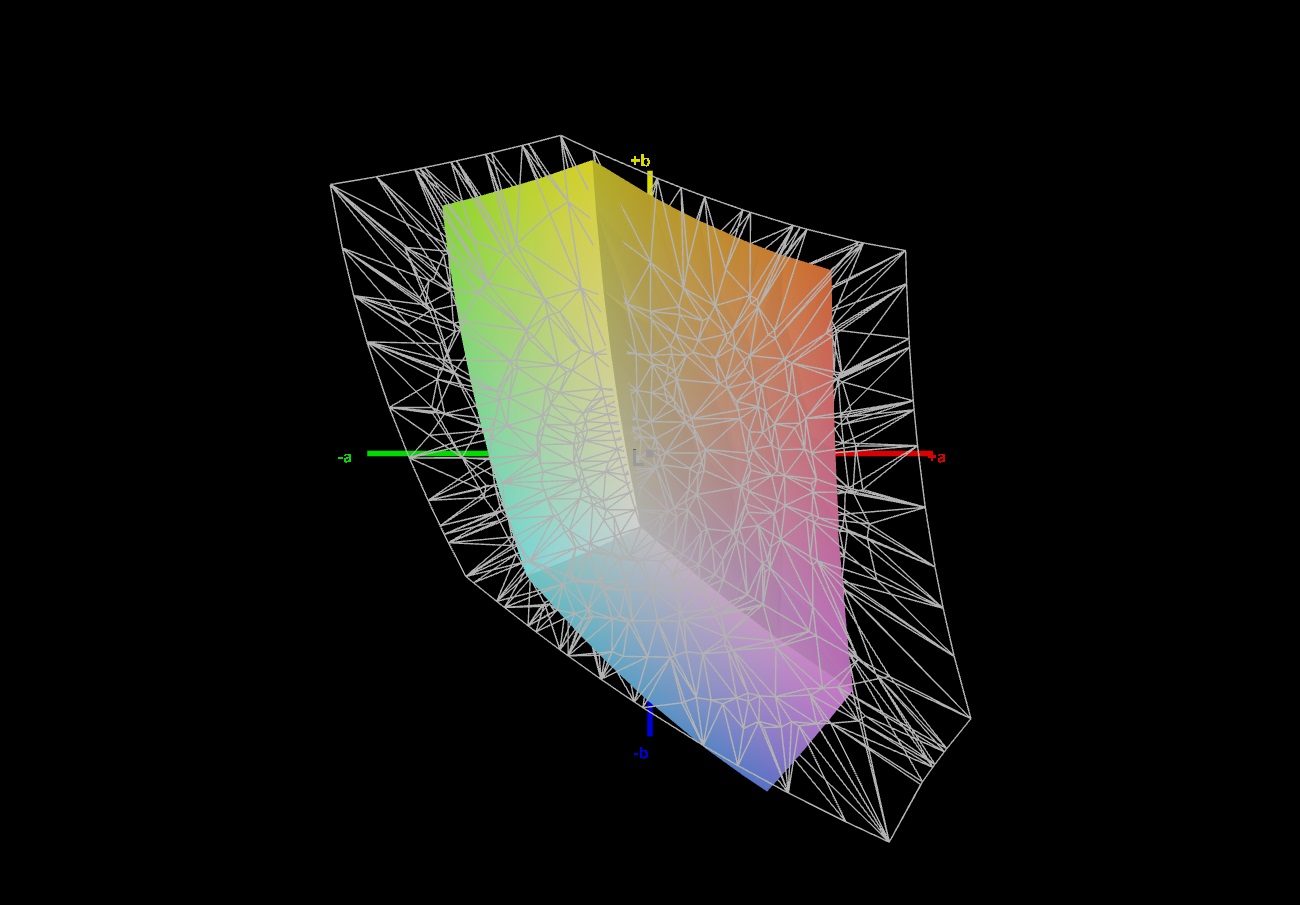
41.4% AdobeRGB 1998 (Argyll 3D)
60% sRGB (Argyll 3D)
40% Display P3 (Argyll 3D)
Gamma: 2.014
CCT: 7178 K
| Acer Nitro V 15 ANV15-51-582S LG LP156WFJ-SPB4 (LGD0742), IPS, 1920x1080, 15.6" | Medion Erazer Crawler E40 - MD 62518 BOE HF NV156FHM-N4G, IPS, 1920x1080, 15.6" | Lenovo LOQ 15IRH8 Core i7 BOE CQ NE156QHM-NY4, IPS, 2560x1440, 15.6" | Asus TUF A15 FA507 N156HMA-GA1, IPS, 1920x1080, 15.6" | Schenker XMG Apex 15 (Late 23) BOE CQ NE156QHM-NY2, IPS, 2560x1440, 15.6" | |
|---|---|---|---|---|---|
| Display | 52% | 64% | 61% | 66% | |
| Display P3 Coverage (%) | 40 | 61.4 54% | 66.3 66% | 64.9 62% | 67.5 69% |
| sRGB Coverage (%) | 60 | 89.7 50% | 96.6 61% | 96.5 61% | 97.6 63% |
| AdobeRGB 1998 Coverage (%) | 41.4 | 63.2 53% | 67.7 64% | 66.6 61% | 68.9 66% |
| Response Times | 70% | 76% | 15% | 64% | |
| Response Time Grey 50% / Grey 80% * (ms) | 34.2 ? | 8 ? 77% | 5 ? 85% | 30.4 ? 11% | 13.2 ? 61% |
| Response Time Black / White * (ms) | 25.8 ? | 9.6 ? 63% | 8.41 ? 67% | 20.8 ? 19% | 8.8 ? 66% |
| PWM Frequency (Hz) | |||||
| Screen | 17% | 23% | 41% | 24% | |
| Brightness middle (cd/m²) | 292 | 364 25% | 373 28% | 288 -1% | 336 15% |
| Brightness (cd/m²) | 263 | 351 33% | 365 39% | 271 3% | 307 17% |
| Brightness Distribution (%) | 80 | 91 14% | 90 13% | 91 14% | 77 -4% |
| Black Level * (cd/m²) | 0.25 | 0.43 -72% | 0.33 -32% | 0.17 32% | 0.38 -52% |
| Contrast (:1) | 1168 | 847 -27% | 1130 -3% | 1694 45% | 884 -24% |
| Colorchecker dE 2000 * | 7.15 | 3.98 44% | 4.19 41% | 1.9 73% | 1.96 73% |
| Colorchecker dE 2000 max. * | 15.51 | 6.38 59% | 8.47 45% | 3.3 79% | 5.07 67% |
| Colorchecker dE 2000 calibrated * | 4.13 | 1.36 67% | 1.07 74% | 0.9 78% | 1.27 69% |
| Greyscale dE 2000 * | 4.9 | 4.39 10% | 5 -2% | 2.7 45% | 2.3 53% |
| Gamma | 2.014 109% | 2.58 85% | 1.93 114% | 2.32 95% | 2.017 109% |
| CCT | 7178 91% | 7316 89% | 7520 86% | 6535 99% | 6644 98% |
| Total Average (Program / Settings) | 46% /
32% | 54% /
39% | 39% /
42% | 51% /
39% |
* ... smaller is better
But you'll start noticing a few shortcomings upon a closer look. First off, the average peak brightness of 263 cd/m² is only adequate for indoor use; the 15-inch laptop doesn’t cut a good figure at all in an outdoor setting.
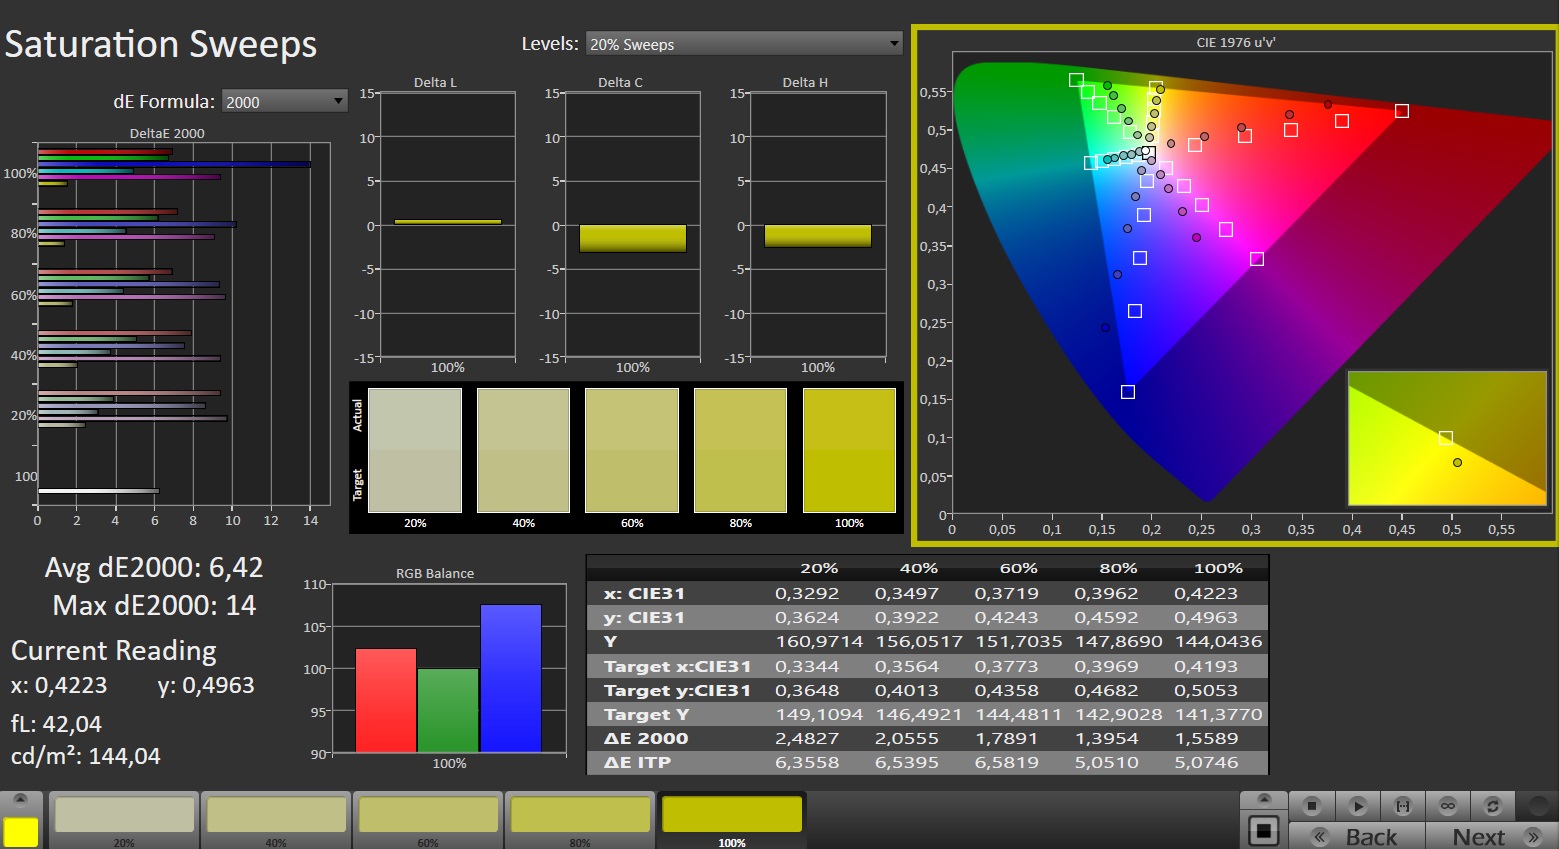
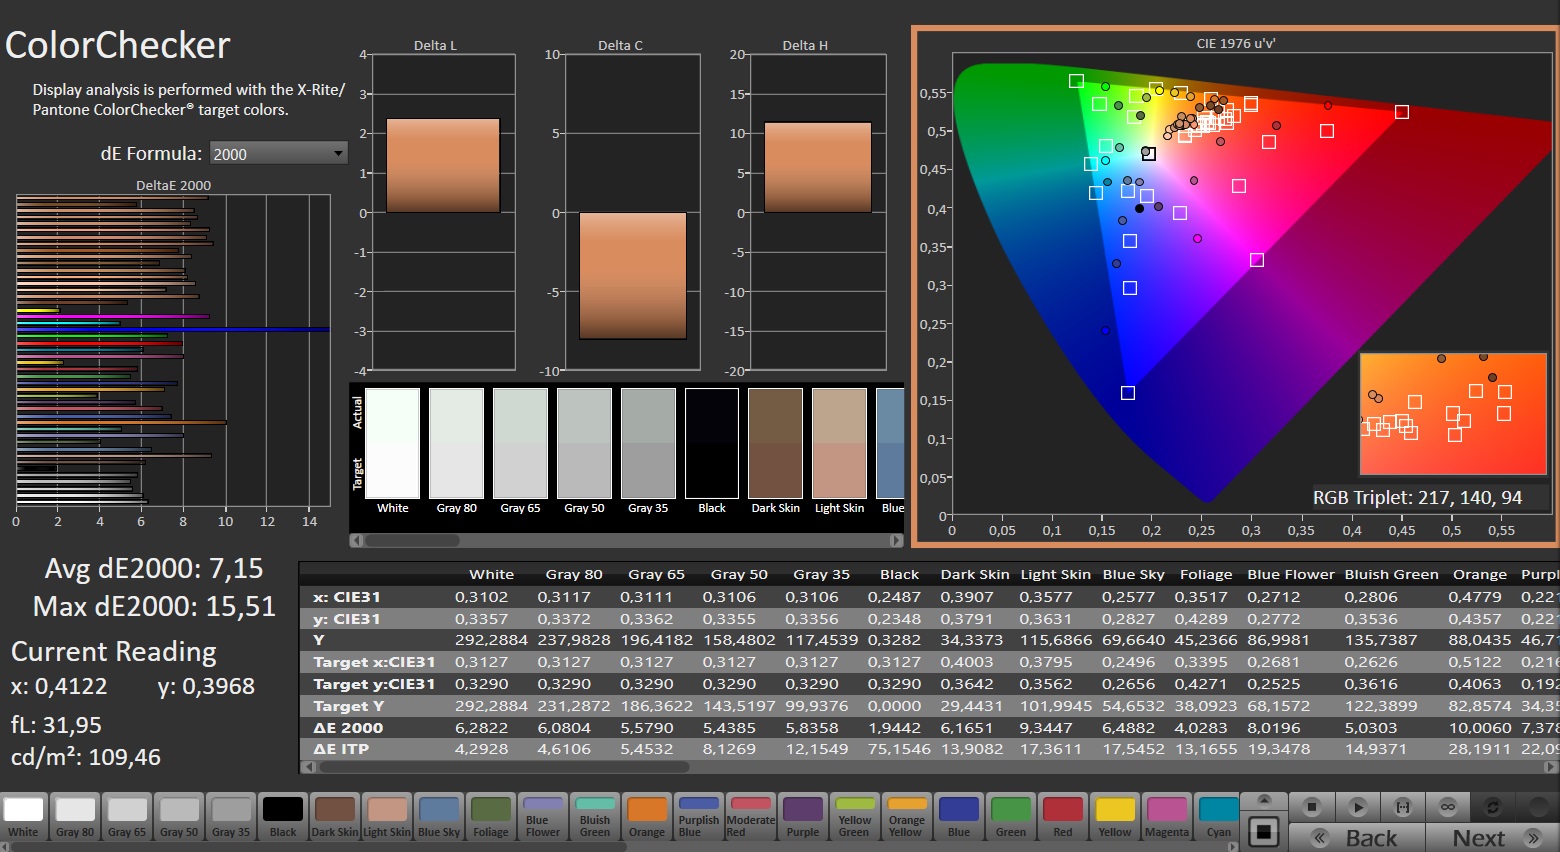
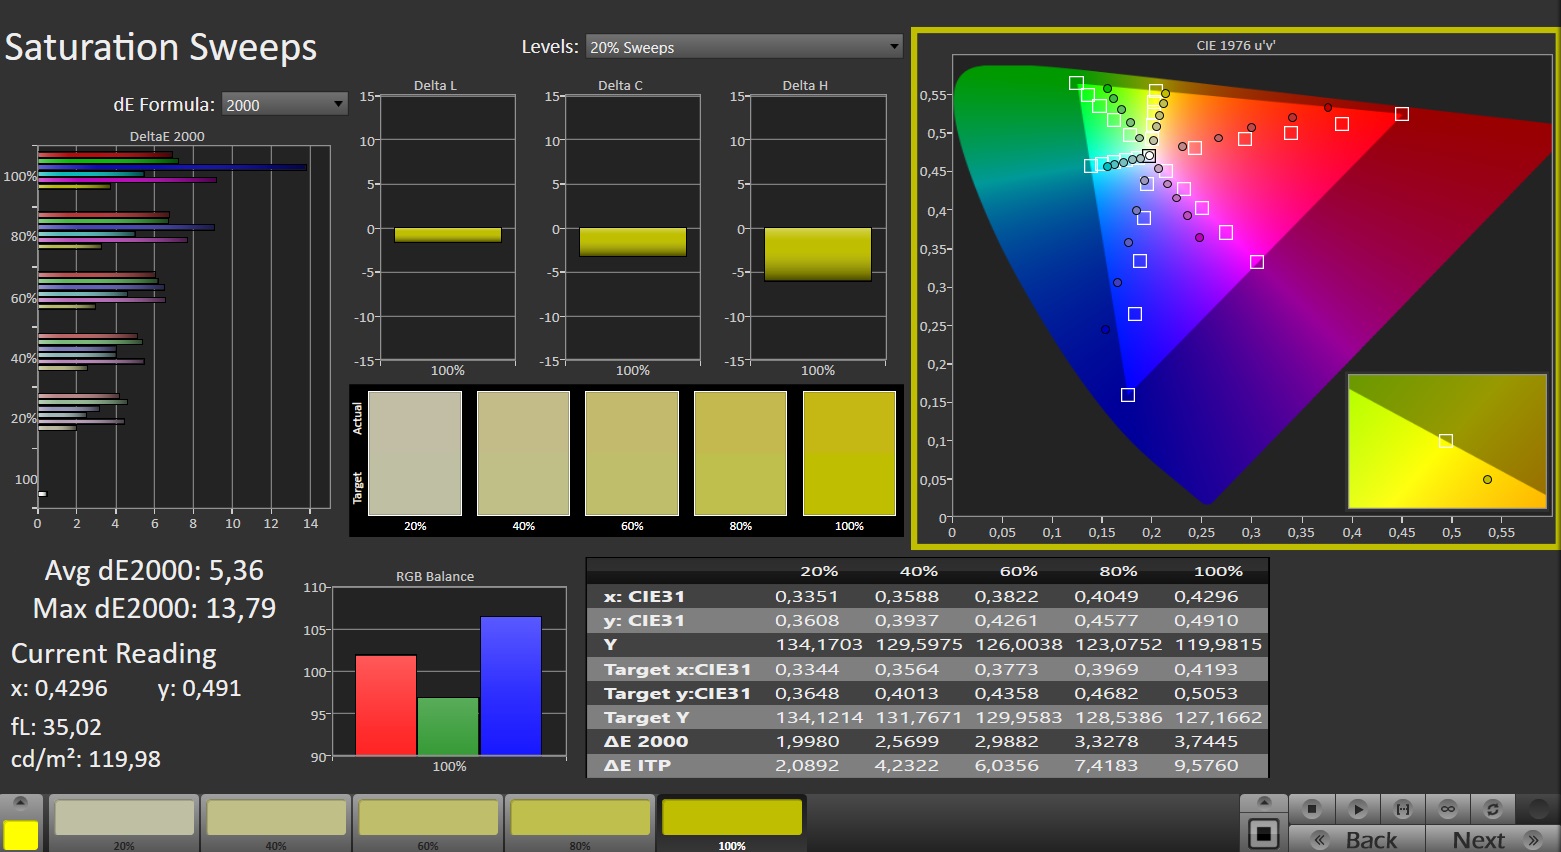
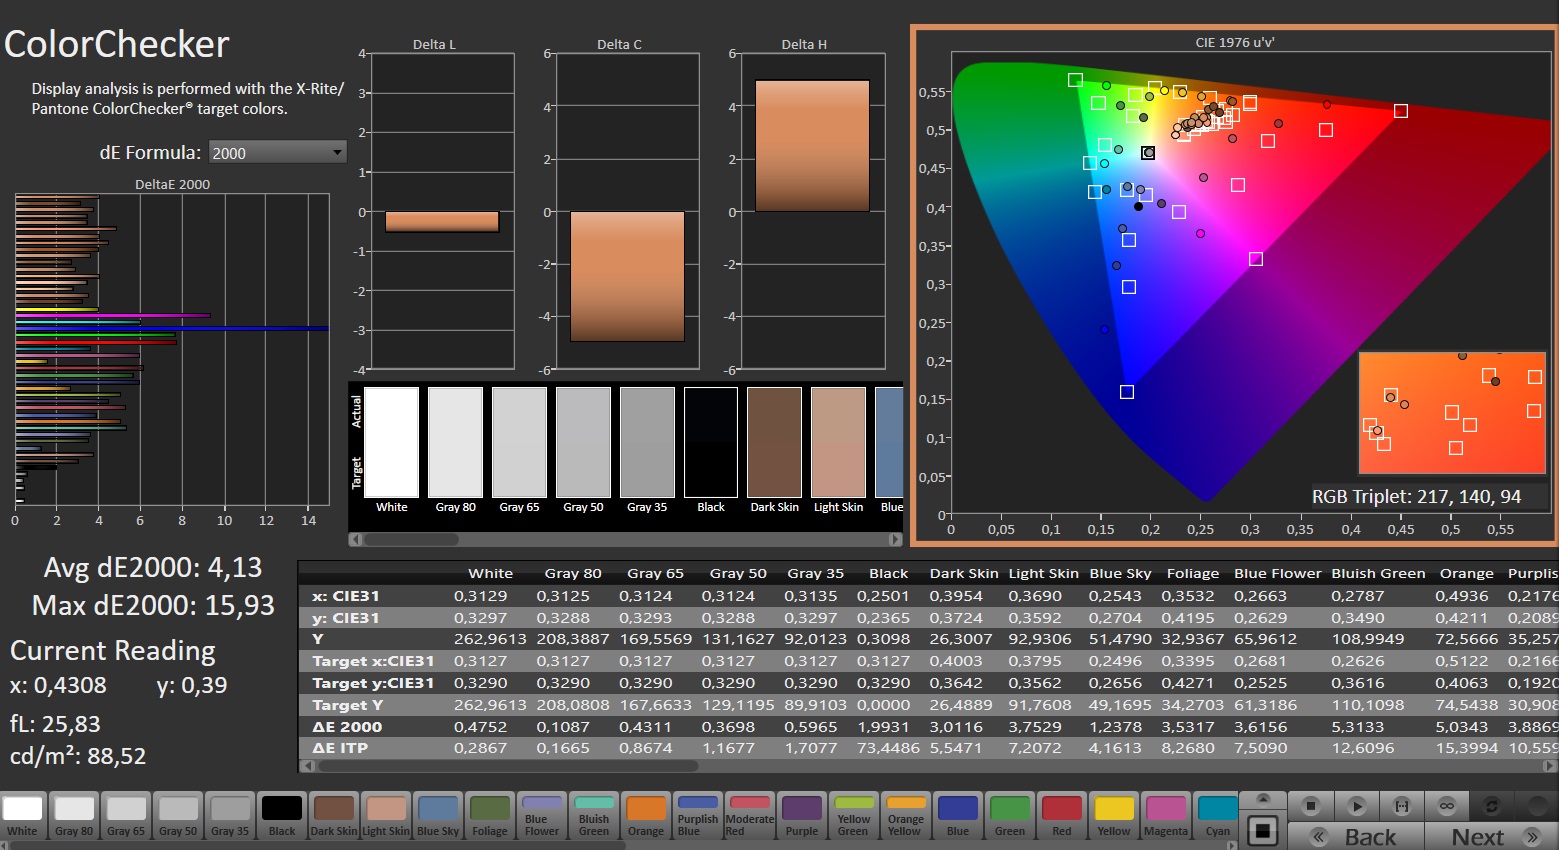
The Nitro V 15 also offers very limited colour coverage: having 60% sRGB and roughly 40% AdobeRGB and DCI-P3 coverage just isn’t going to cut it in 2024 even for a budget gaming notebook.

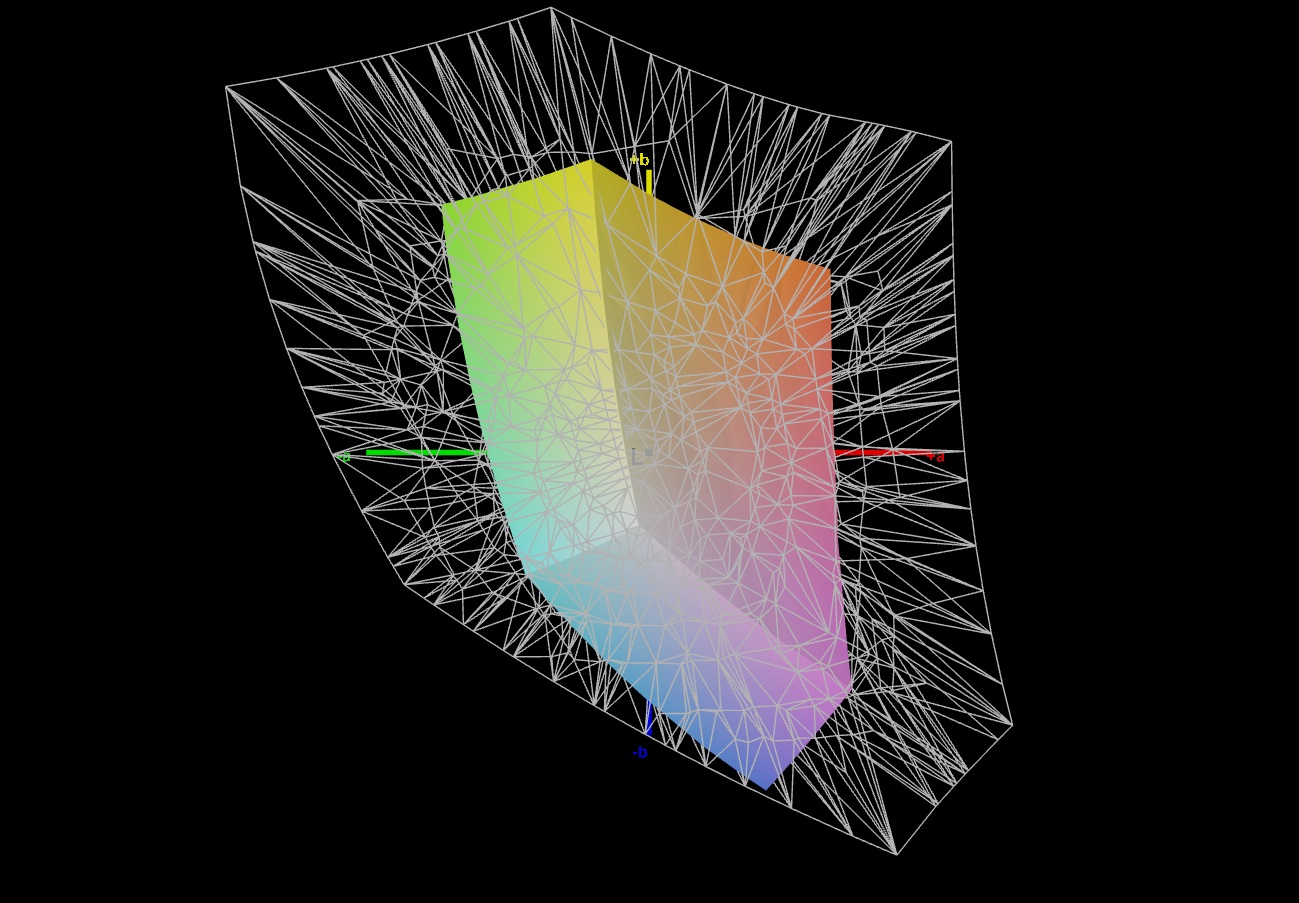
The competitors demonstrate how to do things much better. The Acer Nitro also took the last place in colour accuracy and response time.
Display Response Times
| ↔ Response Time Black to White | ||
|---|---|---|
| 25.8 ms ... rise ↗ and fall ↘ combined | ↗ 13.8 ms rise | 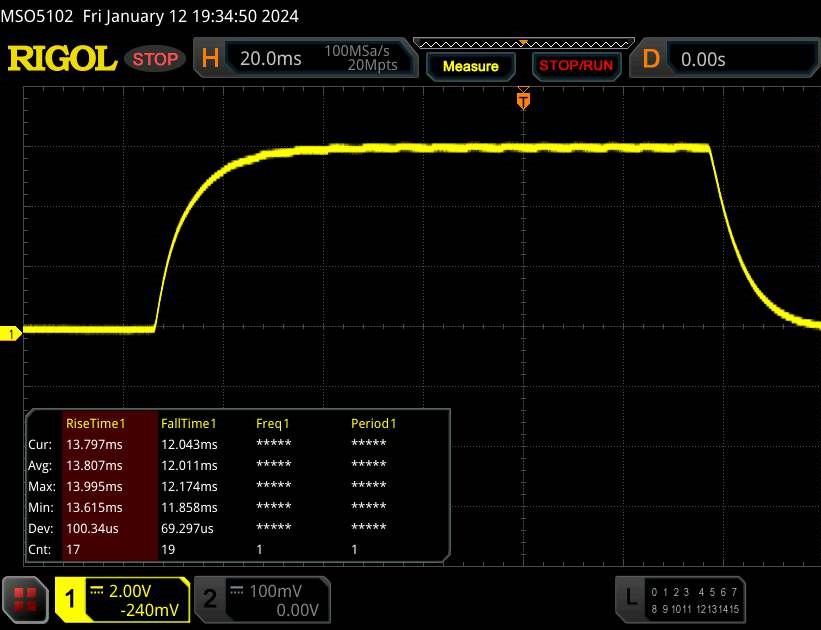 |
| ↘ 12 ms fall | ||
| The screen shows relatively slow response rates in our tests and may be too slow for gamers. In comparison, all tested devices range from 0.1 (minimum) to 240 (maximum) ms. » 62 % of all devices are better. This means that the measured response time is worse than the average of all tested devices (19.9 ms). | ||
| ↔ Response Time 50% Grey to 80% Grey | ||
| 34.2 ms ... rise ↗ and fall ↘ combined | ↗ 15.8 ms rise | 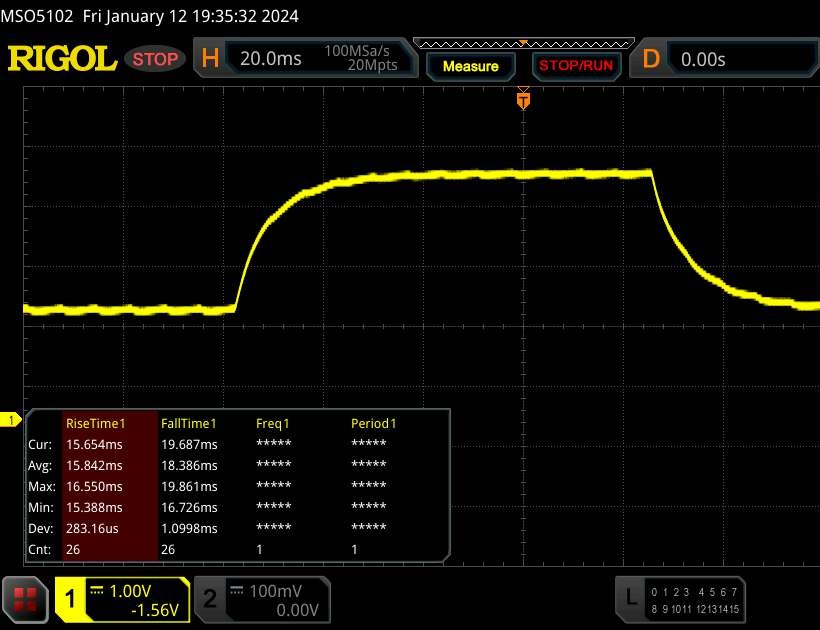 |
| ↘ 18.4 ms fall | ||
| The screen shows slow response rates in our tests and will be unsatisfactory for gamers. In comparison, all tested devices range from 0.165 (minimum) to 636 (maximum) ms. » 48 % of all devices are better. This means that the measured response time is similar to the average of all tested devices (31.1 ms). | ||
Screen Flickering / PWM (Pulse-Width Modulation)
| Screen flickering / PWM not detected | 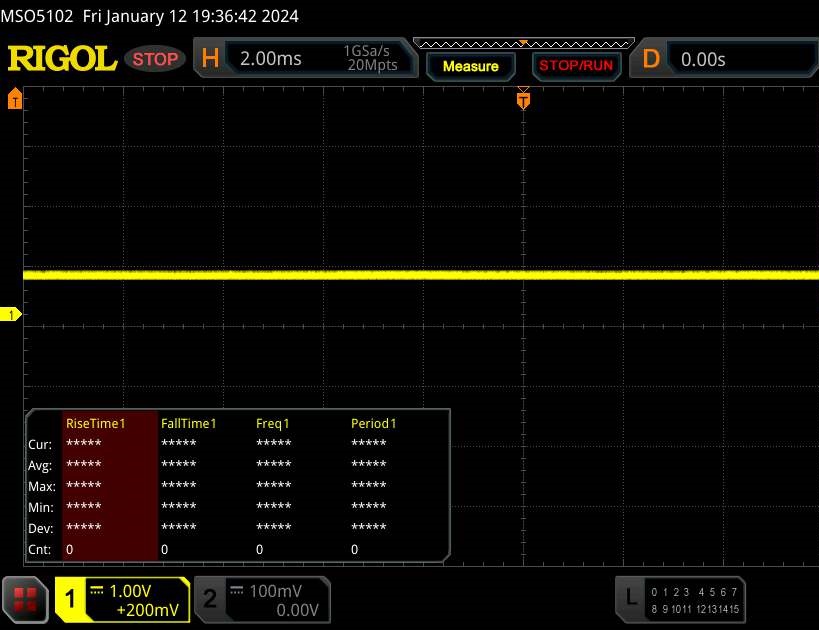 | ||
In comparison: 52 % of all tested devices do not use PWM to dim the display. If PWM was detected, an average of 7798 (minimum: 5 - maximum: 343500) Hz was measured. | |||
Performance
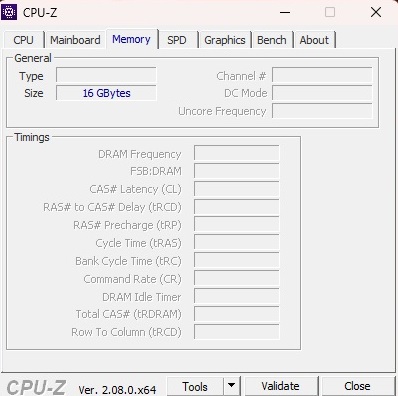
The Nitro V 15 is a mid-range device in terms of both its CPU and GPU performance. The 16 GB of RAM is quite reasonable considering the laptop’s price, but the SSD falls a bit short with its capacity of just 512 GB.

Test conditions
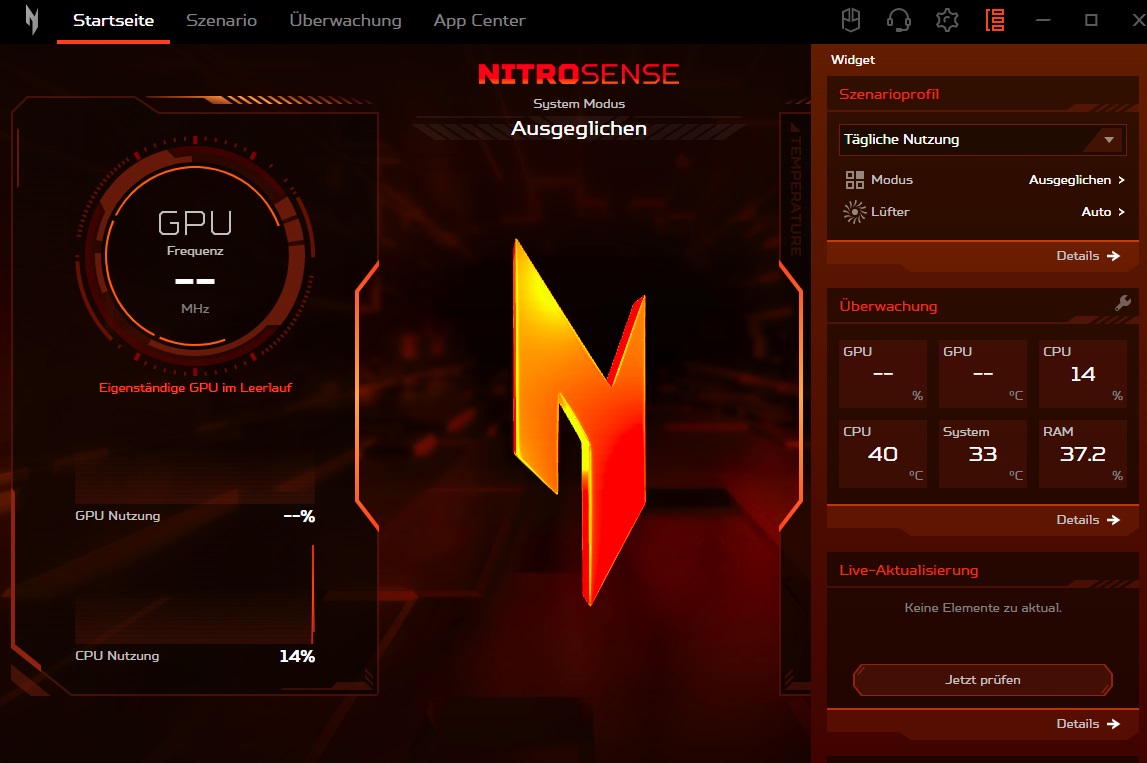
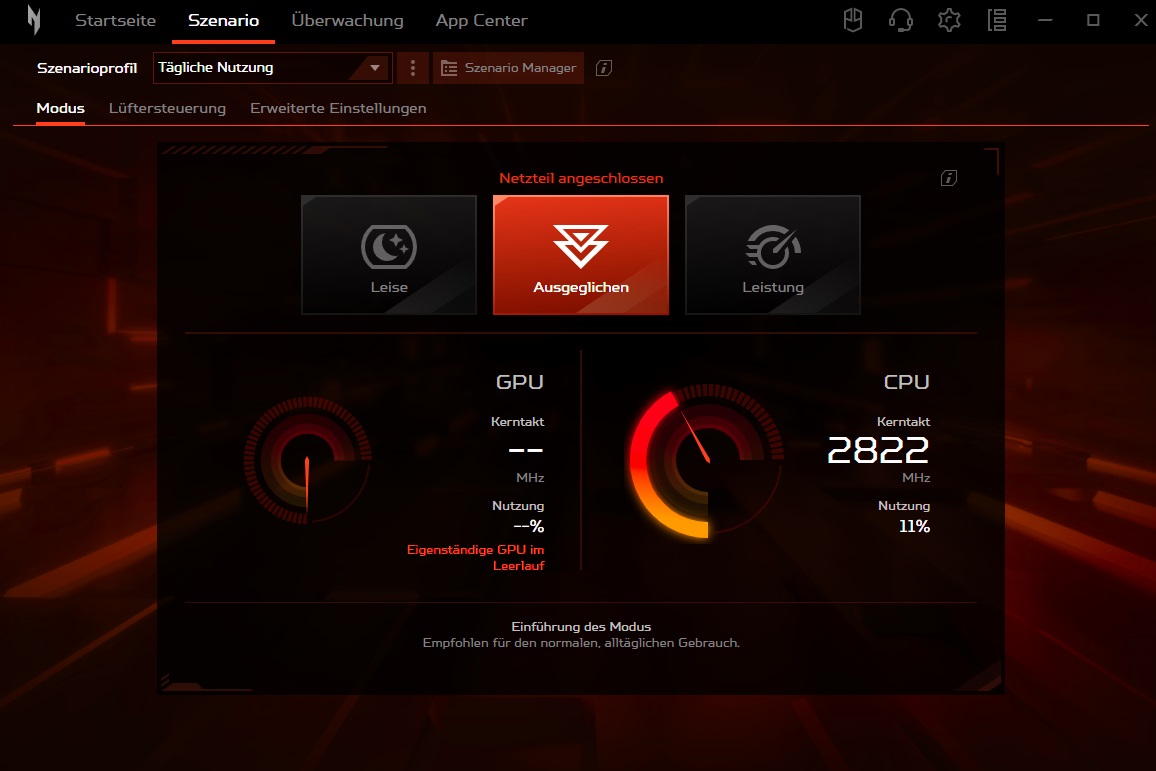
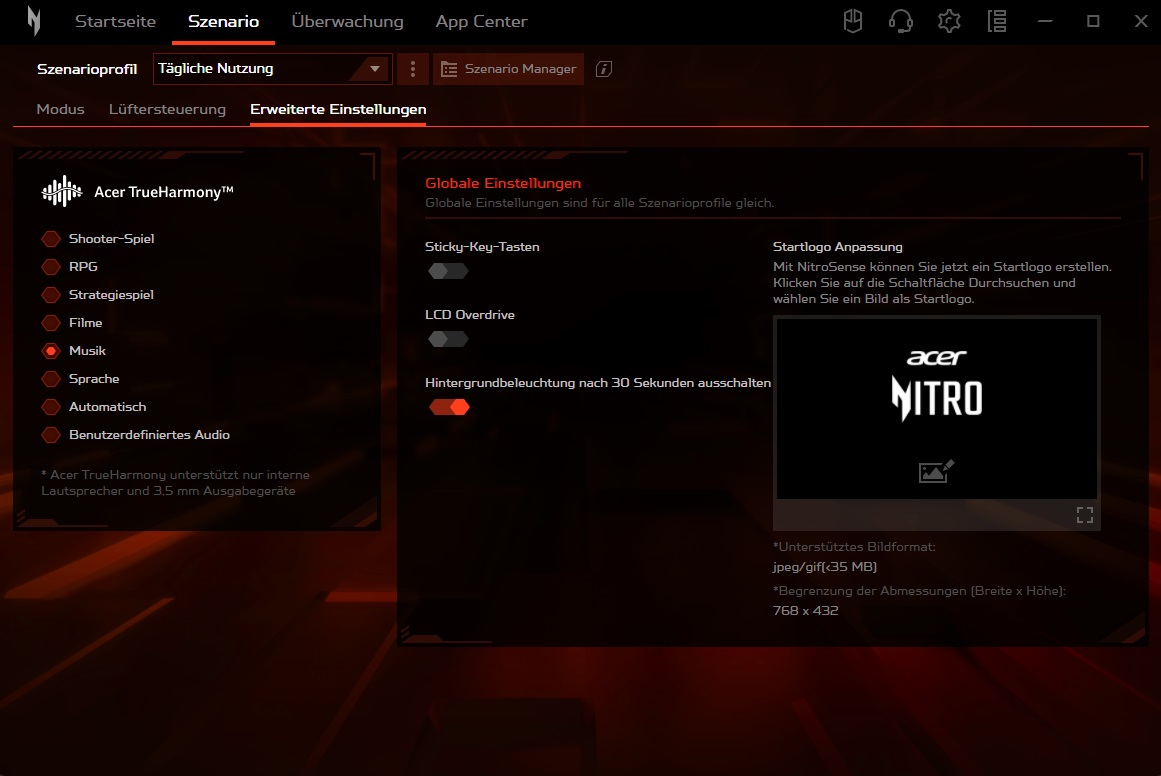
The preinstalled NitroSense app lets users adjust various system settings. The “Scenario” tab is particularly interesting for real-life use. It allows you to tinker with the power plan (“Mode” menu) and fan behaviour (“Fan Control” menu). Our measurements were performed in Balanced mode and with auto fan control, since the laptop runs considerably louder but not much faster in Performance mode.
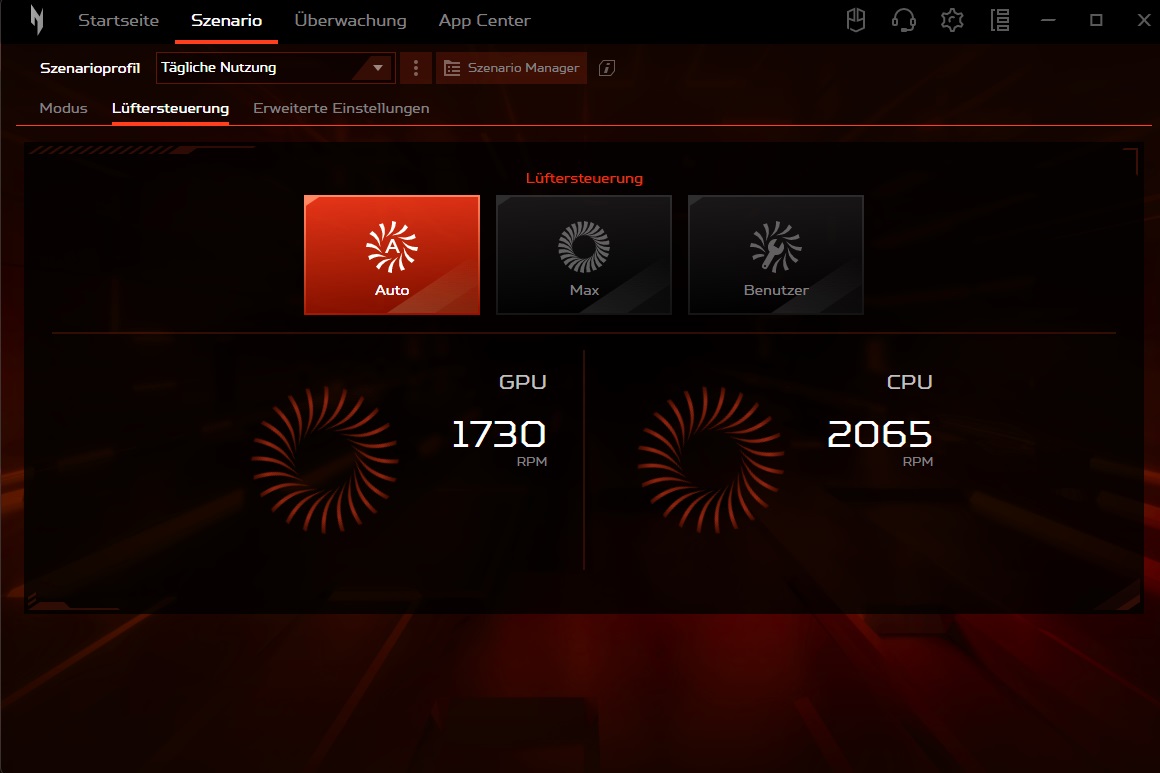
| NitroSense | Quiet | Balanced | Performance |
| CPU PL1 (HWiNFO) | 35 W | 45 W | 55 W |
| CPU PL2 (HWiNFO) | 64 W | 115 W | 115 W |
| Noise (Witcher 3, FHD/Ultra) | 37 dB(A) | 49 dB(A) | 59 dB(A) |
| Performance (Witcher 3, FHD/Ultra) | ~62 FPS | ~78 FPS | ~82 FPS |
Processor
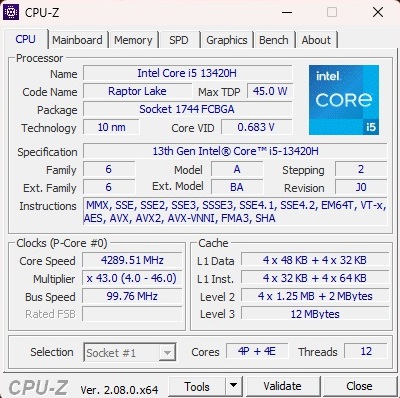
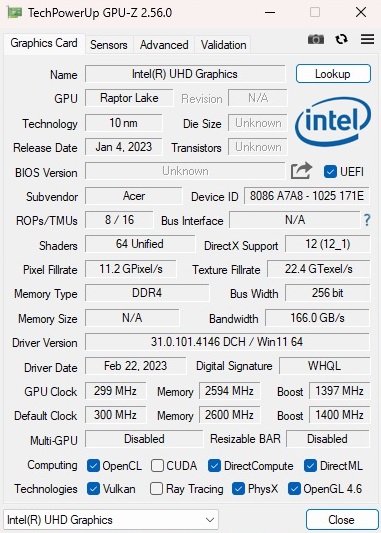
The Core i5-13420H is a processor from Intel’s Raptor Lake lineup (10 nm) that sports four performance cores (with Hyper-Threading) and four efficiency cores (without HT). In our gauntlet of benchmarks, the CPU wasn't just outperformed by its more expensive siblings Core i5-13500H and Core i7-13620H as expected, but also beaten by its AMD competitors Ryzen 7 7735HS and Ryzen 7 7840HS. That said, the CPU’s performance is more than enough for gaming because most games are, as we know, GPU-bound.
Cinebench R15 Multi Sustained Load
* ... smaller is better
AIDA64: FP32 Ray-Trace | FPU Julia | CPU SHA3 | CPU Queen | FPU SinJulia | FPU Mandel | CPU AES | CPU ZLib | FP64 Ray-Trace | CPU PhotoWorxx
| Performance rating | |
| Average of class Gaming | |
| Schenker XMG Apex 15 (Late 23) | |
| Asus TUF A15 FA507 | |
| Medion Erazer Crawler E40 - MD 62518 | |
| Lenovo LOQ 15IRH8 Core i7 | |
| Acer Nitro V 15 ANV15-51-582S | |
| Average Intel Core i5-13420H | |
| AIDA64 / FP32 Ray-Trace | |
| Average of class Gaming (10227 - 85542, n=110, last 2 years) | |
| Schenker XMG Apex 15 (Late 23) | |
| Asus TUF A15 FA507 | |
| Medion Erazer Crawler E40 - MD 62518 | |
| Acer Nitro V 15 ANV15-51-582S | |
| Lenovo LOQ 15IRH8 Core i7 | |
| Average Intel Core i5-13420H (7922 - 12134, n=5) | |
| AIDA64 / FPU Julia | |
| Average of class Gaming (51376 - 238426, n=110, last 2 years) | |
| Schenker XMG Apex 15 (Late 23) | |
| Asus TUF A15 FA507 | |
| Medion Erazer Crawler E40 - MD 62518 | |
| Lenovo LOQ 15IRH8 Core i7 | |
| Acer Nitro V 15 ANV15-51-582S | |
| Average Intel Core i5-13420H (40587 - 59715, n=5) | |
| AIDA64 / CPU SHA3 | |
| Average of class Gaming (2180 - 9817, n=110, last 2 years) | |
| Schenker XMG Apex 15 (Late 23) | |
| Medion Erazer Crawler E40 - MD 62518 | |
| Asus TUF A15 FA507 | |
| Acer Nitro V 15 ANV15-51-582S | |
| Lenovo LOQ 15IRH8 Core i7 | |
| Average Intel Core i5-13420H (1724 - 2634, n=5) | |
| AIDA64 / CPU Queen | |
| Average of class Gaming (49785 - 173351, n=101, last 2 years) | |
| Schenker XMG Apex 15 (Late 23) | |
| Asus TUF A15 FA507 | |
| Medion Erazer Crawler E40 - MD 62518 | |
| Lenovo LOQ 15IRH8 Core i7 | |
| Average Intel Core i5-13420H (69803 - 74956, n=5) | |
| Acer Nitro V 15 ANV15-51-582S | |
| AIDA64 / FPU SinJulia | |
| Schenker XMG Apex 15 (Late 23) | |
| Average of class Gaming (4424 - 33636, n=110, last 2 years) | |
| Asus TUF A15 FA507 | |
| Medion Erazer Crawler E40 - MD 62518 | |
| Lenovo LOQ 15IRH8 Core i7 | |
| Acer Nitro V 15 ANV15-51-582S | |
| Average Intel Core i5-13420H (5485 - 6644, n=5) | |
| AIDA64 / FPU Mandel | |
| Average of class Gaming (25115 - 128721, n=110, last 2 years) | |
| Schenker XMG Apex 15 (Late 23) | |
| Asus TUF A15 FA507 | |
| Medion Erazer Crawler E40 - MD 62518 | |
| Lenovo LOQ 15IRH8 Core i7 | |
| Acer Nitro V 15 ANV15-51-582S | |
| Average Intel Core i5-13420H (19684 - 30163, n=5) | |
| AIDA64 / CPU AES | |
| Schenker XMG Apex 15 (Late 23) | |
| Average of class Gaming (39258 - 247074, n=110, last 2 years) | |
| Acer Nitro V 15 ANV15-51-582S | |
| Asus TUF A15 FA507 | |
| Medion Erazer Crawler E40 - MD 62518 | |
| Average Intel Core i5-13420H (35531 - 93100, n=5) | |
| Lenovo LOQ 15IRH8 Core i7 | |
| AIDA64 / CPU ZLib | |
| Average of class Gaming (574 - 2531, n=110, last 2 years) | |
| Schenker XMG Apex 15 (Late 23) | |
| Medion Erazer Crawler E40 - MD 62518 | |
| Lenovo LOQ 15IRH8 Core i7 | |
| Acer Nitro V 15 ANV15-51-582S | |
| Average Intel Core i5-13420H (509 - 746, n=5) | |
| Asus TUF A15 FA507 | |
| AIDA64 / FP64 Ray-Trace | |
| Average of class Gaming (5509 - 45446, n=110, last 2 years) | |
| Schenker XMG Apex 15 (Late 23) | |
| Asus TUF A15 FA507 | |
| Medion Erazer Crawler E40 - MD 62518 | |
| Lenovo LOQ 15IRH8 Core i7 | |
| Acer Nitro V 15 ANV15-51-582S | |
| Average Intel Core i5-13420H (4283 - 6627, n=5) | |
| AIDA64 / CPU PhotoWorxx | |
| Average of class Gaming (12271 - 89891, n=110, last 2 years) | |
| Medion Erazer Crawler E40 - MD 62518 | |
| Schenker XMG Apex 15 (Late 23) | |
| Lenovo LOQ 15IRH8 Core i7 | |
| Asus TUF A15 FA507 | |
| Acer Nitro V 15 ANV15-51-582S | |
| Average Intel Core i5-13420H (12330 - 37044, n=5) | |
System performance
The Nitro V 15 also can't quite match its competitors in system performance, though the differentials in PCMark 10 aren’t as big as those in the CPU tests.
CrossMark: Overall | Productivity | Creativity | Responsiveness
WebXPRT 3: Overall
WebXPRT 4: Overall
Mozilla Kraken 1.1: Total
| PCMark 10 / Score | |
| Average of class Gaming (5828 - 11574, n=96, last 2 years) | |
| Schenker XMG Apex 15 (Late 23) | |
| Lenovo LOQ 15IRH8 Core i7 | |
| Medion Erazer Crawler E40 - MD 62518 | |
| Asus TUF A15 FA507 | |
| Acer Nitro V 15 ANV15-51-582S | |
| Average Intel Core i5-13420H, NVIDIA GeForce RTX 4050 Laptop GPU (n=1) | |
| PCMark 10 / Essentials | |
| Lenovo LOQ 15IRH8 Core i7 | |
| Schenker XMG Apex 15 (Late 23) | |
| Average of class Gaming (8810 - 12600, n=100, last 2 years) | |
| Asus TUF A15 FA507 | |
| Medion Erazer Crawler E40 - MD 62518 | |
| Acer Nitro V 15 ANV15-51-582S | |
| Average Intel Core i5-13420H, NVIDIA GeForce RTX 4050 Laptop GPU (n=1) | |
| PCMark 10 / Productivity | |
| Average of class Gaming (6845 - 18766, n=98, last 2 years) | |
| Schenker XMG Apex 15 (Late 23) | |
| Lenovo LOQ 15IRH8 Core i7 | |
| Asus TUF A15 FA507 | |
| Medion Erazer Crawler E40 - MD 62518 | |
| Acer Nitro V 15 ANV15-51-582S | |
| Average Intel Core i5-13420H, NVIDIA GeForce RTX 4050 Laptop GPU (n=1) | |
| PCMark 10 / Digital Content Creation | |
| Average of class Gaming (7602 - 19657, n=98, last 2 years) | |
| Lenovo LOQ 15IRH8 Core i7 | |
| Schenker XMG Apex 15 (Late 23) | |
| Medion Erazer Crawler E40 - MD 62518 | |
| Asus TUF A15 FA507 | |
| Acer Nitro V 15 ANV15-51-582S | |
| Average Intel Core i5-13420H, NVIDIA GeForce RTX 4050 Laptop GPU (n=1) | |
| CrossMark / Overall | |
| Average of class Gaming (1366 - 2409, n=98, last 2 years) | |
| Lenovo LOQ 15IRH8 Core i7 | |
| Medion Erazer Crawler E40 - MD 62518 | |
| Schenker XMG Apex 15 (Late 23) | |
| Asus TUF A15 FA507 | |
| CrossMark / Productivity | |
| Average of class Gaming (1386 - 2254, n=98, last 2 years) | |
| Lenovo LOQ 15IRH8 Core i7 | |
| Medion Erazer Crawler E40 - MD 62518 | |
| Schenker XMG Apex 15 (Late 23) | |
| Asus TUF A15 FA507 | |
| CrossMark / Creativity | |
| Average of class Gaming (1343 - 2729, n=98, last 2 years) | |
| Lenovo LOQ 15IRH8 Core i7 | |
| Schenker XMG Apex 15 (Late 23) | |
| Medion Erazer Crawler E40 - MD 62518 | |
| Asus TUF A15 FA507 | |
| CrossMark / Responsiveness | |
| Lenovo LOQ 15IRH8 Core i7 | |
| Medion Erazer Crawler E40 - MD 62518 | |
| Average of class Gaming (1226 - 2334, n=98, last 2 years) | |
| Schenker XMG Apex 15 (Late 23) | |
| Asus TUF A15 FA507 | |
| WebXPRT 3 / Overall | |
| Average of class Gaming (242 - 532, n=101, last 2 years) | |
| Schenker XMG Apex 15 (Late 23) | |
| Asus TUF A15 FA507 | |
| Lenovo LOQ 15IRH8 Core i7 | |
| Medion Erazer Crawler E40 - MD 62518 | |
| Acer Nitro V 15 ANV15-51-582S | |
| Average Intel Core i5-13420H, NVIDIA GeForce RTX 4050 Laptop GPU (n=1) | |
| WebXPRT 4 / Overall | |
| Average of class Gaming (176.4 - 354, n=101, last 2 years) | |
| Lenovo LOQ 15IRH8 Core i7 | |
| Acer Nitro V 15 ANV15-51-582S | |
| Average Intel Core i5-13420H, NVIDIA GeForce RTX 4050 Laptop GPU (n=1) | |
| Medion Erazer Crawler E40 - MD 62518 | |
| Asus TUF A15 FA507 | |
| Mozilla Kraken 1.1 / Total | |
| Asus TUF A15 FA507 | |
| Acer Nitro V 15 ANV15-51-582S | |
| Average Intel Core i5-13420H, NVIDIA GeForce RTX 4050 Laptop GPU (n=1) | |
| Medion Erazer Crawler E40 - MD 62518 | |
| Schenker XMG Apex 15 (Late 23) | |
| Lenovo LOQ 15IRH8 Core i7 | |
| Average of class Gaming (391 - 590, n=106, last 2 years) | |
* ... smaller is better
| PCMark 10 Score | 6569 points | |
Help | ||
| AIDA64 / Memory Copy | |
| Average of class Gaming (21750 - 129946, n=110, last 2 years) | |
| Schenker XMG Apex 15 (Late 23) | |
| Medion Erazer Crawler E40 - MD 62518 | |
| Lenovo LOQ 15IRH8 Core i7 | |
| Asus TUF A15 FA507 | |
| Acer Nitro V 15 ANV15-51-582S | |
| Average Intel Core i5-13420H (22003 - 59609, n=5) | |
| AIDA64 / Memory Read | |
| Average of class Gaming (22956 - 118858, n=110, last 2 years) | |
| Medion Erazer Crawler E40 - MD 62518 | |
| Lenovo LOQ 15IRH8 Core i7 | |
| Schenker XMG Apex 15 (Late 23) | |
| Asus TUF A15 FA507 | |
| Acer Nitro V 15 ANV15-51-582S | |
| Average Intel Core i5-13420H (23499 - 68085, n=5) | |
| AIDA64 / Memory Write | |
| Schenker XMG Apex 15 (Late 23) | |
| Average of class Gaming (22297 - 135096, n=110, last 2 years) | |
| Medion Erazer Crawler E40 - MD 62518 | |
| Asus TUF A15 FA507 | |
| Lenovo LOQ 15IRH8 Core i7 | |
| Acer Nitro V 15 ANV15-51-582S | |
| Average Intel Core i5-13420H (21429 - 62529, n=5) | |
| AIDA64 / Memory Latency | |
| Lenovo LOQ 15IRH8 Core i7 | |
| Average of class Gaming (75.3 - 259, n=110, last 2 years) | |
| Average Intel Core i5-13420H (90.2 - 103.6, n=5) | |
| Medion Erazer Crawler E40 - MD 62518 | |
| Acer Nitro V 15 ANV15-51-582S | |
| Schenker XMG Apex 15 (Late 23) | |
| Asus TUF A15 FA507 | |
* ... smaller is better
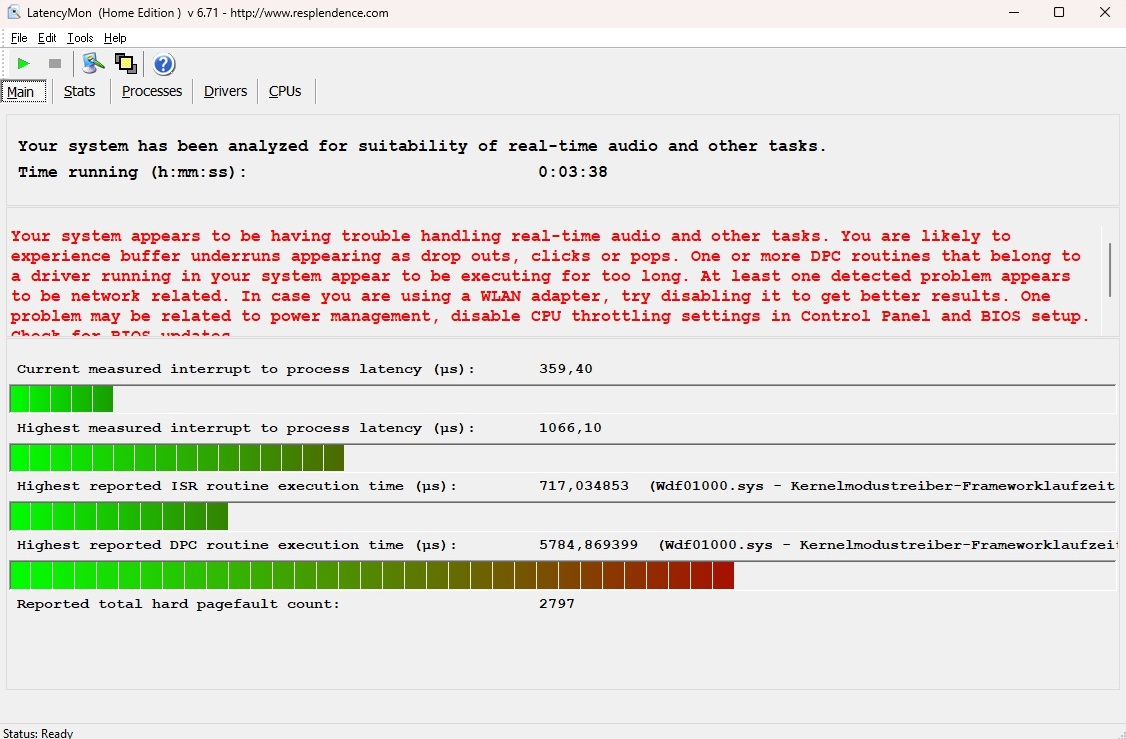
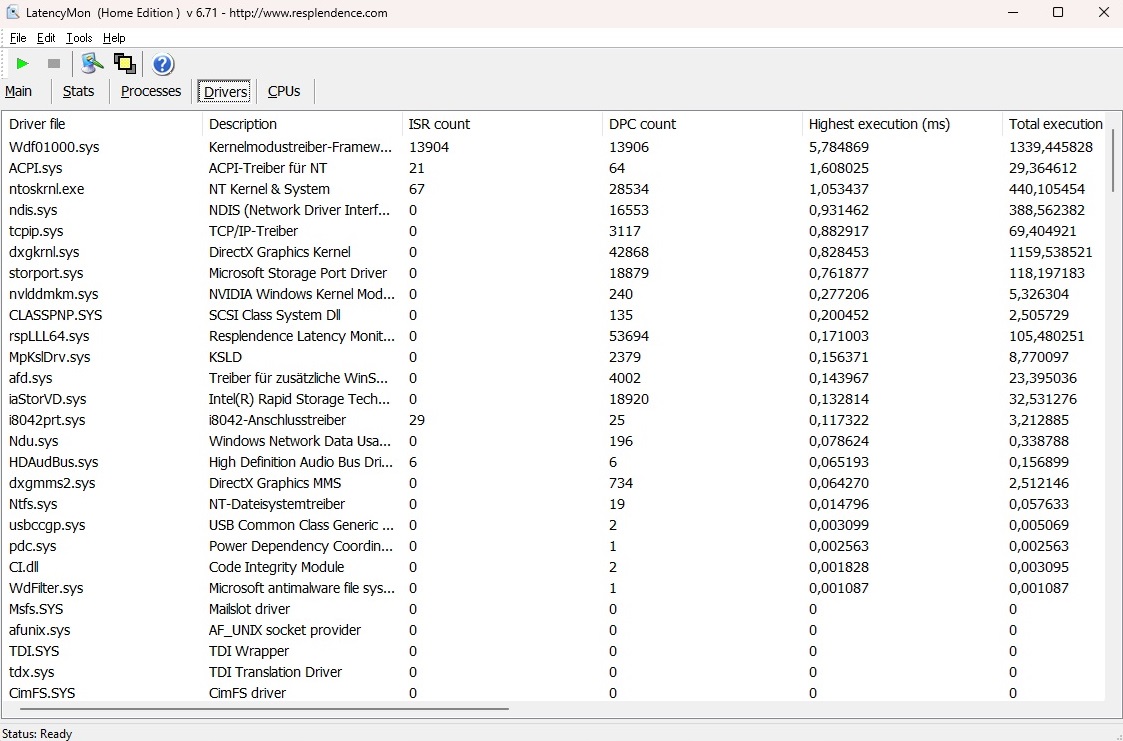
DPC latency
According to LatencyMon, the Nitro V 15 is only partly suitable for latency-sensitive applications such as real-time audio and video editing. However, this issue affects many laptops and is only relevant to certain users.
| DPC Latencies / LatencyMon - interrupt to process latency (max), Web, Youtube, Prime95 | |
| Acer Nitro V 15 ANV15-51-582S | |
| Medion Erazer Crawler E40 - MD 62518 | |
| Lenovo LOQ 15IRH8 Core i7 | |
| Schenker XMG Apex 15 (Late 23) | |
* ... smaller is better
Mass storage
The M.2 storage drive in our review unit is made by SK hynix and delivers solid read and write performance for an NVMe device. However, similar to the SSD in the Lenovo LOQ LOQ 15IRH8, it suffers from a certain level of performance drops and fluctuations under sustained load.

* ... smaller is better
Sustained Load Read: DiskSpd Read Loop, Queue Depth 8
Graphics card
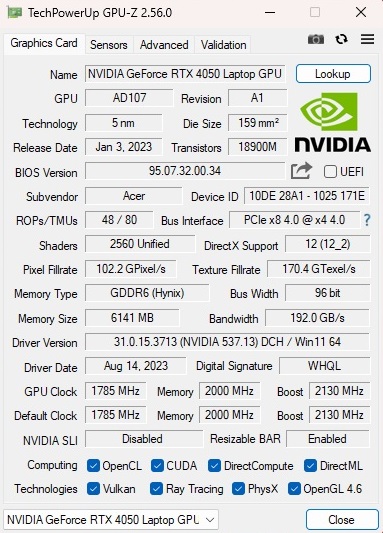
Although the competitors delivered slightly better results in synthetic graphics benchmarks, the RTX 4050 in the Nitro V 15 still offers a level of performance similar to what we’ve seen from this GPU on average. The mid-range model from the Ada Lovelace generation offers 2,560 shading units, but doesn't have a particularly generous memory configuration, having just 6 GB of GDDR6 VRAM and a 96-bit interface. Acer has set the TGP at 75 watts (60 watts plus 15 watts Dynamic Boost), which is fairly low for an RTX 4050.
| 3DMark 11 Performance | 24506 points | |
| 3DMark Ice Storm Standard Score | 133723 points | |
| 3DMark Cloud Gate Standard Score | 50705 points | |
| 3DMark Fire Strike Score | 18795 points | |
| 3DMark Time Spy Score | 7944 points | |
Help | ||
* ... smaller is better
Gaming performance
As long as you keep the internal resolution at Full HD (i.e. 1080p) and don’t go overboard with the settings, the RTX 4050 is also able to handle modern games. Medium to high settings mostly shouldn’t be a problem; only when you get to ultra settings can things become tight at times (e.g. in Lords of the Fallen or Avatar: Frontiers of Pandora). Similar to what we’ve seen in the graphics benchmarks, other RTX 4050 laptops with higher TGP often perform better than the Nitro.
| The Witcher 3 - 1920x1080 Ultra Graphics & Postprocessing (HBAO+) | |
| Average of class Gaming (95 - 240, n=8, last 2 years) | |
| Lenovo LOQ 15IRH8 Core i7 | |
| Schenker XMG Apex 15 (Late 23) | |
| Asus TUF A15 FA507 | |
| Medion Erazer Crawler E40 - MD 62518 | |
| Acer Nitro V 15 ANV15-51-582S | |
| Average NVIDIA GeForce RTX 4050 Laptop GPU (18.5 - 94.7, n=40) | |
| Avatar Frontiers of Pandora - 1920x1080 Ultra Preset AA:T | |
| Average of class Gaming (n=1last 2 years) | |
| Medion Erazer Scout E20 | |
| Acer Nitro V 15 ANV15-51-582S | |
| Average NVIDIA GeForce RTX 4050 Laptop GPU (35 - 35, n=2) | |
| The Finals - 1920x1080 Epic Preset | |
| Medion Erazer Scout E20 | |
| Average NVIDIA GeForce RTX 4050 Laptop GPU (91.8 - 99.2, n=2) | |
| Acer Nitro V 15 ANV15-51-582S | |
| Average of class Gaming (n=1last 2 years) | |
| EA Sports WRC - 1920x1080 Ultra Preset AA:Epic AF:16x | |
| Medion Erazer Scout E20 | |
| Average NVIDIA GeForce RTX 4050 Laptop GPU (61 - 67.3, n=2) | |
| Acer Nitro V 15 ANV15-51-582S | |
| Average of class Gaming (n=1last 2 years) | |
| Assassin's Creed Mirage - 1920x1080 Ultra High Preset (Adaptive Quality Off) | |
| XMG Focus 15 E23 | |
| Average NVIDIA GeForce RTX 4050 Laptop GPU (63 - 70, n=2) | |
| Acer Nitro V 15 ANV15-51-582S | |
| Ready or Not - 1920x1080 Epic Preset | |
| Medion Erazer Scout E20 | |
| Average NVIDIA GeForce RTX 4050 Laptop GPU (95.1 - 107.1, n=2) | |
| Acer Nitro V 15 ANV15-51-582S | |
| Lords of the Fallen - 1920x1080 Ultra Preset | |
| XMG Focus 15 E23 | |
| Average NVIDIA GeForce RTX 4050 Laptop GPU (27.3 - 32.1, n=2) | |
| Acer Nitro V 15 ANV15-51-582S | |
| Counter-Strike 2 - 1920x1080 Very High Preset | |
| Average of class Gaming (26.2 - 275, n=6, last 2 years) | |
| Medion Erazer Scout E20 | |
| Average NVIDIA GeForce RTX 4050 Laptop GPU (80.9 - 110.2, n=2) | |
| Acer Nitro V 15 ANV15-51-582S | |
| Total War Pharaoh - 1920x1080 Ultra Preset | |
| Average of class Gaming (42.9 - 161.4, n=2, last 2 years) | |
| XMG Focus 15 E23 | |
| Average NVIDIA GeForce RTX 4050 Laptop GPU (59.7 - 101, n=3) | |
| Acer Nitro V 15 ANV15-51-582S | |
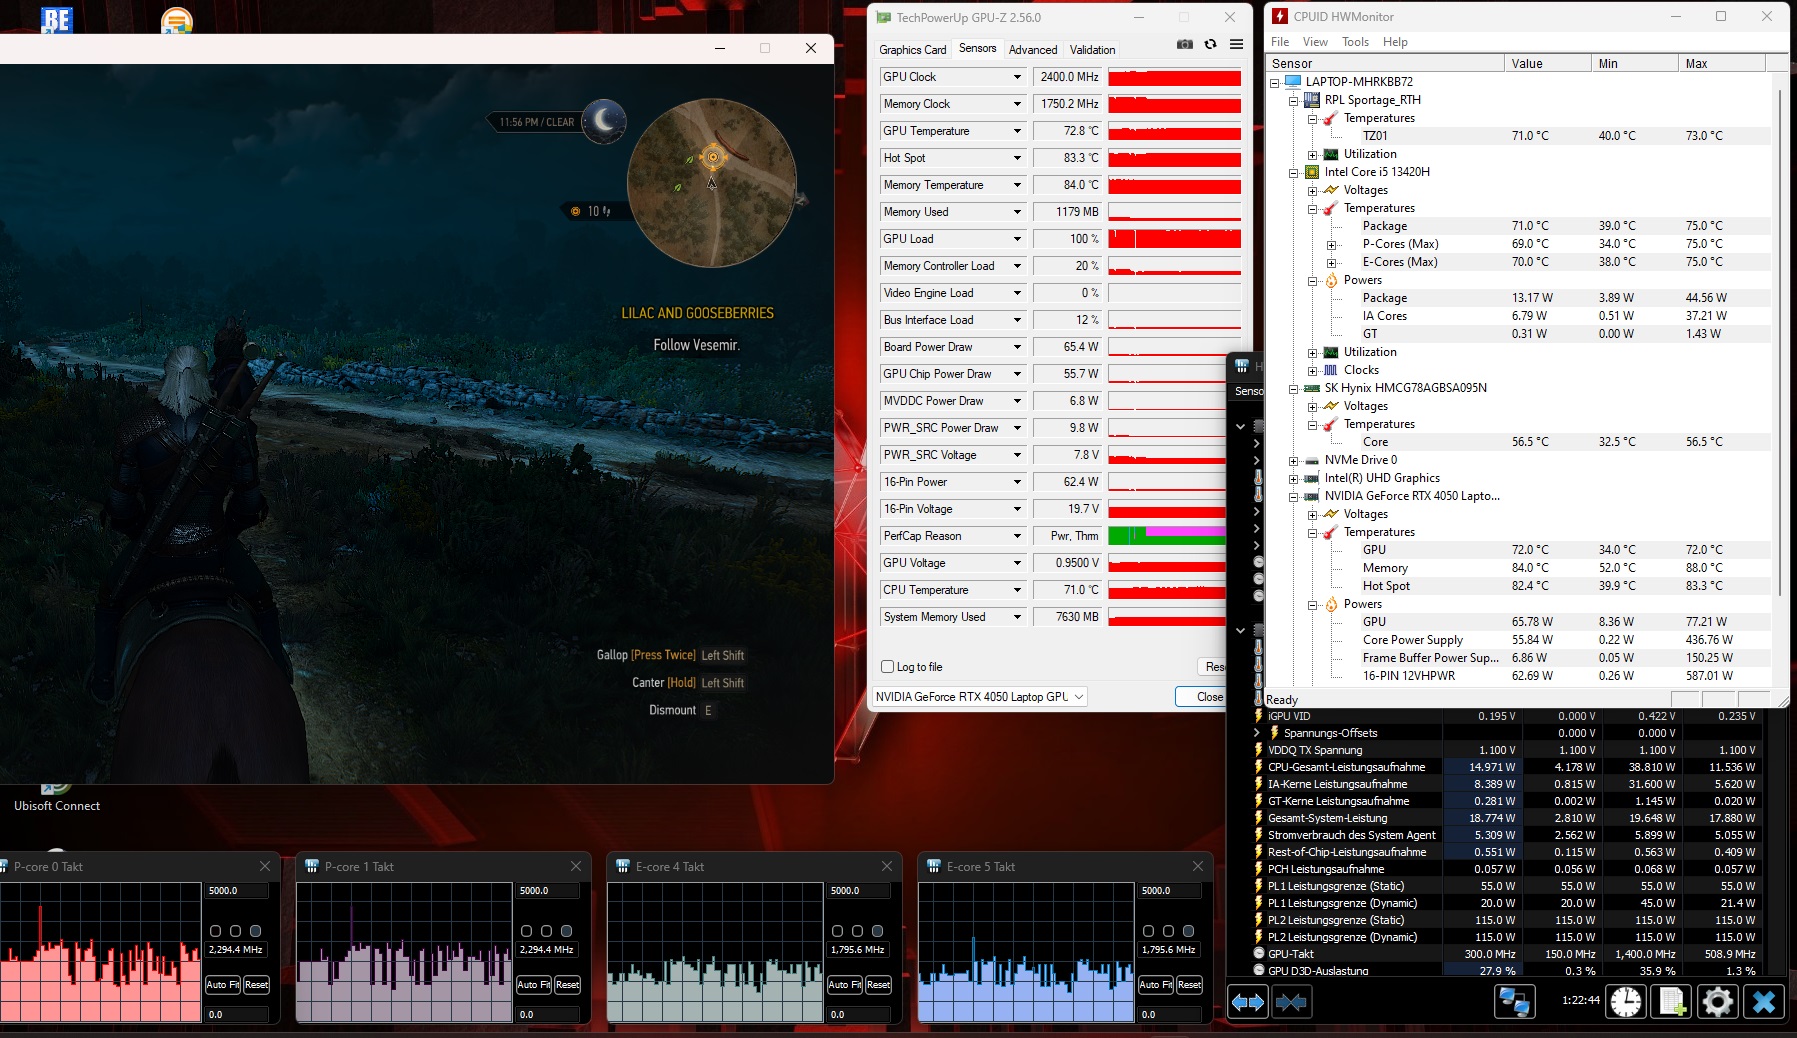
We didn’t encounter any major issues during our stability test (running The Witcher 3 at FHD/Ultra for an hour). Though the frame rate decreased slightly over the course of the test, there weren’t any unusual performance drops or the like.
Witcher 3 FPS chart
| low | med. | high | ultra | |
|---|---|---|---|---|
| GTA V (2015) | 177.3 | 158.2 | 86.9 | |
| The Witcher 3 (2015) | 78 | |||
| Dota 2 Reborn (2015) | 153.7 | 143.6 | 136.5 | 120.3 |
| Final Fantasy XV Benchmark (2018) | 104.3 | 76.5 | ||
| X-Plane 11.11 (2018) | 114.3 | 94.5 | 77 | |
| Far Cry 5 (2018) | 128 | 118 | 102 | |
| Strange Brigade (2018) | 189.5 | 155.2 | 135.2 | |
| Counter-Strike 2 (2023) | 127 | 112.4 | 80.9 | |
| Assassin's Creed Mirage (2023) | 89 | 84 | 63 | |
| Total War Pharaoh (2023) | 147 | 84.1 | 59.7 | |
| Lords of the Fallen (2023) | 54.1 | 38.6 | 27.3 | |
| EA Sports WRC (2023) | 71.2 | 66.6 | 61 | |
| Avatar Frontiers of Pandora (2023) | 55 | 47 | 35 | |
| The Finals (2023) | 130.2 | 113.7 | 91.8 | |
| Ready or Not (2023) | 148.3 | 134.2 | 95.1 |
Emissions
Noise emissions
Relative to the amount of heat generated, the Nitro V 15 is needlessly loud when running 3D applications. We measured around 49 dB(A) of noise during gaming (Balanced mode), which is clearly audible and may be loud enough to bother some users. That said, the laptop isn’t too different from the competitors in this regard. At idle, the two fans inside are either completely still or running at a moderate noise level of 29 to 30 dB(A).
Noise level
| Idle |
| 25 / 29 / 30 dB(A) |
| Load |
| 49 / 51 dB(A) |
 | ||
30 dB silent 40 dB(A) audible 50 dB(A) loud |
||
min: | ||
| Acer Nitro V 15 ANV15-51-582S GeForce RTX 4050 Laptop GPU, i5-13420H | Medion Erazer Crawler E40 - MD 62518 GeForce RTX 4050 Laptop GPU, i5-13500H | Lenovo LOQ 15IRH8 Core i7 GeForce RTX 4050 Laptop GPU, i7-13620H | Asus TUF A15 FA507 GeForce RTX 4050 Laptop GPU, R7 7735HS | Schenker XMG Apex 15 (Late 23) GeForce RTX 4050 Laptop GPU, R7 7840HS | |
|---|---|---|---|---|---|
| Noise | 4% | -0% | 18% | 3% | |
| off / environment * (dB) | 25 | 23 8% | 23.69 5% | 23.3 7% | 24 4% |
| Idle Minimum * (dB) | 25 | 23 8% | 29.03 -16% | 23.3 7% | 25 -0% |
| Idle Average * (dB) | 29 | 23 21% | 29.03 -0% | 23.3 20% | 29 -0% |
| Idle Maximum * (dB) | 30 | 28.02 7% | 29.03 3% | 23.3 22% | 33 -10% |
| Load Average * (dB) | 49 | 50.21 -2% | 48.7 1% | 29.6 40% | 36 27% |
| Witcher 3 ultra * (dB) | 49 | 51.46 -5% | 48.5 1% | 43 12% | 48 2% |
| Load Maximum * (dB) | 51 | 56.79 -11% | 48.7 5% | 43 16% | 53 -4% |
* ... smaller is better
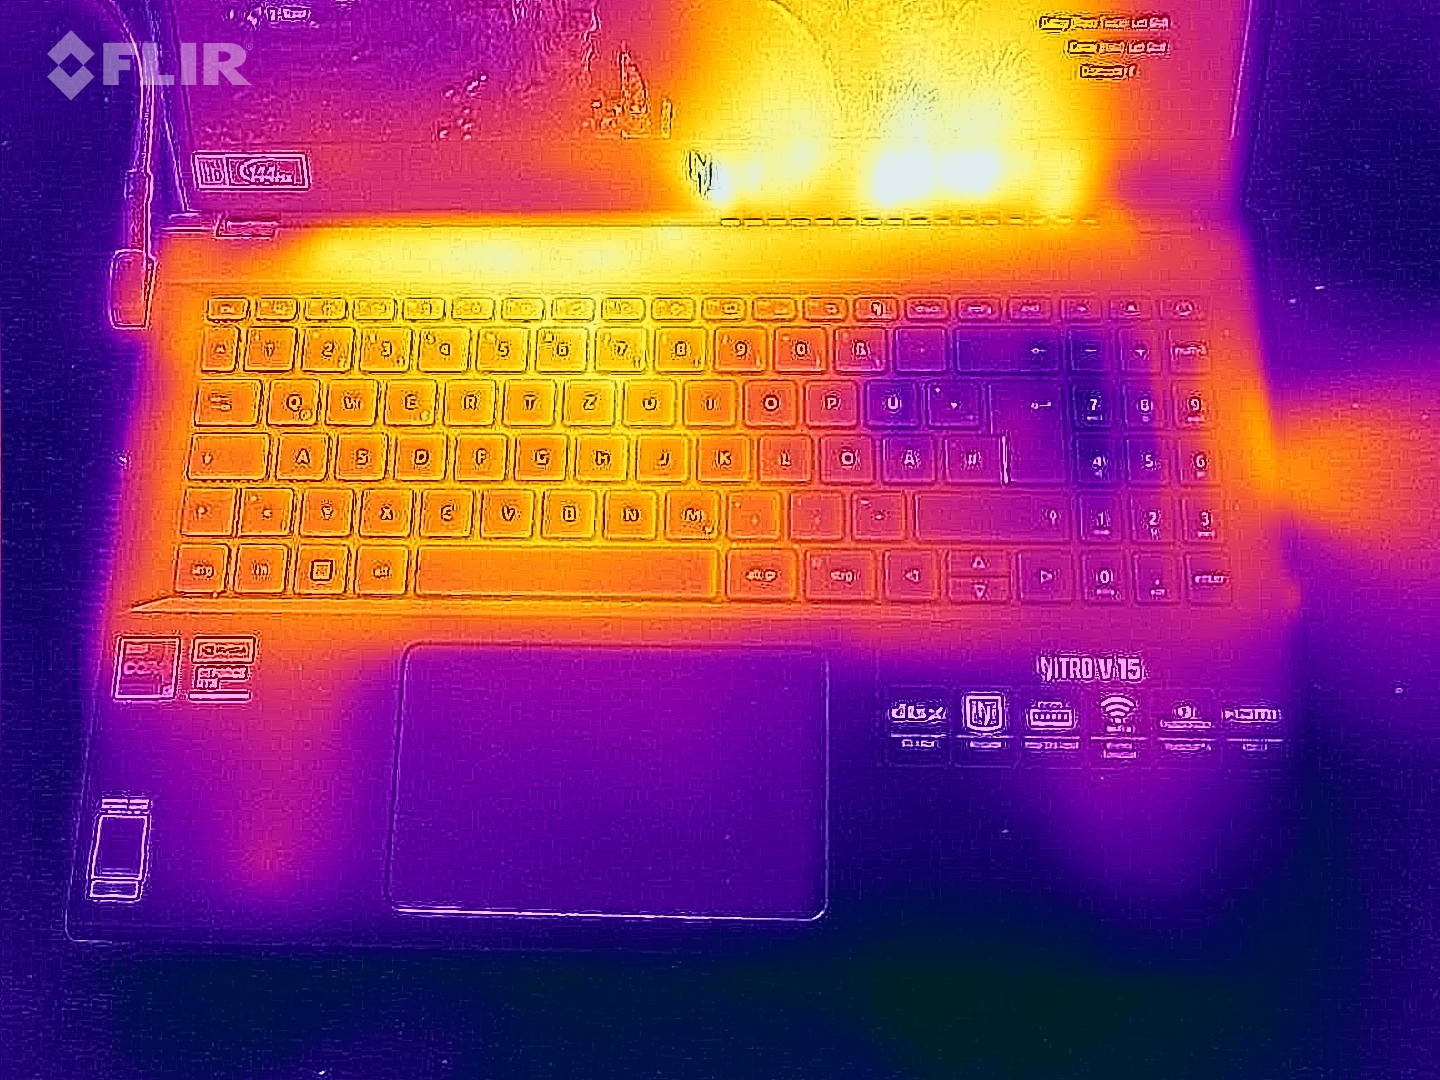
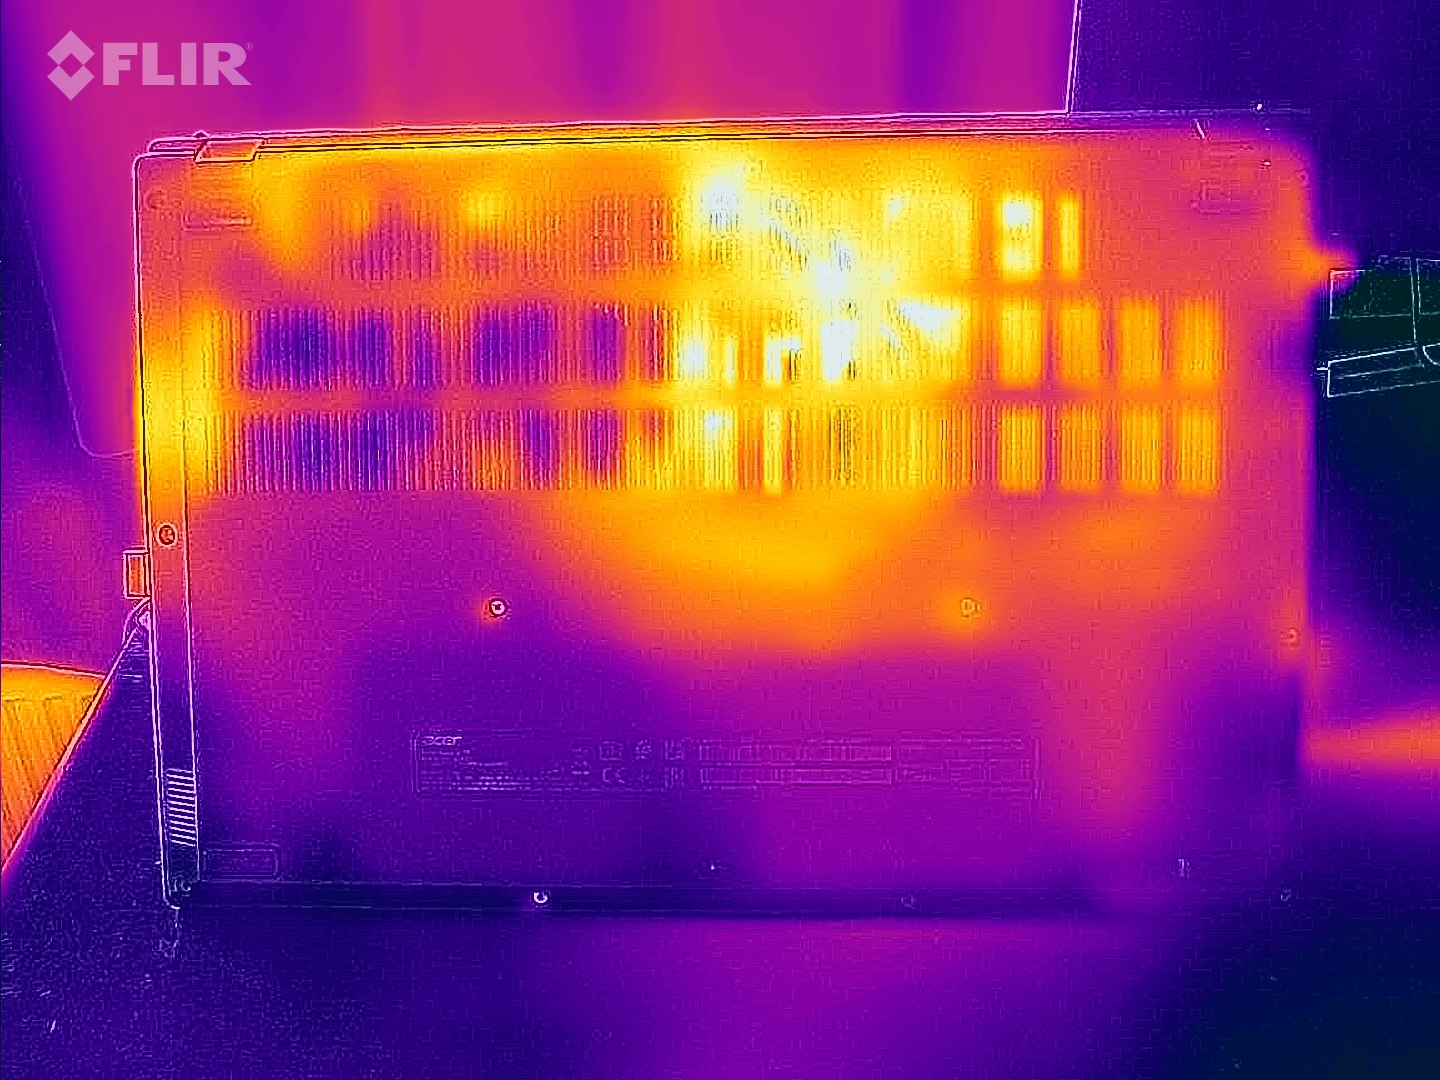
Temperature
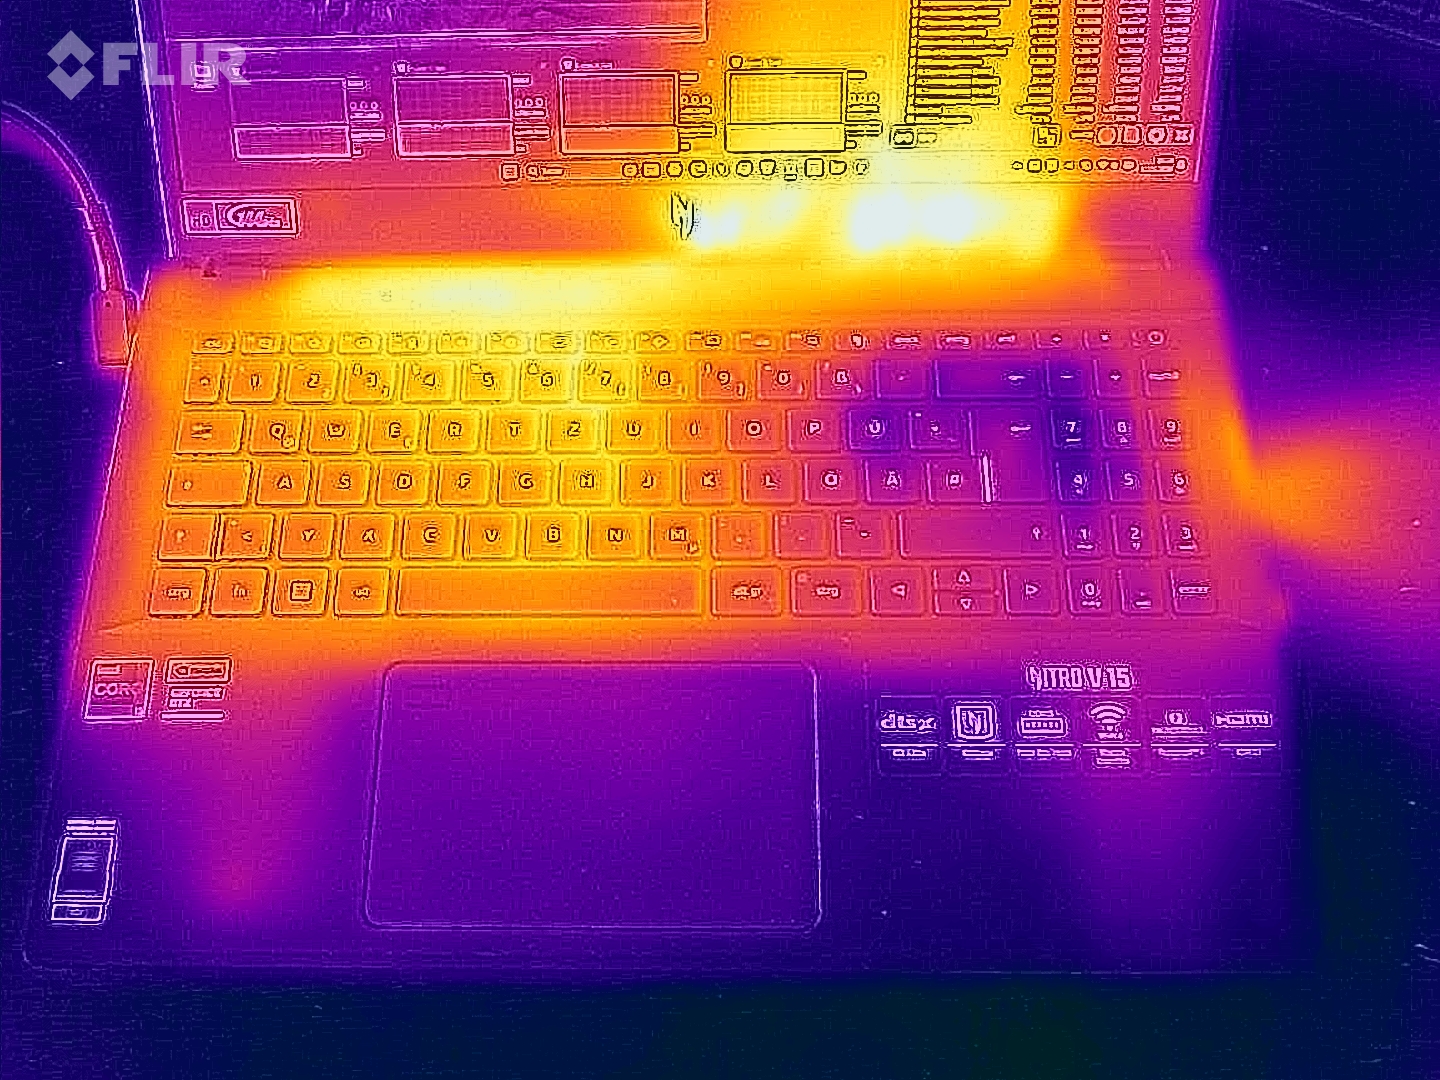
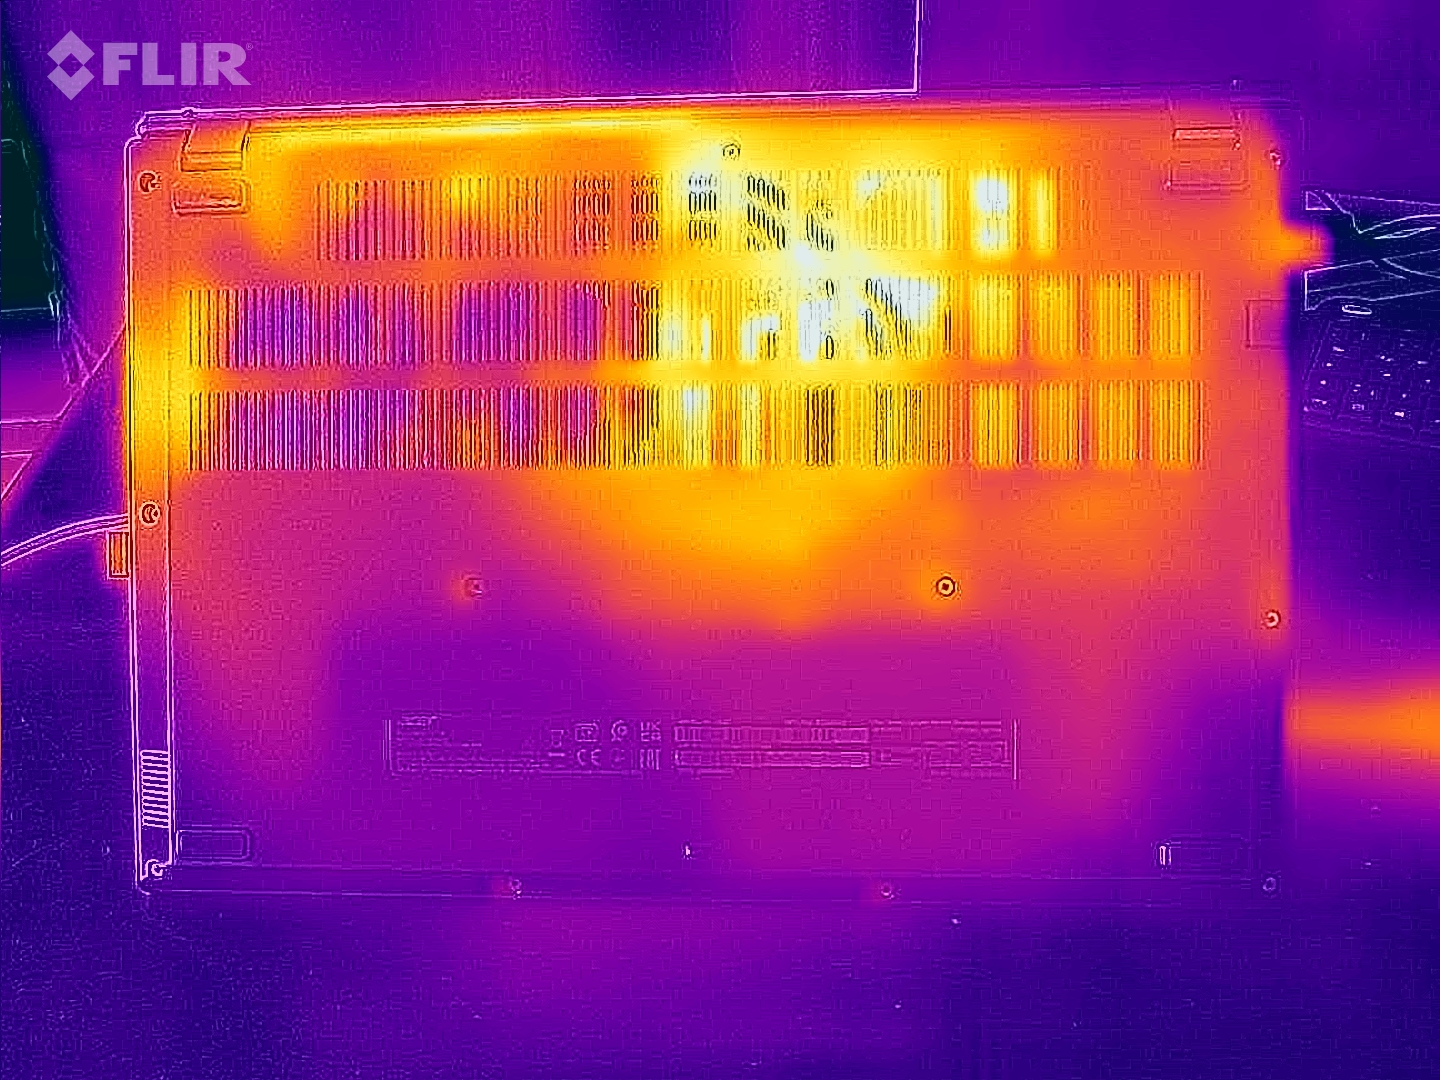
The Nitro V 15 doesn’t get blazing hot. Even after 60 minutes of stress testing (running FurMark and Prime95), the laptop’s surface still remained below the 50°C (122°F) mark. The entire chassis is kept nice and cool at idle – our thermometer only reported temperatures between 22 and 28°C (71.6 and 82.4°F).
(-) The maximum temperature on the upper side is 46 °C / 115 F, compared to the average of 40.4 °C / 105 F, ranging from 21.2 to 68.8 °C for the class Gaming.
(-) The bottom heats up to a maximum of 48 °C / 118 F, compared to the average of 43.2 °C / 110 F
(+) In idle usage, the average temperature for the upper side is 25.1 °C / 77 F, compared to the device average of 33.9 °C / 93 F.
(-) Playing The Witcher 3, the average temperature for the upper side is 39.4 °C / 103 F, compared to the device average of 33.9 °C / 93 F.
(±) The palmrests and touchpad can get very hot to the touch with a maximum of 36 °C / 96.8 F.
(-) The average temperature of the palmrest area of similar devices was 28.8 °C / 83.8 F (-7.2 °C / -13 F).
| Acer Nitro V 15 ANV15-51-582S GeForce RTX 4050 Laptop GPU, i5-13420H | Medion Erazer Crawler E40 - MD 62518 GeForce RTX 4050 Laptop GPU, i5-13500H | Lenovo LOQ 15IRH8 Core i7 GeForce RTX 4050 Laptop GPU, i7-13620H | Asus TUF A15 FA507 GeForce RTX 4050 Laptop GPU, R7 7735HS | Schenker XMG Apex 15 (Late 23) GeForce RTX 4050 Laptop GPU, R7 7840HS | |
|---|---|---|---|---|---|
| Heat | 14% | -20% | 1% | -13% | |
| Maximum Upper Side * (°C) | 46 | 36 22% | 46.4 -1% | 48.9 -6% | 52 -13% |
| Maximum Bottom * (°C) | 48 | 36 25% | 59.2 -23% | 44.6 7% | 47 2% |
| Idle Upper Side * (°C) | 27 | 26 4% | 34.4 -27% | 27.1 -0% | 33 -22% |
| Idle Bottom * (°C) | 28 | 27 4% | 36.2 -29% | 27.5 2% | 33 -18% |
* ... smaller is better
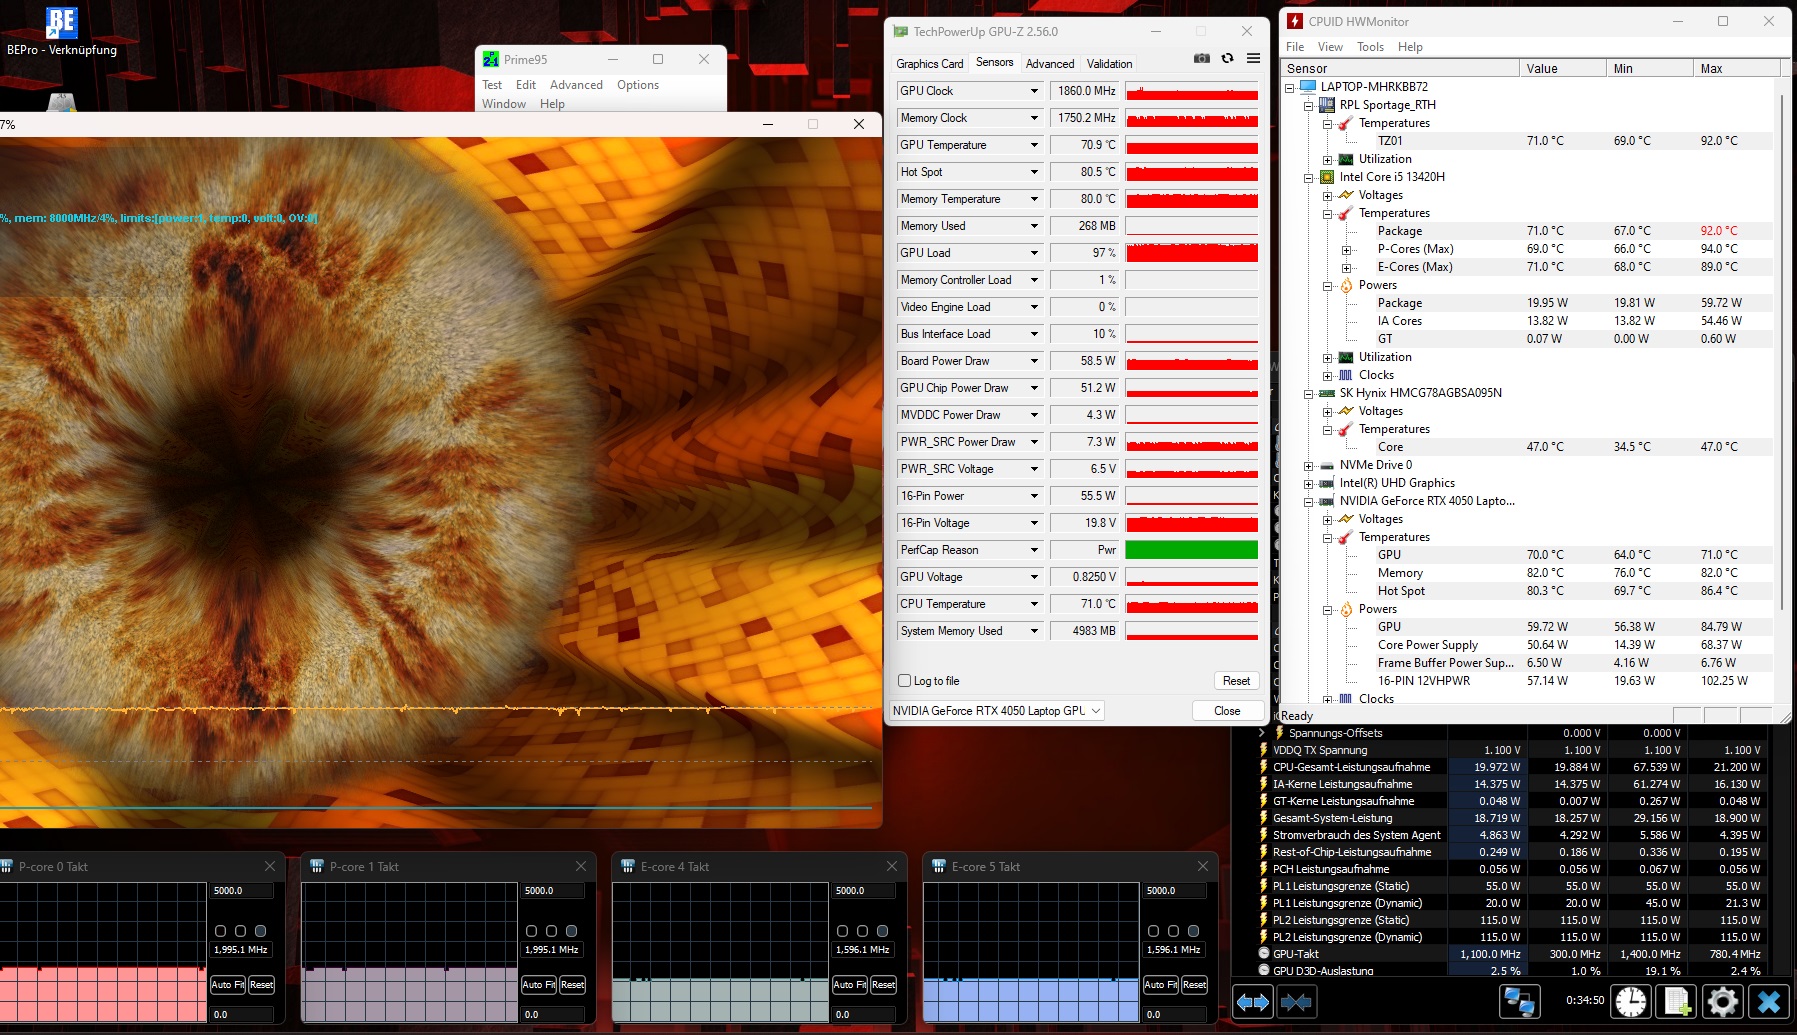
Stress test
The laptop‘s components also don’t overheat at full load. The CPU and GPU ran at an average temp of 71°C (159.8°F), which is a relatively good value that doesn't give any cause for concern or criticism. The 60-minute Witcher 3 test also yielded similar results.
Speakers
The Nitro V 15 offers decent to good sound for a notebook, but, as is often the case, there is a lack of bass. The max volume of 83 dB(A) is pretty good nonetheless.
Acer Nitro V 15 ANV15-51-582S audio analysis
(+) | speakers can play relatively loud (83 dB)
Bass 100 - 315 Hz
(-) | nearly no bass - on average 26.5% lower than median
(±) | linearity of bass is average (13.9% delta to prev. frequency)
Mids 400 - 2000 Hz
(+) | balanced mids - only 3.2% away from median
(+) | mids are linear (4.2% delta to prev. frequency)
Highs 2 - 16 kHz
(+) | balanced highs - only 1.6% away from median
(+) | highs are linear (3.3% delta to prev. frequency)
Overall 100 - 16.000 Hz
(±) | linearity of overall sound is average (15.9% difference to median)
Compared to same class
» 38% of all tested devices in this class were better, 7% similar, 56% worse
» The best had a delta of 6%, average was 18%, worst was 132%
Compared to all devices tested
» 25% of all tested devices were better, 5% similar, 70% worse
» The best had a delta of 4%, average was 24%, worst was 134%
Asus TUF A15 FA507 audio analysis
(±) | speaker loudness is average but good (79.3 dB)
Bass 100 - 315 Hz
(±) | reduced bass - on average 13.7% lower than median
(+) | bass is linear (6.2% delta to prev. frequency)
Mids 400 - 2000 Hz
(±) | higher mids - on average 7.6% higher than median
(±) | linearity of mids is average (7.3% delta to prev. frequency)
Highs 2 - 16 kHz
(+) | balanced highs - only 2.1% away from median
(±) | linearity of highs is average (7.5% delta to prev. frequency)
Overall 100 - 16.000 Hz
(±) | linearity of overall sound is average (17.2% difference to median)
Compared to same class
» 46% of all tested devices in this class were better, 11% similar, 42% worse
» The best had a delta of 6%, average was 18%, worst was 132%
Compared to all devices tested
» 32% of all tested devices were better, 8% similar, 60% worse
» The best had a delta of 4%, average was 24%, worst was 134%
Power management
Power consumption
Thanks in part to graphics switching, the 15-inch laptop requires a fairly low amount of power. It has the lowest power usage in our comparison, drawing only 7 to 11 watts at idle and 76 to 136 watts in 3D applications. Some of the other devices in the comparison consume significantly more power.
| Off / Standby | |
| Idle | |
| Load |
|
Key:
min: | |
| Acer Nitro V 15 ANV15-51-582S GeForce RTX 4050 Laptop GPU, i5-13420H | Medion Erazer Crawler E40 - MD 62518 GeForce RTX 4050 Laptop GPU, i5-13500H | Lenovo LOQ 15IRH8 Core i7 GeForce RTX 4050 Laptop GPU, i7-13620H | Asus TUF A15 FA507 GeForce RTX 4050 Laptop GPU, R7 7735HS | Schenker XMG Apex 15 (Late 23) GeForce RTX 4050 Laptop GPU, R7 7840HS | Average of class Gaming | |
|---|---|---|---|---|---|---|
| Power Consumption | -50% | -107% | -26% | -20% | -96% | |
| Idle Minimum * (Watt) | 7 | 10 -43% | 18.52 -165% | 8 -14% | 6 14% | 13.3 ? -90% |
| Idle Average * (Watt) | 8 | 15.3 -91% | 22.54 -182% | 12.1 -51% | 11 -38% | 19 ? -138% |
| Idle Maximum * (Watt) | 11 | 15.5 -41% | 29.79 -171% | 12.5 -14% | 14 -27% | 24.5 ? -123% |
| Load Average * (Watt) | 76 | 88 -16% | 94.5 -24% | 74.9 1% | 65 14% | 108.1 ? -42% |
| Witcher 3 ultra * (Watt) | 98.2 | 155 -58% | 154.4 -57% | 136.6 -39% | 136.5 -39% | |
| Load Maximum * (Watt) | 136 | 202.47 -49% | 190.4 -40% | 185 -36% | 195 -43% | 254 ? -87% |
* ... smaller is better
Power consumption Witcher 3 / Stresstest
Power consumption with external monitor
Battery life
Conversely, the Nitro V 15 is capable of delivering great battery life and does so despite its battery having a rather modest capacity of 57 Wh. In our Wi-Fi test (brightness reduced to 150 cd/m²), the Acer notebook lasted roughly 9.5 hours – a highly respectable result for this class of laptop.
| Acer Nitro V 15 ANV15-51-582S i5-13420H, GeForce RTX 4050 Laptop GPU, 57 Wh | Medion Erazer Crawler E40 - MD 62518 i5-13500H, GeForce RTX 4050 Laptop GPU, 54 Wh | Lenovo LOQ 15IRH8 Core i7 i7-13620H, GeForce RTX 4050 Laptop GPU, 60 Wh | Asus TUF A15 FA507 R7 7735HS, GeForce RTX 4050 Laptop GPU, 90 Wh | Schenker XMG Apex 15 (Late 23) R7 7840HS, GeForce RTX 4050 Laptop GPU, 62.32 Wh | Average of class Gaming | |
|---|---|---|---|---|---|---|
| Battery runtime | -43% | -37% | -9% | -30% | -33% | |
| Reader / Idle (h) | 21.5 | 8.4 -61% | 8.71 ? -59% | |||
| WiFi v1.3 (h) | 9.4 | 4.1 -56% | 5.9 -37% | 11.7 24% | 7.1 -24% | 7.01 ? -25% |
| Load (h) | 1.7 | 1.2 -29% | 1 -41% | 1.6 -6% | 1.47 ? -14% | |
| H.264 (h) | 3.9 | 6.1 | 12.5 | 8.3 | 8.26 ? |
Pros
Cons
Verdict

The Acer Nitro V 15's strengths and flaws became apparent during our testing.
Whilst the laptop has a stylish design, a relatively compact chassis and impressive battery life going for it, the display isn’t quite up to today’s standards (especially with regard to colour coverage and brightness).
The performance of the Core i5-13420H and GeForce RTX 4050 is roughly what you can expect from a laptop costing about €1,000 (US$1,085).
Price-conscious gamers are getting solid gaming platform capable of churning out usable frame rates – at least at Full HD.
Conveniently, the laptop has a free RAM slot and a second M.2 slot ready for future upgrades. The port selection is also up-to-date thanks to Thunderbolt 4, though there is still room for improvement in some places.
The competitors mentioned in the review, such as the Lenovo LOQ 15IRH8 and Asus TUF A15 FA507, have been given slightly higher overall scores due to their superior displays.
Price and availability
The Acer Nitro V 15 ANV15-51-582S with a Core i5-13420H and GeForce RTX 4050 is available from various online shops (e.g. notebooksbilliger.de) for around €900. On Amazon US, the model with the faster Core i7-13620H can be had for about US$950.
Acer Nitro V 15 ANV15-51-582S
- 01/16/2024 v7 (old)
Florian Glaser
Transparency
The selection of devices to be reviewed is made by our editorial team. The test sample was provided to the author as a loan by the manufacturer or retailer for the purpose of this review. The lender had no influence on this review, nor did the manufacturer receive a copy of this review before publication. There was no obligation to publish this review. As an independent media company, Notebookcheck is not subjected to the authority of manufacturers, retailers or publishers.
This is how Notebookcheck is testing
Every year, Notebookcheck independently reviews hundreds of laptops and smartphones using standardized procedures to ensure that all results are comparable. We have continuously developed our test methods for around 20 years and set industry standards in the process. In our test labs, high-quality measuring equipment is utilized by experienced technicians and editors. These tests involve a multi-stage validation process. Our complex rating system is based on hundreds of well-founded measurements and benchmarks, which maintains objectivity. Further information on our test methods can be found here.
Price comparison

