Verdict
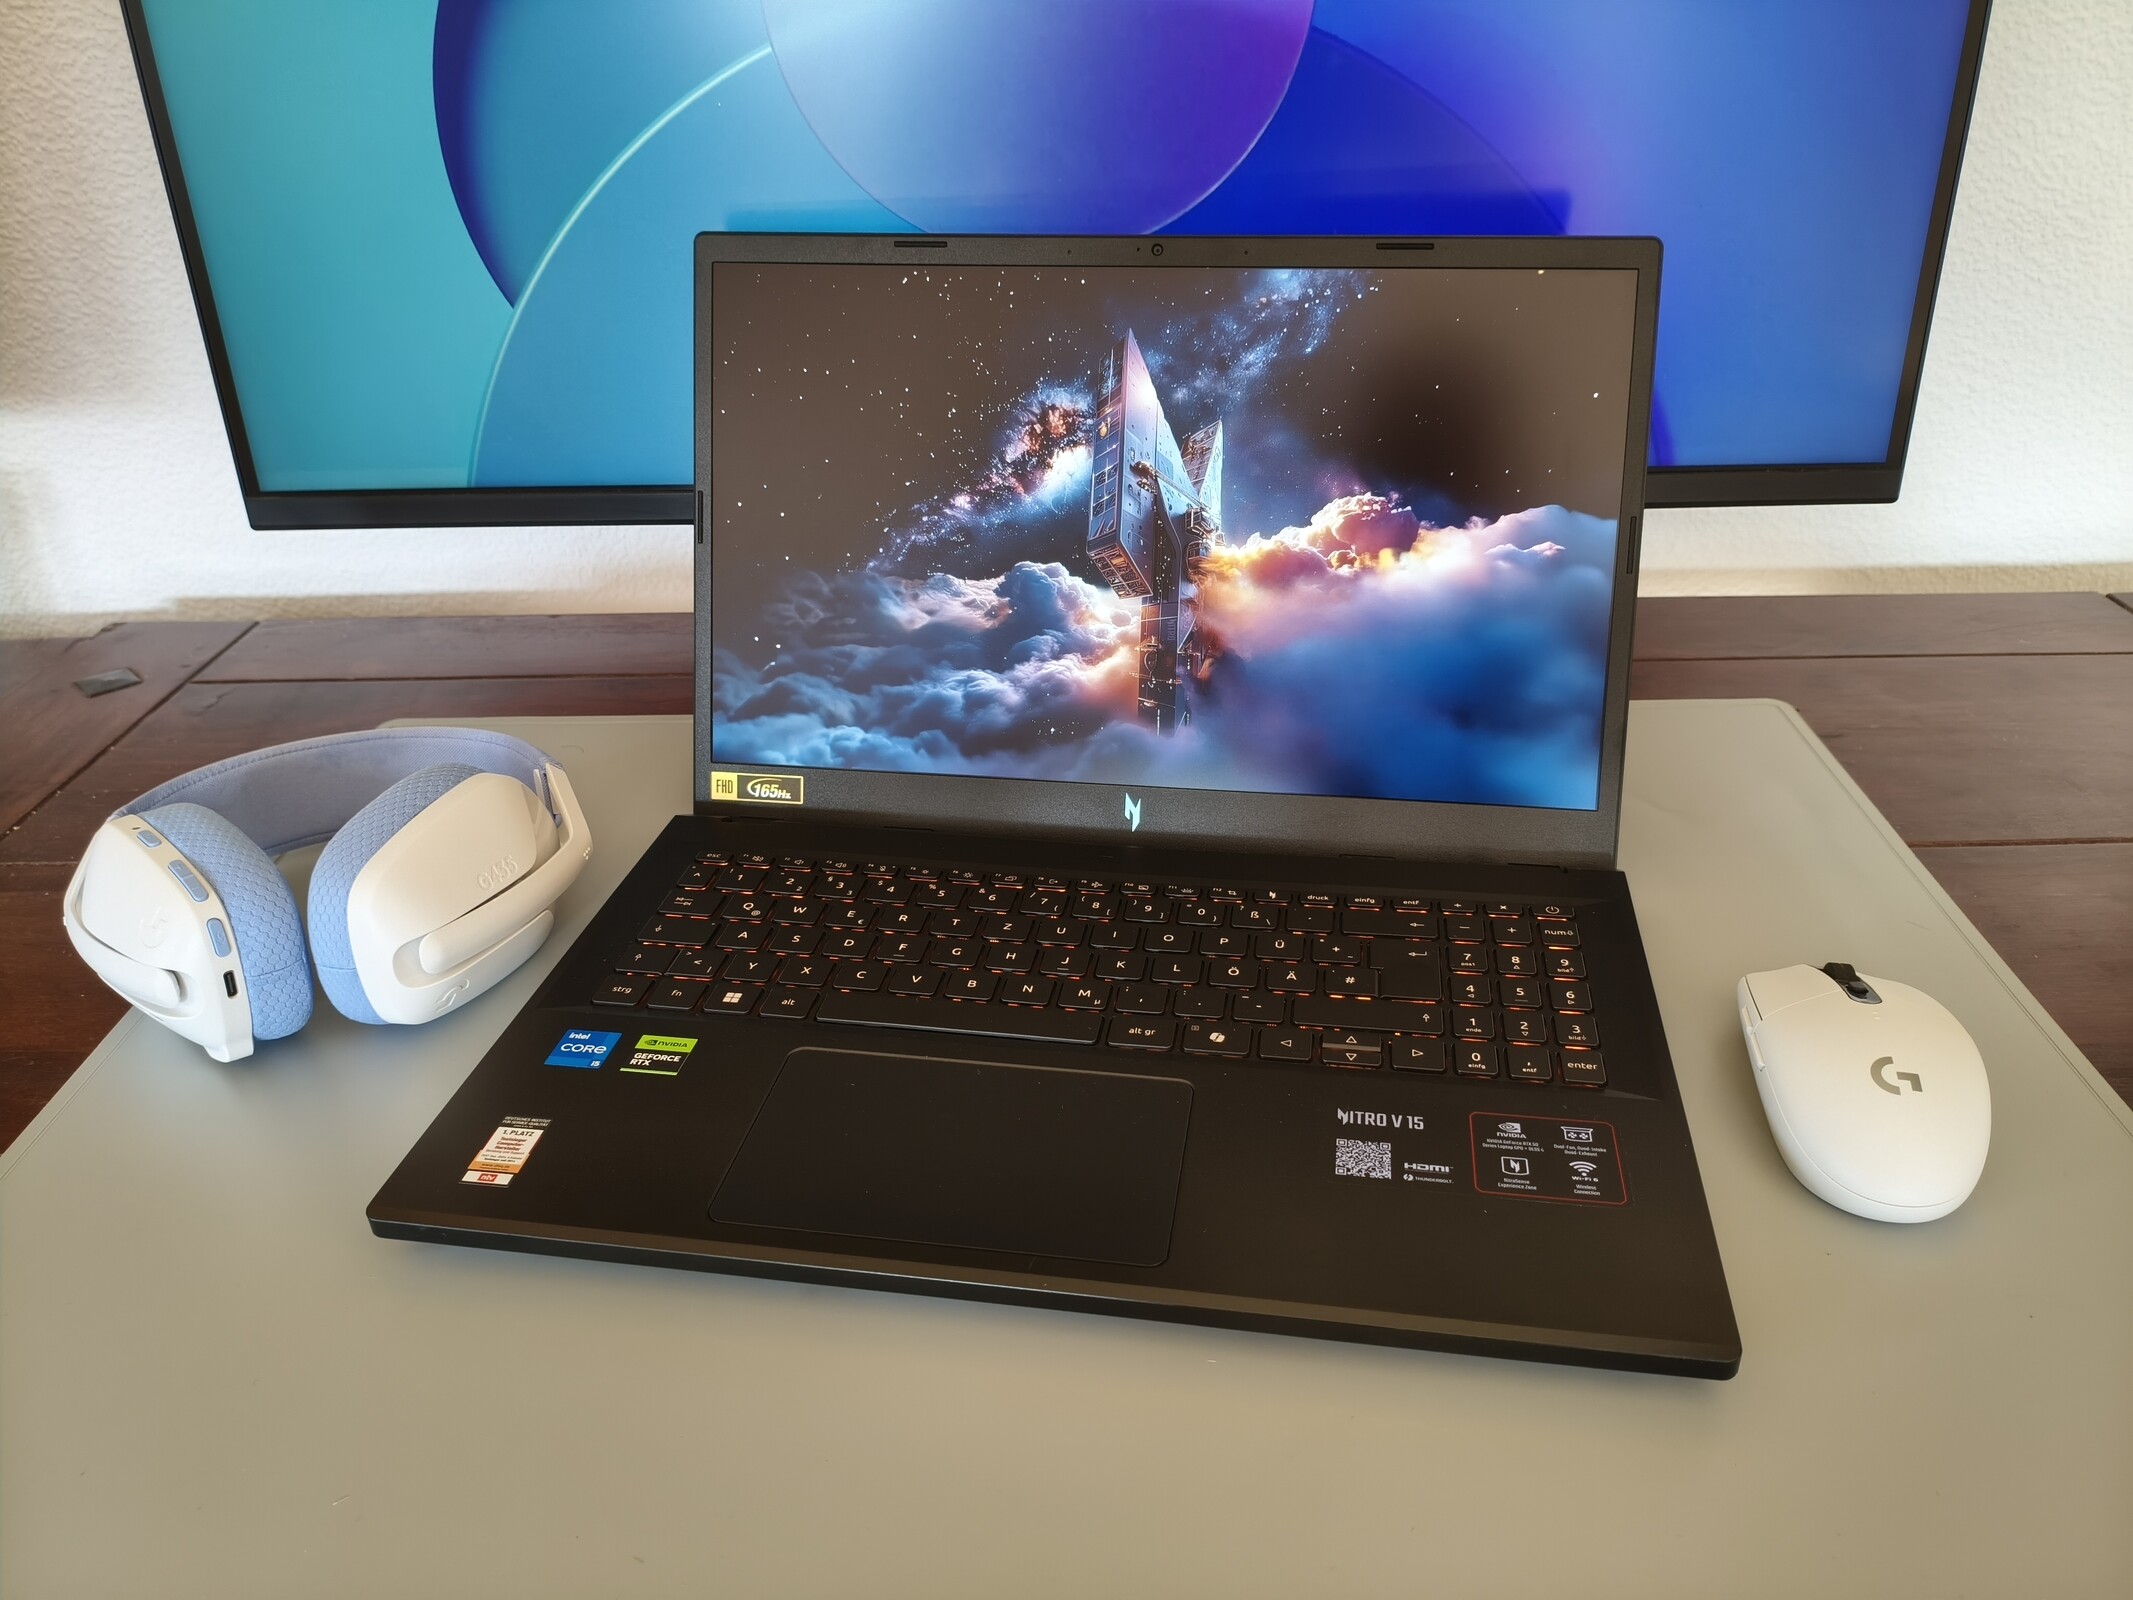
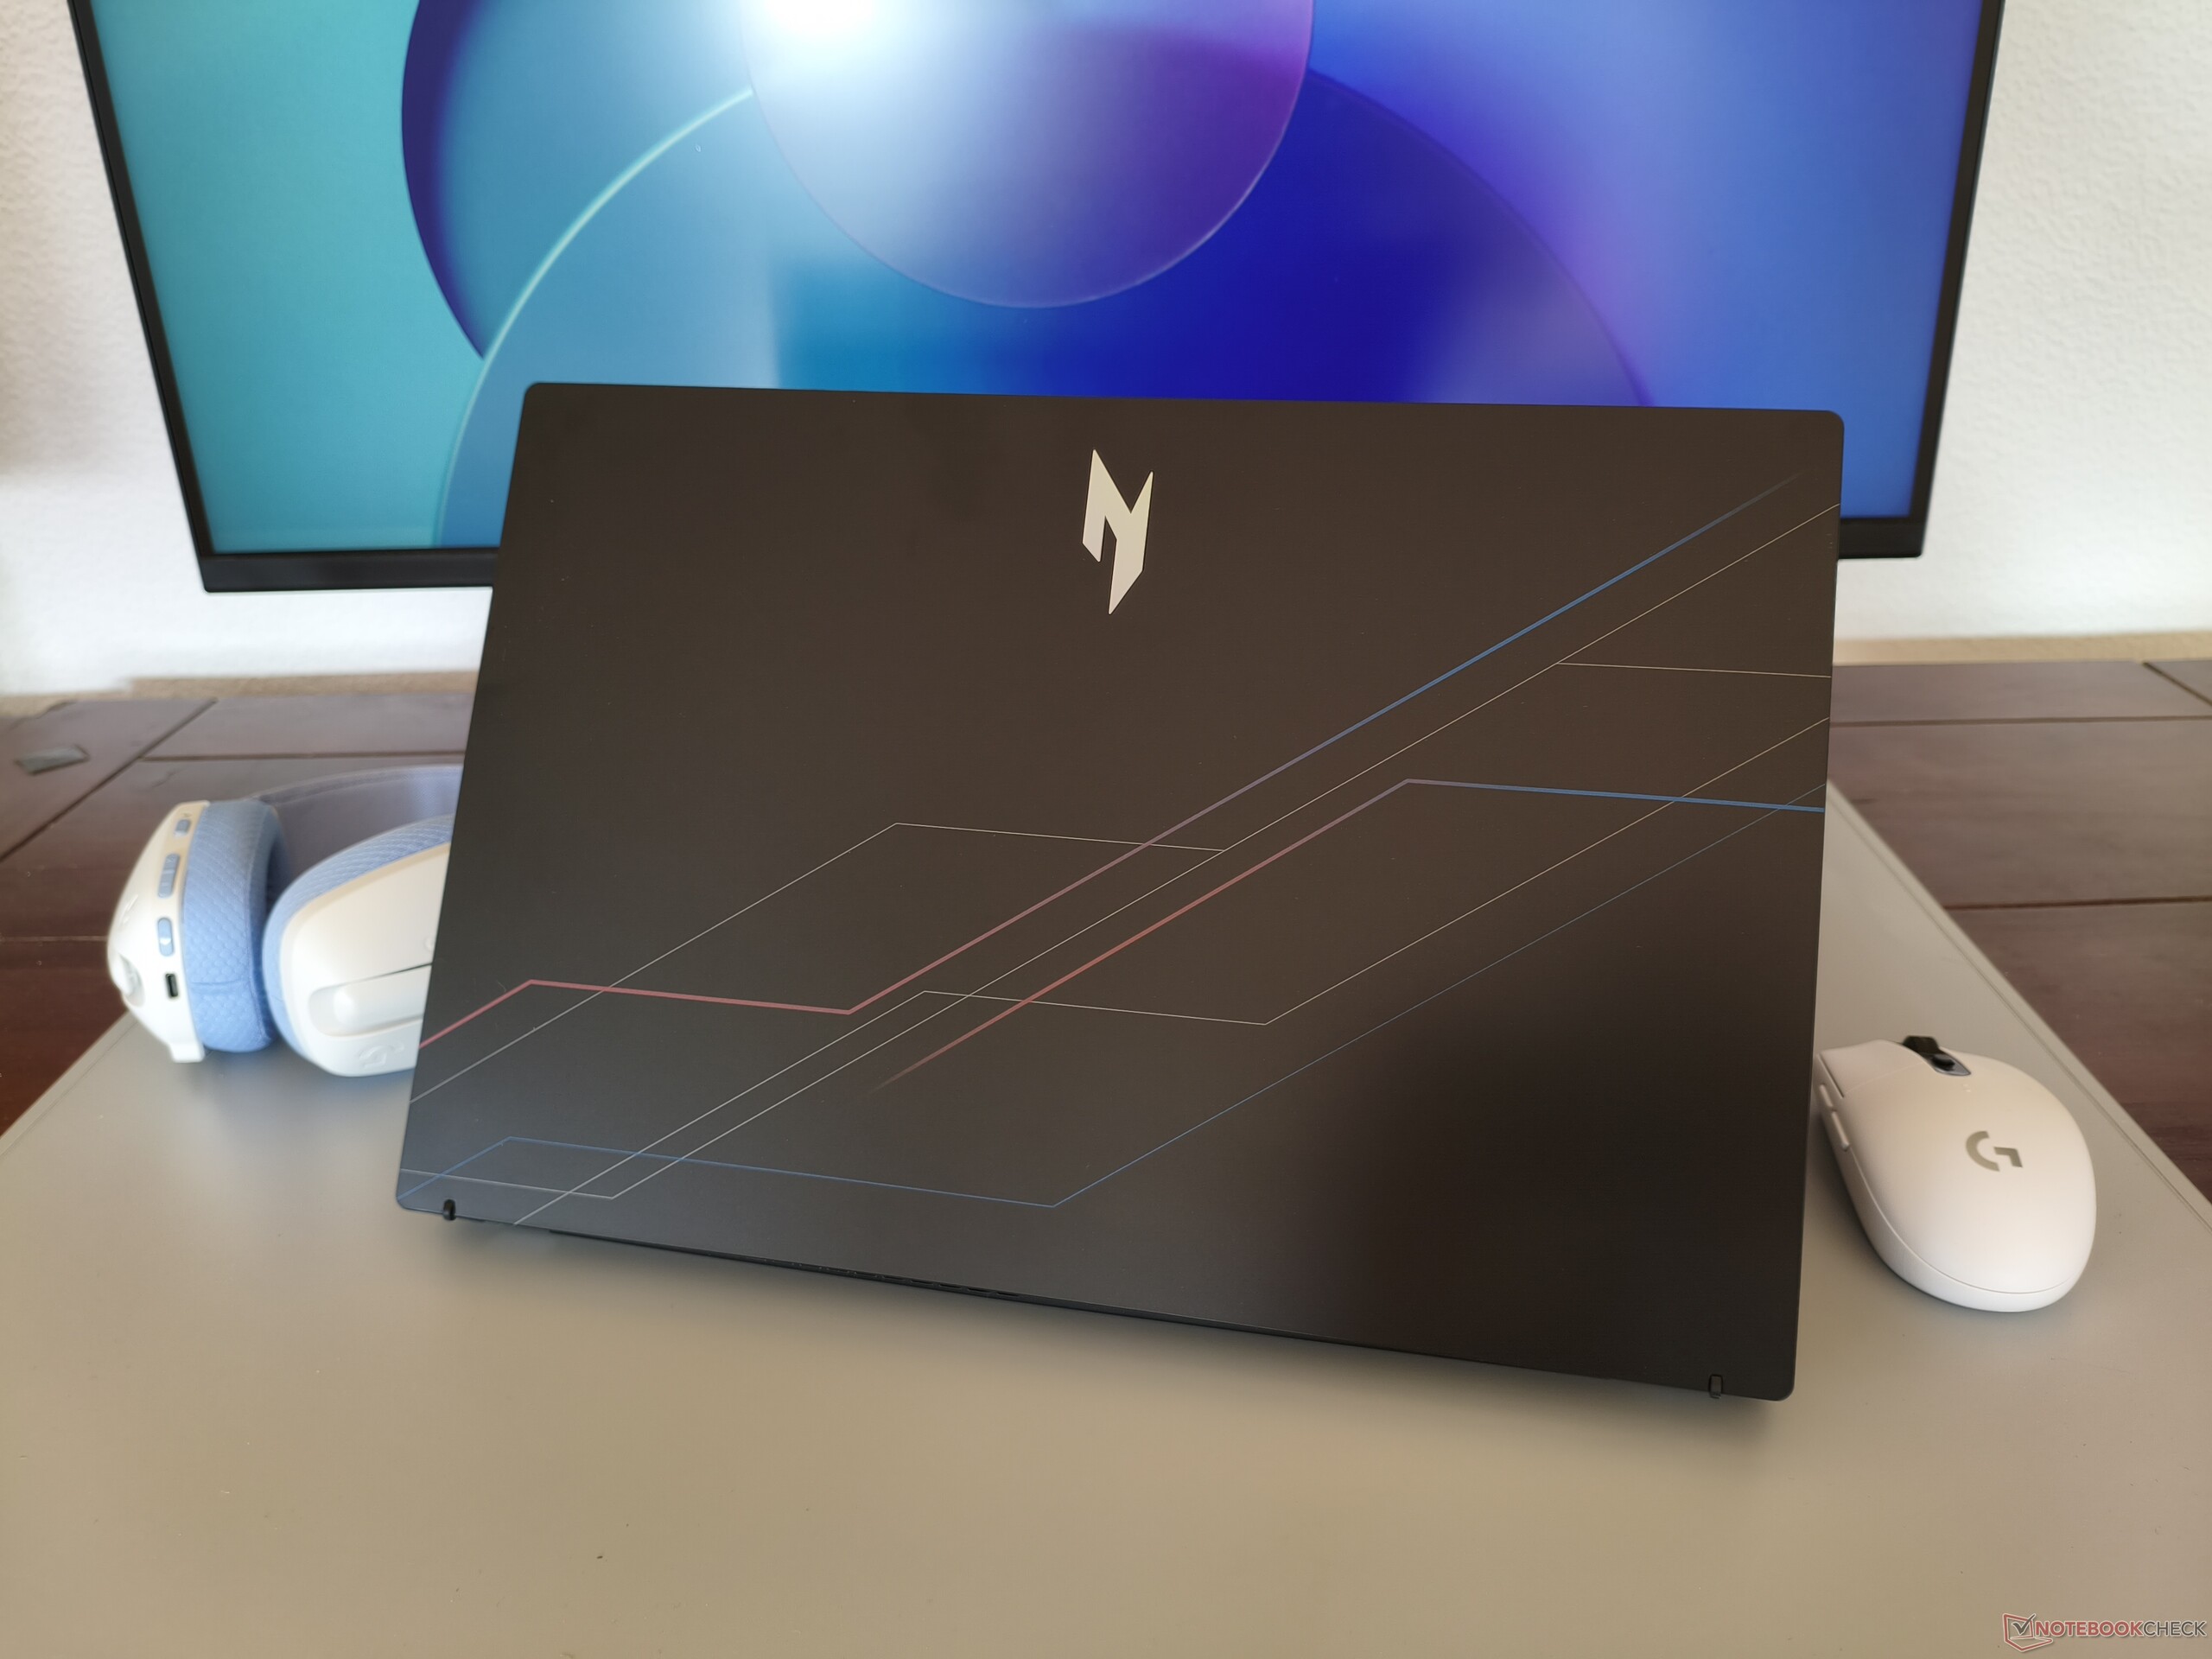
The Nitro V 15 is currently retailing for just over €1,000. Buyers without particularly high expectations will get a capable gaming laptop that may not reach peak performance levels but, aside from its limited display colour gamut, does not commit any major missteps. Starting with the chassis, which features an appealing textured lid, the device also offers decent input devices and a solid port selection, including Thunderbolt 4.
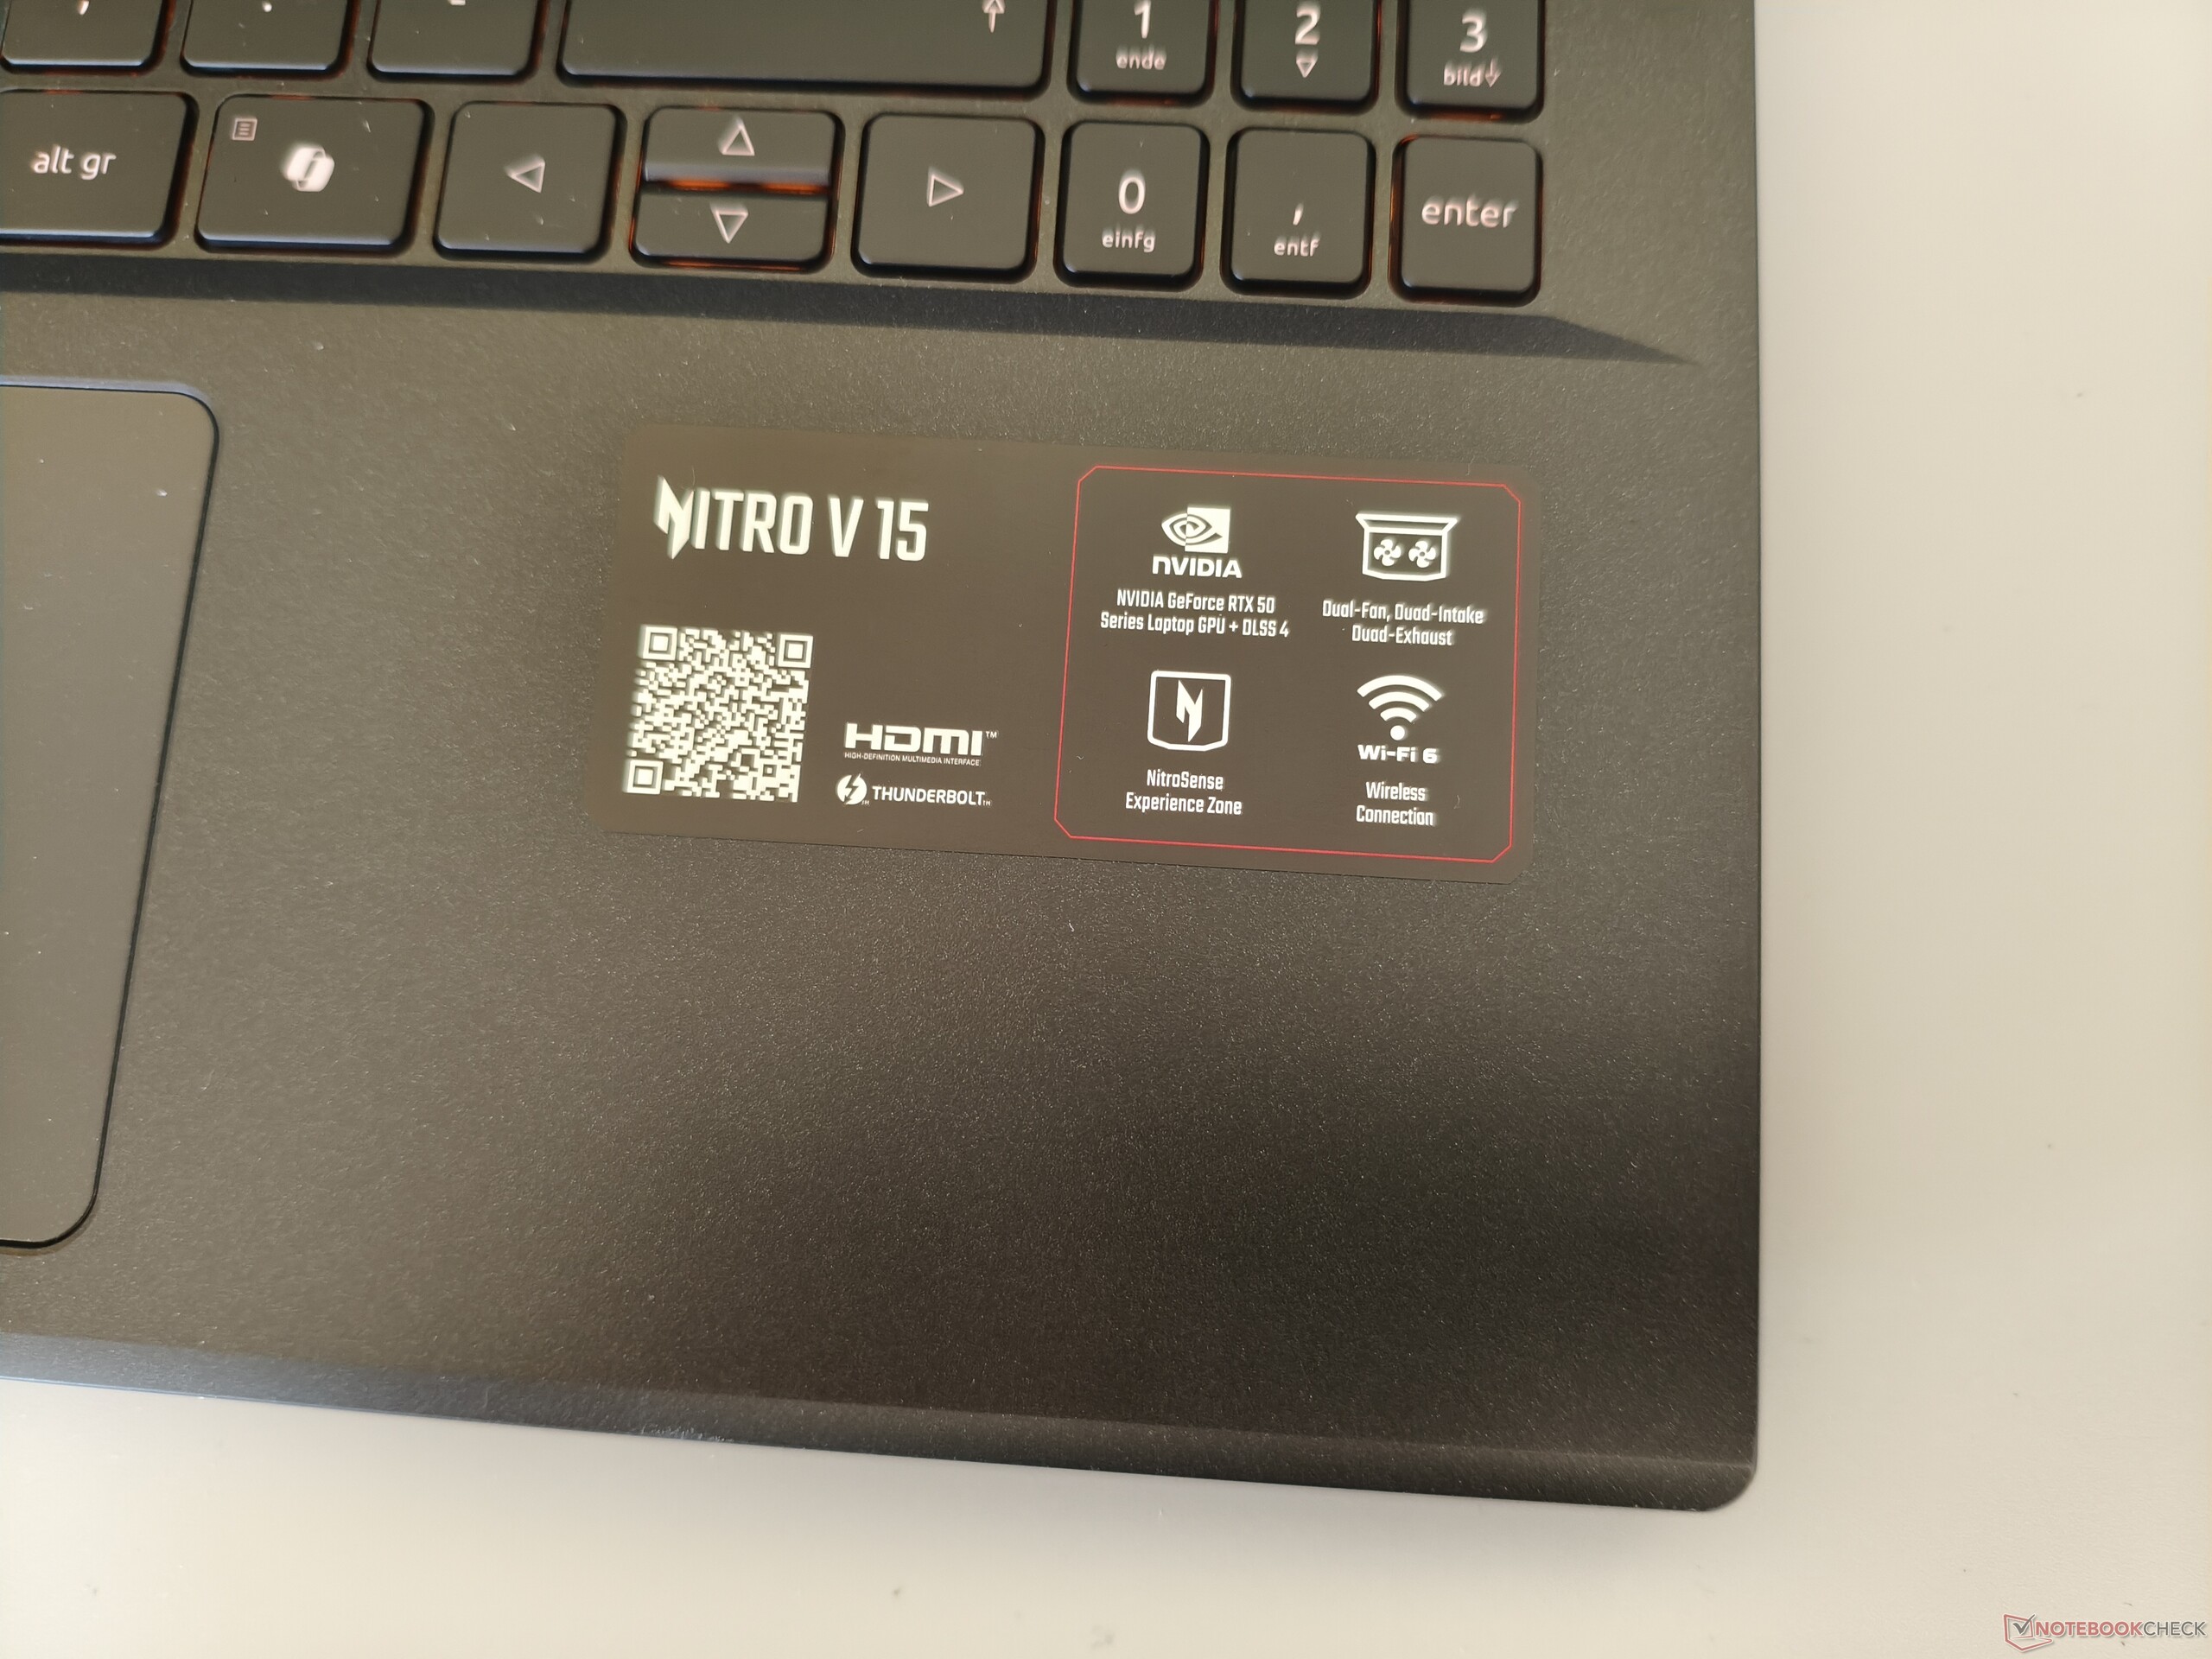
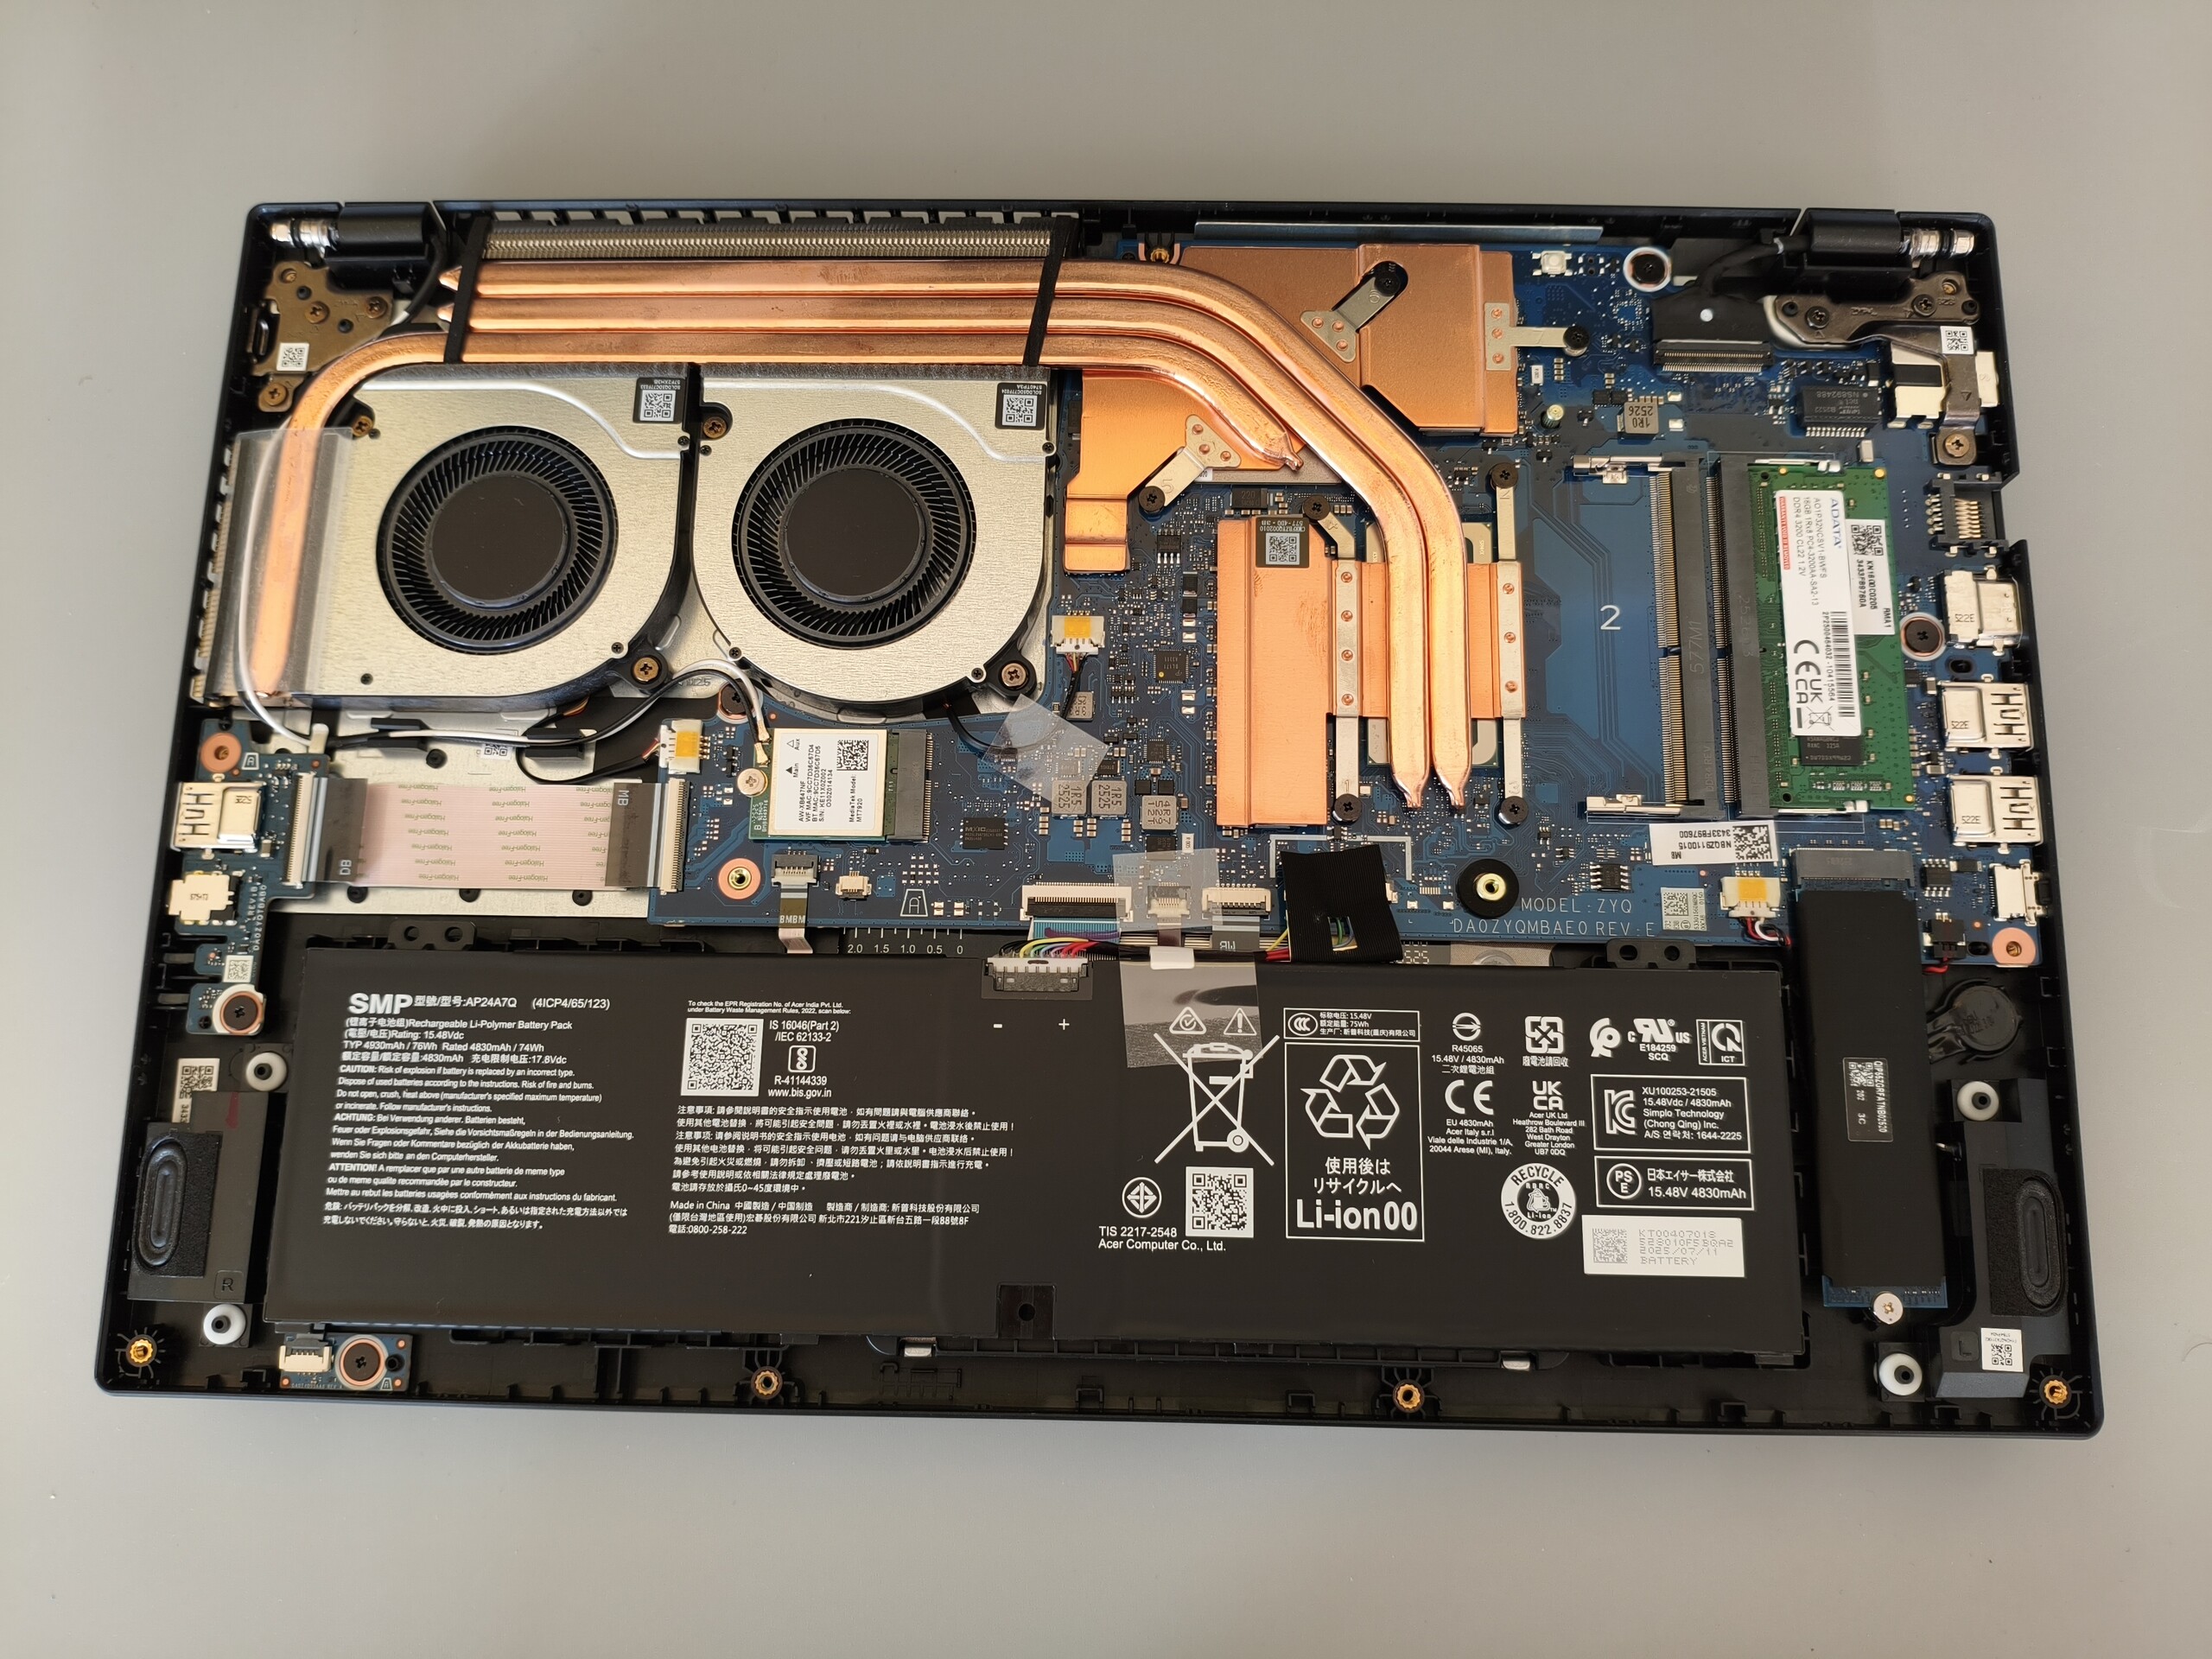
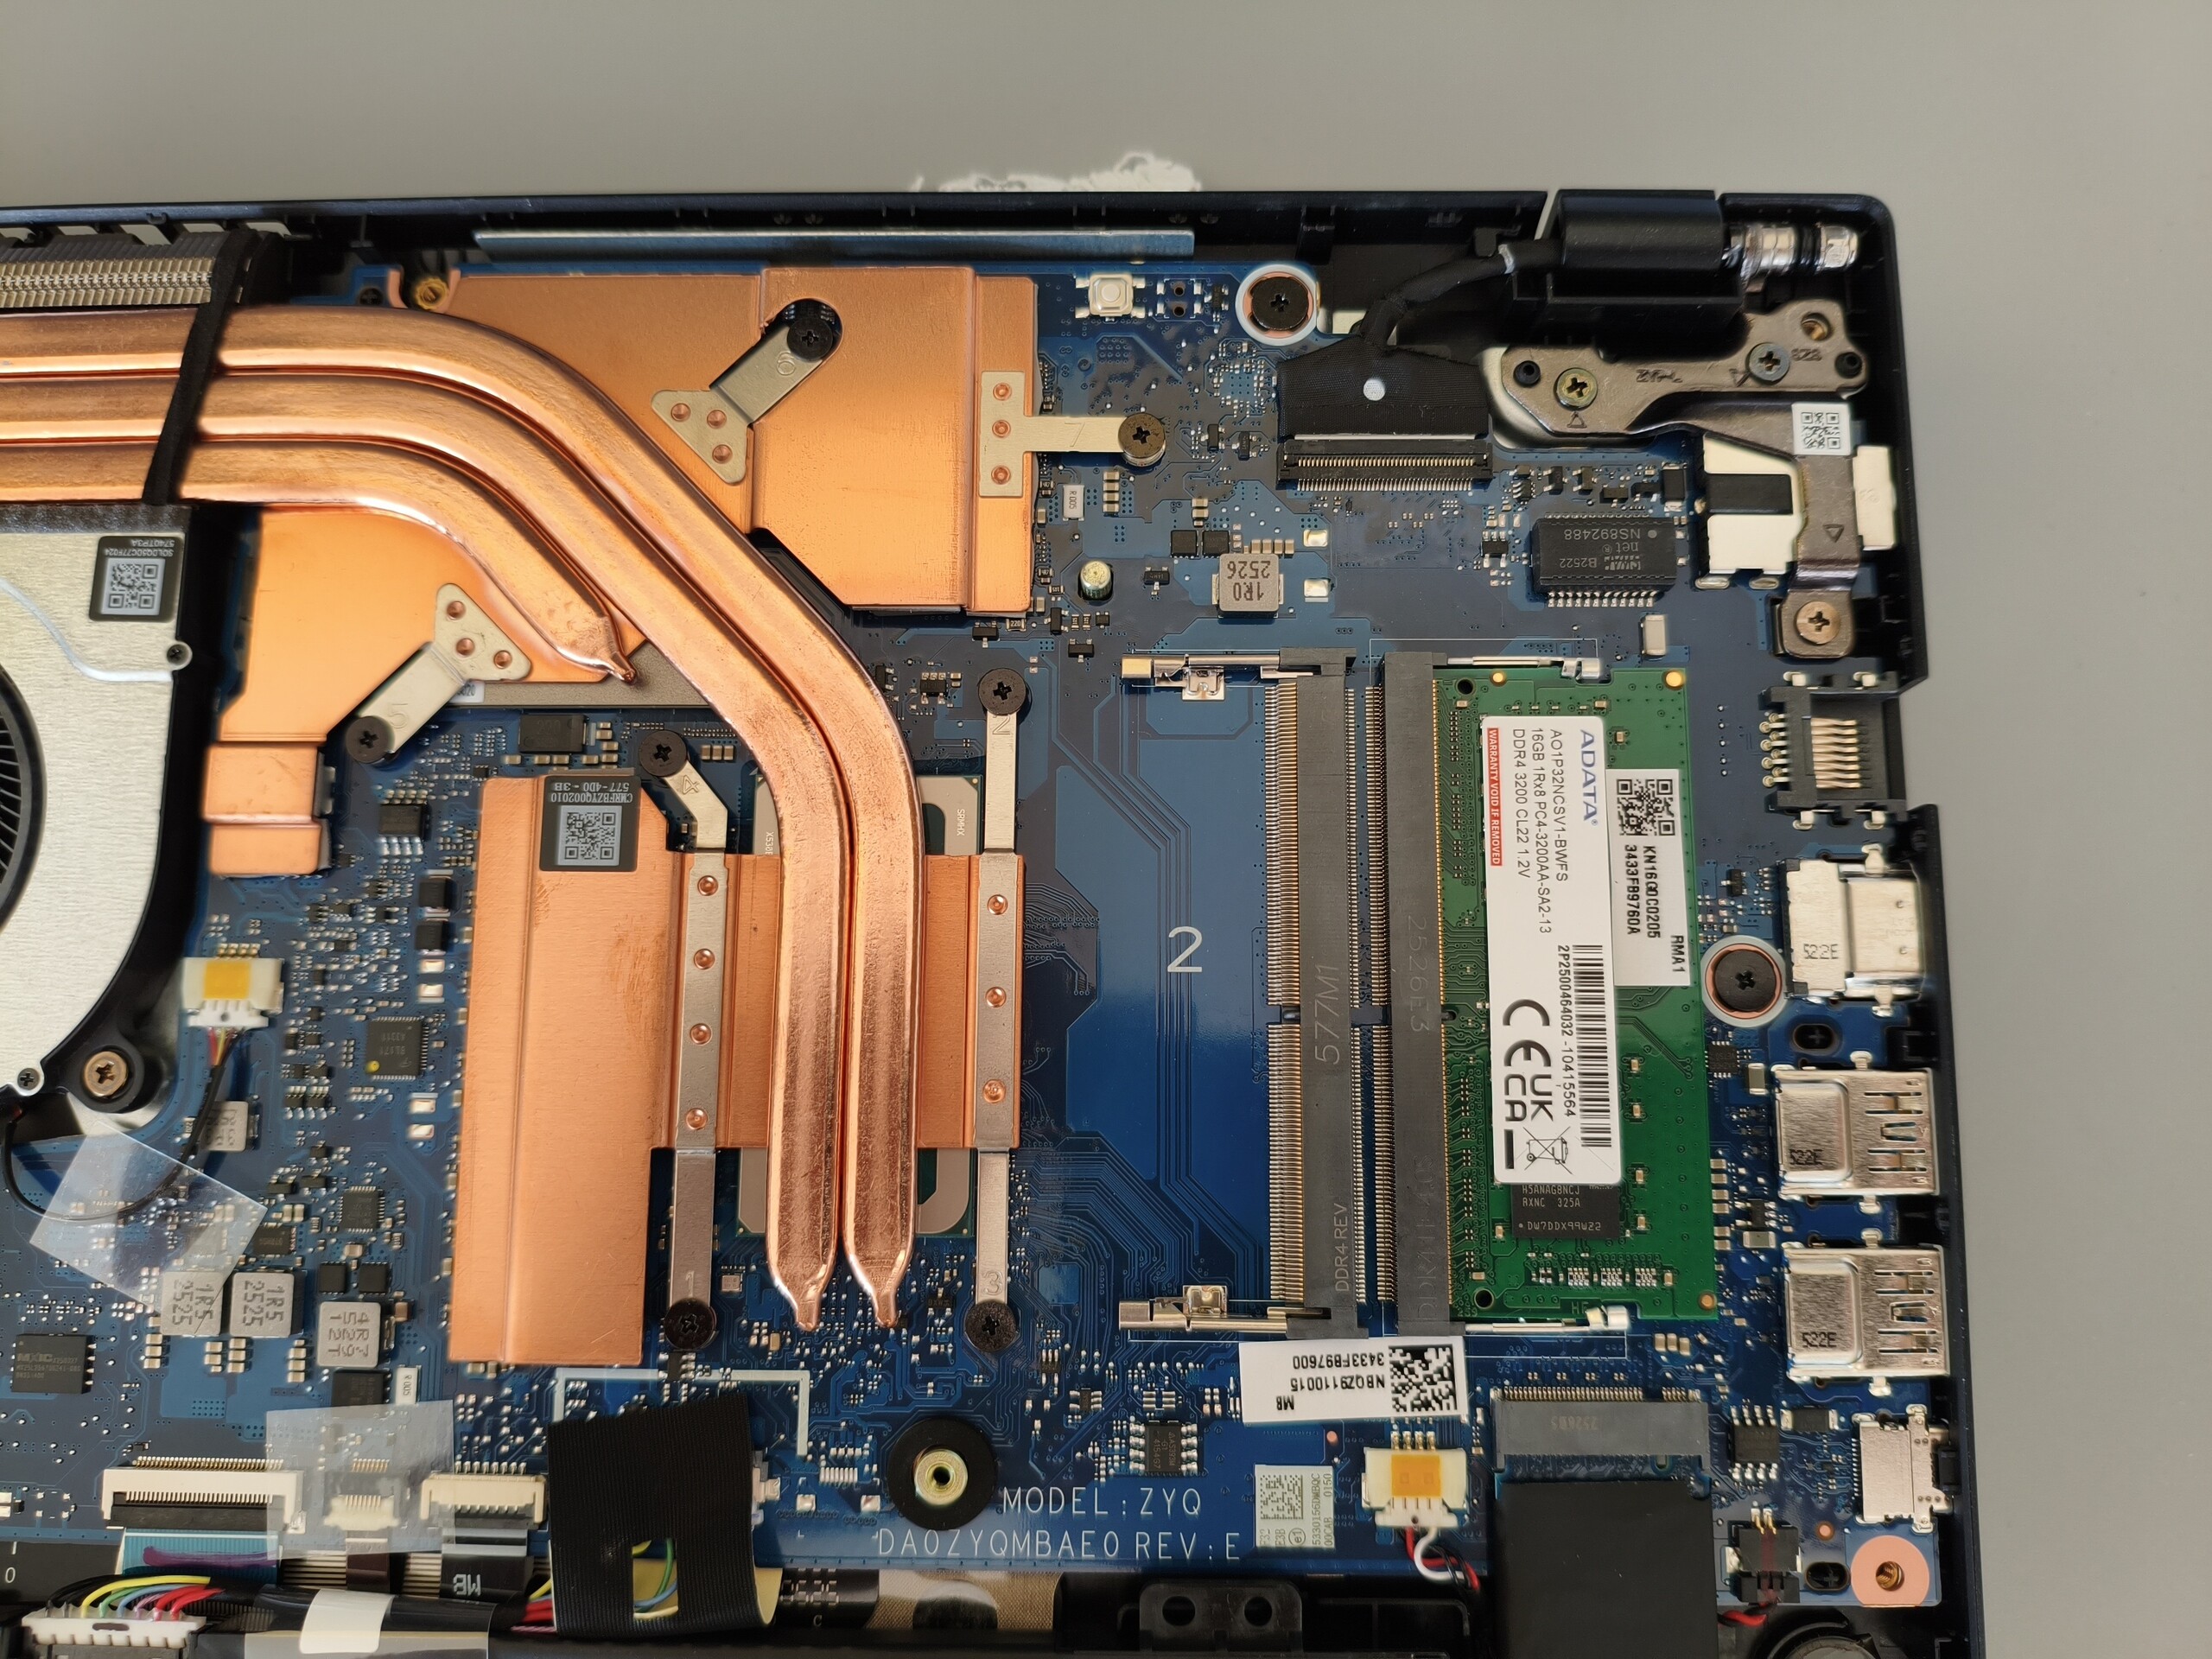
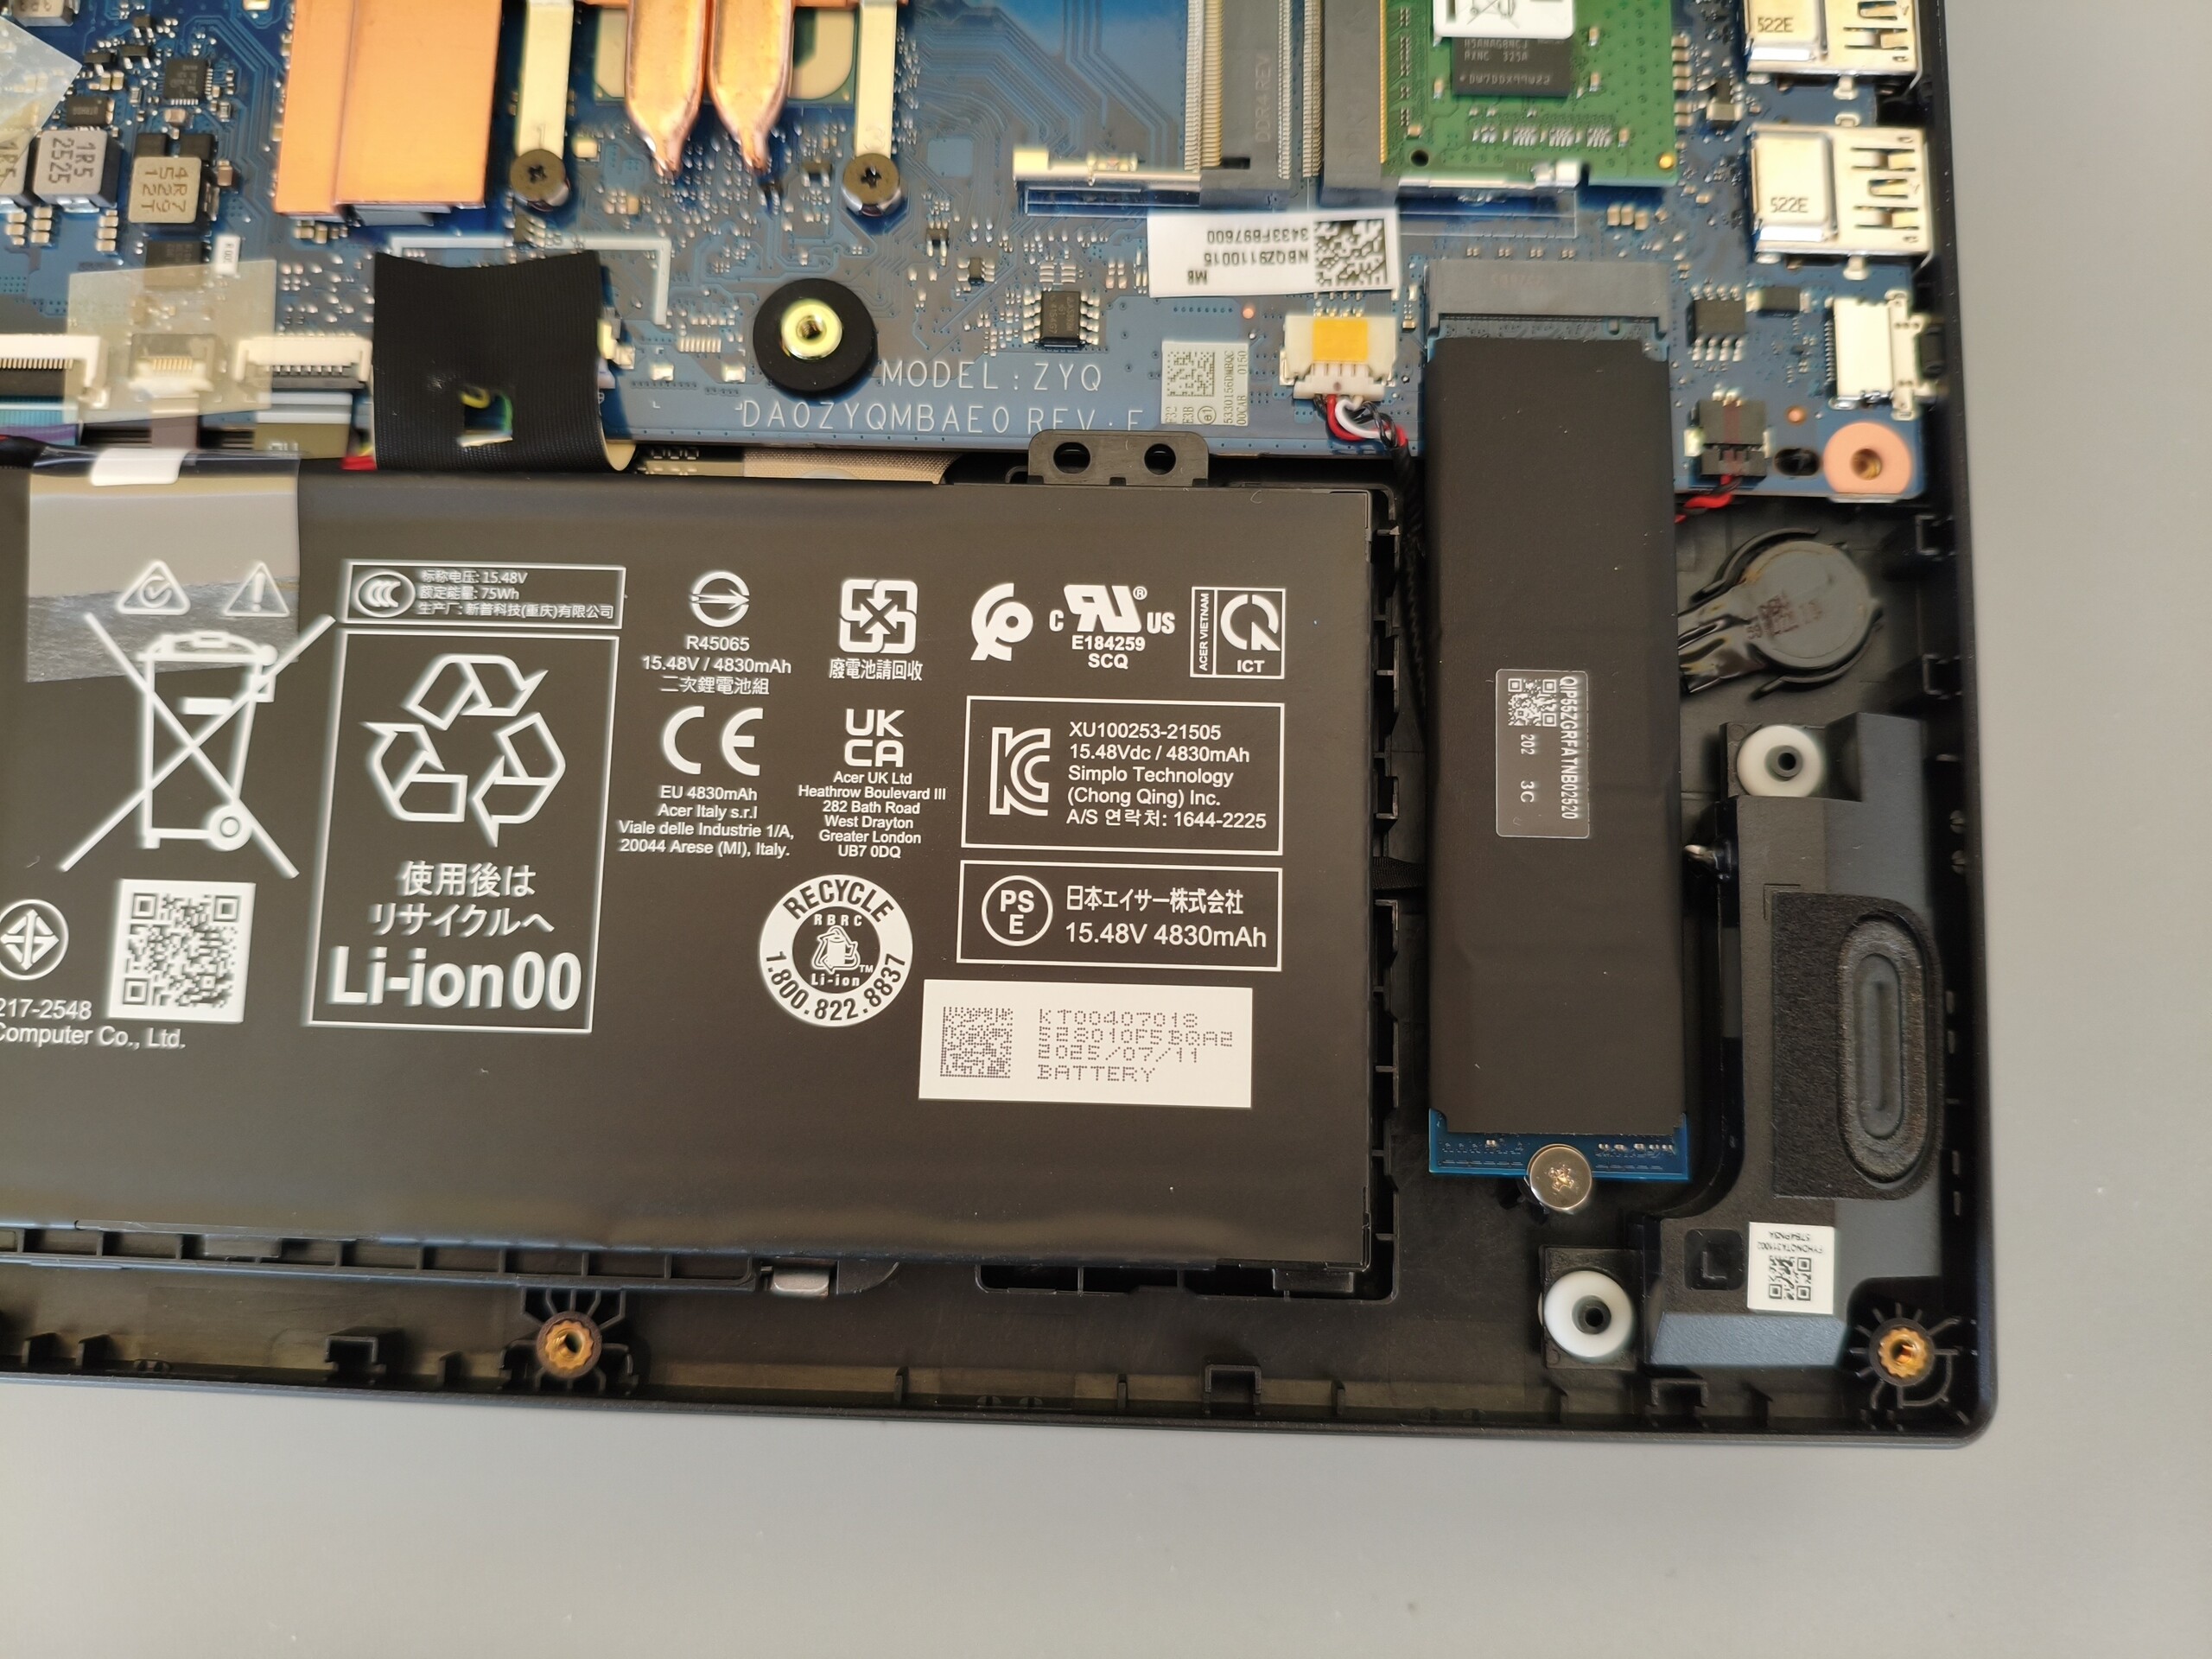
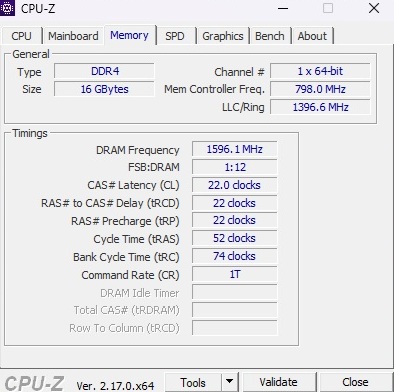
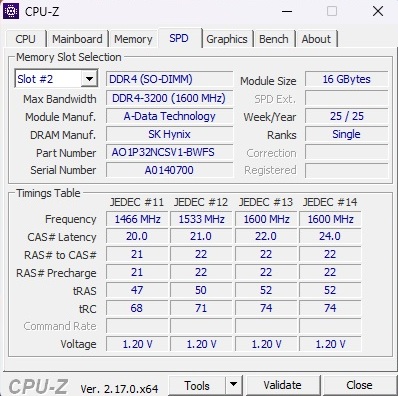
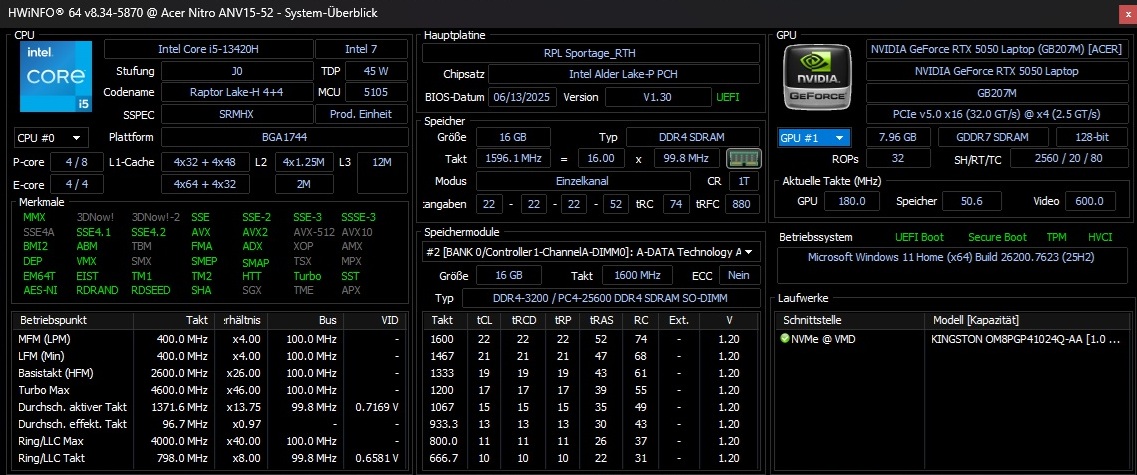
As the RAM (2x 8 GB DDR4) and SSD (1 TB M.2) are not soldered, both memory and storage can be upgraded if required. Unfortunately, gaming performance is somewhat held back, as the Core i5-13420H and RTX 5050 are unable to fully realise their potential in this configuration. Overall, the 15-inch laptop narrowly misses out on a “Good” rating.
Other laptops in this price and performance class worth considering include the MSI Cyborg 15, the HP Victus 15 and the Lenovo LOQ 15.
Pros
Cons
Price and availability
The tested Acer Nitro V 15 ANV15-52-50S2 is available from various online retailers for prices starting at around €1,050 (for example, from Notebooksbilliger). Pricing and availability may vary by region.
- $76.67HPDELGB Replacement for Acer Nitro V 15 N23Q22 ANV15-51-73B9 Gaming ANV15-51 ANV15-51-51H9 LCD Non-Touch Screen Display Panel 15.6" FHD 144HZ 40 pin
- $72.95LCDBros Screen for Acer Nitro V15 ANV15-51 40 Pins FHD 1920x1080 Matte
- $95.58KrystalPix Replacement LCD for Acer Nitro V ANV15-52 ANV15-52-76NK Gaming 165hz Display 15.6" FHD LCD LED Screen 40 pins Non-Touch Panel New
Specifications
Case
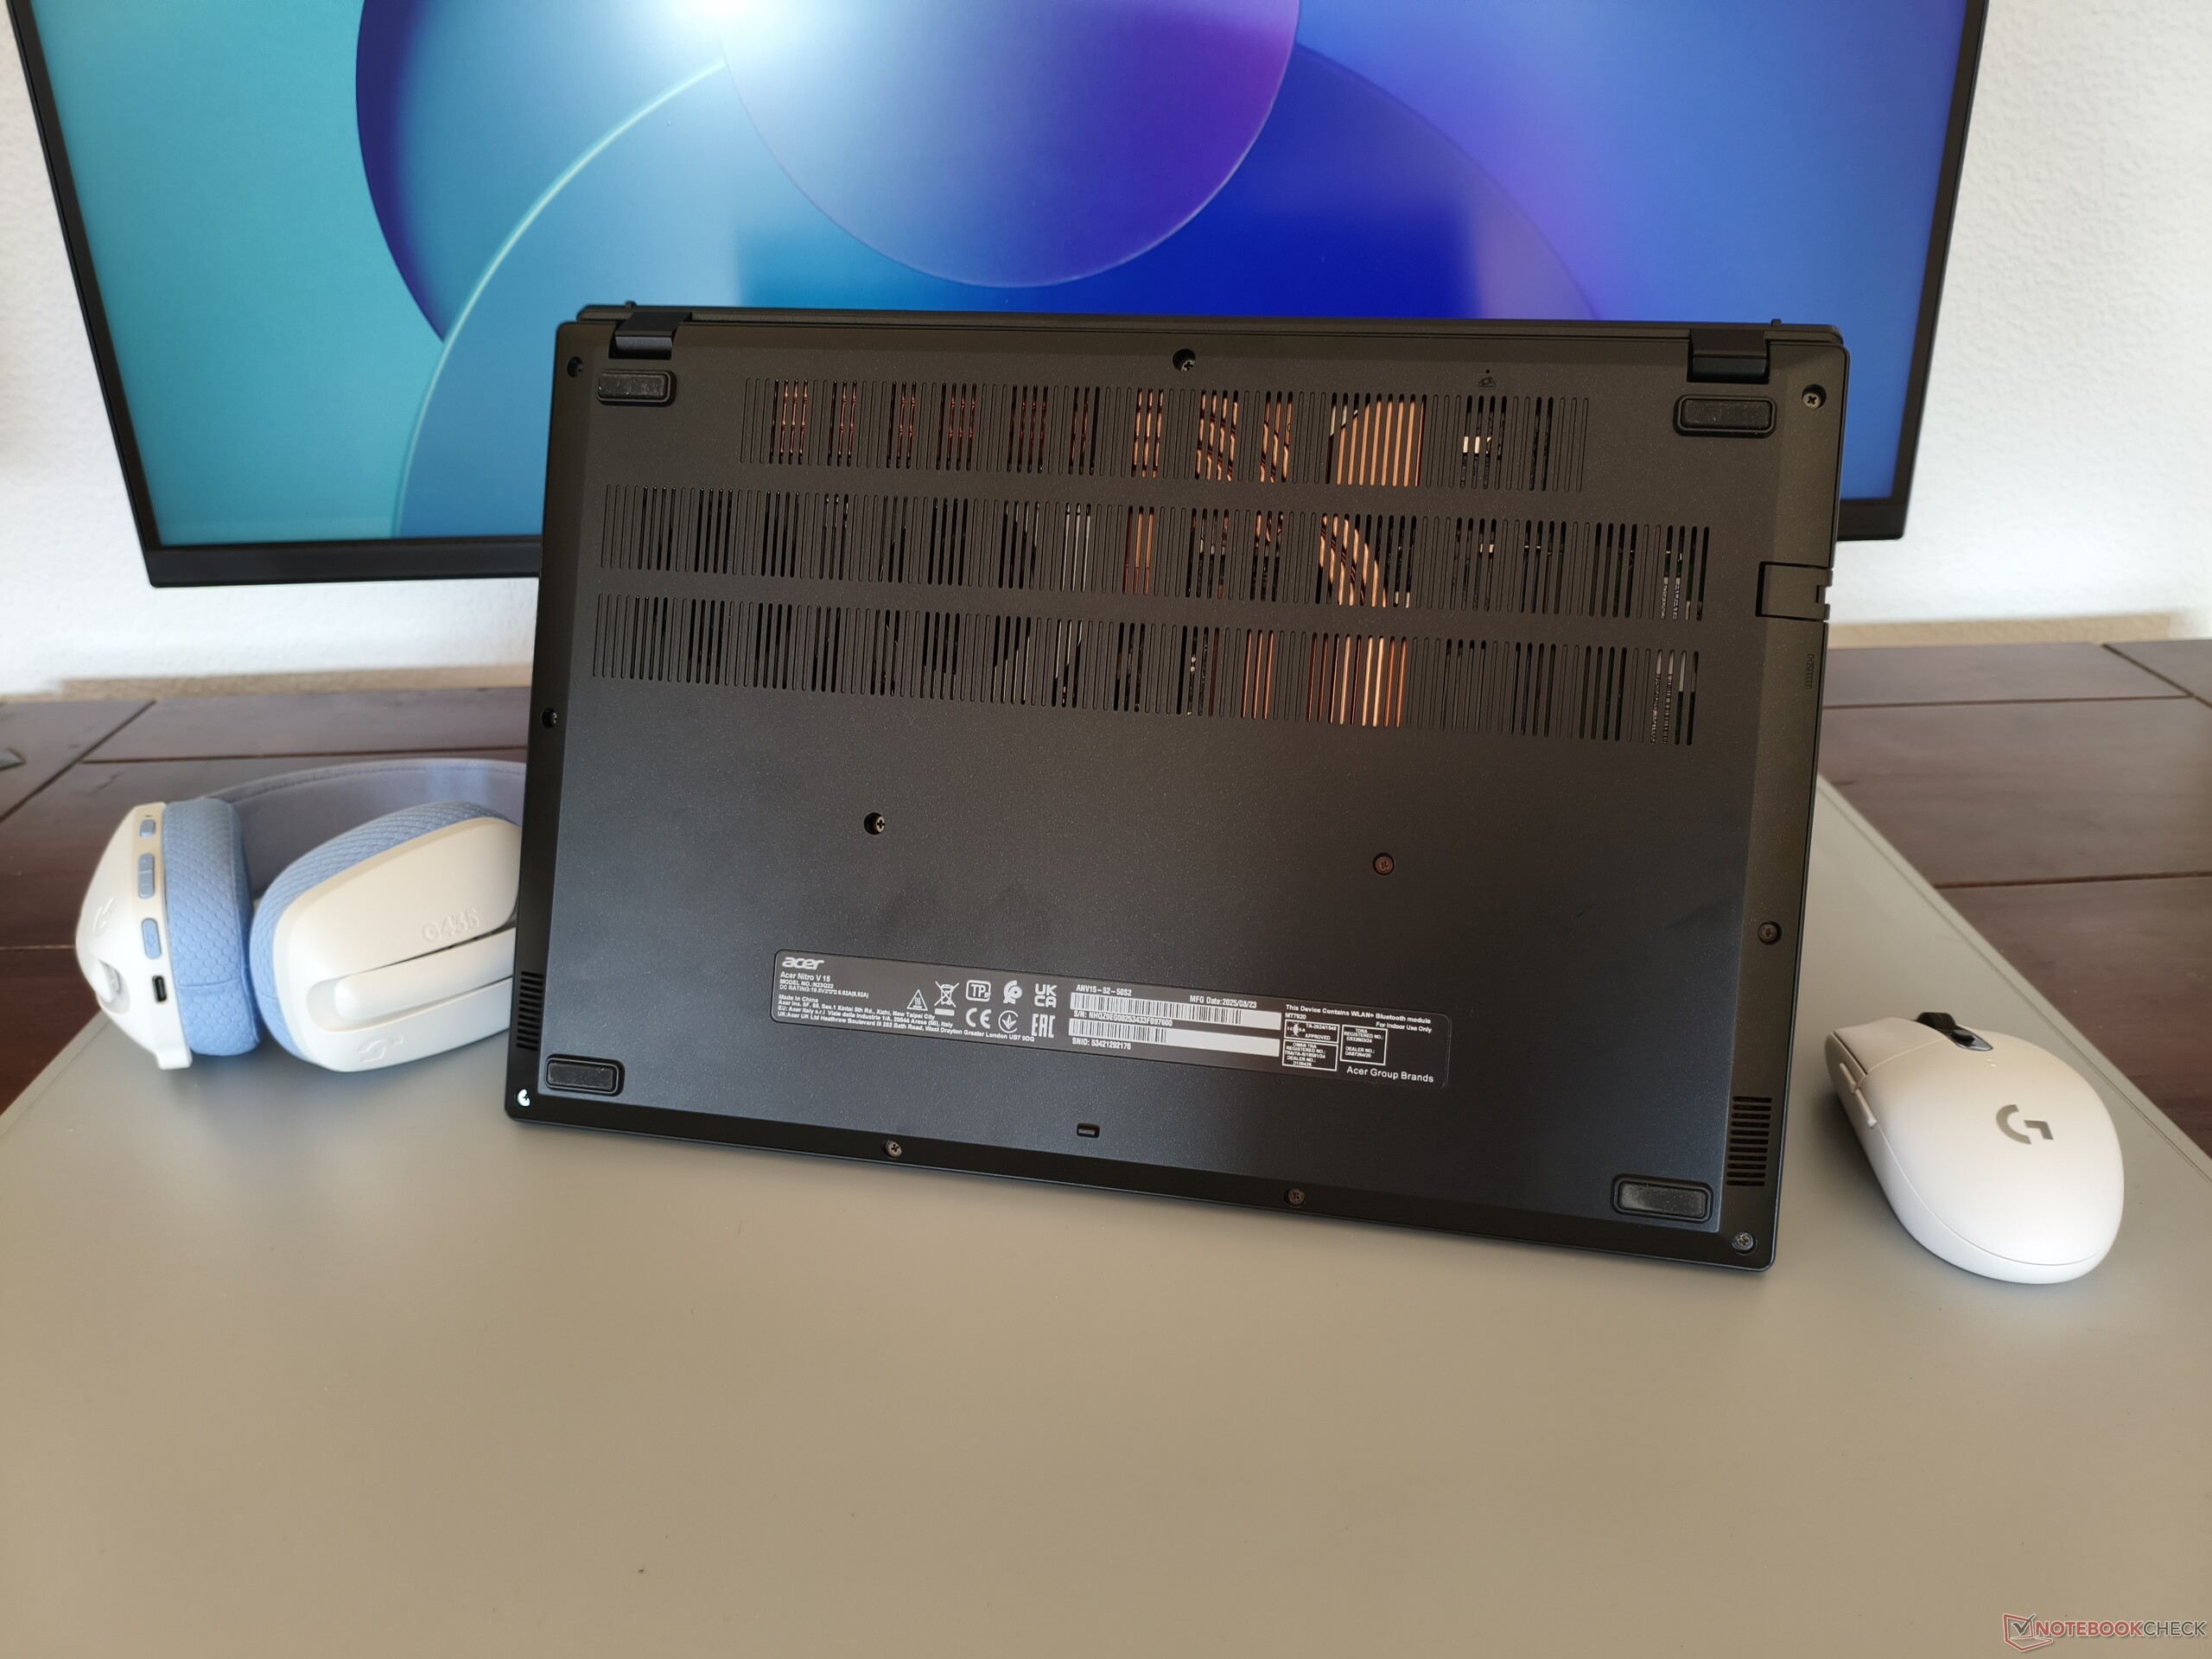
Acer uses an all-plastic chassis that is mostly well finished, although some areas exhibit noticeable flex. The hinges feel a little loose and allow the display to open to a maximum angle of approximately 145°. Weighing 2.1 kg, the laptop matches its predecessor in terms of weight, while the overall design remains similar but not entirely unchanged.

Connectivity
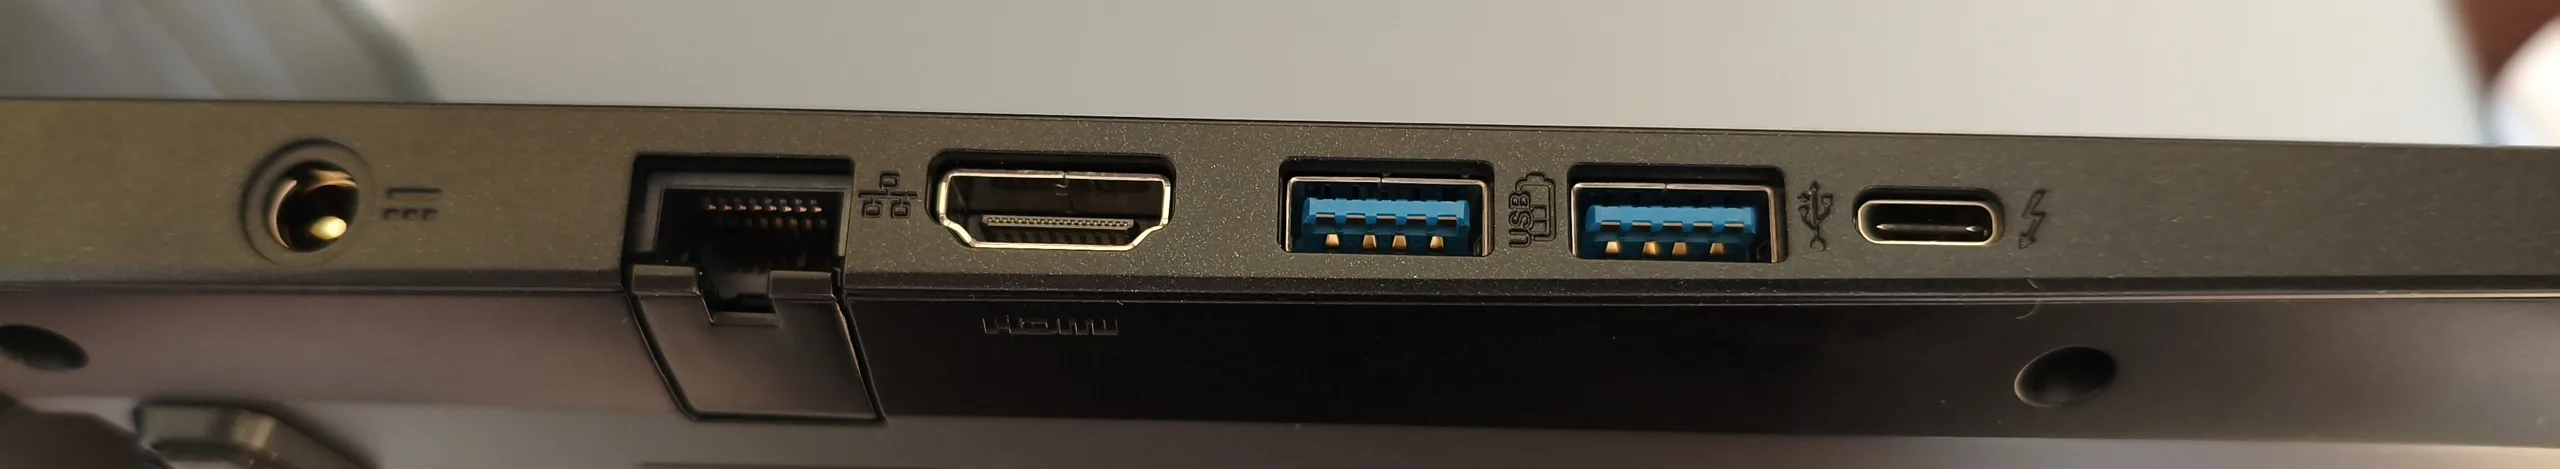
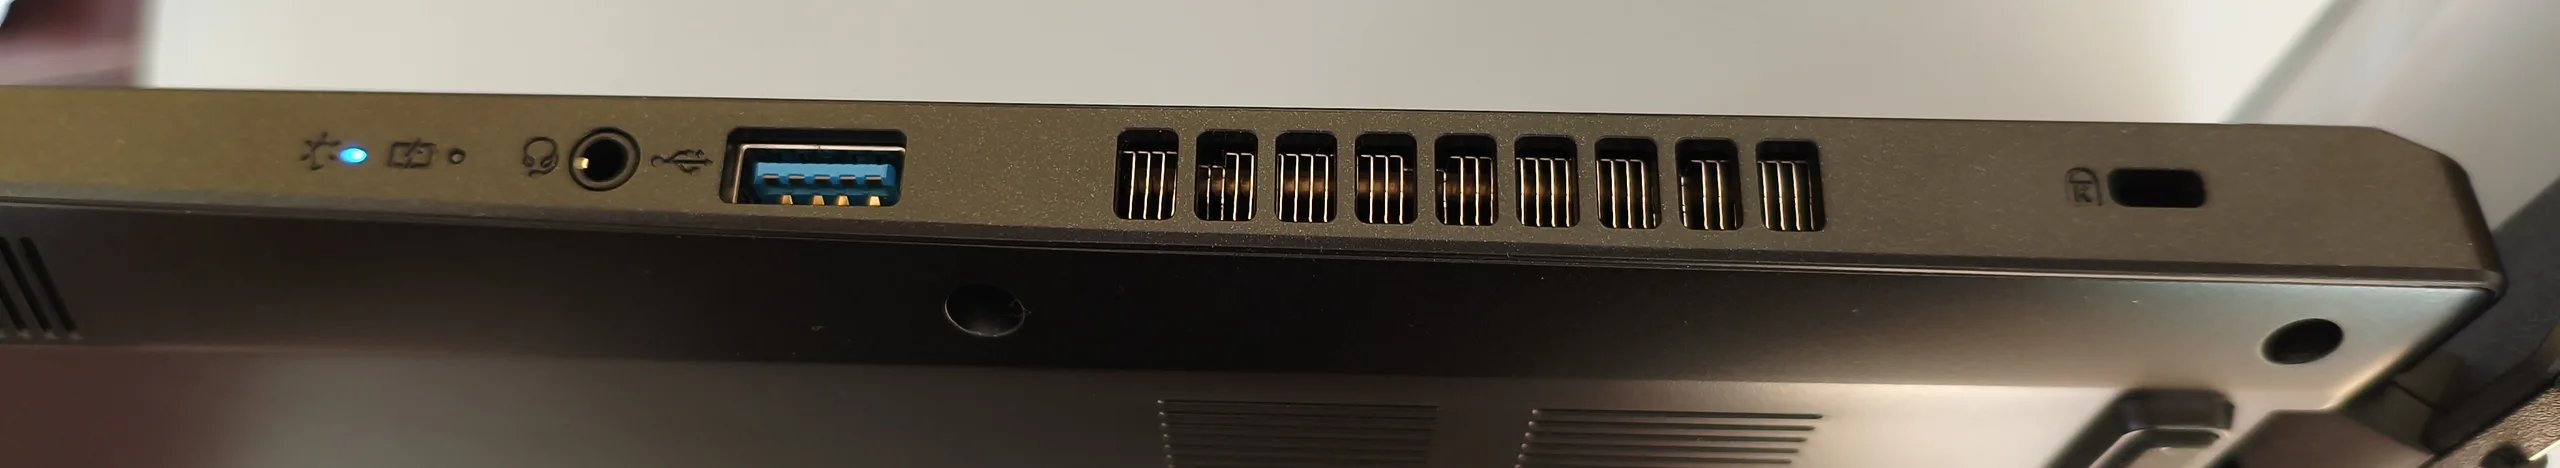
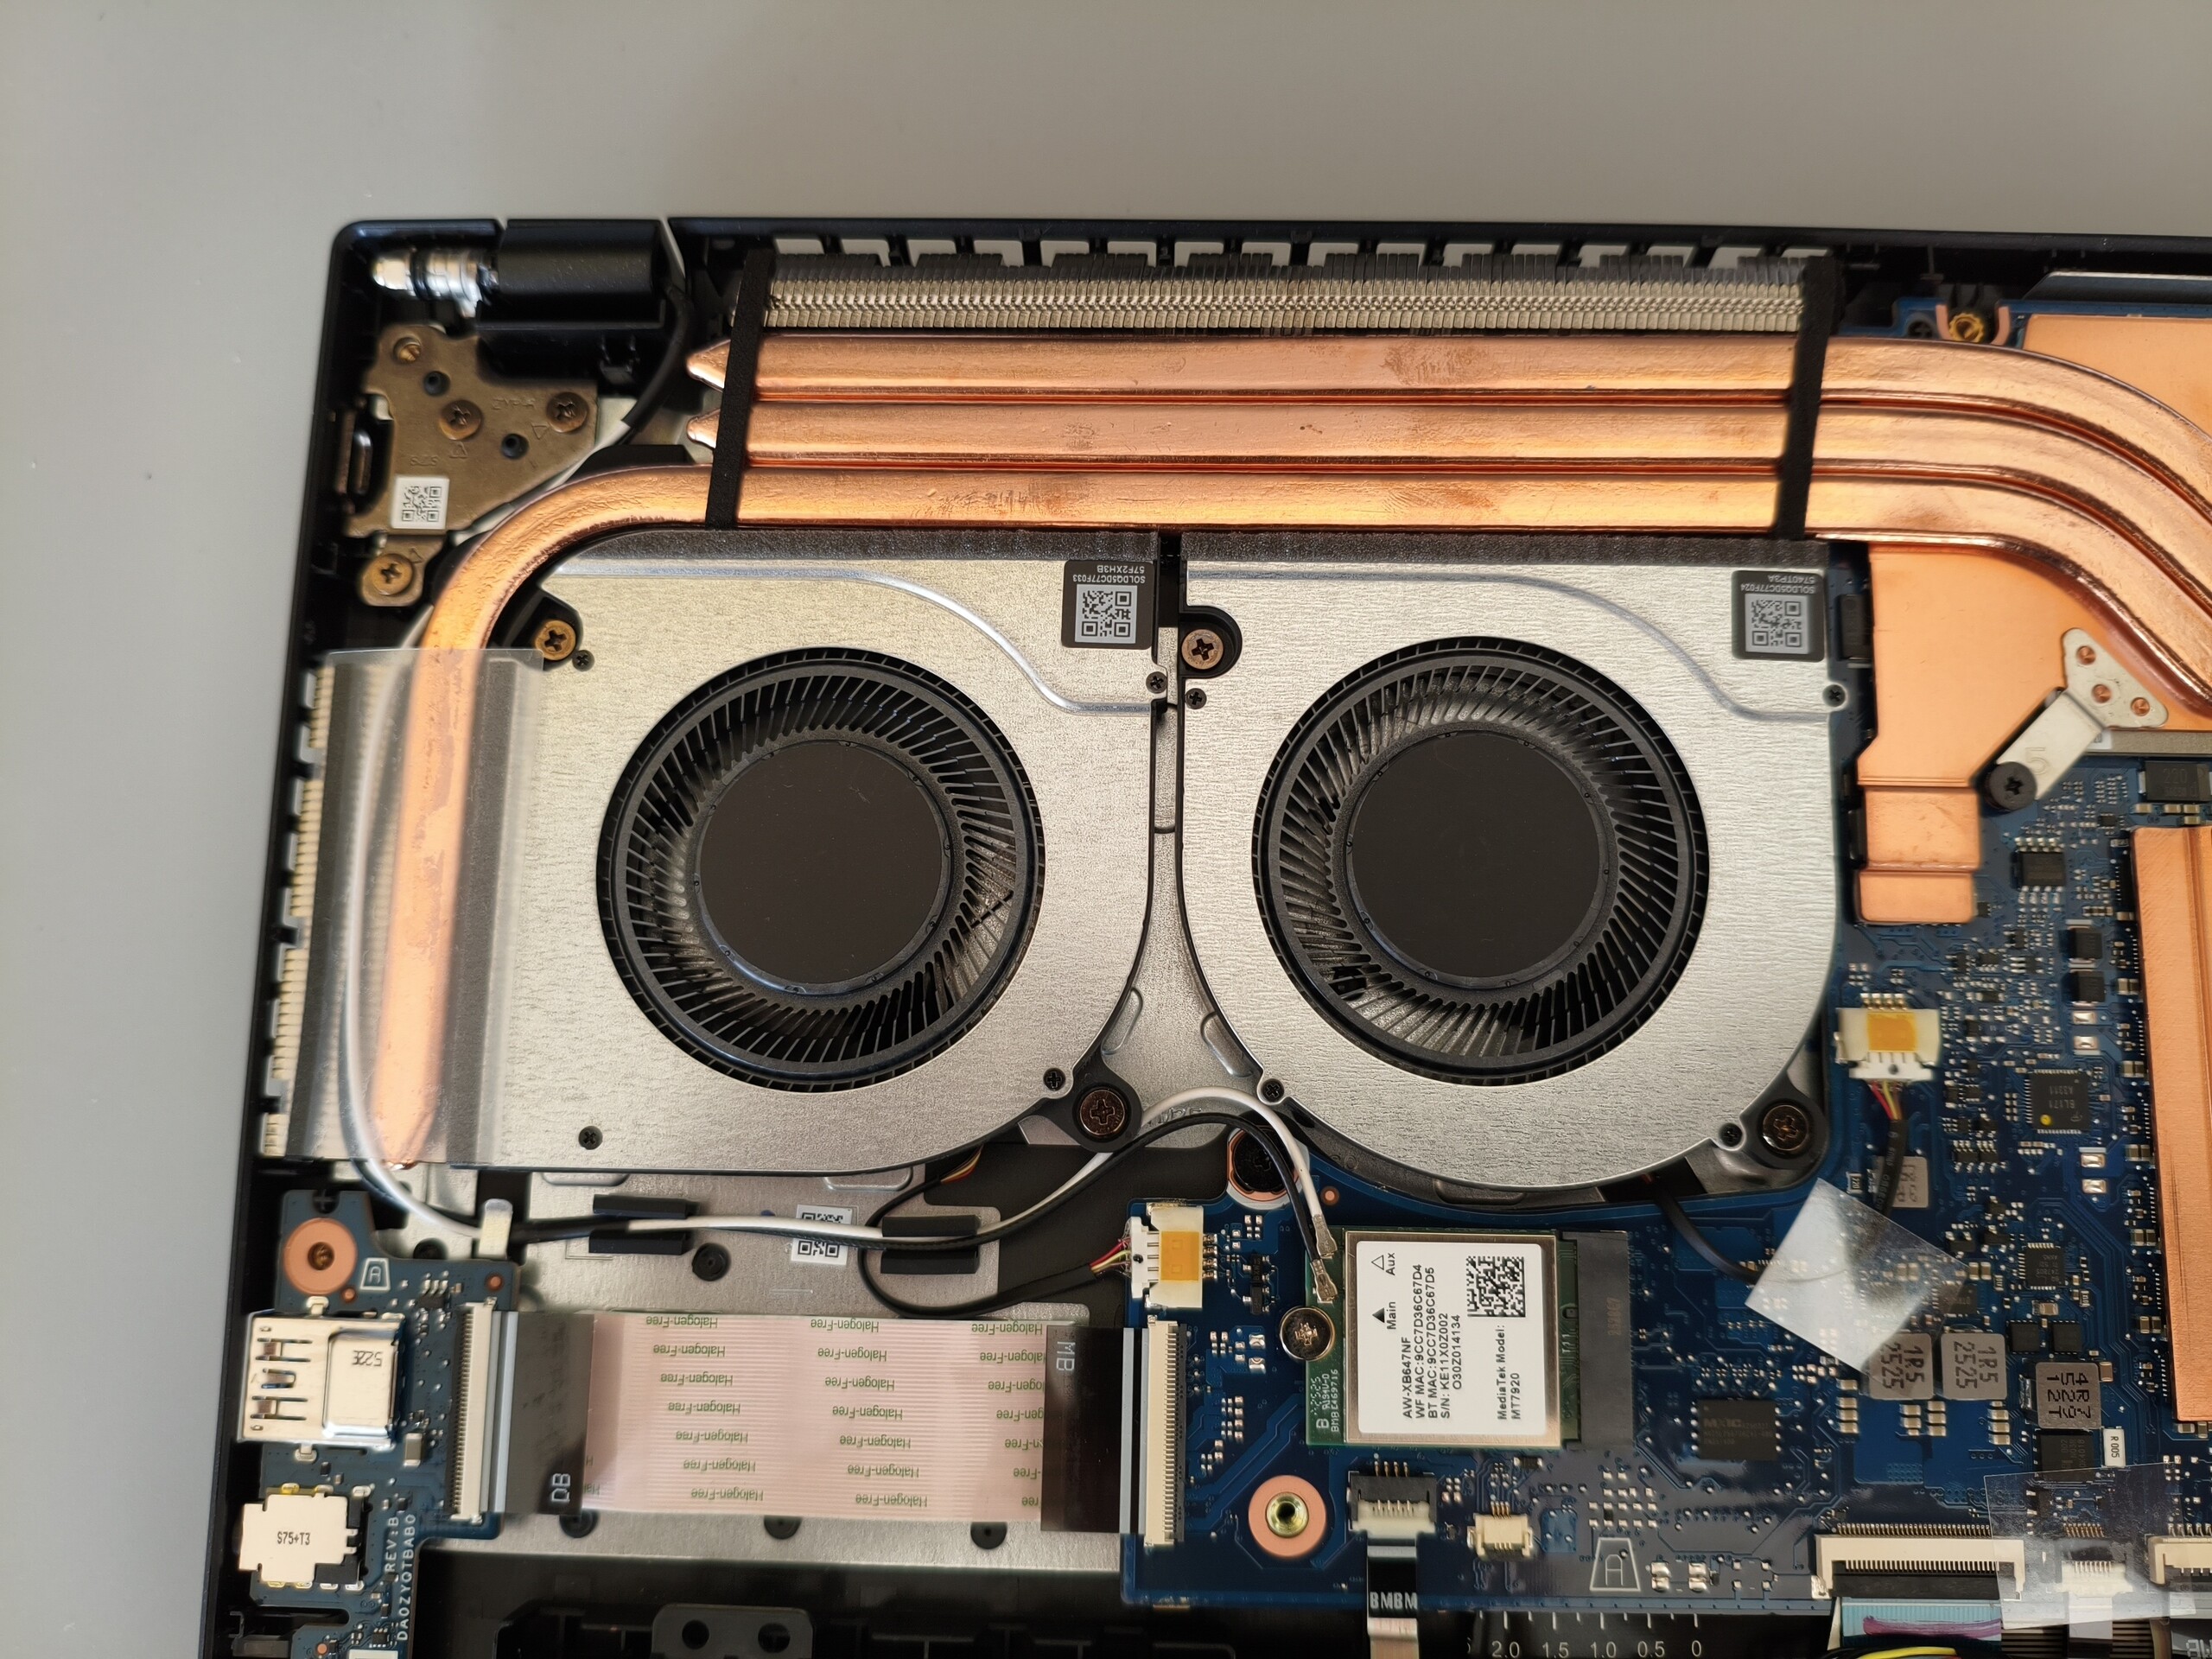
Aside from the absence of a card reader, the port selection leaves little room for criticism. The Gigabit LAN port, HDMI output and 3.5 mm audio jack are complemented by three USB-A ports and a Thunderbolt 4 connector. A Kensington lock slot is also included. The Wi-Fi 6E module delivers middling performance, and the rather soft webcam produces similarly unimpressive results. Accessing the internals requires removing 11 Phillips screws. Images of the interior can be found further below.
Communication
Webcam


Maintenance
Input devices
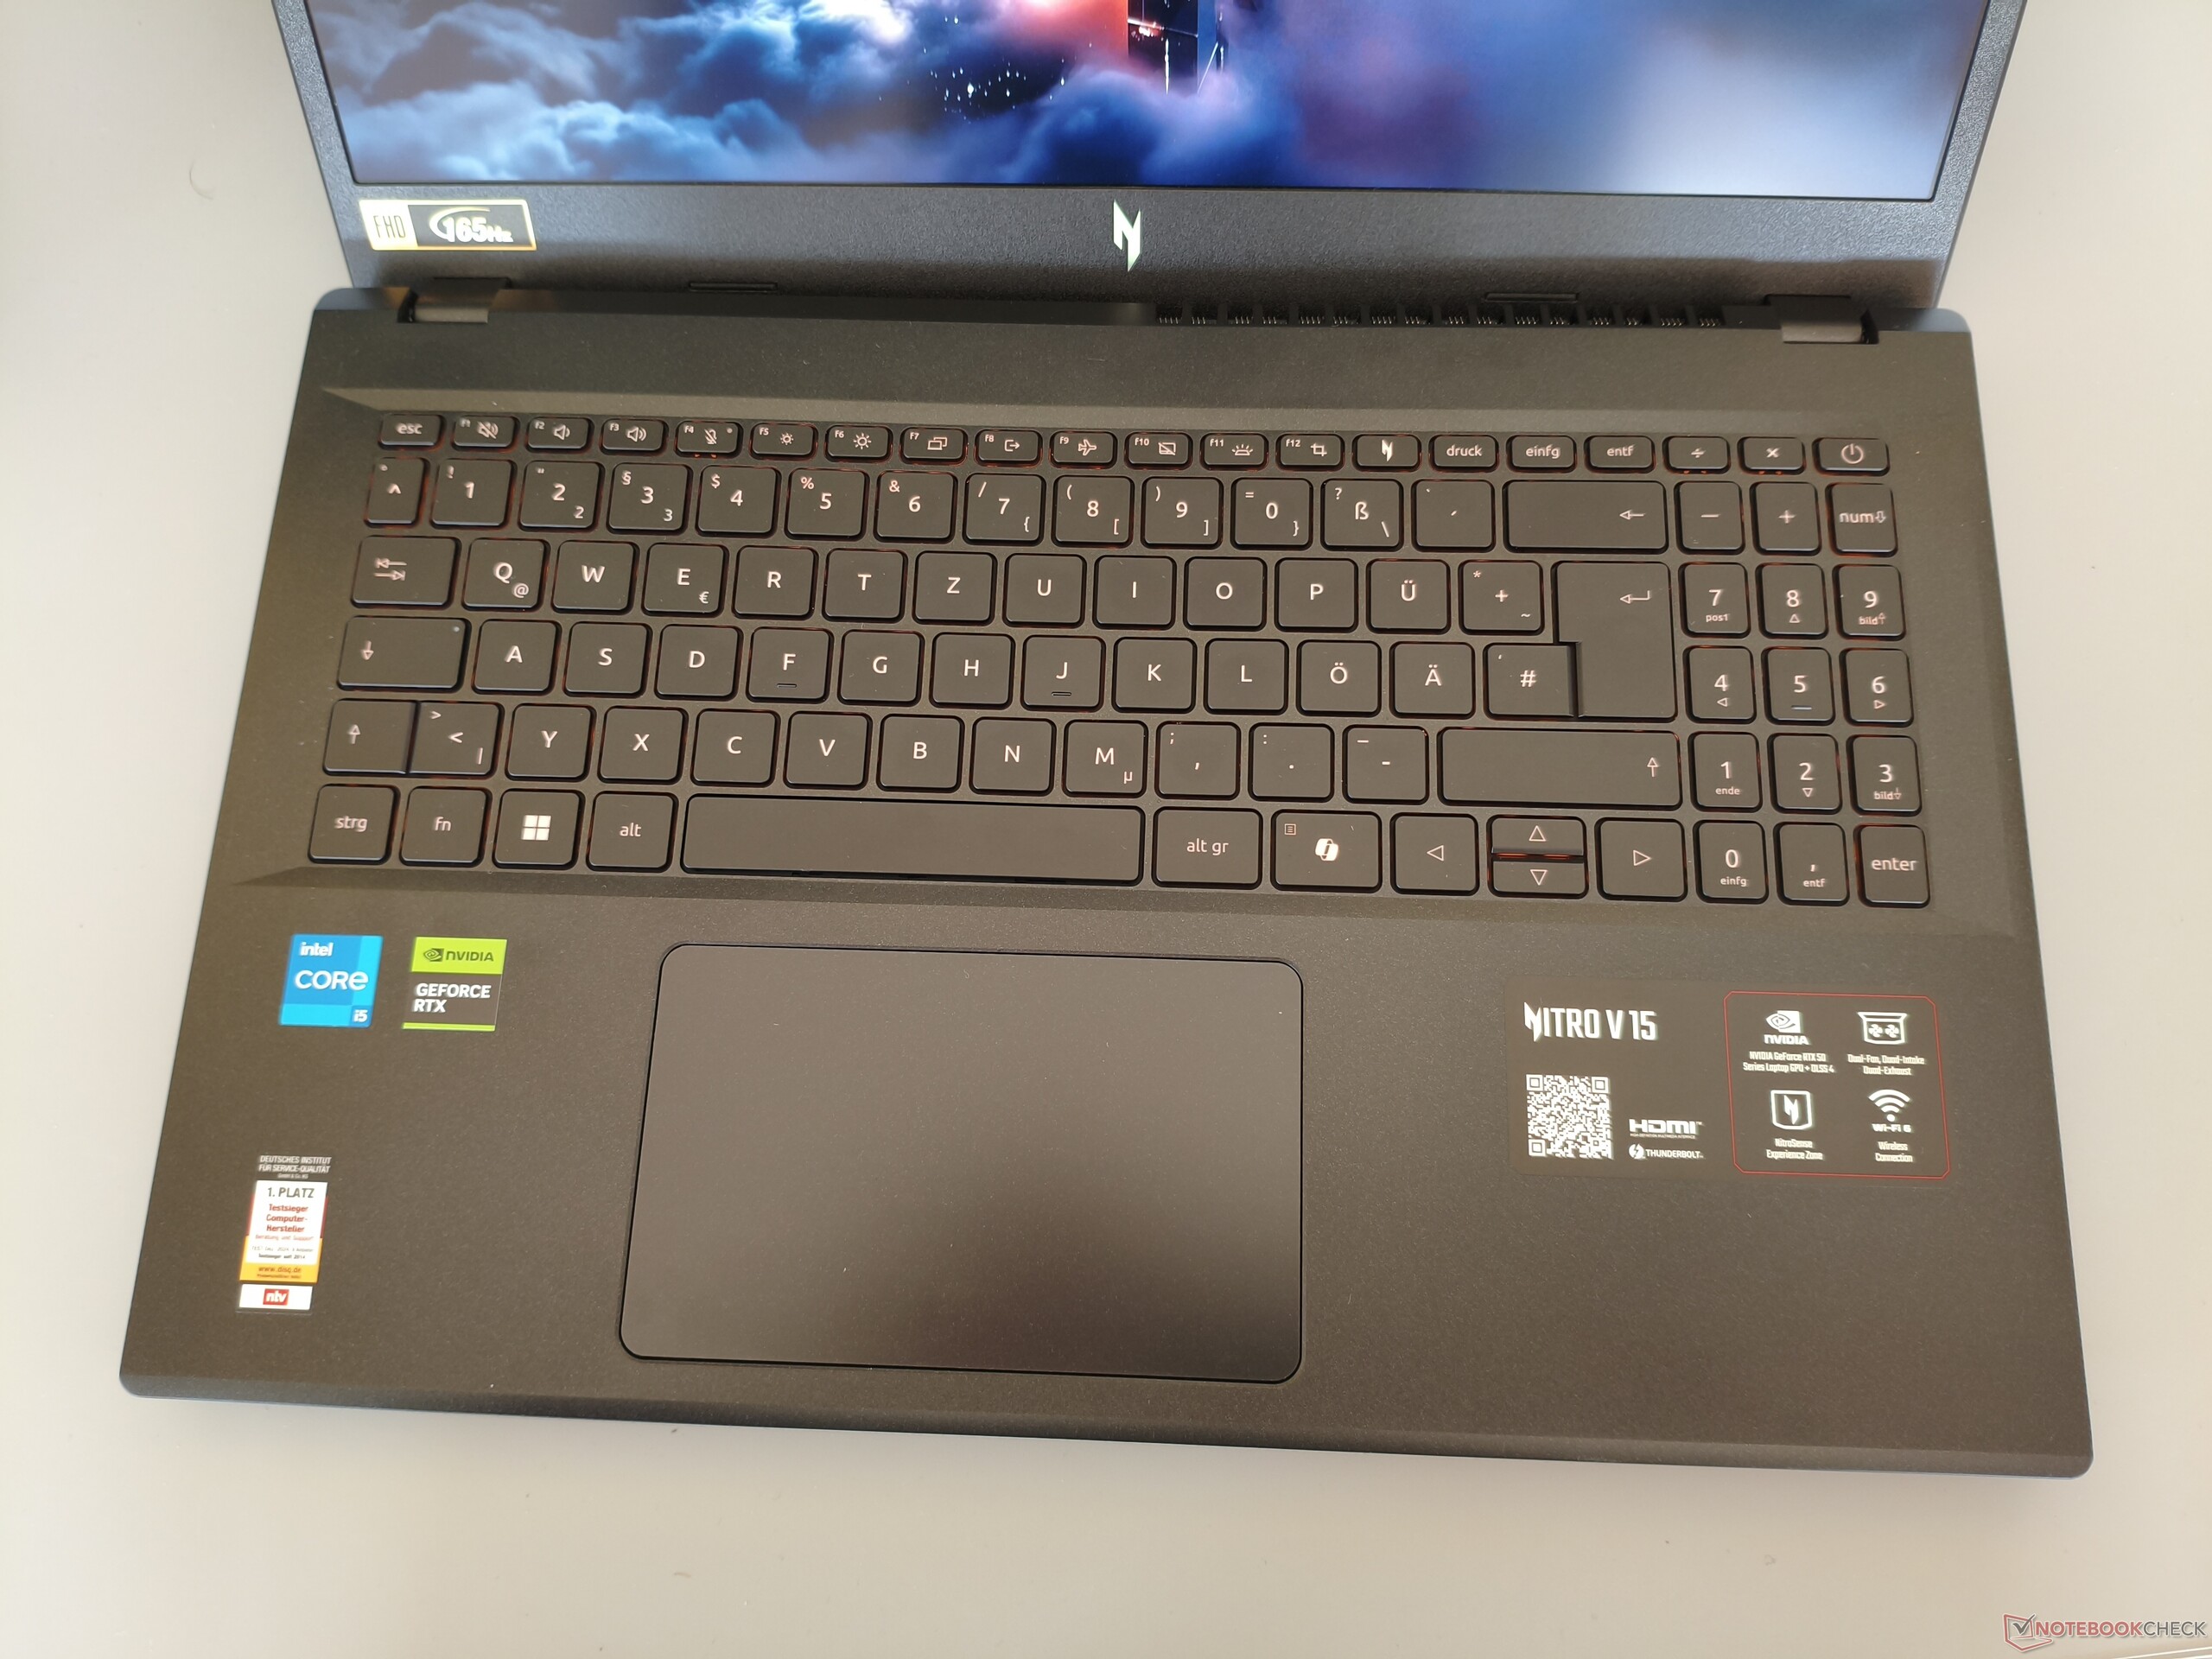
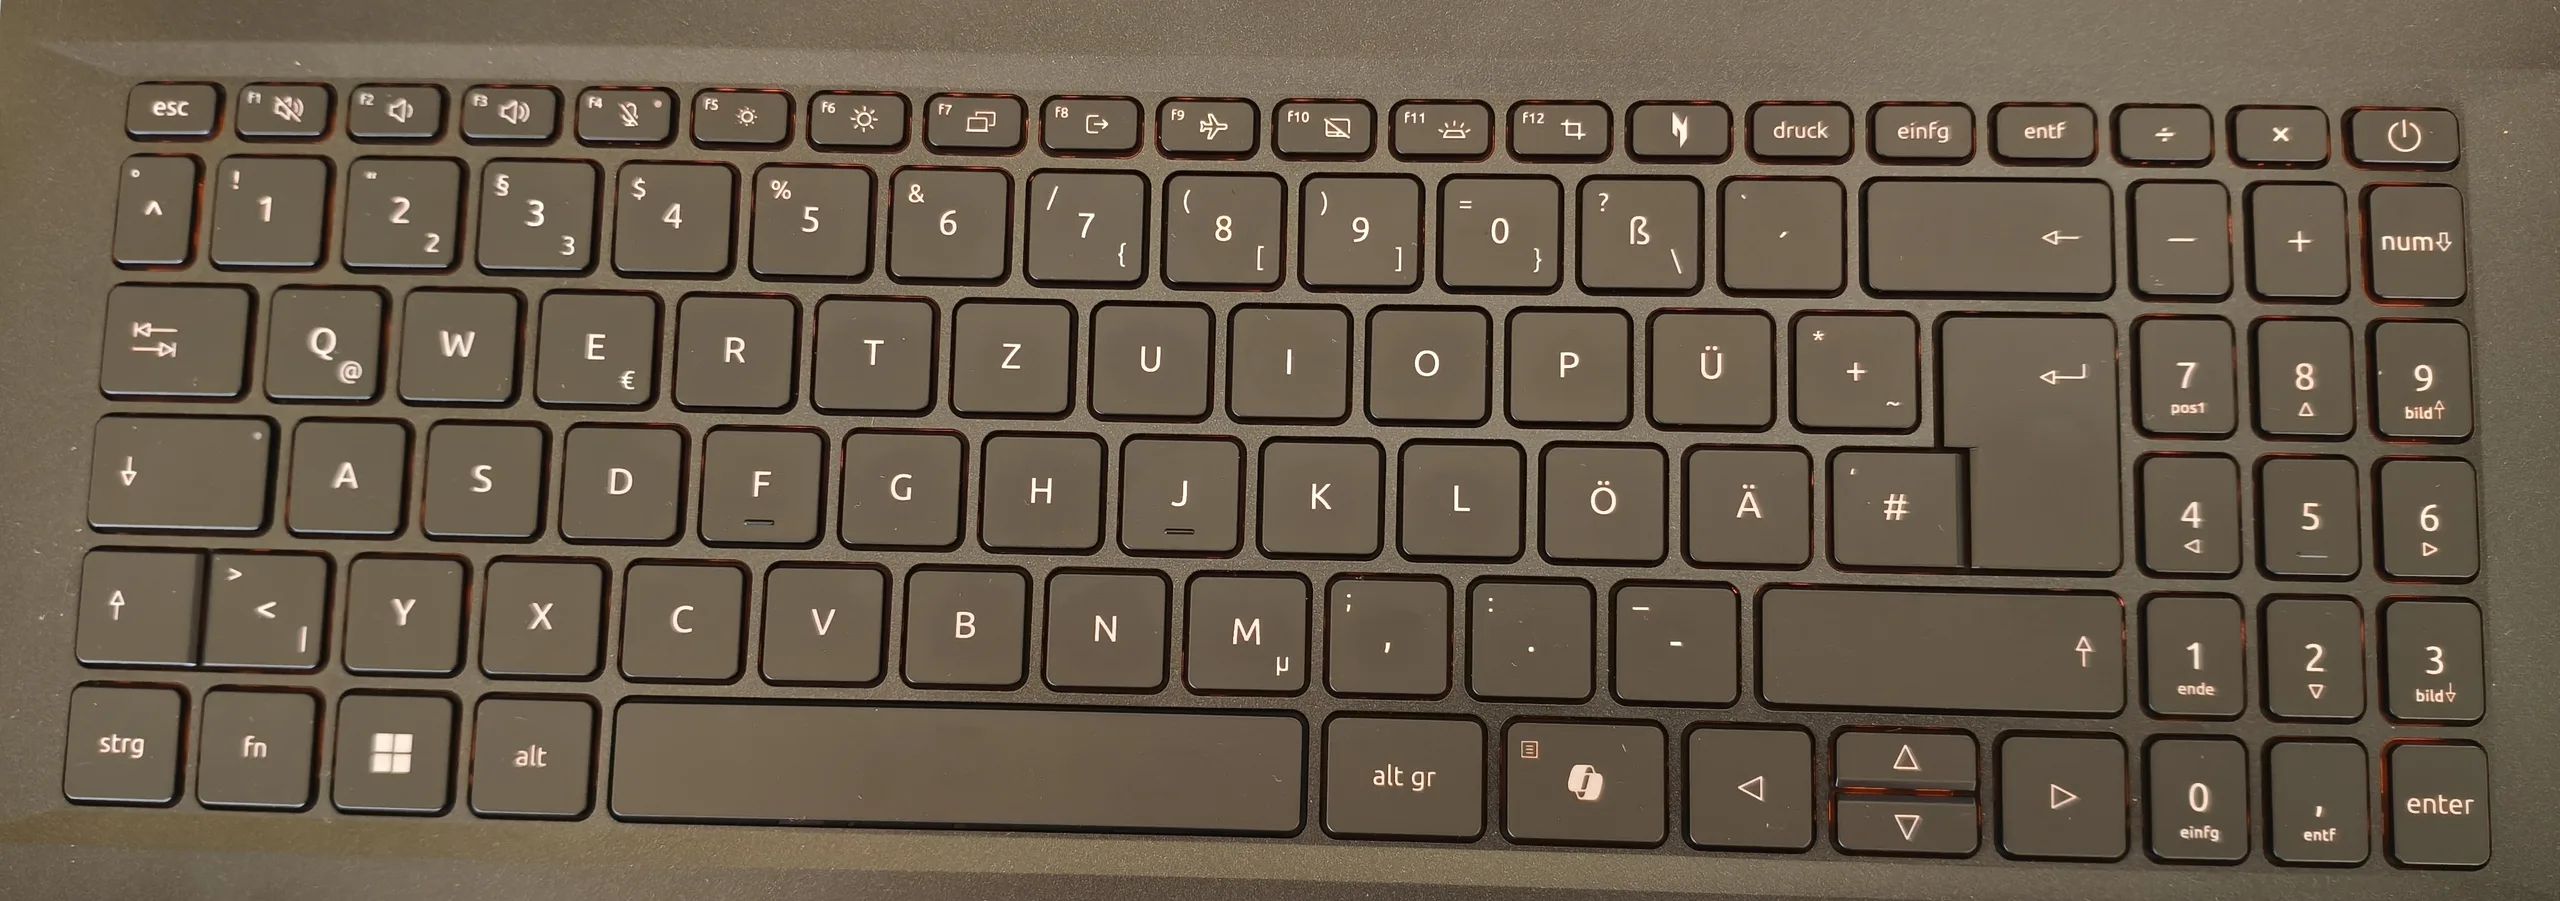
We were not entirely satisfied with the keyboard layout. Points of criticism include the three-column numeric keypad instead of a full four-column layout, as well as the rather small central arrow keys. The typing experience is typical rubber-dome fare and therefore nothing particularly remarkable. There is also room for improvement when it comes to the backlighting. The orange illumination is not especially bright, even at its highest setting. On the plus side, the 15-inch laptop features a fairly large touchpad measuring 12.6 x 7.8 cm, although it feels somewhat rattly when clicked.
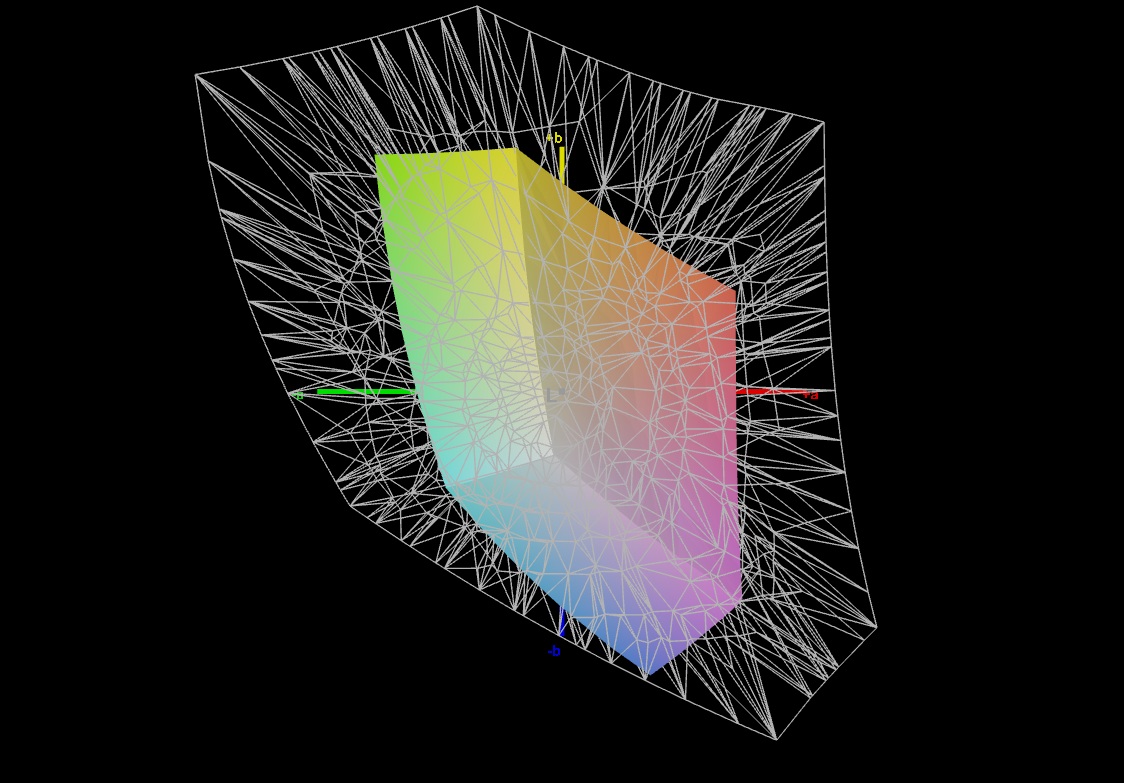
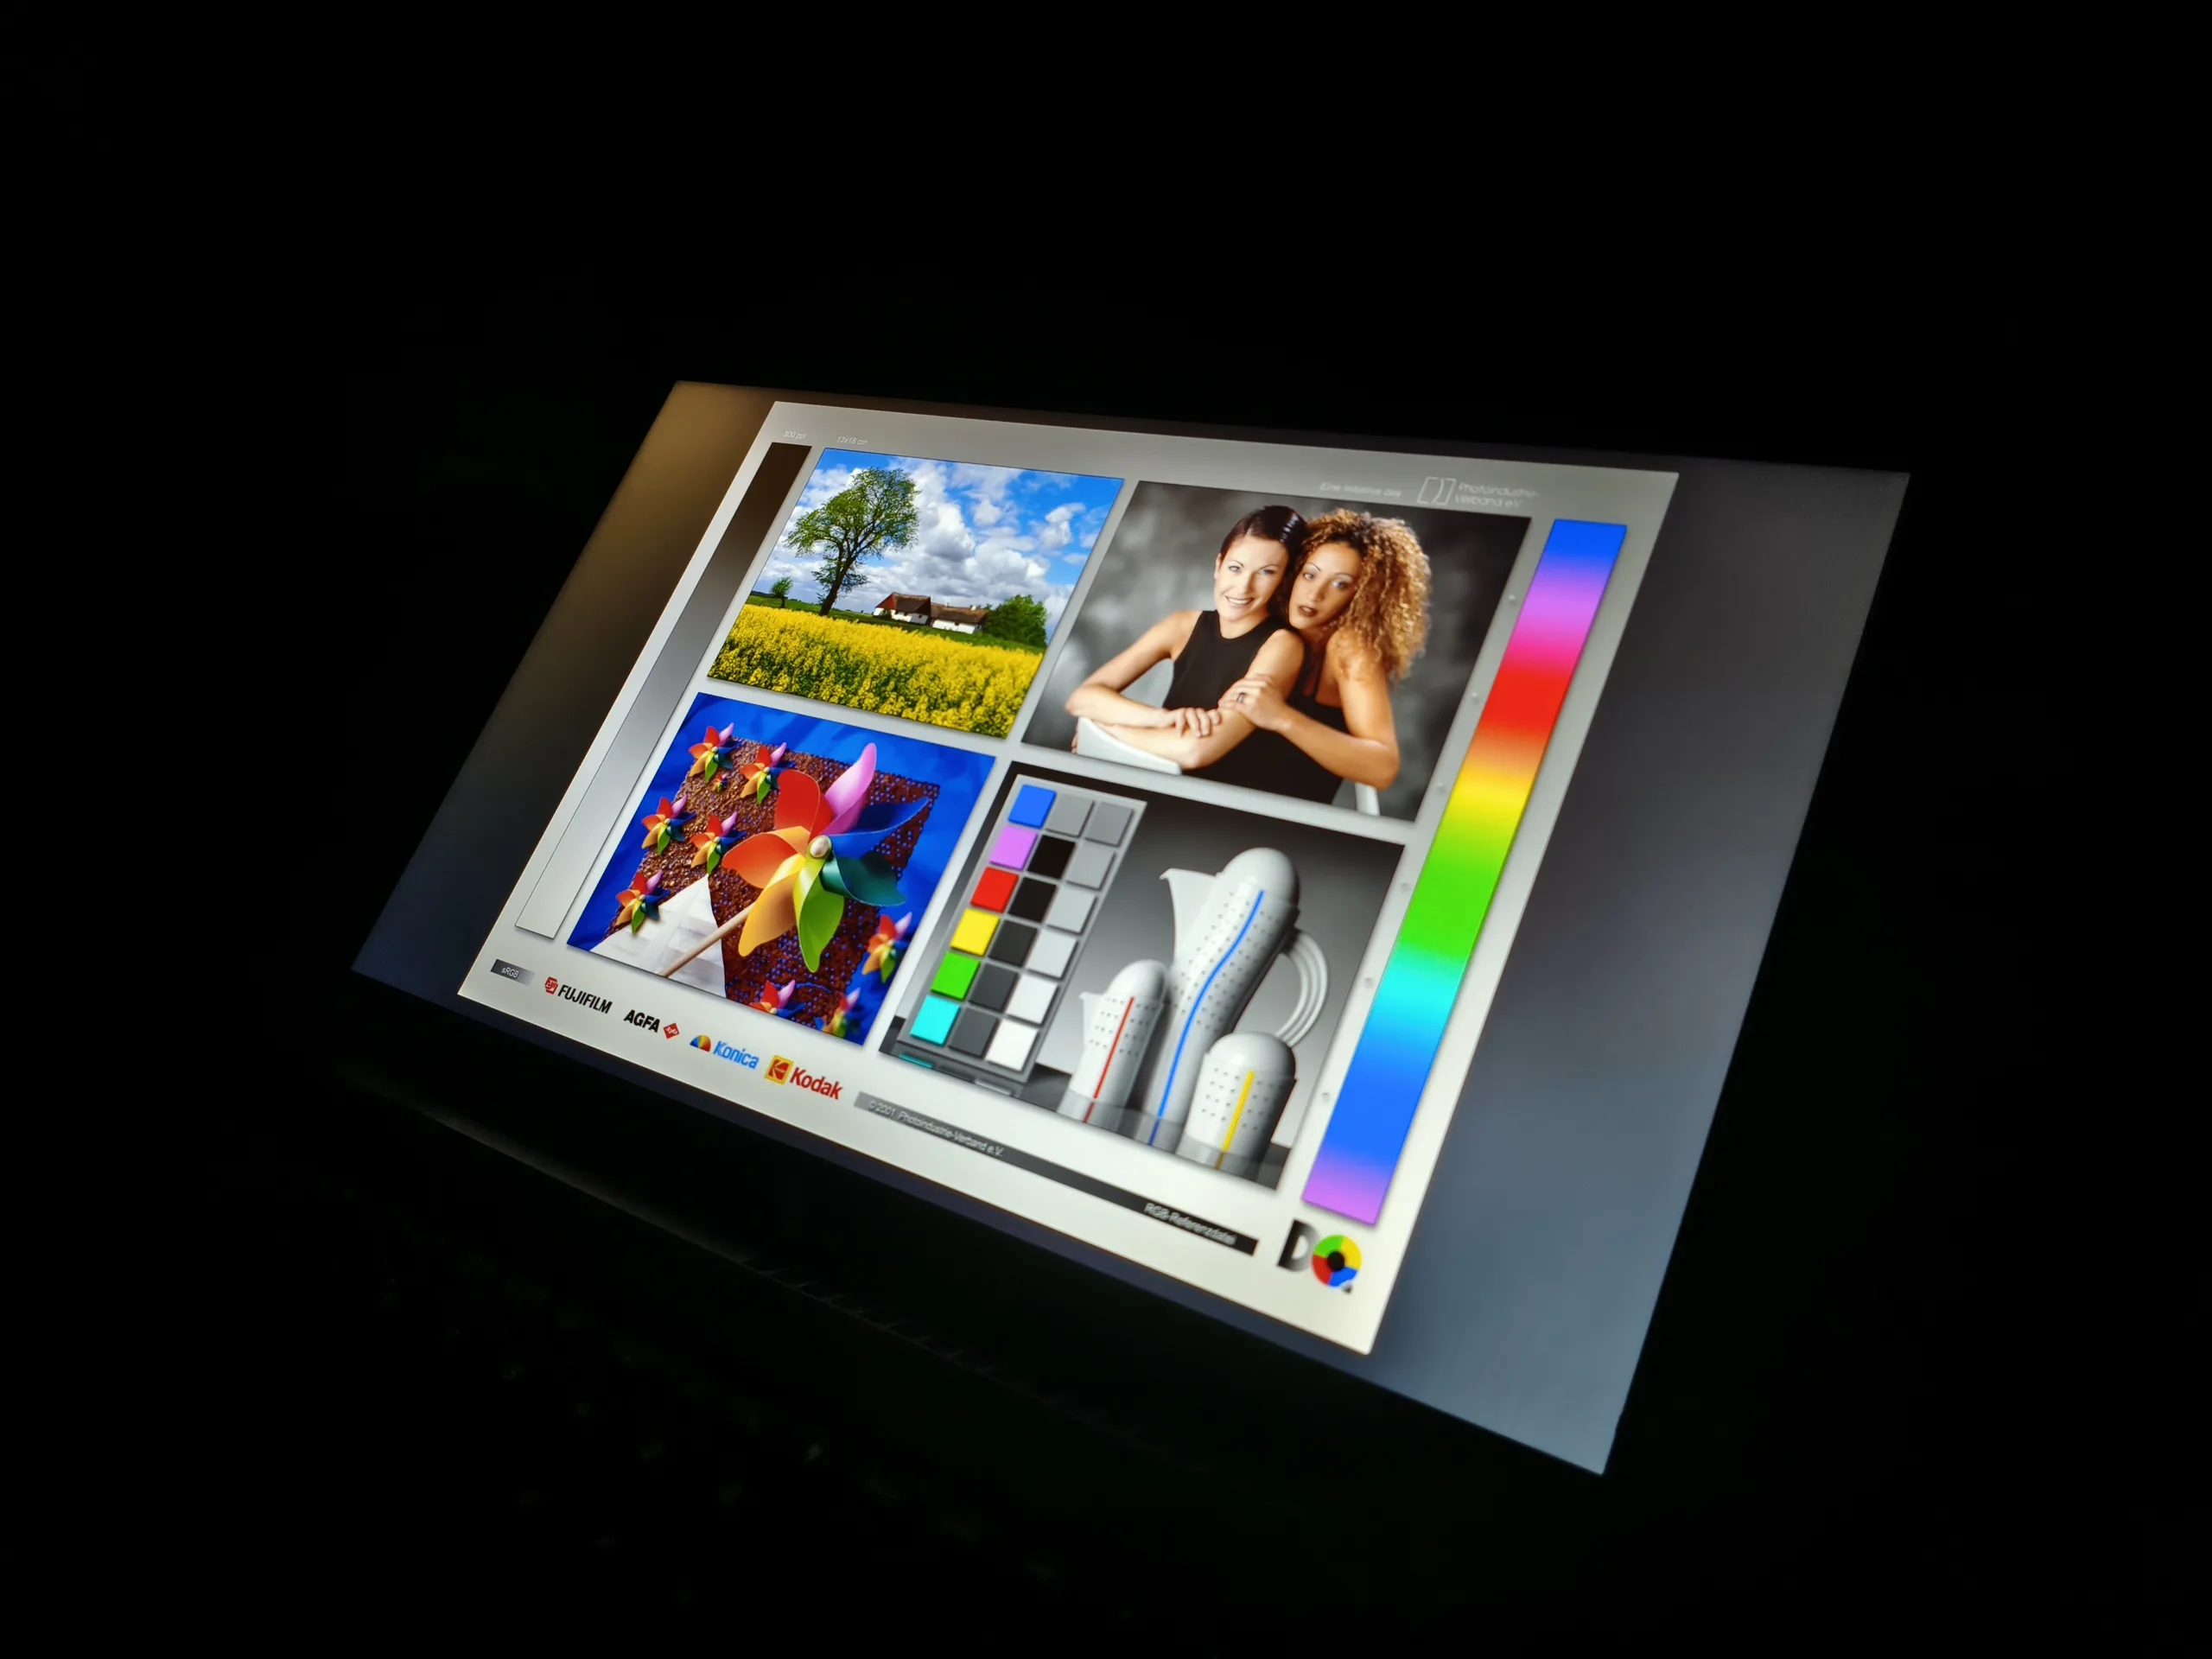
Display
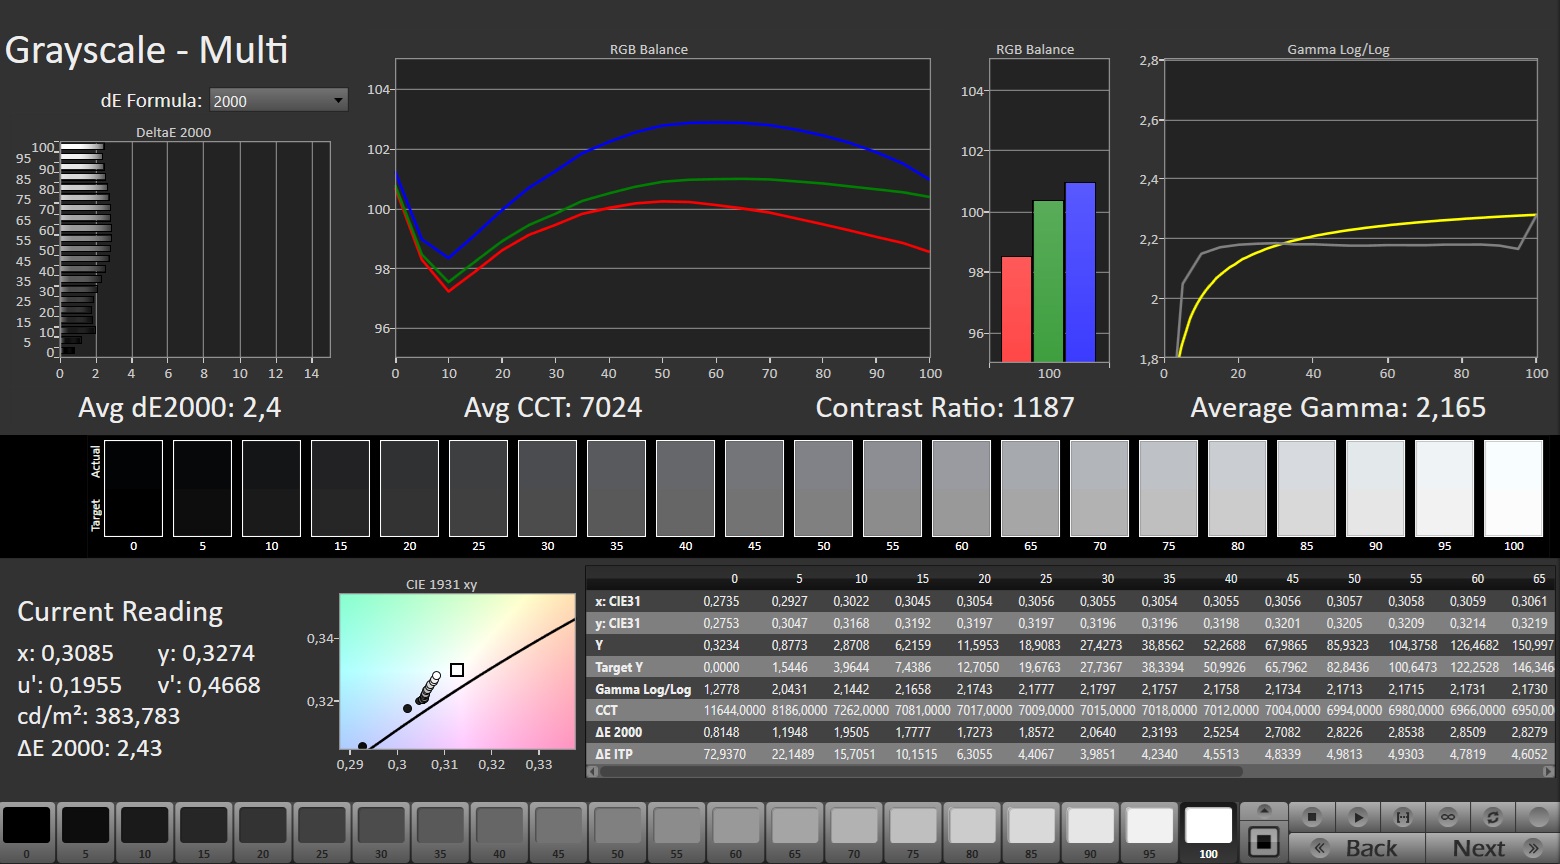
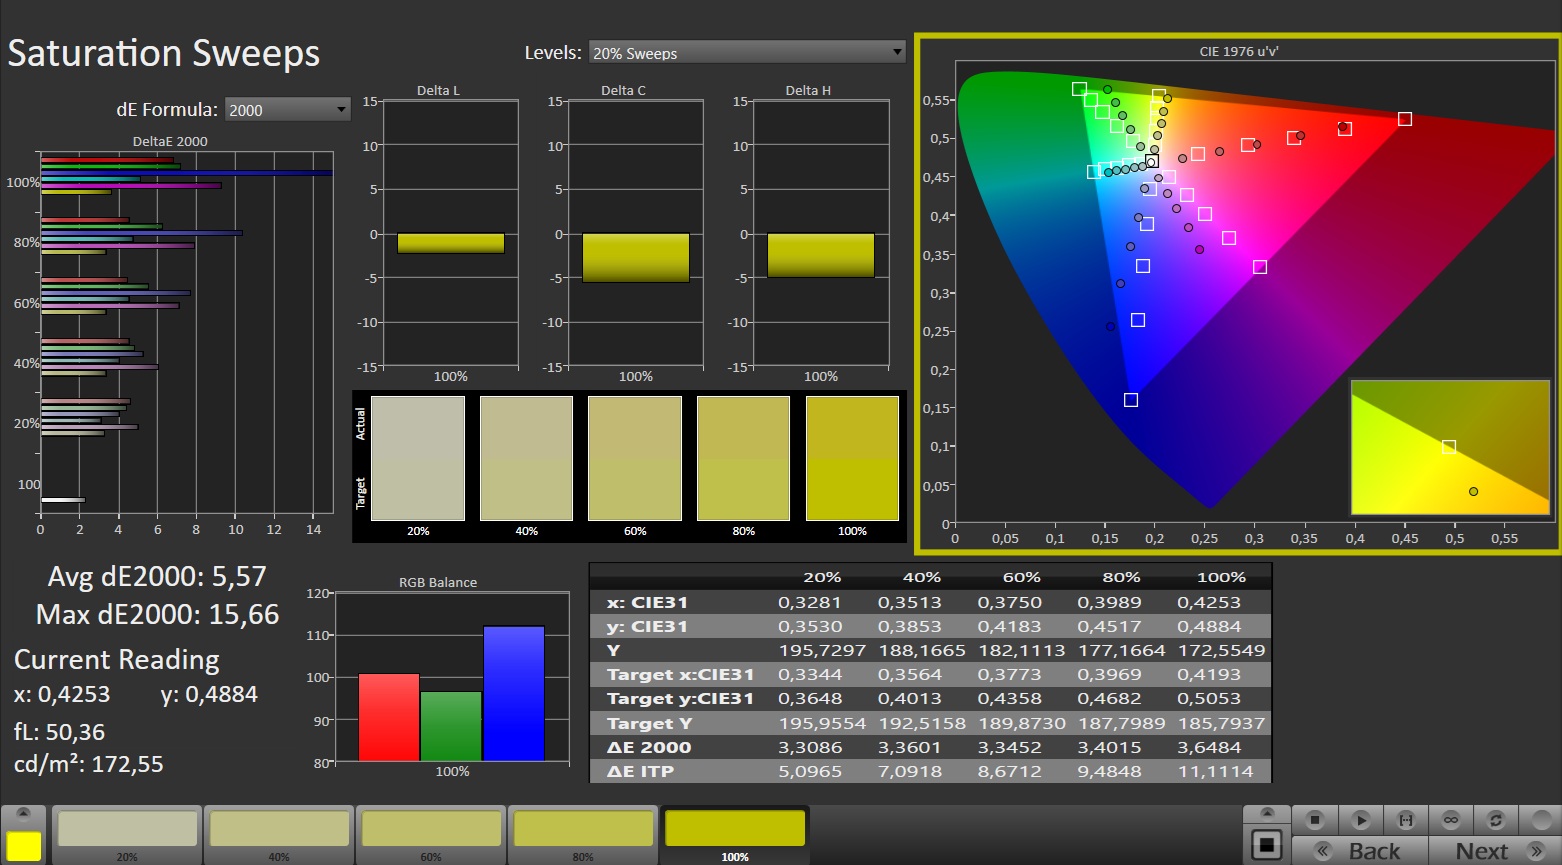
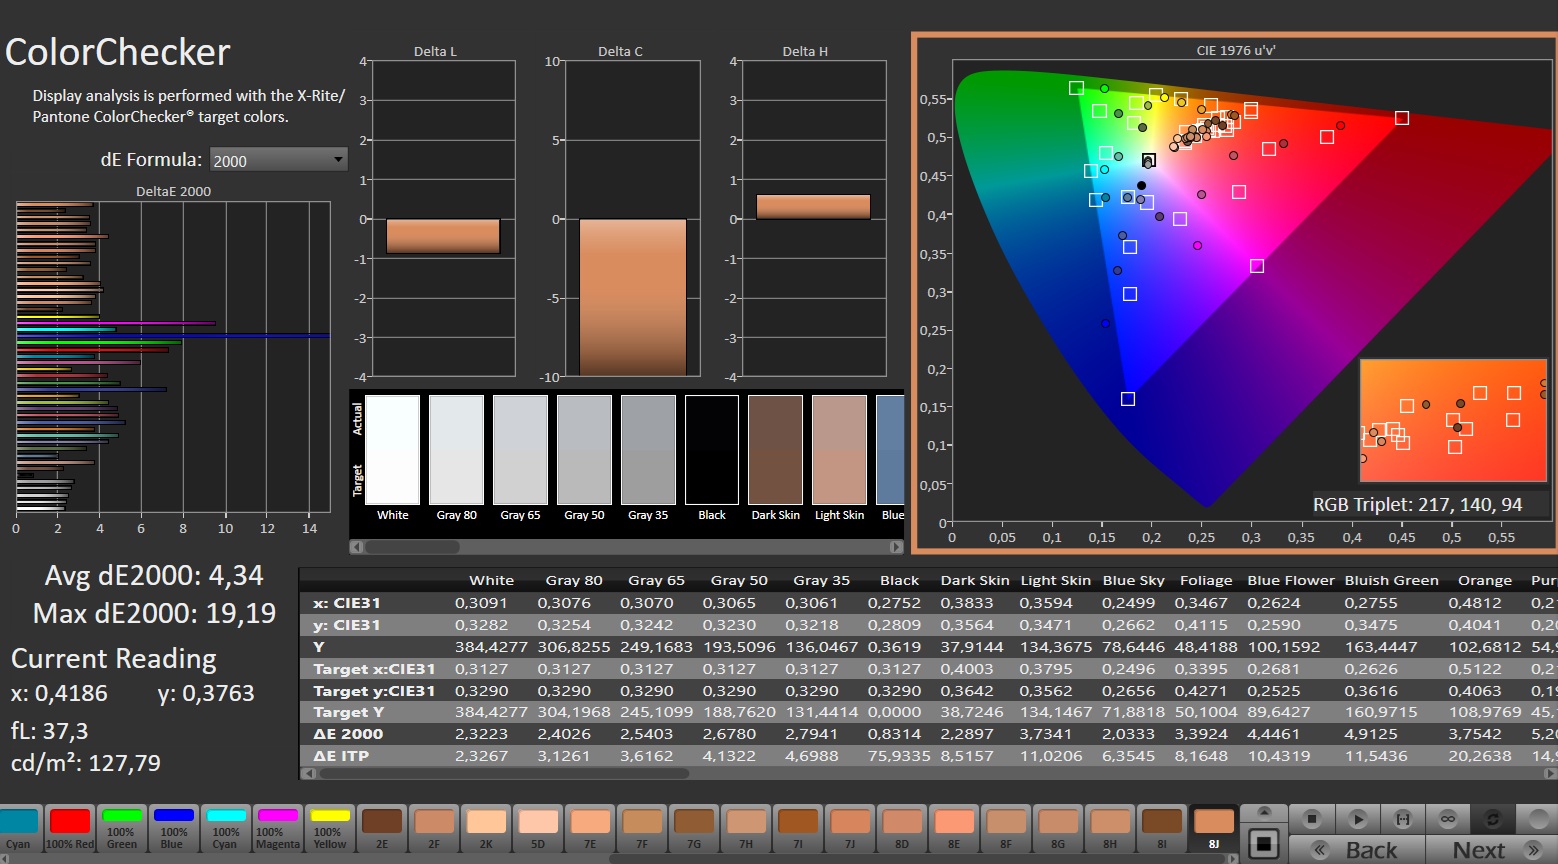
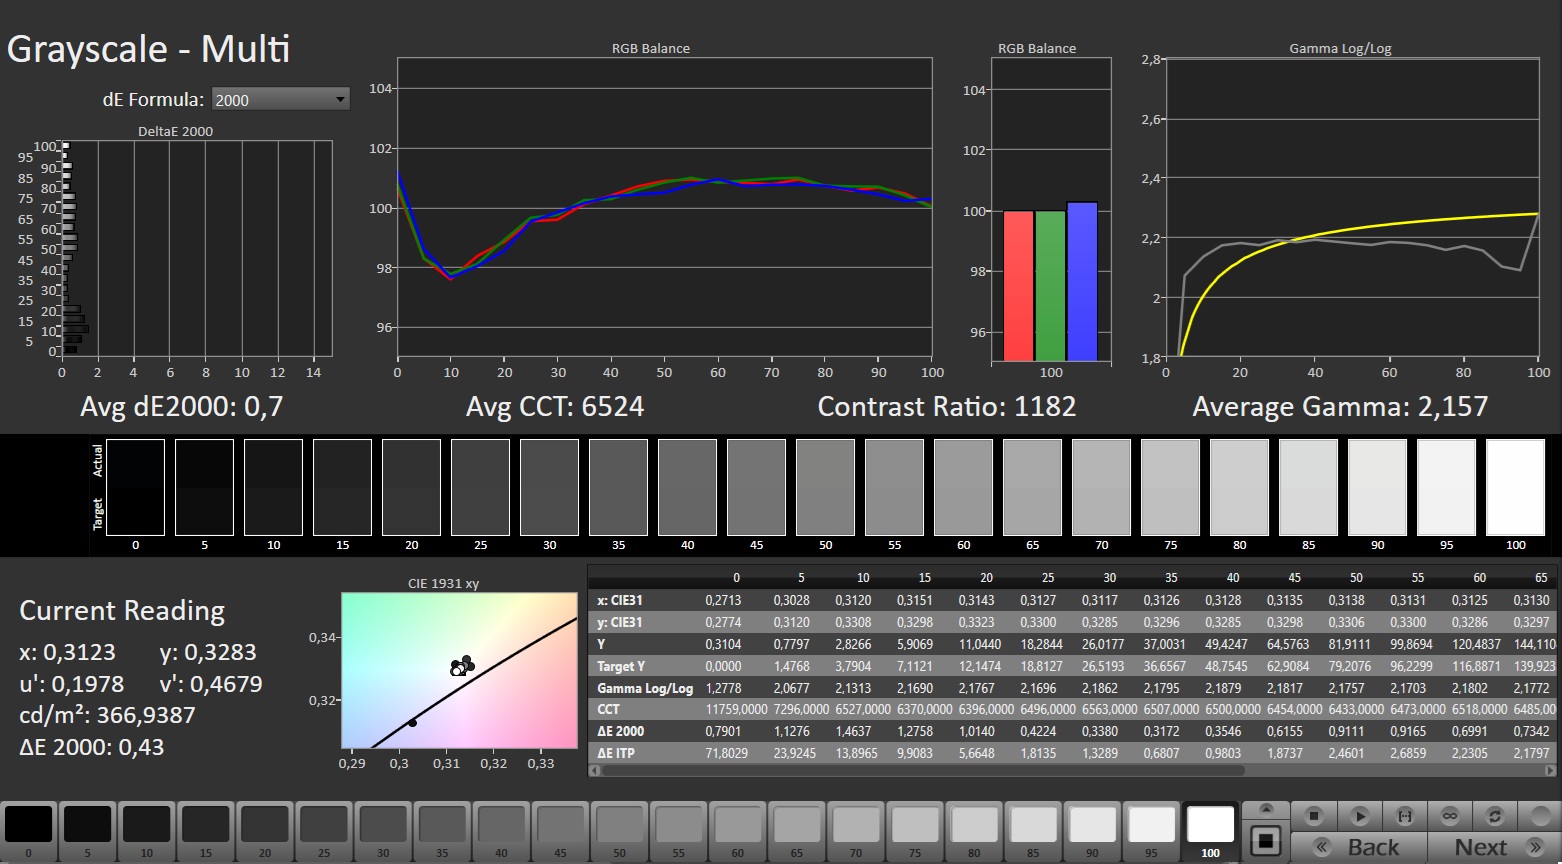
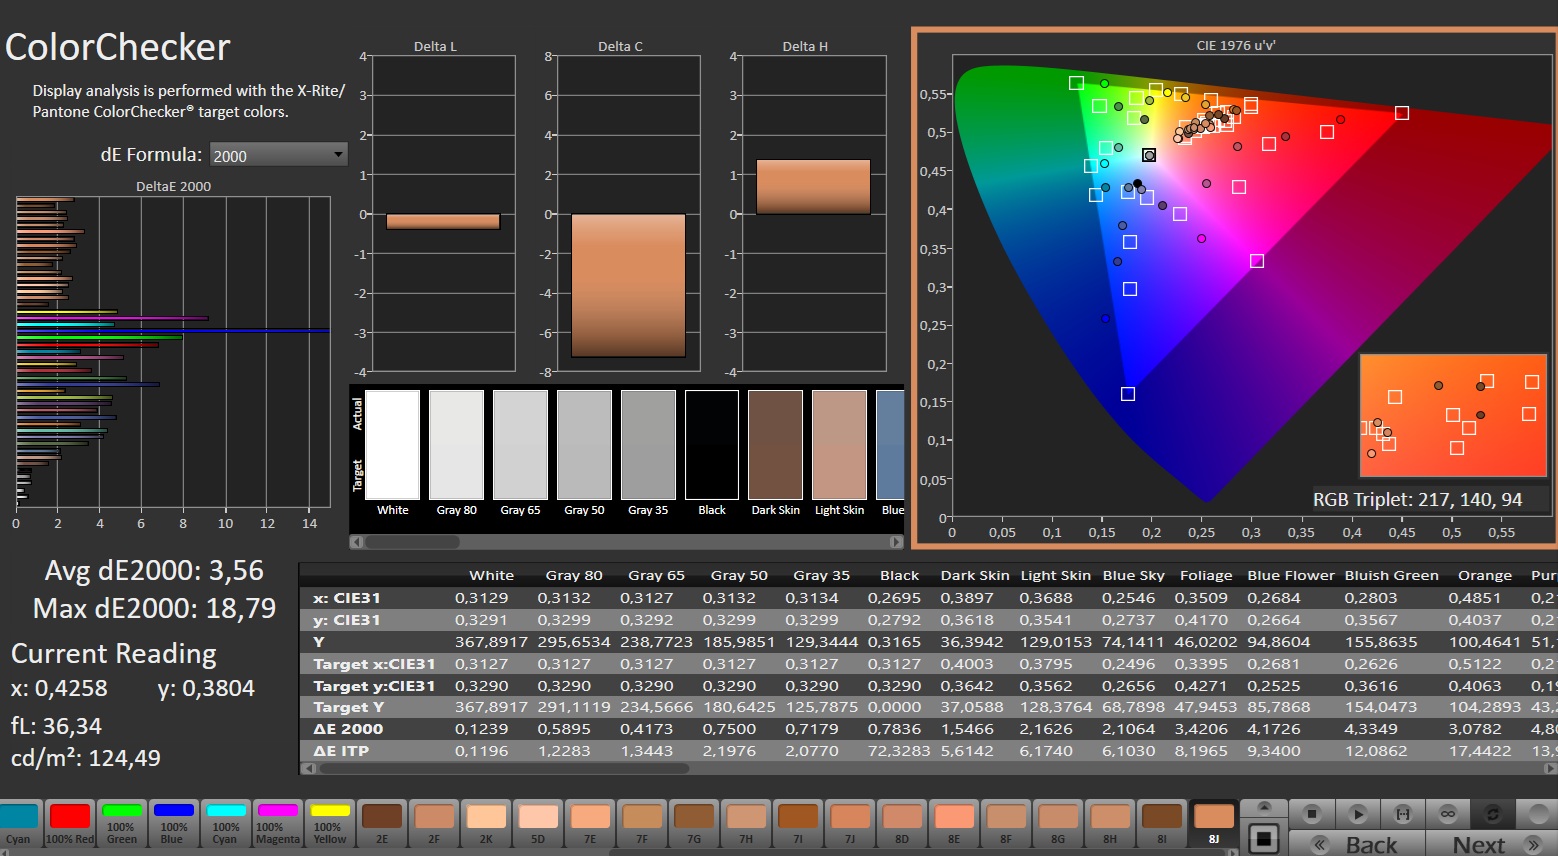
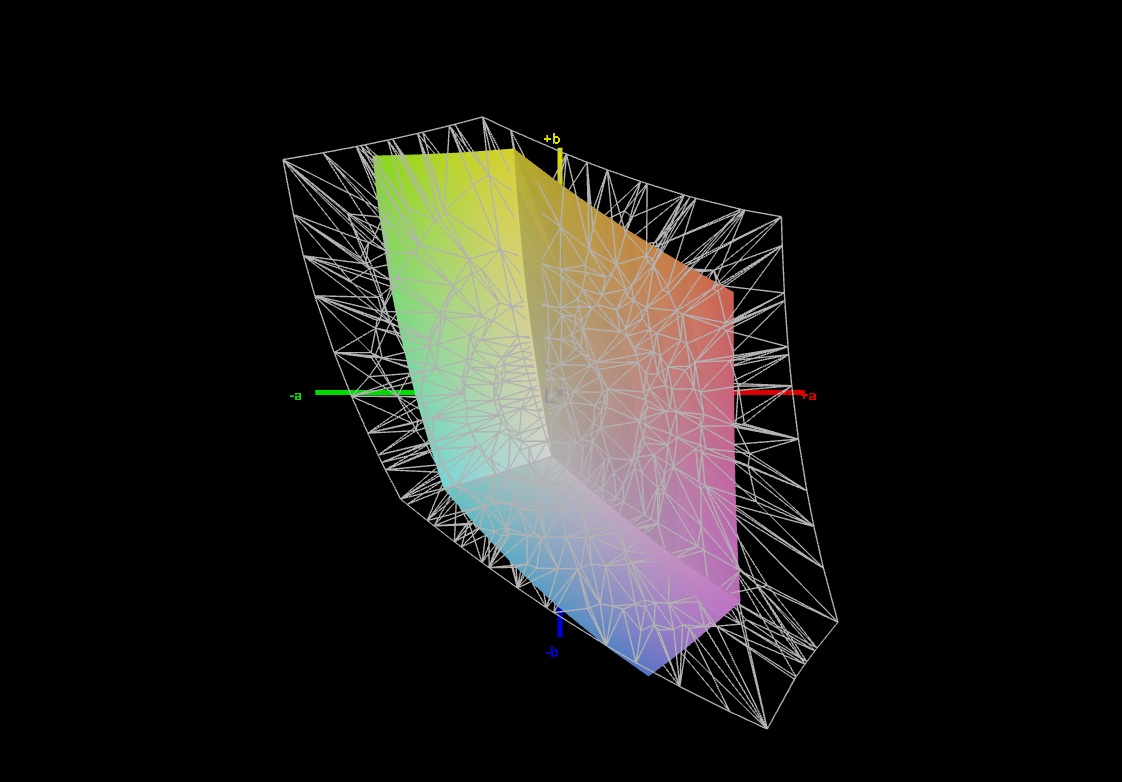
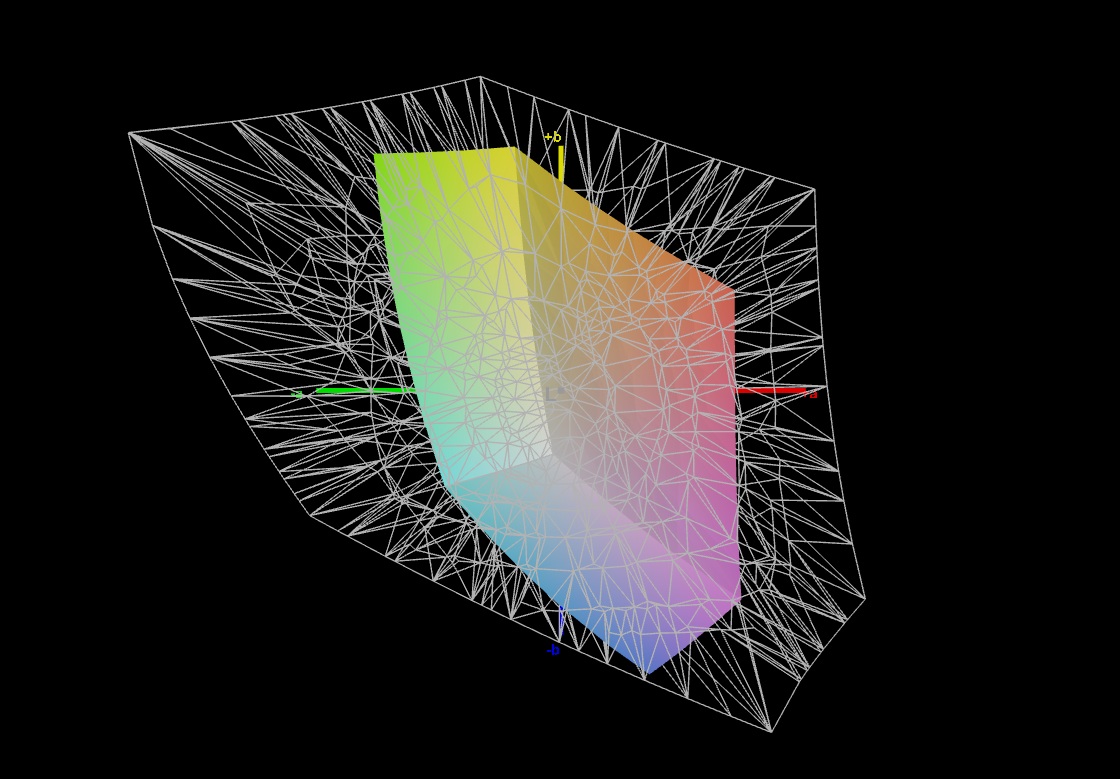
Unfortunately, limited colour coverage remains an issue for more affordable gaming laptops even in 2026. Similar to the Cyborg 15 and the Victus 15, the Nitro V 15 lingers below the 70% sRGB mark, resulting in a rather pale image. The verdict on brightness is more positive. Although the average of 347 cd/m² is not a highlight, most competitors fall short of this figure. The remaining values are typical for an IPS panel, whether it be a black level of 0.31 cd/m² or a contrast ratio of 1,232:1. The same largely applies to the viewing angles.
| |||||||||||||||||||||||||
Brightness Distribution: 86 %
Center on Battery: 382 cd/m²
Contrast: 1232:1 (Black: 0.31 cd/m²)
ΔE ColorChecker Calman: 4.34 | ∀{0.5-29.43 Ø4.73}
calibrated: 3.56
ΔE Greyscale Calman: 2.4 | ∀{0.09-98 Ø4.97}
41.6% AdobeRGB 1998 (Argyll 3D)
60.3% sRGB (Argyll 3D)
40.3% Display P3 (Argyll 3D)
Gamma: 2.165
CCT: 7024 K
| Acer Nitro V 15 ANV15-52-50S2 BOEhydis NE156FHM-NXA, IPS, 1920x1080, 15.6", 165 Hz | Acer Nitro V 15 ANV15-51-582S LG LP156WFJ-SPB4 (LGD0742), IPS, 1920x1080, 15.6", 144 Hz | HP Victus 15-fa2160ng CMN1560, IPS, 1920x1080, 15.6", 144 Hz | MSI Cyborg 15 B2RWEKG CMN N156HRA-EA1, IPS, 1920x1080, 15.6", 144 Hz | Lenovo LOQ 15AHP10 CSOT MNF601BA1-4, IPS, 1920x1080, 15.6", 144 Hz | Lenovo Legion 5 15AHP G10 LEN151WQXGA, OLED, 2560x1600, 15.1", 165 Hz | |
|---|---|---|---|---|---|---|
| Display | -0% | -1% | 8% | 66% | 117% | |
| Display P3 Coverage (%) | 40.3 | 40 -1% | 43 7% | 43.4 8% | 67.3 67% | 99.9 148% |
| sRGB Coverage (%) | 60.3 | 60 0% | 64.3 7% | 64.8 7% | 99.2 65% | 100 66% |
| AdobeRGB 1998 Coverage (%) | 41.6 | 41.4 0% | 34.7 -17% | 44.9 8% | 69.1 66% | 98.3 136% |
| Response Times | -6% | 16% | 17% | 6% | 99% | |
| Response Time Grey 50% / Grey 80% * (ms) | 39 ? | 34.2 ? 12% | 28.6 ? 27% | 27.6 ? 29% | 33.9 ? 13% | 0.42 ? 99% |
| Response Time Black / White * (ms) | 20.8 ? | 25.8 ? -24% | 20 ? 4% | 20 ? 4% | 21.2 ? -2% | 0.4 ? 98% |
| PWM Frequency (Hz) | 1152 ? | |||||
| PWM Amplitude * (%) | 11 | |||||
| Screen | -23% | -6% | -2% | 31% | 50% | |
| Brightness middle (cd/m²) | 382 | 292 -24% | 324 -15% | 286 -25% | 318 -17% | 492 29% |
| Brightness (cd/m²) | 347 | 263 -24% | 303 -13% | 272 -22% | 300 -14% | 495 43% |
| Brightness Distribution (%) | 86 | 80 -7% | 87 1% | 87 1% | 89 3% | 92 7% |
| Black Level * (cd/m²) | 0.31 | 0.25 19% | 0.26 16% | 0.17 45% | 0.2 35% | |
| Contrast (:1) | 1232 | 1168 -5% | 1246 1% | 1682 37% | 1590 29% | |
| Colorchecker dE 2000 * | 4.34 | 7.15 -65% | 4.7 -8% | 4.61 -6% | 1.33 69% | 0.9 79% |
| Colorchecker dE 2000 max. * | 19.19 | 15.51 19% | 18.19 5% | 19.59 -2% | 4.42 77% | 1.8 91% |
| Colorchecker dE 2000 calibrated * | 3.56 | 4.13 -16% | 2.93 18% | 2.99 16% | 0.94 74% | |
| Greyscale dE 2000 * | 2.4 | 4.9 -104% | 3.9 -63% | 3.9 -63% | 1.9 21% | 1.2 50% |
| Gamma | 2.165 102% | 2.014 109% | 2.21 100% | 2.236 98% | 2.187 101% | 2.16 102% |
| CCT | 7024 93% | 7178 91% | 7541 86% | 6792 96% | 6678 97% | 6291 103% |
| Total Average (Program / Settings) | -10% /
-16% | 3% /
-2% | 8% /
3% | 34% /
35% | 89% /
77% |
* ... smaller is better

Display Response Times
| ↔ Response Time Black to White | ||
|---|---|---|
| 20.8 ms ... rise ↗ and fall ↘ combined | ↗ 10 ms rise | 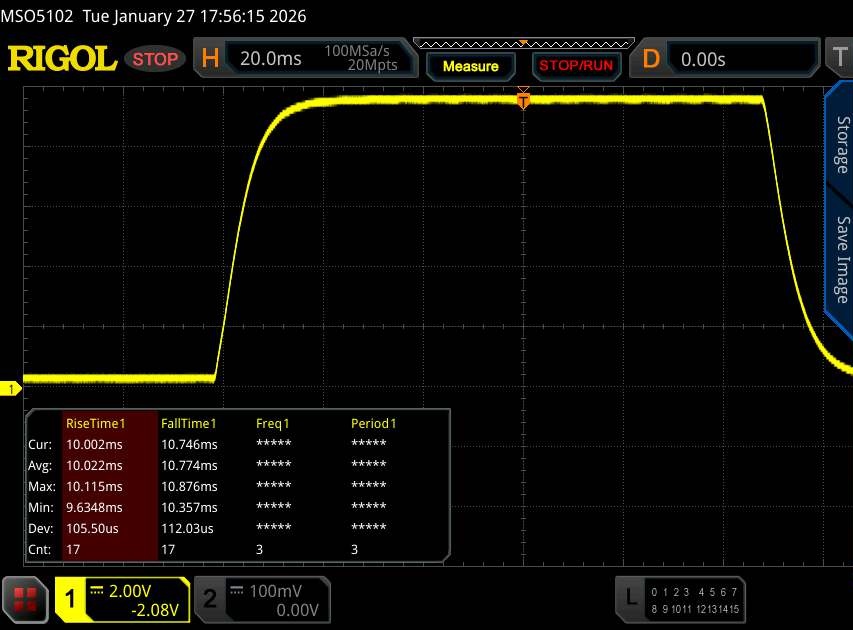 |
| ↘ 10.8 ms fall | ||
| The screen shows good response rates in our tests, but may be too slow for competitive gamers. In comparison, all tested devices range from 0.1 (minimum) to 240 (maximum) ms. » 46 % of all devices are better. This means that the measured response time is similar to the average of all tested devices (19.9 ms). | ||
| ↔ Response Time 50% Grey to 80% Grey | ||
| 39 ms ... rise ↗ and fall ↘ combined | ↗ 17.6 ms rise | 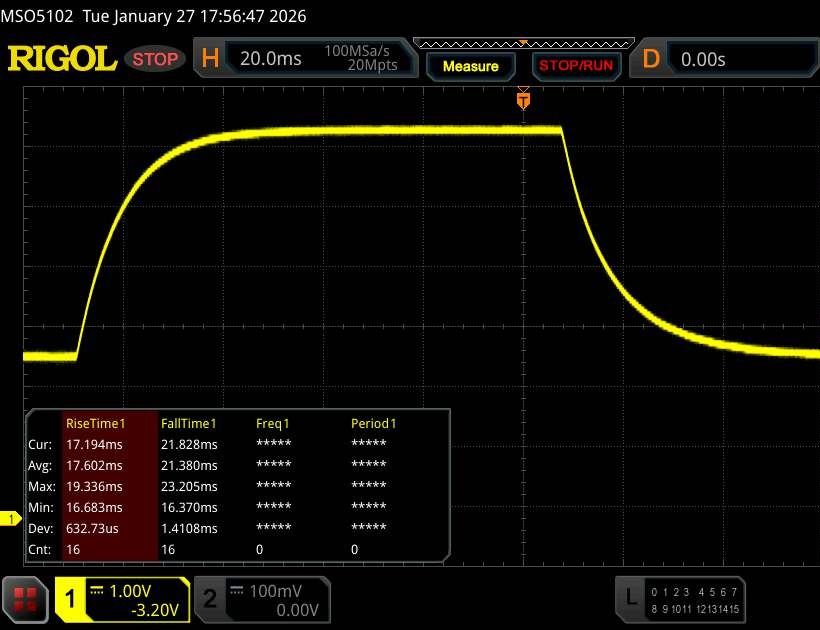 |
| ↘ 21.4 ms fall | ||
| The screen shows slow response rates in our tests and will be unsatisfactory for gamers. In comparison, all tested devices range from 0.165 (minimum) to 636 (maximum) ms. » 59 % of all devices are better. This means that the measured response time is worse than the average of all tested devices (31.1 ms). | ||
Screen Flickering / PWM (Pulse-Width Modulation)
| Screen flickering / PWM not detected |  | ||
In comparison: 52 % of all tested devices do not use PWM to dim the display. If PWM was detected, an average of 7784 (minimum: 5 - maximum: 343500) Hz was measured. | |||
Performance
The Nitro V 15 belongs to the mid-range segment, although performance in some areas tends to lean more towards entry-level. Buyers willing to spend a little more can also opt for configurations featuring a faster CPU (Core i7-13620H) or a more powerful GPU (GeForce RTX 5060 Laptop GPU).
Test conditions
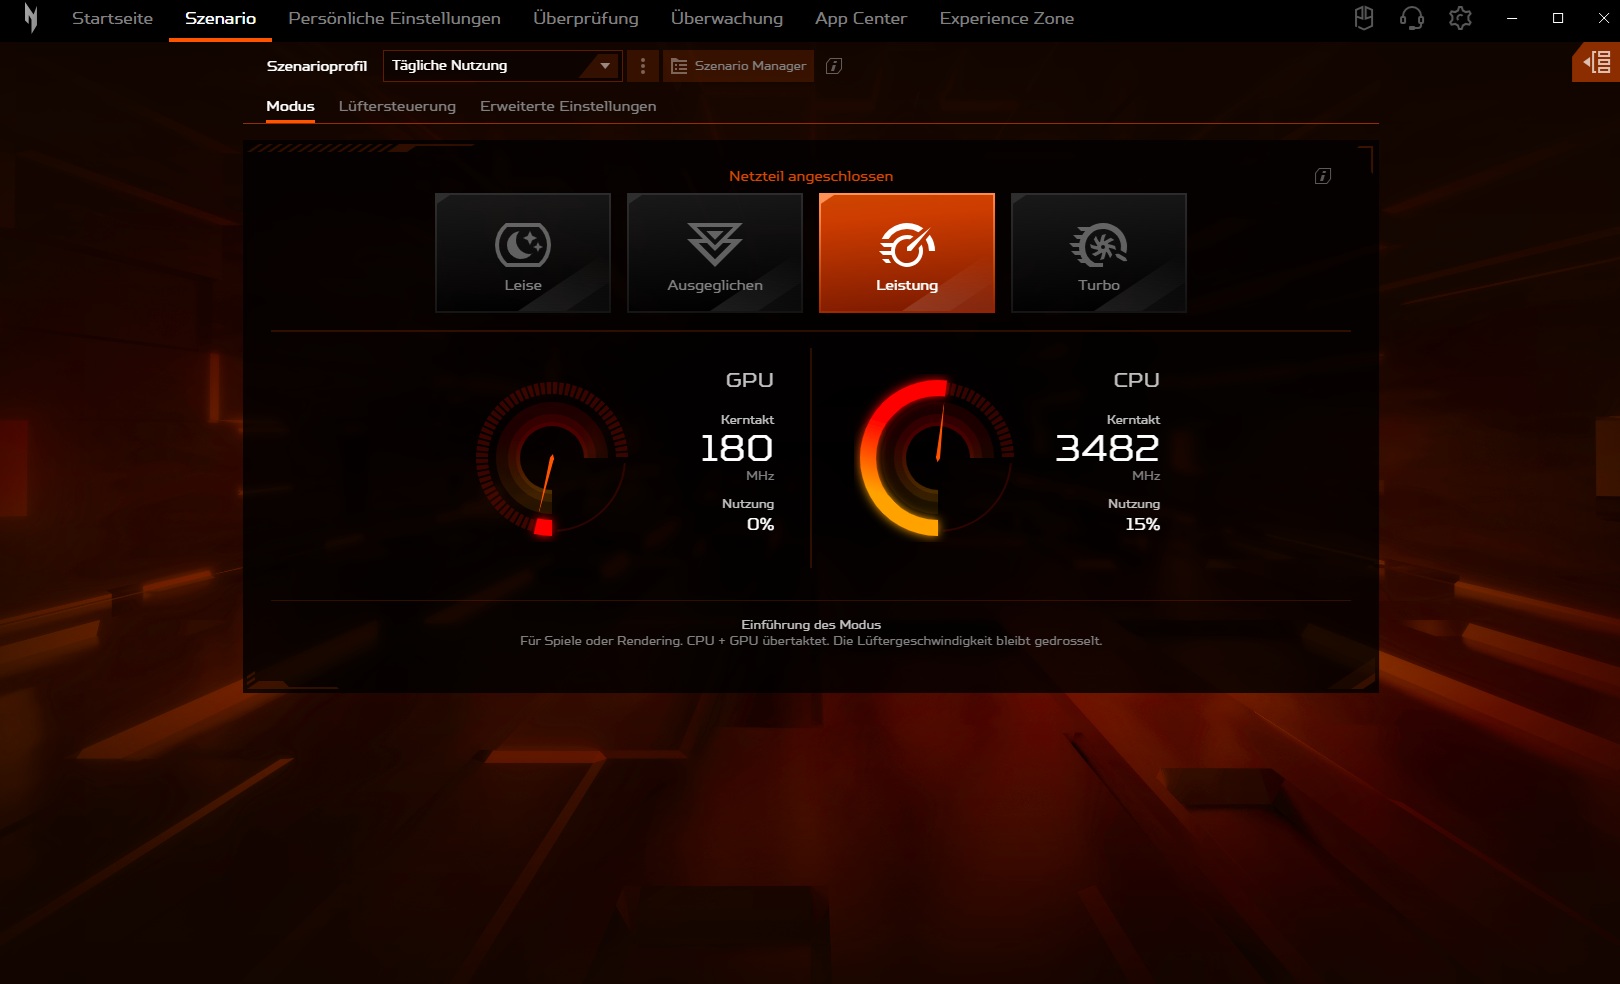
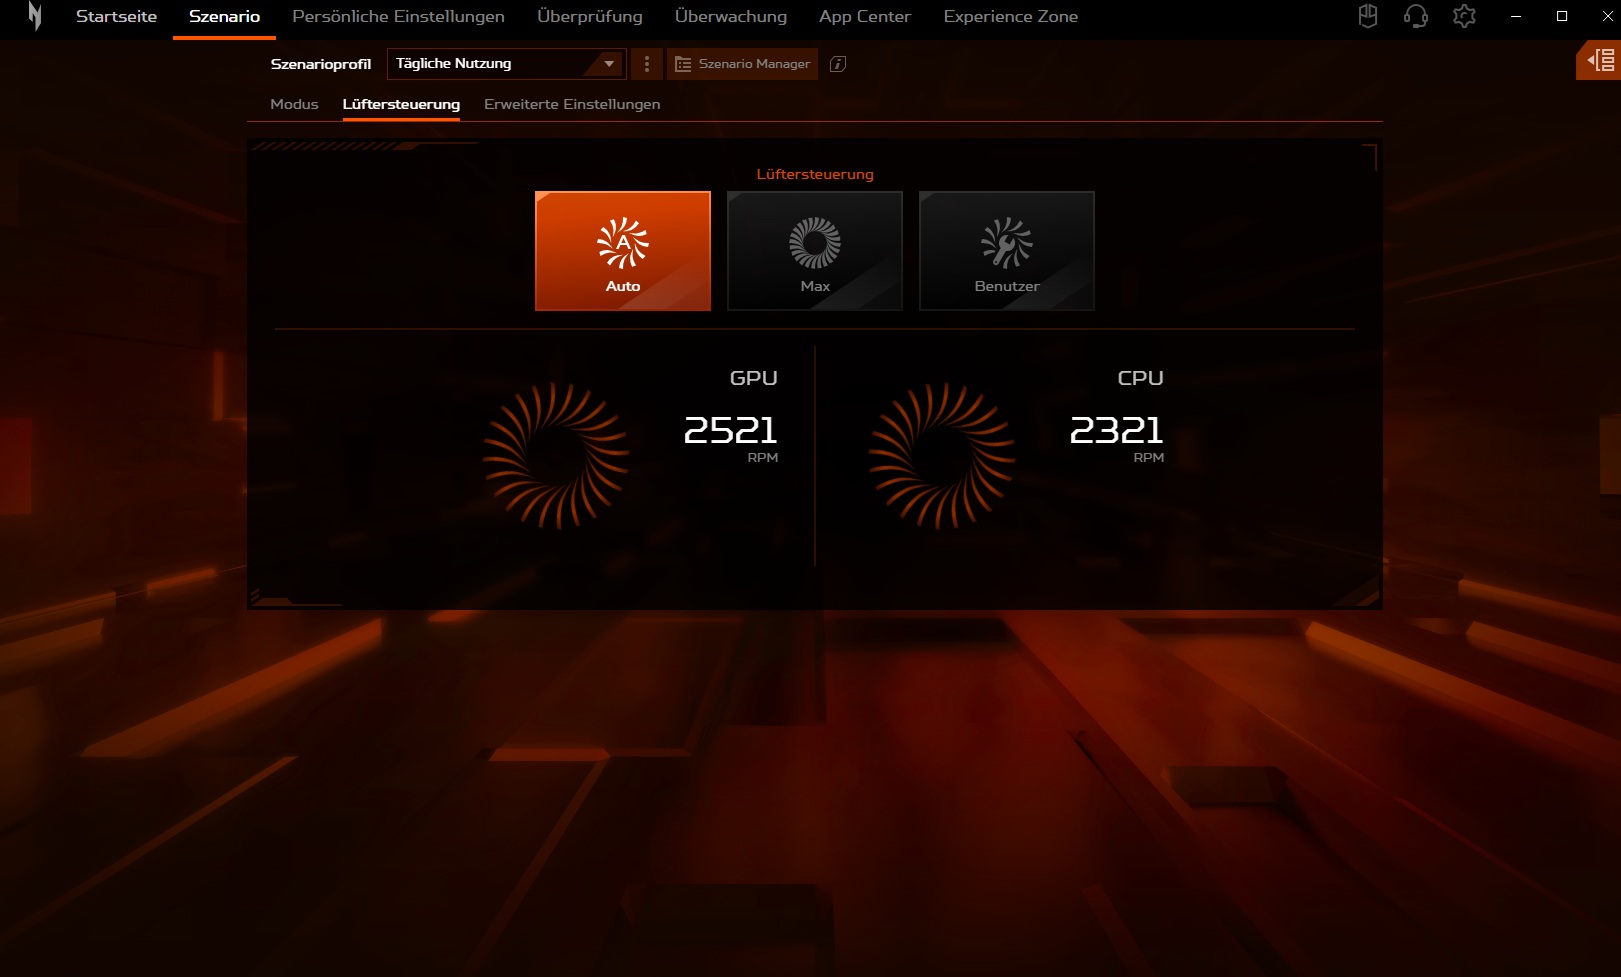
The NitroSense utility offers four operating modes, the differences between which can be found in the table below. All of our measurements were taken in Performance mode, with the exception of the battery test, which was conducted in Balanced mode.
| Mode | Silent | Balanced | Performance | Turbo |
| Cyberpunk 2077 noise | 33 dB(A) | 45 dB(A) | 52 dB(A) | 55 dB(A) |
| Cyberpunk 2077 frame rate (FHD/Ultra) | 45.1 fps | 59 fps | 61.3 fps | 63 fps |
| GPU power draw | ~50 W | ~60 W | ~70 W | ~75 W |
| CPU PL1 | 16 W | 45 W | 50 W | 55 W |
| CPU PL2 | 64 W | 115 W | 115 W | 115 W |
| Cinebench R15 multi-core score | 934 points | 1769 points | 1775 points | 1782 points |
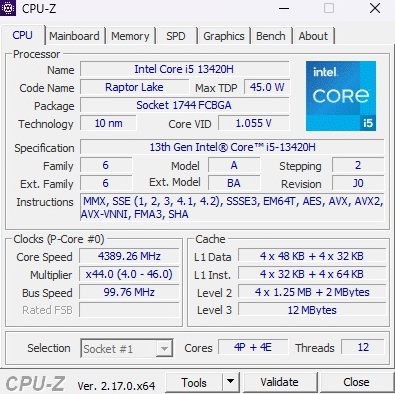
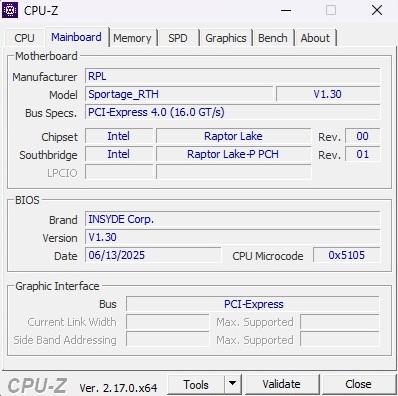
Processor
The installed Core i5-13420H is a no longer particularly new model from Intel's Raptor Lake generation. It features four performance cores (with Hyper-Threading) and four efficiency cores (without Hyper-Threading), allowing for up to 12 simultaneous threads.
The CPU benchmarks revealed no irregularities. Performance remains stable and is in line with other devices equipped with the i5-13420H. Greater performance can be found in competing models based on AMD processors such as the Ryzen 7 250 and Ryzen 7 260.
Cinebench R15 multi-core endurance test
* ... smaller is better
AIDA64: FP32 Ray-Trace | FPU Julia | CPU SHA3 | CPU Queen | FPU SinJulia | FPU Mandel | CPU AES | CPU ZLib | FP64 Ray-Trace | CPU PhotoWorxx
| Performance rating | |
| Average of class Gaming | |
| Lenovo Legion 5 15AHP G10 | |
| Lenovo LOQ 15AHP10 | |
| MSI Cyborg 15 B2RWEKG | |
| Acer Nitro V 15 ANV15-51-582S | |
| Acer Nitro V 15 ANV15-52-50S2 | |
| Average Intel Core i5-13420H | |
| HP Victus 15-fa2160ng | |
| AIDA64 / FP32 Ray-Trace | |
| Average of class Gaming (10227 - 85542, n=107, last 2 years) | |
| Lenovo Legion 5 15AHP G10 | |
| Lenovo LOQ 15AHP10 | |
| Acer Nitro V 15 ANV15-52-50S2 | |
| MSI Cyborg 15 B2RWEKG | |
| Acer Nitro V 15 ANV15-51-582S | |
| Average Intel Core i5-13420H (7922 - 12134, n=5) | |
| HP Victus 15-fa2160ng | |
| AIDA64 / FPU Julia | |
| Average of class Gaming (51376 - 238426, n=107, last 2 years) | |
| Lenovo Legion 5 15AHP G10 | |
| Lenovo LOQ 15AHP10 | |
| Acer Nitro V 15 ANV15-51-582S | |
| Acer Nitro V 15 ANV15-52-50S2 | |
| MSI Cyborg 15 B2RWEKG | |
| Average Intel Core i5-13420H (40587 - 59715, n=5) | |
| HP Victus 15-fa2160ng | |
| AIDA64 / CPU SHA3 | |
| Average of class Gaming (2180 - 9817, n=107, last 2 years) | |
| Lenovo Legion 5 15AHP G10 | |
| Lenovo LOQ 15AHP10 | |
| Acer Nitro V 15 ANV15-51-582S | |
| Acer Nitro V 15 ANV15-52-50S2 | |
| HP Victus 15-fa2160ng | |
| MSI Cyborg 15 B2RWEKG | |
| Average Intel Core i5-13420H (1724 - 2634, n=5) | |
| AIDA64 / CPU Queen | |
| Lenovo Legion 5 15AHP G10 | |
| Average of class Gaming (49785 - 173351, n=98, last 2 years) | |
| Lenovo LOQ 15AHP10 | |
| MSI Cyborg 15 B2RWEKG | |
| Average Intel Core i5-13420H (69803 - 74956, n=5) | |
| Acer Nitro V 15 ANV15-51-582S | |
| Acer Nitro V 15 ANV15-52-50S2 | |
| HP Victus 15-fa2160ng | |
| AIDA64 / FPU SinJulia | |
| Lenovo Legion 5 15AHP G10 | |
| Lenovo LOQ 15AHP10 | |
| Average of class Gaming (4424 - 33636, n=107, last 2 years) | |
| MSI Cyborg 15 B2RWEKG | |
| Acer Nitro V 15 ANV15-52-50S2 | |
| Acer Nitro V 15 ANV15-51-582S | |
| HP Victus 15-fa2160ng | |
| Average Intel Core i5-13420H (5485 - 6644, n=5) | |
| AIDA64 / FPU Mandel | |
| Average of class Gaming (25115 - 128721, n=107, last 2 years) | |
| Lenovo Legion 5 15AHP G10 | |
| Lenovo LOQ 15AHP10 | |
| Acer Nitro V 15 ANV15-52-50S2 | |
| MSI Cyborg 15 B2RWEKG | |
| Acer Nitro V 15 ANV15-51-582S | |
| Average Intel Core i5-13420H (19684 - 30163, n=5) | |
| HP Victus 15-fa2160ng | |
| AIDA64 / CPU AES | |
| Average of class Gaming (39258 - 247074, n=107, last 2 years) | |
| Acer Nitro V 15 ANV15-51-582S | |
| Lenovo Legion 5 15AHP G10 | |
| Lenovo LOQ 15AHP10 | |
| Average Intel Core i5-13420H (35531 - 93100, n=5) | |
| MSI Cyborg 15 B2RWEKG | |
| Acer Nitro V 15 ANV15-52-50S2 | |
| HP Victus 15-fa2160ng | |
| AIDA64 / CPU ZLib | |
| Average of class Gaming (574 - 2531, n=107, last 2 years) | |
| Lenovo Legion 5 15AHP G10 | |
| Lenovo LOQ 15AHP10 | |
| Acer Nitro V 15 ANV15-52-50S2 | |
| Acer Nitro V 15 ANV15-51-582S | |
| HP Victus 15-fa2160ng | |
| MSI Cyborg 15 B2RWEKG | |
| Average Intel Core i5-13420H (509 - 746, n=5) | |
| AIDA64 / FP64 Ray-Trace | |
| Average of class Gaming (5509 - 45446, n=107, last 2 years) | |
| Lenovo Legion 5 15AHP G10 | |
| Lenovo LOQ 15AHP10 | |
| Acer Nitro V 15 ANV15-52-50S2 | |
| MSI Cyborg 15 B2RWEKG | |
| Acer Nitro V 15 ANV15-51-582S | |
| Average Intel Core i5-13420H (4283 - 6627, n=5) | |
| HP Victus 15-fa2160ng | |
| AIDA64 / CPU PhotoWorxx | |
| Average of class Gaming (12271 - 89891, n=107, last 2 years) | |
| Lenovo Legion 5 15AHP G10 | |
| MSI Cyborg 15 B2RWEKG | |
| Acer Nitro V 15 ANV15-51-582S | |
| Lenovo LOQ 15AHP10 | |
| HP Victus 15-fa2160ng | |
| Average Intel Core i5-13420H (12330 - 37044, n=5) | |
| Acer Nitro V 15 ANV15-52-50S2 | |
System performance
Overall system performance is unremarkable and places the Nitro V 15 in the middle of the comparison field. Only the memory performance proves somewhat underwhelming.
PCMark 10: Productivity | Digital Content Creation
CrossMark: Overall | Productivity | Creativity | Responsiveness
WebXPRT 3: Overall
WebXPRT 4: Overall
Mozilla Kraken 1.1: Total
| Performance rating | |
| Average of class Gaming | |
| Lenovo Legion 5 15AHP G10 | |
| Lenovo LOQ 15AHP10 -2! | |
| MSI Cyborg 15 B2RWEKG | |
| Acer Nitro V 15 ANV15-52-50S2 | |
| Average Intel Core i5-13420H, NVIDIA GeForce RTX 5050 Laptop | |
| Acer Nitro V 15 ANV15-51-582S -4! | |
| HP Victus 15-fa2160ng | |
| PCMark 10 / Productivity | |
| MSI Cyborg 15 B2RWEKG | |
| Acer Nitro V 15 ANV15-52-50S2 | |
| Average of class Gaming (6845 - 18766, n=96, last 2 years) | |
| Lenovo Legion 5 15AHP G10 | |
| Lenovo LOQ 15AHP10 | |
| Average Intel Core i5-13420H, NVIDIA GeForce RTX 5050 Laptop (6845 - 10967, n=2) | |
| Acer Nitro V 15 ANV15-51-582S | |
| HP Victus 15-fa2160ng | |
| PCMark 10 / Digital Content Creation | |
| Average of class Gaming (7602 - 19657, n=96, last 2 years) | |
| Lenovo Legion 5 15AHP G10 | |
| Lenovo LOQ 15AHP10 | |
| Acer Nitro V 15 ANV15-51-582S | |
| HP Victus 15-fa2160ng | |
| Average Intel Core i5-13420H, NVIDIA GeForce RTX 5050 Laptop (8618 - 8879, n=2) | |
| Acer Nitro V 15 ANV15-52-50S2 | |
| MSI Cyborg 15 B2RWEKG | |
| CrossMark / Overall | |
| Average of class Gaming (1366 - 2409, n=96, last 2 years) | |
| Lenovo Legion 5 15AHP G10 | |
| Lenovo LOQ 15AHP10 | |
| MSI Cyborg 15 B2RWEKG | |
| Acer Nitro V 15 ANV15-52-50S2 | |
| Average Intel Core i5-13420H, NVIDIA GeForce RTX 5050 Laptop (1366 - 1381, n=2) | |
| HP Victus 15-fa2160ng | |
| CrossMark / Productivity | |
| Average of class Gaming (1386 - 2254, n=96, last 2 years) | |
| Lenovo LOQ 15AHP10 | |
| Lenovo Legion 5 15AHP G10 | |
| MSI Cyborg 15 B2RWEKG | |
| Acer Nitro V 15 ANV15-52-50S2 | |
| Average Intel Core i5-13420H, NVIDIA GeForce RTX 5050 Laptop (1386 - 1426, n=2) | |
| HP Victus 15-fa2160ng | |
| CrossMark / Creativity | |
| Average of class Gaming (1343 - 2729, n=96, last 2 years) | |
| Lenovo Legion 5 15AHP G10 | |
| MSI Cyborg 15 B2RWEKG | |
| Lenovo LOQ 15AHP10 | |
| HP Victus 15-fa2160ng | |
| Average Intel Core i5-13420H, NVIDIA GeForce RTX 5050 Laptop (1343 - 1387, n=2) | |
| Acer Nitro V 15 ANV15-52-50S2 | |
| CrossMark / Responsiveness | |
| Average of class Gaming (1226 - 2334, n=96, last 2 years) | |
| Lenovo LOQ 15AHP10 | |
| Lenovo Legion 5 15AHP G10 | |
| MSI Cyborg 15 B2RWEKG | |
| Acer Nitro V 15 ANV15-52-50S2 | |
| Average Intel Core i5-13420H, NVIDIA GeForce RTX 5050 Laptop (1249 - 1364, n=2) | |
| HP Victus 15-fa2160ng | |
| WebXPRT 3 / Overall | |
| Average of class Gaming (242 - 532, n=99, last 2 years) | |
| Lenovo Legion 5 15AHP G10 | |
| Acer Nitro V 15 ANV15-51-582S | |
| MSI Cyborg 15 B2RWEKG | |
| HP Victus 15-fa2160ng | |
| Average Intel Core i5-13420H, NVIDIA GeForce RTX 5050 Laptop (242 - 247, n=2) | |
| Acer Nitro V 15 ANV15-52-50S2 | |
| WebXPRT 4 / Overall | |
| Average of class Gaming (176.4 - 354, n=99, last 2 years) | |
| Lenovo Legion 5 15AHP G10 | |
| MSI Cyborg 15 B2RWEKG | |
| Acer Nitro V 15 ANV15-51-582S | |
| HP Victus 15-fa2160ng | |
| Average Intel Core i5-13420H, NVIDIA GeForce RTX 5050 Laptop (220 - 226, n=2) | |
| Acer Nitro V 15 ANV15-52-50S2 | |
| Mozilla Kraken 1.1 / Total | |
| Acer Nitro V 15 ANV15-52-50S2 | |
| Average Intel Core i5-13420H, NVIDIA GeForce RTX 5050 Laptop (577 - 586, n=2) | |
| HP Victus 15-fa2160ng | |
| Acer Nitro V 15 ANV15-51-582S | |
| MSI Cyborg 15 B2RWEKG | |
| Lenovo LOQ 15AHP10 | |
| Lenovo Legion 5 15AHP G10 | |
| Average of class Gaming (391 - 590, n=104, last 2 years) | |
* ... smaller is better
| AIDA64 / Memory Copy | |
| Average of class Gaming (21750 - 129946, n=107, last 2 years) | |
| Lenovo Legion 5 15AHP G10 | |
| MSI Cyborg 15 B2RWEKG | |
| Acer Nitro V 15 ANV15-51-582S | |
| Lenovo LOQ 15AHP10 | |
| Average Intel Core i5-13420H (22003 - 59609, n=5) | |
| HP Victus 15-fa2160ng | |
| Acer Nitro V 15 ANV15-52-50S2 | |
| AIDA64 / Memory Read | |
| Average of class Gaming (22956 - 118858, n=107, last 2 years) | |
| MSI Cyborg 15 B2RWEKG | |
| Lenovo Legion 5 15AHP G10 | |
| Acer Nitro V 15 ANV15-51-582S | |
| Average Intel Core i5-13420H (23499 - 68085, n=5) | |
| HP Victus 15-fa2160ng | |
| Lenovo LOQ 15AHP10 | |
| Acer Nitro V 15 ANV15-52-50S2 | |
| AIDA64 / Memory Write | |
| Lenovo Legion 5 15AHP G10 | |
| Average of class Gaming (22297 - 135096, n=107, last 2 years) | |
| MSI Cyborg 15 B2RWEKG | |
| Lenovo LOQ 15AHP10 | |
| Acer Nitro V 15 ANV15-51-582S | |
| Average Intel Core i5-13420H (21429 - 62529, n=5) | |
| HP Victus 15-fa2160ng | |
| Acer Nitro V 15 ANV15-52-50S2 | |
| AIDA64 / Memory Latency | |
| Average of class Gaming (75.3 - 259, n=107, last 2 years) | |
| HP Victus 15-fa2160ng | |
| MSI Cyborg 15 B2RWEKG | |
| Acer Nitro V 15 ANV15-52-50S2 | |
| Lenovo LOQ 15AHP10 | |
| Average Intel Core i5-13420H (90.2 - 103.6, n=5) | |
| Lenovo Legion 5 15AHP G10 | |
| Acer Nitro V 15 ANV15-51-582S | |
* ... smaller is better
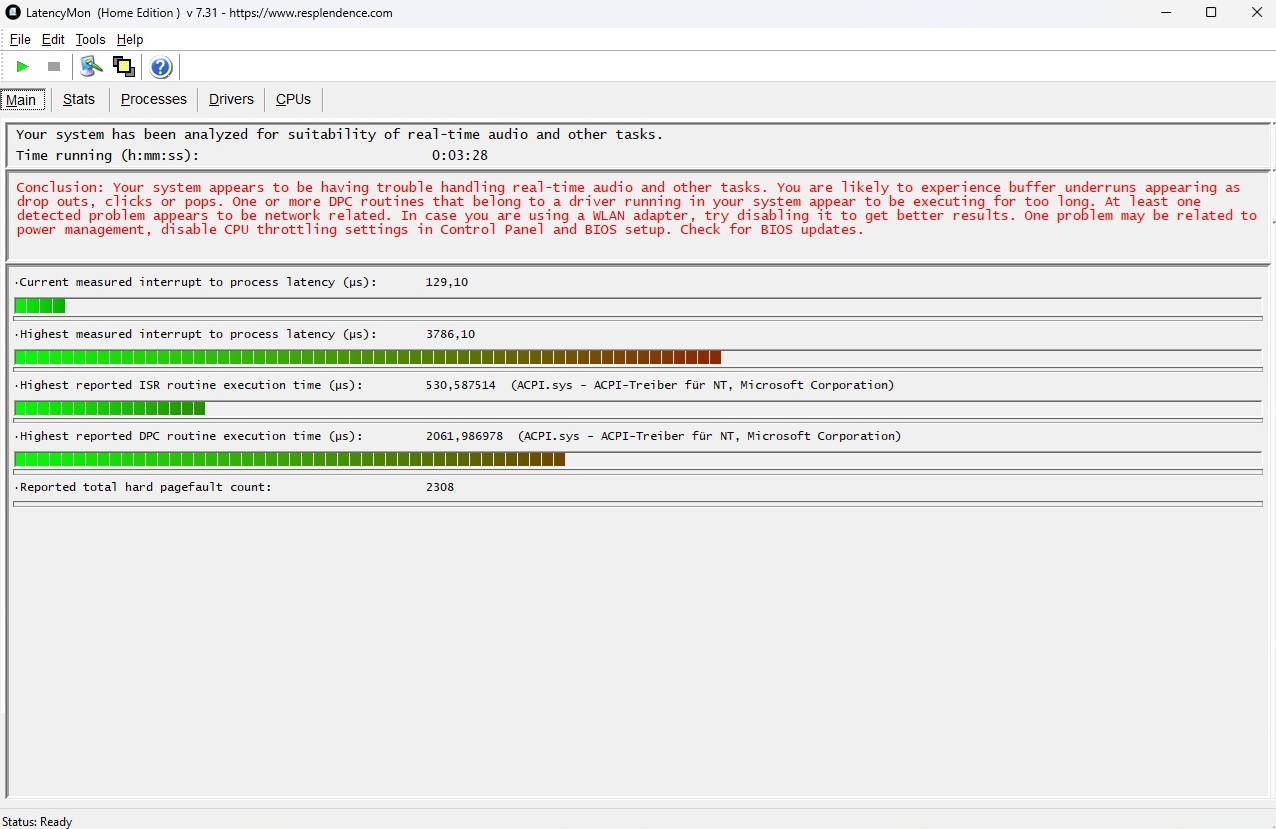
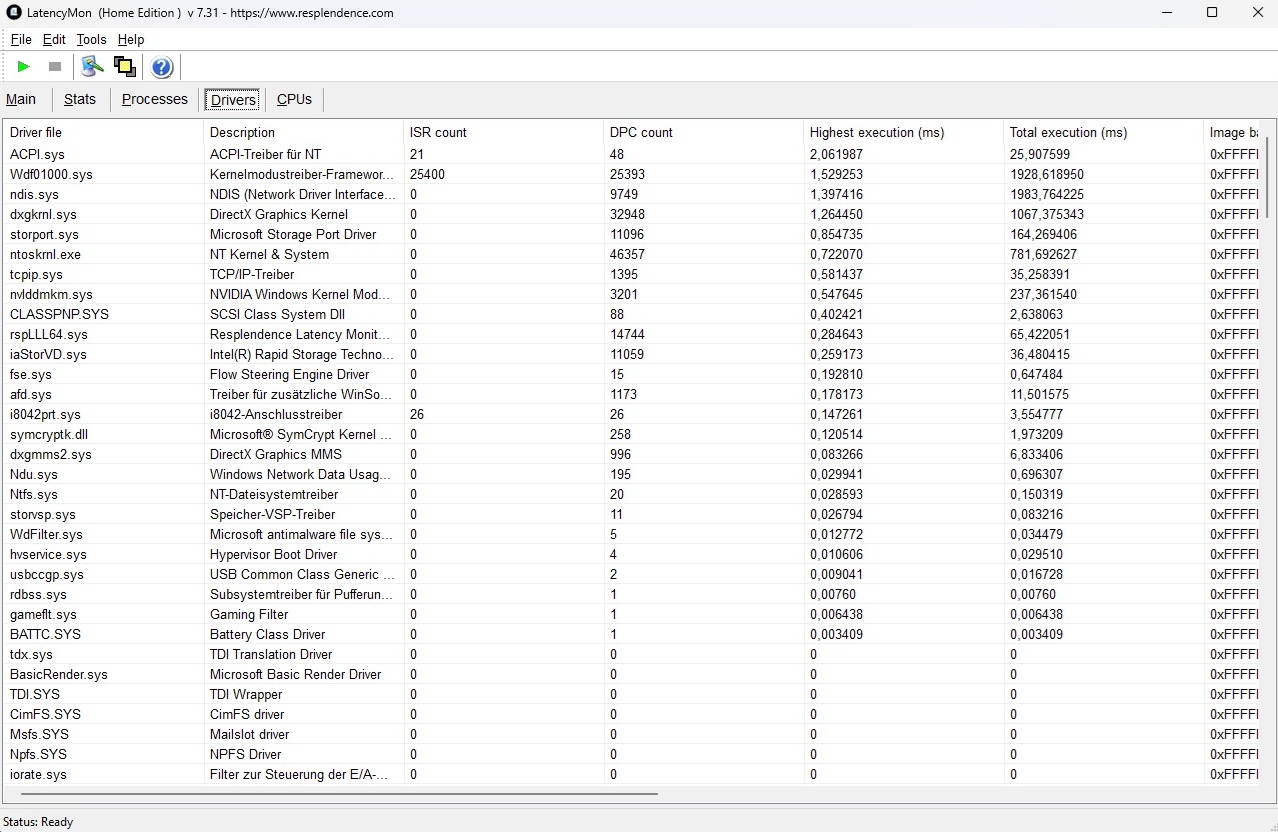
DPC latencies
The latency results are similarly modest to those of the recently tested Cyborg 15. The predecessor achieved significantly lower (that is, better) values in this regard.
| DPC Latencies / LatencyMon - interrupt to process latency (max), Web, Youtube, Prime95 | |
| MSI Cyborg 15 B2RWEKG | |
| Acer Nitro V 15 ANV15-52-50S2 | |
| HP Victus 15-fa2160ng | |
| Lenovo Legion 5 15AHP G10 | |
| Lenovo LOQ 15AHP10 | |
| Acer Nitro V 15 ANV15-51-582S | |
* ... smaller is better
Storage
The 1 TB Kingston SSD unfortunately suffers from performance drops under sustained load. However, this issue is not unique to the Nitro V 15 and also affects several competitors, including the Lenovo LOQ 15.

* ... smaller is better
Sustained read performance: DiskSpd read loop (queue depth 8)
GPU performance
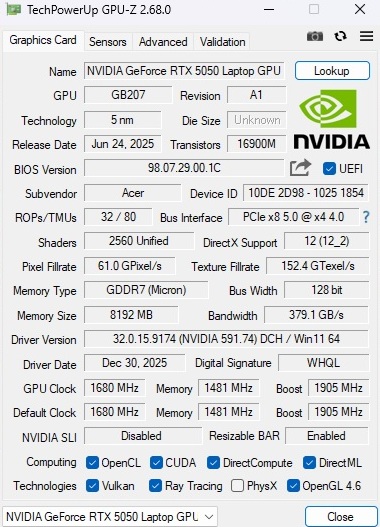
Thanks to its solid maximum TGP of 75 watts, the GeForce RTX 5050 delivers performance in line with the previously recorded average for this GPU. However, the difference compared to the predecessor's RTX 4050 remains rather modest.
| 3DMark 11 Performance | 21647 points | |
| 3DMark Fire Strike Score | 20647 points | |
| 3DMark Time Spy Score | 8449 points | |
Help | ||
* ... smaller is better
Gaming performance
Older or less demanding games generally run smoothly at the native resolution of 1,920 x 1,080 even at maximum settings. However, with current or more demanding titles, only medium to high settings are often the practical limit if frame rates above 40 FPS are desired. Upscaling can be used as an alternative if required.
With DLSS set to Quality mode, for example, Until Dawn achieved 44 FPS on the Ultra preset instead of 36 FPS. As usual, even higher frame rates can be reached through frame generation.
| low | med. | high | ultra | |
|---|---|---|---|---|
| Dota 2 Reborn (2015) | 86.3 | 92.1 | 86.5 | |
| X-Plane 11.11 (2018) | 71.9 | 67.1 | ||
| Strange Brigade (2018) | 185 | 164.8 | 154.6 | |
| Baldur's Gate 3 (2023) | 89.2 | 70.9 | 68.1 | |
| Cyberpunk 2077 (2023) | 77.5 | 67.8 | 61.3 | |
| Until Dawn (2024) | 53.3 | 47.6 | 36.4 | |
| ARC Raiders (2025) | 81 | 68.7 | 49.2 |
| ARC Raiders | |
| 1920x1080 Epic Preset + Epic Raytracing AA:TSR | |
| Average of class Gaming (43.5 - 98.6, n=11, last 2 years) | |
| Average NVIDIA GeForce RTX 5050 Laptop (43.5 - 58.2, n=4) | |
| Acer Nitro V 15 ANV15-52-50S2 | |
| MSI Cyborg 15 B2RWEKG | |
| 1920x1080 High Preset AA:TSR | |
| Average of class Gaming (64.5 - 144.4, n=11, last 2 years) | |
| Average NVIDIA GeForce RTX 5050 Laptop (64.5 - 85.9, n=4) | |
| Acer Nitro V 15 ANV15-52-50S2 | |
| MSI Cyborg 15 B2RWEKG | |
Cyberpunk 2077 Ultra FPS chart
Emissions
Noise emissions
Under load, the Acer Nitro V 15 becomes slightly louder than most competitors at 48 to 54 dB(A). More sensitive users can, of course, select a different operating mode. In Cyberpunk 2077, switching to Balanced mode reduces the noise level from 52 to 45 dB(A) without sacrificing much performance.
Noise level
| Idle |
| 28 / 29 / 33 dB(A) |
| Load |
| 48 / 54 dB(A) |
 | ||
30 dB silent 40 dB(A) audible 50 dB(A) loud |
||
min: | ||
| Acer Nitro V 15 ANV15-52-50S2 i5-13420H, GeForce RTX 5050 Laptop | Acer Nitro V 15 ANV15-51-582S i5-13420H, GeForce RTX 4050 Laptop GPU | HP Victus 15-fa2160ng i5-13420H, GeForce RTX 5050 Laptop | MSI Cyborg 15 B2RWEKG Core 7 240H, GeForce RTX 5050 Laptop | Lenovo LOQ 15AHP10 R7 250, GeForce RTX 5060 Laptop | Lenovo Legion 5 15AHP G10 R7 260, GeForce RTX 5060 Laptop | |
|---|---|---|---|---|---|---|
| Noise | 3% | 7% | 6% | -23% | 10% | |
| off / environment * (dB) | 24 | 25 -4% | 24 -0% | 24 -0% | 25 -4% | 25.5 -6% |
| Idle Minimum * (dB) | 28 | 25 11% | 28 -0% | 25 11% | 43 -54% | 25.5 9% |
| Idle Average * (dB) | 29 | 29 -0% | 29 -0% | 28 3% | 45 -55% | 25.5 12% |
| Idle Maximum * (dB) | 33 | 30 9% | 30 9% | 33 -0% | 48 -45% | 26.9 18% |
| Load Average * (dB) | 48 | 49 -2% | 40 17% | 44 8% | 53 -10% | 34.6 28% |
| Cyberpunk 2077 ultra * (dB) | 52 | 46 12% | 45 13% | 51 2% | 50.1 4% | |
| Load Maximum * (dB) | 54 | 51 6% | 48 11% | 50 7% | 53 2% | 50.1 7% |
| Witcher 3 ultra * (dB) | 49 |
* ... smaller is better
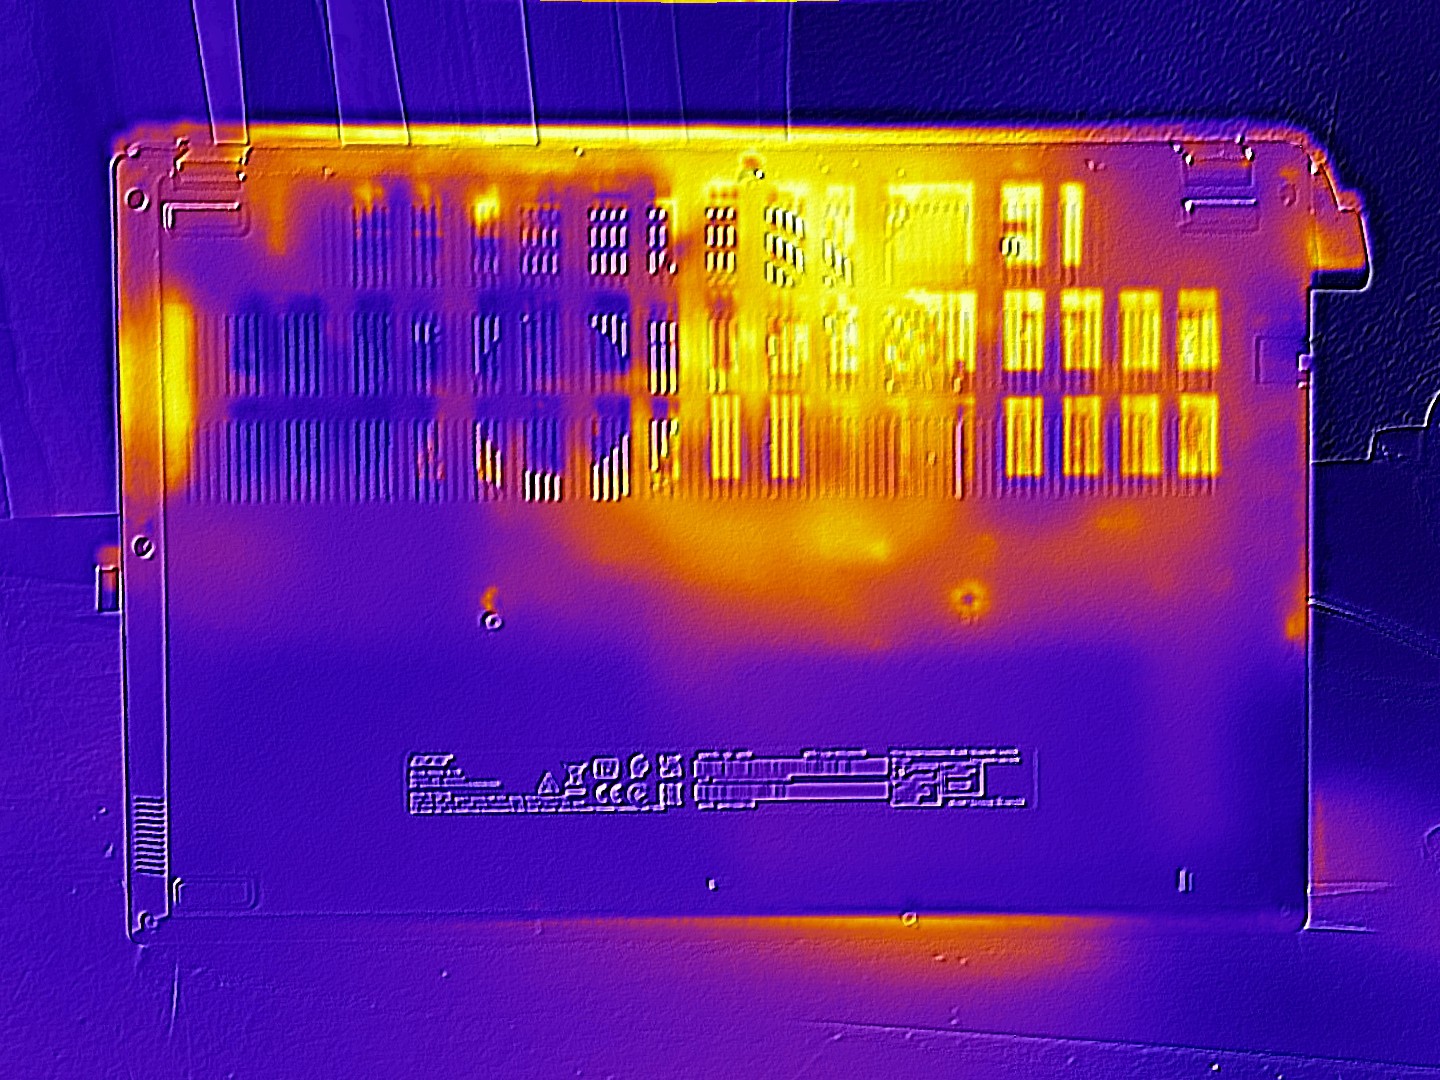
Temperature
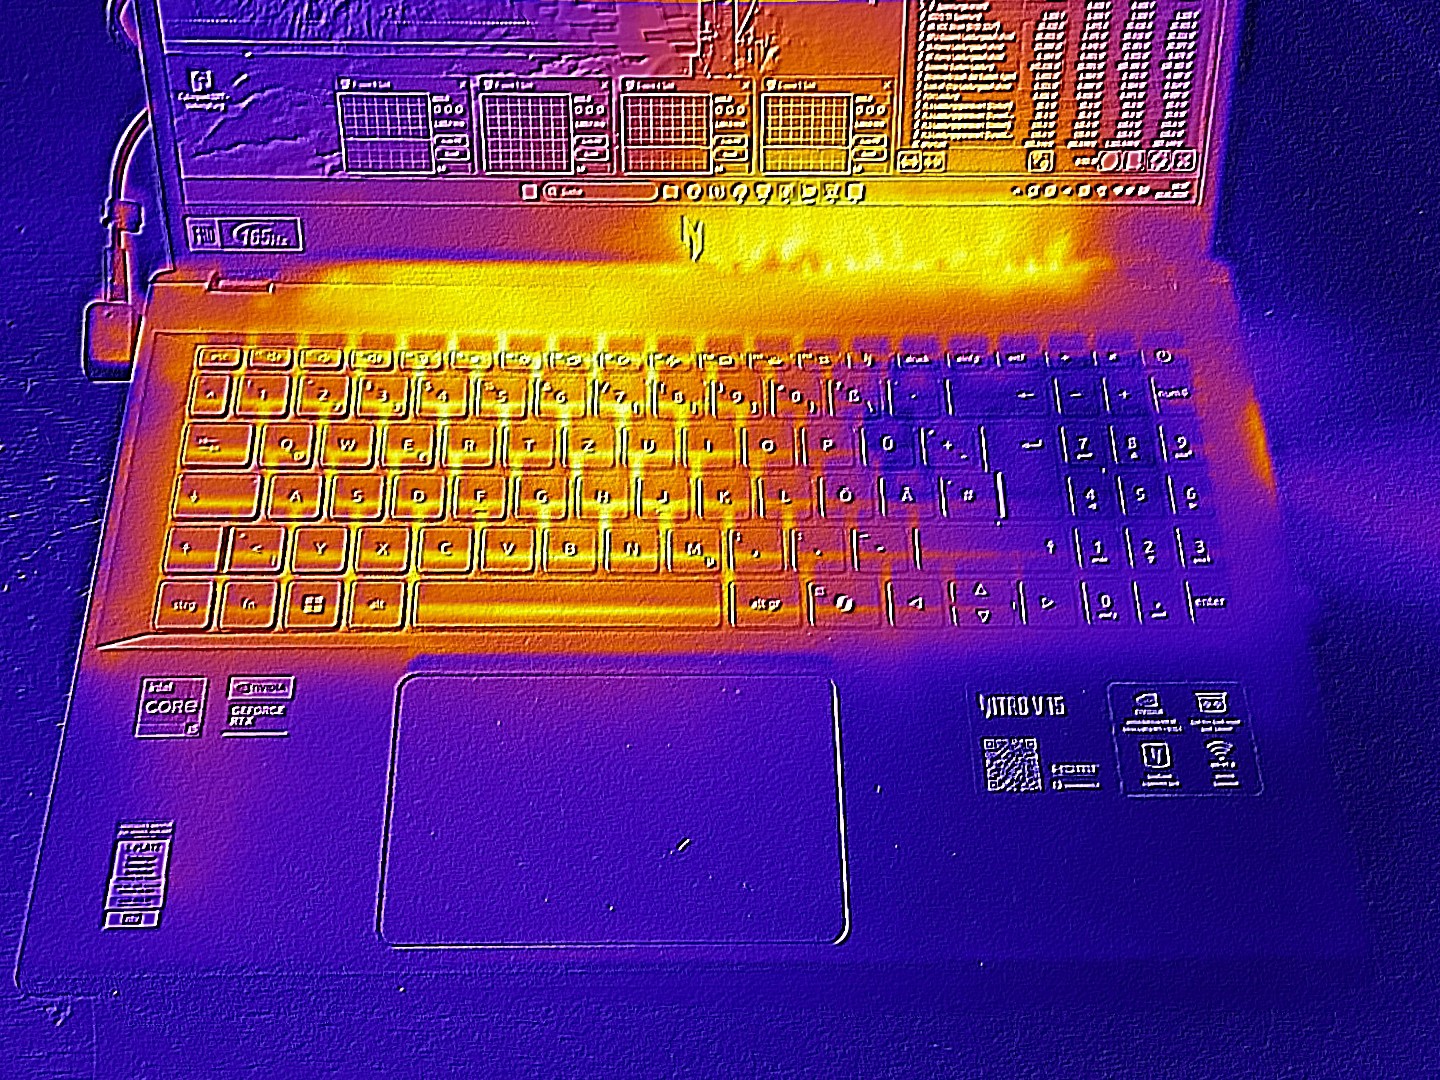
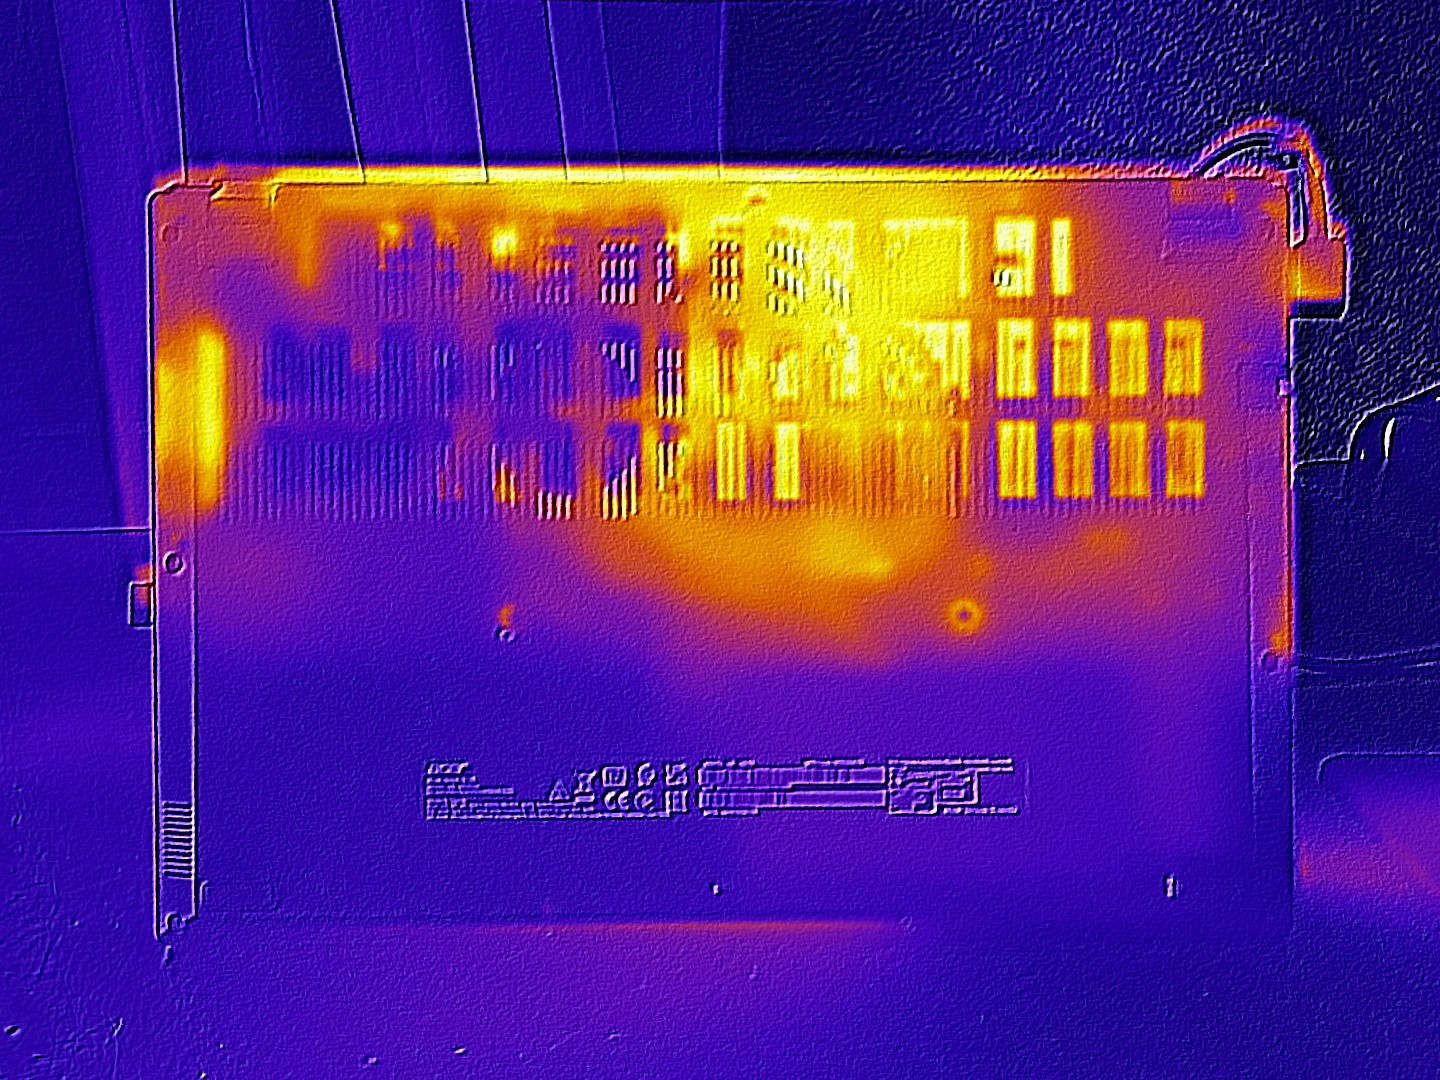
Temperatures are in line with expectations for an RTX 5050 laptop. In idle operation, the chassis remains pleasantly cool.
(-) The maximum temperature on the upper side is 46 °C / 115 F, compared to the average of 40.4 °C / 105 F, ranging from 21.2 to 68.8 °C for the class Gaming.
(-) The bottom heats up to a maximum of 49 °C / 120 F, compared to the average of 43.2 °C / 110 F
(+) In idle usage, the average temperature for the upper side is 25.8 °C / 78 F, compared to the device average of 33.9 °C / 93 F.
(±) 3: The average temperature for the upper side is 37.8 °C / 100 F, compared to the average of 33.9 °C / 93 F for the class Gaming.
(+) The palmrests and touchpad are cooler than skin temperature with a maximum of 31 °C / 87.8 F and are therefore cool to the touch.
(-) The average temperature of the palmrest area of similar devices was 28.8 °C / 83.8 F (-2.2 °C / -4 F).
| Acer Nitro V 15 ANV15-52-50S2 i5-13420H, GeForce RTX 5050 Laptop | Acer Nitro V 15 ANV15-51-582S i5-13420H, GeForce RTX 4050 Laptop GPU | HP Victus 15-fa2160ng i5-13420H, GeForce RTX 5050 Laptop | MSI Cyborg 15 B2RWEKG Core 7 240H, GeForce RTX 5050 Laptop | Lenovo LOQ 15AHP10 R7 250, GeForce RTX 5060 Laptop | Lenovo Legion 5 15AHP G10 R7 260, GeForce RTX 5060 Laptop | |
|---|---|---|---|---|---|---|
| Heat | 3% | -2% | -12% | -9% | 1% | |
| Maximum Upper Side * (°C) | 46 | 46 -0% | 43 7% | 46 -0% | 49 -7% | 42.2 8% |
| Maximum Bottom * (°C) | 49 | 48 2% | 43 12% | 45 8% | 58 -18% | 51.7 -6% |
| Idle Upper Side * (°C) | 28 | 27 4% | 37 -32% | 36 -29% | 32 -14% | 28.5 -2% |
| Idle Bottom * (°C) | 30 | 28 7% | 28 7% | 38 -27% | 29 3% | 29.2 3% |
* ... smaller is better
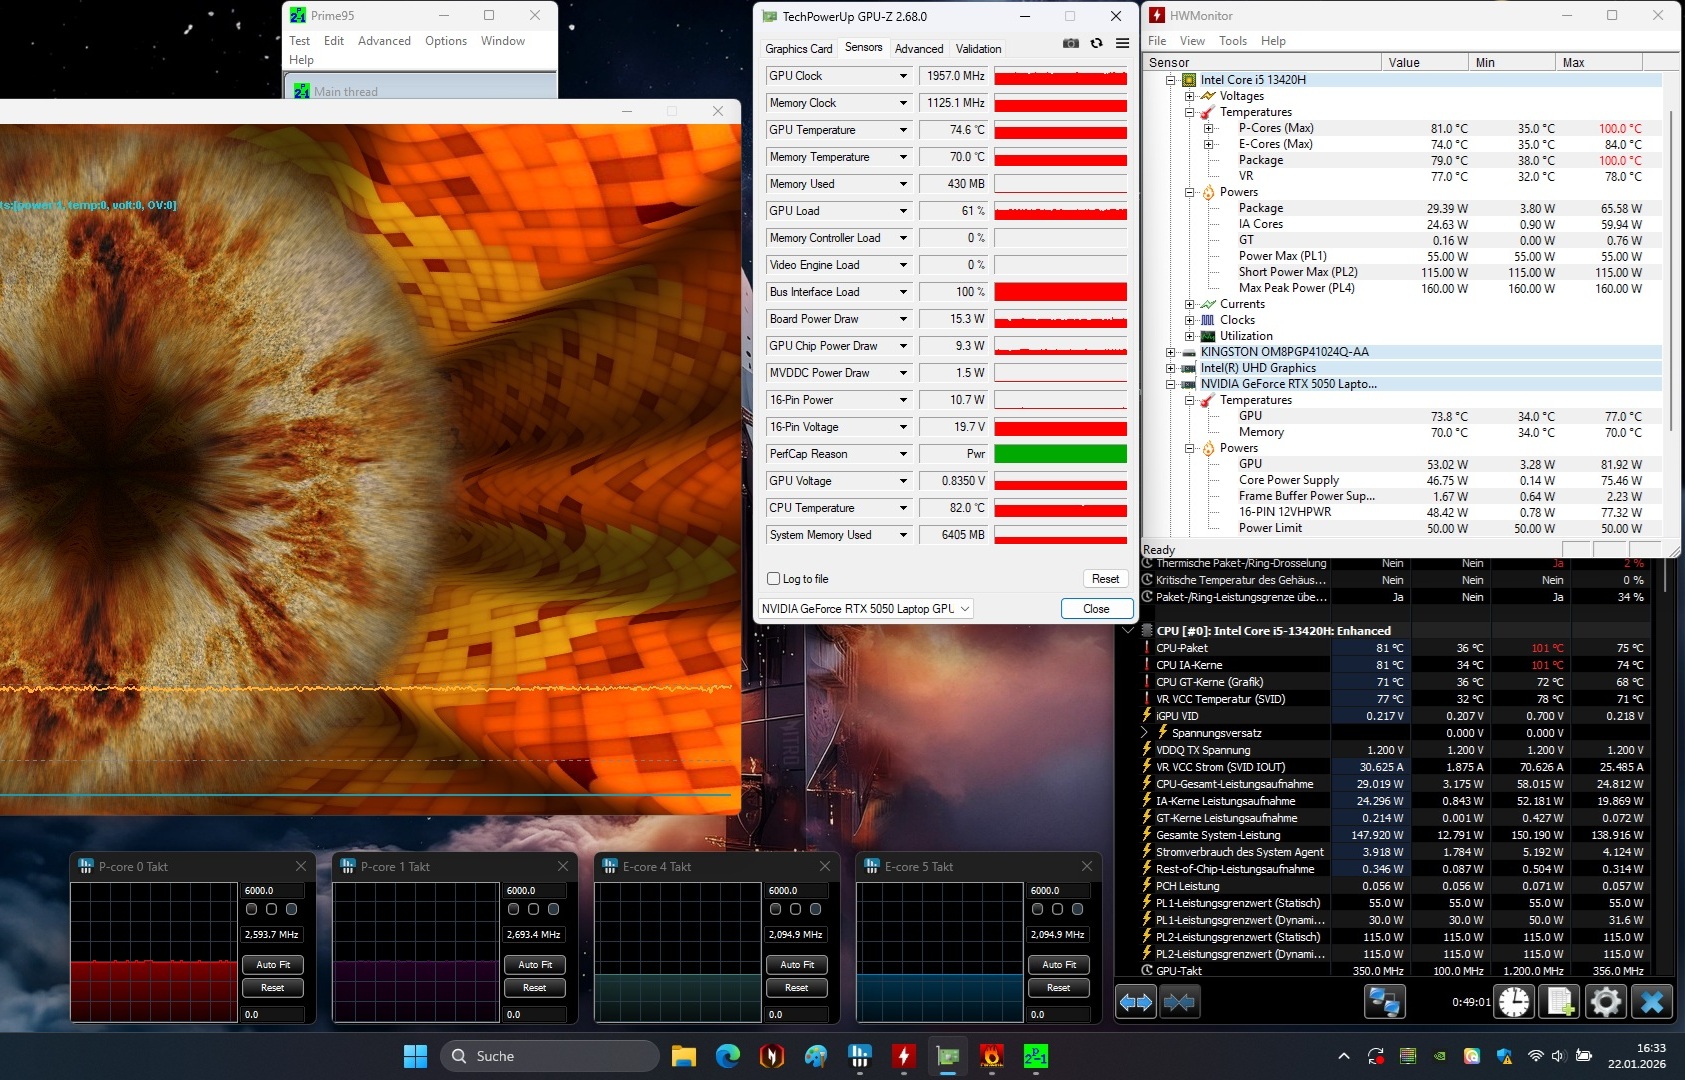
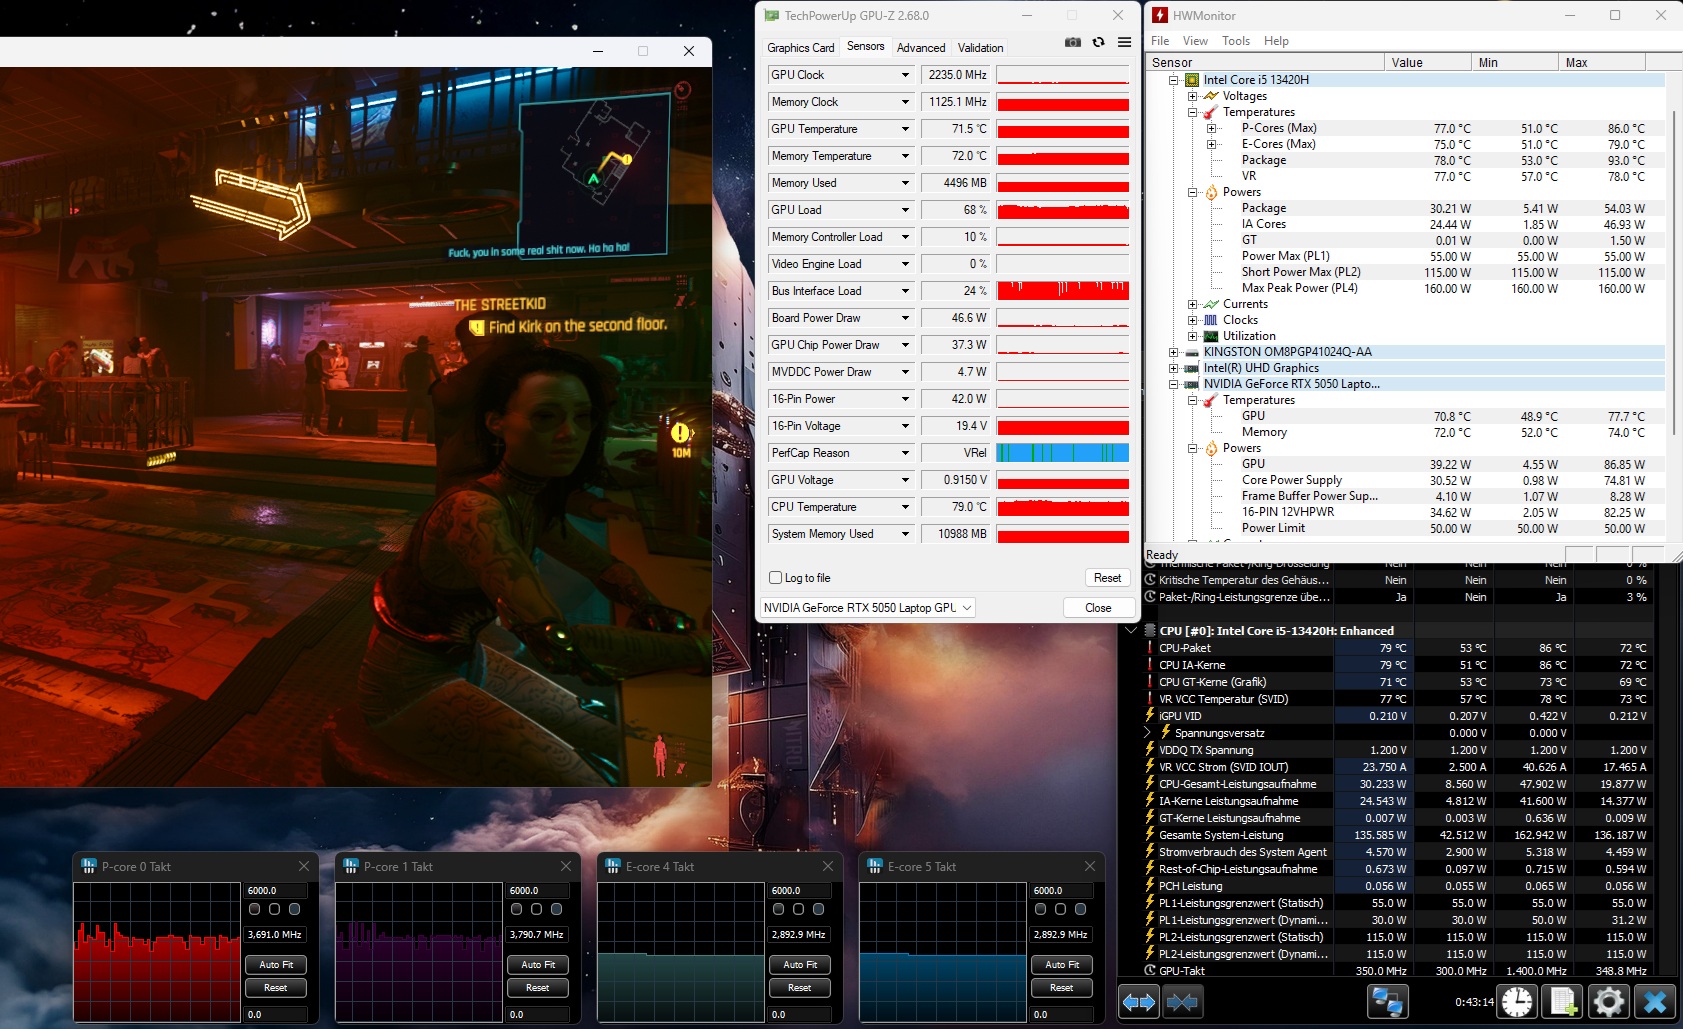
Stress test
Our stress test using the tools FurMark and Prime95 pushed the GPU to around 75 °C, while the CPU settled at approximately 80 °C after a short period.

Loudspeaker
The sound quality is in the mid-range. As with most notebooks, the bass in particular leaves a lot to be desired.
Acer Nitro V 15 ANV15-52-50S2 audio analysis
(+) | speakers can play relatively loud (83 dB)
Bass 100 - 315 Hz
(-) | nearly no bass - on average 27.5% lower than median
(-) | bass is not linear (15% delta to prev. frequency)
Mids 400 - 2000 Hz
(+) | balanced mids - only 4.7% away from median
(+) | mids are linear (4.4% delta to prev. frequency)
Highs 2 - 16 kHz
(+) | balanced highs - only 2% away from median
(+) | highs are linear (4.5% delta to prev. frequency)
Overall 100 - 16.000 Hz
(±) | linearity of overall sound is average (17.9% difference to median)
Compared to same class
» 54% of all tested devices in this class were better, 9% similar, 37% worse
» The best had a delta of 6%, average was 18%, worst was 132%
Compared to all devices tested
» 37% of all tested devices were better, 8% similar, 55% worse
» The best had a delta of 4%, average was 24%, worst was 134%
HP Victus 15-fa2160ng audio analysis
(+) | speakers can play relatively loud (83 dB)
Bass 100 - 315 Hz
(-) | nearly no bass - on average 23.8% lower than median
(±) | linearity of bass is average (12% delta to prev. frequency)
Mids 400 - 2000 Hz
(+) | balanced mids - only 2.1% away from median
(+) | mids are linear (4% delta to prev. frequency)
Highs 2 - 16 kHz
(±) | higher highs - on average 5.5% higher than median
(+) | highs are linear (4.5% delta to prev. frequency)
Overall 100 - 16.000 Hz
(±) | linearity of overall sound is average (17.8% difference to median)
Compared to same class
» 53% of all tested devices in this class were better, 10% similar, 37% worse
» The best had a delta of 6%, average was 18%, worst was 132%
Compared to all devices tested
» 36% of all tested devices were better, 8% similar, 56% worse
» The best had a delta of 4%, average was 24%, worst was 134%
Energy management
energy consumption
With an average of 18 watts, the power requirement in idle mode could be lower. Under load, the 15-incher consumes between 66 and 119 watts, so the included 135-watt power supply is not overtaxed.
| Off / Standby | |
| Idle | |
| Load |
|
Key:
min: | |
| Acer Nitro V 15 ANV15-52-50S2 i5-13420H, GeForce RTX 5050 Laptop | Acer Nitro V 15 ANV15-51-582S i5-13420H, GeForce RTX 4050 Laptop GPU | HP Victus 15-fa2160ng i5-13420H, GeForce RTX 5050 Laptop | MSI Cyborg 15 B2RWEKG Core 7 240H, GeForce RTX 5050 Laptop | Lenovo LOQ 15AHP10 R7 250, GeForce RTX 5060 Laptop | Lenovo Legion 5 15AHP G10 R7 260, GeForce RTX 5060 Laptop | Average of class Gaming | |
|---|---|---|---|---|---|---|---|
| Power Consumption | 26% | 2% | 4% | -28% | -10% | -37% | |
| Idle Minimum * (Watt) | 16.8 | 7 58% | 7.9 53% | 14.9 11% | 20 -19% | 6.9 59% | 13.2 ? 21% |
| Idle Average * (Watt) | 17.6 | 8 55% | 9.2 48% | 16.3 7% | 20.7 -18% | 10.7 39% | 18.9 ? -7% |
| Idle Maximum * (Watt) | 19.8 | 11 44% | 13.5 32% | 22.2 -12% | 22.7 -15% | 11.3 43% | 24.3 ? -23% |
| Load Average * (Watt) | 66 | 76 -15% | 78 -18% | 72 -9% | 71 -8% | 69.7 -6% | 108.3 ? -64% |
| Cyberpunk 2077 ultra * (Watt) | 106.5 | 128.4 -21% | 90.3 15% | 153.1 -44% | 162.6 -53% | ||
| Cyberpunk 2077 ultra external monitor * (Watt) | 105 | 126.7 -21% | 89.6 15% | 151.1 -44% | 165 -57% | ||
| Load Maximum * (Watt) | 119 | 136 -14% | 187 -57% | 117 2% | 172 -45% | 233.6 -96% | 254 ? -113% |
| Witcher 3 ultra * (Watt) | 98.2 |
* ... smaller is better
energy consumption Cyberpunk / Stress test
energy consumption with external monitor
Battery life
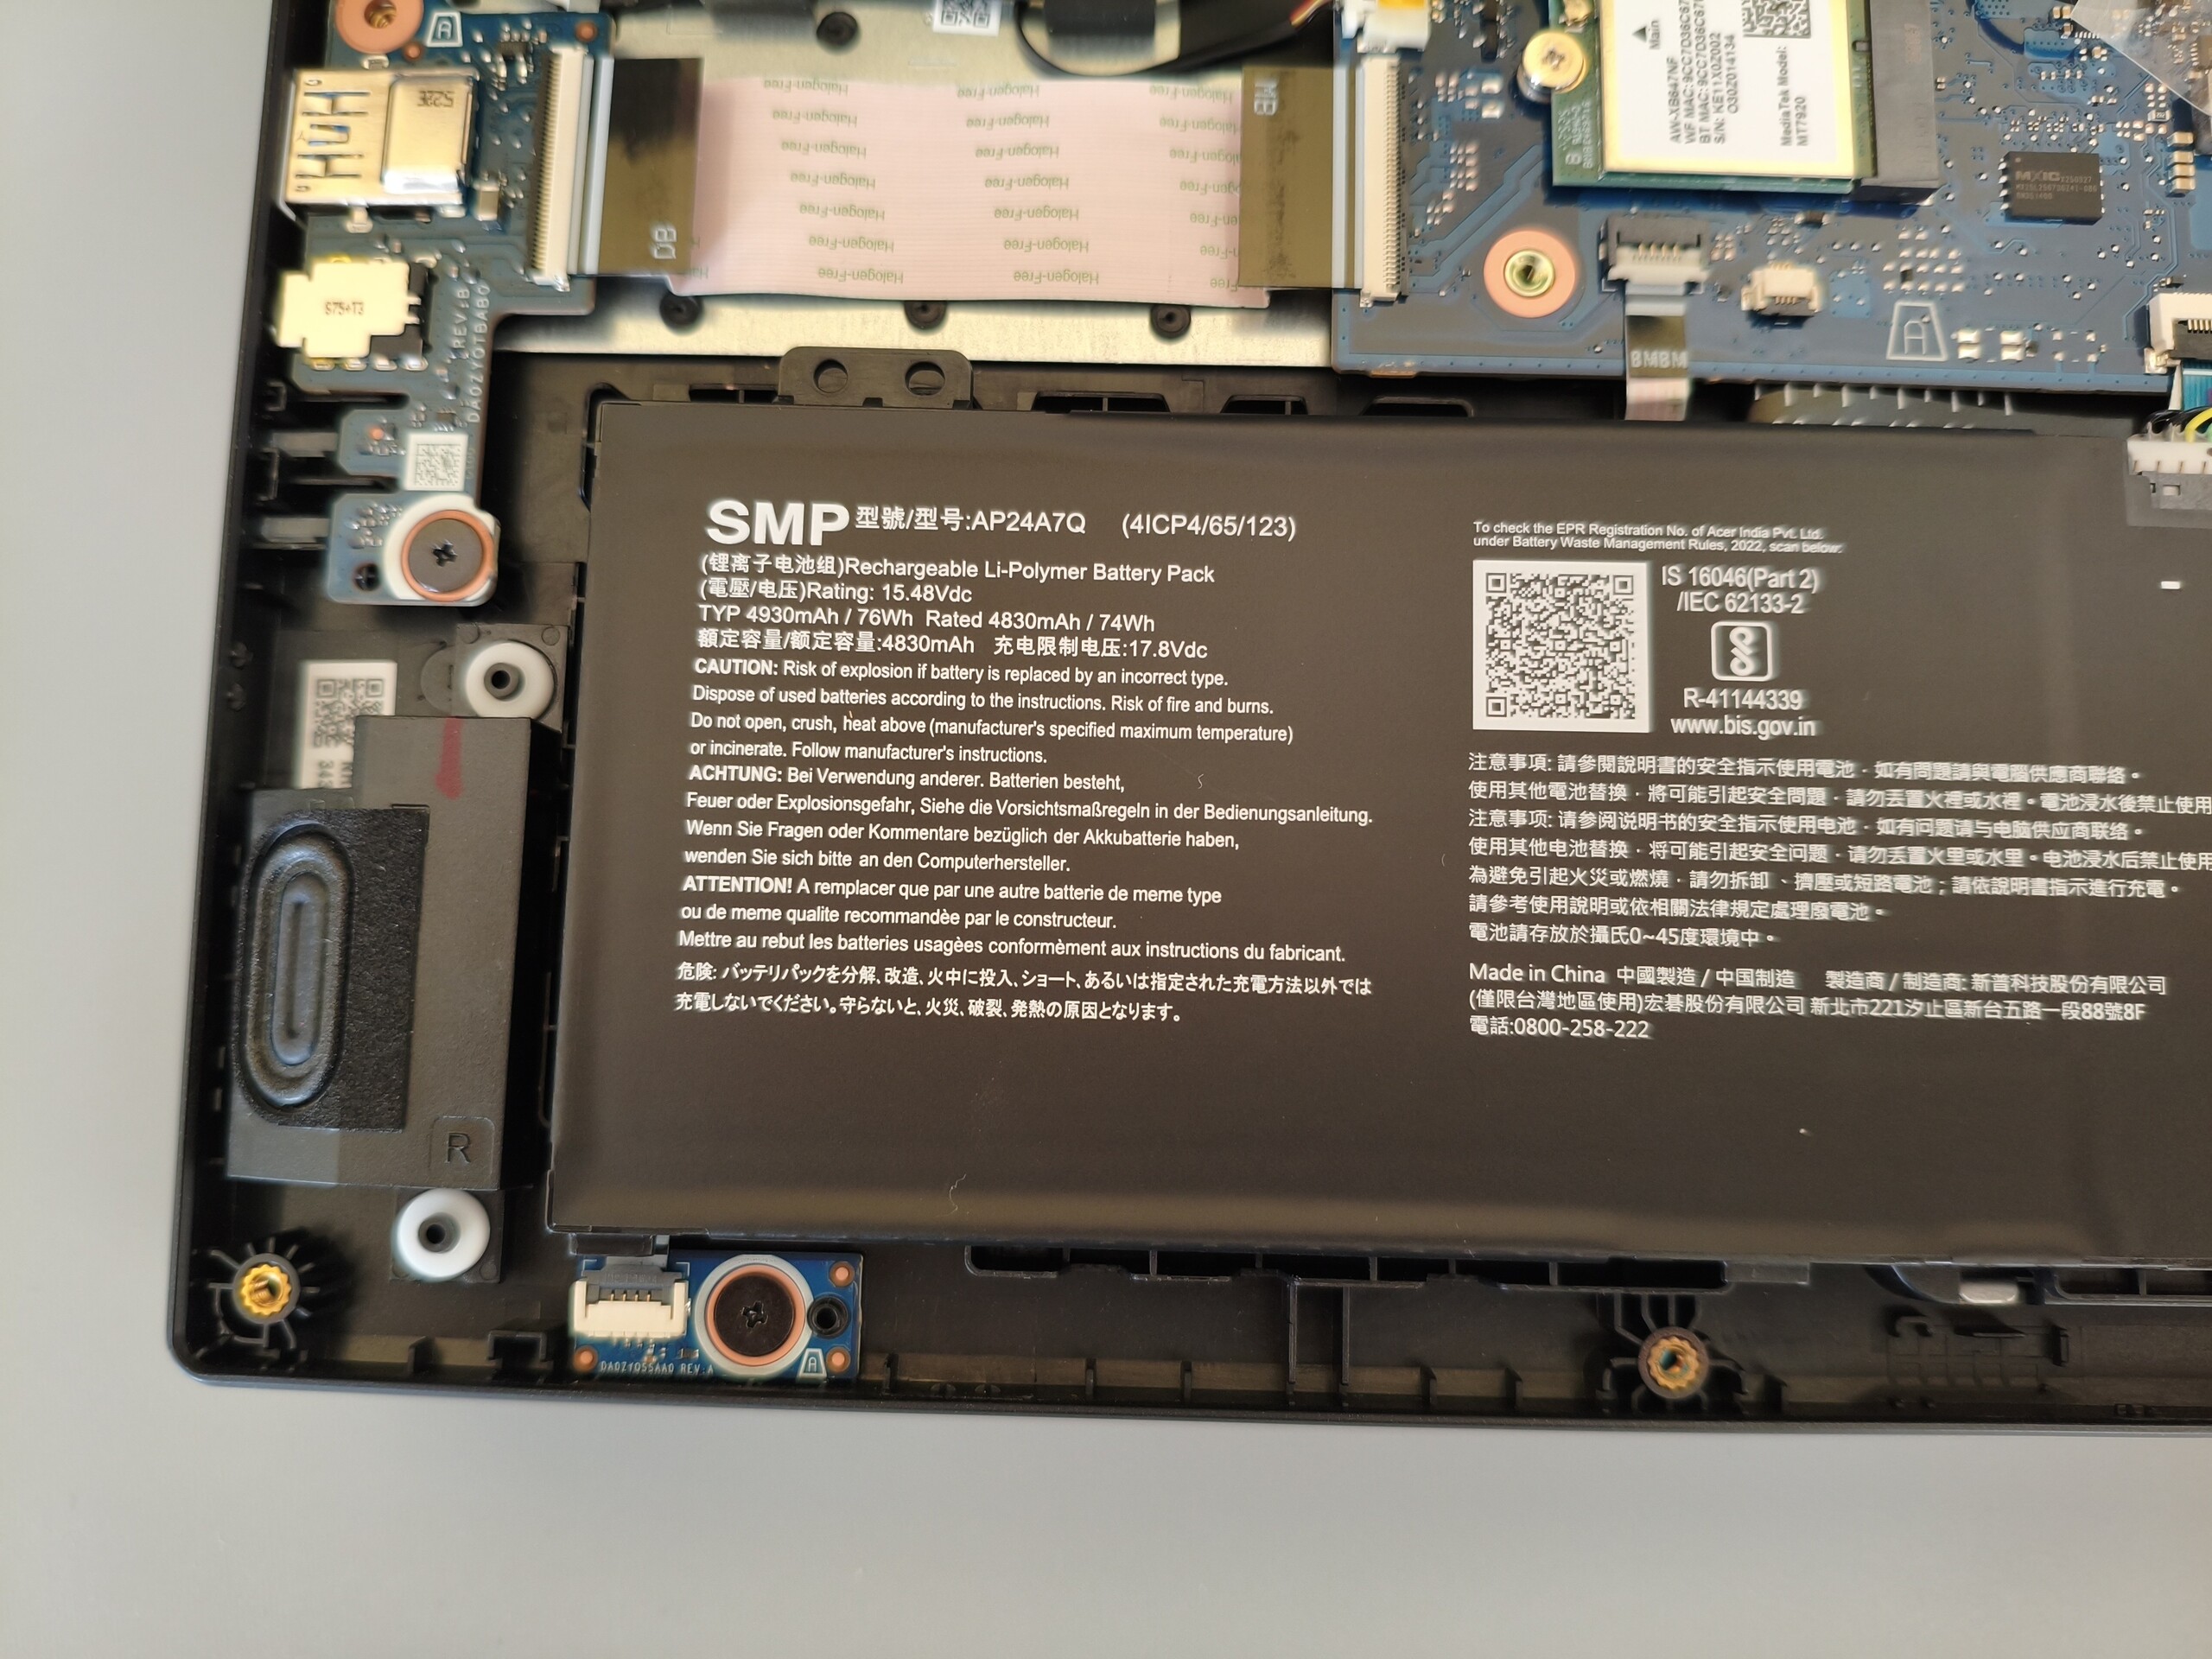
Although the battery capacity has increased significantly from 57 to 76 Wh, battery life is worse than that of the predecessor. In our Wi-Fi test with brightness reduced to 150 cd/m², the device managed only around 5.5 hours, which is still acceptable compared to the competition.
| Acer Nitro V 15 ANV15-52-50S2 i5-13420H, GeForce RTX 5050 Laptop, 76 Wh | Acer Nitro V 15 ANV15-51-582S i5-13420H, GeForce RTX 4050 Laptop GPU, 57 Wh | HP Victus 15-fa2160ng i5-13420H, GeForce RTX 5050 Laptop, 70 Wh | MSI Cyborg 15 B2RWEKG Core 7 240H, GeForce RTX 5050 Laptop, 55.2 Wh | Lenovo LOQ 15AHP10 R7 250, GeForce RTX 5060 Laptop, 60 Wh | Lenovo Legion 5 15AHP G10 R7 260, GeForce RTX 5060 Laptop, 80 Wh | Average of class Gaming | |
|---|---|---|---|---|---|---|---|
| Battery runtime | 71% | -22% | -2% | -18% | 76% | 28% | |
| WiFi v1.3 (h) | 5.5 | 9.4 71% | 4.3 -22% | 5.4 -2% | 4.5 -18% | 9.7 76% | 7.04 ? 28% |
| Reader / Idle (h) | 21.5 | 6.9 | 8.71 ? | ||||
| Load (h) | 1.7 | 1.3 | 1.2 | 1.47 ? | |||
| H.264 (h) | 11.5 | 8.26 ? | |||||
| Cyberpunk 2077 ultra 150cd (h) | 0.9 |
Notebookcheck overall rating
With a wider colour gamut, the Nitro V 15 would be a worthy rival to the Lenovo LOQ 15. As it stands, however, it only reaches the level of the HP Victus 15 and the MSI Cyborg 15, which are similarly priced at around €1,000 but deliver slightly better overall results.
Acer Nitro V 15 ANV15-52-50S2
- 01/29/2026 v8
Florian Glaser
 Total Sustainability Score:
 Possible alternatives at a glance
Image | Model / Review | Price | Weight | Height | Display |
|---|---|---|---|---|---|
1. 73.7%  | Acer Nitro V 15 ANV15-52-50S2 Intel Core i5-13420H ⎘ NVIDIA GeForce RTX 5050 Laptop ⎘ 16 GB Memory, 1024 GB SSD | Amazon: List Price: 1049 EUR | 2.1 kg | 23.5 mm | 15.60" 1920x1080 141 PPI IPS |
2. 82.8% v7 (old)  | Acer Nitro V 15 ANV15-51-582S Intel Core i5-13420H ⎘ NVIDIA GeForce RTX 4050 Laptop GPU ⎘ 16 GB Memory, 512 GB SSD | Amazon: 1. $72.95 LCDBros Screen for Acer Nitr... 2. $76.67 HPDELGB Replacement for Acer... 3. $1,149.98 Acer Nitro V 15 Gaming Lapto... List Price: 900 EUR | 2.1 kg | 23.5 mm | 15.60" 1920x1080 141 PPI IPS |
3. 75.8%  | HP Victus 15-fa2160ng Intel Core i5-13420H ⎘ NVIDIA GeForce RTX 5050 Laptop ⎘ 24 GB Memory, 512 GB SSD | Amazon: List Price: 1000 EUR | 2.4 kg | 23.5 mm | 15.60" 1920x1080 141 PPI IPS |
4. 75.2%  | MSI Cyborg 15 B2RWEKG Intel Core 7 240H ⎘ NVIDIA GeForce RTX 5050 Laptop ⎘ 16 GB Memory, 512 GB SSD | Amazon: List Price: 1099 EUR | 2.2 kg | 23.2 mm | 15.60" 1920x1080 141 PPI IPS |
5. 77.5%  | Lenovo LOQ 15AHP10 AMD Ryzen 7 250 ⎘ NVIDIA GeForce RTX 5060 Laptop ⎘ 16 GB Memory, 1024 GB SSD | Amazon: | 2.4 kg | 24 mm | 15.60" 1920x1080 141 PPI IPS |
6. 87.2% 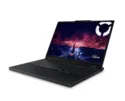 | Lenovo Legion 5 15AHP G10 AMD Ryzen 7 260 ⎘ NVIDIA GeForce RTX 5060 Laptop ⎘ 32 GB Memory, 1024 GB SSD | Amazon: List Price: 1449€ | 1.9 kg | 21.5 mm | 15.10" 2560x1600 200 PPI OLED |
Transparency
The selection of devices to be reviewed is made by our editorial team. The test sample was provided to the author as a loan by the manufacturer or retailer for the purpose of this review. The lender had no influence on this review, nor did the manufacturer receive a copy of this review before publication. There was no obligation to publish this review. As an independent media company, Notebookcheck is not subjected to the authority of manufacturers, retailers or publishers.
This is how Notebookcheck is testing
Every year, Notebookcheck independently reviews hundreds of laptops and smartphones using standardized procedures to ensure that all results are comparable. We have continuously developed our test methods for around 20 years and set industry standards in the process. In our test labs, high-quality measuring equipment is utilized by experienced technicians and editors. These tests involve a multi-stage validation process. Our complex rating system is based on hundreds of well-founded measurements and benchmarks, which maintains objectivity. Further information on our test methods can be found here.

