Notebookcheck Logo

Armored Core 6 Fires of Rubicon tech review: Laptop and desktop benchmarks

Mech fights with dated graphics. Armored Core 6 probably wouldn't have garnered so much interest if it weren’t made by FromSoftware, the game studio behind Dark Souls. Read our tech review to find out how high (or low) its system requirements are.

Notebooks featured in this review

XMG Neo 17 E23 (RTX 4090)
Schenker Key 17 Pro E23 (RTX 4080)
XMG Pro 15 E23 (RTX 4070 & RTX 4060)
XMG Focus 15 E23 (RTX 4050)
Asus ROG Strix Scar 17 (RTX 3080 Ti)
Acer Predator Helios 300 (RTX 3070 Ti)
Asus ROG Zephyrus G14 (RX 6800S & 680M)
 

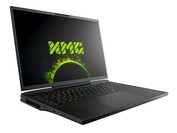
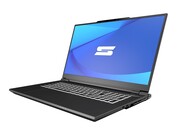
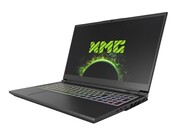
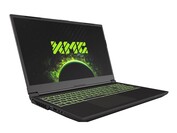
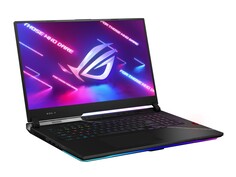
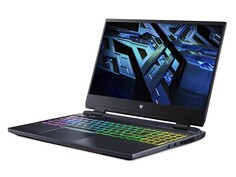
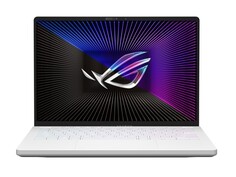
Right now, our gaming benchmarks are performed using these laptops. Click on the images to visit the respective product page. All other test systems (tower PCs, mini-PCs, etc.) are listed at the end of this article.

Technical aspects

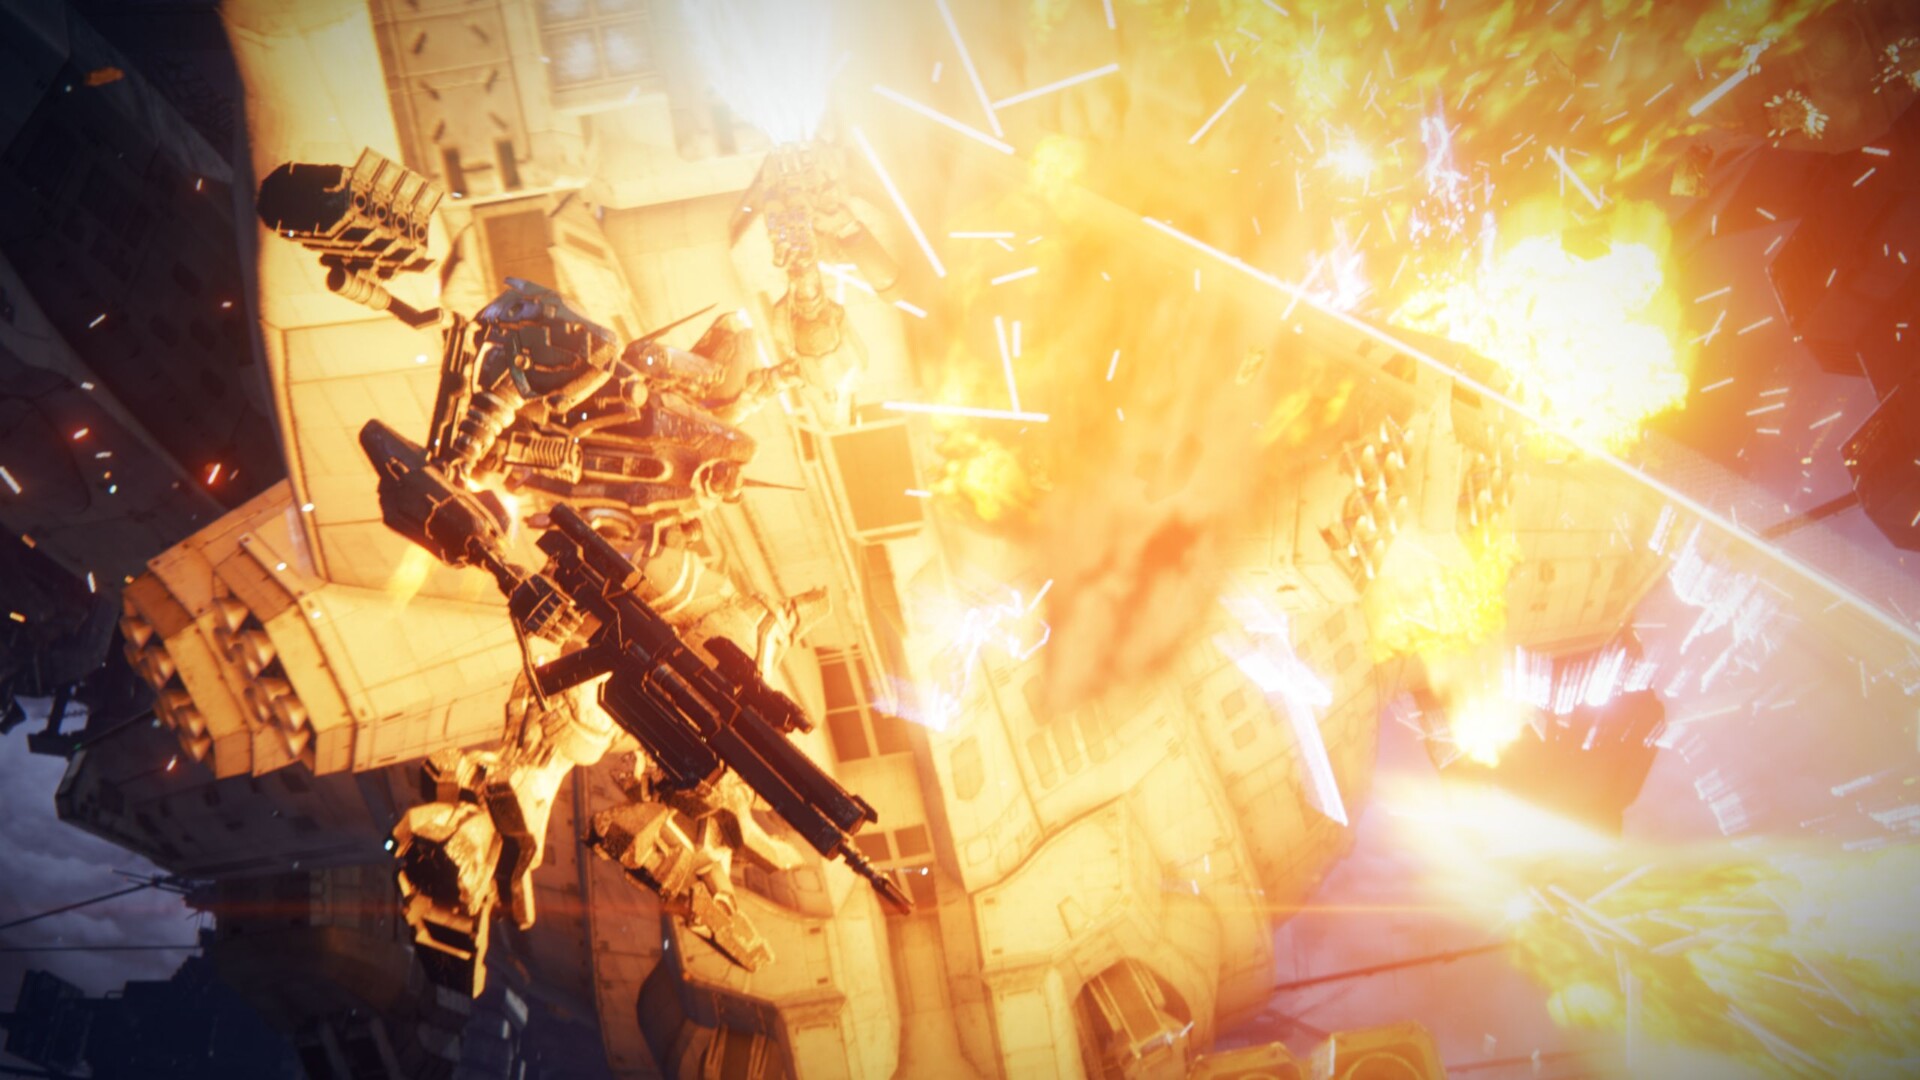
Opinions on Armored Core 6 are quite divided amongst gamers. For instance, whilst some people laud the game’s difficult boss fights, others express their dismay at the rather dull storytelling (cool cutscenes notwithstanding) and the drab, lifeless and graphically fairly uninspiring levels. We can understand both viewpoints and consider Fires of Rubicon a solid, albeit unexceptional game, unlike FromSoftware's other releases such as Elden Ring

Armored Core 6
Armored Core 6
Armored Core 6
Armored Core 6
Armored Core 6
Armored Core 6

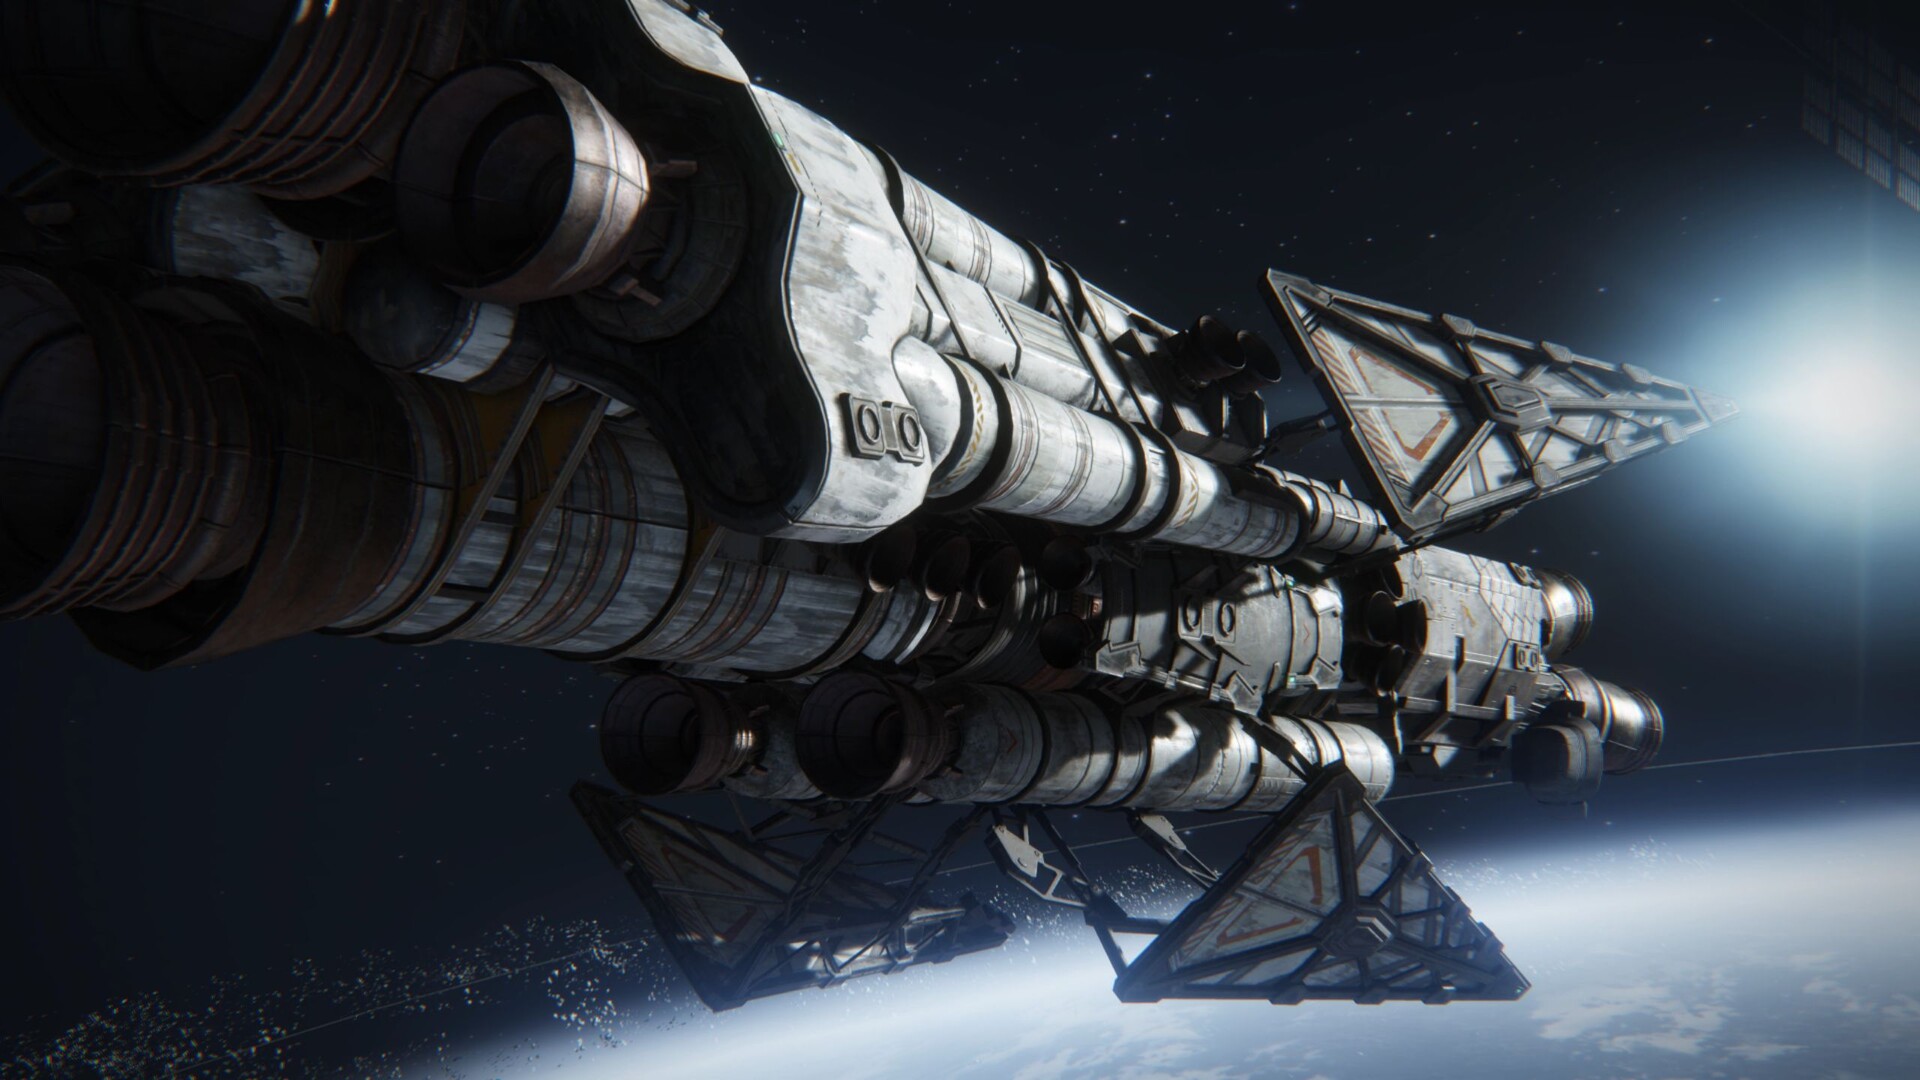
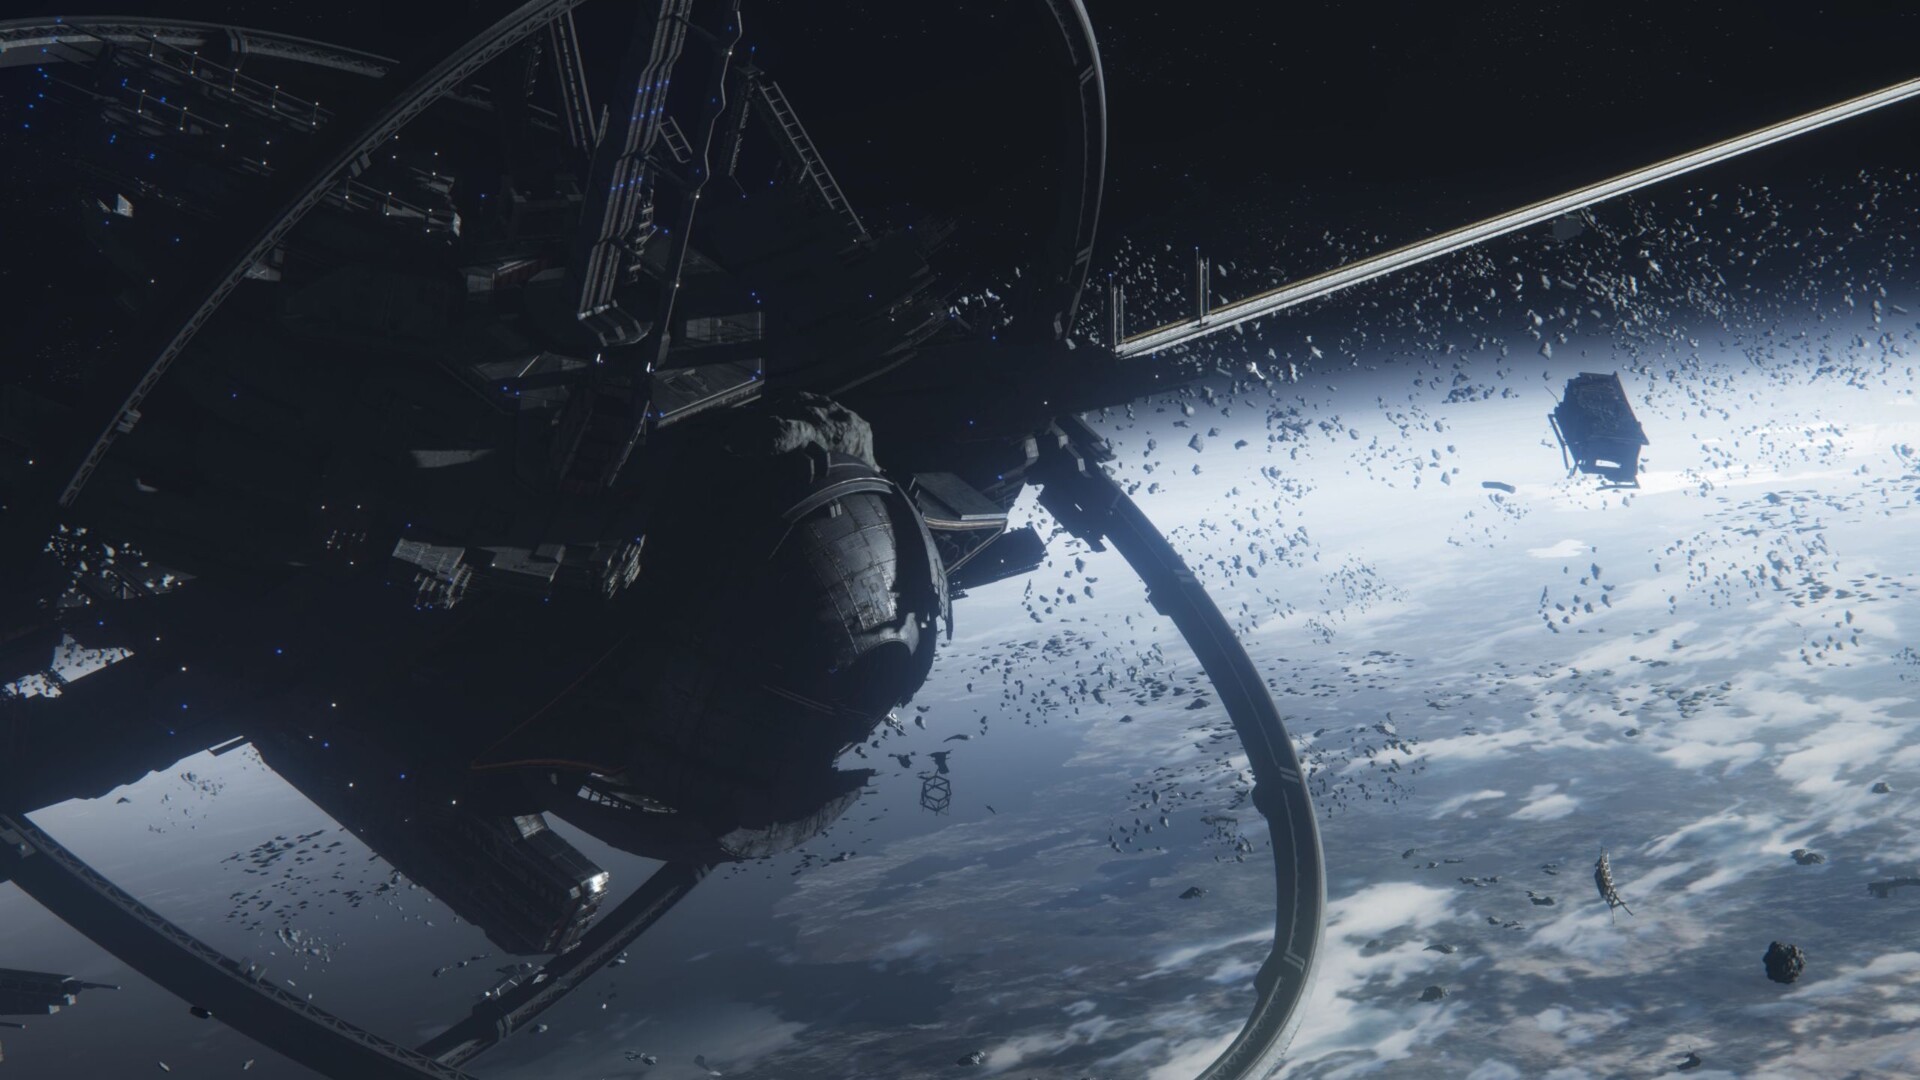
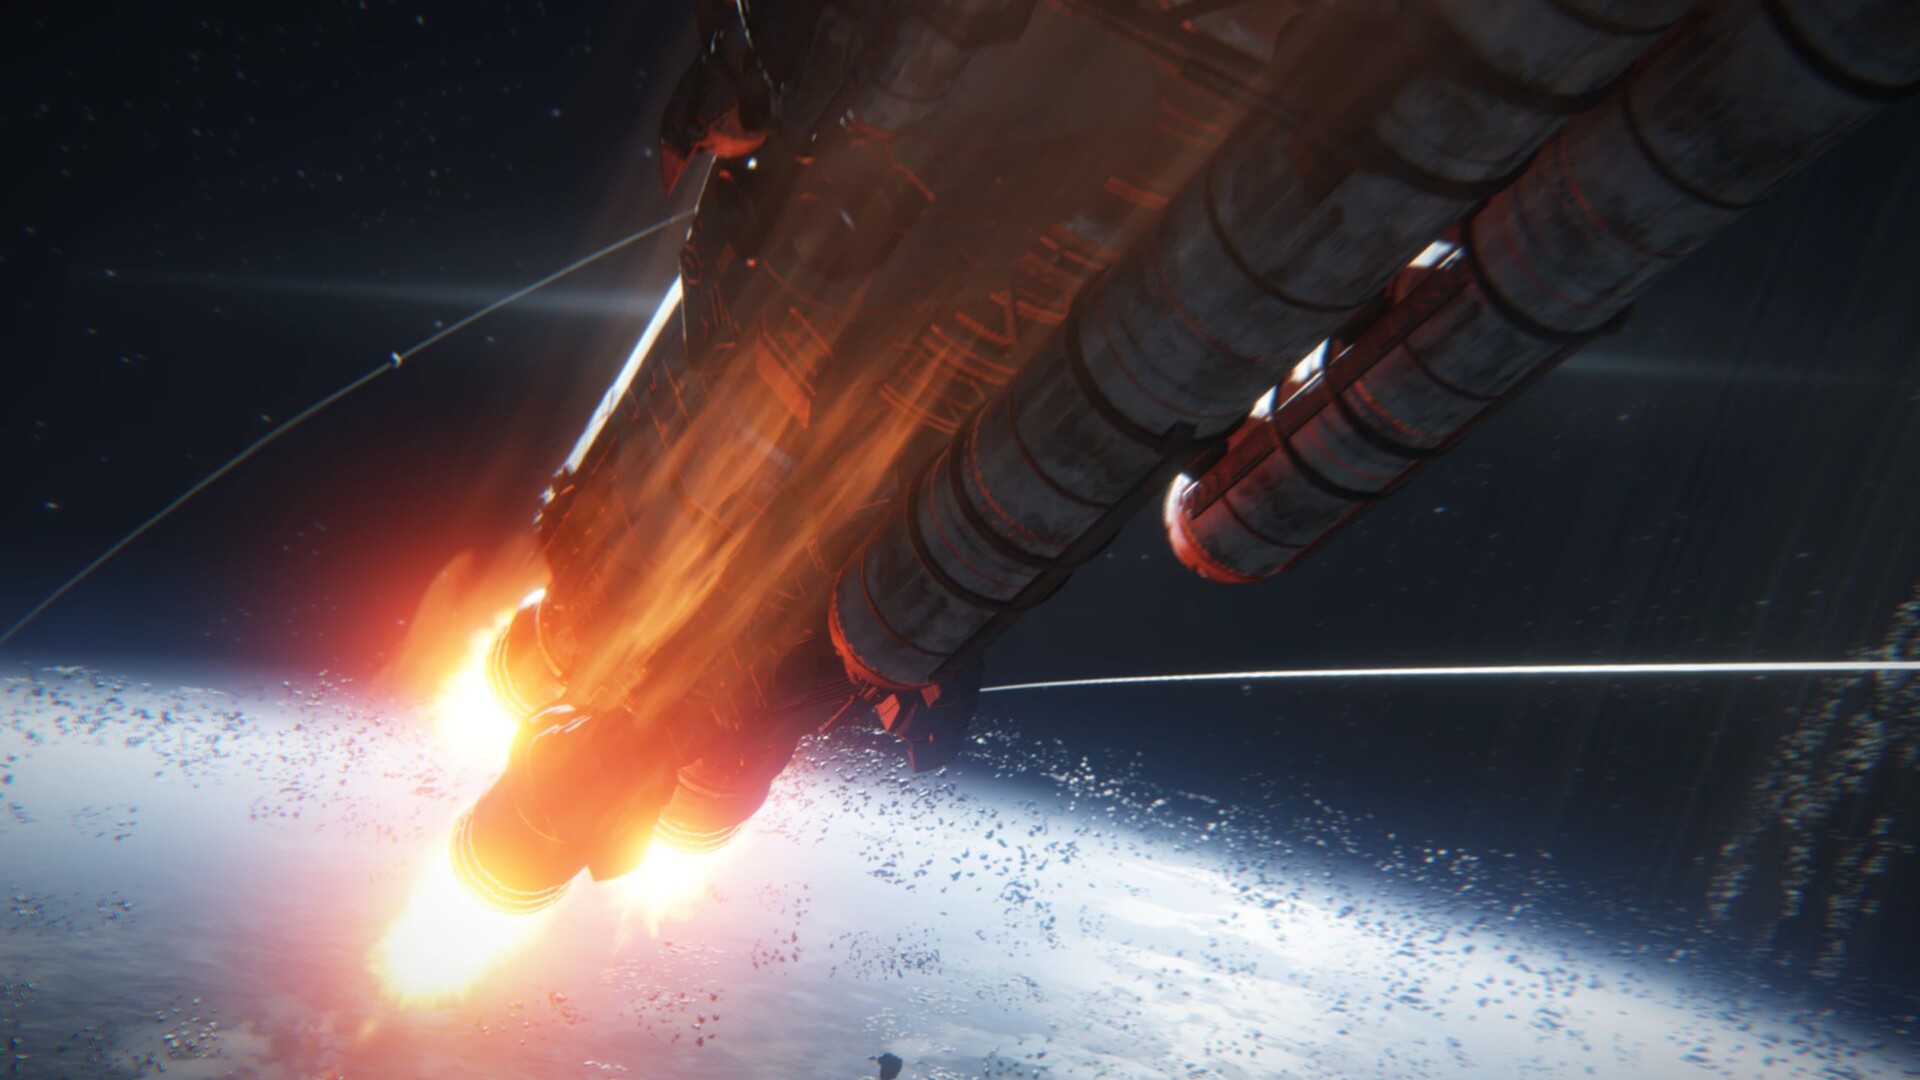
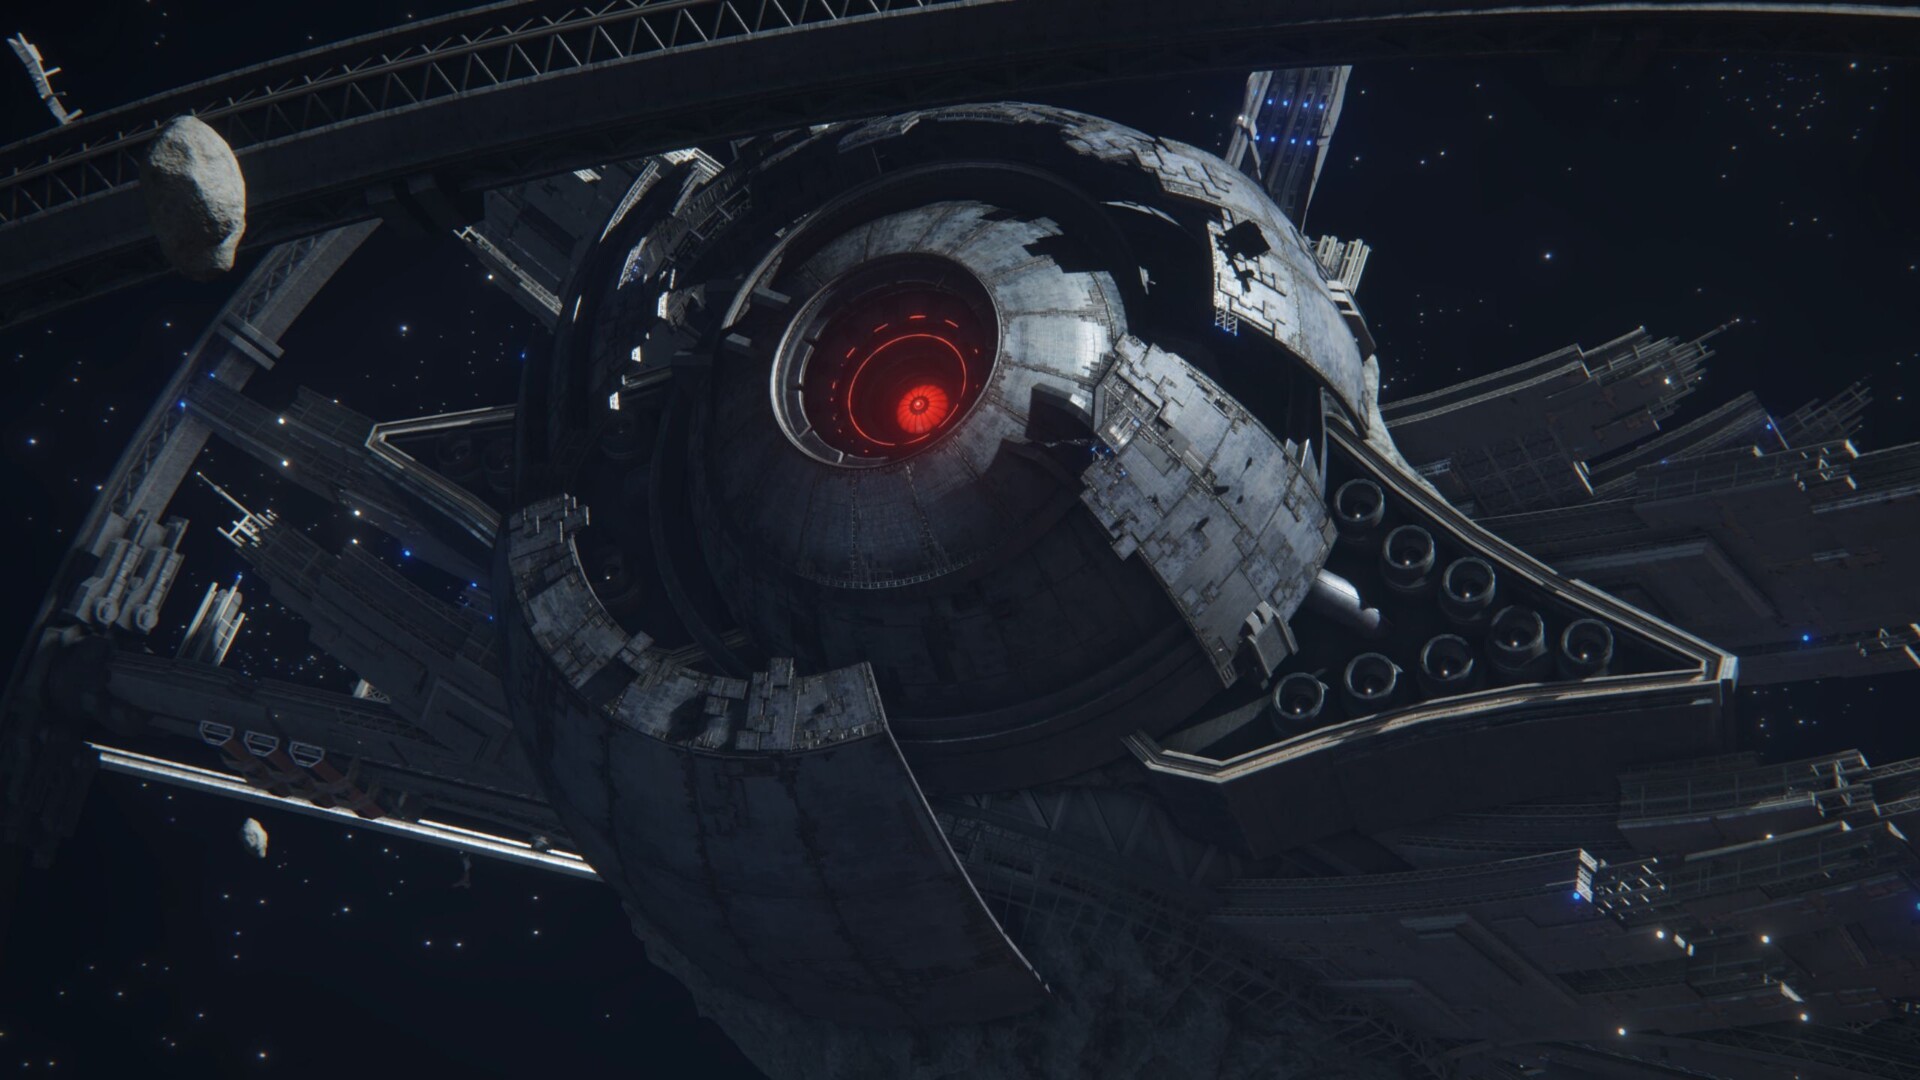
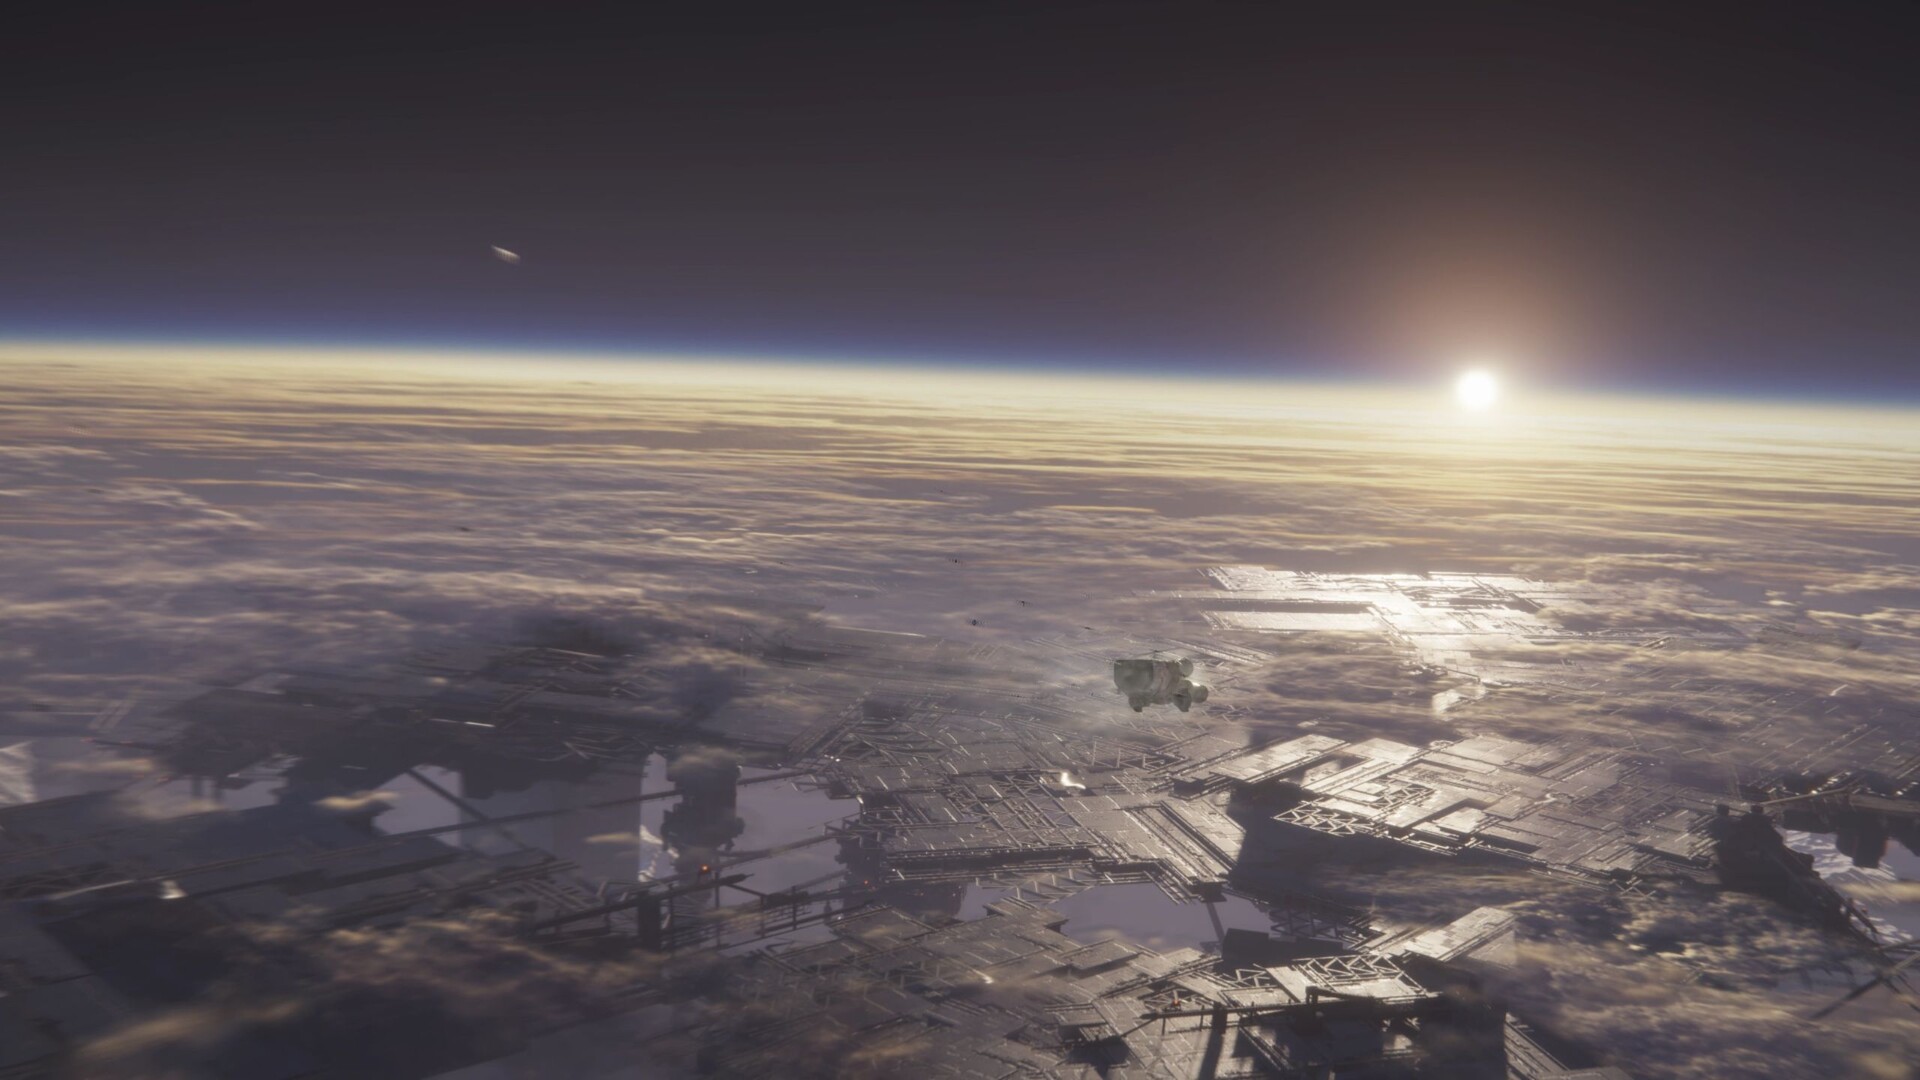
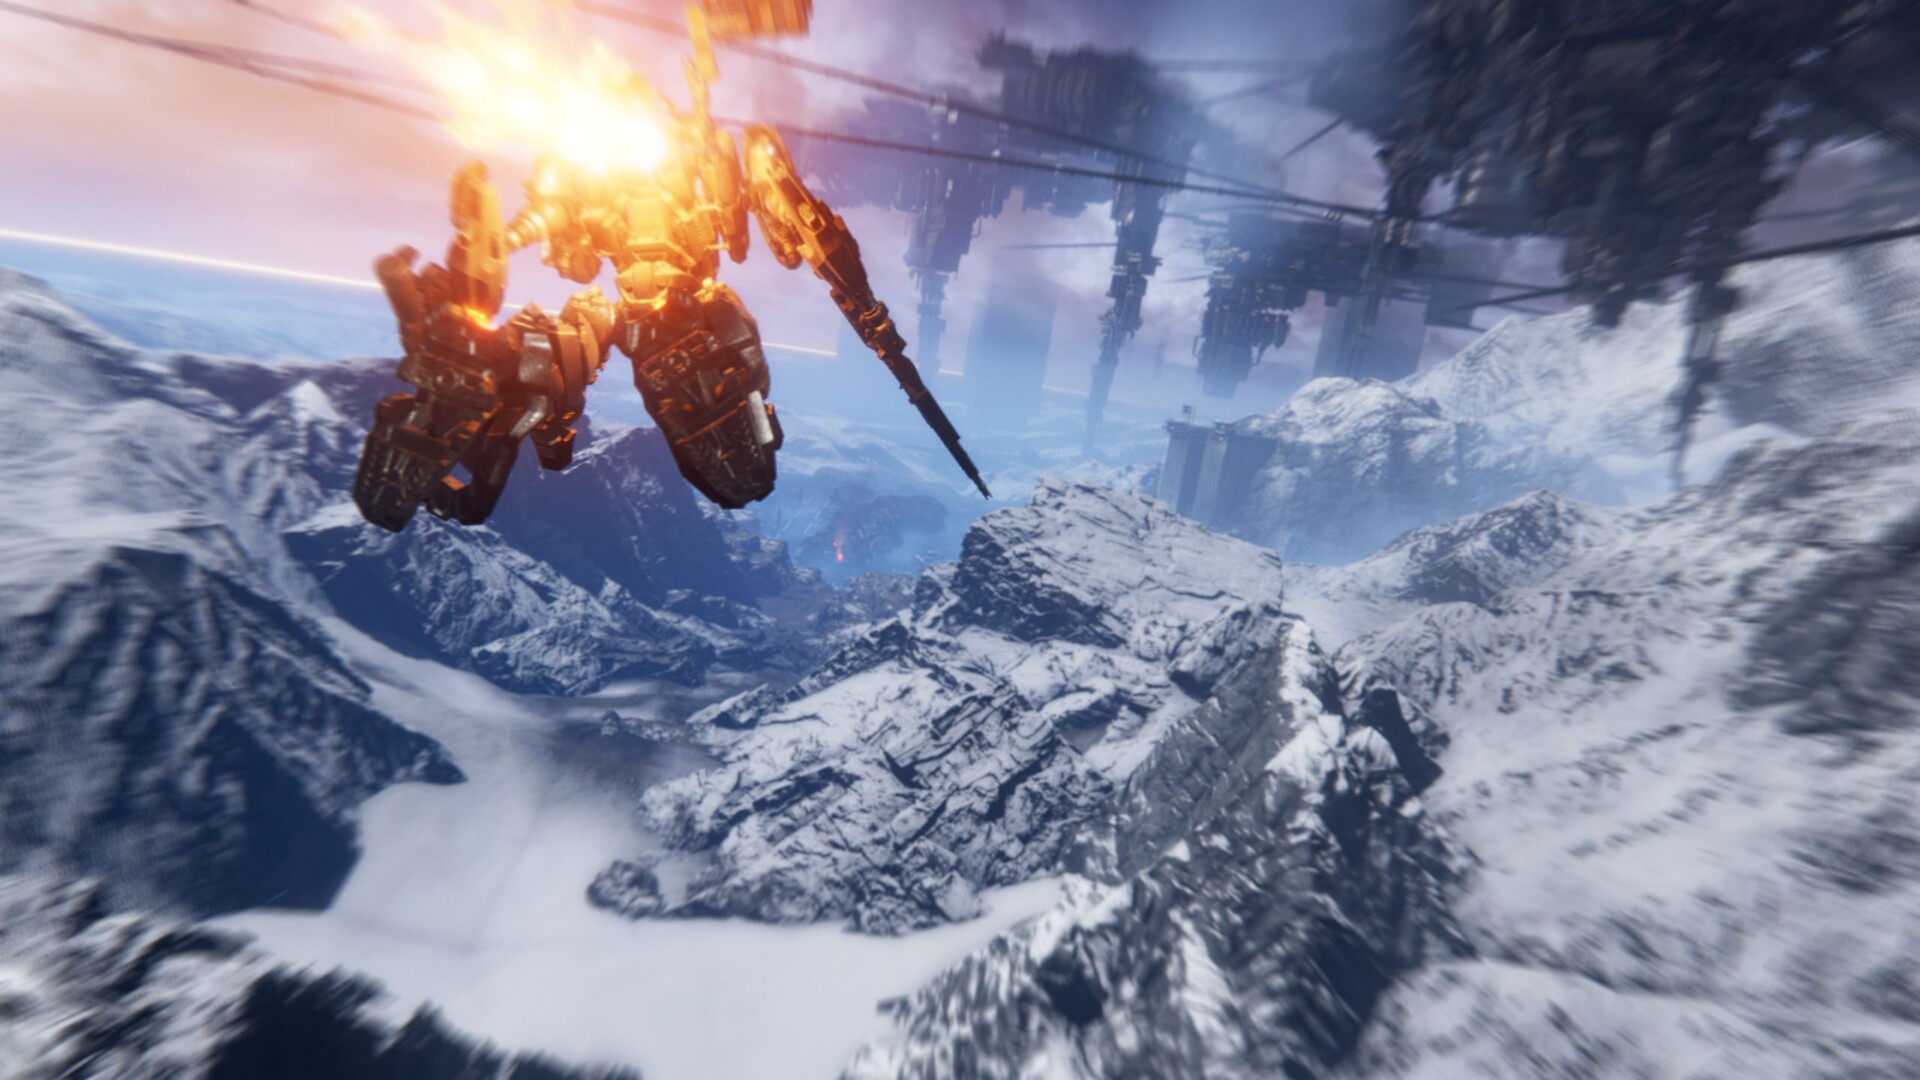
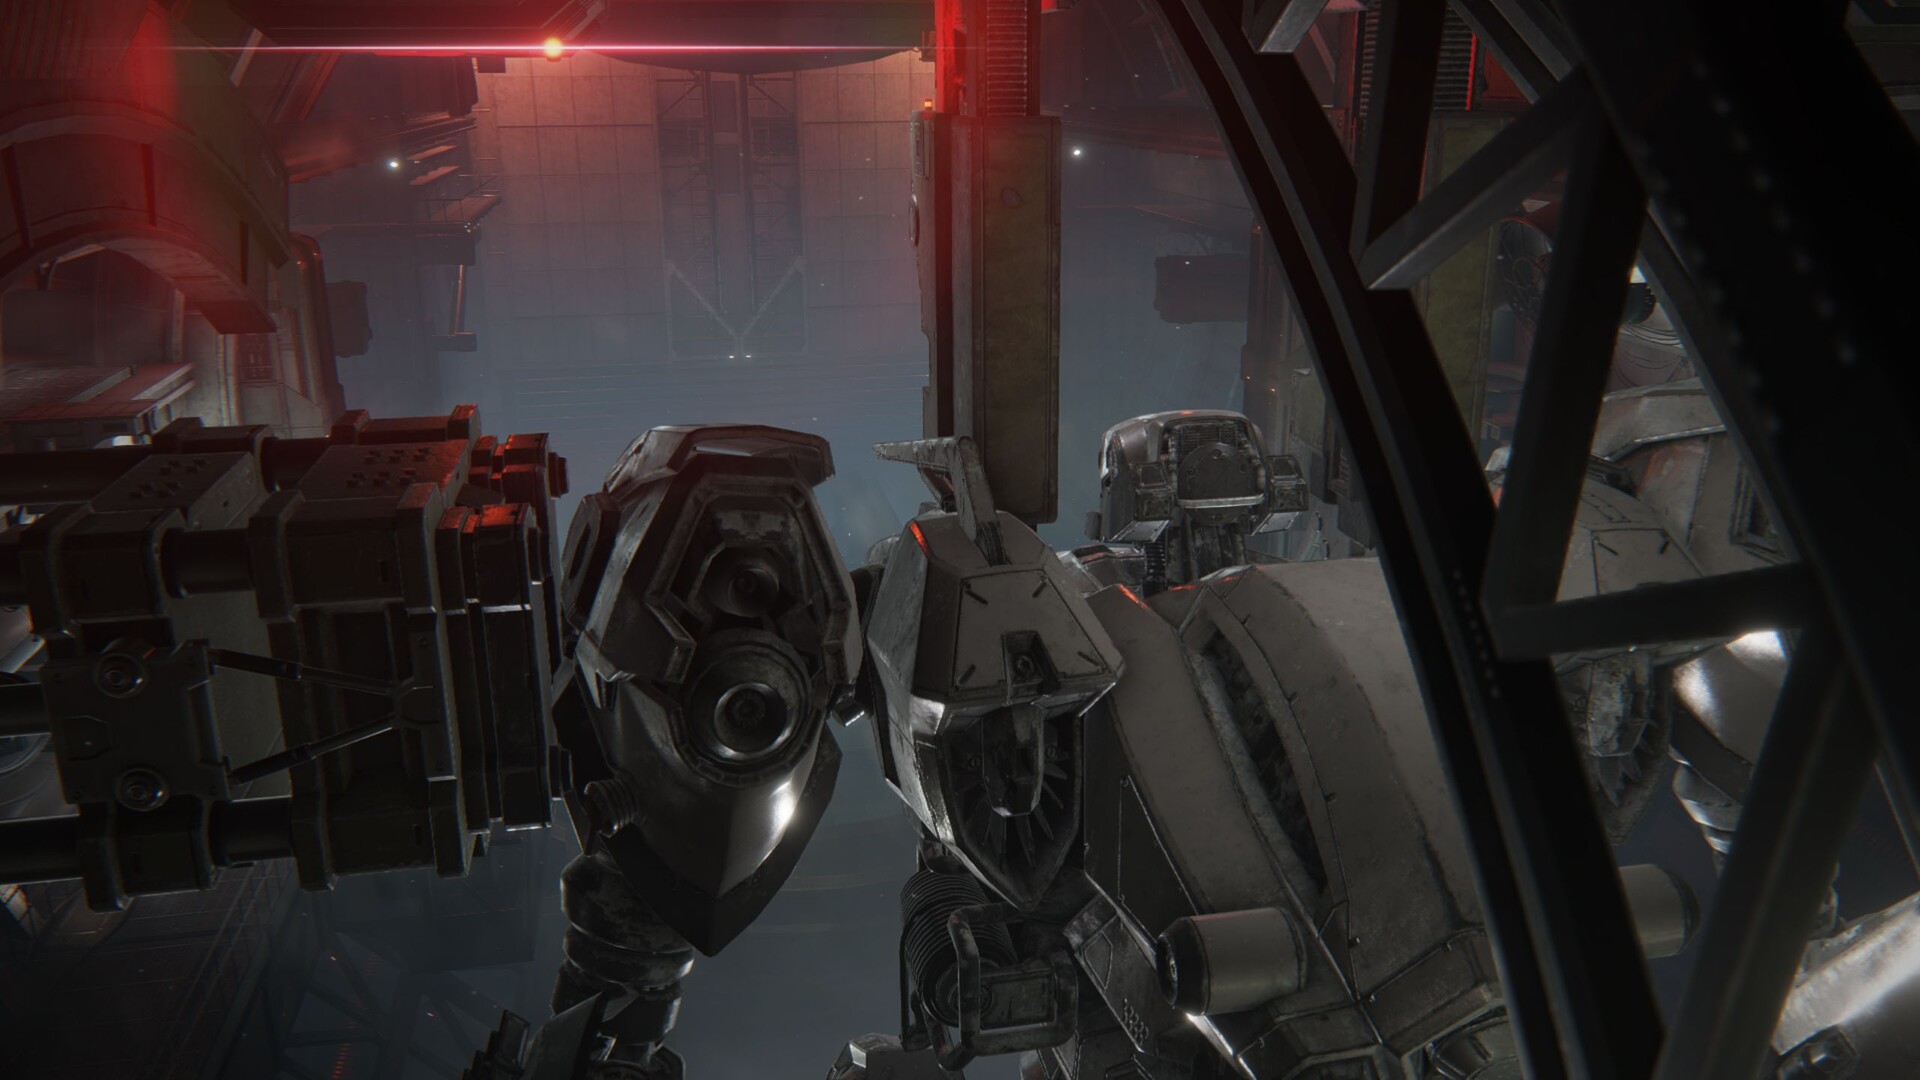
Unfortunately, there are few things to criticise in the technical department. As we hinted at earlier, the game's visuals are very mediocre for a title released in 2023. Other than textures, the level of detail, environmental variety and effects leave something to be desired every now and then. In general, Armored Core 6 looks quite blurry and not very sharp even at higher resolutions. Mechs are also somewhat oddly animated and appear quite stiff in motion, particularly when hovering.

Armored Core 6
Armored Core 6
Armored Core 6
Armored Core 6
Armored Core 6
Armored Core 6

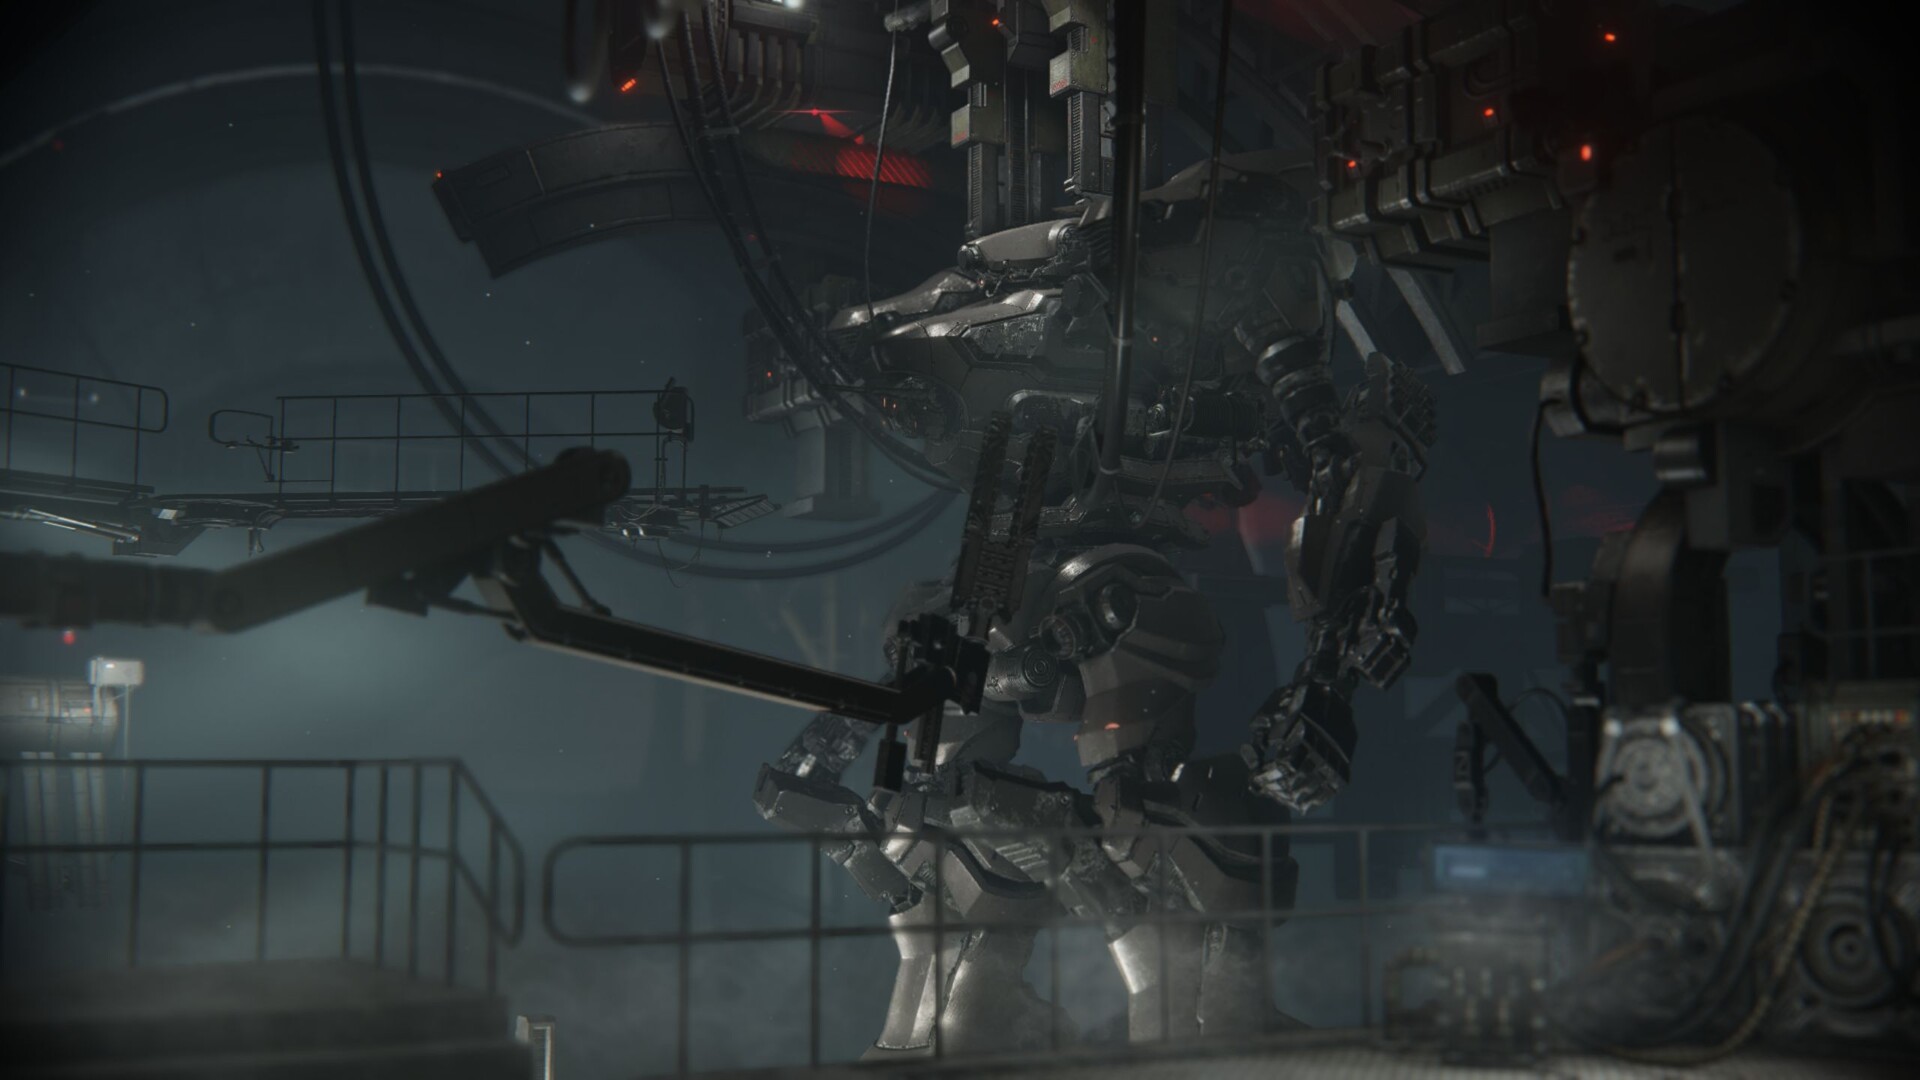
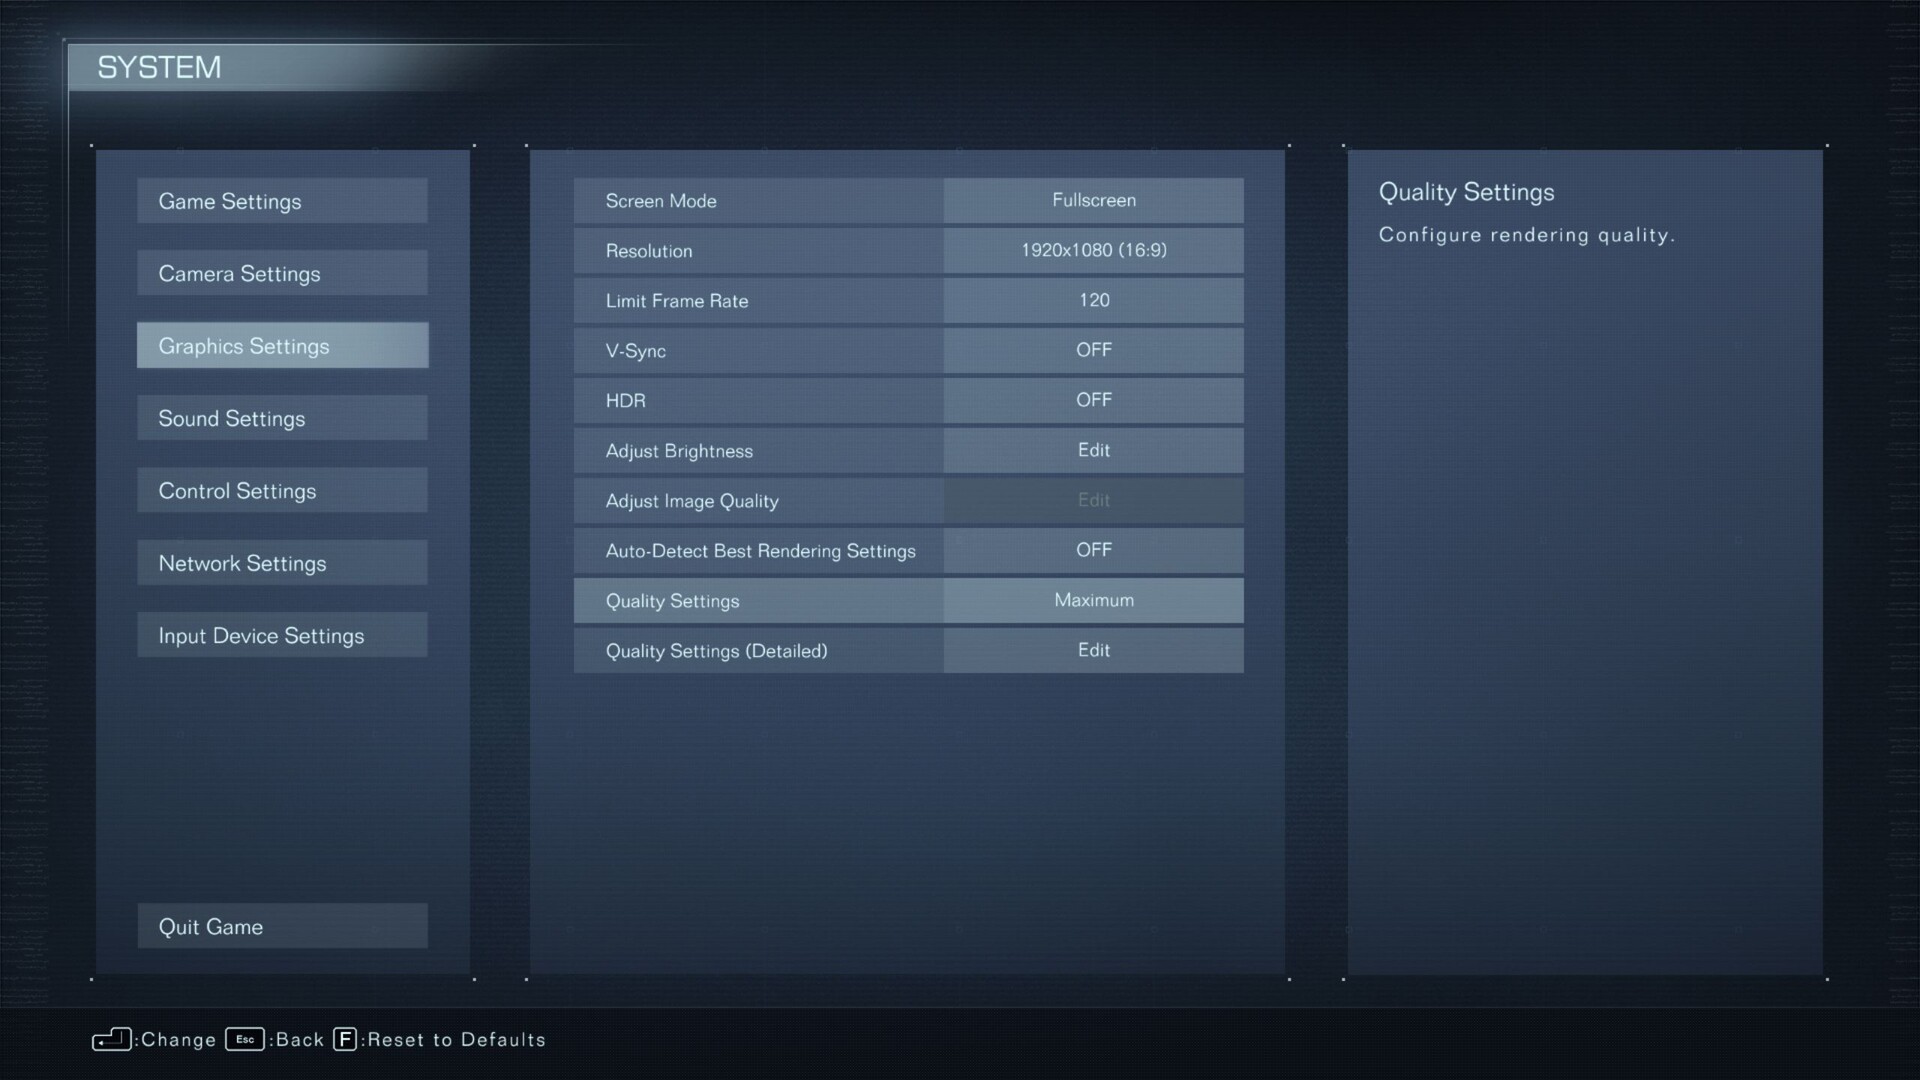
Armored Core 6’s graphics menu is very similar to the one in Elden Ring. The main tab lets you adjust things such as screen mode, resolution and frame rate limit (maximum 120 FPS) and turn V-Sync and HDR on or off. The Quality Setting option offers four handy presets that change almost everything found in the detailed settings window. Ray tracing quality, which only applies to the mech garage, is the only thing unaffected by the quality presets.

Armored Core 6
Armored Core 6

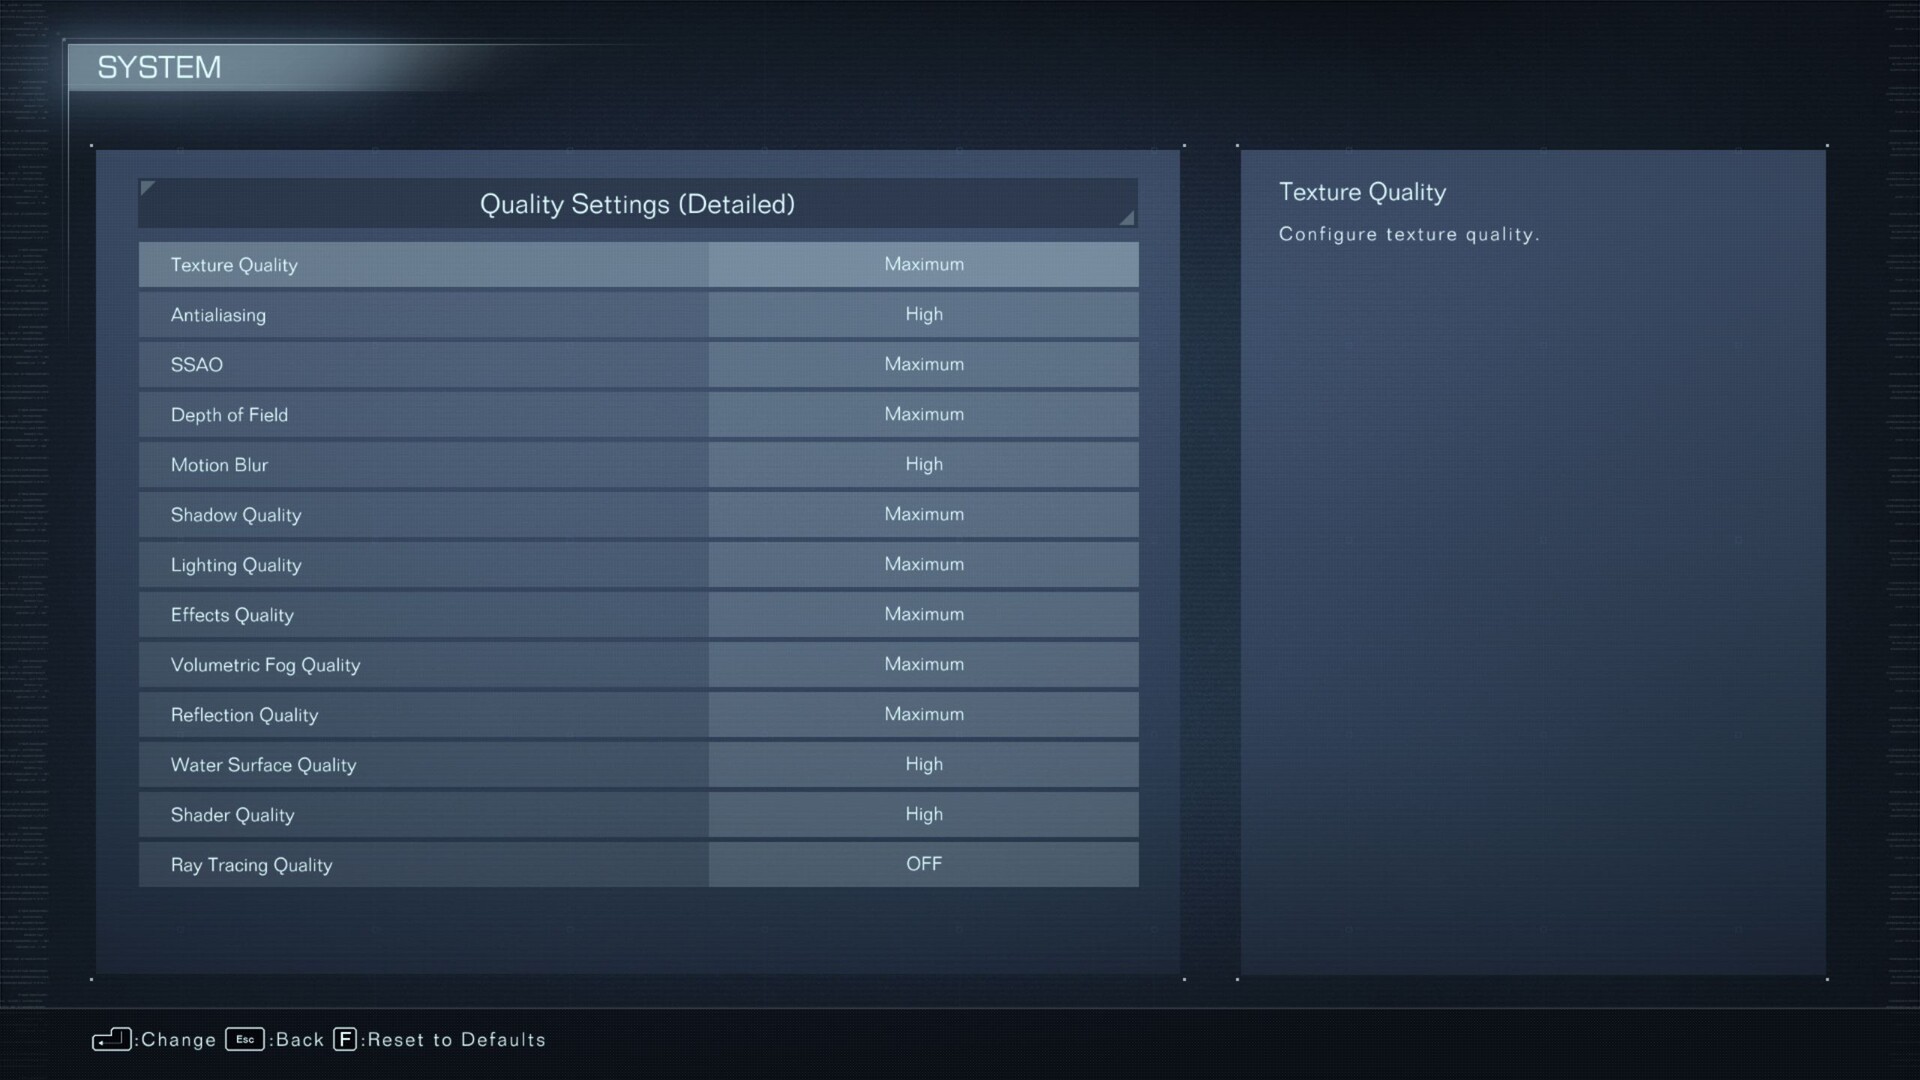
You won’t find any comparison images for the individual settings, but at least the game provides short notes explaining what they do. By contrast, it's fantastic that you don’t need to restart the game after changing any of the settings. The game takes a while to launch because it needs to initialise the anti-cheat, but load times are fine otherwise. At roughly 60 GB, the file size is neither large nor small for a modern game. 

Benchmark

For our benchmark sequence, we used the beginning of the “Destroy Artillery Installations” mission from Chapter 1, which is accessible after the first boss fight. As you can see in the video below, we flew the mech along a set path for around 30 seconds. Frame rates were recorded using CapFrameX. We deem the game decently playable from 40 FPS onwards, but you'll need at least 60 FPS for a truly smooth experience.

Results


FHD (1,920 x 1,080)

One major advantage of the game's modest graphics is the moderate GPU requirements. Though an iGPU like the Radeon 680M can probably only cut it at 720p and minimum settings, a dedicated mid-range GPU like the RX 6800S or similar should have no problem handling the game at 1080p and Ultra settings.

Armored Core 6
    1920x1080 Low Preset     1920x1080 Medium Preset     1920x1080 High Preset     1920x1080 Maximum Preset
NVIDIA GeForce RTX 4080, i9-13900K
Desktop-PC Asus ROG Strix Z790-F
120 (79.5min, 93.4P0.1, 100P1) fps ∼100%
120 (85.7min, 95.5P0.1, 99.3P1) fps ∼100%
120 (84.7min, 95.3P0.1, 98P1) fps ∼100%
AMD Radeon RX 7900 XT, i9-13900K
Desktop-PC Asus ROG Strix Z790-F
118.8 (78.8min, 90.4P0.1, 96.2P1) fps ∼99%
118.9 (69.9min, 86.5P0.1, 97.7P1) fps ∼99%
118.7 (74.5min, 83.4P0.1, 97.6P1) fps ∼99%
NVIDIA GeForce RTX 4090 Laptop GPU, i9-13900HX
XMG Neo 17 E23
116.3 (77.5min, 78.9P0.1, 90.5P1) fps ∼97%
116.1 (71.7min, 74.3P0.1, 91.8P1) fps ∼97%
115.4 (50.9min, 69.6P0.1, 91.4P1) fps ∼96%
NVIDIA GeForce RTX 4080 Laptop GPU, i9-13900HX
Schenker Key 17 Pro E23
111.7 (8.35min, 41.1P0.1, 85.1P1) fps ∼93%
112.1 (7.53min, 78.4P0.1, 87.5P1) fps ∼93%
111.2 (62.5min, 71.1P0.1, 85.7P1) fps ∼93%
NVIDIA GeForce RTX 3080 Ti Laptop GPU, i9-12900H
Asus ROG Strix Scar 17 G733ZX
115.9 (50.4min, 76.9P0.1, 92.5P1) fps ∼97%
114.5 (10.6min, 23.1P0.1, 89.5P1) fps ∼95%
109.6 (20.3min, 46.5P0.1, 81.3P1) fps ∼91%
NVIDIA GeForce RTX 4070 Laptop GPU, i9-13900HX
XMG Pro 15 E23
109.7 (64.9min, 73.1P0.1, 80.8P1) fps ∼91%
109.2 (66.5min, 75.6P0.1, 83P1) fps ∼91%
106.4 (37.5min, 50P0.1, 79.5P1) fps ∼89%
NVIDIA GeForce RTX 4060 Laptop GPU, i9-13900HX
XMG Pro 15 E23
101.7 (55.5min, 59.2P0.1, 73.6P1) fps ∼85%
99.9 (15.1min, 44.2P0.1, 71.1P1) fps ∼83%
98 (47.1min, 55.1P0.1, 74.1P1) fps ∼82%
NVIDIA GeForce RTX 4050 Laptop GPU, i9-13900HX
XMG Focus 15 E23
105.2 (40.4min, 61.6P0.1, 76.6P1) fps ∼88%
99.8 (38.6min, 53.6P0.1, 72P1) fps ∼83%
87.8 (59.5min, 64.9P0.1, 69.8P1) fps ∼73%
NVIDIA GeForce RTX 3070 Ti Laptop GPU, i7-12700H
Acer Predator Helios 300 PH315-55
96.3 (53.2min, 58.4P0.1, 67.1P1) fps ∼80%
89.5 (14.9min, 38.4P0.1, 59P1) fps ∼75%
84.6 (13.4min, 21.2P0.1, 49.5P1) fps ∼71%
AMD Radeon RX 6800S, R9 6900HS
Asus ROG Zephyrus G14
95.4 (41.8min, 58.5P0.1, 69.6P1) fps ∼100%
90.4 (40.7min, 56.1P0.1, 66.3P1) fps ∼75%
84.7 (36.8min, 51P0.1, 62.5P1) fps ∼71%
71.8 (31.6min, 36.6P0.1, 56.3P1) fps ∼60%
AMD Radeon 680M, R9 6900HS
Asus ROG Zephyrus G14
32.3 (5.15min, 5.29P0.1, 21.6P1) fps ∼34%
31.4 (5.99min, 9.32P0.1, 21.8P1) fps ∼26%
30 (6.61min, 6.88P0.1, 19.7P1) fps ∼25%
25.3 (6.68min, 9.1P0.1, 20.1P1) fps ∼21%

QHD (2,560 x 1,440)

The game’s system requirements are also manageable at QHD. A GeForce RTX 4050 is already capable enough to deliver around 60 FPS at 1440p and max settings.

Armored Core 6
    2560x1440 Maximum Preset
NVIDIA GeForce RTX 4080, i9-13900K
Desktop-PC Asus ROG Strix Z790-F
119.9 (72.9min, 93.6P0.1, 98.2P1) fps ∼100%
AMD Radeon RX 7900 XT, i9-13900K
Desktop-PC Asus ROG Strix Z790-F
118.3 (62.7min, 81.1P0.1, 95.5P1) fps ∼99%
NVIDIA GeForce RTX 4090 Laptop GPU, i9-13900HX
XMG Neo 17 E23
114.7 (33min, 52.7P0.1, 86.1P1) fps ∼96%
NVIDIA GeForce RTX 4080 Laptop GPU, i9-13900HX
Schenker Key 17 Pro E23
107.1 (20.6min, 45.4P0.1, 77.1P1) fps ∼89%
NVIDIA GeForce RTX 3080 Ti Laptop GPU, i9-12900H
Asus ROG Strix Scar 17 G733ZX
88.6 (15.1min, 36.2P0.1, 63.9P1) fps ∼74%
NVIDIA GeForce RTX 4070 Laptop GPU, i9-13900HX
XMG Pro 15 E23
85 (31.7min, 61.6P0.1, 68.2P1) fps ∼71%
NVIDIA GeForce RTX 3070 Ti Laptop GPU, i7-12700H
Acer Predator Helios 300 PH315-55
74.5 (20.6min, 31.2P0.1, 47.4P1) fps ∼62%
NVIDIA GeForce RTX 4060 Laptop GPU, i9-13900HX
XMG Pro 15 E23
74.2 (39.7min, 48.1P0.1, 55.9P1) fps ∼62%
NVIDIA GeForce RTX 4050 Laptop GPU, i9-13900HX
XMG Focus 15 E23
61.8 (17.6min, 40.9P0.1, 50P1) fps ∼52%

UHD (3,840 x 2,160)

Armored Core 6 becomes a little demanding only at 4K. We recommend having at least a GeForce RTX 4060 or RTX 4070 if you want to play the game at 4K and max preset.

Armored Core 6
    3840x2160 Maximum Preset
NVIDIA GeForce RTX 4080, i9-13900K
Desktop-PC Asus ROG Strix Z790-F
106.8 (63.5min, 80.1P0.1, 86.1P1) fps ∼100%
NVIDIA GeForce RTX 4090 Laptop GPU, i9-13900HX
XMG Neo 17 E23
92 (14.4min, 18.1P0.1, 67.9P1) fps ∼86%
AMD Radeon RX 7900 XT, i9-13900K
Desktop-PC Asus ROG Strix Z790-F
84.7 (53.8min, 61.7P0.1, 69.6P1) fps ∼79%
NVIDIA GeForce RTX 4080 Laptop GPU, i9-13900HX
Schenker Key 17 Pro E23
70.2 (4.6min, 8.62P0.1, 49P1) fps ∼66%
NVIDIA GeForce RTX 3080 Ti Laptop GPU, i9-12900H
Asus ROG Strix Scar 17 G733ZX
55.5 (13.1min, 15.1P0.1, 42.6P1) fps ∼52%
NVIDIA GeForce RTX 3070 Ti Laptop GPU, i7-12700H
Acer Predator Helios 300 PH315-55
47.6 (25.3min, 25.8P0.1, 33.3P1) fps ∼45%
NVIDIA GeForce RTX 4070 Laptop GPU, i9-13900HX
XMG Pro 15 E23
45.2 (18.5min, 32.1P0.1, 37.8P1) fps ∼42%
NVIDIA GeForce RTX 4060 Laptop GPU, i9-13900HX
XMG Pro 15 E23
40.1 (7.15min, 7.77P0.1, 29.8P1) fps ∼38%
NVIDIA GeForce RTX 4050 Laptop GPU, i9-13900HX
XMG Focus 15 E23
29.2 (1.168min, 1.251P0.1, 25.4P1) fps ∼27%

Note

Because gaming tests are very time-consuming and are often constrained by installation or activation limits, we are only able to provide you with part of the benchmark results at the time of publishing this article. We will be adding more graphics cards over the coming days and weeks.

Overview

Show Restrictions
PosModel< PrevNext >Armored Core 6
 Armored Core 6 (2023)
low
1920x1080
Low Preset
med.
1920x1080
Medium Preset
high
1920x1080
High Preset
ultra
1920x1080
Maximum Preset
QHD
2560x1440
Maximum Preset
4K
3840x2160
Maximum Preset
NVIDIA GeForce RTX 4090
119.8n2
119.75n2
119.8n2
119.7n2
119.7n2
119.6n2
AMD Radeon RX 7900 XTX
120
119.9
119.9
119.9
119.9
103.1
NVIDIA GeForce RTX 4080 Super
119.7
119.9
119.8
119.9
114.1
110.2
NVIDIA GeForce RTX 4080
120
120
120
119.9
106.8
AMD Radeon RX 7900 XT
118.8
118.9
118.7
118.3
84.7
AMD Radeon RX 6950 XT
119.7
119.7
119.9
119.6
115
78.6
NVIDIA GeForce RTX 4090 Laptop GPU
116.3
112.7n2
109.45n2
103.35n2
92
NVIDIA GeForce RTX 3090
119.6n2
119.7n2
119.7n2
119.65n2
119.5n2
83.65n2
AMD Radeon RX 7800 XT
119.6
119.6
119.5
119.7
119.7
70.6
NVIDIA GeForce RTX 4080 Laptop GPU
111.7
112.1
111.2
107.1
70.2
NVIDIA GeForce RTX 3080 12 GB
119.9
119.9
119.7
118.7
73.9
AMD Radeon RX 6800
119.8
119.8
118.9
108.8
93.3
58.8
AMD Radeon RX 7700 XT
119.5
118.9
116.8
106.4
84.3
51.5
NVIDIA Titan RTX
119.7
119.6
119.5
119.1
100.7
60.5
NVIDIA GeForce RTX 3070 Ti
119.6
119.6
119.6
119.3
109.8
66.2
NVIDIA GeForce RTX 4060 Ti 16G
119.4
119.1
119.2
118.8
94.1
50
NVIDIA GeForce RTX 4060 Ti 8G
119.7
119.4
119.5
119.4
97.5
51.2
NVIDIA GeForce RTX 3080 Ti Laptop GPU
115.9
114.5
109.6
88.6
55.5
NVIDIA GeForce RTX 4070 Laptop GPU
106.1n4
105.55n4
101.7n4
80.6n2
45.2
PosModel< PrevNext >Armored Core 6
low med. high ultra QHD 4K
NVIDIA GeForce RTX 3070
119.9
119.8
119.8
98.2
58.3
AMD Radeon RX 6750 XT
119.7
118.6
113.4
99.6
79.2
49.6
AMD Radeon RX 6700 XT
119.8
117.5
112
95
77.1
47.6
NVIDIA GeForce RTX 3060 Ti
119.6
119.3
119.5
118
92.5
53.2
Intel Arc A770
71.6
69.3
68
67.9
66.9
46.7
AMD Radeon RX 7600
119.8
118.4
114.6
100.7
74.5
40.6
NVIDIA GeForce RTX 3070 Ti Laptop GPU
96.3
89.5
84.6
74.5
47.6
NVIDIA GeForce RTX 4060 Laptop GPU
111.1
104.5n3
103.1n3
98n3
74.2n3
40.1
AMD Radeon RX 6650 XT
119.7
114.8
108.4
91.7
68.8
38.6
NVIDIA GeForce RTX 3070 Laptop GPU
104.3
102.4
101.1
96.3
76.6
44.6
AMD Radeon RX 6800S
95.4
90.4
84.7
71.8
AMD Radeon RX 7600M XT
114.4
98.4
91.5
59.2
77.9
34.4
Intel Arc A750
75
73.9
71.5
70.4
65.7
41.6
NVIDIA Titan X Pascal
119.6
118.7
115.5
99.2
75.1
45.6
NVIDIA GeForce RTX 2070 Super (Desktop)
119.6
119.5
115.8
99.5
73.1
43.1
AMD Radeon RX 5700 XT (Desktop)
119.6
108.4
82
64.7
38.8
AMD Radeon RX 7600S
99.7
90.6
75.8
57.9
31.9
Intel Arc A580
106.7
101.5
94.8
82.8
63.8
37.9
NVIDIA GeForce RTX 2060 Super (Desktop)
119.5
115.7
107.3
88.6
65.6
37.9
AMD Radeon RX 6600
119.1
104.6
94.7
77.1
56.2
30.2
PosModel< PrevNext >Armored Core 6
low med. high ultra QHD 4K
AMD Radeon RX 5700 (Desktop)
115
97.2
87.9
74.2
56.6
33.9
AMD Radeon RX 6600M
74.9
72.6
69
68.9
52.3
31.2
AMD Radeon RX 5600 XT (Desktop)
106
84.4
76.6
65.2
51
27.8
NVIDIA GeForce GTX 1660 Super (Desktop)
115.3
97.2
85.5
68.5
49.5
20.4
AMD Radeon RX 6500 XT
89.6
69.3
58.7
35.3
20
10.7
AMD Radeon RX 5500 XT (Desktop)
87.6
69.3
62.1
50.8
37.5
21.9
NVIDIA GeForce RTX 4050 Laptop GPU
102.8
103.8n3
98.9n3
87.1n3
61.6n2
29.2
Intel Arc A730M
70.9
64.3
63.9
58.5
25.2
NVIDIA GeForce GTX 1660 Ti Mobile
69.3
67.5
64.2
60.4
NVIDIA GeForce GTX 1660 (Desktop)
103
80.9
74.1
54.8
60.5
18.9
NVIDIA GeForce GTX 1650 Super (Desktop)
94.2
75.8
68.3
28.7
22.8
12.3
NVIDIA GeForce RTX 3050 4GB Laptop GPU
80.1
63
53.7
41.8
NVIDIA GeForce GTX 1650 Ti Mobile
68.2
58.6
51.4
41
AMD Radeon RX 5500M
47.9
47
45.3
37.4
NVIDIA GeForce RTX 2050 Mobile
42.6
35.9
32
29.6
NVIDIA GeForce GTX 1650 Mobile
64.5
54.4
41.7
21.3
Intel Arc A380
69.9
55.1
47.4
37.2
Intel Arc A310
56.3
43.8
39
26.9
Intel Arc 8-Cores iGPU
50
40.1
36.2
32.2
Intel Arc 7-Cores iGPU
39.7
32.6
28.5
23.5
PosModel< PrevNext >Armored Core 6
low med. high ultra QHD 4K
AMD Radeon 780M
50.3
41.2
36.7
30.3
AMD Radeon 680M
32.3
31.4
30
25.3
NVIDIA GeForce MX350
18.9
14.9
9.89
NVIDIA GeForce MX250
13.7
10.2
Intel Iris Xe Graphics G7 80EUs
27.8
23
20.2
15.5
11.2
Intel Iris Plus Graphics G7 (Ice Lake 64 EU)
14.6
11.9
AMD Radeon RX Vega 10
19.1
15.1
13.6
10.7
Intel UHD Graphics Xe 32EUs (Tiger Lake-H)
22.8
17.5
14.7
AMD Radeon RX Vega 8 (Ryzen 4000/5000)
22.8
16.8
15.2
11.2
AMD Radeon RX Vega 6 (Ryzen 4000/5000)
20.8
15.8
13.9
10.7
Intel UHD Graphics G1 (Ice Lake 32 EU)
6.87
Intel UHD Graphics 630
9.76
Intel UHD Graphics Xe 16EUs (Tiger Lake-H)
10.1
Intel UHD Graphics 620
8.19
AMD Radeon R5 M255
4.46
AMD Radeon RX Vega 3
11.4
(-) * Smaller values are better. / n123 Number of benchmarks for this median value / * Approximate position


Legend
5Stutters – This game is very likely to stutter and have poor frame rates. Based on all known benchmarks using the specified graphical settings, average frame rates are expected to fall below 25fps
May Stutter – This graphics card has not been explicitly tested on this game. Based on interpolated information from surrounding graphics cards of similar performance levels, stutters and poor frame rates are expected.
30Fluent – Based on all known benchmarks using the specified graphical settings, this game should run at or above 25fps
40Fluent – Based on all known benchmarks using the specified graphical settings, this game should run at or above 35fps
60Fluent – Based on all known benchmarks using the specified graphical settings, this game should run at or above 58fps
May Run Fluently – This graphics card has not been explicitly tested on this game. Based on interpolated information from surrounding graphics cards of similar performance levels, fluent frame rates are expected.
?Uncertain – This graphics card experienced unexpected performance issues during testing for this game. A slower card may be able to achieve better and more consistent frame rates than this particular GPU running the same benchmark scene.
Uncertain – This graphics card has not been explicitly tested on this game and no reliable interpolation can be made based on the performances of surrounding cards of the same class or family.
The value in the fields displays the average frame rate of all values in the database. Move your cursor over the value to see individual results.

All test systems

Notebook Graphics card Processor Memory
XMG Neo 17 E23 Nvidia GeForce RTX 4090 @175 W TGP (16 GB GDDR6X) Intel Core i9-13900HX 2 x 16 GB DDR5
Schenker Key 17 Pro E23 Nvidia GeForce RTX 4080 @175 W TGP (12 GB GDDR6X) Intel Core i9-13900HX 2 x 16 GB DDR5
XMG Pro 15 E23 Nvidia GeForce RTX 4070 @140 W TGP (8 GB GDDR6) Intel Core i9-13900HX 2 x 16 GB DDR5
XMG Pro 15 E23 Nvidia GeForce RTX 4060 @140 W TGP (8 GB GDDR6) Intel Core i9-13900HX 2 x 16 GB DDR5
XMG Focus 15 E23 Nvidia GeForce RTX 4050 @140 W TGP (6 GB GDDR6) Intel Core i9-13900HX 2 x 16 GB DDR5
Asus ROG Strix Scar 17 Nvidia GeForce RTX 3080 Ti @150 W TGP (16 GB GDDR6) Intel Core i9-12900H 2 x 16 GB DDR5
Acer Predator Helios 300 Nvidia GeForce RTX 3070 Ti @150 W TGP (8 GB GDDR6) Intel Core i7-12700H 2 x 8 GB DDR5
Asus ROG Zephyrus G14 AMD Radeon RX 6800S (8 GB GDDR6) & AMD Radeon 680M AMD Ryzen 9 6900HS 2 x 16 GB DDR5
Mini-PC Graphics card Processor Memory
Minisforum NUCXi7 Nvidia GeForce RTX 3070 @125 W TGP (8 GB GDDR6) Intel Core i7-11800H 2 x 8 GB DDR4
Minisforum HX99G AMD Radeon RX 6600M @100 W TGP (8 GB GDDR6) AMD Ryzen 9 6900HX 2 x 16 GB DDR5
Morefine S500+ AMD Radeon RX Vega 8 AMD Ryzen 9 5900HX 2 x 16 GB DDR4
4K monitor Operating system Nvidia driver AMD driver
Gigabyte M32U Windows 11 ForceWare 537.13 Adrenalin 28.8.1
static version load dynamic
Loading Comments
Comment on this article
Please share our article, every link counts!
> Expert Reviews and News on Laptops, Smartphones and Tech Innovations > Reviews > Armored Core 6 Fires of Rubicon tech review: Laptop and desktop benchmarks
Florian Glaser, 2023-09- 4 (Update: 2023-09- 4)