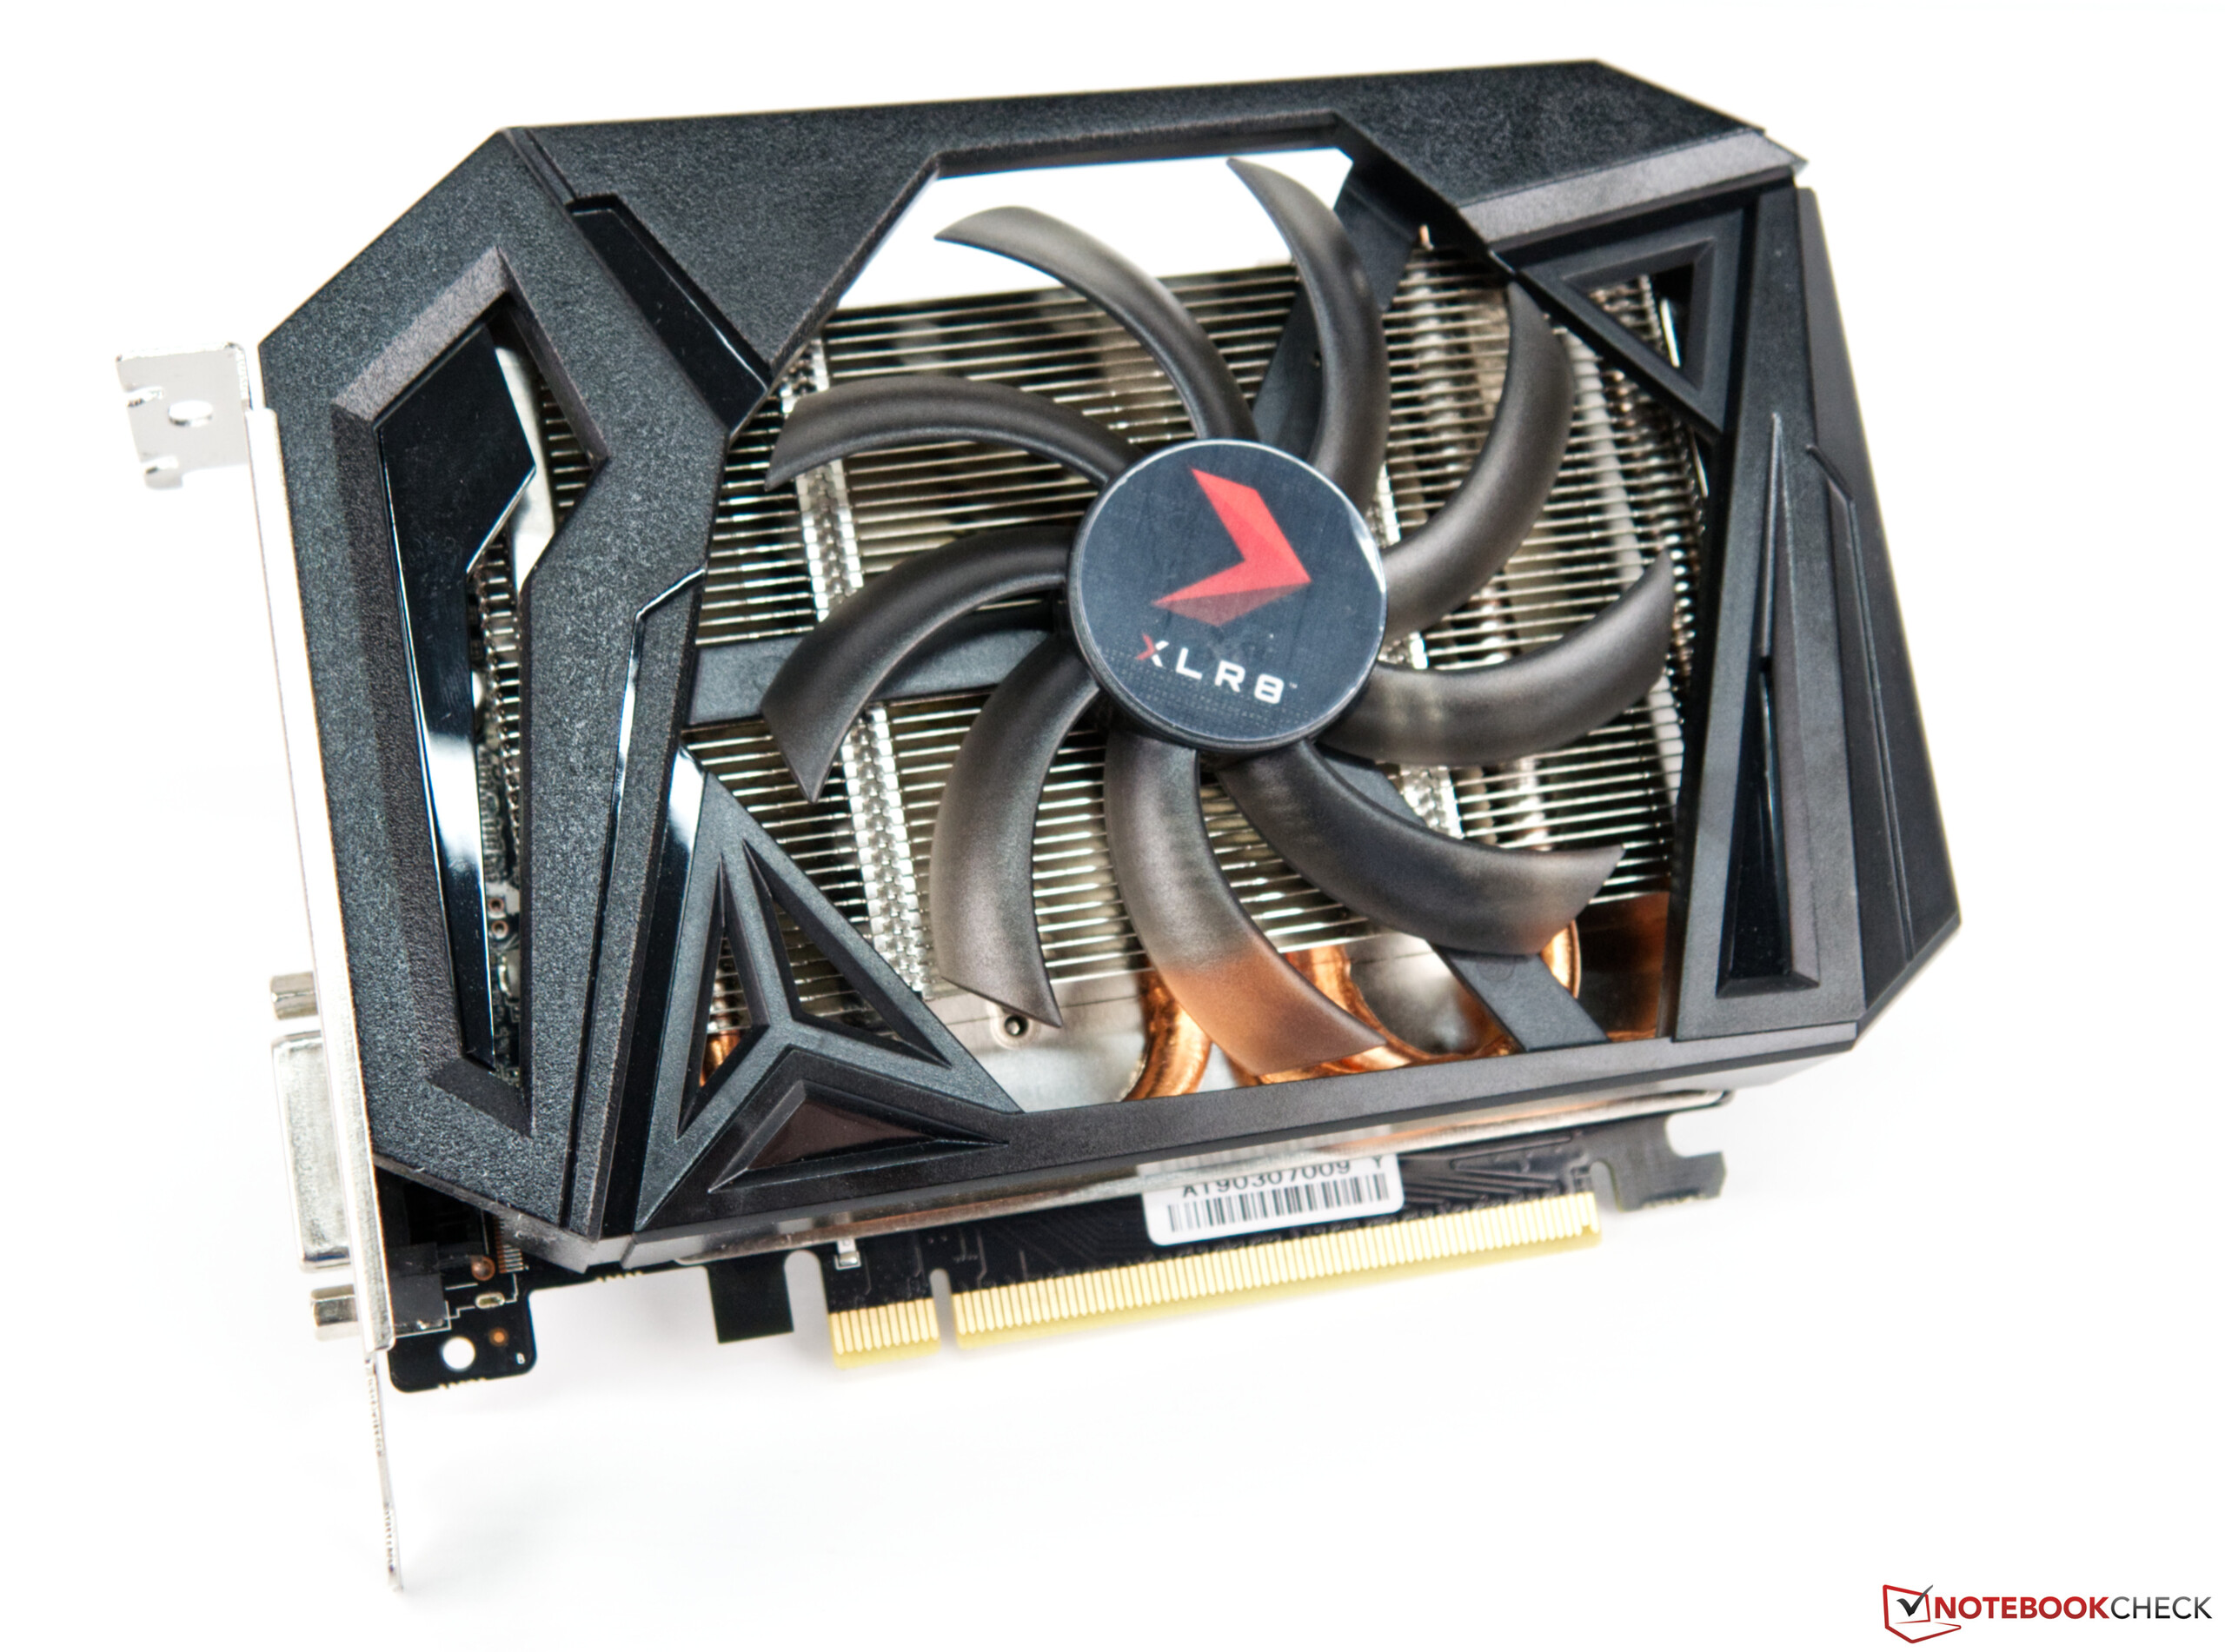
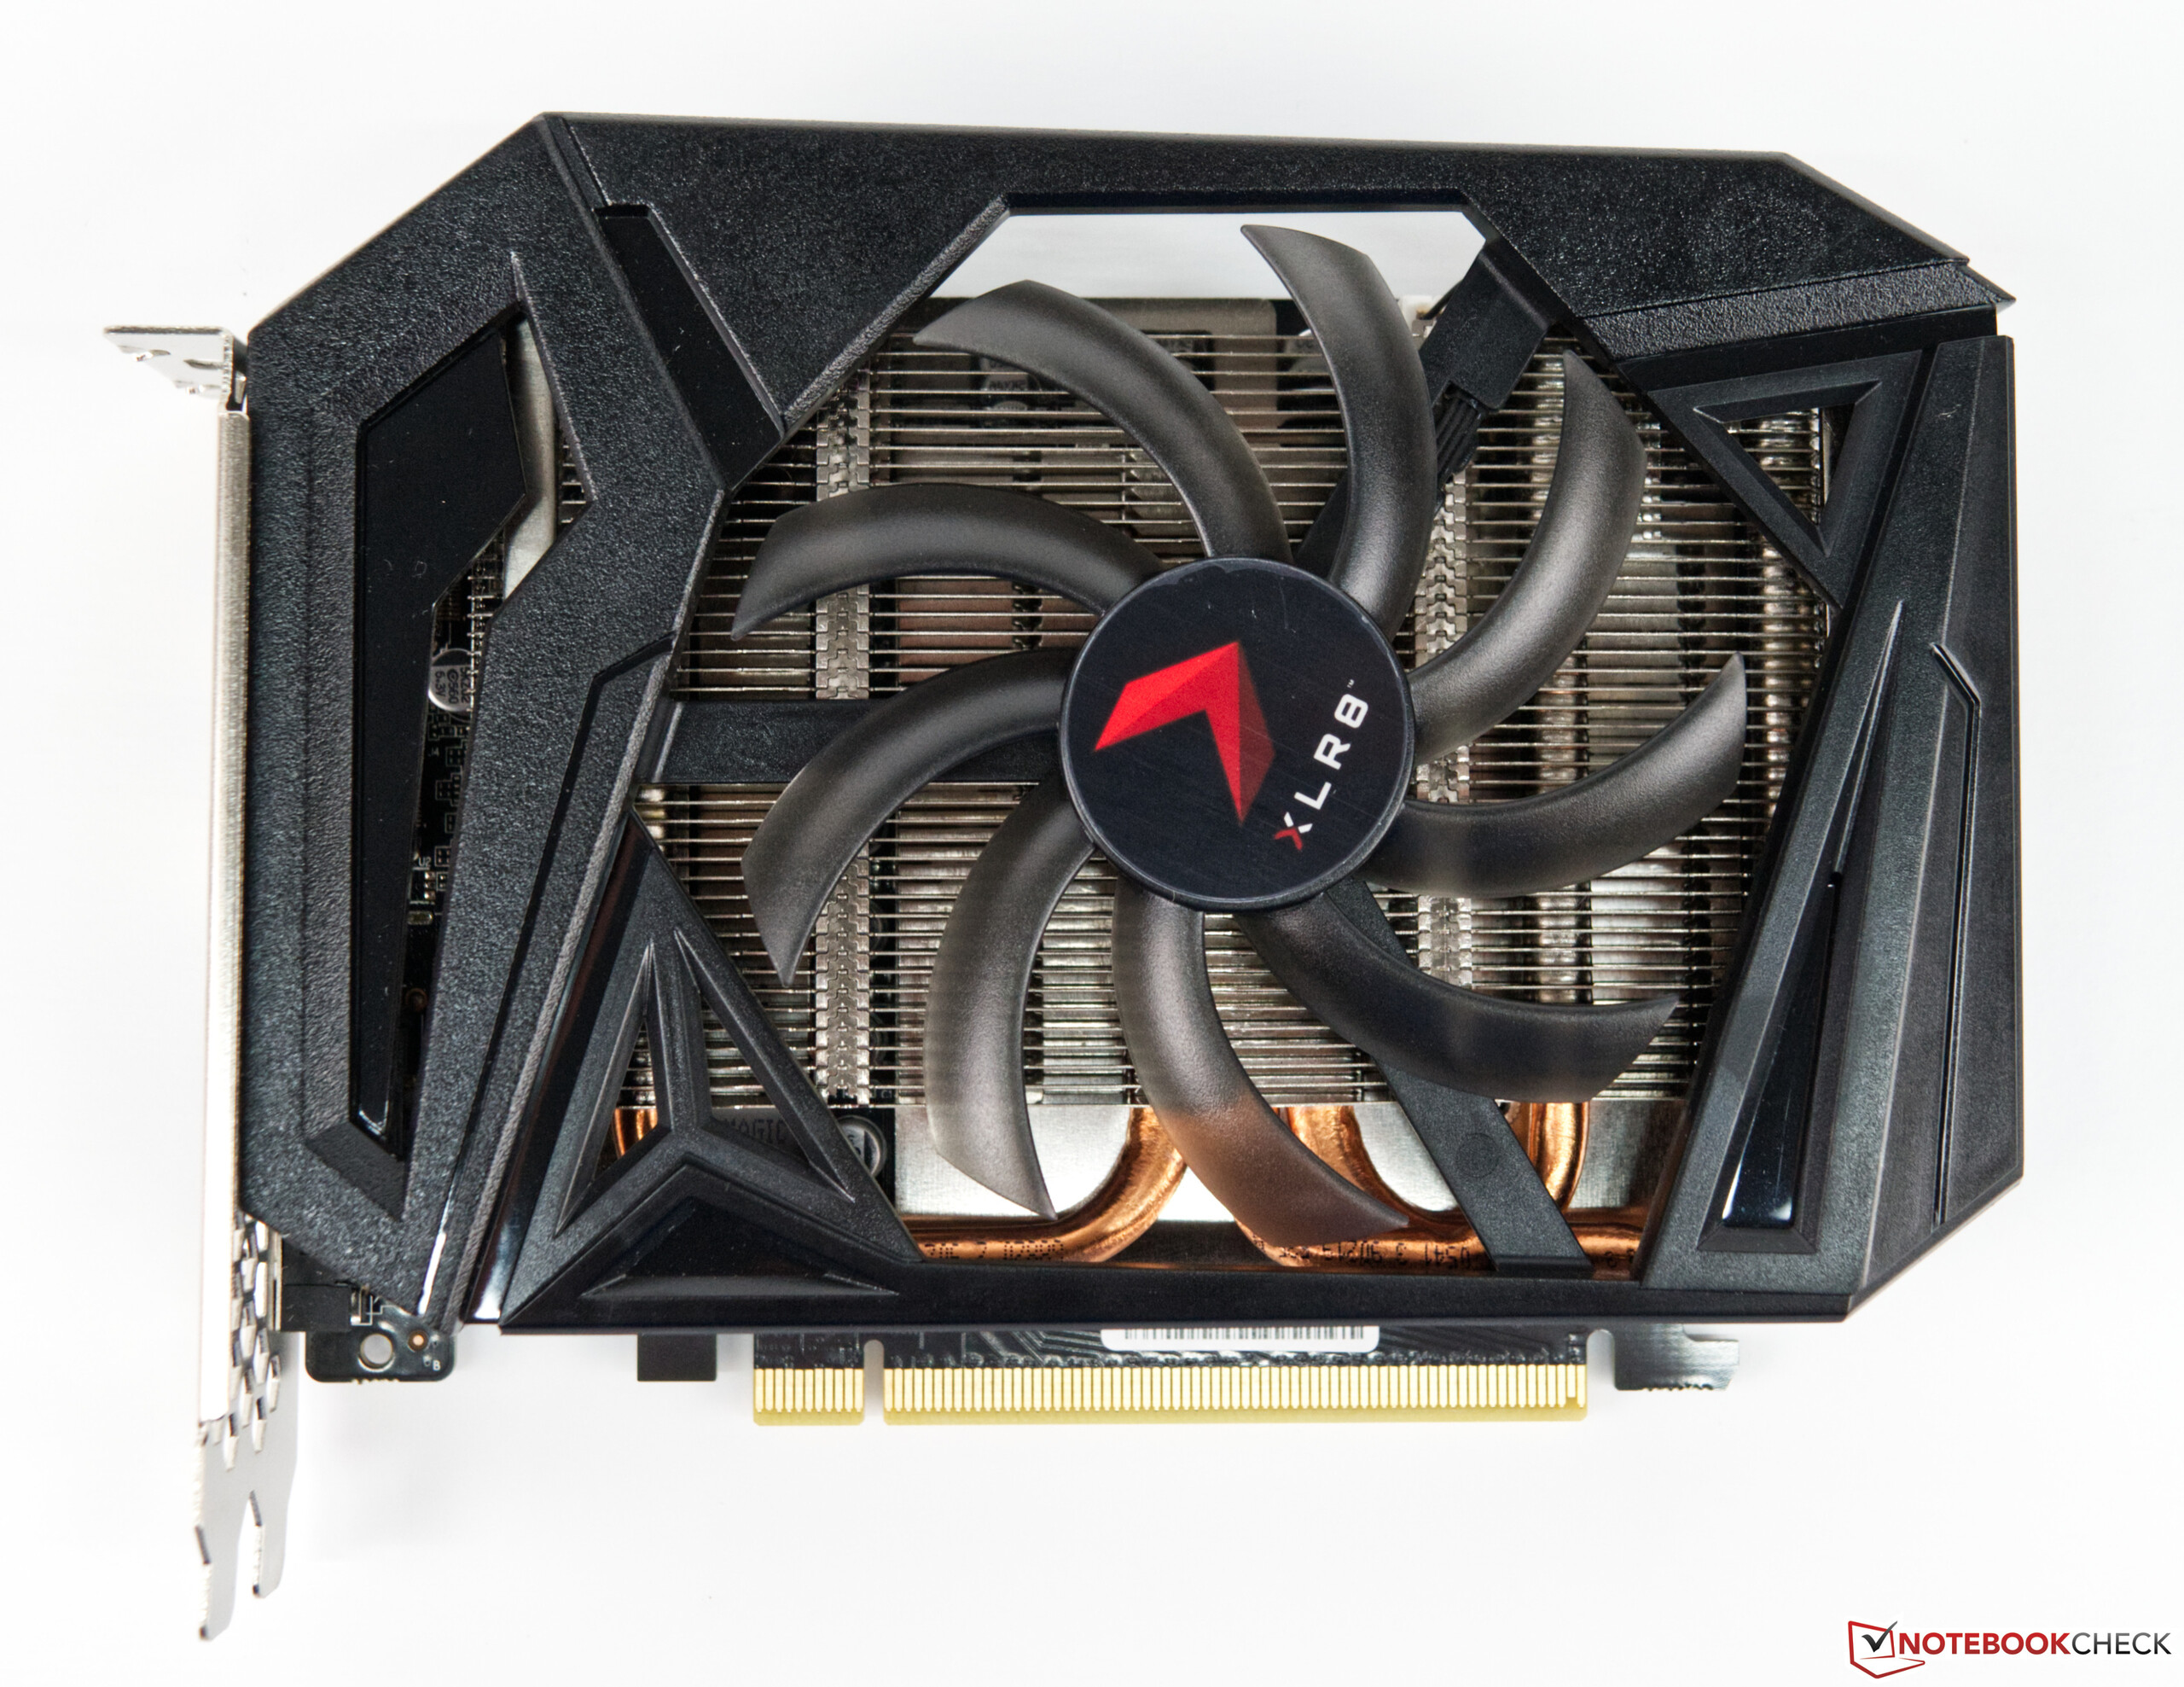
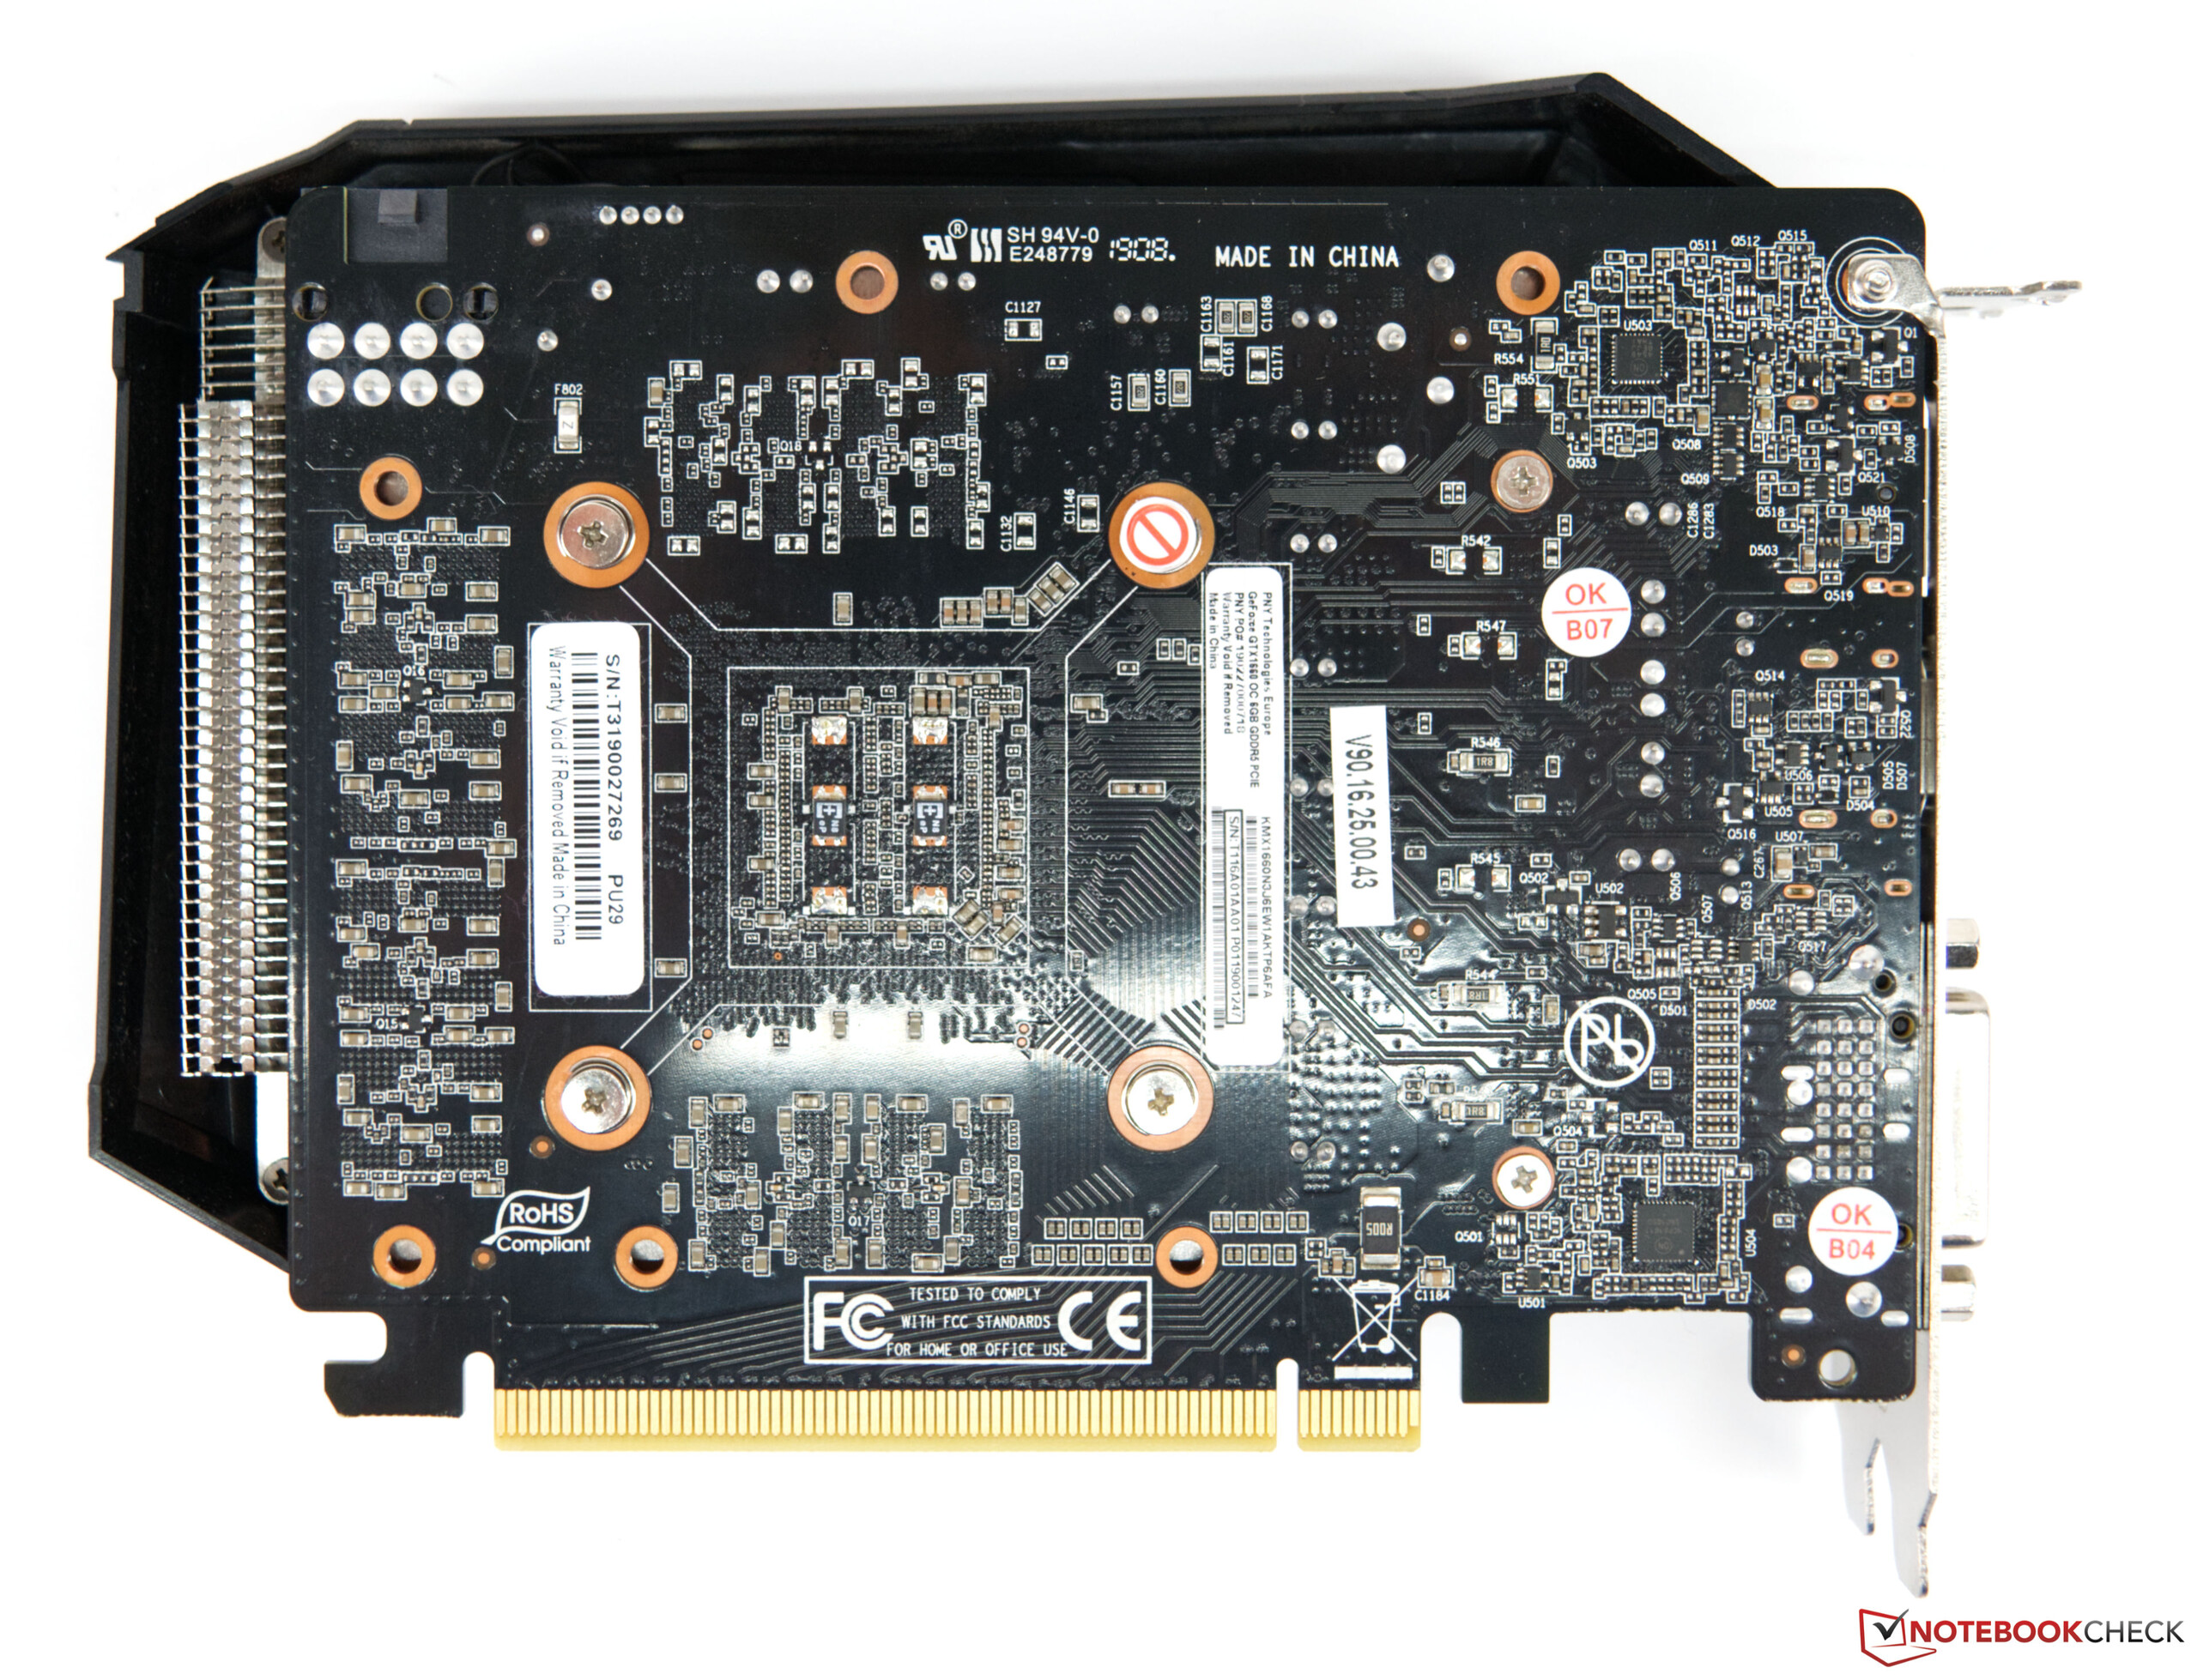
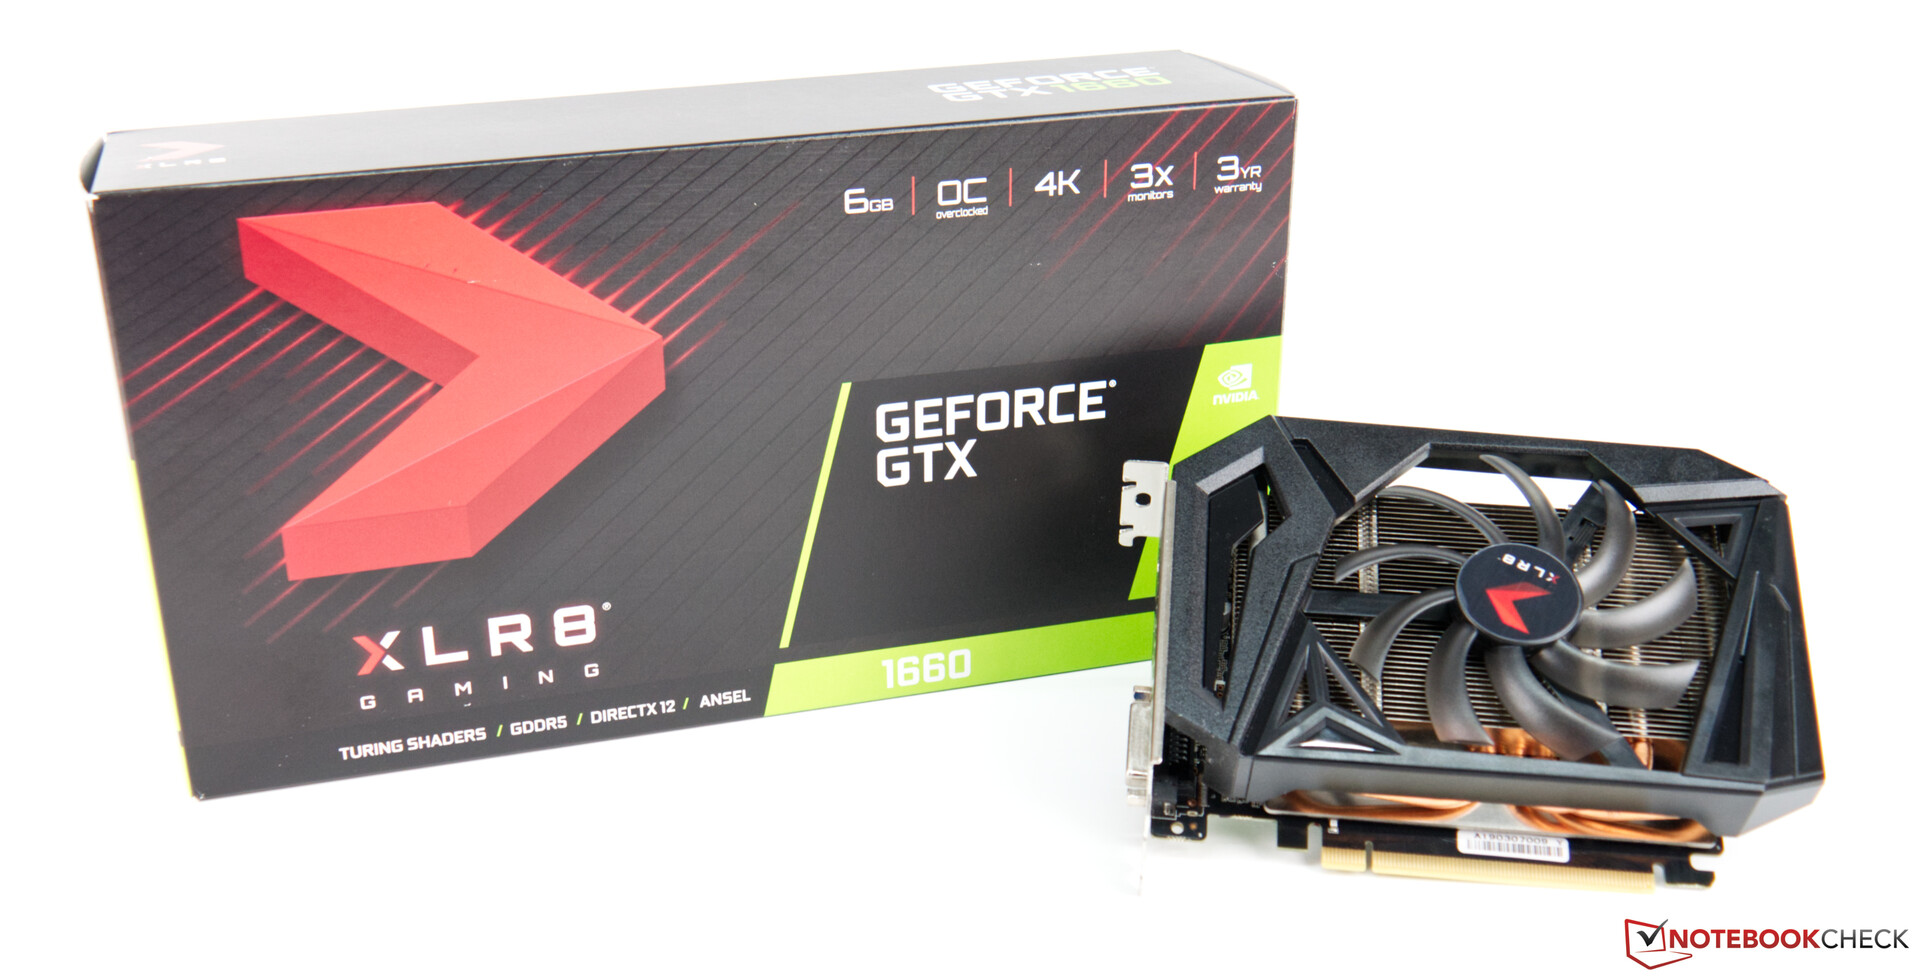
PNY GeForce GTX 1660 XLR8 Gaming OC Graphics Card Review: A small GPU for compact PCs
NVIDIA pitches the GeForce GTX 1660 between the GTX 1650 and GTX 1660 Ti not only on price but also performance. As its name suggests, the GPU has no ray-tracing cores, which NVIDIA reserves for the RTX series.
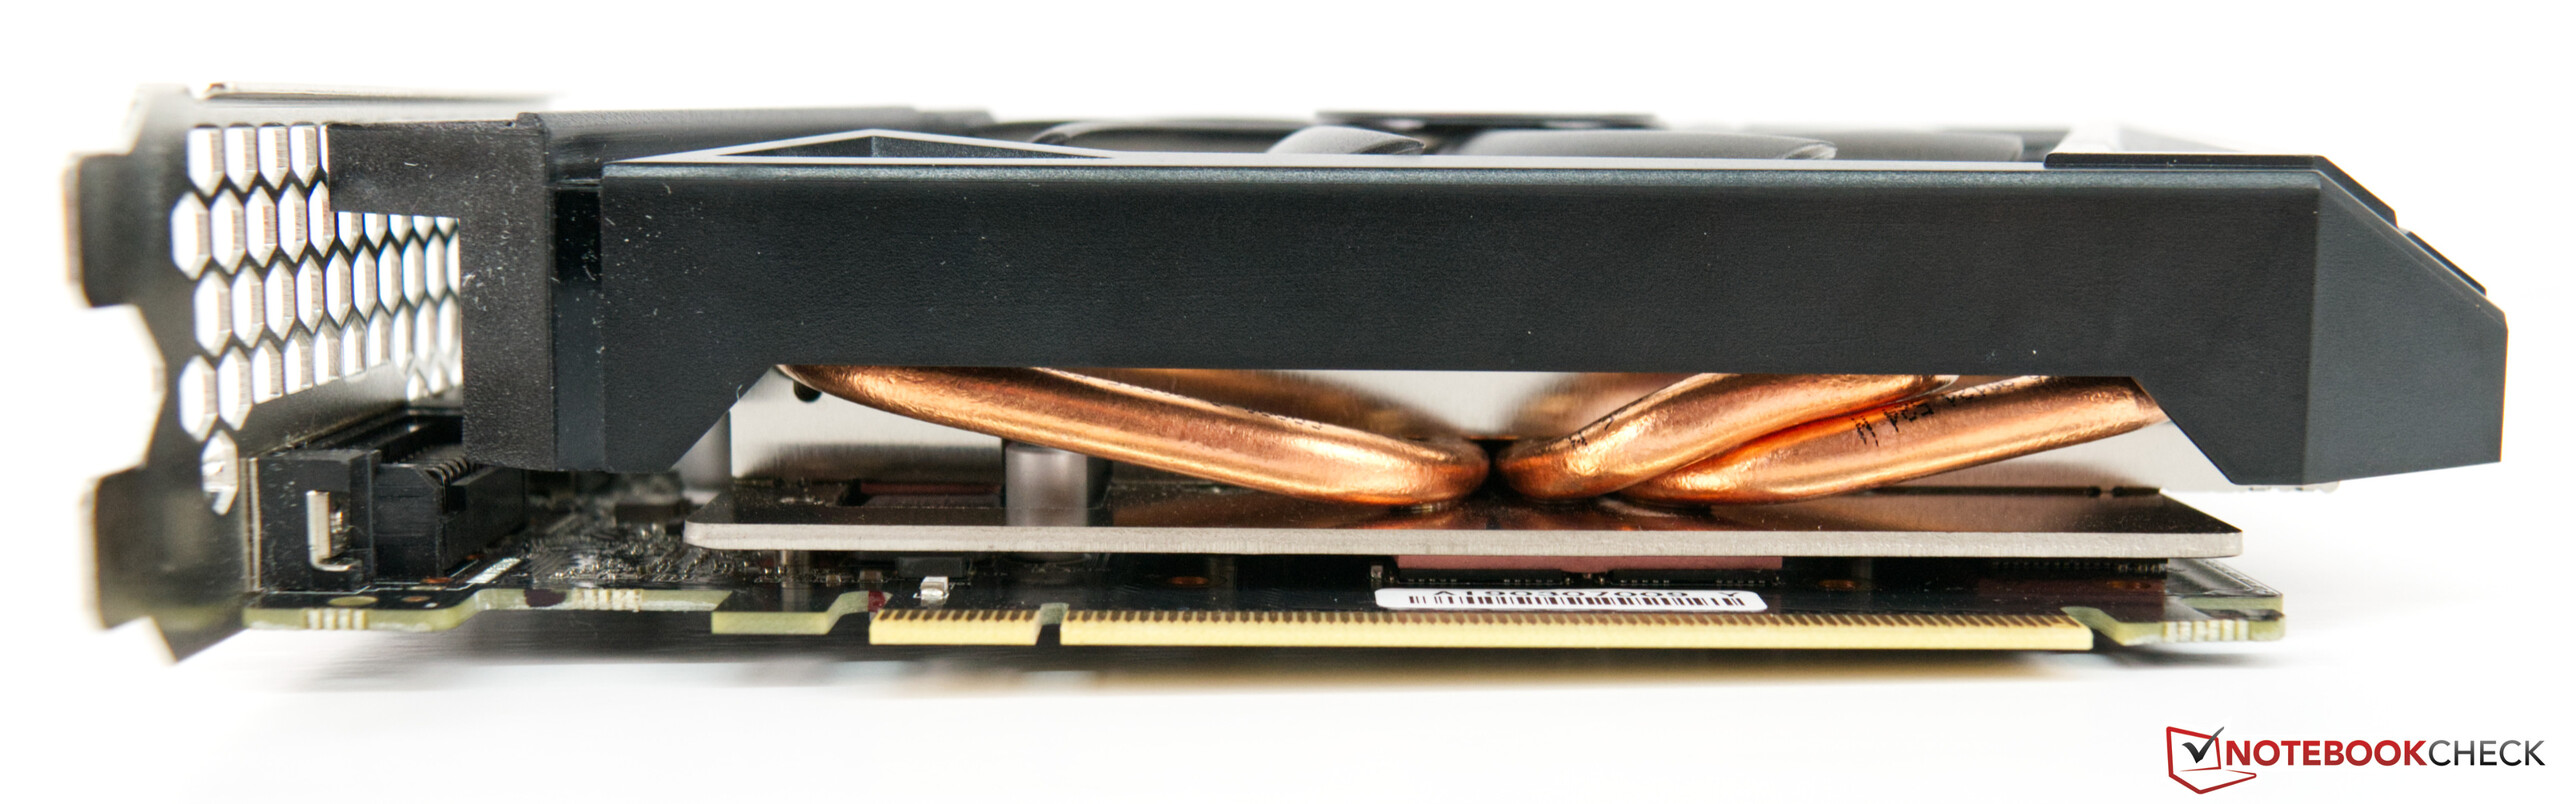
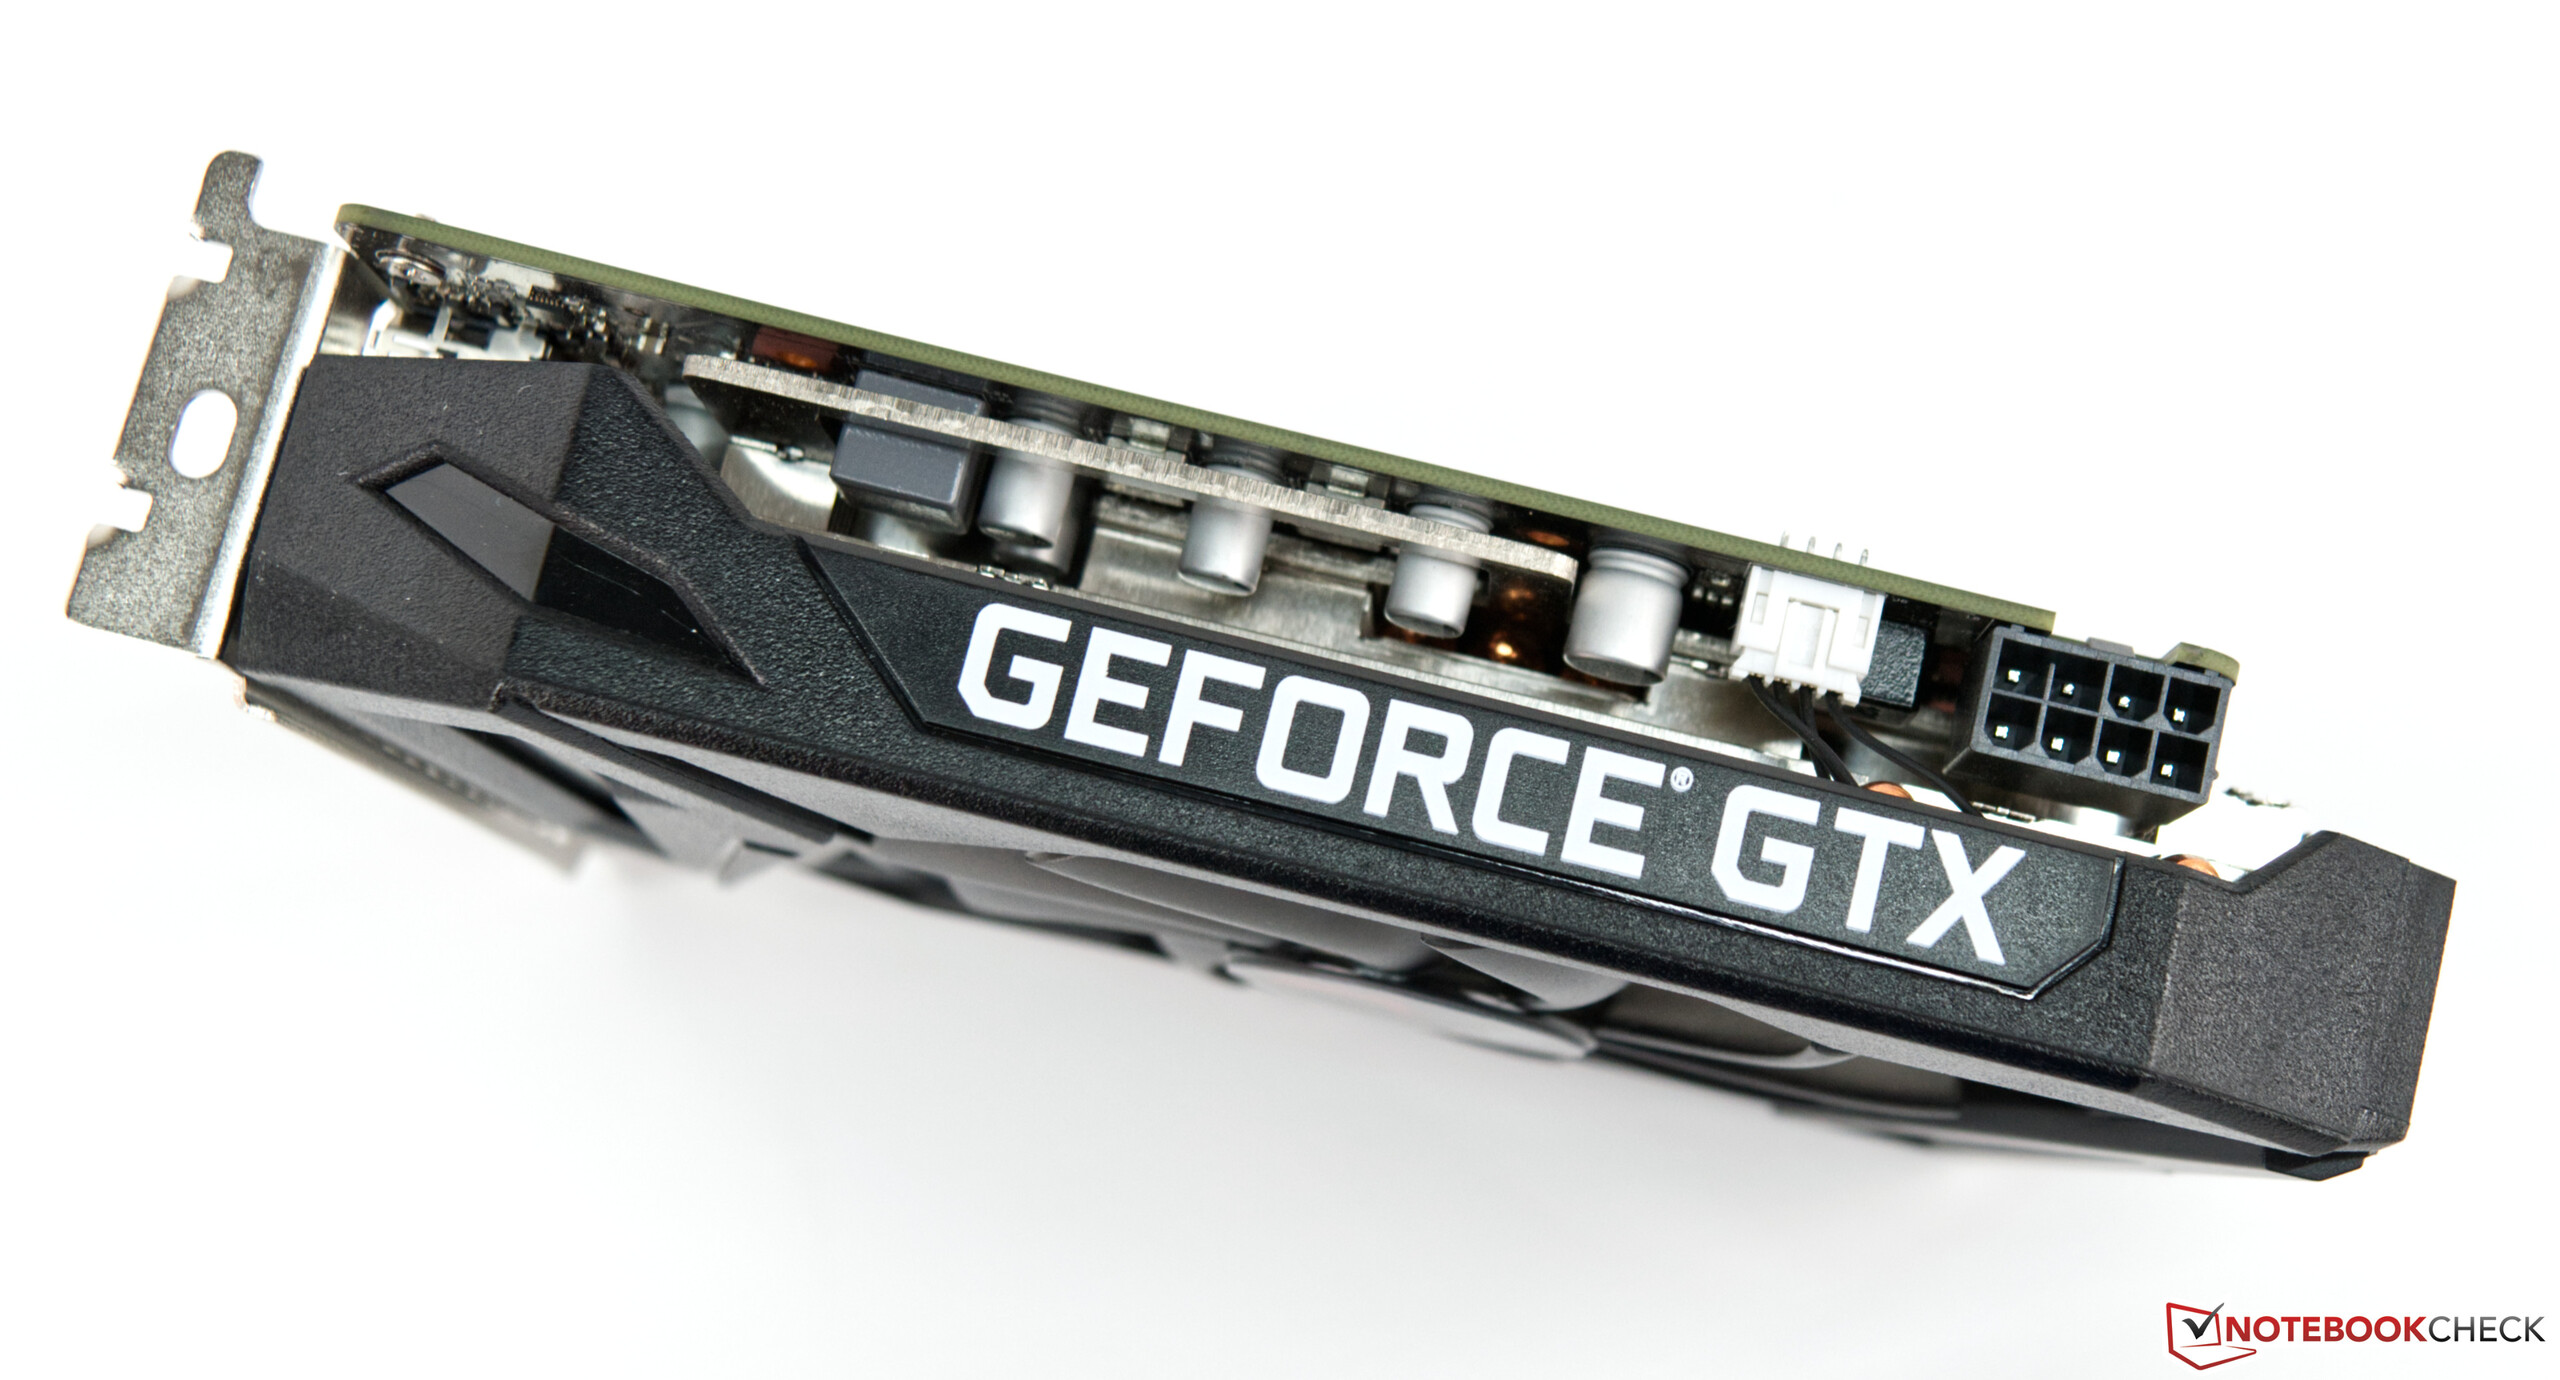
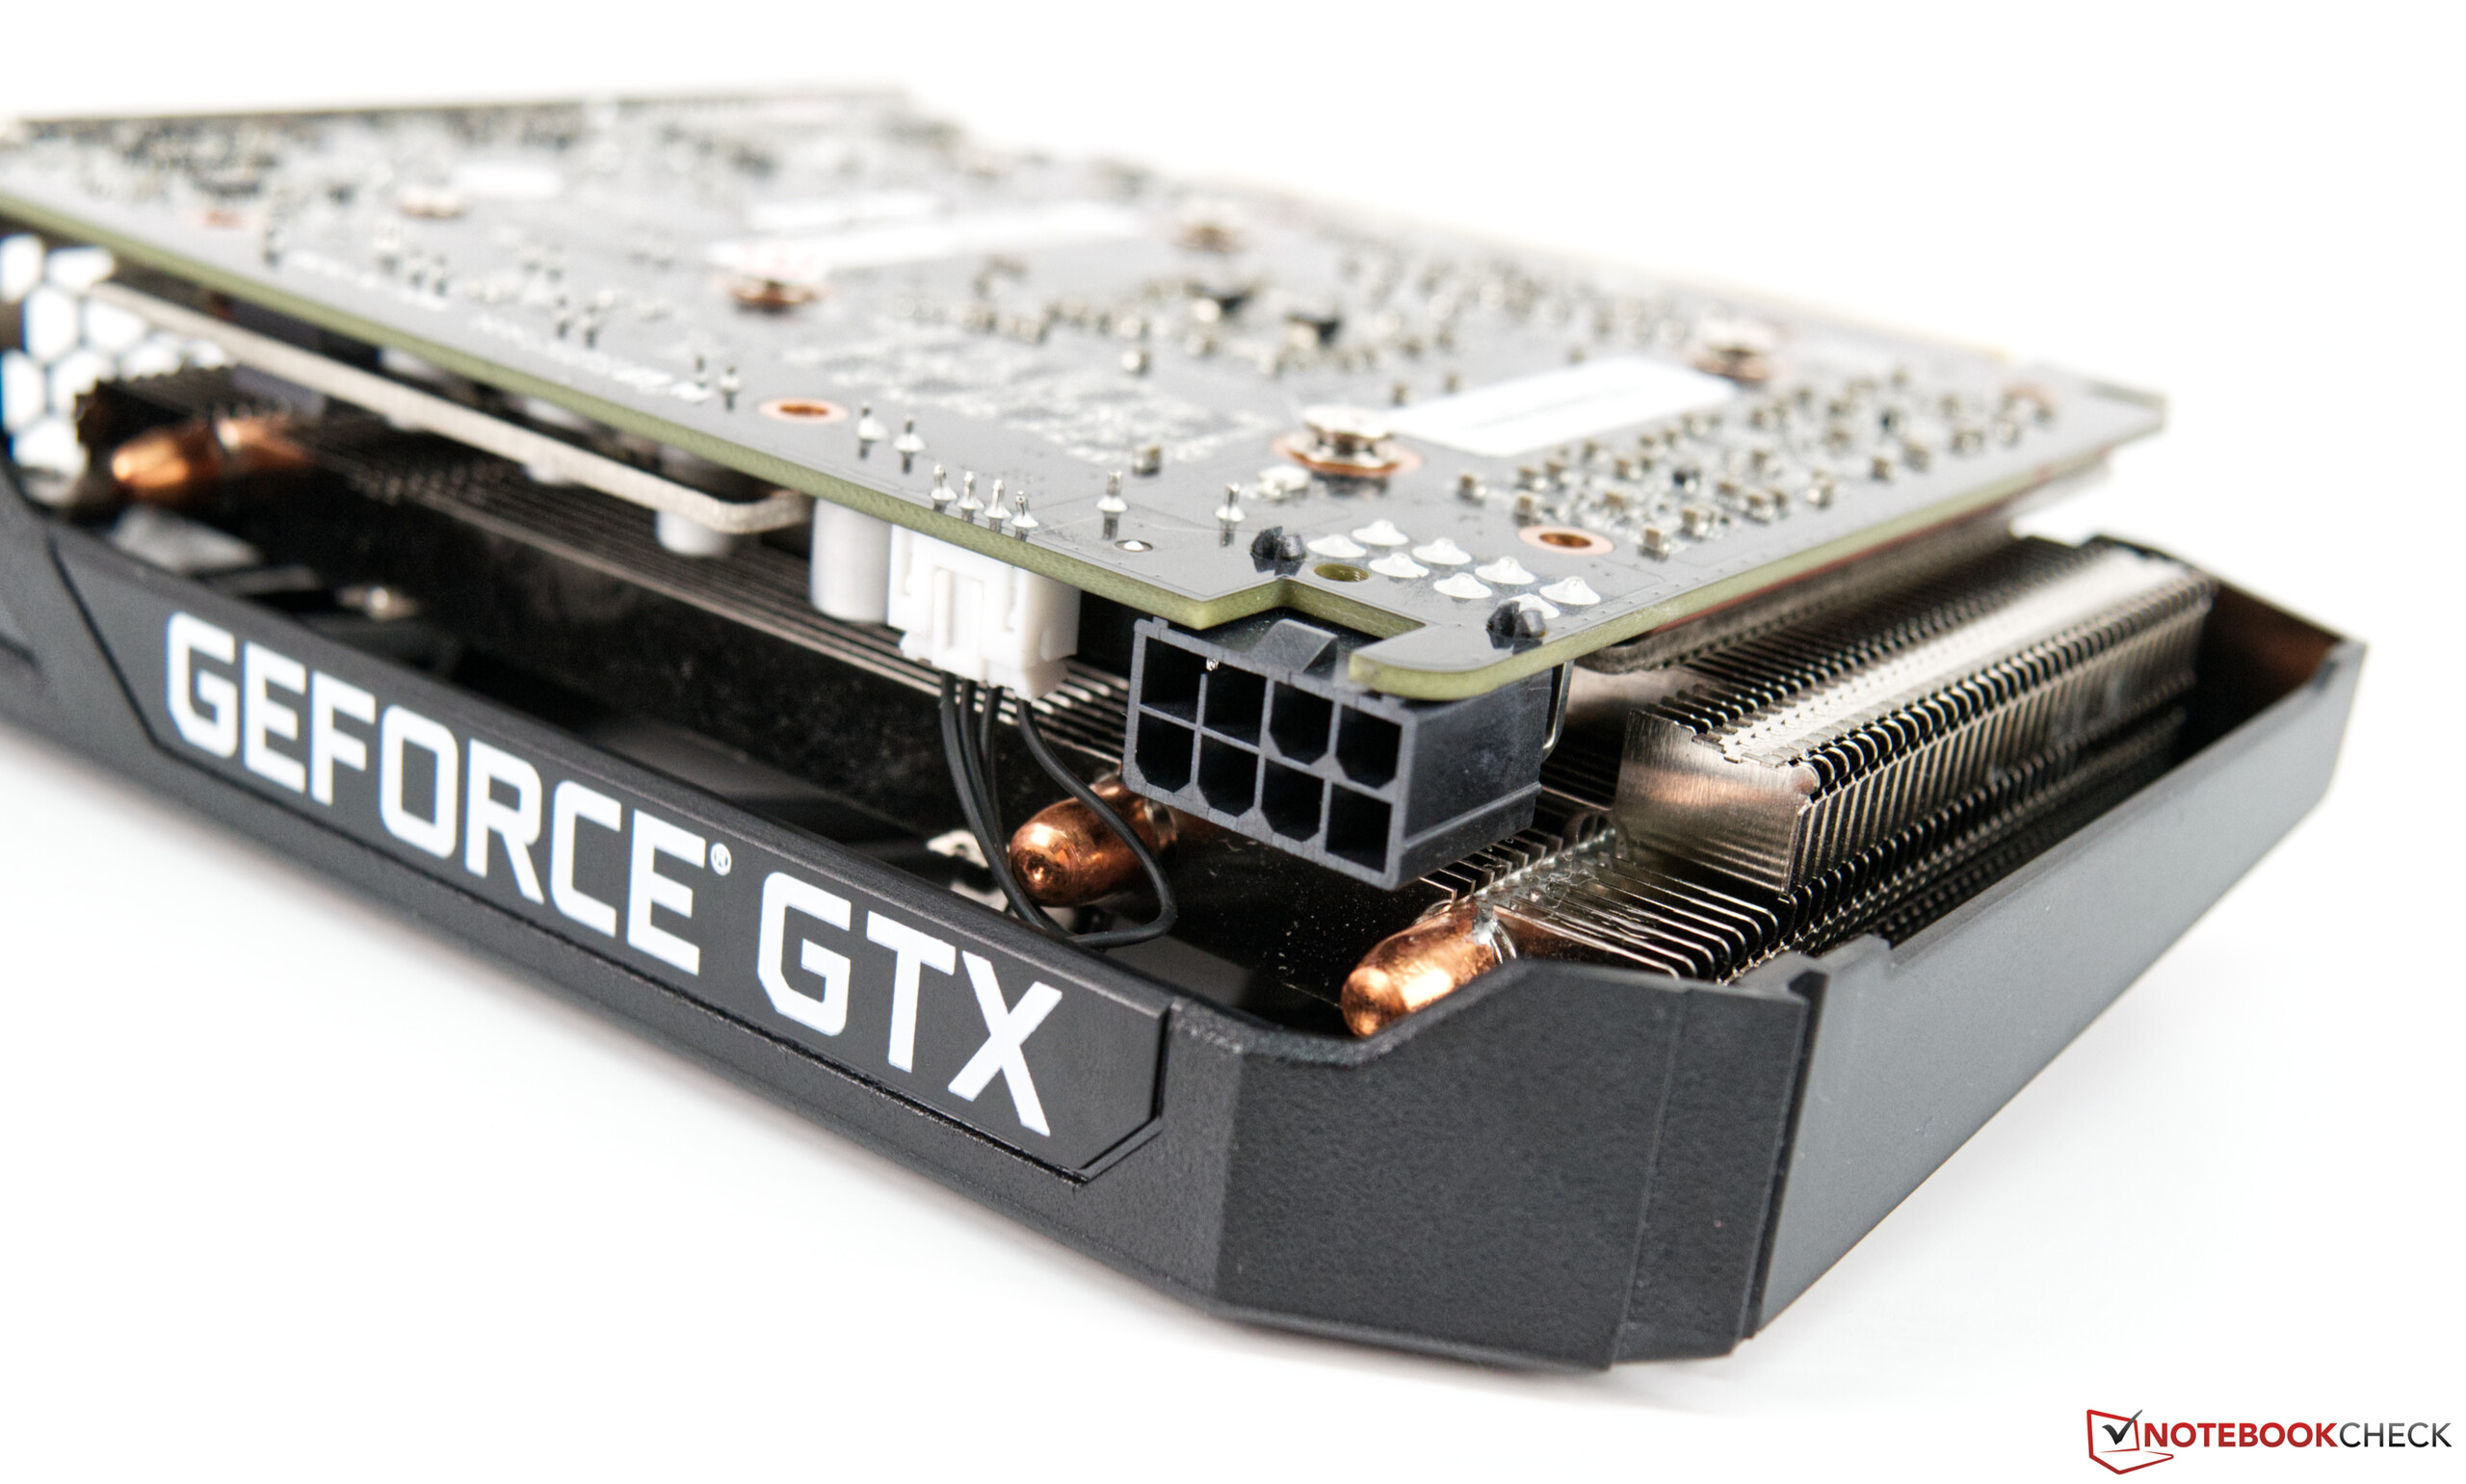
NVIDIA has included an 8-pin power connector on the GTX 1660 as it requires a little more power under load than its Turing entry-level sibling, the GTX 1650. However, the GTX 1660 has fewer shaders and texture units than the GTX 1660 Ti, along with GDDR5 rather than GDDR6 VRAM. Correspondingly, the GTX 1660 has a lower memory bandwidth than the GTX 1660 Ti too, although both operate on the same memory bus. The GTX 1660 has the edge over the GTX 1660 Ti on clock speeds. Both have 6 GB of VRAM too.
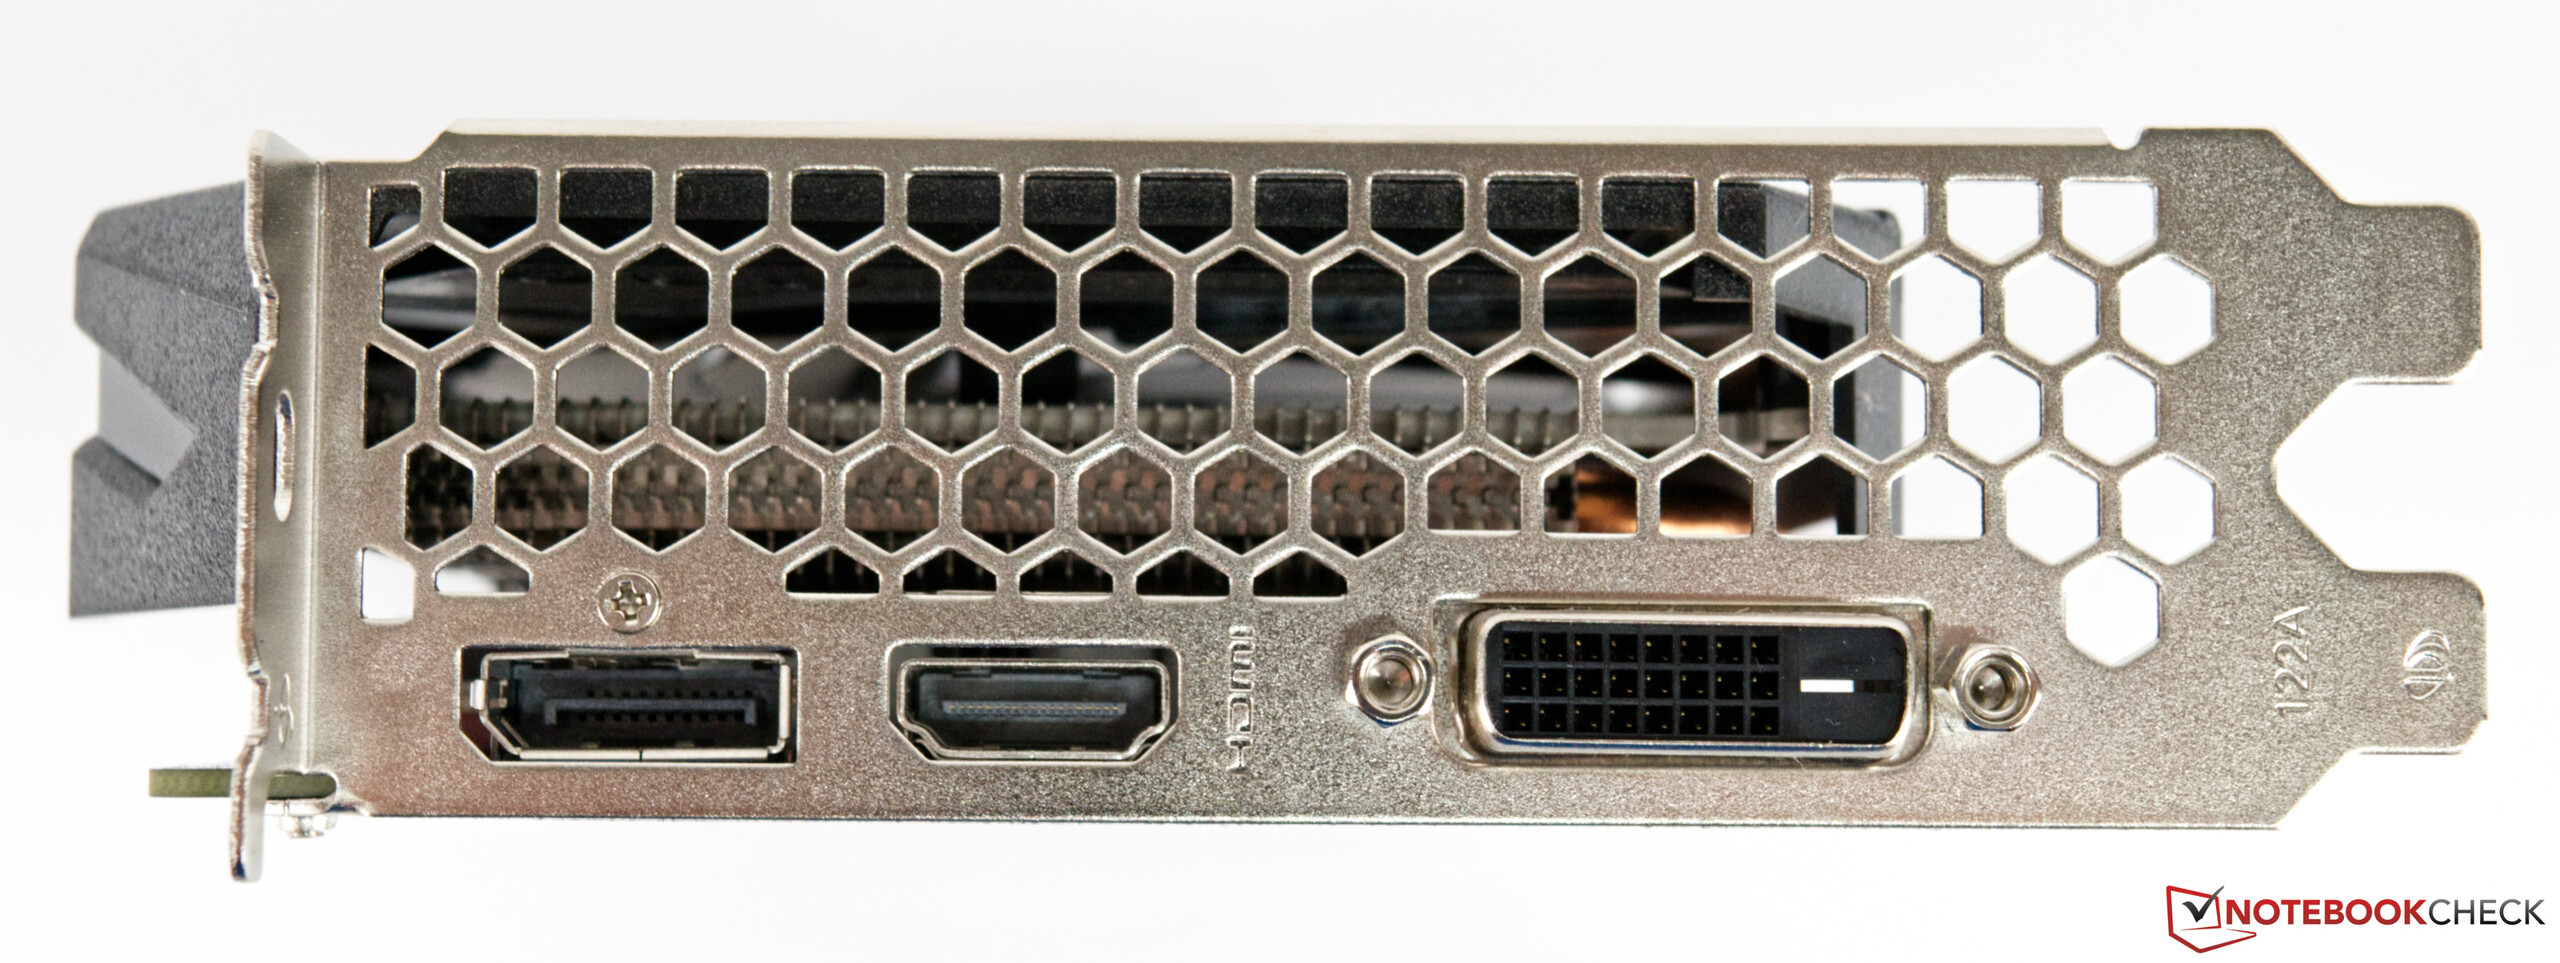
The PNY XLR8 Gaming OC has an HDMI 2.0b port, along with DVI and DisplayPort connections.
PNY includes 36 months' warranty as standard too, which is a nice touch. Please see our Guarantees, Return Policies & Warranties FAQ for country-specific information.

An overview of NVIDIA Turing GPUs
| Specifications | GTX 1650 | GTX 1660 | GTX 1660 Ti | RTX 2060 | RTX 2070 | RTX 2080 | RTX 2080 Ti |
| GPU | TU117 | TU116 | TU116 | TU106 | TU106 | TU104 | TU102 |
| Process | 12 nm | 12 nm | 12 nm | 12 nm | 12 nm | 12 nm | 12 nm |
| Shader units | 896 | 1,408 | 1,536 | 1,920 | 2,304 | 2,944 | 4,352 |
| Texture units | 56 | 88 | 96 | 120 | 144 | 184 | 272 |
| Tensor Cores | - | - | - | 240 | 288 | 368 | 544 |
| RT Cores | - | - | - | 30 | 36 | 46 | 68 |
| GPU base clock | 1,485 MHz | 1,530 MHz | 1,500 MHz | 1,365 MHz | 1,410 MHz | 1,515 MHz | 1,350 MHz |
| GPU boost clock | 1,665 MHz | 1,785 MHz | 1,770 MHz | 1,680 MHz | 1,620 MHz | 1,710 MHz | 1,545 MHz |
| Memory bus | 128 Bit | 192 Bit | 192 Bit | 192 Bit | 256 Bit | 256 Bit | 352 Bit |
| Memory bandwidth | 128 GB/s | 192.1 GB/s | 288 GB/s | 336 GB/s | 448 GB/s | 448 GB/s | 616 GB/s |
| VRAM | 4 GB GDDR5 | 6 GB GDDR5 | 6 GB GDDR6 | 6 GB GDDR6 | 8 GB GDDR6 | 8 GB GDDR6 | 11 GB GDDR6 |
| TDP | 75 W | 120 W | 120 W | 160 W | 175 W | 215 W | 250 W |
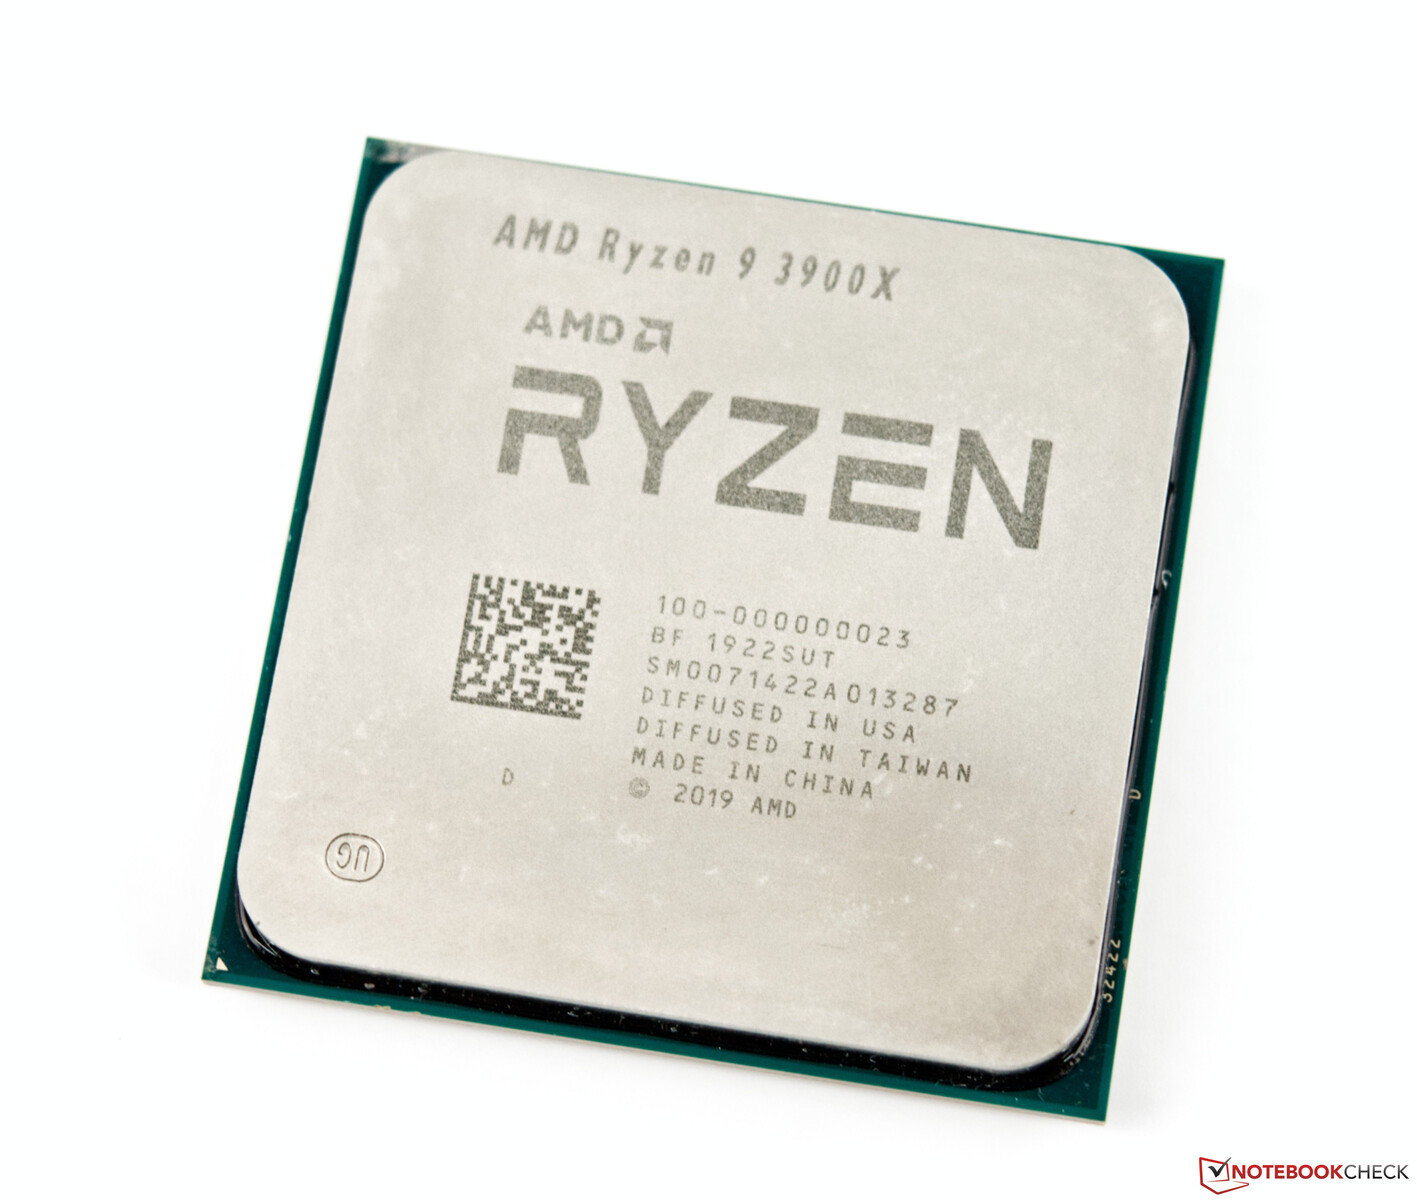
The Test System - AMD Ryzen 9 3900X as a base
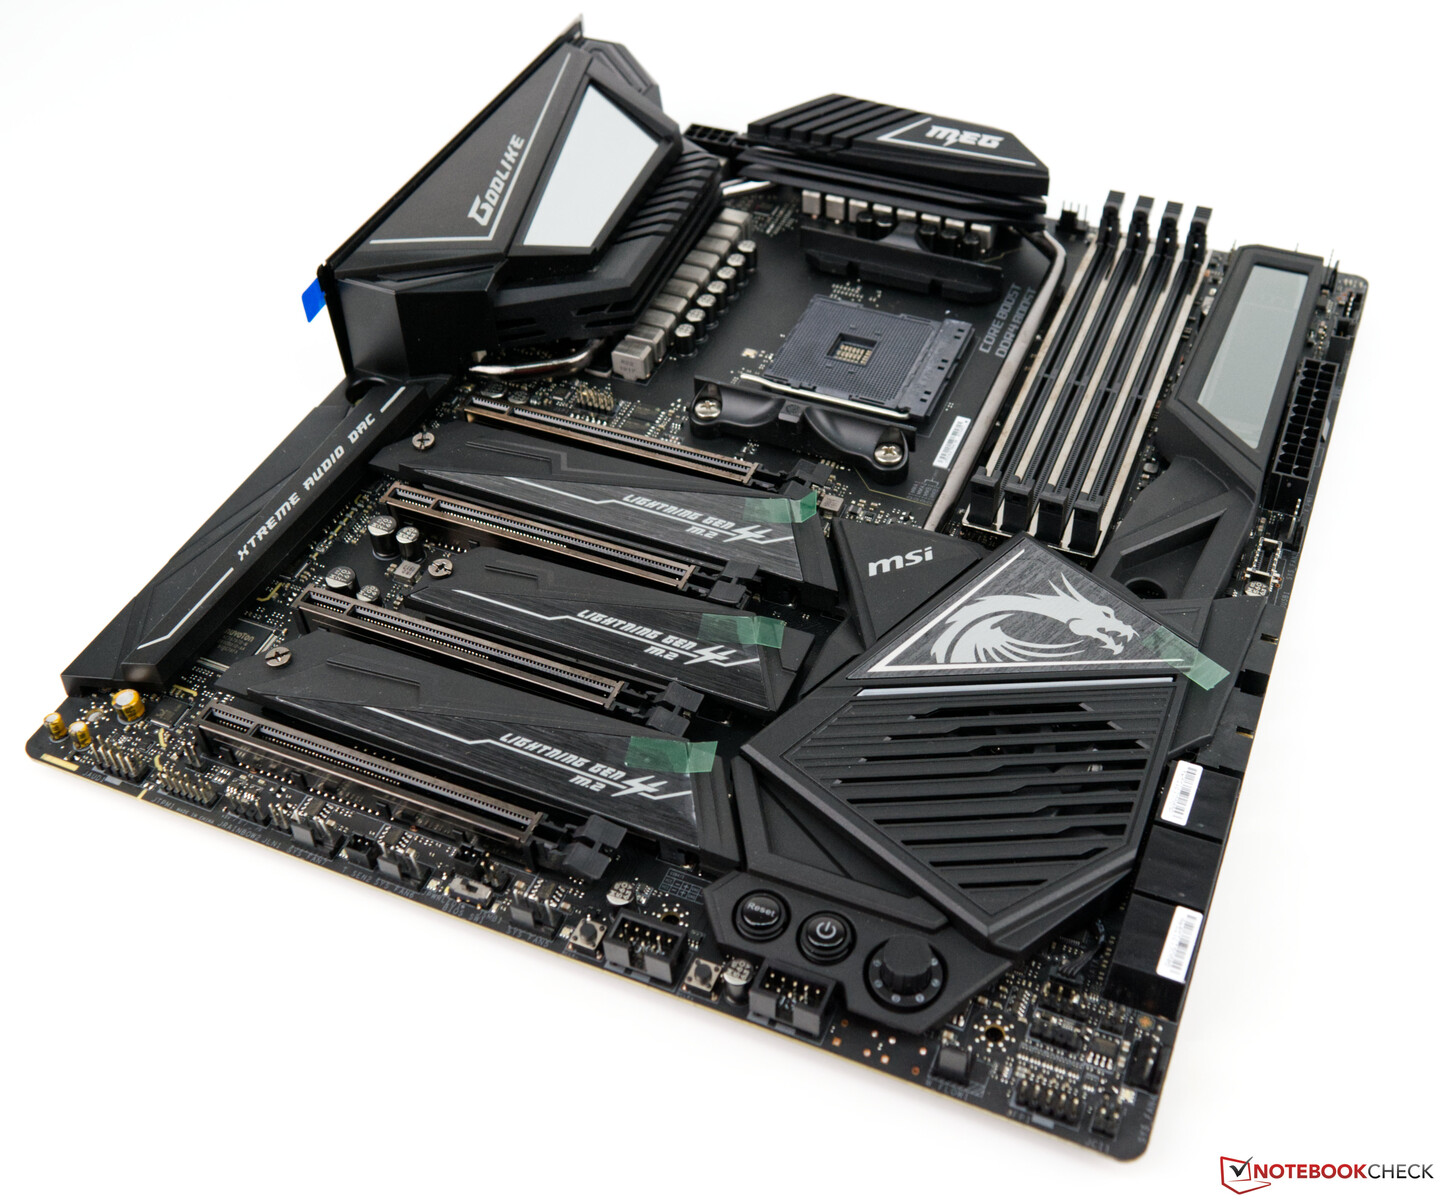
We paired the XLR8 Gaming OC with an MSI MEG X570 Godlike motherboard and an AMD Ryzen 9 3900X processor for our tests. The Ryzen 9 3900X offers excellent performance as we discovered in our review earlier this year, and we used a Be Quiet Silent Loop 280 mm AIO to keep it cool. We also used 16 GB of G-Skill Trident Z Royal Gold RAM that we left clocked at 3,600 MHz on CL16-16-16-36. Finally, we ran all our benchmarks and tests on an Acer Predator XB321HK, a 4K monitor that we have used in many of our gaming reviews.
A big thank you to AMD for kindly providing us with this test platform.
We used the following hardware for our tests and benchmarks:
| Case | Corsair Carbide Air 540 ATX Cube |
|---|---|
| CPU | AMD Ryzen 9 3900X |
| GPU | PNY GeForce GTX 1660 XLR8 Gaming OC |
| CPU cooler | Be Quiet Silent Loop 280 mm |
| RAM | G-Skill Trident Z Royal Gold DDR4-3600 2 x 8 GB (DDR4-3600 CL16-16-16-36) |
| Motherboard | MSI MEG X570 Godlike (BIOS 1.20, Default Settings, XMP 1 for DDR4-3600 CL16) |
| Monitor | Acer Predator XB321HK 4K |
| Power supply | Corsair RM 1000X |
| SSD | Corsair MP600 2 TB M.2 PCIe 4.0 SSD |
| SDD | Western Digital SN720 512 GB - for games |
| SSD | Crucial MX500 2 TB - for games |
| OS | Microsoft Windows 10 Professional 64-Bit (Version 1903) |
| Drivers | NVIDIA 441.12 |
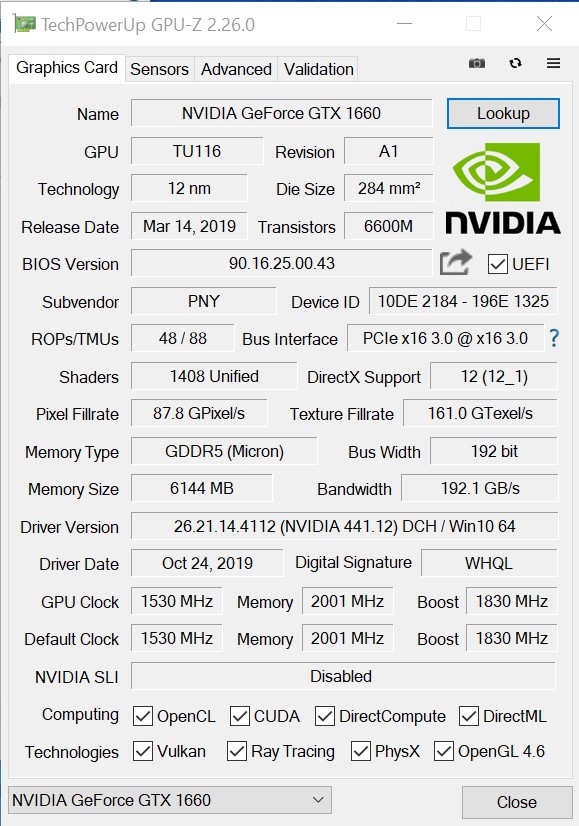
Clock speeds - A higher boost clock than NVIDIA reference speeds
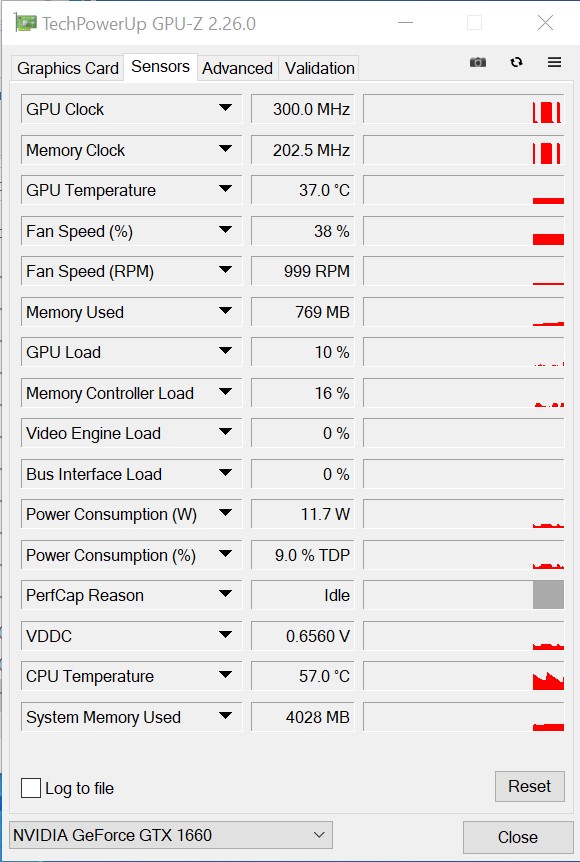
The XLR8 Gaming OC remains close to NVIDIA reference clock speeds. The card can hit 1,830 MHz though, which is 45 MHz higher than the 1,785 MHz reference boost clock. Its 1,530 MHz base clock is unchanged though, as is its 2,000 MHz VRAM clock speed. Correspondingly, the XLR8 Gaming OC has the same 192.1 GB/s memory bandwidth as other GTX 1660 cards.
Synthetic Benchmarks - Keeping pace with the Radeon RX 570
The XLR8 Gaming OC performed as expected in synthetic benchmarks, namely between the GTX 1650 and GTX 1660 Ti. Nonetheless, the gap between our review unit and the GTX 1660 Ti is between 10 and 30%. However, our review unit scores up to 60% more than the GTX 1650, with the largest gaps occurring at higher resolutions because of the additional 2 GB of VRAM that the GTX 1660 has.
Compared to AMD, the XLR8 Gamin OC roughly performs on par with the AMD Radeon RX 570. While the former matches the latter in most instances, the RX 570 occasionally has an edge because of its higher volume of VRAM.
| Performance rating - Percent | |
| AMD Radeon RX 5700 XT -1! | |
| Nvidia GeForce RTX 2060 Super -31! | |
| AMD Radeon RX 5700 -1! | |
| MSI RTX 2060 Gaming Z 6G | |
| Zotac GeForce GTX 1660 Ti 6 GB | |
| XFX AMD Radeon RX 590 OC+ 8 GB -3! | |
| Sapphire NITRO+ RX 570 8 GB -1! | |
| PNY GeForce GTX 1660 | |
| Gainward GeForce GTX 1650 4 GB | |
| 3DMark 11 - 1280x720 Performance GPU | |
| AMD Radeon RX 5700 XT | |
| AMD Radeon RX 5700 | |
| Nvidia GeForce RTX 2060 Super | |
| MSI RTX 2060 Gaming Z 6G | |
| XFX AMD Radeon RX 590 OC+ 8 GB | |
| Zotac GeForce GTX 1660 Ti 6 GB | |
| PNY GeForce GTX 1660 | |
| Sapphire NITRO+ RX 570 8 GB | |
| Gainward GeForce GTX 1650 4 GB | |
| Unigine Heaven 4.0 | |
| Extreme Preset OpenGL | |
| MSI RTX 2060 Gaming Z 6G | |
| AMD Radeon RX 5700 XT | |
| AMD Radeon RX 5700 | |
| Zotac GeForce GTX 1660 Ti 6 GB | |
| PNY GeForce GTX 1660 | |
| XFX AMD Radeon RX 590 OC+ 8 GB | |
| Sapphire NITRO+ RX 570 8 GB | |
| Gainward GeForce GTX 1650 4 GB | |
| Extreme Preset DX11 | |
| AMD Radeon RX 5700 XT | |
| MSI RTX 2060 Gaming Z 6G | |
| AMD Radeon RX 5700 | |
| Zotac GeForce GTX 1660 Ti 6 GB | |
| PNY GeForce GTX 1660 | |
| XFX AMD Radeon RX 590 OC+ 8 GB | |
| Sapphire NITRO+ RX 570 8 GB | |
| Gainward GeForce GTX 1650 4 GB | |
| Unigine Valley 1.0 | |
| 1920x1080 Extreme HD DirectX AA:x8 | |
| AMD Radeon RX 5700 XT | |
| AMD Radeon RX 5700 | |
| MSI RTX 2060 Gaming Z 6G | |
| Zotac GeForce GTX 1660 Ti 6 GB | |
| PNY GeForce GTX 1660 | |
| XFX AMD Radeon RX 590 OC+ 8 GB | |
| Sapphire NITRO+ RX 570 8 GB | |
| Gainward GeForce GTX 1650 4 GB | |
| 1920x1080 Extreme HD Preset OpenGL AA:x8 | |
| AMD Radeon RX 5700 XT | |
| MSI RTX 2060 Gaming Z 6G | |
| AMD Radeon RX 5700 | |
| Zotac GeForce GTX 1660 Ti 6 GB | |
| PNY GeForce GTX 1660 | |
| XFX AMD Radeon RX 590 OC+ 8 GB | |
| Sapphire NITRO+ RX 570 8 GB | |
| Gainward GeForce GTX 1650 4 GB | |
| LuxMark v2.0 64Bit | |
| Room GPUs-only | |
| MSI RTX 2060 Gaming Z 6G | |
| Zotac GeForce GTX 1660 Ti 6 GB | |
| AMD Radeon RX 5700 XT | |
| PNY GeForce GTX 1660 | |
| XFX AMD Radeon RX 590 OC+ 8 GB | |
| AMD Radeon RX 5700 | |
| Sapphire NITRO+ RX 570 8 GB | |
| Gainward GeForce GTX 1650 4 GB | |
| Sala GPUs-only | |
| AMD Radeon RX 5700 XT | |
| MSI RTX 2060 Gaming Z 6G | |
| AMD Radeon RX 5700 | |
| Zotac GeForce GTX 1660 Ti 6 GB | |
| XFX AMD Radeon RX 590 OC+ 8 GB | |
| PNY GeForce GTX 1660 | |
| Sapphire NITRO+ RX 570 8 GB | |
| Gainward GeForce GTX 1650 4 GB | |
| SiSoft Sandra 2016 | |
| Image Processing | |
| AMD Radeon RX 5700 XT | |
| MSI RTX 2060 Gaming Z 6G | |
| AMD Radeon RX 5700 | |
| Zotac GeForce GTX 1660 Ti 6 GB | |
| PNY GeForce GTX 1660 | |
| Gainward GeForce GTX 1650 4 GB | |
| GP Cryptography (Higher Security AES256+SHA2-512) | |
| MSI RTX 2060 Gaming Z 6G | |
| PNY GeForce GTX 1660 | |
| Zotac GeForce GTX 1660 Ti 6 GB | |
| Sapphire NITRO+ RX 570 8 GB | |
| Gainward GeForce GTX 1650 4 GB | |
| GP Financial Analysis (FP High/Double Precision) | |
| Sapphire NITRO+ RX 570 8 GB | |
| MSI RTX 2060 Gaming Z 6G | |
| Zotac GeForce GTX 1660 Ti 6 GB | |
| PNY GeForce GTX 1660 | |
| Gainward GeForce GTX 1650 4 GB | |
| AMD Radeon RX 5700 XT | |
| AMD Radeon RX 5700 | |
| 3DMark 05 Standard | 53031 points | |
| 3DMark 06 Standard Score | 43633 points | |
| 3DMark Vantage P Result | 57895 points | |
| 3DMark 11 Performance | 19912 points | |
| 3DMark Ice Storm Standard Score | 176879 points | |
| 3DMark Cloud Gate Standard Score | 45665 points | |
| 3DMark Fire Strike Score | 12629 points | |
| 3DMark Fire Strike Extreme Score | 6359 points | |
| 3DMark Time Spy Score | 5985 points | |
Help | ||
Gaming Benchmarks - A solid 1080p gamer
The XLR8 Gaming OC also convinced in our gaming tests. The GPU runs out of steam at 1440p and 2160p though, so we would recommend only using it for 1080p gaming. While the GPU is limited in that sense, it outperforms the GTX 1650 to an even greater extent than it does in synthetic benchmarks as our tables below demonstrate.
Our review unit closes the gap to the GTX 1660 Ti too, although please keep in mind that we tested the latter on a slower test system. Conversely, our Polaris generation comparison GPUs struggle to keep pace with the XLR8 Gaming OC. Even the XFX RX 590 falls short of our review unit, which is rather surprising. Only Navi GPUs outperform the XLR8 Gaming OC of our AMD comparison cards, but these are significantly more expensive than PNY's offering.
In short, the XLR8 Gaming OC offers good gaming performance. The card can even handle the latest triple-A games like Call of Duty: Modern Warfare, GRID (2019) or Need for Speed Heat in 1080p. Meanwhile, less resource-intensive titles like FIFA 20 can even be played at 2160p.
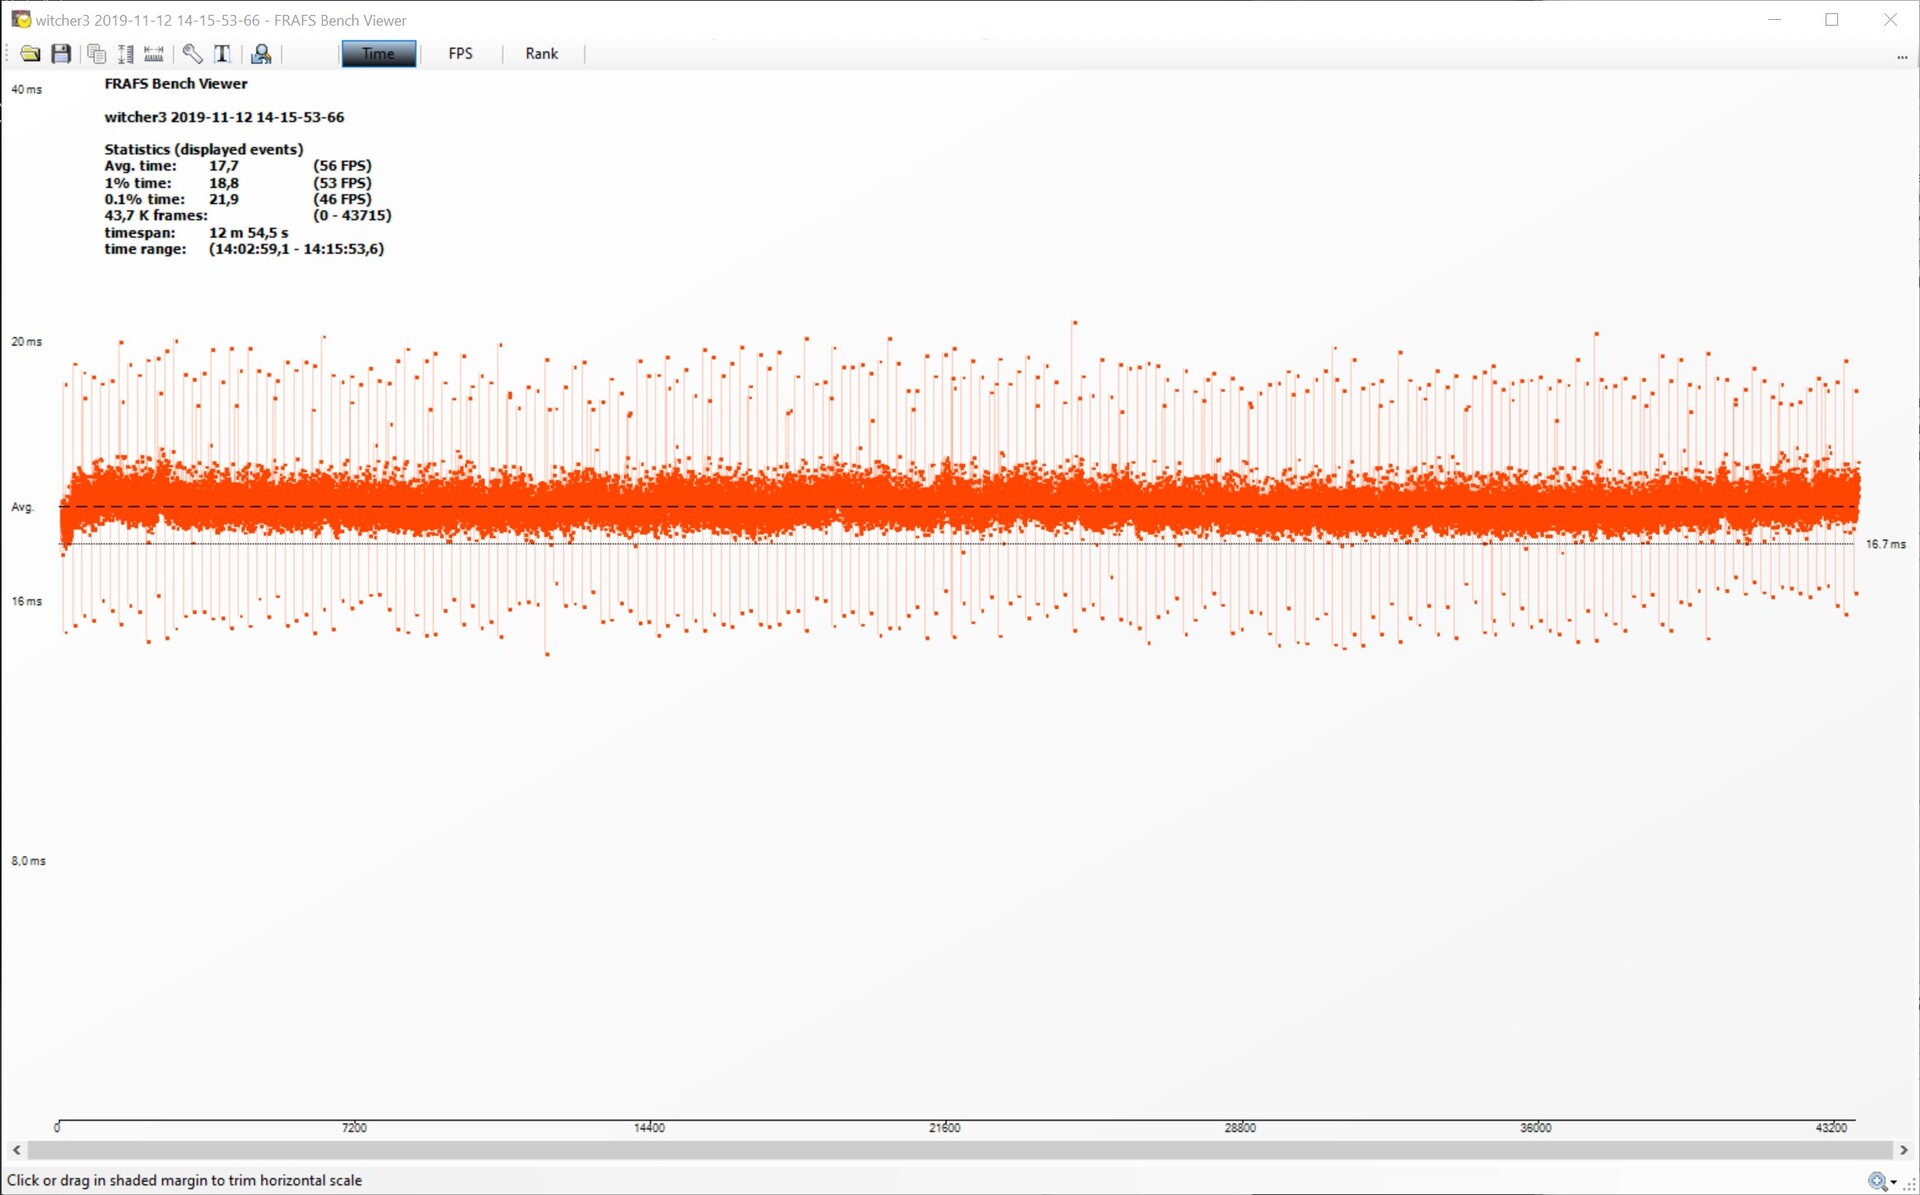
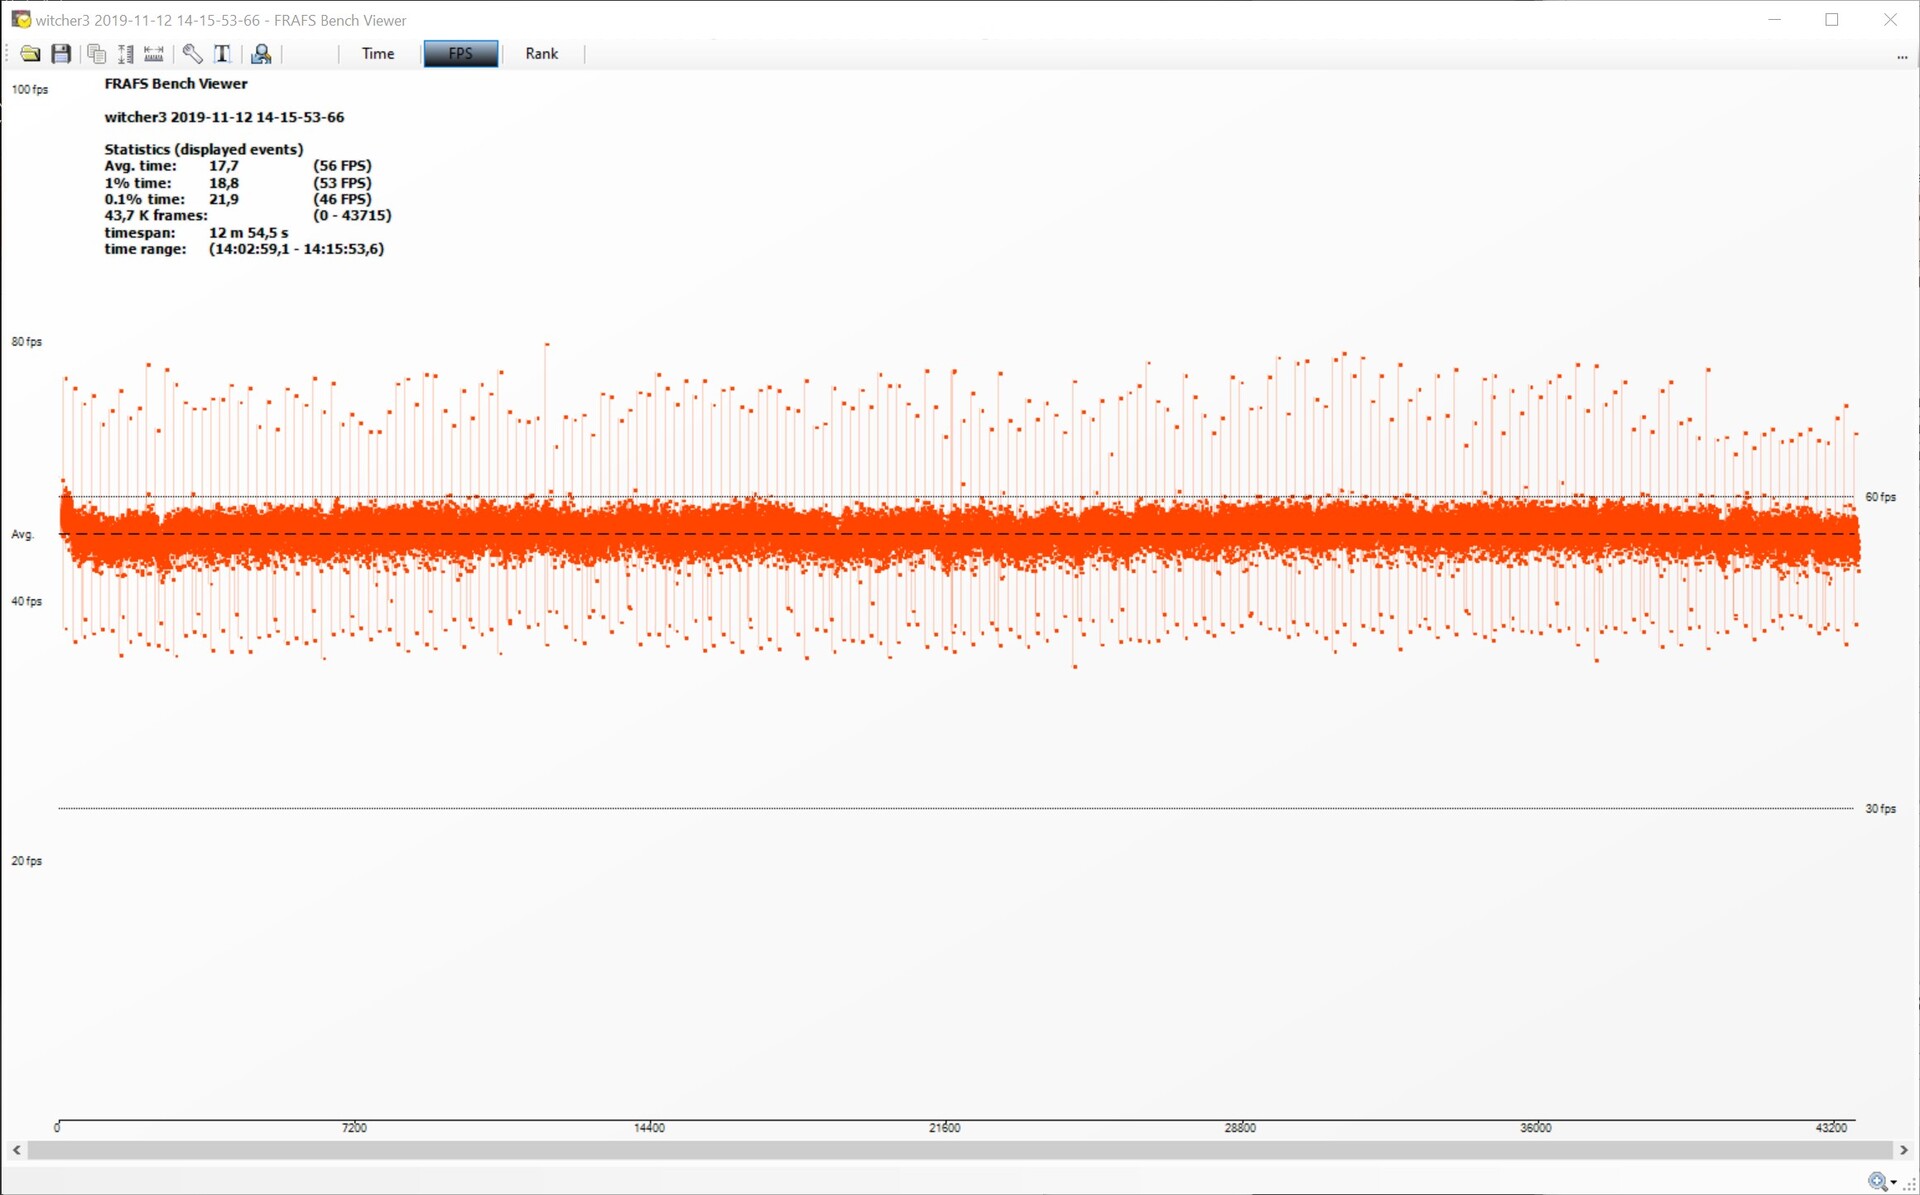
We also looked at how the card performs under sustained load by running The Witcher 3 on the ultra preset at 1080p for an hour. As the graph below demonstrates, the built-in cooler keeps the GPU cool enough to maintain peak performance over prolonged periods. Our review unit only fluctuated between 54 and 59 FPS during this test, so you should not notice any performance drops in long gaming sessions. Frame times were nothing of note either.
The Witcher 3: Frame rates – ultra preset
| Forza Horizon 4 - 1920x1080 Ultra Preset AA:2xMS | |
| AMD Radeon RX 5700 XT | |
| AMD Radeon RX 5700 XT | |
| AMD Radeon RX 5700 | |
| Nvidia GeForce RTX 2060 Super | |
| PNY GeForce GTX 1660 | |
| Zotac GeForce GTX 1660 Ti 6 GB | |
| XFX AMD Radeon RX 590 OC+ 8 GB | |
| Sapphire NITRO+ RX 570 8 GB | |
| Gainward GeForce GTX 1650 4 GB | |
| Far Cry 5 - 1920x1080 Ultra Preset AA:T | |
| AMD Radeon RX 5700 XT | |
| Nvidia GeForce RTX 2060 Super | |
| AMD Radeon RX 5700 XT | |
| Zotac GeForce GTX 1660 Ti 6 GB | |
| AMD Radeon RX 5700 | |
| PNY GeForce GTX 1660 | |
| XFX AMD Radeon RX 590 OC+ 8 GB | |
| Sapphire NITRO+ RX 570 8 GB | |
| Gainward GeForce GTX 1650 4 GB | |
| The Witcher 3 - 1920x1080 Ultra Graphics & Postprocessing (HBAO+) | |
| AMD Radeon RX 5700 XT | |
| AMD Radeon RX 5700 XT | |
| AMD Radeon RX 5700 | |
| Nvidia GeForce RTX 2060 Super | |
| Zotac GeForce GTX 1660 Ti 6 GB | |
| PNY GeForce GTX 1660 | |
| XFX AMD Radeon RX 590 OC+ 8 GB | |
| Gainward GeForce GTX 1650 4 GB | |
| Sapphire NITRO+ RX 570 8 GB | |
| Farming Simulator 19 - 1920x1080 Very High Preset | |
| Zotac GeForce GTX 1660 Ti 6 GB | |
| Nvidia GeForce RTX 2060 Super | |
| AMD Radeon RX 5700 XT | |
| PNY GeForce GTX 1660 | |
| AMD Radeon RX 5700 | |
| Gainward GeForce GTX 1650 4 GB | |
| XFX AMD Radeon RX 590 OC+ 8 GB | |
| Sapphire NITRO+ RX 570 8 GB | |
| Darksiders III - 1920x1080 Epic | |
| AMD Radeon RX 5700 XT | |
| Nvidia GeForce RTX 2060 Super | |
| AMD Radeon RX 5700 | |
| Zotac GeForce GTX 1660 Ti 6 GB | |
| Sapphire NITRO+ RX 570 8 GB | |
| PNY GeForce GTX 1660 | |
| XFX AMD Radeon RX 590 OC+ 8 GB | |
| Gainward GeForce GTX 1650 4 GB | |
| Apex Legends - 1920x1080 Maximum Settings AA:TS AF:16x | |
| Nvidia GeForce RTX 2060 Super | |
| AMD Radeon RX 5700 XT | |
| AMD Radeon RX 5700 | |
| Zotac GeForce GTX 1660 Ti 6 GB | |
| PNY GeForce GTX 1660 | |
| XFX AMD Radeon RX 590 OC+ 8 GB | |
| Sapphire NITRO+ RX 570 8 GB | |
| Gainward GeForce GTX 1650 4 GB | |
| Far Cry New Dawn - 1920x1080 Ultra Preset | |
| AMD Radeon RX 5700 XT | |
| Nvidia GeForce RTX 2060 Super | |
| Zotac GeForce GTX 1660 Ti 6 GB | |
| AMD Radeon RX 5700 | |
| PNY GeForce GTX 1660 | |
| AMD Radeon RX 5700 XT | |
| XFX AMD Radeon RX 590 OC+ 8 GB | |
| Sapphire NITRO+ RX 570 8 GB | |
| Gainward GeForce GTX 1650 4 GB | |
| Metro Exodus - 1920x1080 Ultra Quality AF:16x | |
| AMD Radeon RX 5700 XT | |
| Nvidia GeForce RTX 2060 Super | |
| AMD Radeon RX 5700 | |
| Zotac GeForce GTX 1660 Ti 6 GB | |
| PNY GeForce GTX 1660 | |
| XFX AMD Radeon RX 590 OC+ 8 GB | |
| Sapphire NITRO+ RX 570 8 GB | |
| Gainward GeForce GTX 1650 4 GB | |
| The Division 2 - 1920x1080 Ultra Preset | |
| AMD Radeon RX 5700 XT | |
| Nvidia GeForce RTX 2060 Super | |
| AMD Radeon RX 5700 | |
| Zotac GeForce GTX 1660 Ti 6 GB | |
| XFX AMD Radeon RX 590 OC+ 8 GB | |
| PNY GeForce GTX 1660 | |
| Sapphire NITRO+ RX 570 8 GB | |
| Gainward GeForce GTX 1650 4 GB | |
| Anno 1800 - 1920x1080 Ultra Graphics Quality (DX11) | |
| AMD Radeon RX 5700 XT | |
| AMD Radeon RX 5700 XT | |
| Nvidia GeForce RTX 2060 Super | |
| AMD Radeon RX 5700 | |
| Zotac GeForce GTX 1660 Ti 6 GB | |
| PNY GeForce GTX 1660 | |
| Gainward GeForce GTX 1650 4 GB | |
| Sapphire NITRO+ RX 570 8 GB | |
| XFX AMD Radeon RX 590 OC+ 8 GB | |
| Rage 2 - 1920x1080 Ultra Preset (Resolution Scale Off) | |
| Nvidia GeForce RTX 2060 Super | |
| AMD Radeon RX 5700 XT | |
| XFX AMD Radeon RX 590 OC+ 8 GB | |
| PNY GeForce GTX 1660 | |
| Sapphire NITRO+ RX 570 8 GB | |
| Gainward GeForce GTX 1650 4 GB | |
| F1 2019 - 1920x1080 Ultra High Preset AA:T AF:16x | |
| AMD Radeon RX 5700 XT | |
| AMD Radeon RX 5700 XT | |
| AMD Radeon RX 5700 | |
| Nvidia GeForce RTX 2060 Super | |
| XFX AMD Radeon RX 590 OC+ 8 GB | |
| PNY GeForce GTX 1660 | |
| Sapphire NITRO+ RX 570 8 GB | |
| Gainward GeForce GTX 1650 4 GB | |
| Rocket League - 1920x1080 High Quality AA:High FX | |
| Nvidia GeForce RTX 2060 Super | |
| AMD Radeon RX 5700 XT | |
| XFX AMD Radeon RX 590 OC+ 8 GB | |
| AMD Radeon RX 5700 | |
| PNY GeForce GTX 1660 | |
| X-Plane 11.11 - 1920x1080 high (fps_test=3) | |
| PNY GeForce GTX 1660 | |
| Nvidia GeForce RTX 2060 Super | |
| AMD Radeon RX 5700 XT | |
| AMD Radeon RX 5700 XT | |
| AMD Radeon RX 5700 | |
| Shadow of the Tomb Raider - 1920x1080 Highest Preset AA:T | |
| AMD Radeon RX 5700 XT | |
| AMD Radeon RX 5700 XT | |
| Nvidia GeForce RTX 2060 Super | |
| AMD Radeon RX 5700 | |
| Zotac GeForce GTX 1660 Ti 6 GB | |
| PNY GeForce GTX 1660 | |
| XFX AMD Radeon RX 590 OC+ 8 GB | |
| Sapphire NITRO+ RX 570 8 GB | |
| Gainward GeForce GTX 1650 4 GB | |
| FIFA 20 - 1920x1080 Ultra Preset AA:4xMS | |
| AMD Radeon RX 5700 | |
| AMD Radeon RX 5700 XT | |
| XFX AMD Radeon RX 590 OC+ 8 GB | |
| Nvidia GeForce RTX 2060 Super | |
| PNY GeForce GTX 1660 | |
| Sapphire NITRO+ RX 570 8 GB | |
| Gainward GeForce GTX 1650 4 GB | |
| Control - 1920x1080 High Quality Preset | |
| AMD Radeon RX 5700 XT | |
| Nvidia GeForce RTX 2060 Super | |
| AMD Radeon RX 5700 | |
| PNY GeForce GTX 1660 | |
| XFX AMD Radeon RX 590 OC+ 8 GB | |
| Sapphire NITRO+ RX 570 8 GB | |
| Gainward GeForce GTX 1650 4 GB | |
| Borderlands 3 - 1920x1080 Badass Overall Quality (DX11) | |
| AMD Radeon RX 5700 XT | |
| Nvidia GeForce RTX 2060 Super | |
| AMD Radeon RX 5700 | |
| PNY GeForce GTX 1660 | |
| XFX AMD Radeon RX 590 OC+ 8 GB | |
| Sapphire NITRO+ RX 570 8 GB | |
| Gainward GeForce GTX 1650 4 GB | |
| Ghost Recon Breakpoint - 1920x1080 Ultra Preset AA:T | |
| AMD Radeon RX 5700 XT | |
| Nvidia GeForce RTX 2060 Super | |
| AMD Radeon RX 5700 | |
| PNY GeForce GTX 1660 | |
| XFX AMD Radeon RX 590 OC+ 8 GB | |
| Sapphire NITRO+ RX 570 8 GB | |
| Gainward GeForce GTX 1650 4 GB | |
| GRID 2019 - 1920x1080 Ultra High Preset | |
| AMD Radeon RX 5700 XT | |
| AMD Radeon RX 5700 | |
| Nvidia GeForce RTX 2060 Super | |
| PNY GeForce GTX 1660 | |
| XFX AMD Radeon RX 590 OC+ 8 GB | |
| Sapphire NITRO+ RX 570 8 GB | |
| Gainward GeForce GTX 1650 4 GB | |
| Call of Duty Modern Warfare 2019 - 1920x1080 Maximum Settings AA:T2X Filmic SM | |
| AMD Radeon RX 5700 XT | |
| Nvidia GeForce RTX 2060 Super | |
| AMD Radeon RX 5700 | |
| PNY GeForce GTX 1660 | |
| XFX AMD Radeon RX 590 OC+ 8 GB | |
| Sapphire NITRO+ RX 570 8 GB | |
| Gainward GeForce GTX 1650 4 GB | |
| Need for Speed Heat - 1920x1080 Ultra Preset | |
| Nvidia GeForce RTX 2060 Super | |
| AMD Radeon RX 5700 XT | |
| AMD Radeon RX 5700 | |
| PNY GeForce GTX 1660 | |
| XFX AMD Radeon RX 590 OC+ 8 GB | |
| Gainward GeForce GTX 1650 4 GB | |
| low | med. | high | ultra | QHD | 4K | |
|---|---|---|---|---|---|---|
| The Witcher 3 (2015) | 282 | 181 | 99 | 55.5 | 34.9 | |
| Dota 2 Reborn (2015) | 163.7 | 152.4 | 145.9 | 136.7 | 85.9 | |
| Rocket League (2017) | 249 | 249 | 183 | 129 | 81 | |
| X-Plane 11.11 (2018) | 127 | 114 | 93 | 79 | ||
| Far Cry 5 (2018) | 142 | 95 | 87 | 82 | 57 | 29 |
| Strange Brigade (2018) | 313 | 129 | 105 | 88.1 | 63.7 | 34.5 |
| Shadow of the Tomb Raider (2018) | 152 | 92 | 80 | 72 | 47 | 23 |
| Forza Horizon 4 (2018) | 200 | 132 | 123 | 98 | 76 | 50 |
| Farming Simulator 19 (2018) | 242 | 190 | 153 | 116 | 80 | 41.9 |
| Darksiders III (2018) | 196 | 115 | 96 | 83 | 54.5 | 18.8 |
| Apex Legends (2019) | 144 | 144 | 114 | 111 | 77 | 43.6 |
| Far Cry New Dawn (2019) | 132 | 92 | 87 | 80 | 58 | 31 |
| Metro Exodus (2019) | 118 | 61 | 45 | 38 | 29 | 19 |
| The Division 2 (2019) | 185 | 103 | 82 | 59 | 40 | 21 |
| Anno 1800 (2019) | 94 | 92 | 69 | 34.9 | 23.6 | 14 |
| Rage 2 (2019) | 168 | 83 | 71 | 71 | 45.3 | 21.7 |
| Total War: Three Kingdoms (2019) | 237.8 | 98.2 | 60.6 | 42 | 25.8 | |
| F1 2019 (2019) | 261 | 142 | 123 | 82 | 64 | 38 |
| Control (2019) | 198 | 70 | 52.5 | 31.6 | 15.8 | |
| Borderlands 3 (2019) | 143 | 91 | 61 | 49 | 34 | 14 |
| FIFA 20 (2019) | 265 | 262 | 241 | 239 | 202 | 127 |
| Ghost Recon Breakpoint (2019) | 114 | 73 | 67 | 49 | 34 | 17 |
| GRID 2019 (2019) | 160 | 119 | 97 | 67 | 51.4 | 31.9 |
| Call of Duty Modern Warfare 2019 (2019) | 159 | 112 | 90 | 79 | 56.8 | 31.6 |
| Need for Speed Heat (2019) | 111 | 89 | 79 | 70 | 49.5 | 23 |
| Star Wars Jedi Fallen Order (2019) | 112 | 90 | 81 | 53.1 | 26.4 | |
| Red Dead Redemption 2 (2019) | 130 | 73 | 49.1 | 30.9 | 24.7 | |
| Escape from Tarkov (2020) | 121 | 121 | 93.2 | 79.2 | 47.6 | 23.9 |
| Hunt Showdown (2020) | 211 | 82.1 | 64.8 | 39.7 | 19.8 | |
| Doom Eternal (2020) | 257 | 138 | 121 | 115 | 71.7 | 38.2 |
| Gears Tactics (2020) | 297.9 | 141.7 | 92 | 61.9 | 43 | 22.8 |
| Valorant (2020) | 324.5 | 306.2 | 287.1 | 226.3 | 125.3 | |
| F1 2020 (2020) | 292 | 160 | 128 | 89.8 | 66.1 | 37.2 |
| Death Stranding (2020) | 138 | 86.7 | 79.3 | 77.6 | 53.3 | 28.6 |
| Horizon Zero Dawn (2020) | 130 | 82 | 67 | 54 | 40 | 21 |
| Flight Simulator 2020 (2020) | 84.6 | 49.9 | 35.8 | 23.7 | 18.4 | 10.4 |
| Serious Sam 4 (2020) | 141.5 | 81.4 | 68 | 50.5 | 38.8 | 24.4 |
| Mafia Definitive Edition (2020) | 135.9 | 70.6 | 64.9 | 42.7 | 21.8 | |
| Star Wars Squadrons (2020) | 389 | 203 | 172 | 157 | 103 | 57.8 |
| FIFA 21 (2020) | 231 | 227 | 214 | 214 | 187 | 120 |
| Watch Dogs Legion (2020) | 114 | 77.9 | 65.9 | 29.4 | 19.4 | 12 |
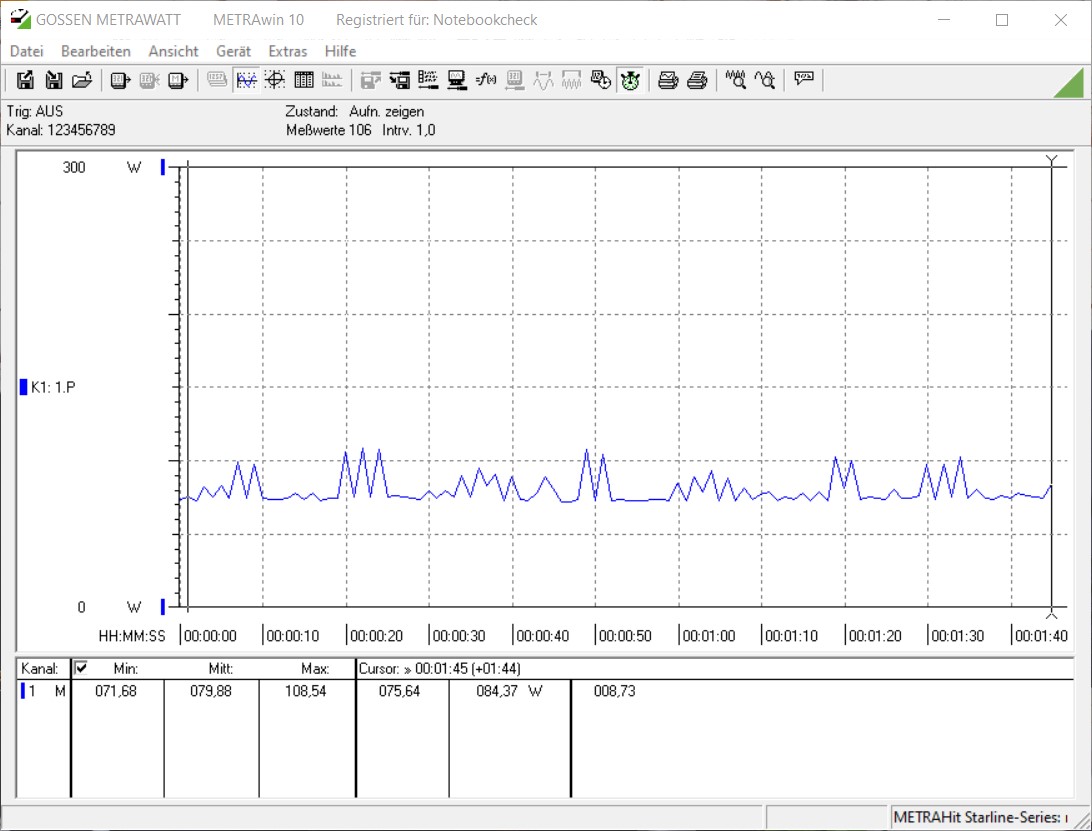
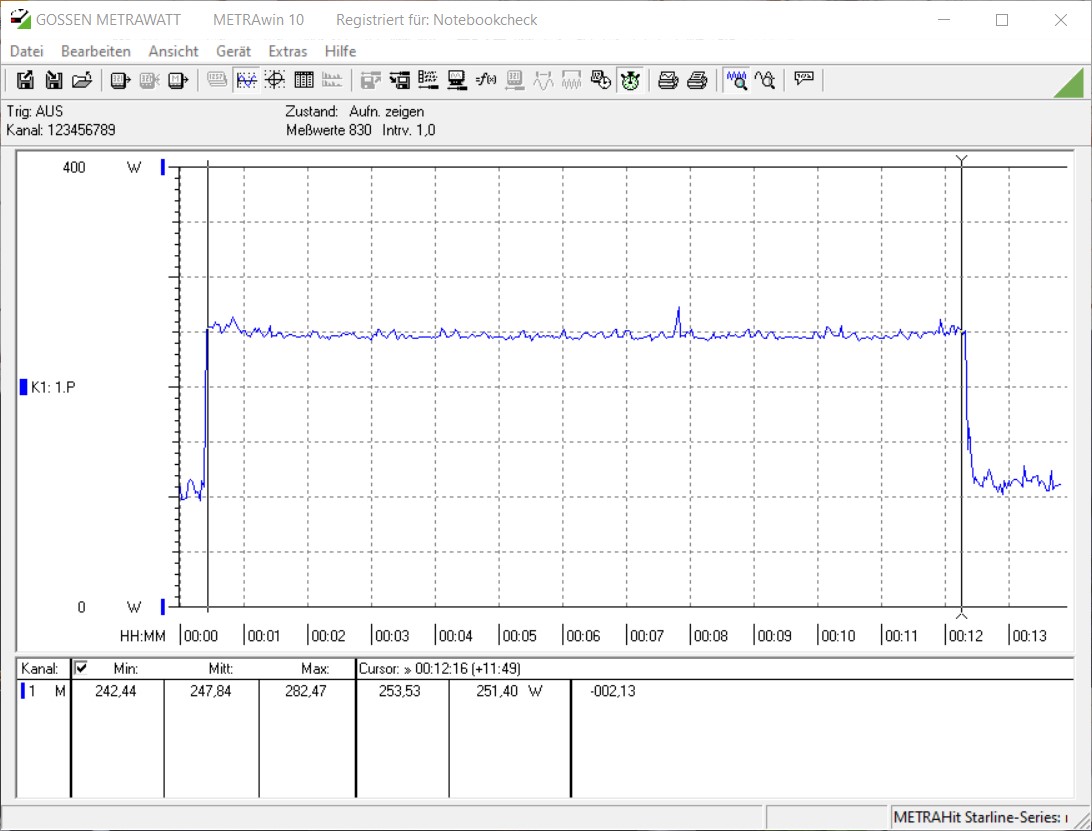
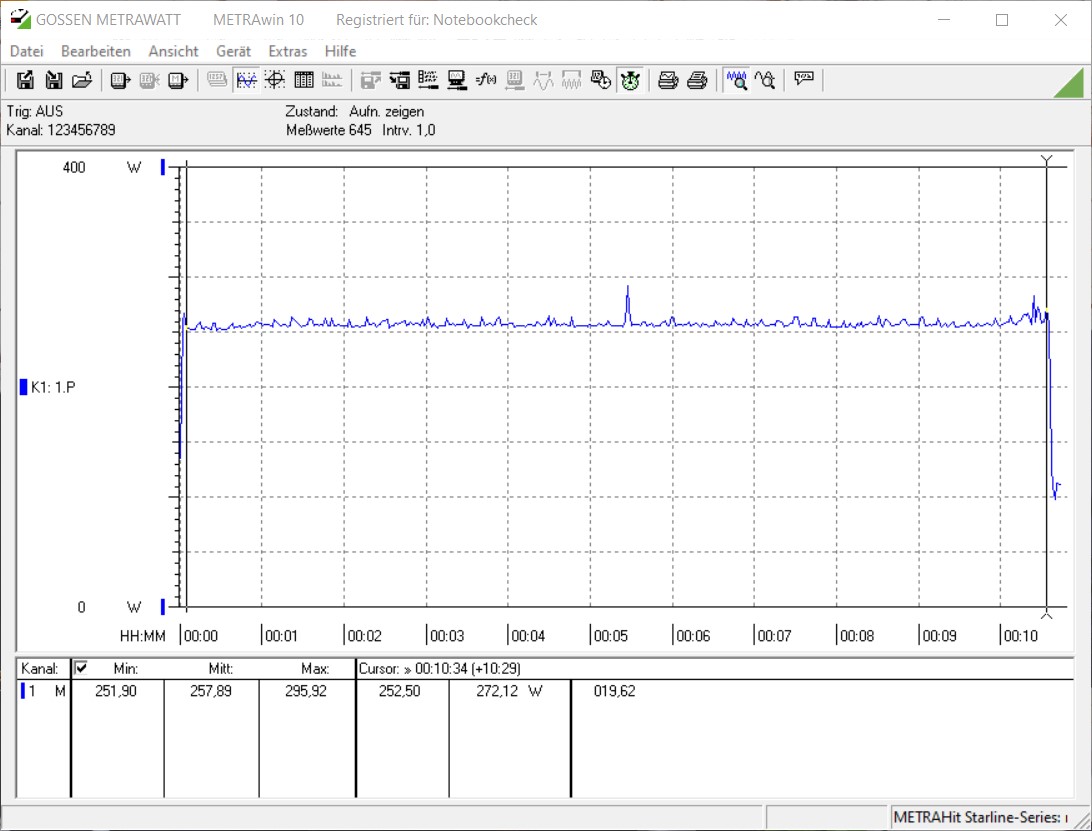
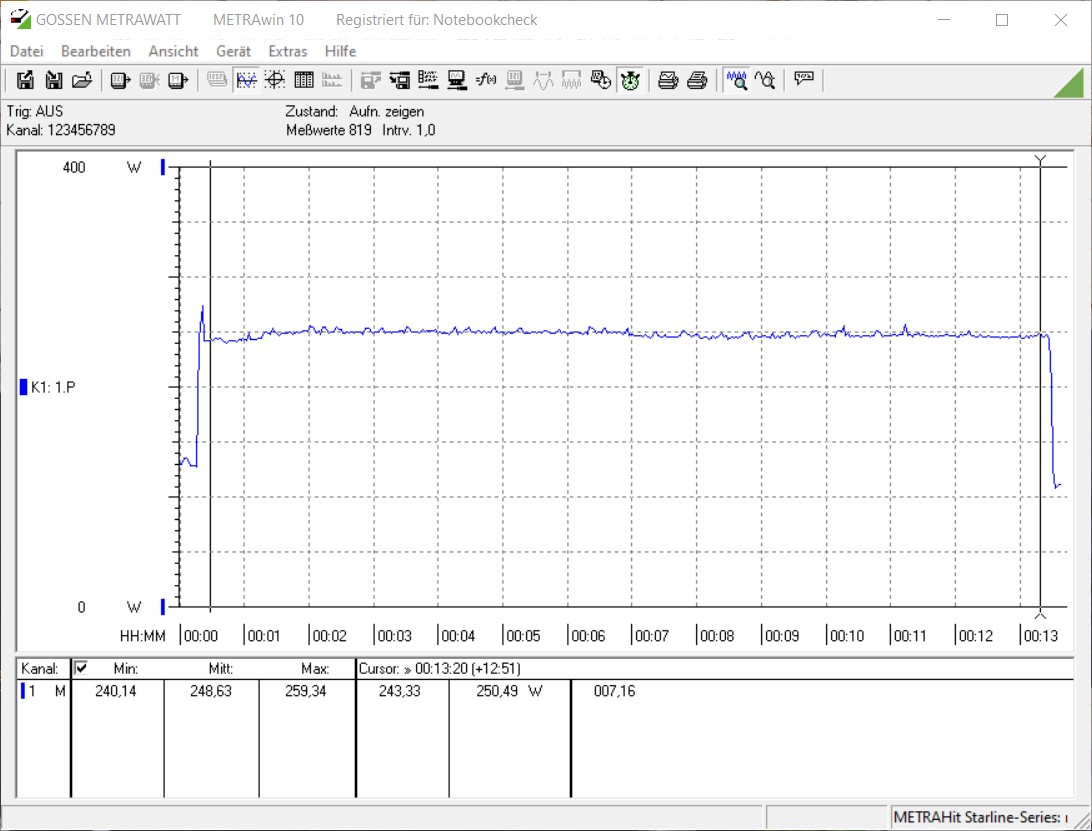
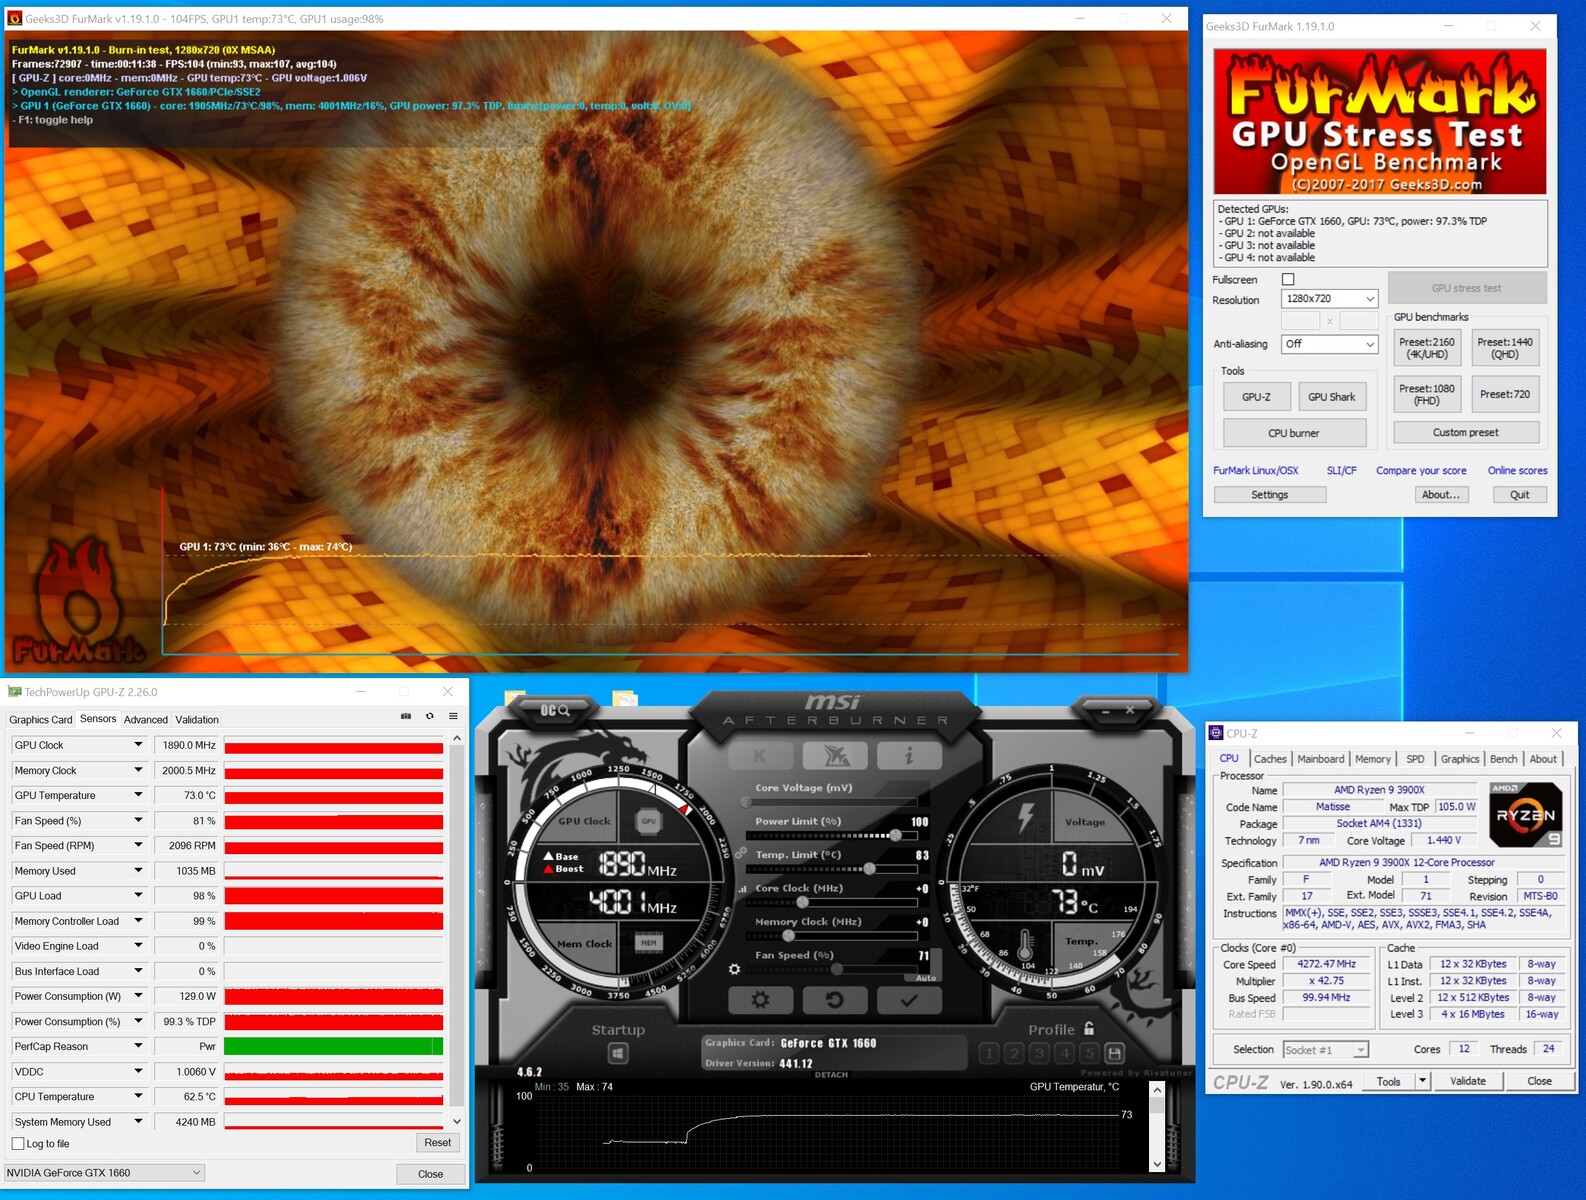
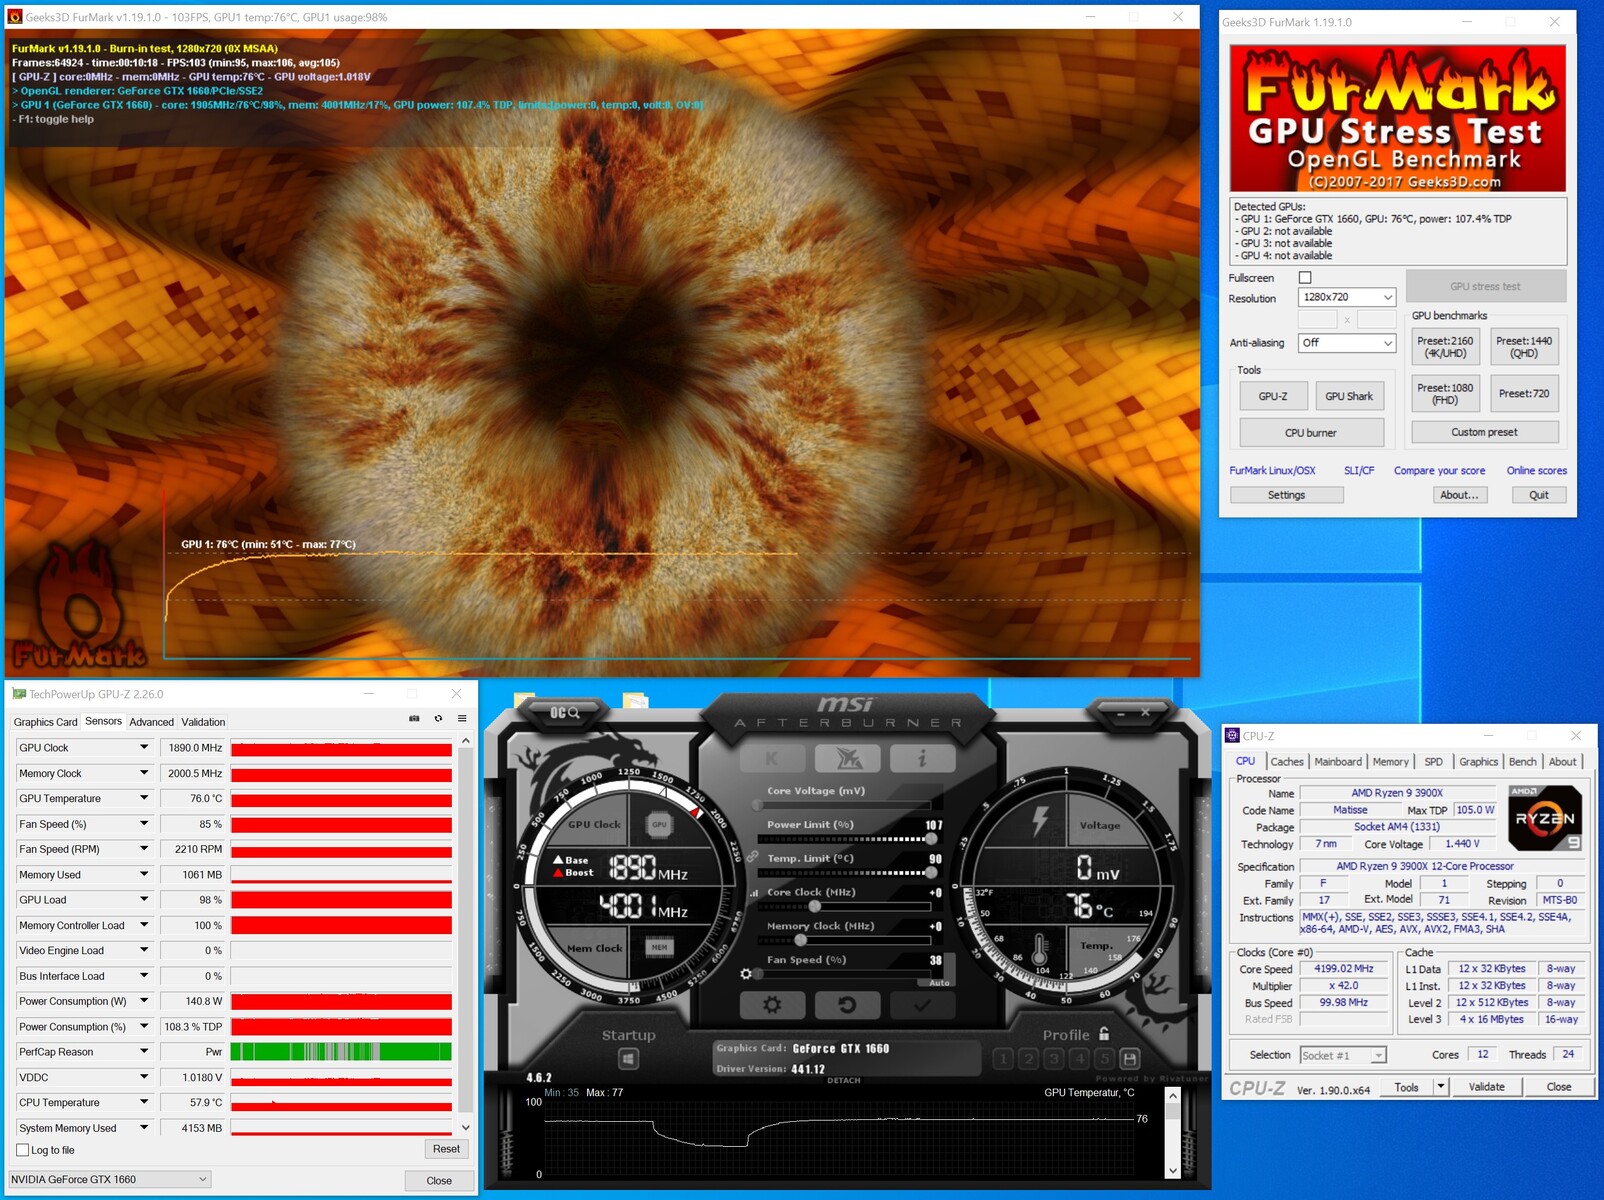
Emissions - Noisy, but no coil whine
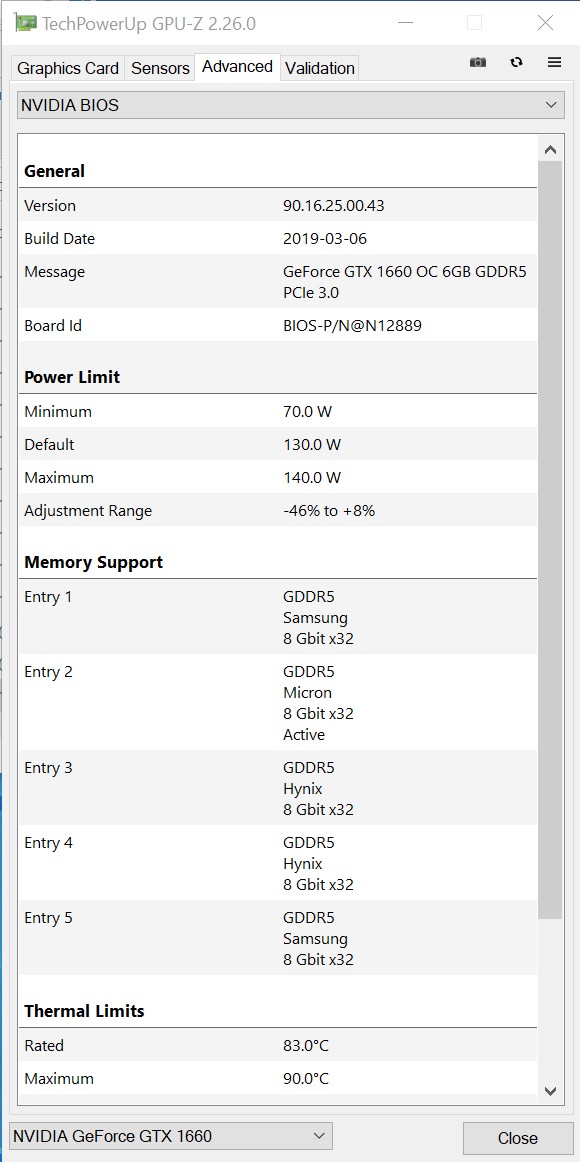
PNY has set the TDP of the XLR8 Gaming OC at 120 W, the same as the GTX 1660 Ti has. Nevertheless, the latter offers better performance per watt because of its higher volume of shader and texture units. Having GDDR6 VRAM instead of GDDR5 helps the GTX 1660 Ti pull away from the GTX 1660 too.
Our test system consumes just under 80 W when idling, a value that increases to 248 W under sustained load. Incidentally, PNY allows the power target (PT) of the GPU to be increased to 107%, which results in a peak TDP of 128.4 W. We confirmed this during our tests, while our test system peaked at 258 W under load too.
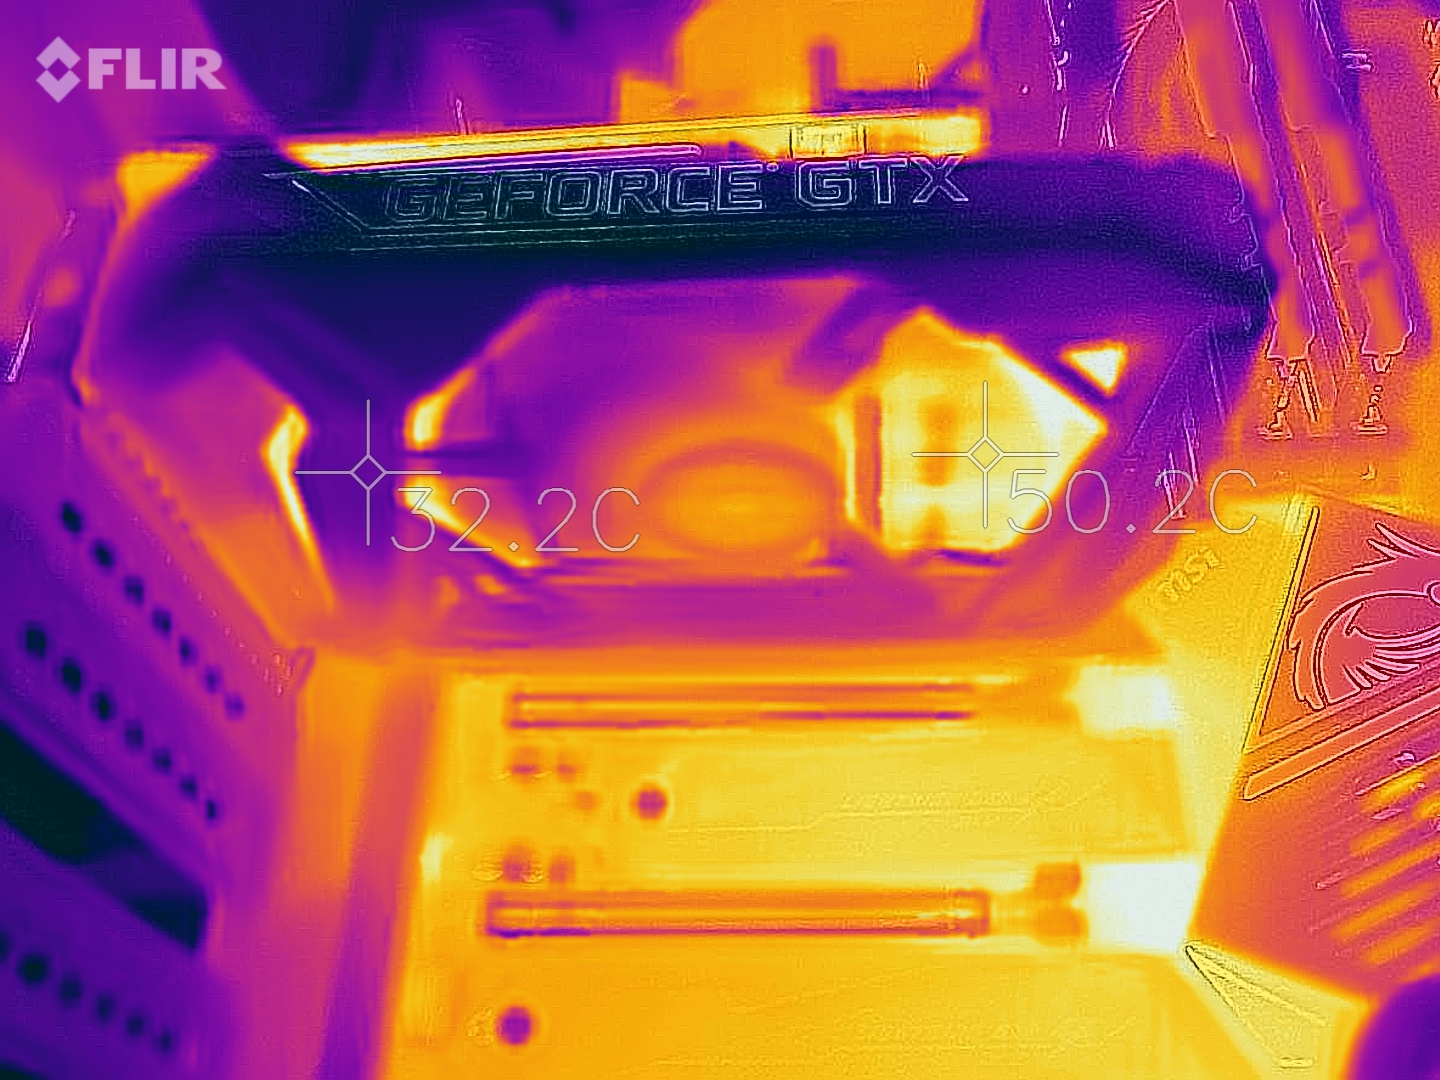
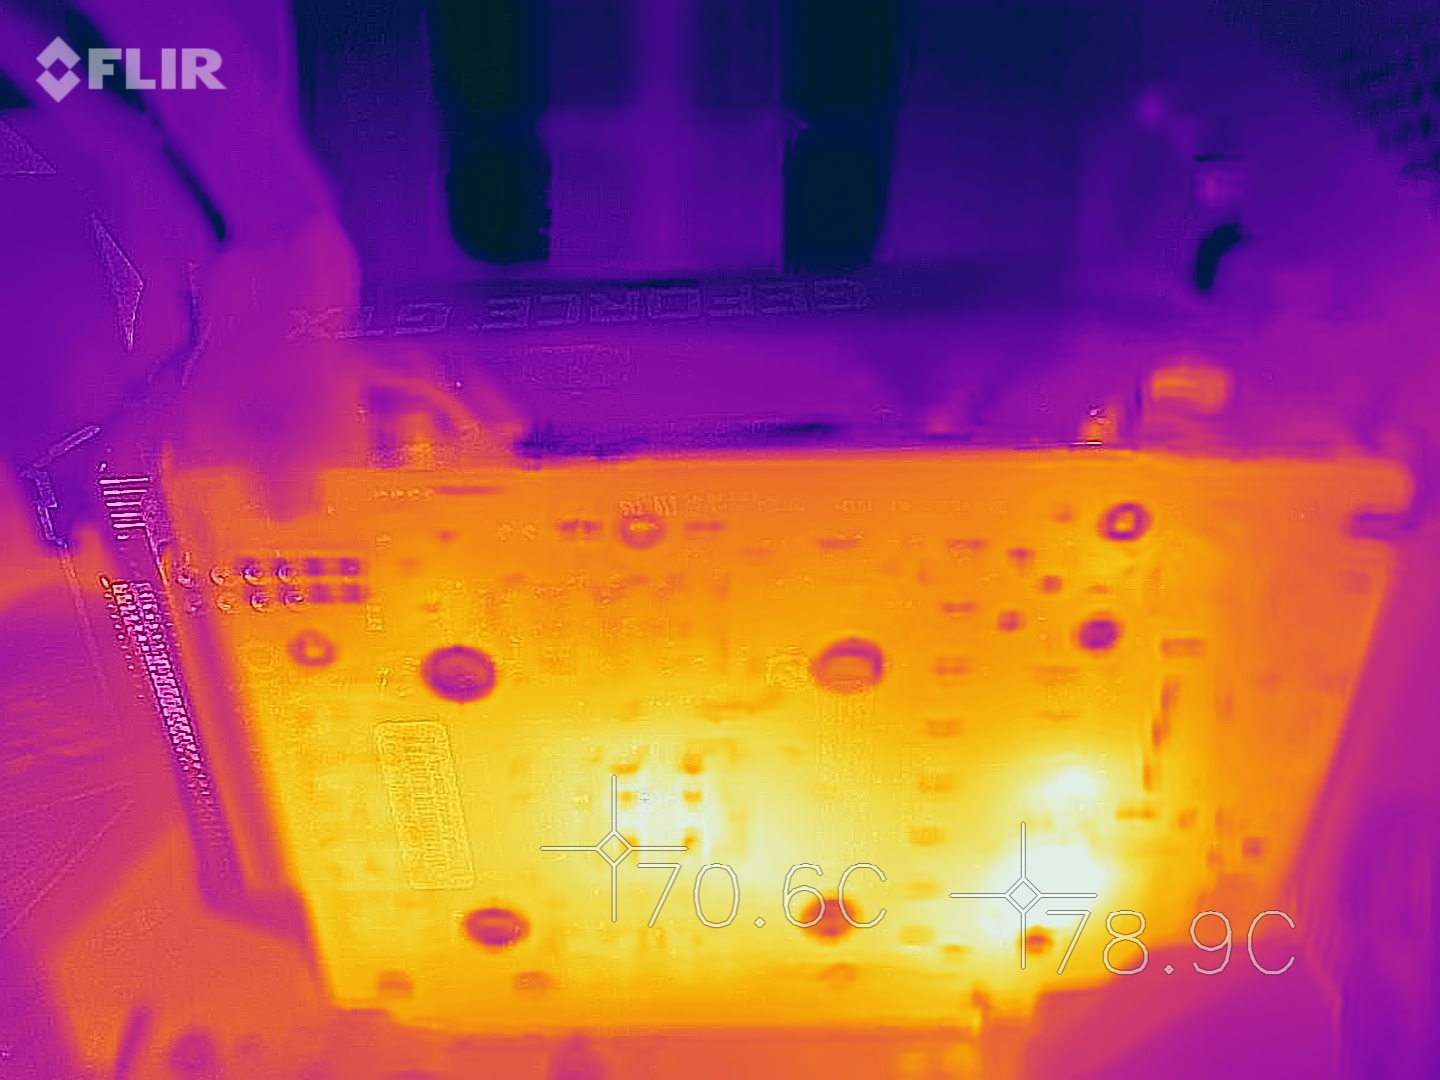
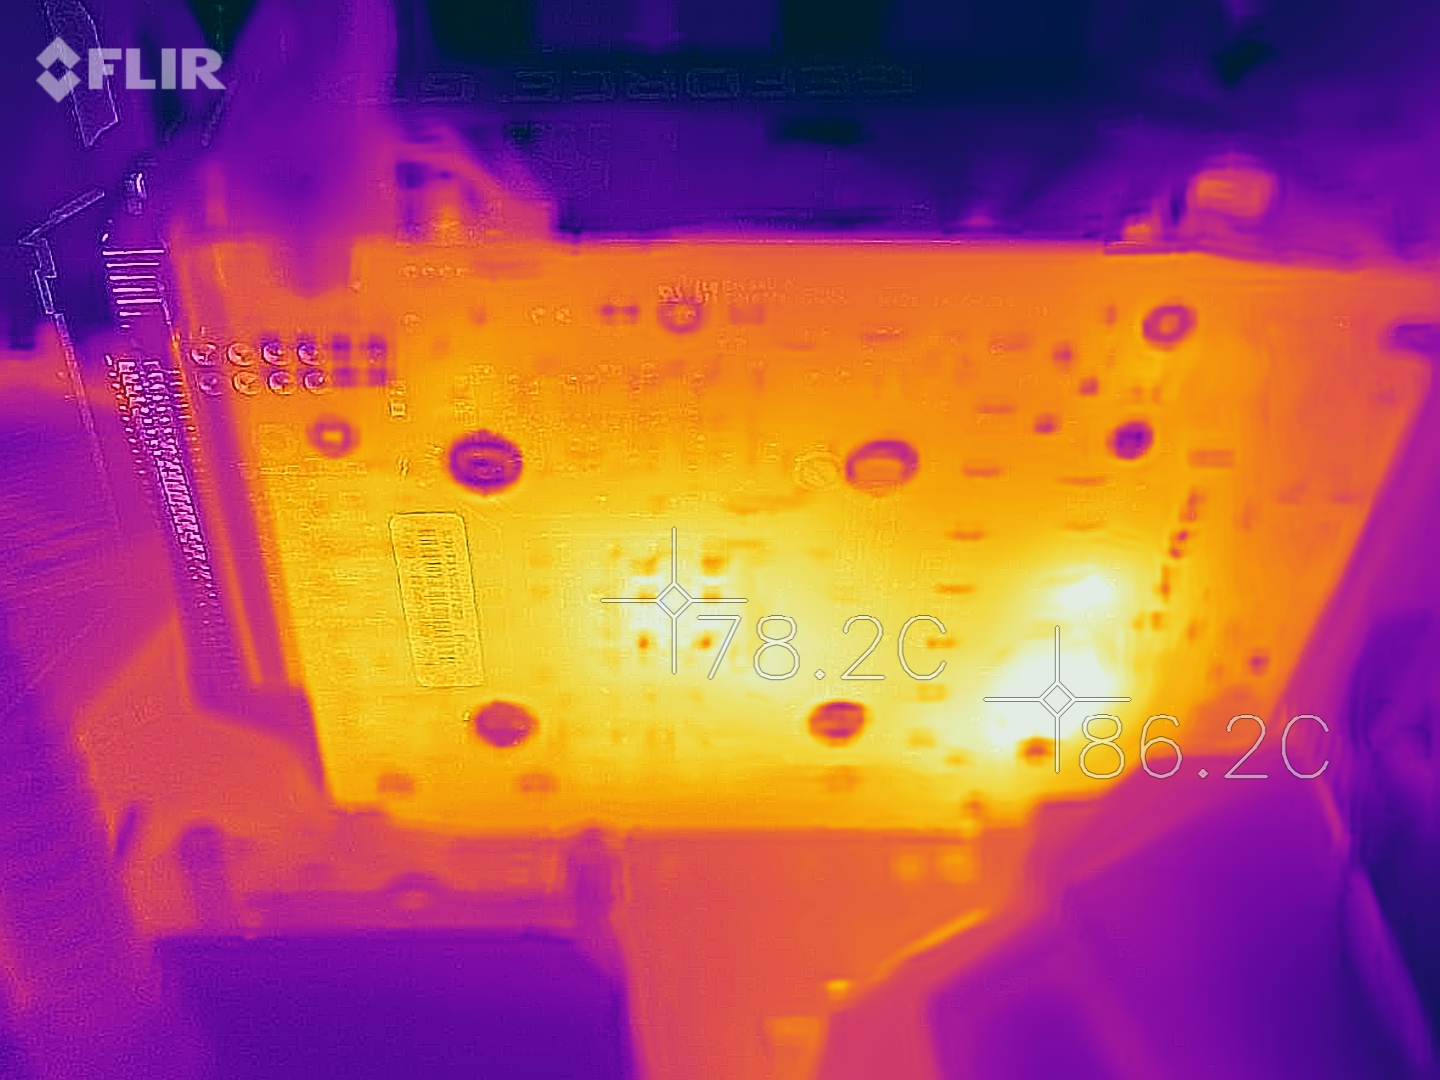
We encountered no temperature issues with the XLR8 Gaming OC during our tests. Core temperatures peaked at 76 °C even with its PT set to 107%, although the PCB reached 86 °C. This is still within safe limits, though. Reducing the PT to 100% resulted in temperatures dropping to 80 °C on the back of the PCB too.
Additionally, the GPU fan runs more quietly when at 100% PT, but our review unit always run comparatively loudly. We did not hear any coil whine during our tests, though.
| Power Consumption | |
| 1920x1080 The Witcher 3 ultra (external Monitor) | |
| AMD Radeon RX 5700 XT (Idle: 83.2 W) | |
| XFX AMD Radeon RX 590 OC+ 8 GB (Idle: 85.9 W) | |
| AMD Radeon RX 5700 XT (Idle: 69.8 W) | |
| XFX AMD Radeon RX 590 OC+ 8 GB | |
| Nvidia GeForce RTX 2060 Super (Idle: 86.7 W) | |
| AMD Radeon RX 5700 (Idle: 77.9 W) | |
| Sapphire NITRO+ RX 570 8 GB (Idle: 85.5 W) | |
| Nvidia GeForce RTX 2060 Super (82.7 fps, Idle: 77.12 W) | |
| AMD Radeon RX 5700 (84.2 fps, Idle: 64.5 W) | |
| MSI RTX 2060 Gaming Z 6G (Idle: 74.66 W) | |
| Sapphire NITRO+ RX 570 8 GB (Idle: 72.61 W) | |
| PNY GeForce GTX 1660 (Idle: 79.88 W) | |
| Zotac GeForce GTX 1660 Ti 6 GB (Idle: 68.3 W) | |
| Gainward GeForce GTX 1650 4 GB (Idle: 82.4 W) | |
| Gainward GeForce GTX 1650 4 GB (Idle: 64.63 W) | |
| 1280x720 FurMark 1.19 GPU Stress Test (external Monitor) | |
| XFX AMD Radeon RX 590 OC+ 8 GB (Idle: 85.9 W) | |
| XFX AMD Radeon RX 590 OC+ 8 GB | |
| AMD Radeon RX 5700 XT (Idle: 83.2 W) | |
| AMD Radeon RX 5700 XT (239 fps, Idle: 69.8 W) | |
| Sapphire NITRO+ RX 570 8 GB (Idle: 85.5 W) | |
| Nvidia GeForce RTX 2060 Super (Idle: 86.7 W) | |
| Sapphire NITRO+ RX 570 8 GB (Idle: 72.61 W) | |
| AMD Radeon RX 5700 (Idle: 77.9 W) | |
| MSI RTX 2060 Gaming Z 6G (Idle: 74.66 W) | |
| Nvidia GeForce RTX 2060 Super (237 fps, Idle: 77.12 W) | |
| AMD Radeon RX 5700 (207 fps, Idle: 64.5 W) | |
| PNY GeForce GTX 1660 (Idle: 79.88 W) | |
| Zotac GeForce GTX 1660 Ti 6 GB (Idle: 68.3 W) | |
| Gainward GeForce GTX 1650 4 GB (Idle: 82.4 W) | |
| Gainward GeForce GTX 1650 4 GB (Idle: 64.63 W, Idle: 64.63 W) | |
* ... smaller is better
Pros
Cons
Verdict - An affordable and compact alternative for 1080p gaming
Anyone who has a budget of around 250 Euros (~$276) for a new graphics card will stumble upon a GeForce GTX 1660 sooner or later. The PNY GeForce GTX 1660 XLR8 Gaming OC can handle all modern titles in at least 1080p and at maximum graphics. While the card is capable of playing some games like FIFA 20 at 2160p, the GTX 1660 offers worse performance per watt than the GTX 1660 Ti. This is to be expected though, as the two cards share the same TDP, but the GTX 1660 Ti has the edge in many other specifications.
The PNY GeForce GTX 1660 XLR8 Gaming OC costs approximately 225 Euros (~$249) at the time of writing, and it should fit in most compact PC builds. Its 6 GB of VRAM does not hold the card back either, as our review unit held its own against the AMD Radeon RX 570, which has an additional 2 GB of VRAM.
If you are undecided about the XLR8 Gaming OC, then it is worth keeping in mind that the card is not the quietest on the market. We can even hear our review unit whirring away in a closed case, so we would recommend buying a dual-fan version if you are intent on having a quiet build.
The PNY GeForce GTX 1660 XLR8 Gaming OC offers excellent value for money. However, it falls short of the performance per watt that the GeForce GTX 1660 Ti offers.
Overall, we liked the performance that the PNY GeForce GTX 1660 XLR8 Gaming OC offers. NVIDIA almost has a free run currently as AMD has not brought any new affordable GPUs to market. While this may change soon, Polaris cards remain the only alternatives to NVIDIA's GeForce GTX 16 series. AMD has its Radeon RX 5700 series, but these are priced in a different league to the GTX 16 series and are designed for 1440p gaming.
NVIDIA GeForce GTX 1660 benchmarks (vendor agnostic)
Benchmarks
3DM Vant. Perf. total +
specvp12 sw-03 +
* Smaller numbers mean a higher performance
Game Benchmarks
The following benchmarks stem from our benchmarks of review laptops. The performance depends on the used graphics memory, clock rate, processor, system settings, drivers, and operating systems. So the results don't have to be representative for all laptops with this GPU. For detailed information on the benchmark results, click on the fps number.

Forza Horizon 6
2026
Pragmata
2026
Civilization 7
2025Monster Hunter Wilds
2025
Black Myth: Wukong
2024
Once Human
2024
The First Descendant
2024
F1 24
2024

Ghost of Tsushima
2024

Alone in the Dark
2024
Dragon's Dogma 2
2024
Last Epoch
2024
Skull & Bones
2024
Helldivers 2
2024
Enshrouded
2024
Palworld
2024

Ready or Not
2023
The Finals
2023


EA Sports WRC
2023
Alan Wake 2
2023
Lords of the Fallen
2023
Total War Pharaoh
2023

EA Sports FC 24
2023
Counter-Strike 2
2023
Cyberpunk 2077
2023
Baldur's Gate 3
2023
Lies of P
2023
Starfield
2023
Armored Core 6
2023
Immortals of Aveum
2023
Atlas Fallen
2023

F1 23
2023
Diablo 4
2023

Dead Island 2
2023
The Last of Us
2023

Company of Heroes 3
2023
Sons of the Forest
2023
Atomic Heart
2023
Returnal
2023
Hogwarts Legacy
2023
Dead Space Remake
2023
The Witcher 3 v4
2023
High On Life
2023


FIFA 23
2022
The Quarry
2022
F1 22
2022
Vampire Bloodhunt
2022
Ghostwire Tokyo
2022

Cyberpunk 2077 1.6
2022
Elex 2
2022
GRID Legends
2022
Elden Ring
2022
Dying Light 2
2022

God of War
2022
Halo Infinite
2021
Farming Simulator 22
2021
Battlefield 2042
2021
Forza Horizon 5
2021

Riders Republic
2021

Back 4 Blood
2021
Far Cry 6
2021
Alan Wake Remastered
2021
New World
2021
Deathloop
2021
F1 2021
2021

Days Gone
2021


Outriders
2021
Hitman 3
2021
Cyberpunk 2077 1.0
2020

Yakuza Like a Dragon
2020


Dirt 5
2020
Watch Dogs Legion
2020
FIFA 21
2020
Star Wars Squadrons
2020

Serious Sam 4
2020
Crysis Remastered
2020

Horizon Zero Dawn
2020
Death Stranding
2020
F1 2020
2020
Valorant
2020
Gears Tactics
2020
Doom Eternal
2020
Hunt Showdown
2020
Escape from Tarkov
2020


Need for Speed Heat
2019

GRID 2019
2019

FIFA 20
2019
Borderlands 3
2019
Control
2019
F1 2019
2019

Rage 2
2019
Anno 1800
2019
The Division 2
2019
Far Cry New Dawn
2019
Metro Exodus
2019
Apex Legends
2019
Darksiders III
2018
Farming Simulator 19
2018
Forza Horizon 4
2018

Strange Brigade
2018
Far Cry 5
2018
X-Plane 11.11
2018
Rocket League
2017Dota 2 Reborn
2015
The Witcher 3
2015
GTA V
2015| low | med. | high | ultra | QHD | 4K | |
|---|---|---|---|---|---|---|
| Forza Horizon 6 | 93 | 55 | 27 | |||
| Pragmata | 64.1 | 46.2 | ||||
| Civilization 7 | 218 | 124.5 | 61.9 | 38.8 | 18.3 | |
| Monster Hunter Wilds | 37.7 | 30 | ||||
| Black Myth: Wukong | 42 | 30 | 22 | 11 | ||
| Once Human | 111 | 73.7 | 53.7 | 34.3 | 58.4 | 16.2 |
| The First Descendant | 102.8 | 60.8 | 46.8 | 37.2 | 22.7 | 10.7 |
| F1 24 | 170.7 | 137.6 | 103.2 | |||
| Senua's Saga Hellblade 2 | 32.8 | 26.5 | 16.4 | |||
| Ghost of Tsushima | 59.9 | 50.7 | 43.5 | 30.5 | ||
| Horizon Forbidden West | 63.9 | 55 | 38.8 | 35 | 24.5 | 12 |
| Alone in the Dark | 149.9 | 116.5 | 96.3 | 30.3 | 12.3 | |
| Dragon's Dogma 2 | 40.3 | 35.4 | 26.7 | 14.6 | ||
| Last Epoch | 135.6 | 106 | 88.9 | 67.3 | 42.4 | 18.6 |
| Skull & Bones | 72 | 64 | 51 | 44 | 32 | 21 |
| Helldivers 2 | 82.7 | 61.6 | 52.6 | 51.6 | 35.3 | 18.1 |
| Enshrouded | 43.6 | 37.3 | 29.9 | 20.6 | 17.2 | 8.5 |
| Palworld | 81.7 | 67.9 | 51.4 | 46.7 | 33.6 | 17.2 |
| Prince of Persia The Lost Crown | 359 | 310 | 182.7 | 90.8 | ||
| Ready or Not | 138.8 | 113.7 | 107.6 | 63.7 | 35.3 | 10.9 |
| The Finals | 153.7 | 109.7 | 95.8 | 70.1 | 42 | 16.3 |
| Avatar Frontiers of Pandora | 50 | 44 | 36 | 27 | 21 | 16 |
| Call of Duty Modern Warfare 3 2023 | 71 | 65 | 47 | 45 | 30 | 17 |
| EA Sports WRC | 76.1 | 55 | 50.8 | 47.1 | 27.8 | 12.9 |
| Alan Wake 2 | 37.7 | 31.7 | 29.1 | 17.3 | 9.2 | |
| Lords of the Fallen | 50.8 | 40.7 | 29.5 | 19.7 | 13 | 4.9 |
| Total War Pharaoh | 209.8 | 144.2 | 82.8 | 65.9 | 43.5 | 21.1 |
| Assassin's Creed Mirage | 74 | 67 | 63 | 48 | 35 | 19 |
| EA Sports FC 24 | 166.9 | 156.7 | 130 | 107.2 | 77.9 | 23.8 |
| Counter-Strike 2 | 271 | 223 | 132.5 | 81.2 | 62.3 | 31.3 |
| Cyberpunk 2077 | 71.9 | 56.4 | 47.7 | 43.1 | 26.1 | 11.2 |
| Baldur's Gate 3 | 67.7 | 54.6 | 45.2 | 45 | 30.1 | 15.7 |
| Lies of P | 106.6 | 92 | 77.1 | 68.3 | 33.3 | 24.9 |
| Starfield | 38.4 | 32.8 | 26.2 | 23.5 | 18.6 | 11.3 |
| Armored Core 6 | 103 | 80.9 | 74.1 | 54.8 | 60.5 | 18.9 |
| Immortals of Aveum | 32.1 | 26.6 | 19.9 | 12.6 | ||
| Atlas Fallen | 82.4 | 78.1 | 72.8 | 62.1 | 41.8 | 20 |
| Ratchet & Clank Rift Apart | 59.6 | 49.3 | 36.4 | 31.9 | 21.6 | 13.5 |
| F1 23 | 179.9 | 159.5 | 109.3 | 78.6 | 57 | 29.4 |
| Diablo 4 | 141.5 | 122.3 | 107.8 | 89.1 | 57.3 | 29.1 |
| Star Wars Jedi Survivor | 48.4 | 41 | 38.6 | 36.1 | 22.2 | 10.2 |
| Dead Island 2 | 156.4 | 135.1 | 92.3 | 67.7 | 43.4 | 18.2 |
| The Last of Us | 59.7 | 47.1 | 38.9 | 31.6 | 18.9 | |
| Resident Evil 4 Remake | 78.4 | 54.2 | 49.3 | 42.2 | 29.5 | 11.8 |
| Company of Heroes 3 | 116.9 | 96.9 | 74 | 73.7 | 52.5 | 29.2 |
| Sons of the Forest | 67.2 | 51.2 | 47.6 | 47.1 | 33.2 | 18.1 |
| Atomic Heart | 111.4 | 83.4 | 48.5 | 38.4 | 28.1 | 14.8 |
| Returnal | 60 | 58 | 51 | 44 | 32 | 16 |
| Hogwarts Legacy | 78.9 | 59 | 45.5 | 35.7 | 24.3 | 12.8 |
| Dead Space Remake | 52 | 48 | 42 | 42 | 27 | |
| The Witcher 3 v4 | 123.5 | 92.9 | 78 | 63.9 | 44.2 | 23.8 |
| High On Life | 157.3 | 89.9 | 72.6 | 57.6 | 34.8 | 14.3 |
| The Callisto Protocol | 92.8 | 67.4 | 42.6 | 42.7 | 30.1 | 12.6 |
| Need for Speed Unbound | 97.7 | 85.8 | 67.8 | 53.7 | 31.9 | 16.5 |
| Spider-Man Miles Morales | 85.1 | 74.2 | 72.2 | 62.3 | 41 | 17.3 |
| Call of Duty Modern Warfare 2 2022 | 85 | 75 | 55 | 50 | 35 | 21 |
| Uncharted Legacy of Thieves Collection | 55.1 | 52.1 | 40.5 | 39 | 25 | 9.36 |
| A Plague Tale Requiem | 67.7 | 50 | 36.6 | 27.3 | 19 | 9.97 |
| FIFA 23 | 185.2 | 174.1 | 117 | 114.9 | 83.4 | 47.2 |
| The Quarry | 90 | 67 | 55 | 36 | 19 | 6 |
| F1 22 | 182 | 162 | 117 | 86 | 63 | 34 |
| Vampire Bloodhunt | 216 | 115.7 | 111 | 107.2 | 68.4 | 29.6 |
| Ghostwire Tokyo | 84.1 | 83.8 | 83.1 | 82.2 | 51.6 | 22.3 |
| Tiny Tina's Wonderlands | 115 | 91 | 62 | 48 | 33 | 12 |
| Cyberpunk 2077 1.6 | 71 | 58 | 47 | 40 | 24 | 10 |
| Elex 2 | 65.3 | 59.5 | 51.8 | 46.7 | 33.1 | 17.4 |
| GRID Legends | 183 | 136 | 110 | 79 | 60 | 33 |
| Elden Ring | 59.9 | 59.8 | 59.5 | 54.9 | 41.8 | 24.3 |
| Dying Light 2 | 51 | 39.1 | 32.1 | 21.8 | 10.7 | |
| Rainbow Six Extraction | 102 | 97 | 95 | 77 | 47 | 21 |
| God of War | 81 | 67 | 52 | 35 | 28 | 19 |
| Halo Infinite | 74.6 | 67.7 | 68 | 69.6 | 49.3 | |
| Farming Simulator 22 | 288 | 154 | 114 | 92 | 68.3 | 40.9 |
| Battlefield 2042 | 142 | 79.4 | 66.5 | 58.6 | 42.3 | 22.6 |
| Forza Horizon 5 | 201 | 99 | 87 | 42 | 35 | 23 |
| Call of Duty Vanguard | 89.8 | 80.5 | 62.7 | 55.8 | 40.1 | 21.6 |
| Riders Republic | 149 | 86 | 68 | 59 | 40 | 20 |
| Guardians of the Galaxy | 128 | 83 | 80 | 77 | 54 | 28 |
| Back 4 Blood | 140 | 124 | 113 | 71.2 | 34.6 | |
| Far Cry 6 | 156 | 87 | 76 | 65 | 34 | 3 |
| Alan Wake Remastered | 92.6 | 88.2 | 85.9 | 60 | ||
| New World | 143 | 71.1 | 65 | 55.4 | 36.8 | 25.2 |
| Deathloop | 117 | 74.2 | 60.1 | 49 | 33.5 | 16.8 |
| F1 2021 | 367 | 181 | 145 | 99 | 75 | 42 |
| Monster Hunter Stories 2 | 144 | 144 | 143 | 125 | 75.1 | |
| Days Gone | 156 | 90 | 80.6 | 59.3 | 42.1 | 23.3 |
| Mass Effect Legendary Edition | 114 | 112 | 94.6 | 47.9 | ||
| Resident Evil Village | 259 | 110 | 99.6 | 86.6 | 56 | 27.8 |
| Outriders | 183 | 99.5 | 80.8 | 68.3 | 44.8 | 30.3 |
| Hitman 3 | 195 | 110 | 93 | 86 | 57 | 31 |
| Cyberpunk 2077 1.0 | 97.6 | 51.9 | 42.6 | 36.6 | 22.3 | 9.55 |
| Immortals Fenyx Rising | 96 | 58 | 49 | 45 | 36 | 21 |
| Yakuza Like a Dragon | 110 | 68.9 | 66.8 | 59 | 39 | 19 |
| Call of Duty Black Ops Cold War | 151 | 91.7 | 70 | 52.5 | 36.8 | 2.01 |
| Assassin´s Creed Valhalla | 110 | 59 | 42 | 37 | 27 | 15 |
| Dirt 5 | 151 | 78.6 | 60.7 | 50 | 40.8 | 25.7 |
| Watch Dogs Legion | 114 | 77.9 | 65.9 | 29.4 | 19.4 | 12 |
| FIFA 21 | 231 | 227 | 214 | 214 | 187 | 120 |
| Star Wars Squadrons | 389 | 203 | 172 | 157 | 103 | 57.8 |
| Mafia Definitive Edition | 135.9 | 70.6 | 64.9 | 42.7 | 21.8 | |
| Serious Sam 4 | 141.5 | 81.4 | 68 | 50.5 | 38.8 | 24.4 |
| Crysis Remastered | 212 | 94.3 | 51.4 | 40.8 | 28.9 | 16.6 |
| Flight Simulator 2020 | 84.6 | 49.9 | 35.8 | 23.7 | 18.4 | 10.4 |
| Horizon Zero Dawn | 130 | 82 | 67 | 54 | 40 | 21 |
| Death Stranding | 138 | 86.7 | 79.3 | 77.6 | 53.3 | 28.6 |
| F1 2020 | 329 | 170 | 134 | 93 | 67 | 38 |
| Valorant | 324.5 | 306.2 | 287.1 | 226.3 | 125.3 | |
| Gears Tactics | 297.9 | 141.7 | 92 | 61.9 | 43 | 22.8 |
| Doom Eternal | 257 | 138 | 121 | 115 | 71.7 | 38.2 |
| Hunt Showdown | 211 | 82.1 | 64.8 | 39.7 | 19.8 | |
| Escape from Tarkov | 121 | 121 | 93.2 | 79.2 | 47.6 | 23.9 |
| Red Dead Redemption 2 | 130 | 73 | 49.1 | 30.9 | 24.7 | |
| Star Wars Jedi Fallen Order | 112 | 90 | 81 | 53.1 | 26.4 | |
| Need for Speed Heat | 111 | 89 | 79 | 70 | 49.5 | 23 |
| Call of Duty Modern Warfare 2019 | 159 | 112 | 90 | 79 | 56.8 | 31.6 |
| GRID 2019 | 160 | 119 | 97 | 67 | 51.4 | 31.9 |
| Ghost Recon Breakpoint | 114 | 73 | 67 | 49 | 34 | 17 |
| FIFA 20 | 265 | 262 | 241 | 239 | 202 | 127 |
| Borderlands 3 | 196 | 96 | 64 | 49 | 34 | 15 |
| Control | 198 | 70 | 52.5 | 31.6 | 15.8 | |
| F1 2019 | 261 | 142 | 123 | 82 | 64 | 38 |
| Total War: Three Kingdoms | 237.8 | 98.2 | 60.6 | 42 | 25.8 | |
| Rage 2 | 168 | 83 | 71 | 71 | 45.3 | 21.7 |
| Anno 1800 | 94 | 92 | 69 | 34.9 | 23.6 | 14 |
| The Division 2 | 185 | 103 | 82 | 59 | 40 | 21 |
| Far Cry New Dawn | 157 | 95 | 89 | 82 | 59 | 31 |
| Metro Exodus | 147 | 70 | 52 | 42 | 32 | 20 |
| Apex Legends | 144 | 144 | 114 | 111 | 77 | 43.6 |
| Darksiders III | 196 | 115 | 96 | 83 | 54.5 | 18.8 |
| Farming Simulator 19 | 242 | 190 | 153 | 116 | 80 | 41.9 |
| Forza Horizon 4 | 200 | 132 | 123 | 98 | 76 | 50 |
| Shadow of the Tomb Raider | 204 | 93 | 81 | 73 | 48 | 24 |
| Strange Brigade | 322 | 131 | 108 | 93 | 66 | 35 |
| Far Cry 5 | 176 | 99 | 91 | 85 | 58 | 30 |
| X-Plane 11.11 | 190 | 166 | 131 | 98 | ||
| Final Fantasy XV Benchmark | 159 | 80 | 56 | 41 | 23 | |
| Rocket League | 249 | 249 | 183 | 129 | 81 | |
| Dota 2 Reborn | 253 | 224 | 196 | 178 | 86 | |
| The Witcher 3 | 295 | 187 | 101 | 57 | 36 | |
| GTA V | 188 | 188 | 155 | 75 | 52 | 49 |
| low | med. | high | ultra | QHD | 4K | < 30 fps < 60 fps < 120 fps ≥ 120 fps | 18 46 71 | 1 32 70 34 | 8 41 69 19 | 9 58 50 4 | 33 70 21 6 | 93 25 6 3 |
For more games that might be playable and a list of all games and graphics cards visit our Gaming List

