Notebookcheck Logo

AMD Radeon R9 380

The AMD Radeon R9 380 is a desktop graphics card of the performance class that was introduced in mid 2015. It is based on the 28 nm Tonga GPU with 1792 activated shaders (of the 2048) and a 256 Bit GDDR5 memory interface (5700 MHz effective resulting in 182.4 GB/s). The card integrates 112 TMUs and 28 ROPs and supports DirectX 12 (Feature Level 12_0).

The R9 380 competes with the desktop GeForce GTX 960 and in our benchmark tests it was able to pull slightly ahead on average but stay behind the older Radeon R9 280X. Therefore, demanding games of 2015 should be playable in maximum detail settings and full HD resolution. See below for a list of tested games.

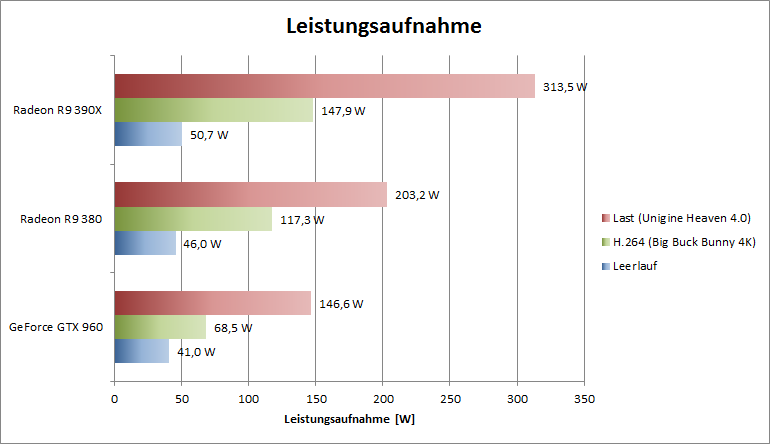
The power consumption is rated at 190 Watt (TDP) and is on average clearly higher than the GTX 960. Compared to the only slightly faster 280X however, the 280 is very efficient.

R9 300 Series

Radeon R9 390X2 compare 2x 2520/ cores @ 1 GHz512 Bit @ 5400 MHz
Radeon R9 390X compare 2816 @ 1.05 GHz512 Bit @ 6000 MHz
Radeon R9 380 1792 @ 0.97 GHz384 Bit @ 5700 MHz
CodenameTonga Pro
ArchitectureGCN
Pipelines1792 - unified
Core Speed970 MHz
Memory Speed5700 MHz
Memory Bus Width384 Bit
Memory TypeGDDR5
Max. Amount of Memory4 GB
Shared Memoryno
APIDirectX 12 (FL 12_0), OpenGL 4.4
Power Consumption190 Watt
Transistor Count5 Billion
technology28 nm
FeaturesMantle, Eyefinity, CrossFire, PowerTune, ZeroCore, HD3D, TrueAudio, FreeSync
Date of Announcement26.06.2015
InformationPCI-E 3.0, HDMI mit 4K-Support (max. 30 Hz)
Link to Manufacturer Pagewww.amd.com

Benchmarks

Performance Rating - 3DMark 11 + Fire Strike + Time Spy
3.7 pt (11%)
3DMark Vantage
3DM Vant. Perf. total +
3DM Vant. Perf. GPU no PhysX +
3DMark 06 3DMark 06 - Standard 1280x1024 +
GFXBench (DX / GLBenchmark) 2.7
GFXBench T-Rex HD Offscreen C24Z16 +
- Range of benchmark values for this graphics card
- Average benchmark values for this graphics card
* Smaller numbers mean a higher performance

Game Benchmarks

The following benchmarks stem from our benchmarks of review laptops. The performance depends on the used graphics memory, clock rate, processor, system settings, drivers, and operating systems. So the results don't have to be representative for all laptops with this GPU. For detailed information on the benchmark results, click on the fps number.

low 1024x768
130.6  fps    + Compare
med. 1366x768
124.6  fps    + Compare
high 1920x1080
68.5  fps    + Compare
ultra 1920x1080
61.3  fps    + Compare
4K 3840x2160
24.5  fps    + Compare
» With all tested laptops playable in detail settings ultra.
low 1024x768
62.7  fps    + Compare
med. 1366x768
54.8  fps    + Compare
high 1920x1080
41.4  fps    + Compare
ultra 1920x1080
17.4  fps    + Compare
4K 3840x2160
16.3  fps    + Compare
» With all tested laptops playable in detail settings high.
Fallout 4

Fallout 4

2015
low 1280x720
155.2  fps    + Compare
med. 1366x768
107  fps    + Compare
high 1920x1080
60.9  fps    + Compare
ultra 1920x1080
46.7  fps    + Compare
4K 3840x2160
21.3  fps    + Compare
» With all tested laptops playable in detail settings ultra.
low 1024x768
129.8  fps    + Compare
med. 1366x768
120.2  fps    + Compare
high 1920x1080
61.1  fps    + Compare
ultra 1920x1080
50.7  fps    + Compare
4K 3840x2160
21.4  fps    + Compare
» With all tested laptops playable in detail settings ultra.
Anno 2205

Anno 2205

2015
low 1024x768
160.1  fps    + Compare
med. 1366x768
96.5  fps    + Compare
high 1920x1080
44.2  fps    + Compare
ultra 1920x1080
17.6  fps    + Compare
4K 3840x2160
17.8  fps    + Compare
» With all tested laptops playable in detail settings high.
low 1366x768
186.4  fps    + Compare
med. 1366x768
148.9  fps    + Compare
high 1920x1080
125.3  fps    + Compare
ultra 1920x1080
101.1  fps    + Compare
4K 3840 x 2160
36.4  fps    + Compare
» With all tested laptops playable in detail settings ultra.
low 1024x768
60  fps    + Compare
med. 1366x768
60  fps    + Compare
high 1920x1080
60  fps    + Compare
ultra 1920x1080
59.9  fps    + Compare
4K 3840x2160
31.8  fps    + Compare
» With all tested laptops playable in detail settings ultra.
Mad Max

Mad Max

2015
med. 1366x768
175.4  fps    + Compare
high 1920x1080
93.4  fps    + Compare
ultra 1920x1080
84  fps    + Compare
4K 3840x2160
30.3  fps    + Compare
» With all tested laptops playable in detail settings ultra.
low 1280x720
117  fps    + Compare
med. 1366x768
112  fps    + Compare
high 1920x1080
64  fps    + Compare
4K 3840x2160
19  fps    + Compare
» With all tested laptops playable in detail settings high.
low 1024x768
144.3  fps    + Compare
med. 1366x768
89.6  fps    + Compare
high 1920x1080
51.3  fps    + Compare
ultra 1920x1080
29.9  fps    + Compare
4K 3840x2160
18.5  fps    + Compare
» With all tested laptops playable in detail settings high.
low 1024x768
363.9  fps    + Compare
med. 1366x768
135.3  fps    + Compare
high 1920x1080
100.3  fps    + Compare
ultra 1920x1080
60.5  fps    + Compare
4K 3840x2160
45.1  fps    + Compare
» With all tested laptops playable in detail settings ultra.
low 1024x768
183.4  fps    + Compare
med. 1366x768
181.9  fps    + Compare
high 1920x1080
92.6  fps    + Compare
ultra 1920x1080
61.4  fps    + Compare
» With all tested laptops playable in detail settings ultra.
low 1024x768
179.7  fps    + Compare
med. 1366x768
148.6  fps    + Compare
high 1920x1080
62.8  fps    + Compare
ultra 1920x1080
41.6  fps    + Compare
» With all tested laptops playable in detail settings ultra.
low 1280x720
203.9  fps    + Compare
high 1920x1080
82.8  fps    + Compare
ultra 1920x1080
61.6  fps    + Compare
» With all tested laptops playable in detail settings ultra.
Sims 4

Sims 4

2014
low 1024x768
179.8  fps    + Compare
med. 1366x768
131.7  fps    + Compare
high 1920x1080
95  fps    + Compare
ultra 1920x1080
92.8  fps    + Compare
» With all tested laptops playable in detail settings ultra.
Thief

Thief

2014
low 1024x768
87.3  fps    + Compare
med. 1366x768
77.8  fps    + Compare
high 1366x768
76.5  fps    + Compare
ultra 1920x1080
54.6  fps    + Compare
» With all tested laptops playable in detail settings ultra.
low 1024x768
194.3  fps    + Compare
med. 1366x768
176.1  fps    + Compare
high 1366x768
148.9  fps    + Compare
ultra 1920x1080
59.5  fps    + Compare
4K 3840x2160
25.3  fps    + Compare
» With all tested laptops playable in detail settings ultra.
low 1024x768
119.9  fps    + Compare
med. 1366x768
113.2  fps    + Compare
high 1366x768
104.6  fps    + Compare
ultra 1920x1080
54.9  fps    + Compare
» With all tested laptops playable in detail settings ultra.
low 1280x720
287.5  fps    + Compare
med. 1366x768
219.2  fps    + Compare
high 1366x768
191.9  fps    + Compare
ultra 1920x1080
80.8  fps    + Compare
» With all tested laptops playable in detail settings ultra.
low 1024x768
529  fps    + Compare
med. 1366x768
287.9  fps    + Compare
high 1366x768
216  fps    + Compare
ultra 1920x1080
104.5  fps    + Compare
» With all tested laptops playable in detail settings ultra.
Crysis 3

Crysis 3

2013
low 1024x768
137.3  fps    + Compare
med. 1366x768
122.9  fps    + Compare
high 1366x768
87.4  fps    + Compare
ultra 1920x1080
39.4  fps    + Compare
» With all tested laptops playable in detail settings ultra.
lowmed.highultraQHD4K
Star Wars Battlefront130.6124.668.561.324.5
Assassin's Creed Syndicate62.754.841.417.416.3
Fallout 4155.210760.946.721.3
Call of Duty: Black Ops 3129.8120.261.150.721.4
Anno 2205160.196.544.217.617.8
World of Warships186.4148.9125.3101.136.4
Metal Gear Solid V60606059.931.8
Mad Max175.493.48430.3
Batman: Arkham Knight1171126419
The Witcher 3144.389.651.329.918.5
Dirt Rally363.9135.3100.360.545.1
Battlefield Hardline183.4181.992.661.4
Dragon Age: Inquisition179.7148.662.841.6
Middle-earth: Shadow of Mordor203.982.861.6
Sims 4179.8131.79592.8
Thief87.377.876.554.6
Battlefield 4194.3176.1148.959.525.3
Metro: Last Light119.9113.2104.654.9
BioShock Infinite287.5219.2191.980.8
Tomb Raider529287.9216104.5
Crysis 3137.3122.987.439.4
< 30 fps
< 60 fps
< 120 fps
≥ 120 fps


5
15

1
7
12

3
14
4
3
8
9


8
4

For more games that might be playable and a list of all games and graphics cards visit our Gaming List

Add one or more devices and compare

In the following list you can select (and also search for) devices that should be added to the comparison. You can select more than one device.

restrict list:

show all (including archived), 2024, 2023
v1.26
log 17. 16:57:20

#0 no ids found in url (should be separated by "_") +0s ... 0s

#1 not redirecting to Ajax server +0s ... 0s

#2 did not recreate cache, as it is less than 5 days old! Created at Sat, 16 Mar 2024 05:38:32 +0100 +0.001s ... 0.001s

#3 composed specs +0.051s ... 0.052s

#4 did output specs +0s ... 0.052s

#5 start showIntegratedCPUs +0s ... 0.052s

#6 getting avg benchmarks for device 7049 +0.032s ... 0.084s

#7 got single benchmarks 7049 +0.007s ... 0.091s

#8 got avg benchmarks for devices +0s ... 0.091s

#9 min, max, avg, median took s +0.583s ... 0.674s

#10 before gaming benchmark output +0s ... 0.674s

#11 Got 93 rows for game benchmarks. +0.004s ... 0.678s

#12 composed SQL query for gamebenchmarks +0s ... 0.678s

#13 got data and put it in $dataArray +0.018s ... 0.696s

#14 benchmarks composed for output. +0.944s ... 1.639s

#15 return log +0.048s ... 1.687s

The following tests were conducted with a Xeon E3-1230 v3, 16 GB DDR3-RAM, 1x HDD, 1x SSD and a be quiet! Straight Power E9 400W. The measurements were taken at the power supply level.

No reviews found for this graphics card.

Please share our article, every link counts!

» Comparison of GPUs
Detailed list of all laptop GPUs sorted by class and performance.

» Benchmark List
Sort and restrict laptop GPUs based on performance in synthetic benchmarks.

» Notebook Gaming List
Playable games for each graphics card and their average FPS results.

Class 0

Arc A380

Class 1

Arc A580 Desktop

Class 2

Class 3

UHD Graphics 32EUs
UHD Graphics 750

Class 4

* Approximate position of the graphics adapter

> Expert Reviews and News on Laptops, Smartphones and Tech Innovations > Benchmarks / Tech > Comparison of Laptop Graphics Cards > AMD Radeon R9 380 benchmarks and specs
Klaus Hinum (Update: 2017-09- 5)