


AMD Radeon RX 9060 XT Review: Powerful desktop GPU with 16 GB VRAM in a price-performance check
The Gigabyte Radeon RX 9060 XT Gaming OC 16G is AMD's affordable offering of the new RDNA 4 architecture for desktops. We test gaming performance, FSR 4, and the cooling system to show how this mid-range GPU stacks up against the Nvidia GeForce RTX 5060 and other GPUs.
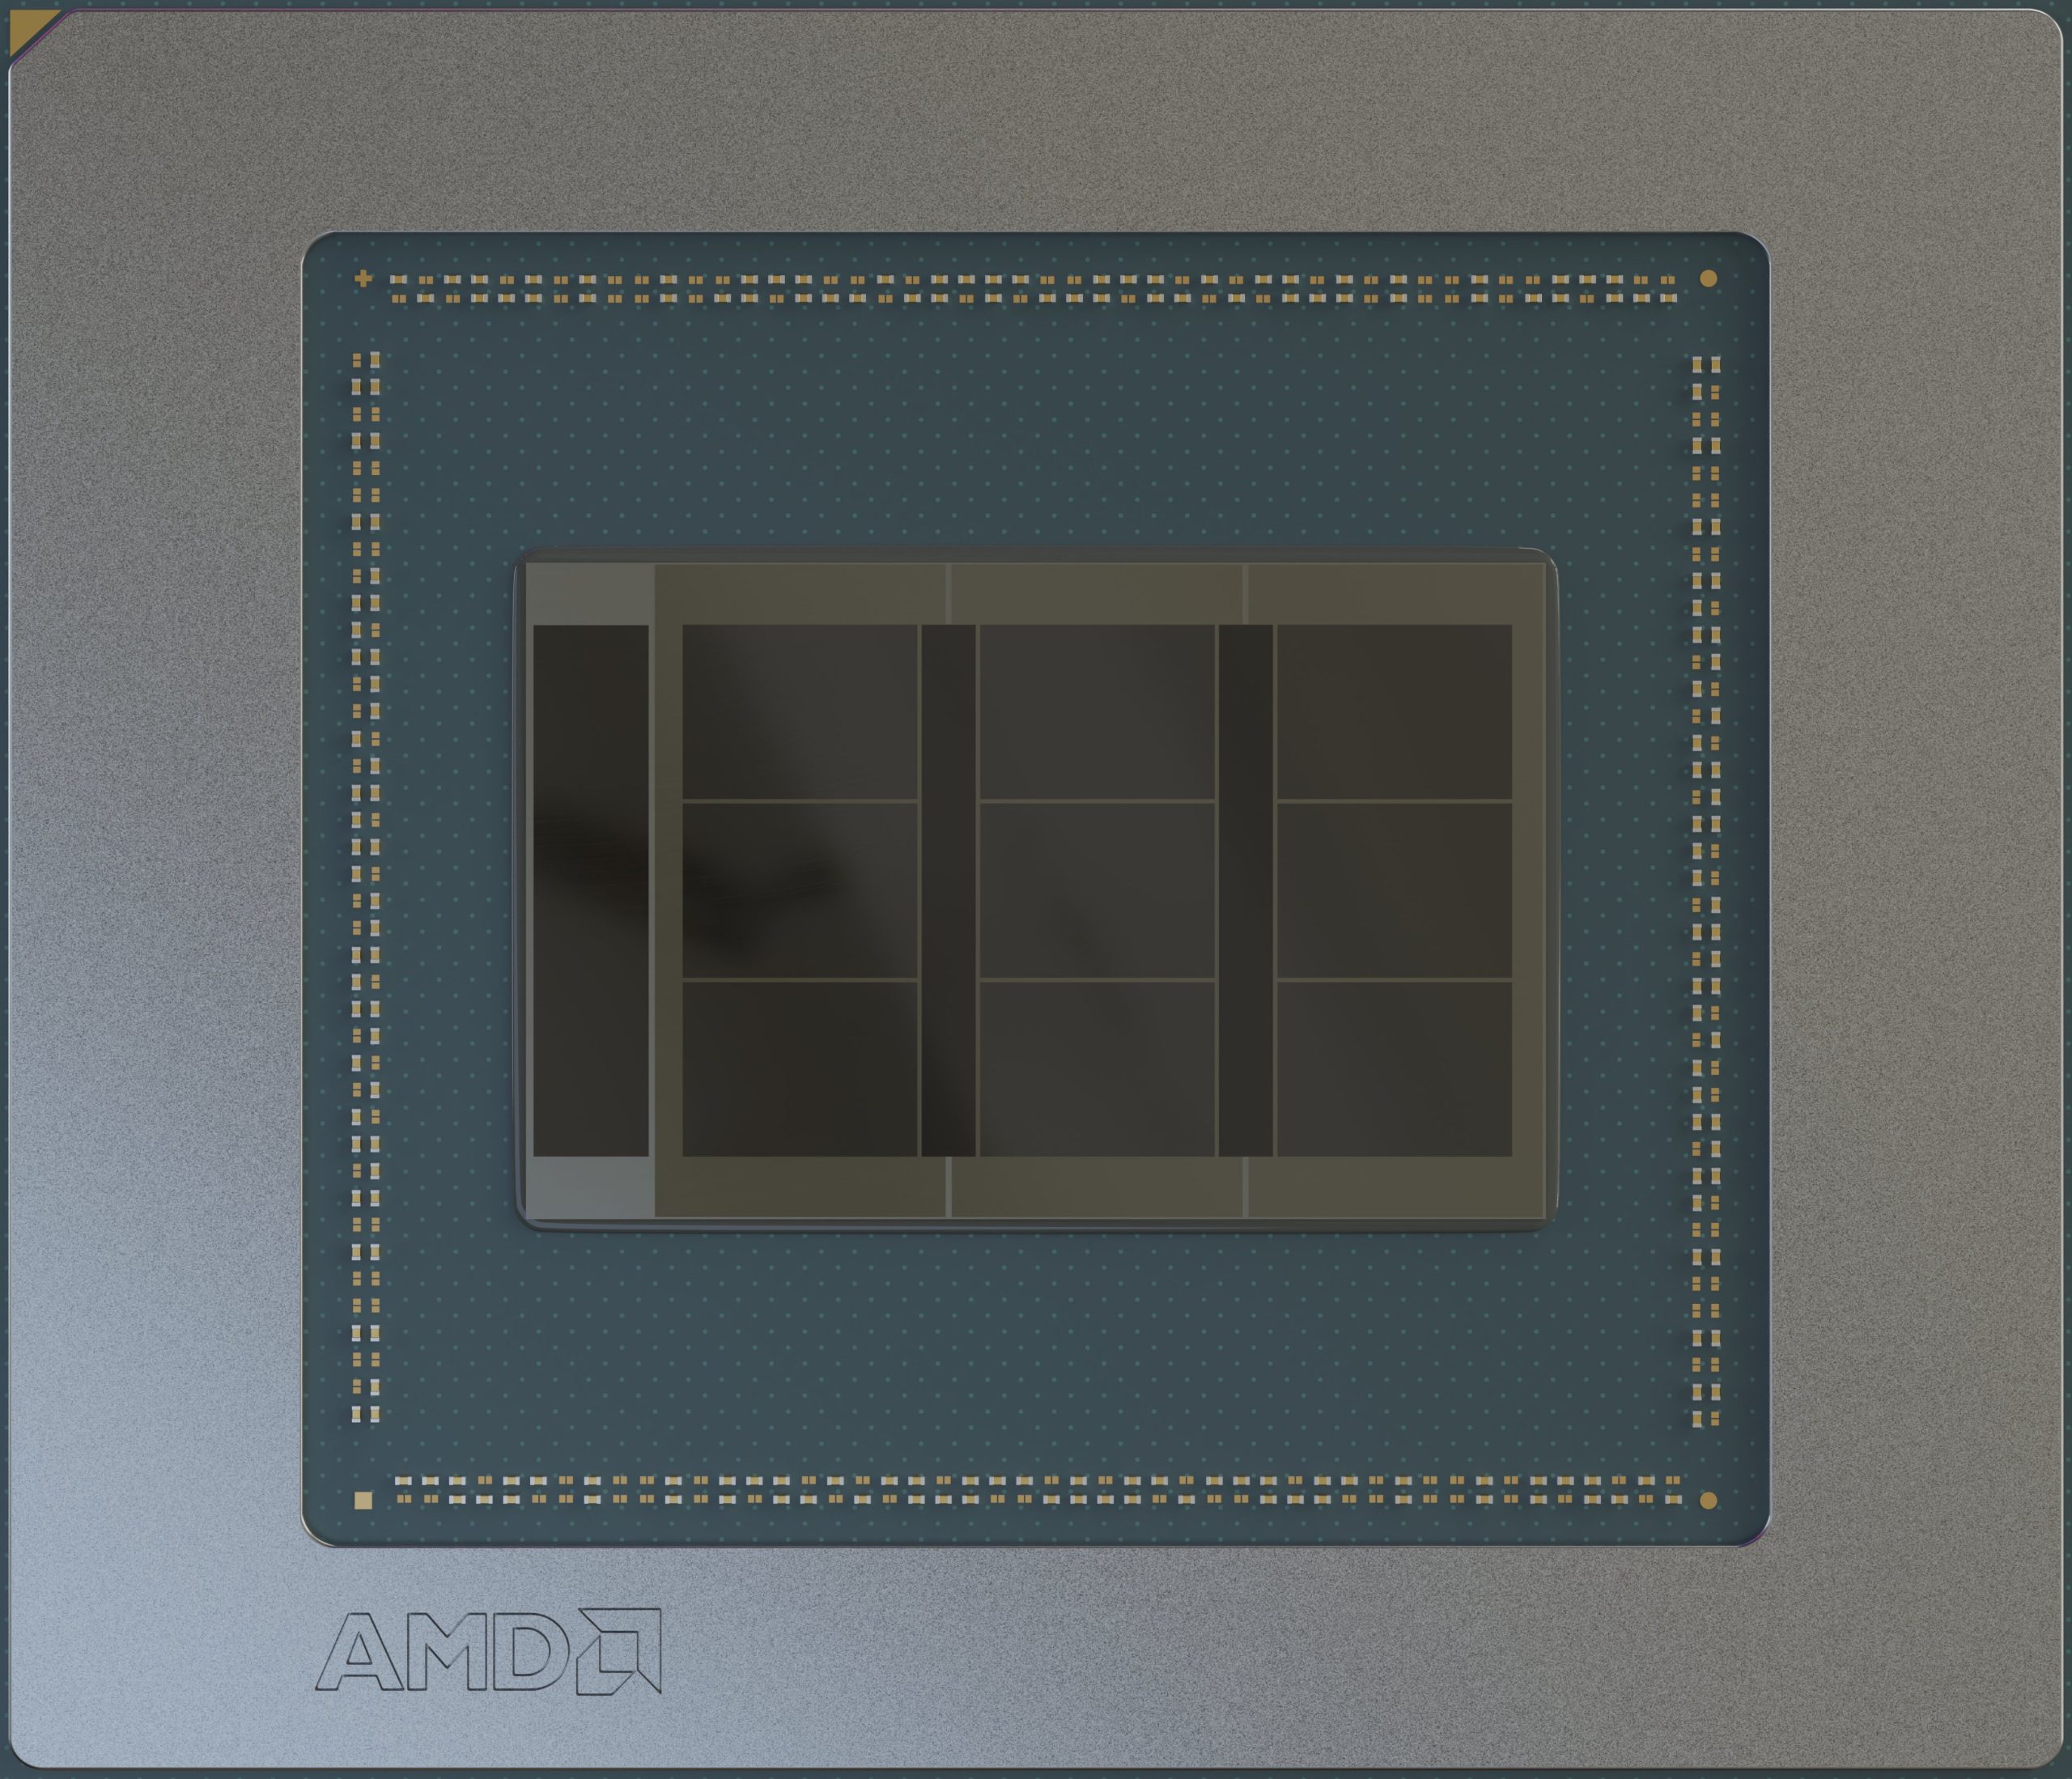
AMD Ryzen 7 9800X3D | AMD Radeon RX 9060 XT 16GB | 848 g
AMD Ryzen 7 9800X3D | AMD Radeon RX 9060 XT 16GB | 848 g