Lenovo ThinkPad P14s G4 AMD review: fast, portable, straightforward
The ThinkPad P14s's attraction is not limited to business customers. While its SmartCard slot and remote maintenance options for the Ryzen Pro processor make it almost predestined as a work fleet computer, the device's full focus on high computing power even for graphically demanding tasks, its practical long battery life and its robust build will appeal to a wide range of laptop users.
A look at possible competitors yields the ThinkPad T14s G4, which is somewhat more compact and otherwise very similar, and the HP EliteBook 845 G10, which has also placed its bet on the efficiency of the powerful iGPU AMD Radeon 780M. Find out where the ThinkPad P14s performs better or worse and how big the difference is compared to Intel's aging iGPU Intel Iris.
Comparison of possible competitors
Rating | Date | Model | Weight | Height | Size | Resolution | Price |
|---|---|---|---|---|---|---|---|
| 87.8 % v7 (old) | 01 / 2024 | Lenovo ThinkPad P14s G4 21K5000LGE R7 PRO 7840U, Radeon 780M | 1.3 kg | 21.8 mm | 14.00" | 1920x1200 | |
| 90.5 % v7 (old) | 09 / 2023 | HP EliteBook 845 G10 5Z4X0ES R7 7840U, Radeon 780M | 1.5 kg | 17.9 mm | 14.00" | 1920x1200 | |
| 90.4 % v7 (old) | 12 / 2023 | Lenovo ThinkPad T14 G4 21K4S02000 R7 PRO 7840U, Radeon 780M | 1.5 kg | 17.9 mm | 14.00" | 1920x1200 | |
| 88.9 % v7 (old) | 12 / 2023 | HP ZBook Power 15 G10 R7 PRO 7840HS, RTX 2000 Ada Generation Laptop | 2 kg | 22.9 mm | 15.60" | 2560x1440 | |
| 86.9 % v7 (old) | 04 / 2023 | Lenovo ThinkPad P14s G3 AMD 21J6S05000 R7 PRO 6850U, Radeon 680M | 1.5 kg | 17.9 mm | 14.00" | 1920x1200 | |
| 86.2 % v7 (old) | 12 / 2023 | HP ProBook 450 G10 i7-1355U, GeForce RTX 2050 Mobile | 1.8 kg | 19.9 mm | 15.60" | 1920x1080 | |
| 85.6 % v7 (old) | 05 / 2023 | Samsung Galaxy Book3 Pro 14 i7-1360P, Iris Xe G7 96EUs | 1.2 kg | 11.3 mm | 14.00" | 2880x1800 | |
| 90.2 % v7 (old) | 03 / 2024 | Lenovo ThinkPad P16 G2 21FA000FGE i7-13700HX, RTX 2000 Ada Generation Laptop | 3 kg | 30.23 mm | 16.00" | 2560x1600 |
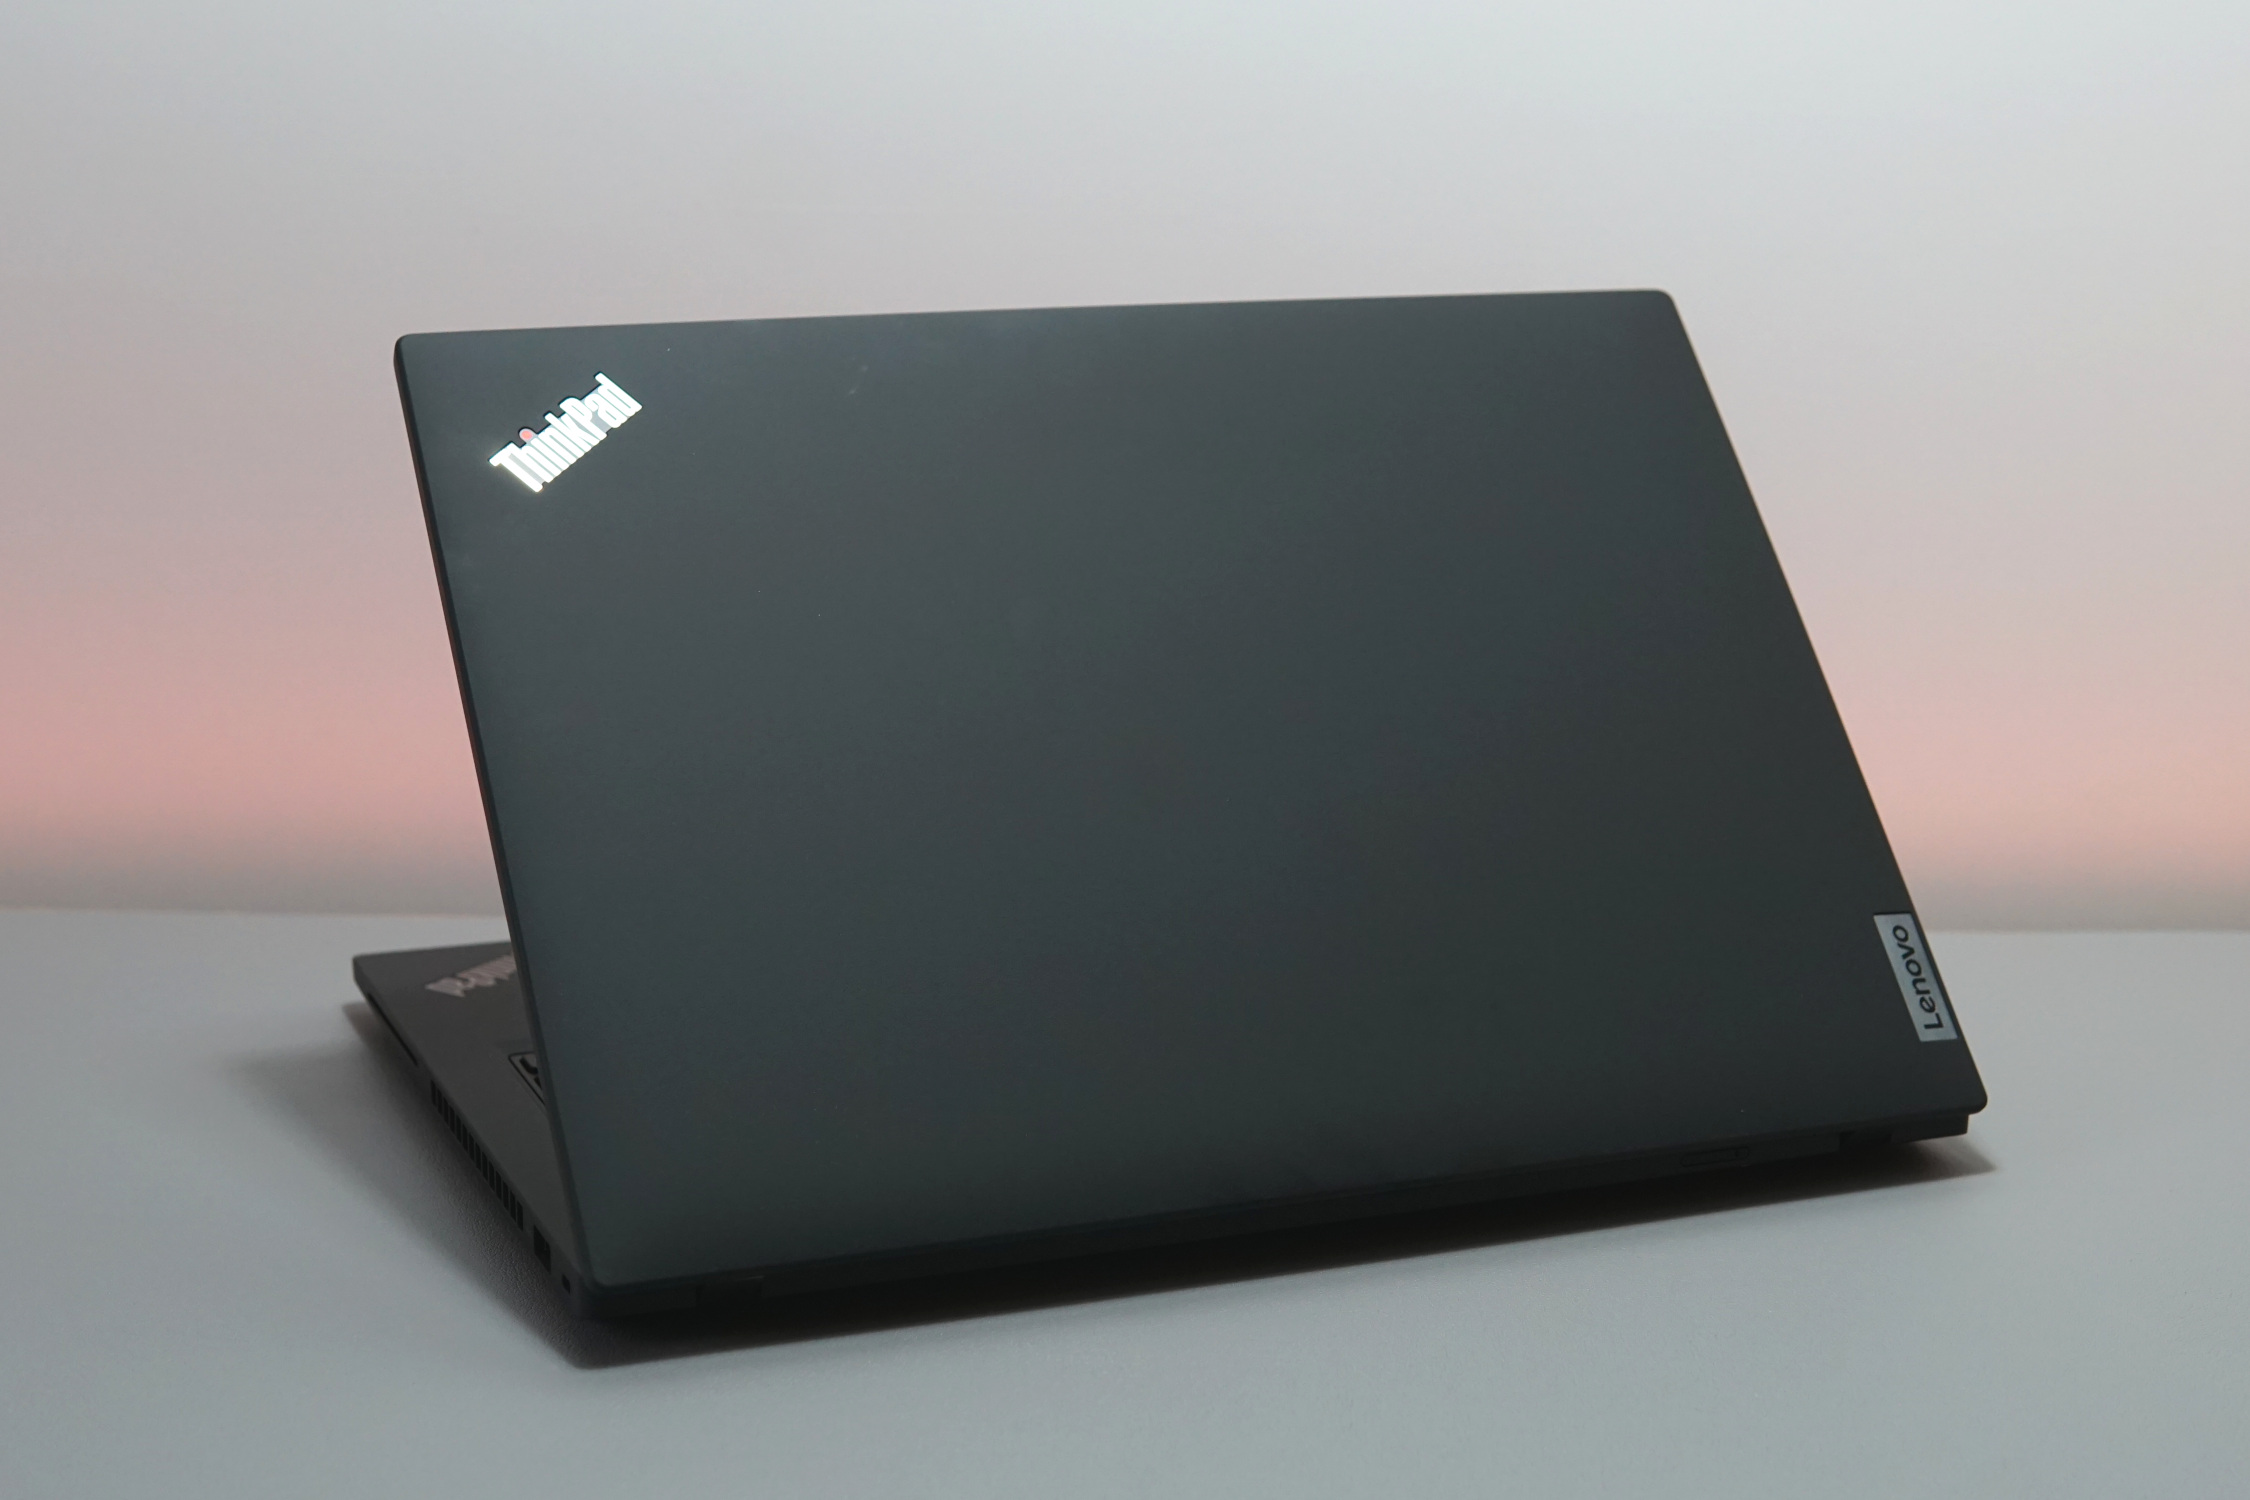
Case - Bland but sturdy
The exterior of the ThinkPad P14s is fairly unspectacular. Its matte dark gray surface along with the lit-up dot on the i position it as a ThinkPad. Other than that, the main impression is that of a robust and high-quality chassis.
The display will only warp minimally; the base unit not at all. The hinges are pleasantly tight at every opening angle; when closed, the lid is flush with the base unit and sits tightly. Everything looks as if it could withstand daily stress over a long period of time.

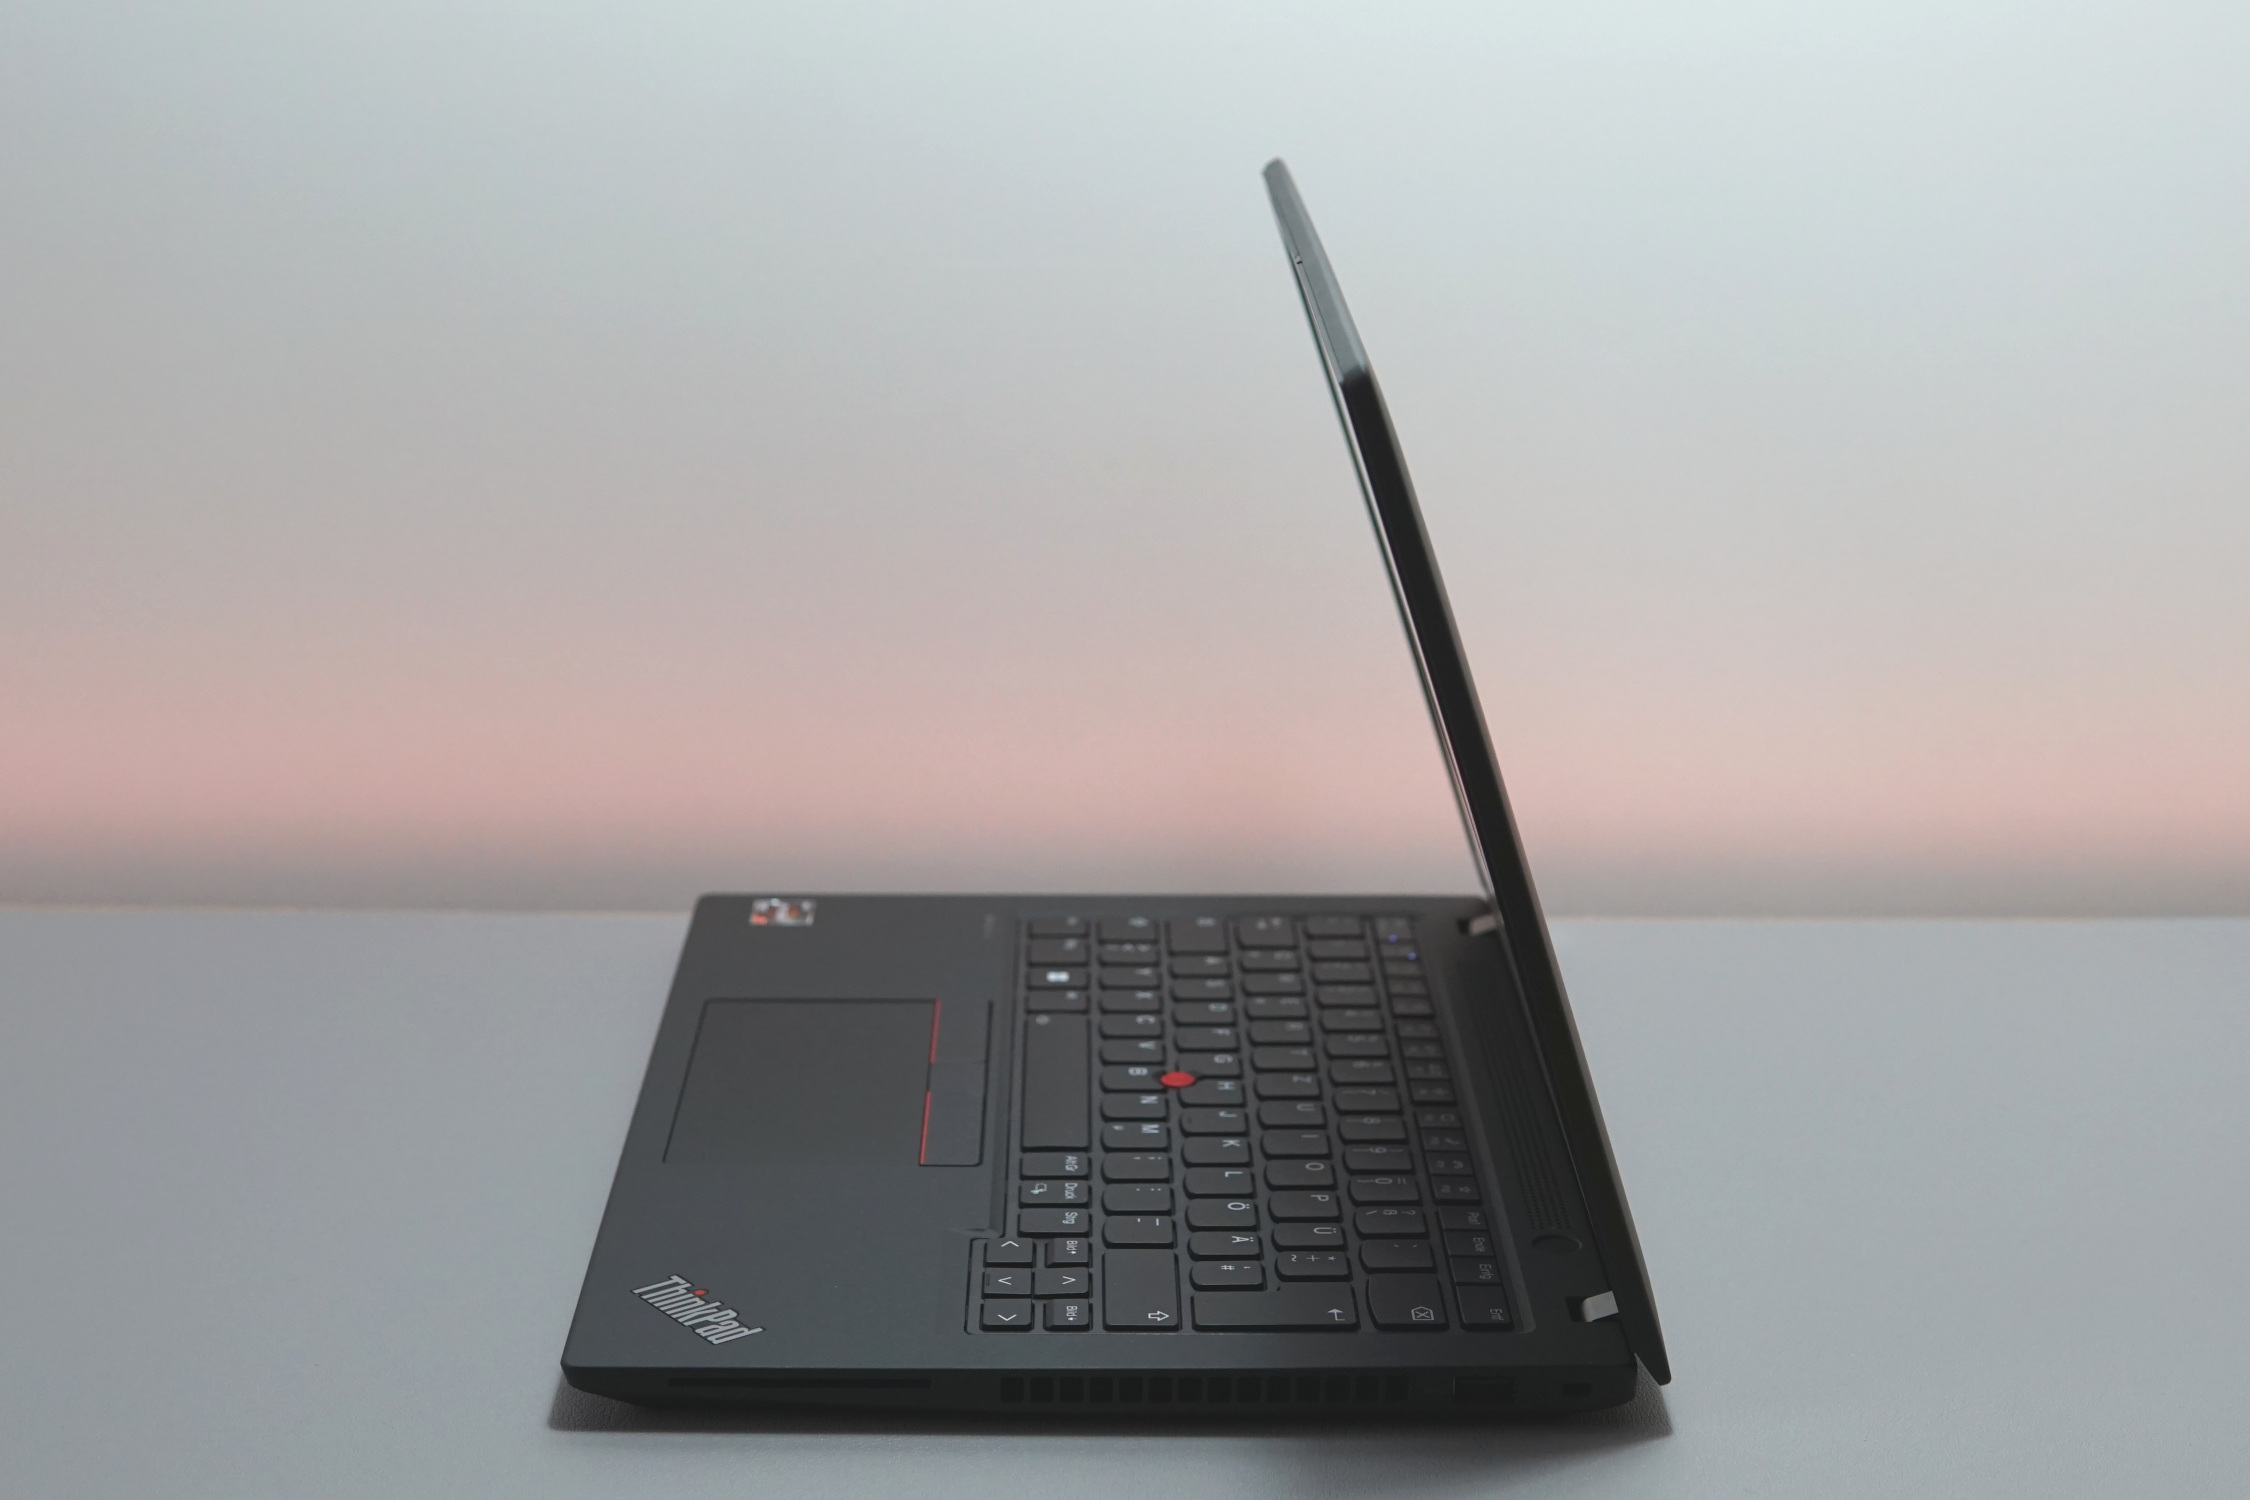
The chassis is a fairly thick, especially when you know that it doesn't contain a dedicated GPU and the RAM and Wi-Fi modules are soldered on. Other than that, the ThinkPad P14s is compact and light, weighing only 1.3 kg. This is impressive considering the device's sturdiness. The Samsung Galaxy Book3 Pro may not be as robust, but it illustrates just how slim a 14-inch notebook can be.
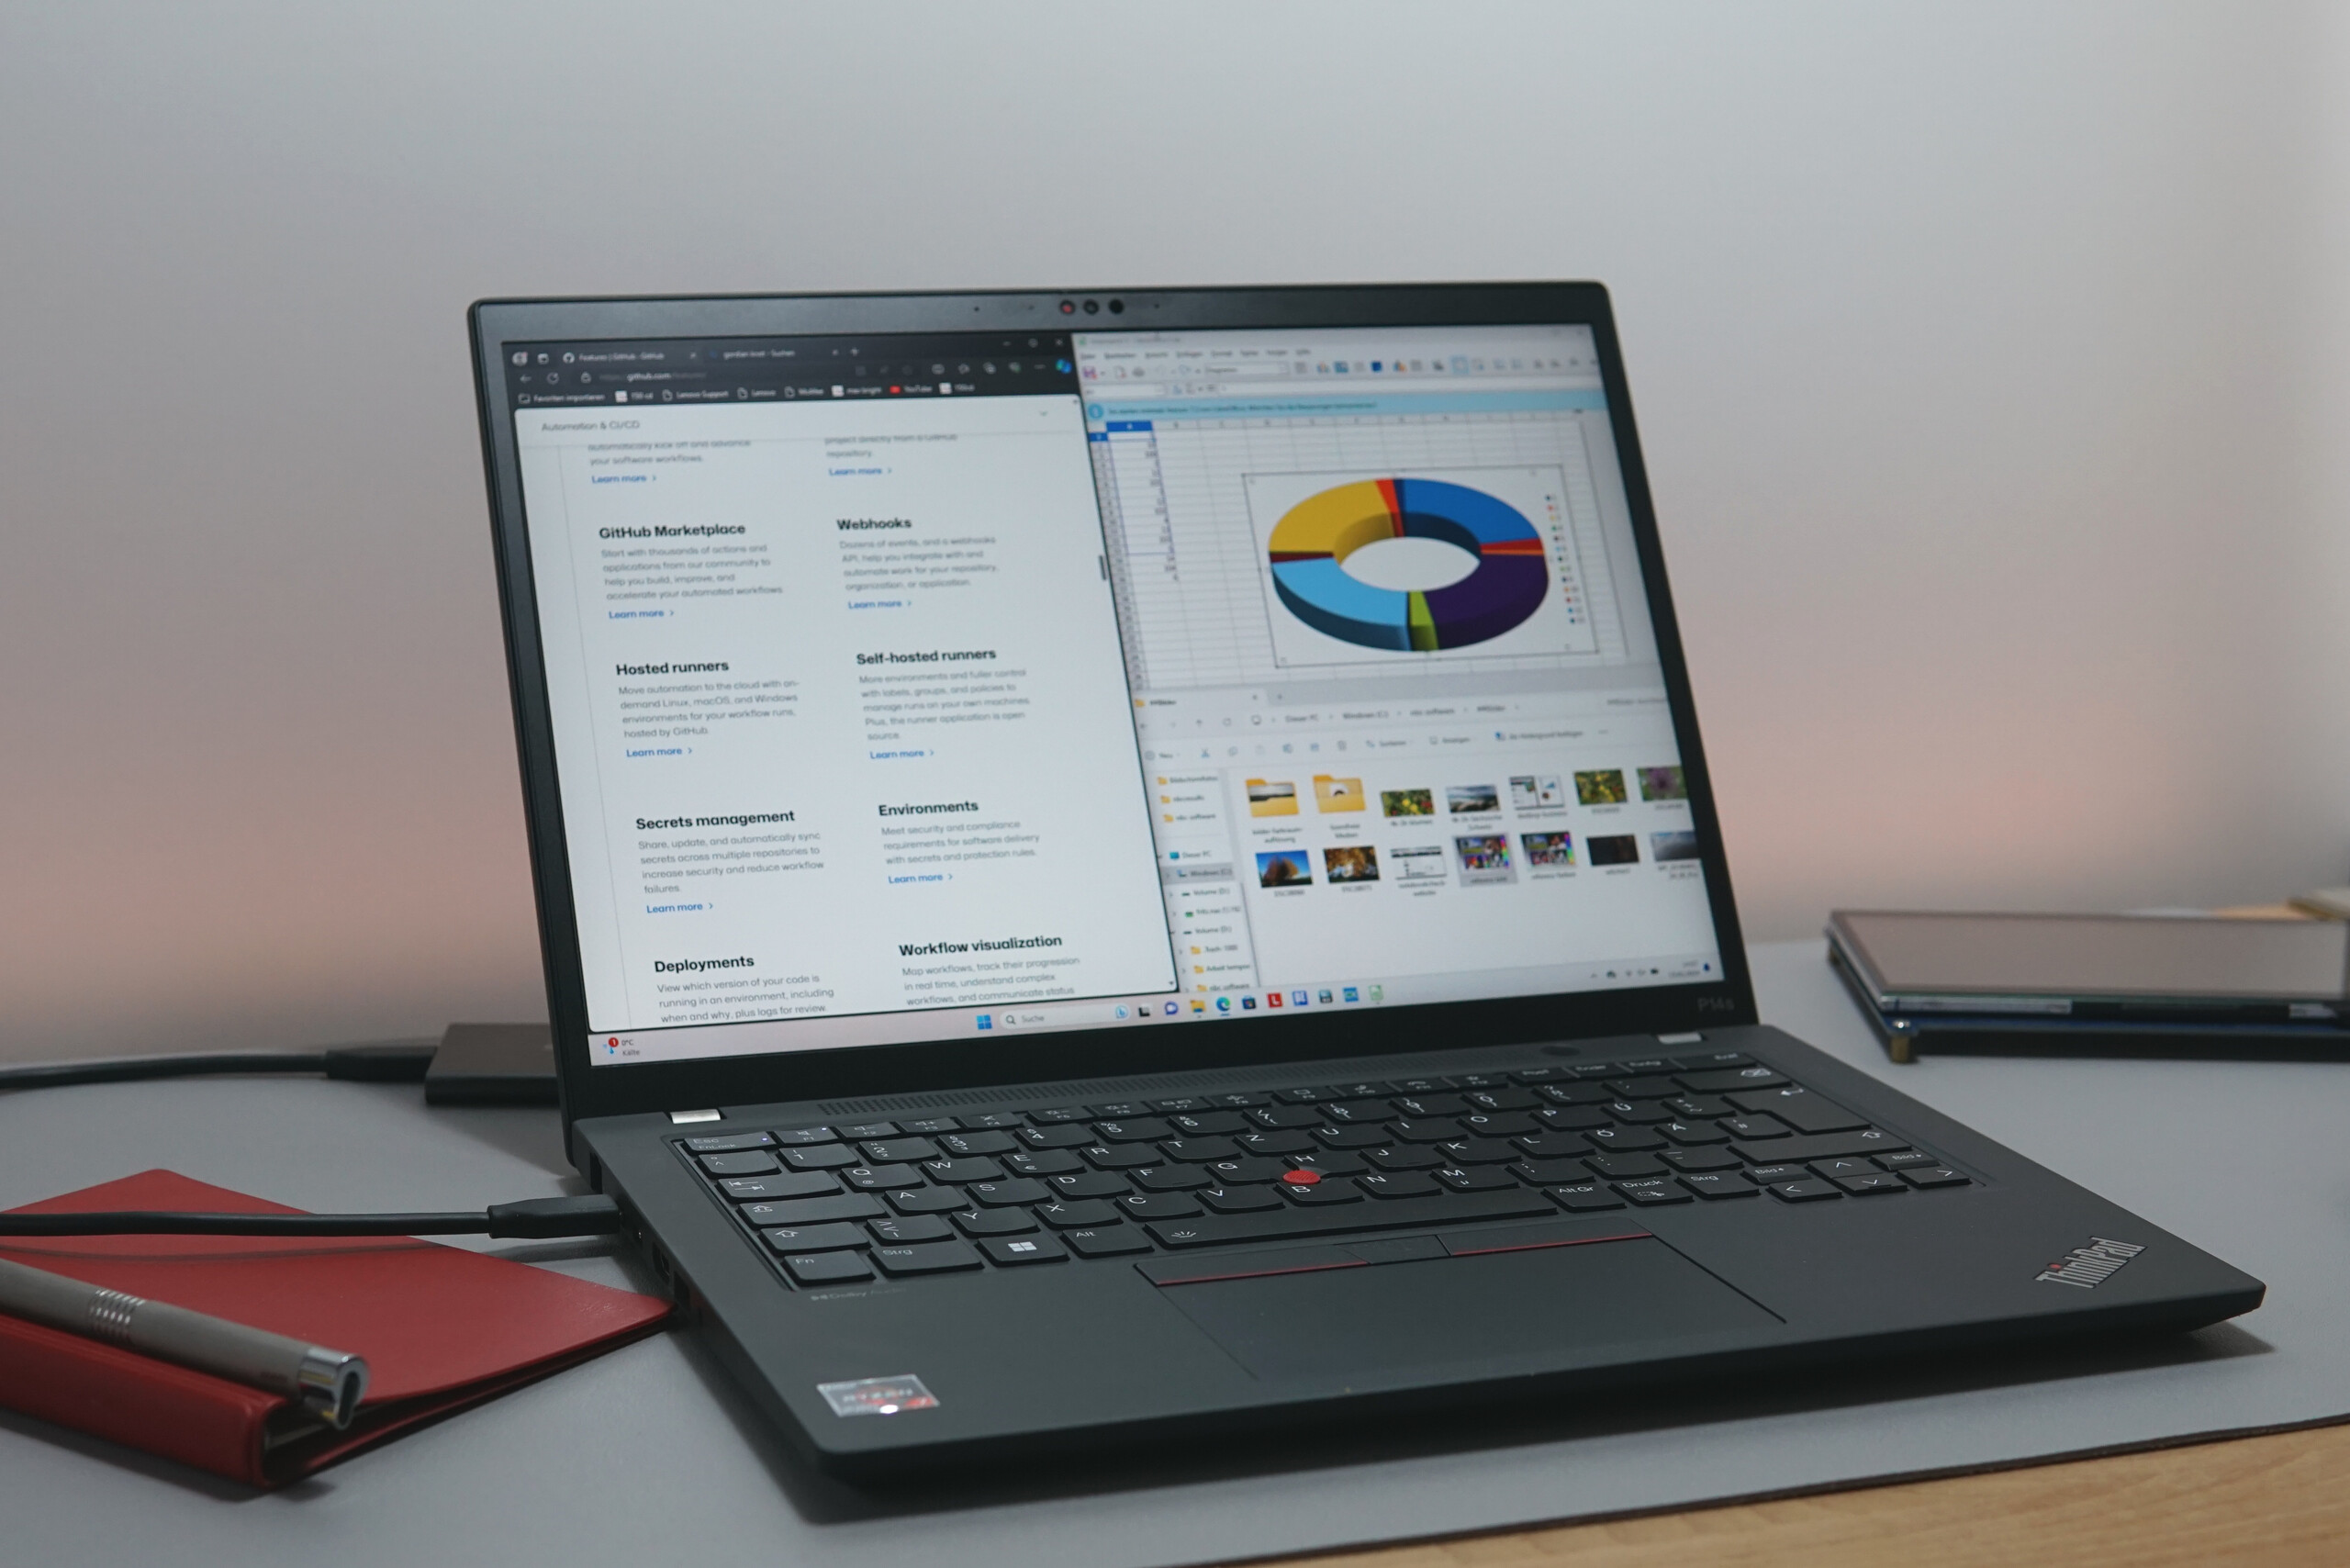
Connectivity - ThinkPad P14s with a good camera
Everything important is there: USB-A ports on either side, two USB-C ports, two video outputs, and a LAN port. The network connector isn't self-evident for a 14-inch notebook, and the USB4 port ensures easy use of a docking station.
Unlike the similarly positioned Intel laptops, however, our ThinkPad features only one fast USB-C port, which would usually be used to connect the docking station or the AC adaptor. The second USB-C port also supports charging and can output video. The high transfer rates of up to 40 Gbit/s are only available on one port. We would have also preferred seeing 10 Gbit/s for the USB-A ports, instead of only 5 Gbit/s - a speed many external SSDs can easily reach nowadays.


Communication
Qualcomm's Wi-Fi module did not achieve optimum data throughput when sending data in our test. When receiving data, however, the module reached the expected level. With more than 1500 Mbit/s, wireless transmission with Wi-Fi 6 can clearly outperform the LAN port if the distance is short enough.
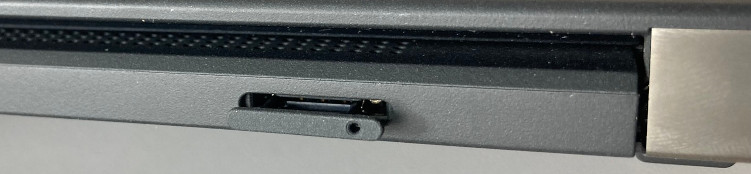
Everything is prepared for a 5G/LTE module, with both the SIM card slot and the cables for antennas in place.
Webcam
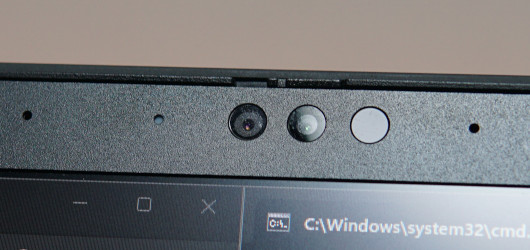
The ThinkPad P14s's webcam is fully equipped. It has a high resolution and allows details to be recognized and transmitted during video conferences, for example. The manual shutter enables the user to reliably shut off the lens when not in use. Other features include the IR sensor for face recognition and a dual-array microphone.
The color deviation and image noise reduce the overall image quality - but fortunately, this plays next to no role in video calls. On the other hand, the good illumination of dark scenes, the level of detail and the excellently functioning microphone really come into their own. Voices are recorded clearly and at a consistent volume from different directions and distances.


Security
As is usual for a workstation laptop, all important security functions are integrated. Everything has been thought of, from the fingerprint scanner and facial recognition to the SmartCard reader and the Kensington lock.
Accessories
There are no other accessories apart from the 65-Watt USB-C power supply unit. It is worth mentioning that no unnecessary plastic was used for the packaging and all padding is made from recycled cardboard.
Thanks to USB4, most docking stations with USB-C or Thunderbolt should be fully compatible.
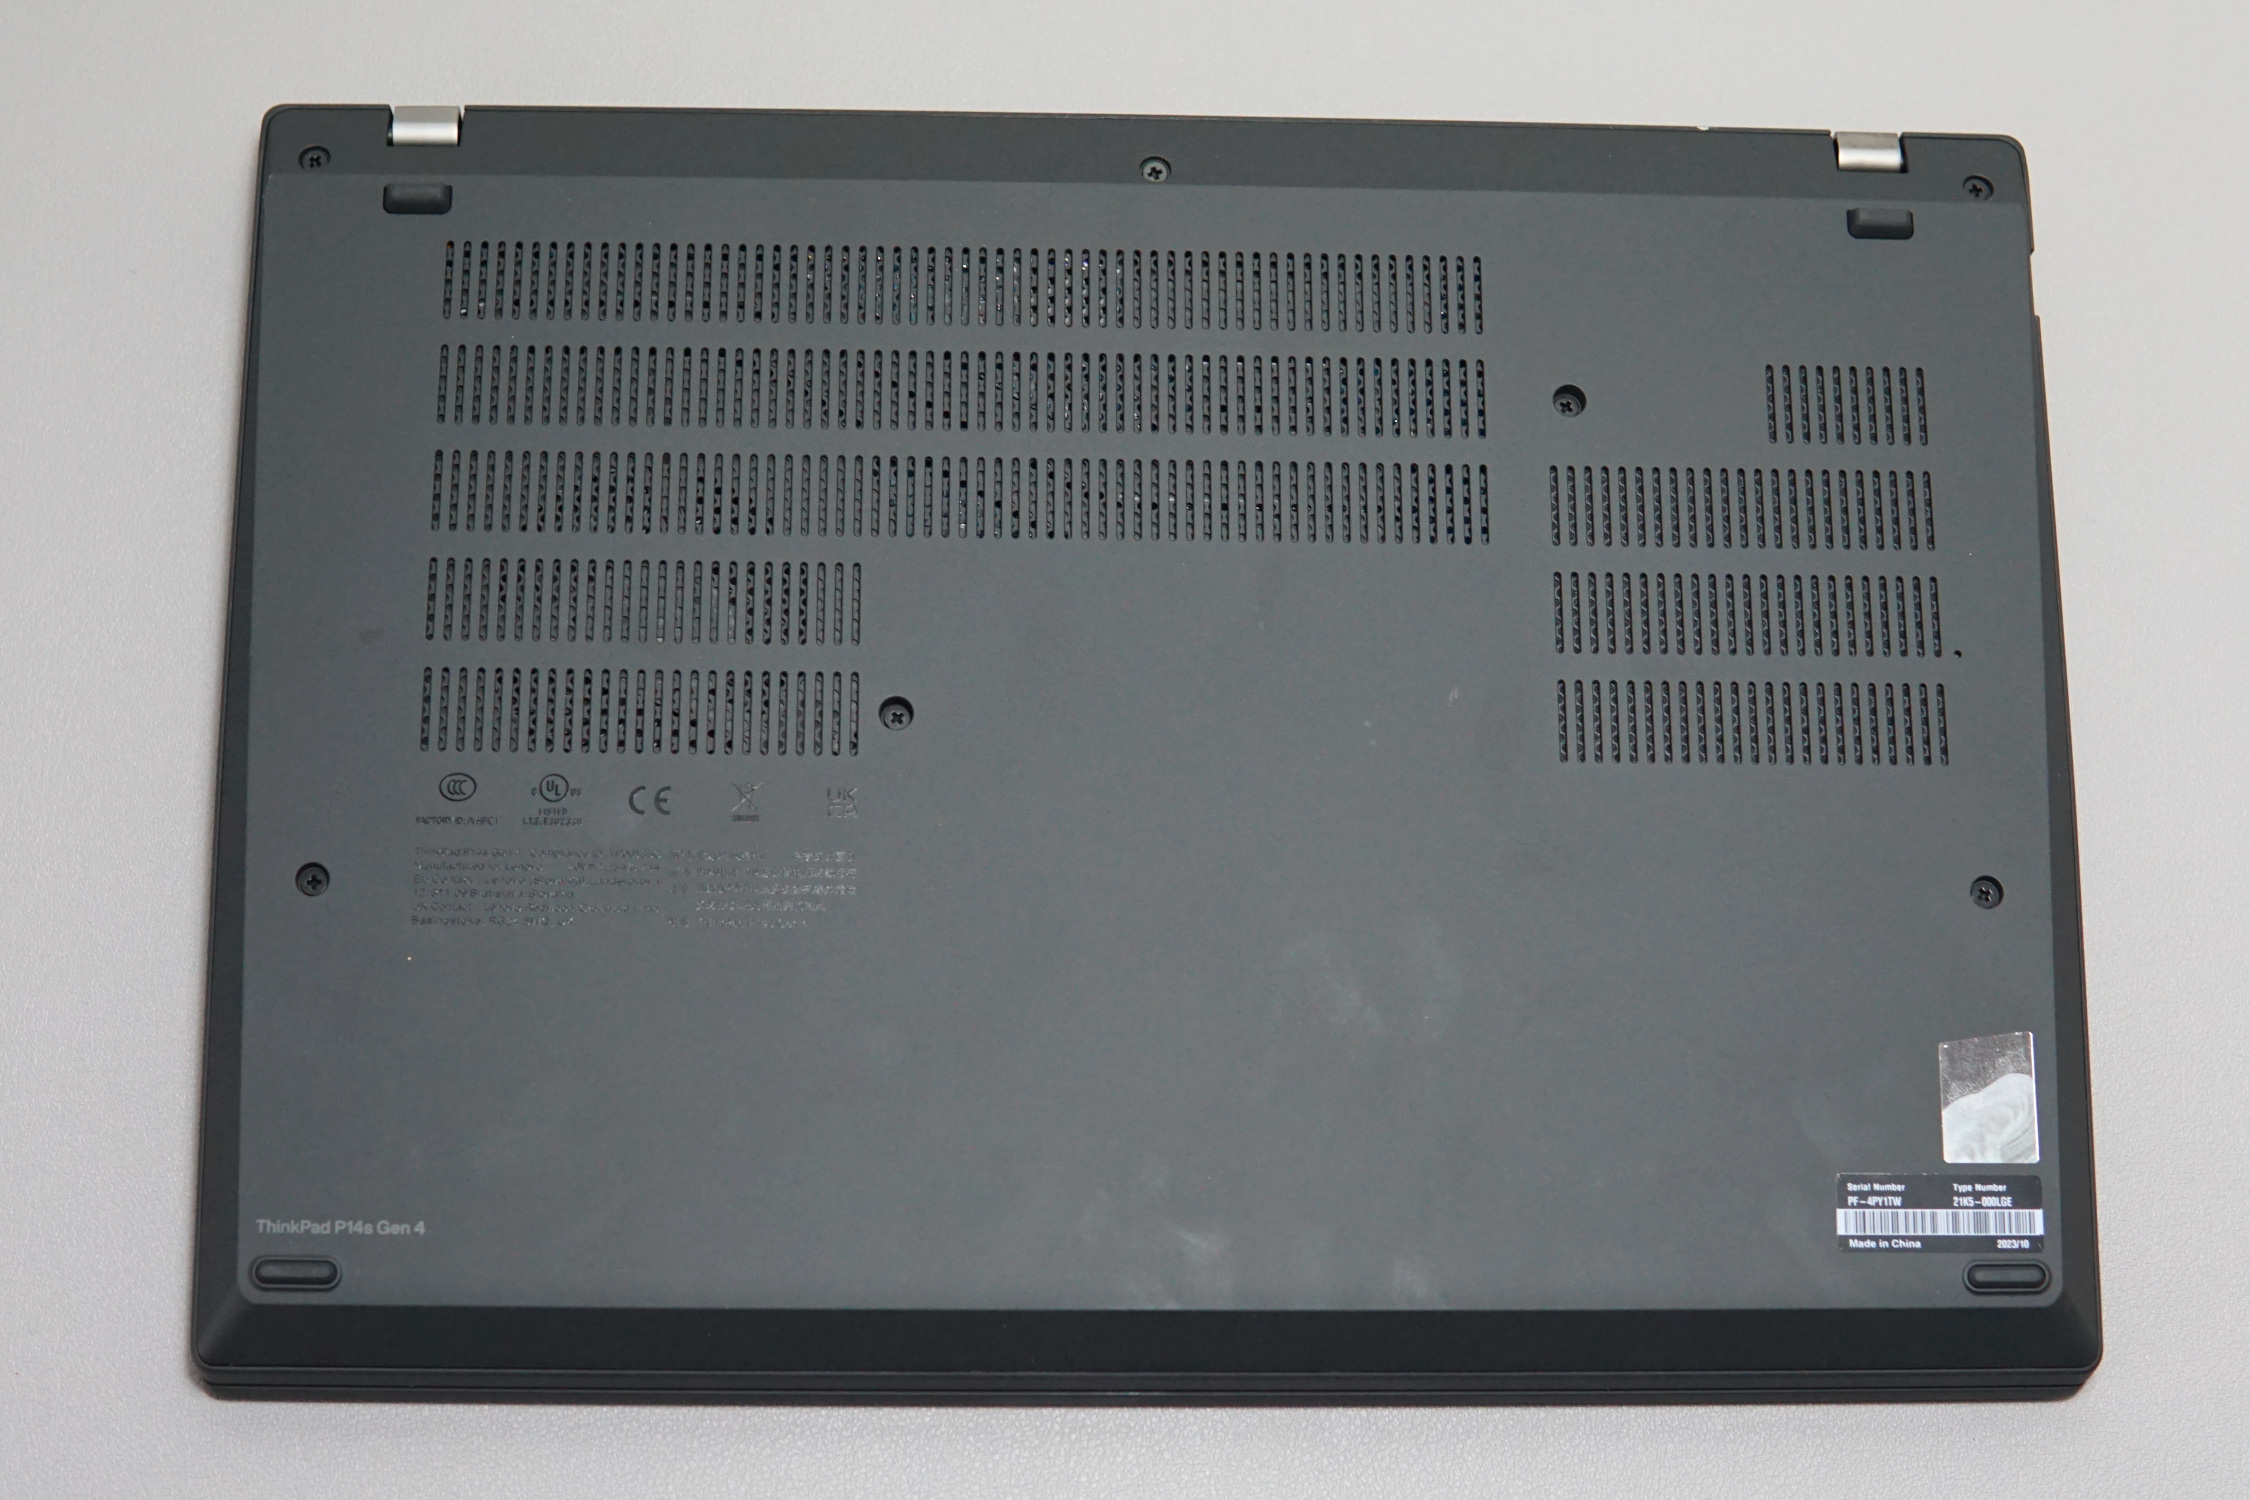
Maintenance
The screws in the base are easily accessible and can be loosened using standard tools. We recommend using a lifting tool to remove the base plate, but this is not necessary. The plastic clips can also be opened without tools and can be closed again later just as easily.
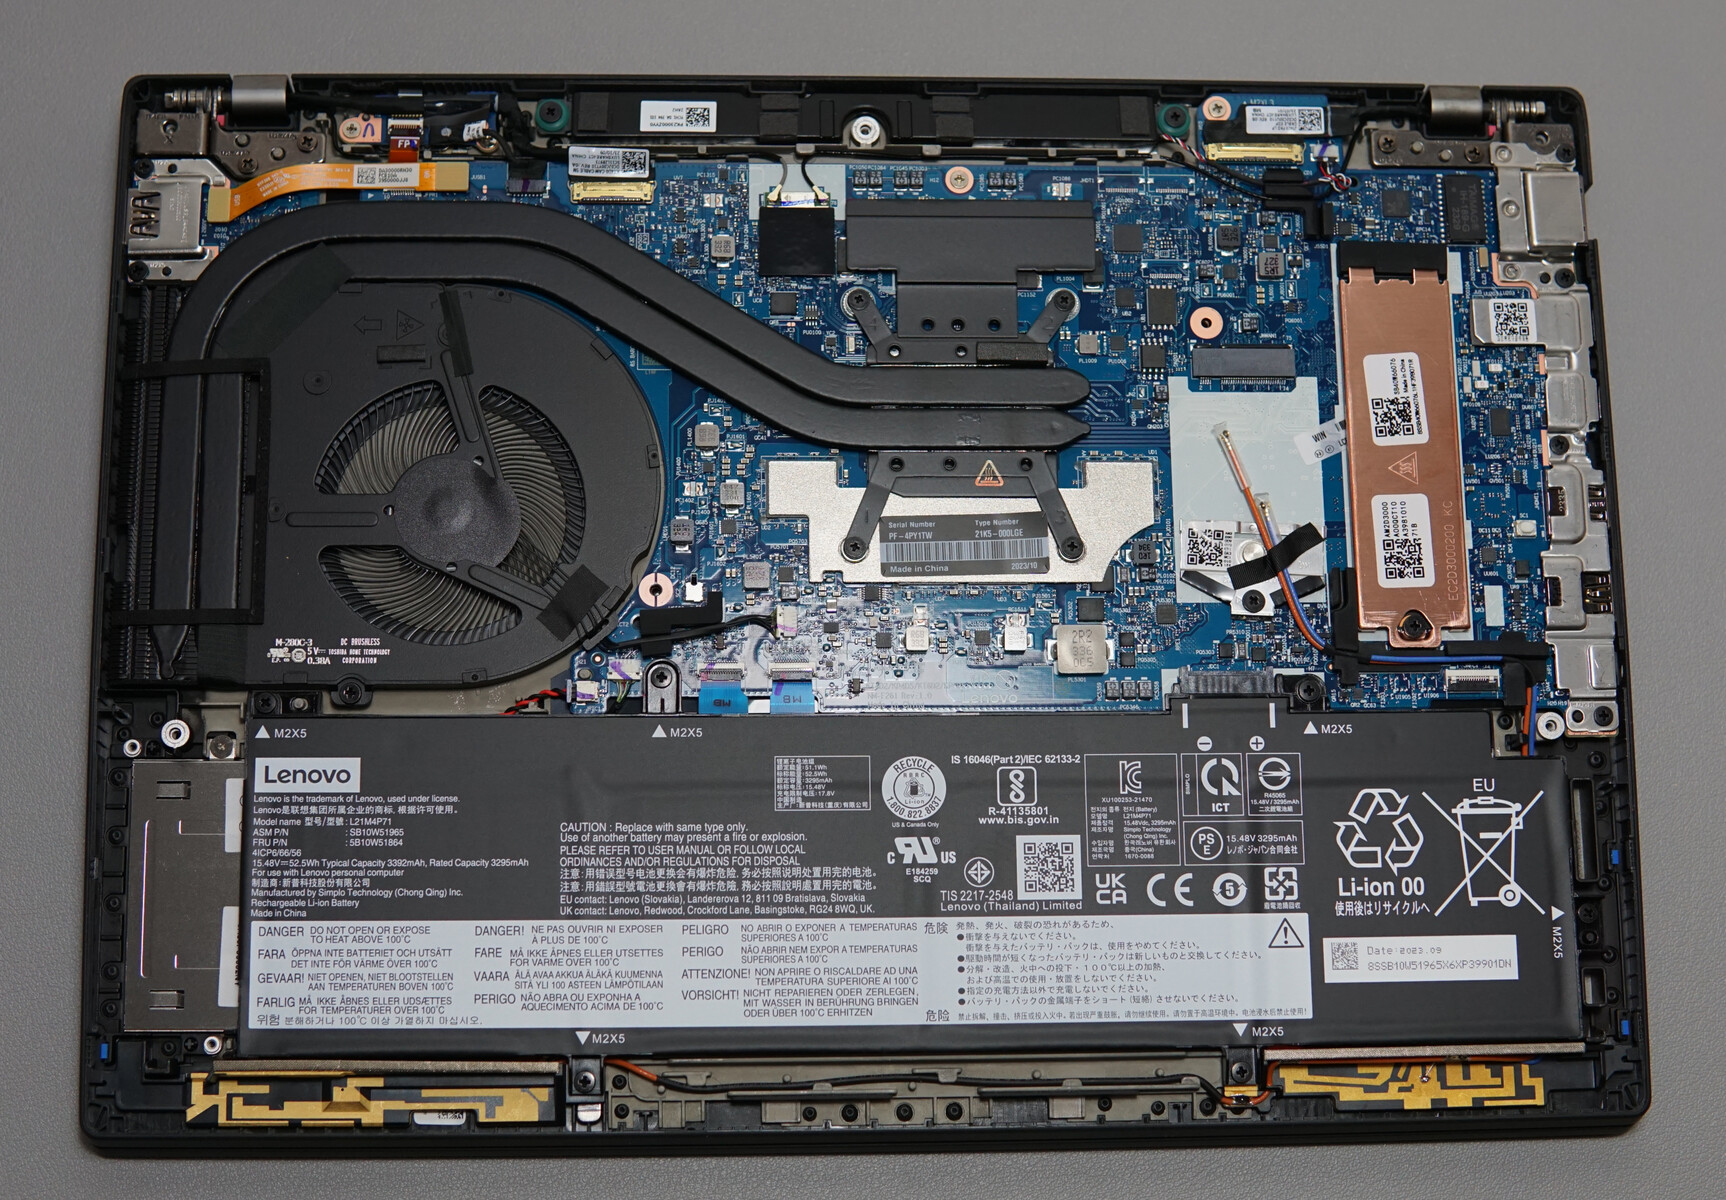
Removing the base plate gives users access to the battery, the M.2 SSD and the optional WWAN card. The RAM and WLAN modules are soldered on and cannot be expanded. It would have been preferable to be able to replace or expand the RAM in particular. This is something a workstation laptop, especially one that is not particularly thin, should be able to offer.
Warranty
Lenovo grants one year of "Premier Support" through its own webshop. This includes on-site repairs on the next working day and can be extended to 3 years for a fee.
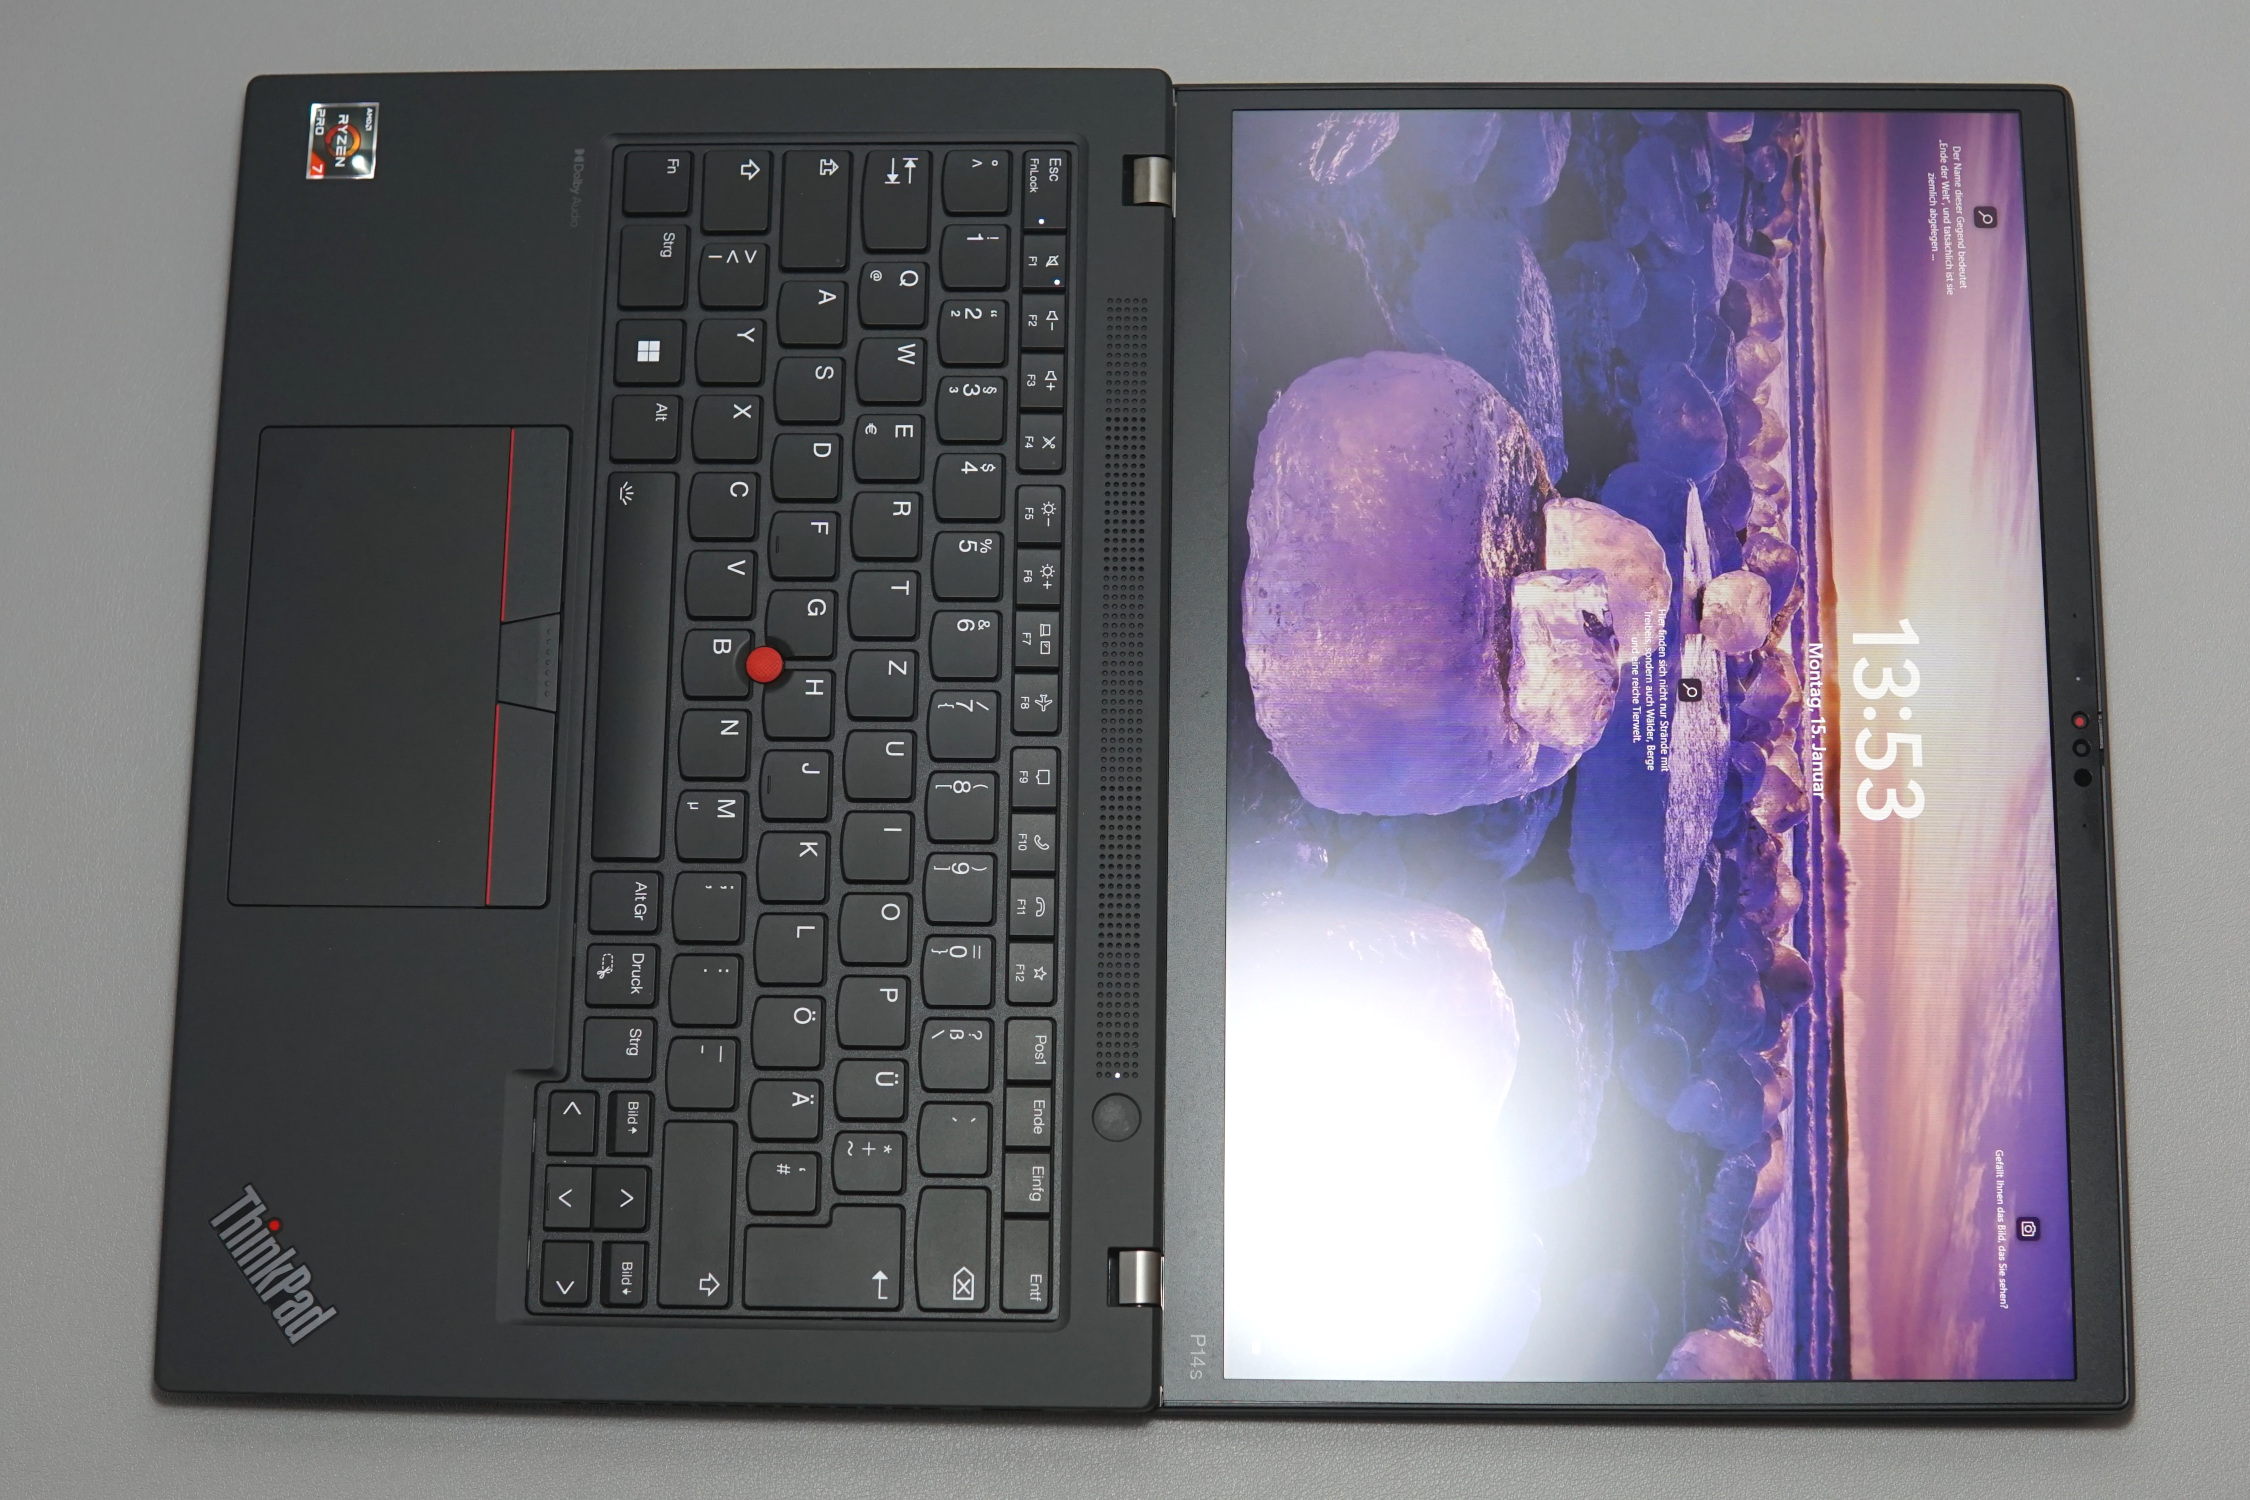
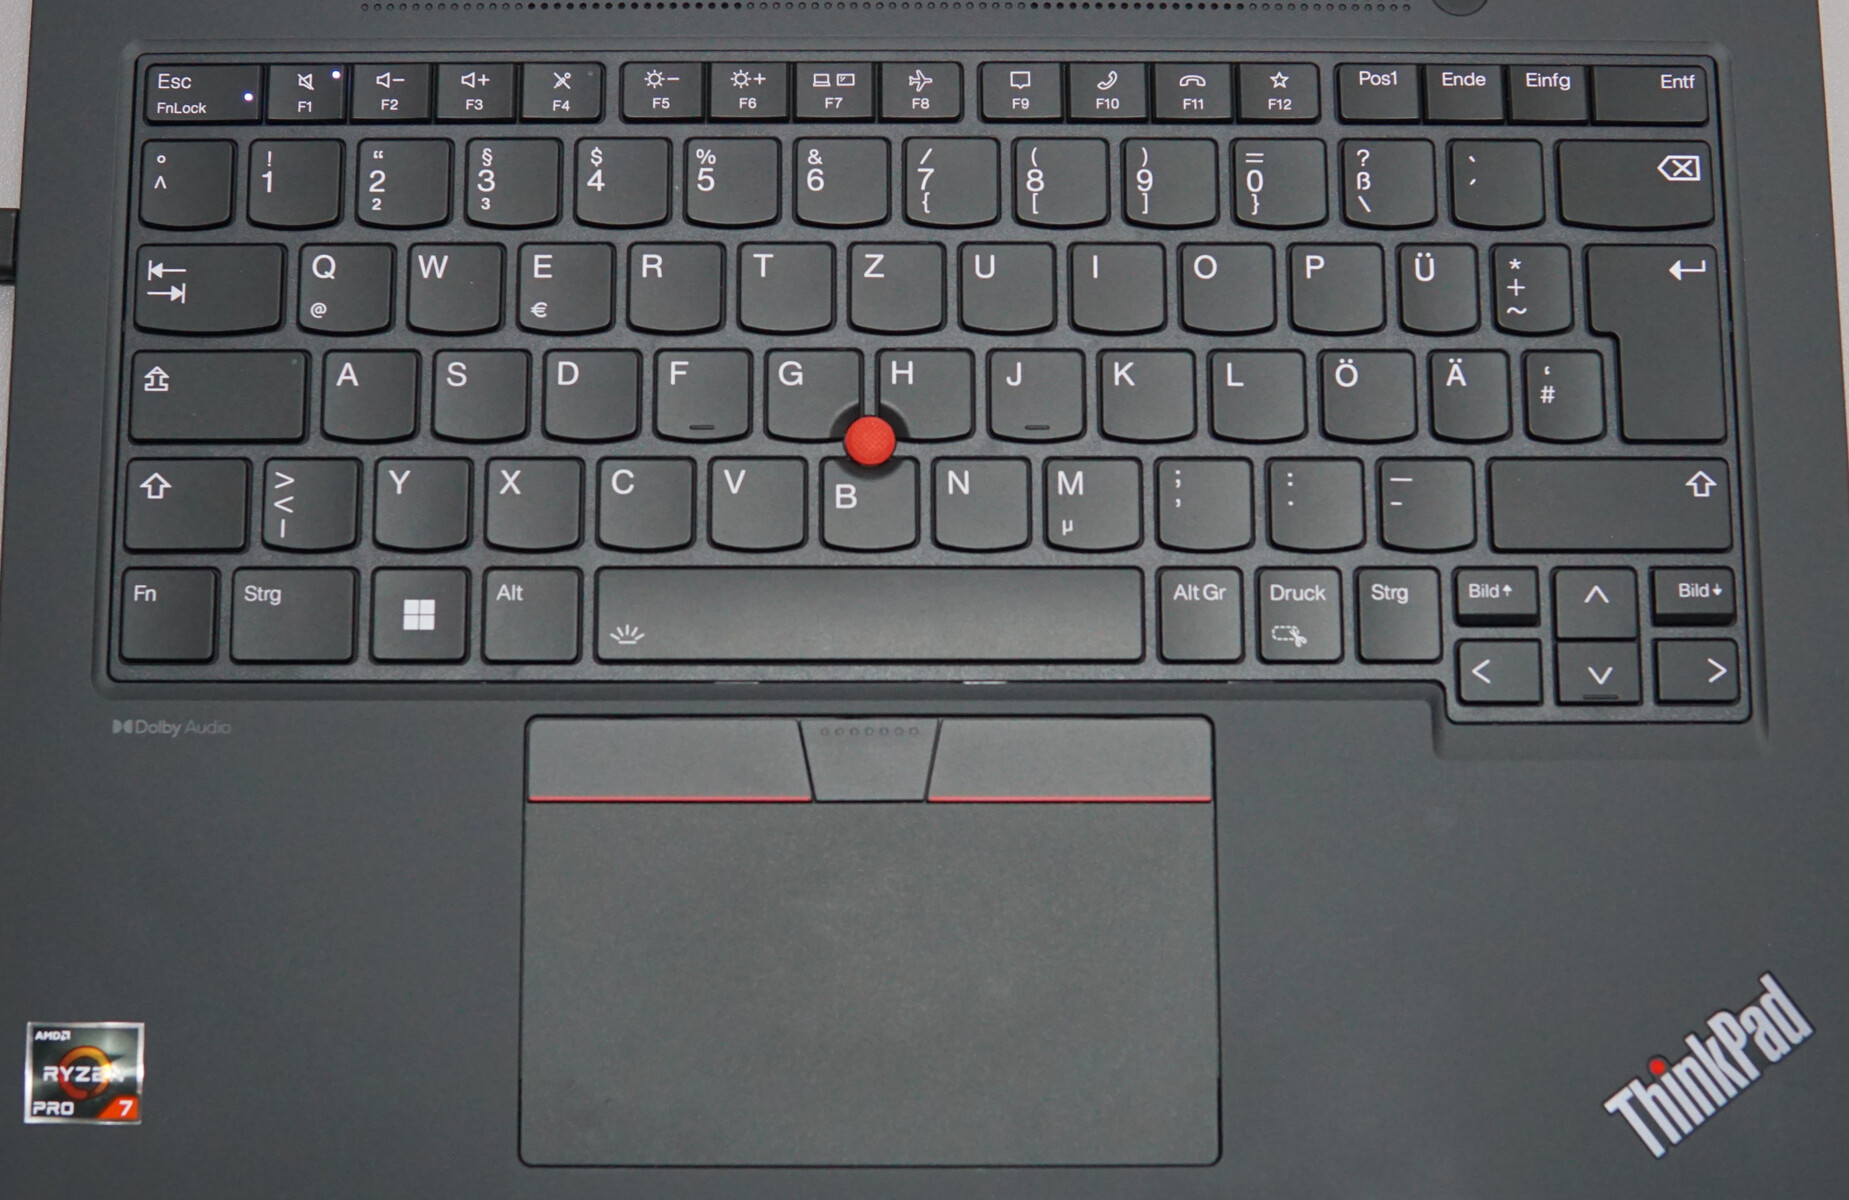
Input Devices - Good but not perfect
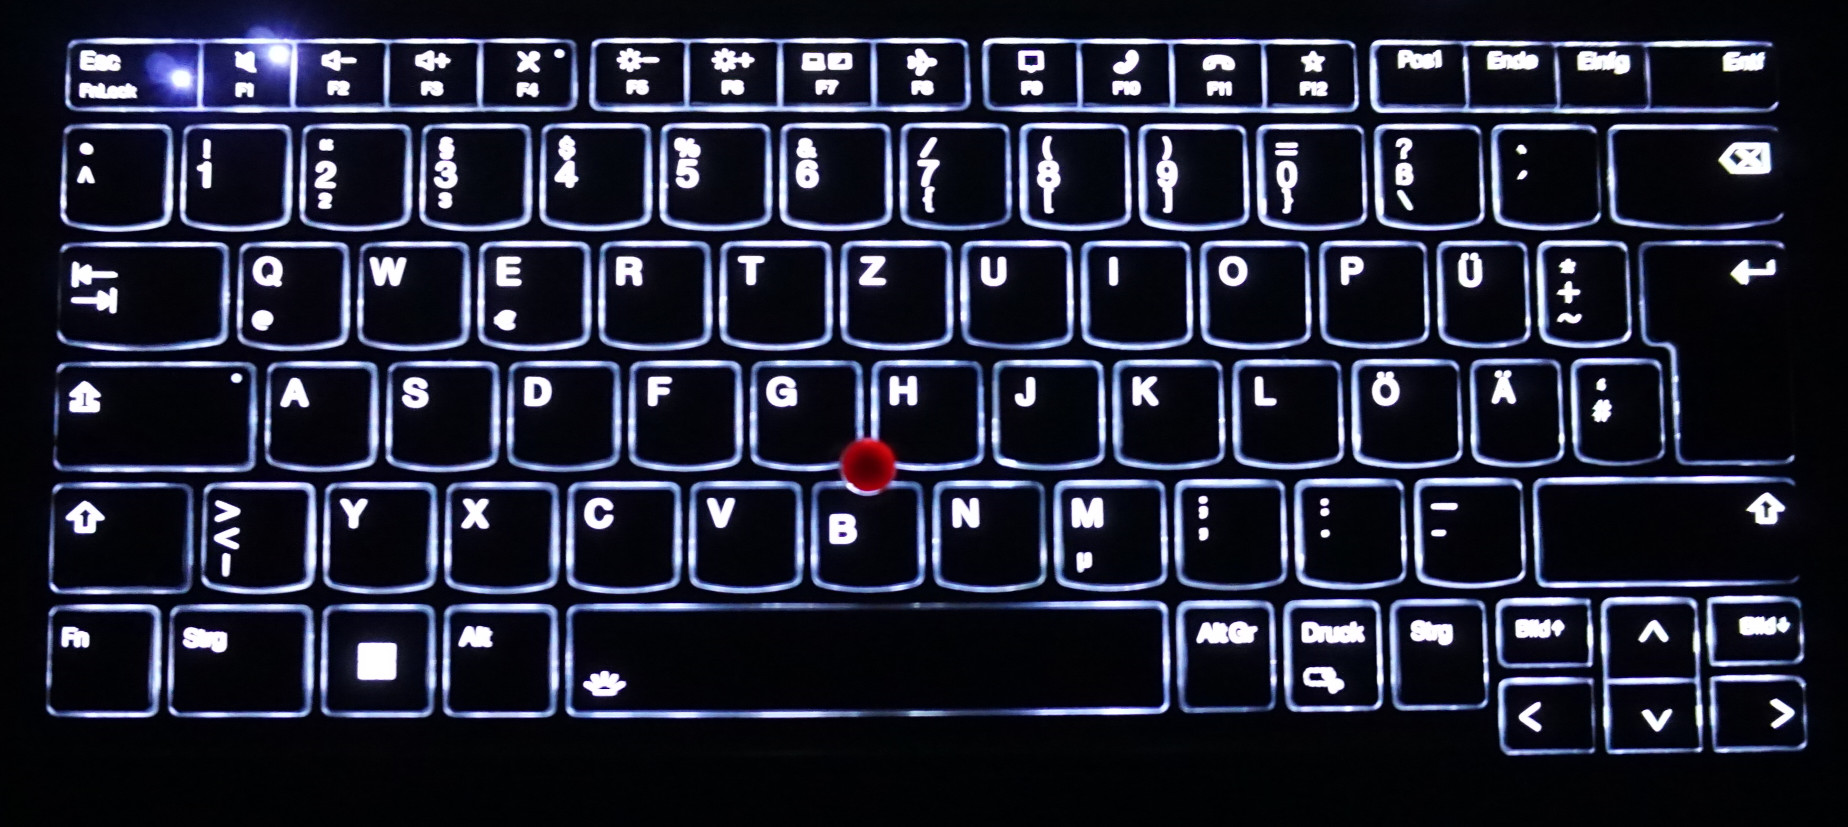
The keyboard meets the expected high standard. The slightly roughened and curved keys allow for precise and fast typing. The uniform backlight ensures optimum legibility at all times.
The 1.5 mm travel (our measurement) may be too short for fast typers and the slight flexing of the keyboard frame is not ideal. But don't get us wrong: The keyboard is very good for a notebook - the small weaknesses are just not necessarily what you would expect from a ThinkPad.
The touchpad and trackpoint show few weaknesses. Their input precision is impressive and the actuating pressure is well aligned with the keys.
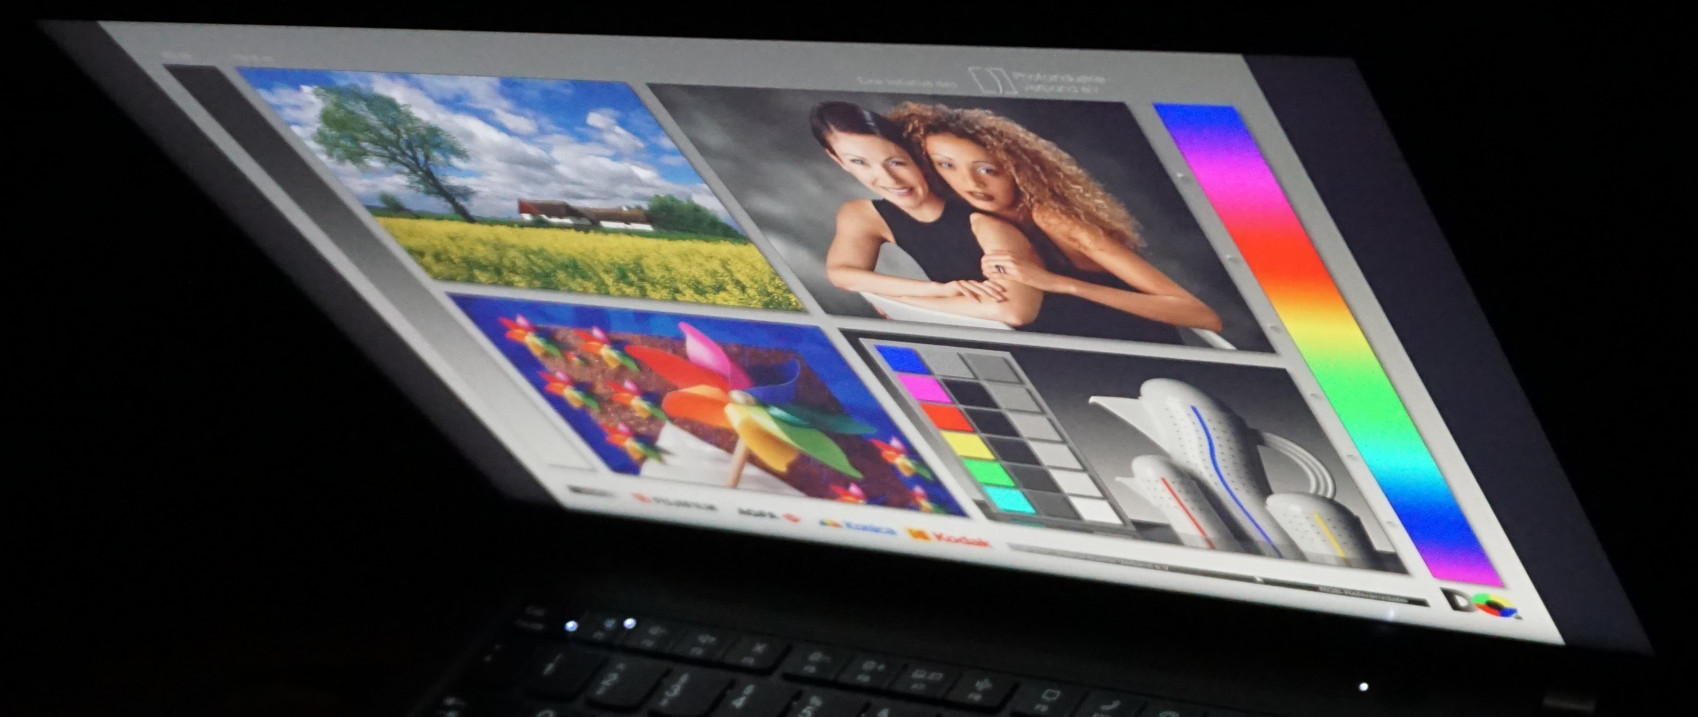
Display - Almost always the right choice
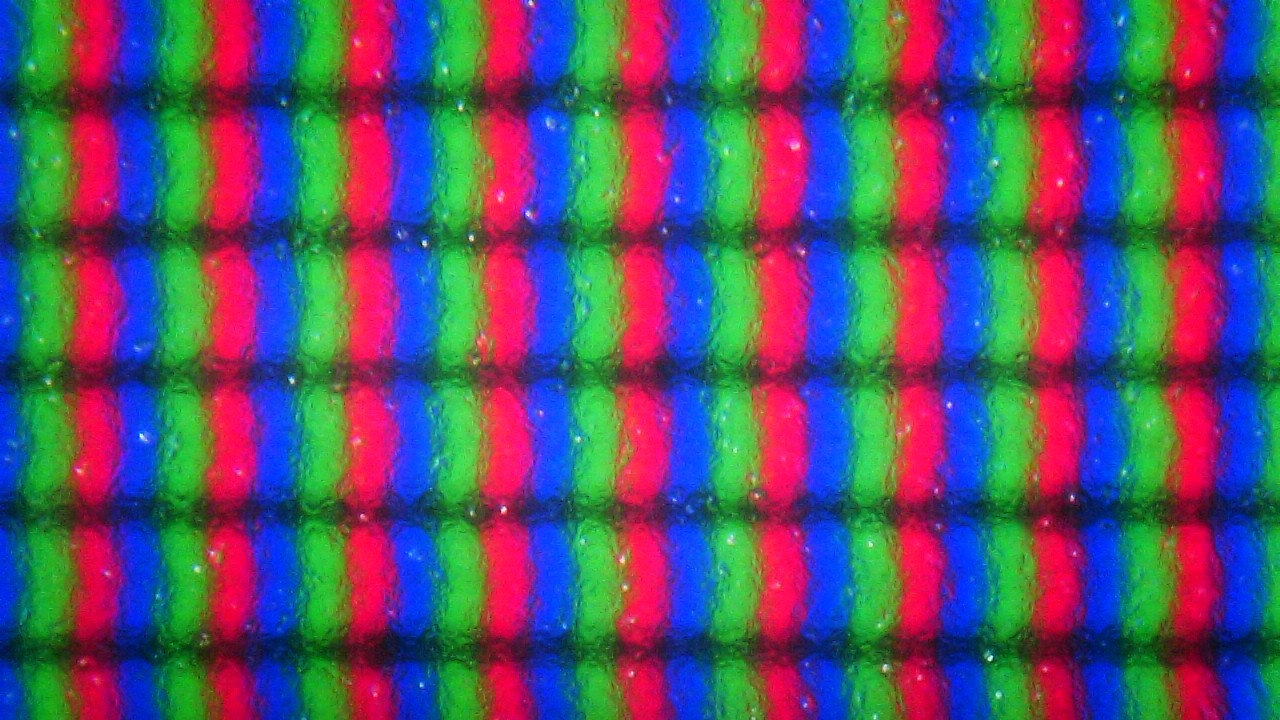
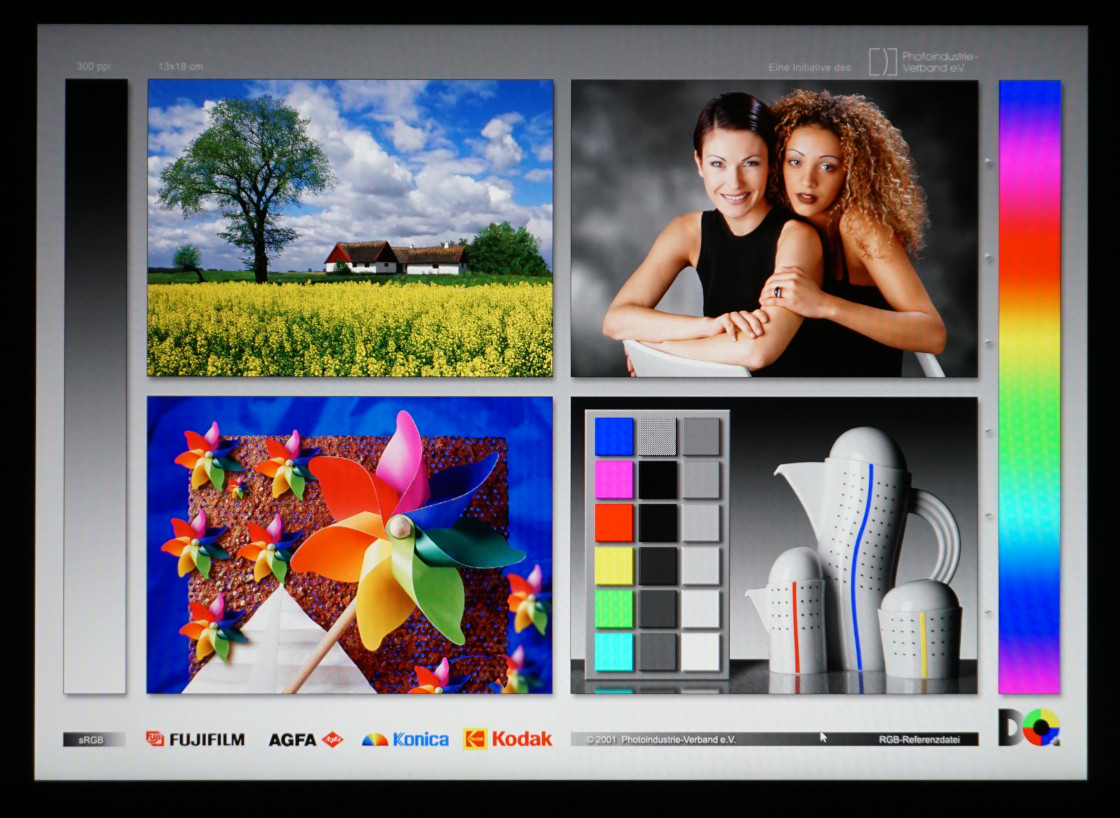
The display is perfectly suited for typical workstation laptop tasks. It has a decent resolution of 1920 x 1200 pixels with a 16:10 aspect ratio.
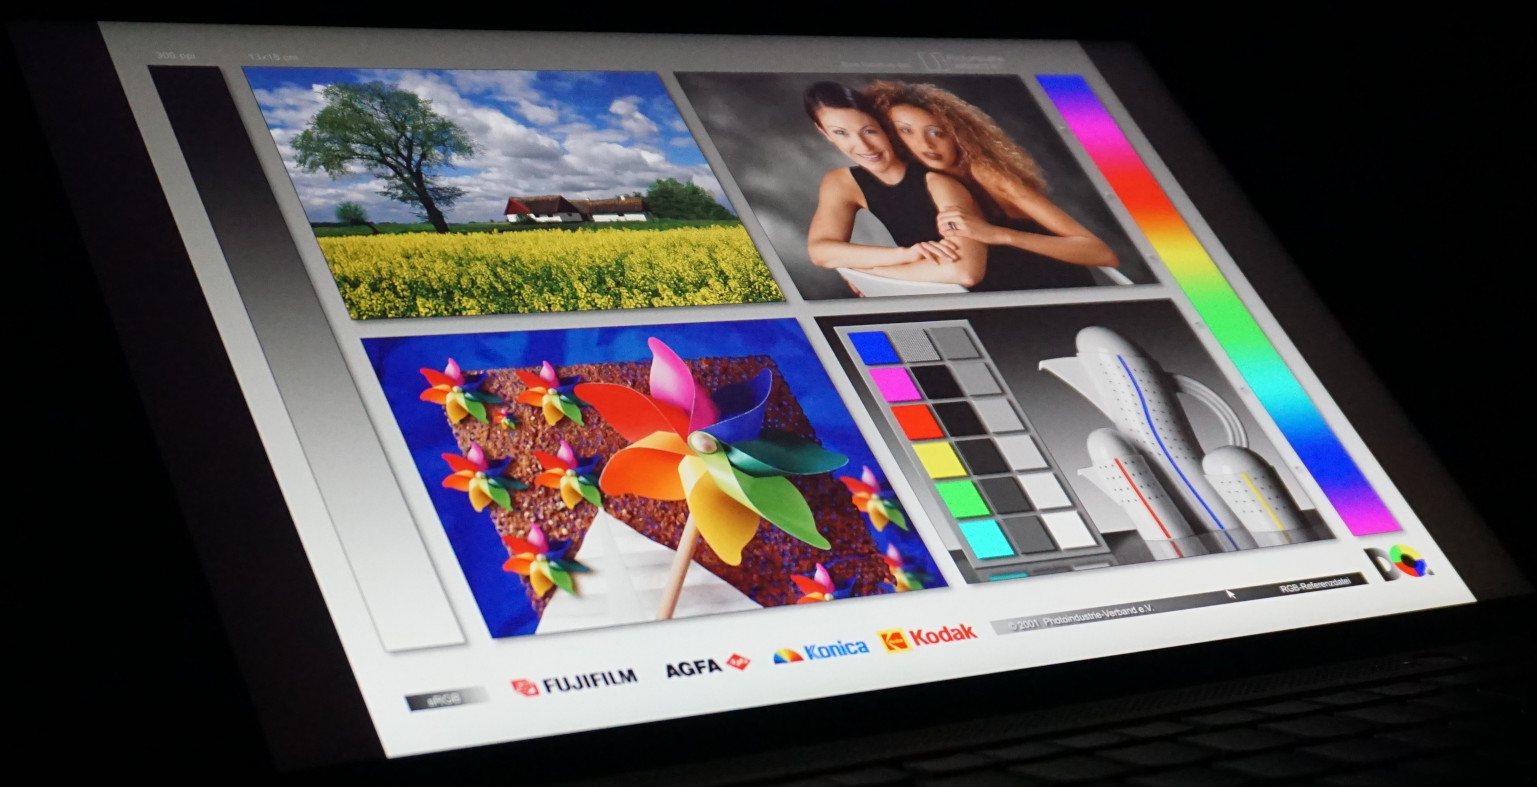
The IPS panel displays colors accurately and has stable viewing angles - a feature not to be underestimated, especially when a group of people is viewing the ThinkPad P14s's screen from different angles.
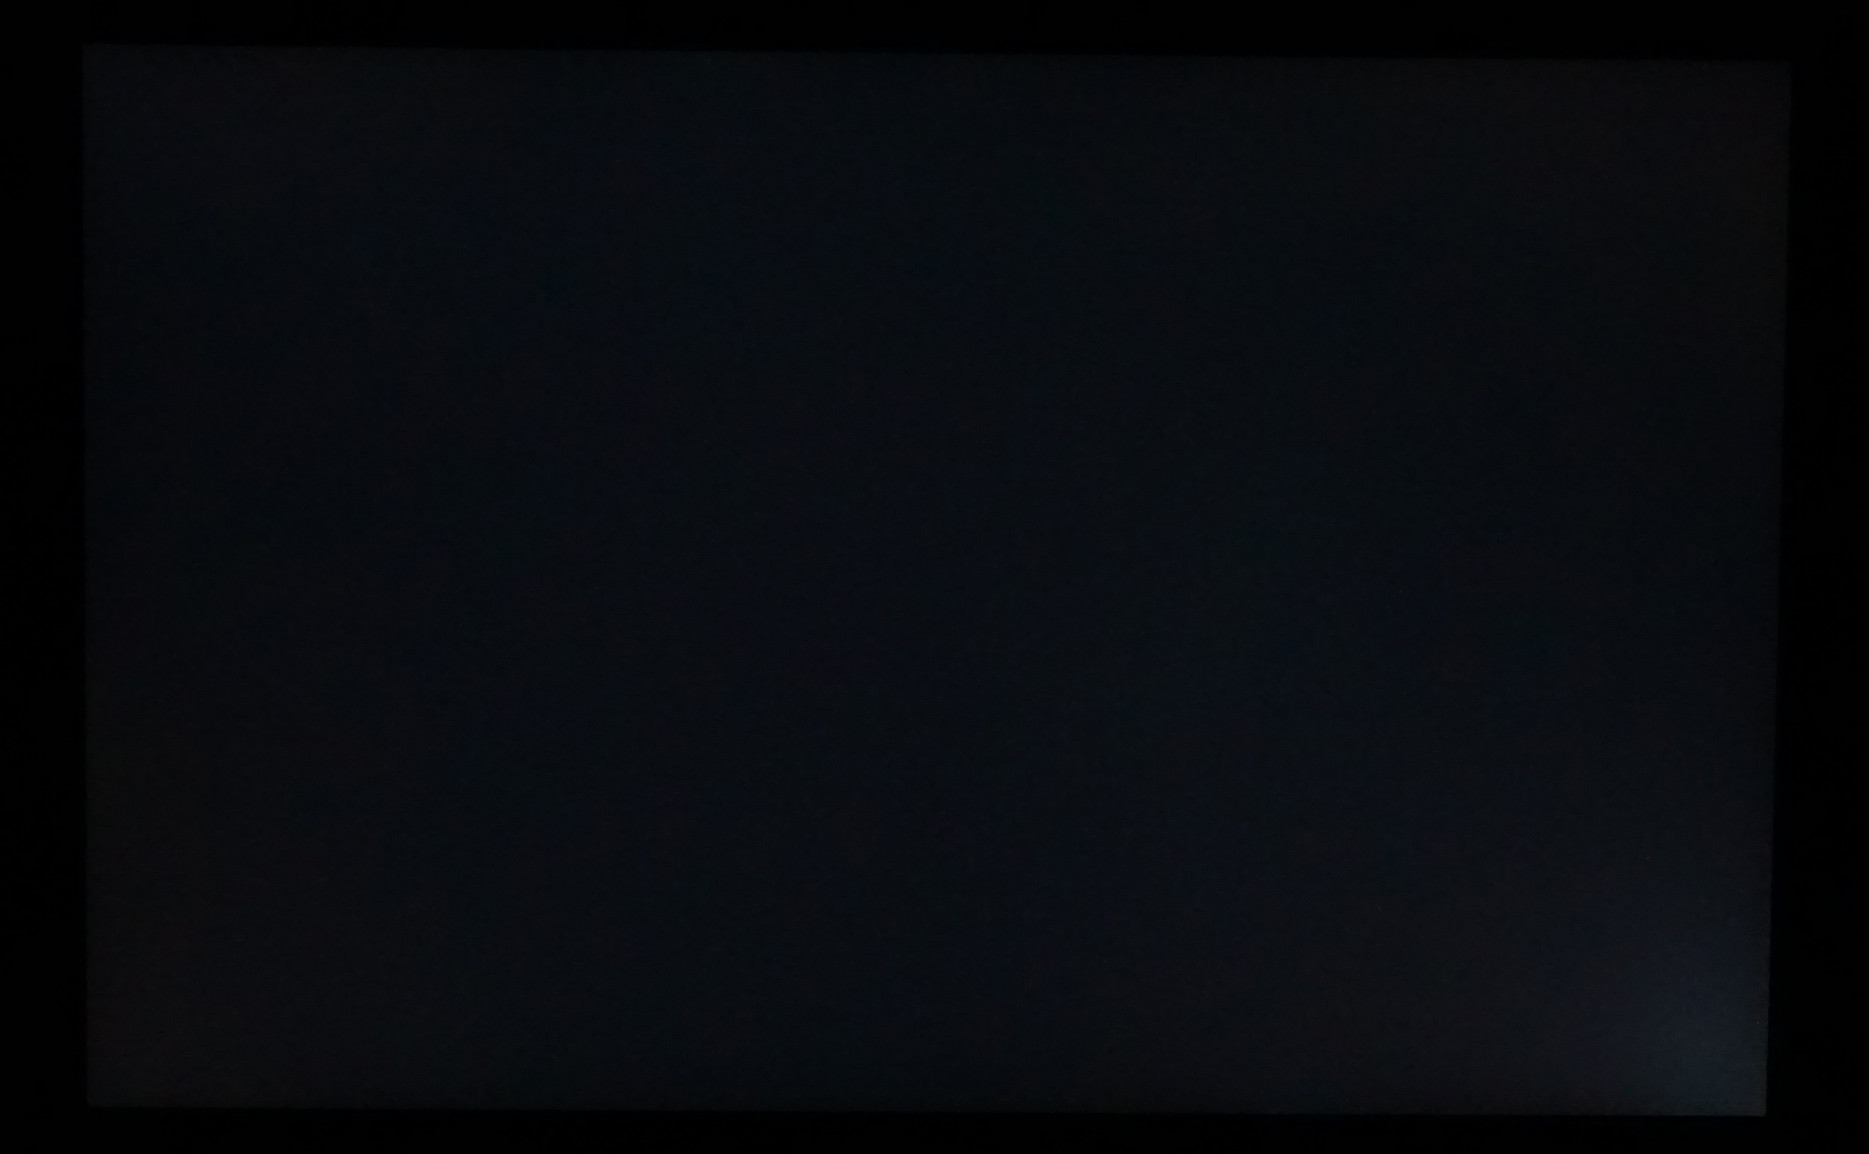
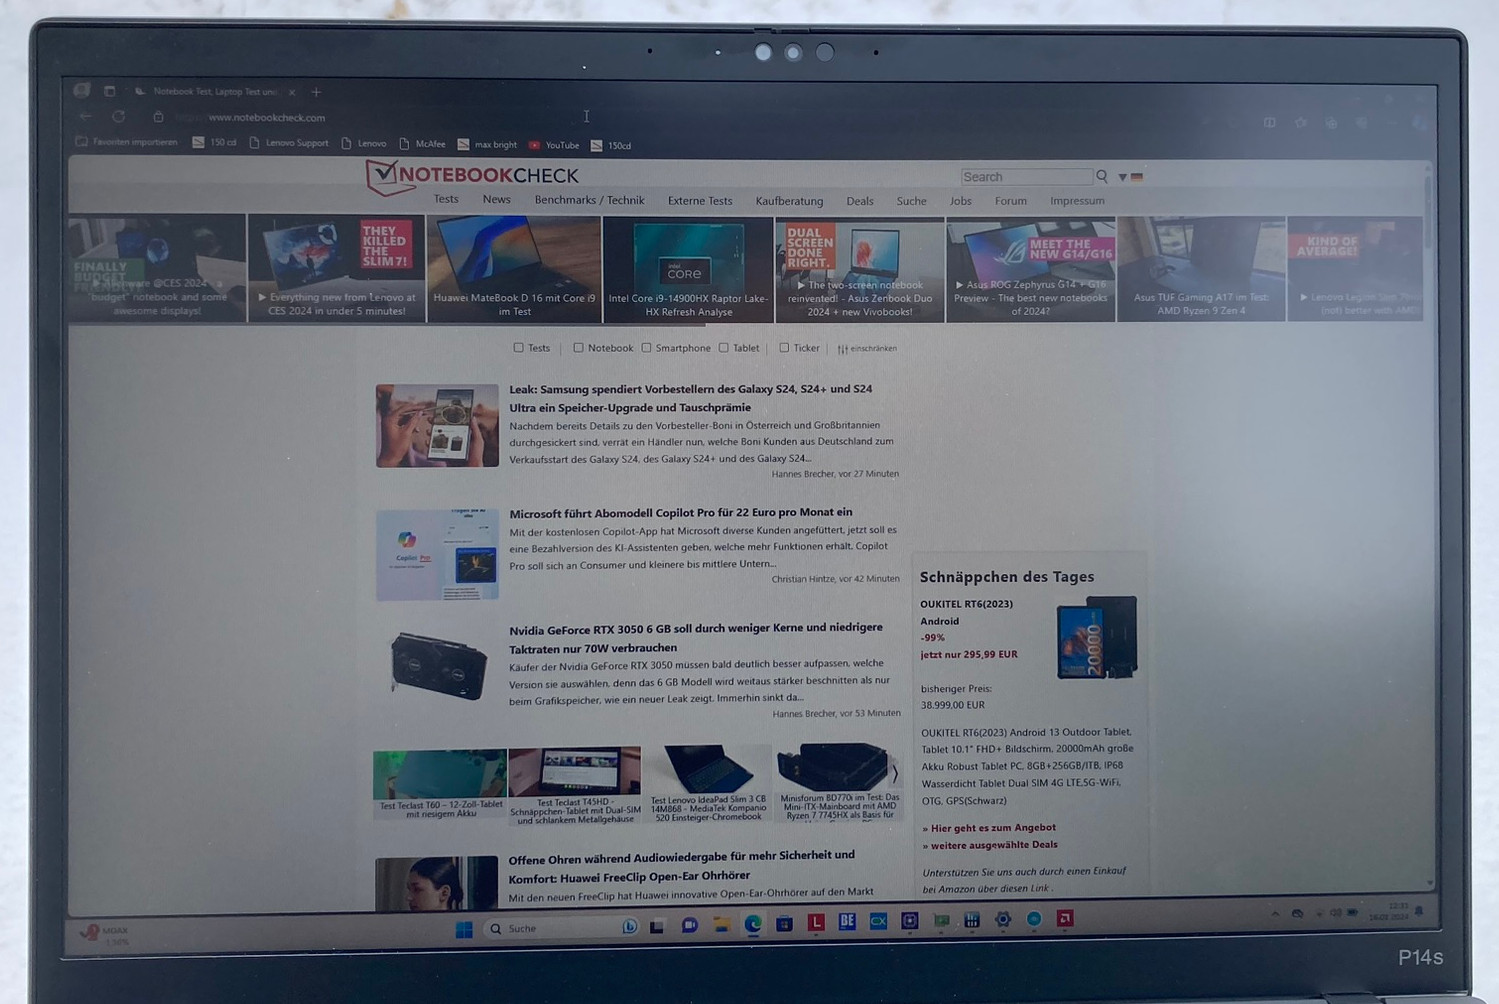
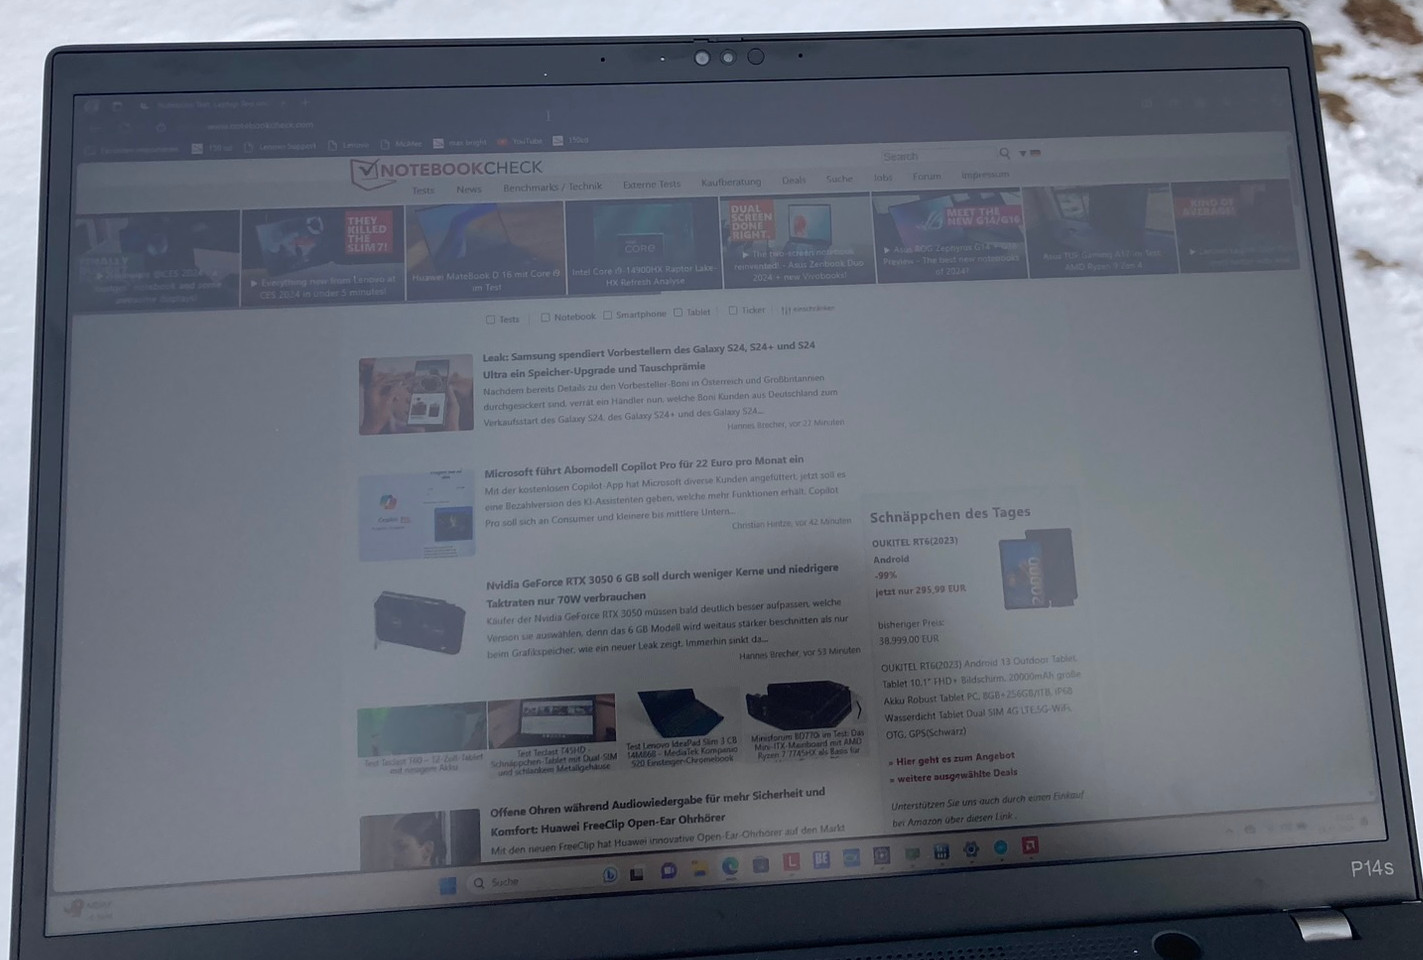
The matte surface and slightly above-average brightness ensure the laptop is easy to use outdoors. The black value is good and the high contrast ratio further improves the screen's legibility. We only noticed minimal backlight bleeding, mainly in the bottom right corner.
The frame rate of only 60 Hz and below-average response rates should be irrelevant as most users will not require the fast-moving content to be displayed perfectly.
| |||||||||||||||||||||||||
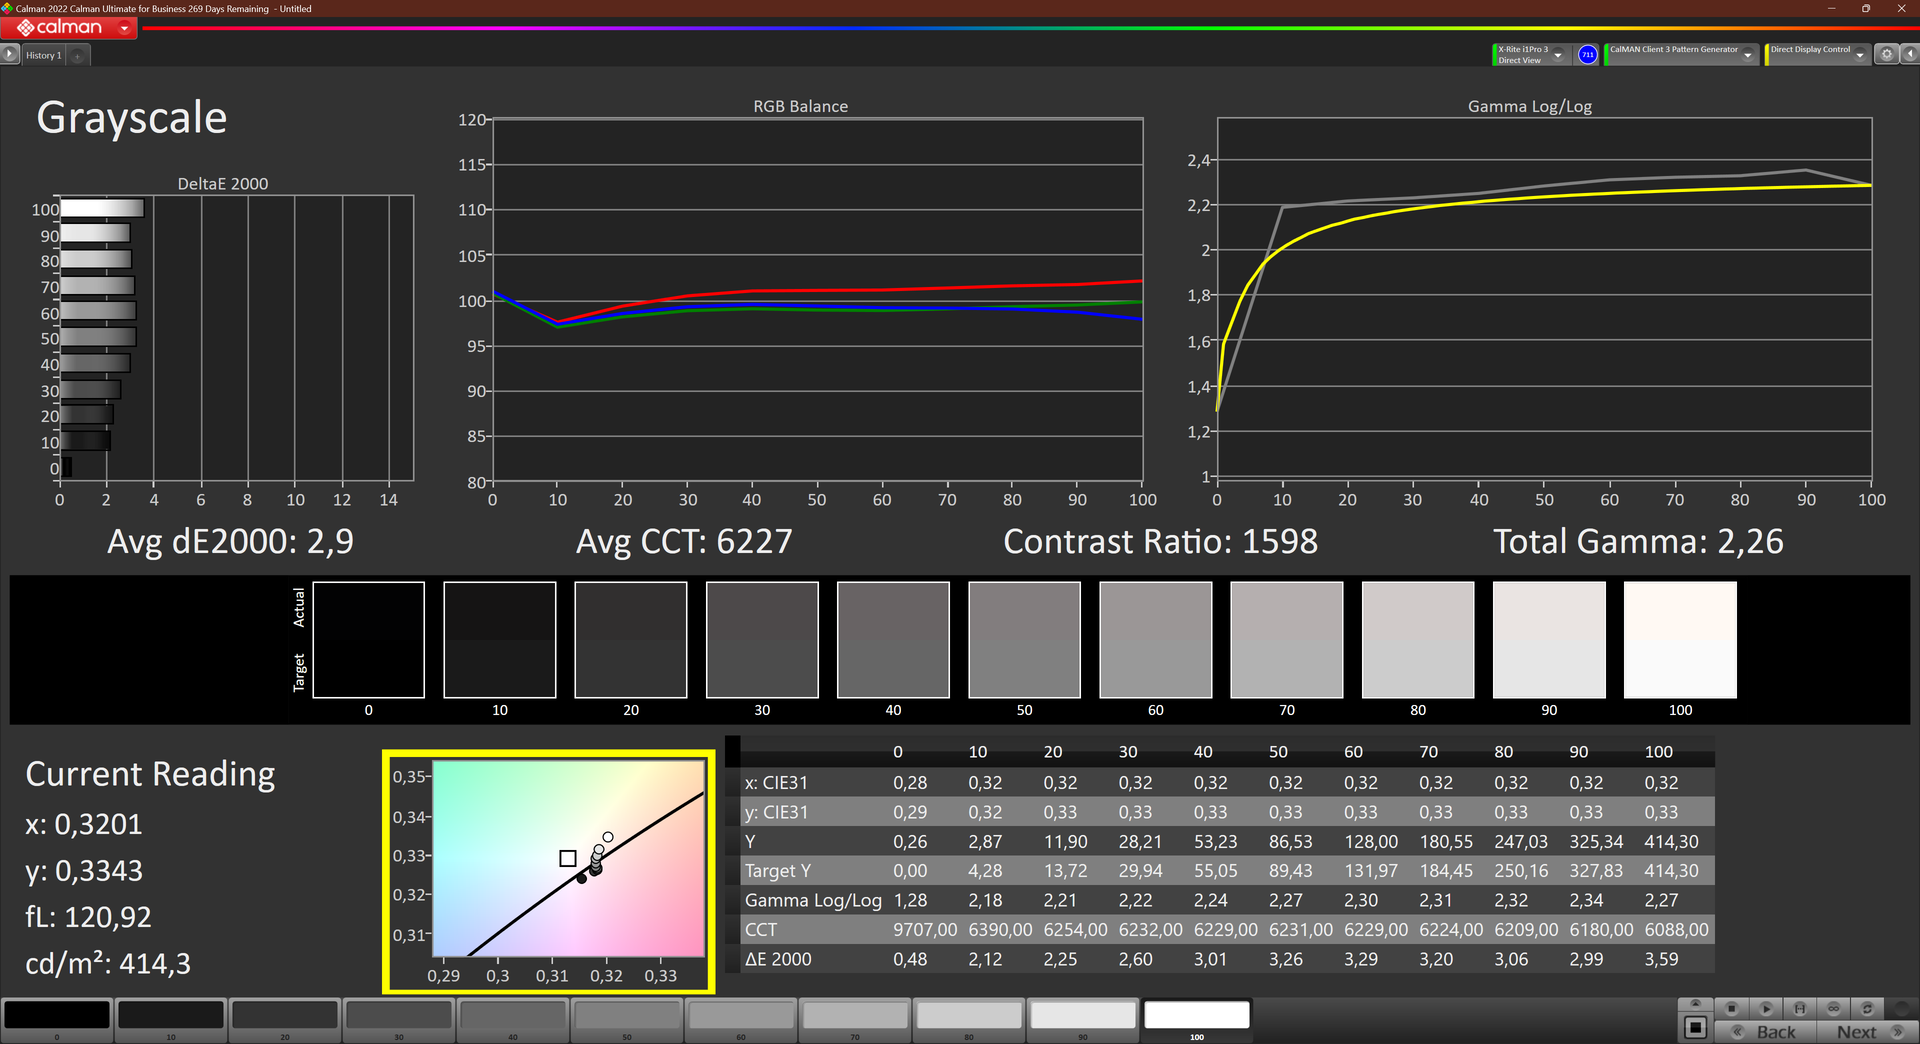
Brightness Distribution: 89 %
Center on Battery: 414 cd/m²
Contrast: 1592:1 (Black: 0.26 cd/m²)
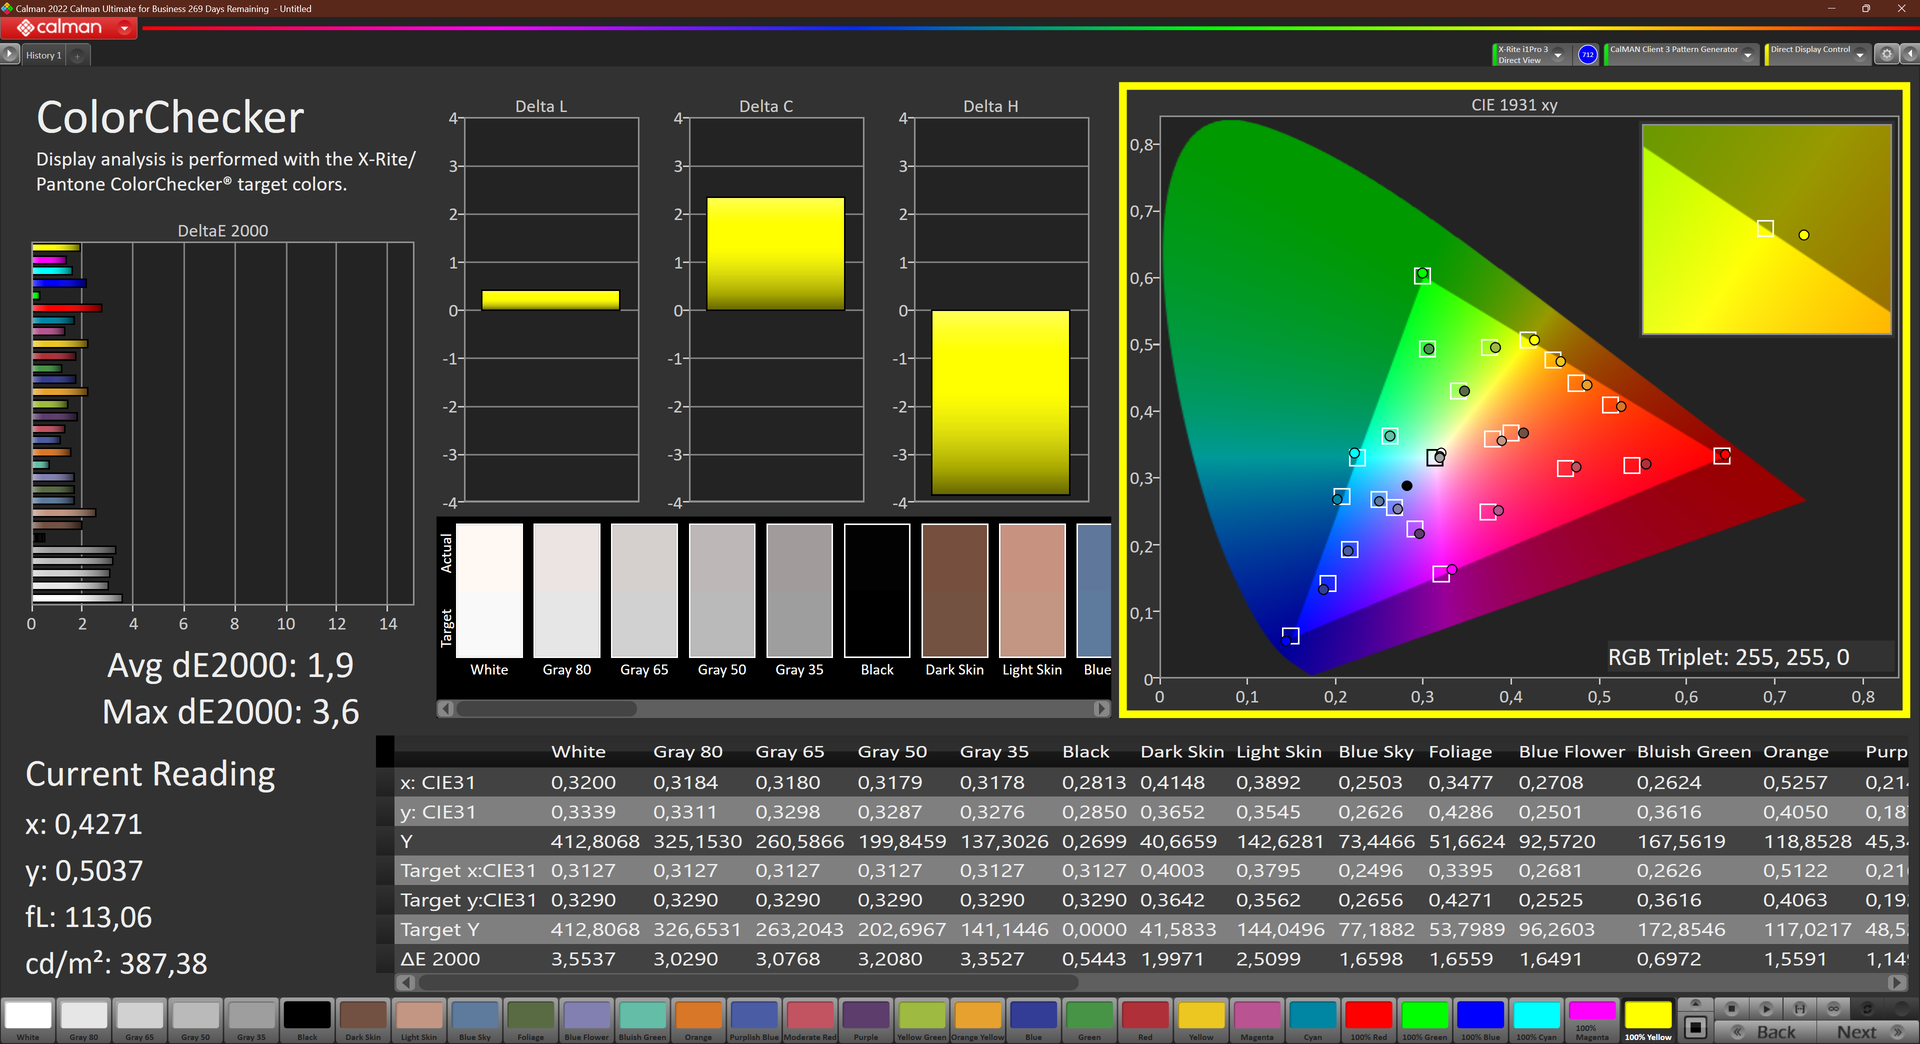
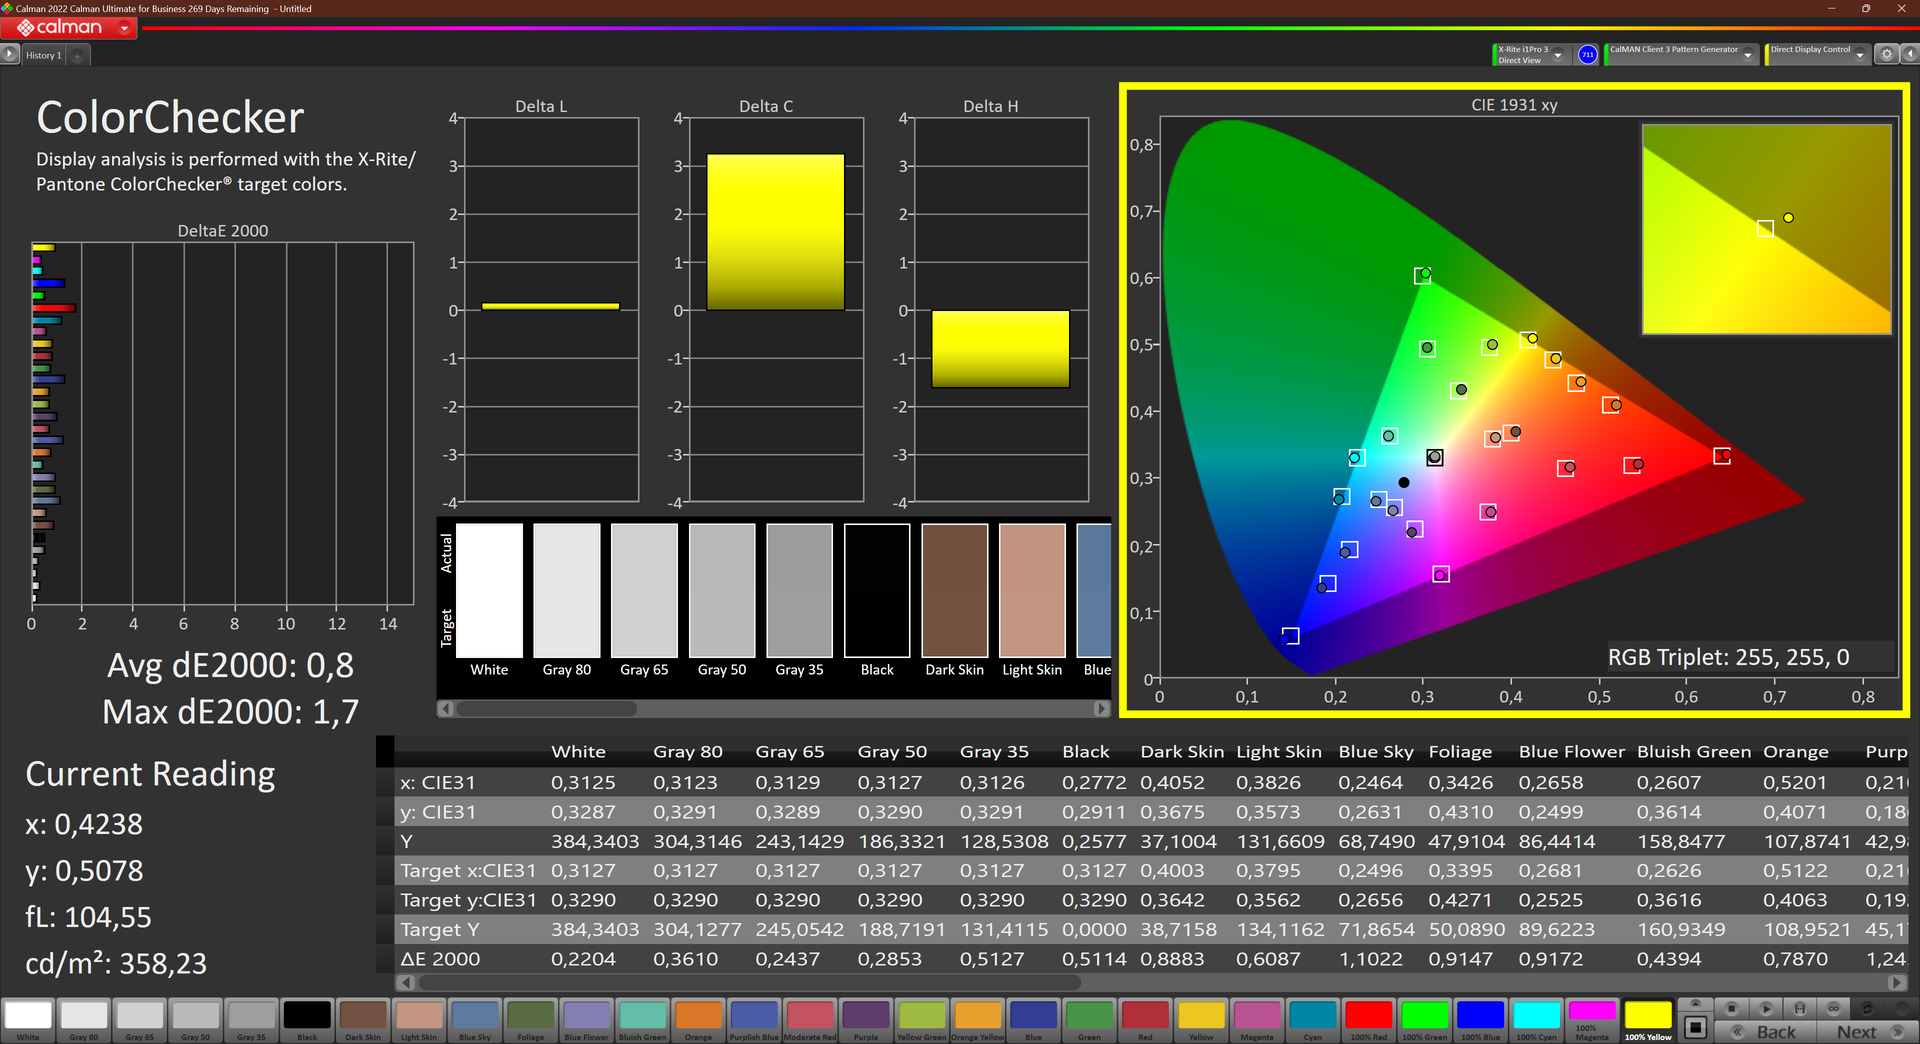
ΔE ColorChecker Calman: 1.9 | ∀{0.5-29.43 Ø4.73}
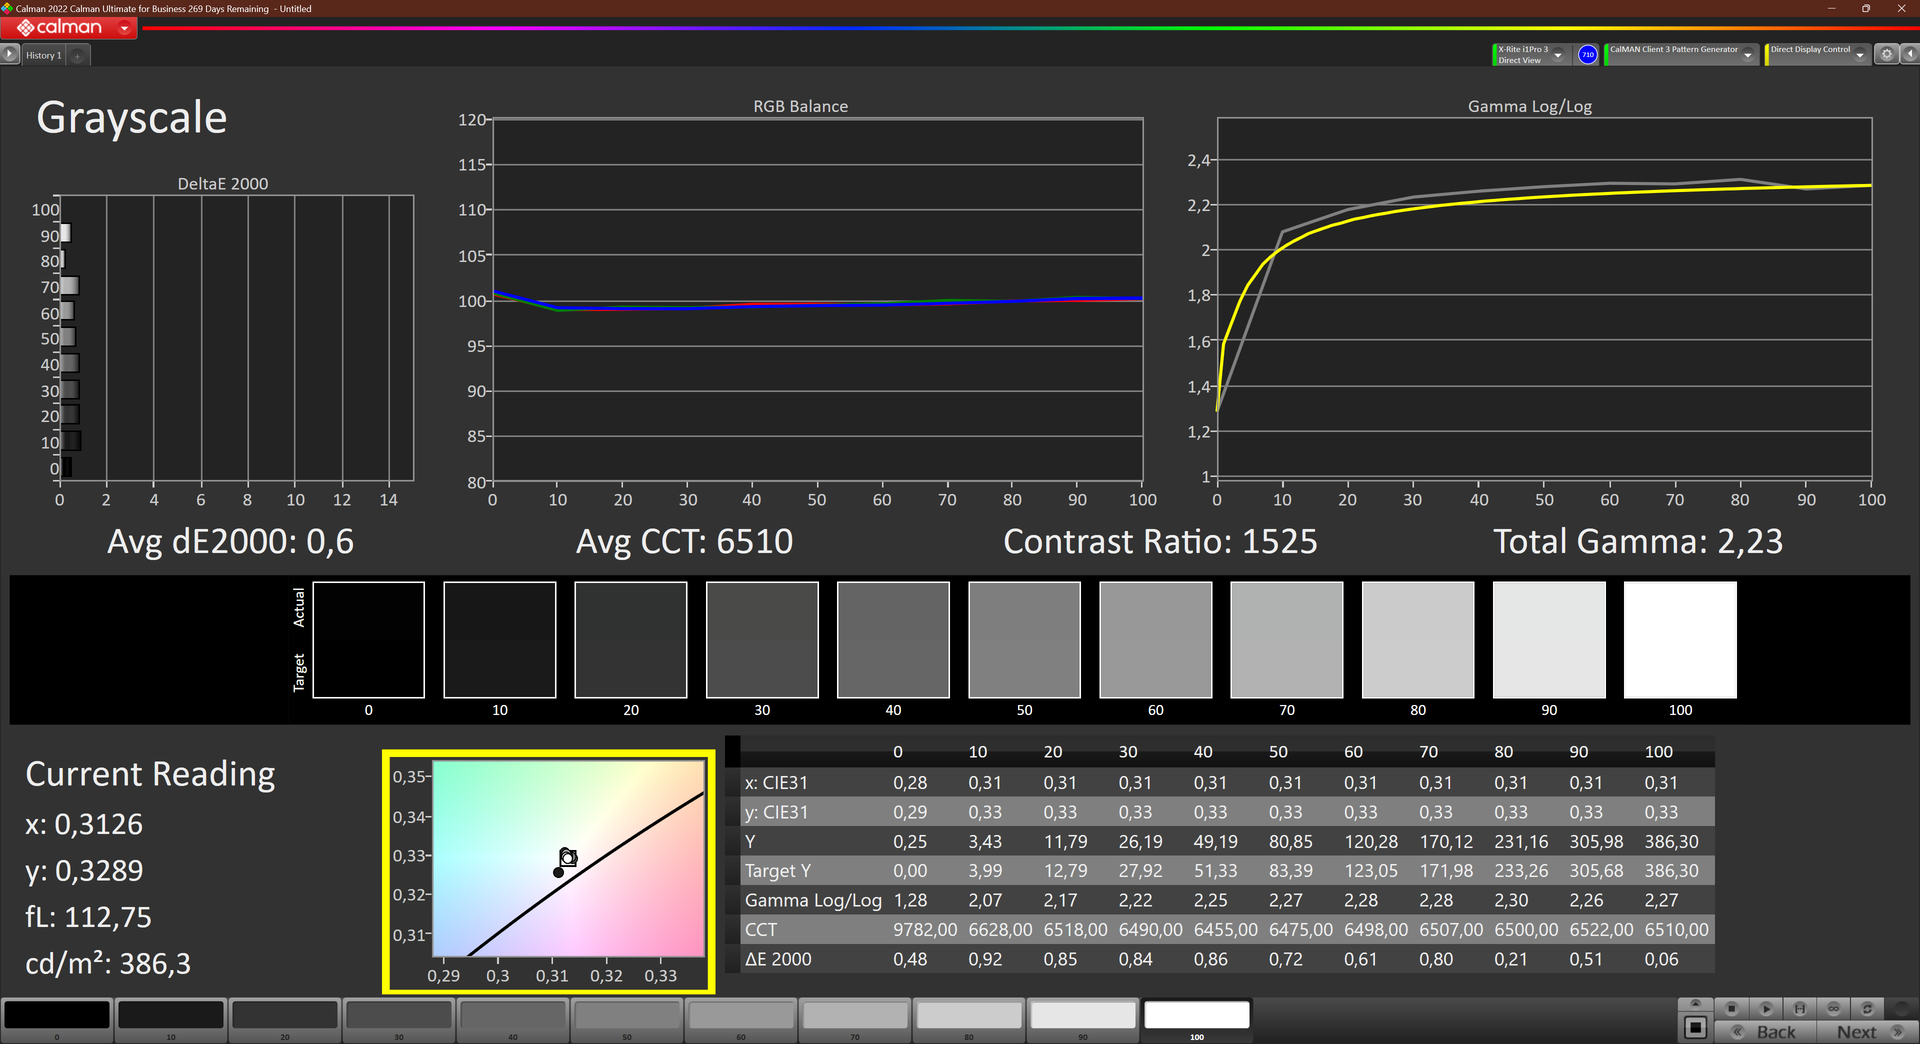
calibrated: 0.8
ΔE Greyscale Calman: 2.9 | ∀{0.09-98 Ø4.97}
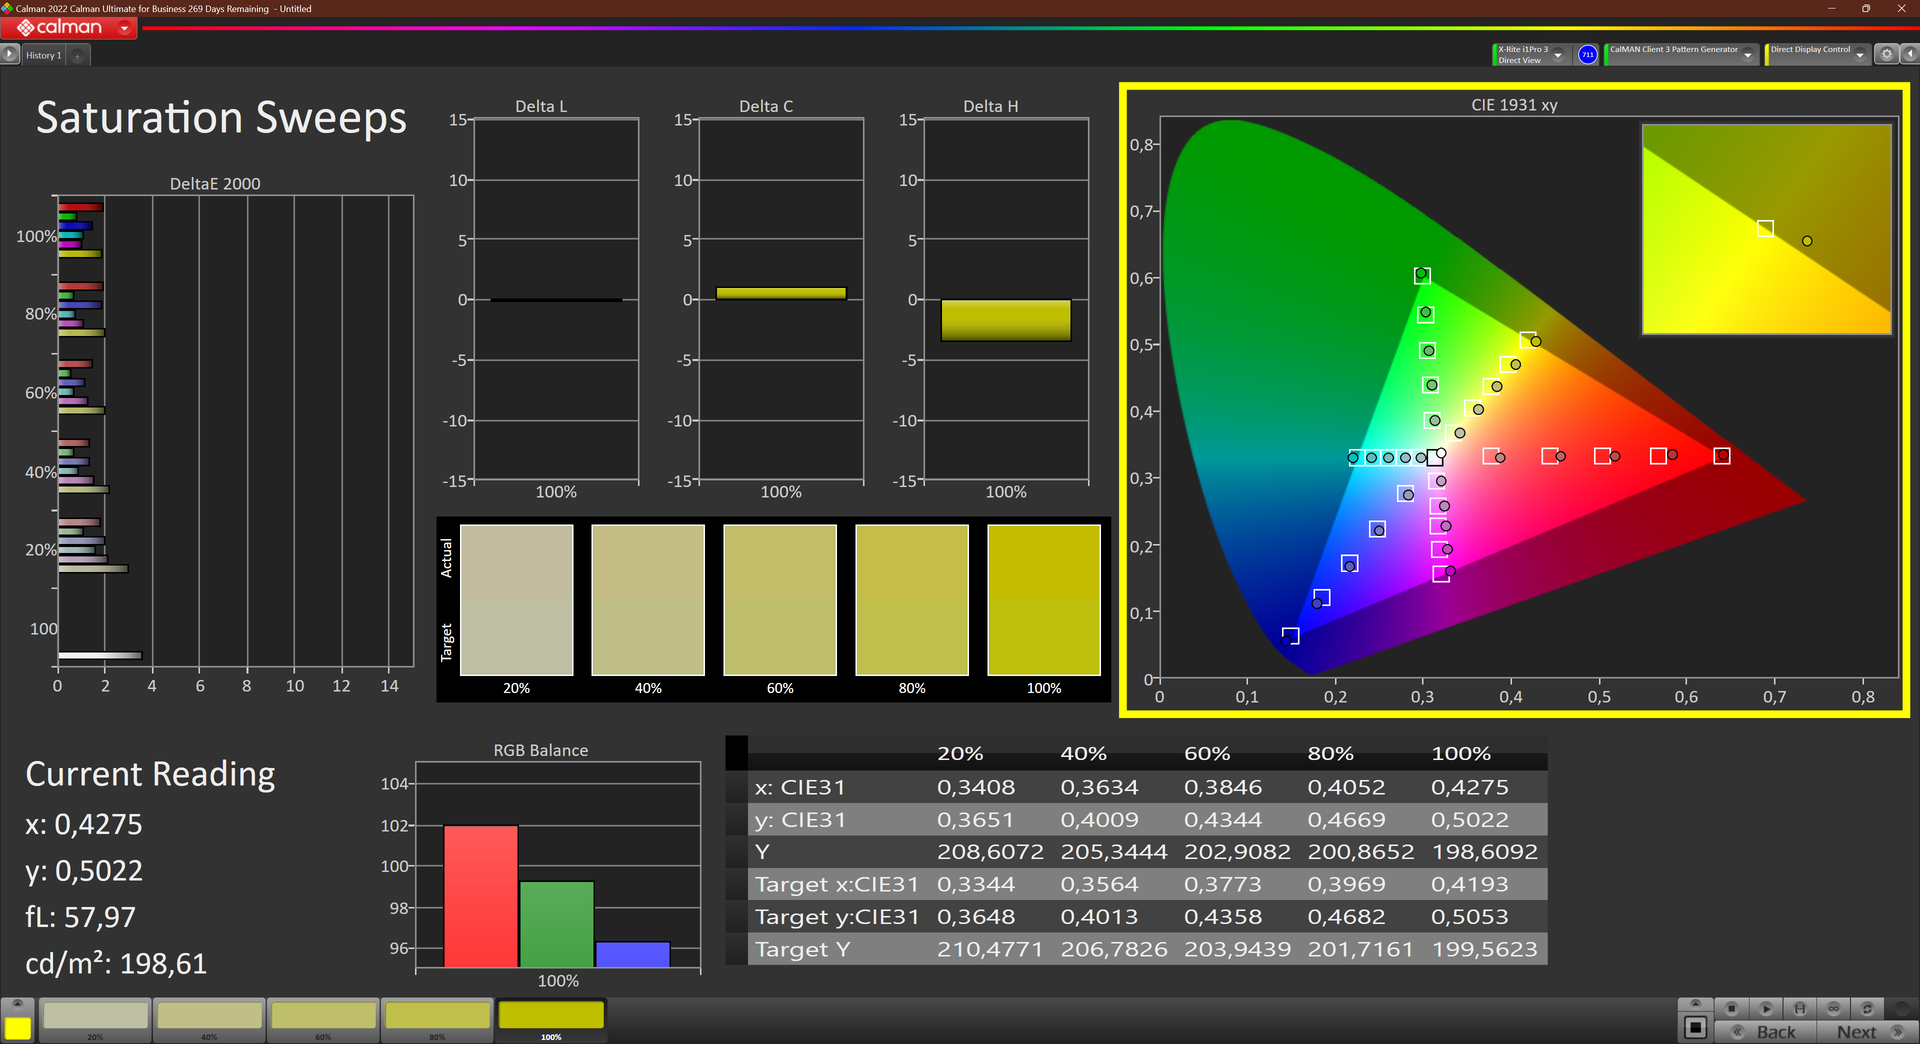
71.4% AdobeRGB 1998 (Argyll 3D)
99.9% sRGB (Argyll 3D)
69.4% Display P3 (Argyll 3D)
Gamma: 2.26
CCT: 6227 K
| Lenovo ThinkPad P14s G4 21K5000LGE Lenovo MNE007JA1-1, IPS, 1920x1200, 14" | HP EliteBook 845 G10 5Z4X0ES CMN1435, IPS, 1920x1200, 14" | Lenovo ThinkPad T14 G4 21K4S02000 MNE007JA1-1, IPS LED, 1920x1200, 14" | HP ZBook Power 15 G10 BOE0B6A, IPS, 2560x1440, 15.6" | Lenovo ThinkPad P14s G3 AMD 21J6S05000 LP140WU1-SPB2, IPS LED, 1920x1200, 14" | HP ProBook 450 G10 LG Philips LP156WFC-SPMD, IPS, 1920x1080, 15.6" | Samsung Galaxy Book3 Pro 14 Samsung ATNA40CU02-0, AMOLED, 2880x1800, 14" | |
|---|---|---|---|---|---|---|---|
| Display | 1% | -3% | -2% | -5% | -44% | 26% | |
| Display P3 Coverage (%) | 69.4 | 70.6 2% | 67.1 -3% | 68.2 -2% | 65.9 -5% | 38.4 -45% | 99.7 44% |
| sRGB Coverage (%) | 99.9 | 100 0% | 97.8 -2% | 95.6 -4% | 94.3 -6% | 57.3 -43% | 100 0% |
| AdobeRGB 1998 Coverage (%) | 71.4 | 72.4 1% | 69.4 -3% | 70.5 -1% | 68.2 -4% | 39.7 -44% | 95.7 34% |
| Response Times | -7% | 17% | 69% | 23% | 24% | 100% | |
| Response Time Grey 50% / Grey 80% * (ms) | 45.9 ? | 59.7 ? -30% | 38.4 ? 16% | 13 ? 72% | 33.5 ? 27% | 35.5 ? 23% | 0.5 ? 99% |
| Response Time Black / White * (ms) | 30.7 ? | 25.5 ? 17% | 25.1 ? 18% | 10.4 ? 66% | 24.9 ? 19% | 23 ? 25% | 0.1 ? 100% |
| PWM Frequency (Hz) | 240 ? | ||||||
| Screen | -5% | 7% | -40% | -6% | -148% | 249% | |
| Brightness middle (cd/m²) | 414 | 409 -1% | 398 -4% | 313.8 -24% | 448 8% | 285 -31% | 409 -1% |
| Brightness (cd/m²) | 392 | 391 0% | 379 -3% | 302 -23% | 422 8% | 266 -32% | 410 5% |
| Brightness Distribution (%) | 89 | 92 3% | 90 1% | 83 -7% | 85 -4% | 88 -1% | 99 11% |
| Black Level * (cd/m²) | 0.26 | 0.27 -4% | 0.23 12% | 0.29 -12% | 0.23 12% | 0.26 -0% | 0.01 96% |
| Contrast (:1) | 1592 | 1515 -5% | 1730 9% | 1082 -32% | 1948 22% | 1096 -31% | 40900 2469% |
| Colorchecker dE 2000 * | 1.9 | 2.3 -21% | 1.3 32% | 3.27 -72% | 2.5 -32% | 6.3 -232% | 2.36 -24% |
| Colorchecker dE 2000 max. * | 3.6 | 4.4 -22% | 3.1 14% | 7.81 -117% | 3.7 -3% | 18.3 -408% | 4.07 -13% |
| Colorchecker dE 2000 calibrated * | 0.8 | 0.9 -13% | 1.2 -50% | 0.56 30% | 1.3 -63% | 5.2 -550% | 3.16 -295% |
| Greyscale dE 2000 * | 2.9 | 2.4 17% | 1.4 52% | 5.9 -103% | 2.9 -0% | 4.3 -48% | 3.06 -6% |
| Gamma | 2.26 97% | 2.06 107% | 2.26 97% | 2.18 101% | 2.03 108% | 2.32 95% | 2.49 88% |
| CCT | 6227 104% | 6293 103% | 6448 101% | 6323 103% | 6840 95% | 6374 102% | 6882 94% |
| Total Average (Program / Settings) | -4% /
-4% | 7% /
6% | 9% /
-16% | 4% /
-2% | -56% /
-101% | 125% /
180% |
* ... smaller is better
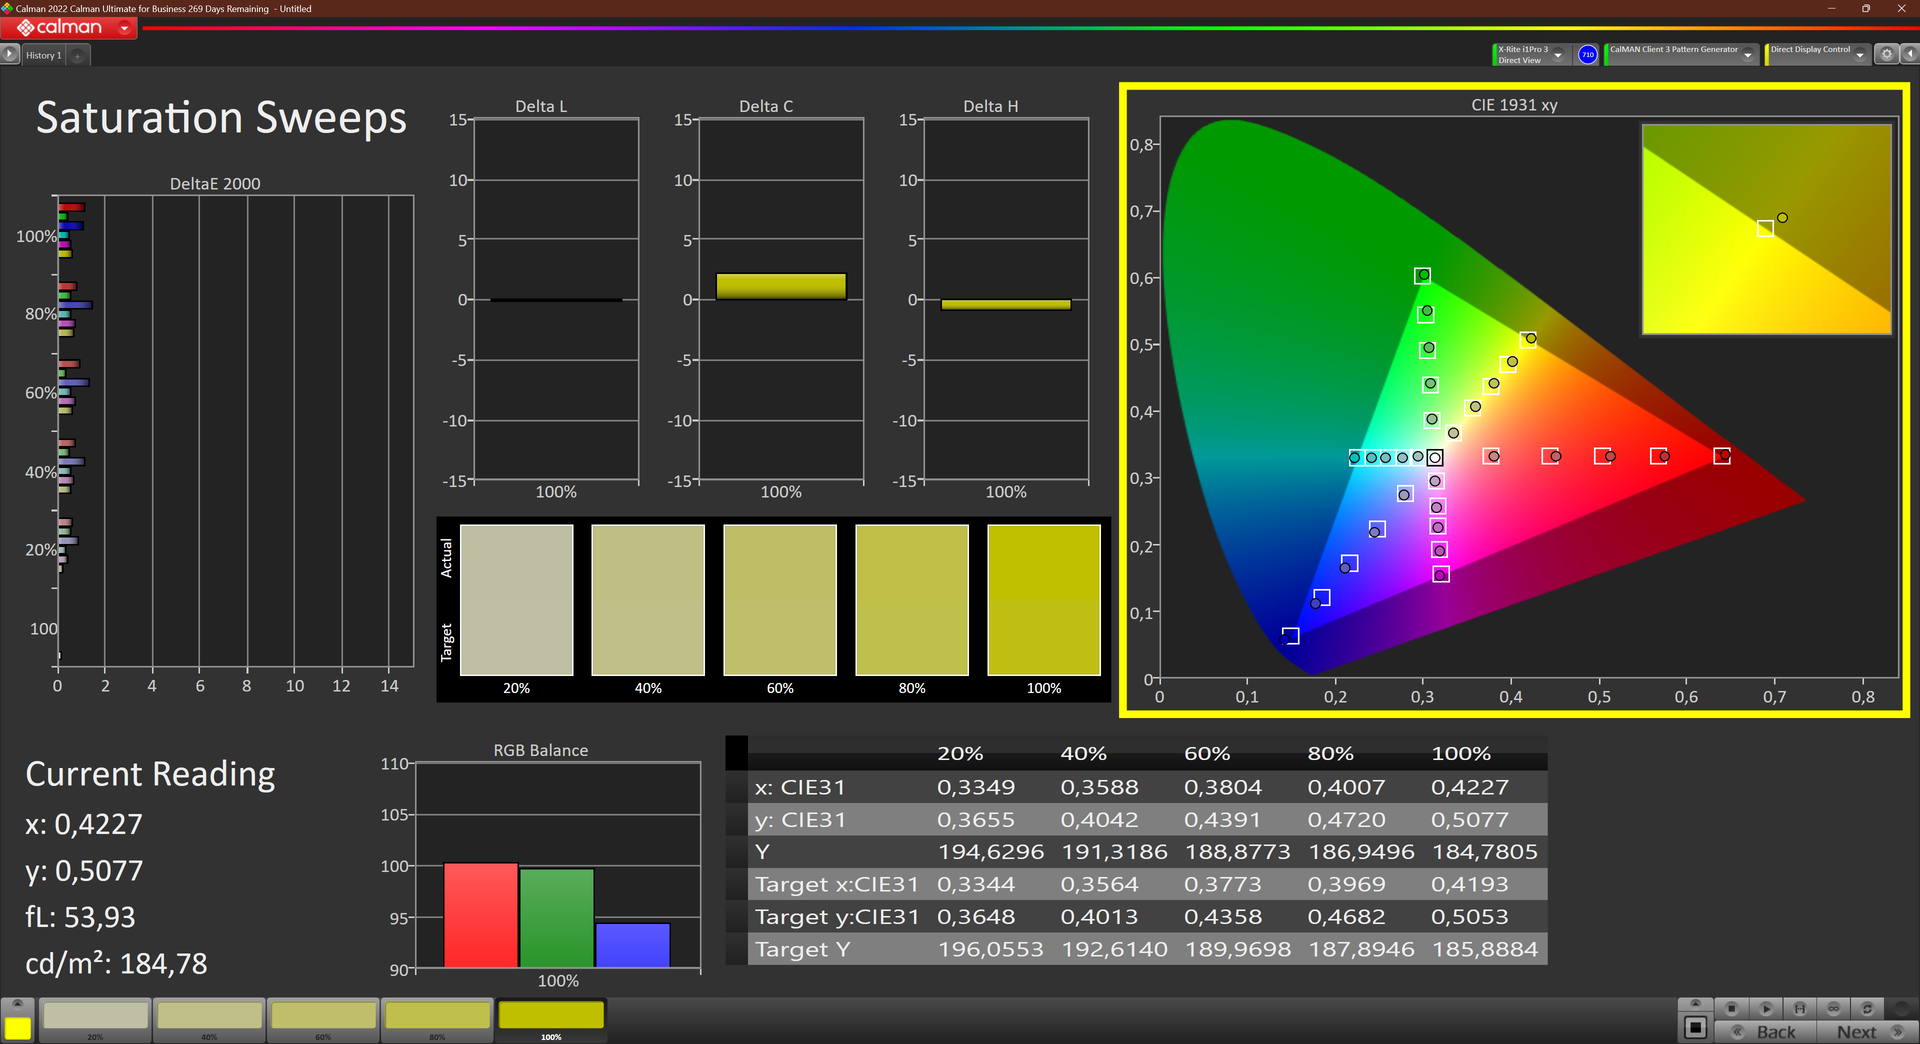
The display covers the entire sRGB color space and is well-equipped to display multimedia content. Professional image processing would require a larger color space, but again, this will not be relevant to most ThinkPad P14s users.
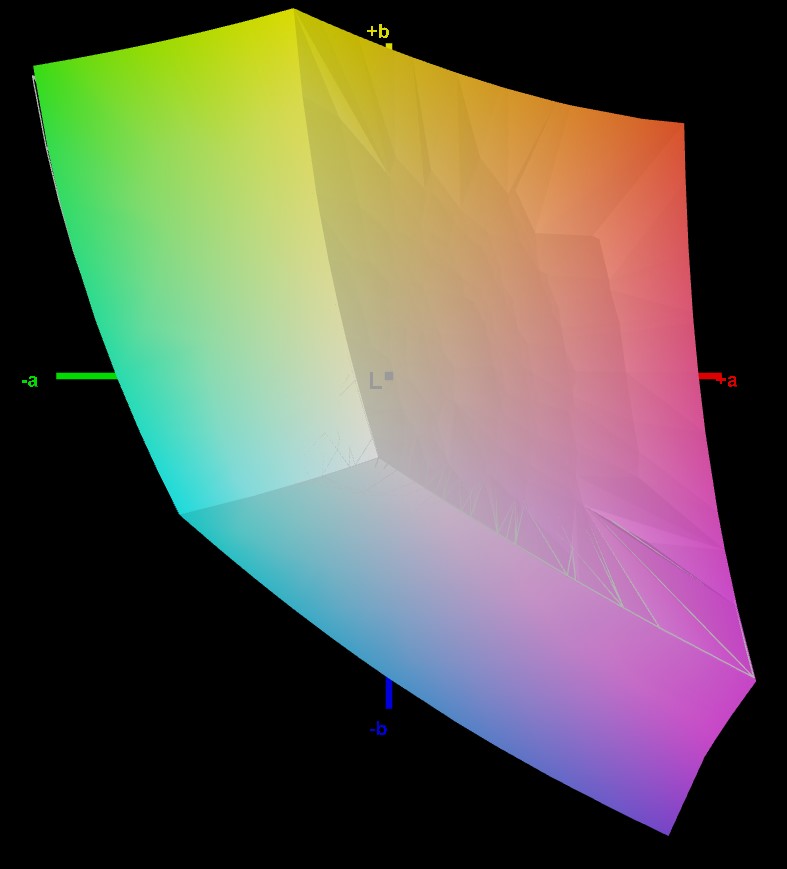
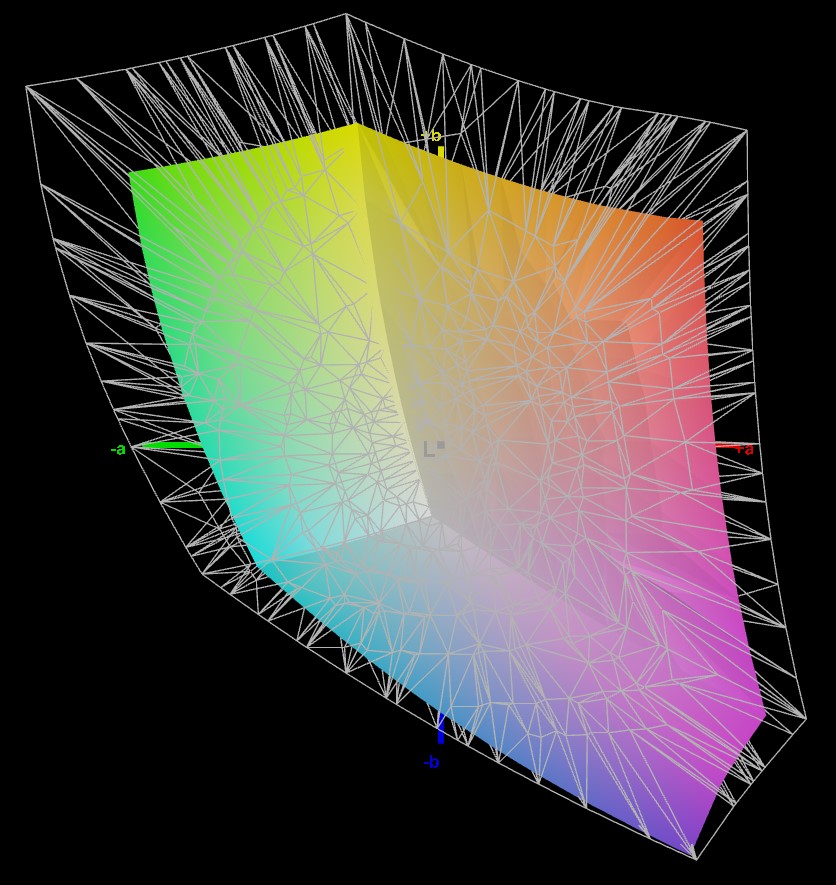
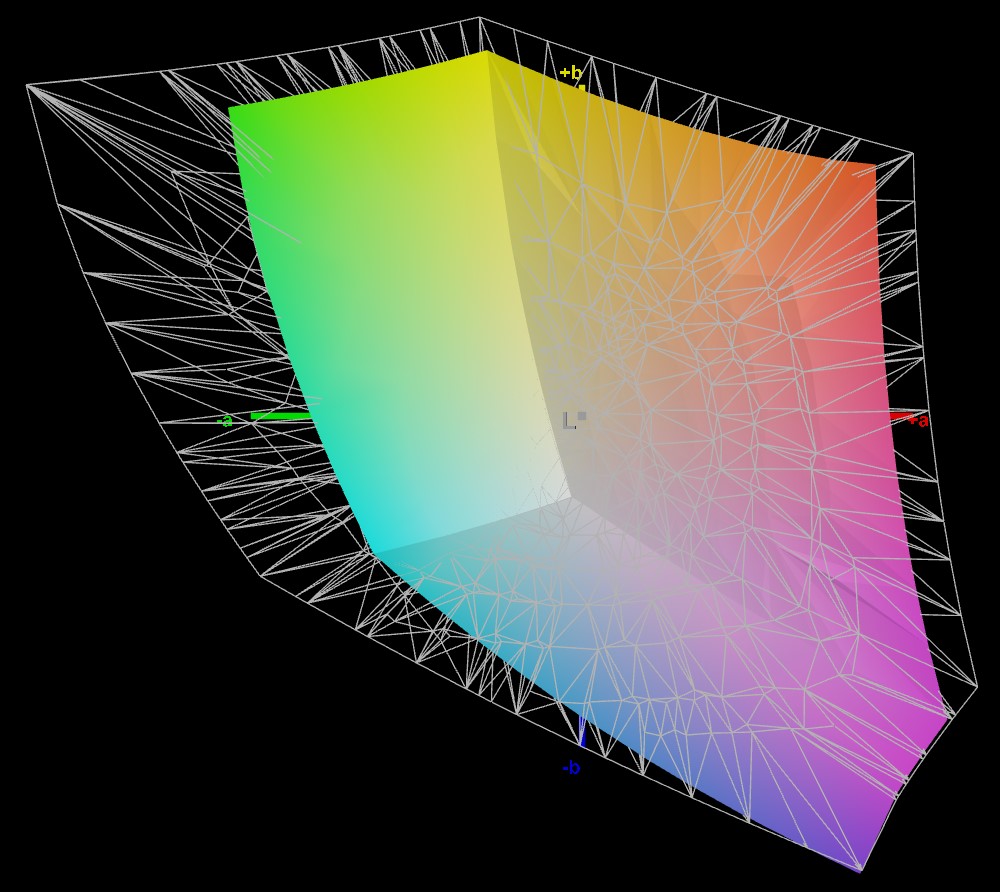
Colors are displayed well out of the box. Our measurements indicate that the color space deviation is just above what is perceptible. This mainly affects several gray tones and is hardly noteworthy even there. We were able to further improve the color display by calibrating the panel, although this won't be necessary for most users. Even trained eyes will not be able to see significant differences in the color display with or without calibration.
Display Response Times
| ↔ Response Time Black to White | ||
|---|---|---|
| 30.7 ms ... rise ↗ and fall ↘ combined | ↗ 16.6 ms rise | 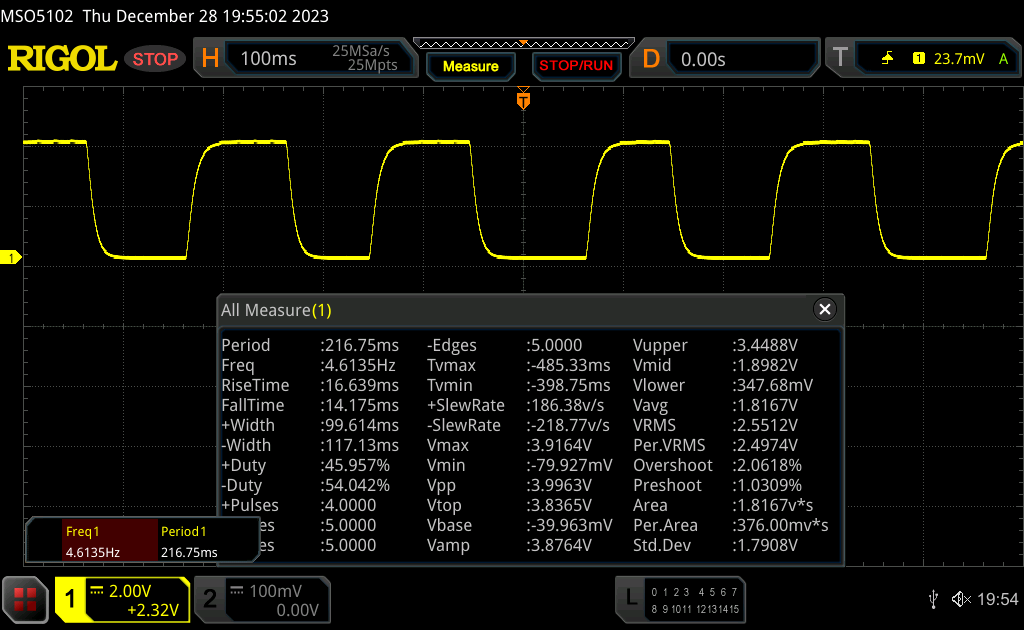 |
| ↘ 14.1 ms fall | ||
| The screen shows slow response rates in our tests and will be unsatisfactory for gamers. In comparison, all tested devices range from 0.1 (minimum) to 240 (maximum) ms. » 83 % of all devices are better. This means that the measured response time is worse than the average of all tested devices (19.9 ms). | ||
| ↔ Response Time 50% Grey to 80% Grey | ||
| 45.9 ms ... rise ↗ and fall ↘ combined | ↗ 21.9 ms rise | 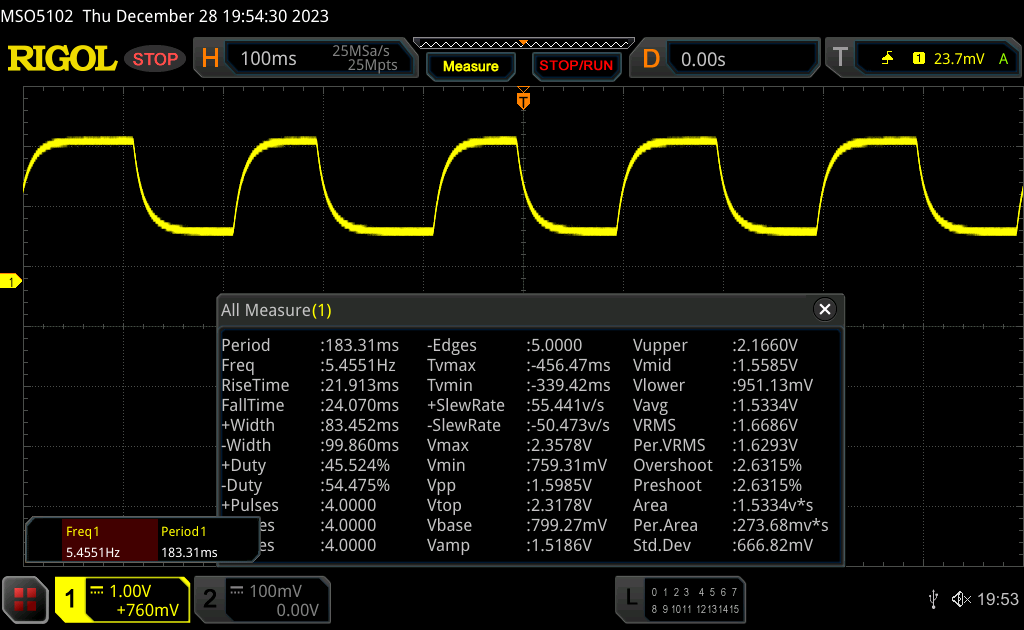 |
| ↘ 24 ms fall | ||
| The screen shows slow response rates in our tests and will be unsatisfactory for gamers. In comparison, all tested devices range from 0.165 (minimum) to 636 (maximum) ms. » 79 % of all devices are better. This means that the measured response time is worse than the average of all tested devices (31.1 ms). | ||
Screen Flickering / PWM (Pulse-Width Modulation)
| Screen flickering / PWM not detected | 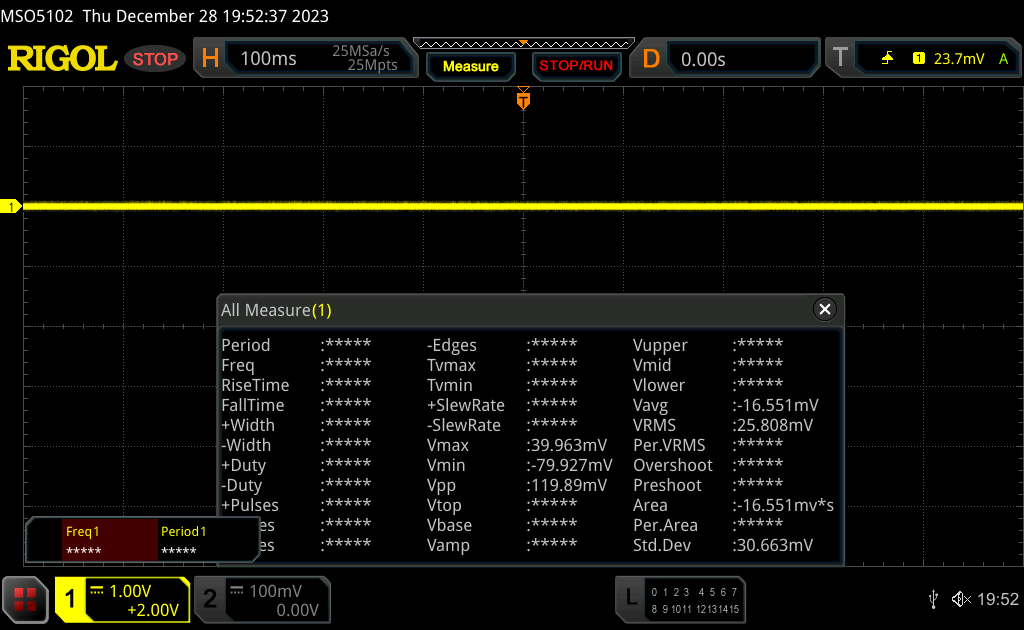 | ||
In comparison: 52 % of all tested devices do not use PWM to dim the display. If PWM was detected, an average of 7797 (minimum: 5 - maximum: 343500) Hz was measured. | |||
The high maximum brightness and good contrast ratio are put to good use when using the ThinkPad P14s outdoors. While seeing the sky reflected in the screen can be annoying, there is nothing to stop you from working outdoors as long as the light doesn't fall directly on the display.
As expected from an IPS panel, colors and brightness remain stable even at inclined viewing angles.
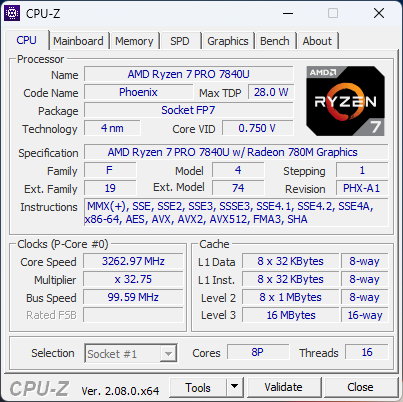
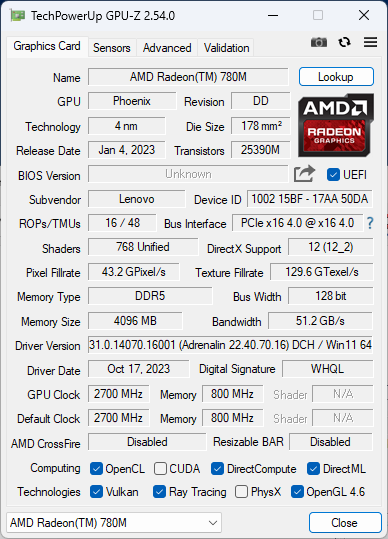
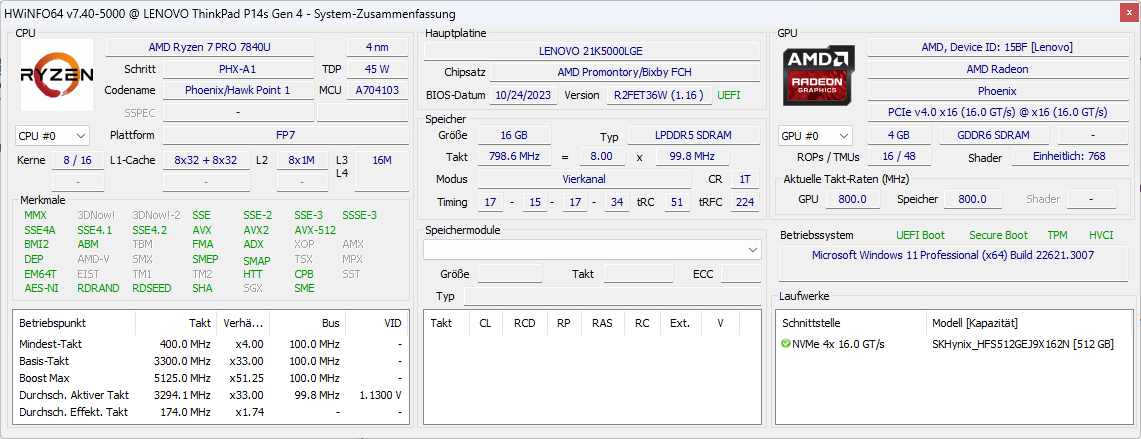
Performance - Ryzen 7 between power and efficiency
The ThinkPad P14s G4 is equipped with an AMD Ryzen 7 Pro 7840U, which includes the integrated GPU AMD Radeon 780M. The CPU is characterized by high computing power, good graphics on par with a small dedicated graphics card and its Pro series support for remote maintenance. Another configuration is available with the slightly weaker AMD Ryzen 5 Pro 7540U and a Radeon 740M.
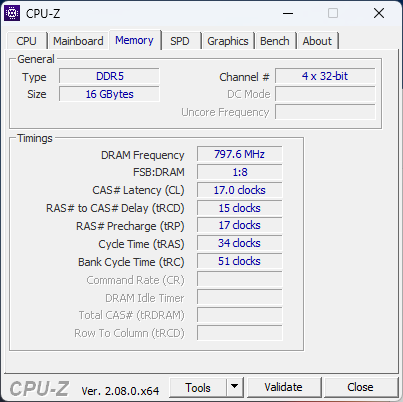
There are several RAM options available, ranging from 16, 32 to 64 GB of DDR5 RAM with 6400 MHz. Because the modules are soldered on, we would recommend choosing the more generous option if in doubt.
Testing Conditions
The performance modes are managed through Windows. You can choose between "Best Performance", "Balanced" and "Energy Saving" modes in the energy tab of the settings. The Lenovo Commercial Vantage software is set to the highest performance as a standard. Overall, the changes to the CPU's power limits are minimal.
This means that the notebook's performance is comparably high in balanced mode. While the loss in speed is measurable, users will hardly feel the difference in everyday use. The fan remains audible at full load, albeit at a lower level. Things are more relaxed in energy-saving mode, although the performance is still comparably high. The fan remains unobtrusive even during the stress test in this mode.
The notebook automatically switches to balanced mode when you disconnect it from external power supply, but users can easily switch the performance mode back to their preferred setting. Our tests and benchmarks were all performed in best performance mode.
| PL2 | PL1 | |
|---|---|---|
| Best Performance | 40 W | 32 W |
| Balanced | 36 W | 32 W |
| Energy Saving | 30 W | 26 W |
Processor
The AMD Ryzen 7 Pro 7840U is a powerful CPU that also prioritizes efficiency. Thanks to its 8 cores and 16 threats, it provides sufficient computing power for complex applications and multitasking, while simultaneously limiting energy and cooling needs through a TDP of 28 W.
The AMD Ryzen 7 7840U has the same basic build and performance but lacks the additional security chip of the Pro series. This chip supports numerous remote functions including centralized updates and management functions.
Our CPU beats Intel's 13th-generation mobile CPUs with ease. While the Intel Core i7-13700H has much better features on paper and achieves a similar performance to our test unit, it cannot offer the same efficiency, consuming between 20 and 30 percent more electricity than our ThinkPad P14s, depending on the laptop model.
The ThinkPad P14s clearly fulfills its promise of performance and efficiency.
You can find more benchmark comparisons in our CPU benchmark list.
Cinebench R15 Multi Loop
Cinebench R23: Multi Core | Single Core
Cinebench R20: CPU (Multi Core) | CPU (Single Core)
Cinebench R15: CPU Multi 64Bit | CPU Single 64Bit
Blender: v2.79 BMW27 CPU
7-Zip 18.03: 7z b 4 | 7z b 4 -mmt1
Geekbench 5.5: Multi-Core | Single-Core
HWBOT x265 Benchmark v2.2: 4k Preset
LibreOffice : 20 Documents To PDF
R Benchmark 2.5: Overall mean
| CPU Performance rating | |
| Average of class Workstation | |
| HP ZBook Power 15 G10 | |
| Schenker Vision 14 2023 | |
| Lenovo ThinkPad T14 G4 21K4S02000 | |
| Lenovo ThinkPad P14s G4 21K5000LGE | |
| Average AMD Ryzen 7 PRO 7840U | |
| HP EliteBook 845 G10 5Z4X0ES | |
| Lenovo ThinkPad X1 Carbon G11 21HNS54T00 | |
| Samsung Galaxy Book3 Pro 14 | |
| Lenovo ThinkPad P14s G3 AMD 21J6S05000 | |
| HP ProBook 450 G10 | |
| Cinebench R23 / Multi Core | |
| Average of class Workstation (14055 - 38520, n=25, last 2 years) | |
| HP ZBook Power 15 G10 | |
| Lenovo ThinkPad P14s G4 21K5000LGE | |
| Average AMD Ryzen 7 PRO 7840U (10576 - 15142, n=5) | |
| Lenovo ThinkPad T14 G4 21K4S02000 | |
| Lenovo ThinkPad X1 Carbon G11 21HNS54T00 | |
| HP EliteBook 845 G10 5Z4X0ES | |
| Schenker Vision 14 2023 | |
| Lenovo ThinkPad P14s G3 AMD 21J6S05000 | |
| Samsung Galaxy Book3 Pro 14 | |
| HP ProBook 450 G10 | |
| Cinebench R23 / Single Core | |
| Average of class Workstation (1712 - 2228, n=25, last 2 years) | |
| Schenker Vision 14 2023 | |
| HP ProBook 450 G10 | |
| HP ZBook Power 15 G10 | |
| Lenovo ThinkPad X1 Carbon G11 21HNS54T00 | |
| Lenovo ThinkPad T14 G4 21K4S02000 | |
| Average AMD Ryzen 7 PRO 7840U (1703 - 1747, n=5) | |
| Lenovo ThinkPad P14s G4 21K5000LGE | |
| Samsung Galaxy Book3 Pro 14 | |
| HP EliteBook 845 G10 5Z4X0ES | |
| Lenovo ThinkPad P14s G3 AMD 21J6S05000 | |
| Cinebench R20 / CPU (Multi Core) | |
| Average of class Workstation (5471 - 15043, n=25, last 2 years) | |
| HP ZBook Power 15 G10 | |
| Lenovo ThinkPad P14s G4 21K5000LGE | |
| Average AMD Ryzen 7 PRO 7840U (4210 - 5981, n=5) | |
| Lenovo ThinkPad X1 Carbon G11 21HNS54T00 | |
| Lenovo ThinkPad T14 G4 21K4S02000 | |
| Schenker Vision 14 2023 | |
| HP EliteBook 845 G10 5Z4X0ES | |
| Lenovo ThinkPad P14s G3 AMD 21J6S05000 | |
| Samsung Galaxy Book3 Pro 14 | |
| HP ProBook 450 G10 | |
| Cinebench R20 / CPU (Single Core) | |
| Average of class Workstation (671 - 857, n=25, last 2 years) | |
| Schenker Vision 14 2023 | |
| HP ProBook 450 G10 | |
| HP ZBook Power 15 G10 | |
| Lenovo ThinkPad T14 G4 21K4S02000 | |
| Lenovo ThinkPad X1 Carbon G11 21HNS54T00 | |
| Average AMD Ryzen 7 PRO 7840U (652 - 684, n=5) | |
| Lenovo ThinkPad P14s G4 21K5000LGE | |
| Samsung Galaxy Book3 Pro 14 | |
| HP EliteBook 845 G10 5Z4X0ES | |
| Lenovo ThinkPad P14s G3 AMD 21J6S05000 | |
| Cinebench R15 / CPU Multi 64Bit | |
| Average of class Workstation (2489 - 5810, n=25, last 2 years) | |
| HP ZBook Power 15 G10 | |
| Lenovo ThinkPad P14s G4 21K5000LGE | |
| Average AMD Ryzen 7 PRO 7840U (1590 - 2418, n=5) | |
| Lenovo ThinkPad X1 Carbon G11 21HNS54T00 | |
| Lenovo ThinkPad T14 G4 21K4S02000 | |
| Schenker Vision 14 2023 | |
| HP EliteBook 845 G10 5Z4X0ES | |
| Lenovo ThinkPad P14s G3 AMD 21J6S05000 | |
| Samsung Galaxy Book3 Pro 14 | |
| HP ProBook 450 G10 | |
| Cinebench R15 / CPU Single 64Bit | |
| Average of class Workstation (191.4 - 328, n=25, last 2 years) | |
| Schenker Vision 14 2023 | |
| HP ZBook Power 15 G10 | |
| Lenovo ThinkPad T14 G4 21K4S02000 | |
| Lenovo ThinkPad P14s G4 21K5000LGE | |
| Average AMD Ryzen 7 PRO 7840U (247 - 273, n=5) | |
| HP ProBook 450 G10 | |
| Lenovo ThinkPad X1 Carbon G11 21HNS54T00 | |
| HP EliteBook 845 G10 5Z4X0ES | |
| Lenovo ThinkPad P14s G3 AMD 21J6S05000 | |
| Samsung Galaxy Book3 Pro 14 | |
| Blender / v2.79 BMW27 CPU | |
| HP ProBook 450 G10 | |
| Lenovo ThinkPad X1 Carbon G11 21HNS54T00 | |
| Samsung Galaxy Book3 Pro 14 | |
| Lenovo ThinkPad P14s G3 AMD 21J6S05000 | |
| Average AMD Ryzen 7 PRO 7840U (217 - 380, n=5) | |
| HP EliteBook 845 G10 5Z4X0ES | |
| Lenovo ThinkPad T14 G4 21K4S02000 | |
| Schenker Vision 14 2023 | |
| Lenovo ThinkPad P14s G4 21K5000LGE | |
| HP ZBook Power 15 G10 | |
| Average of class Workstation (91 - 261, n=25, last 2 years) | |
| 7-Zip 18.03 / 7z b 4 | |
| Average of class Workstation (54741 - 116969, n=25, last 2 years) | |
| HP ZBook Power 15 G10 | |
| Lenovo ThinkPad P14s G4 21K5000LGE | |
| Lenovo ThinkPad T14 G4 21K4S02000 | |
| HP EliteBook 845 G10 5Z4X0ES | |
| Schenker Vision 14 2023 | |
| Average AMD Ryzen 7 PRO 7840U (34490 - 62320, n=5) | |
| Lenovo ThinkPad X1 Carbon G11 21HNS54T00 | |
| Lenovo ThinkPad P14s G3 AMD 21J6S05000 | |
| Samsung Galaxy Book3 Pro 14 | |
| HP ProBook 450 G10 | |
| 7-Zip 18.03 / 7z b 4 -mmt1 | |
| HP ZBook Power 15 G10 | |
| Schenker Vision 14 2023 | |
| Average of class Workstation (5126 - 6960, n=25, last 2 years) | |
| Lenovo ThinkPad X1 Carbon G11 21HNS54T00 | |
| Lenovo ThinkPad T14 G4 21K4S02000 | |
| HP EliteBook 845 G10 5Z4X0ES | |
| Average AMD Ryzen 7 PRO 7840U (5633 - 5988, n=5) | |
| Lenovo ThinkPad P14s G4 21K5000LGE | |
| Samsung Galaxy Book3 Pro 14 | |
| HP ProBook 450 G10 | |
| Lenovo ThinkPad P14s G3 AMD 21J6S05000 | |
| Geekbench 5.5 / Multi-Core | |
| Average of class Workstation (11542 - 25554, n=25, last 2 years) | |
| HP ZBook Power 15 G10 | |
| Schenker Vision 14 2023 | |
| Lenovo ThinkPad X1 Carbon G11 21HNS54T00 | |
| Average AMD Ryzen 7 PRO 7840U (9663 - 10920, n=5) | |
| Lenovo ThinkPad P14s G4 21K5000LGE | |
| HP EliteBook 845 G10 5Z4X0ES | |
| Lenovo ThinkPad T14 G4 21K4S02000 | |
| Samsung Galaxy Book3 Pro 14 | |
| HP ProBook 450 G10 | |
| Lenovo ThinkPad P14s G3 AMD 21J6S05000 | |
| Geekbench 5.5 / Single-Core | |
| Average of class Workstation (1781 - 2183, n=25, last 2 years) | |
| HP ZBook Power 15 G10 | |
| Lenovo ThinkPad X1 Carbon G11 21HNS54T00 | |
| Lenovo ThinkPad T14 G4 21K4S02000 | |
| Schenker Vision 14 2023 | |
| Average AMD Ryzen 7 PRO 7840U (1740 - 1895, n=5) | |
| HP ProBook 450 G10 | |
| Samsung Galaxy Book3 Pro 14 | |
| Lenovo ThinkPad P14s G4 21K5000LGE | |
| HP EliteBook 845 G10 5Z4X0ES | |
| Lenovo ThinkPad P14s G3 AMD 21J6S05000 | |
| HWBOT x265 Benchmark v2.2 / 4k Preset | |
| Average of class Workstation (14.4 - 40.5, n=25, last 2 years) | |
| HP ZBook Power 15 G10 | |
| Lenovo ThinkPad P14s G4 21K5000LGE | |
| Average AMD Ryzen 7 PRO 7840U (13.6 - 17.8, n=5) | |
| Lenovo ThinkPad T14 G4 21K4S02000 | |
| HP EliteBook 845 G10 5Z4X0ES | |
| Schenker Vision 14 2023 | |
| Lenovo ThinkPad P14s G3 AMD 21J6S05000 | |
| Lenovo ThinkPad X1 Carbon G11 21HNS54T00 | |
| Samsung Galaxy Book3 Pro 14 | |
| HP ProBook 450 G10 | |
| LibreOffice / 20 Documents To PDF | |
| Lenovo ThinkPad P14s G3 AMD 21J6S05000 | |
| HP ProBook 450 G10 | |
| HP ZBook Power 15 G10 | |
| Schenker Vision 14 2023 | |
| Lenovo ThinkPad P14s G4 21K5000LGE | |
| Average AMD Ryzen 7 PRO 7840U (45.8 - 52, n=5) | |
| Average of class Workstation (37.1 - 74.7, n=25, last 2 years) | |
| Lenovo ThinkPad T14 G4 21K4S02000 | |
| HP EliteBook 845 G10 5Z4X0ES | |
| Samsung Galaxy Book3 Pro 14 | |
| Lenovo ThinkPad X1 Carbon G11 21HNS54T00 | |
| R Benchmark 2.5 / Overall mean | |
| Lenovo ThinkPad P14s G3 AMD 21J6S05000 | |
| Samsung Galaxy Book3 Pro 14 | |
| Lenovo ThinkPad P14s G4 21K5000LGE | |
| HP EliteBook 845 G10 5Z4X0ES | |
| Average AMD Ryzen 7 PRO 7840U (0.4658 - 0.4807, n=5) | |
| Lenovo ThinkPad T14 G4 21K4S02000 | |
| Lenovo ThinkPad X1 Carbon G11 21HNS54T00 | |
| HP ZBook Power 15 G10 | |
| HP ProBook 450 G10 | |
| Schenker Vision 14 2023 | |
| Average of class Workstation (0.3825 - 0.603, n=25, last 2 years) | |
* ... smaller is better
AIDA64: FP32 Ray-Trace | FPU Julia | CPU SHA3 | CPU Queen | FPU SinJulia | FPU Mandel | CPU AES | CPU ZLib | FP64 Ray-Trace | CPU PhotoWorxx
| Performance rating | |
| Average of class Workstation | |
| HP ZBook Power 15 G10 | |
| Lenovo ThinkPad T14 G4 21K4S02000 | |
| Average AMD Ryzen 7 PRO 7840U | |
| Lenovo ThinkPad P14s G4 21K5000LGE | |
| HP EliteBook 845 G10 5Z4X0ES | |
| Lenovo ThinkPad P14s G3 AMD 21J6S05000 | |
| Schenker Vision 14 2023 | |
| Lenovo ThinkPad X1 Carbon G11 21HNS54T00 | |
| Samsung Galaxy Book3 Pro 14 | |
| HP ProBook 450 G10 | |
| AIDA64 / FP32 Ray-Trace | |
| Average of class Workstation (10658 - 61611, n=25, last 2 years) | |
| HP ZBook Power 15 G10 | |
| Lenovo ThinkPad P14s G4 21K5000LGE | |
| Average AMD Ryzen 7 PRO 7840U (17604 - 23889, n=5) | |
| Lenovo ThinkPad T14 G4 21K4S02000 | |
| HP EliteBook 845 G10 5Z4X0ES | |
| Schenker Vision 14 2023 | |
| Lenovo ThinkPad P14s G3 AMD 21J6S05000 | |
| HP ProBook 450 G10 | |
| Samsung Galaxy Book3 Pro 14 | |
| Lenovo ThinkPad X1 Carbon G11 21HNS54T00 | |
| AIDA64 / FPU Julia | |
| Average of class Workstation (56664 - 186971, n=25, last 2 years) | |
| HP ZBook Power 15 G10 | |
| Lenovo ThinkPad P14s G4 21K5000LGE | |
| Average AMD Ryzen 7 PRO 7840U (77578 - 100087, n=5) | |
| Lenovo ThinkPad T14 G4 21K4S02000 | |
| HP EliteBook 845 G10 5Z4X0ES | |
| Lenovo ThinkPad P14s G3 AMD 21J6S05000 | |
| Schenker Vision 14 2023 | |
| Samsung Galaxy Book3 Pro 14 | |
| HP ProBook 450 G10 | |
| Lenovo ThinkPad X1 Carbon G11 21HNS54T00 | |
| AIDA64 / CPU SHA3 | |
| Average of class Workstation (2608 - 8975, n=25, last 2 years) | |
| HP ZBook Power 15 G10 | |
| Average AMD Ryzen 7 PRO 7840U (3611 - 4394, n=5) | |
| Lenovo ThinkPad P14s G4 21K5000LGE | |
| Lenovo ThinkPad T14 G4 21K4S02000 | |
| HP EliteBook 845 G10 5Z4X0ES | |
| Schenker Vision 14 2023 | |
| Lenovo ThinkPad P14s G3 AMD 21J6S05000 | |
| HP ProBook 450 G10 | |
| Samsung Galaxy Book3 Pro 14 | |
| Lenovo ThinkPad X1 Carbon G11 21HNS54T00 | |
| AIDA64 / CPU Queen | |
| HP ZBook Power 15 G10 | |
| Average of class Workstation (60778 - 144411, n=25, last 2 years) | |
| Lenovo ThinkPad P14s G4 21K5000LGE | |
| Average AMD Ryzen 7 PRO 7840U (95020 - 110151, n=5) | |
| Lenovo ThinkPad X1 Carbon G11 21HNS54T00 | |
| HP EliteBook 845 G10 5Z4X0ES | |
| Lenovo ThinkPad T14 G4 21K4S02000 | |
| Lenovo ThinkPad P14s G3 AMD 21J6S05000 | |
| Schenker Vision 14 2023 | |
| Samsung Galaxy Book3 Pro 14 | |
| HP ProBook 450 G10 | |
| AIDA64 / FPU SinJulia | |
| HP ZBook Power 15 G10 | |
| Average of class Workstation (8165 - 29343, n=25, last 2 years) | |
| Lenovo ThinkPad P14s G4 21K5000LGE | |
| Average AMD Ryzen 7 PRO 7840U (12250 - 14151, n=5) | |
| Lenovo ThinkPad T14 G4 21K4S02000 | |
| HP EliteBook 845 G10 5Z4X0ES | |
| Lenovo ThinkPad P14s G3 AMD 21J6S05000 | |
| Lenovo ThinkPad X1 Carbon G11 21HNS54T00 | |
| Schenker Vision 14 2023 | |
| Samsung Galaxy Book3 Pro 14 | |
| HP ProBook 450 G10 | |
| AIDA64 / FPU Mandel | |
| Average of class Workstation (27301 - 98153, n=25, last 2 years) | |
| HP ZBook Power 15 G10 | |
| Lenovo ThinkPad P14s G4 21K5000LGE | |
| Average AMD Ryzen 7 PRO 7840U (41143 - 53280, n=5) | |
| Lenovo ThinkPad T14 G4 21K4S02000 | |
| Lenovo ThinkPad P14s G3 AMD 21J6S05000 | |
| HP EliteBook 845 G10 5Z4X0ES | |
| Lenovo ThinkPad X1 Carbon G11 21HNS54T00 | |
| Schenker Vision 14 2023 | |
| HP ProBook 450 G10 | |
| Samsung Galaxy Book3 Pro 14 | |
| AIDA64 / CPU AES | |
| Lenovo ThinkPad T14 G4 21K4S02000 | |
| Average of class Workstation (56077 - 187841, n=25, last 2 years) | |
| Average AMD Ryzen 7 PRO 7840U (66300 - 142329, n=5) | |
| HP ZBook Power 15 G10 | |
| Lenovo ThinkPad P14s G4 21K5000LGE | |
| Schenker Vision 14 2023 | |
| HP EliteBook 845 G10 5Z4X0ES | |
| Samsung Galaxy Book3 Pro 14 | |
| Lenovo ThinkPad P14s G3 AMD 21J6S05000 | |
| HP ProBook 450 G10 | |
| Lenovo ThinkPad X1 Carbon G11 21HNS54T00 | |
| AIDA64 / CPU ZLib | |
| Average of class Workstation (742 - 2148, n=25, last 2 years) | |
| HP ZBook Power 15 G10 | |
| Lenovo ThinkPad P14s G4 21K5000LGE | |
| Average AMD Ryzen 7 PRO 7840U (777 - 1004, n=5) | |
| Lenovo ThinkPad T14 G4 21K4S02000 | |
| Schenker Vision 14 2023 | |
| HP EliteBook 845 G10 5Z4X0ES | |
| Lenovo ThinkPad P14s G3 AMD 21J6S05000 | |
| HP ProBook 450 G10 | |
| Samsung Galaxy Book3 Pro 14 | |
| Lenovo ThinkPad X1 Carbon G11 21HNS54T00 | |
| AIDA64 / FP64 Ray-Trace | |
| Average of class Workstation (5580 - 32891, n=25, last 2 years) | |
| HP ZBook Power 15 G10 | |
| Lenovo ThinkPad P14s G4 21K5000LGE | |
| Average AMD Ryzen 7 PRO 7840U (9494 - 12540, n=5) | |
| Lenovo ThinkPad T14 G4 21K4S02000 | |
| HP EliteBook 845 G10 5Z4X0ES | |
| Schenker Vision 14 2023 | |
| Lenovo ThinkPad P14s G3 AMD 21J6S05000 | |
| HP ProBook 450 G10 | |
| Samsung Galaxy Book3 Pro 14 | |
| Lenovo ThinkPad X1 Carbon G11 21HNS54T00 | |
| AIDA64 / CPU PhotoWorxx | |
| Average of class Workstation (37151 - 93684, n=25, last 2 years) | |
| Schenker Vision 14 2023 | |
| HP ZBook Power 15 G10 | |
| Samsung Galaxy Book3 Pro 14 | |
| Lenovo ThinkPad T14 G4 21K4S02000 | |
| Average AMD Ryzen 7 PRO 7840U (33564 - 38442, n=5) | |
| Lenovo ThinkPad P14s G4 21K5000LGE | |
| HP EliteBook 845 G10 5Z4X0ES | |
| Lenovo ThinkPad X1 Carbon G11 21HNS54T00 | |
| HP ProBook 450 G10 | |
| Lenovo ThinkPad P14s G3 AMD 21J6S05000 | |
* ... smaller is better
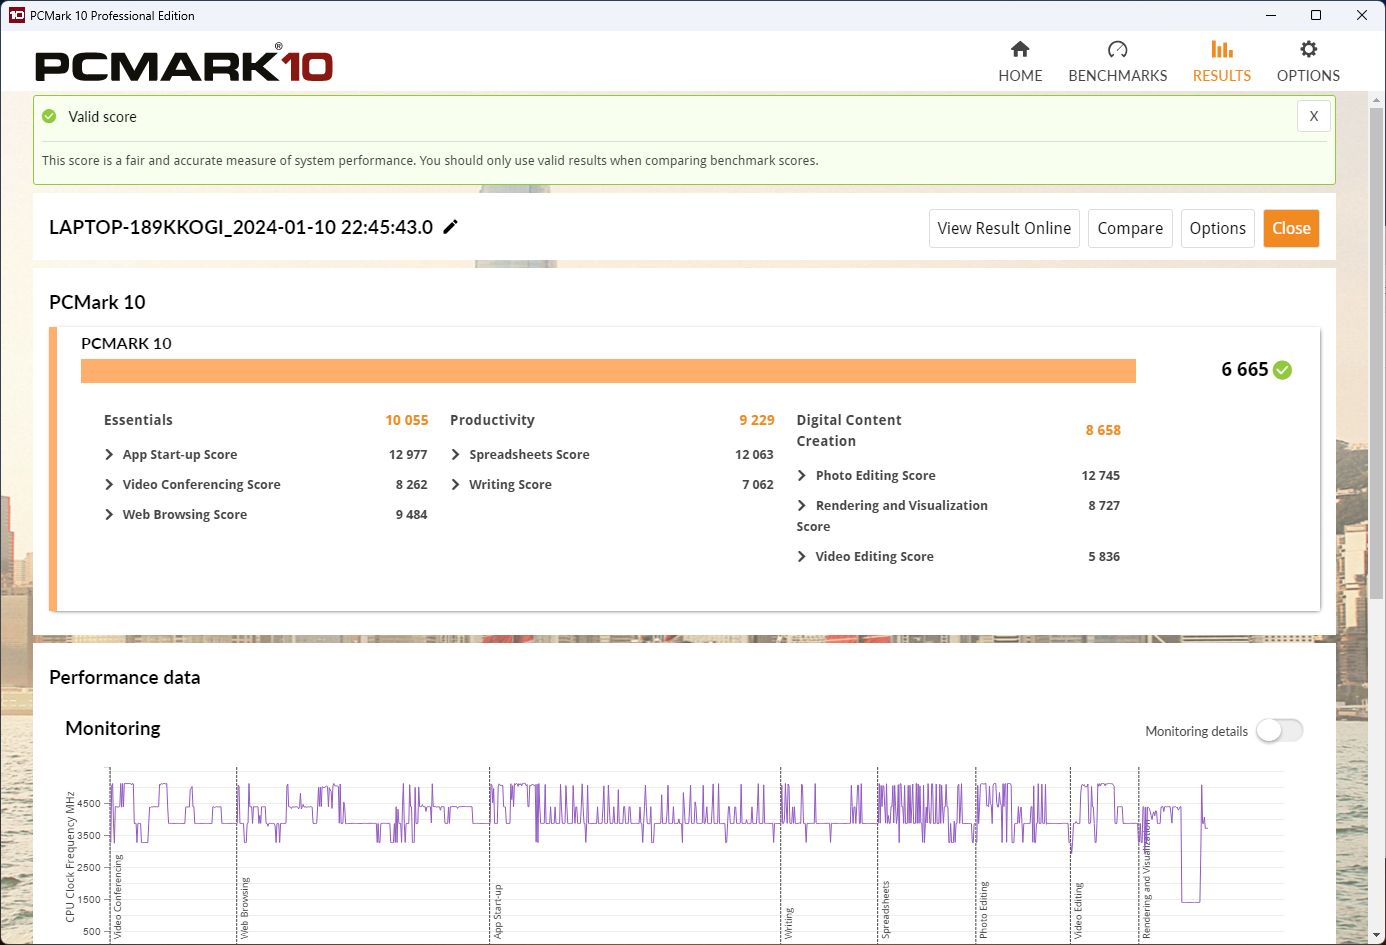
System Performance
The PCMark 10 results are remarkable and underline the ThinkPad P14s G4's good performance. It can easily beat the Schenker Vision 14 2023, whose integrated GPU cannot keep up when it comes to media creation.
Running on battery in balanced mode limits performance by 20 percent. But even then, the delay when running, installing or uninstalling programs is only barely noticeable. The workstation laptop provides a decent performance at all times.

CrossMark: Overall | Productivity | Creativity | Responsiveness
WebXPRT 3: Overall
WebXPRT 4: Overall
Mozilla Kraken 1.1: Total
| PCMark 10 / Score | |
| Average of class Workstation (6436 - 10409, n=21, last 2 years) | |
| HP ZBook Power 15 G10 | |
| Lenovo ThinkPad T14 G4 21K4S02000 | |
| Average AMD Ryzen 7 PRO 7840U, AMD Radeon 780M (6541 - 7012, n=5) | |
| HP EliteBook 845 G10 5Z4X0ES | |
| Lenovo ThinkPad P14s G4 21K5000LGE | |
| HP ProBook 450 G10 | |
| Lenovo ThinkPad P14s G3 AMD 21J6S05000 | |
| Schenker Vision 14 2023 | |
| Samsung Galaxy Book3 Pro 14 | |
| PCMark 10 / Essentials | |
| Lenovo ThinkPad T14 G4 21K4S02000 | |
| HP ZBook Power 15 G10 | |
| HP EliteBook 845 G10 5Z4X0ES | |
| Samsung Galaxy Book3 Pro 14 | |
| Average of class Workstation (9622 - 11157, n=21, last 2 years) | |
| Average AMD Ryzen 7 PRO 7840U, AMD Radeon 780M (10055 - 10934, n=5) | |
| Schenker Vision 14 2023 | |
| HP ProBook 450 G10 | |
| Lenovo ThinkPad P14s G4 21K5000LGE | |
| Lenovo ThinkPad P14s G3 AMD 21J6S05000 | |
| PCMark 10 / Productivity | |
| Average of class Workstation (8789 - 20616, n=21, last 2 years) | |
| Lenovo ThinkPad T14 G4 21K4S02000 | |
| HP ZBook Power 15 G10 | |
| HP EliteBook 845 G10 5Z4X0ES | |
| Average AMD Ryzen 7 PRO 7840U, AMD Radeon 780M (8921 - 9933, n=5) | |
| Lenovo ThinkPad P14s G4 21K5000LGE | |
| HP ProBook 450 G10 | |
| Lenovo ThinkPad P14s G3 AMD 21J6S05000 | |
| Schenker Vision 14 2023 | |
| Samsung Galaxy Book3 Pro 14 | |
| PCMark 10 / Digital Content Creation | |
| Average of class Workstation (7744 - 15631, n=21, last 2 years) | |
| HP ZBook Power 15 G10 | |
| Lenovo ThinkPad P14s G4 21K5000LGE | |
| Lenovo ThinkPad T14 G4 21K4S02000 | |
| Average AMD Ryzen 7 PRO 7840U, AMD Radeon 780M (7806 - 8874, n=5) | |
| HP EliteBook 845 G10 5Z4X0ES | |
| Lenovo ThinkPad P14s G3 AMD 21J6S05000 | |
| HP ProBook 450 G10 | |
| Schenker Vision 14 2023 | |
| Samsung Galaxy Book3 Pro 14 | |
| CrossMark / Overall | |
| Average of class Workstation (1307 - 2267, n=24, last 2 years) | |
| Lenovo ThinkPad T14 G4 21K4S02000 | |
| Samsung Galaxy Book3 Pro 14 | |
| HP ZBook Power 15 G10 | |
| HP ProBook 450 G10 | |
| Average AMD Ryzen 7 PRO 7840U, AMD Radeon 780M (1533 - 1669, n=5) | |
| Lenovo ThinkPad P14s G4 21K5000LGE | |
| Schenker Vision 14 2023 | |
| HP EliteBook 845 G10 5Z4X0ES | |
| Lenovo ThinkPad P14s G3 AMD 21J6S05000 | |
| CrossMark / Productivity | |
| Average of class Workstation (1130 - 2122, n=24, last 2 years) | |
| HP ProBook 450 G10 | |
| Lenovo ThinkPad T14 G4 21K4S02000 | |
| Samsung Galaxy Book3 Pro 14 | |
| HP ZBook Power 15 G10 | |
| Average AMD Ryzen 7 PRO 7840U, AMD Radeon 780M (1461 - 1624, n=5) | |
| Lenovo ThinkPad P14s G4 21K5000LGE | |
| Schenker Vision 14 2023 | |
| HP EliteBook 845 G10 5Z4X0ES | |
| Lenovo ThinkPad P14s G3 AMD 21J6S05000 | |
| CrossMark / Creativity | |
| Average of class Workstation (1657 - 2725, n=24, last 2 years) | |
| HP ZBook Power 15 G10 | |
| Lenovo ThinkPad T14 G4 21K4S02000 | |
| Average AMD Ryzen 7 PRO 7840U, AMD Radeon 780M (1697 - 1824, n=5) | |
| Samsung Galaxy Book3 Pro 14 | |
| HP EliteBook 845 G10 5Z4X0ES | |
| Lenovo ThinkPad P14s G4 21K5000LGE | |
| HP ProBook 450 G10 | |
| Schenker Vision 14 2023 | |
| Lenovo ThinkPad P14s G3 AMD 21J6S05000 | |
| CrossMark / Responsiveness | |
| Samsung Galaxy Book3 Pro 14 | |
| Average of class Workstation (993 - 2096, n=24, last 2 years) | |
| HP ProBook 450 G10 | |
| Schenker Vision 14 2023 | |
| Lenovo ThinkPad T14 G4 21K4S02000 | |
| Lenovo ThinkPad P14s G4 21K5000LGE | |
| Average AMD Ryzen 7 PRO 7840U, AMD Radeon 780M (1049 - 1499, n=5) | |
| HP ZBook Power 15 G10 | |
| HP EliteBook 845 G10 5Z4X0ES | |
| Lenovo ThinkPad P14s G3 AMD 21J6S05000 | |
| WebXPRT 3 / Overall | |
| Lenovo ThinkPad T14 G4 21K4S02000 | |
| Average of class Workstation (260 - 360, n=25, last 2 years) | |
| HP ZBook Power 15 G10 | |
| HP EliteBook 845 G10 5Z4X0ES | |
| Schenker Vision 14 2023 | |
| HP ProBook 450 G10 | |
| Average AMD Ryzen 7 PRO 7840U, AMD Radeon 780M (259 - 317, n=5) | |
| Samsung Galaxy Book3 Pro 14 | |
| Lenovo ThinkPad P14s G4 21K5000LGE | |
| Lenovo ThinkPad P14s G3 AMD 21J6S05000 | |
| WebXPRT 4 / Overall | |
| Average of class Workstation (189.2 - 326, n=25, last 2 years) | |
| Schenker Vision 14 2023 | |
| Average AMD Ryzen 7 PRO 7840U, AMD Radeon 780M (234 - 245, n=2) | |
| HP EliteBook 845 G10 5Z4X0ES | |
| Samsung Galaxy Book3 Pro 14 | |
| HP ZBook Power 15 G10 | |
| Lenovo ThinkPad P14s G3 AMD 21J6S05000 | |
| Mozilla Kraken 1.1 / Total | |
| Lenovo ThinkPad P14s G3 AMD 21J6S05000 | |
| Lenovo ThinkPad P14s G4 21K5000LGE | |
| HP EliteBook 845 G10 5Z4X0ES | |
| Average AMD Ryzen 7 PRO 7840U, AMD Radeon 780M (523 - 571, n=5) | |
| HP ZBook Power 15 G10 | |
| Lenovo ThinkPad T14 G4 21K4S02000 | |
| Samsung Galaxy Book3 Pro 14 | |
| HP ProBook 450 G10 | |
| HP ProBook 450 G10 | |
| Schenker Vision 14 2023 | |
| Average of class Workstation (411 - 538, n=25, last 2 years) | |
* ... smaller is better
| PCMark 10 Score | 6665 points | |
Help | ||
| AIDA64 / Memory Copy | |
| Average of class Workstation (56003 - 164795, n=25, last 2 years) | |
| Samsung Galaxy Book3 Pro 14 | |
| HP ZBook Power 15 G10 | |
| Lenovo ThinkPad T14 G4 21K4S02000 | |
| Lenovo ThinkPad P14s G4 21K5000LGE | |
| Average AMD Ryzen 7 PRO 7840U (66487 - 67856, n=5) | |
| HP EliteBook 845 G10 5Z4X0ES | |
| Lenovo ThinkPad P14s G3 AMD 21J6S05000 | |
| HP ProBook 450 G10 | |
| AIDA64 / Memory Read | |
| Average of class Workstation (55795 - 121563, n=25, last 2 years) | |
| Samsung Galaxy Book3 Pro 14 | |
| HP ZBook Power 15 G10 | |
| HP EliteBook 845 G10 5Z4X0ES | |
| Lenovo ThinkPad T14 G4 21K4S02000 | |
| Average AMD Ryzen 7 PRO 7840U (47725 - 50543, n=5) | |
| Lenovo ThinkPad P14s G4 21K5000LGE | |
| HP ProBook 450 G10 | |
| Lenovo ThinkPad P14s G3 AMD 21J6S05000 | |
| AIDA64 / Memory Write | |
| Lenovo ThinkPad T14 G4 21K4S02000 | |
| Lenovo ThinkPad P14s G4 21K5000LGE | |
| Average AMD Ryzen 7 PRO 7840U (89477 - 94965, n=5) | |
| Samsung Galaxy Book3 Pro 14 | |
| Average of class Workstation (55663 - 214520, n=25, last 2 years) | |
| HP ZBook Power 15 G10 | |
| HP EliteBook 845 G10 5Z4X0ES | |
| Lenovo ThinkPad P14s G3 AMD 21J6S05000 | |
| HP ProBook 450 G10 | |
| AIDA64 / Memory Latency | |
| Lenovo ThinkPad P14s G4 21K5000LGE | |
| Average AMD Ryzen 7 PRO 7840U (128.6 - 138.9, n=5) | |
| Lenovo ThinkPad T14 G4 21K4S02000 | |
| Average of class Workstation (84.5 - 165.2, n=25, last 2 years) | |
| Lenovo ThinkPad P14s G3 AMD 21J6S05000 | |
| HP ZBook Power 15 G10 | |
| Samsung Galaxy Book3 Pro 14 | |
| HP EliteBook 845 G10 5Z4X0ES | |
| HP ProBook 450 G10 | |
* ... smaller is better
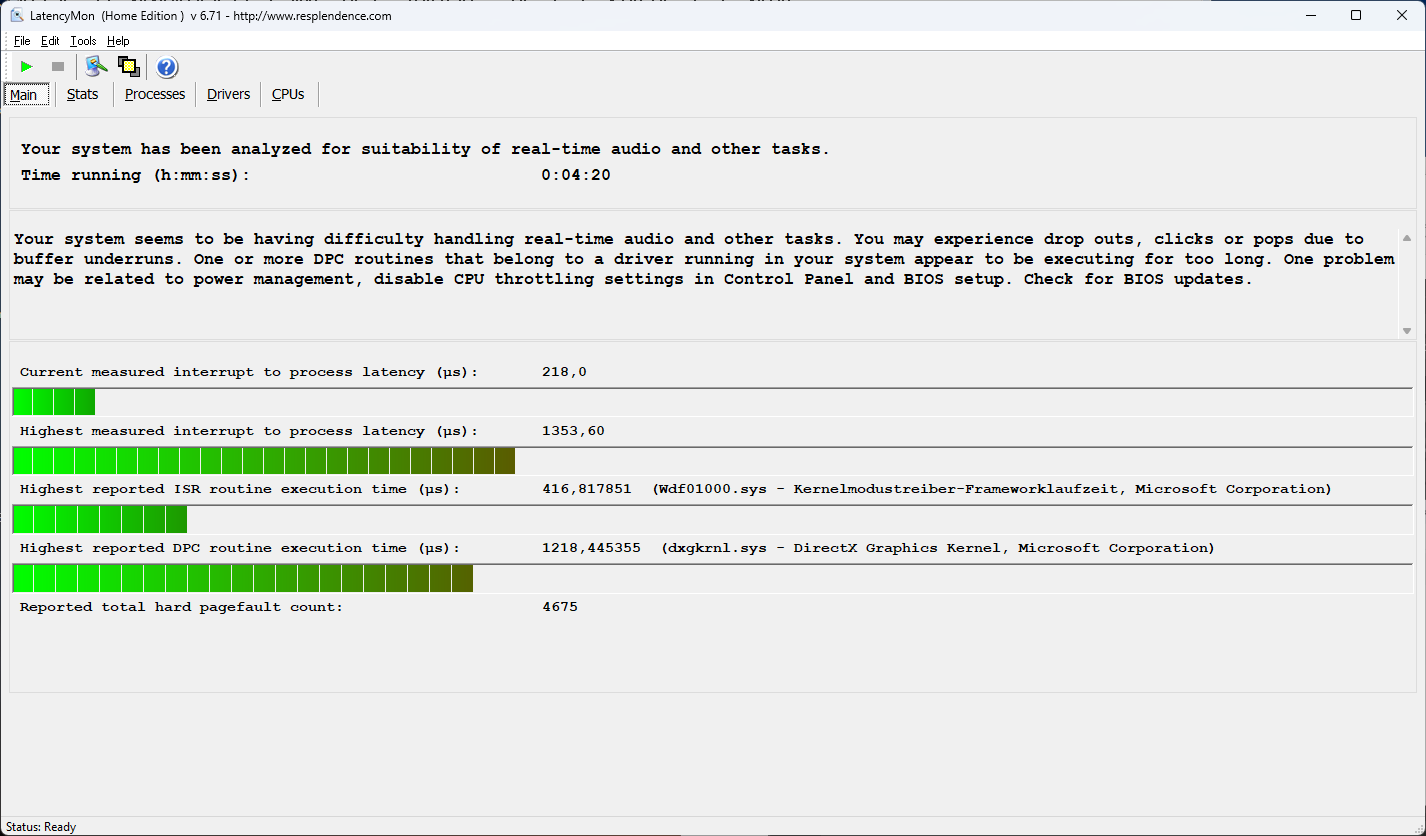
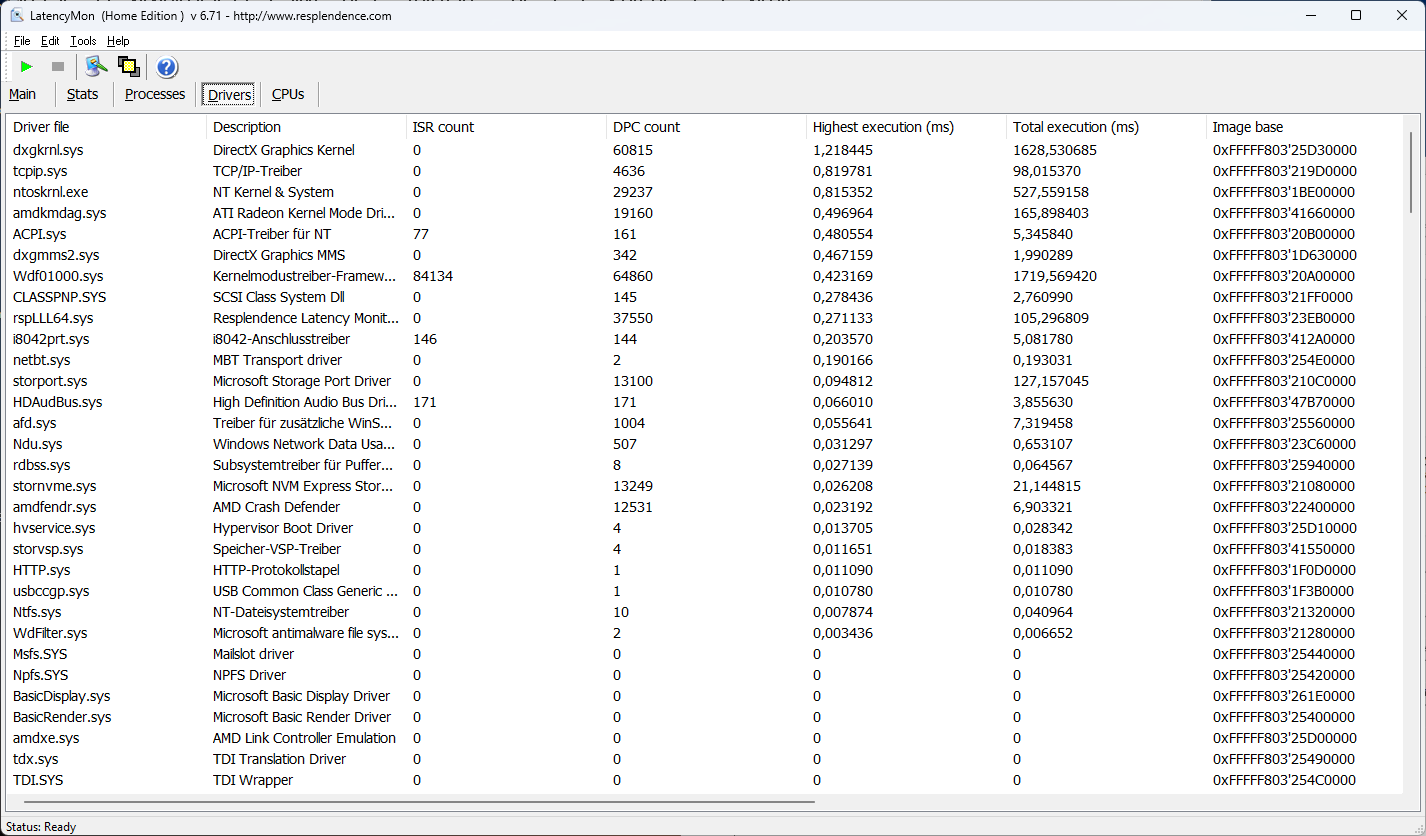
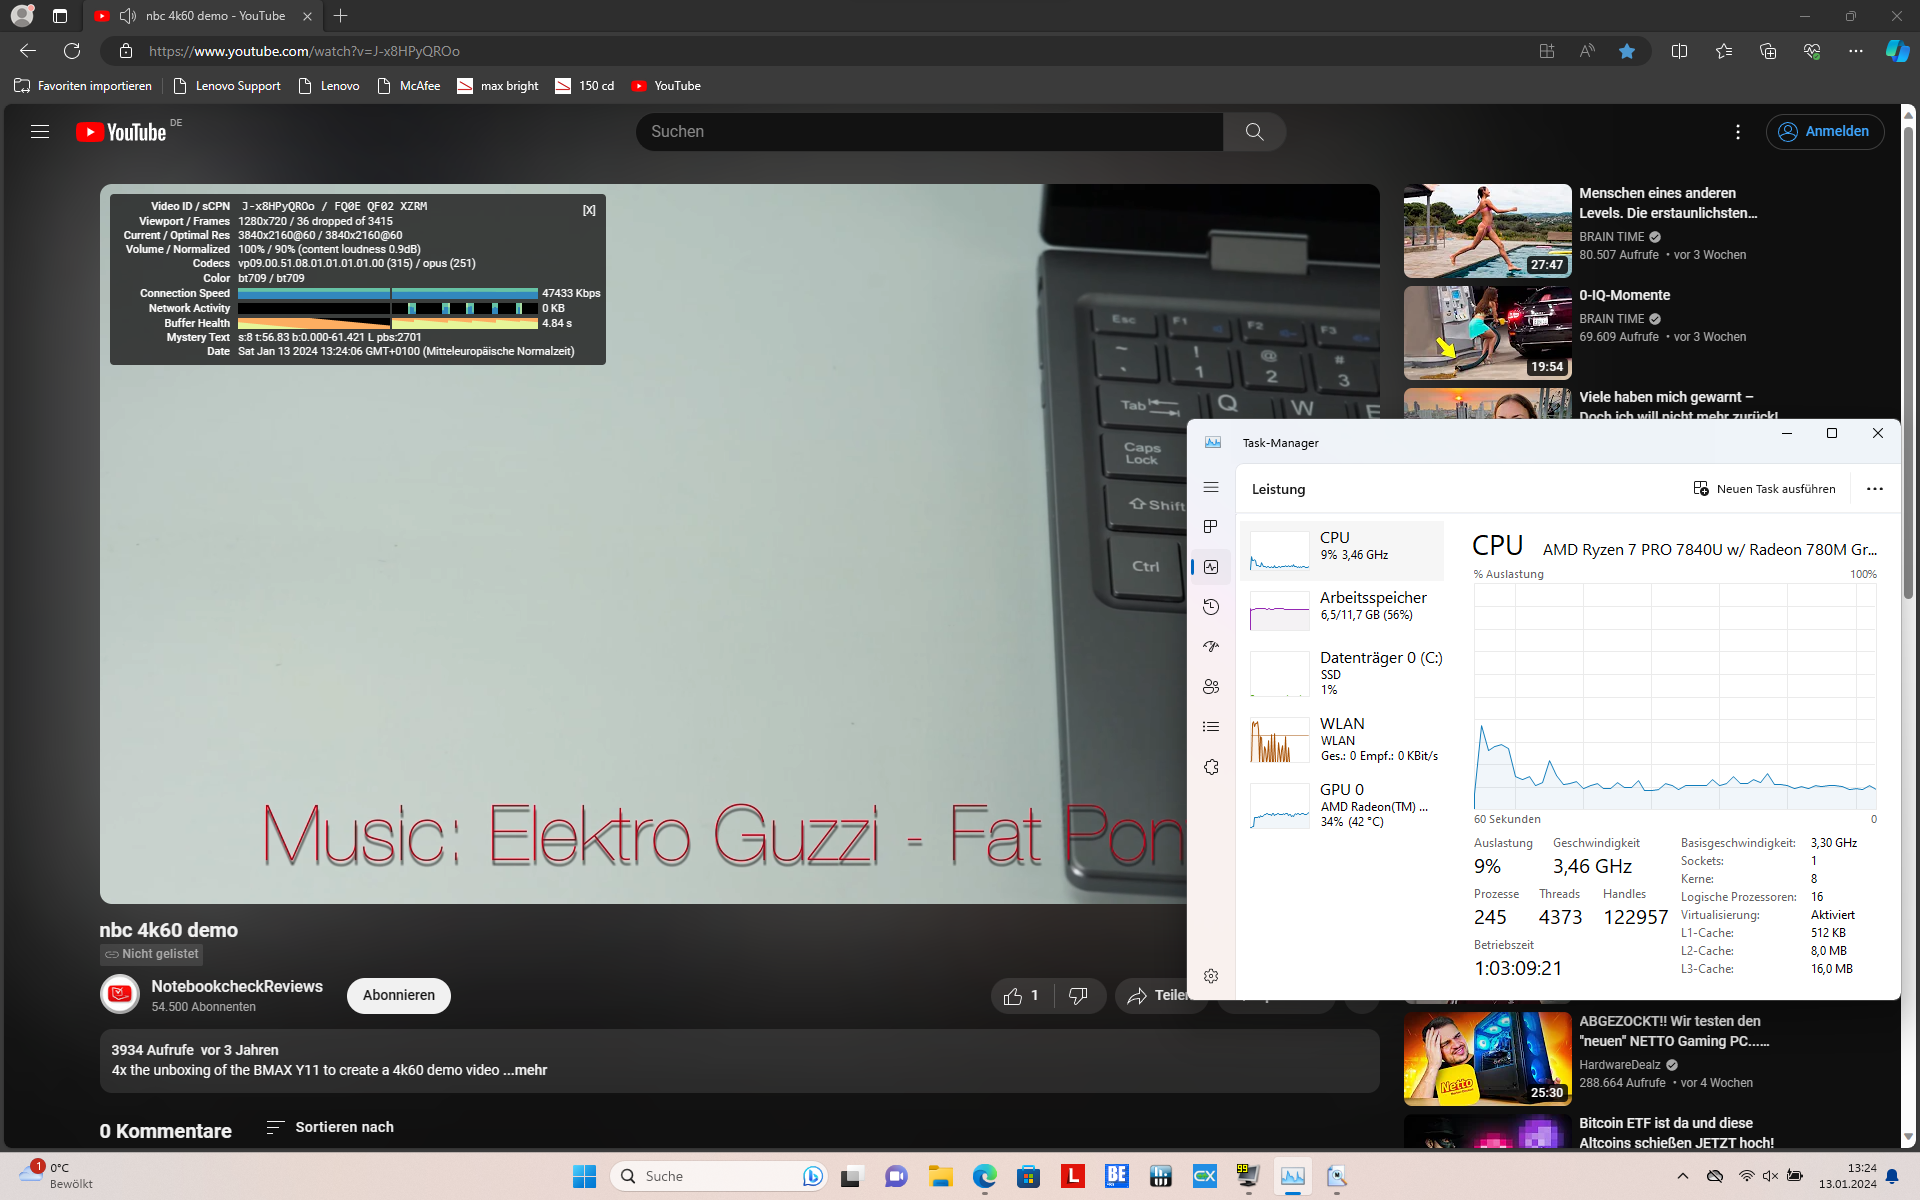
DPC Latencies
The results of our LatencyMon test aren't quite as compelling. Users may have some difficulties when trying to process audio and video in real-time. This is largely due to the DirectX driver - something a future update may improve.
A change in the driver configuration can always bring about major changes in either direction.
| DPC Latencies / LatencyMon - interrupt to process latency (max), Web, Youtube, Prime95 | |
| HP ProBook 450 G10 | |
| HP ZBook Power 15 G10 | |
| Samsung Galaxy Book3 Pro 14 | |
| Lenovo ThinkPad P14s G4 21K5000LGE | |
| Lenovo ThinkPad P14s G3 AMD 21J6S05000 | |
| HP EliteBook 845 G10 5Z4X0ES | |
| Lenovo ThinkPad T14 G4 21K4S02000 | |
* ... smaller is better
Mass storage
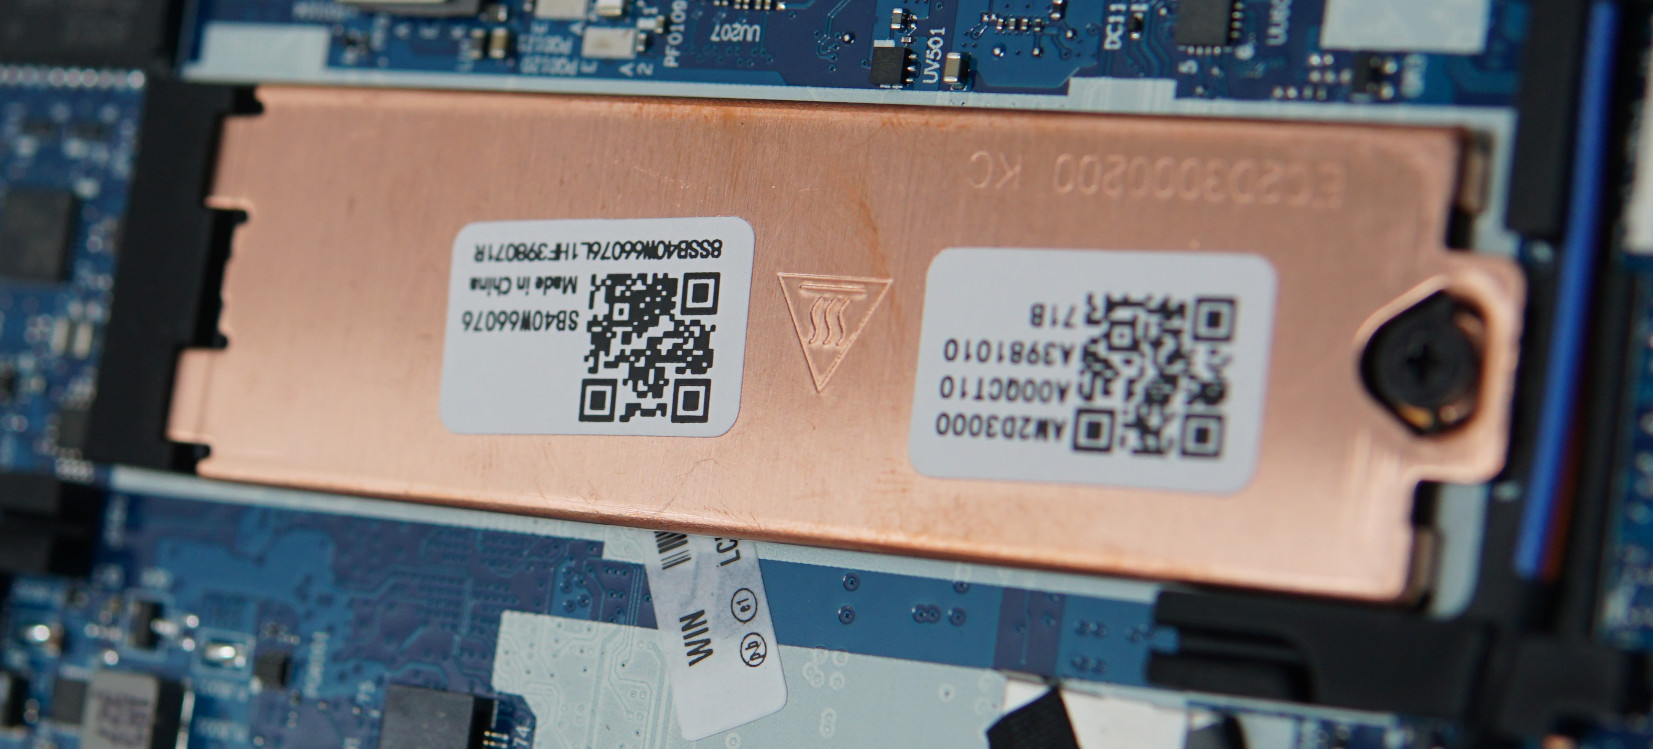
The SK Hynix SSD is firmly glued onto a copper heat sink and offers a stable high performance even under continuous load. However, the results diminish when the SSD is charged with writing large volumes of data or has to handle parallel access.
This has little to no influence on the normal use of programs - even demanding ones.

* ... smaller is better
Disk Throttling: DiskSpd Read Loop, Queue Depth 8
Graphics
The integrated graphics unit AMD Radeon 780M cannot perform miracles, but it does impressively illustrate how an iGPU can easily reach the level of a Nvidia GeForce RTX 2050 - with a fraction of the power consumption.
In the workstation segment, the graphics performance is particularly relevant for professional applications and CAD/CAM software. SPECviewperf can give a good idea of the GPU's suitability for these applications - and the integrated graphics unit performs well, coming close to dedicated GPUs such as the RTX A1000, which are built for these professional tasks. The latter achieves 50 percent more performance with significantly greater effort. The performance of the Radeon 780M is also 30 percent higher than that of its predecessor, the Radeon 680M.
Comparing the Intel Iris Xe Graphics 96EUs with our Radeon 780M is particularly impressive: The Samsung Galaxy Book3 Pro with this iGPU only reaches half the amount of points across all 3DMark tests.
More numbers, tests and assessments are available on our GPU benchmark page.
| 3DMark 11 Performance | 11964 points | |
| 3DMark Cloud Gate Standard Score | 35597 points | |
| 3DMark Fire Strike Score | 7604 points | |
| 3DMark Time Spy Score | 3186 points | |
Help | ||
Gaming Performance
The good synthetic benchmark results are reflected when playing current and particularly somewhat older games. Many titles can easily be played at medium or high settings and Full HD resolution.
The GPU does reach its limits when playing very complex games such as Starfield, however, where the ThinkPad fails to display 30 FPS even at minimum settings. Nevertheless, the game continues to run smoothly despite the low framerate.
| The Witcher 3 - 1920x1080 Ultra Graphics & Postprocessing (HBAO+) | |
| HP ZBook Power 15 G10 | |
| Average of class Workstation (26.3 - 91.7, n=3, last 2 years) | |
| Lenovo ThinkPad P14s G4 21K5000LGE | |
| Lenovo ThinkPad P14s G3 AMD 21J6S05000 | |
| Lenovo ThinkPad T14 G4 21K4S02000 | |
| HP ProBook 450 G10 | |
| HP EliteBook 845 G10 5Z4X0ES | |
| Samsung Galaxy Book3 Pro 14 | |
| Starfield | |
| 1920x1080 High Preset | |
| Average AMD Radeon 780M (19 - 21.3, n=3) | |
| Lenovo ThinkPad P14s G4 21K5000LGE | |
| 1920x1080 Ultra Preset | |
| Average AMD Radeon 780M (15 - 19.1, n=3) | |
| Lenovo ThinkPad P14s G4 21K5000LGE | |
Our continuous Witcher 3 loop shows no abrupt jumps or spontaneous drops in performance. The slight drop is connected to the day and night rhythm in the game. This shows that the device's maximum performance remains stable even under long-term load.
Witcher 3 FPS diagram
| low | med. | high | ultra | |
|---|---|---|---|---|
| GTA V (2015) | 146.9 | 134.3 | 64.2 | 26.6 |
| The Witcher 3 (2015) | 137 | 91 | 46 | 29 |
| Dota 2 Reborn (2015) | 115.2 | 90.4 | 79.9 | 69.1 |
| Final Fantasy XV Benchmark (2018) | 74 | 36.2 | 27.3 | |
| X-Plane 11.11 (2018) | 45.8 | 32.8 | 28 | |
| Far Cry 5 (2018) | 73 | 44 | 41 | 39 |
| Strange Brigade (2018) | 158.5 | 66.4 | 56.9 | 48.4 |
| F1 23 (2023) | 79.3 | 71.2 | 50 | 11.6 |
| Starfield (2023) | 26 | 22 | 19 | 16 |
Emissions - Quiet, warm ThinkPad P14s
Noise Emissions
The Lenovo notebook remains almost entirely silent during everyday use. The fans slowly speed up when more performance is required, for example during a lengthy installation process or extensive rendering. The fan noise that results from that is best described as a clearly audible murmur.
The user will rarely be bothered by the fan as the latter only reaches such a noise level in exceptional circumstances, as confirmed by the average value under load. While 31 dB(A) is audible, it is scarcely or not at all disturbing. The Samsung Galaxy Book3 Pro 14 that we tested not so long ago was about twice as noisy at about 45 dB(A) which totally is annoying and can hamper your workflow. Those not ready to put up with noisy fans should give the Lenovo ThinkPad T14 G4 a chance. The SKU we tested was notieably quiter than the P14s G4, despite being powered by the same AMD 7840U chip. The caveat? The P14s G4 lags behind the T14 G4 in CPU performance tests. This is due to the higher CPU power limits of the latter.
Noise level
| Idle |
| 22.4 / 22.4 / 22.4 dB(A) |
| Load |
| 31.3 / 39.2 dB(A) |
 | ||
30 dB silent 40 dB(A) audible 50 dB(A) loud |
||
min: | ||
| Lenovo ThinkPad P14s G4 21K5000LGE Radeon 780M, R7 PRO 7840U, SK hynix PC801 HFS512GEJ9X162N | HP EliteBook 845 G10 5Z4X0ES Radeon 780M, R7 7840U, WD PC SN740 512GB SDDPNQD-512G | Lenovo ThinkPad T14 G4 21K4S02000 Radeon 780M, R7 PRO 7840U, Samsung PM9A1a MZVL21T0HDLU | HP ZBook Power 15 G10 RTX 2000 Ada Generation Laptop, R7 PRO 7840HS, WDC PC SN810 2TB | Lenovo ThinkPad P14s G3 AMD 21J6S05000 Radeon 680M, R7 PRO 6850U, Samsung PM9A1 MZVL21T0HCLR | HP ProBook 450 G10 GeForce RTX 2050 Mobile, i7-1355U, Micron 3400 1TB MTFDKBA1T0TFH | Samsung Galaxy Book3 Pro 14 Iris Xe G7 96EUs, i7-1360P, WD PC SN740 512GB SDDPMQD-512G-1101 | |
|---|---|---|---|---|---|---|---|
| Noise | 7% | 3% | -7% | -1% | -6% | -24% | |
| off / environment * (dB) | 22.4 | 22.9 -2% | 23.1 -3% | 24.2 -8% | 22.9 -2% | 23.5 -5% | 25.2 -13% |
| Idle Minimum * (dB) | 22.4 | 22.9 -2% | 23.1 -3% | 24.4 -9% | 22.9 -2% | 23.5 -5% | 25.2 -13% |
| Idle Average * (dB) | 22.4 | 22.9 -2% | 23.1 -3% | 24.4 -9% | 22.9 -2% | 23.5 -5% | 25.2 -13% |
| Idle Maximum * (dB) | 22.4 | 22.9 -2% | 23.1 -3% | 24.4 -9% | 22.9 -2% | 23.5 -5% | 32 -43% |
| Load Average * (dB) | 31.3 | 24.3 22% | 26.5 15% | 27.4 12% | 30.8 2% | 38 -21% | 45.25 -45% |
| Witcher 3 ultra * (dB) | 39.5 | 32.4 18% | 35.7 10% | 43.3 -10% | 39.4 -0% | 38.2 3% | |
| Load Maximum * (dB) | 39.2 | 33.9 14% | 35.78 9% | 46.8 -19% | 39.5 -1% | 41.4 -6% | 45.3 -16% |
* ... smaller is better
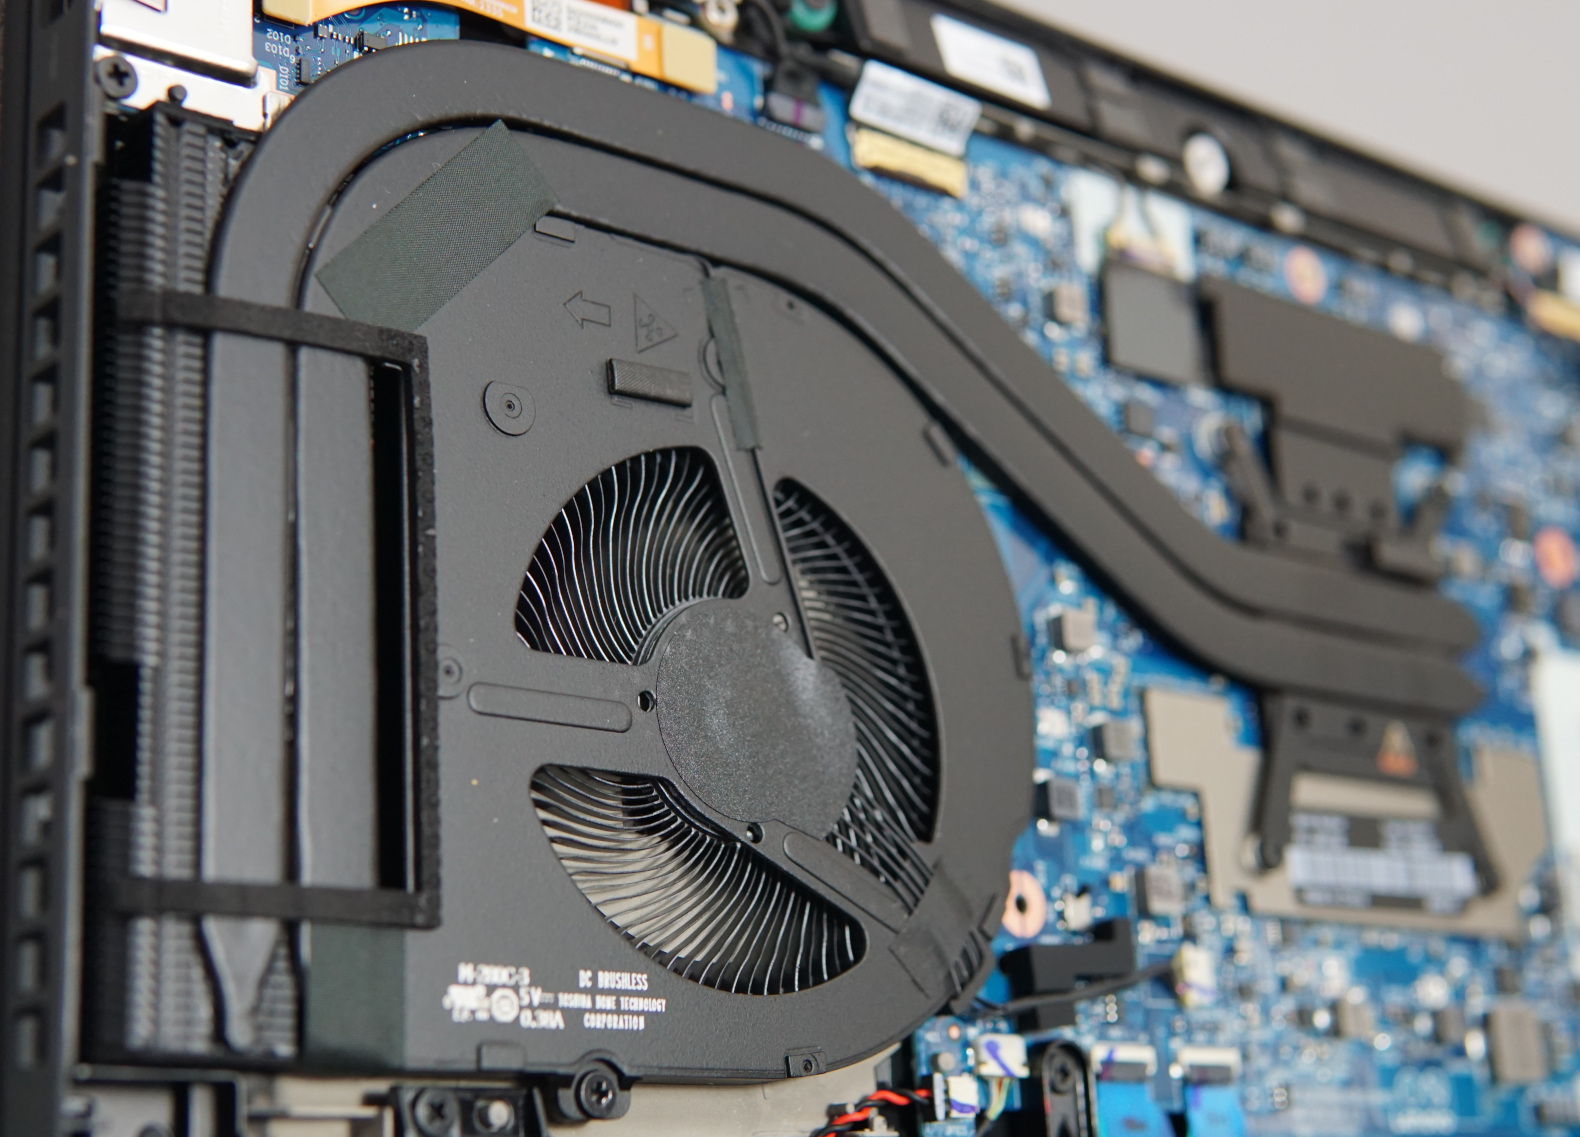
Temperature
The low noise development has a detrimental effect on temperature development. The bottom of the base unit almost always heats up noticeably, reaching a maximum temperature of 48 °C. This is considerable, despite comparable devices reaching similar temperatures. The heat produced by the strong CPU has to go somewhere, after all.
This surface temperature should not be a big issue when working at a desk, although the manufacturers could have put more effort into reducing temperatures on the keyboard, which can also reach over 40 °C at times.
(±) The maximum temperature on the upper side is 41.1 °C / 106 F, compared to the average of 38.2 °C / 101 F, ranging from 22.2 to 69.8 °C for the class Workstation.
(-) The bottom heats up to a maximum of 48.2 °C / 119 F, compared to the average of 41.1 °C / 106 F
(+) In idle usage, the average temperature for the upper side is 24.7 °C / 76 F, compared to the device average of 32 °C / 90 F.
(±) Playing The Witcher 3, the average temperature for the upper side is 34.5 °C / 94 F, compared to the device average of 32 °C / 90 F.
(+) The palmrests and touchpad are reaching skin temperature as a maximum (32 °C / 89.6 F) and are therefore not hot.
(-) The average temperature of the palmrest area of similar devices was 27.8 °C / 82 F (-4.2 °C / -7.6 F).
| Lenovo ThinkPad P14s G4 21K5000LGE AMD Ryzen 7 PRO 7840U, AMD Radeon 780M | HP EliteBook 845 G10 5Z4X0ES AMD Ryzen 7 7840U, AMD Radeon 780M | Lenovo ThinkPad T14 G4 21K4S02000 AMD Ryzen 7 PRO 7840U, AMD Radeon 780M | HP ZBook Power 15 G10 AMD Ryzen 7 PRO 7840HS, NVIDIA RTX 2000 Ada Generation Laptop | Lenovo ThinkPad P14s G3 AMD 21J6S05000 AMD Ryzen 7 PRO 6850U, AMD Radeon 680M | HP ProBook 450 G10 Intel Core i7-1355U, NVIDIA GeForce RTX 2050 Mobile | Samsung Galaxy Book3 Pro 14 Intel Core i7-1360P, Intel Iris Xe Graphics G7 96EUs | |
|---|---|---|---|---|---|---|---|
| Heat | -4% | 1% | -1% | 3% | 2% | -11% | |
| Maximum Upper Side * (°C) | 41.1 | 45.4 -10% | 43.5 -6% | 42.4 -3% | 42.7 -4% | 39.9 3% | 43.9 -7% |
| Maximum Bottom * (°C) | 48.2 | 50.6 -5% | 47.4 2% | 47.8 1% | 43.1 11% | 43 11% | 50.7 -5% |
| Idle Upper Side * (°C) | 26.5 | 26.8 -1% | 24.9 6% | 26.8 -1% | 25.7 3% | 26.4 -0% | 30.8 -16% |
| Idle Bottom * (°C) | 26.9 | 26.8 -0% | 26 3% | 27.2 -1% | 26.4 2% | 29 -8% | 31.6 -17% |
* ... smaller is better
Stress test
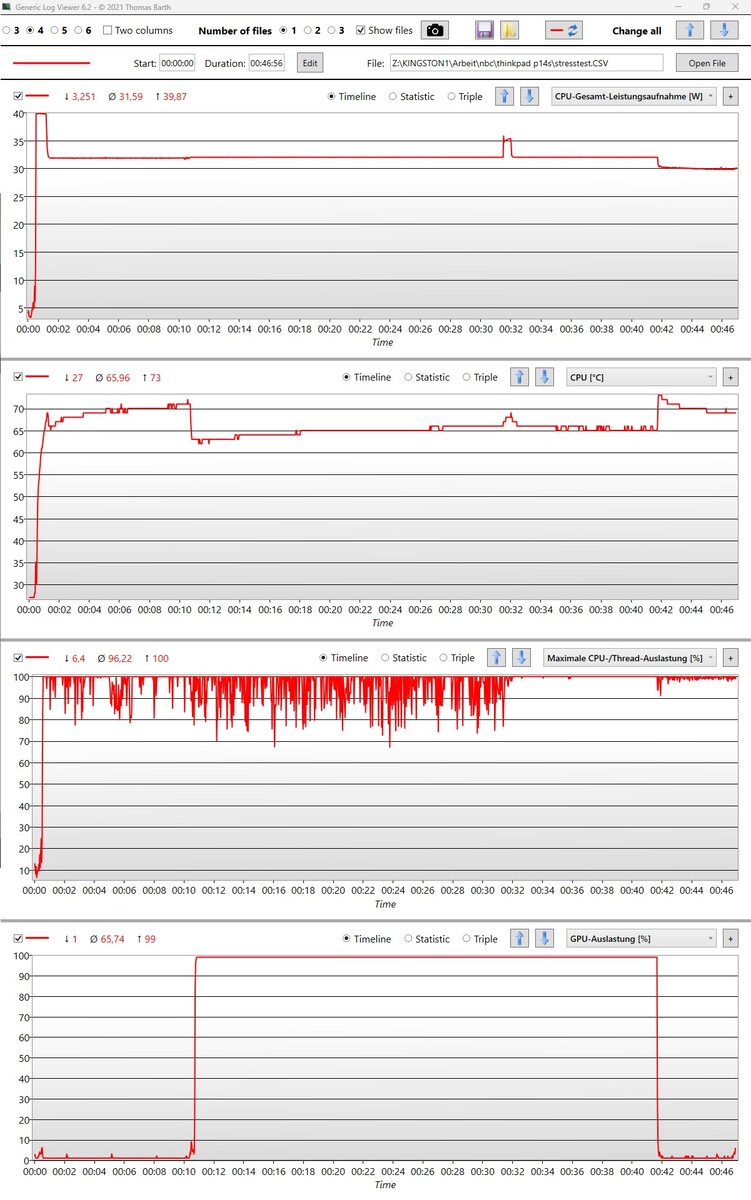
As promised, the CPU's maximum power consumption remains constant at 40 W for about 30 seconds. After that, the value drops to a stable 32 W. The measured temperatures usually remain below 70 °C, which indicates very effective heat transportation.
The average capacity during the stress test, meanwhile, is almost always at 100%. The GPU can also be used at maximum capacity at the same time. To measure this, we activated FurMark after 10 minutes and deactivated it again before completing the stress test.
The ThinkPad P14s does not show any signs of throttling or excessive heat generation. In other words, nothing stands in the way of continuous use.
Speaker
The speakers are decent but not good. Bass and lower mids are barely audible and the drivers lack power.
The quality is good enough for video calls, the occasional video stream and for playing music in the background. The sound is balanced and remains pleasant over time. Distortion can only be heard at very high frequencies, which is the case for most notebook speakers.
Lenovo ThinkPad P14s G4 21K5000LGE audio analysis
(±) | speaker loudness is average but good (74.9 dB)
Bass 100 - 315 Hz
(-) | nearly no bass - on average 25.5% lower than median
(±) | linearity of bass is average (11.1% delta to prev. frequency)
Mids 400 - 2000 Hz
(+) | balanced mids - only 2.1% away from median
(+) | mids are linear (4.8% delta to prev. frequency)
Highs 2 - 16 kHz
(+) | balanced highs - only 2.7% away from median
(+) | highs are linear (3.1% delta to prev. frequency)
Overall 100 - 16.000 Hz
(±) | linearity of overall sound is average (19.5% difference to median)
Compared to same class
» 70% of all tested devices in this class were better, 4% similar, 26% worse
» The best had a delta of 7%, average was 17%, worst was 35%
Compared to all devices tested
» 48% of all tested devices were better, 7% similar, 44% worse
» The best had a delta of 4%, average was 24%, worst was 134%
Apple MacBook Pro 16 2021 M1 Pro audio analysis
(+) | speakers can play relatively loud (84.7 dB)
Bass 100 - 315 Hz
(+) | good bass - only 3.8% away from median
(+) | bass is linear (5.2% delta to prev. frequency)
Mids 400 - 2000 Hz
(+) | balanced mids - only 1.3% away from median
(+) | mids are linear (2.1% delta to prev. frequency)
Highs 2 - 16 kHz
(+) | balanced highs - only 1.9% away from median
(+) | highs are linear (2.7% delta to prev. frequency)
Overall 100 - 16.000 Hz
(+) | overall sound is linear (4.6% difference to median)
Compared to same class
» 0% of all tested devices in this class were better, 0% similar, 100% worse
» The best had a delta of 5%, average was 17%, worst was 45%
Compared to all devices tested
» 0% of all tested devices were better, 0% similar, 100% worse
» The best had a delta of 4%, average was 24%, worst was 134%
Energy Management - Efficient ThinkPad for long trips
Power Consumption
The workstation laptop's power consumption is very low while idling, with the device drawing under 3 W at times. At full load, however, power consumption can increase to up to 60 W.
This is an ideal situation for mobile devices. Very little energy is required during breaks or while browsing the web or reading a document, but when the system is under load, it has 60 W available, which the 65-Watt power supply can also provide at any time.
| Off / Standby | |
| Idle | |
| Load |
|
Key:
min: | |
| Lenovo ThinkPad P14s G4 21K5000LGE R7 PRO 7840U, Radeon 780M, SK hynix PC801 HFS512GEJ9X162N, IPS, 1920x1200, 14" | Lenovo ThinkPad T14 G4 21K4S02000 R7 PRO 7840U, Radeon 780M, Samsung PM9A1a MZVL21T0HDLU, IPS LED, 1920x1200, 14" | Samsung Galaxy Book3 Pro 14 i7-1360P, Iris Xe G7 96EUs, WD PC SN740 512GB SDDPMQD-512G-1101, AMOLED, 2880x1800, 14" | HP EliteBook 845 G10 5Z4X0ES R7 7840U, Radeon 780M, WD PC SN740 512GB SDDPNQD-512G, IPS, 1920x1200, 14" | HP ProBook 450 G10 i7-1355U, GeForce RTX 2050 Mobile, Micron 3400 1TB MTFDKBA1T0TFH, IPS, 1920x1080, 15.6" | Lenovo ThinkPad P14s G3 AMD 21J6S05000 R7 PRO 6850U, Radeon 680M, Samsung PM9A1 MZVL21T0HCLR, IPS LED, 1920x1200, 14" | Average AMD Radeon 780M | Average of class Workstation | |
|---|---|---|---|---|---|---|---|---|
| Power Consumption | 3% | -30% | 10% | -30% | 2% | -58% | -174% | |
| Idle Minimum * (Watt) | 2.9 | 3.3 -14% | 4.2 -45% | 3.2 -10% | 4.6 -59% | 2.6 10% | 6.01 ? -107% | 8.94 ? -208% |
| Idle Average * (Watt) | 5.1 | 5.6 -10% | 4.7 8% | 5.1 -0% | 7.3 -43% | 5 2% | 8.15 ? -60% | 13.8 ? -171% |
| Idle Maximum * (Watt) | 5.6 | 6.1 -9% | 11.4 -104% | 5.4 4% | 8.4 -50% | 5.6 -0% | 10.3 ? -84% | 17.5 ? -213% |
| Load Average * (Watt) | 51.2 | 40.1 22% | 61.5 -20% | 39.1 24% | 57.3 -12% | 49.7 3% | 57.6 ? -13% | 95 ? -86% |
| Witcher 3 ultra * (Watt) | 49.9 | 41.4 17% | 55.1 -10% | 39.8 20% | 49.3 1% | 50.6 -1% | ||
| Load Maximum * (Watt) | 60.2 | 51.8 14% | 64 -6% | 46.6 23% | 69.7 -16% | 61.1 -1% | 77 ? -28% | 175.2 ? -191% |
* ... smaller is better
Power Consumption Witcher 3 / stress test
Power consumption with an external display
Battery Life
The remarkably low power consumption during less demanding tasks is reflected in the battery life. The laptop keeps going for over 11 hours in our web browsing test, which is longer than the average device. Increasing screen brightness does, however, have a significant impact on battery life. Still, our best value was reached at almost 70% brightness, which is usually sufficient when working at a desk.
The battery life was equally good in our video test, reaching almost 10 hours. This is a satisfactory result, especially when you consider that the battery isn't very large at 52 Wh.
Because the workstation notebook provides a lot of power even when running on battery, the battery life drops to just under 1 hour under load.
| Lenovo ThinkPad P14s G4 21K5000LGE R7 PRO 7840U, Radeon 780M, 52 Wh | Lenovo ThinkPad T14 G4 21K4S02000 R7 PRO 7840U, Radeon 780M, 52.5 Wh | Samsung Galaxy Book3 Pro 14 i7-1360P, Iris Xe G7 96EUs, 63 Wh | HP EliteBook 845 G10 5Z4X0ES R7 7840U, Radeon 780M, 51 Wh | HP ProBook 450 G10 i7-1355U, GeForce RTX 2050 Mobile, 51.3 Wh | Lenovo ThinkPad P14s G3 AMD 21J6S05000 R7 PRO 6850U, Radeon 680M, 52.5 Wh | Average of class Workstation | |
|---|---|---|---|---|---|---|---|
| Battery runtime | 31% | 20% | 23% | 51% | 9% | 0% | |
| H.264 (h) | 9.9 | 11.9 20% | 12.7 28% | 11.4 15% | 12 21% | 9.51 ? -4% | |
| WiFi v1.3 (h) | 11.4 | 12.2 7% | 8.8 -23% | 13 14% | 9.3 -18% | 12.2 7% | 8.53 ? -25% |
| Load (h) | 1.1 | 1.7 55% | 1.8 64% | 1.4 27% | 2.8 155% | 1.1 0% | 1.429 ? 30% |
| Reader / Idle (h) | 21 | 18.1 | 26.1 ? |
Pros
Cons
Verdict - The P14s is perfect for pragmatists
As long as graphics don't play a major role, the Lenovo ThinkPad P14s G4 AMD offers outstanding characteristics for a portable workstation. Its CPU and GPU performance is impressive. The Radeon 780M can easily replace a small dedicated GPU. In addition, the device is highly efficient and its battery lasts an entire day.
Countless security features, including face recognition, ensure the safety of your data. The robust construction and remote maintenance options add further protection.
Somewhat bland with suboptimal ports but plenty of power, a strong iGPU and more-than-decent battery life: Objectively speaking, the ThinkPad P14s is a very good choice.
There is room for improvement in the area of connectivity. A strong webcam, all the main connectors and USB4 make the device versatile, with the option of adding 5G/LTE in addition to the already available LAN port. The presence of only one really fast USB port next to the two dated USB 3.0 connectors slightly dampens the good impression. Comparable Intel notebooks have more to offer. And a workstation laptop really should allow users to replace and/or expand the RAM module.
Nonetheless, the P14s G4 AMD is a superbly well-equipped device that does without fancy extras or a stylish appearance in favor of being affordable. Users looking for even more portability may consider the similarly equipped ThinkPad T14 G4 a good alternative. The HP ZBook Power G10, meanwhile, brings more power to the table, especially when it comes to graphics.
Price and Availability
Several configurations of the Lenovo ThinkPad P14s G4, including our test unit equipped with a Ryzen 7 PRO 7840U, are available from the Lenovo webshop.
Lenovo ThinkPad P14s G4 21K5000LGE
- 01/21/2024 v7 (old)
Mario Petzold
Transparency
The selection of devices to be reviewed is made by our editorial team. The test sample was provided to the author as a loan by the manufacturer or retailer for the purpose of this review. The lender had no influence on this review, nor did the manufacturer receive a copy of this review before publication. There was no obligation to publish this review. As an independent media company, Notebookcheck is not subjected to the authority of manufacturers, retailers or publishers.
This is how Notebookcheck is testing
Every year, Notebookcheck independently reviews hundreds of laptops and smartphones using standardized procedures to ensure that all results are comparable. We have continuously developed our test methods for around 20 years and set industry standards in the process. In our test labs, high-quality measuring equipment is utilized by experienced technicians and editors. These tests involve a multi-stage validation process. Our complex rating system is based on hundreds of well-founded measurements and benchmarks, which maintains objectivity. Further information on our test methods can be found here.
Price comparison

