HP ProBook 450 G10 review: GeForce RTX power inside an office laptop
Within the ProBook 400 series, HP has bundled together entry-level to mid-range business laptops that won't cost you an arm and a leg. The cheapest 15.6-inch models start from around US$750. For our test device, the top-of-the-range model in this series, you will likely have to spend about US$1,000. HP relies on Raptor Lake CPUs from Intel for this model. Quite a few versions additionally feature a GeForce RTX 2050 graphics card — our test device being one of those.
The competition includes devices such as the Acer Aspire 5 A515-58GM, Schenker VIA 15 Pro M22, Lenovo ThinkPad L15 Gen 4, Fujitsu LifeBook E5412A and the Dell Latitude 3440 — in the case of the latter two laptops, this applies to a greater extent to their respective 15.6-inch sister models.
Possible competitors compared
Rating | Date | Model | Weight | Height | Size | Resolution | Price |
|---|---|---|---|---|---|---|---|
| 86.2 % v7 (old) | 12 / 2023 | HP ProBook 450 G10 i7-1355U, GeForce RTX 2050 Mobile | 1.8 kg | 19.9 mm | 15.60" | 1920x1080 | |
| 82 % v7 (old) | 09 / 2023 | Acer Aspire 5 A515-58GM-76S8 i7-1355U, GeForce RTX 2050 Mobile | 1.8 kg | 19.7 mm | 15.60" | 1920x1080 | |
| 87.1 % v7 (old) | 06 / 2023 | Schenker VIA 15 Pro M22 R7 5700U, Vega 8 | 1.4 kg | 16.8 mm | 15.60" | 2560x1440 | |
| 86.6 % v7 (old) | 12 / 2023 | Lenovo ThinkPad L15 Gen 4 21H70021GE R7 PRO 7730U, Vega 8 | 1.9 kg | 19.93 mm | 15.60" | 1920x1080 | |
| 82.1 % v7 (old) | 06 / 2023 | Fujitsu LifeBook E5412A E542AMHAAMDE R5 PRO 5675U, Vega 7 | 1.4 kg | 19.9 mm | 14.00" | 1920x1080 | |
| 85.3 % v7 (old) | 06 / 2023 | Dell Latitude 3440 i5-1345U, Iris Xe G7 80EUs | 1.5 kg | 19.4 mm | 14.00" | 1920x1080 |
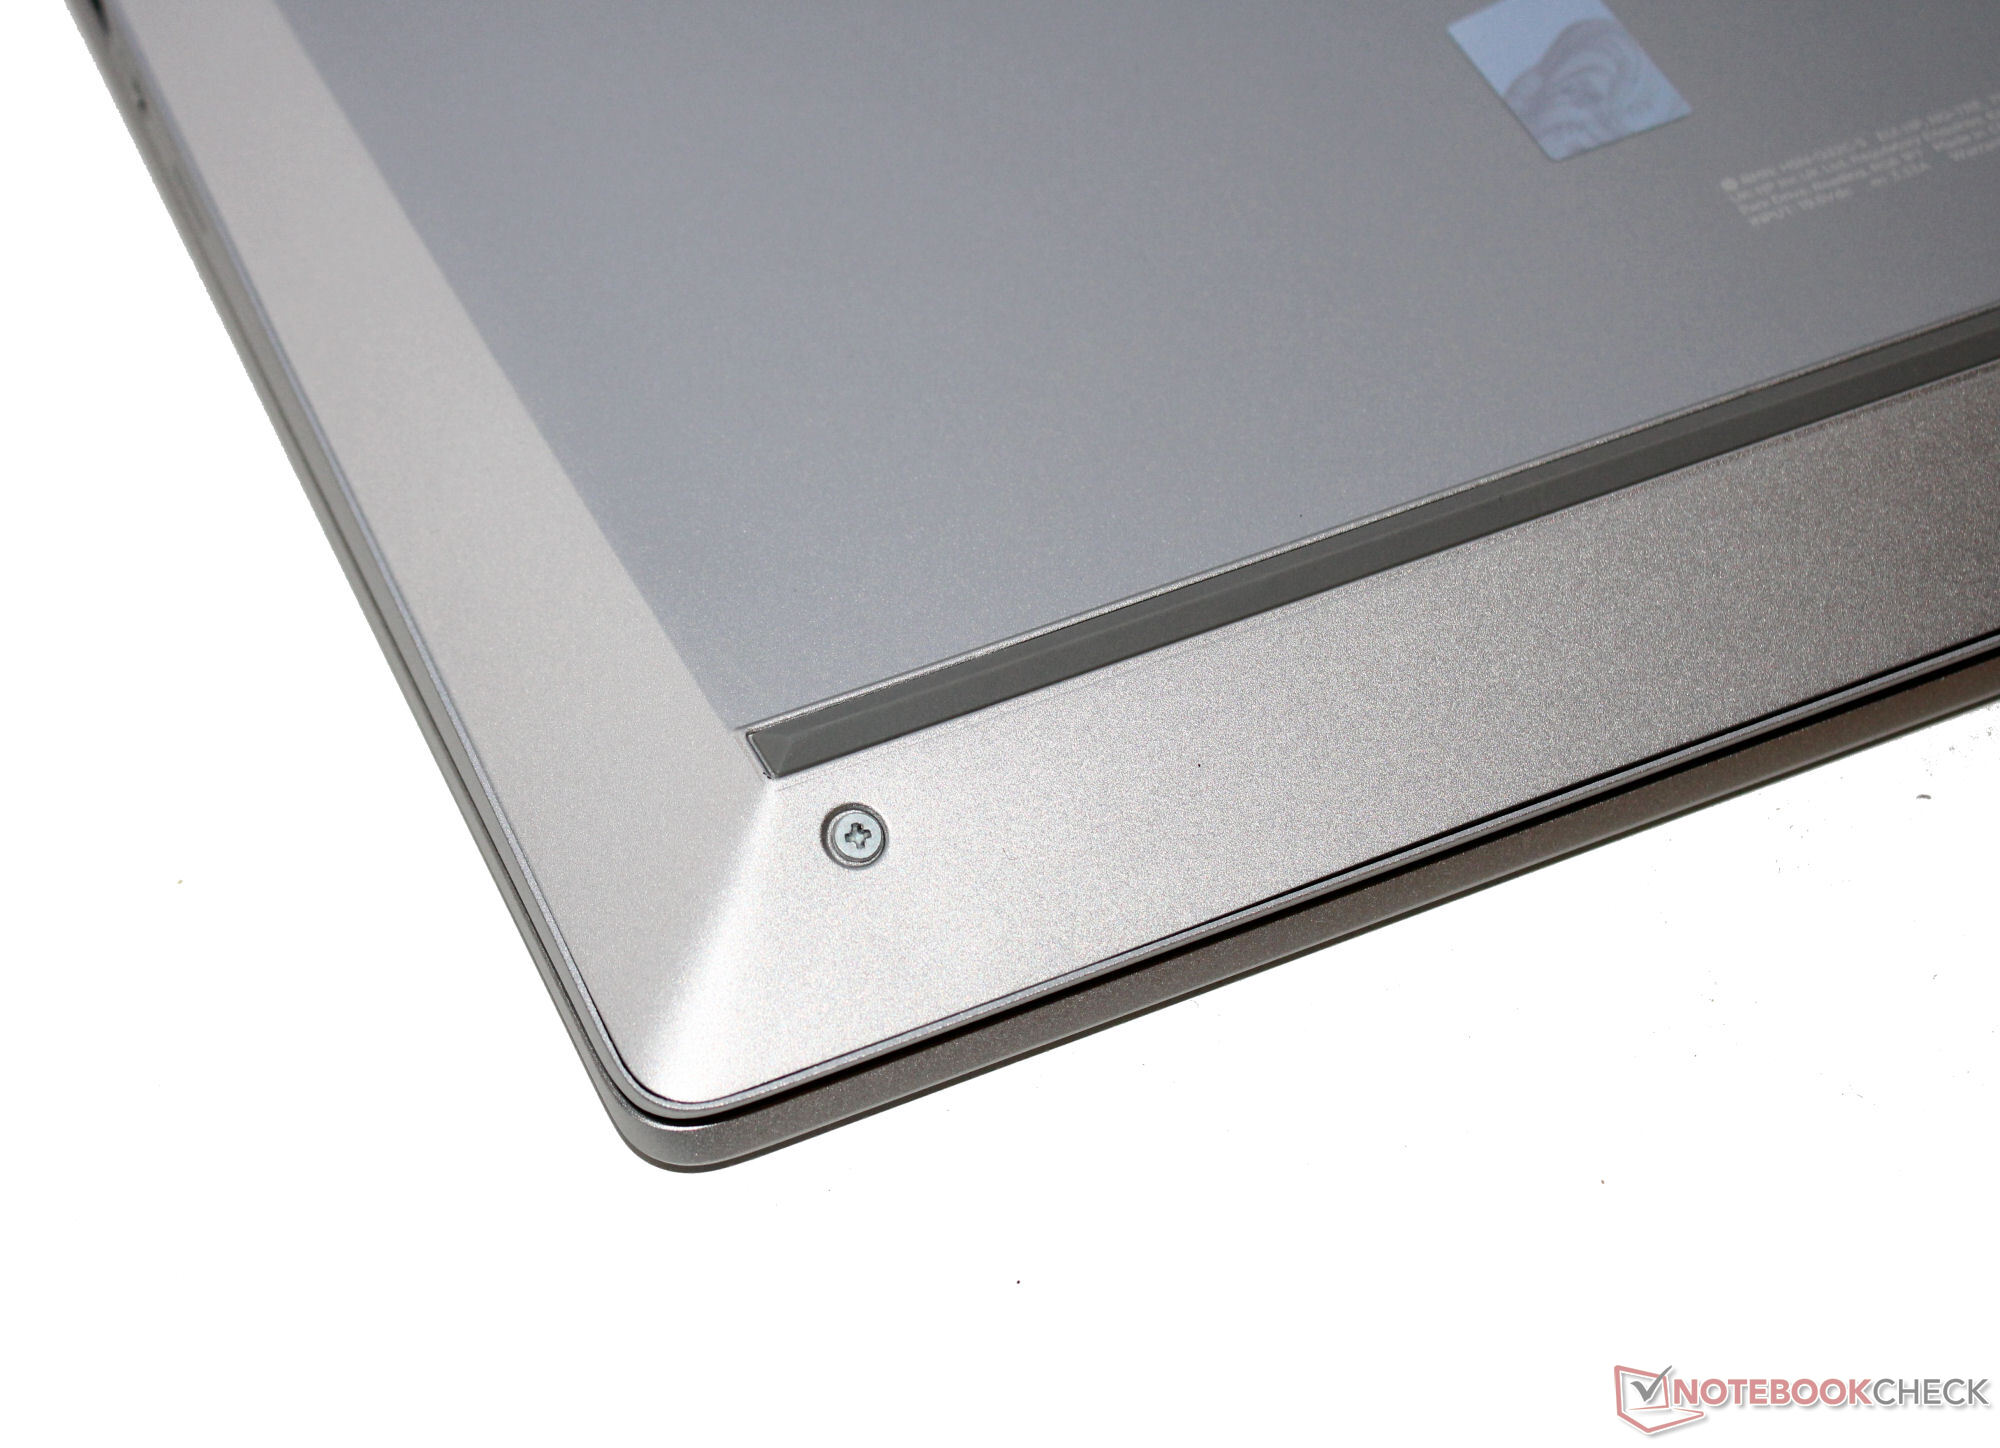
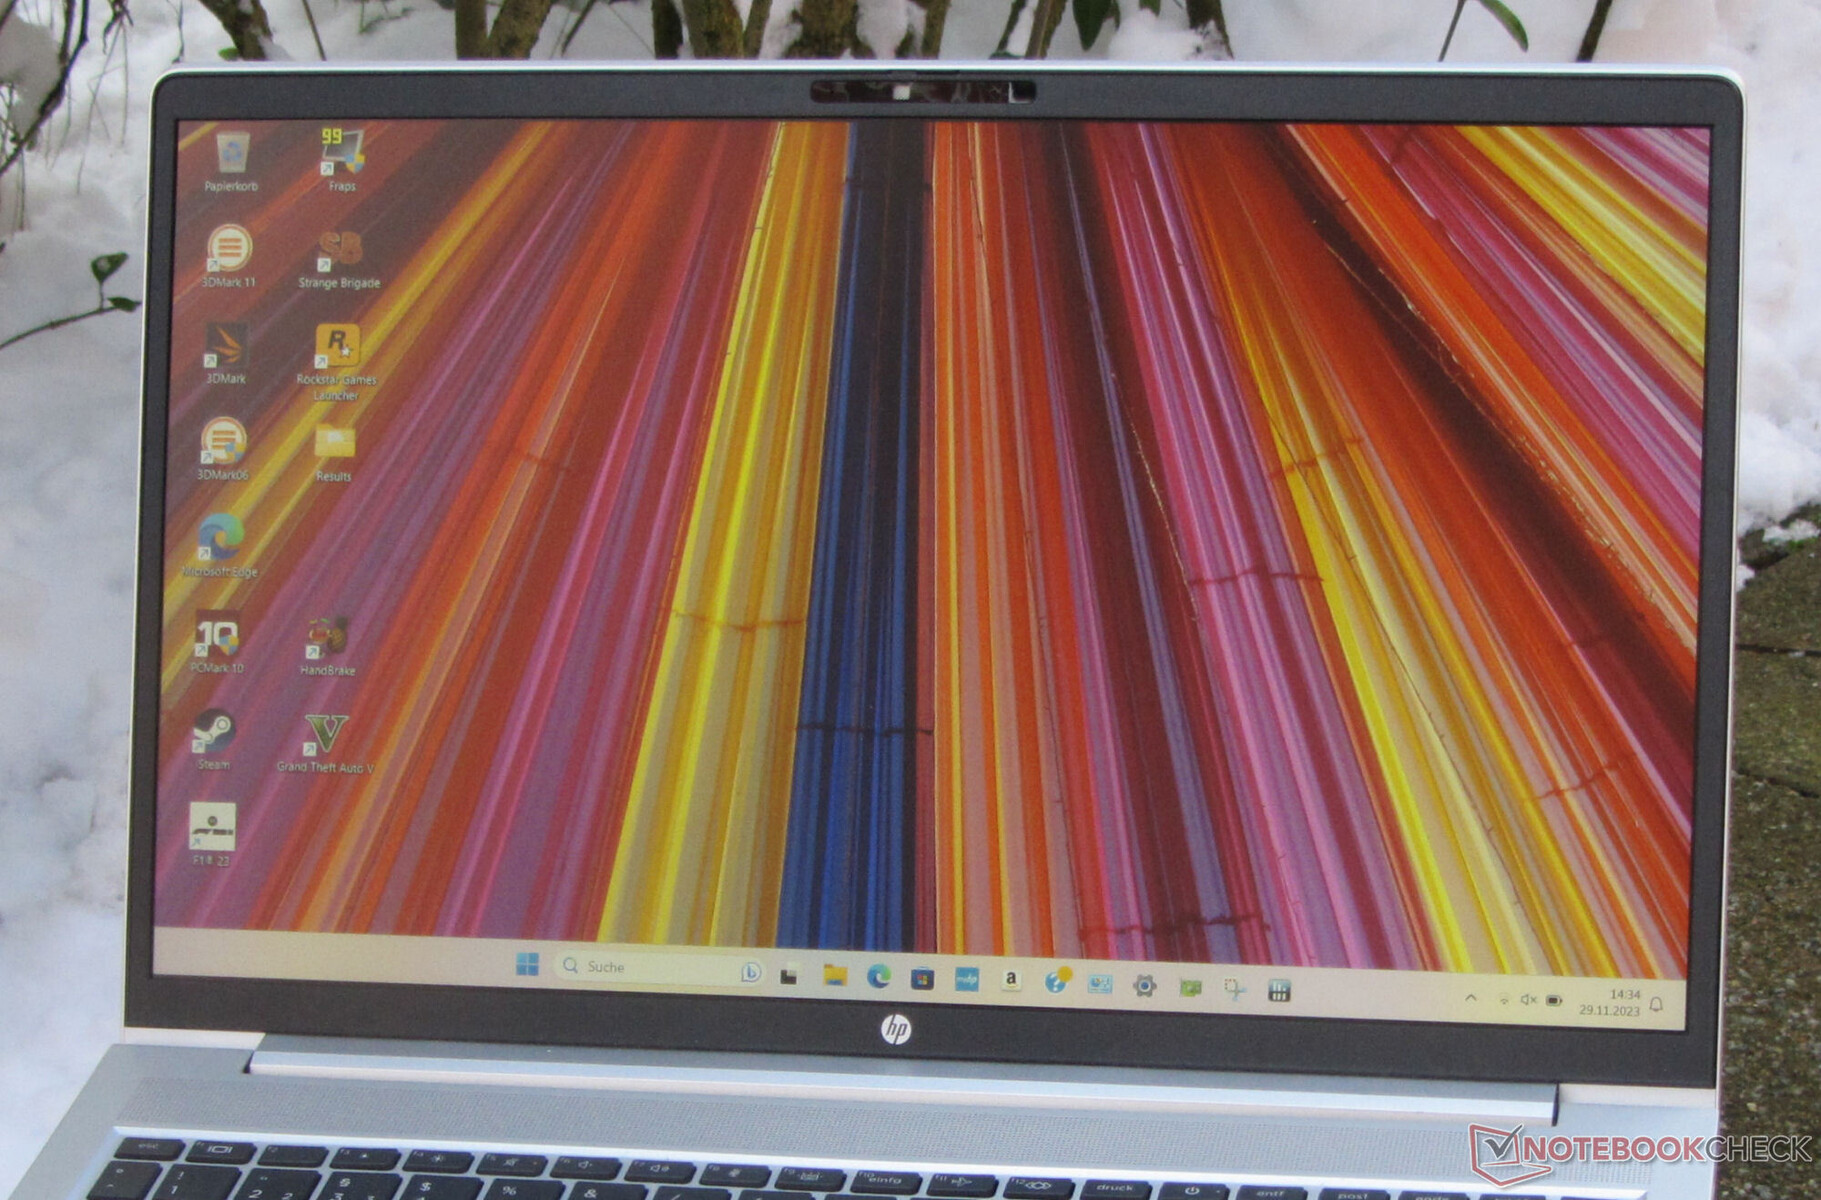
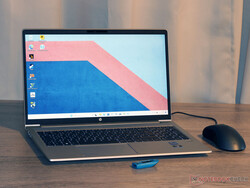
Case - HP uses aluminum and plastic
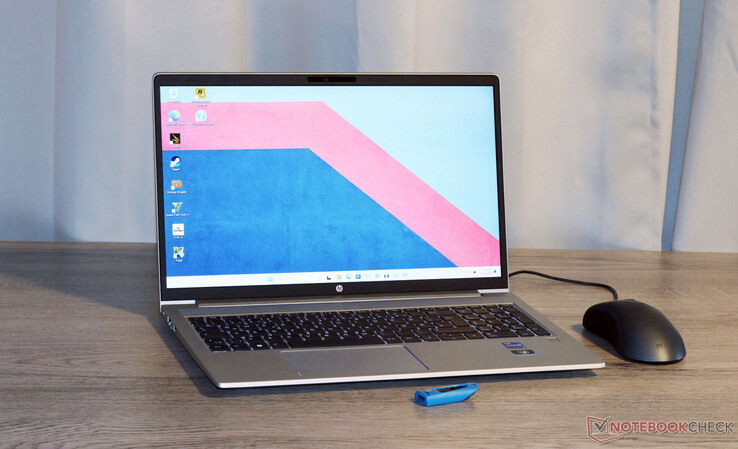
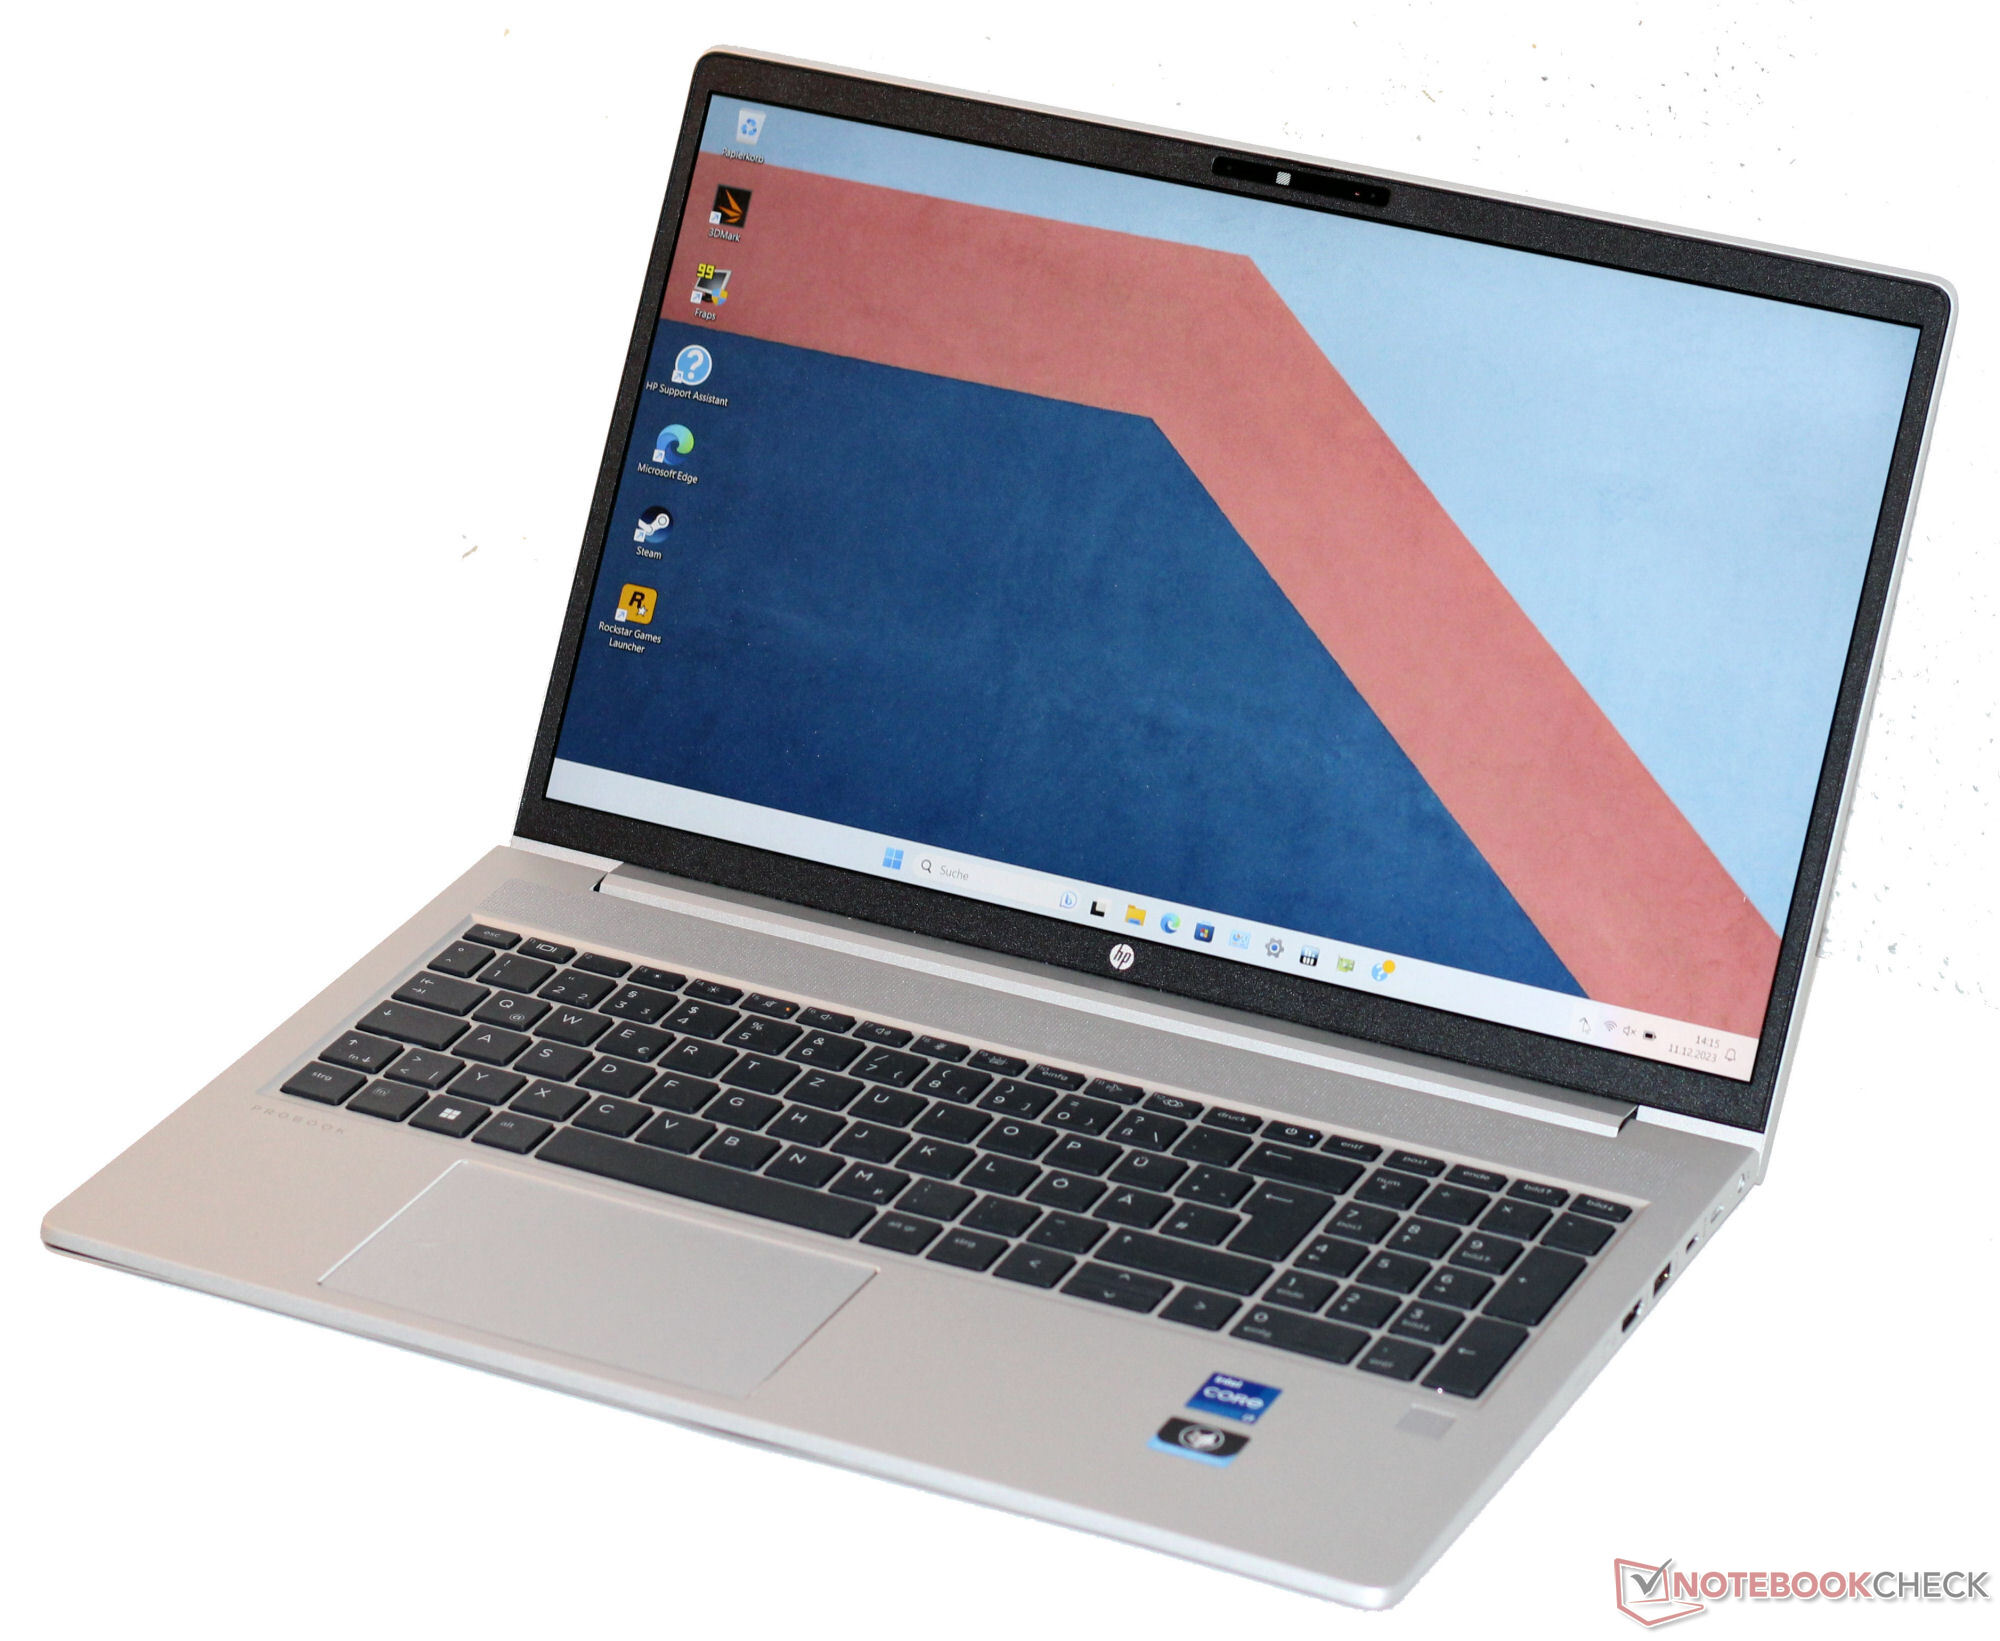
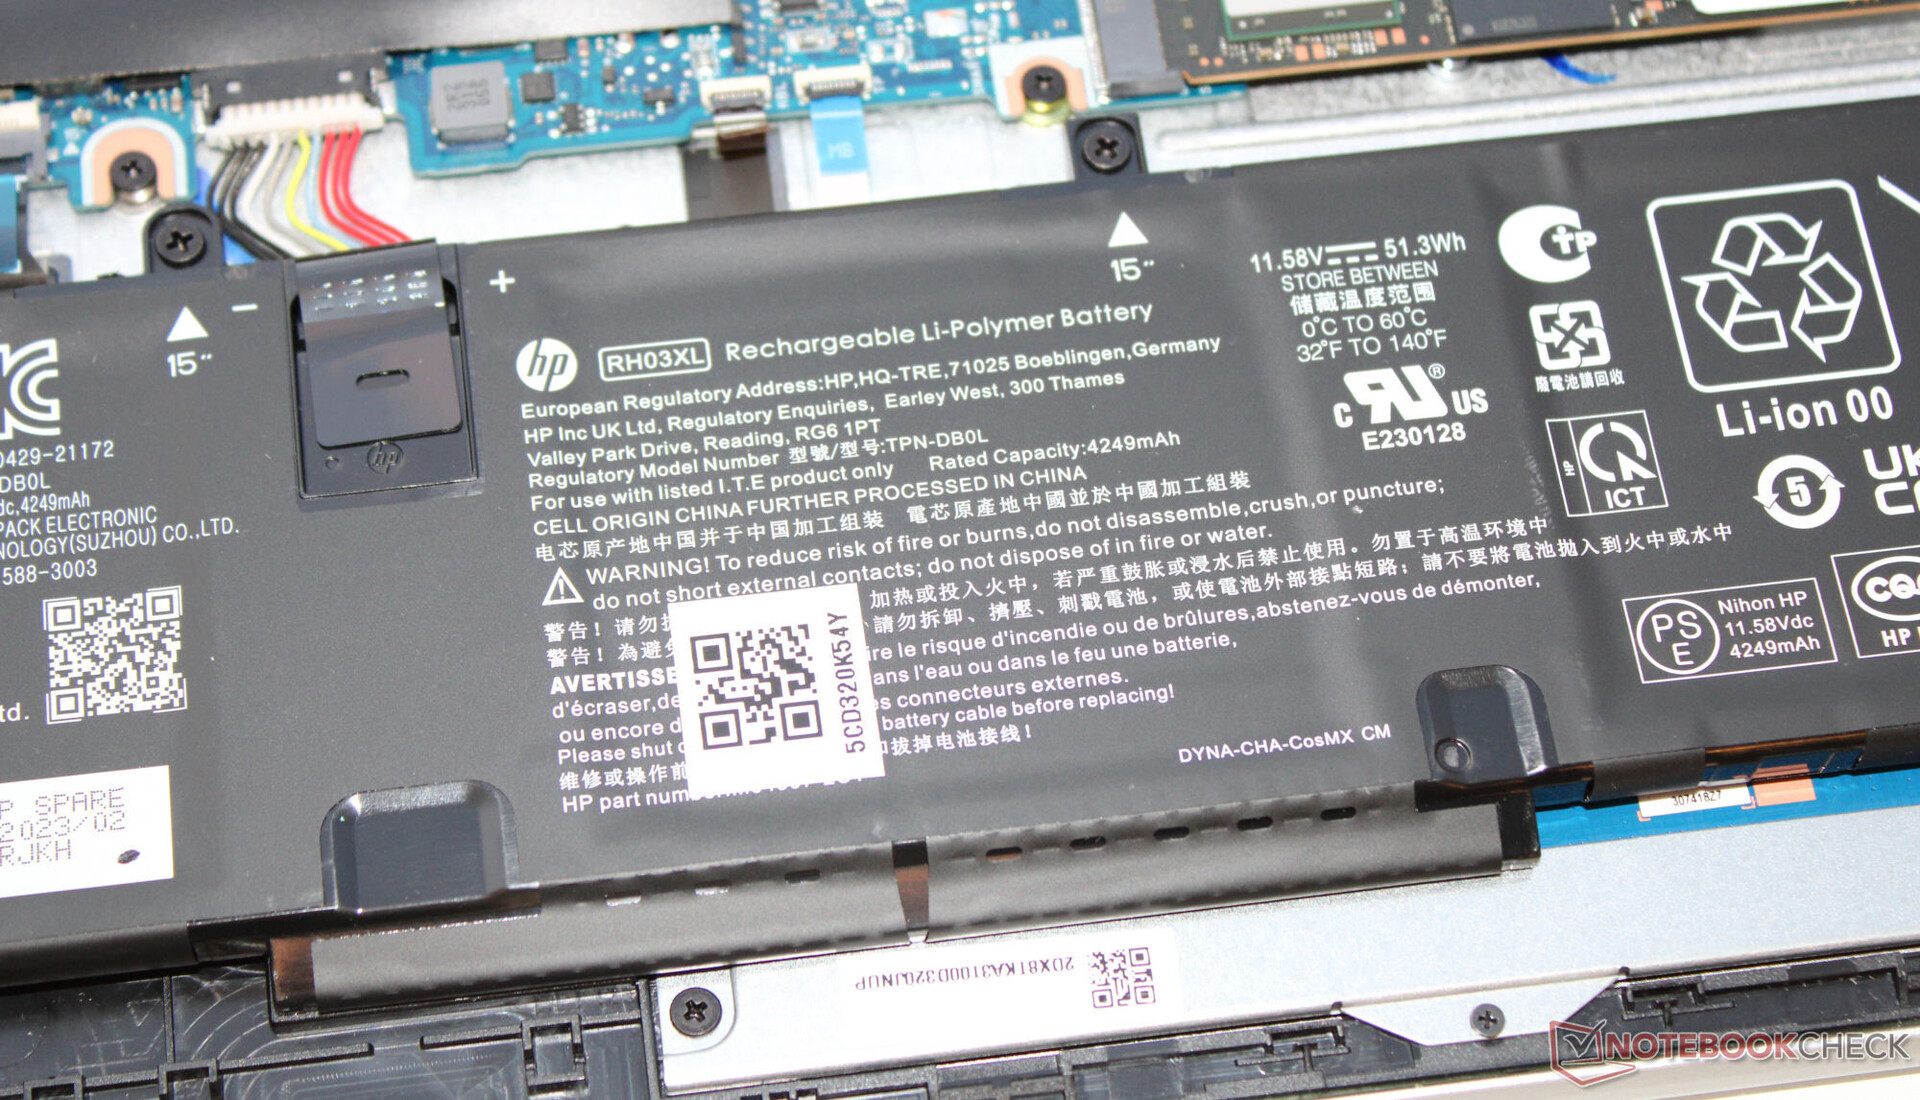
Visually, nothing has changed compared to the laptop's predecessor: HP relies on a silver-gray, sleek and simple case (aluminum & plastic) known from the 450 G9 which features matte, smooth surfaces. Heat is dissipated via the back of the case. If you have the lid closed (for example, if the laptop is docked), some heat may build up. In order to access the battery (screwed in, not glued on) and the rest of the laptop's hardware, you will have to remove the bottom plate.
Its build shows no reason for criticism. There are no gaps or material excesses. The base unit and lid can be twisted a little too much. You would expect more from a laptop costing this much. Pressing down on the back of the lid doesn't lead to any picture changes. The hinges hold the lid firmly in position right up to its maximum opening angle (180 degrees). It is possible to open the lid with one hand.

Within the comparison field, the ProBook has a relatively average weight for a laptop (about 1.8 kg). In terms of dimensions, the 15.6-inch devices are all pretty similar. Of course, the 14-inch competitors are considerably more compact and lightweight.
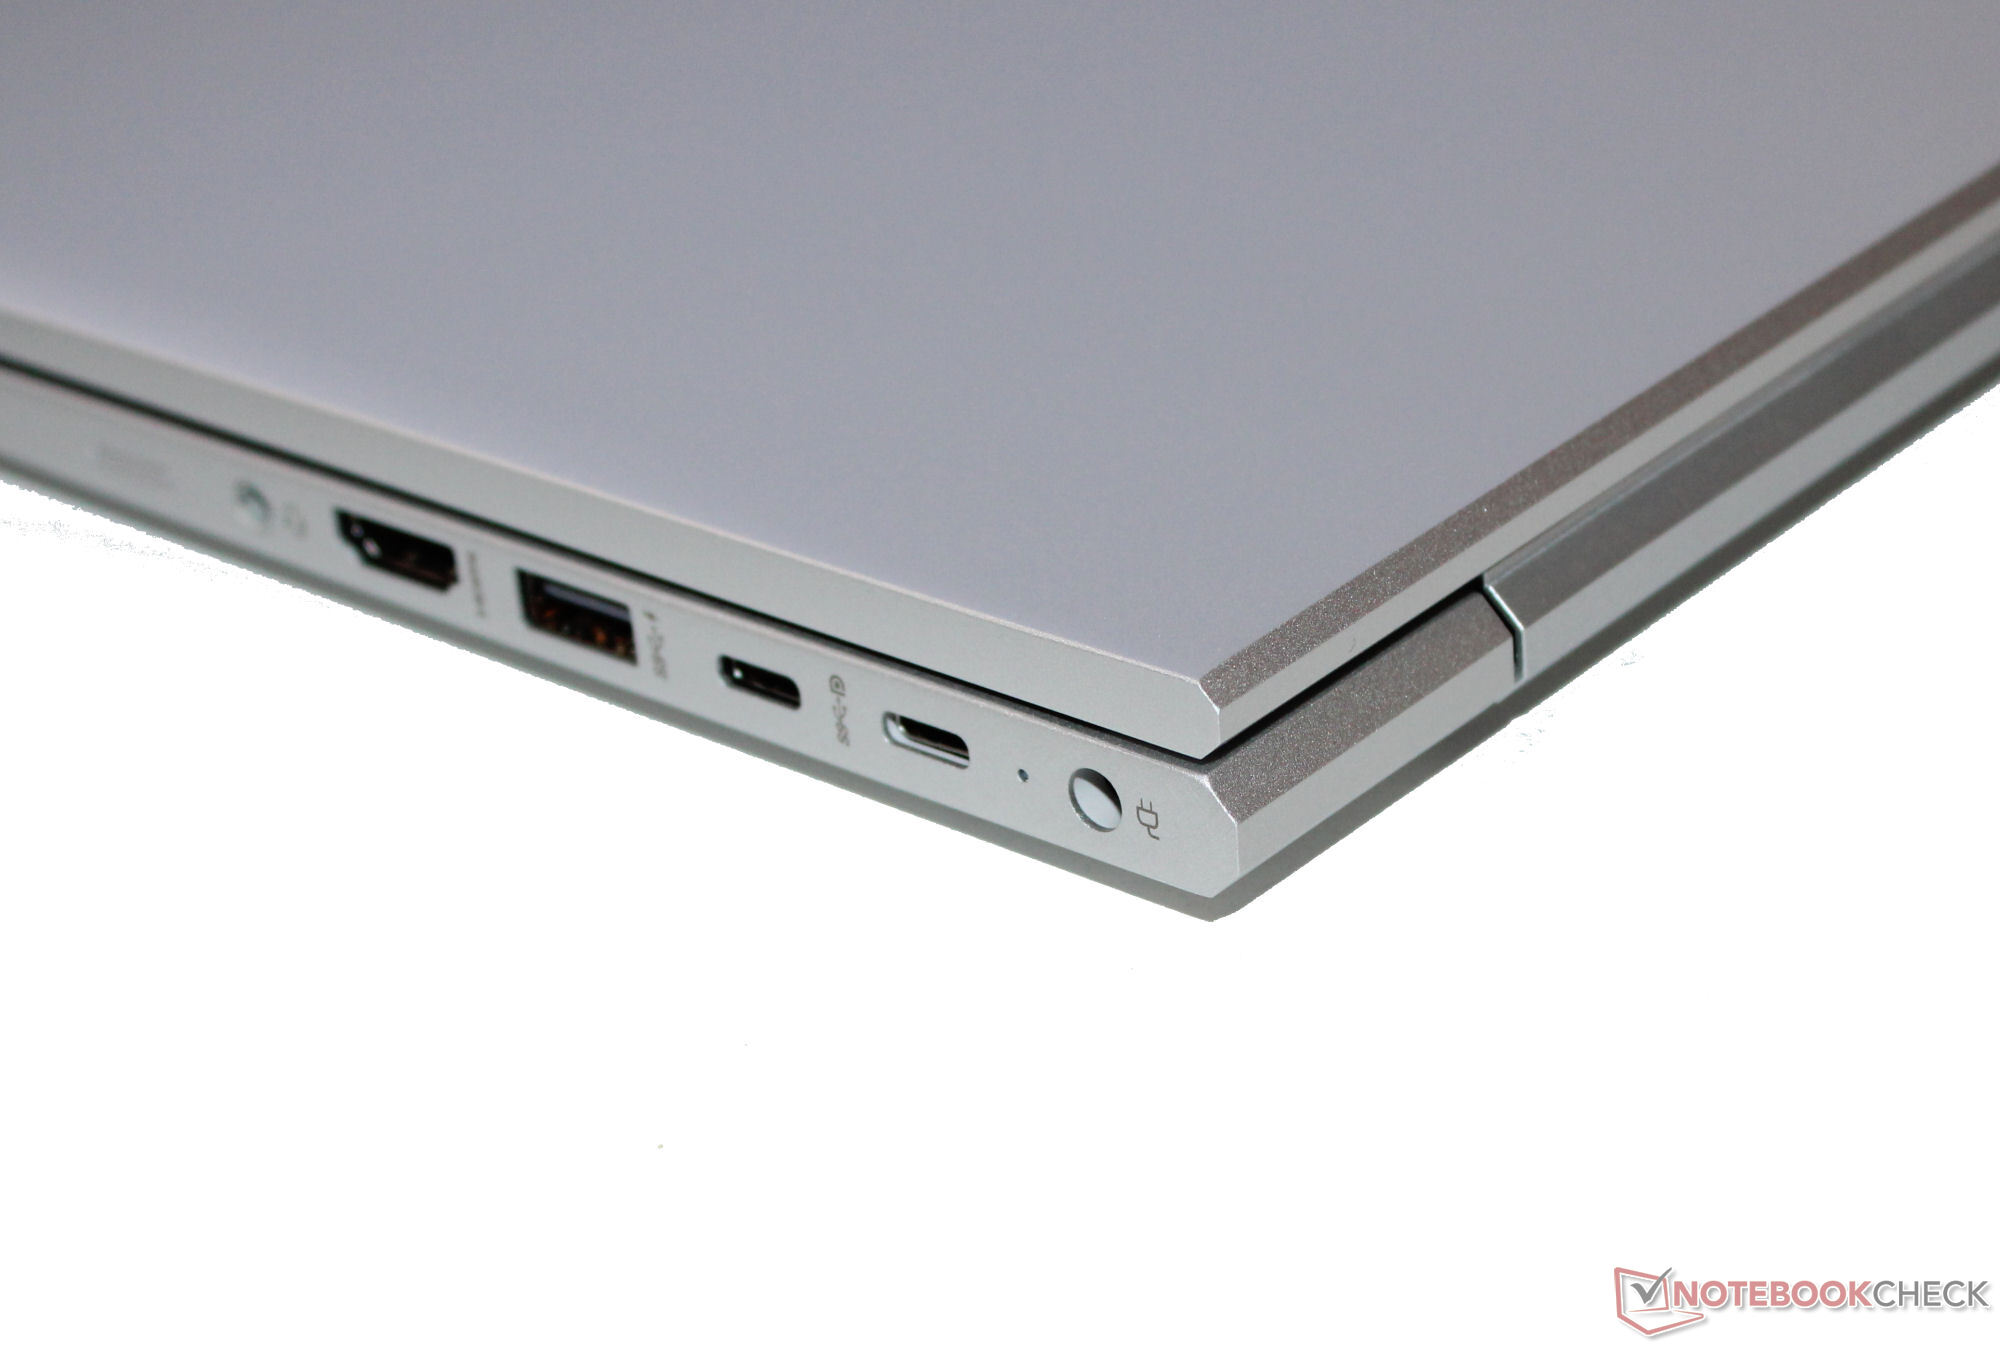
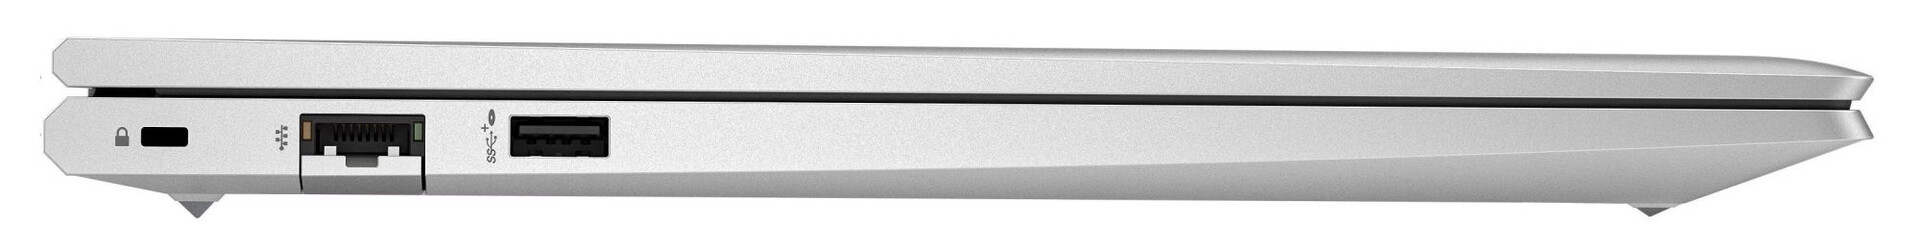
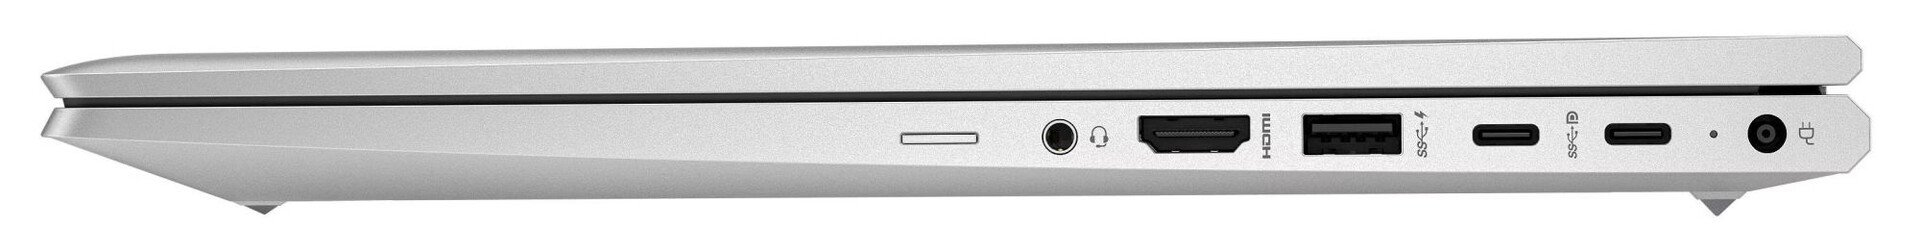
Connectivity - No Thunderbolt 4 on the ProBook 450
The ProBook features two USB-A connections (USB 3.2 Gen 1) and two USB-C ports (USB 3.2 Gen 2; Power Delivery, DisplayPort). In total, the laptop has three video outputs (2x DP, 1x HDMI). A combined audio jack and a Gigabit Ethernet port complete the setup. The device doesn't have an SD card reader.
Communication
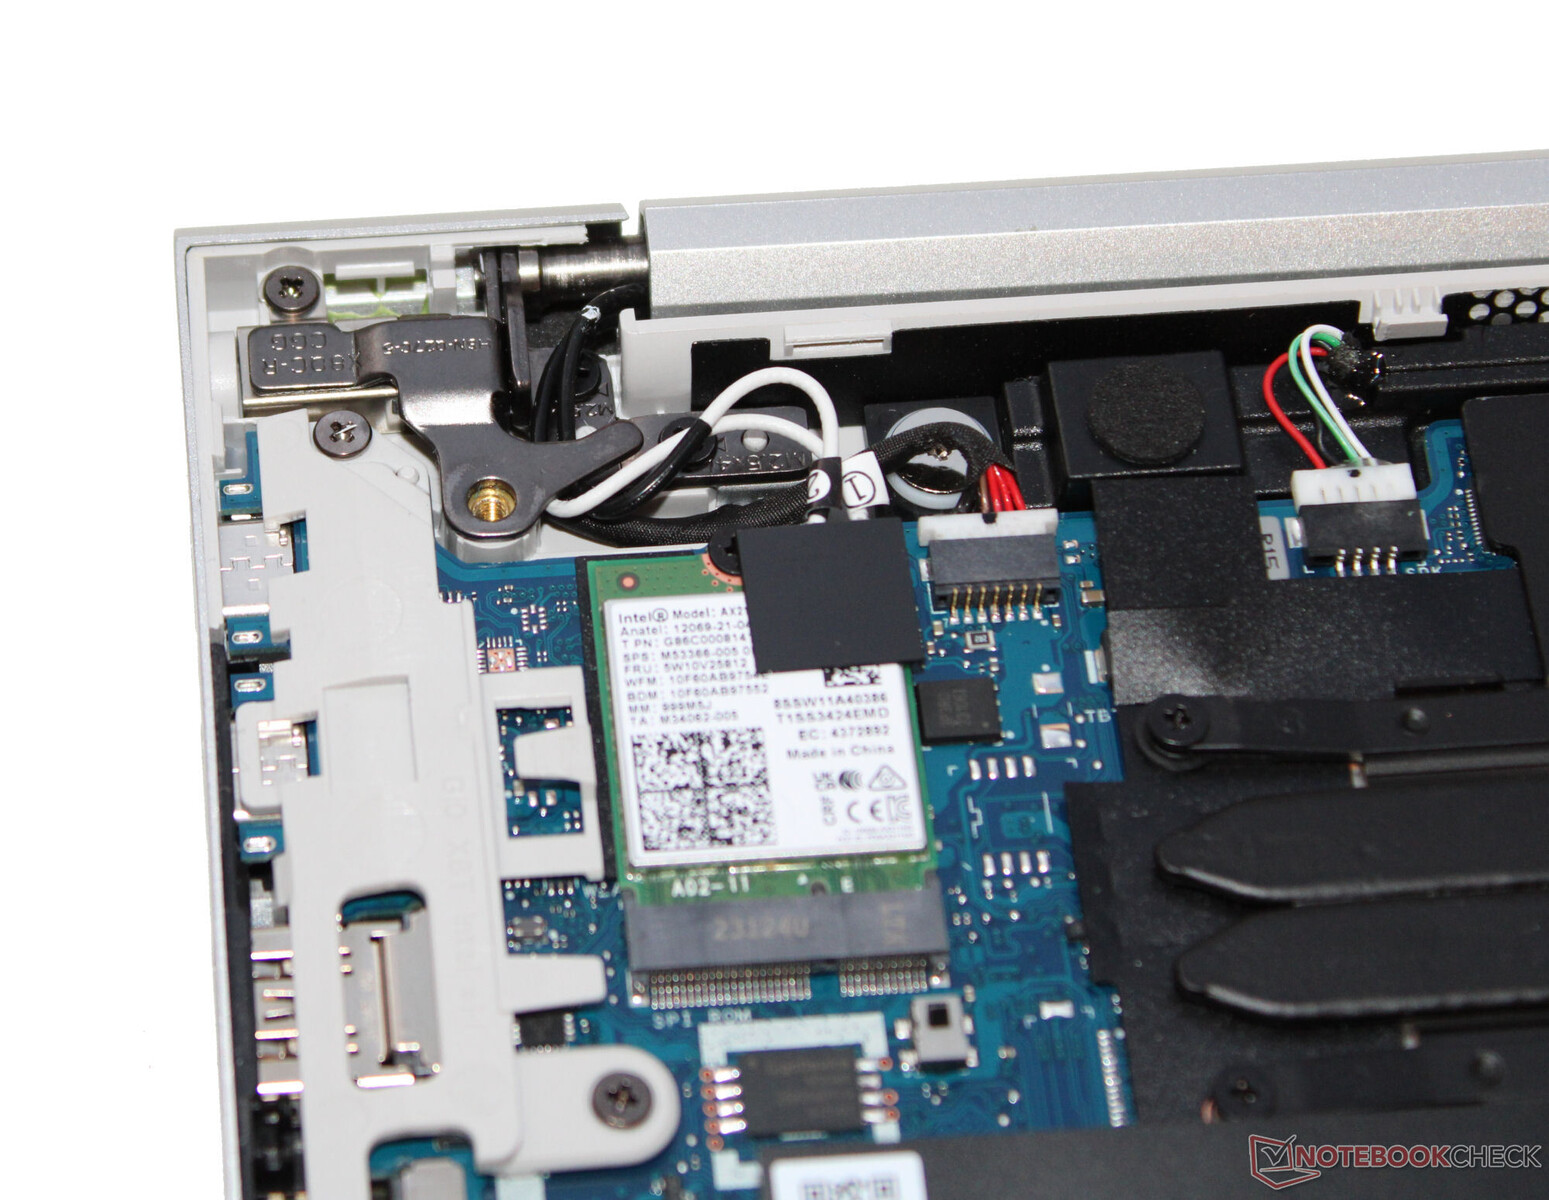
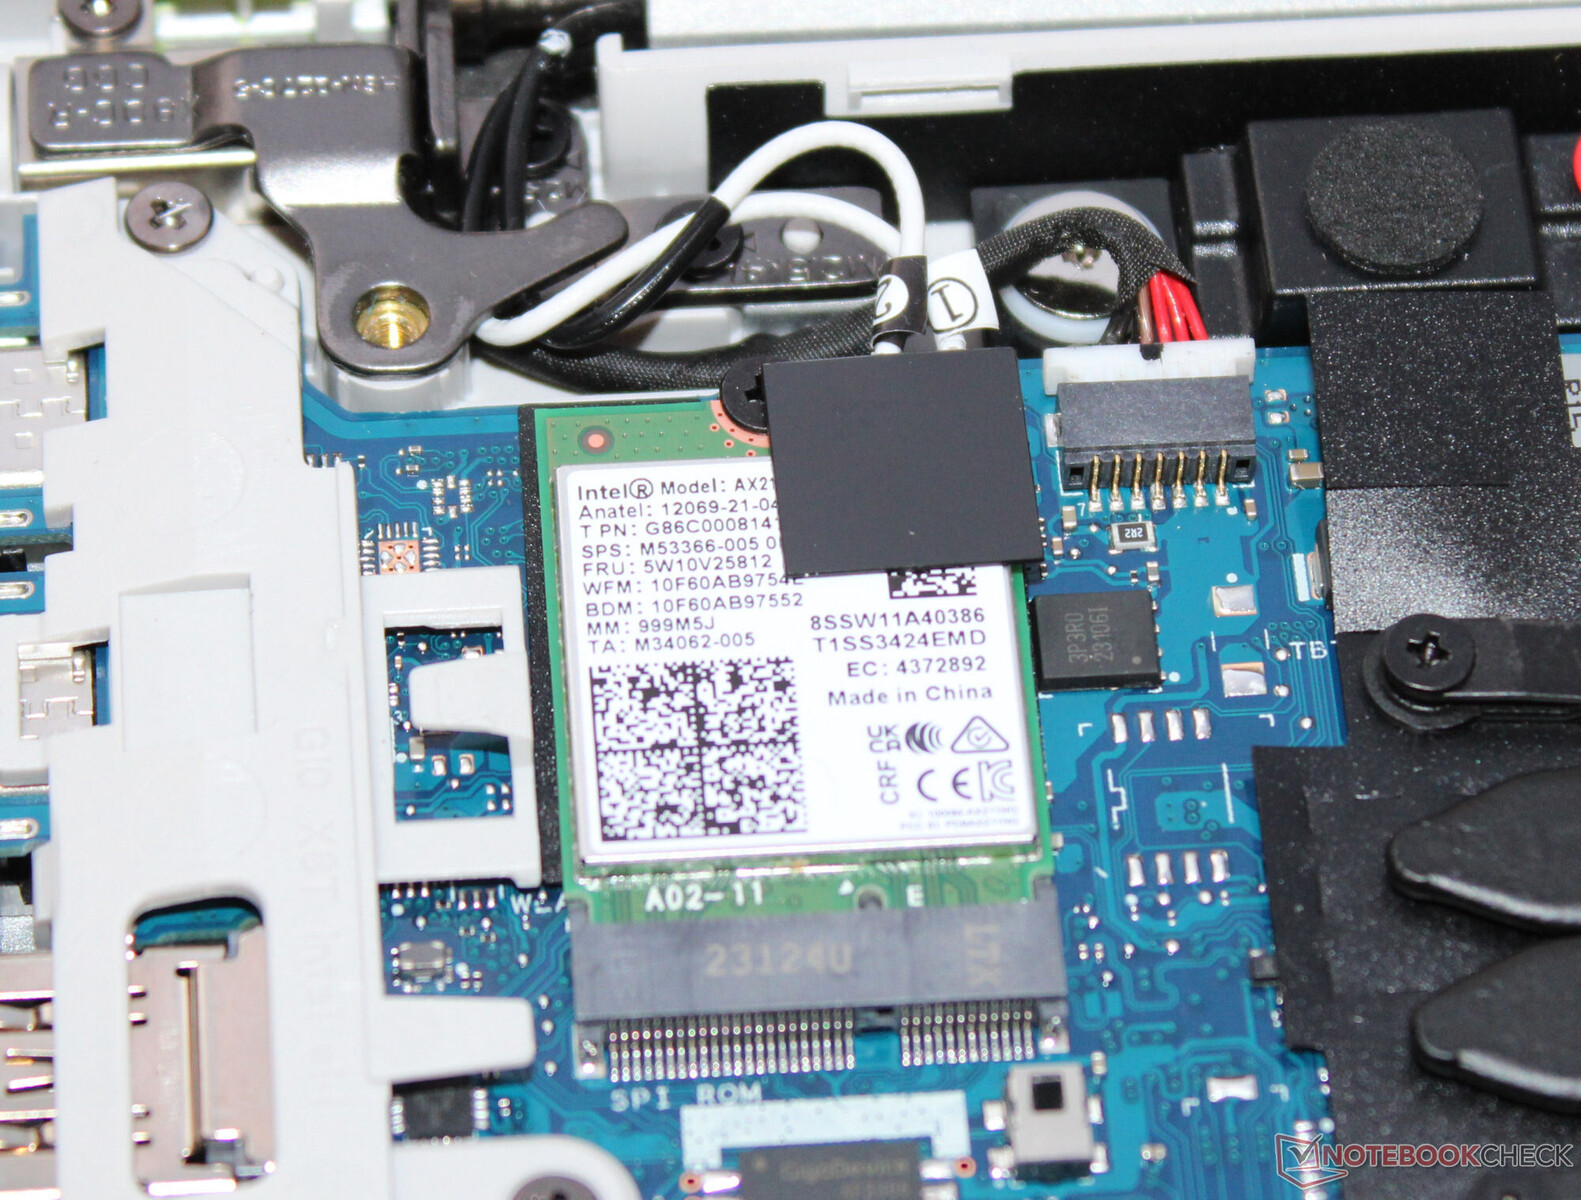
Under optimum conditions (no WLAN devices in close vicinity, short distance between laptop and server PC), it achieves very good WiFi data rates. The 450 uses a WiFi 6E chip (Intel AX211). Wired connections are taken care of by a controller (RTL8168/8111; 1 GBit/s) made by Realtek.
The present test device neither features an LTE/5G modem, nor can it be fitted with one. It doesn't have an antenna or a SIM card reader. If you require this, you will have to go for a different model of the ProBook. In general, the series offers WWAN support.
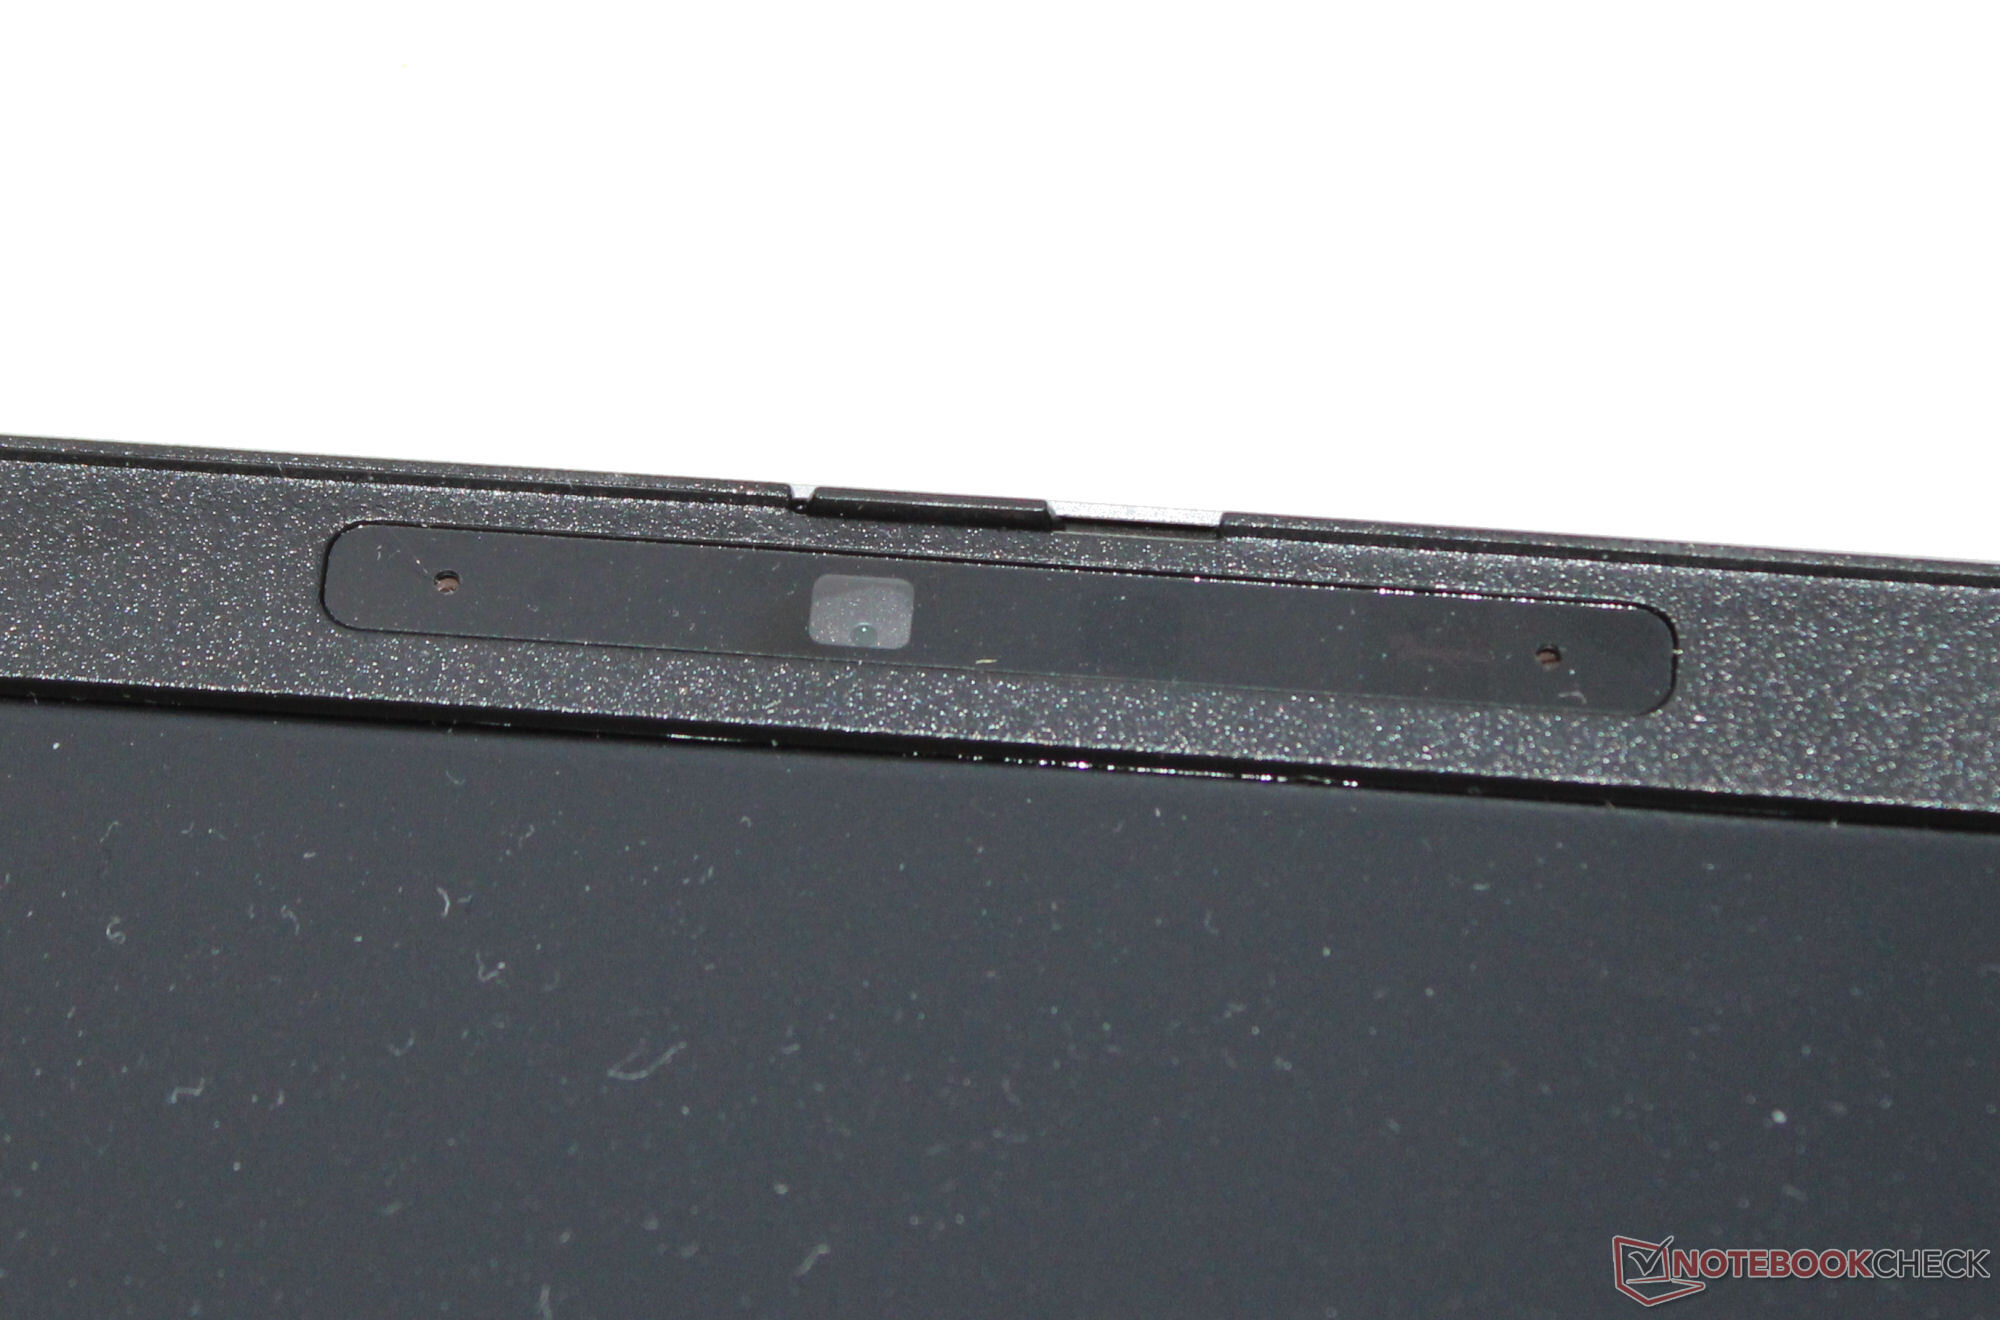
Webcam
HP accommodates the continuing trend towards video conferences and Zoom meetings with a 5 MP webcam (max. 2,560 x 1,440 pixels, infrared). It will not likely produce any works of art: the image quality is average at best. In addition: With a color deviation of almost 20, the target (DeltaE < 3) is missed by a long shot. Positive: The camera has a mechanical cover.


Security
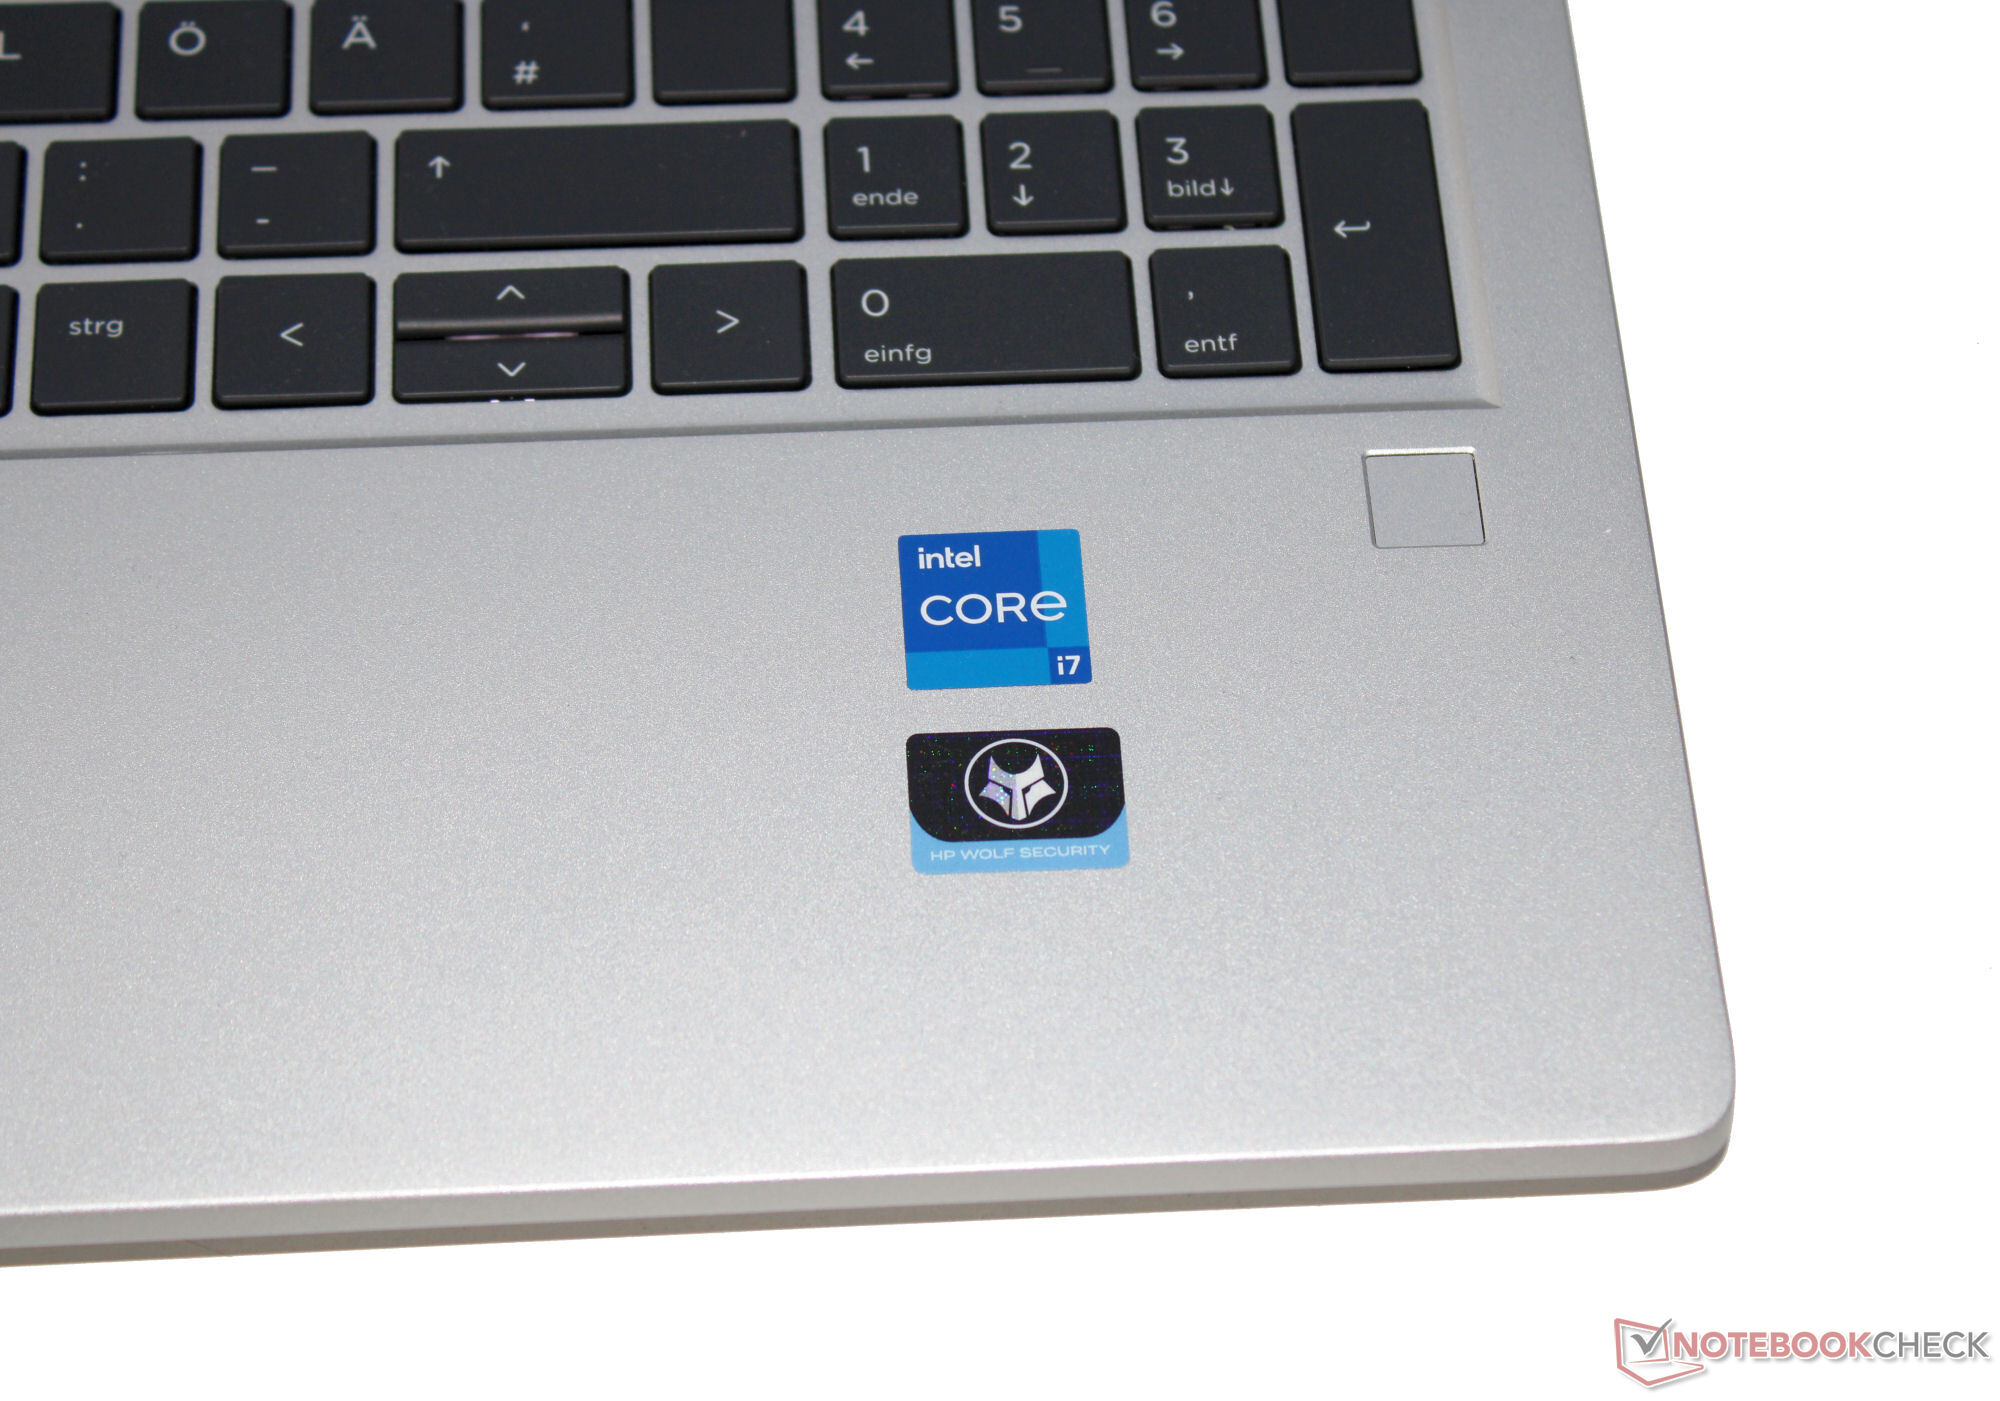
The laptop allows access security via fingerprint and Windows Hello. There is also a Trusted Platform Module (2.0) on board. The device can be physically secured using a cable lock. On the software side, there are various HP proprietary applications - such as HP Sure Run (monitoring applications for attacks) and HP Wolf Security for Business (protecting end devices from attacks).
Accessories
Aside from the usual documents (warranty information, quick-start poster), the 450 doesn't come with any additional accessories.
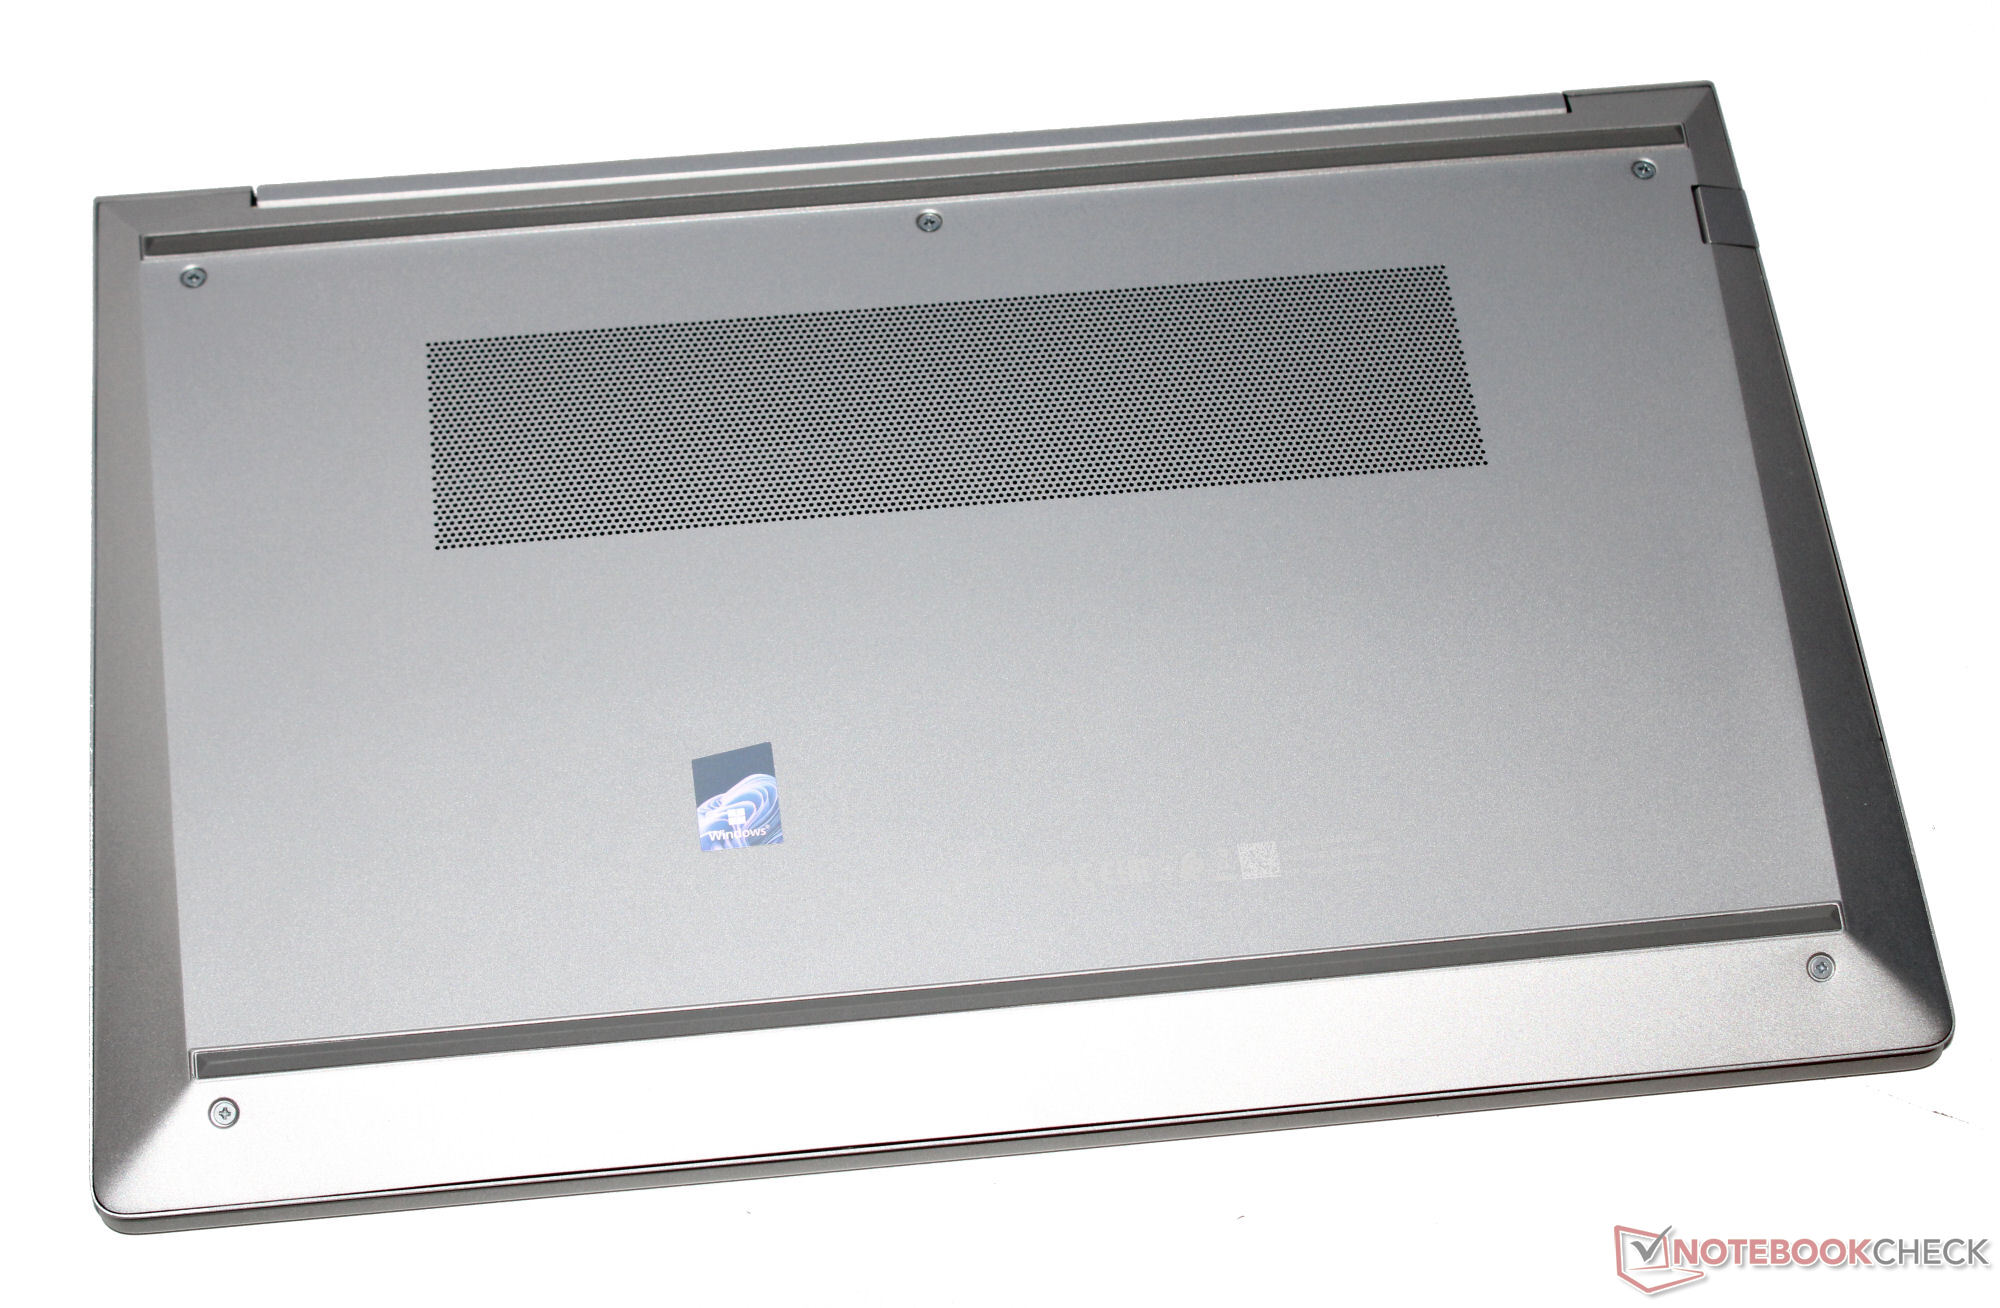
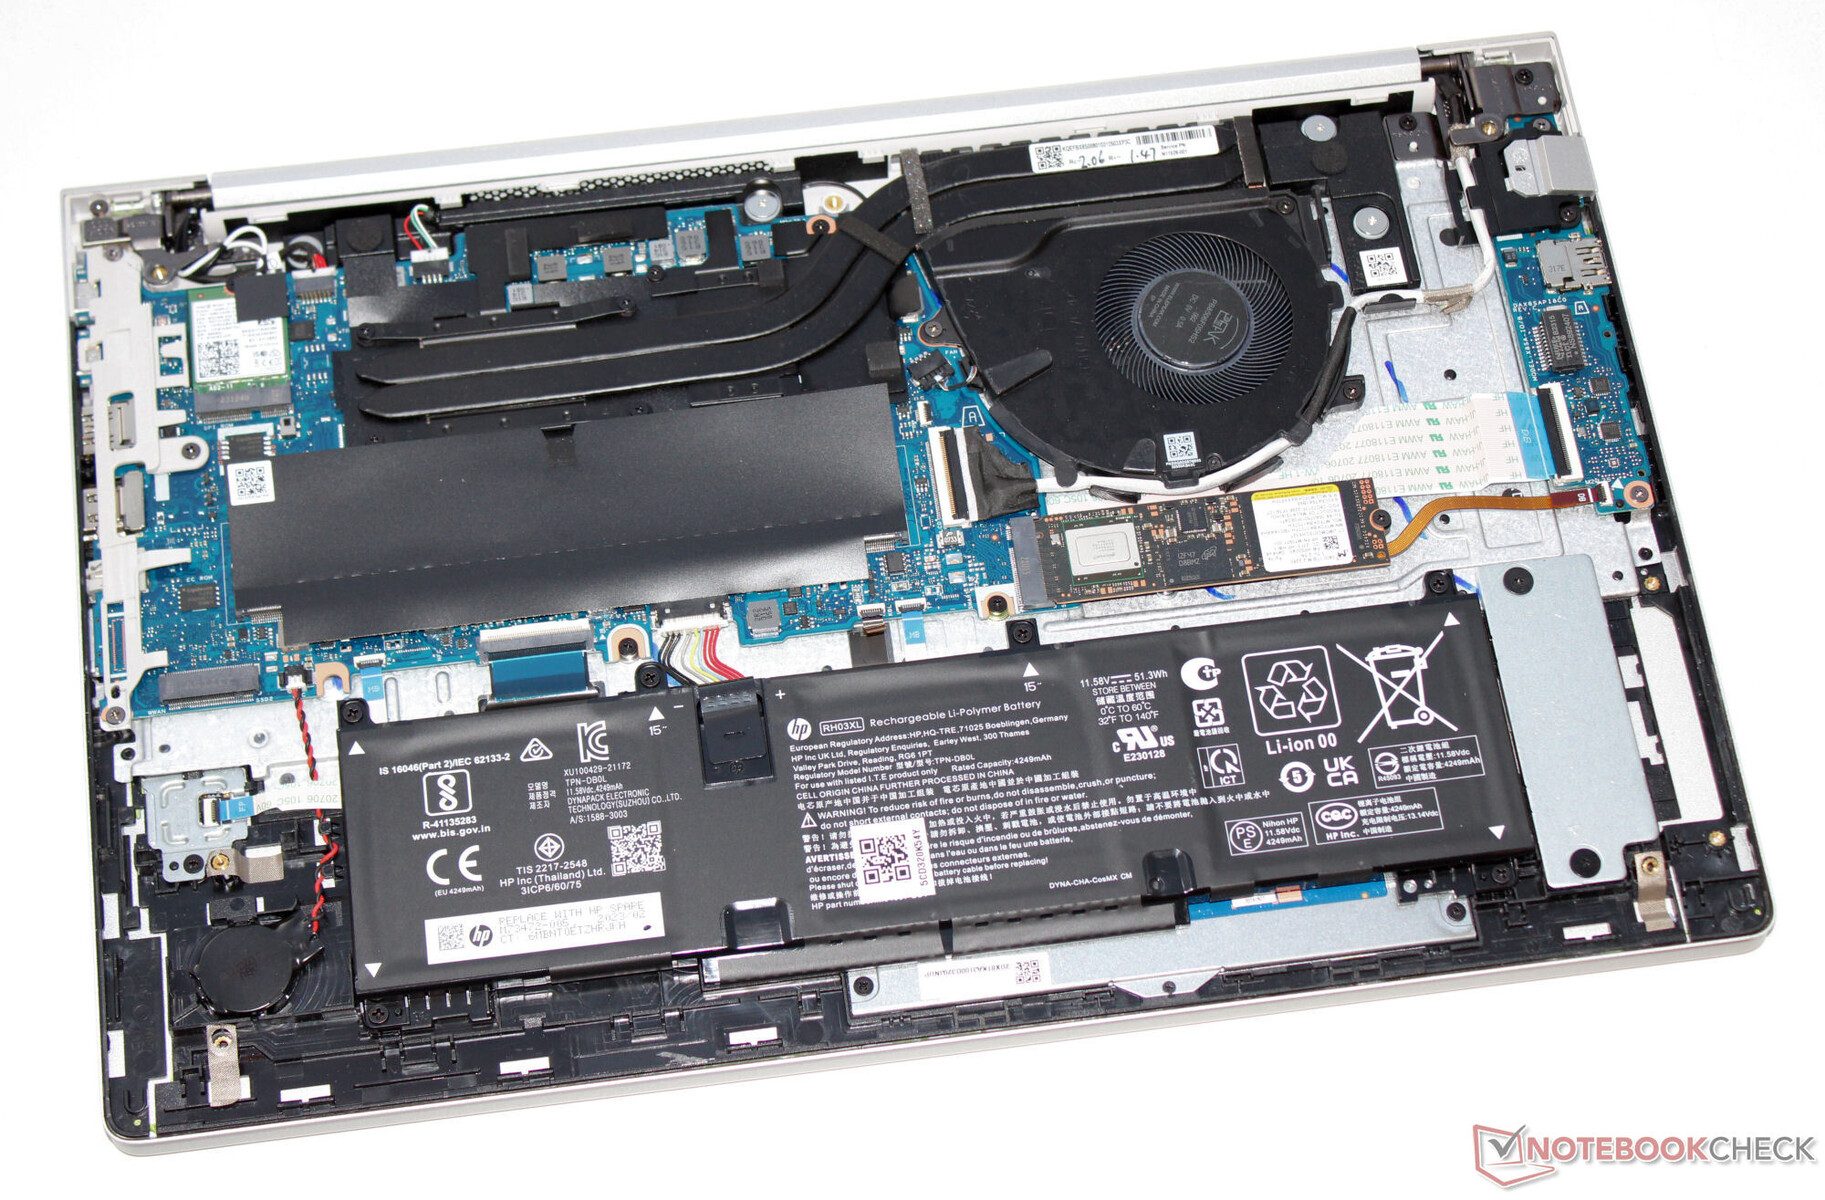
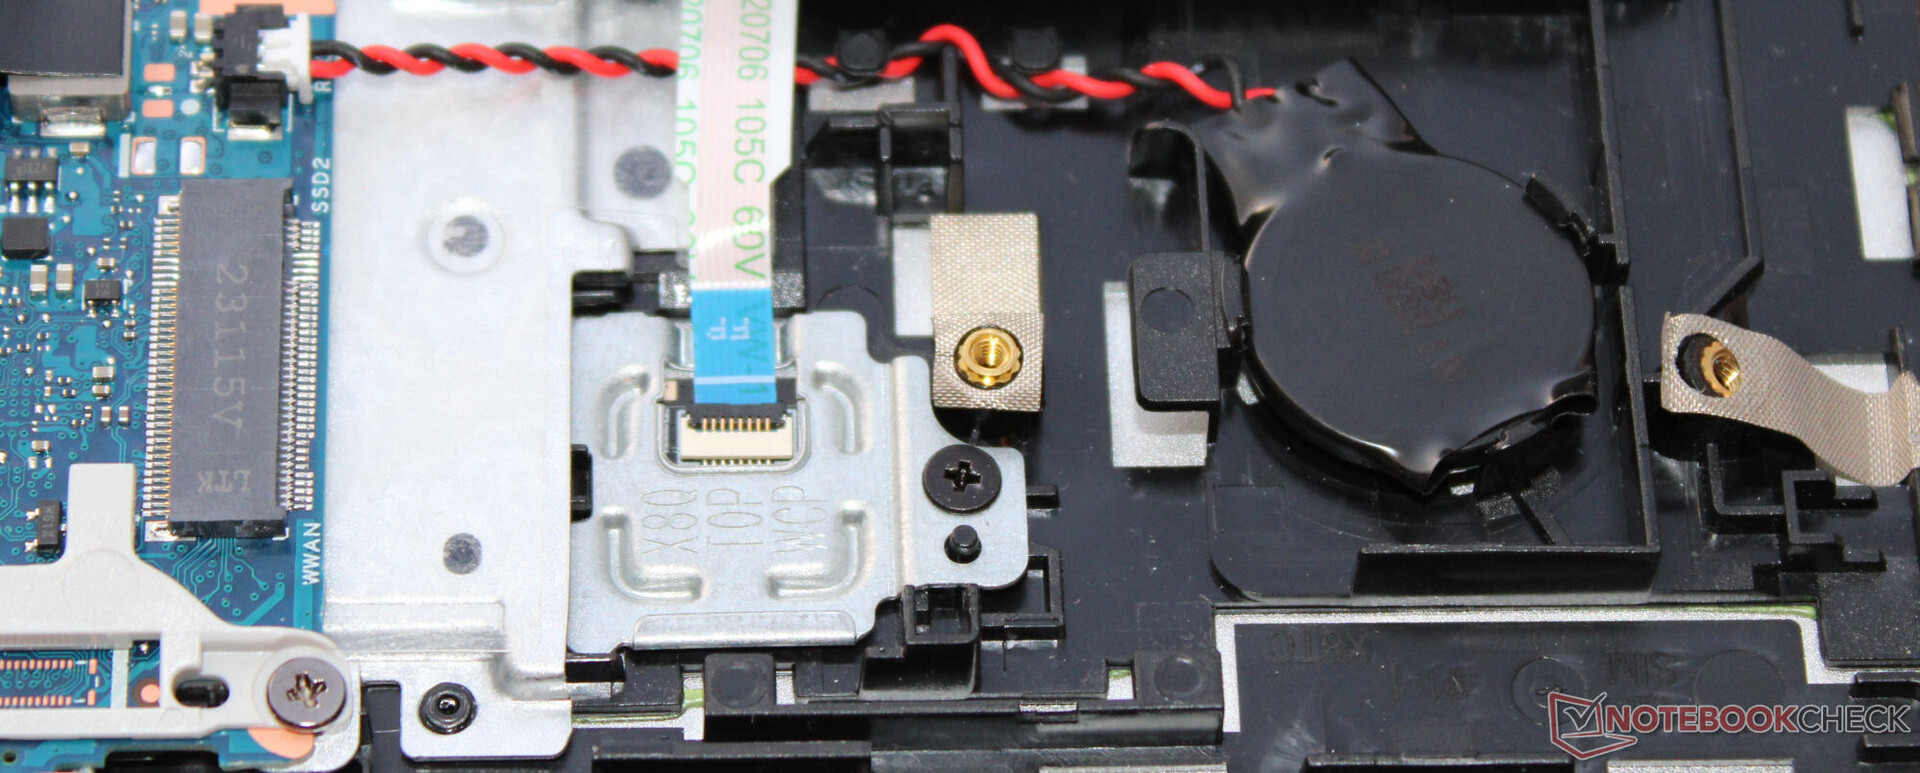
Maintenance
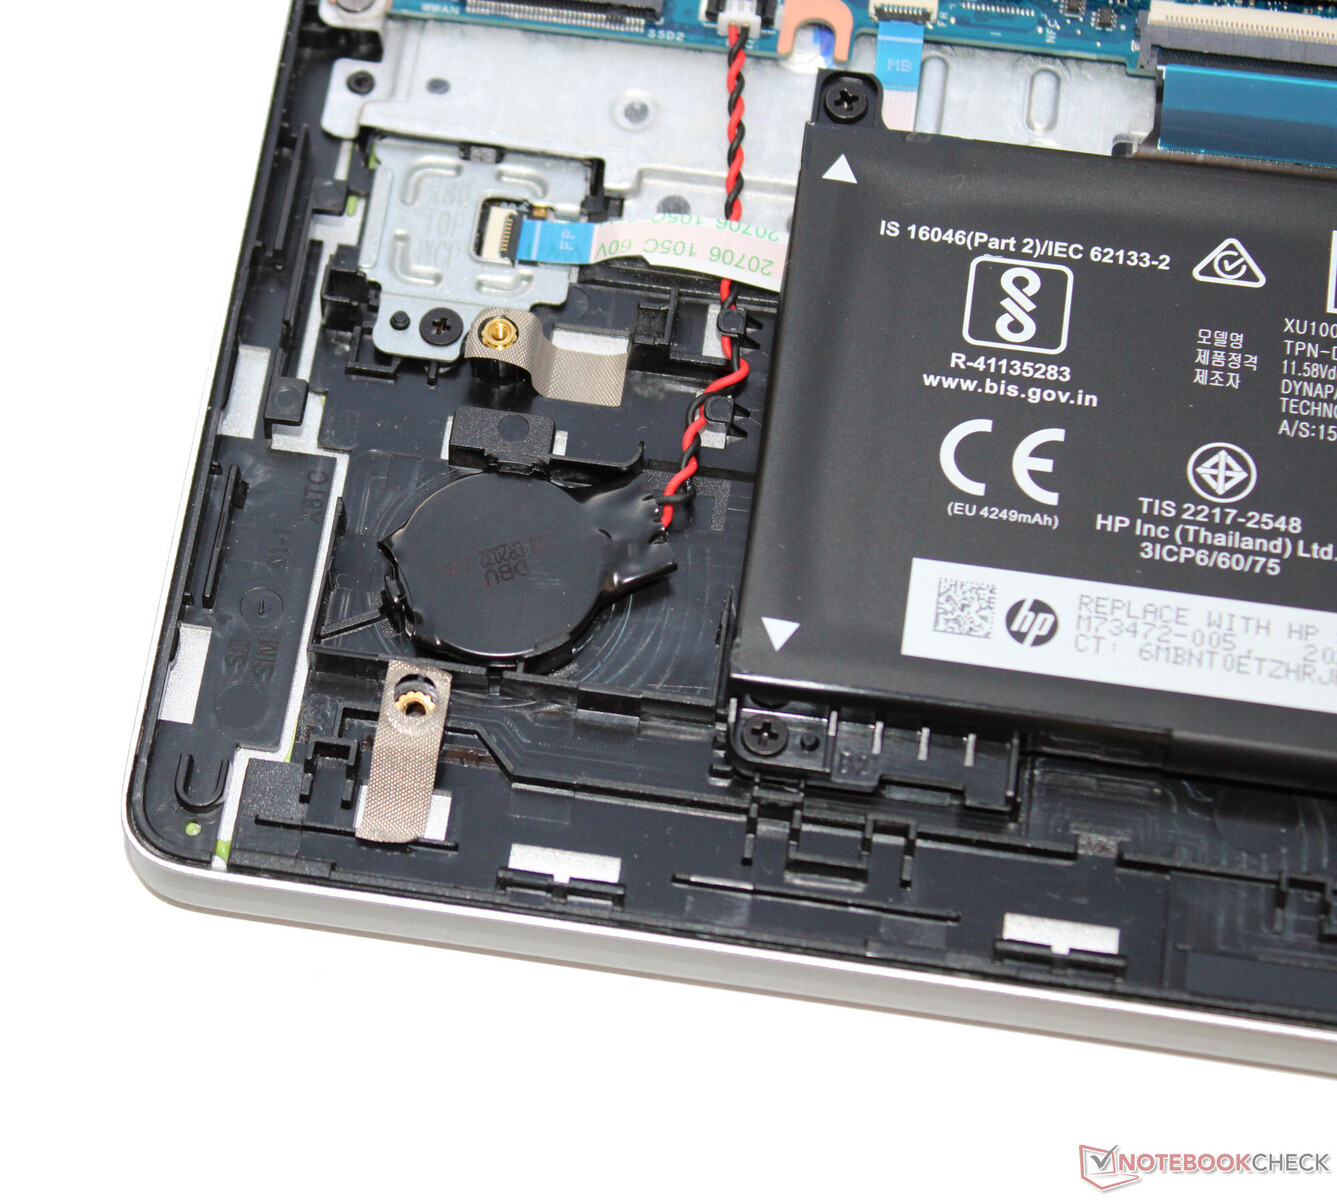
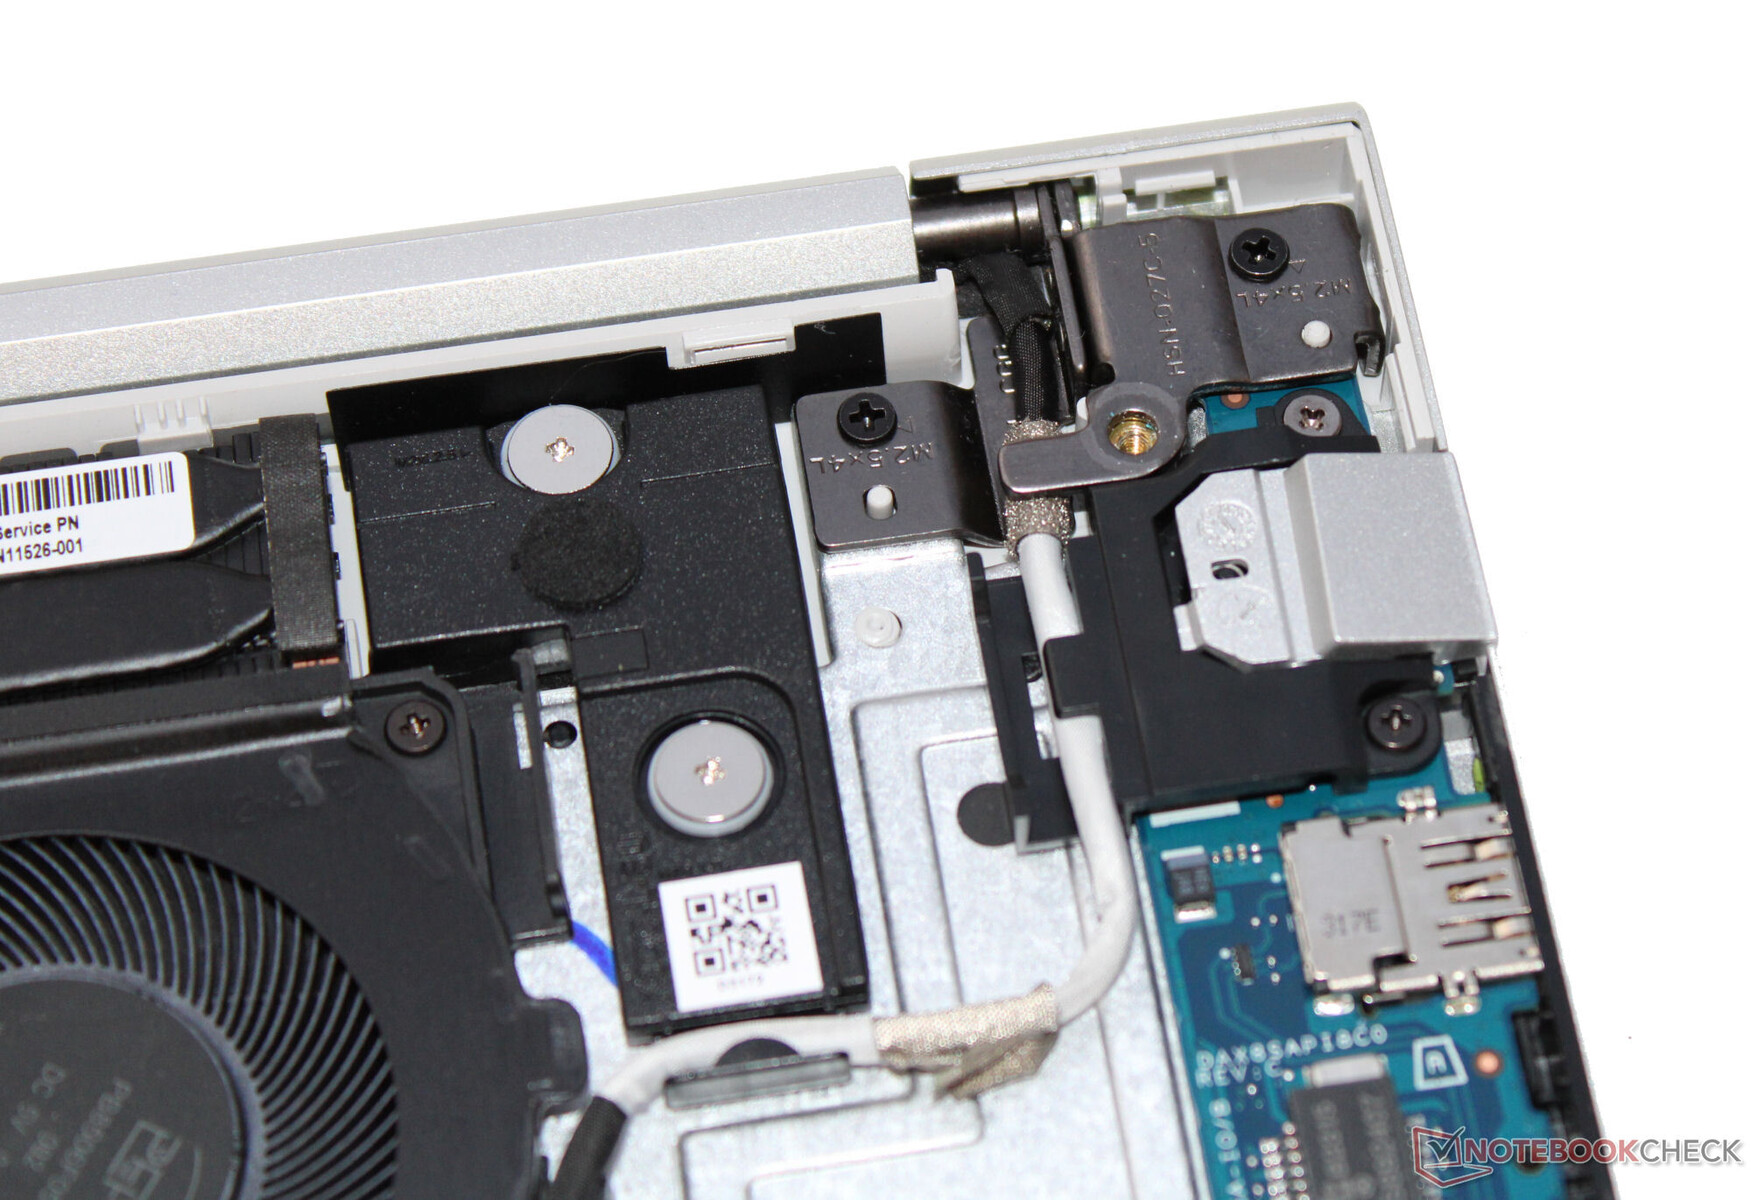
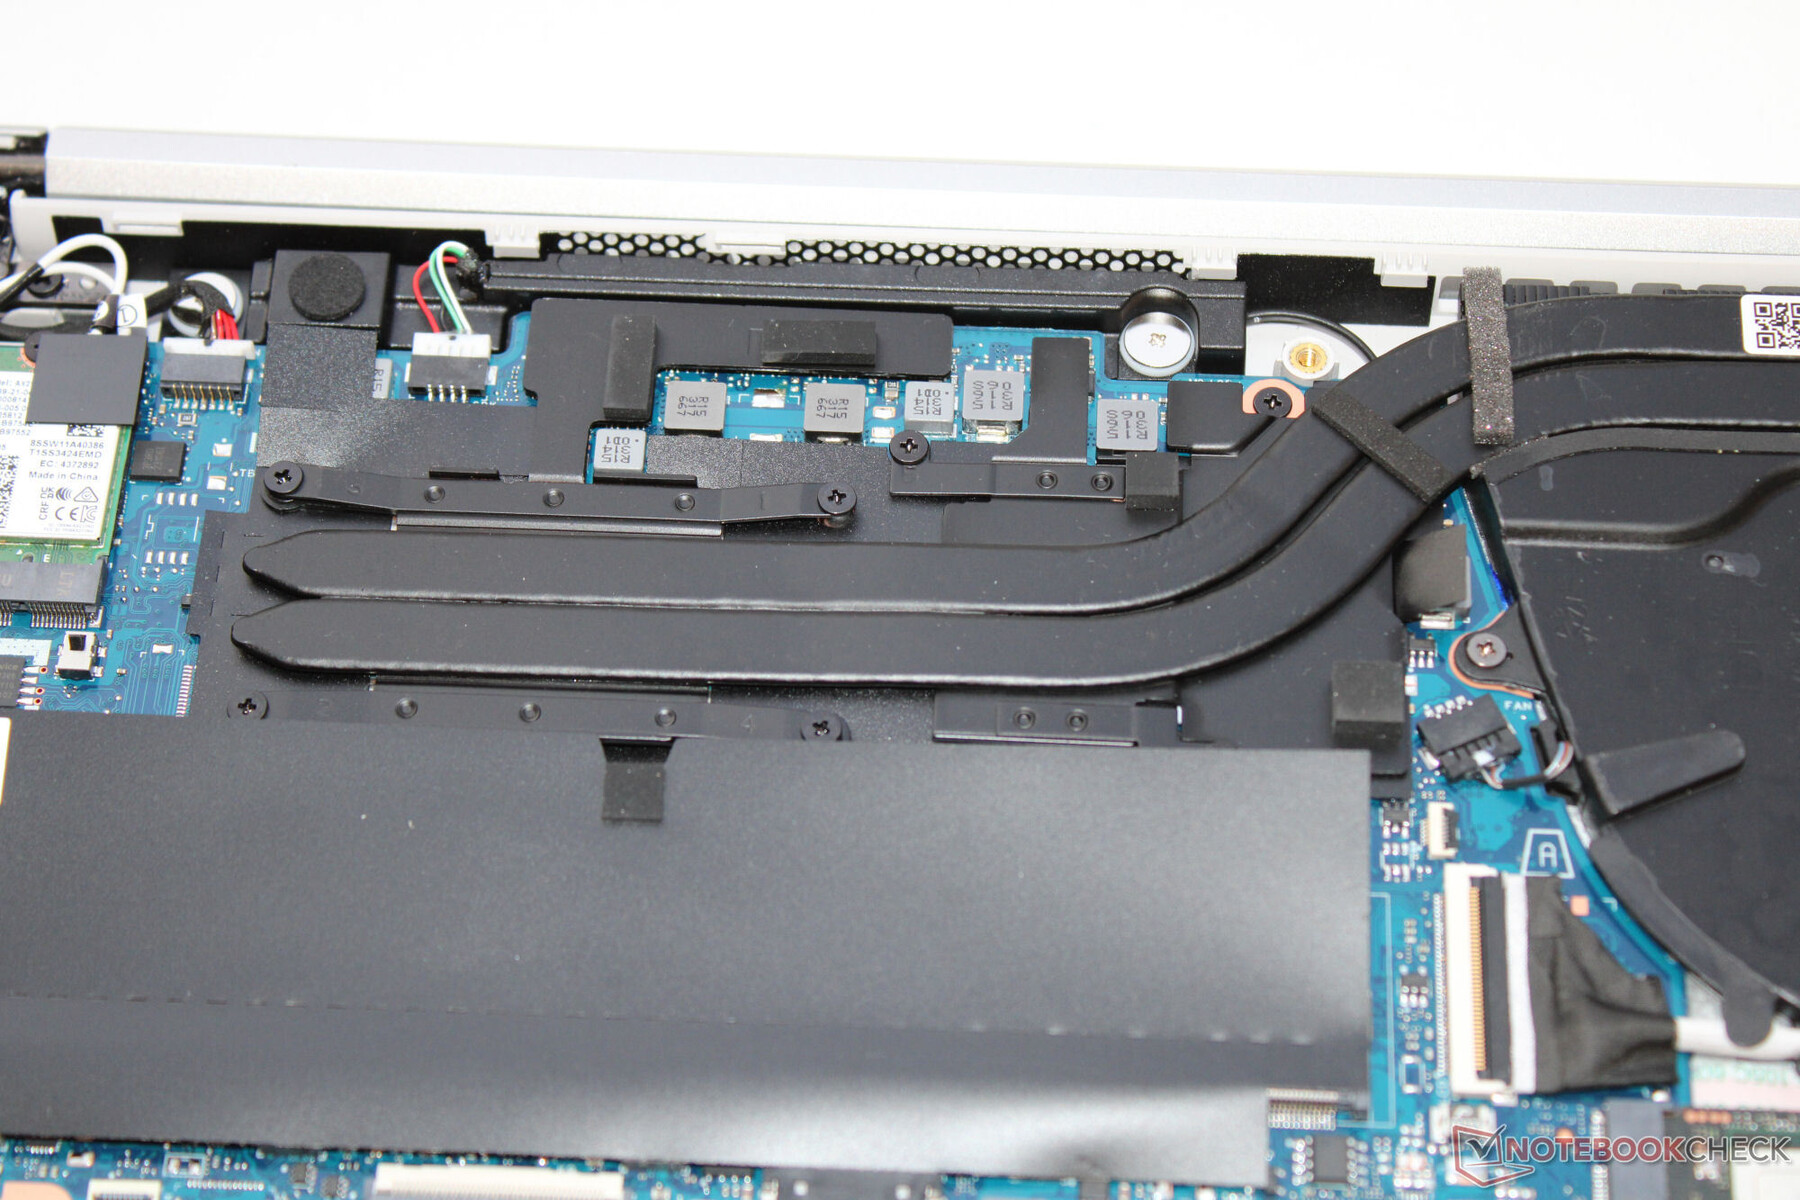
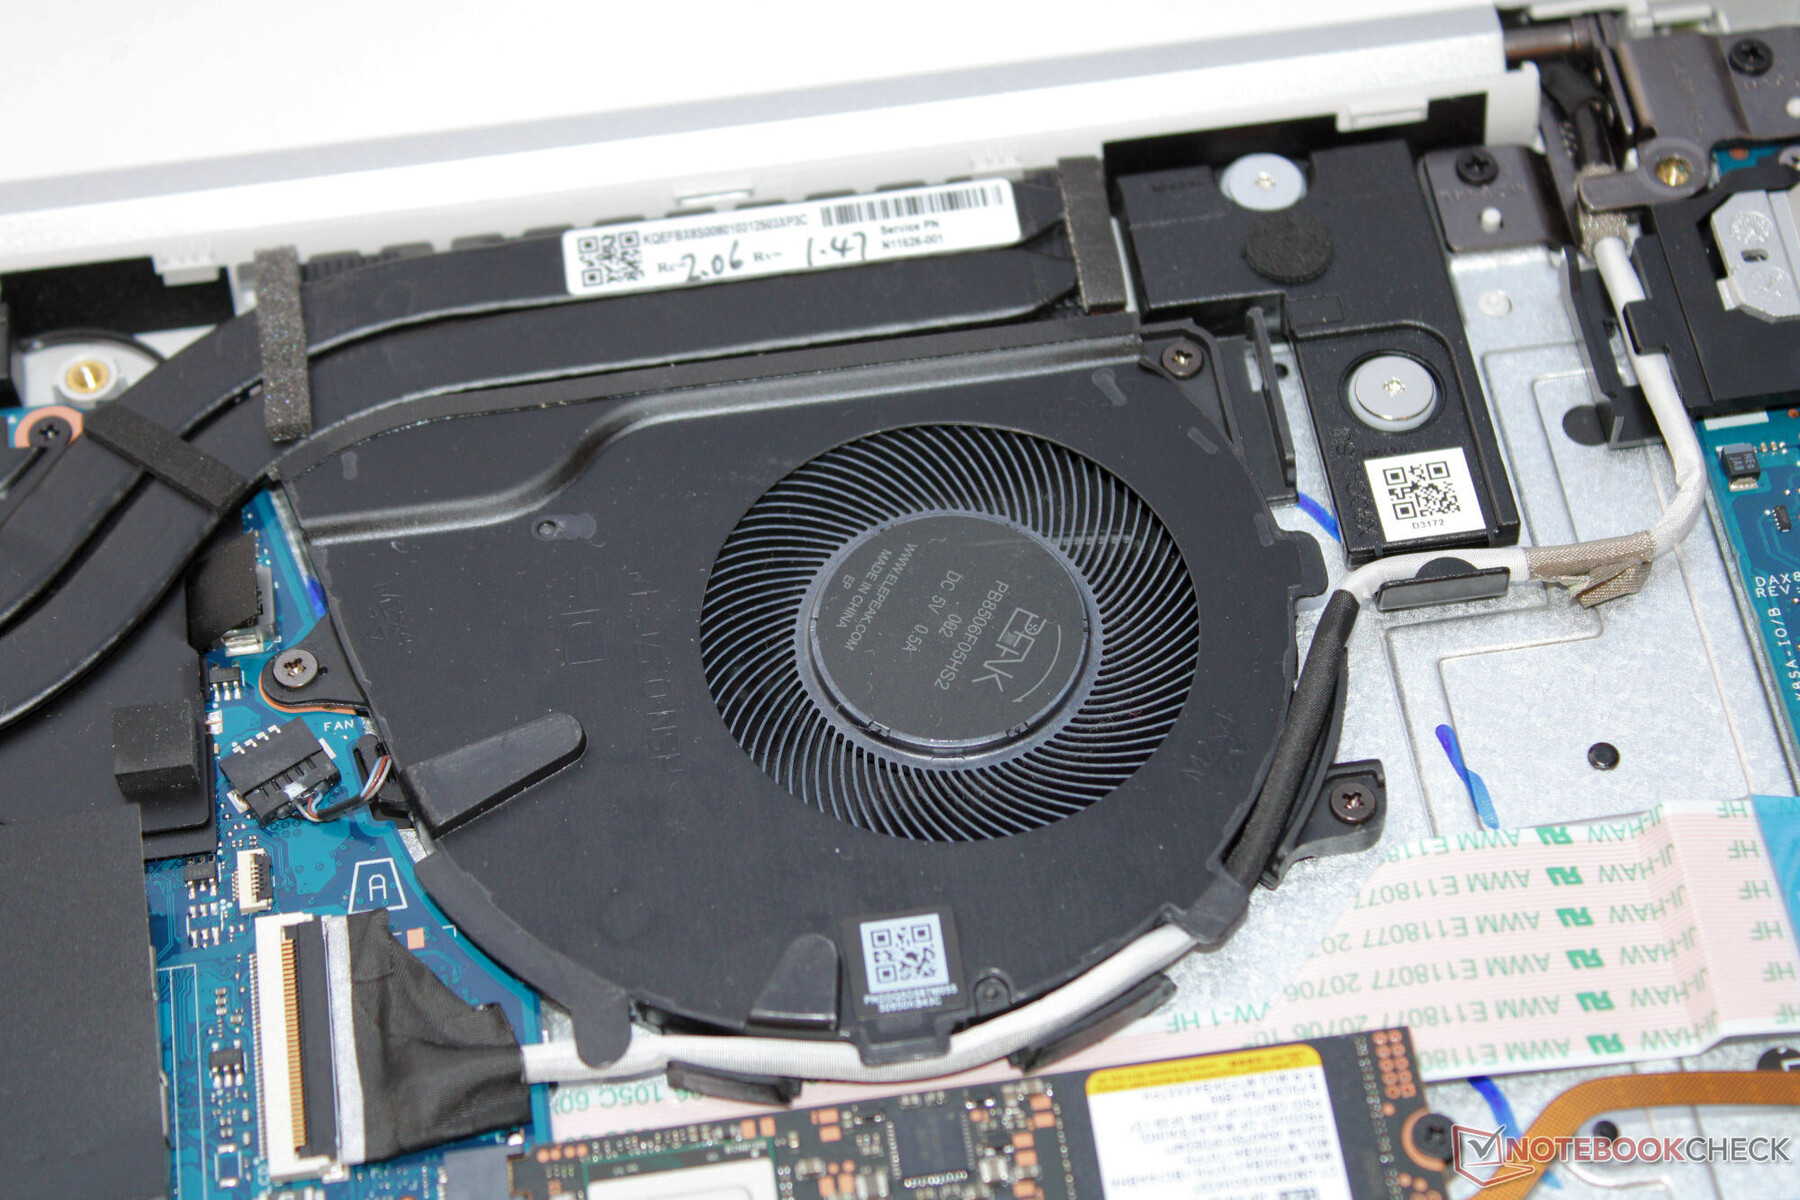
After removing the five screws on the bottom (the rubber strip doesn't hide any additional screws), you can take off the bottom plate with the help of a spatula or a plectrum. Then you can access the SSD (PCIe 4), second SSD slot (M.2-2242 or M.2-2230 with the corresponding extension), WLAN module, memory banks, battery, speakers, fans and the BIOS battery.
In contrast to the earlier ProBook models, the G10 keyboard cannot simply be replaced. In order to do this, you would have to replace the top part of the case, which would require taking apart the entire laptop.
Warranty
In the US, the ProBook is given a one-year limited warranty. There are options to extend this via HP's website for a surcharge.
Input devices - The HP Laptop with a crisp keyboard
Keyboard
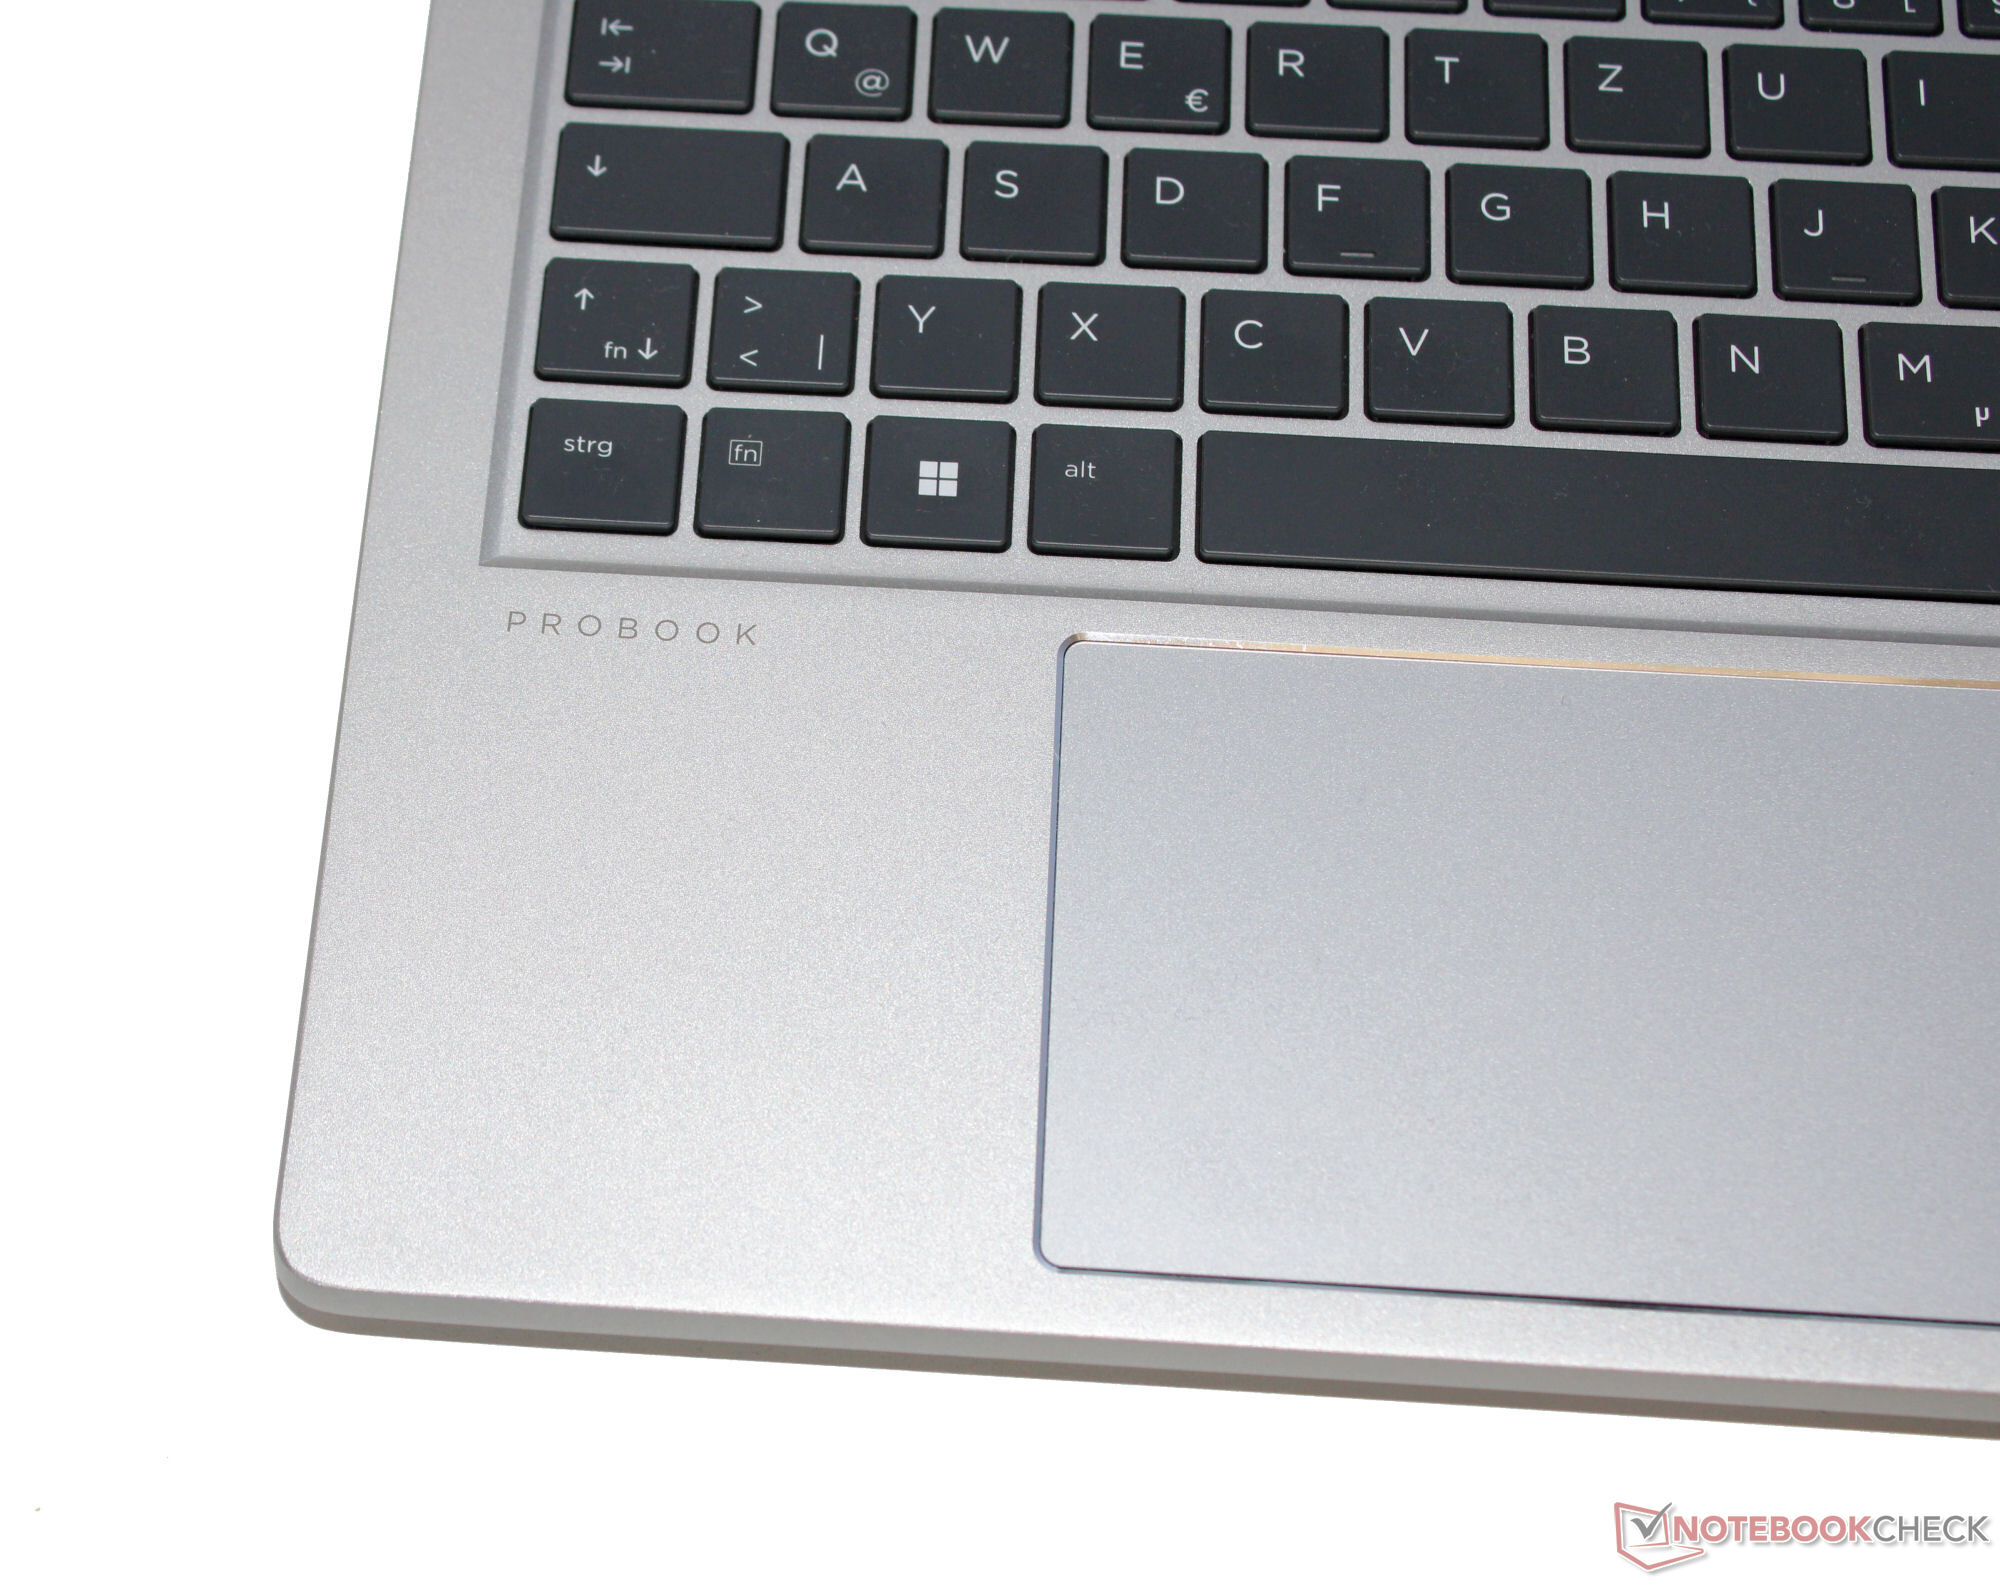
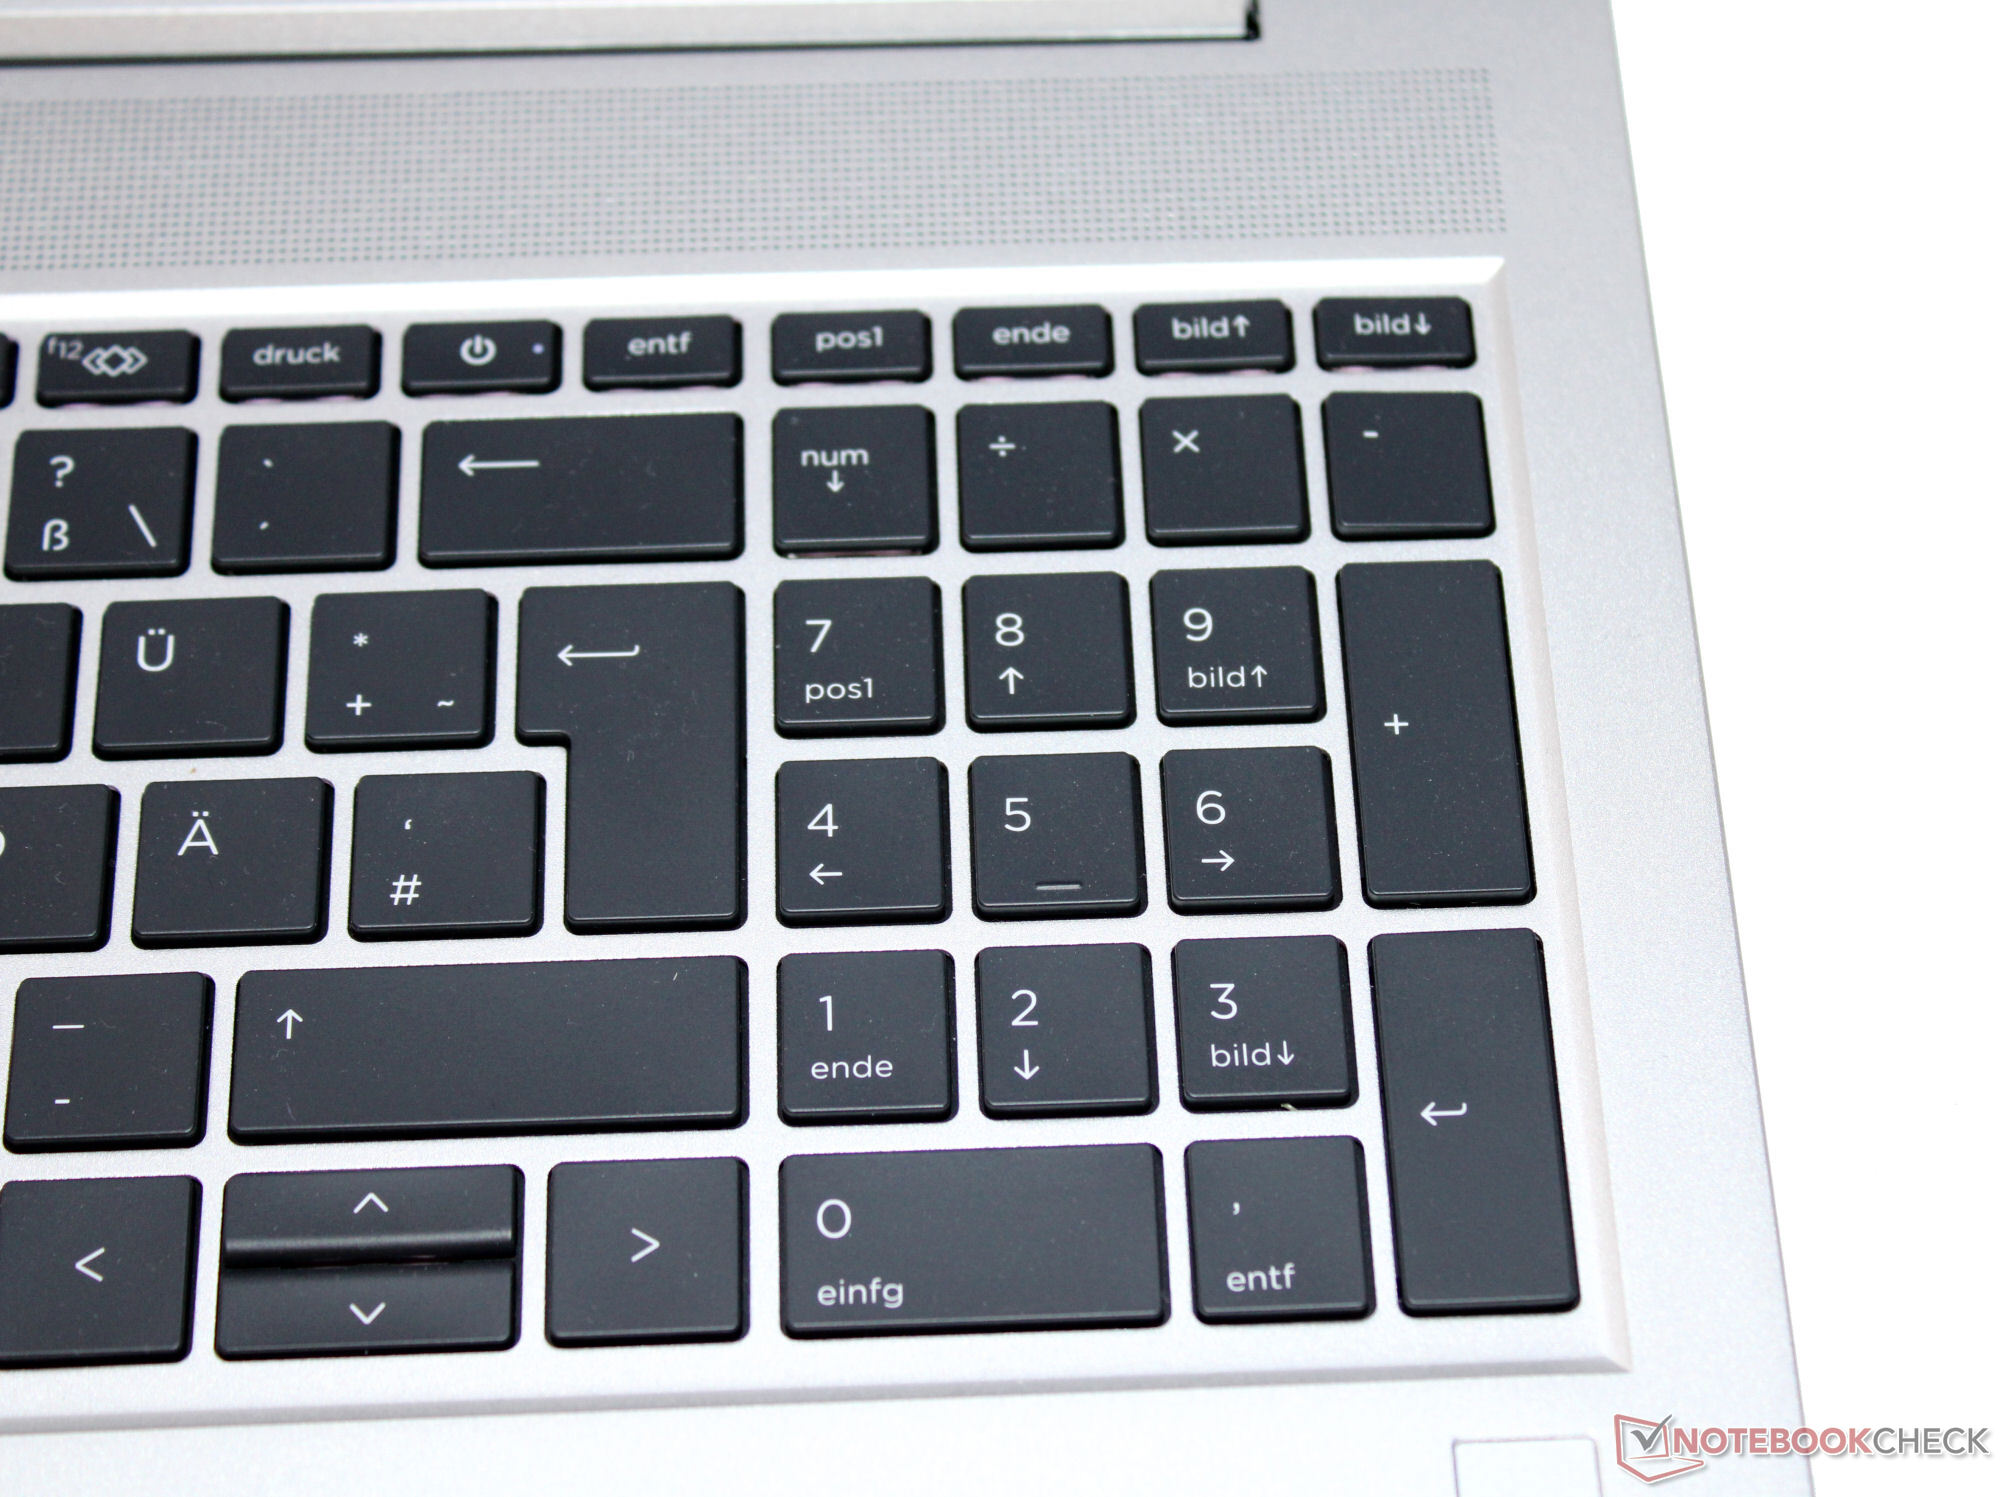
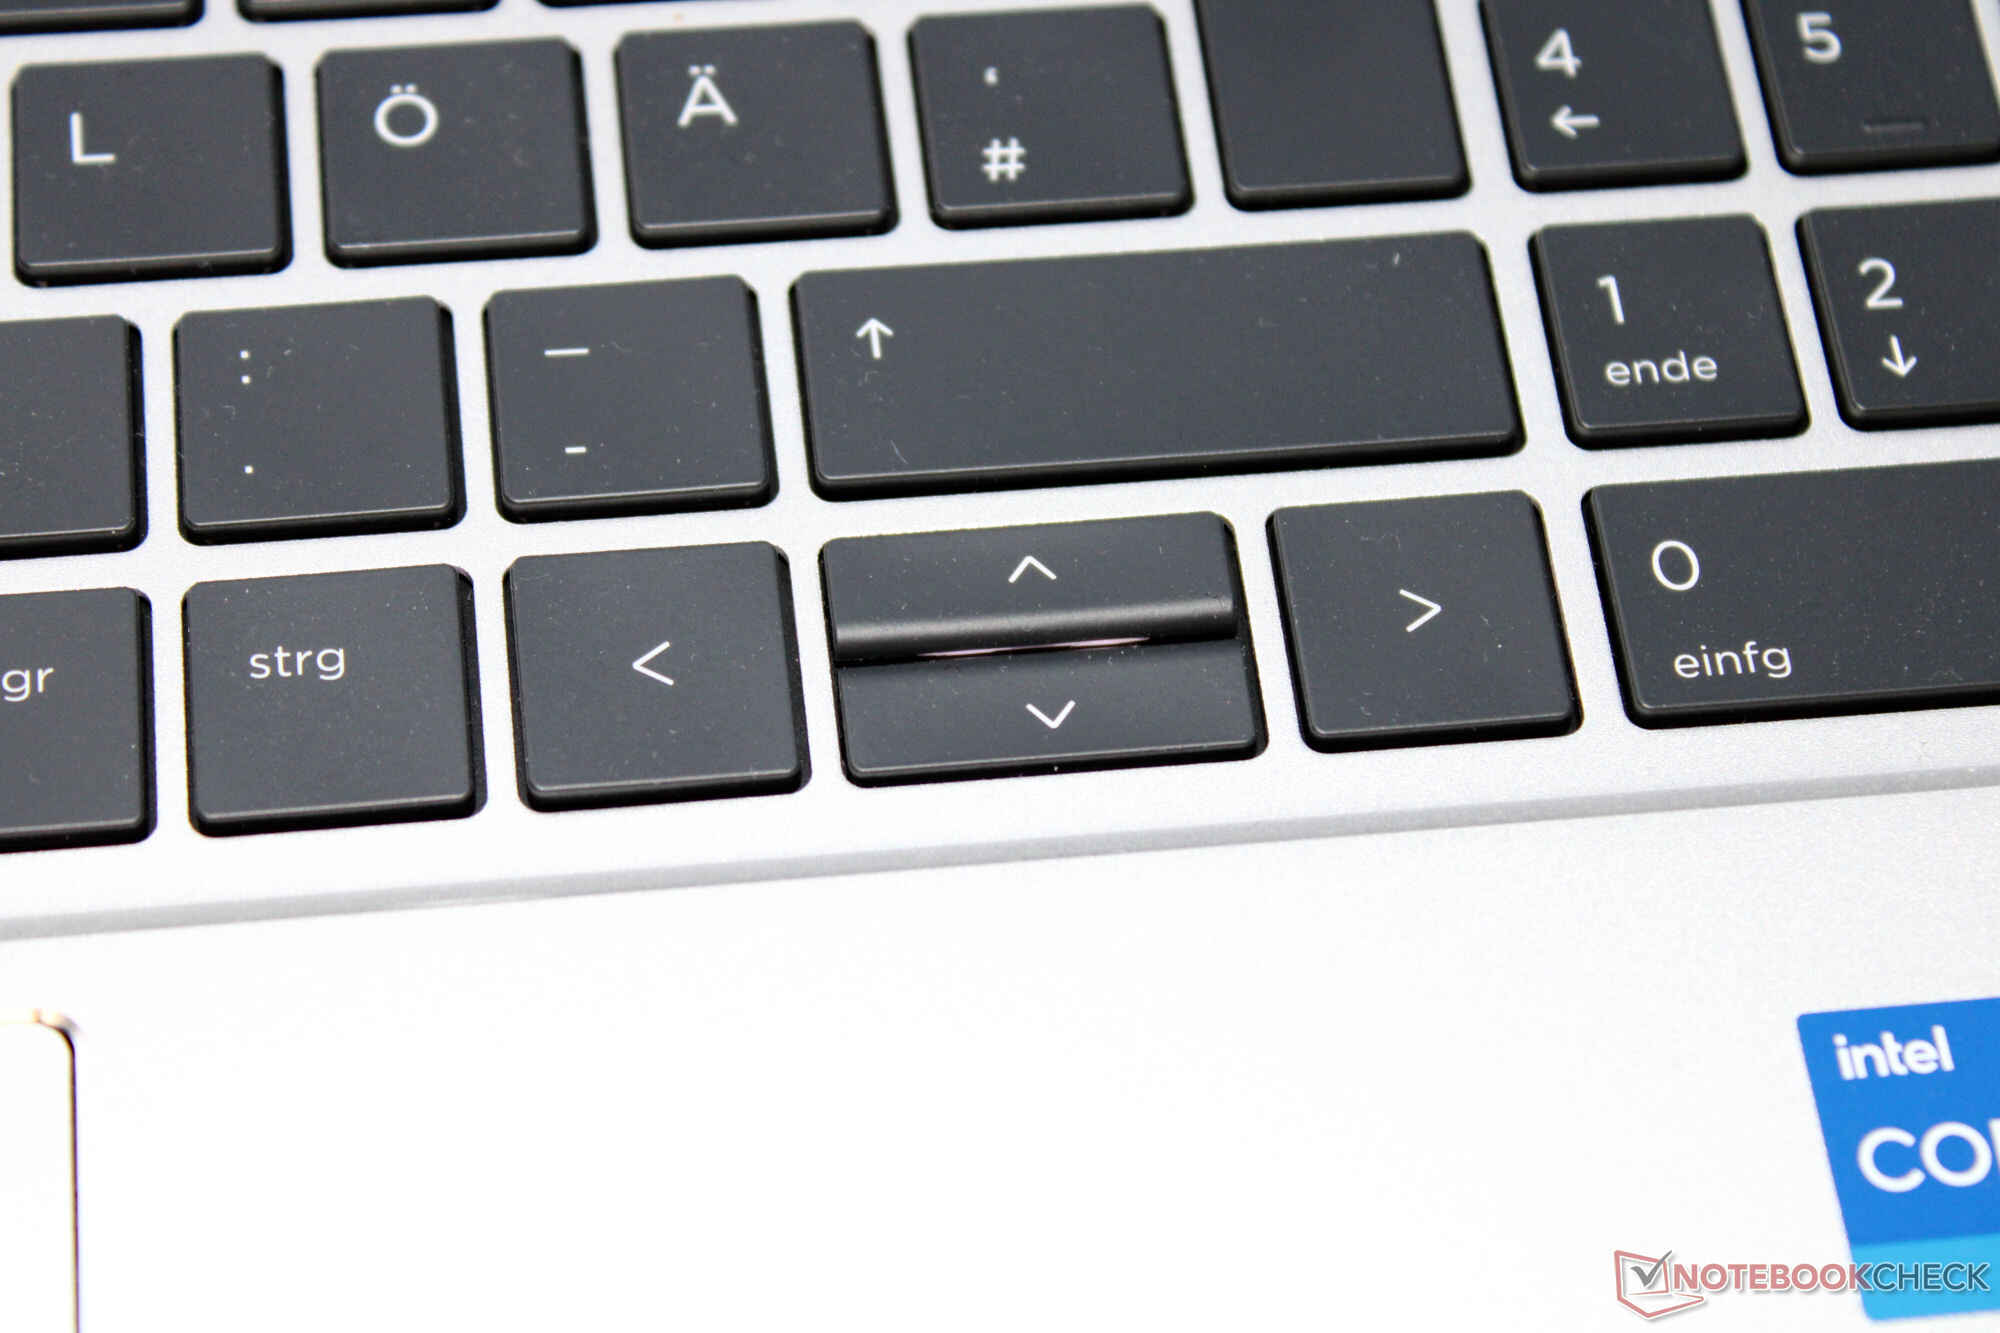
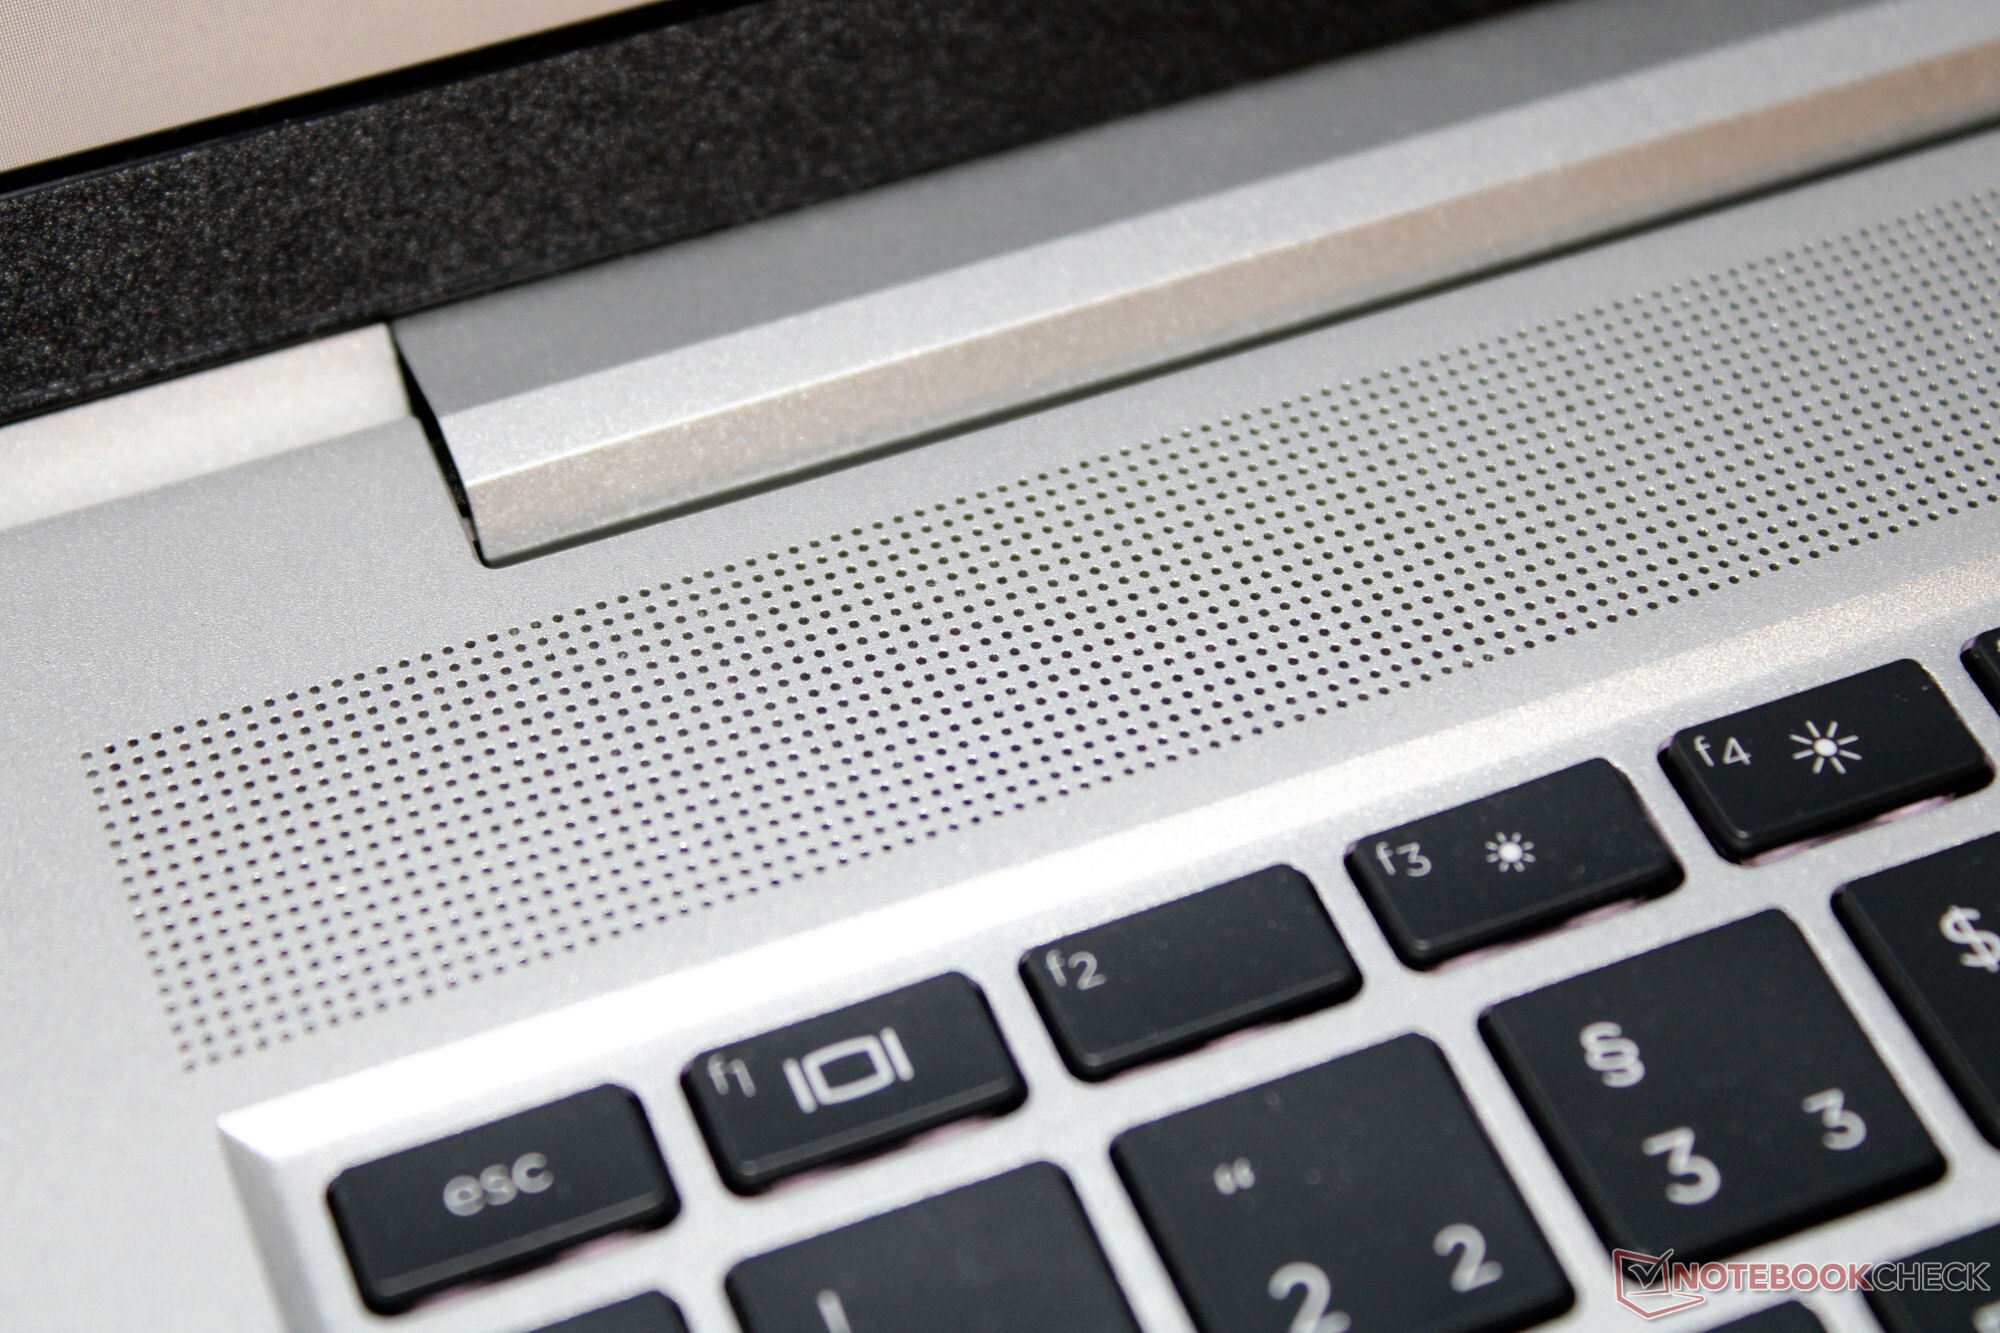
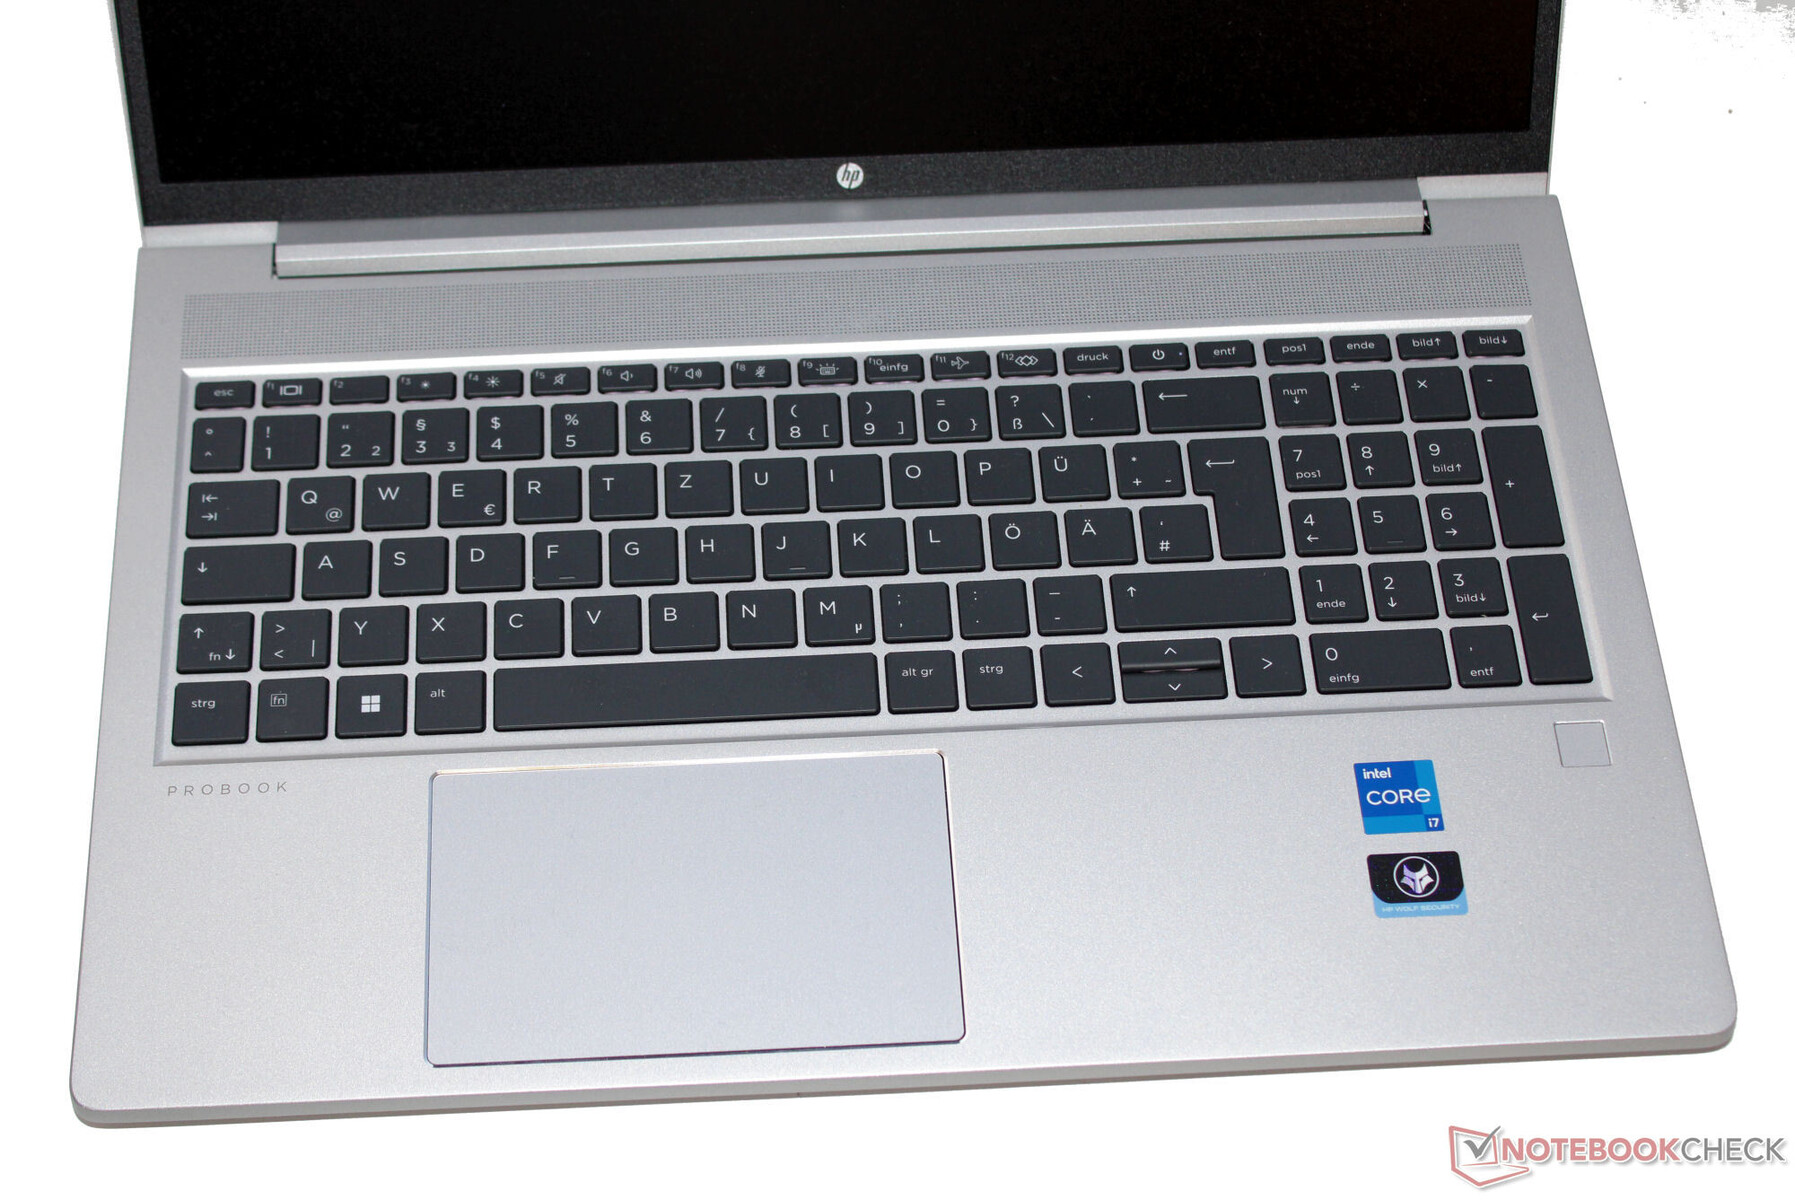
The laptop's installed chiclet keyboard boasts backlighting (two levels), a numerical keypad and some protection against water. Its concave keys feature a short lift and a precise pressure point. The crisp key resistance deserves some praise. The keyboard bobs ever so slightly while you type, but this didn't prove to be annoying during our test. The laptop's power button is housed in between the function keys. Touching it accidentally doesn't lead to the laptop being shut down. All-in-all, HP has delivered a successful keyboard fit for everyday use.
Touchpad
A click pad (approx. 11.5 x 7 cm) featuring a short lift and crisp pressure point serves as a replacement for a mouse.
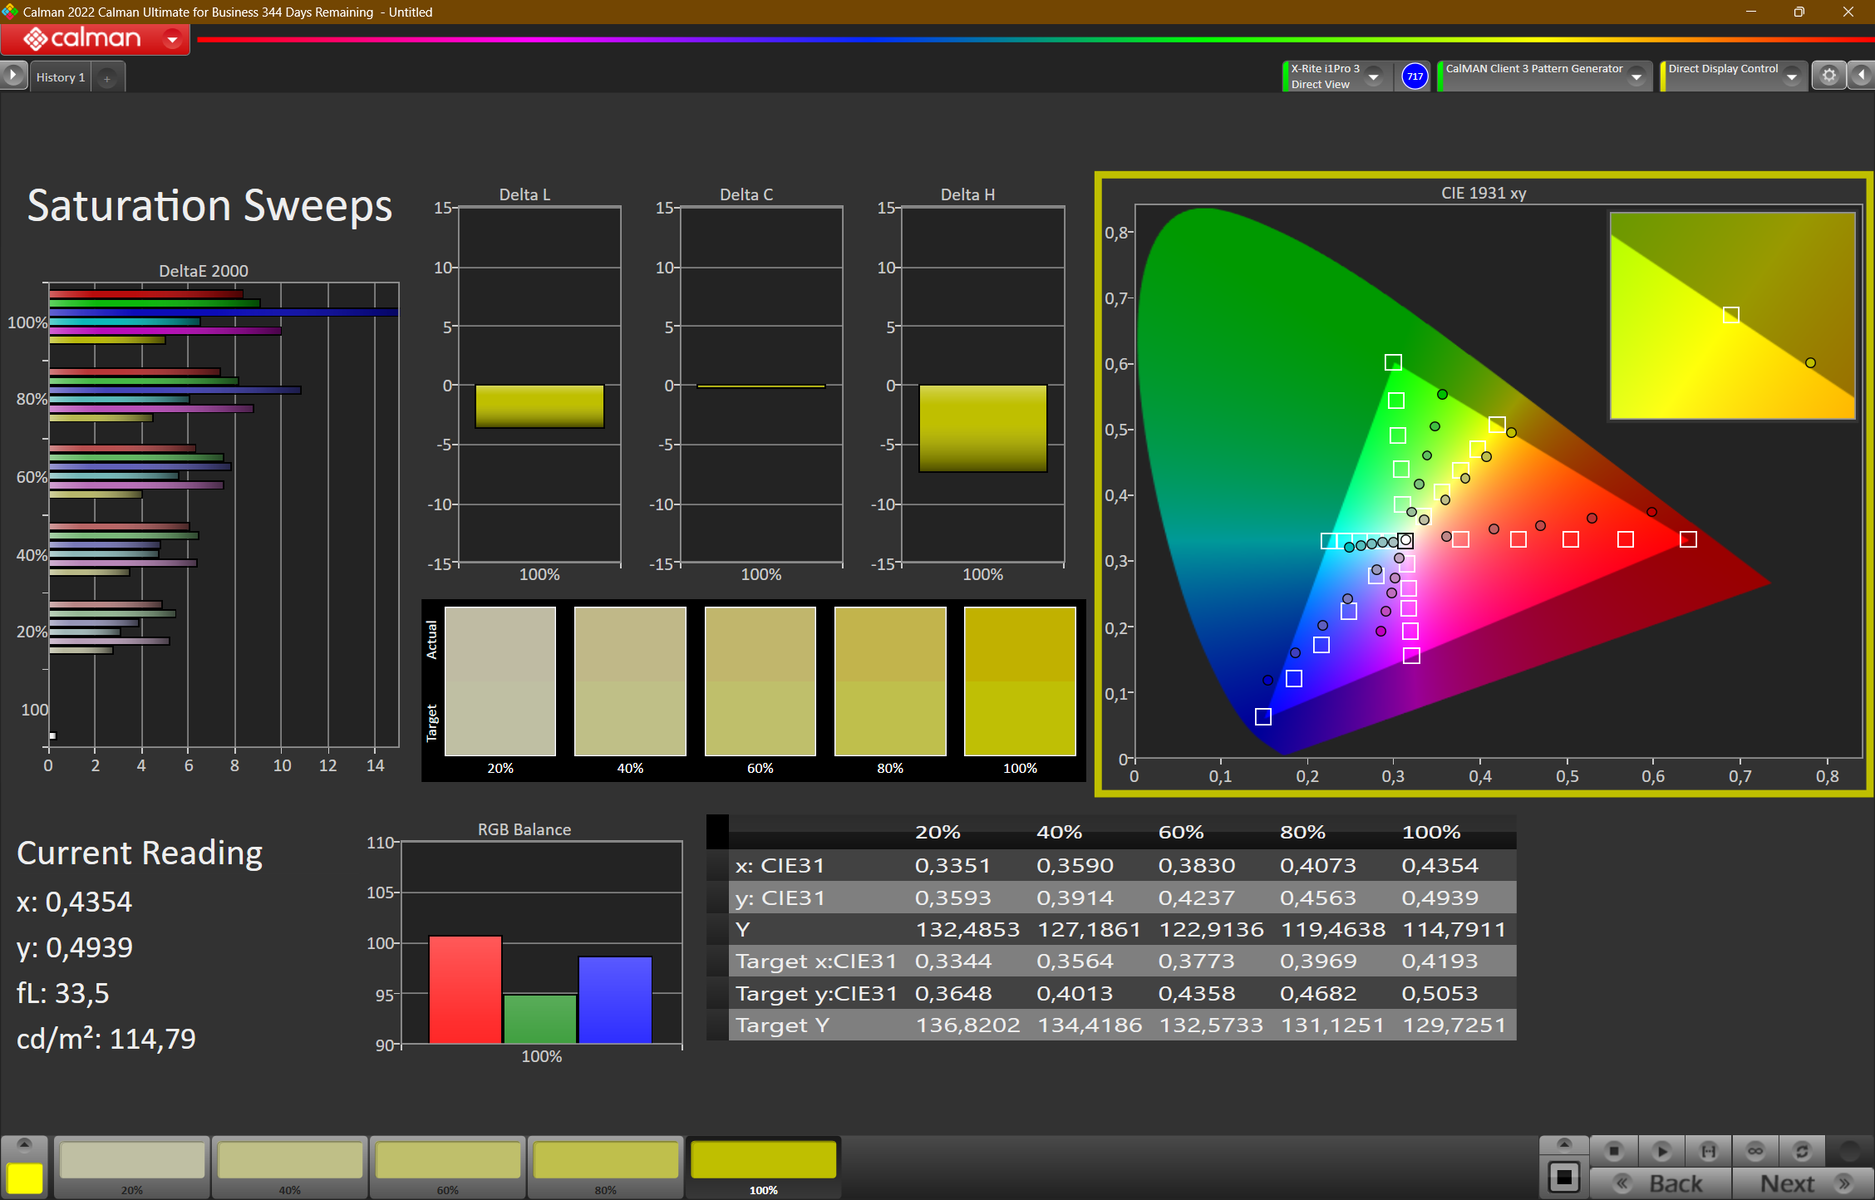
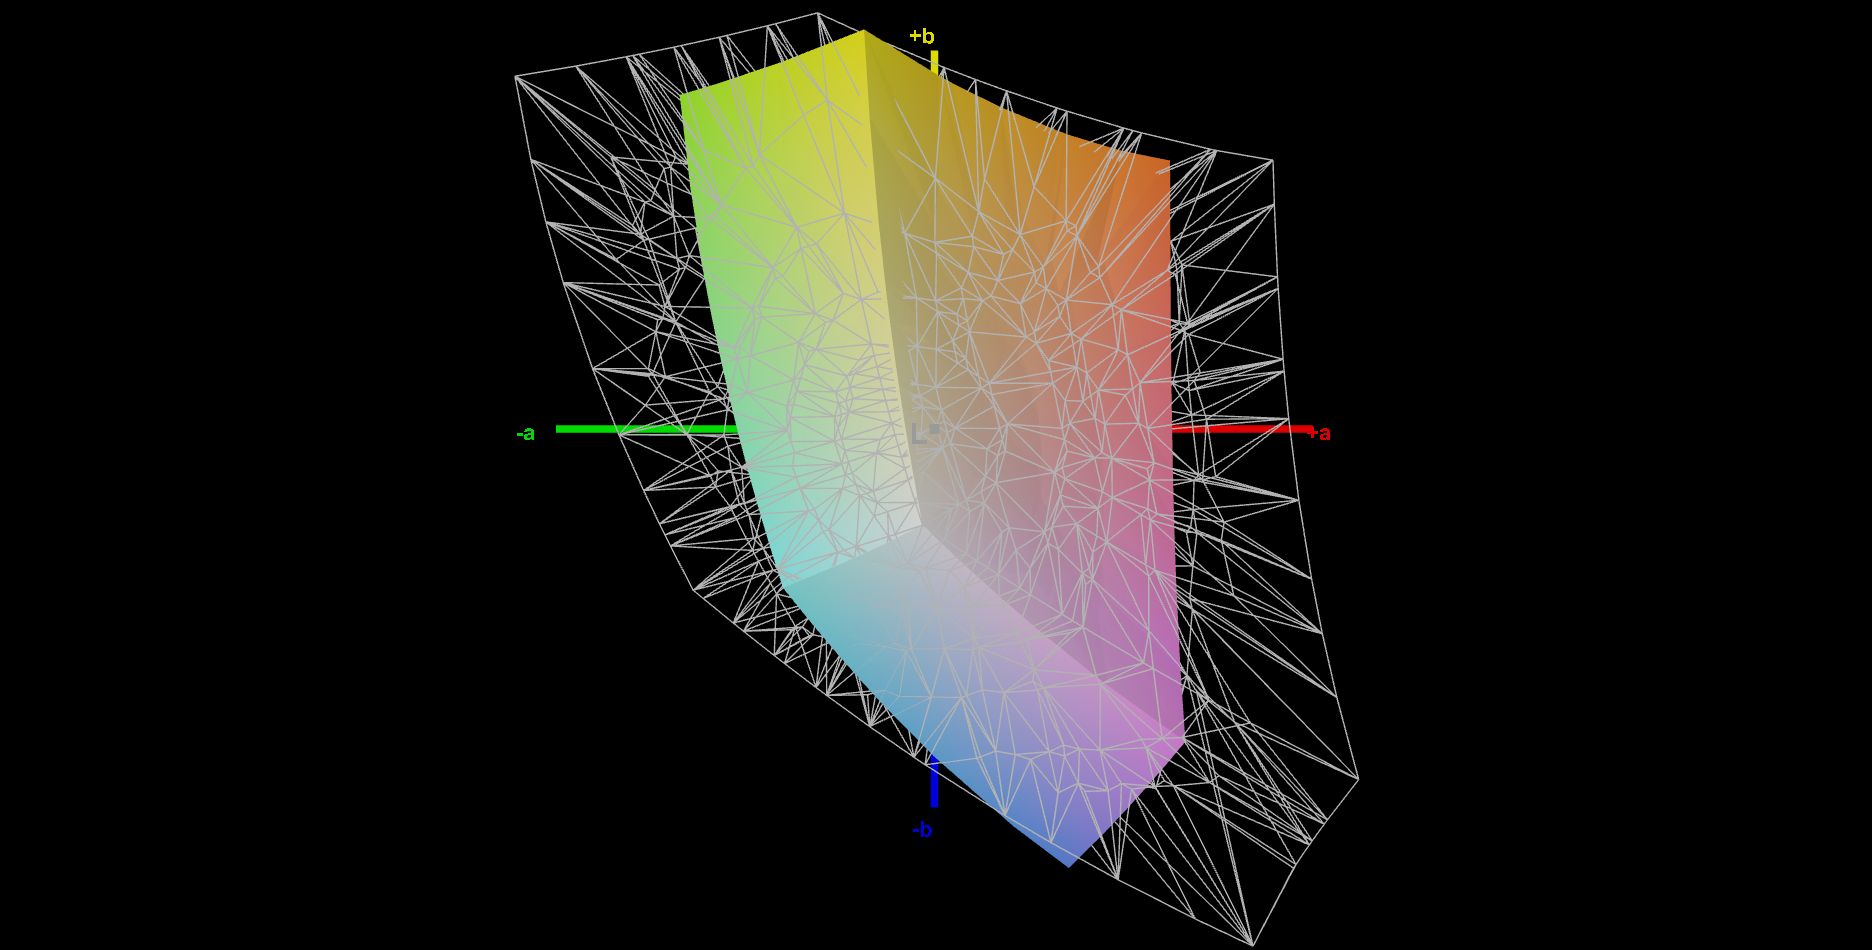
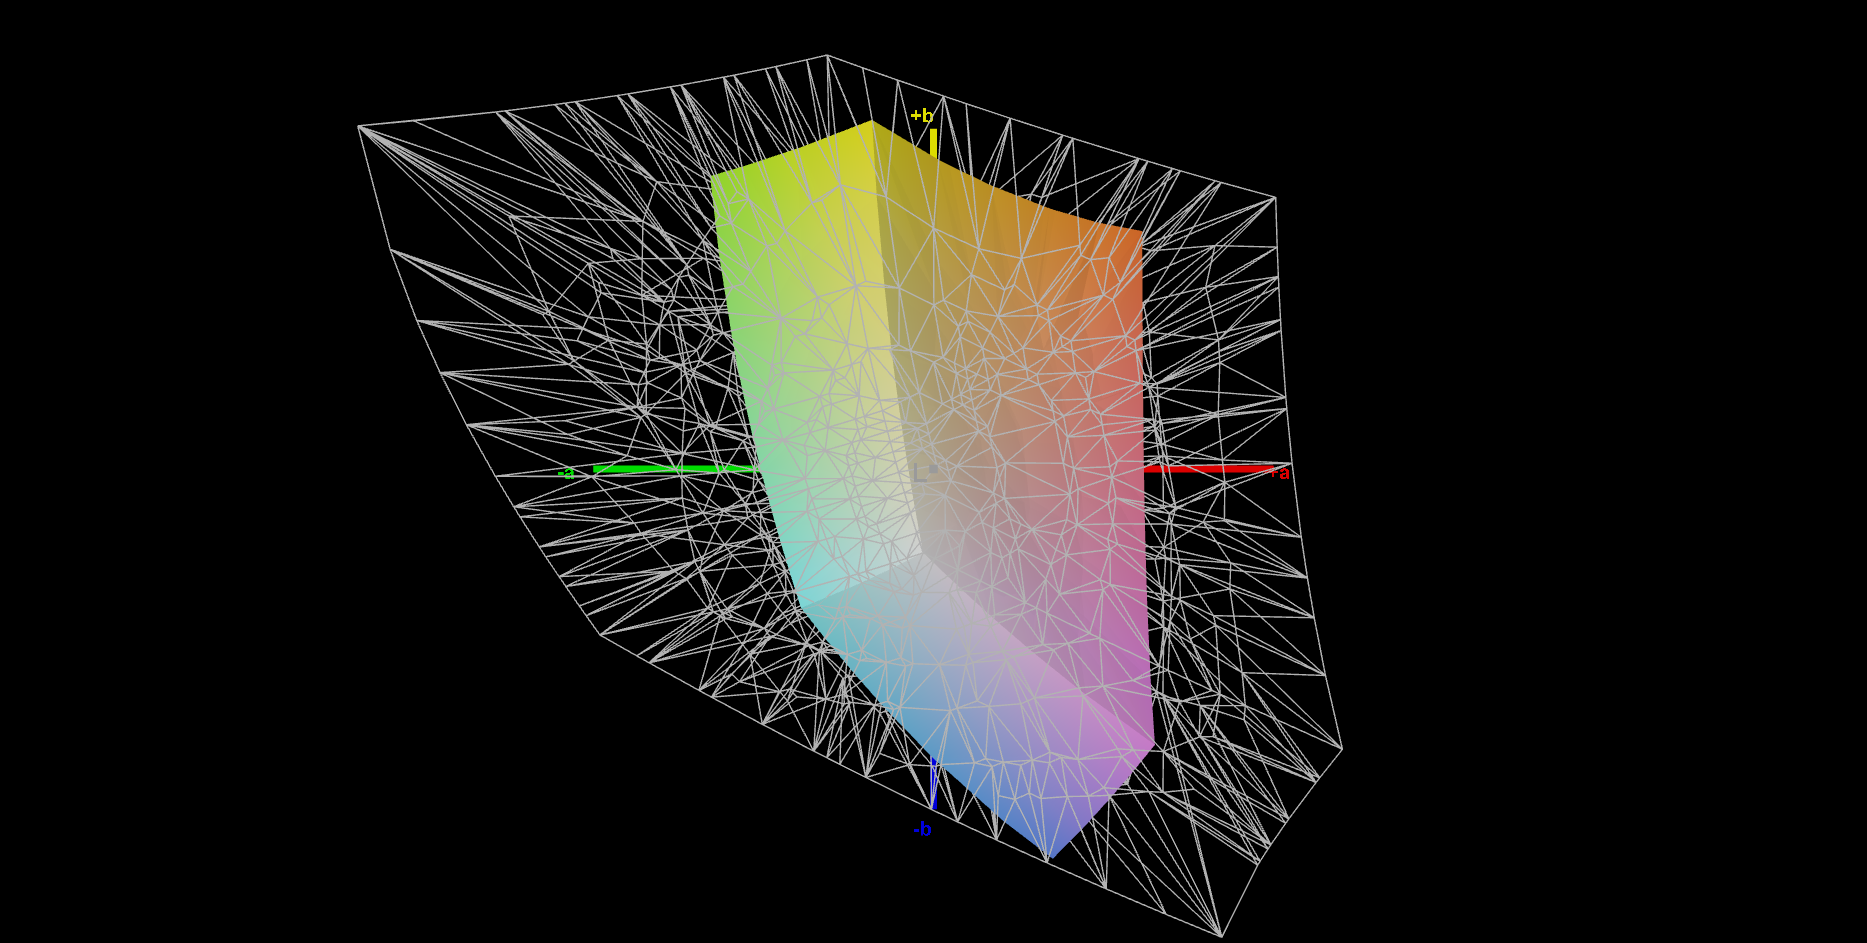
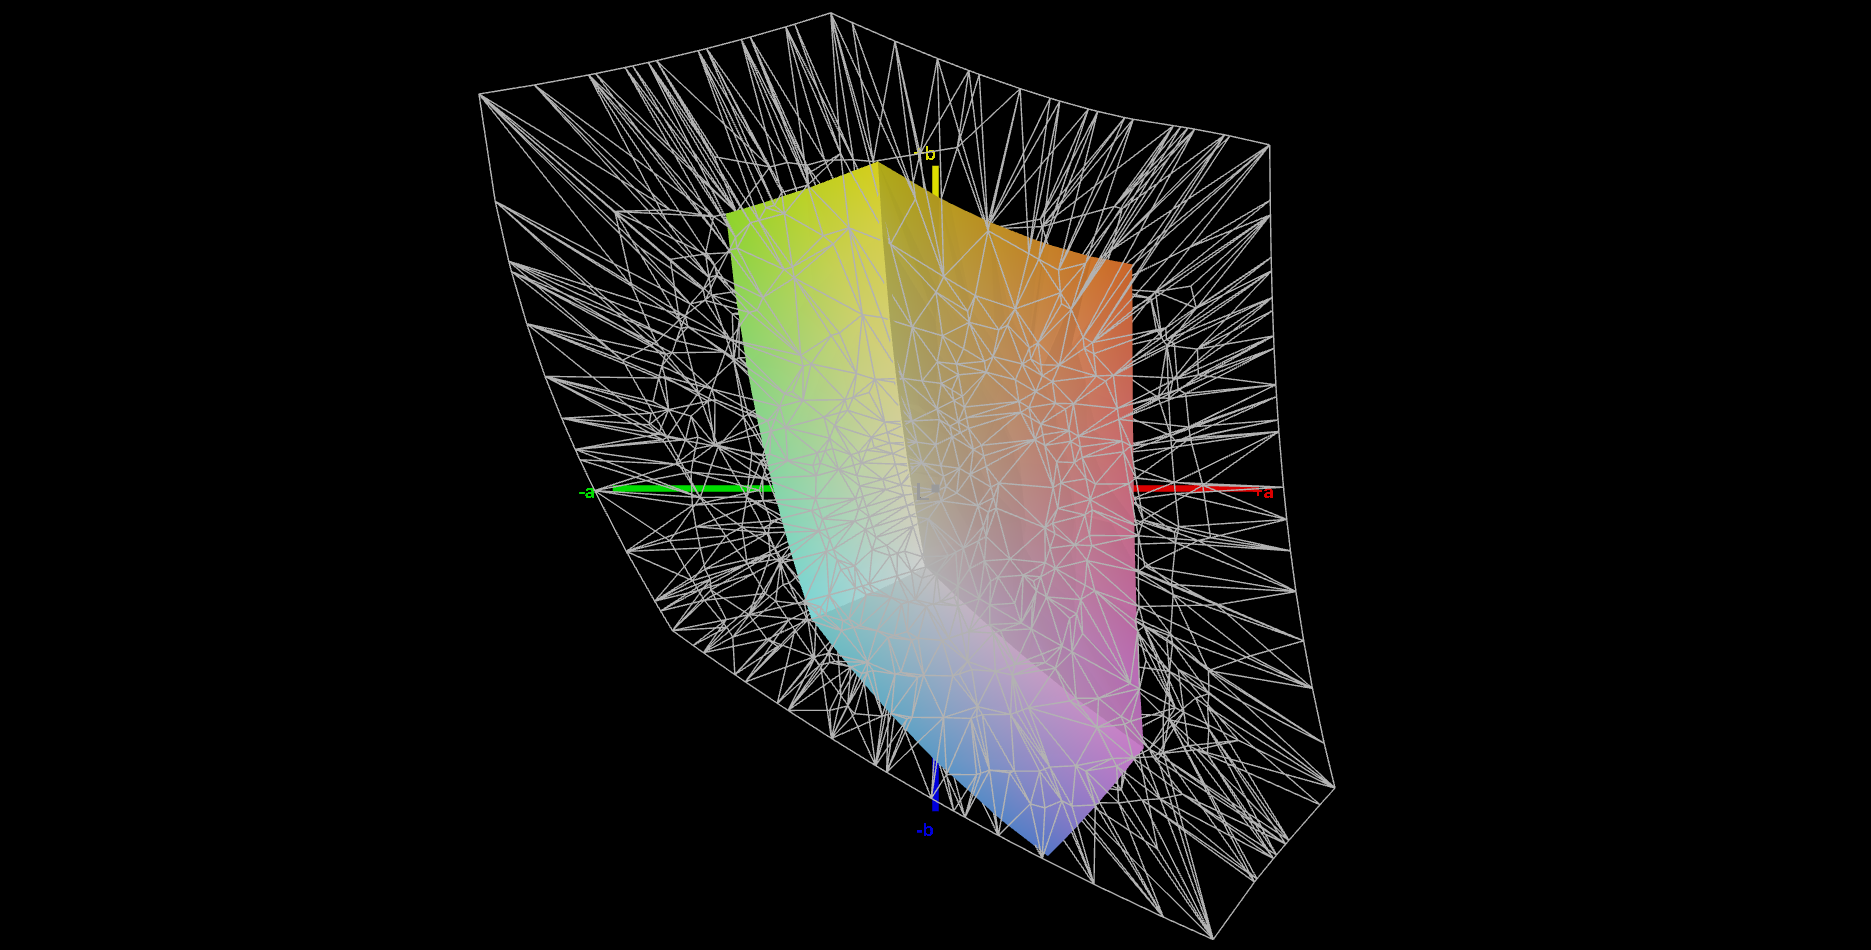
Display - FHD panel with poor color space coverage
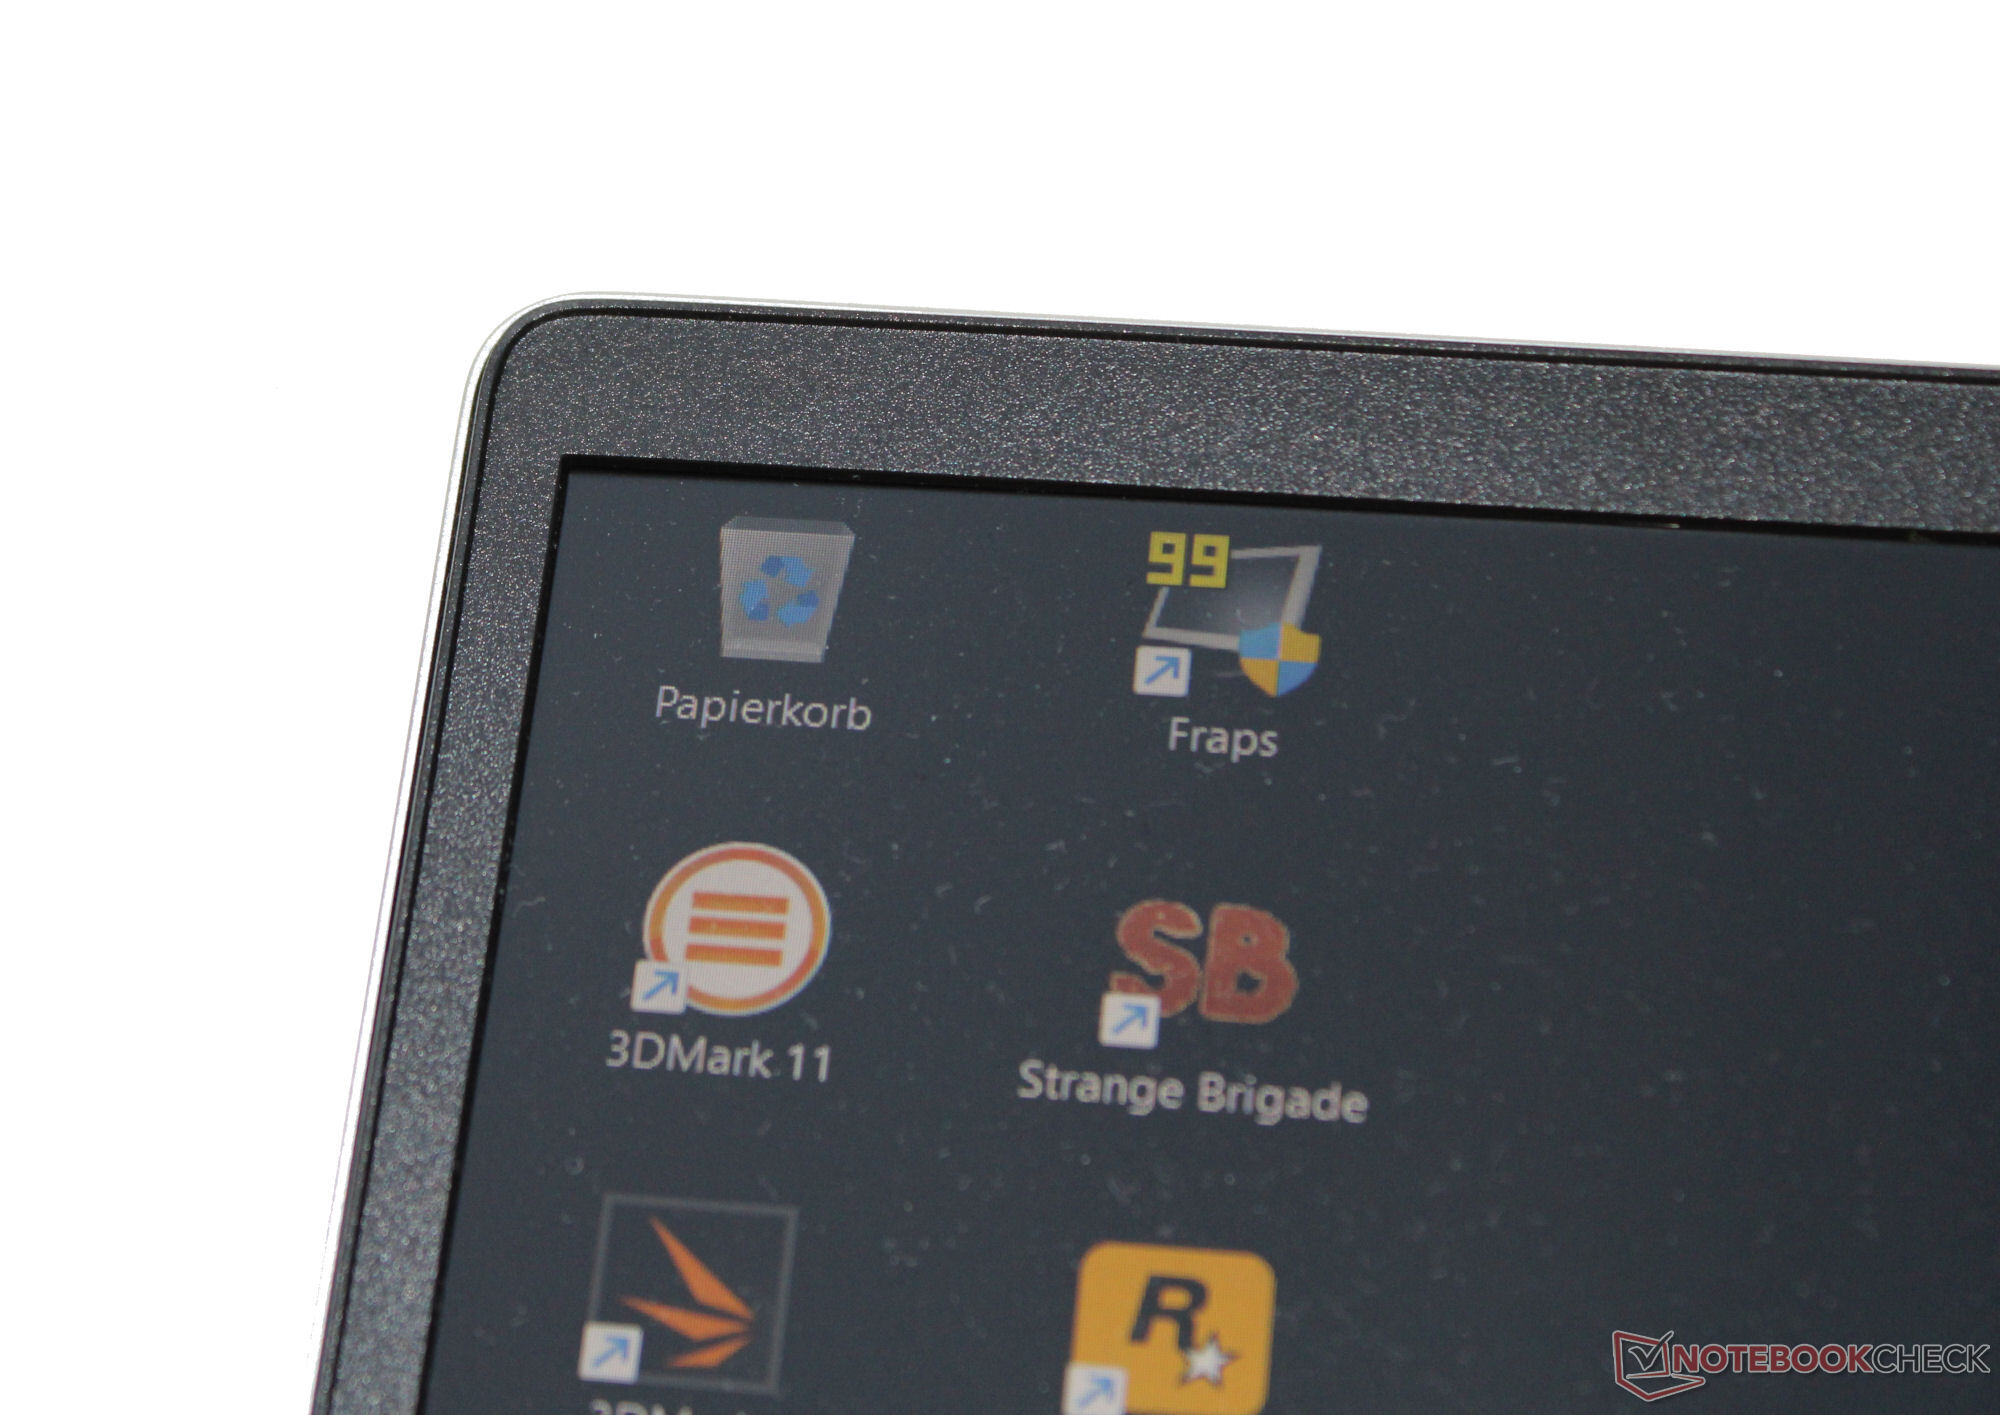
HP has equipped the ProBook with a matte, viewing-angle stable 15.6-inch display (1,920 x 1,080 pixels) which has an aspect ratio of 16:9. While its contrast levels have hit the target value (> 1,000:1), its brightness leaves more to be desired (target: > 300 cd/m²). Positive: We didn't note any PWM flickering. Alternatively, the 450 G10 can be had with a brighter FHD panel (ca. 400 cd/m²).

| |||||||||||||||||||||||||
Brightness Distribution: 88 %
Center on Battery: 285 cd/m²
Contrast: 1096:1 (Black: 0.26 cd/m²)
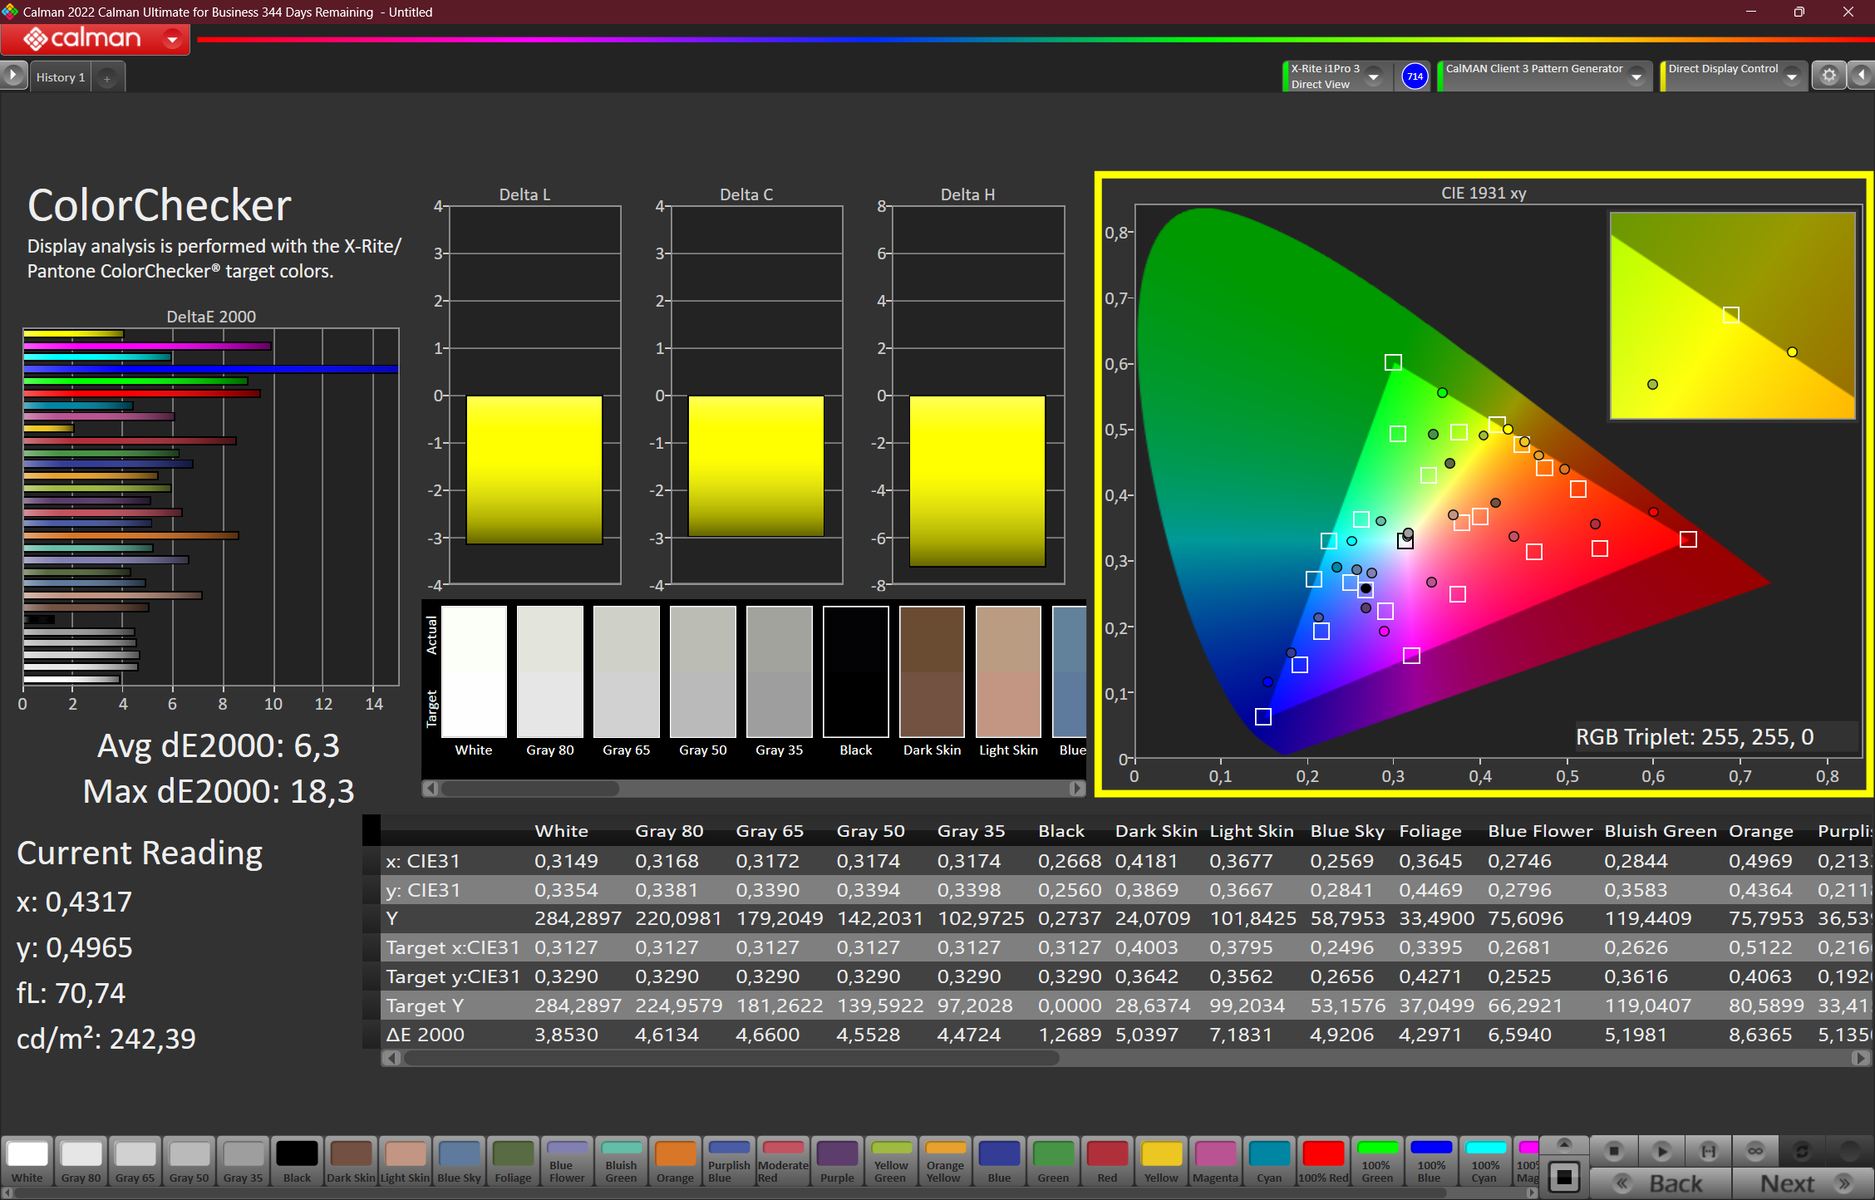
ΔE ColorChecker Calman: 6.3 | ∀{0.5-29.43 Ø4.72}
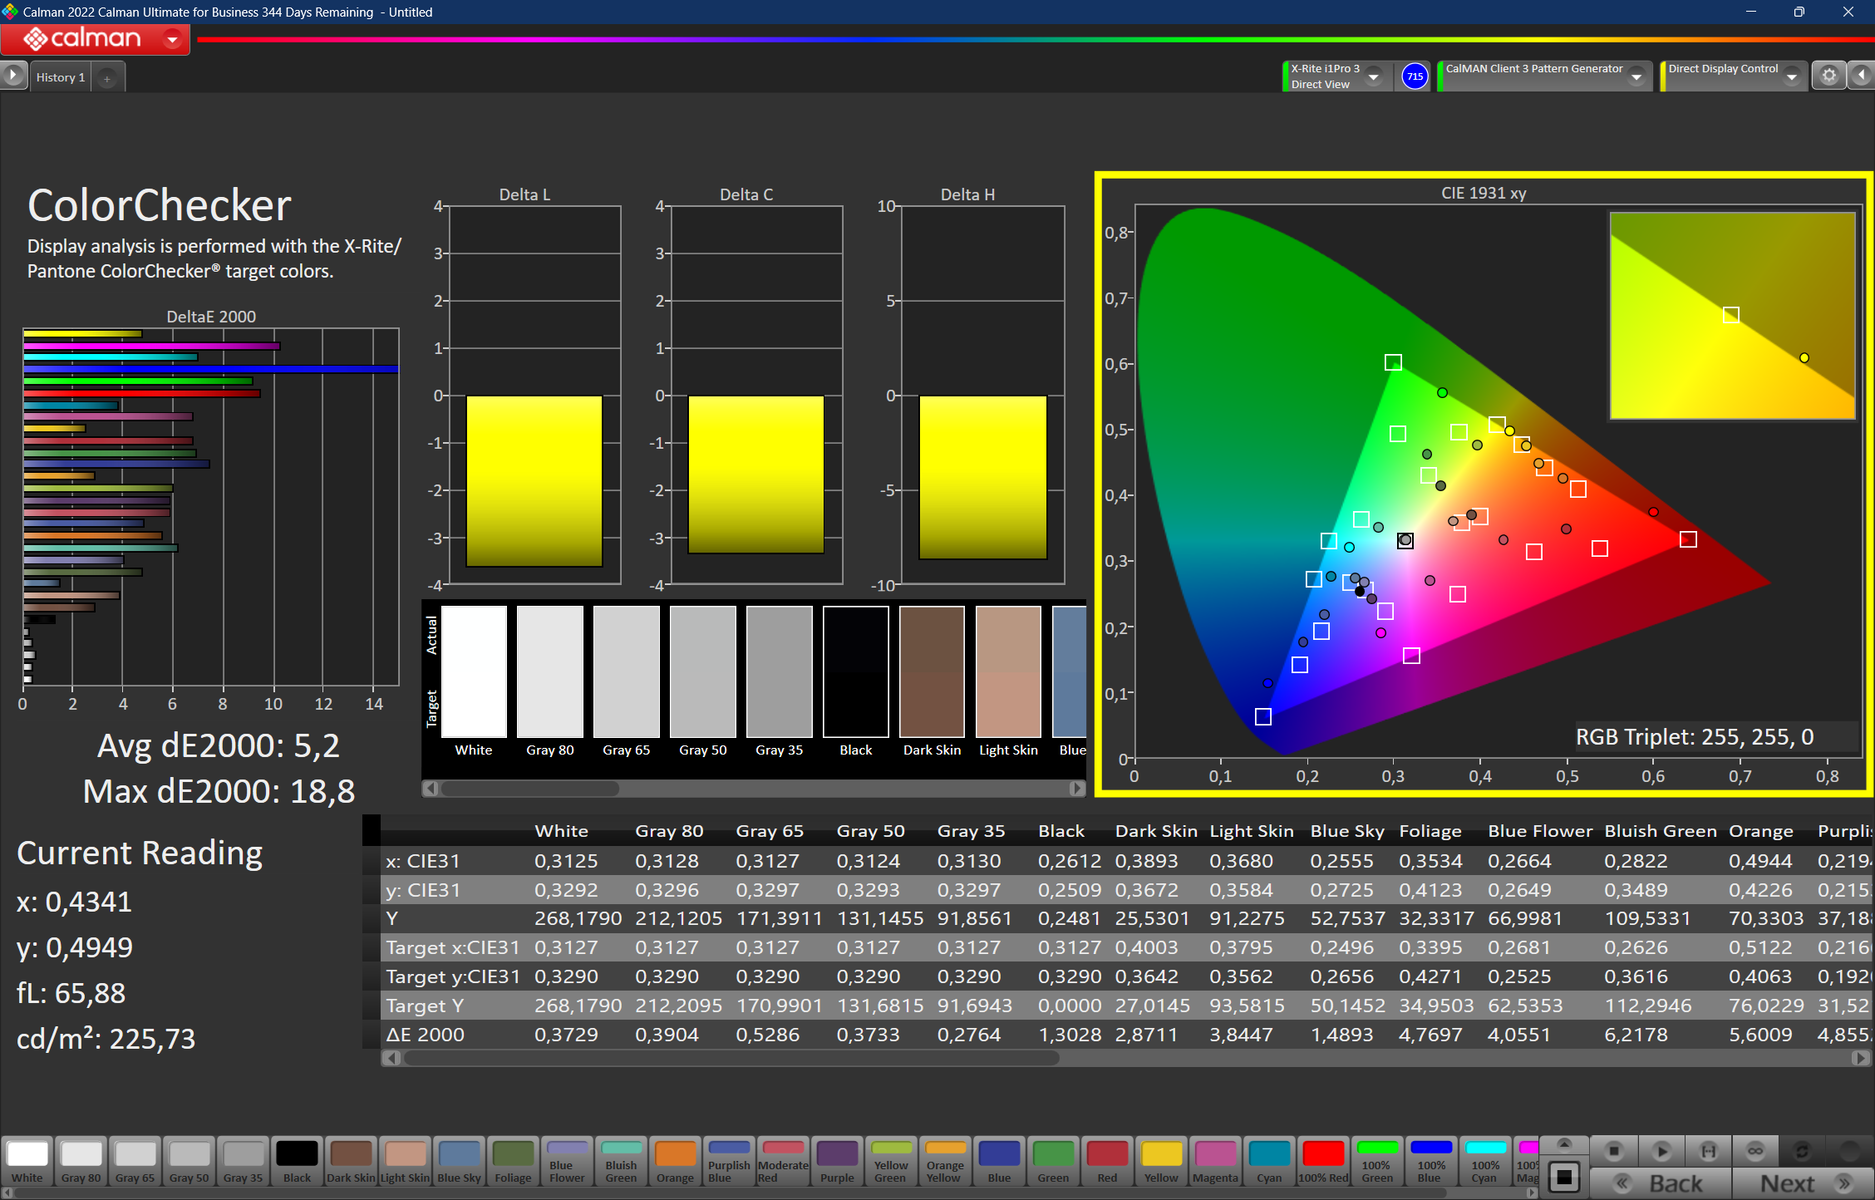
calibrated: 5.2
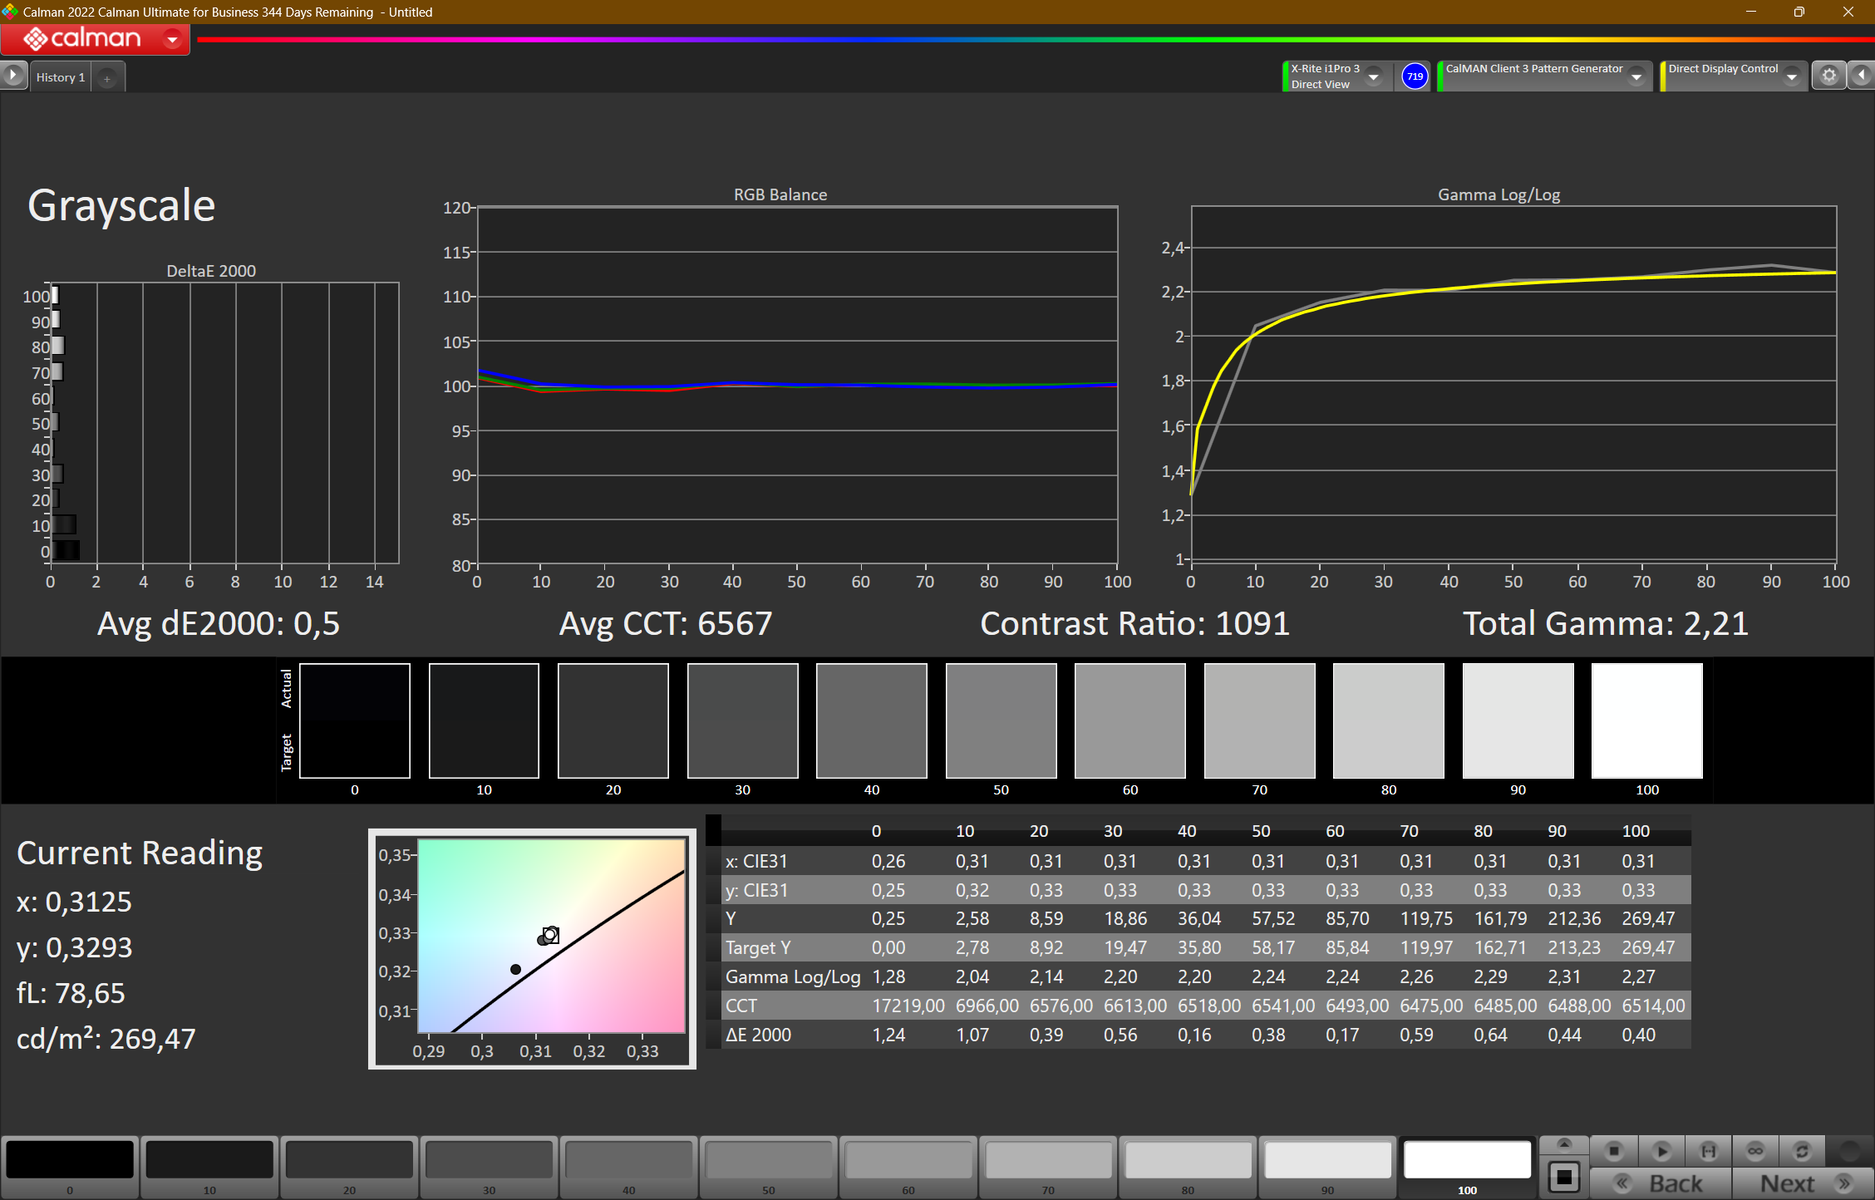
ΔE Greyscale Calman: 4.3 | ∀{0.09-98 Ø4.97}
39.7% AdobeRGB 1998 (Argyll 3D)
57.3% sRGB (Argyll 3D)
38.4% Display P3 (Argyll 3D)
Gamma: 2.32
CCT: 6374 K
| HP ProBook 450 G10 LG Philips LP156WFC-SPMD, IPS, 1920x1080, 15.6" | Acer Aspire 5 A515-58GM-76S8 LP156WFH-SPD5, IPS, 1920x1080, 15.6" | Schenker VIA 15 Pro M22 NE156QHM-NY2, IPS, 2560x1440, 15.6" | Lenovo ThinkPad L15 Gen 4 21H70021GE N156HCA-E5B, IPS, 1920x1080, 15.6" | Fujitsu LifeBook E5412A E542AMHAAMDE LP140WFH-SPD1, IPS, 1920x1080, 14" | Dell Latitude 3440 BOE NE140FH, IPS, 1920x1080, 14" | |
|---|---|---|---|---|---|---|
| Display | -0% | 73% | 9% | -2% | 5% | |
| Display P3 Coverage (%) | 38.4 | 38.11 -1% | 67.5 76% | 41.8 9% | 37.5 -2% | 40.4 5% |
| sRGB Coverage (%) | 57.3 | 57.7 1% | 97.1 69% | 62.5 9% | 56.1 -2% | 60.7 6% |
| AdobeRGB 1998 Coverage (%) | 39.7 | 39.41 -1% | 68.5 73% | 43.2 9% | 38.8 -2% | 41.8 5% |
| Response Times | -2% | 59% | 23% | -5% | -15% | |
| Response Time Grey 50% / Grey 80% * (ms) | 35.5 ? | 33.6 ? 5% | 13.8 ? 61% | 24.4 ? 31% | 35 ? 1% | 35.3 ? 1% |
| Response Time Black / White * (ms) | 23 ? | 24.8 ? -8% | 9.8 ? 57% | 19.7 ? 14% | 25.6 ? -11% | 29.8 ? -30% |
| PWM Frequency (Hz) | 60 ? | |||||
| Screen | -5% | 21% | 11% | -17% | 21% | |
| Brightness middle (cd/m²) | 285 | 257.4 -10% | 354 24% | 275 -4% | 231 -19% | 292.6 3% |
| Brightness (cd/m²) | 266 | 248 -7% | 331 24% | 252 -5% | 228 -14% | 270 2% |
| Brightness Distribution (%) | 88 | 88 0% | 80 -9% | 84 -5% | 77 -12% | 88 0% |
| Black Level * (cd/m²) | 0.26 | 0.3209 -23% | 0.41 -58% | 0.16 38% | 0.31 -19% | 0.19 27% |
| Contrast (:1) | 1096 | 802 -27% | 863 -21% | 1719 57% | 745 -32% | 1540 41% |
| Colorchecker dE 2000 * | 6.3 | 6.26 1% | 2.4 62% | 6.2 2% | 7.2 -14% | 4.63 27% |
| Colorchecker dE 2000 max. * | 18.3 | 18.28 -0% | 6.4 65% | 19.2 -5% | 20.8 -14% | 17.1 7% |
| Colorchecker dE 2000 calibrated * | 5.2 | 4.99 4% | 1.4 73% | 4.2 19% | 5.5 -6% | 2.13 59% |
| Greyscale dE 2000 * | 4.3 | 3.7 14% | 3.2 26% | 4.1 5% | 5.3 -23% | 3.2 26% |
| Gamma | 2.32 95% | 2.186 101% | 2.08 106% | 1.91 115% | 2.16 102% | 2.34 94% |
| CCT | 6374 102% | 6606 98% | 6786 96% | 6352 102% | 6407 101% | 7184 90% |
| Total Average (Program / Settings) | -2% /
-4% | 51% /
37% | 14% /
12% | -8% /
-12% | 4% /
13% |
* ... smaller is better
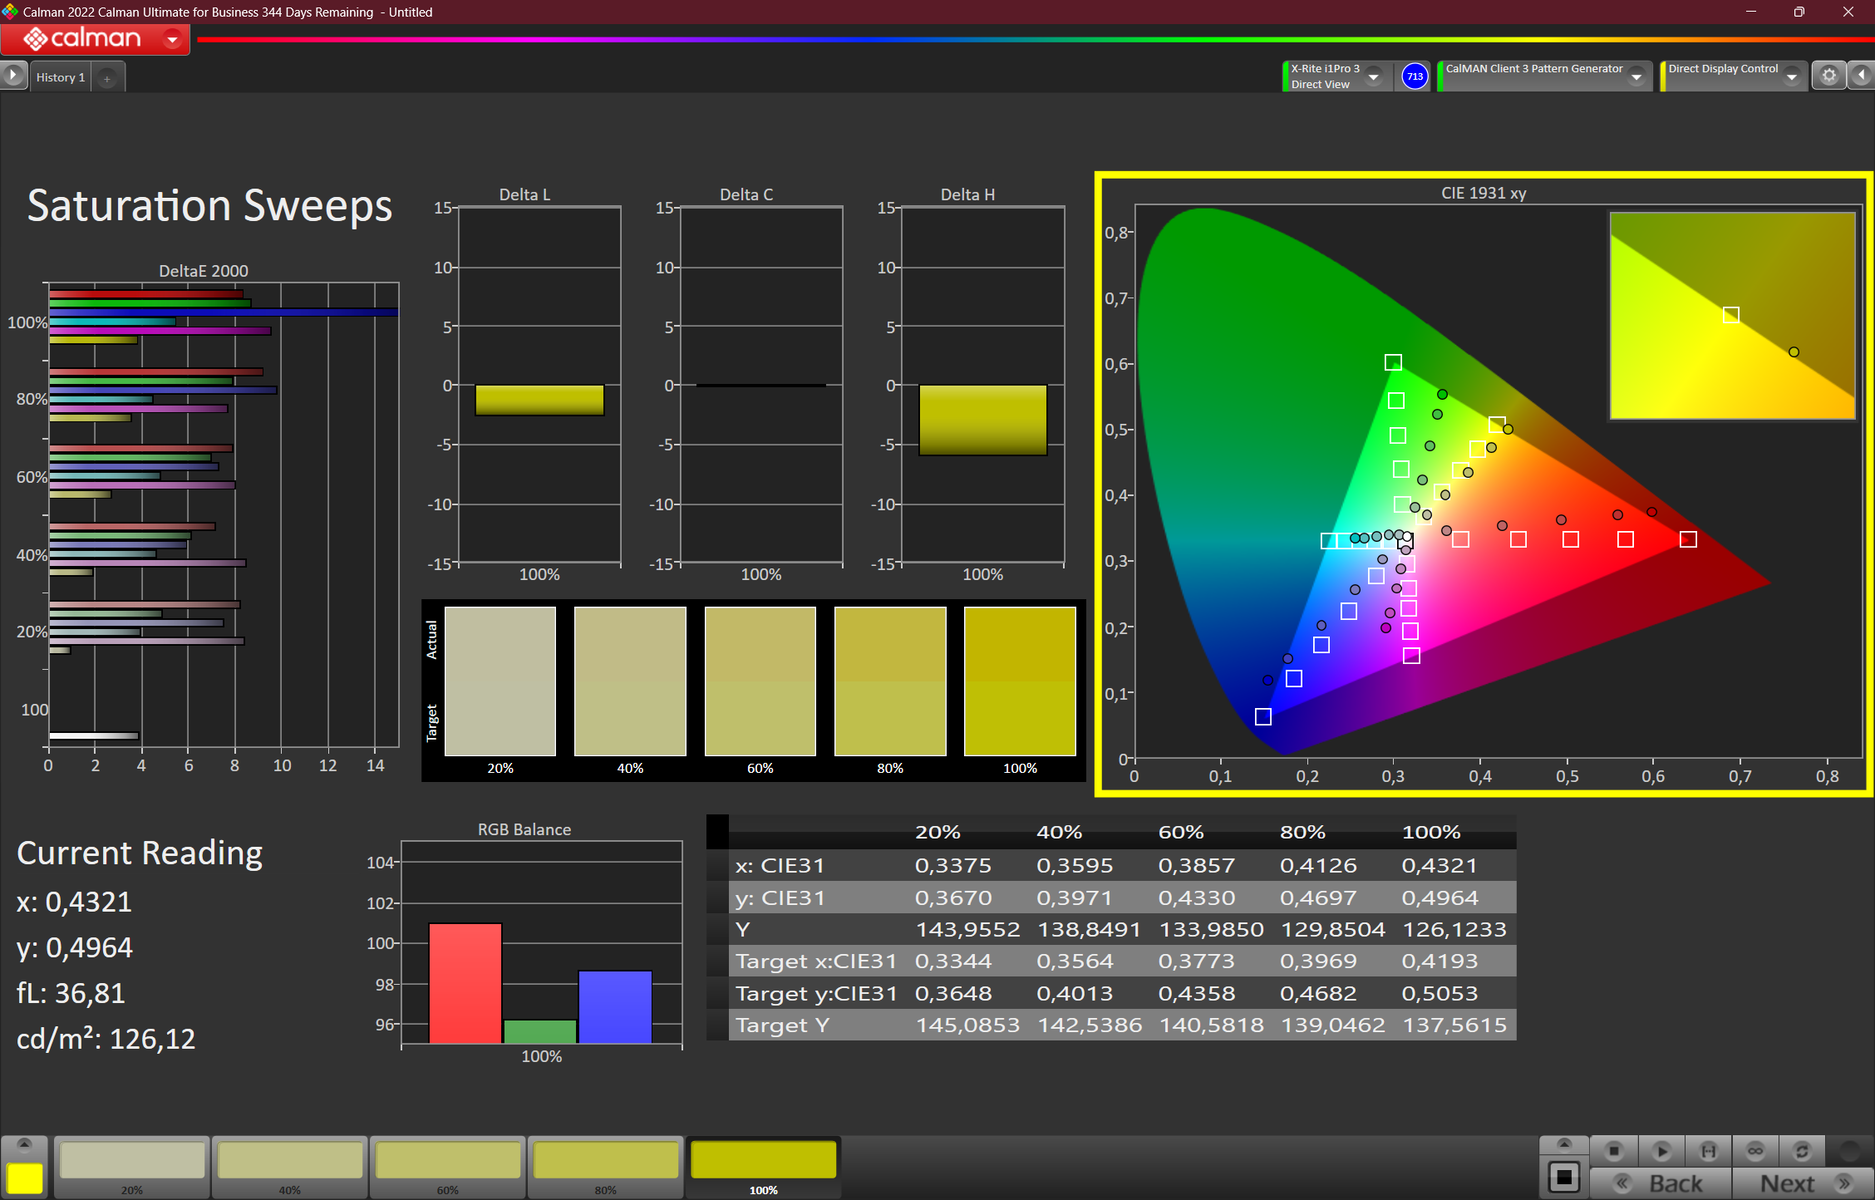
Ex works, the screen shows acceptable color depiction: With a deviation of around 6.3, its target value has unfortunately been missed (DeltaE < 3). Calibrating lowers the value to 5.2 and makes gray tones look more balanced. The color spaces DCI-P3, sRGB and AdobeRGB cannot be depicted by the panel — the same can be said for most of the competitors' screens. The alternatively available, brighter FHD panel offers better color depiction (sRGB).

Display Response Times
| ↔ Response Time Black to White | ||
|---|---|---|
| 23 ms ... rise ↗ and fall ↘ combined | ↗ 13 ms rise | 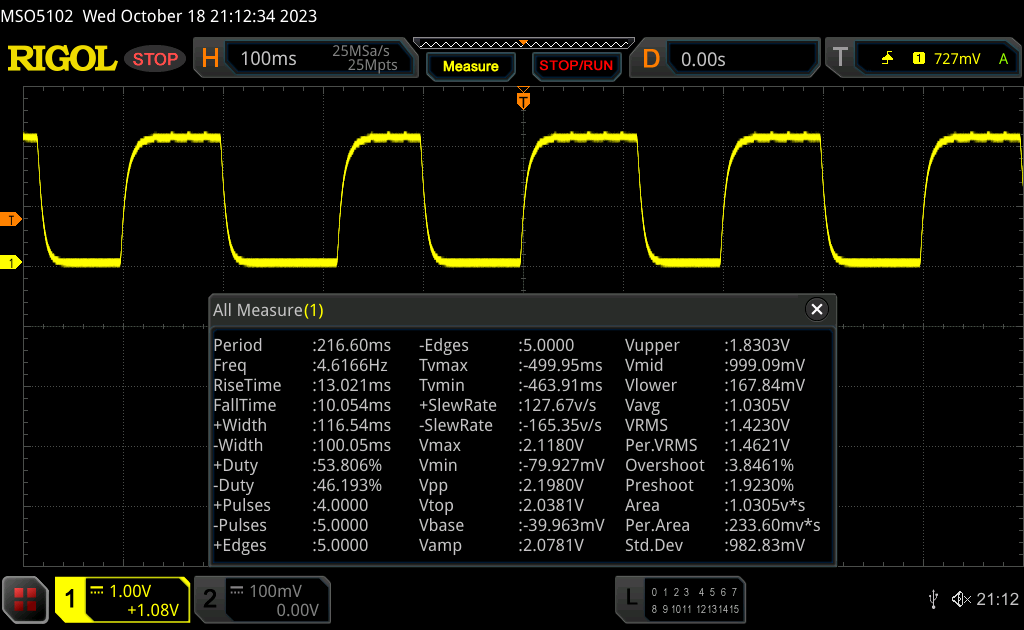 |
| ↘ 10 ms fall | ||
| The screen shows good response rates in our tests, but may be too slow for competitive gamers. In comparison, all tested devices range from 0.1 (minimum) to 240 (maximum) ms. » 52 % of all devices are better. This means that the measured response time is worse than the average of all tested devices (19.8 ms). | ||
| ↔ Response Time 50% Grey to 80% Grey | ||
| 35.5 ms ... rise ↗ and fall ↘ combined | ↗ 18.6 ms rise | 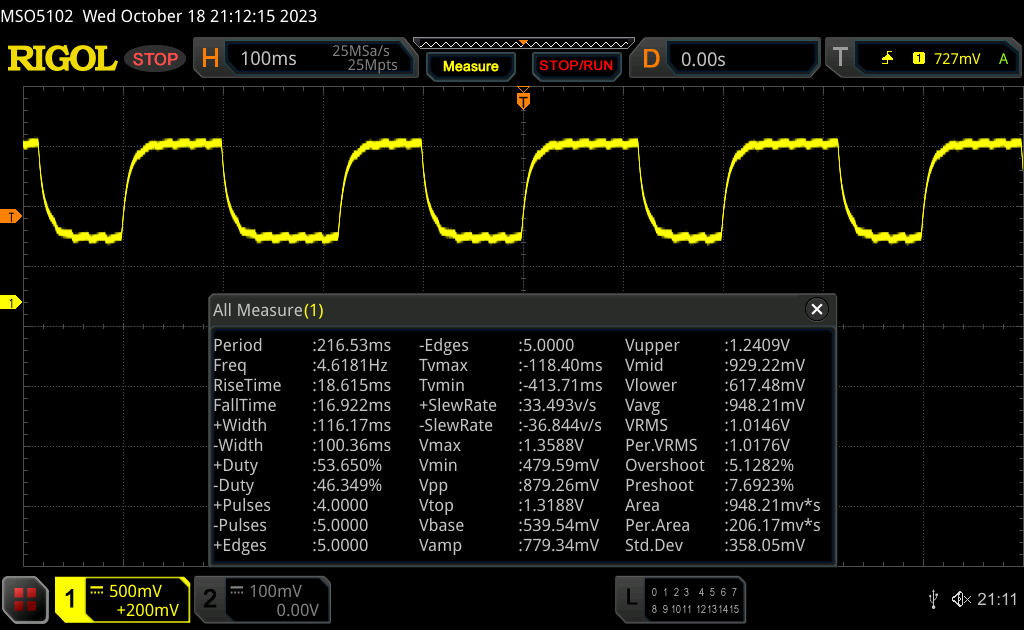 |
| ↘ 16.9 ms fall | ||
| The screen shows slow response rates in our tests and will be unsatisfactory for gamers. In comparison, all tested devices range from 0.165 (minimum) to 636 (maximum) ms. » 50 % of all devices are better. This means that the measured response time is worse than the average of all tested devices (31 ms). | ||
Screen Flickering / PWM (Pulse-Width Modulation)
| Screen flickering / PWM not detected |  | ||
In comparison: 52 % of all tested devices do not use PWM to dim the display. If PWM was detected, an average of 7753 (minimum: 5 - maximum: 343500) Hz was measured. | |||
The viewing-angle stable IPS panel remains legible from every angle. Outside, it is possible to read from the display as long as the sun isn't shining too brightly.

Performance - Raptor Lake and Ampere power the HP laptop
Within the ProBook 400 G10 series, HP relies on APUs from AMD (ProBook 455) as well as CPUs from Intel (ProBook 450). The 450 G10 models available at the time of testing can be found for between US$750 and US$1,100. The present variant can be had from around US$1,000.
Testing conditions
Instead of using its own energy profile, HP uses ones from Windows — called Power Status (see table). We used the profiles "best performance" (benchmarks, load runtimes) and "balanced" (other runtime tests).
As the power limits are identical on all three profiles, there are barely any differences when it comes to CPU performance. GPU performance, on the other hand, varies depending on the profile.
| Best performance | Balanced | Best power saving | |
|---|---|---|---|
| Power Limit 1 (HWInfo) | 24 watts | 24 watts | 24 watts |
| Power Limit 2 (HWInfo) | 55 watts | 55 watts | 55 watts |
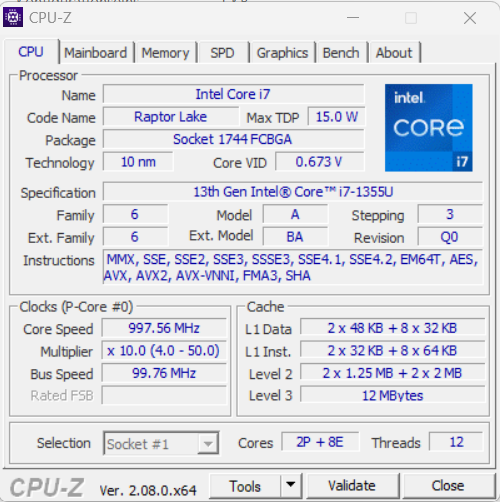
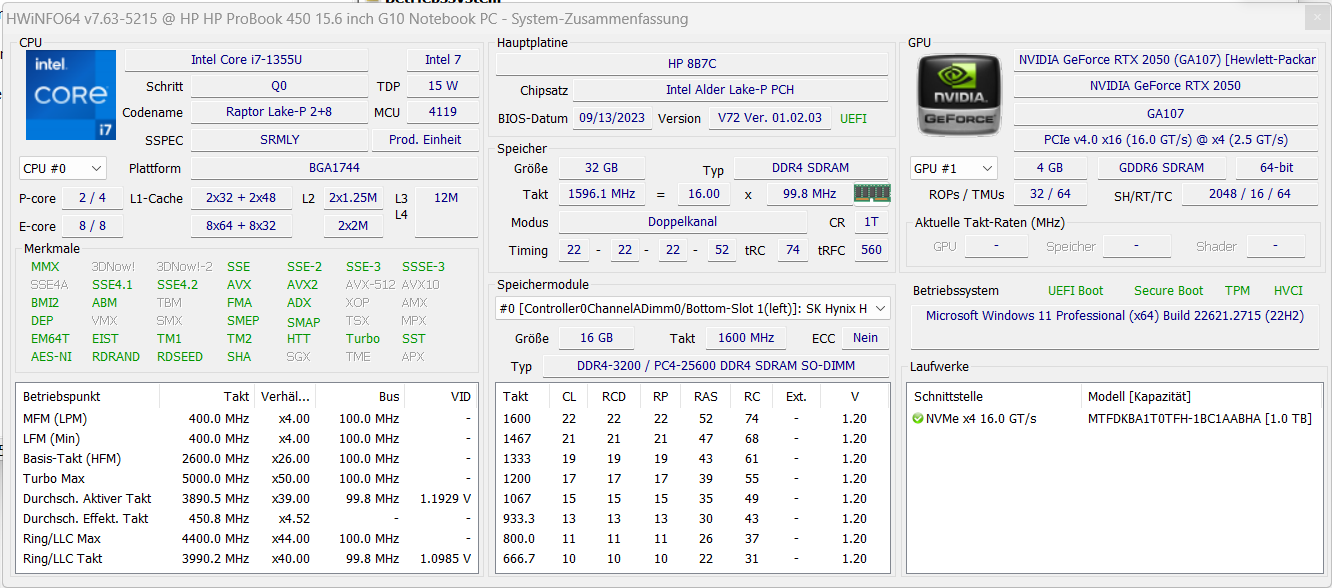
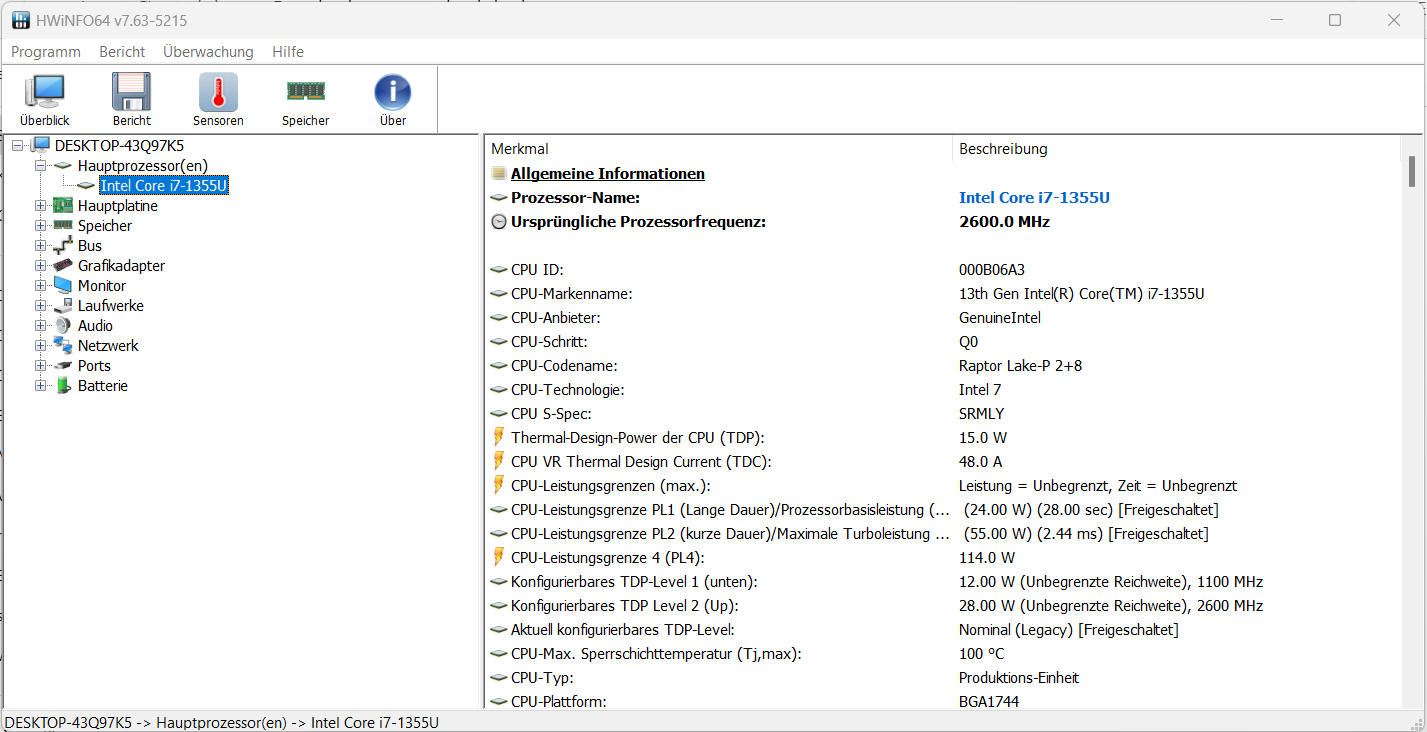
Processor
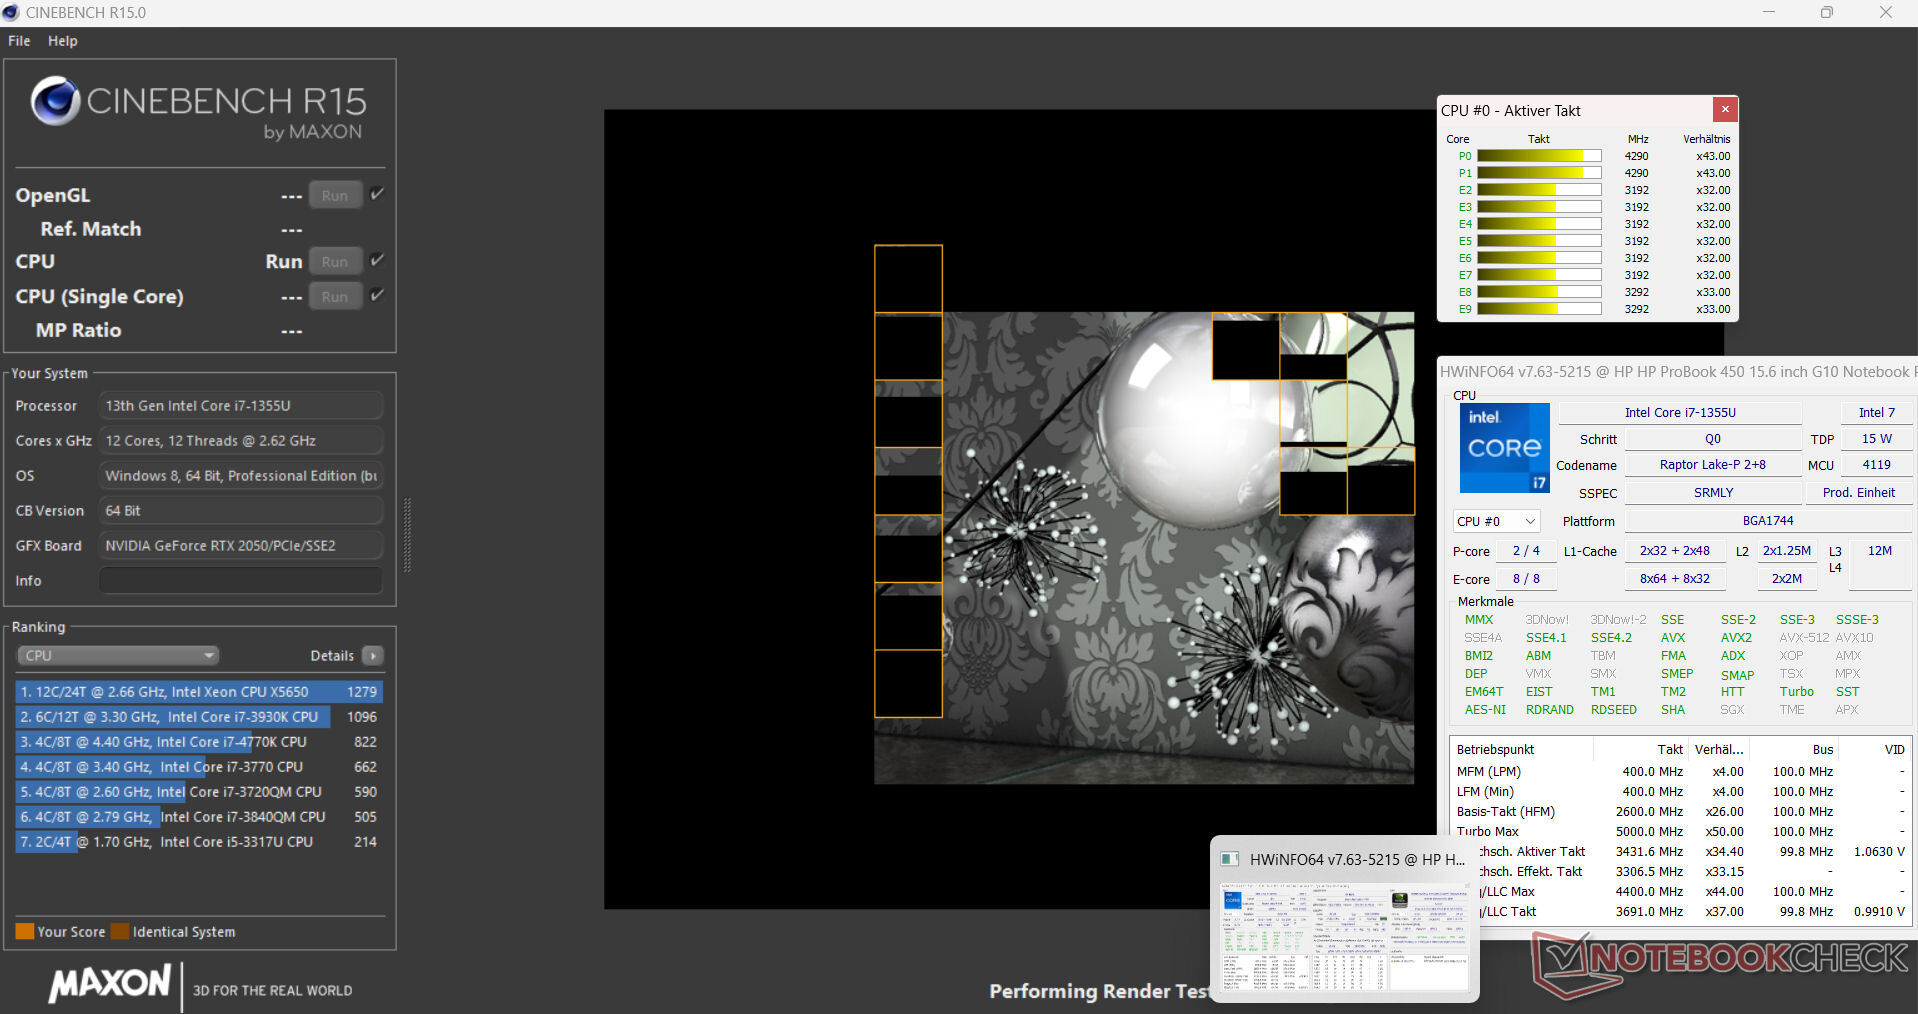
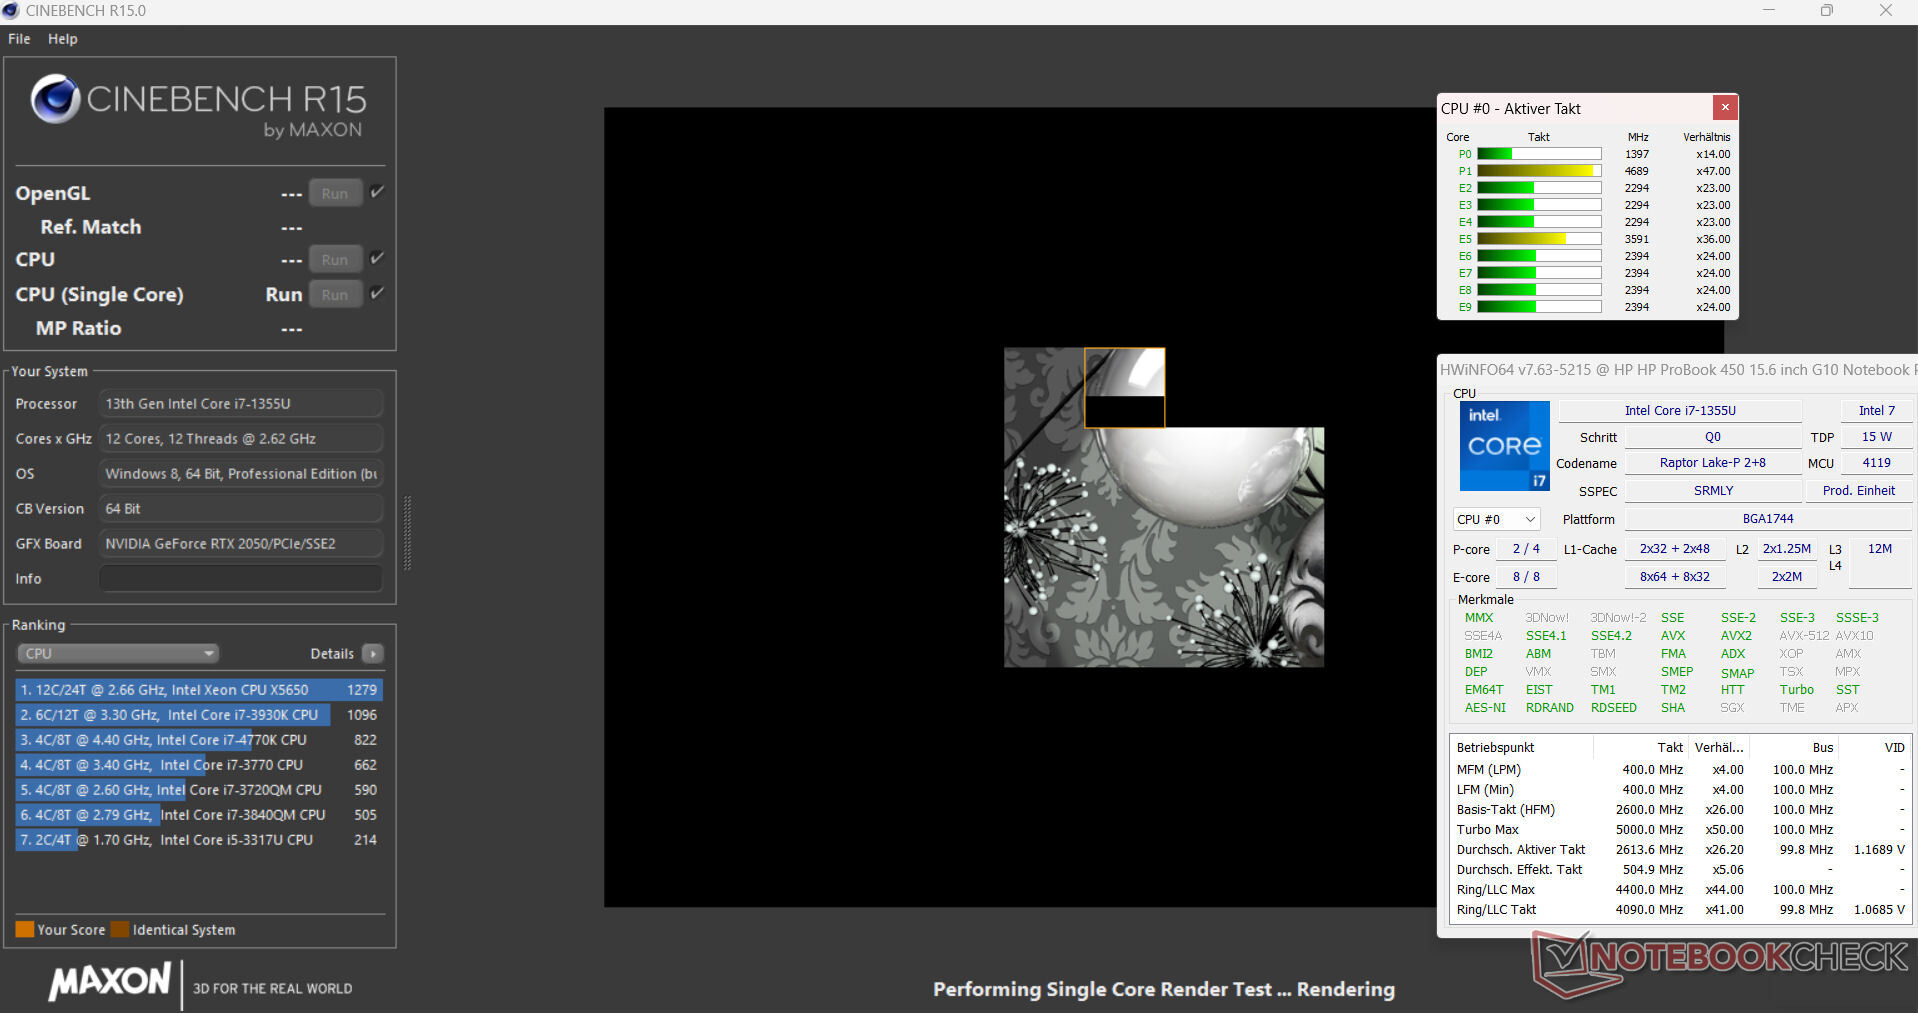
The Core i7-1355U's 10 CPU cores (2P, 8E) achieve maximum clock rates of 5 GHz (P) and 3.7 GHz (E). Permanent multi-thread load (CB15 Loop) leads the clock rate to sink a little from the first to the second run. After this, it remains constant.
The Aspire fitted with the same CPU achieved better benchmark results than the ProBook due to its higher Power Limit 1 (28 watts vs. 24 watts). The latter delivered results average for the installed CPU (when connected to mains). In battery use, its more relevant single-thread performance (162 points; CB15) sank to a lesser extent than its multi-thread performance (673 points; CB15).
Cinebench R15 Multi continuous test
* ... smaller is better
AIDA64: FP32 Ray-Trace | FPU Julia | CPU SHA3 | CPU Queen | FPU SinJulia | FPU Mandel | CPU AES | CPU ZLib | FP64 Ray-Trace | CPU PhotoWorxx
| Performance rating | |
| Schenker VIA 15 Pro M22 | |
| Average of class Office | |
| Lenovo ThinkPad L15 Gen 4 21H70021GE | |
| Acer Aspire 5 A515-58GM-76S8 | |
| Fujitsu LifeBook E5412A E542AMHAAMDE | |
| Average Intel Core i7-1355U | |
| HP ProBook 450 G10 | |
| Dell Latitude 3440 | |
| AIDA64 / FP32 Ray-Trace | |
| Average of class Office (2083 - 31245, n=80, last 2 years) | |
| Schenker VIA 15 Pro M22 | |
| Lenovo ThinkPad L15 Gen 4 21H70021GE | |
| Fujitsu LifeBook E5412A E542AMHAAMDE | |
| Acer Aspire 5 A515-58GM-76S8 | |
| HP ProBook 450 G10 | |
| Dell Latitude 3440 | |
| Average Intel Core i7-1355U (5673 - 8424, n=18) | |
| AIDA64 / FPU Julia | |
| Lenovo ThinkPad L15 Gen 4 21H70021GE | |
| Schenker VIA 15 Pro M22 | |
| Average of class Office (8191 - 125394, n=80, last 2 years) | |
| Fujitsu LifeBook E5412A E542AMHAAMDE | |
| Acer Aspire 5 A515-58GM-76S8 | |
| Average Intel Core i7-1355U (29580 - 42706, n=18) | |
| HP ProBook 450 G10 | |
| Dell Latitude 3440 | |
| AIDA64 / CPU SHA3 | |
| Average of class Office (433 - 5755, n=80, last 2 years) | |
| Lenovo ThinkPad L15 Gen 4 21H70021GE | |
| Schenker VIA 15 Pro M22 | |
| Acer Aspire 5 A515-58GM-76S8 | |
| Fujitsu LifeBook E5412A E542AMHAAMDE | |
| Average Intel Core i7-1355U (1529 - 2200, n=18) | |
| Dell Latitude 3440 | |
| HP ProBook 450 G10 | |
| AIDA64 / CPU Queen | |
| Schenker VIA 15 Pro M22 | |
| Lenovo ThinkPad L15 Gen 4 21H70021GE | |
| Fujitsu LifeBook E5412A E542AMHAAMDE | |
| Acer Aspire 5 A515-58GM-76S8 | |
| HP ProBook 450 G10 | |
| Average of class Office (22784 - 115197, n=67, last 2 years) | |
| Average Intel Core i7-1355U (21547 - 66907, n=18) | |
| Dell Latitude 3440 | |
| AIDA64 / FPU SinJulia | |
| Schenker VIA 15 Pro M22 | |
| Lenovo ThinkPad L15 Gen 4 21H70021GE | |
| Fujitsu LifeBook E5412A E542AMHAAMDE | |
| Average of class Office (1378 - 18321, n=80, last 2 years) | |
| Acer Aspire 5 A515-58GM-76S8 | |
| HP ProBook 450 G10 | |
| Average Intel Core i7-1355U (4045 - 5426, n=18) | |
| Dell Latitude 3440 | |
| AIDA64 / FPU Mandel | |
| Lenovo ThinkPad L15 Gen 4 21H70021GE | |
| Schenker VIA 15 Pro M22 | |
| Average of class Office (4601 - 66922, n=80, last 2 years) | |
| Fujitsu LifeBook E5412A E542AMHAAMDE | |
| Acer Aspire 5 A515-58GM-76S8 | |
| Average Intel Core i7-1355U (14596 - 21627, n=18) | |
| HP ProBook 450 G10 | |
| Dell Latitude 3440 | |
| AIDA64 / CPU AES | |
| Acer Aspire 5 A515-58GM-76S8 | |
| Average of class Office (4854 - 155900, n=80, last 2 years) | |
| Lenovo ThinkPad L15 Gen 4 21H70021GE | |
| Schenker VIA 15 Pro M22 | |
| Average Intel Core i7-1355U (31432 - 75408, n=18) | |
| HP ProBook 450 G10 | |
| Dell Latitude 3440 | |
| Fujitsu LifeBook E5412A E542AMHAAMDE | |
| AIDA64 / CPU ZLib | |
| Schenker VIA 15 Pro M22 | |
| Average of class Office (114.6 - 1366, n=80, last 2 years) | |
| Lenovo ThinkPad L15 Gen 4 21H70021GE | |
| Acer Aspire 5 A515-58GM-76S8 | |
| Average Intel Core i7-1355U (454 - 684, n=18) | |
| Dell Latitude 3440 | |
| HP ProBook 450 G10 | |
| Fujitsu LifeBook E5412A E542AMHAAMDE | |
| AIDA64 / FP64 Ray-Trace | |
| Average of class Office (1109 - 17834, n=80, last 2 years) | |
| Schenker VIA 15 Pro M22 | |
| Lenovo ThinkPad L15 Gen 4 21H70021GE | |
| Fujitsu LifeBook E5412A E542AMHAAMDE | |
| Acer Aspire 5 A515-58GM-76S8 | |
| Dell Latitude 3440 | |
| HP ProBook 450 G10 | |
| Average Intel Core i7-1355U (2991 - 4453, n=18) | |
| AIDA64 / CPU PhotoWorxx | |
| Average of class Office (11090 - 65229, n=80, last 2 years) | |
| Average Intel Core i7-1355U (21800 - 46154, n=18) | |
| HP ProBook 450 G10 | |
| Schenker VIA 15 Pro M22 | |
| Dell Latitude 3440 | |
| Acer Aspire 5 A515-58GM-76S8 | |
| Fujitsu LifeBook E5412A E542AMHAAMDE | |
| Lenovo ThinkPad L15 Gen 4 21H70021GE | |
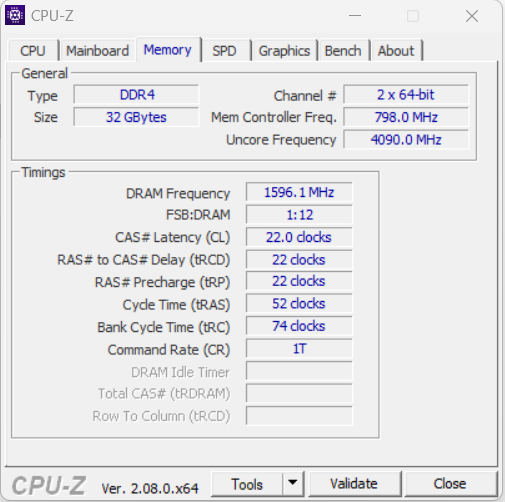
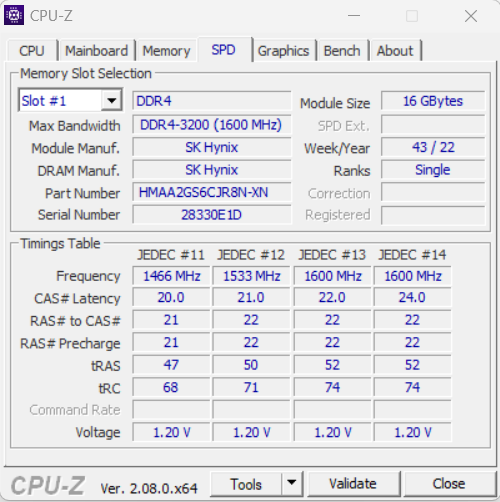
System performance
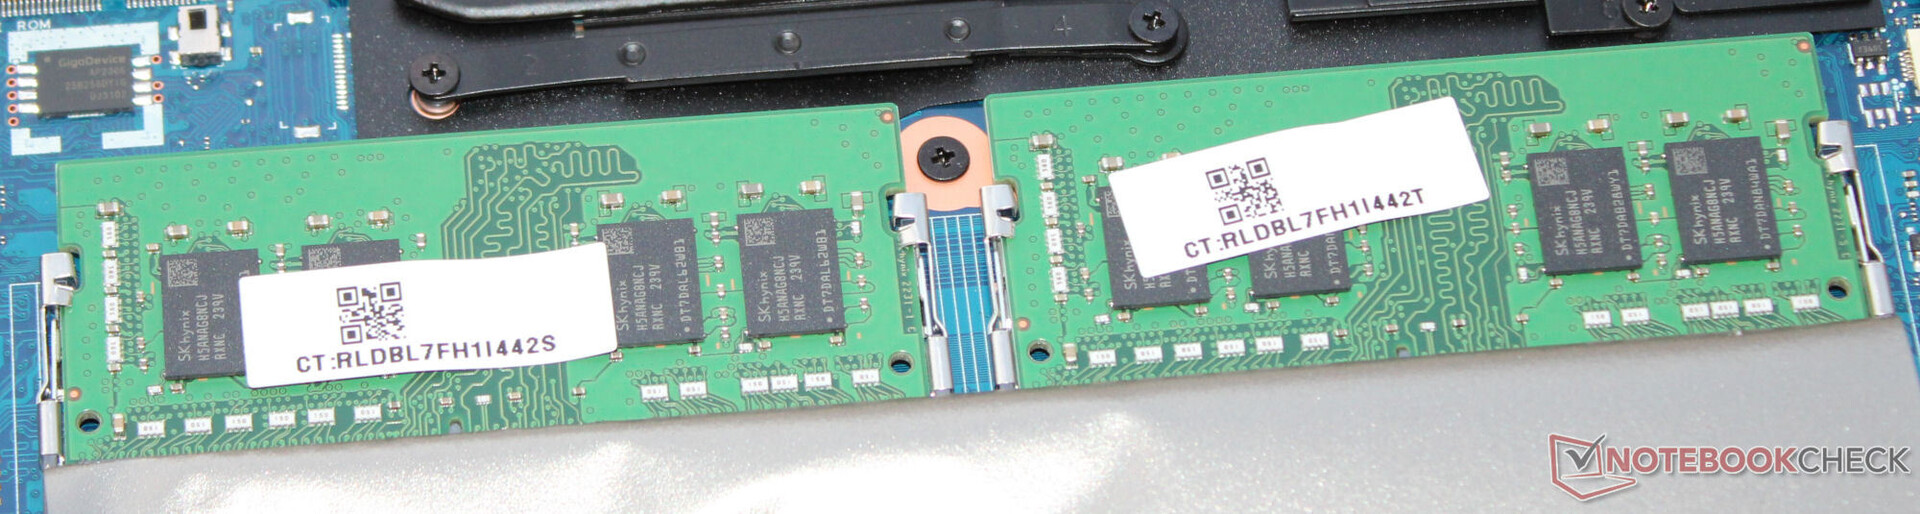
The smooth-running system masters office and internet uses, GPU-intensive programs as well as games with moderate requirements. The same as on its predecessor, HP relies on DDR4-3200 RAM for this laptop. More modern DDR5 could've squeezed a bit more performance out of the CPU. The RAM's data rates are normal for DDR4-3200 RAM. Its PC Mark results were good.
CrossMark: Overall | Productivity | Creativity | Responsiveness
| PCMark 10 / Score | |
| Average of class Office (2601 - 9298, n=66, last 2 years) | |
| Acer Aspire 5 A515-58GM-76S8 | |
| Average Intel Core i7-1355U, NVIDIA GeForce RTX 2050 Mobile (6235 - 6540, n=3) | |
| HP ProBook 450 G10 | |
| Fujitsu LifeBook E5412A E542AMHAAMDE | |
| Lenovo ThinkPad L15 Gen 4 21H70021GE | |
| Dell Latitude 3440 | |
| Schenker VIA 15 Pro M22 | |
| PCMark 10 / Essentials | |
| Acer Aspire 5 A515-58GM-76S8 | |
| Average Intel Core i7-1355U, NVIDIA GeForce RTX 2050 Mobile (10174 - 20841, n=3) | |
| Dell Latitude 3440 | |
| HP ProBook 450 G10 | |
| Average of class Office (3245 - 11594, n=66, last 2 years) | |
| Lenovo ThinkPad L15 Gen 4 21H70021GE | |
| Fujitsu LifeBook E5412A E542AMHAAMDE | |
| Schenker VIA 15 Pro M22 | |
| PCMark 10 / Productivity | |
| Average of class Office (5336 - 17243, n=66, last 2 years) | |
| Fujitsu LifeBook E5412A E542AMHAAMDE | |
| Lenovo ThinkPad L15 Gen 4 21H70021GE | |
| HP ProBook 450 G10 | |
| Acer Aspire 5 A515-58GM-76S8 | |
| Average Intel Core i7-1355U, NVIDIA GeForce RTX 2050 Mobile (8449 - 8841, n=3) | |
| Schenker VIA 15 Pro M22 | |
| Dell Latitude 3440 | |
| PCMark 10 / Digital Content Creation | |
| Average of class Office (2049 - 13541, n=66, last 2 years) | |
| Acer Aspire 5 A515-58GM-76S8 | |
| Average Intel Core i7-1355U, NVIDIA GeForce RTX 2050 Mobile (7278 - 7967, n=3) | |
| HP ProBook 450 G10 | |
| Schenker VIA 15 Pro M22 | |
| Dell Latitude 3440 | |
| Fujitsu LifeBook E5412A E542AMHAAMDE | |
| Lenovo ThinkPad L15 Gen 4 21H70021GE | |
| CrossMark / Overall | |
| Acer Aspire 5 A515-58GM-76S8 | |
| Average Intel Core i7-1355U, NVIDIA GeForce RTX 2050 Mobile (1629 - 1794, n=3) | |
| HP ProBook 450 G10 | |
| Average of class Office (381 - 2010, n=72, last 2 years) | |
| Dell Latitude 3440 | |
| Fujitsu LifeBook E5412A E542AMHAAMDE | |
| Lenovo ThinkPad L15 Gen 4 21H70021GE | |
| Schenker VIA 15 Pro M22 | |
| CrossMark / Productivity | |
| Acer Aspire 5 A515-58GM-76S8 | |
| Average Intel Core i7-1355U, NVIDIA GeForce RTX 2050 Mobile (1635 - 1870, n=3) | |
| HP ProBook 450 G10 | |
| Average of class Office (464 - 1880, n=72, last 2 years) | |
| Dell Latitude 3440 | |
| Fujitsu LifeBook E5412A E542AMHAAMDE | |
| Lenovo ThinkPad L15 Gen 4 21H70021GE | |
| Schenker VIA 15 Pro M22 | |
| CrossMark / Creativity | |
| Average Intel Core i7-1355U, NVIDIA GeForce RTX 2050 Mobile (1655 - 1766, n=3) | |
| HP ProBook 450 G10 | |
| Acer Aspire 5 A515-58GM-76S8 | |
| Average of class Office (319 - 2361, n=72, last 2 years) | |
| Dell Latitude 3440 | |
| Fujitsu LifeBook E5412A E542AMHAAMDE | |
| Lenovo ThinkPad L15 Gen 4 21H70021GE | |
| Schenker VIA 15 Pro M22 | |
| CrossMark / Responsiveness | |
| Acer Aspire 5 A515-58GM-76S8 | |
| Average Intel Core i7-1355U, NVIDIA GeForce RTX 2050 Mobile (1504 - 2017, n=3) | |
| HP ProBook 450 G10 | |
| Average of class Office (360 - 1820, n=72, last 2 years) | |
| Dell Latitude 3440 | |
| Schenker VIA 15 Pro M22 | |
| Lenovo ThinkPad L15 Gen 4 21H70021GE | |
| Fujitsu LifeBook E5412A E542AMHAAMDE | |
| PCMark 10 Score | 6235 points | |
Help | ||
| AIDA64 / Memory Copy | |
| Average of class Office (20075 - 110930, n=77, last 2 years) | |
| Average Intel Core i7-1355U (35017 - 71600, n=18) | |
| HP ProBook 450 G10 | |
| Acer Aspire 5 A515-58GM-76S8 | |
| Dell Latitude 3440 | |
| Schenker VIA 15 Pro M22 | |
| Fujitsu LifeBook E5412A E542AMHAAMDE | |
| Lenovo ThinkPad L15 Gen 4 21H70021GE | |
| AIDA64 / Memory Read | |
| Average of class Office (10084 - 128030, n=78, last 2 years) | |
| Average Intel Core i7-1355U (38551 - 73377, n=18) | |
| HP ProBook 450 G10 | |
| Schenker VIA 15 Pro M22 | |
| Acer Aspire 5 A515-58GM-76S8 | |
| Dell Latitude 3440 | |
| Fujitsu LifeBook E5412A E542AMHAAMDE | |
| Lenovo ThinkPad L15 Gen 4 21H70021GE | |
| AIDA64 / Memory Write | |
| Average Intel Core i7-1355U (35910 - 93342, n=18) | |
| Average of class Office (20073 - 119858, n=78, last 2 years) | |
| HP ProBook 450 G10 | |
| Schenker VIA 15 Pro M22 | |
| Dell Latitude 3440 | |
| Acer Aspire 5 A515-58GM-76S8 | |
| Fujitsu LifeBook E5412A E542AMHAAMDE | |
| Lenovo ThinkPad L15 Gen 4 21H70021GE | |
| AIDA64 / Memory Latency | |
| Average Intel Core i7-1355U (72.2 - 346, n=18) | |
| Average of class Office (7.6 - 162.9, n=73, last 2 years) | |
| Lenovo ThinkPad L15 Gen 4 21H70021GE | |
| Fujitsu LifeBook E5412A E542AMHAAMDE | |
| Schenker VIA 15 Pro M22 | |
| Dell Latitude 3440 | |
| Acer Aspire 5 A515-58GM-76S8 | |
| HP ProBook 450 G10 | |
* ... smaller is better
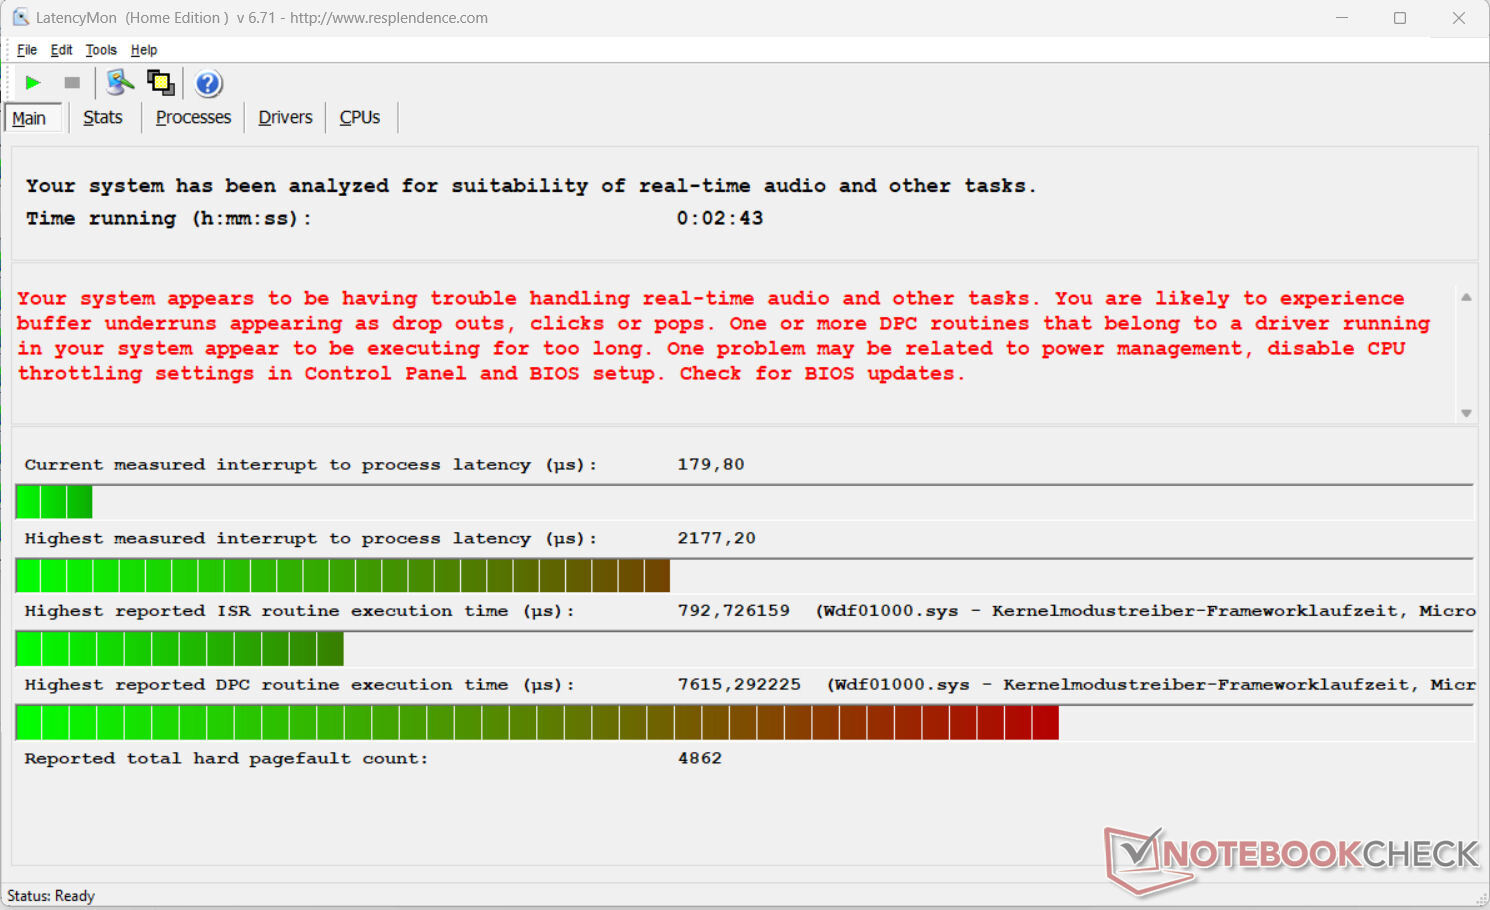
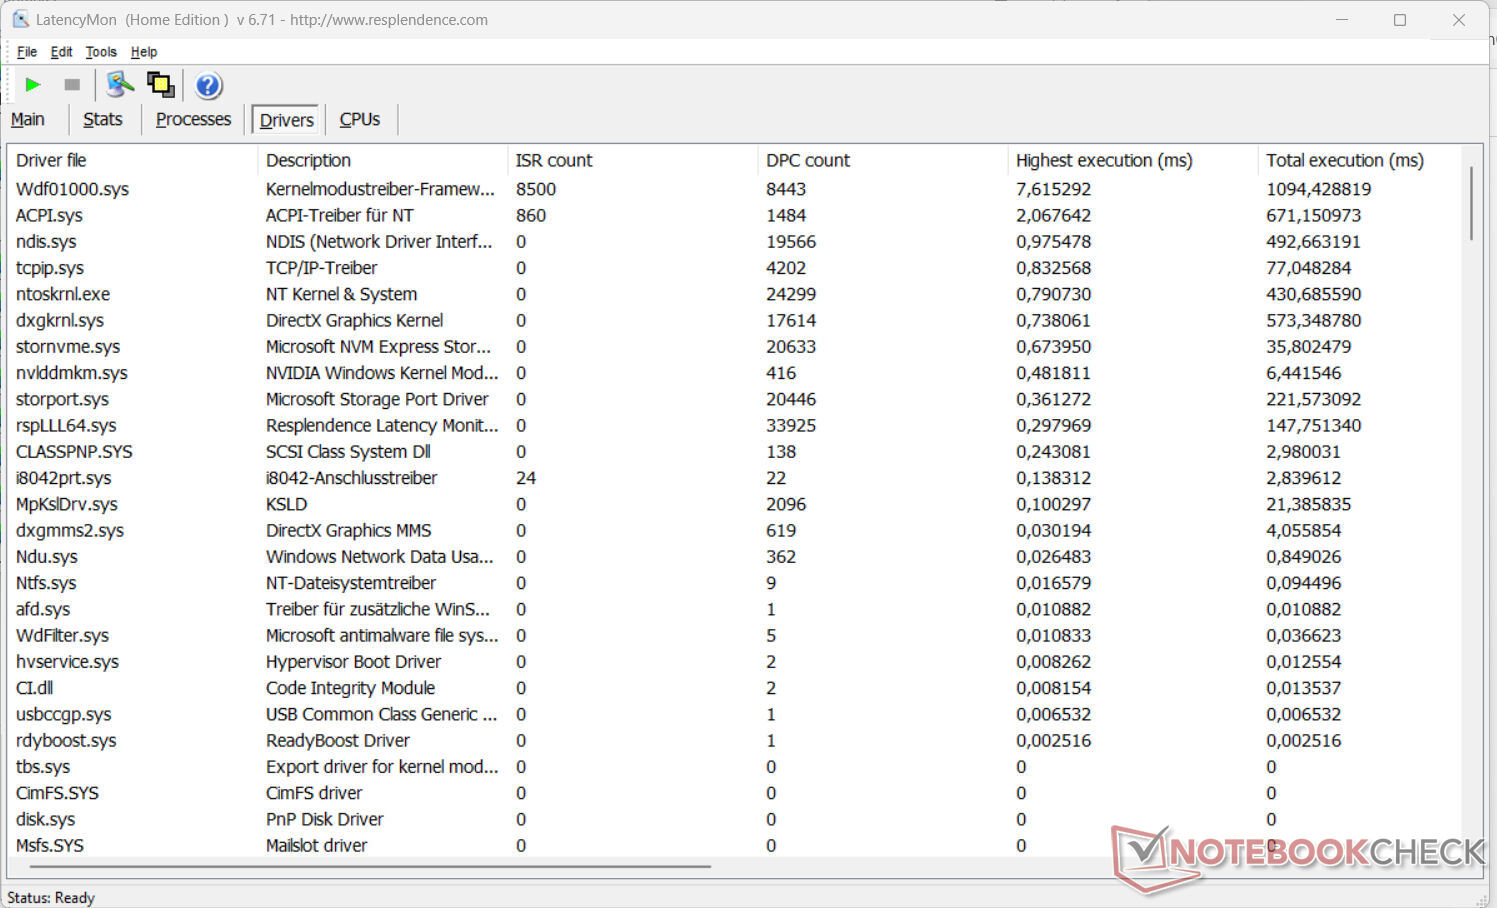
DPC latency
The standardized latency monitor test (web surfing, 4k video playback, Prime95 high load) revealed some anomalies. The system does not appear to be suitable for video and audio editing in real-time. Future software updates could lead to improvements or even deteriorations.
| DPC Latencies / LatencyMon - interrupt to process latency (max), Web, Youtube, Prime95 | |
| HP ProBook 450 G10 | |
| Schenker VIA 15 Pro M22 | |
| Dell Latitude 3440 | |
| Fujitsu LifeBook E5412A E542AMHAAMDE | |
| Lenovo ThinkPad L15 Gen 4 21H70021GE | |
| Acer Aspire 5 A515-58GM-76S8 | |
* ... smaller is better
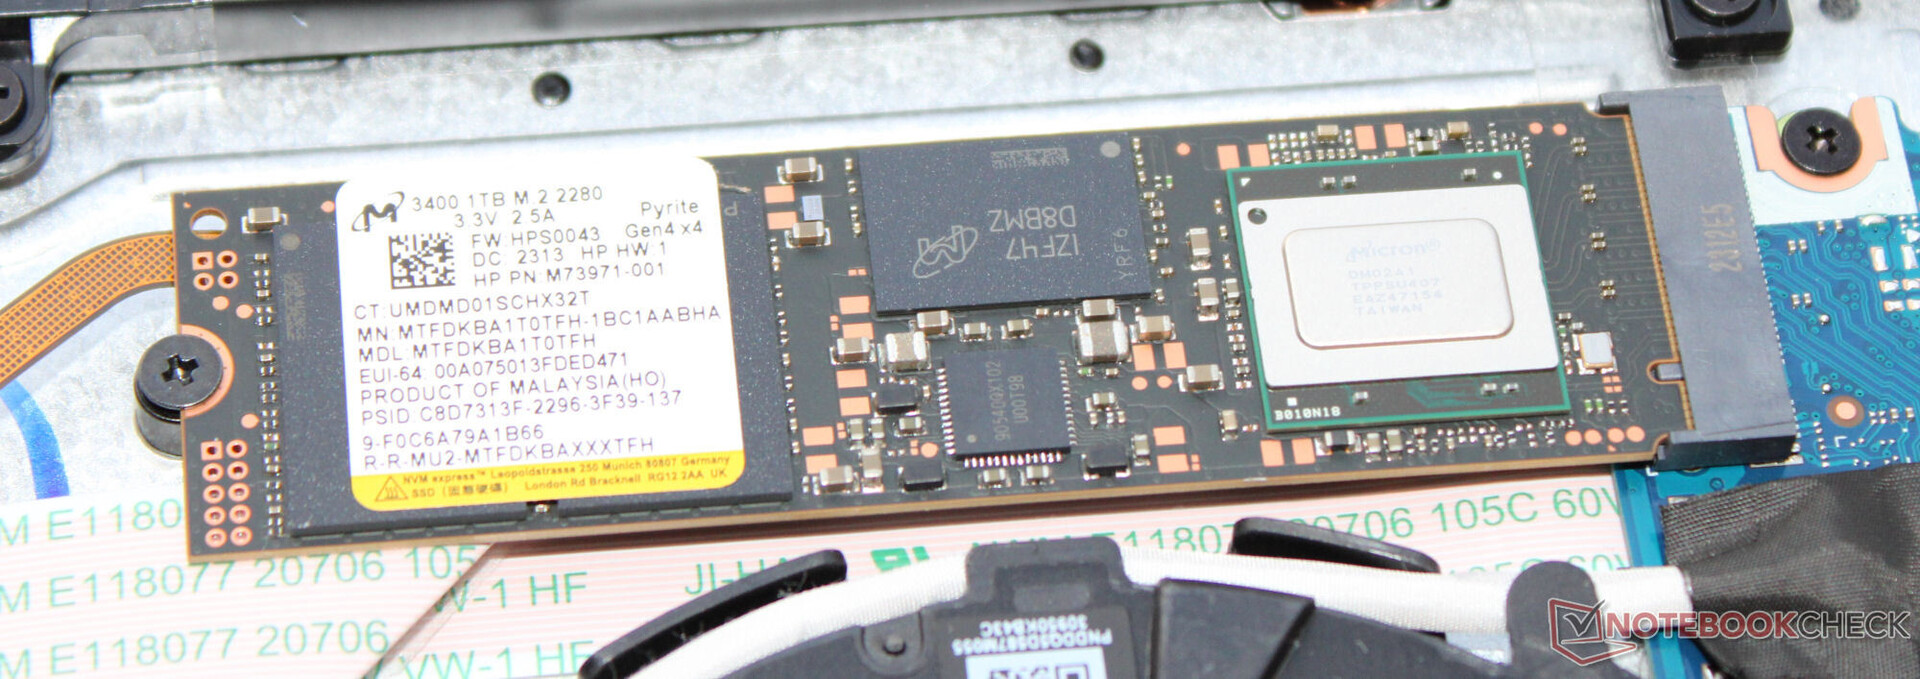
Storage devices
The device's PCIe 4 SSD (M.2-2280) from Micron features a capacity of 1 TB and it delivered excellent data rates during our test. A shame: After a short while, we noted some thermal throttling. The laptop has space for a second PCIe SSD (only M.2-2242 or M.2-2230 with the corresponding holding plate).

* ... smaller is better
Reading continuous performance: DiskSpd Read Loop, Queue Depth 8
Graphics card
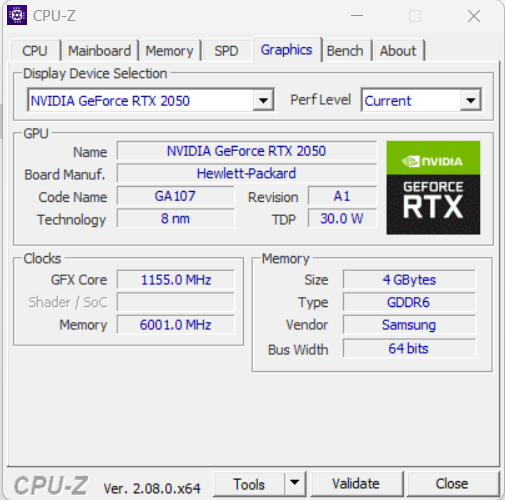
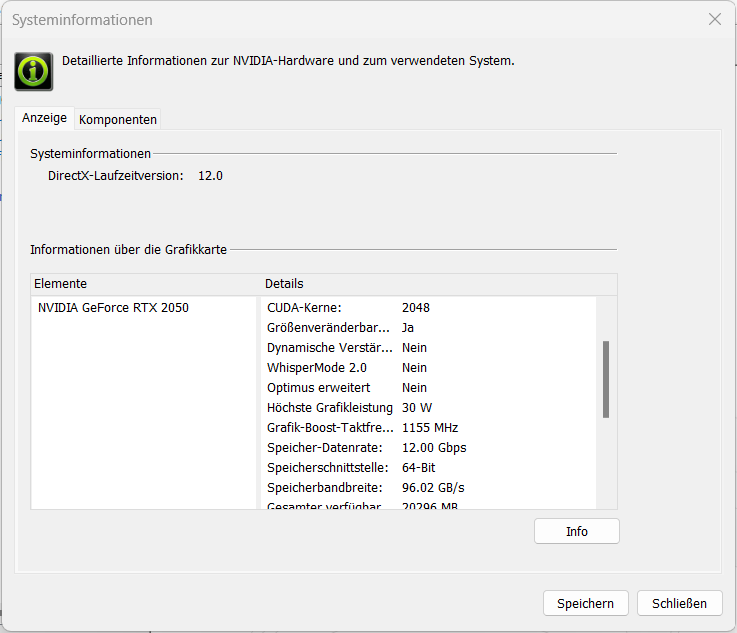
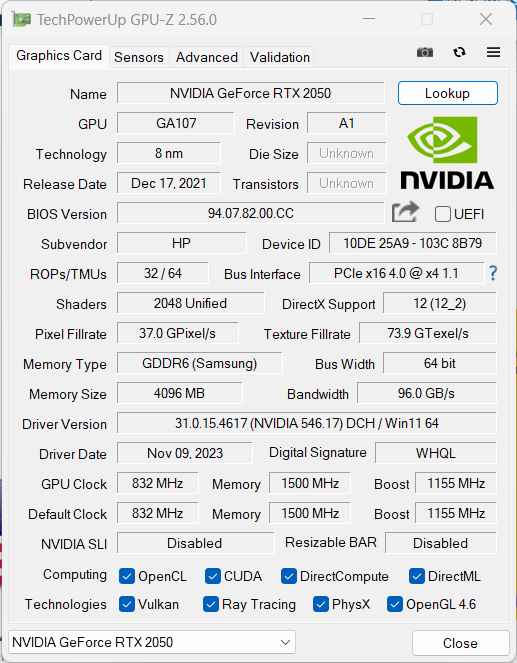
Within Nvidia's current RTX GPU range, the GeForce RTX 2050 is the weakest model. The GPU offers 2,048 shaders, a 64-bit wide bus, fast GDDR6 RAM (4,096 MB), ray tracing and DLSS. HP has given it a TGP of 30 watts — a value on the lower margin of what is possible. As expected, its benchmark results came below the previous RTX-2050 average.
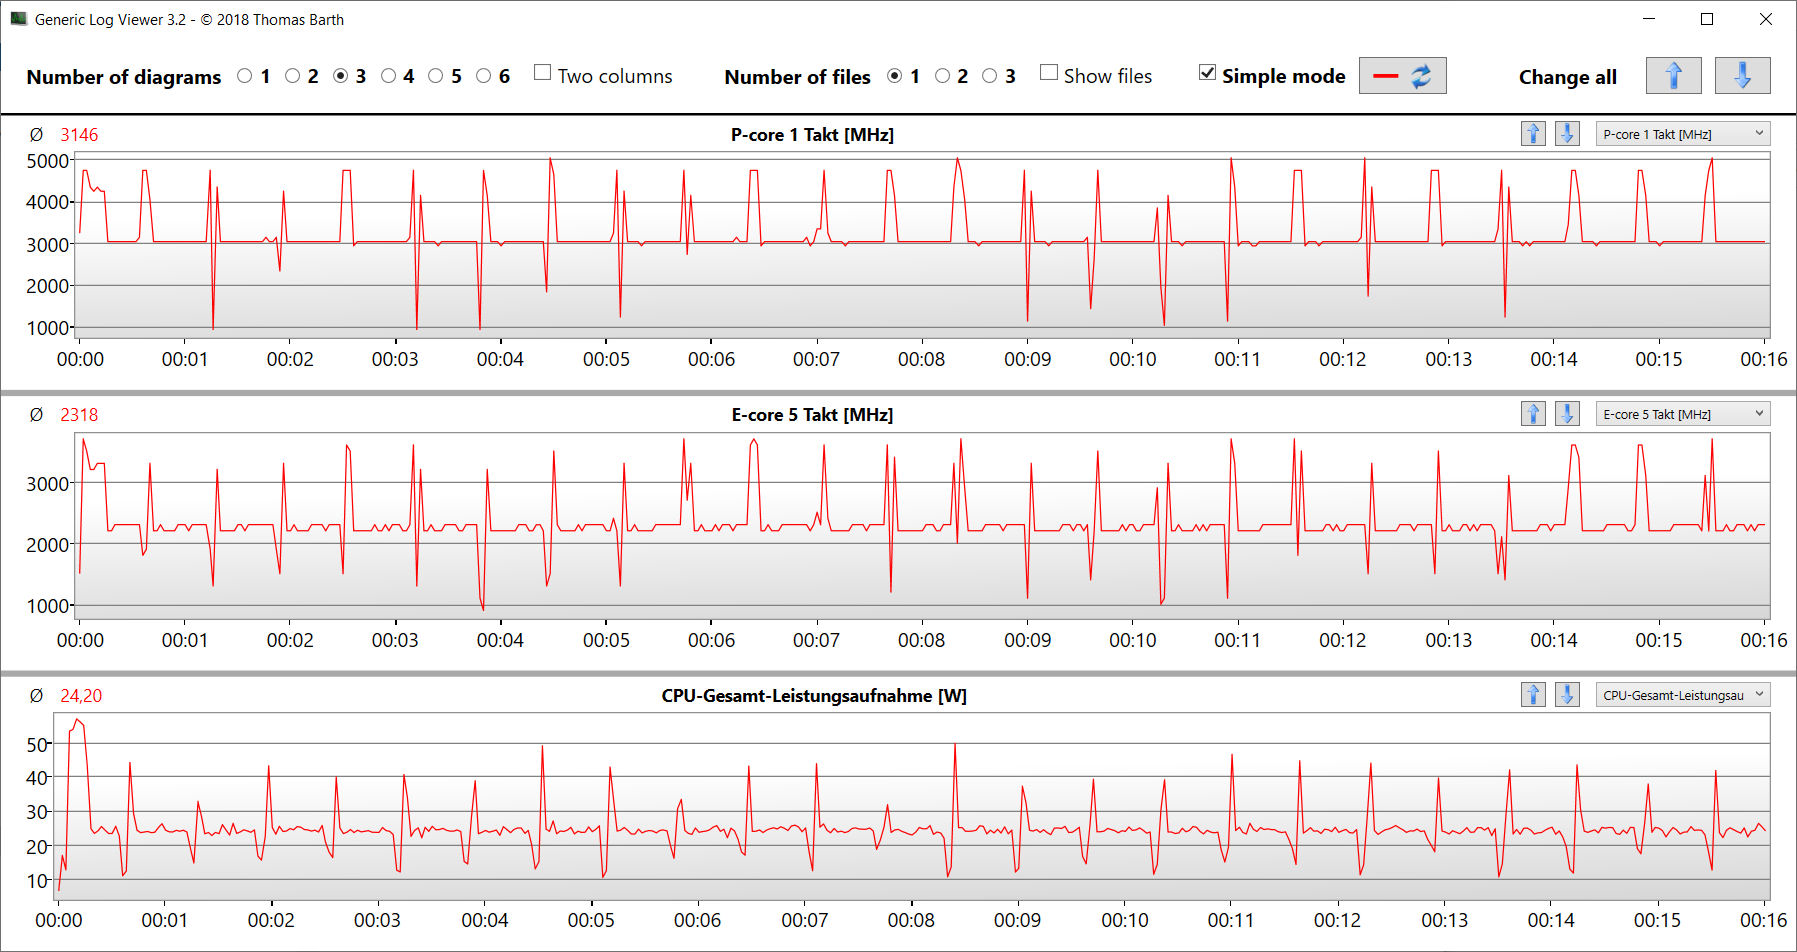
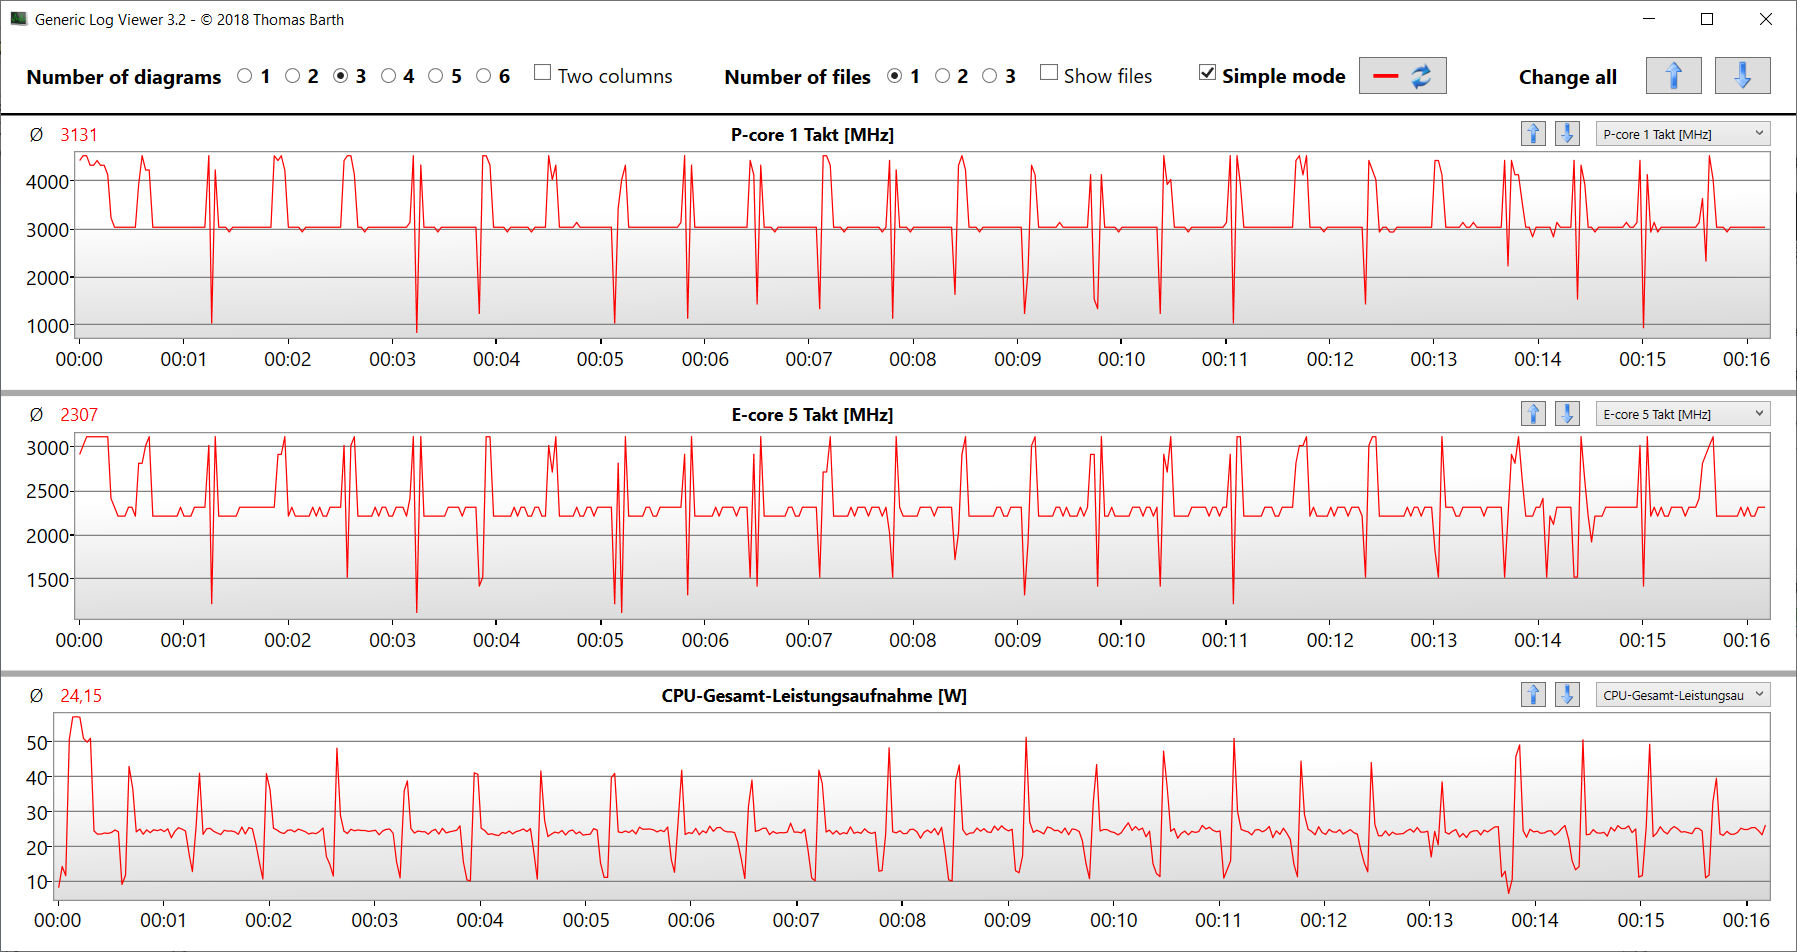
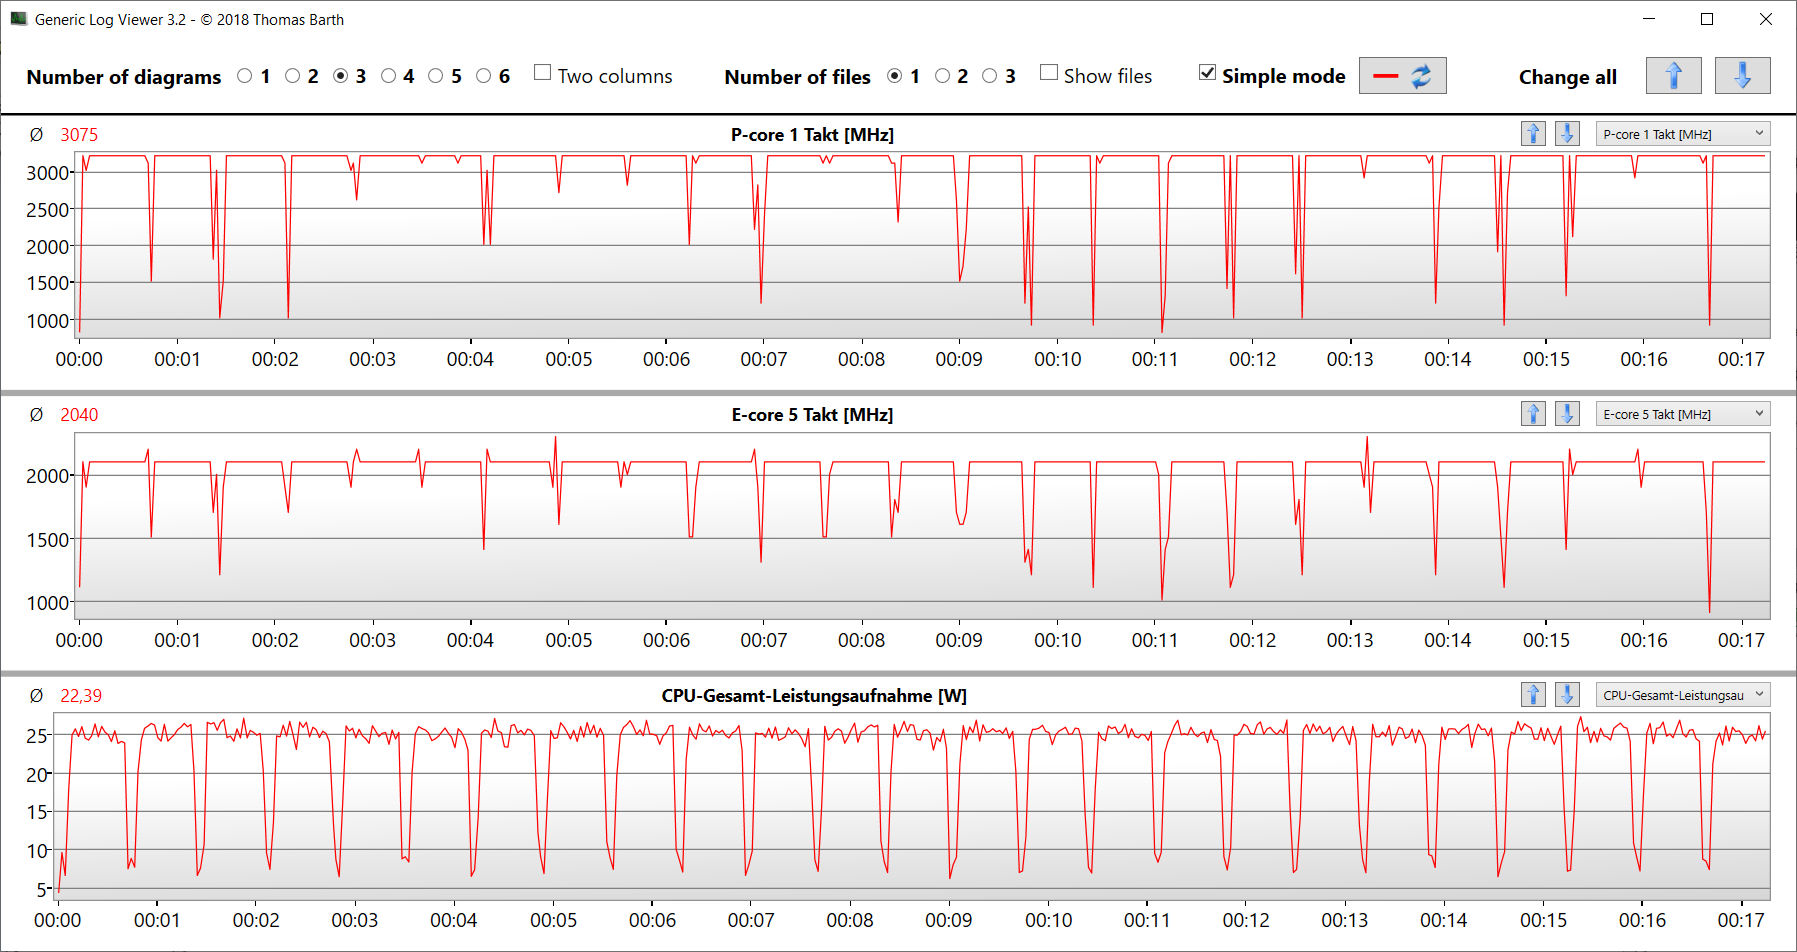
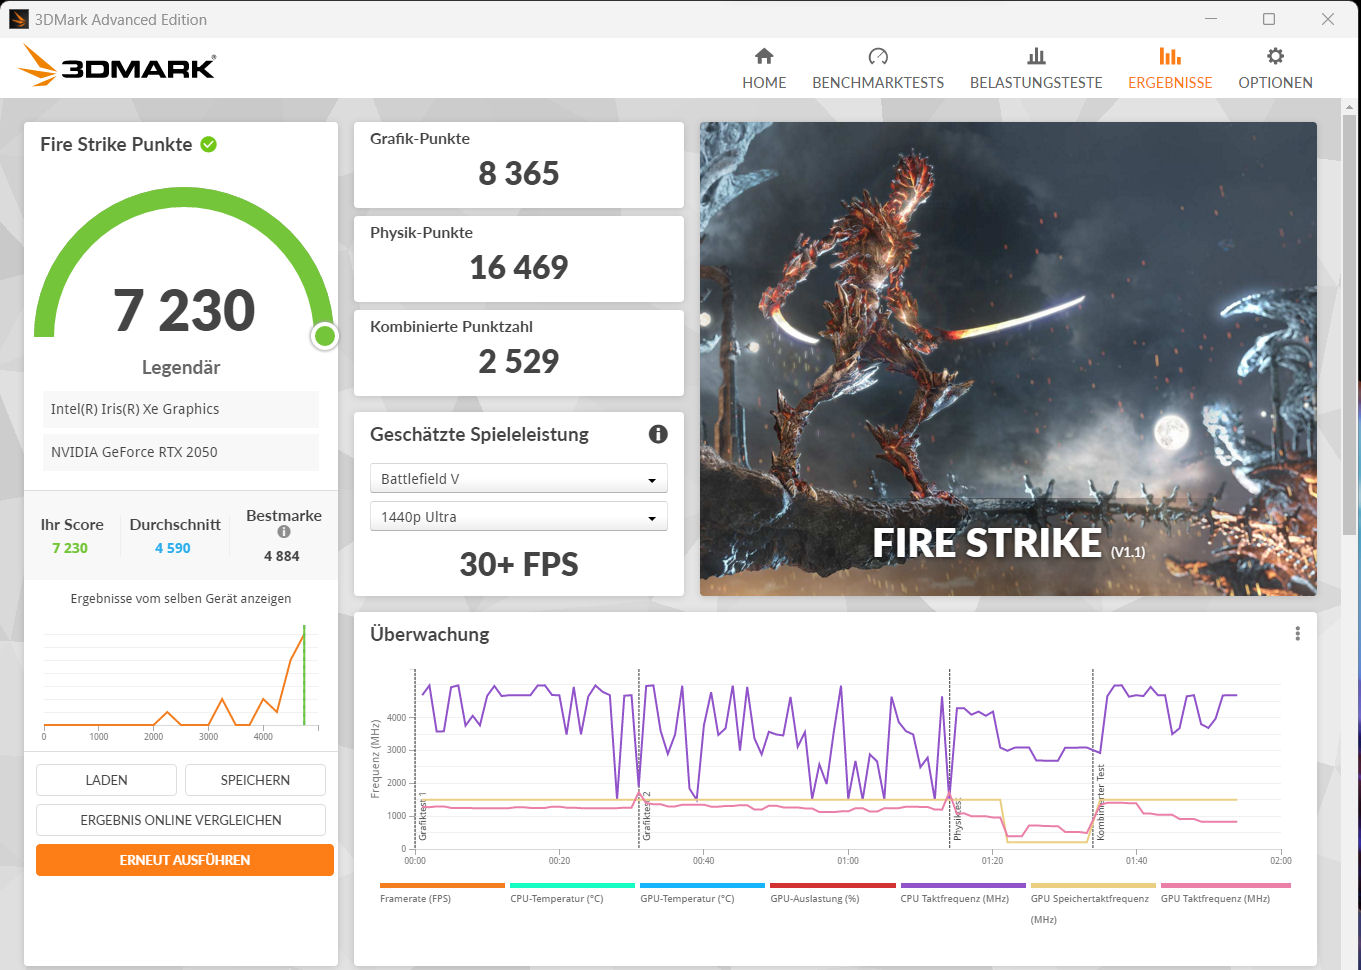
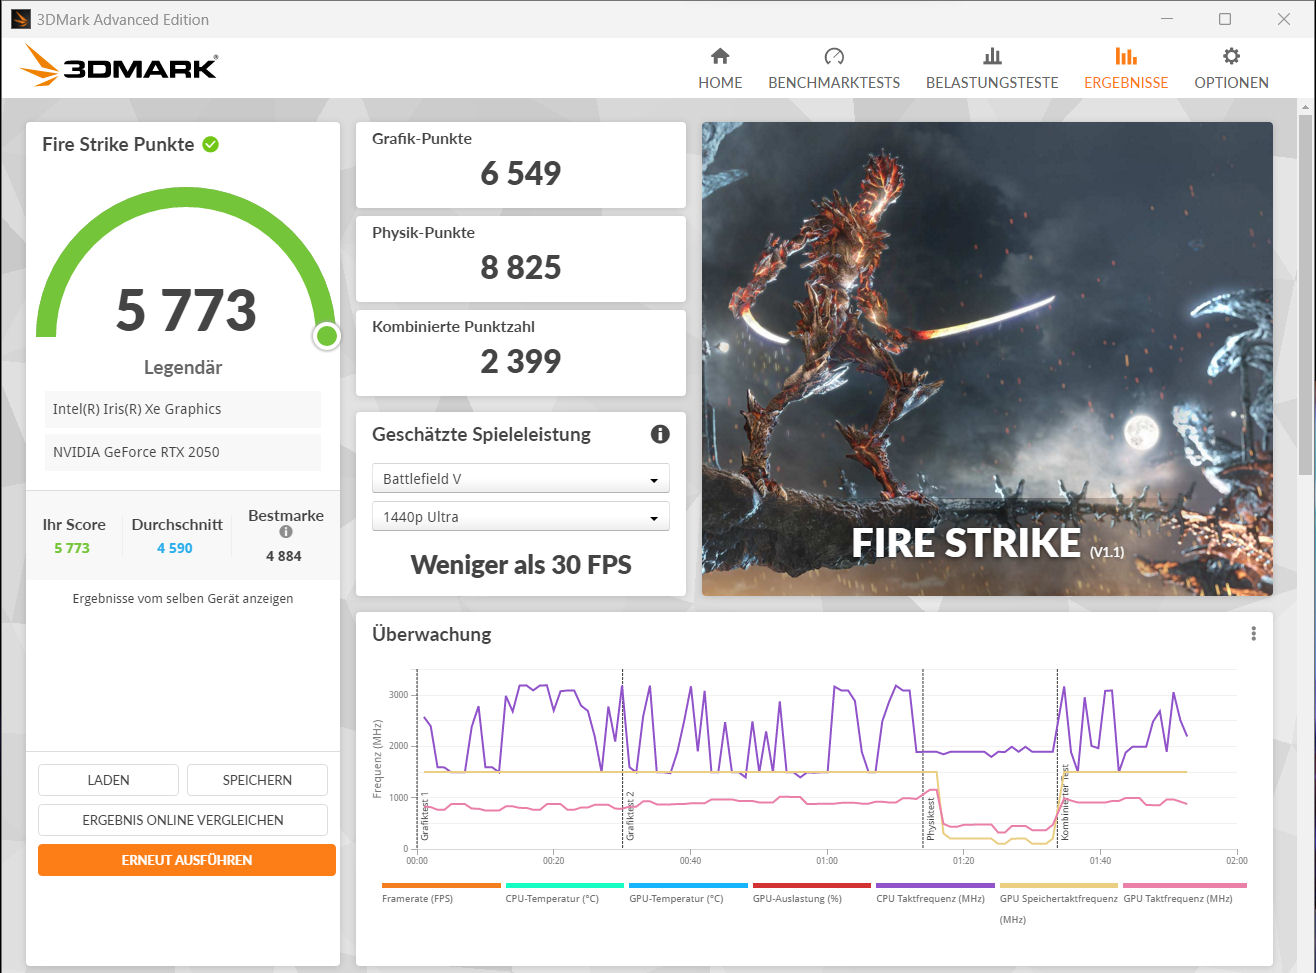
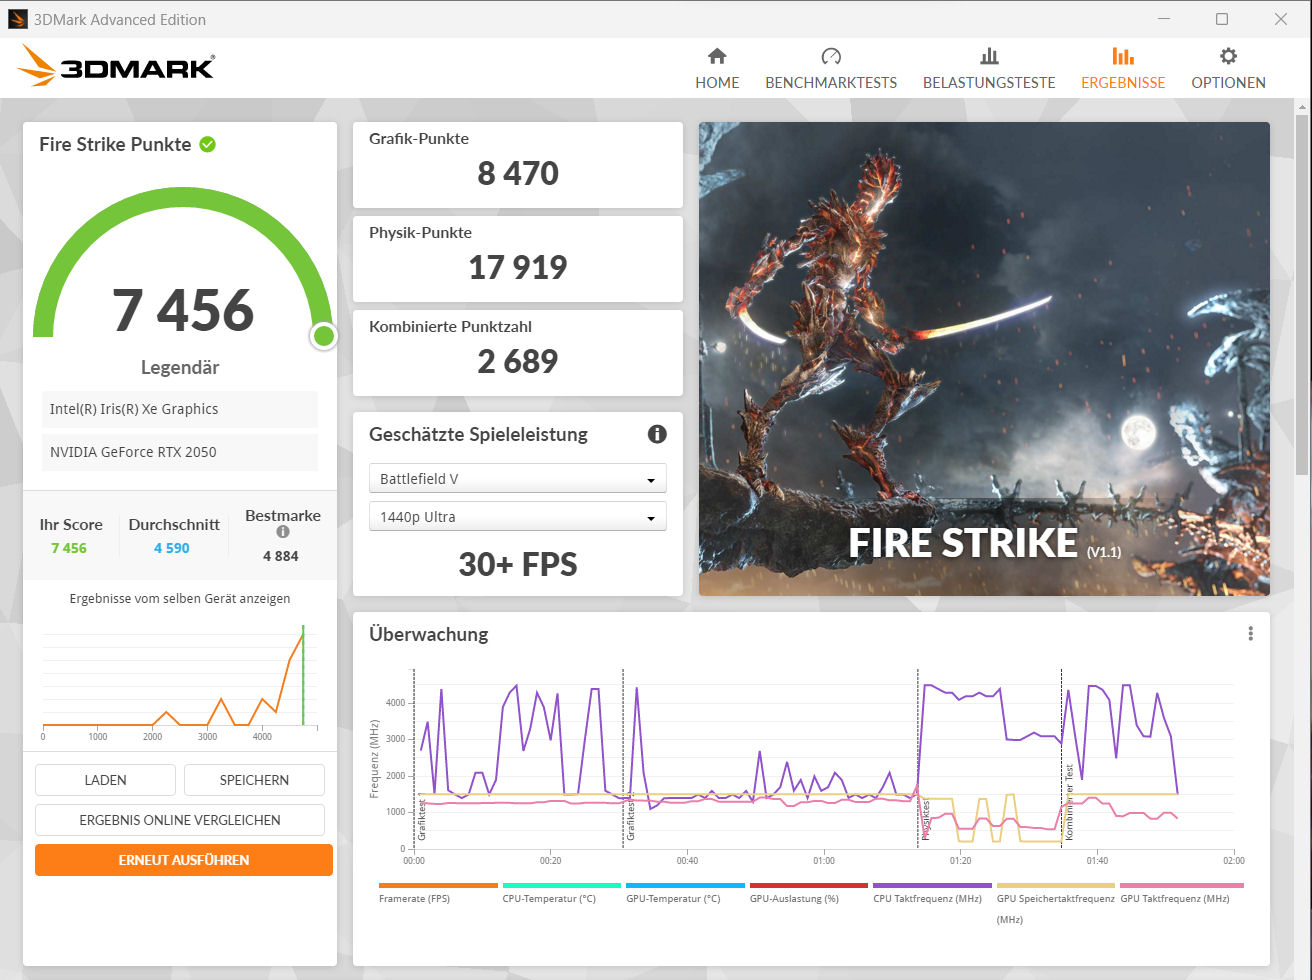
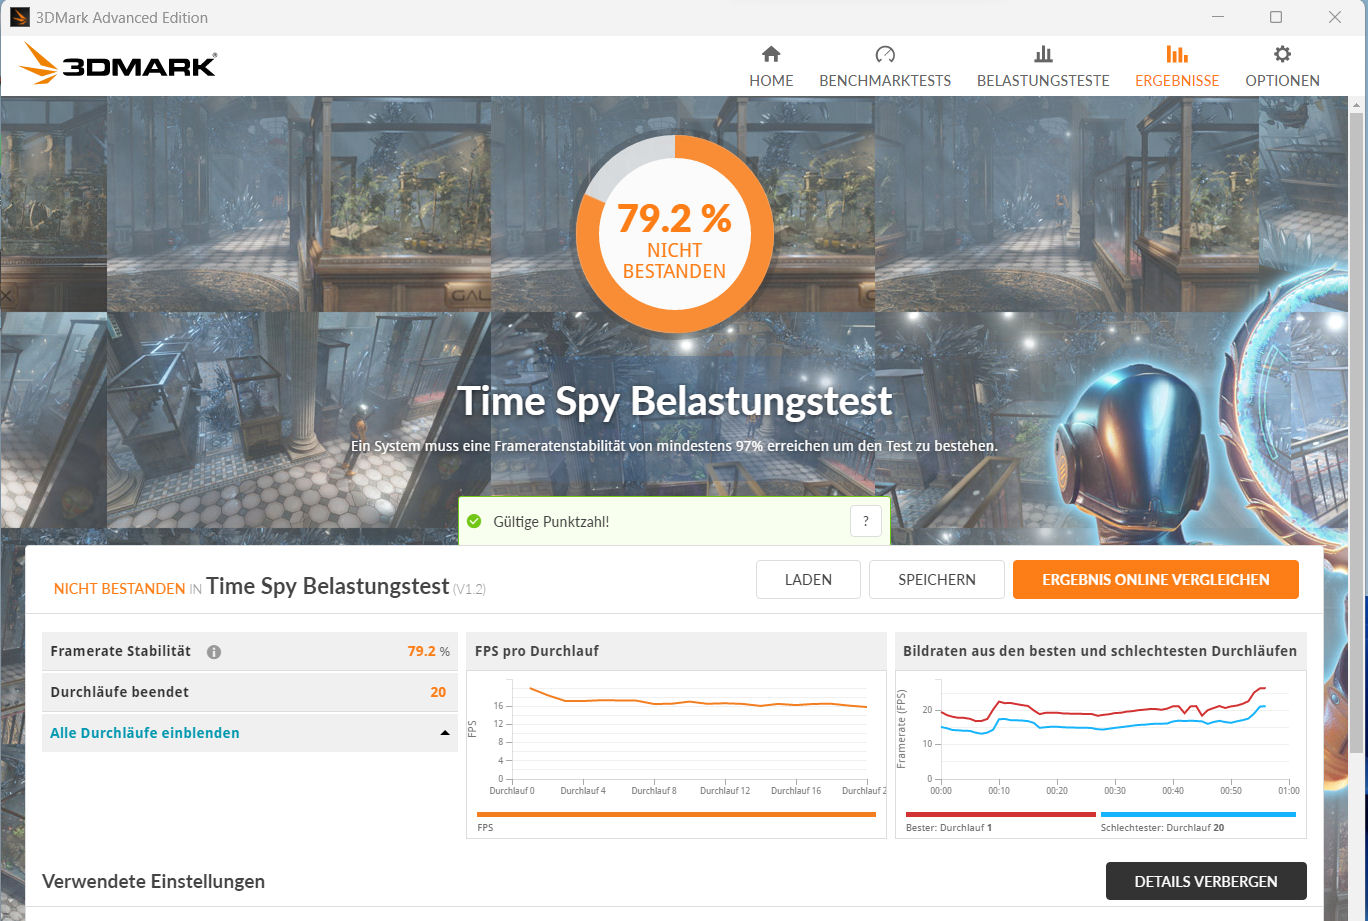
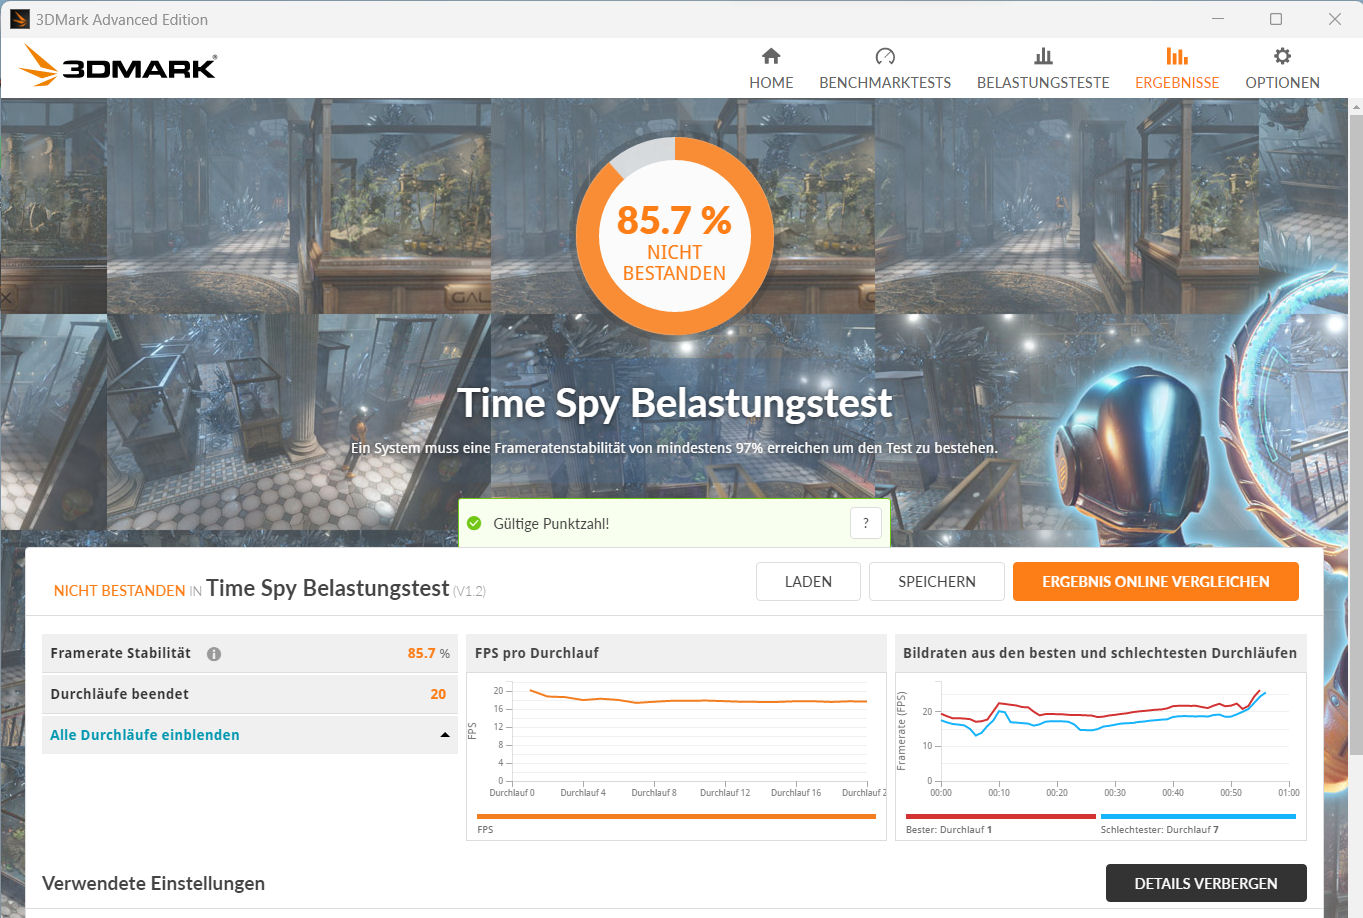
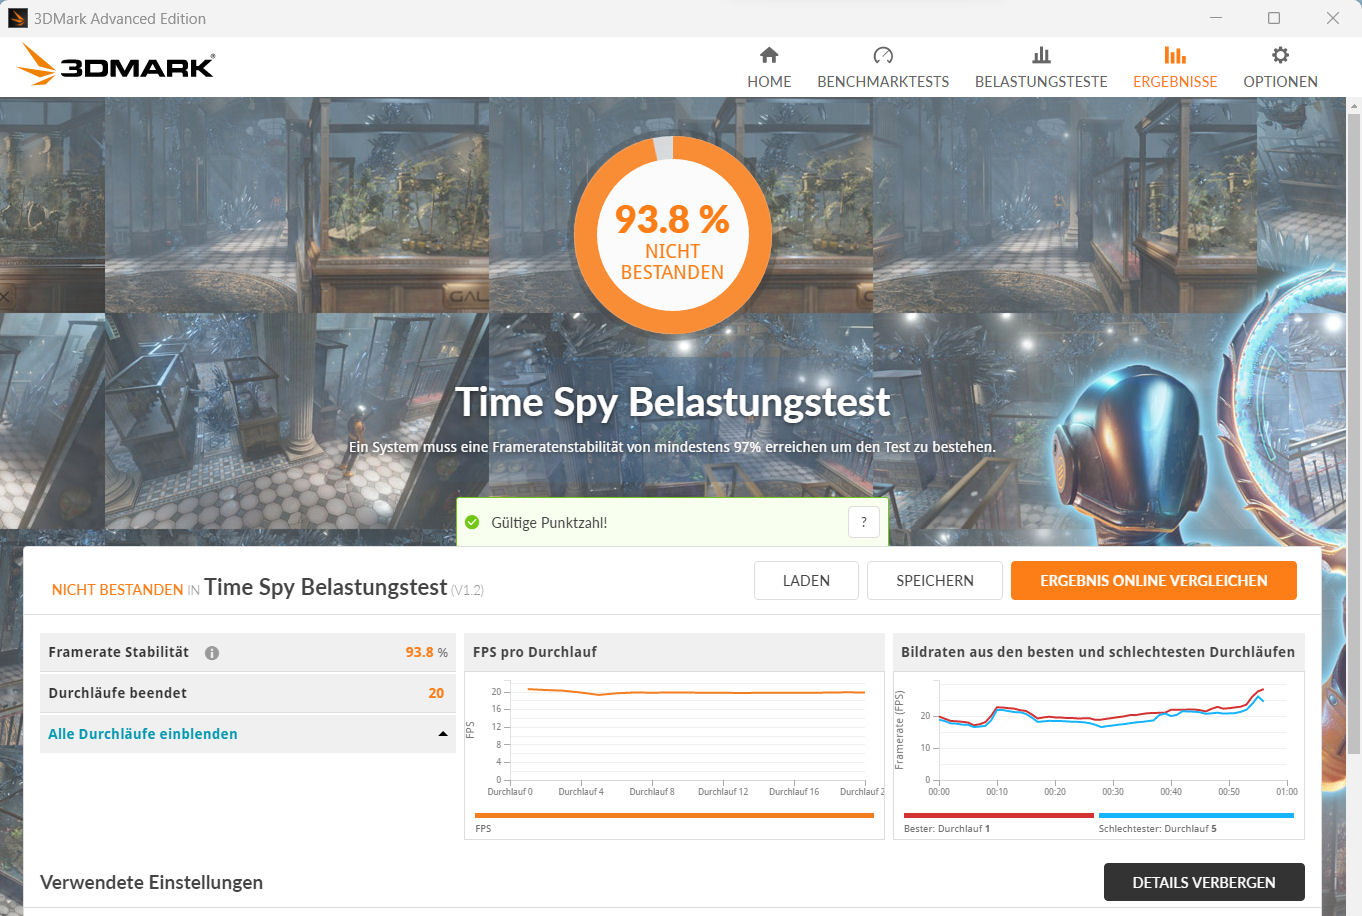
The GPU can work at full power for a short period of time and in the long run, its clock rates sink. The extent depends on the selected energy profile — however, against expectations: "Best performance" has the biggest effect, "best power saving" leads to the smallest drop. The Witcher 3 test log data shows these differences very clearly (image further below). The Time Spy stress test further evidences this behavior.
Please note: We can't rule out an error on our test device. If this turns out to be a general problem, then HP may fix this with the help of a future BIOS update.
Update: We contacted HP and they could not reproduce the issue. We assume that it is a singular problem only present on our specific review device.

| 3DMark 06 Standard Score | 38036 points | |
| 3DMark 11 Performance | 10898 points | |
| 3DMark Cloud Gate Standard Score | 25686 points | |
| 3DMark Fire Strike Score | 7230 points | |
| 3DMark Time Spy Score | 3129 points | |
Help | ||
* ... smaller is better
Gaming performance
The ProBook can't be classed as a gaming laptop, however, thanks to its GeForce GPU, it is able to run quite a few games. You should use the energy profile "best power saving". Only then does the GPU run with relatively constant and high clock rates.
The hardware allows for FHD gaming using low to high settings. Current games often require you to lower the settings. To achieve high enough frame rates, you should pick your settings more conservatively.
| The Witcher 3 - 1920x1080 Ultra Graphics & Postprocessing (HBAO+) | |
| Acer Aspire 5 A515-58GM-76S8 | |
| Average NVIDIA GeForce RTX 2050 Mobile (24.3 - 39.6, n=9) | |
| HP ProBook 450 G10 | |
| Average of class Office (14.8 - 28.1, n=3, last 2 years) | |
| Schenker VIA 15 Pro M22 | |
| Fujitsu LifeBook E5412A E542AMHAAMDE | |
| Dell Latitude 3440 | |
| Lenovo ThinkPad L15 Gen 4 21H70021GE | |
To test whether the frame rates remain stable over a longer period of time, we let the game The Witcher 3 run for about 60 minutes in Full HD resolution and maximum quality settings. We didn't move the character. The profile "best performance" resulted in fluctuating frame rates, while the profile "best power saving" allowed for frame rates more in line with our expectations.
Witcher 3 FPS diagram
| low | med. | high | ultra | |
|---|---|---|---|---|
| GTA V (2015) | 156.4 | 153.1 | 74 | 35.6 |
| The Witcher 3 (2015) | 142.1 | 84.2 | 46.7 | 24.3 |
| Dota 2 Reborn (2015) | 149.1 | 123.5 | 108.2 | 98.6 |
| Final Fantasy XV Benchmark (2018) | 68.1 | 32.3 | 24.8 | |
| X-Plane 11.11 (2018) | 91 | 80.9 | 69.6 | |
| Far Cry 5 (2018) | 93 | 39 | 35 | 34 |
| Strange Brigade (2018) | 143.1 | 66.5 | 53.7 | 46.2 |
| Cyberpunk 2077 1.6 (2022) | 32.2 | 23.5 | 19.1 | 16.8 |
| F1 23 (2023) | 54.8 | 50.8 | 36.9 | 11.3 |
Emissions - The HP G10 doesn't produce much noise and heat
Noise emissions
The fan remains largely quiet in everyday use and it often stands completely still. It gets louder under medium to full load: sound pressure levels of 41.4 dB(A) were reached in our test. All in all, this background noise is perfectly acceptable for an office laptop with a dedicated GPU.
Noise level
| Idle |
| 23.5 / 23.5 / 23.5 dB(A) |
| Load |
| 38 / 41.4 dB(A) |
 | ||
30 dB silent 40 dB(A) audible 50 dB(A) loud |
||
min: | ||
| HP ProBook 450 G10 GeForce RTX 2050 Mobile, i7-1355U, Micron 3400 1TB MTFDKBA1T0TFH | Acer Aspire 5 A515-58GM-76S8 GeForce RTX 2050 Mobile, i7-1355U, Micron 2450 1TB MTFDKBA1T0TFK | Schenker VIA 15 Pro M22 Vega 8, R7 5700U, Samsung SSD 970 EVO Plus 1TB | Lenovo ThinkPad L15 Gen 4 21H70021GE Vega 8, R7 PRO 7730U, SK hynix HFS512GEJ4X113N | Fujitsu LifeBook E5412A E542AMHAAMDE Vega 7, R5 PRO 5675U, WDC PC SN530 SDBQNPZ-512G | Dell Latitude 3440 Iris Xe G7 80EUs, i5-1345U, Samsung PM9A1 MZVL2512HCJQ | |
|---|---|---|---|---|---|---|
| Noise | -10% | -0% | 9% | -0% | -1% | |
| off / environment * (dB) | 23.5 | 25.04 -7% | 24 -2% | 23.5 -0% | 23.6 -0% | 23.9 -2% |
| Idle Minimum * (dB) | 23.5 | 26.3 -12% | 24 -2% | 23.5 -0% | 23.6 -0% | 24.4 -4% |
| Idle Average * (dB) | 23.5 | 26.3 -12% | 24 -2% | 23.5 -0% | 23.6 -0% | 24.4 -4% |
| Idle Maximum * (dB) | 23.5 | 26.3 -12% | 27.5 -17% | 23.5 -0% | 28.7 -22% | 24.4 -4% |
| Load Average * (dB) | 38 | 32.5 14% | 33.7 11% | 27.5 28% | 36.3 4% | 37.1 2% |
| Witcher 3 ultra * (dB) | 38.2 | 46.7 -22% | 33.7 12% | 32.7 14% | 36.3 5% | 38.2 -0% |
| Load Maximum * (dB) | 41.4 | 49 -18% | 42.4 -2% | 32.7 21% | 36.3 12% | 40.2 3% |
* ... smaller is better
Temperature
The laptop doesn't get all too warm under load (stress test, Witcher 3 test). In everyday use (office, internet), the values remain within the green zone.
(+) The maximum temperature on the upper side is 39.9 °C / 104 F, compared to the average of 34.3 °C / 94 F, ranging from 21.2 to 62.5 °C for the class Office.
(±) The bottom heats up to a maximum of 43 °C / 109 F, compared to the average of 36.8 °C / 98 F
(+) In idle usage, the average temperature for the upper side is 23.5 °C / 74 F, compared to the device average of 29.5 °C / 85 F.
(+) Playing The Witcher 3, the average temperature for the upper side is 31.4 °C / 89 F, compared to the device average of 29.5 °C / 85 F.
(+) The palmrests and touchpad are cooler than skin temperature with a maximum of 29.1 °C / 84.4 F and are therefore cool to the touch.
(±) The average temperature of the palmrest area of similar devices was 27.5 °C / 81.5 F (-1.6 °C / -2.9 F).
| HP ProBook 450 G10 Intel Core i7-1355U, NVIDIA GeForce RTX 2050 Mobile | Acer Aspire 5 A515-58GM-76S8 Intel Core i7-1355U, NVIDIA GeForce RTX 2050 Mobile | Schenker VIA 15 Pro M22 AMD Ryzen 7 5700U, AMD Radeon RX Vega 8 (Ryzen 4000/5000) | Lenovo ThinkPad L15 Gen 4 21H70021GE AMD Ryzen 7 PRO 7730U, AMD Radeon RX Vega 8 (Ryzen 4000/5000) | Fujitsu LifeBook E5412A E542AMHAAMDE AMD Ryzen 5 PRO 5675U, AMD Radeon RX Vega 7 | Dell Latitude 3440 Intel Core i5-1345U, Intel Iris Xe Graphics G7 80EUs | |
|---|---|---|---|---|---|---|
| Heat | 6% | -2% | 10% | -14% | -2% | |
| Maximum Upper Side * (°C) | 39.9 | 35.7 11% | 41.2 -3% | 39.1 2% | 49.5 -24% | 35.2 12% |
| Maximum Bottom * (°C) | 43 | 36.8 14% | 43.5 -1% | 36.1 16% | 50.3 -17% | 41 5% |
| Idle Upper Side * (°C) | 26.4 | 27.9 -6% | 28.4 -8% | 23.1 12% | 29.6 -12% | 29.8 -13% |
| Idle Bottom * (°C) | 29 | 27.9 4% | 28.1 3% | 25.7 11% | 30 -3% | 32 -10% |
* ... smaller is better
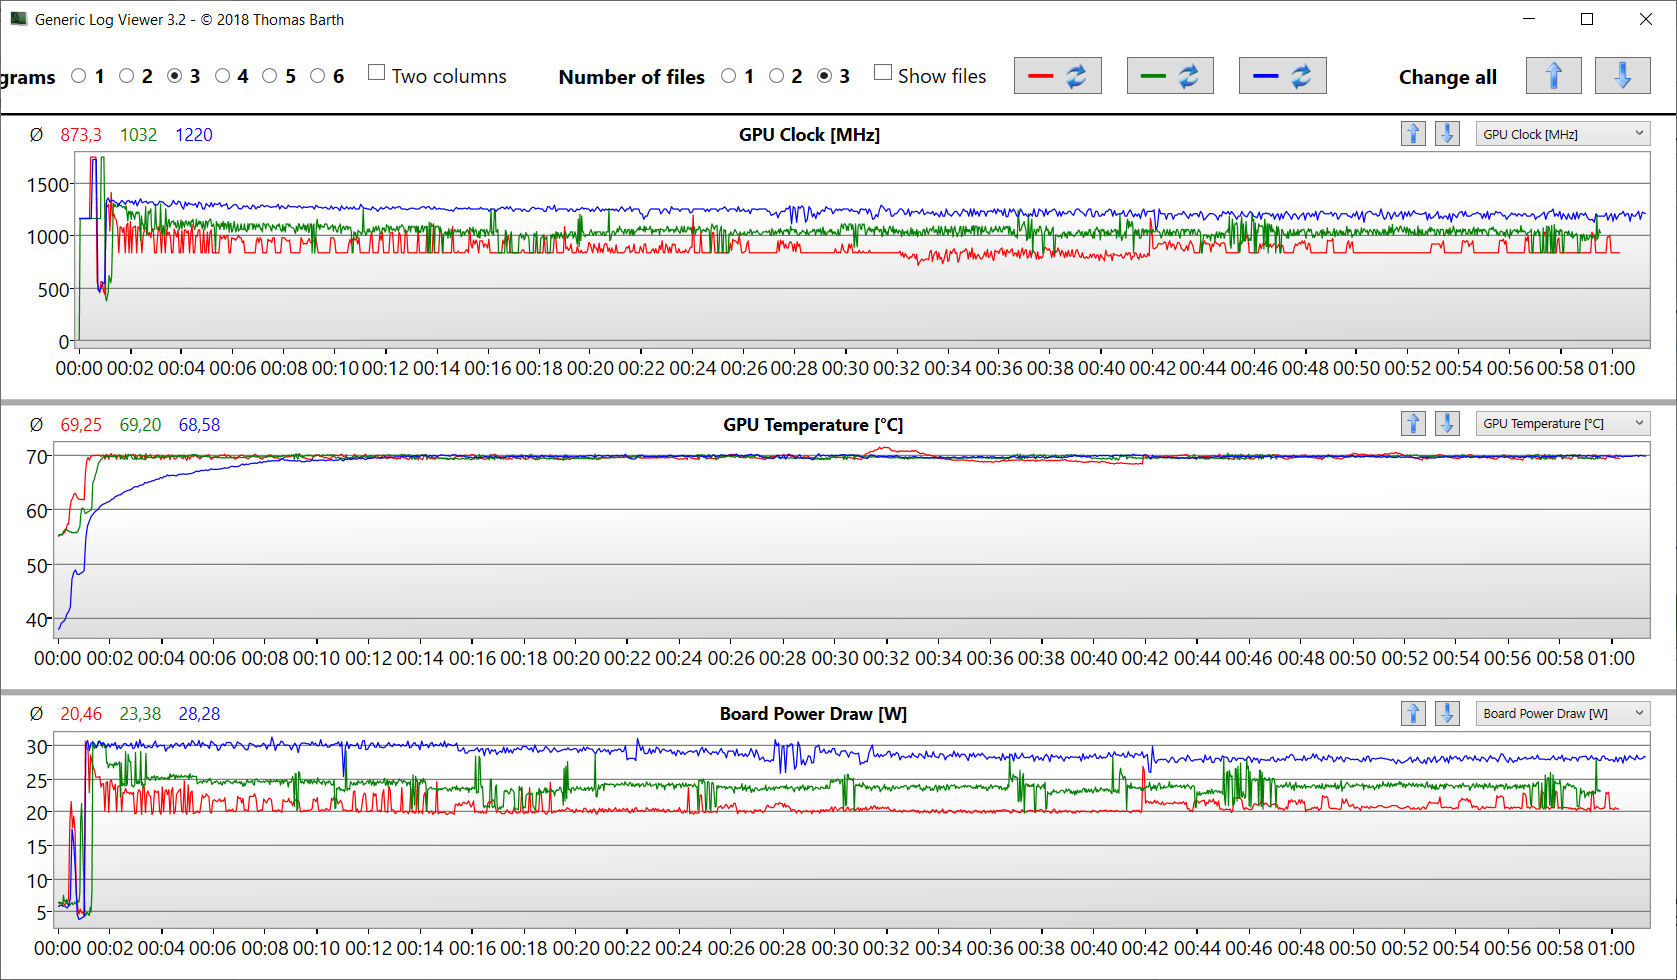
Stress test
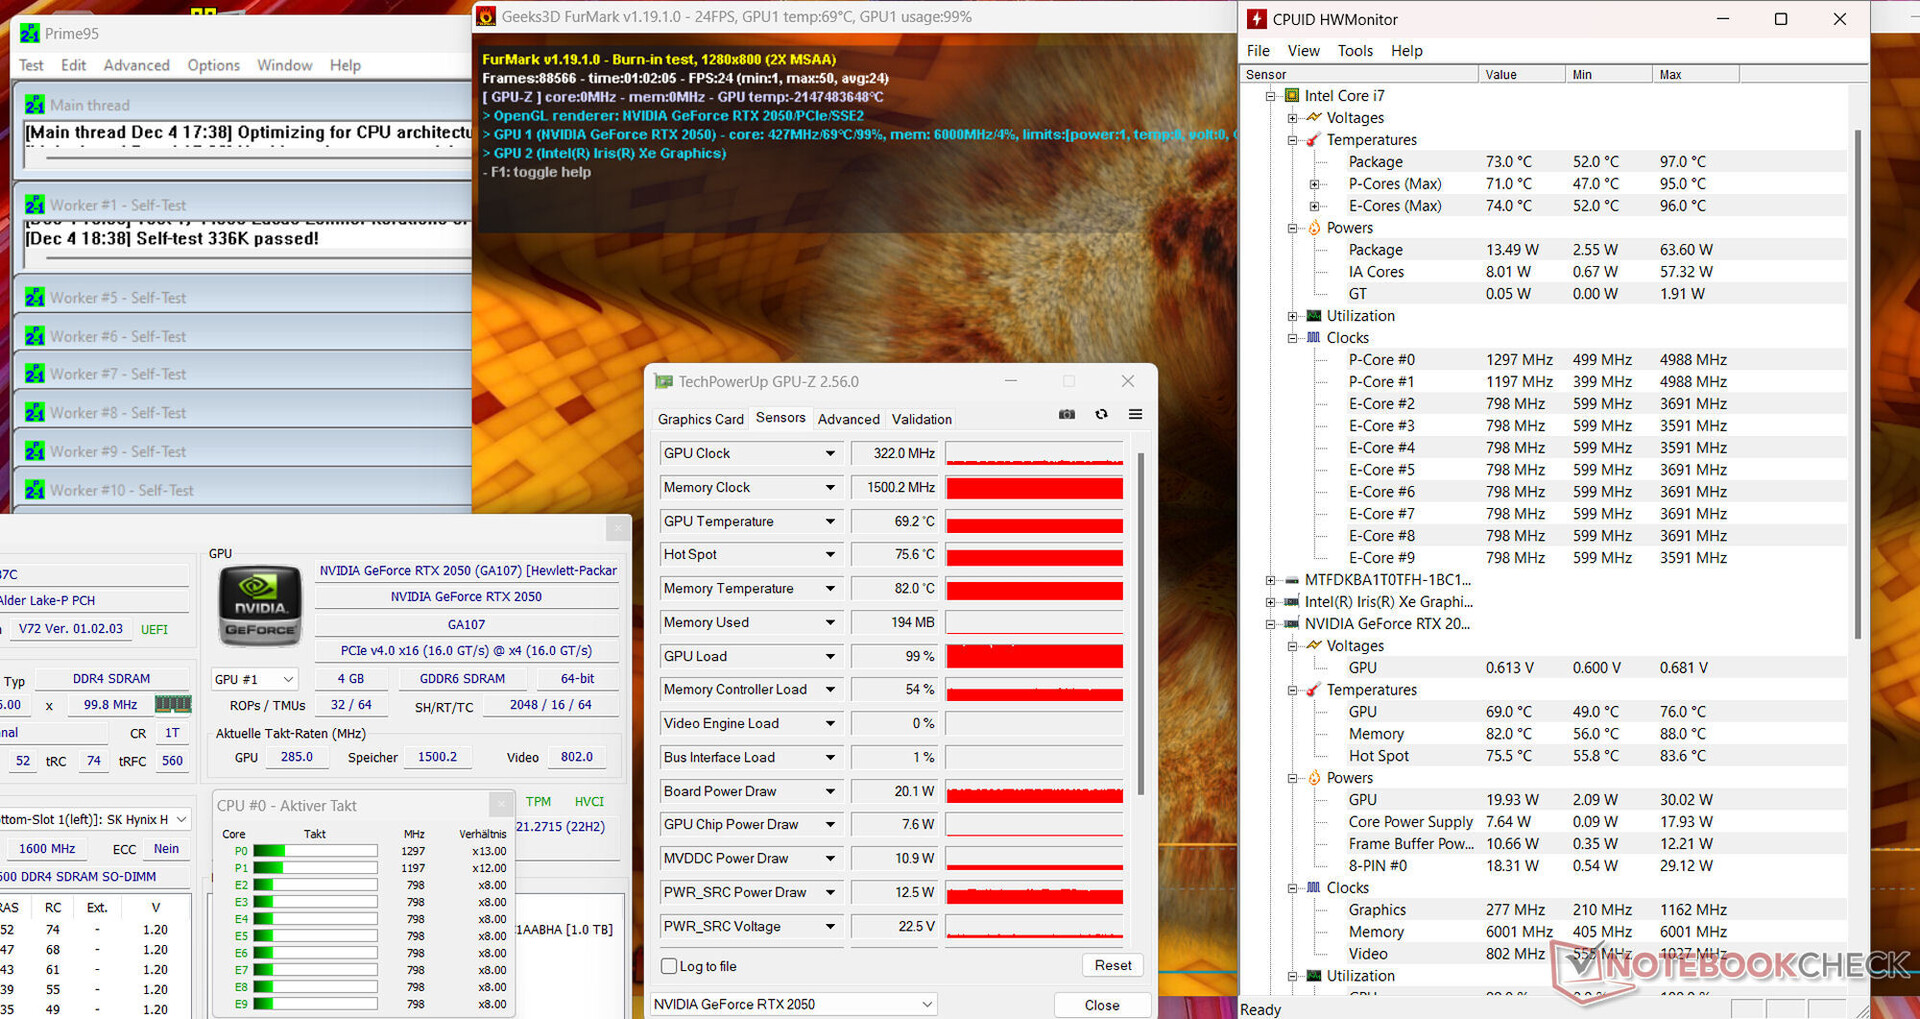
The stress test (Prime95 and Furmark in continuous use) simulates an extreme scenario in order to test the system's stability under full load. The CPU (P: 2.5 GHz, E: 1.9 GHz) and GPU (832 MHz) began the test with relatively low clock rates. as the process continued, the values plummeted.
Speakers
The stereo speakers produce a decent sound — but with hardly any bass. We would recommend using headphones or external speakers for a more enjoyable sound experience.
HP ProBook 450 G10 audio analysis
(±) | speaker loudness is average but good (74.8 dB)
Bass 100 - 315 Hz
(-) | nearly no bass - on average 28.4% lower than median
(±) | linearity of bass is average (10.9% delta to prev. frequency)
Mids 400 - 2000 Hz
(+) | balanced mids - only 2.9% away from median
(+) | mids are linear (5.8% delta to prev. frequency)
Highs 2 - 16 kHz
(+) | balanced highs - only 3.6% away from median
(+) | highs are linear (3.5% delta to prev. frequency)
Overall 100 - 16.000 Hz
(±) | linearity of overall sound is average (22.2% difference to median)
Compared to same class
» 58% of all tested devices in this class were better, 9% similar, 33% worse
» The best had a delta of 7%, average was 21%, worst was 53%
Compared to all devices tested
» 65% of all tested devices were better, 6% similar, 29% worse
» The best had a delta of 4%, average was 23%, worst was 134%
Acer Aspire 5 A515-58GM-76S8 audio analysis
(±) | speaker loudness is average but good (76 dB)
Bass 100 - 315 Hz
(-) | nearly no bass - on average 23.8% lower than median
(±) | linearity of bass is average (11.6% delta to prev. frequency)
Mids 400 - 2000 Hz
(+) | balanced mids - only 1.9% away from median
(±) | linearity of mids is average (8.7% delta to prev. frequency)
Highs 2 - 16 kHz
(+) | balanced highs - only 3.9% away from median
(+) | highs are linear (5.6% delta to prev. frequency)
Overall 100 - 16.000 Hz
(±) | linearity of overall sound is average (19.9% difference to median)
Compared to same class
» 42% of all tested devices in this class were better, 9% similar, 49% worse
» The best had a delta of 7%, average was 21%, worst was 53%
Compared to all devices tested
» 51% of all tested devices were better, 7% similar, 42% worse
» The best had a delta of 4%, average was 23%, worst was 134%
Power management - The HP computer has long runtimes
Power consumption
Under load, the ProBook is happy with a much smaller amount of energy than the Aspire 5 fitted with the same CPU/GPU combination. No surprise: At the end of the day, the HP laptop's hardware is run with much more conservative performance settings. As a result, the 450 G10 is fine with a 65-watt power supply (Aspire: 90 watts). While the Witcher 3 test was completed with fluctuating power consumption values, its consumption during the test first sank slowly, then from a certain point it plummeted.
| Off / Standby | |
| Idle | |
| Load |
|
Key:
min: | |
| HP ProBook 450 G10 i7-1355U, GeForce RTX 2050 Mobile, Micron 3400 1TB MTFDKBA1T0TFH, IPS, 1920x1080, 15.6" | Acer Aspire 5 A515-58GM-76S8 i7-1355U, GeForce RTX 2050 Mobile, Micron 2450 1TB MTFDKBA1T0TFK, IPS, 1920x1080, 15.6" | Schenker VIA 15 Pro M22 R7 5700U, Vega 8, Samsung SSD 970 EVO Plus 1TB, IPS, 2560x1440, 15.6" | Lenovo ThinkPad L15 Gen 4 21H70021GE R7 PRO 7730U, Vega 8, SK hynix HFS512GEJ4X113N, IPS, 1920x1080, 15.6" | Fujitsu LifeBook E5412A E542AMHAAMDE R5 PRO 5675U, Vega 7, WDC PC SN530 SDBQNPZ-512G, IPS, 1920x1080, 14" | Dell Latitude 3440 i5-1345U, Iris Xe G7 80EUs, Samsung PM9A1 MZVL2512HCJQ, IPS, 1920x1080, 14" | Average NVIDIA GeForce RTX 2050 Mobile | Average of class Office | |
|---|---|---|---|---|---|---|---|---|
| Power Consumption | -10% | -21% | 7% | 17% | 9% | -23% | 7% | |
| Idle Minimum * (Watt) | 4.6 | 4.31 6% | 6.9 -50% | 4.5 2% | 4.1 11% | 3.7 20% | 5.11 ? -11% | 4.3 ? 7% |
| Idle Average * (Watt) | 7.3 | 6.52 11% | 10.9 -49% | 8.5 -16% | 6.6 10% | 6.5 11% | 9.15 ? -25% | 7.33 ? -0% |
| Idle Maximum * (Watt) | 8.4 | 8.037 4% | 11.3 -35% | 10.5 -25% | 7.4 12% | 9.5 -13% | 11.2 ? -33% | 8.59 ? -2% |
| Load Average * (Watt) | 57.3 | 75.2 -31% | 54.2 5% | 35.6 38% | 43.1 25% | 46.9 18% | 70.6 ? -23% | 43.6 ? 24% |
| Witcher 3 ultra * (Watt) | 49.3 | 60.8 -23% | 47.3 4% | 37.4 24% | 42.6 14% | 42.1 15% | ||
| Load Maximum * (Watt) | 69.7 | 89.5 -28% | 69 1% | 57.9 17% | 50.9 27% | 67 4% | 87.4 ? -25% | 64.2 ? 8% |
* ... smaller is better
Power consumption Witcher 3 / stress test
Power consumption with external monitor
Runtimes
According to the data sheet, HP has provided the ProBook with two battery options (42 Wh, 51 Wh) — our test device features the larger model. As a result, the 15.6-inch device achieved practical runtimes of 9:19 h (WiFi; accessing websites via a script) and 11:25 h (video; short film Big Buck Bunny (H.264 encoding, FHD) — good values.
| HP ProBook 450 G10 i7-1355U, GeForce RTX 2050 Mobile, 51.3 Wh | Acer Aspire 5 A515-58GM-76S8 i7-1355U, GeForce RTX 2050 Mobile, 48 Wh | Schenker VIA 15 Pro M22 R7 5700U, Vega 8, 91 Wh | Lenovo ThinkPad L15 Gen 4 21H70021GE R7 PRO 7730U, Vega 8, 57 Wh | Fujitsu LifeBook E5412A E542AMHAAMDE R5 PRO 5675U, Vega 7, 60 Wh | Dell Latitude 3440 i5-1345U, Iris Xe G7 80EUs, 54 Wh | Average of class Office | |
|---|---|---|---|---|---|---|---|
| Battery runtime | -26% | 18% | 7% | -24% | -5% | 16% | |
| Reader / Idle (h) | 18.1 | 25.1 39% | 23.7 ? 31% | ||||
| H.264 (h) | 11.4 | 6.6 -42% | 9.5 -17% | 8.2 -28% | 15.1 ? 32% | ||
| WiFi v1.3 (h) | 9.3 | 8.7 -6% | 11 18% | 11.9 28% | 10.4 12% | 8.8 -5% | 13 ? 40% |
| Load (h) | 2.8 | 2 -29% | 2.2 -21% | 1.2 -57% | 1.742 ? -38% |
Pros
Cons
Verdict - The office laptop allows for casual gaming

Office and internet uses are mastered by the installed combination consisting of a Core i7-1355U and 32 GB RAM (dual-channel). GPU-intensive uses such as gaming profit from the GeForce RTX 2050. However: The GPU absorbs short load peaks at full power, but has to take things a little slower under prolonged load.
No experiments. Similar to its predecessor, the HP ProBook 450 G10 has revealed itself to be a solid office laptop for organisations, companies and private users.
The device's heat and noise emissions are okay. Portability is ensured thanks to its moderate weight (ca. 1.8 kg), compact case and practical runtimes (9 to 11 h). Two USB-C ports (USB 3.2 Gen 2) allow for easy integration into an existing workplace setup.
Power is delivered via a proprietary HP power supply. Alternatively, you can use a USB-C charger — both USB-C ports support Power Delivery (and can output a DisplayPort signal). Unfortunately, they are "only" USB 3.2 Gen 2 ports. Thunderbolt 4 cannot be found on HP's ProBooks. Another positive is its crisp keyboard.
The installed FHD display (IPS, 15.6 inches) only offers limited color space coverage and isn't able to reach its target brightness (> 300 cd/m²). A ProBook- model with an alternatively available 400-nit panel (FHD) including sRGB coverage could potentially be a better solution for many users.
The laptop's price range is fair. Models without a GeForce GPU can already be found well under US$1000 and the same can be said for the identically built ProBook 455 G10 series (Ryzen 7000).
An alternative to the 450 G10 could be the Acer Aspire 5 A515-58GM. It offers slightly more performance with the same CPU/GPU combination, and it also features a Thunderbolt 4 port. The Aspire produces slightly more noise at its peak than the HP laptop and under load, it has a larger power requirement. You will have to spend around US$1000 on the Acer device.
Price and availability
The version of the HP ProBook 450 G10 which we tested can currently be found for US$969 on Amazon.
HP ProBook 450 G10
- 12/13/2023 v7 (old)
Sascha Mölck
Transparency
The selection of devices to be reviewed is made by our editorial team. The test sample was provided to the author as a loan by the manufacturer or retailer for the purpose of this review. The lender had no influence on this review, nor did the manufacturer receive a copy of this review before publication. There was no obligation to publish this review. As an independent media company, Notebookcheck is not subjected to the authority of manufacturers, retailers or publishers.
This is how Notebookcheck is testing
Every year, Notebookcheck independently reviews hundreds of laptops and smartphones using standardized procedures to ensure that all results are comparable. We have continuously developed our test methods for around 20 years and set industry standards in the process. In our test labs, high-quality measuring equipment is utilized by experienced technicians and editors. These tests involve a multi-stage validation process. Our complex rating system is based on hundreds of well-founded measurements and benchmarks, which maintains objectivity. Further information on our test methods can be found here.
Price comparison

