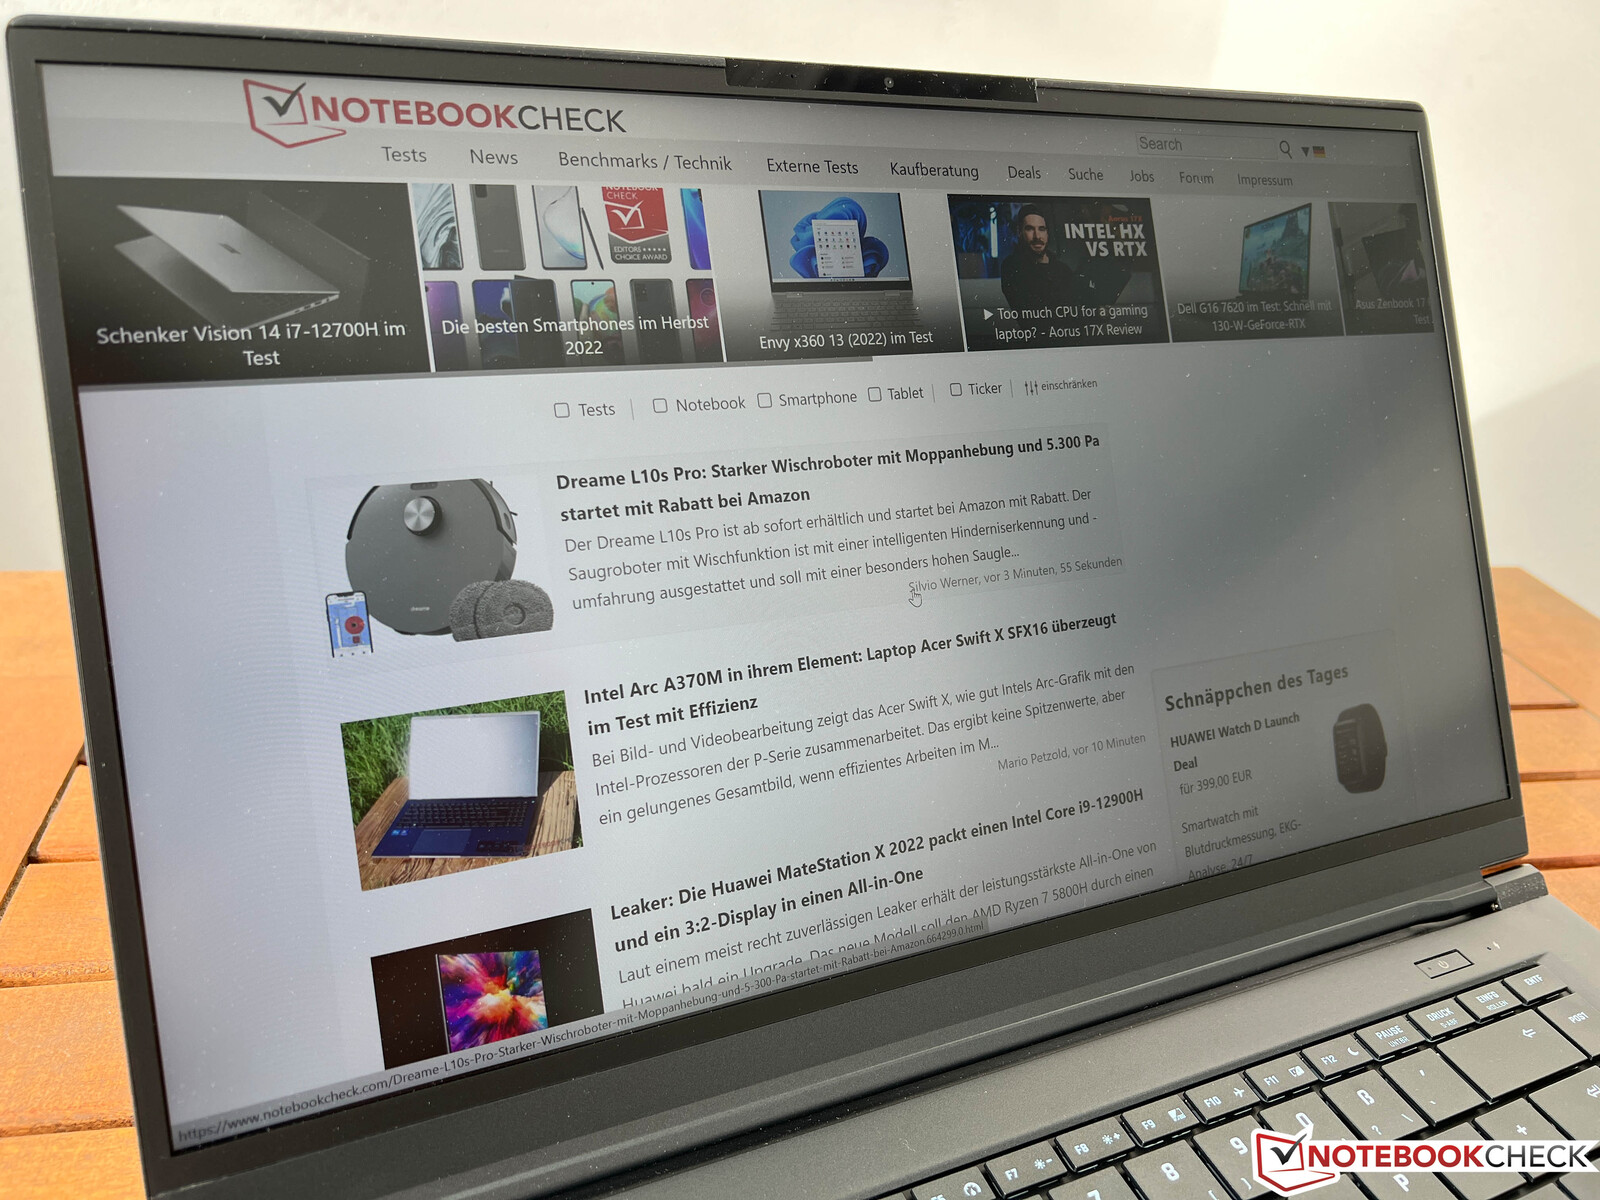
Schenker VIA 15 Pro review - AMD office laptop with long battery life
Schenker offers a fast office notebook with the VIA 15 Pro, which uses a matte IPS panel with a 165 Hz refresh rate in addition to good input devices. An AMD Ryzen processor is responsible for the performance and both RAM and the SSD can be configured according to one's needs. The starting price for the configuration with the Ryzen 7 5700U, 8 GB RAM and a 512 GB SSD is 1,149 Euros; our test unit with 32 GB RAM and a 1 TB SSD costs 1,298 Euros without the operating system.
Possible competitors in comparison
Rating | Date | Model | Weight | Height | Size | Resolution | Price |
|---|---|---|---|---|---|---|---|
| 87.1 % v7 (old) | 06 / 2023 | Schenker VIA 15 Pro M22 R7 5700U, Vega 8 | 1.4 kg | 16.8 mm | 15.60" | 2560x1440 | |
| 84.6 % v7 (old) | 02 / 2023 | Dell Latitude 3520 i5-1135G7, Iris Xe G7 80EUs | 1.8 kg | 18.06 mm | 15.60" | 1920x1080 | |
| 85 % v7 (old) | 08 / 2022 | HP ProBook 450 G9 6A180EA i7-1255U, Iris Xe G7 96EUs | 1.7 kg | 19.9 mm | 15.60" | 1920x1080 | |
| 84.7 % v7 (old) | 07 / 2022 | Dell Inspiron 15 5515-H8P8F R7 5700U, Vega 8 | 1.6 kg | 18 mm | 15.60" | 1920x1080 | |
| 84.9 % v7 (old) | 09 / 2022 | Lenovo ThinkBook 15 G4 21DL0009GE R5 5625U, Vega 7 | 1.8 kg | 23 mm | 15.60" | 1920x1080 |
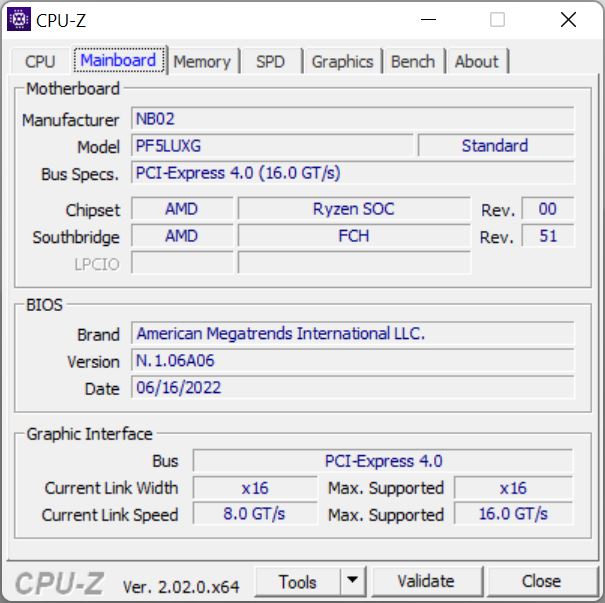
Case & Equipment
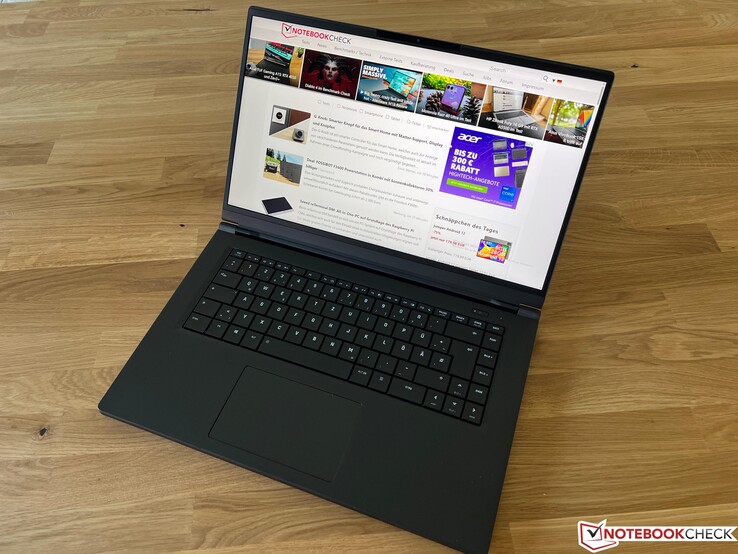
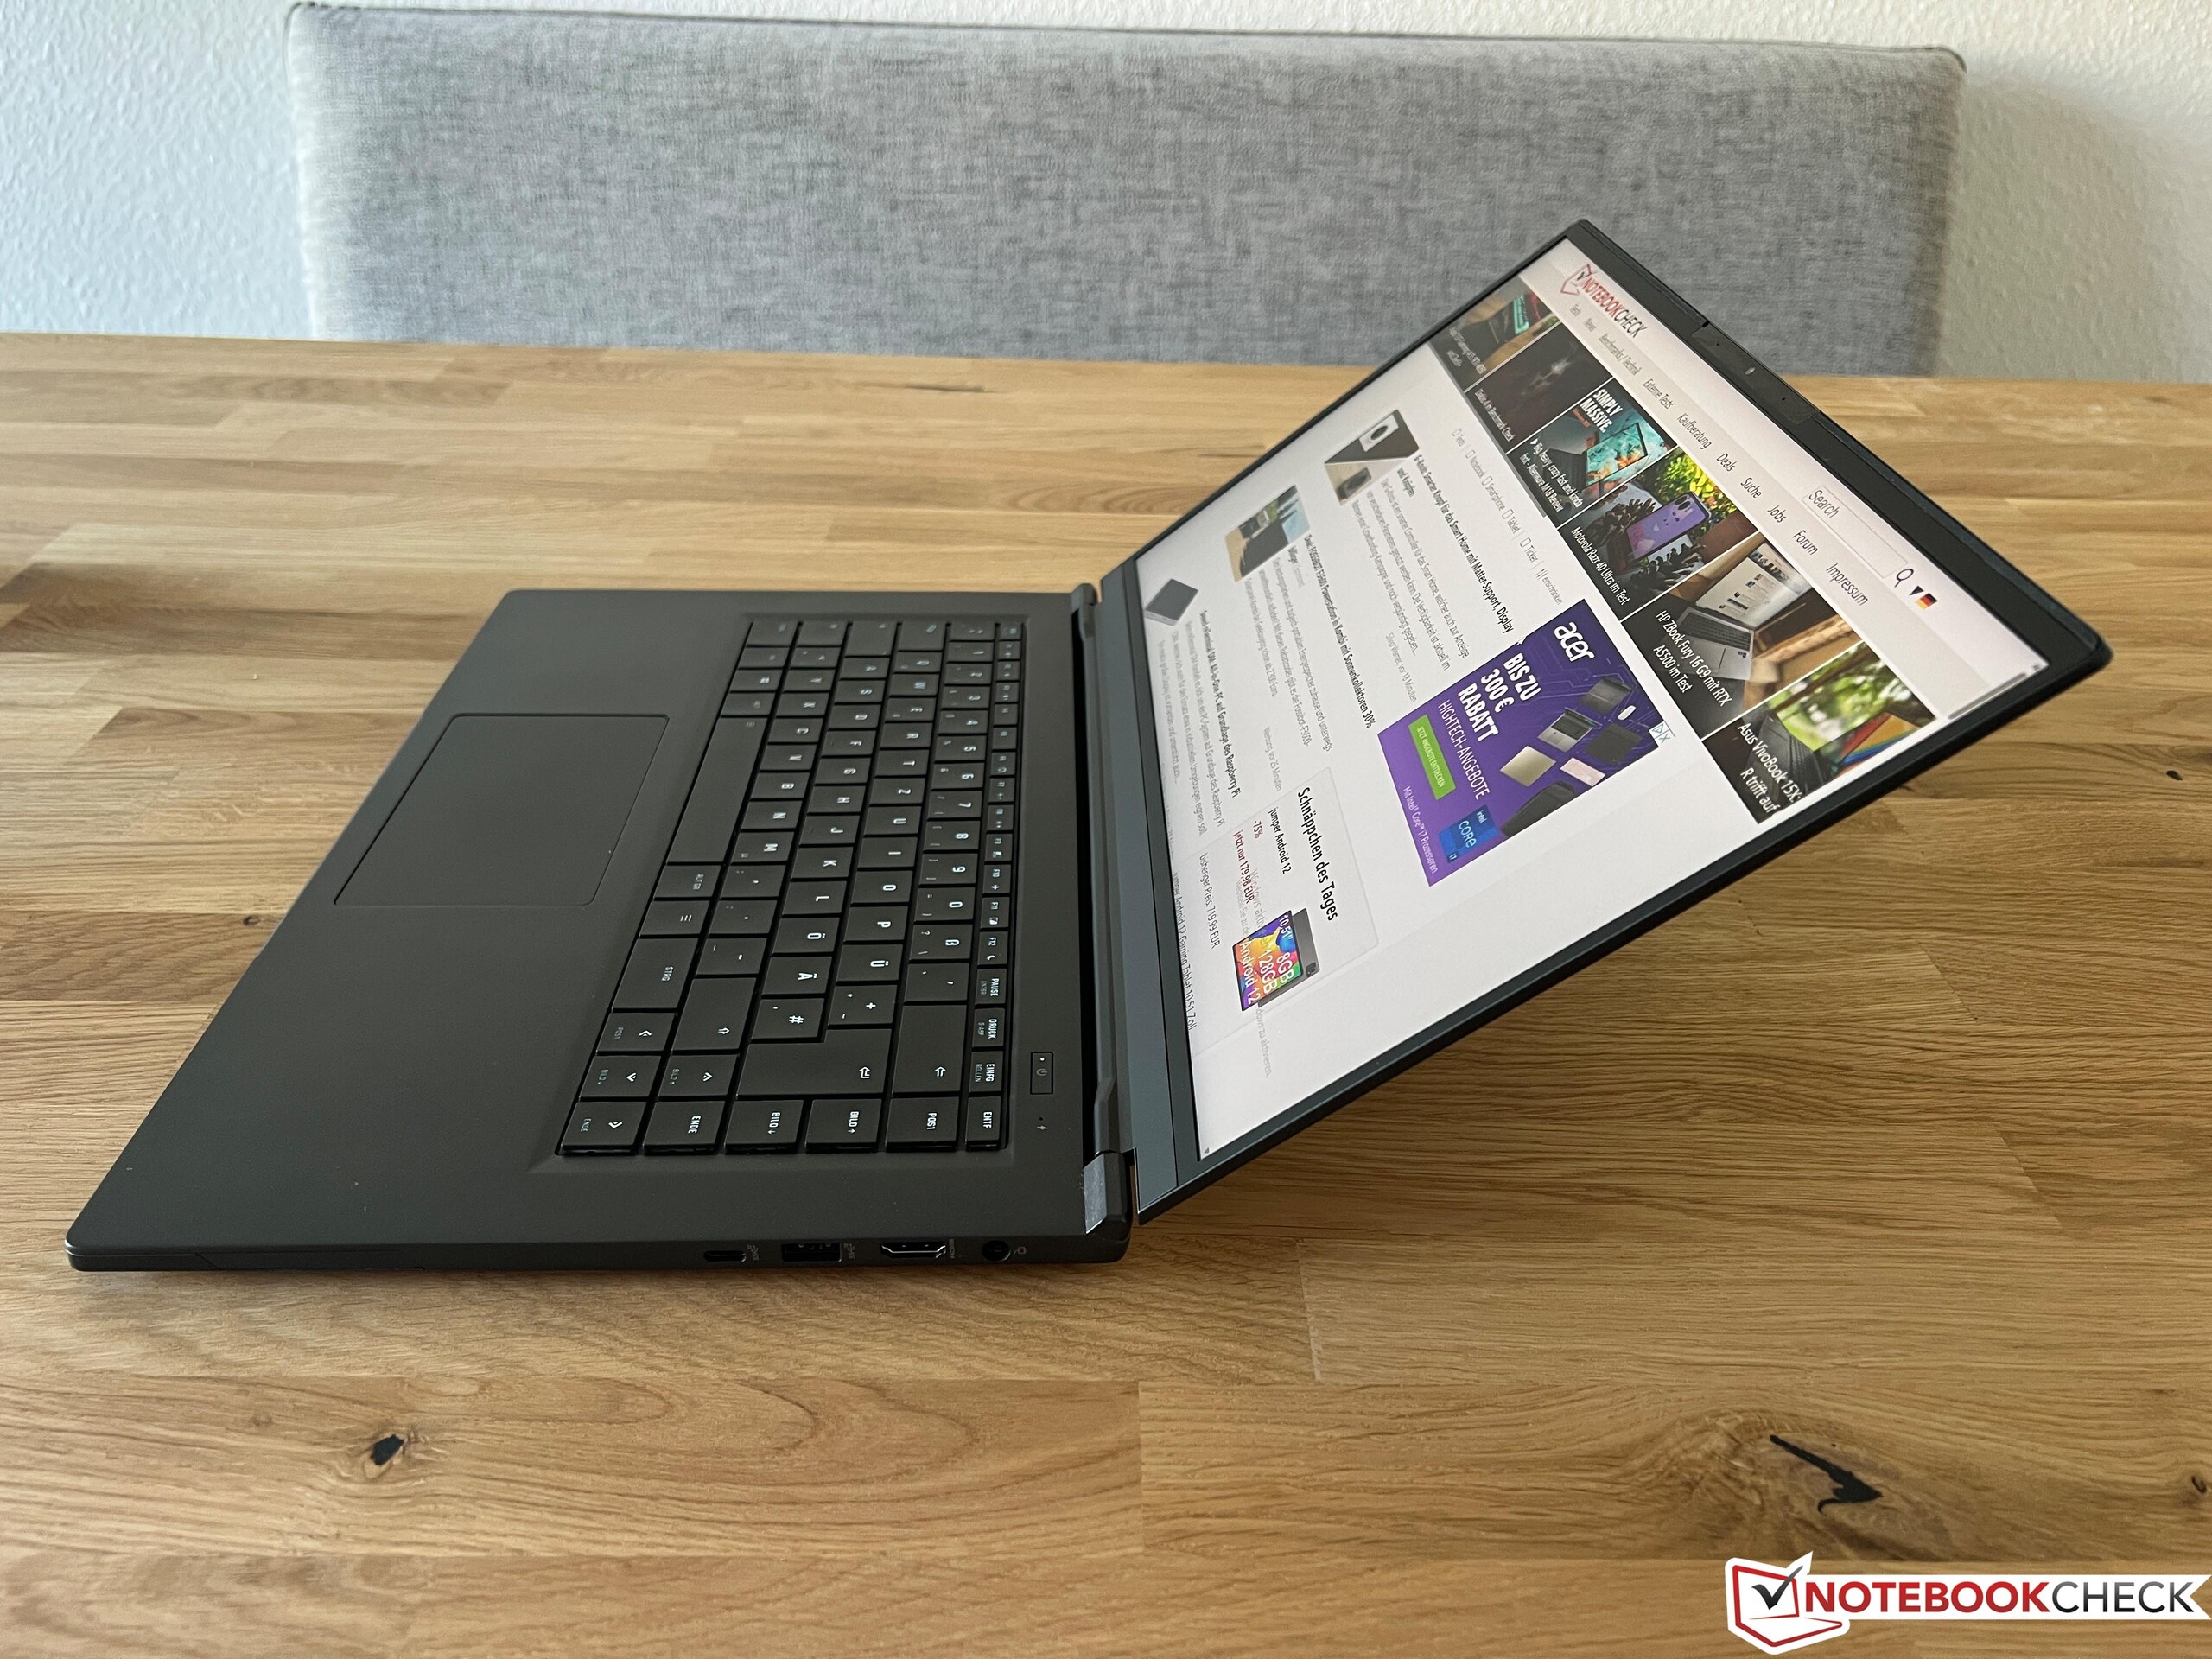
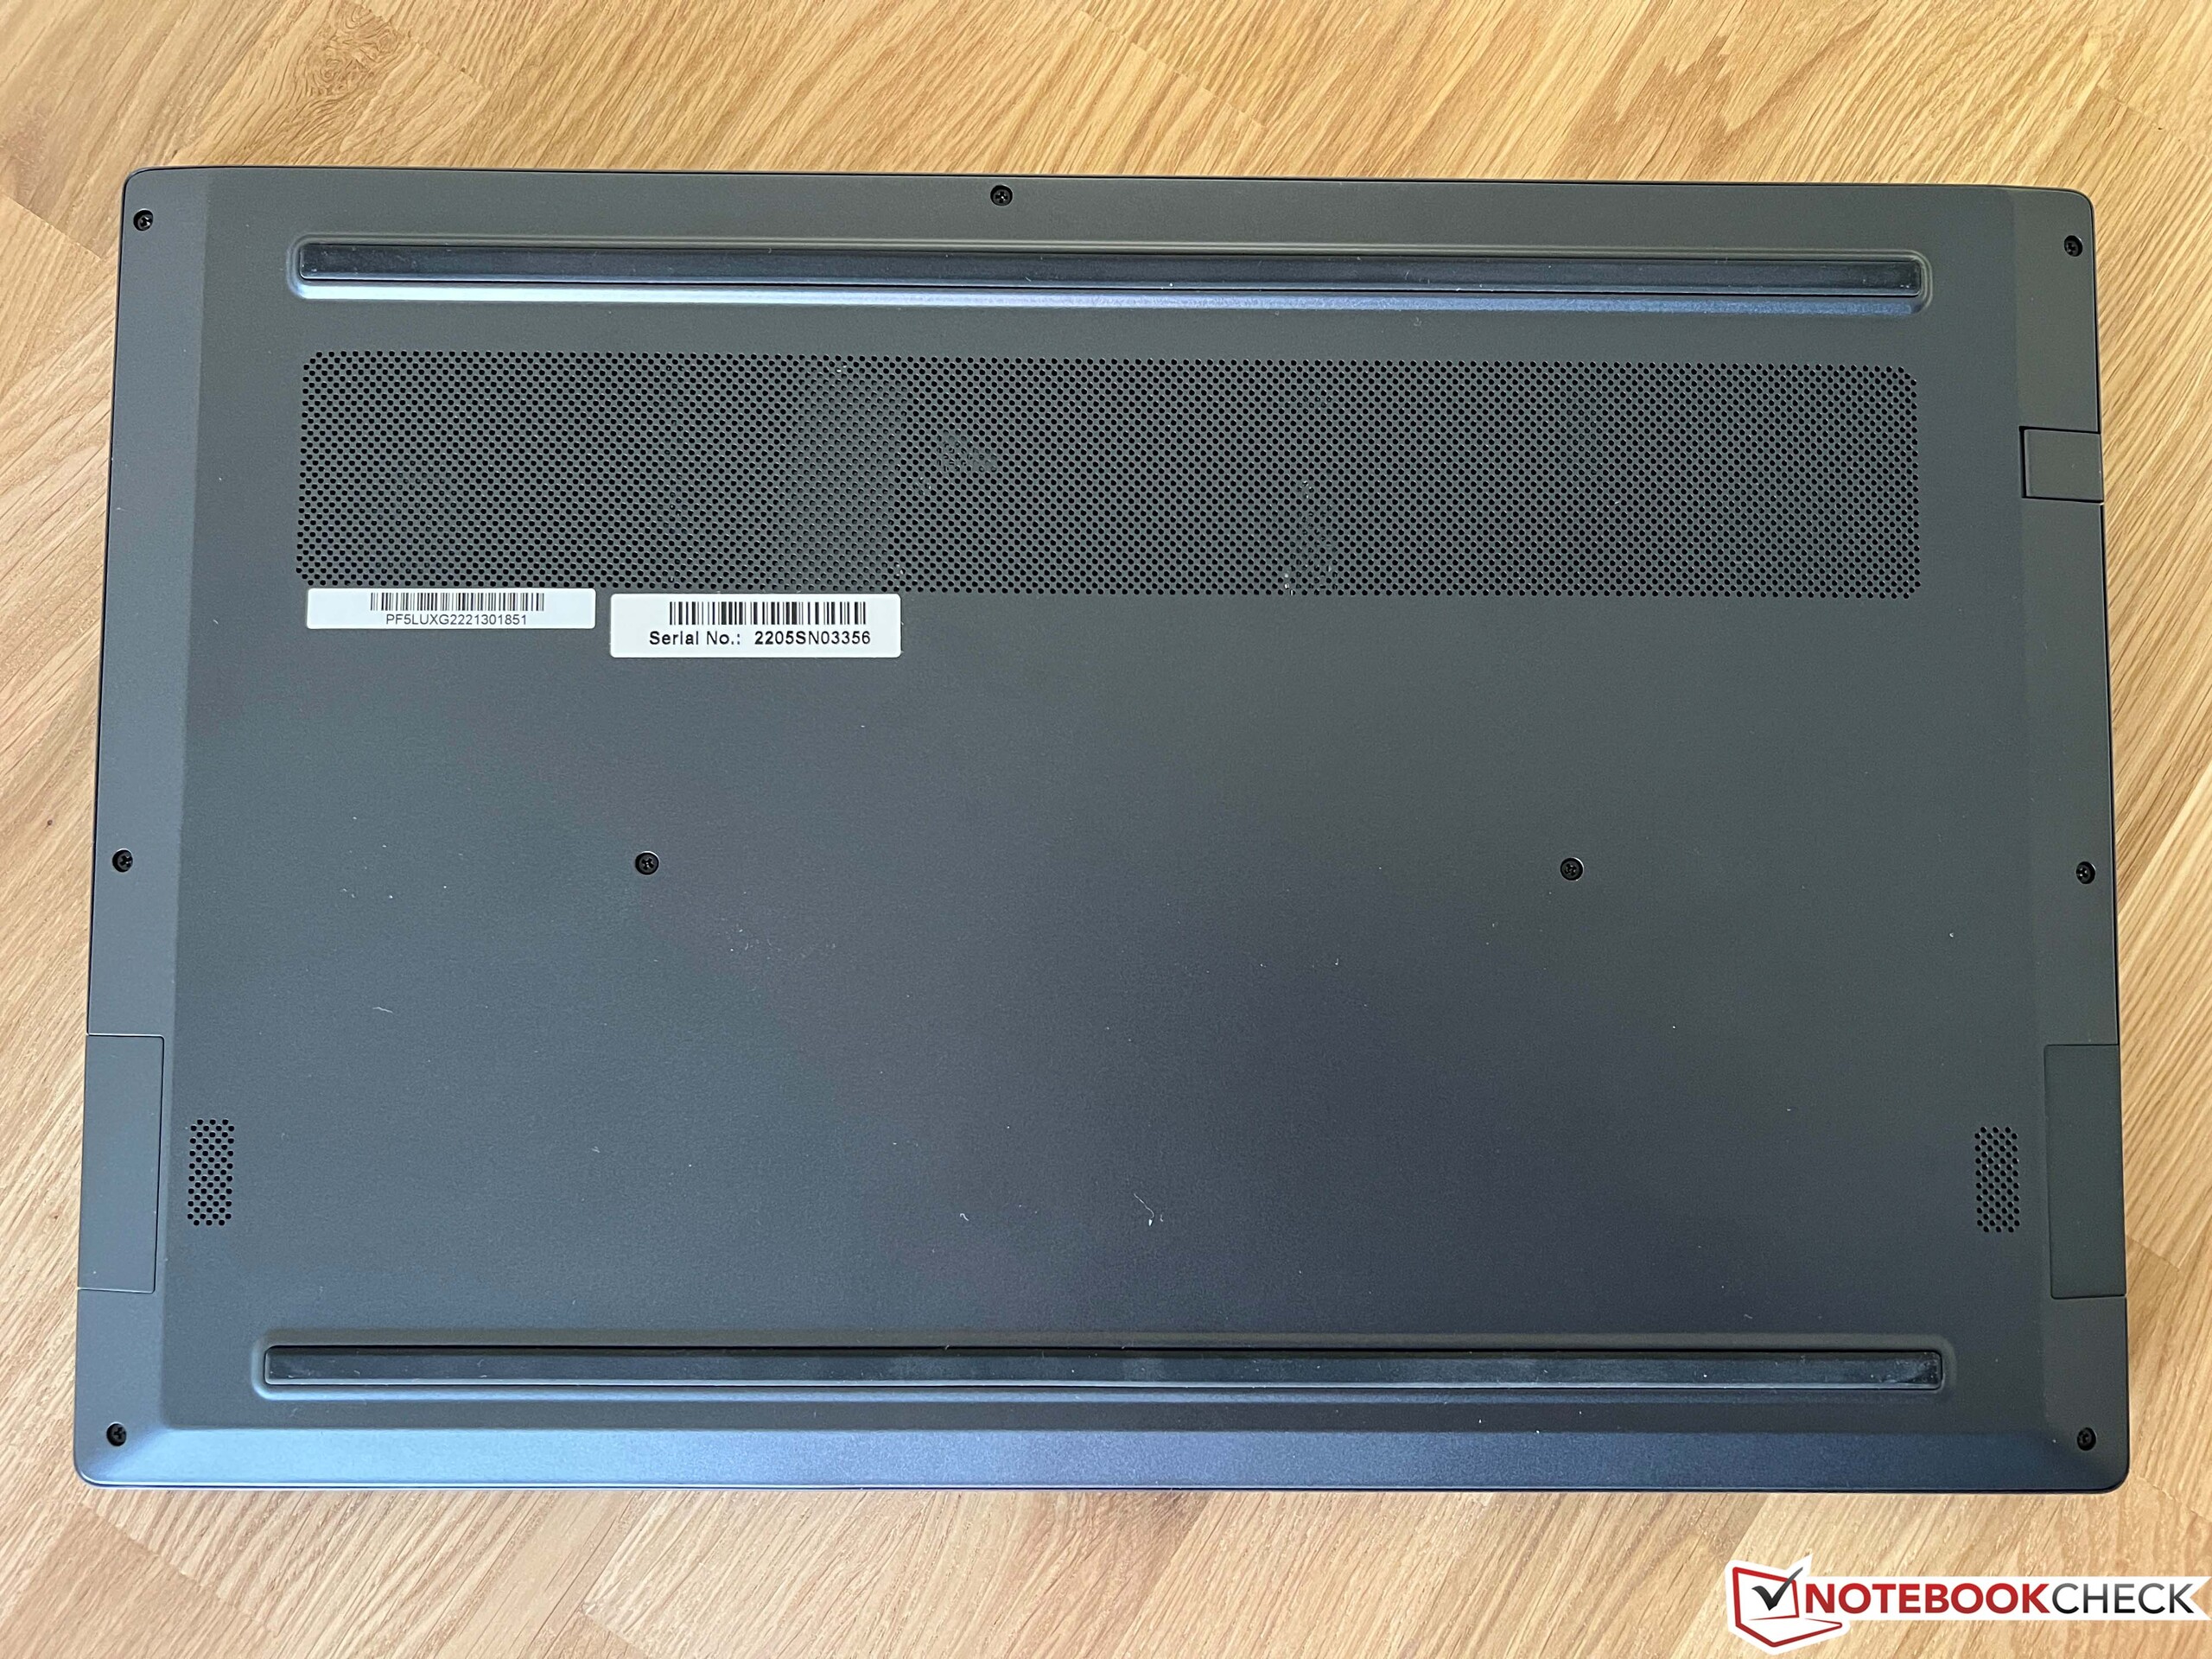
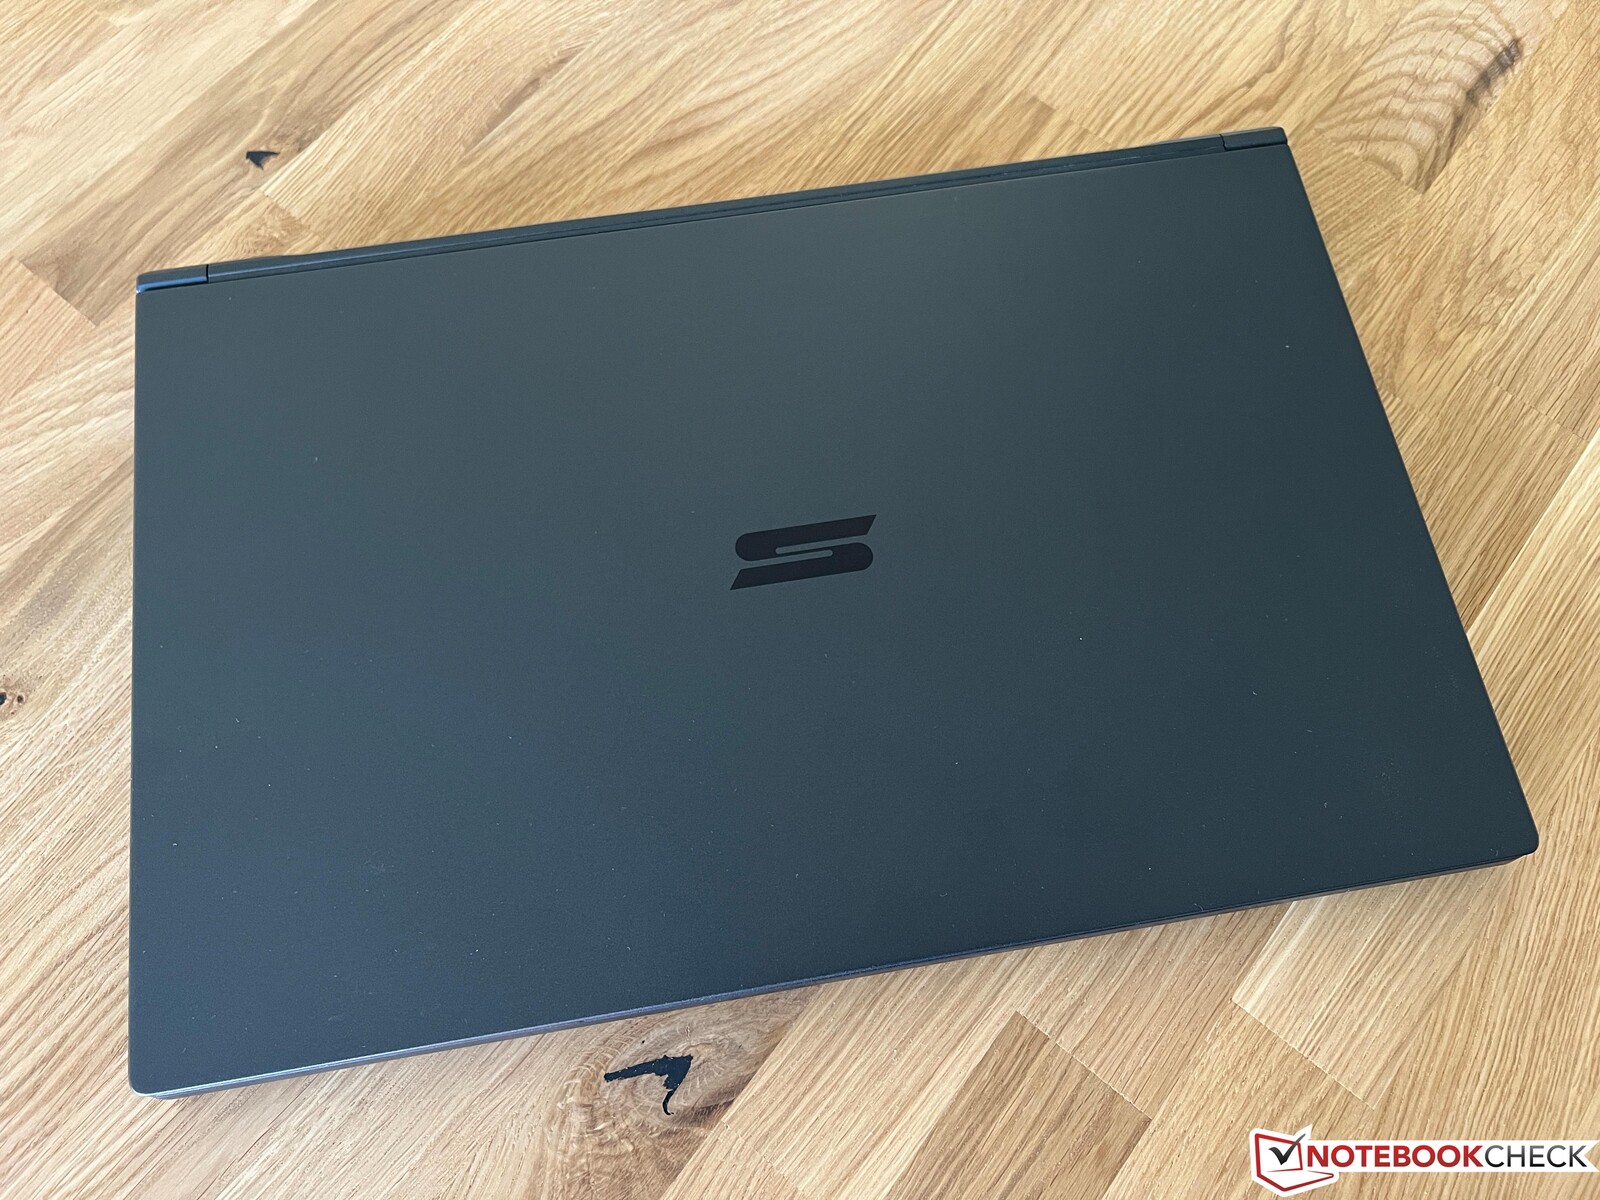
The dark case is made of an AZ91D magnesium alloy (lid and top of the base unit, rest aluminum), which is why the 15-incher weighs just 1.446 kg and is thus noticeably lighter than its competitors. The stability of the base unit is very good, only the lid is a bit more flexible (but we could not provoke any image errors). The hinges allow a maximum opening angle of about 145 degrees, but cannot prevent a certain bouncing. Overall, the design is very restrained and the VIA Pro can be used in the office without any problems. You can even remove the logo on the lid for a surcharge of 29 euro. Fingerprints are not a big problem on dark surfaces.
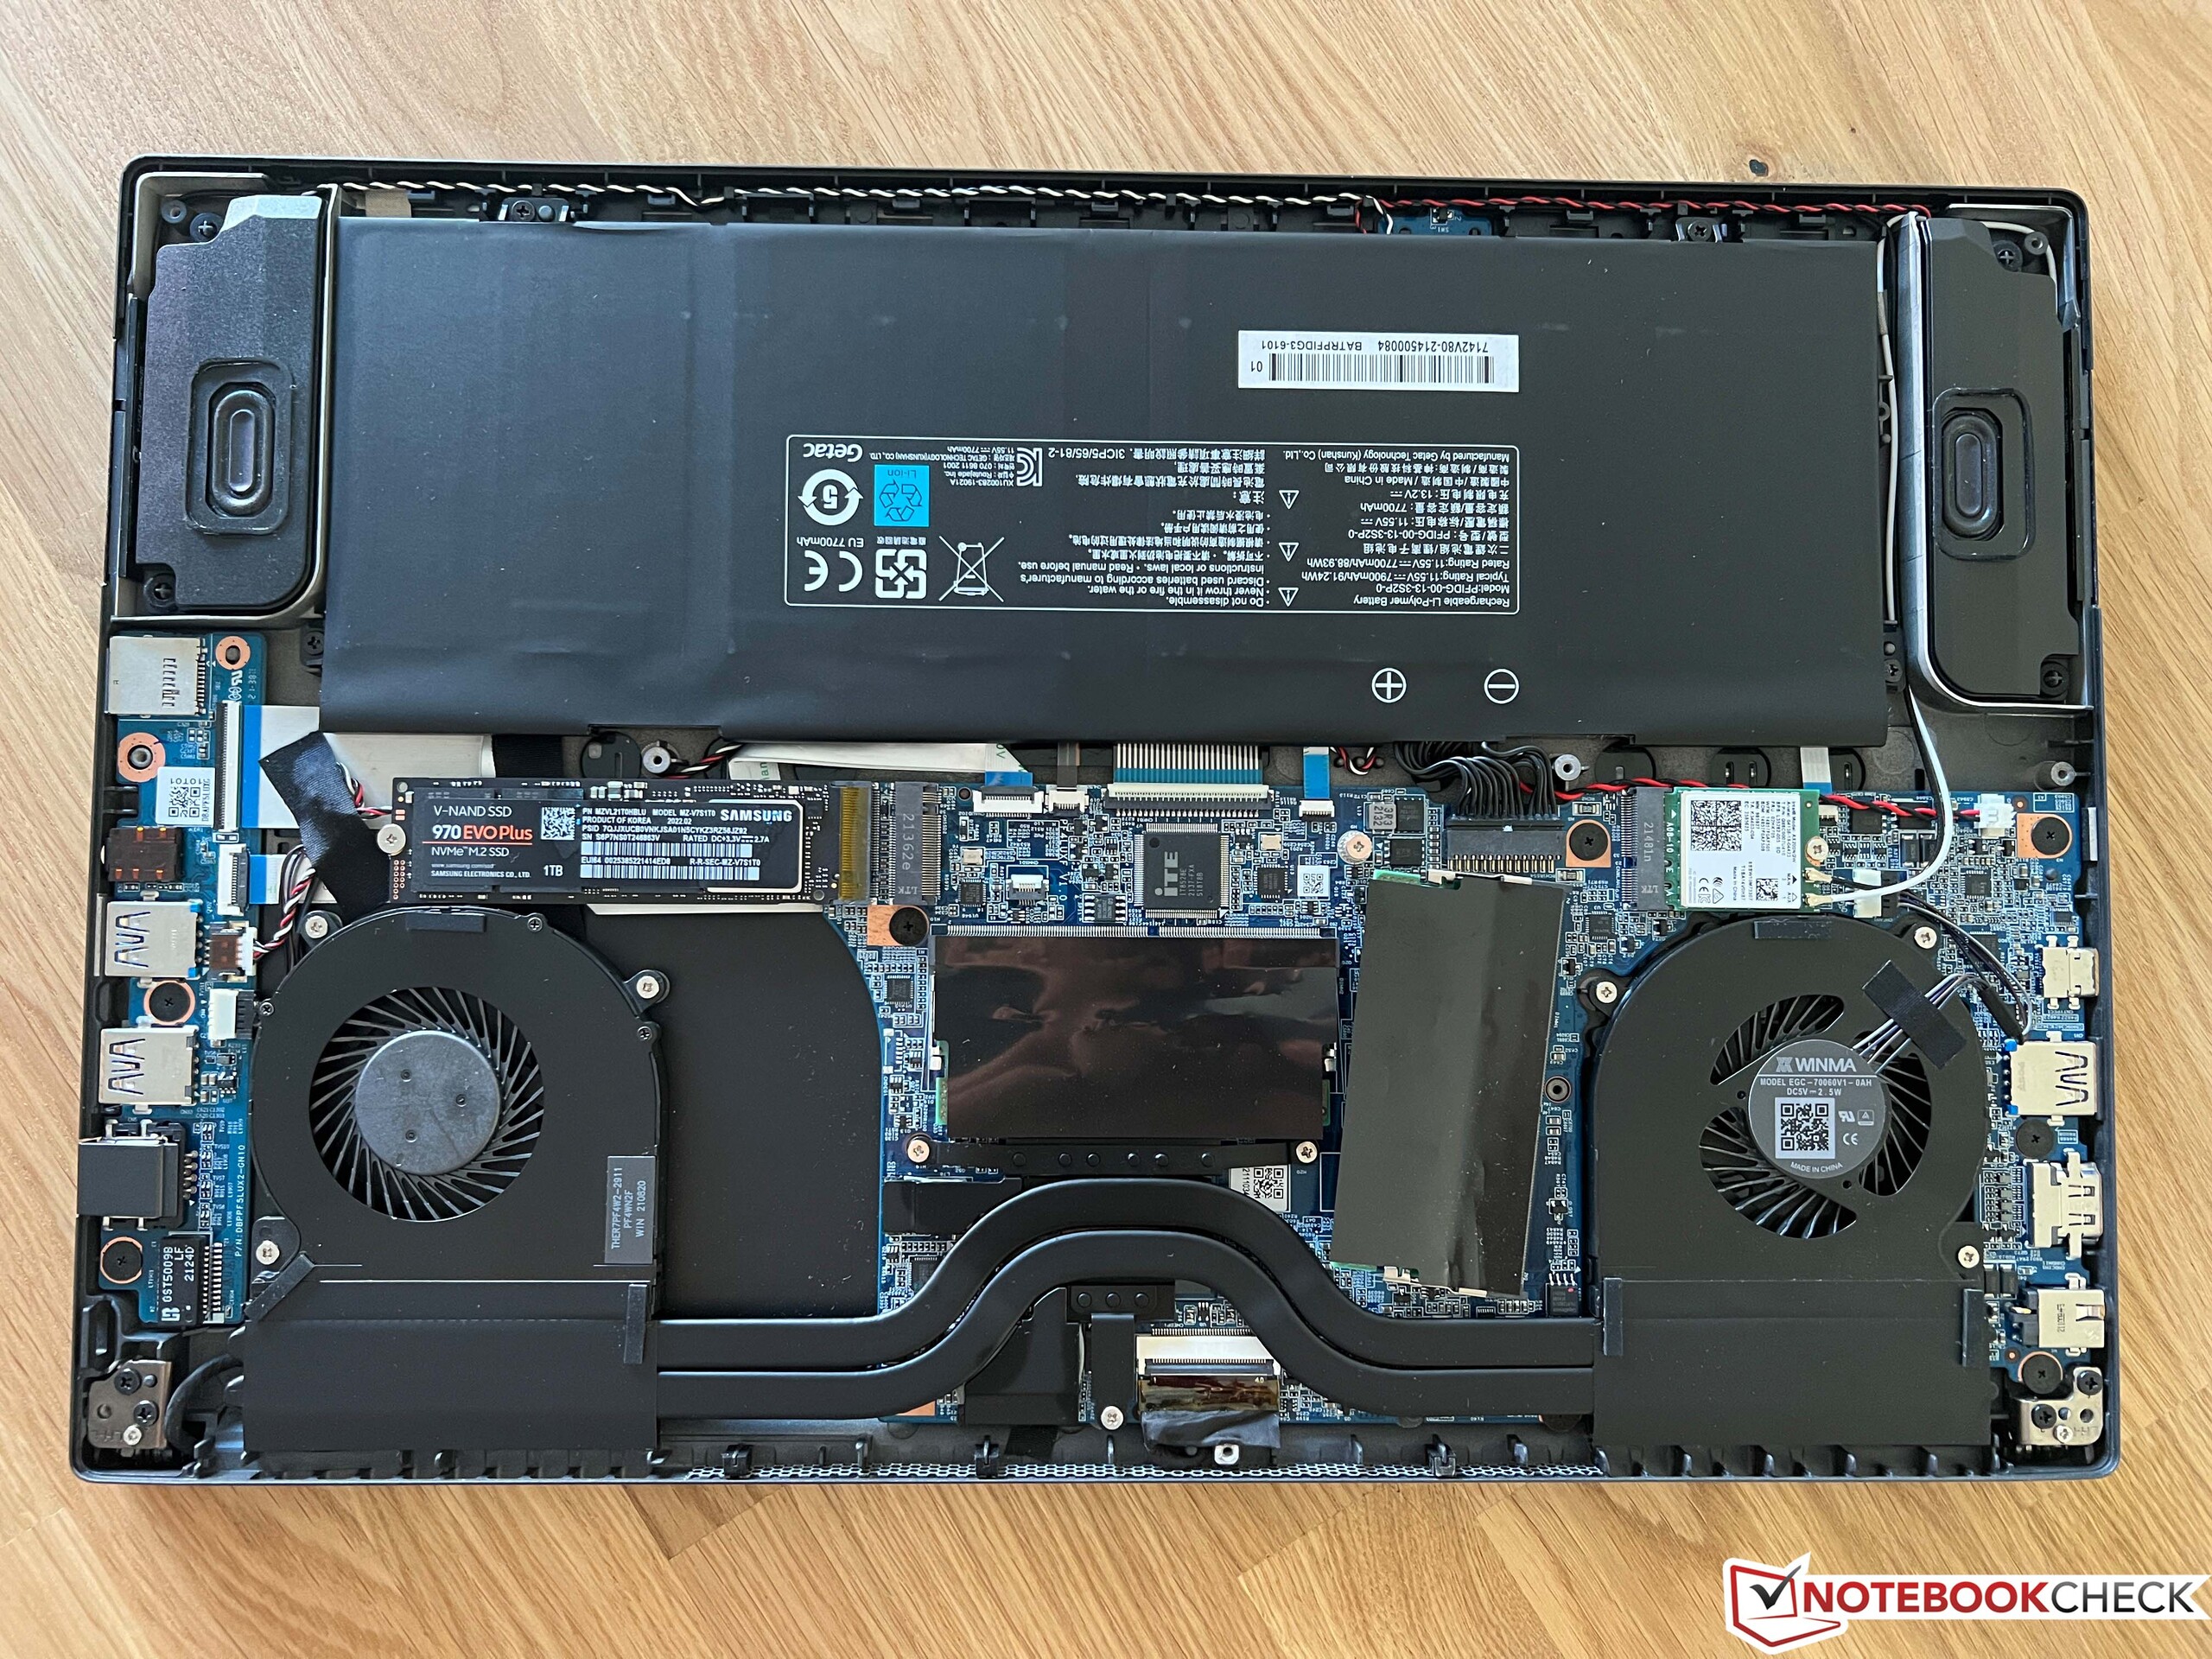
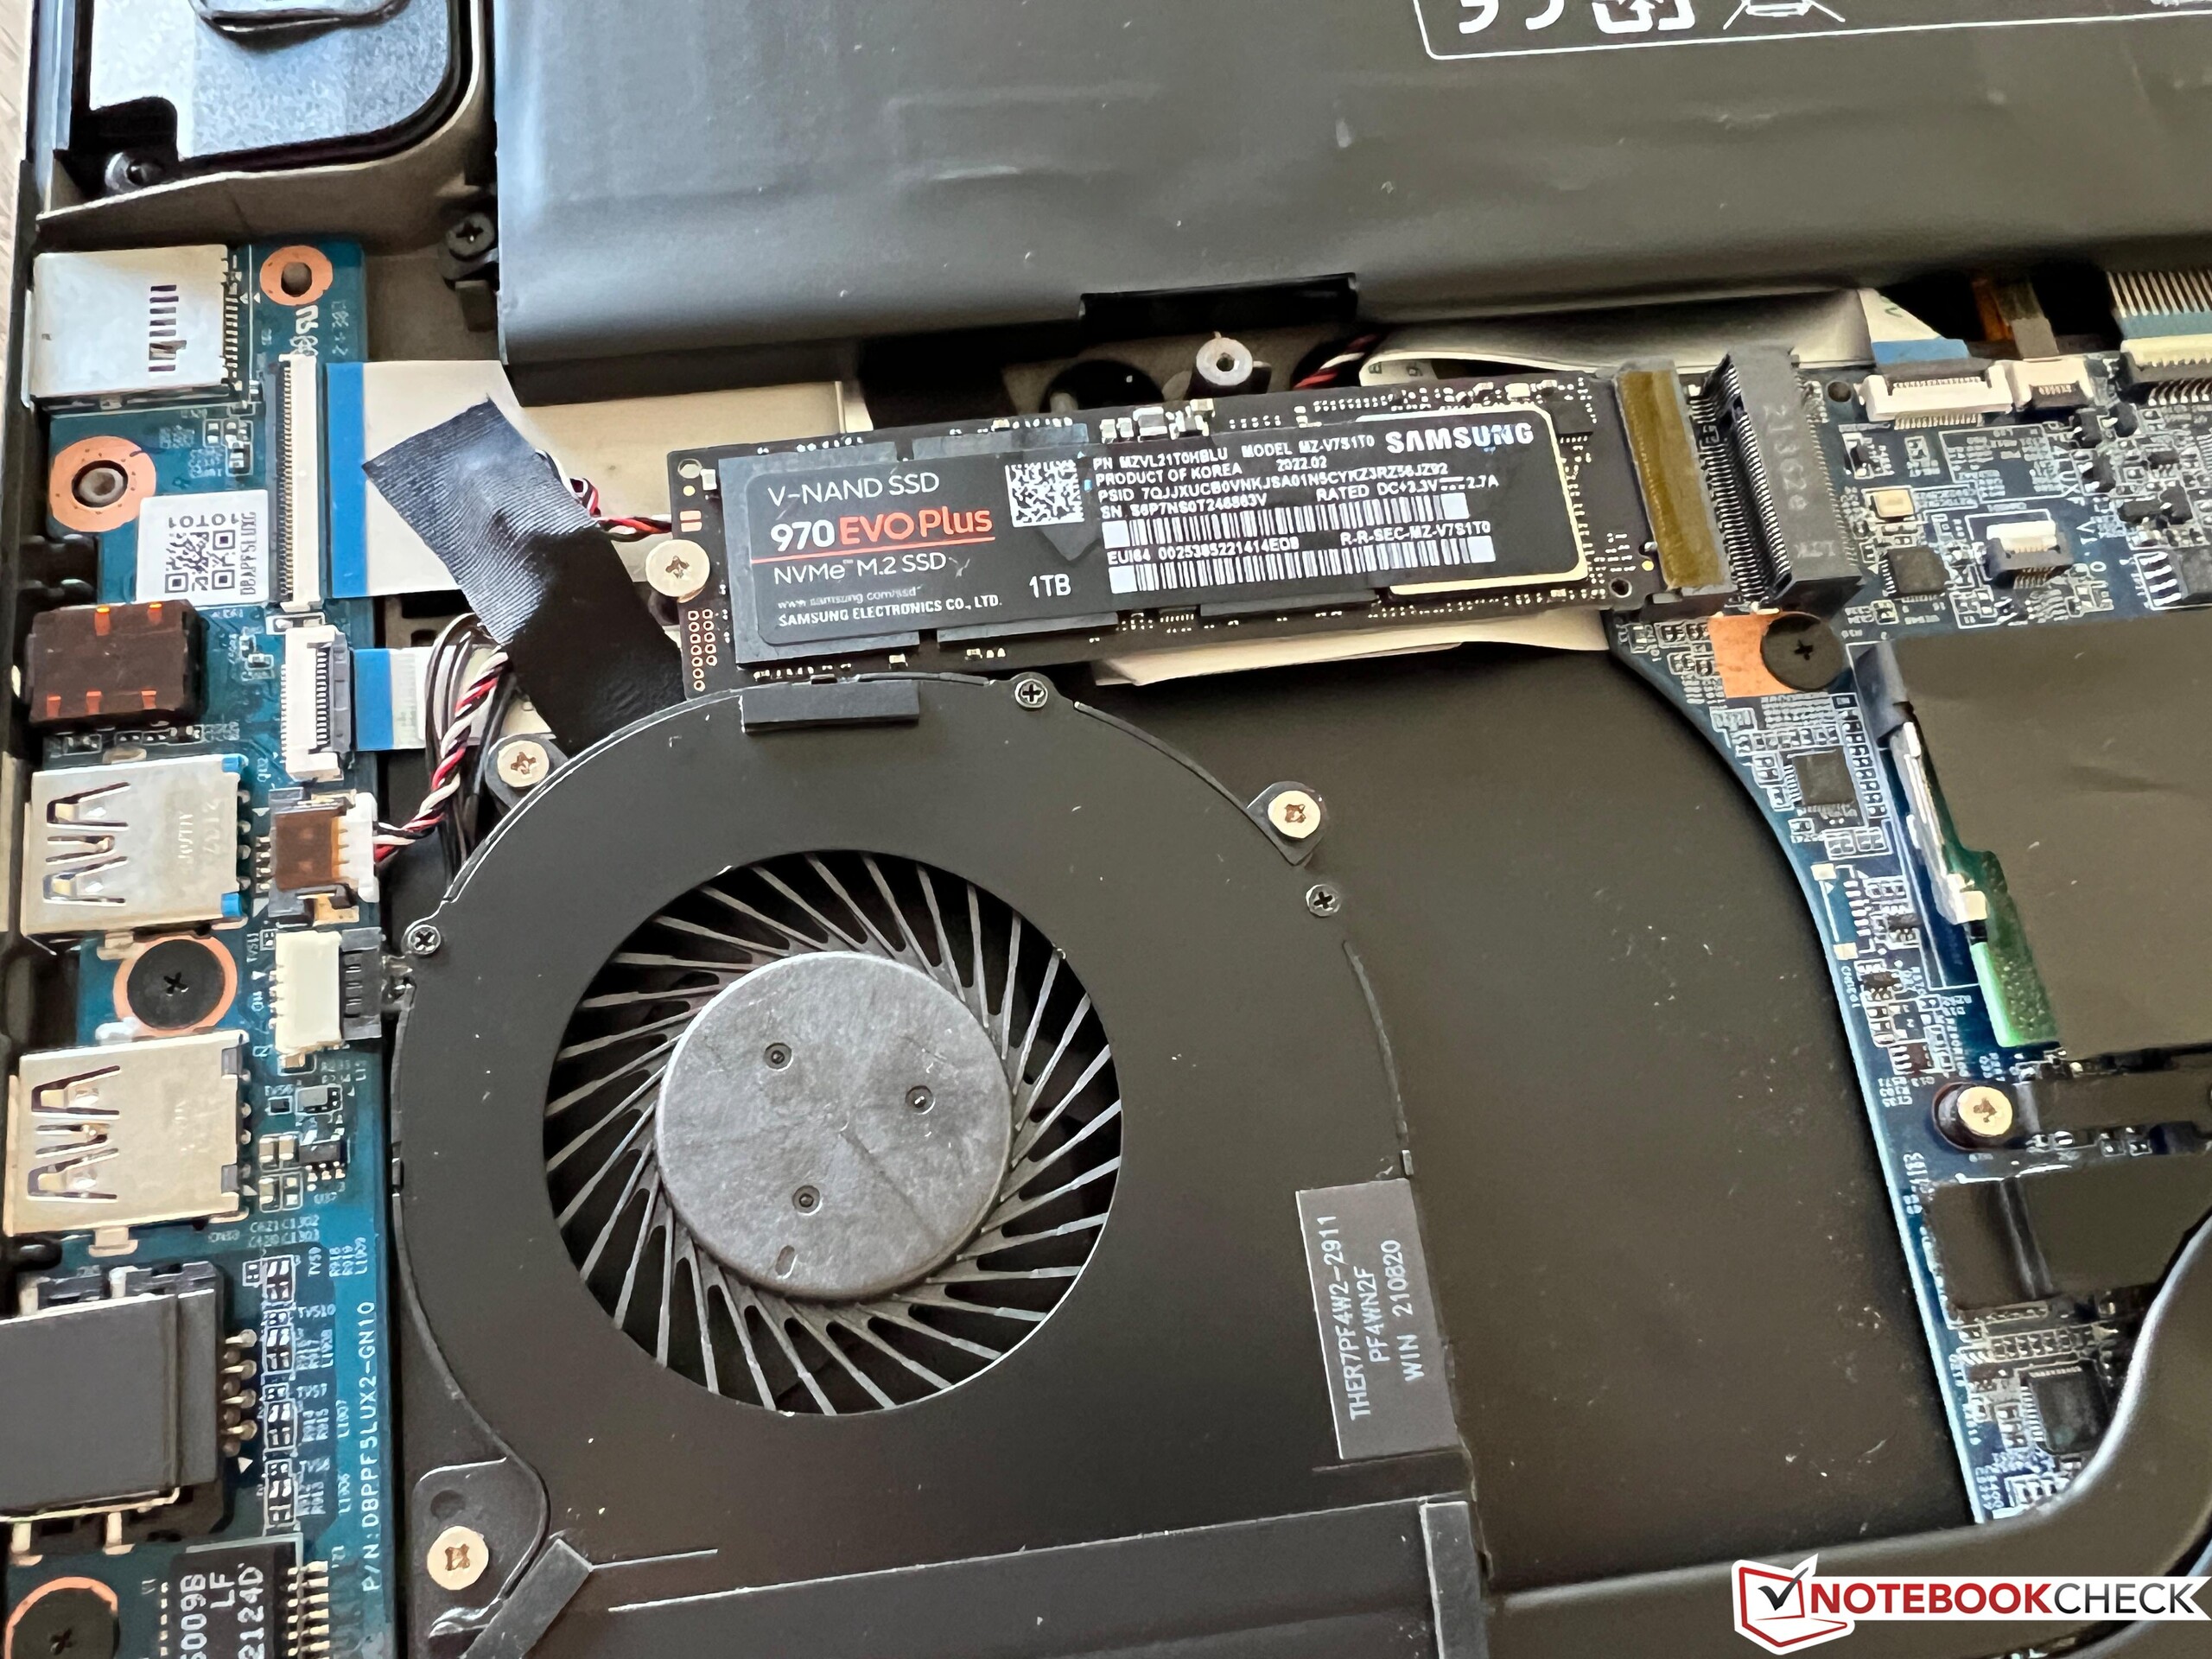
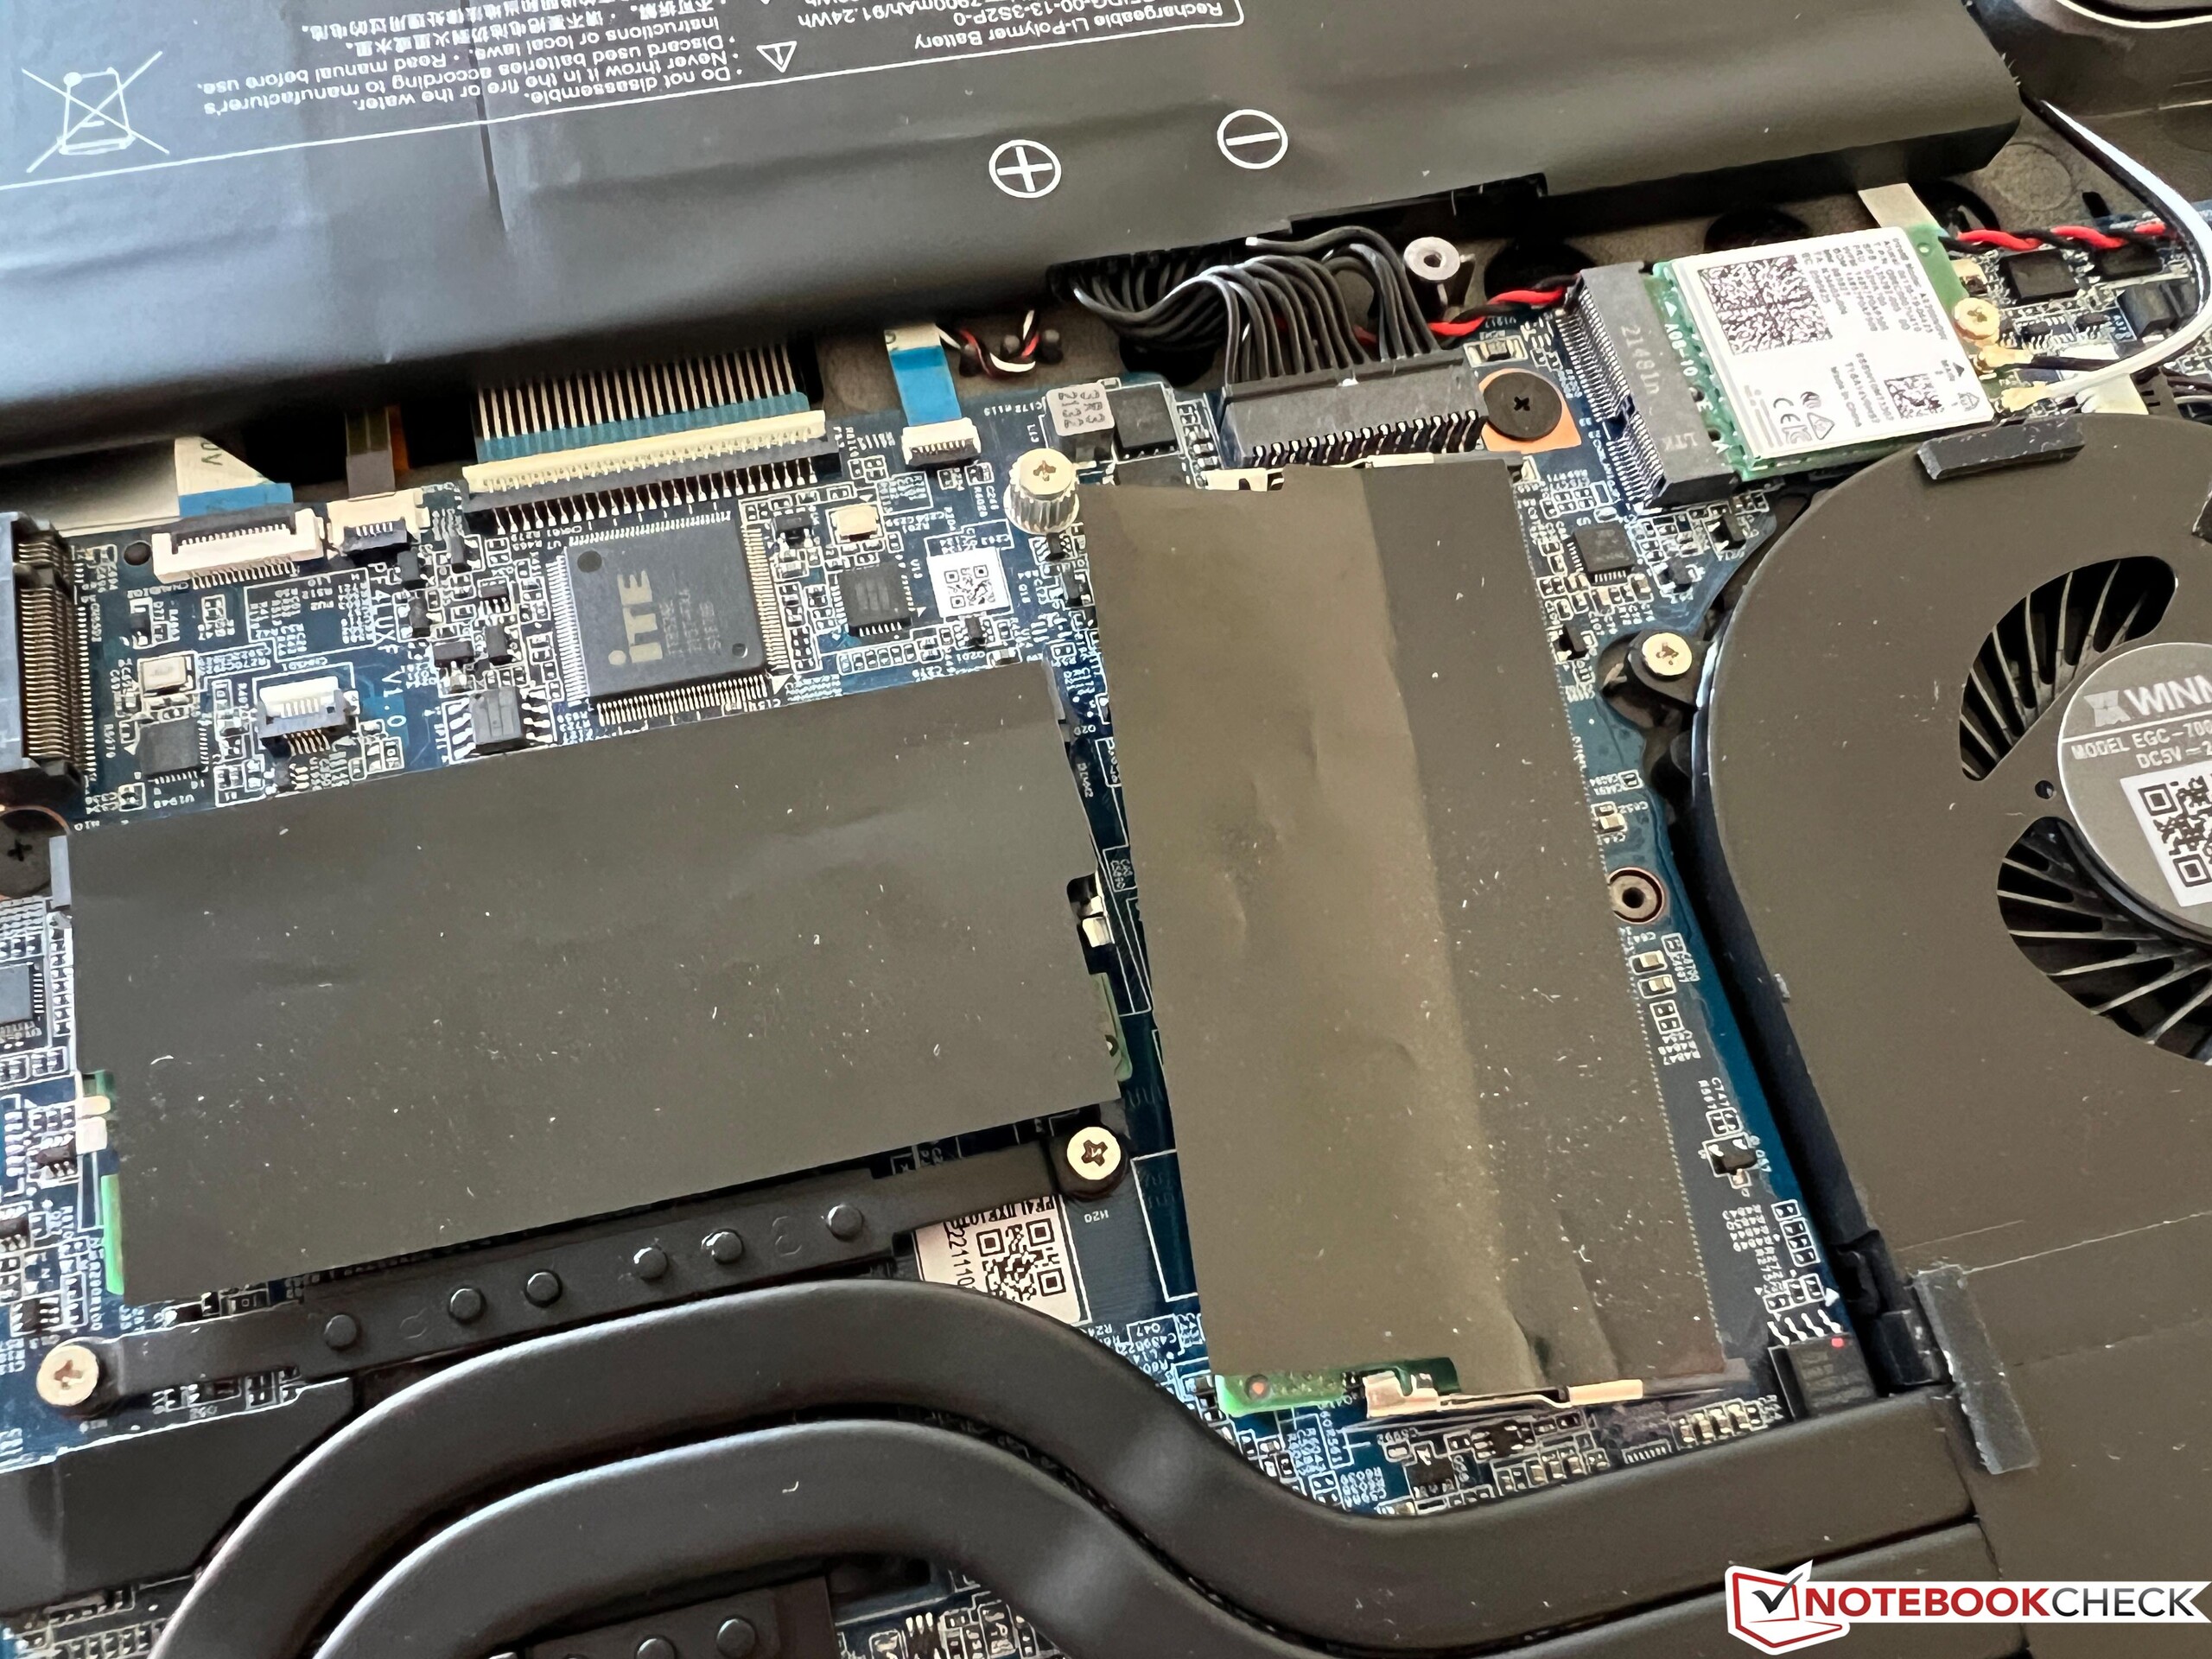
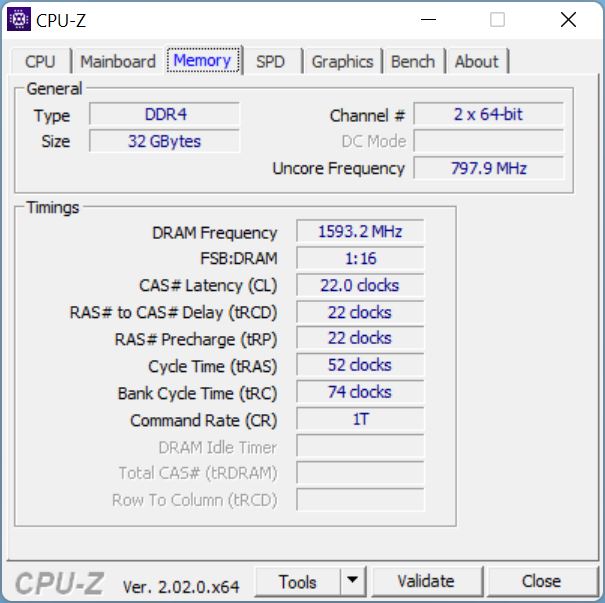
The test device collects points in the upgrade options because there are two slots each for RAM modules and M.2-2280 SSDs. The WLAN module can also be replaced, but the antenna configuration does not support 6 GHz networks. Nevertheless, WLAN 6 and Bluetooth 5.1 are supported with the Intel AX200. The transfer rates were good in our test. A microSD reader is also installed on the left side, but it is not particularly fast with about 30 MB/s. The 720p webcam is also only the most necessary and the picture quality is not particularly good.
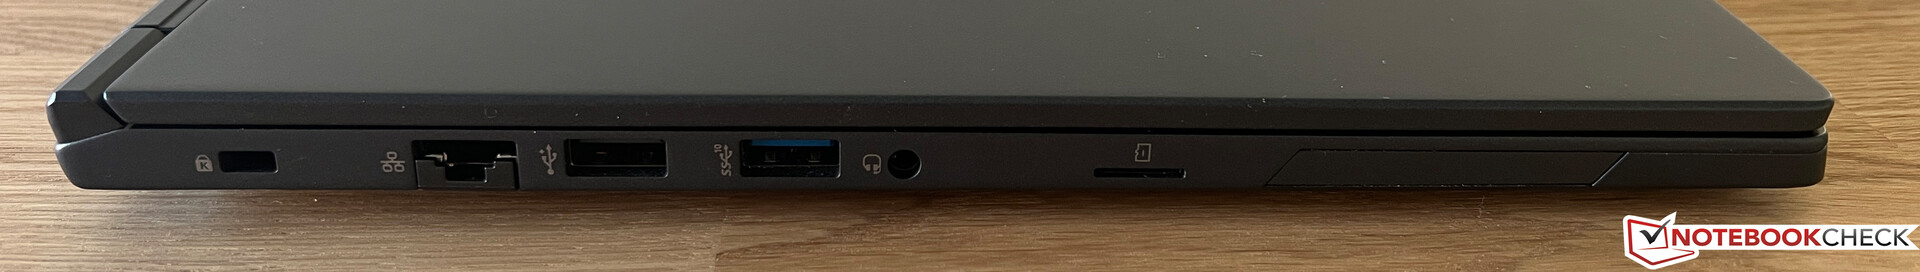
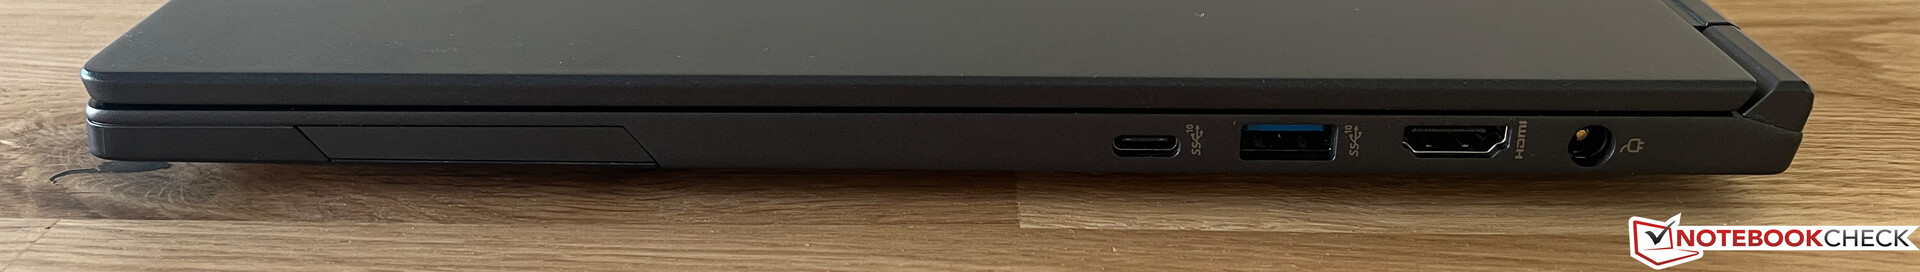
All the important ports are represented, whereby one of the USB-A ports still corresponds to the old 2.0 standard, which is no longer up-to-date. However, the device can also be charged via USB-C in addition to a power supply port. A Gigabit Ethernet port is also available for wired networks.


| SD Card Reader | |
| average JPG Copy Test (av. of 3 runs) | |
| Lenovo ThinkBook 15 G4 21DL0009GE | |
| Average of class Office (19.8 - 198.5, n=22, last 2 years) | |
| Schenker VIA 15 Pro M22 (Angelbird AV Pro V60) | |
| Dell Latitude 3520 (AV Pro SD microSD 128 GB V60) | |
| Dell Inspiron 15 5515-H8P8F (AV Pro SD microSD 128 GB V60) | |
| maximum AS SSD Seq Read Test (1GB) | |
| Lenovo ThinkBook 15 G4 21DL0009GE | |
| Average of class Office (27.4 - 249, n=21, last 2 years) | |
| Dell Inspiron 15 5515-H8P8F (AV Pro SD microSD 128 GB V60) | |
| Schenker VIA 15 Pro M22 (Angelbird AV Pro V60) | |
| Dell Latitude 3520 (AV Pro SD microSD 128 GB V60) | |
| Networking | |
| Schenker VIA 15 Pro M22 | |
| iperf3 transmit AXE11000 | |
| iperf3 receive AXE11000 | |
| Dell Latitude 3520 | |
| iperf3 transmit AXE11000 | |
| iperf3 receive AXE11000 | |
| HP ProBook 450 G9 6A180EA | |
| iperf3 transmit AXE11000 6GHz | |
| iperf3 receive AXE11000 6GHz | |
| Dell Inspiron 15 5515-H8P8F | |
| iperf3 transmit AXE11000 6GHz | |
| iperf3 receive AXE11000 6GHz | |
| Lenovo ThinkBook 15 G4 21DL0009GE | |
| iperf3 transmit AXE11000 | |
| iperf3 receive AXE11000 | |


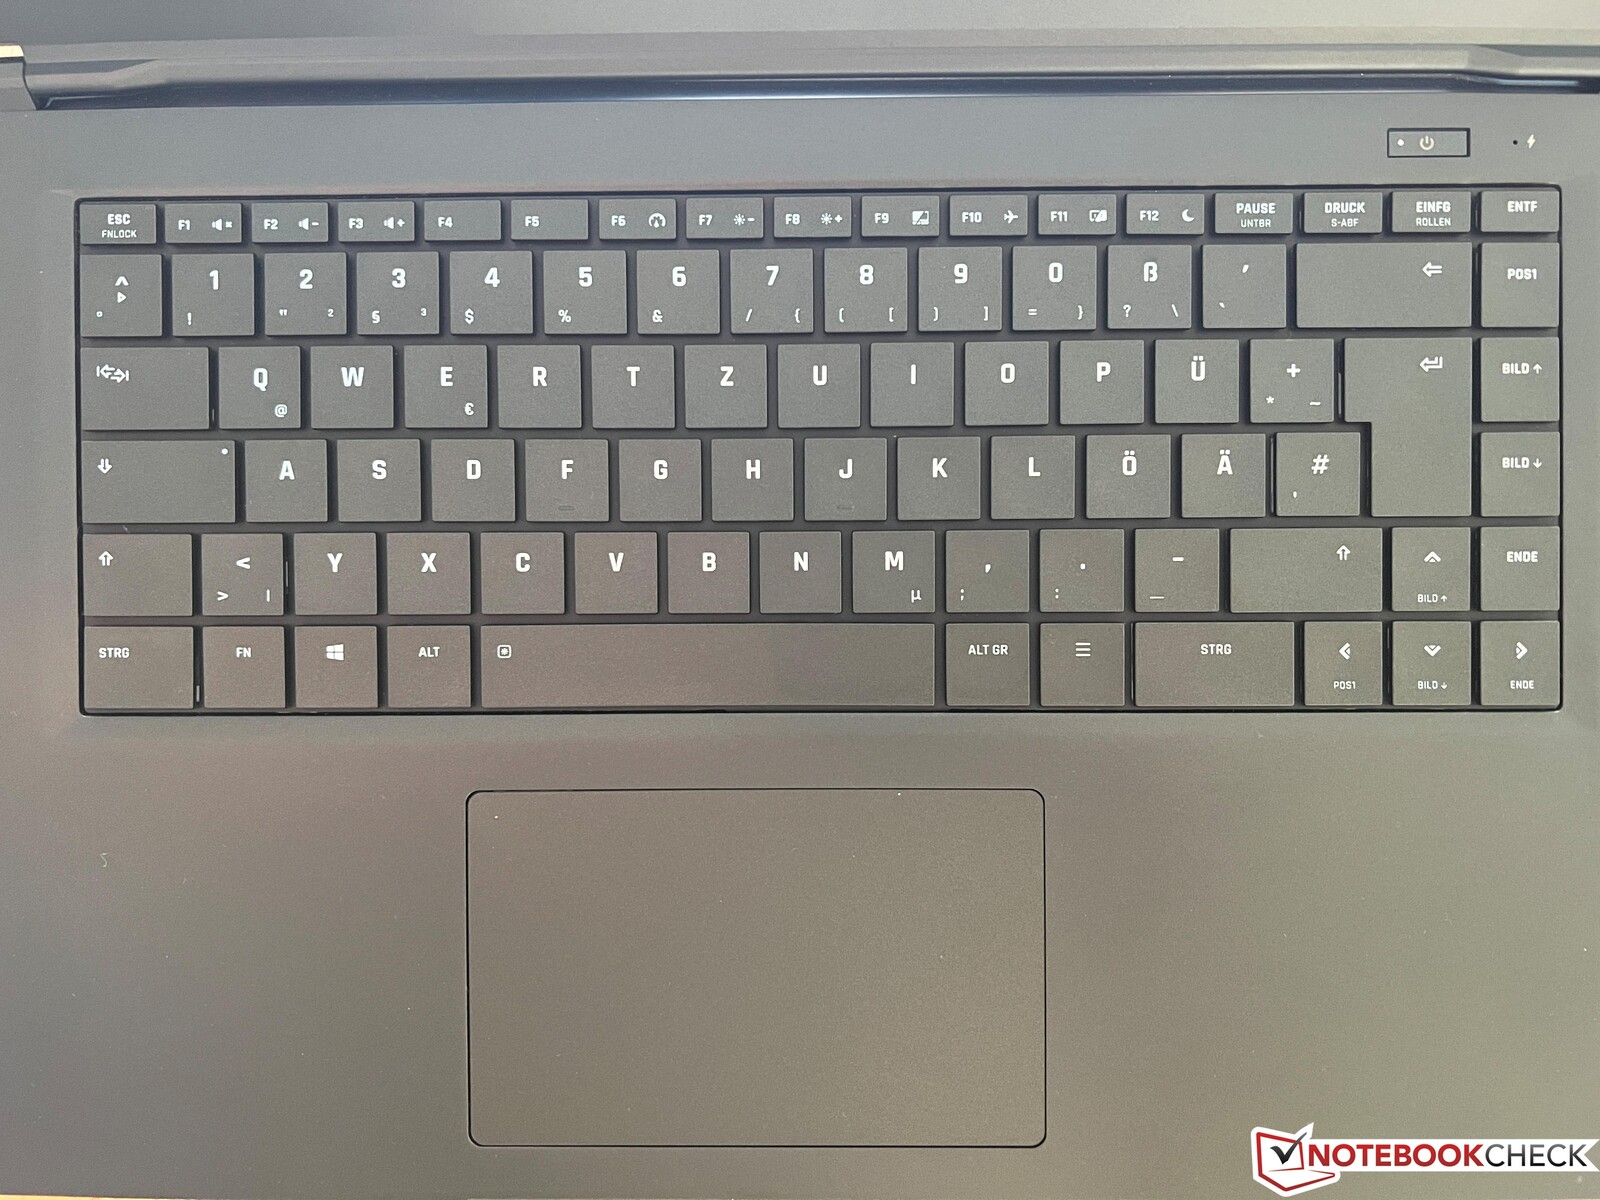
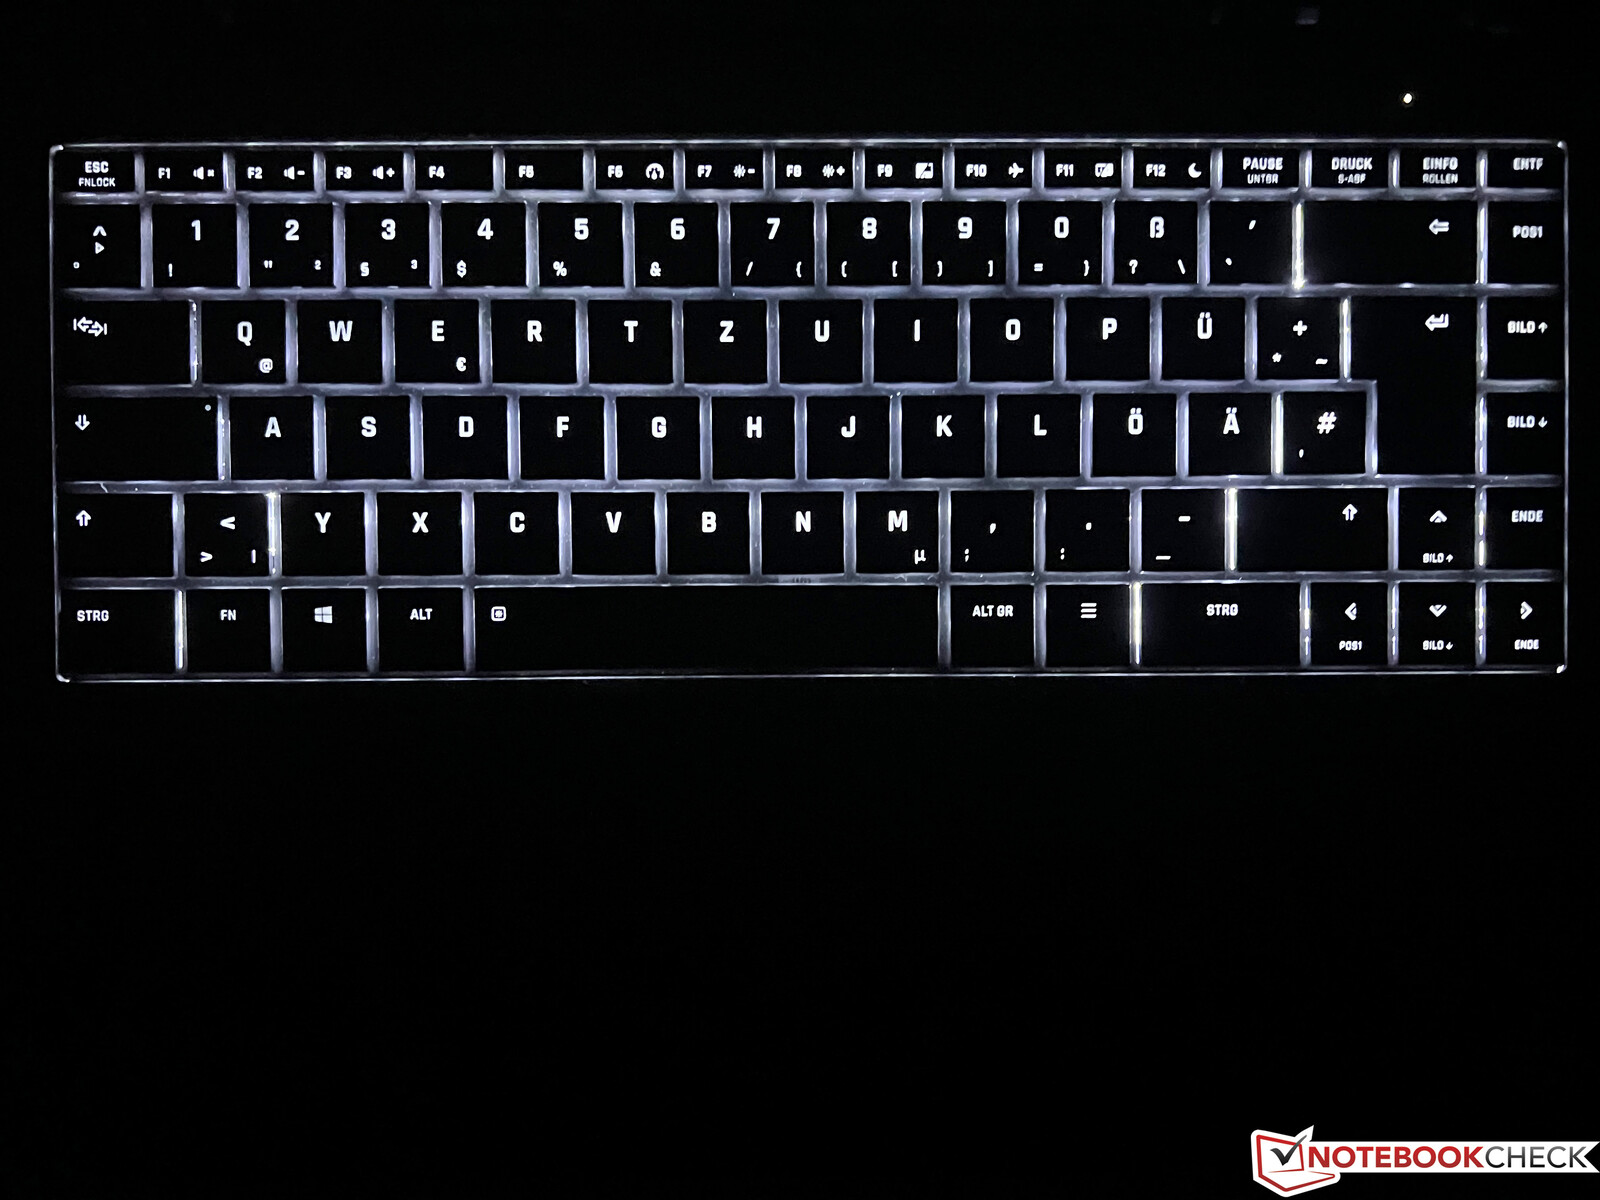
Input devices - Illuminated keyboard
The VIA Pro 15 offers a large backlit keyboard with a very comfortable typing feel, which makes it easy to write longer texts. However, you have to get used to the layout, since there is an additional column with special keys on the right (e.g. dedicated keys for Page Up/Page Down). However, you have to do without a number pad. The large ClickPad also works flawlessly and can be pressed down in the lower half, which is accompanied by loud clicking noises.
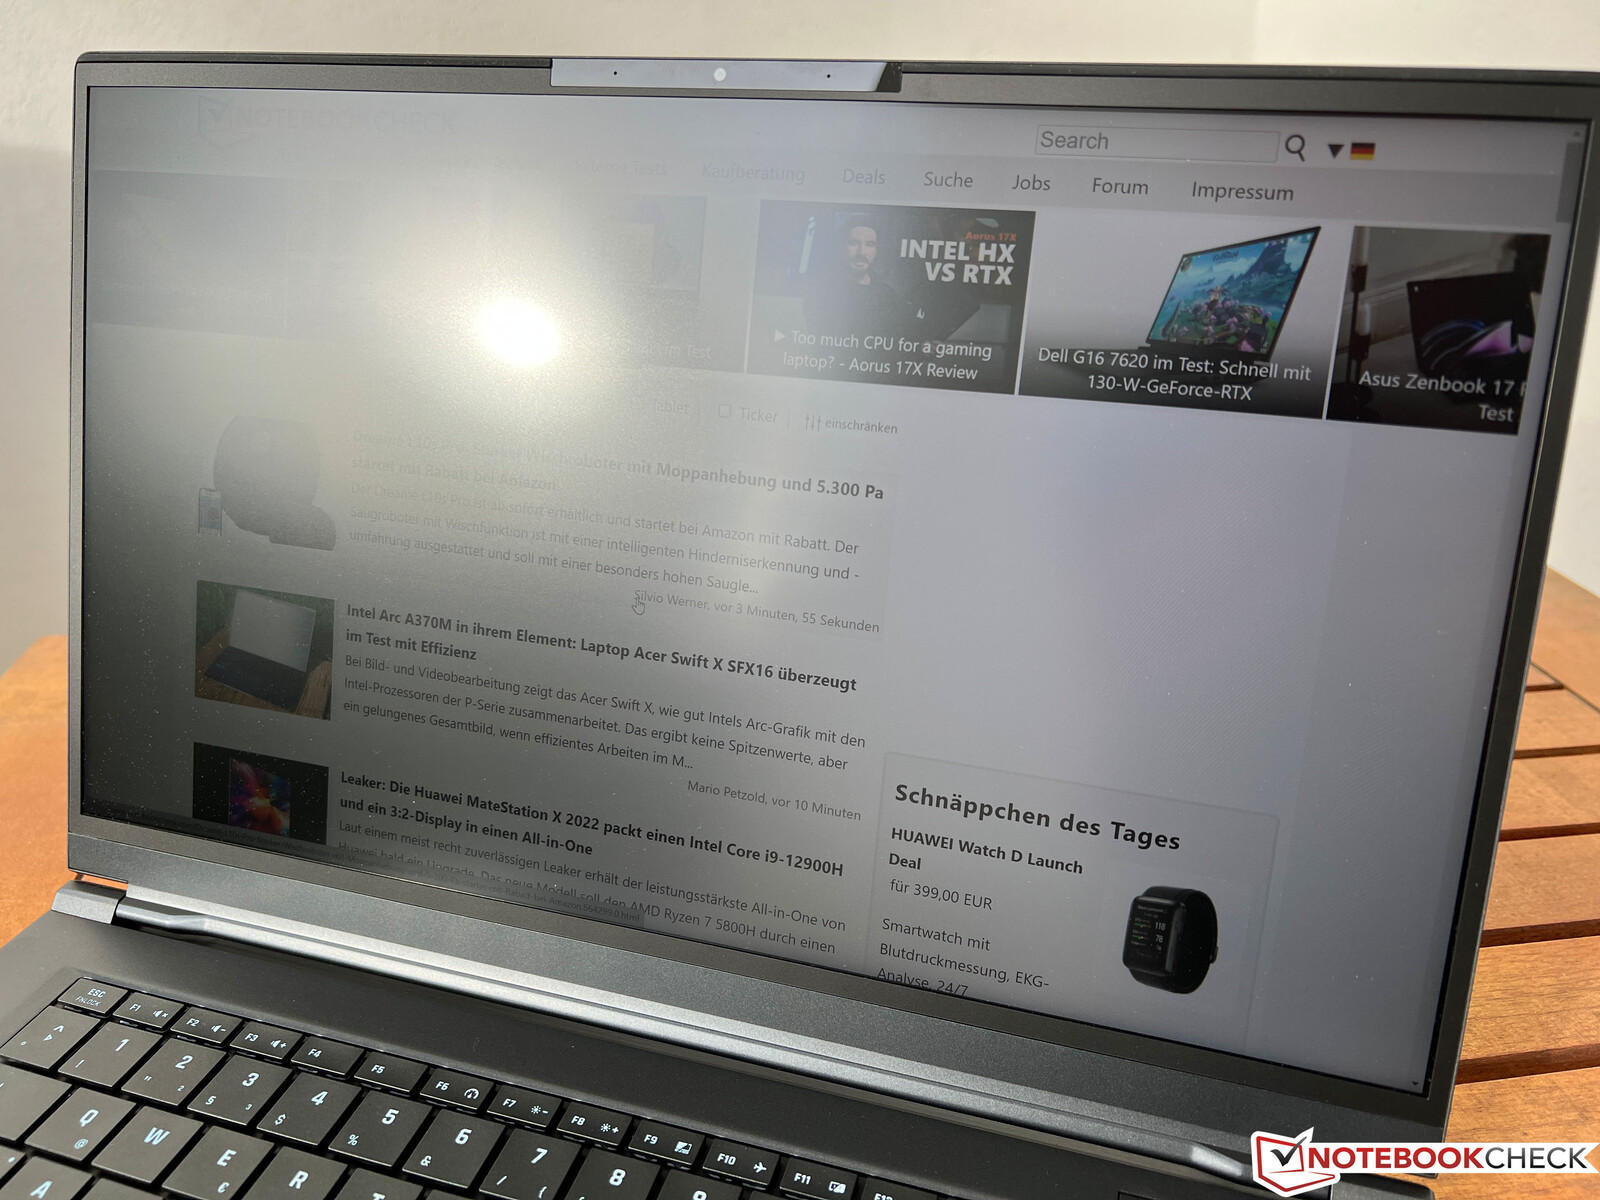
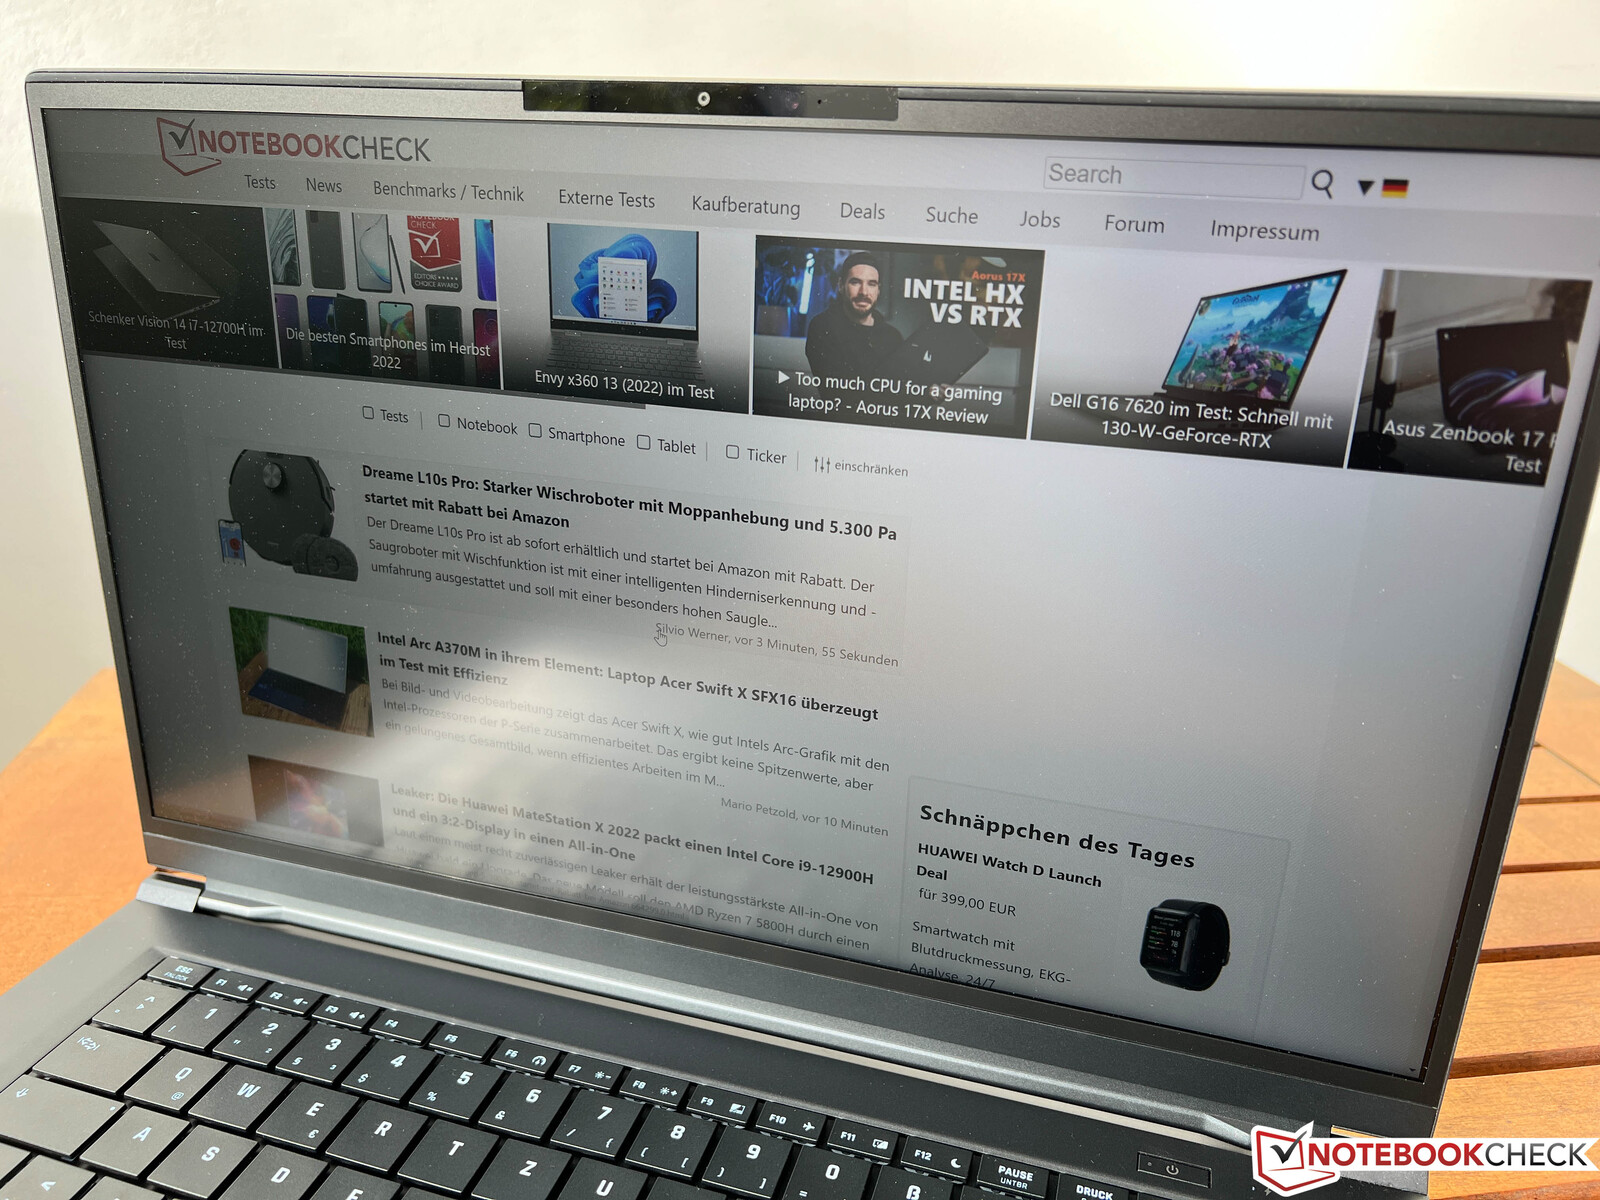
Display - WQHD panel with 165 Hz

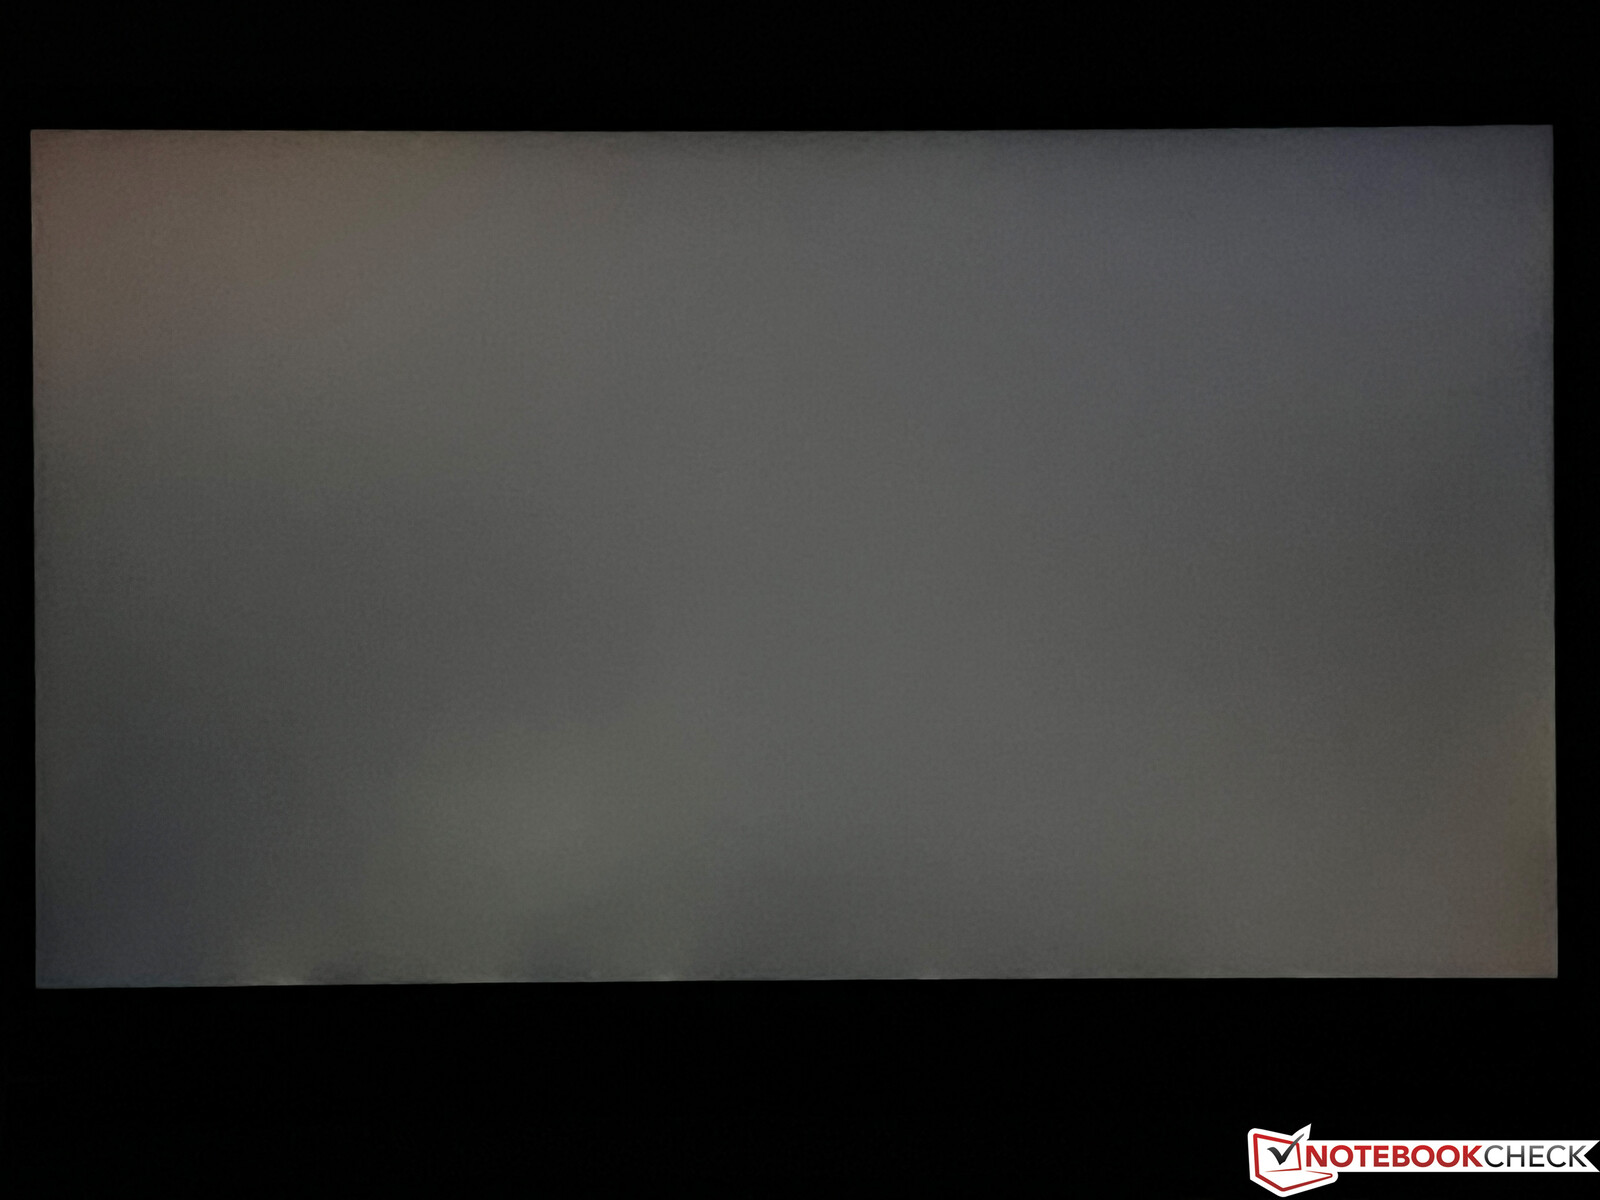
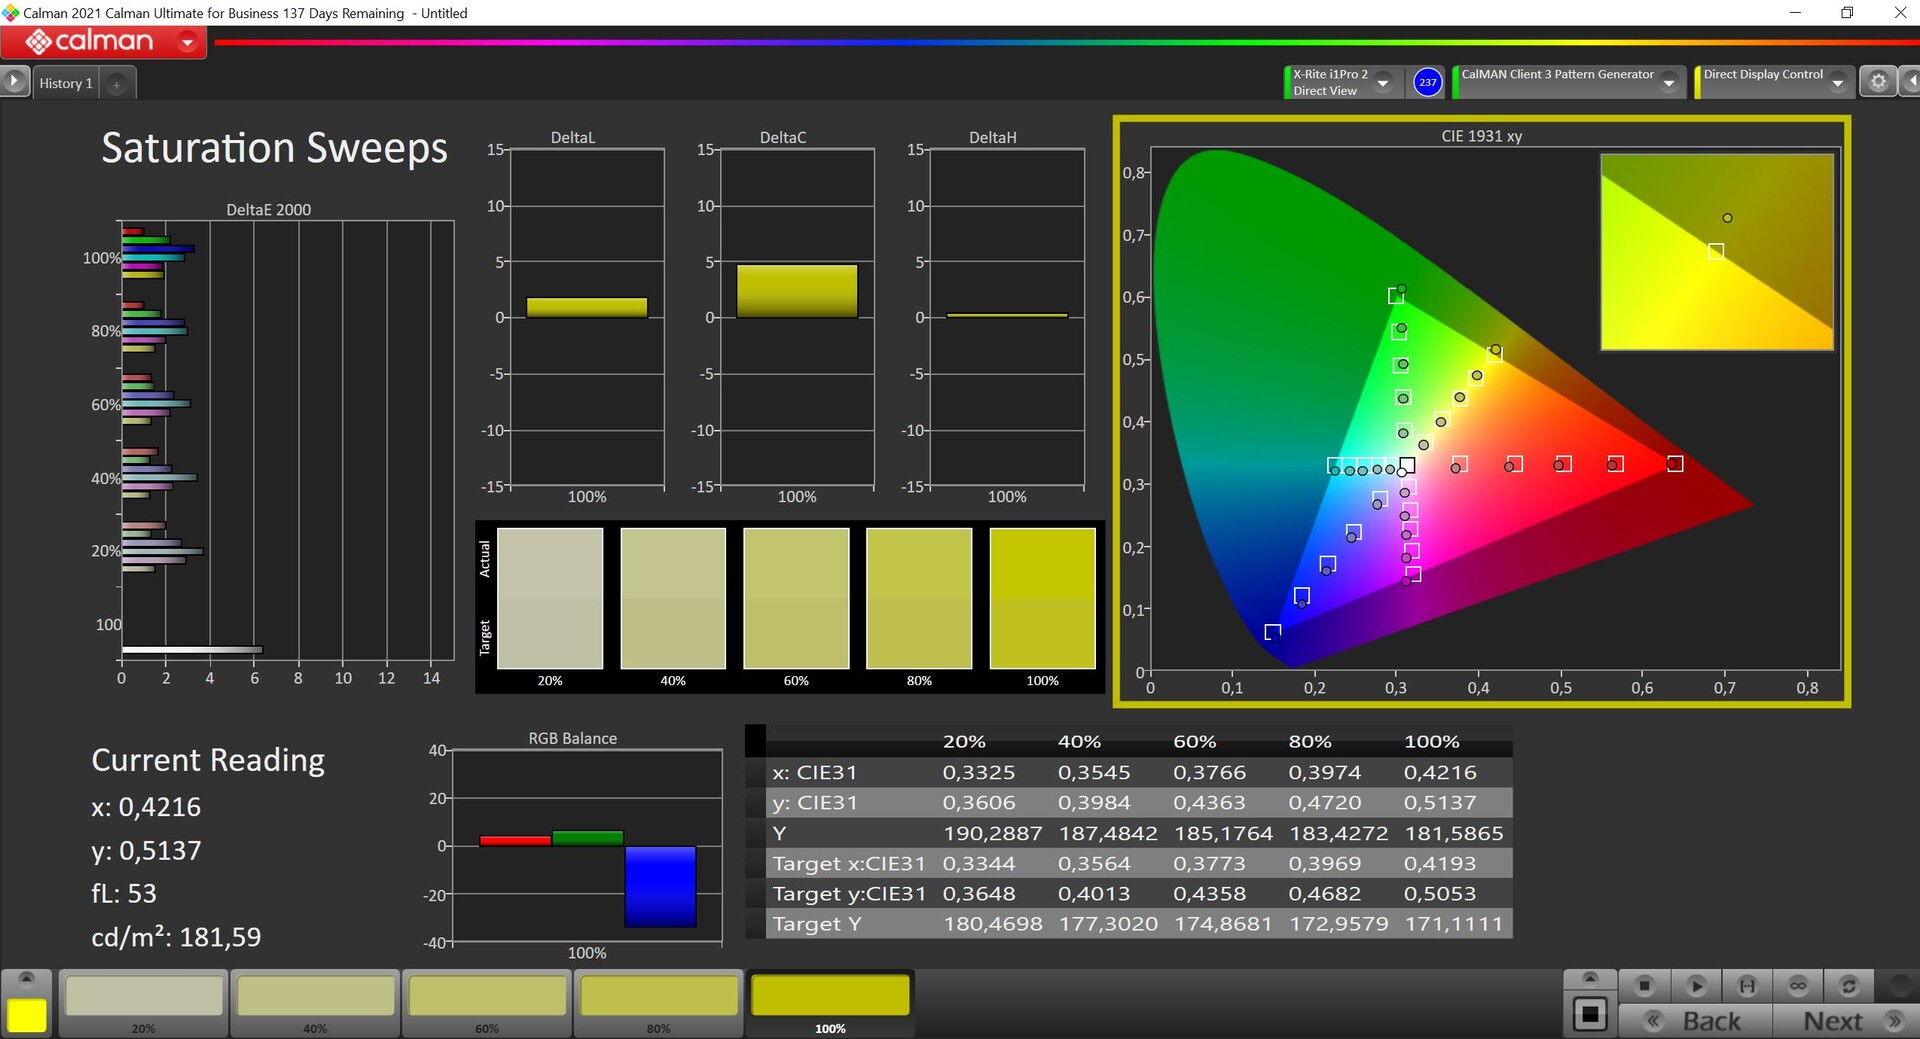
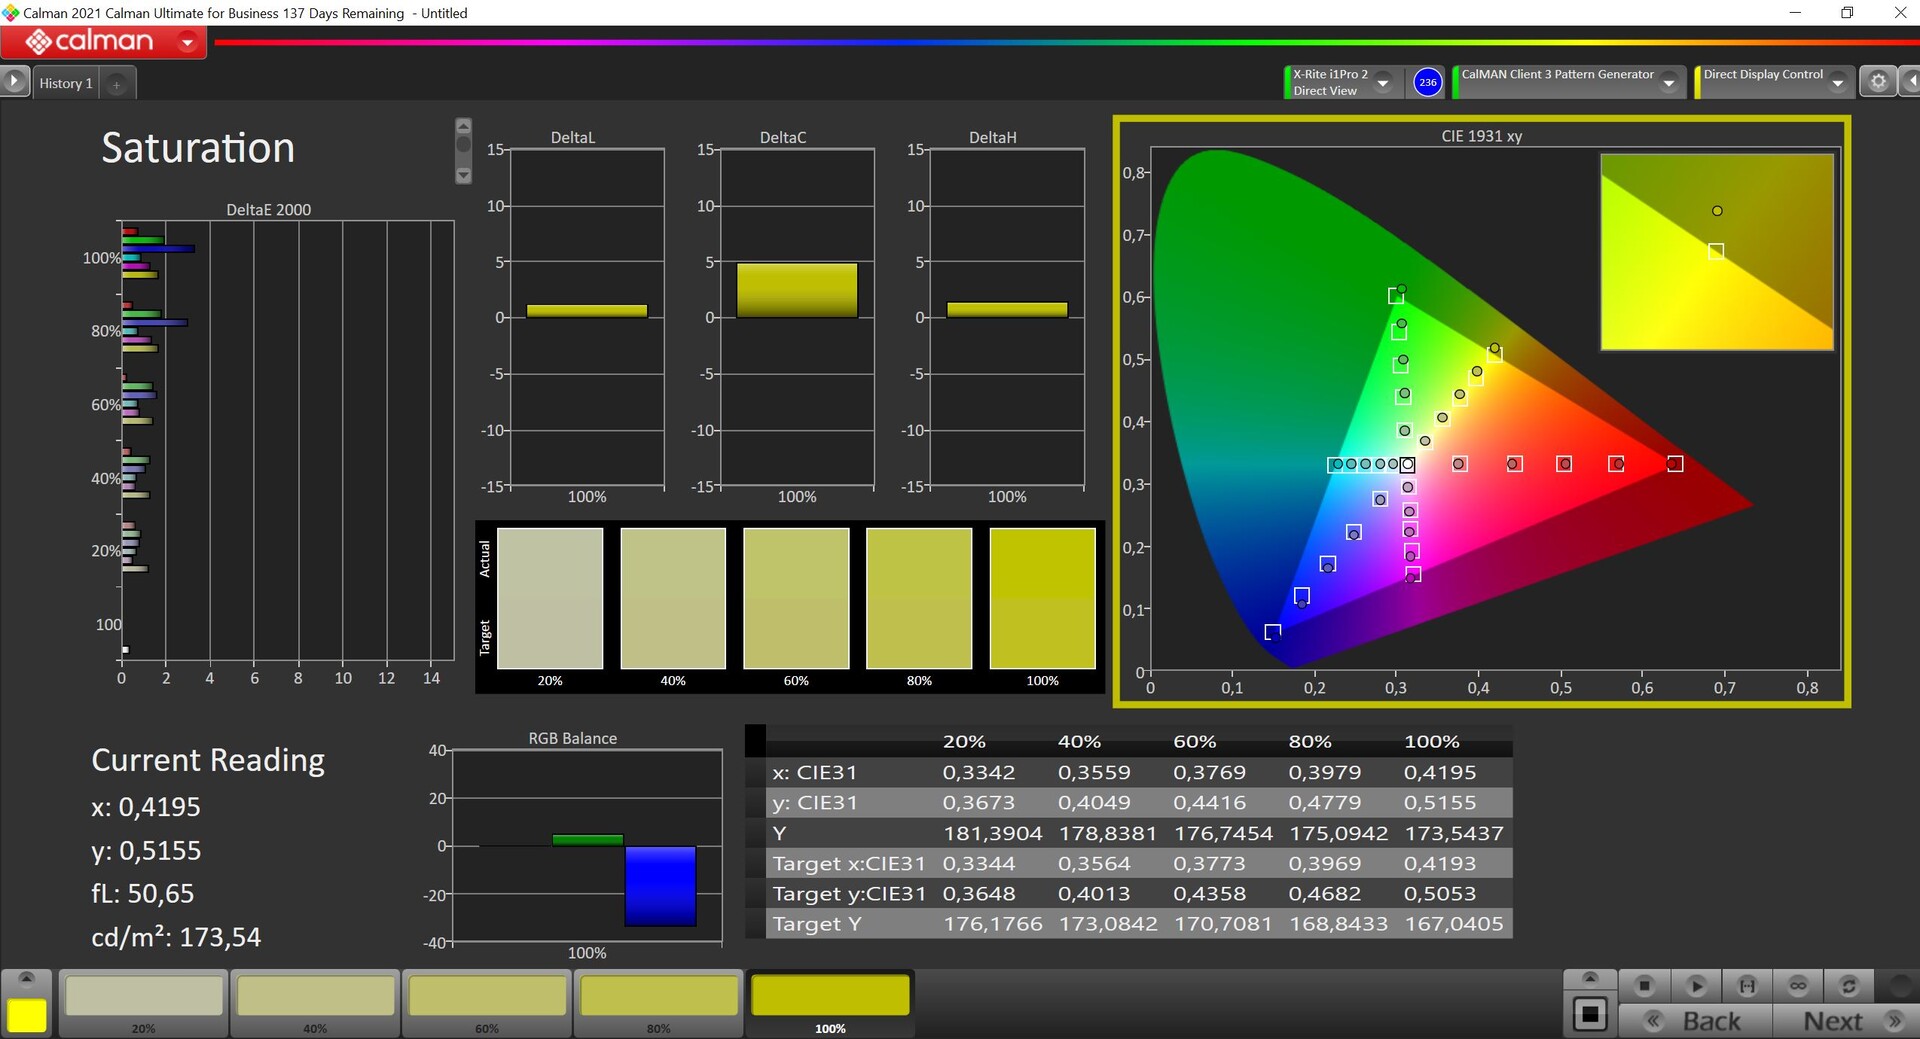
The 16:9 display offers WQHD resolution (2,560 x 1,440 pixels) and a fast refresh rate of 165 Hz. Thus, movements are very smooth and the subjective picture impression of the matte panel is also excellent otherwise because even bright surfaces do not look grainy. The response times are pleasantly fast and no PWM is used, but there are visible halos in high brightness and dark backgrounds.
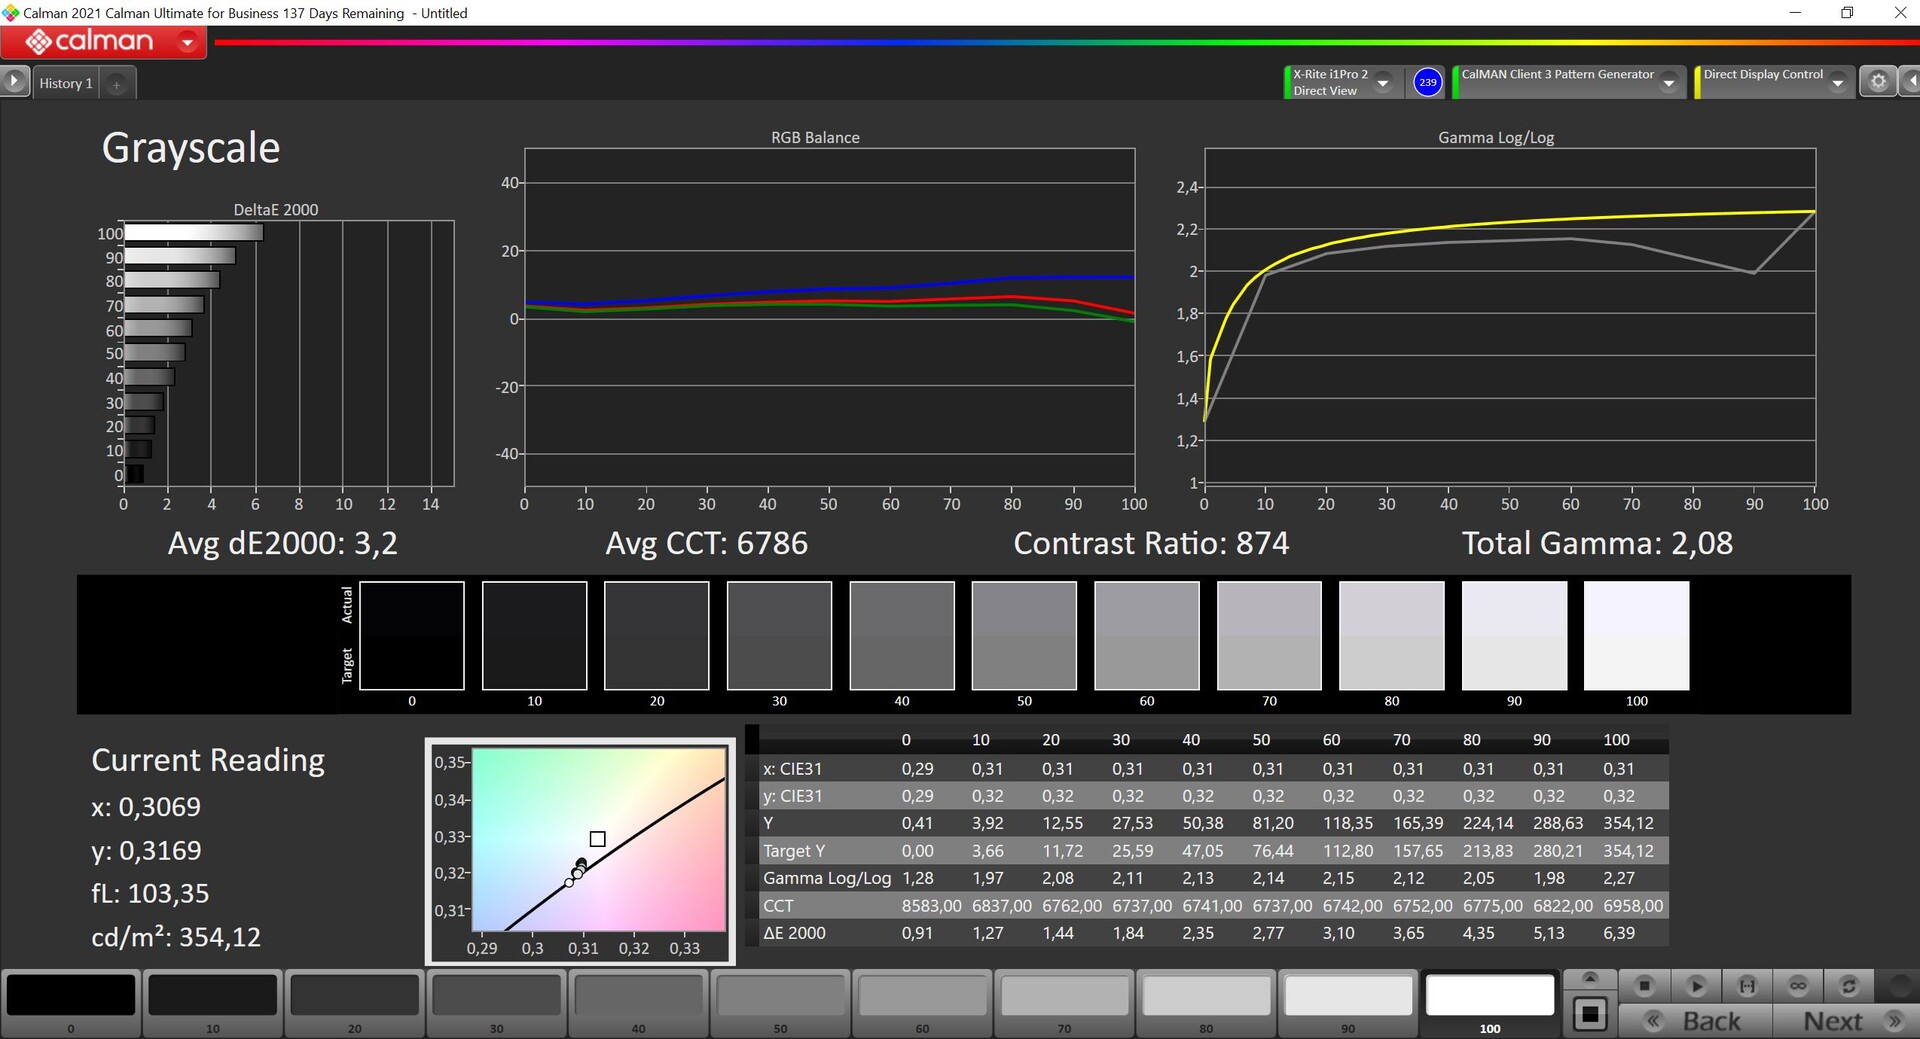
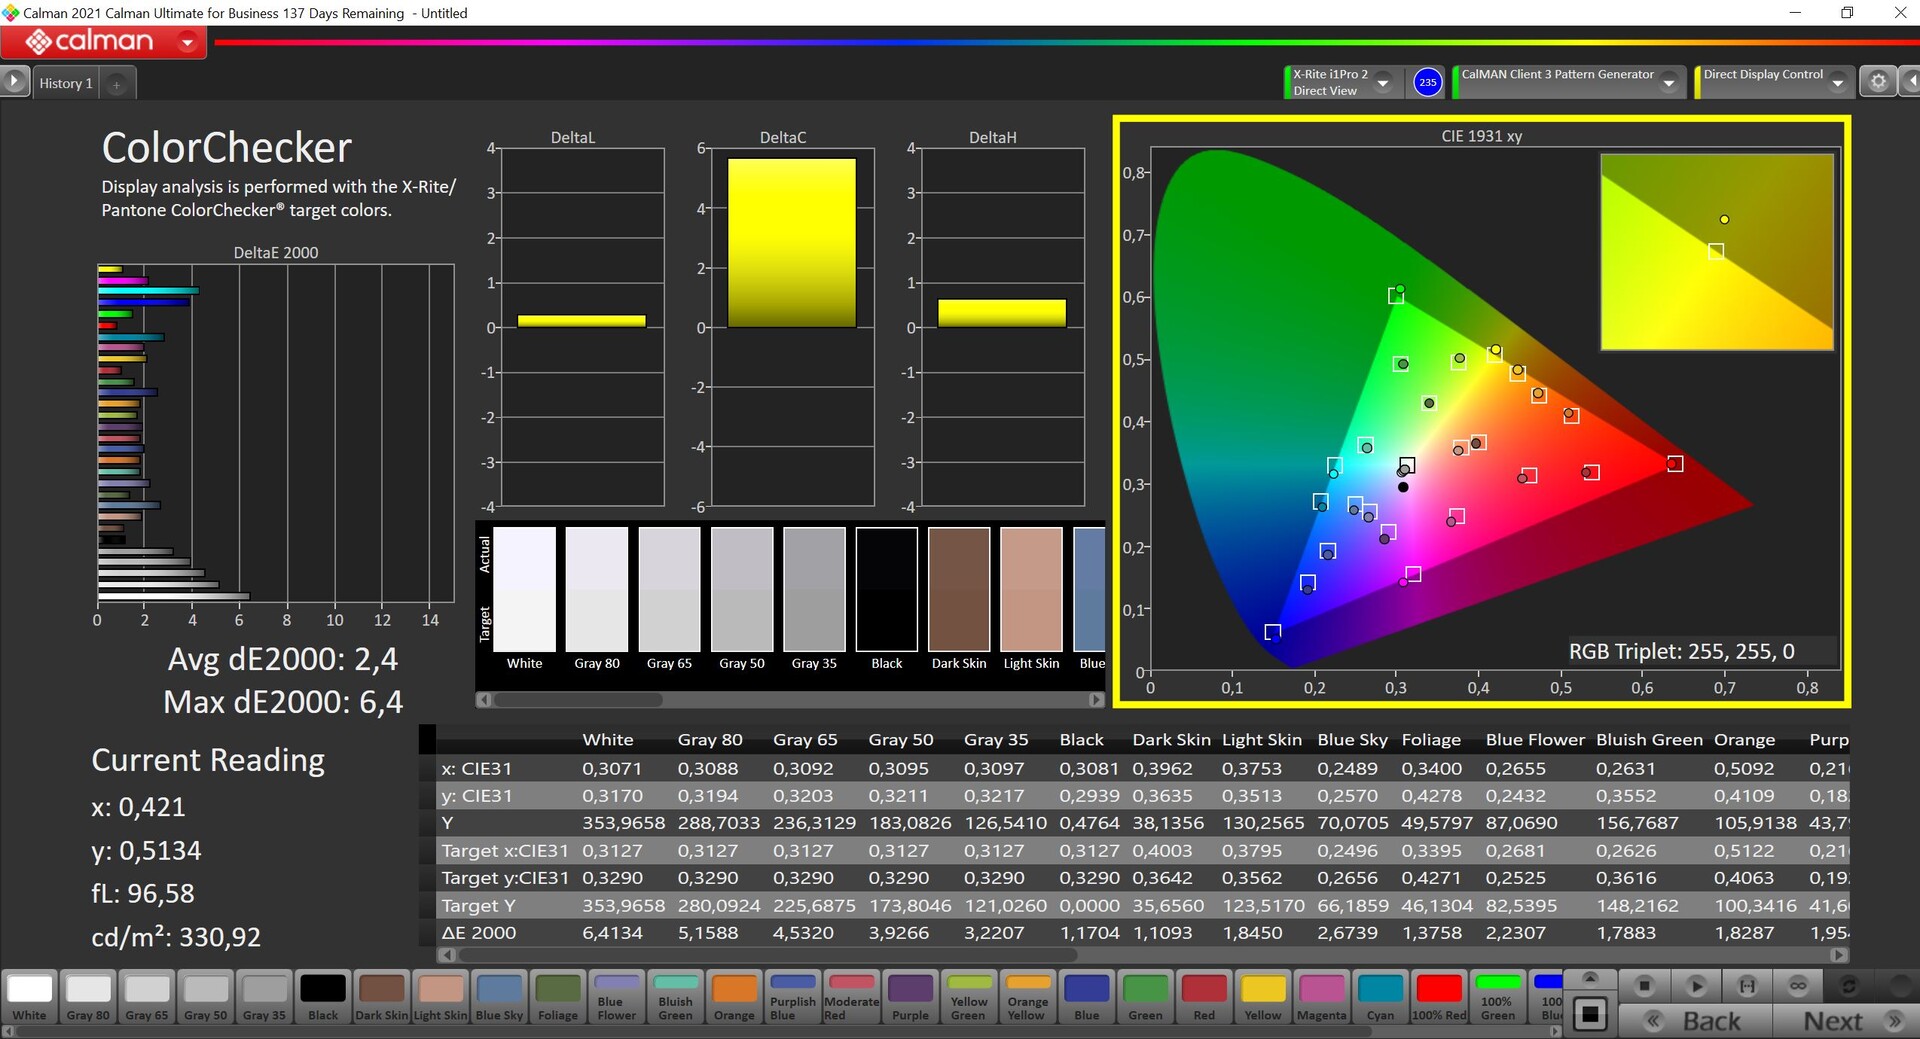
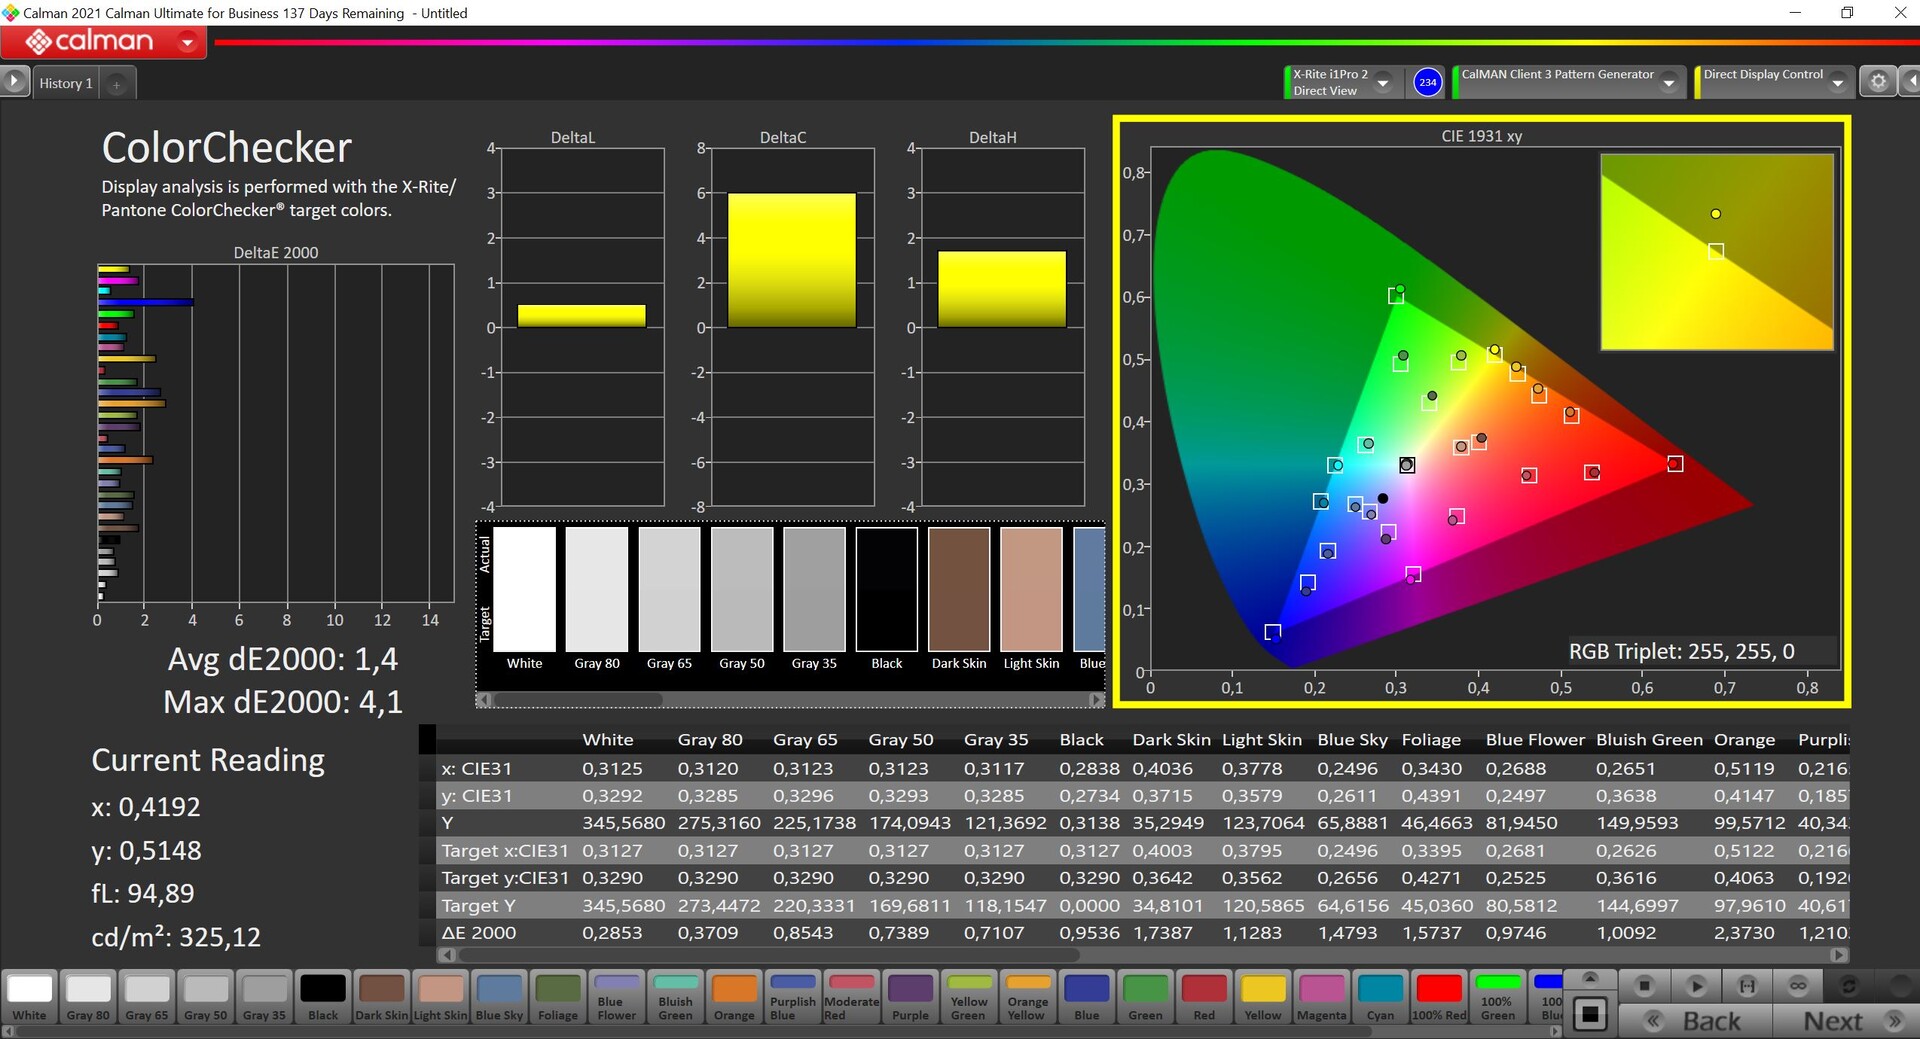
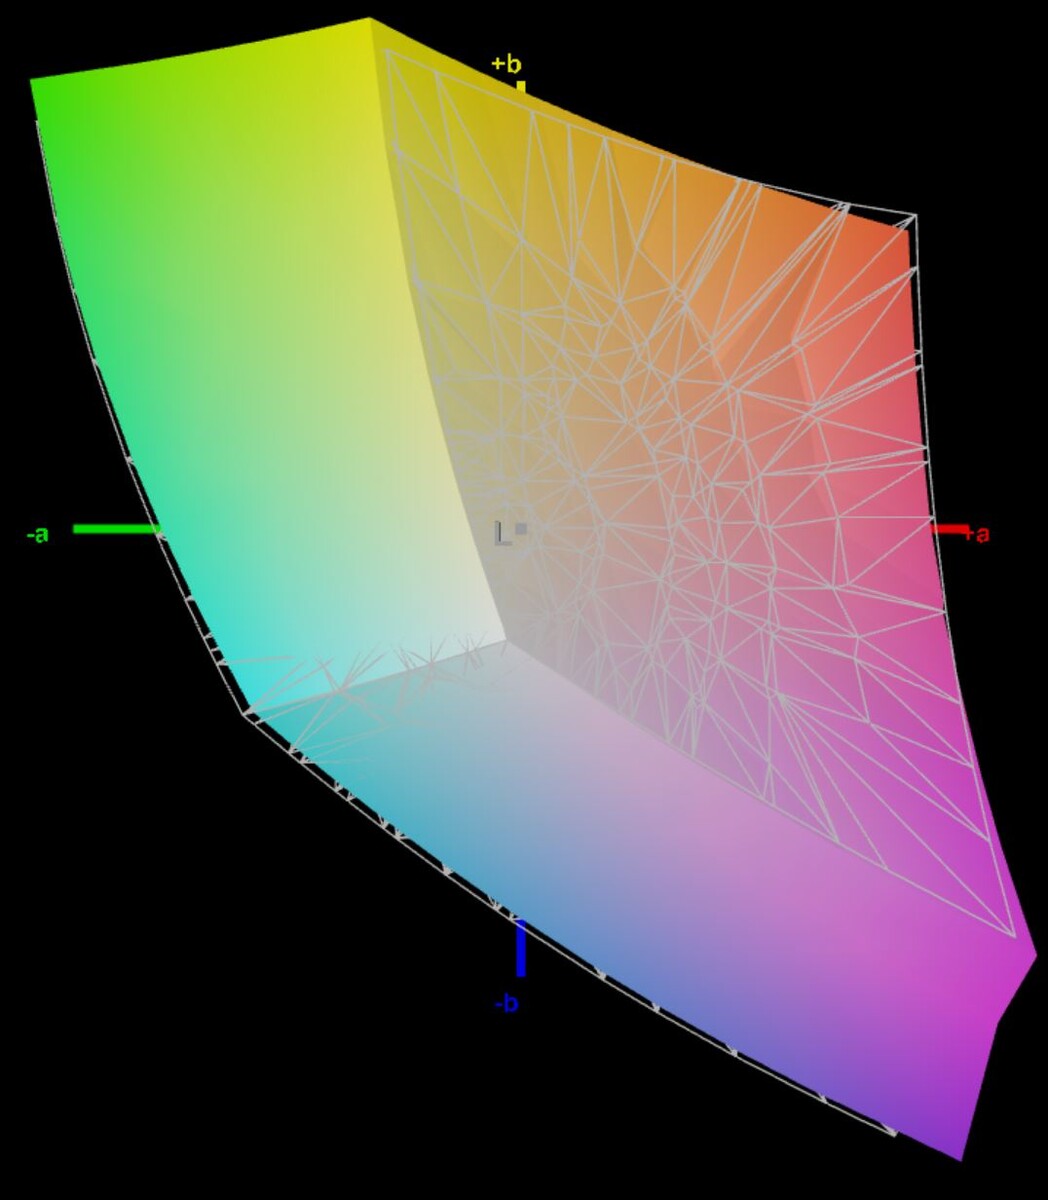
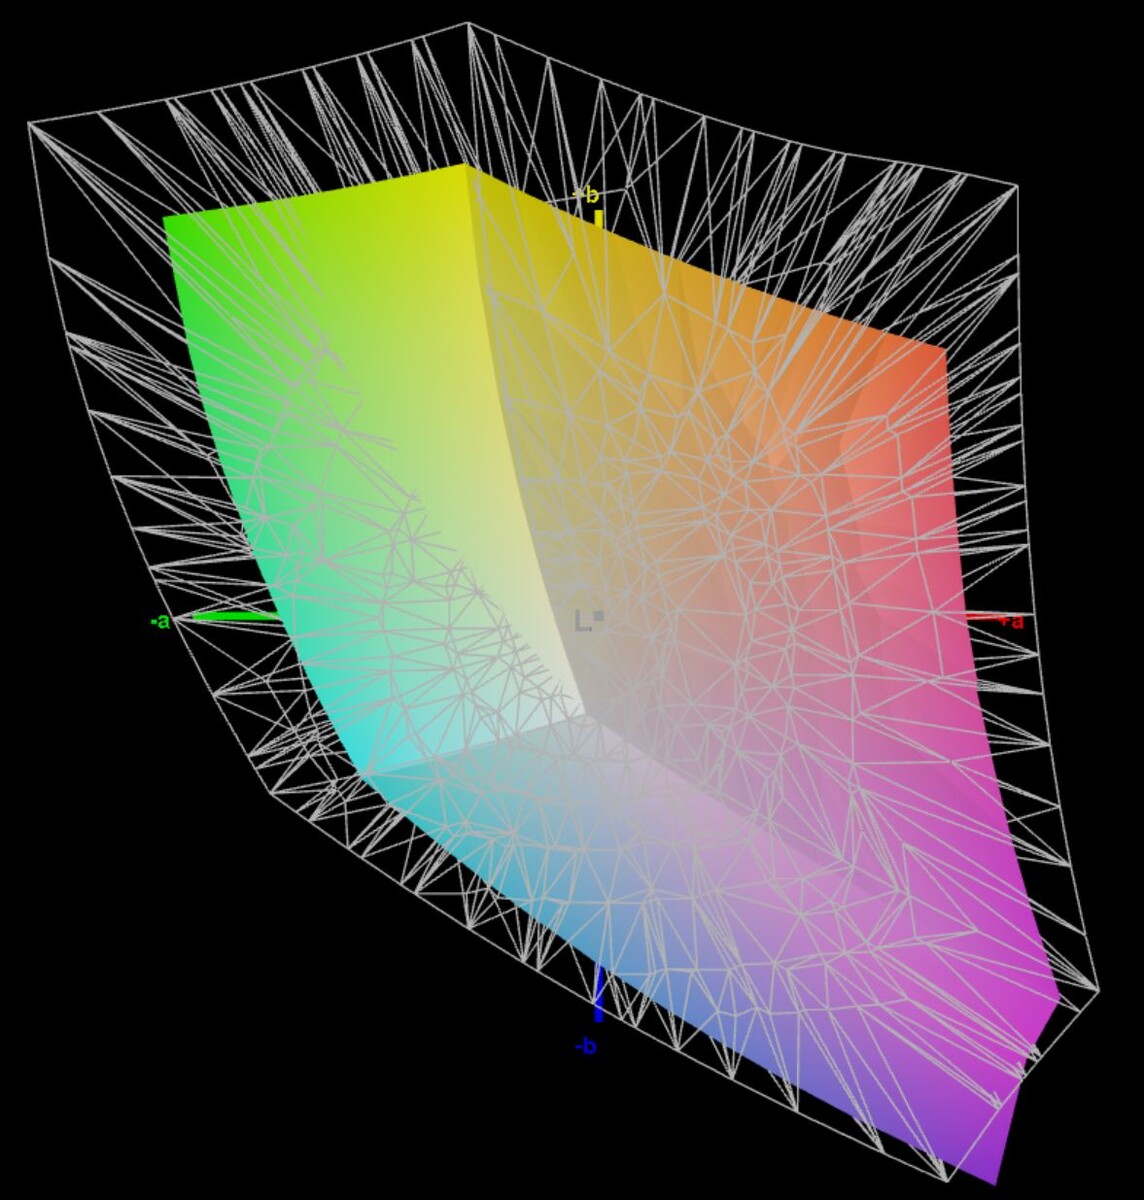
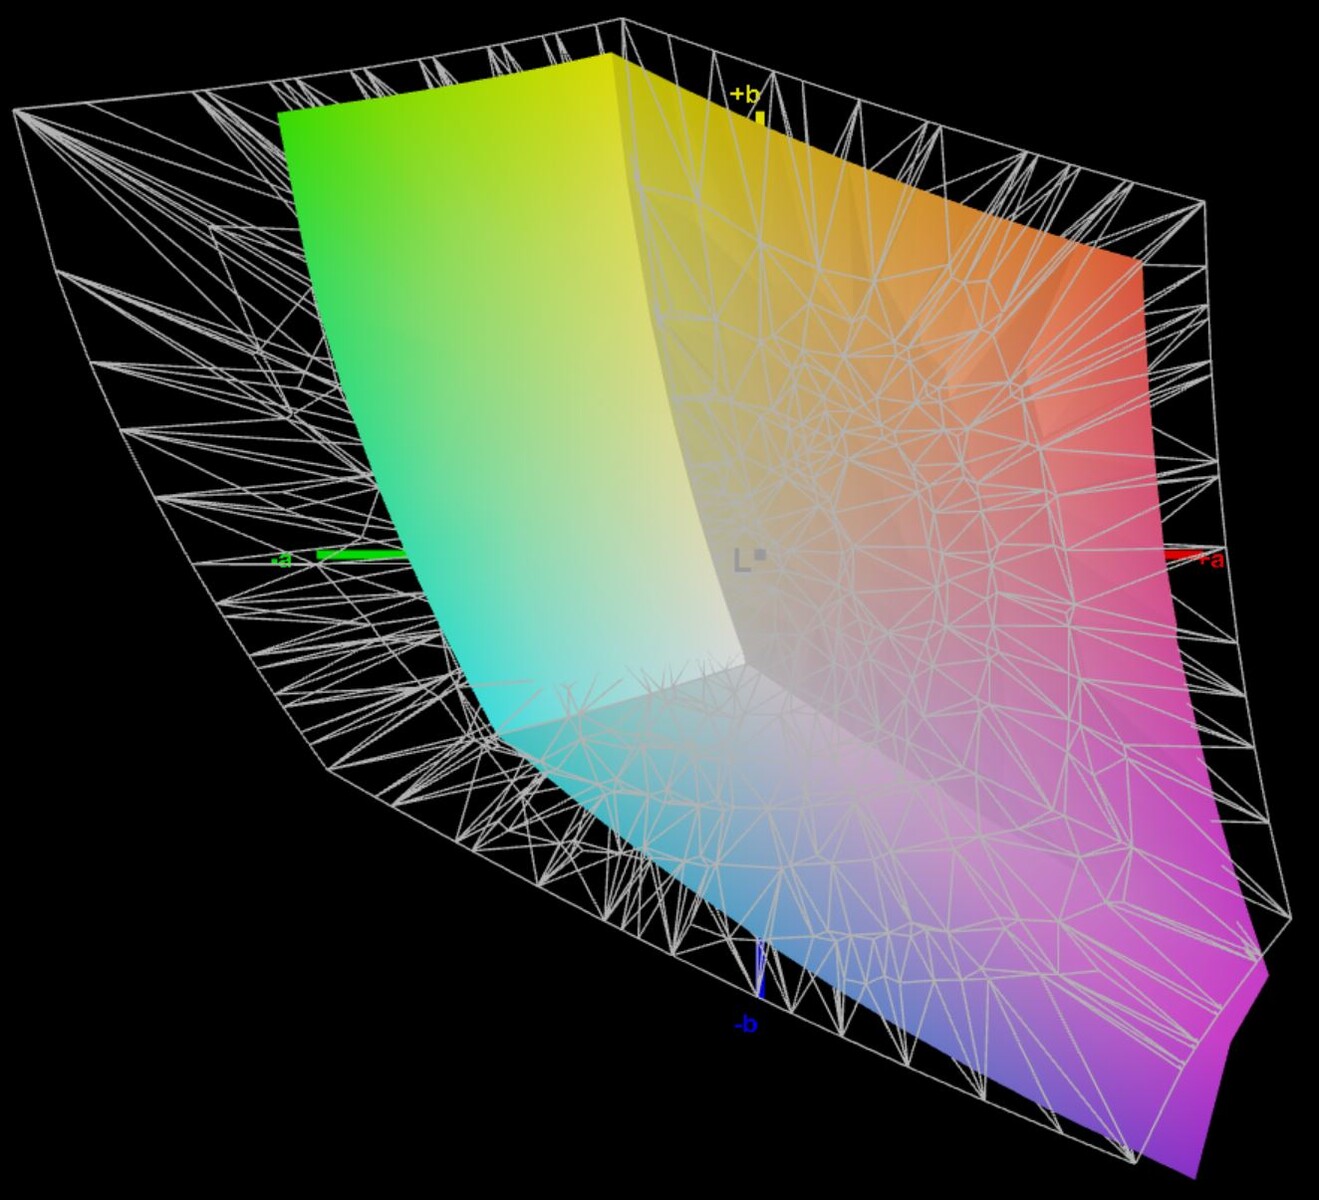
Schenker specifies a brightness of 300 cd/m², which is surpassed by our test device with an average of 330 cd/m². However, the black value is elevated at 0.41, which is why the contrast ratio is only just under 900:1. There is a minimal blue cast in the state of delivery, but this does not bother us in everyday office use. However, we can improve the display with our own calibration, and you can even edit pictures thanks to the full sRGB coverage. The viewing angles are okay, but we would have preferred a brighter panel outdoors despite the matte surface.
| |||||||||||||||||||||||||
Brightness Distribution: 80 %
Center on Battery: 354 cd/m²
Contrast: 863:1 (Black: 0.41 cd/m²)
ΔE ColorChecker Calman: 2.4 | ∀{0.5-29.43 Ø4.72}
calibrated: 1.4
ΔE Greyscale Calman: 3.2 | ∀{0.09-98 Ø4.97}
68.5% AdobeRGB 1998 (Argyll 3D)
97.1% sRGB (Argyll 3D)
67.5% Display P3 (Argyll 3D)
Gamma: 2.08
CCT: 6786 K
| Schenker VIA 15 Pro M22 NE156QHM-NY2, IPS, 2560x1440, 15.6" | Dell Latitude 3520 BOE NE156FH, IPS, 1920x1080, 15.6" | HP ProBook 450 G9 6A180EA Chi Mei CMN1512, , 1920x1080, 15.6" | Dell Inspiron 15 5515-H8P8F BOE NV15N4V, IPS, 1920x1080, 15.6" | Lenovo ThinkBook 15 G4 21DL0009GE LENOVO LEN156FHD , IPS, 1920x1080, 15.6" | |
|---|---|---|---|---|---|
| Display | -40% | -35% | -45% | -32% | |
| Display P3 Coverage (%) | 67.5 | 40 -41% | 42.76 -37% | 36.58 -46% | 44.8 -34% |
| sRGB Coverage (%) | 97.1 | 60.2 -38% | 63.9 -34% | 54.37 -44% | 66.8 -31% |
| AdobeRGB 1998 Coverage (%) | 68.5 | 41.4 -40% | 44.2 -35% | 37.79 -45% | 46.3 -32% |
| Response Times | -54% | -104% | -218% | -100% | |
| Response Time Grey 50% / Grey 80% * (ms) | 13.8 ? | 24 ? -74% | 28 ? -103% | 44 ? -219% | 29 ? -110% |
| Response Time Black / White * (ms) | 9.8 ? | 13 ? -33% | 20 ? -104% | 31 ? -216% | 18.5 ? -89% |
| PWM Frequency (Hz) | 1250 ? | 37037 ? | |||
| Screen | -50% | -52% | -27% | -47% | |
| Brightness middle (cd/m²) | 354 | 322 -9% | 234 -34% | 251 -29% | 313 -12% |
| Brightness (cd/m²) | 331 | 294 -11% | 218 -34% | 241 -27% | 301 -9% |
| Brightness Distribution (%) | 80 | 87 9% | 85 6% | 87 9% | 90 13% |
| Black Level * (cd/m²) | 0.41 | 0.445 -9% | 0.17 59% | 0.23 44% | 0.21 49% |
| Contrast (:1) | 863 | 724 -16% | 1376 59% | 1091 26% | 1490 73% |
| Colorchecker dE 2000 * | 2.4 | 4.54 -89% | 5.04 -110% | 5.14 -114% | 5.3 -121% |
| Colorchecker dE 2000 max. * | 6.4 | 17.27 -170% | 18.04 -182% | 18.41 -188% | 18.7 -192% |
| Colorchecker dE 2000 calibrated * | 1.4 | 4.43 -216% | 4.13 -195% | 4 -186% | |
| Greyscale dE 2000 * | 3.2 | 1.25 61% | 4.43 -38% | 1.08 66% | 4.4 -38% |
| Gamma | 2.08 106% | 2.46 89% | 2.41 91% | 2.43 91% | 2.08 106% |
| CCT | 6786 96% | 6677 97% | 6350 102% | 6534 99% | 6479 100% |
| Color Space (Percent of AdobeRGB 1998) (%) | 37.79 | ||||
| Color Space (Percent of sRGB) (%) | 54.37 | ||||
| Total Average (Program / Settings) | -48% /
-48% | -64% /
-56% | -97% /
-60% | -60% /
-51% |
* ... smaller is better

Display Response Times
| ↔ Response Time Black to White | ||
|---|---|---|
| 9.8 ms ... rise ↗ and fall ↘ combined | ↗ 4.8 ms rise | 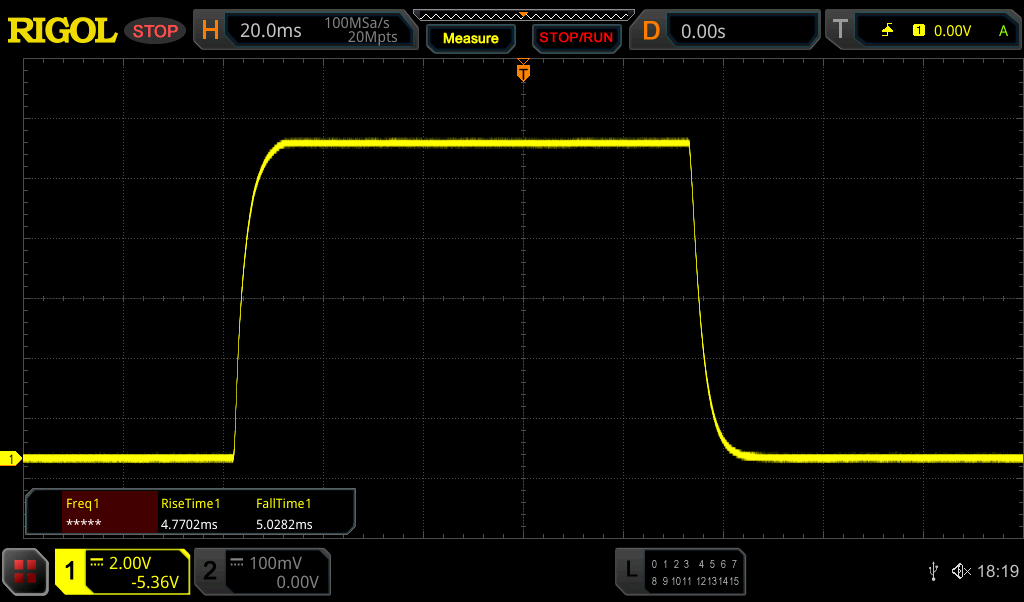 |
| ↘ 5 ms fall | ||
| The screen shows fast response rates in our tests and should be suited for gaming. In comparison, all tested devices range from 0.1 (minimum) to 240 (maximum) ms. » 27 % of all devices are better. This means that the measured response time is better than the average of all tested devices (19.8 ms). | ||
| ↔ Response Time 50% Grey to 80% Grey | ||
| 13.8 ms ... rise ↗ and fall ↘ combined | ↗ 6.7 ms rise | 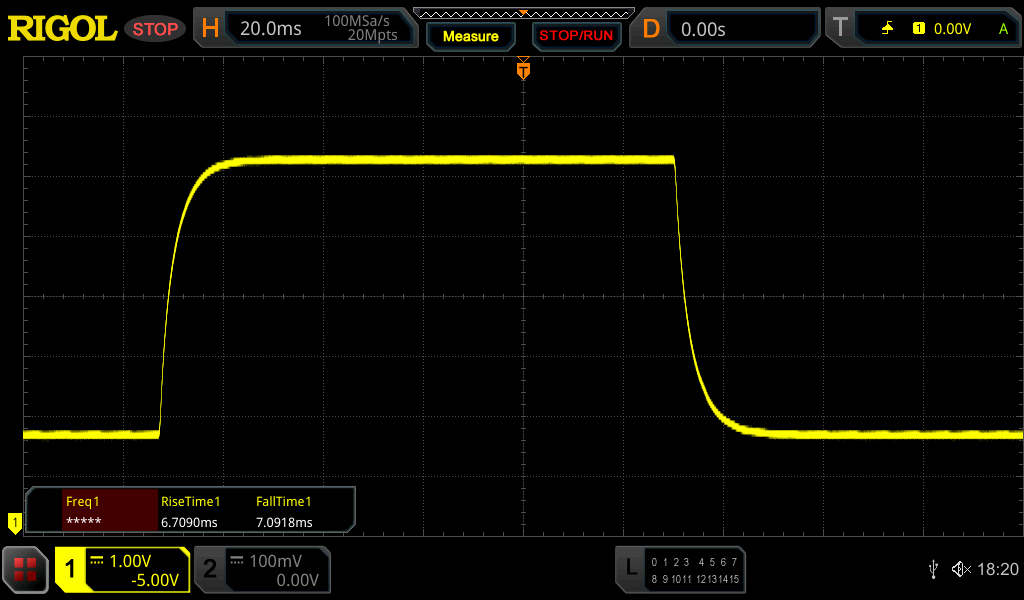 |
| ↘ 7.1 ms fall | ||
| The screen shows good response rates in our tests, but may be too slow for competitive gamers. In comparison, all tested devices range from 0.165 (minimum) to 636 (maximum) ms. » 28 % of all devices are better. This means that the measured response time is better than the average of all tested devices (31 ms). | ||
Screen Flickering / PWM (Pulse-Width Modulation)
| Screen flickering / PWM not detected | 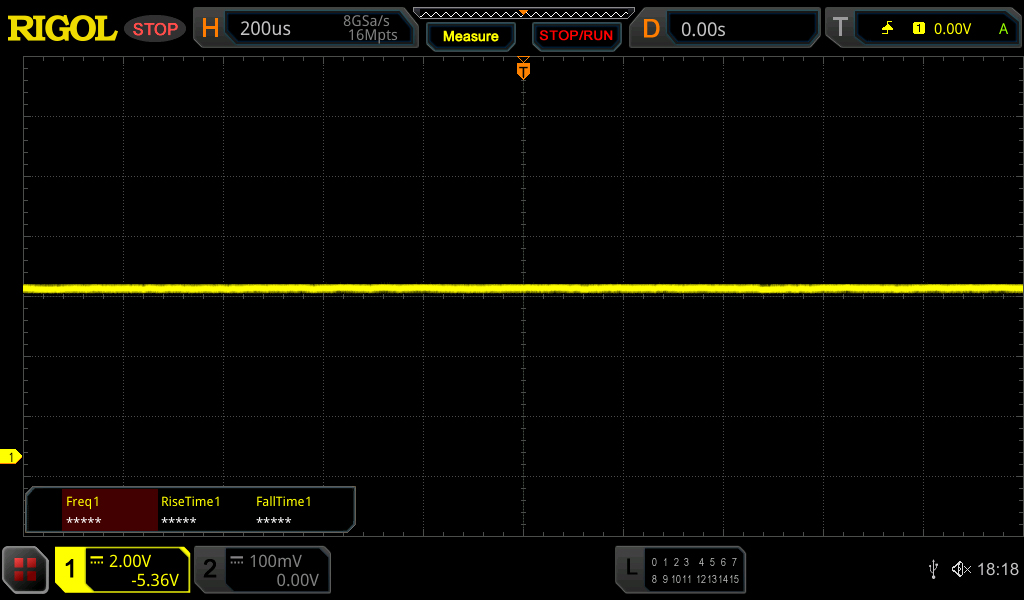 | ||
In comparison: 52 % of all tested devices do not use PWM to dim the display. If PWM was detected, an average of 7750 (minimum: 5 - maximum: 343500) Hz was measured. | |||

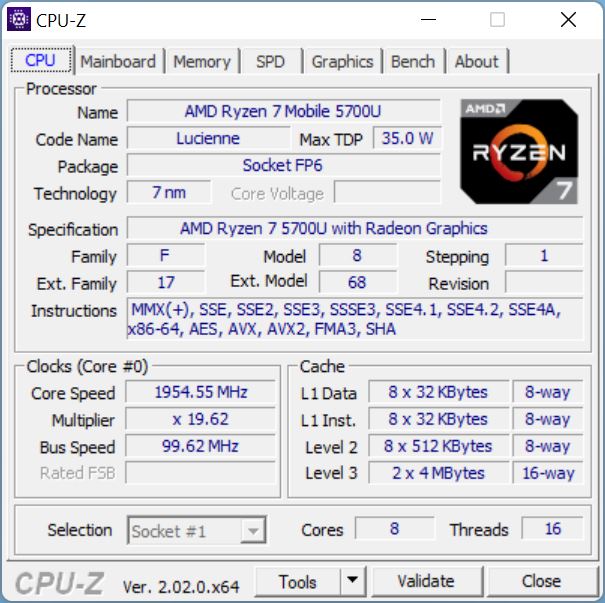
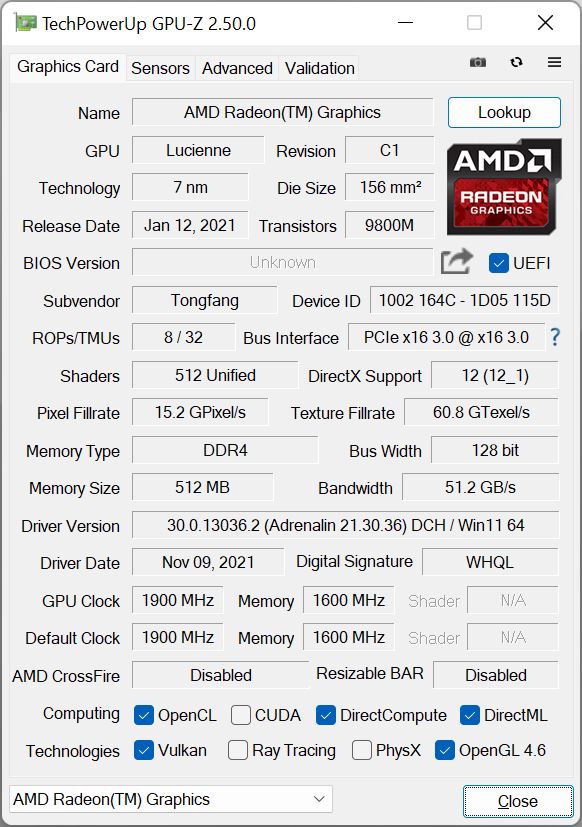
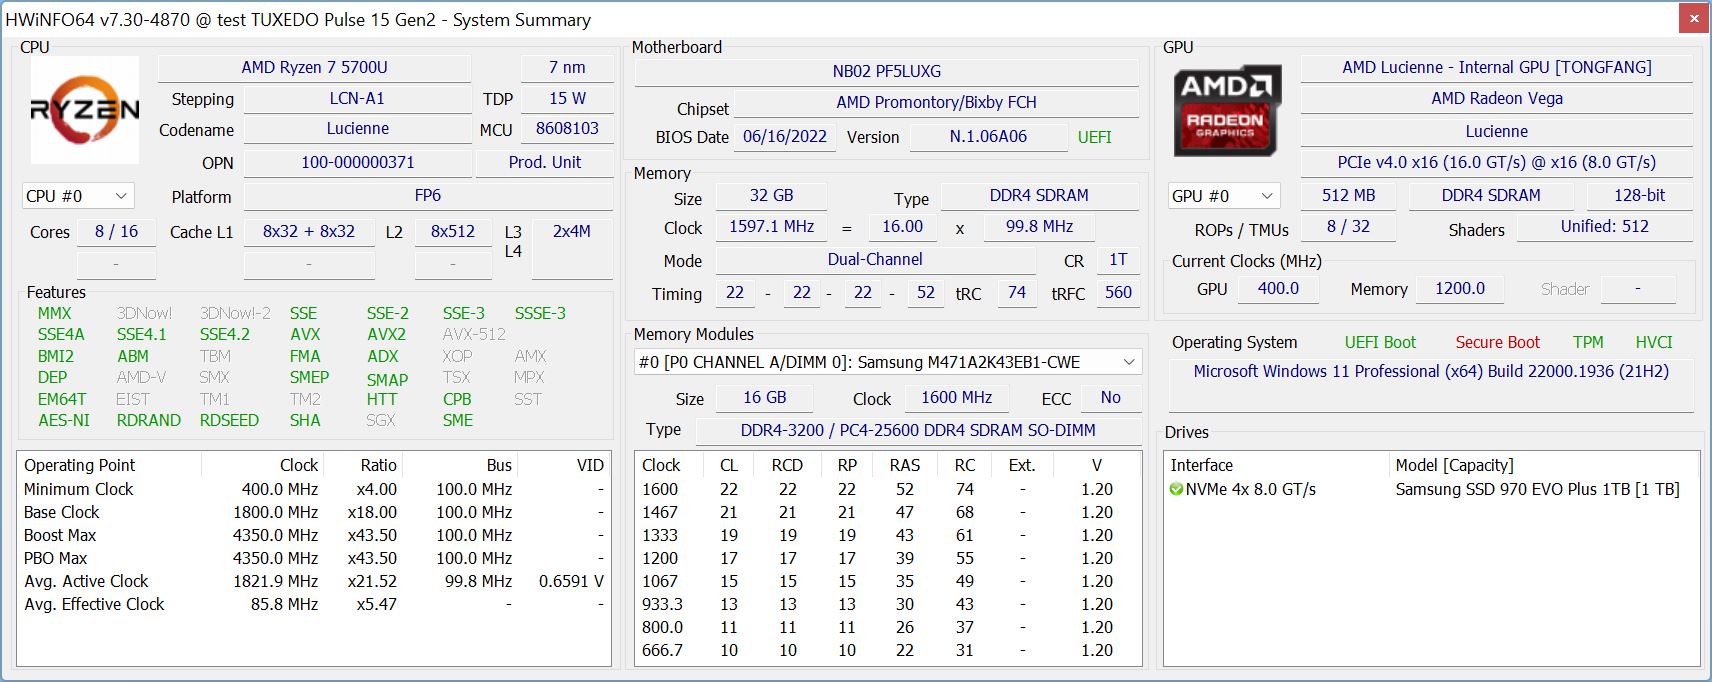
Performance - AMD Ryzen 7 5700U
Schenker relies on the somewhat dusty AMD Ryzen 7 5700U with 8 Zen 2 cores for the VIA 15 Pro, but it still offers decent performance. The power limits are 40/35 watts in Enthusiast mode (or 25/12W in Ultra-Silent mode), which gives it a very high and stable multi-core performance. In the multi-core tests, it even beats current Intel Raptor Lake U-series chips like the Core i7-1355U in the Lenovo ThinkPad X1 Yoga G8. In the single-core tests, however, the old Ryzen suffers.
Overall, the performance is completely sufficient for everyday office use, which is also due to the fast PCIe-SSD. The laptop is responsive at all times and we could not identify any problems during the test. The graphics performance of the Vega 8 iGPU is also perfectly sufficient for everyday use and rendering high-resolution videos also works flawlessly. The performance is even slightly better than that of the rivals with the Iris Xe Graphics G7. On battery power, the performance is slightly lower overall, especially in multi-core applications (deficit of ~25%).
Cinebench R15 Multi Loop
Cinebench R23: Multi Core | Single Core
Cinebench R20: CPU (Multi Core) | CPU (Single Core)
Cinebench R15: CPU Multi 64Bit | CPU Single 64Bit
Blender: v2.79 BMW27 CPU
7-Zip 18.03: 7z b 4 | 7z b 4 -mmt1
Geekbench 5.5: Multi-Core | Single-Core
HWBOT x265 Benchmark v2.2: 4k Preset
LibreOffice : 20 Documents To PDF
R Benchmark 2.5: Overall mean
| CPU Performance rating | |
| Lenovo ThinkPad X1 Yoga G8 i7-1355U -1! | |
| Average of class Office | |
| Lenovo ThinkBook 15 G4 21DL0009GE | |
| Schenker VIA 15 Pro M22 | |
| Average AMD Ryzen 7 5700U | |
| Dell Inspiron 15 5515-H8P8F | |
| HP ProBook 450 G9 6A180EA | |
| Dell Latitude 3520 | |
| Cinebench R23 / Multi Core | |
| Average of class Office (1673 - 22808, n=73, last 2 years) | |
| Schenker VIA 15 Pro M22 | |
| Lenovo ThinkPad X1 Yoga G8 i7-1355U | |
| Lenovo ThinkBook 15 G4 21DL0009GE | |
| Dell Inspiron 15 5515-H8P8F | |
| Average AMD Ryzen 7 5700U (4861 - 10139, n=20) | |
| HP ProBook 450 G9 6A180EA | |
| Dell Latitude 3520 | |
| Cinebench R23 / Single Core | |
| Lenovo ThinkPad X1 Yoga G8 i7-1355U | |
| Average of class Office (708 - 2130, n=73, last 2 years) | |
| HP ProBook 450 G9 6A180EA | |
| Lenovo ThinkBook 15 G4 21DL0009GE | |
| Dell Latitude 3520 | |
| Schenker VIA 15 Pro M22 | |
| Average AMD Ryzen 7 5700U (1177 - 1268, n=20) | |
| Dell Inspiron 15 5515-H8P8F | |
| Cinebench R20 / CPU (Multi Core) | |
| Average of class Office (648 - 8840, n=72, last 2 years) | |
| Schenker VIA 15 Pro M22 | |
| Lenovo ThinkPad X1 Yoga G8 i7-1355U | |
| Lenovo ThinkBook 15 G4 21DL0009GE | |
| Dell Inspiron 15 5515-H8P8F | |
| Average AMD Ryzen 7 5700U (1887 - 3877, n=21) | |
| HP ProBook 450 G9 6A180EA | |
| Dell Latitude 3520 | |
| Cinebench R20 / CPU (Single Core) | |
| Lenovo ThinkPad X1 Yoga G8 i7-1355U | |
| Average of class Office (345 - 816, n=72, last 2 years) | |
| HP ProBook 450 G9 6A180EA | |
| Lenovo ThinkBook 15 G4 21DL0009GE | |
| Dell Latitude 3520 | |
| Dell Inspiron 15 5515-H8P8F | |
| Schenker VIA 15 Pro M22 | |
| Average AMD Ryzen 7 5700U (471 - 495, n=21) | |
| Cinebench R15 / CPU Multi 64Bit | |
| Average of class Office (250 - 3380, n=74, last 2 years) | |
| Schenker VIA 15 Pro M22 | |
| Lenovo ThinkPad X1 Yoga G8 i7-1355U | |
| Lenovo ThinkBook 15 G4 21DL0009GE | |
| Dell Inspiron 15 5515-H8P8F | |
| Average AMD Ryzen 7 5700U (856 - 1691, n=20) | |
| HP ProBook 450 G9 6A180EA | |
| Dell Latitude 3520 | |
| Cinebench R15 / CPU Single 64Bit | |
| Lenovo ThinkPad X1 Yoga G8 i7-1355U | |
| Average of class Office (99.5 - 312, n=74, last 2 years) | |
| Lenovo ThinkBook 15 G4 21DL0009GE | |
| HP ProBook 450 G9 6A180EA | |
| Dell Latitude 3520 | |
| Dell Inspiron 15 5515-H8P8F | |
| Schenker VIA 15 Pro M22 | |
| Average AMD Ryzen 7 5700U (181 - 190, n=19) | |
| Blender / v2.79 BMW27 CPU | |
| Dell Latitude 3520 | |
| HP ProBook 450 G9 6A180EA | |
| Dell Inspiron 15 5515-H8P8F | |
| Lenovo ThinkBook 15 G4 21DL0009GE | |
| Average AMD Ryzen 7 5700U (292 - 557, n=20) | |
| Average of class Office (158 - 1940, n=73, last 2 years) | |
| Schenker VIA 15 Pro M22 | |
| 7-Zip 18.03 / 7z b 4 | |
| Schenker VIA 15 Pro M22 | |
| Average of class Office (7098 - 76886, n=74, last 2 years) | |
| Lenovo ThinkPad X1 Yoga G8 i7-1355U | |
| Lenovo ThinkBook 15 G4 21DL0009GE | |
| Average AMD Ryzen 7 5700U (29095 - 47501, n=20) | |
| Dell Inspiron 15 5515-H8P8F | |
| HP ProBook 450 G9 6A180EA | |
| Dell Latitude 3520 | |
| 7-Zip 18.03 / 7z b 4 -mmt1 | |
| Lenovo ThinkPad X1 Yoga G8 i7-1355U | |
| Average of class Office (3387 - 6469, n=74, last 2 years) | |
| Lenovo ThinkBook 15 G4 21DL0009GE | |
| HP ProBook 450 G9 6A180EA | |
| Dell Latitude 3520 | |
| Schenker VIA 15 Pro M22 | |
| Average AMD Ryzen 7 5700U (4402 - 4620, n=20) | |
| Dell Inspiron 15 5515-H8P8F | |
| Geekbench 5.5 / Multi-Core | |
| Average of class Office (1483 - 16999, n=70, last 2 years) | |
| Lenovo ThinkPad X1 Yoga G8 i7-1355U | |
| Schenker VIA 15 Pro M22 | |
| Lenovo ThinkBook 15 G4 21DL0009GE | |
| Average AMD Ryzen 7 5700U (4254 - 7635, n=19) | |
| HP ProBook 450 G9 6A180EA | |
| Dell Inspiron 15 5515-H8P8F | |
| Dell Latitude 3520 | |
| Geekbench 5.5 / Single-Core | |
| Average of class Office (811 - 2148, n=70, last 2 years) | |
| Lenovo ThinkPad X1 Yoga G8 i7-1355U | |
| HP ProBook 450 G9 6A180EA | |
| Lenovo ThinkBook 15 G4 21DL0009GE | |
| Dell Latitude 3520 | |
| Schenker VIA 15 Pro M22 | |
| Average AMD Ryzen 7 5700U (1105 - 1205, n=19) | |
| Dell Inspiron 15 5515-H8P8F | |
| HWBOT x265 Benchmark v2.2 / 4k Preset | |
| Average of class Office (2.21 - 26, n=73, last 2 years) | |
| Schenker VIA 15 Pro M22 | |
| Lenovo ThinkBook 15 G4 21DL0009GE | |
| Lenovo ThinkPad X1 Yoga G8 i7-1355U | |
| Average AMD Ryzen 7 5700U (6.08 - 12.1, n=20) | |
| Dell Inspiron 15 5515-H8P8F | |
| HP ProBook 450 G9 6A180EA | |
| Dell Latitude 3520 | |
| LibreOffice / 20 Documents To PDF | |
| Dell Inspiron 15 5515-H8P8F | |
| Schenker VIA 15 Pro M22 | |
| Average AMD Ryzen 7 5700U (52.4 - 75.5, n=20) | |
| Average of class Office (39.9 - 102.3, n=73, last 2 years) | |
| Dell Latitude 3520 | |
| Lenovo ThinkBook 15 G4 21DL0009GE | |
| HP ProBook 450 G9 6A180EA | |
| Lenovo ThinkPad X1 Yoga G8 i7-1355U | |
| R Benchmark 2.5 / Overall mean | |
| Dell Latitude 3520 | |
| Dell Inspiron 15 5515-H8P8F | |
| Average AMD Ryzen 7 5700U (0.567 - 0.641, n=20) | |
| Schenker VIA 15 Pro M22 | |
| HP ProBook 450 G9 6A180EA | |
| Lenovo ThinkBook 15 G4 21DL0009GE | |
| Average of class Office (0.4098 - 0.888, n=73, last 2 years) | |
| Lenovo ThinkPad X1 Yoga G8 i7-1355U | |
* ... smaller is better
AIDA64: FP32 Ray-Trace | FPU Julia | CPU SHA3 | CPU Queen | FPU SinJulia | FPU Mandel | CPU AES | CPU ZLib | FP64 Ray-Trace | CPU PhotoWorxx
| Performance rating | |
| Schenker VIA 15 Pro M22 | |
| Average of class Office | |
| Lenovo ThinkBook 15 G4 21DL0009GE | |
| Average AMD Ryzen 7 5700U | |
| Dell Inspiron 15 5515-H8P8F | |
| Dell Latitude 3520 | |
| HP ProBook 450 G9 6A180EA | |
| AIDA64 / FP32 Ray-Trace | |
| Average of class Office (2083 - 31245, n=80, last 2 years) | |
| Schenker VIA 15 Pro M22 | |
| Lenovo ThinkBook 15 G4 21DL0009GE | |
| Dell Inspiron 15 5515-H8P8F | |
| Average AMD Ryzen 7 5700U (5679 - 12346, n=20) | |
| Dell Latitude 3520 | |
| HP ProBook 450 G9 6A180EA | |
| AIDA64 / FPU Julia | |
| Schenker VIA 15 Pro M22 | |
| Lenovo ThinkBook 15 G4 21DL0009GE | |
| Average of class Office (8191 - 125394, n=80, last 2 years) | |
| Dell Inspiron 15 5515-H8P8F | |
| Average AMD Ryzen 7 5700U (39042 - 69580, n=20) | |
| HP ProBook 450 G9 6A180EA | |
| Dell Latitude 3520 | |
| AIDA64 / CPU SHA3 | |
| Average of class Office (433 - 5755, n=80, last 2 years) | |
| Lenovo ThinkBook 15 G4 21DL0009GE | |
| Schenker VIA 15 Pro M22 | |
| Dell Inspiron 15 5515-H8P8F | |
| Average AMD Ryzen 7 5700U (1103 - 2231, n=20) | |
| Dell Latitude 3520 | |
| HP ProBook 450 G9 6A180EA | |
| AIDA64 / CPU Queen | |
| Schenker VIA 15 Pro M22 | |
| Dell Inspiron 15 5515-H8P8F | |
| Average AMD Ryzen 7 5700U (57016 - 99178, n=20) | |
| Lenovo ThinkBook 15 G4 21DL0009GE | |
| Average of class Office (22784 - 115197, n=67, last 2 years) | |
| HP ProBook 450 G9 6A180EA | |
| Dell Latitude 3520 | |
| AIDA64 / FPU SinJulia | |
| Schenker VIA 15 Pro M22 | |
| Dell Inspiron 15 5515-H8P8F | |
| Average AMD Ryzen 7 5700U (6837 - 14169, n=20) | |
| Lenovo ThinkBook 15 G4 21DL0009GE | |
| Average of class Office (1378 - 18321, n=80, last 2 years) | |
| Dell Latitude 3520 | |
| HP ProBook 450 G9 6A180EA | |
| AIDA64 / FPU Mandel | |
| Lenovo ThinkBook 15 G4 21DL0009GE | |
| Schenker VIA 15 Pro M22 | |
| Average of class Office (4601 - 66922, n=80, last 2 years) | |
| Dell Inspiron 15 5515-H8P8F | |
| Average AMD Ryzen 7 5700U (20179 - 36523, n=20) | |
| Dell Latitude 3520 | |
| HP ProBook 450 G9 6A180EA | |
| AIDA64 / CPU AES | |
| Lenovo ThinkBook 15 G4 21DL0009GE | |
| Dell Latitude 3520 | |
| Dell Inspiron 15 5515-H8P8F | |
| Average AMD Ryzen 7 5700U (26066 - 64646, n=20) | |
| Average of class Office (4854 - 155900, n=80, last 2 years) | |
| Schenker VIA 15 Pro M22 | |
| HP ProBook 450 G9 6A180EA | |
| AIDA64 / CPU ZLib | |
| Schenker VIA 15 Pro M22 | |
| Average of class Office (114.6 - 1366, n=80, last 2 years) | |
| Dell Inspiron 15 5515-H8P8F | |
| Average AMD Ryzen 7 5700U (440 - 776, n=20) | |
| Lenovo ThinkBook 15 G4 21DL0009GE | |
| HP ProBook 450 G9 6A180EA | |
| Dell Latitude 3520 | |
| AIDA64 / FP64 Ray-Trace | |
| Average of class Office (1109 - 17834, n=80, last 2 years) | |
| Schenker VIA 15 Pro M22 | |
| Dell Inspiron 15 5515-H8P8F | |
| Lenovo ThinkBook 15 G4 21DL0009GE | |
| Average AMD Ryzen 7 5700U (2985 - 6784, n=20) | |
| Dell Latitude 3520 | |
| HP ProBook 450 G9 6A180EA | |
| AIDA64 / CPU PhotoWorxx | |
| Average of class Office (11090 - 65229, n=80, last 2 years) | |
| Schenker VIA 15 Pro M22 | |
| Average AMD Ryzen 7 5700U (6903 - 25066, n=20) | |
| Lenovo ThinkBook 15 G4 21DL0009GE | |
| HP ProBook 450 G9 6A180EA | |
| Dell Latitude 3520 | |
| Dell Inspiron 15 5515-H8P8F | |
CrossMark: Overall | Productivity | Creativity | Responsiveness
| PCMark 10 / Score | |
| Average of class Office (2601 - 9298, n=66, last 2 years) | |
| Lenovo ThinkBook 15 G4 21DL0009GE | |
| Average AMD Ryzen 7 5700U, AMD Radeon RX Vega 8 (Ryzen 4000/5000) (4325 - 5518, n=15) | |
| Schenker VIA 15 Pro M22 | |
| Dell Inspiron 15 5515-H8P8F | |
| HP ProBook 450 G9 6A180EA | |
| Dell Latitude 3520 | |
| PCMark 10 / Essentials | |
| Lenovo ThinkBook 15 G4 21DL0009GE | |
| Average of class Office (3245 - 11594, n=66, last 2 years) | |
| HP ProBook 450 G9 6A180EA | |
| Average AMD Ryzen 7 5700U, AMD Radeon RX Vega 8 (Ryzen 4000/5000) (8025 - 10091, n=15) | |
| Dell Latitude 3520 | |
| Schenker VIA 15 Pro M22 | |
| Dell Inspiron 15 5515-H8P8F | |
| PCMark 10 / Productivity | |
| Average of class Office (5336 - 17243, n=66, last 2 years) | |
| Lenovo ThinkBook 15 G4 21DL0009GE | |
| Average AMD Ryzen 7 5700U, AMD Radeon RX Vega 8 (Ryzen 4000/5000) (7001 - 8457, n=15) | |
| Dell Inspiron 15 5515-H8P8F | |
| Schenker VIA 15 Pro M22 | |
| HP ProBook 450 G9 6A180EA | |
| Dell Latitude 3520 | |
| PCMark 10 / Digital Content Creation | |
| Average of class Office (2049 - 13541, n=66, last 2 years) | |
| Lenovo ThinkBook 15 G4 21DL0009GE | |
| Schenker VIA 15 Pro M22 | |
| Average AMD Ryzen 7 5700U, AMD Radeon RX Vega 8 (Ryzen 4000/5000) (3738 - 5964, n=15) | |
| Dell Inspiron 15 5515-H8P8F | |
| Dell Latitude 3520 | |
| HP ProBook 450 G9 6A180EA | |
| CrossMark / Overall | |
| Average of class Office (381 - 2010, n=73, last 2 years) | |
| HP ProBook 450 G9 6A180EA | |
| Lenovo ThinkBook 15 G4 21DL0009GE | |
| Schenker VIA 15 Pro M22 | |
| Dell Latitude 3520 | |
| Average AMD Ryzen 7 5700U, AMD Radeon RX Vega 8 (Ryzen 4000/5000) (866 - 1183, n=8) | |
| Dell Inspiron 15 5515-H8P8F | |
| CrossMark / Productivity | |
| Average of class Office (464 - 1880, n=73, last 2 years) | |
| Lenovo ThinkBook 15 G4 21DL0009GE | |
| HP ProBook 450 G9 6A180EA | |
| Dell Latitude 3520 | |
| Schenker VIA 15 Pro M22 | |
| Average AMD Ryzen 7 5700U, AMD Radeon RX Vega 8 (Ryzen 4000/5000) (931 - 1191, n=8) | |
| Dell Inspiron 15 5515-H8P8F | |
| CrossMark / Creativity | |
| Average of class Office (319 - 2361, n=73, last 2 years) | |
| HP ProBook 450 G9 6A180EA | |
| Lenovo ThinkBook 15 G4 21DL0009GE | |
| Schenker VIA 15 Pro M22 | |
| Average AMD Ryzen 7 5700U, AMD Radeon RX Vega 8 (Ryzen 4000/5000) (907 - 1197, n=8) | |
| Dell Latitude 3520 | |
| Dell Inspiron 15 5515-H8P8F | |
| CrossMark / Responsiveness | |
| Average of class Office (360 - 1820, n=73, last 2 years) | |
| Dell Latitude 3520 | |
| Lenovo ThinkBook 15 G4 21DL0009GE | |
| Schenker VIA 15 Pro M22 | |
| HP ProBook 450 G9 6A180EA | |
| Average AMD Ryzen 7 5700U, AMD Radeon RX Vega 8 (Ryzen 4000/5000) (605 - 1159, n=8) | |
| Dell Inspiron 15 5515-H8P8F | |
| PCMark 10 Score | 5025 points | |
Help | ||
| AIDA64 / Memory Copy | |
| Average of class Office (20075 - 110930, n=77, last 2 years) | |
| Schenker VIA 15 Pro M22 | |
| Lenovo ThinkBook 15 G4 21DL0009GE | |
| Average AMD Ryzen 7 5700U (15867 - 39326, n=20) | |
| HP ProBook 450 G9 6A180EA | |
| Dell Latitude 3520 | |
| Dell Inspiron 15 5515-H8P8F | |
| AIDA64 / Memory Read | |
| Average of class Office (10084 - 128030, n=78, last 2 years) | |
| Schenker VIA 15 Pro M22 | |
| Lenovo ThinkBook 15 G4 21DL0009GE | |
| Average AMD Ryzen 7 5700U (17632 - 47190, n=20) | |
| HP ProBook 450 G9 6A180EA | |
| Dell Latitude 3520 | |
| Dell Inspiron 15 5515-H8P8F | |
| AIDA64 / Memory Write | |
| Average of class Office (20073 - 119858, n=78, last 2 years) | |
| Schenker VIA 15 Pro M22 | |
| Average AMD Ryzen 7 5700U (11554 - 47048, n=20) | |
| Lenovo ThinkBook 15 G4 21DL0009GE | |
| HP ProBook 450 G9 6A180EA | |
| Dell Latitude 3520 | |
| Dell Inspiron 15 5515-H8P8F | |
| AIDA64 / Memory Latency | |
| Average of class Office (7.6 - 162.9, n=73, last 2 years) | |
| Schenker VIA 15 Pro M22 | |
| Dell Inspiron 15 5515-H8P8F | |
| Lenovo ThinkBook 15 G4 21DL0009GE | |
| Average AMD Ryzen 7 5700U (84.9 - 113, n=20) | |
| HP ProBook 450 G9 6A180EA | |
| Dell Latitude 3520 | |
* ... smaller is better
| DPC Latencies / LatencyMon - interrupt to process latency (max), Web, Youtube, Prime95 | |
| Lenovo ThinkBook 15 G4 21DL0009GE | |
| HP ProBook 450 G9 6A180EA | |
| Dell Inspiron 15 5515-H8P8F | |
| Schenker VIA 15 Pro M22 | |
| Dell Latitude 3520 | |
* ... smaller is better

* ... smaller is better
Continuous Read: DiskSpd Read Loop, Queue Depth 8
| 3DMark 11 Performance | 6709 points | |
| 3DMark Fire Strike Score | 3718 points | |
| 3DMark Time Spy Score | 1456 points | |
Help | ||
| Blender / v3.3 Classroom CPU | |
| HP ProBook 450 G9 6A180EA | |
| Dell Latitude 3520 | |
| Lenovo ThinkBook 15 G4 21DL0009GE | |
| Average of class Office (245 - 3219, n=72, last 2 years) | |
| Average AMD Radeon RX Vega 8 (Ryzen 4000/5000) (463 - 1042, n=21) | |
| Schenker VIA 15 Pro M22 | |
* ... smaller is better
| Performance rating - Percent | |
| Average of class Office | |
| Schenker VIA 15 Pro M22 | |
| Lenovo ThinkBook 15 G4 21DL0009GE | |
| HP ProBook 450 G9 6A180EA -1! | |
| Dell Inspiron 15 5515-H8P8F -3! | |
| Dell Latitude 3520 -1! | |
| The Witcher 3 - 1920x1080 Ultra Graphics & Postprocessing (HBAO+) | |
| Average of class Office (14.8 - 28.1, n=3, last 2 years) | |
| Schenker VIA 15 Pro M22 | |
| Lenovo ThinkBook 15 G4 21DL0009GE | |
| HP ProBook 450 G9 6A180EA | |
| Dell Inspiron 15 5515-H8P8F | |
| Dell Latitude 3520 | |
| GTA V - 1920x1080 Highest AA:4xMSAA + FX AF:16x | |
| Average of class Office (5.77 - 45.3, n=66, last 2 years) | |
| Schenker VIA 15 Pro M22 | |
| Lenovo ThinkBook 15 G4 21DL0009GE | |
| Dell Latitude 3520 | |
| Final Fantasy XV Benchmark - 1920x1080 High Quality | |
| Average of class Office (8.09 - 79.5, n=68, last 2 years) | |
| Schenker VIA 15 Pro M22 | |
| Lenovo ThinkBook 15 G4 21DL0009GE | |
| HP ProBook 450 G9 6A180EA | |
| Dell Latitude 3520 | |
| Strange Brigade - 1920x1080 ultra AA:ultra AF:16 | |
| Average of class Office (12.9 - 142.1, n=50, last 2 years) | |
| Schenker VIA 15 Pro M22 | |
| Lenovo ThinkBook 15 G4 21DL0009GE | |
| HP ProBook 450 G9 6A180EA | |
| Dota 2 Reborn - 1920x1080 ultra (3/3) best looking | |
| Average of class Office (14.6 - 135, n=74, last 2 years) | |
| Schenker VIA 15 Pro M22 | |
| Lenovo ThinkBook 15 G4 21DL0009GE | |
| HP ProBook 450 G9 6A180EA | |
| Dell Latitude 3520 | |
| Dell Inspiron 15 5515-H8P8F | |
| X-Plane 11.11 - 1920x1080 high (fps_test=3) | |
| Lenovo ThinkBook 15 G4 21DL0009GE | |
| Average of class Office (12 - 82.4, n=66, last 2 years) | |
| Schenker VIA 15 Pro M22 | |
| Dell Latitude 3520 | |
| HP ProBook 450 G9 6A180EA | |
| Dell Inspiron 15 5515-H8P8F | |
Witcher 3 FPS Chart
| low | med. | high | ultra | |
|---|---|---|---|---|
| GTA V (2015) | 101 | 92.8 | 28.6 | 12 |
| The Witcher 3 (2015) | 68 | 44 | 23 | 14.8 |
| Dota 2 Reborn (2015) | 97.3 | 82.7 | 56.5 | 53.5 |
| Final Fantasy XV Benchmark (2018) | 38.3 | 19.8 | 13.9 | |
| X-Plane 11.11 (2018) | 33.7 | 29.9 | 26.5 | |
| Strange Brigade (2018) | 75.7 | 32 | 27 | 24 |
| F1 2021 (2021) | 93.1 | 40.6 | 31.7 | 21.5 |
| F1 22 (2022) | 37.4 | 32.5 | 24.3 |
Emissions & Energy management
With its two fans, the VIA 15 Pro is usually very quiet in everyday use. It only gets louder when the CPU load increases and you can also hear the fans very clearly with ~42 dB(A) in extreme cases. If you want to be on the safe side and don't need the full CPU performance, the ultra-silent mode is recommended, since we could only determine a maximum of ~28 dB(A) even in the stress test, which can hardly be heard. There were no other electronic noises.
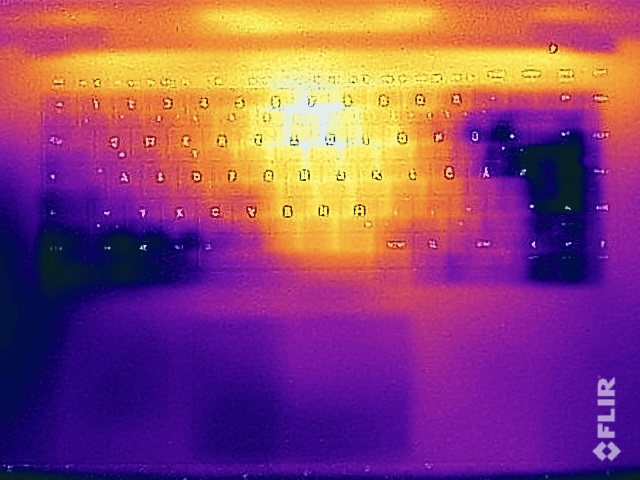
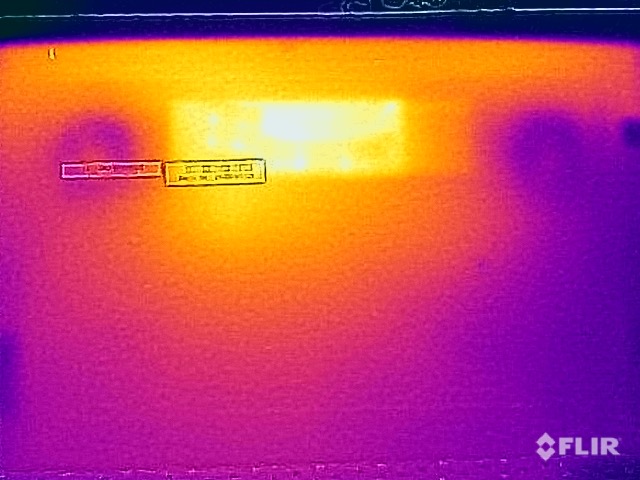
The surface temperatures remain pleasantly low in everyday use and even in the stress test, we could measure a maximum of 41 °C in the upper middle area of the base unit after one hour (~43 °C on the bottom). Thus, there are no restrictions even in this extreme scenario. The two stereo speakers are a weak point because the overall sound is quite quiet and very thin. At least trebles are rendered cleanly, which benefits the reproduction of voices.
With the 91-Wh battery, the VIA 15 Pro achieves very good runtimes even at 165 Hz. We determine 11 hours with an adjusted brightness of 150 cd/m² and still 8 hours at full brightness.
Noise level
| Idle |
| 24 / 24 / 27.5 dB(A) |
| Load |
| 33.7 / 42.4 dB(A) |
 | ||
30 dB silent 40 dB(A) audible 50 dB(A) loud |
||
min: | ||
| Schenker VIA 15 Pro M22 Vega 8, R7 5700U, Samsung SSD 970 EVO Plus 1TB | Dell Latitude 3520 Iris Xe G7 80EUs, i5-1135G7, Kioxia BG5 KBG50ZNS256G | HP ProBook 450 G9 6A180EA Iris Xe G7 96EUs, i7-1255U, SK Hynix HFM512GD3JX013N | Dell Inspiron 15 5515-H8P8F Vega 8, R7 5700U, Toshiba KBG40ZNS512G NVMe | Lenovo ThinkBook 15 G4 21DL0009GE Vega 7, R5 5625U, Samsung PM991a MZALQ512HBLU | |
|---|---|---|---|---|---|
| Noise | -2% | 7% | -1% | 4% | |
| off / environment * (dB) | 24 | 26 -8% | 25.5 -6% | 25.4 -6% | 23.21 3% |
| Idle Minimum * (dB) | 24 | 26 -8% | 25.5 -6% | 25.4 -6% | 23.21 3% |
| Idle Average * (dB) | 24 | 26 -8% | 25.5 -6% | 25.4 -6% | 23.21 3% |
| Idle Maximum * (dB) | 27.5 | 26 5% | 25.5 7% | 25.4 8% | 23.21 16% |
| Load Average * (dB) | 33.7 | 31.1 8% | 28 17% | 34 -1% | 33 2% |
| Witcher 3 ultra * (dB) | 33.7 | ||||
| Load Maximum * (dB) | 42.4 | 41.5 2% | 27.7 35% | 40 6% | 43.34 -2% |
* ... smaller is better
(±) The maximum temperature on the upper side is 41.2 °C / 106 F, compared to the average of 34.3 °C / 94 F, ranging from 21.2 to 62.5 °C for the class Office.
(±) The bottom heats up to a maximum of 43.5 °C / 110 F, compared to the average of 36.8 °C / 98 F
(+) In idle usage, the average temperature for the upper side is 26.2 °C / 79 F, compared to the device average of 29.5 °C / 85 F.
(+) Playing The Witcher 3, the average temperature for the upper side is 31.7 °C / 89 F, compared to the device average of 29.5 °C / 85 F.
(+) The palmrests and touchpad are cooler than skin temperature with a maximum of 27.2 °C / 81 F and are therefore cool to the touch.
(±) The average temperature of the palmrest area of similar devices was 27.5 °C / 81.5 F (+0.3 °C / 0.5 F).
| Schenker VIA 15 Pro M22 AMD Ryzen 7 5700U, AMD Radeon RX Vega 8 (Ryzen 4000/5000) | Dell Latitude 3520 Intel Core i5-1135G7, Intel Iris Xe Graphics G7 80EUs | HP ProBook 450 G9 6A180EA Intel Core i7-1255U, Intel Iris Xe Graphics G7 96EUs | Dell Inspiron 15 5515-H8P8F AMD Ryzen 7 5700U, AMD Radeon RX Vega 8 (Ryzen 4000/5000) | Lenovo ThinkBook 15 G4 21DL0009GE AMD Ryzen 5 5625U, AMD Radeon RX Vega 7 | |
|---|---|---|---|---|---|
| Heat | -4% | -11% | -11% | -12% | |
| Maximum Upper Side * (°C) | 41.2 | 37.5 9% | 40.5 2% | 39.4 4% | 41.1 -0% |
| Maximum Bottom * (°C) | 43.5 | 49.7 -14% | 47.6 -9% | 45.4 -4% | 45.6 -5% |
| Idle Upper Side * (°C) | 28.4 | 29 -2% | 32.6 -15% | 33.2 -17% | 31.6 -11% |
| Idle Bottom * (°C) | 28.1 | 30.1 -7% | 34.2 -22% | 35.1 -25% | 36.5 -30% |
* ... smaller is better
Schenker VIA 15 Pro M22 audio analysis
(±) | speaker loudness is average but good (74.8 dB)
Bass 100 - 315 Hz
(-) | nearly no bass - on average 22.2% lower than median
(±) | linearity of bass is average (12% delta to prev. frequency)
Mids 400 - 2000 Hz
(±) | higher mids - on average 5.1% higher than median
(±) | linearity of mids is average (10.2% delta to prev. frequency)
Highs 2 - 16 kHz
(+) | balanced highs - only 4.3% away from median
(+) | highs are linear (6.6% delta to prev. frequency)
Overall 100 - 16.000 Hz
(±) | linearity of overall sound is average (22.8% difference to median)
Compared to same class
» 62% of all tested devices in this class were better, 8% similar, 30% worse
» The best had a delta of 7%, average was 21%, worst was 53%
Compared to all devices tested
» 68% of all tested devices were better, 5% similar, 27% worse
» The best had a delta of 4%, average was 23%, worst was 134%
Lenovo ThinkBook 15 G4 21DL0009GE audio analysis
(-) | not very loud speakers (64.28 dB)
Bass 100 - 315 Hz
(±) | reduced bass - on average 13.6% lower than median
(-) | bass is not linear (15.1% delta to prev. frequency)
Mids 400 - 2000 Hz
(+) | balanced mids - only 4.9% away from median
(±) | linearity of mids is average (8.1% delta to prev. frequency)
Highs 2 - 16 kHz
(+) | balanced highs - only 3.2% away from median
(±) | linearity of highs is average (9.5% delta to prev. frequency)
Overall 100 - 16.000 Hz
(±) | linearity of overall sound is average (21.2% difference to median)
Compared to same class
» 52% of all tested devices in this class were better, 9% similar, 40% worse
» The best had a delta of 7%, average was 21%, worst was 53%
Compared to all devices tested
» 59% of all tested devices were better, 7% similar, 34% worse
» The best had a delta of 4%, average was 23%, worst was 134%
| Off / Standby | |
| Idle | |
| Load |
|
Key:
min: | |
Power consumption Witcher 3 / Stress test
Power consumption external Monitor
Pros
Cons
Verdict - VIA 15 Pro convinces with a good display and light case
Schenker's Via 15 Pro is an interesting office notebook that primarily stands out from the direct competition due to the high-quality casing and the good WQHD panel. The sRGB color space is completely covered and even moving pictures are very smooth thanks to the high refresh rate as well as fast response times. Despite the matte surface, even the bright content is not grainy.
Furthermore, Schenker takes a different approach in terms of upgrade options, as two slots each for RAM modules and M.2-2280 SSDs are by no means a matter of course. The keyboard leaves a good impression, as does the battery life, and there are enough ports for everyday use, although the USB 2.0 port is no longer up-to-date.
The Via 15 Pro is an interesting office machine with a light case, good keyboard and good 165 Hz display. Battery runtimes and upgrade options are equally convincing, but the old Zen 2 processor from AMD is disappointing in view of the rather high entry price.
The entry-level price of more than 1,100 Euros is certainly a hurdle, especially in view of the old AMD processor. However, it has to be said here that the multi-core performance in particular is still competitive and also turns out better than that of the rivals. Another weak point is the poor speaker system.
Price and availability
The VIA Pro 15 can be configured at Bestware starting at 1,149 euro.
Schenker VIA 15 Pro M22
- 06/29/2023 v7 (old)
Andreas Osthoff
Transparency
The selection of devices to be reviewed is made by our editorial team. The test sample was provided to the author as a loan by the manufacturer or retailer for the purpose of this review. The lender had no influence on this review, nor did the manufacturer receive a copy of this review before publication. There was no obligation to publish this review. As an independent media company, Notebookcheck is not subjected to the authority of manufacturers, retailers or publishers.
This is how Notebookcheck is testing
Every year, Notebookcheck independently reviews hundreds of laptops and smartphones using standardized procedures to ensure that all results are comparable. We have continuously developed our test methods for around 20 years and set industry standards in the process. In our test labs, high-quality measuring equipment is utilized by experienced technicians and editors. These tests involve a multi-stage validation process. Our complex rating system is based on hundreds of well-founded measurements and benchmarks, which maintains objectivity. Further information on our test methods can be found here.
Price comparison

