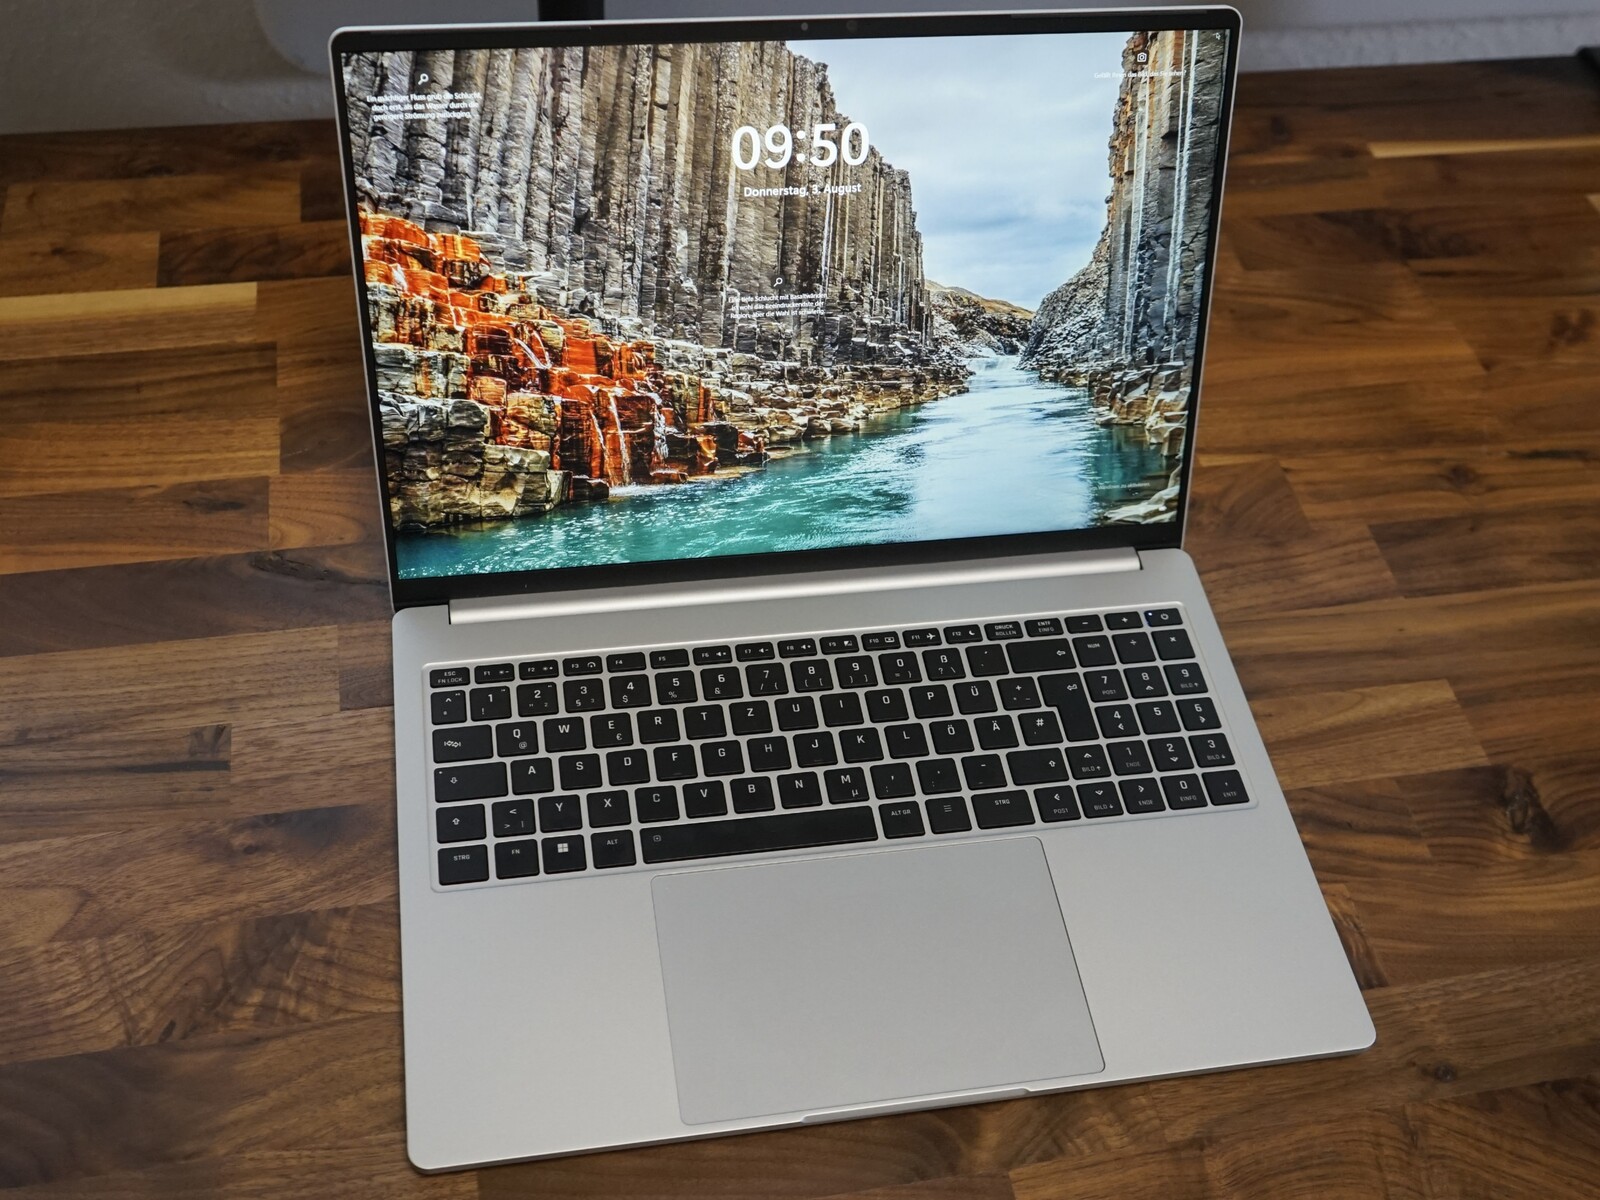
Schenker Vision 16 2023 Review: 16 inch lightweight with many ports

Aside from the Vision 16 Pro, Schenker also offers the Vision 16. The especially lightweight 16 inch ultrabook offers the newest Intel Raptor Lake chip Core i7-13700H. Dedicated GPUs are reserved for the Pro models. While last years model of the Vision 16 achieved a weight of 1.45 kg, the new model weights 1.5 kg, which still makes it one of the lightest 16 inch laptops of the market.
Instead of the 90 Hz screen of last years model, the new Vision 16 gets the 240 Hz WQXGA panel of the Pro variant. Liquid metal to transfer the heat of the Core i7-13700H is still utilized, though the cooling system was reworked to make the Vision 16 less noisy under load.
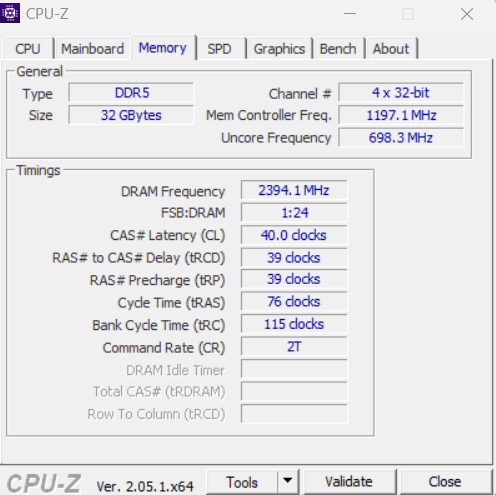
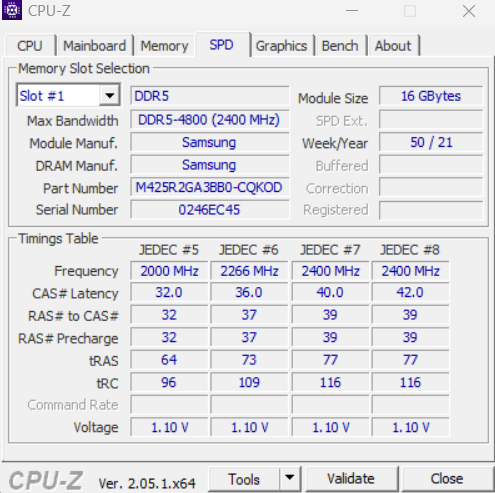
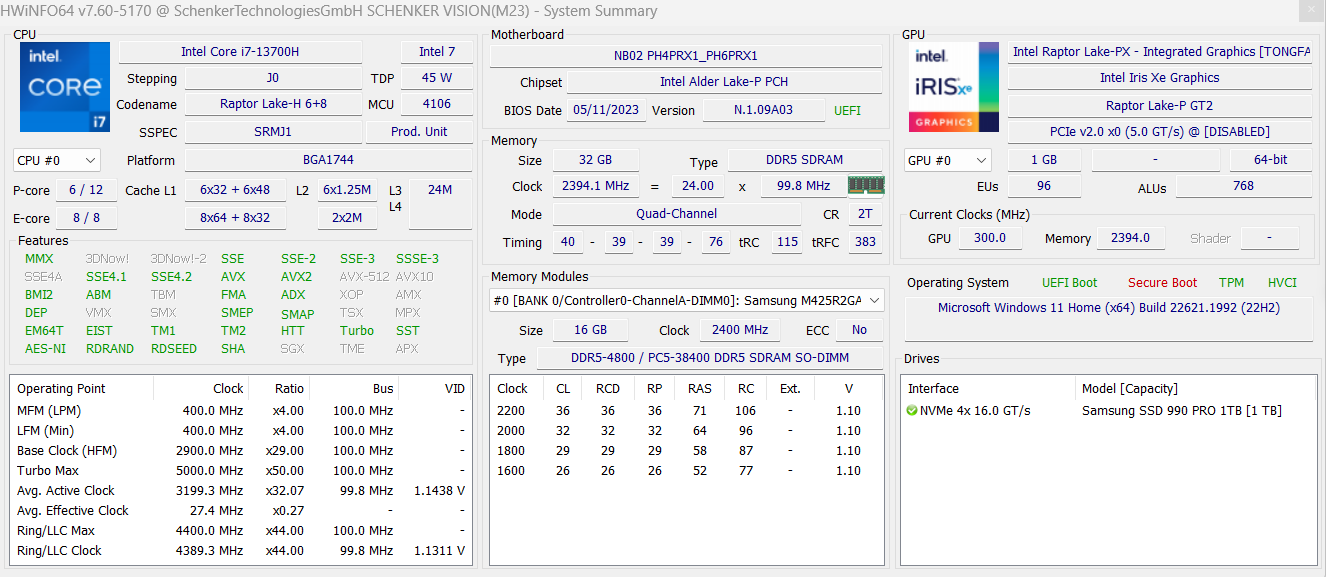
The Vision 16 is available from €1.539. This base model has 16 GB DDR5-4800 memory and a 500 GB M.2 SSD by Samsung. Our review model is equipped with 32 GB memory and a 1 TB M.2 Samsung 990 Pro SSD. With Windows, the reviewed version is available for roughly €1,660.
Update 30.08.2023: Because of the weak result, we repeated the DiskSpd benchmark. The same review unit was used, with a clean Windows installation. The results improved significantly, leading to a better total score of 88.6 percent instead of 88.4 percent. This means the total rating is now 89 instead of 88 percent.
Possible competitors in comparison
Rating | Date | Model | Weight | Height | Size | Resolution | Price |
|---|---|---|---|---|---|---|---|
| 88.6 % v7 (old) | 08 / 2023 | Schenker Vision 16 PH6PRX1 i7-13700H, Iris Xe G7 96EUs | 1.5 kg | 17.1 mm | 16.00" | 2560x1600 | |
| 91.8 % v7 (old) | 06 / 2023 | Apple MacBook Air 15 2023 M2 16 GB M2, M2 10-Core GPU | 1.5 kg | 11.5 mm | 15.30" | 2880x1864 | |
| 86.6 % v7 (old) | 06 / 2023 | Acer Swift Go SFG16-71 i7-13700H, Iris Xe G7 96EUs | 1.6 kg | 19 mm | 16.00" | 3200x2000 | |
| 85 % v7 (old) | 07 / 2023 | LG Gram SuperSlim (2023) i7-1360P, Iris Xe G7 96EUs | 990 g | 10.9 mm | 15.60" | 1920x1080 | |
| 84.3 % v7 (old) | 04 / 2023 | Microsoft Surface Laptop 5 15, i7-1255U i7-1255U, Iris Xe G7 96EUs | 1.6 kg | 14.7 mm | 15.00" | 2496x1664 | |
| 83.2 % v7 (old) | 02 / 2023 | Asus VivoBook S15 M3502RA-L1029W R7 6800H, Radeon 680M | 1.9 kg | 18.8 mm | 15.60" | 1920x1080 |
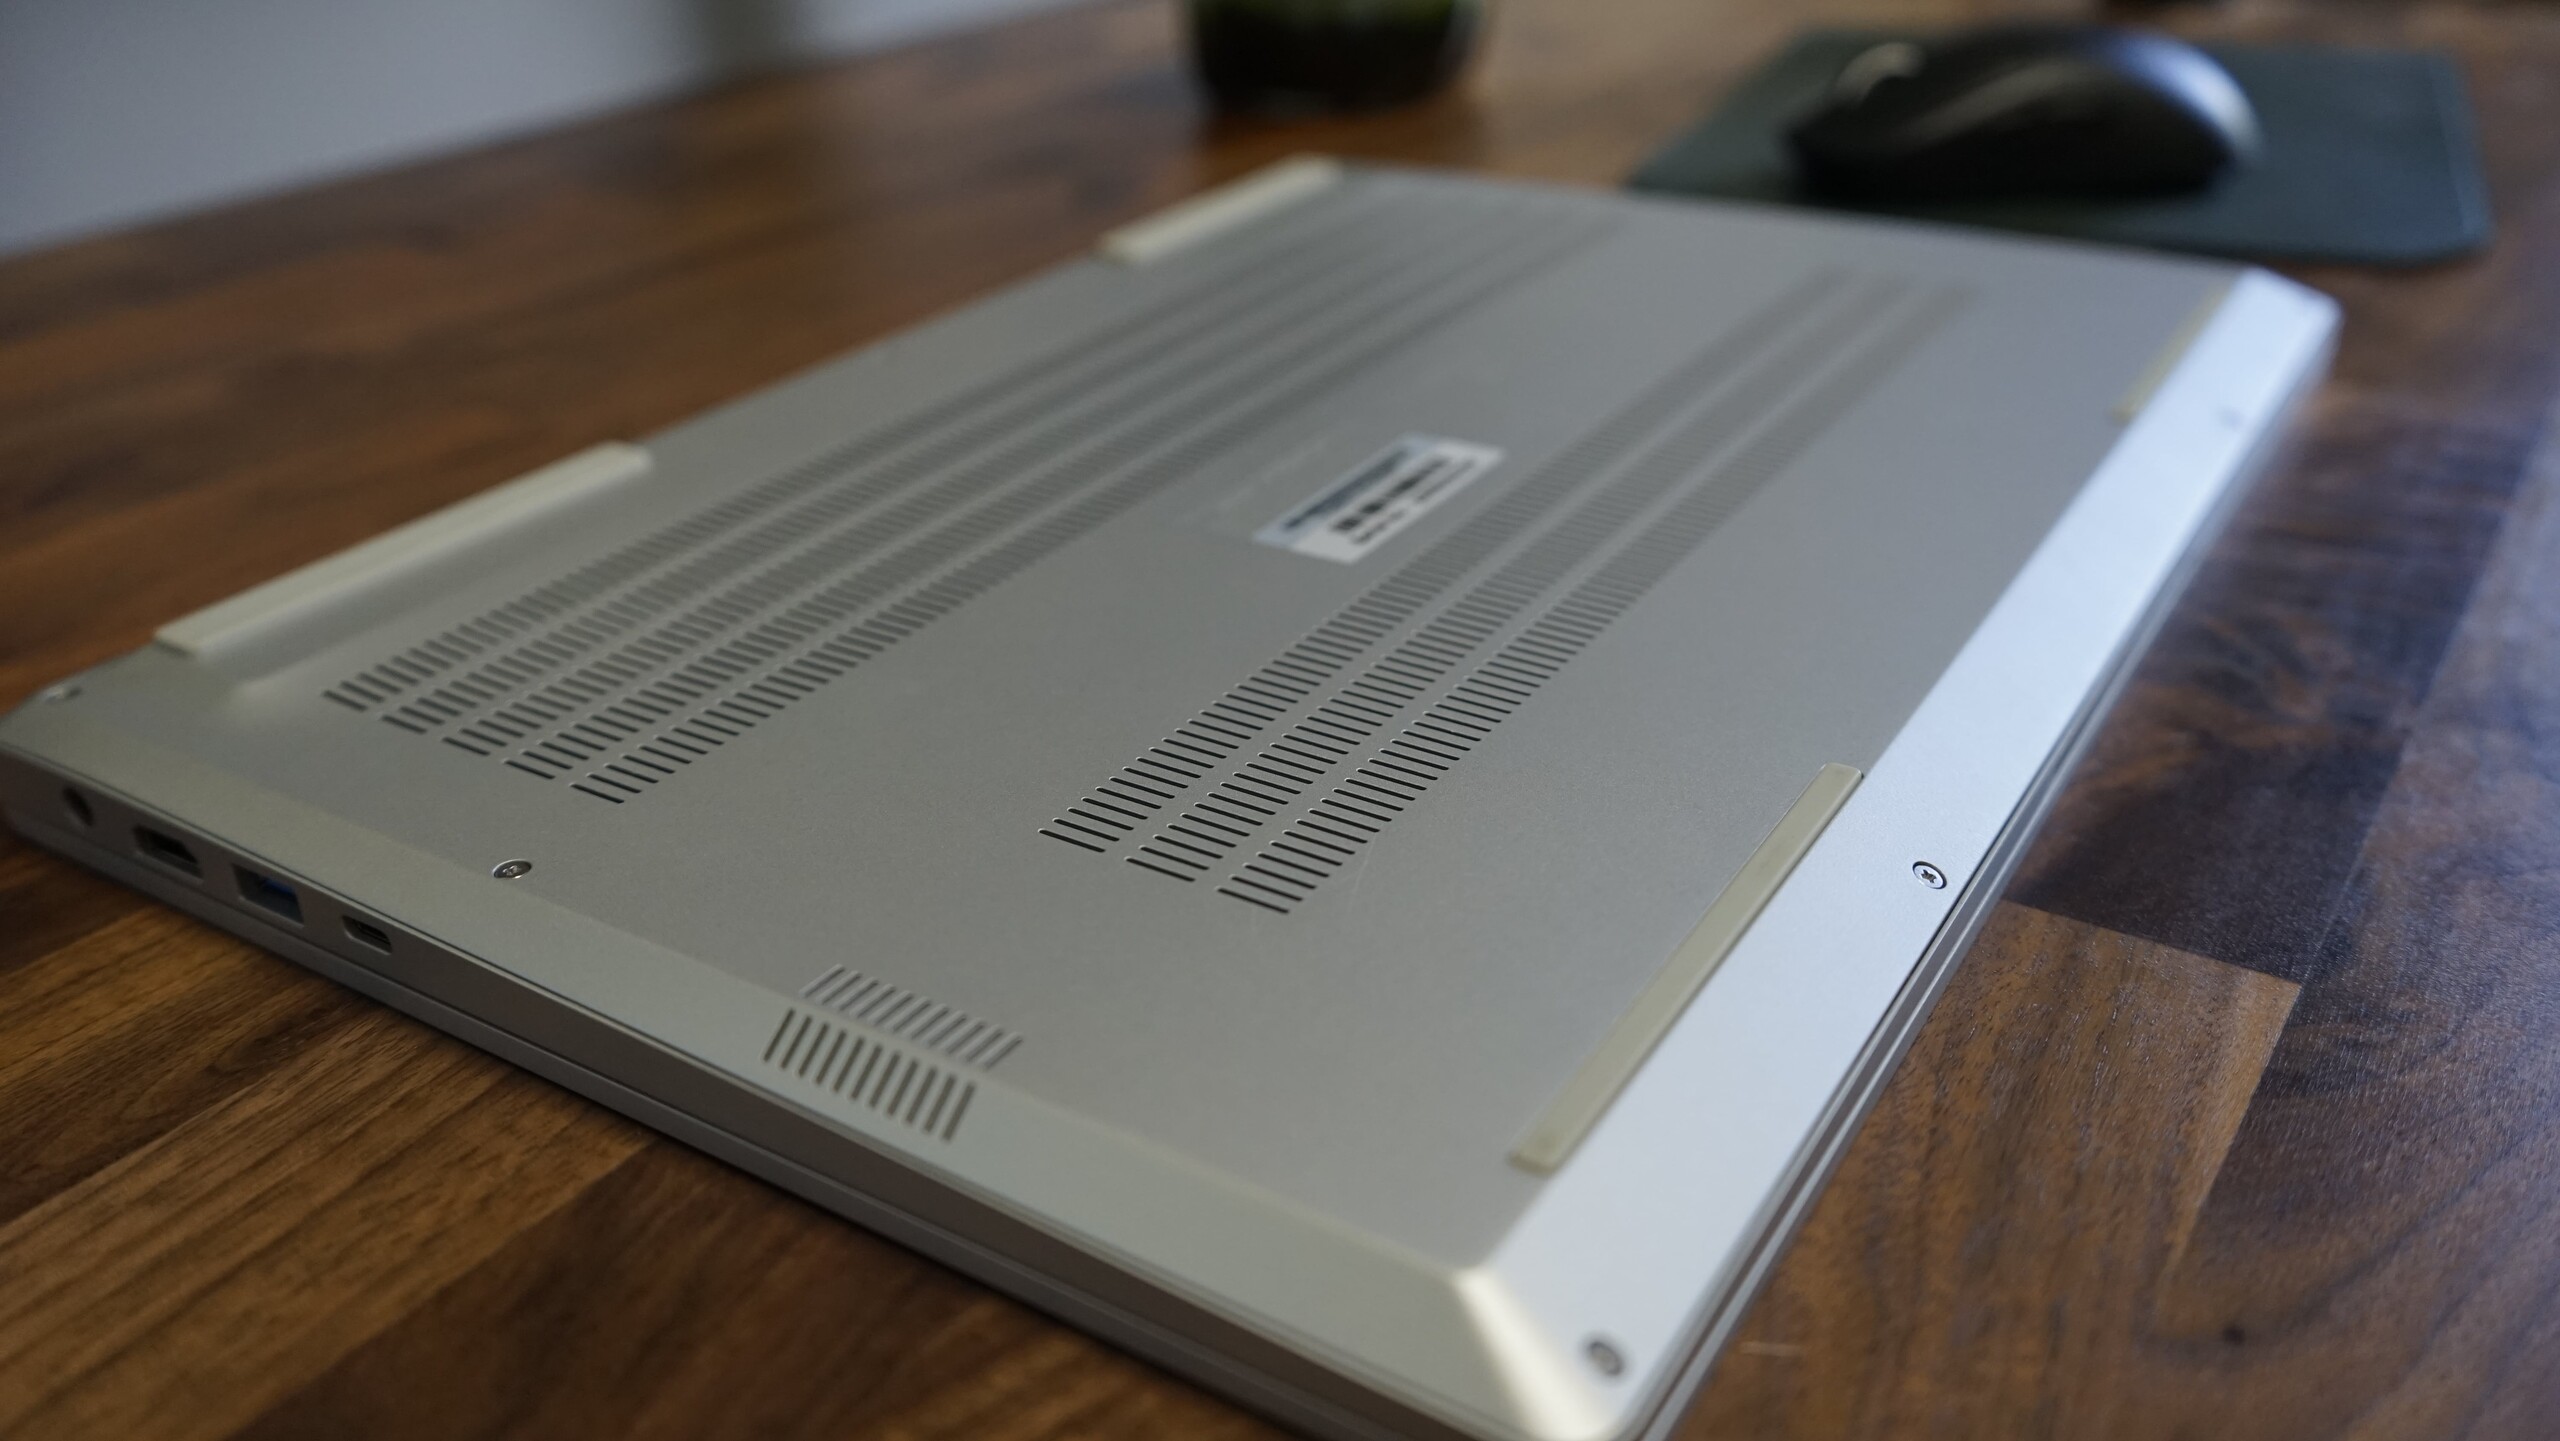
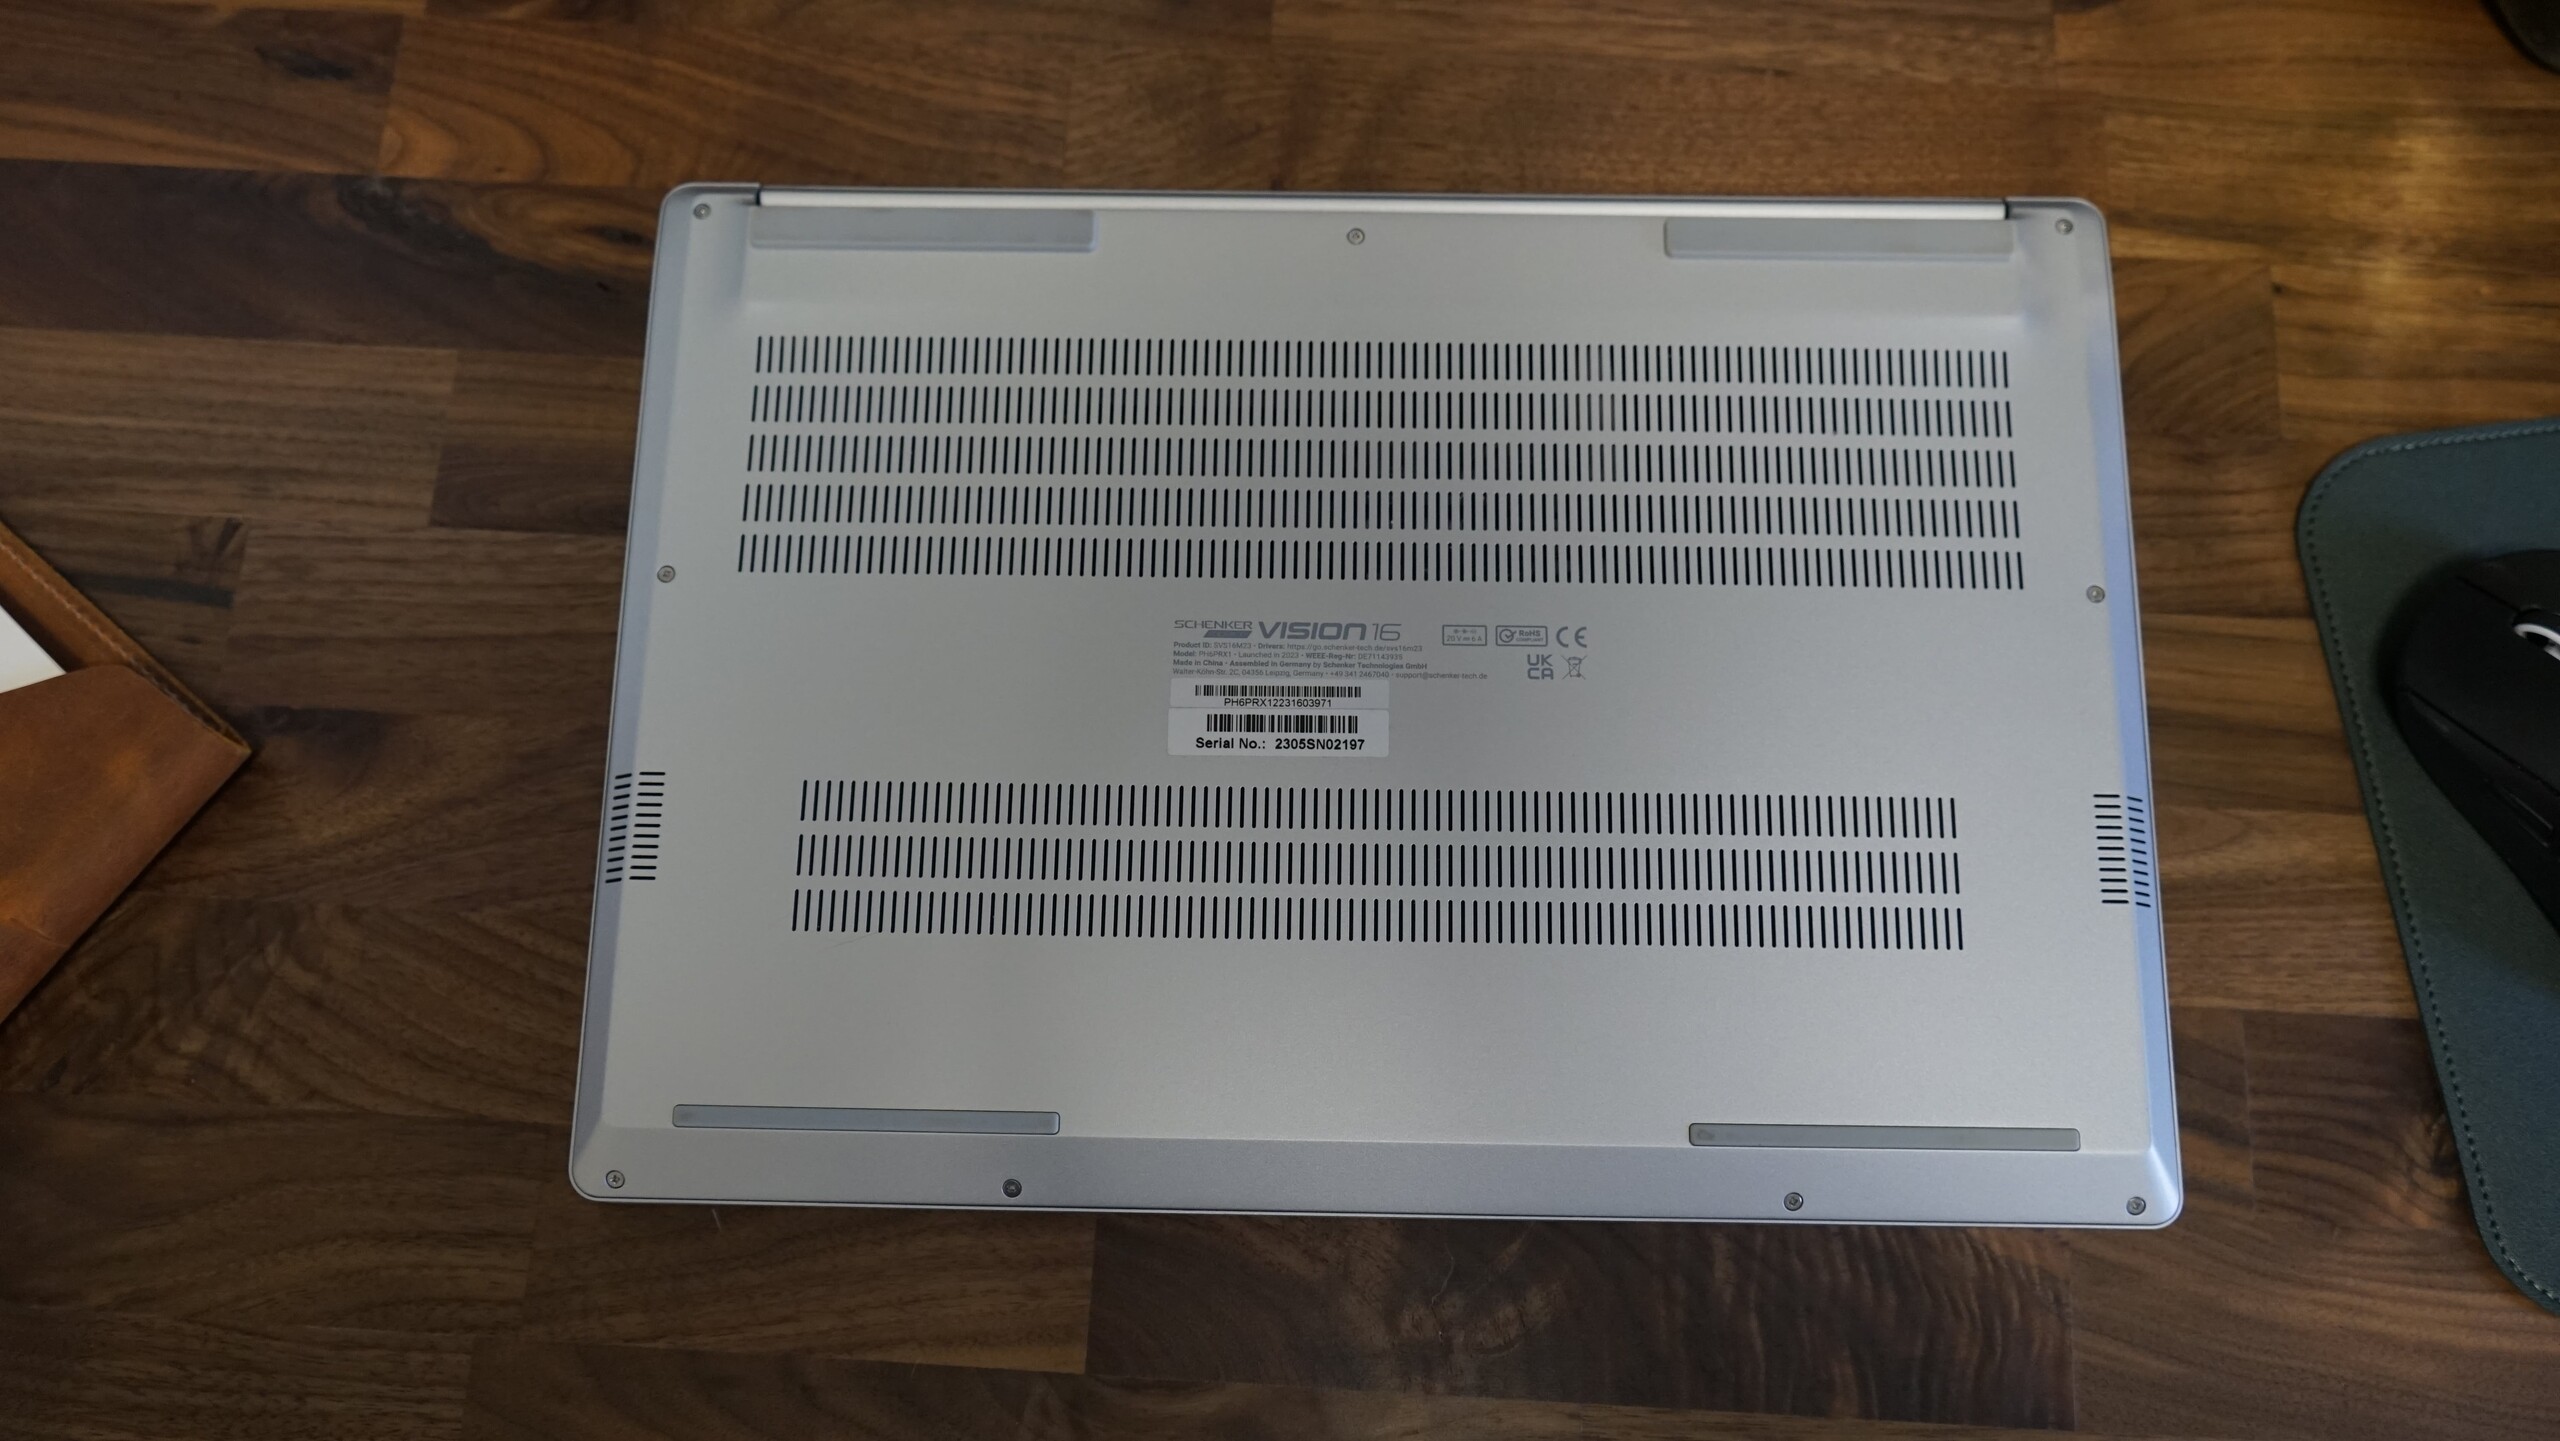
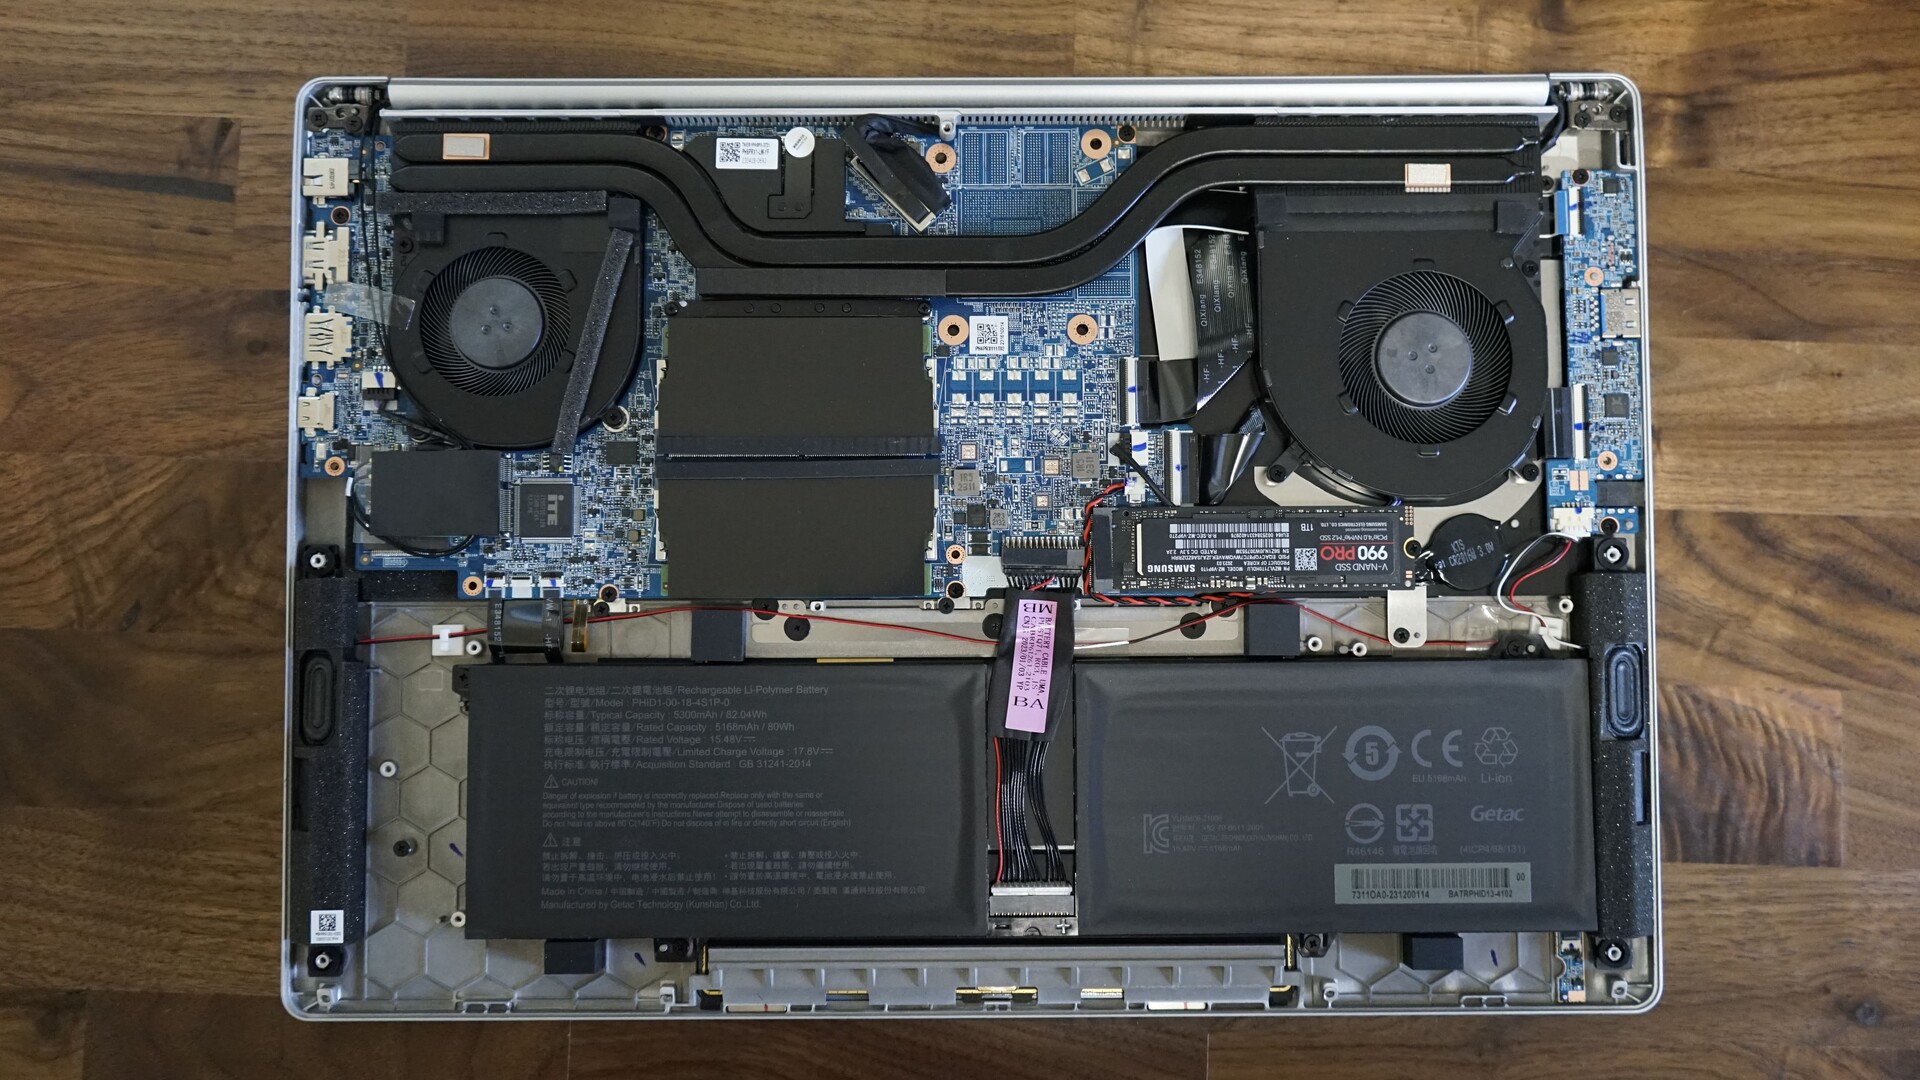
Chassis - 1.5 kg magnesium laptop
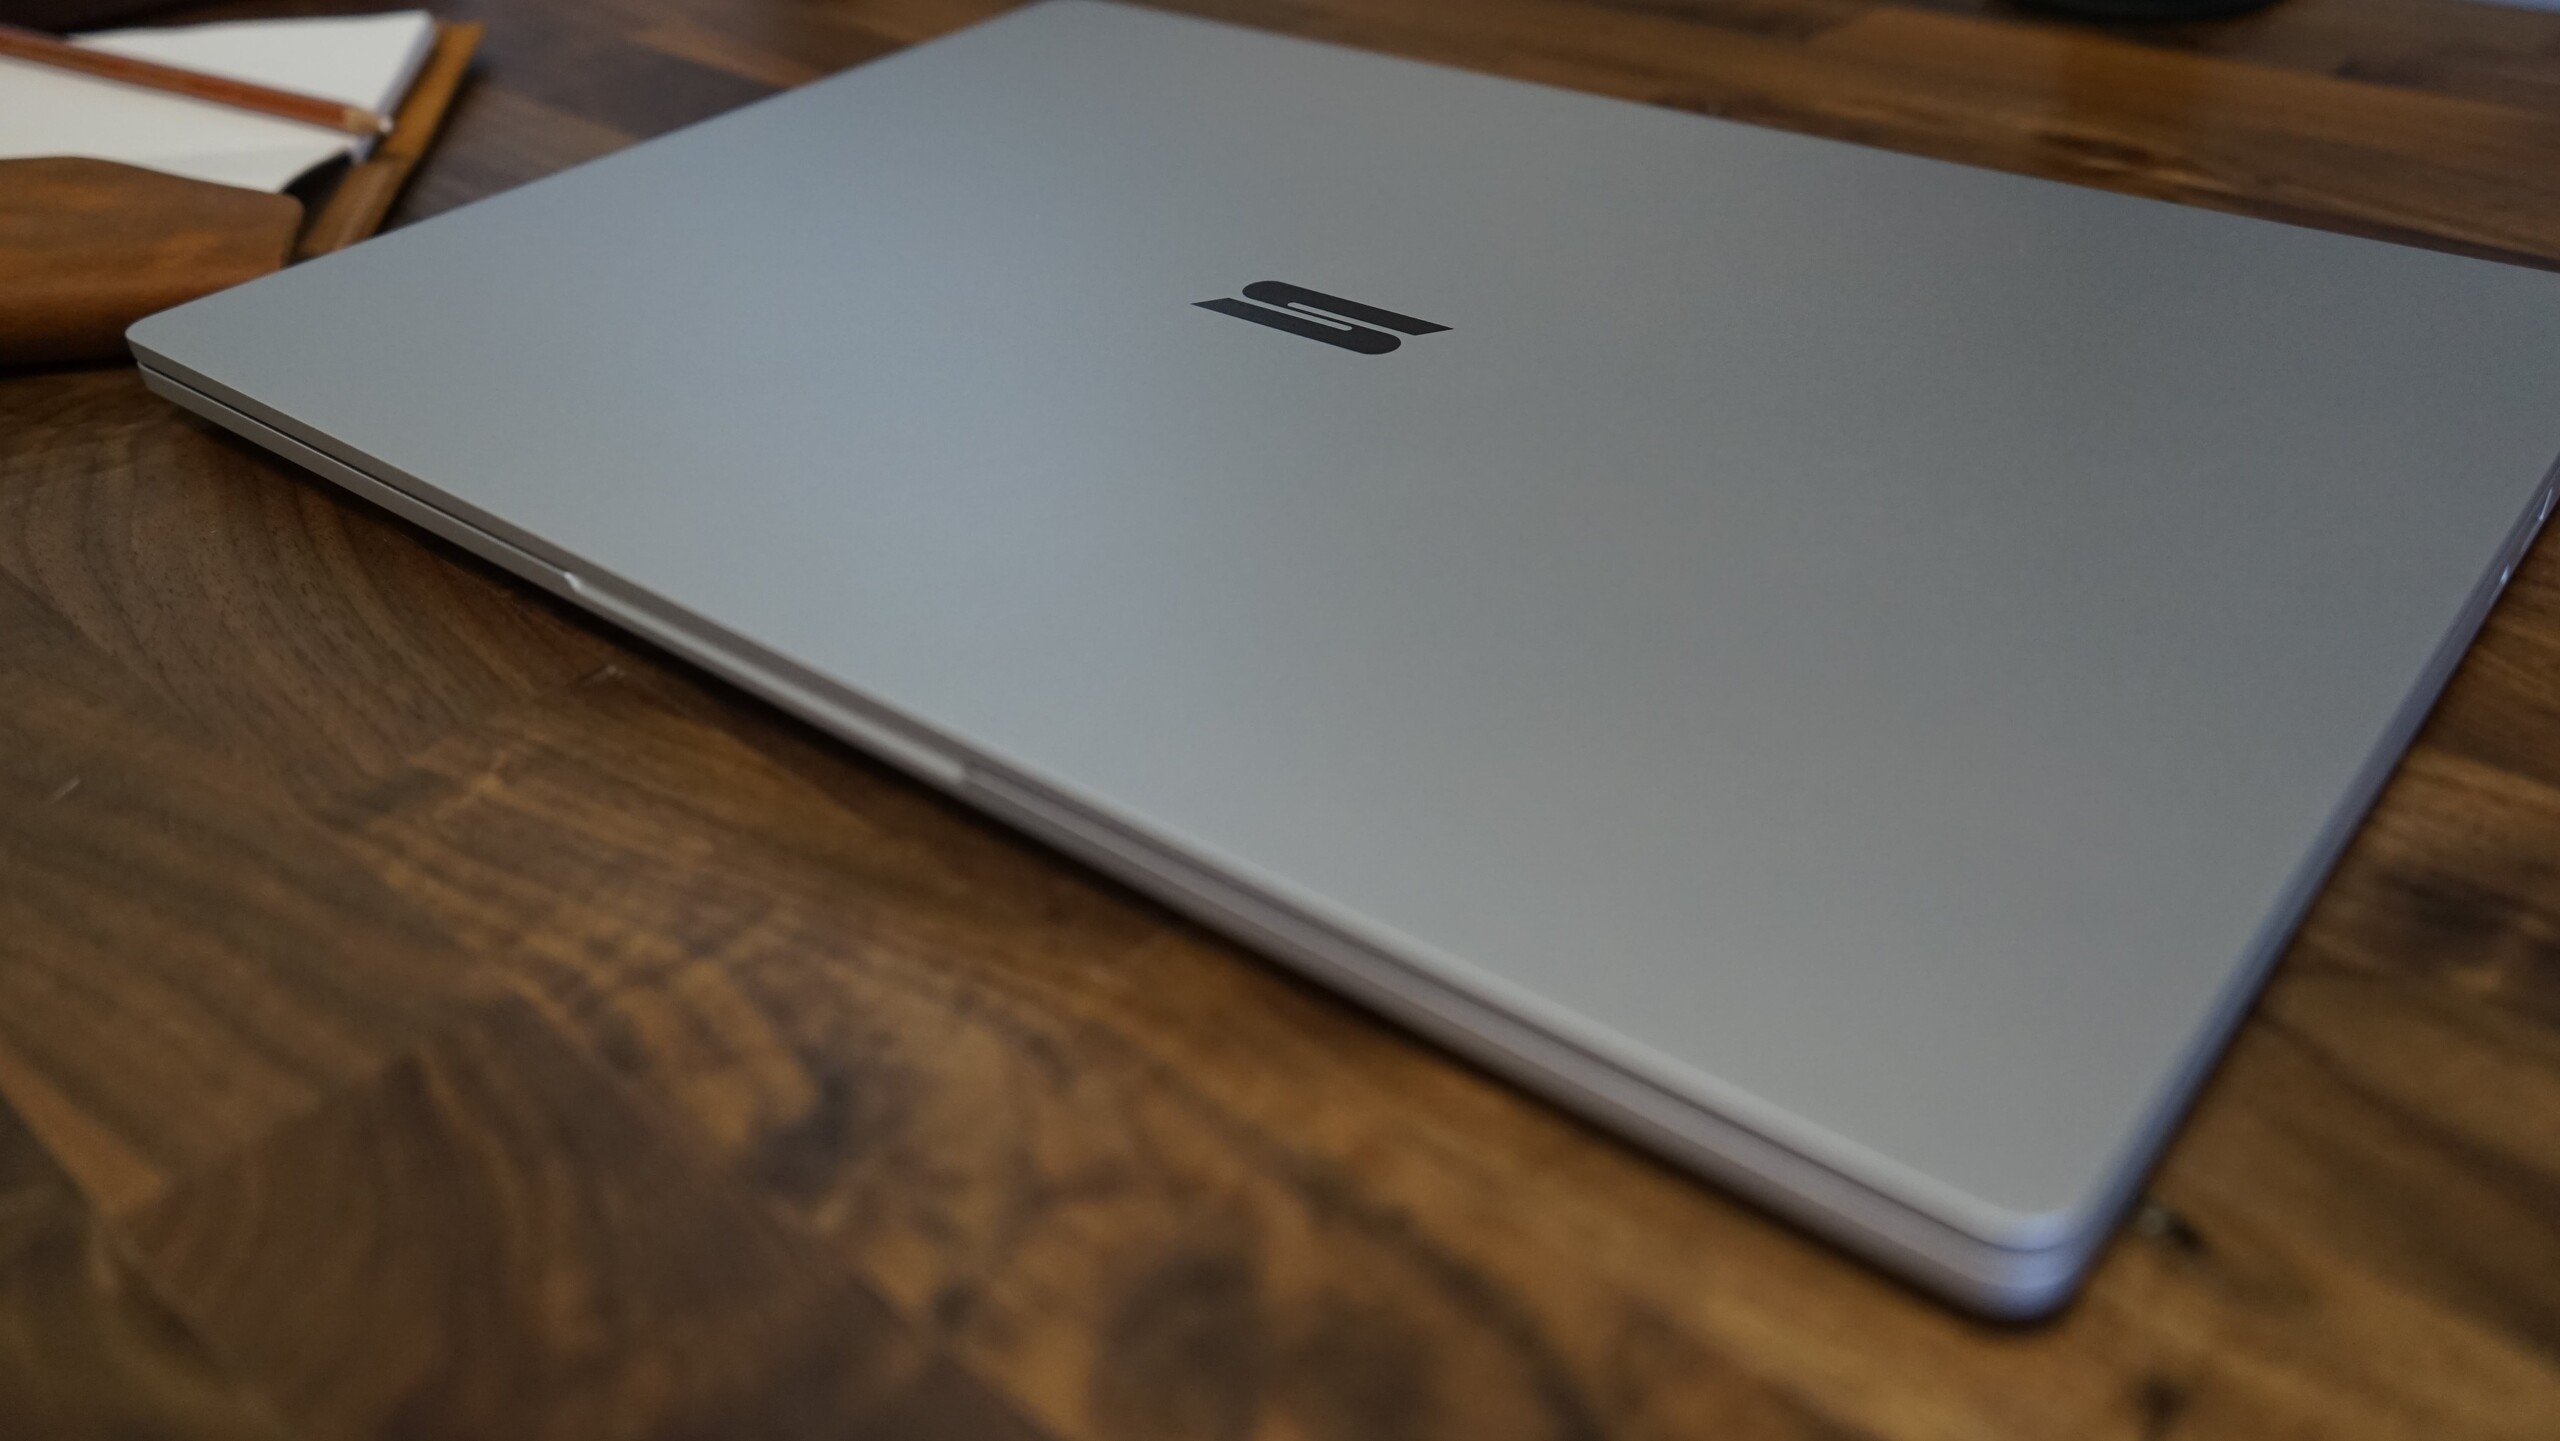
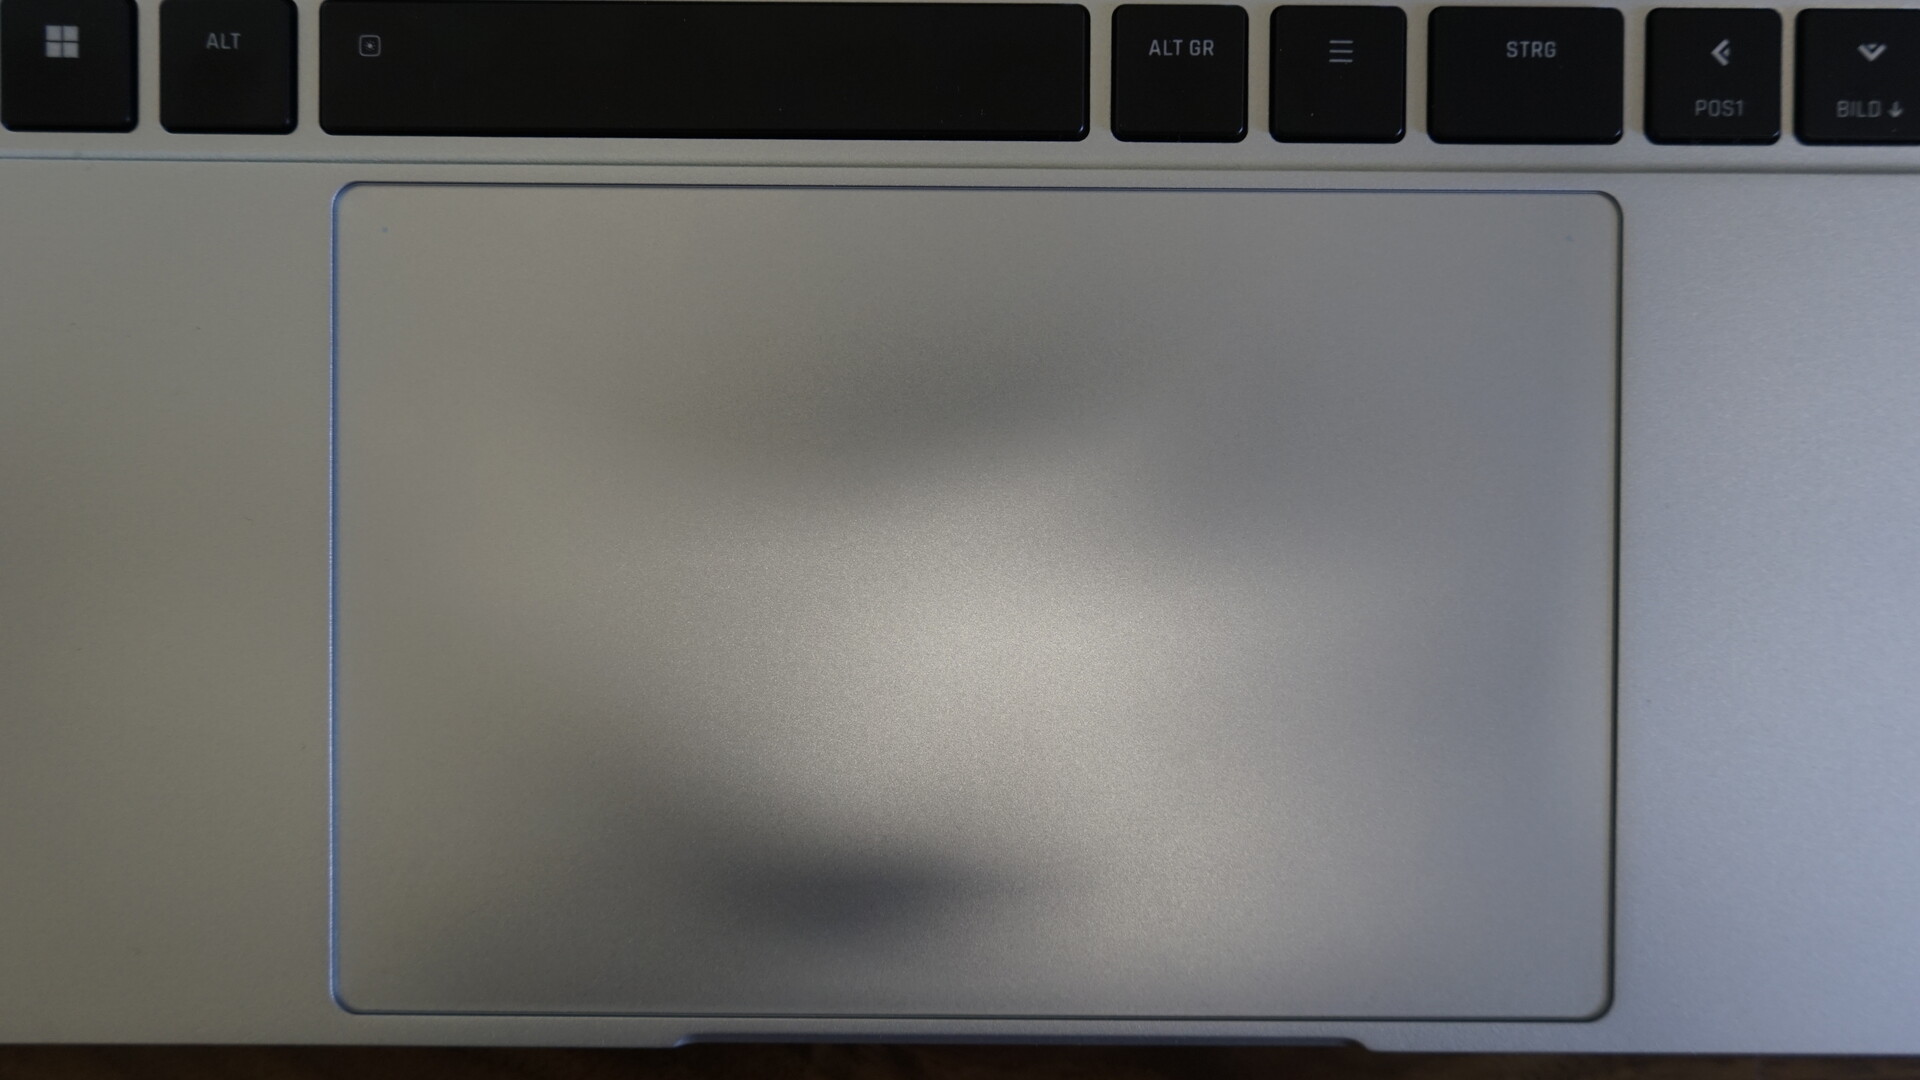
The chassis is identical to the Vision 16 Pro and pretty much unchanged to the preceding model. We are reviewing the silver variation, while we reviewed the Vision 16 Pro in black. The silver version stands out more and reminds us of the MacBook Pro 16, due to the oversized touchpad. The magnesium chassis (base and screen cover) keeps the weight low with just 1.5 kg. There is only a slight give in the center of the keyboard, otherwise the chassis is rigid. The hinges are not very strong and allow for a good amount of screen wobble.
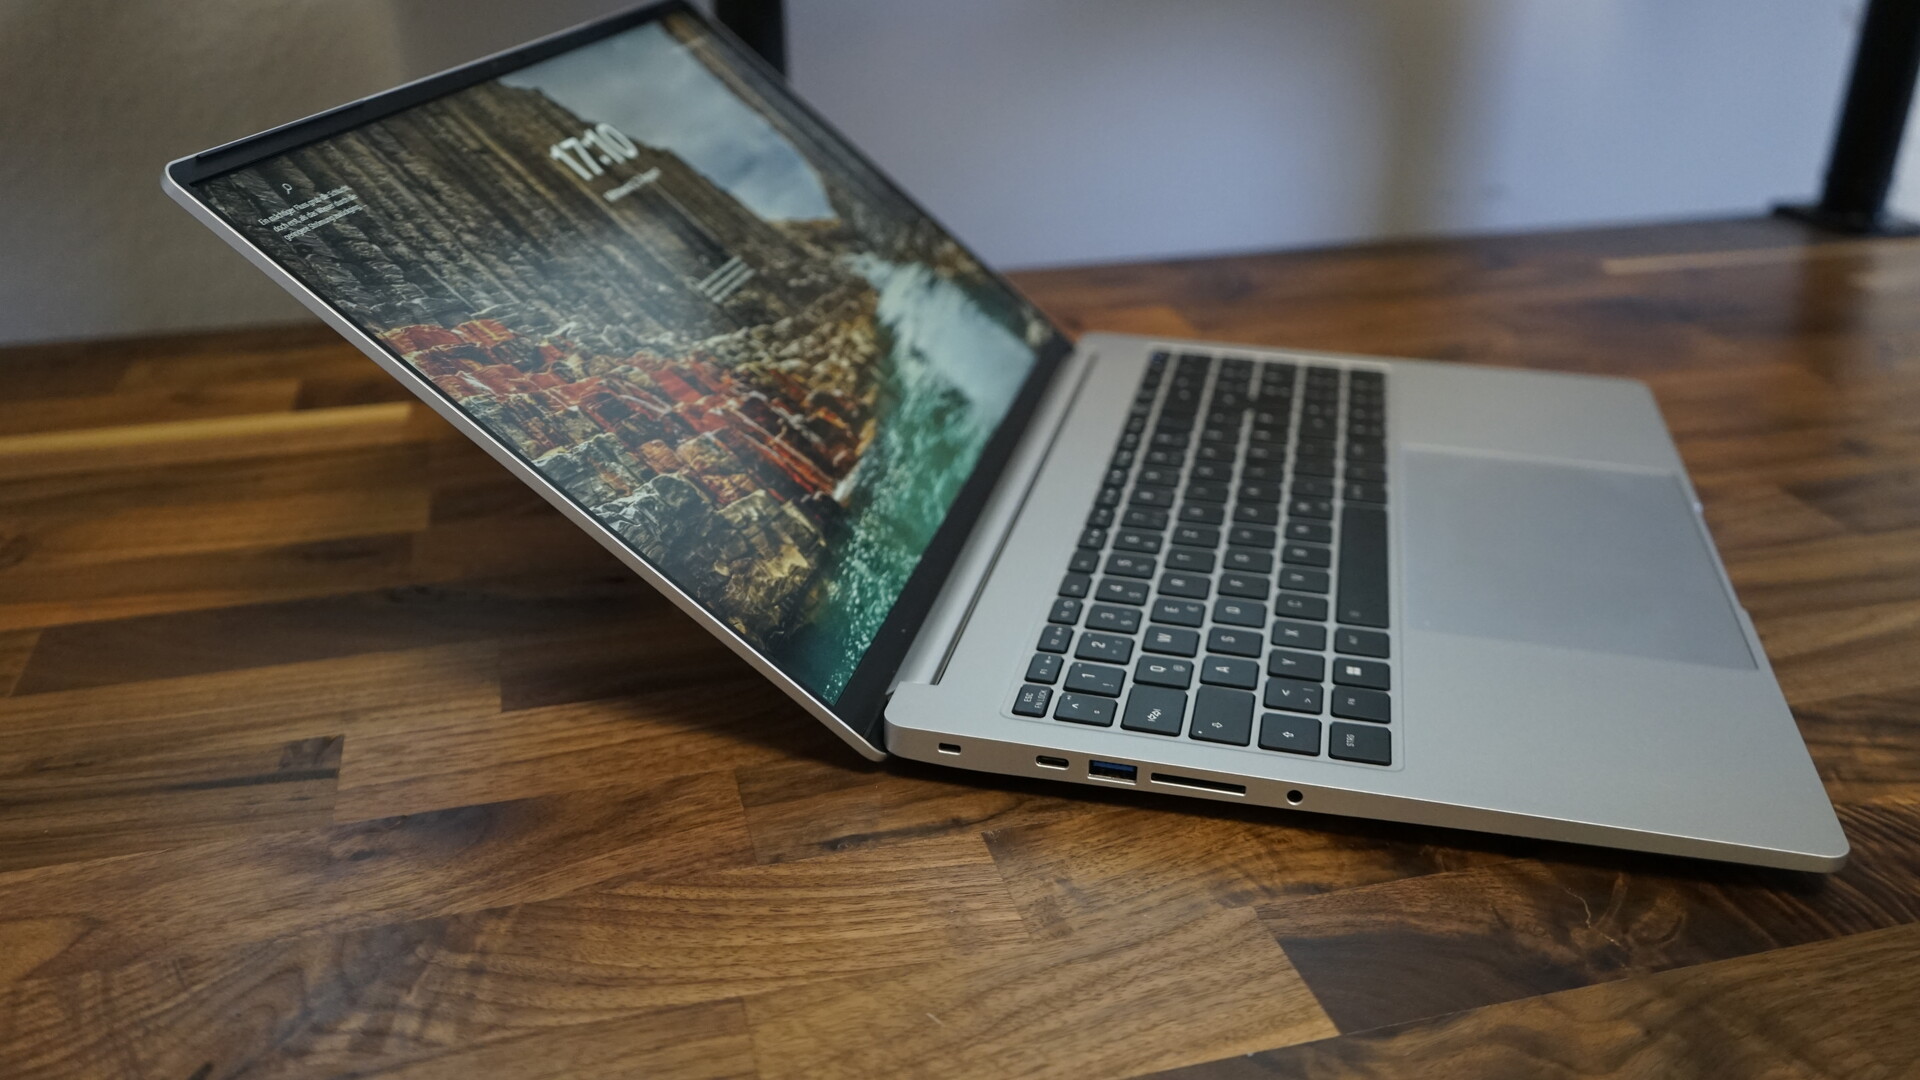
Connectivity - Thunderbolt 4, full size SD card reader and many USB ports
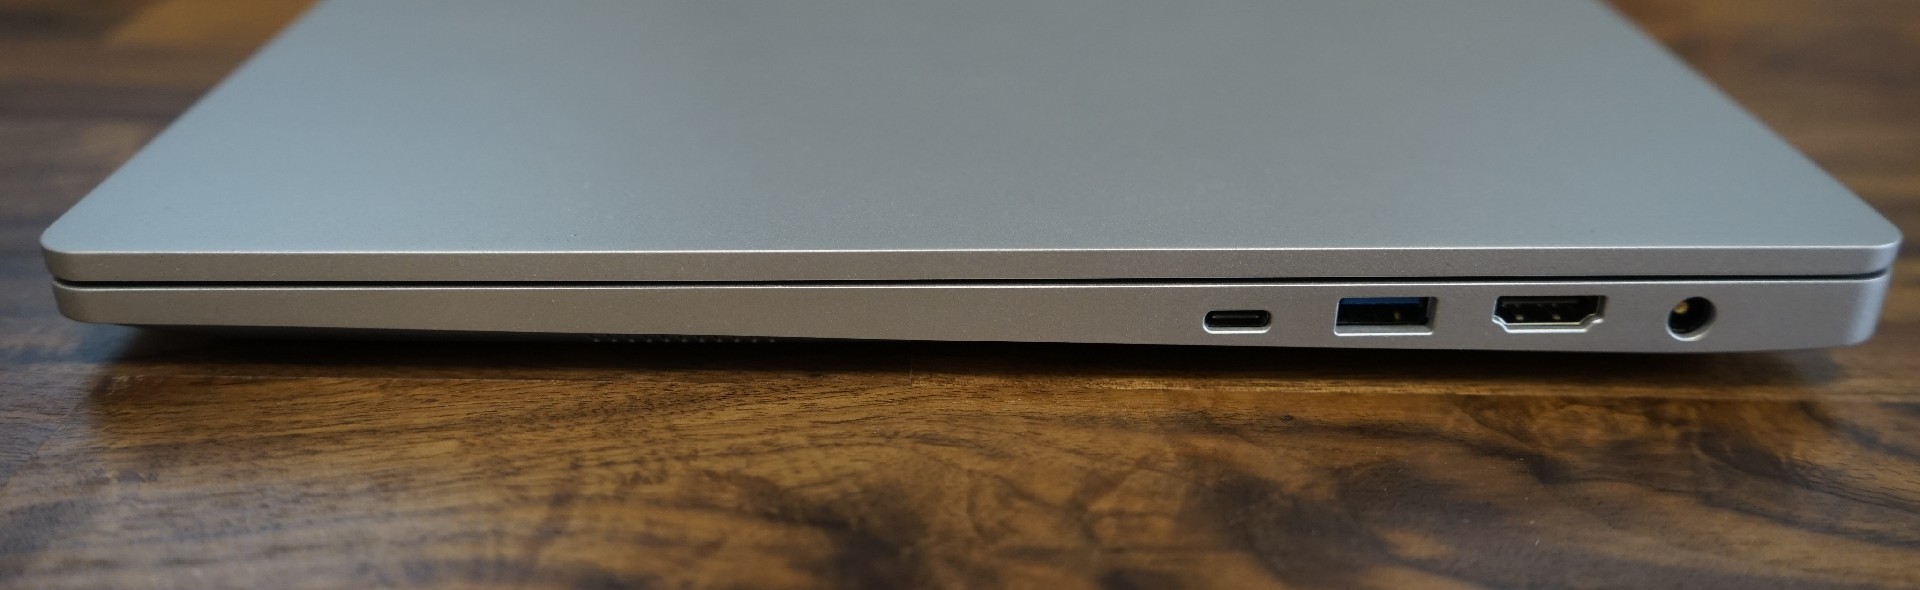
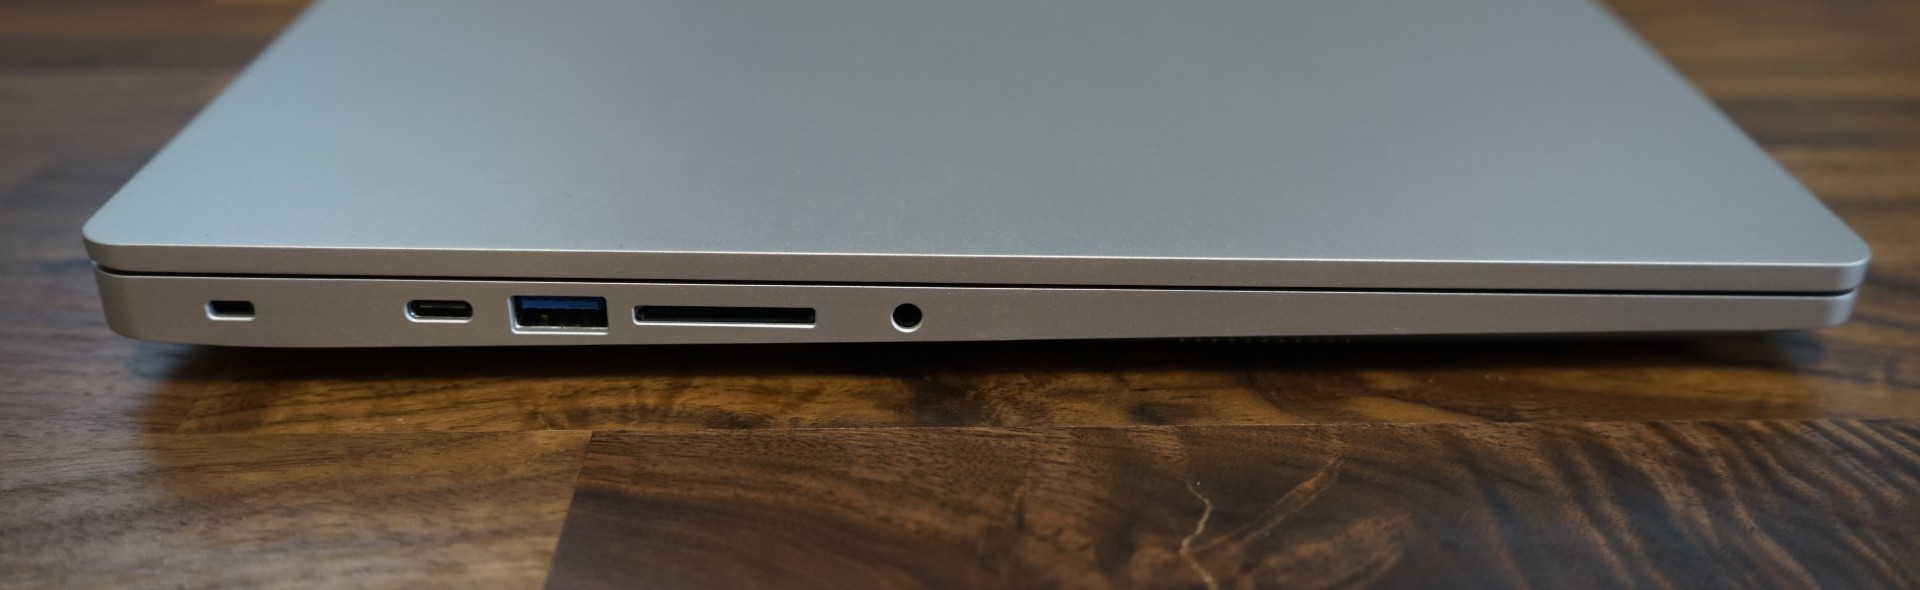
The ports are identical to the Vision 16 Pro, too. Dongles or adapters are not necessary for this ultrabook, thanks to the good port selection. Compared with a MacBook Air, the Vision 16 has basically all the ports most people will need. On the left, there is a 3.5mm audio jack and a full size SD card slot. The two USB A 3.2 Gen 1 ports make dongles for a mouse or keyboard unnecessary. Also practical is the HDMI port, though this is only HDMI 2.0b, not HDMI 2.1. The Thunderbolt 4 port on the left and the USB C port on the right complete the connectivity options. Thanks to the dedicated proprietary charging port, none of the other ports are occupied during charging. The only thing missing is an Ethernet jack.
SD card reader
The Schenker Vision 16 has an SD card reader, but it is a pretty slow one, as the 22.7 MB/s write speed and 27.7 MB/s read speed we measured with our reference card (Angelbird AV Ori V60) attest. For heavy users, an external card reader might be the better option. For casual use, the card reader should suffice.
| SD Card Reader | |
| average JPG Copy Test (av. of 3 runs) | |
| MSI Stealth 16 Studio A13VG | |
| Dell XPS 15 9530 RTX 4070 (Toshiba Exceria Pro SDXC 64 GB UHS-II) | |
| Average of class Office (19.8 - 198.5, n=22, last 2 years) | |
| Schenker Vision 16 PH6PRX1 (AV Pro V60) | |
| Acer Swift Go SFG16-71 | |
| maximum AS SSD Seq Read Test (1GB) | |
| Dell XPS 15 9530 RTX 4070 (Toshiba Exceria Pro SDXC 64 GB UHS-II) | |
| MSI Stealth 16 Studio A13VG | |
| Average of class Office (27.4 - 249, n=21, last 2 years) | |
| Schenker Vision 16 PH6PRX1 (AV Pro V60) | |
| Acer Swift Go SFG16-71 | |
Communication
The AX201 WiFi 6 module in the Vision 16 delivered good results while receiving data, but it showed weaknesses when sending data. The experience may vary though, as the same WLAN module in the nearly identical Schenker Vision 16 Pro delivered better results.
Webcam
The FHD webcam of the Schenker Vision 16 can create acceptable pictures. It is sufficient for video conferencing, as long as lighting conditions are not bad. The 2 megapixel webcam enables a biometric log-in via Windows Hello, thanks to the integrated IR sensor.


Maintenance
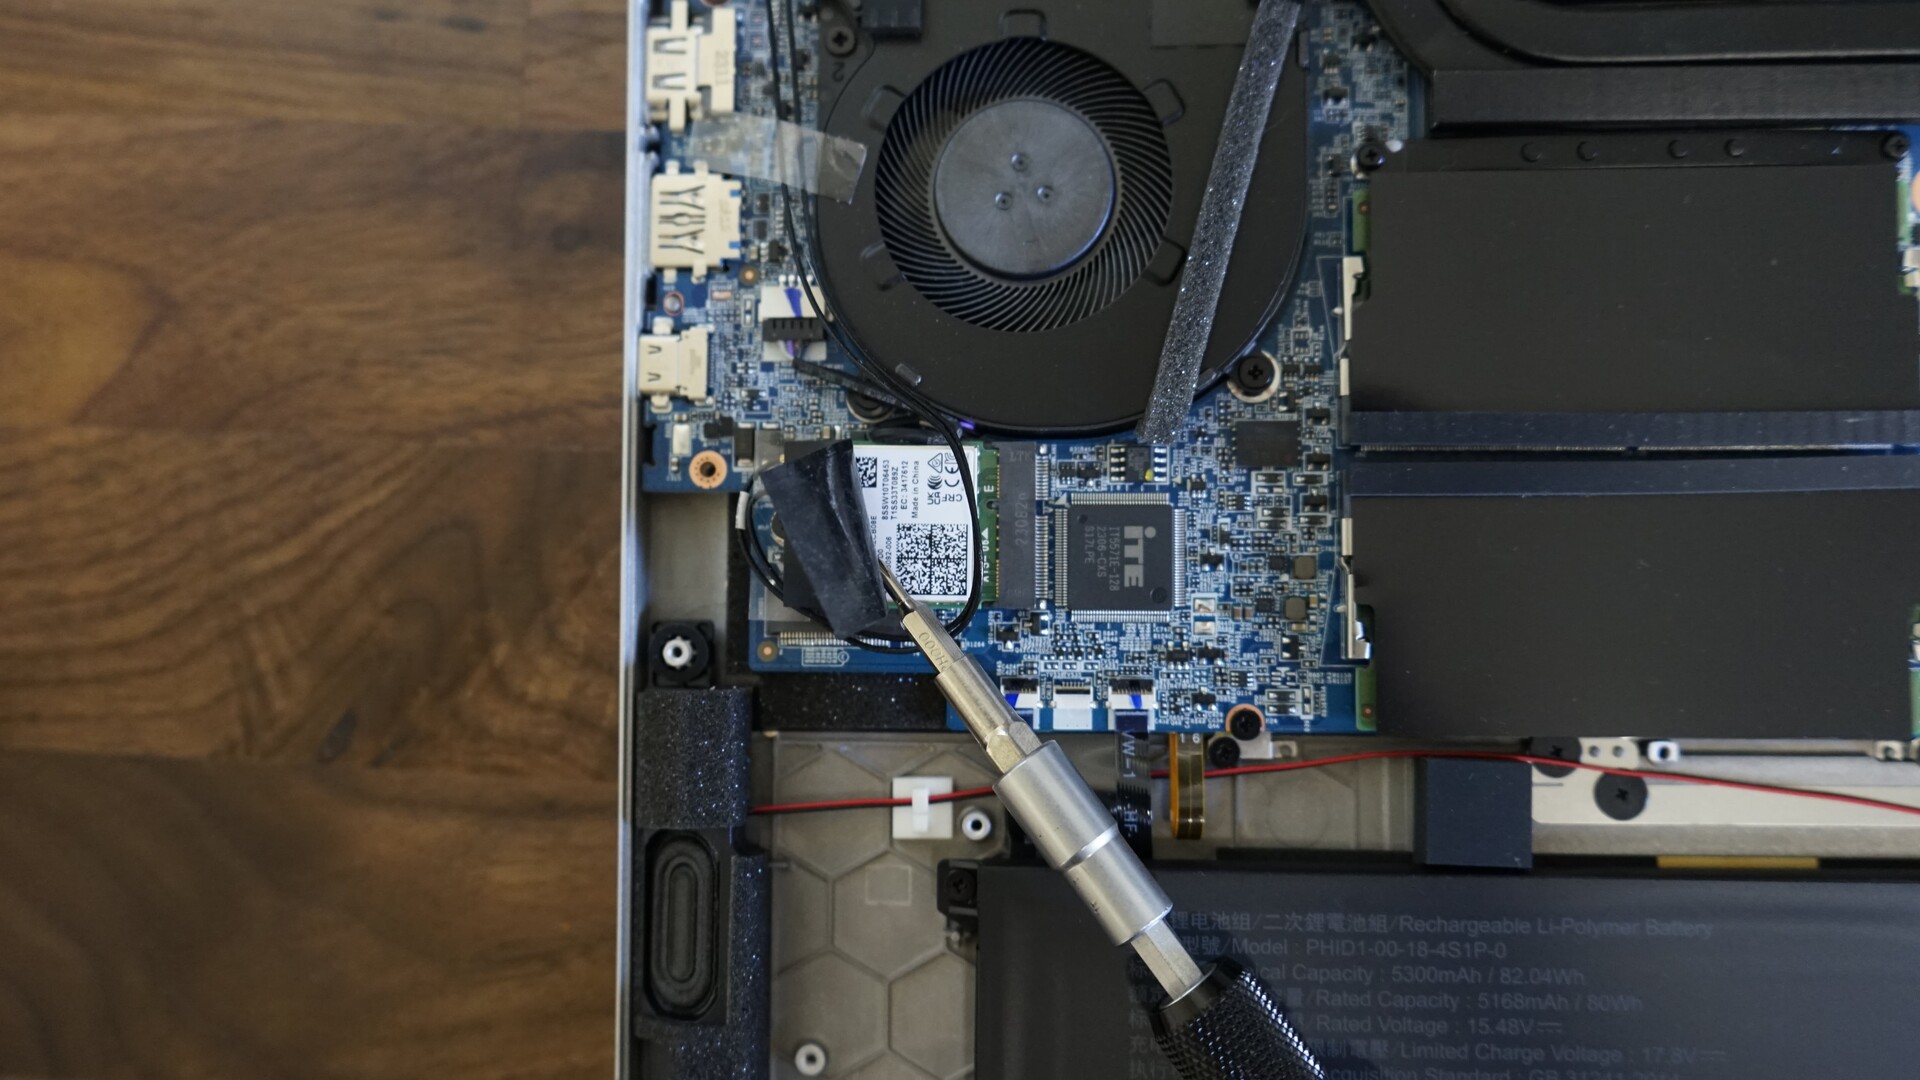
The bottom cover of the Schenker Vision 16 is secured with a total of nine screws. The four screws on the front and the middle screw on the back are shorter than the other screws. The internal space is very similar to the Vision 16 Pro except for the missing GPU, the lower amount of heatpipes and the smaller right fan. The last aspect will become relevant for our performance measurements.
Users of the Vision 16 are enabled to change both RAM modules, the WiFi modules, the M.2 SSD and the battery. There is also a free second M.2 SSD slot.
Warranty
Schenker offers a base warranty of 24 months, which includes Pickup & Return service as well as a fast repair in the first six months. At will, a 36 month warranty can be selected and expanded with various warranty packages, like a fast repair for the whole warranty period.
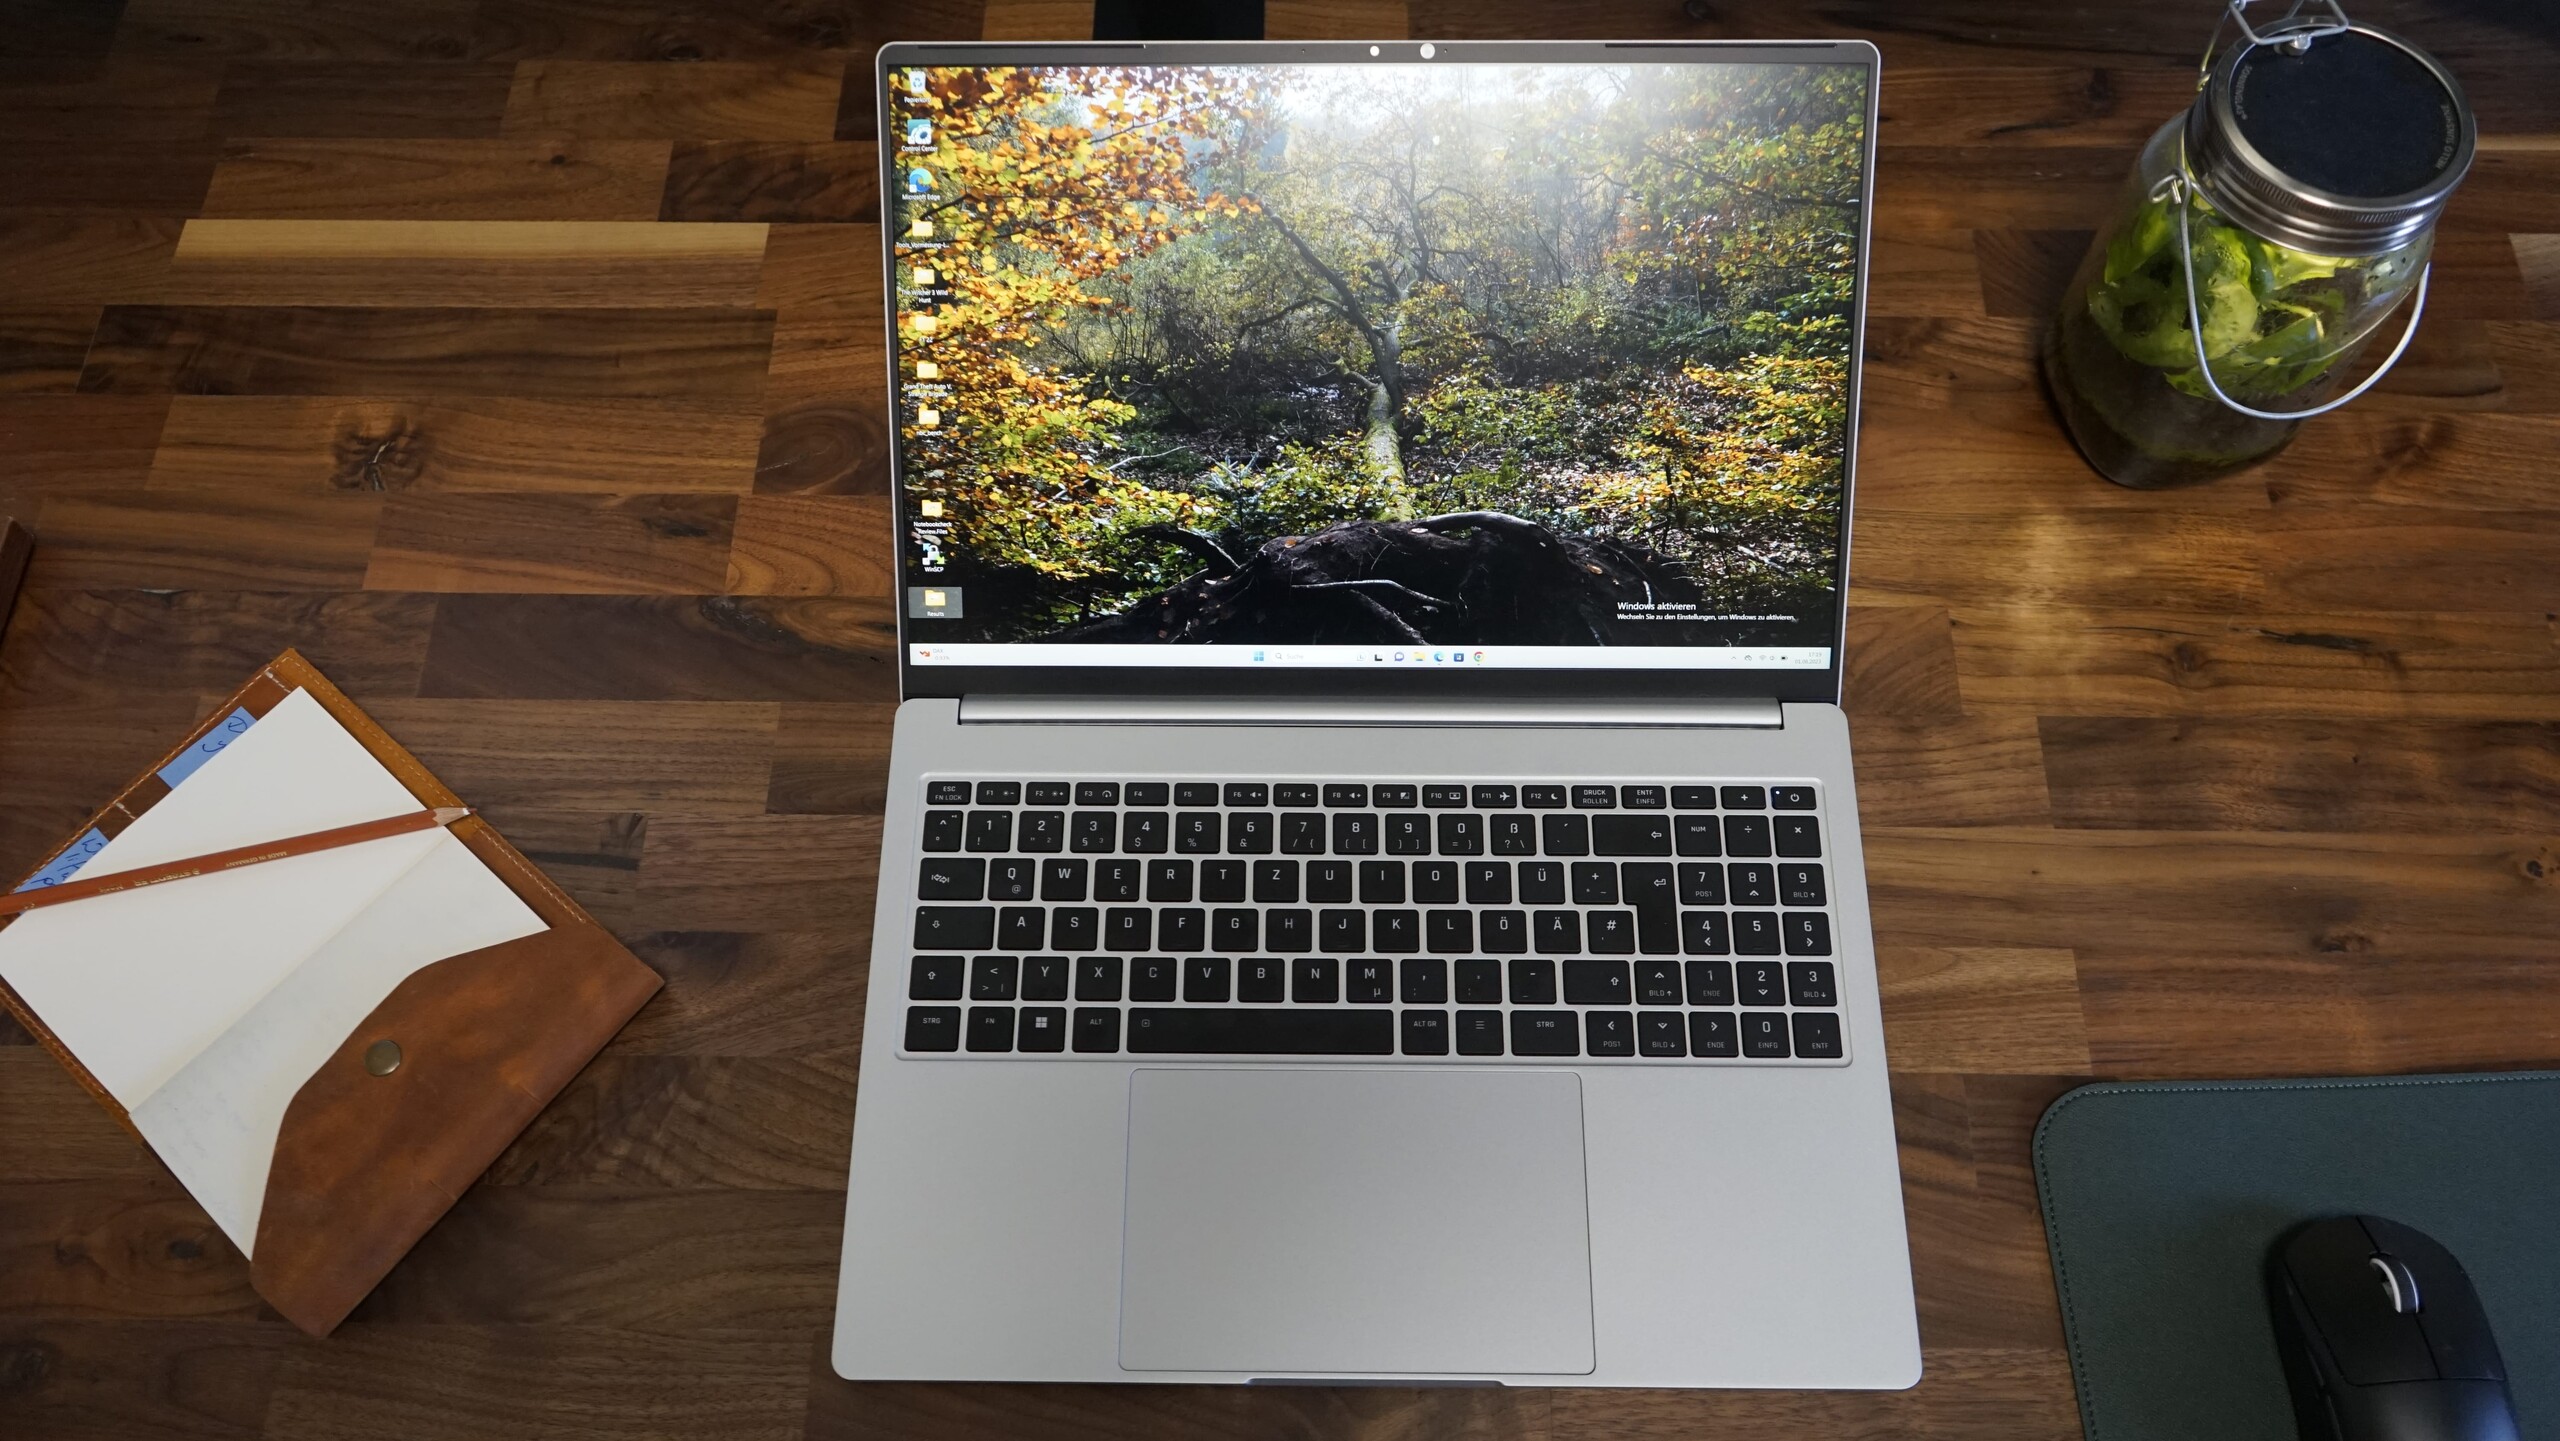
Input devices - huge glass clickpad, but less-than-ideal keyboard layout.
The input devices of the Vision 16 are solid. The touchpad is very large and precise, but there are some weaknesses when it comes to the keyboard.
Keyboard
The keyboard has a dedicated numblock with full-sized arrow keys, shortening the right Shift key and displacing the additional enter key of the numblock. The numblock is a rather compressed version and not very usable for quick number entry. This begs the question why Schenker included the numblock at all, as the whole keyboard is shifted to the left because of it. Due to the shifted keyboard and the shorter right Shift key, typing is negatively impacted and the keyboard requires a longer time to get used to it.
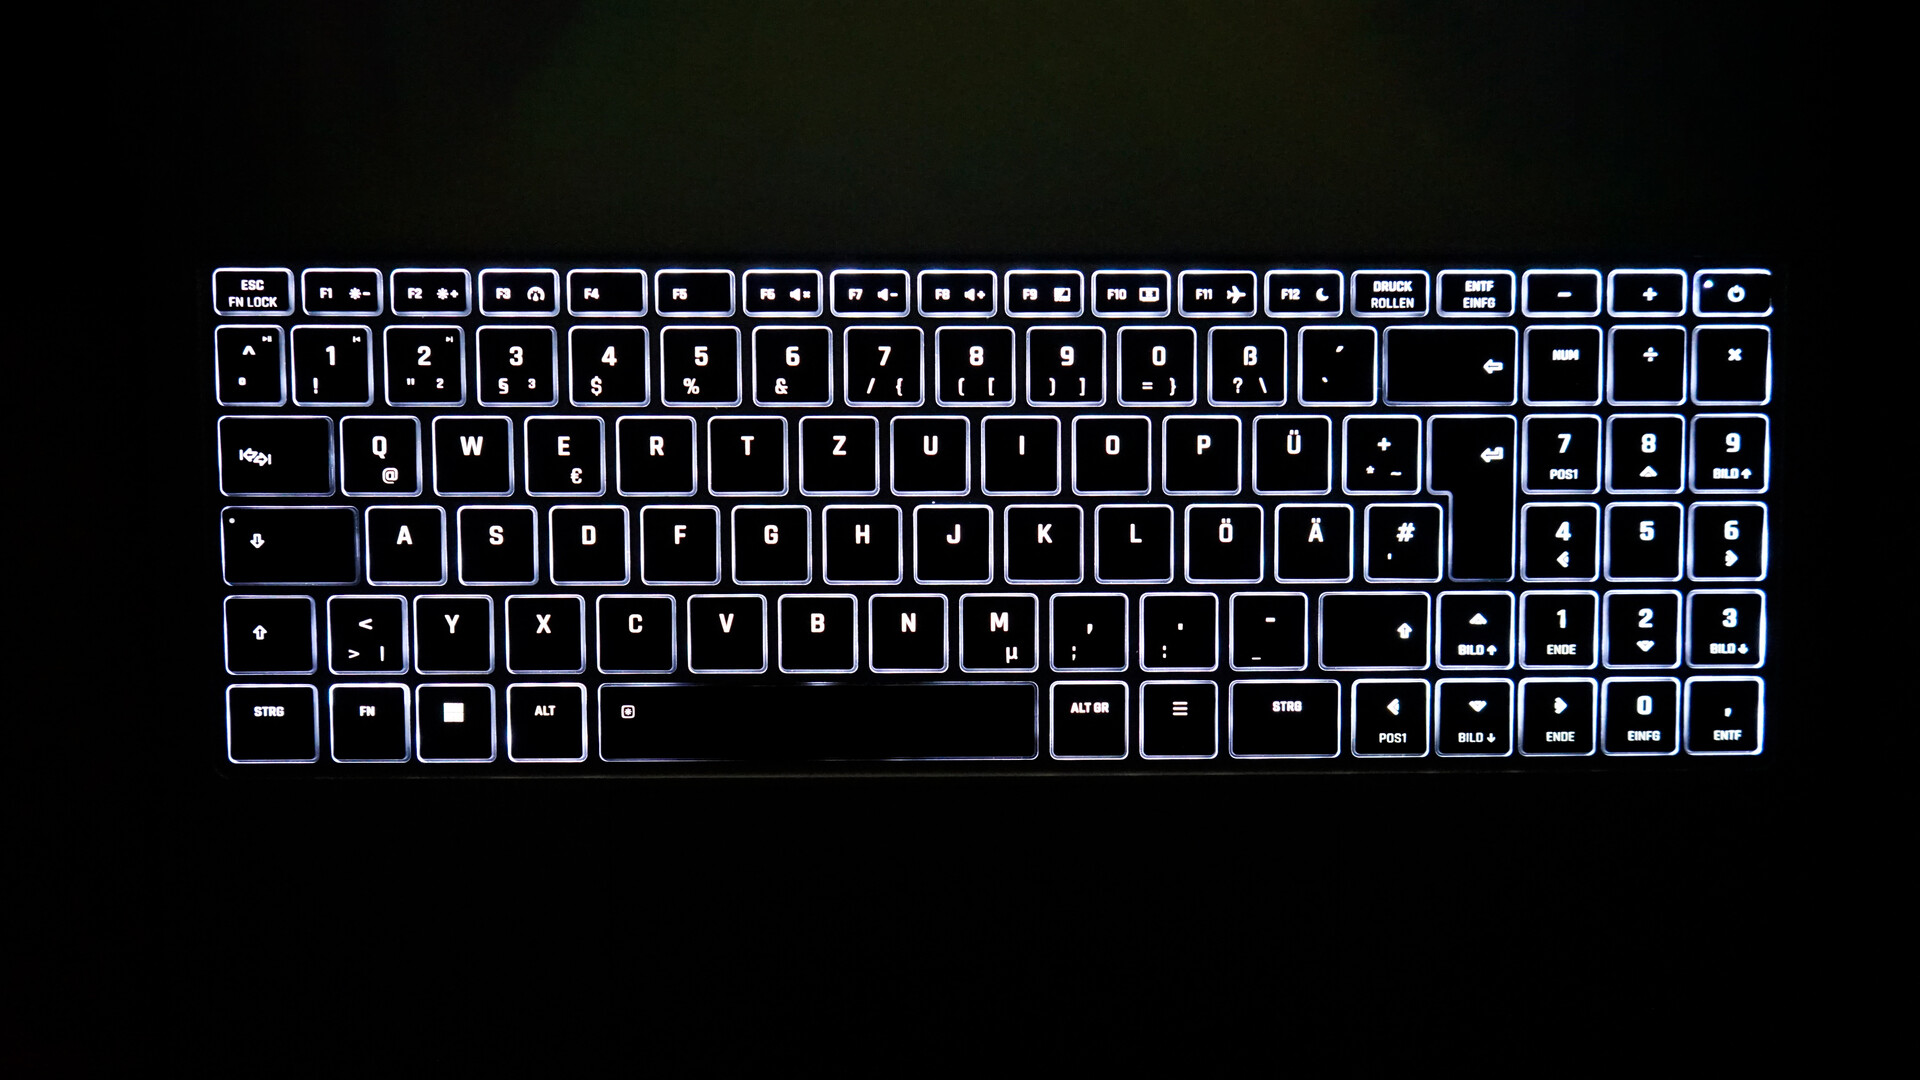
As far as the keys them self go, the offer a very good and precise typing feel with a solid, not too loud typing noise. It is backlit with two levels of brightness and all keys are lighted evenly.
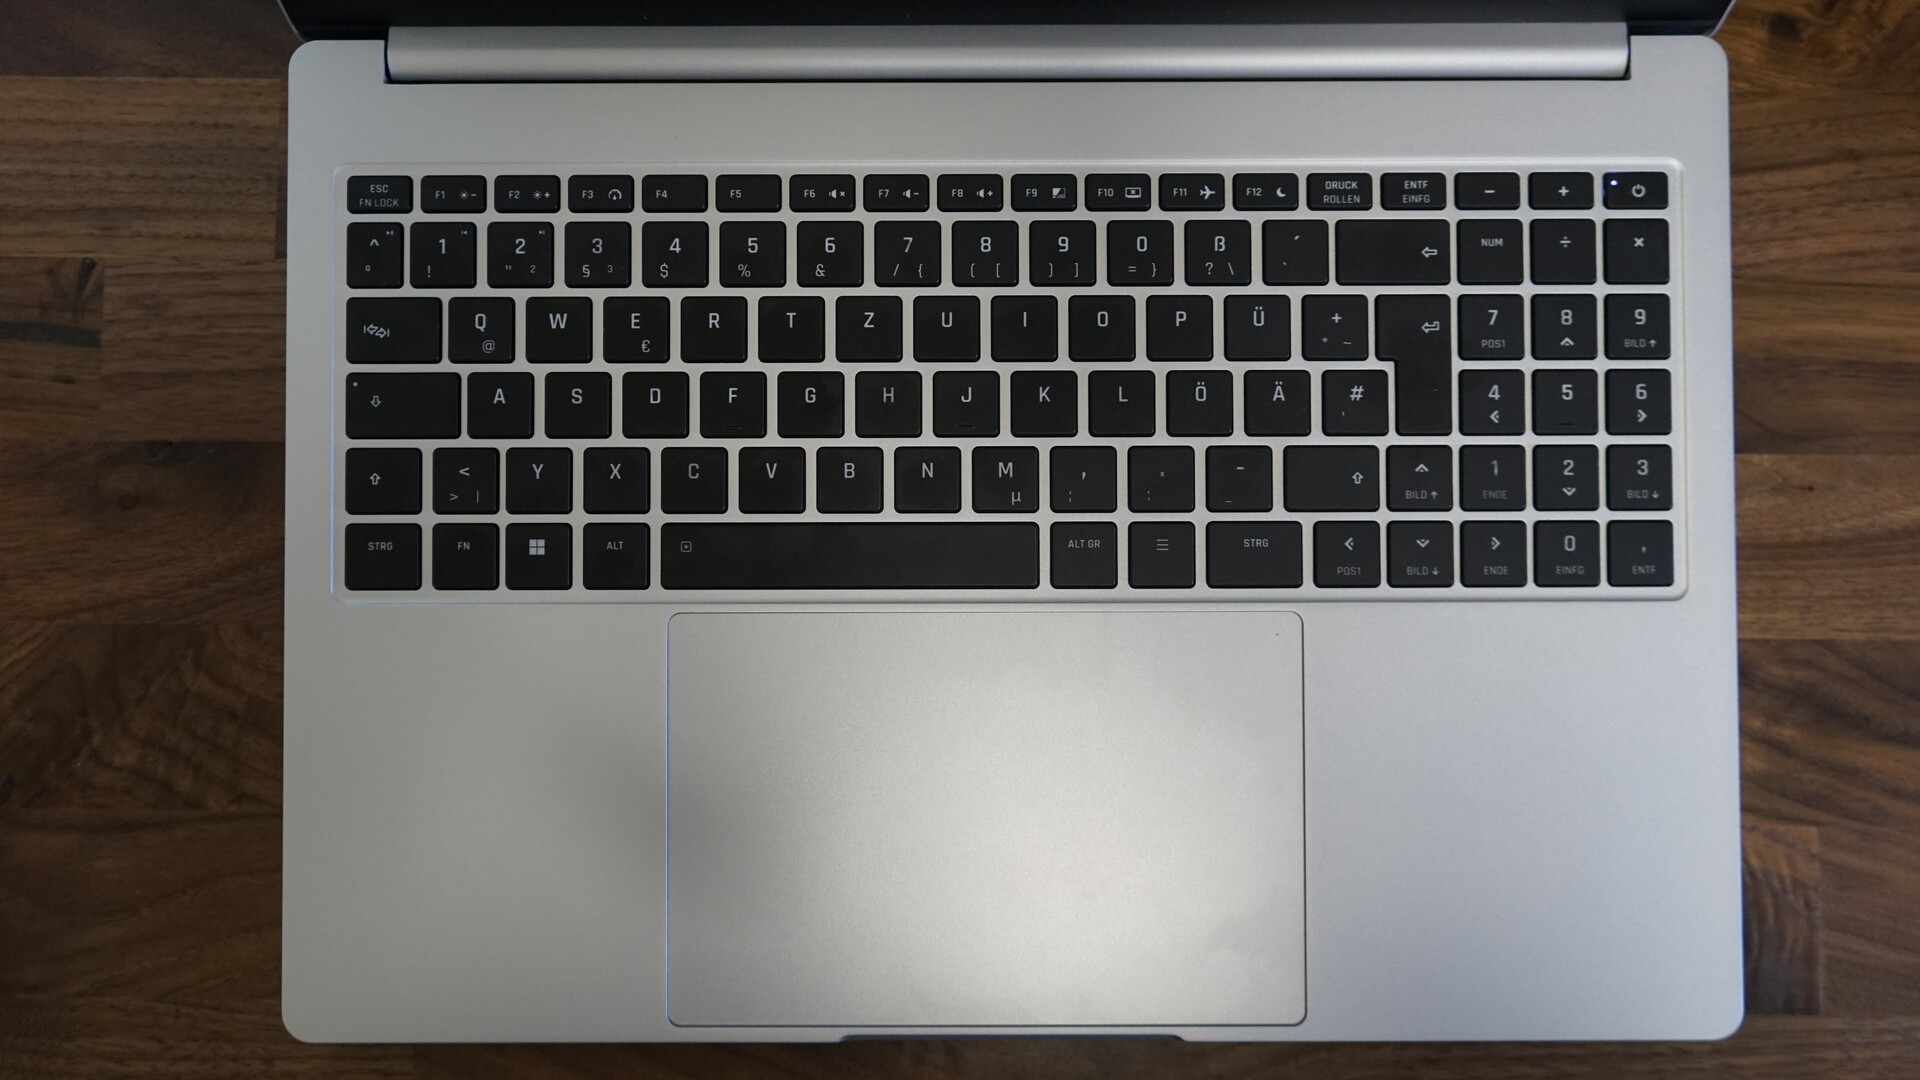
Touchpad
A highlight of the Vision 16 and the Pro version is the large glass clickpad (15.4 x 10 cm). Using the trackpad is easy and thanks to the large surface, gestures and cursor movement are smooth. The precision of this touchpad is very good. It could be slightly less noise when it comes to the click mechanism though, and hitting the right-click area can be tricky.
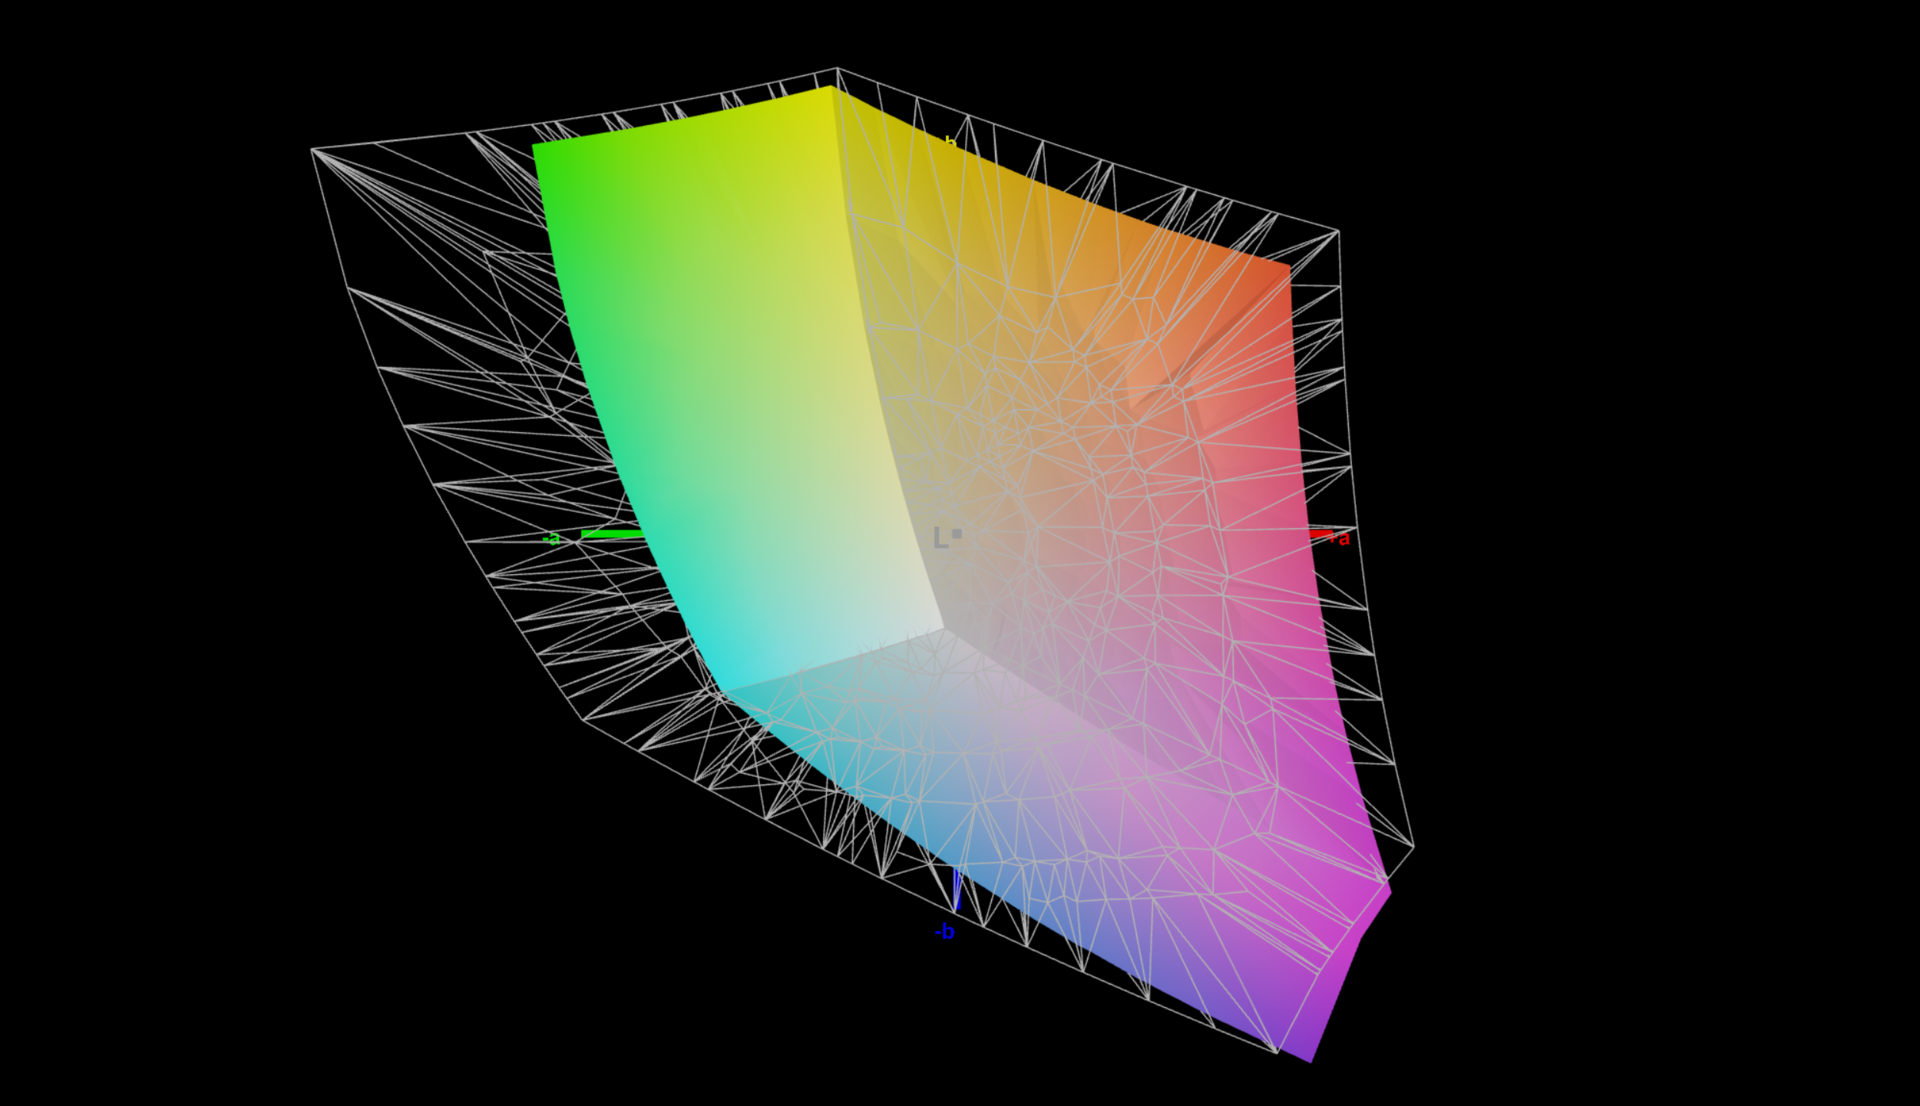
Display - 240 Hz IPS screen in the 16:10 format

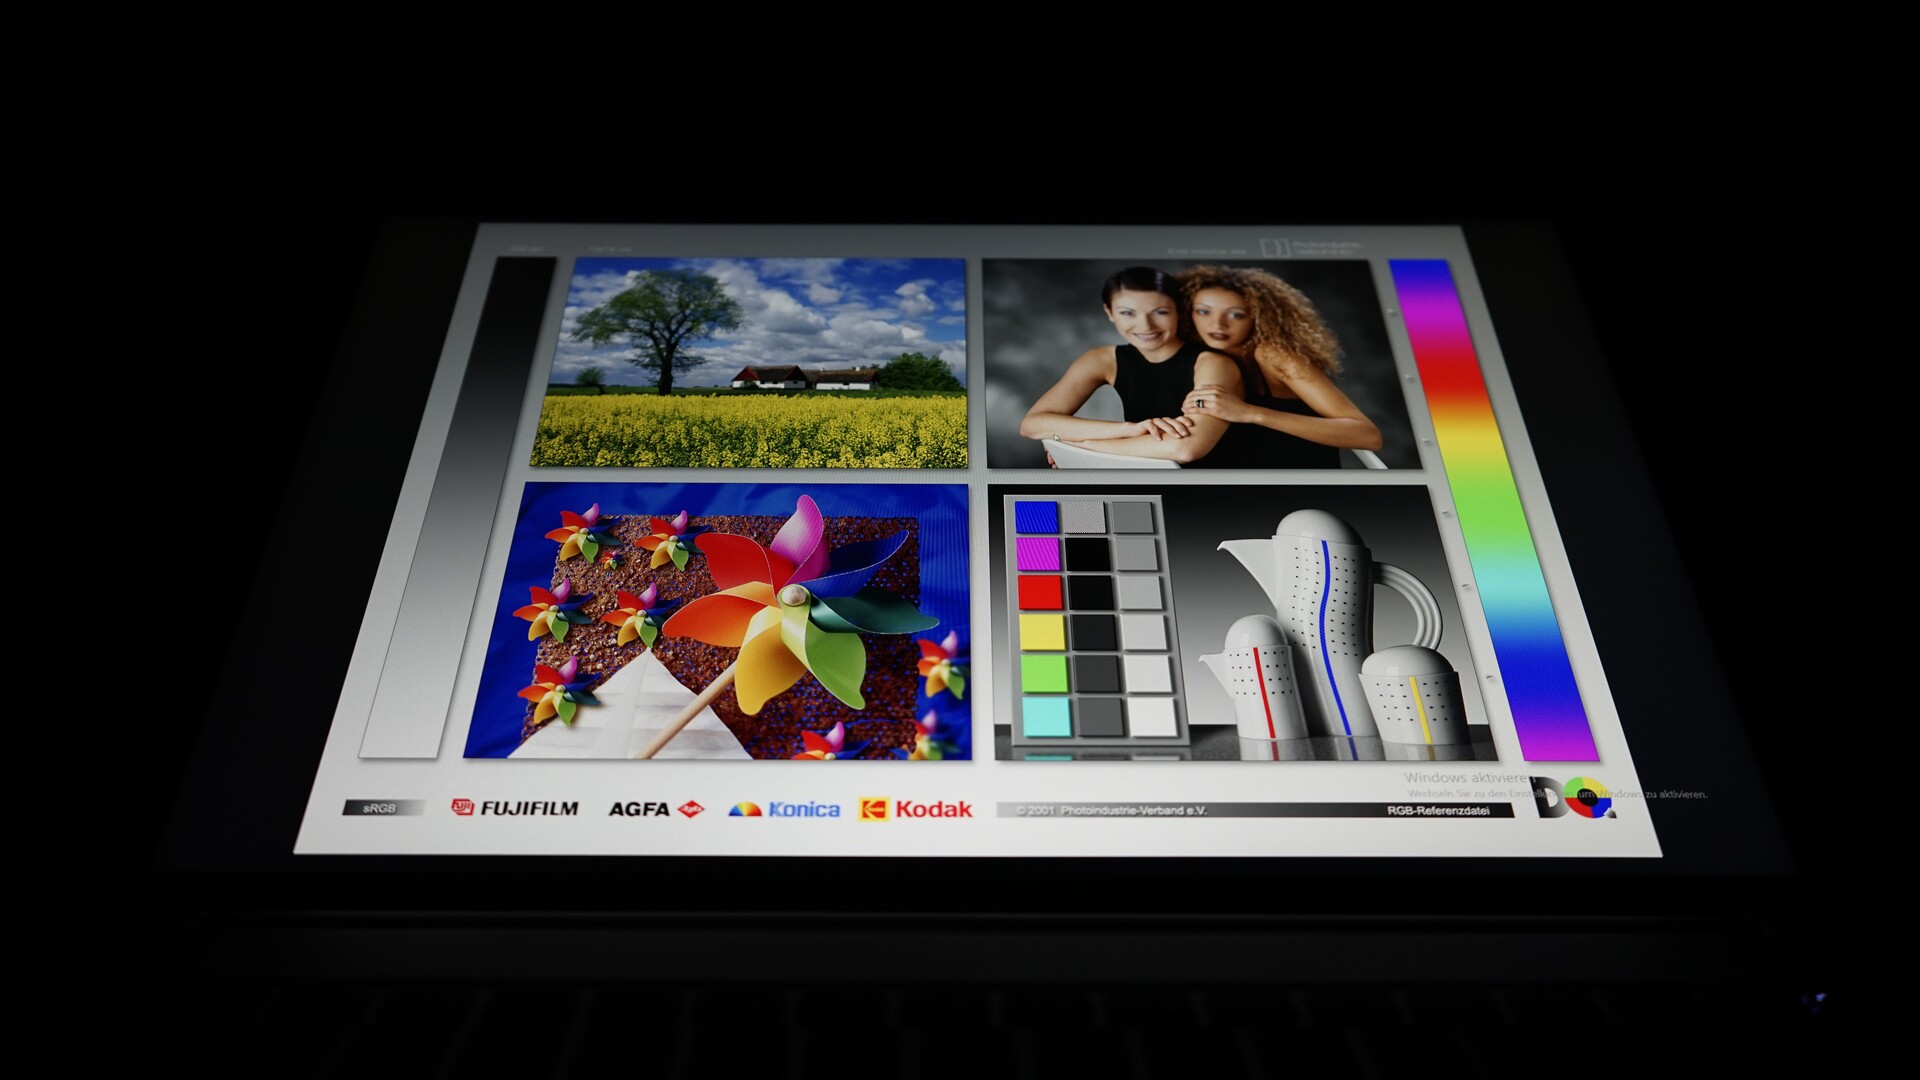
One of the highlights of the Vision 16 ultrabook 2023 is the new WQXGA panel (2,560 x 1,600), which was exclusive to the Pro version with last years model. Instead of 90 Hz, this years moodel of the Vision 16 offers a refresh rate of 240 Hz - unusual for office laptops.
Despite the fact that both versions of the Vision 16 use the same screen this year, the Vision 16 slightly outperformed the Vision 16 Pro in our review. We attribute these differences to normal quality variance between panels. The brightness of the screen should reach 350 cd/m² according to Schenker, which our measurements confirm.
The high frequency of 240 Hz creates a smooth user experience. The real advantages of this smoothness while gaming are wasted on the Vision 16 though, unless it is combined with an external Thunderbolt GPU.
| |||||||||||||||||||||||||
Brightness Distribution: 93 %
Center on Battery: 356 cd/m²
Contrast: 1271:1 (Black: 0.28 cd/m²)
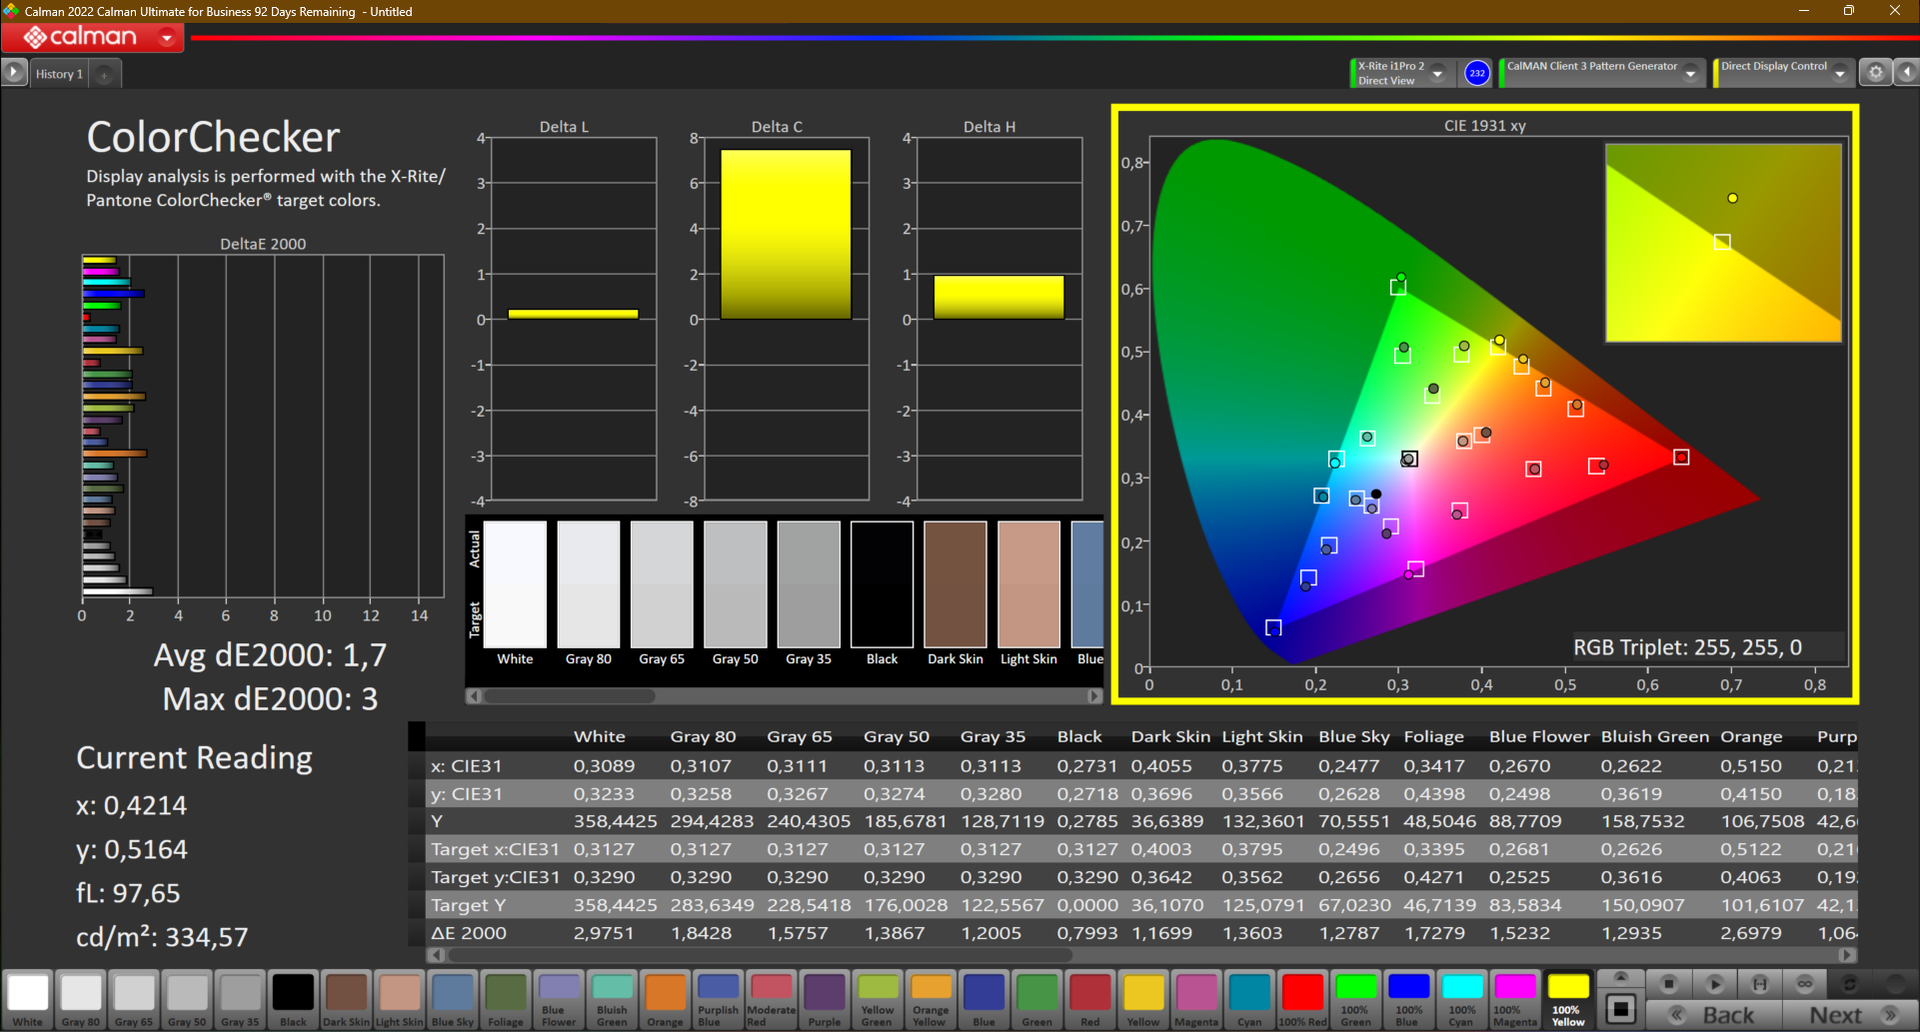
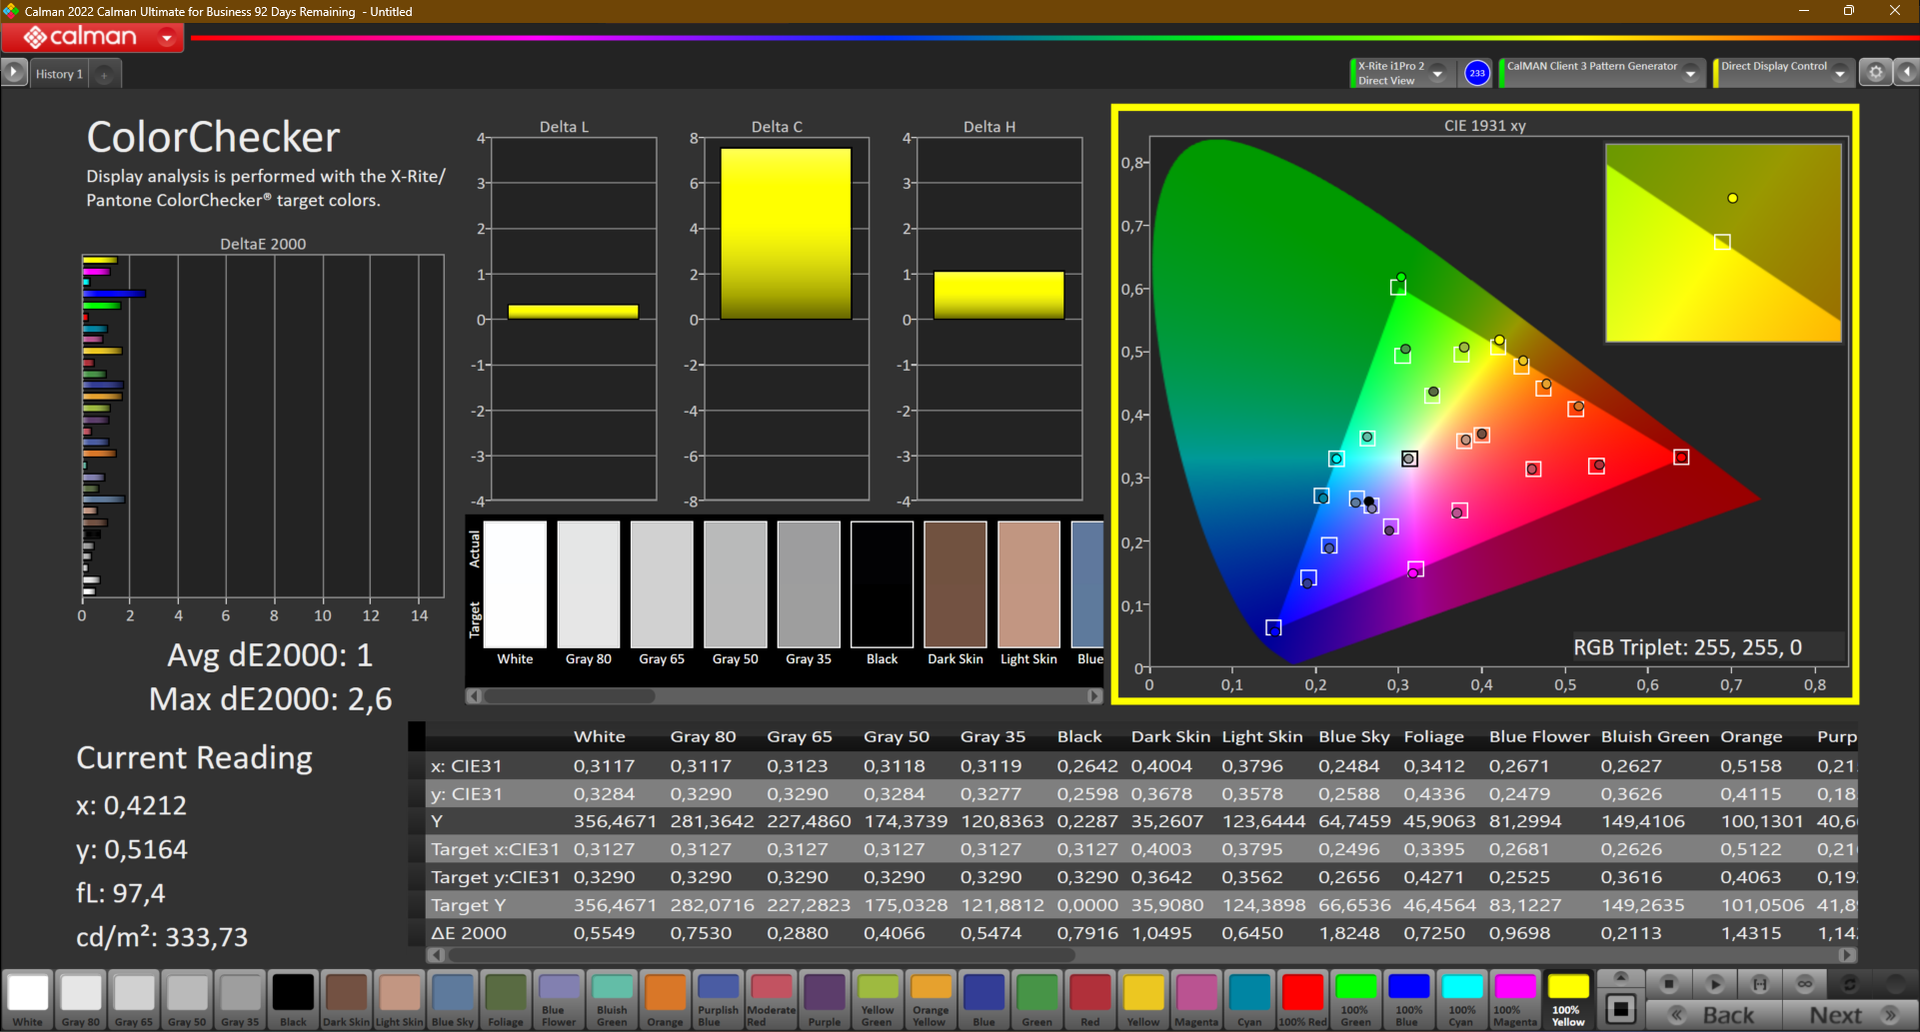
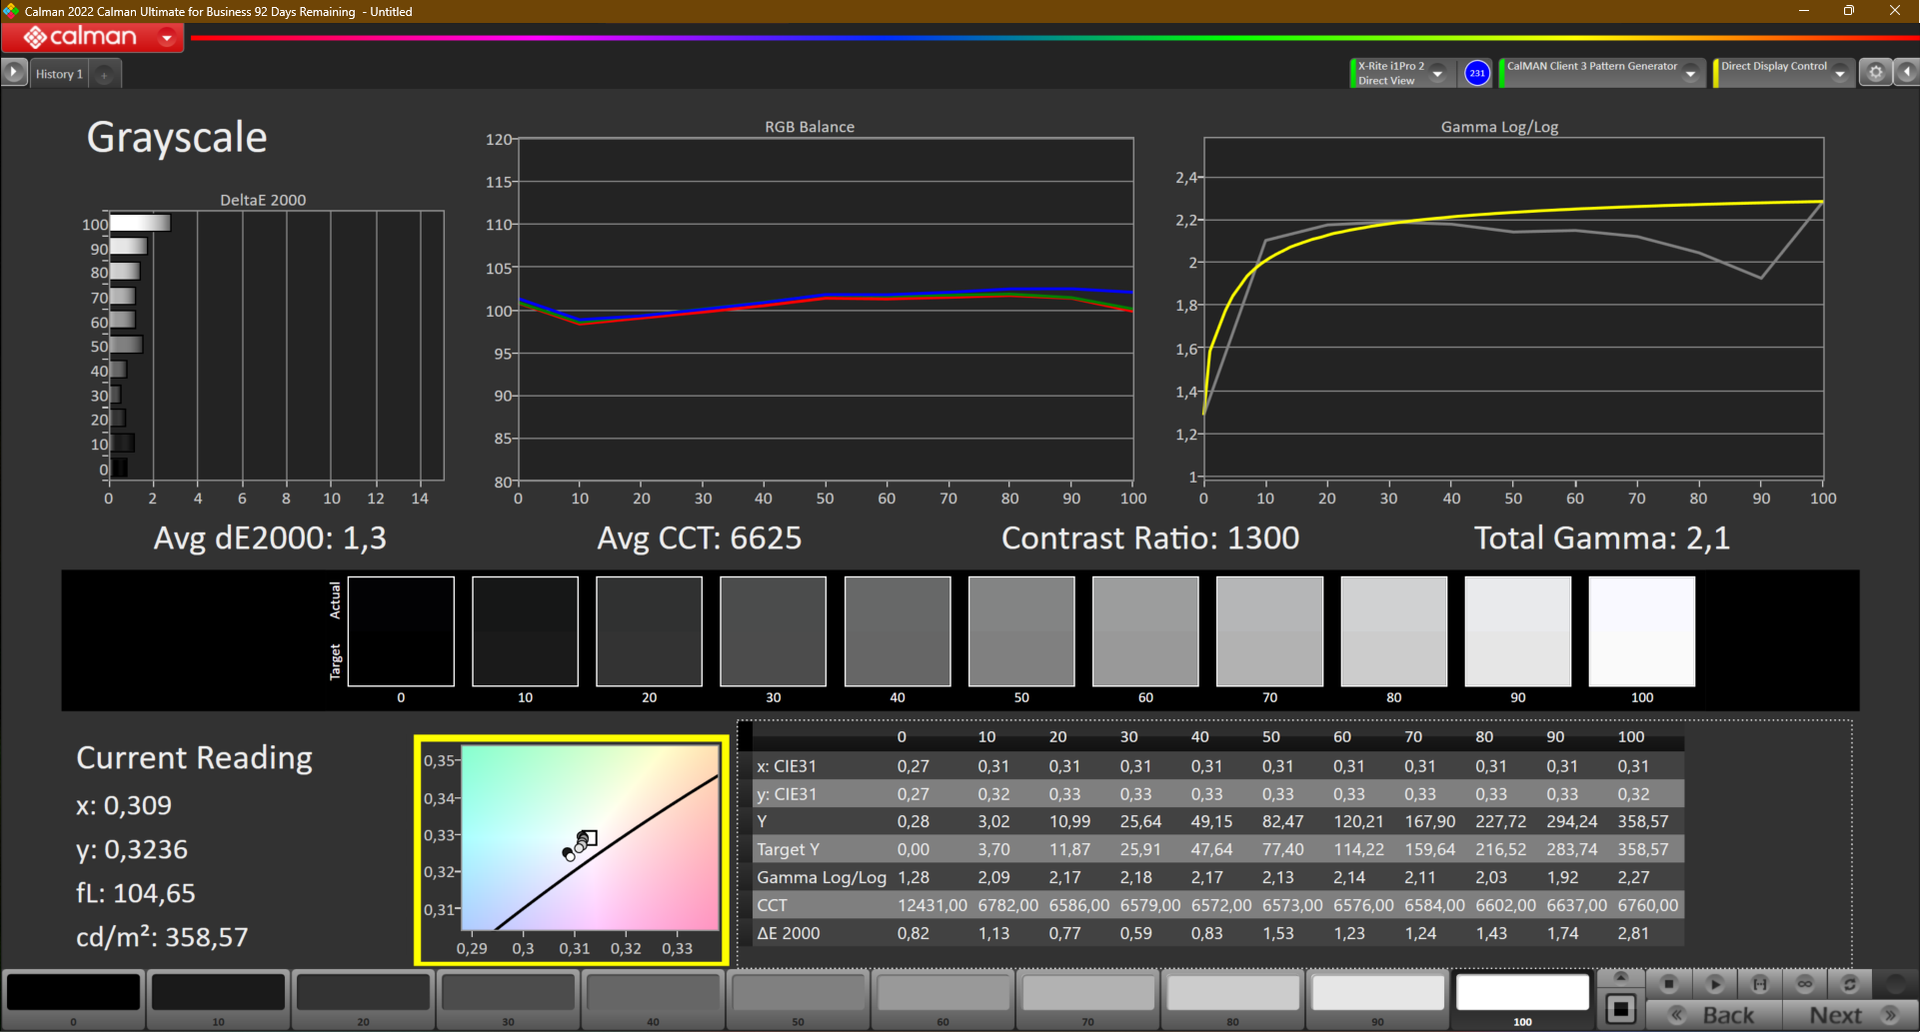
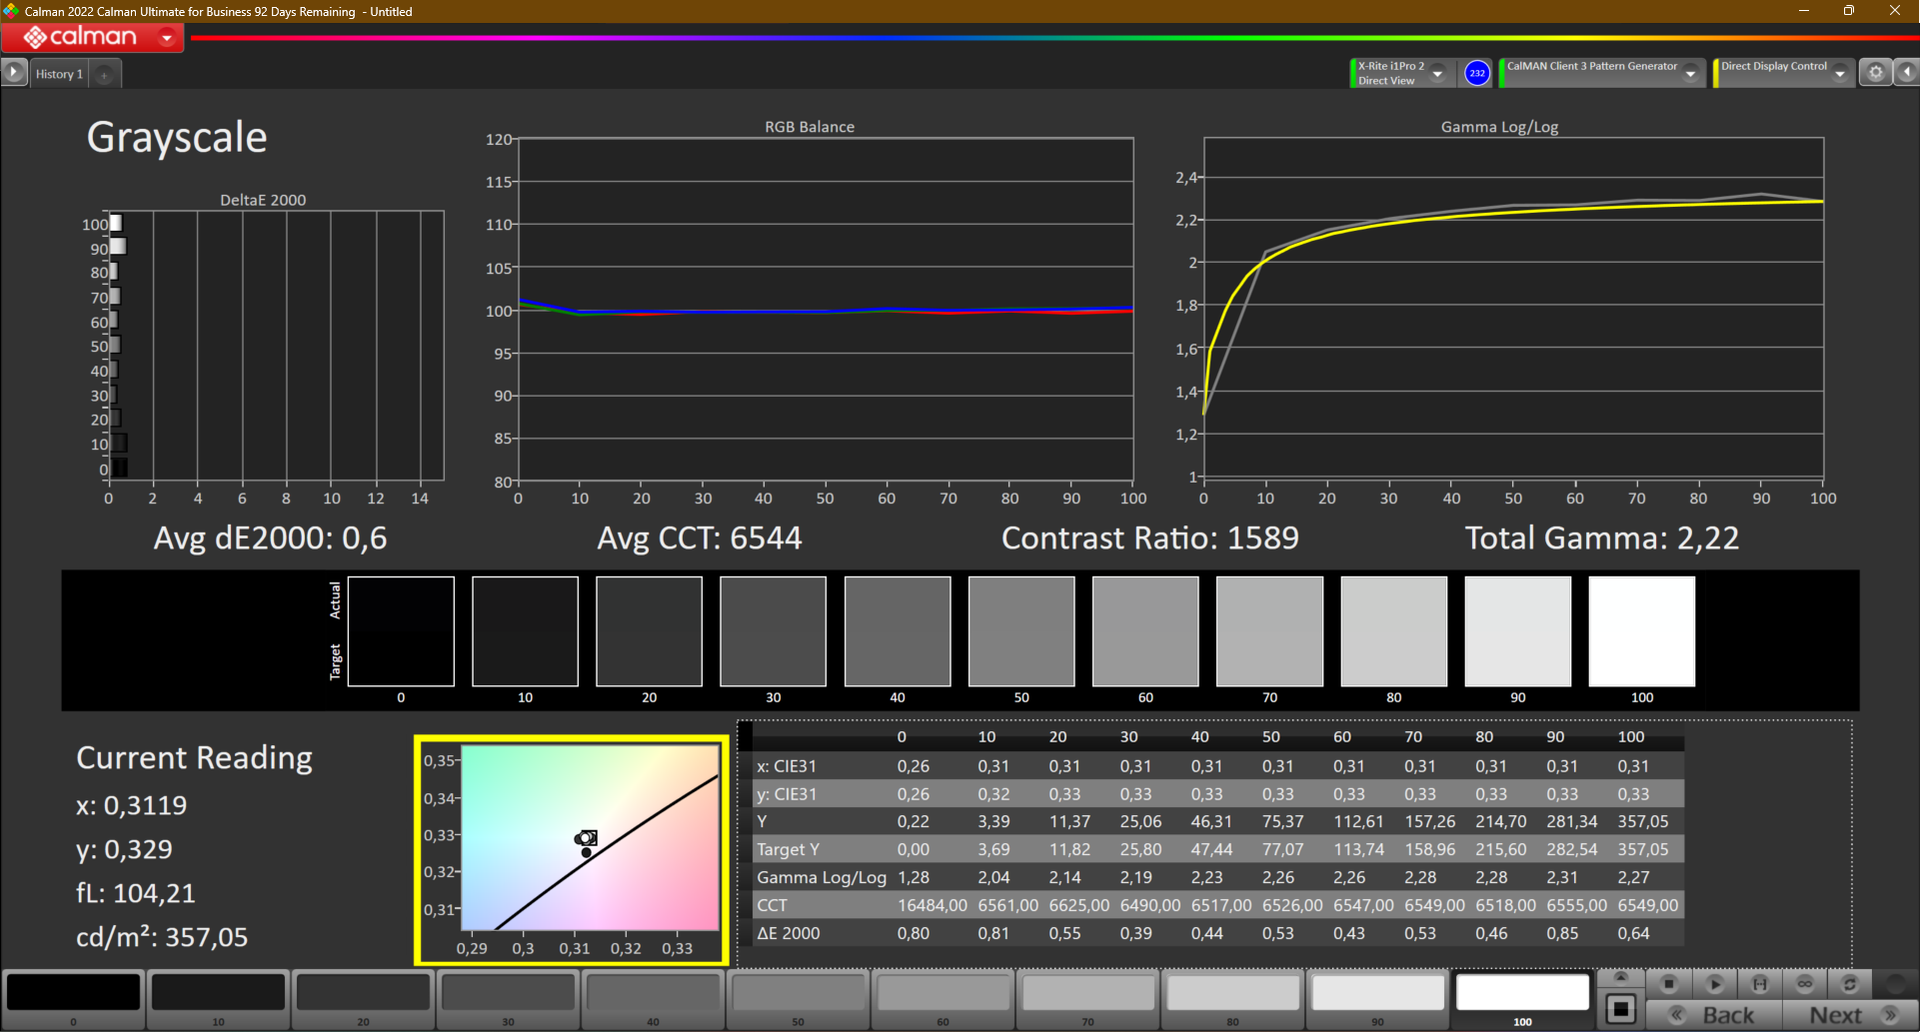
ΔE ColorChecker Calman: 1.7 | ∀{0.5-29.43 Ø4.71}
calibrated: 1
ΔE Greyscale Calman: 1.3 | ∀{0.09-98 Ø4.96}
71.2% AdobeRGB 1998 (Argyll 3D)
99.3% sRGB (Argyll 3D)
70% Display P3 (Argyll 3D)
Gamma: 2.1
CCT: 6625 K
| Schenker Vision 16 PH6PRX1 BOE CQ NE160QDM-NZ1 , IPS, 2560x1600, 16" | Apple MacBook Air 15 2023 M2 16 GB IPS, 2880x1864, 15.3" | Acer Swift Go SFG16-71 Samsung SDC418D ATNA60BC03-0, OLED, 3200x2000, 16" | LG Gram SuperSlim (2023) Samsung ATNA56YX08-0, OLED, 1920x1080, 15.6" | Microsoft Surface Laptop 5 15, i7-1255U LQ150P1JX51, IPS, 2496x1664, 15" | Asus VivoBook S15 M3502RA-L1029W Samsung SDC4161, OLED, 1920x1080, 15.6" | |
|---|---|---|---|---|---|---|
| Display | 22% | 28% | 27% | -2% | 27% | |
| Display P3 Coverage (%) | 70 | 98.7 41% | 99.91 43% | 99.8 43% | 68.1 -3% | 99.9 43% |
| sRGB Coverage (%) | 99.3 | 99.9 1% | 100 1% | 100 1% | 97.3 -2% | 100 1% |
| AdobeRGB 1998 Coverage (%) | 71.2 | 87.9 23% | 98.87 39% | 98.09 38% | 70.3 -1% | 98.6 38% |
| Response Times | -149% | 79% | 79% | -318% | 84% | |
| Response Time Grey 50% / Grey 80% * (ms) | 11 ? | 28.8 ? -162% | 2 ? 82% | 2 ? 82% | 52.4 ? -376% | 0.74 93% |
| Response Time Black / White * (ms) | 8 ? | 18.9 ? -136% | 2 ? 75% | 2 ? 75% | 28.7 ? -259% | 2 ? 75% |
| PWM Frequency (Hz) | 227 ? | 22000 ? | 59 ? | |||
| Screen | 9% | -52% | -20% | 18% | -36% | |
| Brightness middle (cd/m²) | 356 | 517 45% | 370 4% | 395 11% | 397 12% | 378 6% |
| Brightness (cd/m²) | 349 | 501 44% | 371 6% | 392 12% | 399 14% | 378 8% |
| Brightness Distribution (%) | 93 | 93 0% | 98 5% | 97 4% | 85 -9% | 98 5% |
| Black Level * (cd/m²) | 0.28 | 0.39 -39% | 0.1 64% | 0.29 -4% | ||
| Contrast (:1) | 1271 | 1326 4% | 3950 211% | 1369 8% | ||
| Colorchecker dE 2000 * | 1.7 | 1.2 29% | 2.77 -63% | 2.2 -29% | 0.8 53% | 2.2 -29% |
| Colorchecker dE 2000 max. * | 3 | 2.5 17% | 4.08 -36% | 4.43 -48% | 1.4 53% | 4.87 -62% |
| Colorchecker dE 2000 calibrated * | 1 | 0.8 20% | 2.83 -183% | 4.65 -365% | 2.68 -168% | |
| Greyscale dE 2000 * | 1.3 | 1.8 -38% | 2.58 -98% | 1.78 -37% | 1.1 15% | 1.43 -10% |
| Gamma | 2.1 105% | 2.24 98% | 2.46 89% | 2.39 92% | 2.18 101% | 2.47 89% |
| CCT | 6625 98% | 6241 104% | 6284 103% | 6705 97% | 6464 101% | |
| Total Average (Program / Settings) | -39% /
-11% | 18% /
-10% | 29% /
4% | -101% /
-38% | 25% /
0% |
* ... smaller is better
The measurements of the black value came out to a solid 0.28 cd/m², which results in a contrast ratio of the screen of more than 1,200:1. Still, the IPS display can not compete with the deep black values of OLED panels.
The deltaE value of the screen prior to calibration sits at a good 1.7 and we were able to improve it down to 1.0. In comparison, the display of the Vision 16 Pro had a deltaE of 3.4 prior to calibration. The difference is especially noticeable in terms of the greyscale. Ex factory, the Pro version had a greyscale deltaE of 4.9, while our Vision 16 review sample had a much lower greyscale deltaE of 1.3.
We did not detect and blue-hue like with the screen of the Vision 16 Pro. Due to the good ex-factory calibration, we did not use the Schenker color profile in the control center. The difference in measurements between Vision 16 and Vision 16 Pro show that the quality of the screen is luck. As always, we the color profile we created for the Schenker Vision 16 is available to download for free in the grey box above.

As the screen covers the sRGB gamut almost completely, the Vision 16 2023 is suited for simple photo editing. For professional photographers or videographers, the screen is not good enough, as the wider AdobeRGB and DCI P3 are not cover sufficiently.

Display Response Times
| ↔ Response Time Black to White | ||
|---|---|---|
| 8 ms ... rise ↗ and fall ↘ combined | ↗ 4 ms rise |  |
| ↘ 4 ms fall | ||
| The screen shows fast response rates in our tests and should be suited for gaming. In comparison, all tested devices range from 0.1 (minimum) to 240 (maximum) ms. » 22 % of all devices are better. This means that the measured response time is better than the average of all tested devices (19.8 ms). | ||
| ↔ Response Time 50% Grey to 80% Grey | ||
| 11 ms ... rise ↗ and fall ↘ combined | ↗ 5 ms rise |  |
| ↘ 6 ms fall | ||
| The screen shows good response rates in our tests, but may be too slow for competitive gamers. In comparison, all tested devices range from 0.165 (minimum) to 636 (maximum) ms. » 25 % of all devices are better. This means that the measured response time is better than the average of all tested devices (30.9 ms). | ||
Screen Flickering / PWM (Pulse-Width Modulation)
| Screen flickering / PWM not detected |  | ||
In comparison: 52 % of all tested devices do not use PWM to dim the display. If PWM was detected, an average of 7741 (minimum: 5 - maximum: 343500) Hz was measured. | |||
Thanks to the matte screen, the Vision 16 is usable in outdoor environments. Direct sunlight should be avoided though, as it makes work rather hard.
The viewing angle stability is good, but not at the level of OLED screens. The display loses contrast when viewed from extreme angles.


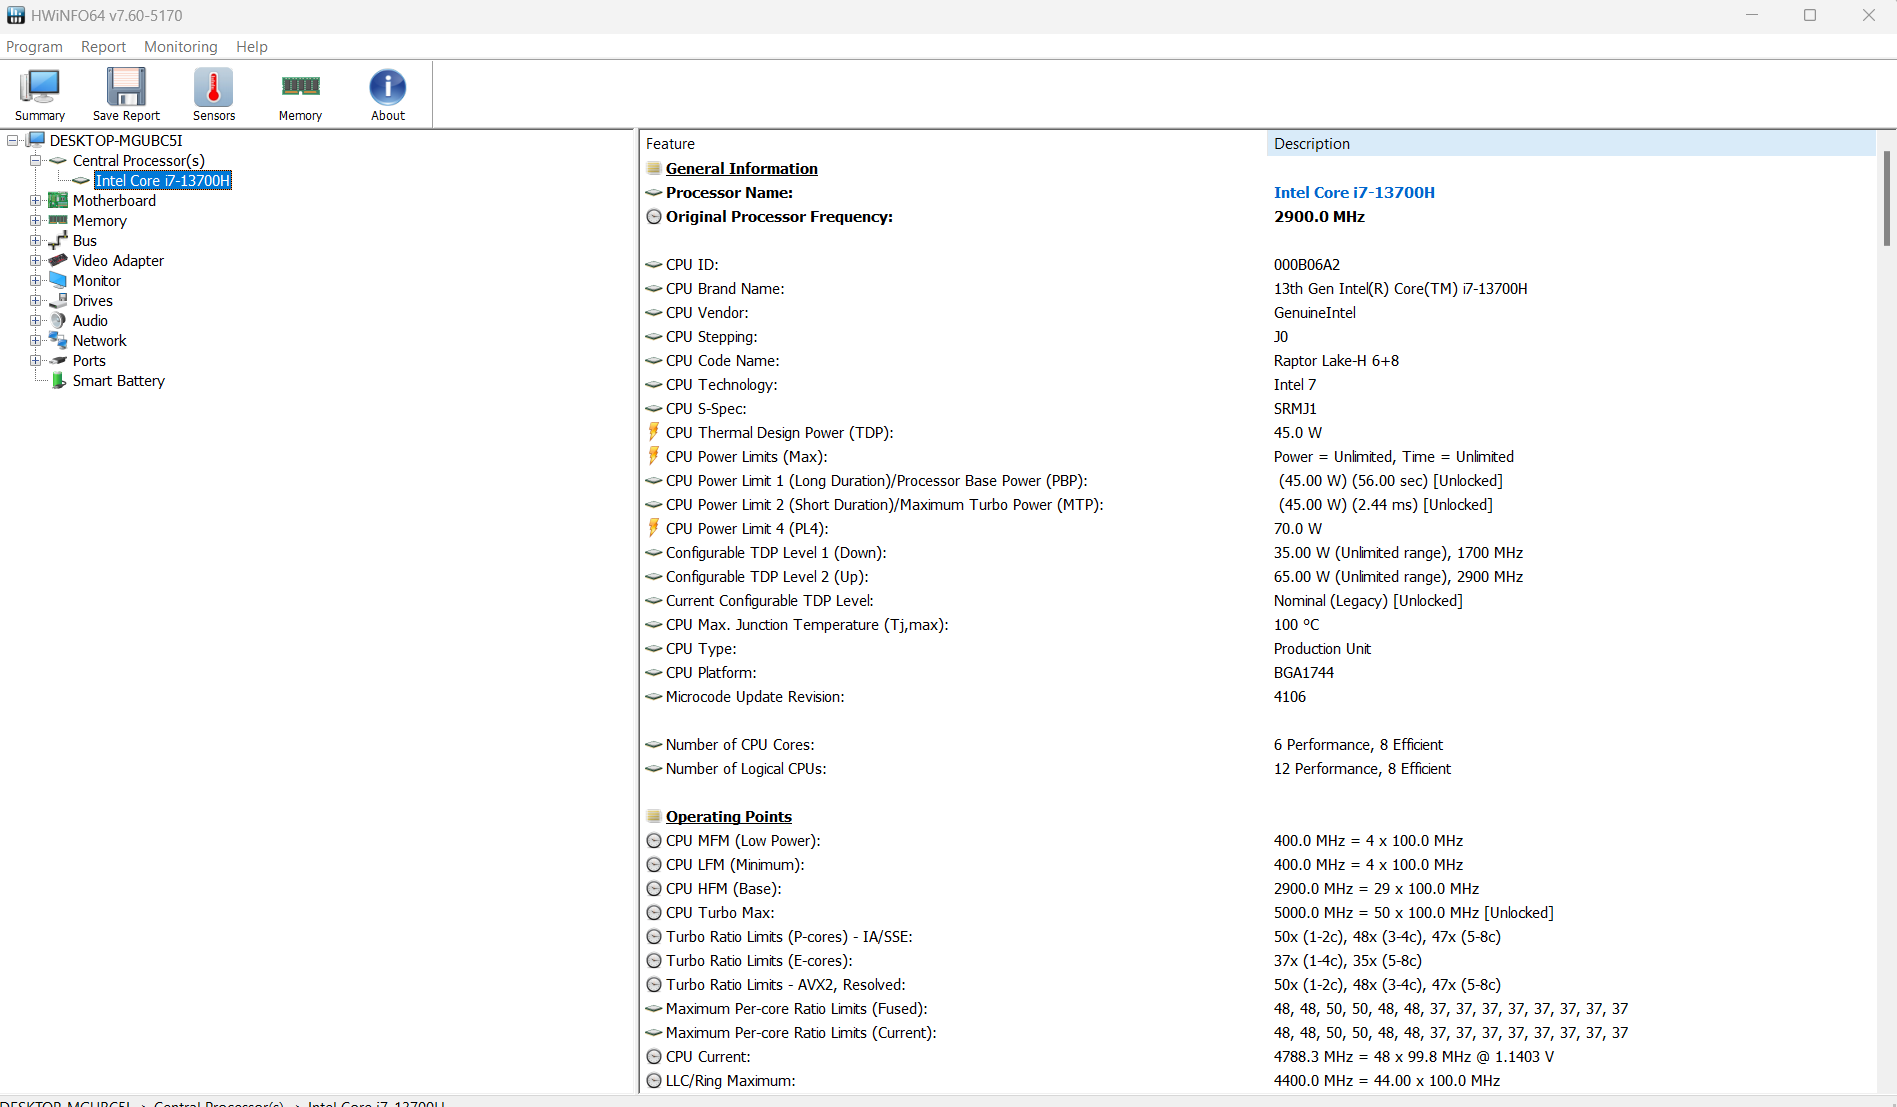
Performance - Core i7-13700H can not run at full capacity
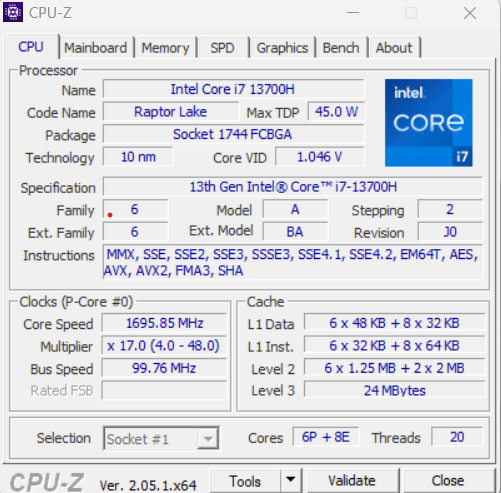
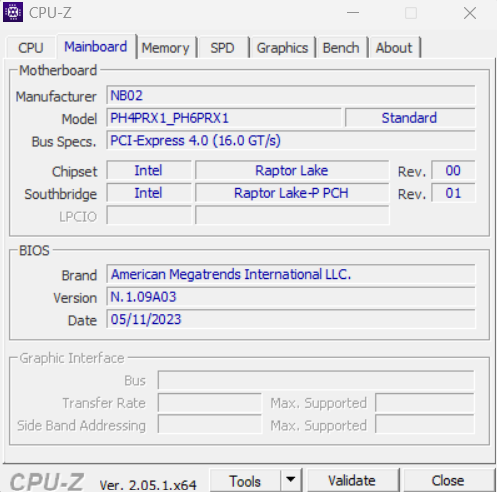
Instead of last years Intel Core i7-12700H. the new model of the Vision 16 offers the newer Intel Core i7-13700H. While the predecessor offered a RTX 3050 Ti, this year model only contains the integrated GPU of the Intel processor. Also part of the package is 32 GB DDR5 RAM and a 1 TB M.2 NVMe PCIe SSD.
Testing conditions
Schenker offers multiple profiles in the Control center application, but the manual profile is not available anymore as it was the predecessor. The TDP thresholds of the processor are thus not changeable by the user. All performance benchmarks are done in the "Enthusiast" mode, with a TDP of 45 W. In the mode "Quiet" of the Control Center app of Schenker, the TDP is fixed to 15 W. For the battery testing, we use the "Balanced" mode, which also has a TDP limit of 45 W.
| Enthusiast | Balanced | Quiet | |
|---|---|---|---|
| CPU PL1 (HWInfo) | 45 Watt | 45 Watt | 15 Watt |
| CPU PL2 (HWInfo) | 45 Watt | 45 Watt | 15 Watt |
Processor
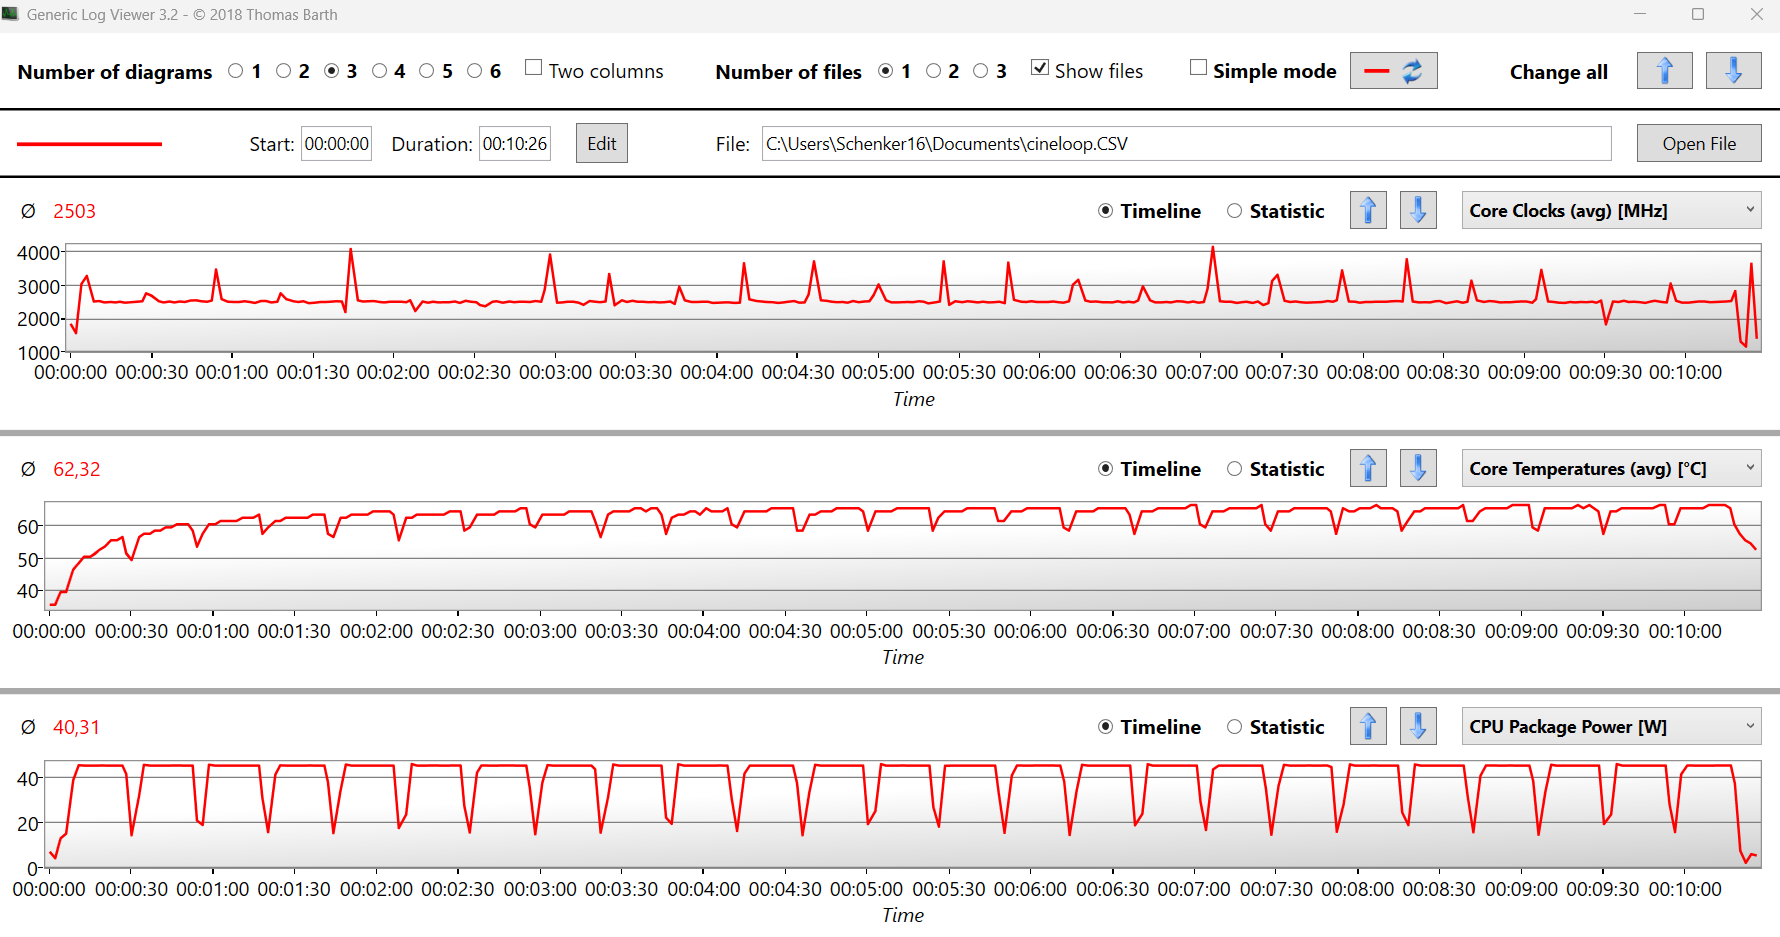
In the Vision 16, the same Core i7-13700H from Intel's Raptor Lake generation is used as in the Vision 16 Pro. Since the power limit is rather limited, the temperatures stay low, but performance suffers and the processor is slower compared with the Vision 16 Pro. The Multi core performance in the Cinebench R15 loop of the Vision 16 is roughly 15 percent worse than the Vision 16 Pro. We attribute this lower result to the worse cooling system of the Vision 16. Since we measured a rather low temperature of 62 degrees during the Cinebench loop, the processor does have headroom to perform better. In battery mode, the CPU is limited to 35 W, which lowers the Multi core performance by 20 percent.
Cinebench R15 Multi sustained loop
Cinebench R23: Multi Core | Single Core
Cinebench R20: CPU (Multi Core) | CPU (Single Core)
Cinebench R15: CPU Multi 64Bit | CPU Single 64Bit
Blender: v2.79 BMW27 CPU
7-Zip 18.03: 7z b 4 | 7z b 4 -mmt1
Geekbench 5.5: Multi-Core | Single-Core
HWBOT x265 Benchmark v2.2: 4k Preset
LibreOffice : 20 Documents To PDF
R Benchmark 2.5: Overall mean
| CPU Performance rating | |
| Schenker VISION 16 Pro (M23) | |
| Average Intel Core i7-13700H | |
| Acer Swift Go SFG16-71 | |
| Schenker Vision 16 PH6PRX1 | |
| Asus VivoBook S15 M3502RA-L1029W | |
| Average of class Office | |
| LG Gram SuperSlim (2023) | |
| Microsoft Surface Laptop 5 15, i7-1255U | |
| Apple MacBook Air 15 2023 M2 16 GB -5! | |
| Cinebench R23 / Multi Core | |
| Average Intel Core i7-13700H (5890 - 20034, n=29) | |
| Schenker VISION 16 Pro (M23) | |
| Acer Swift Go SFG16-71 | |
| Asus VivoBook S15 M3502RA-L1029W | |
| Schenker Vision 16 PH6PRX1 | |
| Average of class Office (1673 - 22808, n=77, last 2 years) | |
| LG Gram SuperSlim (2023) | |
| Microsoft Surface Laptop 5 15, i7-1255U | |
| Apple MacBook Air 15 2023 M2 16 GB | |
| Cinebench R23 / Single Core | |
| Acer Swift Go SFG16-71 | |
| Schenker VISION 16 Pro (M23) | |
| Schenker Vision 16 PH6PRX1 | |
| Average Intel Core i7-13700H (1323 - 1914, n=29) | |
| LG Gram SuperSlim (2023) | |
| Average of class Office (708 - 2130, n=77, last 2 years) | |
| Microsoft Surface Laptop 5 15, i7-1255U | |
| Apple MacBook Air 15 2023 M2 16 GB | |
| Asus VivoBook S15 M3502RA-L1029W | |
| Cinebench R20 / CPU (Multi Core) | |
| Average Intel Core i7-13700H (2322 - 7674, n=29) | |
| Schenker VISION 16 Pro (M23) | |
| Acer Swift Go SFG16-71 | |
| Asus VivoBook S15 M3502RA-L1029W | |
| Schenker Vision 16 PH6PRX1 | |
| Average of class Office (648 - 8840, n=76, last 2 years) | |
| LG Gram SuperSlim (2023) | |
| Microsoft Surface Laptop 5 15, i7-1255U | |
| Apple MacBook Air 15 2023 M2 16 GB | |
| Cinebench R20 / CPU (Single Core) | |
| Schenker VISION 16 Pro (M23) | |
| Acer Swift Go SFG16-71 | |
| Schenker Vision 16 PH6PRX1 | |
| Average Intel Core i7-13700H (508 - 741, n=29) | |
| LG Gram SuperSlim (2023) | |
| Average of class Office (345 - 816, n=76, last 2 years) | |
| Microsoft Surface Laptop 5 15, i7-1255U | |
| Asus VivoBook S15 M3502RA-L1029W | |
| Apple MacBook Air 15 2023 M2 16 GB | |
| Cinebench R15 / CPU Multi 64Bit | |
| Average Intel Core i7-13700H (905 - 2982, n=29) | |
| Acer Swift Go SFG16-71 | |
| Schenker VISION 16 Pro (M23) | |
| Asus VivoBook S15 M3502RA-L1029W | |
| Schenker Vision 16 PH6PRX1 | |
| Average of class Office (250 - 3380, n=78, last 2 years) | |
| LG Gram SuperSlim (2023) | |
| Microsoft Surface Laptop 5 15, i7-1255U | |
| Apple MacBook Air 15 2023 M2 16 GB | |
| Cinebench R15 / CPU Single 64Bit | |
| Schenker VISION 16 Pro (M23) | |
| Schenker Vision 16 PH6PRX1 | |
| Average Intel Core i7-13700H (213 - 278, n=29) | |
| Acer Swift Go SFG16-71 | |
| Average of class Office (99.5 - 316, n=78, last 2 years) | |
| LG Gram SuperSlim (2023) | |
| Asus VivoBook S15 M3502RA-L1029W | |
| Microsoft Surface Laptop 5 15, i7-1255U | |
| Apple MacBook Air 15 2023 M2 16 GB | |
| Blender / v2.79 BMW27 CPU | |
| Apple MacBook Air 15 2023 M2 16 GB | |
| Microsoft Surface Laptop 5 15, i7-1255U | |
| Average of class Office (158 - 1940, n=77, last 2 years) | |
| LG Gram SuperSlim (2023) | |
| Acer Swift Go SFG16-71 | |
| Asus VivoBook S15 M3502RA-L1029W | |
| Schenker Vision 16 PH6PRX1 | |
| Average Intel Core i7-13700H (169 - 555, n=29) | |
| Schenker VISION 16 Pro (M23) | |
| 7-Zip 18.03 / 7z b 4 | |
| Schenker VISION 16 Pro (M23) | |
| Average Intel Core i7-13700H (27322 - 76344, n=29) | |
| Asus VivoBook S15 M3502RA-L1029W | |
| Acer Swift Go SFG16-71 | |
| Schenker Vision 16 PH6PRX1 | |
| Average of class Office (7098 - 76886, n=78, last 2 years) | |
| LG Gram SuperSlim (2023) | |
| Microsoft Surface Laptop 5 15, i7-1255U | |
| 7-Zip 18.03 / 7z b 4 -mmt1 | |
| Schenker VISION 16 Pro (M23) | |
| Acer Swift Go SFG16-71 | |
| Schenker Vision 16 PH6PRX1 | |
| Average Intel Core i7-13700H (4825 - 6238, n=29) | |
| Asus VivoBook S15 M3502RA-L1029W | |
| Average of class Office (3387 - 6469, n=78, last 2 years) | |
| LG Gram SuperSlim (2023) | |
| Microsoft Surface Laptop 5 15, i7-1255U | |
| Geekbench 5.5 / Multi-Core | |
| Acer Swift Go SFG16-71 | |
| Schenker VISION 16 Pro (M23) | |
| Average Intel Core i7-13700H (6165 - 14215, n=29) | |
| LG Gram SuperSlim (2023) | |
| Average of class Office (1483 - 16999, n=74, last 2 years) | |
| Asus VivoBook S15 M3502RA-L1029W | |
| Schenker Vision 16 PH6PRX1 | |
| Apple MacBook Air 15 2023 M2 16 GB | |
| Microsoft Surface Laptop 5 15, i7-1255U | |
| Geekbench 5.5 / Single-Core | |
| Apple MacBook Air 15 2023 M2 16 GB | |
| Schenker VISION 16 Pro (M23) | |
| Acer Swift Go SFG16-71 | |
| LG Gram SuperSlim (2023) | |
| Schenker Vision 16 PH6PRX1 | |
| Average of class Office (811 - 2175, n=74, last 2 years) | |
| Average Intel Core i7-13700H (1362 - 1919, n=29) | |
| Microsoft Surface Laptop 5 15, i7-1255U | |
| Asus VivoBook S15 M3502RA-L1029W | |
| HWBOT x265 Benchmark v2.2 / 4k Preset | |
| Schenker VISION 16 Pro (M23) | |
| Average Intel Core i7-13700H (6.72 - 21.2, n=29) | |
| Acer Swift Go SFG16-71 | |
| Asus VivoBook S15 M3502RA-L1029W | |
| Schenker Vision 16 PH6PRX1 | |
| Average of class Office (2.21 - 26, n=77, last 2 years) | |
| LG Gram SuperSlim (2023) | |
| Microsoft Surface Laptop 5 15, i7-1255U | |
| LibreOffice / 20 Documents To PDF | |
| Average of class Office (39.9 - 102.3, n=77, last 2 years) | |
| Asus VivoBook S15 M3502RA-L1029W | |
| Average Intel Core i7-13700H (31.3 - 62.4, n=29) | |
| Schenker VISION 16 Pro (M23) | |
| Microsoft Surface Laptop 5 15, i7-1255U | |
| LG Gram SuperSlim (2023) | |
| Acer Swift Go SFG16-71 | |
| Schenker Vision 16 PH6PRX1 | |
| R Benchmark 2.5 / Overall mean | |
| Average of class Office (0.393 - 0.888, n=77, last 2 years) | |
| Microsoft Surface Laptop 5 15, i7-1255U | |
| Asus VivoBook S15 M3502RA-L1029W | |
| LG Gram SuperSlim (2023) | |
| Average Intel Core i7-13700H (0.4308 - 0.607, n=29) | |
| Schenker Vision 16 PH6PRX1 | |
| Acer Swift Go SFG16-71 | |
| Schenker VISION 16 Pro (M23) | |
* ... smaller is better
AIDA64: FP32 Ray-Trace | FPU Julia | CPU SHA3 | CPU Queen | FPU SinJulia | FPU Mandel | CPU AES | CPU ZLib | FP64 Ray-Trace | CPU PhotoWorxx
| Performance rating | |
| Asus VivoBook S15 M3502RA-L1029W | |
| Average Intel Core i7-13700H | |
| Acer Swift Go SFG16-71 | |
| Average of class Office | |
| Schenker Vision 16 PH6PRX1 | |
| Microsoft Surface Laptop 5 15, i7-1255U | |
| LG Gram SuperSlim (2023) | |
| AIDA64 / FP32 Ray-Trace | |
| Average of class Office (2083 - 31245, n=85, last 2 years) | |
| Asus VivoBook S15 M3502RA-L1029W | |
| Average Intel Core i7-13700H (4986 - 18908, n=29) | |
| Acer Swift Go SFG16-71 | |
| Schenker Vision 16 PH6PRX1 | |
| LG Gram SuperSlim (2023) | |
| Microsoft Surface Laptop 5 15, i7-1255U | |
| AIDA64 / FPU Julia | |
| Asus VivoBook S15 M3502RA-L1029W | |
| Average Intel Core i7-13700H (25360 - 92359, n=29) | |
| Acer Swift Go SFG16-71 | |
| Average of class Office (8191 - 125394, n=85, last 2 years) | |
| Schenker Vision 16 PH6PRX1 | |
| Microsoft Surface Laptop 5 15, i7-1255U | |
| LG Gram SuperSlim (2023) | |
| AIDA64 / CPU SHA3 | |
| Average Intel Core i7-13700H (1339 - 4224, n=29) | |
| Asus VivoBook S15 M3502RA-L1029W | |
| Acer Swift Go SFG16-71 | |
| Average of class Office (433 - 5755, n=85, last 2 years) | |
| Schenker Vision 16 PH6PRX1 | |
| Microsoft Surface Laptop 5 15, i7-1255U | |
| LG Gram SuperSlim (2023) | |
| AIDA64 / CPU Queen | |
| Asus VivoBook S15 M3502RA-L1029W | |
| Acer Swift Go SFG16-71 | |
| Average Intel Core i7-13700H (59324 - 107159, n=29) | |
| Schenker Vision 16 PH6PRX1 | |
| LG Gram SuperSlim (2023) | |
| Average of class Office (22784 - 115197, n=68, last 2 years) | |
| Microsoft Surface Laptop 5 15, i7-1255U | |
| AIDA64 / FPU SinJulia | |
| Asus VivoBook S15 M3502RA-L1029W | |
| Average Intel Core i7-13700H (4800 - 11050, n=29) | |
| Acer Swift Go SFG16-71 | |
| Average of class Office (1378 - 18321, n=85, last 2 years) | |
| Schenker Vision 16 PH6PRX1 | |
| LG Gram SuperSlim (2023) | |
| Microsoft Surface Laptop 5 15, i7-1255U | |
| AIDA64 / FPU Mandel | |
| Asus VivoBook S15 M3502RA-L1029W | |
| Average Intel Core i7-13700H (12321 - 45118, n=29) | |
| Acer Swift Go SFG16-71 | |
| Average of class Office (4601 - 66922, n=85, last 2 years) | |
| Schenker Vision 16 PH6PRX1 | |
| Microsoft Surface Laptop 5 15, i7-1255U | |
| LG Gram SuperSlim (2023) | |
| AIDA64 / CPU AES | |
| Asus VivoBook S15 M3502RA-L1029W | |
| Average Intel Core i7-13700H (28769 - 151254, n=29) | |
| Acer Swift Go SFG16-71 | |
| Schenker Vision 16 PH6PRX1 | |
| Average of class Office (4854 - 155900, n=85, last 2 years) | |
| Microsoft Surface Laptop 5 15, i7-1255U | |
| LG Gram SuperSlim (2023) | |
| AIDA64 / CPU ZLib | |
| Average Intel Core i7-13700H (389 - 1215, n=29) | |
| Acer Swift Go SFG16-71 | |
| Schenker Vision 16 PH6PRX1 | |
| Asus VivoBook S15 M3502RA-L1029W | |
| Average of class Office (114.6 - 1366, n=85, last 2 years) | |
| Microsoft Surface Laptop 5 15, i7-1255U | |
| LG Gram SuperSlim (2023) | |
| AIDA64 / FP64 Ray-Trace | |
| Average of class Office (1109 - 17834, n=85, last 2 years) | |
| Asus VivoBook S15 M3502RA-L1029W | |
| Average Intel Core i7-13700H (2540 - 10135, n=29) | |
| Acer Swift Go SFG16-71 | |
| Schenker Vision 16 PH6PRX1 | |
| Microsoft Surface Laptop 5 15, i7-1255U | |
| LG Gram SuperSlim (2023) | |
| AIDA64 / CPU PhotoWorxx | |
| Schenker Vision 16 PH6PRX1 | |
| Microsoft Surface Laptop 5 15, i7-1255U | |
| Acer Swift Go SFG16-71 | |
| Average Intel Core i7-13700H (12872 - 52727, n=29) | |
| LG Gram SuperSlim (2023) | |
| Average of class Office (11090 - 65229, n=85, last 2 years) | |
| Asus VivoBook S15 M3502RA-L1029W | |
System performance
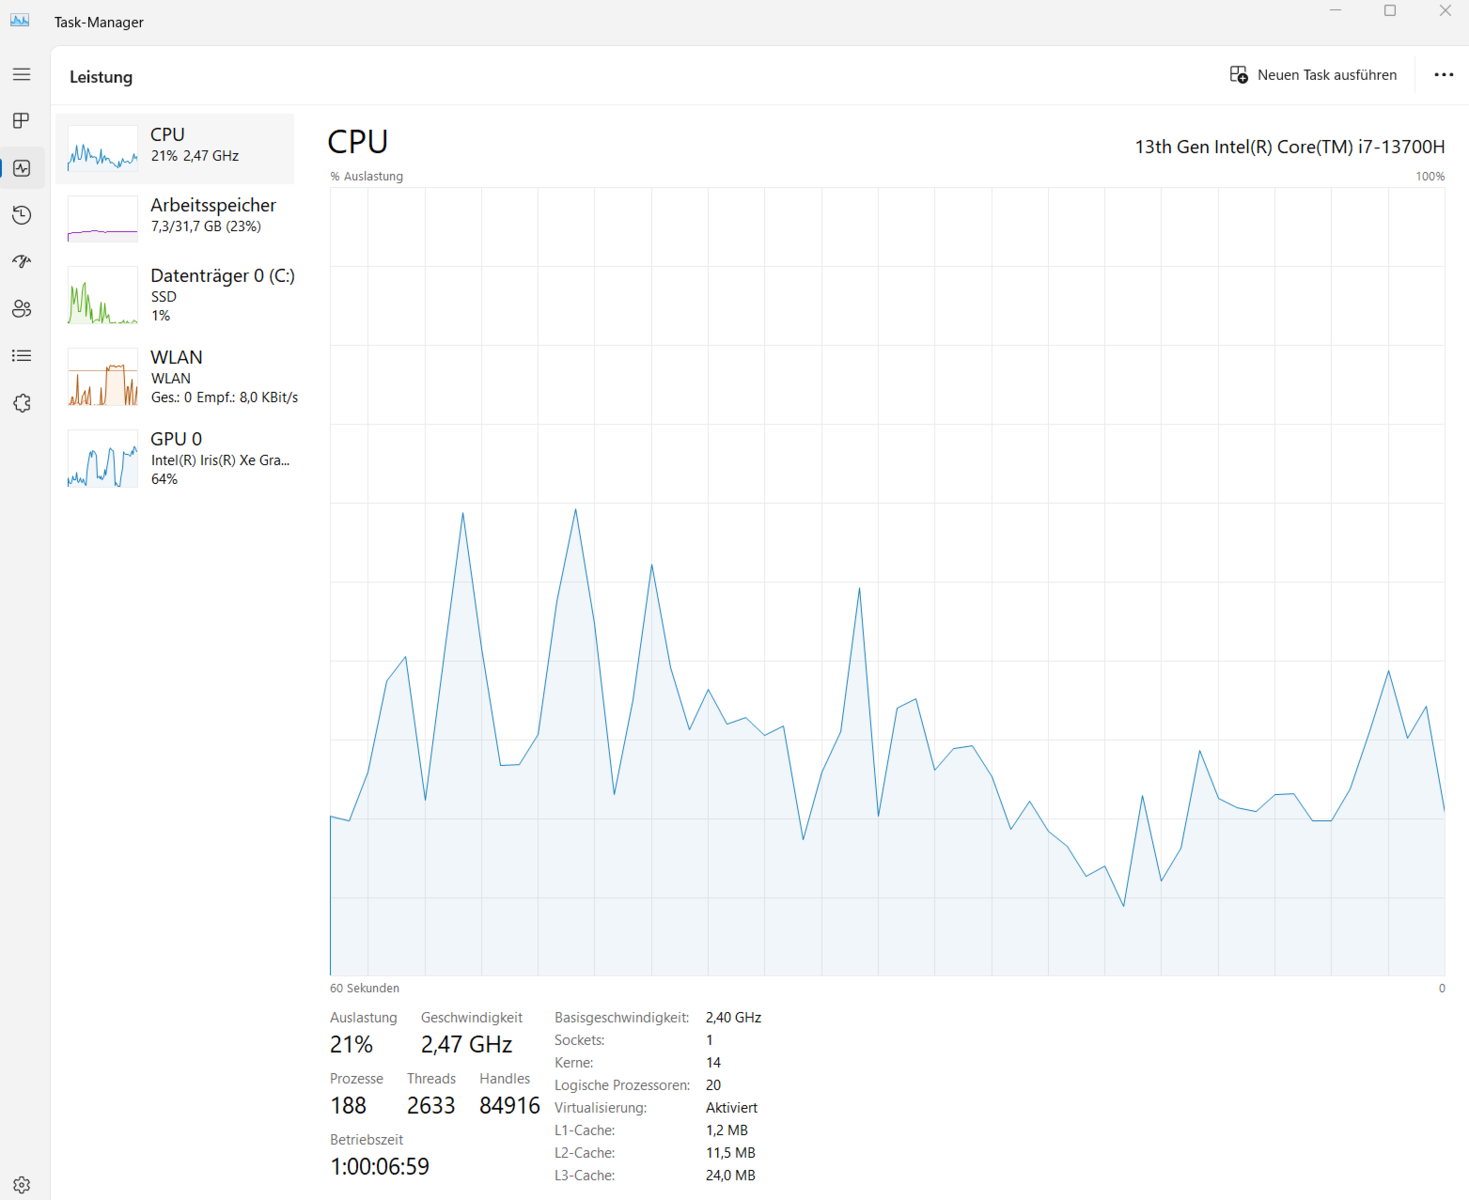
The direct comparison with the Acer Swift Go SFG16-71 again shows that the Core i7-13700H in the Vision 16 is limited by the low TDP. The performance of the processor in the synthetic benchmarks is slightly below average, though the subjective performance of the ultrabook is very good. When browsing the web, 4K Youtube videos or multitasking with Office programs and browsing at the same time, the Vision 16 showed no signs of slowing down.
CrossMark: Overall | Productivity | Creativity | Responsiveness
| PCMark 10 / Score | |
| Asus VivoBook S15 M3502RA-L1029W | |
| Average of class Office (2601 - 9298, n=69, last 2 years) | |
| Acer Swift Go SFG16-71 | |
| Average Intel Core i7-13700H, Intel Iris Xe Graphics G7 96EUs (5531 - 6247, n=5) | |
| LG Gram SuperSlim (2023) | |
| Schenker Vision 16 PH6PRX1 | |
| Microsoft Surface Laptop 5 15, i7-1255U | |
| PCMark 10 / Essentials | |
| LG Gram SuperSlim (2023) | |
| Acer Swift Go SFG16-71 | |
| Average Intel Core i7-13700H, Intel Iris Xe Graphics G7 96EUs (9648 - 11401, n=5) | |
| Asus VivoBook S15 M3502RA-L1029W | |
| Microsoft Surface Laptop 5 15, i7-1255U | |
| Average of class Office (3245 - 11594, n=69, last 2 years) | |
| Schenker Vision 16 PH6PRX1 | |
| PCMark 10 / Productivity | |
| Average of class Office (5336 - 17243, n=69, last 2 years) | |
| Asus VivoBook S15 M3502RA-L1029W | |
| Acer Swift Go SFG16-71 | |
| Average Intel Core i7-13700H, Intel Iris Xe Graphics G7 96EUs (7072 - 7691, n=5) | |
| Microsoft Surface Laptop 5 15, i7-1255U | |
| Schenker Vision 16 PH6PRX1 | |
| LG Gram SuperSlim (2023) | |
| PCMark 10 / Digital Content Creation | |
| Asus VivoBook S15 M3502RA-L1029W | |
| Average of class Office (2049 - 13541, n=69, last 2 years) | |
| Acer Swift Go SFG16-71 | |
| Average Intel Core i7-13700H, Intel Iris Xe Graphics G7 96EUs (6413 - 7727, n=5) | |
| LG Gram SuperSlim (2023) | |
| Schenker Vision 16 PH6PRX1 | |
| Microsoft Surface Laptop 5 15, i7-1255U | |
| CrossMark / Overall | |
| Acer Swift Go SFG16-71 | |
| Schenker Vision 16 PH6PRX1 | |
| Average Intel Core i7-13700H, Intel Iris Xe Graphics G7 96EUs (1548 - 1868, n=5) | |
| LG Gram SuperSlim (2023) | |
| Asus VivoBook S15 M3502RA-L1029W | |
| Apple MacBook Air 15 2023 M2 16 GB | |
| Average of class Office (381 - 2010, n=76, last 2 years) | |
| Microsoft Surface Laptop 5 15, i7-1255U | |
| CrossMark / Productivity | |
| Acer Swift Go SFG16-71 | |
| Schenker Vision 16 PH6PRX1 | |
| Average Intel Core i7-13700H, Intel Iris Xe Graphics G7 96EUs (1500 - 1787, n=5) | |
| LG Gram SuperSlim (2023) | |
| Asus VivoBook S15 M3502RA-L1029W | |
| Microsoft Surface Laptop 5 15, i7-1255U | |
| Average of class Office (464 - 1880, n=76, last 2 years) | |
| Apple MacBook Air 15 2023 M2 16 GB | |
| CrossMark / Creativity | |
| Acer Swift Go SFG16-71 | |
| Apple MacBook Air 15 2023 M2 16 GB | |
| Average Intel Core i7-13700H, Intel Iris Xe Graphics G7 96EUs (1620 - 2009, n=5) | |
| Asus VivoBook S15 M3502RA-L1029W | |
| LG Gram SuperSlim (2023) | |
| Schenker Vision 16 PH6PRX1 | |
| Average of class Office (319 - 2361, n=76, last 2 years) | |
| Microsoft Surface Laptop 5 15, i7-1255U | |
| CrossMark / Responsiveness | |
| Acer Swift Go SFG16-71 | |
| LG Gram SuperSlim (2023) | |
| Schenker Vision 16 PH6PRX1 | |
| Average Intel Core i7-13700H, Intel Iris Xe Graphics G7 96EUs (1439 - 1715, n=5) | |
| Asus VivoBook S15 M3502RA-L1029W | |
| Average of class Office (360 - 1820, n=76, last 2 years) | |
| Microsoft Surface Laptop 5 15, i7-1255U | |
| Apple MacBook Air 15 2023 M2 16 GB | |
| PCMark 10 Score | 5531 points | |
Help | ||
| AIDA64 / Memory Copy | |
| Average of class Office (20075 - 110930, n=82, last 2 years) | |
| Schenker Vision 16 PH6PRX1 | |
| Average Intel Core i7-13700H (24334 - 78081, n=29) | |
| AIDA64 / Memory Read | |
| Schenker Vision 16 PH6PRX1 | |
| Average of class Office (10084 - 128030, n=83, last 2 years) | |
| Average Intel Core i7-13700H (23681 - 79656, n=29) | |
| AIDA64 / Memory Write | |
| Average of class Office (20073 - 119858, n=83, last 2 years) | |
| Average Intel Core i7-13700H (22986 - 99898, n=29) | |
| Schenker Vision 16 PH6PRX1 | |
| AIDA64 / Memory Latency | |
| Average of class Office (7.6 - 162.9, n=78, last 2 years) | |
| Average Intel Core i7-13700H (82.4 - 136.8, n=29) | |
| Schenker Vision 16 PH6PRX1 | |
* ... smaller is better
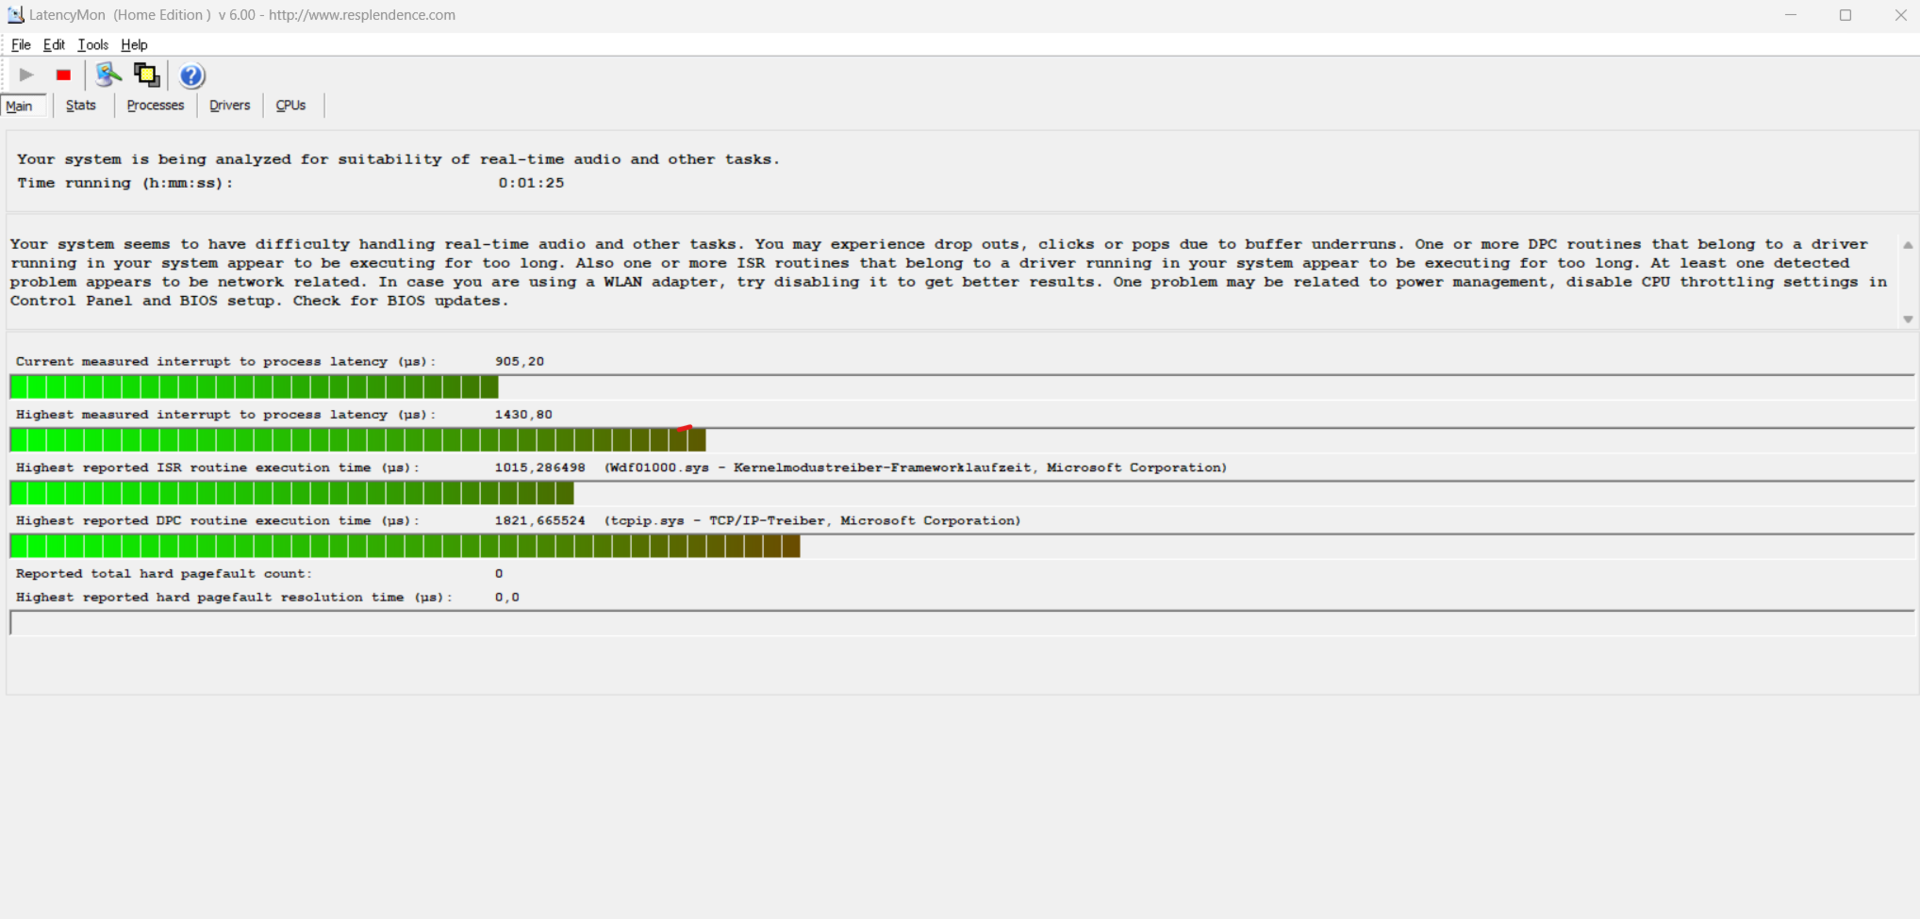
DPC latency
Our standardized latency test (surfing the web, 4K Youtube, CPU load) showed some DPC latency problems. The Vision 16 is not completely usable for real time audio in its tested state, but BIOS updates could solve this problem.
| DPC Latencies / LatencyMon - interrupt to process latency (max), Web, Youtube, Prime95 | |
| Acer Swift Go SFG16-71 | |
| LG Gram SuperSlim (2023) | |
| Schenker Vision 16 PH6PRX1 | |
| Microsoft Surface Laptop 5 15, i7-1255U | |
| Asus VivoBook S15 M3502RA-L1029W | |
* ... smaller is better
Mass storage
In the Schenker Vision 16, there are two PCIe 4.0 slots for SSDs. In our review sample is a 1 TB Samsung 990 Pro M.2 SSD. The benchmark results with DiskSpd show clear weaknesses in terms of read and write speeds of the SSD. The AS SSD measurements paint a better picture, with speeds more fitting for a high performance SSD. The same Samsung 990 Pro SSD was used in the review sample of the Vision 16 Pro and delivered better results there.
Update 30.08.2023: Because of the weak result, we repeated the DiskSpd benchmark. The same review unit was used, with a clean Windows installation. The results are much improved, though not as good as the Schenker Vision 16 pro. Even under prolonged load, the SSD performance stays stable.

* ... smaller is better
Sustained load Read: DiskSpd Read Loop, Queue Depth 8
Graphics card
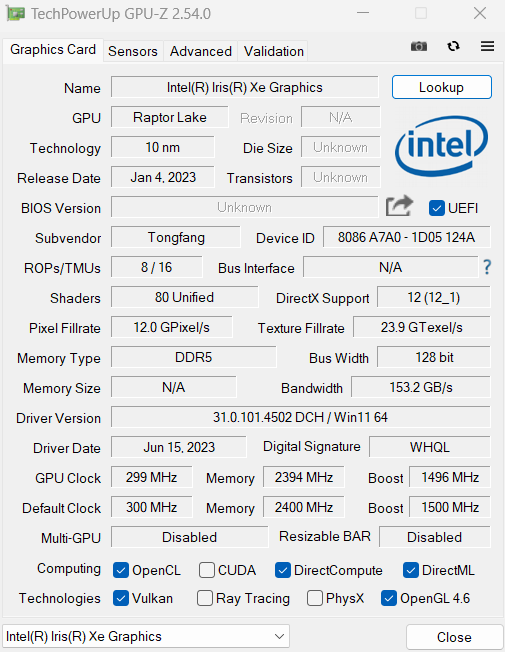
The Vision 16 of 2022 was offered with the RTX 3050. This years model only has the integrated Intel Iris Xe Graphics G7 with 96 EUs. Everyday tasks are no problem, but it is not suitable for gaming. The iGPU at least performs better than the average Intel Iris Xe Graphics G7 by 11 percent in the synthetic benchmarks.
| 3DMark 11 Performance | 7613 points | |
| 3DMark Cloud Gate Standard Score | 21964 points | |
| 3DMark Fire Strike Score | 5433 points | |
| 3DMark Time Spy Score | 1953 points | |
Help | ||
| Blender - v3.3 Classroom CPU | |
| Average Intel Iris Xe Graphics G7 96EUs (336 - 1259, n=109) | |
| Average of class Office (245 - 3219, n=76, last 2 years) | |
| Schenker Vision 16 PH6PRX1 | |
* ... smaller is better
Gaming performance
The Iris Xe Graphics G7 is the strongest iGPU from Intel, but the gaming performance is rather low. The AMD iGPUs like the Radeon 680M or the Radeon 780M are more both powerful. As long as the resolution and graphical setting are kept low, older games are still playable. The 240 Hz screen is still wasted without an external GPU, which can be connected via Thunderbolt 4.
| The Witcher 3 - 1920x1080 Ultra Graphics & Postprocessing (HBAO+) | |
| Apple MacBook Air 15 2023 M2 16 GB | |
| Asus VivoBook S15 M3502RA-L1029W | |
| Schenker Vision 16 PH6PRX1 | |
| Average of class Office (14.7 - 28.1, n=4, last 2 years) | |
| Acer Swift Go SFG16-71 | |
| LG Gram SuperSlim (2023) | |
| Microsoft Surface Laptop 5 15, i7-1255U | |
| GTA V - 1920x1080 Highest AA:4xMSAA + FX AF:16x | |
| Asus VivoBook S15 M3502RA-L1029W | |
| Average of class Office (5.77 - 45.3, n=70, last 2 years) | |
| Acer Swift Go SFG16-71 | |
| Schenker Vision 16 PH6PRX1 | |
| Microsoft Surface Laptop 5 15, i7-1255U | |
| Final Fantasy XV Benchmark - 1920x1080 High Quality | |
| Average of class Office (8.09 - 79.5, n=72, last 2 years) | |
| Asus VivoBook S15 M3502RA-L1029W | |
| Schenker Vision 16 PH6PRX1 | |
| Acer Swift Go SFG16-71 | |
| LG Gram SuperSlim (2023) | |
| Microsoft Surface Laptop 5 15, i7-1255U | |
| Strange Brigade - 1920x1080 ultra AA:ultra AF:16 | |
| Asus VivoBook S15 M3502RA-L1029W | |
| Average of class Office (12.9 - 142.1, n=54, last 2 years) | |
| Acer Swift Go SFG16-71 | |
| Schenker Vision 16 PH6PRX1 | |
| Microsoft Surface Laptop 5 15, i7-1255U | |
| LG Gram SuperSlim (2023) | |
Witcher 3 FPS diagramm
| low | med. | high | ultra | QHD | 4K | |
|---|---|---|---|---|---|---|
| GTA V (2015) | 117.4 | 104.3 | 24.8 | 10.4 | 6.7 | |
| The Witcher 3 (2015) | 45 | 35 | 23 | 19 | ||
| Dota 2 Reborn (2015) | 95.5 | 70.8 | 61.3 | 52.4 | ||
| Final Fantasy XV Benchmark (2018) | 44 | 24 | 18 | 12 | 7 | |
| X-Plane 11.11 (2018) | 35 | 33 | 32 | 27 | ||
| Far Cry 5 (2018) | 52 | 28 | 26 | 24 | 17 | |
| Strange Brigade (2018) | 81.7 | 39.7 | 31.7 | 25.1 | ||
| F1 23 (2023) | 39.4 | 35.5 | 24.8 | 18.4 |
Emissions
Noise
The emissions of the Vision 16 are acceptable. While idling, the fans almost always run and are audible in quiet conditions. Under max load we measured 45 dB(a), which will not be reached in most applications. In everyday use, the fan will more likely run at 33.8 dB(a), which is rather quiet. In normal office usage, the ultrabook almost never stays quiet, the fan noise had a low frequency though and it was not disturbing. More sensitive users can still be annoyed by it.
Noise level
| Idle |
| 25.5 / 28.7 / 29.1 dB(A) |
| Load |
| 33.8 / 44.9 dB(A) |
 | ||
30 dB silent 40 dB(A) audible 50 dB(A) loud |
||
min: | ||
| Schenker Vision 16 PH6PRX1 Iris Xe G7 96EUs, i7-13700H, Samsung 990 Pro 1 TB | Apple MacBook Air 15 2023 M2 16 GB M2 10-Core GPU, M2, Apple SSD AP1024Z | Acer Swift Go SFG16-71 Iris Xe G7 96EUs, i7-13700H, Micron 2400 MTFDKBA1T0QFM | LG Gram SuperSlim (2023) Iris Xe G7 96EUs, i7-1360P, SK hynix PC801 HFS001TEJ9X101N | Microsoft Surface Laptop 5 15, i7-1255U Iris Xe G7 96EUs, i7-1255U, SK Hynix BC711 512GB HFM512GD3GX013N | Asus VivoBook S15 M3502RA-L1029W Radeon 680M, R7 6800H, WD PC SN735 SDBPNHH-512G | |
|---|---|---|---|---|---|---|
| Noise | -4% | 1% | 10% | -17% | ||
| off / environment * (dB) | 25.5 | 25.7 -1% | 25.2 1% | 23.3 9% | 26 -2% | |
| Idle Minimum * (dB) | 25.5 | 26.1 -2% | 25.2 1% | 23.3 9% | 26 -2% | |
| Idle Average * (dB) | 28.7 | 26.1 9% | 25.2 12% | 23.3 19% | 26 9% | |
| Idle Maximum * (dB) | 29.1 | 27.2 7% | 25.2 13% | 23.3 20% | 28.1 3% | |
| Load Average * (dB) | 33.8 | 44.2 -31% | 43.1 -28% | 35 -4% | 56.9 -68% | |
| Witcher 3 ultra * (dB) | 37.6 | 38.1 -1% | ||||
| Load Maximum * (dB) | 44.9 | 47.5 -6% | 43.3 4% | 38.1 15% | 62.6 -39% |
* ... smaller is better
Heat
Despite the rather quiet fans, the Vision 16 stays relatively cool. The palmrest-temperatures under load reach 28.5 degrees Celsius / 83 F at the hotspot above the keyboard. Under load, the hot spot is located in the center of the keyboard, where the temperatures reach 42 degrees Celsius / 108 F, an uncomfortable temperature. But this max load temperature will usually not be reached during everyday usage.
The two fans take in the air from the bottom and expel it from the back.
(±) The maximum temperature on the upper side is 41.1 °C / 106 F, compared to the average of 34.3 °C / 94 F, ranging from 21.2 to 62.5 °C for the class Office.
(±) The bottom heats up to a maximum of 42 °C / 108 F, compared to the average of 36.8 °C / 98 F
(+) In idle usage, the average temperature for the upper side is 25.7 °C / 78 F, compared to the device average of 29.5 °C / 85 F.
(+) Playing The Witcher 3, the average temperature for the upper side is 28.8 °C / 84 F, compared to the device average of 29.5 °C / 85 F.
(+) The palmrests and touchpad are cooler than skin temperature with a maximum of 28.2 °C / 82.8 F and are therefore cool to the touch.
(±) The average temperature of the palmrest area of similar devices was 27.6 °C / 81.7 F (-0.6 °C / -1.1 F).
| Schenker Vision 16 PH6PRX1 Intel Core i7-13700H, Intel Iris Xe Graphics G7 96EUs | Apple MacBook Air 15 2023 M2 16 GB Apple M2, Apple M2 10-Core GPU | Acer Swift Go SFG16-71 Intel Core i7-13700H, Intel Iris Xe Graphics G7 96EUs | LG Gram SuperSlim (2023) Intel Core i7-1360P, Intel Iris Xe Graphics G7 96EUs | Microsoft Surface Laptop 5 15, i7-1255U Intel Core i7-1255U, Intel Iris Xe Graphics G7 96EUs | Asus VivoBook S15 M3502RA-L1029W AMD Ryzen 7 6800H, AMD Radeon 680M | |
|---|---|---|---|---|---|---|
| Heat | 1% | -13% | -23% | 3% | -21% | |
| Maximum Upper Side * (°C) | 41.1 | 45.1 -10% | 44.4 -8% | 43.9 -7% | 44.6 -9% | 50.2 -22% |
| Maximum Bottom * (°C) | 42 | 42.5 -1% | 48 -14% | 50.4 -20% | 47.4 -13% | 50.2 -20% |
| Idle Upper Side * (°C) | 28.5 | 25.9 9% | 31.9 -12% | 35.8 -26% | 22.6 21% | 32.1 -13% |
| Idle Bottom * (°C) | 26.8 | 25.8 4% | 31.9 -19% | 37.5 -40% | 23.3 13% | 34.6 -29% |
* ... smaller is better
Stress test
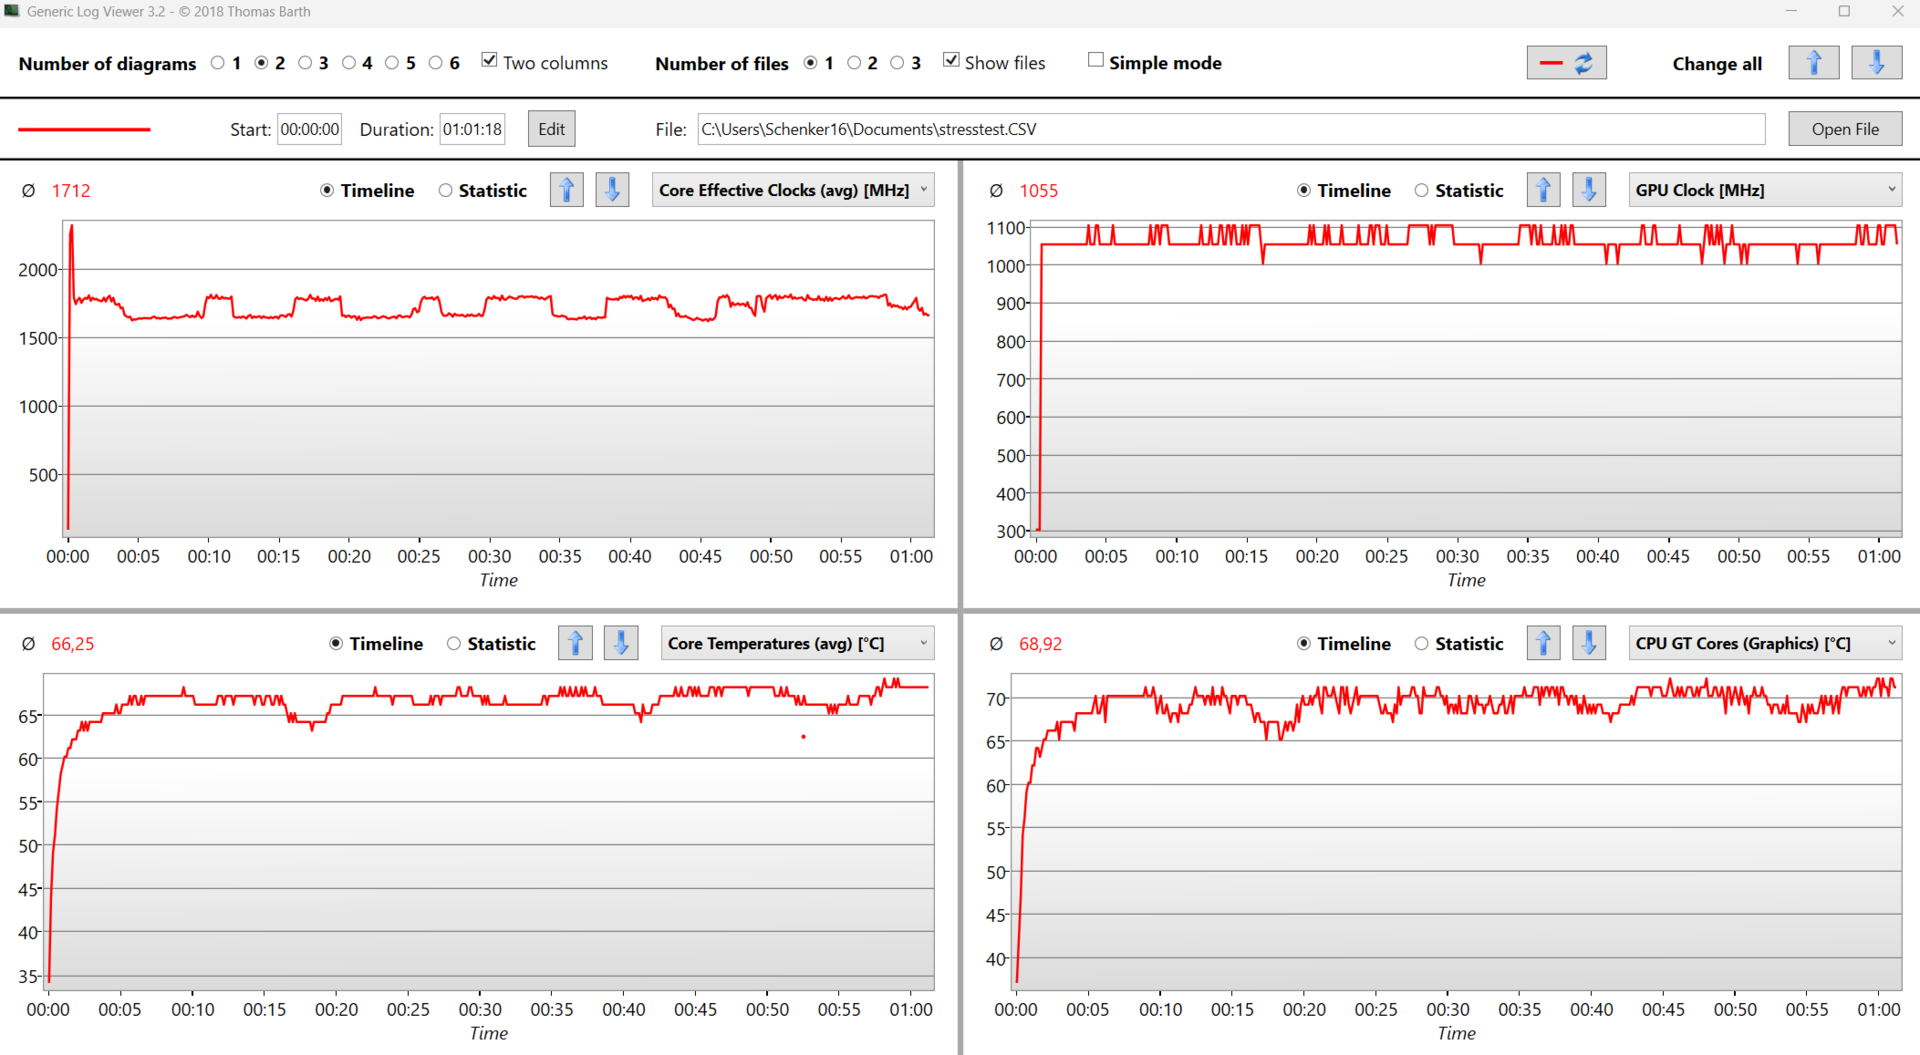
At the start of the stress test (Prime95 and Furmark) the CPU reaches 2.5 GHz, but it quickly settles down between 1.6 and 1.7 GHz. As in the Witcher loop test, the performance stabilizes later during the stress test and remains at 1.7 GHz. The temperatures of the CPU stay low with an average temperature of 66 degrees Celsius / 150 F, likely due to the low TDP.
Speakers
The speaker system is identical to the Vision 16 Pro and unchanged compared to the predecessor. The highs are precise, but it is lacking in the base.
Schenker Vision 16 PH6PRX1 audio analysis
(±) | speaker loudness is average but good (78.4 dB)
Bass 100 - 315 Hz
(-) | nearly no bass - on average 15.5% lower than median
(±) | linearity of bass is average (11.9% delta to prev. frequency)
Mids 400 - 2000 Hz
(+) | balanced mids - only 3.6% away from median
(+) | mids are linear (3.2% delta to prev. frequency)
Highs 2 - 16 kHz
(+) | balanced highs - only 2.9% away from median
(+) | highs are linear (3.9% delta to prev. frequency)
Overall 100 - 16.000 Hz
(+) | overall sound is linear (14.7% difference to median)
Compared to same class
» 13% of all tested devices in this class were better, 4% similar, 83% worse
» The best had a delta of 7%, average was 21%, worst was 53%
Compared to all devices tested
» 19% of all tested devices were better, 4% similar, 77% worse
» The best had a delta of 4%, average was 23%, worst was 134%
Acer Swift Go SFG16-71 audio analysis
(±) | speaker loudness is average but good (81.6 dB)
Bass 100 - 315 Hz
(-) | nearly no bass - on average 18.1% lower than median
(±) | linearity of bass is average (10% delta to prev. frequency)
Mids 400 - 2000 Hz
(+) | balanced mids - only 1% away from median
(+) | mids are linear (4.9% delta to prev. frequency)
Highs 2 - 16 kHz
(+) | balanced highs - only 2.4% away from median
(+) | highs are linear (6.6% delta to prev. frequency)
Overall 100 - 16.000 Hz
(+) | overall sound is linear (13% difference to median)
Compared to same class
» 26% of all tested devices in this class were better, 5% similar, 70% worse
» The best had a delta of 5%, average was 17%, worst was 45%
Compared to all devices tested
» 13% of all tested devices were better, 2% similar, 85% worse
» The best had a delta of 4%, average was 23%, worst was 134%
Energy management - too power hungry for an office laptop
Power consumption
For an ultrabook without a dedicated GPU, the power usage while idling is significantly higher than comparable devices. The higher consumption is probably due to the H processor from Intel, as office laptops usally use U/P CPUs. AMD processors have the edge in this regard. The Asus VivoBook S15 is more efficient thanks to the less power hungry processor, despite the OLED display. Under load, the consumption normalizes and is sometimes lower compared with the other laptops.
| Off / Standby | |
| Idle | |
| Load |
|
Key:
min: | |
| Schenker Vision 16 PH6PRX1 i7-13700H, Iris Xe G7 96EUs, Samsung 990 Pro 1 TB, IPS, 2560x1600, 16" | Apple MacBook Air 15 2023 M2 16 GB M2, M2 10-Core GPU, Apple SSD AP1024Z, IPS, 2880x1864, 15.3" | Acer Swift Go SFG16-71 i7-13700H, Iris Xe G7 96EUs, Micron 2400 MTFDKBA1T0QFM, OLED, 3200x2000, 16" | LG Gram SuperSlim (2023) i7-1360P, Iris Xe G7 96EUs, SK hynix PC801 HFS001TEJ9X101N, OLED, 1920x1080, 15.6" | Microsoft Surface Laptop 5 15, i7-1255U i7-1255U, Iris Xe G7 96EUs, SK Hynix BC711 512GB HFM512GD3GX013N, IPS, 2496x1664, 15" | Asus VivoBook S15 M3502RA-L1029W R7 6800H, Radeon 680M, WD PC SN735 SDBPNHH-512G, OLED, 1920x1080, 15.6" | Average Intel Iris Xe Graphics G7 96EUs | Average of class Office | |
|---|---|---|---|---|---|---|---|---|
| Power Consumption | 44% | 11% | 26% | 27% | 8% | 21% | 32% | |
| Idle Minimum * (Watt) | 6.3 | 2.2 65% | 5.8 8% | 4.2 33% | 3.8 40% | 4.4 30% | 5.51 ? 13% | 4.25 ? 33% |
| Idle Average * (Watt) | 14.4 | 10 31% | 6 58% | 8.9 38% | 8.2 43% | 5.1 65% | 8.66 ? 40% | 7.3 ? 49% |
| Idle Maximum * (Watt) | 16.2 | 10.1 38% | 6.9 57% | 10.3 36% | 8.4 48% | 9.3 43% | 10.9 ? 33% | 8.57 ? 47% |
| Load Average * (Watt) | 46.2 | 33.6 27% | 59 -28% | 47 -2% | 50.1 -8% | 67 -45% | 45.6 ? 1% | 43.8 ? 5% |
| Witcher 3 ultra * (Watt) | 49.4 | 27.8 44% | 61.1 -24% | 43.8 11% | 38.8 21% | 66.4 -34% | ||
| Load Maximum * (Watt) | 85.2 | 37.2 56% | 92 -8% | 49 42% | 69.6 18% | 93.5 -10% | 67.8 ? 20% | 64.3 ? 25% |
* ... smaller is better
Power consumption Witcher 3 / stress test
Power consumption external monitor
Battery life
The battery life of the Vision 16 is not good, despite the 80 Wh battery. With our WiFi test and 150 cd/m² of screen brightness, the laptop runs for almost exactly eight hours. The H processor is just too powerhungry for an office laptop. In comparison with the Vision 16 pro with RTX 4070, the removal of the dedicated GPU does not give the Vision 16 any advantages when it comes to the battery life.
With maximum brightness during the WiFi script, the battery life of the Vision 16 is further reduced down to six hours and thirty minutes.
| Schenker Vision 16 PH6PRX1 i7-13700H, Iris Xe G7 96EUs, 80 Wh | Apple MacBook Air 15 2023 M2 16 GB M2, M2 10-Core GPU, 66.5 Wh | Acer Swift Go SFG16-71 i7-13700H, Iris Xe G7 96EUs, 65 Wh | LG Gram SuperSlim (2023) i7-1360P, Iris Xe G7 96EUs, 60 Wh | Microsoft Surface Laptop 5 15, i7-1255U i7-1255U, Iris Xe G7 96EUs, 47.4 Wh | Asus VivoBook S15 M3502RA-L1029W R7 6800H, Radeon 680M, 70 Wh | Schenker VISION 16 Pro (M23) i7-13700H, GeForce RTX 4070 Laptop GPU, 80 Wh | Average of class Office | |
|---|---|---|---|---|---|---|---|---|
| Battery runtime | 68% | -13% | 40% | -2% | -9% | -26% | 18% | |
| WiFi v1.3 (h) | 8 | 16.6 108% | 7.8 -2% | 12.5 56% | 8.6 8% | 11.5 44% | 7.8 -2% | 13.2 ? 65% |
| Load (h) | 2.6 | 3.3 27% | 2 -23% | 3.2 23% | 2.3 -12% | 1 -62% | 1.3 -50% | 1.808 ? -30% |
| H.264 (h) | 16.8 | 14.7 | 9.7 | 12.8 | 7.8 | 15.4 ? | ||
| Reader / Idle (h) | 27.5 | 22.2 ? |
Pros
Cons
Verdict - Vision 16 has a solid port selection, but limited processor performance
This years version of the Vision 16 contains the newest Intel Raptor Lake CPUs, an improved cooling system and a faster 240 Hz screen. The TDP of the processor is limited to 45 W, keeping temperatures low. However, this also limits the performance of the H processor from Intel. The chassis of the Vision 16 is made out of magnesium and feels premium. This enables the 16 inch laptop to achieve a low weight of 1.5 kg, making it a lightweight in its class.
Different from past models, the TDP is no longer user-controllable in the Schenker Control Center. Since the CPU only reaches 70 degrees Celsius during the stress test (Prime95 and FurMark), the device could potentially perform better. A customizable TDP could have enabled a better performance.
The Vision 16 stays rather cool, except for the center area of the keyboard. And even under load, the fan noise is bearable. However, the fans almost never stay truly quiet, they always run with a low noise level, even when idling. Considering the fact that the low TDP limits the Intel H chip so much, a P/U series CPU might have been the better fit for the Vision 16. The Core i7-13700H has disadvantages when it comes to the power consumption, so the Schenker 16 consumes more than comparable competitors.
In our review, we also found problems with the internal M.2 SSD and the SD card reader. Both are handicapped in their speed.
The Schenker Vision 16 offer a good level of performance, a good port selection and upgradeability despite the lightweight and thin chassis.
The new matte IPS display is a marked improvement and well calibrated, even before our own calibration, and well suited for simple photo editing. For an office laptop, the refresh rate of 240 Hz is unusual. It creates a smooth user experience, but the laptop is not powerful enough for games, wasting some of the potential of the panel. The panel does not cover a wider color gamut and it lacks HDR support, but there is no PWM here.
As an alternative to the Schenker Vision 16, the Vision 16 Pro is a more powerful variation with faster CPU speeds, despite the same processor, and an optional RTX 4070 CPU. The Acer Swift Go 16 uses the same processor, but allows a higher TDP of 80 W. Also, Acer uses an OLED screen. Neither of the two offer the low weight of the Vision 16 though.
Update 30.08.2023: Because of the weak result, we repeated the DiskSpd benchmark. The same review unit was used, with a clean Windows installation. The results improved significantly, leading to a better total score of 88.6 percent instead of 88.4 percent. This means the total rating is now 89 instead of 88 percent.
Pricing and availability
The new Vision 16 2023 is available in Germany starting at €1,424 from Bestware. Our review configuration with 32 GB RAM and a 1 TB M.2 Samsung 990 Pro SSD costs €1,661.
Schenker Vision 16 PH6PRX1
- 08/30/2023 v7 (old)
Philip Macdonald
Transparency
The selection of devices to be reviewed is made by our editorial team. The test sample was provided to the author as a loan by the manufacturer or retailer for the purpose of this review. The lender had no influence on this review, nor did the manufacturer receive a copy of this review before publication. There was no obligation to publish this review. As an independent media company, Notebookcheck is not subjected to the authority of manufacturers, retailers or publishers.
This is how Notebookcheck is testing
Every year, Notebookcheck independently reviews hundreds of laptops and smartphones using standardized procedures to ensure that all results are comparable. We have continuously developed our test methods for around 20 years and set industry standards in the process. In our test labs, high-quality measuring equipment is utilized by experienced technicians and editors. These tests involve a multi-stage validation process. Our complex rating system is based on hundreds of well-founded measurements and benchmarks, which maintains objectivity. Further information on our test methods can be found here.
Price comparison

