Apple MacBook Air 15 2023 M2 review: The everyday MacBook now in 15 inches
Apple has finally introduced the large MacBook Air, thus filling a large gap in its product portfolio, because anyone who previously wanted a large MacBook had to go for the MacBook Pro 16. This offers a lot of performance, but many users do not need it at all and, above all, the MBP 16 is comparatively bulky and expensive. With the new MacBook Air 15, Apple is now offering a larger MacBook for everyday use, which technically is an almost perfect copy of the smaller MacBook Air 13. This essentially means that you have to do without a new processor and get the familiar M2 SoC from last year, which is again passively cooled. The display is of course larger at 15.3 inches, but the specs remain the same, i.e. there is no HDR support or ProMotion (120 Hz).
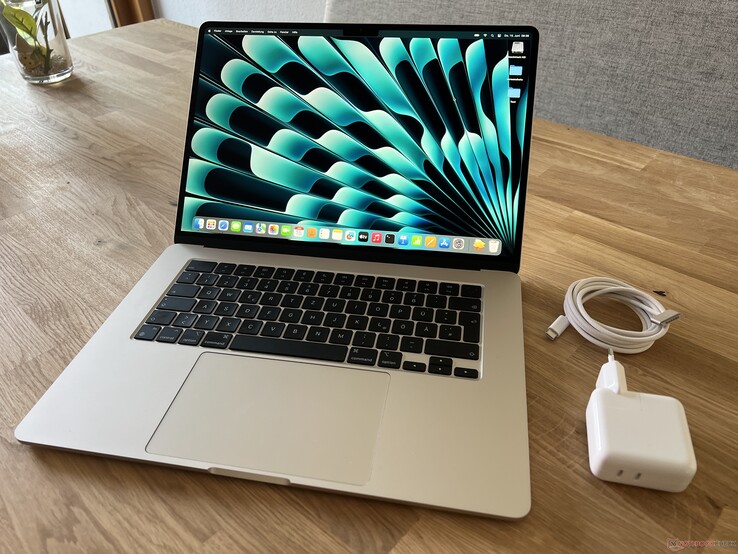
The starting price is US$1299.00 and, in contrast to the smaller 13-inch model, the Air 15 is only available with the faster M2 SoC that offers 10 GPU cores. The remaining specs are sobering, however, as there is only 8 GB of RAM and a small 256 GB SSD. The second basic model offers 512 GB SSD storage, but costs a whopping US$200 more at $1499.00. Today's test device houses a 1 TB SSD and 16 GB RAM for a grand total of EUR 2289 (~US$2500). In the next few days we'll also take a closer look at the base model with 8 GB and the 256 GB SSD.
Possible competitors in comparison
Rating | Date | Model | Weight | Height | Size | Resolution | Price |
|---|---|---|---|---|---|---|---|
| 91.8 % v7 (old) | 06 / 2023 | Apple MacBook Air 15 2023 M2 16 GB M2, M2 10-Core GPU | 1.5 kg | 11.5 mm | 15.30" | 2880x1864 | |
| 84.3 % v7 (old) | 04 / 2023 | Microsoft Surface Laptop 5 15, i7-1255U i7-1255U, Iris Xe G7 96EUs | 1.6 kg | 14.7 mm | 15.00" | 2496x1664 | |
| 85.9 % v7 (old) | 12 / 2022 | LG Gram 15Z90Q i5-1240P, Iris Xe G7 80EUs | 1.1 kg | 17.4 mm | 15.60" | 1920x1080 | |
| 83.2 % v7 (old) | 02 / 2023 | Asus VivoBook S15 M3502RA-L1029W R7 6800H, Radeon 680M | 1.9 kg | 18.8 mm | 15.60" | 1920x1080 | |
| 92 % v7 (old) | 08 / 2022 | Apple MacBook Air M2 10C GPU M2, M2 10-Core GPU | 1.2 kg | 11.3 mm | 13.60" | 2560x1664 |
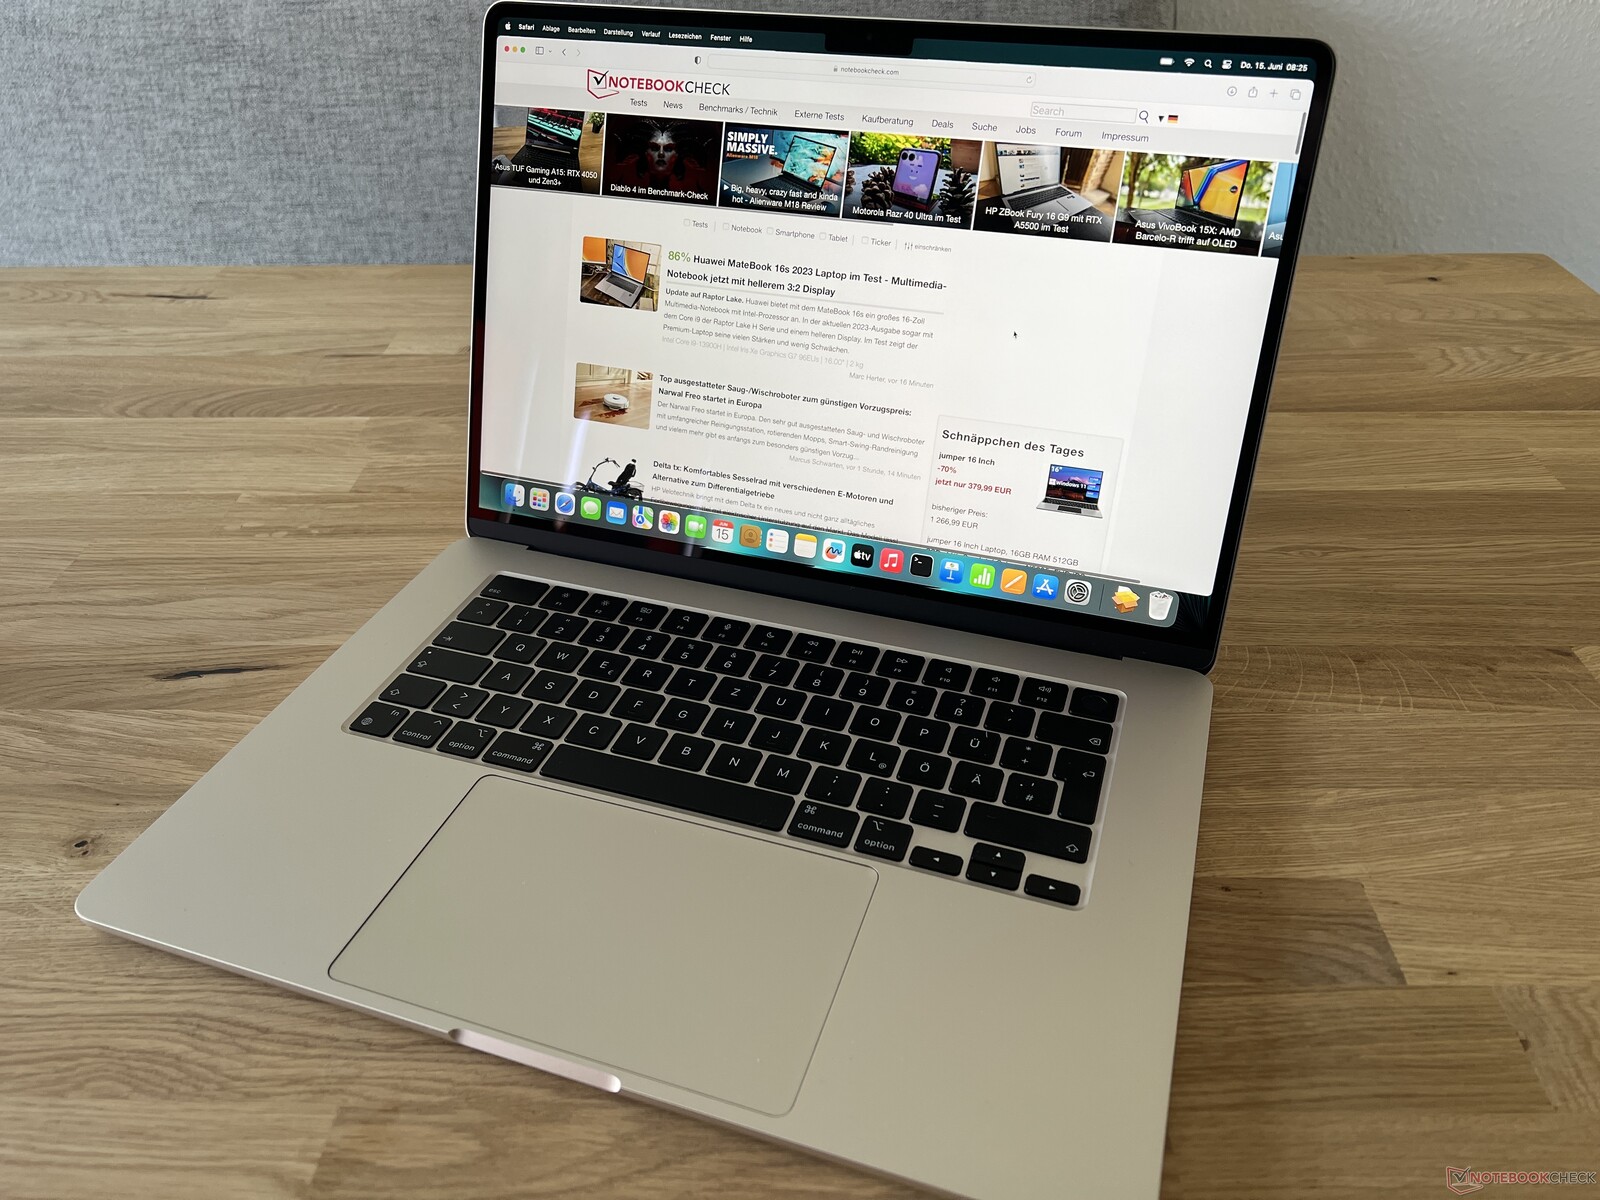
Case - A larger MacBook Air
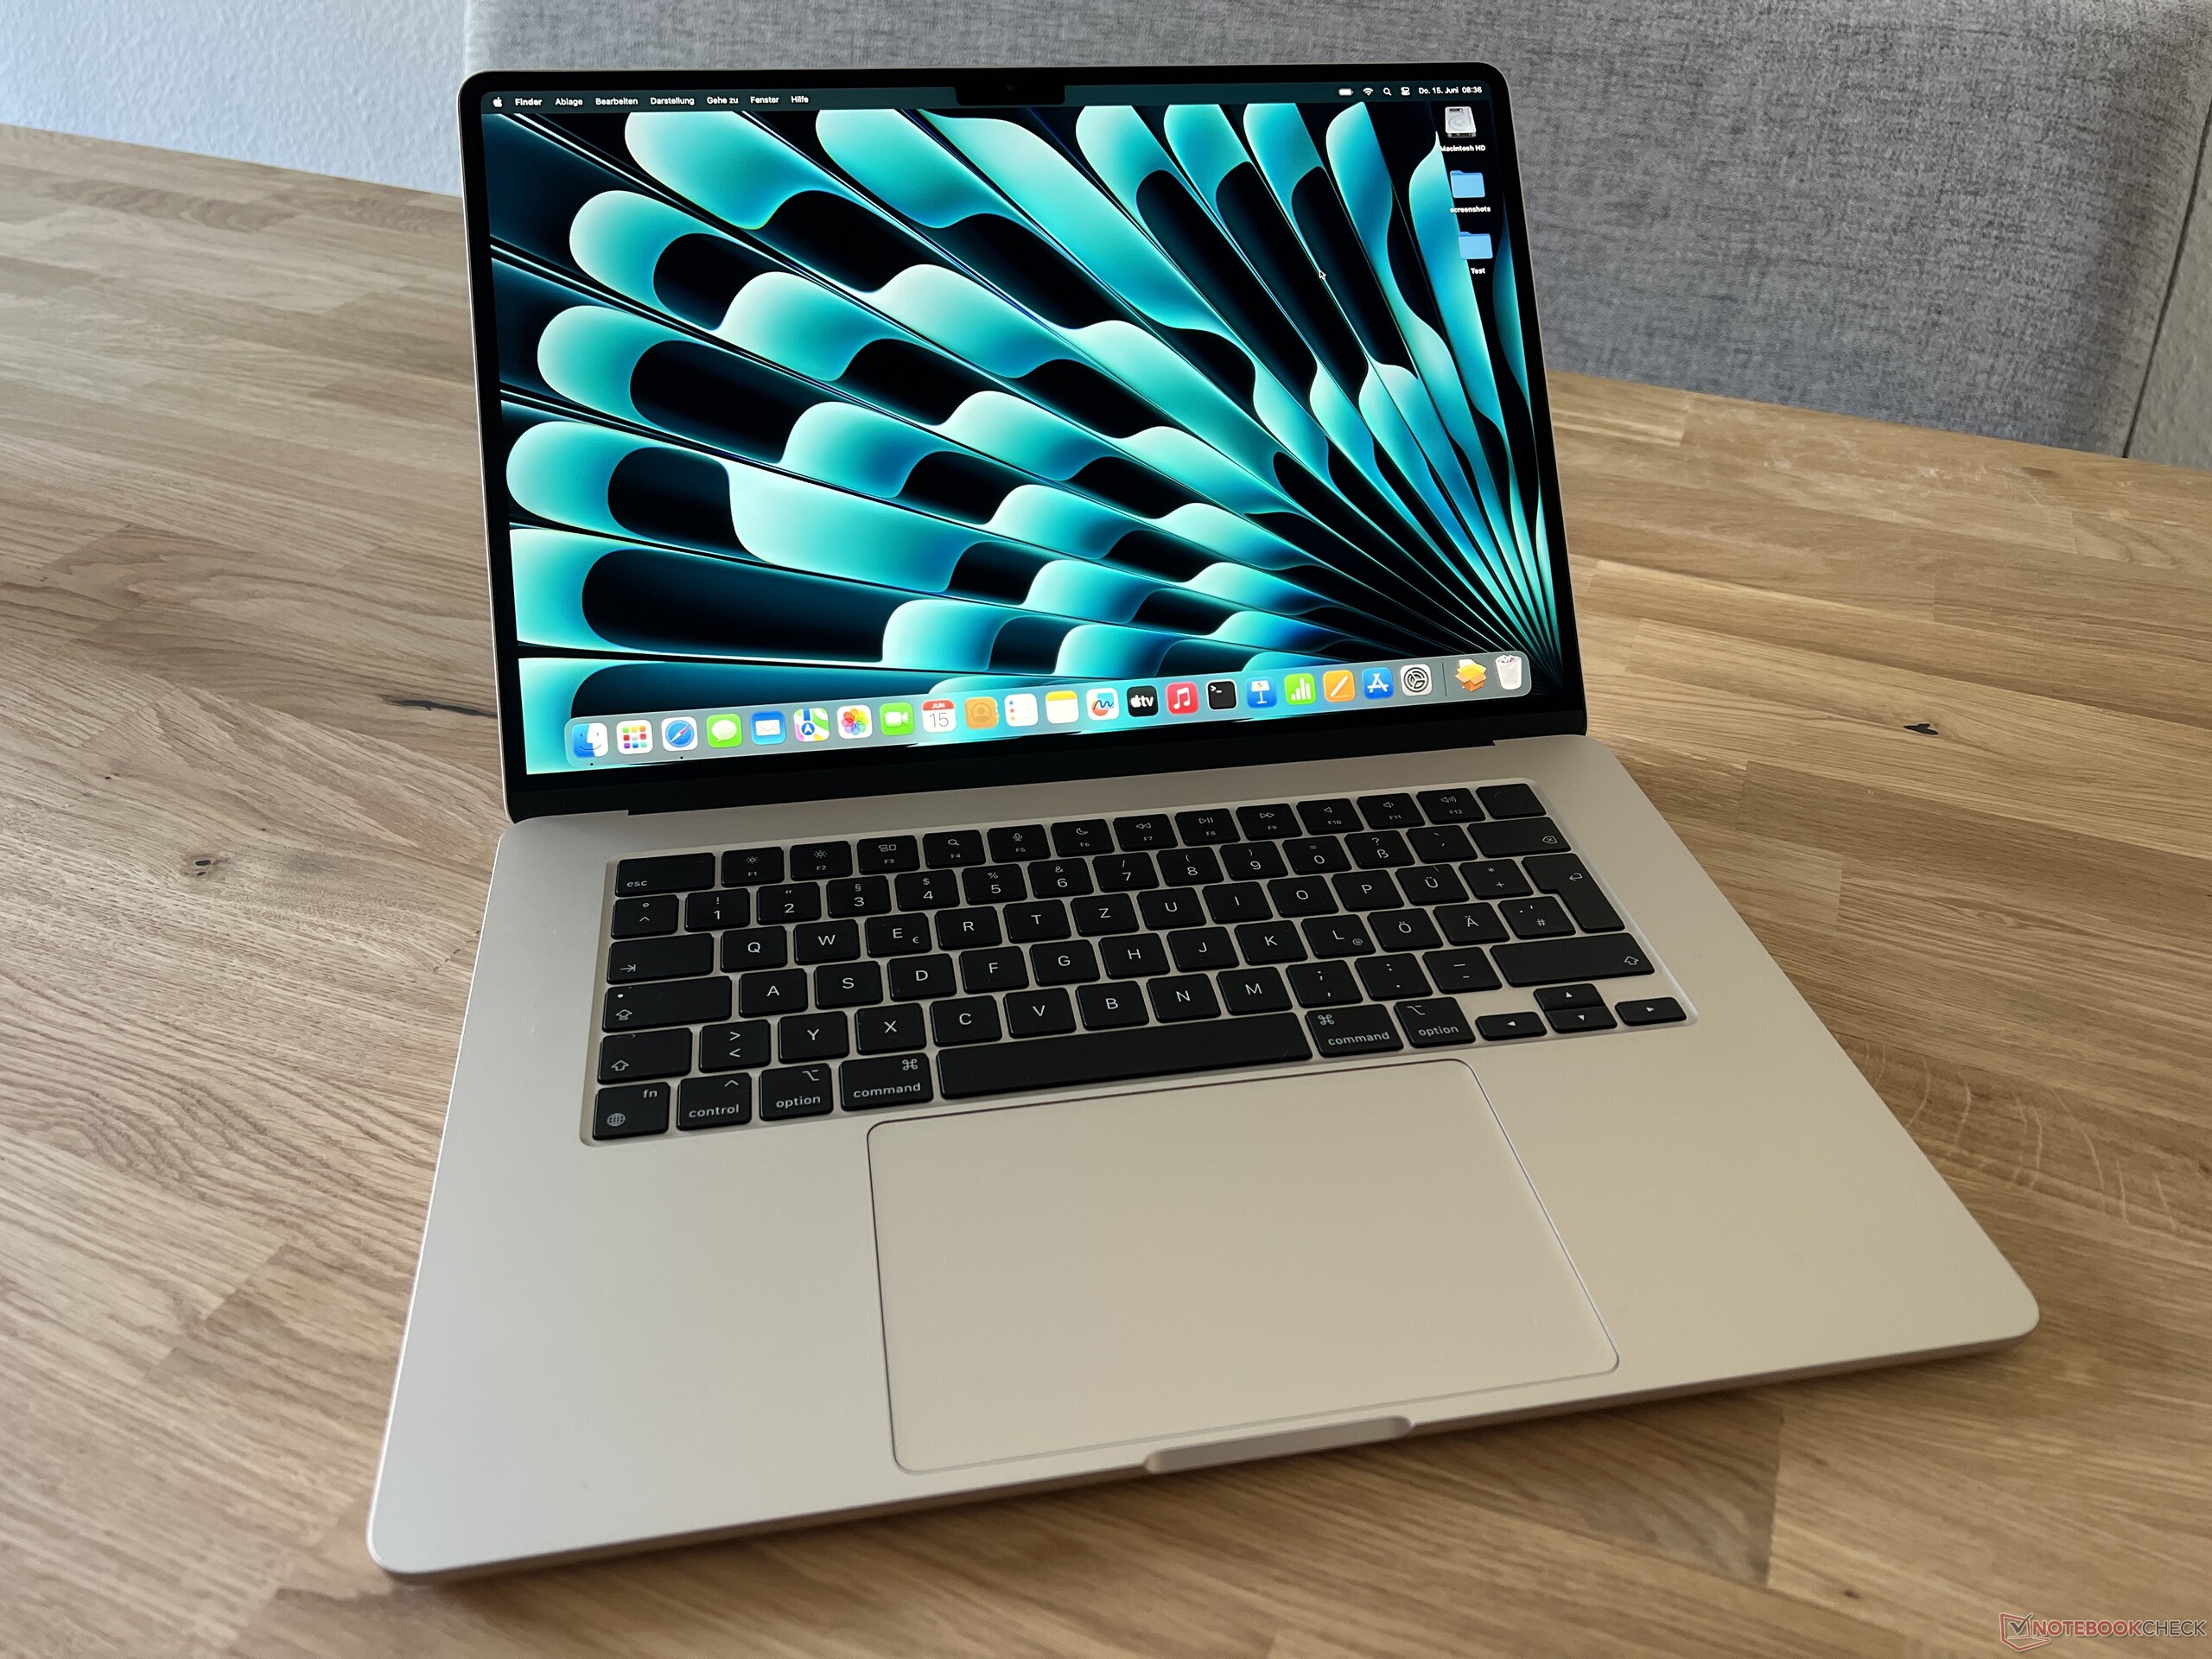
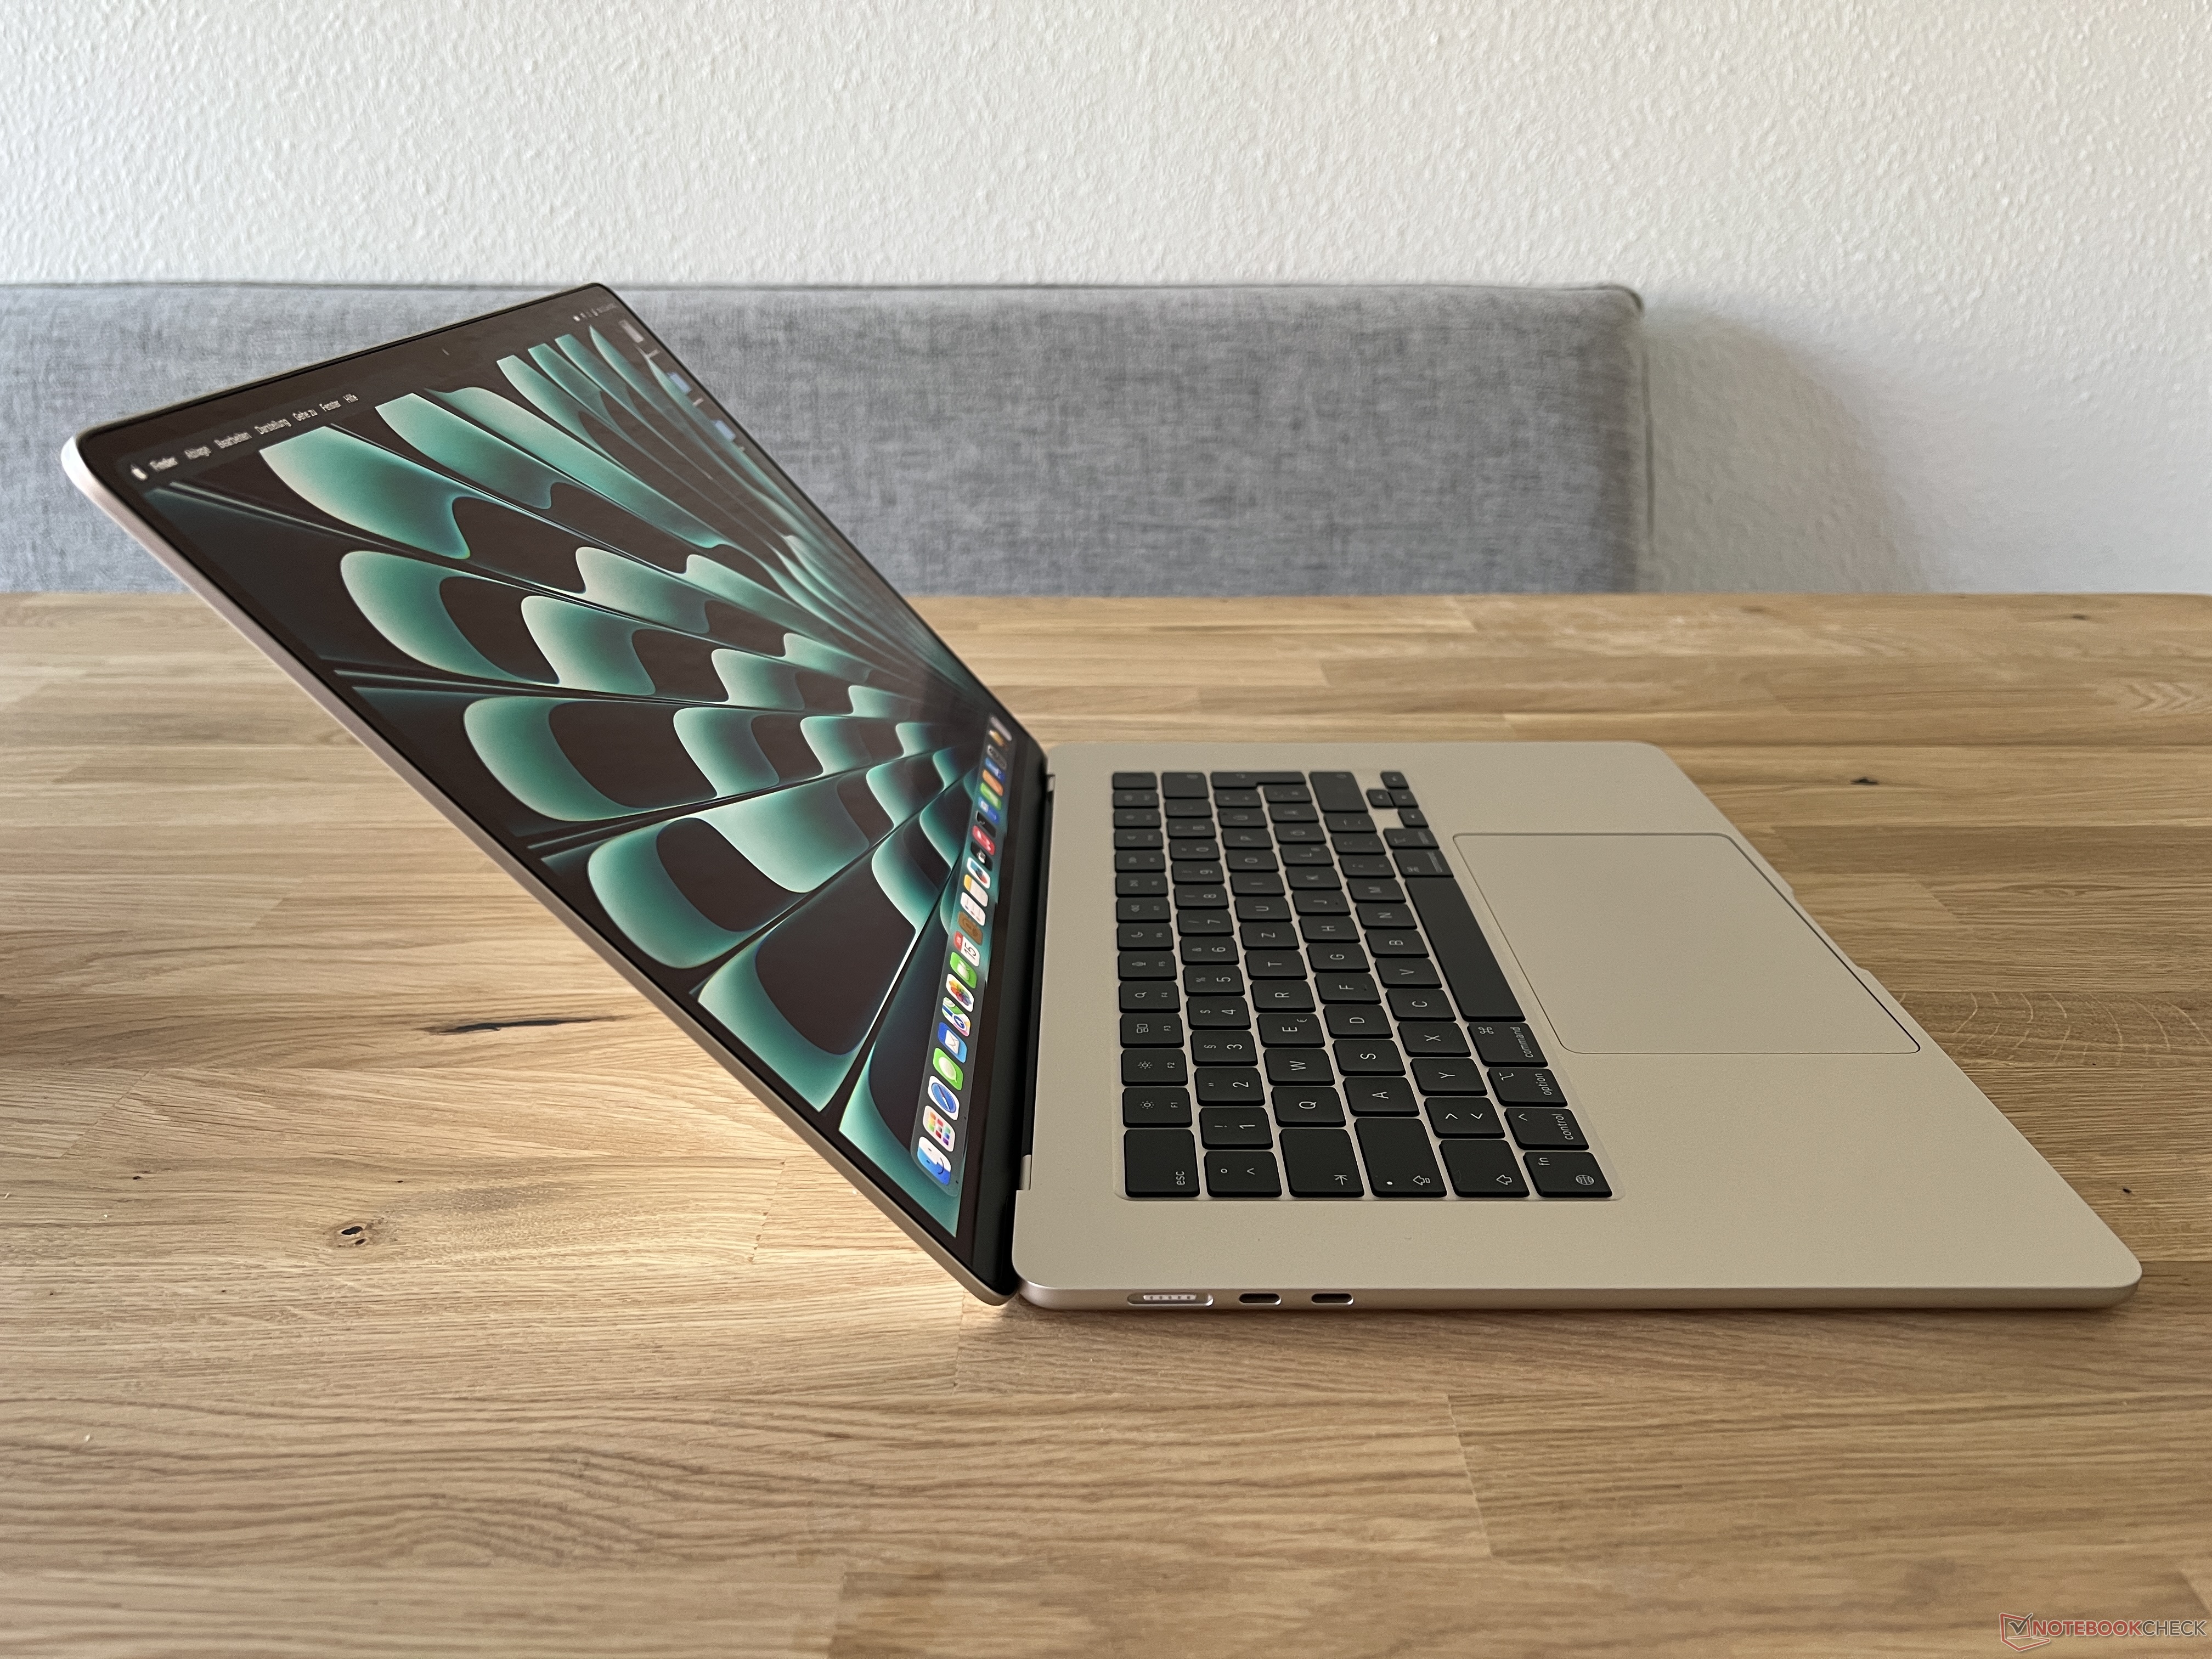
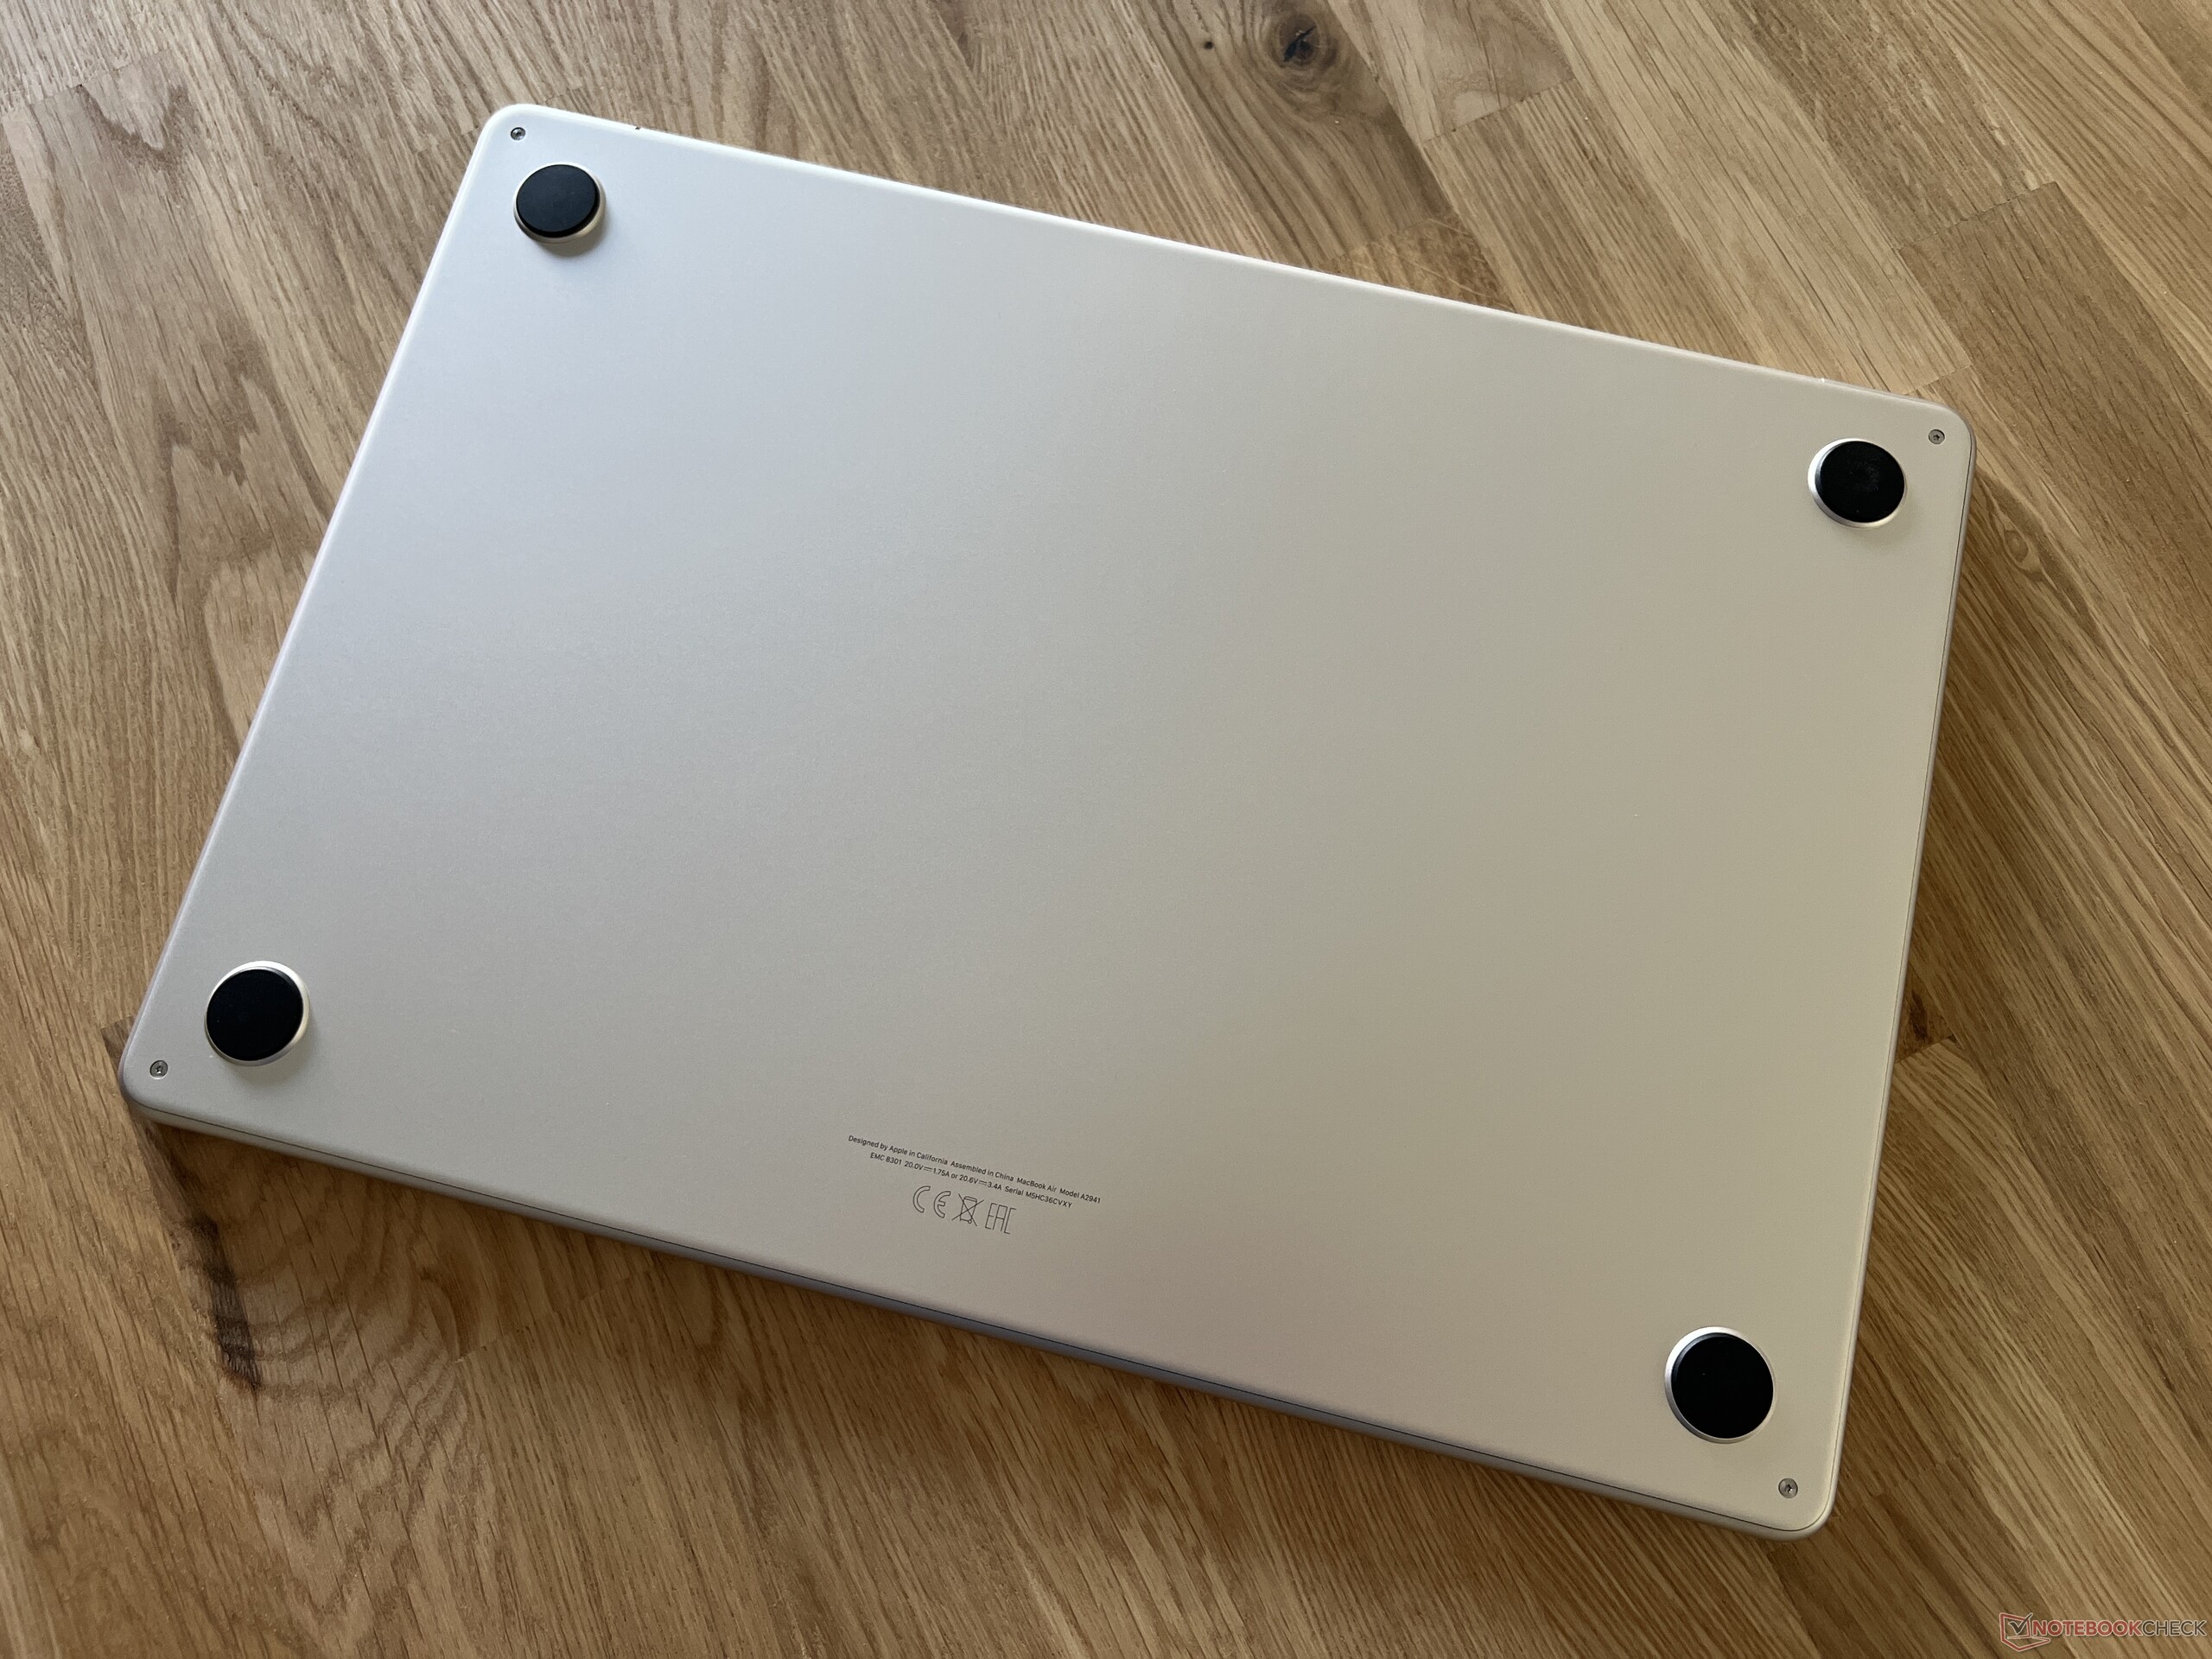
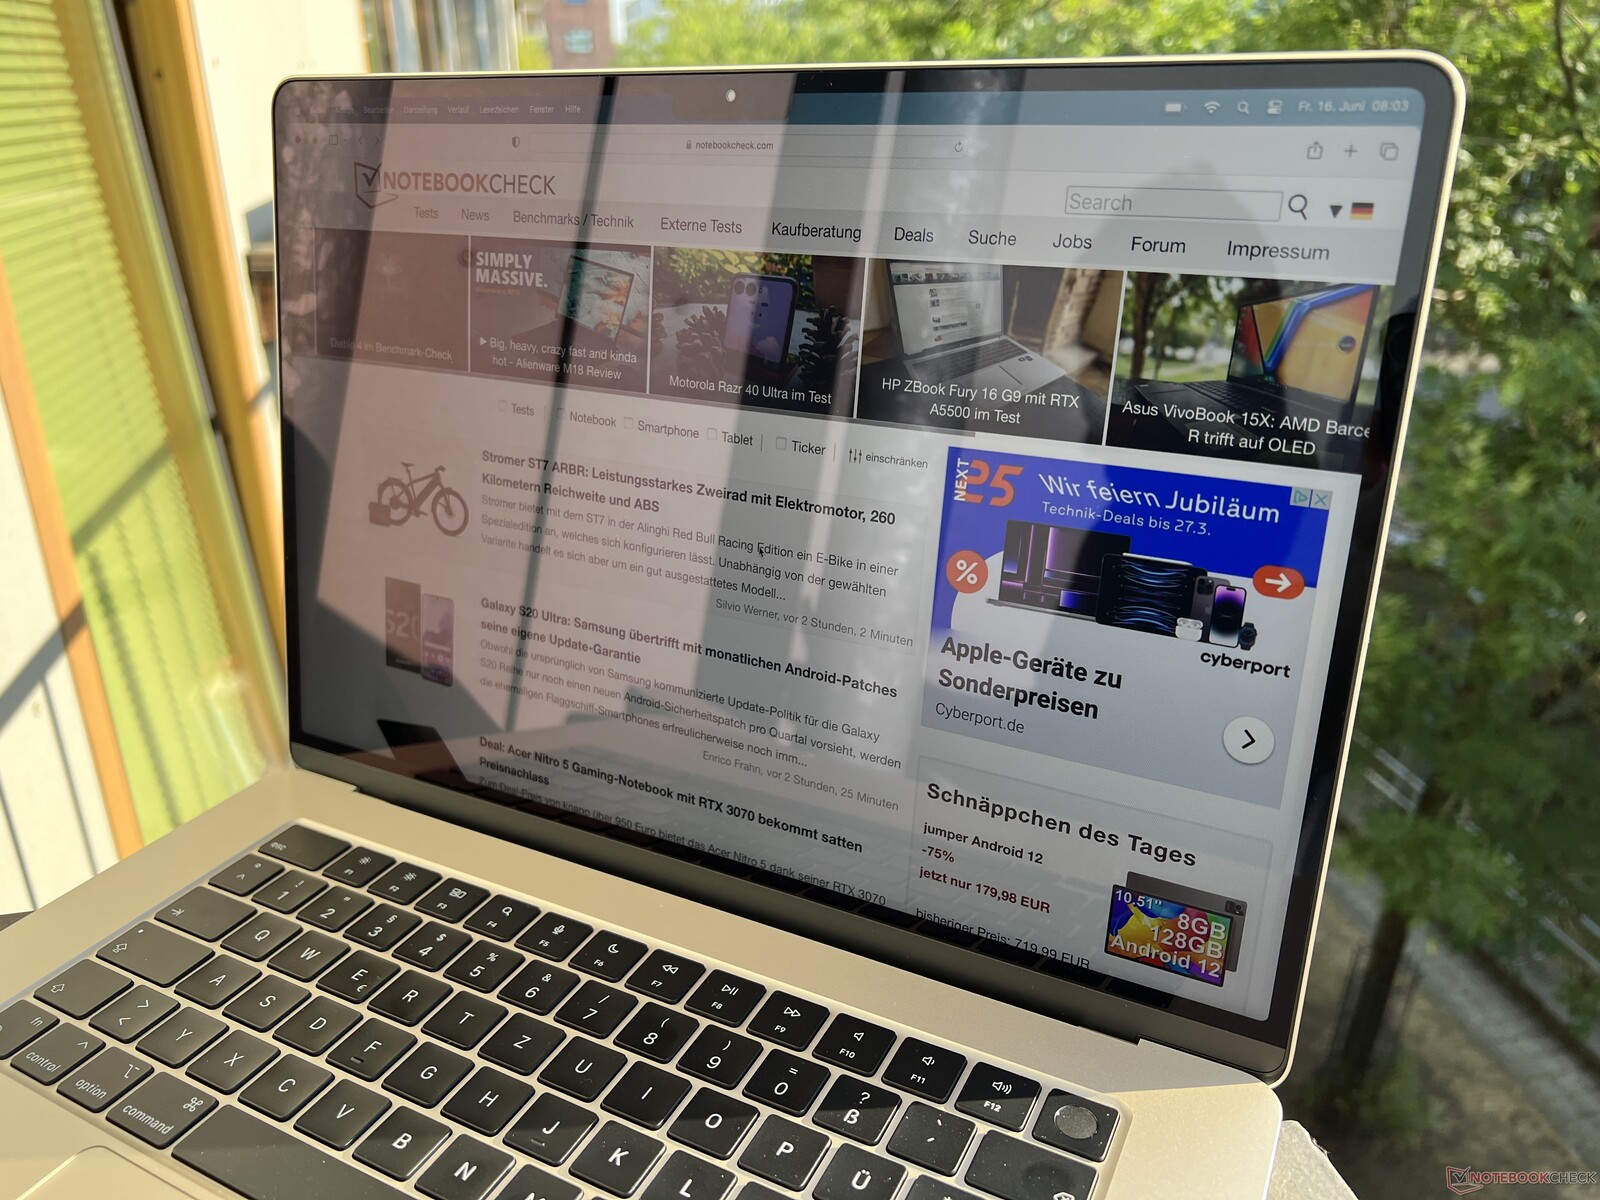
Apple has kept the design of the small MacBook Air 13 unchanged for its 15-inch model; only the footprint is slightly larger. Then again, the overall height is practically identical at 11.5 mm, and due to the larger case, the new MBA 15 appears even thinner than its smaller sibling. Stability is very good and neither the base unit nor the display lid can be warped in any way. The maximum opening angle is, as usual, around 130 degrees.
The display edges are relatively narrow, although there are Windows devices with even thinner edges. Of course, the recess for the webcam in the upper area is still noticeable, which does not have any drawbacks, at least not functionally. However, we still think it doesn't look particularly good, but this is naturally a matter of taste. The front edge of the base unit is quite sharp, but since the base itself is so thin, this does not cut into the wrists.
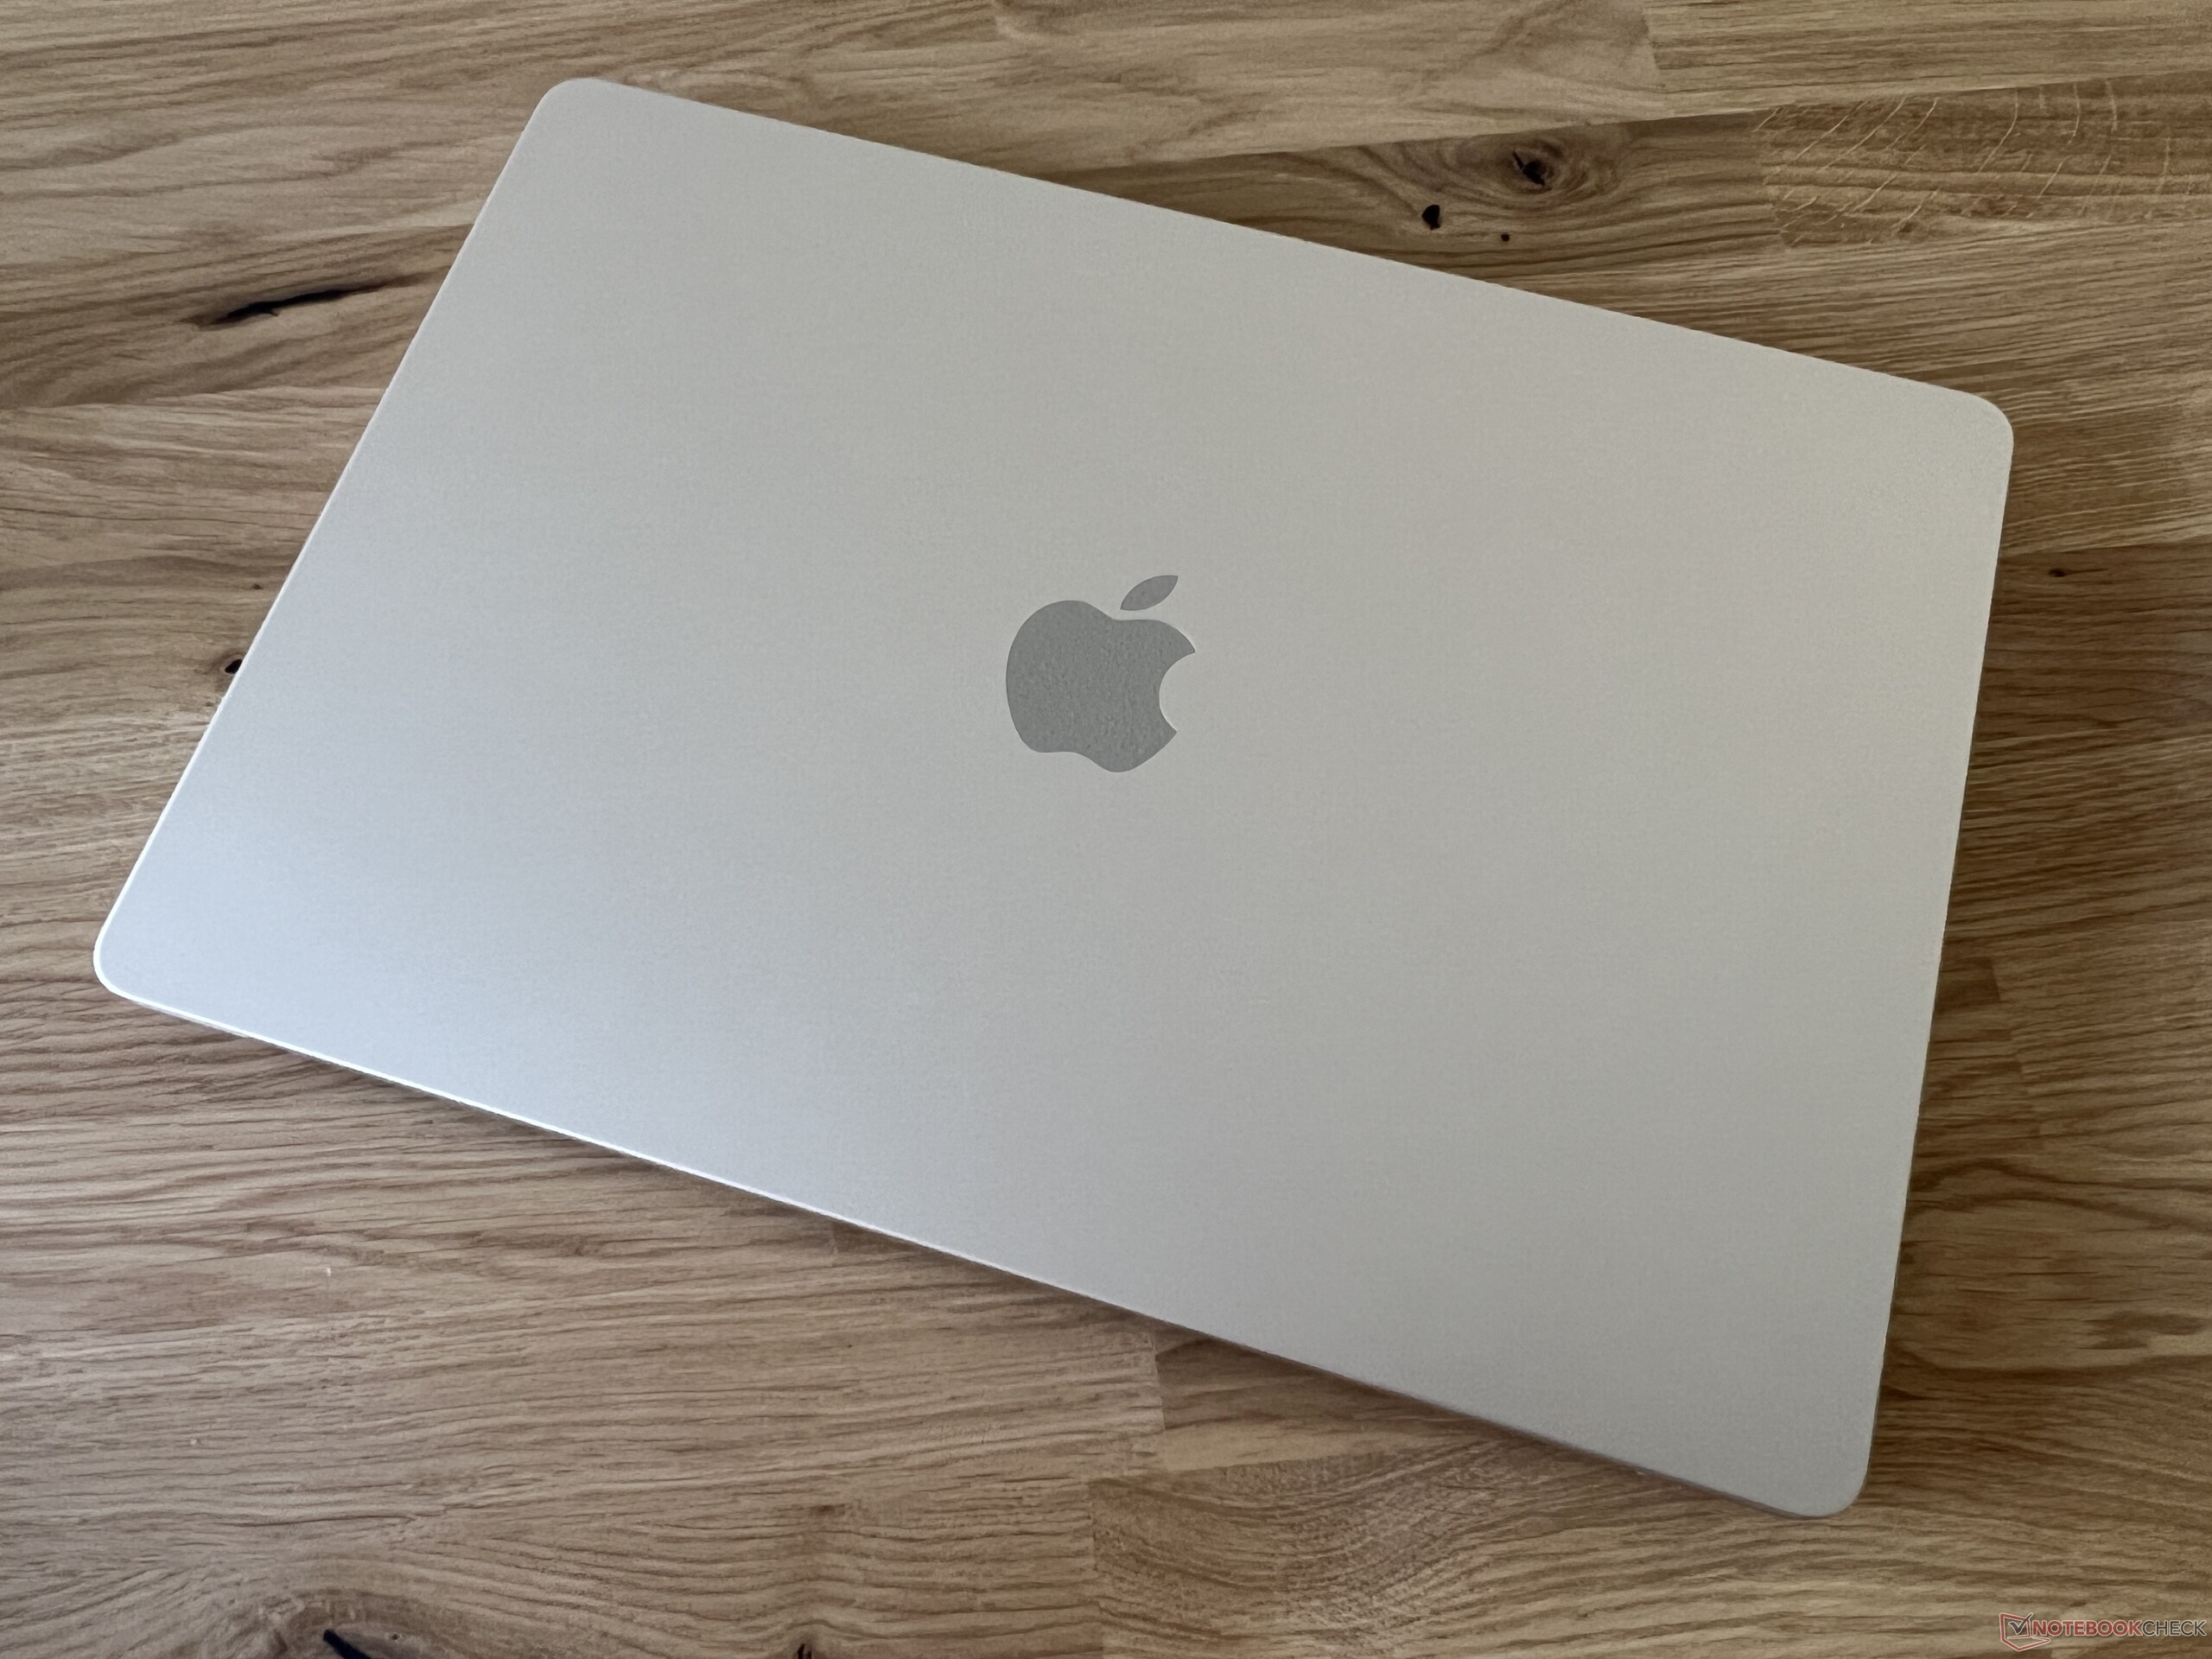
Qualitatively, the MacBook Air leaves no room for criticism. The workmanship is perfect and the metal case simply feels very high-end. Three of the four available colors (Silver, Space Gray & Starlight) are very resistant to dirt and fingerprints overall. The Midnight color variant (dark blue), on the other hand, looks good upon unpacking, but constantly needs to be cleaned afterwards.
The regular MacBook Air 13 itself is no lightweight, and the metal body of the larger Air 15 takes its toll here as well. Weighing a little over 1.5 kg, it feels surprisingly heavy when held for the first time. The LG Gram 15 (~1.1 kg) is a real lightweight in comparison, and the Surface Laptop 5 is a little lighter but also a little thicker. The dual USB-C power supply with 35 watts is very compact and weighs 186 grams, including the MagSafe cable.
Equipment - MagSafe and USB 4.0
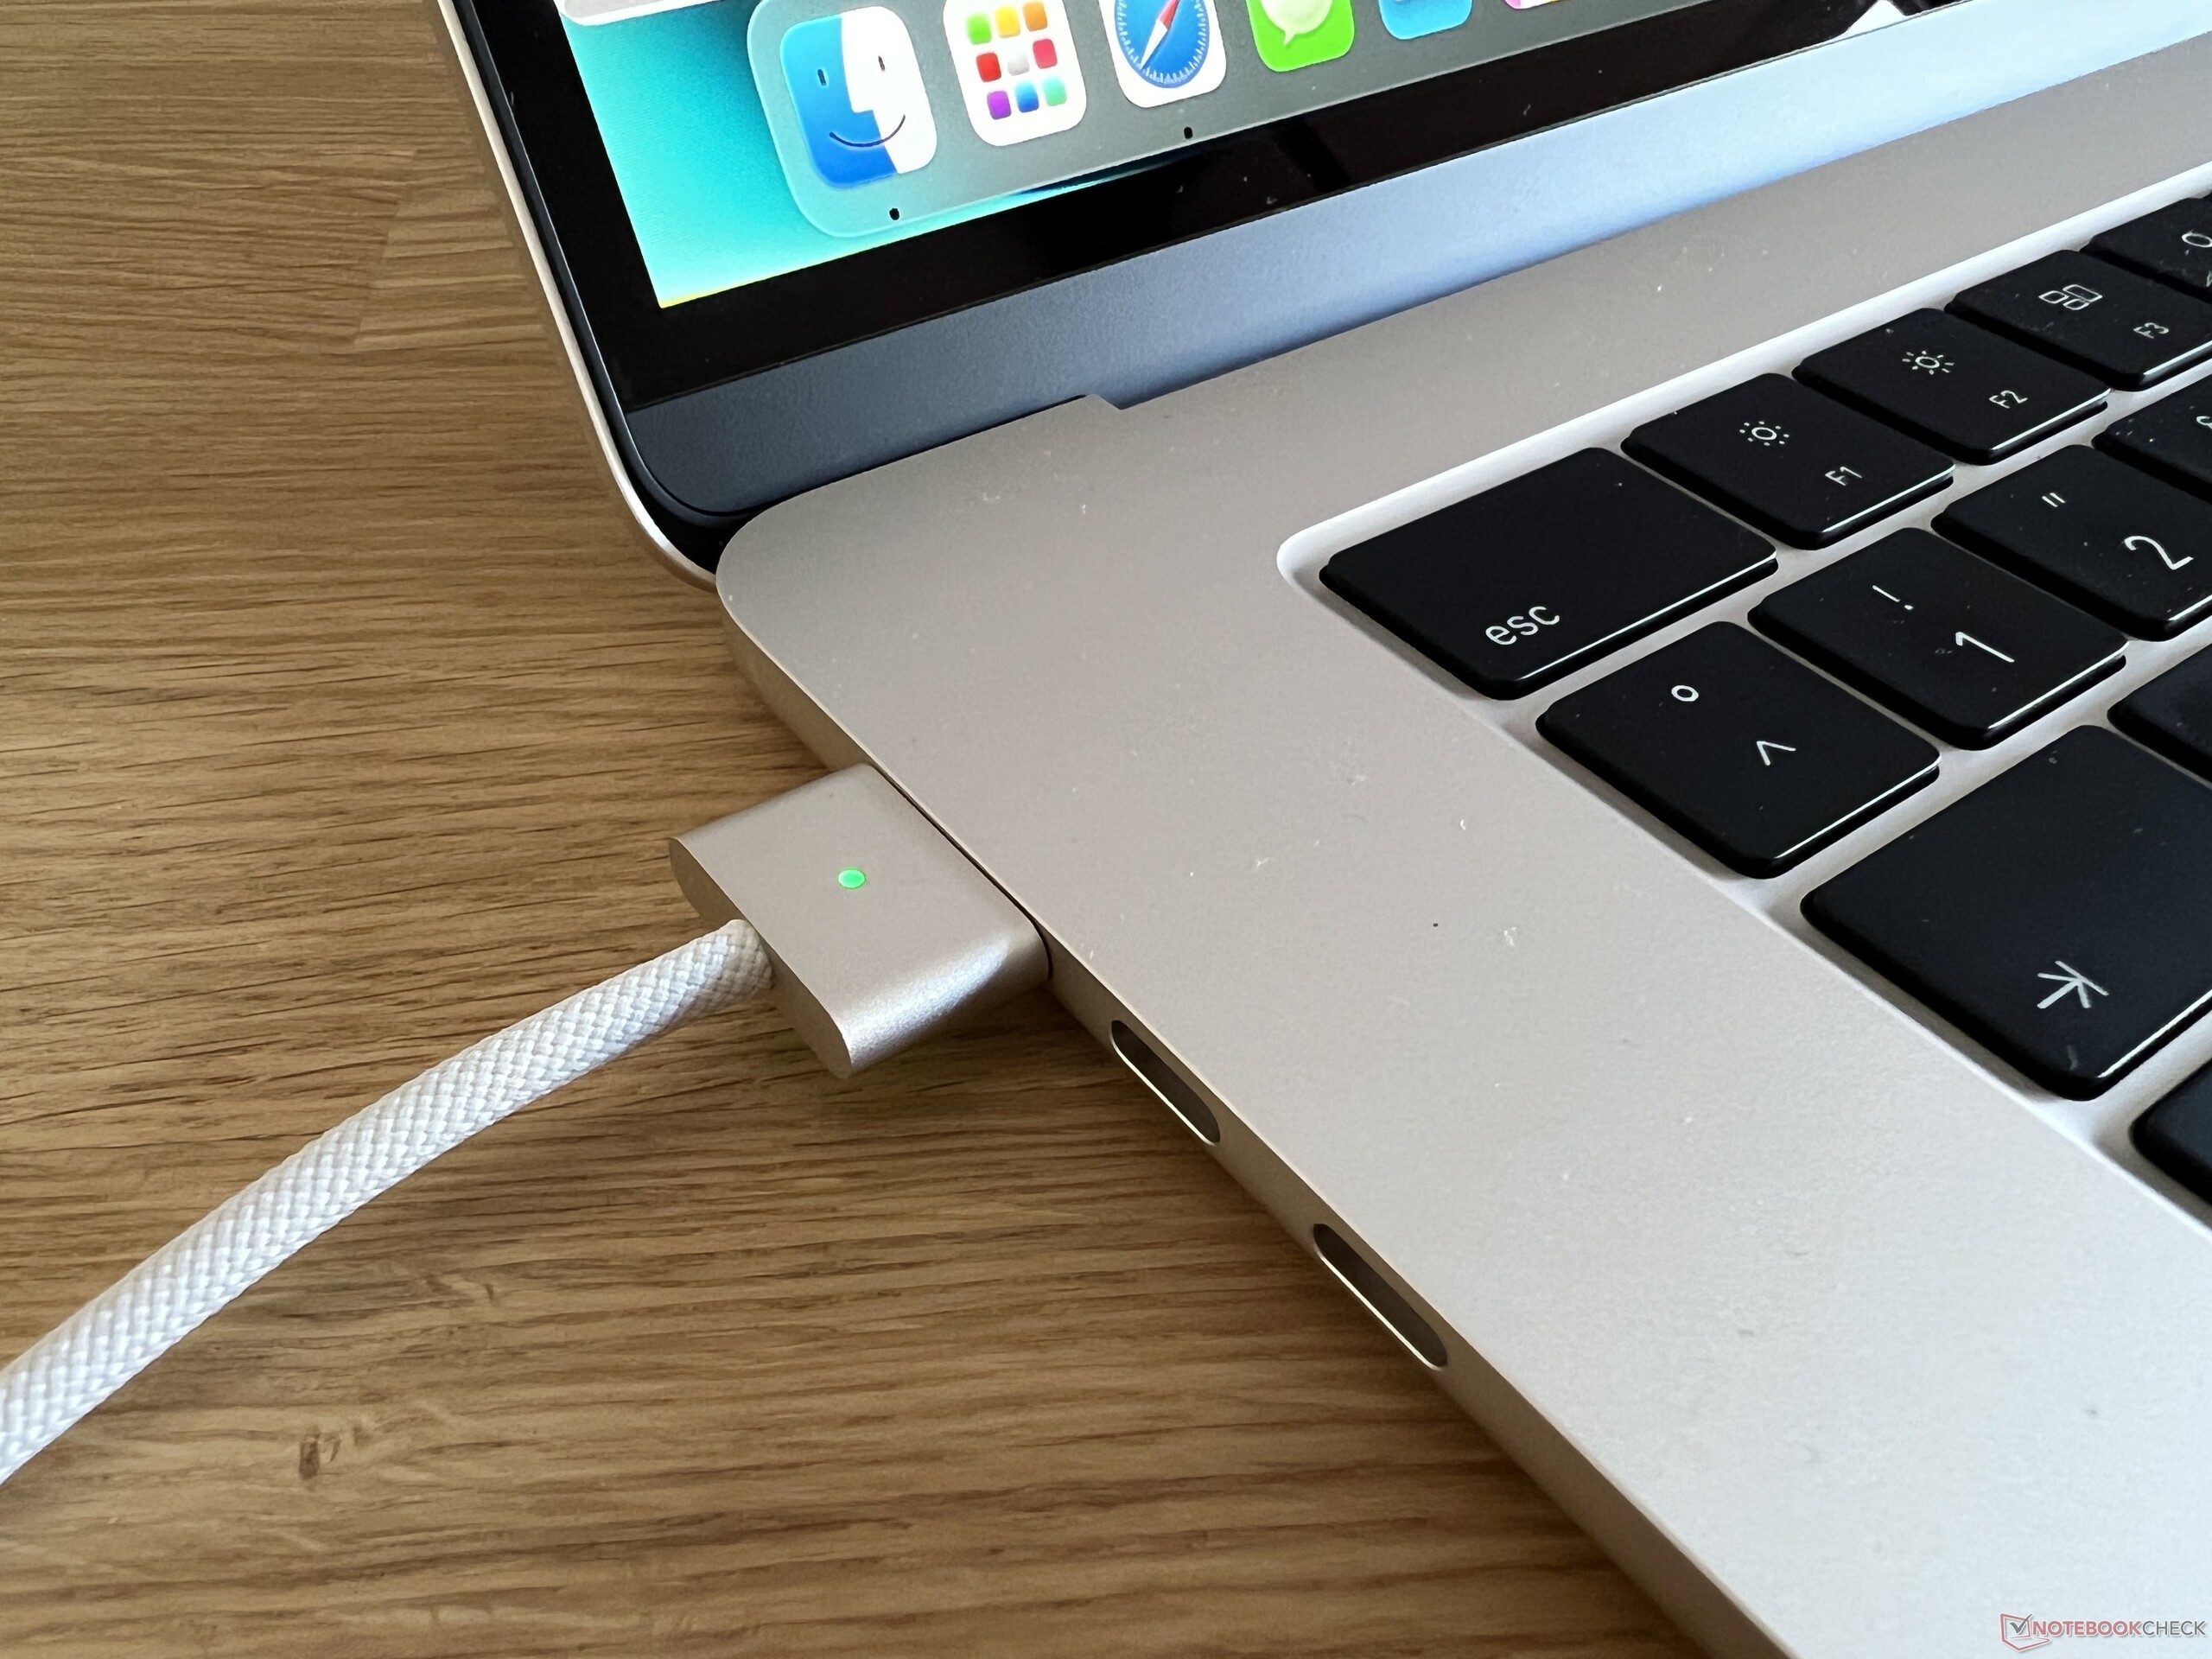
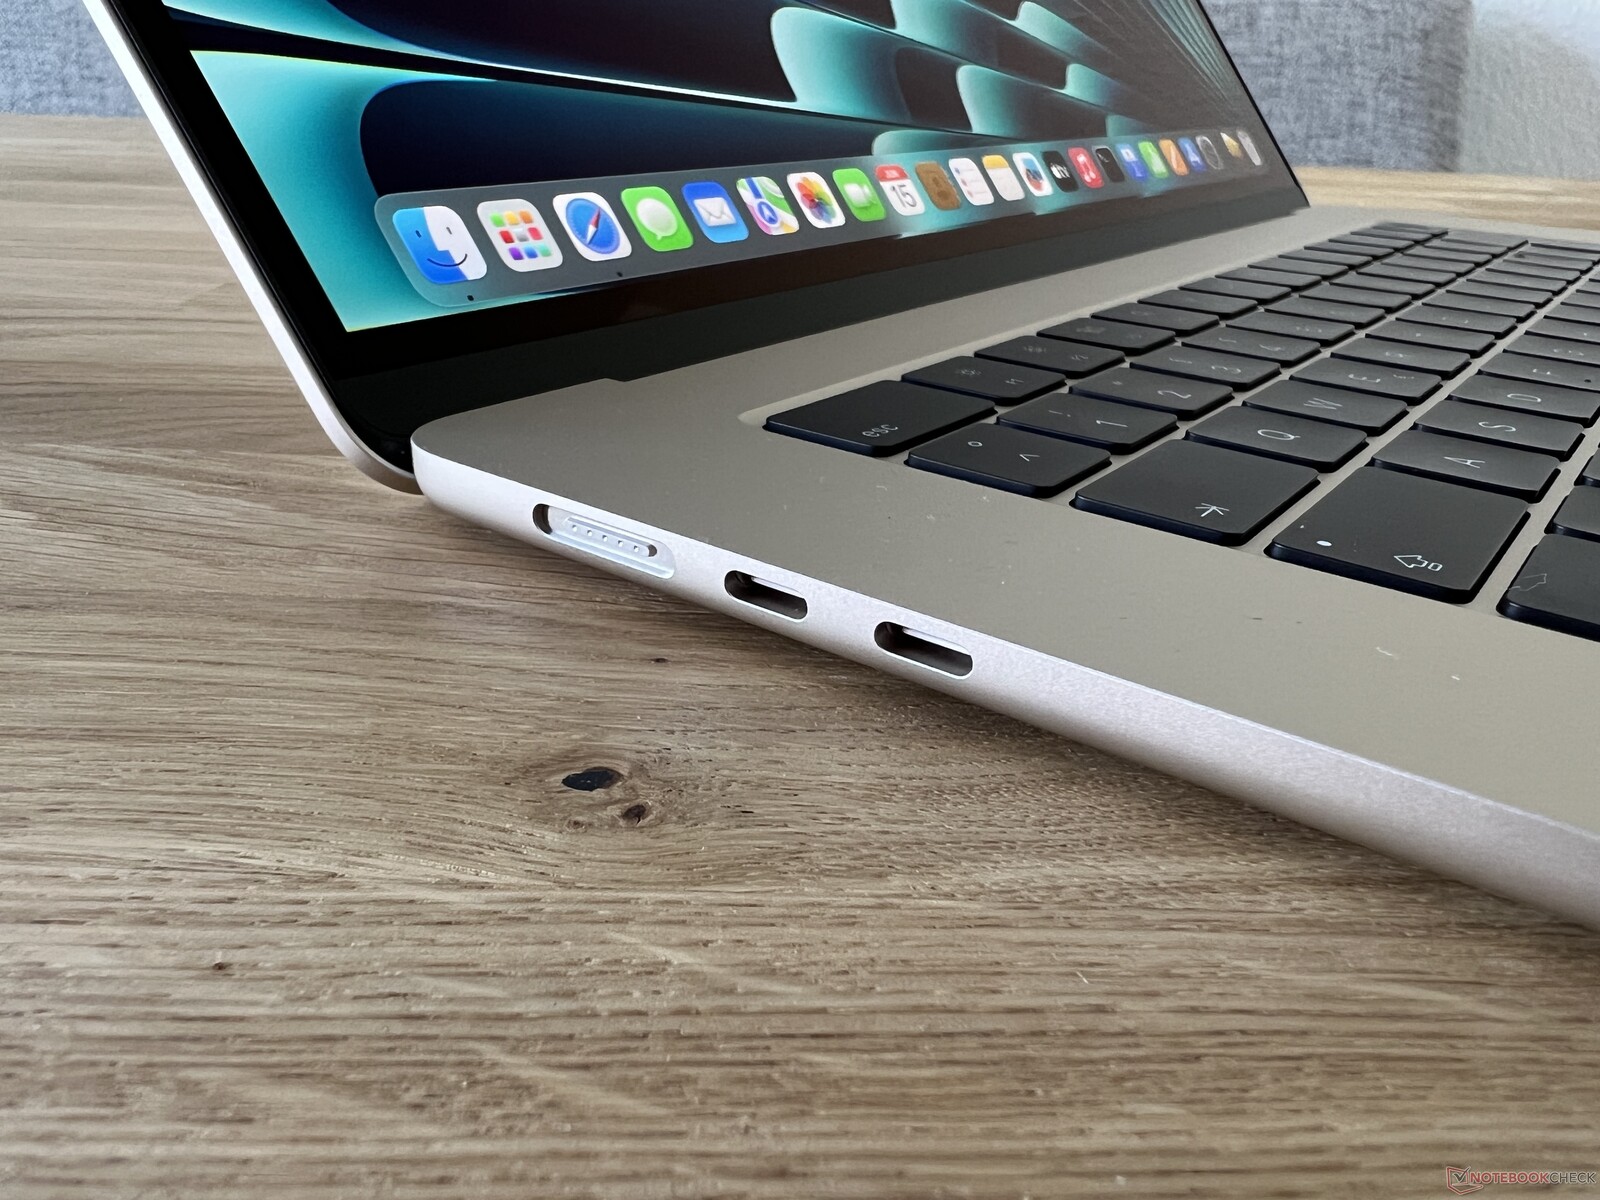
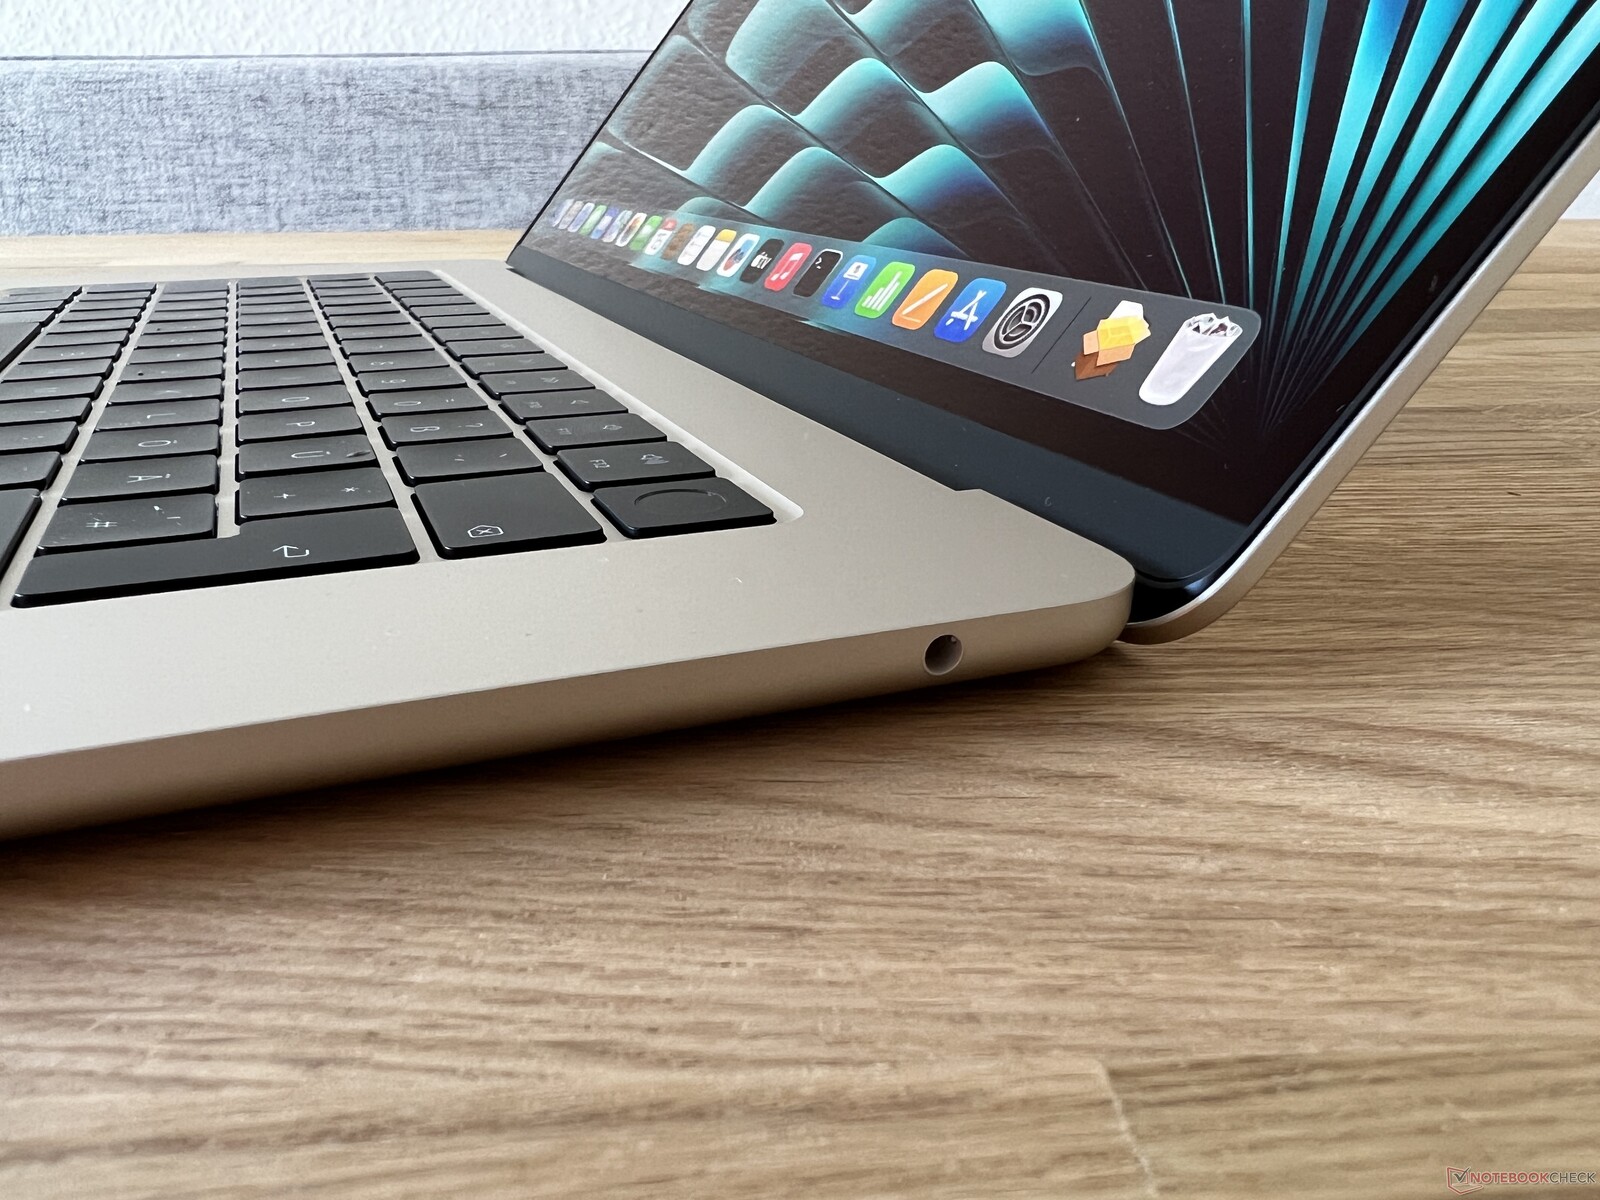
With two USB-C ports (Thunderbolt 3, USB 4.0) as well as MagSafe on the left side and a 3.5 mm jack, the port distribution is the same as that of the smaller model. So, Apple didn't put in any additional work here, leaving the additional space on the case unused. Another USB-C port on the right side and perhaps an SD card reader (like in the Pro models) would have been nice. Also, only one external display can be connected to the larger MacBook Air (max. 6K @60 Hz).
Communication
The Wi-Fi module is also the same as in the small MacBook Air M2 and not the Pro models. Wi-Fi 6 is only supported at 80 MHz, which limits the transfer rates to around 900 Mbps. With our reference router from Asus, the transfer rates are on the expected level and there are no restrictions in everyday use, but it is still not quite up to date for a premium notebook. The MacBook Air also supports Bluetooth 5.3.
| Networking | |
| Apple MacBook Air 15 2023 M2 16 GB | |
| iperf3 transmit AXE11000 | |
| iperf3 receive AXE11000 | |
| Microsoft Surface Laptop 5 15, i7-1255U | |
| iperf3 transmit AXE11000 | |
| iperf3 receive AXE11000 | |
| LG Gram 15Z90Q | |
| iperf3 transmit AXE11000 | |
| iperf3 receive AXE11000 | |
| Asus VivoBook S15 M3502RA-L1029W | |
| iperf3 transmit AXE11000 | |
| iperf3 receive AXE11000 | |
| Apple MacBook Pro 16 2021 M1 Pro | |
| iperf3 transmit AX12 | |
| iperf3 receive AX12 | |
| iperf3 transmit AXE11000 | |
| iperf3 receive AXE11000 | |
| Apple MacBook Pro 14 2023 M2 Pro | |
| iperf3 transmit AXE11000 6GHz | |
| iperf3 receive AXE11000 6GHz | |
Webcam
Face ID is still not available on the MacBooks, but the 1080p webcam offers good quality and is also good for video calls. The same is also true of the microphones.


Maintenance
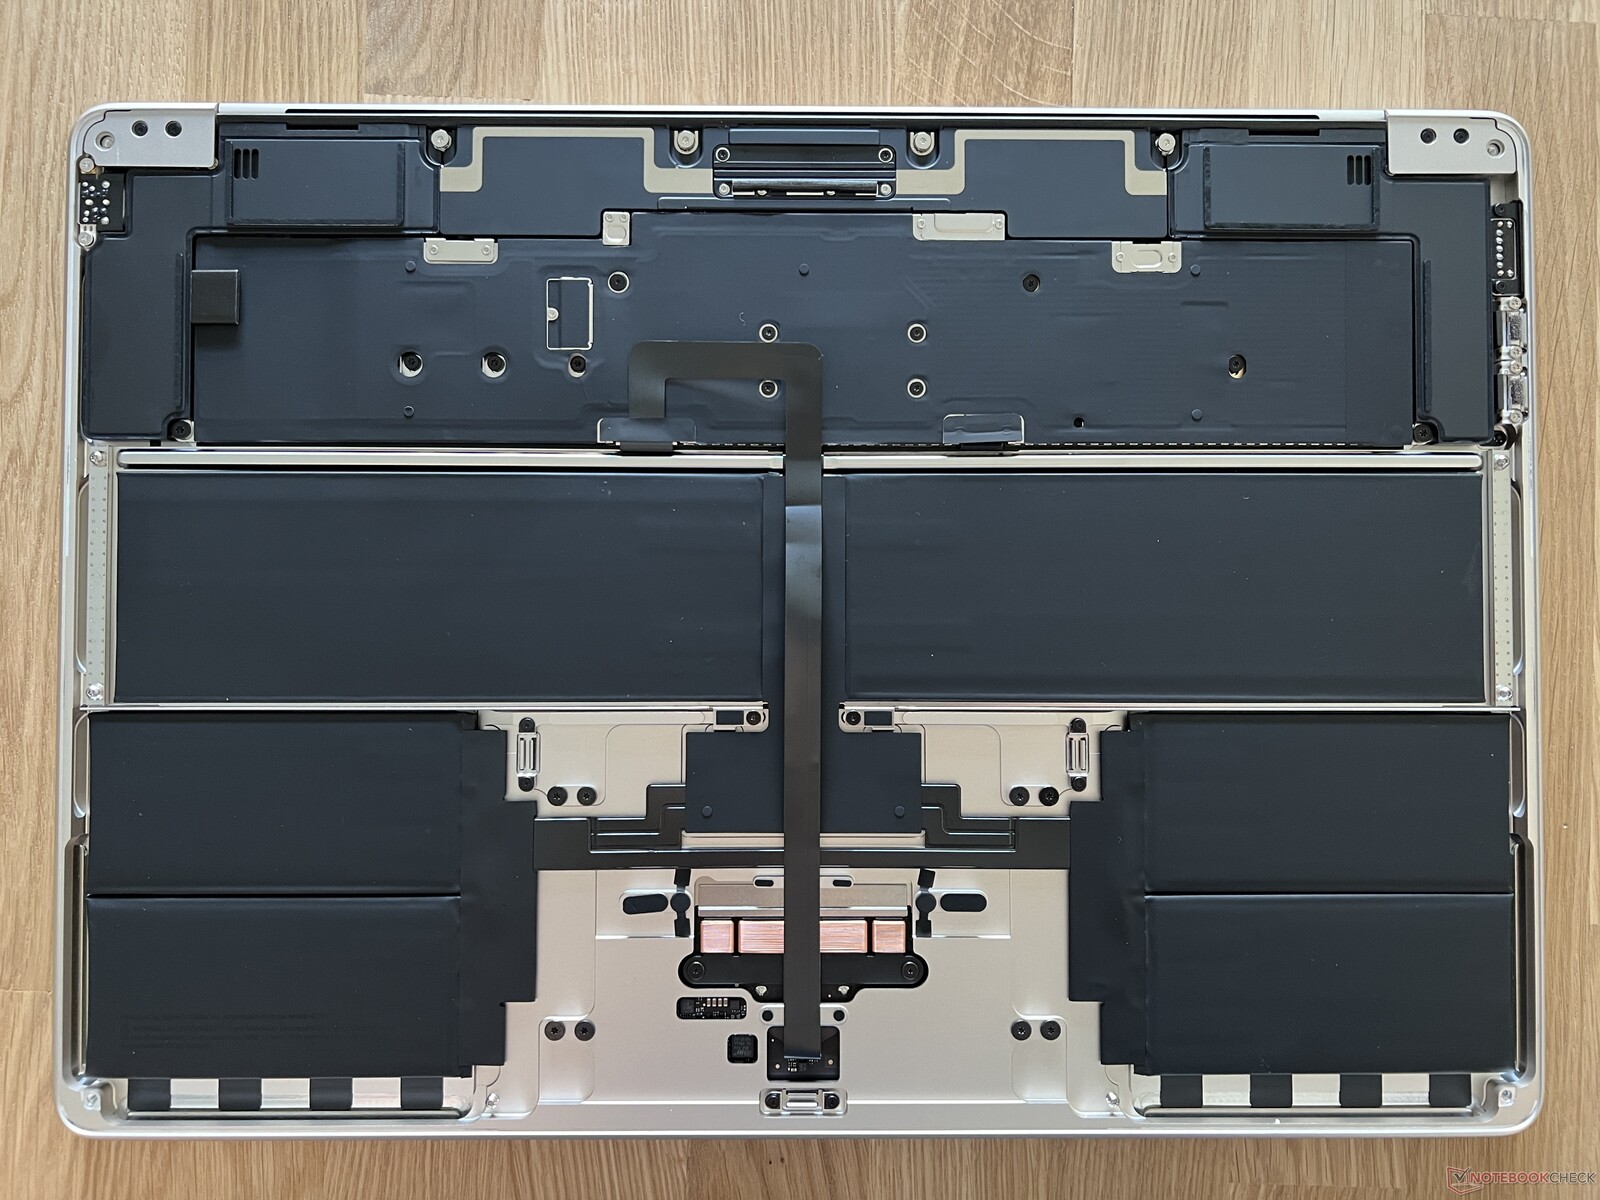
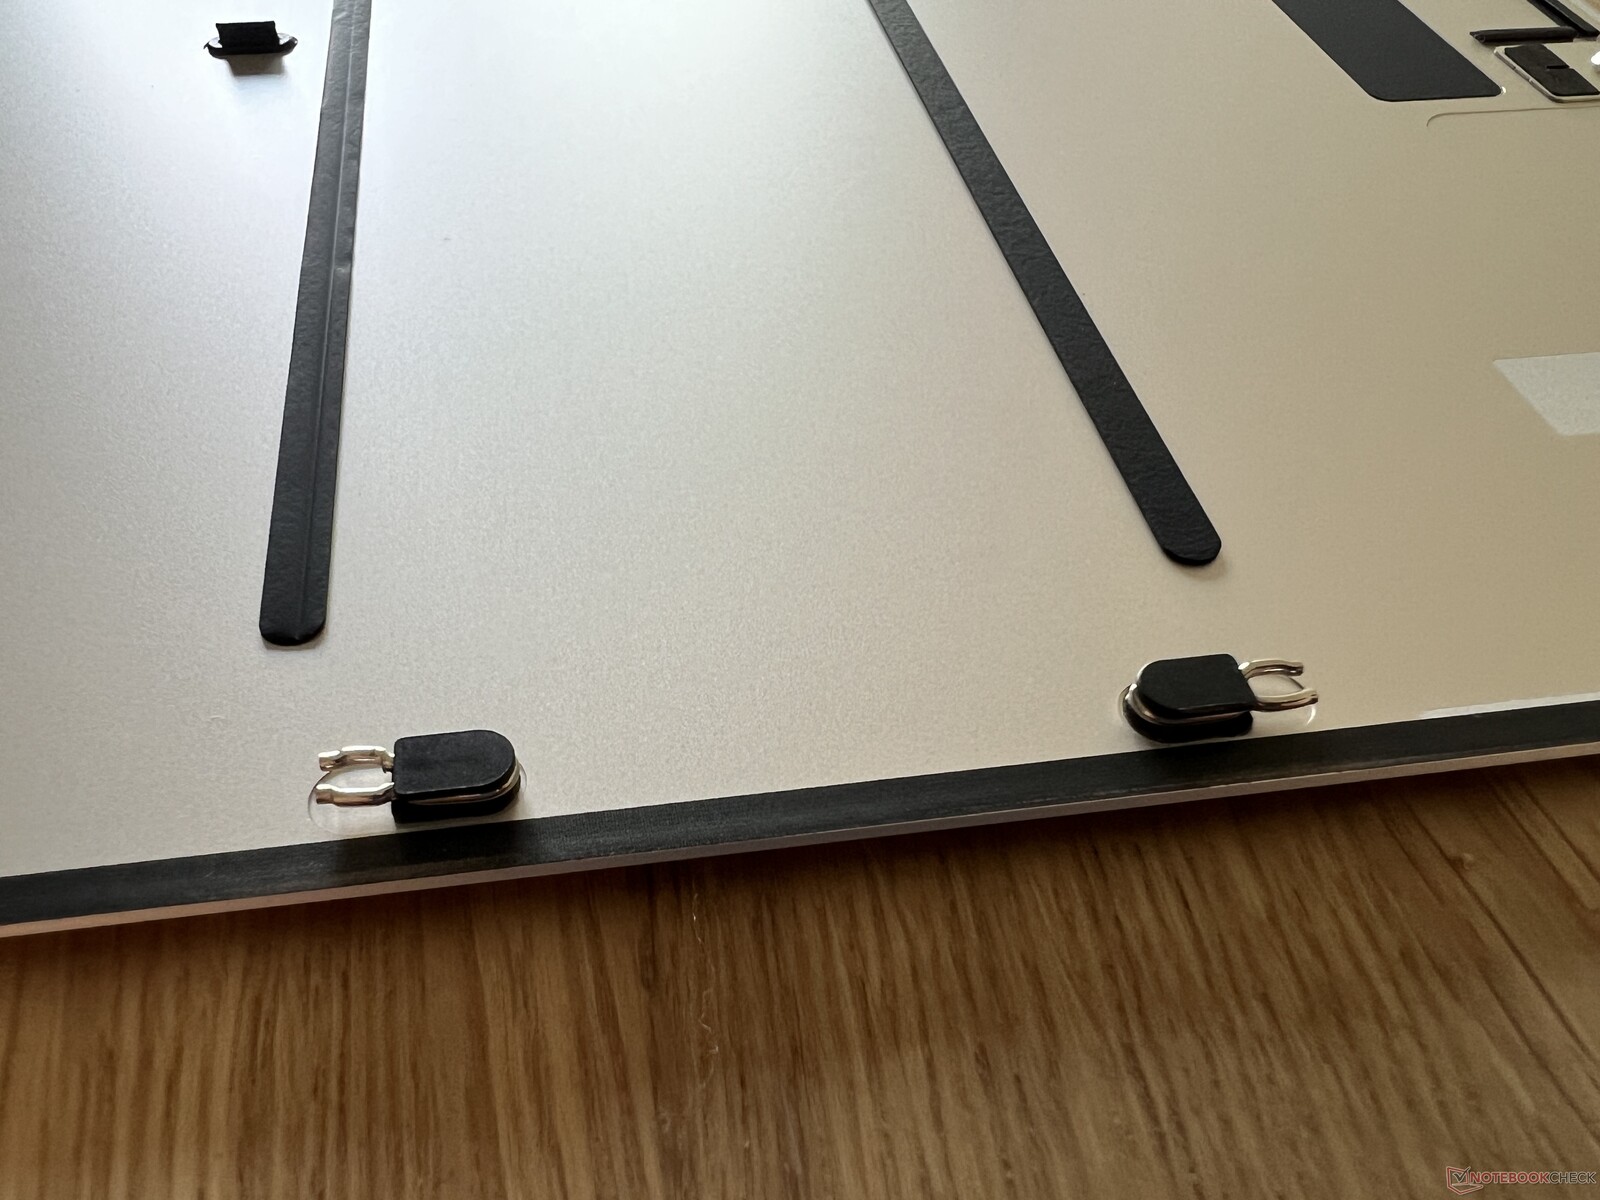
The bottom cover is secured with a few pentalobe screws, but there are still some retaining clips in the middle. Here you have to use some force (and preferably a suction cup) to loosen the clamps, after which the cover can be pulled forward. The internals (which are dominated by the battery) also appear good, but there is nothing the user can do here. In an emergency, components can be replaced, such as the battery (which is held in place with screws and several pull tabs).

Input Devices - Huge trackpad
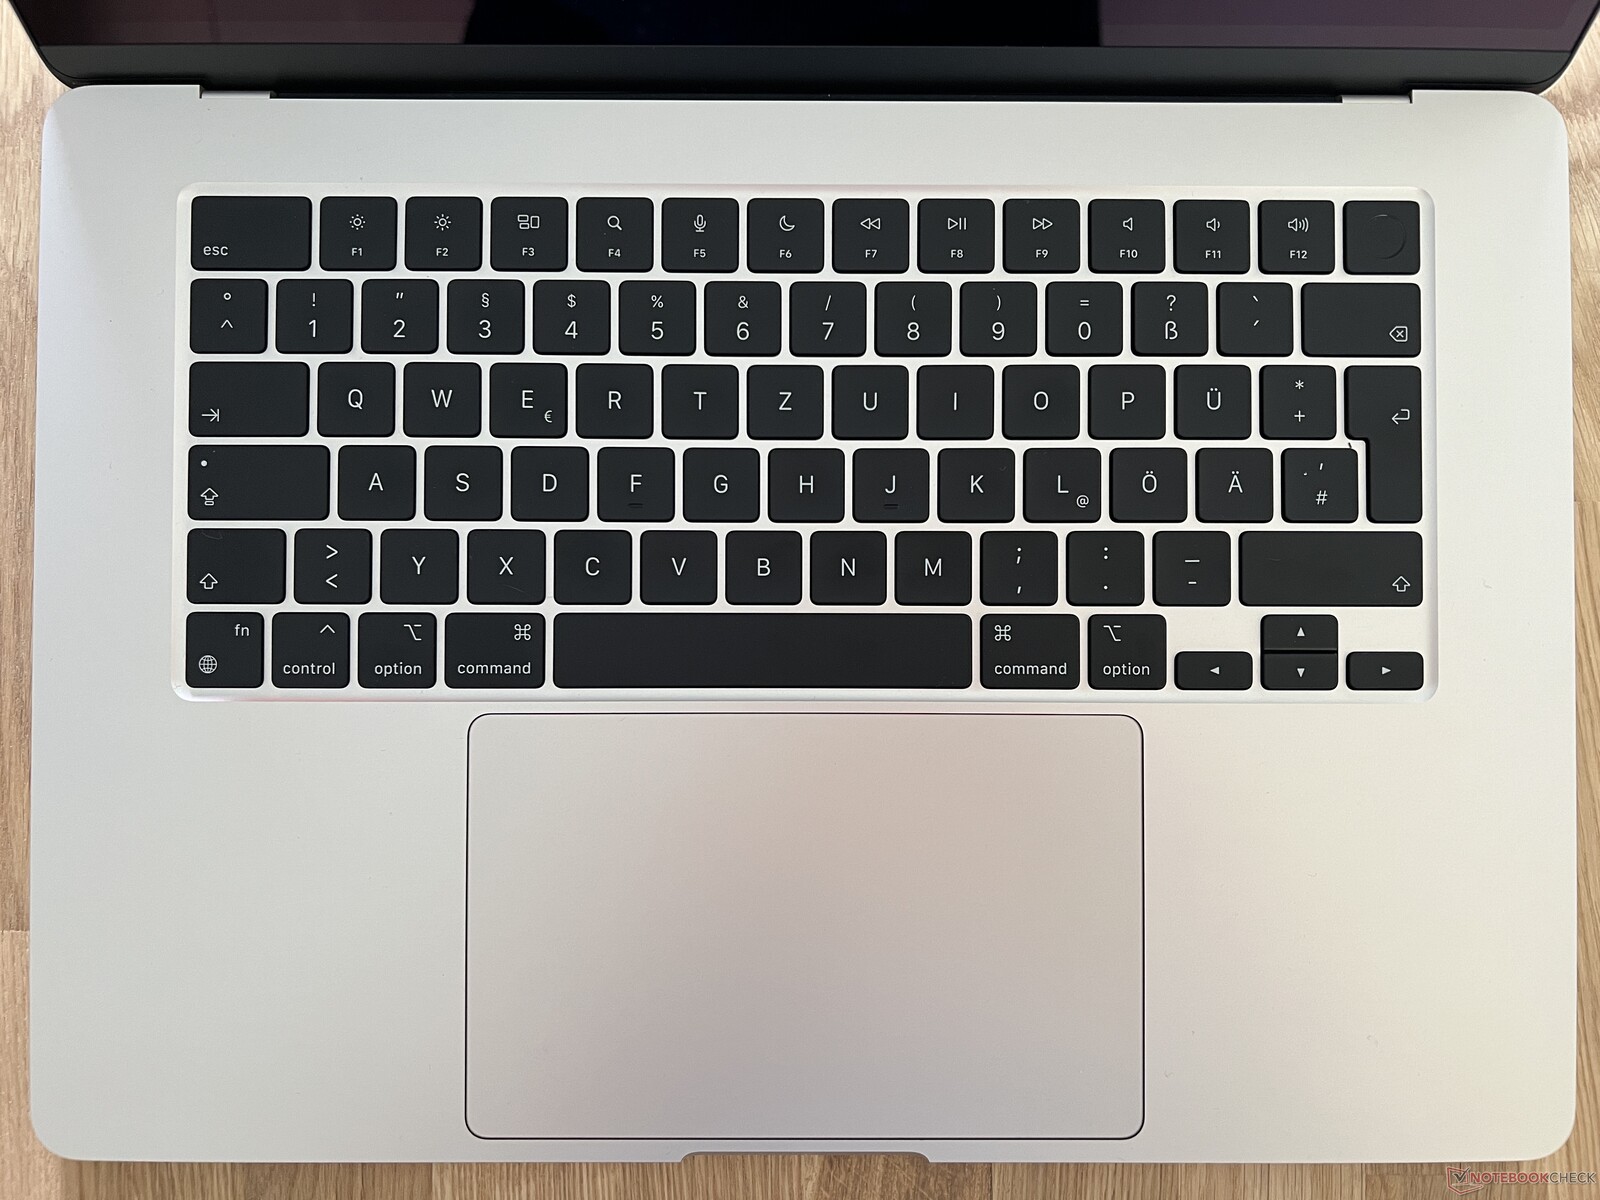
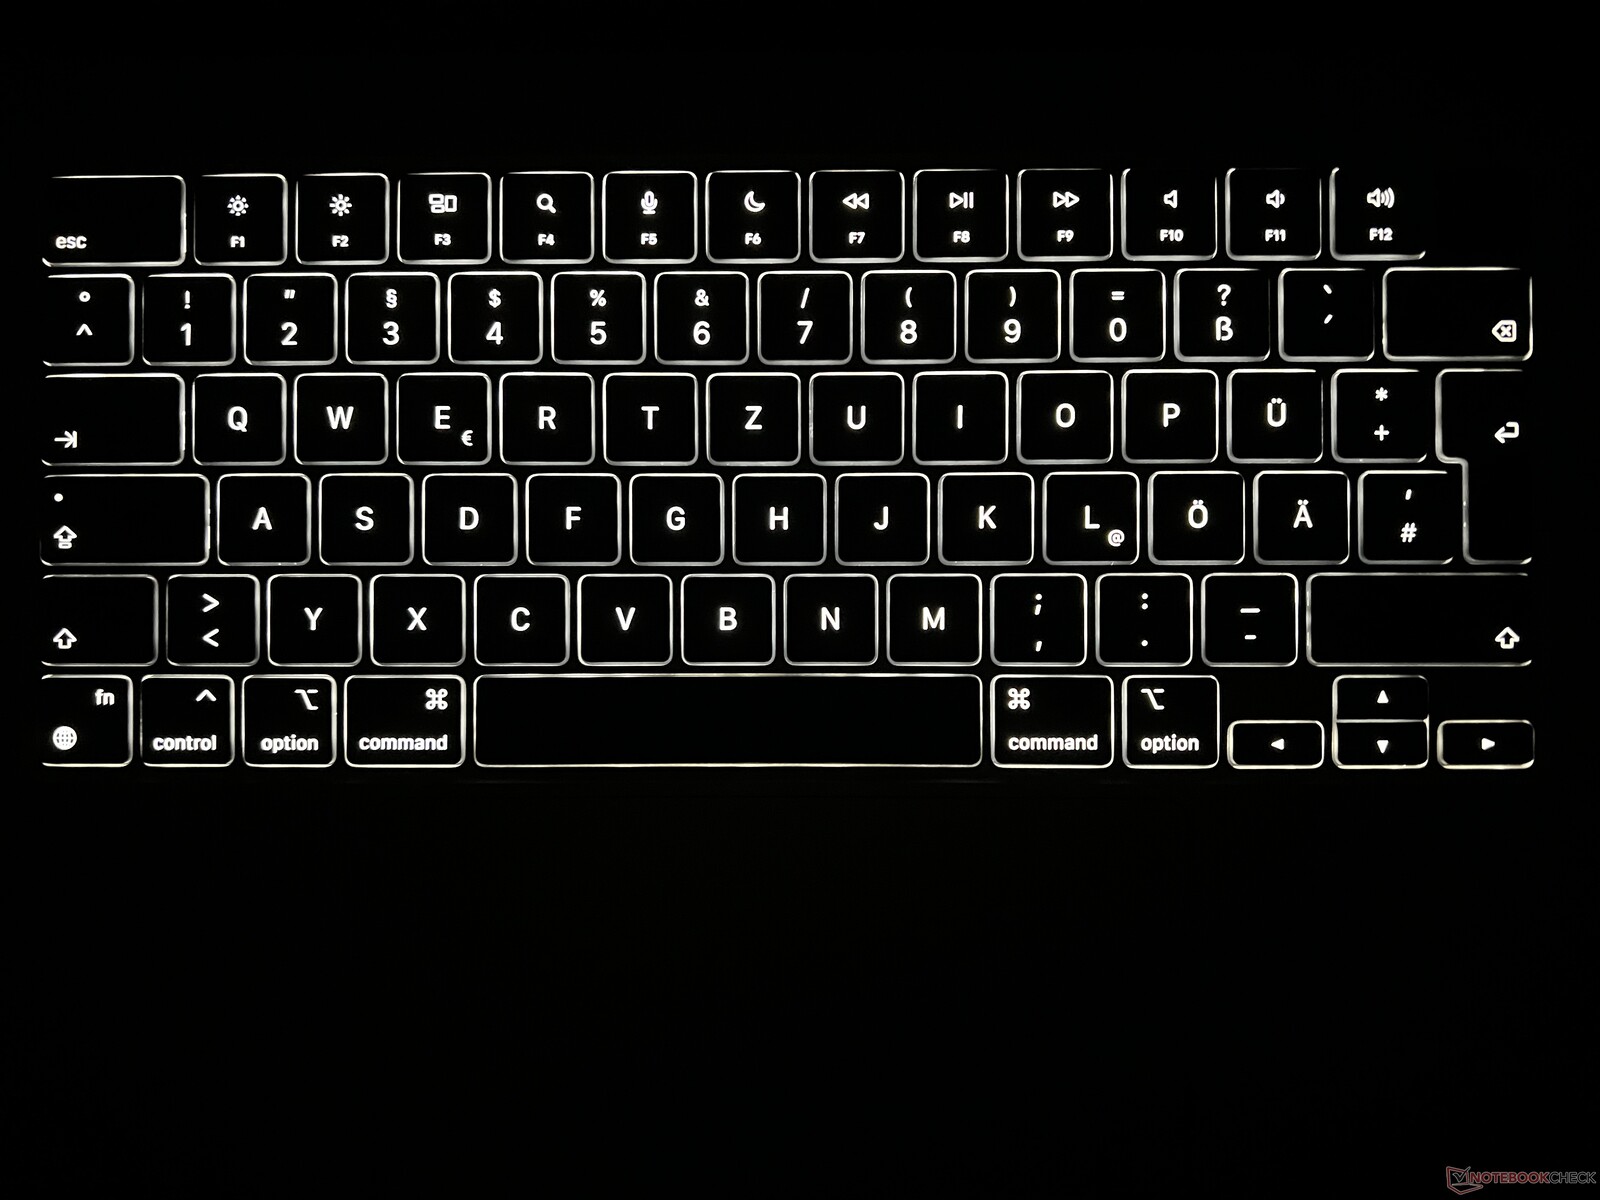
The input devices have also been copied over unchanged. The black keyboard is on a good level and the normal scissor keys are also pleasant to type on, but there are undoubtedly even better keyboards, especially in the business sector. The additional width has neither been utilized for a numpad nor speaker covers - just more case surface. The Touch ID fingerprint scanner still works flawlessly. Apple has been the leader in white keyboard lighting for years, since the intensity is very finely tuned and automatically adjusted to the ambient light. In some Windows laptops, the keyboard is also activated via sensor, but there are usually only two or maximum three levels with hard transitions.
The large TrackPad still sets the bar in the mobile sector and the integration into macOS is excellent. Thanks to Force Touch, the clicks are uniform and not too loud, and gestures are implemented perfectly. As usual, the MacBook Air does not offer a touchscreen.
Display - Liquid Retina in 15.3 inches
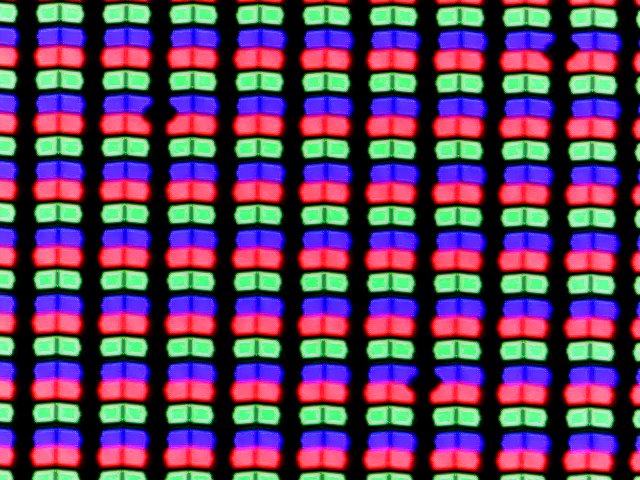
The MacBook Air 15 uses a 15.3-inch, 60 Hz IPS panel. The resolution is a somewhat crooked 2880 x 1864, which is caused by the camera notch in the upper display frame. The actual 16:10 panel has a resolution of 2880 x 1800 and the 64 additional vertical pixels were simply added on top. The notch does not take any space away from the 16:10 display.
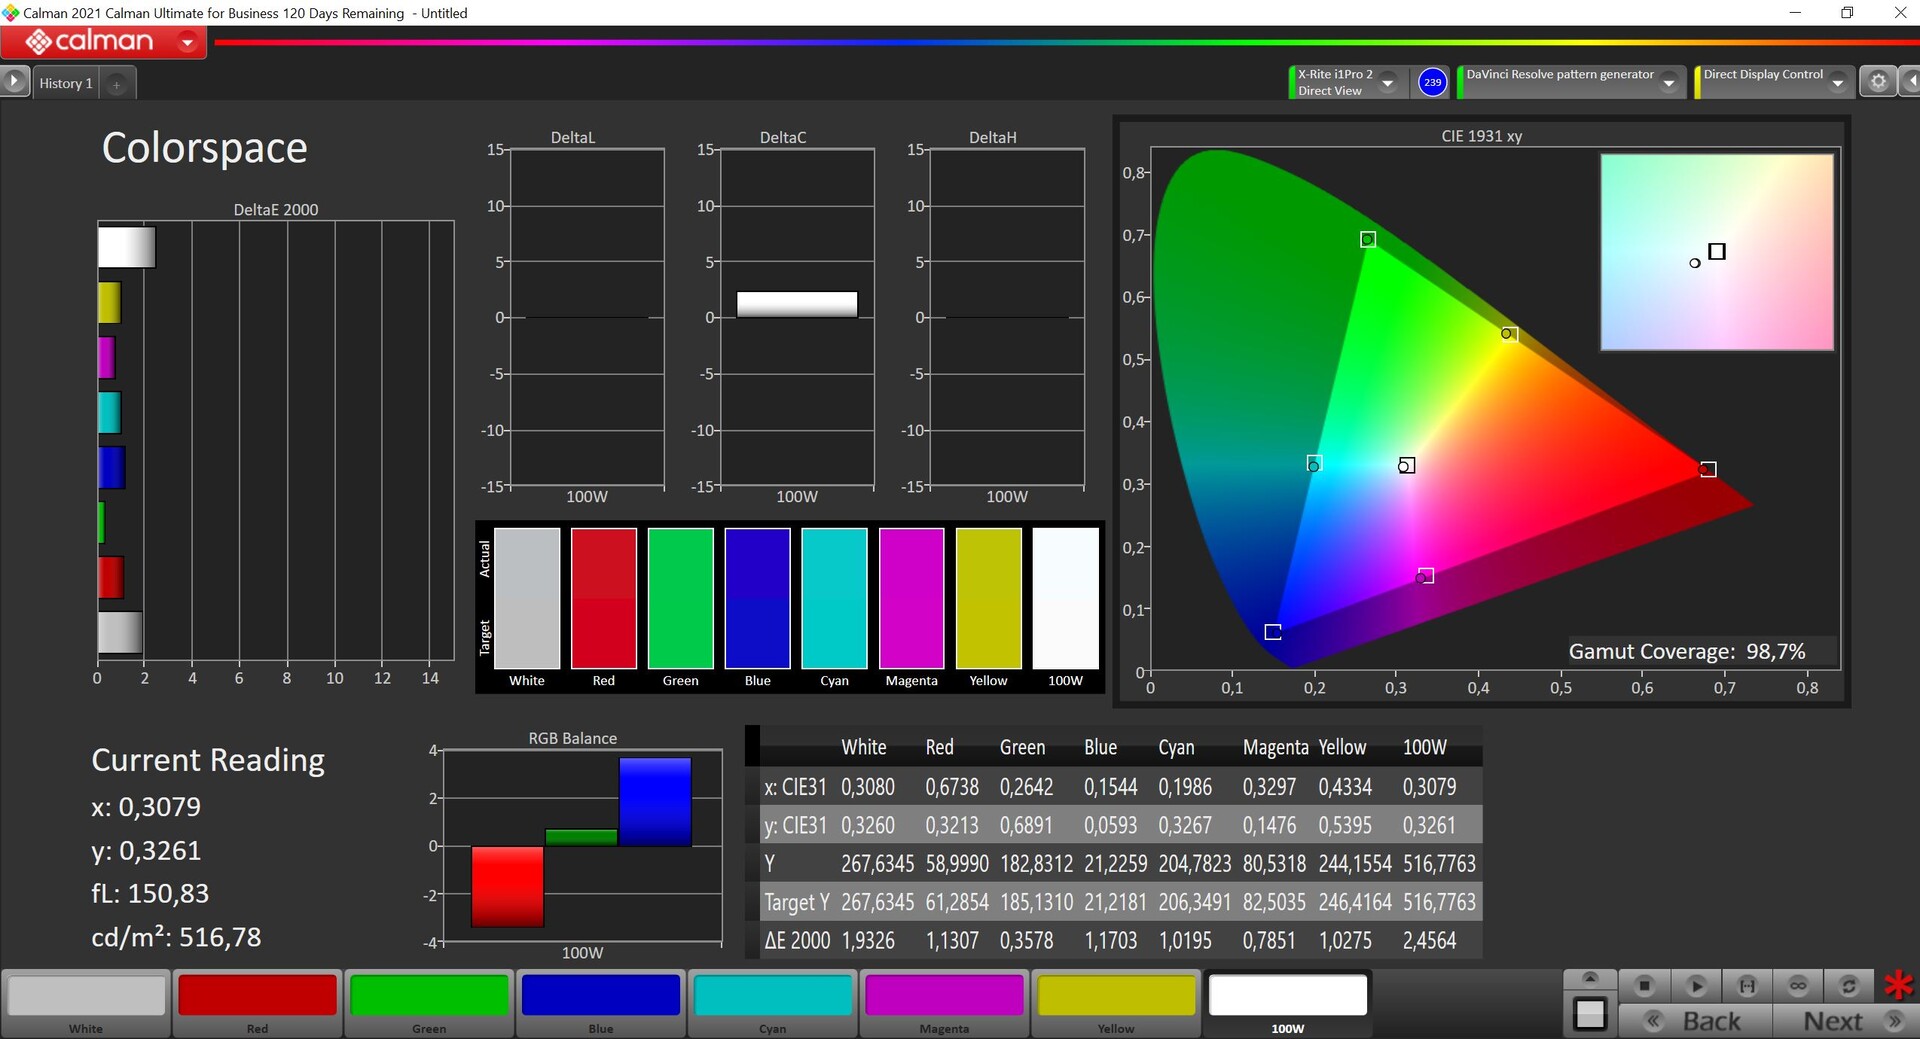
Apart from the higher resolution, nothing has changed in technical specifications compared to the 13-inch model and we can confirm the advertised brightness of 500 cd/m² (it is actually 501 cd/m² on average). The illumination of 93% is also very homogeneous. The SDR brightness is thus on par with the MacBook Pro models, but the lack of HDR support means the Air will not be able to display HDR content in all of its glory.
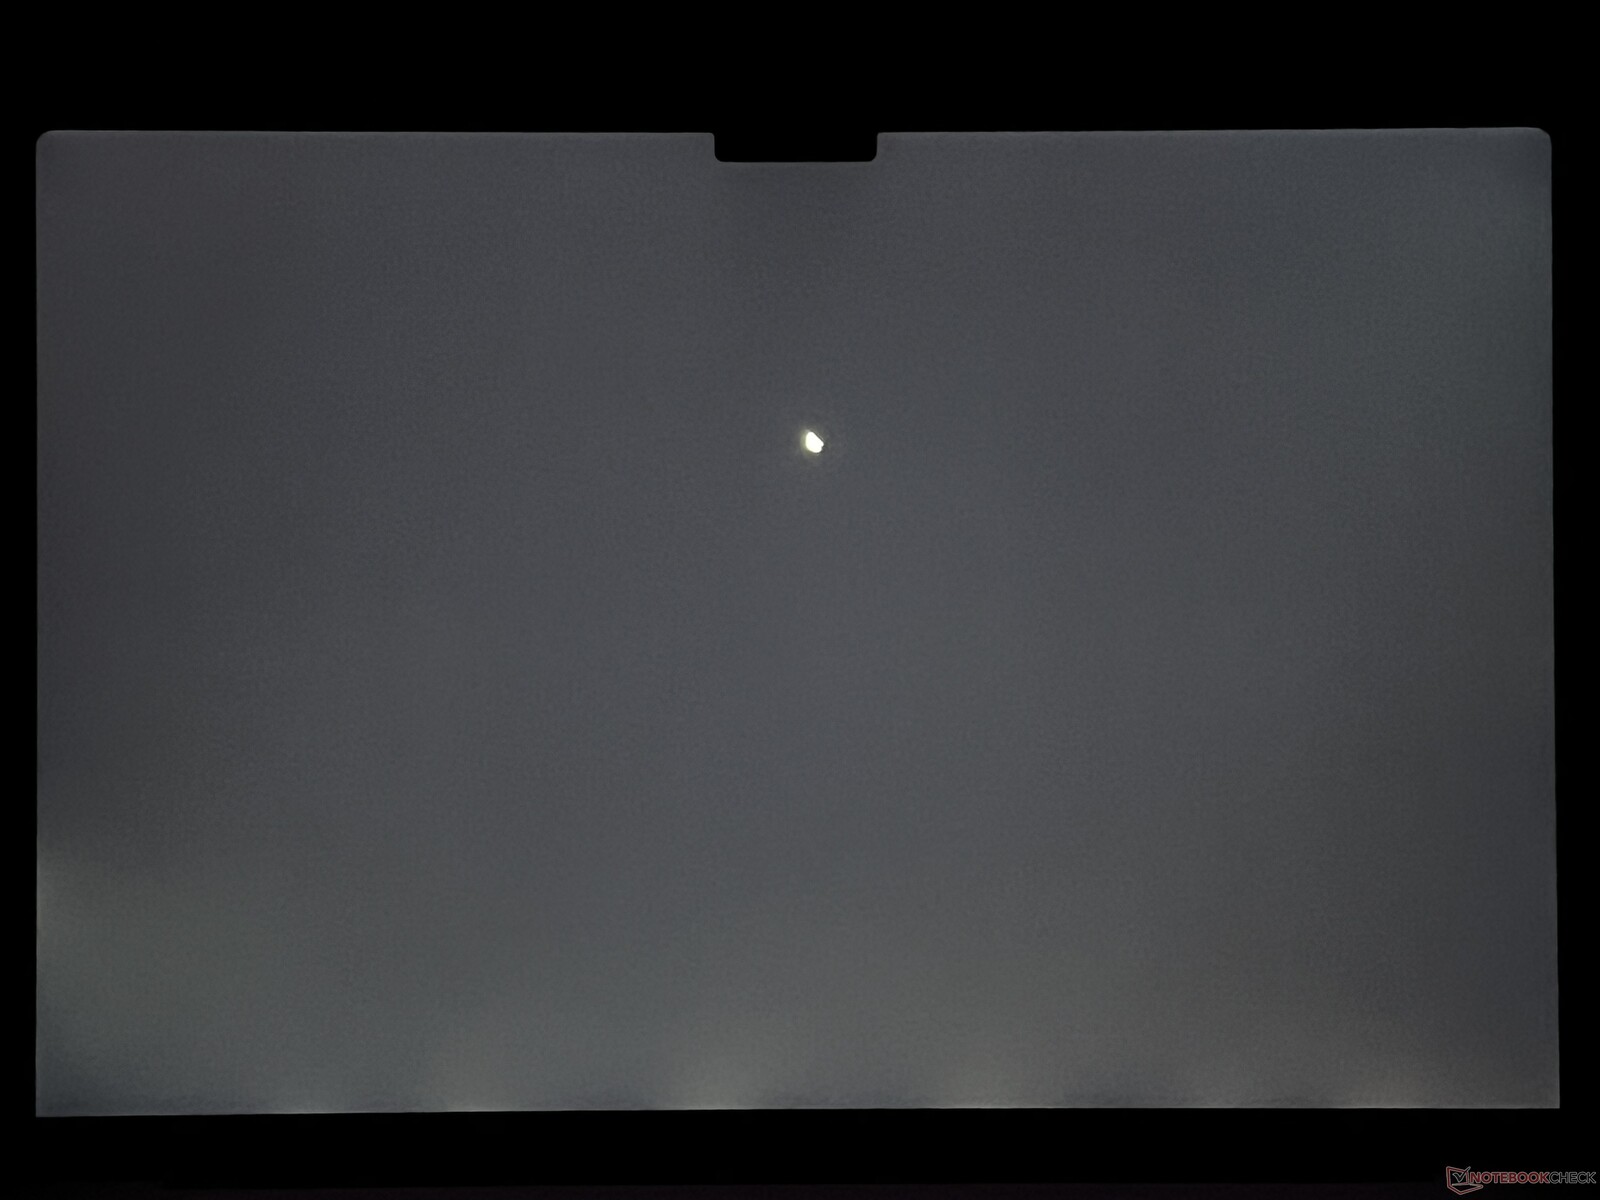
The black value of the IPS panel is on the higher side at 0.39 cd/m², which is why the contrast ratio is "only" ~1300:1. Slight halos can be seen at the bottom edge on a dark background, but they appear enhanced in our photos (due to the camera). The response times are perfectly fine for an everyday device, and we didn't notice any PWM flickering on the IPS panel either. Both the brightness and the color temperature are controlled automatically, which no Windows laptop can do satisfactorily. However, the Air has to do without the 120 Hz ProMotion technology.
| |||||||||||||||||||||||||
Brightness Distribution: 93 %
Center on Battery: 513 cd/m²
Contrast: 1326:1 (Black: 0.39 cd/m²)
ΔE ColorChecker Calman: 1.2 | ∀{0.5-29.43 Ø4.72}
calibrated: 0.8
ΔE Greyscale Calman: 1.8 | ∀{0.09-98 Ø4.97}
87.9% AdobeRGB 1998 (Argyll 3D)
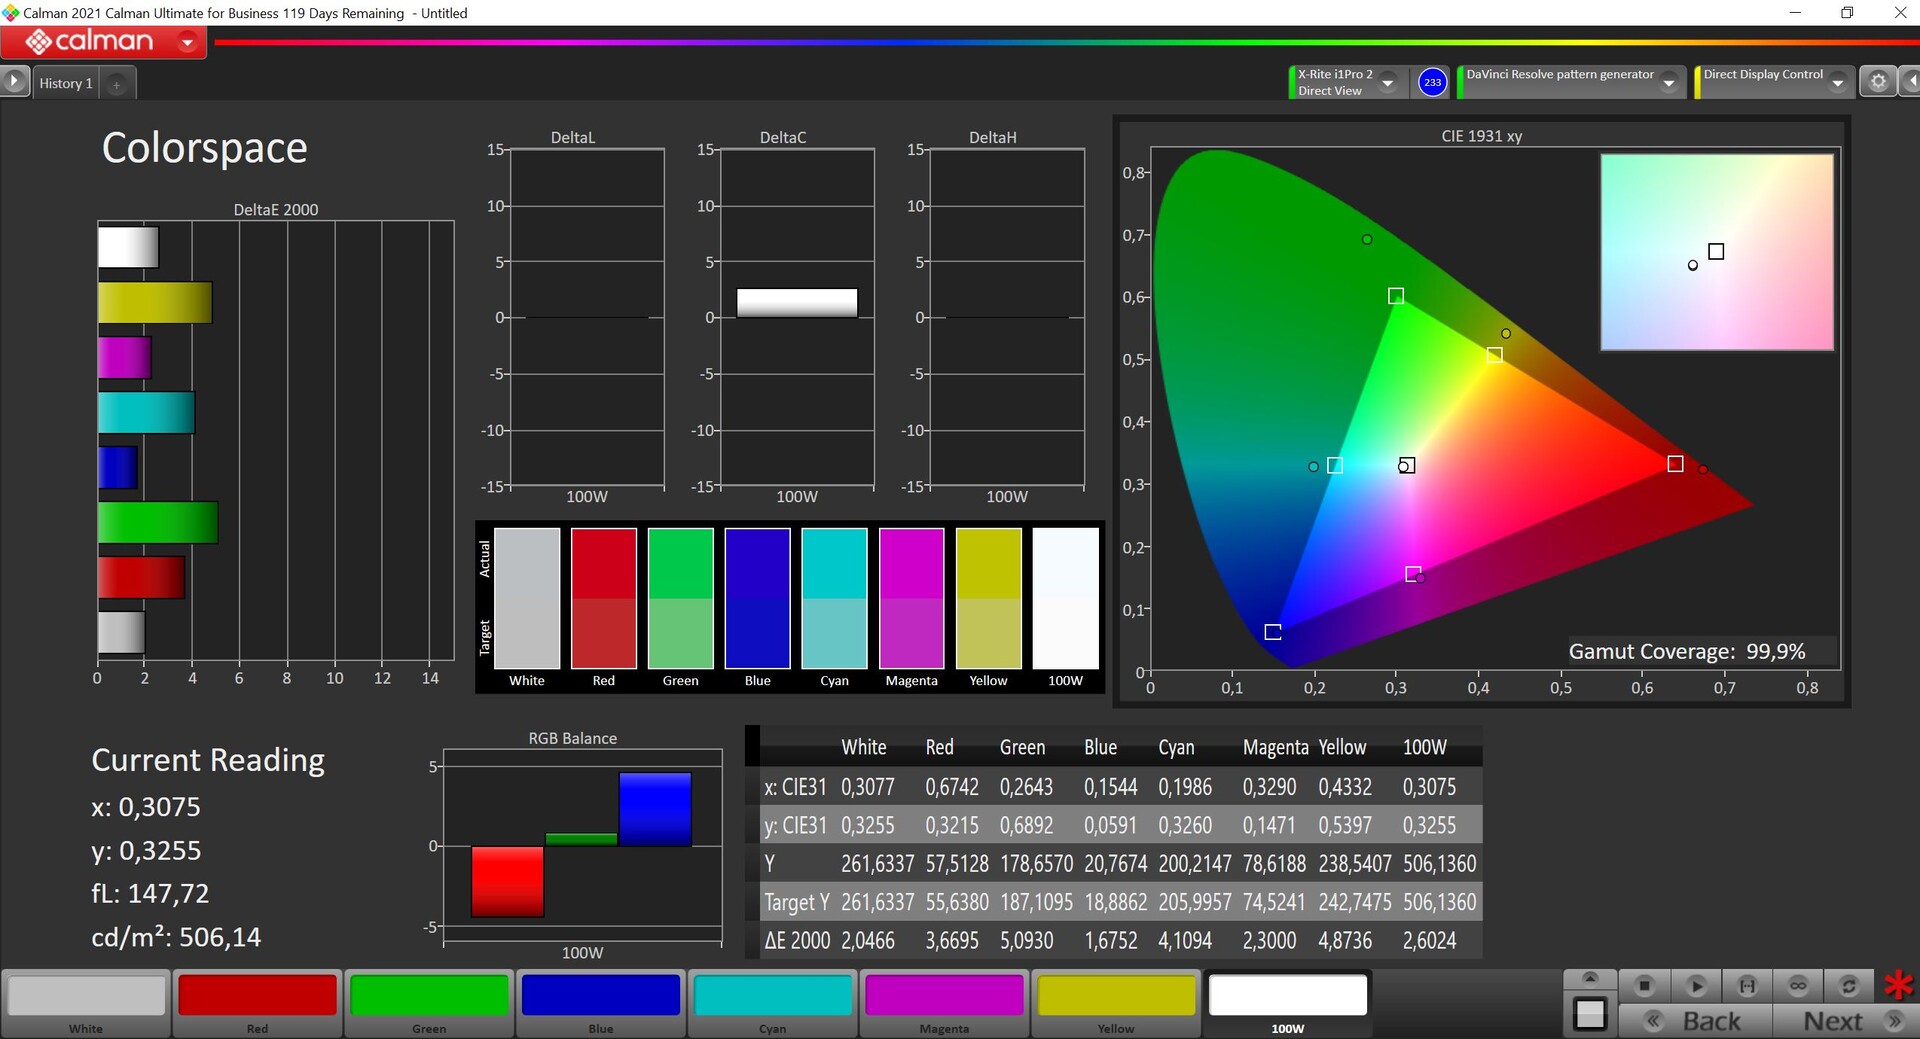
99.9% sRGB (Argyll 3D)
98.7% Display P3 (Argyll 3D)
Gamma: 2.24
| Apple MacBook Air 15 2023 M2 16 GB IPS, 2880x1864, 15.3" | Microsoft Surface Laptop 5 15, i7-1255U LQ150P1JX51, IPS, 2496x1664, 15" | LG Gram 15Z90Q LG LP156WFC-SPZ2 (LGD0706), IPS, 1920x1080, 15.6" | Asus VivoBook S15 M3502RA-L1029W Samsung SDC4161, OLED, 1920x1080, 15.6" | Apple MacBook Air M2 Entry IPS, 2560x1664, 13.6" | Apple MacBook Pro 16 2021 M1 Pro Liquid Retina XDR, Mini-LED, 3456x2234, 16.2" | Apple MacBook Pro 14 2023 M2 Pro Mini-LED, 3024x1964, 14.2" | |
|---|---|---|---|---|---|---|---|
| Display | -18% | -22% | 4% | 0% | 0% | 1% | |
| Display P3 Coverage (%) | 98.7 | 68.1 -31% | 63.5 -36% | 99.9 1% | 98.4 0% | 99.1 0% | 99.2 1% |
| sRGB Coverage (%) | 99.9 | 97.3 -3% | 95 -5% | 100 0% | 99.9 0% | 100 0% | |
| AdobeRGB 1998 Coverage (%) | 87.9 | 70.3 -20% | 65.1 -26% | 98.6 12% | 87.6 0% | 88 0% | |
| Response Times | -67% | -36% | 93% | -23% | -217% | -31% | |
| Response Time Grey 50% / Grey 80% * (ms) | 28.8 ? | 52.4 ? -82% | 48.4 ? -68% | 0.74 97% | 32.9 ? -14% | 42.8 ? -49% | 35.2 ? -22% |
| Response Time Black / White * (ms) | 18.9 ? | 28.7 ? -52% | 19.6 ? -4% | 2 ? 89% | 24.9 ? -32% | 91.6 ? -385% | 26.4 ? -40% |
| PWM Frequency (Hz) | 22000 ? | 59 ? | 14880 | 14880 ? | |||
| Screen | 12% | -44% | -63% | -2% | 235% | 235% | |
| Brightness middle (cd/m²) | 517 | 397 -23% | 420 -19% | 378 -27% | 526 2% | 514 -1% | 500 -3% |
| Brightness (cd/m²) | 501 | 399 -20% | 399 -20% | 378 -25% | 486 -3% | 497 -1% | 489 -2% |
| Brightness Distribution (%) | 93 | 85 -9% | 88 -5% | 98 5% | 87 -6% | 95 2% | 94 1% |
| Black Level * (cd/m²) | 0.39 | 0.29 26% | 0.32 18% | 0.38 3% | 0.02 95% | 0.02 95% | |
| Contrast (:1) | 1326 | 1369 3% | 1313 -1% | 1384 4% | 25700 1838% | 25000 1785% | |
| Colorchecker dE 2000 * | 1.2 | 0.8 33% | 2.51 -109% | 2.2 -83% | 1.3 -8% | 1.4 -17% | 1.2 -0% |
| Colorchecker dE 2000 max. * | 2.5 | 1.4 44% | 6.64 -166% | 4.87 -95% | 2.7 -8% | 2.8 -12% | 2.6 -4% |
| Colorchecker dE 2000 calibrated * | 0.8 | 0.89 -11% | 2.68 -235% | 0.7 13% | |||
| Greyscale dE 2000 * | 1.8 | 1.1 39% | 3.3 -83% | 1.43 21% | 2 -11% | 2.3 -28% | 1.7 6% |
| Gamma | 2.24 98% | 2.18 101% | 2.052 107% | 2.47 89% | 2.25 98% | 2.27 97% | 2.24 98% |
| CCT | 6705 97% | 6921 94% | 6464 101% | 6858 95% | 6792 96% | 6791 96% | |
| Total Average (Program / Settings) | -24% /
-7% | -34% /
-38% | 11% /
-20% | -8% /
-4% | 6% /
111% | 68% /
165% |
* ... smaller is better
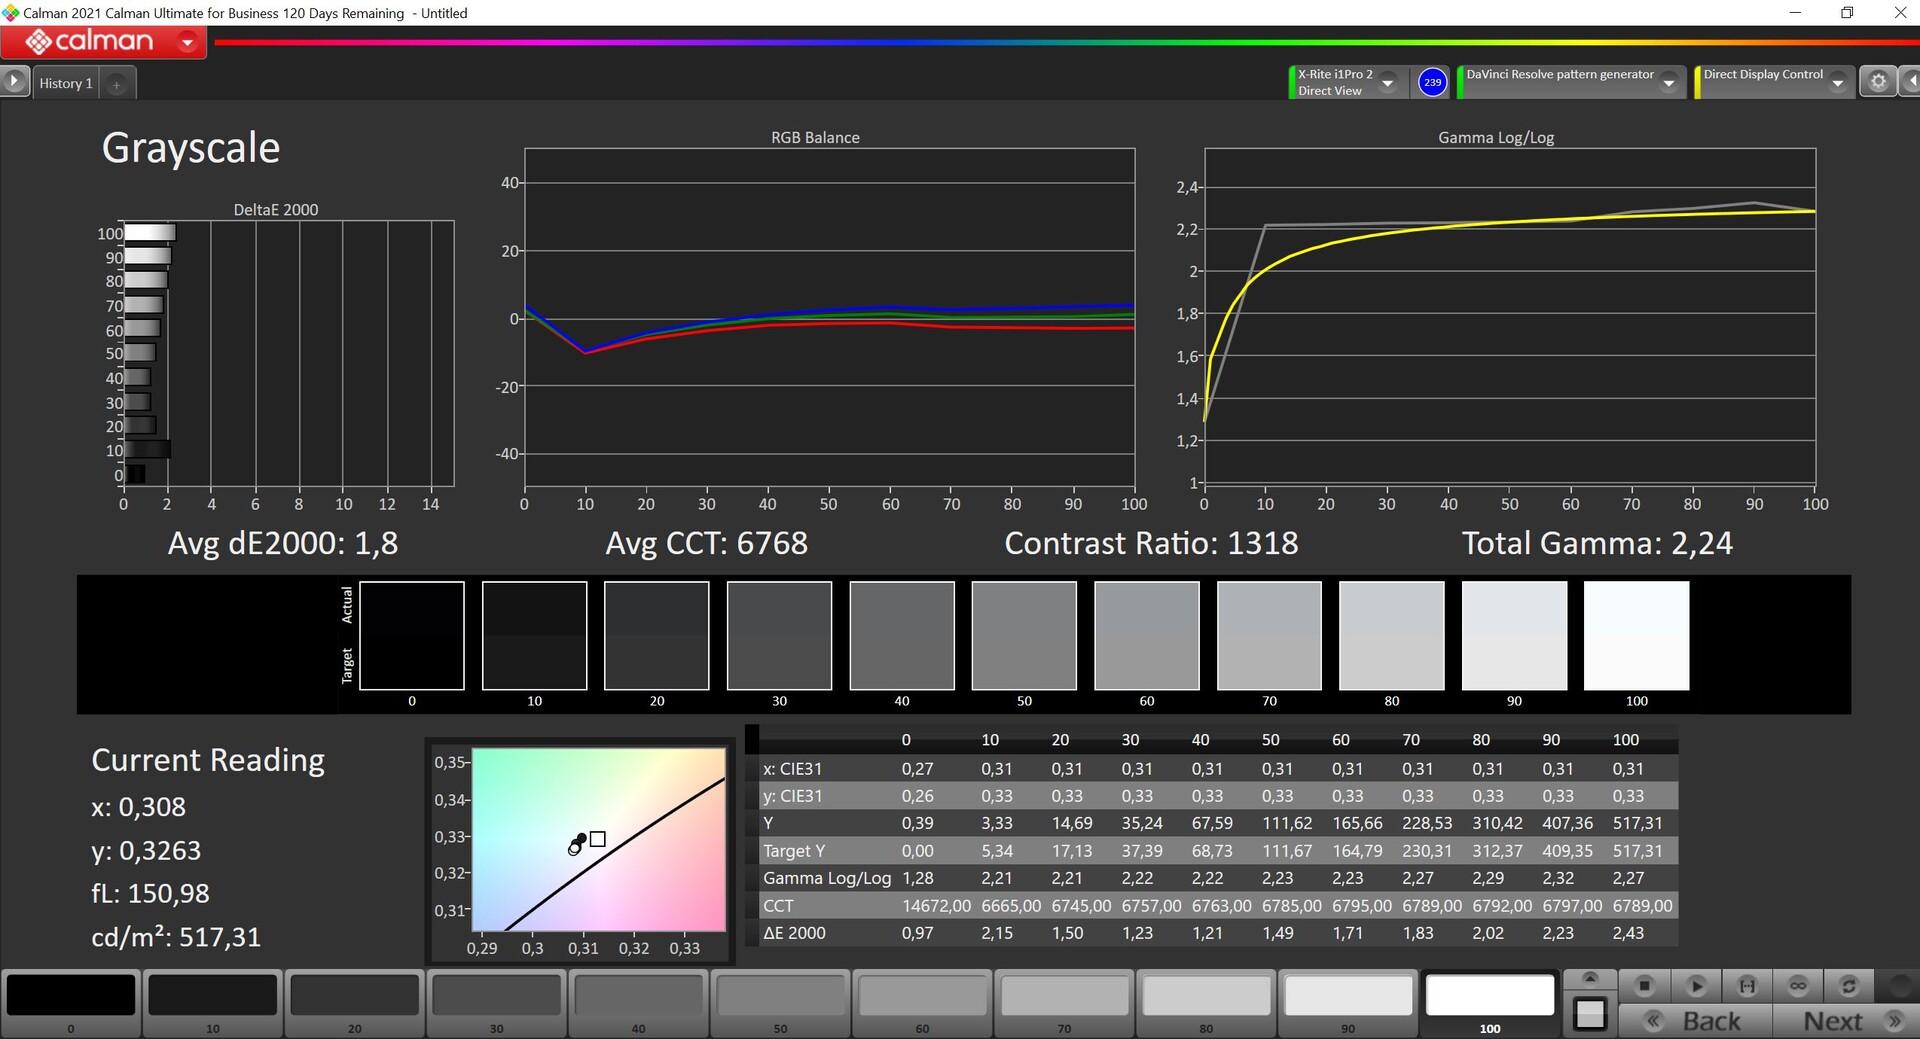
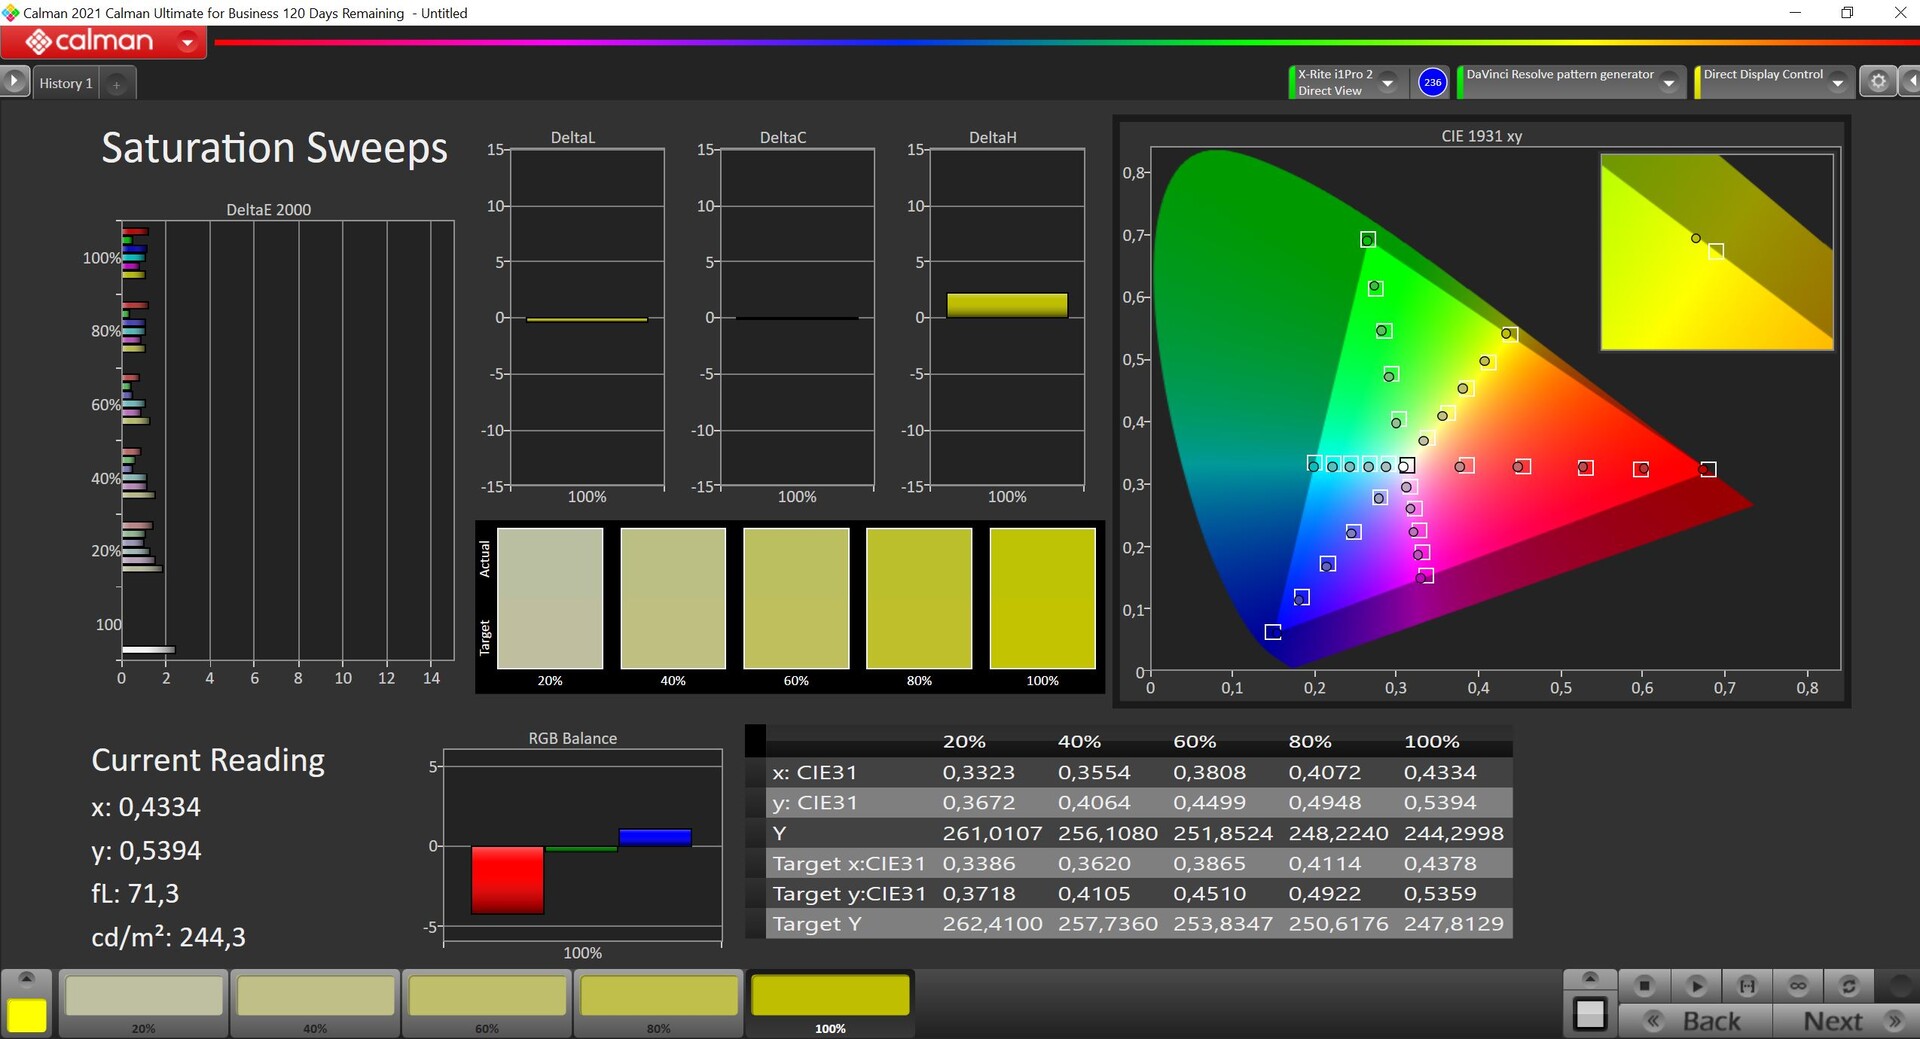
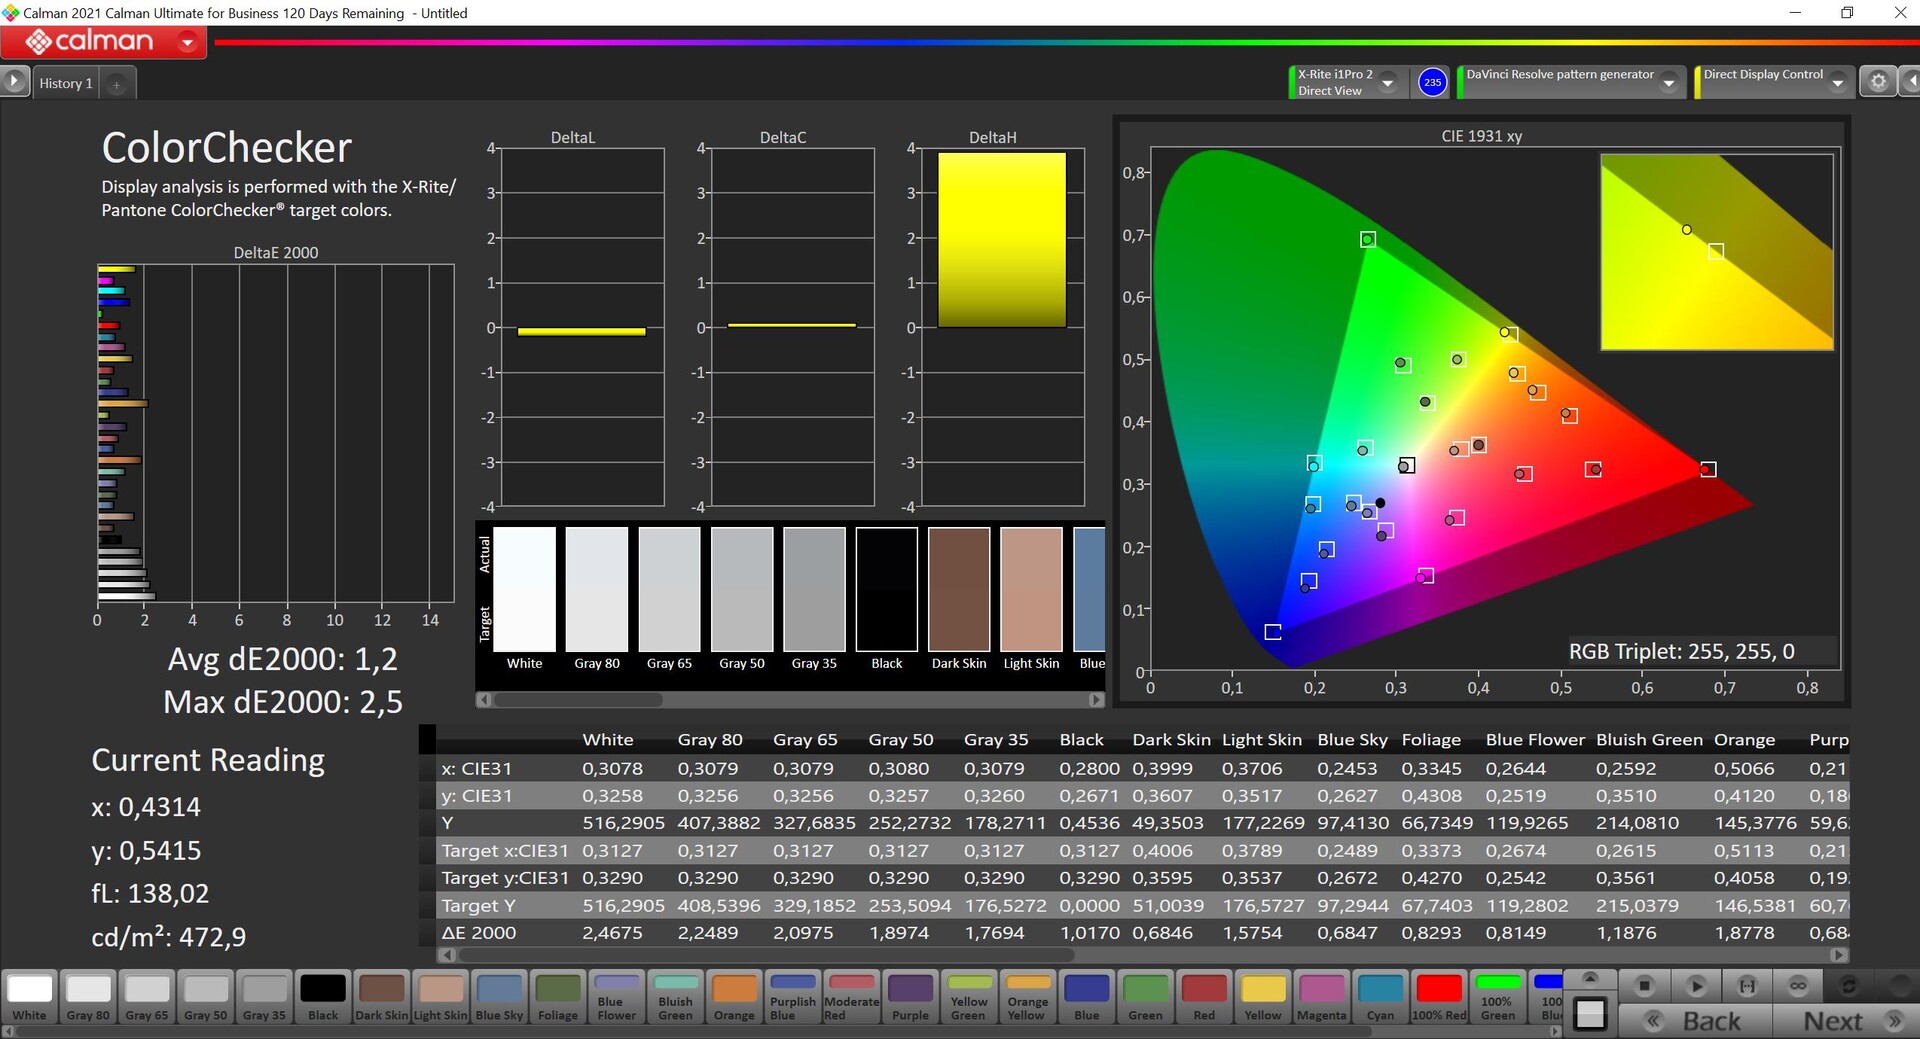
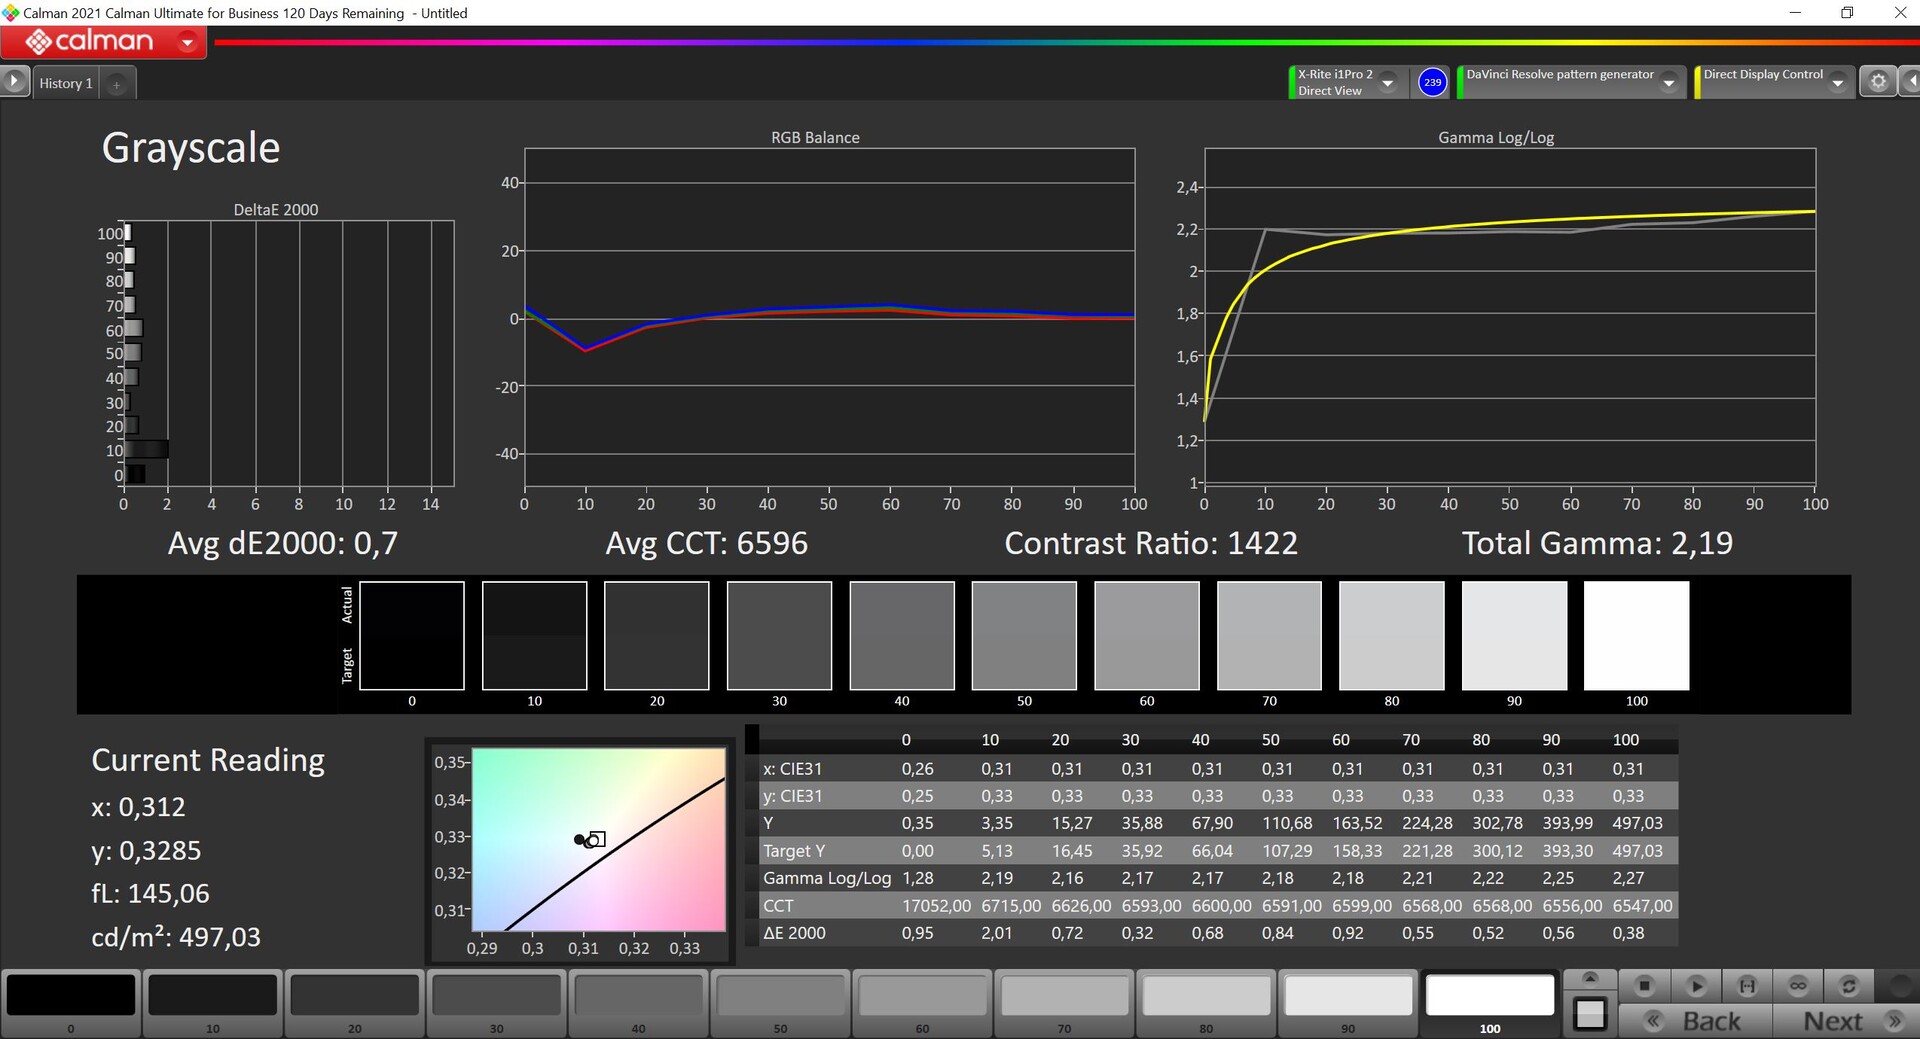
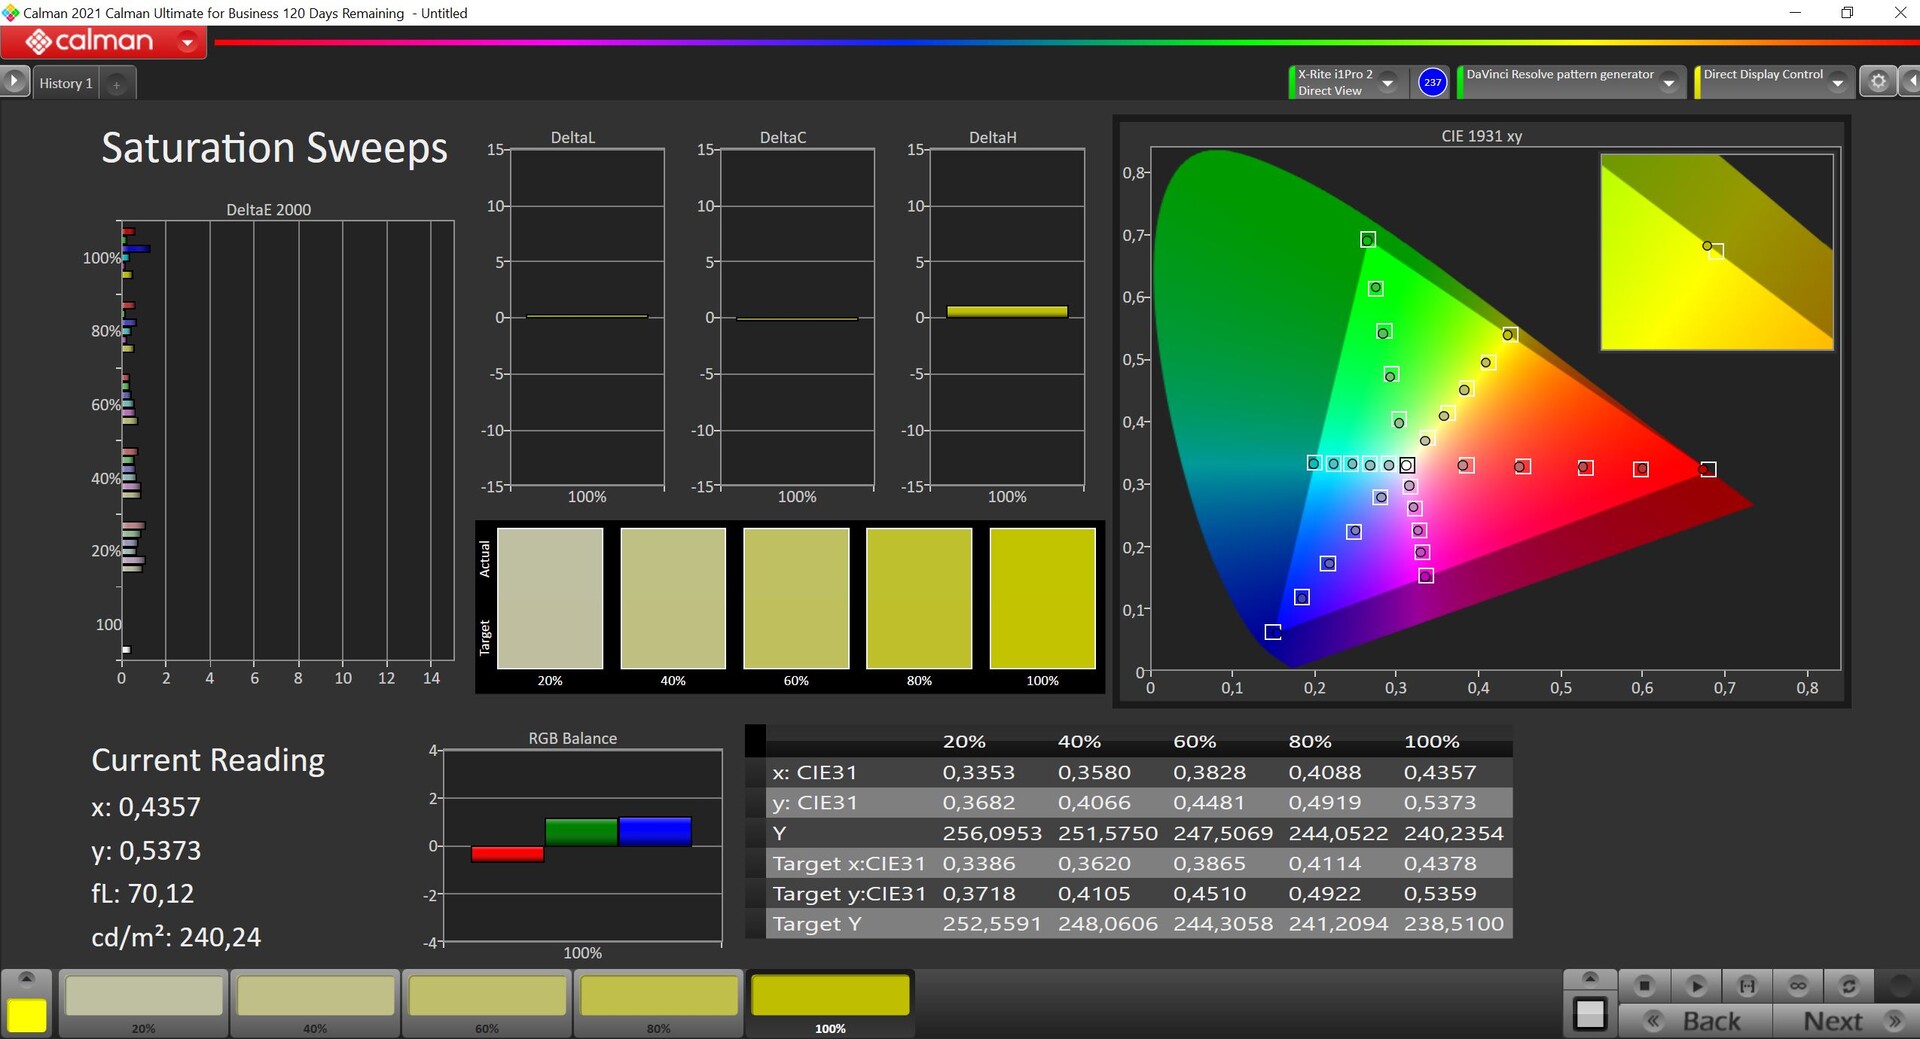

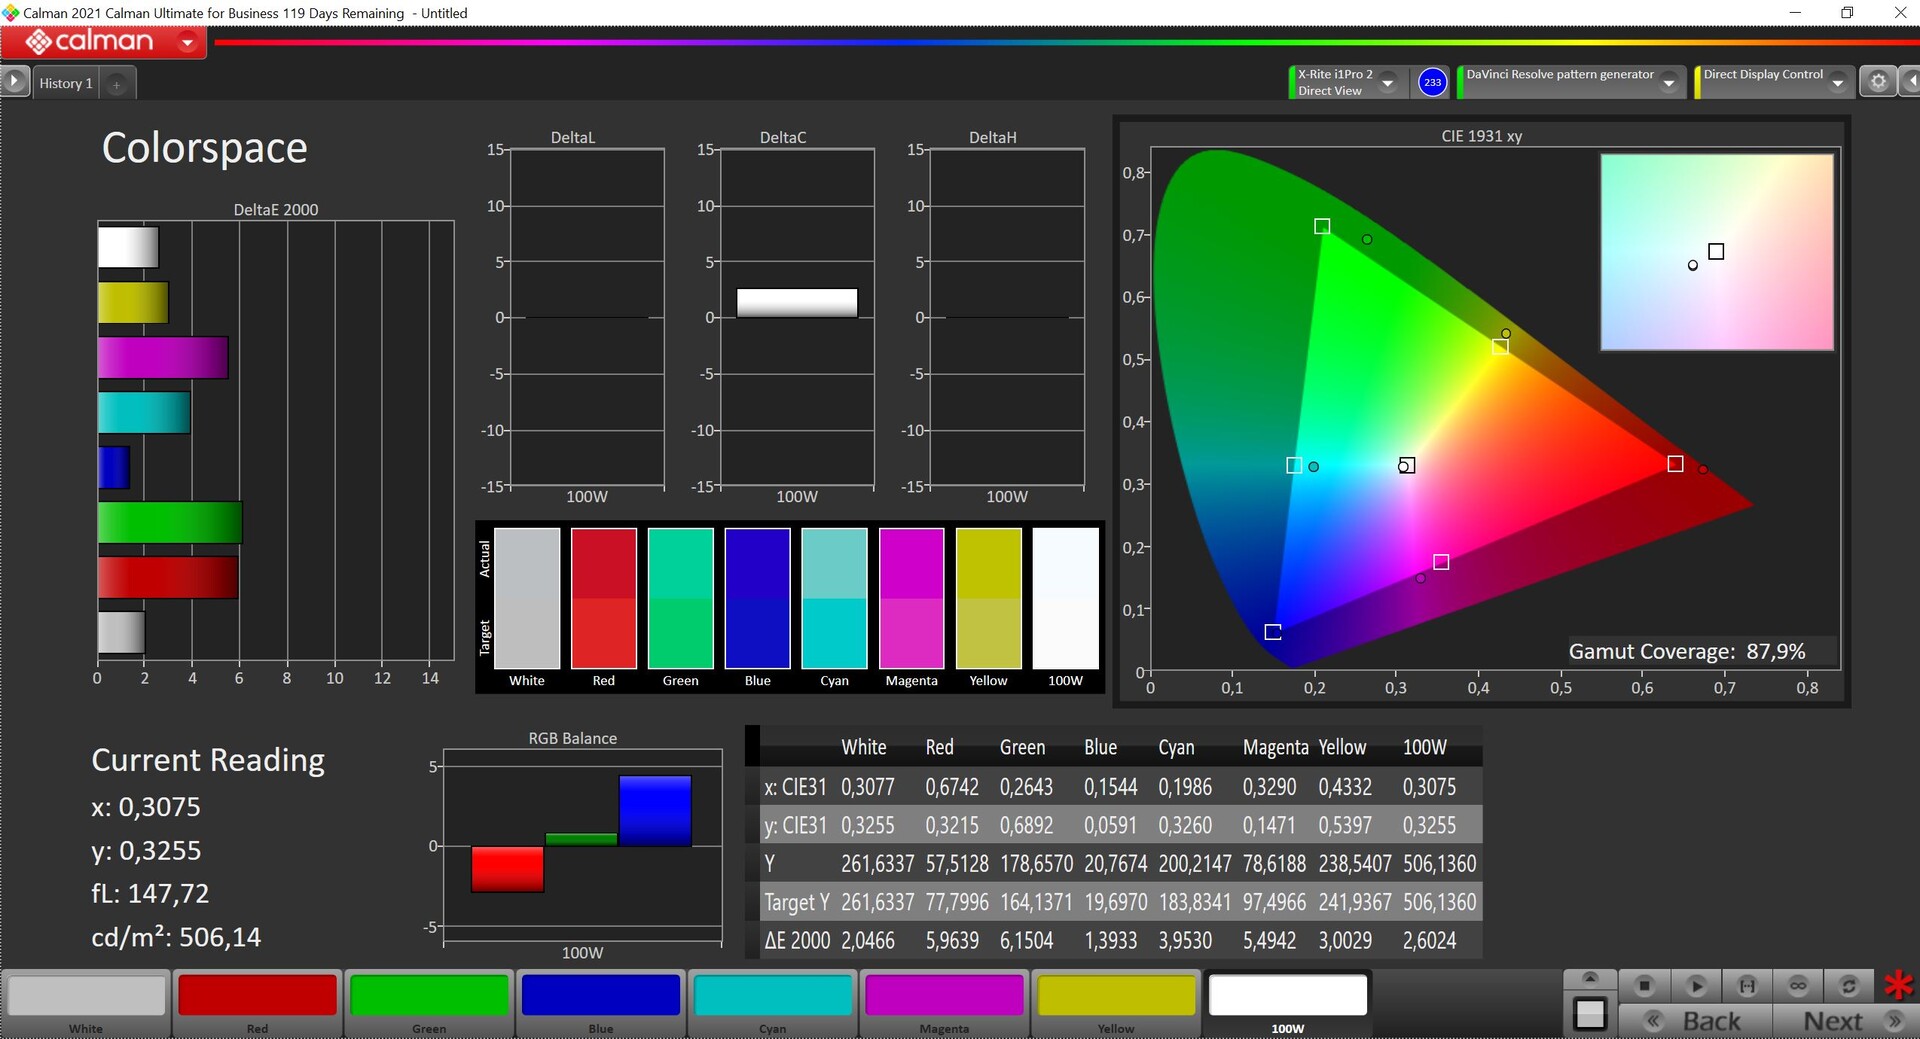
The MacBook Air is already very well calibrated out of the box. We measured the panel using professional CalMAN software (X-Rite i1 Pro 2). Both the deviations of the grayscale and the colors compared to the P3 reference color space are already below 3, so the human eye cannot distinguish any differences to the reference colors. However, there is a minimal blue cast in conjunction with a color temperature that is a little too cool. We were able to eliminate these minor flaws and improve the display a little more overall with our own calibration (profile is available for free download above). The sRGB and P3 color spaces are completely covered.
Display Response Times
| ↔ Response Time Black to White | ||
|---|---|---|
| 18.9 ms ... rise ↗ and fall ↘ combined | ↗ 8.5 ms rise | 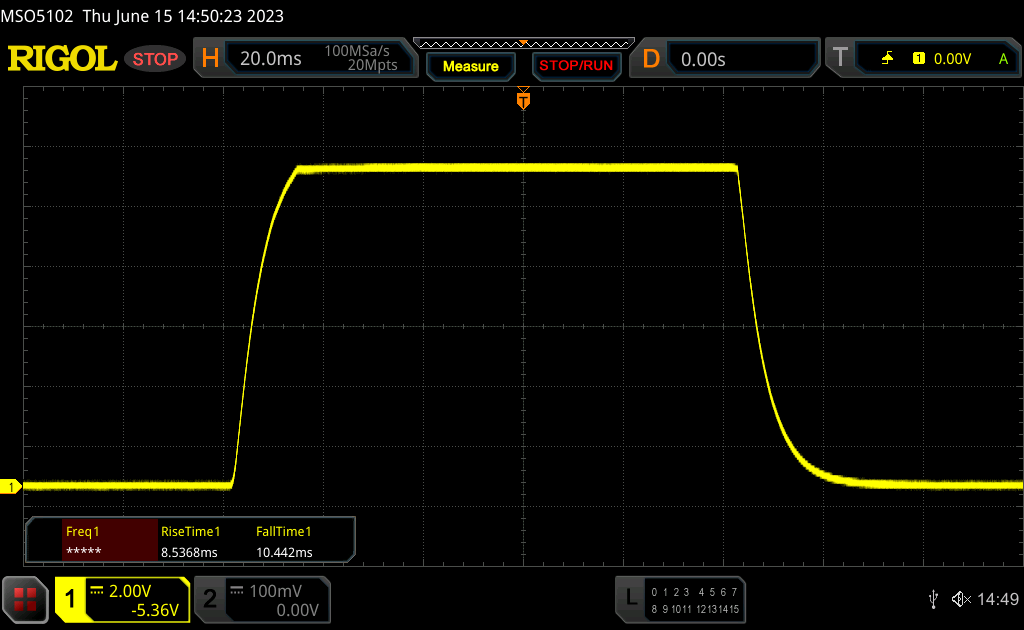 |
| ↘ 10.4 ms fall | ||
| The screen shows good response rates in our tests, but may be too slow for competitive gamers. In comparison, all tested devices range from 0.1 (minimum) to 240 (maximum) ms. » 42 % of all devices are better. This means that the measured response time is similar to the average of all tested devices (19.8 ms). | ||
| ↔ Response Time 50% Grey to 80% Grey | ||
| 28.8 ms ... rise ↗ and fall ↘ combined | ↗ 14.2 ms rise | 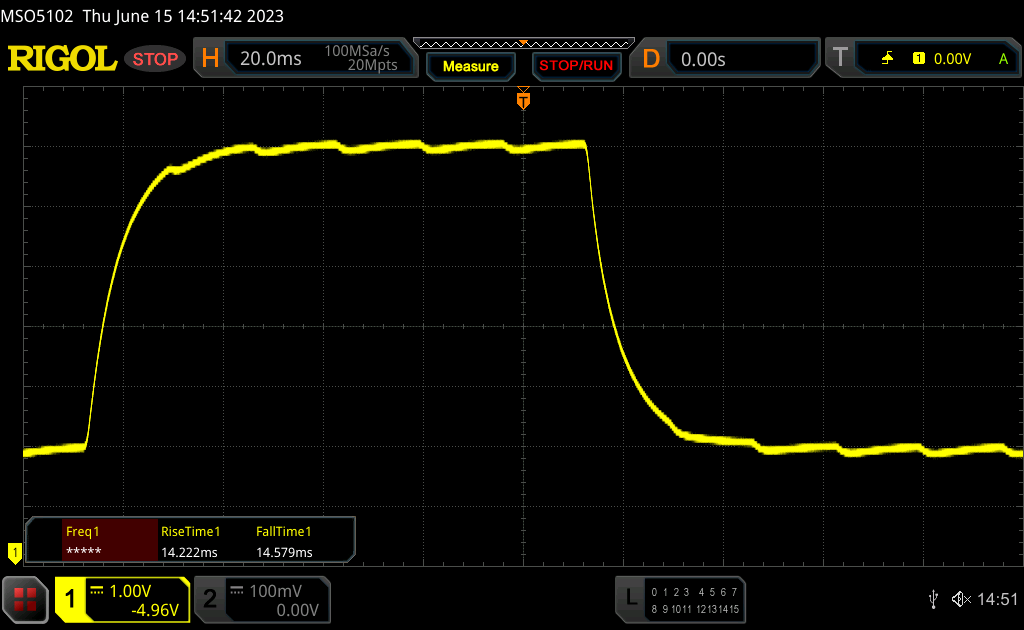 |
| ↘ 14.6 ms fall | ||
| The screen shows relatively slow response rates in our tests and may be too slow for gamers. In comparison, all tested devices range from 0.165 (minimum) to 636 (maximum) ms. » 39 % of all devices are better. This means that the measured response time is similar to the average of all tested devices (31 ms). | ||
Screen Flickering / PWM (Pulse-Width Modulation)
| Screen flickering / PWM not detected |  | ||
In comparison: 52 % of all tested devices do not use PWM to dim the display. If PWM was detected, an average of 7763 (minimum: 5 - maximum: 343500) Hz was measured. | |||
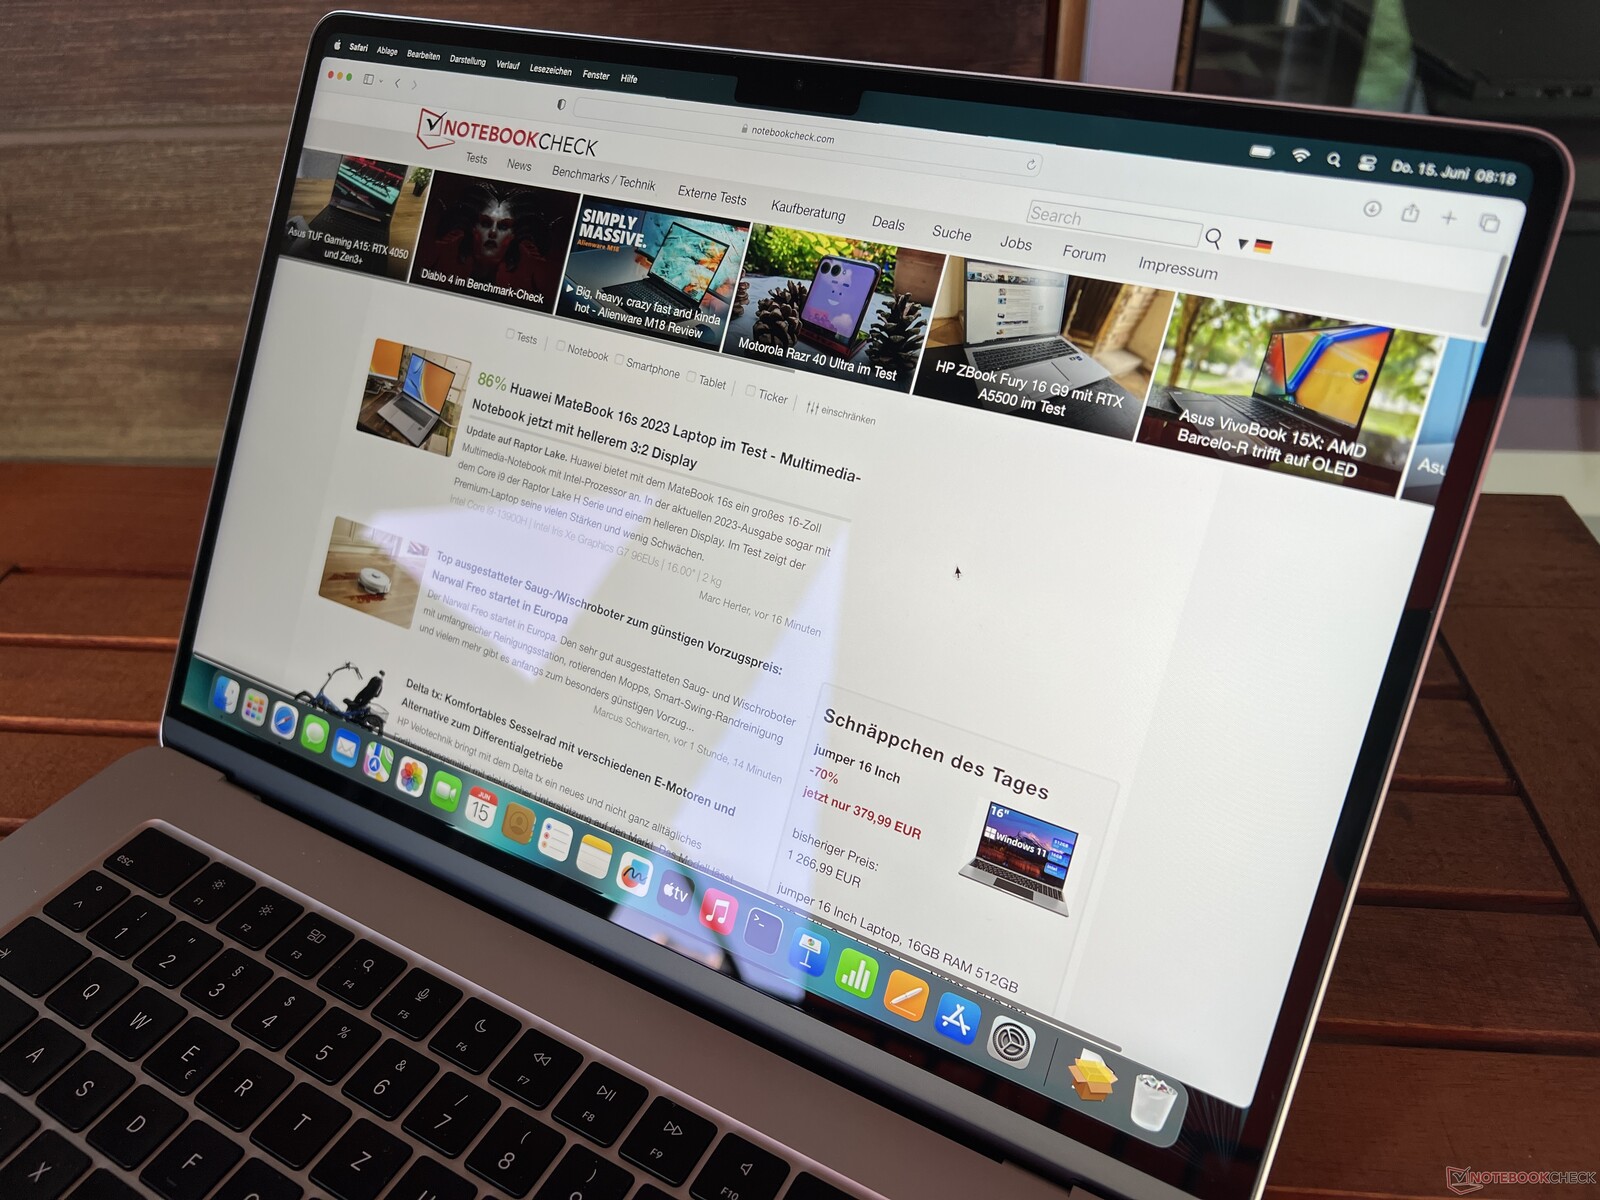
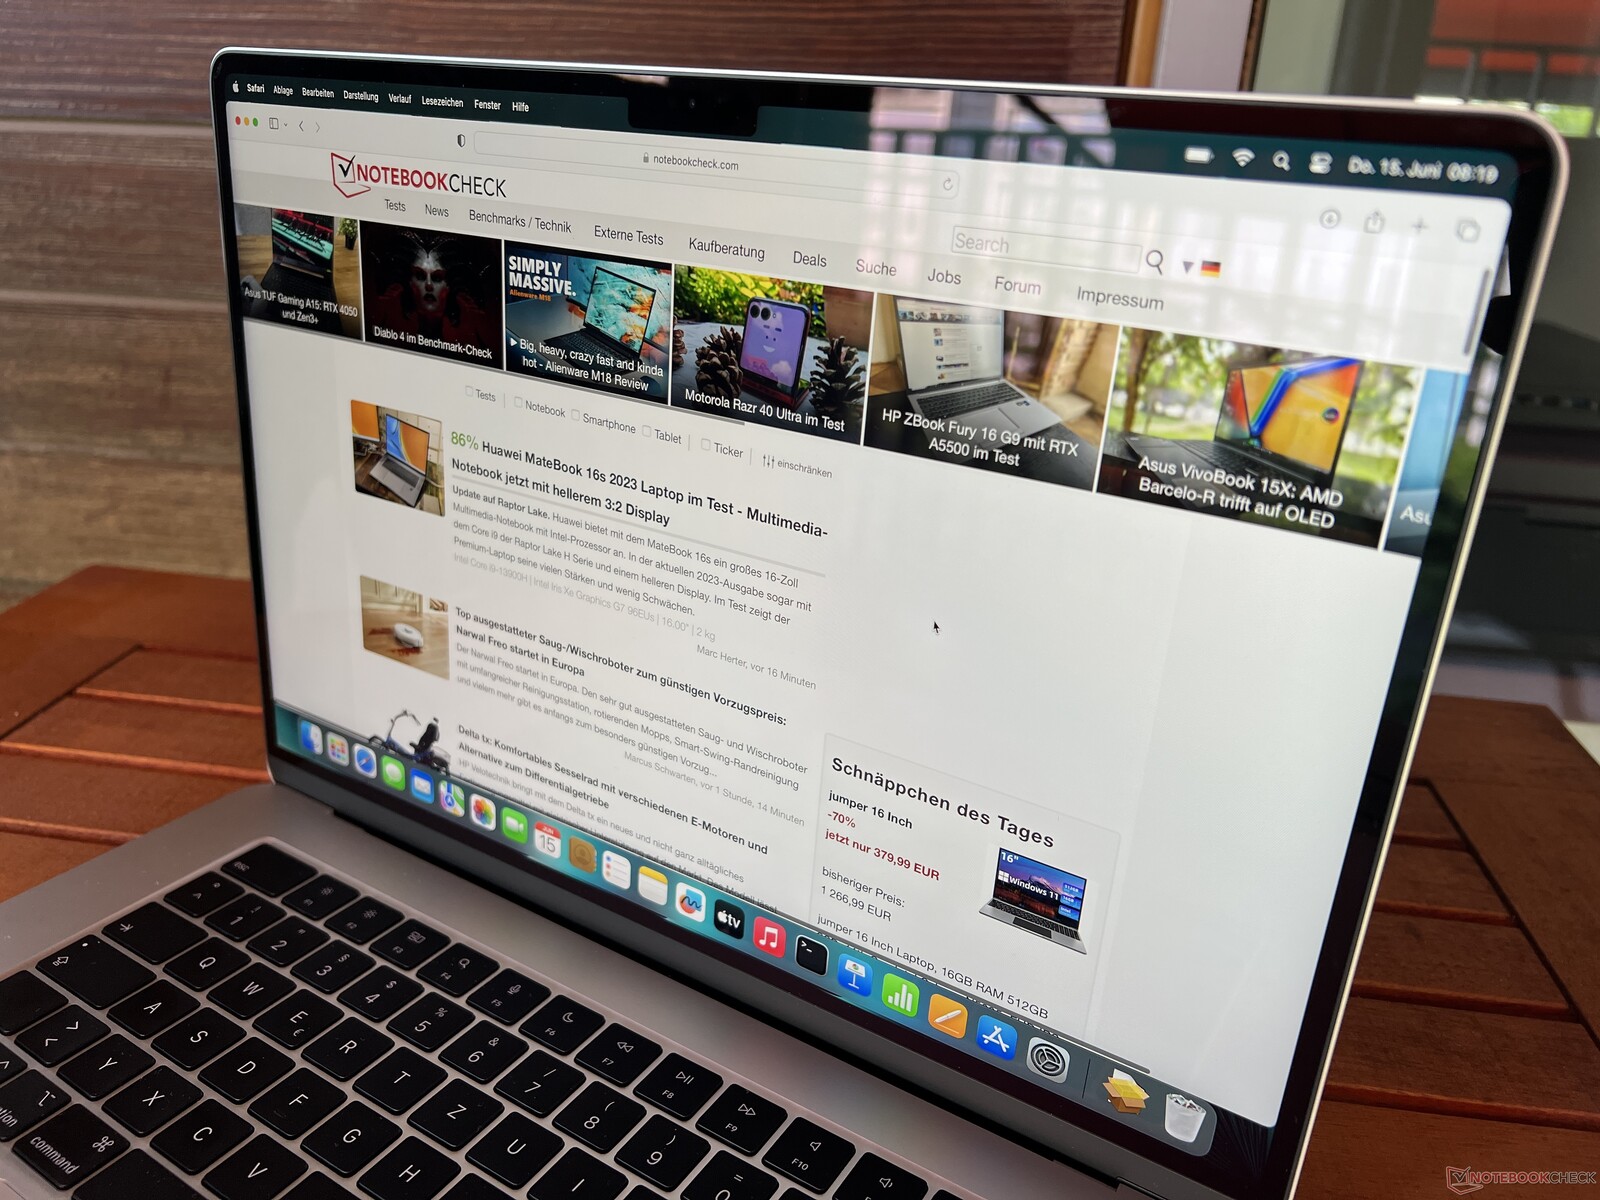
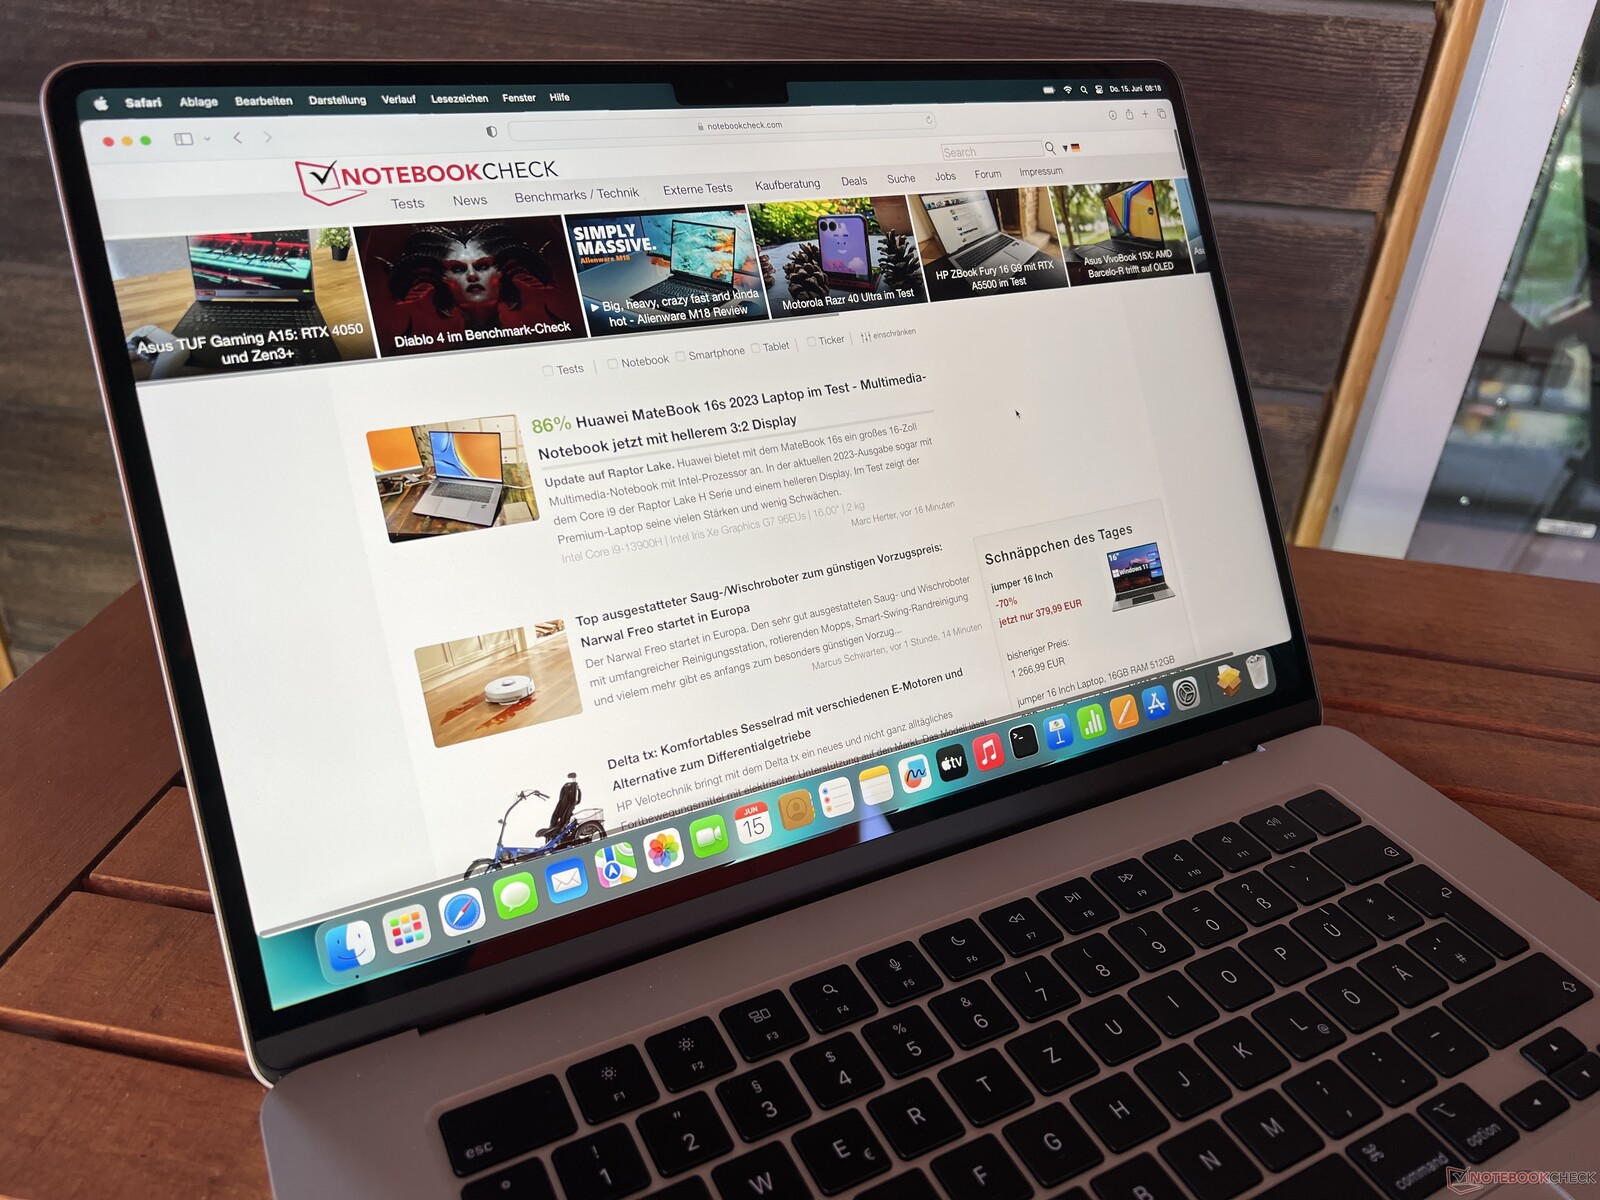
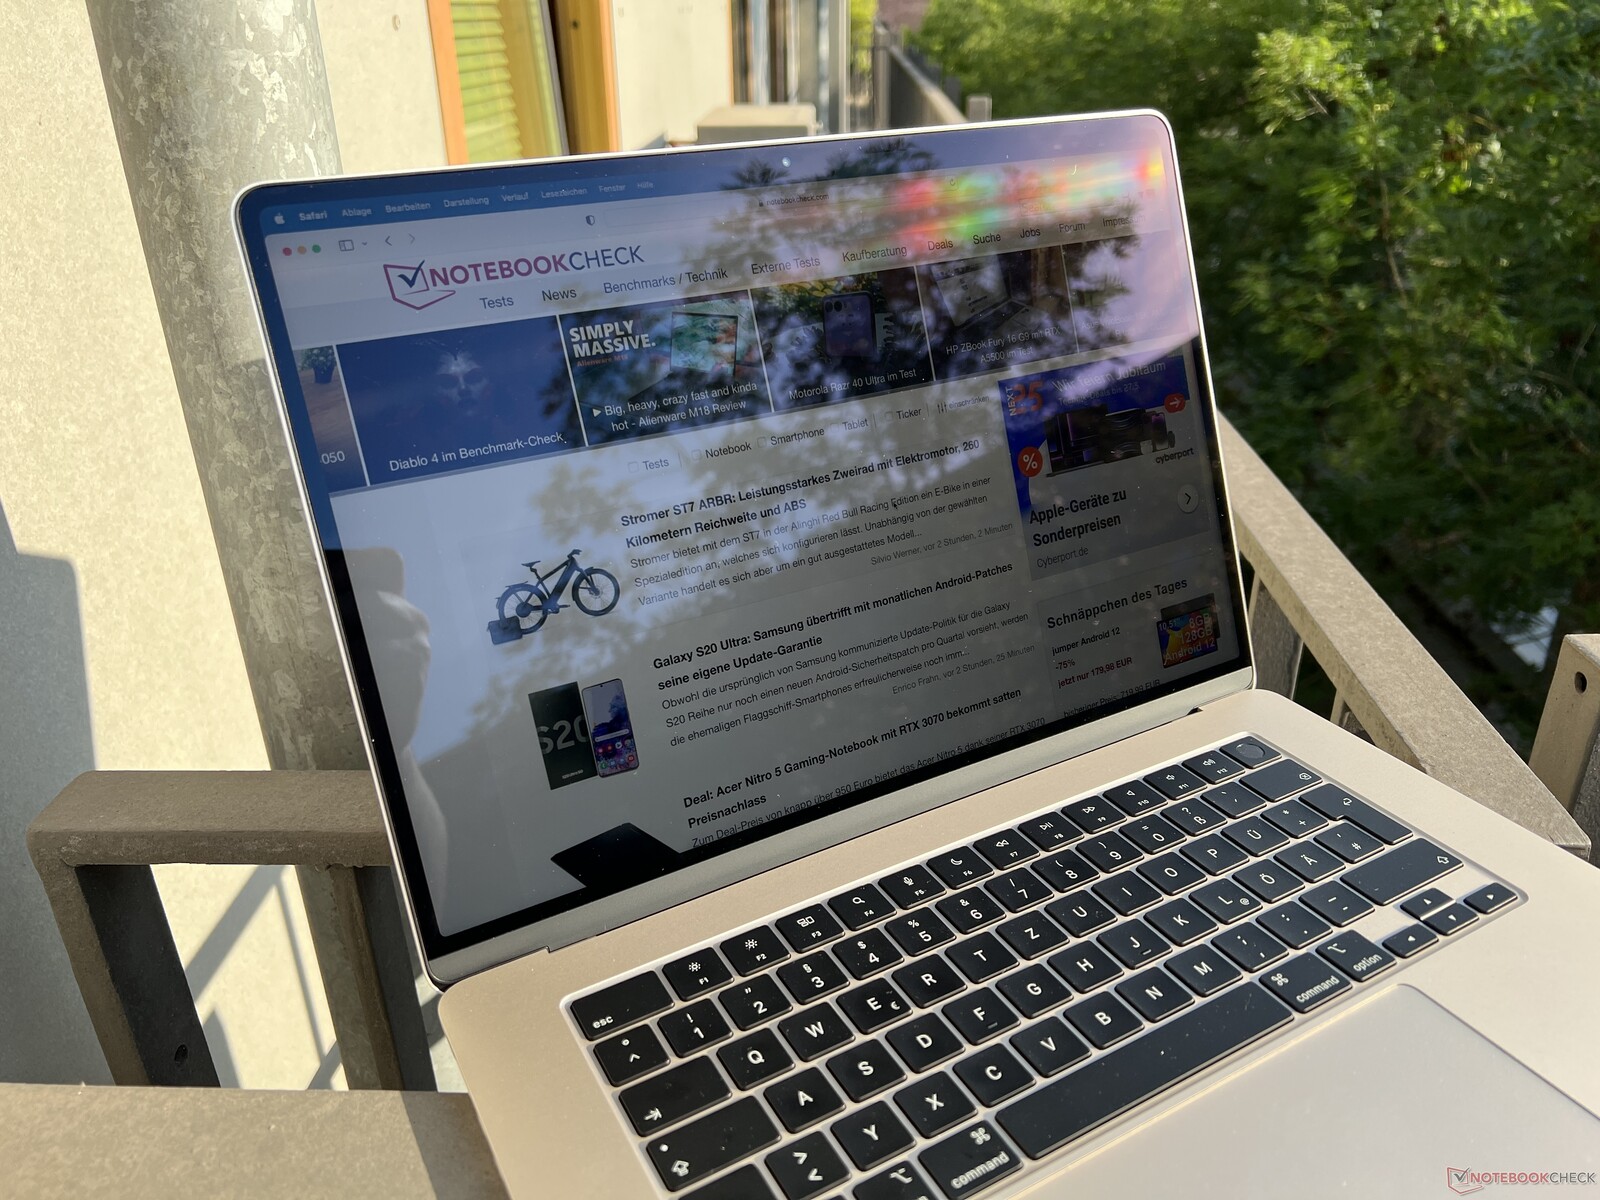
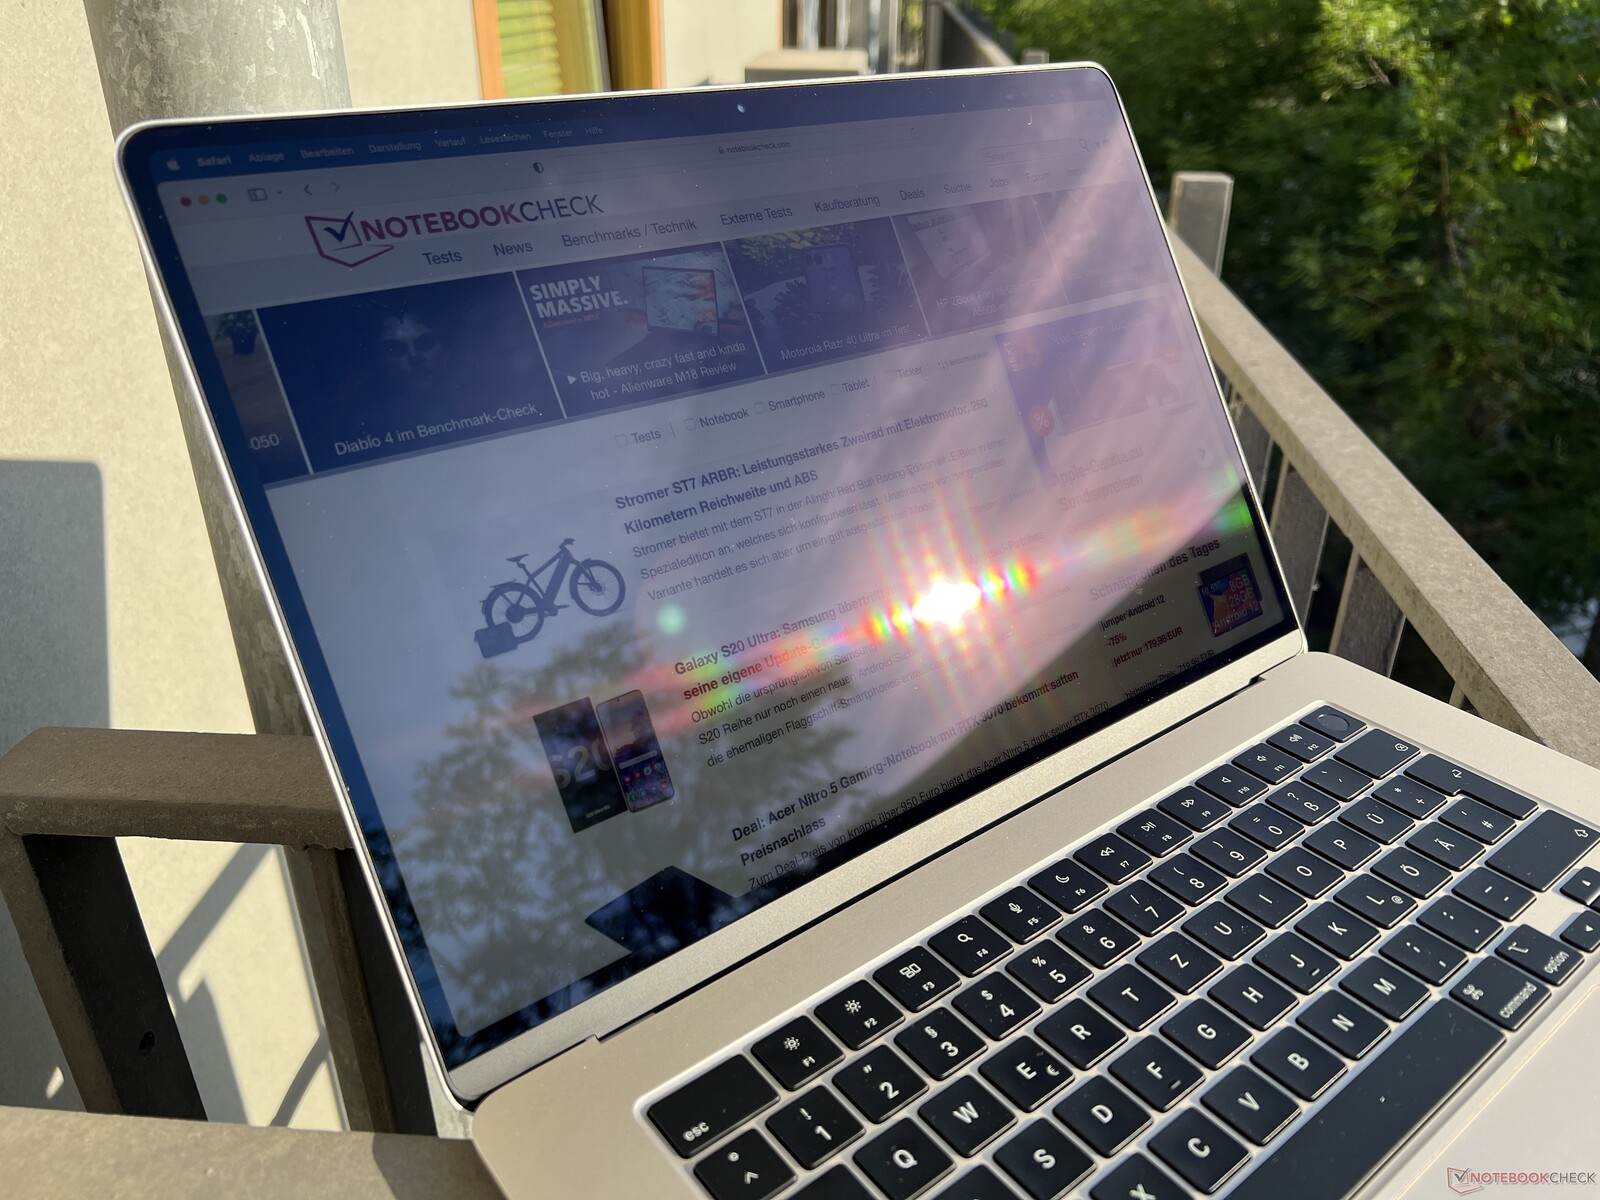
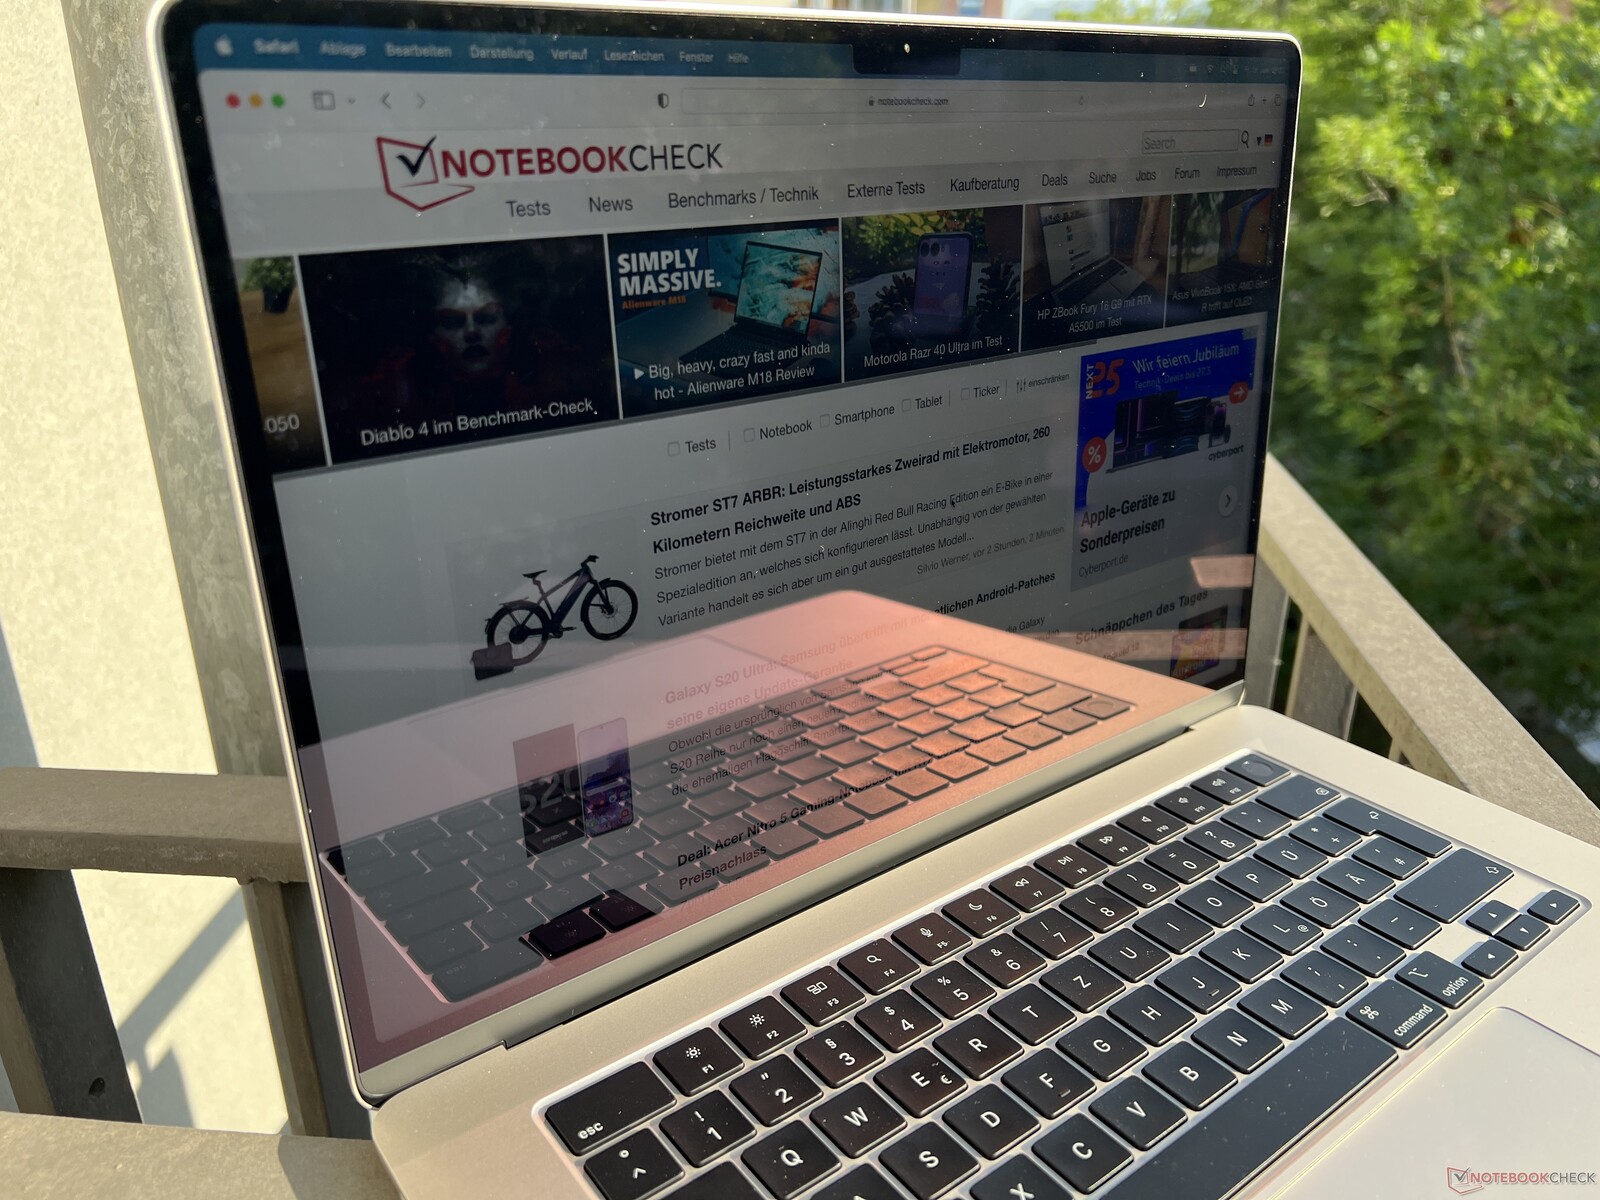
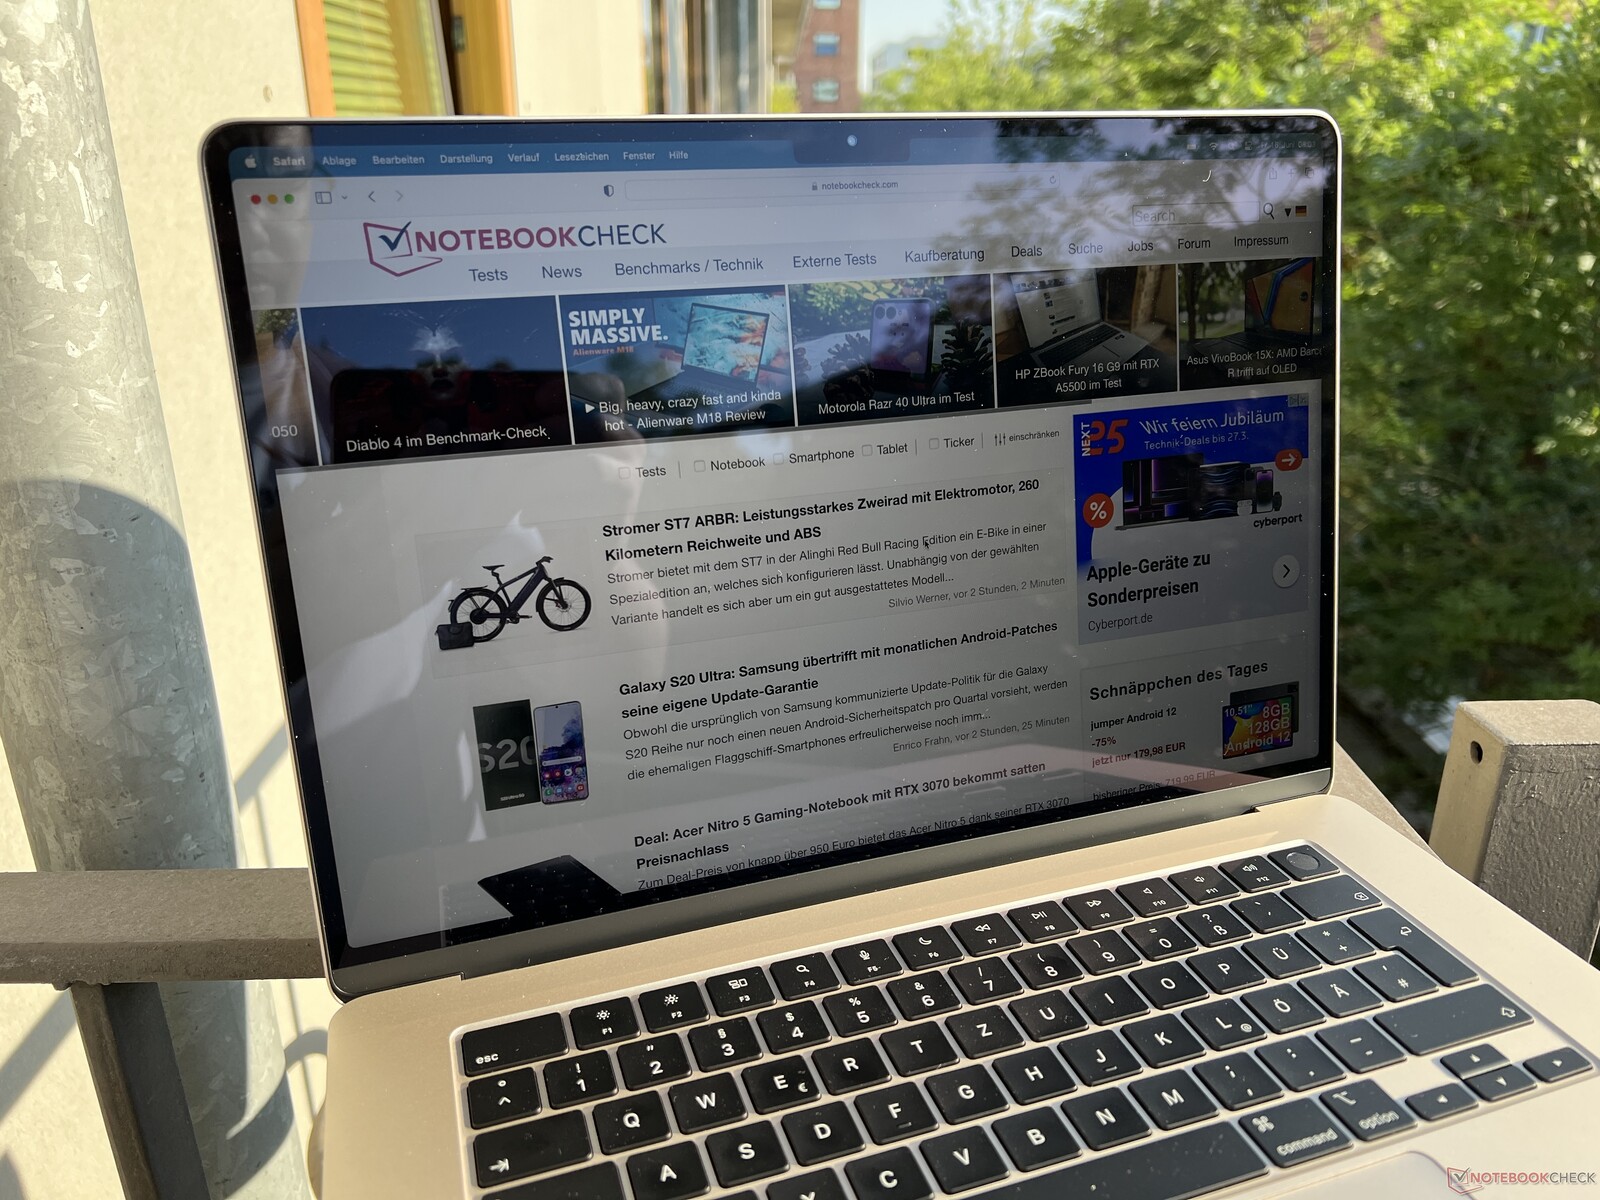
The display of the MacBook Air is glossy, but not as glossy as many other Windows laptops. Of course, reflections can still occur outdoors, but with the good brightness, you can always find a suitable position. The viewing angle stability is very good.

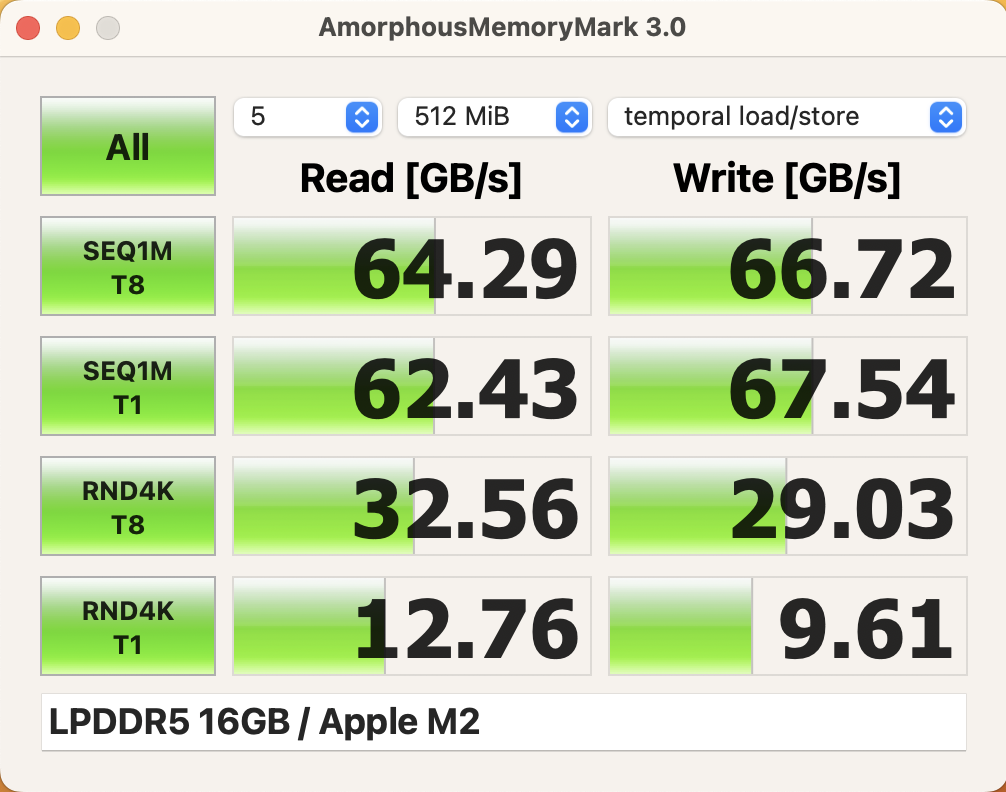
Performance - Apple M2 with 10 GPU cores
The MacBook Air 15 is exclusively available with the faster M2 chip, which is equipped with 10 GPU cores. The device can be configured with up to 24 GB of RAM and a 2 TB PCIe SSD, although the surcharges are huge as usual and the most expensive version costs EUR 2979 (~US$3250).
Processor
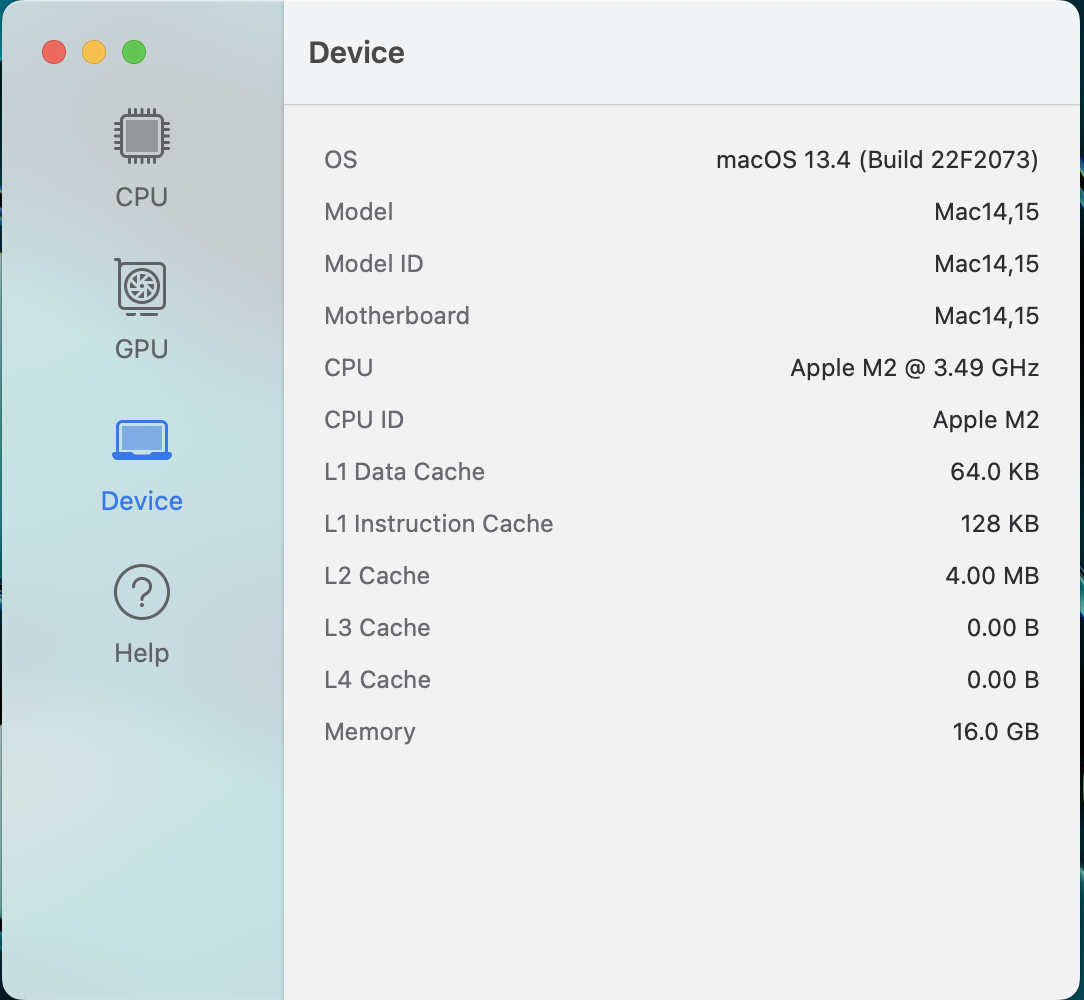
As mentioned at the beginning, only the stronger M2 SoC with 10 GPU cores is used in the larger MacBook Air. The processor offers 8 cores, divided into two clusters with 4 cores each. The four performance cores reach a maximum of ~3.5 GHz and the four efficiency cores a maximum of 2.4 GHz. The M2 can consume up to 20 watts for short periods of time, but only 9 watts under sustained load.
So the processor is already a year old, which is why there are no surprises in terms of performance here. The only question is whether the passive cooling benefits from the larger case and whether the performance remains stable for longer. The answer here is no, although the currently very summery temperatures (up to 30°C/80°F) may have a minor influence here. Overall, both the results in short benchmarks and long-term load are on par with the smaller MacBook Air M2. The Surface Laptop 5 with its Core i7-1255U is only marginally faster in native benchmarks, such as Cinebench R23, but the Core i5-1240P in LG's Gram 15 is slower.
CPU performance does not drop in battery mode. More benchmarks are available in our tech section.
Cinebench R15 Multi Sustained Load
Cinebench R23: Multi Core | Single Core
Cinebench R20: CPU (Multi Core) | CPU (Single Core)
Cinebench R15: CPU Multi 64Bit | CPU Single 64Bit
Blender: v2.79 BMW27 CPU
Geekbench 5.5: Multi-Core | Single-Core
Blender: v3.3 Classroom CPU
| CPU Performance rating | |
| Average of class Subnotebook | |
| Asus VivoBook S15 M3502RA-L1029W | |
| Apple MacBook Pro 16 2021 M1 Pro -1! | |
| Apple MacBook Pro 14 2023 M2 Pro Entry | |
| Microsoft Surface Laptop 5 15, i7-1255U | |
| LG Gram 15Z90Q | |
| Apple MacBook Air 15 2023 M2 16 GB | |
| Average Apple M2 | |
| Apple MacBook Air M2 10C GPU | |
| Cinebench R23 / Multi Core | |
| Asus VivoBook S15 M3502RA-L1029W | |
| Apple MacBook Pro 16 2021 M1 Pro | |
| Average of class Subnotebook (1555 - 21812, n=59, last 2 years) | |
| Apple MacBook Pro 14 2023 M2 Pro Entry | |
| Microsoft Surface Laptop 5 15, i7-1255U | |
| Average Apple M2 (8517 - 8772, n=5) | |
| Apple MacBook Air 15 2023 M2 16 GB | |
| Apple MacBook Air M2 10C GPU | |
| LG Gram 15Z90Q | |
| Cinebench R23 / Single Core | |
| Average of class Subnotebook (358 - 2213, n=60, last 2 years) | |
| Microsoft Surface Laptop 5 15, i7-1255U | |
| Apple MacBook Pro 14 2023 M2 Pro Entry | |
| Average Apple M2 (1580 - 1638, n=5) | |
| Apple MacBook Air 15 2023 M2 16 GB | |
| Apple MacBook Air M2 10C GPU | |
| Asus VivoBook S15 M3502RA-L1029W | |
| Apple MacBook Pro 16 2021 M1 Pro | |
| LG Gram 15Z90Q | |
| Cinebench R20 / CPU (Multi Core) | |
| Asus VivoBook S15 M3502RA-L1029W | |
| Average of class Subnotebook (579 - 8541, n=56, last 2 years) | |
| Microsoft Surface Laptop 5 15, i7-1255U | |
| Apple MacBook Pro 14 2023 M2 Pro Entry | |
| LG Gram 15Z90Q | |
| Apple MacBook Pro 16 2021 M1 Pro | |
| Average Apple M2 (2231 - 2416, n=5) | |
| Apple MacBook Air 15 2023 M2 16 GB | |
| Apple MacBook Air M2 10C GPU | |
| Cinebench R20 / CPU (Single Core) | |
| Average of class Subnotebook (128 - 832, n=56, last 2 years) | |
| Microsoft Surface Laptop 5 15, i7-1255U | |
| Asus VivoBook S15 M3502RA-L1029W | |
| LG Gram 15Z90Q | |
| Apple MacBook Pro 14 2023 M2 Pro Entry | |
| Apple MacBook Air 15 2023 M2 16 GB | |
| Apple MacBook Pro 16 2021 M1 Pro | |
| Apple MacBook Air M2 10C GPU | |
| Average Apple M2 (216 - 446, n=5) | |
| Cinebench R15 / CPU Multi 64Bit | |
| Asus VivoBook S15 M3502RA-L1029W | |
| Average of class Subnotebook (327 - 3345, n=56, last 2 years) | |
| Apple MacBook Pro 16 2021 M1 Pro | |
| Apple MacBook Pro 14 2023 M2 Pro Entry | |
| Microsoft Surface Laptop 5 15, i7-1255U | |
| LG Gram 15Z90Q | |
| Average Apple M2 (1210 - 1243, n=5) | |
| Apple MacBook Air M2 10C GPU | |
| Apple MacBook Air 15 2023 M2 16 GB | |
| Cinebench R15 / CPU Single 64Bit | |
| Average of class Subnotebook (72.4 - 322, n=56, last 2 years) | |
| Asus VivoBook S15 M3502RA-L1029W | |
| Microsoft Surface Laptop 5 15, i7-1255U | |
| Apple MacBook Pro 14 2023 M2 Pro Entry | |
| Average Apple M2 (222 - 229, n=5) | |
| Apple MacBook Air M2 10C GPU | |
| Apple MacBook Air 15 2023 M2 16 GB | |
| Apple MacBook Pro 16 2021 M1 Pro | |
| LG Gram 15Z90Q | |
| Blender / v2.79 BMW27 CPU | |
| Apple MacBook Air M2 10C GPU | |
| Average Apple M2 (549 - 713, n=5) | |
| Apple MacBook Air 15 2023 M2 16 GB | |
| LG Gram 15Z90Q | |
| Apple MacBook Pro 14 2023 M2 Pro Entry | |
| Microsoft Surface Laptop 5 15, i7-1255U | |
| Average of class Subnotebook (159 - 2271, n=57, last 2 years) | |
| Asus VivoBook S15 M3502RA-L1029W | |
| Apple MacBook Pro 16 2021 M1 Pro | |
| Geekbench 5.5 / Multi-Core | |
| Apple MacBook Pro 16 2021 M1 Pro | |
| Apple MacBook Pro 14 2023 M2 Pro Entry | |
| Average of class Subnotebook (2557 - 17218, n=47, last 2 years) | |
| Asus VivoBook S15 M3502RA-L1029W | |
| Apple MacBook Air M2 10C GPU | |
| Apple MacBook Air 15 2023 M2 16 GB | |
| Average Apple M2 (8491 - 8994, n=8) | |
| Microsoft Surface Laptop 5 15, i7-1255U | |
| LG Gram 15Z90Q | |
| Geekbench 5.5 / Single-Core | |
| Apple MacBook Pro 14 2023 M2 Pro Entry | |
| Apple MacBook Air M2 10C GPU | |
| Apple MacBook Air 15 2023 M2 16 GB | |
| Average of class Subnotebook (726 - 2224, n=47, last 2 years) | |
| Average Apple M2 (1887 - 1953, n=8) | |
| Apple MacBook Pro 16 2021 M1 Pro | |
| Microsoft Surface Laptop 5 15, i7-1255U | |
| LG Gram 15Z90Q | |
| Asus VivoBook S15 M3502RA-L1029W | |
| Blender / v3.3 Classroom CPU | |
| LG Gram 15Z90Q | |
| Microsoft Surface Laptop 5 15, i7-1255U | |
| Apple MacBook Air M2 10C GPU | |
| Average Apple M2 (540 - 702, n=4) | |
| Apple MacBook Air 15 2023 M2 16 GB | |
| Average of class Subnotebook (241 - 861, n=59, last 2 years) | |
| Apple MacBook Pro 14 2023 M2 Pro Entry | |
| Asus VivoBook S15 M3502RA-L1029W | |
* ... smaller is better
System Performance
The subjective performance impression is excellent, especially in native applications. Even extensive apps such as Adobe Photoshop or Premiere Pro pose no issue for the passively cooled Air. Thanks to Rosetta 2, the Air can emulate programs made for x64 Macs, which works well in practice. However, the performance can be noticeably worse than with native apps, especially with complex apps (like Photoshop).
WebXPRT 3: Overall
WebXPRT 4: Overall
Blackmagic RAW Speed Test: 12:1 8K Metal | 12:1 8K CPU
Jetstream 2: 2.0 Total
Speedometer 2.0: Result 2.0
| CrossMark / Overall | |
| Apple MacBook Pro 14 2023 M2 Pro Entry | |
| Average of class Subnotebook (365 - 2356, n=59, last 2 years) | |
| Asus VivoBook S15 M3502RA-L1029W | |
| Apple MacBook Pro 16 2021 M1 Pro | |
| Apple MacBook Air 15 2023 M2 16 GB | |
| Average Apple M2, Apple M2 10-Core GPU (1437 - 1585, n=8) | |
| Microsoft Surface Laptop 5 15, i7-1255U | |
| Apple MacBook Air M2 10C GPU | |
| CrossMark / Productivity | |
| Average of class Subnotebook (364 - 2277, n=59, last 2 years) | |
| Asus VivoBook S15 M3502RA-L1029W | |
| Apple MacBook Pro 14 2023 M2 Pro Entry | |
| Microsoft Surface Laptop 5 15, i7-1255U | |
| Apple MacBook Air 15 2023 M2 16 GB | |
| Average Apple M2, Apple M2 10-Core GPU (1319 - 1441, n=8) | |
| Apple MacBook Air M2 10C GPU | |
| Apple MacBook Pro 16 2021 M1 Pro | |
| CrossMark / Creativity | |
| Apple MacBook Pro 14 2023 M2 Pro Entry | |
| Apple MacBook Pro 16 2021 M1 Pro | |
| Average of class Subnotebook (372 - 2743, n=59, last 2 years) | |
| Average Apple M2, Apple M2 10-Core GPU (1765 - 1967, n=8) | |
| Apple MacBook Air M2 10C GPU | |
| Apple MacBook Air 15 2023 M2 16 GB | |
| Asus VivoBook S15 M3502RA-L1029W | |
| Microsoft Surface Laptop 5 15, i7-1255U | |
| CrossMark / Responsiveness | |
| Average of class Subnotebook (312 - 1854, n=59, last 2 years) | |
| Asus VivoBook S15 M3502RA-L1029W | |
| Apple MacBook Pro 14 2023 M2 Pro Entry | |
| Microsoft Surface Laptop 5 15, i7-1255U | |
| Apple MacBook Air 15 2023 M2 16 GB | |
| Average Apple M2, Apple M2 10-Core GPU (1008 - 1182, n=8) | |
| Apple MacBook Air M2 10C GPU | |
| Apple MacBook Pro 16 2021 M1 Pro | |
| WebXPRT 3 / Overall | |
| Apple MacBook Pro 14 2023 M2 Pro Entry | |
| Apple MacBook Air 15 2023 M2 16 GB | |
| Apple MacBook Air M2 10C GPU | |
| Average Apple M2, Apple M2 10-Core GPU (342 - 387, n=7) | |
| Apple MacBook Pro 16 2021 M1 Pro | |
| Average of class Subnotebook (156 - 530, n=55, last 2 years) | |
| Microsoft Surface Laptop 5 15, i7-1255U | |
| Asus VivoBook S15 M3502RA-L1029W | |
| LG Gram 15Z90Q | |
| WebXPRT 4 / Overall | |
| Average of class Subnotebook (132 - 378, n=60, last 2 years) | |
| Apple MacBook Air 15 2023 M2 16 GB | |
| Apple MacBook Pro 14 2023 M2 Pro Entry | |
| Average Apple M2, Apple M2 10-Core GPU (223 - 256, n=7) | |
| Microsoft Surface Laptop 5 15, i7-1255U | |
| Asus VivoBook S15 M3502RA-L1029W | |
| Apple MacBook Air M2 10C GPU | |
| LG Gram 15Z90Q | |
| Blackmagic RAW Speed Test / 12:1 8K Metal | |
| Apple MacBook Pro 16 2021 M1 Pro | |
| Apple MacBook Pro 14 2023 M2 Pro Entry | |
| Apple MacBook Air M2 10C GPU | |
| Average of class Subnotebook (41 - 99, n=5, last 2 years) | |
| Average Apple M2, Apple M2 10-Core GPU (59 - 85, n=4) | |
| Apple MacBook Air 15 2023 M2 16 GB | |
| Blackmagic RAW Speed Test / 12:1 8K CPU | |
| Average of class Subnotebook (22 - 49, n=5, last 2 years) | |
| Apple MacBook Pro 14 2023 M2 Pro Entry | |
| Apple MacBook Pro 16 2021 M1 Pro | |
| Apple MacBook Air 15 2023 M2 16 GB | |
| Average Apple M2, Apple M2 10-Core GPU (24 - 26, n=4) | |
| Apple MacBook Air M2 10C GPU | |
| Jetstream 2 / 2.0 Total | |
| Average of class Subnotebook (117 - 476, n=27, last 2 years) | |
| Microsoft Surface Laptop 5 15, i7-1255U | |
| Asus VivoBook S15 M3502RA-L1029W | |
| Apple MacBook Air 15 2023 M2 16 GB | |
| Average Apple M2, Apple M2 10-Core GPU (220 - 257, n=8) | |
| Apple MacBook Pro 14 2023 M2 Pro Entry | |
| Apple MacBook Air M2 10C GPU | |
| Apple MacBook Pro 16 2021 M1 Pro | |
| Speedometer 2.0 / Result 2.0 | |
| Average of class Subnotebook (110 - 793, n=25, last 2 years) | |
| Apple MacBook Air 15 2023 M2 16 GB | |
| Apple MacBook Pro 14 2023 M2 Pro Entry | |
| Apple MacBook Air M2 10C GPU | |
| Average Apple M2, Apple M2 10-Core GPU (437 - 445, n=9) | |
| Microsoft Surface Laptop 5 15, i7-1255U | |
| Apple MacBook Pro 16 2021 M1 Pro | |
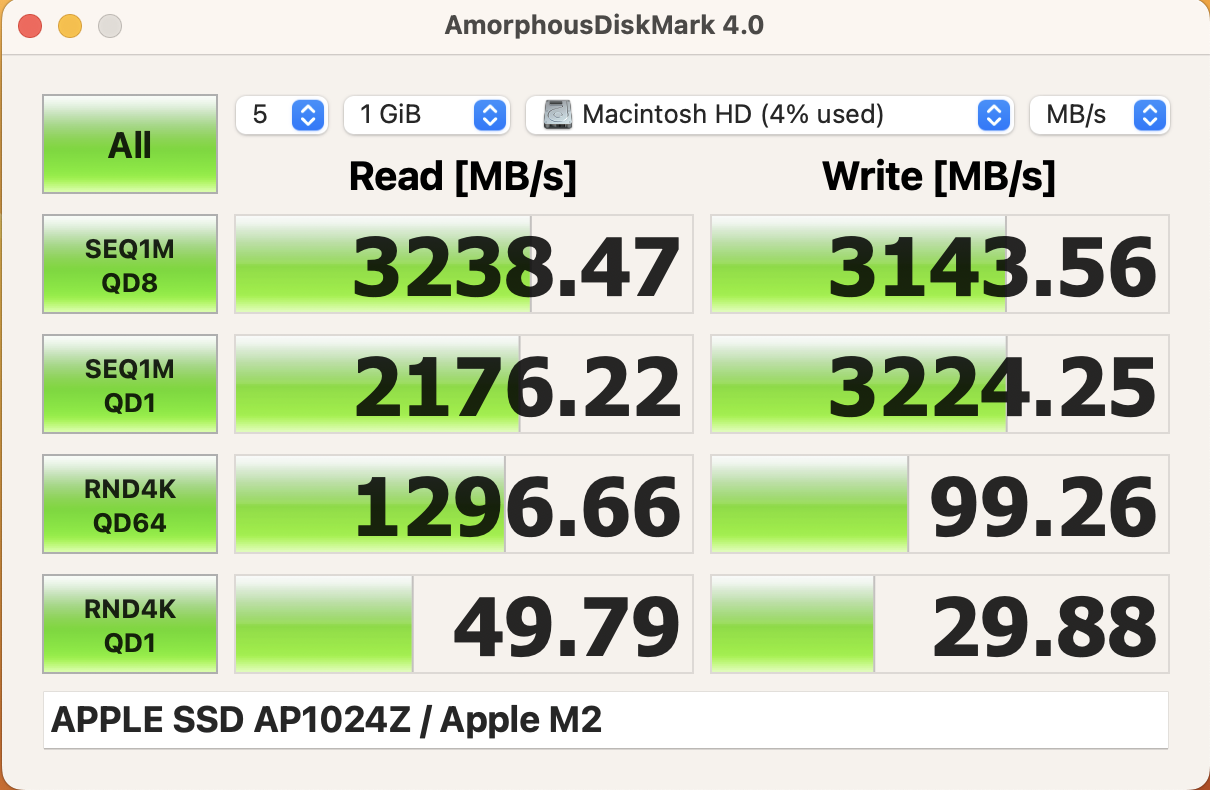
Storage Devices
The SSD is the AP1024Z, which we already know from the smaller model. It is a PCIe 3.0 SSD with a storage capacity of 1 TB, of which 968 GB is available upon starting up for the first time. The transfer rates are on the expected level and, even if the PCIe 4.0 SSDs of the Pro models are faster, there are no limitations in everyday use. More SSD benchmarks are available here.
Graphics
The graphics adapter of the Apple M2 SoC offers 10 cores that work at a maximum of 1.4 GHz. The performance of the iGPU is still very good and well ahead of the current iGPUs from Intel and AMD. In everyday life, the iGPU easily copes with all tasks, including the playback of high-resolution videos.
However, as with the small MacBook Air M2, performance does not remain constant, but drops by around 25 percent after a few minutes under sustained load. But there is no further performance reduction in battery mode. More GPU benchmarks are listed here.
| GFXBench | |
| 3840x2160 4K Aztec Ruins High Tier Offscreen | |
| Apple MacBook Pro 14 2023 M2 Pro Entry | |
| Apple MacBook Pro 16 2021 M1 Pro | |
| Apple MacBook Air M2 10C GPU | |
| Apple MacBook Air 15 2023 M2 16 GB | |
| Average Apple M2 10-Core GPU (35.6 - 48.6, n=7) | |
| 2560x1440 Aztec Ruins High Tier Offscreen | |
| Apple MacBook Pro 14 2023 M2 Pro Entry | |
| Apple MacBook Pro 16 2021 M1 Pro | |
| Apple MacBook Air M2 10C GPU | |
| Apple MacBook Air 15 2023 M2 16 GB | |
| Average Apple M2 10-Core GPU (68 - 110, n=8) | |
| Blender - v3.3 Classroom METAL | |
| Apple MacBook Air 15 2023 M2 16 GB | |
| Average Apple M2 10-Core GPU (205 - 237, n=2) | |
| Apple MacBook Pro 14 2023 M2 Pro Entry | |
* ... smaller is better
Gaming Performance
After last week's WWDC, the gaming landscape on MacBooks may soon change massively. In addition to native titles such as No Man's Sky or Death Stranding, which should be available in the future, Apple has presented the "Game Porting Toolkit", which allows developers to port DirectX 12 games to macOS relatively easily. Demos for titles such as Cyberpoint 2077 already run relatively well on Apple hardware. The technology is based on CrossOver's source code, which we also use to run Windows titles such as Witcher 3 on the current MacBooks. The gaming performance here is on par with the small MacBook Air M2.
| low | med. | high | ultra | |
|---|---|---|---|---|
| The Witcher 3 (2015) | 34 | 28 | ||
| Shadow of the Tomb Raider (2018) | 76 | 31 | 27 | 23 |
| Total War: Three Kingdoms (2019) | 136 | 39 | 22 | 16 |
| Borderlands 3 (2019) | 66.8 | 34 | 22 | 15 |
Emissions - Silent operation; better speakers
Noise
Since the MacBook Air 15 does not have a fan, it is absolutely silent at all times. No electronic noises, such as coil whine, were detected in our test device.
| Apple MacBook Air 15 2023 M2 16 GB M2 10-Core GPU, M2, Apple SSD AP1024Z | Microsoft Surface Laptop 5 15, i7-1255U Iris Xe G7 96EUs, i7-1255U, SK Hynix BC711 512GB HFM512GD3GX013N | LG Gram 15Z90Q Iris Xe G7 80EUs, i5-1240P, Samsung PM9A1 MZVL21T0HCLR | Asus VivoBook S15 M3502RA-L1029W Radeon 680M, R7 6800H, WD PC SN735 SDBPNHH-512G | Apple MacBook Air M2 10C GPU M2 10-Core GPU, M2, Apple SSD AP1024Z | Apple MacBook Pro 16 2021 M1 Pro M1 Pro 16-Core GPU, M1 Pro, Apple SSD AP1024R | Apple MacBook Pro 14 2023 M2 Pro Entry M2 Pro 16-Core GPU, M2 Pro 10-Core, Apple SSD AP0512Z | |
|---|---|---|---|---|---|---|---|
| Noise | |||||||
| off / environment * (dB) | 23.3 | 25 | 26 | 24.7 | 23.6 | ||
| Idle Minimum * (dB) | 23.3 | 26 | 26 | 24.7 | 23.6 | ||
| Idle Average * (dB) | 23.3 | 27 | 26 | 24.7 | 23.6 | ||
| Idle Maximum * (dB) | 23.3 | 28 | 28.1 | 24.7 | 23.6 | ||
| Load Average * (dB) | 35 | 37 | 56.9 | 26.1 | 24.2 | ||
| Witcher 3 ultra * (dB) | 38.1 | 37 | |||||
| Load Maximum * (dB) | 38.1 | 37 | 62.6 | 37.4 | 47.5 |
* ... smaller is better
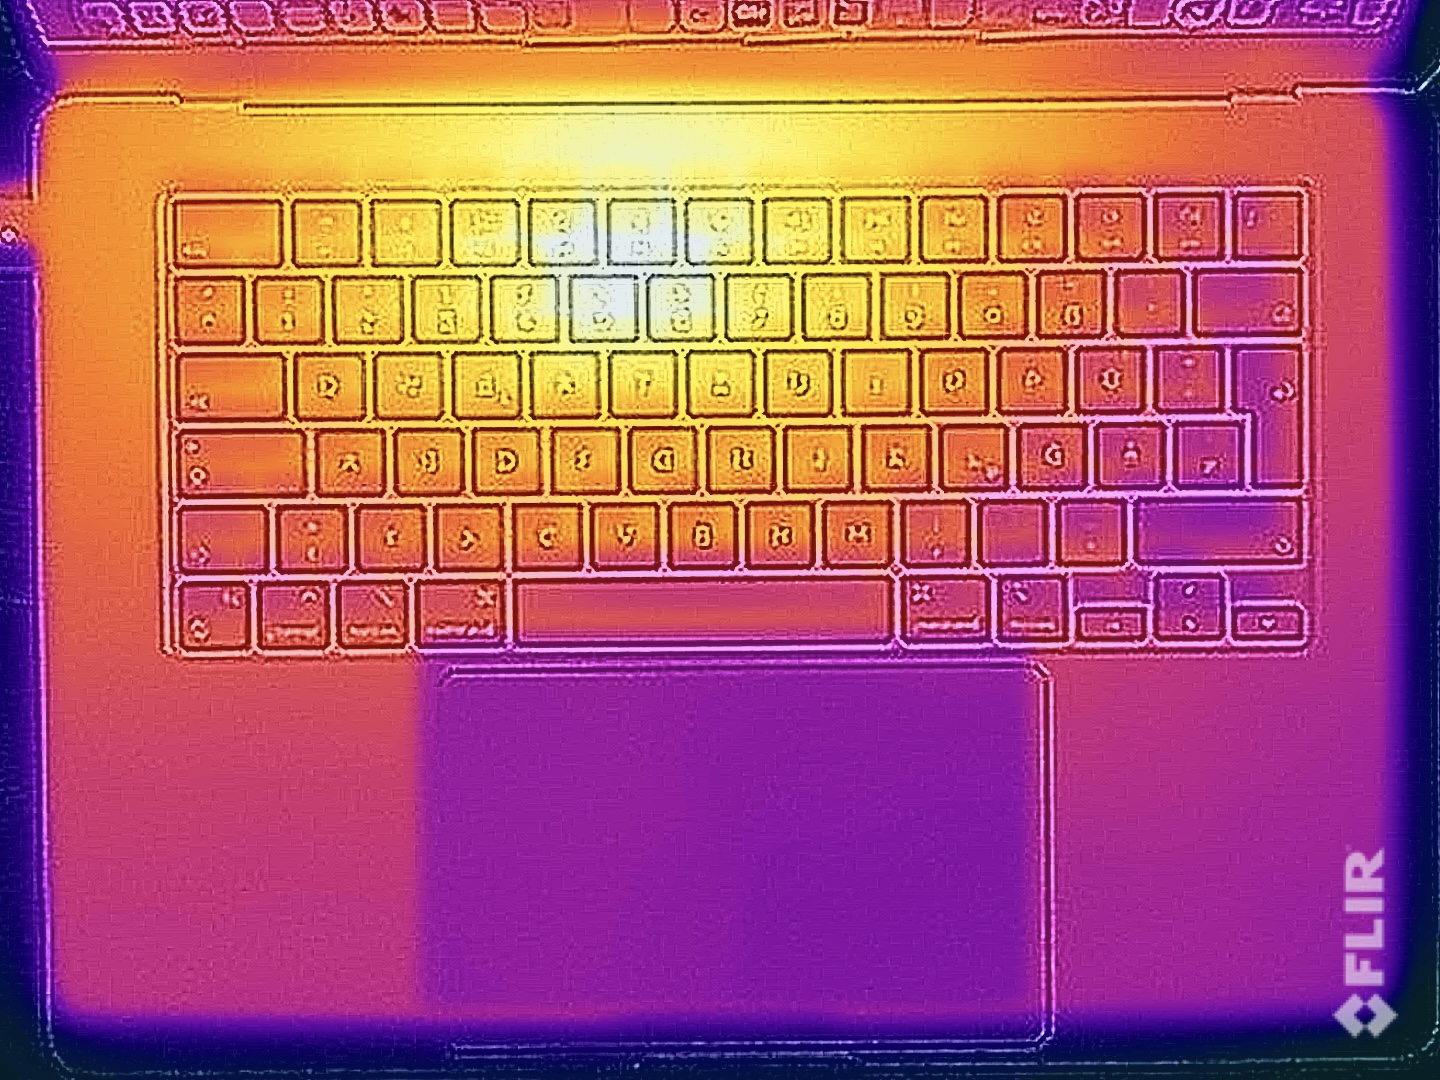
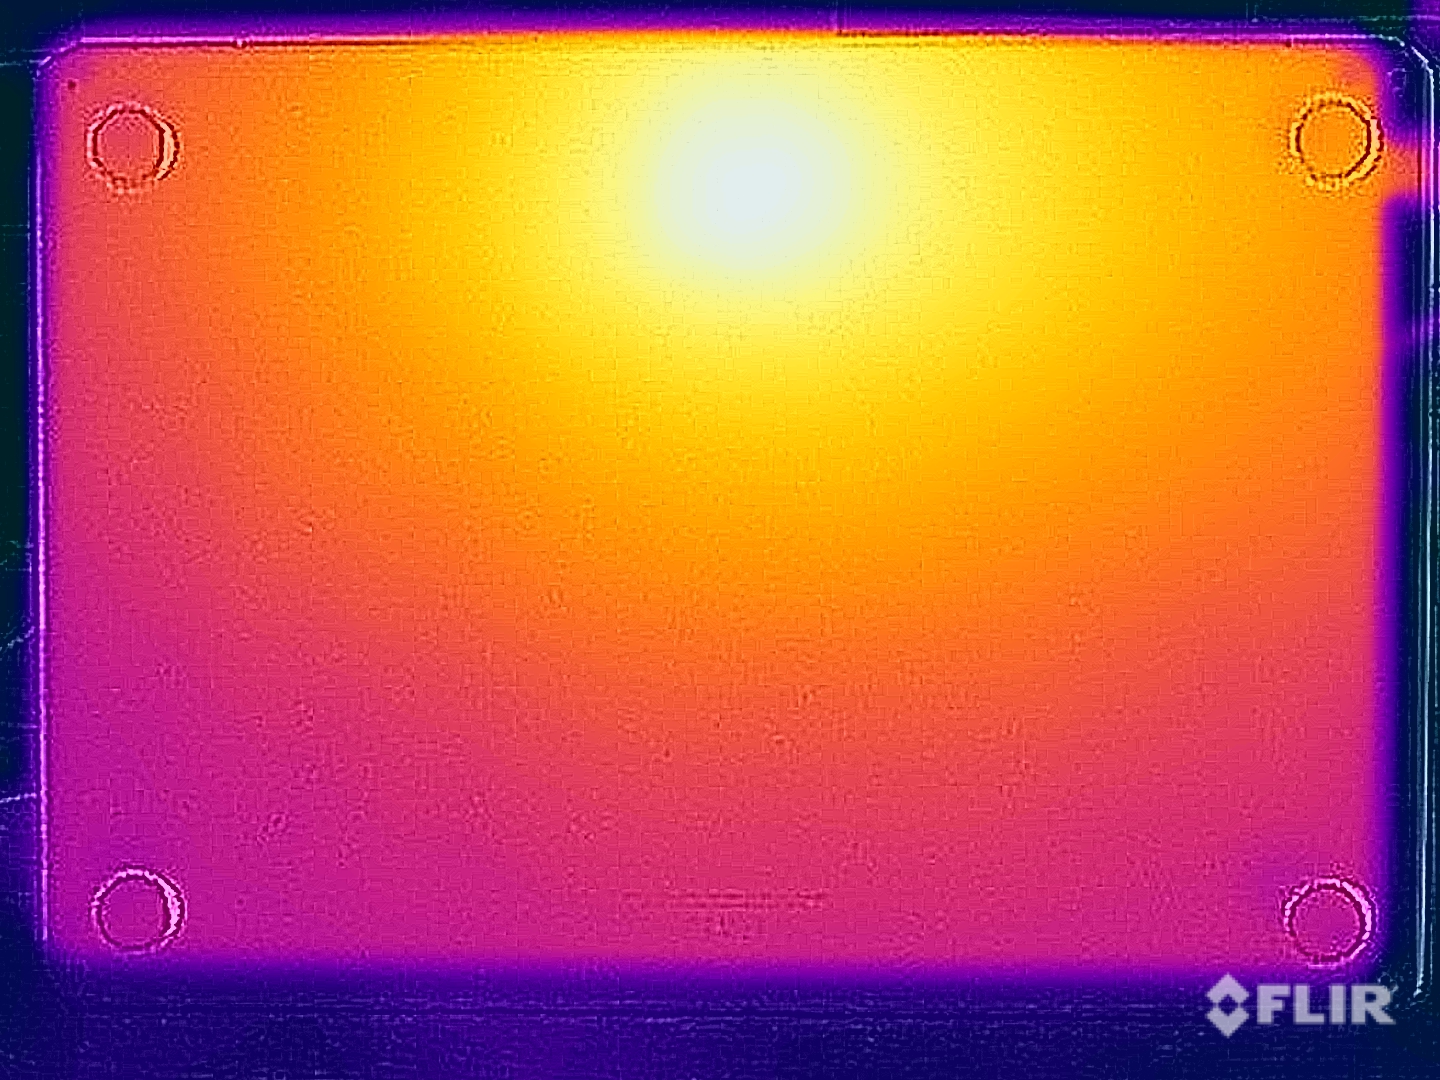
Temperature
Apple has the surface temperatures of the MacBook Air 15 well under control and there are no restrictions in everyday use or during less demanding tasks. The hotspot is in the upper-middle area of the base unit, where the processor is located. We measured up to 45 °C during high load and gaming, which is of course noticeable with the fingers, but not problematic. The underside stays a little cooler at a maximum of 42 °C. The Air 15 can be placed on the thighs at any time.
(-) The maximum temperature on the upper side is 45.1 °C / 113 F, compared to the average of 35.9 °C / 97 F, ranging from 21.4 to 59 °C for the class Subnotebook.
(±) The bottom heats up to a maximum of 42.5 °C / 109 F, compared to the average of 39.2 °C / 103 F
(+) In idle usage, the average temperature for the upper side is 25.6 °C / 78 F, compared to the device average of 30.8 °C / 87 F.
(±) Playing The Witcher 3, the average temperature for the upper side is 37.4 °C / 99 F, compared to the device average of 30.8 °C / 87 F.
(+) The palmrests and touchpad are reaching skin temperature as a maximum (34.5 °C / 94.1 F) and are therefore not hot.
(-) The average temperature of the palmrest area of similar devices was 28.2 °C / 82.8 F (-6.3 °C / -11.3 F).
| Apple MacBook Air 15 2023 M2 16 GB Apple M2, Apple M2 10-Core GPU | Microsoft Surface Laptop 5 15, i7-1255U Intel Core i7-1255U, Intel Iris Xe Graphics G7 96EUs | LG Gram 15Z90Q Intel Core i5-1240P, Intel Iris Xe Graphics G7 80EUs | Asus VivoBook S15 M3502RA-L1029W AMD Ryzen 7 6800H, AMD Radeon 680M | Apple MacBook Air M2 10C GPU Apple M2, Apple M2 10-Core GPU | Apple MacBook Pro 16 2021 M1 Pro Apple M1 Pro, Apple M1 Pro 16-Core GPU | Apple MacBook Pro 14 2023 M2 Pro Entry Apple M2 Pro 10-Core, Apple M2 Pro 16-Core GPU | |
|---|---|---|---|---|---|---|---|
| Heat | 3% | 1% | -22% | 0% | 8% | 6% | |
| Maximum Upper Side * (°C) | 45.1 | 44.6 1% | 46 -2% | 50.2 -11% | 44.7 1% | 41 9% | 47 -4% |
| Maximum Bottom * (°C) | 42.5 | 47.4 -12% | 45 -6% | 50.2 -18% | 44.6 -5% | 39 8% | 42.8 -1% |
| Idle Upper Side * (°C) | 25.9 | 22.6 13% | 25 3% | 32.1 -24% | 25.1 3% | 24 7% | 22.3 14% |
| Idle Bottom * (°C) | 25.8 | 23.3 10% | 24 7% | 34.6 -34% | 25.3 2% | 24 7% | 21.7 16% |
* ... smaller is better
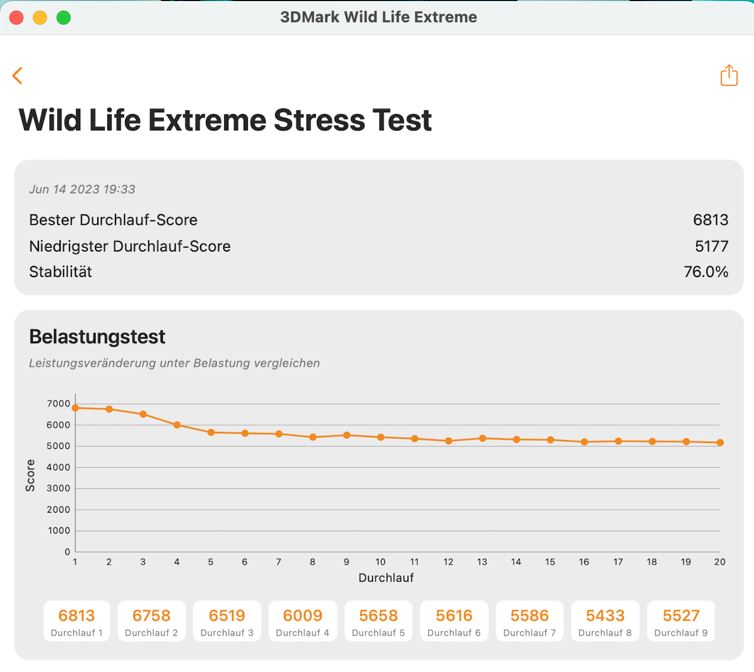
Stress test
In the stress test, the behavior of the SoC is again comparable to that of the smaller MacBook Air. During the runs of Cinebench R23 and the 3DMark Wildlife Extreme stress test (which is of course an extreme scenario for the Air), the consumption of the M2 chip settles at around 8.5-9 watts after a short time. The larger Air has a slight advantage here, but you cannot really perceive this in practice.
Speakers
For the sound system, Apple has increased the number of modules from 4 to 6, which is also noticeable in our audio analysis and there is a slight advantage over the smaller MacBook Air M2. The sound system of the larger MacBook Pro 16 packs a little more punch, but this is hairsplitting. Overall, the performance of the speakers is very good and often you won't need external speakers or headphones.
Apple MacBook Air 15 2023 M2 16 GB audio analysis
(+) | speakers can play relatively loud (85 dB)
Bass 100 - 315 Hz
(±) | reduced bass - on average 7% lower than median
(±) | linearity of bass is average (7.2% delta to prev. frequency)
Mids 400 - 2000 Hz
(+) | balanced mids - only 1.5% away from median
(+) | mids are linear (2.5% delta to prev. frequency)
Highs 2 - 16 kHz
(+) | balanced highs - only 3.2% away from median
(+) | highs are linear (2.3% delta to prev. frequency)
Overall 100 - 16.000 Hz
(+) | overall sound is linear (6.8% difference to median)
Compared to same class
» 1% of all tested devices in this class were better, 0% similar, 99% worse
» The best had a delta of 5%, average was 18%, worst was 53%
Compared to all devices tested
» 1% of all tested devices were better, 0% similar, 99% worse
» The best had a delta of 4%, average was 23%, worst was 134%
Apple MacBook Pro 16 2021 M1 Pro audio analysis
(+) | speakers can play relatively loud (84.7 dB)
Bass 100 - 315 Hz
(+) | good bass - only 3.8% away from median
(+) | bass is linear (5.2% delta to prev. frequency)
Mids 400 - 2000 Hz
(+) | balanced mids - only 1.3% away from median
(+) | mids are linear (2.1% delta to prev. frequency)
Highs 2 - 16 kHz
(+) | balanced highs - only 1.9% away from median
(+) | highs are linear (2.7% delta to prev. frequency)
Overall 100 - 16.000 Hz
(+) | overall sound is linear (4.6% difference to median)
Compared to same class
» 0% of all tested devices in this class were better, 0% similar, 100% worse
» The best had a delta of 5%, average was 17%, worst was 45%
Compared to all devices tested
» 0% of all tested devices were better, 0% similar, 100% worse
» The best had a delta of 4%, average was 23%, worst was 134%
Apple MacBook Air M2 Entry audio analysis
(+) | speakers can play relatively loud (82.7 dB)
Bass 100 - 315 Hz
(±) | reduced bass - on average 12.2% lower than median
(±) | linearity of bass is average (12.6% delta to prev. frequency)
Mids 400 - 2000 Hz
(+) | balanced mids - only 1.1% away from median
(+) | mids are linear (3.1% delta to prev. frequency)
Highs 2 - 16 kHz
(+) | balanced highs - only 2.4% away from median
(+) | highs are linear (1.9% delta to prev. frequency)
Overall 100 - 16.000 Hz
(+) | overall sound is linear (9.5% difference to median)
Compared to same class
» 5% of all tested devices in this class were better, 2% similar, 93% worse
» The best had a delta of 5%, average was 18%, worst was 53%
Compared to all devices tested
» 4% of all tested devices were better, 1% similar, 95% worse
» The best had a delta of 4%, average was 23%, worst was 134%
Power Management - Air 15 with even longer battery life
Power Consumption
The MacBook Air 15 is very efficient, but the consumption is significantly influenced by the screen brightness, with the difference between very low brightness and maximum brightness being around 7-8 watts. In our stress test, the 35 watt power supply limits the power consumption: for example, we measured up to 57 watts with a 65 watt power supply and 38 watts for some time afterwards. In the course of the stress test, consumption levels off at 26 watts. The 35-watt power supply is thus too weak, but since the SoC throttles quite quickly when the CPU and GPU are stressed at the same time, the effect in everyday use is rather small.
| Off / Standby | |
| Idle | |
| Load |
|
Key:
min: | |
| Apple MacBook Air 15 2023 M2 16 GB M2, M2 10-Core GPU, Apple SSD AP1024Z, IPS, 2880x1864, 15.3" | Microsoft Surface Laptop 5 15, i7-1255U i7-1255U, Iris Xe G7 96EUs, SK Hynix BC711 512GB HFM512GD3GX013N, IPS, 2496x1664, 15" | LG Gram 15Z90Q i5-1240P, Iris Xe G7 80EUs, Samsung PM9A1 MZVL21T0HCLR, IPS, 1920x1080, 15.6" | Asus VivoBook S15 M3502RA-L1029W R7 6800H, Radeon 680M, WD PC SN735 SDBPNHH-512G, OLED, 1920x1080, 15.6" | Apple MacBook Air M2 10C GPU M2, M2 10-Core GPU, Apple SSD AP1024Z, IPS, 2560x1664, 13.6" | Average Apple M2 10-Core GPU | Average of class Subnotebook | |
|---|---|---|---|---|---|---|---|
| Power Consumption | -36% | -37% | -72% | 3% | 23% | -23% | |
| Idle Minimum * (Watt) | 2.2 | 3.8 -73% | 4 -82% | 4.4 -100% | 1.9 14% | 1.93 ? 12% | 3.78 ? -72% |
| Idle Average * (Watt) | 10 | 8.2 18% | 7 30% | 5.1 49% | 9.6 4% | 7.94 ? 21% | 6.57 ? 34% |
| Idle Maximum * (Watt) | 10.1 | 8.4 17% | 13 -29% | 9.3 8% | 9.7 4% | 7.5 ? 26% | 7.94 ? 21% |
| Load Average * (Watt) | 33.6 | 50.1 -49% | 45 -34% | 67 -99% | 32.4 4% | 21.6 ? 36% | 41.9 ? -25% |
| Witcher 3 ultra * (Watt) | 27.8 | 38.8 -40% | 35.2 -27% | 66.4 -139% | 30.8 -11% | ||
| Load Maximum * (Watt) | 37.2 | 69.6 -87% | 66 -77% | 93.5 -151% | 35.7 4% | 30.1 ? 19% | 64.4 ? -73% |
* ... smaller is better
Power consumption Witcher 3 / Stress test
Power consumption with an external monitor
Battery Life
The larger case was mainly used for a larger battery; instead of 52.6 Wh in the 13-inch model, the Air 15 has 66.5 Wh. In both the video and WLAN tests at a brightness of 150 cd/m² (the brightness was reduced by 7 large & 2 small levels), the Air 15 achieves extremely long battery runtimes of around 16.5 hours. This puts it at least an hour ahead of the small MBA 13 and is only just beaten by the larger MacBook Pro 16, which is equipped with a significantly larger battery (99.6 Wh). In the WLAN test at full brightness, we measured a solid runtime of just over 7 hours; under load (and at maximum brightness), the battery goes flat in 3:15 hours.
Apple's 70-watt power supply was not available to us during our review. A complete recharge with the included 35-watt supply takes around 2:50 hours when the device is turned on, and this is reduced to around 2 hours with a normal 65-watt power supply (USB-C).
| Apple MacBook Air 15 2023 M2 16 GB M2, M2 10-Core GPU, 66.5 Wh | Microsoft Surface Laptop 5 15, i7-1255U i7-1255U, Iris Xe G7 96EUs, 47.4 Wh | LG Gram 15Z90Q i5-1240P, Iris Xe G7 80EUs, 80 Wh | Asus VivoBook S15 M3502RA-L1029W R7 6800H, Radeon 680M, 70 Wh | Apple MacBook Air M2 10C GPU M2, M2 10-Core GPU, 52.6 Wh | Apple MacBook Pro 16 2021 M1 Pro M1 Pro, M1 Pro 16-Core GPU, 99.6 Wh | Apple MacBook Pro 14 2023 M2 Pro Entry M2 Pro 10-Core, M2 Pro 16-Core GPU, 70 Wh | Average of class Subnotebook | |
|---|---|---|---|---|---|---|---|---|
| Battery runtime | -40% | -20% | -42% | -9% | 3% | -12% | -21% | |
| H.264 (h) | 16.8 | 9.7 -42% | 12.8 -24% | 15.8 -6% | 17.5 4% | 16.4 -2% | 15.4 ? -8% | |
| WiFi v1.3 (h) | 16.6 | 8.6 -48% | 11.9 -28% | 11.5 -31% | 14.7 -11% | 16.9 2% | 12.9 -22% | 14 ? -16% |
| Load (h) | 3.3 | 2.3 -30% | 2.9 -12% | 1 -70% | 1.969 ? -40% |
Pros
Cons
Verdict - MacBook Air 15 is boringly good
The new MacBook Air 15 is a very good, but also boring device, because apart from the larger screen and the higher price, there are no differences compared to the smaller MacBook Air M2 from last year. No new processor, no additional ports, just the usual basic hardware - but the overall package is extremely good and it simply works. Above all, the lack of fans is an aspect that should not be underestimated in everyday use. In our opinion, the Air could be a lot better, but Apple goes easy on itself here.
The case looks even flatter in the 15-inch model, but the Air 15 is by no means a lightweight at more than 1.5 kg. The display is very good and the quality is also comparable to the smaller Air. Of course, there are some disadvantages compared to the MacBook Pro, but there is no PWM, which is certainly an important factor for some users. The speakers have two additional modules and are a little better overall, but still not quite as powerful as the MacBook Pro 16. On the other hand, Apple has also been able to improve the battery life compared to the smaller sibling.
Apple gives customers exactly what they want: a larger MacBook Air. Although one year later, the new MacBook Air 15 differs from its smaller sibling only in the display size. All other pros and cons have been simply copied over. No innovation here, but that doesn't change the fact that this is also a very good laptop overall.
We suspect that Apple originally planned to launch the big MacBook Air 15 with the new M3 SoC, but it simply isn't ready yet. Honestly, this isn't really a problem because the passively cooled M2 SoC still offers more than enough performance for most users. Even the old 2020 MacBook Air with the M1 chip can still be recommended without hesitation. However, Apple is attempting to maximize profits, especially with the RAM, which can also be seen in the two basic models (256 or 512 GB SSD) that are only equipped with 8 GB RAM. These basic models are often reduced in price (even the new Air 15 is already available for much less), but those who want more RAM usually have to pay the high surcharge. And EUR 230 (US$200) for 8 GB RAM is outrageous, to put it bluntly. You should also keep in mind aspects such as the non-existent maintenance and upgrade options. If these play an important role in the purchase decision, the big Air 15 disqualifies itself from the start.
The biggest competitor from the Windows camp is probably Microsoft's Surface Laptop 5, but this lags behind in practically every respect and is also somewhat neglected by Microsoft. The LG Gram 15 is considerably lighter at just over 1.1 kg, but performs worse than the Air 15 in most other categories.
With a view to the price-performance ratio, the 14-inch MacBook Pro is naturally the much better option, because the street price is now around EUR 2050 (US$1999.99), which is pretty much on par with the new MacBook Air 15 with 16 GB of RAM and 512 GB of SSD storage. In addition, the Pro comes with a mini-LED panel and significantly more performance. But the truth is that the two devices do not compete with each other and Apple is addressing a different target group with the Air 15, who simply want a bigger MacBook Air. And if you consider macOS with the extensive preinstalled software (complete office suite, video editing etc.), the MacBook Air M2 (regardless of whether 13- or 15 inches) is simply an extremely good overall package with a long battery life.
Price and Availability
In the US, the two configurations of the new MacBook Air 15 are currently sold out on Amazon, but are available for $1299.00 (256 GB) or $1499.00 (512 GB) in all four colors at Best Buy:
- Midnight, 256 GB
- Midnight, 512 GB
- Starlight, 256 GB
- Starlight, 512 GB
- Space Gray, 256 GB
- Space Gray, 512 GB
- Silver, 256 GB
- Silver, 512 GB
Prices and availability are as of 19.06.2023 and are subject to change.
Apple MacBook Air 15 2023 M2 16 GB
- 06/19/2023 v7 (old)
Andreas Osthoff
Transparency
The selection of devices to be reviewed is made by our editorial team. The test sample was provided to the author as a loan by the manufacturer or retailer for the purpose of this review. The lender had no influence on this review, nor did the manufacturer receive a copy of this review before publication. There was no obligation to publish this review. As an independent media company, Notebookcheck is not subjected to the authority of manufacturers, retailers or publishers.
This is how Notebookcheck is testing
Every year, Notebookcheck independently reviews hundreds of laptops and smartphones using standardized procedures to ensure that all results are comparable. We have continuously developed our test methods for around 20 years and set industry standards in the process. In our test labs, high-quality measuring equipment is utilized by experienced technicians and editors. These tests involve a multi-stage validation process. Our complex rating system is based on hundreds of well-founded measurements and benchmarks, which maintains objectivity. Further information on our test methods can be found here.
Price comparison

