Apple M2 SoC Analysis - Worse CPU efficiency compared to the M1
When Apple launched its own M1 SoC around two years ago, it was an impressive chip that beat the competition from Intel and AMD in many aspects, especially in terms of efficiency. We now had the chance to review both new versions of the M2 SoC, which is based on the same architecture and still manufactured in a 5 nm process. This problem - to get more and more performance out of an existing chip architecture - is already familiar from the competition, since customers expect performance gains with every new product generation.
Apple promised more performance compared to the old M1 processor during the launch, both for the processor as well as the graphics card. When the manufacturer from Cupertino compares the efficiency, however, it is mostly against PC laptop chips and not always the old M1. We can confirm the general performance improvements, but also higher consumption figures, so we want to have a closer look at the efficiency.
The Apple M2 SoC
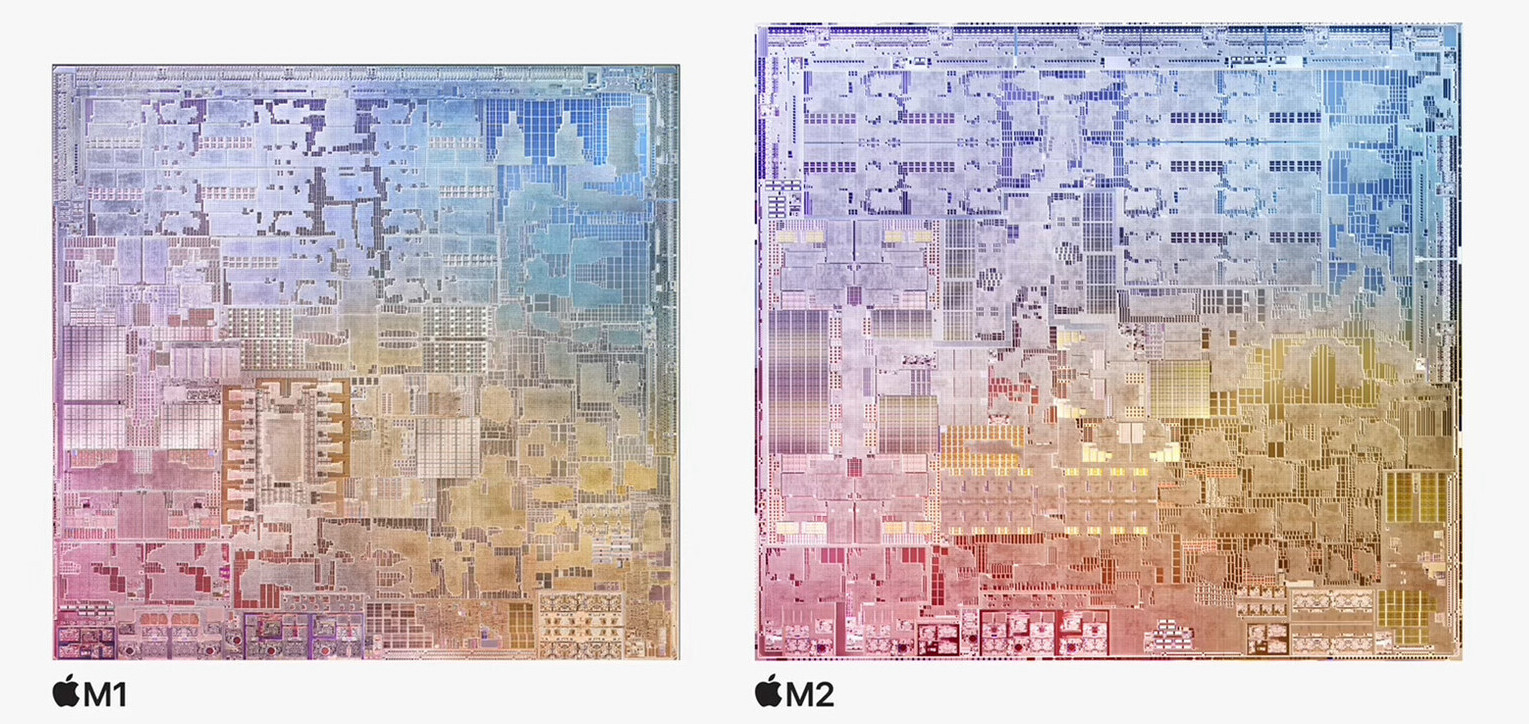
The new M2 SoC is based on the old M1 chip and is manufactured in an improved 5 nm process (probably N5P at TSMC). In addition to an increased number of transistors (now 20 vs. 16 billion), a new Media Engine with support for 8K & ProRes files (which is also used for the M1 Pro, M1 Max & M1 Ultra) as well as a faster Neural Engine, you now get more powerful GPUs with 8 or 10 cores. The switch from LPDDR4x to LPDDR5x RAM also allowed Apple to improve the maximum memory bandwidth from 68.25 GB/s to 100 GB/s and you can now get up to 24 GB unified memory. The memory interface itself is still 128-bit wide, while the larger M1 Pro chips use 256-bit and the M1 Max even 512-bit interfaces.
The basic CPU configuration did not change, either, and you still get a total of 8 cores divided into a performance cluster (4 cores) and an efficiency cluster (4 cores). The maximum clock was increased though, and the efficiency cores now reach up to 2.4 GHz (previously up to 2.1 GHz) and the also benefit from the higher memory bandwidth. The performance cores also reach a higher maximum clock of up to 3.48 GHz (previously 3.2 GHz), but Apple also increased their L2 cache from 12 to 16 MB.
We are not sure what Apple changed about the integrated graphics card. We can definitely confirm a higher clock for the GPU cores (both 8 and 10-core versions) of 1398 MHz compared to 1278 MHz for the old M1 GPU. The GPU will also benefit from the increased memory bandwidth, but we noticed that the power consumption of the 8-core GPU was not really increased, so there have to be additional improvements.
Single-Core Performance & Efficiency
The single-core benchmarks benefit from the higher clock of the performance cores, because the new M2 SoC is not only faster than the old M1, but also every other M1 variant including Pro, Max, and even Ultra. They all use the same performance cores with the same clock we know from the M1, so the new M2 MacBooks offer the best single-core performance in Apple's portfolio right now. All in all, the advantage is between 6-8 percent depending on the benchmark.
| Single-Core Performance rating - Percent | |
| Apple M2 | |
| Apple M2 | |
| Apple M1 Pro | |
| Apple M1 Pro 8-Core | |
| Apple M1 | |
| Apple M1 | |
| Cinebench R23 - Single Core | |
| Apple M2 | |
| Apple M2 | |
| Apple M1 Pro | |
| Apple M1 Pro 8-Core | |
| Apple M1 | |
| Apple M1 | |
| Geekbench 5.5 - Single-Core | |
| Apple M2 | |
| Apple M2 | |
| Apple M1 Pro 8-Core | |
| Apple M1 Pro | |
| Apple M1 | |
| Apple M1 | |
The higher clock requires more power, because the old M1 consumed ~3.7 Watts and the new M2 requires ~5.3 Watts. The M1 Pro models consume even more at 7 Watts, but they are much larger chips with more cores. This means that the single-core efficiency of the new M2 is about 26 % worse compared to the old M1 processor.
| Power Consumption | |
| Cinebench R23 Single Package Power | |
| Apple M1 Pro 8-Core | |
| Apple M1 Pro | |
| Apple M2 | |
| Apple M2 | |
| Apple M1 | |
| Apple M1 | |
| Cinebench R23 Single Package Power Efficiency | |
| Apple M1 | |
| Apple M1 | |
| Apple M2 | |
| Apple M2 | |
| Apple M1 Pro 8-Core | |
| Apple M1 Pro | |
* ... smaller is better
Multi-Core Performance & Efficiency
The performance improvements compared to the old M1 are bigger in multi-core scenarios since all 8 cores benefit from higher clocks. We can see a maximum improvement of 18 % in Geekbench 5, which is also advertised by Apple. The advantage is a bit smaller in Cinebench R23, and we get an average performance increase of around 15 %.
The M1 Pro CPUs still have a big advantage in multi-core benchmarks, at least the 10-core versions (+40 %) with 8 performance cores. The 8-core model of the M1 Pro in the entry-level MacBook Pro 14 only uses 6 performance cores, so the advantage over the new M2 is much smaller at around 10 %.
| Multi-Core Performance rating - Percent | |
| Apple M1 Pro | |
| Apple M1 Pro 8-Core | |
| Apple M2 | |
| Apple M2 | |
| Apple M1 | |
| Apple M1 | |
| Cinebench R23 - Multi Core | |
| Apple M1 Pro | |
| Apple M1 Pro 8-Core | |
| Apple M2 | |
| Apple M2 | |
| Apple M1 | |
| Apple M1 | |
| Geekbench 5.5 - Multi-Core | |
| Apple M1 Pro | |
| Apple M1 Pro 8-Core | |
| Apple M2 | |
| Apple M2 | |
| Apple M1 | |
| Apple M1 | |
This performance advantage of 15 % on average countered by an additional power consumption of 35-40 %, so the overall efficiency is 20-25 % lower. The new M2 is therefore almost on par with the M1 Pro chips with 10 CPU cores.
| Power Consumption | |
| Cinebench R23 Multi Package Power | |
| Apple M1 Pro | |
| Apple M1 Pro 8-Core | |
| Apple M2 | |
| Apple M2 | |
| Apple M1 | |
| Apple M1 | |
| Cinebench R23 Multi Package Power Efficiency | |
| Apple M1 | |
| Apple M1 | |
| Apple M2 | |
| Apple M2 | |
| Apple M1 Pro | |
| Apple M1 Pro 8-Core | |
* ... smaller is better
Comparison with AMD and Intel
Intel's new Alder Lake-P chips offer both more single-core as well as multi-core performance compared to the Apple M2 (the Geekbench 5 single-core test is the only exception). However, this is only the case for the chips with high TDP numbers; the Alder Lake-P CPU in the Samsung Galaxy Book2 at 20 Watts, for example, is not competitive at all.
The new AMD Ryzen 7 6800U is slower than the M2 in single-core tests, but has an advantage of 20 % in Cinebench R23 Multi. However, the Apple M2 performs very well in Geekbench 5 and is once again ahead of the 6800U. If you combine all the results, the new M2 is actually ahead of the Ryzen 7 6800U in the performance rating.
| Performance rating - Percent | |
| Intel Core i7-12700H | |
| Intel Core i7-1260P | |
| Intel Core i5-1240P | |
| Apple M2 | |
| Apple M2 | |
| AMD Ryzen 7 6800U | |
| AMD Ryzen 5 5600U | |
| Intel Core i5-1240P | |
Even though the efficiency of the new M2 is much worse compared to the old M1 chip, the M2 is still significantly better than the rivals from AMD and Intel. The efficiency is much higher in single-core scenarios and the Alder Lake chips fall behind with the high consumption of the performance cores (25-30 Watts). AMD is a bit better with the Ryzen 7 6800U, but it also consumes more than 15 Watts in single-core scenarios, despite the lower performance.
Intel's current mobile CPUs are also much worse in terms of multi-core efficiency, even though the difference is not as big as in the single-core tests. The Ryzen 7 6800U on the other hand can almost completely close the gap, at least when we look at Cinebench R23.
| Power Consumption / Cinebench R23 Single Package Power Efficiency | |
| Apple M2 | |
| Apple M2 | |
| AMD Ryzen 5 5600U | |
| AMD Ryzen 7 6800U | |
| Intel Core i5-1240P | |
| Intel Core i7-1260P | |
| Intel Core i7-12700H | |
| Power Consumption / Cinebench R23 Multi Package Power Efficiency | |
| Apple M2 | |
| Apple M2 | |
| AMD Ryzen 7 6800U | |
| AMD Ryzen 5 5600U | |
| Intel Core i5-1240P | |
| Intel Core i7-1260P | |
| Intel Core i7-12700H | |
| Intel Core i5-1240P | |
| Power Consumption / Cinebench R23 Single Package Power | |
| Intel Core i7-12700H | |
| Intel Core i7-1260P | |
| Intel Core i5-1240P | |
| AMD Ryzen 7 6800U | |
| AMD Ryzen 5 5600U | |
| Apple M2 | |
| Apple M2 | |
| Power Consumption / Cinebench R23 Multi Package Power | |
| Intel Core i7-12700H | |
| Intel Core i5-1240P | |
| Intel Core i7-1260P | |
| AMD Ryzen 7 6800U | |
| Intel Core i5-1240P | |
| Apple M2 | |
| AMD Ryzen 5 5600U | |
| Apple M2 | |
* ... smaller is better
GPU Performance & Efficiency
We evaluate the performance of the new M2 GPU with the native benchmarks 3DMark Wild Life Extreme Unlimited as well as Geekbench and GFXBench, which use the Metal API. The new M2 variants fit well into the existing MacBook lineup, because the new 8-core M2 GPU is around 16 % faster than the 8-core version of the M1. The 10-core version of the M2 is another 19 % faster.
| GPU Performance rating - Percent | |
| Apple M1 Pro 16-Core GPU | |
| Apple M1 Pro 14-Core GPU | |
| Apple M2 10-Core GPU | |
| Apple M2 8-Core GPU | |
| Apple M1 8-Core GPU | |
| Apple M1 7-Core GPU | |
| 3DMark - Wild Life Extreme Unlimited | |
| Apple M1 Pro 16-Core GPU | |
| Apple M1 Pro 14-Core GPU | |
| Apple M2 10-Core GPU | |
| Apple M2 8-Core GPU | |
| Apple M1 8-Core GPU | |
| Apple M1 7-Core GPU | |
| Geekbench 5.5 - Metal Score | |
| Apple M1 Pro 16-Core GPU | |
| Apple M1 Pro 14-Core GPU | |
| Apple M2 10-Core GPU | |
| Apple M2 8-Core GPU | |
| Apple M1 8-Core GPU | |
| Apple M1 7-Core GPU | |
| GFXBench - 2560x1440 Aztec Ruins High Tier Offscreen | |
| Apple M1 Pro 16-Core GPU | |
| Apple M1 Pro 14-Core GPU | |
| Apple M2 10-Core GPU | |
| Apple M2 8-Core GPU | |
| Apple M1 8-Core GPU | |
| Apple M1 7-Core GPU | |
Despite the higher performance, the power consumption of the 8-core M2 GPU is actually just a little bit higher compared to the M1 8-core GPU. The M2 is very linear in terms of scaling and the 10-core version obviously consumes more power, but both models are 11 % more efficient than the old M1 GPU.
| Power Consumption | |
| 3DMark Wild Life Extreme Unlimited GPU Power | |
| Apple M1 Pro 16-Core GPU | |
| Apple M2 10-Core GPU | |
| Apple M2 8-Core GPU | |
| Apple M1 8-Core GPU | |
| 3DMark Wild Life Extreme Unlimited GPU Efficiency (internal tool) | |
| Apple M2 10-Core GPU | |
| Apple M2 8-Core GPU | |
| Apple M1 8-Core GPU | |
| Apple M1 Pro 16-Core GPU | |
* ... smaller is better
Verdict - The M2 is just a small upgrade
All in all, the new M2 SoC is once again a very good and also efficient chip, which combines many features. It is extremely efficient while idling, which also explains the excellent battery runtimes of the MacBook Pro 13 and the MacBook Air. The advantage over AMD and Intel is still huge in single-core scenarios when you compare the efficiency. AMD's Ryzen 6000 generation, however, is not far away in terms of multi-core efficiency.
Apple is still using a 5 nm manufacturing process we know from the M1 (even though there were optimizations), so we see the same problem Intel faced for many years. The performance advantage of the M2 CPU over the M1 is mostly a result of higher clocks in addition to the higher memory bandwidth and the larger L2 cache of the performance cores. However, the higher clocks require more power and a maximum performance advantage of 18 % in multi-core scenarios is result of around 40 % higher power consumption, so the CPU of the new M2 is not as efficient as the M1 anymore. The integrated GPU on the other hand is actually around 10 % more efficient than before, because the power consumption of the 8-core M2 GPU is comparable to the 8-core M1 GPU, despite the performance improvements.
Apple uses a lot of power to improve the CPU performance of the M2, and the efficiency is noticeably worse compared to the old M1. There is still an efficiency advantage over AMD and Intel, especially in single-core scenarios.
All these values are no indication for the upcoming Pro models of the M2 that we expect in the updated MacBook Pro 14 and 16 models later this year since these chips are supposed to be manufactured in a new 3 nm process.
