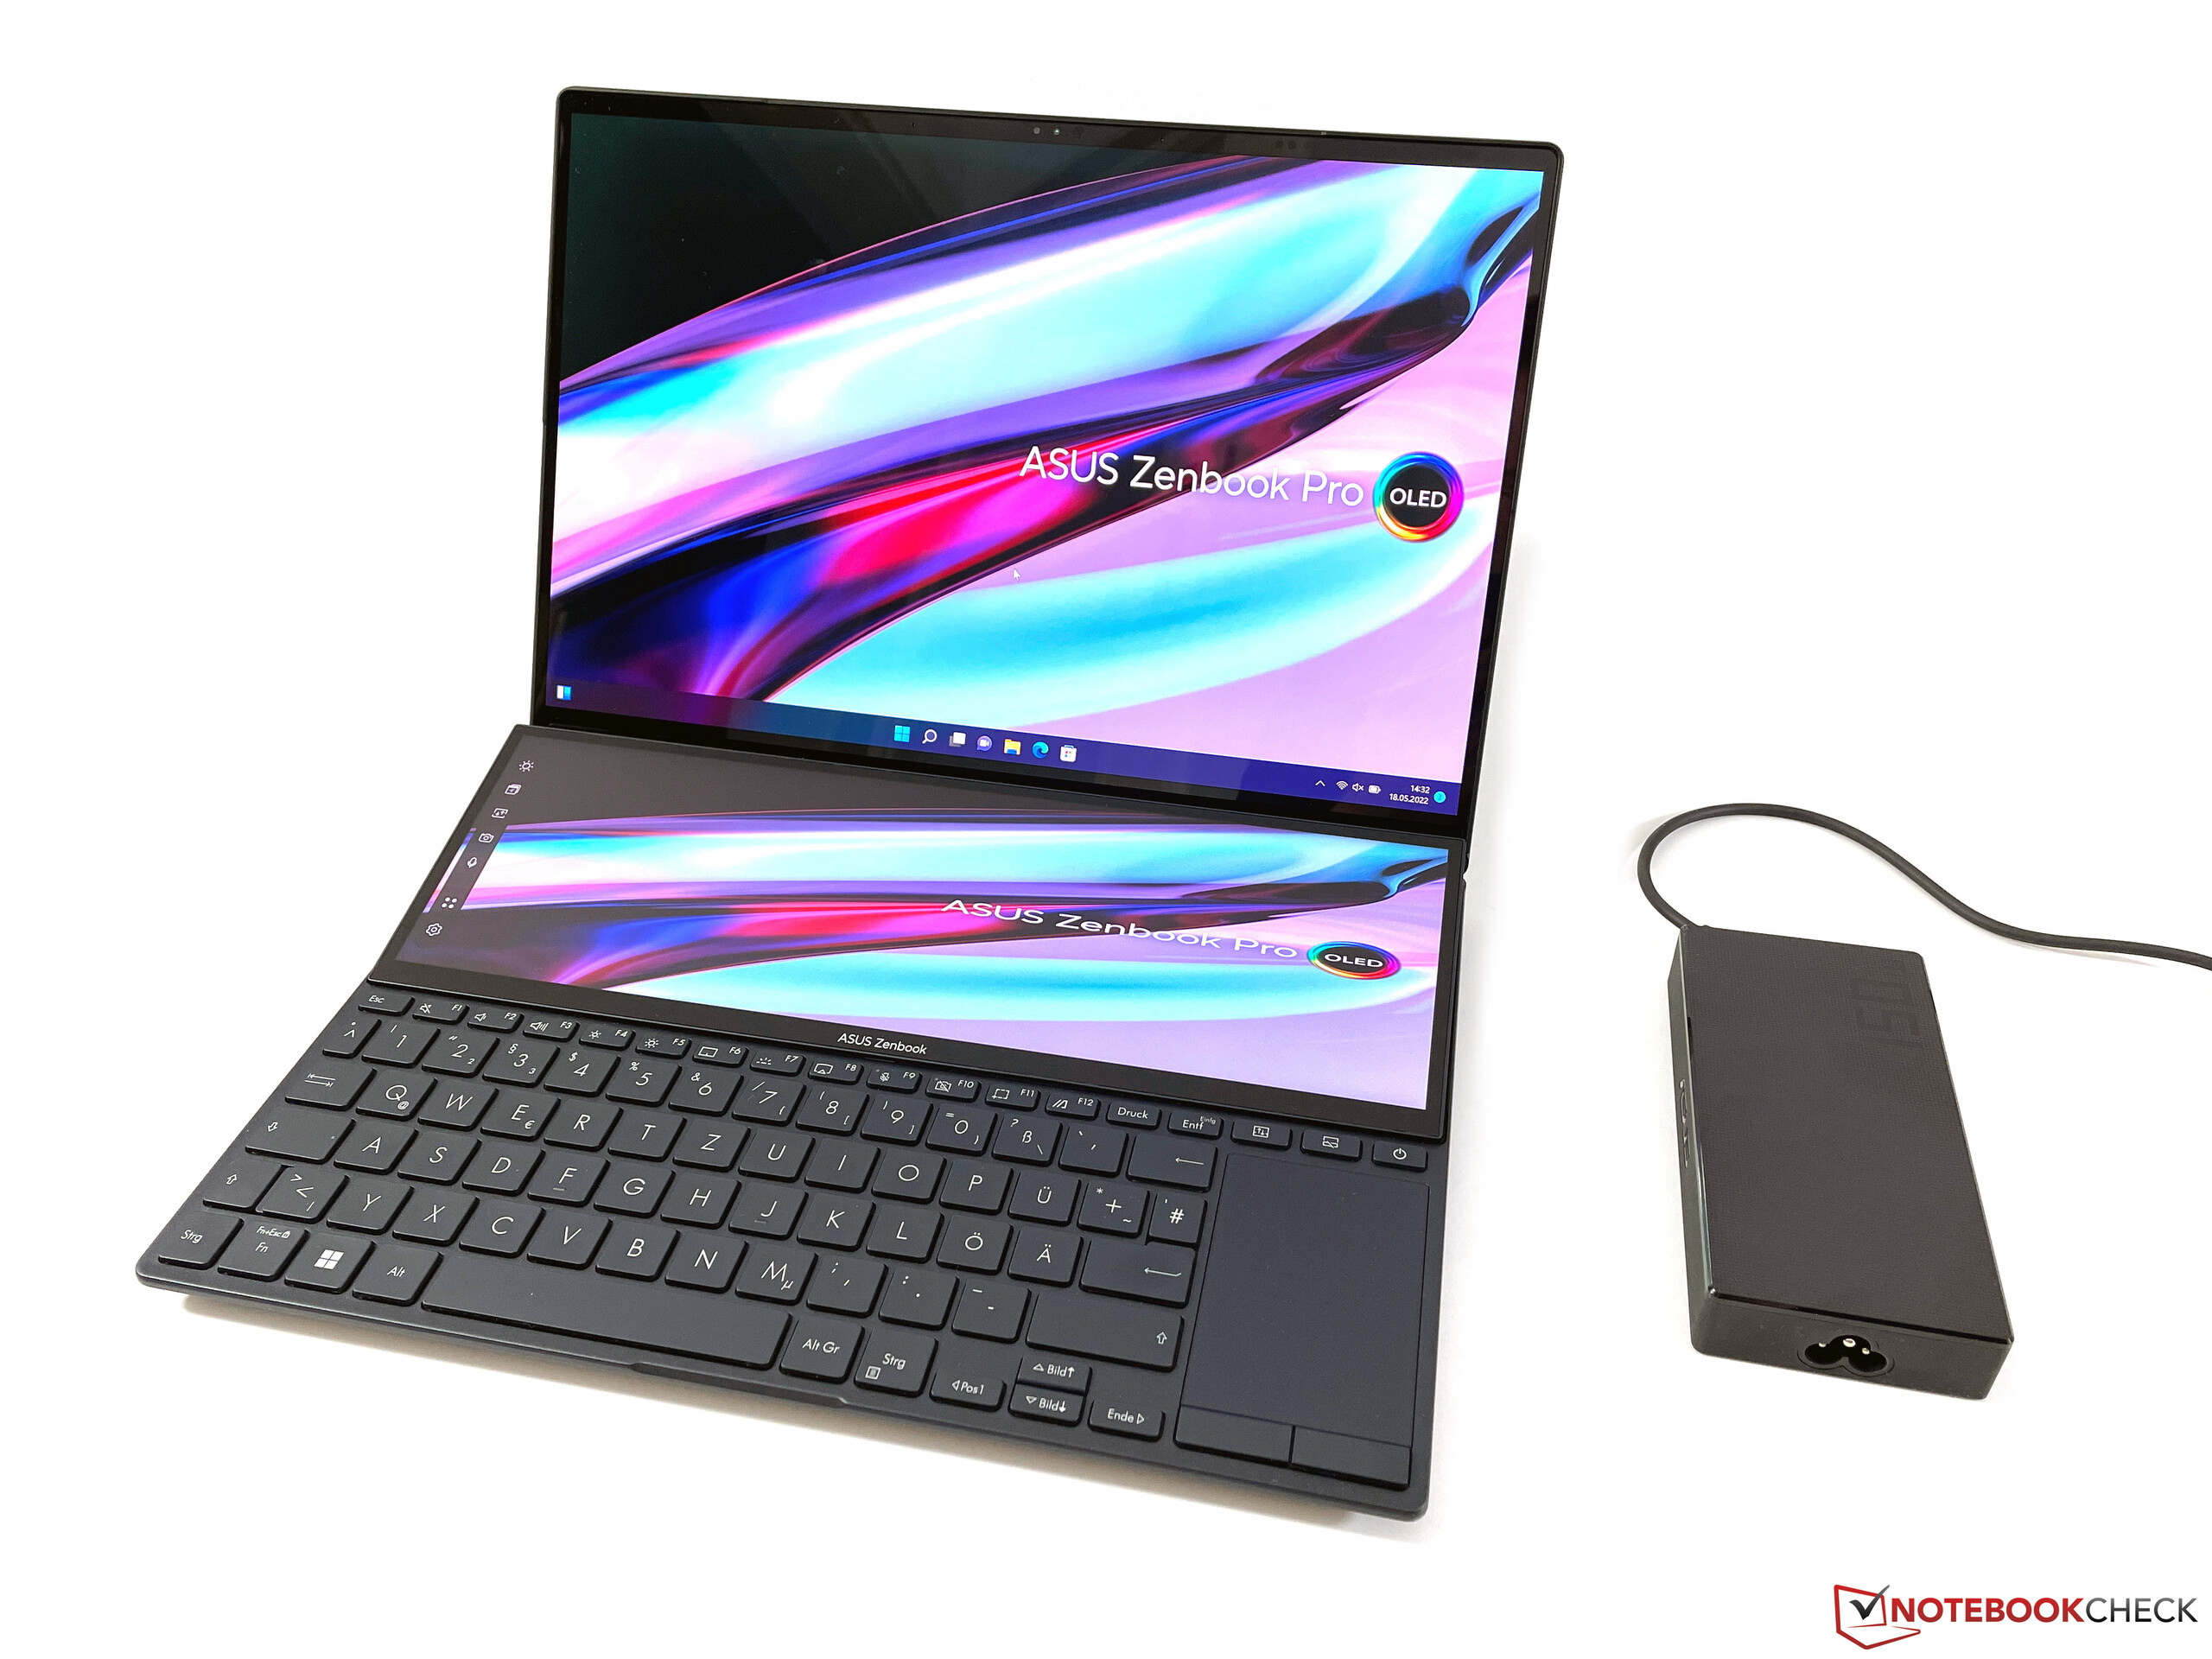
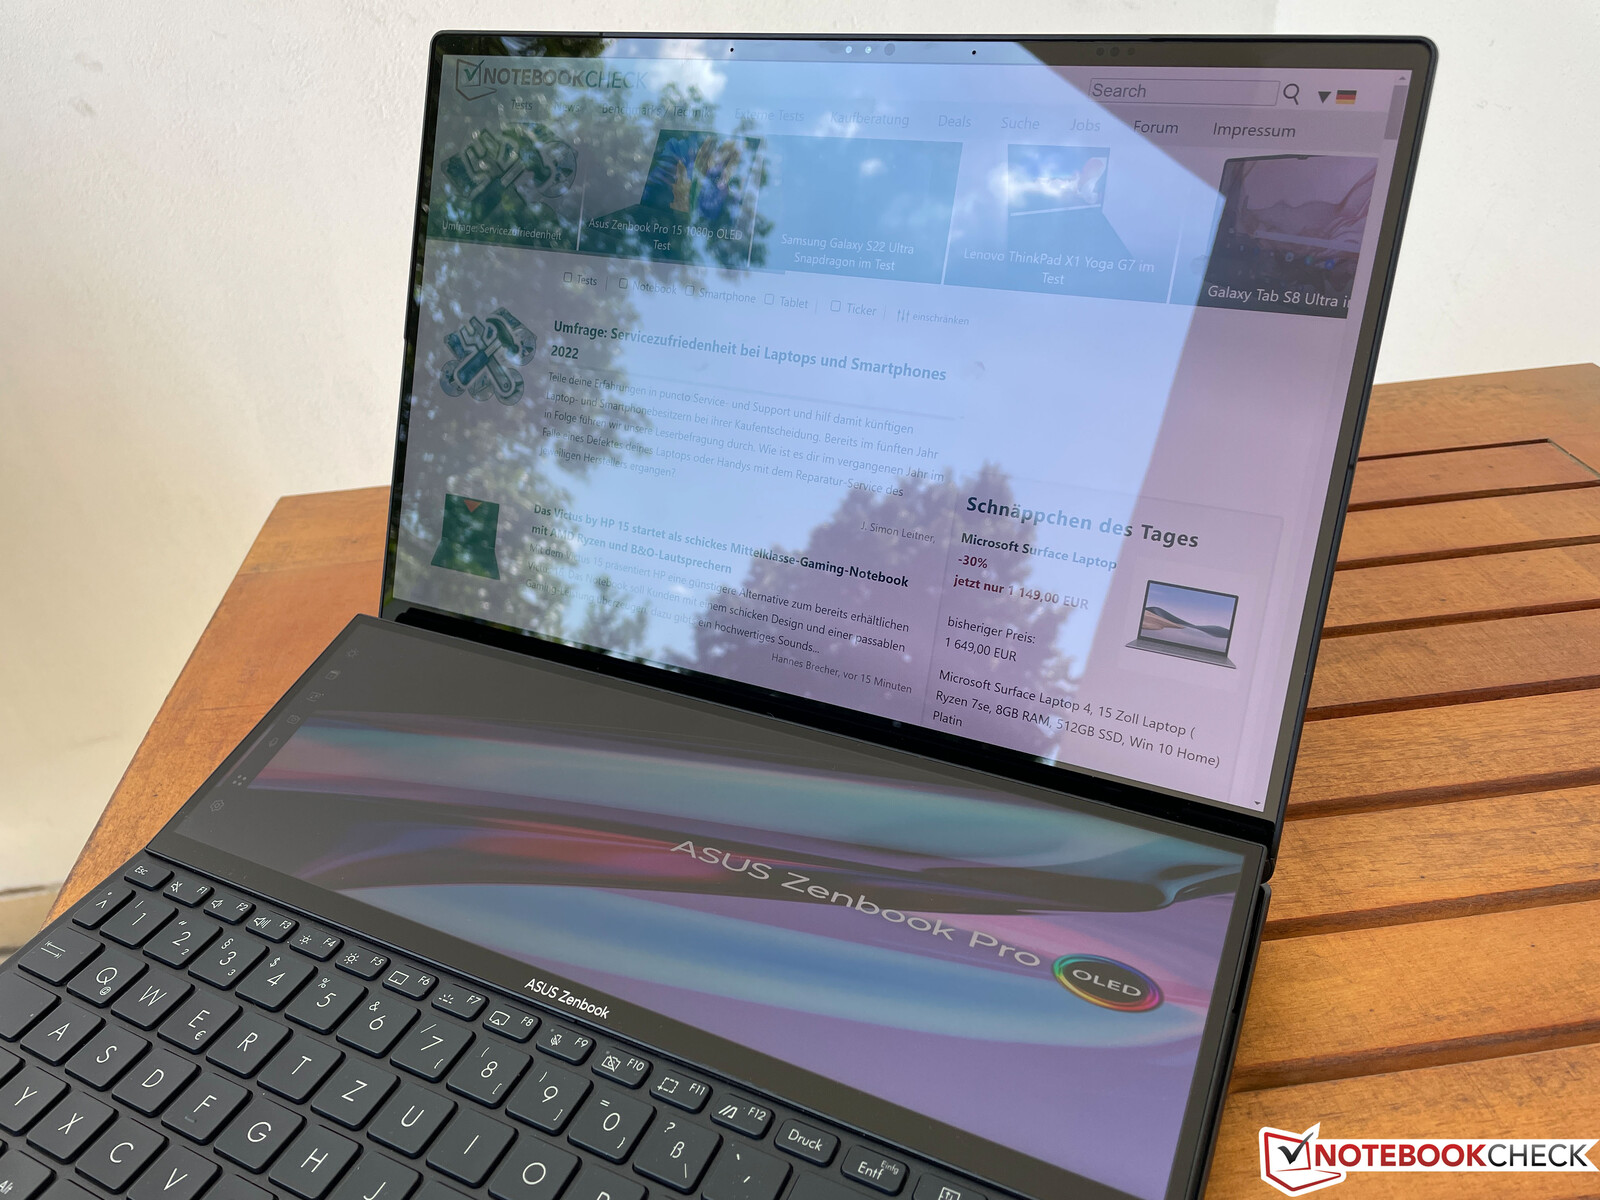
Asus Zenbook Pro 14 Duo in review: Dual-screen laptop with a fast 120 Hz OLED display
With the new Zenbook Pro 14 Duo, Asus introduces a powerful multimedia laptop with two screens. We're already familiar with the basic concept from the old ZenBook Duo 14 UX482, but the new Pro 14 Duo features some important changes, and overall, users can particularly look forward to more performance. While the predecessor was still equipped with Intel Tiger Lake U processors, Asus is now using the much faster H45 CPUs from the new Alder Lake generation. A dedicated Nvidia GeForce RTX 3050 Ti is also optionally available. The main display is a 14.5-inch 4K OLED screen, and the second screen uses an IPS panel; they both run at a fast 120 Hz.
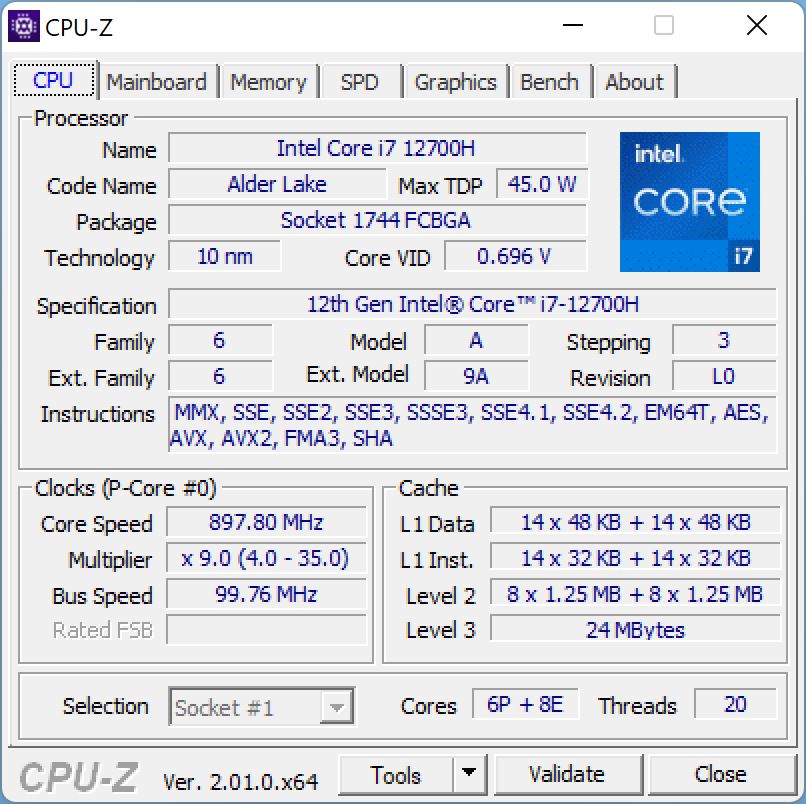
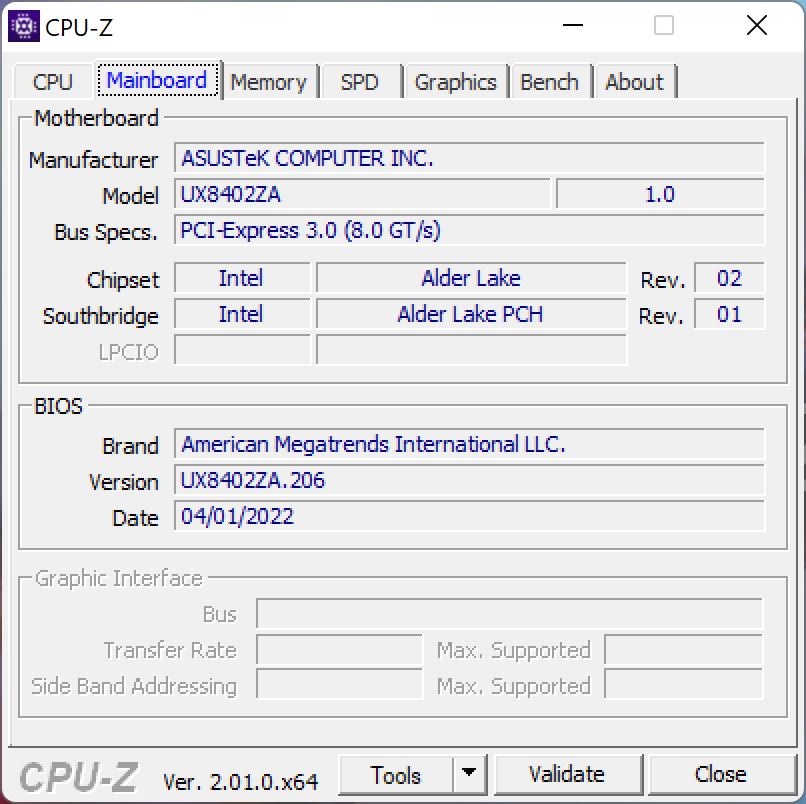
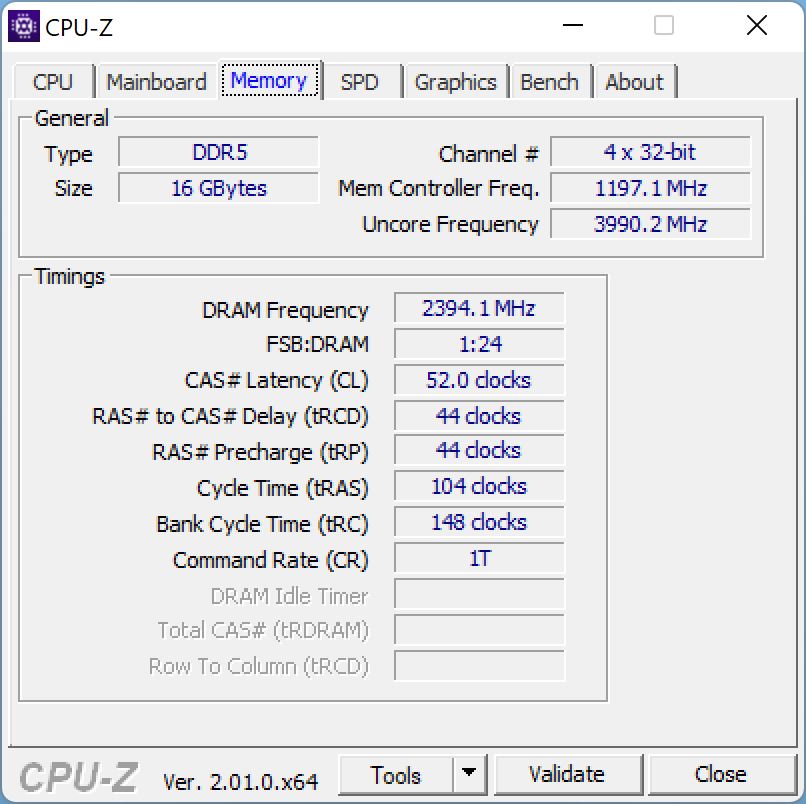
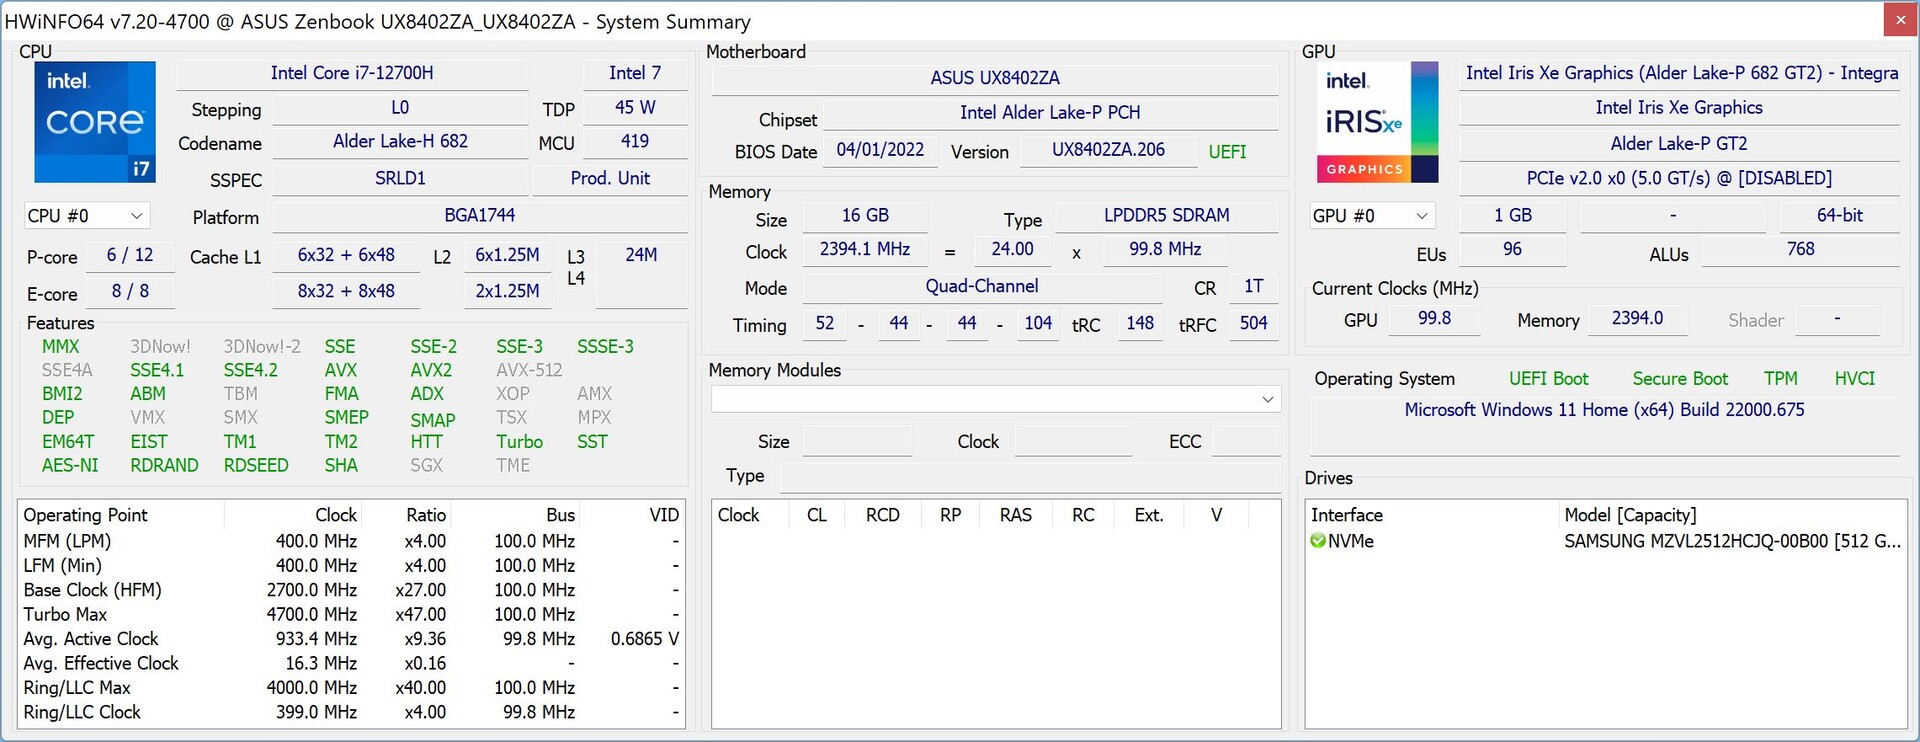
Our review unit bears the UX8402Z model designation and uses the Core i7-12700H in combination with 16 GB of LPDDR5 RAM and a 512 GB PCIe 4.0 SSD. However, our device has to do without the dedicated GeForce GPU; graphics computations are exclusively handled by the processor's integrated Iris Xe Graphics G7. Our configuration costs around 1,899 Euros (~$2,033), while the model with the RTX 3050 Ti and a 1 TB SSD costs 2,299 Euros (~$2,462).
Possible contenders in comparison
Rating | Date | Model | Weight | Height | Size | Resolution | Price |
|---|---|---|---|---|---|---|---|
| 84.4 % v7 (old) | 06 / 2022 | Asus Zenbook Pro 14 Duo OLED UX8402ZA i7-12700H, Iris Xe G7 96EUs | 1.7 kg | 19.6 mm | 14.50" | 2880x1800 | |
| 89 % v7 (old) | 03 / 2022 | Microsoft Surface Laptop Studio i7 RTX 3050 Ti i7-11370H, GeForce RTX 3050 Ti Laptop GPU | 1.8 kg | 19 mm | 14.40" | 2400x1600 | |
| 92.7 % v7 (old) | 11 / 2021 | Apple MacBook Pro 14 2021 M1 Pro Entry M1 Pro 8-Core, M1 Pro 14-Core GPU | 1.6 kg | 15.5 mm | 14.20" | 3024x1964 | |
| 90.6 % v7 (old) | 05 / 2022 | Lenovo Yoga 9i 14 2022 i7-1260P i7-1260P, Iris Xe G7 96EUs | 1.4 kg | 15.25 mm | 14.00" | 3840x2400 | |
| 85.1 % v7 (old) | 01 / 2021 | Asus ZenBook Duo 14 UX482EA i7-1165G7, Iris Xe G7 96EUs | 1.6 kg | 16.9 mm | 14.00" | 1920x1080 |
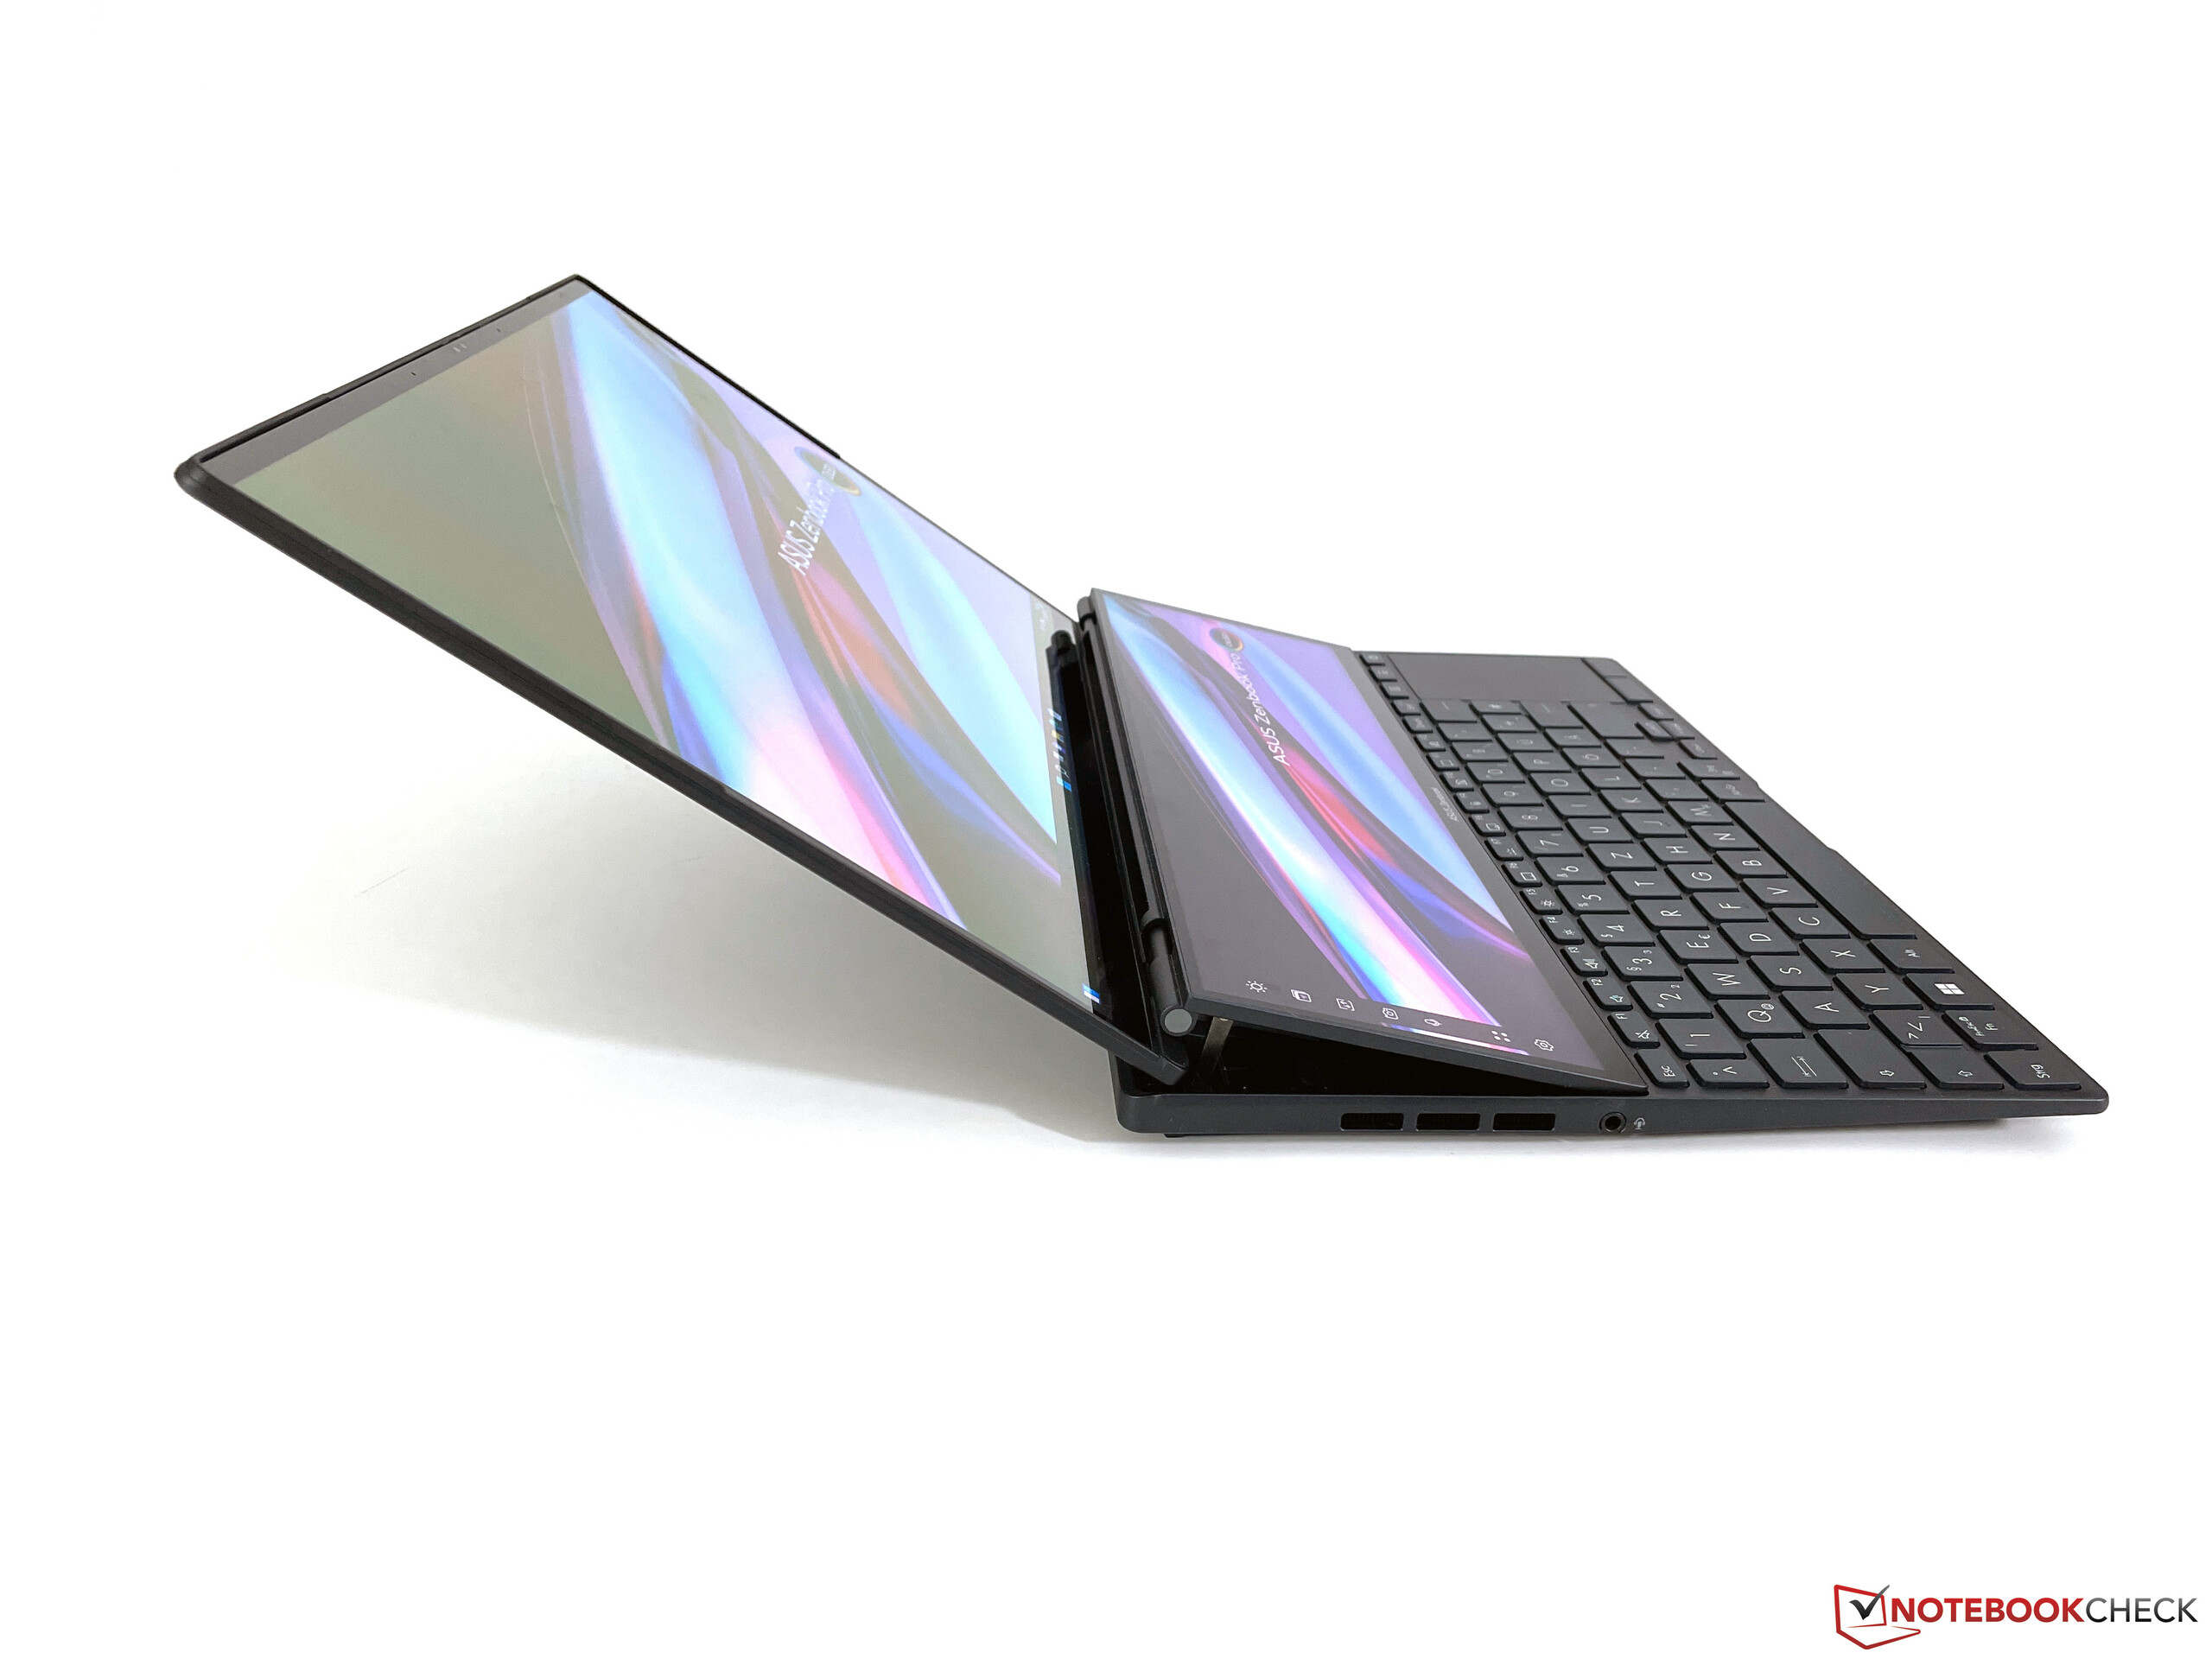
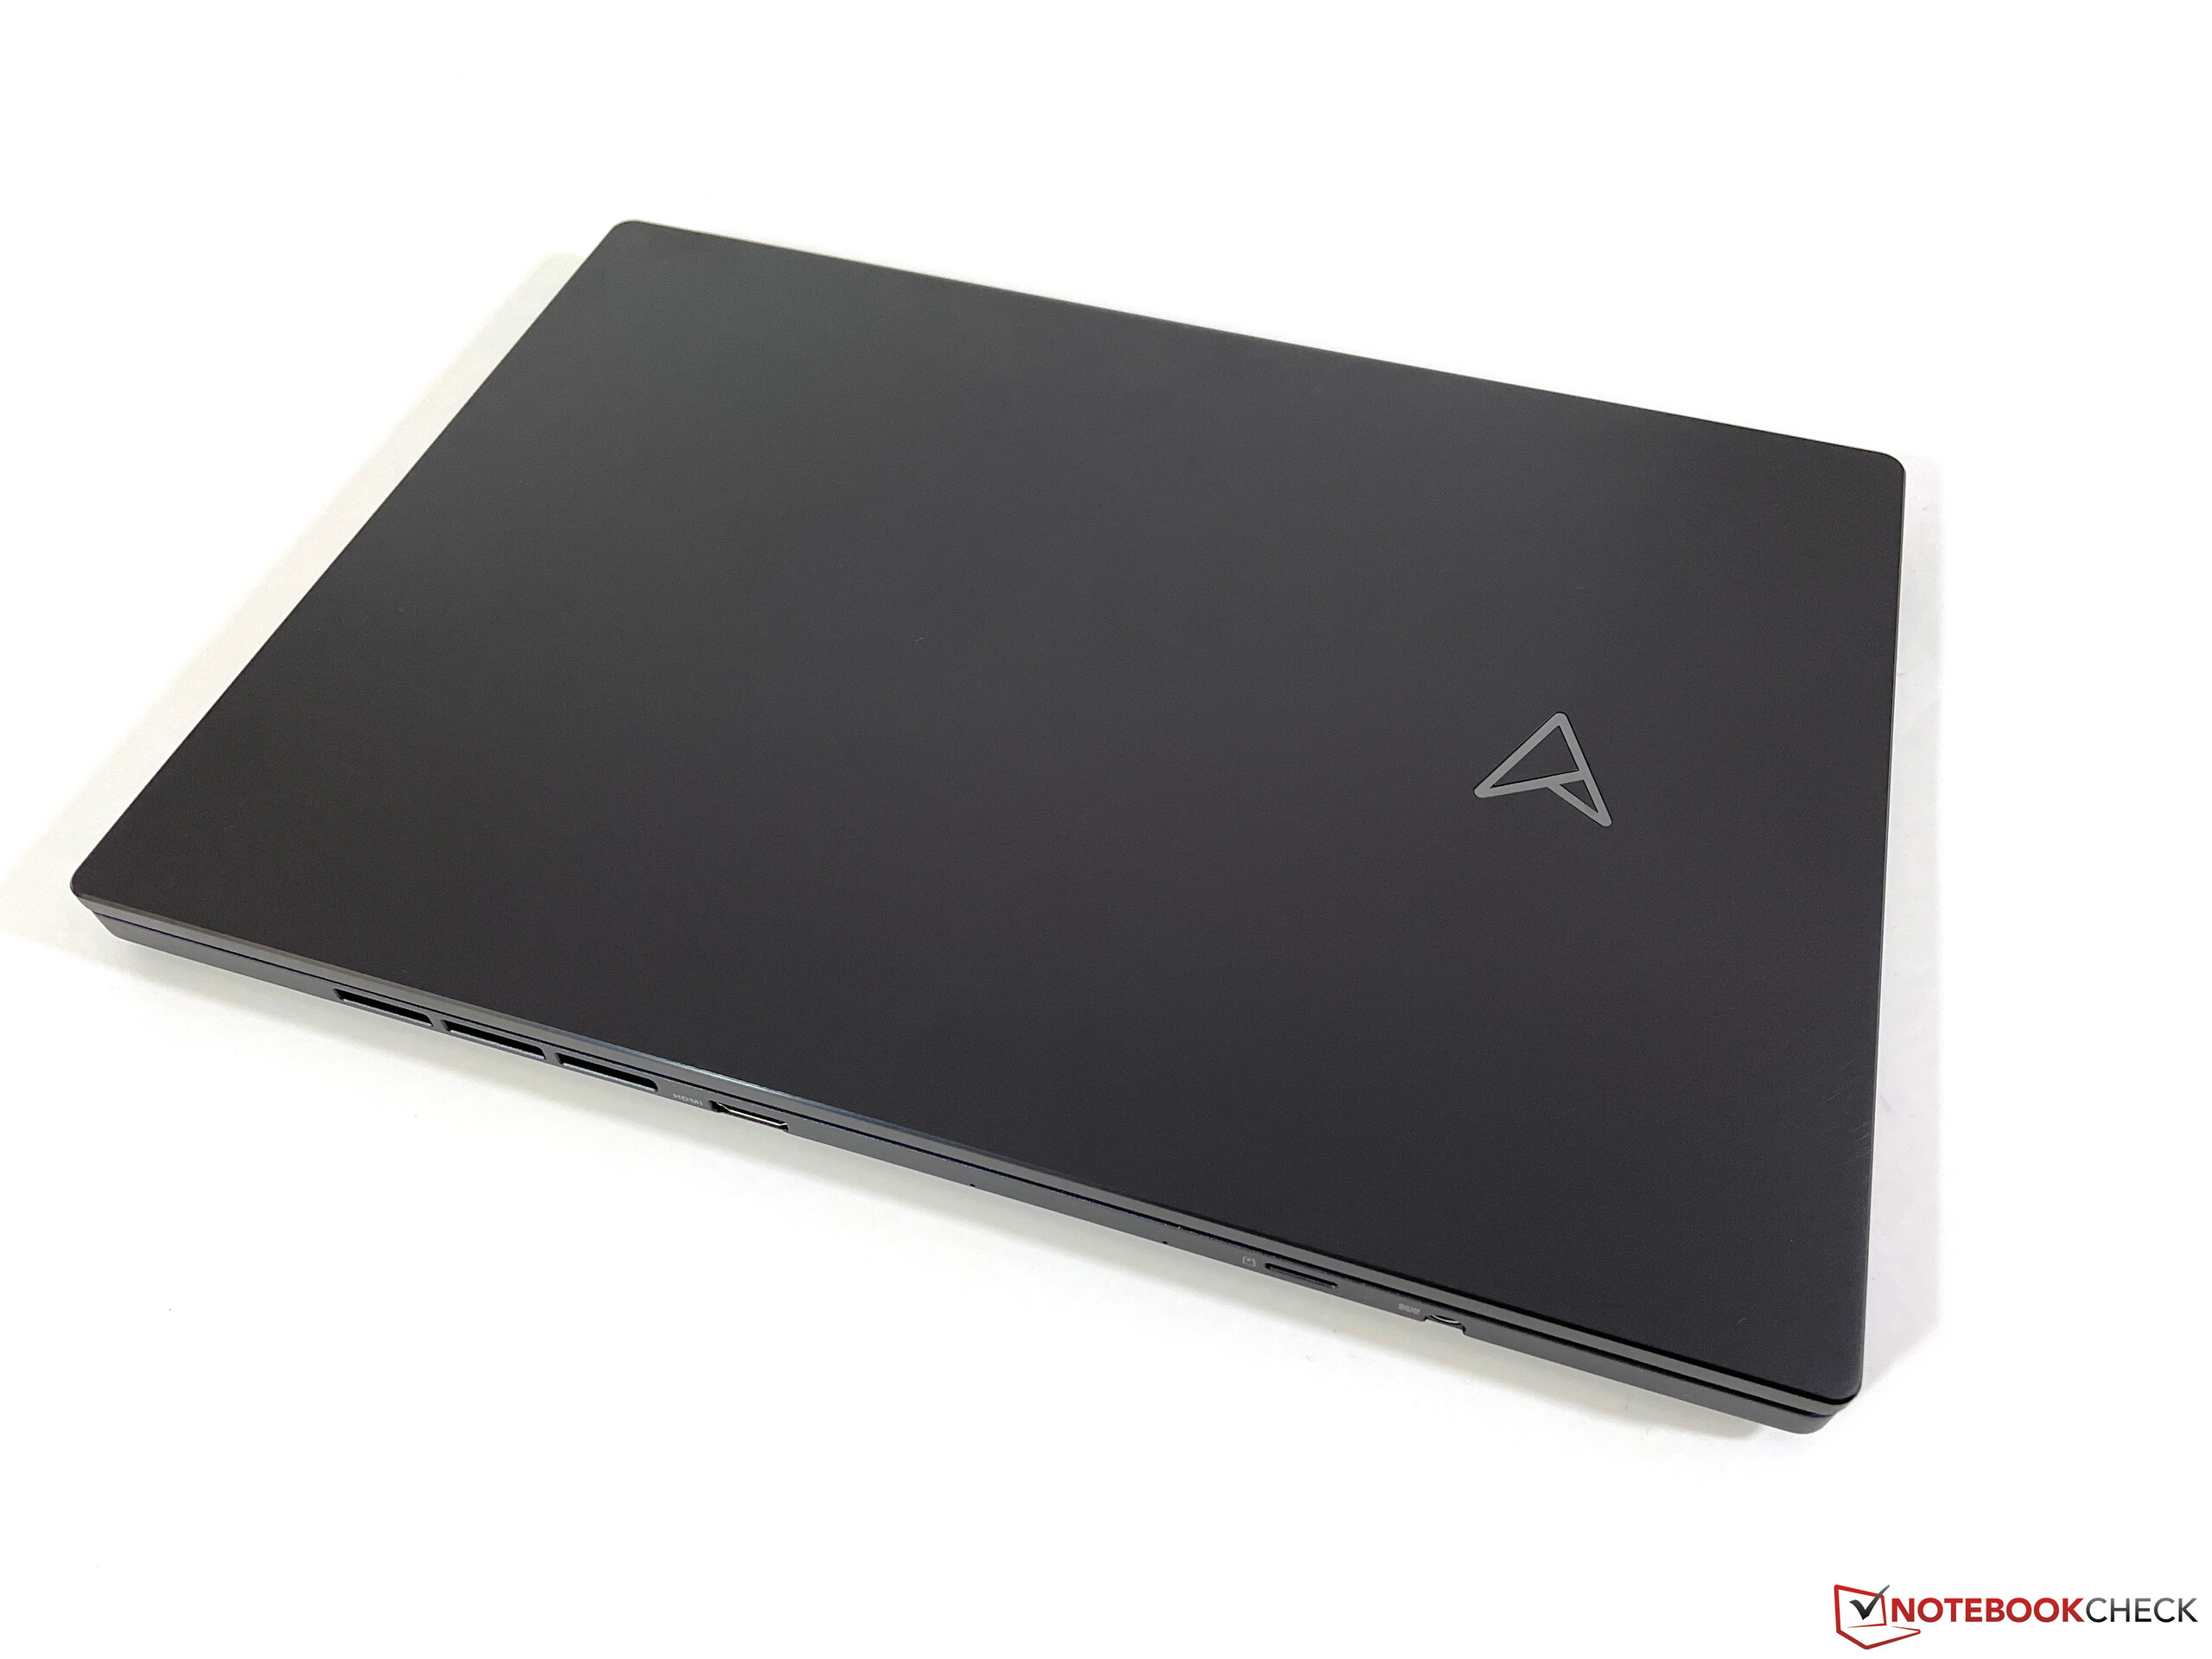
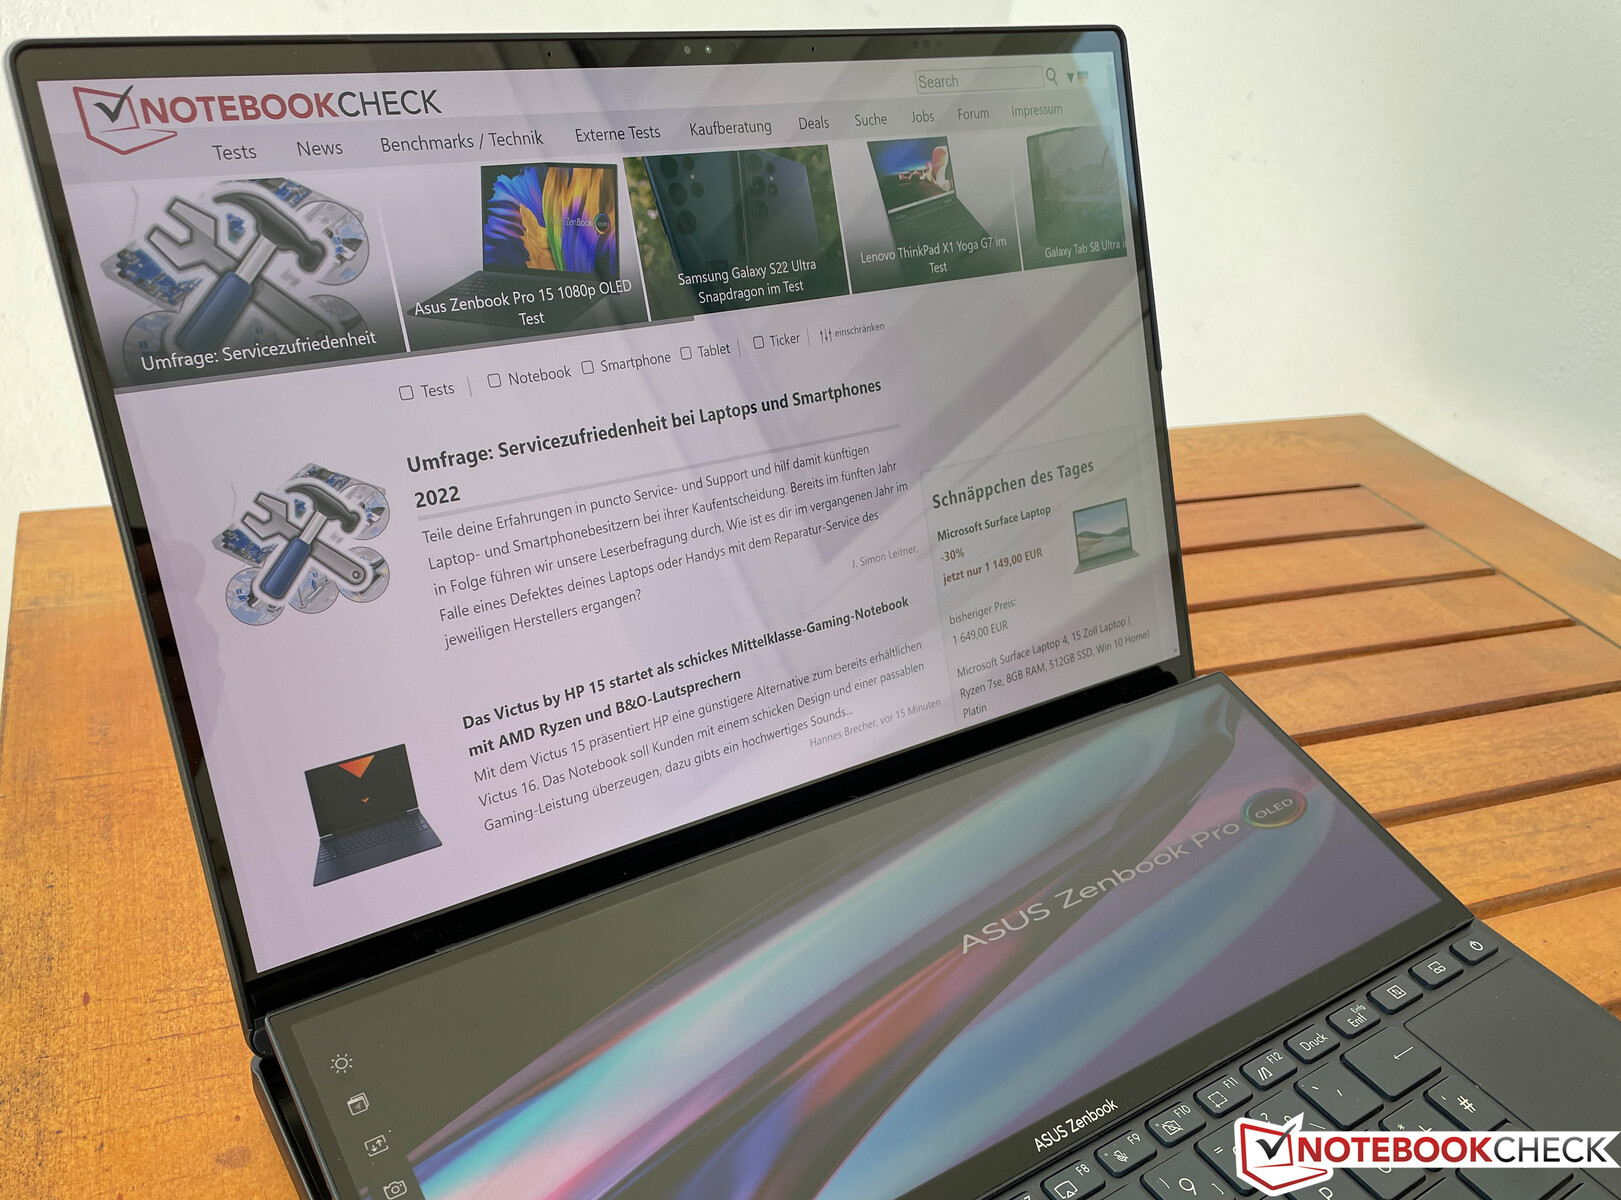
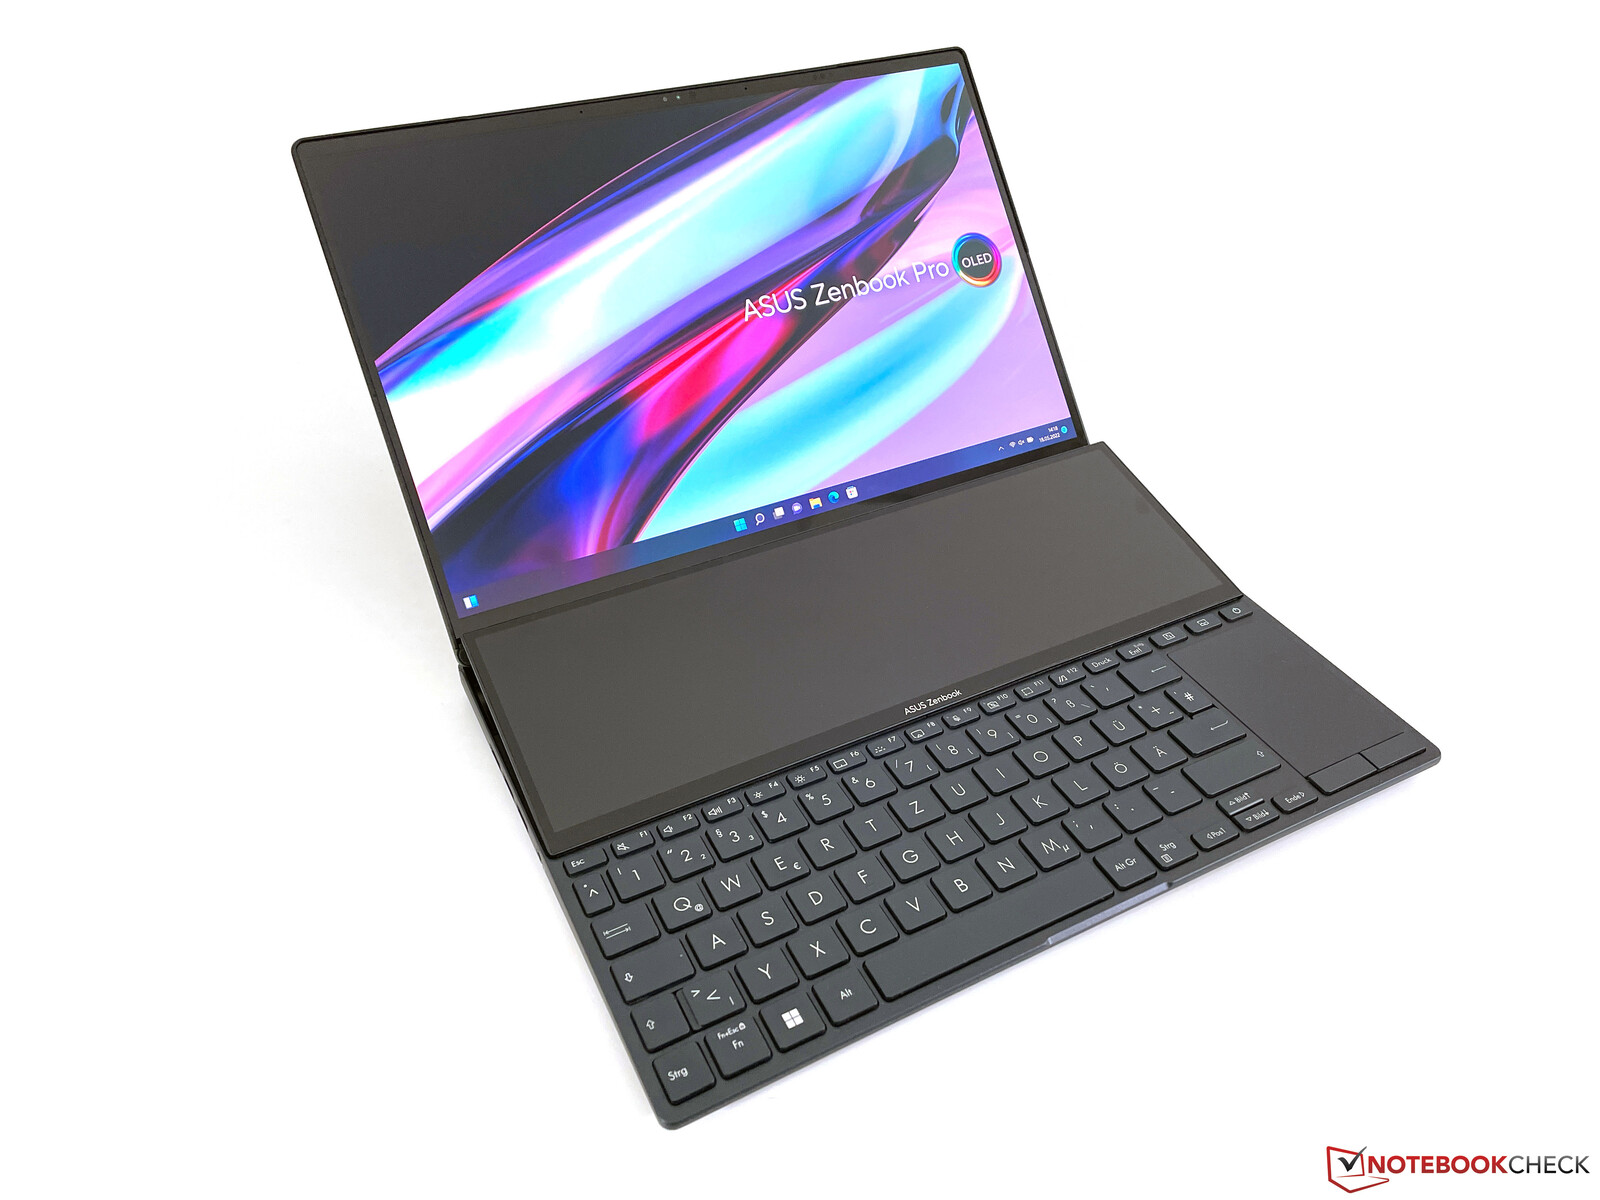
Case - Zenbook with new hinge mechanism
Compared to the Zenbook Duo 14, Asus has completely redesigned both the case and the hinge mechanism that lifts the second screen. This is a full metal case in the Tech Black color variant, and the entire case design is quite discreet overall. The display lid features the subtle new Asus logo, and the concentric circle pattern is still present, but you have to look closely in order to notice it. According to Asus, there's also an anti-dirt coating, but you should still wipe the lid from time to time.
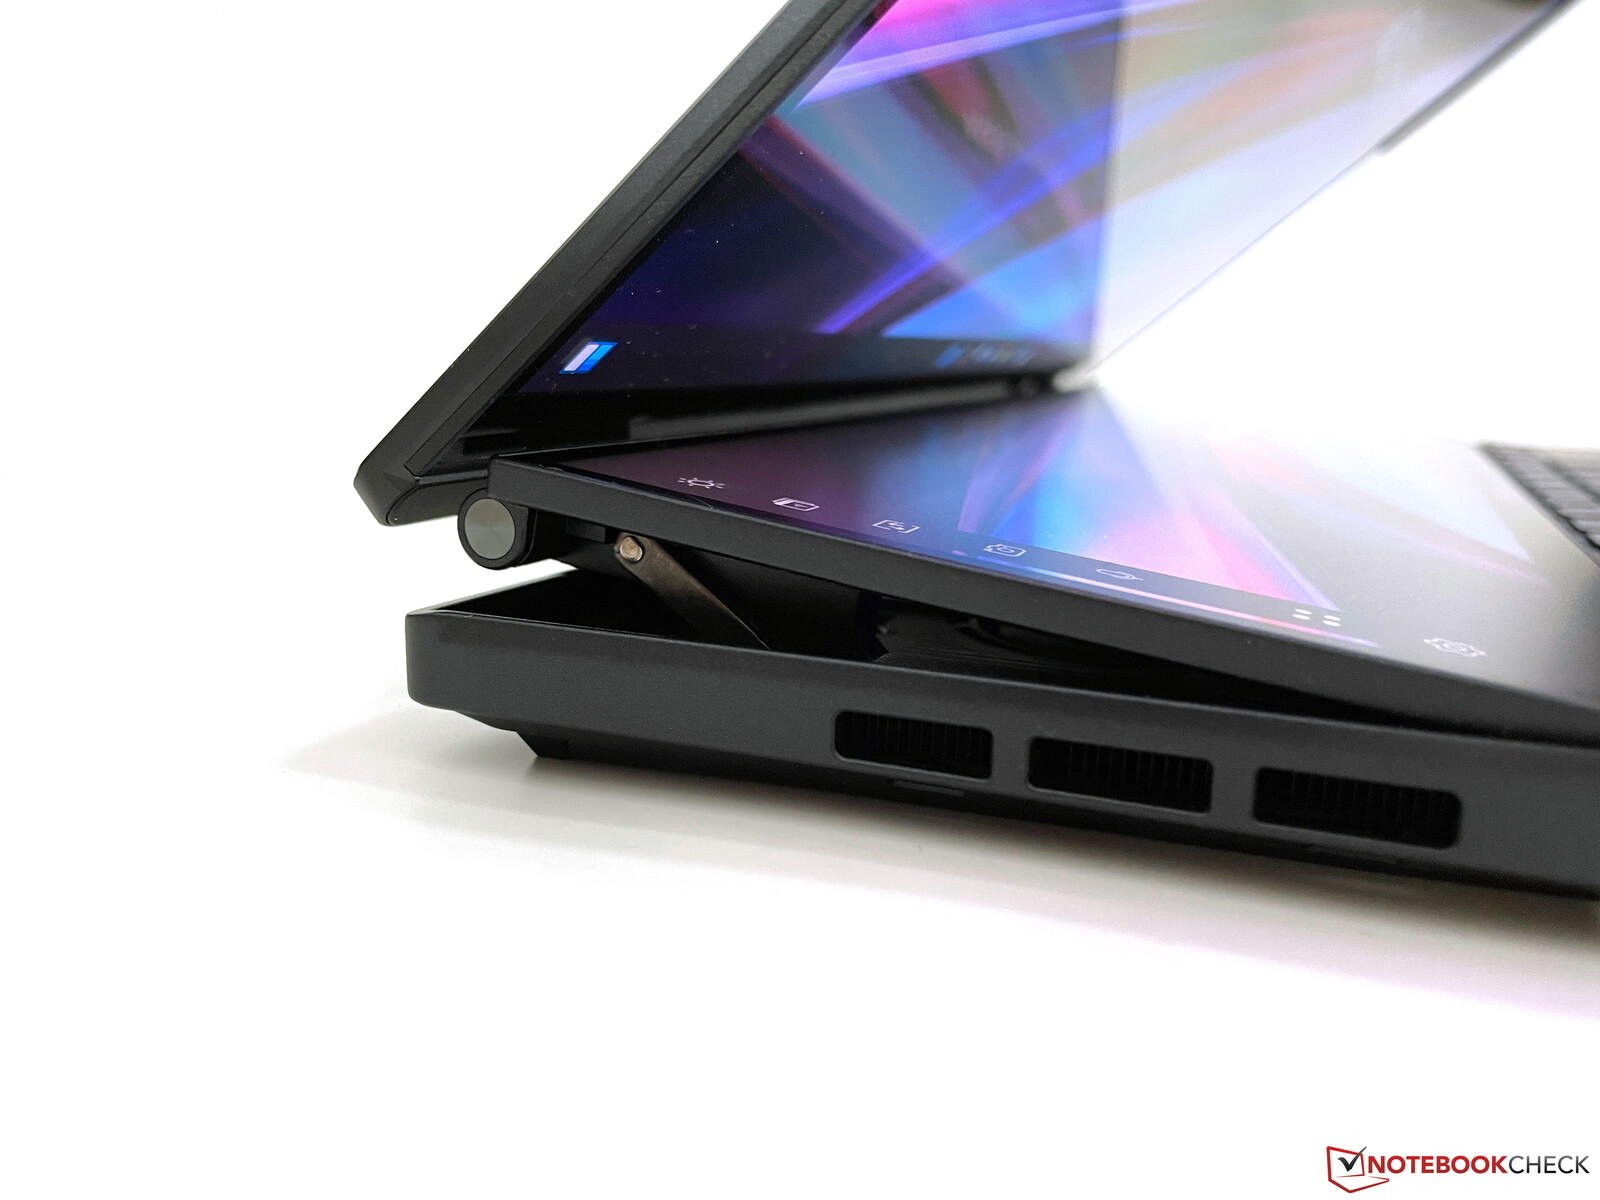
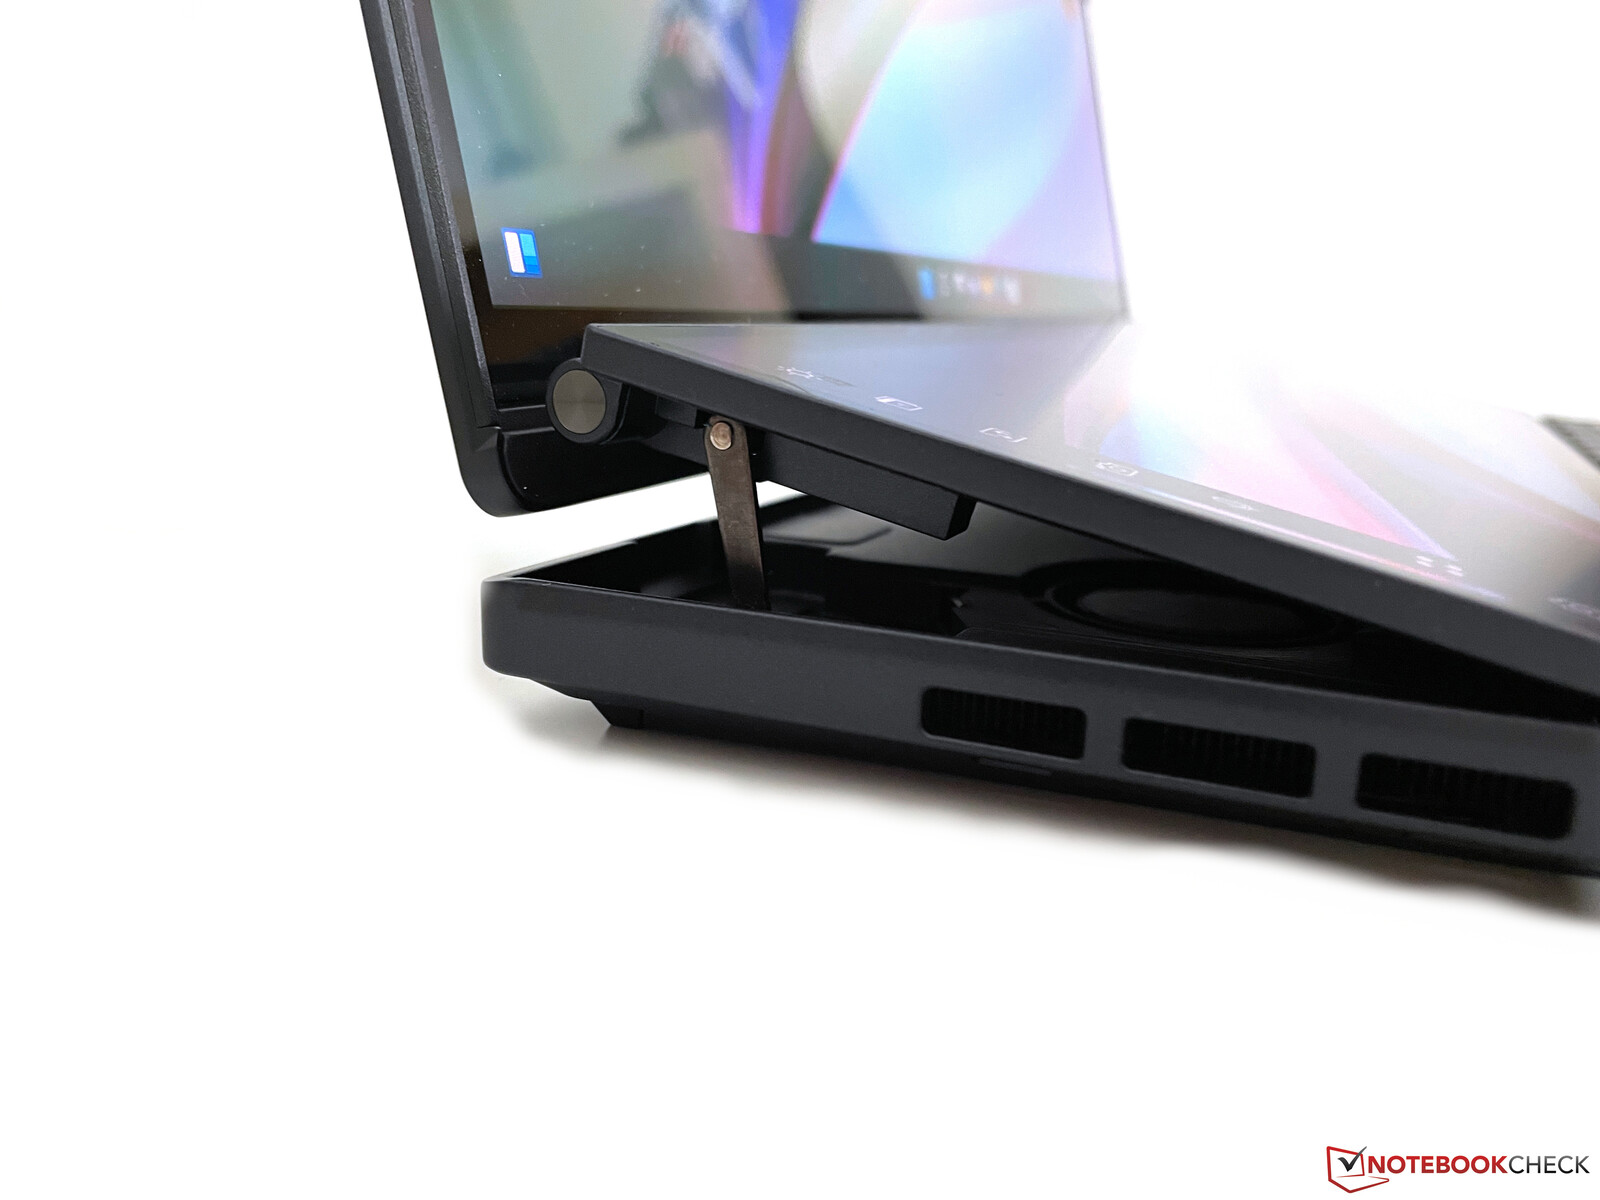
The new hinge mechanism leaves an overall stable impression. As soon as you open the lid, the secondary display is raised as well. Although the two support struts look quite fragile, they do their job quite well. The main display itself is attached to the ScreenPad with two hinges and not directly to the base unit. This helps Asus ensure that there is always a clean transition between the two screens, but the stability of the hinges is not satisfactory, since the main screen wobbles visibly when you change the opening angle (max. ~145-150 degrees). The screen lid itself is very stable, though, and even localized pressure doesn't lead to image distortions. This also applies to the base unit, and the keyboard doesn't flex when typing, either.

When it comes to the footprint, our comparison devices hardly differ, but the additional screen also affects the build height and the weight. However, there are no major differences here, either. You still have to take the 420-gram power adapter into account when transporting the device.
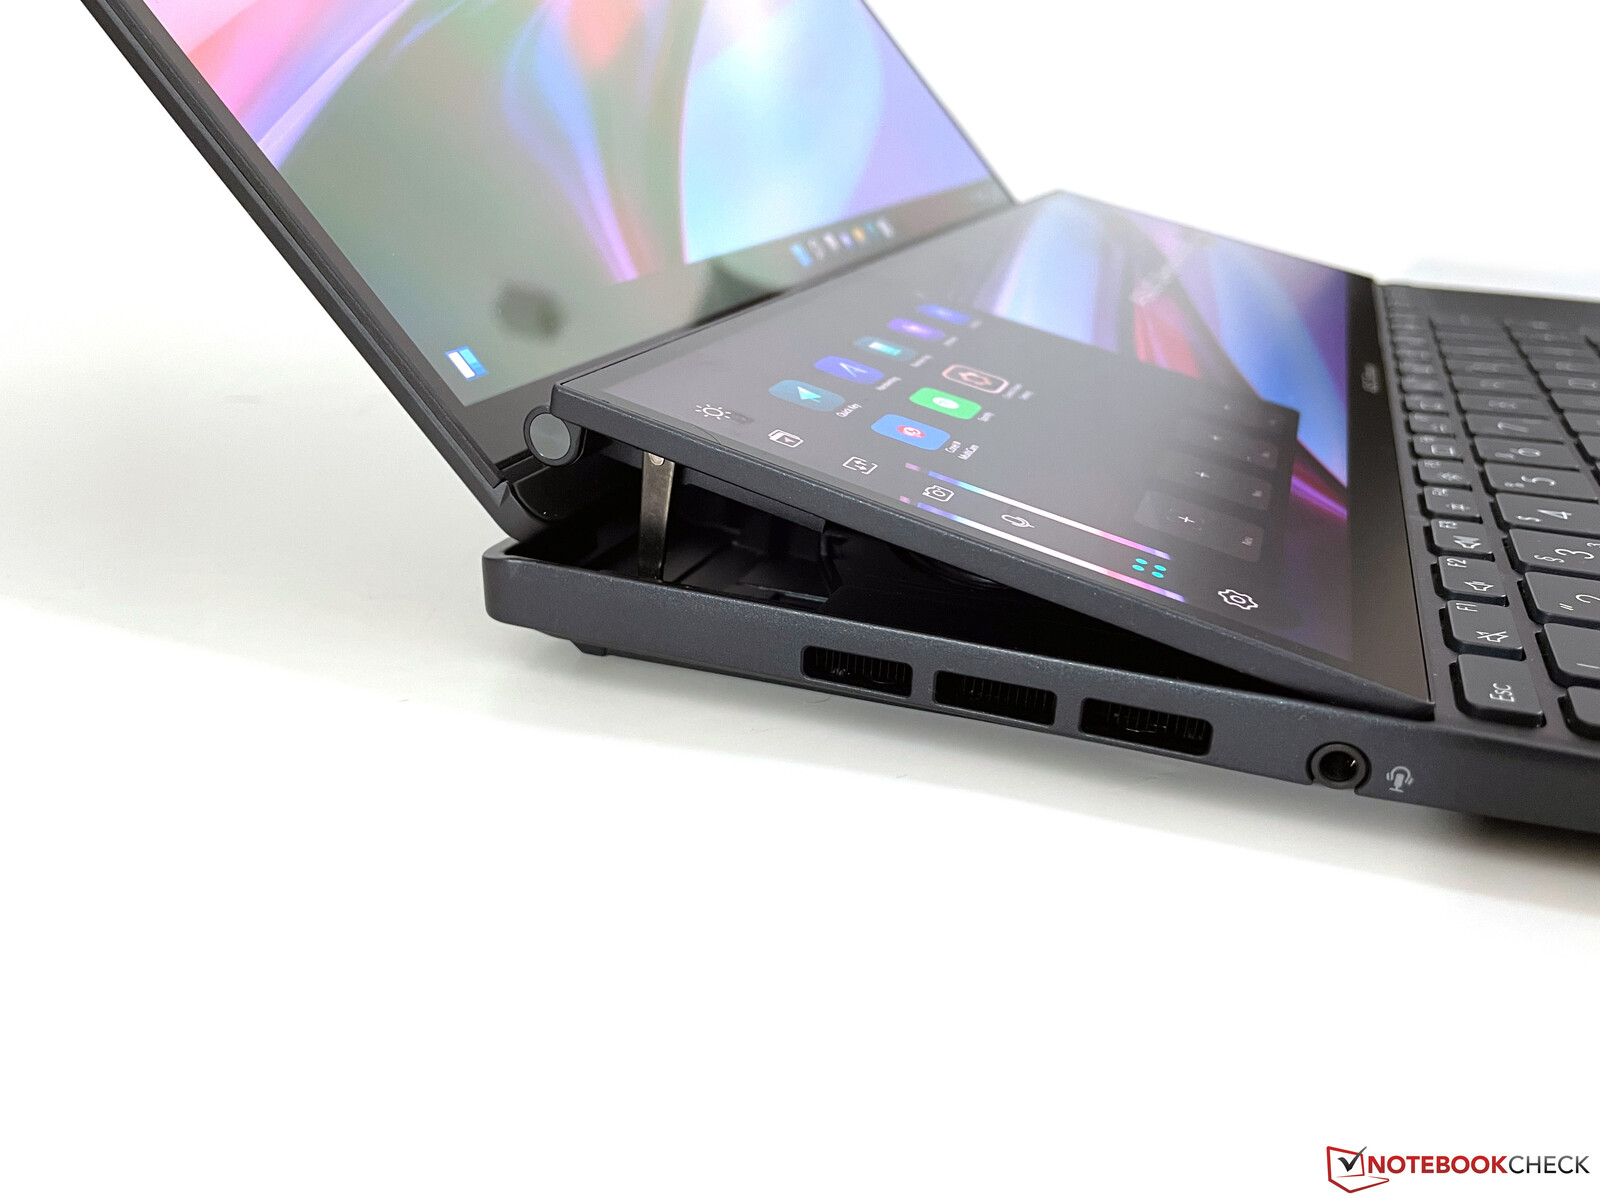
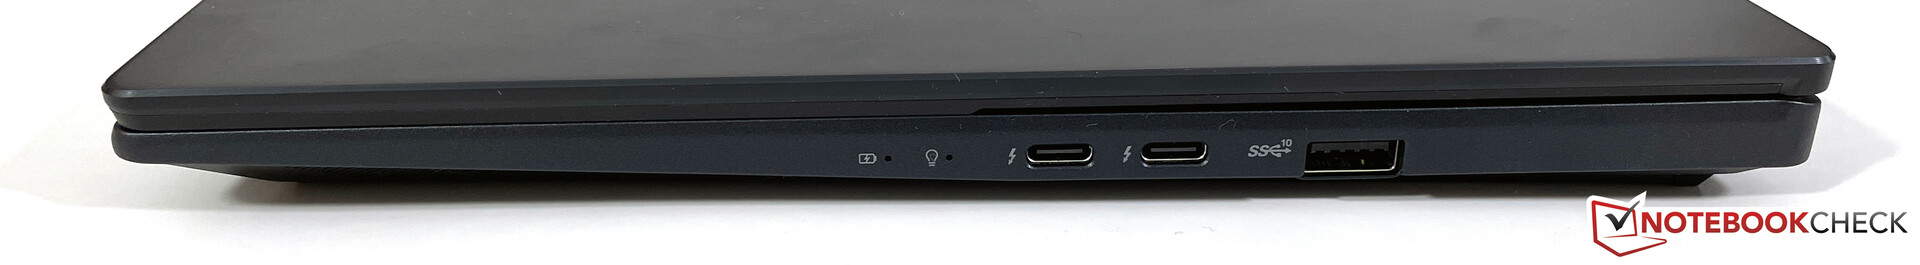
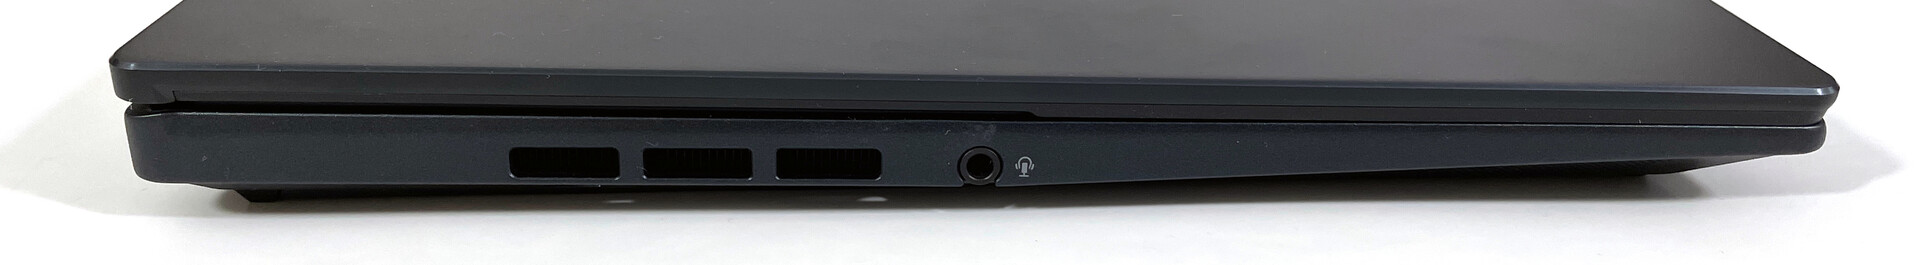
Connectivity - Zenbook with Thunderbolt and USB-A
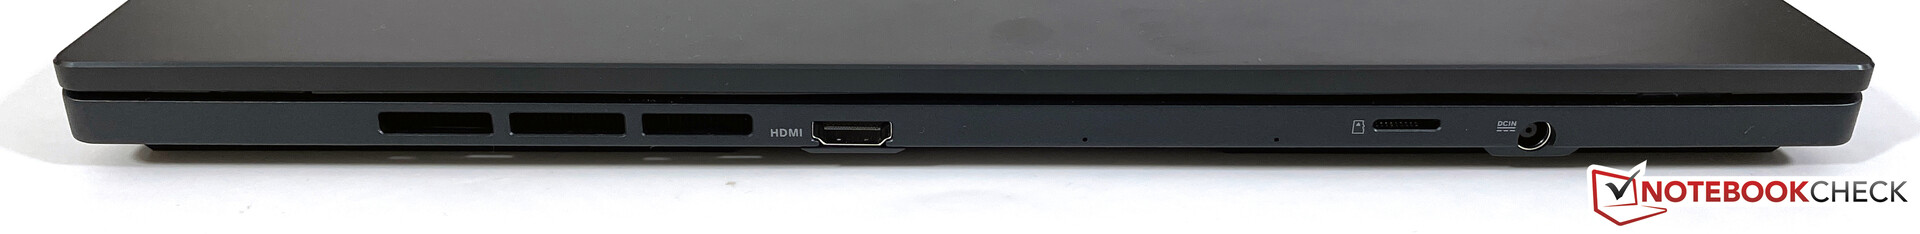
The Zenbook Pro 14 Duo's ports are distributed across both sides as well as the back. The USB ports are all located on the right and also quite in the middle, which isn't ideal in every situation. The proprietary power connector, the microSD reader, and the HDMI output are on the back. Since the screen is also raised a bit when opening the device due to the special mechanism, the ports on the back always remain accessible.
The iGPU version allows connecting a maximum of three external monitors, but only when the Zenbook's second screen is disabled. Using both of the built-in screens limits the number of external displays to two.
SD card reader
The microSD card reader on the back uses a spring mechanism and is able to fully accommodate the memory card. With our reference card (Angelbird AV Pro V60), we determine average transfer rates of around 80 MB/s, which is a substantial increase compared to the old model.
| SD Card Reader | |
| average JPG Copy Test (av. of 3 runs) | |
| Average of class Multimedia (23 - 531, n=43, last 2 years) | |
| Apple MacBook Pro 14 2021 M1 Pro Entry (AV PRO V60) | |
| Asus Zenbook Pro 14 Duo OLED UX8402ZA (Angelbird AV Pro V60) | |
| Asus ZenBook Duo 14 UX482EA (Toshiba Exceria Pro M501 microSDXC 32GB) | |
| maximum AS SSD Seq Read Test (1GB) | |
| Average of class Multimedia (27.9 - 1455, n=42, last 2 years) | |
| Asus Zenbook Pro 14 Duo OLED UX8402ZA (Angelbird AV Pro V60) | |
| Asus ZenBook Duo 14 UX482EA (Toshiba Exceria Pro M501 microSDXC 32GB) | |
Communication
Users will have to do without an Ethernet module (but this can be achieved via TB4 adapters), but in return, Intel's built-in AX211E is one of the most modern WLAN modules. We were able to connect to the 6 GHz network (Wi-Fi 6E) provided by our reference router from Asus (GT-AXE11000) without any issues, and the transfer rates of over 1.6 GHz were very high and also very stable. The connection to more common Wi-Fi 6 and Wi-Fi 5 networks didn't show any irregularities, either.
Webcam
Asus still uses a 720p webcam in the top bezel of the screen. The camera does its job, but the pictures aren't especially sharp, and things could have certainly been better here.


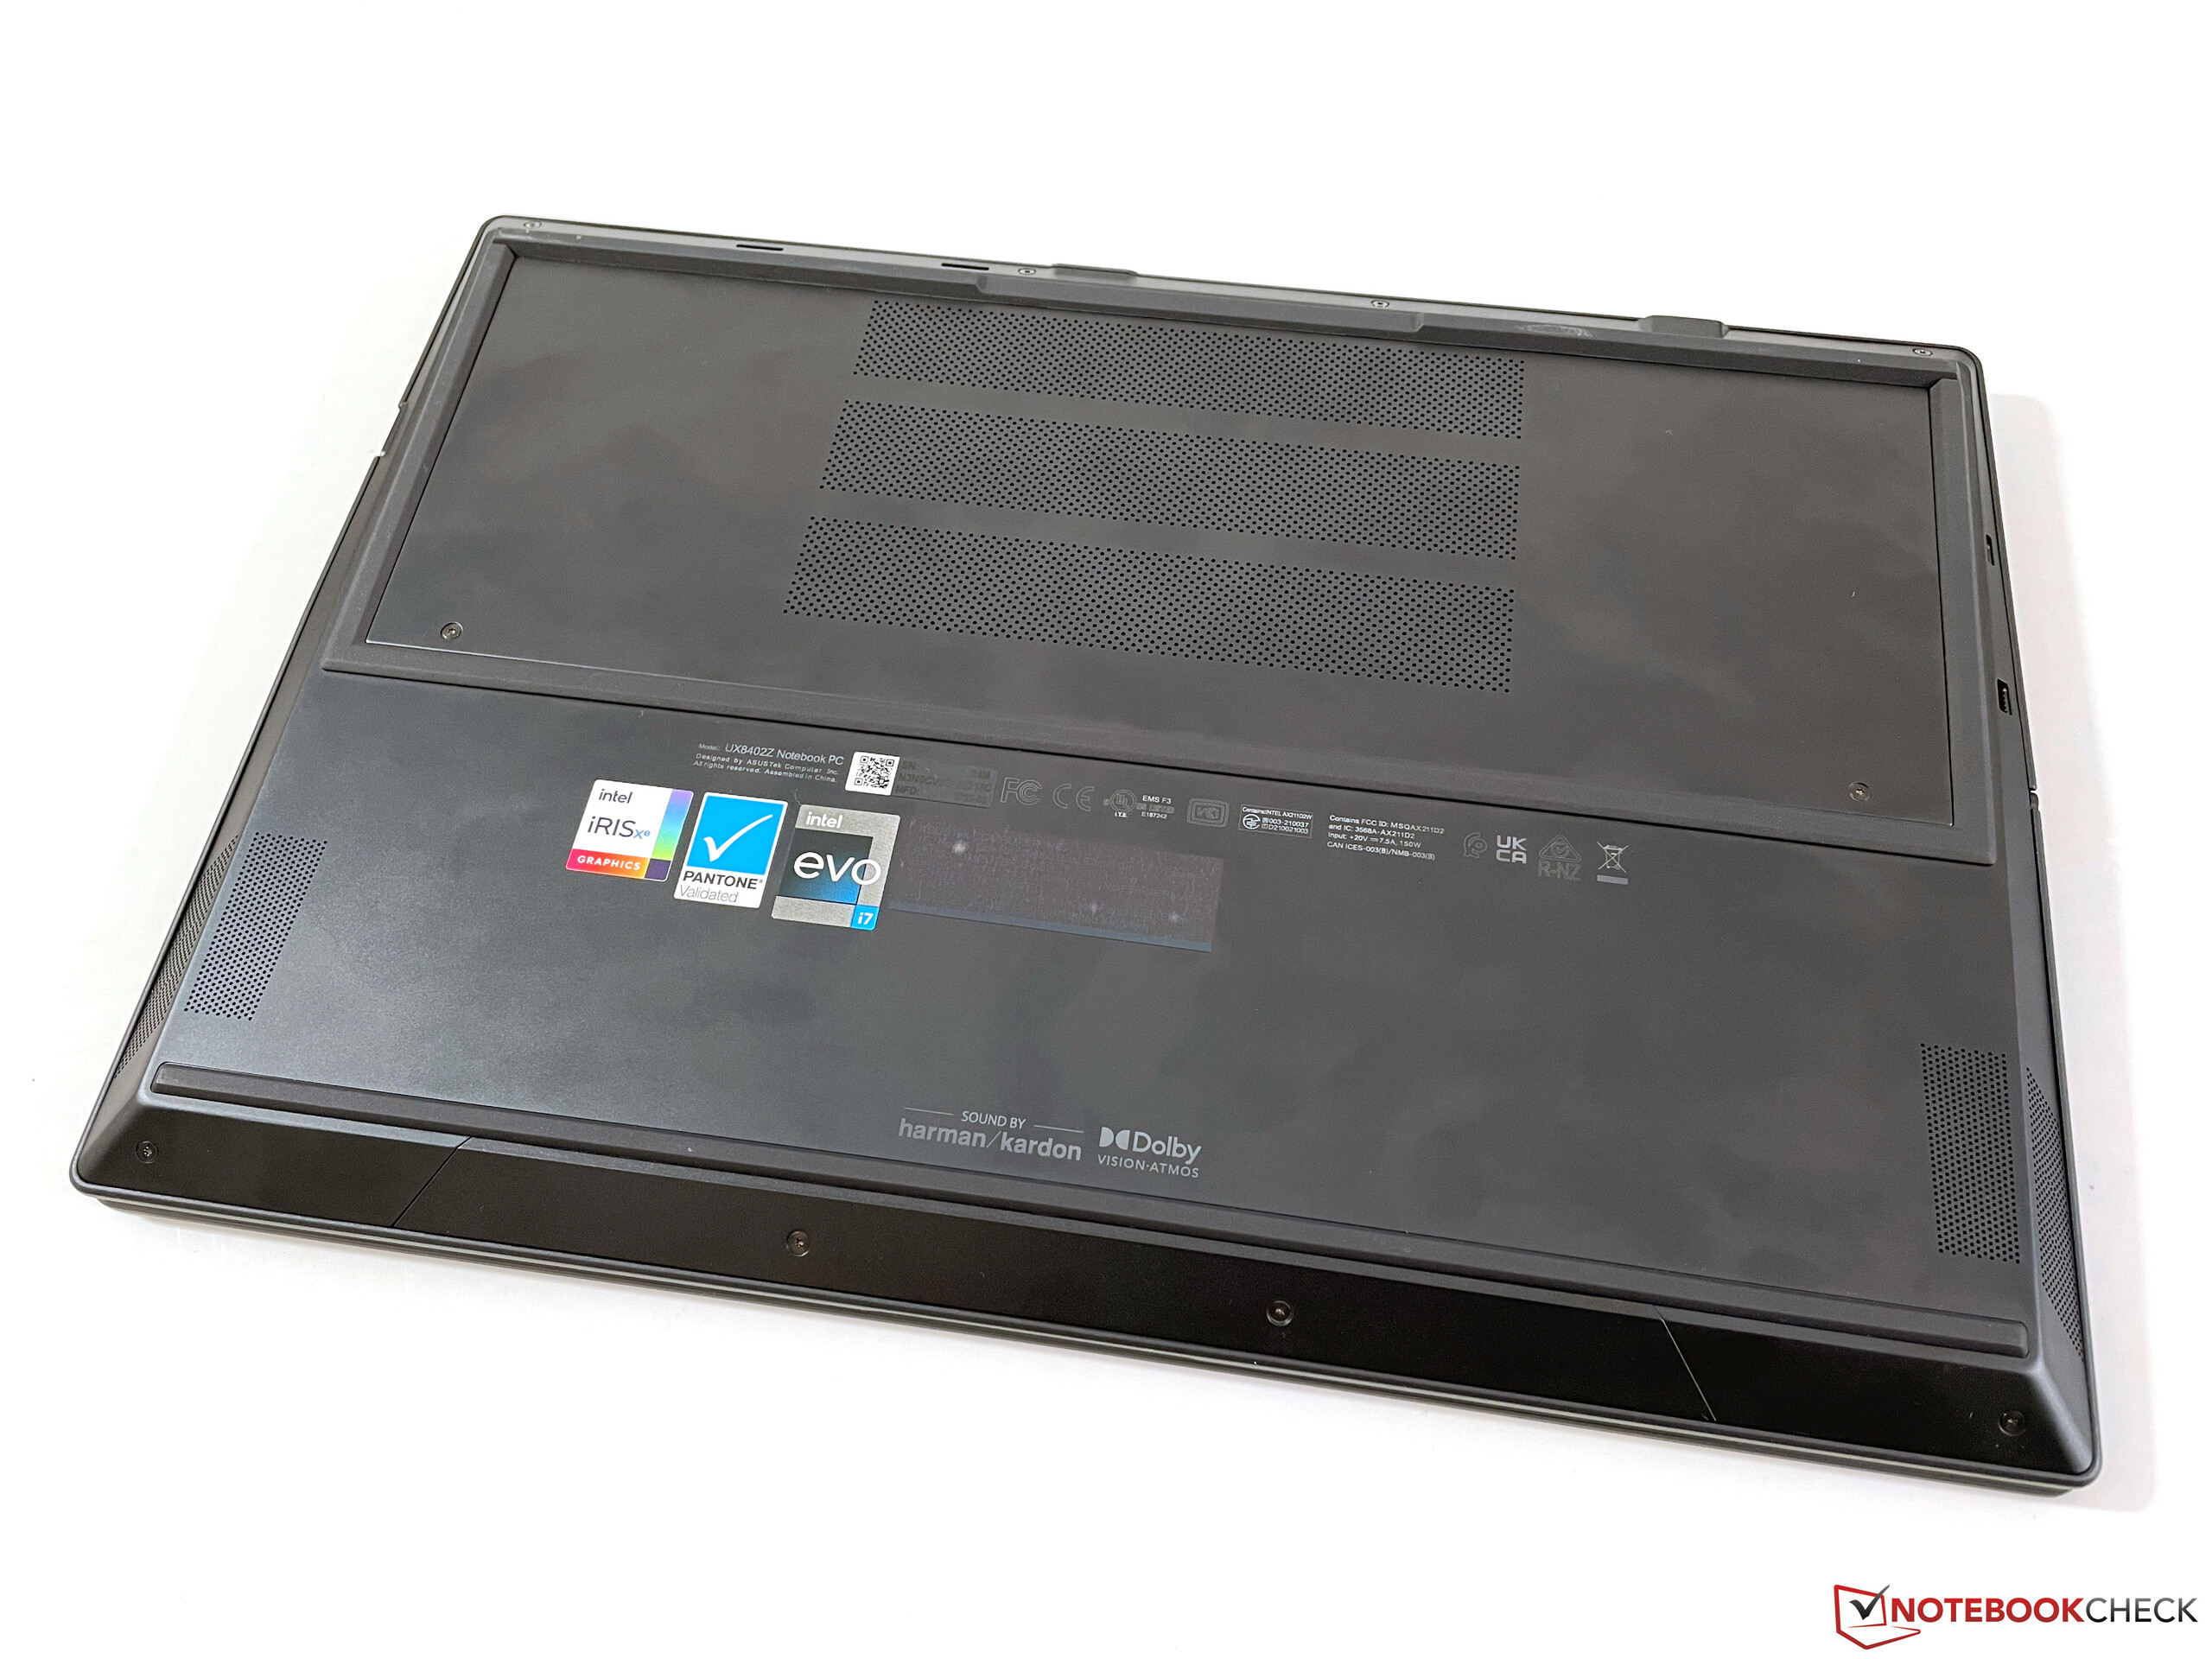
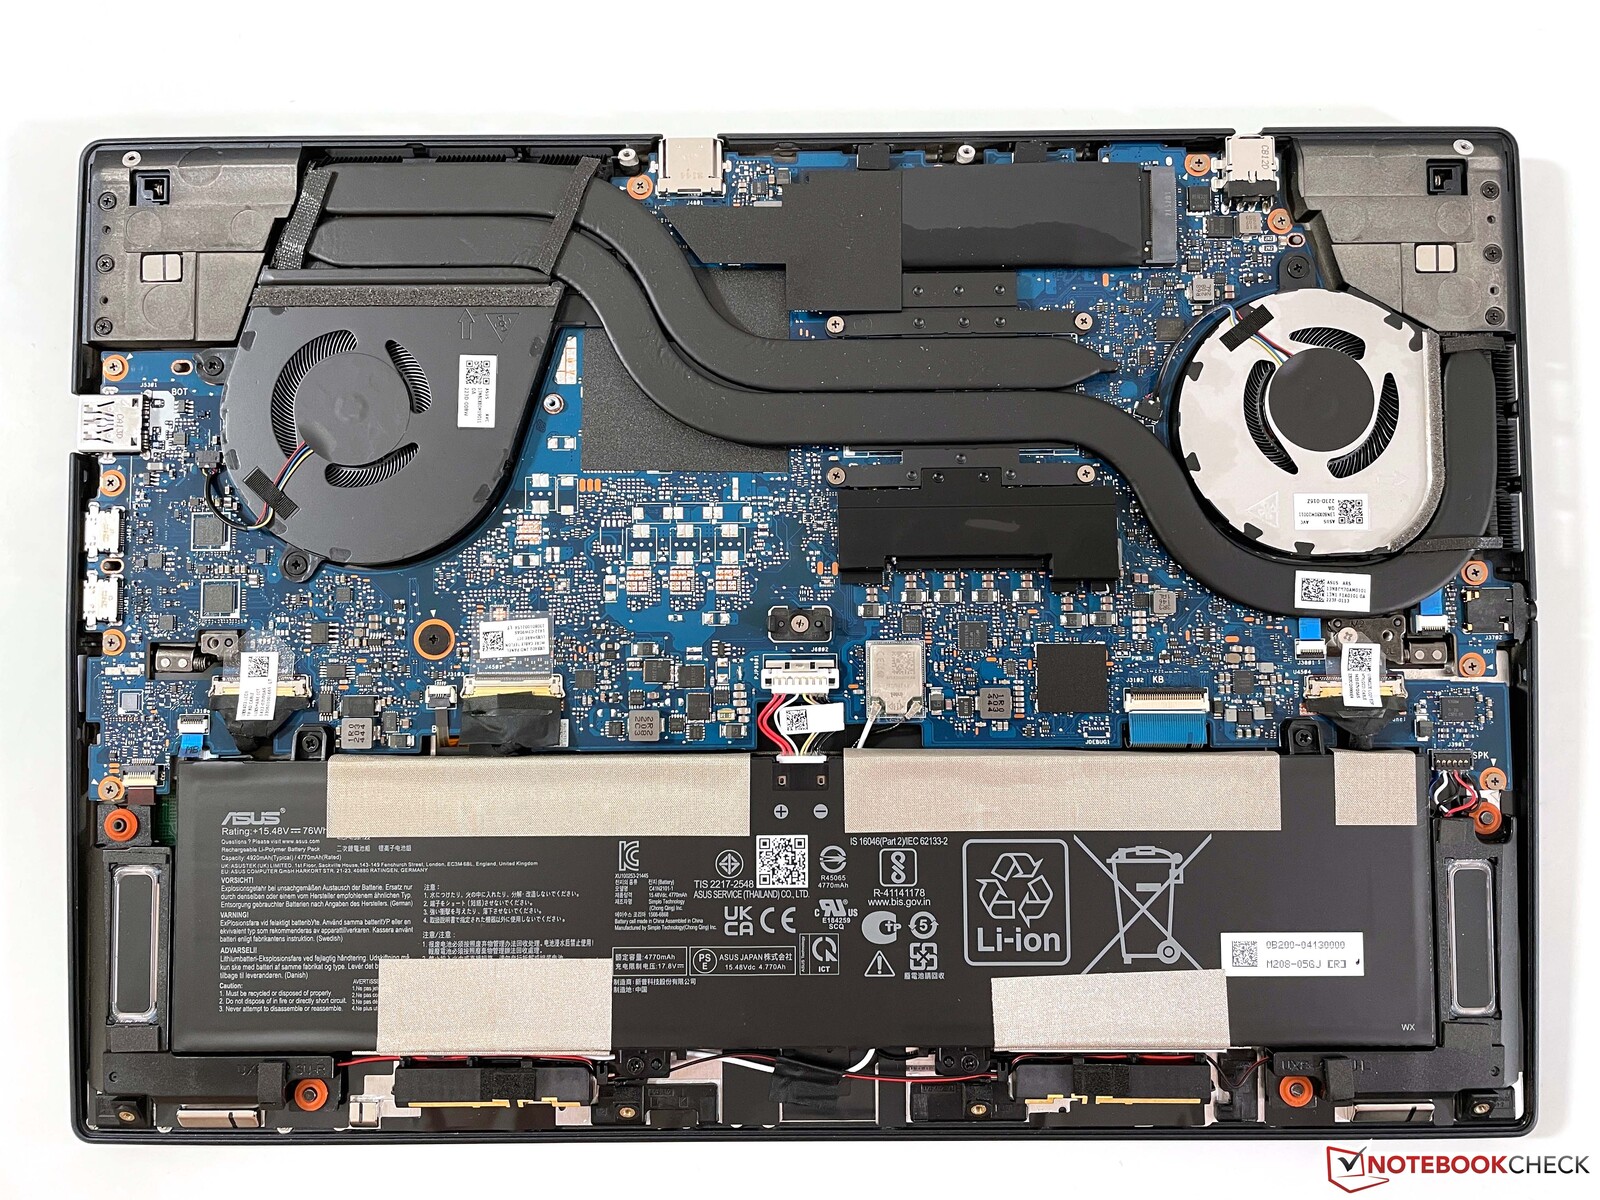
Maintenance
The bottom case cover is secured with several Torx screws (T5), and it can be removed. However, maintenance is limited to cleaning the fans and the M.2 2280 SSD, which can be replaced.
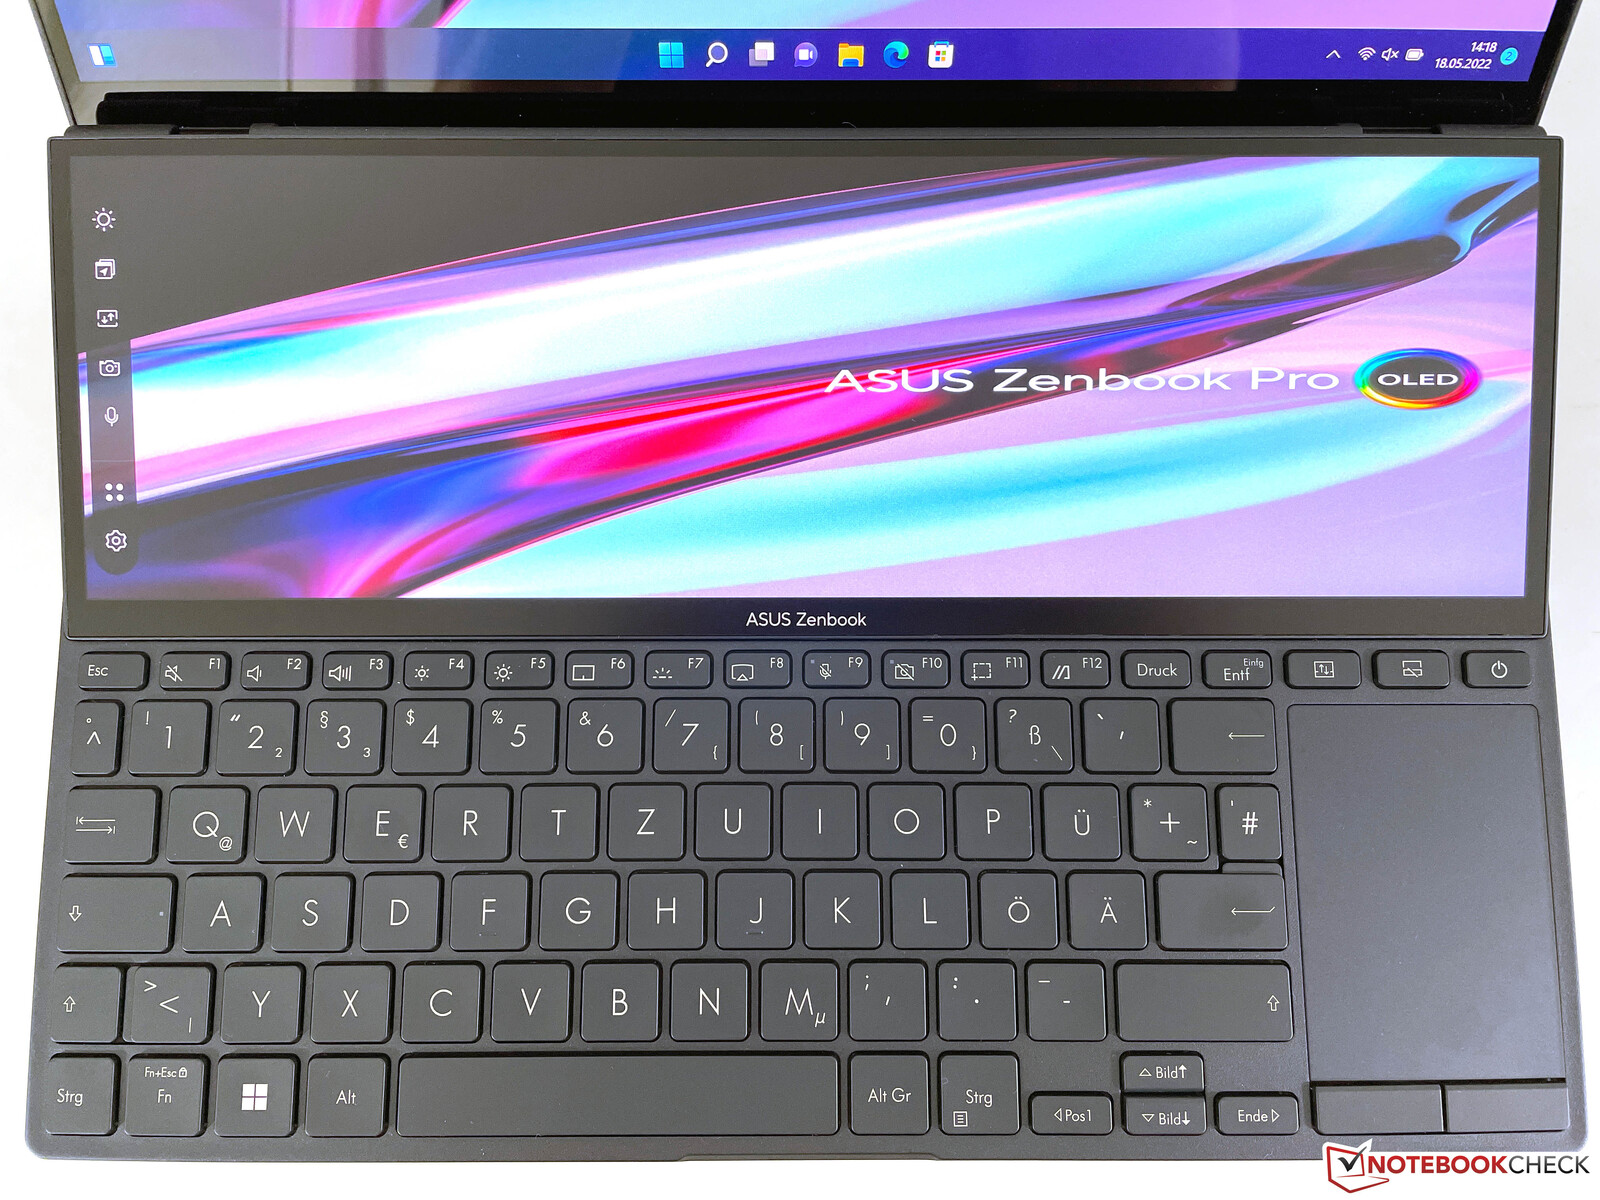
Input devices - Zenbook without palm rest
Keyboard
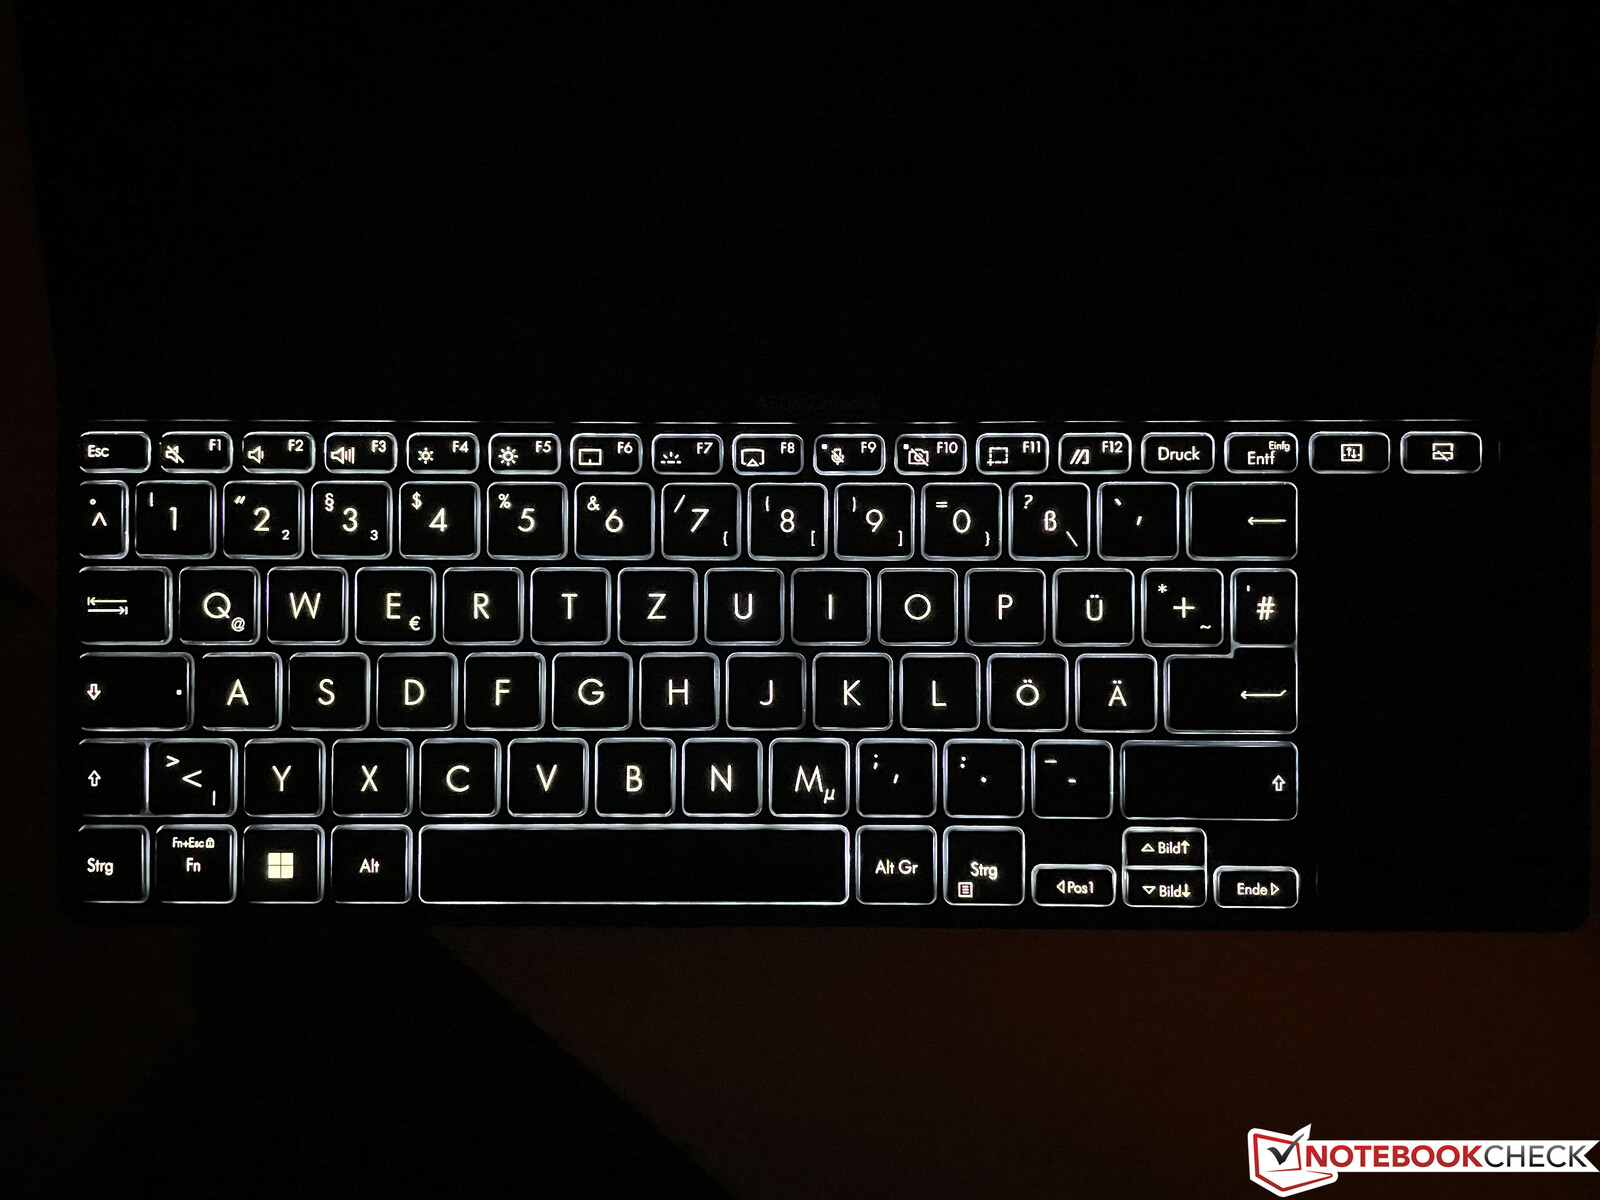
Because of the additional display, the keyboard has been moved completely to the front, which is why there's no palm rest at all. If you have enough space (for example on a desk) this can work, but if that's not the case it quickly becomes uncomfortable. Furthermore, the keys on the right side are a bit cramped (only a single-line Enter key), and especially the arrow keys are extremely small. This is a pity, because the keyboard itself provides a very comfortable typing experience, and with its key travel of 1.4 mm, it's definitely suitable for longer typing sessions. The white backlight can be adjusted in three levels, and it can also be activated/deactivated automatically via the ambient light sensor, which works well and is just very practical.
Touchpad and touchscreen
The touchpad has moved to the right of the keyboard, and it requires some compromises in portrait mode. The gliding properties are very good, and all our inputs were implemented smoothly. However, the small surface (5.3 x 7.8 cm) often forces you to reposition your finger, even for simple pointer movements. Furthermore, gestures involving more than two fingers are very difficult due to the limited space alone. Two dedicated mouse buttons are located underneath the touchpad (no ClickPad), which have a comparatively long travel and don't make such a loud clicking sound.
Of course, the two capacitive touchscreens are also available for input, and we have no criticism whatsoever here, as they work very well. According to Asus, stylus input is also supported, but our review sample didn't come with one.
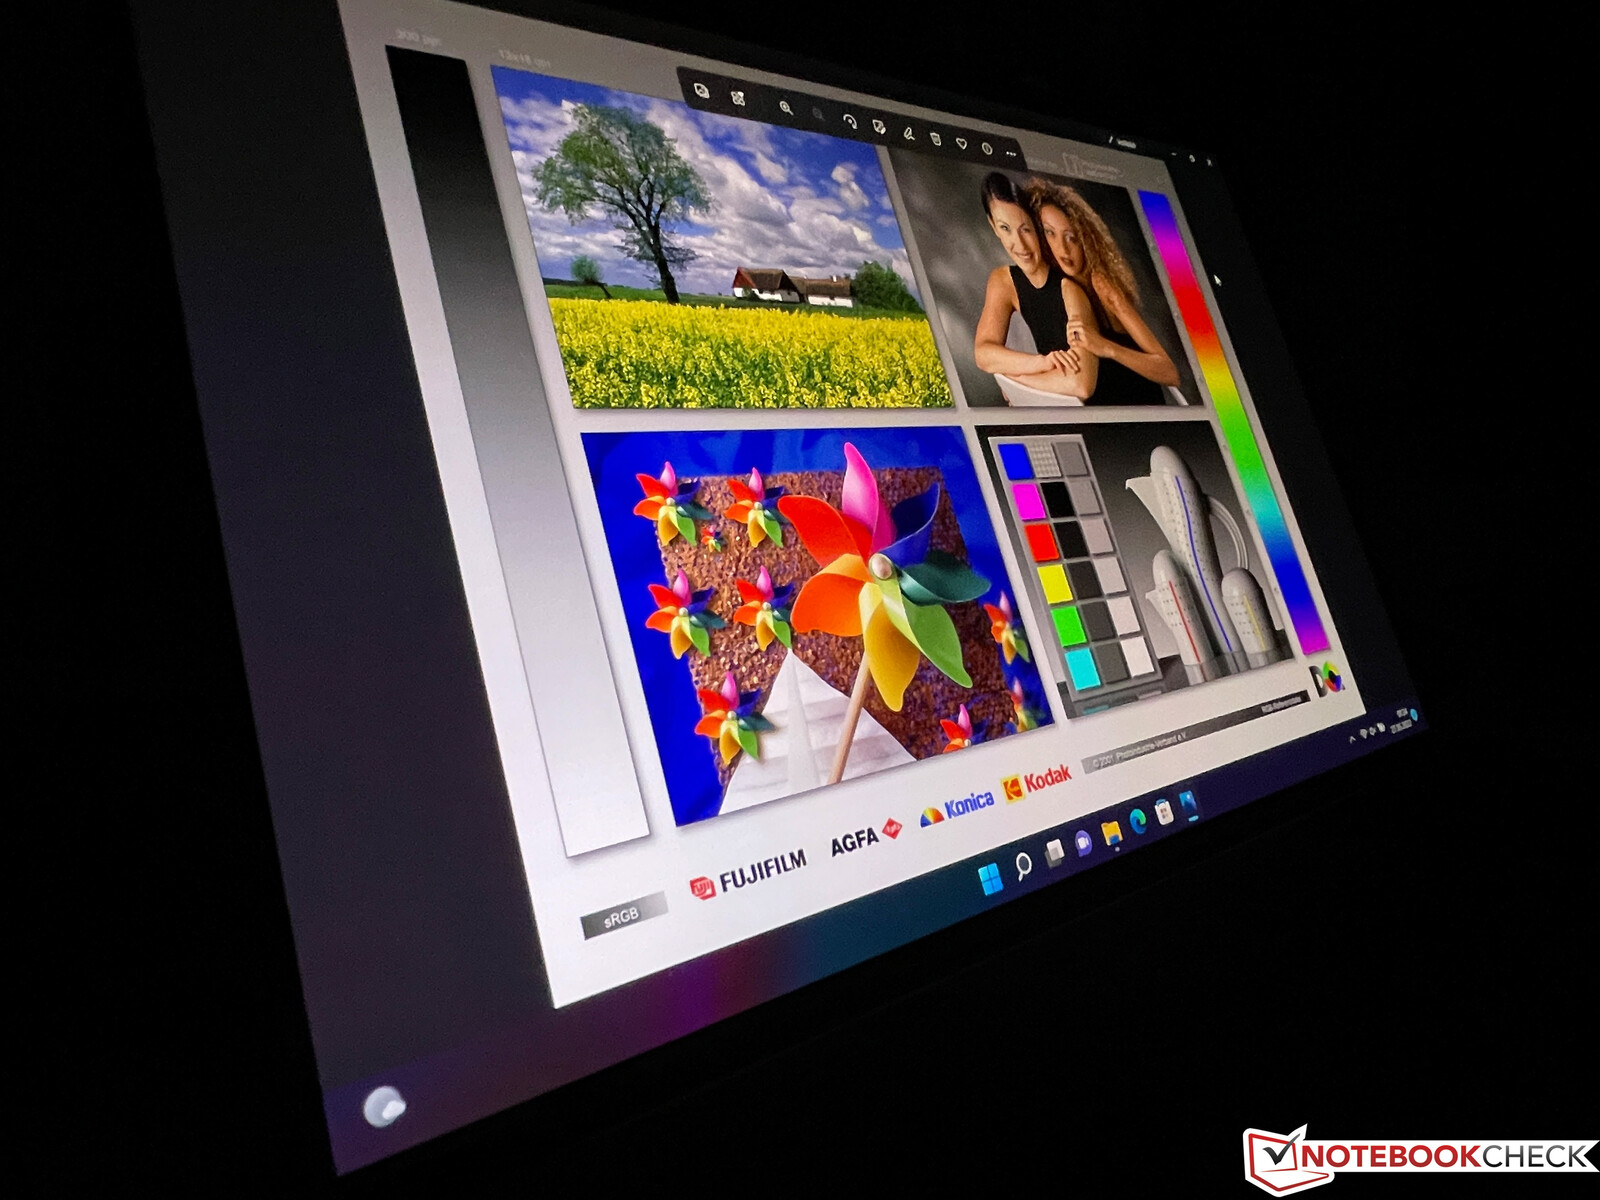
Display - Zenbook with a 120 Hz OLED display
First of all, we'll take a look at the main display, for which Asus has chosen a 14.5-inch 2.8K OLED panel. There are 2,880x1,800 pixels (234 DPI) spread across the 16:10 panel, and the subjective image quality is excellent. Images and content look very vivid and detailed, and the image impression during movements also benefits from the high refresh rate (120 Hz), which you first have to activate manually, though.
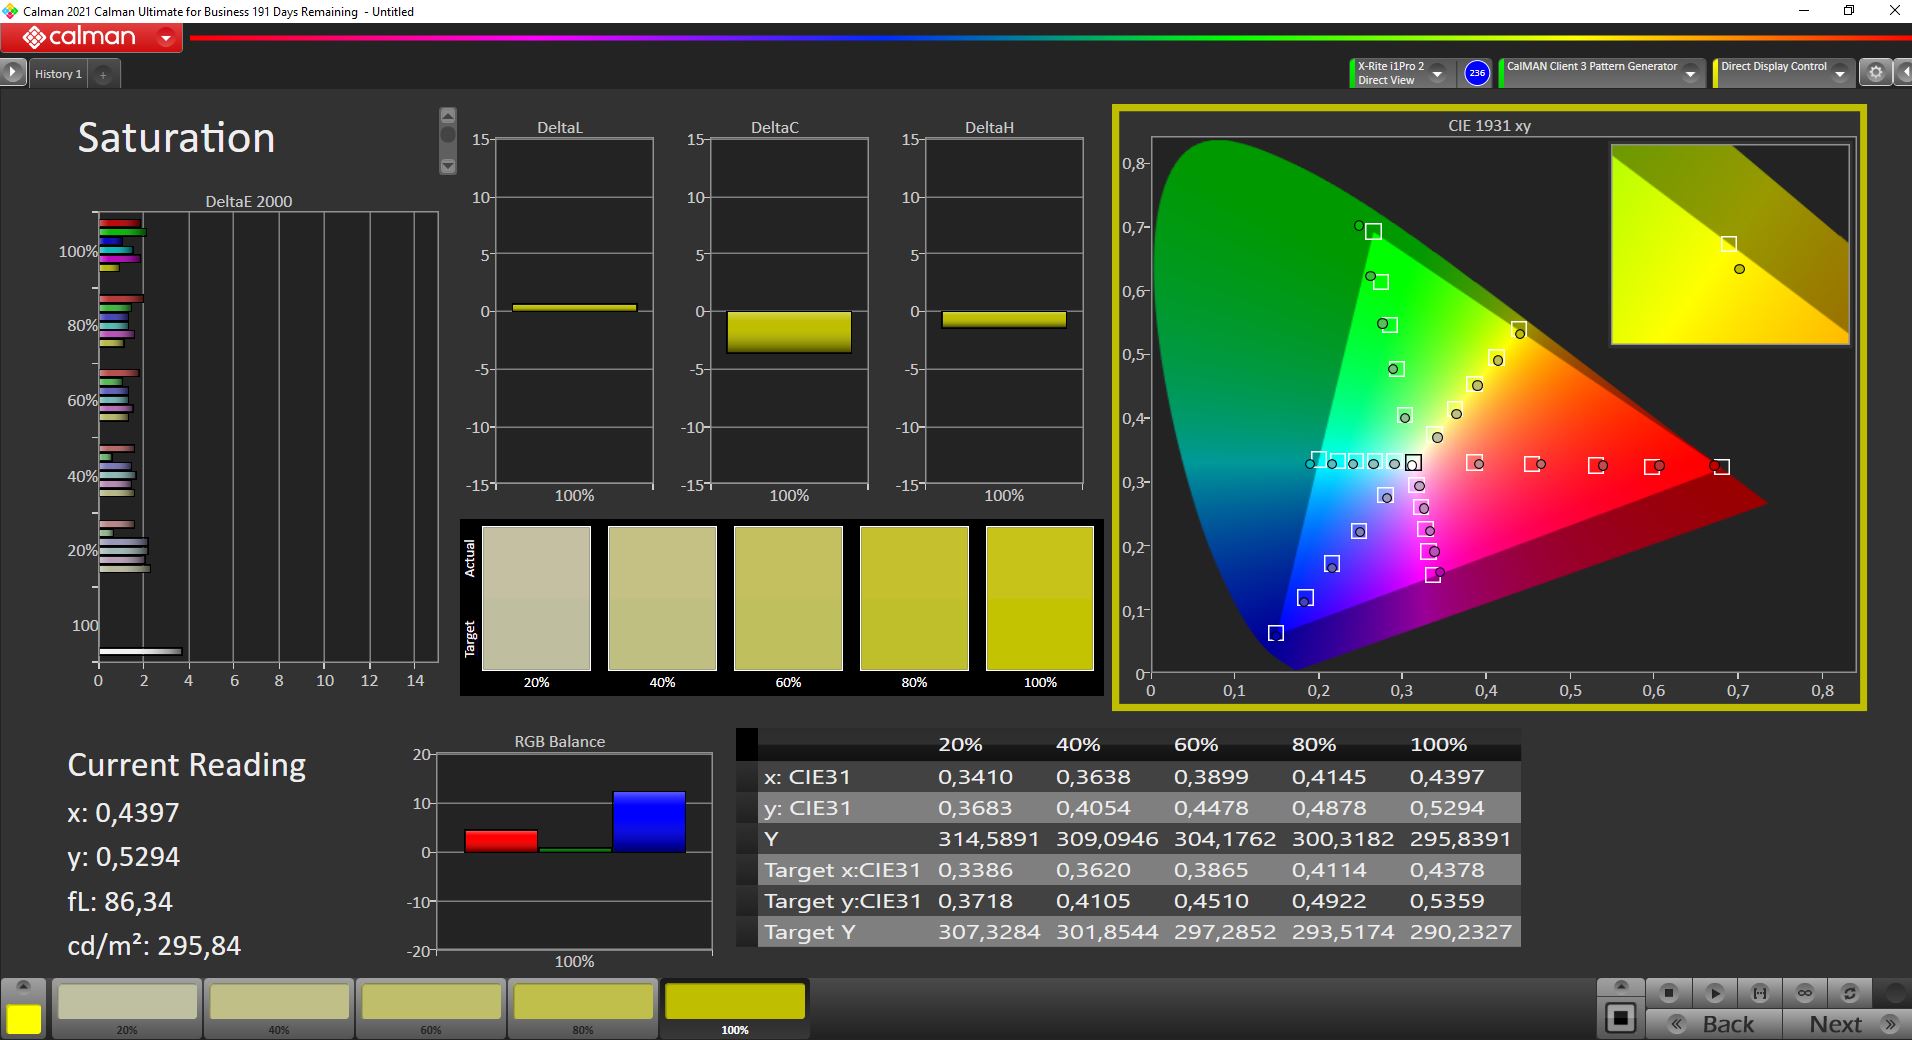
Asus specifies a brightness of up to 550 cd/m² (which can also be adjusted automatically via the sensor), but you have to differentiate between SDR and HDR content here. In normal use, the maximum brightness is "only" around 360 cd/m². That doesn't sound like a lot, but the extremely high contrast of the OLED panel somewhat compensates for that. As soon as you enable HDR in the settings and watch the right content, you can also enjoy brightness values of up to 580 cd/m², which we were able to measure on a small white screen section. Around 460 cd/m² is still possible with an almost completely white image. These rates are on par with most OLED panels currently found in laptops. However, users who often work with HDR content should take a look at the MacBook Pro 14, which has a mini-LED panel that automatically detects HDR content and achieves brightness values of more than 1,500 cd/m² as a result. As with Apple, the Zenbook's color temperature can also be automatically adjusted to the ambient light via a sensor. There's no screen bleeding in OLED displays.
| |||||||||||||||||||||||||
Brightness Distribution: 99 %
Center on Battery: 356 cd/m²
Contrast: 17800:1 (Black: 0.02 cd/m²)
ΔE ColorChecker Calman: 2.6 | ∀{0.5-29.43 Ø4.73}
calibrated: 2
ΔE Greyscale Calman: 2.2 | ∀{0.09-98 Ø4.97}
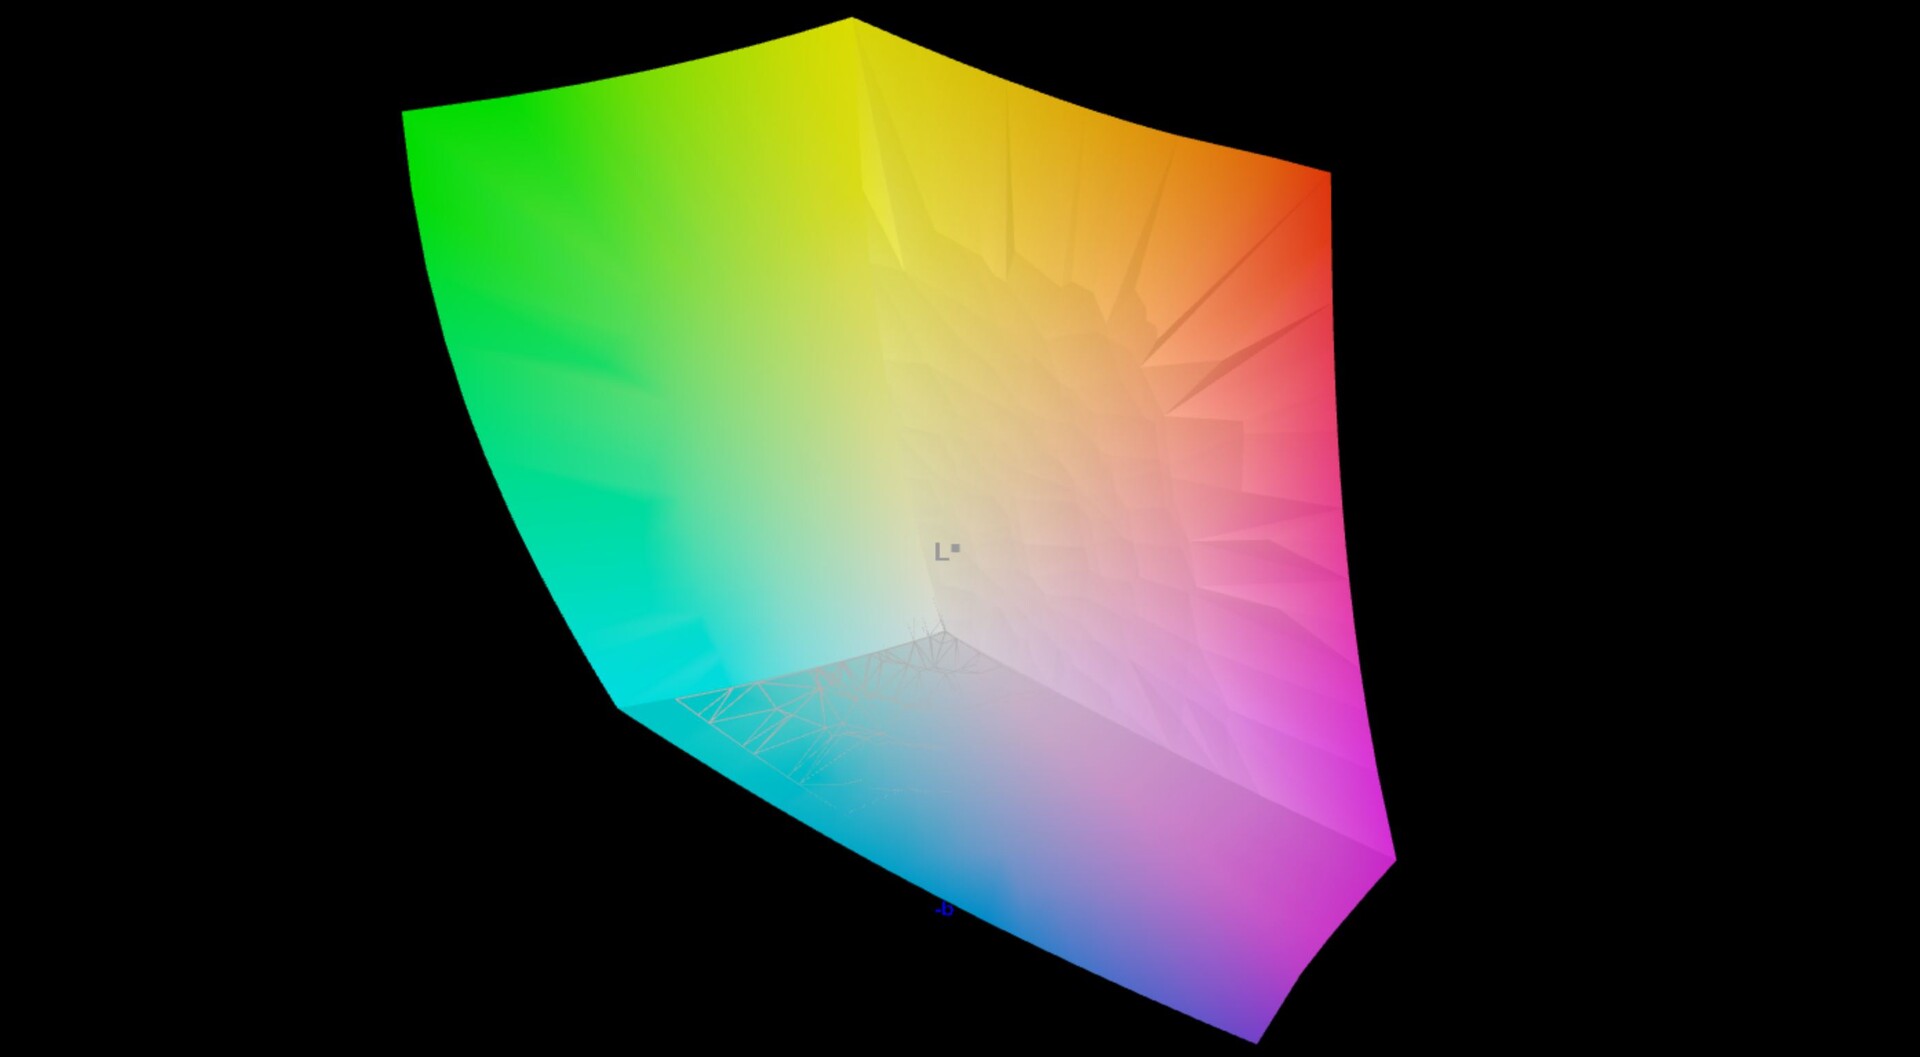
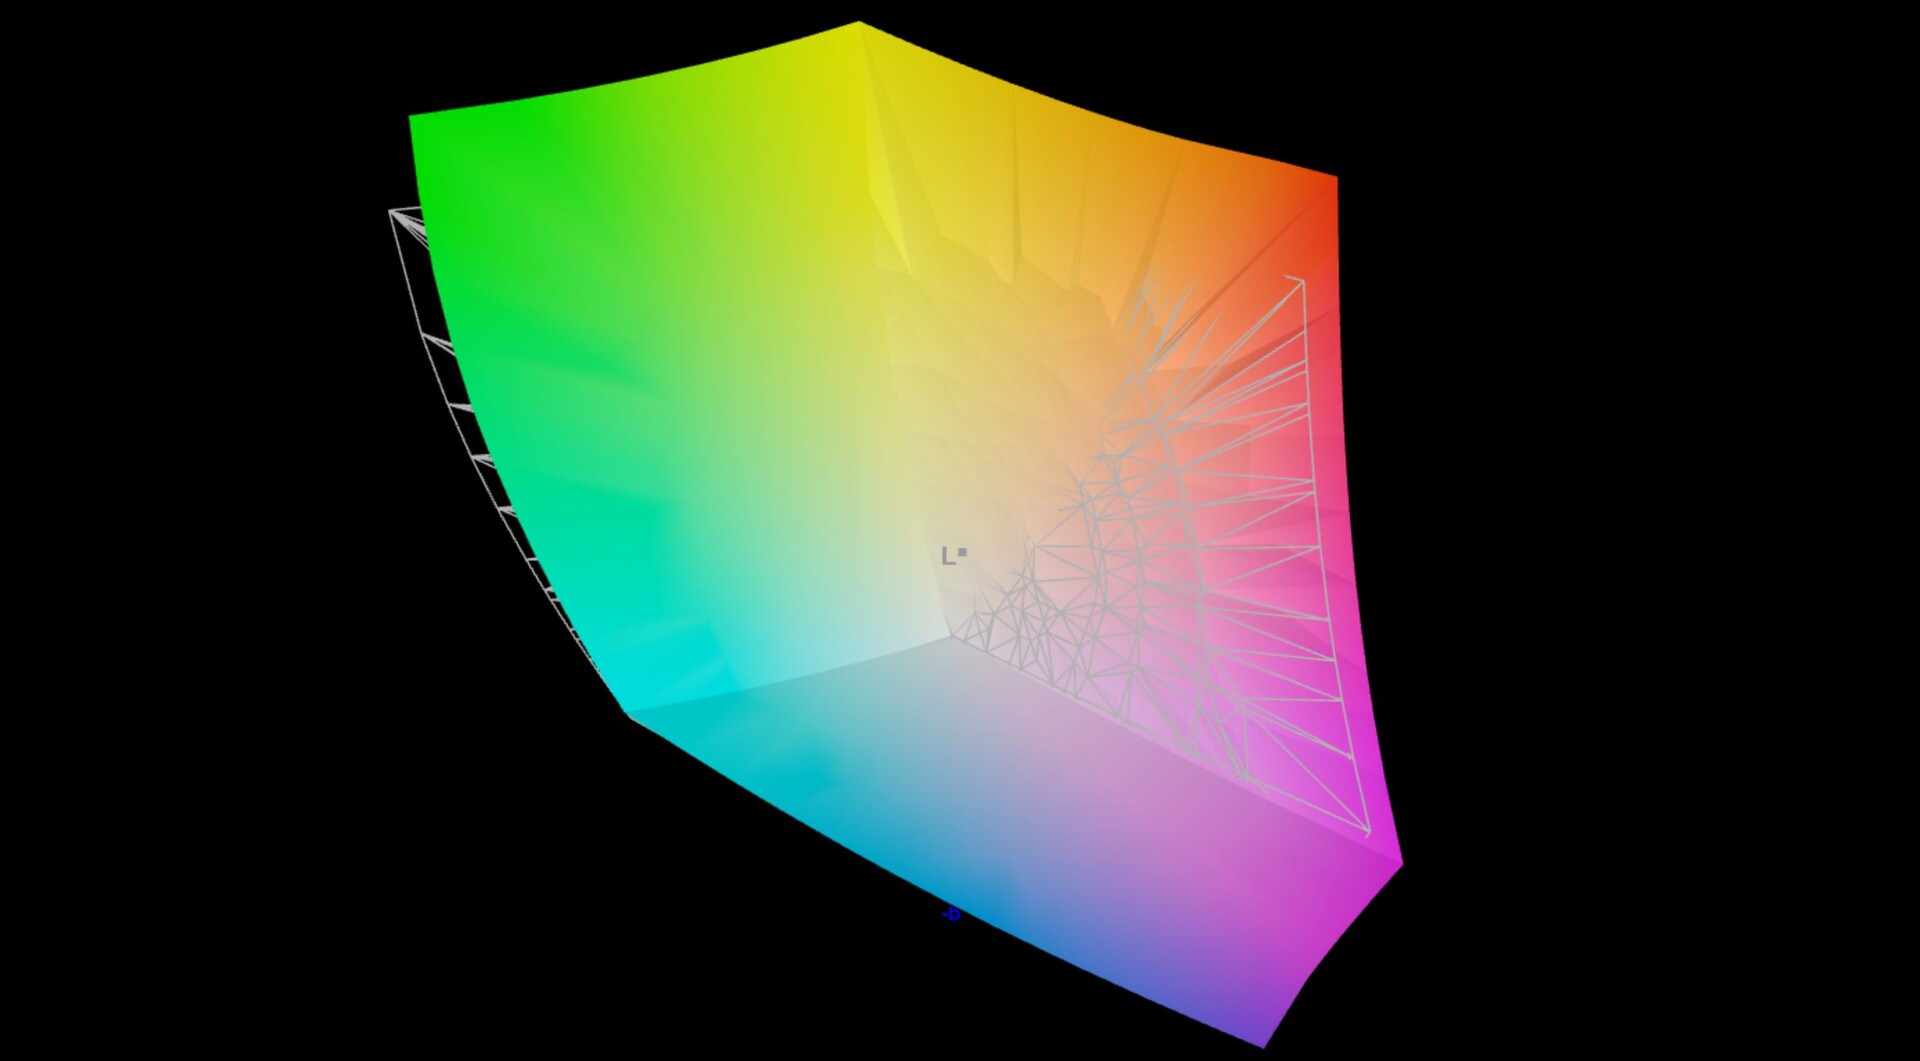
97.4% AdobeRGB 1998 (Argyll 3D)
100% sRGB (Argyll 3D)
99.9% Display P3 (Argyll 3D)
Gamma: 2.2
CCT: 6246 K
| Asus Zenbook Pro 14 Duo OLED UX8402ZA ATNA45AF01-0, OLED, 2880x1800, 14.5" | Microsoft Surface Laptop Studio i7 RTX 3050 Ti LQ144P1JX01, IPS, 2400x1600, 14.4" | Apple MacBook Pro 14 2021 M1 Pro Entry Mini-LED, 3024x1964, 14.2" | Lenovo Yoga 9i 14 2022 i7-1260P LEN140WQUXGA, OLED, 3840x2400, 14" | Asus ZenBook Duo 14 UX482EA AU Optronics B140HAN06.8, IPS, 1920x1080, 14" | |
|---|---|---|---|---|---|
| Display | -13% | -1% | 0% | -20% | |
| Display P3 Coverage (%) | 99.9 | 80.6 -19% | 99.3 -1% | 98.7 -1% | 69 -31% |
| sRGB Coverage (%) | 100 | 99.9 0% | 99.8 0% | 99.1 -1% | |
| AdobeRGB 1998 Coverage (%) | 97.4 | 78.5 -19% | 98.5 1% | 71 -27% | |
| Response Times | -1617% | -1958% | -17% | -2034% | |
| Response Time Grey 50% / Grey 80% * (ms) | 2.4 ? | 58.4 ? -2333% | 58.4 ? -2333% | 2.8 ? -17% | 56.4 ? -2250% |
| Response Time Black / White * (ms) | 2.4 ? | 24 ? -900% | 40.4 ? -1583% | 2.8 ? -17% | 46 ? -1817% |
| PWM Frequency (Hz) | 240 ? | 5000 ? | 14880 | 239.2 ? | |
| Screen | -134% | 60% | 250% | -139% | |
| Brightness middle (cd/m²) | 356 | 497 40% | 489 37% | 361 1% | 361.8 2% |
| Brightness (cd/m²) | 357 | 491 38% | 479 34% | 362 1% | 351 -2% |
| Brightness Distribution (%) | 99 | 92 -7% | 94 -5% | 98 -1% | 90 -9% |
| Black Level * (cd/m²) | 0.02 | 0.29 -1350% | 0.01 50% | 0.001 95% | 0.28 -1300% |
| Contrast (:1) | 17800 | 1714 -90% | 48900 175% | 361000 1928% | 1292 -93% |
| Colorchecker dE 2000 * | 2.6 | 1.2 54% | 0.8 69% | 2.8 -8% | 1.44 45% |
| Colorchecker dE 2000 max. * | 4.5 | 2.8 38% | 1.3 71% | 5.8 -29% | 3.3 27% |
| Colorchecker dE 2000 calibrated * | 2 | 0.8 60% | 1.24 38% | ||
| Greyscale dE 2000 * | 2.2 | 1.9 14% | 1.1 50% | 1.9 14% | 1.3 41% |
| Gamma | 2.2 100% | 2.14 103% | 2.24 98% | 2.16 102% | 2.15 102% |
| CCT | 6246 104% | 6821 95% | 6181 105% | 6411 101% | |
| Color Space (Percent of AdobeRGB 1998) (%) | 64.9 | ||||
| Color Space (Percent of sRGB) (%) | 99.3 | ||||
| Total Average (Program / Settings) | -588% /
-320% | -633% /
-312% | 78% /
151% | -731% /
-384% |
* ... smaller is better
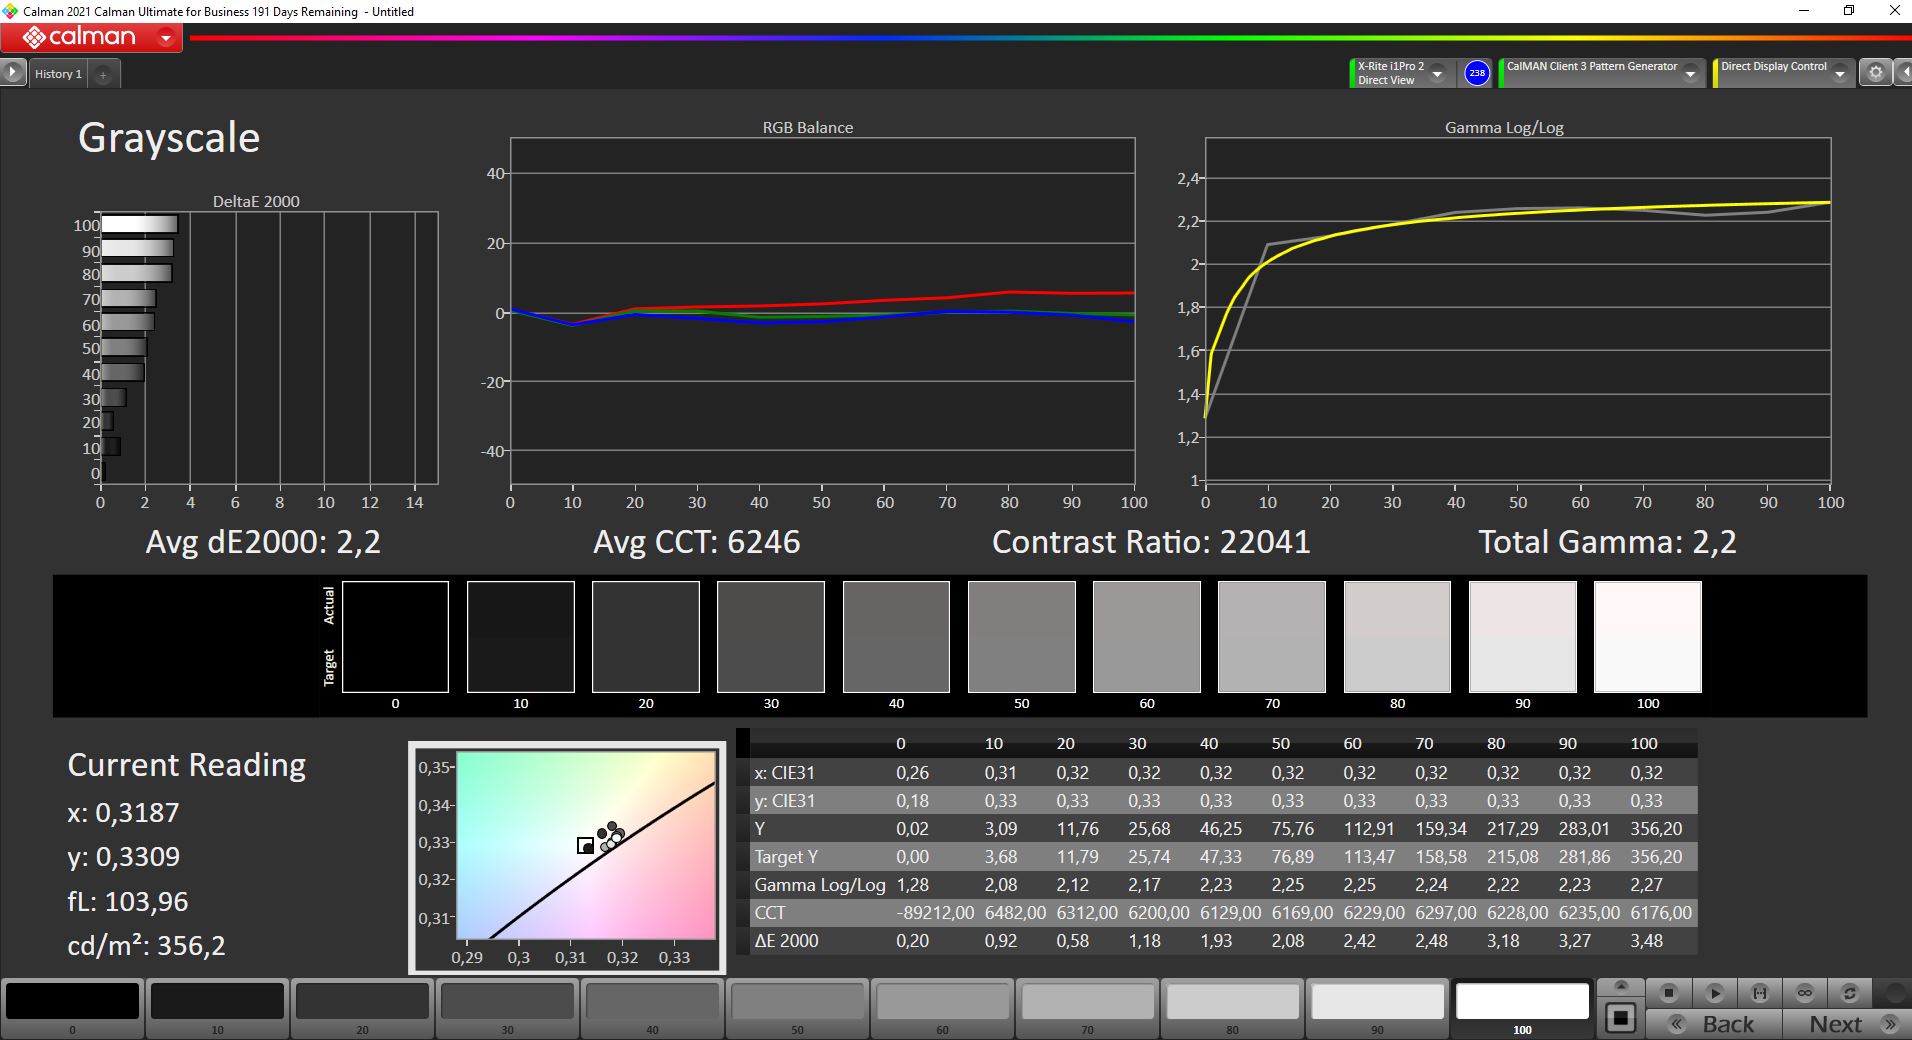

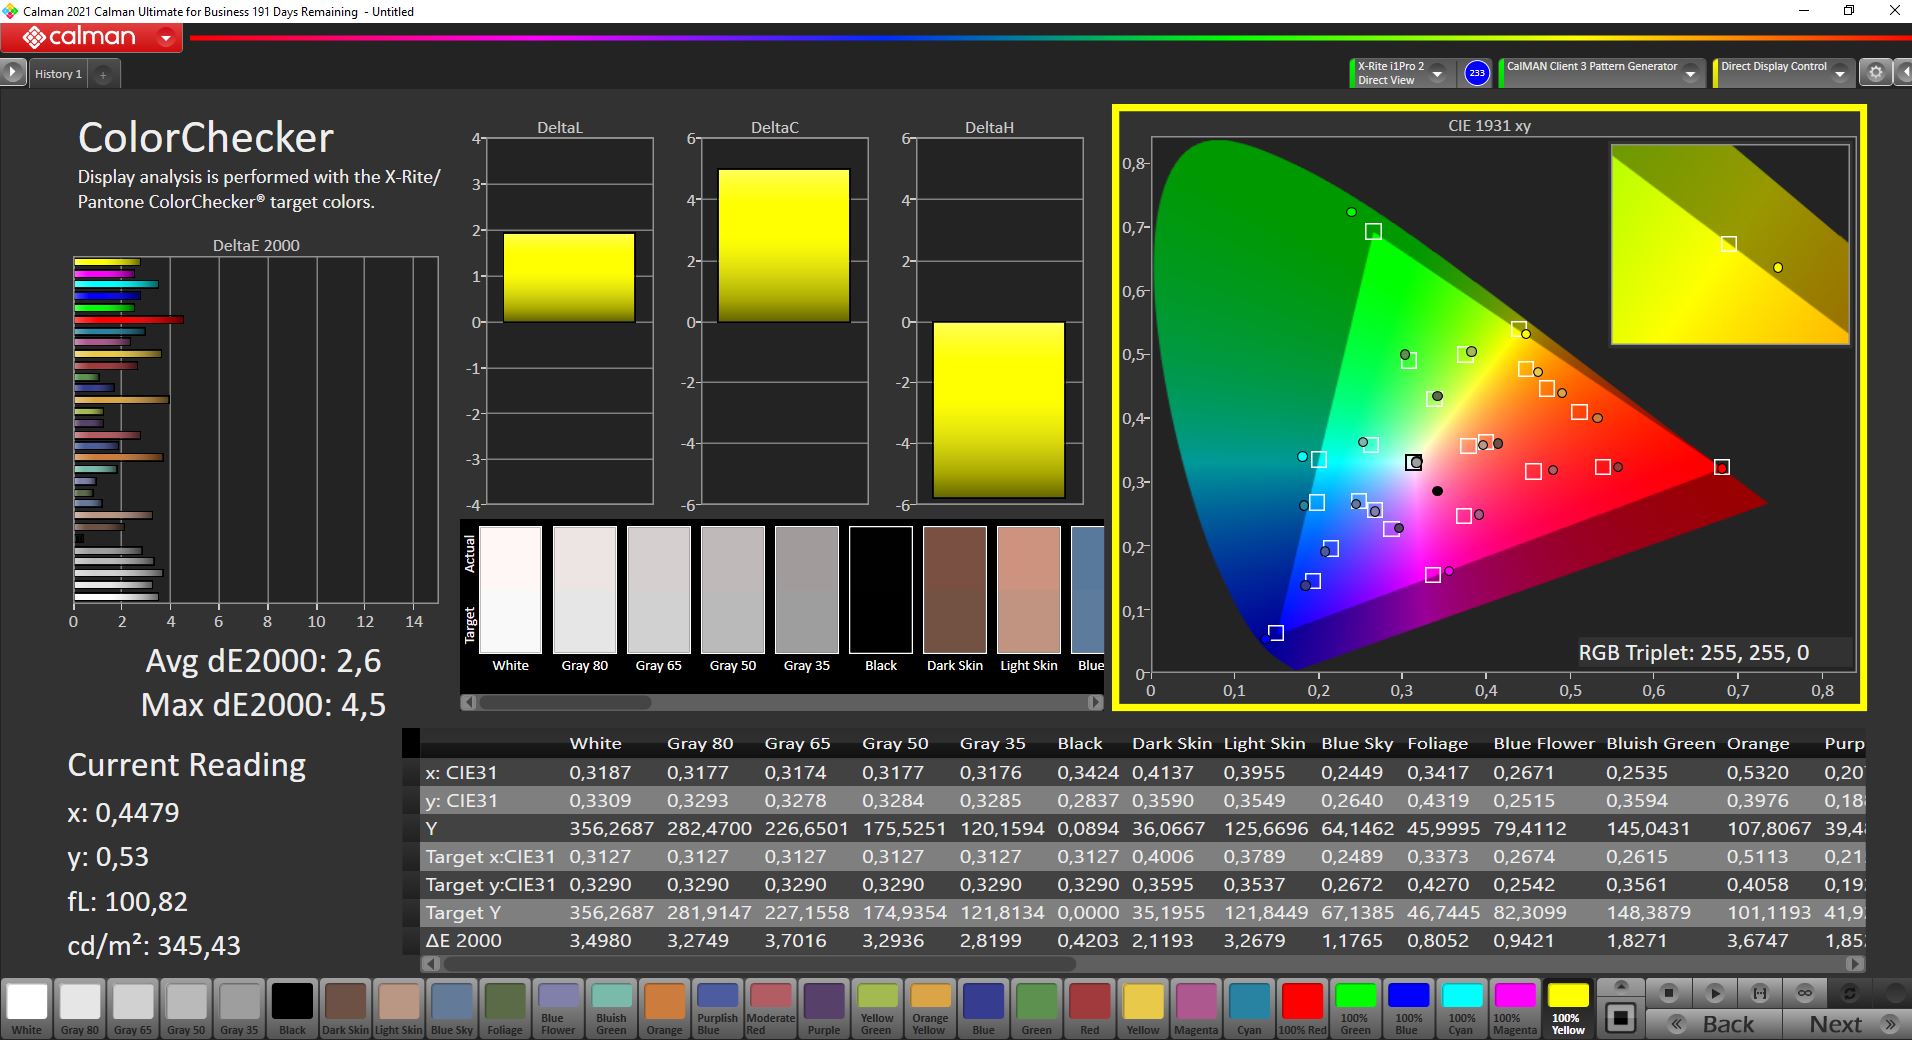


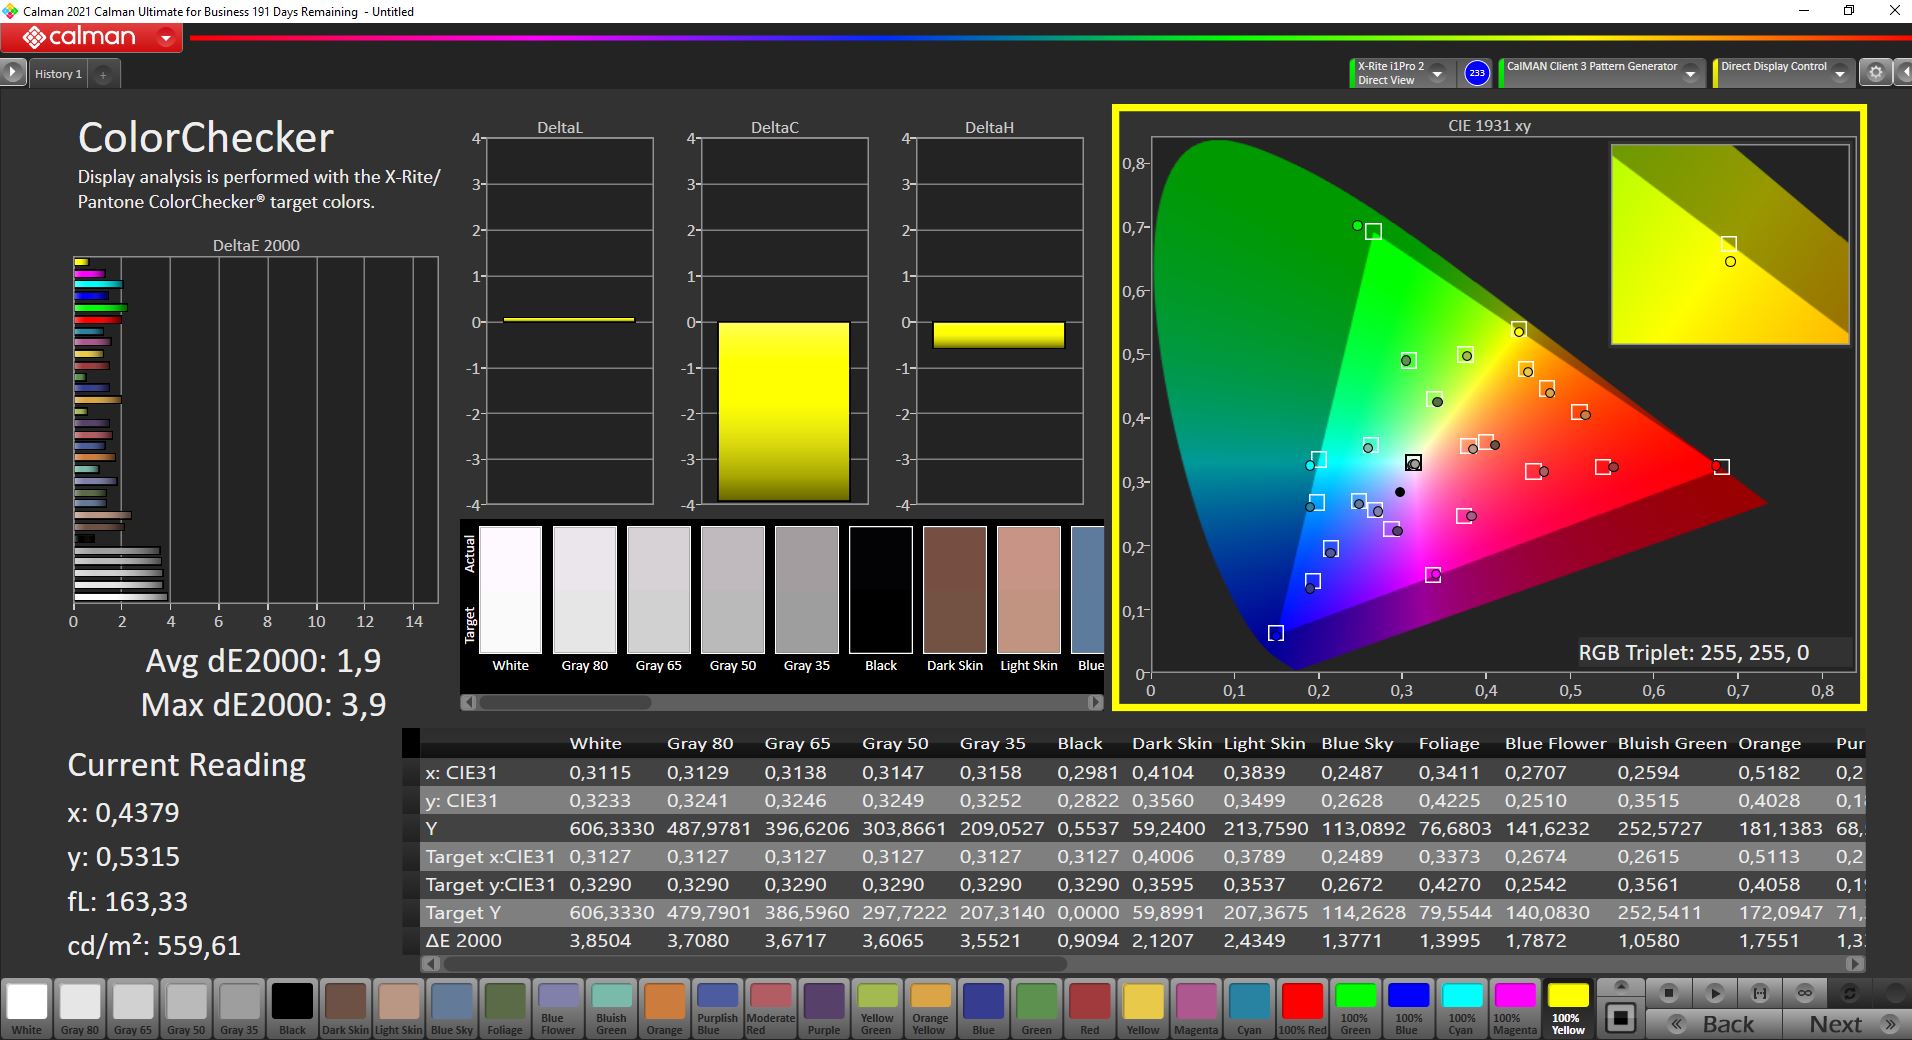
We analyzed the panel with the professional CalMAN software (X-Rite i1 Pro 2) and used the Native preset in the MyAsus app (also corresponds to the Display P3 profile), but you can alternatively switch to sRGB. Out of the box, performance is already very good, and only a few isolated colors are above the important DeltaE 2000 deviation of 3 (compared to the DCI-P3 reference). With our own calibration (profile is available for free download above), we can improve the reproduction quality even further. Only at 100% red does the slightly elevated deviation remain. Nevertheless, the Zenbook Pro 14 Duo is suitable for image editing, and the P3 color space is also fully covered.

Display Response Times
| ↔ Response Time Black to White | ||
|---|---|---|
| 2.4 ms ... rise ↗ and fall ↘ combined | ↗ 1.2 ms rise | 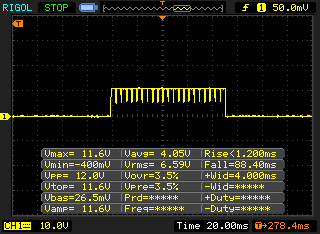 |
| ↘ 1.2 ms fall | ||
| The screen shows very fast response rates in our tests and should be very well suited for fast-paced gaming. In comparison, all tested devices range from 0.1 (minimum) to 240 (maximum) ms. » 12 % of all devices are better. This means that the measured response time is better than the average of all tested devices (19.9 ms). | ||
| ↔ Response Time 50% Grey to 80% Grey | ||
| 2.4 ms ... rise ↗ and fall ↘ combined | ↗ 1.2 ms rise | 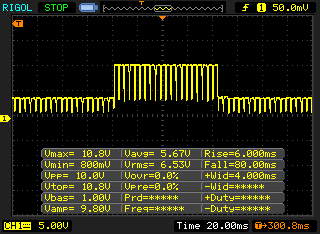 |
| ↘ 1.2 ms fall | ||
| The screen shows very fast response rates in our tests and should be very well suited for fast-paced gaming. In comparison, all tested devices range from 0.165 (minimum) to 636 (maximum) ms. » 11 % of all devices are better. This means that the measured response time is better than the average of all tested devices (31.1 ms). | ||
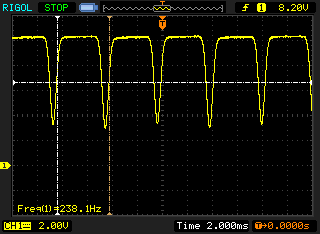
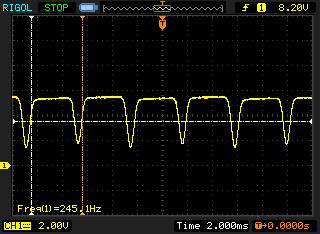
Screen Flickering / PWM (Pulse-Width Modulation)
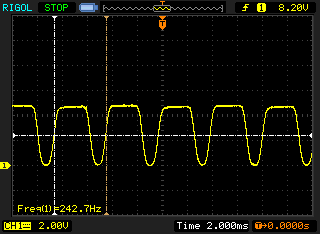
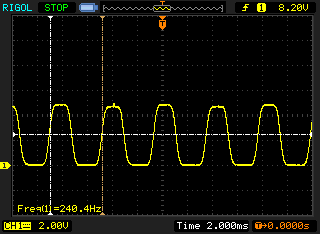
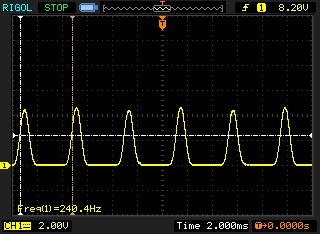
| Screen flickering / PWM detected | 240 Hz | ≤ 100 % brightness setting | 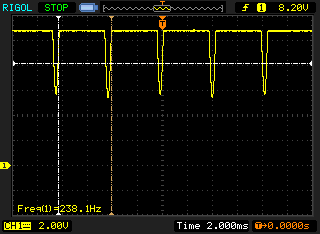 |
The display backlight flickers at 240 Hz (worst case, e.g., utilizing PWM) Flickering detected at a brightness setting of 100 % and below. There should be no flickering or PWM above this brightness setting. The frequency of 240 Hz is relatively low, so sensitive users will likely notice flickering and experience eyestrain at the stated brightness setting and below. In comparison: 52 % of all tested devices do not use PWM to dim the display. If PWM was detected, an average of 7801 (minimum: 5 - maximum: 343500) Hz was measured. | |||
We have to discuss the subject of PWM in OLED displays a bit more in detail. In principle, we can determine a flickering of 240 Hz in all brightness values. However, the so-called DC dimming is used in the range of 100% - 60% brightness, which is much less problematic for the eyes. As soon as the brightness drops below 60%, Asus recommends that the user takes a break in case of eye strain. However, the manufacturer also offers another alternative in the MyAsus app, which the manufacturer calls "flicker-free OLED dimming". The OLED's dimming level can be adjusted gradually there (power consumption remains the same, though), and DC dimming is still used. This makes a lot of sense, and it's a good alternative for users who are sensitive to OLED flickering in particular.
Naturally, the glossy OLED touchscreen has issues with reflections in outdoor use. However, the high contrast still helps, and as long as you can avoid direct light sources/reflections, you should still be able to see the screen content properly. The OLED display's viewing-angle stability remains unimpaired as well, but from certain angles, you'll get the familiar slight bluish tint.
ScreenPad Plus - Matte IPS panel running at 120 Hz

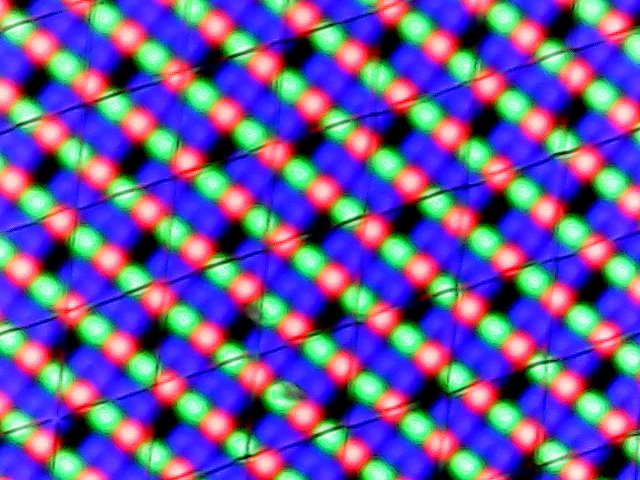
Now we'll take a look at the additional display above the keyboard. This is a matte IPS touchscreen with a resolution of 2,880x864 pixels. Subjectively, though, the image quality is extremely poor and reminiscent of matte touchscreens from 10 years ago. We haven't seen such a grainy display (see also the subpixel picture) for a long time. Using the second display (there's a button for dragging windows, but you can also simply drag windows to the second display with the mouse) works quite well apart from some scaling issues (window size is always changed), and we can see how the second display can really make sense depending on the workflow, but it's not exactly enjoyable to use due to the grainy image impression.
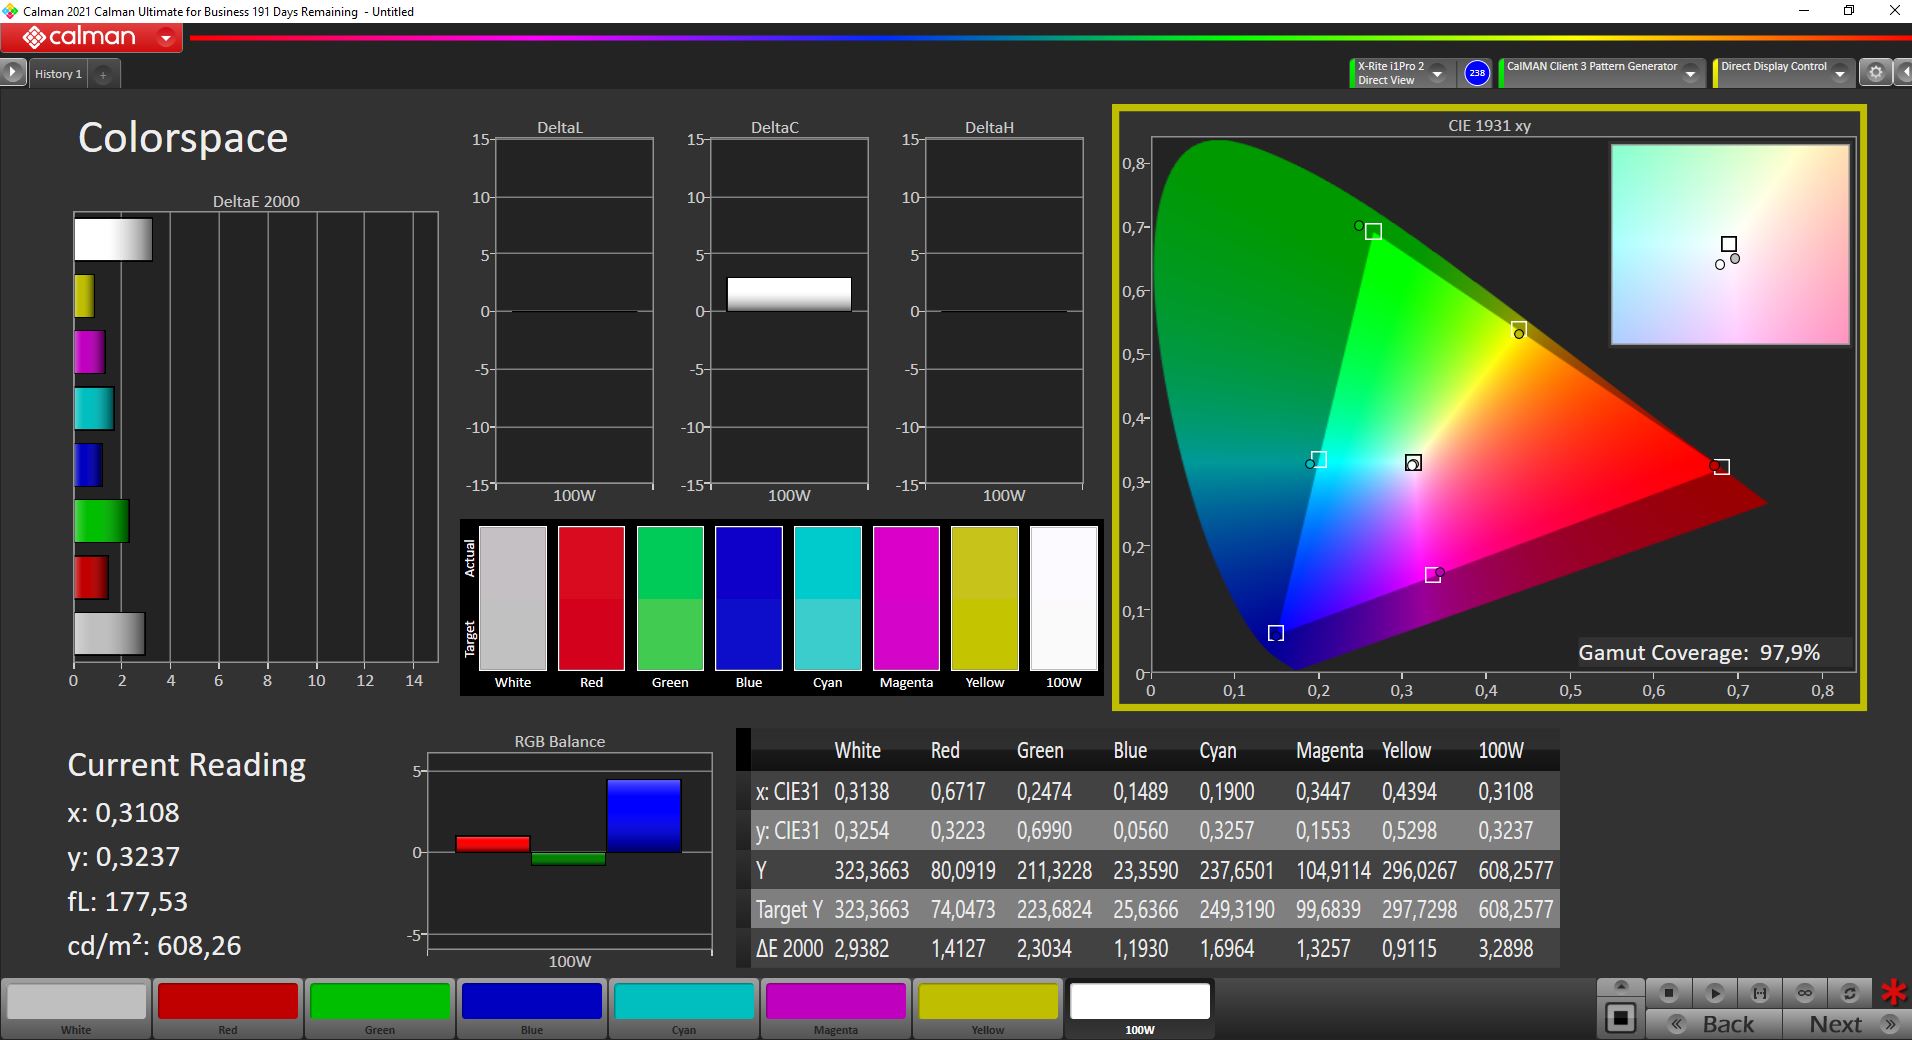
That's a shame, because it's actually a pretty good display without PWM, with fast response times (120 Hz as well), and even a decent performance in our CalMAN analysis. With a maximum of 600 cd/m², the second display even gets a bit brighter than the OLED display in HDR mode.
| |||||||||||||||||||||||||
Brightness Distribution: 81 %
Center on Battery: 605 cd/m²
Contrast: 1315:1 (Black: 0.46 cd/m²)
ΔE ColorChecker Calman: 1.9 | ∀{0.5-29.43 Ø4.73}
ΔE Greyscale Calman: 2.9 | ∀{0.09-98 Ø4.97}
Gamma: 2.2
CCT: 6392 K

Display Response Times
| ↔ Response Time Black to White | ||
|---|---|---|
| 13.6 ms ... rise ↗ and fall ↘ combined | ↗ 4.4 ms rise | 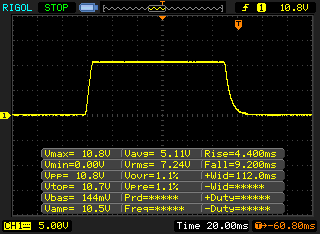 |
| ↘ 9.2 ms fall | ||
| The screen shows good response rates in our tests, but may be too slow for competitive gamers. In comparison, all tested devices range from 0.1 (minimum) to 240 (maximum) ms. » 34 % of all devices are better. This means that the measured response time is better than the average of all tested devices (19.9 ms). | ||
| ↔ Response Time 50% Grey to 80% Grey | ||
| 29.6 ms ... rise ↗ and fall ↘ combined | ↗ 13.2 ms rise | 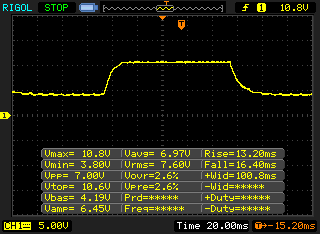 |
| ↘ 16.4 ms fall | ||
| The screen shows relatively slow response rates in our tests and may be too slow for gamers. In comparison, all tested devices range from 0.165 (minimum) to 636 (maximum) ms. » 40 % of all devices are better. This means that the measured response time is similar to the average of all tested devices (31.1 ms). | ||
Screen Flickering / PWM (Pulse-Width Modulation)
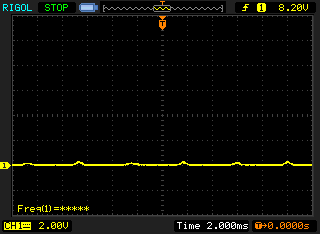
| Screen flickering / PWM not detected |  | ||
In comparison: 52 % of all tested devices do not use PWM to dim the display. If PWM was detected, an average of 7801 (minimum: 5 - maximum: 343500) Hz was measured. | |||
Performance - Asus opts for 45-watt CPUs from Intel
Test conditions
There are three different power settings in the MyAsus app: Whisper Mode, Standard, and Performance, where Performance is only available when plugged in. The modes affect both the performance as well as the fan volume. We have listed the TDP values corresponding to each of the three modes in the table below:
| MyAsus Mode | PL2 | PL1 | Max. fan volume |
|---|---|---|---|
| Whisper Mode | 60 watts | 35 watts | 29.2 dB(A) |
| Standard Mode | 80 watts | 60 -> 55 watts | 41.7 dB(A) |
| Performance Mode | 80 watts | 70 -> 62 watts | 48.8 dB(A) |
Performance Mode only affects the CPU's multi-core performance. However, the advantage over Standard Mode isn't huge, and the fans get significantly louder, which is why we also primarily performed our measurements and benchmarks using the Standard preset (Asus recommended Energy Profile, Windows Performance Mode: Best Performance). This behavior might differ in configurations with the dedicated RTX 3050 Ti.
Processor - Core i7-12700H
The Intel Core i7-12700H is part of the latest Alder Lake H45 generation, and it's based on a hybrid architecture of 6 fast performance cores (max. 4.7 GHz) and 8 efficiency cores (up to 3.5 GHz). Technically, this is a 45-watt processor, but we have seen in other tests that the Core i7 can consume over 120 watts under load. With the power limits of 80/60 watts, the Zenbook Pro 14 Duo is still in good shape, and it achieves consistently good benchmark results. Especially compared to the old Zenbook 14 Duo with its ULV processor, performance has been significantly increased.
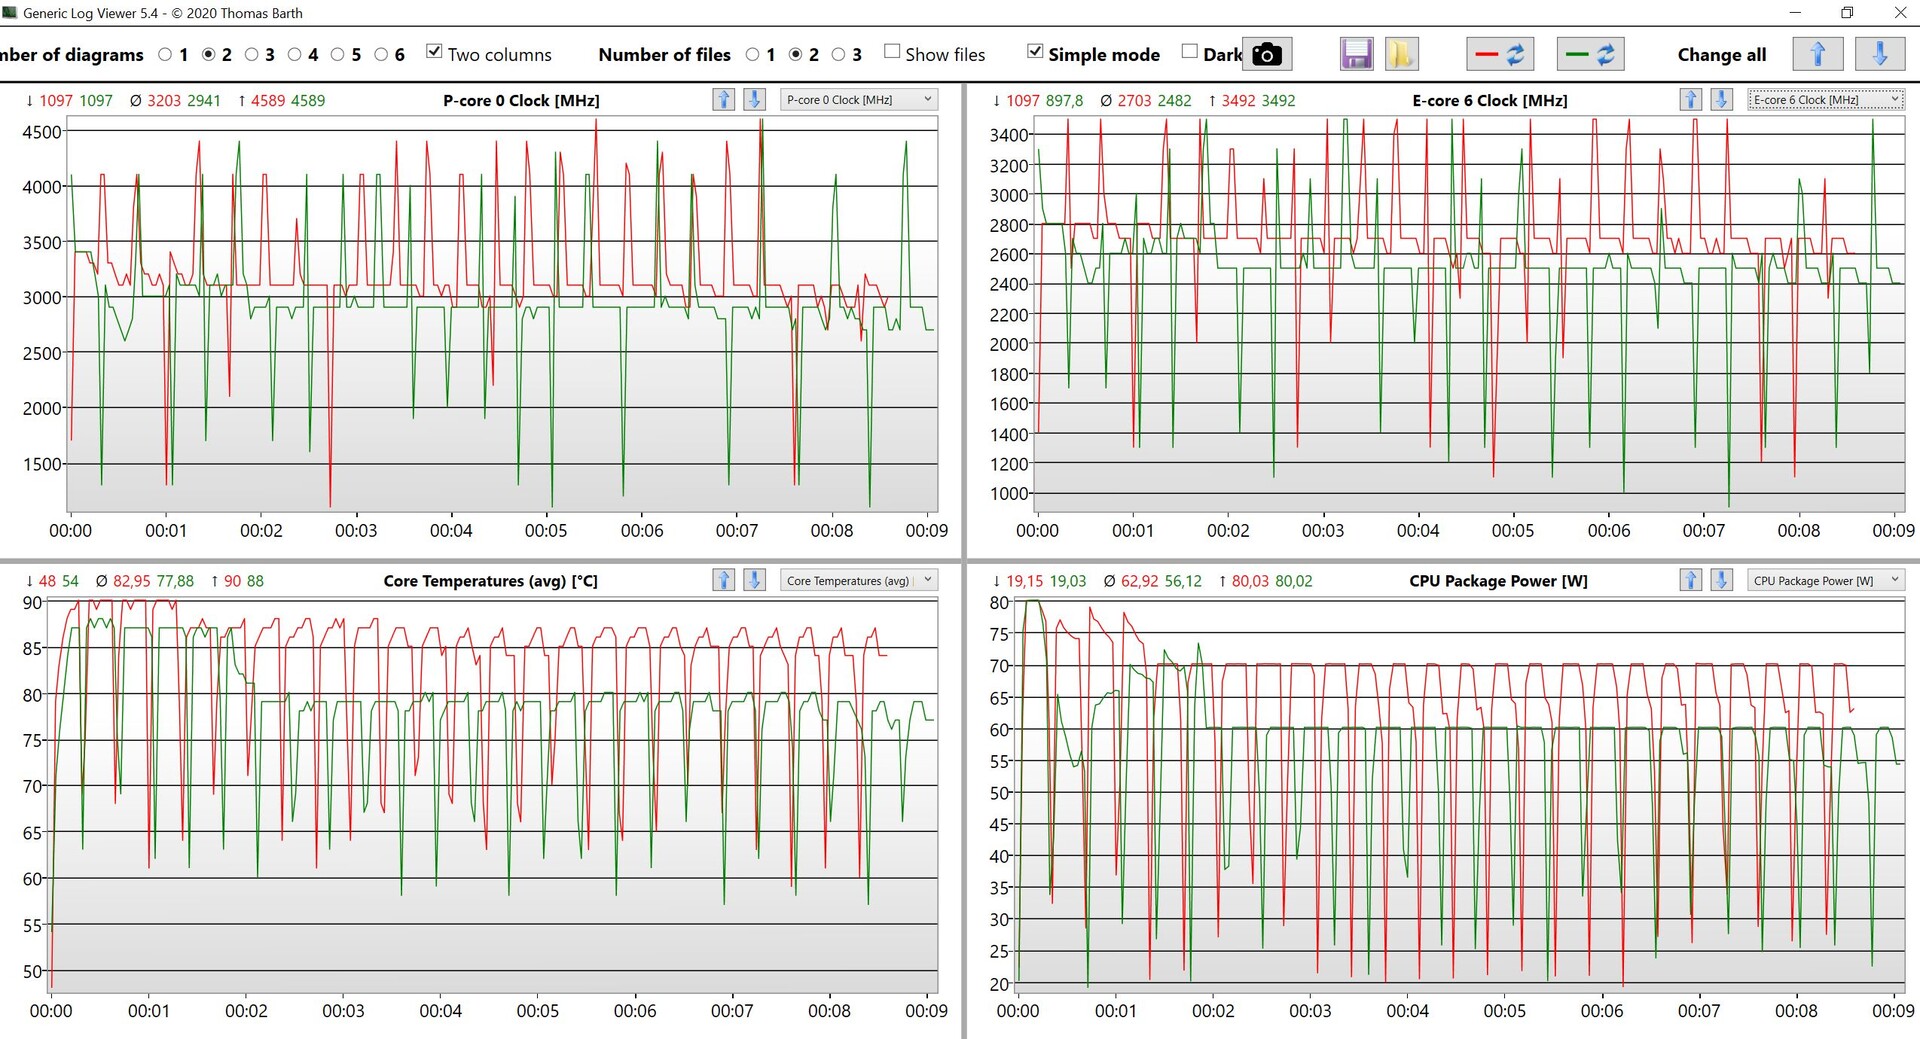
Cinebench R15 Multi endurance test
We noticed an interesting (reproducible) behavior in the Cinebench loop in Standard Mode, where performance briefly drops a bit after the first run until the fans kick in. In Performance Mode, the multi-core performance is about 7% higher, but the fans also get significantly louder here.
The processor can consume a maximum of 46 watts on battery power. This has no impact on single-core performance, but multi-core performance is about 23% lower. Additional CPU benchmarks are available here.
Cinebench R23: Multi Core | Single Core
Cinebench R20: CPU (Multi Core) | CPU (Single Core)
Cinebench R15: CPU Multi 64Bit | CPU Single 64Bit
Blender: v2.79 BMW27 CPU
7-Zip 18.03: 7z b 4 | 7z b 4 -mmt1
Geekbench 5.5: Multi-Core | Single-Core
HWBOT x265 Benchmark v2.2: 4k Preset
LibreOffice : 20 Documents To PDF
R Benchmark 2.5: Overall mean
| CPU Performance rating | |
| Average of class Multimedia | |
| Asus Zenbook Pro 14 Duo OLED UX8402ZA | |
| Average Intel Core i7-12700H | |
| Lenovo Yoga 9i 14 2022 i7-1260P | |
| Apple MacBook Pro 14 2021 M1 Pro Entry -8! | |
| Microsoft Surface Laptop Studio i7 RTX 3050 Ti | |
| Asus ZenBook Duo 14 UX482EA -2! | |
| Cinebench R23 / Multi Core | |
| Average of class Multimedia (4861 - 33362, n=81, last 2 years) | |
| Average Intel Core i7-12700H (4032 - 19330, n=64) | |
| Asus Zenbook Pro 14 Duo OLED UX8402ZA | |
| Lenovo Yoga 9i 14 2022 i7-1260P | |
| Apple MacBook Pro 14 2021 M1 Pro Entry | |
| Microsoft Surface Laptop Studio i7 RTX 3050 Ti | |
| Asus ZenBook Duo 14 UX482EA | |
| Cinebench R23 / Single Core | |
| Average of class Multimedia (1128 - 2459, n=73, last 2 years) | |
| Asus Zenbook Pro 14 Duo OLED UX8402ZA | |
| Lenovo Yoga 9i 14 2022 i7-1260P | |
| Average Intel Core i7-12700H (778 - 1826, n=63) | |
| Apple MacBook Pro 14 2021 M1 Pro Entry | |
| Microsoft Surface Laptop Studio i7 RTX 3050 Ti | |
| Asus ZenBook Duo 14 UX482EA | |
| Cinebench R20 / CPU (Multi Core) | |
| Average of class Multimedia (1887 - 12912, n=64, last 2 years) | |
| Average Intel Core i7-12700H (1576 - 7407, n=64) | |
| Asus Zenbook Pro 14 Duo OLED UX8402ZA | |
| Lenovo Yoga 9i 14 2022 i7-1260P | |
| Microsoft Surface Laptop Studio i7 RTX 3050 Ti | |
| Asus ZenBook Duo 14 UX482EA | |
| Cinebench R20 / CPU (Single Core) | |
| Average of class Multimedia (425 - 853, n=64, last 2 years) | |
| Asus Zenbook Pro 14 Duo OLED UX8402ZA | |
| Average Intel Core i7-12700H (300 - 704, n=64) | |
| Lenovo Yoga 9i 14 2022 i7-1260P | |
| Microsoft Surface Laptop Studio i7 RTX 3050 Ti | |
| Asus ZenBook Duo 14 UX482EA | |
| Cinebench R15 / CPU Multi 64Bit | |
| Average of class Multimedia (856 - 5224, n=68, last 2 years) | |
| Average Intel Core i7-12700H (1379 - 2916, n=70) | |
| Asus Zenbook Pro 14 Duo OLED UX8402ZA | |
| Asus Zenbook Pro 14 Duo OLED UX8402ZA | |
| Lenovo Yoga 9i 14 2022 i7-1260P | |
| Apple MacBook Pro 14 2021 M1 Pro Entry | |
| Microsoft Surface Laptop Studio i7 RTX 3050 Ti | |
| Asus ZenBook Duo 14 UX482EA | |
| Cinebench R15 / CPU Single 64Bit | |
| Average of class Multimedia (184.8 - 326, n=66, last 2 years) | |
| Asus Zenbook Pro 14 Duo OLED UX8402ZA | |
| Average Intel Core i7-12700H (113 - 263, n=65) | |
| Lenovo Yoga 9i 14 2022 i7-1260P | |
| Asus ZenBook Duo 14 UX482EA | |
| Microsoft Surface Laptop Studio i7 RTX 3050 Ti | |
| Apple MacBook Pro 14 2021 M1 Pro Entry | |
| Blender / v2.79 BMW27 CPU | |
| Asus ZenBook Duo 14 UX482EA | |
| Microsoft Surface Laptop Studio i7 RTX 3050 Ti | |
| Lenovo Yoga 9i 14 2022 i7-1260P | |
| Average of class Multimedia (100 - 557, n=65, last 2 years) | |
| Average Intel Core i7-12700H (168 - 732, n=63) | |
| Asus Zenbook Pro 14 Duo OLED UX8402ZA | |
| 7-Zip 18.03 / 7z b 4 | |
| Asus Zenbook Pro 14 Duo OLED UX8402ZA | |
| Average Intel Core i7-12700H (22844 - 73067, n=63) | |
| Average of class Multimedia (29095 - 130368, n=62, last 2 years) | |
| Lenovo Yoga 9i 14 2022 i7-1260P | |
| Microsoft Surface Laptop Studio i7 RTX 3050 Ti | |
| Asus ZenBook Duo 14 UX482EA | |
| 7-Zip 18.03 / 7z b 4 -mmt1 | |
| Average of class Multimedia (3666 - 7545, n=63, last 2 years) | |
| Asus Zenbook Pro 14 Duo OLED UX8402ZA | |
| Average Intel Core i7-12700H (2743 - 5972, n=63) | |
| Asus ZenBook Duo 14 UX482EA | |
| Lenovo Yoga 9i 14 2022 i7-1260P | |
| Microsoft Surface Laptop Studio i7 RTX 3050 Ti | |
| Geekbench 5.5 / Multi-Core | |
| Average of class Multimedia (4652 - 20422, n=62, last 2 years) | |
| Asus Zenbook Pro 14 Duo OLED UX8402ZA | |
| Average Intel Core i7-12700H (5144 - 13745, n=64) | |
| Lenovo Yoga 9i 14 2022 i7-1260P | |
| Apple MacBook Pro 14 2021 M1 Pro Entry | |
| Microsoft Surface Laptop Studio i7 RTX 3050 Ti | |
| Geekbench 5.5 / Single-Core | |
| Average of class Multimedia (805 - 2974, n=62, last 2 years) | |
| Asus Zenbook Pro 14 Duo OLED UX8402ZA | |
| Apple MacBook Pro 14 2021 M1 Pro Entry | |
| Lenovo Yoga 9i 14 2022 i7-1260P | |
| Average Intel Core i7-12700H (803 - 1851, n=64) | |
| Microsoft Surface Laptop Studio i7 RTX 3050 Ti | |
| HWBOT x265 Benchmark v2.2 / 4k Preset | |
| Average of class Multimedia (5.26 - 36.1, n=63, last 2 years) | |
| Average Intel Core i7-12700H (4.67 - 21.8, n=64) | |
| Asus Zenbook Pro 14 Duo OLED UX8402ZA | |
| Lenovo Yoga 9i 14 2022 i7-1260P | |
| Microsoft Surface Laptop Studio i7 RTX 3050 Ti | |
| Asus ZenBook Duo 14 UX482EA | |
| LibreOffice / 20 Documents To PDF | |
| Asus ZenBook Duo 14 UX482EA | |
| Microsoft Surface Laptop Studio i7 RTX 3050 Ti | |
| Average of class Multimedia (23.9 - 146.7, n=64, last 2 years) | |
| Lenovo Yoga 9i 14 2022 i7-1260P | |
| Average Intel Core i7-12700H (34.2 - 95.3, n=63) | |
| Asus Zenbook Pro 14 Duo OLED UX8402ZA | |
| R Benchmark 2.5 / Overall mean | |
| Asus ZenBook Duo 14 UX482EA | |
| Microsoft Surface Laptop Studio i7 RTX 3050 Ti | |
| Lenovo Yoga 9i 14 2022 i7-1260P | |
| Average Intel Core i7-12700H (0.4441 - 1.052, n=63) | |
| Average of class Multimedia (0.3604 - 0.947, n=63, last 2 years) | |
| Asus Zenbook Pro 14 Duo OLED UX8402ZA | |
* ... smaller is better
AIDA64: FP32 Ray-Trace | FPU Julia | CPU SHA3 | CPU Queen | FPU SinJulia | FPU Mandel | CPU AES | CPU ZLib | FP64 Ray-Trace | CPU PhotoWorxx
| Performance rating | |
| Average of class Multimedia | |
| Average Intel Core i7-12700H | |
| Asus Zenbook Pro 14 Duo OLED UX8402ZA | |
| Microsoft Surface Laptop Studio i7 RTX 3050 Ti | |
| Lenovo Yoga 9i 14 2022 i7-1260P | |
| AIDA64 / FP32 Ray-Trace | |
| Average of class Multimedia (2214 - 50388, n=60, last 2 years) | |
| Average Intel Core i7-12700H (2585 - 17957, n=64) | |
| Microsoft Surface Laptop Studio i7 RTX 3050 Ti | |
| Asus Zenbook Pro 14 Duo OLED UX8402ZA | |
| Lenovo Yoga 9i 14 2022 i7-1260P | |
| AIDA64 / FPU Julia | |
| Average of class Multimedia (12867 - 201874, n=61, last 2 years) | |
| Average Intel Core i7-12700H (12439 - 90760, n=64) | |
| Asus Zenbook Pro 14 Duo OLED UX8402ZA | |
| Microsoft Surface Laptop Studio i7 RTX 3050 Ti | |
| Lenovo Yoga 9i 14 2022 i7-1260P | |
| AIDA64 / CPU SHA3 | |
| Average of class Multimedia (653 - 8623, n=61, last 2 years) | |
| Average Intel Core i7-12700H (833 - 4242, n=64) | |
| Asus Zenbook Pro 14 Duo OLED UX8402ZA | |
| Lenovo Yoga 9i 14 2022 i7-1260P | |
| Microsoft Surface Laptop Studio i7 RTX 3050 Ti | |
| AIDA64 / CPU Queen | |
| Asus Zenbook Pro 14 Duo OLED UX8402ZA | |
| Average Intel Core i7-12700H (57923 - 103202, n=63) | |
| Average of class Multimedia (13483 - 181505, n=49, last 2 years) | |
| Microsoft Surface Laptop Studio i7 RTX 3050 Ti | |
| Lenovo Yoga 9i 14 2022 i7-1260P | |
| AIDA64 / FPU SinJulia | |
| Average of class Multimedia (1240 - 28794, n=61, last 2 years) | |
| Average Intel Core i7-12700H (3249 - 9939, n=64) | |
| Asus Zenbook Pro 14 Duo OLED UX8402ZA | |
| Lenovo Yoga 9i 14 2022 i7-1260P | |
| Microsoft Surface Laptop Studio i7 RTX 3050 Ti | |
| AIDA64 / FPU Mandel | |
| Average of class Multimedia (6395 - 105740, n=60, last 2 years) | |
| Average Intel Core i7-12700H (7135 - 44760, n=64) | |
| Asus Zenbook Pro 14 Duo OLED UX8402ZA | |
| Microsoft Surface Laptop Studio i7 RTX 3050 Ti | |
| Lenovo Yoga 9i 14 2022 i7-1260P | |
| AIDA64 / CPU AES | |
| Average Intel Core i7-12700H (31839 - 144360, n=64) | |
| Average of class Multimedia (13243 - 126790, n=61, last 2 years) | |
| Asus Zenbook Pro 14 Duo OLED UX8402ZA | |
| Microsoft Surface Laptop Studio i7 RTX 3050 Ti | |
| Lenovo Yoga 9i 14 2022 i7-1260P | |
| AIDA64 / CPU ZLib | |
| Average of class Multimedia (167.2 - 2022, n=61, last 2 years) | |
| Average Intel Core i7-12700H (305 - 1171, n=64) | |
| Asus Zenbook Pro 14 Duo OLED UX8402ZA | |
| Lenovo Yoga 9i 14 2022 i7-1260P | |
| Microsoft Surface Laptop Studio i7 RTX 3050 Ti | |
| AIDA64 / FP64 Ray-Trace | |
| Average of class Multimedia (1014 - 26875, n=61, last 2 years) | |
| Average Intel Core i7-12700H (1437 - 9692, n=64) | |
| Asus Zenbook Pro 14 Duo OLED UX8402ZA | |
| Microsoft Surface Laptop Studio i7 RTX 3050 Ti | |
| Lenovo Yoga 9i 14 2022 i7-1260P | |
| AIDA64 / CPU PhotoWorxx | |
| Average of class Multimedia (12860 - 88154, n=61, last 2 years) | |
| Asus Zenbook Pro 14 Duo OLED UX8402ZA | |
| Microsoft Surface Laptop Studio i7 RTX 3050 Ti | |
| Average Intel Core i7-12700H (12863 - 52207, n=64) | |
| Lenovo Yoga 9i 14 2022 i7-1260P | |
System performance
Despite the lack of a dedicated GeForce GPU, the Zenbook Pro 14 Duo performs very well in the synthetic productivity benchmarks (PCMark, CrossMark), which is also confirmed by our subjective impression. The Zenbook is extremely responsive in everyday use, and the system also handles the second display without issues.
CrossMark: Overall | Productivity | Creativity | Responsiveness
| PCMark 10 / Score | |
| Average of class Multimedia (4325 - 10386, n=58, last 2 years) | |
| Asus Zenbook Pro 14 Duo OLED UX8402ZA | |
| Average Intel Core i7-12700H, Intel Iris Xe Graphics G7 96EUs (5541 - 6281, n=8) | |
| Lenovo Yoga 9i 14 2022 i7-1260P | |
| Microsoft Surface Laptop Studio i7 RTX 3050 Ti | |
| Asus ZenBook Duo 14 UX482EA | |
| PCMark 10 / Essentials | |
| Average Intel Core i7-12700H, Intel Iris Xe Graphics G7 96EUs (9991 - 11699, n=8) | |
| Asus Zenbook Pro 14 Duo OLED UX8402ZA | |
| Lenovo Yoga 9i 14 2022 i7-1260P | |
| Average of class Multimedia (8025 - 11664, n=57, last 2 years) | |
| Asus ZenBook Duo 14 UX482EA | |
| Microsoft Surface Laptop Studio i7 RTX 3050 Ti | |
| PCMark 10 / Productivity | |
| Average of class Multimedia (7323 - 18233, n=57, last 2 years) | |
| Microsoft Surface Laptop Studio i7 RTX 3050 Ti | |
| Average Intel Core i7-12700H, Intel Iris Xe Graphics G7 96EUs (6690 - 8038, n=8) | |
| Lenovo Yoga 9i 14 2022 i7-1260P | |
| Asus Zenbook Pro 14 Duo OLED UX8402ZA | |
| Asus ZenBook Duo 14 UX482EA | |
| PCMark 10 / Digital Content Creation | |
| Average of class Multimedia (3651 - 16240, n=57, last 2 years) | |
| Asus Zenbook Pro 14 Duo OLED UX8402ZA | |
| Average Intel Core i7-12700H, Intel Iris Xe Graphics G7 96EUs (6207 - 7401, n=8) | |
| Lenovo Yoga 9i 14 2022 i7-1260P | |
| Microsoft Surface Laptop Studio i7 RTX 3050 Ti | |
| Asus ZenBook Duo 14 UX482EA | |
| CrossMark / Overall | |
| Average of class Multimedia (866 - 2728, n=67, last 2 years) | |
| Asus Zenbook Pro 14 Duo OLED UX8402ZA | |
| Average Intel Core i7-12700H, Intel Iris Xe Graphics G7 96EUs (1492 - 1907, n=8) | |
| Lenovo Yoga 9i 14 2022 i7-1260P | |
| Apple MacBook Pro 14 2021 M1 Pro Entry | |
| Microsoft Surface Laptop Studio i7 RTX 3050 Ti | |
| CrossMark / Productivity | |
| Average of class Multimedia (931 - 2489, n=67, last 2 years) | |
| Asus Zenbook Pro 14 Duo OLED UX8402ZA | |
| Average Intel Core i7-12700H, Intel Iris Xe Graphics G7 96EUs (1499 - 1832, n=8) | |
| Lenovo Yoga 9i 14 2022 i7-1260P | |
| Microsoft Surface Laptop Studio i7 RTX 3050 Ti | |
| Apple MacBook Pro 14 2021 M1 Pro Entry | |
| CrossMark / Creativity | |
| Average of class Multimedia (907 - 3465, n=67, last 2 years) | |
| Asus Zenbook Pro 14 Duo OLED UX8402ZA | |
| Apple MacBook Pro 14 2021 M1 Pro Entry | |
| Lenovo Yoga 9i 14 2022 i7-1260P | |
| Average Intel Core i7-12700H, Intel Iris Xe Graphics G7 96EUs (1507 - 2016, n=8) | |
| Microsoft Surface Laptop Studio i7 RTX 3050 Ti | |
| CrossMark / Responsiveness | |
| Average Intel Core i7-12700H, Intel Iris Xe Graphics G7 96EUs (1384 - 1831, n=8) | |
| Lenovo Yoga 9i 14 2022 i7-1260P | |
| Asus Zenbook Pro 14 Duo OLED UX8402ZA | |
| Average of class Multimedia (605 - 2024, n=67, last 2 years) | |
| Microsoft Surface Laptop Studio i7 RTX 3050 Ti | |
| Apple MacBook Pro 14 2021 M1 Pro Entry | |
| PCMark 10 Score | 5948 points | |
Help | ||
| AIDA64 / Memory Copy | |
| Average of class Multimedia (21158 - 132135, n=61, last 2 years) | |
| Asus Zenbook Pro 14 Duo OLED UX8402ZA | |
| Microsoft Surface Laptop Studio i7 RTX 3050 Ti | |
| Average Intel Core i7-12700H (25615 - 80511, n=64) | |
| AIDA64 / Memory Read | |
| Average of class Multimedia (19699 - 174586, n=61, last 2 years) | |
| Asus Zenbook Pro 14 Duo OLED UX8402ZA | |
| Microsoft Surface Laptop Studio i7 RTX 3050 Ti | |
| Average Intel Core i7-12700H (25586 - 79442, n=64) | |
| AIDA64 / Memory Write | |
| Average of class Multimedia (17733 - 134998, n=61, last 2 years) | |
| Microsoft Surface Laptop Studio i7 RTX 3050 Ti | |
| Asus Zenbook Pro 14 Duo OLED UX8402ZA | |
| Average Intel Core i7-12700H (23679 - 88660, n=64) | |
| AIDA64 / Memory Latency | |
| Average of class Multimedia (7 - 535, n=60, last 2 years) | |
| Microsoft Surface Laptop Studio i7 RTX 3050 Ti | |
| Average Intel Core i7-12700H (76.2 - 133.9, n=62) | |
| Asus Zenbook Pro 14 Duo OLED UX8402ZA | |
* ... smaller is better
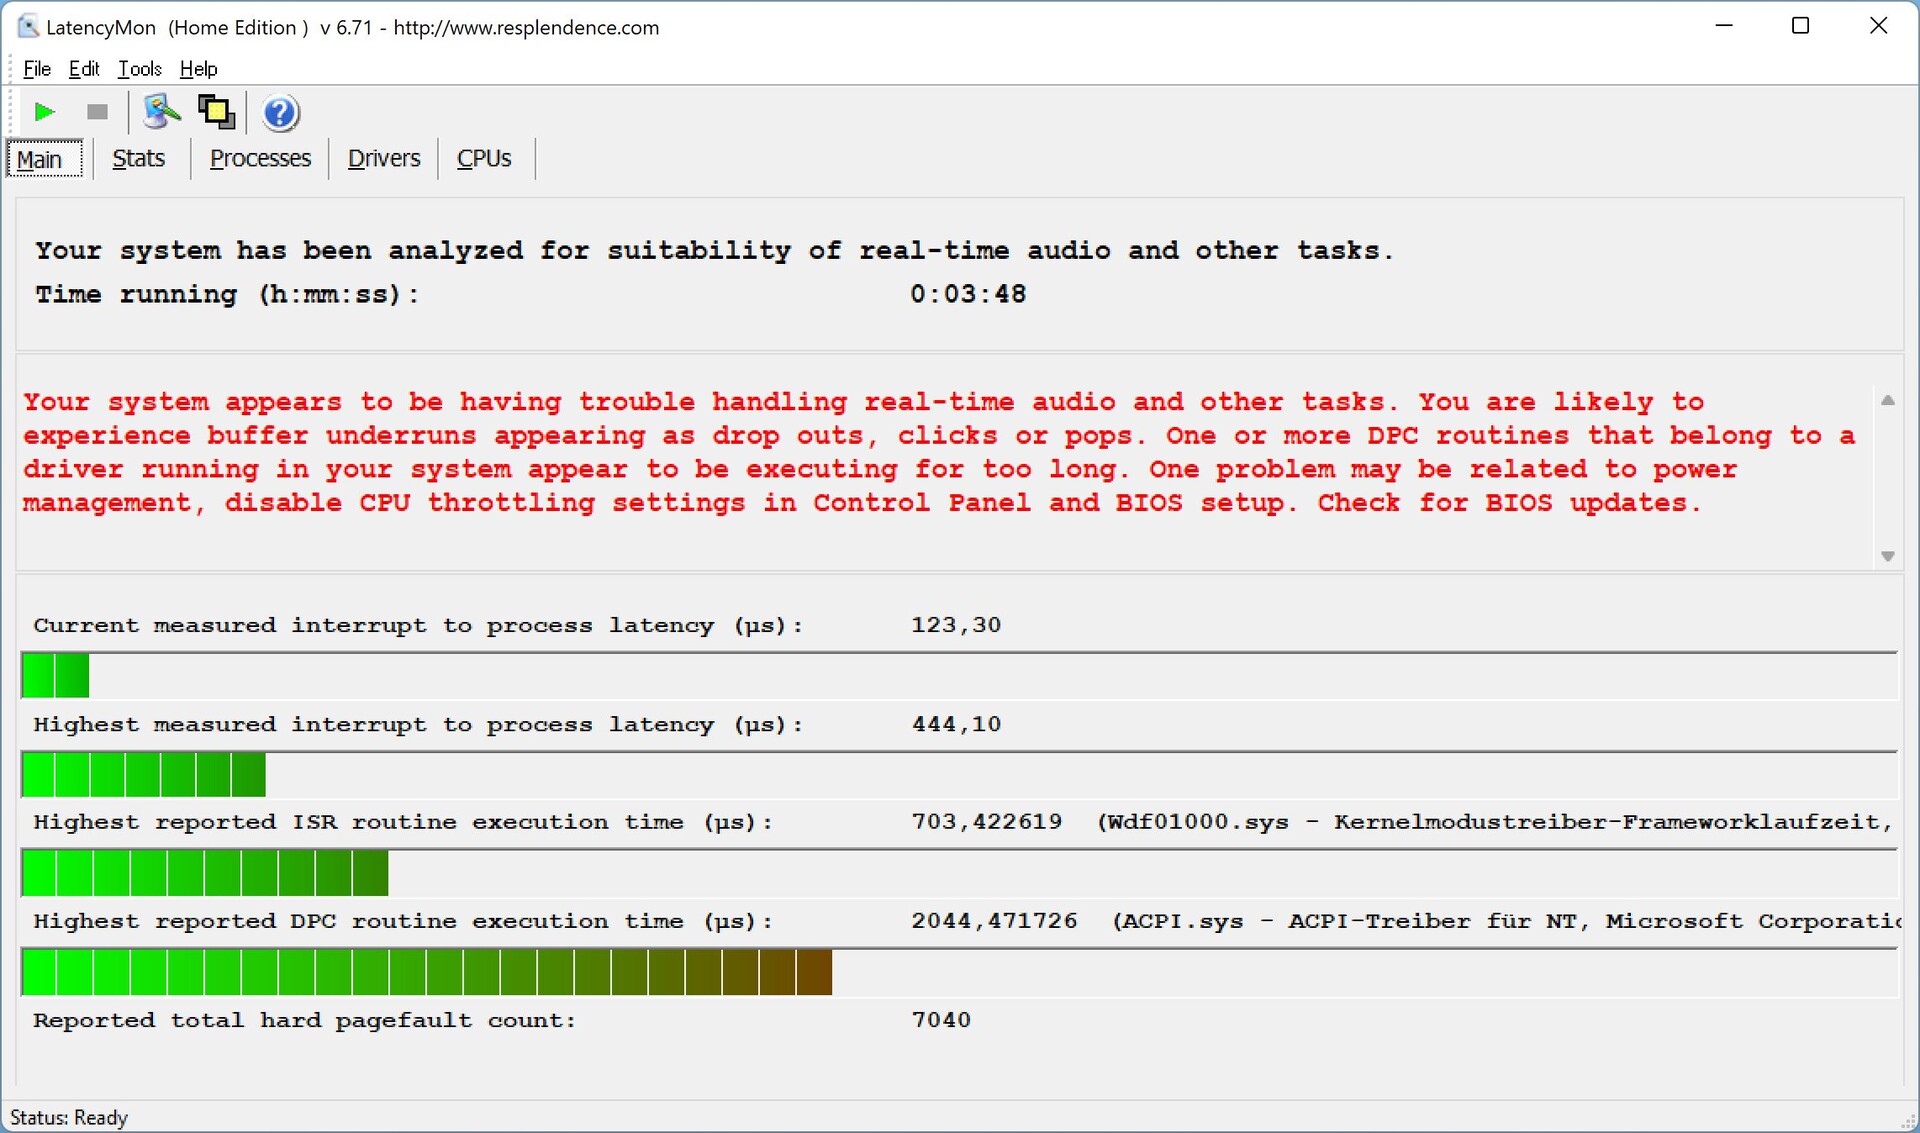
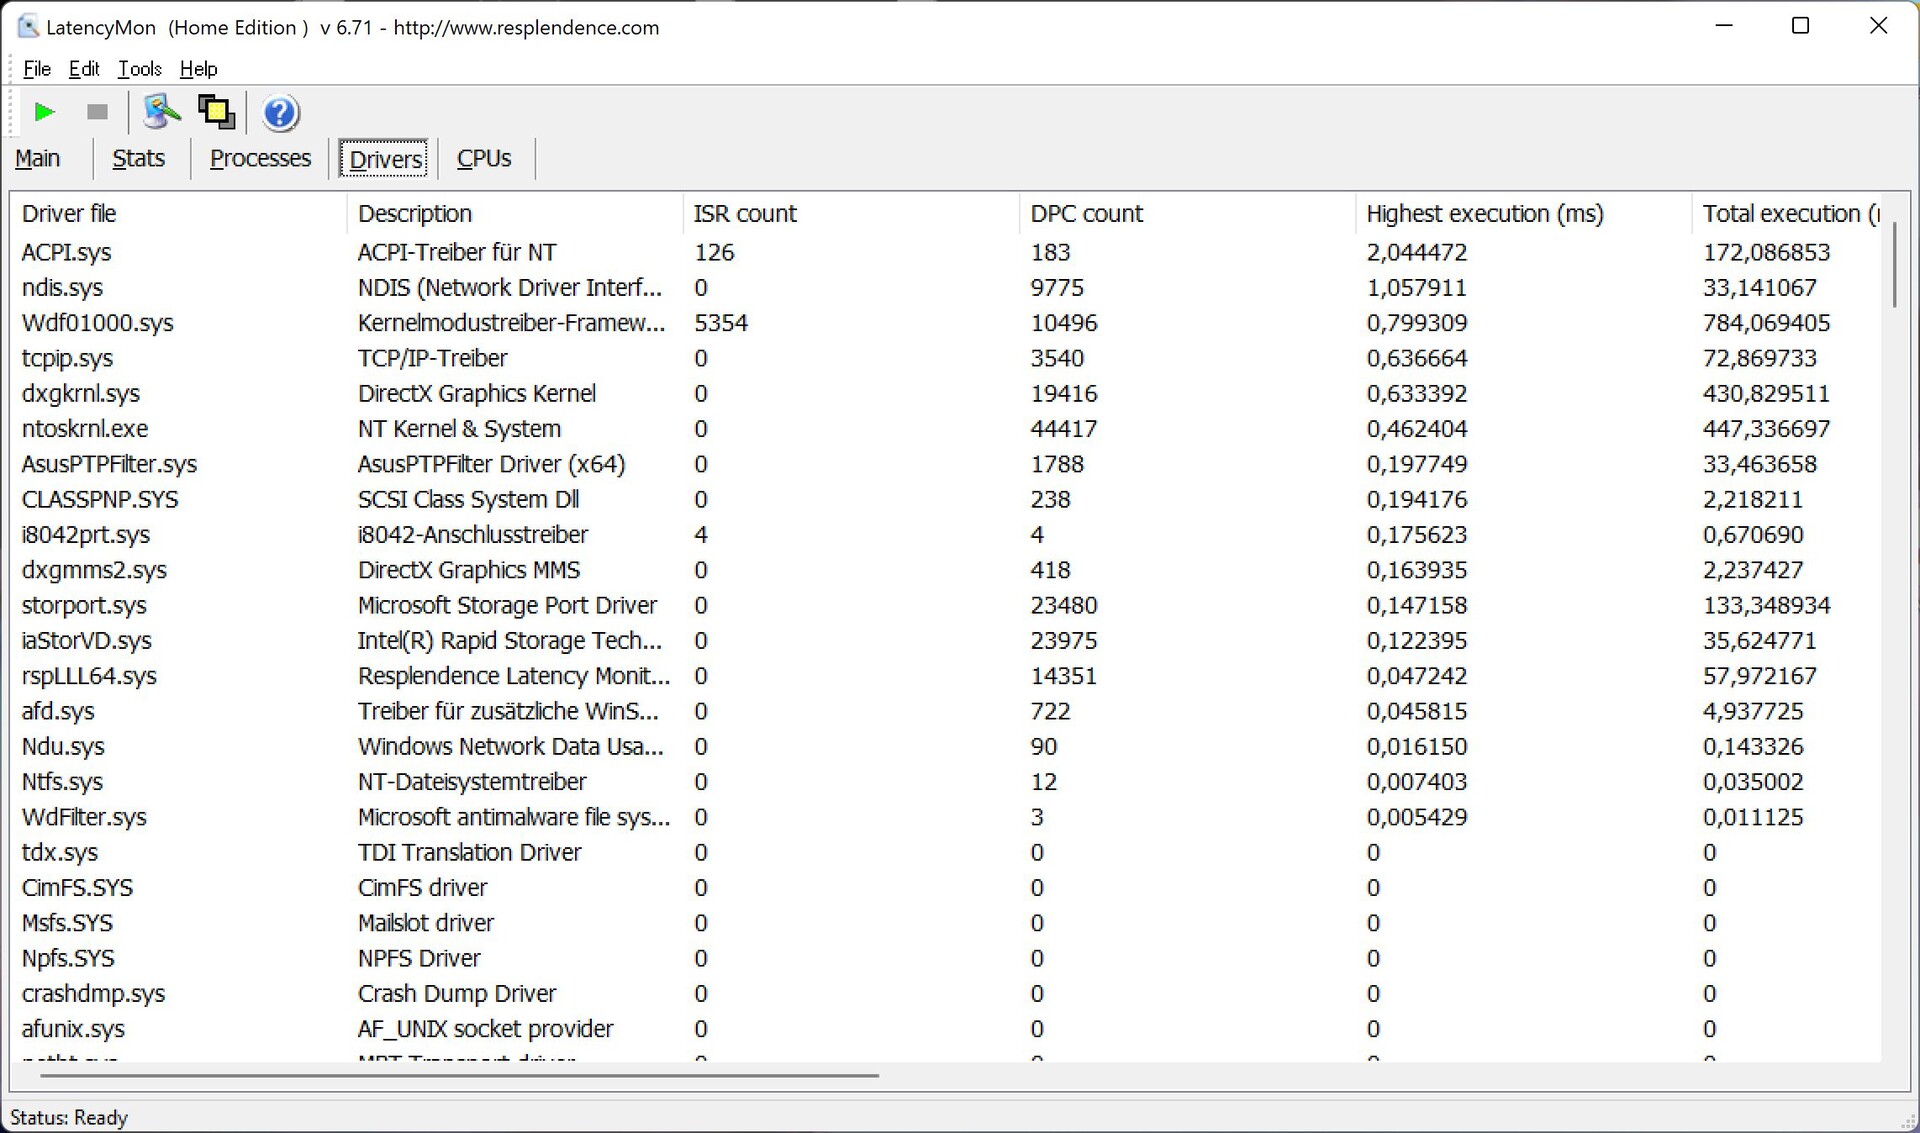
DPC latencies
In our standardized latency test, the Zenbook doesn't show any major problems using the current BIOS version, and there are no skipped frames (dropped frames) when playing videos, but one driver causes a bit of trouble (ACPI driver).
| DPC Latencies / LatencyMon - interrupt to process latency (max), Web, Youtube, Prime95 | |
| Lenovo Yoga 9i 14 2022 i7-1260P | |
| Microsoft Surface Laptop Studio i7 RTX 3050 Ti | |
| Asus ZenBook Duo 14 UX482EA | |
| Asus Zenbook Pro 14 Duo OLED UX8402ZA | |
* ... smaller is better
Storage
Asus installs a fast PCIe 4.0 SSD from Samsung (PM9A1) with a storage capacity of 512 GB, of which about 430 GB is available after the first startup. The SSD performs slightly below expectations in the benchmarks, and slight performance drops can also be observed during continuous load. This doesn't have an impact in everyday use, but the Samsung SSD can't exploit its full potential. The reason for this is probably temperature issues because the drive is placed very close to the processor and the heat pipes inside the case. Further SSD benchmarks are available in our HDD/SSD Benchmarks article.

* ... smaller is better
Continuous load read: DiskSpd Read Loop, Queue Depth 8
Graphics card
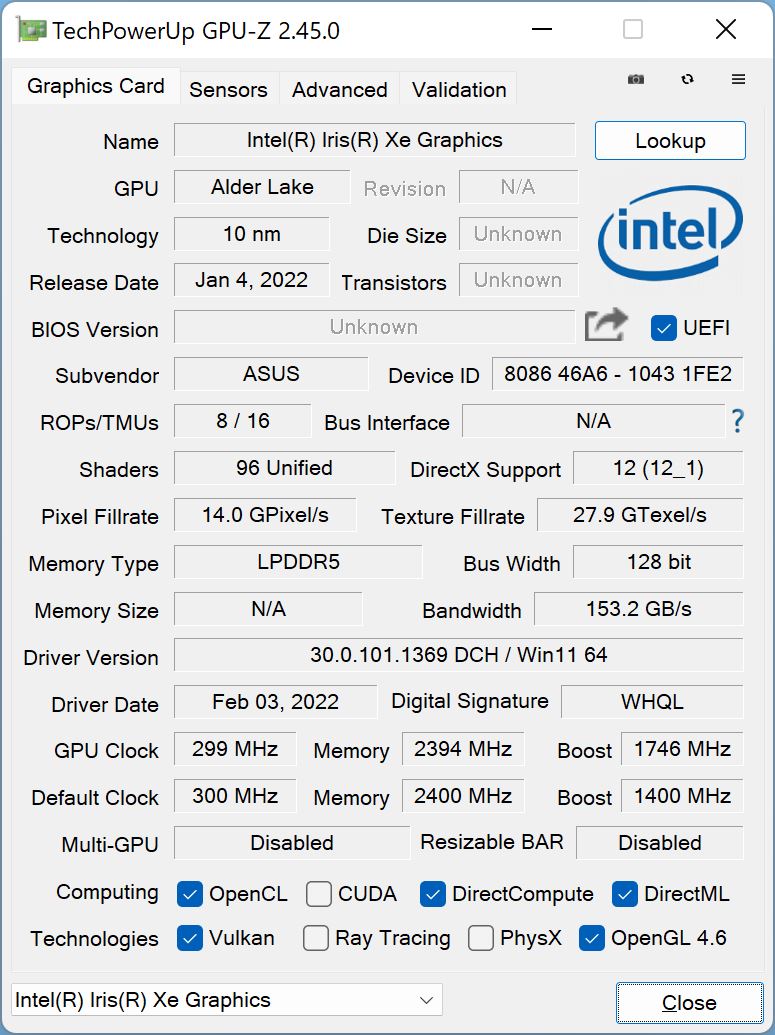
As we mentioned before, our review configuration of the Zenbook Pro 14 Duo doesn't have a dedicated graphics card. Instead, the processor's iGPU handles this task. Unlike the old Tiger Lake H45 CPUs, which were still equipped with the slower UHD Graphics, the new Alder Lake models are equipped with the Iris Xe Graphics G7 with 96 EUs, a technology that we've been familiar with for a while thanks to the Tiger Lake ULV processors. The iGPU is very well suited for everyday tasks and high-resolution video playback. Depending on the codec used, video editing is also possible, but users who want to play games from time to time should definitely go for the model with the RTX 3050 Ti. With the Iris Xe, you have to focus on less demanding or older titles, but you still have to reduce the level of details often. Performance is stable even under prolonged load and on battery power, both in Performance Mode and using the Standard preset. Additional GPU benchmarks are listed here.
Asus states that the Zenbook Pro 14 Duo is capable of cooling a total of 85 watts, so we assume that this would be a 40- or 50-watt version of the GeForce RTX 3050 Ti. To get an idea of the performance when using the optional dGPU, you can take a cue from the Surface Laptop Studio, which uses the 50-watt version of the RTX 3050 Ti.
| 3DMark 11 Performance | 7917 points | |
| 3DMark Cloud Gate Standard Score | 26837 points | |
| 3DMark Fire Strike Score | 5675 points | |
| 3DMark Time Spy Score | 2095 points | |
Help | ||
The Witcher 3 FPS diagram
| low | med. | high | ultra | QHD | |
|---|---|---|---|---|---|
| GTA V (2015) | 130.8 | 115.6 | 26.9 | 11.2 | |
| The Witcher 3 (2015) | 109 | 68 | 37 | 16.1 | |
| Dota 2 Reborn (2015) | 134.3 | 99.8 | 75.5 | 68.9 | |
| Final Fantasy XV Benchmark (2018) | 51.4 | 27.8 | 27.8 | ||
| X-Plane 11.11 (2018) | 68.3 | 49.4 | 43.5 | ||
| Far Cry 5 (2018) | 67 | 29 | 27 | 25 | 18 |
| Strange Brigade (2018) | 102.4 | 48.3 | 38.1 | 30.8 | |
| F1 2021 (2021) | 115.7 | 59.5 | 47.3 | 32.5 | |
| Farming Simulator 22 (2021) | 103 | 48 | 34 | 28 |
Emissions - The Zenbook Pro impresses with good sound
The following results only apply to the version without the dedicated GPU. According to Asus, the cooling system can handle a total of 85 watts, which we believe will result in louder fans and higher temperatures than in our review unit.
Noise emissions
The Zenbook Pro 14 Duo's two fans are often completely inactive during simple tasks and everyday use, and even short load peaks are usually overcome without using the fans. We were able to measure around 38 dB(A) under load while gaming, and just under 42 dB(A) was recorded in the stress test. We would only recommend the optional Performance Mode if it's absolutely necessary, because it gets considerably louder at a maximum of 48.8 dB(A). Whisper Mode is recommended for very quiet surroundings. It lives up to its name with a maximum noise level of 29.2 dB(A), but performance is naturally reduced. We couldn't detect any other electronic noises.
Noise level
| Idle |
| 23.7 / 23.7 / 23.7 dB(A) |
| Load |
| 37.6 / 41.7 dB(A) |
 | ||
30 dB silent 40 dB(A) audible 50 dB(A) loud |
||
min: | ||
| Asus Zenbook Pro 14 Duo OLED UX8402ZA Iris Xe G7 96EUs, i7-12700H, Samsung PM9A1 MZVL2512HCJQ | Microsoft Surface Laptop Studio i7 RTX 3050 Ti GeForce RTX 3050 Ti Laptop GPU, i7-11370H, SK Hynix PC711 1TB HFS001TDE9X084N | Apple MacBook Pro 14 2021 M1 Pro Entry M1 Pro 14-Core GPU, M1 Pro 8-Core, Apple SSD AP0512 | Lenovo Yoga 9i 14 2022 i7-1260P Iris Xe G7 96EUs, i7-1260P, Samsung PM9A1 MZVL21T0HCLR | Asus ZenBook Duo 14 UX482EA Iris Xe G7 96EUs, i7-1165G7, SK Hynix HFM512GD3JX013N | |
|---|---|---|---|---|---|
| Noise | -5% | 2% | -5% | -5% | |
| off / environment * (dB) | 23.7 | 24.7 -4% | 24.8 -5% | 24.1 -2% | 26.3 -11% |
| Idle Minimum * (dB) | 23.7 | 24.7 -4% | 24.8 -5% | 24.1 -2% | 26.5 -12% |
| Idle Average * (dB) | 23.7 | 24.7 -4% | 24.8 -5% | 24.1 -2% | 26.5 -12% |
| Idle Maximum * (dB) | 23.7 | 24.7 -4% | 24.8 -5% | 30 -27% | 26.5 -12% |
| Load Average * (dB) | 37.6 | 33.2 12% | 27.8 26% | 39.4 -5% | 26.7 29% |
| Witcher 3 ultra * (dB) | 37.6 | 44.5 -18% | 27.8 26% | 39.4 -5% | 40.7 -8% |
| Load Maximum * (dB) | 41.7 | 46.7 -12% | 49.5 -19% | 39.4 6% | 45.6 -9% |
* ... smaller is better
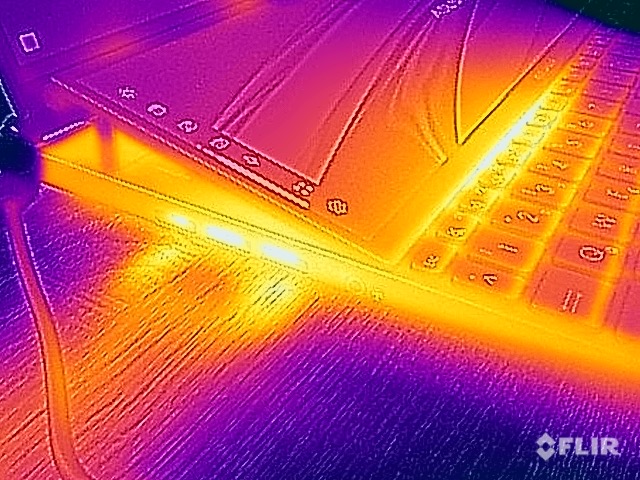
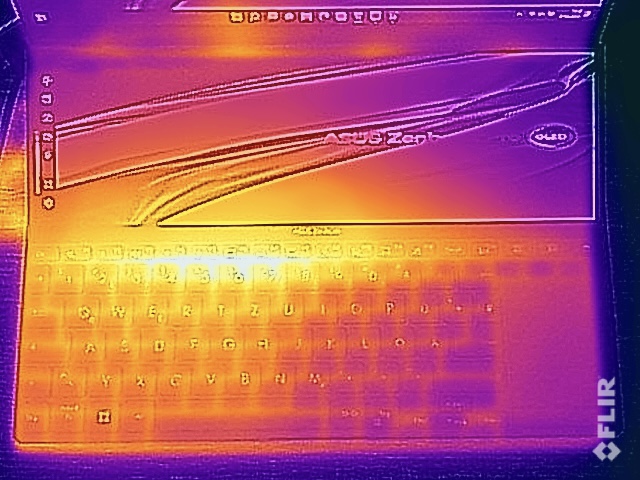
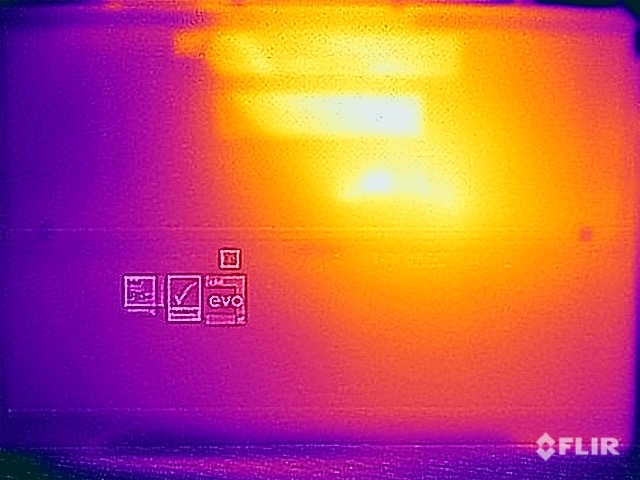
Temperature
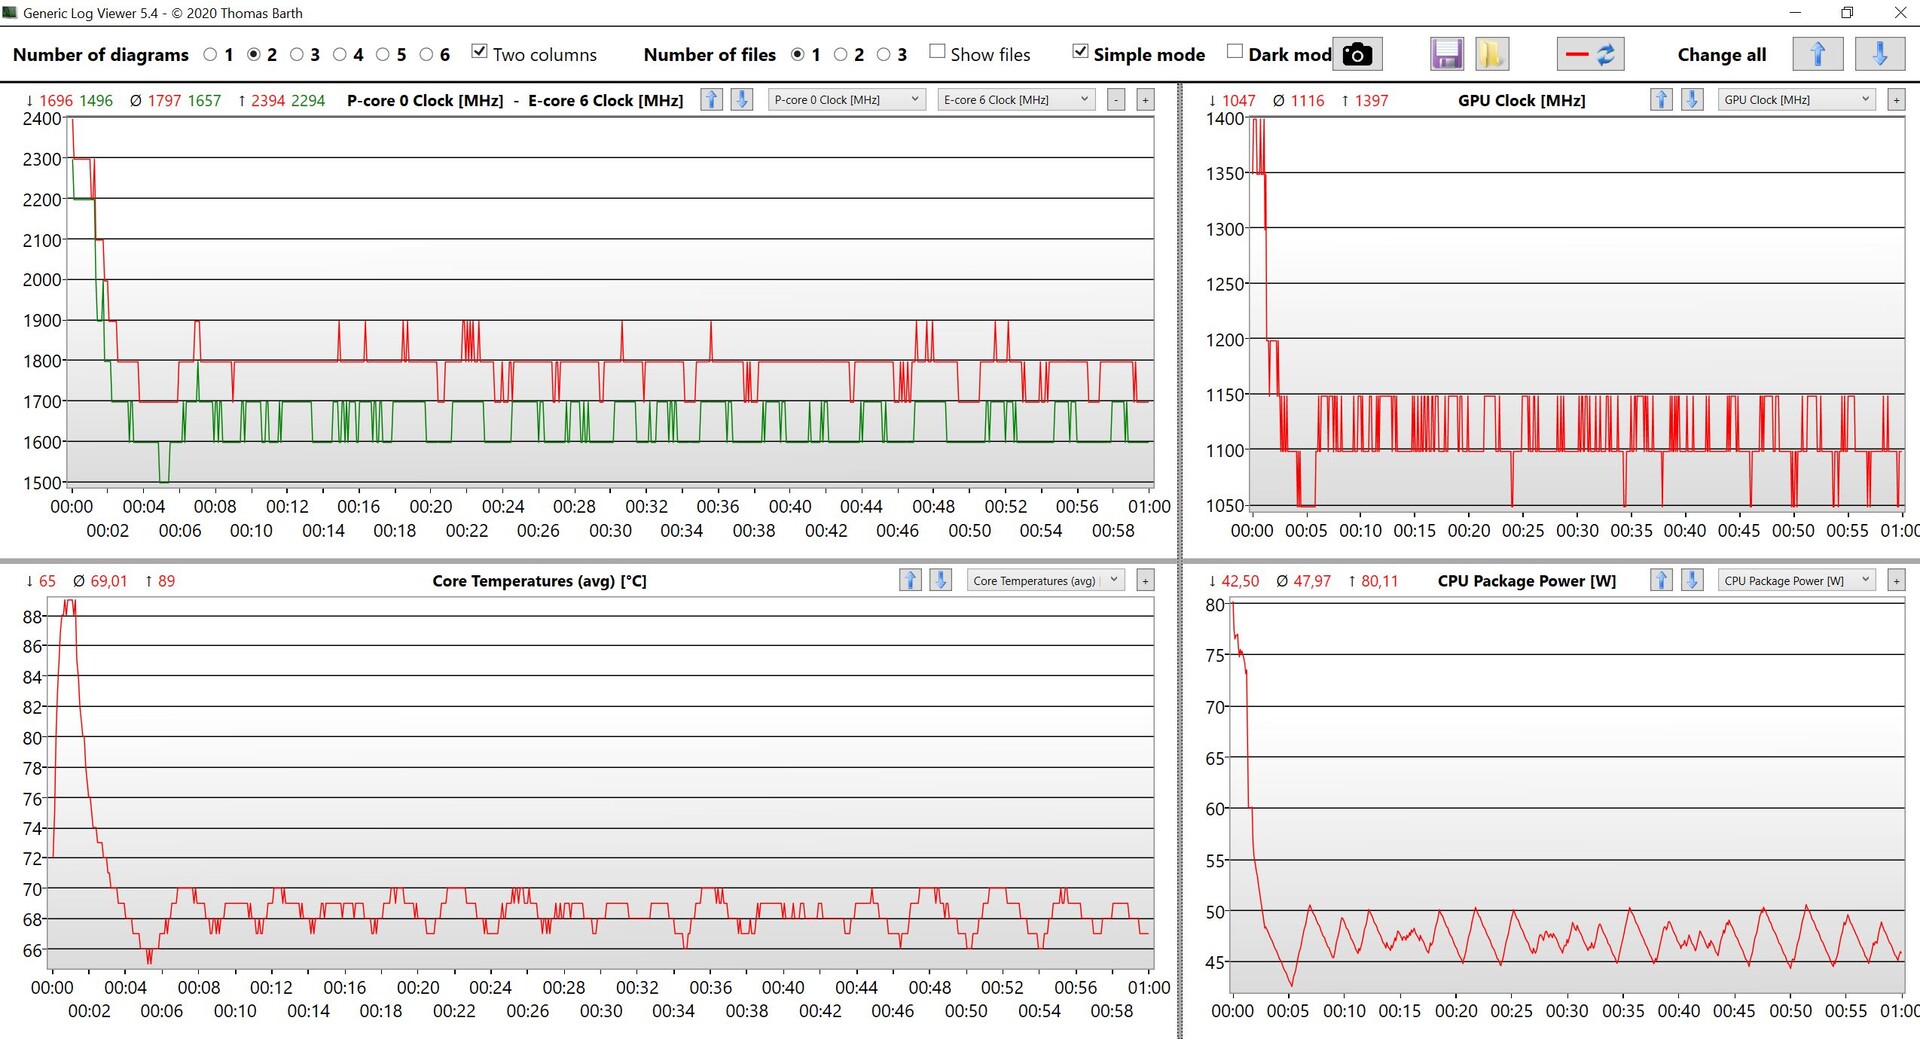
Asus makes use of the additional space underneath the second display for cooling, since fresh air can be sucked in very easily here, which is then transported out of the case again through both sides. Under load, however, there is a clearly noticeable hotspot at the junction between the keyboard and the ScreenPad, namely in the area of the F4-F6 keys, which can also be clearly felt when typing. The bottom also heats up noticeably in the stress test to over 47 °C (~117 °F), and having the device on your lap becomes uncomfortable in the long run, but there are still basically no performance limitations here. The case stays much cooler in everyday use, but the surface temperatures at the bottom are also relatively high here at a bit over 30 °C (~86 °F).
In the stress test with combined CPU/GPU load, the processor quickly settles at a consumption of 45-50 watts. In this case, the graphics card still operates at a clock rate of ~1.1 GHz and the processor at around 1.7-1.8 GHz. There was no performance decrease straight after the stress test.
(±) The maximum temperature on the upper side is 43.2 °C / 110 F, compared to the average of 36.8 °C / 98 F, ranging from 21 to 71 °C for the class Multimedia.
(-) The bottom heats up to a maximum of 47.8 °C / 118 F, compared to the average of 39.1 °C / 102 F
(+) In idle usage, the average temperature for the upper side is 27 °C / 81 F, compared to the device average of 31.3 °C / 88 F.
(±) Playing The Witcher 3, the average temperature for the upper side is 35 °C / 95 F, compared to the device average of 31.3 °C / 88 F.
(±) The palmrests and touchpad can get very hot to the touch with a maximum of 37.2 °C / 99 F.
(-) The average temperature of the palmrest area of similar devices was 28.7 °C / 83.7 F (-8.5 °C / -15.3 F).
| Asus Zenbook Pro 14 Duo OLED UX8402ZA Intel Core i7-12700H, Intel Iris Xe Graphics G7 96EUs | Microsoft Surface Laptop Studio i7 RTX 3050 Ti Intel Core i7-11370H, NVIDIA GeForce RTX 3050 Ti Laptop GPU | Apple MacBook Pro 14 2021 M1 Pro Entry Apple M1 Pro 8-Core, Apple M1 Pro 14-Core GPU | Lenovo Yoga 9i 14 2022 i7-1260P Intel Core i7-1260P, Intel Iris Xe Graphics G7 96EUs | Asus ZenBook Duo 14 UX482EA Intel Core i7-1165G7, Intel Iris Xe Graphics G7 96EUs | |
|---|---|---|---|---|---|
| Heat | 16% | 11% | -1% | -9% | |
| Maximum Upper Side * (°C) | 43.2 | 42.3 2% | 46.8 -8% | 47.5 -10% | 37.2 14% |
| Maximum Bottom * (°C) | 47.8 | 38.2 20% | 40.9 14% | 52.2 -9% | 56.6 -18% |
| Idle Upper Side * (°C) | 28 | 23.4 16% | 24.2 14% | 27.1 3% | 31.4 -12% |
| Idle Bottom * (°C) | 32.2 | 23.5 27% | 24.2 25% | 28.5 11% | 38.2 -19% |
* ... smaller is better
Speakers
The two stereo speakers are located at the front of the base unit, and they project the sound downwards and diagonally to the side. Several profiles are available in the preinstalled Dolby Access app, and there's also the option to save your own profiles with equalizer settings. Although the two modules aren't among the loudest on the market, their sound quality is very good, and playing music as well as movies is thoroughly enjoyable. Sure, you could improve things with your own subwoofer, but the Zenbook definitely doesn't need to shy away from its rivals here.
Asus Zenbook Pro 14 Duo OLED UX8402ZA audio analysis
(±) | speaker loudness is average but good (76.6 dB)
Bass 100 - 315 Hz
(±) | reduced bass - on average 11.1% lower than median
(±) | linearity of bass is average (10.1% delta to prev. frequency)
Mids 400 - 2000 Hz
(+) | balanced mids - only 1.9% away from median
(+) | mids are linear (3.3% delta to prev. frequency)
Highs 2 - 16 kHz
(+) | balanced highs - only 1.8% away from median
(+) | highs are linear (4.4% delta to prev. frequency)
Overall 100 - 16.000 Hz
(+) | overall sound is linear (10.7% difference to median)
Compared to same class
» 16% of all tested devices in this class were better, 2% similar, 82% worse
» The best had a delta of 5%, average was 17%, worst was 45%
Compared to all devices tested
» 6% of all tested devices were better, 2% similar, 93% worse
» The best had a delta of 4%, average was 24%, worst was 134%
Apple MacBook Pro 14 2021 M1 Pro Entry audio analysis
(+) | speakers can play relatively loud (84.9 dB)
Bass 100 - 315 Hz
(+) | good bass - only 4.3% away from median
(+) | bass is linear (5.9% delta to prev. frequency)
Mids 400 - 2000 Hz
(+) | balanced mids - only 1.1% away from median
(+) | mids are linear (1.9% delta to prev. frequency)
Highs 2 - 16 kHz
(+) | balanced highs - only 2.9% away from median
(+) | highs are linear (3% delta to prev. frequency)
Overall 100 - 16.000 Hz
(+) | overall sound is linear (5.6% difference to median)
Compared to same class
» 2% of all tested devices in this class were better, 1% similar, 97% worse
» The best had a delta of 5%, average was 17%, worst was 45%
Compared to all devices tested
» 0% of all tested devices were better, 0% similar, 100% worse
» The best had a delta of 4%, average was 24%, worst was 134%
Energy management - Two displays cost battery life
Energy consumption
The second display was deactivated for the measurements in the following table. Depending on the brightness, you can add between 3 and 7 watts here. But even without the second display, the idle rates aren't particularly good, which means that the 120 Hz OLED panel requires a lot of power. We carried out our measurements using the 120 Hz mode, but particularly when it comes to static screen content, a higher frequency doesn't have much of an impact.
We briefly observe a consumption of 111 watts under load, but it quickly stabilizes at ~66-70 watts in the stress test, analogous to the processor's TDP. The included 150-watt power adapter is therefore perfectly adequate.
| Off / Standby | |
| Idle | |
| Load |
|
Key:
min: | |
| Asus Zenbook Pro 14 Duo OLED UX8402ZA i7-12700H, Iris Xe G7 96EUs, Samsung PM9A1 MZVL2512HCJQ, OLED, 2880x1800, 14.5" | Microsoft Surface Laptop Studio i7 RTX 3050 Ti i7-11370H, GeForce RTX 3050 Ti Laptop GPU, SK Hynix PC711 1TB HFS001TDE9X084N, IPS, 2400x1600, 14.4" | Apple MacBook Pro 14 2021 M1 Pro Entry M1 Pro 8-Core, M1 Pro 14-Core GPU, Apple SSD AP0512, Mini-LED, 3024x1964, 14.2" | Lenovo Yoga 9i 14 2022 i7-1260P i7-1260P, Iris Xe G7 96EUs, Samsung PM9A1 MZVL21T0HCLR, OLED, 3840x2400, 14" | Asus ZenBook Duo 14 UX482EA i7-1165G7, Iris Xe G7 96EUs, SK Hynix HFM512GD3JX013N, IPS, 1920x1080, 14" | Average Intel Iris Xe Graphics G7 96EUs | Average of class Multimedia | |
|---|---|---|---|---|---|---|---|
| Power Consumption | 19% | 25% | 17% | 37% | 34% | 16% | |
| Idle Minimum * (Watt) | 8.8 | 2.6 70% | 2.9 67% | 7.1 19% | 3.6 59% | 5.51 ? 37% | 5.71 ? 35% |
| Idle Average * (Watt) | 12.6 | 7.1 44% | 11.6 8% | 10 21% | 9.3 26% | 8.66 ? 31% | 10.1 ? 20% |
| Idle Maximum * (Watt) | 13.9 | 7.9 43% | 11.9 14% | 10.8 22% | 10 28% | 10.9 ? 22% | 12.4 ? 11% |
| Load Average * (Watt) | 77.5 | 76.8 1% | 49.5 36% | 64 17% | 40.6 48% | 45.6 ? 41% | 65 ? 16% |
| Witcher 3 ultra * (Watt) | 52.4 | 83 -58% | 58.2 -11% | 47.7 9% | 44.3 15% | ||
| Load Maximum * (Watt) | 111 | 97.3 12% | 68.5 38% | 97 13% | 62.4 44% | 67.8 ? 39% | 112.2 ? -1% |
* ... smaller is better
Energy consumption during The Witcher 3 / stress test
Energy consumption with an external monitor
Battery life
The 76 Wh battery doesn't allow for particularly long battery runtimes. In our tests at a brightness of 150 cd/m² (corresponds to 72% of the maximum brightness in our test device), we observe runtimes between 6:30-7 hours, but this is only true when the secondary display is disabled. As soon as you activate it at medium brightness, the result is only just under 4 hours in our Wi-Fi test at 150 cd/m². As we've already noticed with other review devices, the refresh rate doesn't have much of an impact in our Wi-Fi test, since the test only runs for 14 minutes longer (6:40 hours) at 60 Hz and 150 cd/m².
If you want to enjoy an HDR video at full brightness on the go, it shouldn't be too long because the battery runs out after a bit over 3 hours (196 minutes) here.
A full charge takes 107 minutes when the device is turned on, with 50% of the capacity being available again after just 30 minutes (80% after 54 minutes). If you don't be lugging the bulky 150-watt power adapter around all the time, the Zenbook Pro 14 Duo can also be charged with more compact USB power adapters.
| Asus Zenbook Pro 14 Duo OLED UX8402ZA i7-12700H, Iris Xe G7 96EUs, 76 Wh | Microsoft Surface Laptop Studio i7 RTX 3050 Ti i7-11370H, GeForce RTX 3050 Ti Laptop GPU, 58 Wh | Apple MacBook Pro 14 2021 M1 Pro Entry M1 Pro 8-Core, M1 Pro 14-Core GPU, 69.9 Wh | Lenovo Yoga 9i 14 2022 i7-1260P i7-1260P, Iris Xe G7 96EUs, 75 Wh | Asus ZenBook Duo 14 UX482EA i7-1165G7, Iris Xe G7 96EUs, 70 Wh | Average of class Multimedia | |
|---|---|---|---|---|---|---|
| Battery runtime | 22% | 68% | 38% | 95% | 76% | |
| H.264 (h) | 6.8 | 12.3 81% | 15 121% | 12.6 85% | 16.4 ? 141% | |
| WiFi v1.3 (h) | 6.4 | 8 25% | 13.6 113% | 8.6 34% | 8.4 31% | 12 ? 88% |
| Load (h) | 1.7 | 1 -41% | 1.2 -29% | 1.6 -6% | 4.4 159% | 1.675 ? -1% |
| Reader / Idle (h) | 36.8 | 25.2 ? |
Pros
Cons
Verdict - The second display is the Zenbook Pro 14 Duo's weakness
The concept with the additional screen continues to be interesting, and there are certainly use cases where productivity significantly benefits from the additional display. Nonetheless, it's still a niche product, and although Asus has been able to improve the Zenbook Pro 14 Duo in some areas (e.g. CPU performance), the second display is the 14-inch laptop's biggest problem at the same time.
The most obvious drawback is the position of the input devices, since there is no palm rest and the touchpad is downright tiny by modern standards. Battery life is very poor when both displays are enabled, and using them is a bit awkward at times, which is mainly due to the different scaling factors and the low vertical resolution of the ScreenPad, respectively. However, the biggest problem is the poor subjective image quality. Although the measurements are consistently fine, the matte IPS display is simply extremely grainy, and it's not particularly enjoyable to watch content on it when you have the outstanding OLED display a few centimeters further up.
The display impresses with its familiar good performance, and we would especially like to emphasize the dimming software feature here, which allows Asus to bypass the annoying aspects of PWM flickering. A dialog informs the user that DC dimming only works at brightness levels of 60% and above; PWM flickering kicks in at lower brightness levels and can lead to adverse effects. Using the software to reduce brightness is a bit more complicated, but it's worth it.
More productivity and a lot of CPU power: Due to the switch to the new Alder Lake H processors, the Zenbook Pro 14 Duo provides a lot of processing power, and the additional display can significantly increase productivity depending on the intended use, but the poor subjective image quality of the ScreenPad tarnishes the overall impression.
Configurations with the optional GeForce RTX 3050 Ti are surely going to be more interesting for many users. In terms of price, the Zenbook Pro 14 Duo is on par with the Microsoft Surface Laptop Studio, which still has to make do with the old Tiger Lake CPU. The Apple MacBook Pro 14 is also in this price range, but it simply has massive advantages with its mini-LED panel if you work a lot with HDR content. The Lenovo Yoga 9i 14 convertible is also an interesting alternative, which is also a bit more mobile while also already featuring the latest technologies.
Price and availability
At the time of writing, the Asus Zenbook Pro 14 Duo OLED UX8402ZA is listed as "coming soon" in the US. You can currently find it in B&H's online store with the Intel Core i7-12700H, 32 GB of RAM, 1 TB of storage space, and integrated Iris Xe Graphics for approximately $2,000. You can also wait for the device to become available on Amazon, for example.
Asus Zenbook Pro 14 Duo OLED UX8402ZA
- 06/05/2022 v7 (old)
Andreas Osthoff
Price comparison

