

Asus ZenBook Pro 14 Duo laptop review with second display for creatives: Increased productivity

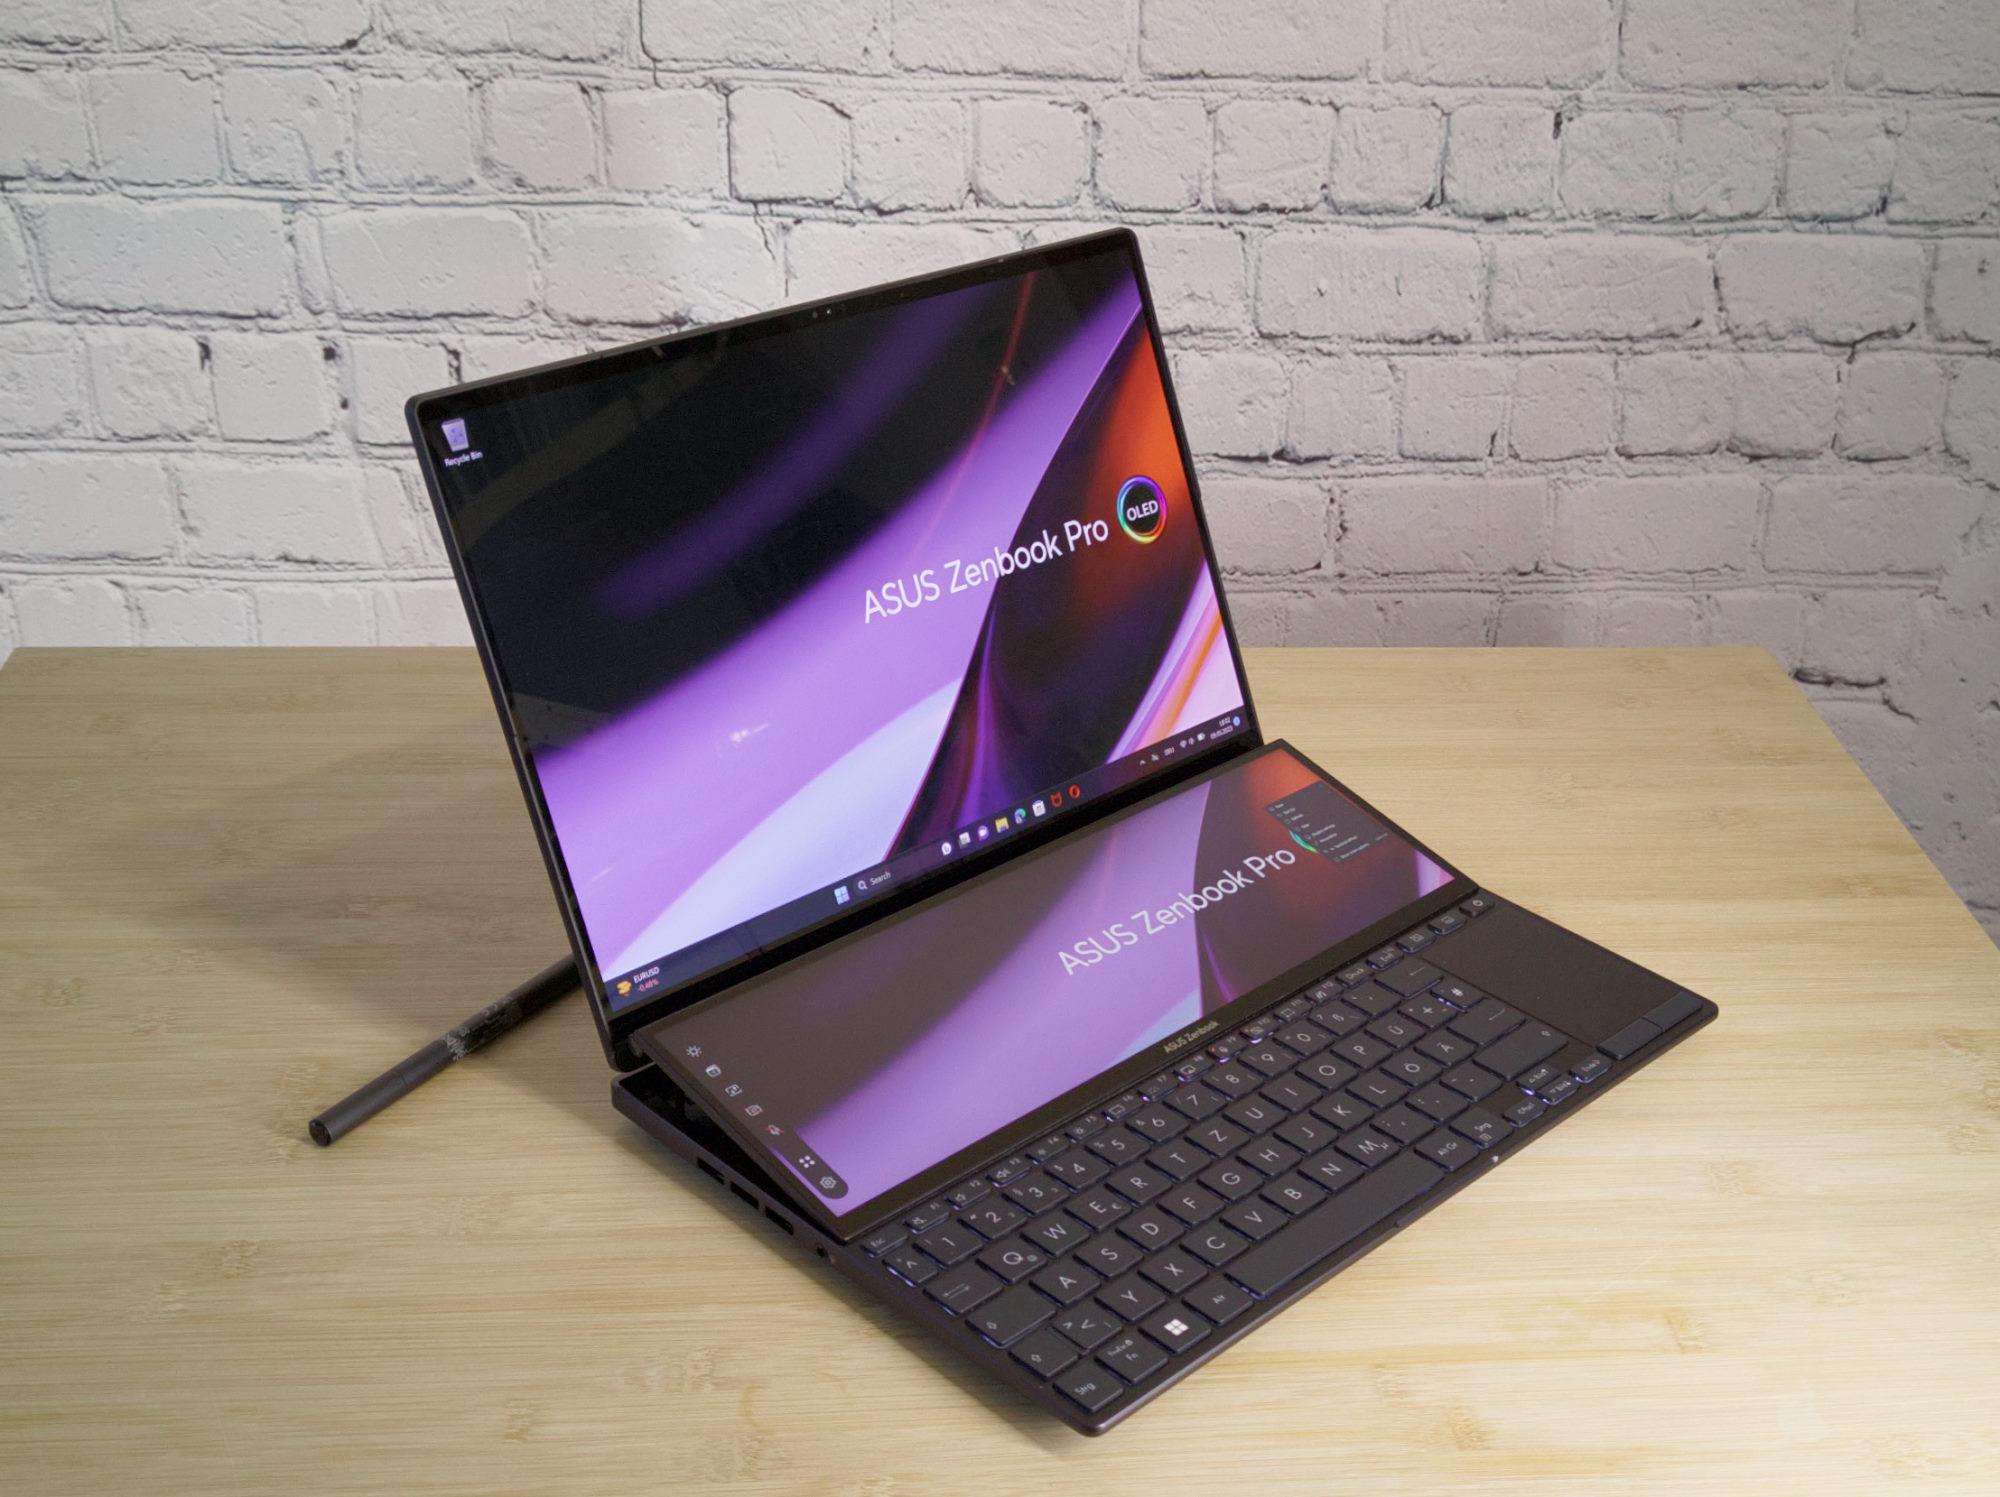
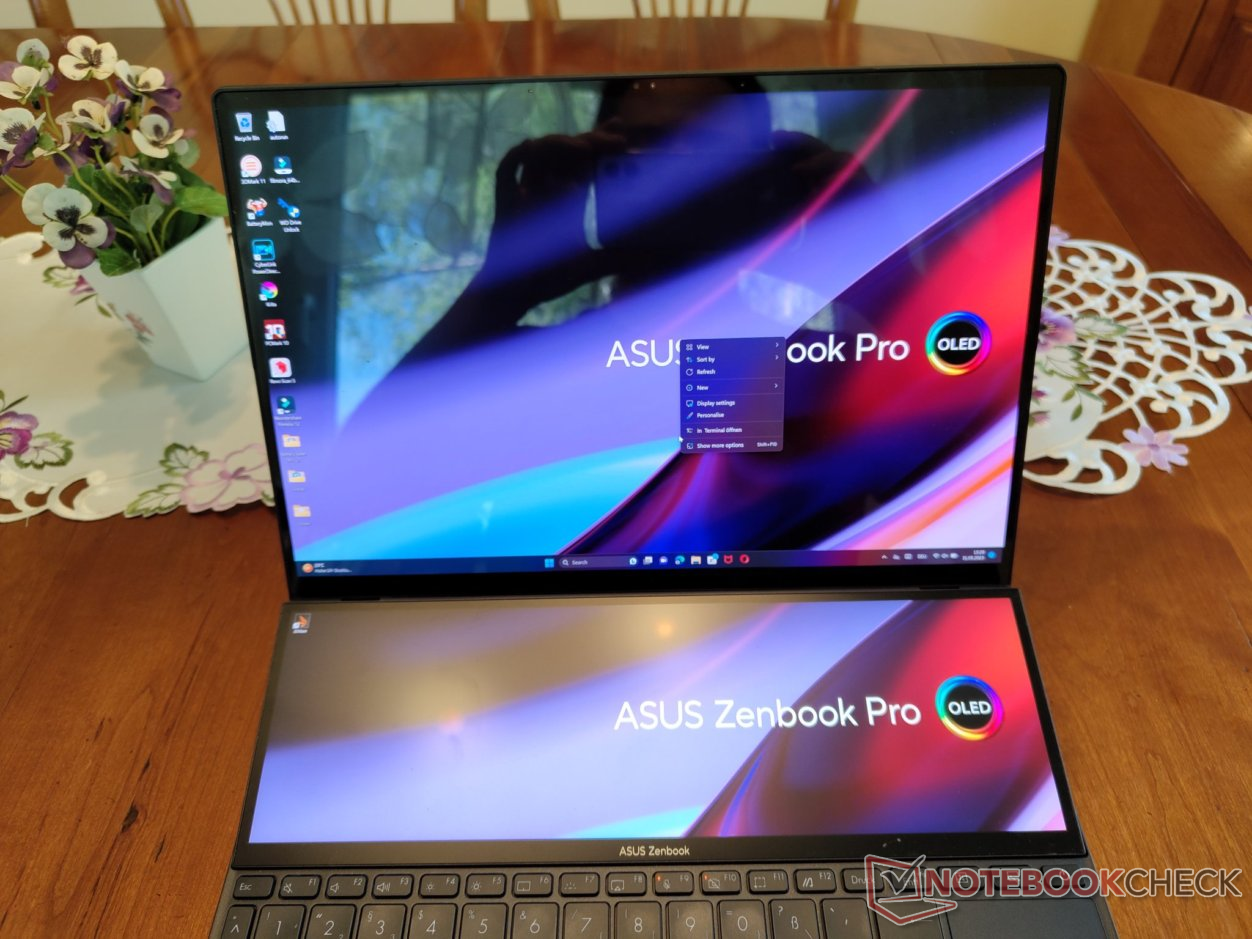
You can see better with the second one! This is how our YouTube video on the Asus ROG Zephyrus Duo 16 was called. But the gaming laptop isn't the only device from Asus with a second display. Instead of an AMD processor and RTX 4090, the Asus Zenbook Pro 14 Duo uses an Nvidia GeForce RTX 4060 and Intel Core i9-13900H. We already tested a Zenbook Pro 14 Duo with a 14.5-inch display last year, but at that time it didn't have a dGPU. Similar to the keyboard of the Zenbook Pro 16X that can be folded up, the foldable second display gives the fans of the laptop access to a more powerful air stream, possibly leading to more efficient cooling and finally a higher performance of the laptop.
With the Nvida GeForce RTX 4060, the laptop becomes significantly more productive. The second display invites you to simply move the toolbars of many creative programs to the bottom, thus giving more display area for the essential tasks.
Although the small laptop might be unique with its concept of operational control, there are many competitors in the area of small laptops with powerful CPU and GPU options. For example, while the Gigabyte Aero 14 OLED and Schenker Vision 14 are slightly smaller than the Zenbook in all regards, they are also classical laptops without the advantages and disadvantages of a second display. If you want a laptop from Asus, the Vivobook S 14X might also be interesting.
Possible Competitors in Comparison
Rating | Date | Model | Weight | Height | Size | Resolution | Price |
|---|---|---|---|---|---|---|---|
| 87 % v7 (old) | 06 / 2023 | Asus ZenBook Pro 14 Duo UX8402VV-P1021W i9-13900H, GeForce RTX 4060 Laptop GPU | 1.8 kg | 21 mm | 14.50" | 2880x1800 | |
| 86 % v7 (old) | 11 / 2022 | Acer Predator Triton 300 SE i9-12900H, GeForce RTX 3060 Laptop GPU | 1.7 kg | 19.8 mm | 14.00" | 2880x1800 | |
| 90.2 % v7 (old) | 05 / 2023 | Lenovo Yoga Pro 7 14IRH G8 i7-13700H, GeForce RTX 4050 Laptop GPU | 1.5 kg | 15.6 mm | 14.50" | 3072x1920 | |
| 89.4 % v7 (old) | 05 / 2023 | Gigabyte Aero 14 OLED BMF i7-13700H, GeForce RTX 4050 Laptop GPU | 1.4 kg | 17 mm | 14.00" | 2880x1800 | |
| 88 % v7 (old) | 04 / 2023 | Asus Zephyrus Duo 16 GX650PY-NM006W R9 7945HX, GeForce RTX 4090 Laptop GPU | 2.7 kg | 29.7 mm | 16.00" | 2560x1600 | |
| 88.8 % v7 (old) | 10 / 2022 | Schenker Vision 14 2022 RTX 3050 Ti i7-12700H, GeForce RTX 3050 Ti Laptop GPU | 1.3 kg | 16.6 mm | 14.00" | 2880x1800 | |
| 84.4 % v7 (old) | 06 / 2022 | Asus Zenbook Pro 14 Duo OLED UX8402ZA i7-12700H, Iris Xe G7 96EUs | 1.7 kg | 19.6 mm | 14.50" | 2880x1800 | |
| 84.1 % v7 (old) | 06 / 2022 | Asus VivoBook S 14X S5402Z i7-12700H, Iris Xe G7 96EUs | 1.6 kg | 17.9 mm | 14.50" | 2880x1800 |
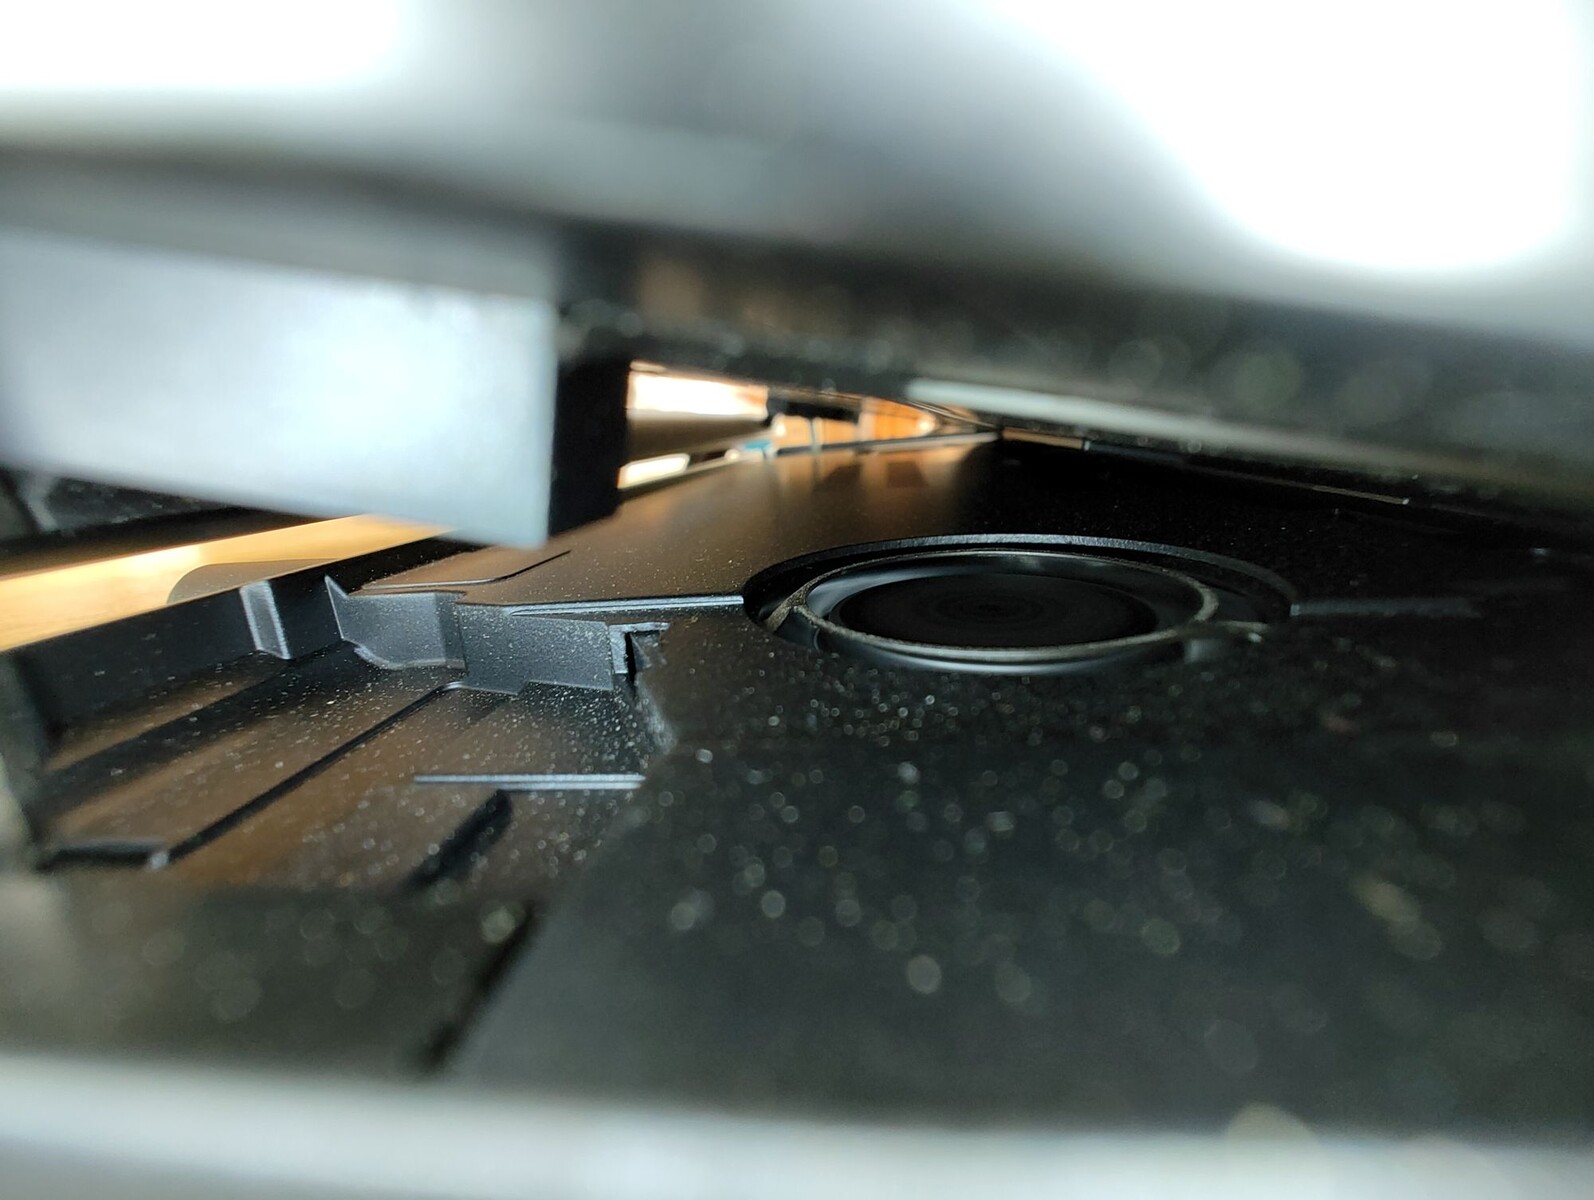
Case - AAS cooling below the second display
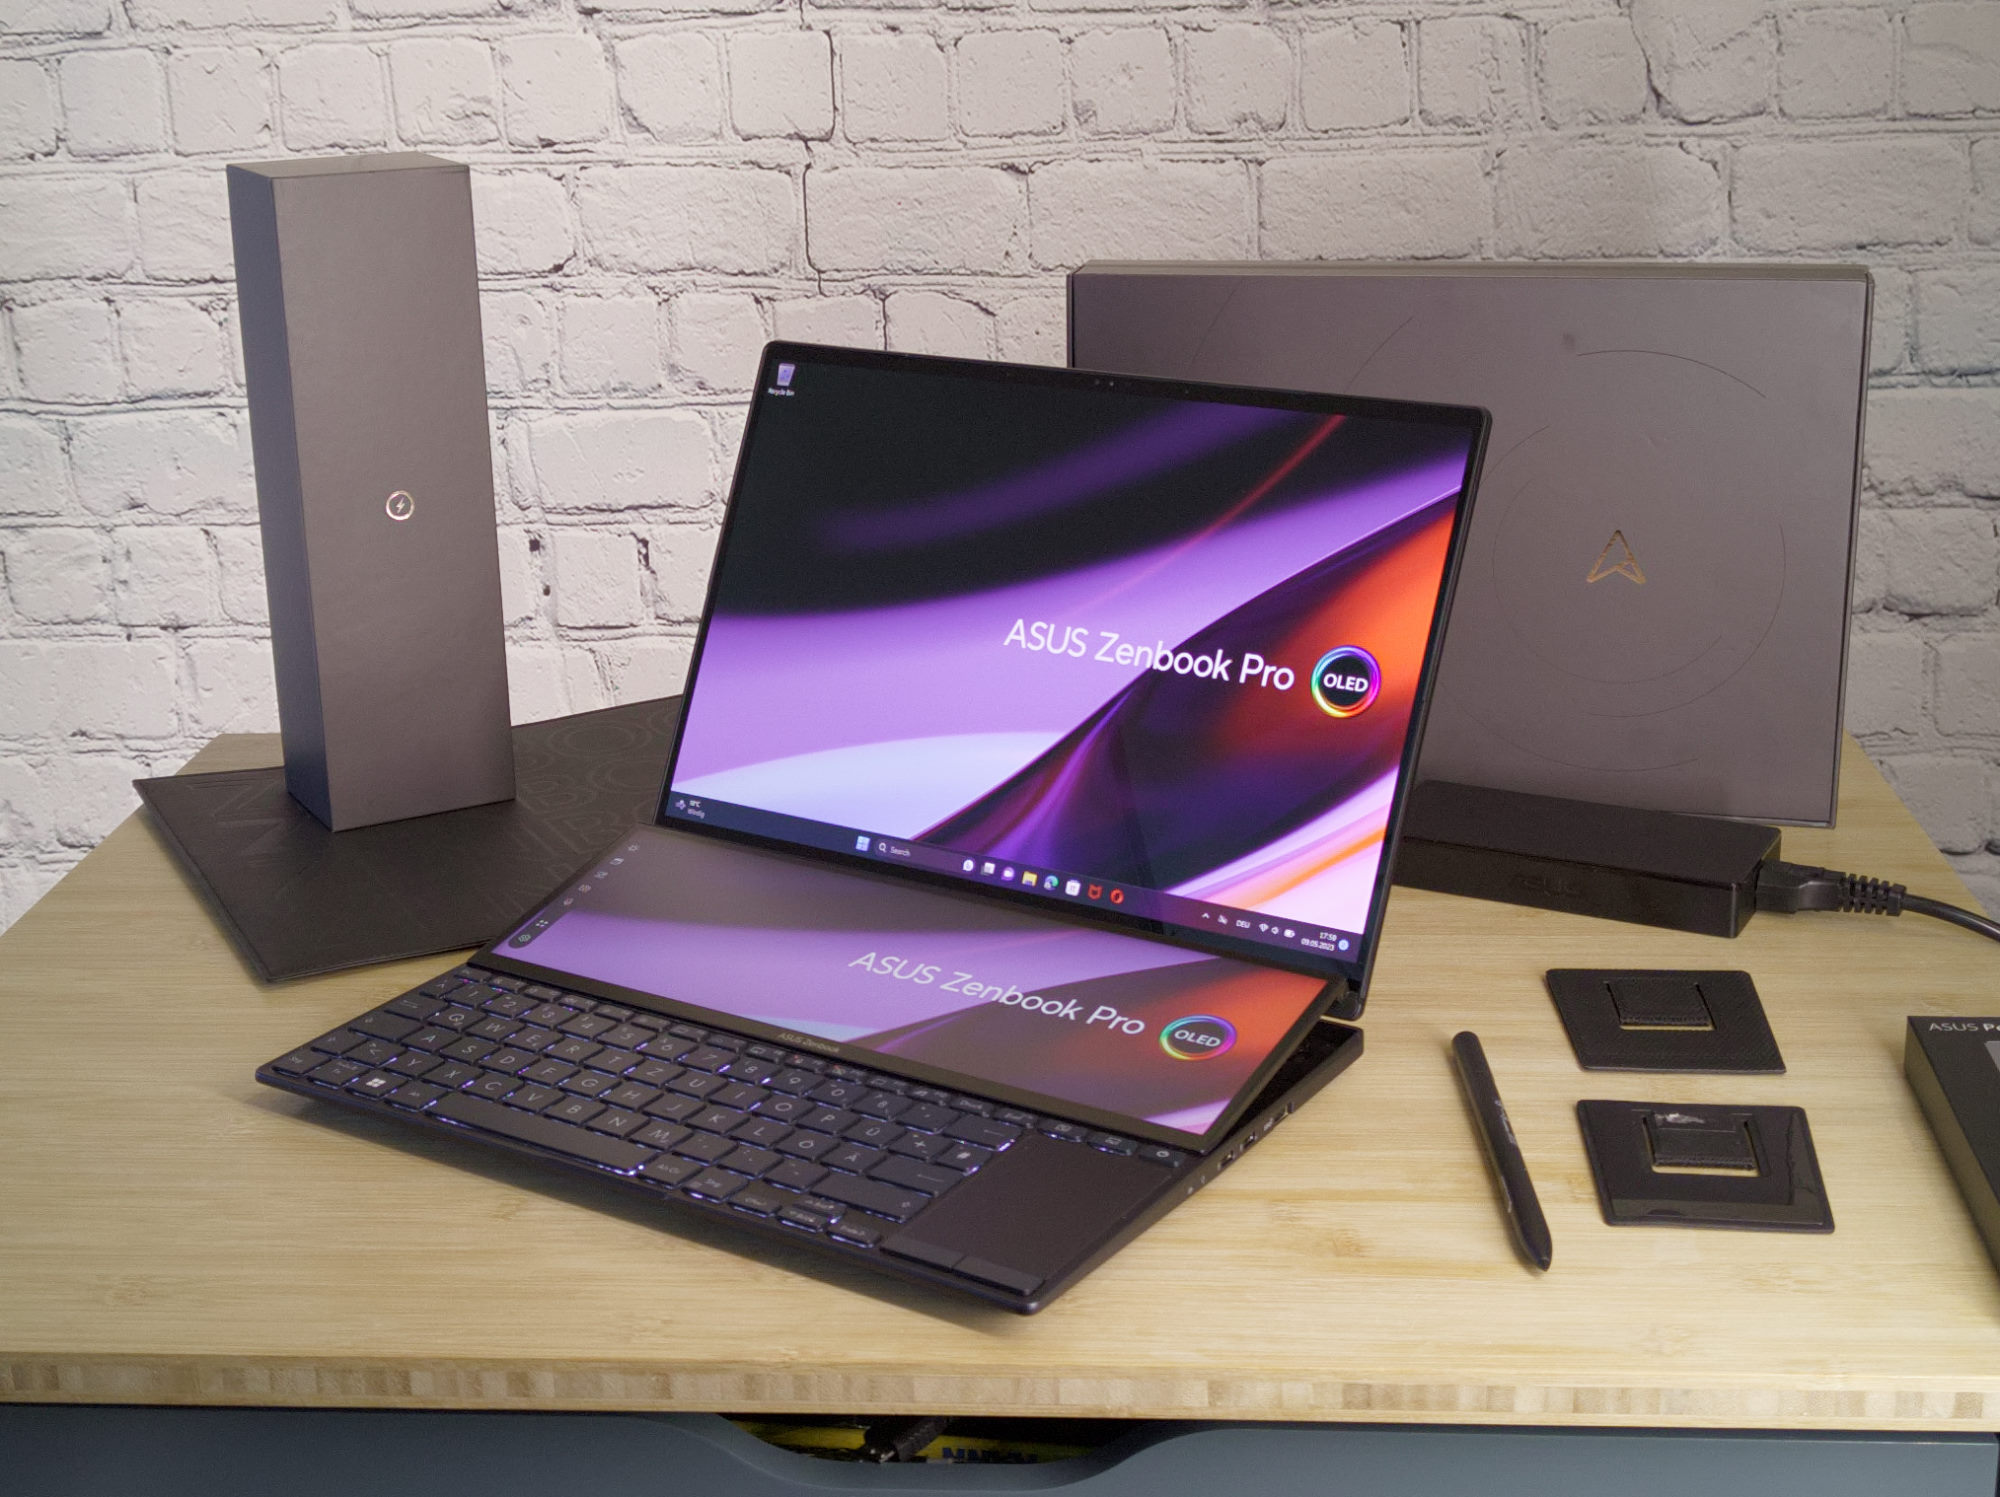
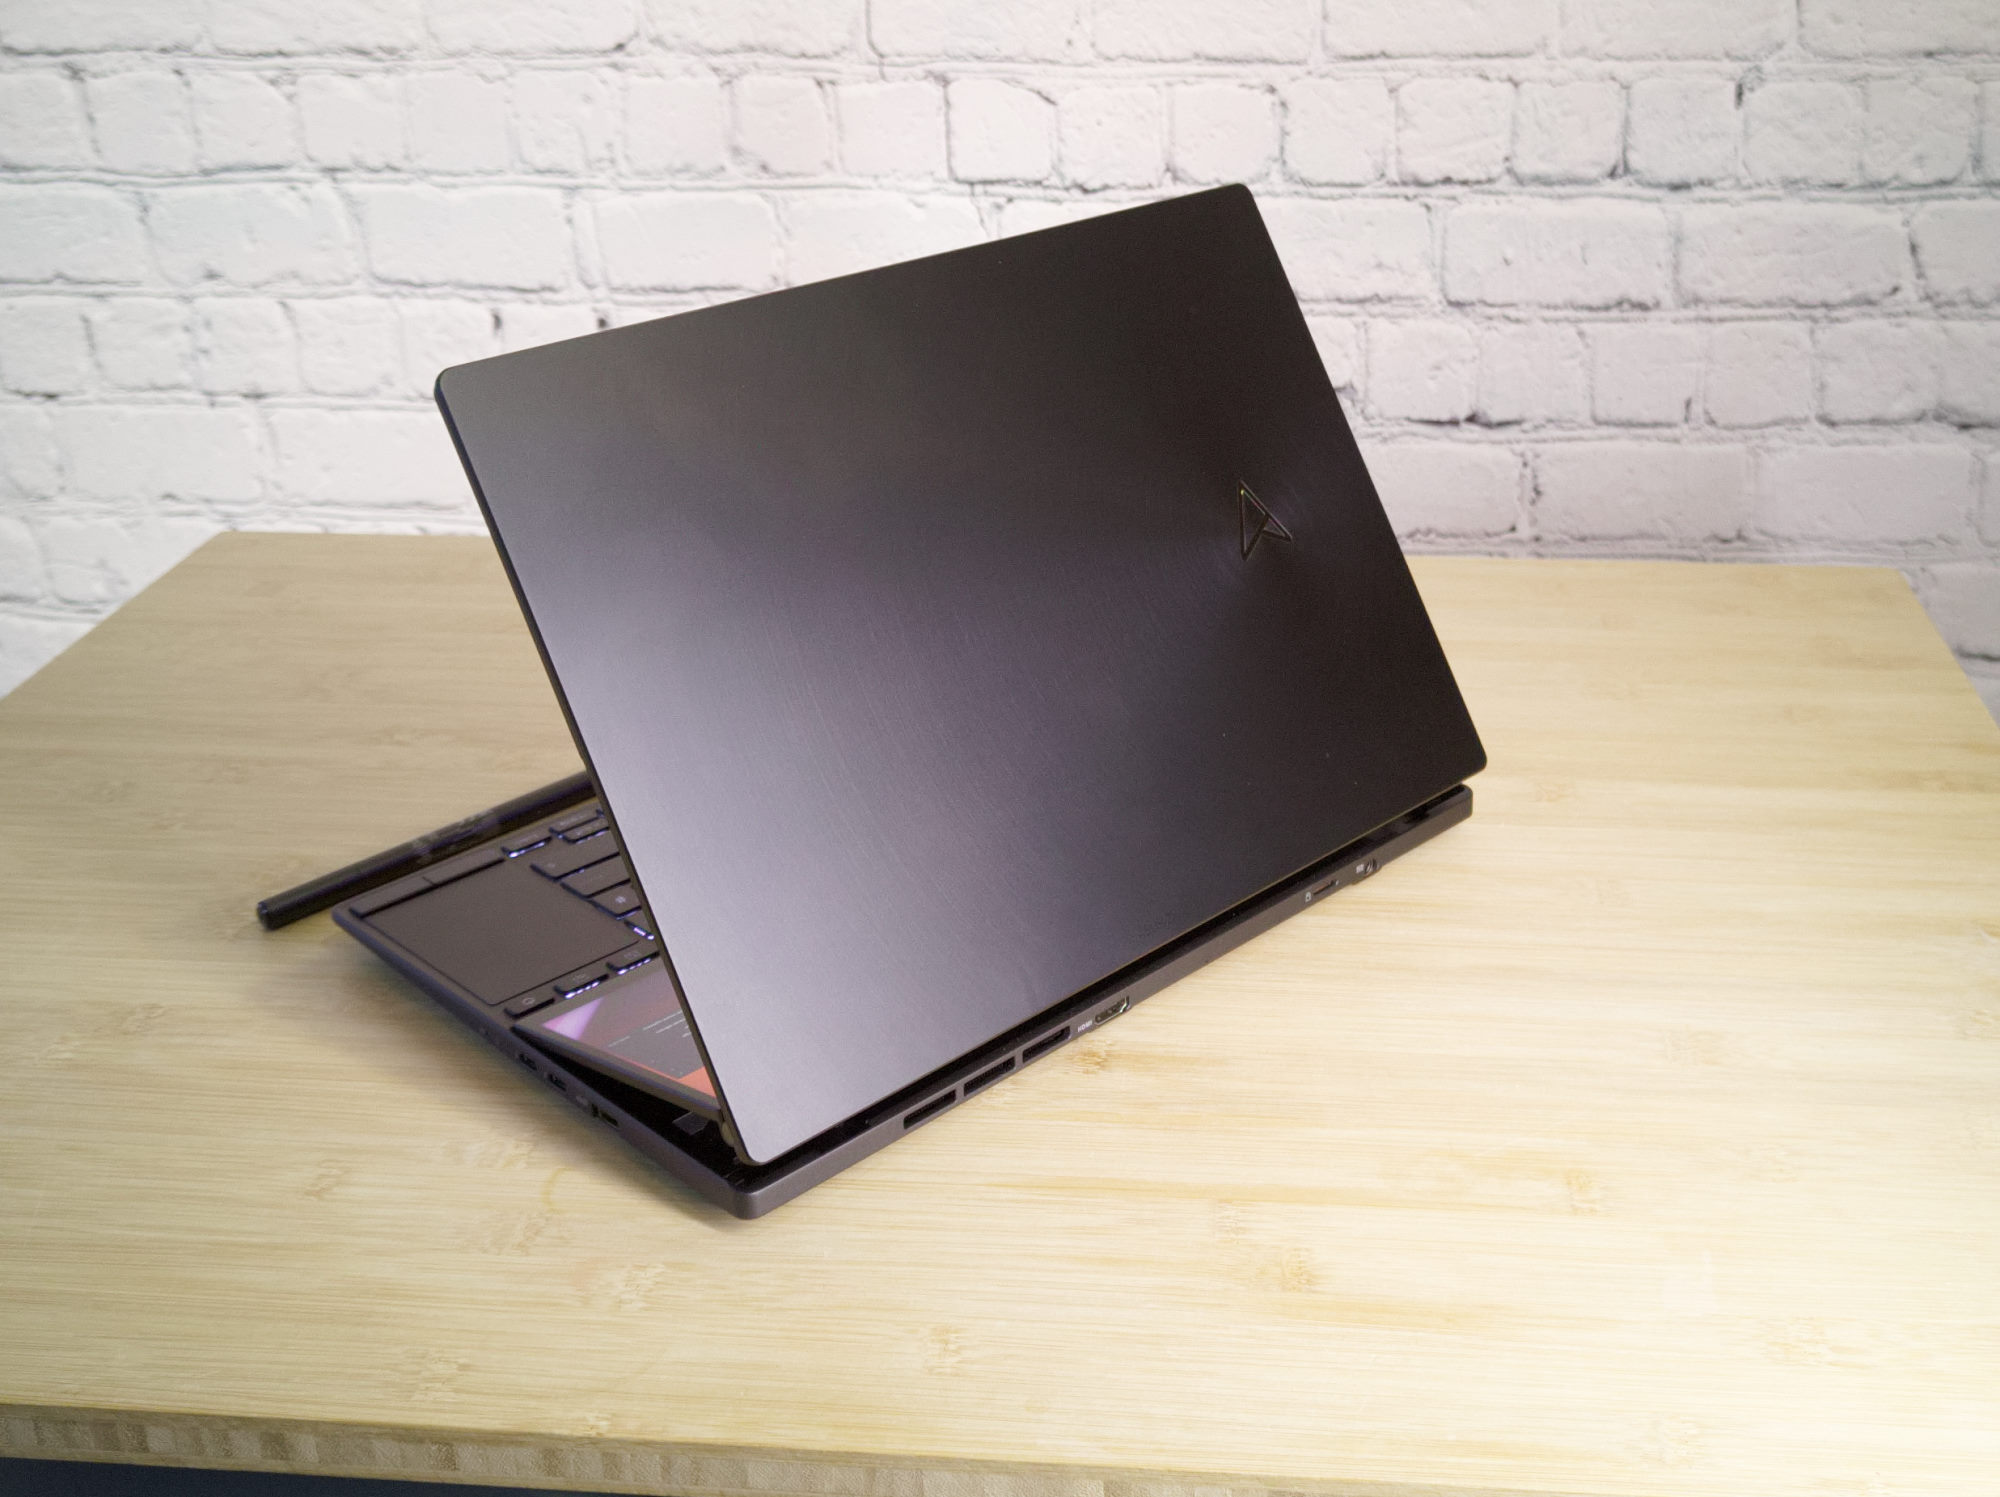
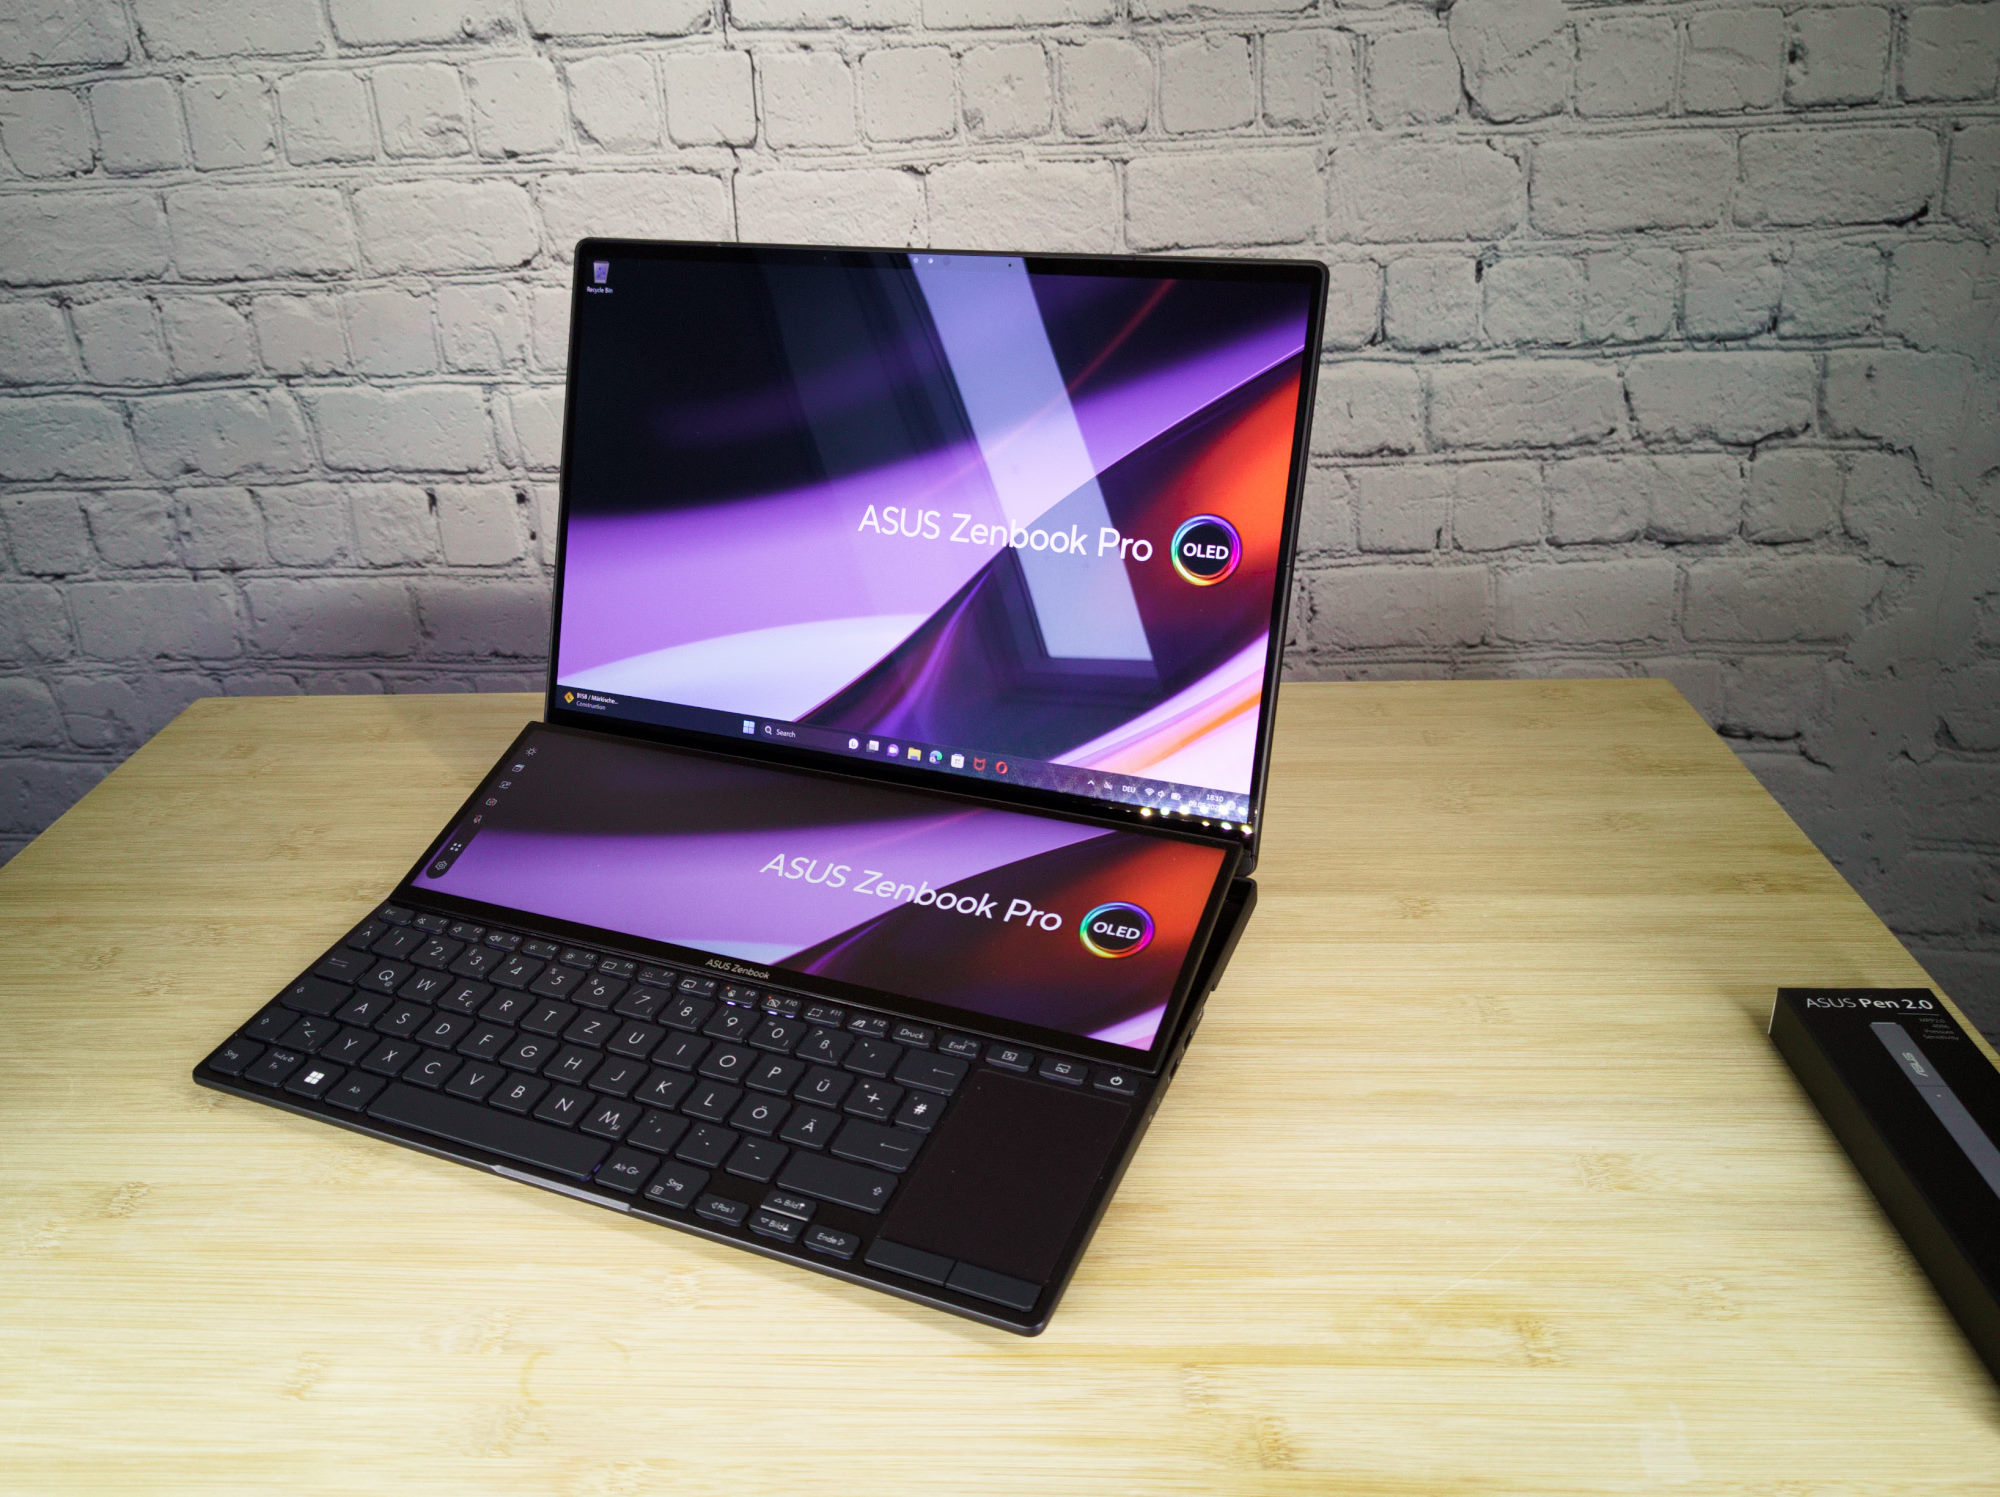
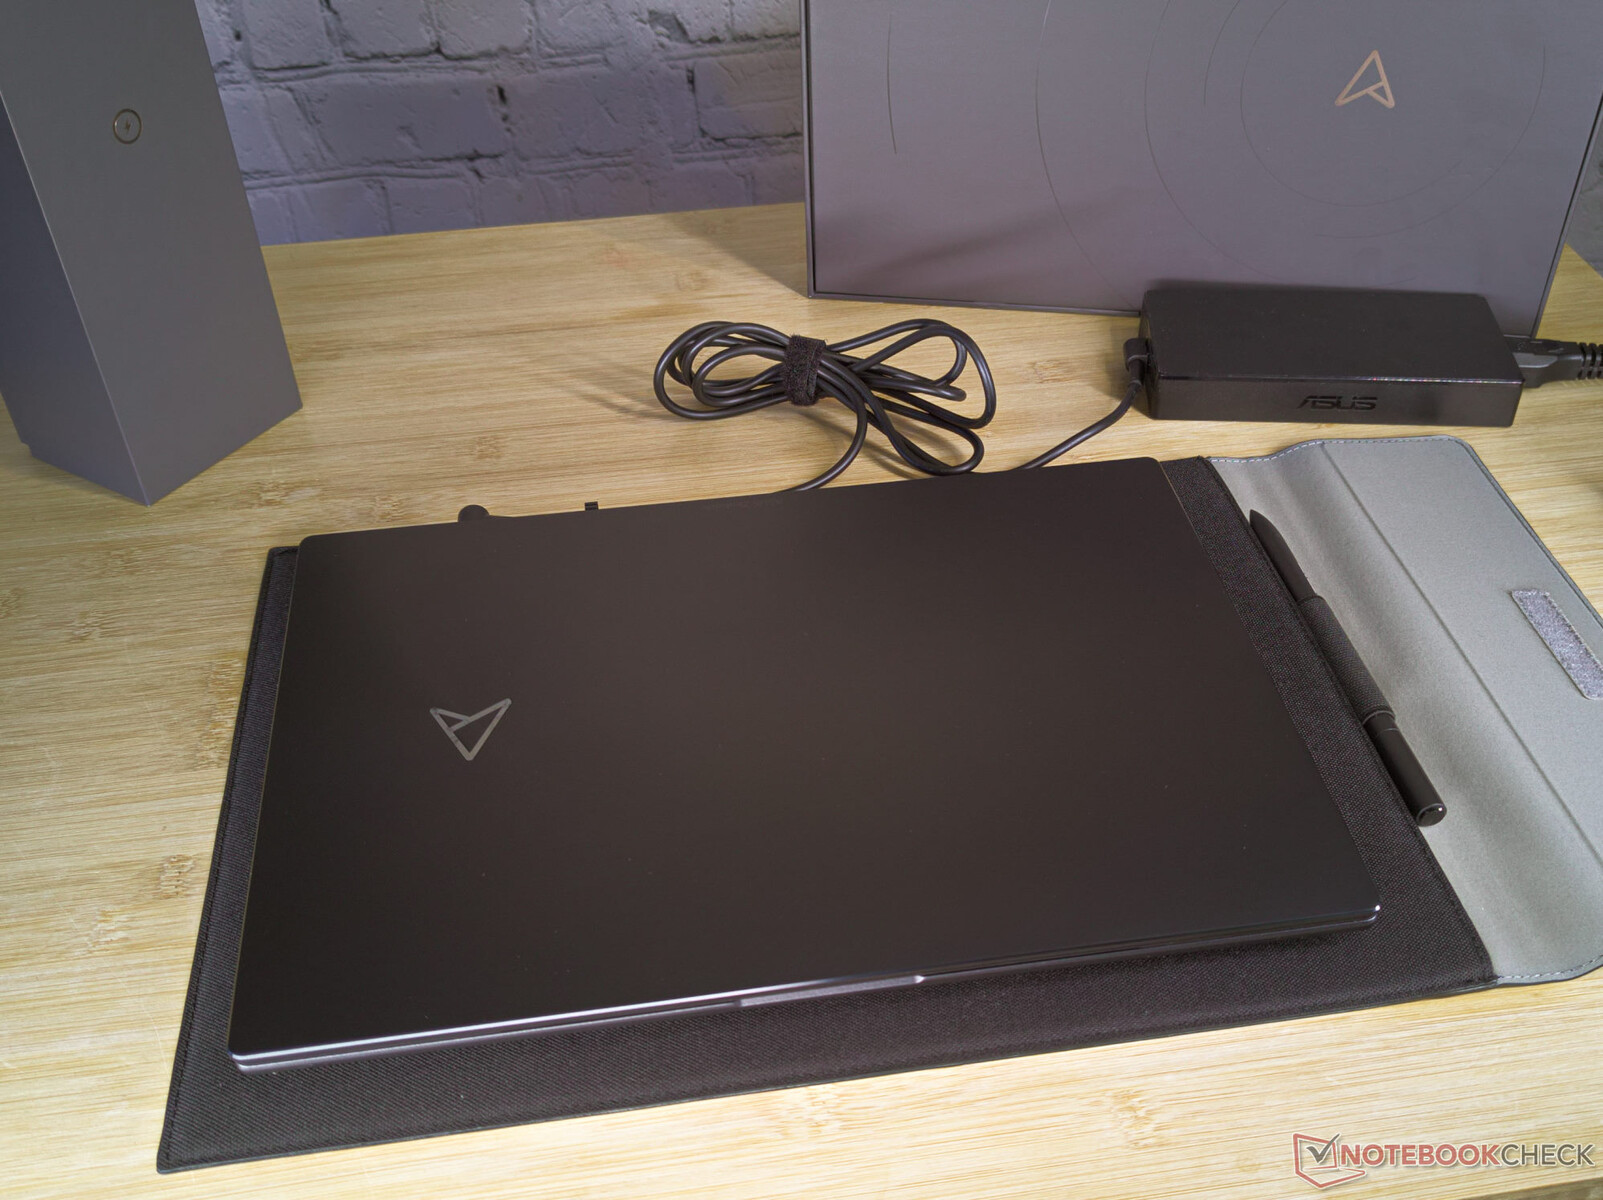
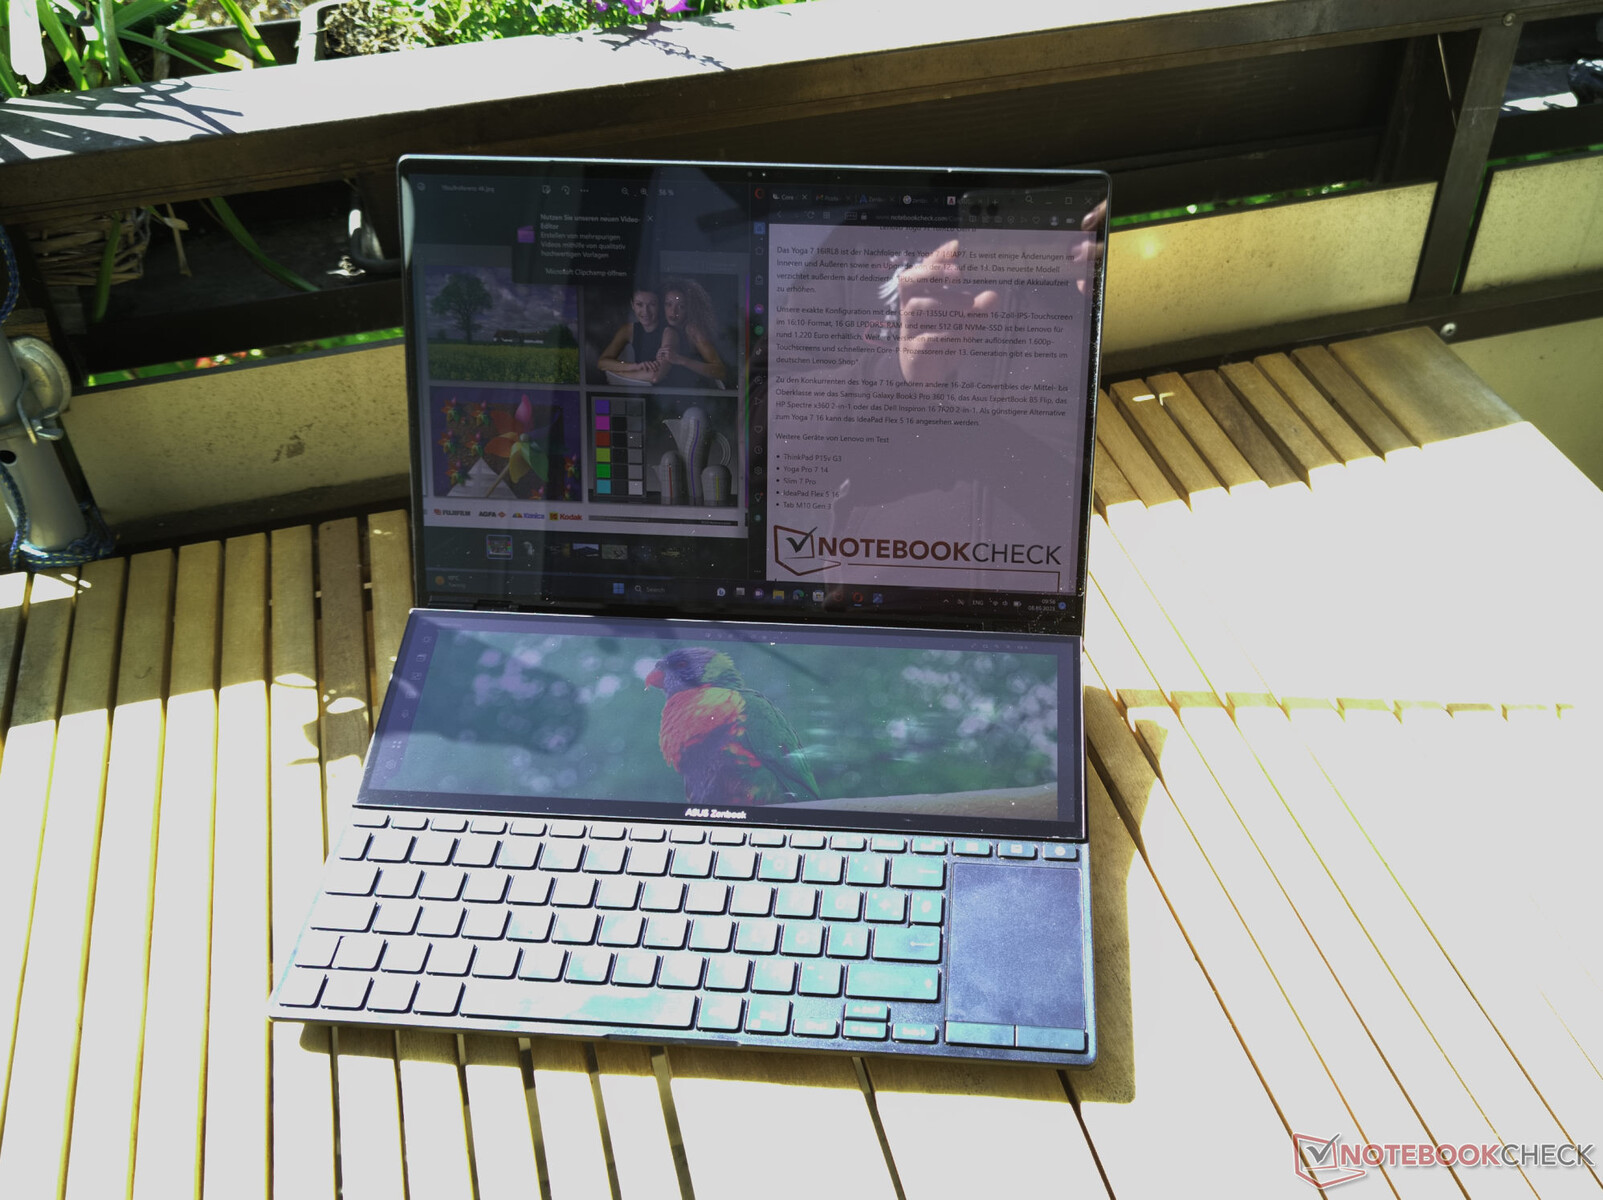
As long as the Zenbook is closed, it looks very unremarkable, and you cannot see the unusual design concept of the laptop with its 14.5-inch display. With its aluminum components for the display lid and base cover, it appears to be of a high quality and perhaps a bit heavy, if you pick up the small device. Only when you open up the Zenbook Pro Duo can you see the changes in the design to make room for the second display. The keyboard and touchpad share the space of the bottom half of the base. The palm rests have been removed completely. Above the keyboard is the large second display, which is now called "Screenpad+" and also offers several control elements in addition to its function as a second display. Since our previous review of the Zenbook Pro Duo 14 in 2022, Asus did not make any visible changes to the laptop's exterior.
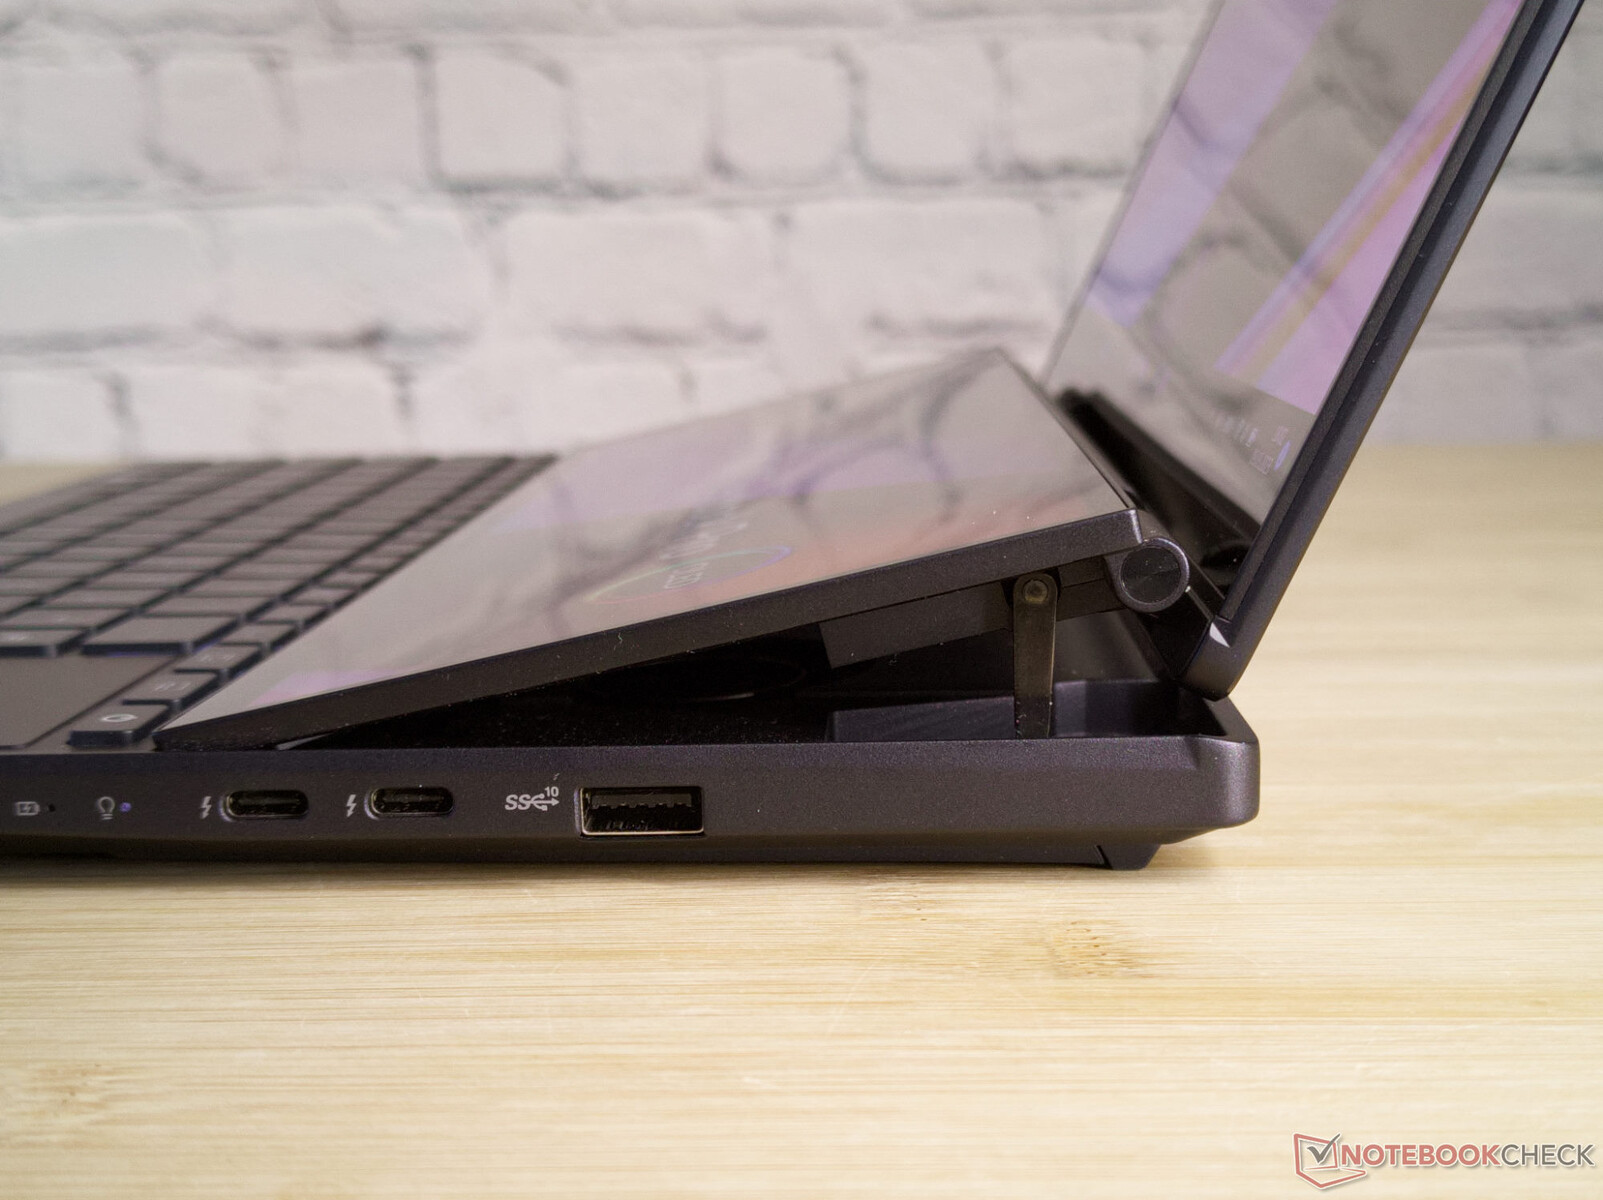
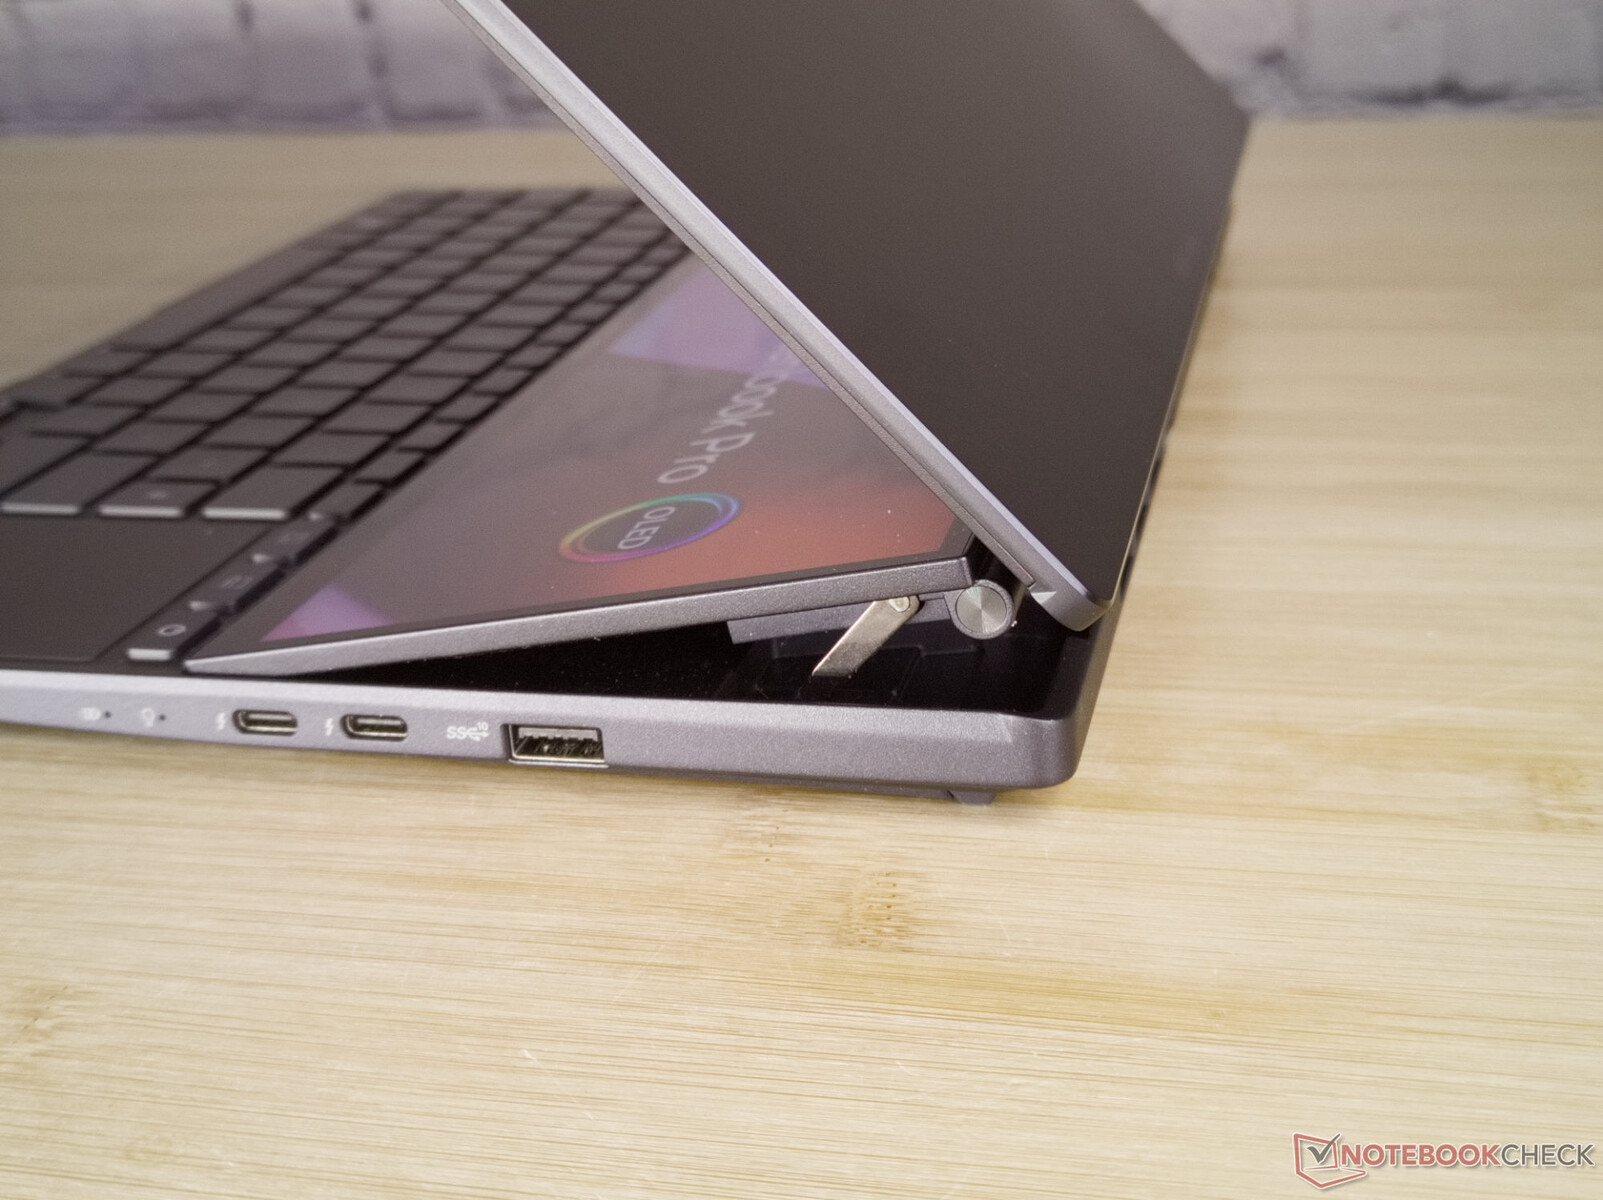
The hinge mechanism of the main display continues to be slightly wobbly, while the Sceenpad+ stays tightly fixed at its 15° opening angle. Even though the large display can be warped slightly, the stiffness of the base still provides the Zenbook Pro Duo 14 with a high-quality and robust feel.
Sitting on the desktop, the laptop requires a slightly deeper space than a comparably sized device without the second display. With the lack of the palm rests, the palms have to be placed in front of the device. This also turns using the laptop on your lap into a balancing act. The laptop's center of gravity is relatively far in the back, and the place where you'd usually stabilize the laptop with your hands is now occupied by the touchpad and keyboard. The only practical solution that remains is using an onscreen keyboard on the second display and turning off the physical input devices.

At a weight of 1.8 kg (~4 lb) and thickness of 21 mm (~0.83 in), the Zenbook Pro Duo is fairly large and heavy among the 14 to 15-inch laptops. The second display with its complicated hinge mechanics surely adds a few grams and millimeters. But Asus also added a massive cooling system with thick heat pipes and relatively large fans, which also increase the weight. So it is not surprising that all the other 14-inch devices from the competitors are slimmer and lighter. In addition, the footprint actually required for using the laptop is increased due to the lack of the palm rests.
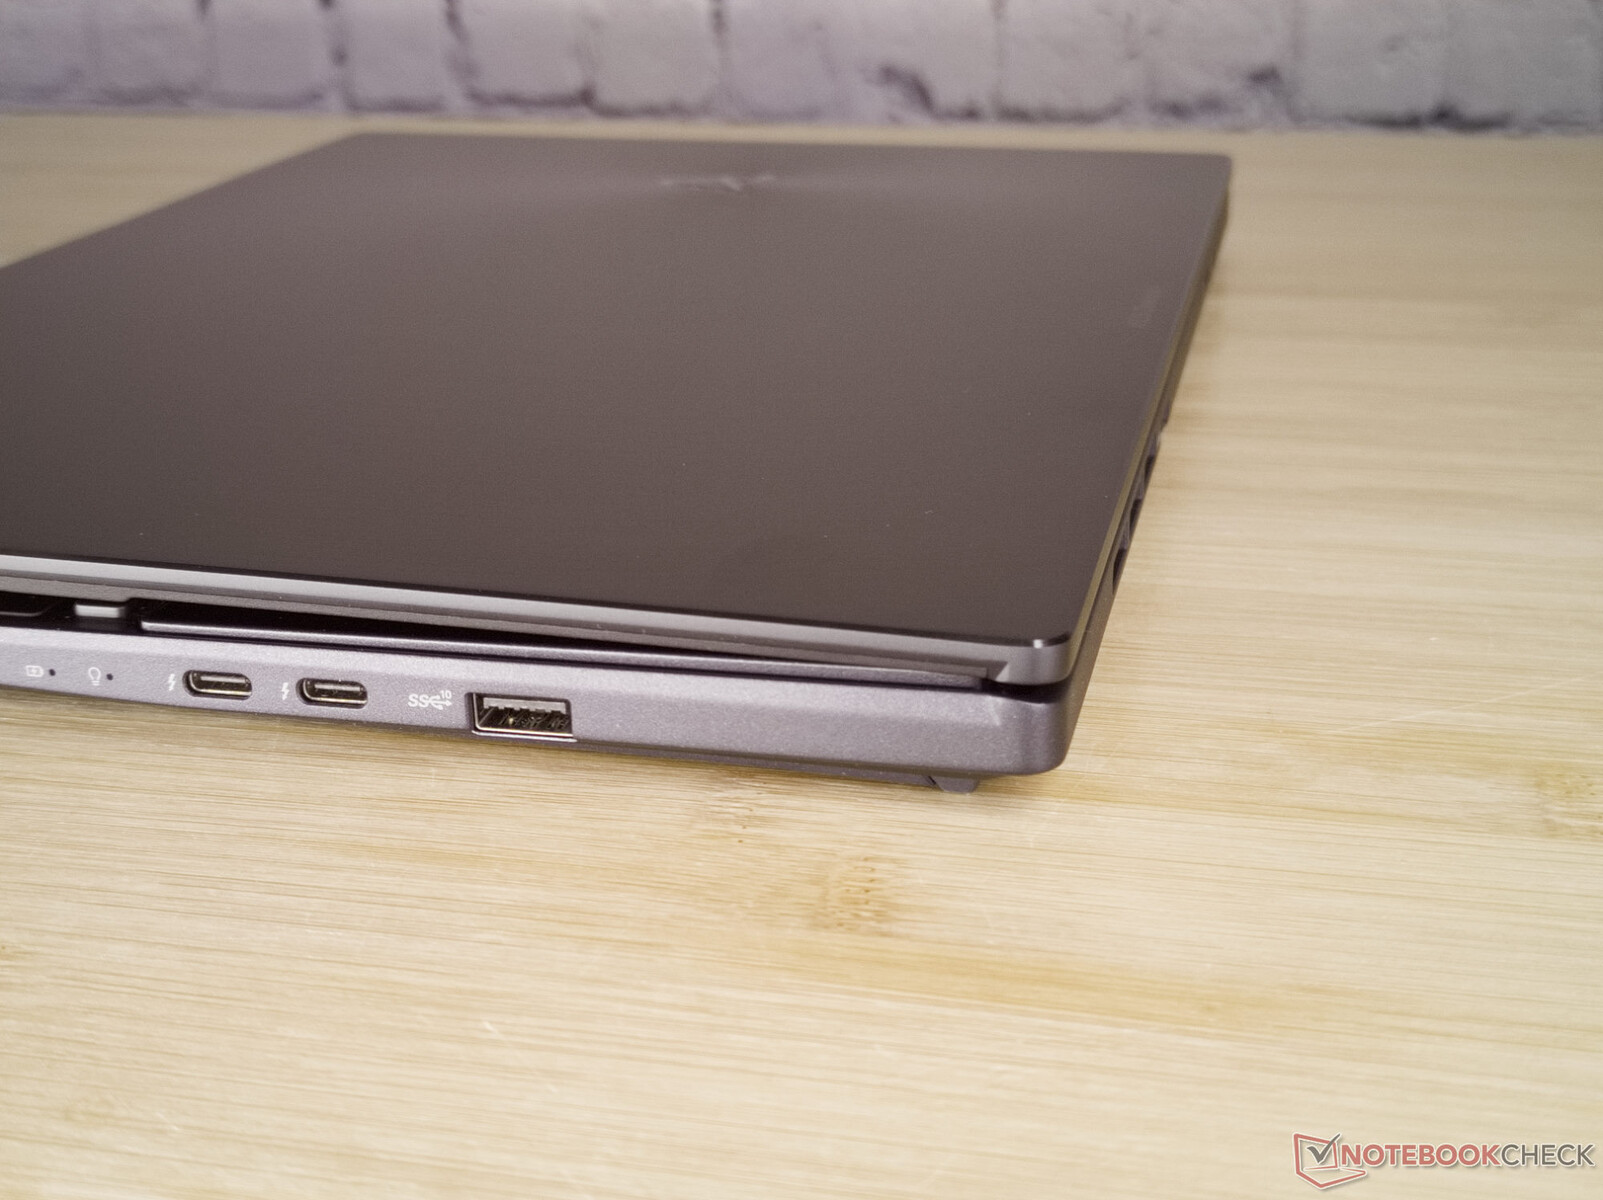
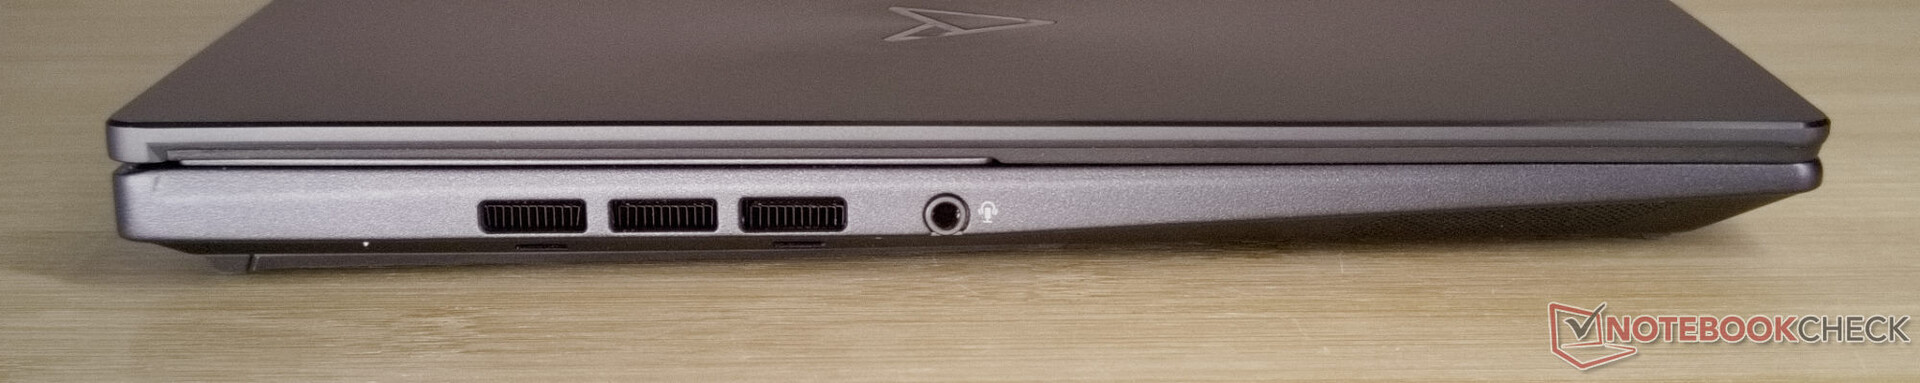
Equipment - microSD card reader in the back
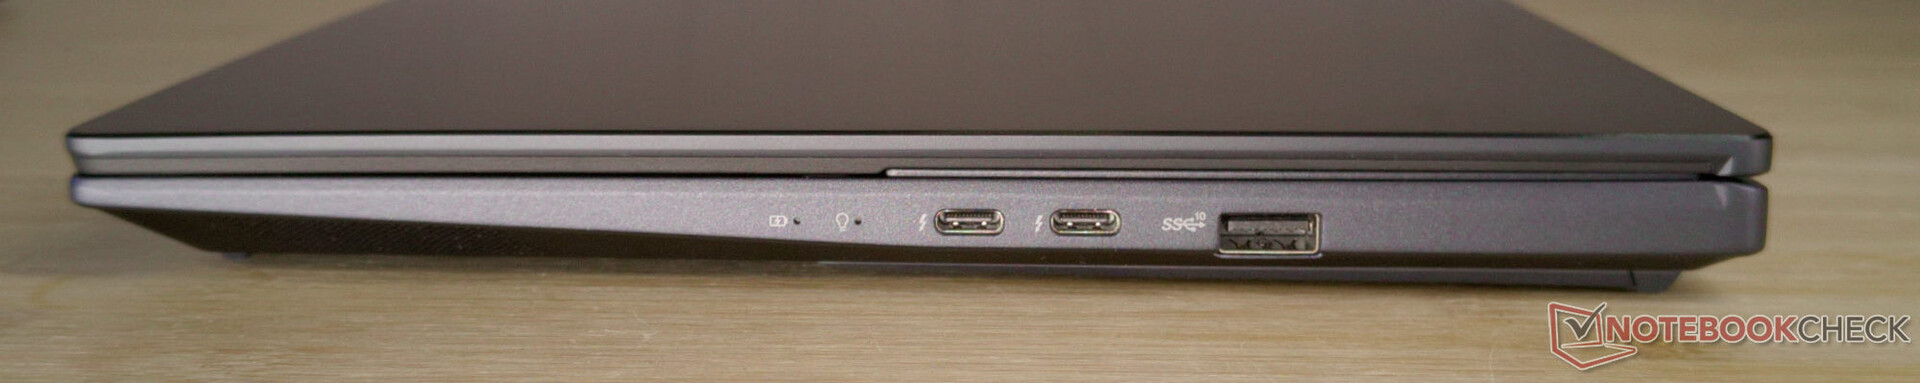
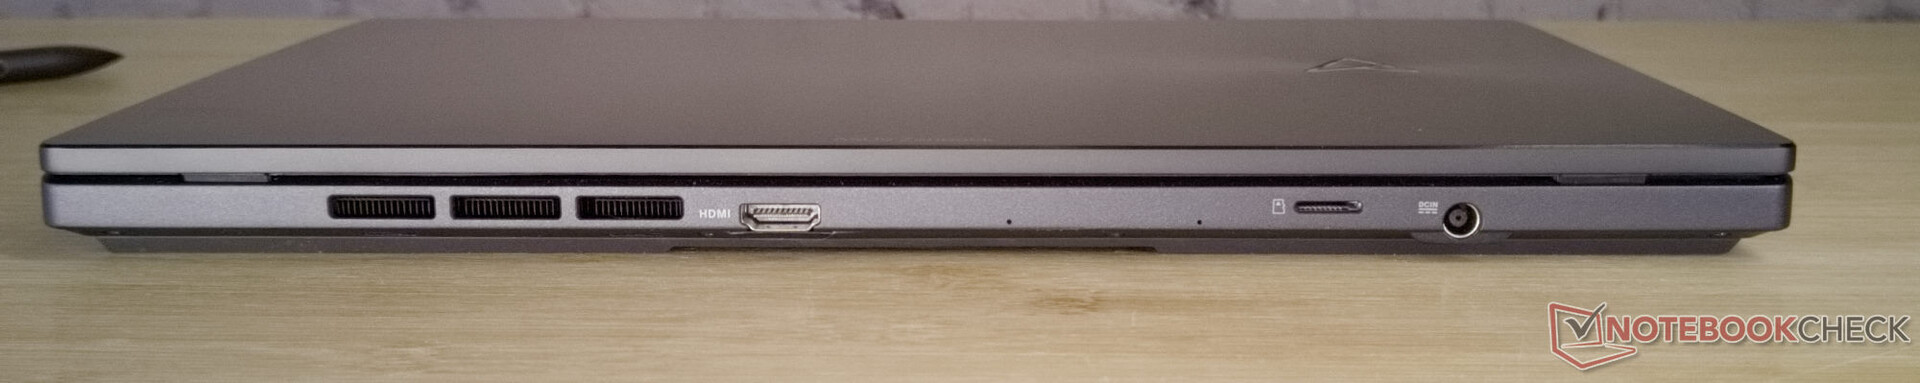
The connections of the Zenbooks are distributed over three sides. The left side remains almost completely empty with only a 3.5 mm audio port. Together with a power connection and the HDMI port, the microSD card reader is placed in the back of the laptop, leaving only the right side for several USB connections. Overall, the connection equipment is fairly limited.
SD Card Reader
Using our 128-GB AV PRO microSD of the V60 speed class, the transfer speeds remain rather mediocre. The Aero 14 OLED from Gigabyte has a significantly faster card reader, but that of the Schenker Vision 14 is slower. In addition, the microSD card reader is hard to reach in the back.
| SD Card Reader | |
| average JPG Copy Test (av. of 3 runs) | |
| Asus Zephyrus Duo 16 GX650PY-NM006W (Angelbird AV Pro V60) | |
| Gigabyte Aero 14 OLED BMF | |
| Average of class Multimedia (21.1 - 198, n=42, last 2 years) | |
| Asus Zenbook Pro 14 Duo OLED UX8402ZA (Angelbird AV Pro V60) | |
| Asus ZenBook Pro 14 Duo UX8402VV-P1021W (AV Pro SD microSD 128 GB V60) | |
| Schenker Vision 14 2022 RTX 3050 Ti | |
| maximum AS SSD Seq Read Test (1GB) | |
| Asus Zephyrus Duo 16 GX650PY-NM006W (Angelbird AV Pro V60) | |
| Gigabyte Aero 14 OLED BMF | |
| Average of class Multimedia (27.4 - 262, n=42, last 2 years) | |
| Asus ZenBook Pro 14 Duo UX8402VV-P1021W (AV Pro SD microSD 128 GB V60) | |
| Asus Zenbook Pro 14 Duo OLED UX8402ZA (Angelbird AV Pro V60) | |
| Schenker Vision 14 2022 RTX 3050 Ti | |
Communication
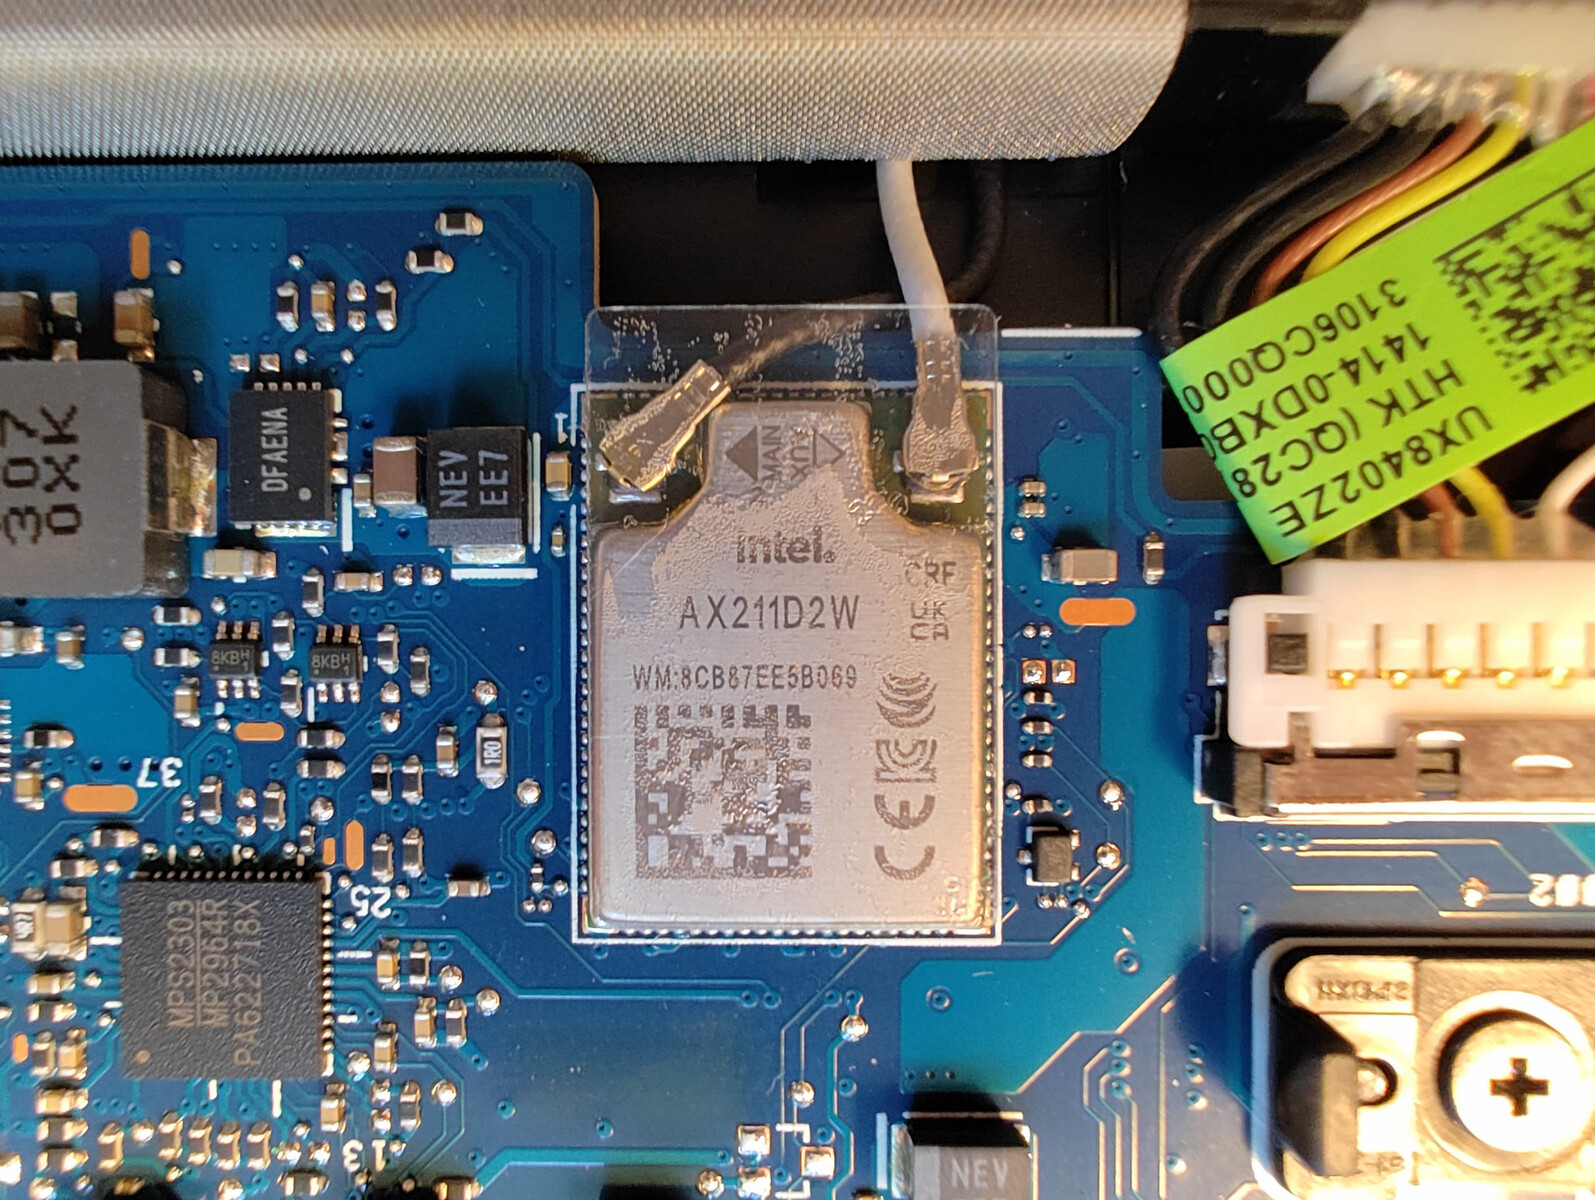
Intel's AX 211 WLAN Modul shows its peak performance for a second time here. The transfer speeds of the Asus Zenbook Pro Duo are high and stable with our AXE11000 router. However, what stands out is that the connection in the 5 GHz network is faster than that in the 6 GHz net.
Webcam
In good light conditions, the Full-HD webcam of the Zenbook delivers a sharp image and satisfactory color reproduction. It is also used for face recognition via Windows Hello and should be able to deliver correct results in bad light conditions thanks to using infrared. However, the regular webcam image loses in quality as soon as the light conditions become weaker.


Security
A TPM is standard in modern laptops. Aside from that, the other security functions of the Zenbook Pro Duo 14 are limited. Only the camera with face recognition and the integrated security features of the Intel Core i9 could be listed here.
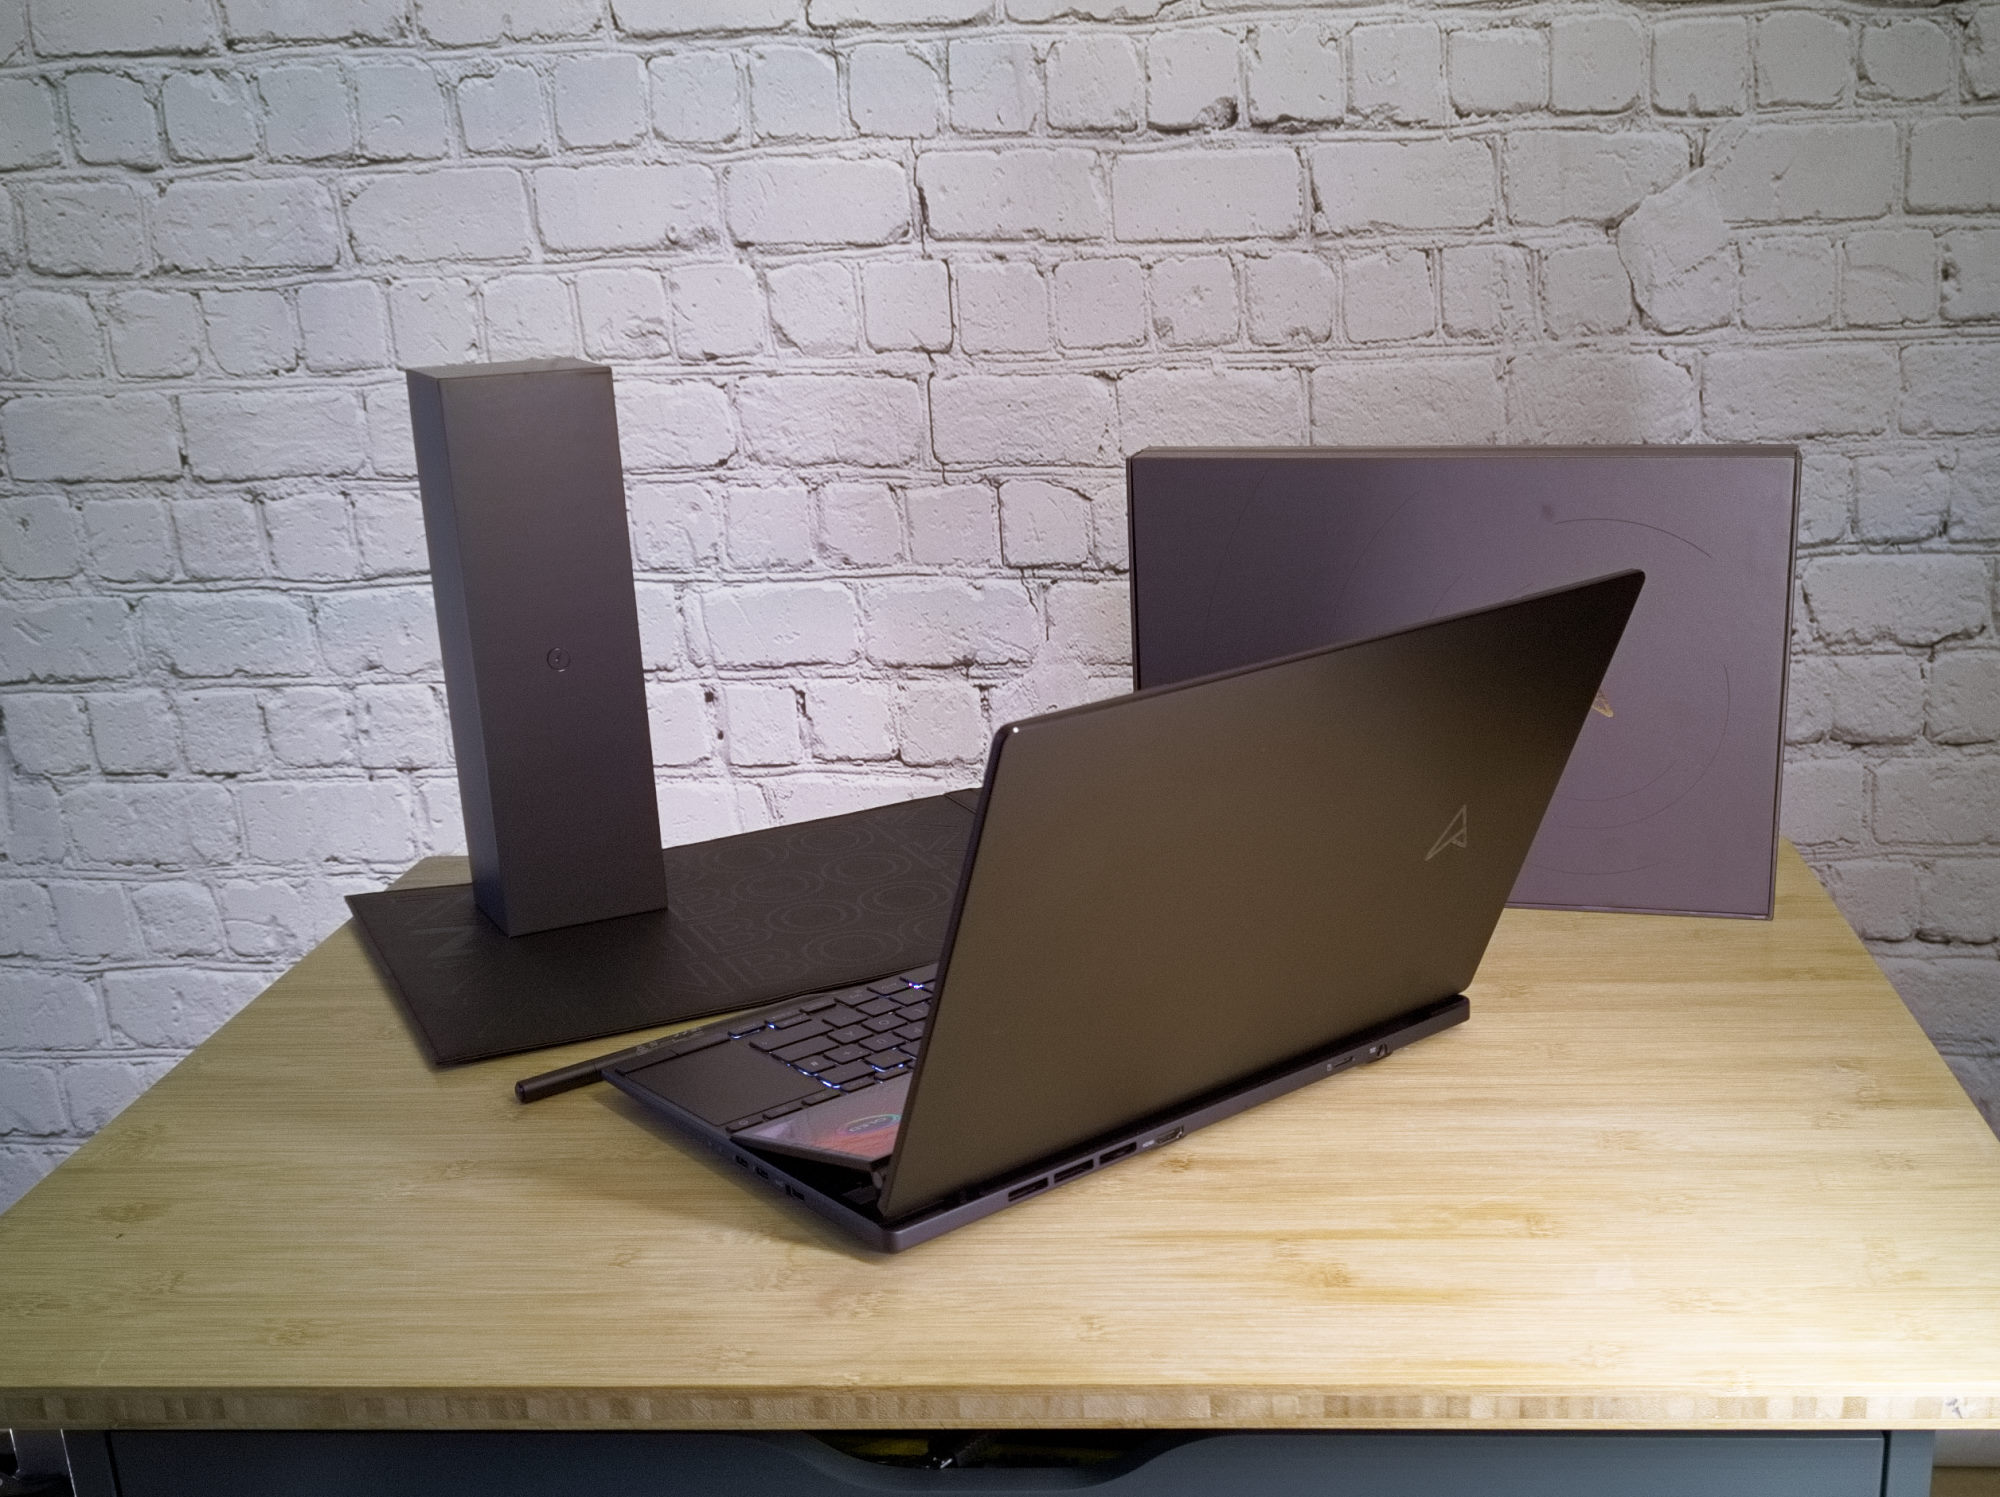
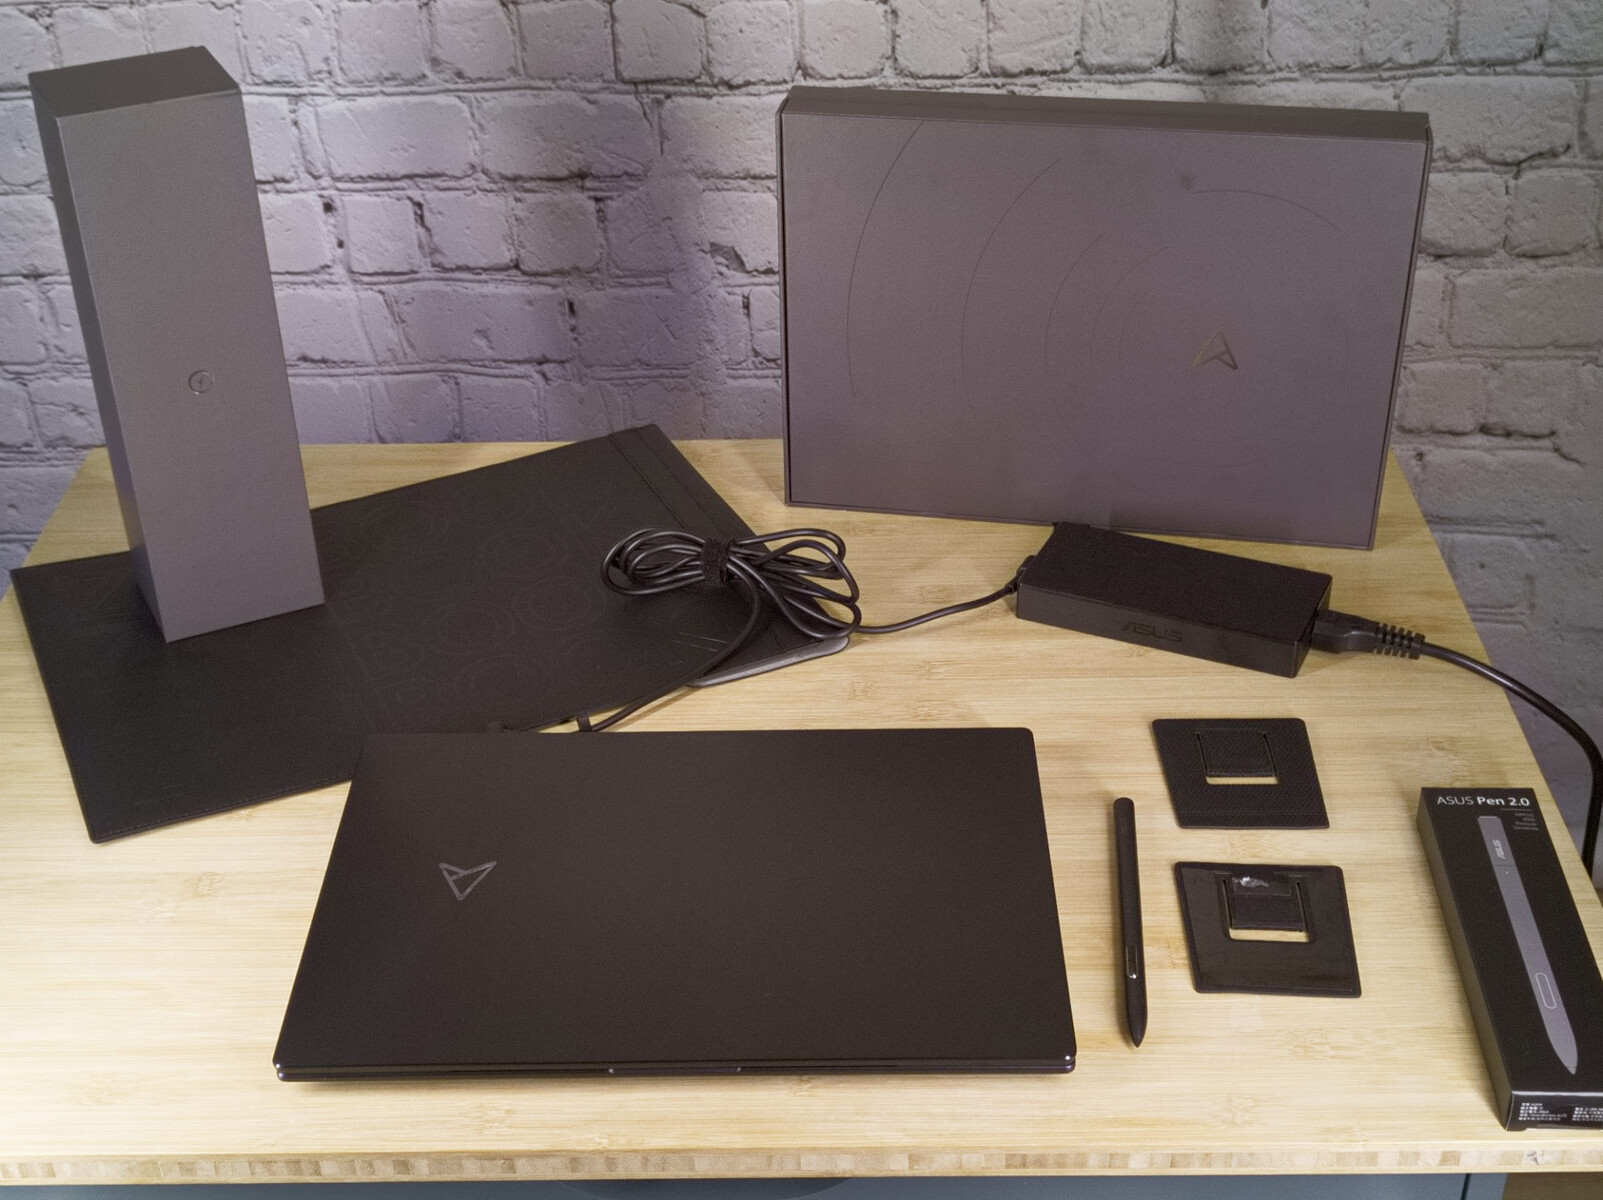
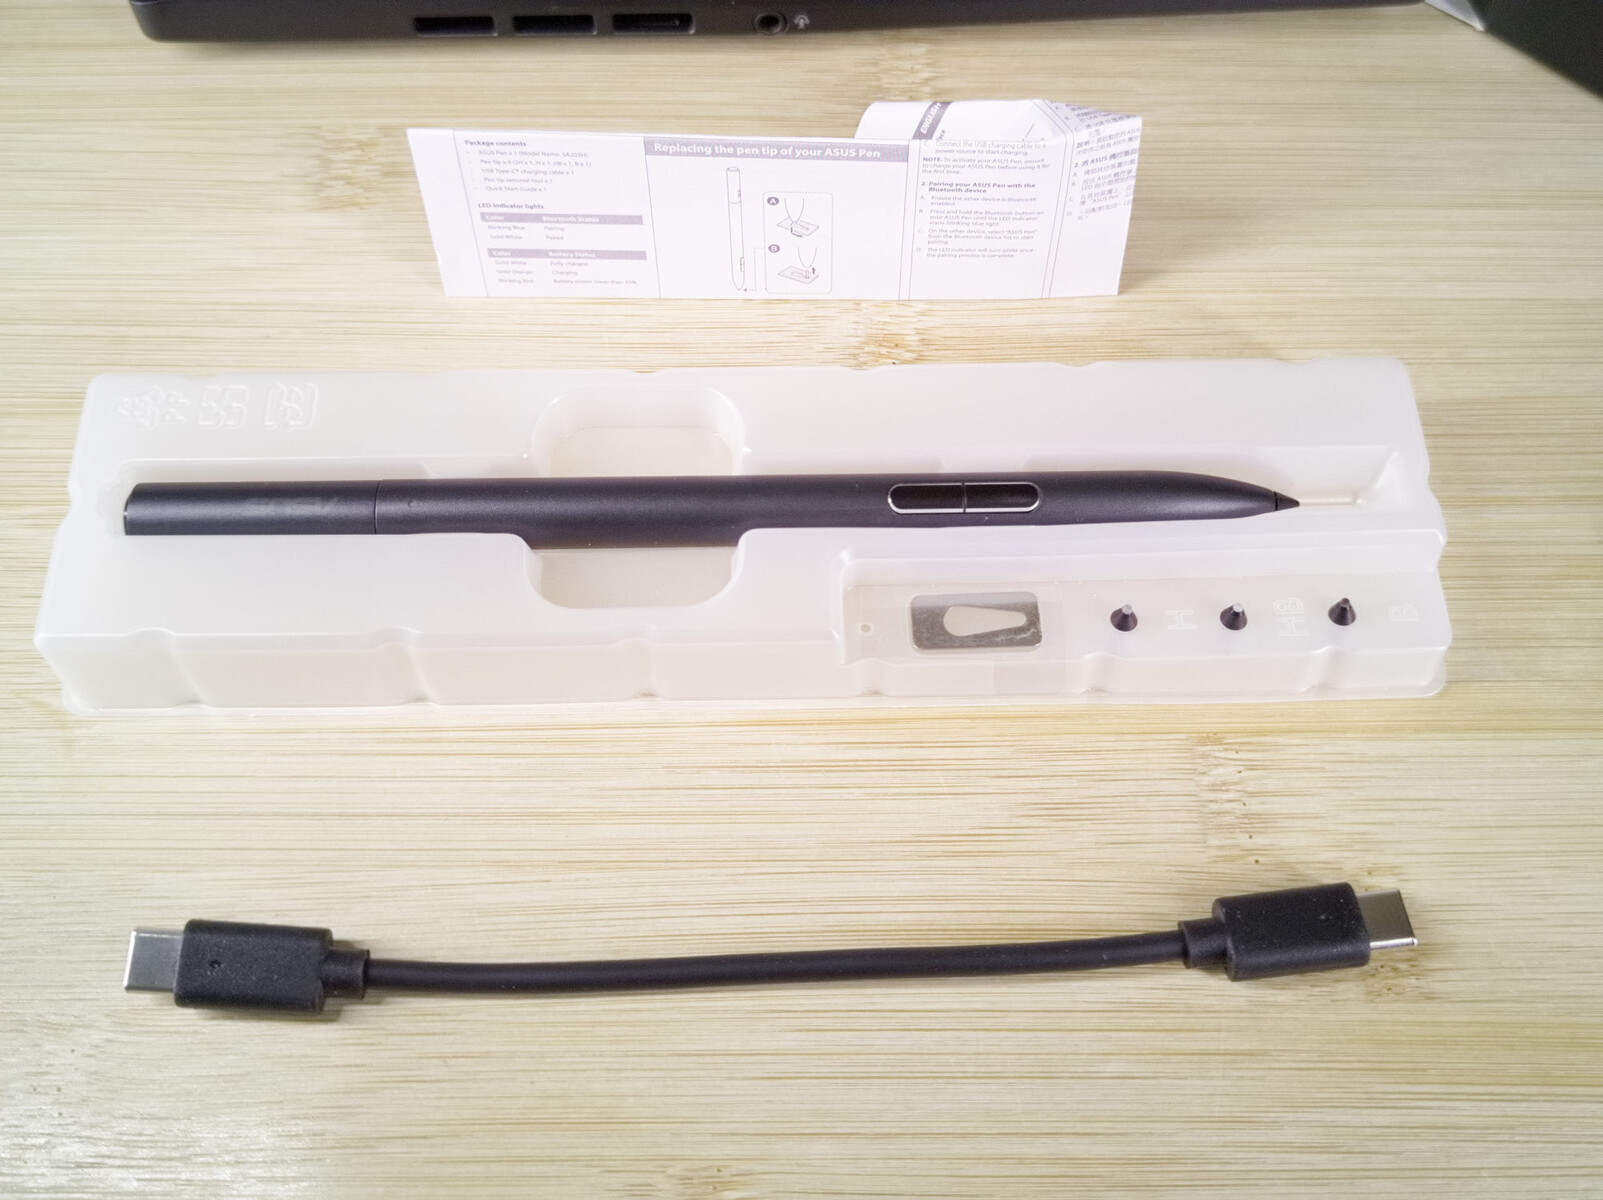
Accessories
The box of the unusual laptop is filled to the brim. In addition to the corresponding charger and obligatory paper collection, we can also find a set of feet, a protective sleeve, and the Asus Stylus.
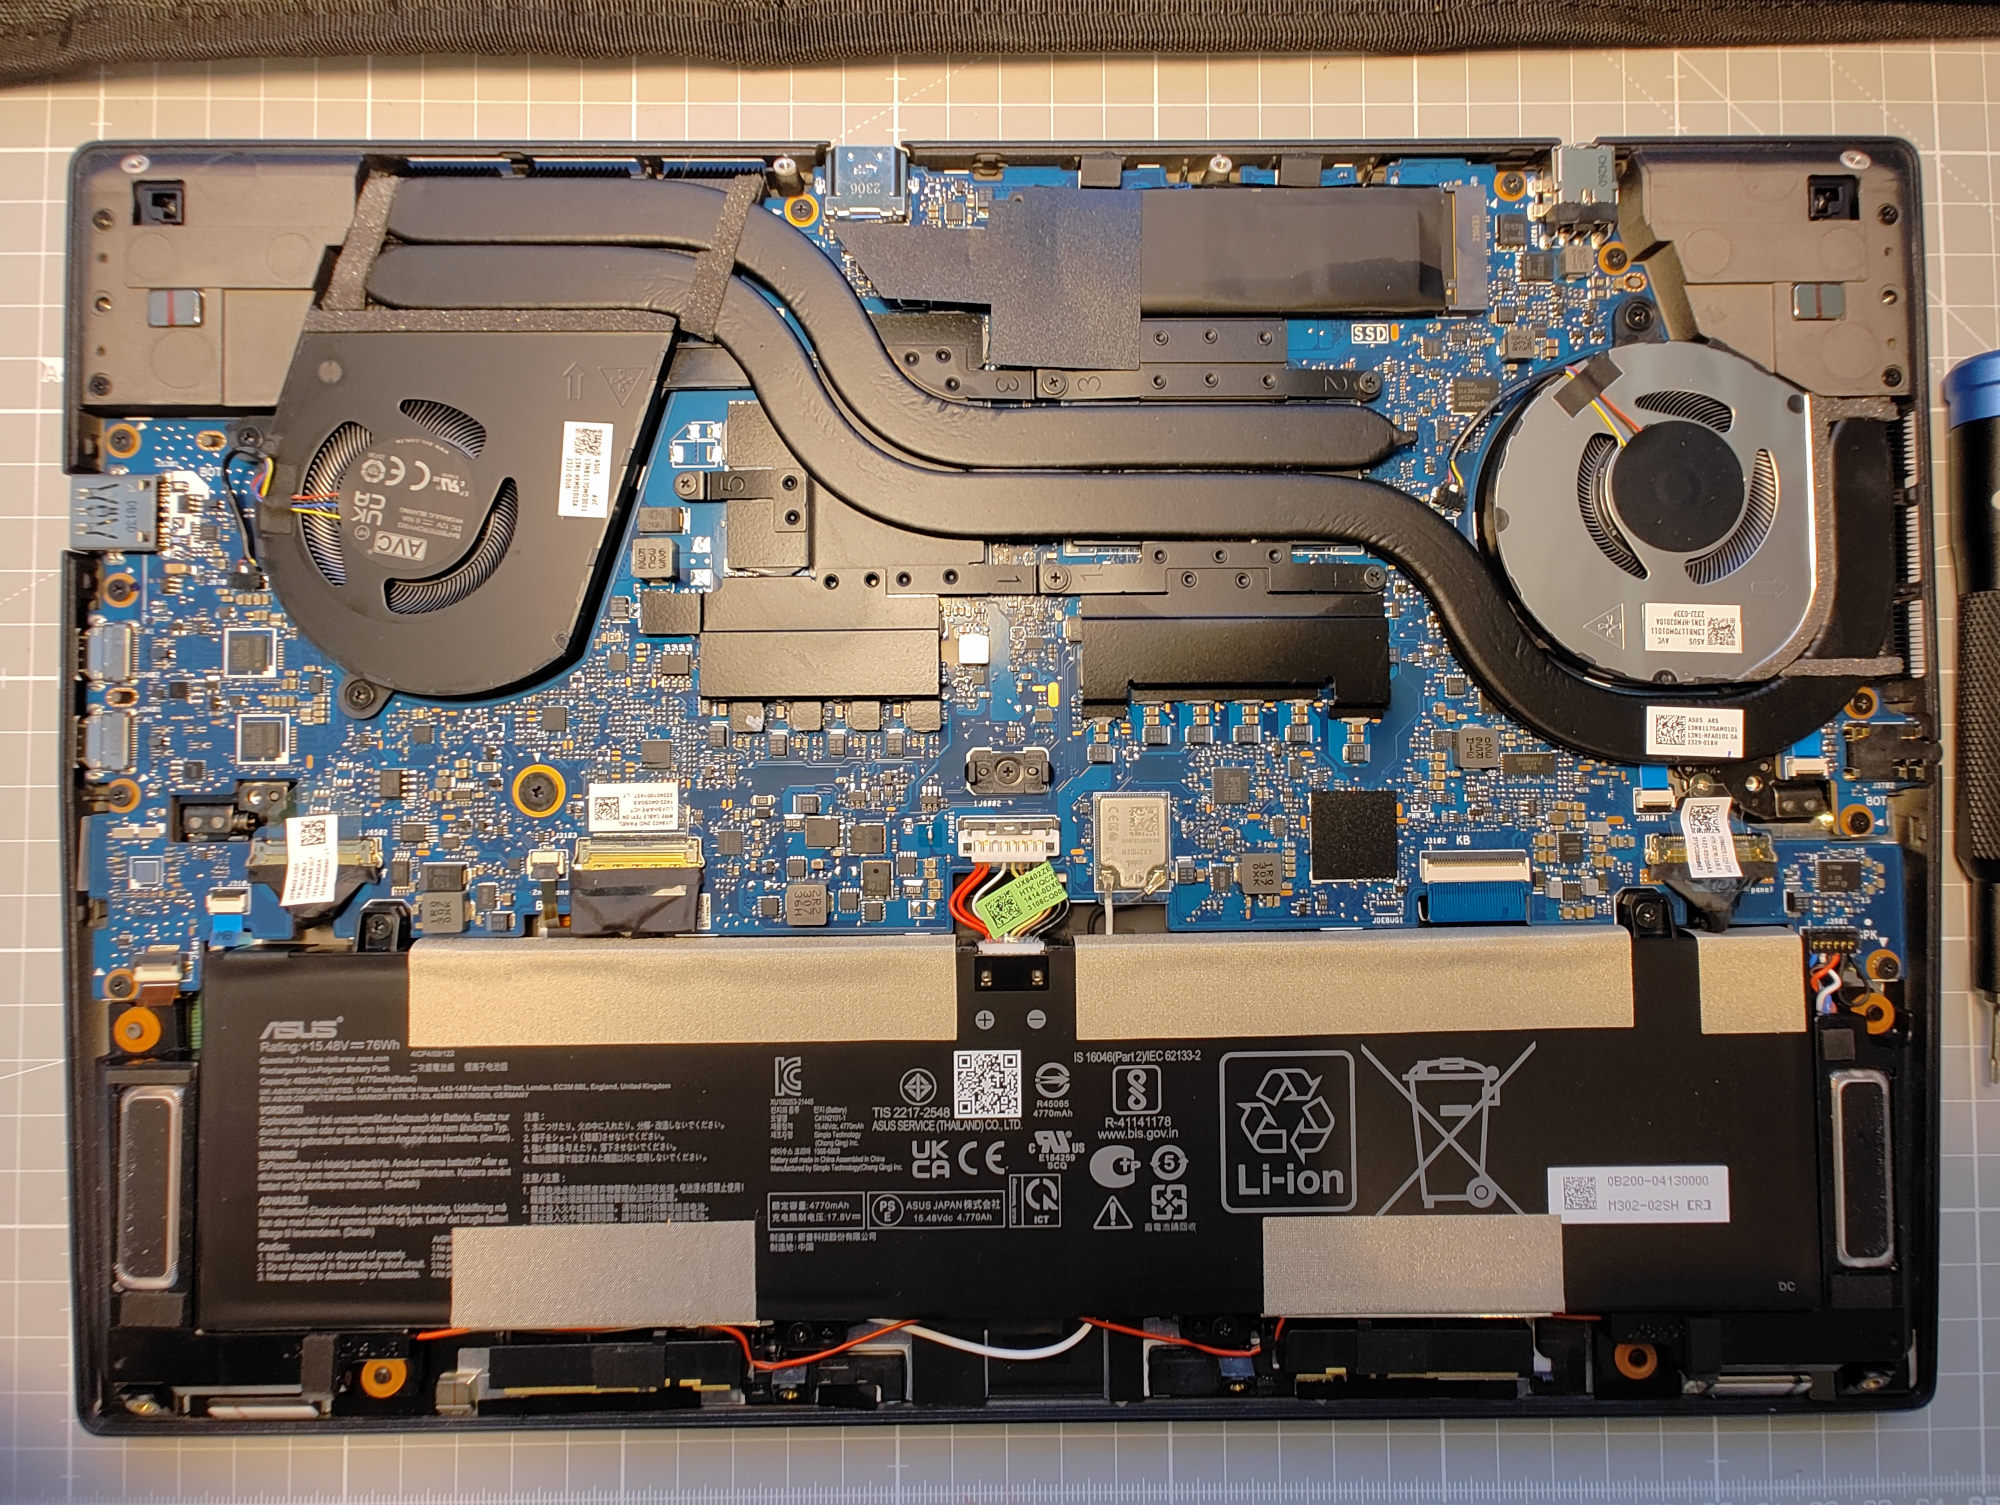
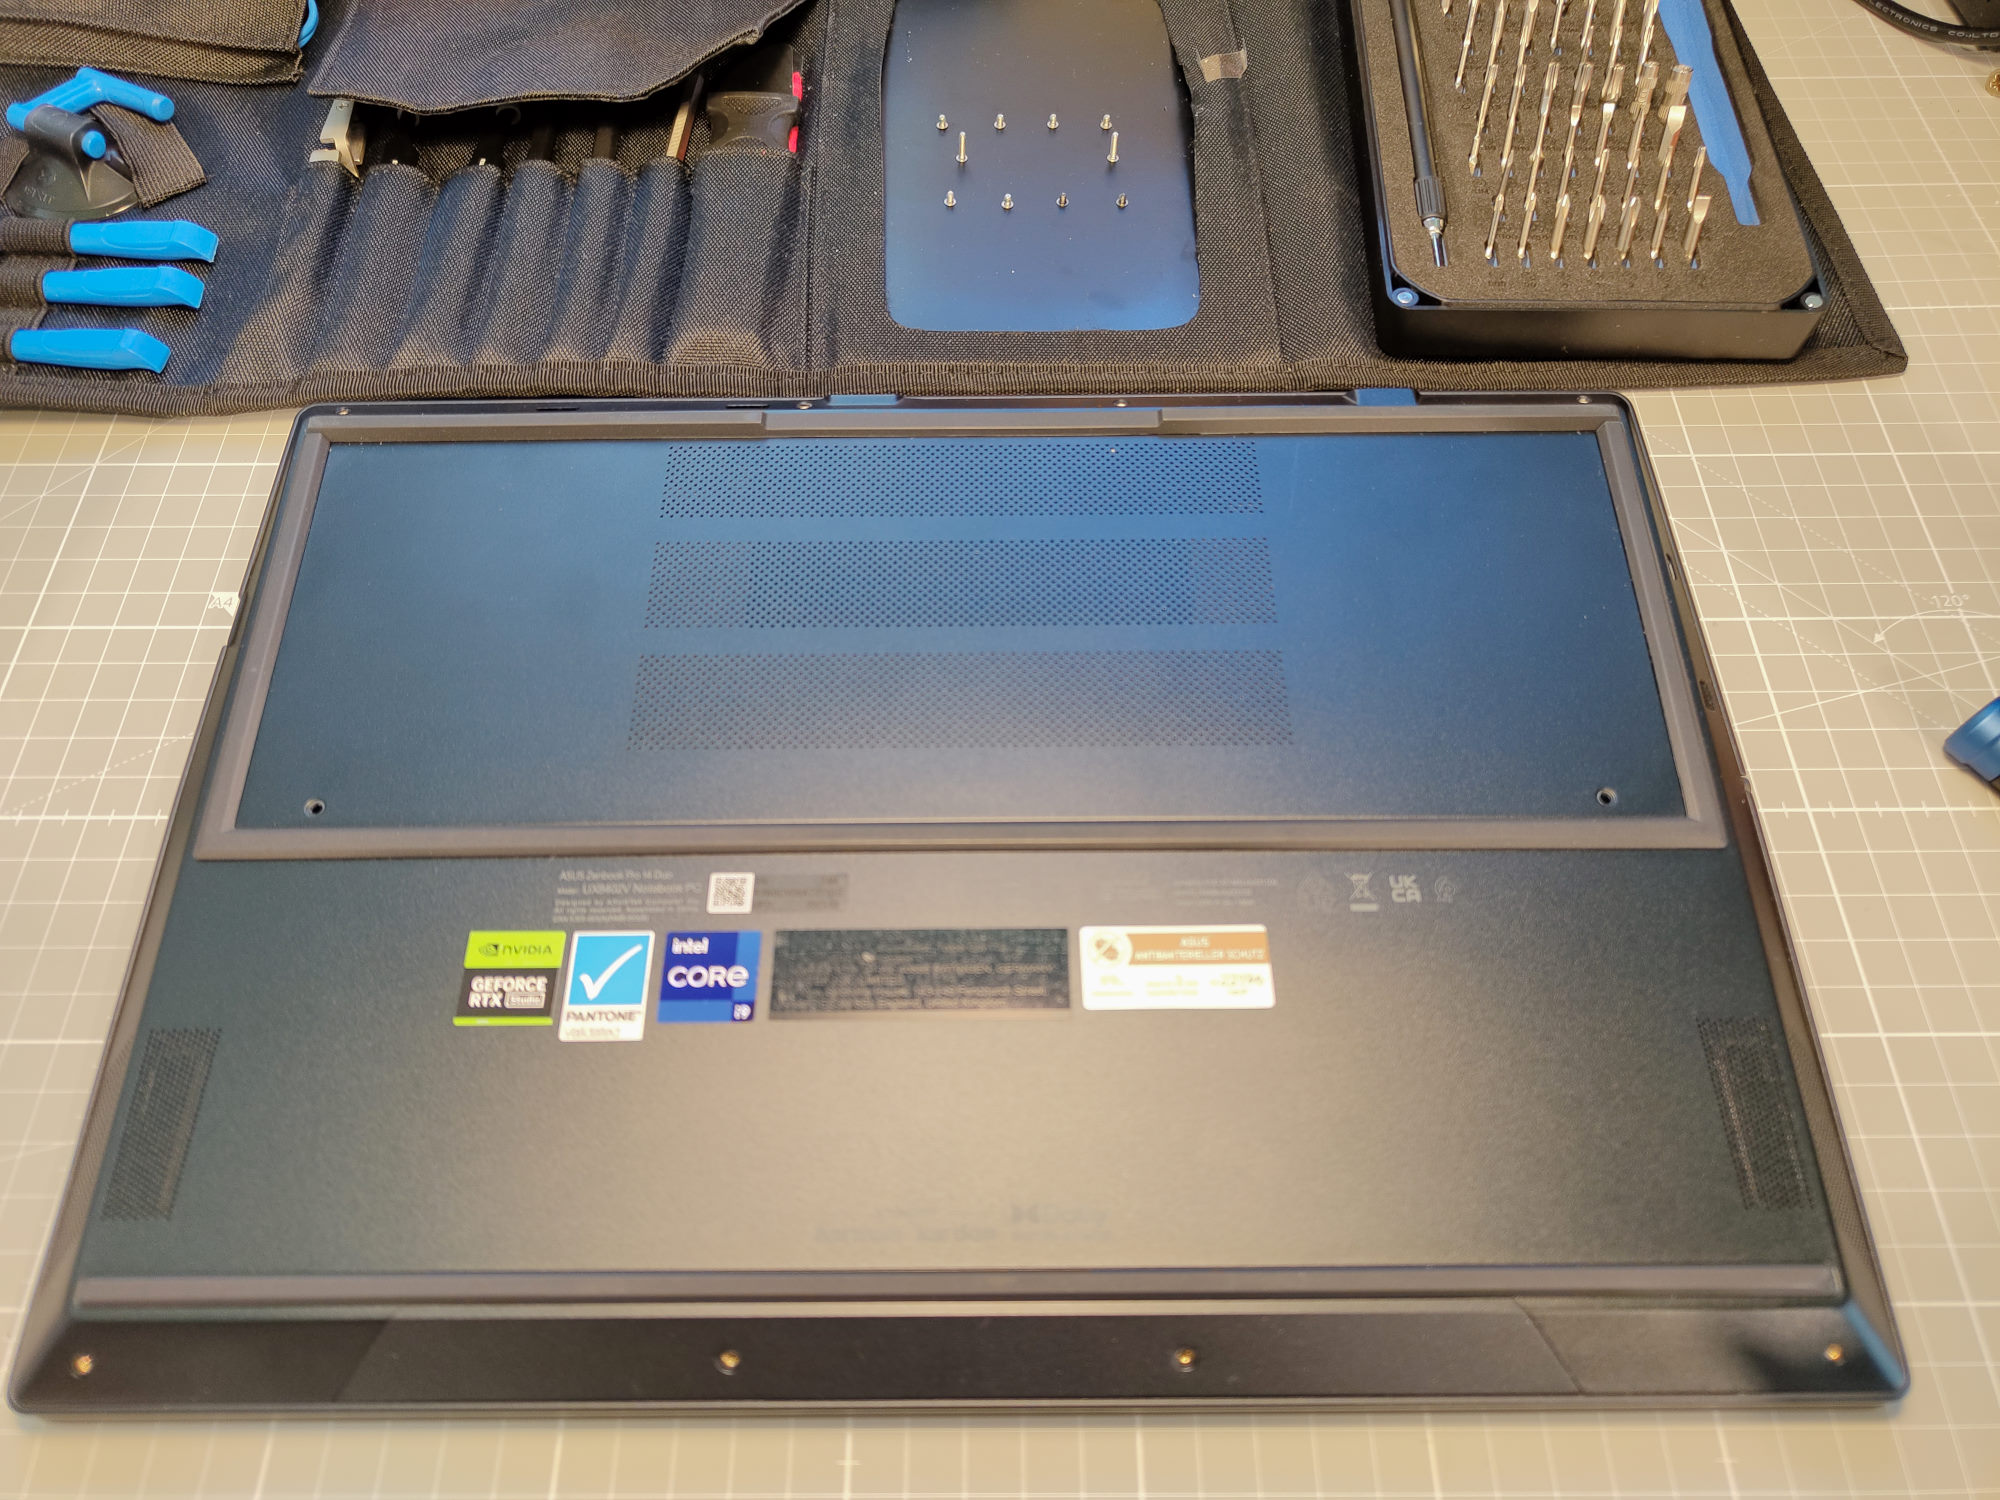
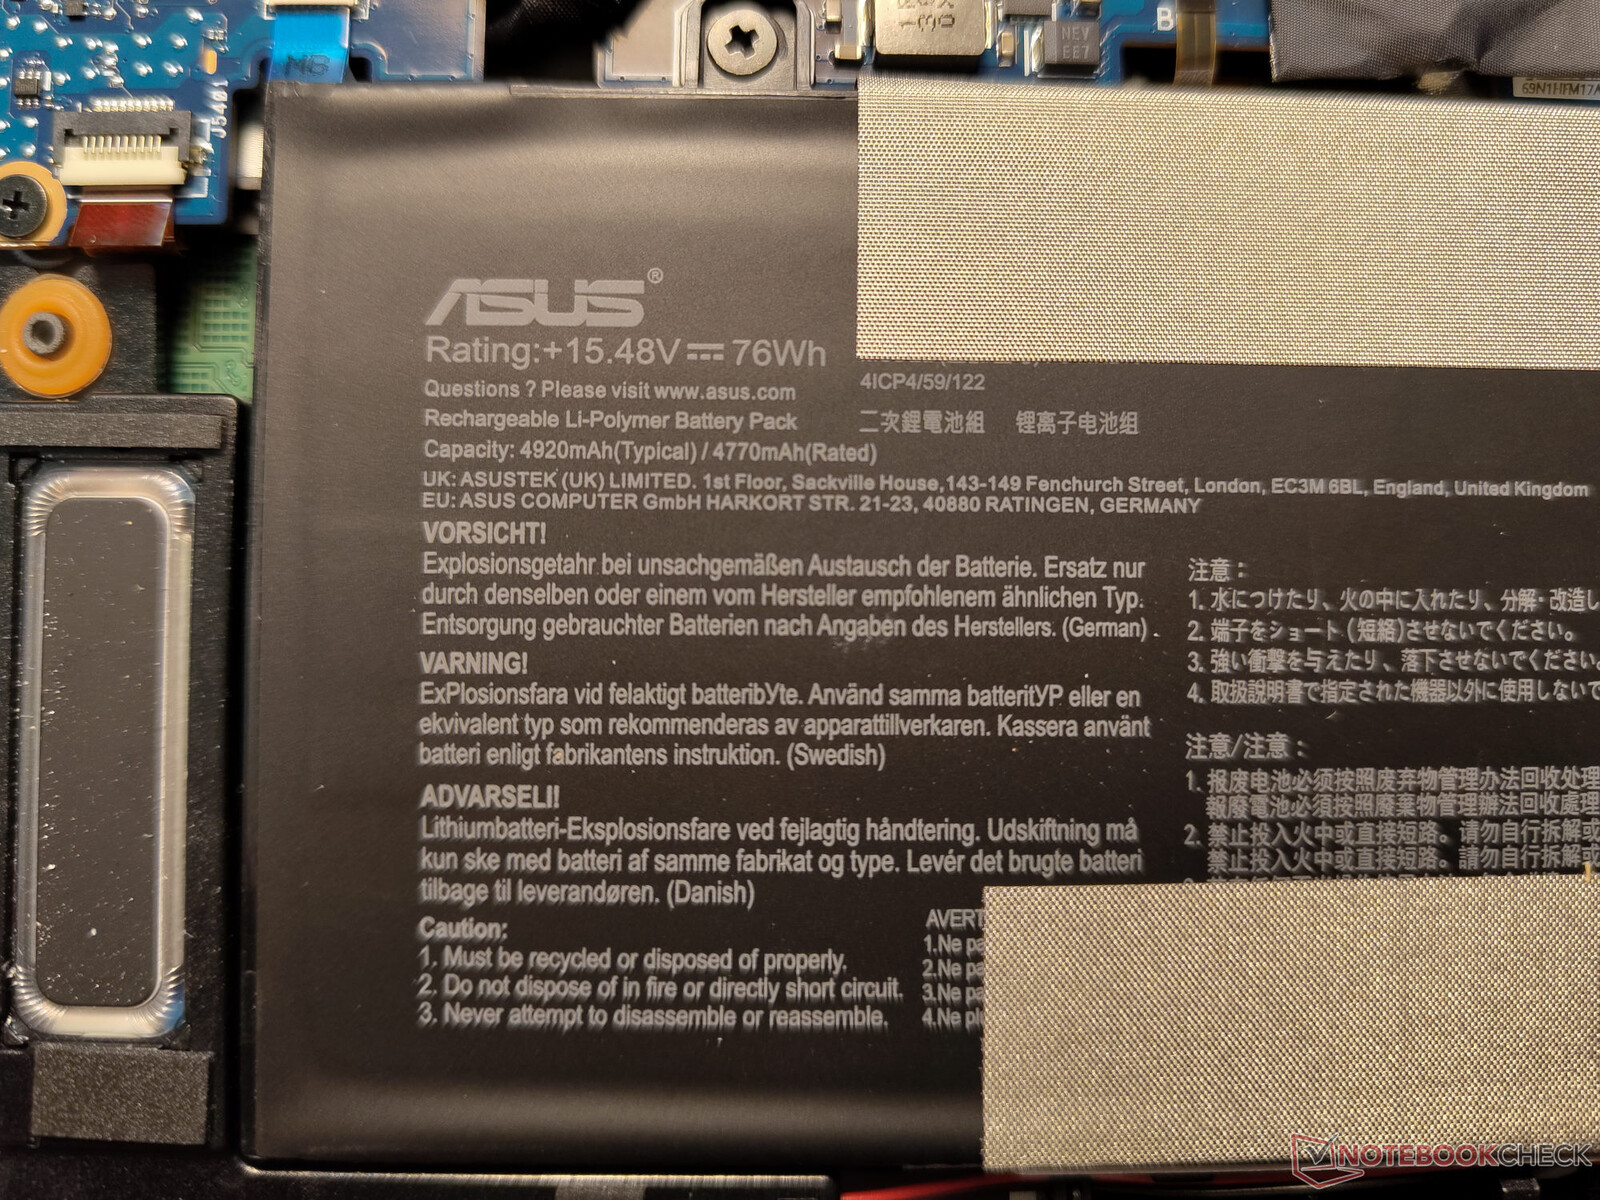
Maintenance
The Asus Zenbook Pro Duo 14 can be opened quickly without having to use many tools. The bottom of the case is fixed by a dozen TX5 screws. Once they are removed, you can easily take off the bottom cover, since it is then only held in place by two plastic clips in the middle of the laptop. After a gentle yank, you hold the cover in your hands. Underneath, you can see many soldered components. Of all the hardware components, only the SSD can be replaced easily. There are neither a free M.2 slot nor SO-DIMM slots for additional working memory. Replacing the battery would also be very difficult, since it is secured with several glue strips and screws. Aside from cleaning the fans, you cannot perform many tasks inside the laptop.

Warranty
Asus provides a worldwide warranty of two years on our test unit. Other configurations may have different warranty conditions.
Input Devices - With fingers, input pen, mouse, and keyboard
The Zenbook Pro Duo 14 and its larger siblings with a second display are fairly unique in terms of their input devices. First, the layout of the keyboard and touchpad are unusual. Instead of being able to place your hands on palm rests, you have to place them in front of the laptop. But you quickly get used to the position and format of the touchpad. Already after a few hours in our test, we are looking for it in vain on any other laptop to the right of the keyboard. Then, the input devices also include both displays, since they are touch sensitive and also support inputs via MPP 2.0 pen. Asus has included a corresponding Asus Pen 2.0.
Keyboard
The keyboard of the Zenbook Pro Duo offers a fairly long key stroke of 1.4 mm (~0.055 in). But it still has some catching up to do concerning the haptic feedback. Unfortunately, the typing experience has to be described as rather spongy. With the unusual design of the laptop, there was no way around some adjustments also in the keyboard layout. This means that the Enter key turned out slightly small and the arrow keys have shrunk significantly.
Touchpad
The touchpad also turned out fairly small, measuring only 5.4 x 7.7 cm (~2.1 x 3.0 in), which is about the size of that in an Asus eee pc laptop from 2008. On the other hand, the Zenbook looks significantly better nowadays in terms of the workmanship. The touchpad consists of a fairly thick and matte glass plate. It responds to up to five touch points and shows a low latency. Despite its small size, you don't get the feeling that you constantly have to switch your finger position or that the inputs are not accurate enough. Unfortunately, the two keys below the touchpad are also slightly spongy, just like the keyboard.
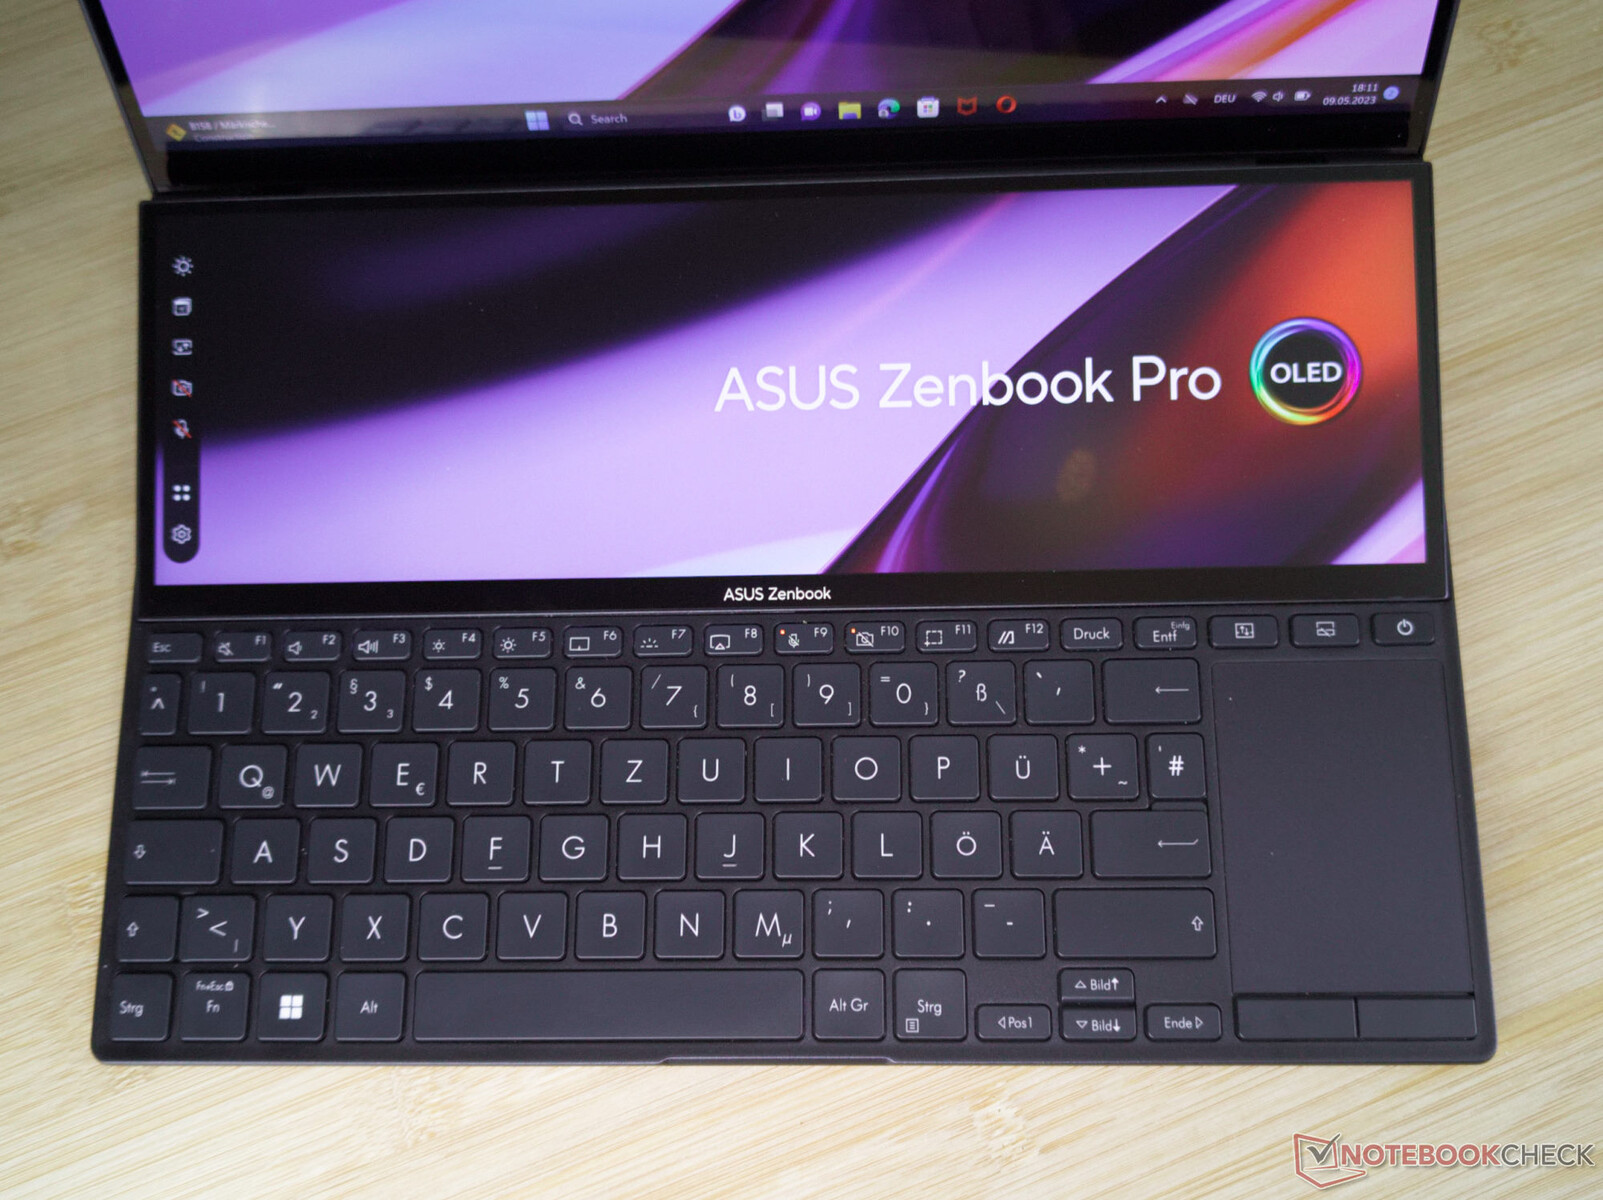
Screenpad+ and Touchscreen
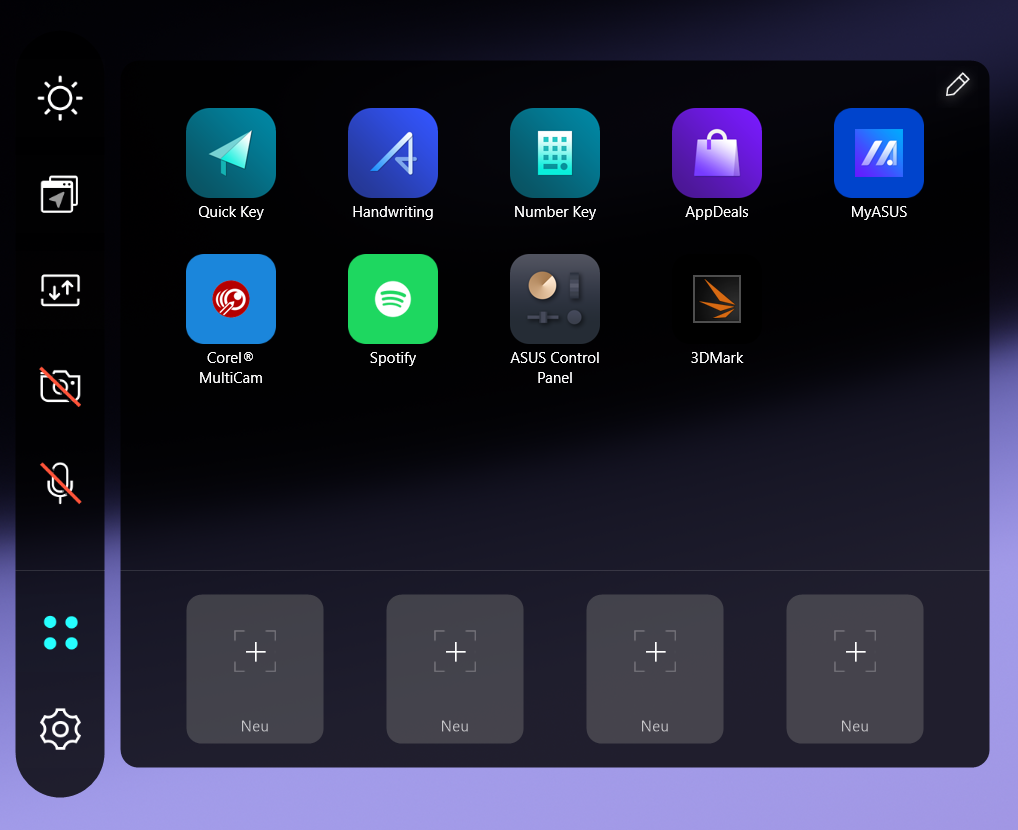
Both screens of the Zenbook Pro Duo respond to touch inputs with up to 10 fingers simultaneously. However, the main screen is a real fingerprint magnet with its glossy surface, and the matte surface of the Screenpad+ is better suited for touch inputs. Asus has included various additional functions in a practical menu bar here. The secondary display can also be used as a touchpad or number block.
Unfortunately, we also saw in our test that Windows occasionally has problems to associate the input hardware to the corresponding display. At times, the touch input or MPP 2.0 pen input was transferred from the Screenpad+ to the main display. Only the ASUS Sceenpad 2 Optimizer that is offered by the manufacturer for download will provide a remedy here. This application will associate all the devices with the correct display, but it also requires a restart of Windows.
The Control Panel in the ProArt Creator Hub offers adjustable control bars for the Screenpad+. You can find pre-created profiles here for several applications from Adobe, Microsoft Office, and several browsers. The Control Center also offers the option to create the corresponding control bars for other programs yourself. But we also have to note that we have some difficulties with the necessary inputs of key combinations to achieve this in our test. The reason for this is that the ProArt Creator Hub uses an English keyboard layout for inputs, despite the laptop using a German keyboard layout and the German language. We can only create useful inputs by connecting an external keyboard with the US layout, since even the Windows onscreen keyboard has the wrong layout here.
Asus Pen 2.0
The Asus Pen 2.0 is compatible with the MPP 2 standard. Thanks to its internal battery and USB-C port, the input pen doesn't need any batteries. Asus also includes various input tips that produce different amounts of friction on the screen. You cannot fasten or insert the pen into the laptop itself, but the included sleeve has a loop for the pen.
The pen offers three programmable keys. It supports 4096 pressure levels but doesn't have a position sensor. This means that the input point is not always exactly below the tip of the pen.
Display - Significantly more screen area
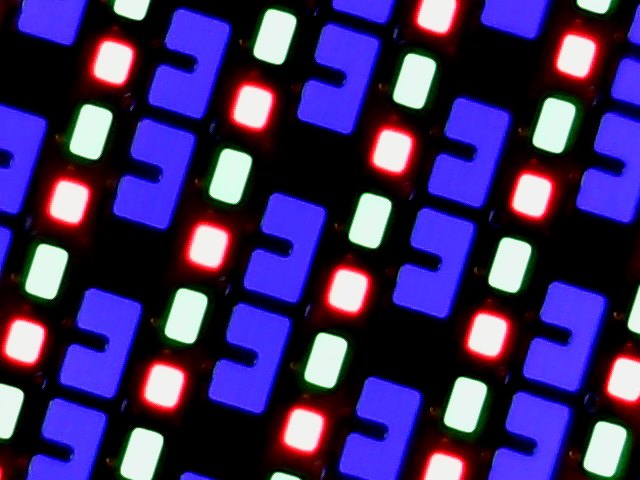
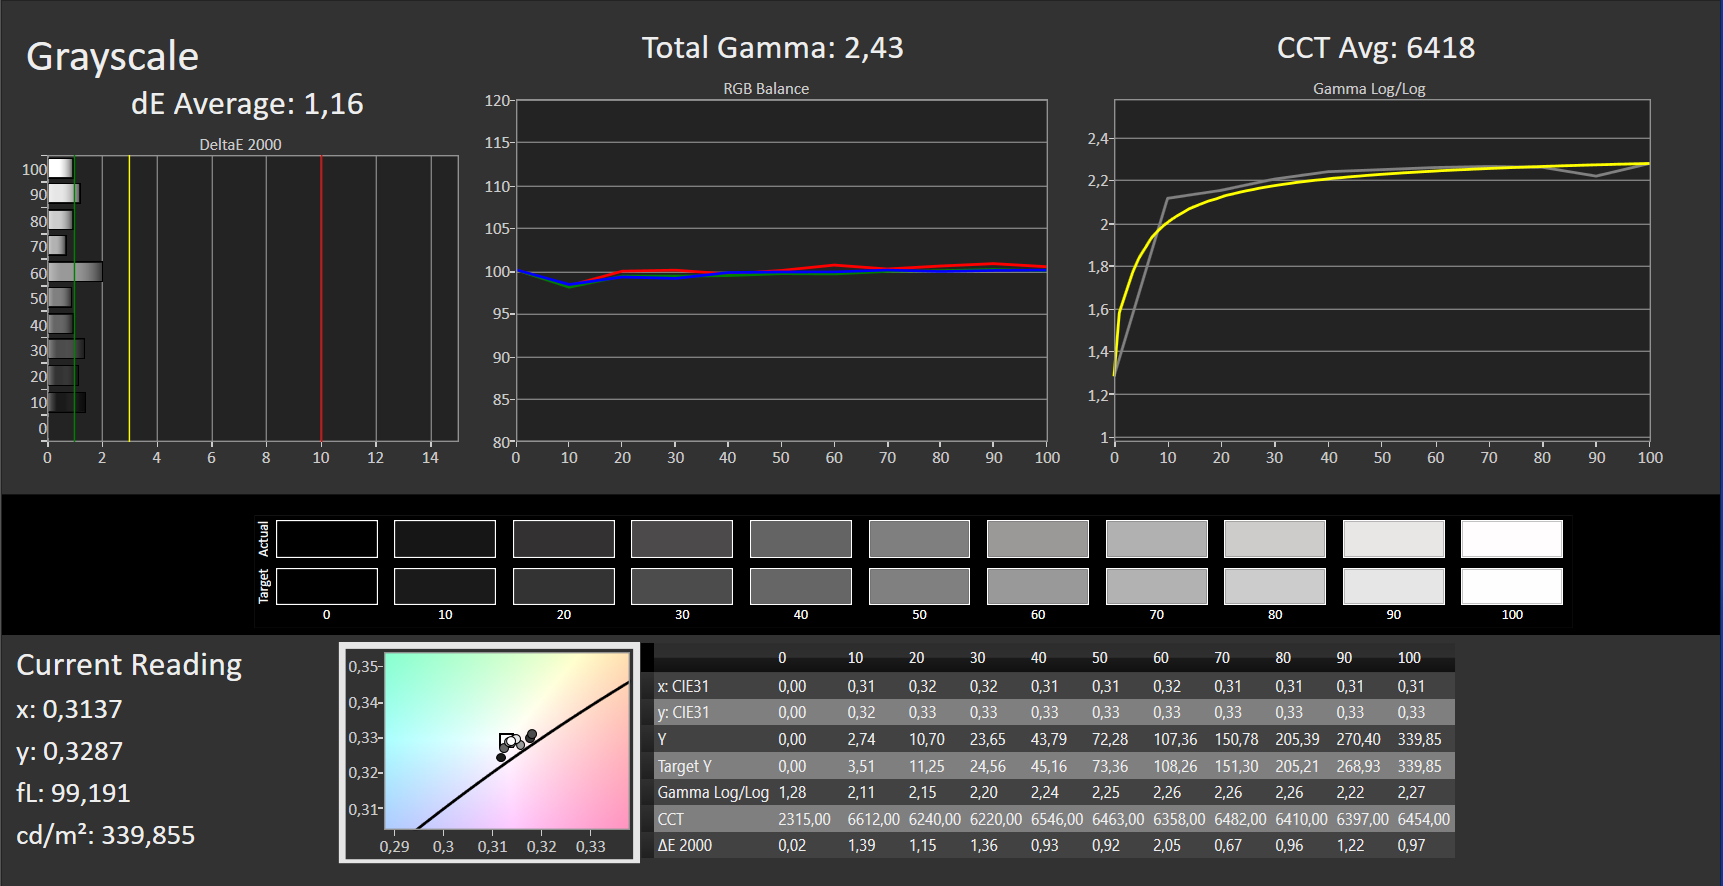
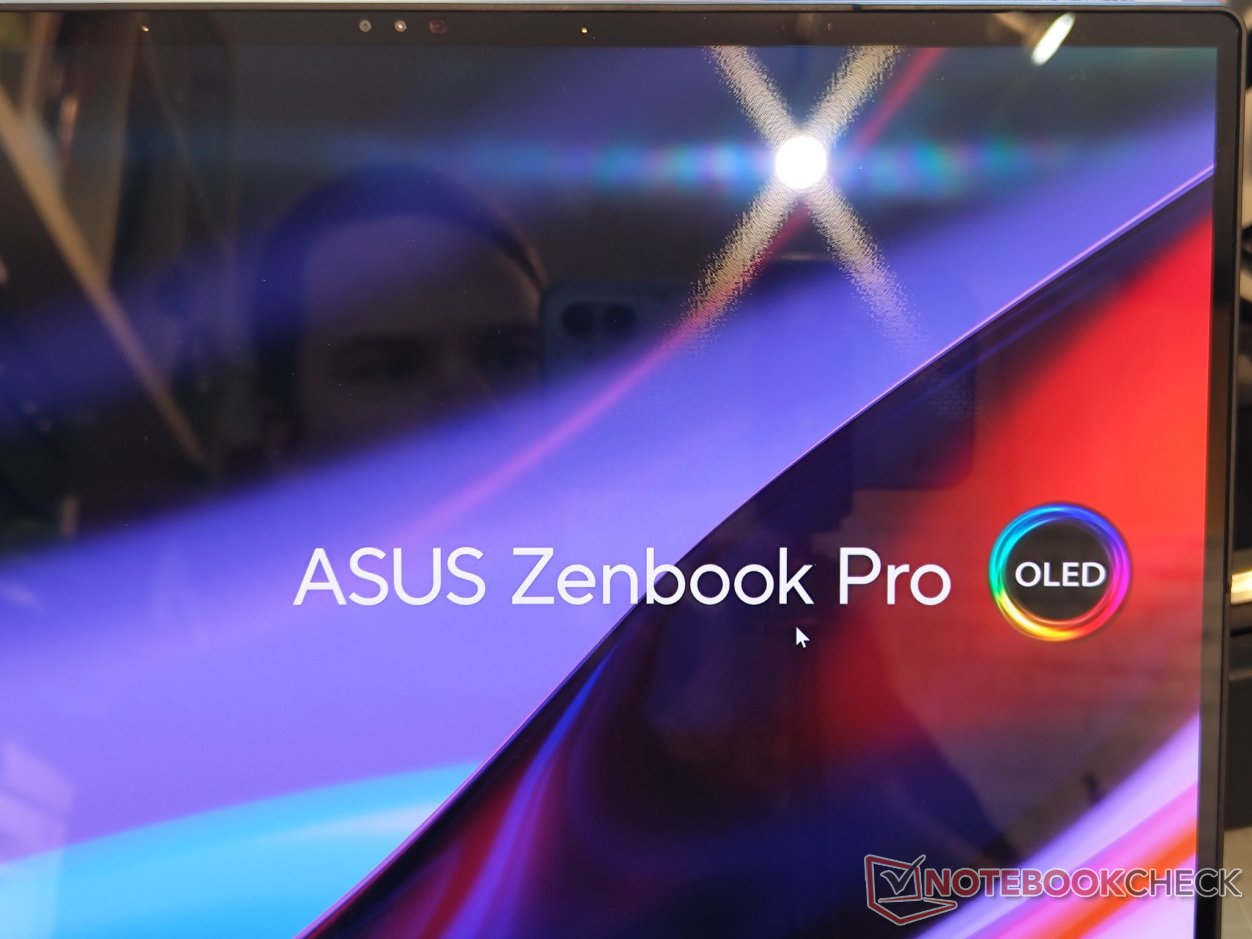
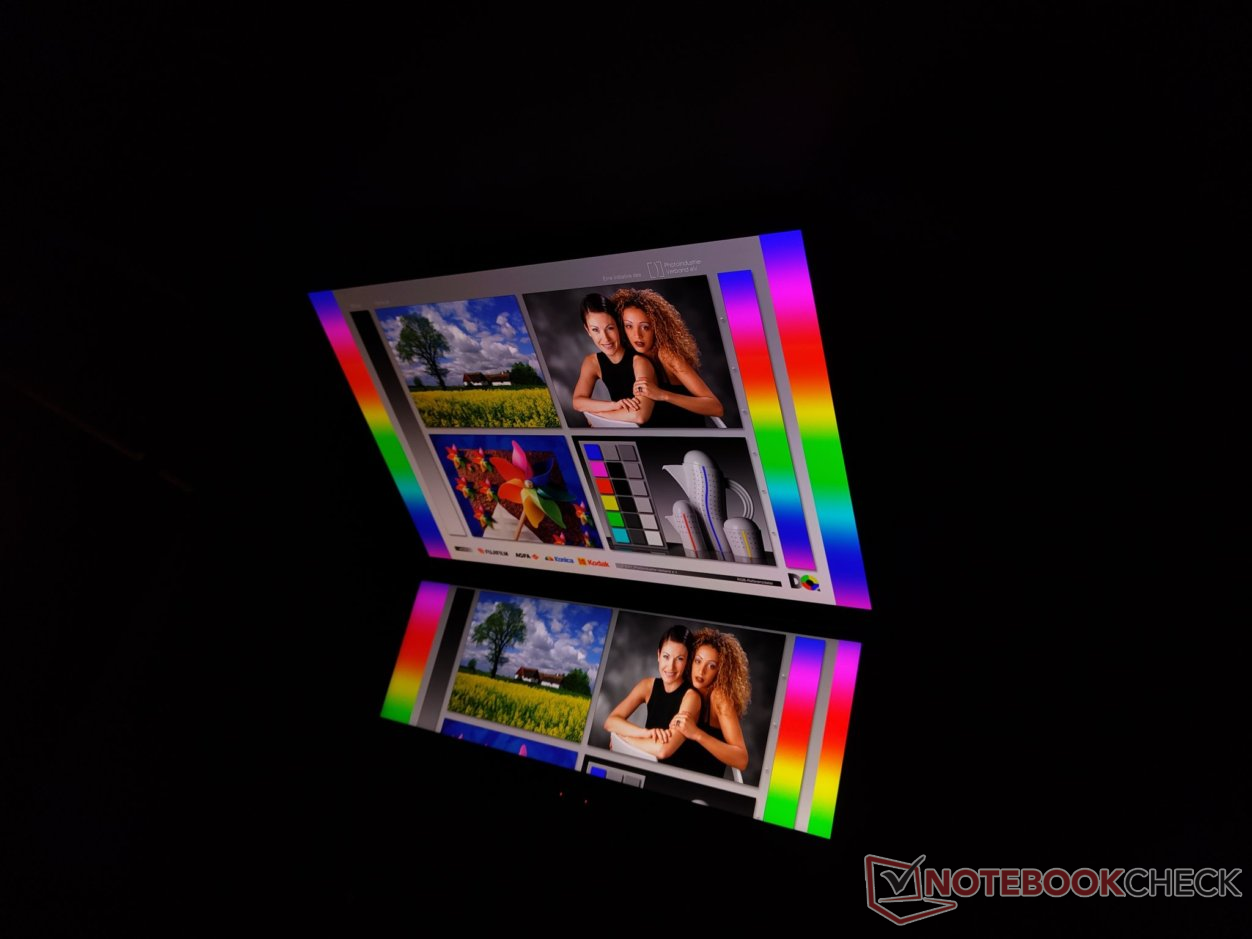
Asus uses a contrast rich OLED display with 120 Hz as the main display of the Zenbook Pro Duo. Its strengths are short response times and an excellent color reproduction. With 2,880 × 1,800 pixels, it has a high 243 ppi resolution. However, the reflective display also has its weaknesses, and particularly some reflections keep annoying the user. Light sources are clearly reflected on the various layers of the touchscreen, allowing you to even see the individual conductor traces. As typical for OLED screens, there are no faults in the illumination.
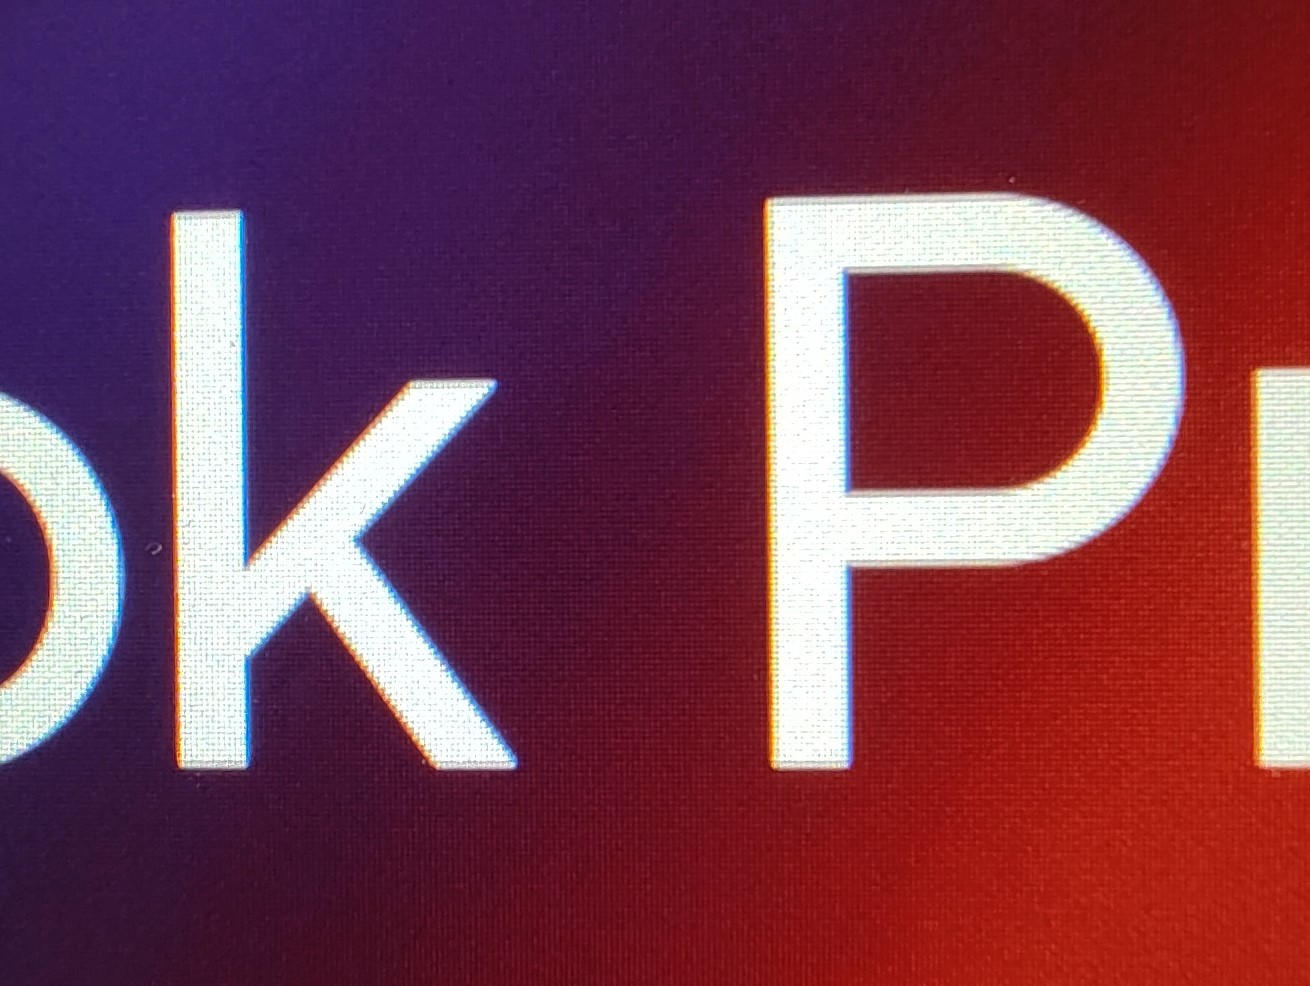
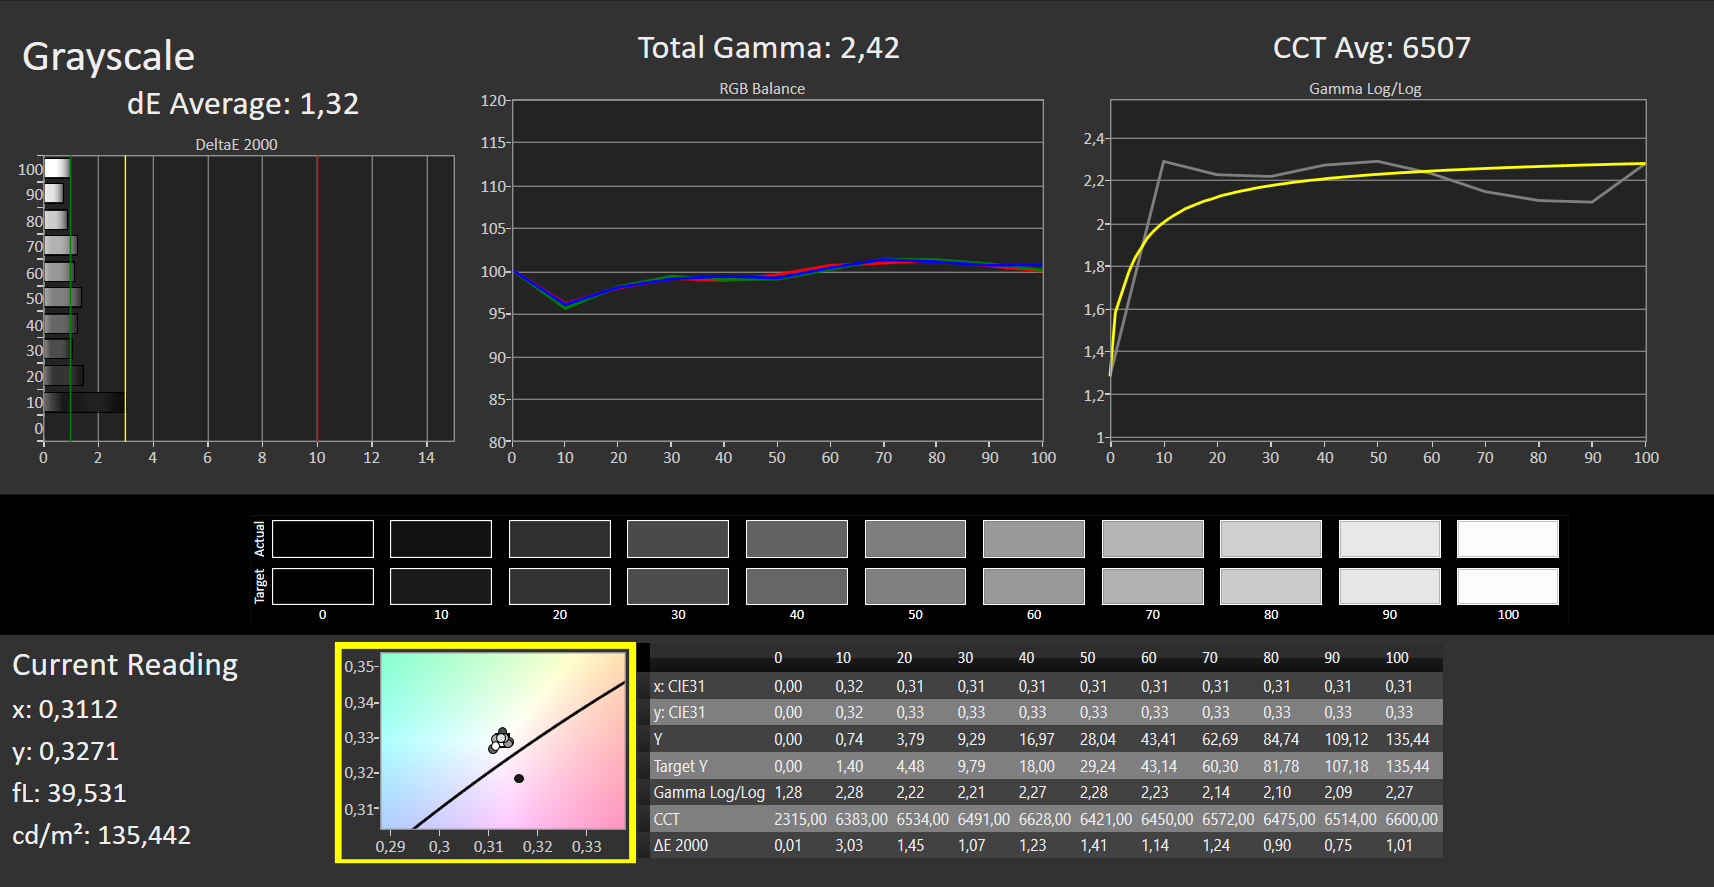
While Asus uses a new panel for the main display, the Screenpad+ remains unchanged. For a more detailed analysis of the secondary display, we refer you to our test of the sibling model. The matte second display uses an IPS panel with a resolution of 2,880 × 864 pixels. However, due to the matte surface, the high resolution isn't fully effective, and the image appears slightly grainy here. This can be seen primarily in high-contrast color transitions. In addition, most of the time Windows is unable to use the second display as much as we had hoped. While the main display can be adjusted with scaling from 100% to 250%, the secondary display only offers 100% and 125%. This also means that when moving Windows between the main and secondary display, the size of the displayed elements constantly changes.
| |||||||||||||||||||||||||
Brightness Distribution: 99 %
Center on Battery: 336 cd/m²
Contrast: 170000:1 (Black: 0.002 cd/m²)
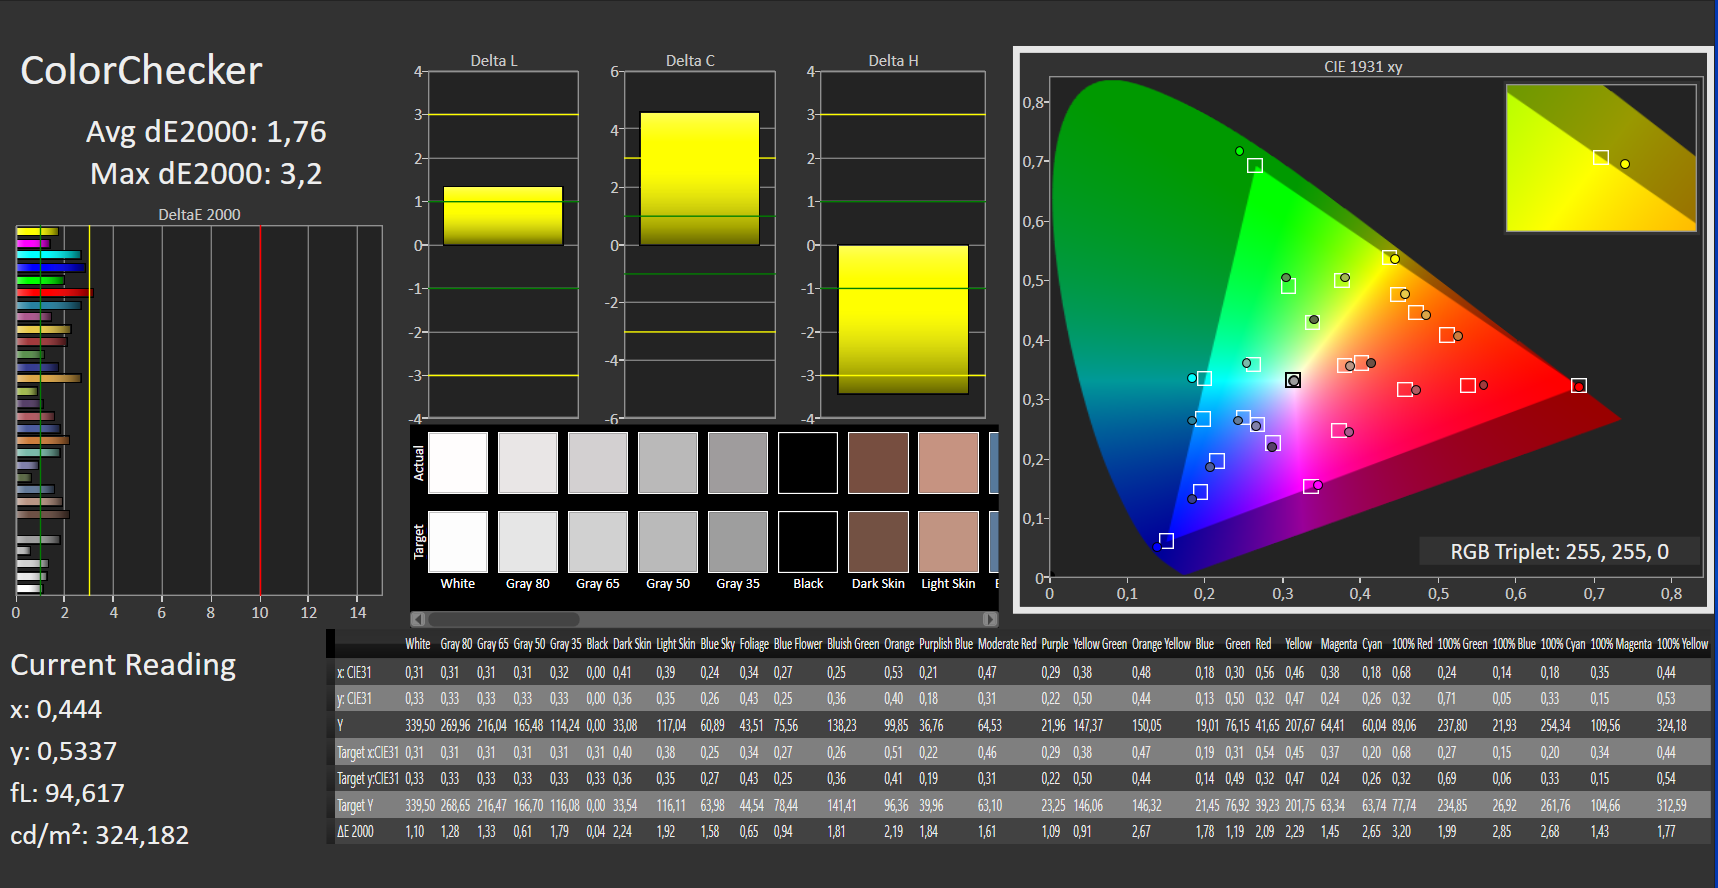
ΔE ColorChecker Calman: 1.76 | ∀{0.5-29.43 Ø4.79}
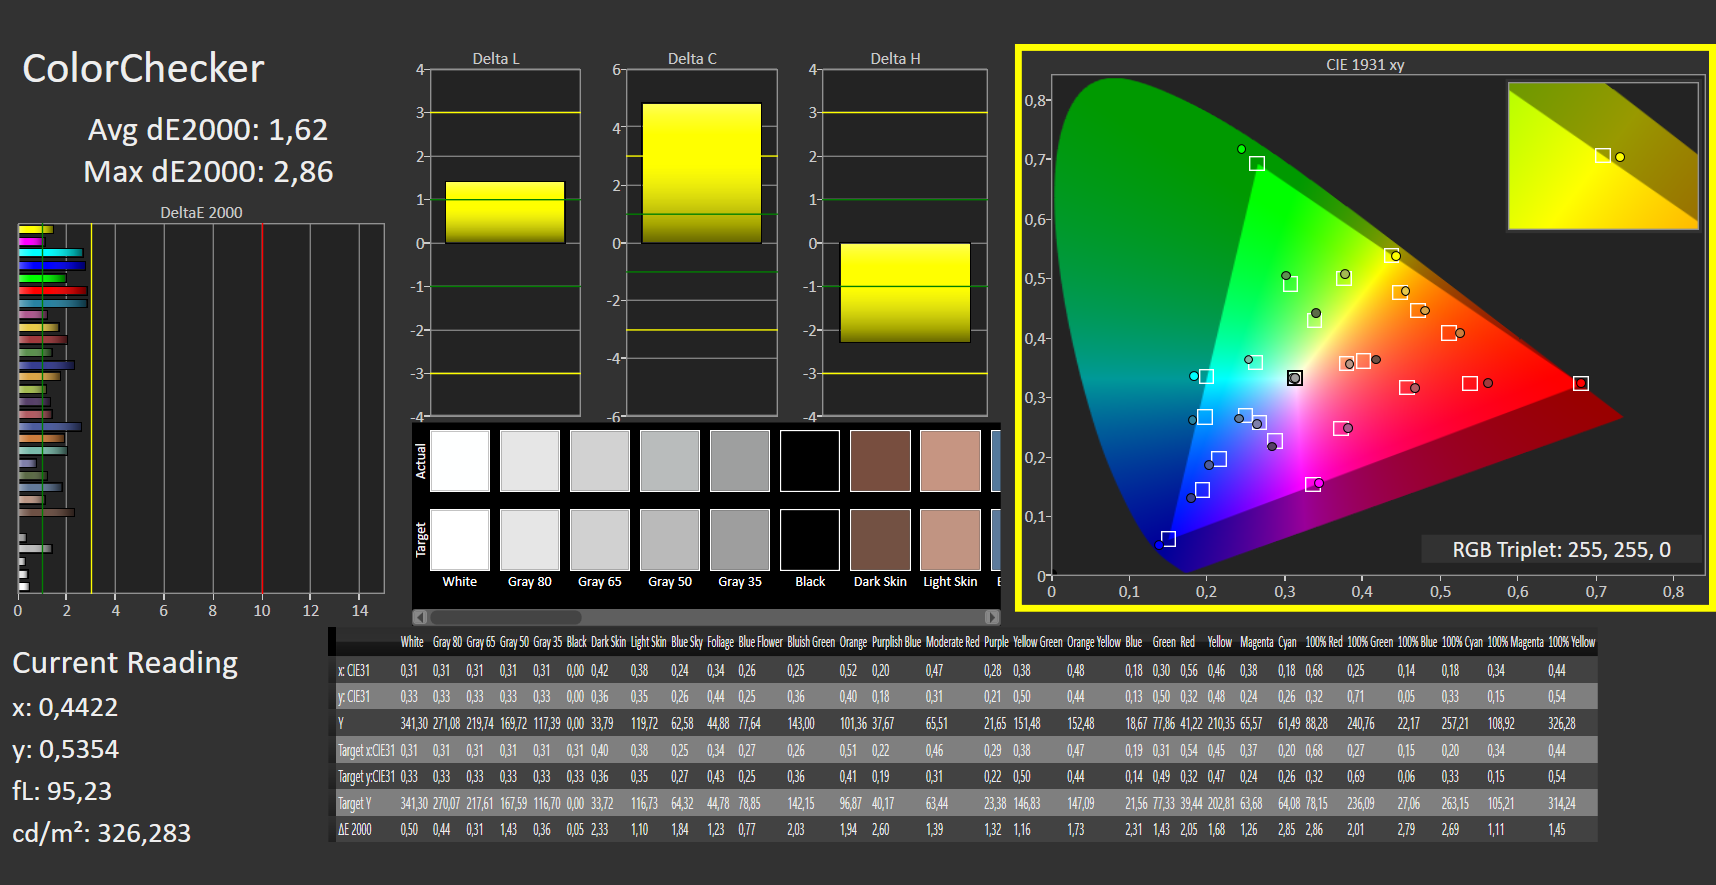
calibrated: 1.62
ΔE Greyscale Calman: 1.16 | ∀{0.09-98 Ø5}
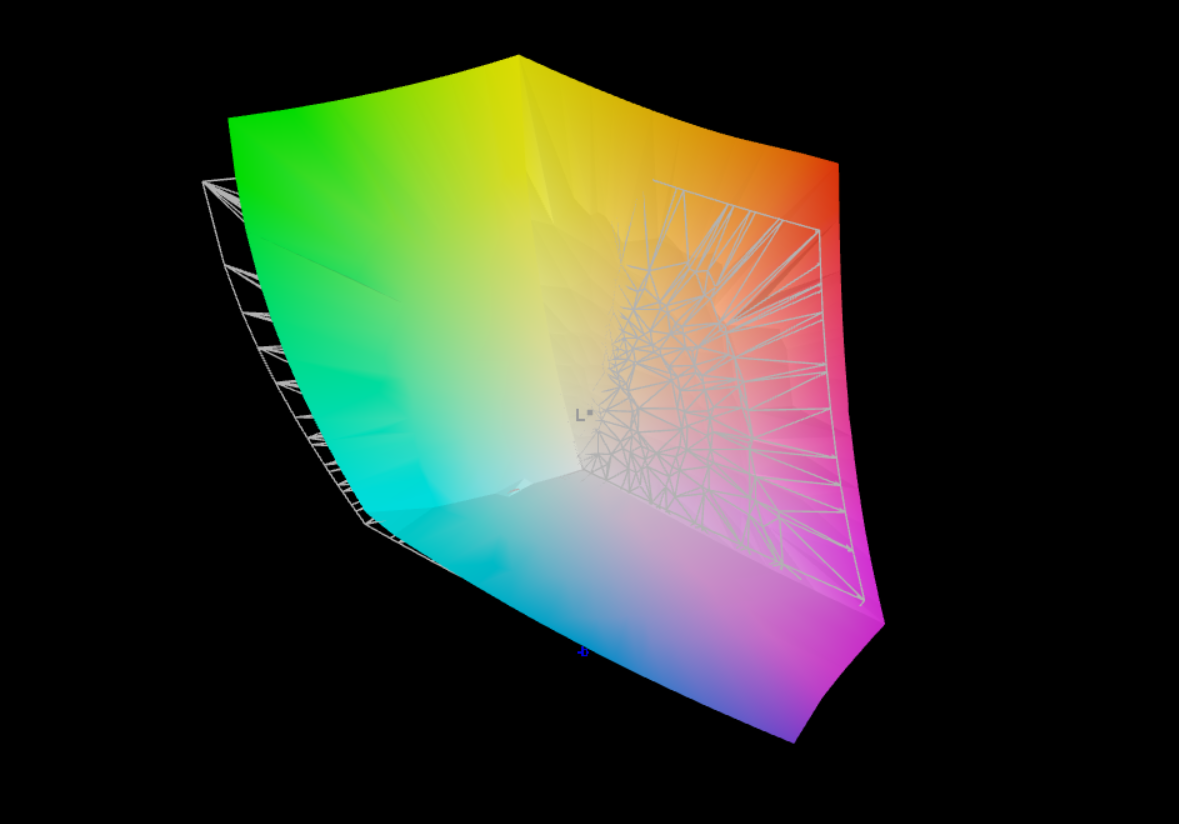
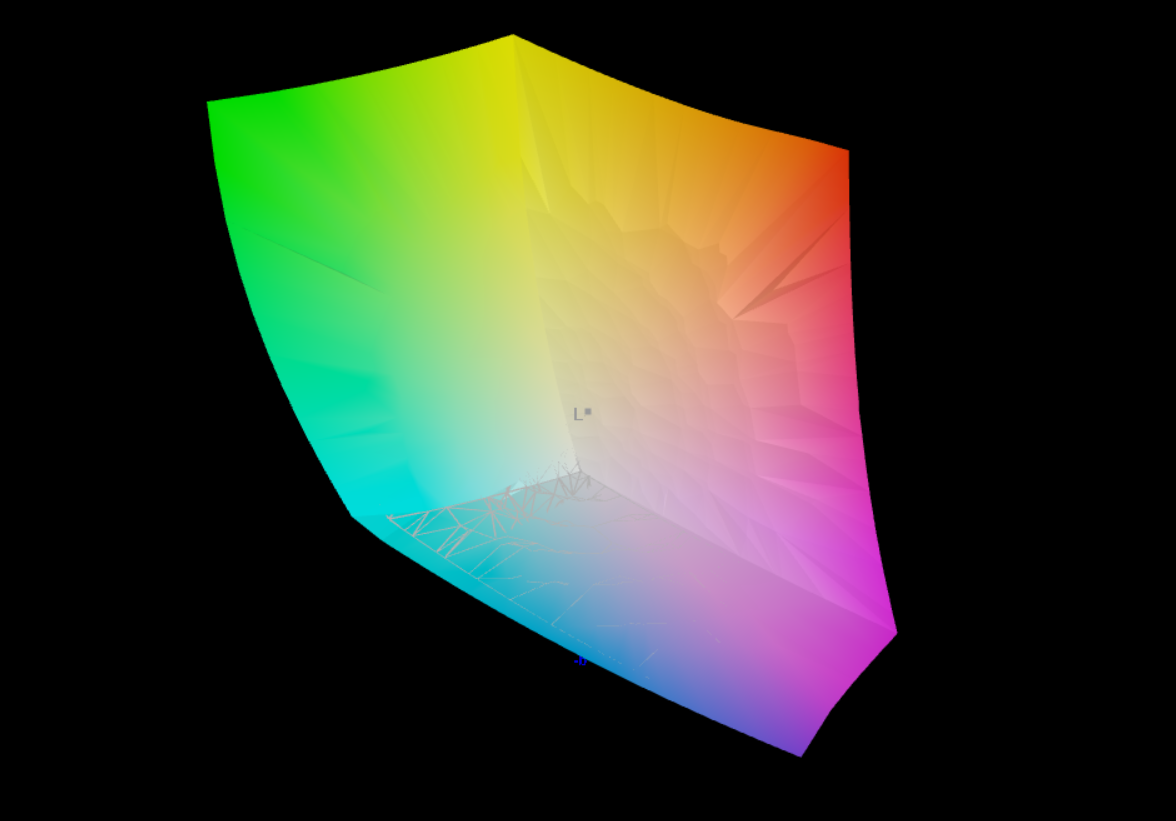
95.35% AdobeRGB 1998 (Argyll 3D)
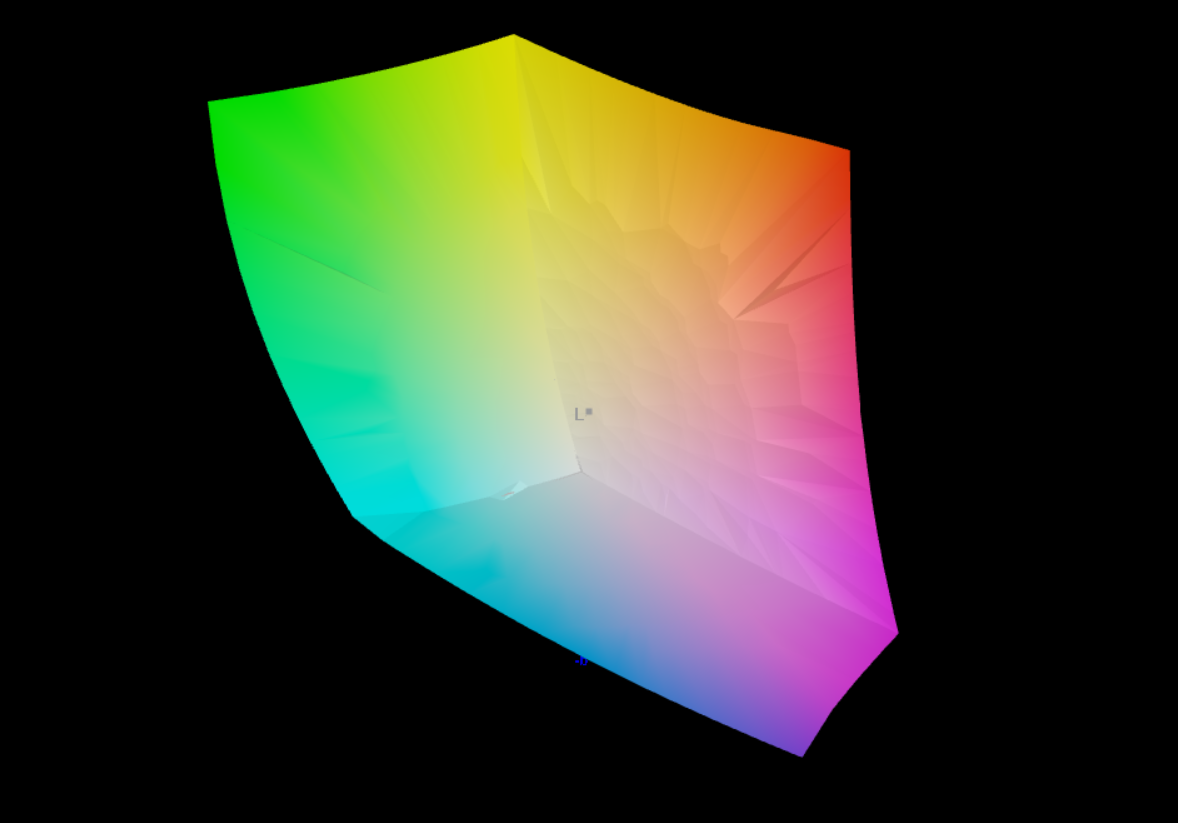
100% sRGB (Argyll 3D)
99.91% Display P3 (Argyll 3D)
Gamma: 2.43
CCT: 6418 K
| Asus ZenBook Pro 14 Duo UX8402VV-P1021W ATNA45AF04-0 , OLED, 2880x1800, 14.5" | Acer Predator Triton 300 SE Samsung ATNA40YK07-0, OLED, 2880x1800, 14" | Lenovo Yoga Pro 7 14IRH G8 LEN145-3K, IPS, 3072x1920, 14.5" | Gigabyte Aero 14 OLED BMF Samsung SDC4192 (ATNA40YK14-0), OLED, 2880x1800, 14" | Asus Zephyrus Duo 16 GX650PY-NM006W NE160QDM-NM4, MiniLED, 2560x1600, 16" | Schenker Vision 14 2022 RTX 3050 Ti MNE007ZA1-1, IPS, 2880x1800, 14" | Asus Zenbook Pro 14 Duo OLED UX8402ZA ATNA45AF01-0, OLED, 2880x1800, 14.5" | Asus VivoBook S 14X S5402Z Samsung ATNA45AF01-0, OLED, 2880x1800, 14.5" | |
|---|---|---|---|---|---|---|---|---|
| Display | 1% | -3% | -2% | -2% | -17% | 1% | 0% | |
| Display P3 Coverage (%) | 99.91 | 99.9 0% | 98.7 -1% | 99.8 0% | 99.4 -1% | 74.1 -26% | 99.9 0% | 99.9 0% |
| sRGB Coverage (%) | 100 | 100 0% | 100 0% | 100 0% | 100 0% | 97.4 -3% | 100 0% | 100 0% |
| AdobeRGB 1998 Coverage (%) | 95.35 | 99 4% | 87.6 -8% | 88.7 -7% | 90.8 -5% | 75.3 -21% | 97.4 2% | 95.5 0% |
| Response Times | 32% | -1083% | -20% | -755% | -1050% | -20% | 57% | |
| Response Time Grey 50% / Grey 80% * (ms) | 2 ? | 1.36 ? 32% | 31.5 ? -1475% | 2.4 ? -20% | 15.2 ? -660% | 31.5 ? -1475% | 2.4 ? -20% | 0.73 ? 63% |
| Response Time Black / White * (ms) | 2 ? | 1.36 ? 32% | 15.8 ? -690% | 2.4 ? -20% | 19 ? -850% | 14.5 ? -625% | 2.4 ? -20% | 1 ? 50% |
| PWM Frequency (Hz) | 240 | 367.6 ? | 300 | 12000 ? | 240 ? | 240.4 ? | ||
| Screen | -53% | -1858% | -527% | -380% | -1602% | -131% | -21% | |
| Brightness middle (cd/m²) | 340 | 414.3 22% | 441 30% | 423 24% | 712 109% | 421 24% | 356 5% | 373 10% |
| Brightness (cd/m²) | 340 | 416 22% | 453 33% | 427 26% | 703 107% | 416 22% | 357 5% | 375 10% |
| Brightness Distribution (%) | 99 | 99 0% | 92 -7% | 98 -1% | 95 -4% | 89 -10% | 99 0% | 99 0% |
| Black Level * (cd/m²) | 0.002 | 0.34 -16900% | 0.1 -4900% | 0.07 -3400% | 0.28 -13900% | 0.02 -900% | ||
| Contrast (:1) | 170000 | 1297 -99% | 4230 -98% | 10171 -94% | 1504 -99% | 17800 -90% | ||
| Colorchecker dE 2000 * | 1.76 | 4.68 -166% | 0.6 66% | 0.55 69% | 1.7 3% | 3.2 -82% | 2.6 -48% | 2.26 -28% |
| Colorchecker dE 2000 max. * | 3.2 | 7.78 -143% | 1.3 59% | 1.15 64% | 4 -25% | 5.5 -72% | 4.5 -41% | 6.22 -94% |
| Colorchecker dE 2000 calibrated * | 1.62 | 0.6 63% | 1.15 29% | 1.2 26% | 2 -23% | 2 -23% | ||
| Greyscale dE 2000 * | 1.16 | 1.8 -55% | 0.8 31% | 0.69 41% | 2.8 -141% | 4.4 -279% | 2.2 -90% | 1.4 -21% |
| Gamma | 2.43 91% | 2.22 99% | 2.2 100% | 2.42 91% | 2.21 100% | 2.22 99% | 2.2 100% | 2.22 99% |
| CCT | 6418 101% | 6207 105% | 6597 99% | 6479 100% | 6978 93% | 6384 102% | 6246 104% | 6417 101% |
| Total Average (Program / Settings) | -7% /
-23% | -981% /
-1350% | -183% /
-342% | -379% /
-353% | -890% /
-1184% | -50% /
-87% | 12% /
-1% |
* ... smaller is better
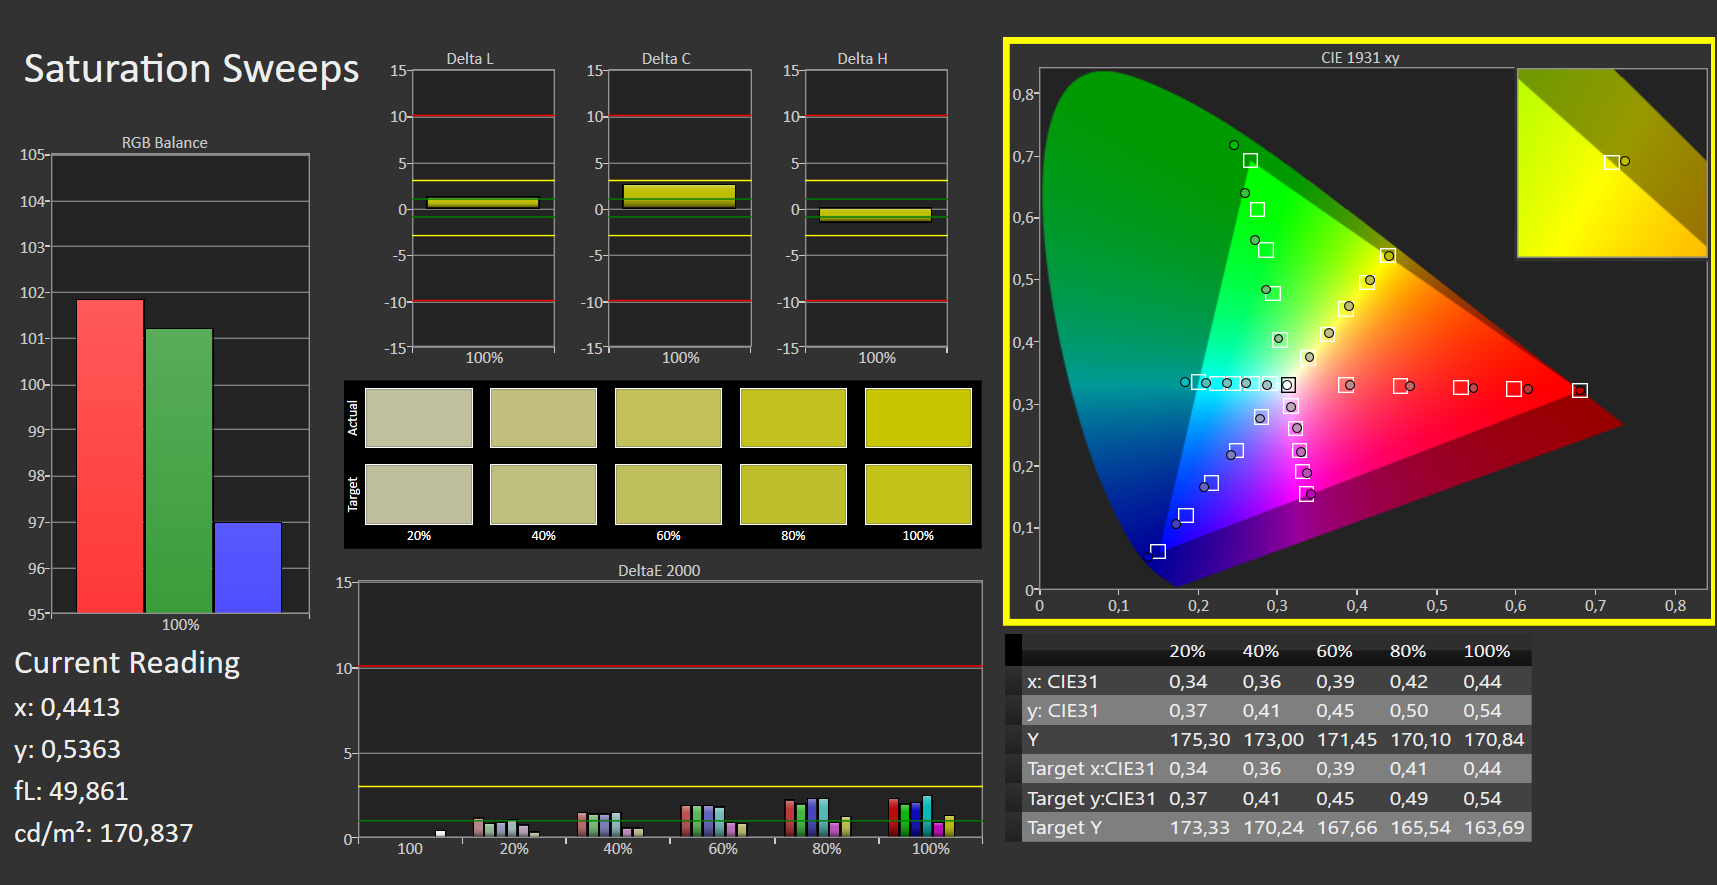
The OLED display is able to reproduce the sRGB and DisplayP3 color spaces almost completely, and the Zenbook also covers 95% of the AdobeRGB color space, which is more important for photographers.
The ICC profile we created (download link in the info box above) only slightly improves the color reproduction of the Zenbook Pro 14 Duo, which has already been very good, causing the absolute color deviations to fall to slightly below ΔΕ 3. However, this also goes to the detriment of the Grayscale, where the color deviations are slightly increased.
Before the display calibration using X-Rite i1 Pro and Calman ColorChecker, the color values are already very accurate, and only trained eyes will recognize any difference. The ProArt Creator Hub also offers an option to calibrate the colors, but it currently only supports the i1Display color calibrator.

Display Response Times
| ↔ Response Time Black to White | ||
|---|---|---|
| 2 ms ... rise ↗ and fall ↘ combined | ↗ 1 ms rise |  |
| ↘ 1 ms fall | ||
| The screen shows very fast response rates in our tests and should be very well suited for fast-paced gaming. In comparison, all tested devices range from 0.1 (minimum) to 240 (maximum) ms. » 9 % of all devices are better. This means that the measured response time is better than the average of all tested devices (20.3 ms). | ||
| ↔ Response Time 50% Grey to 80% Grey | ||
| 2 ms ... rise ↗ and fall ↘ combined | ↗ 1 ms rise |  |
| ↘ 1 ms fall | ||
| The screen shows very fast response rates in our tests and should be very well suited for fast-paced gaming. In comparison, all tested devices range from 0.165 (minimum) to 636 (maximum) ms. » 8 % of all devices are better. This means that the measured response time is better than the average of all tested devices (31.7 ms). | ||
Screen Flickering / PWM (Pulse-Width Modulation)
| Screen flickering / PWM detected | 240 Hz |  | |
The display backlight flickers at 240 Hz (worst case, e.g., utilizing PWM) . The frequency of 240 Hz is relatively low, so sensitive users will likely notice flickering and experience eyestrain at the stated brightness setting and below. In comparison: 53 % of all tested devices do not use PWM to dim the display. If PWM was detected, an average of 8152 (minimum: 5 - maximum: 343500) Hz was measured. | |||


Outdoors, the Screenpad+ is significantly easier to read than the main display. However, the readability of the small display is also impacted to some extent by strong light sources from above.
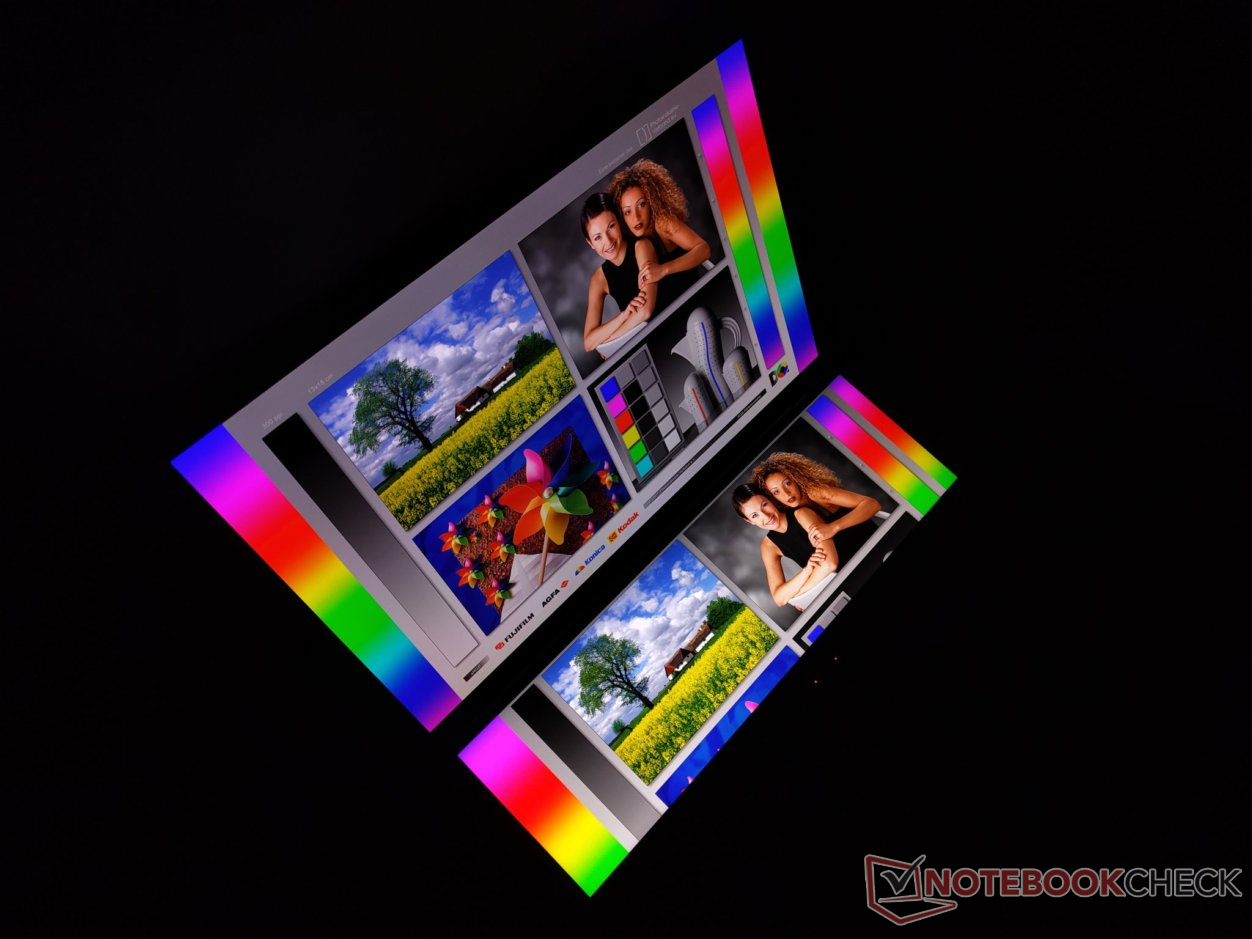
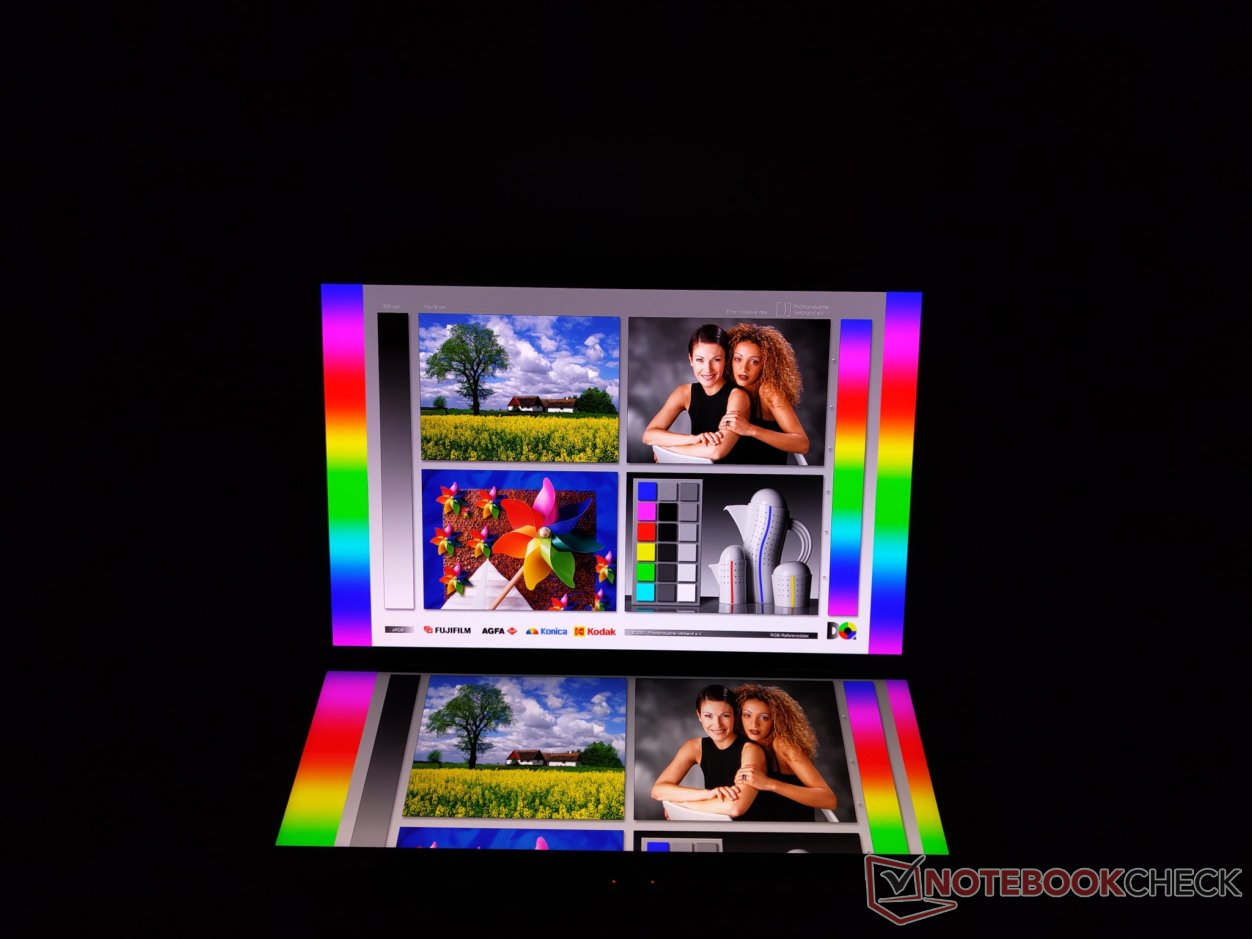
As typical for OLED and IPS screens, both displays also offer a good image even from steeper viewing angles. There are hardly any noticeable color deviations or changes in brightness.
Performance - A powerful combination of RTX 4060 and Intel Core i9
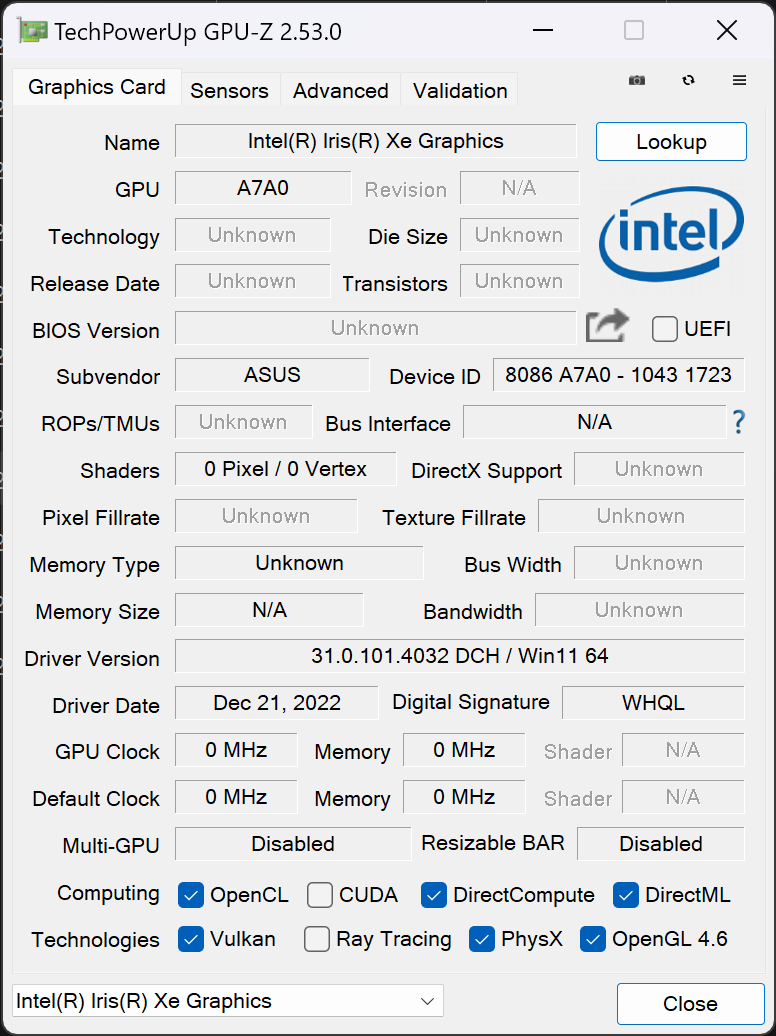
The Asus Zenbook Pro 14 Duo is available in various equipment configurations. You can select among Intel Core i7 and i9 processors of the 12th and 13th generation that are supported by up to 32 GB of working memory. There are also various equipment versions in terms of the graphics chips, and the available options range from the Intel Iris Xe iGPU of the i7, via the Nvidia GeForce RTX 3050 and 4050, up to the RTX 4060.
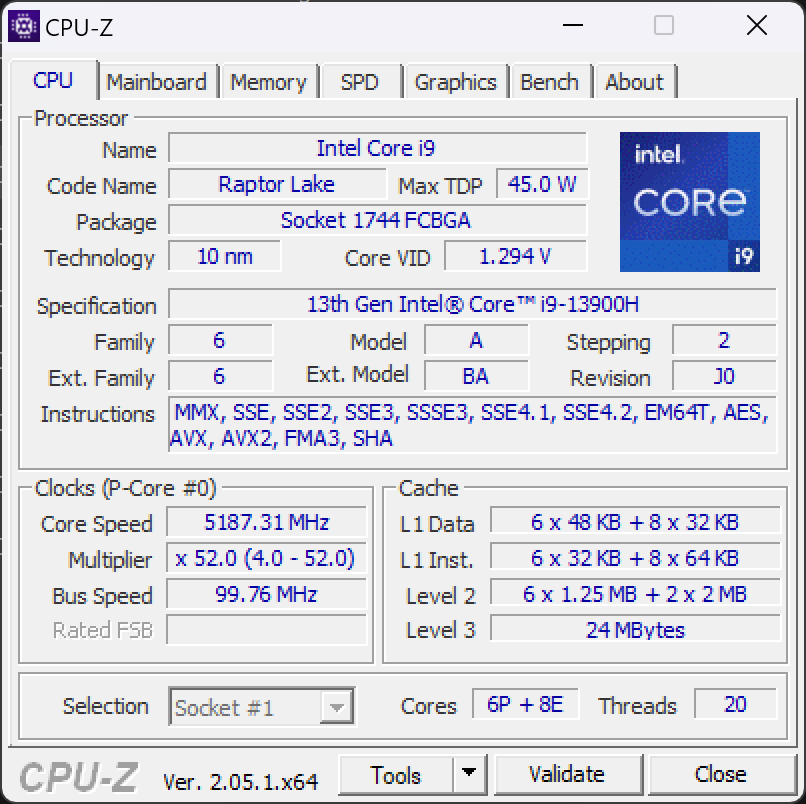
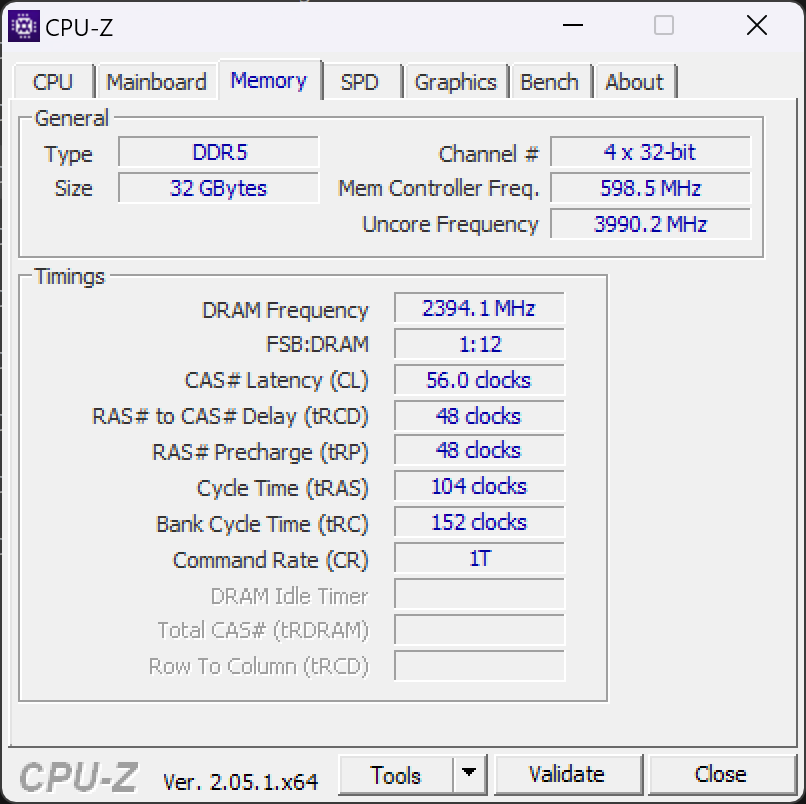
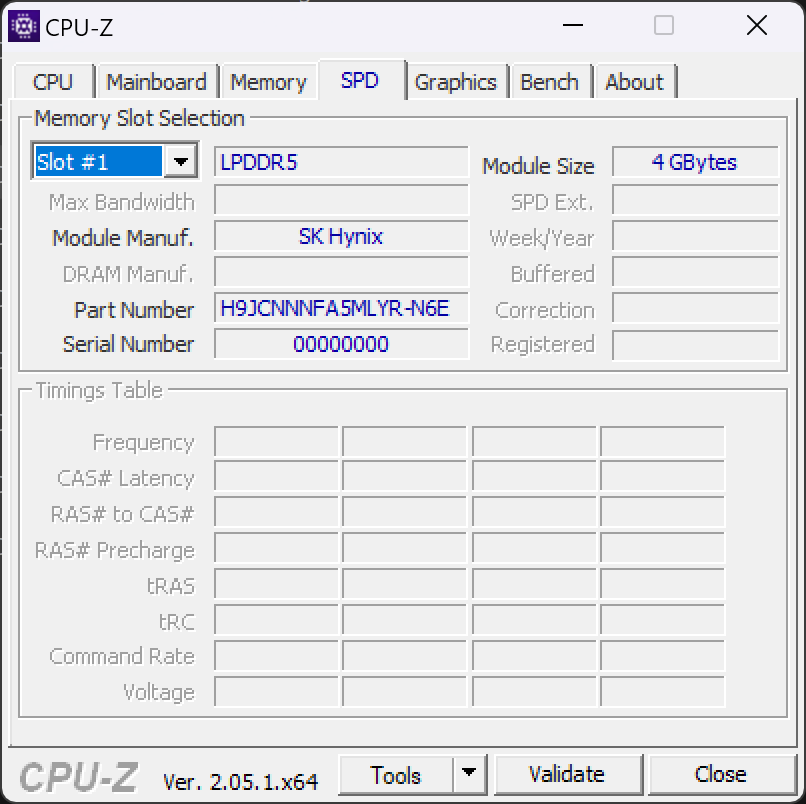
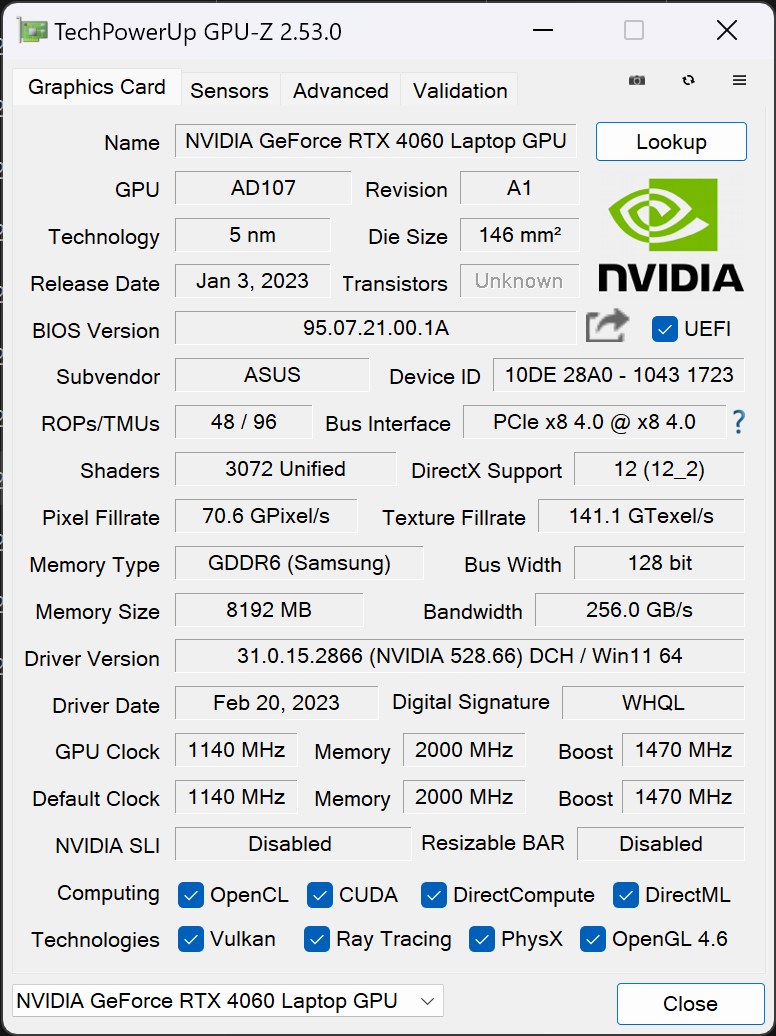
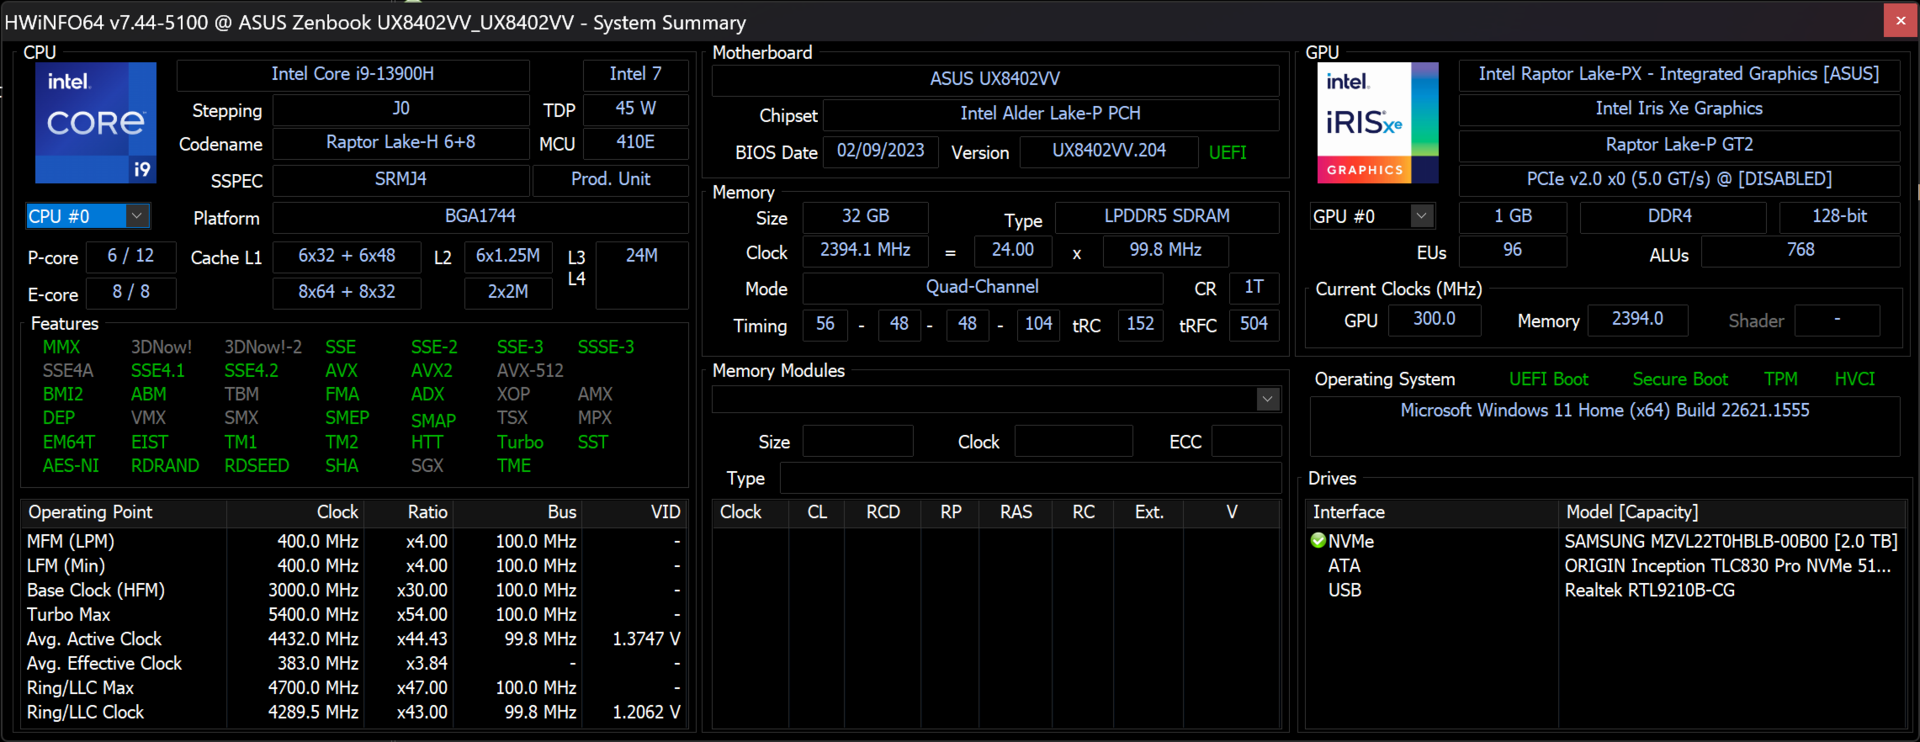
Our test unit is equipped with an Intel Core i9-13900H and Nvidia GeForce RTX 4060. The processor is supported by 32 GB of DDR5 storage. With the top equipment, the laptop is extremely productive, but it is also able to run efficiently using the MUX switch. Games, 3D applications, creative image and video processing, as well as CAD applications represent no problem for the laptop.
Performance Control and Test Conditions
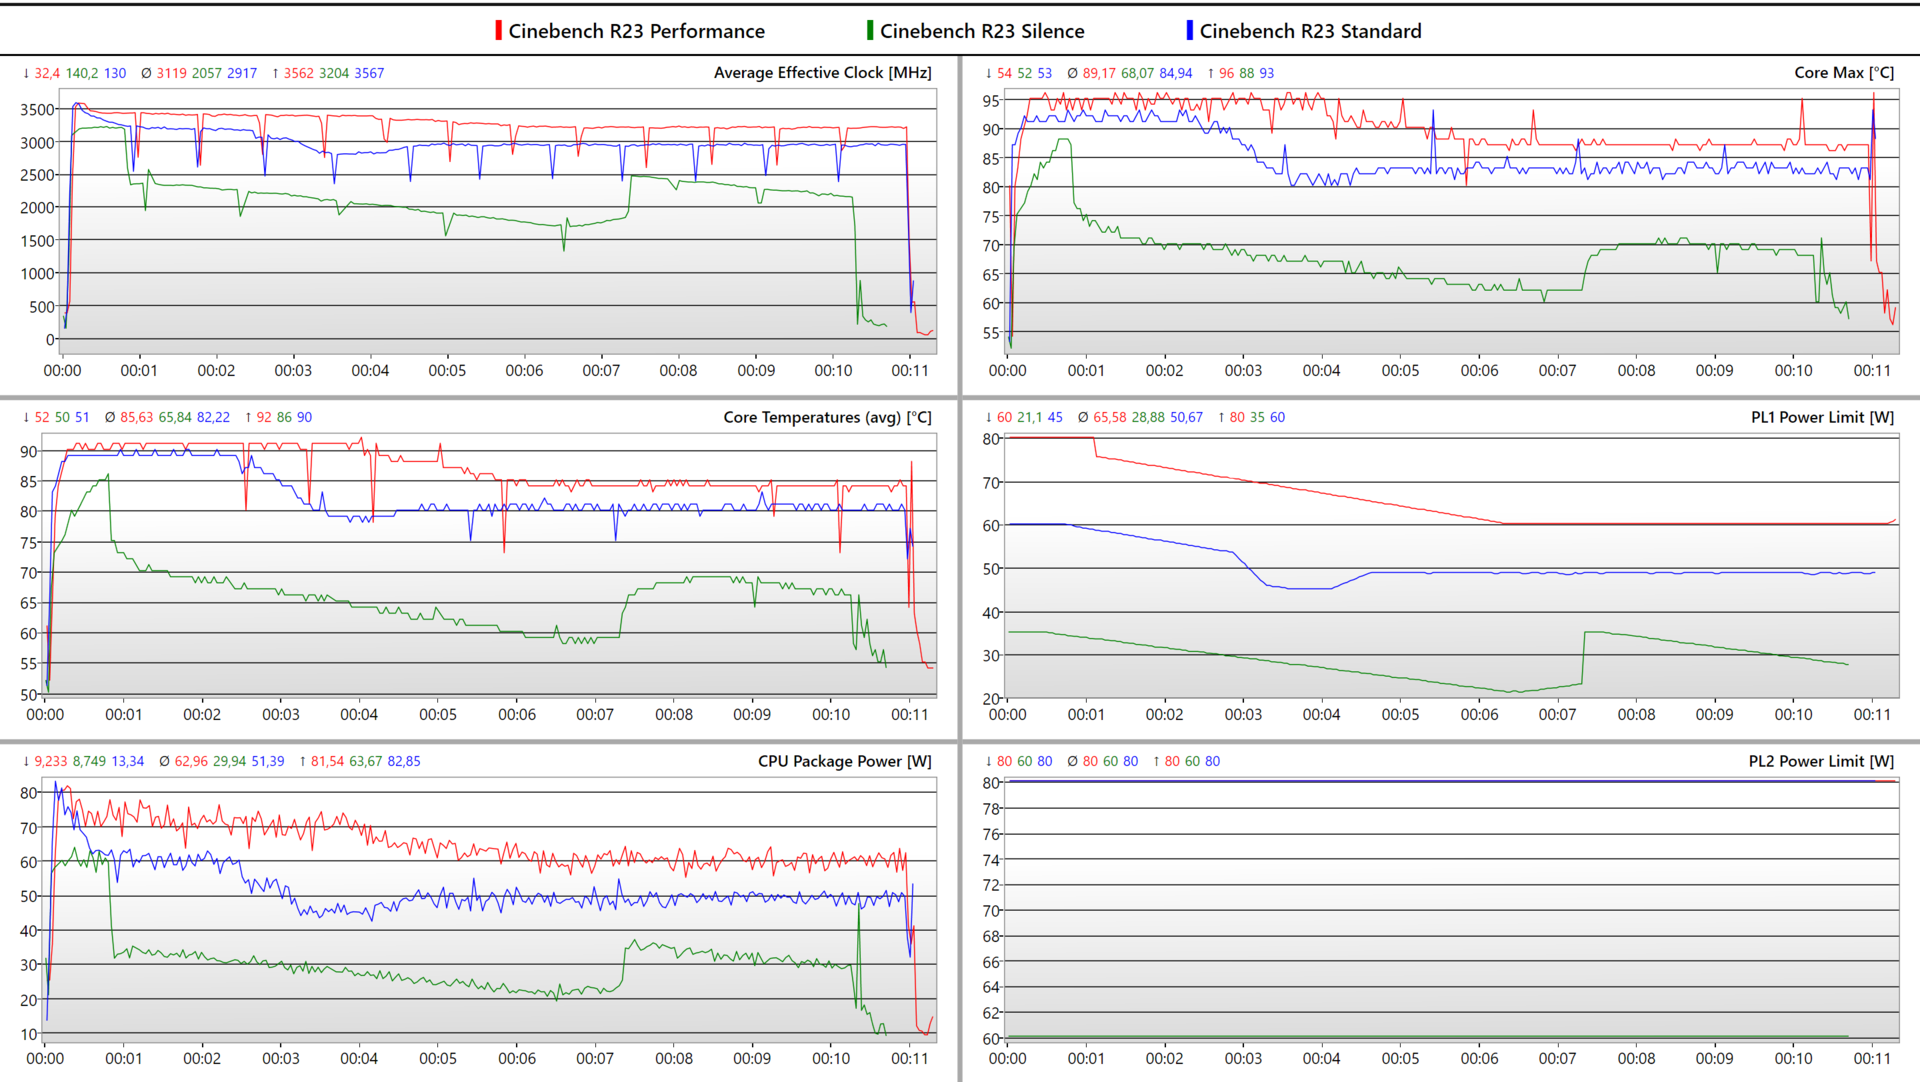
Using the ProArt Creator Hub or MyAsus App, you can select among the three power profiles Performance, Standard, and Silent. None of the profiles allow the processor to maintain its performance constantly. In the Performance and Standard modes, the Boost performance of the i9 is limited to 80 watts, and the Silent mode allows for a PL2 of 60 watts. In the Performance mode, the PL1 of the Intel Core i9-13900H is also 80 watts in the beginning, while it is 60 and 35 watts in the Standard and Silent mode respectively. The PL1 is adjusted dynamically here. During our test, we have to note that the Zenbook is unable to maintain these performances over a longer time period. Within 10 minutes under load, the power limit is reduced in all of the power modes by 10 to 20 watts.
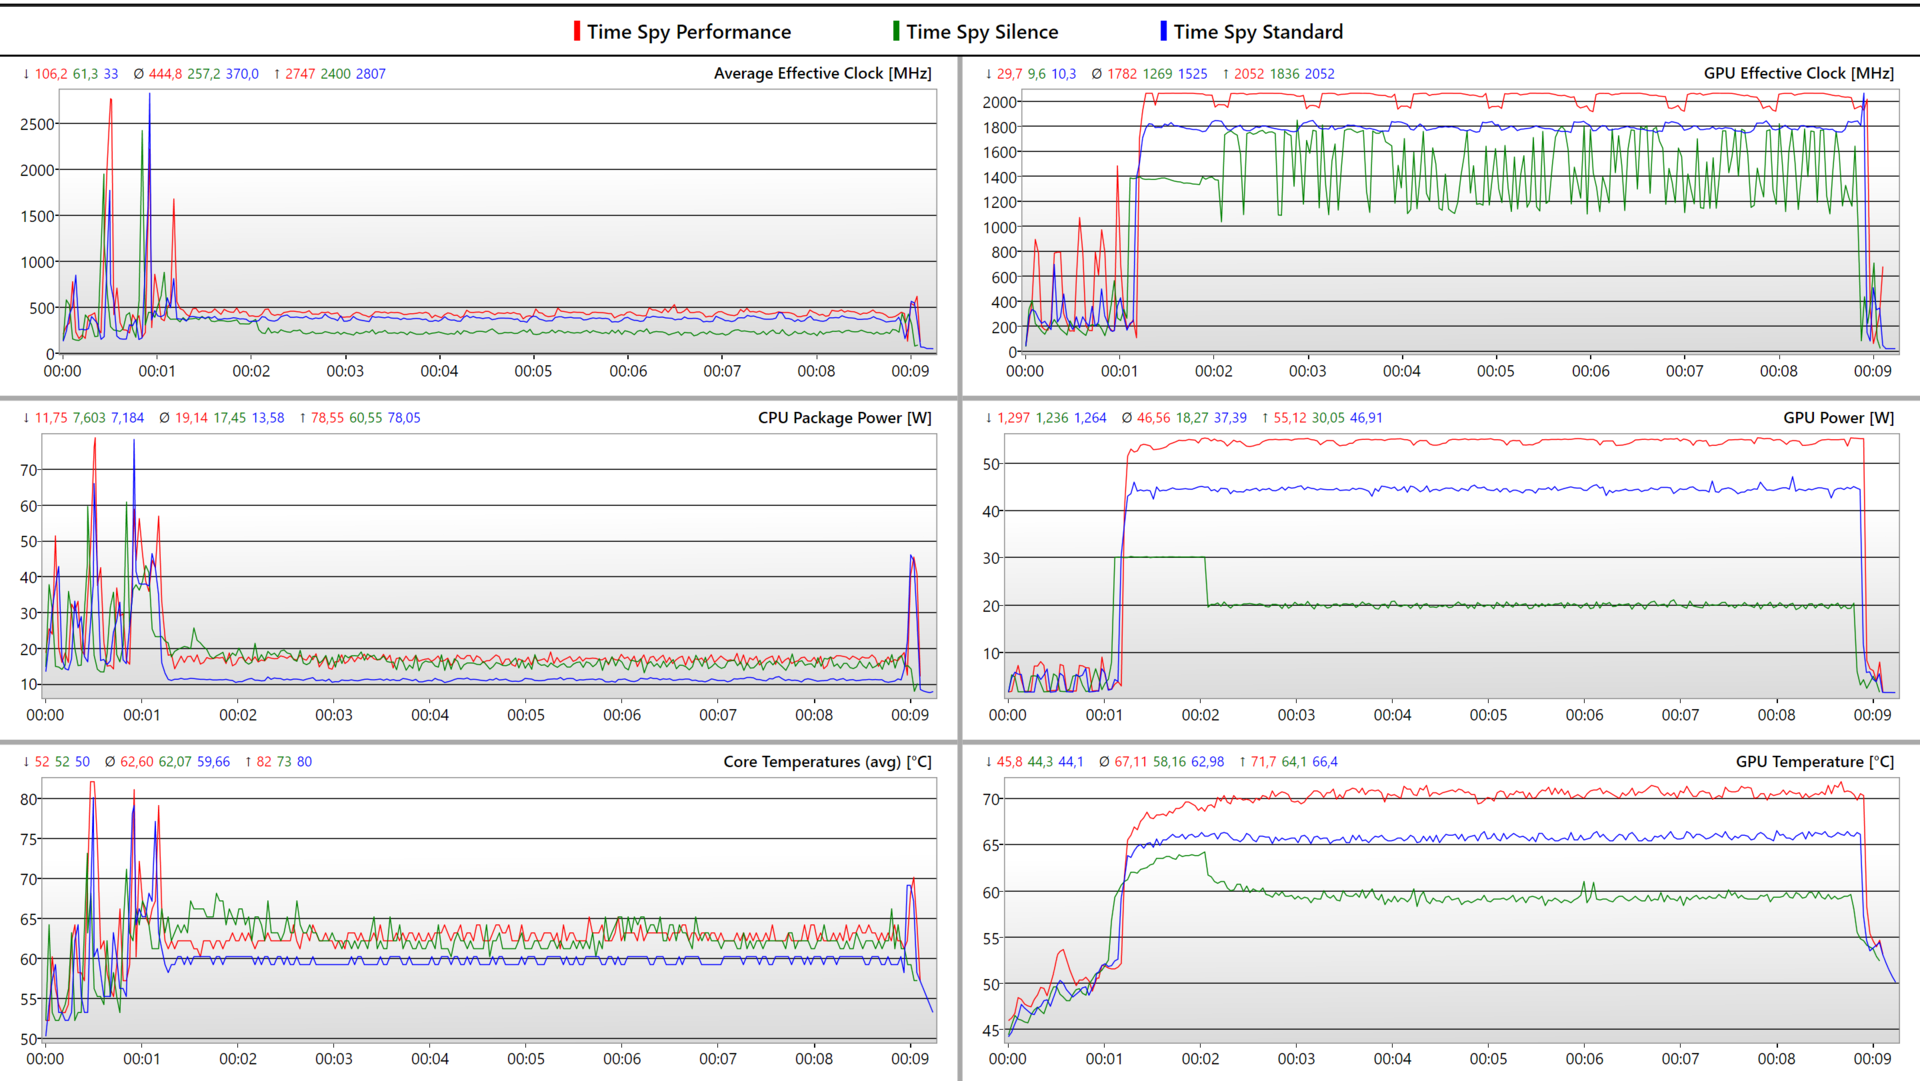
The performance of the RTX 4060 is also controlled by the power management. Depending on the selected power mode, it can consume 55 watts, 45 watts, or 20 watts. Up to 15 watts are drawn by the CPU (Dynamic Power Shift). The logs show that in contrast to the processor, the graphics card is able to constantly maintain its performance.
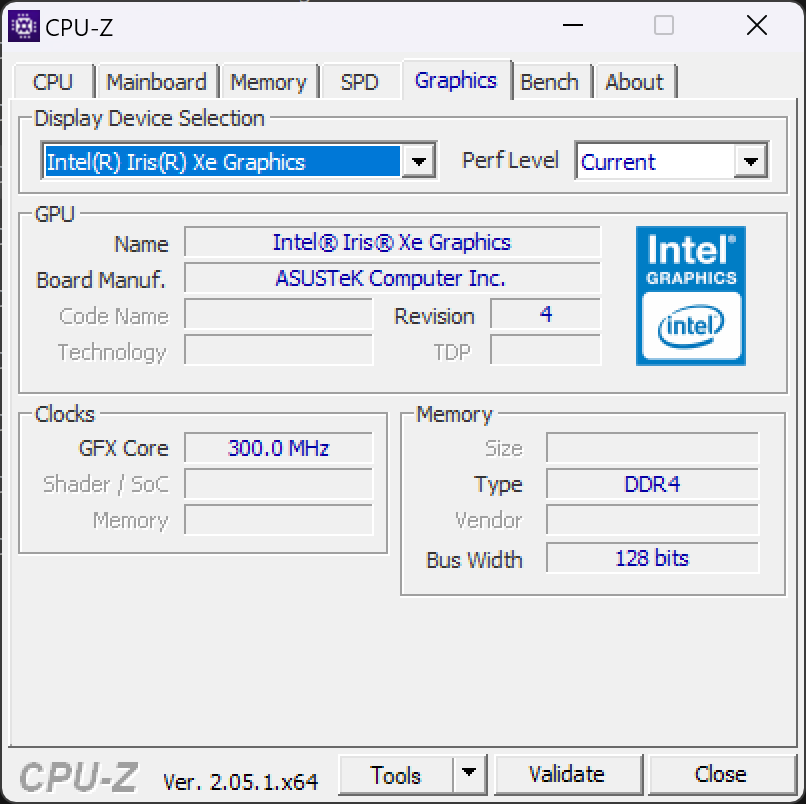
The laptop includes a MUX switch to control the graphics card. The screens can be connected directly to the iGPU of the Core i9 or to the GeForce RTX 4060. This also offers the option to completely turn off the iGPU or the dGPU.
For the benchmarks on the system performance, we decided to use the Standard mode for the laptop, since this demands mainly the Boost performance identical to the Performance mode. The gaming benchmarks were run using the Performance mode, additionally deactivating the iGPU and Screenpad+.
Processor
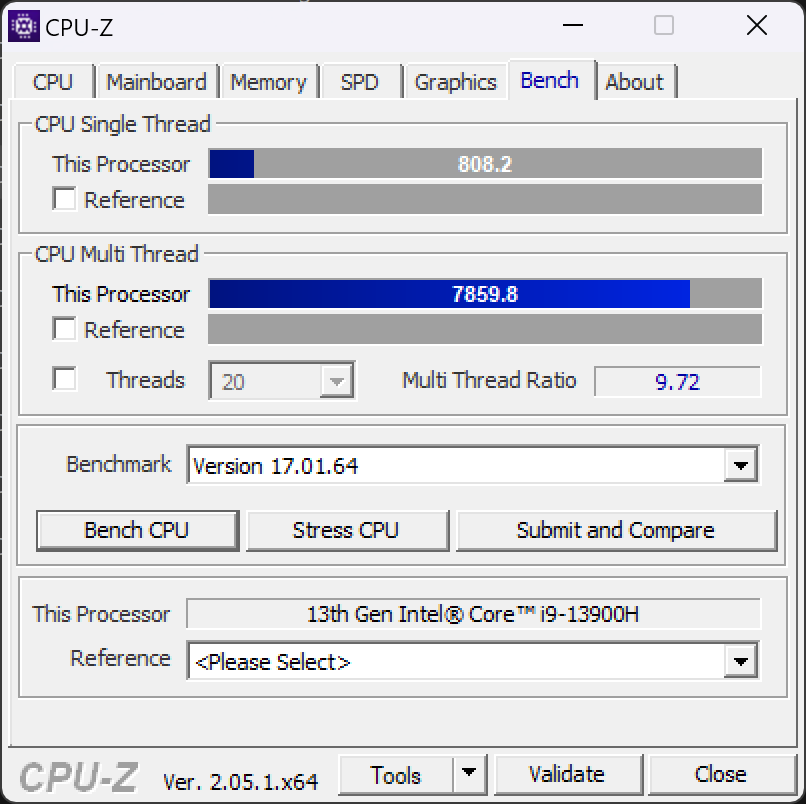
As a high-end CPU of the Raptor Lake H series, the i9-13900H is one of the most powerful CPUs on the market. While the i9 runs at an above average speed during brief load peaks in our test unit, it is unable to maintain this performance in the long run. Regardless of the load level, the otherwise high performance drops slightly after a few minutes. However, with its 20 threads distributed over six P cores and eight E cores, the performance drop is hardly noticeable, and the i9 accomplishes all the outstanding tasks quickly. A factor for the i9-13900H in the Zenbook Pro 14 Duo appearing with an above-average power should also be the fact that, despite its slight throttling, the processor is allowed to consume more than the TDP of 45 watts suggested by Intel.
The comparison of the processor benchmarks gives a fairly clear picture, and we don't see a clear performance advantage coming from the AAS cooling in the Zenbook Pro 14 Duo. For example, the Asus Zenbook Pro 14 OLED delivers a similar computing performance with the same processor hardware even without the special cooling system. But we also have to consider that the benchmarks in that laptop were run using the Performance mode. So in the end, the Intel Core i9-13900H delivers exactly the high performance here that we should be able to expect from the Raptor Lake H series. A clear advantage to Alder Lake is not noticeable with this. The AMD Ryzen 9 7945HX in the Zephyrus Duo 16 is therefore significantly more powerful.
Cinebench R15 Multi Constant Load Test
Cinebench R23: Multi Core | Single Core
Cinebench R20: CPU (Multi Core) | CPU (Single Core)
Cinebench R15: CPU Multi 64Bit | CPU Single 64Bit
Blender: v2.79 BMW27 CPU
7-Zip 18.03: 7z b 4 | 7z b 4 -mmt1
Geekbench 5.5: Multi-Core | Single-Core
HWBOT x265 Benchmark v2.2: 4k Preset
LibreOffice : 20 Documents To PDF
R Benchmark 2.5: Overall mean
| CPU Performance rating | |
| Asus Zephyrus Duo 16 GX650PY-NM006W | |
| Asus Zenbook Pro 14 OLED UX6404VI | |
| Asus ROG Flow Z13 GZ301V | |
| Asus ZenBook Pro 14 Duo UX8402VV-P1021W | |
| Lenovo Yoga Pro 7 14IRH G8 | |
| Acer Predator Triton 300 SE | |
| Average Intel Core i9-13900H | |
| Gigabyte Aero 14 OLED BMF | |
| Average of class Multimedia | |
| Schenker Vision 14 2022 RTX 3050 Ti | |
| Cinebench R23 / Multi Core | |
| Asus Zephyrus Duo 16 GX650PY-NM006W | |
| Asus Zenbook Pro 14 OLED UX6404VI | |
| Asus ROG Flow Z13 GZ301V | |
| Lenovo Yoga Pro 7 14IRH G8 | |
| Asus ZenBook Pro 14 Duo UX8402VV-P1021W | |
| Average Intel Core i9-13900H (11997 - 20385, n=28) | |
| Average of class Multimedia (4861 - 30783, n=81, last 2 years) | |
| Acer Predator Triton 300 SE | |
| Schenker Vision 14 2022 RTX 3050 Ti | |
| Gigabyte Aero 14 OLED BMF | |
| Cinebench R23 / Single Core | |
| Asus Zenbook Pro 14 OLED UX6404VI | |
| Asus ROG Flow Z13 GZ301V | |
| Asus ZenBook Pro 14 Duo UX8402VV-P1021W | |
| Asus Zephyrus Duo 16 GX650PY-NM006W | |
| Acer Predator Triton 300 SE | |
| Average Intel Core i9-13900H (1297 - 2054, n=26) | |
| Lenovo Yoga Pro 7 14IRH G8 | |
| Average of class Multimedia (1128 - 2459, n=73, last 2 years) | |
| Gigabyte Aero 14 OLED BMF | |
| Schenker Vision 14 2022 RTX 3050 Ti | |
| Cinebench R20 / CPU (Multi Core) | |
| Asus Zephyrus Duo 16 GX650PY-NM006W | |
| Asus Zenbook Pro 14 OLED UX6404VI | |
| Asus ROG Flow Z13 GZ301V | |
| Lenovo Yoga Pro 7 14IRH G8 | |
| Asus ZenBook Pro 14 Duo UX8402VV-P1021W | |
| Average Intel Core i9-13900H (4935 - 7716, n=25) | |
| Acer Predator Triton 300 SE | |
| Average of class Multimedia (1887 - 11924, n=63, last 2 years) | |
| Schenker Vision 14 2022 RTX 3050 Ti | |
| Gigabyte Aero 14 OLED BMF | |
| Cinebench R20 / CPU (Single Core) | |
| Asus ROG Flow Z13 GZ301V | |
| Asus Zenbook Pro 14 OLED UX6404VI | |
| Asus ZenBook Pro 14 Duo UX8402VV-P1021W | |
| Asus Zephyrus Duo 16 GX650PY-NM006W | |
| Acer Predator Triton 300 SE | |
| Lenovo Yoga Pro 7 14IRH G8 | |
| Average Intel Core i9-13900H (428 - 792, n=25) | |
| Gigabyte Aero 14 OLED BMF | |
| Schenker Vision 14 2022 RTX 3050 Ti | |
| Average of class Multimedia (420 - 853, n=63, last 2 years) | |
| Cinebench R15 / CPU Multi 64Bit | |
| Asus Zephyrus Duo 16 GX650PY-NM006W | |
| Asus Zenbook Pro 14 OLED UX6404VI | |
| Asus ROG Flow Z13 GZ301V | |
| Asus ZenBook Pro 14 Duo UX8402VV-P1021W | |
| Average Intel Core i9-13900H (2061 - 3100, n=26) | |
| Lenovo Yoga Pro 7 14IRH G8 | |
| Average of class Multimedia (856 - 5224, n=71, last 2 years) | |
| Gigabyte Aero 14 OLED BMF | |
| Acer Predator Triton 300 SE | |
| Schenker Vision 14 2022 RTX 3050 Ti | |
| Cinebench R15 / CPU Single 64Bit | |
| Asus Zephyrus Duo 16 GX650PY-NM006W | |
| Asus Zenbook Pro 14 OLED UX6404VI | |
| Asus ROG Flow Z13 GZ301V | |
| Asus ZenBook Pro 14 Duo UX8402VV-P1021W | |
| Lenovo Yoga Pro 7 14IRH G8 | |
| Acer Predator Triton 300 SE | |
| Average Intel Core i9-13900H (211 - 297, n=26) | |
| Gigabyte Aero 14 OLED BMF | |
| Average of class Multimedia (99.6 - 323, n=66, last 2 years) | |
| Schenker Vision 14 2022 RTX 3050 Ti | |
| Blender / v2.79 BMW27 CPU | |
| Schenker Vision 14 2022 RTX 3050 Ti | |
| Average of class Multimedia (100 - 557, n=65, last 2 years) | |
| Gigabyte Aero 14 OLED BMF | |
| Average Intel Core i9-13900H (166 - 268, n=24) | |
| Acer Predator Triton 300 SE | |
| Lenovo Yoga Pro 7 14IRH G8 | |
| Asus ROG Flow Z13 GZ301V | |
| Asus ZenBook Pro 14 Duo UX8402VV-P1021W | |
| Asus Zenbook Pro 14 OLED UX6404VI | |
| Asus Zephyrus Duo 16 GX650PY-NM006W | |
| 7-Zip 18.03 / 7z b 4 | |
| Asus Zephyrus Duo 16 GX650PY-NM006W | |
| Asus Zenbook Pro 14 OLED UX6404VI | |
| Asus ZenBook Pro 14 Duo UX8402VV-P1021W | |
| Asus ROG Flow Z13 GZ301V | |
| Lenovo Yoga Pro 7 14IRH G8 | |
| Average Intel Core i9-13900H (45045 - 79032, n=25) | |
| Acer Predator Triton 300 SE | |
| Average of class Multimedia (29095 - 130368, n=60, last 2 years) | |
| Gigabyte Aero 14 OLED BMF | |
| Schenker Vision 14 2022 RTX 3050 Ti | |
| 7-Zip 18.03 / 7z b 4 -mmt1 | |
| Asus Zephyrus Duo 16 GX650PY-NM006W | |
| Asus ROG Flow Z13 GZ301V | |
| Asus Zenbook Pro 14 OLED UX6404VI | |
| Asus ZenBook Pro 14 Duo UX8402VV-P1021W | |
| Average Intel Core i9-13900H (3665 - 6600, n=25) | |
| Gigabyte Aero 14 OLED BMF | |
| Lenovo Yoga Pro 7 14IRH G8 | |
| Schenker Vision 14 2022 RTX 3050 Ti | |
| Average of class Multimedia (3666 - 7545, n=60, last 2 years) | |
| Acer Predator Triton 300 SE | |
| Geekbench 5.5 / Multi-Core | |
| Asus Zephyrus Duo 16 GX650PY-NM006W | |
| Asus Zenbook Pro 14 OLED UX6404VI | |
| Asus ROG Flow Z13 GZ301V | |
| Lenovo Yoga Pro 7 14IRH G8 | |
| Acer Predator Triton 300 SE | |
| Asus ZenBook Pro 14 Duo UX8402VV-P1021W | |
| Average Intel Core i9-13900H (9094 - 15410, n=26) | |
| Average of class Multimedia (4652 - 23059, n=64, last 2 years) | |
| Schenker Vision 14 2022 RTX 3050 Ti | |
| Gigabyte Aero 14 OLED BMF | |
| Geekbench 5.5 / Single-Core | |
| Asus Zephyrus Duo 16 GX650PY-NM006W | |
| Asus ROG Flow Z13 GZ301V | |
| Asus Zenbook Pro 14 OLED UX6404VI | |
| Asus ZenBook Pro 14 Duo UX8402VV-P1021W | |
| Average Intel Core i9-13900H (1140 - 2043, n=26) | |
| Average of class Multimedia (805 - 2974, n=64, last 2 years) | |
| Lenovo Yoga Pro 7 14IRH G8 | |
| Gigabyte Aero 14 OLED BMF | |
| Acer Predator Triton 300 SE | |
| Schenker Vision 14 2022 RTX 3050 Ti | |
| HWBOT x265 Benchmark v2.2 / 4k Preset | |
| Asus Zephyrus Duo 16 GX650PY-NM006W | |
| Asus Zenbook Pro 14 OLED UX6404VI | |
| Asus ROG Flow Z13 GZ301V | |
| Lenovo Yoga Pro 7 14IRH G8 | |
| Acer Predator Triton 300 SE | |
| Average Intel Core i9-13900H (14.1 - 22.3, n=25) | |
| Asus ZenBook Pro 14 Duo UX8402VV-P1021W | |
| Average of class Multimedia (5.26 - 34.3, n=60, last 2 years) | |
| Gigabyte Aero 14 OLED BMF | |
| Schenker Vision 14 2022 RTX 3050 Ti | |
| LibreOffice / 20 Documents To PDF | |
| Asus Zephyrus Duo 16 GX650PY-NM006W | |
| Average of class Multimedia (23.9 - 146.7, n=61, last 2 years) | |
| Average Intel Core i9-13900H (34.4 - 82.8, n=25) | |
| Lenovo Yoga Pro 7 14IRH G8 | |
| Asus Zenbook Pro 14 OLED UX6404VI | |
| Schenker Vision 14 2022 RTX 3050 Ti | |
| Acer Predator Triton 300 SE | |
| Gigabyte Aero 14 OLED BMF | |
| Asus ZenBook Pro 14 Duo UX8402VV-P1021W | |
| Asus ROG Flow Z13 GZ301V | |
| R Benchmark 2.5 / Overall mean | |
| Average of class Multimedia (0.3604 - 0.947, n=60, last 2 years) | |
| Schenker Vision 14 2022 RTX 3050 Ti | |
| Average Intel Core i9-13900H (0.4052 - 0.723, n=25) | |
| Gigabyte Aero 14 OLED BMF | |
| Asus ZenBook Pro 14 Duo UX8402VV-P1021W | |
| Lenovo Yoga Pro 7 14IRH G8 | |
| Acer Predator Triton 300 SE | |
| Asus Zenbook Pro 14 OLED UX6404VI | |
| Asus ROG Flow Z13 GZ301V | |
| Asus Zephyrus Duo 16 GX650PY-NM006W | |
* ... smaller is better
AIDA64: FP32 Ray-Trace | FPU Julia | CPU SHA3 | CPU Queen | FPU SinJulia | FPU Mandel | CPU AES | CPU ZLib | FP64 Ray-Trace | CPU PhotoWorxx
| Performance rating | |
| Asus Zenbook Pro 14 OLED UX6404VI | |
| Acer Predator Triton 300 SE | |
| Asus ROG Flow Z13 GZ301V | |
| Average of class Multimedia | |
| Average Intel Core i9-13900H | |
| Lenovo Yoga Pro 7 14IRH G8 | |
| Gigabyte Aero 14 OLED BMF | |
| Asus ZenBook Pro 14 Duo UX8402VV-P1021W | |
| Schenker Vision 14 2022 RTX 3050 Ti | |
| AIDA64 / FP32 Ray-Trace | |
| Average of class Multimedia (5121 - 50388, n=57, last 2 years) | |
| Asus Zenbook Pro 14 OLED UX6404VI | |
| Asus ROG Flow Z13 GZ301V | |
| Acer Predator Triton 300 SE | |
| Average Intel Core i9-13900H (6788 - 19557, n=25) | |
| Asus ZenBook Pro 14 Duo UX8402VV-P1021W | |
| Lenovo Yoga Pro 7 14IRH G8 | |
| Gigabyte Aero 14 OLED BMF | |
| Schenker Vision 14 2022 RTX 3050 Ti | |
| AIDA64 / FPU Julia | |
| Asus Zenbook Pro 14 OLED UX6404VI | |
| Average of class Multimedia (14528 - 201874, n=58, last 2 years) | |
| Asus ROG Flow Z13 GZ301V | |
| Average Intel Core i9-13900H (22551 - 95579, n=25) | |
| Acer Predator Triton 300 SE | |
| Lenovo Yoga Pro 7 14IRH G8 | |
| Asus ZenBook Pro 14 Duo UX8402VV-P1021W | |
| Gigabyte Aero 14 OLED BMF | |
| Schenker Vision 14 2022 RTX 3050 Ti | |
| AIDA64 / CPU SHA3 | |
| Asus Zenbook Pro 14 OLED UX6404VI | |
| Average of class Multimedia (1188 - 8623, n=58, last 2 years) | |
| Acer Predator Triton 300 SE | |
| Average Intel Core i9-13900H (2491 - 4270, n=25) | |
| Asus ROG Flow Z13 GZ301V | |
| Lenovo Yoga Pro 7 14IRH G8 | |
| Asus ZenBook Pro 14 Duo UX8402VV-P1021W | |
| Gigabyte Aero 14 OLED BMF | |
| Schenker Vision 14 2022 RTX 3050 Ti | |
| AIDA64 / CPU Queen | |
| Asus Zenbook Pro 14 OLED UX6404VI | |
| Asus ROG Flow Z13 GZ301V | |
| Acer Predator Triton 300 SE | |
| Asus ZenBook Pro 14 Duo UX8402VV-P1021W | |
| Gigabyte Aero 14 OLED BMF | |
| Lenovo Yoga Pro 7 14IRH G8 | |
| Average Intel Core i9-13900H (65121 - 120936, n=25) | |
| Schenker Vision 14 2022 RTX 3050 Ti | |
| Average of class Multimedia (21547 - 181505, n=58, last 2 years) | |
| AIDA64 / FPU SinJulia | |
| Asus Zenbook Pro 14 OLED UX6404VI | |
| Asus ROG Flow Z13 GZ301V | |
| Average of class Multimedia (1240 - 28794, n=58, last 2 years) | |
| Lenovo Yoga Pro 7 14IRH G8 | |
| Acer Predator Triton 300 SE | |
| Average Intel Core i9-13900H (6108 - 11631, n=25) | |
| Asus ZenBook Pro 14 Duo UX8402VV-P1021W | |
| Gigabyte Aero 14 OLED BMF | |
| Schenker Vision 14 2022 RTX 3050 Ti | |
| AIDA64 / FPU Mandel | |
| Asus Zenbook Pro 14 OLED UX6404VI | |
| Average of class Multimedia (9903 - 105740, n=57, last 2 years) | |
| Asus ROG Flow Z13 GZ301V | |
| Average Intel Core i9-13900H (11283 - 48474, n=25) | |
| Acer Predator Triton 300 SE | |
| Lenovo Yoga Pro 7 14IRH G8 | |
| Asus ZenBook Pro 14 Duo UX8402VV-P1021W | |
| Gigabyte Aero 14 OLED BMF | |
| Schenker Vision 14 2022 RTX 3050 Ti | |
| AIDA64 / CPU AES | |
| Acer Predator Triton 300 SE | |
| Gigabyte Aero 14 OLED BMF | |
| Average Intel Core i9-13900H (3691 - 149377, n=25) | |
| Asus Zenbook Pro 14 OLED UX6404VI | |
| Average of class Multimedia (26066 - 169946, n=58, last 2 years) | |
| Lenovo Yoga Pro 7 14IRH G8 | |
| Asus ROG Flow Z13 GZ301V | |
| Schenker Vision 14 2022 RTX 3050 Ti | |
| Asus ZenBook Pro 14 Duo UX8402VV-P1021W | |
| AIDA64 / CPU ZLib | |
| Asus Zenbook Pro 14 OLED UX6404VI | |
| Lenovo Yoga Pro 7 14IRH G8 | |
| Asus ROG Flow Z13 GZ301V | |
| Average Intel Core i9-13900H (789 - 1254, n=25) | |
| Acer Predator Triton 300 SE | |
| Average of class Multimedia (440 - 2022, n=58, last 2 years) | |
| Schenker Vision 14 2022 RTX 3050 Ti | |
| Asus ZenBook Pro 14 Duo UX8402VV-P1021W | |
| Gigabyte Aero 14 OLED BMF | |
| AIDA64 / FP64 Ray-Trace | |
| Average of class Multimedia (2759 - 26875, n=58, last 2 years) | |
| Asus Zenbook Pro 14 OLED UX6404VI | |
| Asus ROG Flow Z13 GZ301V | |
| Average Intel Core i9-13900H (3655 - 10716, n=25) | |
| Acer Predator Triton 300 SE | |
| Asus ZenBook Pro 14 Duo UX8402VV-P1021W | |
| Lenovo Yoga Pro 7 14IRH G8 | |
| Gigabyte Aero 14 OLED BMF | |
| Schenker Vision 14 2022 RTX 3050 Ti | |
| AIDA64 / CPU PhotoWorxx | |
| Gigabyte Aero 14 OLED BMF | |
| Acer Predator Triton 300 SE | |
| Average of class Multimedia (12860 - 65787, n=58, last 2 years) | |
| Asus ROG Flow Z13 GZ301V | |
| Asus Zenbook Pro 14 OLED UX6404VI | |
| Lenovo Yoga Pro 7 14IRH G8 | |
| Asus ZenBook Pro 14 Duo UX8402VV-P1021W | |
| Average Intel Core i9-13900H (10871 - 50488, n=25) | |
| Schenker Vision 14 2022 RTX 3050 Ti | |
System Performance
In the benchmarks on the system performance with PCMark10 and Crossmark, the Zenbook Pro 14 Duo doesn't show any weaknesses, delivering very good results in all the sub-disciplines. What stands out more here is another laptop in our comparison. The Acer Predator Triton 300 SE, which is smaller, lighter, and equipped with supposedly weaker hardware from the previous generation, is able to place ahead of our Asus test unit again and again. With higher TGP and TDP values, Acer is able to squeeze out a significantly higher performance from the processors and graphics chips. On the other hand, the Acer laptop also has a considerably higher power consumption with this.
CrossMark: Overall | Productivity | Creativity | Responsiveness
| PCMark 10 / Score | |
| Asus Zephyrus Duo 16 GX650PY-NM006W | |
| Average Intel Core i9-13900H, NVIDIA GeForce RTX 4060 Laptop GPU (7578 - 7884, n=3) | |
| Acer Predator Triton 300 SE | |
| Asus ZenBook Pro 14 Duo UX8402VV-P1021W | |
| Lenovo Yoga Pro 7 14IRH G8 | |
| Gigabyte Aero 14 OLED BMF | |
| Average of class Multimedia (4325 - 8670, n=54, last 2 years) | |
| Schenker Vision 14 2022 RTX 3050 Ti | |
| Asus Zenbook Pro 14 Duo OLED UX8402ZA | |
| Asus VivoBook S 14X S5402Z | |
| PCMark 10 / Essentials | |
| Asus Zephyrus Duo 16 GX650PY-NM006W | |
| Gigabyte Aero 14 OLED BMF | |
| Average Intel Core i9-13900H, NVIDIA GeForce RTX 4060 Laptop GPU (11235 - 11539, n=3) | |
| Asus ZenBook Pro 14 Duo UX8402VV-P1021W | |
| Acer Predator Triton 300 SE | |
| Asus Zenbook Pro 14 Duo OLED UX8402ZA | |
| Lenovo Yoga Pro 7 14IRH G8 | |
| Asus VivoBook S 14X S5402Z | |
| Average of class Multimedia (8025 - 12420, n=54, last 2 years) | |
| Schenker Vision 14 2022 RTX 3050 Ti | |
| PCMark 10 / Productivity | |
| Asus Zephyrus Duo 16 GX650PY-NM006W | |
| Acer Predator Triton 300 SE | |
| Average Intel Core i9-13900H, NVIDIA GeForce RTX 4060 Laptop GPU (9888 - 10222, n=3) | |
| Asus ZenBook Pro 14 Duo UX8402VV-P1021W | |
| Gigabyte Aero 14 OLED BMF | |
| Lenovo Yoga Pro 7 14IRH G8 | |
| Average of class Multimedia (6763 - 10615, n=54, last 2 years) | |
| Schenker Vision 14 2022 RTX 3050 Ti | |
| Asus VivoBook S 14X S5402Z | |
| Asus Zenbook Pro 14 Duo OLED UX8402ZA | |
| PCMark 10 / Digital Content Creation | |
| Asus Zephyrus Duo 16 GX650PY-NM006W | |
| Average Intel Core i9-13900H, NVIDIA GeForce RTX 4060 Laptop GPU (10418 - 11272, n=3) | |
| Acer Predator Triton 300 SE | |
| Asus ZenBook Pro 14 Duo UX8402VV-P1021W | |
| Lenovo Yoga Pro 7 14IRH G8 | |
| Gigabyte Aero 14 OLED BMF | |
| Average of class Multimedia (3651 - 15438, n=54, last 2 years) | |
| Schenker Vision 14 2022 RTX 3050 Ti | |
| Asus Zenbook Pro 14 Duo OLED UX8402ZA | |
| Asus VivoBook S 14X S5402Z | |
| CrossMark / Overall | |
| Asus Zephyrus Duo 16 GX650PY-NM006W | |
| Acer Predator Triton 300 SE | |
| Average Intel Core i9-13900H, NVIDIA GeForce RTX 4060 Laptop GPU (1874 - 1983, n=3) | |
| Asus ZenBook Pro 14 Duo UX8402VV-P1021W | |
| Gigabyte Aero 14 OLED BMF | |
| Asus Zenbook Pro 14 Duo OLED UX8402ZA | |
| Lenovo Yoga Pro 7 14IRH G8 | |
| Average of class Multimedia (866 - 2426, n=65, last 2 years) | |
| Schenker Vision 14 2022 RTX 3050 Ti | |
| Asus VivoBook S 14X S5402Z | |
| CrossMark / Productivity | |
| Asus Zephyrus Duo 16 GX650PY-NM006W | |
| Acer Predator Triton 300 SE | |
| Average Intel Core i9-13900H, NVIDIA GeForce RTX 4060 Laptop GPU (1779 - 1889, n=3) | |
| Gigabyte Aero 14 OLED BMF | |
| Asus ZenBook Pro 14 Duo UX8402VV-P1021W | |
| Asus Zenbook Pro 14 Duo OLED UX8402ZA | |
| Lenovo Yoga Pro 7 14IRH G8 | |
| Average of class Multimedia (913 - 2344, n=65, last 2 years) | |
| Schenker Vision 14 2022 RTX 3050 Ti | |
| Asus VivoBook S 14X S5402Z | |
| CrossMark / Creativity | |
| Asus Zephyrus Duo 16 GX650PY-NM006W | |
| Average Intel Core i9-13900H, NVIDIA GeForce RTX 4060 Laptop GPU (2104 - 2195, n=3) | |
| Acer Predator Triton 300 SE | |
| Asus ZenBook Pro 14 Duo UX8402VV-P1021W | |
| Lenovo Yoga Pro 7 14IRH G8 | |
| Asus Zenbook Pro 14 Duo OLED UX8402ZA | |
| Average of class Multimedia (907 - 2820, n=65, last 2 years) | |
| Gigabyte Aero 14 OLED BMF | |
| Schenker Vision 14 2022 RTX 3050 Ti | |
| Asus VivoBook S 14X S5402Z | |
| CrossMark / Responsiveness | |
| Acer Predator Triton 300 SE | |
| Gigabyte Aero 14 OLED BMF | |
| Asus Zephyrus Duo 16 GX650PY-NM006W | |
| Average Intel Core i9-13900H, NVIDIA GeForce RTX 4060 Laptop GPU (1548 - 1698, n=3) | |
| Asus ZenBook Pro 14 Duo UX8402VV-P1021W | |
| Asus Zenbook Pro 14 Duo OLED UX8402ZA | |
| Schenker Vision 14 2022 RTX 3050 Ti | |
| Average of class Multimedia (605 - 2094, n=65, last 2 years) | |
| Lenovo Yoga Pro 7 14IRH G8 | |
| Asus VivoBook S 14X S5402Z | |
| PCMark 10 Score | 7578 points | |
Help | ||
| AIDA64 / Memory Copy | |
| Average of class Multimedia (21158 - 109252, n=58, last 2 years) | |
| Average Intel Core i9-13900H (37448 - 74486, n=25) | |
| Asus ZenBook Pro 14 Duo UX8402VV-P1021W | |
| AIDA64 / Memory Read | |
| Average of class Multimedia (24312 - 125604, n=58, last 2 years) | |
| Average Intel Core i9-13900H (41599 - 75433, n=25) | |
| Asus ZenBook Pro 14 Duo UX8402VV-P1021W | |
| AIDA64 / Memory Write | |
| Average of class Multimedia (24382 - 117933, n=58, last 2 years) | |
| Asus ZenBook Pro 14 Duo UX8402VV-P1021W | |
| Average Intel Core i9-13900H (36152 - 88505, n=25) | |
| AIDA64 / Memory Latency | |
| Average of class Multimedia (7 - 346, n=58, last 2 years) | |
| Asus ZenBook Pro 14 Duo UX8402VV-P1021W | |
| Average Intel Core i9-13900H (75.8 - 102.3, n=25) | |
* ... smaller is better
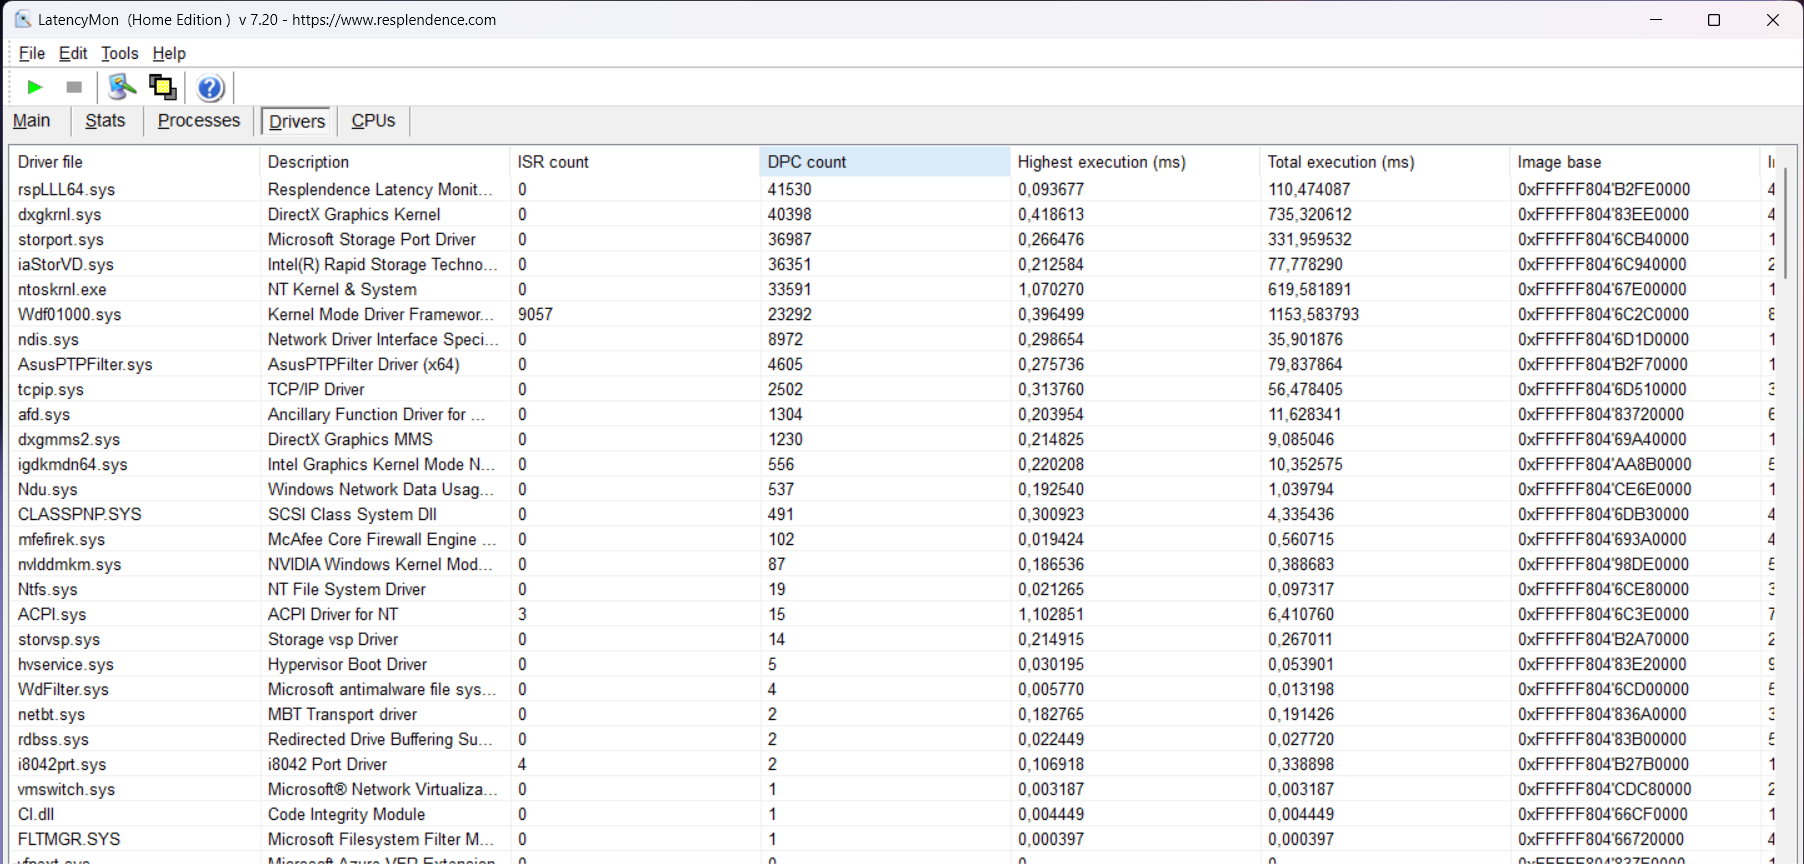
DPC Latencies
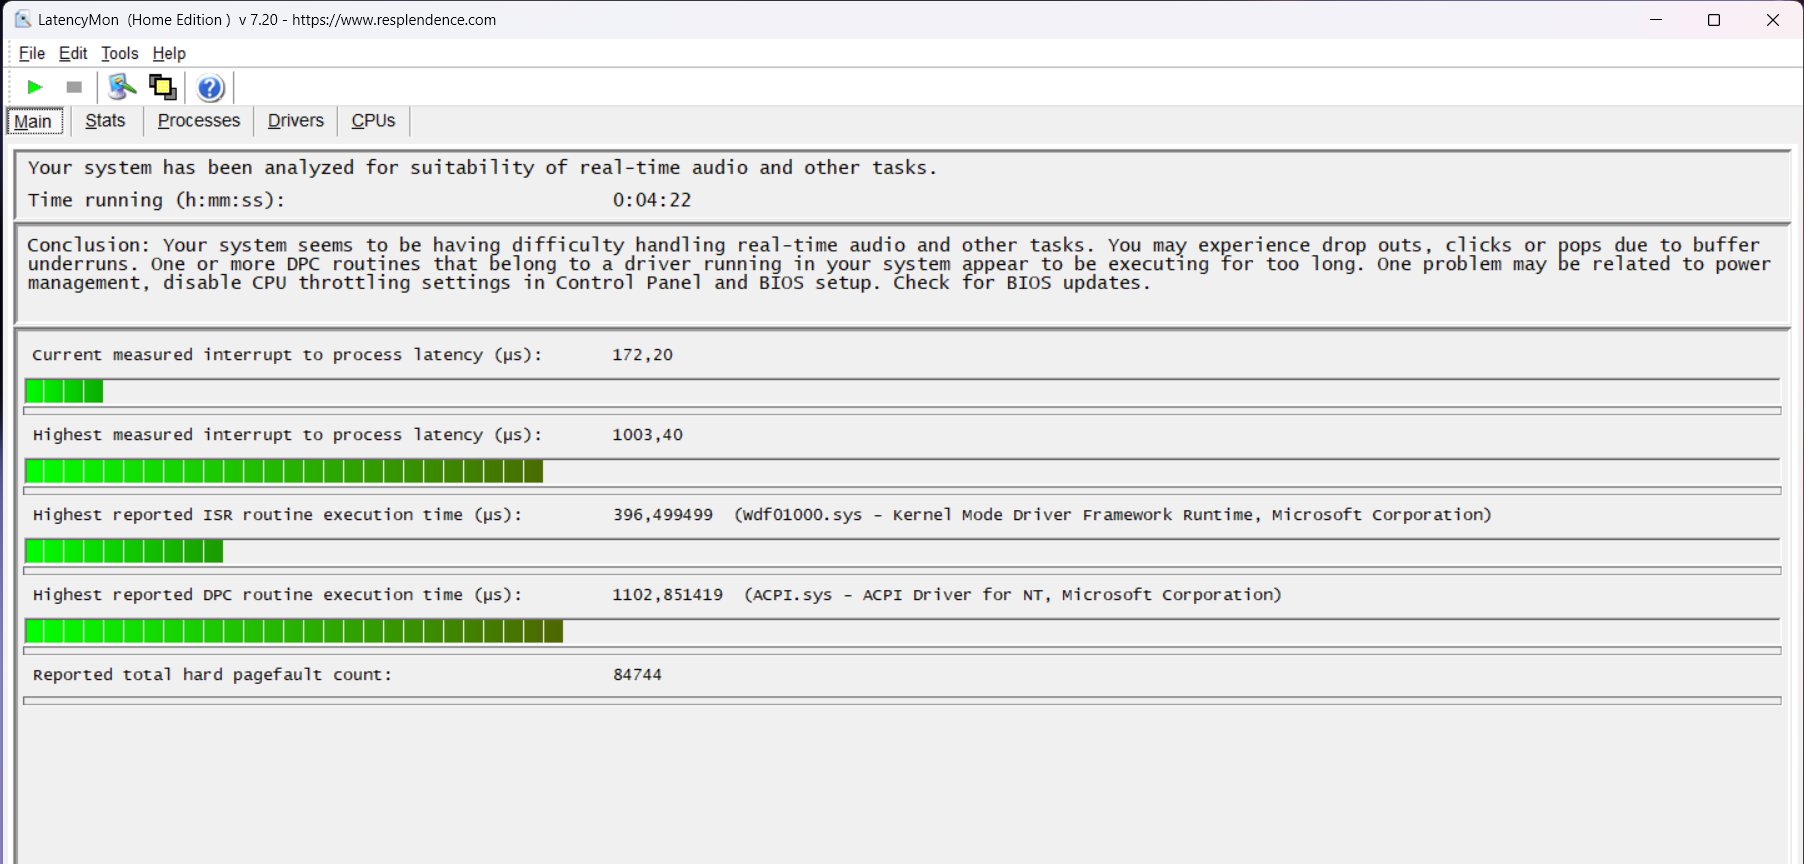
With the drivers that are current at the time of this test, the DPC latencies of the Asus Zenbook Pro 14 Duo fall into a range that can lead to problems with real-time video and audio applications. In audio applications, the latencies of 1003 µs could lead to audible stutters.
| DPC Latencies / LatencyMon - interrupt to process latency (max), Web, Youtube, Prime95 | |
| Asus ROG Flow Z13 GZ301V | |
| Asus Zephyrus Duo 16 GX650PY-NM006W | |
| Acer Predator Triton 300 SE | |
| Gigabyte Aero 14 OLED BMF | |
| Asus Zenbook Pro 14 OLED UX6404VI | |
| Asus ZenBook Pro 14 Duo UX8402VV-P1021W | |
| Lenovo Yoga Pro 7 14IRH G8 | |
| Schenker Vision 14 2022 RTX 3050 Ti | |
* ... smaller is better
Storage Solution
The Samsung PM9A1 with 2 TB of storage capacity used here is able to maintain its high performance even over long time periods. In the DiskSpd loop, the results vary by only 1%. However, we also notice that the behavior of the SSD differs significantly here from other laptops we tested so far that also used this SSD. During the random read and write access tests, the storage solution is considerably slower in our test unit than the average of the tested Samsung PM9A1 in our benchmark list of SSDs and HDDs. Possibly, Samsung might use some different RAM chips or storage controllers than before.

* ... smaller is better
Disk Throttling: DiskSpd Read Loop, Queue Depth 8
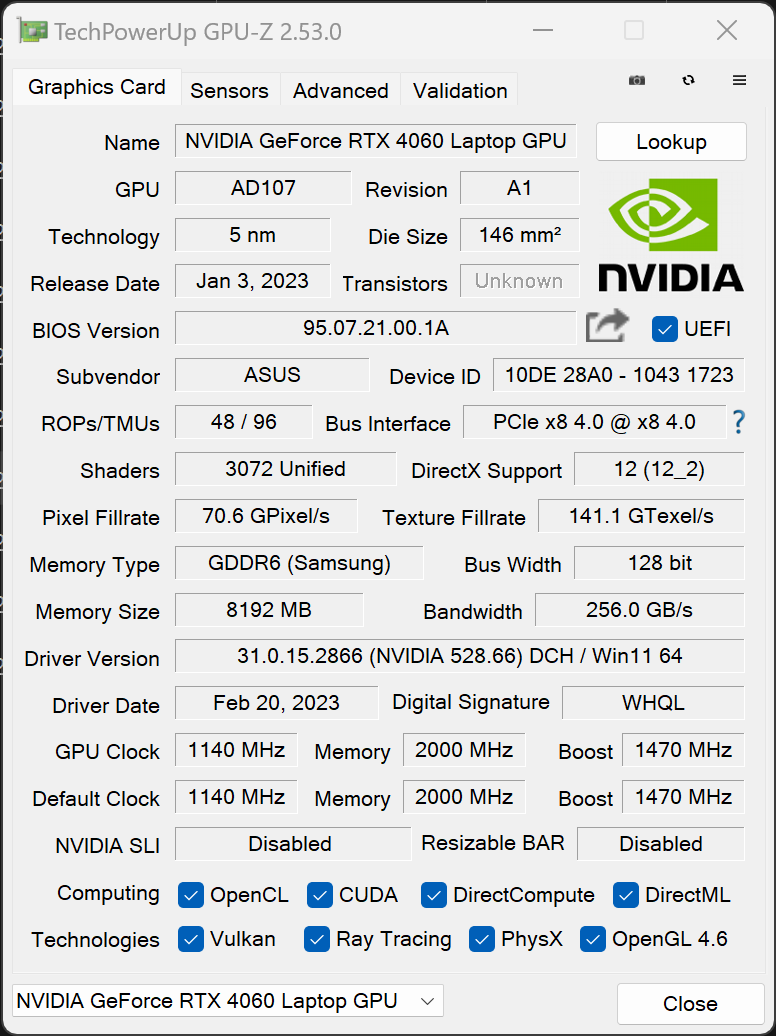
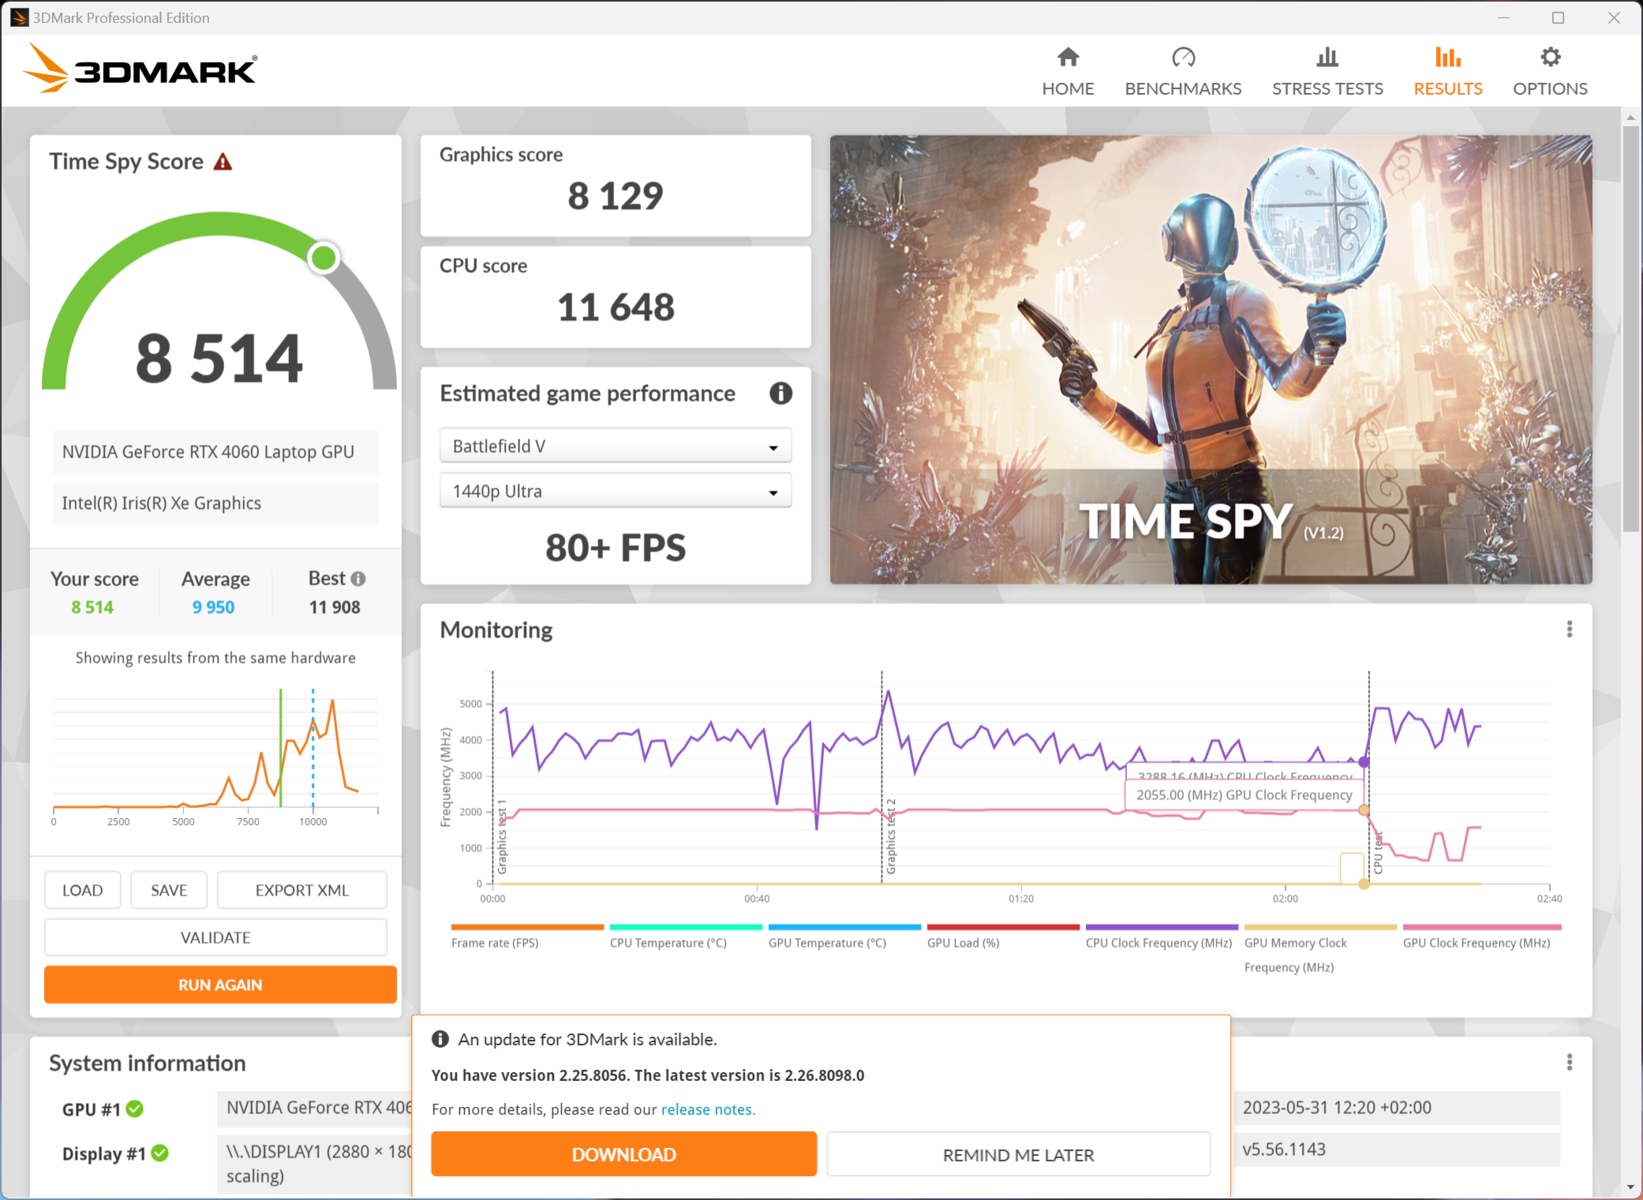
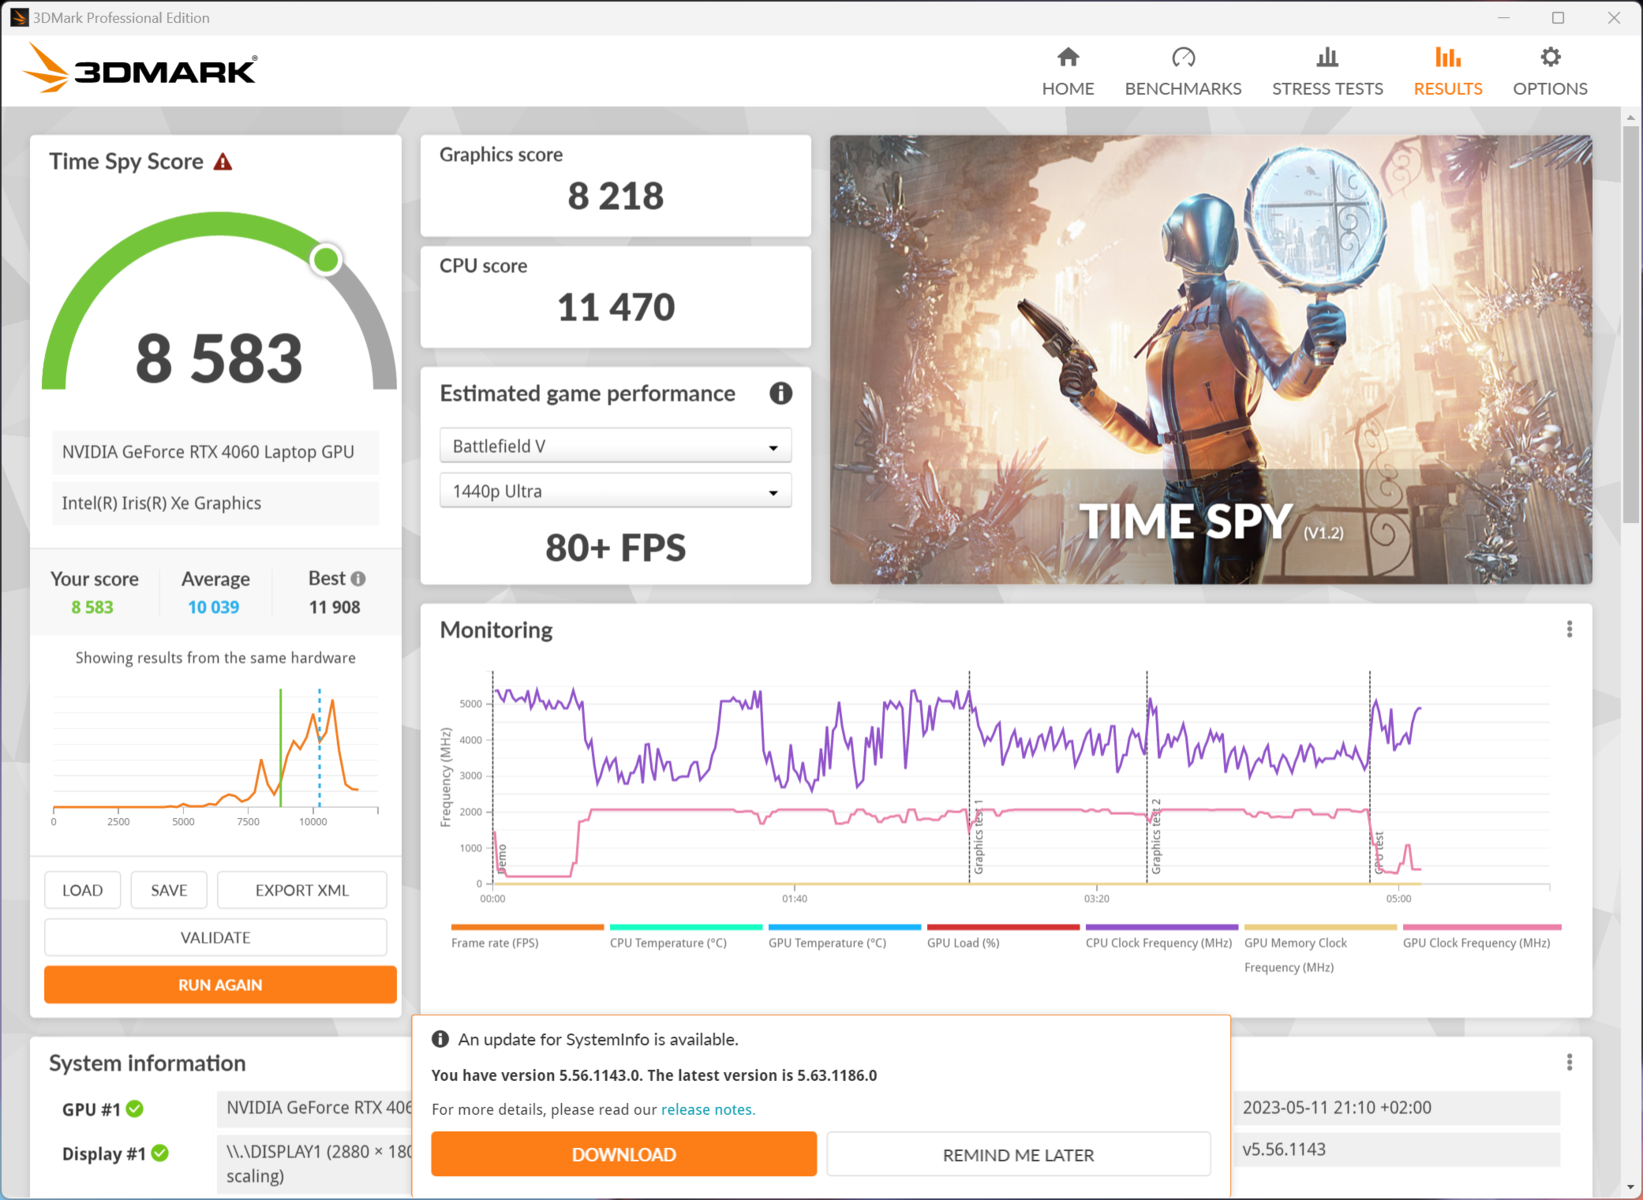
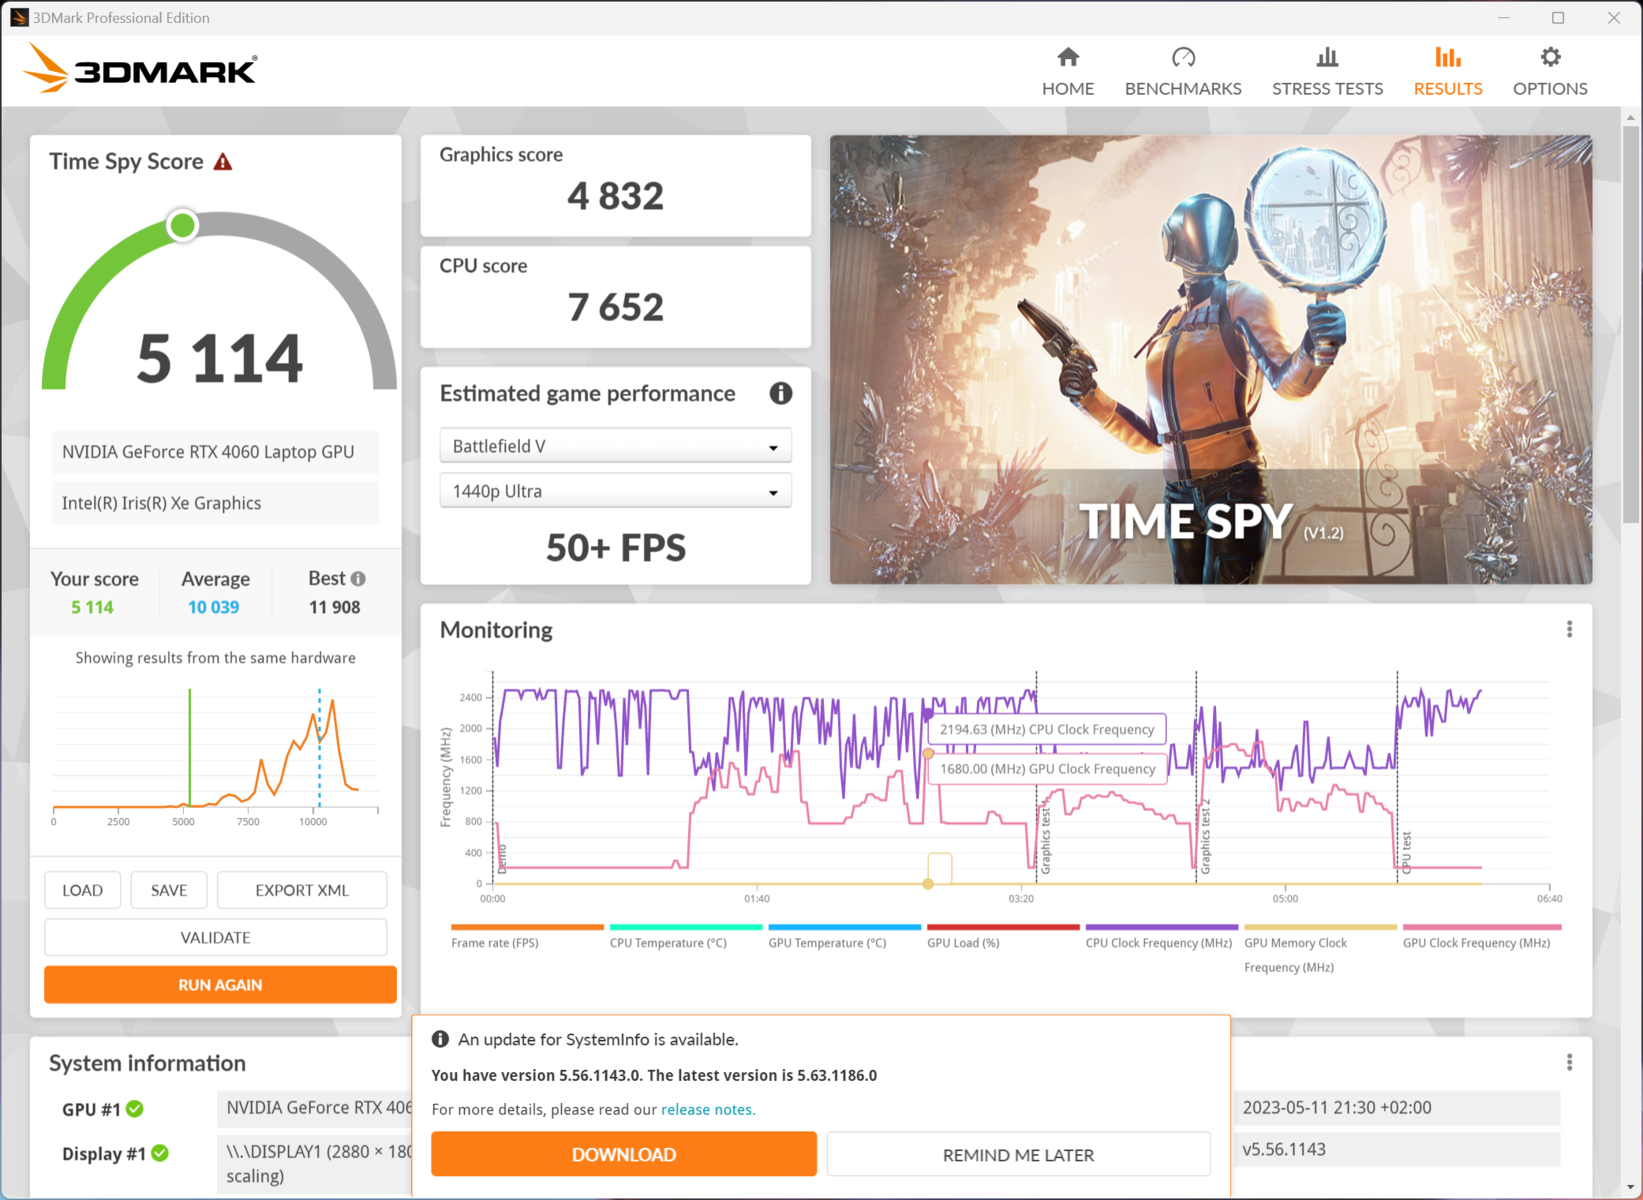
Graphics Card
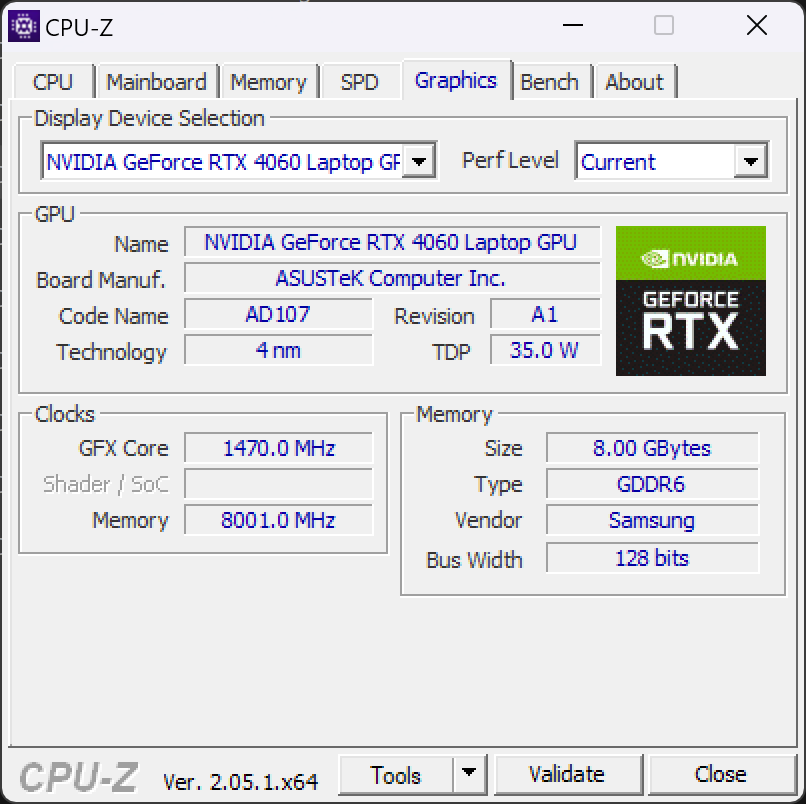
Our test configuration is equipped with the Nvidia GeForce RTX4060, which is currently the most powerful graphics chip in the Asus Zenbook Pro 14 Duo. The chip is able to consume a maximum of 55 watts in our test unit. Due to the MUX switch, the GeForce RTX 4060 can either run alone or together with the iGPU of the Intel Core i9. The midrange chip from Nvidia's Ada Lovelace generation is significantly more efficient than its predecessors. So the 4060 in the Zenbook is at least equal to the 3060 in the Acer Predator Triton 300 SE, although that is able to consume 40 watts more power. However, in battery operation, the graphics card only delivers half the performance that it can provide in mains operation.
| 3DMark 11 Performance | 27133 points | |
| 3DMark Ice Storm Standard Score | 155098 points | |
| 3DMark Cloud Gate Standard Score | 58342 points | |
| 3DMark Fire Strike Score | 19869 points | |
| 3DMark Time Spy Score | 8514 points | |
Help | ||
* ... smaller is better
Gaming Performance
The Zenbook Pro 14 Duo is suitable for HD games almost without any limitations in our test. But with only 8 GB of graphics storage, the most current games could create some problems even in low resolutions. In the native display resolution, at least more than 30 FPS are possible in many games, while raytracing clearly shows the limits of the midrange GPU. So overall, the laptop is also suitable for gaming, but a pure gaming laptop should be able to deliver a significantly higher performance.
| low | med. | high | ultra | QHD | 4K | |
|---|---|---|---|---|---|---|
| GTA V (2015) | 183.5 | 153.7 | 86.5 | 64.9 | 60.1 | |
| The Witcher 3 (2015) | 333 | 176.4 | 163.5 | 143.2 | ||
| Dota 2 Reborn (2015) | 188.8 | 166.9 | 161.7 | 144.9 | 95.3 | |
| Final Fantasy XV Benchmark (2018) | 171 | 116.9 | 84 | 61 | 34.3 | |
| X-Plane 11.11 (2018) | 154.9 | 135 | 105.4 | 95.2 | ||
| Strange Brigade (2018) | 420 | 226 | 181.8 | 155.2 | ||
| F1 22 (2022) | 199.2 | 189.2 | 145.5 | 52.4 |
Emissions - The AAS cooling gets loud
Noise Levels
By using various power profiles, you can switch between a very quiet or very powerful but also loud laptop. In the Performance mode, we determine a maximum noise level of more than 60 dB(A) at a distance of 15 cm (~6 in). The fan noise sounds significantly louder in front of the laptop than with other laptops. This is probably due to the AAS system, where we feel a significantly stronger air stream on the sides of the laptop than with many other laptops when they have to produce their top performance.
On the other hand, the Zenbook almost always remains very quiet in everyday operation, and only when the graphics card and processor of the laptop have to deliver their full performance do the fans rev up to their full speed. Under medium load, we measure only a whisper-quiet 32 dB(A).
Noise level
| Idle |
| 25.2 / 25.2 / 32.5 dB(A) |
| Load |
| 59.7 / 60.9 dB(A) |
 | ||
30 dB silent 40 dB(A) audible 50 dB(A) loud |
||
min: | ||
| Asus ZenBook Pro 14 Duo UX8402VV-P1021W GeForce RTX 4060 Laptop GPU, i9-13900H, Samsung PM9A1 MZVL22T0HBLB | Acer Predator Triton 300 SE GeForce RTX 3060 Laptop GPU, i9-12900H, Micron 3400 1TB MTFDKBA1T0TFH | Lenovo Yoga Pro 7 14IRH G8 GeForce RTX 4050 Laptop GPU, i7-13700H, Samsung PM9A1 MZVL21T0HCLR | Gigabyte Aero 14 OLED BMF GeForce RTX 4050 Laptop GPU, i7-13700H, Gigabyte AG470S1TB-SI B10 | Asus Zephyrus Duo 16 GX650PY-NM006W GeForce RTX 4090 Laptop GPU, R9 7945HX, SK hynix PC801 HFS002TEJ9X101N | Schenker Vision 14 2022 RTX 3050 Ti GeForce RTX 3050 Ti Laptop GPU, i7-12700H, Samsung SSD 980 Pro 1TB MZ-V8P1T0BW | Asus Zenbook Pro 14 OLED UX6404VI GeForce RTX 4070 Laptop GPU, i9-13900H, Micron 3400 2TB MTFDKBA2T0TFH | Asus ROG Flow Z13 GZ301V GeForce RTX 4060 Laptop GPU, i9-13900H, WD PC SN740 SDDPTQD-1T00 | |
|---|---|---|---|---|---|---|---|---|
| Noise | 9% | 11% | 4% | 1% | 12% | 18% | 17% | |
| off / environment * (dB) | 25.2 | 23.8 6% | 22.9 9% | 24 5% | 23.9 5% | 24.4 3% | 23.3 8% | 24 5% |
| Idle Minimum * (dB) | 25.2 | 23.8 6% | 22.9 9% | 24 5% | 23.9 5% | 24.4 3% | 23.3 8% | 24 5% |
| Idle Average * (dB) | 25.2 | 23.8 6% | 22.9 9% | 24 5% | 32.9 -31% | 24.4 3% | 23.3 8% | 24 5% |
| Idle Maximum * (dB) | 32.5 | 30.6 6% | 36.8 -13% | 35.71 -10% | 36.5 -12% | 27.8 14% | 23.3 28% | 24 26% |
| Load Average * (dB) | 59.7 | 44.2 26% | 43.7 27% | 42.9 28% | 43.3 27% | 39.3 34% | 38.61 35% | |
| Load Maximum * (dB) | 60.9 | 60 1% | 46.2 24% | 51.93 15% | 56 8% | 48.8 20% | 48.8 20% | 43.59 28% |
| Witcher 3 ultra * (dB) | 60.1 | 46.2 | 40.22 | 51.2 | 48.2 | 48.8 | 41.24 |
* ... smaller is better
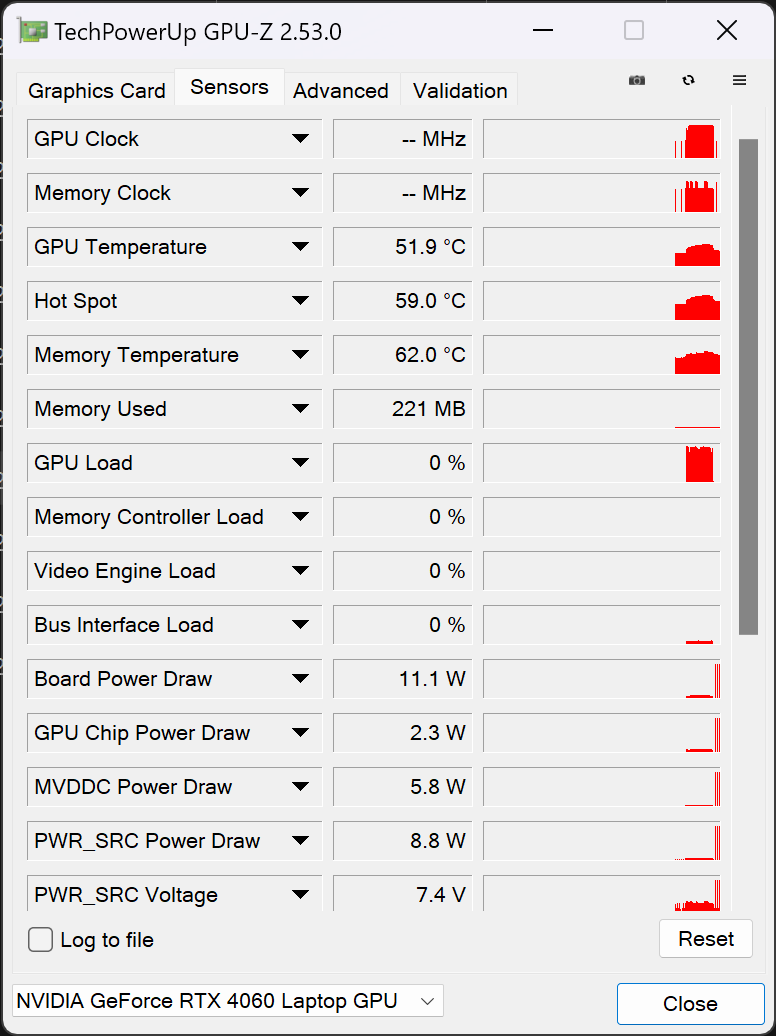
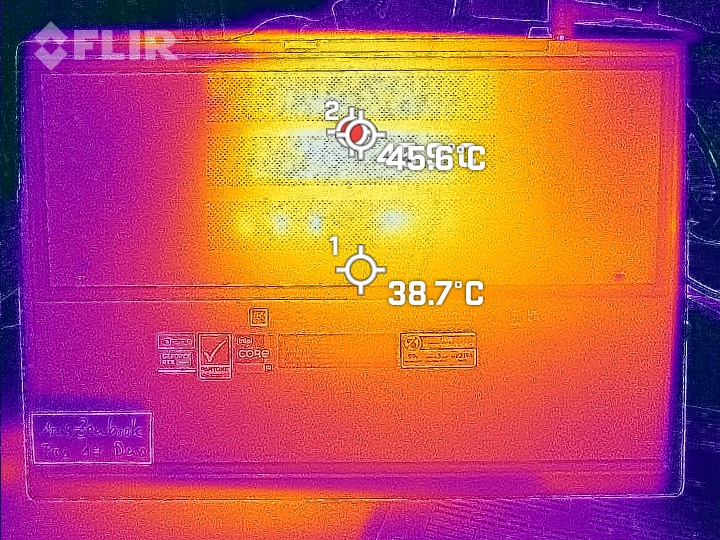
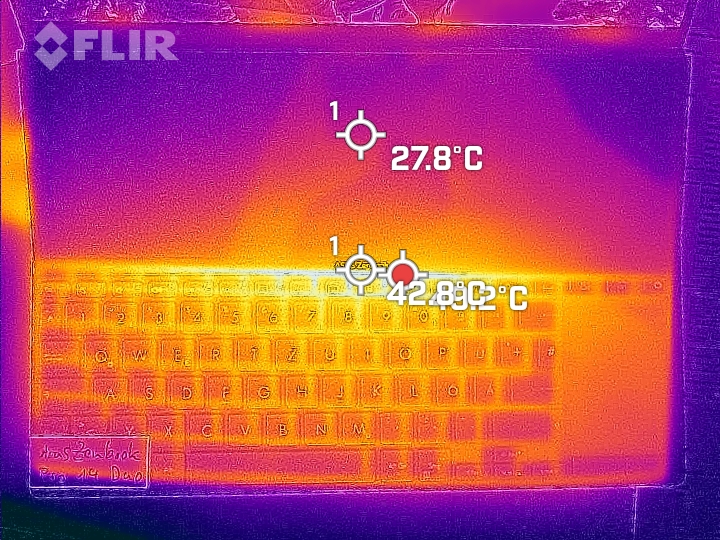
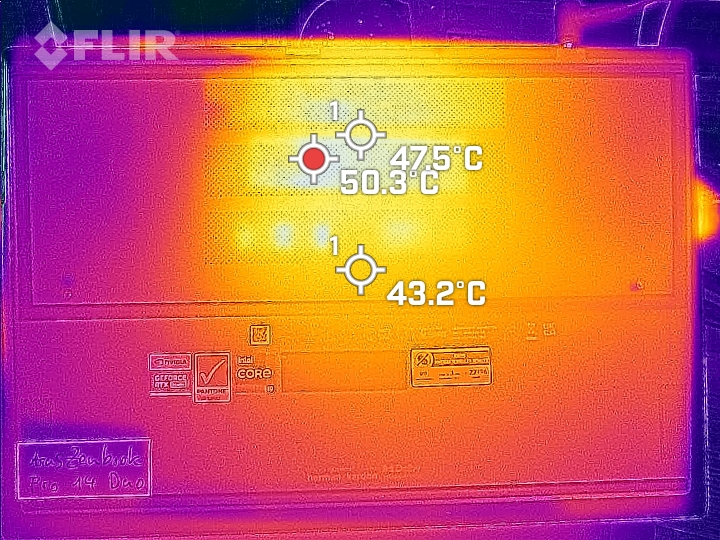
Temperatures
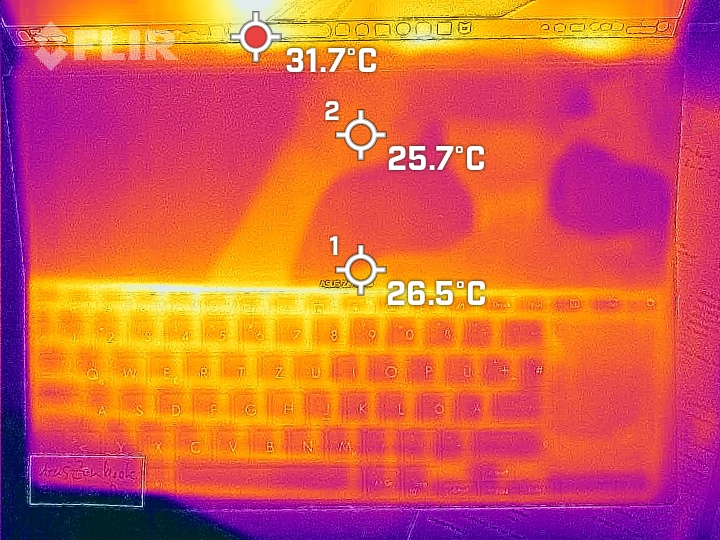
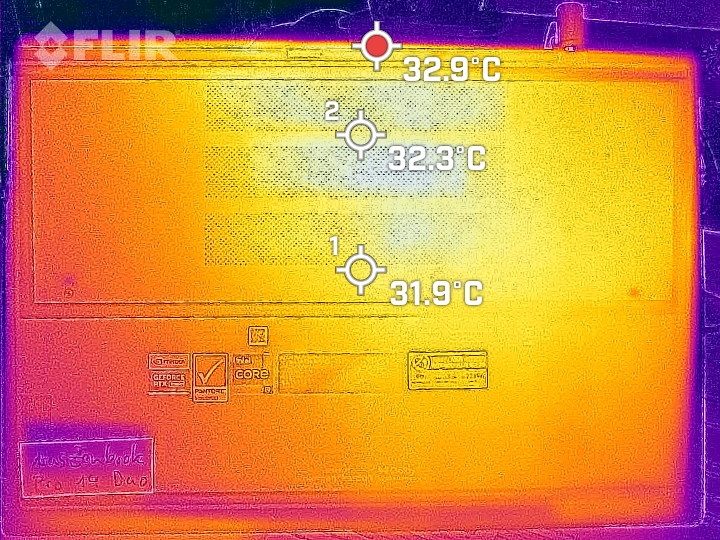
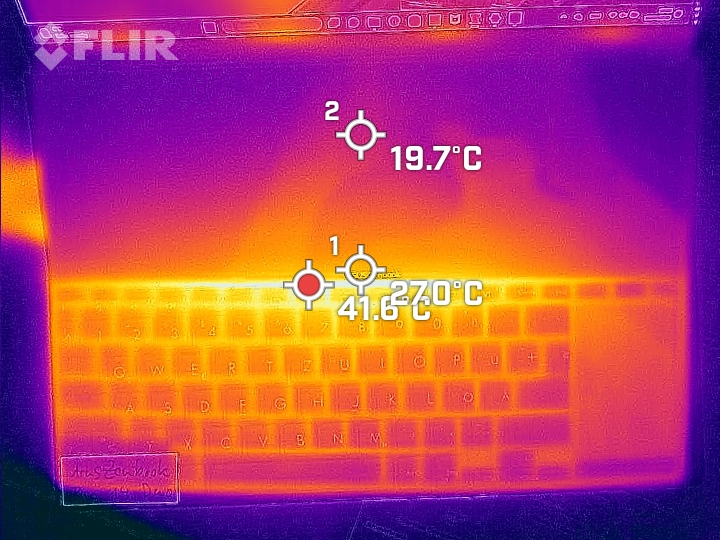
Since this laptop lacks the palm rests and you can hardly use it on your lap anyways, you also don't have to be concerned as much about the surface temperatures of the laptop. But it is still worth mention that the Zenbook can maintain mostly comfortable surface temperatures. Only a small strip between the Screenpad+ and keyboard reaches more than 40 °C (104 °F) on top. In our heatmaps of the bottom, you can see the heat pipes shining through between the CPU and GPU. When we measure with a temperature sensor, the temperatures at the grid come closer to 40°C (104 °F).
(+) The maximum temperature on the upper side is 37.1 °C / 99 F, compared to the average of 36.9 °C / 98 F, ranging from 21.1 to 71 °C for the class Multimedia.
(-) The bottom heats up to a maximum of 49.4 °C / 121 F, compared to the average of 39.2 °C / 103 F
(+) In idle usage, the average temperature for the upper side is 27.7 °C / 82 F, compared to the device average of 31.3 °C / 88 F.
(+) Playing The Witcher 3, the average temperature for the upper side is 30.1 °C / 86 F, compared to the device average of 31.3 °C / 88 F.
(±) The palmrests and touchpad can get very hot to the touch with a maximum of 37.1 °C / 98.8 F.
(-) The average temperature of the palmrest area of similar devices was 28.7 °C / 83.7 F (-8.4 °C / -15.1 F).
| Asus ZenBook Pro 14 Duo UX8402VV-P1021W Intel Core i9-13900H, NVIDIA GeForce RTX 4060 Laptop GPU | Acer Predator Triton 300 SE Intel Core i9-12900H, NVIDIA GeForce RTX 3060 Laptop GPU | Lenovo Yoga Pro 7 14IRH G8 Intel Core i7-13700H, NVIDIA GeForce RTX 4050 Laptop GPU | Gigabyte Aero 14 OLED BMF Intel Core i7-13700H, NVIDIA GeForce RTX 4050 Laptop GPU | Asus Zephyrus Duo 16 GX650PY-NM006W AMD Ryzen 9 7945HX, NVIDIA GeForce RTX 4090 Laptop GPU | Schenker Vision 14 2022 RTX 3050 Ti Intel Core i7-12700H, NVIDIA GeForce RTX 3050 Ti Laptop GPU | Asus Zenbook Pro 14 OLED UX6404VI Intel Core i9-13900H, NVIDIA GeForce RTX 4070 Laptop GPU | Asus ROG Flow Z13 GZ301V Intel Core i9-13900H, NVIDIA GeForce RTX 4060 Laptop GPU | |
|---|---|---|---|---|---|---|---|---|
| Heat | 2% | 1% | 3% | -1% | -8% | 1% | 2% | |
| Maximum Upper Side * (°C) | 37.1 | 43 -16% | 41.6 -12% | 42 -13% | 44.2 -19% | 48.4 -30% | 40.6 -9% | 42 -13% |
| Maximum Bottom * (°C) | 49.4 | 46.4 6% | 55.7 -13% | 52 -5% | 46.8 5% | 57.1 -16% | 49.5 -0% | 47 5% |
| Idle Upper Side * (°C) | 30 | 28.2 6% | 25.9 14% | 26 13% | 29.2 3% | 28.1 6% | 28.2 6% | 27 10% |
| Idle Bottom * (°C) | 32.4 | 28.4 12% | 28 14% | 27 17% | 30.2 7% | 29 10% | 30.6 6% | 30 7% |
* ... smaller is better
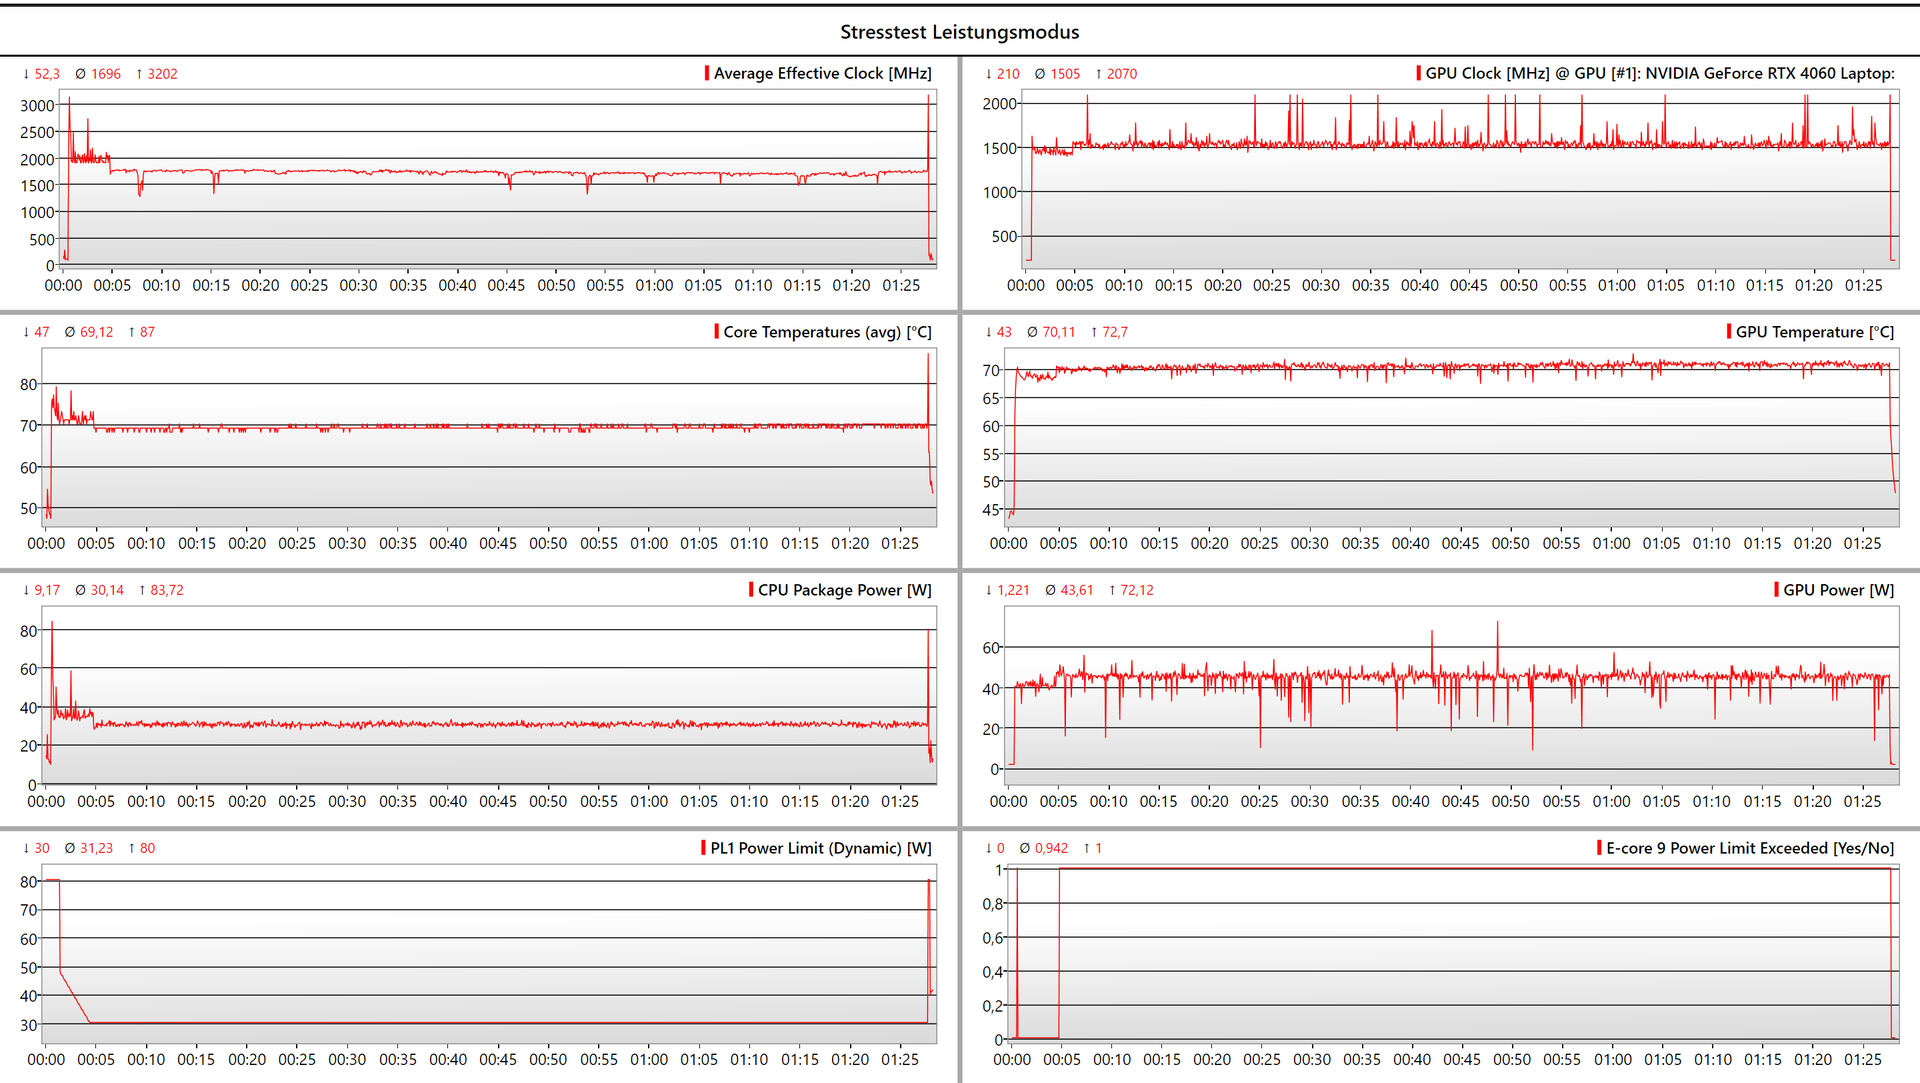
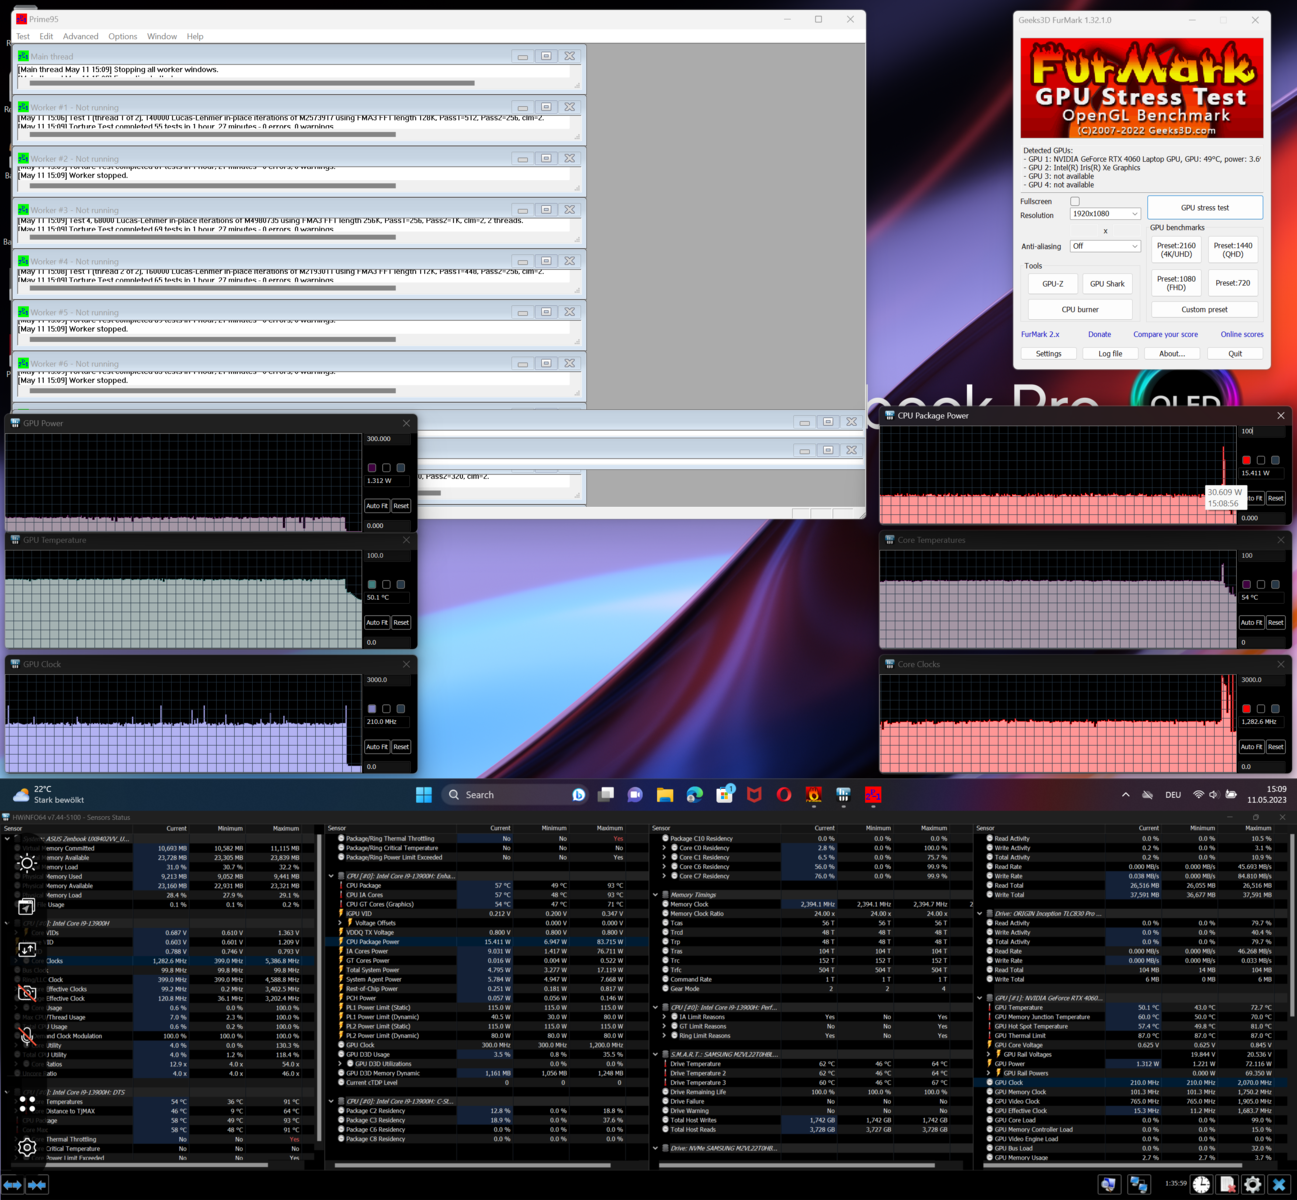
Stress Test
After about five minutes in the stress test, the CPU and GPU power consumptions level out at 35 and 45 watts respectively. Both chips then reach a constant 70 °C (158 °F). We do not see any significant fluctuations in the performance, clock speed, or temperatures during the hour-long load with Prime95 and FurMark.
Speakers
When measuring the loudspeakers during the test, we determine that they deliver hardly any bass and the highs are significantly overemphasized. But at least, you can adjust the highs using the equalizer in Windows. Although at 66 dB(A), the average volume of the two speakers in the Zenbook is significantly louder than the laptop fans, their sound isn't always able to get through the fan noise. At times, headphones connected via Bluetooth or the 3.5 mm audio port seem to be the better choice here.
Asus ZenBook Pro 14 Duo UX8402VV-P1021W audio analysis
(+) | speakers can play relatively loud (83.7 dB)
Bass 100 - 315 Hz
(-) | nearly no bass - on average 19.9% lower than median
(±) | linearity of bass is average (11.9% delta to prev. frequency)
Mids 400 - 2000 Hz
(+) | balanced mids - only 1.2% away from median
(+) | mids are linear (4.7% delta to prev. frequency)
Highs 2 - 16 kHz
(±) | higher highs - on average 5.5% higher than median
(+) | highs are linear (5.9% delta to prev. frequency)
Overall 100 - 16.000 Hz
(±) | linearity of overall sound is average (16.1% difference to median)
Compared to same class
» 38% of all tested devices in this class were better, 6% similar, 56% worse
» The best had a delta of 5%, average was 17%, worst was 45%
Compared to all devices tested
» 25% of all tested devices were better, 5% similar, 70% worse
» The best had a delta of 4%, average was 24%, worst was 134%
Apple MacBook Pro 16 2021 M1 Pro audio analysis
(+) | speakers can play relatively loud (84.7 dB)
Bass 100 - 315 Hz
(+) | good bass - only 3.8% away from median
(+) | bass is linear (5.2% delta to prev. frequency)
Mids 400 - 2000 Hz
(+) | balanced mids - only 1.3% away from median
(+) | mids are linear (2.1% delta to prev. frequency)
Highs 2 - 16 kHz
(+) | balanced highs - only 1.9% away from median
(+) | highs are linear (2.7% delta to prev. frequency)
Overall 100 - 16.000 Hz
(+) | overall sound is linear (4.6% difference to median)
Compared to same class
» 0% of all tested devices in this class were better, 0% similar, 100% worse
» The best had a delta of 5%, average was 17%, worst was 45%
Compared to all devices tested
» 0% of all tested devices were better, 0% similar, 100% worse
» The best had a delta of 4%, average was 24%, worst was 134%
Power Management - A long battery life with 76 Wh
Power Consumption
In some situations, the Asus Zenbook Pro 14 Duo is significantly more efficient than its competitors. At least among the competitors with a dGPU, the laptop places in the middle of the field. The RTX 4060 also shows here that it is able to run significantly more efficiently than the RTX 3060. Under the same load, the power consumption of the Zenbook remains clearly below that of the Acer Predator Triton.
Asus includes a 180 Watt power supply with the Zenbook. We measure a maximum power consumption of 140 watts under all load conditions, so the included power supply delivers more than enough power.
| Off / Standby | |
| Idle | |
| Load |
|
Key:
min: | |
| Asus ZenBook Pro 14 Duo UX8402VV-P1021W i9-13900H, GeForce RTX 4060 Laptop GPU, Samsung PM9A1 MZVL22T0HBLB, OLED, 2880x1800, 14.5" | Acer Predator Triton 300 SE i9-12900H, GeForce RTX 3060 Laptop GPU, Micron 3400 1TB MTFDKBA1T0TFH, OLED, 2880x1800, 14" | Lenovo Yoga Pro 7 14IRH G8 i7-13700H, GeForce RTX 4050 Laptop GPU, Samsung PM9A1 MZVL21T0HCLR, IPS, 3072x1920, 14.5" | Gigabyte Aero 14 OLED BMF i7-13700H, GeForce RTX 4050 Laptop GPU, Gigabyte AG470S1TB-SI B10, OLED, 2880x1800, 14" | Asus Zephyrus Duo 16 GX650PY-NM006W R9 7945HX, GeForce RTX 4090 Laptop GPU, SK hynix PC801 HFS002TEJ9X101N, MiniLED, 2560x1600, 16" | Schenker Vision 14 2022 RTX 3050 Ti i7-12700H, GeForce RTX 3050 Ti Laptop GPU, Samsung SSD 980 Pro 1TB MZ-V8P1T0BW, IPS, 2880x1800, 14" | Asus Zenbook Pro 14 OLED UX6404VI i9-13900H, GeForce RTX 4070 Laptop GPU, Micron 3400 2TB MTFDKBA2T0TFH, OLED, 2880x1800, 14.5" | Asus ROG Flow Z13 GZ301V i9-13900H, GeForce RTX 4060 Laptop GPU, WD PC SN740 SDDPTQD-1T00, IPS, 2560x1600, 13.4" | Average NVIDIA GeForce RTX 4060 Laptop GPU | Average of class Multimedia | |
|---|---|---|---|---|---|---|---|---|---|---|
| Power Consumption | -23% | -1% | 21% | -128% | 12% | -9% | 1% | -36% | 18% | |
| Idle Minimum * (Watt) | 8.5 | 7.6 11% | 7.6 11% | 7.4 13% | 19.2 -126% | 7.5 12% | 7.5 12% | 8.5 -0% | 11.5 ? -35% | 5.83 ? 31% |
| Idle Average * (Watt) | 8.8 | 12.3 -40% | 13.3 -51% | 8.3 6% | 29.7 -238% | 10.4 -18% | 11.1 -26% | 12.4 -41% | 16 ? -82% | 10.4 ? -18% |
| Idle Maximum * (Watt) | 16.5 | 17.6 -7% | 13.7 17% | 8.7 47% | 30.8 -87% | 11.4 31% | 11.6 30% | 13.3 19% | 20.3 ? -23% | 12.7 ? 23% |
| Load Average * (Watt) | 102 | 111 -9% | 88.2 14% | 76 25% | 126 -24% | 83.3 18% | 91.9 10% | 93 9% | 92.9 ? 9% | 69 ? 32% |
| Witcher 3 ultra * (Watt) | 101.2 | 117.1 -16% | 94.2 7% | 70 31% | 258 -155% | 92.7 8% | 132.2 -31% | 87.8 13% | ||
| Load Maximum * (Watt) | 140 | 245.8 -76% | 143 -2% | 132 6% | 330 -136% | 110.3 21% | 208 -49% | 135 4% | 210 ? -50% | 111.9 ? 20% |
* ... smaller is better
Power Consumption The Witcher 3 / Stress Test
Power Consumption With External Monitor
Battery Life
Depending on the usage scenarios and loads on the laptop, we also get very different runtimes. During our Wi-Fi web surfing test at a display brightness of 150 cd/m², we deactivate the second display, resulting in the Zenbook Pro 14 Duo lasting for nine hours away from the charger. With both displays at full brightness it is three-and-a-half hours less, though. Both tests use the hybrid GPU mode, where the Nvidia graphics chip can be deactivated. In the Battery Eater test under medium load, the 76-Wh battery still lasts for more than three hours. Depending on the usage scenario, the laptop is suitable for mobile use with this. On the road, you can also charge the Zenbook using a USB-C charger, although that should at least deliver 45 watts to be able to still charge the battery during operation of the laptop.
| Asus ZenBook Pro 14 Duo UX8402VV-P1021W i9-13900H, GeForce RTX 4060 Laptop GPU, 76 Wh | Acer Predator Triton 300 SE i9-12900H, GeForce RTX 3060 Laptop GPU, 76 Wh | Lenovo Yoga Pro 7 14IRH G8 i7-13700H, GeForce RTX 4050 Laptop GPU, 73 Wh | Asus Zephyrus Duo 16 GX650PY-NM006W R9 7945HX, GeForce RTX 4090 Laptop GPU, 90 Wh | Schenker Vision 14 2022 RTX 3050 Ti i7-12700H, GeForce RTX 3050 Ti Laptop GPU, 99.8 Wh | Average of class Multimedia | |
|---|---|---|---|---|---|---|
| Battery runtime | -47% | -34% | -64% | -14% | -12% | |
| WiFi v1.3 (h) | 9 | 6.2 -31% | 9.9 10% | 4 -56% | 10.1 12% | 11.6 ? 29% |
| Load (h) | 3.5 | 1.3 -63% | 0.8 -77% | 1 -71% | 2.1 -40% | 1.655 ? -53% |
| Reader / Idle (h) | 8.1 | 22 ? | ||||
| H.264 (h) | 12.4 | 3.8 | 11.1 | 16.2 ? |
Pros
Cons
Verdict - Not for everyone
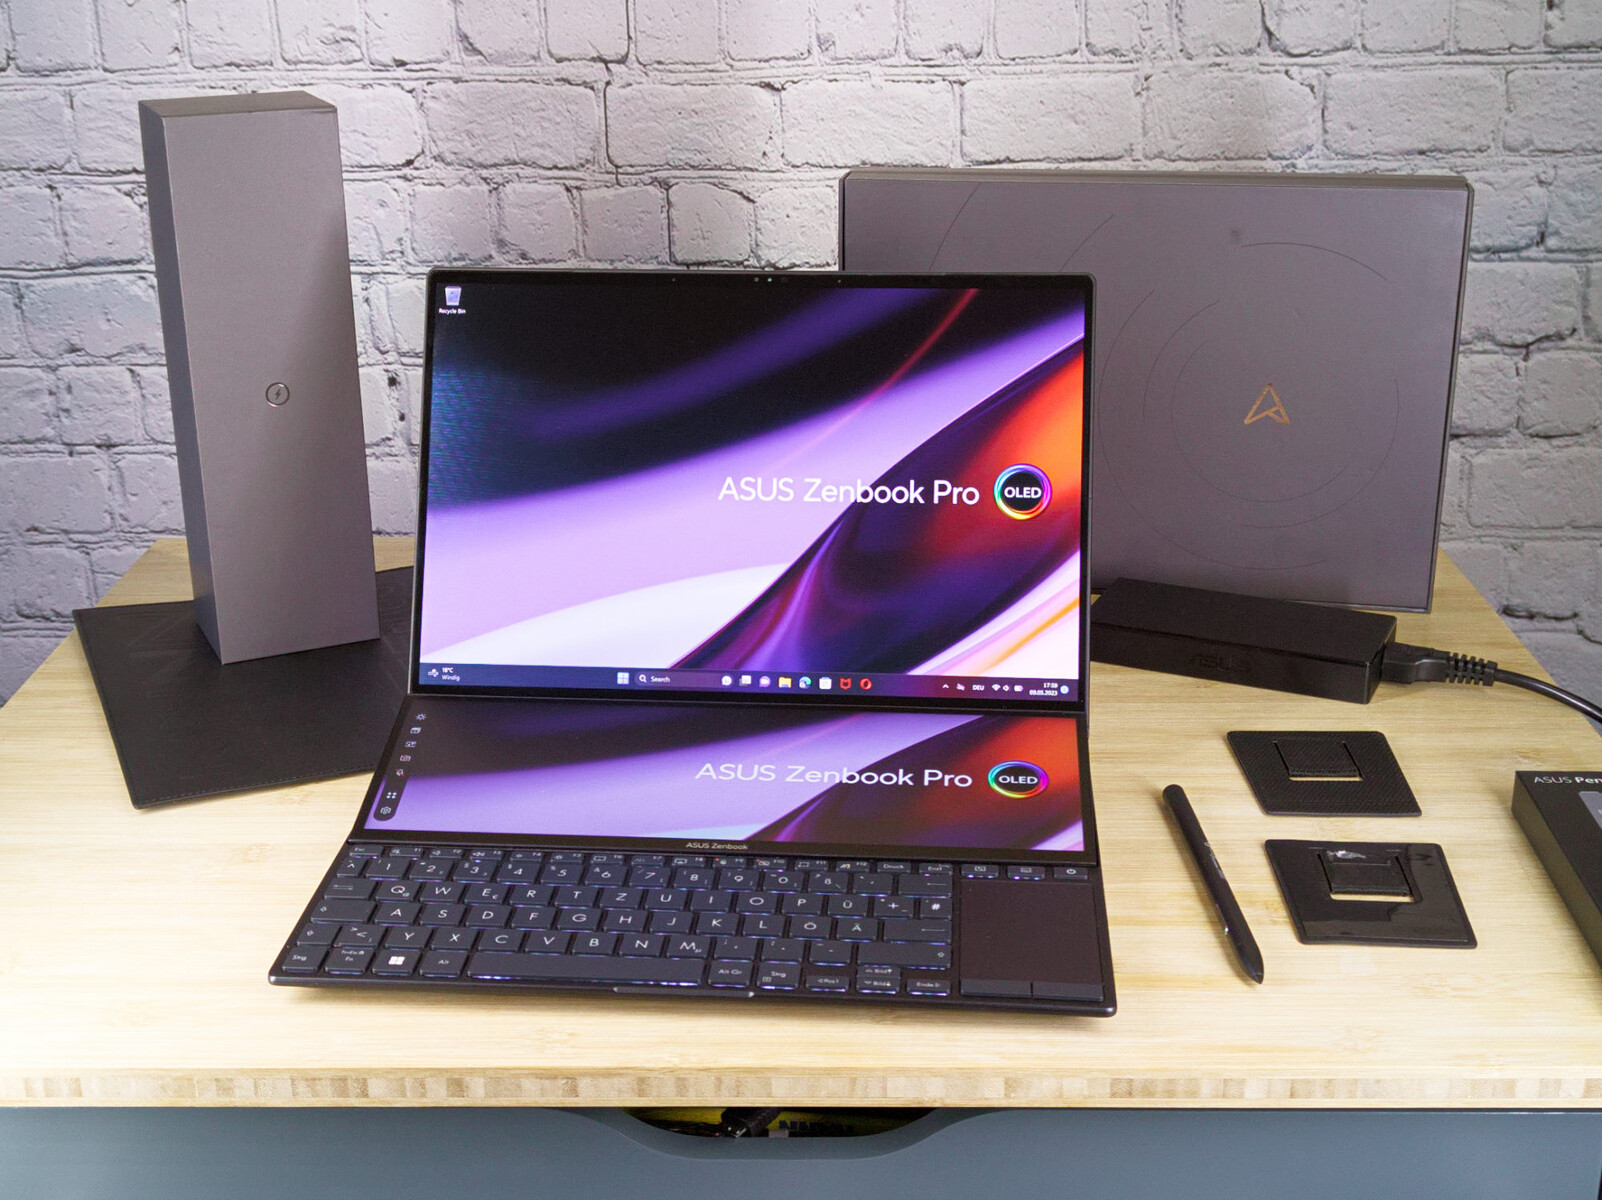
With its equipment, the Zenbook Pro 14 Duo is prepared for many application scenarios. The hardware is powerful with the Intel Core i9-13900H and Nvidia GeForce RTX 4060, offering also an elevated performance in the Zenbook. With the secondary display, the productivity of the laptop can be increased significantly. However, due to its unusual layout, the laptop isn't as mobile as other devices. It is best, if it remains on the desktop, but it also requires more space there than other laptops. On the small tables in trains, planes, or lecture halls, space can get tight for the Zenbook Pro 14 Duo, and it clearly loses the mobility advantage of being a 14.5-inch laptop.
Even though you can be more productive with the second display, you also need more space for the Zenbook Pro 14 Duo.
The high performance of the laptop is marred by the fact that the AAS cooling doesn't bring any significant advantage compared to other 14 or 15-inch laptops. Neither in the performance, nor the power consumption or temperatures is the Zenbook Pro 14 Duo able to place significantly ahead of the competitors.
The 3,600 Euros (~$3,871) Asus is asking for the laptop are therefore only justified if you can make full use of the second display. Otherwise, devices like the Lenovo Yoga Pro 7 or Asus VivoBook S 14X might be a better choice.
Price and Availability
The Zenbook Pro 14 Duo is available from the manufacturer starting from ~$2000 in the US. With Nvidia GeForce RTX 4060, the Zenbook Pro 14 Duo costs ~$2,400 from the manufacturer. Amazon currently also lists a version with the RTX 3050 Ti for ~$2,200.
Asus ZenBook Pro 14 Duo UX8402VV-P1021W
- 05/31/2023 v7 (old)
Marc Herter
Transparency
The selection of devices to be reviewed is made by our editorial team. The test sample was provided to the author as a loan by the manufacturer or retailer for the purpose of this review. The lender had no influence on this review, nor did the manufacturer receive a copy of this review before publication. There was no obligation to publish this review. As an independent media company, Notebookcheck is not subjected to the authority of manufacturers, retailers or publishers.
This is how Notebookcheck is testing
Every year, Notebookcheck independently reviews hundreds of laptops and smartphones using standardized procedures to ensure that all results are comparable. We have continuously developed our test methods for around 20 years and set industry standards in the process. In our test labs, high-quality measuring equipment is utilized by experienced technicians and editors. These tests involve a multi-stage validation process. Our complex rating system is based on hundreds of well-founded measurements and benchmarks, which maintains objectivity. Further information on our test methods can be found here.
Price comparison

