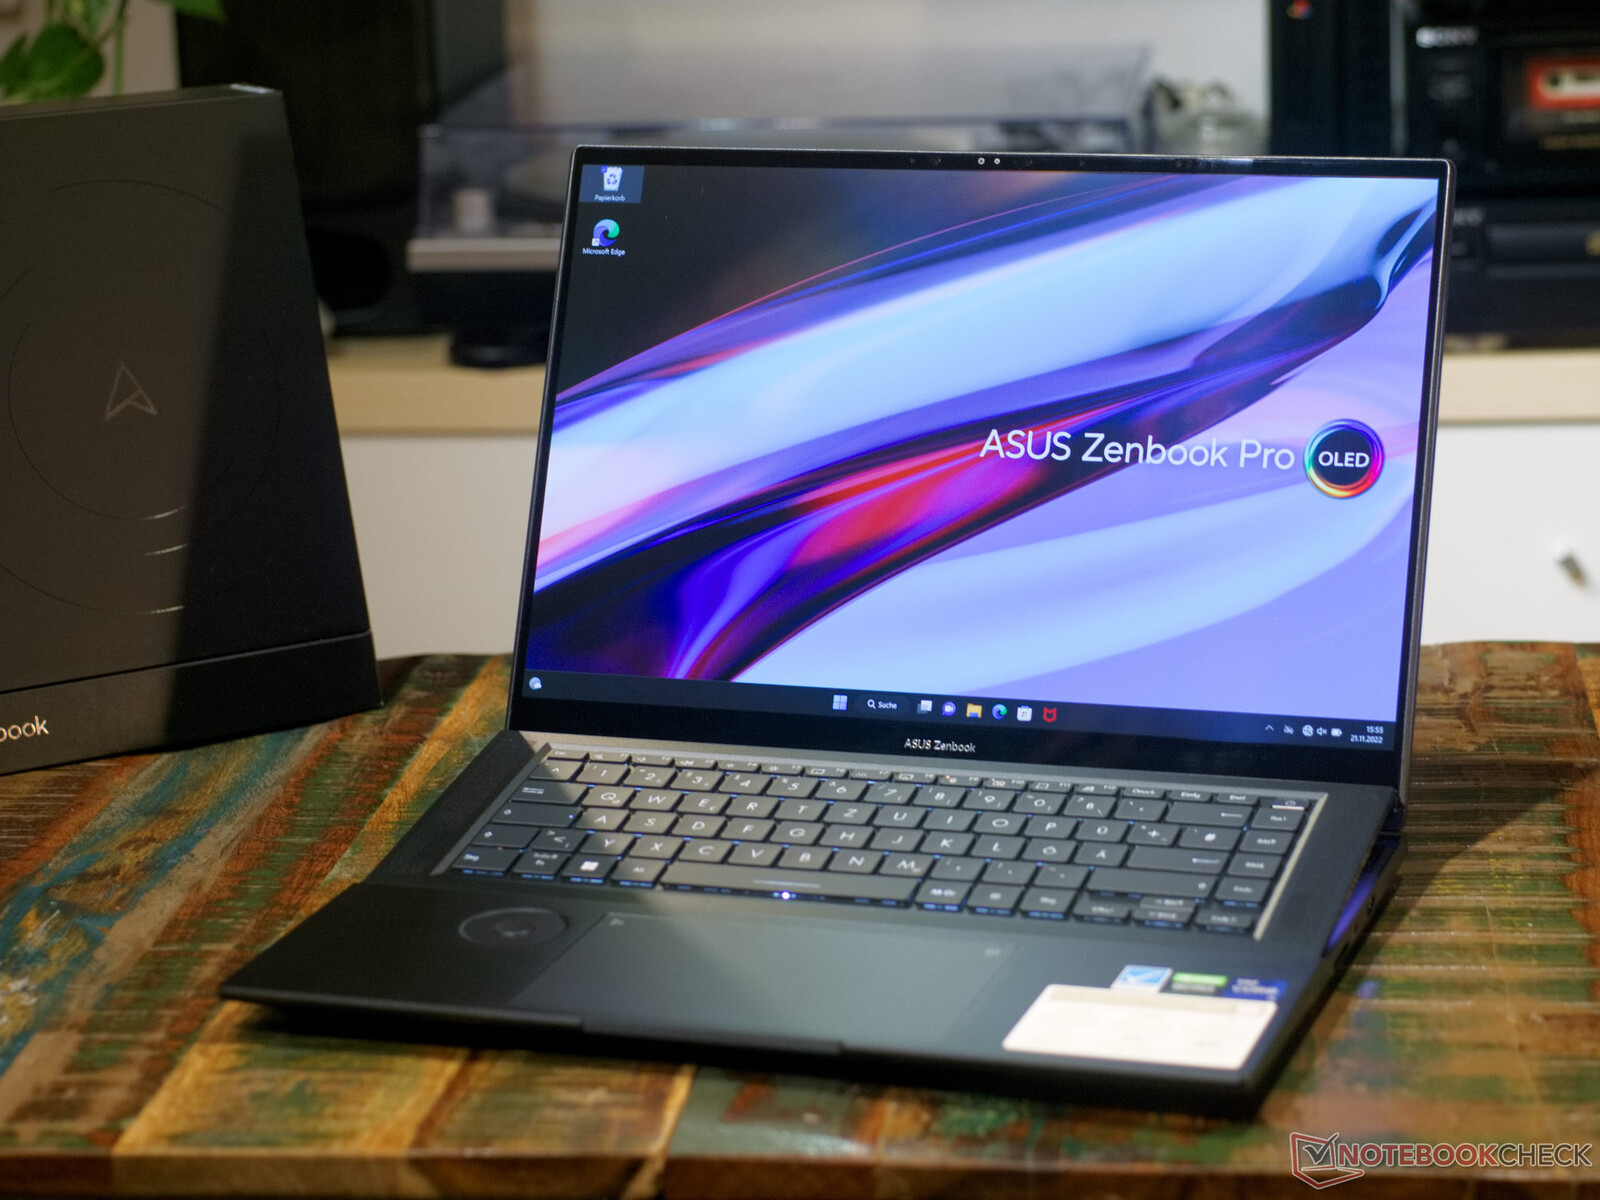
Asus Zenbook Pro 16X OLED review - Extreme laptop with a special trick
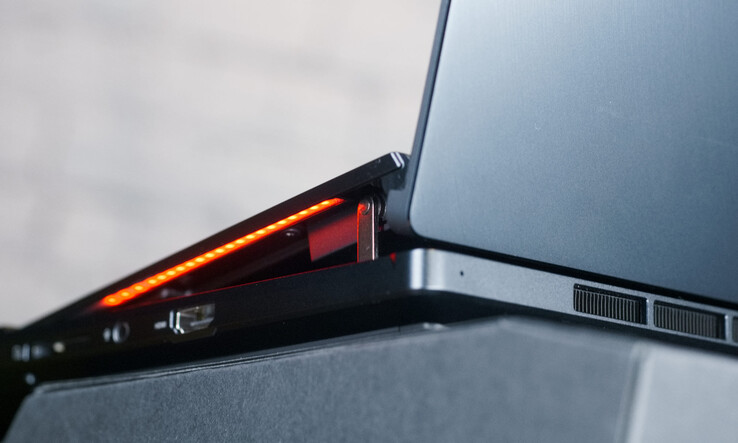
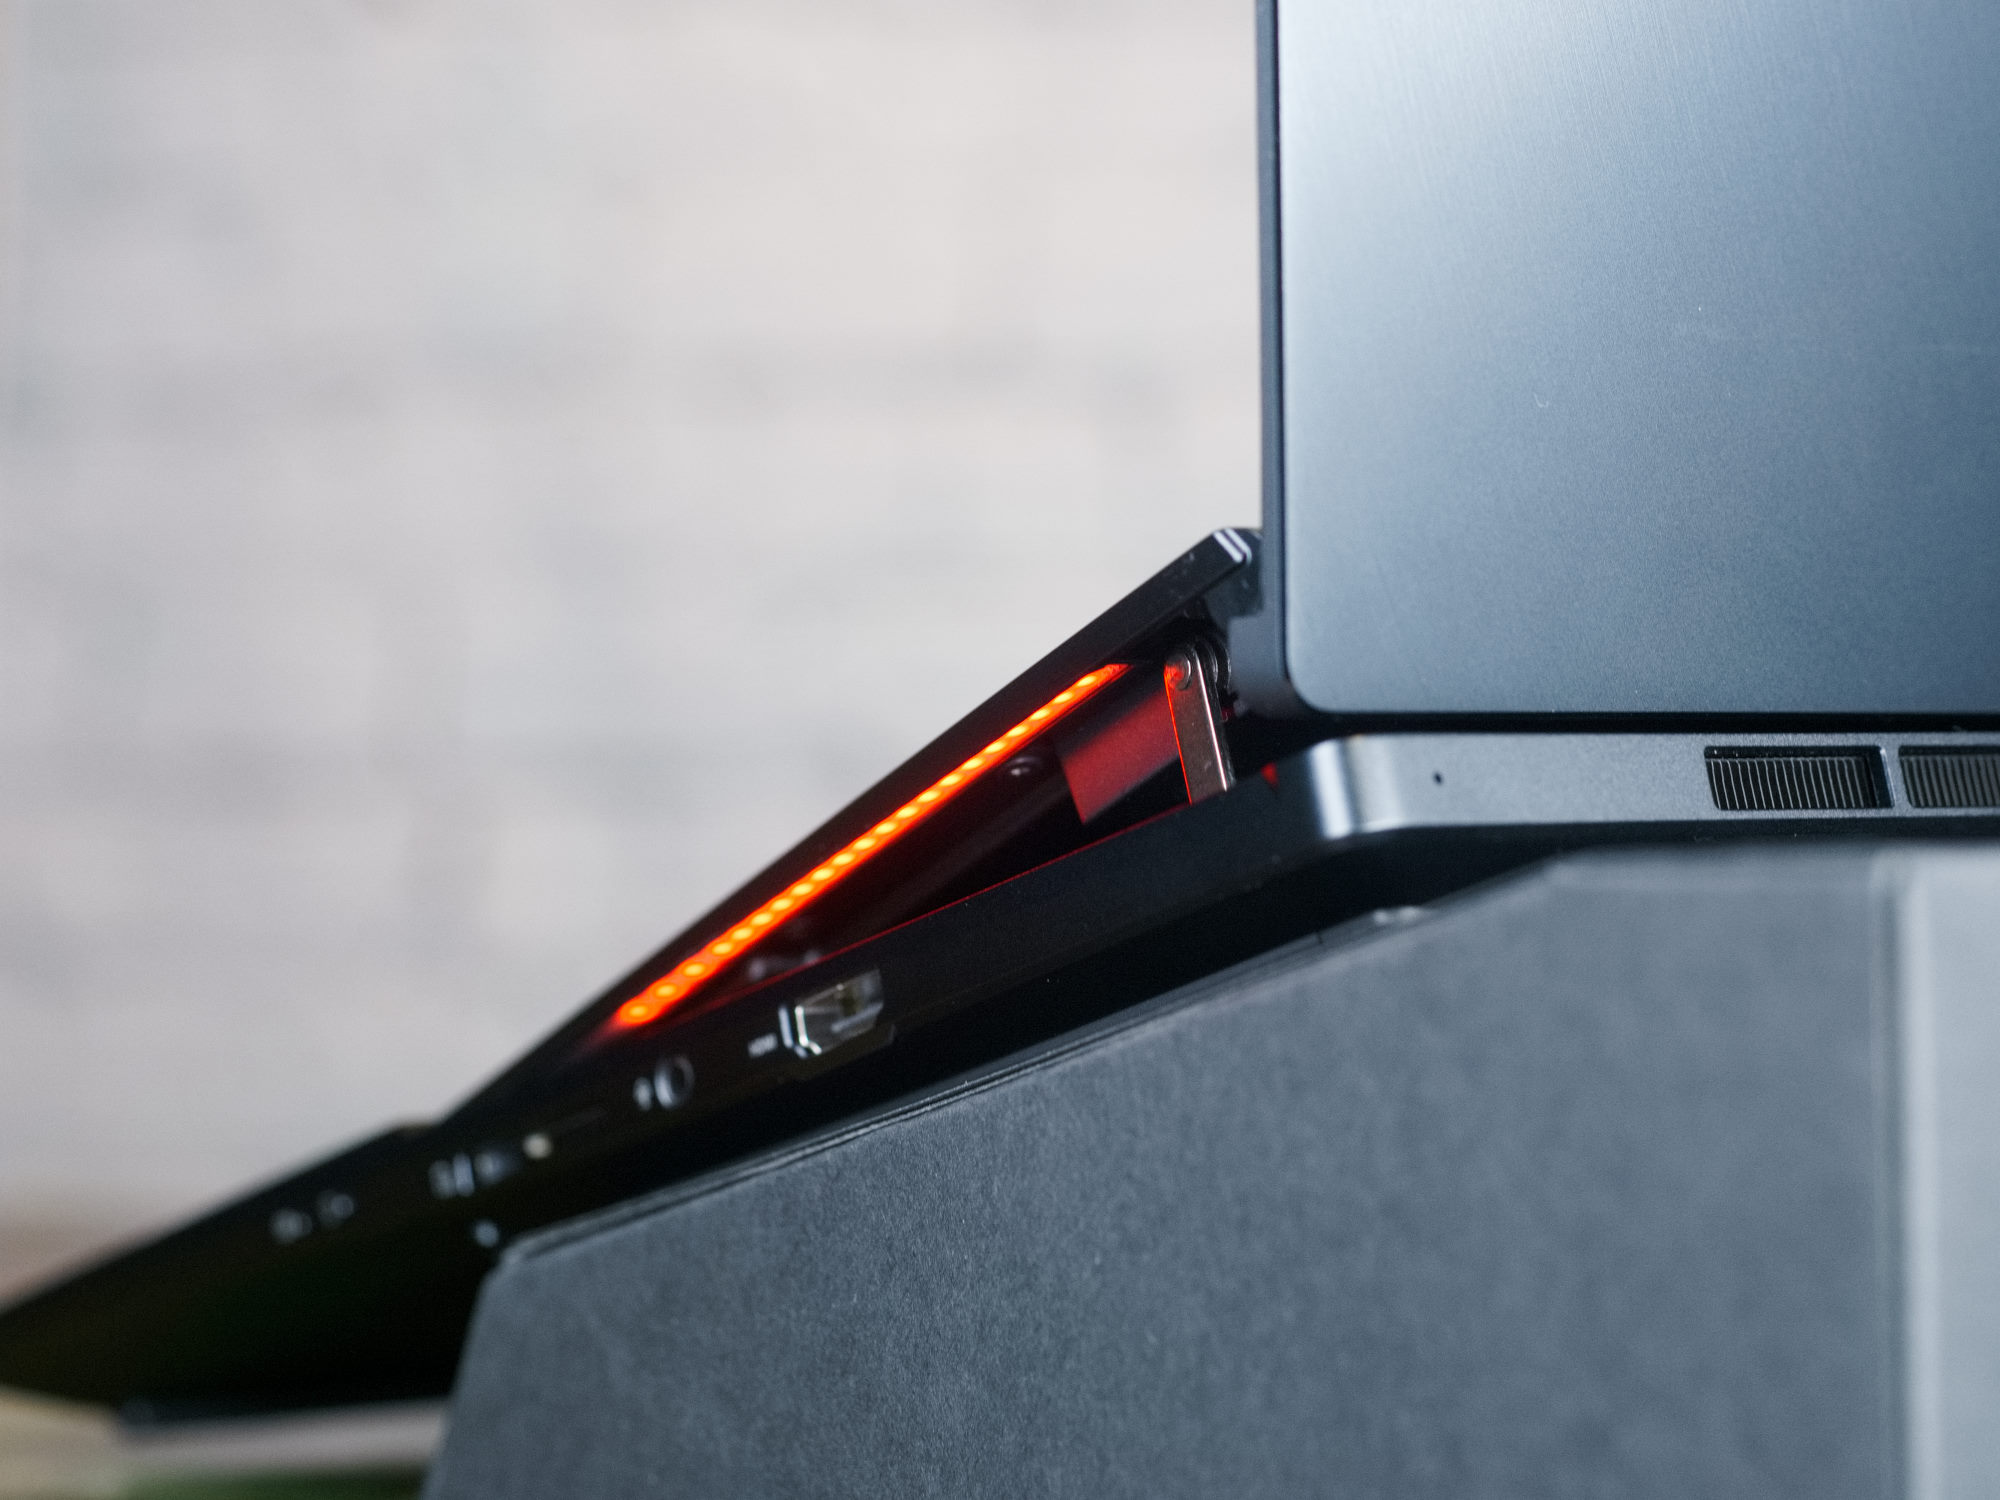
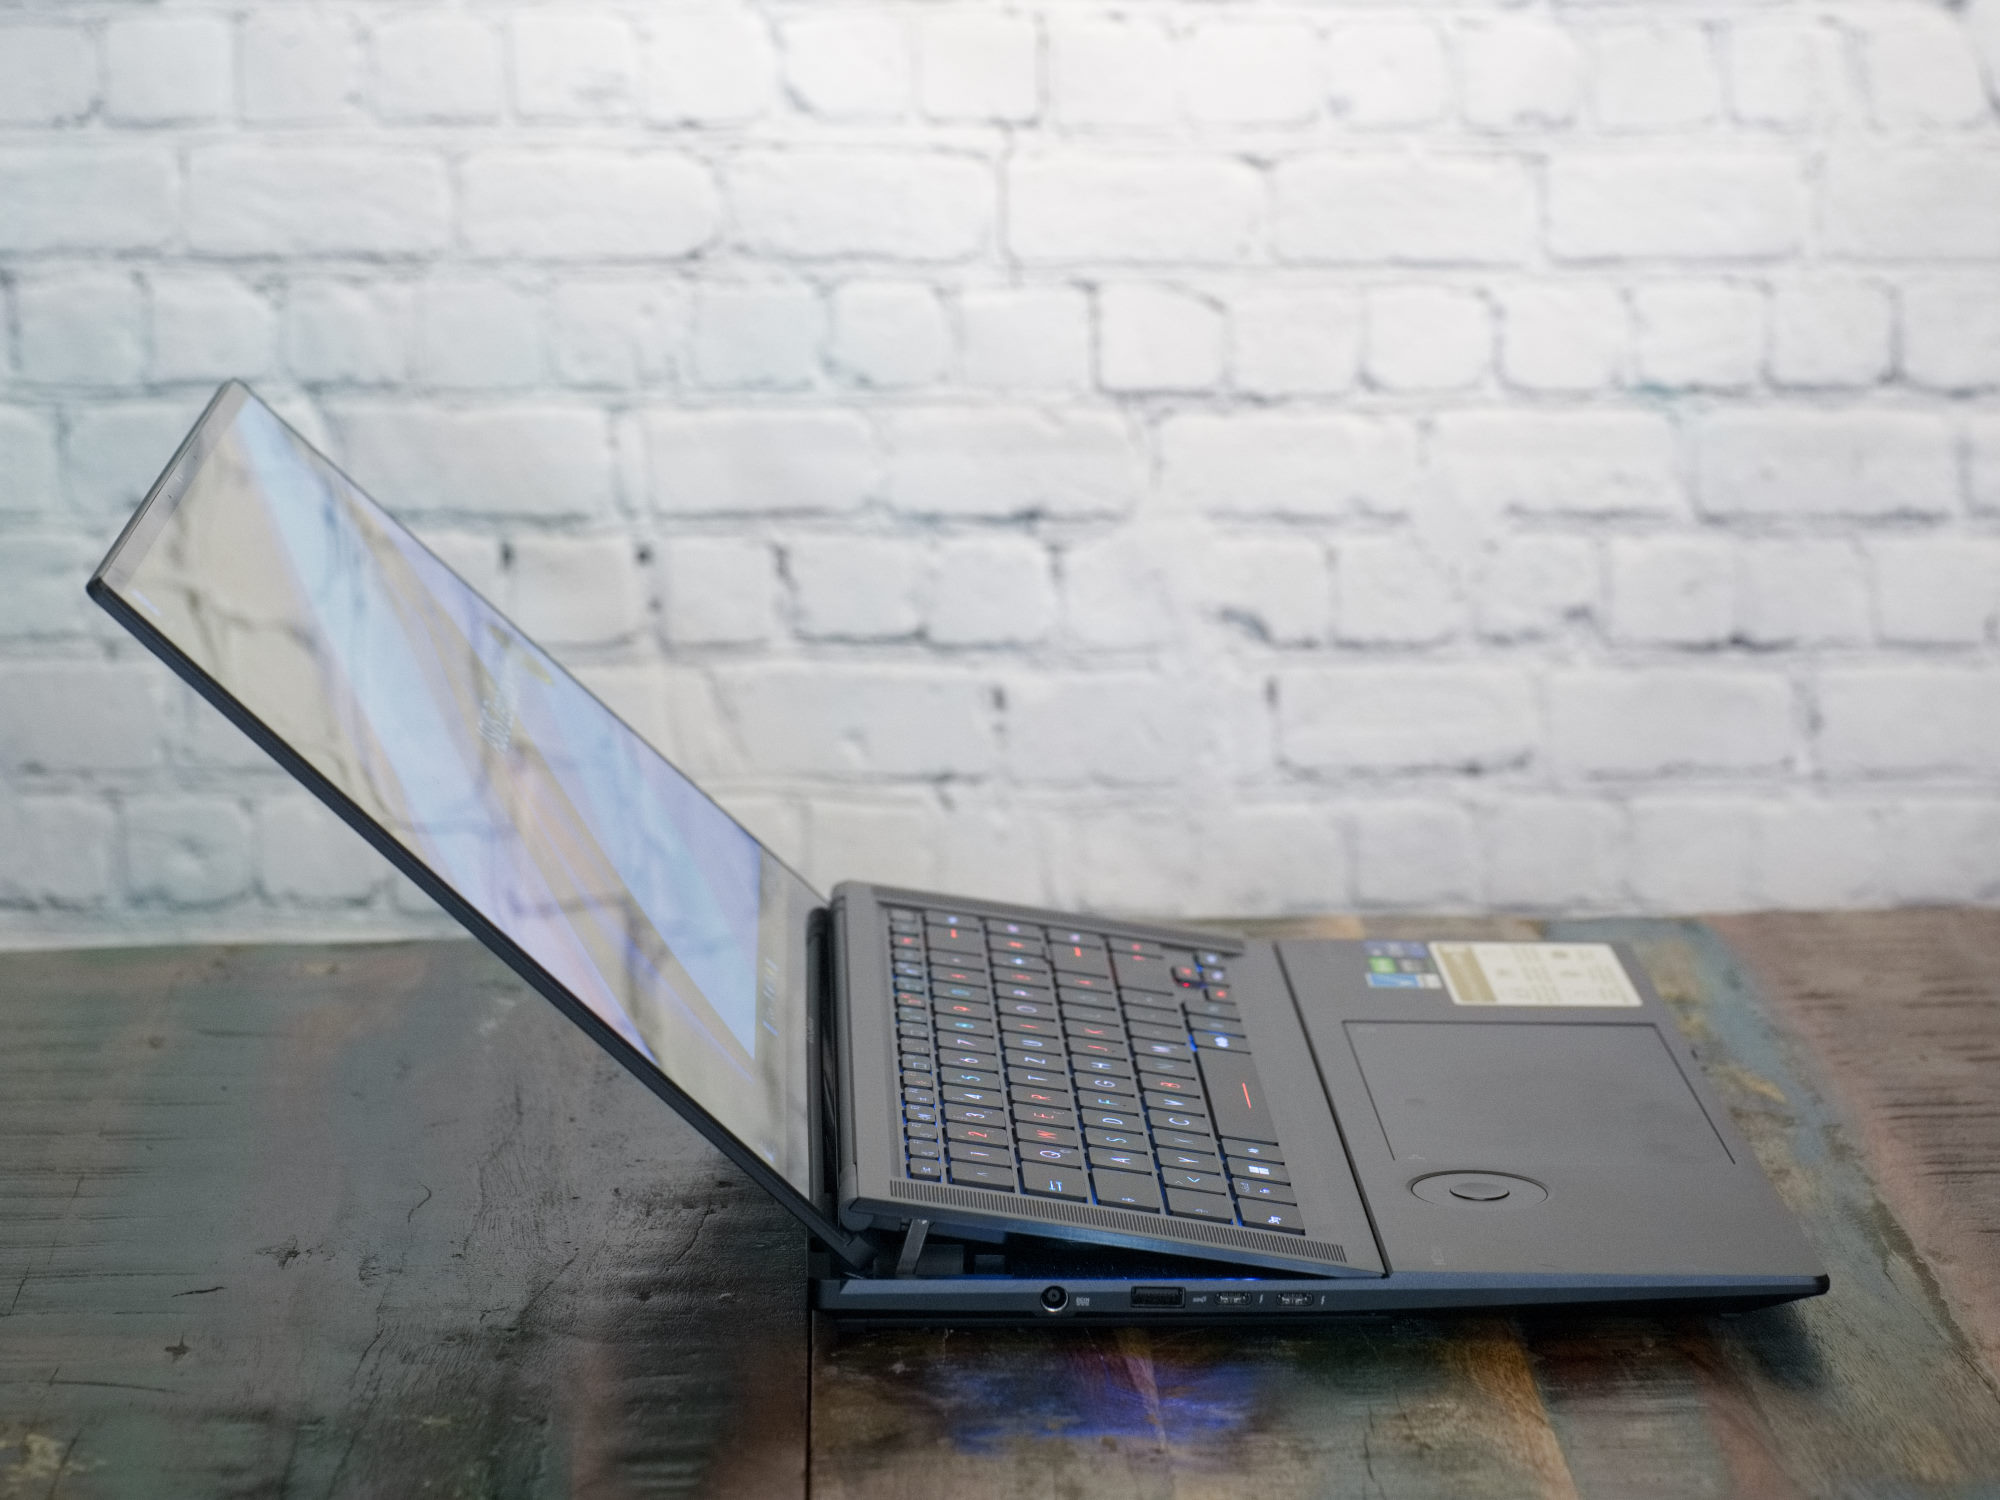
Zenbooks are usually extravagant laptops with unusual features and an interesting design. The most unusual representative of the series may well be the Zenbook 17 Fold. The Zenbook Pro 16X OLED looks almost sterling alongside the foldable laptop, but as soon as you open the display, the Zenbook 17 still stands out among many other notebooks. This is due to AAS Ultra Cooling, for which the keyboard is folded up together with the screen. The keyboard is placed at an ergonomic, 7° degree angle, which supposedly provides 30% more airflow. Our review reveals that the laptop does not always have a performance advantage, but it can maintain low operating temperatures for long periods of time.
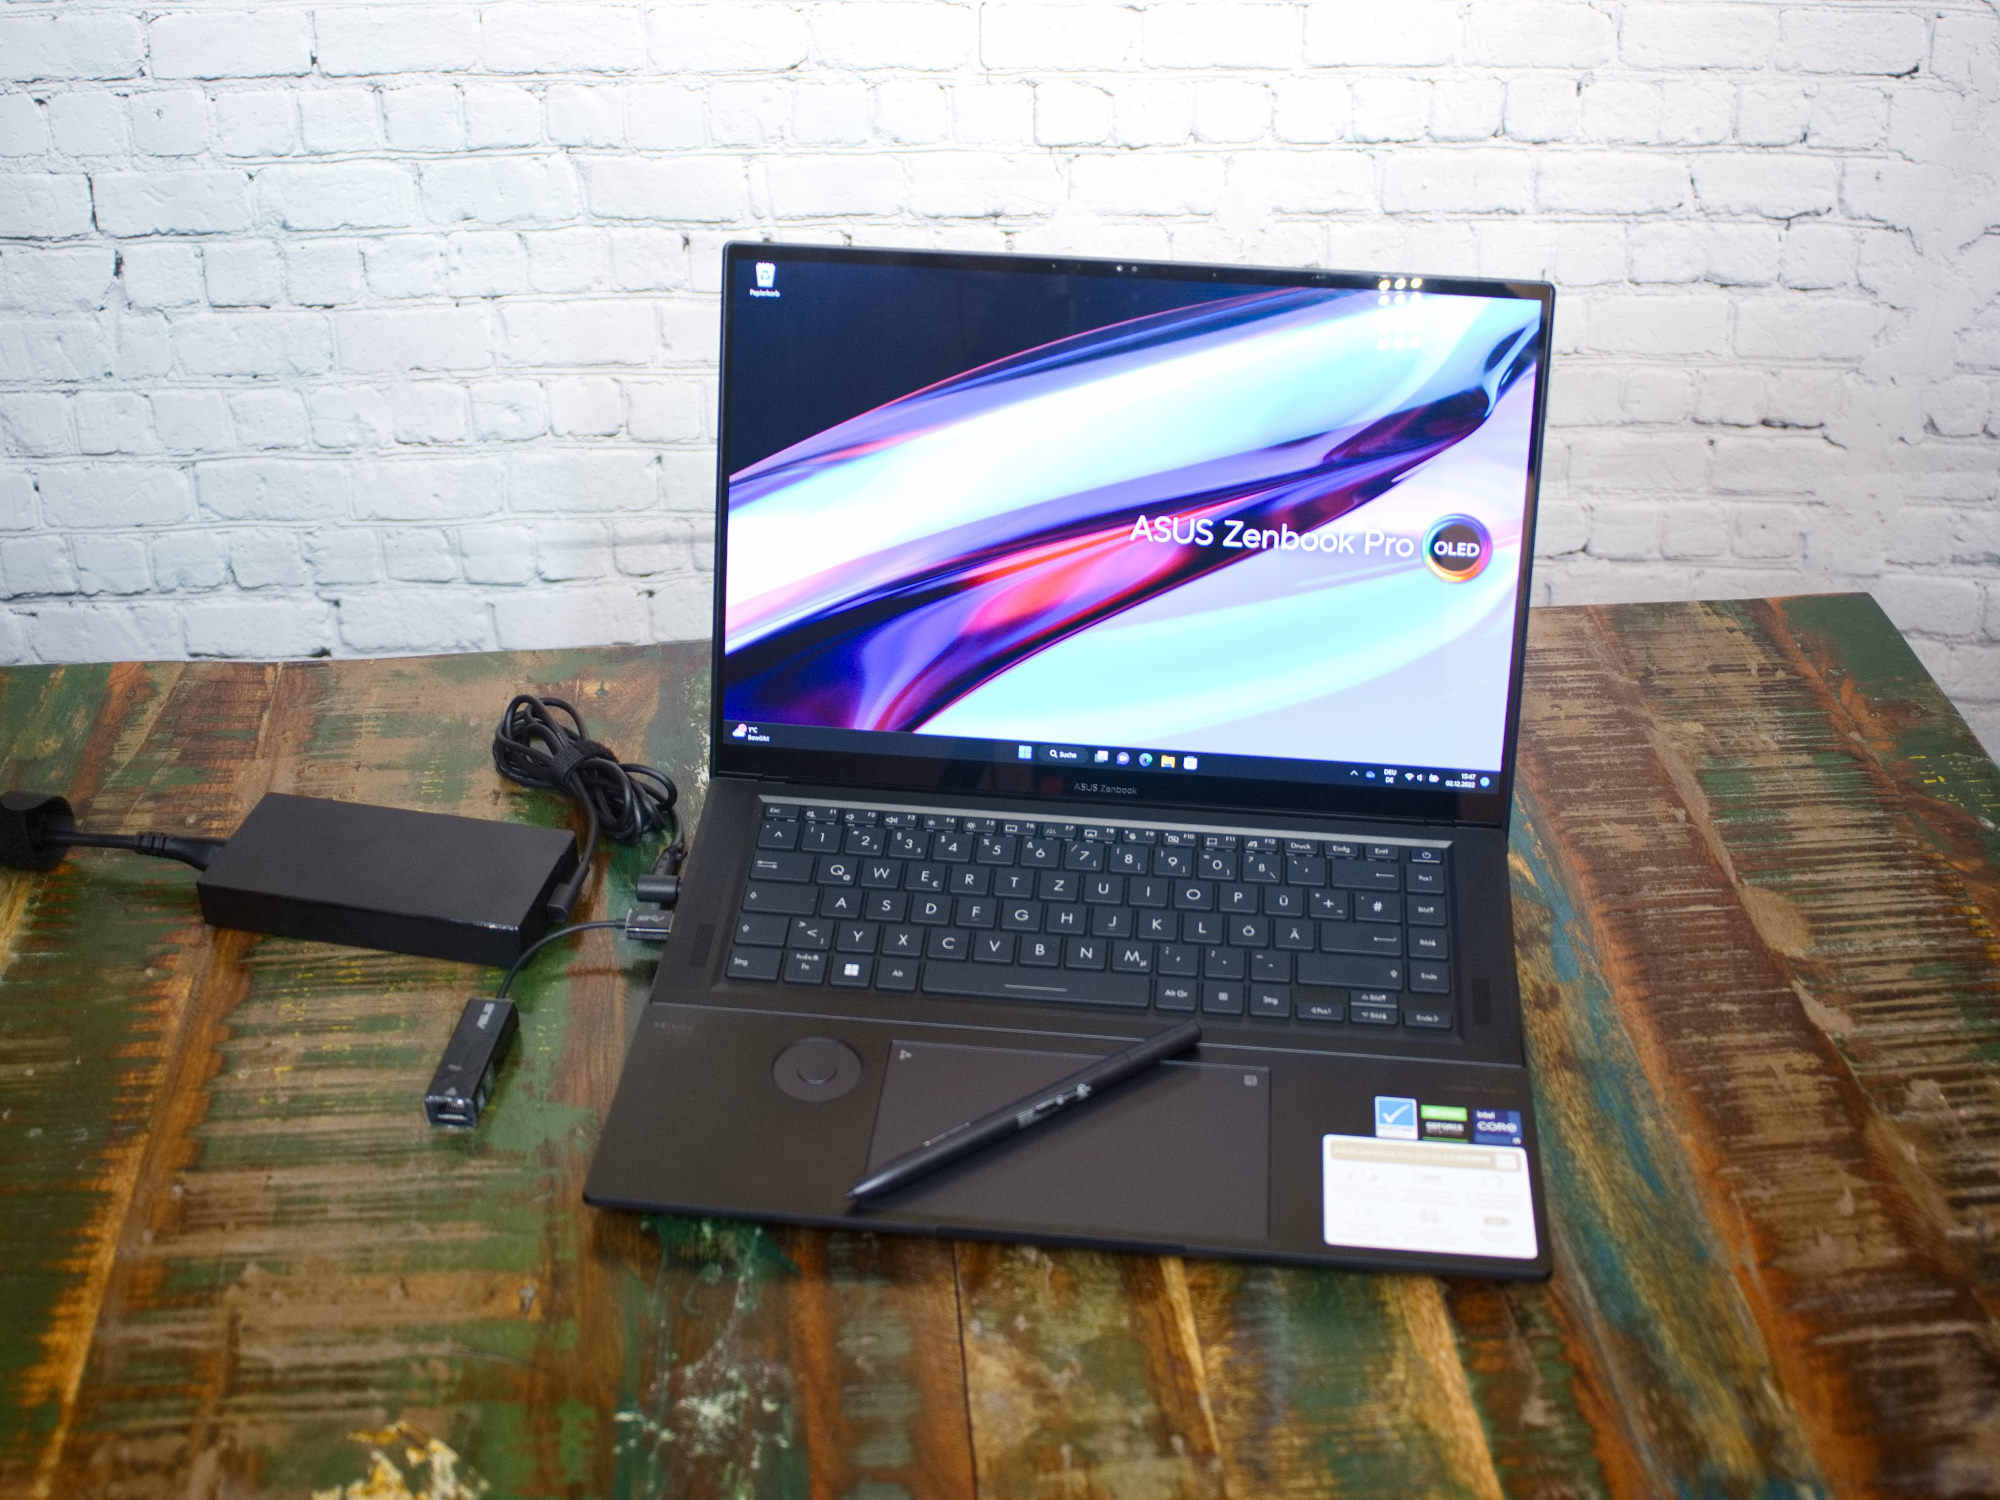
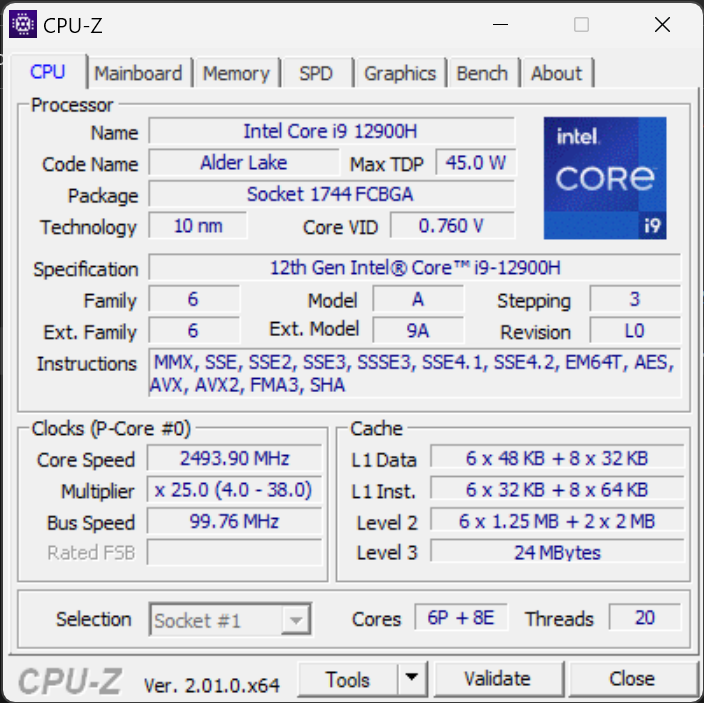
Furthermore, the Zenbook Pro 16X is full of interesting features. Full RGBW backlighting for the keyboard, an Asus Dial and a stylus input are included, as well as a strong OLED display with complete DisplayP3 color space coverage. Last but not least, we should also mention the Zenbook's strong hardware. An Intel Core i9-12900H, 32 GB LPDDR5 and an Nvidia GeForce RTX 3060 are installed here and are cooled by a vapor chamber. The Pantone validated 16-inch laptop in a metal case thus achieves high scores in many categories. In terms of price, the studio laptop is in a tolerable range, with Asus asking around US$3000.
We have selected various 16-inch notebooks from our database as comparison devices. Since the Asus ZenBook Pro 16X OLED is relatively expensive, it is in direct competition with some workstations with professional graphics chips such as the MSI CreatorPro Z16P or the HP ZBook Studio 16 G9. Gaming laptops such as the Corsair Voyager A1600 can also be considered as a good alternative to the Asus laptop. Those who prefer simplicity to extravagance should take a look at Asus' VivoBook Pro 16X OLED, which can also be equipped with similar features as the ZenBook.
Possible Competitors in Comparison
Rating | Date | Model | Weight | Height | Size | Resolution | Price |
|---|---|---|---|---|---|---|---|
| 88.4 % v7 (old) | 12 / 2022 | Asus ZenBook Pro 16X OLED UX7602ZM-ME115W i9-12900H, GeForce RTX 3060 Laptop GPU | 2.4 kg | 19.5 mm | 16.00" | 3840x2400 | |
| 88.7 % v7 (old) | 12 / 2022 | Lenovo ThinkPad X1 Extreme G5-21DE003RGE i7-12700H, GeForce RTX 3060 Laptop GPU | 2.1 kg | 17.9 mm | 16.00" | 3840x2400 | |
| 86.4 % v7 (old) | 11 / 2022 | HP Omen 16-n0033dx R7 6800H, Radeon RX 6650M | 2.4 kg | 22.6 mm | 16.10" | 1920x1080 | |
| 90.1 % v7 (old) | 11 / 2022 | HP ZBook Studio 16 G9 62U04EA i7-12800H, RTX A2000 Laptop GPU | 1.8 kg | 19 mm | 16.00" | 3840x2400 | |
| 86.6 % v7 (old) | 12 / 2022 | Corsair Voyager a1600 R9 6900HS, Radeon RX 6800M | 2.4 kg | 19.9 mm | 16.00" | 2560x1600 | |
| 88.4 % v7 (old) | 10 / 2022 | Dell Precision 7670 i7-12850HX, RTX A2000 Laptop GPU | 2.7 kg | 24.7 mm | 16.00" | 3840x2400 | |
| 83.7 % v7 (old) | 11 / 2022 | Asus VivoBook Pro 16X OLED N7600PC-L2026X i7-11370H, GeForce RTX 3050 4GB Laptop GPU | 2 kg | 18.9 mm | 16.00" | 3840x2400 | |
| 84.3 % v7 (old) | 11 / 2022 | MSI CreatorPro Z16P B12UKST i7-12700H, RTX A3000 Laptop GPU | 2.4 kg | 19 mm | 16.00" | 2560x1600 |
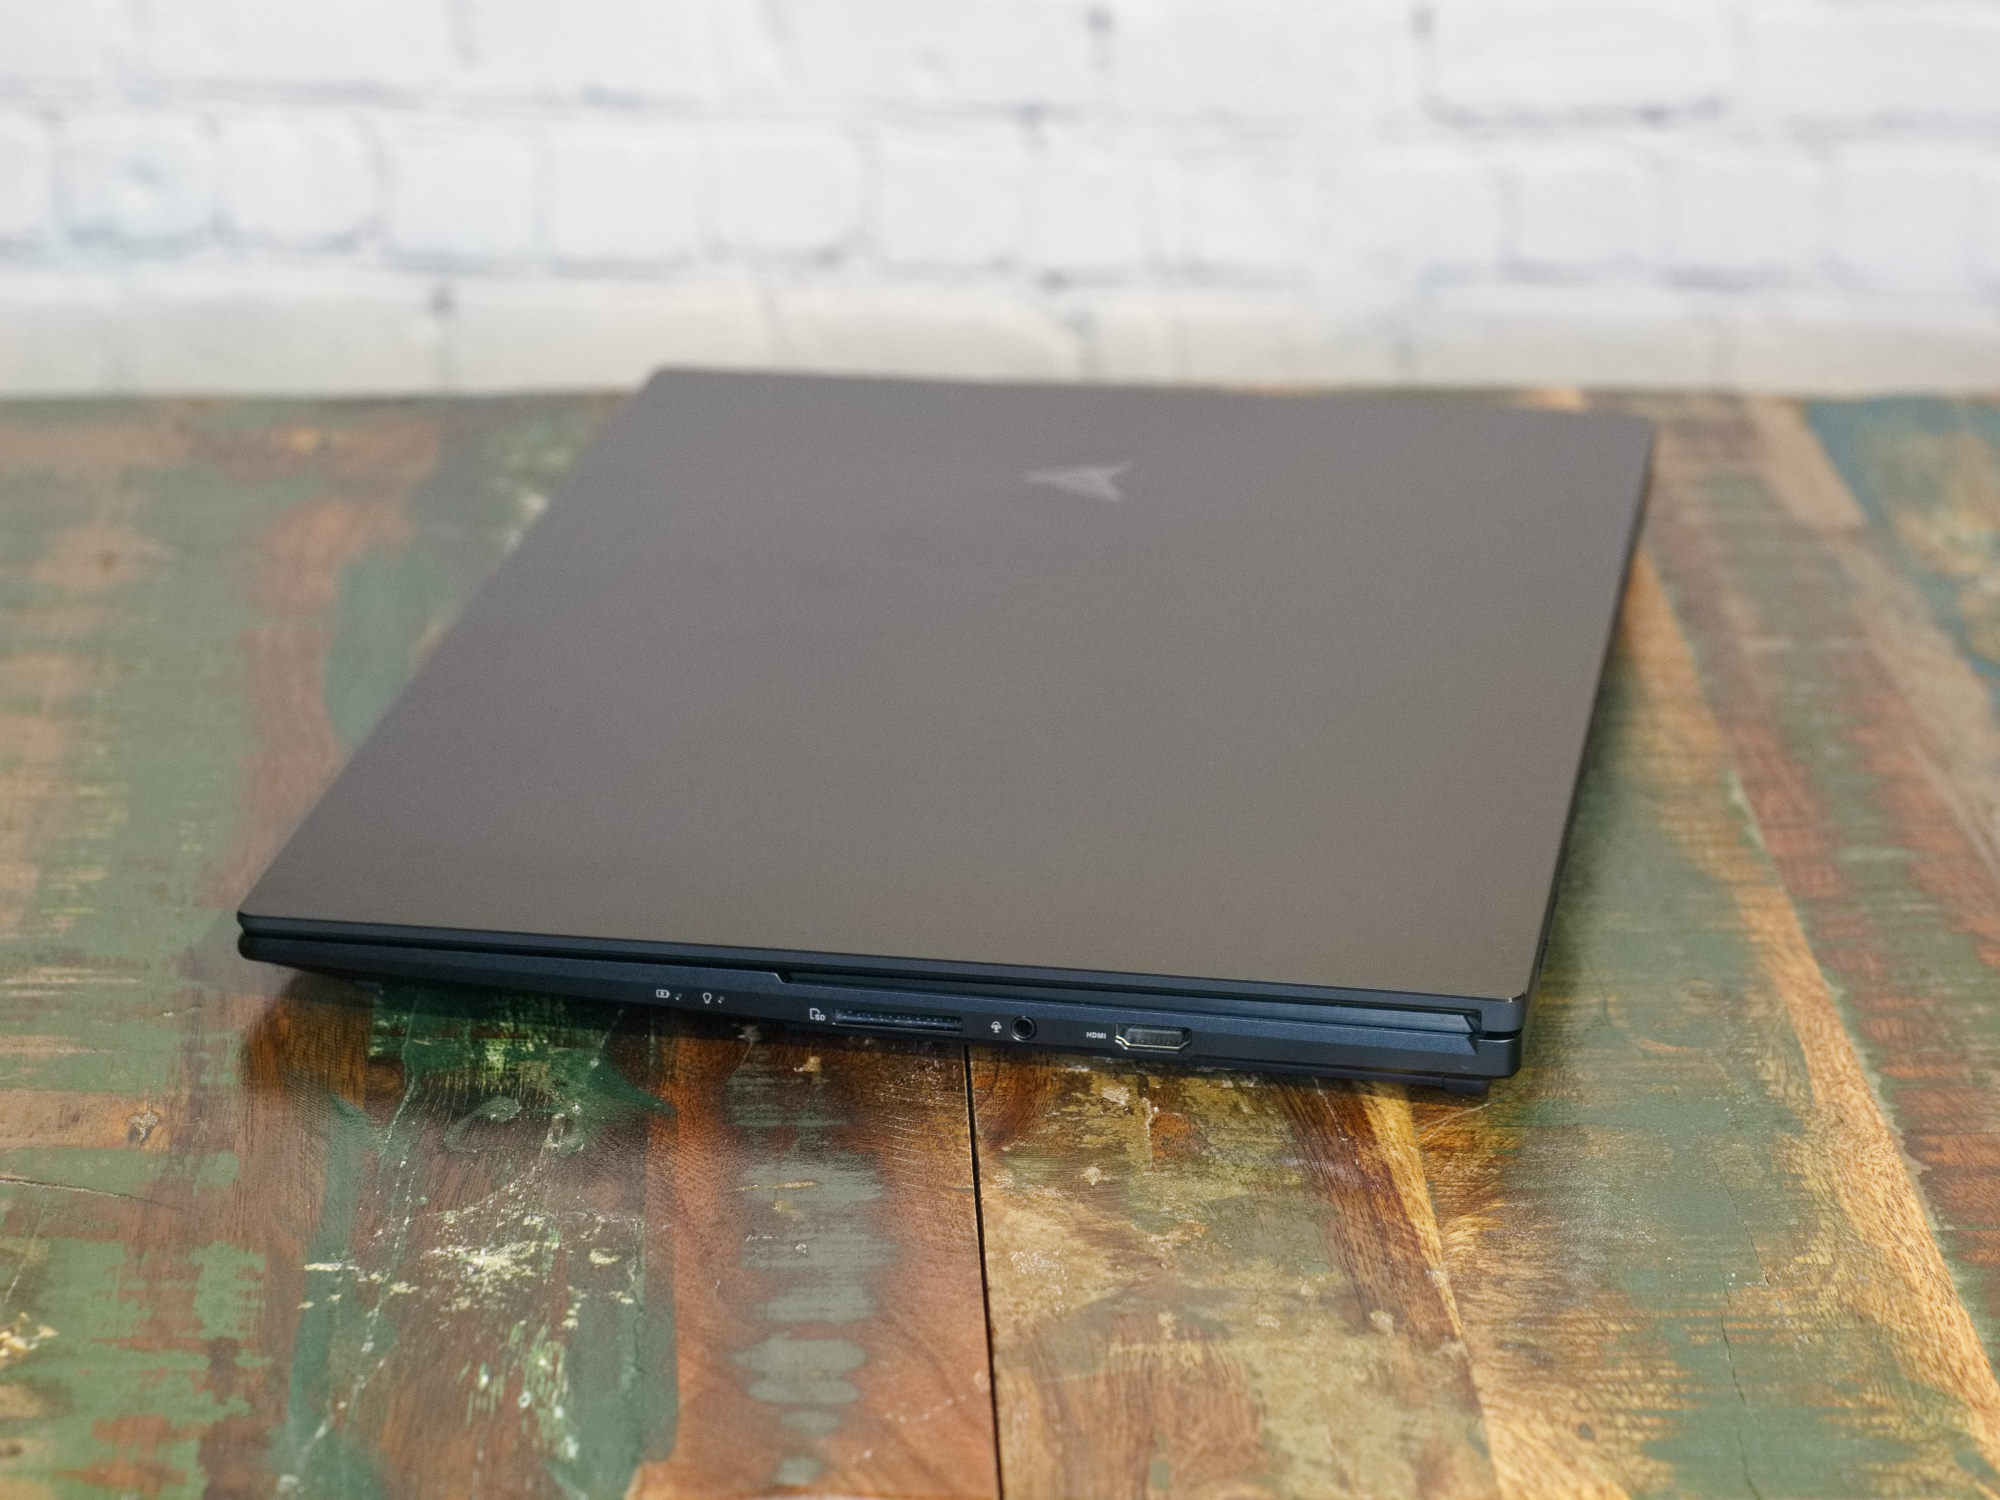
Case - Unusual in every detail
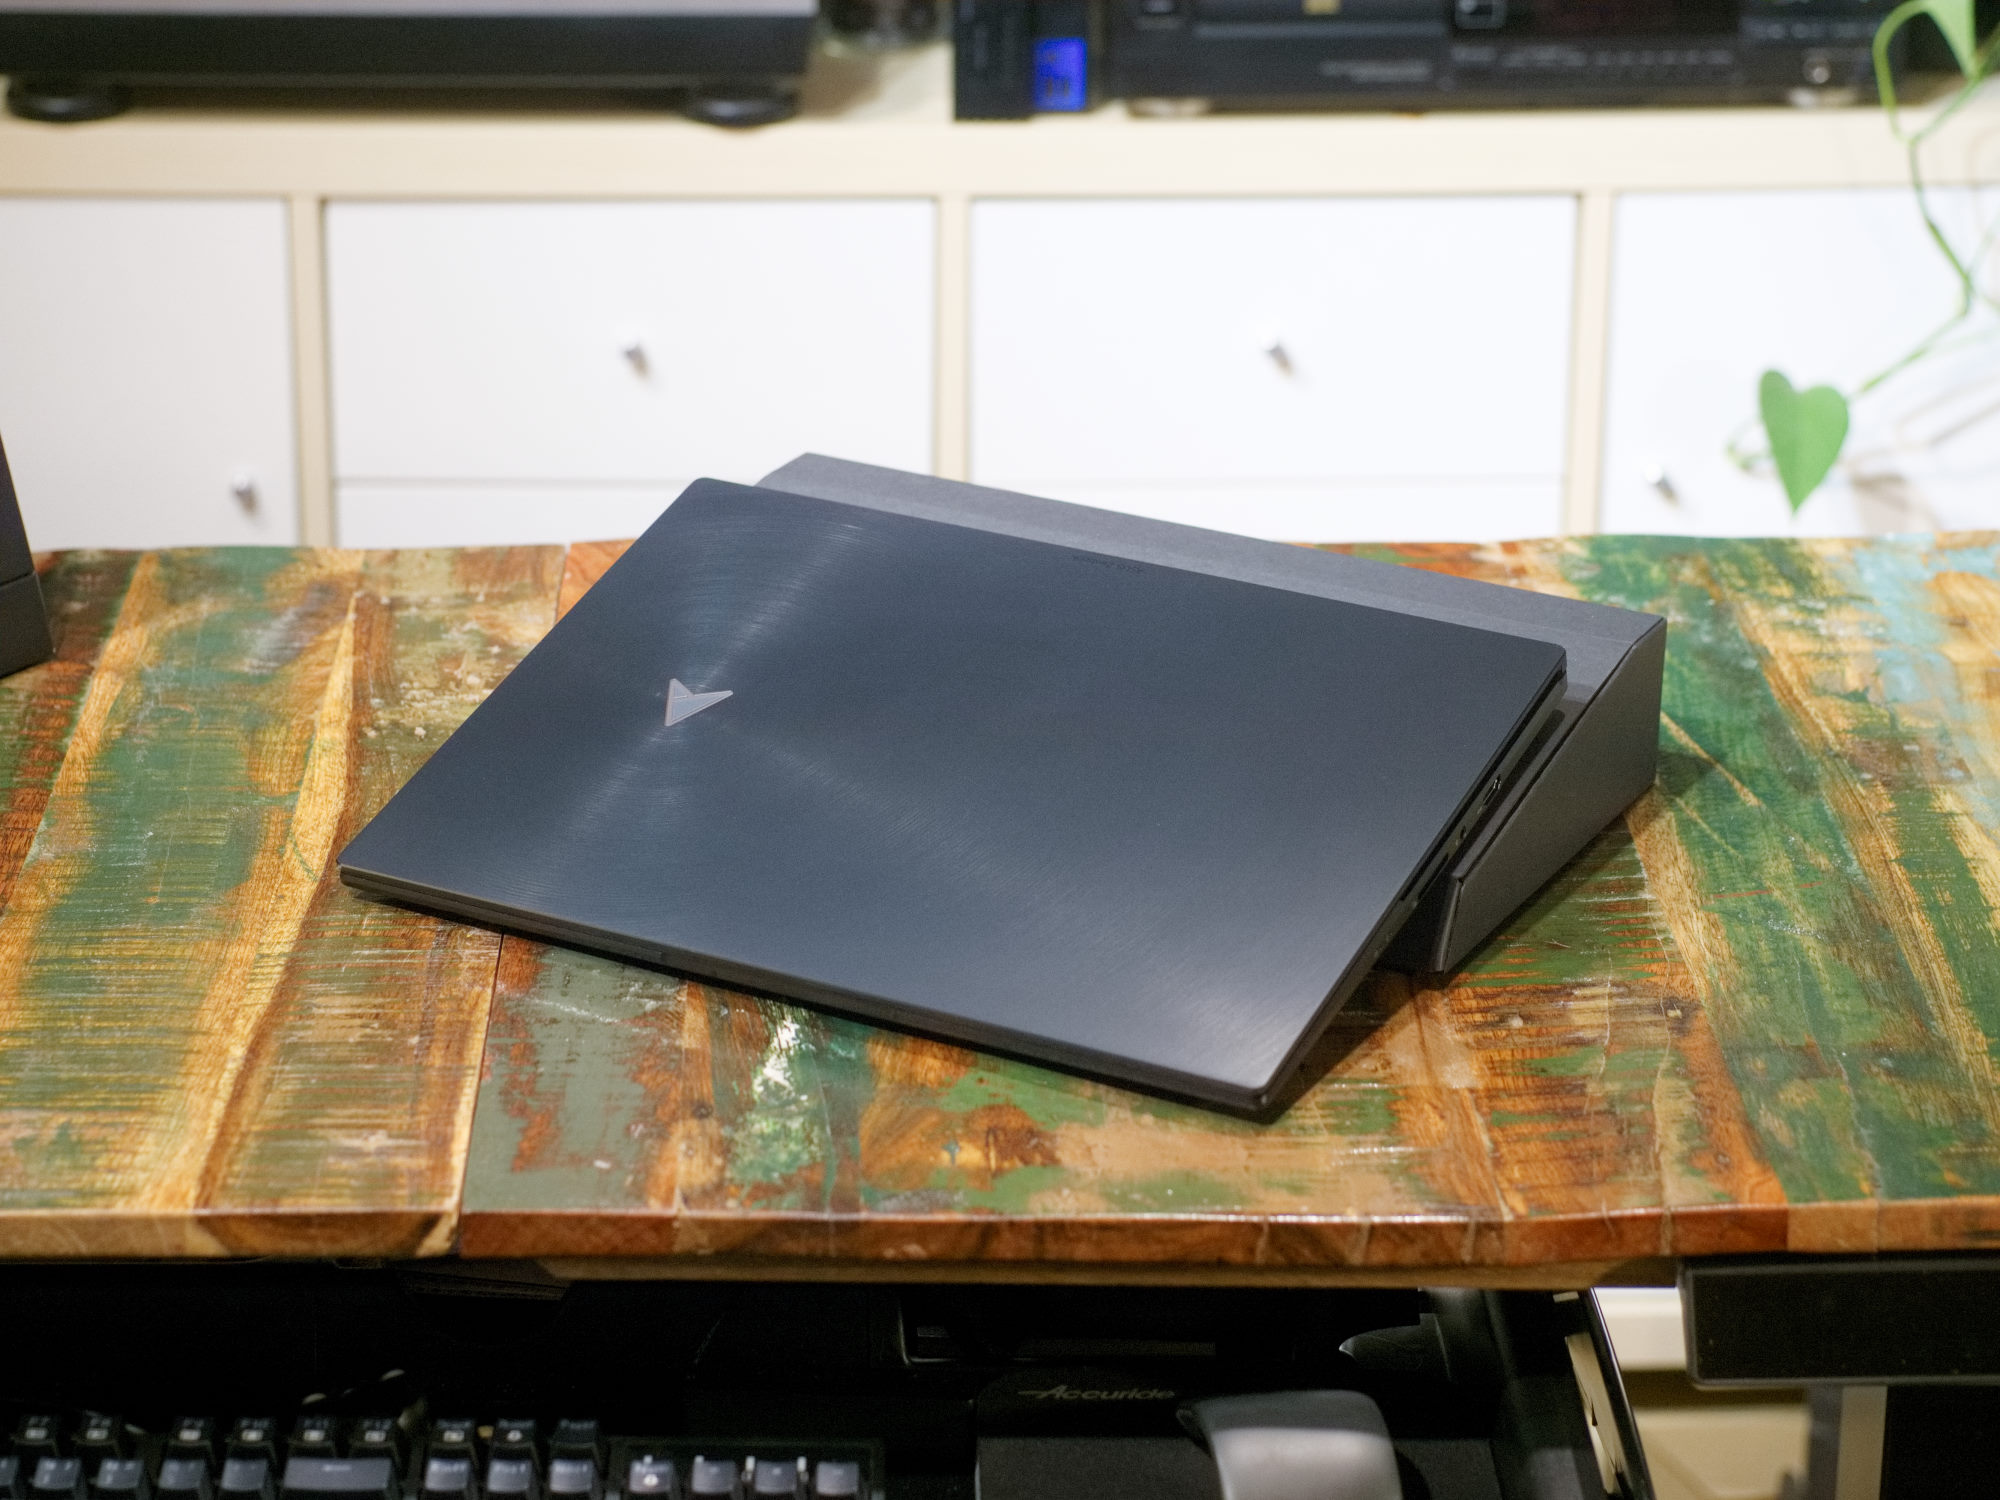
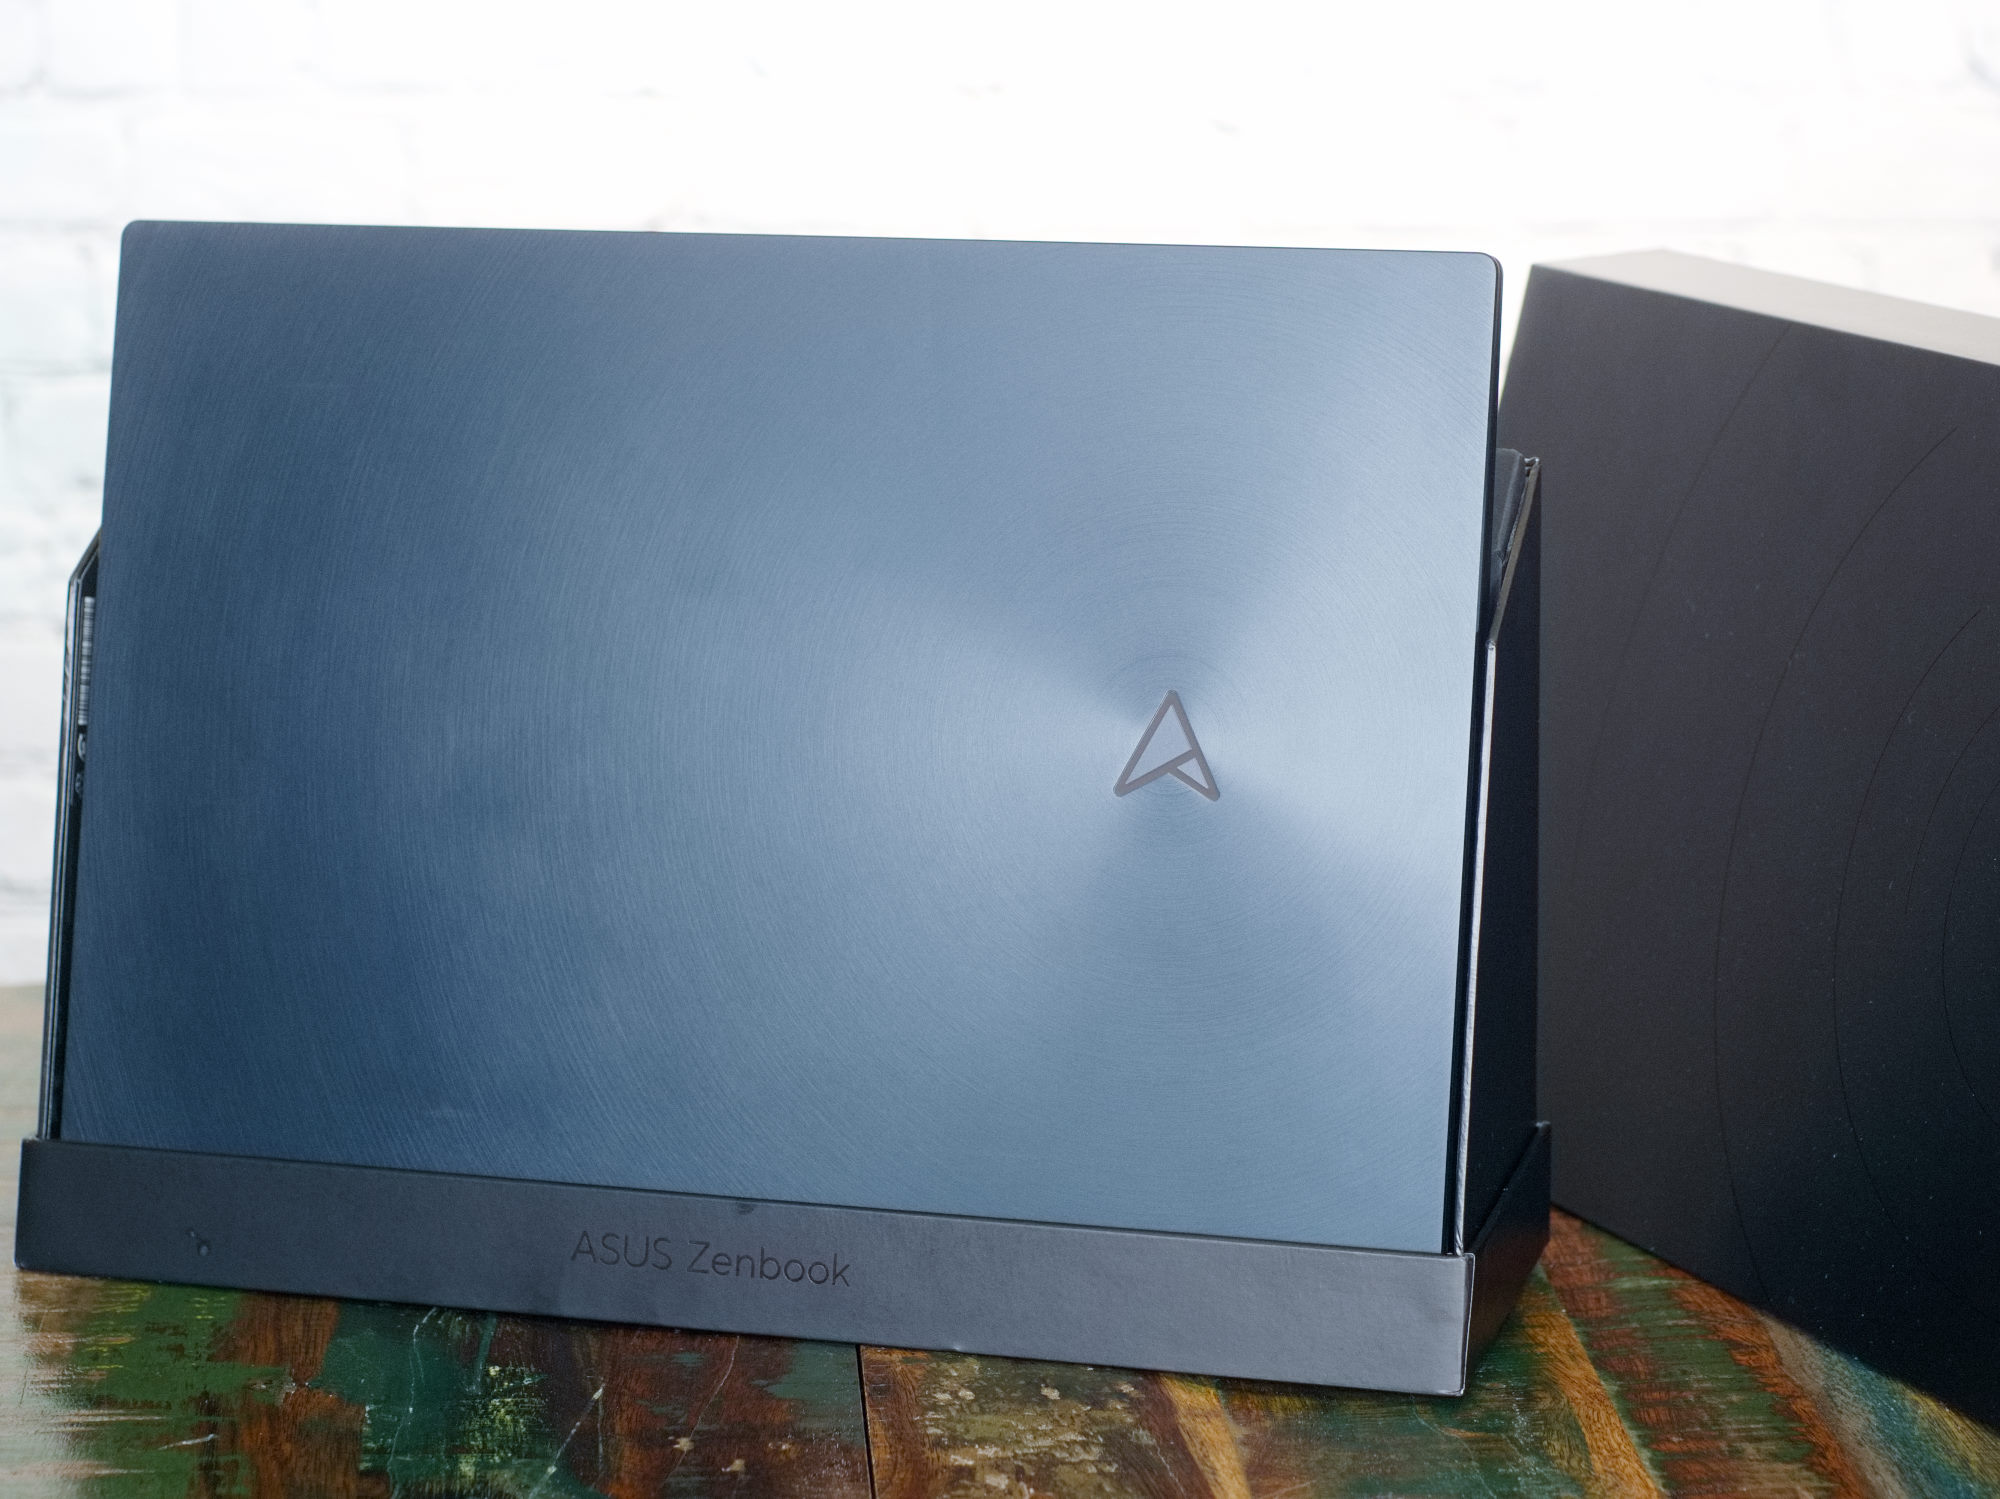
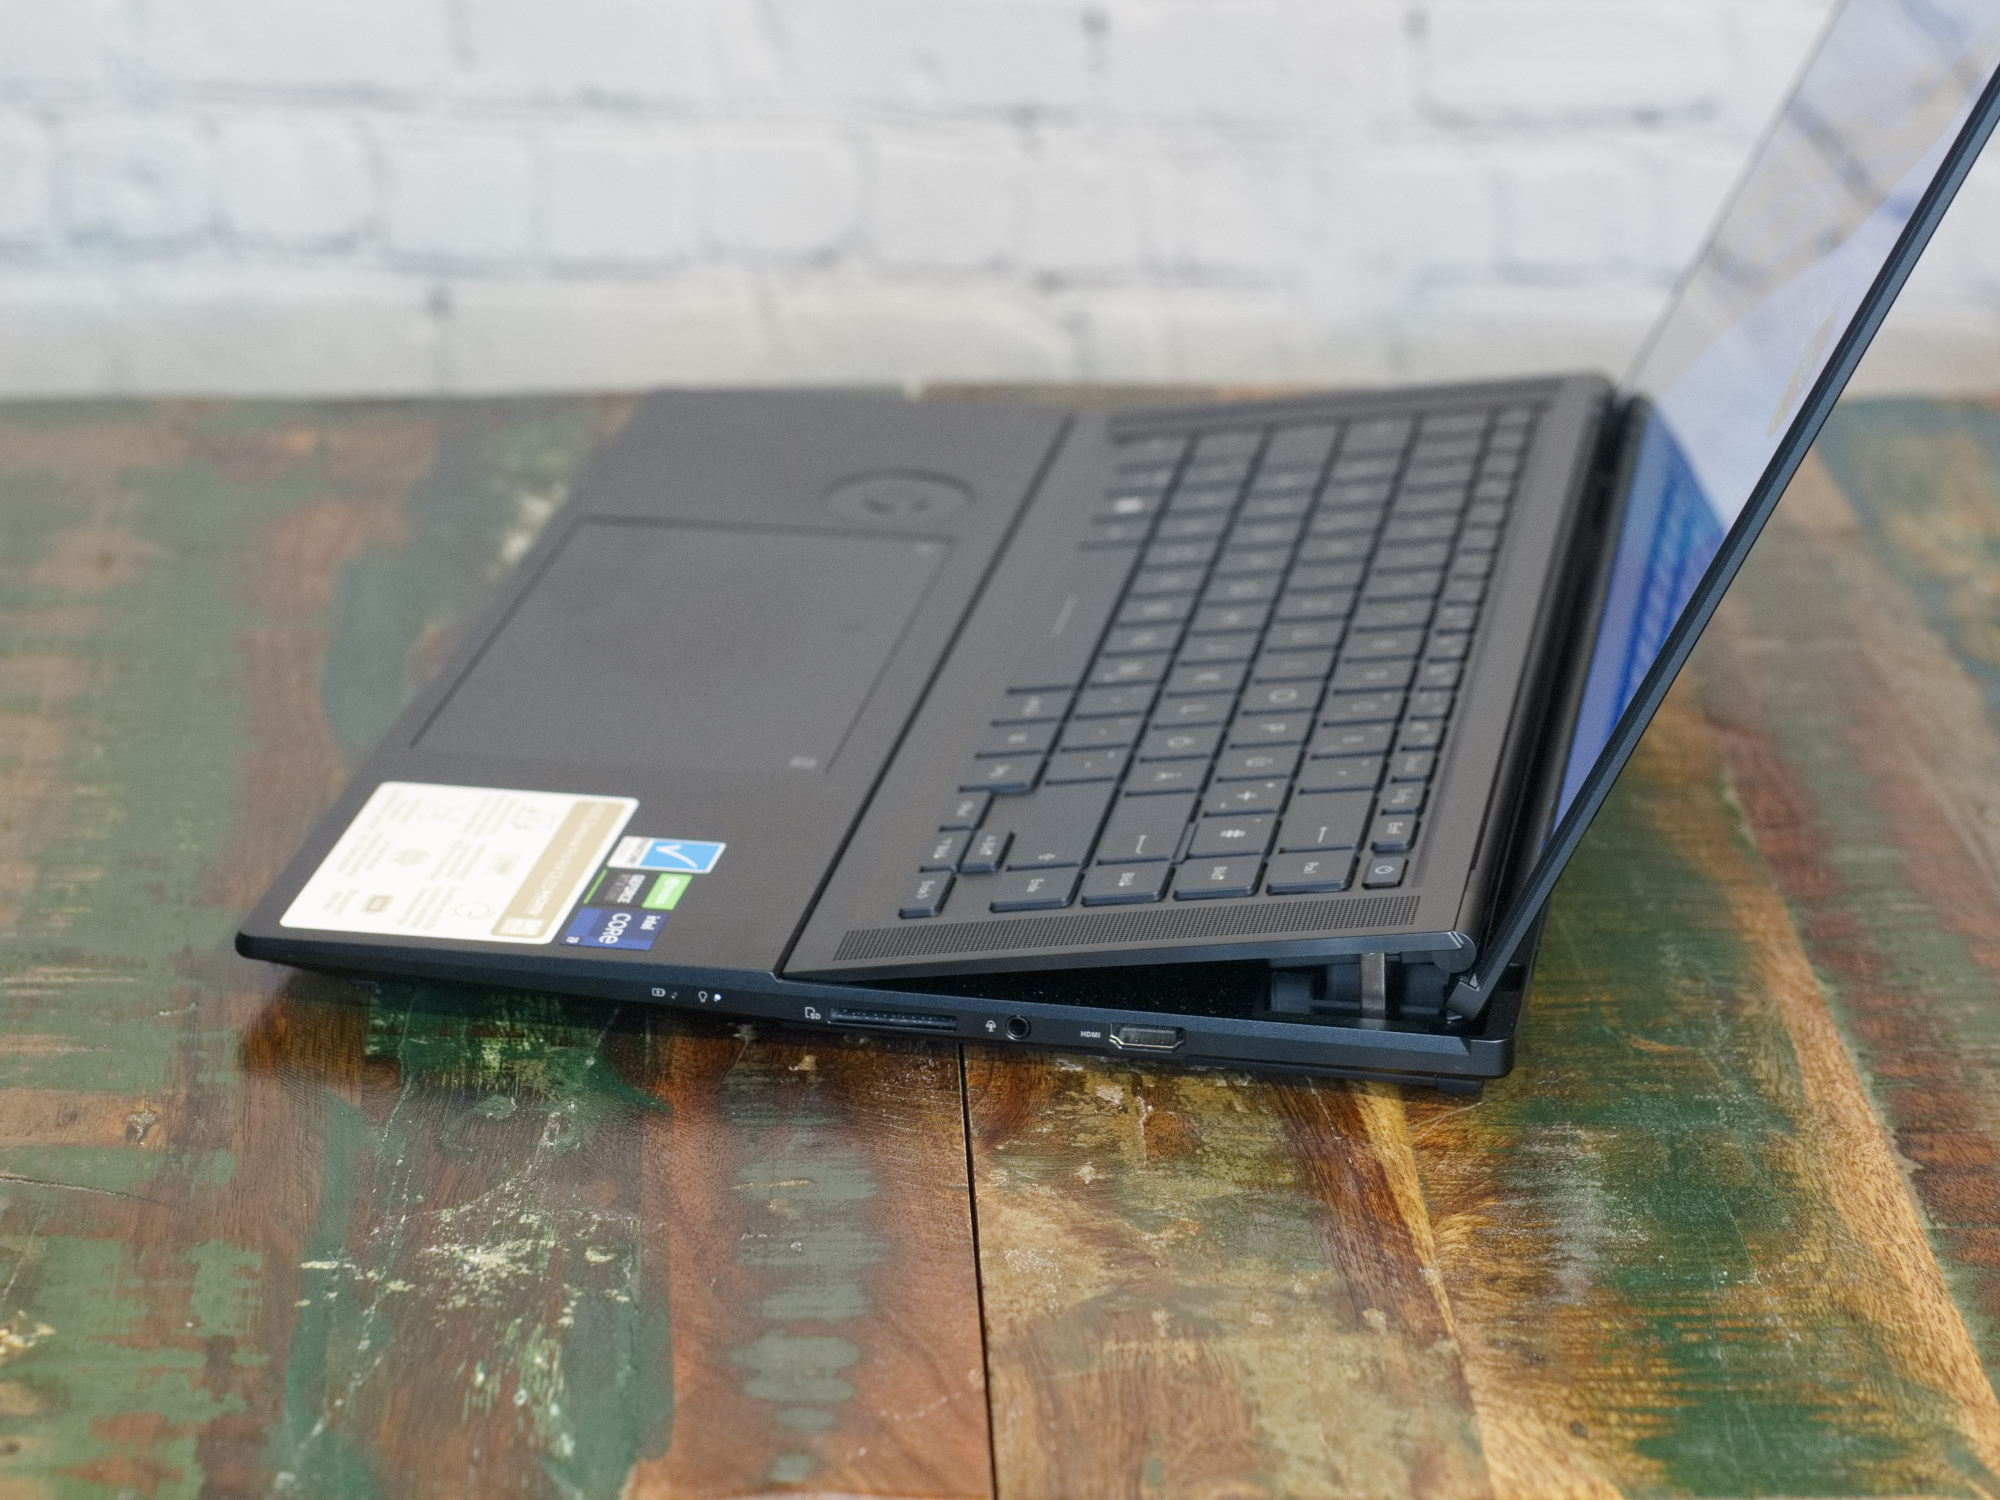
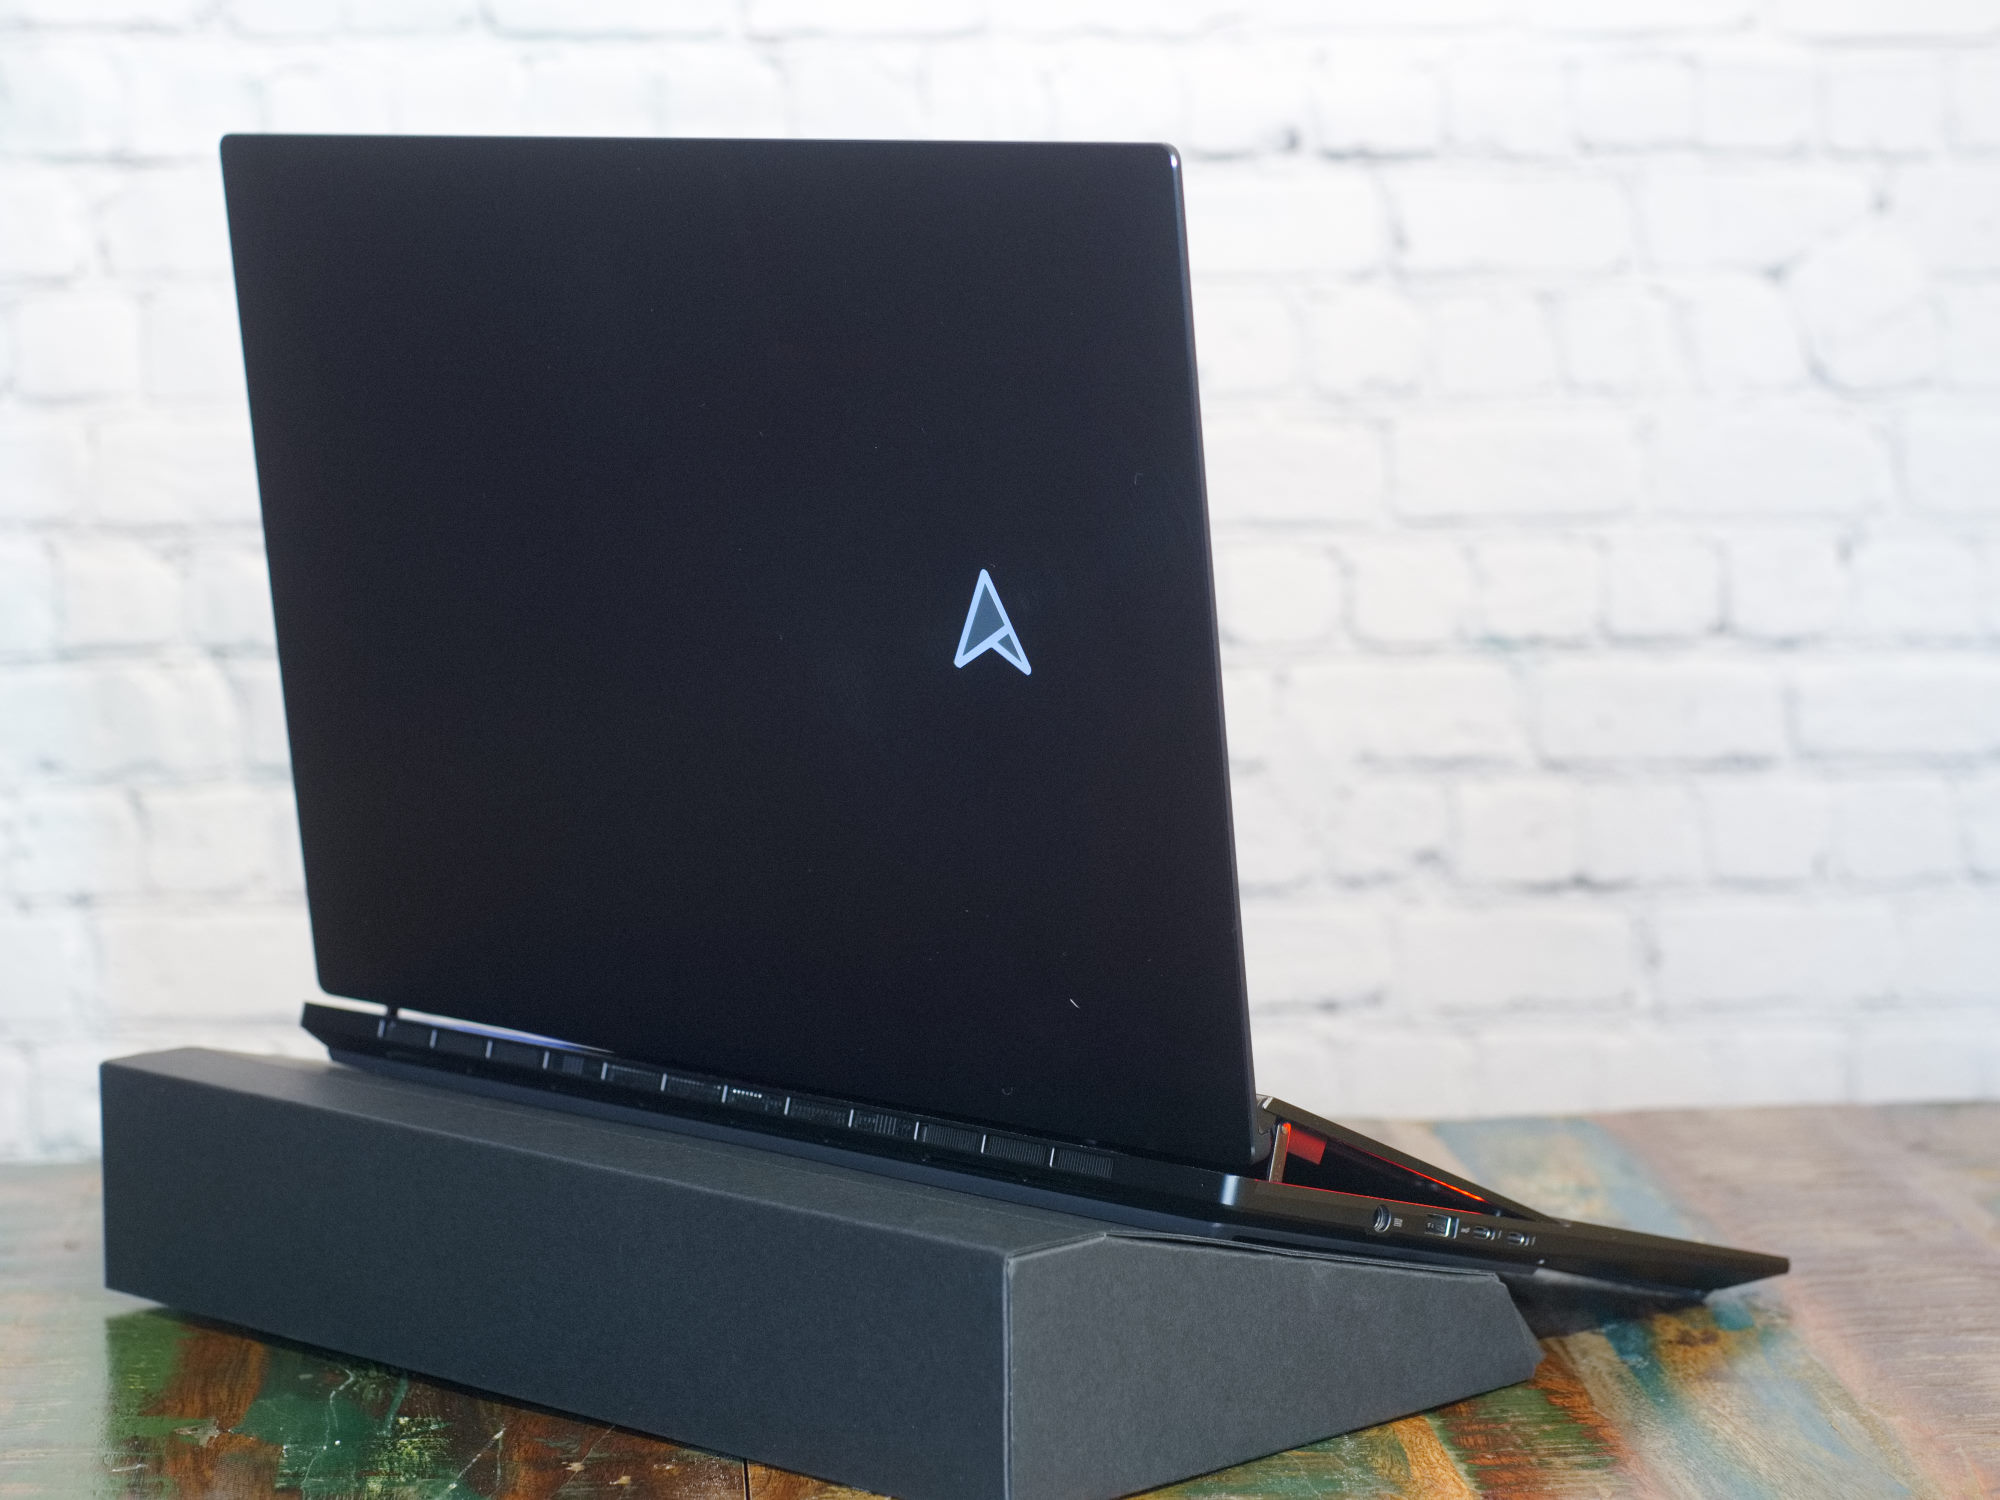
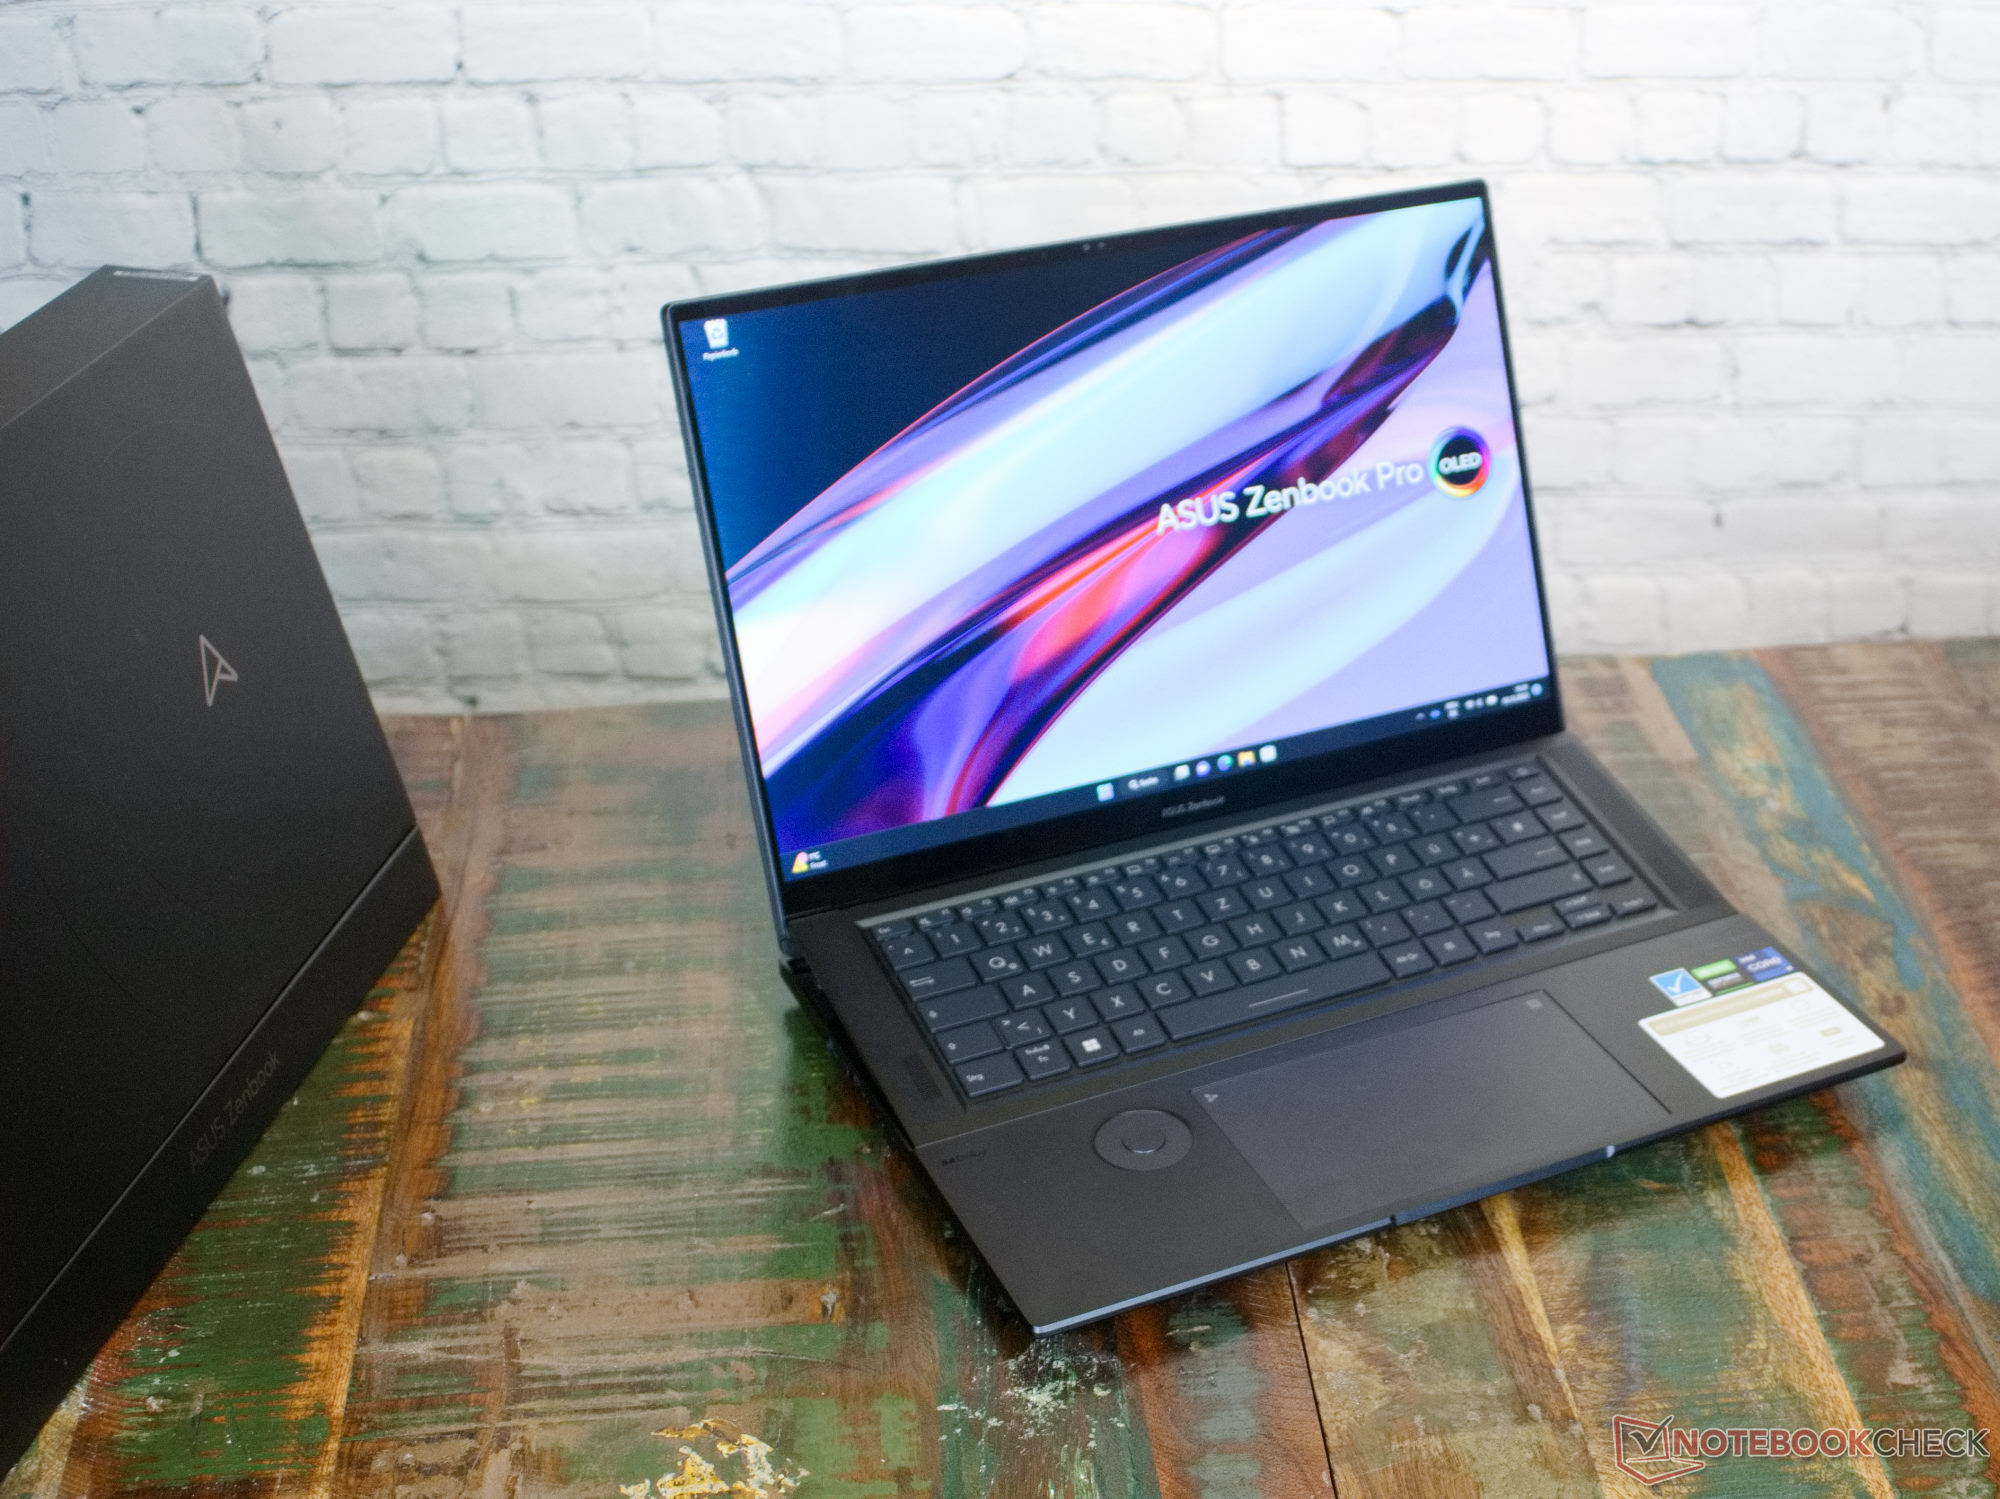
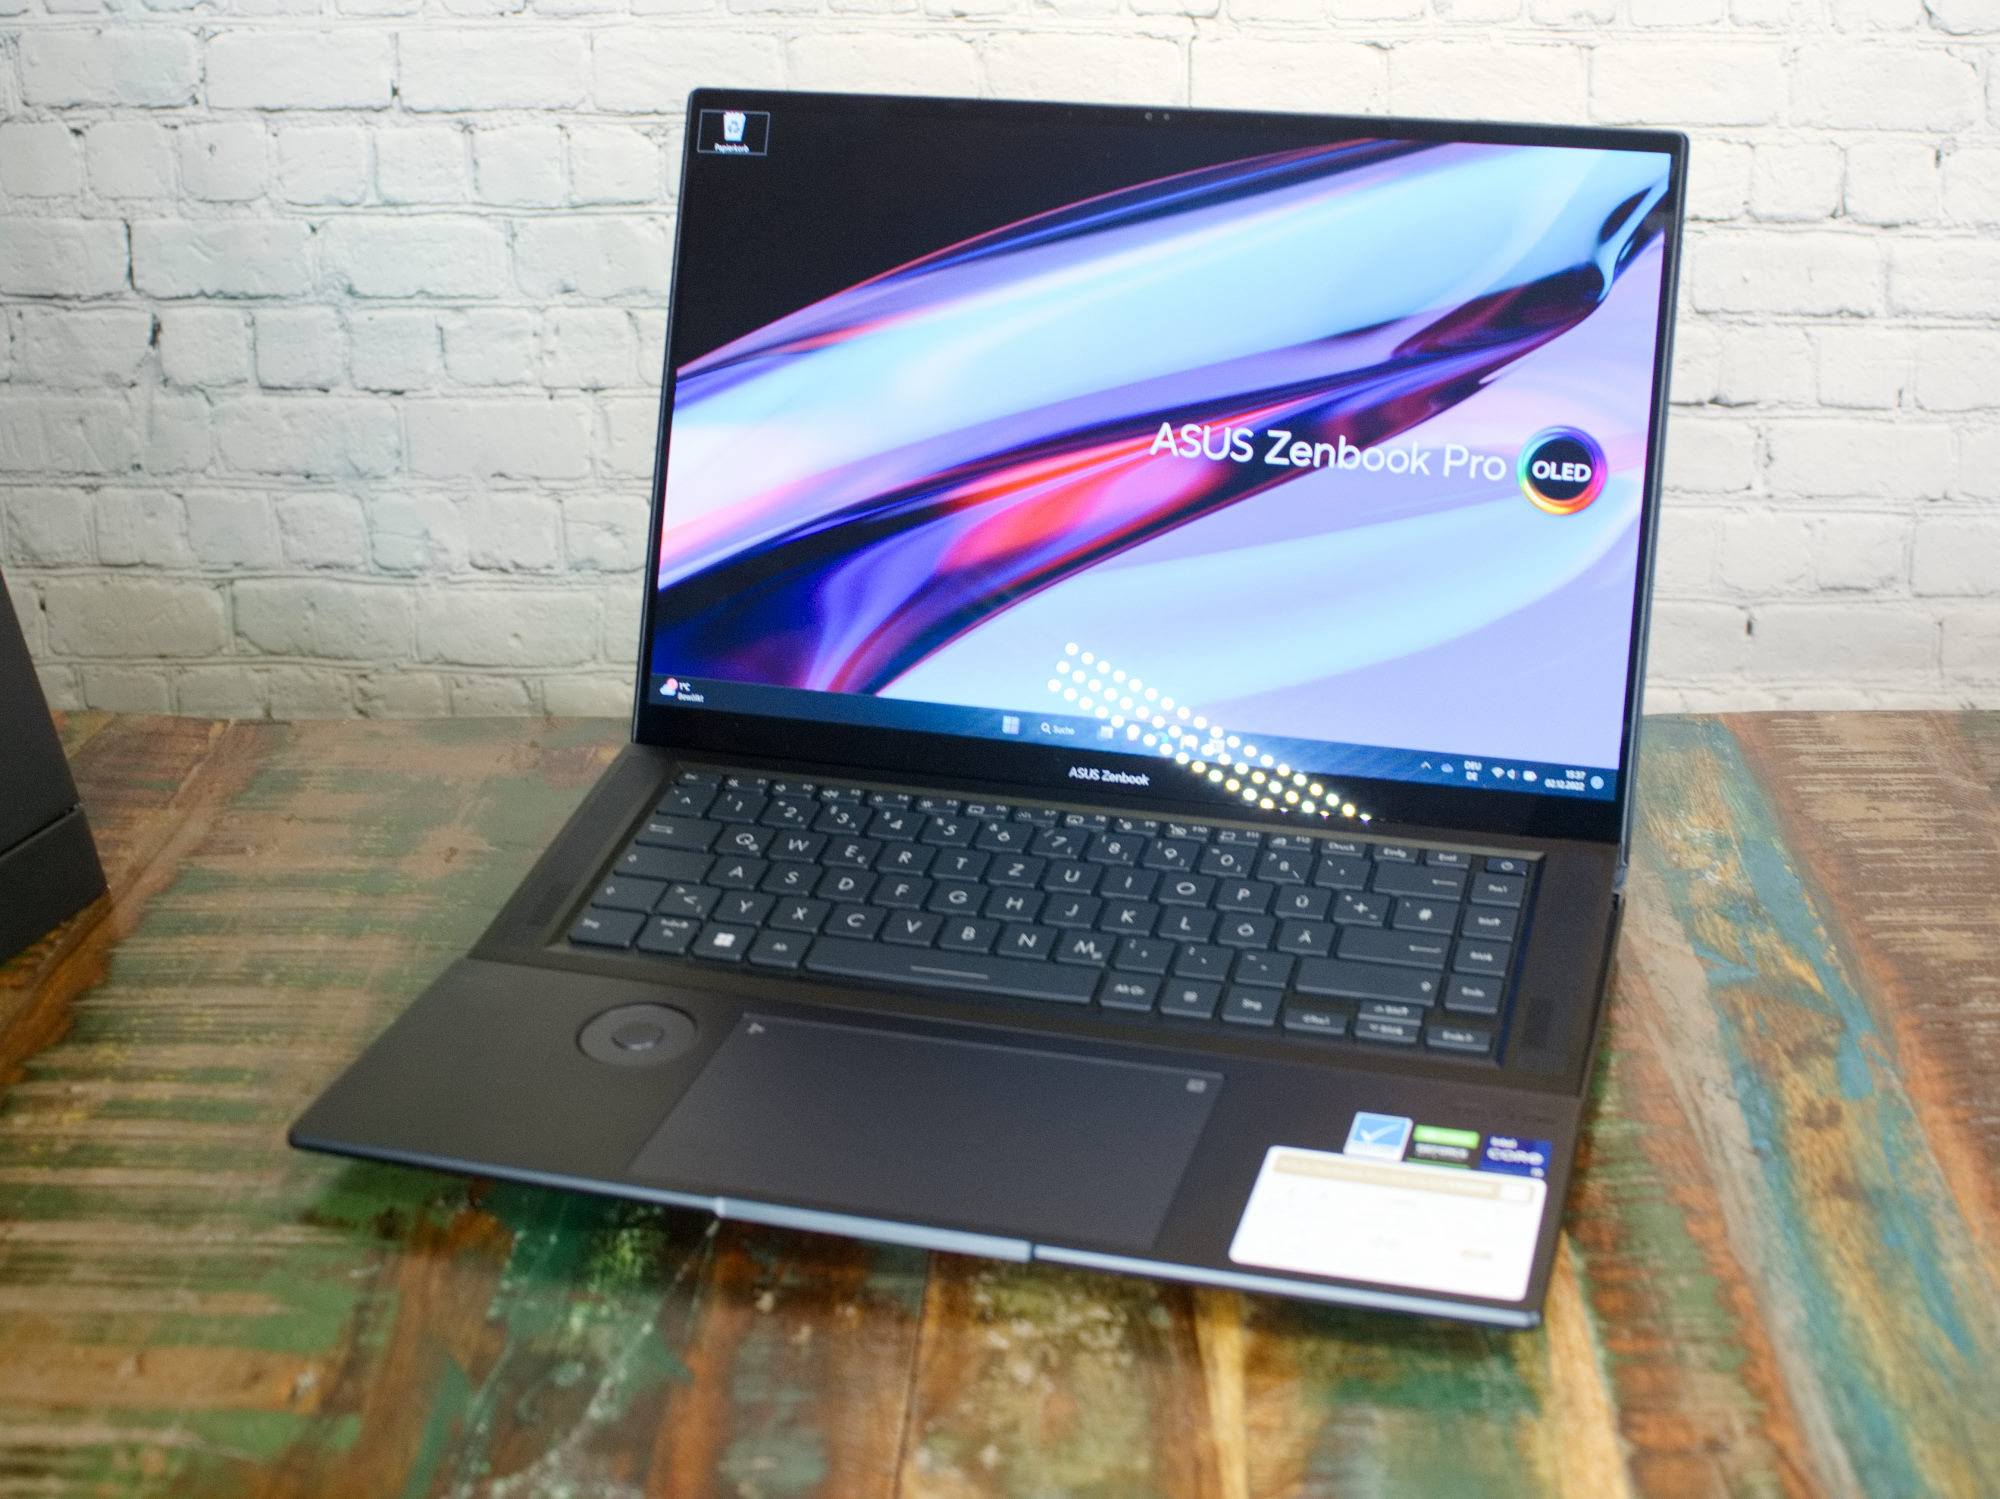
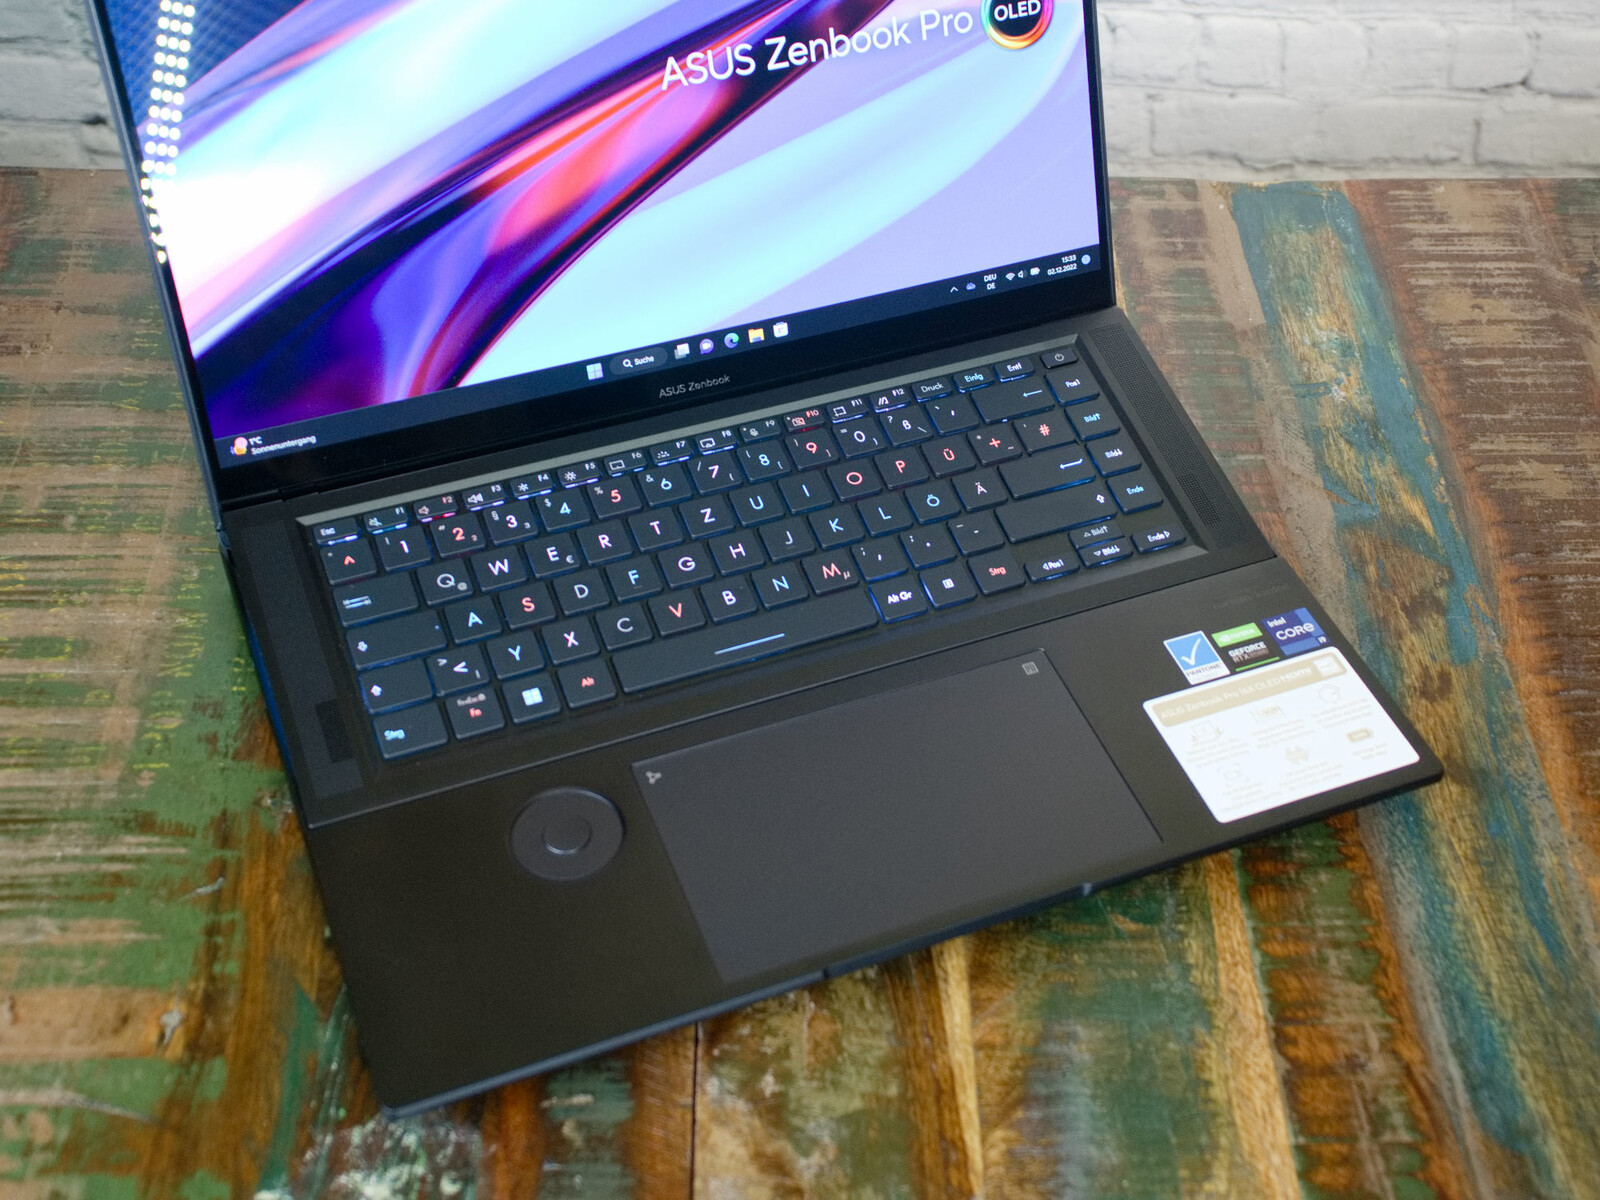
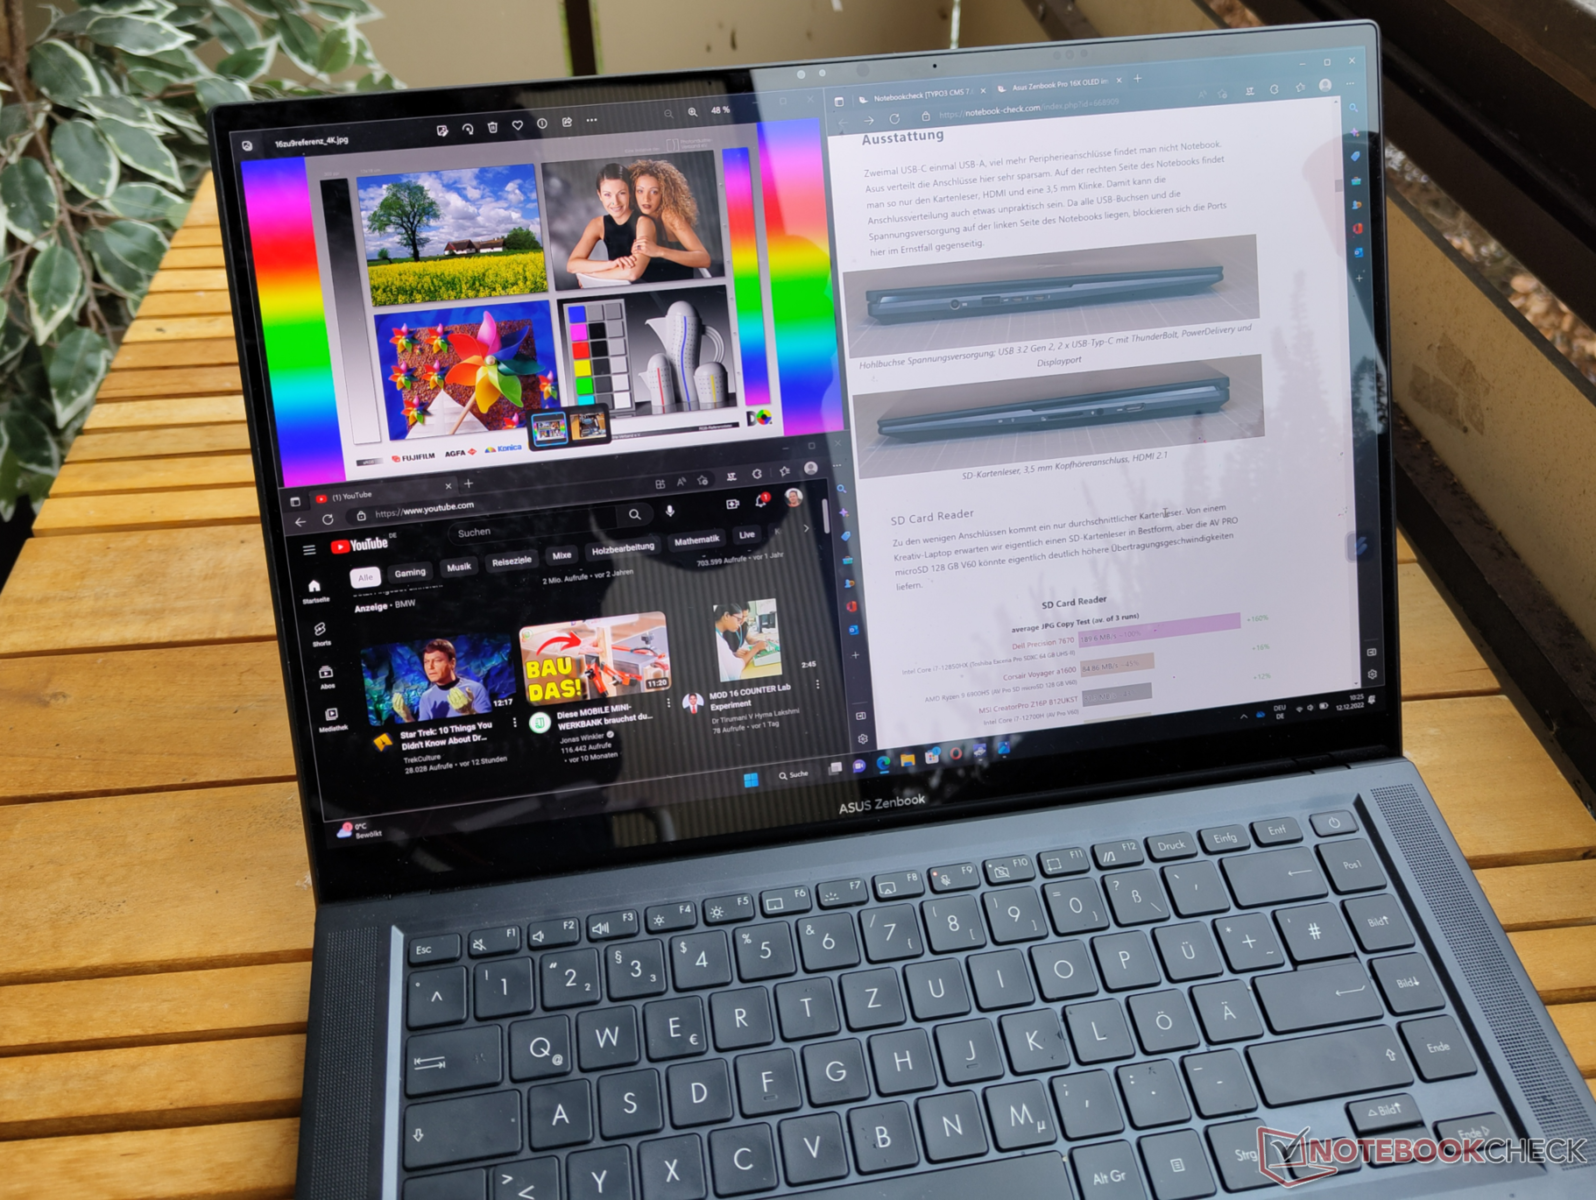
Asus always presents laptops with unique designs, and the ZenBook 16X OLED is no exception. Even the laptop's packaging is unusual. When you open the packaging for the first time, you notice that the design of the laptop is reflected in the packaging. Again, we find a concentric pattern around a stylized A. Star Trek fans might find this laptop particularly interesting for that reason alone. Like the keyboard, the up arrow is RGB backlit. The many edges on the notebook are softened by gentle bevels, which, however, retain an aggressive look. At times, the Zenbook Pro 16X OLED looks more like a gaming laptop.
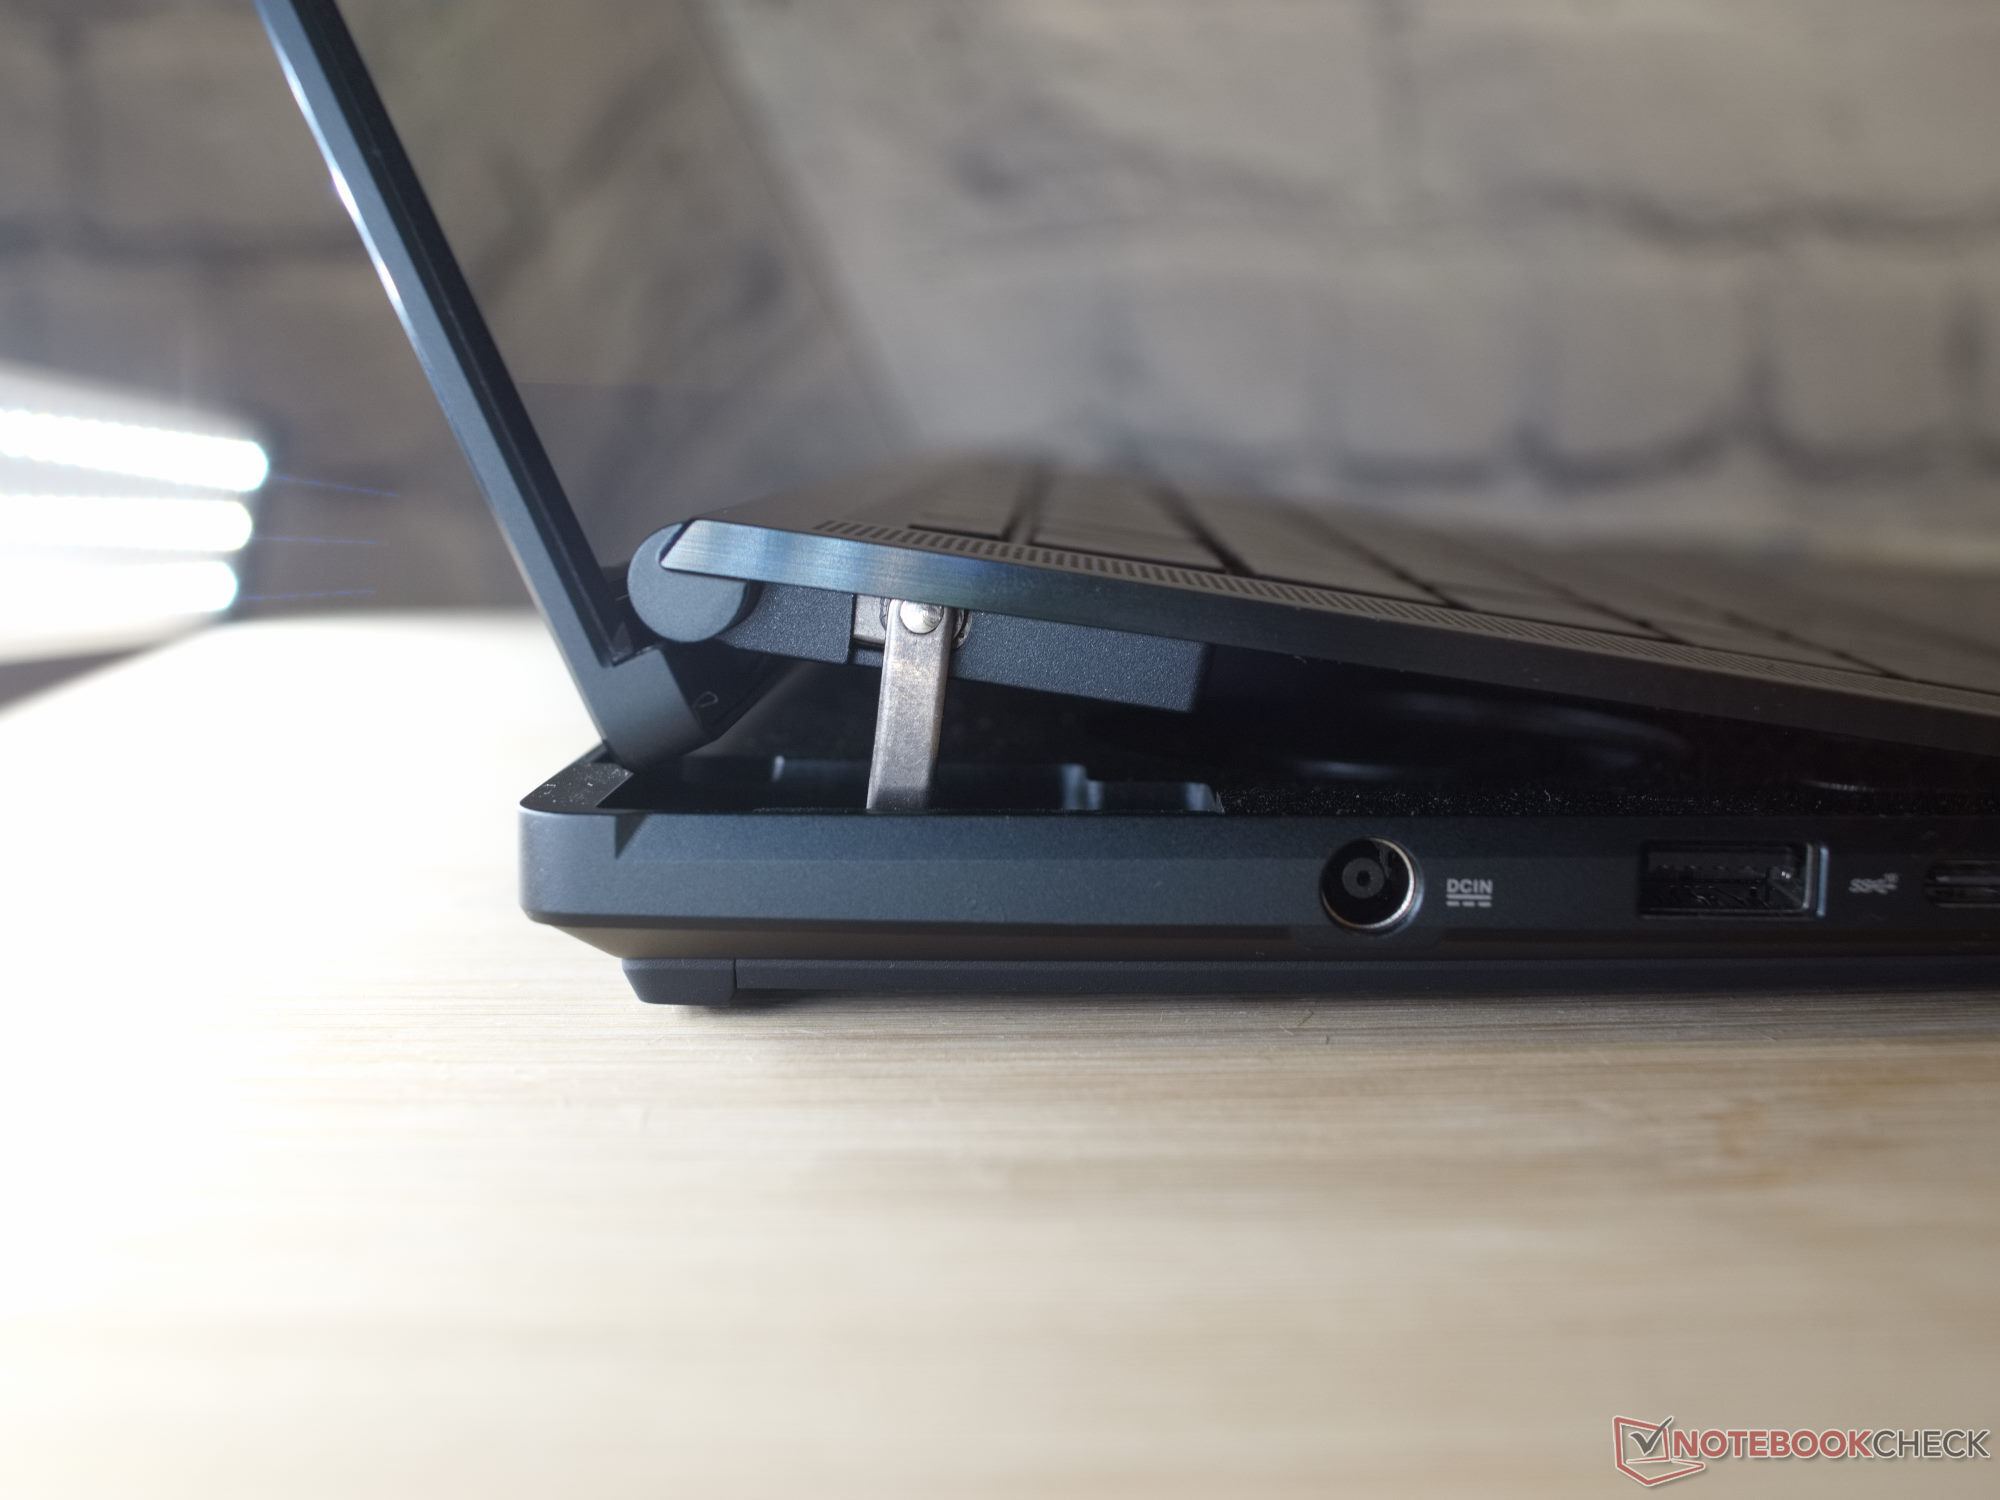
When you open the dark gray laptop, the keyboard is raised by about 2 cm at the back. This is supposed to ensure better ventilation for the hardware and a better hand position when typing. Asus designates the system as "AAS Ultra Cooling" and states that it confers an advantage of 30% increased air flow. The laptop's maximum opening angle is around 145°. Despite the complicated folding mechanism, opening is easy and can be done with one hand, and it appears delicate and stable at the same time. The screen seems to float in the air a few millimeters above the base. Unfortunately, the folding mechanism is also slightly loose, so the screen may rattle slightly during vibrations. A combination of high-quality materials otherwise provides the case with a feeling of stability, with lots of glass and aluminum making up the laptop's surfaces.

The Asus Zenbook Pro 16X OLED is not a featherweight, but it hardly stands out among competitors with strong graphics cards. The entire comparison field with graphics chips equivalent to the Nvidia GeForce RTX 3060 is on par in terms of size and weight. Laptops with a GA107 graphics chip (RTX 3050 and RTX A2000) are around 400 to 500 grams lighter.
Equipment - Meager port selection
Two USB-C ports and one USB-A port - you won't find many more peripheral connections on the notebook. Asus distributes the ports very sparingly here. On the right side of the notebook you only find the card reader, HDMI and a 3.5 mm jack, making the port distribution somewhat impractical. Since all USB ports and the power supply are on the left side of the notebook, the ports may block each other when all in use. Docking solutions are the only probable remedy here in the long run.

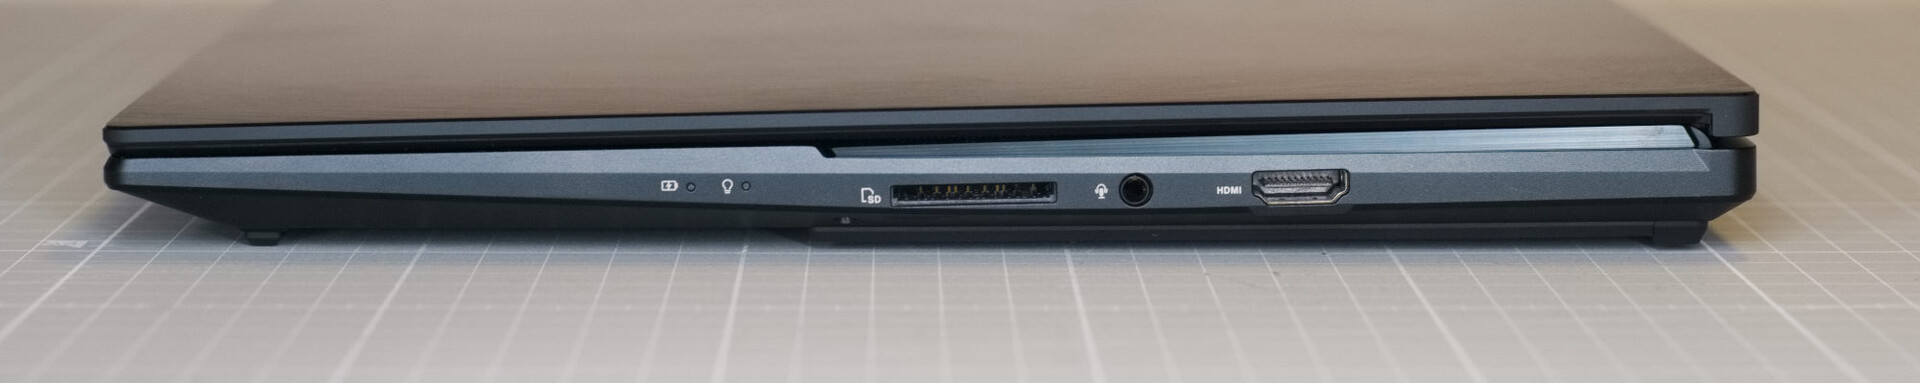
SD Card Reader
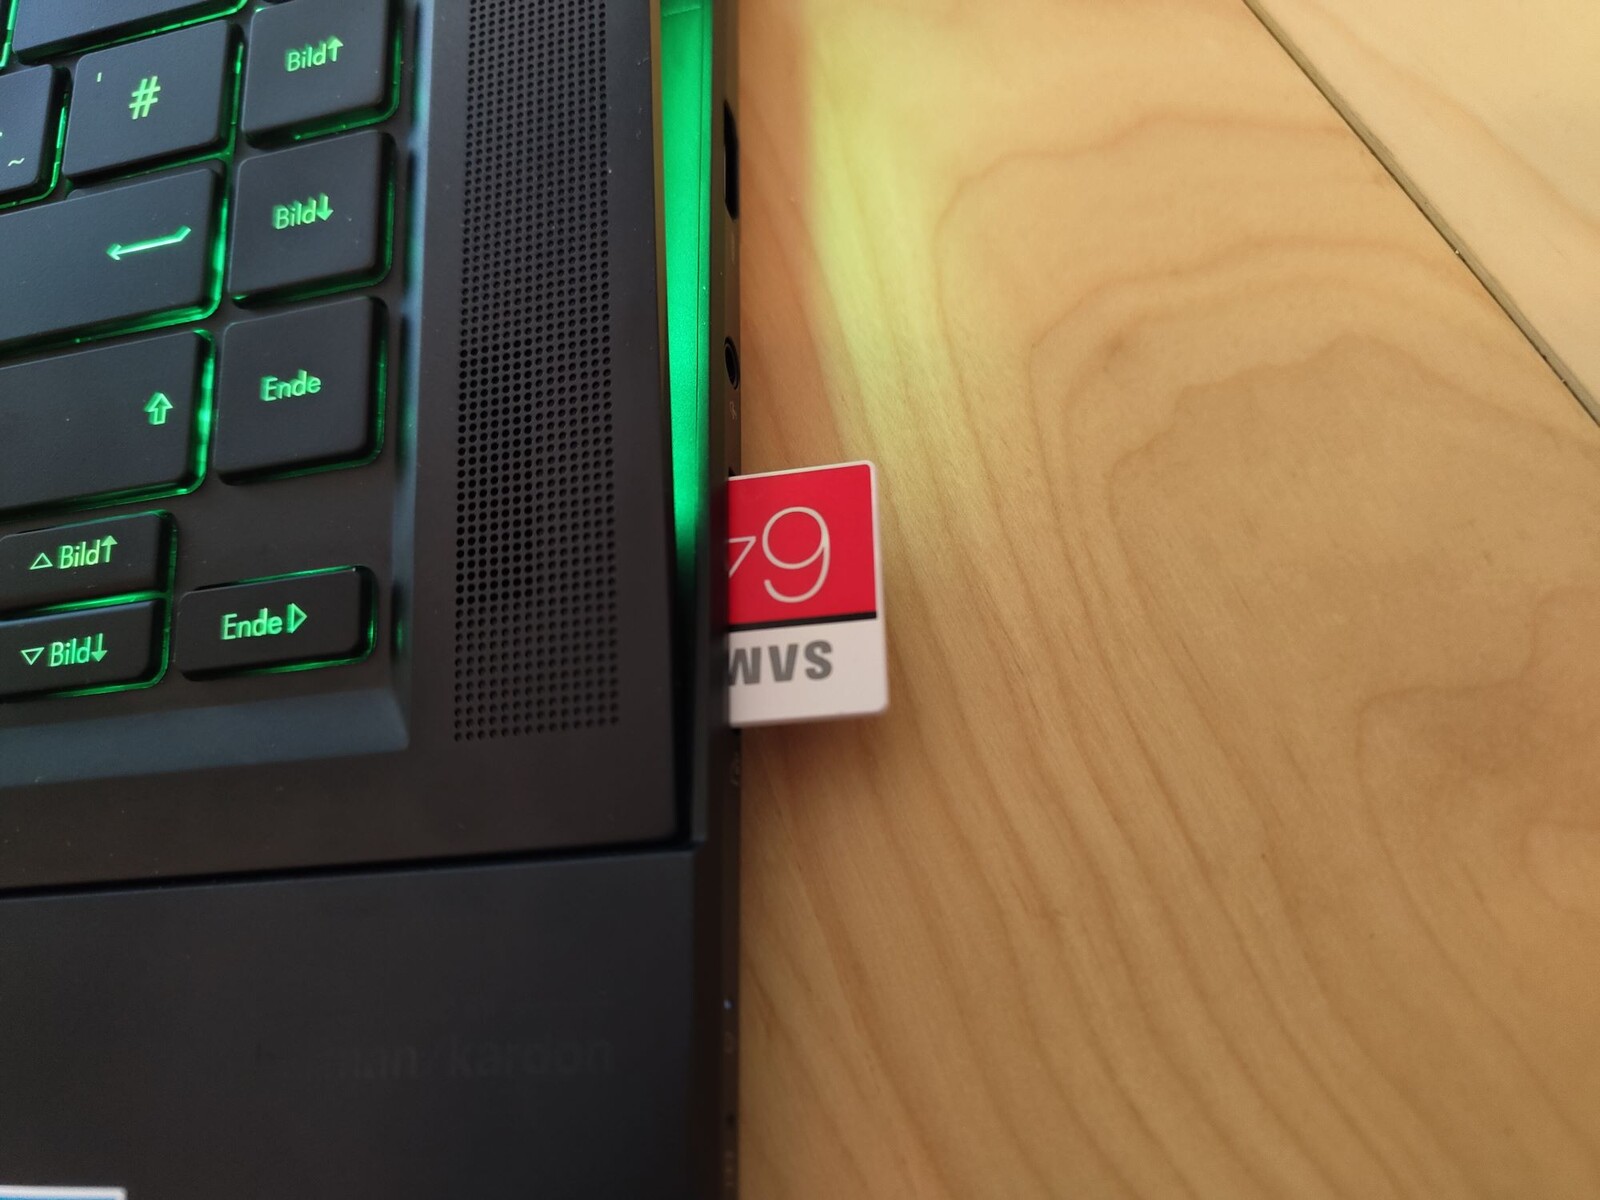
In addition to the scarce selection of ports, the card reader delivers only average performance. We actually expect the SD card reader in a creative laptop to be top-of-the-line, but other laptops manage to deliver higher transfer rates with the AV PRO microSD 128 GB V60.
Communication
Positioning the WLAN antennas can be difficult in laptops with a metal case. Asus does not appear to have made a good choice in its arrangement of the three antennas in the ZenBook Pro 16X OLED. Consequently, the upload- and download speeds fall far below the capabilities of the installed Intel AX211 module, although Asus has installed an amplifier with automatic switching between two of the antennas.
Webcam
There are two cameras in the ZenBook. An infrared camera handles the user identification process via facial recognition. Another webcam with a Full HD sensor is right next to it, offering good image quality and performing well in low ambient light. According to the laptop's user manual, it should also be possible to use the IR camera in a fully dark room. Unfortunately, we were unable to activate feature for purposes of testing. However, other AI features are available that are intended to improve image quality.


Security
3D facial recognition via IR webcam and a fingerprint scanner are available for logging into Windows. The inbuilt Intel Core i9-12900H also has security features such as TPM2.0 and SecureBoot.
Accessories
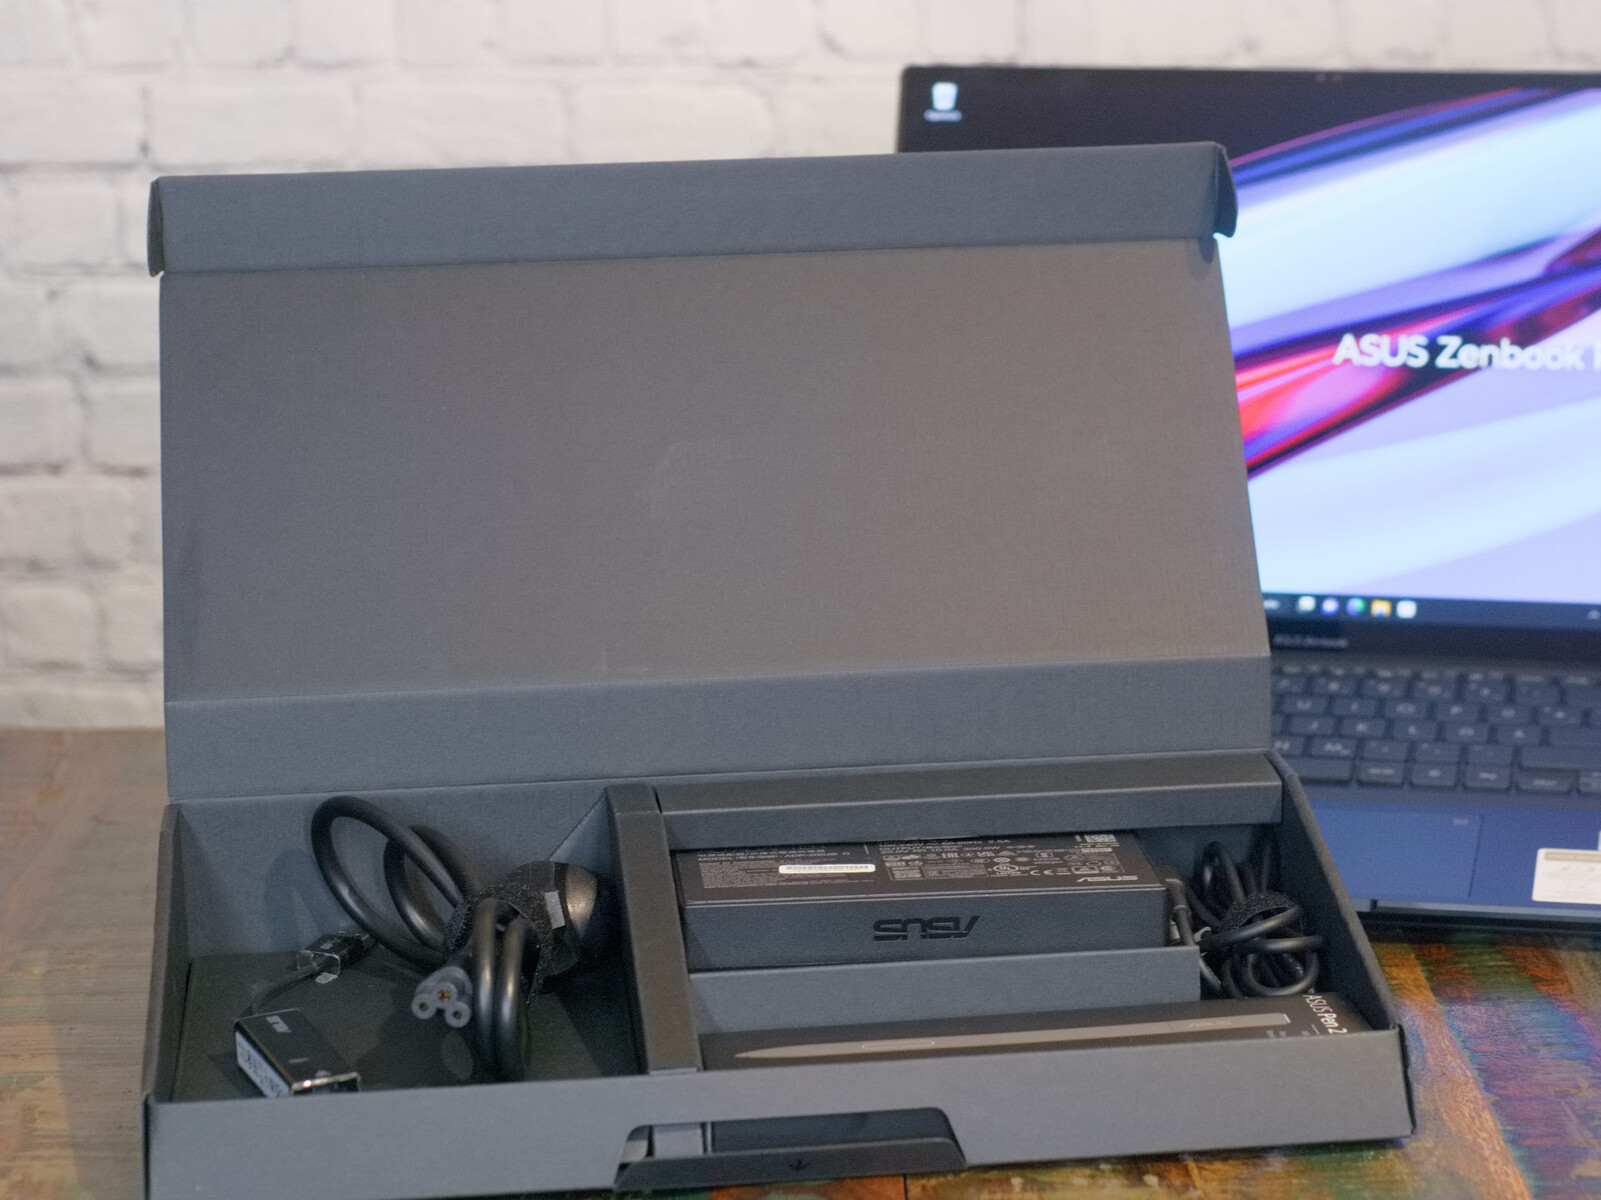
Accessories for the Asus ZenBook Pro 16X also include the packaging, which can serve as a raised platform upon which the laptop can be placed. In the box we find an Asus Pen 2.0 with the accompanying charging cable and three additional pen tips for differing frictional properties and hardness, a power adapter and a LAN adapter. All accessories can be conveniently stowed away in the box.
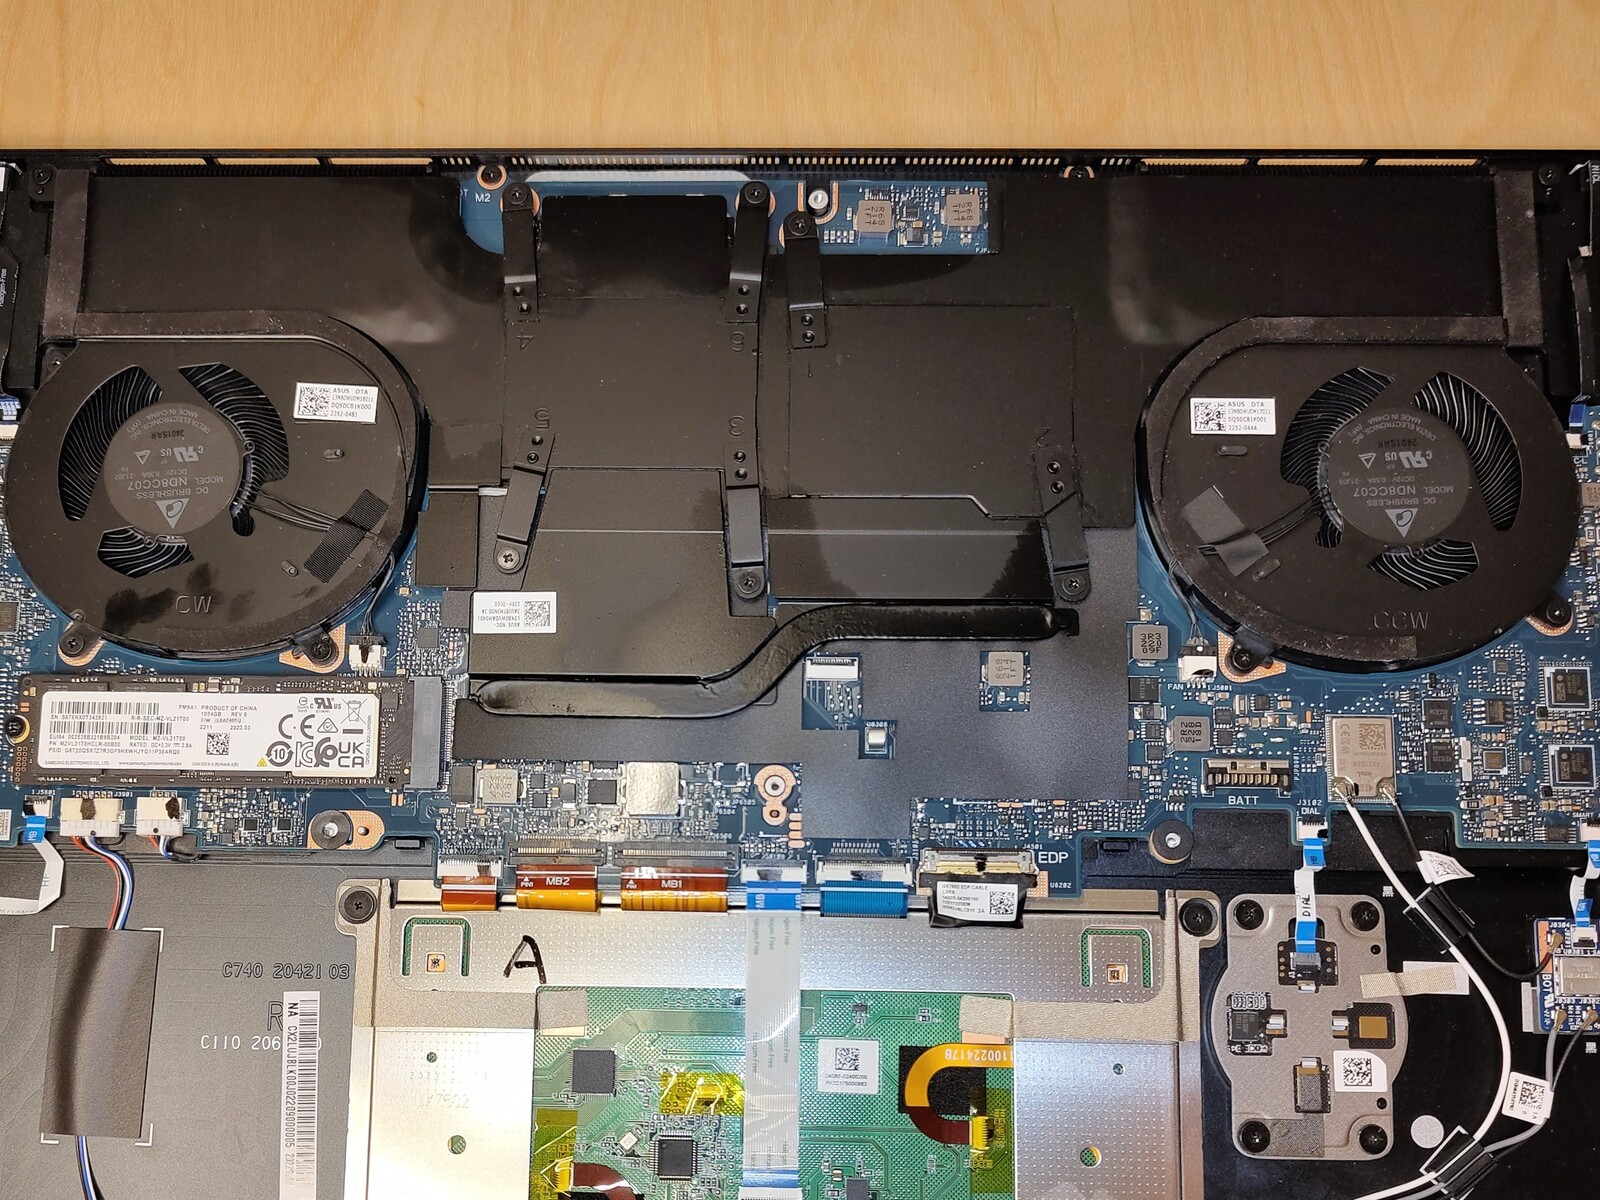
Maintenance
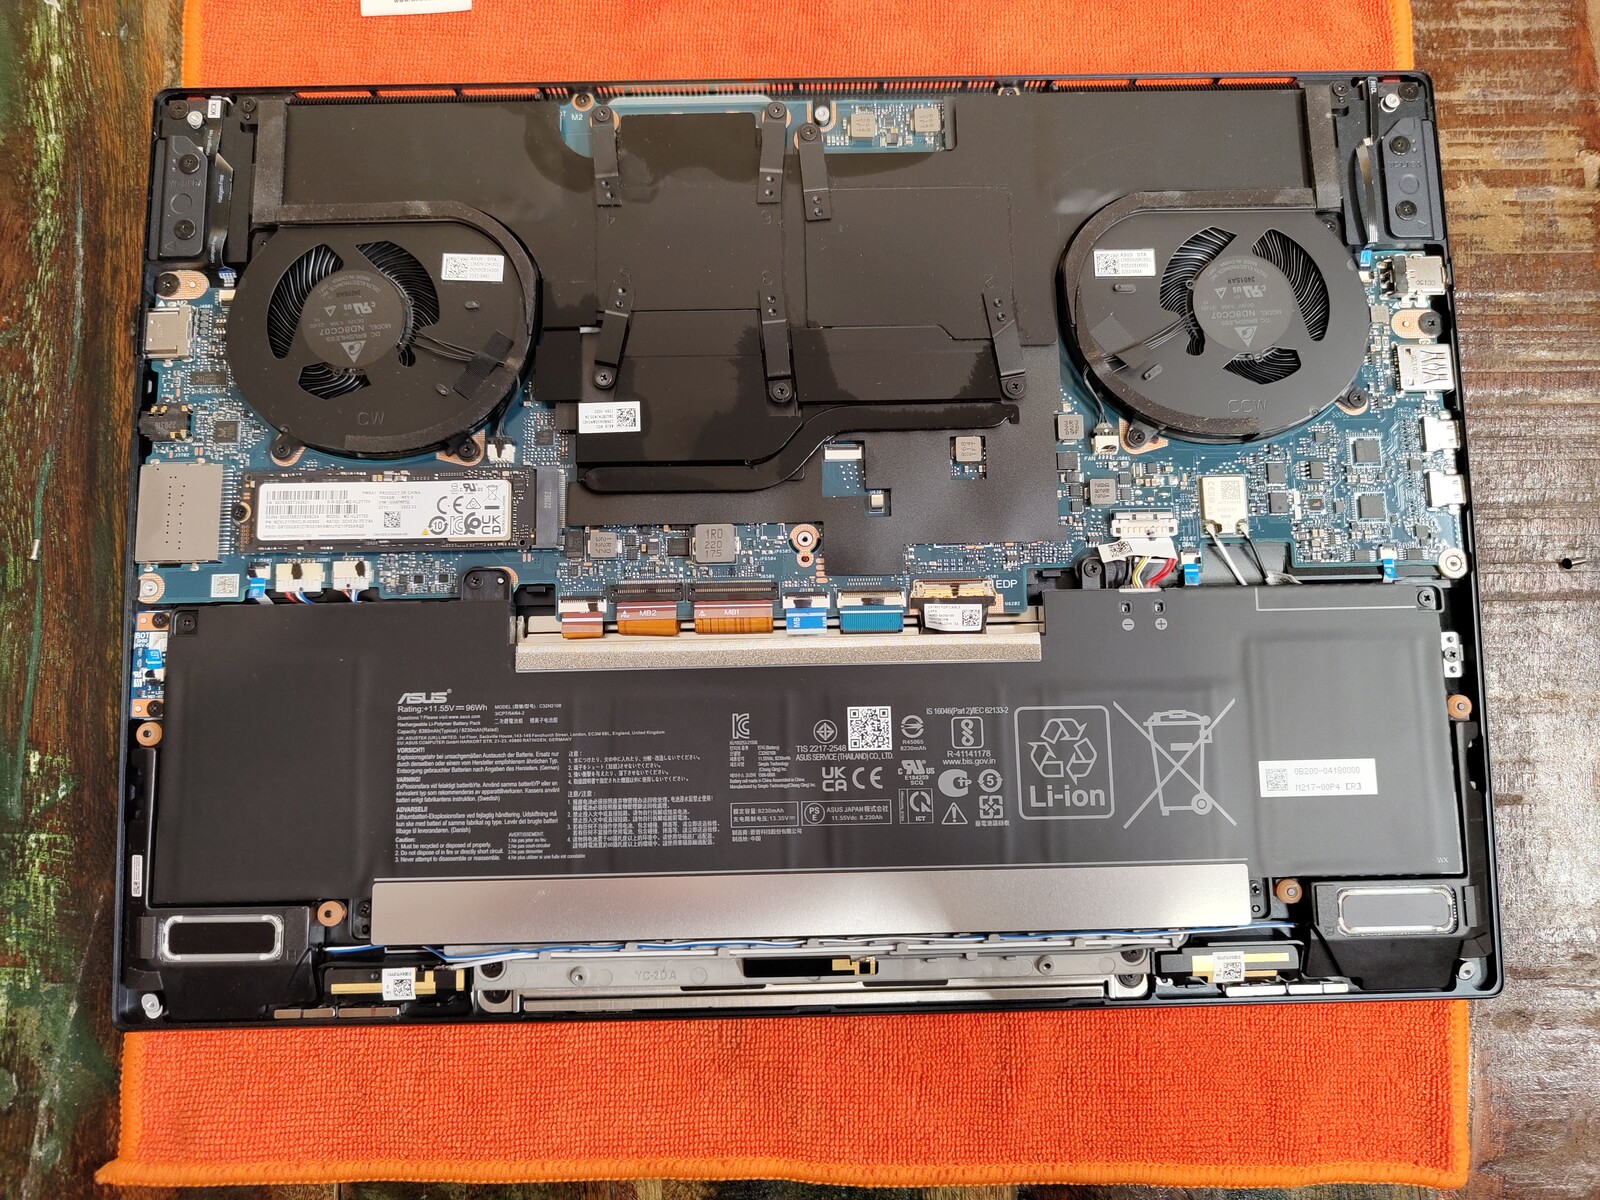
Upgradability was unlikely to have been a top priority in the development of the Asus Zenbook Pro 16X. Once the base cover is removed, only the NVMe SSD is replaceable.
Warranty
The Asus Zenbook Pro 16X OLED is sold worldwide with a two-year warranty. However, there are differences in the services offered, depending on the region, so interested buyers should check with their supplier before purchasing.
Input devices - Zenbook with Asus Dial, stylus, touchscreen and haptic pad
Keyboard, touchpad, touchscreen, Asus Dial and Asus Pen 2.0 - Asus has left no stone unturned in its selection of input methods. Unfortunately, we do not always find the arrangement of the individual elements to be practical here. Too often the individual elements get in each other's way.
Keyboard
The angle at which the keyboard is placed makes typing on the Zenbook much more comfortable than on a flat laptop. RGBW lighting ensures perfect visibility of the keys. Every single key can be individually adjusted. The chiclet keyboard with N-key rollover also offers a key travel of 1.7 mm. So the keyboard's ergonomics could hardly be better, if it weren't for the somewhat weak pressure point.
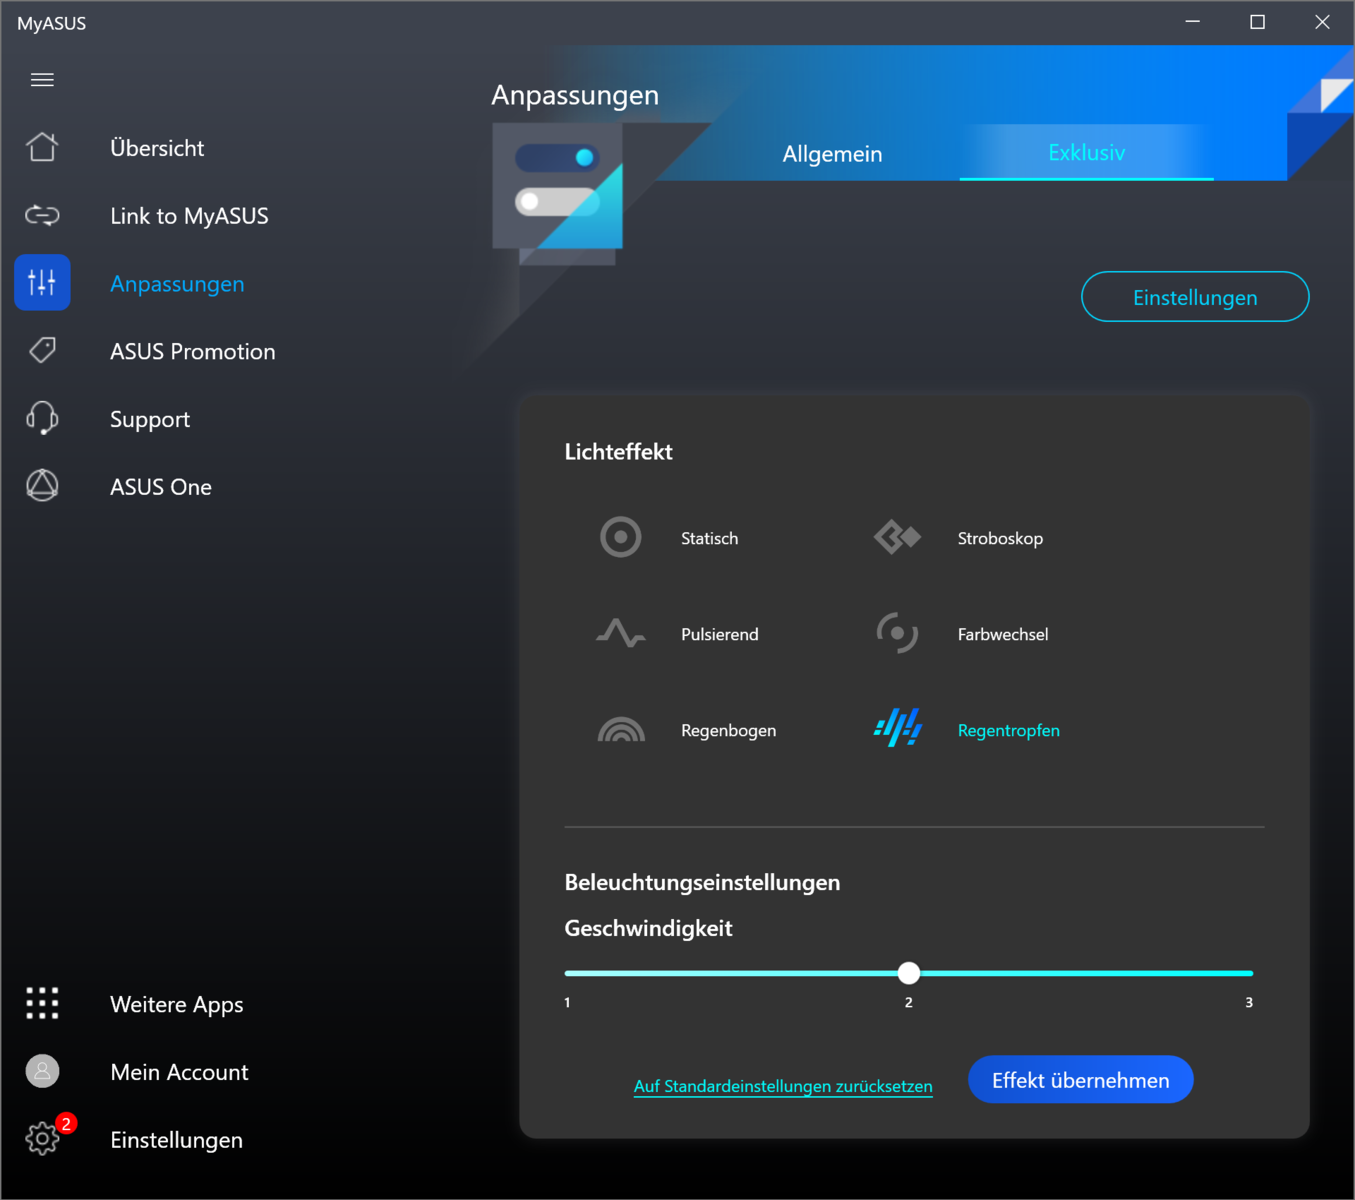
Not only the keyboard is RGBW-lit here, but there is also another light strip with RBGW LEDs in the gap between the keyboard and the base, which adapts to the color of the keyboard. In dark rooms, this creates an effect similar to that of bias lighting. You can also link the laptop's lighting to system notifications in Windows, thereby making for a large notification LED. Those looking to highlight only certain keys for gaming will be disappointed. MyAsus offers only a very limited selection of lighting effects for the keyboard, so creating individual patterns is not possible.
Touchpad
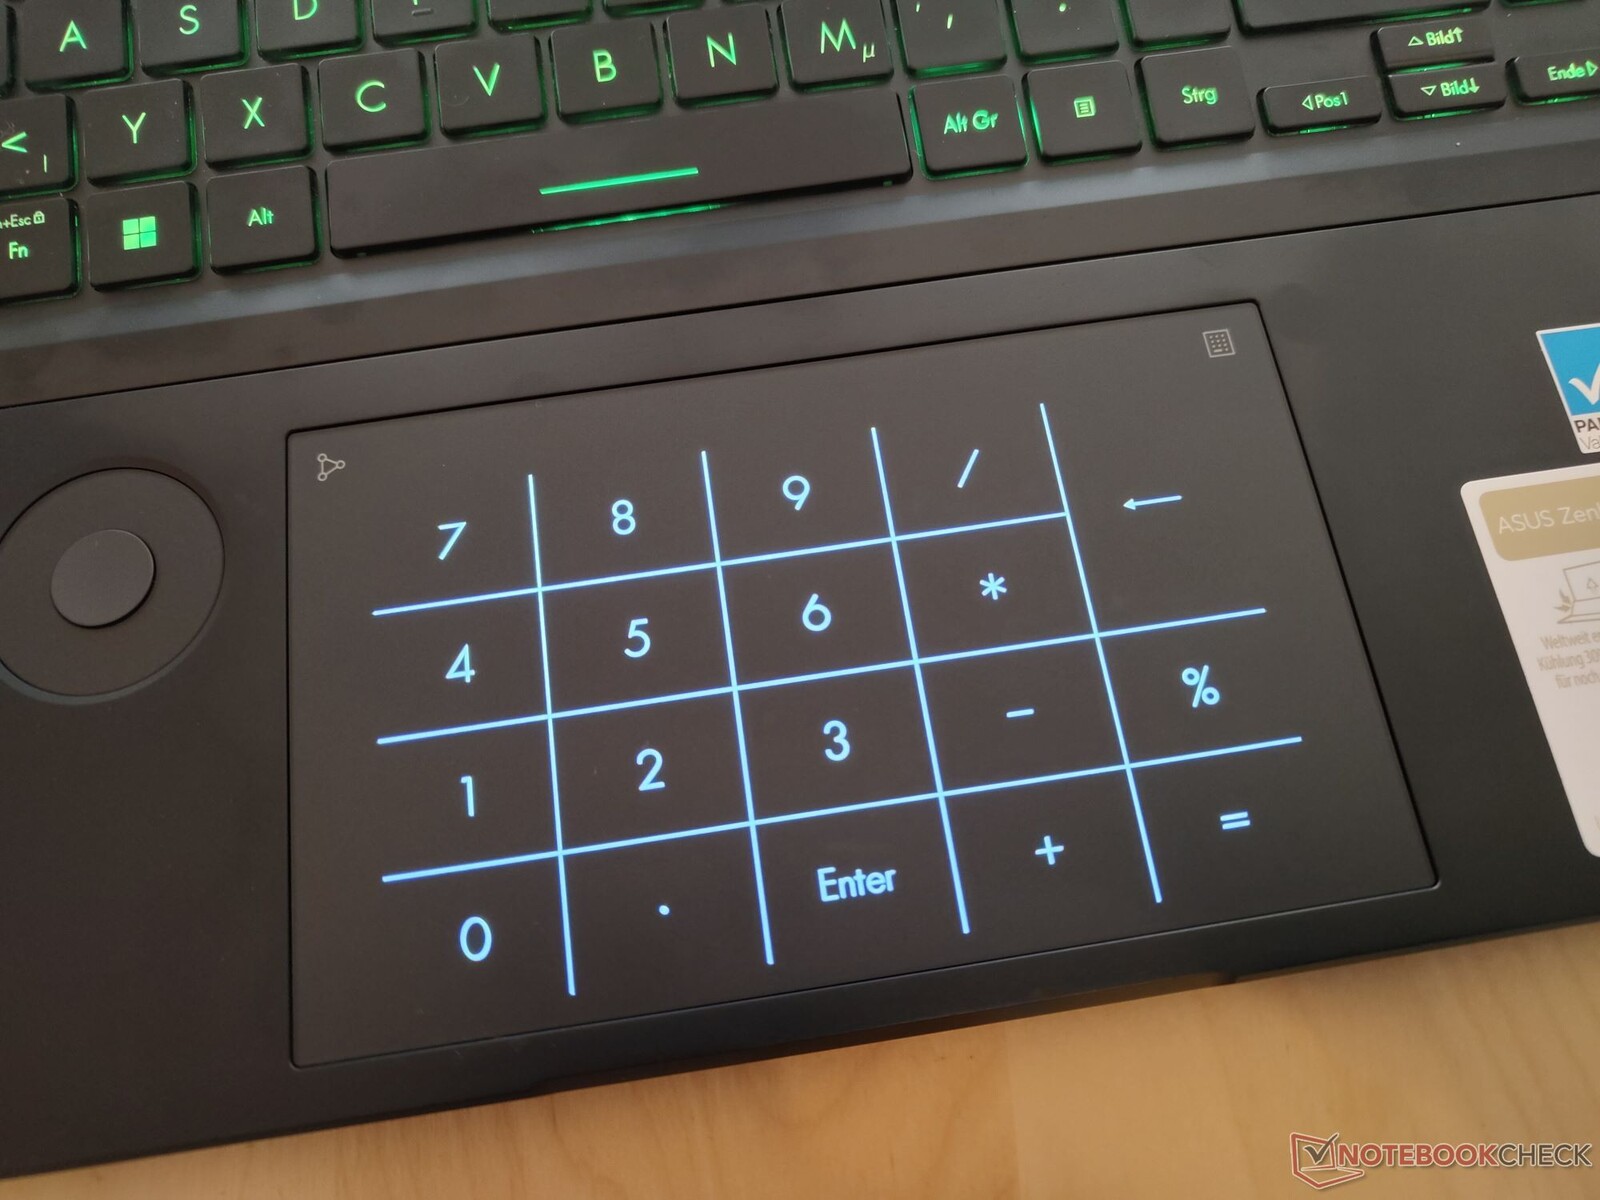
The touchpad on the Zenbook is a little more than 15 × 9 cm. Keystrokes work quite differently on this notebook than they normally do. Neither tactile buttons nor mouse buttons have been installed here. Instead, the touchpad is pressure-sensitive and has a haptic motor that simulates a keystroke. The difference is hardly noticeable in terms of feel, but the technology is supposed to be more robust and durable than normal keys. The touchpad's glass surface is pleasant and should be very durable. The haptic feedback of the touchpad can also be switched off via the settings in Windows, but operating the notebook then feels much spongier.
As with many Asus notebooks, the Zenbook Pro 16X also offers a virtual numpad in the touchpad. Long rows of numbers can be entered quickly after a short familiarization phase.
It is immediately noticeable that the ClickPad reacts only slowly in wintry temperatures. The mouse cursor regularly hangs when the touchpad is below 15 °C.
Asus Dial
The Asus Dial should actually prove practical for many users, because you can use it to quickly access and adjust many controls. It also offers some options for the Adobe Creative Cloud programs, and can also emulate a Microsoft Surface Dial and its range of functions.
But when working on the laptop's keyboard, the Asus Dial constantly gets in the way. This is because it is located exactly where the heel of the hand rests when typing, so you constantly make unwanted inputs. It also doesn't seem to have palm recognition and can only be turned on and off via the ProArt Creator Hub application.
Asus Pen 2.0
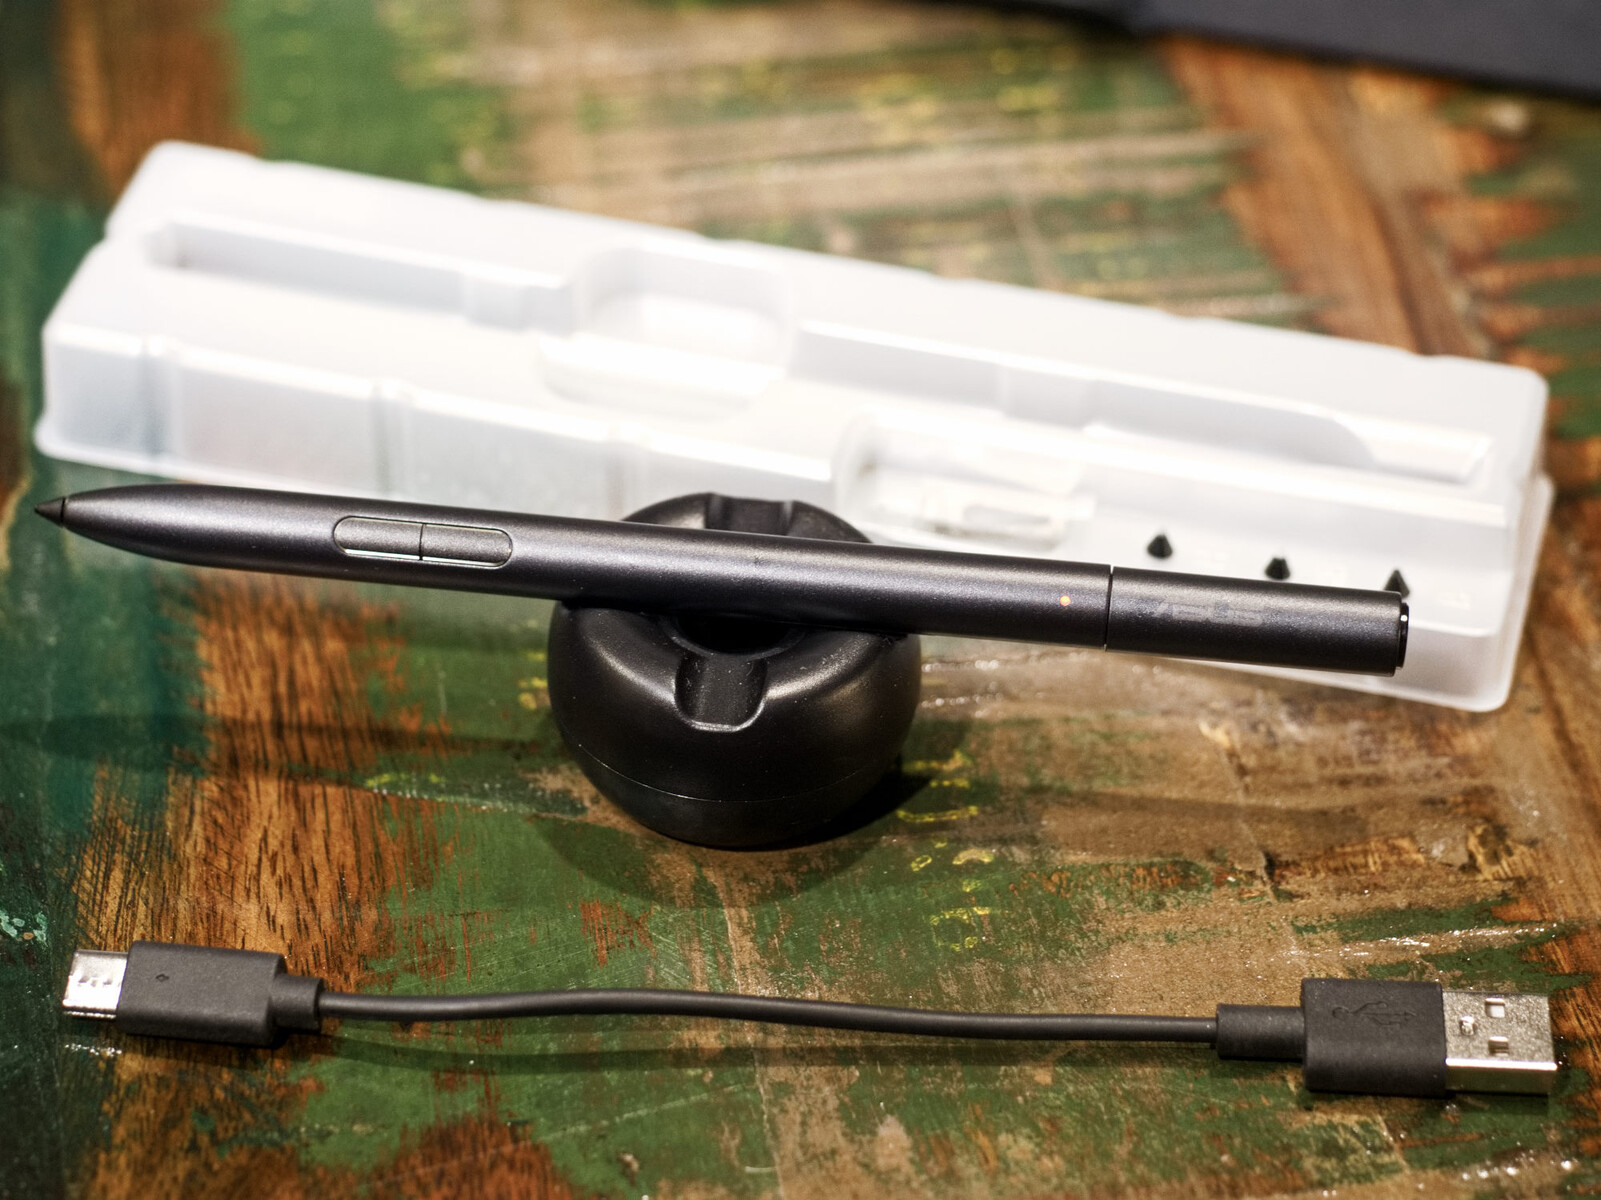
The Asus Pen itself is great, there is no other way to put it. 4096 pressure levels and a sampling rate of 266 Hz ensure precise work. The stylus offers three programmable buttons that can also be used at some distance from the screen via Bluetooth connection. The pen is charged in 30 minutes via USB-C. According to Asus, this provides up to 140 hours of battery life. With the included range of writing tips, you have more control over the degree of friction between the pen and screen. But this is where the problem of the stylus starts: the screen angle and the laptop's stability are not exactly conducive to stylus work. The screen also yields slightly under pressure, making it rather impractical for pen input.
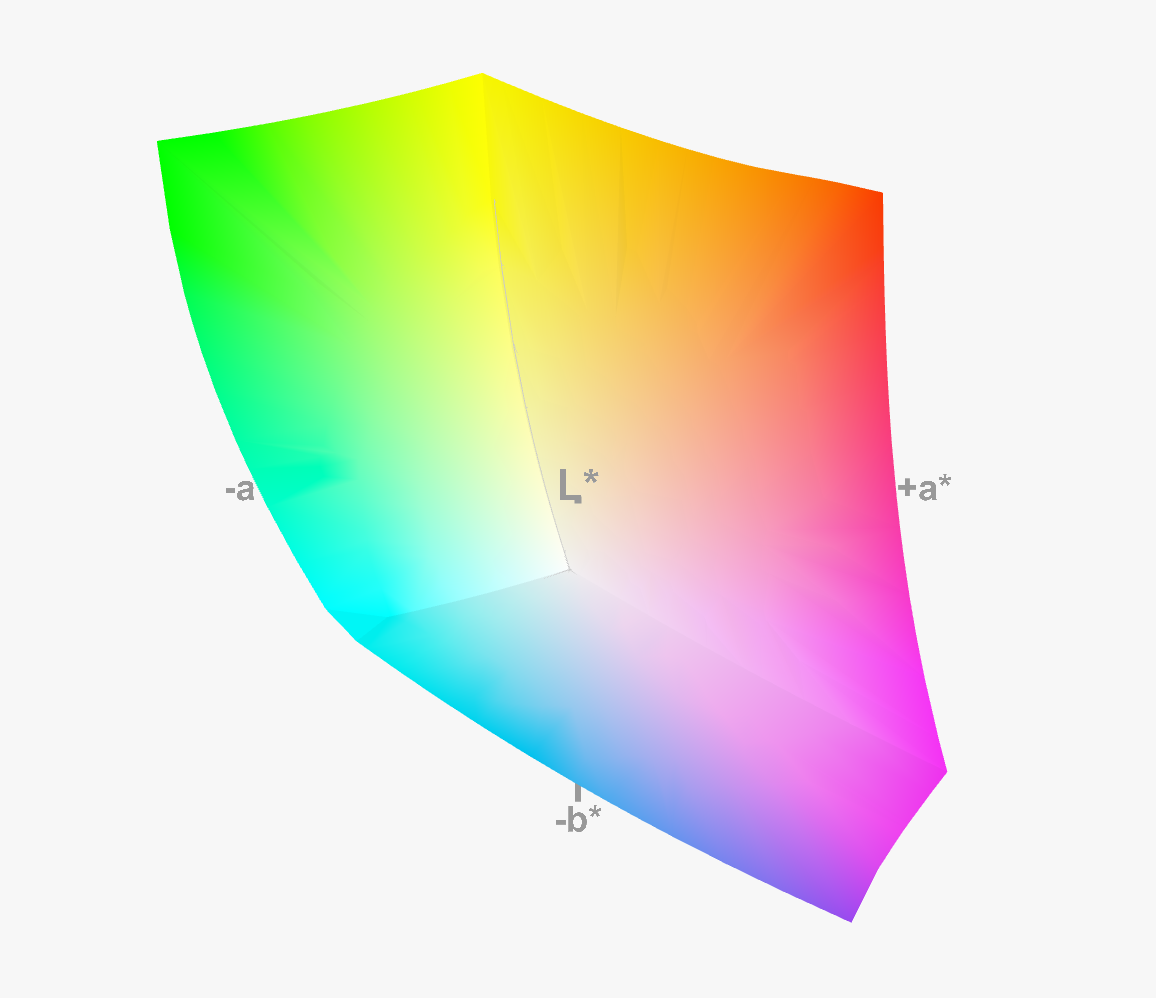
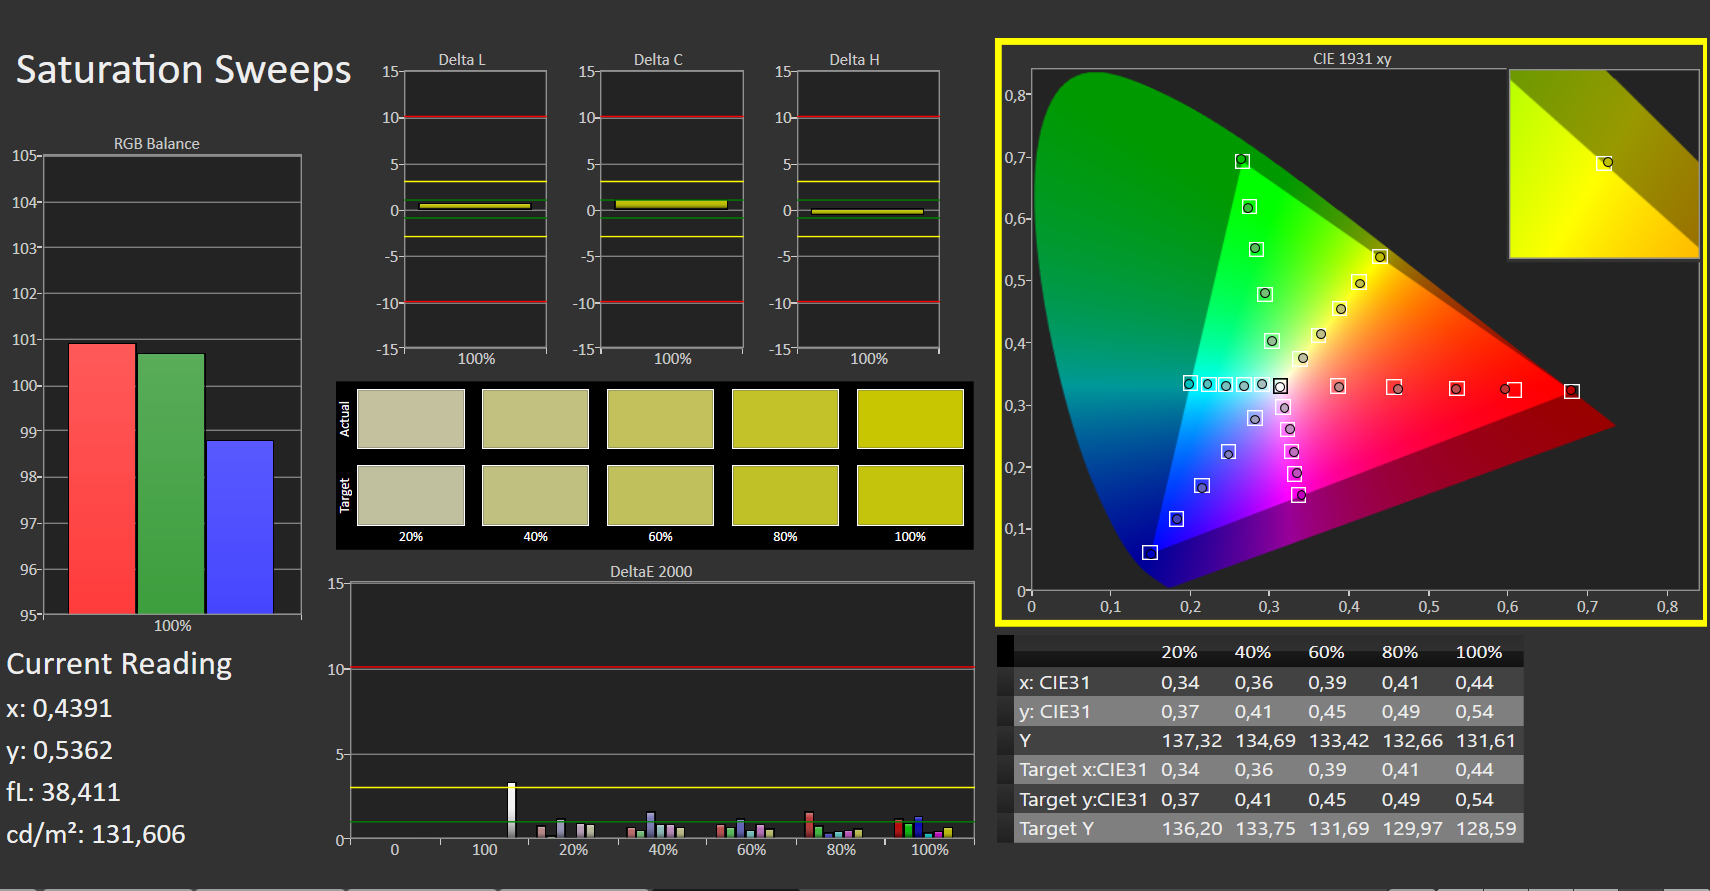
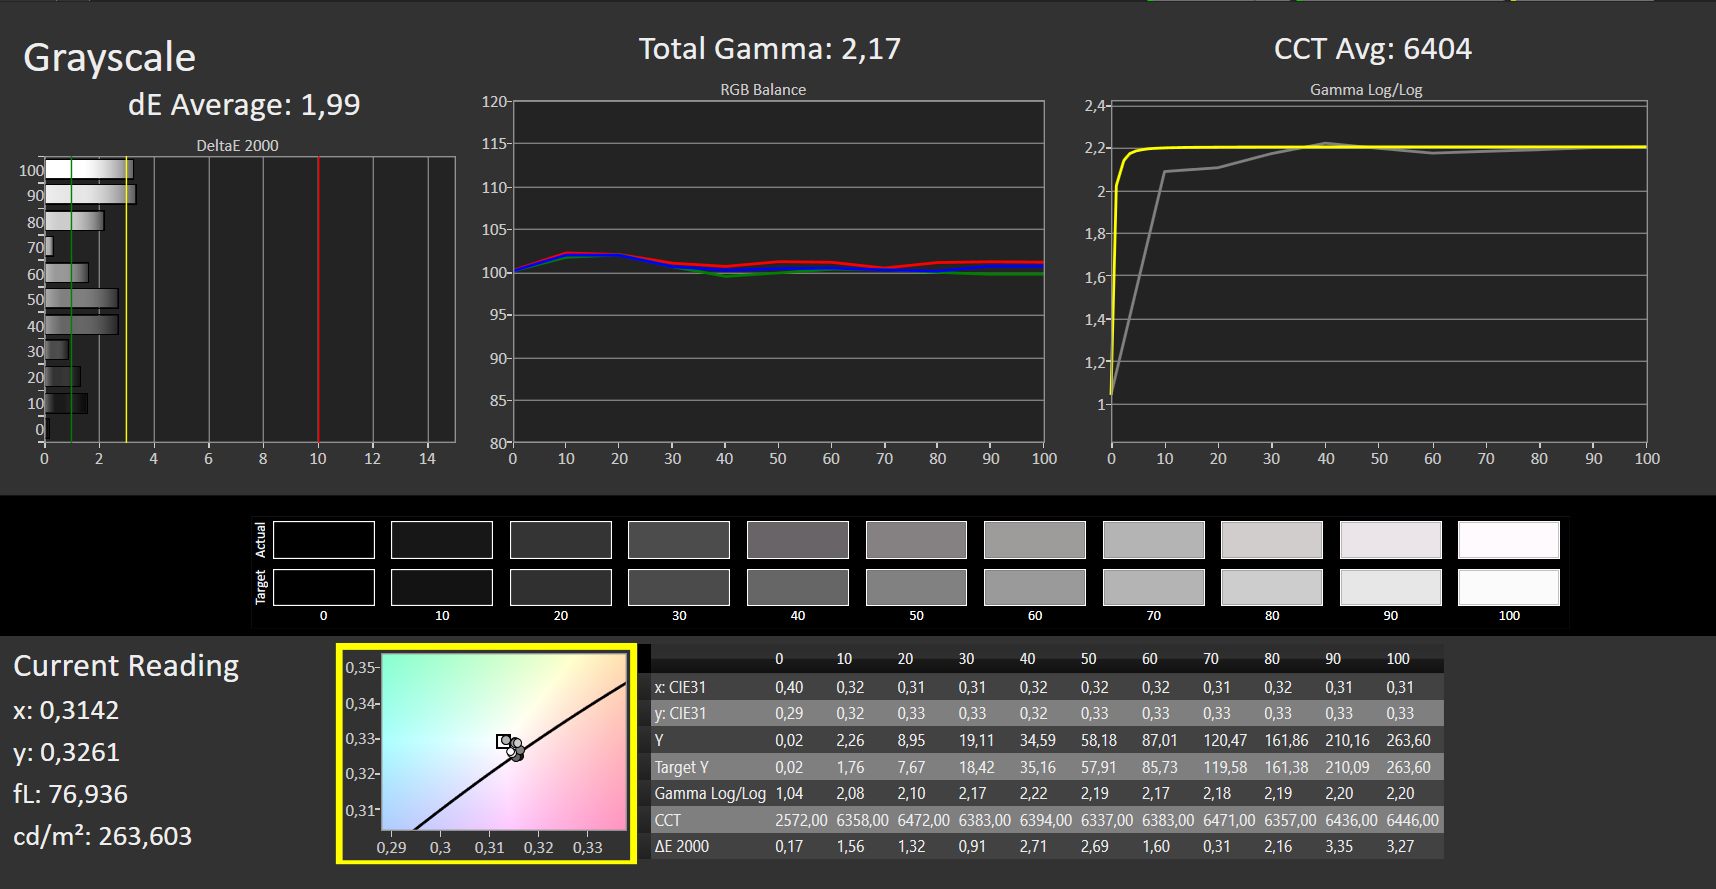
Display - Pantone validated OLED with DCI P3 color space coverage

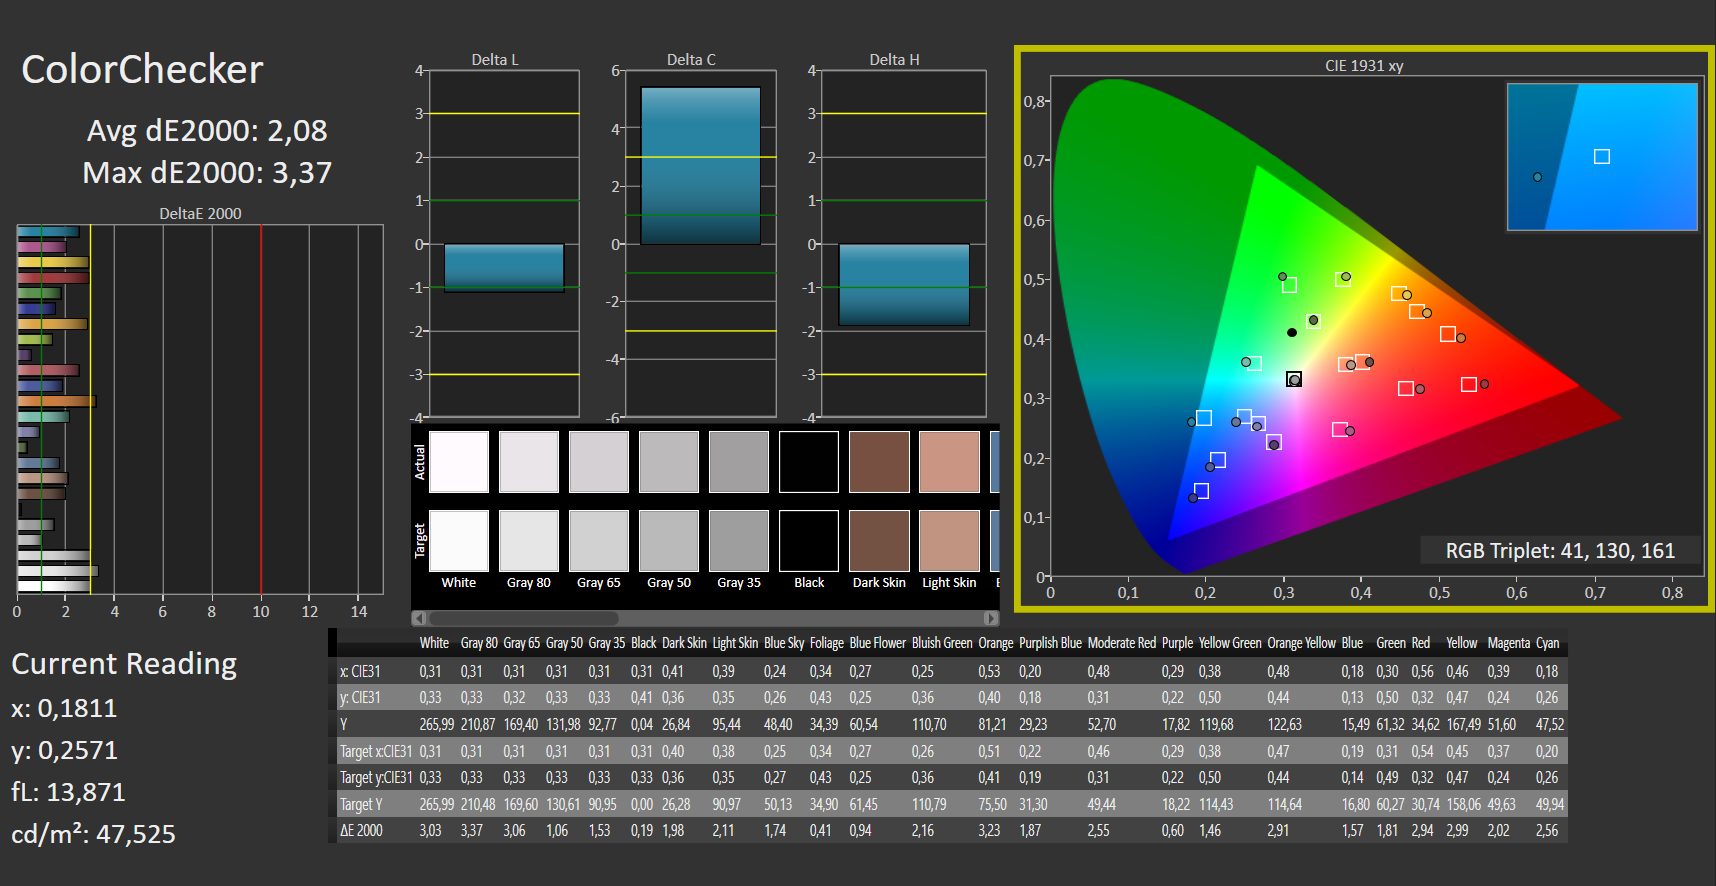
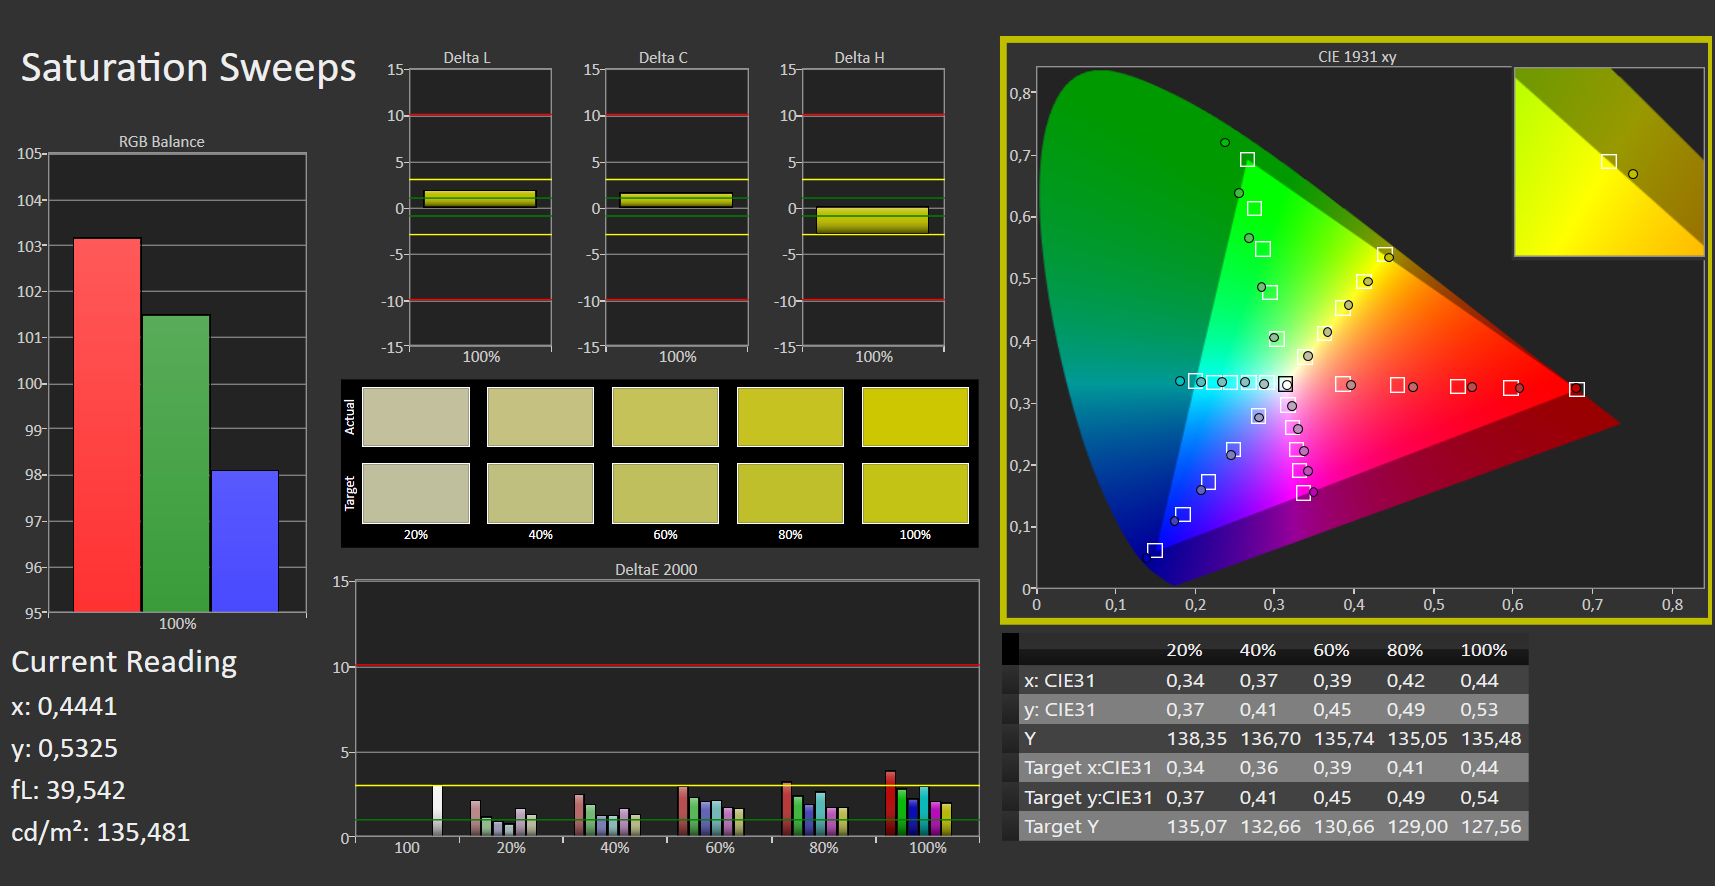
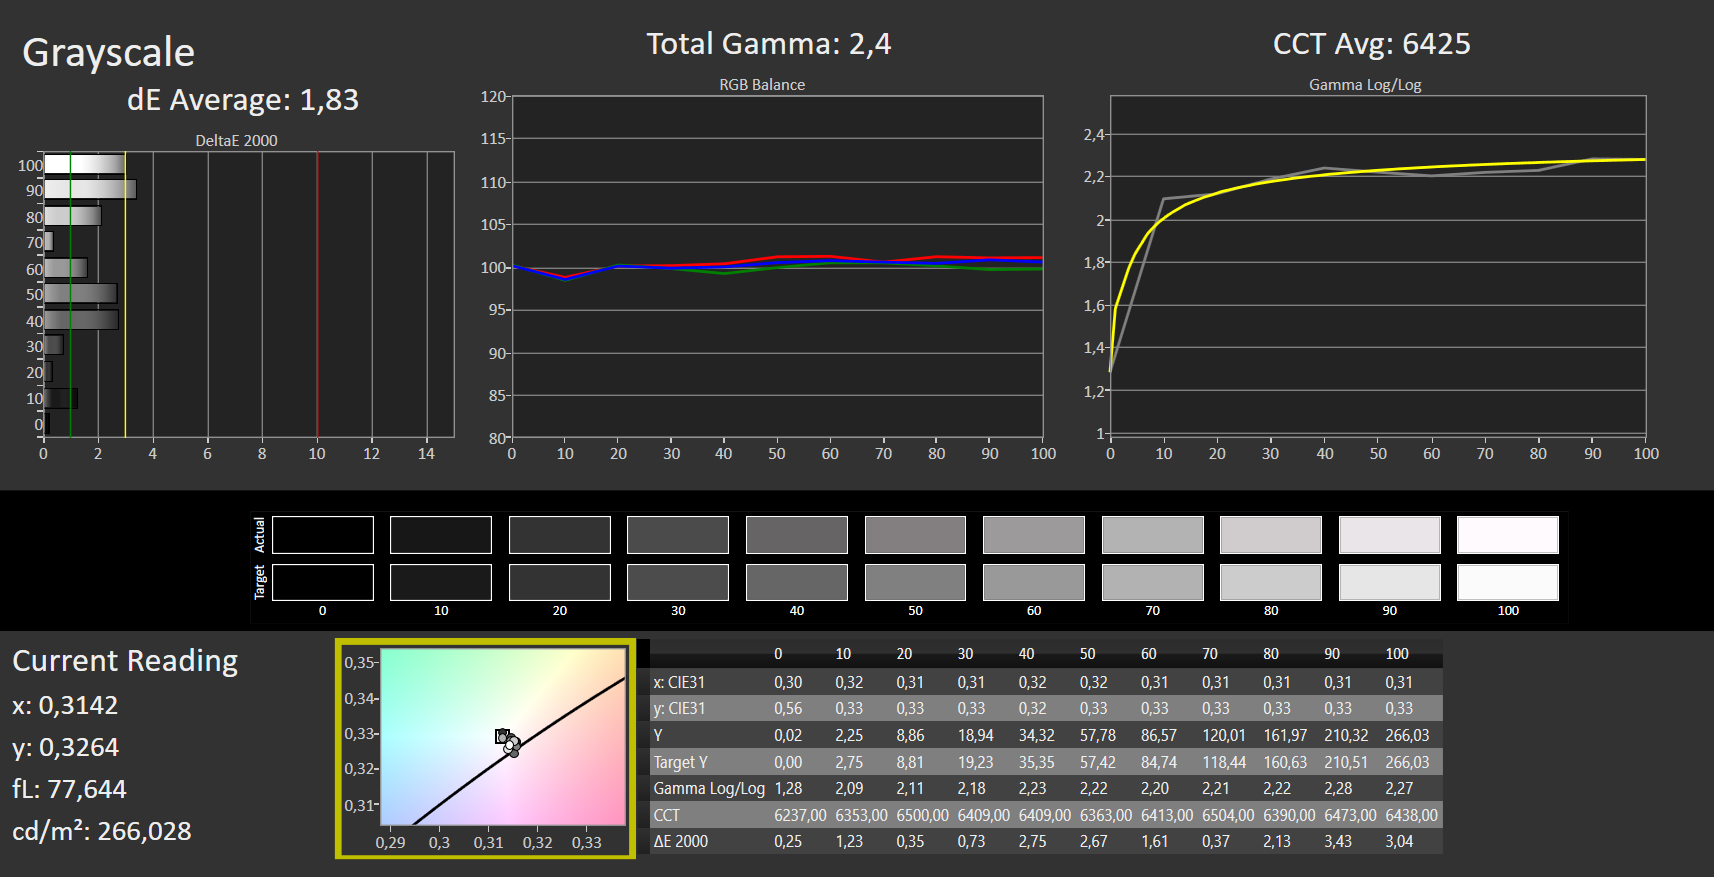
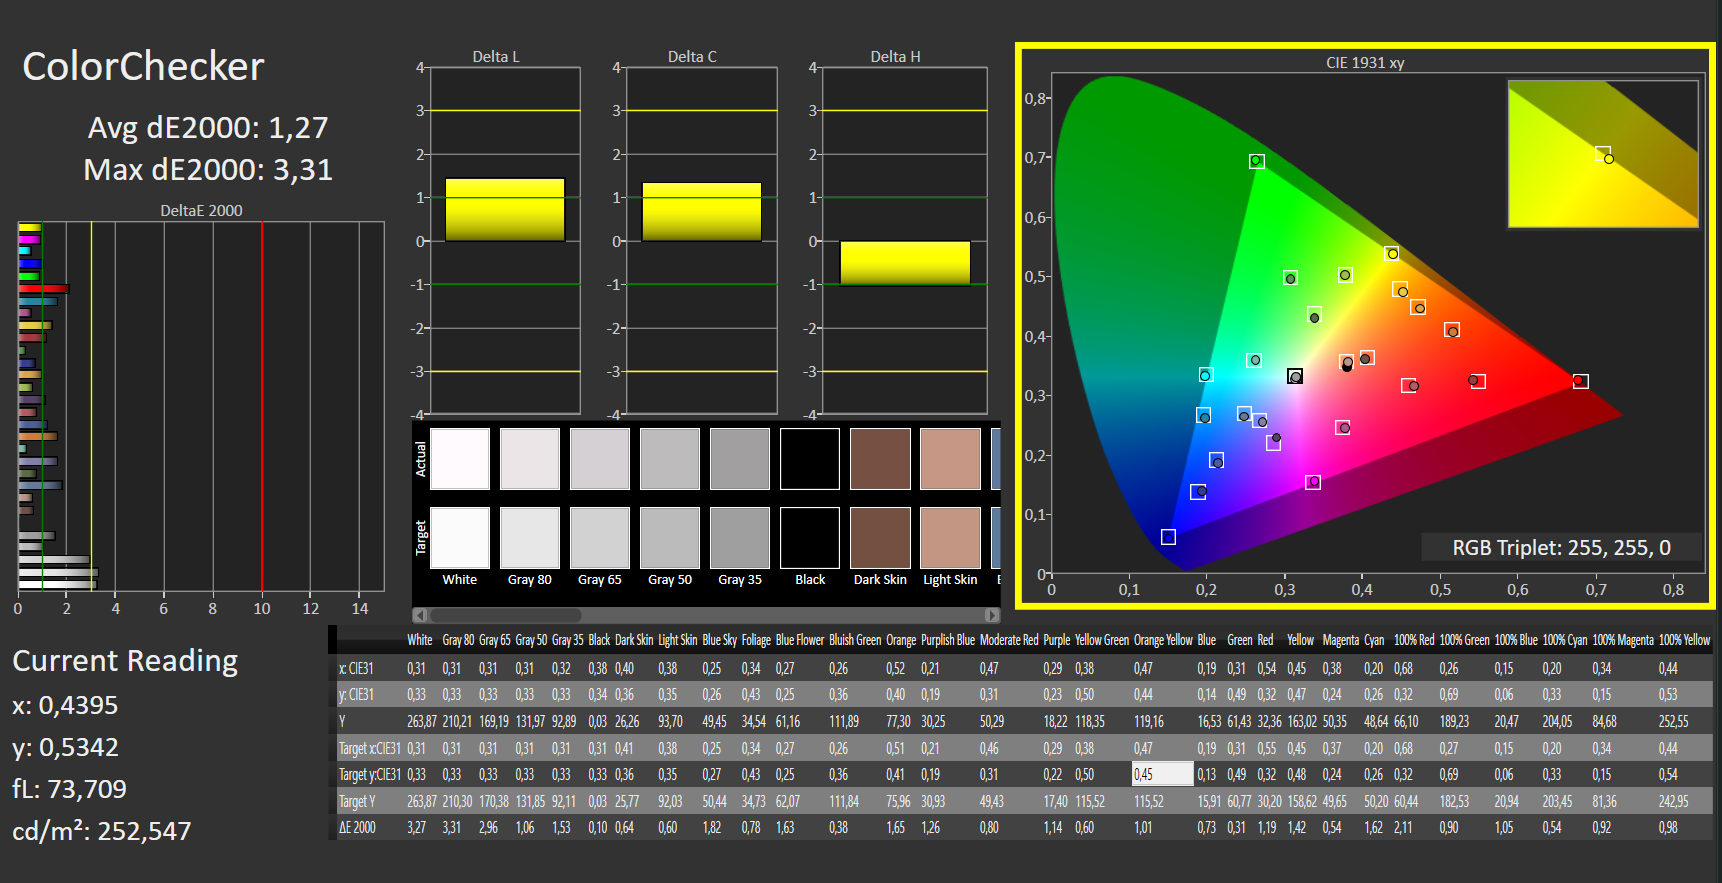
The OLED display in the Zenbook Pro 16X has a resolution of 3840 × 2400. The UHD display in 16:10 format offers strong contrasts and impressive colors. Screen bleeding or uneven illumination usually do not occur in OLED displays. Display settings are adjusted via the MyAsus app and the ProArt Creator Hub. The laptop has two light sensors that adjust the picture and the screen brightness to the ambient light. We determined a maximum brightness of 360 cd/m² here. Color temperature and brightness are automatically adjusted in order to maintain perfect picture quality. The display additionally supports several HDR standards and Dolby Vision. With so many setting options, it can be easy to lose track. Color space representation, color temperature, brightness control, HDR, sensor behavior and many other factors can be personalized here. Unfortunately, the various options are spread over three different programs. One criticism of the screen is the noticeable holes in the subpixel matrix. At full brightness, small gray dots can sometimes be seen on the display.
Another feature of the Asus laptop is Asus GlideX. The preinstalled program allows for the display to be extended onto any Android or iOS device, so even older tablets can serve as an extension for the PC.
| |||||||||||||||||||||||||
Brightness Distribution: 96 %
Center on Battery: 346 cd/m²
Contrast: ∞:1 (Black: 0 cd/m²)
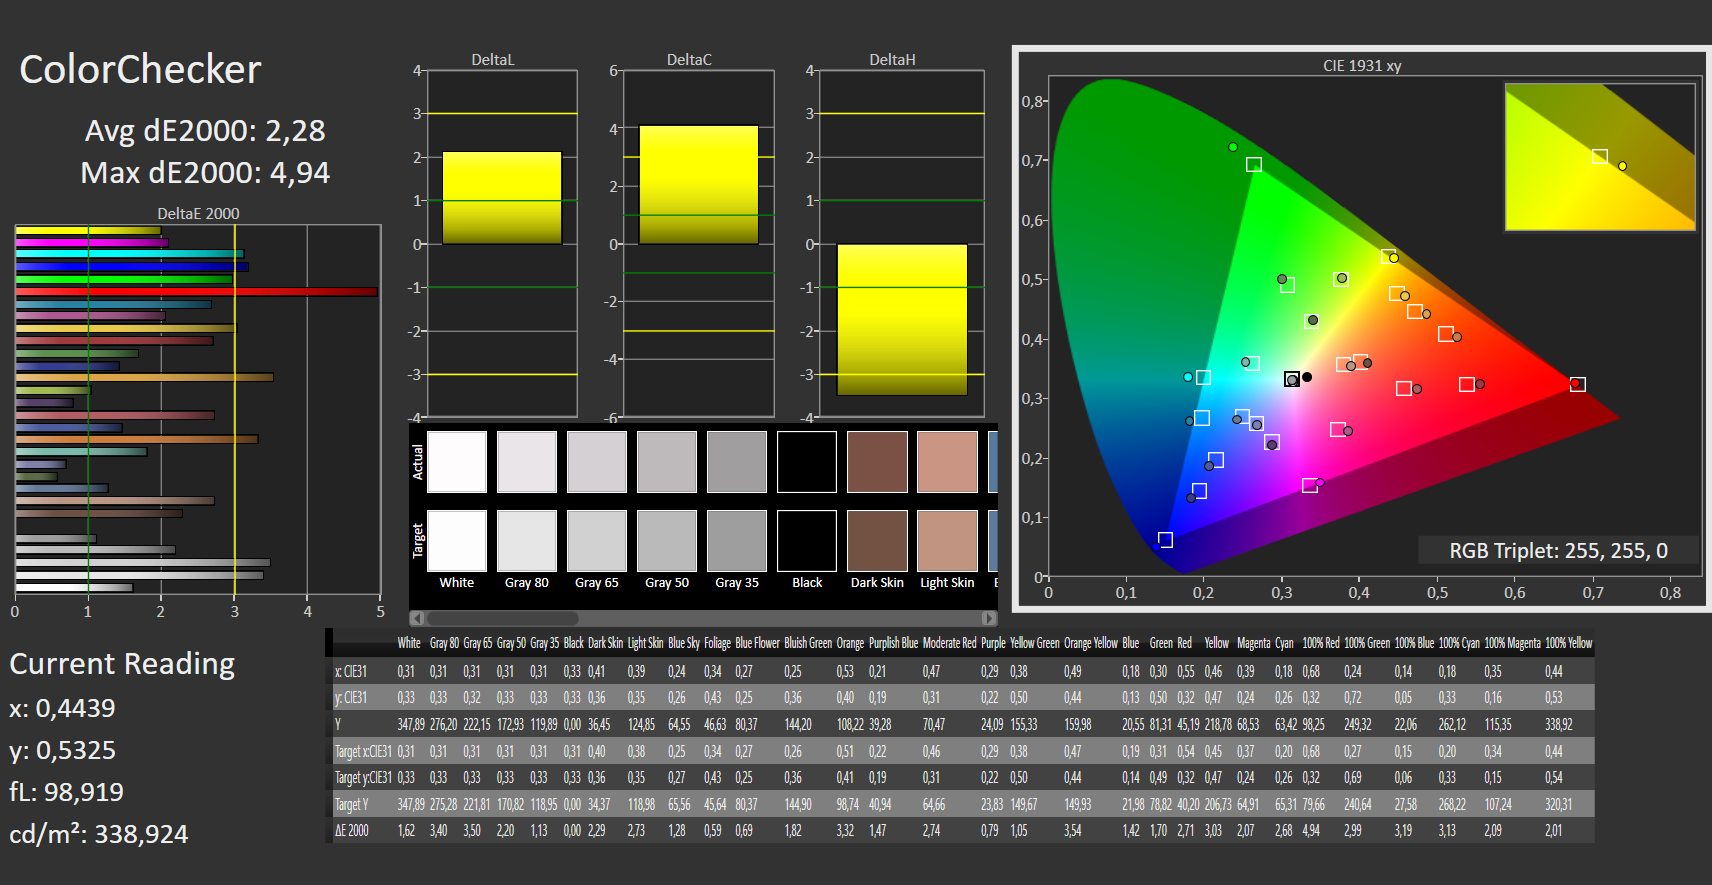
ΔE ColorChecker Calman: 2.28 | ∀{0.5-29.43 Ø4.72}
calibrated: 2.16
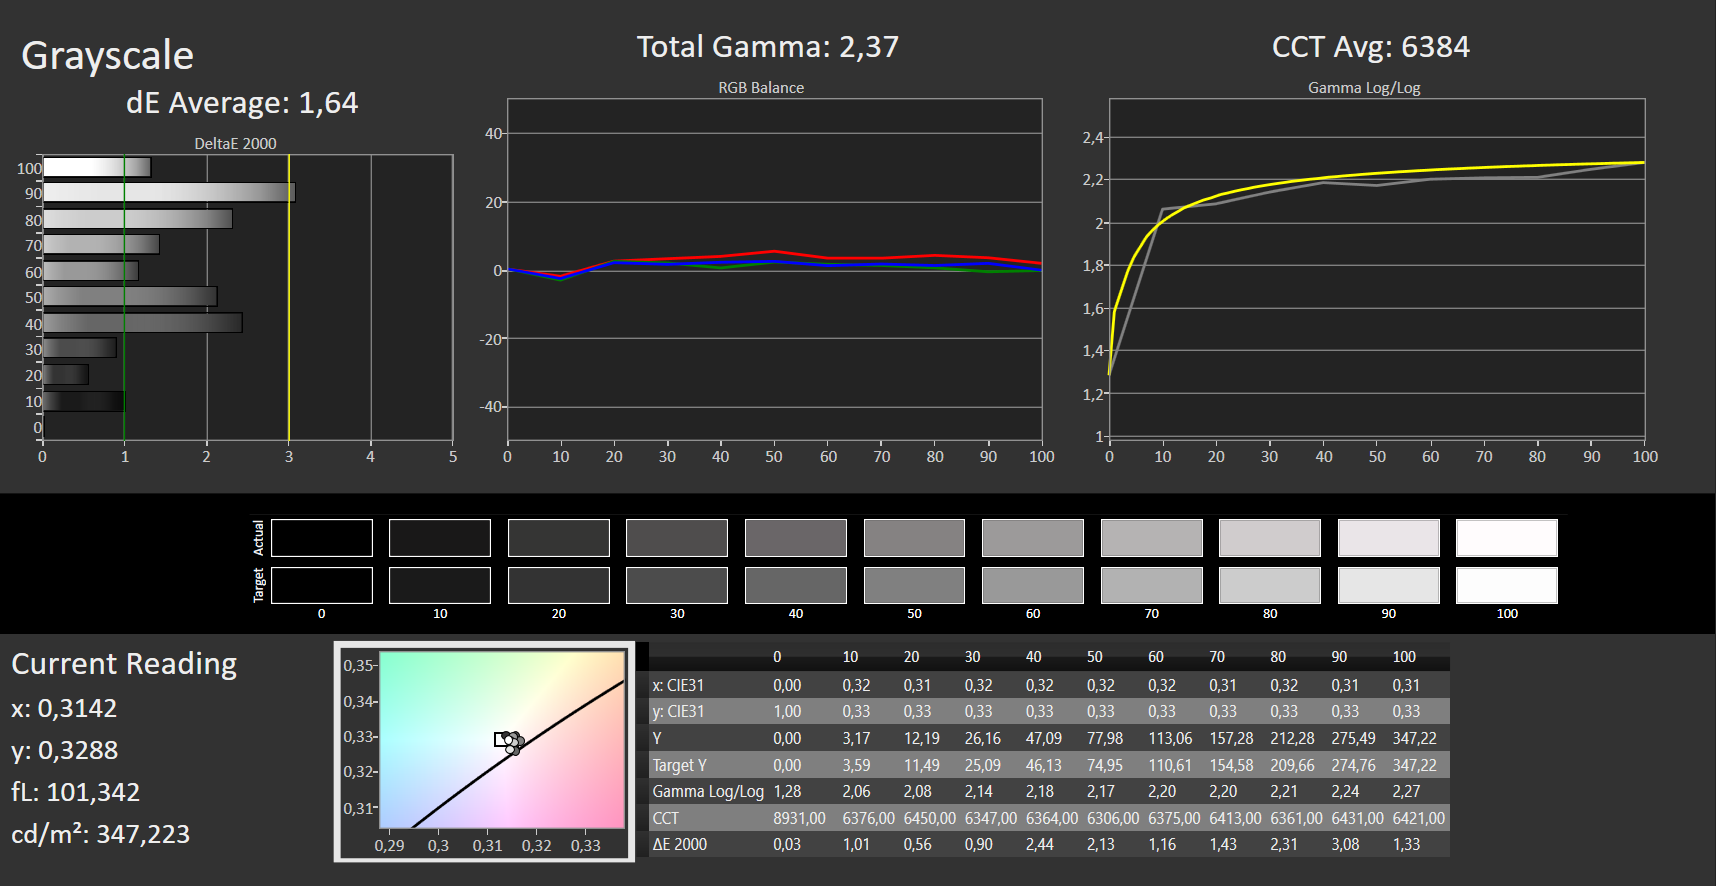
ΔE Greyscale Calman: 1.64 | ∀{0.09-98 Ø4.97}
88.9% AdobeRGB 1998 (Argyll 3D)
99.99% sRGB (Argyll 3D)
99.84% Display P3 (Argyll 3D)
Gamma: 2.37
CCT: 6384 K
| Asus ZenBook Pro 16X OLED UX7602ZM-ME115W Samsung SDC415D, OLED, 3840x2400, 16" | Lenovo ThinkPad X1 Extreme G5-21DE003RGE LP160UQ1-SPB1, IPS, 3840x2400, 16" | HP Omen 16-n0033dx BOE0AAE, IPS, 1920x1080, 16.1" | HP ZBook Studio 16 G9 62U04EA BOE0A52, IPS, 3840x2400, 16" | Corsair Voyager a1600 BOE0A3B, IPS, 2560x1600, 16" | Dell Precision 7670 Samsung 160YV03, OLED, 3840x2400, 16" | Asus VivoBook Pro 16X OLED N7600PC-L2026X Samsung ATNA60YV02-0, OLED, 3840x2400, 16" | MSI CreatorPro Z16P B12UKST B160QAN02.N, IPS, 2560x1600, 16" | |
|---|---|---|---|---|---|---|---|---|
| Display | -2% | -14% | -2% | -18% | 3% | 3% | -1% | |
| Display P3 Coverage (%) | 99.84 | 84.6 -15% | 74.4 -25% | 97.5 -2% | 68.7 -31% | 99.9 0% | 99.9 0% | 97.6 -2% |
| sRGB Coverage (%) | 99.99 | 99.2 -1% | 99.2 -1% | 99.9 0% | 98.2 -2% | 100 0% | 100 0% | 99.9 0% |
| AdobeRGB 1998 Coverage (%) | 88.9 | 97.7 10% | 73.4 -17% | 86.3 -3% | 70.1 -21% | 97.5 10% | 98.05 10% | 87.4 -2% |
| Response Times | -1530% | -620% | -435% | -475% | 3% | 25% | -405% | |
| Response Time Grey 50% / Grey 80% * (ms) | 2 ? | 46 ? -2200% | 17.6 ? -780% | 15.3 ? -665% | 13 ? -550% | 1.9 ? 5% | 1 50% | 12.8 ? -540% |
| Response Time Black / White * (ms) | 2 ? | 19.2 ? -860% | 11.2 ? -460% | 6.1 ? -205% | 10 ? -400% | 2 ? -0% | 2 ? -0% | 7.4 ? -270% |
| PWM Frequency (Hz) | 59 ? | 59.5 ? | 247 ? | |||||
| Screen | 12% | -9% | 39% | -2% | -32% | 7% | 22% | |
| Brightness middle (cd/m²) | 346 | 476 38% | 373.3 8% | 554 60% | 355 3% | 340.1 -2% | 383 11% | 407 18% |
| Brightness (cd/m²) | 354 | 470 33% | 361 2% | 516 46% | 340 -4% | 342 -3% | 390 10% | 388 10% |
| Brightness Distribution (%) | 96 | 90 -6% | 79 -18% | 84 -12% | 91 -5% | 98 2% | 96 0% | 88 -8% |
| Black Level * (cd/m²) | 0.35 | 0.44 | 0.47 | 0.53 | 0.027 | 0.36 | ||
| Colorchecker dE 2000 * | 2.28 | 1.9 17% | 2.12 7% | 1 56% | 2.43 -7% | 2.5 -10% | 2.29 -0% | 1.3 43% |
| Colorchecker dE 2000 max. * | 4.94 | 4.7 5% | 5.62 -14% | 2.4 51% | 4.31 13% | 8.19 -66% | 3.47 30% | 2.5 49% |
| Colorchecker dE 2000 calibrated * | 2.16 | 1.3 40% | 2.06 5% | 0.6 72% | 1.14 47% | 0.7 68% | ||
| Greyscale dE 2000 * | 1.64 | 2.4 -46% | 2.5 -52% | 1.6 2% | 2.62 -60% | 3.5 -113% | 1.84 -12% | 2.1 -28% |
| Gamma | 2.37 93% | 2.24 98% | 2.3 96% | 2.29 96% | 2.28 96% | 2.12 104% | 2.32 95% | 2.26 97% |
| CCT | 6384 102% | 6377 102% | 6408 101% | 6458 101% | 6909 94% | 6704 97% | 6308 103% | 6437 101% |
| Contrast (:1) | 1360 | 848 | 1179 | 670 | 14185 | 1131 | ||
| Total Average (Program / Settings) | -507% /
-249% | -214% /
-112% | -133% /
-50% | -165% /
-85% | -9% /
-16% | 12% /
9% | -128% /
-55% |
* ... smaller is better
The Zenbook has several display options that influence the displayable color space. The measurements were carried out here in DisplayP3 mode. The Zenbook Pro 16X achieves almost 100% coverage of DisplayP3 and sRGB. Around 88% of the color space is reproduced in Adobe RGB.
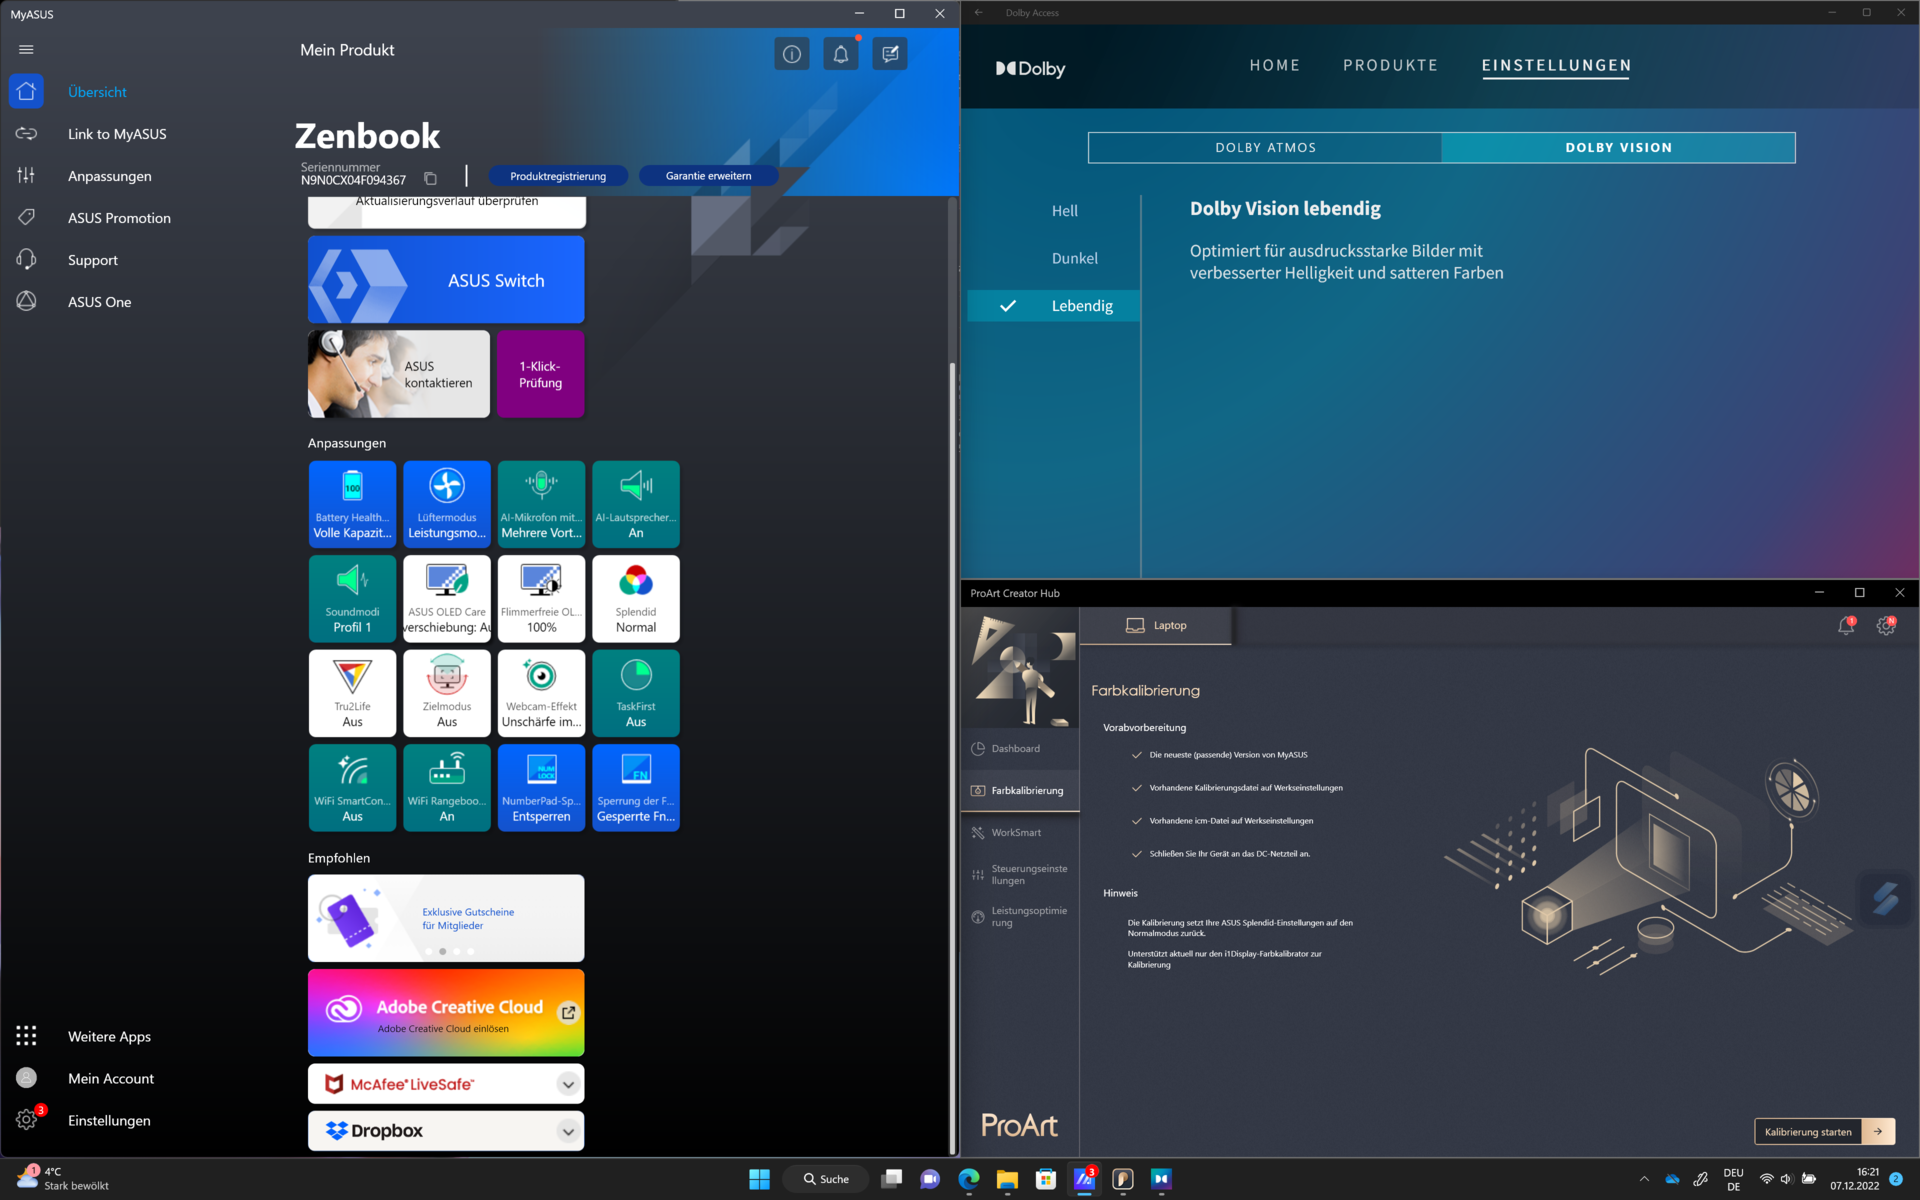
The screen in many Asus laptops is Pantone validated, and the corresponding sticker can be found on the Zenbook Pro 16X. This certificate states that the laptop reproduces the approximately 4000 Pantone colors very accurately. In the full DisplayP3 color space that the laptop can display, however, there are more than a billion colors. We checked for deviations via Calman ColorChecker and Xrite i1 Pro 2. Validating the measurements can be difficult with the many settings that affect color reproduction on this laptop. This might be one of the reasons why Asus includes its own color calibration software in the ProArt Creator Hub. This also requires an Xrite i1 Display Pro or i1 Display Plus colorimeter. However, the app does not appear to be compatible with the i1 Pro 2 we used. Asus also already stores several color profiles that can be accessed via the Windows display settings.
We repeated the measurements of the color deviations several times at different settings and came up with strongly varying results for the color deviations. We also covered the RGB ambient light sensor during testing in order to avoid falsification of the results. The lowest color deviations were achieved in the DisplayP3 color space with the DisplyP3 ICC profile provided by Asus and the activated DisplayP3 screen mode. The average color deviations here are only ΔΕ 1.27.


Display Response Times
| ↔ Response Time Black to White | ||
|---|---|---|
| 2 ms ... rise ↗ and fall ↘ combined | ↗ 1 ms rise |  |
| ↘ 1 ms fall | ||
| The screen shows very fast response rates in our tests and should be very well suited for fast-paced gaming. In comparison, all tested devices range from 0.1 (minimum) to 240 (maximum) ms. » 11 % of all devices are better. This means that the measured response time is better than the average of all tested devices (19.8 ms). | ||
| ↔ Response Time 50% Grey to 80% Grey | ||
| 2 ms ... rise ↗ and fall ↘ combined | ↗ 1 ms rise |  |
| ↘ 1 ms fall | ||
| The screen shows very fast response rates in our tests and should be very well suited for fast-paced gaming. In comparison, all tested devices range from 0.165 (minimum) to 636 (maximum) ms. » 10 % of all devices are better. This means that the measured response time is better than the average of all tested devices (31 ms). | ||
Screen Flickering / PWM (Pulse-Width Modulation)
| Screen flickering / PWM detected | 59 Hz | ≤ 80 % brightness setting |  |
The display backlight flickers at 59 Hz (worst case, e.g., utilizing PWM) Flickering detected at a brightness setting of 80 % and below. There should be no flickering or PWM above this brightness setting. The frequency of 59 Hz is very low, so the flickering may cause eyestrain and headaches after extended use. In comparison: 52 % of all tested devices do not use PWM to dim the display. If PWM was detected, an average of 7747 (minimum: 5 - maximum: 343500) Hz was measured. | |||
As is typical for OLED displays, the laptop's screen sometimes flickers quite strongly if you look only at the measurement results. In truth, only a rolling strip of the screen goes black. However, this is a normal occurrence in OLED displays. If we tried to measure the flickering further away from the screen, we would hardly get a result. Hence, depending on the user, the flickering of OLED displays is not noticed at all or is sometimes perceived as very annoying. Only your own experience can decide here.


The screen's brightness should ensure good readability outdoors. However, if the ambient light is unfavorable for the monitor, refractions in the OLED and strong reflections on the reflective screen surface become visible.
Color reproduction and perceptible brightness hardly change when you change the viewing angle of the Zenbook's screen. The OLED panel is extremely viewing-angle stable.

Performance - AAS and Vapor-Chamber ensure low temperatures in the Core i9
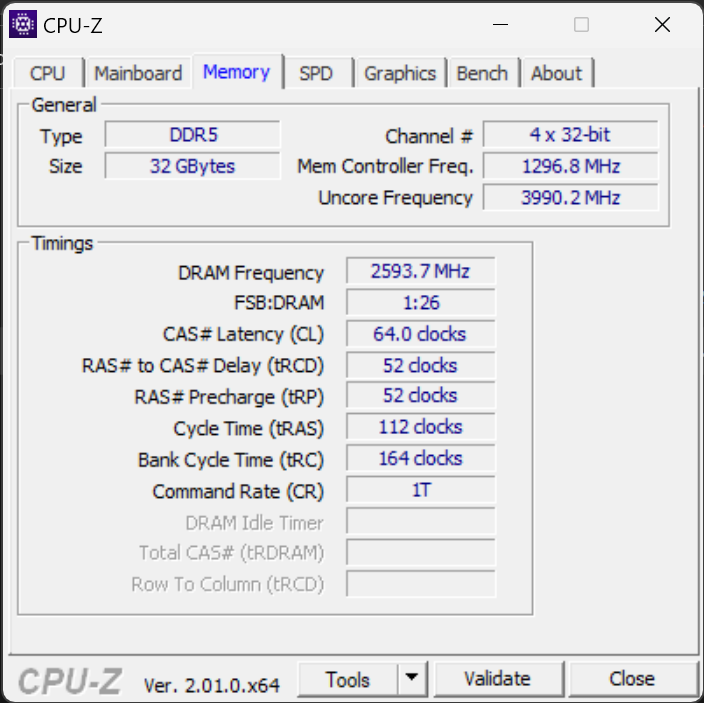
According to the product page of the Asus Zenbook Pro16X OLED, the multimedia laptop is only available with the Intel Core i9-12900H and the Nvidia GeForce RTX 3060. You can choose between 16 or 32 GB of RAM. There is a little more choice for the installed hard drive. Our review sample has 32 GB LPDDR5 RAM and a 1 TB hard drive.
The studio laptop's hardware is clearly designed for complex applications. Image and video editing, 3D rendering and a wide variety of current games are handled without issue.

Power Control and Testing Conditions
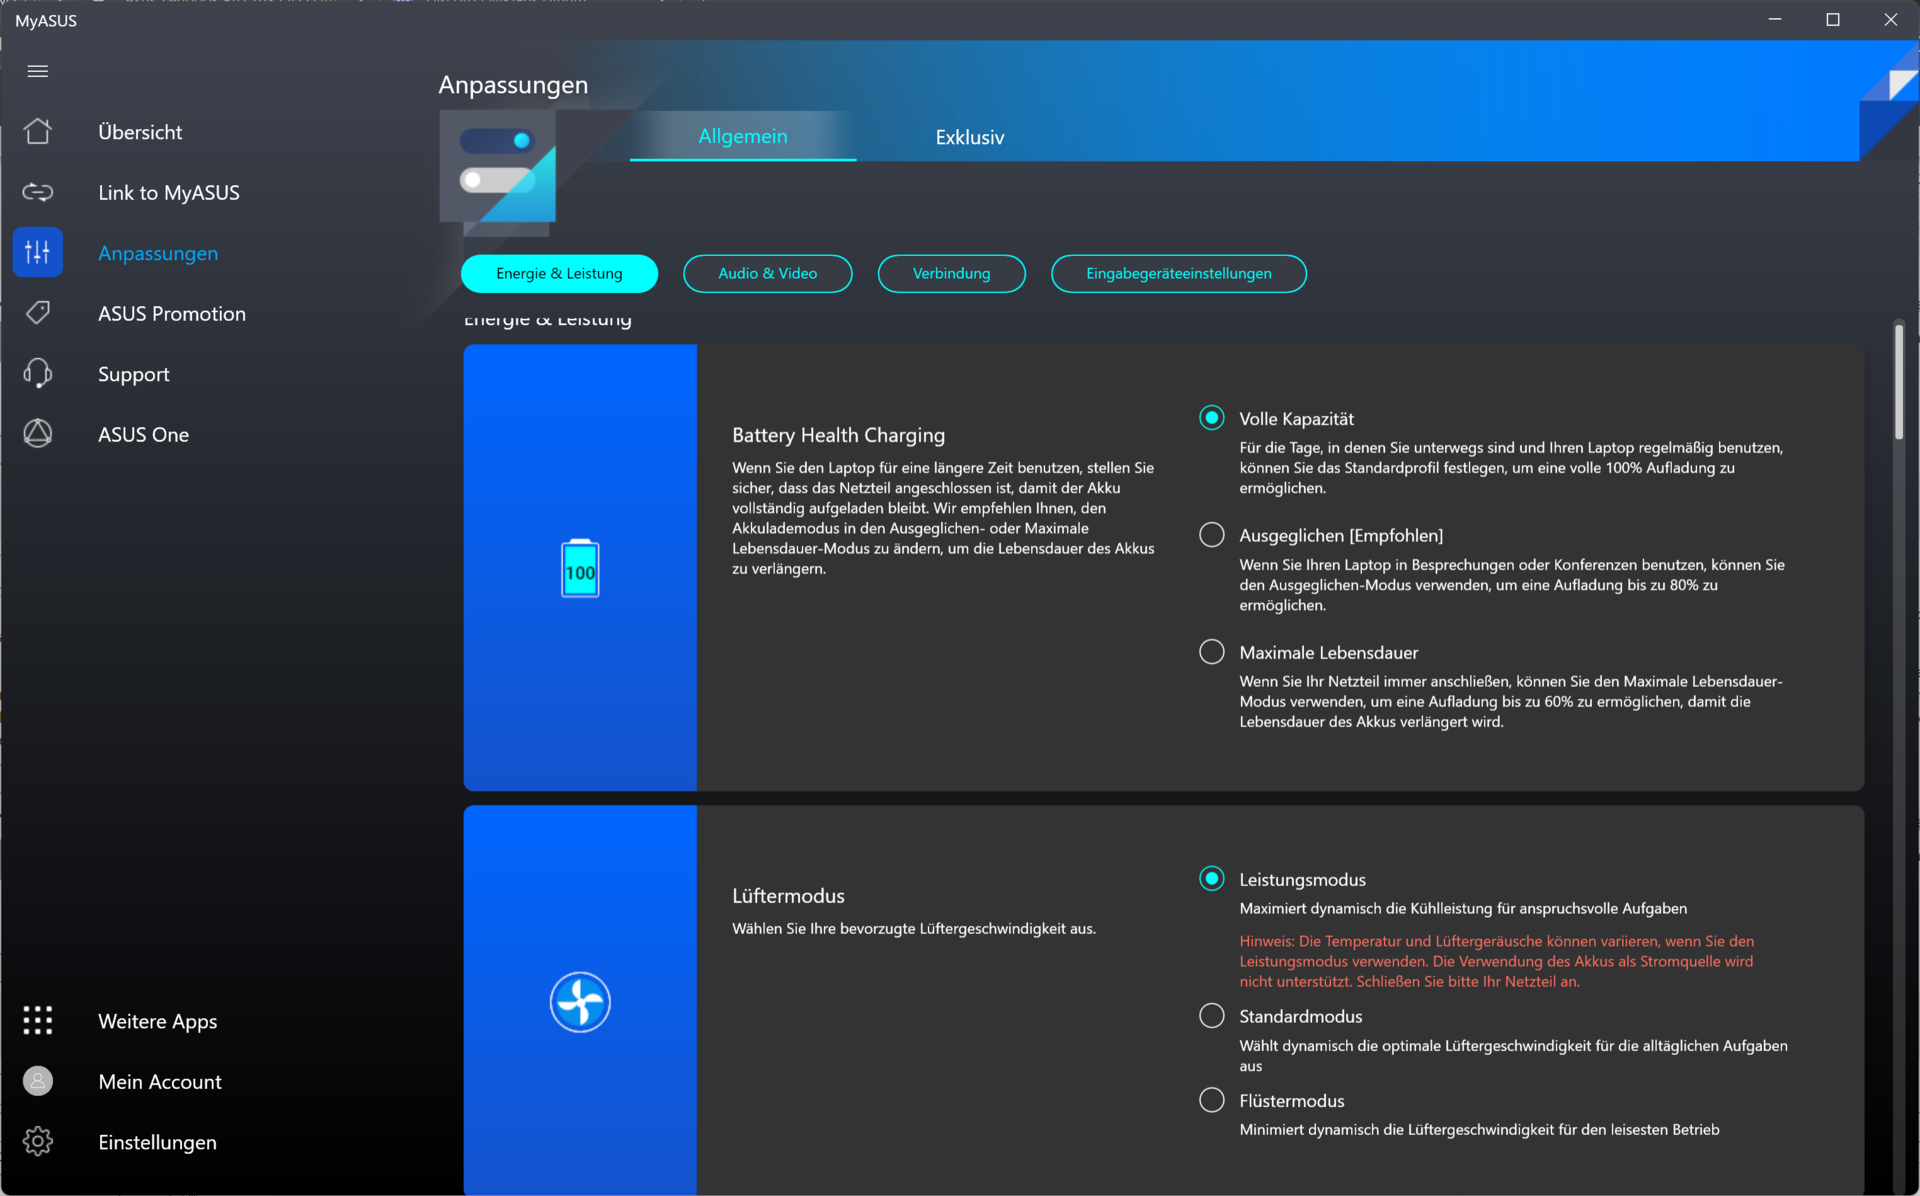
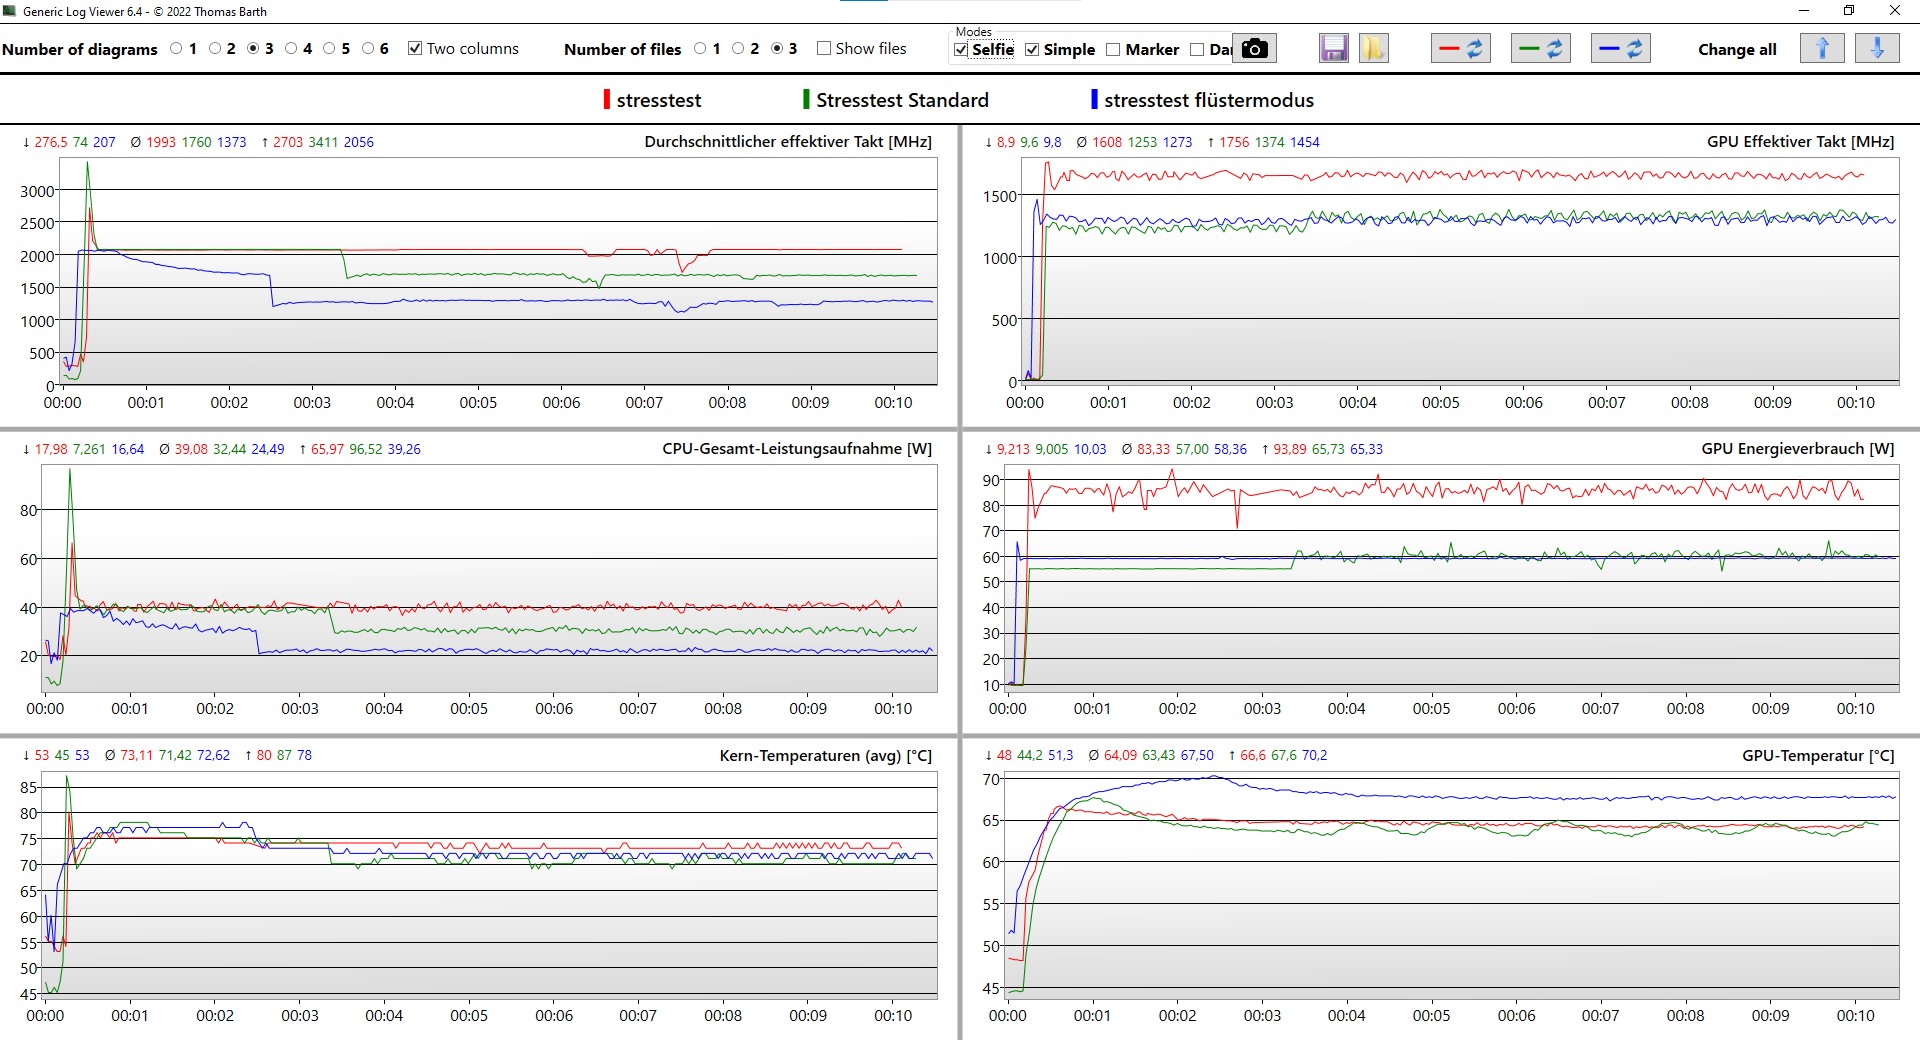
A large number of settings can be set via the MyAsus application that change the notebook's performance readiness. Three different performance options (Silent mode, Standard mode, Performance mode) are available in mains operation. The three modes more or less influence the available performance of the GPU and CPU.
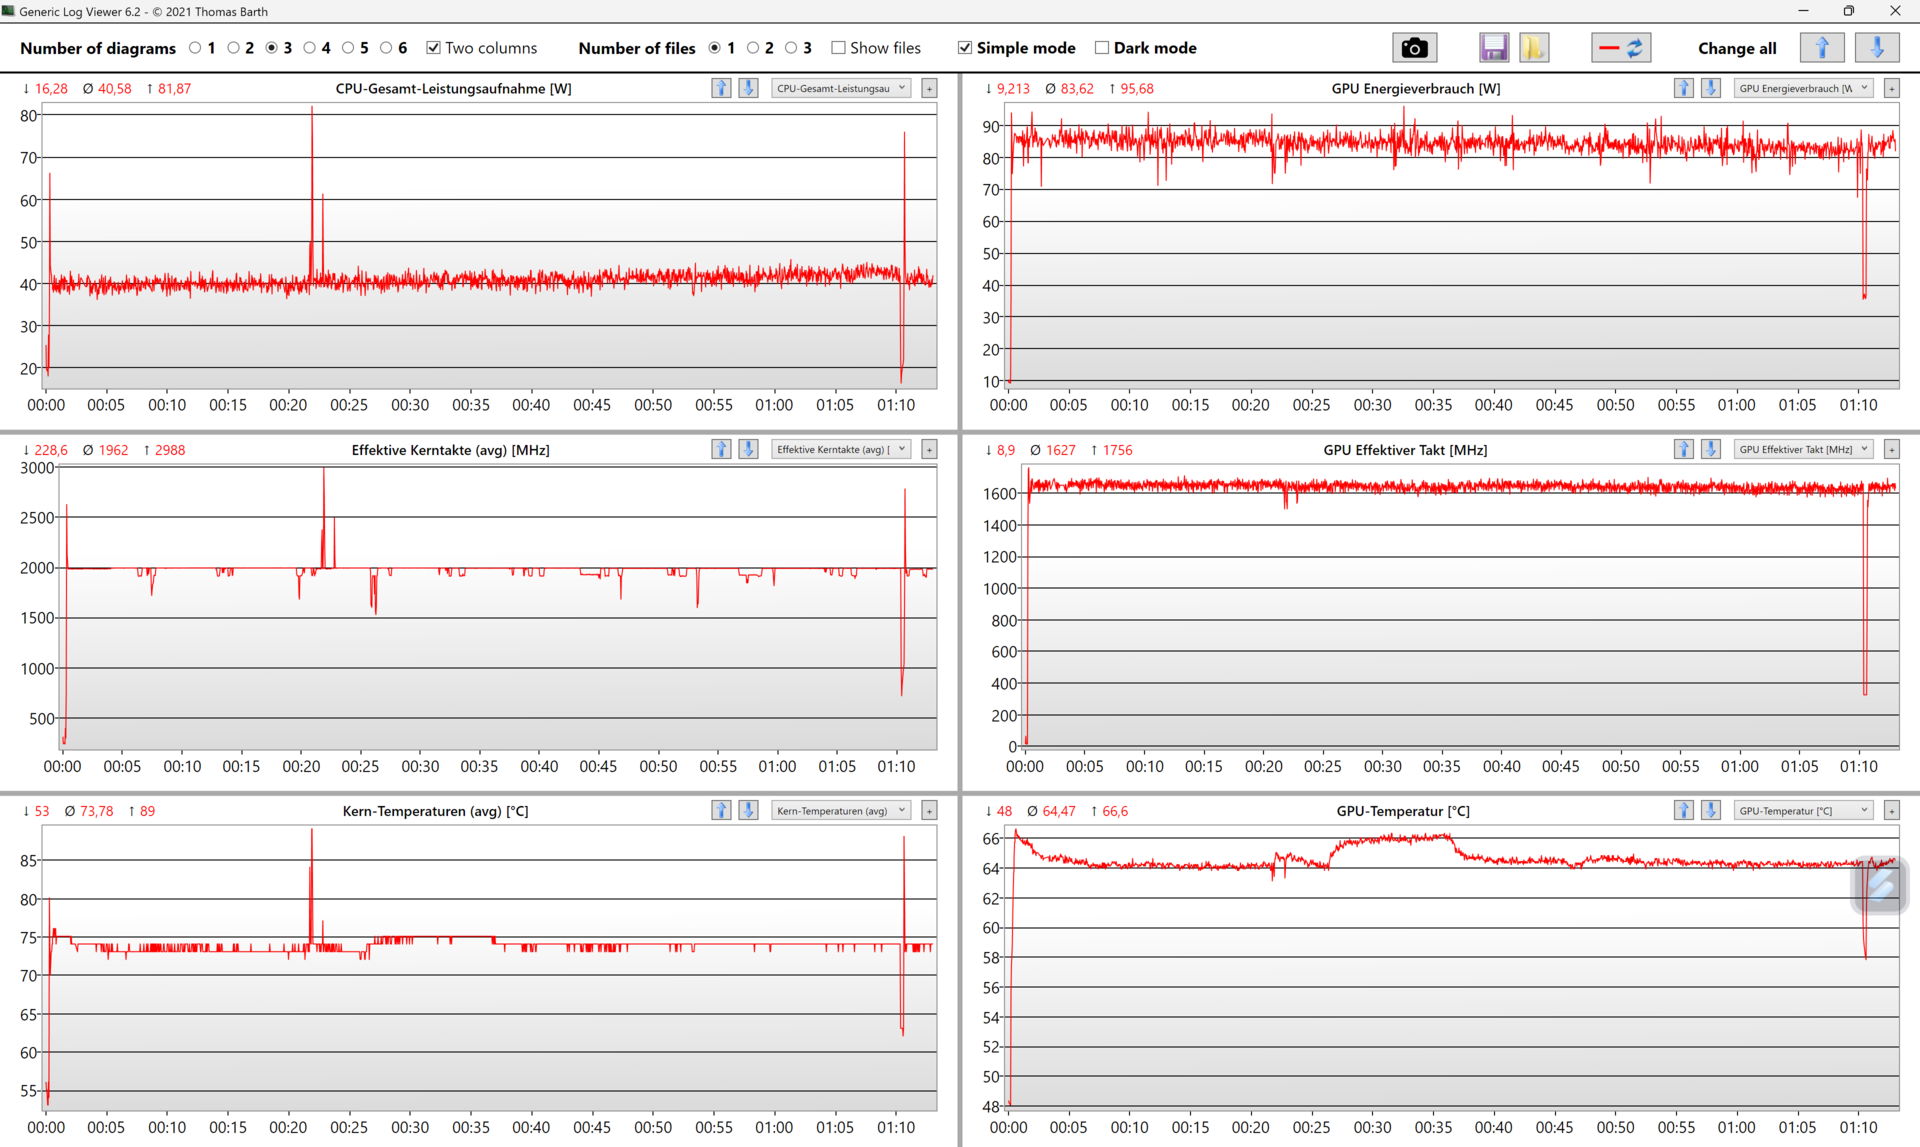
In Performance mode as well as in Standard mode, the Intel Core i9's boost power amounts to a strong 120 watts, while it is supplied with a maximum of 45 watts in Silent mode. The high-end processor's continuous power is 85 watts in both Standard and Performance mode. But in Standard mode, the laptop limits itself after a good five minutes, with core power shrinking to around 75 watts.
If the graphics chip and processor work together, the amount of power available for the processor shrinks to around 40 watts. Depending on the performance mode, continuous power is also reduced after a while; to around 30 watts in Standard mode and 20 watts in Silent mode. The Nvidia GeForce 3060 is allowed to work with around 83 watts in the stress test with Performance mode set. In Standard and Silent mode, this is 60 watts. If only the graphics card is stressed, for example via Furmark, its continuous power increases to up to 95 watts.
Asus specifies a system TDP of up to 140 watts. This value is just barely reached in our test. We determined a maximum of 137 watts of combined power from the CPU and GPU in our logs.
All benchmarks were run in Performance mode. Volume- and power measurements were created according to the requirements of the respective tests.
Processor
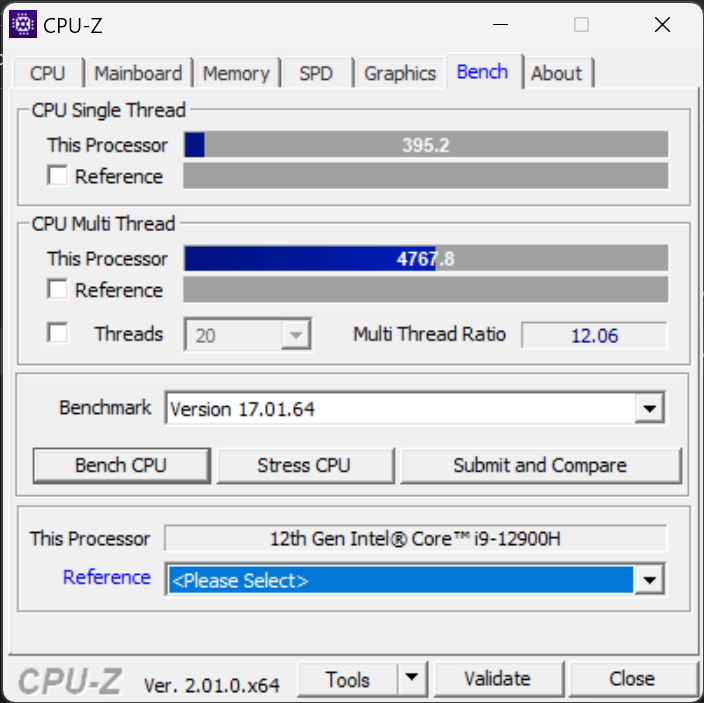
The Intel Core i9-12900H is one of the most powerful Intel processors for laptops. In the Asus Zenbook Pro 16X OLED, the processor is able to work at high performance for long periods of time. With up to 80 watts distributed over six P and eight E cores, it quickly cleaves through pending tasks and thus achieves good scores. The processor accelerates quickly up to 5 GHz and, thanks to 20 threads, is able to process a wide variety of tasks simultaneously.
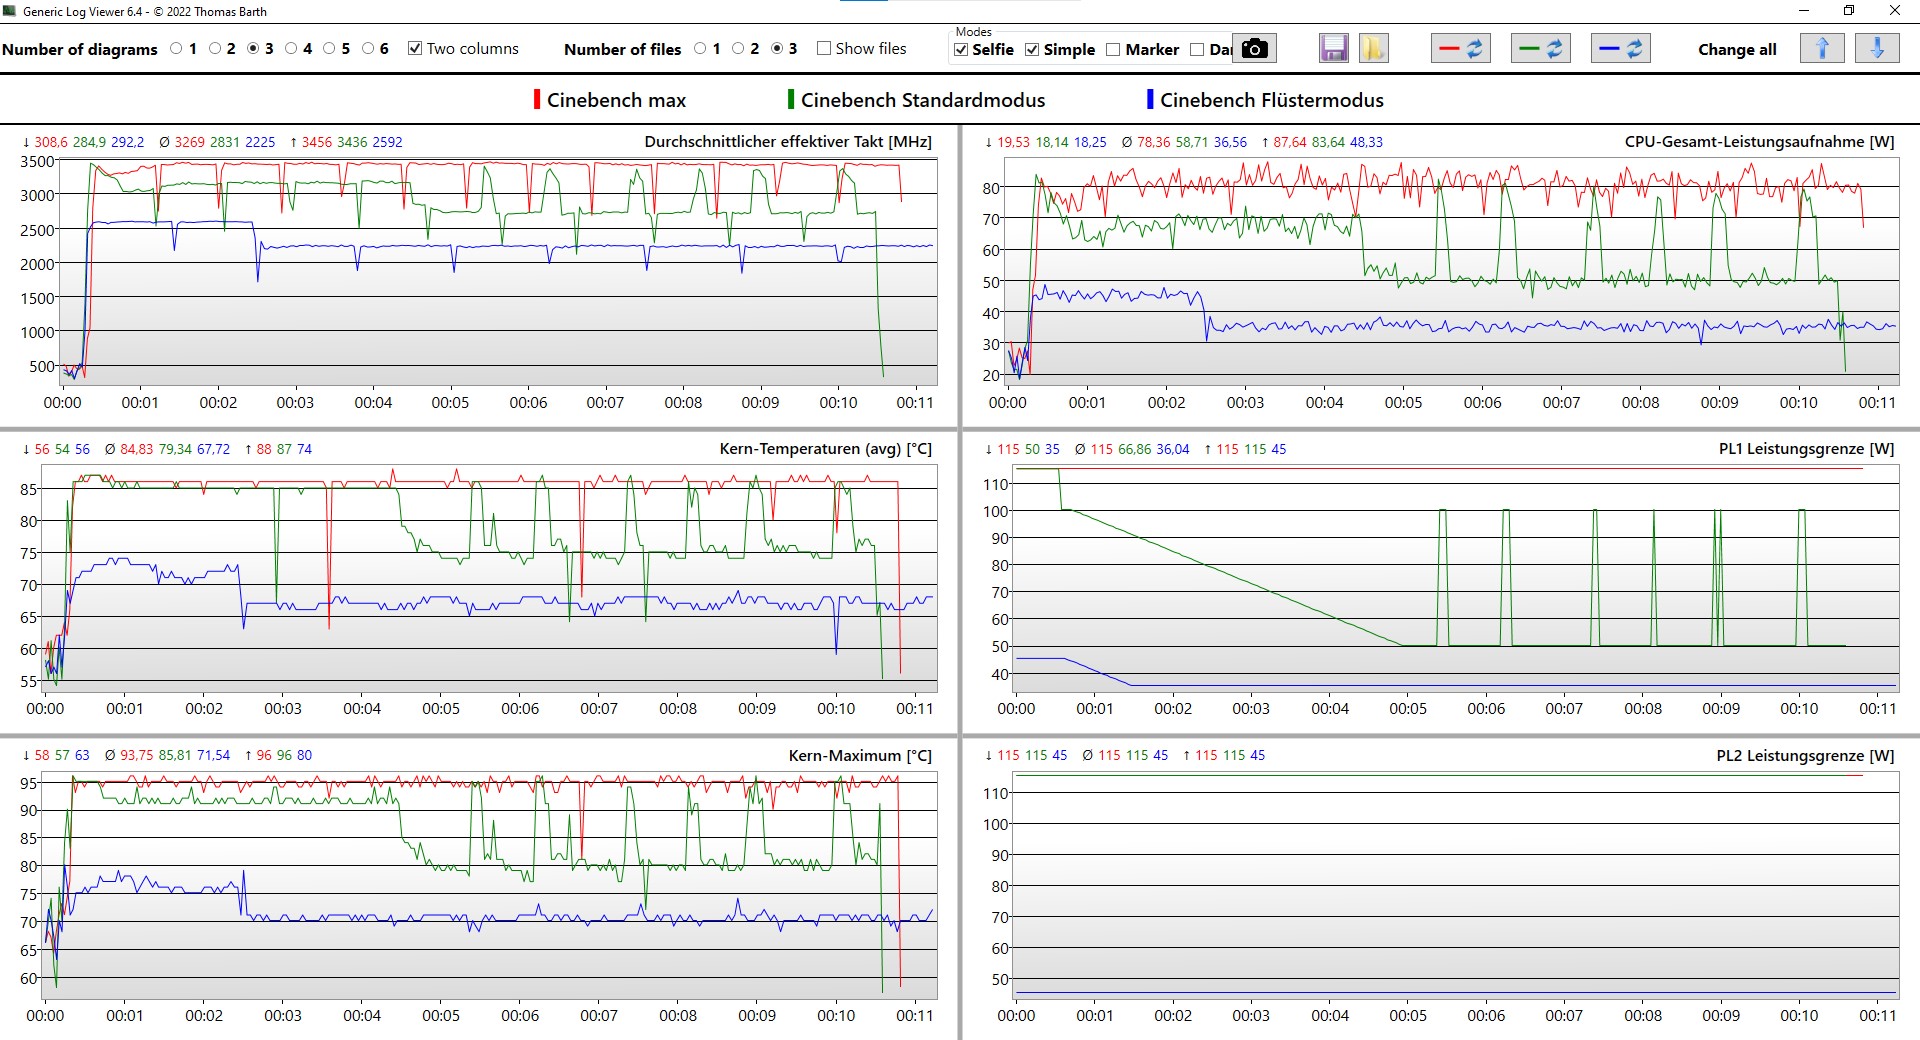
The only thing that stands out here is the somewhat timid power control. The processor sometimes only reaches its full performance after a long period of load and the Zenbook's fans delay in firing up. So the laptop remains as quiet as possible for a long time, but in doing so, cannot achieve top performance in the benchmarks that demand short-term performance only. In this respect, the Lenovo ThinkPad X1 Extreme G5 proves to be a tough opponent for the Zenbook. Even without AAS, the laptop with a supposedly weaker processor manages an equal or higher performance in almost all processor benchmarks. On the other hand, regarding the benchmarks of creative applications such as Blender, the Zenbook completes upcoming tasks faster than the ThinkPad. So Asus appears to have made the right adjustments here when fine-tuning the device.
Cinebench R15 Multi Dauertest
Cinebench R23: Multi Core | Single Core
Cinebench R20: CPU (Multi Core) | CPU (Single Core)
Cinebench R15: CPU Multi 64Bit | CPU Single 64Bit
Blender: v2.79 BMW27 CPU
7-Zip 18.03: 7z b 4 | 7z b 4 -mmt1
Geekbench 5.5: Multi-Core | Single-Core
HWBOT x265 Benchmark v2.2: 4k Preset
LibreOffice : 20 Documents To PDF
R Benchmark 2.5: Overall mean
| CPU Performance rating | |
| HP ZBook Studio 16 G9 62U04EA | |
| Lenovo ThinkPad X1 Extreme G5-21DE003RGE | |
| Asus ZenBook Pro 16X OLED UX7602ZM-ME115W | |
| Average of class Multimedia | |
| MSI CreatorPro Z16P B12UKST | |
| Average Intel Core i9-12900H | |
| Dell Precision 7670 | |
| Corsair Voyager a1600 | |
| HP Omen 16-n0033dx | |
| Asus VivoBook Pro 16X OLED N7600PC-L2026X | |
| Cinebench R23 / Multi Core | |
| Lenovo ThinkPad X1 Extreme G5-21DE003RGE | |
| MSI CreatorPro Z16P B12UKST | |
| Average of class Multimedia (4861 - 33362, n=77, last 2 years) | |
| Asus ZenBook Pro 16X OLED UX7602ZM-ME115W | |
| HP ZBook Studio 16 G9 62U04EA | |
| Average Intel Core i9-12900H (7359 - 19648, n=28) | |
| Dell Precision 7670 | |
| Corsair Voyager a1600 | |
| HP Omen 16-n0033dx | |
| Asus VivoBook Pro 16X OLED N7600PC-L2026X | |
| Cinebench R23 / Single Core | |
| Average of class Multimedia (1128 - 2459, n=69, last 2 years) | |
| HP ZBook Studio 16 G9 62U04EA | |
| Average Intel Core i9-12900H (1634 - 1930, n=28) | |
| Lenovo ThinkPad X1 Extreme G5-21DE003RGE | |
| MSI CreatorPro Z16P B12UKST | |
| Asus ZenBook Pro 16X OLED UX7602ZM-ME115W | |
| Dell Precision 7670 | |
| Corsair Voyager a1600 | |
| Asus VivoBook Pro 16X OLED N7600PC-L2026X | |
| HP Omen 16-n0033dx | |
| Cinebench R20 / CPU (Multi Core) | |
| Lenovo ThinkPad X1 Extreme G5-21DE003RGE | |
| MSI CreatorPro Z16P B12UKST | |
| HP ZBook Studio 16 G9 62U04EA | |
| Average of class Multimedia (1887 - 12912, n=60, last 2 years) | |
| Dell Precision 7670 | |
| Asus ZenBook Pro 16X OLED UX7602ZM-ME115W | |
| Average Intel Core i9-12900H (2681 - 7471, n=28) | |
| Corsair Voyager a1600 | |
| HP Omen 16-n0033dx | |
| Asus VivoBook Pro 16X OLED N7600PC-L2026X | |
| Cinebench R20 / CPU (Single Core) | |
| Average of class Multimedia (425 - 853, n=60, last 2 years) | |
| HP ZBook Studio 16 G9 62U04EA | |
| Average Intel Core i9-12900H (624 - 738, n=28) | |
| Lenovo ThinkPad X1 Extreme G5-21DE003RGE | |
| Dell Precision 7670 | |
| Asus ZenBook Pro 16X OLED UX7602ZM-ME115W | |
| MSI CreatorPro Z16P B12UKST | |
| HP Omen 16-n0033dx | |
| Corsair Voyager a1600 | |
| Asus VivoBook Pro 16X OLED N7600PC-L2026X | |
| Cinebench R15 / CPU Multi 64Bit | |
| Lenovo ThinkPad X1 Extreme G5-21DE003RGE | |
| Asus ZenBook Pro 16X OLED UX7602ZM-ME115W | |
| Average of class Multimedia (856 - 5224, n=64, last 2 years) | |
| HP ZBook Studio 16 G9 62U04EA | |
| Average Intel Core i9-12900H (1395 - 3077, n=28) | |
| Dell Precision 7670 | |
| MSI CreatorPro Z16P B12UKST | |
| Corsair Voyager a1600 | |
| HP Omen 16-n0033dx | |
| Asus VivoBook Pro 16X OLED N7600PC-L2026X | |
| Cinebench R15 / CPU Single 64Bit | |
| Average of class Multimedia (184.8 - 326, n=62, last 2 years) | |
| HP ZBook Studio 16 G9 62U04EA | |
| Asus ZenBook Pro 16X OLED UX7602ZM-ME115W | |
| Asus ZenBook Pro 16X OLED UX7602ZM-ME115W | |
| Average Intel Core i9-12900H (235 - 277, n=29) | |
| Lenovo ThinkPad X1 Extreme G5-21DE003RGE | |
| Dell Precision 7670 | |
| Corsair Voyager a1600 | |
| HP Omen 16-n0033dx | |
| MSI CreatorPro Z16P B12UKST | |
| Asus VivoBook Pro 16X OLED N7600PC-L2026X | |
| Asus VivoBook Pro 16X OLED N7600PC-L2026X | |
| Blender / v2.79 BMW27 CPU | |
| Asus VivoBook Pro 16X OLED N7600PC-L2026X | |
| Average of class Multimedia (100 - 557, n=61, last 2 years) | |
| HP Omen 16-n0033dx | |
| Average Intel Core i9-12900H (160 - 451, n=28) | |
| Corsair Voyager a1600 | |
| Dell Precision 7670 | |
| MSI CreatorPro Z16P B12UKST | |
| HP ZBook Studio 16 G9 62U04EA | |
| Lenovo ThinkPad X1 Extreme G5-21DE003RGE | |
| Asus ZenBook Pro 16X OLED UX7602ZM-ME115W | |
| 7-Zip 18.03 / 7z b 4 | |
| Asus ZenBook Pro 16X OLED UX7602ZM-ME115W | |
| HP ZBook Studio 16 G9 62U04EA | |
| MSI CreatorPro Z16P B12UKST | |
| Lenovo ThinkPad X1 Extreme G5-21DE003RGE | |
| Corsair Voyager a1600 | |
| Average Intel Core i9-12900H (34684 - 76677, n=28) | |
| HP Omen 16-n0033dx | |
| Average of class Multimedia (26062 - 130368, n=58, last 2 years) | |
| Dell Precision 7670 | |
| Asus VivoBook Pro 16X OLED N7600PC-L2026X | |
| 7-Zip 18.03 / 7z b 4 -mmt1 | |
| HP ZBook Studio 16 G9 62U04EA | |
| Average of class Multimedia (3666 - 7545, n=59, last 2 years) | |
| Lenovo ThinkPad X1 Extreme G5-21DE003RGE | |
| Average Intel Core i9-12900H (5302 - 6289, n=28) | |
| Asus ZenBook Pro 16X OLED UX7602ZM-ME115W | |
| Corsair Voyager a1600 | |
| MSI CreatorPro Z16P B12UKST | |
| HP Omen 16-n0033dx | |
| Dell Precision 7670 | |
| Asus VivoBook Pro 16X OLED N7600PC-L2026X | |
| Geekbench 5.5 / Multi-Core | |
| Asus ZenBook Pro 16X OLED UX7602ZM-ME115W | |
| Average of class Multimedia (4652 - 20422, n=59, last 2 years) | |
| HP ZBook Studio 16 G9 62U04EA | |
| MSI CreatorPro Z16P B12UKST | |
| Average Intel Core i9-12900H (8519 - 14376, n=31) | |
| Lenovo ThinkPad X1 Extreme G5-21DE003RGE | |
| Dell Precision 7670 | |
| Corsair Voyager a1600 | |
| HP Omen 16-n0033dx | |
| Asus VivoBook Pro 16X OLED N7600PC-L2026X | |
| Geekbench 5.5 / Single-Core | |
| Average of class Multimedia (805 - 2974, n=59, last 2 years) | |
| HP ZBook Studio 16 G9 62U04EA | |
| Asus ZenBook Pro 16X OLED UX7602ZM-ME115W | |
| Lenovo ThinkPad X1 Extreme G5-21DE003RGE | |
| Average Intel Core i9-12900H (1631 - 1897, n=31) | |
| MSI CreatorPro Z16P B12UKST | |
| Dell Precision 7670 | |
| HP Omen 16-n0033dx | |
| Asus VivoBook Pro 16X OLED N7600PC-L2026X | |
| Corsair Voyager a1600 | |
| HWBOT x265 Benchmark v2.2 / 4k Preset | |
| HP ZBook Studio 16 G9 62U04EA | |
| MSI CreatorPro Z16P B12UKST | |
| Asus ZenBook Pro 16X OLED UX7602ZM-ME115W | |
| Average of class Multimedia (5.26 - 36.1, n=59, last 2 years) | |
| Dell Precision 7670 | |
| Lenovo ThinkPad X1 Extreme G5-21DE003RGE | |
| Average Intel Core i9-12900H (8.05 - 22.5, n=28) | |
| Corsair Voyager a1600 | |
| HP Omen 16-n0033dx | |
| Asus VivoBook Pro 16X OLED N7600PC-L2026X | |
| LibreOffice / 20 Documents To PDF | |
| HP Omen 16-n0033dx | |
| Corsair Voyager a1600 | |
| Asus VivoBook Pro 16X OLED N7600PC-L2026X | |
| Average of class Multimedia (23.9 - 146.7, n=60, last 2 years) | |
| Dell Precision 7670 | |
| HP ZBook Studio 16 G9 62U04EA | |
| Average Intel Core i9-12900H (36.8 - 59.8, n=28) | |
| Lenovo ThinkPad X1 Extreme G5-21DE003RGE | |
| Asus ZenBook Pro 16X OLED UX7602ZM-ME115W | |
| MSI CreatorPro Z16P B12UKST | |
| R Benchmark 2.5 / Overall mean | |
| Asus VivoBook Pro 16X OLED N7600PC-L2026X | |
| HP Omen 16-n0033dx | |
| Corsair Voyager a1600 | |
| Dell Precision 7670 | |
| Lenovo ThinkPad X1 Extreme G5-21DE003RGE | |
| Average of class Multimedia (0.3604 - 0.947, n=59, last 2 years) | |
| MSI CreatorPro Z16P B12UKST | |
| Average Intel Core i9-12900H (0.4218 - 0.506, n=28) | |
| Asus ZenBook Pro 16X OLED UX7602ZM-ME115W | |
| HP ZBook Studio 16 G9 62U04EA | |
* ... smaller is better
AIDA64: FP32 Ray-Trace | FPU Julia | CPU SHA3 | CPU Queen | FPU SinJulia | FPU Mandel | CPU AES | CPU ZLib | FP64 Ray-Trace | CPU PhotoWorxx
| Performance rating | |
| Corsair Voyager a1600 | |
| HP Omen 16-n0033dx | |
| MSI CreatorPro Z16P B12UKST | |
| Average of class Multimedia | |
| HP ZBook Studio 16 G9 62U04EA | |
| Asus ZenBook Pro 16X OLED UX7602ZM-ME115W | |
| Lenovo ThinkPad X1 Extreme G5-21DE003RGE | |
| Average Intel Core i9-12900H | |
| Dell Precision 7670 | |
| Asus VivoBook Pro 16X OLED N7600PC-L2026X | |
| AIDA64 / FP32 Ray-Trace | |
| Average of class Multimedia (2214 - 50388, n=56, last 2 years) | |
| Lenovo ThinkPad X1 Extreme G5-21DE003RGE | |
| Corsair Voyager a1600 | |
| HP Omen 16-n0033dx | |
| HP ZBook Studio 16 G9 62U04EA | |
| MSI CreatorPro Z16P B12UKST | |
| Asus ZenBook Pro 16X OLED UX7602ZM-ME115W | |
| Dell Precision 7670 | |
| Average Intel Core i9-12900H (4074 - 18289, n=29) | |
| Asus VivoBook Pro 16X OLED N7600PC-L2026X | |
| AIDA64 / FPU Julia | |
| Corsair Voyager a1600 | |
| HP Omen 16-n0033dx | |
| Average of class Multimedia (12867 - 201874, n=57, last 2 years) | |
| Lenovo ThinkPad X1 Extreme G5-21DE003RGE | |
| HP ZBook Studio 16 G9 62U04EA | |
| Asus ZenBook Pro 16X OLED UX7602ZM-ME115W | |
| MSI CreatorPro Z16P B12UKST | |
| Dell Precision 7670 | |
| Average Intel Core i9-12900H (22307 - 93236, n=29) | |
| Asus VivoBook Pro 16X OLED N7600PC-L2026X | |
| AIDA64 / CPU SHA3 | |
| Average of class Multimedia (626 - 8623, n=57, last 2 years) | |
| Lenovo ThinkPad X1 Extreme G5-21DE003RGE | |
| HP ZBook Studio 16 G9 62U04EA | |
| Asus ZenBook Pro 16X OLED UX7602ZM-ME115W | |
| MSI CreatorPro Z16P B12UKST | |
| Corsair Voyager a1600 | |
| HP Omen 16-n0033dx | |
| Dell Precision 7670 | |
| Average Intel Core i9-12900H (1378 - 4215, n=29) | |
| Asus VivoBook Pro 16X OLED N7600PC-L2026X | |
| AIDA64 / CPU Queen | |
| Asus ZenBook Pro 16X OLED UX7602ZM-ME115W | |
| HP ZBook Studio 16 G9 62U04EA | |
| HP Omen 16-n0033dx | |
| Corsair Voyager a1600 | |
| Lenovo ThinkPad X1 Extreme G5-21DE003RGE | |
| MSI CreatorPro Z16P B12UKST | |
| Average Intel Core i9-12900H (78172 - 111241, n=28) | |
| Average of class Multimedia (13483 - 181505, n=44, last 2 years) | |
| Asus VivoBook Pro 16X OLED N7600PC-L2026X | |
| Dell Precision 7670 | |
| AIDA64 / FPU SinJulia | |
| Corsair Voyager a1600 | |
| HP Omen 16-n0033dx | |
| Lenovo ThinkPad X1 Extreme G5-21DE003RGE | |
| Dell Precision 7670 | |
| Asus ZenBook Pro 16X OLED UX7602ZM-ME115W | |
| HP ZBook Studio 16 G9 62U04EA | |
| MSI CreatorPro Z16P B12UKST | |
| Average Intel Core i9-12900H (5709 - 10410, n=29) | |
| Average of class Multimedia (886 - 28794, n=57, last 2 years) | |
| Asus VivoBook Pro 16X OLED N7600PC-L2026X | |
| AIDA64 / FPU Mandel | |
| Corsair Voyager a1600 | |
| HP Omen 16-n0033dx | |
| Average of class Multimedia (6395 - 105740, n=56, last 2 years) | |
| Lenovo ThinkPad X1 Extreme G5-21DE003RGE | |
| HP ZBook Studio 16 G9 62U04EA | |
| Asus ZenBook Pro 16X OLED UX7602ZM-ME115W | |
| MSI CreatorPro Z16P B12UKST | |
| Dell Precision 7670 | |
| Average Intel Core i9-12900H (11257 - 45581, n=29) | |
| Asus VivoBook Pro 16X OLED N7600PC-L2026X | |
| AIDA64 / CPU AES | |
| HP Omen 16-n0033dx | |
| Corsair Voyager a1600 | |
| MSI CreatorPro Z16P B12UKST | |
| Average Intel Core i9-12900H (31935 - 151546, n=29) | |
| Lenovo ThinkPad X1 Extreme G5-21DE003RGE | |
| HP ZBook Studio 16 G9 62U04EA | |
| Asus ZenBook Pro 16X OLED UX7602ZM-ME115W | |
| Average of class Multimedia (8171 - 126790, n=57, last 2 years) | |
| Dell Precision 7670 | |
| Asus VivoBook Pro 16X OLED N7600PC-L2026X | |
| AIDA64 / CPU ZLib | |
| Lenovo ThinkPad X1 Extreme G5-21DE003RGE | |
| HP ZBook Studio 16 G9 62U04EA | |
| Asus ZenBook Pro 16X OLED UX7602ZM-ME115W | |
| MSI CreatorPro Z16P B12UKST | |
| Average of class Multimedia (143.8 - 2022, n=57, last 2 years) | |
| Average Intel Core i9-12900H (449 - 1193, n=29) | |
| HP Omen 16-n0033dx | |
| Corsair Voyager a1600 | |
| Dell Precision 7670 | |
| Asus VivoBook Pro 16X OLED N7600PC-L2026X | |
| AIDA64 / FP64 Ray-Trace | |
| Average of class Multimedia (1014 - 26875, n=57, last 2 years) | |
| Lenovo ThinkPad X1 Extreme G5-21DE003RGE | |
| HP ZBook Studio 16 G9 62U04EA | |
| Corsair Voyager a1600 | |
| HP Omen 16-n0033dx | |
| Asus ZenBook Pro 16X OLED UX7602ZM-ME115W | |
| MSI CreatorPro Z16P B12UKST | |
| Dell Precision 7670 | |
| Average Intel Core i9-12900H (2235 - 10511, n=29) | |
| Asus VivoBook Pro 16X OLED N7600PC-L2026X | |
| AIDA64 / CPU PhotoWorxx | |
| Average of class Multimedia (8187 - 88154, n=57, last 2 years) | |
| Asus ZenBook Pro 16X OLED UX7602ZM-ME115W | |
| MSI CreatorPro Z16P B12UKST | |
| Dell Precision 7670 | |
| HP ZBook Studio 16 G9 62U04EA | |
| Average Intel Core i9-12900H (20960 - 48269, n=30) | |
| Corsair Voyager a1600 | |
| HP Omen 16-n0033dx | |
| Lenovo ThinkPad X1 Extreme G5-21DE003RGE | |
| Asus VivoBook Pro 16X OLED N7600PC-L2026X | |
System Performance

Regarding benchmarks in system performance, the Asus Zenbook 16X OLED has a strong advantage over the ThinkPad X1 Extreme for the first time. The powerful studio laptop from Asus is able provide its graphics card with at least 20 watts more than the Lenovo laptop. So it's hardly surprising that our review device with its vapor chamber scores excellently in the system performance benchmarks. According to Asus, the Zenbook Pro 16X has a total TDP of 140 watts at its disposal.
The strengths of the notebook are also evident in its responsivity and extremely quick reaction times. Regardless of the performance mode set, the laptop does not display any weaknesses in everyday use. Practically every application starts faster than average. Whether Blender, Fusion 360, Darktable or DaVinci Resolve, the laptop performs well in video editing, 3D applications and other programs. The large amount of RAM and its high bandwidth is likely to be partly responsible for this.
CrossMark: Overall | Productivity | Creativity | Responsiveness
| PCMark 10 / Score | |
| Average of class Multimedia (4325 - 10386, n=55, last 2 years) | |
| Average Intel Core i9-12900H, NVIDIA GeForce RTX 3060 Laptop GPU (7135 - 7861, n=4) | |
| Asus ZenBook Pro 16X OLED UX7602ZM-ME115W | |
| Lenovo ThinkPad X1 Extreme G5-21DE003RGE | |
| Corsair Voyager a1600 | |
| HP Omen 16-n0033dx | |
| MSI CreatorPro Z16P B12UKST | |
| Dell Precision 7670 | |
| HP ZBook Studio 16 G9 62U04EA | |
| Asus VivoBook Pro 16X OLED N7600PC-L2026X | |
| PCMark 10 / Essentials | |
| Asus ZenBook Pro 16X OLED UX7602ZM-ME115W | |
| Average Intel Core i9-12900H, NVIDIA GeForce RTX 3060 Laptop GPU (10380 - 11198, n=4) | |
| MSI CreatorPro Z16P B12UKST | |
| Dell Precision 7670 | |
| Lenovo ThinkPad X1 Extreme G5-21DE003RGE | |
| Average of class Multimedia (8025 - 11664, n=54, last 2 years) | |
| HP Omen 16-n0033dx | |
| Corsair Voyager a1600 | |
| HP ZBook Studio 16 G9 62U04EA | |
| Asus VivoBook Pro 16X OLED N7600PC-L2026X | |
| PCMark 10 / Productivity | |
| Average of class Multimedia (7323 - 18233, n=54, last 2 years) | |
| Average Intel Core i9-12900H, NVIDIA GeForce RTX 3060 Laptop GPU (9751 - 10486, n=4) | |
| Asus ZenBook Pro 16X OLED UX7602ZM-ME115W | |
| Lenovo ThinkPad X1 Extreme G5-21DE003RGE | |
| MSI CreatorPro Z16P B12UKST | |
| HP Omen 16-n0033dx | |
| Dell Precision 7670 | |
| Corsair Voyager a1600 | |
| Asus VivoBook Pro 16X OLED N7600PC-L2026X | |
| HP ZBook Studio 16 G9 62U04EA | |
| PCMark 10 / Digital Content Creation | |
| Corsair Voyager a1600 | |
| HP Omen 16-n0033dx | |
| Average of class Multimedia (3651 - 16240, n=54, last 2 years) | |
| Lenovo ThinkPad X1 Extreme G5-21DE003RGE | |
| Average Intel Core i9-12900H, NVIDIA GeForce RTX 3060 Laptop GPU (9741 - 11226, n=4) | |
| Asus ZenBook Pro 16X OLED UX7602ZM-ME115W | |
| MSI CreatorPro Z16P B12UKST | |
| HP ZBook Studio 16 G9 62U04EA | |
| Dell Precision 7670 | |
| Asus VivoBook Pro 16X OLED N7600PC-L2026X | |
| CrossMark / Overall | |
| Average Intel Core i9-12900H, NVIDIA GeForce RTX 3060 Laptop GPU (1789 - 2096, n=4) | |
| MSI CreatorPro Z16P B12UKST | |
| Average of class Multimedia (866 - 2728, n=63, last 2 years) | |
| HP ZBook Studio 16 G9 62U04EA | |
| Asus ZenBook Pro 16X OLED UX7602ZM-ME115W | |
| Lenovo ThinkPad X1 Extreme G5-21DE003RGE | |
| HP Omen 16-n0033dx | |
| Dell Precision 7670 | |
| Corsair Voyager a1600 | |
| Asus VivoBook Pro 16X OLED N7600PC-L2026X | |
| CrossMark / Productivity | |
| Average Intel Core i9-12900H, NVIDIA GeForce RTX 3060 Laptop GPU (1677 - 2062, n=4) | |
| MSI CreatorPro Z16P B12UKST | |
| Average of class Multimedia (931 - 2489, n=63, last 2 years) | |
| HP ZBook Studio 16 G9 62U04EA | |
| Asus ZenBook Pro 16X OLED UX7602ZM-ME115W | |
| Lenovo ThinkPad X1 Extreme G5-21DE003RGE | |
| HP Omen 16-n0033dx | |
| Dell Precision 7670 | |
| Corsair Voyager a1600 | |
| Asus VivoBook Pro 16X OLED N7600PC-L2026X | |
| CrossMark / Creativity | |
| Average of class Multimedia (907 - 3465, n=63, last 2 years) | |
| HP ZBook Studio 16 G9 62U04EA | |
| Average Intel Core i9-12900H, NVIDIA GeForce RTX 3060 Laptop GPU (2032 - 2125, n=4) | |
| MSI CreatorPro Z16P B12UKST | |
| Asus ZenBook Pro 16X OLED UX7602ZM-ME115W | |
| Lenovo ThinkPad X1 Extreme G5-21DE003RGE | |
| Dell Precision 7670 | |
| HP Omen 16-n0033dx | |
| Corsair Voyager a1600 | |
| Asus VivoBook Pro 16X OLED N7600PC-L2026X | |
| CrossMark / Responsiveness | |
| Average Intel Core i9-12900H, NVIDIA GeForce RTX 3060 Laptop GPU (1486 - 2230, n=4) | |
| MSI CreatorPro Z16P B12UKST | |
| HP ZBook Studio 16 G9 62U04EA | |
| Average of class Multimedia (605 - 2024, n=63, last 2 years) | |
| Asus ZenBook Pro 16X OLED UX7602ZM-ME115W | |
| Lenovo ThinkPad X1 Extreme G5-21DE003RGE | |
| Dell Precision 7670 | |
| HP Omen 16-n0033dx | |
| Asus VivoBook Pro 16X OLED N7600PC-L2026X | |
| Corsair Voyager a1600 | |
| PCMark 10 Score | 7455 points | |
Help | ||
| AIDA64 / Memory Copy | |
| Average of class Multimedia (11299 - 132135, n=57, last 2 years) | |
| Asus ZenBook Pro 16X OLED UX7602ZM-ME115W | |
| Dell Precision 7670 | |
| MSI CreatorPro Z16P B12UKST | |
| HP ZBook Studio 16 G9 62U04EA | |
| Average Intel Core i9-12900H (34438 - 74264, n=29) | |
| Corsair Voyager a1600 | |
| HP Omen 16-n0033dx | |
| Lenovo ThinkPad X1 Extreme G5-21DE003RGE | |
| Asus VivoBook Pro 16X OLED N7600PC-L2026X | |
| AIDA64 / Memory Read | |
| Average of class Multimedia (11624 - 174586, n=57, last 2 years) | |
| Asus ZenBook Pro 16X OLED UX7602ZM-ME115W | |
| Dell Precision 7670 | |
| MSI CreatorPro Z16P B12UKST | |
| HP ZBook Studio 16 G9 62U04EA | |
| Average Intel Core i9-12900H (36365 - 74642, n=29) | |
| Corsair Voyager a1600 | |
| HP Omen 16-n0033dx | |
| Lenovo ThinkPad X1 Extreme G5-21DE003RGE | |
| Asus VivoBook Pro 16X OLED N7600PC-L2026X | |
| AIDA64 / Memory Write | |
| Average of class Multimedia (11755 - 134998, n=57, last 2 years) | |
| MSI CreatorPro Z16P B12UKST | |
| HP ZBook Studio 16 G9 62U04EA | |
| Dell Precision 7670 | |
| Asus ZenBook Pro 16X OLED UX7602ZM-ME115W | |
| Average Intel Core i9-12900H (32276 - 67858, n=29) | |
| Corsair Voyager a1600 | |
| HP Omen 16-n0033dx | |
| Asus VivoBook Pro 16X OLED N7600PC-L2026X | |
| Lenovo ThinkPad X1 Extreme G5-21DE003RGE | |
| AIDA64 / Memory Latency | |
| Average of class Multimedia (7 - 535, n=56, last 2 years) | |
| Asus ZenBook Pro 16X OLED UX7602ZM-ME115W | |
| Corsair Voyager a1600 | |
| MSI CreatorPro Z16P B12UKST | |
| Asus VivoBook Pro 16X OLED N7600PC-L2026X | |
| HP ZBook Studio 16 G9 62U04EA | |
| Dell Precision 7670 | |
| HP Omen 16-n0033dx | |
| Lenovo ThinkPad X1 Extreme G5-21DE003RGE | |
| Average Intel Core i9-12900H (74.7 - 118.1, n=28) | |
* ... smaller is better
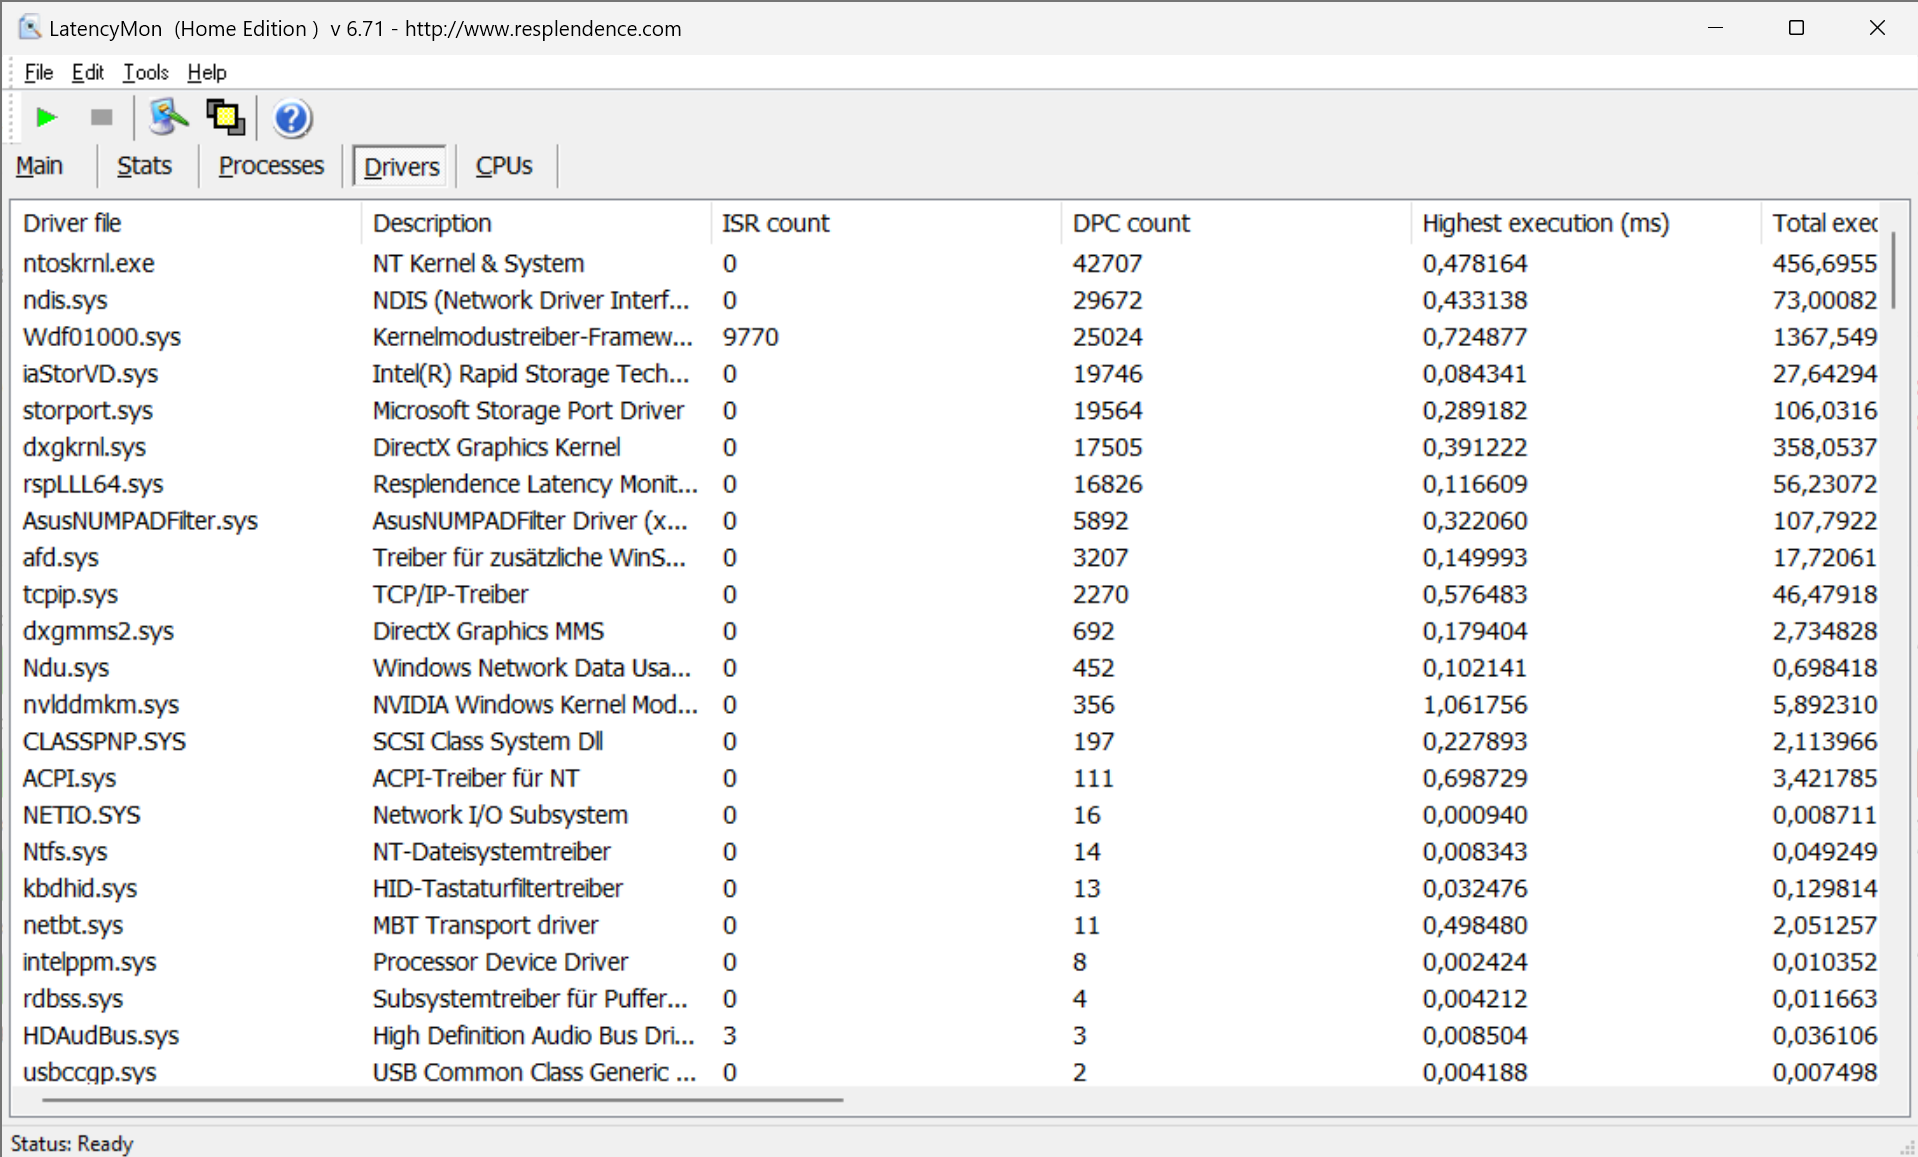
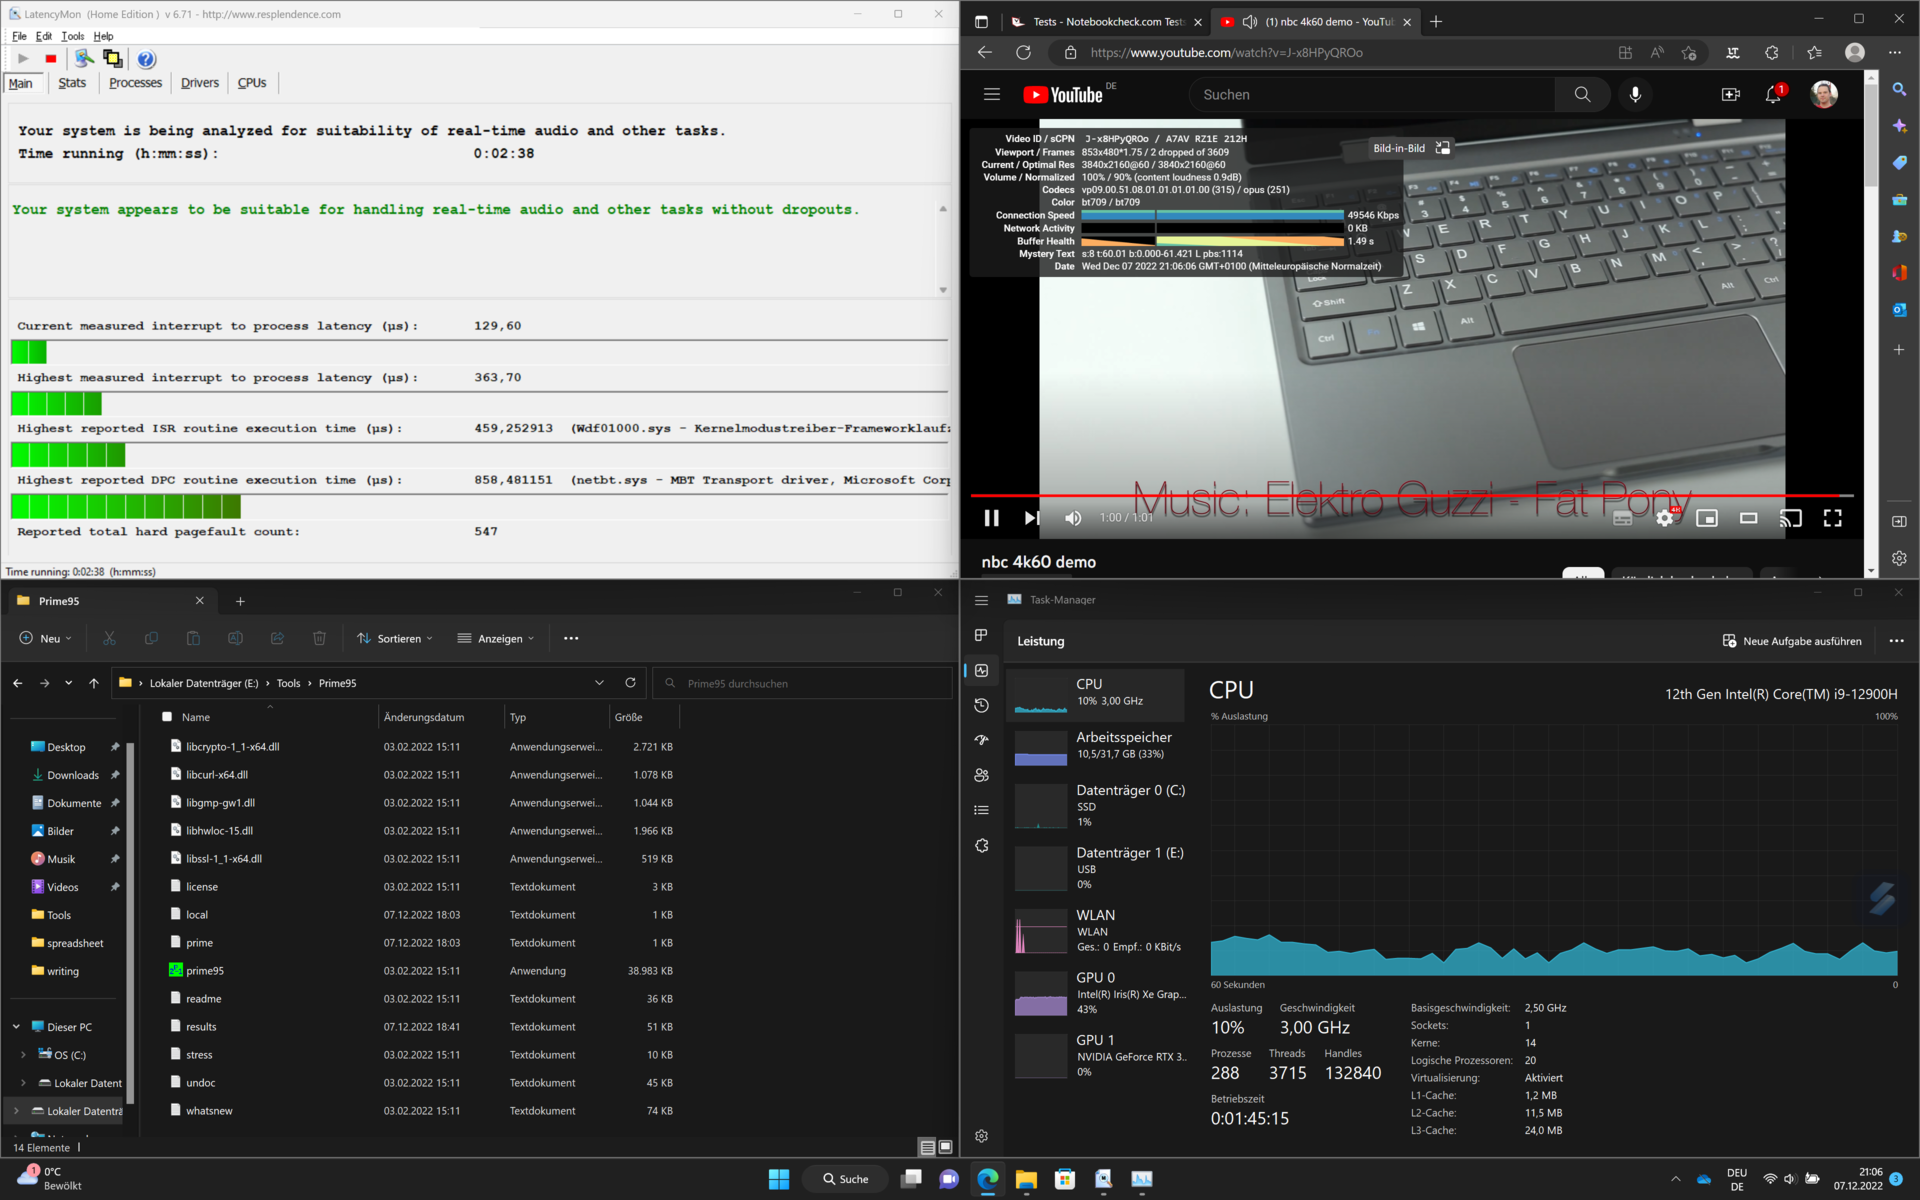
DPC Latency
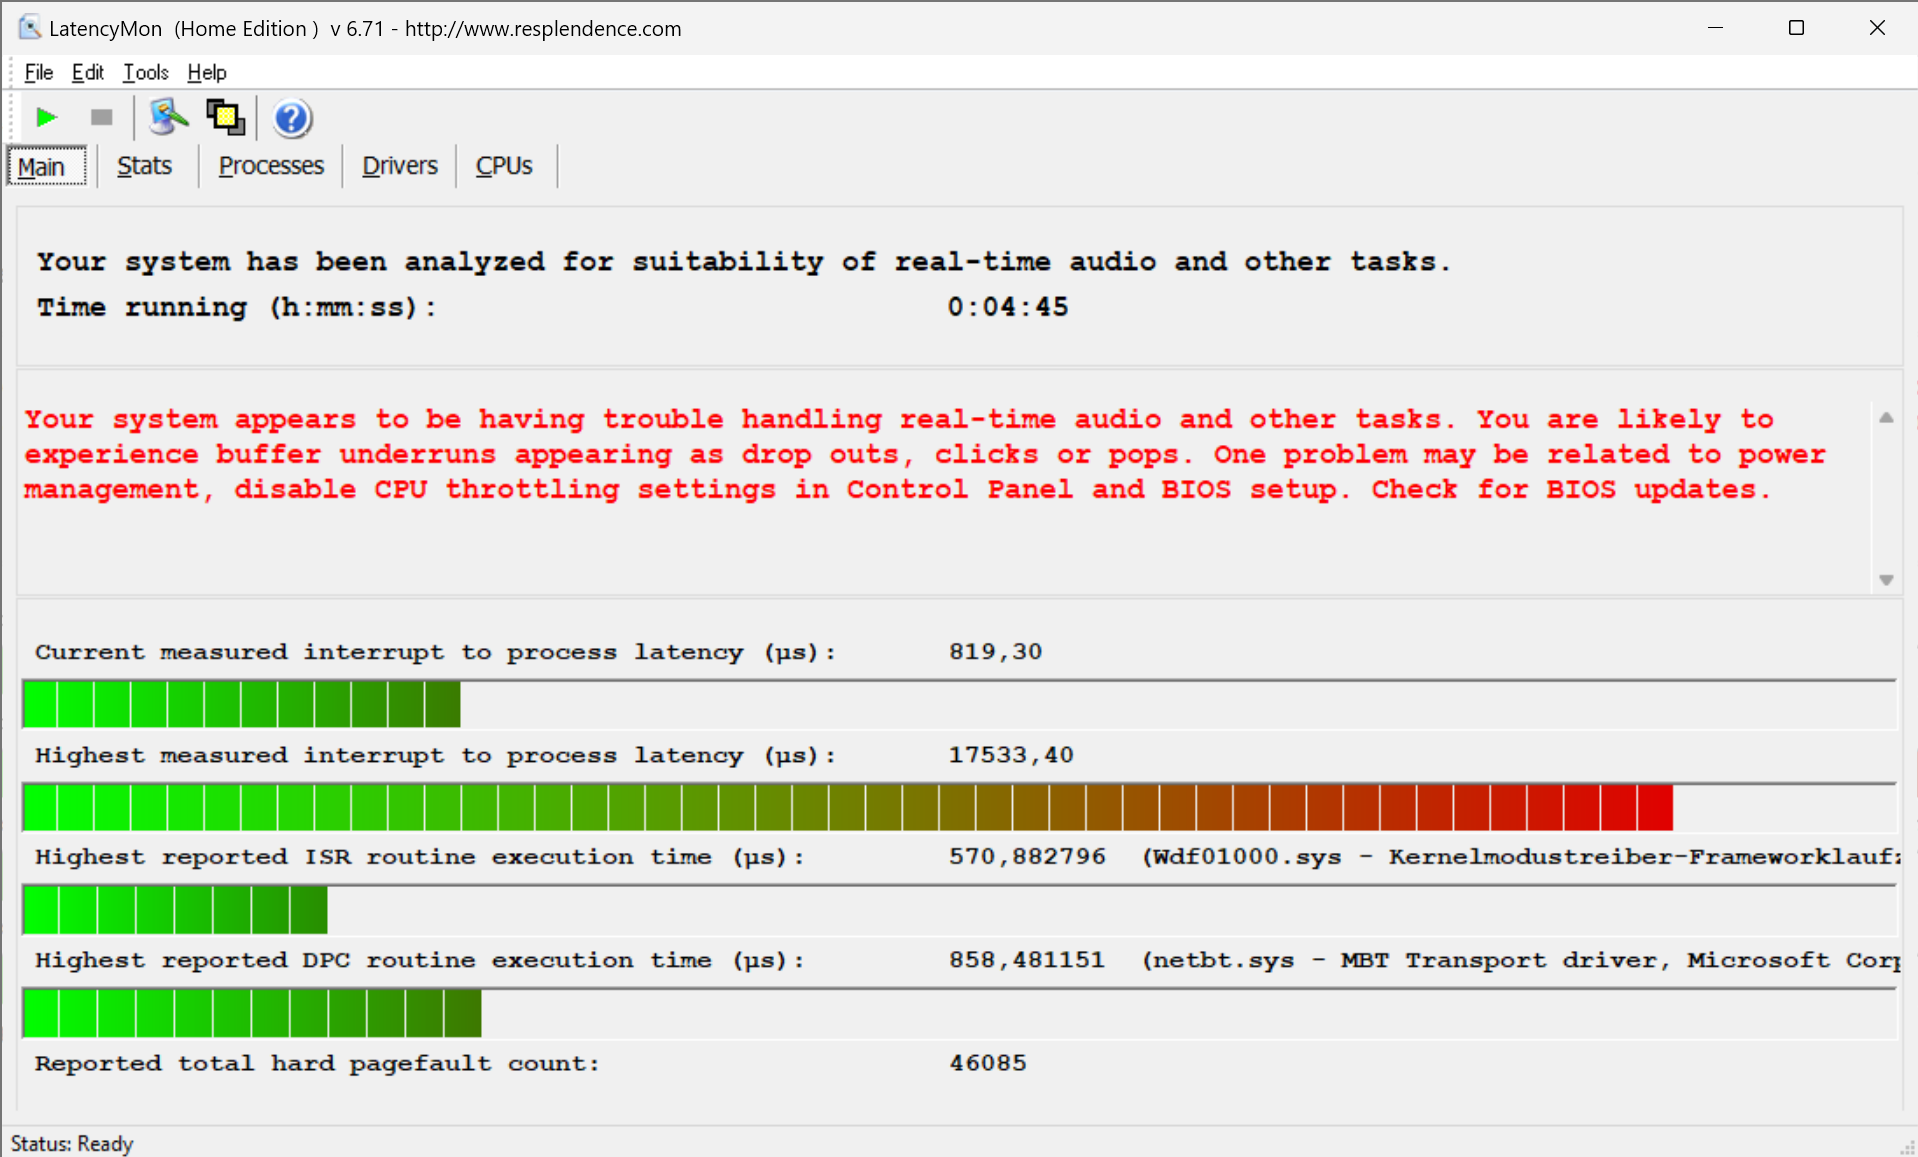
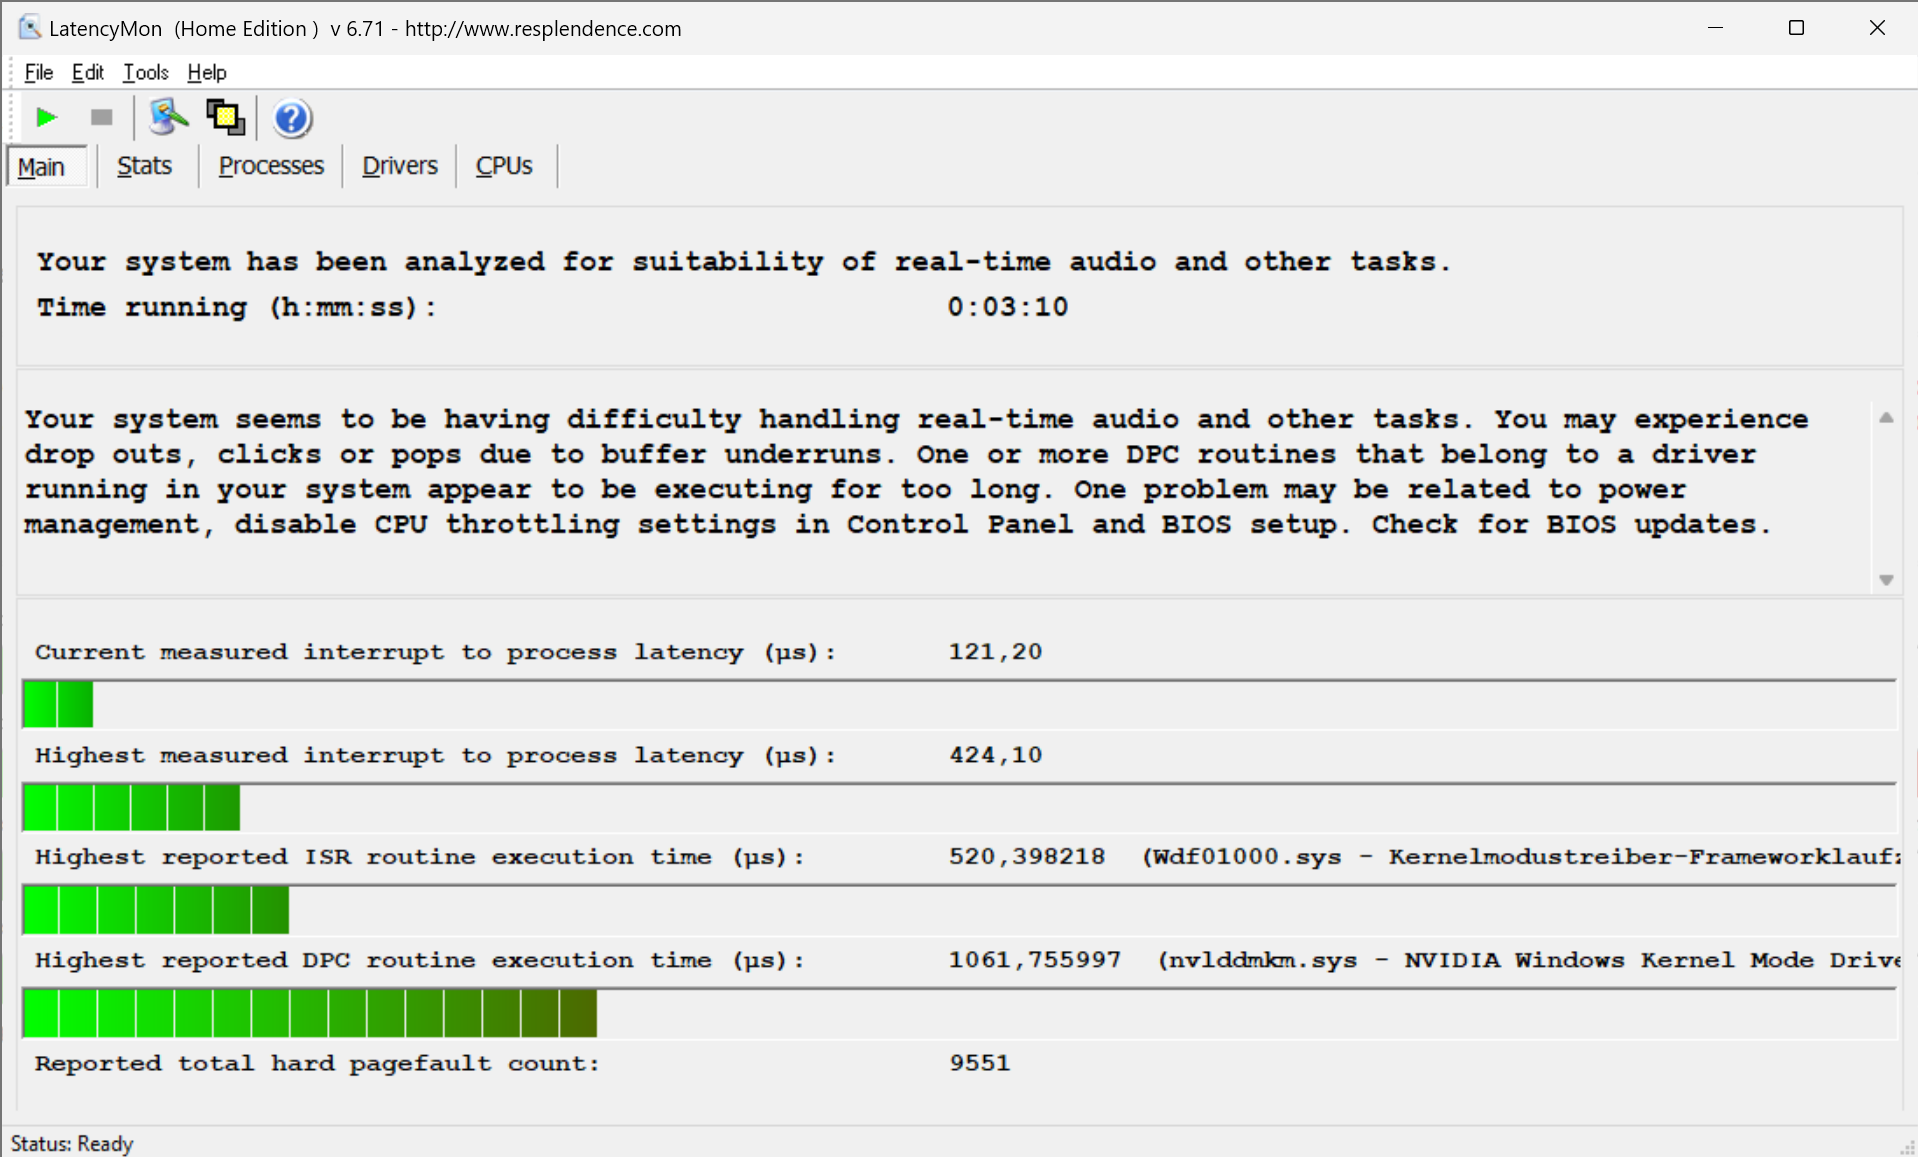
We ran the DPC latency test twice on this notebook. On the first attempt, the Zenbook 16X almost crashed. Just a few more milliseconds would have forced Windows Watchdog to carry out an emergency shutdown. But this behavior did not repeat itself despite deliberate attempts on our part. Therefore, we assume that this was a one-off.
The YouTube 4K60Hz test gave no reason for complaint. Only two frames were missed.
| DPC Latencies / LatencyMon - interrupt to process latency (max), Web, Youtube, Prime95 | |
| Dell Precision 7670 | |
| Lenovo ThinkPad X1 Extreme G5-21DE003RGE | |
| HP ZBook Studio 16 G9 62U04EA | |
| HP Omen 16-n0033dx | |
| Corsair Voyager a1600 | |
| MSI CreatorPro Z16P B12UKST | |
| Asus ZenBook Pro 16X OLED UX7602ZM-ME115W | |
| Asus VivoBook Pro 16X OLED N7600PC-L2026X | |
* ... smaller is better
Storage Devices
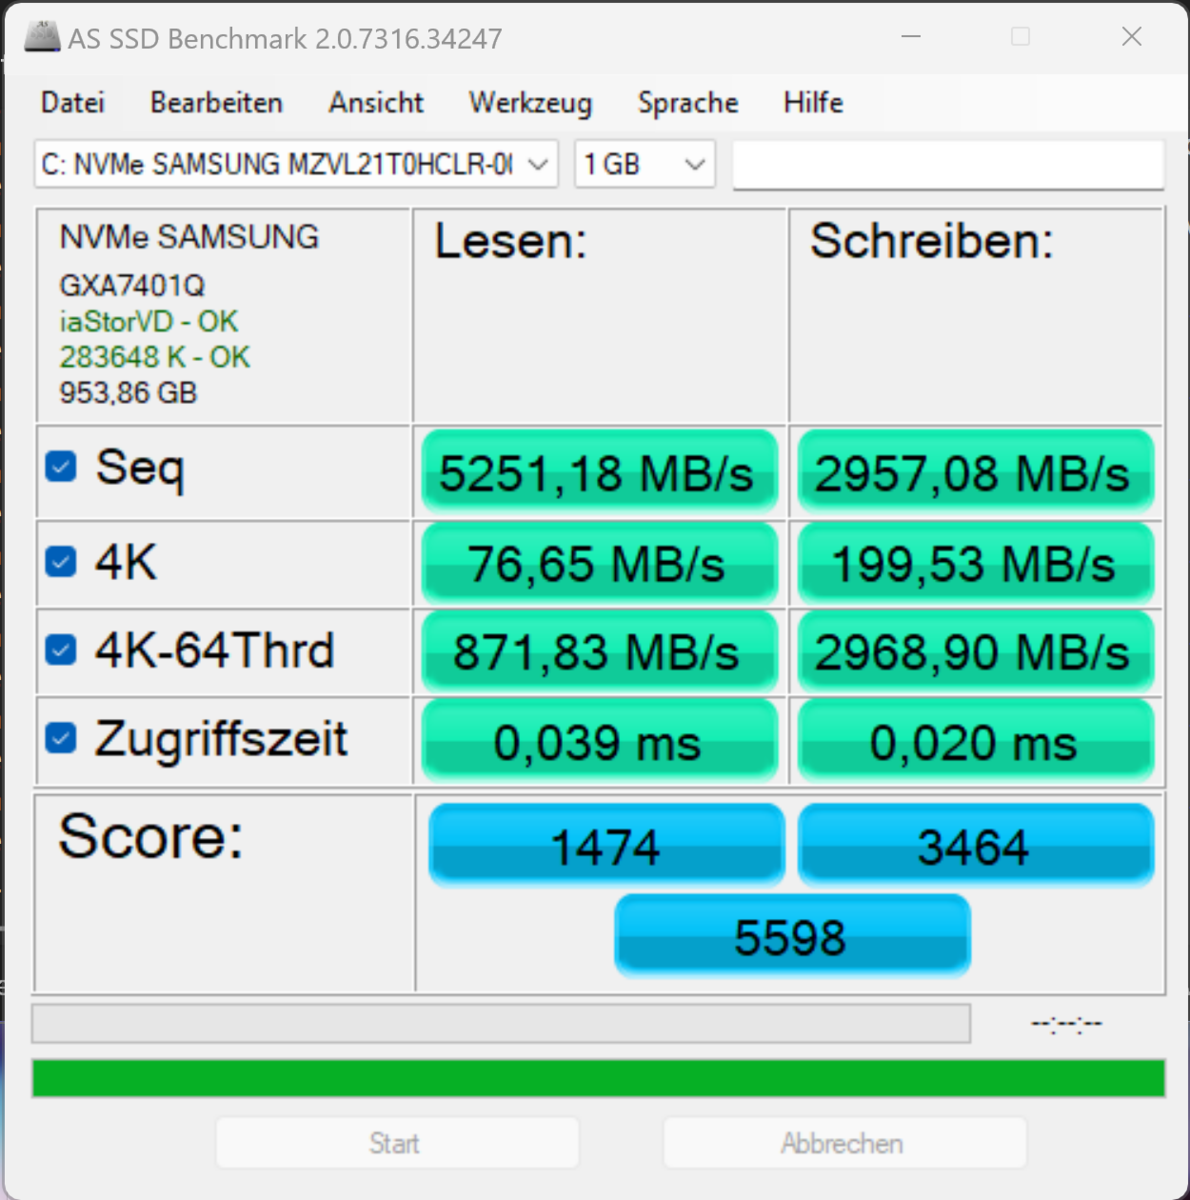
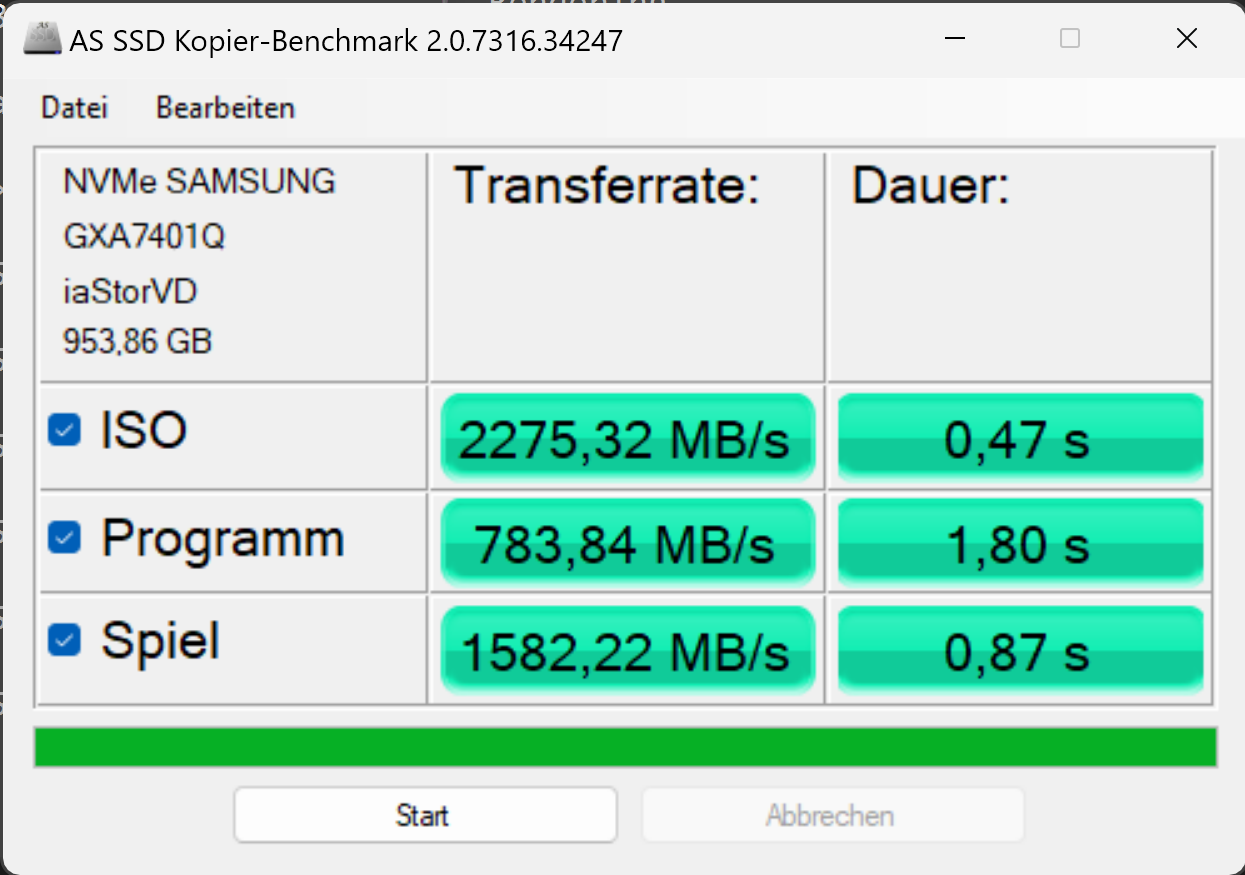
The Samsung PM9A1 installed in our review device is very fast. The transfer rates of the hard drive are very high, and none of the comparison devices have a faster hard drive. However, you should not ignore the short drops in the transfer speed, which indicate a temperature problem in the Samsung SSD.

* ... smaller is better
Sustained Read Performance: DiskSpd Read Loop, Queue Depth 8
Graphics Card
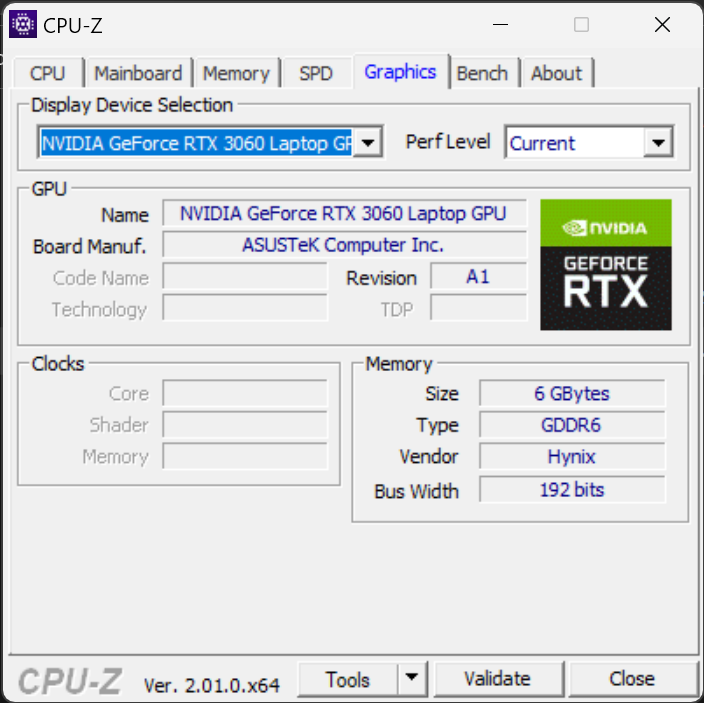
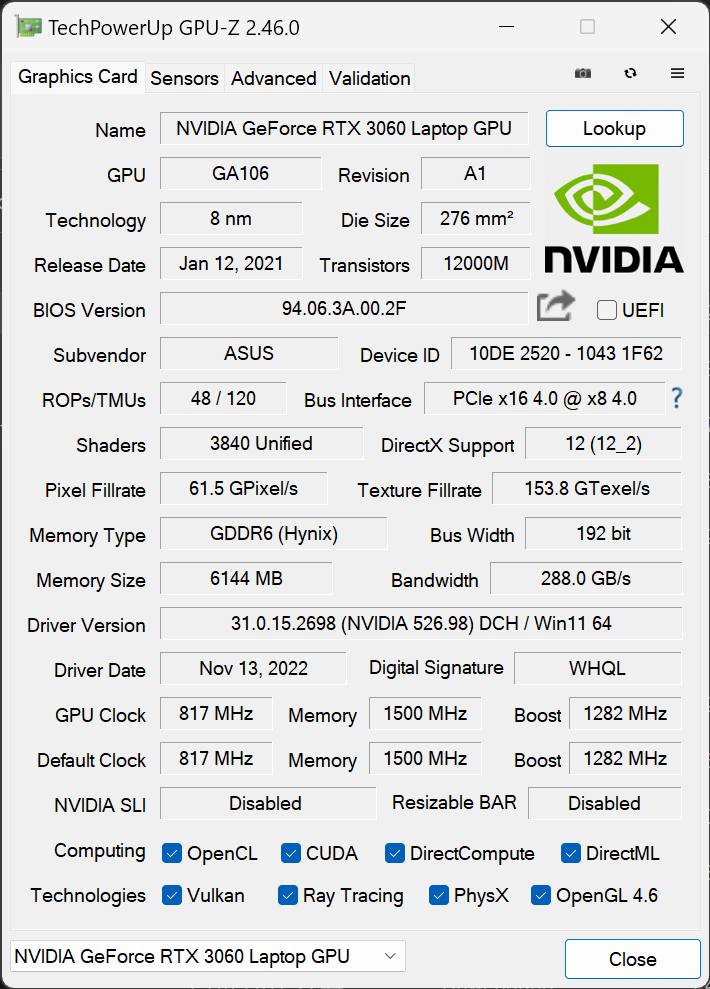
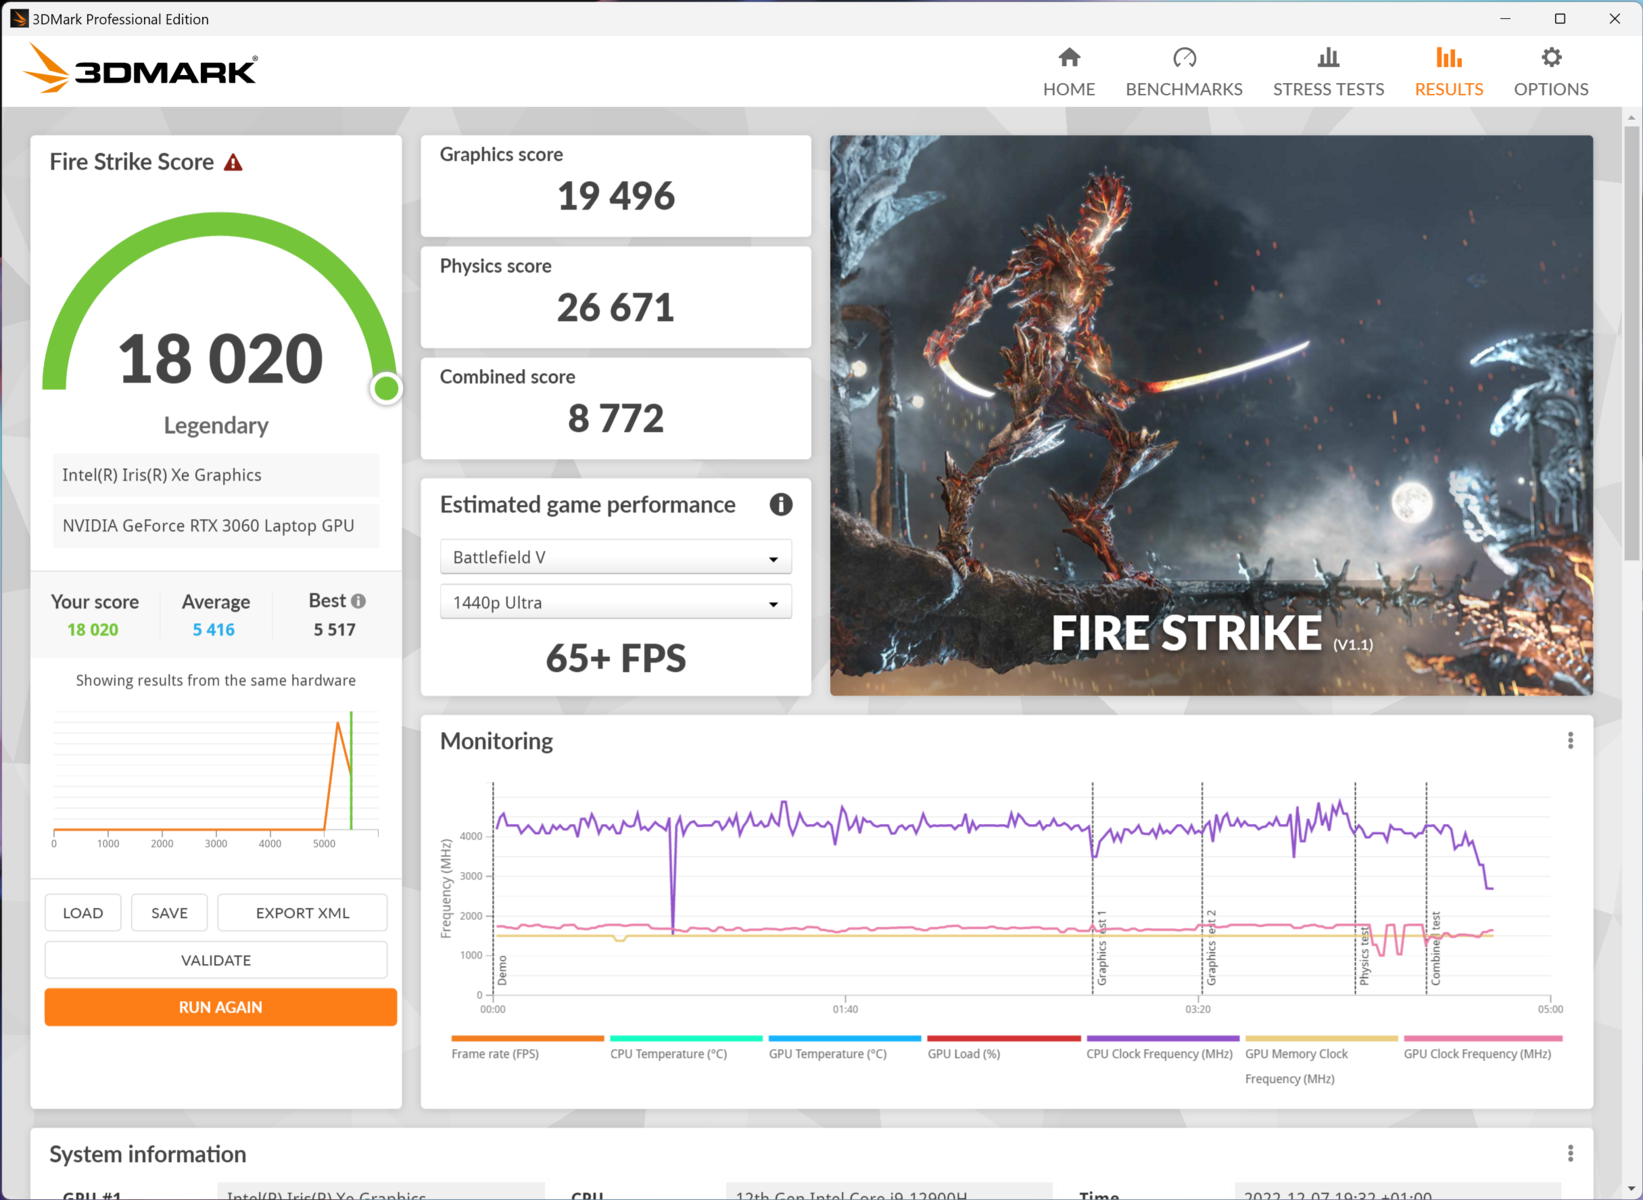
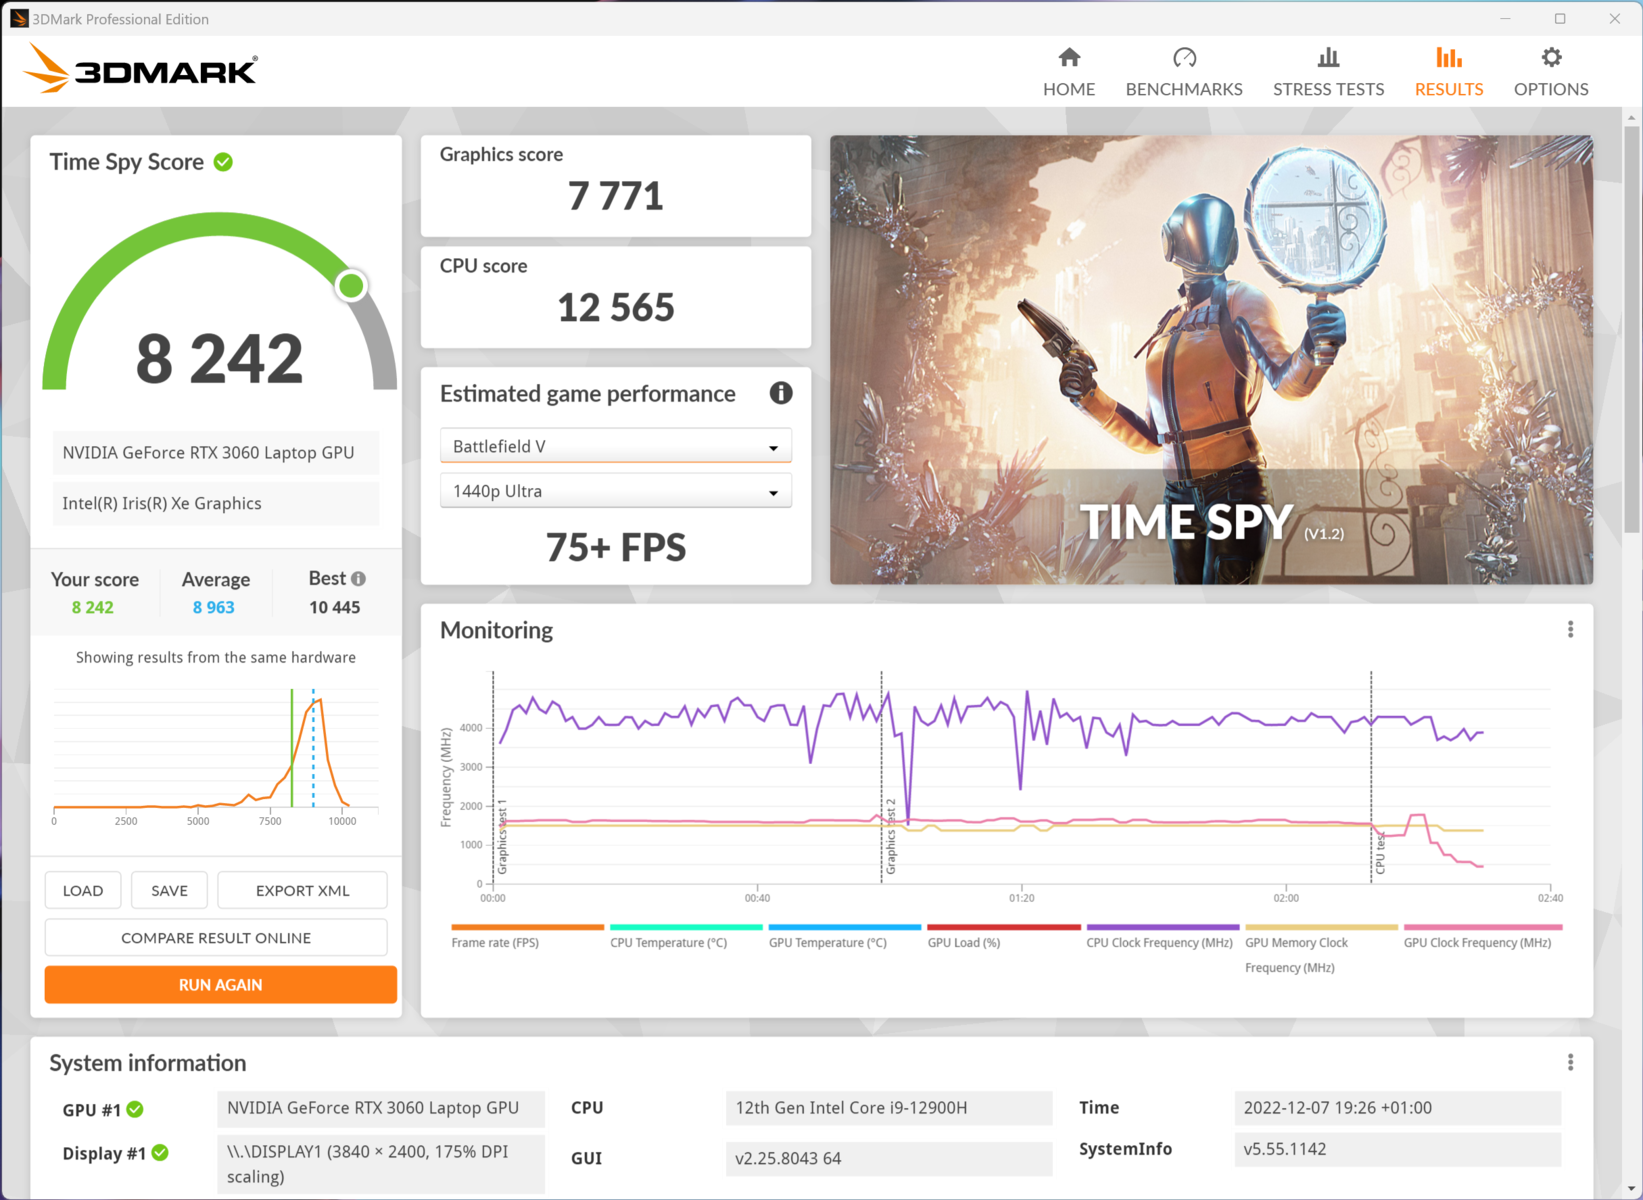
The Nvidia GeForce RTX 3060 is one of the stronger laptop GPUs. The corresponding graphics chip in the Zenbook works with up to 90 watts TGP. The graphics card is powerful enough for several games in QHD resolution and all other kinds of tasks. In applications that require the full power of the graphics chip, the positive influence of the AAS Ultra cooling system also becomes clear: The graphics chip is able to deliver significantly more performance than in other laptops of comparable size while maintaining low temperatures between 60 °C and 70 °C for long periods of time.
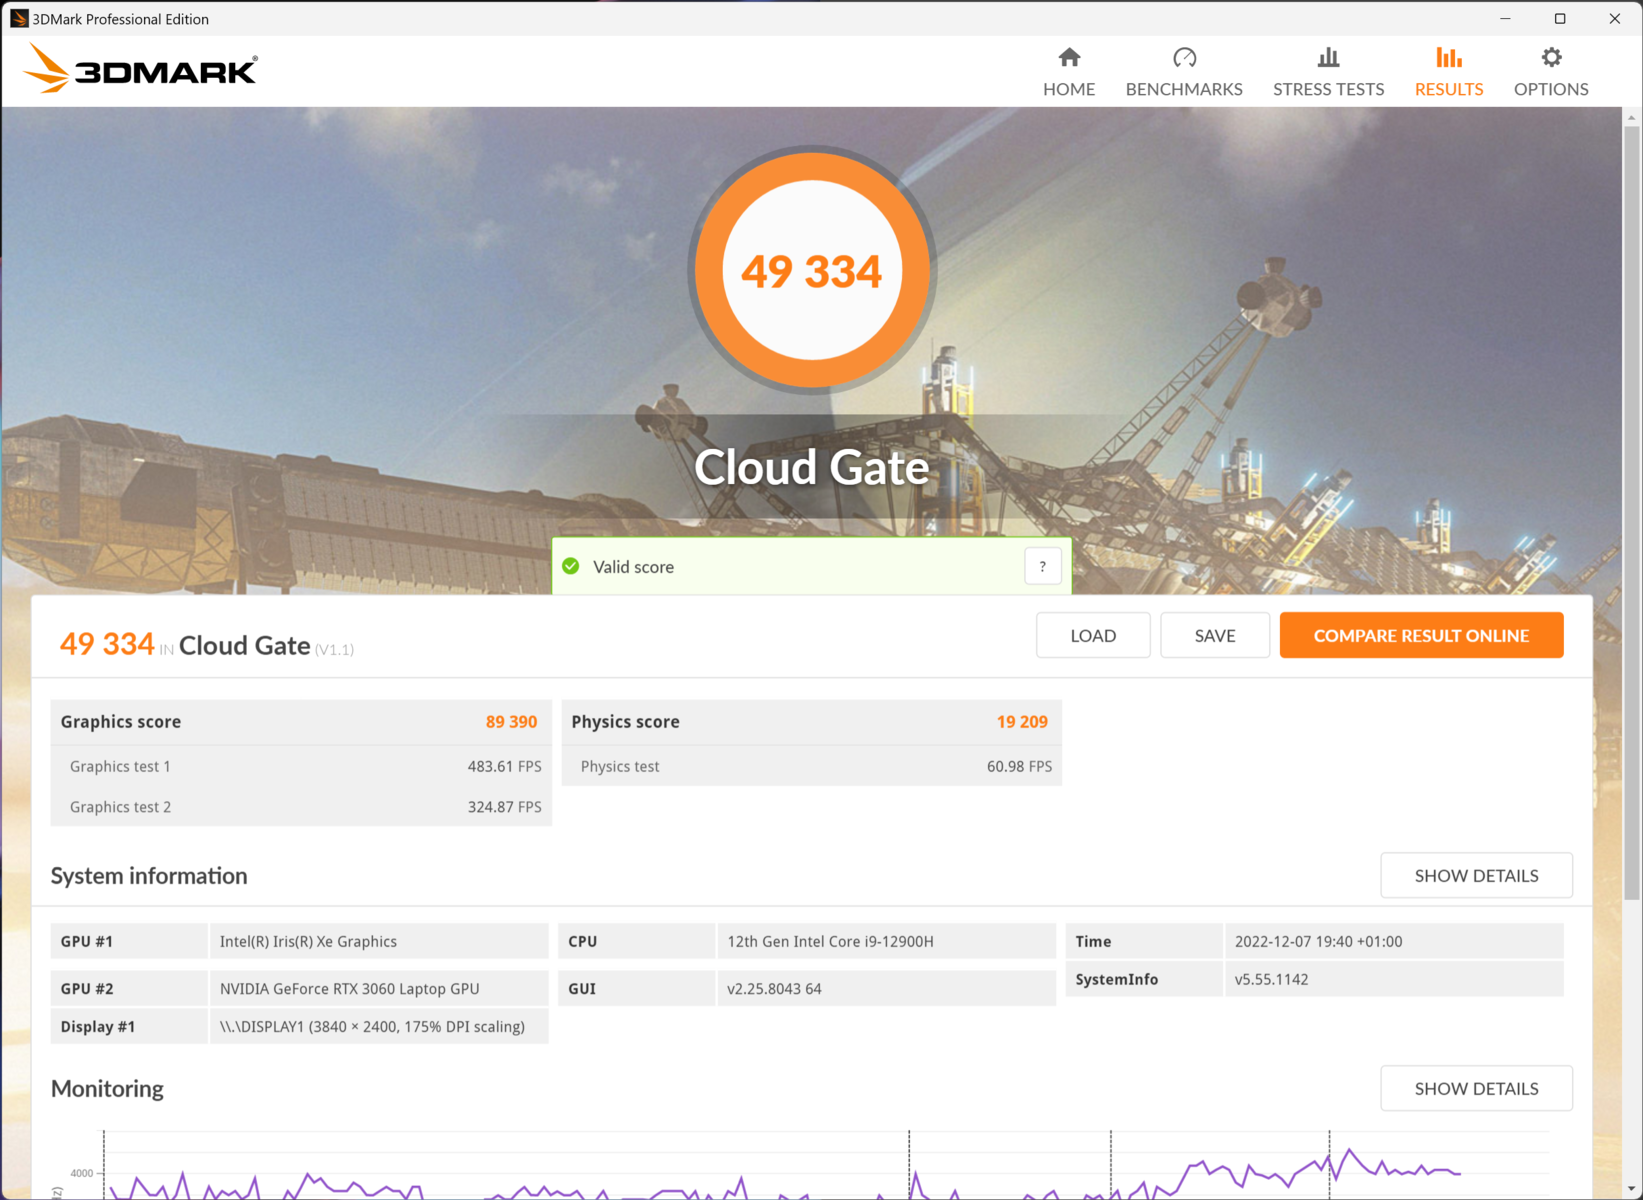
| 3DMark 11 Performance | 25678 points | |
| 3DMark Cloud Gate Standard Score | 49334 points | |
| 3DMark Fire Strike Score | 18020 points | |
| 3DMark Time Spy Score | 8242 points | |
Help | ||
* ... smaller is better
Gaming Performance
The Zenbook doesn't quite have the performance of a high-end gaming laptop, but it makes very good use of the hardware at its disposal and is definitely suitable for gaming. A lot of games run at the highest quality settings in Full HD or Quad HD with correspondingly high frame rates. Only current demanding titles such as F1 22 overwhelm the Nvidia GeForce 3060 a little. Ray tracing also strains the graphics card to a certain degree, depending on the resolution. The available memory and the number of ray tracing cores in the graphics unit are hardly sufficient for the Zenbook Pro16X OLED's full screen resolution. Since the notebook only has a 60 Hz screen installed, it is also worth using V-Sync here in order not to have to call up the full performance of the graphics card.
| The Witcher 3 - 1920x1080 Ultra Graphics & Postprocessing (HBAO+) | |
| Corsair Voyager a1600 | |
| Asus ZenBook Pro 16X OLED UX7602ZM-ME115W | |
| Lenovo ThinkPad X1 Extreme G5-21DE003RGE | |
| MSI CreatorPro Z16P B12UKST | |
| Dell Precision 7670 | |
| Average of class Multimedia (11 - 121, n=11, last 2 years) | |
| HP ZBook Studio 16 G9 62U04EA | |
| Asus VivoBook Pro 16X OLED N7600PC-L2026X | |
| low | med. | high | ultra | QHD | 4K | |
|---|---|---|---|---|---|---|
| GTA V (2015) | 174.8 | 167.8 | 97.6 | 76.4 | ||
| The Witcher 3 (2015) | 111 | 70 | 31.5 | |||
| Dota 2 Reborn (2015) | 161.3 | 147.2 | 139.5 | 135.1 | 100.1 | |
| Final Fantasy XV Benchmark (2018) | 112.1 | 83.8 | 62.1 | 35 | ||
| X-Plane 11.11 (2018) | 138.1 | 116.8 | 94.7 | 75 | ||
| Far Cry 5 (2018) | 125 | 117 | 109 | 83 | 40 | |
| Strange Brigade (2018) | 201 | 160.9 | 139.1 | 100.6 | ||
| F1 22 (2022) | 194.1 | 190.5 | 148.8 | 51.8 | 14.4 |
Emissions - Rather quiet despite 140 watts of TDP
Noise
Although the AAS Ultra system provides more airflow, the Zenbook is not louder or quieter than many other multimedia laptops with dedicated graphics cards. The only noticeable thing is that the fan control is rather unpredictable. Sometimes it takes two minutes under load before it reacts accordingly and the fans rev up to full speed. Depending on use, this can also ensure that the Zenbook is largely quiet to silent. When browsing or working with office applications and programs that only cause short load peaks, the notebook remains barely audible. The Zenbook's Vapor Chamber is able to absorb the load peaks of many of these apps without needing the fans.
Noise level
| Idle |
| 26 / 26 / 26 dB(A) |
| Load |
| 48 / 54.6 dB(A) |
 | ||
30 dB silent 40 dB(A) audible 50 dB(A) loud |
||
min: | ||
| Asus ZenBook Pro 16X OLED UX7602ZM-ME115W GeForce RTX 3060 Laptop GPU, i9-12900H, Samsung PM9A1 MZVL21T0HCLR | Lenovo ThinkPad X1 Extreme G5-21DE003RGE GeForce RTX 3060 Laptop GPU, i7-12700H, Micron 3400 1TB MTFDKBA1T0TFH | HP Omen 16-n0033dx Radeon RX 6650M, R7 6800H, Samsung PM9A1 MZVL21T0HCLR | HP ZBook Studio 16 G9 62U04EA RTX A2000 Laptop GPU, i7-12800H, Micron 3400 1TB MTFDKBA1T0TFH | Corsair Voyager a1600 Radeon RX 6800M, R9 6900HS, Samsung PM9A1 MZVL22T0HBLB | Dell Precision 7670 RTX A2000 Laptop GPU, i7-12850HX, SK Hynix HFS001TEJ9X115N | Asus VivoBook Pro 16X OLED N7600PC-L2026X GeForce RTX 3050 4GB Laptop GPU, i7-11370H, Intel Optane Memory H10 with Solid State Storage 32GB + 512GB HBRPEKNX0202A(L/H) | MSI CreatorPro Z16P B12UKST RTX A3000 Laptop GPU, i7-12700H, Samsung PM9A1 MZVL21T0HCLR | |
|---|---|---|---|---|---|---|---|---|
| Noise | 11% | 2% | 5% | -9% | 8% | -13% | 3% | |
| off / environment * (dB) | 26 | 23.2 11% | 24.2 7% | 24 8% | 29.9 -15% | 22.7 13% | 25.15 3% | 24.1 7% |
| Idle Minimum * (dB) | 26 | 23.2 11% | 27.4 -5% | 24 8% | 30.5 -17% | 22.9 12% | 30 -15% | 27.1 -4% |
| Idle Average * (dB) | 26 | 23.2 11% | 27.4 -5% | 27.7 -7% | 30.6 -18% | 22.9 12% | 30 -15% | 27.1 -4% |
| Idle Maximum * (dB) | 26 | 23.2 11% | 28.9 -11% | 27.7 -7% | 30.7 -18% | 24.5 6% | 30 -15% | 27.1 -4% |
| Load Average * (dB) | 48 | 45.5 5% | 32.3 33% | 39.8 17% | 44.5 7% | 48.7 -1% | 57.6 -20% | 42.9 11% |
| Load Maximum * (dB) | 54.6 | 45.5 17% | 57.6 -5% | 47.7 13% | 51.1 6% | 52.1 5% | 62.9 -15% | 47 14% |
| Witcher 3 ultra * (dB) | 45.5 | 54.1 | 44.3 | 45.2 | 44 |
* ... smaller is better
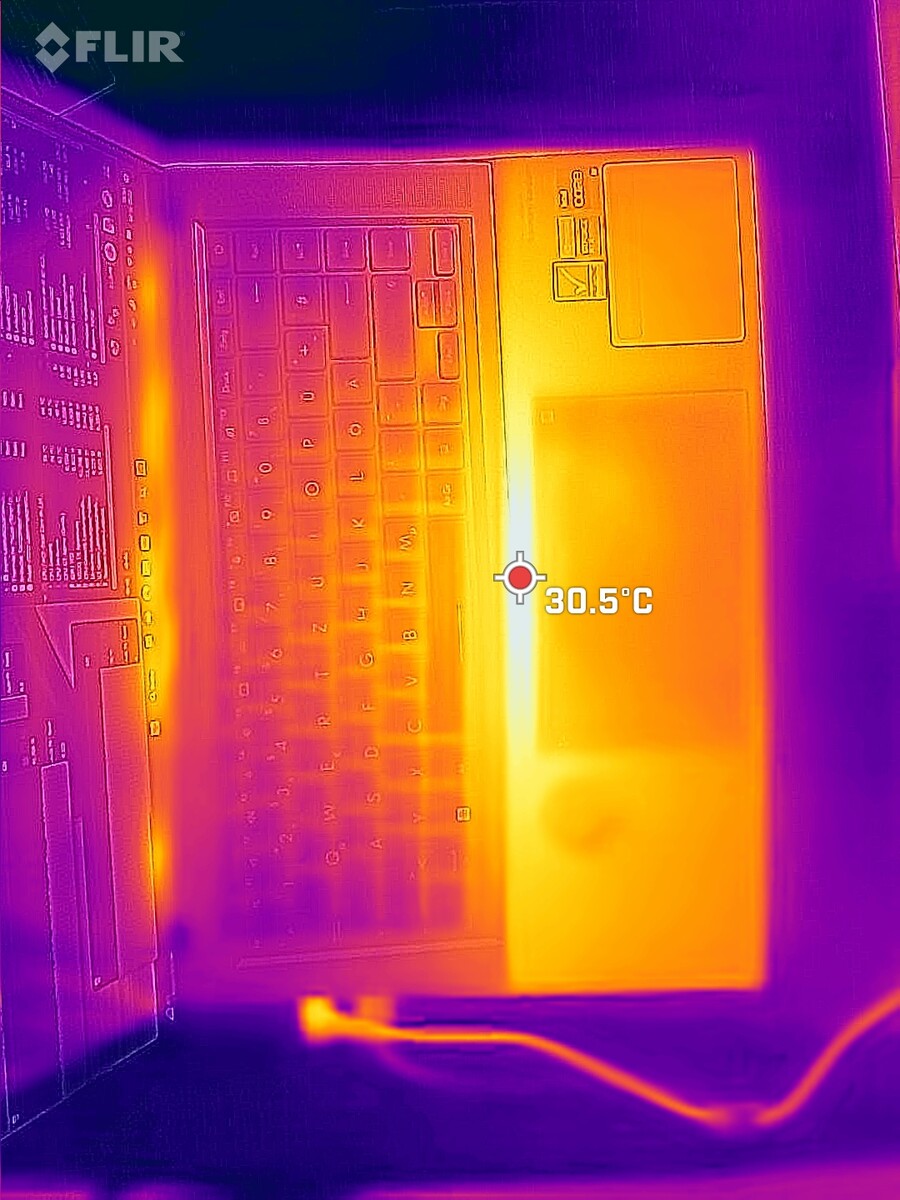
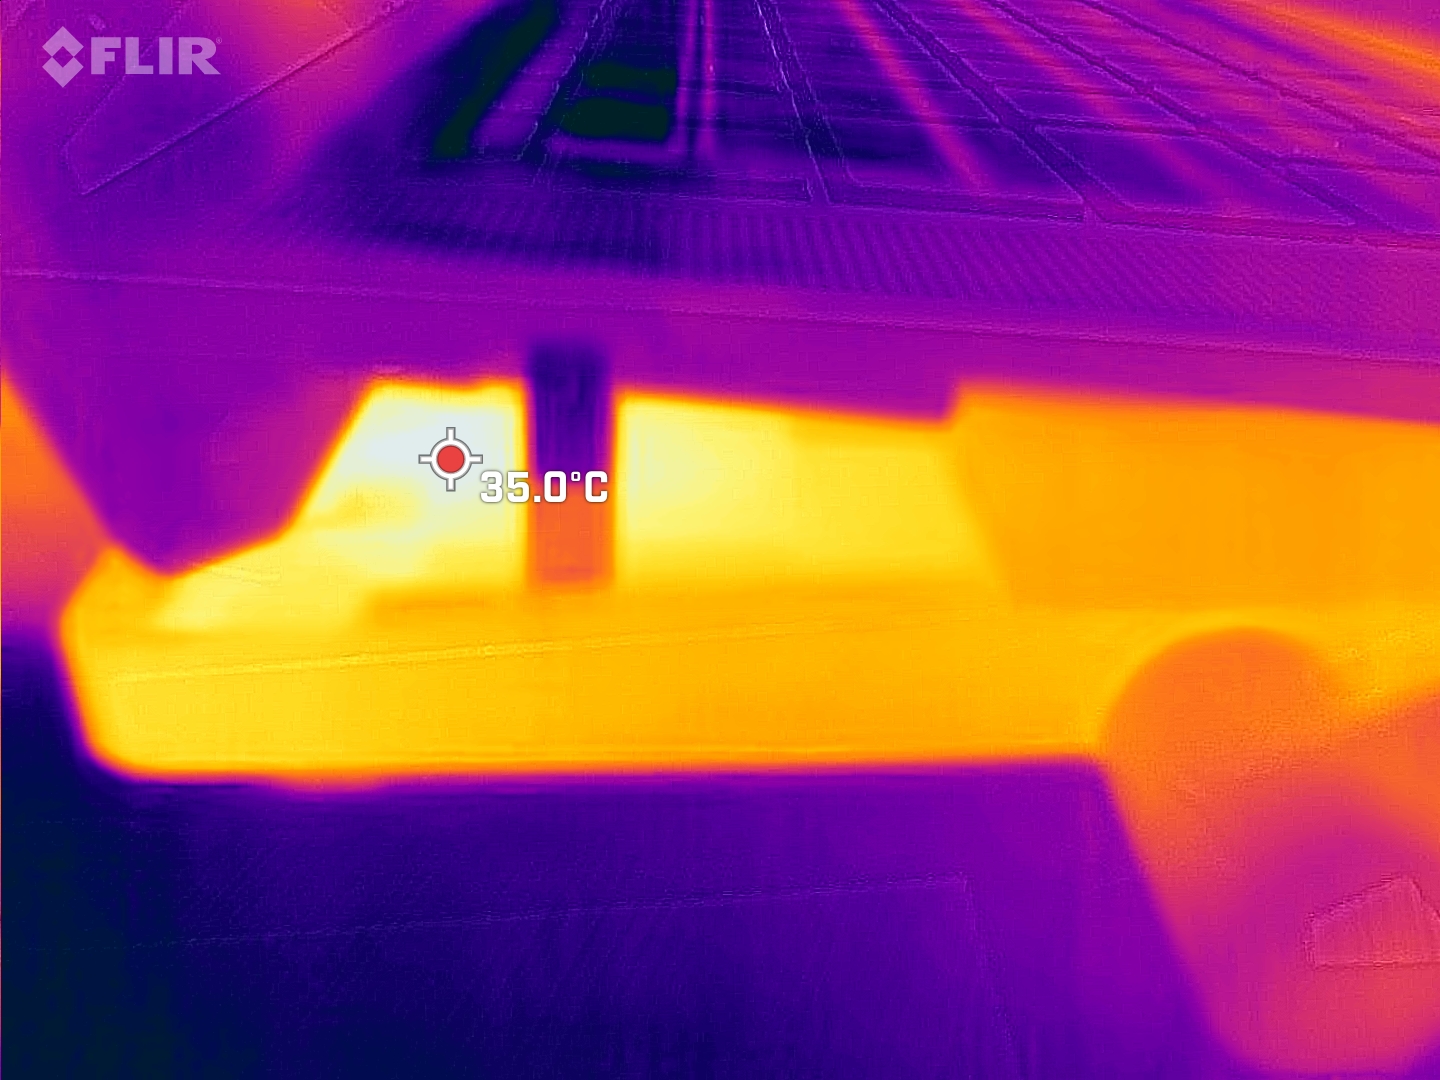
Temperature
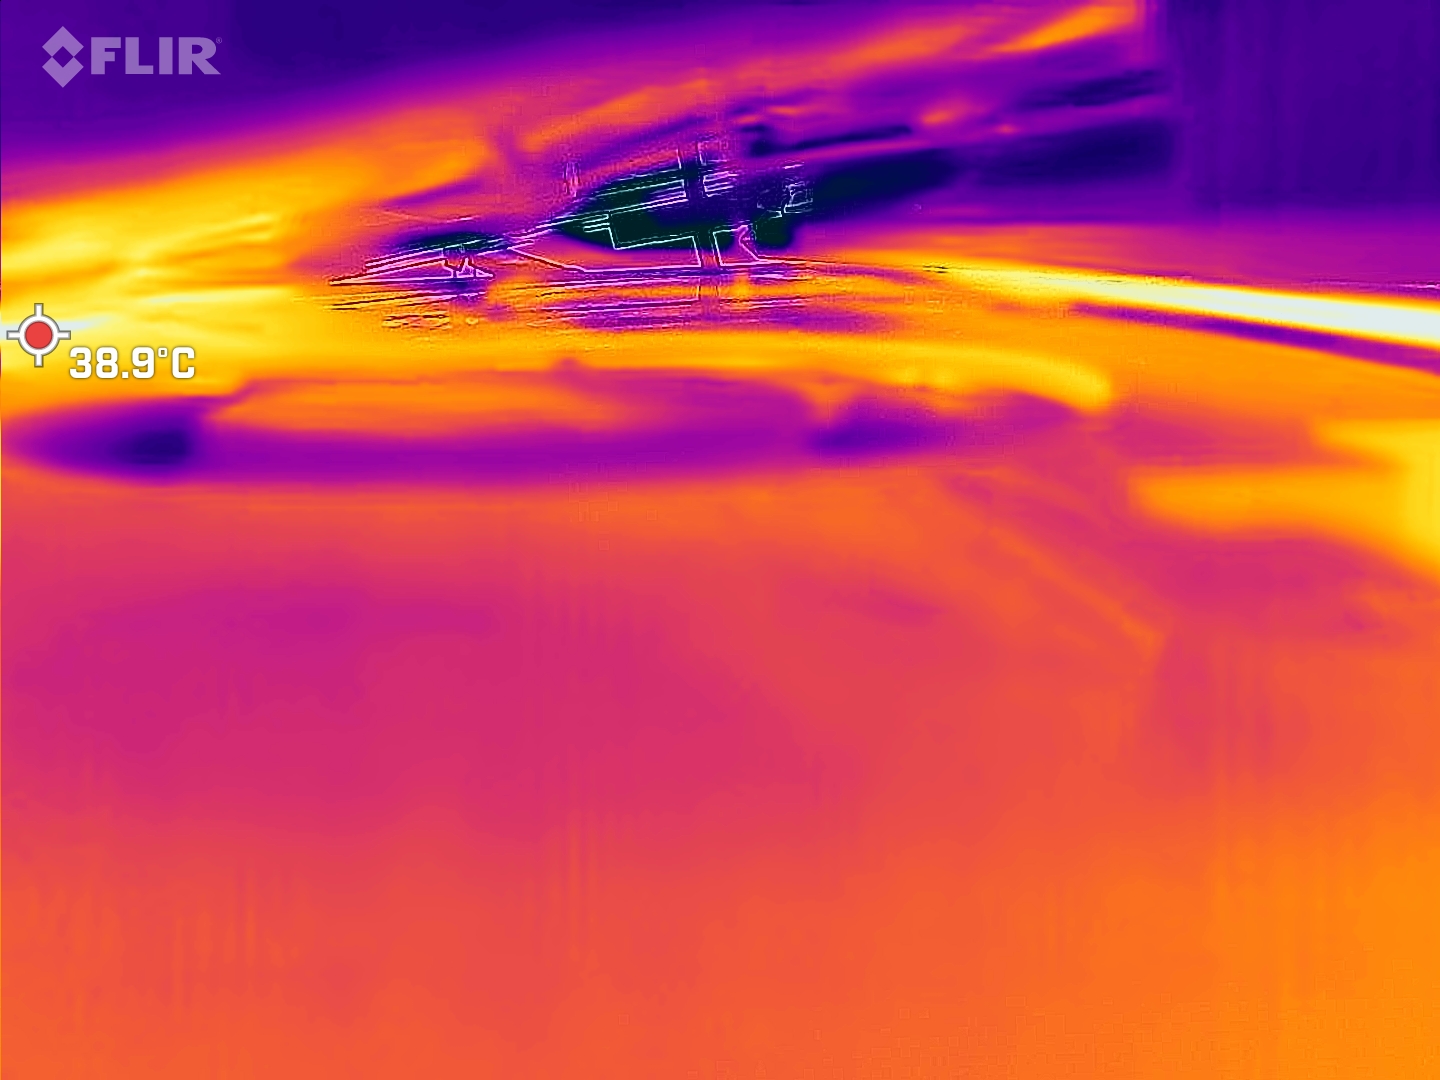
The AAS-Ultra system, which raises the keyboard sightly, is primarily intended to keep the laptop cool. This is exactly what it does. By keeping the keyboard slightly away from the laptop's heat sources, it remains decidedly cool. In fact, the hottest spots on the laptop's upper side hover around 30 °C, even after an hour of stress testing. The laptop stays mostly below 40 °C on the underside as well. Temperatures in the gap between the keyboard and the base are significantly hotter, but do not rise too much above the 40 °C mark. The vapor chamber, AAS-Ultra cooling and the laptop's set performance limits ensure a cool system.
(+) The maximum temperature on the upper side is 32 °C / 90 F, compared to the average of 36.8 °C / 98 F, ranging from 21 to 71 °C for the class Multimedia.
(±) The bottom heats up to a maximum of 41.6 °C / 107 F, compared to the average of 39.1 °C / 102 F
(+) In idle usage, the average temperature for the upper side is 31.6 °C / 89 F, compared to the device average of 31.3 °C / 88 F.
(+) Playing The Witcher 3, the average temperature for the upper side is 30.3 °C / 87 F, compared to the device average of 31.3 °C / 88 F.
(+) The palmrests and touchpad are reaching skin temperature as a maximum (32.7 °C / 90.9 F) and are therefore not hot.
(-) The average temperature of the palmrest area of similar devices was 28.7 °C / 83.7 F (-4 °C / -7.2 F).
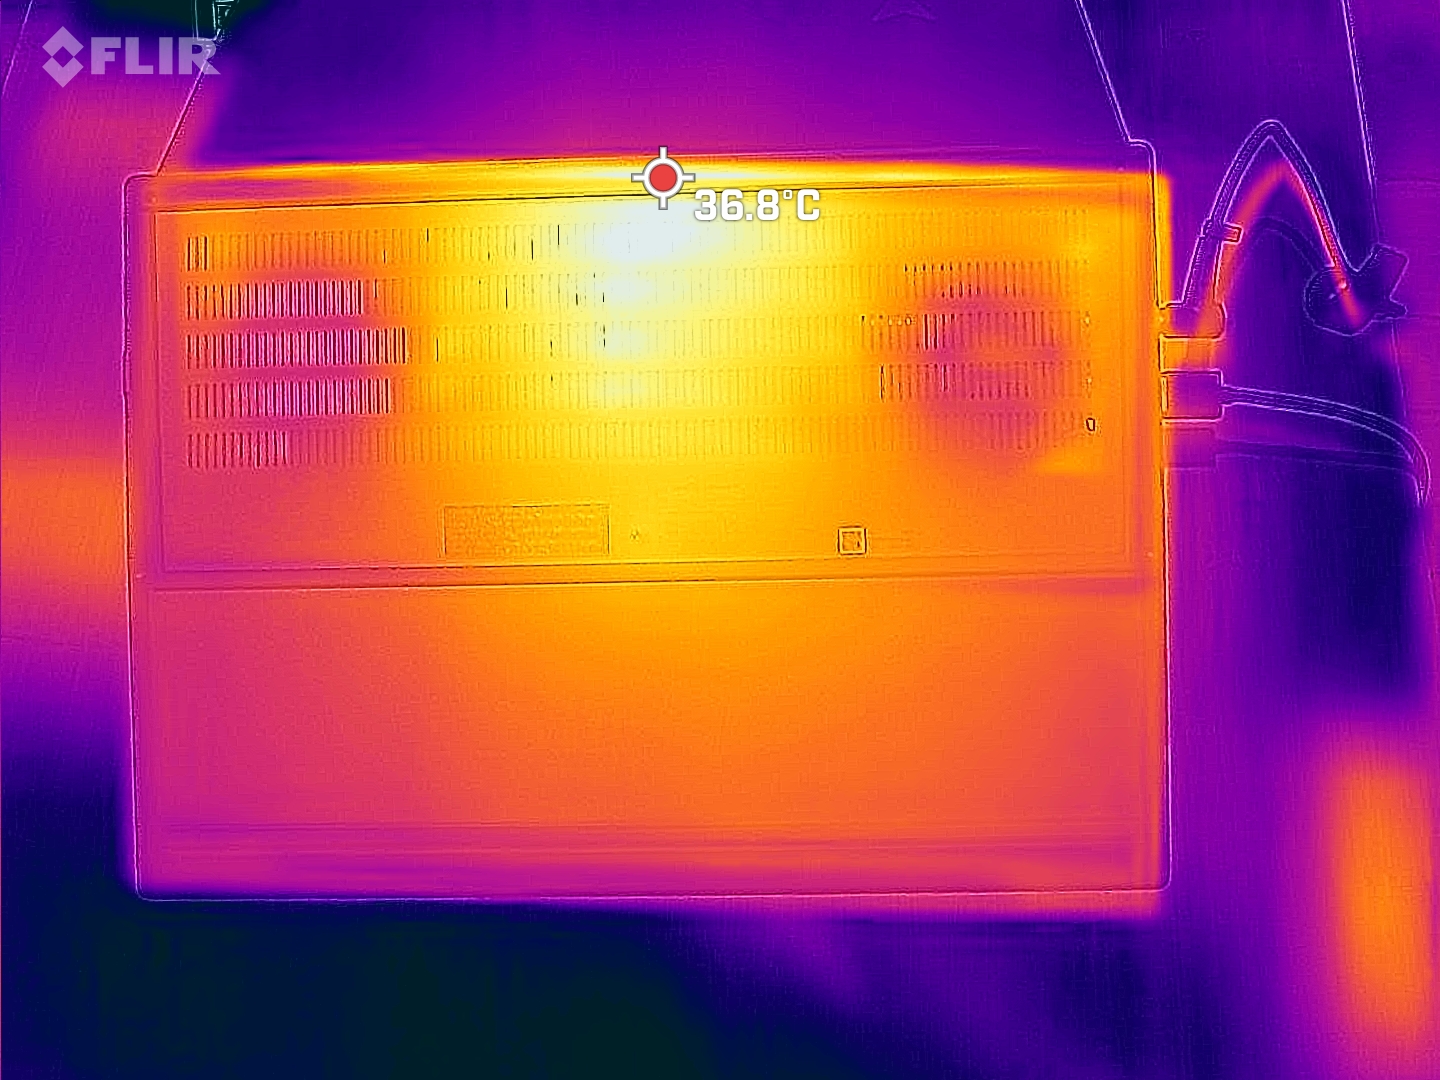
| Asus ZenBook Pro 16X OLED UX7602ZM-ME115W Intel Core i9-12900H, NVIDIA GeForce RTX 3060 Laptop GPU | Lenovo ThinkPad X1 Extreme G5-21DE003RGE Intel Core i7-12700H, NVIDIA GeForce RTX 3060 Laptop GPU | HP Omen 16-n0033dx AMD Ryzen 7 6800H, AMD Radeon RX 6650M | HP ZBook Studio 16 G9 62U04EA Intel Core i7-12800H, NVIDIA RTX A2000 Laptop GPU | Corsair Voyager a1600 AMD Ryzen 9 6900HS, AMD Radeon RX 6800M | Asus VivoBook Pro 16X OLED N7600PC-L2026X Intel Core i7-11370H, NVIDIA GeForce RTX 3050 4GB Laptop GPU | |
|---|---|---|---|---|---|---|
| Heat | -14% | -4% | -5% | -23% | -6% | |
| Maximum Upper Side * (°C) | 32 | 52 -63% | 41.2 -29% | 38.7 -21% | 50.7 -58% | 40.6 -27% |
| Maximum Bottom * (°C) | 41.6 | 56.4 -36% | 53.2 -28% | 53.4 -28% | 54.2 -30% | 53 -27% |
| Idle Upper Side * (°C) | 32.6 | 26.4 19% | 26.4 19% | 27.3 16% | 35.8 -10% | 29 11% |
| Idle Bottom * (°C) | 36 | 27.2 24% | 27.8 23% | 31.6 12% | 33 8% | 28.3 21% |
* ... smaller is better
Stress Test
The Zenbook Pro 16X OLED was able to consistently maintain high levels of performance under stress testing. With the flip-up keyboard, the studio laptop is able to, by all appearances, constantly dissipate its operating heat. 40 watts of processor power and around 84 watts of graphics card power ensure that temperatures in the processor and graphics chip do not get too high. At averages of 75 °C and 65 °C, respectively, the Zenbook could well stress both chips even more. But according to the log analysis, overall performance here was limited by the energy consumption. Asus seems to have set concrete values here with a combined CPU-GPU performance of around 140 watts.
Speakers
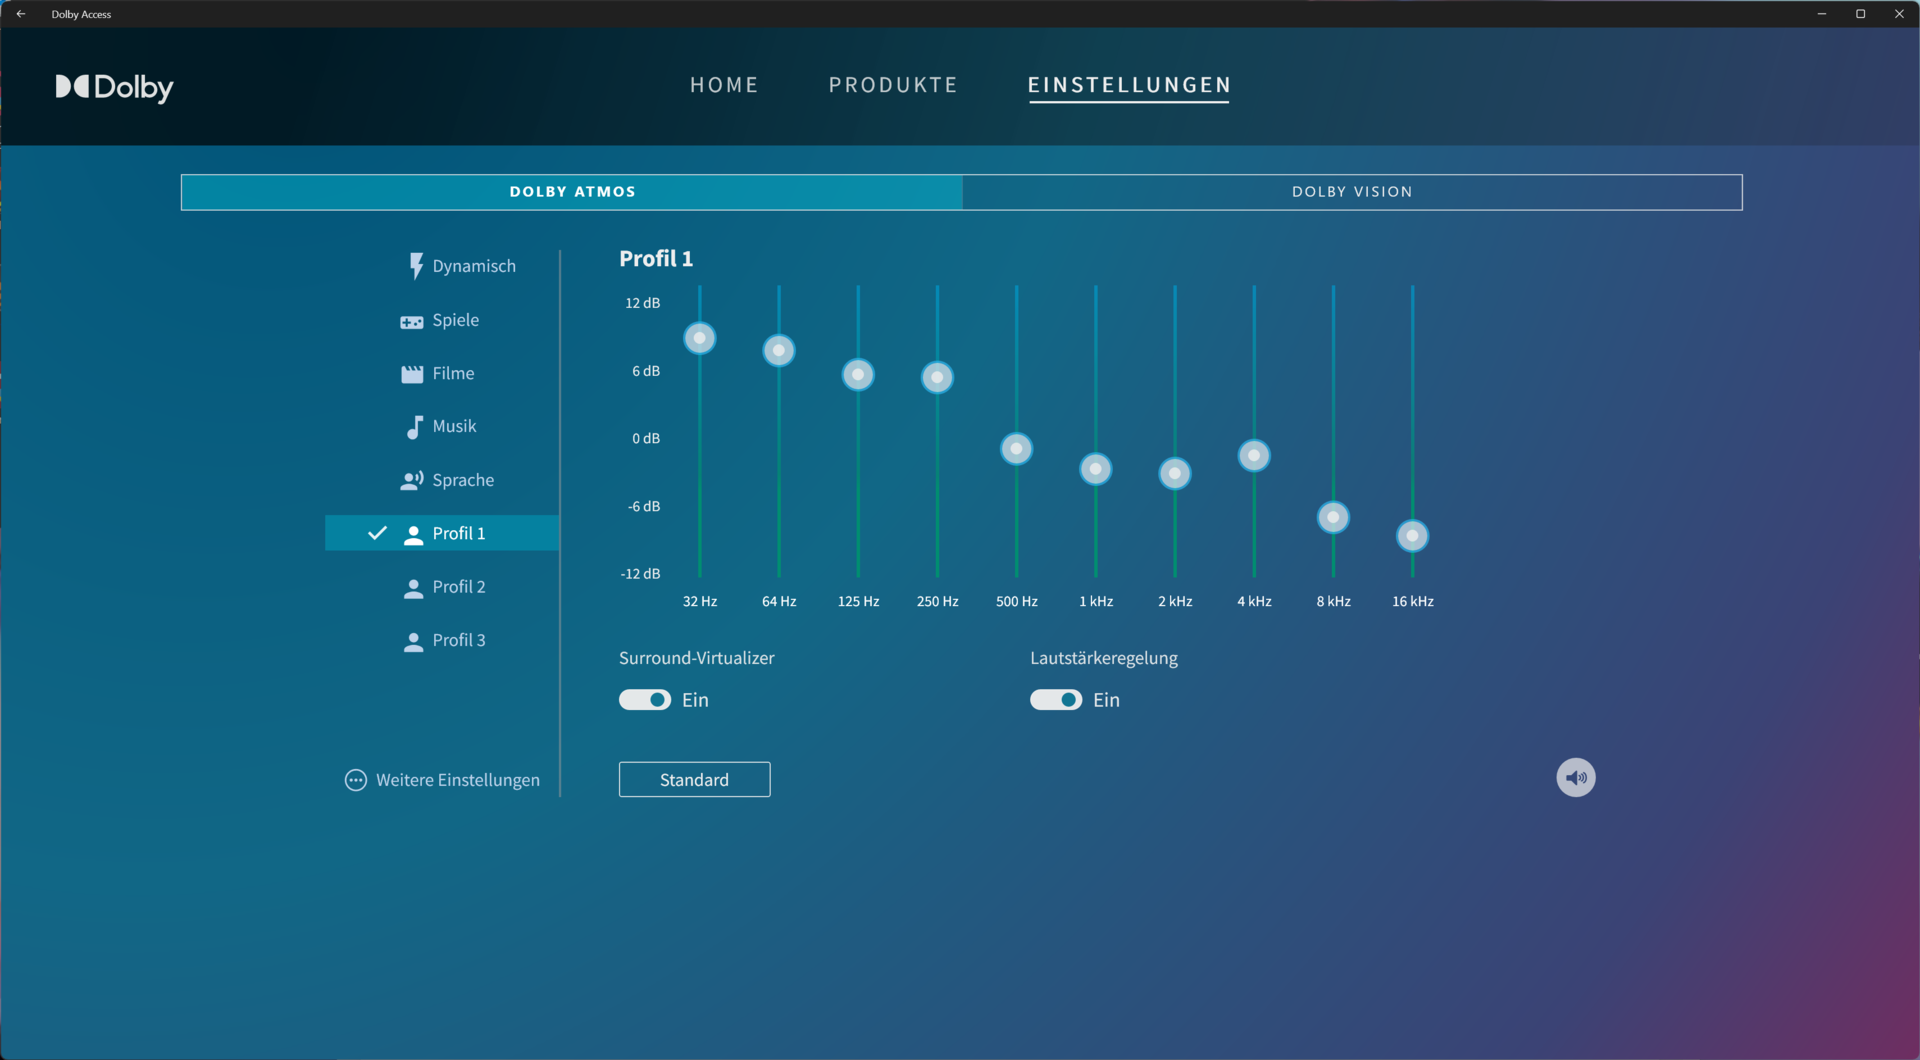
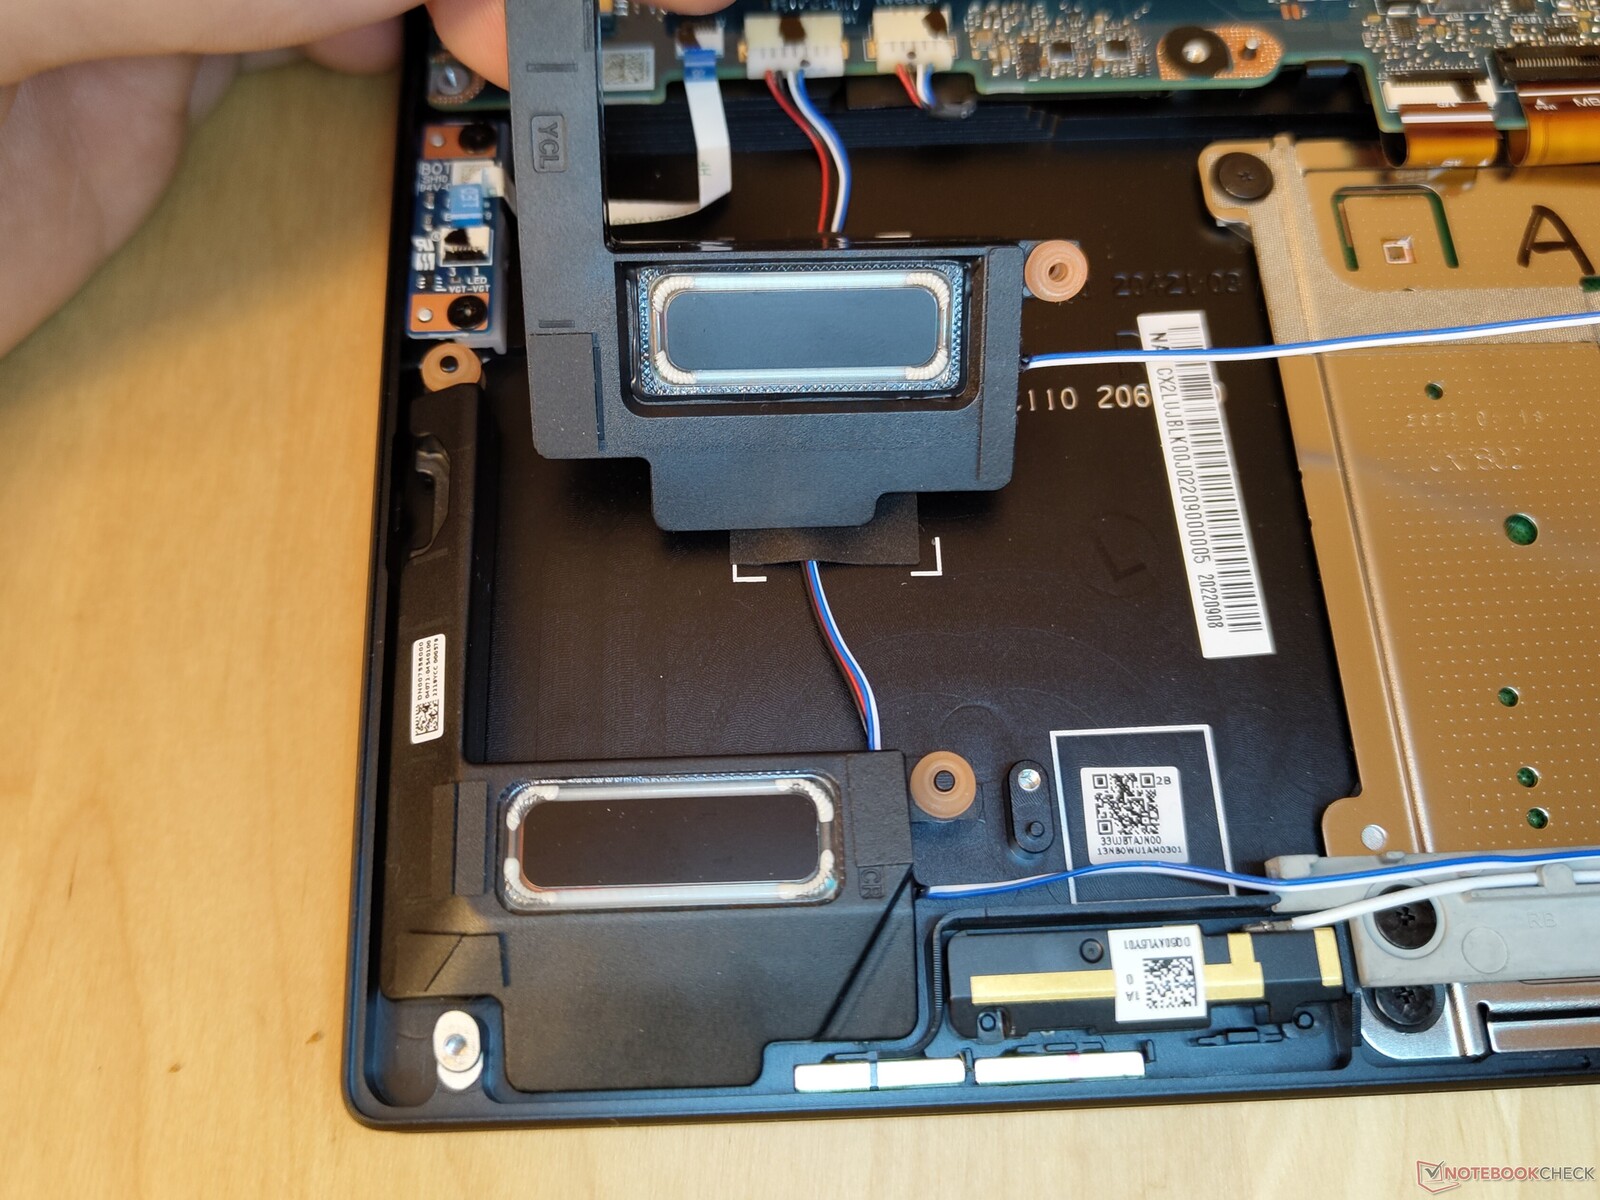
Six speakers are installed in the Asus Zenbook Pro 16X OLED. To the left and right of the keyboard are the laptop's tweeters. In the base, two more pairs of speakers for the mids and lows face upwards and downwards, making for a good sound experience. At the same time, the laptop can also get really loud at 94.7 dB(A) without any significant deterioration in audio quality. Maxing out the volume is not recommended because the lows then become a little too weak. At 80% of maximum volume, the laptop is still more than loud enough to drown out its fans. A wide variety of Dolby Atmos settings are also available on the Zenbook, which can positively influence the listening experience. In sum, the Asus device delivers impressive sound quality overall.
Asus ZenBook Pro 16X OLED UX7602ZM-ME115W audio analysis
(+) | speakers can play relatively loud (94.7 dB)
Bass 100 - 315 Hz
(-) | nearly no bass - on average 16% lower than median
(±) | linearity of bass is average (7.9% delta to prev. frequency)
Mids 400 - 2000 Hz
(+) | balanced mids - only 1.8% away from median
(+) | mids are linear (3.8% delta to prev. frequency)
Highs 2 - 16 kHz
(±) | higher highs - on average 6.2% higher than median
(+) | highs are linear (2.8% delta to prev. frequency)
Overall 100 - 16.000 Hz
(+) | overall sound is linear (13.3% difference to median)
Compared to same class
» 28% of all tested devices in this class were better, 4% similar, 68% worse
» The best had a delta of 5%, average was 17%, worst was 45%
Compared to all devices tested
» 14% of all tested devices were better, 3% similar, 83% worse
» The best had a delta of 4%, average was 23%, worst was 134%
Corsair Voyager a1600 audio analysis
(-) | not very loud speakers (69 dB)
Bass 100 - 315 Hz
(±) | reduced bass - on average 10.2% lower than median
(±) | linearity of bass is average (13.7% delta to prev. frequency)
Mids 400 - 2000 Hz
(±) | higher mids - on average 7.8% higher than median
(±) | linearity of mids is average (7% delta to prev. frequency)
Highs 2 - 16 kHz
(+) | balanced highs - only 1.8% away from median
(±) | linearity of highs is average (11.4% delta to prev. frequency)
Overall 100 - 16.000 Hz
(±) | linearity of overall sound is average (25.5% difference to median)
Compared to same class
» 91% of all tested devices in this class were better, 2% similar, 7% worse
» The best had a delta of 6%, average was 18%, worst was 132%
Compared to all devices tested
» 78% of all tested devices were better, 4% similar, 17% worse
» The best had a delta of 4%, average was 23%, worst was 134%
Power Management - Giant battery provides stamina
Power Consumption
The Zenbook rarely runs its 200-watt power supply at full capacity. During various energy measurement tests, 197 watts in Witcher 3 was the highest level of power consumption recorded. Generally speaking, the more powerful the hardware, the more energy that is needed. The values we measured for the Asus laptop thus fall within the corresponding range of its performance class. At most, the laptop is guilty of slightly higher consumption rates in idle mode.
| Off / Standby | |
| Idle | |
| Load |
|
Key:
min: | |
| Asus ZenBook Pro 16X OLED UX7602ZM-ME115W i9-12900H, GeForce RTX 3060 Laptop GPU, Samsung PM9A1 MZVL21T0HCLR, OLED, 3840x2400, 16" | Lenovo ThinkPad X1 Extreme G5-21DE003RGE i7-12700H, GeForce RTX 3060 Laptop GPU, Micron 3400 1TB MTFDKBA1T0TFH, IPS, 3840x2400, 16" | HP Omen 16-n0033dx R7 6800H, Radeon RX 6650M, Samsung PM9A1 MZVL21T0HCLR, IPS, 1920x1080, 16.1" | HP ZBook Studio 16 G9 62U04EA i7-12800H, RTX A2000 Laptop GPU, Micron 3400 1TB MTFDKBA1T0TFH, IPS, 3840x2400, 16" | Corsair Voyager a1600 R9 6900HS, Radeon RX 6800M, Samsung PM9A1 MZVL22T0HBLB, IPS, 2560x1600, 16" | Asus VivoBook Pro 16X OLED N7600PC-L2026X i7-11370H, GeForce RTX 3050 4GB Laptop GPU, Intel Optane Memory H10 with Solid State Storage 32GB + 512GB HBRPEKNX0202A(L/H), OLED, 3840x2400, 16" | Average NVIDIA GeForce RTX 3060 Laptop GPU | Average of class Multimedia | |
|---|---|---|---|---|---|---|---|---|
| Power Consumption | -29% | -7% | -1% | -46% | 26% | -11% | 34% | |
| Idle Minimum * (Watt) | 11.1 | 11.8 -6% | 7.9 29% | 7.2 35% | 16.9 -52% | 8.9 20% | 10.4 ? 6% | 5.68 ? 49% |
| Idle Average * (Watt) | 11.4 | 22.4 -96% | 11.5 -1% | 18.1 -59% | 20.3 -78% | 10.2 11% | 14.5 ? -27% | 10.2 ? 11% |
| Idle Maximum * (Watt) | 14.4 | 23.1 -60% | 18.3 -27% | 18.5 -28% | 22.2 -54% | 12 17% | 21.4 ? -49% | 12.4 ? 14% |
| Load Average * (Watt) | 137.4 | 138 -0% | 88.1 36% | 112.8 18% | 133.4 3% | 94 32% | 109.3 ? 20% | 65.4 ? 52% |
| Witcher 3 ultra * (Watt) | 136 | 129.9 4% | 206 -51% | 106.7 22% | 206 -51% | 93.1 32% | ||
| Load Maximum * (Watt) | 197 | 225.6 -15% | 246.4 -25% | 186 6% | 112 43% | 206 ? -5% | 113.3 ? 42% |
* ... smaller is better
Power consumption Witcher 3 / Stress test
Power consumption with an external monitor
Battery Life
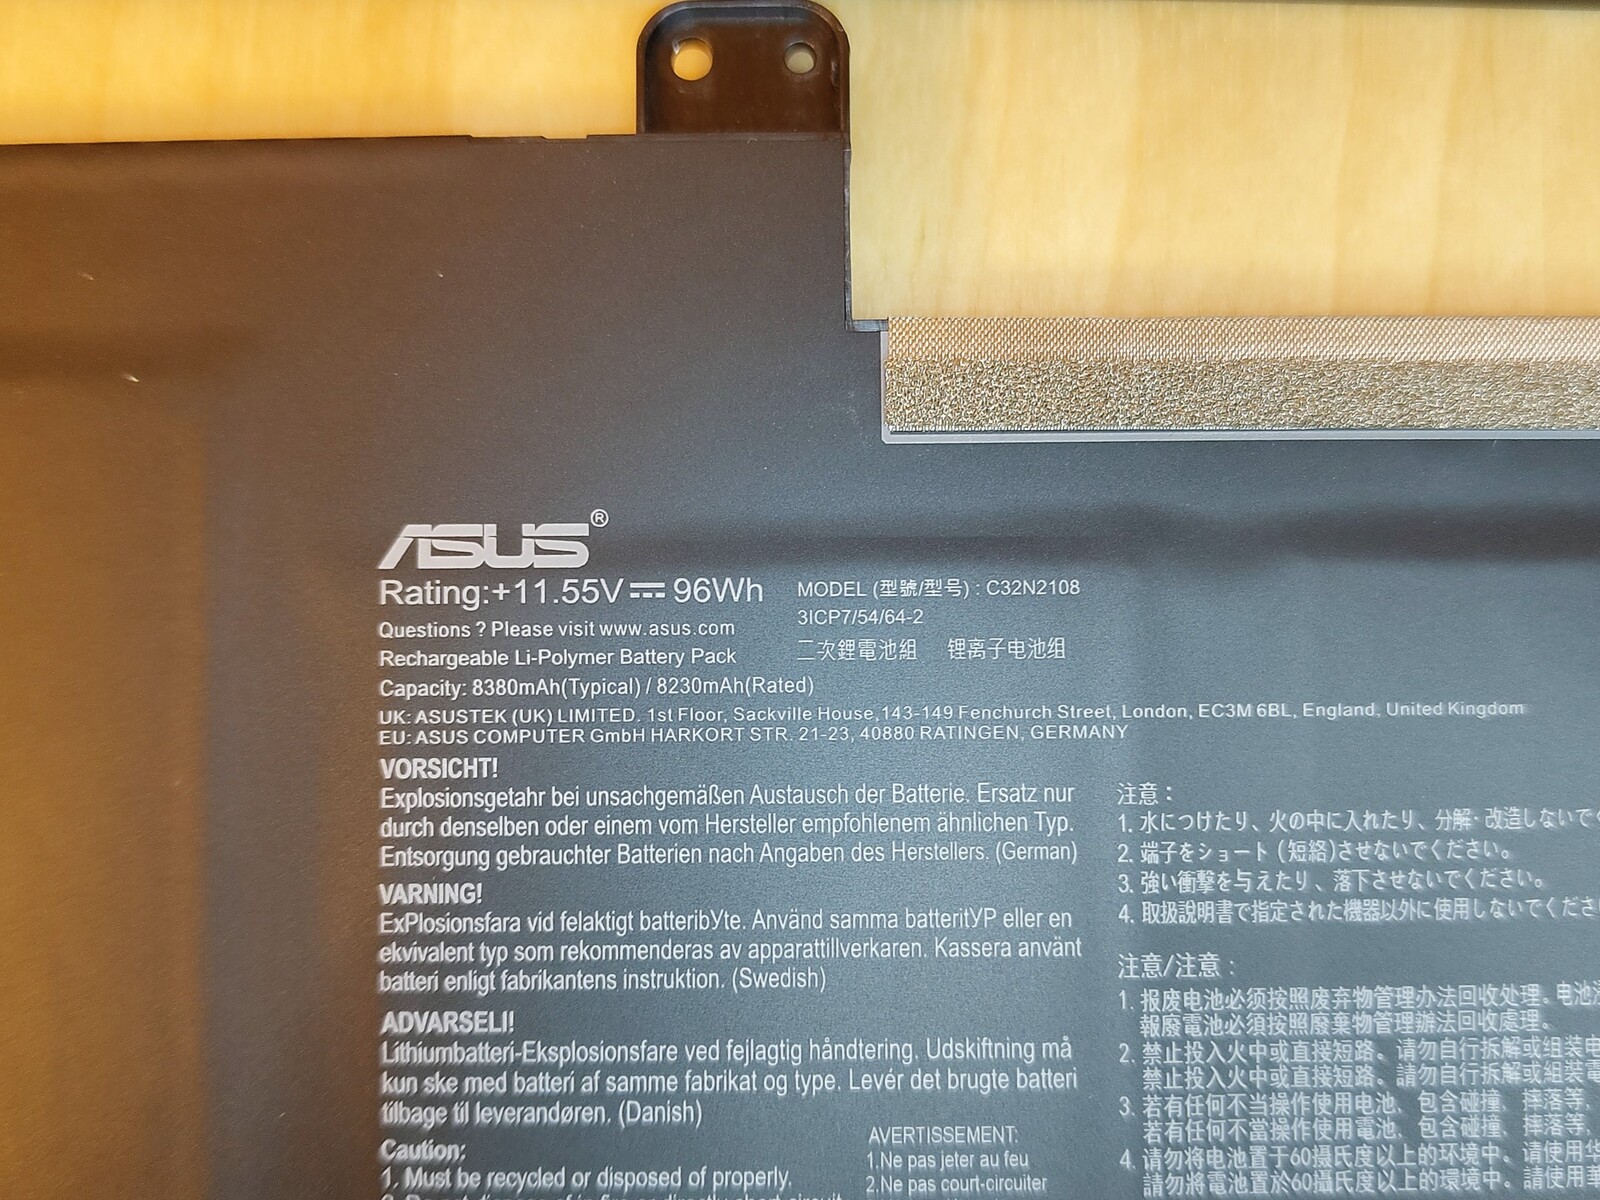
The Asus Zenbook is very strong in terms of battery life. A laptop battery can have a maximum of 100 watt hours, and the Zenbook has 96 Wh. Asus' studio laptop is thus ahead of its competitors in all battery tests. Compared to the Asus Vivobook Pro 16X OLED, the Zenbook is also much longer-lasting with slightly more modern hardware.
| Asus ZenBook Pro 16X OLED UX7602ZM-ME115W i9-12900H, GeForce RTX 3060 Laptop GPU, 96 Wh | Lenovo ThinkPad X1 Extreme G5-21DE003RGE i7-12700H, GeForce RTX 3060 Laptop GPU, 90 Wh | HP Omen 16-n0033dx R7 6800H, Radeon RX 6650M, 68 Wh | HP ZBook Studio 16 G9 62U04EA i7-12800H, RTX A2000 Laptop GPU, 86 Wh | Corsair Voyager a1600 R9 6900HS, Radeon RX 6800M, 99 Wh | Asus VivoBook Pro 16X OLED N7600PC-L2026X i7-11370H, GeForce RTX 3050 4GB Laptop GPU, 96 Wh | Average of class Multimedia | |
|---|---|---|---|---|---|---|---|
| Battery runtime | -30% | -33% | -44% | -33% | -6% | 33% | |
| Reader / Idle (h) | 12.7 | 10 -21% | 7 -45% | 11.1 -13% | 25.2 ? 98% | ||
| WiFi v1.3 (h) | 8.9 | 6.7 -25% | 7 -21% | 6.3 -29% | 5.8 -35% | 8.7 -2% | 12.2 ? 37% |
| Load (h) | 2.6 | 1.7 -35% | 1.1 -58% | 1.1 -58% | 2.1 -19% | 2.5 -4% | 1.662 ? -36% |
| H.264 (h) | 7.3 | 8.5 | 6 | 16.4 ? |
Pros
Cons
Verdict - Strong performance, yet potential wasted
Asus now regularly introduces laptops that stand out with unusual features. The flip-up keyboard of the Zenbook Pro 16X is certainly one of those features. The many RGBW LEDs also stand out if so desired. The AAS Ultra system functions better than expected. Overall, the laptop's concept is interesting, but it can certaintly do more. Asus puts a leash on the Zenbook's hardware and unnecessarily slows down the laptop with tentative performance controls. Sure, the Zenbook is faster than many of its competitors, but the log results show that the hardware still has room for improvement. On the other hand, one can definitely say that the laptop is considerably stronger and cooler than, for example, the similarly equipped Lenovo ThinkPad X1 Extreme with its liquid metal cooling.
The Asus laptop is almost a flagship in its class. A high computing power, a true-color OLED display, balanced sound and a good webcam are some of the laptop's strengths.
We didn't find any real points of criticism in the device. Rather, it's the small things that annoy us, such as the touchpad, which refuses to work properly in the cold, or the subpixel matrix, which becomes noticeable at full brightness. The dust that collects in the gap between the keyboard and the base is also irritating, because you can hardly clean it out. Ultimately, purchasing the Zenbook is a question of taste and money. After all, many laptops offer similar performance at a similar or lower price. For example, the Vivobook Pro 16X OLED is a good US$500 cheaper in a comparable configuration variant. Those looking for a more professional laptop will find it in the HP ZBook Studio or the MSI CreatorPro. Both have Nvidia's professional graphics cards with special drivers installed.
Price and Availability
In the US, the Asus Zenbook Pro 16X OLED with 32 GB RAM is currently listed on Amazon for US$2.999,00.
Asus ZenBook Pro 16X OLED UX7602ZM-ME115W
- 12/13/2022 v7 (old)
Marc Herter
Price comparison

