Dell Precision 7670 workstation review: Core i7-12850HX and CAMM RAM debut

The Precision 7000 series is home to Dell's flagship mobile workstations in contrast to the midrange Precision 5000 series or budget Precision 3000 series. The Precision 7670 is the first 16-inch model in the family sitting in between the 15.6-inch Precision 7560 and 17.3-inch Precision 7760. Confusingly, Dell is producing two variants of the Precision 7670 called the "Performance base" and "Thin base". This specific review is on the "Thin base" variant with the "Performance base" review to come at a later date.
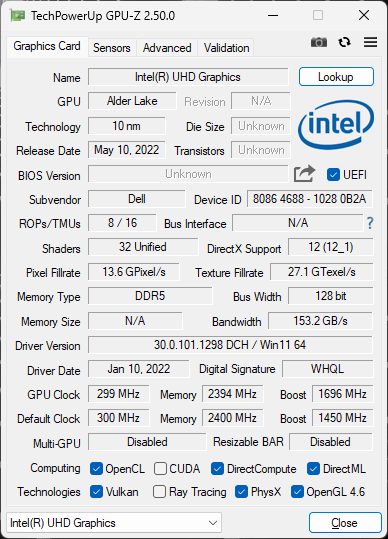
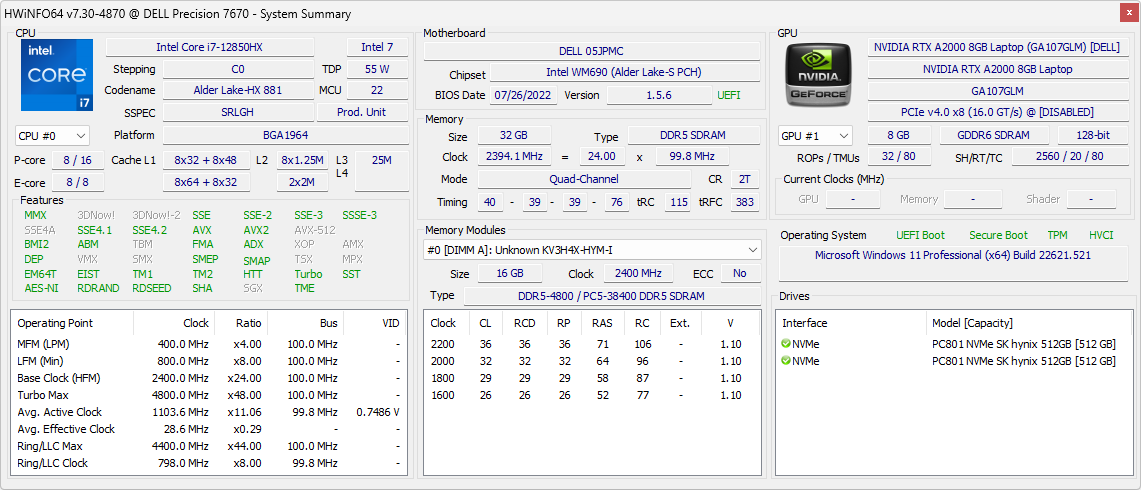
Options are very wide ranging from the Core i5-12600HX to the i9-12950HX, Iris Xe graphics up to the discrete Nvidia RTX A5500, FHD IPS to 4K OLED display, and even SODIMM or CAMM RAM up to 128 GB. Our specific review unit is a midrange configuration with the i7-12850HX, 95 W RTX A2000, and 4K OLED touchscreen for approximately $4100 USD.
There are unfortunately no Xeon or ECC RAM options for the Precision 7670 at the moment, but vPro is supported on all SKUs.
There are few direct competitors at the moment as the 16-inch workstation space is still relatively new. Current alternatives include the Asus ProArt StudioBook Pro 16, Lenovo ThinkPad P1 G4, and the HP ZBook Fury 16.
More Dell reviews:
Potential Competitors in Comparison
Rating | Date | Model | Weight | Height | Size | Resolution | Price |
|---|---|---|---|---|---|---|---|
| 88.4 % v7 (old) | 10 / 2022 | Dell Precision 7670 i7-12850HX, RTX A2000 Laptop GPU | 2.7 kg | 24.7 mm | 16.00" | 3840x2400 | |
| 89.3 % v7 (old) | 02 / 2022 | Lenovo ThinkPad P1 G4-20Y4Z9DVUS i7-11800H, T1200 Laptop GPU | 1.8 kg | 17.7 mm | 16.00" | 2560x1600 | |
v (old) | 12 / 2021 | Asus ProArt StudioBook 16 W7600H5A-2BL2 W-11955M, RTX A5000 Laptop GPU | 2.4 kg | 21.4 mm | 16.00" | 3840x2400 | |
| 88.3 % v7 (old) | 10 / 2021 | Dell Precision 5000 5560 i7-11850H, RTX A2000 Laptop GPU | 2 kg | 18 mm | 15.60" | 3840x2400 | |
| 87.8 % v7 (old) | 08 / 2020 | Dell Precision 7550 W-10885M, Quadro RTX 5000 Max-Q | 2.8 kg | 27.36 mm | 15.60" | 3840x2160 | |
| 90.3 % v7 (old) | 10 / 2021 | HP ZBook Fury 15 G8 i9-11950H, RTX A5000 Laptop GPU | 2.5 kg | 25.9 mm | 15.60" | 3840x2160 |
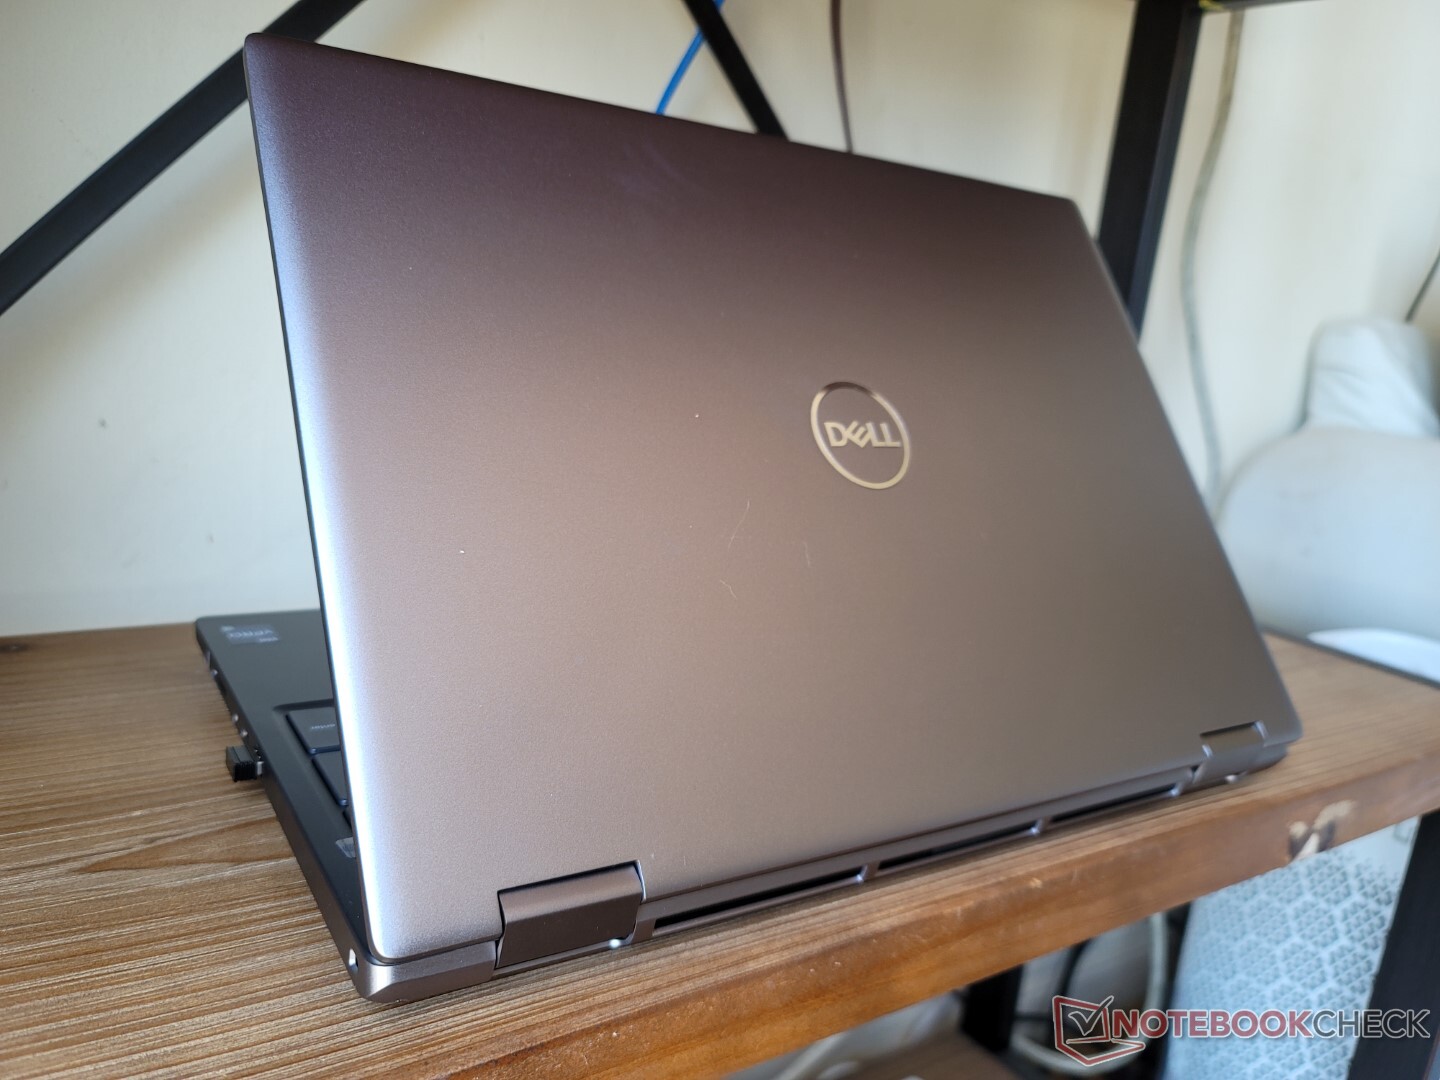
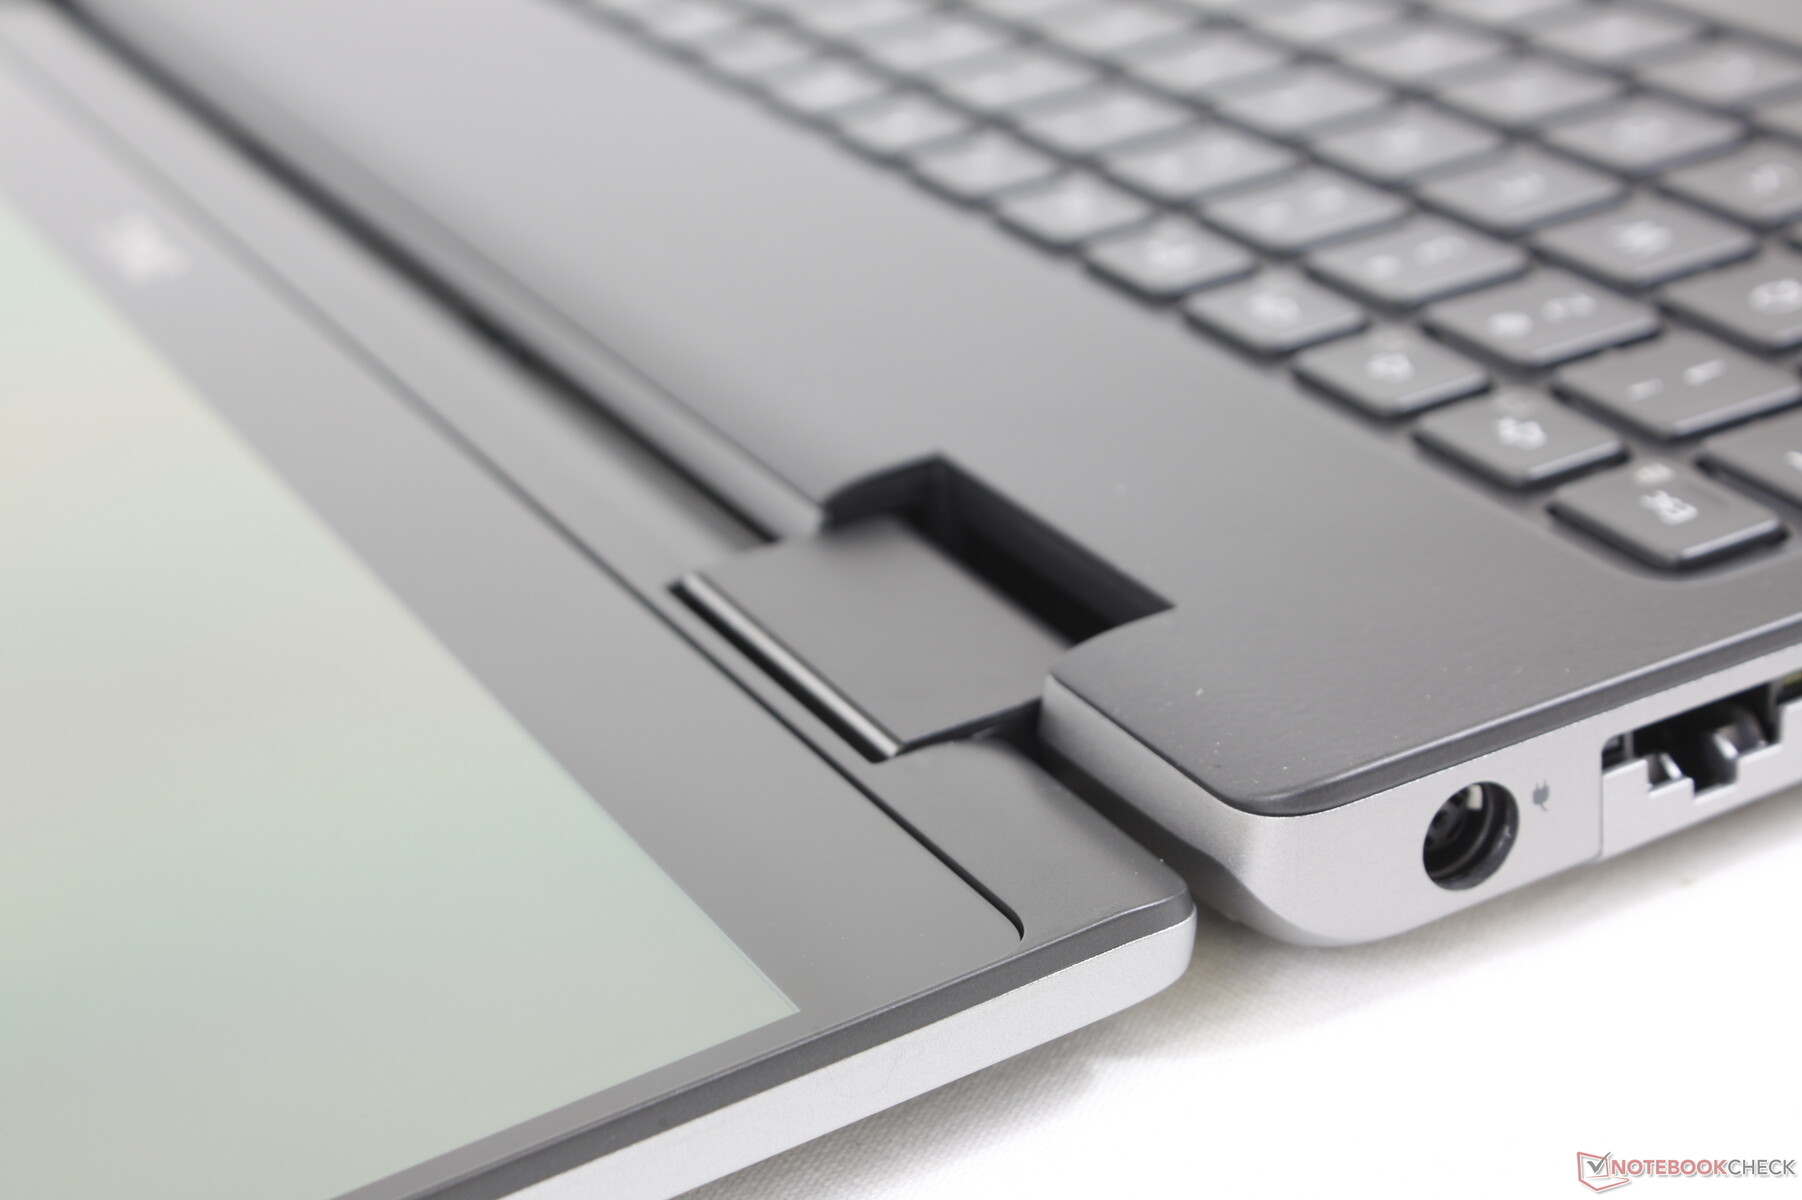
Case — Classic Precision Look And Feel
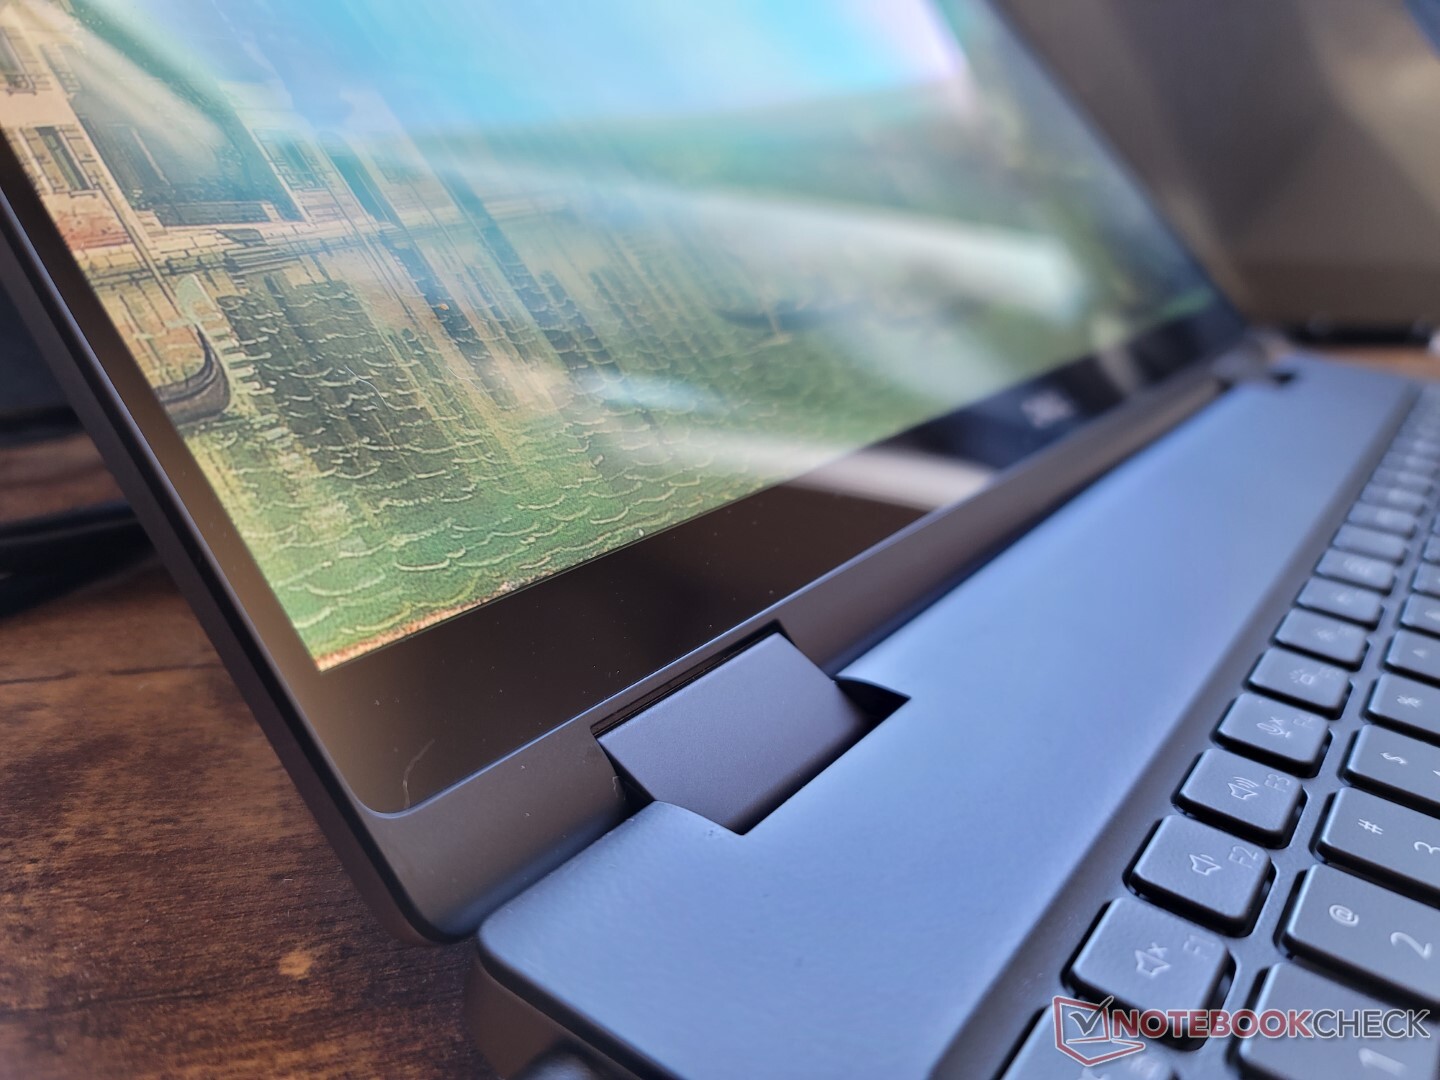
Chassis design and materials closely match the 2020 Precision 7550. The black keyboard deck, for example, is still slightly rubberized for a premium feel while the outer metal skeleton remains thick for stronger first impressions than the ThinkPad P1 G4 or Asus ProArt StudioBook. Applying pressure on the keyboard center or outer lid will warp their surfaces slightly more than on an HP ZBook Studio, but we can otherwise notice no creaking or major weak spots.
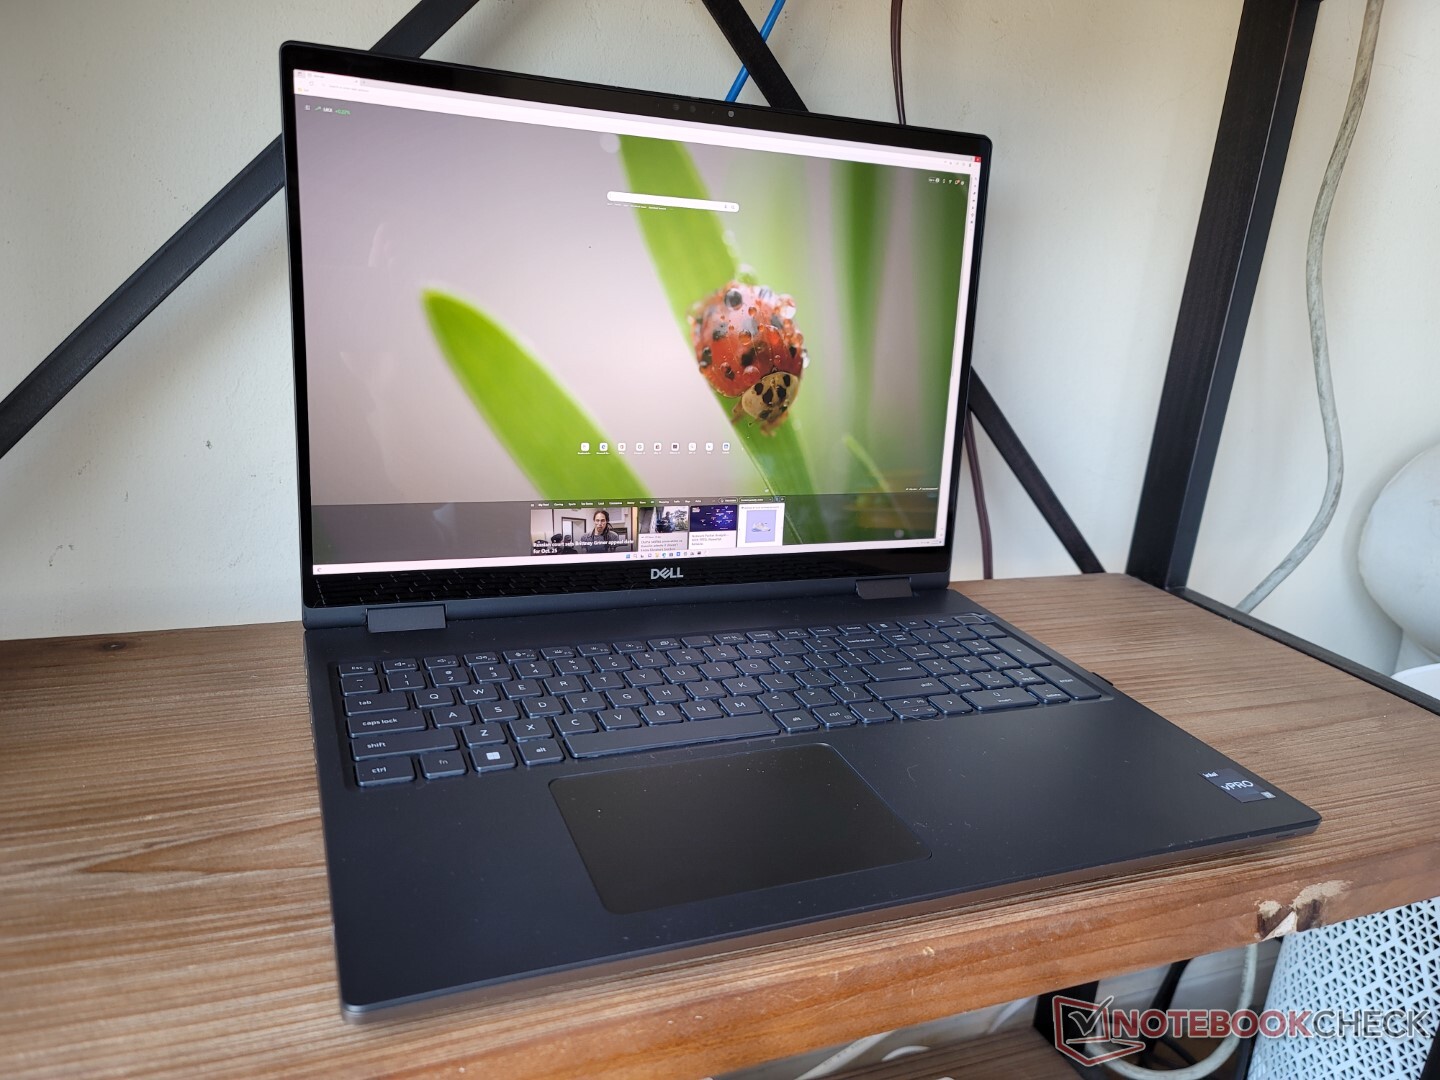
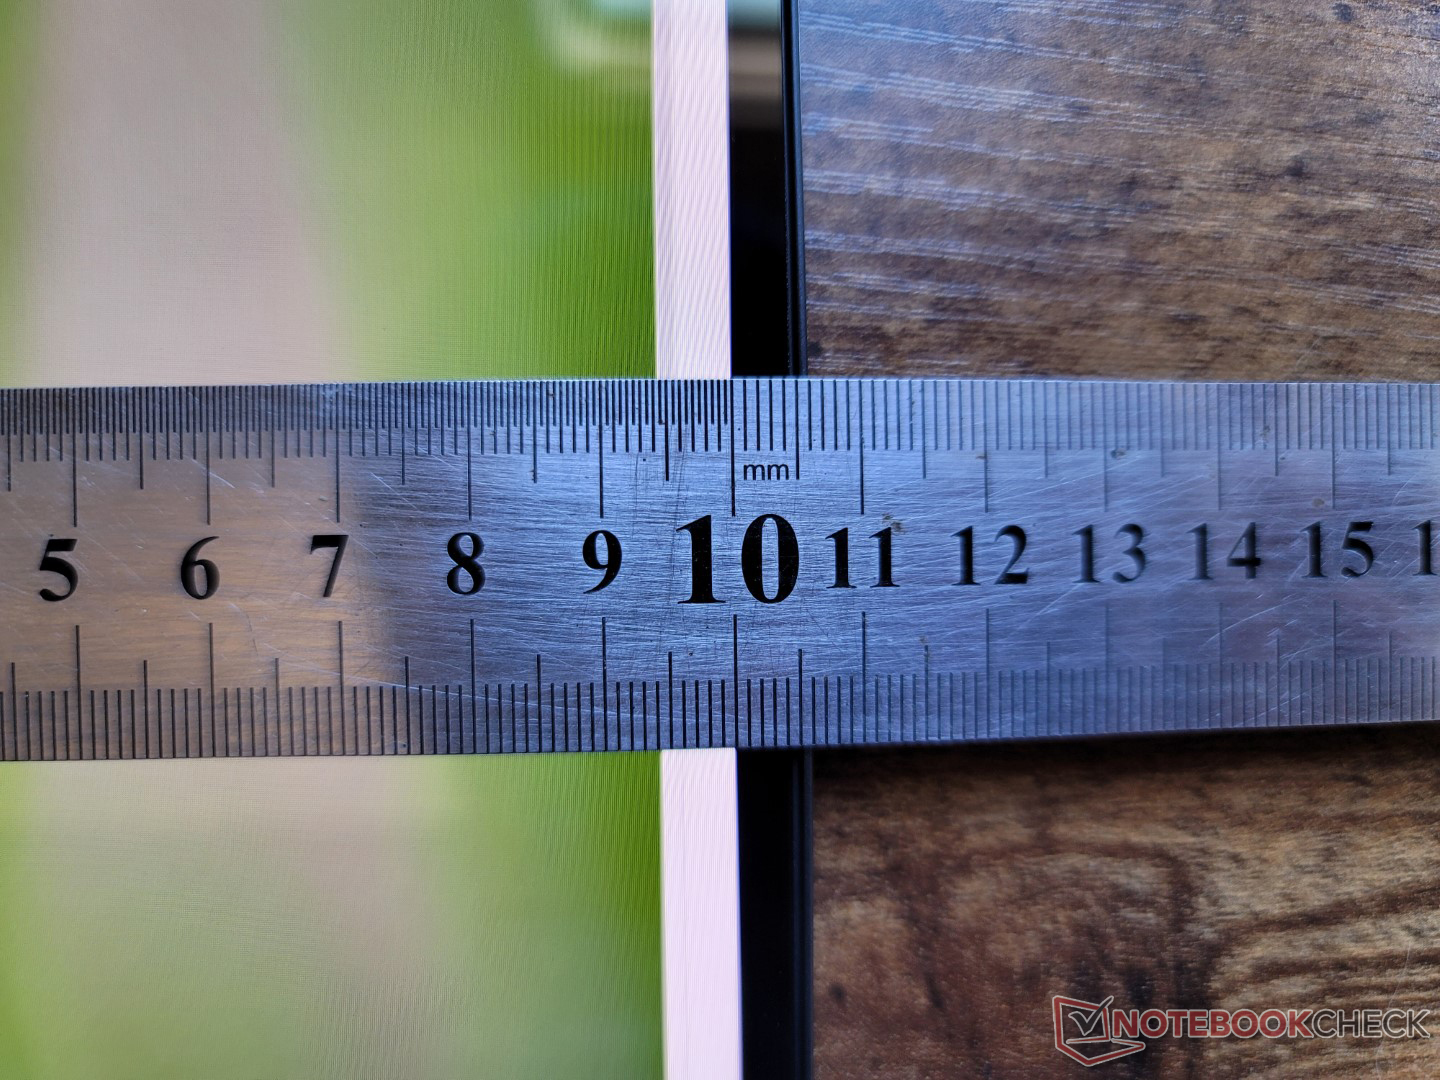
The Precision 7670 is still relatively large and weighty despite our test unit being the "Thin base" version. At 24.7 mm thick, the system is thicker than the Asus ProArt StudioBook 16 and just a hair thinner than the HP ZBook Fury 15 G8. It's also much heavier by several hundred grams each due in part to the larger 16-inch 16:10 form factor.
The "Performance base" is about 3 mm thicker and at least 70 g heavier than the "Thin base" depending on the configuration.
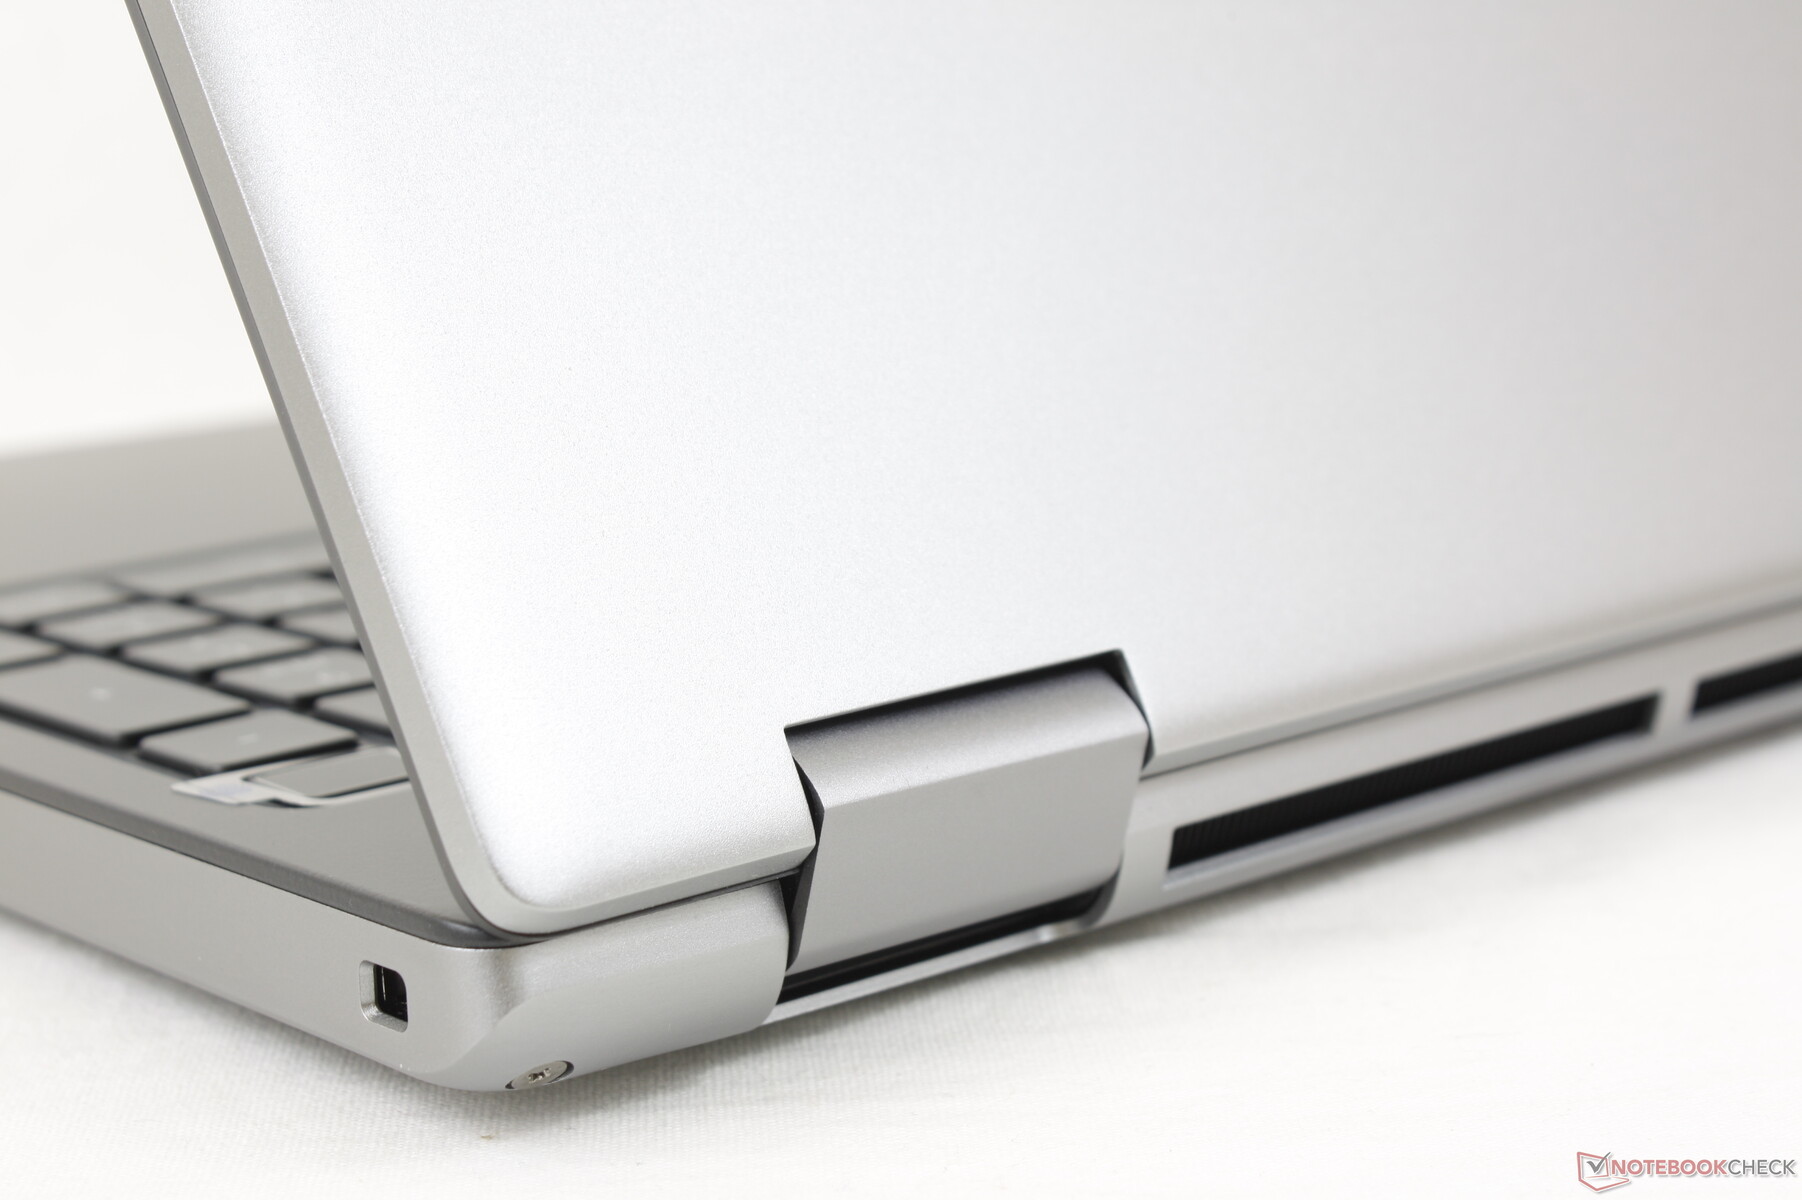
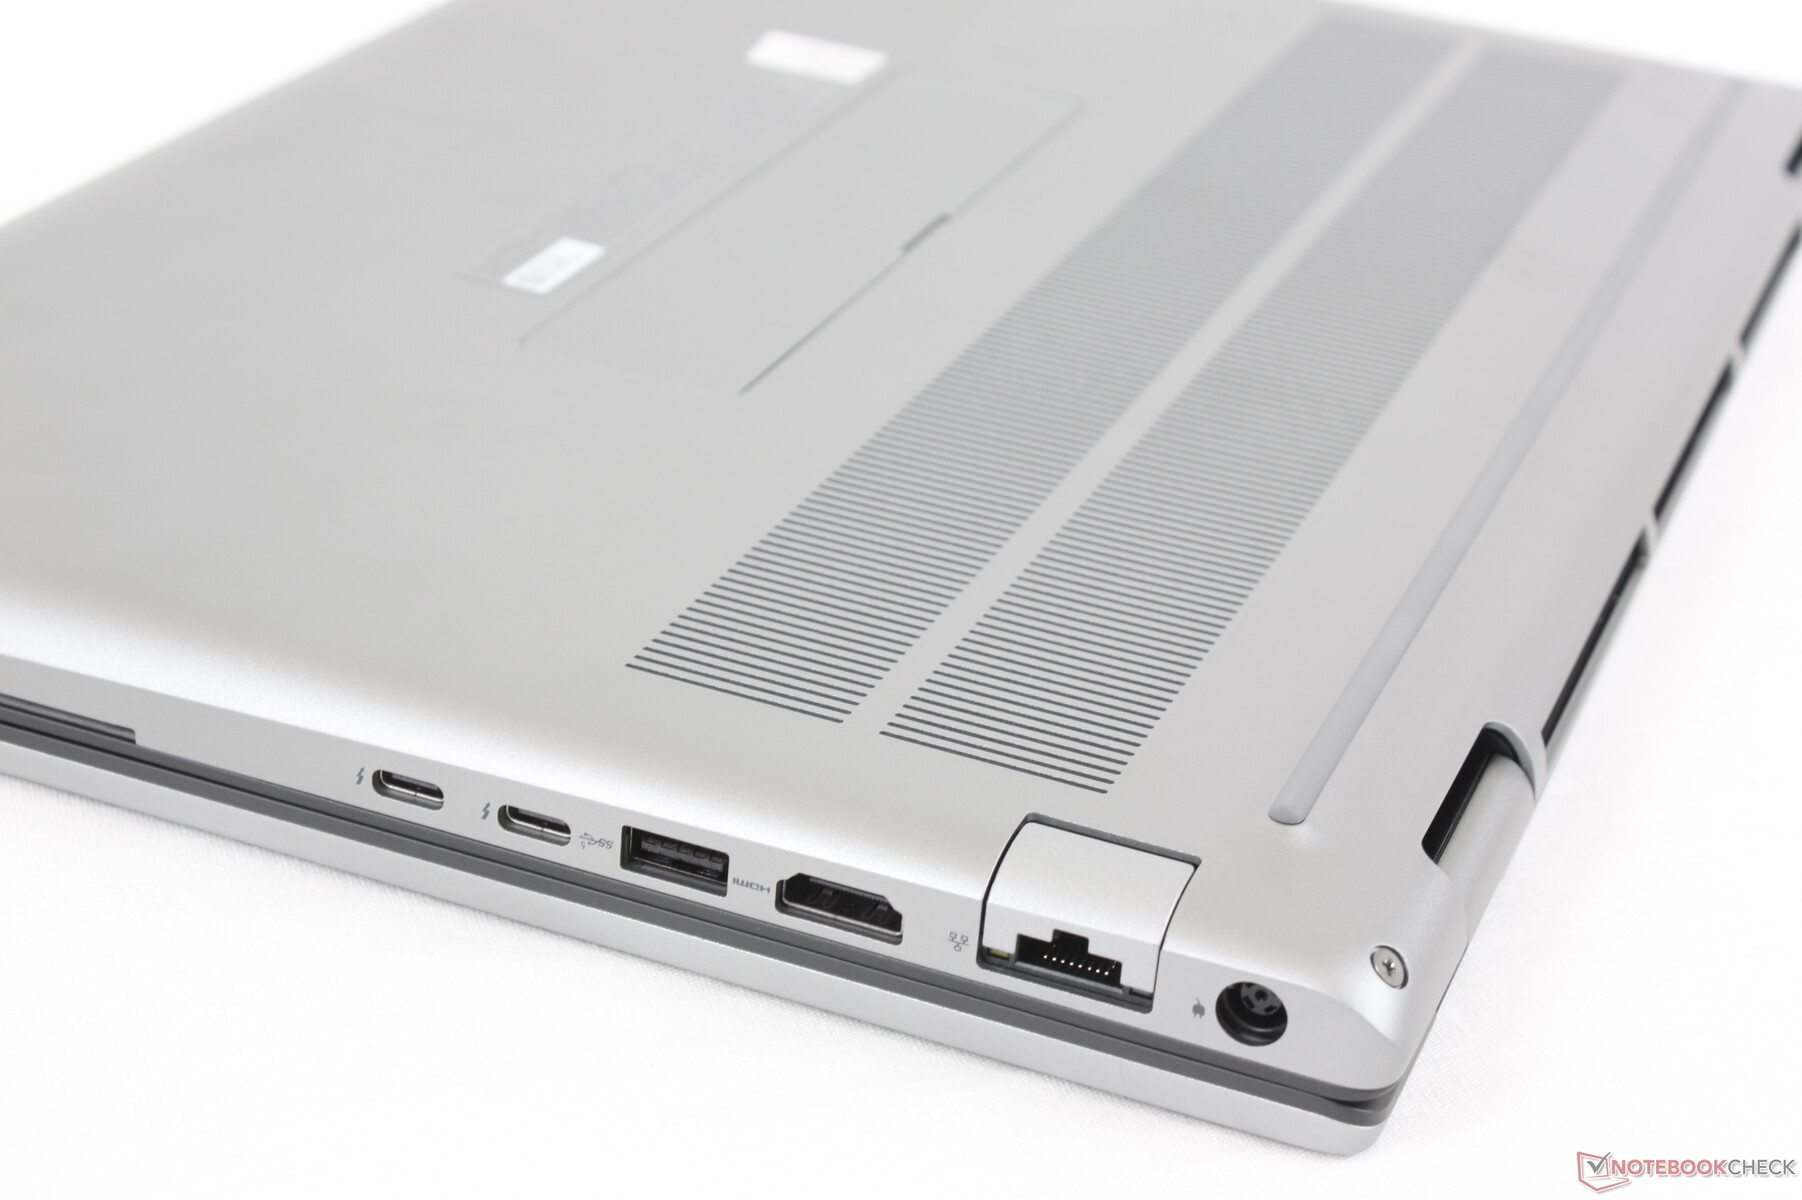
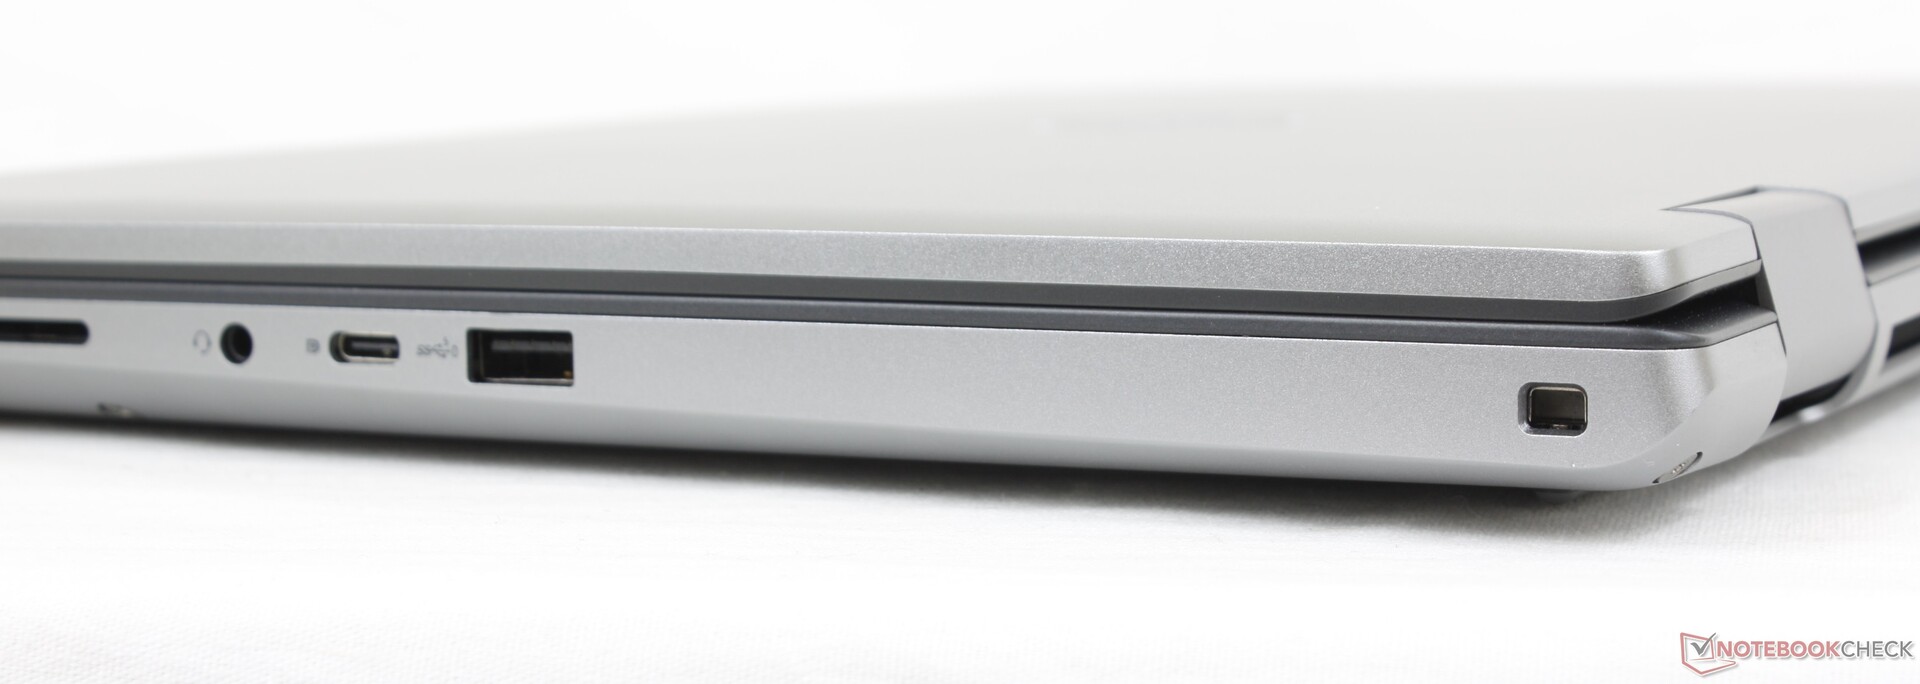
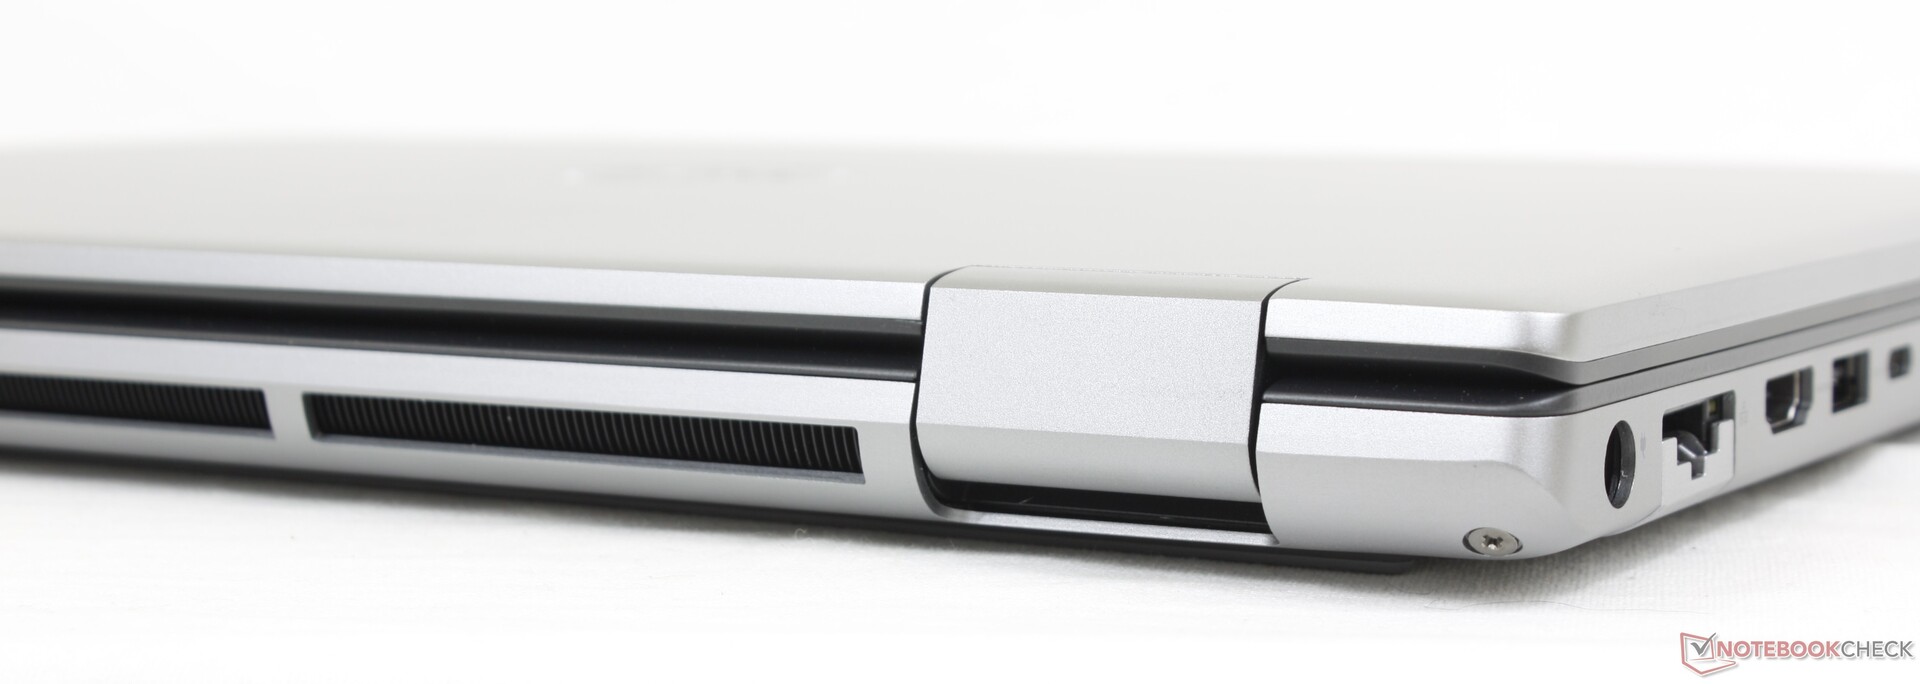
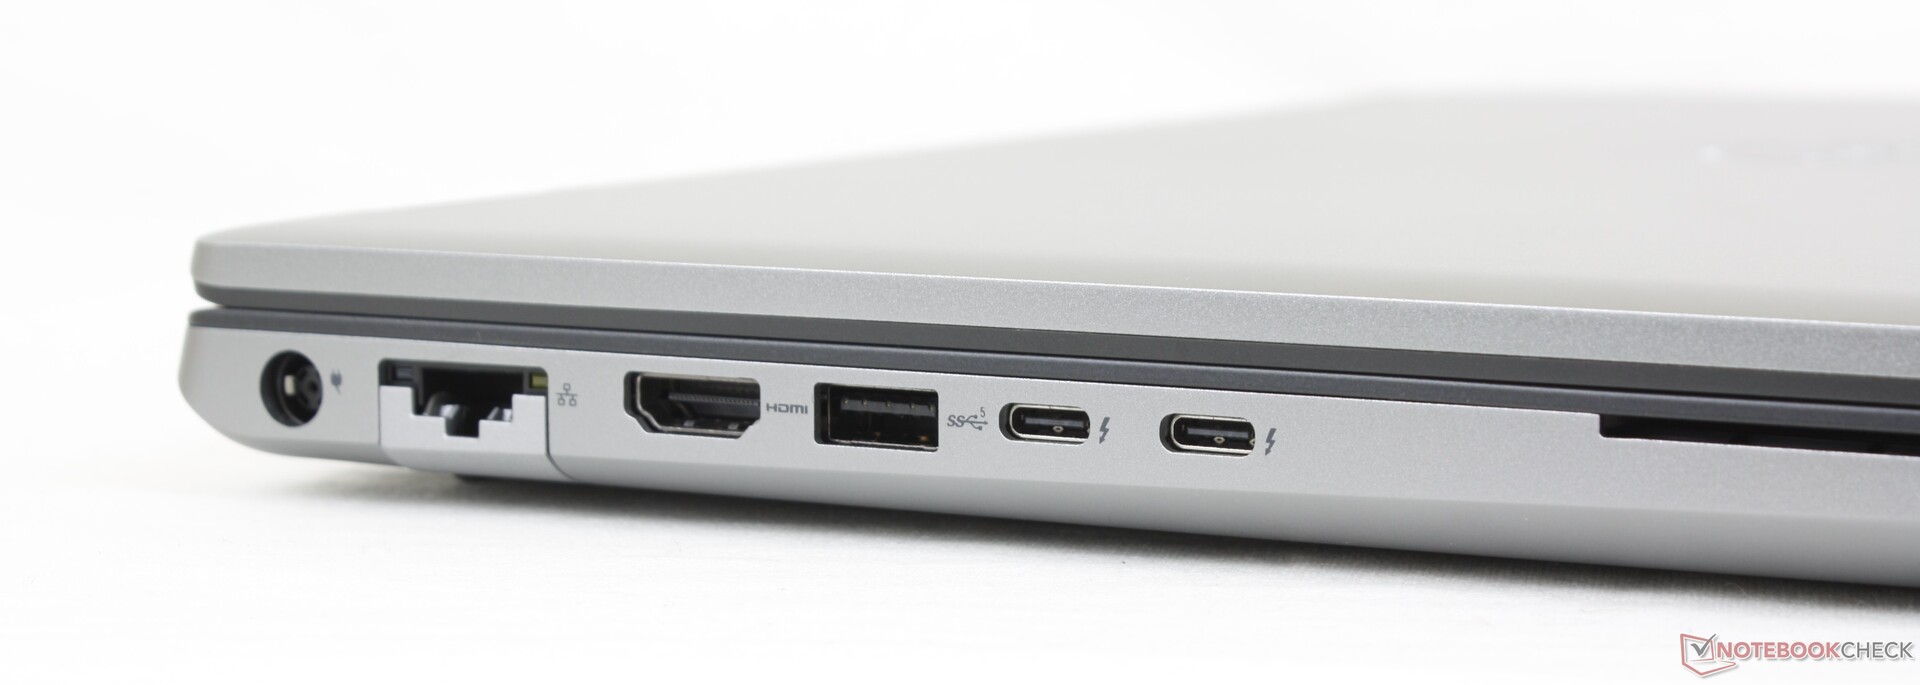
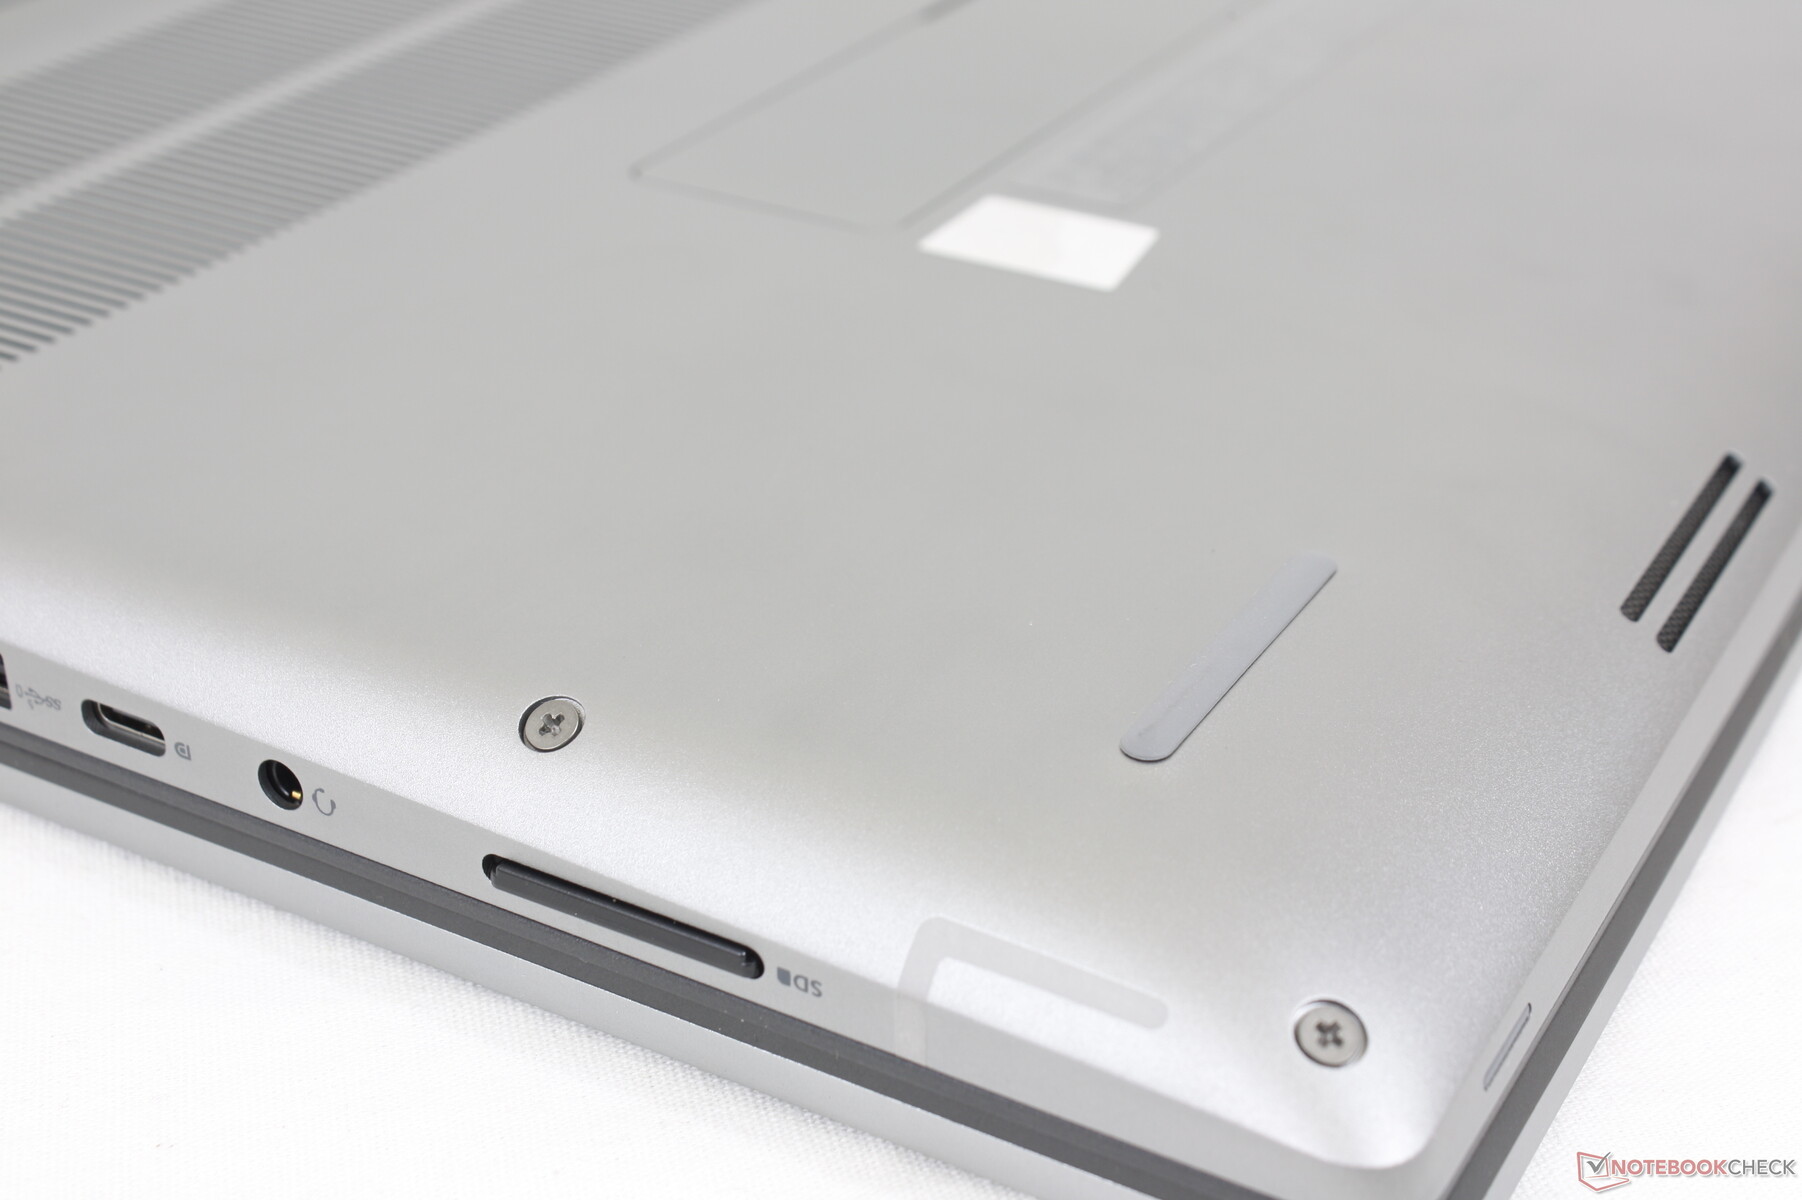
Connectivity — Thunderbolt 4 But No PD-In
Port options are excellent especially since there are more USB ports than on most other workstations. Many of the ports are along the left edge while the ports on the right edge are rather close to the front. Note that the RJ-45 port only supports speeds of up to 1 Gbps instead of 10 Gbps.
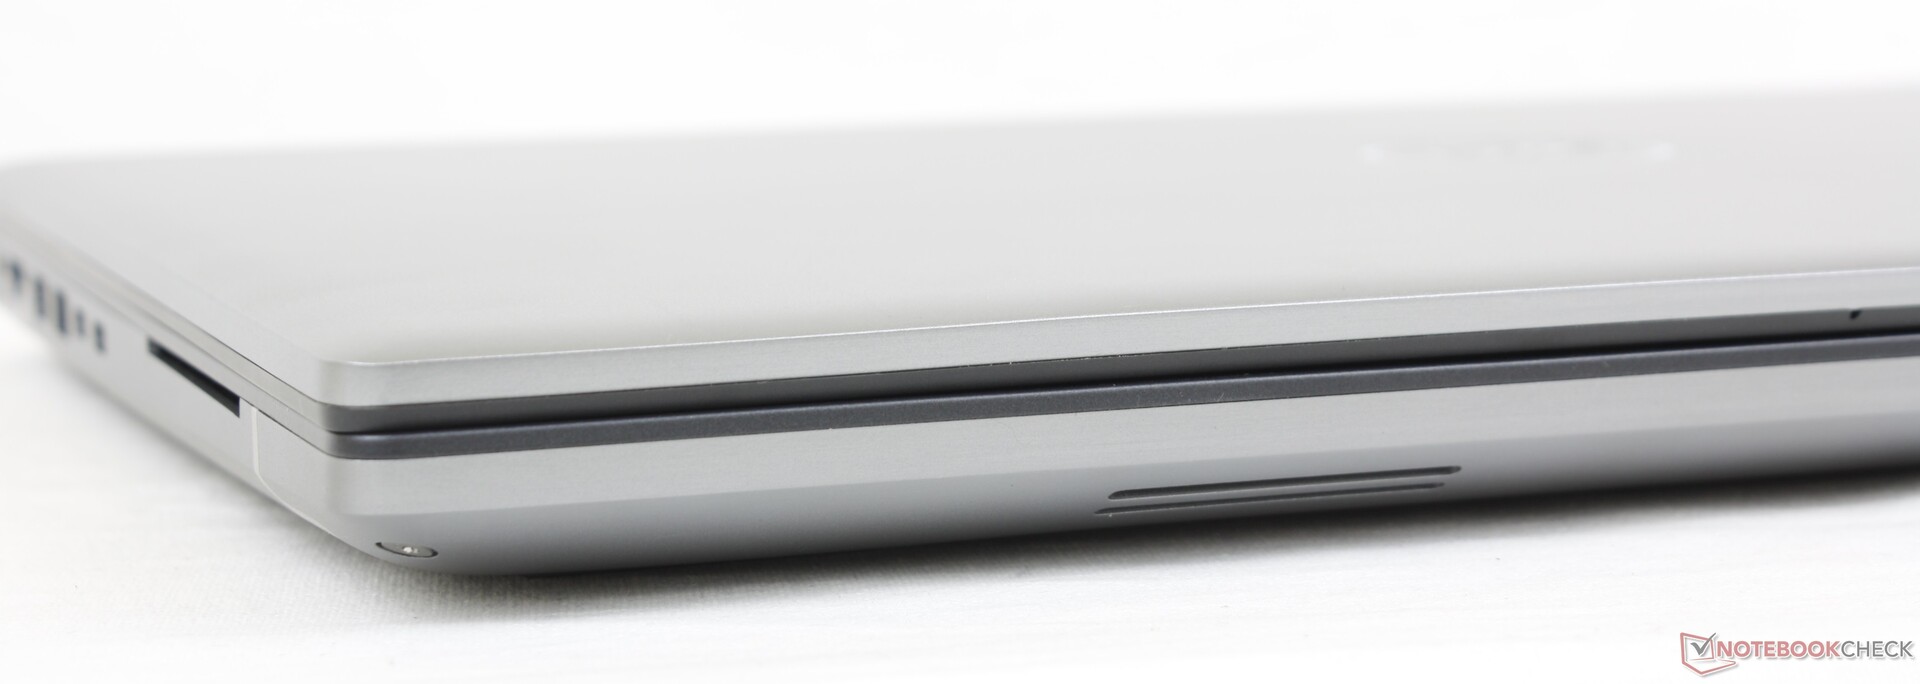
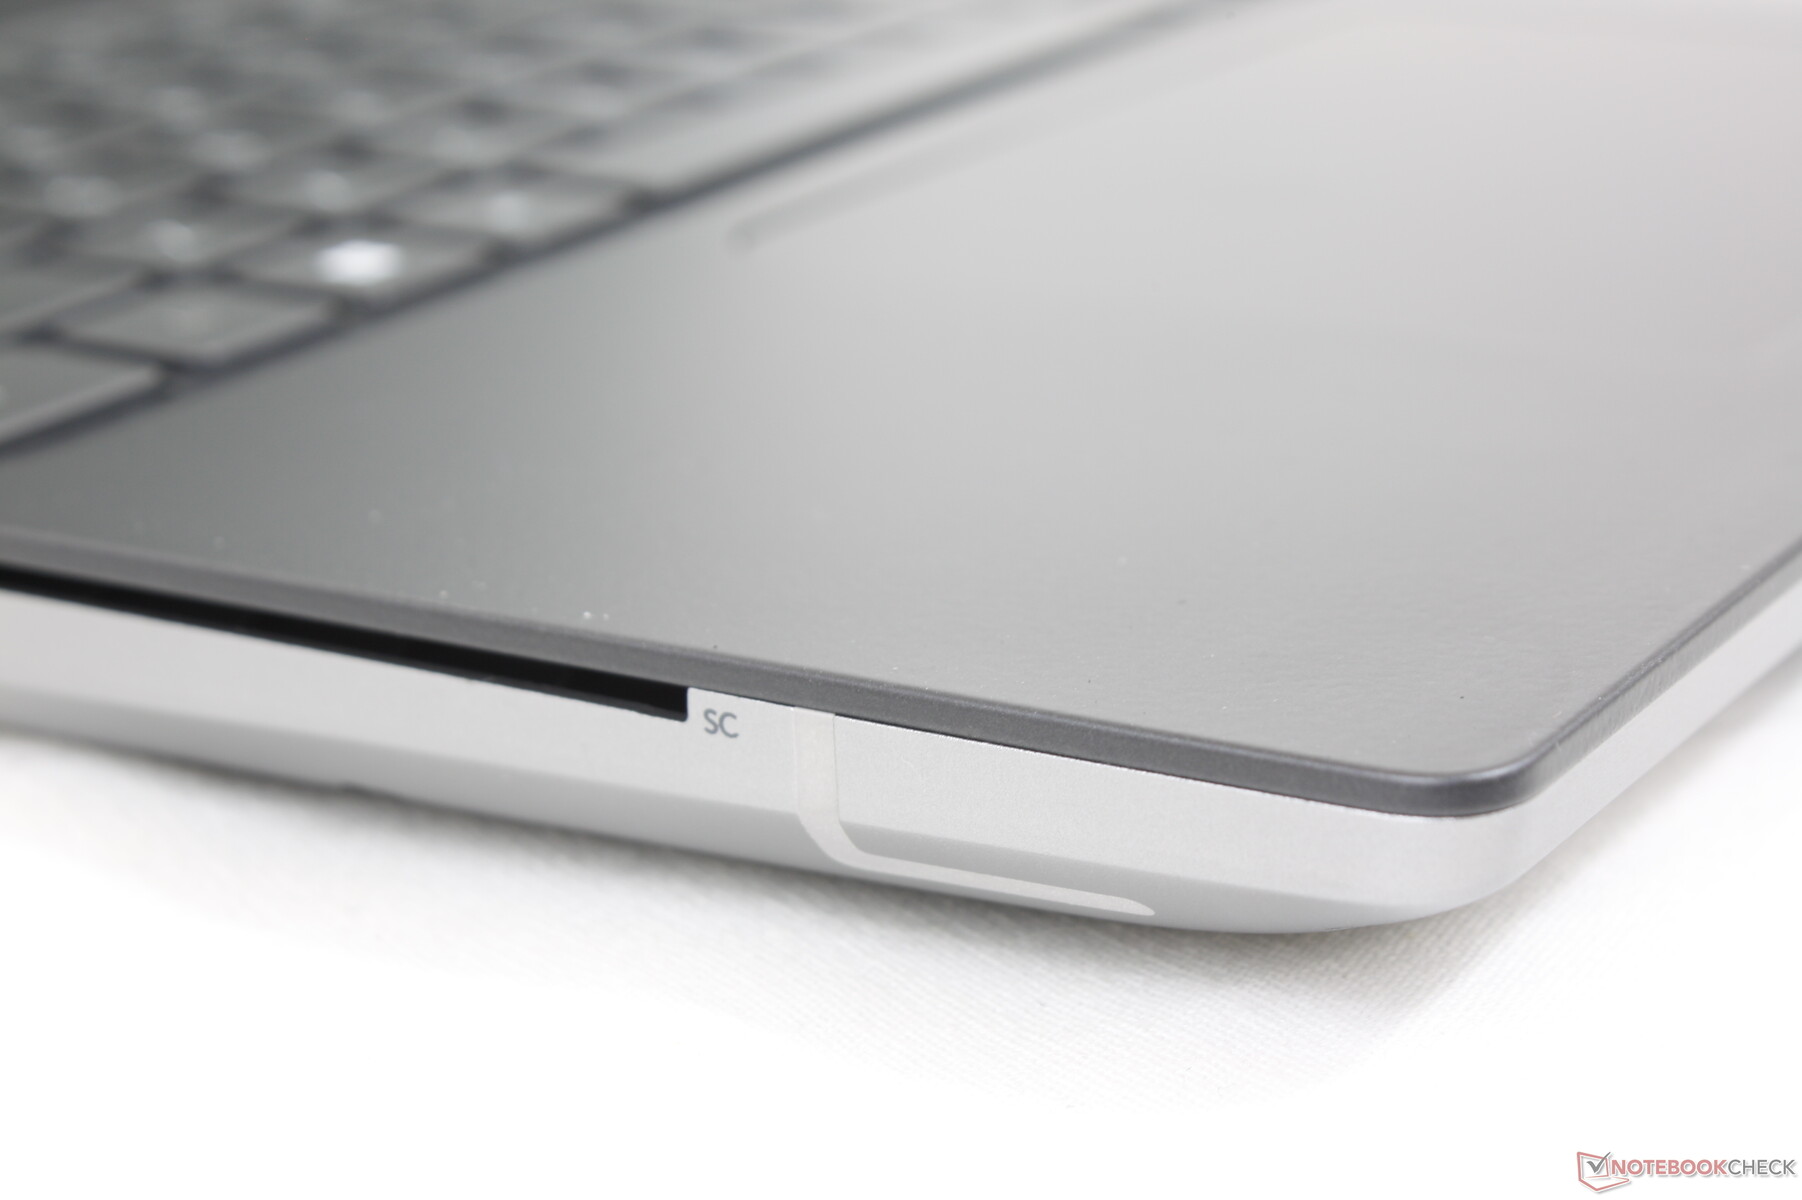
SD Card Reader
Transfer rates with the spring-loaded SD reader are as fast as on the Precision 7550 or over 2x faster than on the HP ZBook Fury G8. Moving 1 GB of pictures from our UHS-II card to desktop takes only 5 to 6 seconds.
| SD Card Reader | |
| average JPG Copy Test (av. of 3 runs) | |
| Lenovo ThinkPad P1 G4-20Y4Z9DVUS (Angelbird AV Pro V60) | |
| Dell Precision 5000 5560 (AV Pro V60) | |
| Dell Precision 7670 (Toshiba Exceria Pro SDXC 64 GB UHS-II) | |
| Dell Precision 7550 (Toshiba Exceria Pro SDXC 64 GB UHS-II) | |
| HP ZBook Fury 15 G8 (AV Pro V60) | |
| Asus ProArt StudioBook 16 W7600H5A-2BL2 (AV Pro SD microSD 128 GB V60) | |
| maximum AS SSD Seq Read Test (1GB) | |
| Dell Precision 5000 5560 (AV Pro V60) | |
| Dell Precision 7550 (Toshiba Exceria Pro SDXC 64 GB UHS-II) | |
| Dell Precision 7670 (Toshiba Exceria Pro SDXC 64 GB UHS-II) | |
| Lenovo ThinkPad P1 G4-20Y4Z9DVUS (Angelbird AV Pro V60) | |
| HP ZBook Fury 15 G8 (AV Pro V60) | |
| Asus ProArt StudioBook 16 W7600H5A-2BL2 (AV Pro SD microSD 128 GB V60) | |
Communication
An Intel AX211 comes standard for Wi-Fi 6E connectivity and optional Bluetooth. Unfortunately, Wi-Fi 6E is not necessarily faster than Wi-Fi 6 in many situations. Transfer rates appear to vary much more on our Precision 7670 when compared to most other workstations even when only one to two meters away from our 6 GHz access point.
| Networking | |
| iperf3 transmit AX12 | |
| Lenovo ThinkPad P1 G4-20Y4Z9DVUS | |
| HP ZBook Fury 15 G8 | |
| Dell Precision 7550 | |
| Dell Precision 5000 5560 | |
| Asus ProArt StudioBook 16 W7600H5A-2BL2 | |
| iperf3 receive AX12 | |
| Dell Precision 5000 5560 | |
| Lenovo ThinkPad P1 G4-20Y4Z9DVUS | |
| Dell Precision 7550 | |
| HP ZBook Fury 15 G8 | |
| Asus ProArt StudioBook 16 W7600H5A-2BL2 | |
| iperf3 receive AXE11000 6GHz | |
| Dell Precision 7670 | |
| iperf3 transmit AXE11000 6GHz | |
| Dell Precision 7670 | |
Webcam
The 2 MP webcam is an upgrade from the 1 MP webcams on most XPS systems. It still pales in comparison to the 5 MP cameras on most of the newest HP laptops, however.
Both IR and a shutter are included for Windows Hello support and privacy, respectively.


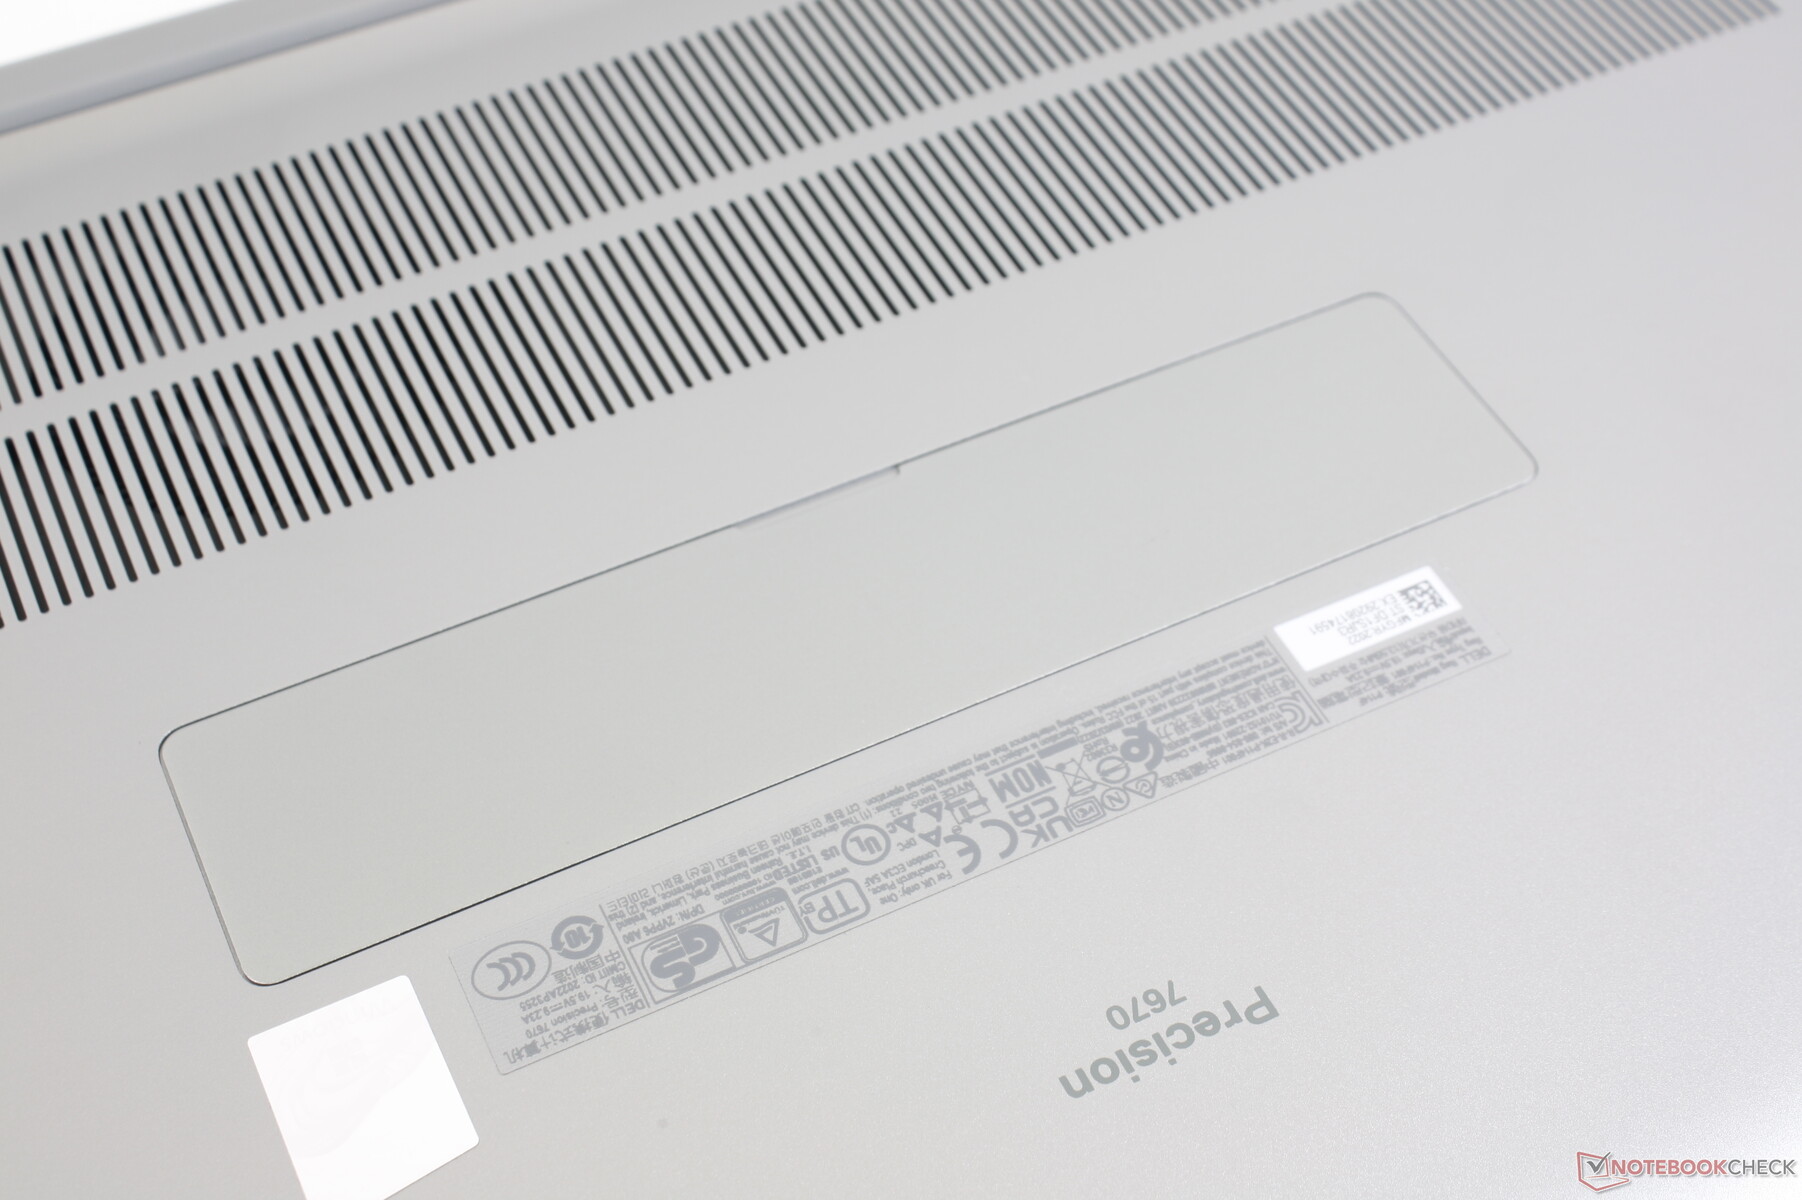
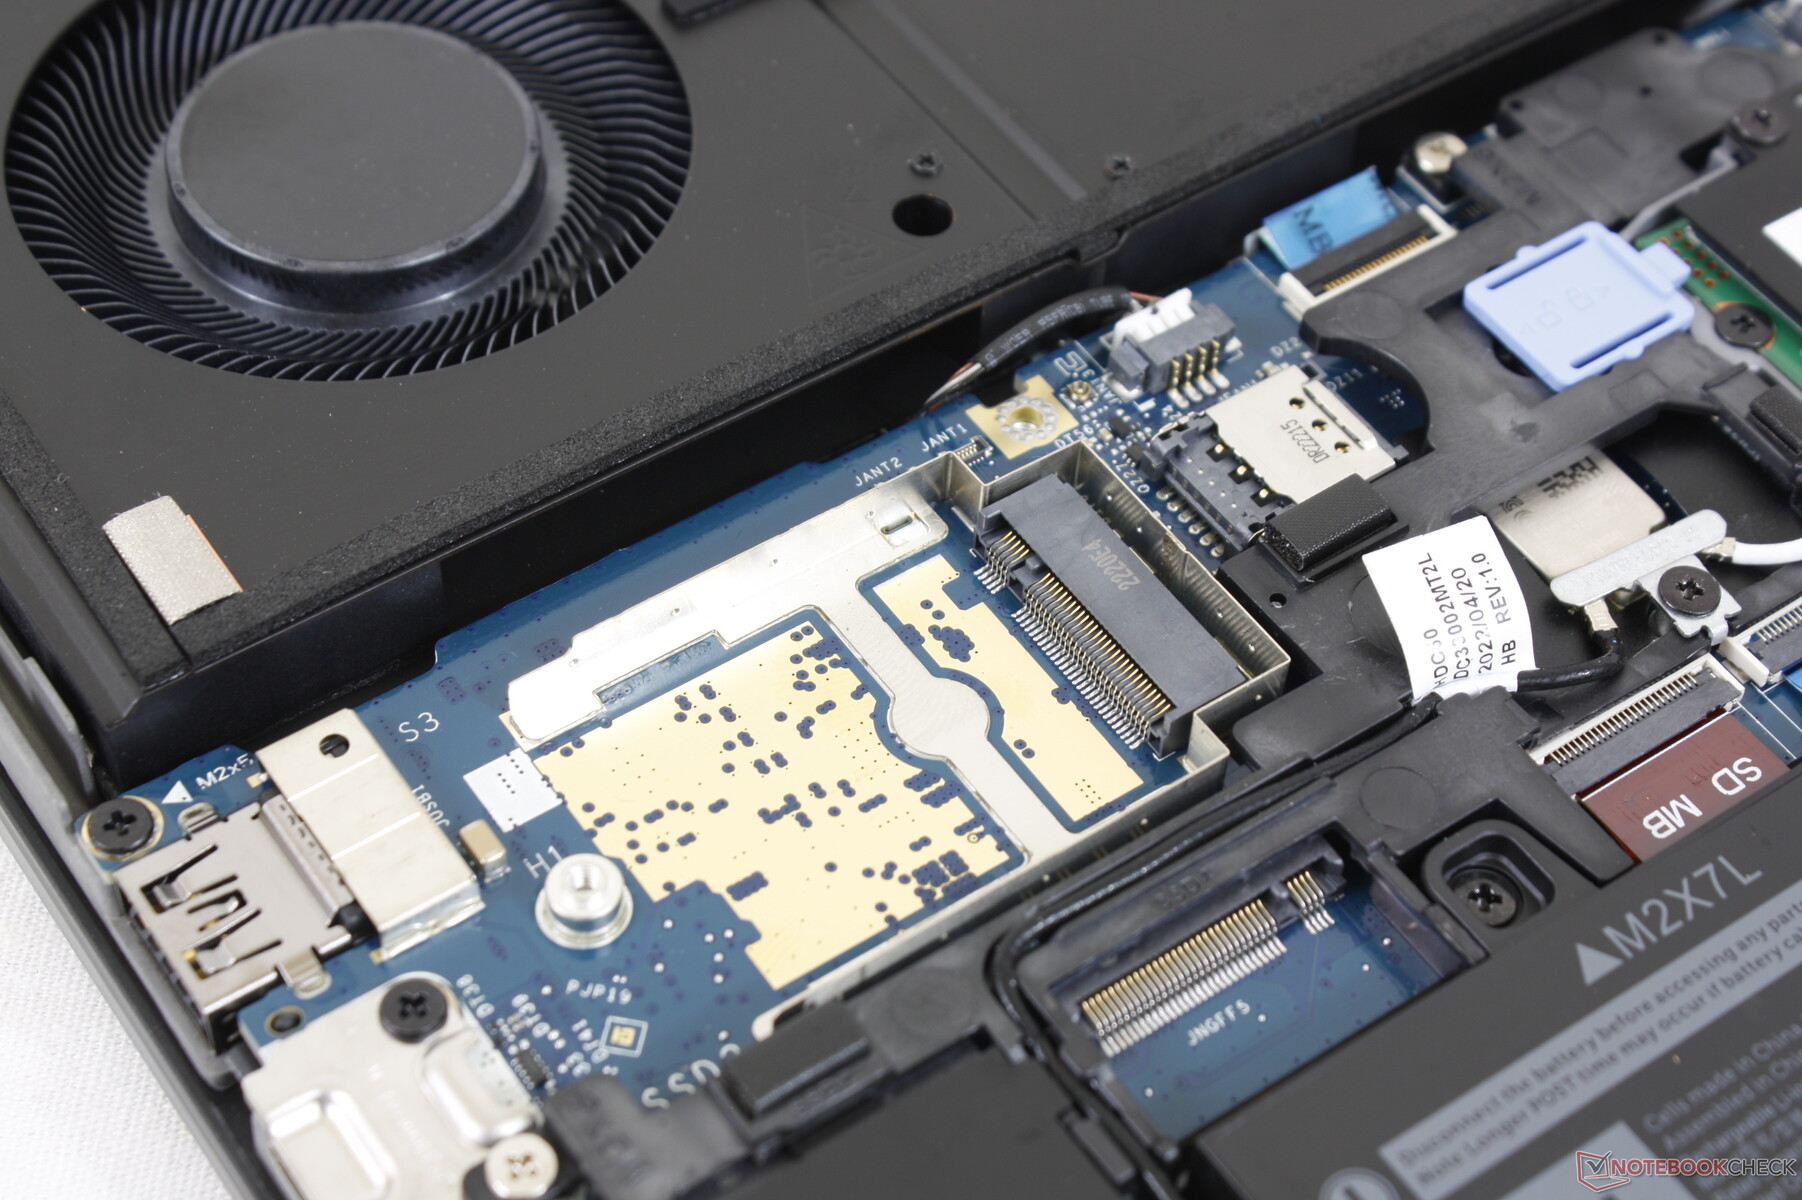
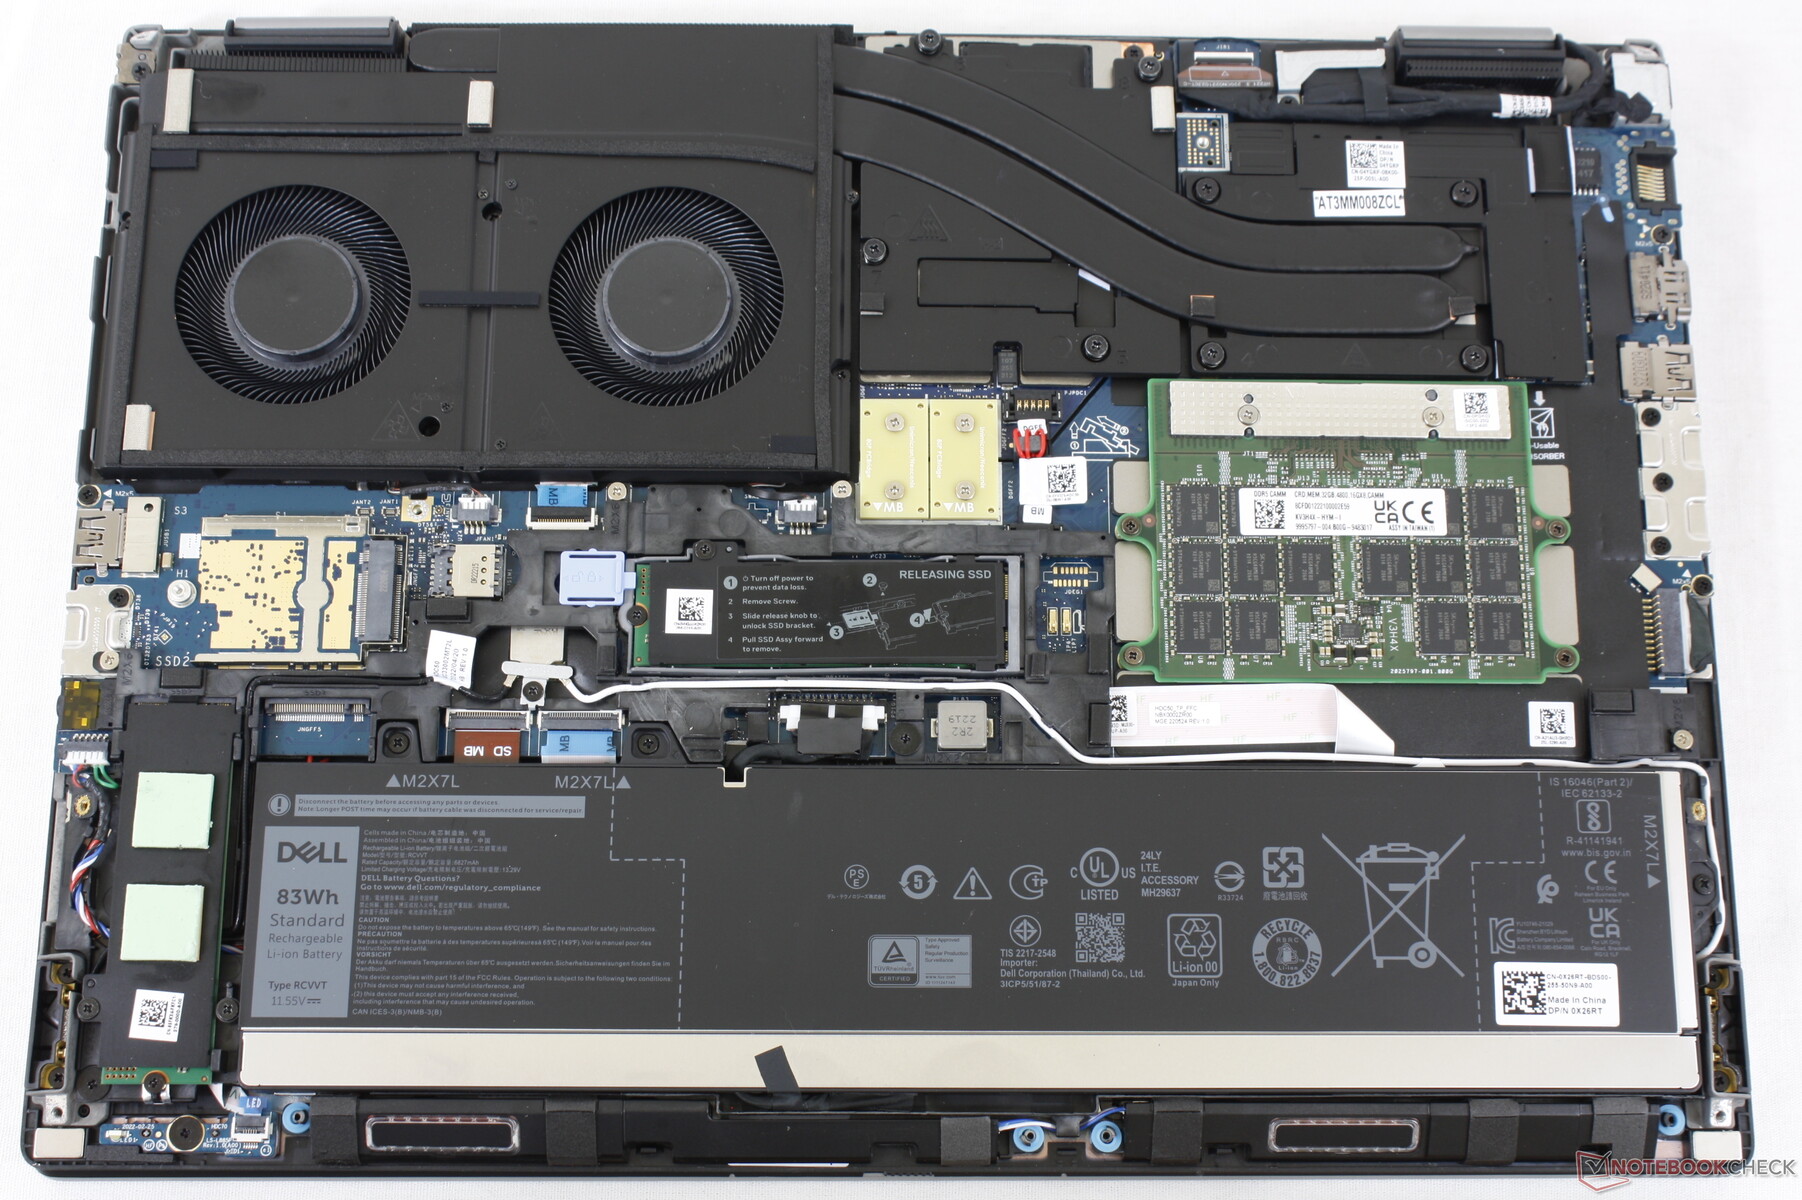
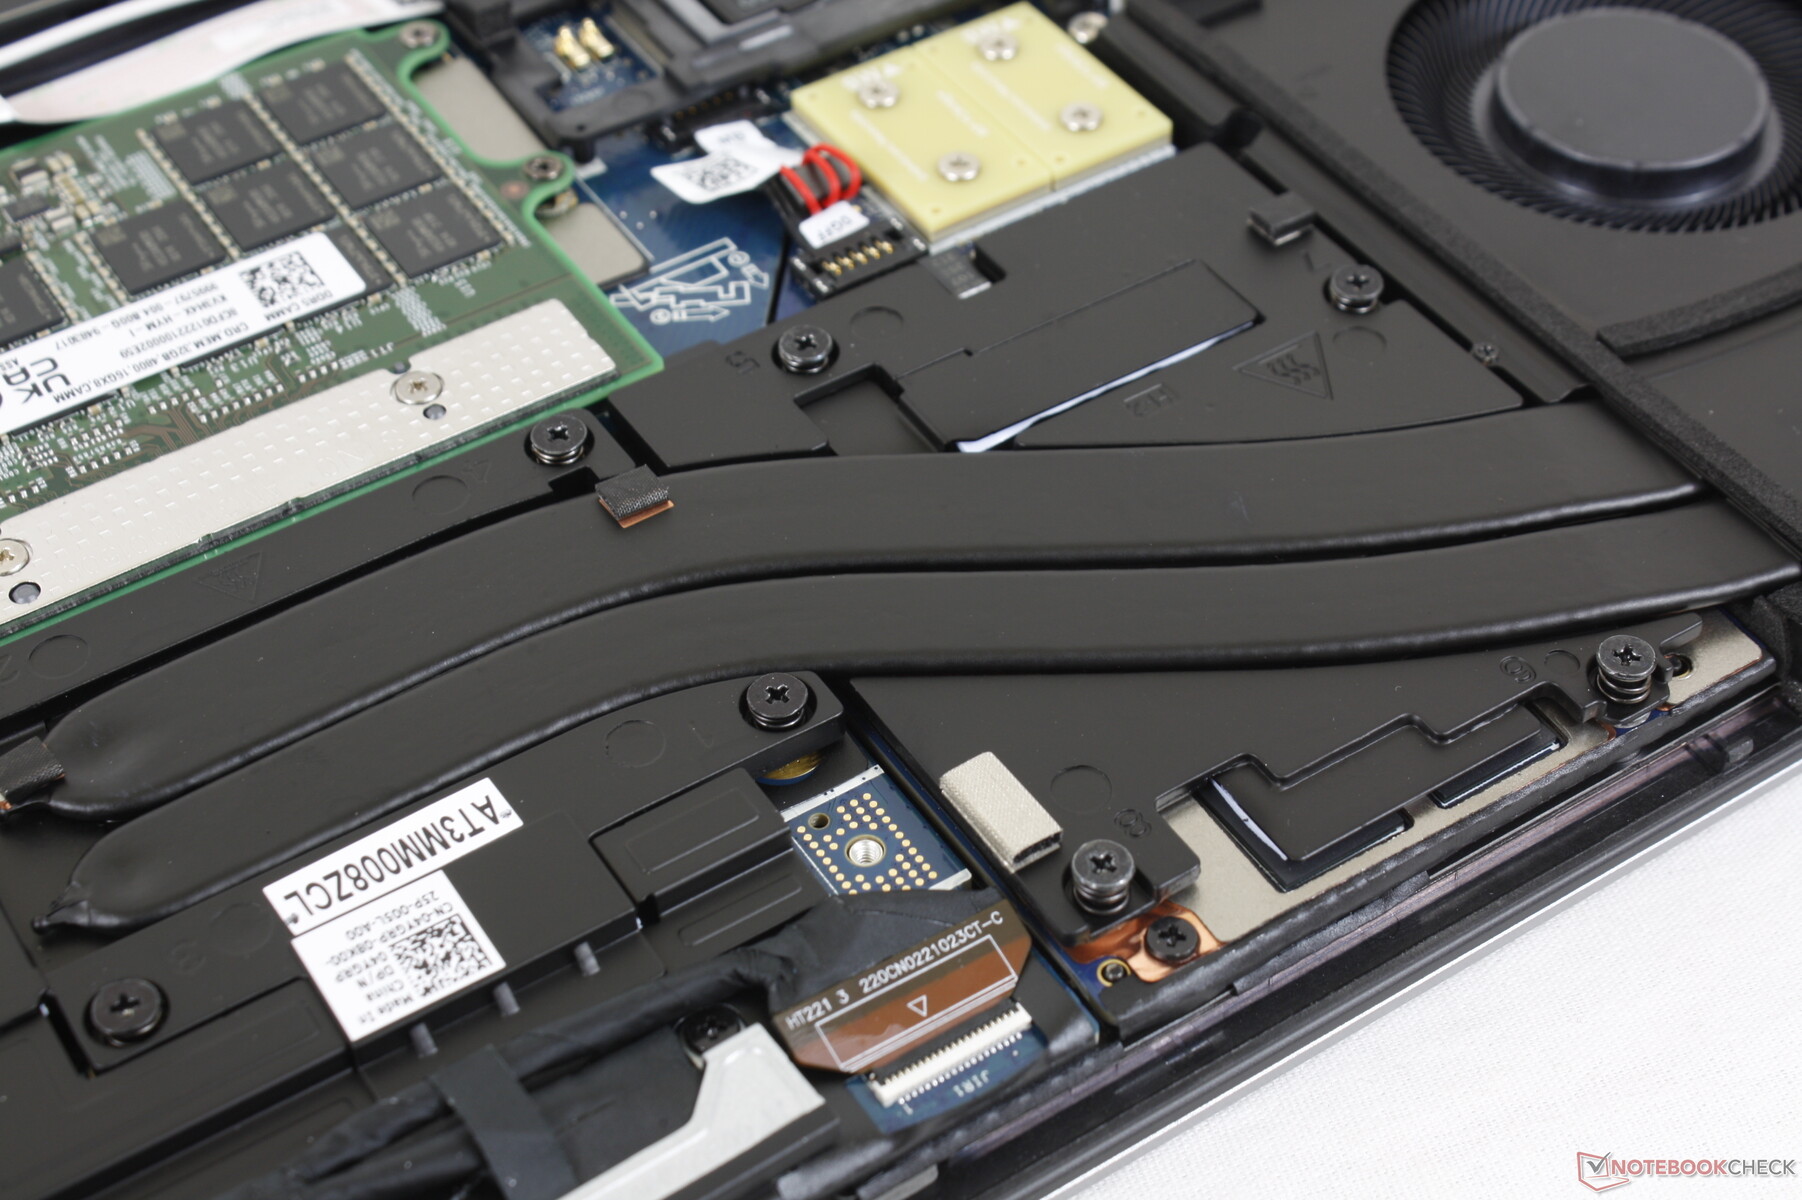
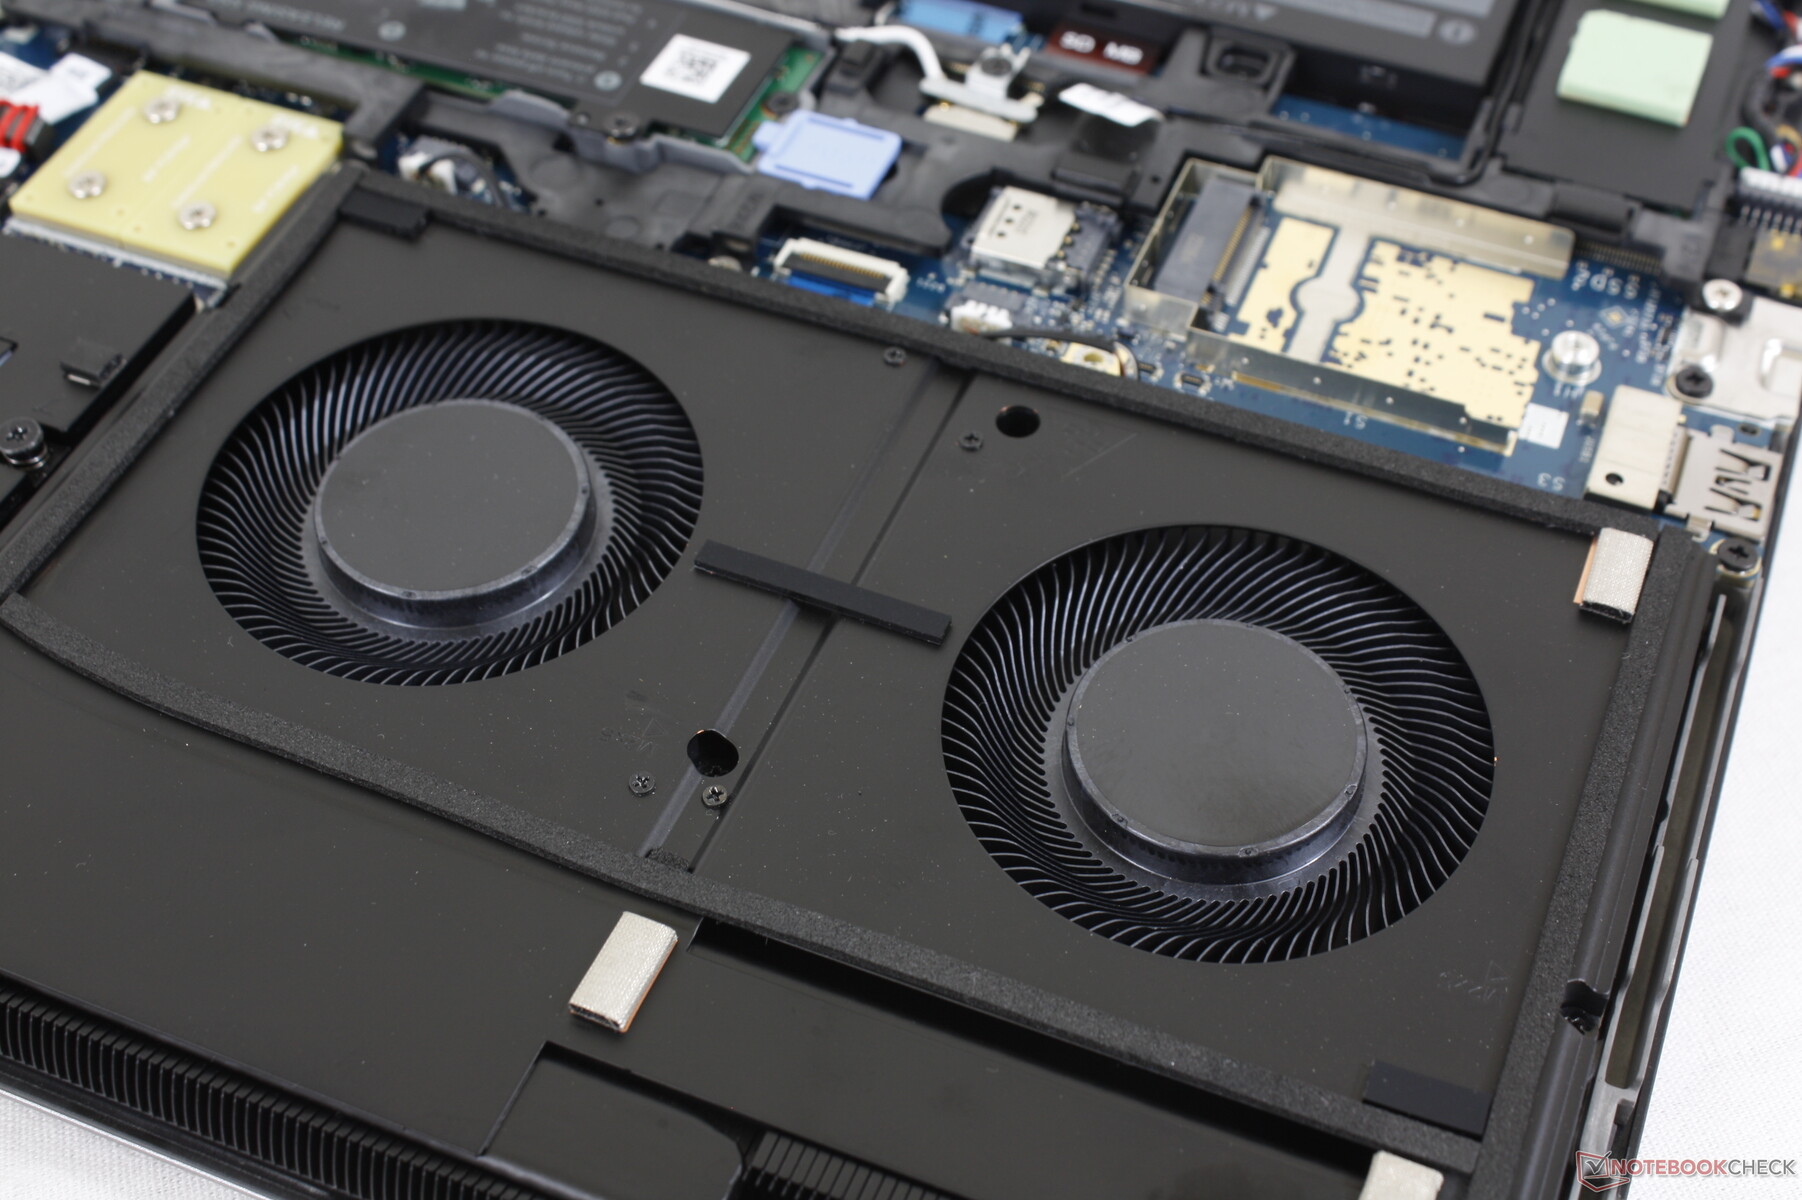
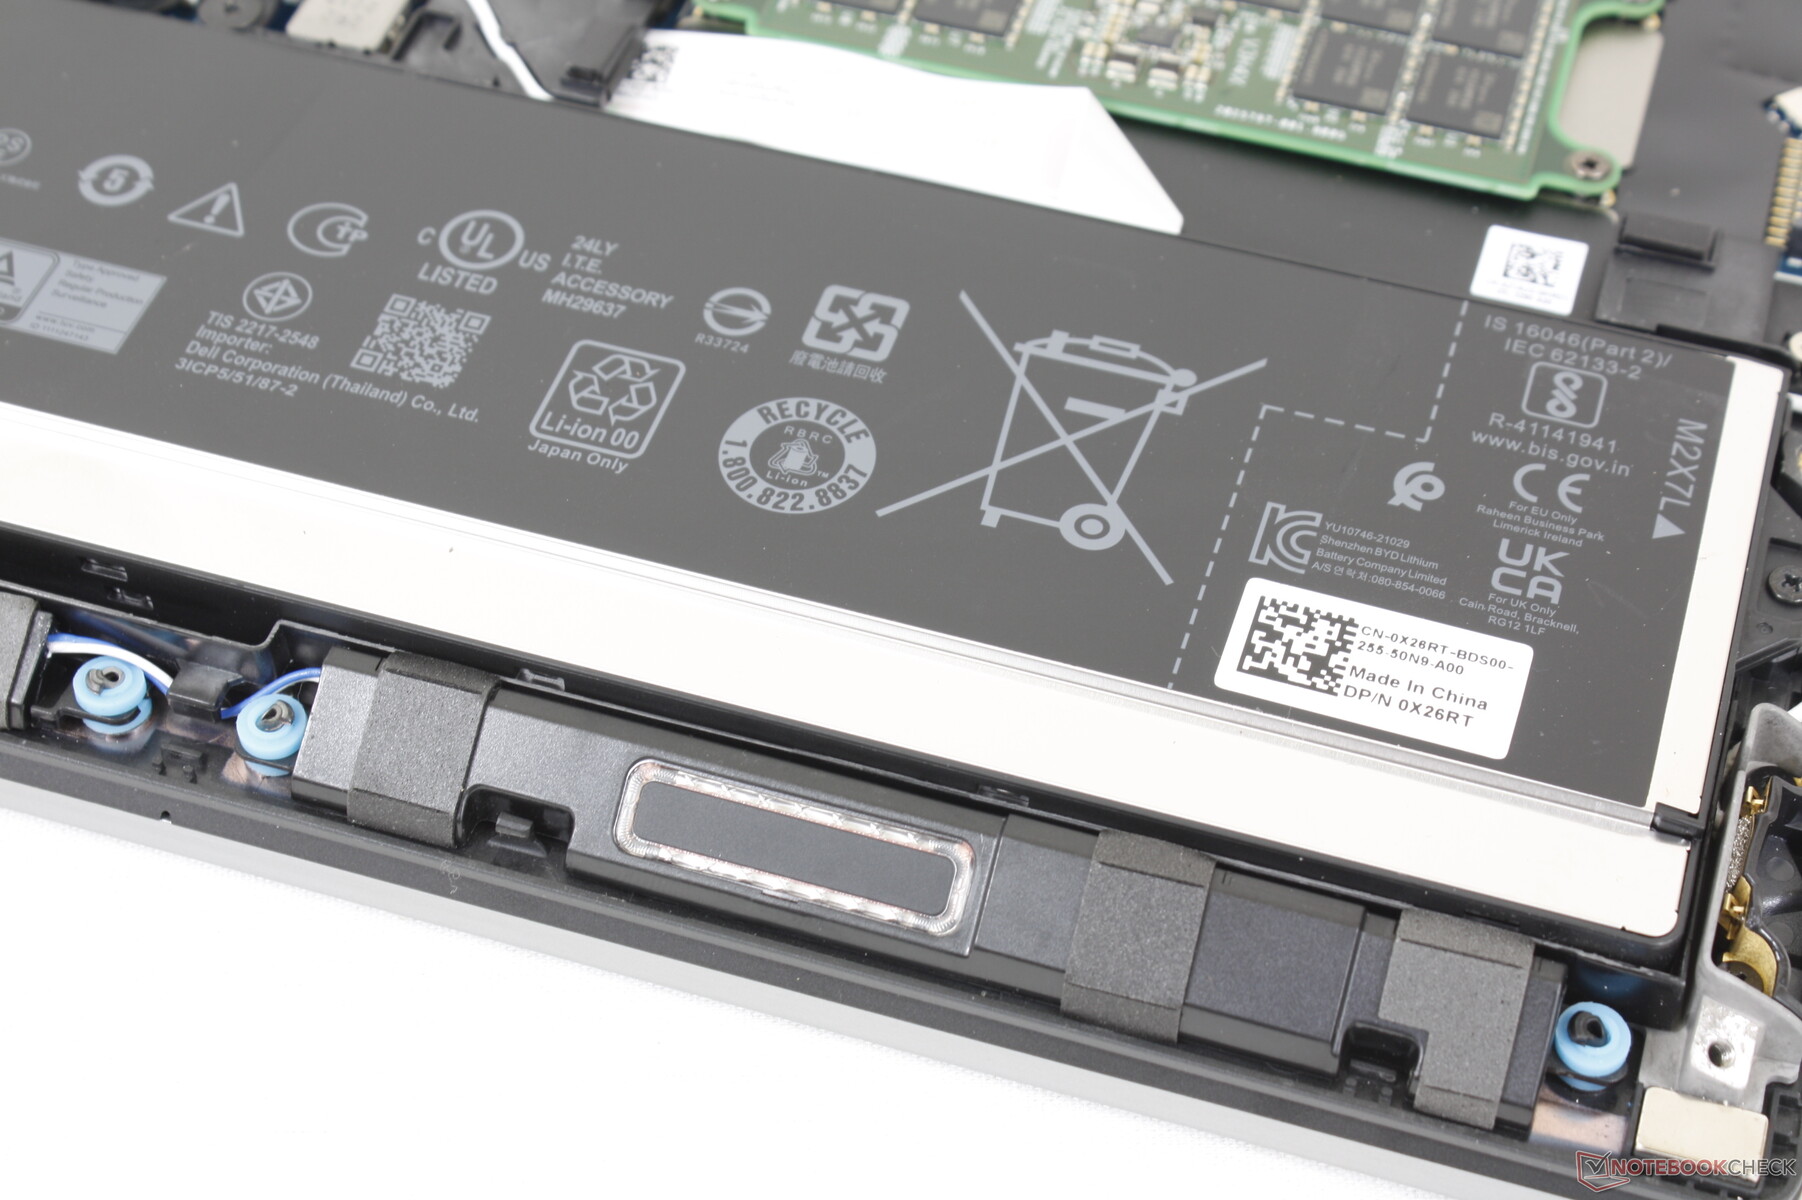
Maintenance — Easy Access
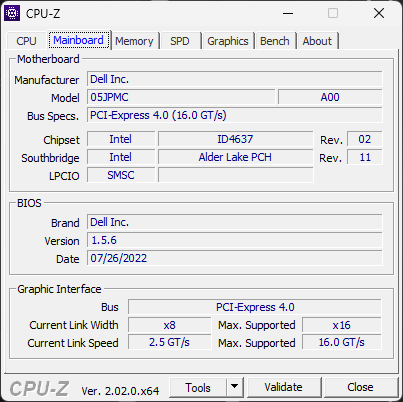
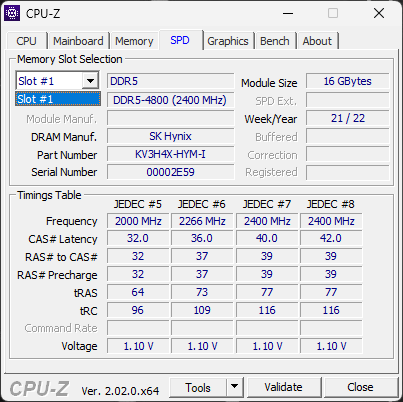
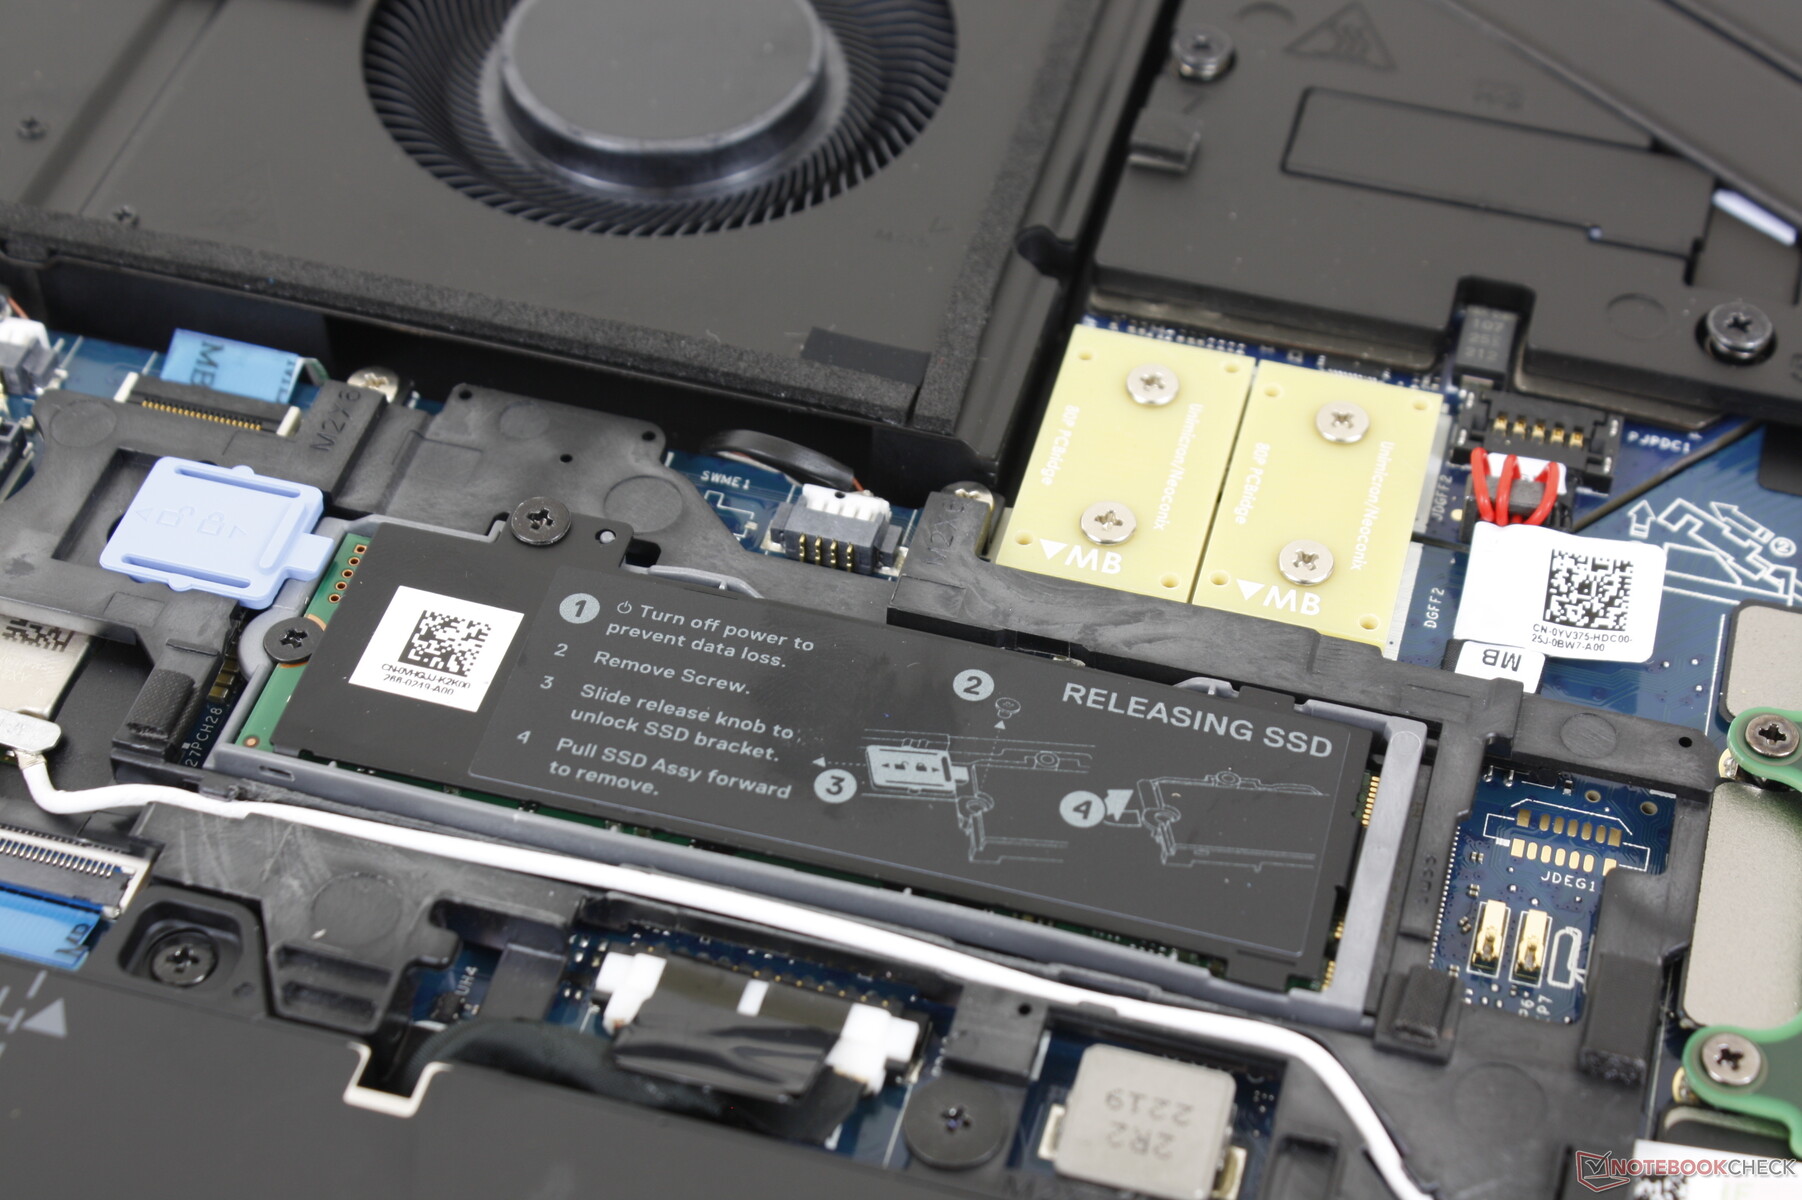
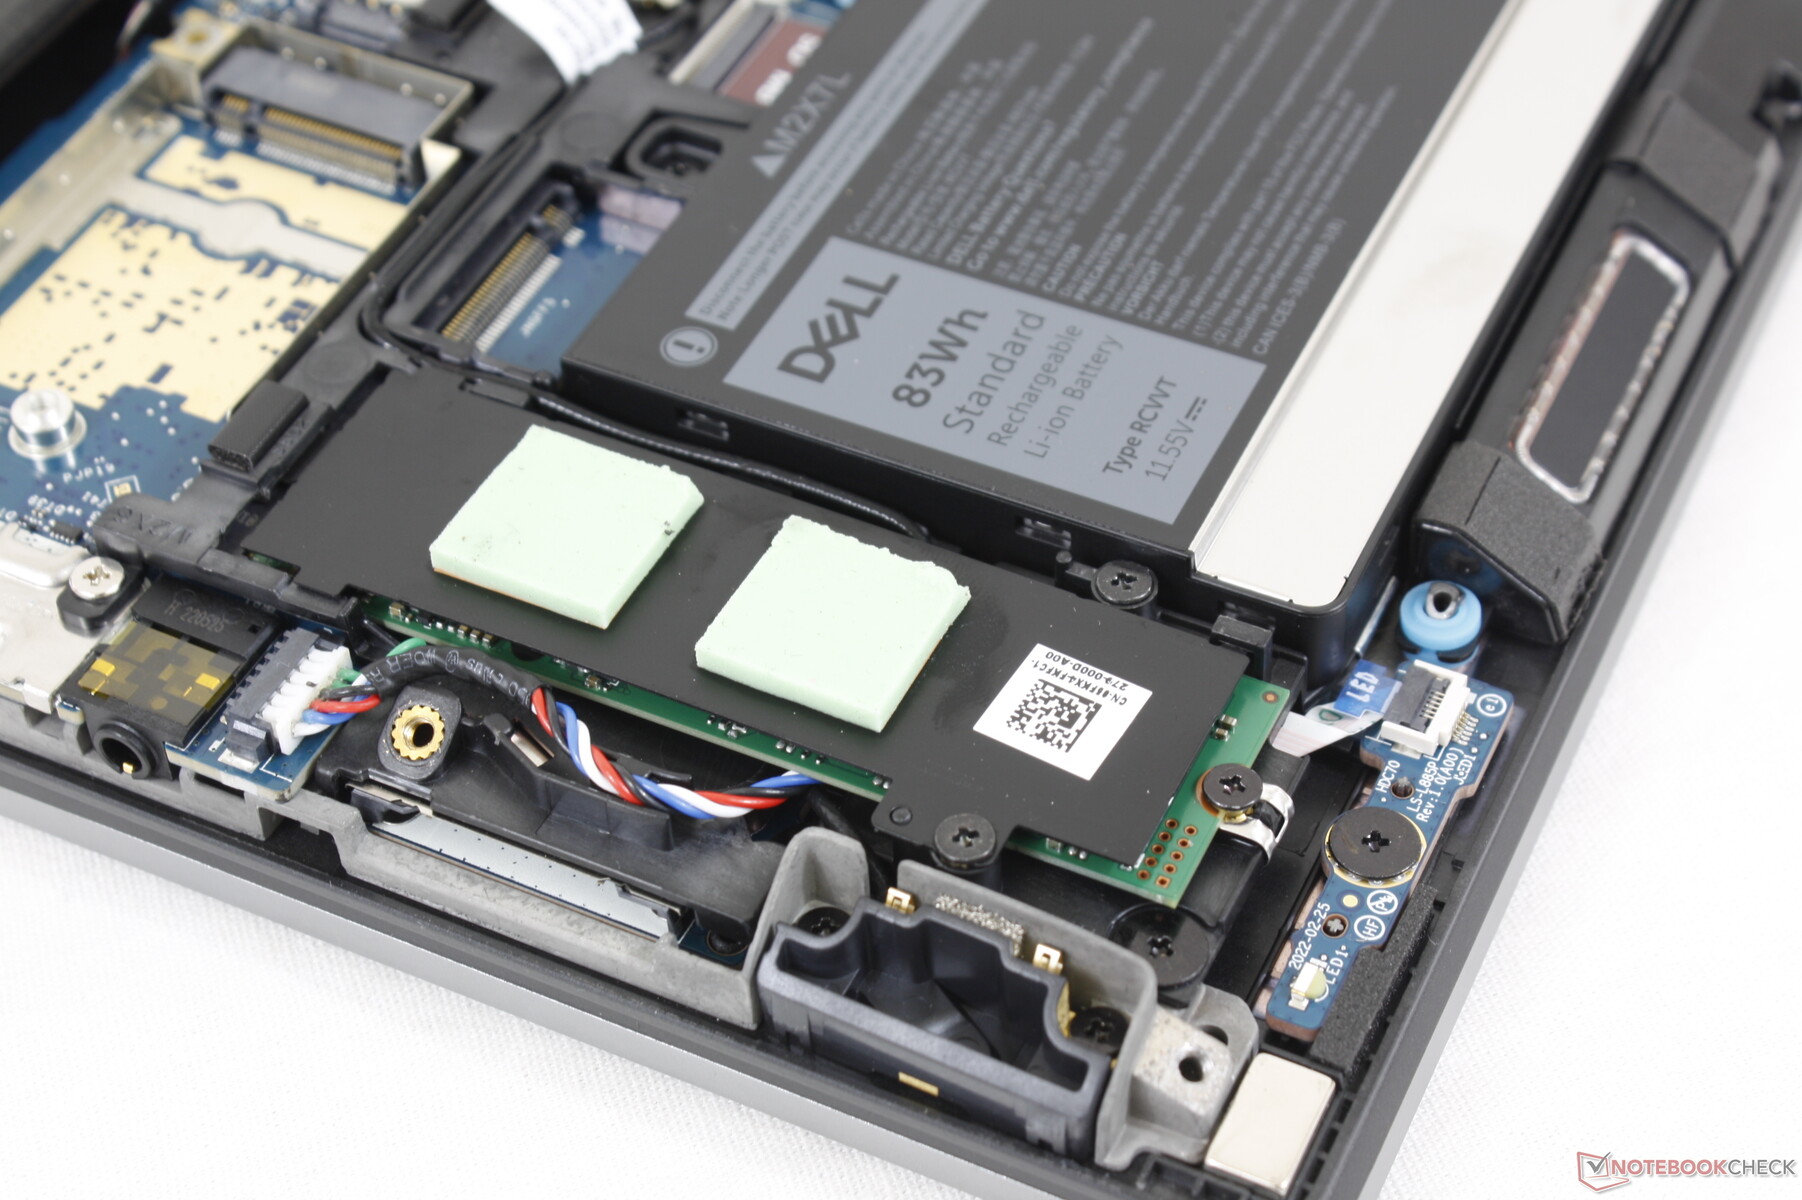
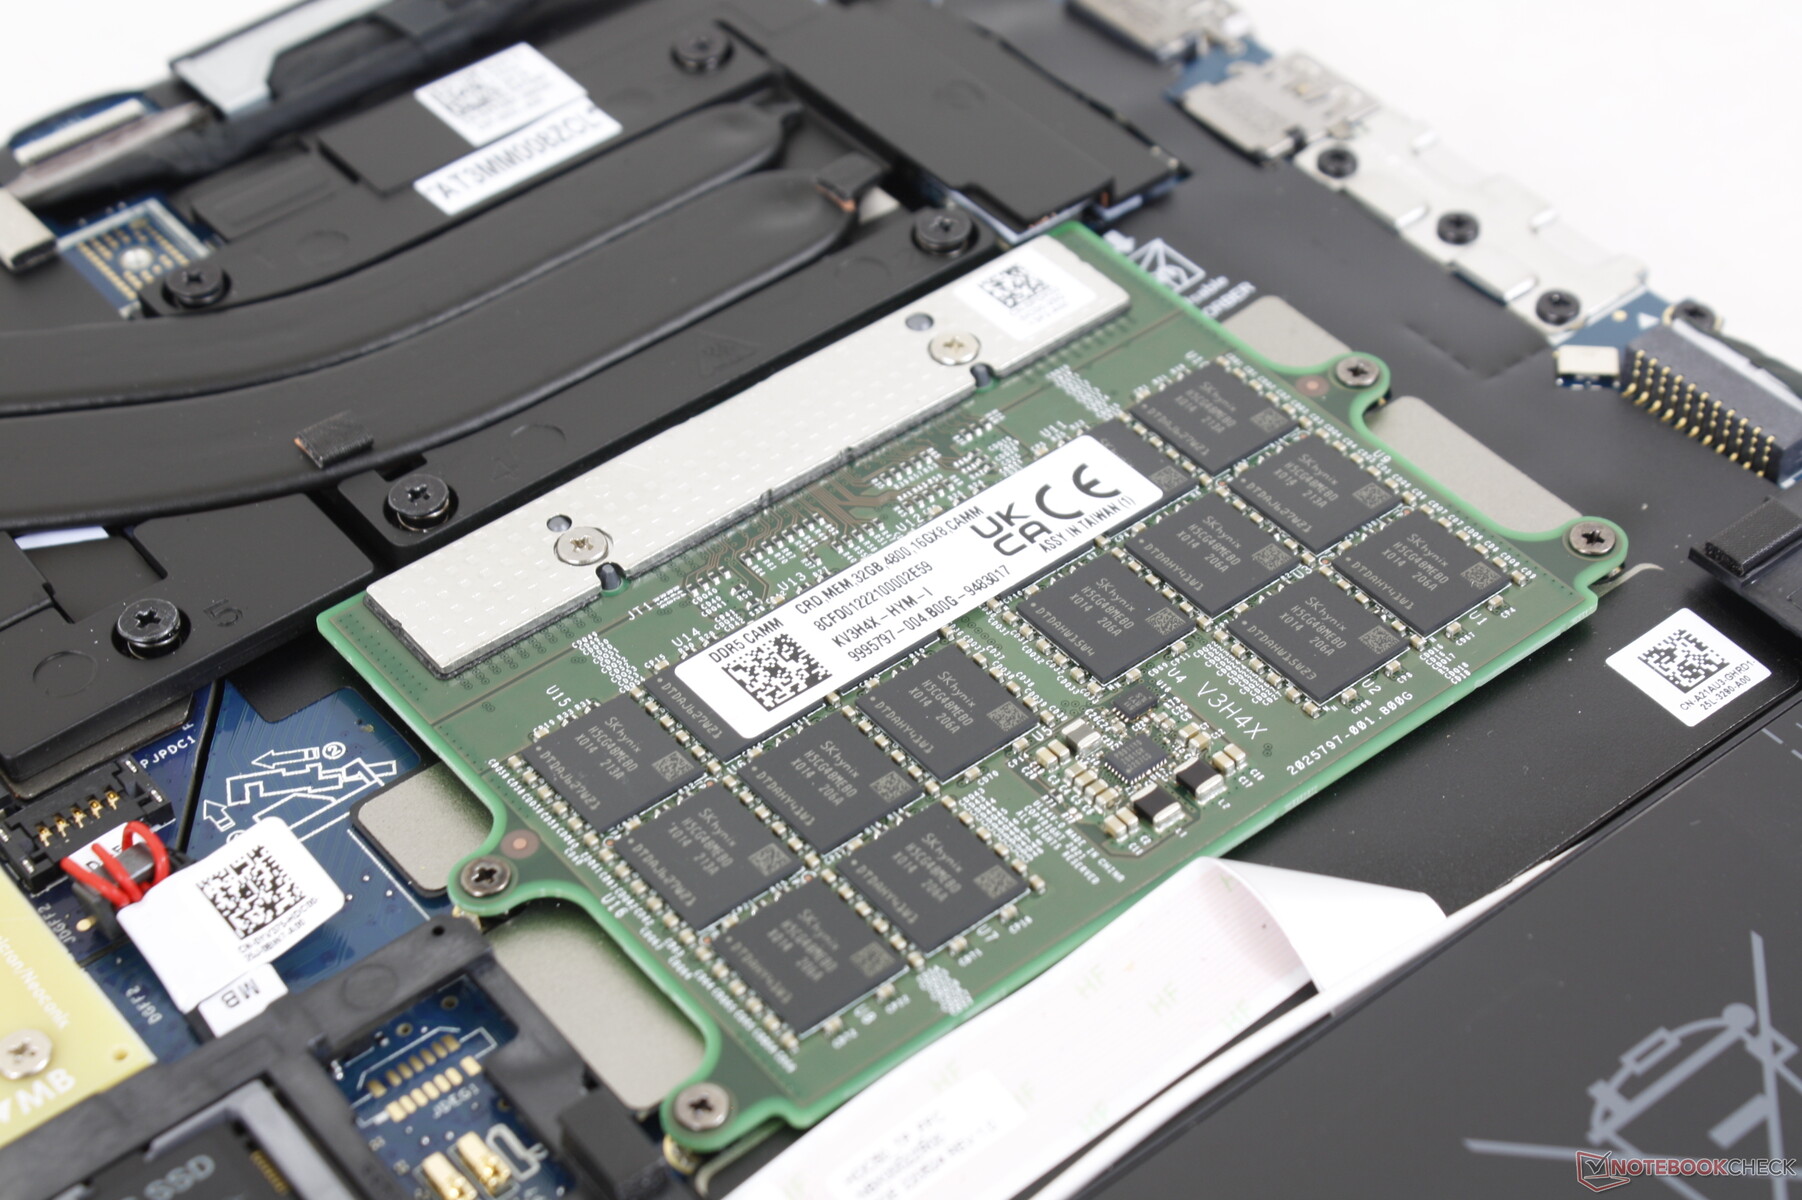
The bottom panel is secured by 6 Philips screws for easy servicing. Users have access to two M.2 PCIe4 x4 2280 slots, WAN slot, Nano-SIM slot, and either SODIMM or CAMM slots depending on the configuration. The WLAN module is not removable.
Certain configurations can house up to three M.2 SSDs as exemplified by the third M.2 slot near the edge of the battery.
More information on CAMM RAM can be found on our preview page here.
Accessories and Warranty
There are no extras in the box other than the AC adapter and paperwork. A three-year limited manufacturer warranty comes standard if purchased directly from Dell.
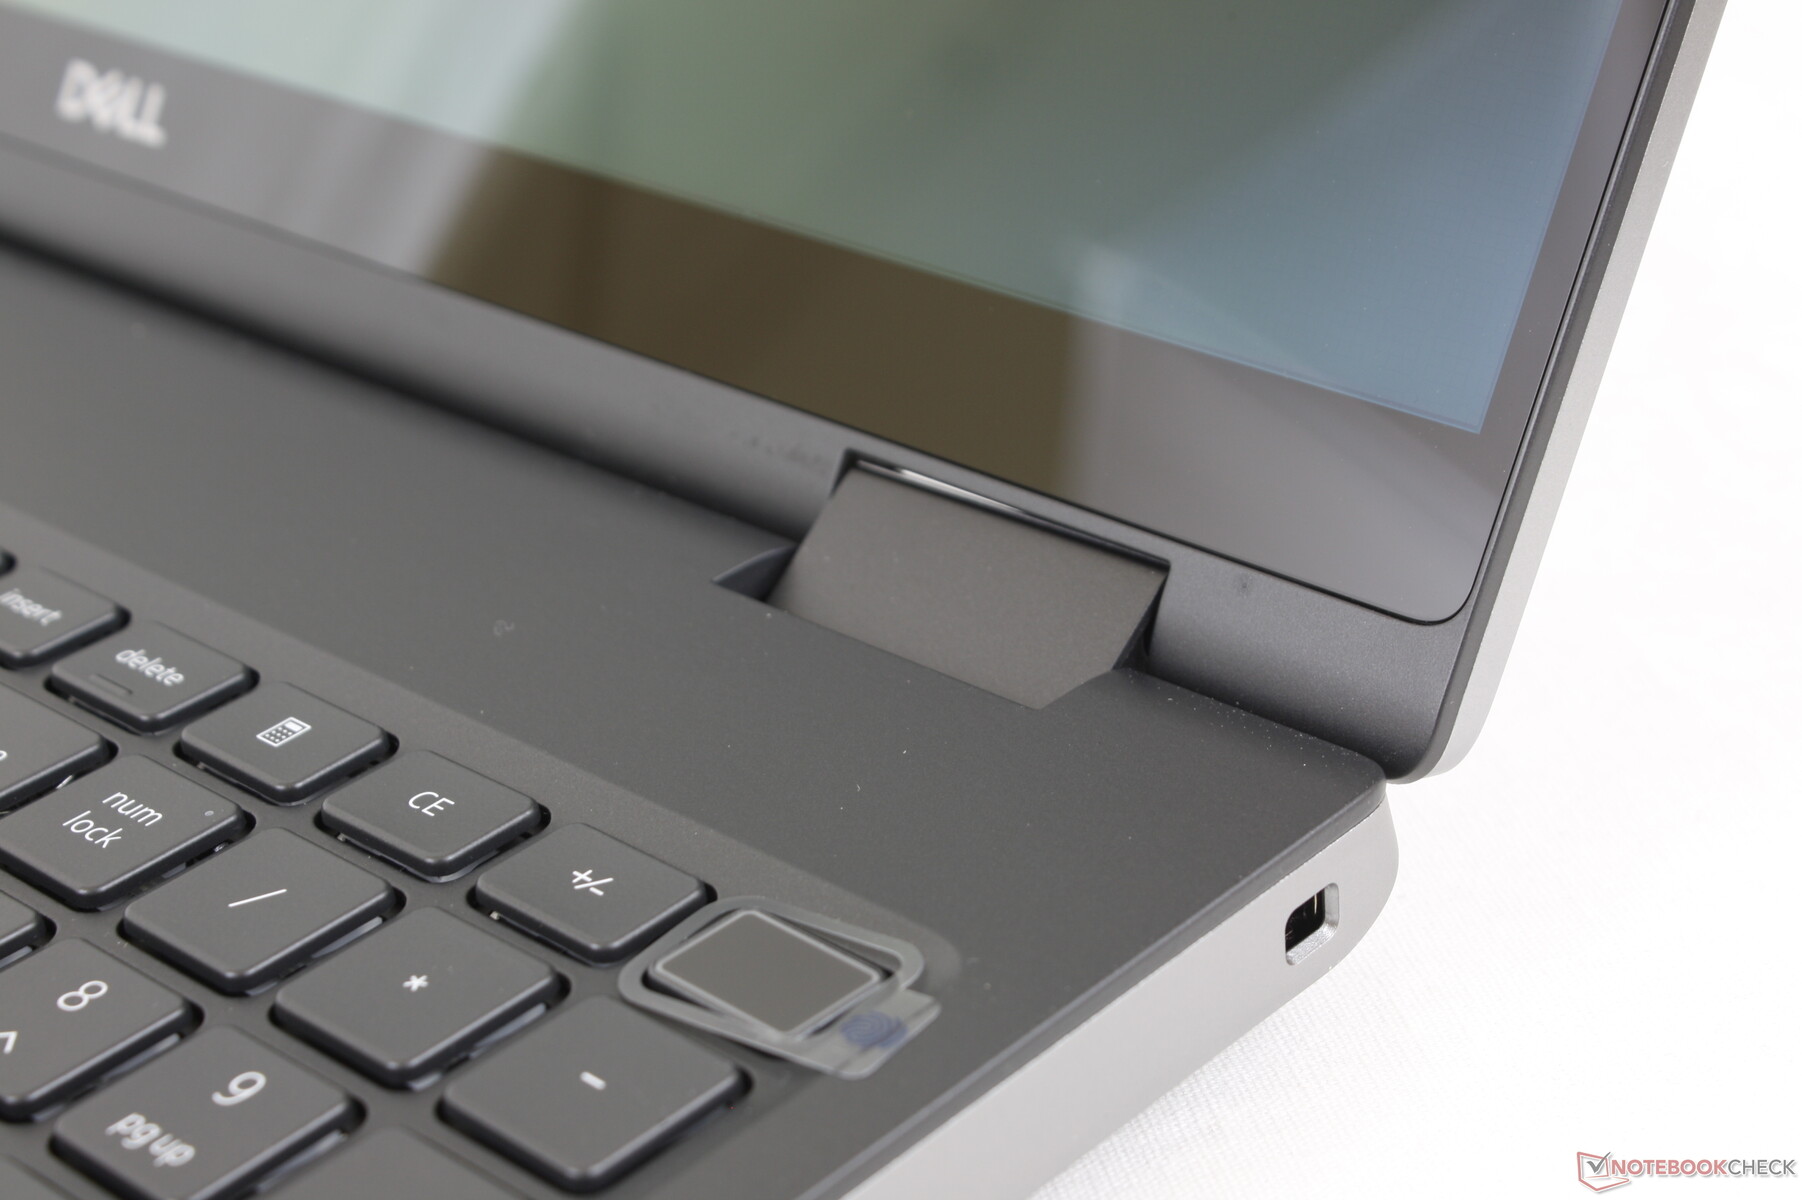
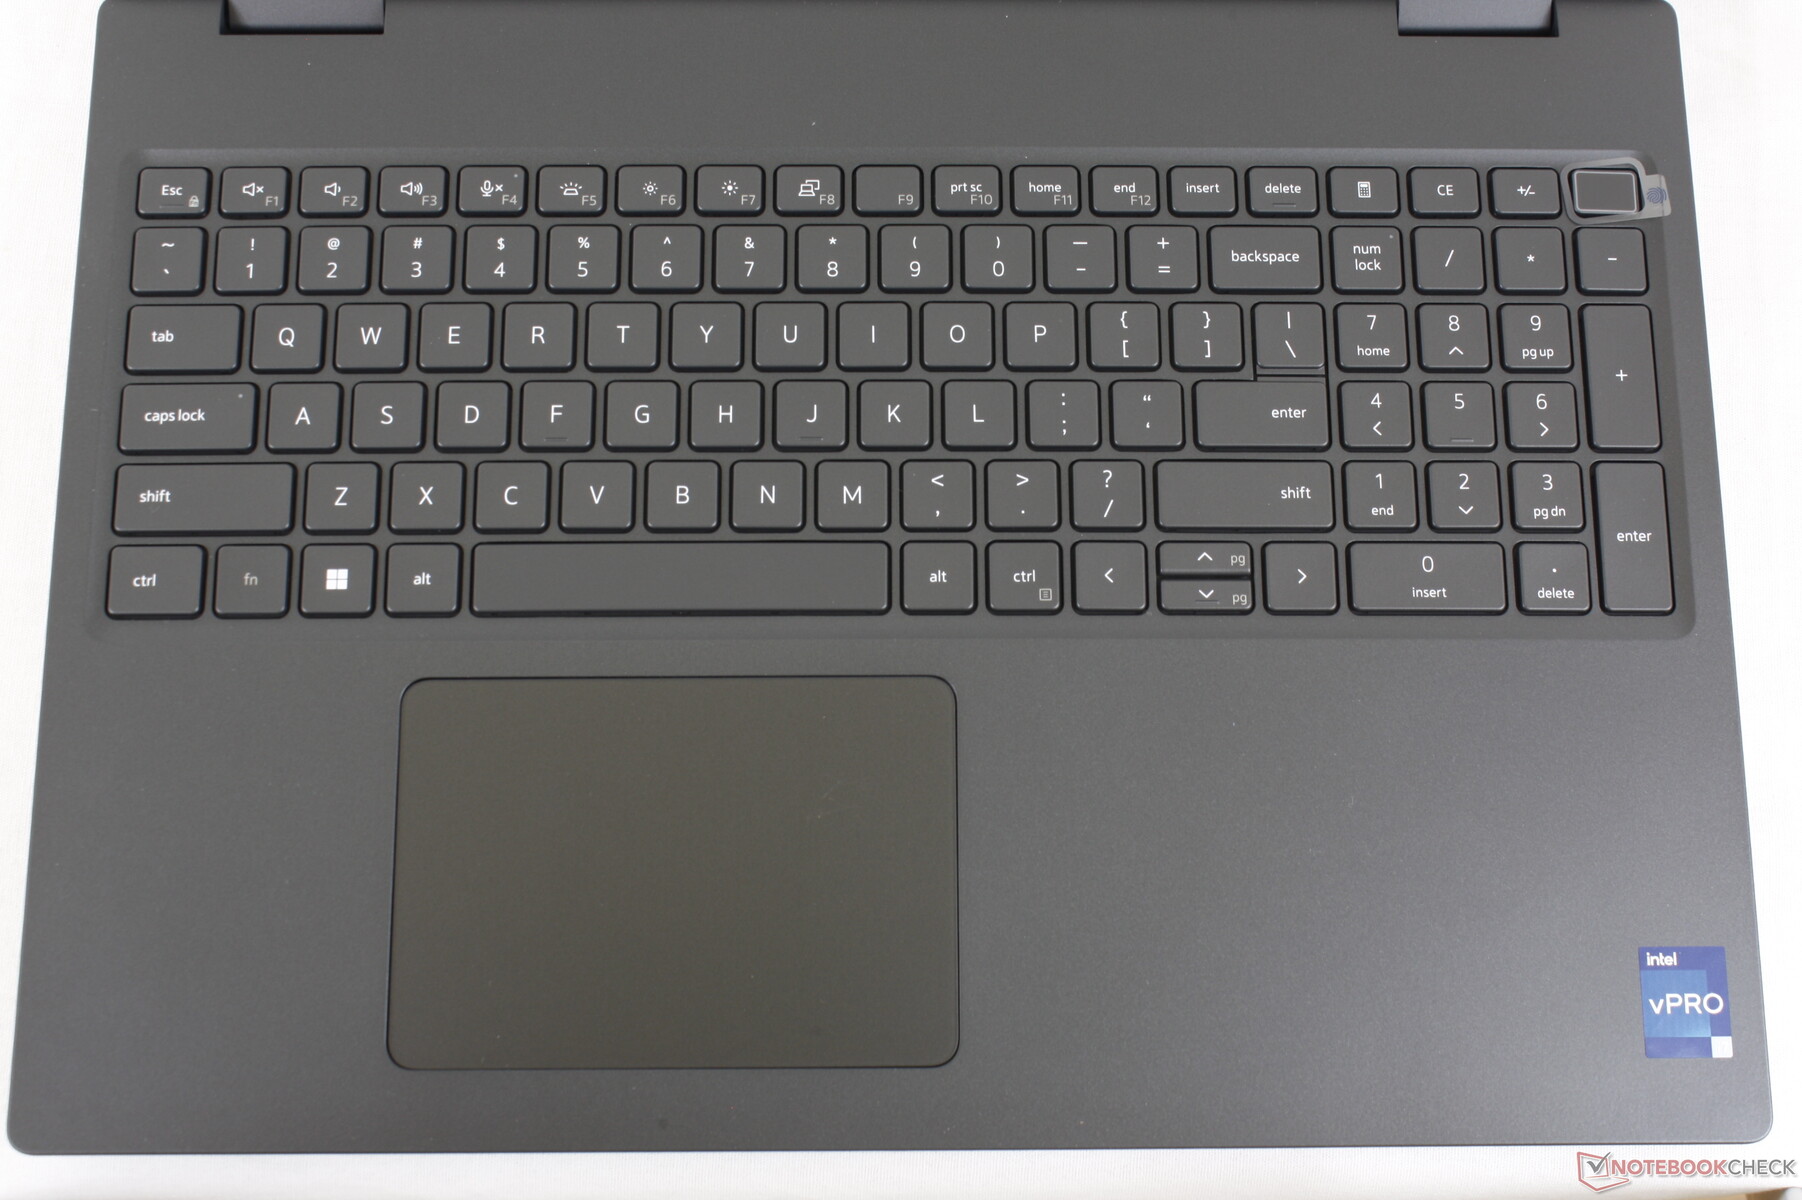
Input Devices — Large Clickpad With A Comfortable Keyboard
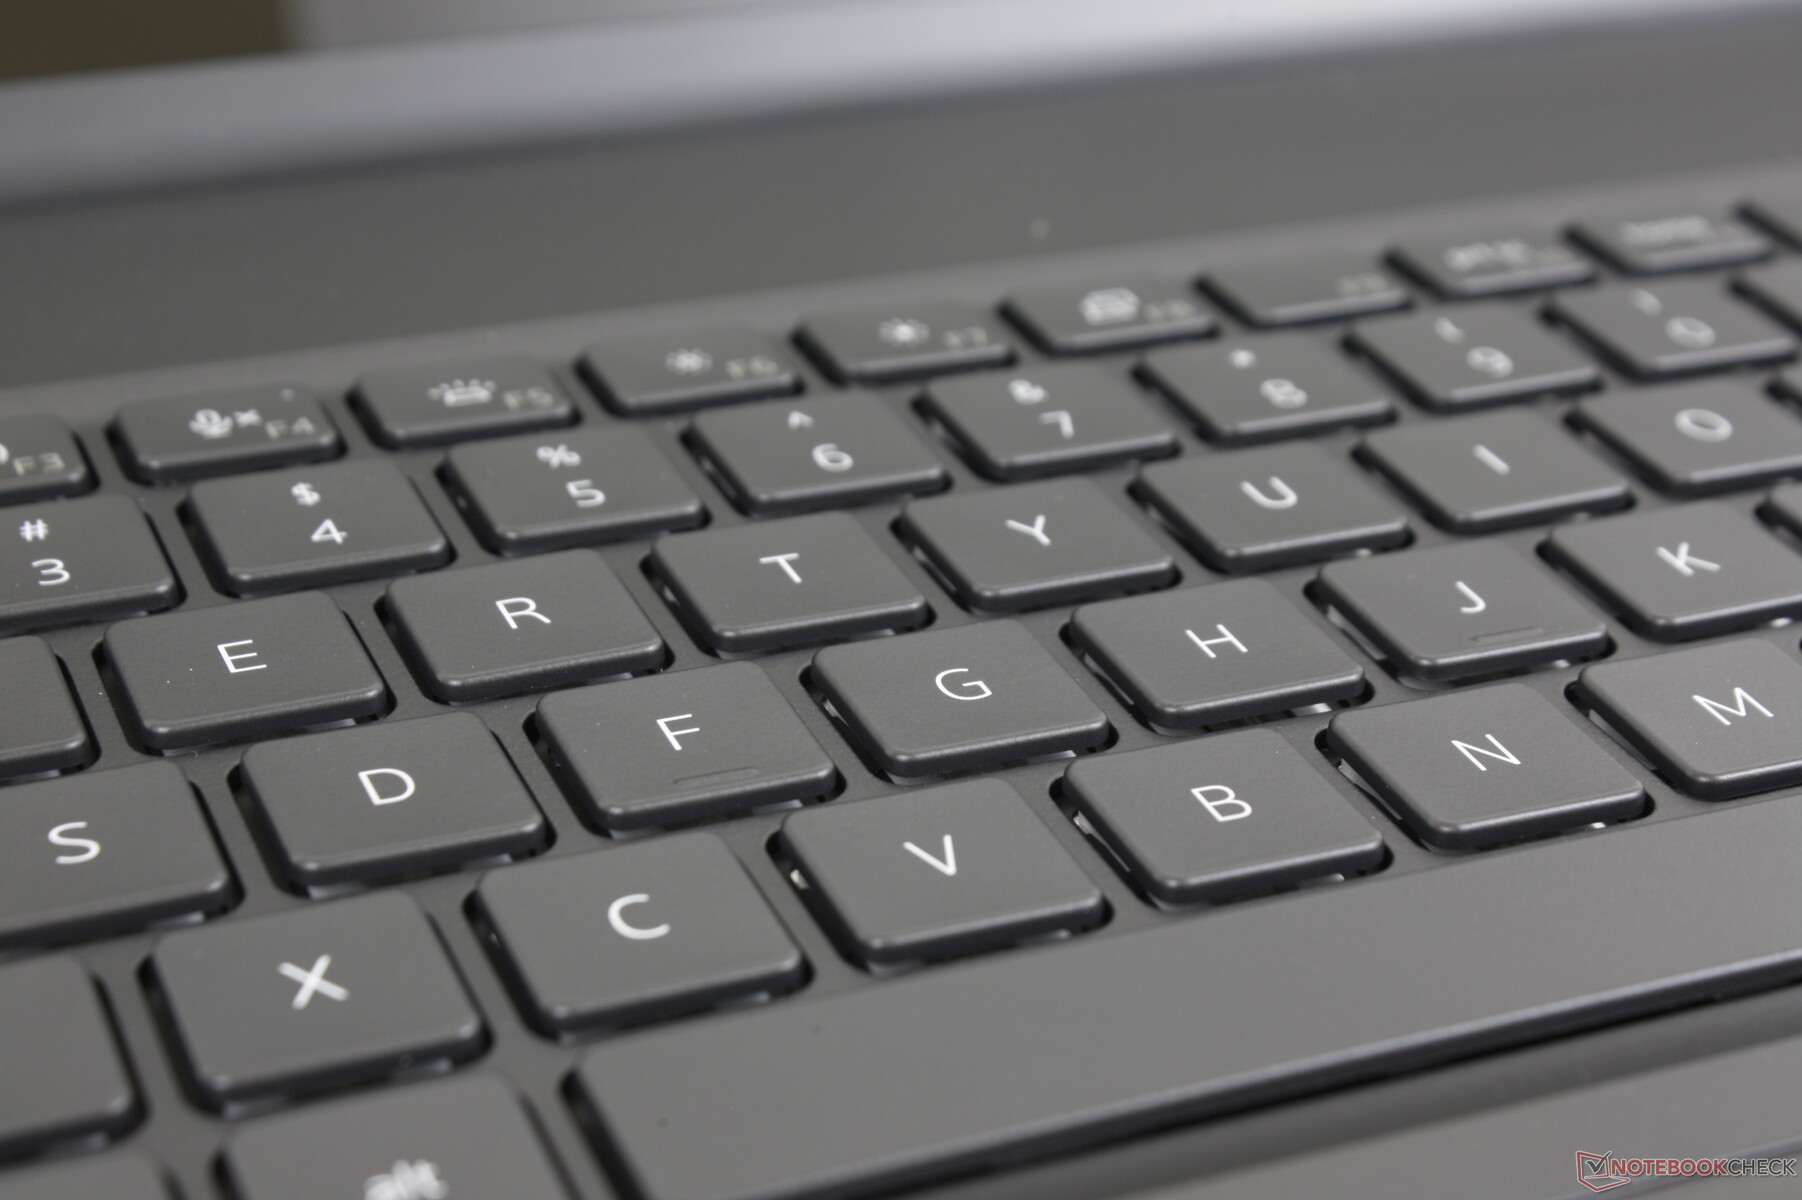
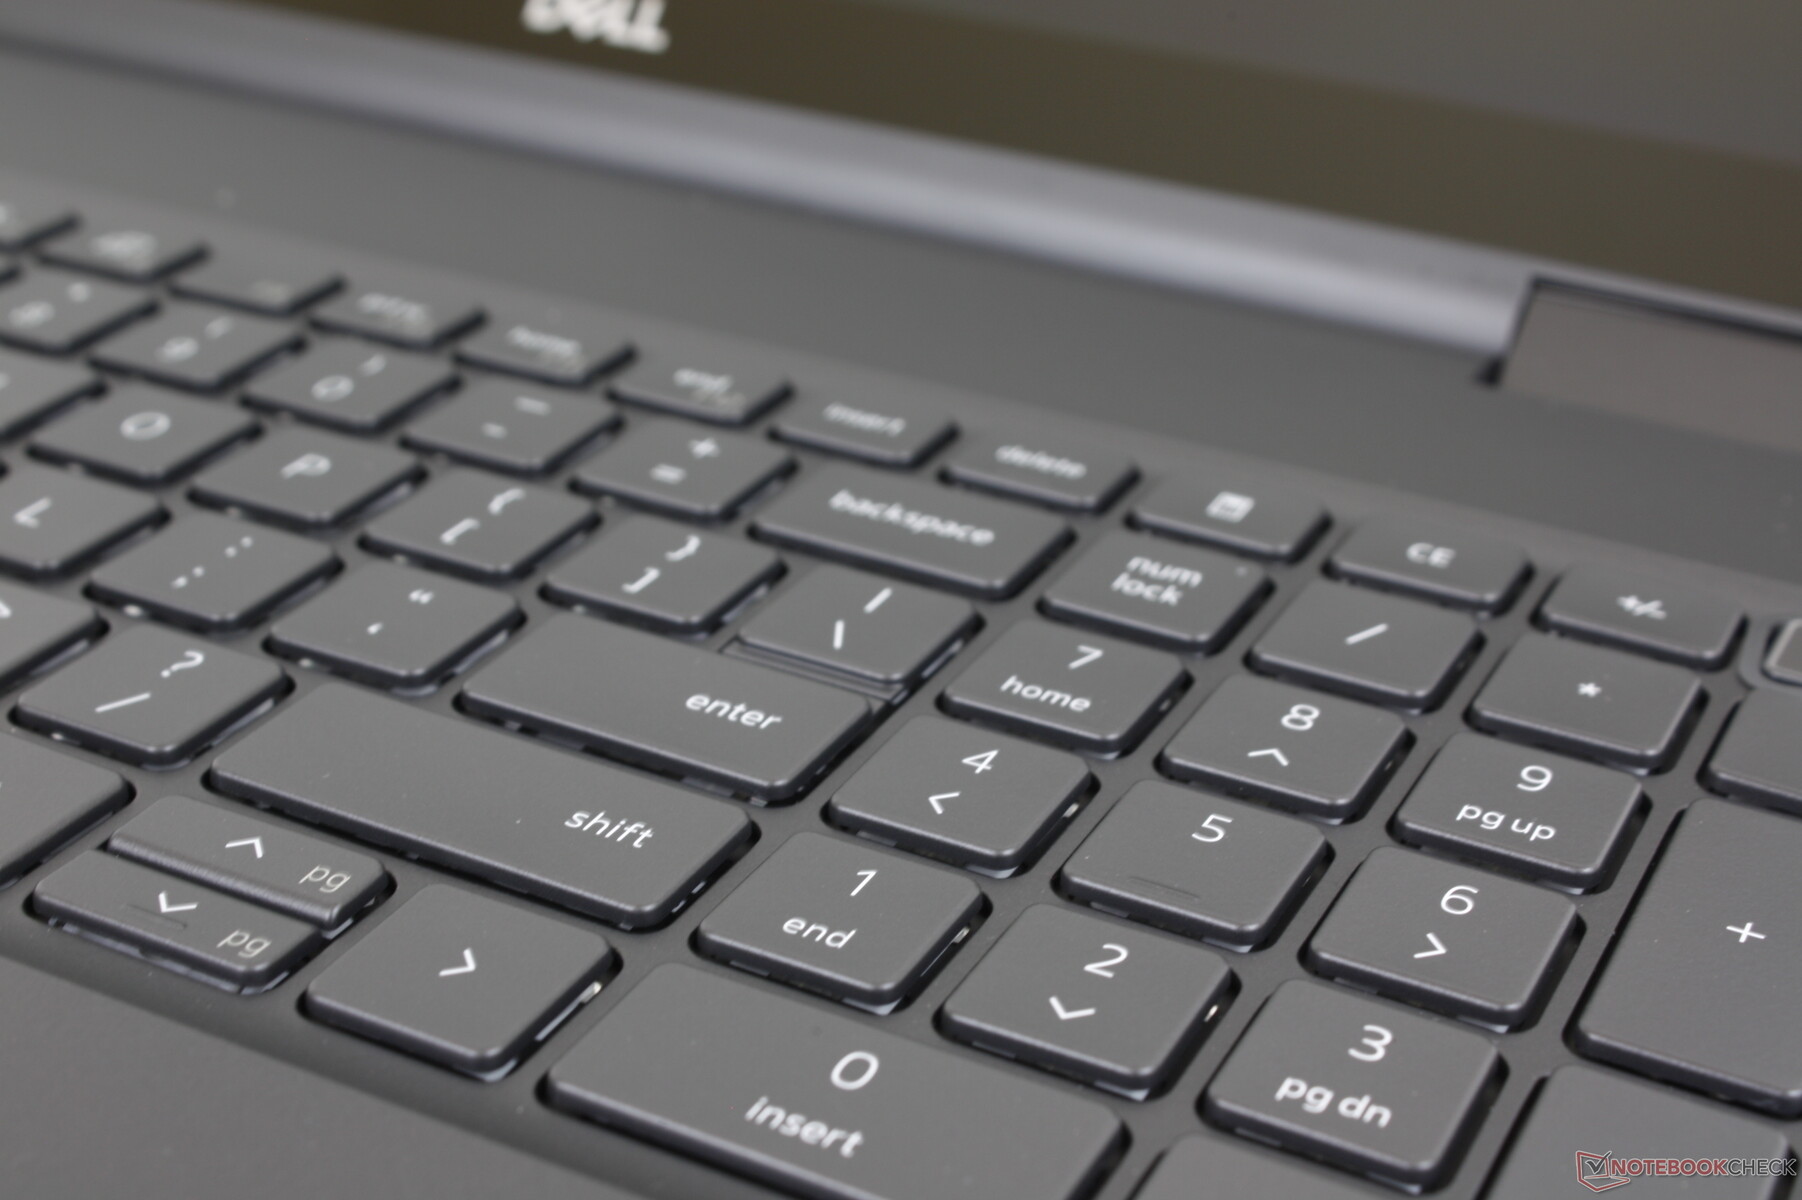
Keyboard
Key layout and feedback haven't changed from the Precision 7550. We find the keys to be slightly louder than the keys on the XPS series but with both stronger feedback and deeper travel. However, the arrow keys are still cramped unlike the larger arrow keys on the ThinkPad P1 G4 or Asus ProArt StudioBook.
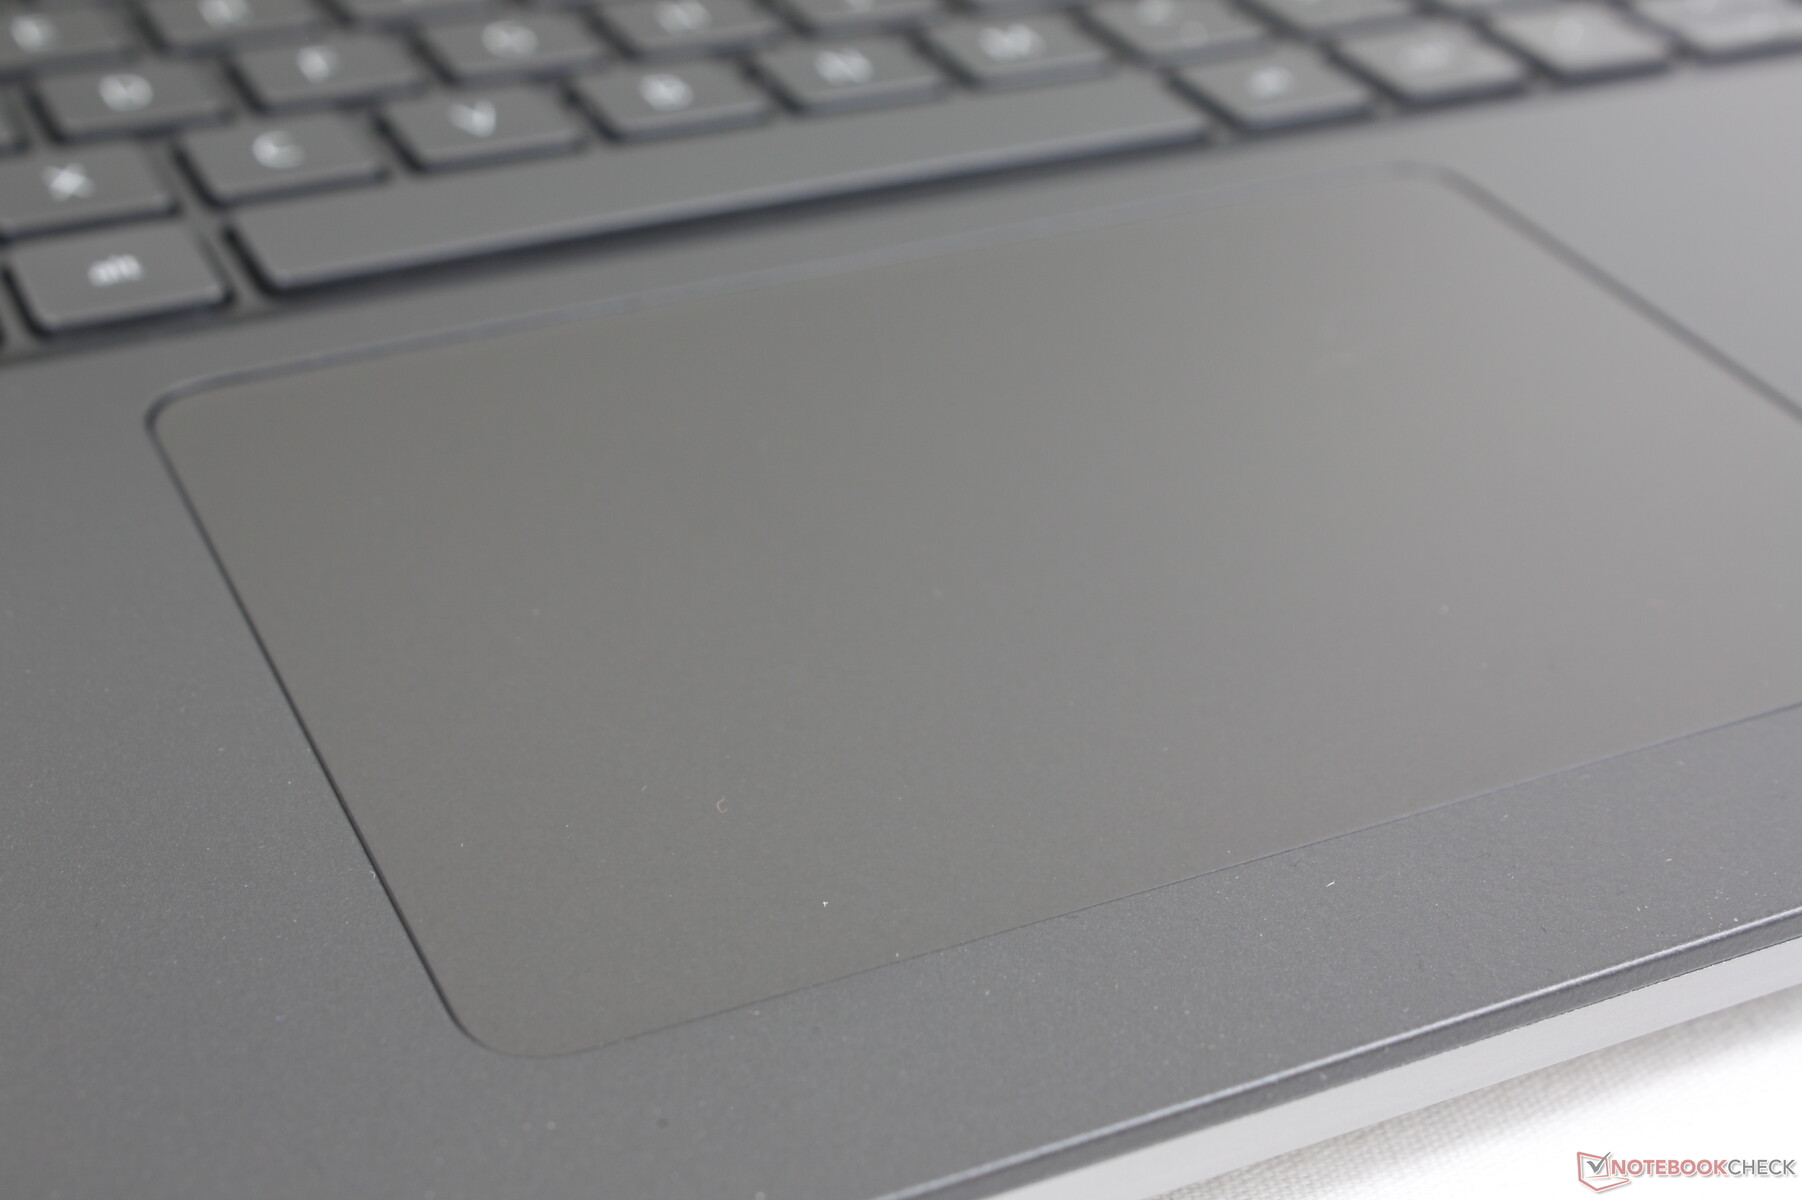
Touchpad
The clickpad is larger than the one on the Precision 7550 (11.5 x 8 cm vs. 10 x 6.5 cm). There are no more dedicated mouse buttons, however, and so the user experience is closer to a traditional Ultrabook than to a business-centric ThinkPad or ZBook where mouse buttons are still prominent. We personally prefer dedicated buttons as drag-and-drop actions are made easier, but the lack of buttons has resulted in a larger clickpad surface area which others may appreciate.
Display — No 120 Hz Options
Dell offers three display options as of this writing:
- 1200p, 60 Hz, 60 percent sRGB, 250 nits, non-touch
- 1200p, 60 Hz, 99 percent DCI-P3, 500 nits, non-touch, IPS
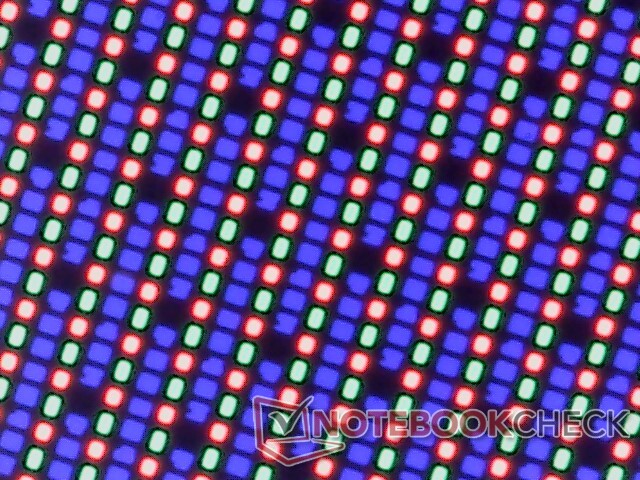
- 2400p, 60 Hz, 100 percent DCI-P3, 400 nits, touch, OLED
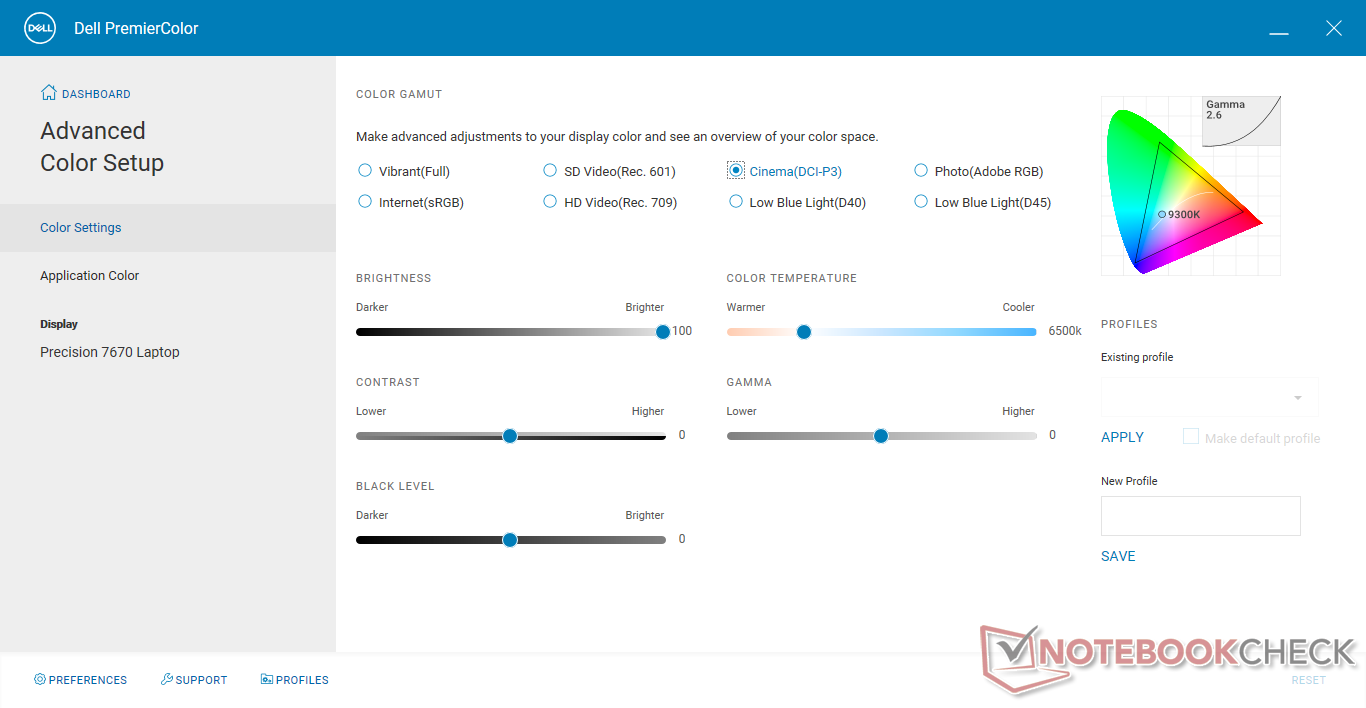
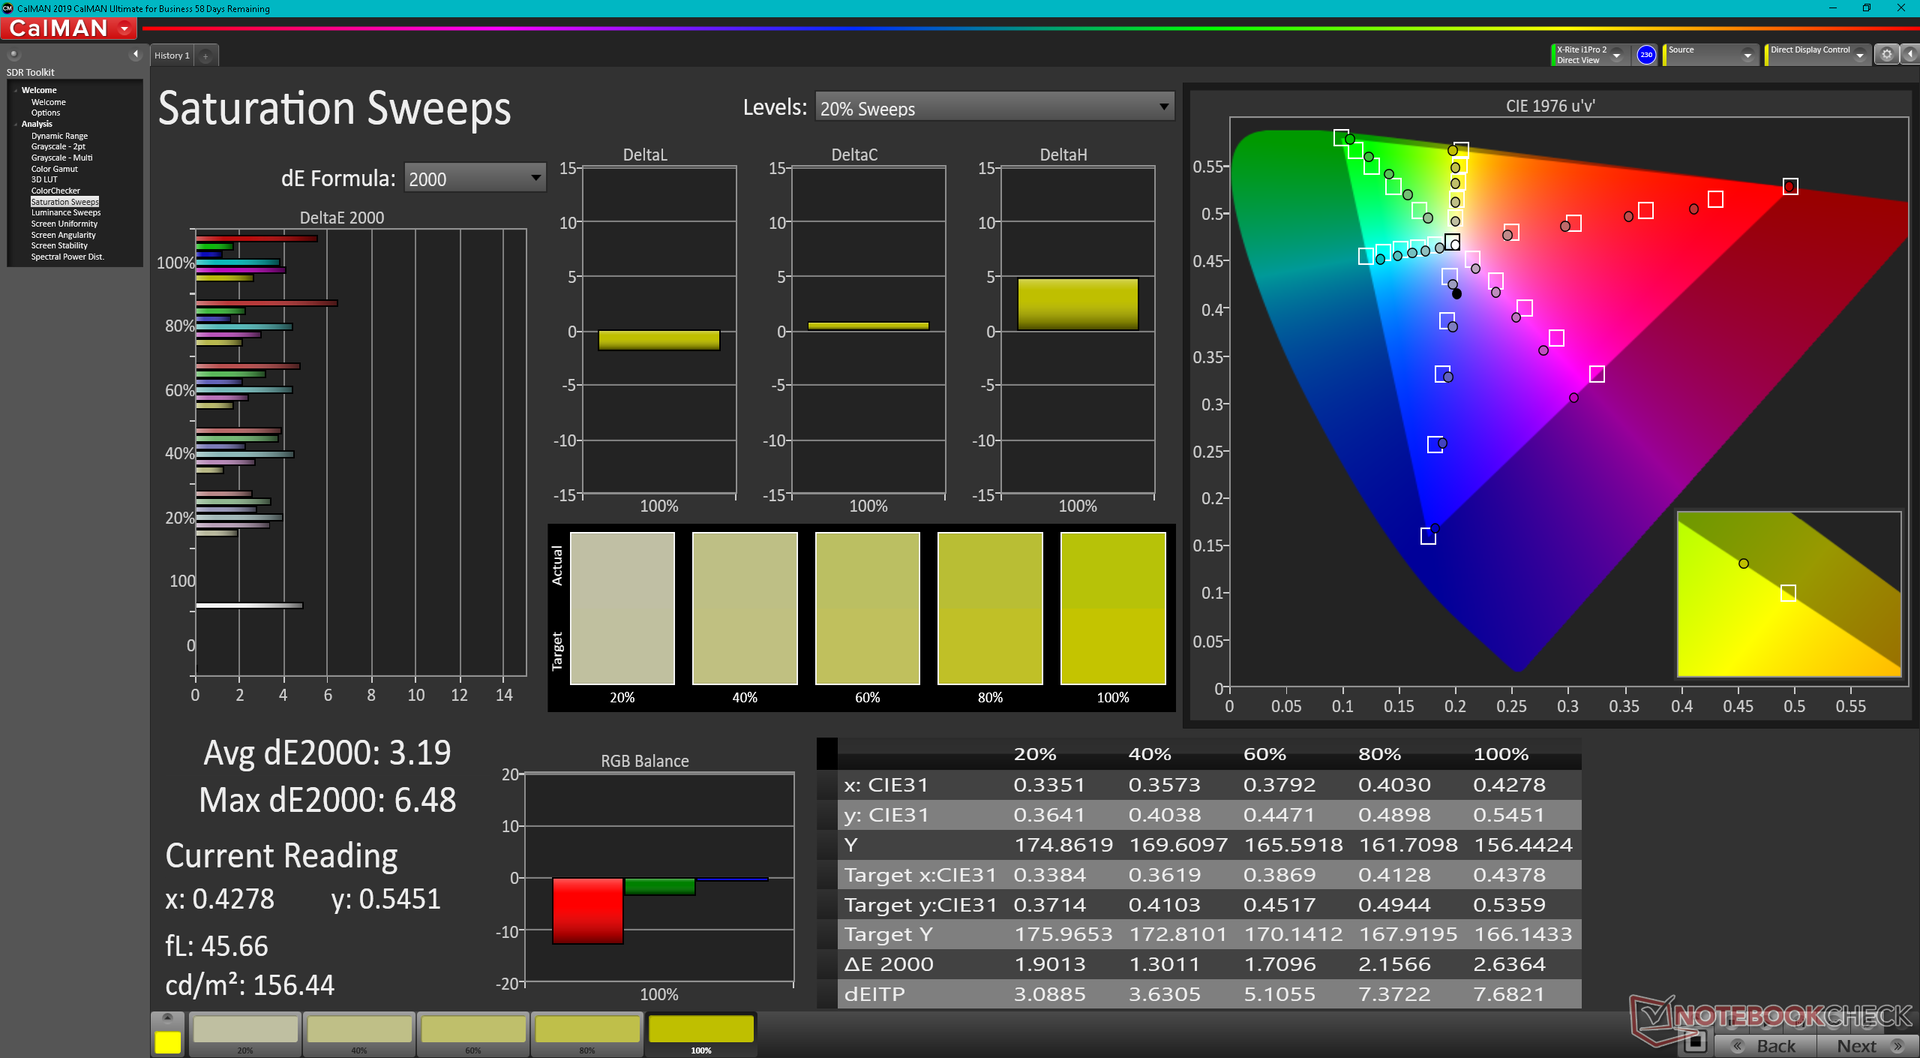
Our independent measurements below reflect only the bold option above. If accurate colors are important for your workloads, then we highly recommend avoiding the base 250-nit option as its color reproduction is as poor as many budget consumer laptops. Owners should become familiar with Dell PremierColor software for adjusting the color profile of the display.
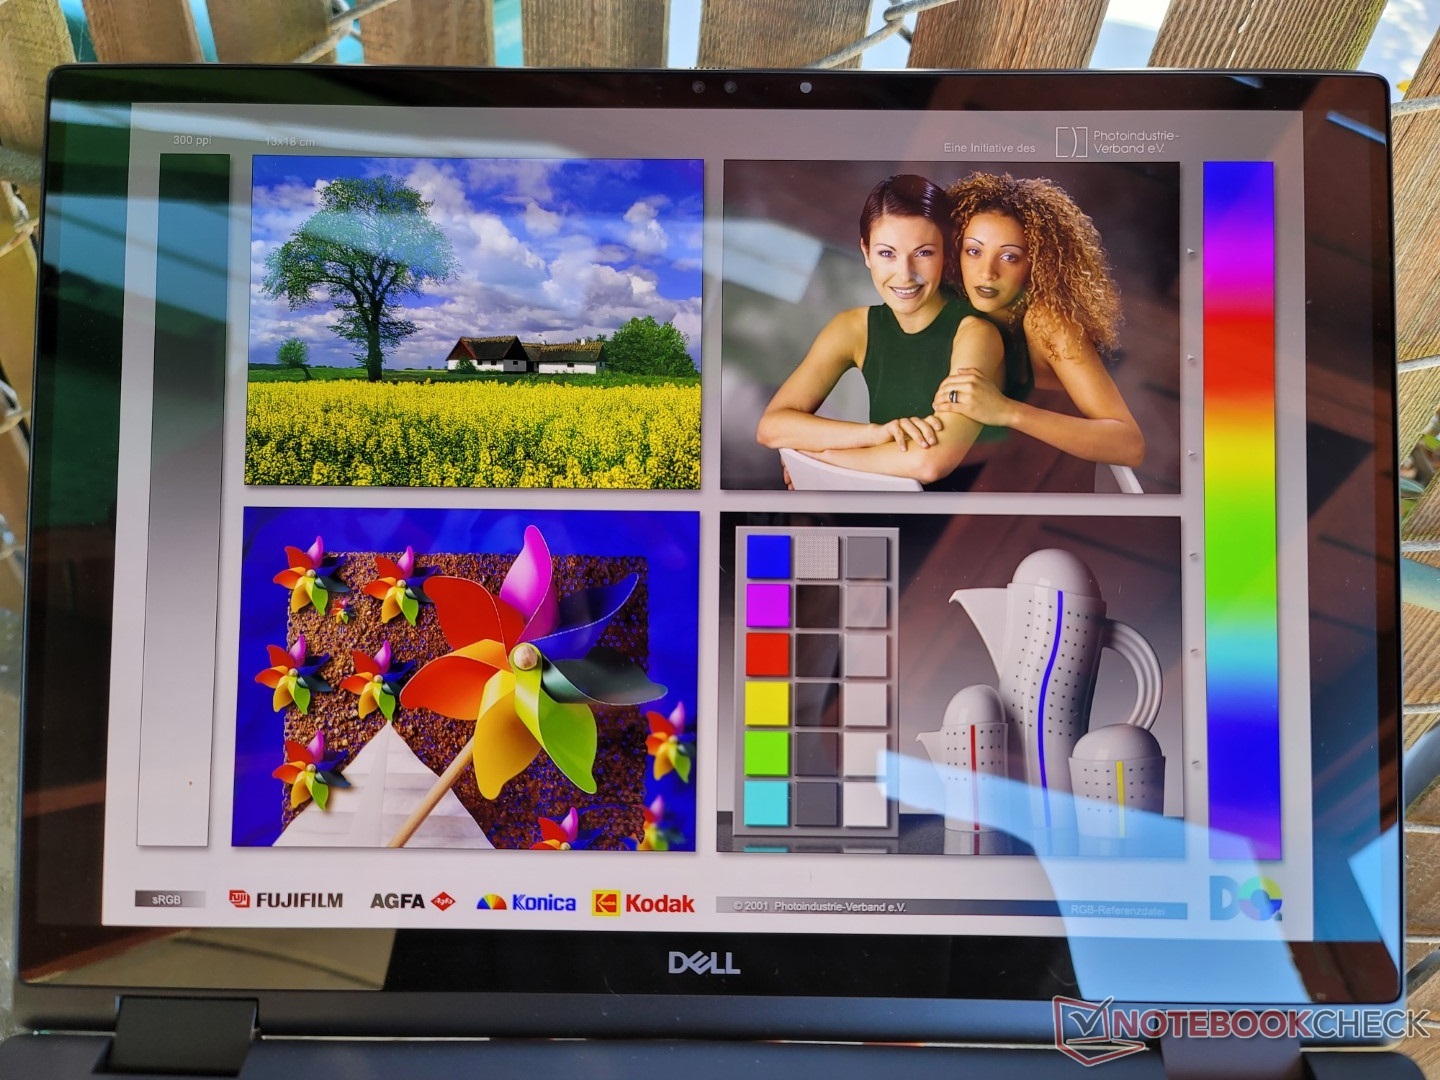
Though we're able to confirm the full DCI-P3 coverage of the OLED panel with our own X-Rite colorimeter, the maximum brightness of the screen is only about 340 nits compared to the advertised 400 nits even after disabling automatic brightness control. This makes our display dimmer than on most other workstations where a brightness of 450-nit or greater is common.
| |||||||||||||||||||||||||
Brightness Distribution: 98 %
Center on Battery: 340.1 cd/m²
Contrast: ∞:1 (Black: 0 cd/m²)
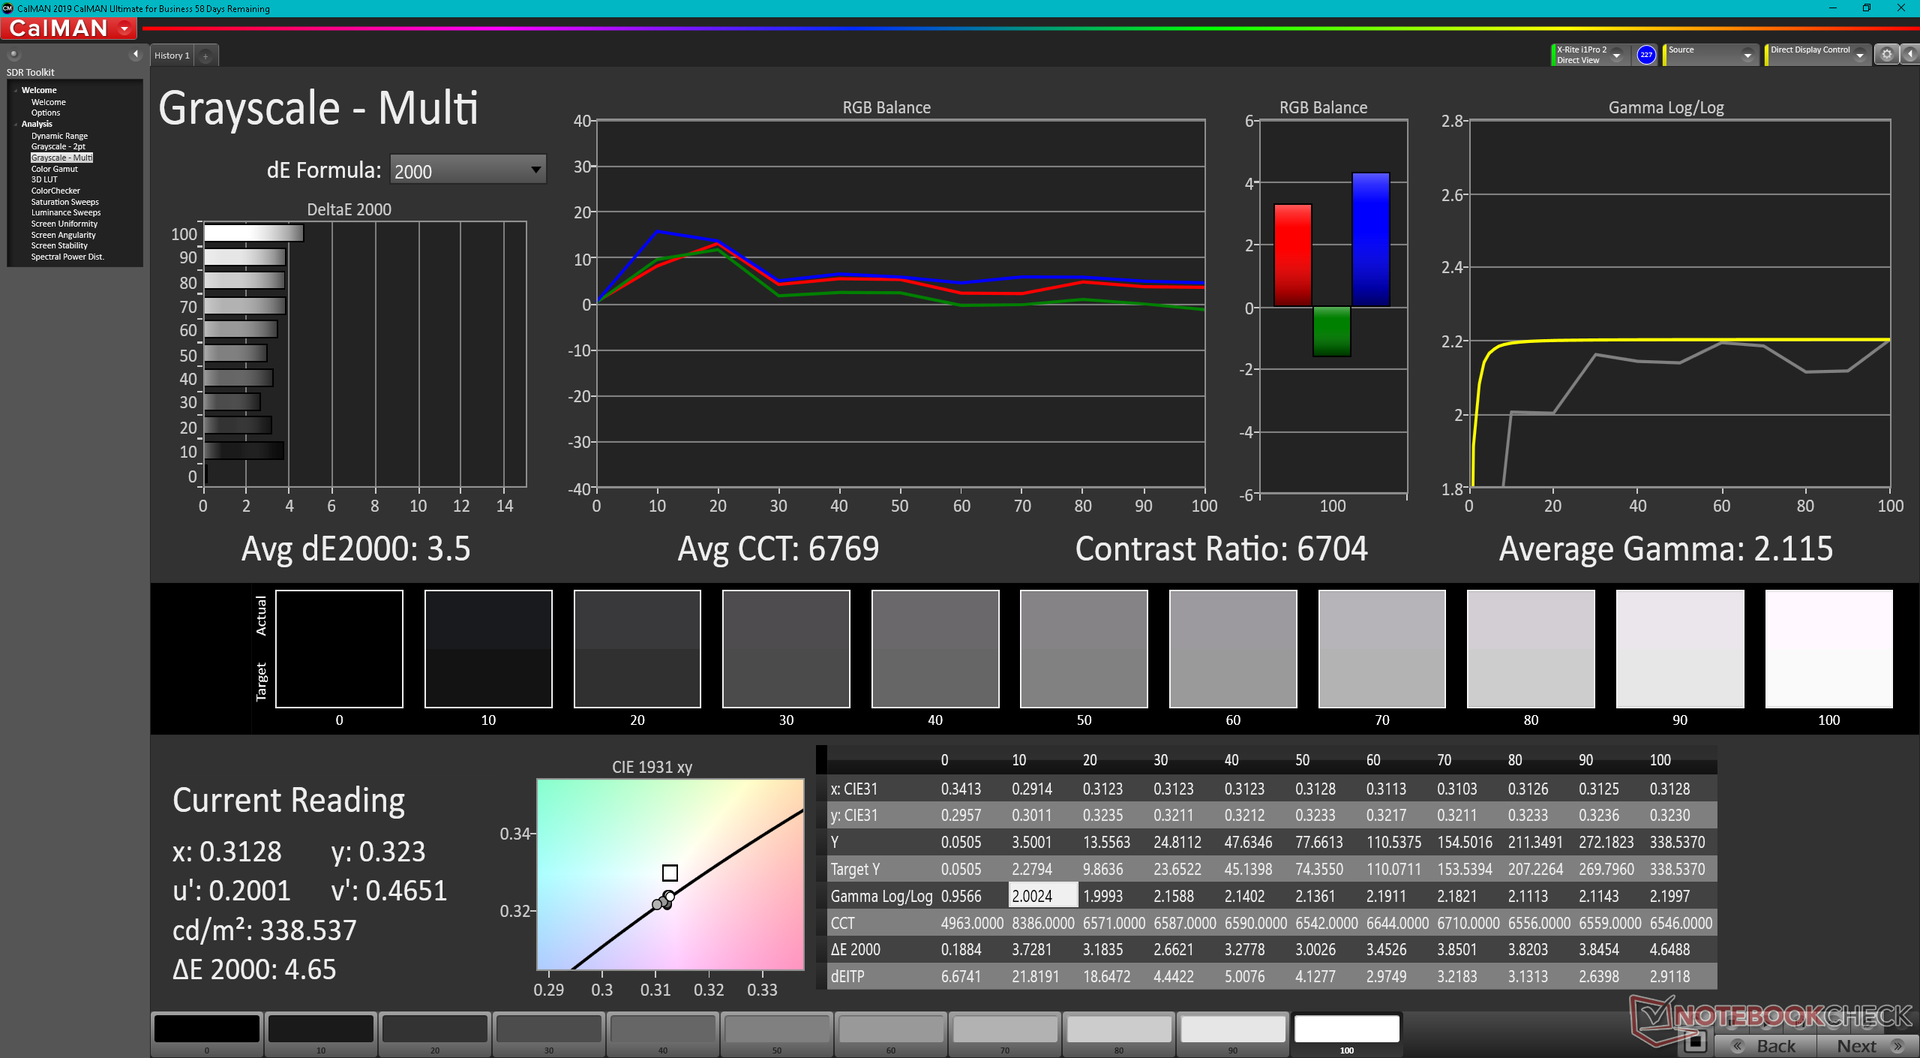
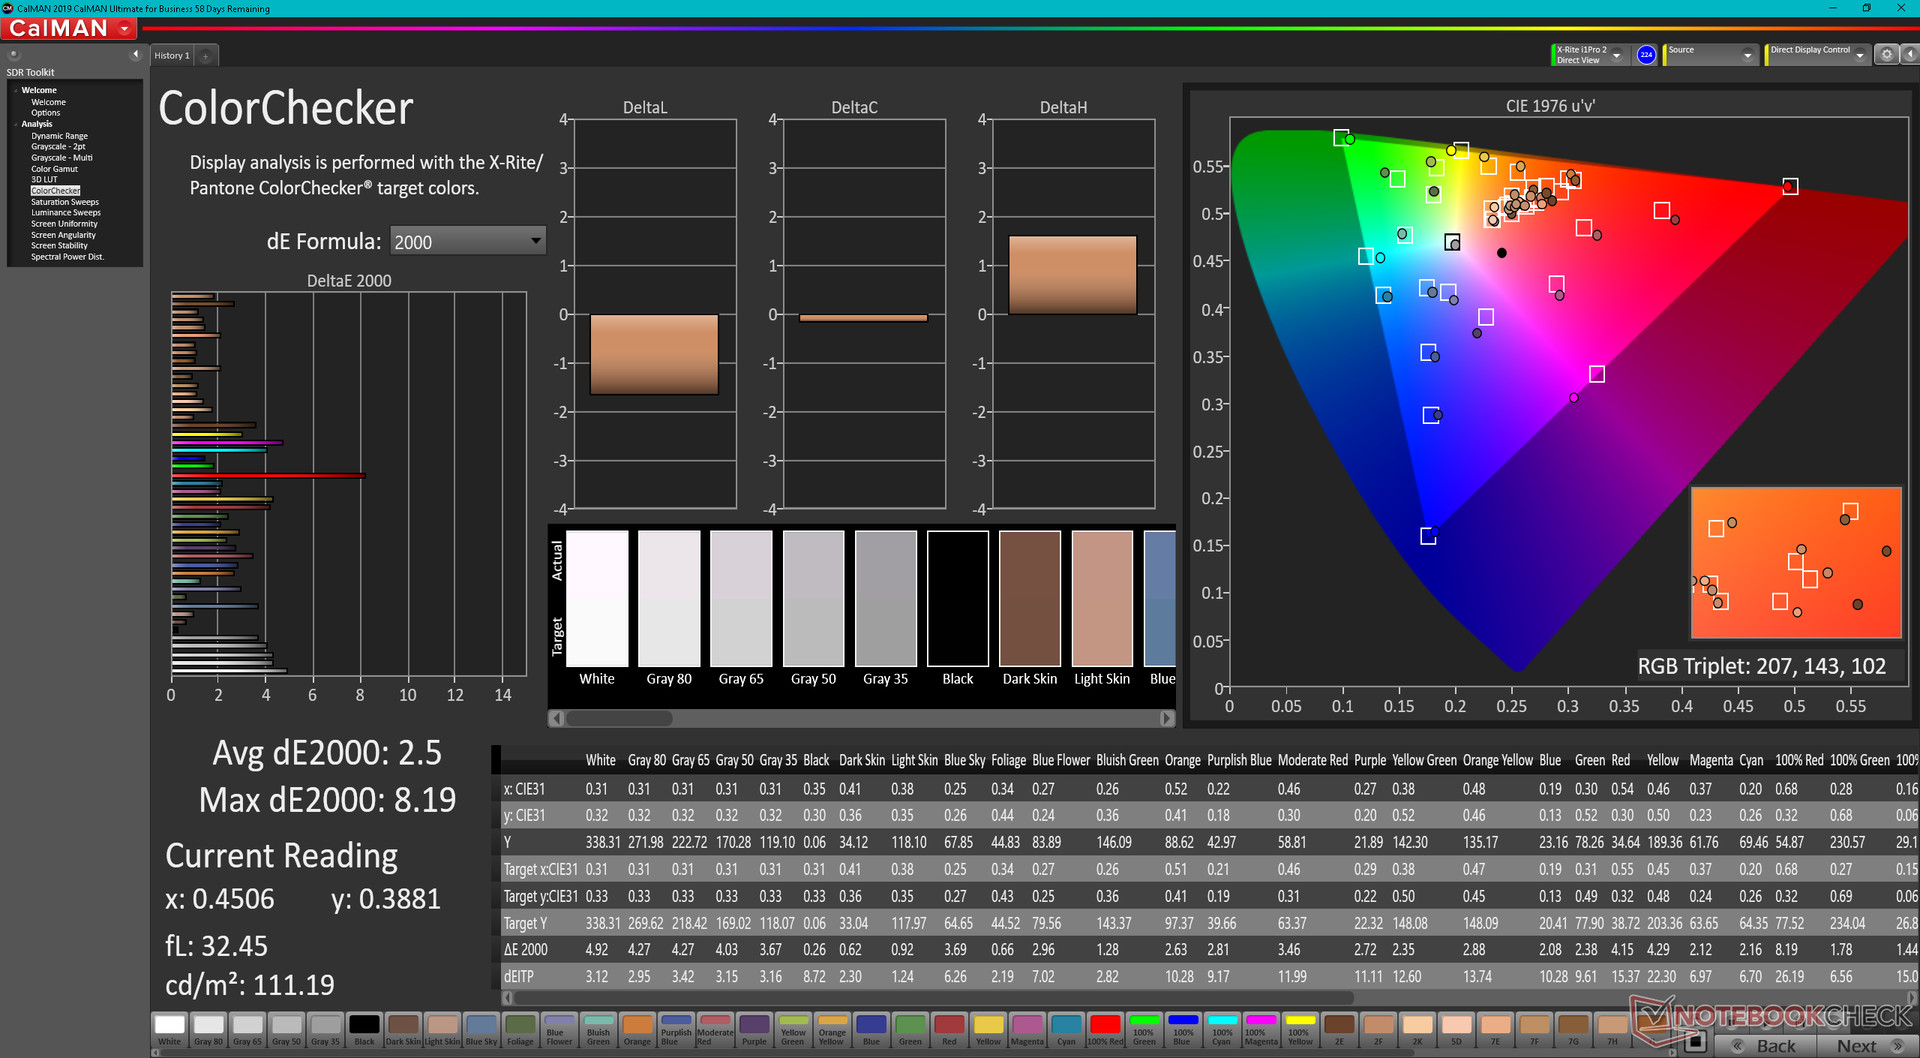
ΔE ColorChecker Calman: 2.5 | ∀{0.5-29.43 Ø4.72}
ΔE Greyscale Calman: 3.5 | ∀{0.09-98 Ø4.97}
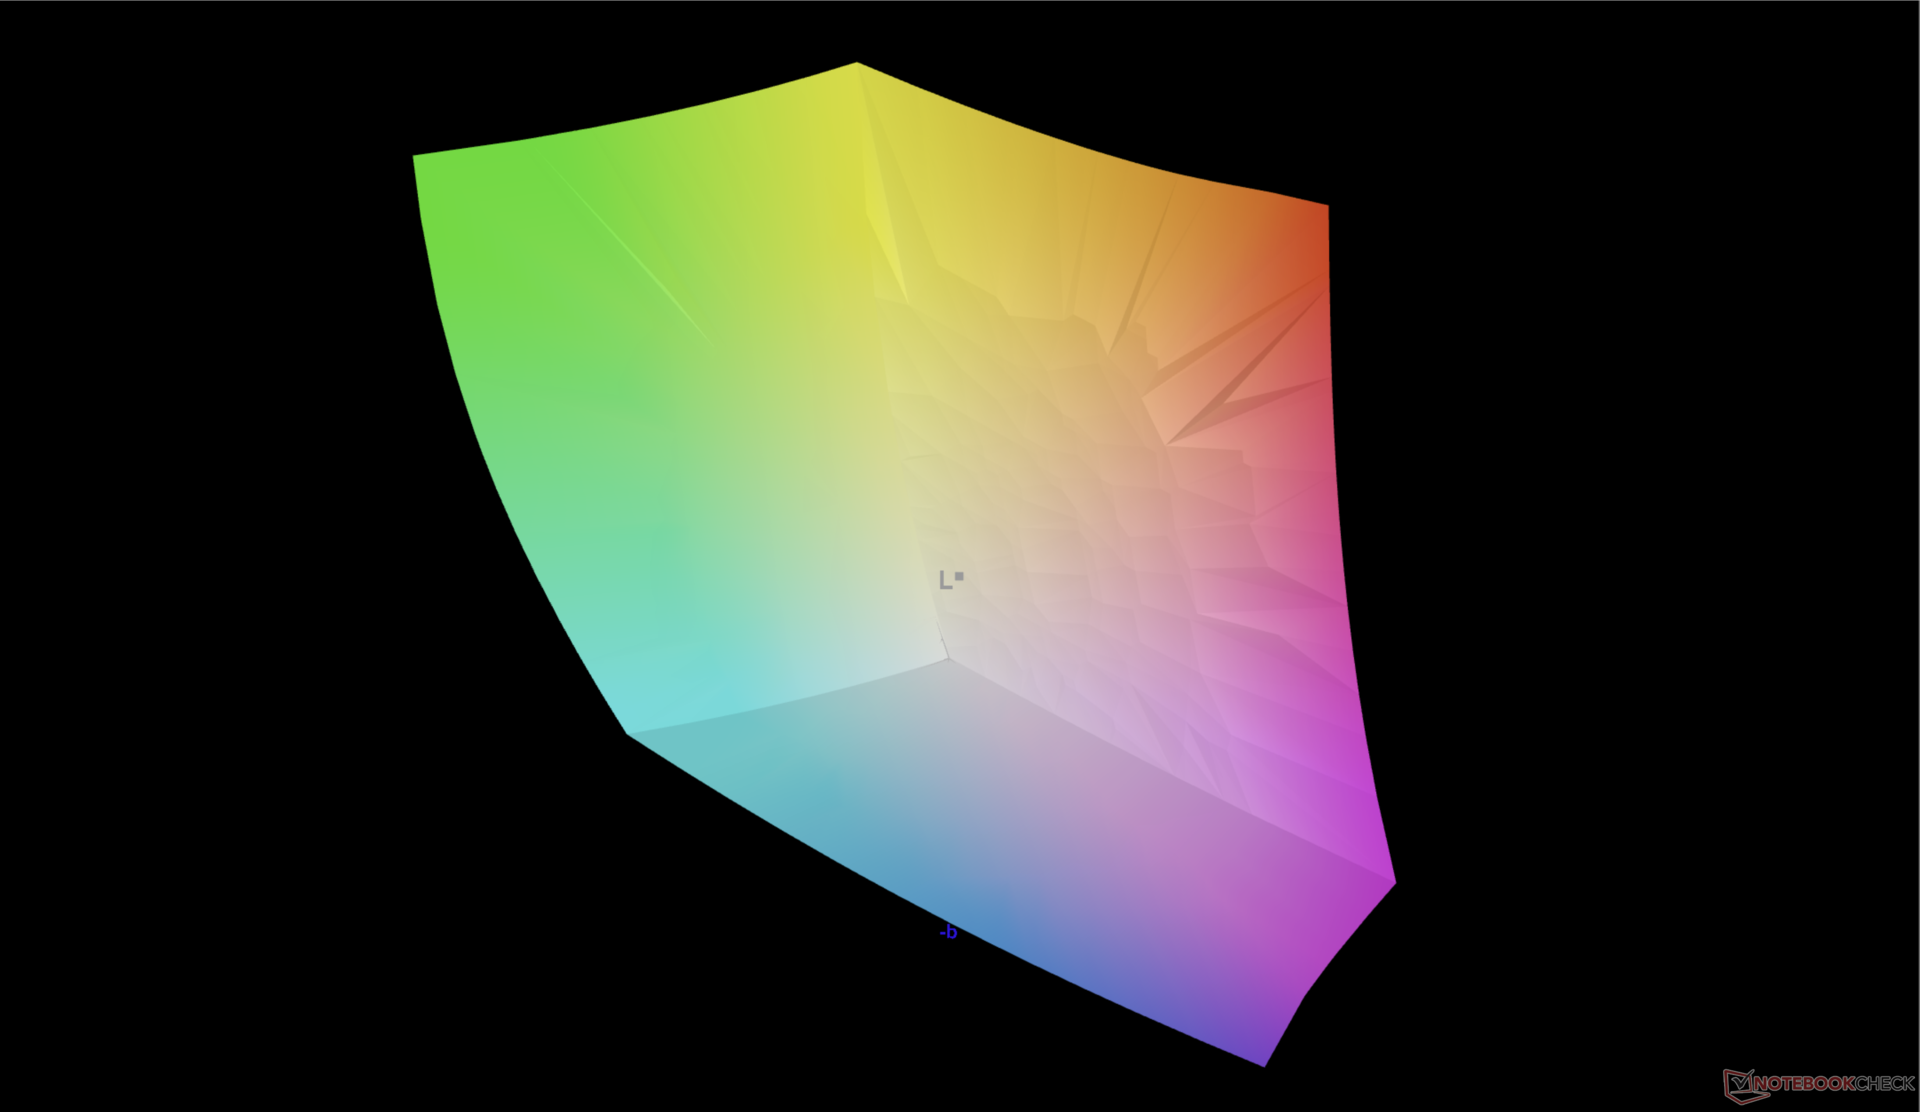
97.5% AdobeRGB 1998 (Argyll 3D)
100% sRGB (Argyll 3D)
99.9% Display P3 (Argyll 3D)
Gamma: 2.12
CCT: 6704 K
| Dell Precision 7670 Samsung 160YV03, OLED, 3840x2400, 16" | Lenovo ThinkPad P1 G4-20Y4Z9DVUS NE160QDM-N63, IPS, 2560x1600, 16" | Asus ProArt StudioBook 16 W7600H5A-2BL2 ATNA60YV02-0, OLED, 3840x2400, 16" | Dell Precision 5000 5560 Sharp LQ156R1, IPS, 3840x2400, 15.6" | Dell Precision 7550 AU Optronics B156ZAN, IPS, 3840x2160, 15.6" | HP ZBook Fury 15 G8 BOE0969, IPS, 3840x2160, 15.6" | |
|---|---|---|---|---|---|---|
| Display | -17% | 0% | -1% | -6% | -5% | |
| Display P3 Coverage (%) | 99.9 | 72.7 -27% | 99.9 0% | 94.9 -5% | 82.1 -18% | 95.9 -4% |
| sRGB Coverage (%) | 100 | 99.3 -1% | 100 0% | 100 0% | 99.6 0% | 100 0% |
| AdobeRGB 1998 Coverage (%) | 97.5 | 74.7 -23% | 98.6 1% | 100 3% | 96.8 -1% | 87.3 -10% |
| Response Times | -1494% | -3% | -1902% | -2098% | -565% | |
| Response Time Grey 50% / Grey 80% * (ms) | 1.9 ? | 40.8 -2047% | 2 ? -5% | 47.2 ? -2384% | 51.2 ? -2595% | 14.8 ? -679% |
| Response Time Black / White * (ms) | 2 ? | 20.8 -940% | 2 ? -0% | 30.4 ? -1420% | 34 ? -1600% | 11 ? -450% |
| PWM Frequency (Hz) | 59.5 ? | 240 ? | ||||
| Screen | 7% | 18% | -4% | -16% | -10% | |
| Brightness middle (cd/m²) | 340.1 | 441 30% | 353 4% | 501.5 47% | 473.5 39% | 626 84% |
| Brightness (cd/m²) | 342 | 420 23% | 360 5% | 467 37% | 461 35% | 589 72% |
| Brightness Distribution (%) | 98 | 90 -8% | 96 -2% | 83 -15% | 90 -8% | 87 -11% |
| Black Level * (cd/m²) | 0.27 | 0.44 | 0.55 | 0.58 | ||
| Colorchecker dE 2000 * | 2.5 | 2.6 -4% | 2.45 2% | 4.73 -89% | 4.8 -92% | 5.41 -116% |
| Colorchecker dE 2000 max. * | 8.19 | 6 27% | 3.75 54% | 8.45 -3% | 8.73 -7% | 9.05 -11% |
| Greyscale dE 2000 * | 3.5 | 4.5 -29% | 1.88 46% | 3.6 -3% | 5.6 -60% | 6.2 -77% |
| Gamma | 2.12 104% | 2.18 101% | 2.31 95% | 2.08 106% | 2.34 94% | 2.66 83% |
| CCT | 6704 97% | 6623 98% | 6441 101% | 6447 101% | 7549 86% | 6101 107% |
| Contrast (:1) | 1633 | 1140 | 861 | 1079 | ||
| Colorchecker dE 2000 calibrated * | 1.2 | 2.77 | 0.51 | 3.08 | 0.6 | |
| Color Space (Percent of AdobeRGB 1998) (%) | 86.4 | |||||
| Color Space (Percent of sRGB) (%) | 99.7 | |||||
| Total Average (Program / Settings) | -501% /
-273% | 5% /
10% | -636% /
-348% | -707% /
-392% | -193% /
-109% |
* ... smaller is better
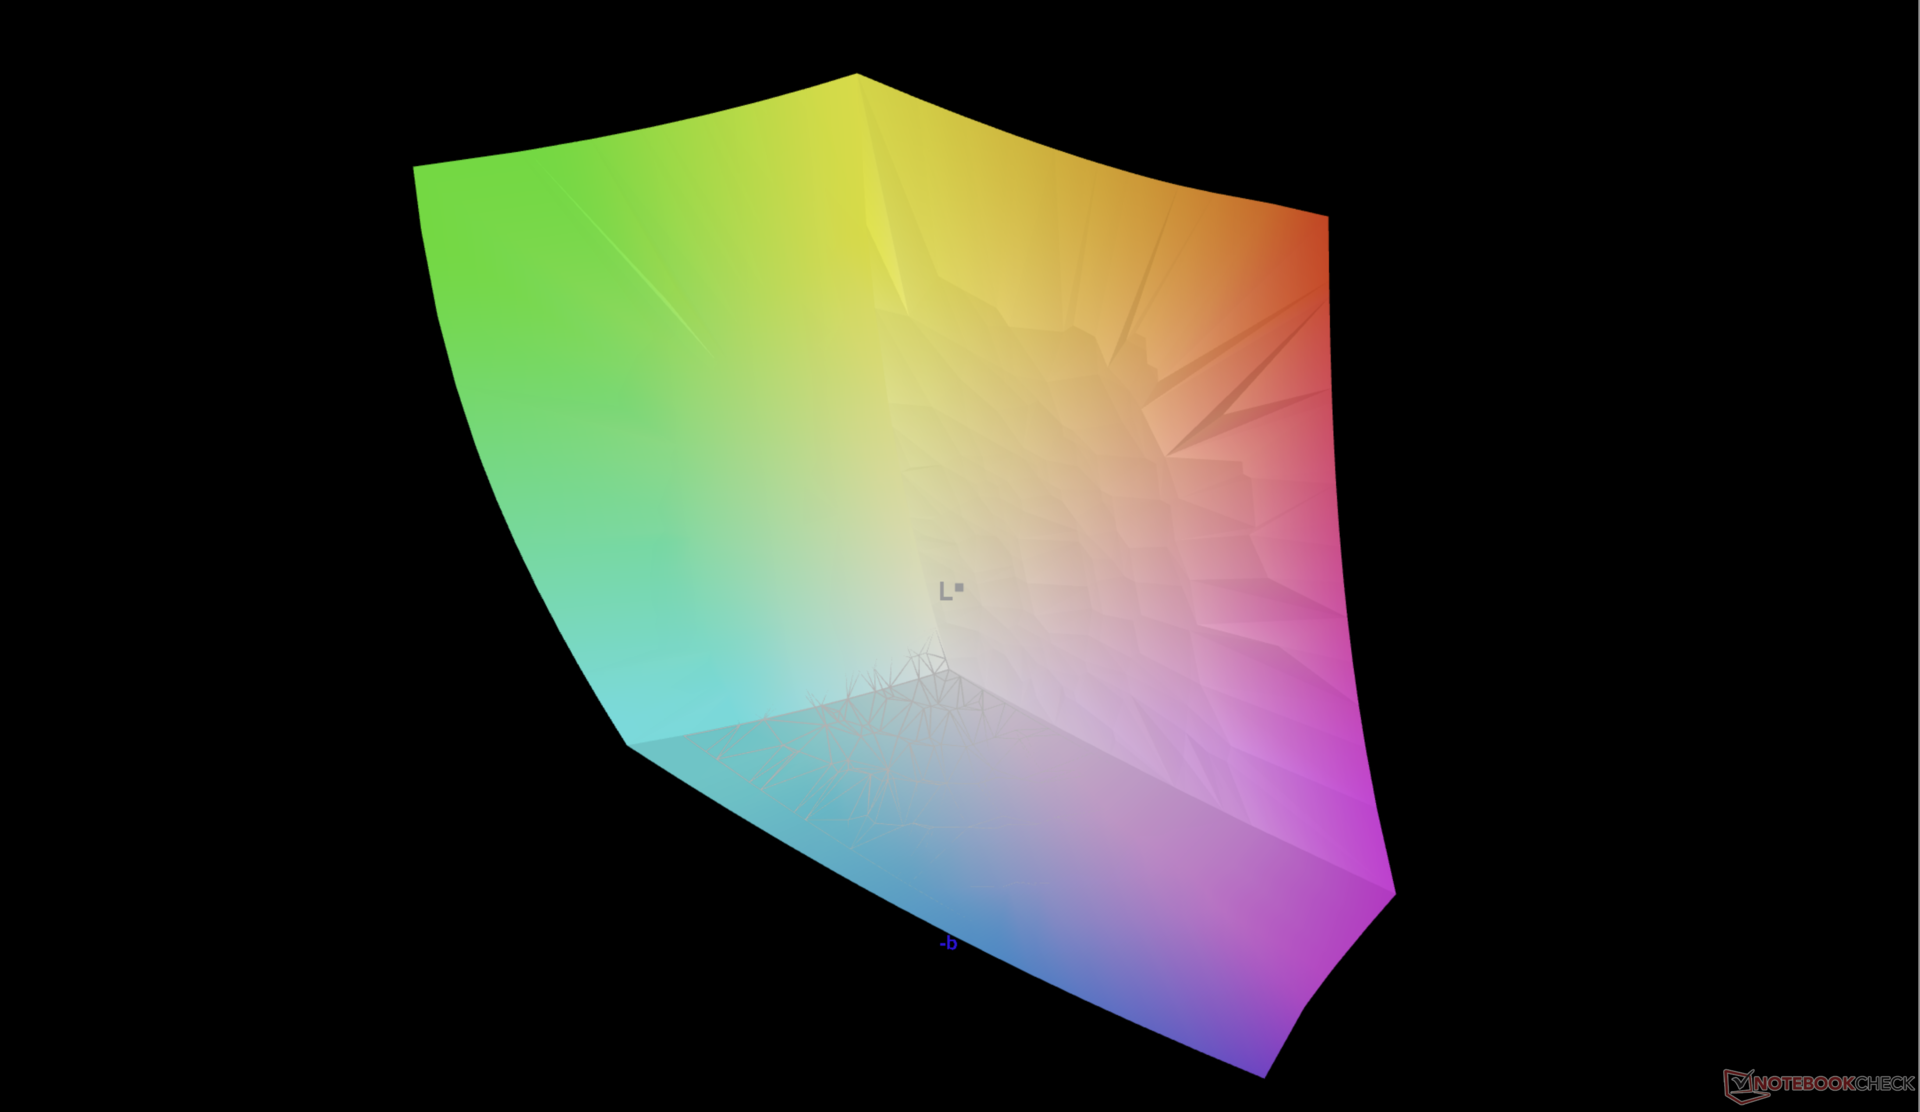
Nowhere in any of Dell's advertisements or materials do they mention a pre-calibrated display at factory. Grayscale and colors are still reasonably accurate on our OLED panel nonetheless with average deltaE values of only 3.5 and 2.5, respectively.
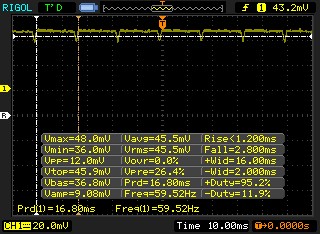
Display Response Times
| ↔ Response Time Black to White | ||
|---|---|---|
| 2 ms ... rise ↗ and fall ↘ combined | ↗ 0.8 ms rise | 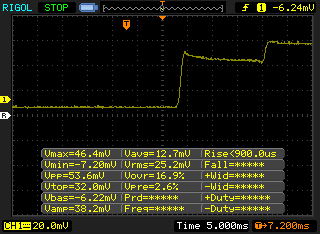 |
| ↘ 1.2 ms fall | ||
| The screen shows very fast response rates in our tests and should be very well suited for fast-paced gaming. In comparison, all tested devices range from 0.1 (minimum) to 240 (maximum) ms. » 11 % of all devices are better. This means that the measured response time is better than the average of all tested devices (19.8 ms). | ||
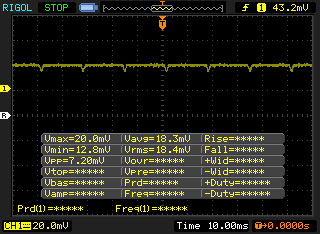
| ↔ Response Time 50% Grey to 80% Grey | ||
| 1.9 ms ... rise ↗ and fall ↘ combined | ↗ 1.1 ms rise | 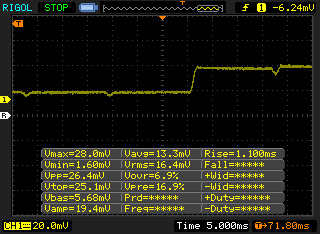 |
| ↘ 0.8 ms fall | ||
| The screen shows very fast response rates in our tests and should be very well suited for fast-paced gaming. In comparison, all tested devices range from 0.165 (minimum) to 636 (maximum) ms. » 9 % of all devices are better. This means that the measured response time is better than the average of all tested devices (31 ms). | ||
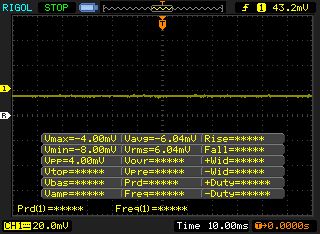
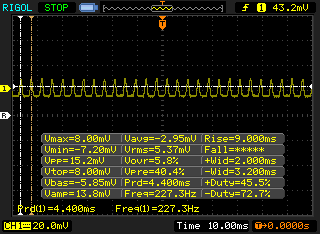
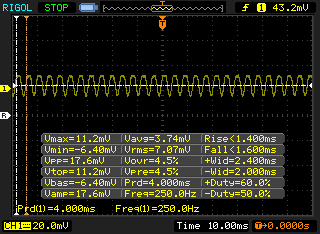
Screen Flickering / PWM (Pulse-Width Modulation)
| Screen flickering / PWM detected | 59.5 Hz | ≤ 100 % brightness setting |  |
The display backlight flickers at 59.5 Hz (worst case, e.g., utilizing PWM) Flickering detected at a brightness setting of 100 % and below. There should be no flickering or PWM above this brightness setting. The frequency of 59.5 Hz is very low, so the flickering may cause eyestrain and headaches after extended use. In comparison: 52 % of all tested devices do not use PWM to dim the display. If PWM was detected, an average of 7781 (minimum: 5 - maximum: 343500) Hz was measured. | |||
Flickering is present on all brightness levels much like on most other OLED panels. We're able to detect a frequency of 250 Hz from 1 to 56 percent brightness and 59.5 Hz from 57 percent brightness to maximum.
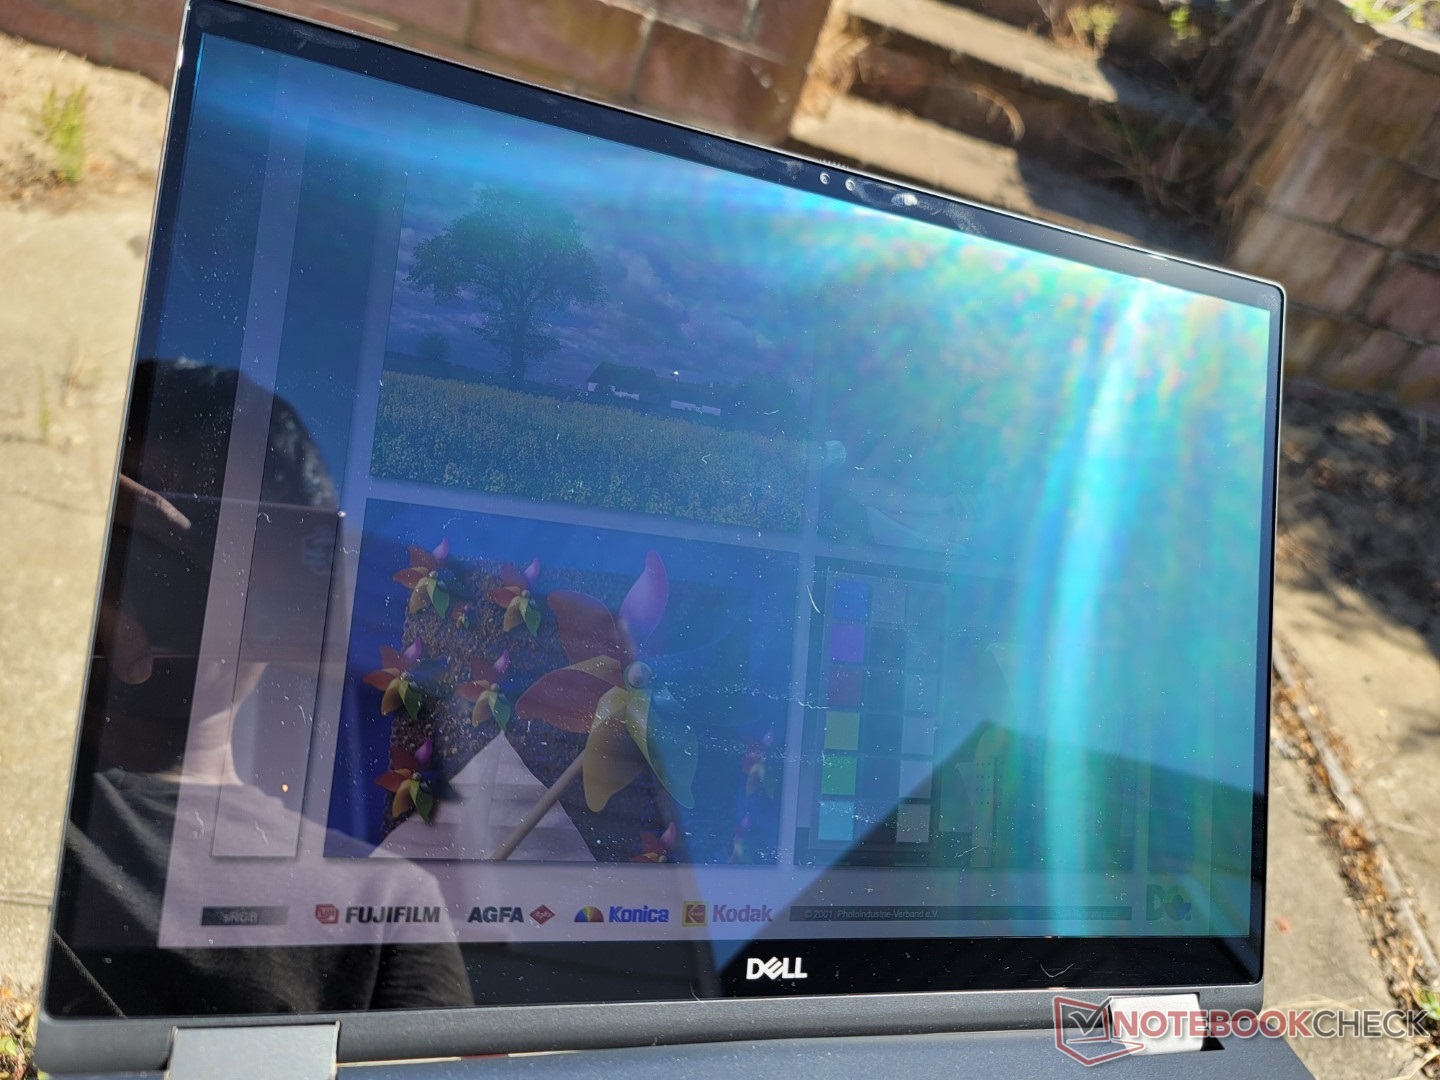
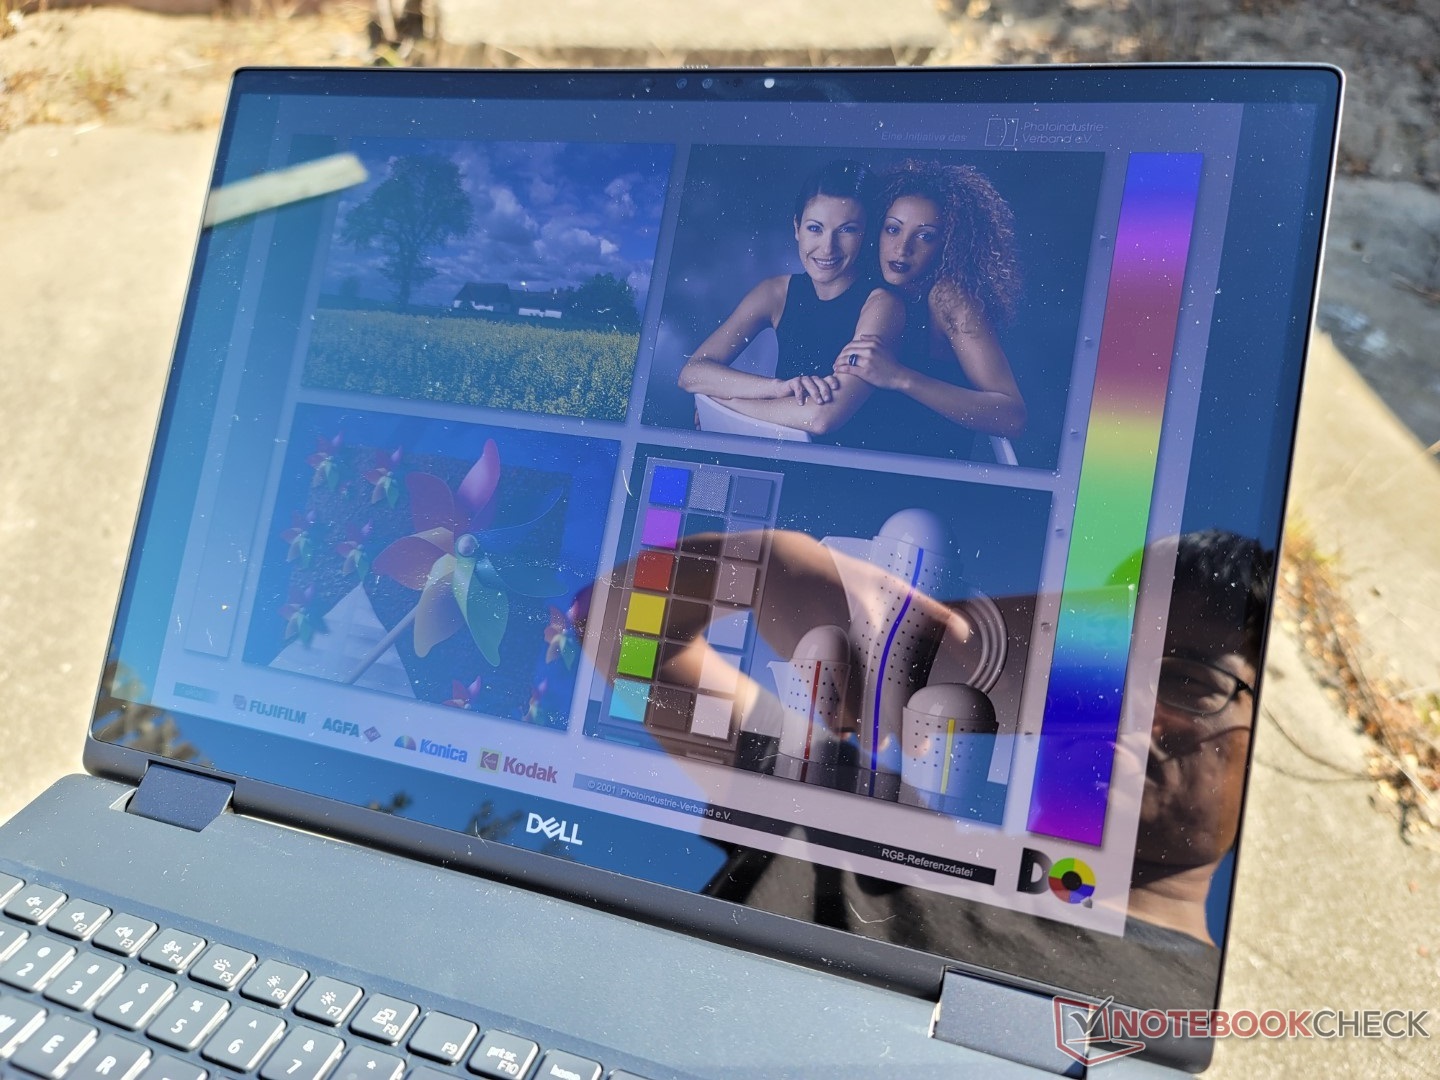
There is heavy glare despite the fact that this is technically an "anti-glare" display. The backlight is not bright enough for comfortable viewing in most outdoors scenarios unless if you happen to be under shade. If outdoor visibility is important, then we recommend checking out the HP ZBook Fury 15 G8 which has a display that's almost two times as bright as our Precision unit.
Performance — Intel vPro For All
Testing Conditions
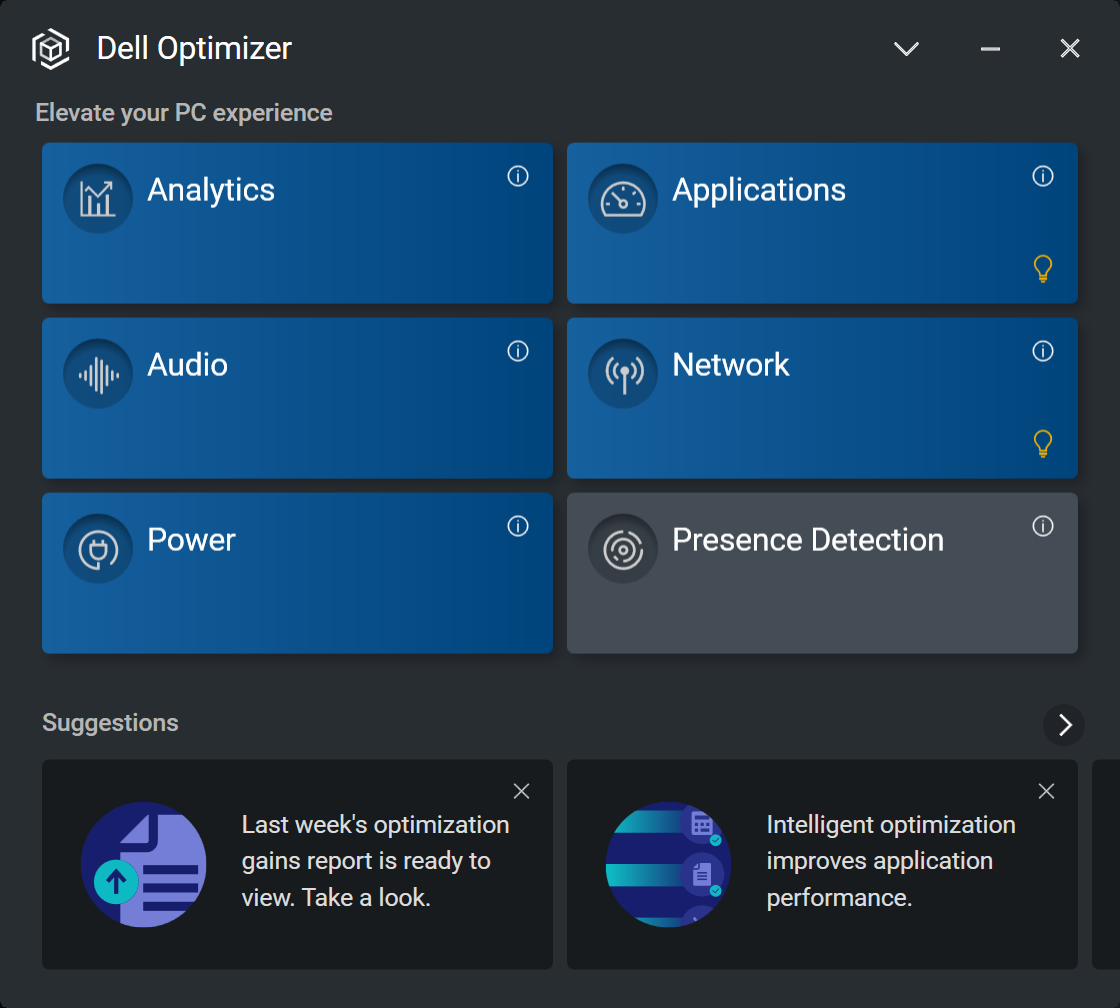
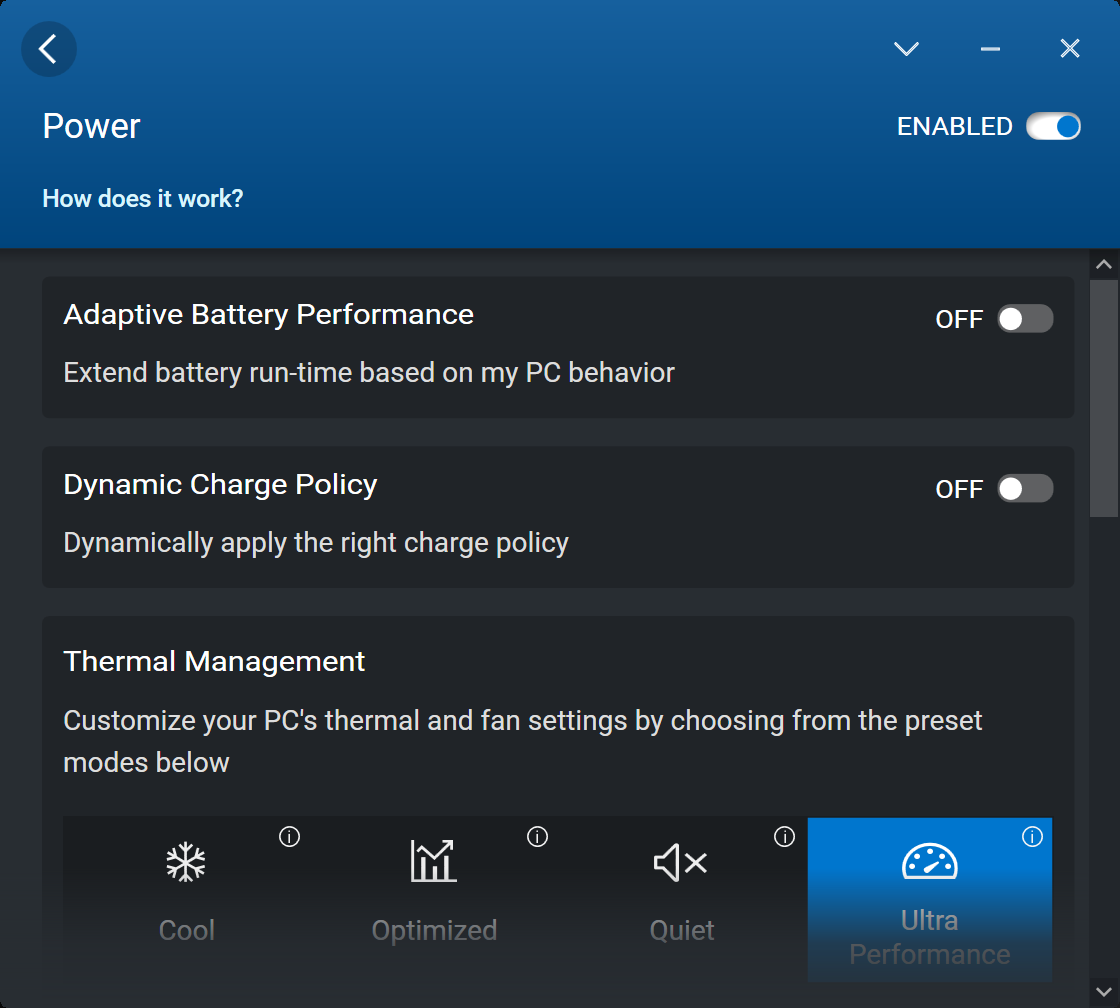
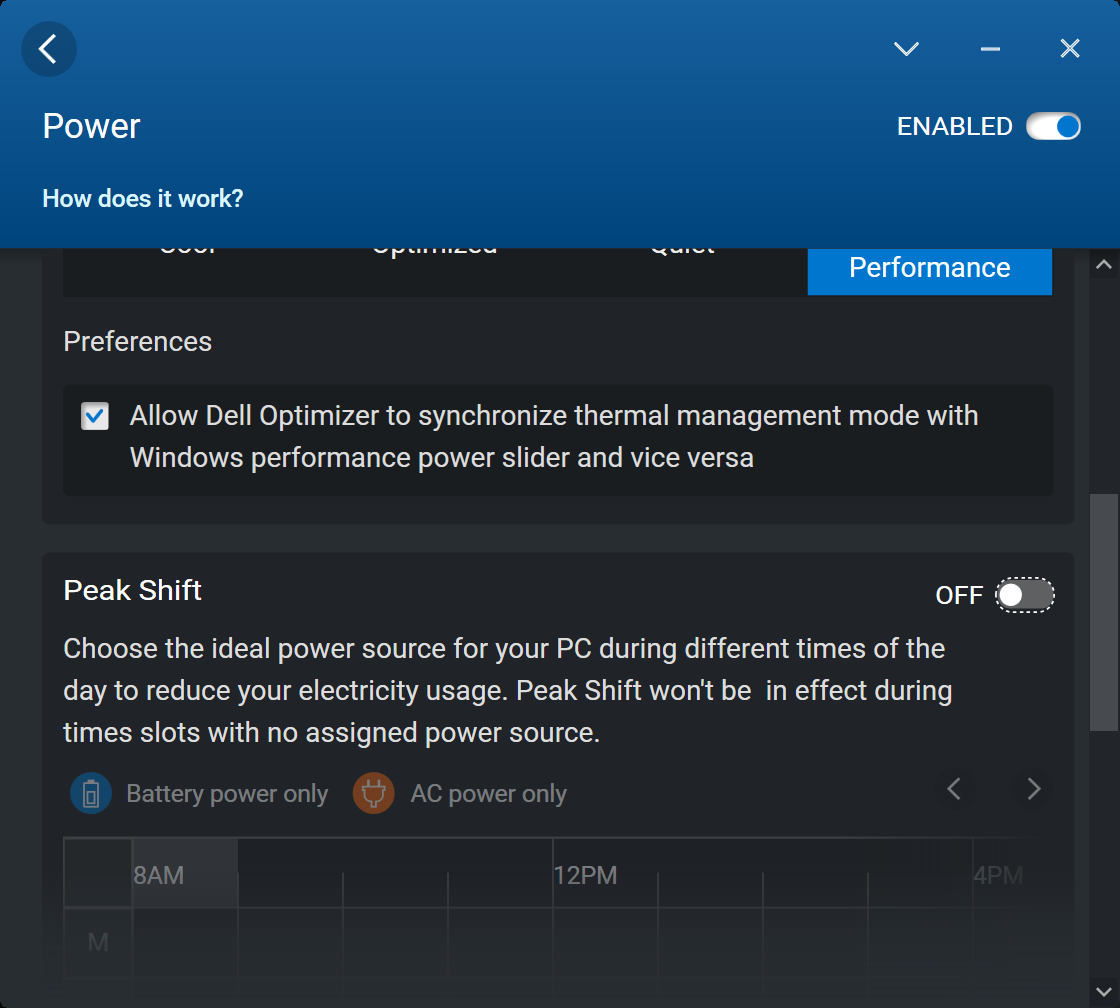
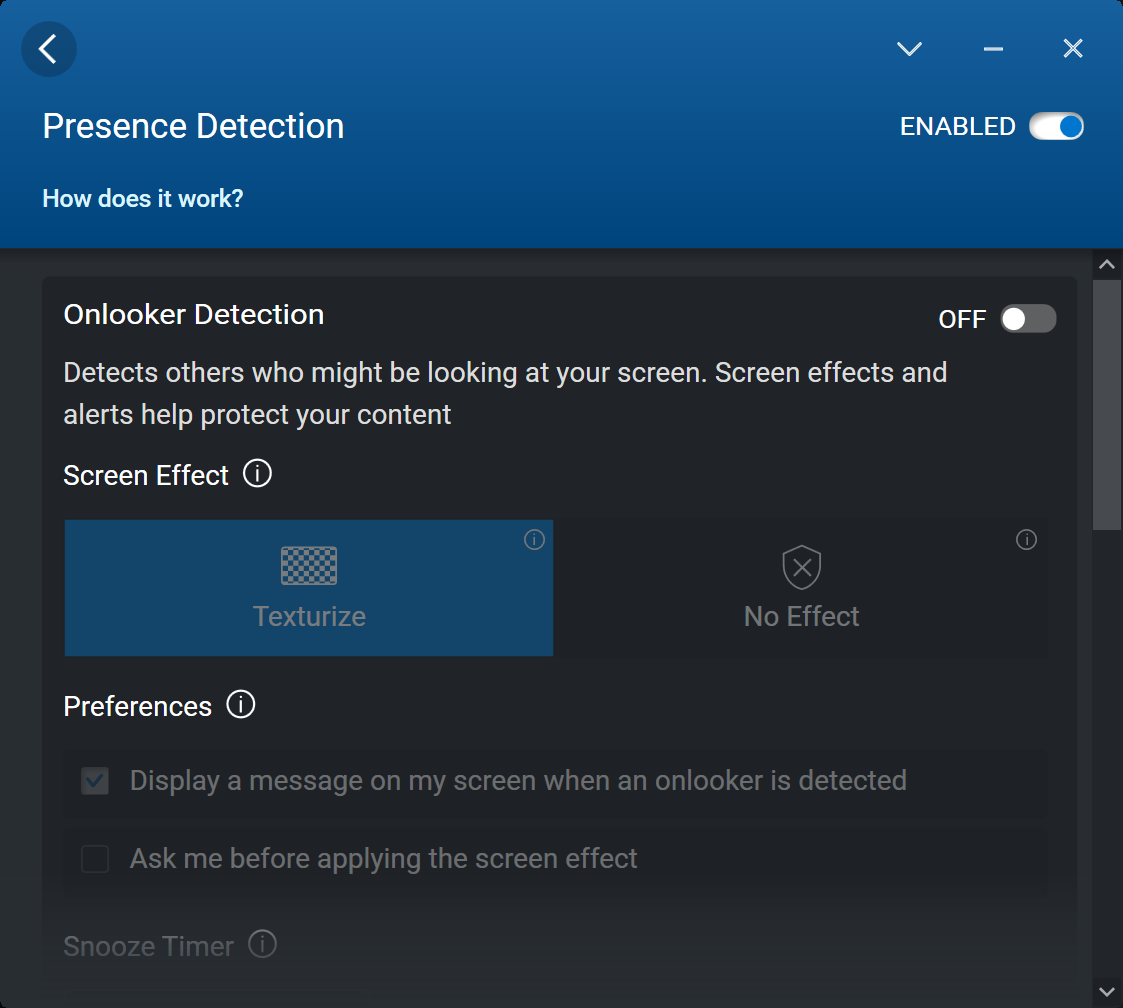
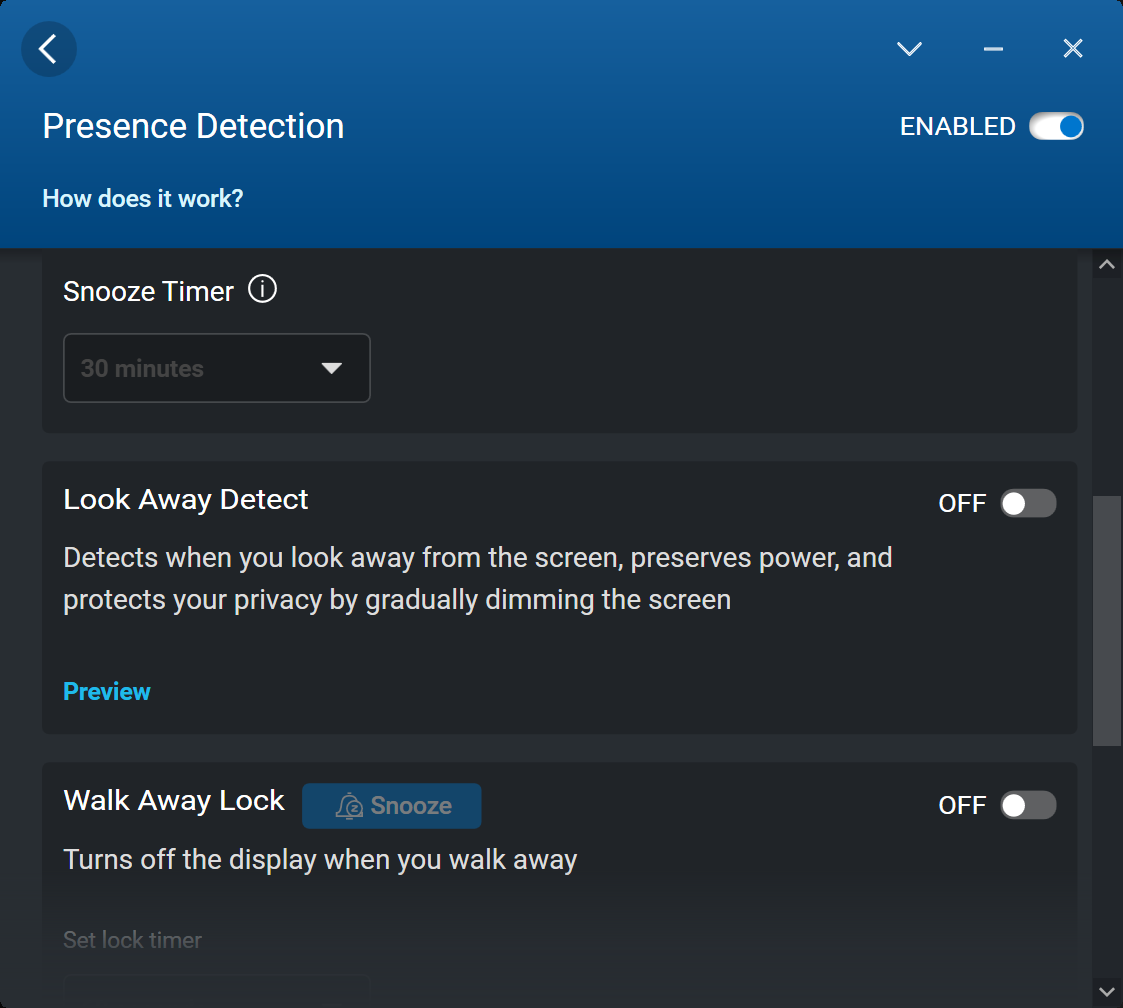
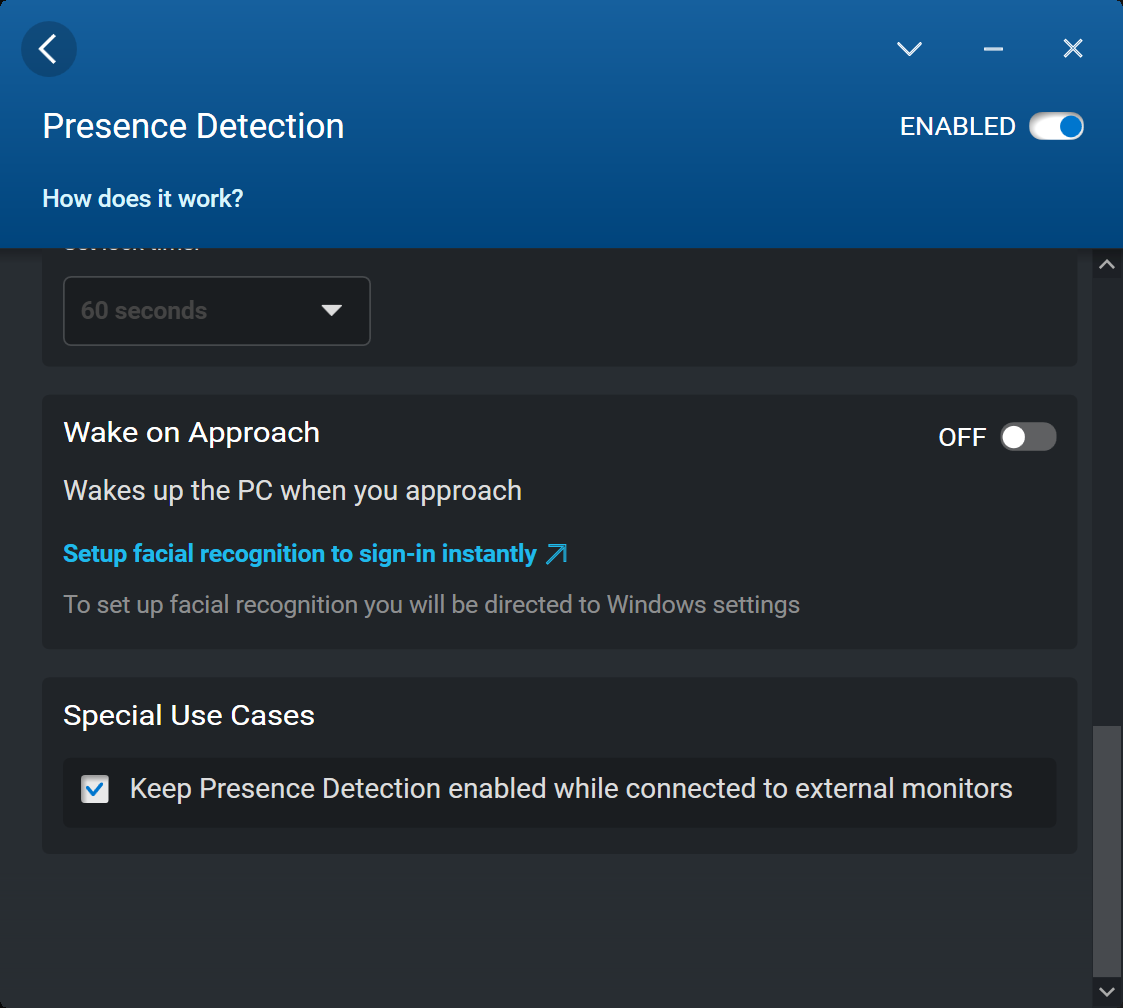
We set our unit to Ultra Performance mode via the Dell Optimizer software and the GPU to discrete mode via the Nvidia Control Panel prior to running any benchmarks below. Annoyingly, the power profile can be tuned through Windows, Dell Optimizer, or Dell Power Manager which can make things very confusing. We recommend enabling power profile synchronization between the three different applications through Optimizer as shown by the screenshot below.
Processor
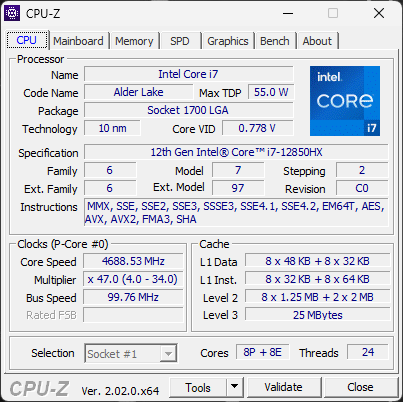
On paper, the Core i7-12850HX shares similar clock rates, core count, and cache sizes as the i7-12800HX but with added vPro support. In reality, however, their performances can vary quite significantly.
CPU performance is closer to the Core i7-12800H than it is to the Core i7-12800HX. In fact, multi-thread performance is about 30 percent slower than the i7-12800HX as found on the MSI GE67 HX due to its more capable cooling solution. Even so, performance is still one of the fastest when compared to other workstations as many are still running on 11th gen Intel CPUs.
Turbo Boost sustainability could have been better. When running CineBench R15 xT in a loop, performance would drop by as much as 25 percent after two or three repetitions which would help explain the wide performance deficit against the Core i7-12800HX mentioned above.
Cinebench R15 Multi Loop
Cinebench R23: Multi Core | Single Core
Cinebench R15: CPU Multi 64Bit | CPU Single 64Bit
Blender: v2.79 BMW27 CPU
7-Zip 18.03: 7z b 4 | 7z b 4 -mmt1
Geekbench 5.5: Multi-Core | Single-Core
HWBOT x265 Benchmark v2.2: 4k Preset
LibreOffice : 20 Documents To PDF
R Benchmark 2.5: Overall mean
Cinebench R23: Multi Core | Single Core
Cinebench R15: CPU Multi 64Bit | CPU Single 64Bit
Blender: v2.79 BMW27 CPU
7-Zip 18.03: 7z b 4 | 7z b 4 -mmt1
Geekbench 5.5: Multi-Core | Single-Core
HWBOT x265 Benchmark v2.2: 4k Preset
LibreOffice : 20 Documents To PDF
R Benchmark 2.5: Overall mean
* ... smaller is better
AIDA64: FP32 Ray-Trace | FPU Julia | CPU SHA3 | CPU Queen | FPU SinJulia | FPU Mandel | CPU AES | CPU ZLib | FP64 Ray-Trace | CPU PhotoWorxx
| Performance rating | |
| Average Intel Core i7-12850HX | |
| HP ZBook Fury 15 G8 | |
| Lenovo ThinkPad P1 G4-20Y4Z9DVUS | |
| Dell Precision 7670 | |
| Asus ProArt StudioBook 16 W7600H5A-2BL2 -9! | |
| Dell Precision 5000 5560 -9! | |
| AIDA64 / FP32 Ray-Trace | |
| Lenovo ThinkPad P1 G4-20Y4Z9DVUS | |
| Average Intel Core i7-12850HX (12983 - 16752, n=2) | |
| HP ZBook Fury 15 G8 | |
| Dell Precision 7670 | |
| AIDA64 / FPU Julia | |
| Average Intel Core i7-12850HX (68219 - 87231, n=2) | |
| Dell Precision 7670 | |
| Lenovo ThinkPad P1 G4-20Y4Z9DVUS | |
| HP ZBook Fury 15 G8 | |
| AIDA64 / CPU SHA3 | |
| Lenovo ThinkPad P1 G4-20Y4Z9DVUS | |
| HP ZBook Fury 15 G8 | |
| Average Intel Core i7-12850HX (3098 - 3818, n=2) | |
| Dell Precision 7670 | |
| AIDA64 / CPU Queen | |
| HP ZBook Fury 15 G8 | |
| Lenovo ThinkPad P1 G4-20Y4Z9DVUS | |
| Average Intel Core i7-12850HX (26716 - 95664, n=2) | |
| Dell Precision 7670 | |
| AIDA64 / FPU SinJulia | |
| Average Intel Core i7-12850HX (9869 - 11286, n=2) | |
| HP ZBook Fury 15 G8 | |
| Dell Precision 7670 | |
| Lenovo ThinkPad P1 G4-20Y4Z9DVUS | |
| AIDA64 / FPU Mandel | |
| Average Intel Core i7-12850HX (34218 - 42580, n=2) | |
| Lenovo ThinkPad P1 G4-20Y4Z9DVUS | |
| HP ZBook Fury 15 G8 | |
| Dell Precision 7670 | |
| AIDA64 / CPU AES | |
| Lenovo ThinkPad P1 G4-20Y4Z9DVUS | |
| HP ZBook Fury 15 G8 | |
| Average Intel Core i7-12850HX (63362 - 80775, n=2) | |
| Dell Precision 7670 | |
| AIDA64 / CPU ZLib | |
| Average Intel Core i7-12850HX (817 - 1102, n=2) | |
| Dell Precision 7670 | |
| Lenovo ThinkPad P1 G4-20Y4Z9DVUS | |
| HP ZBook Fury 15 G8 | |
| Asus ProArt StudioBook 16 W7600H5A-2BL2 | |
| Asus ProArt StudioBook 16 W7600H5A-2BL2 | |
| Dell Precision 5000 5560 | |
| AIDA64 / FP64 Ray-Trace | |
| Average Intel Core i7-12850HX (7671 - 9145, n=2) | |
| Lenovo ThinkPad P1 G4-20Y4Z9DVUS | |
| HP ZBook Fury 15 G8 | |
| Dell Precision 7670 | |
| AIDA64 / CPU PhotoWorxx | |
| Dell Precision 7670 | |
| Average Intel Core i7-12850HX (33415 - 42035, n=2) | |
| HP ZBook Fury 15 G8 | |
| Lenovo ThinkPad P1 G4-20Y4Z9DVUS | |
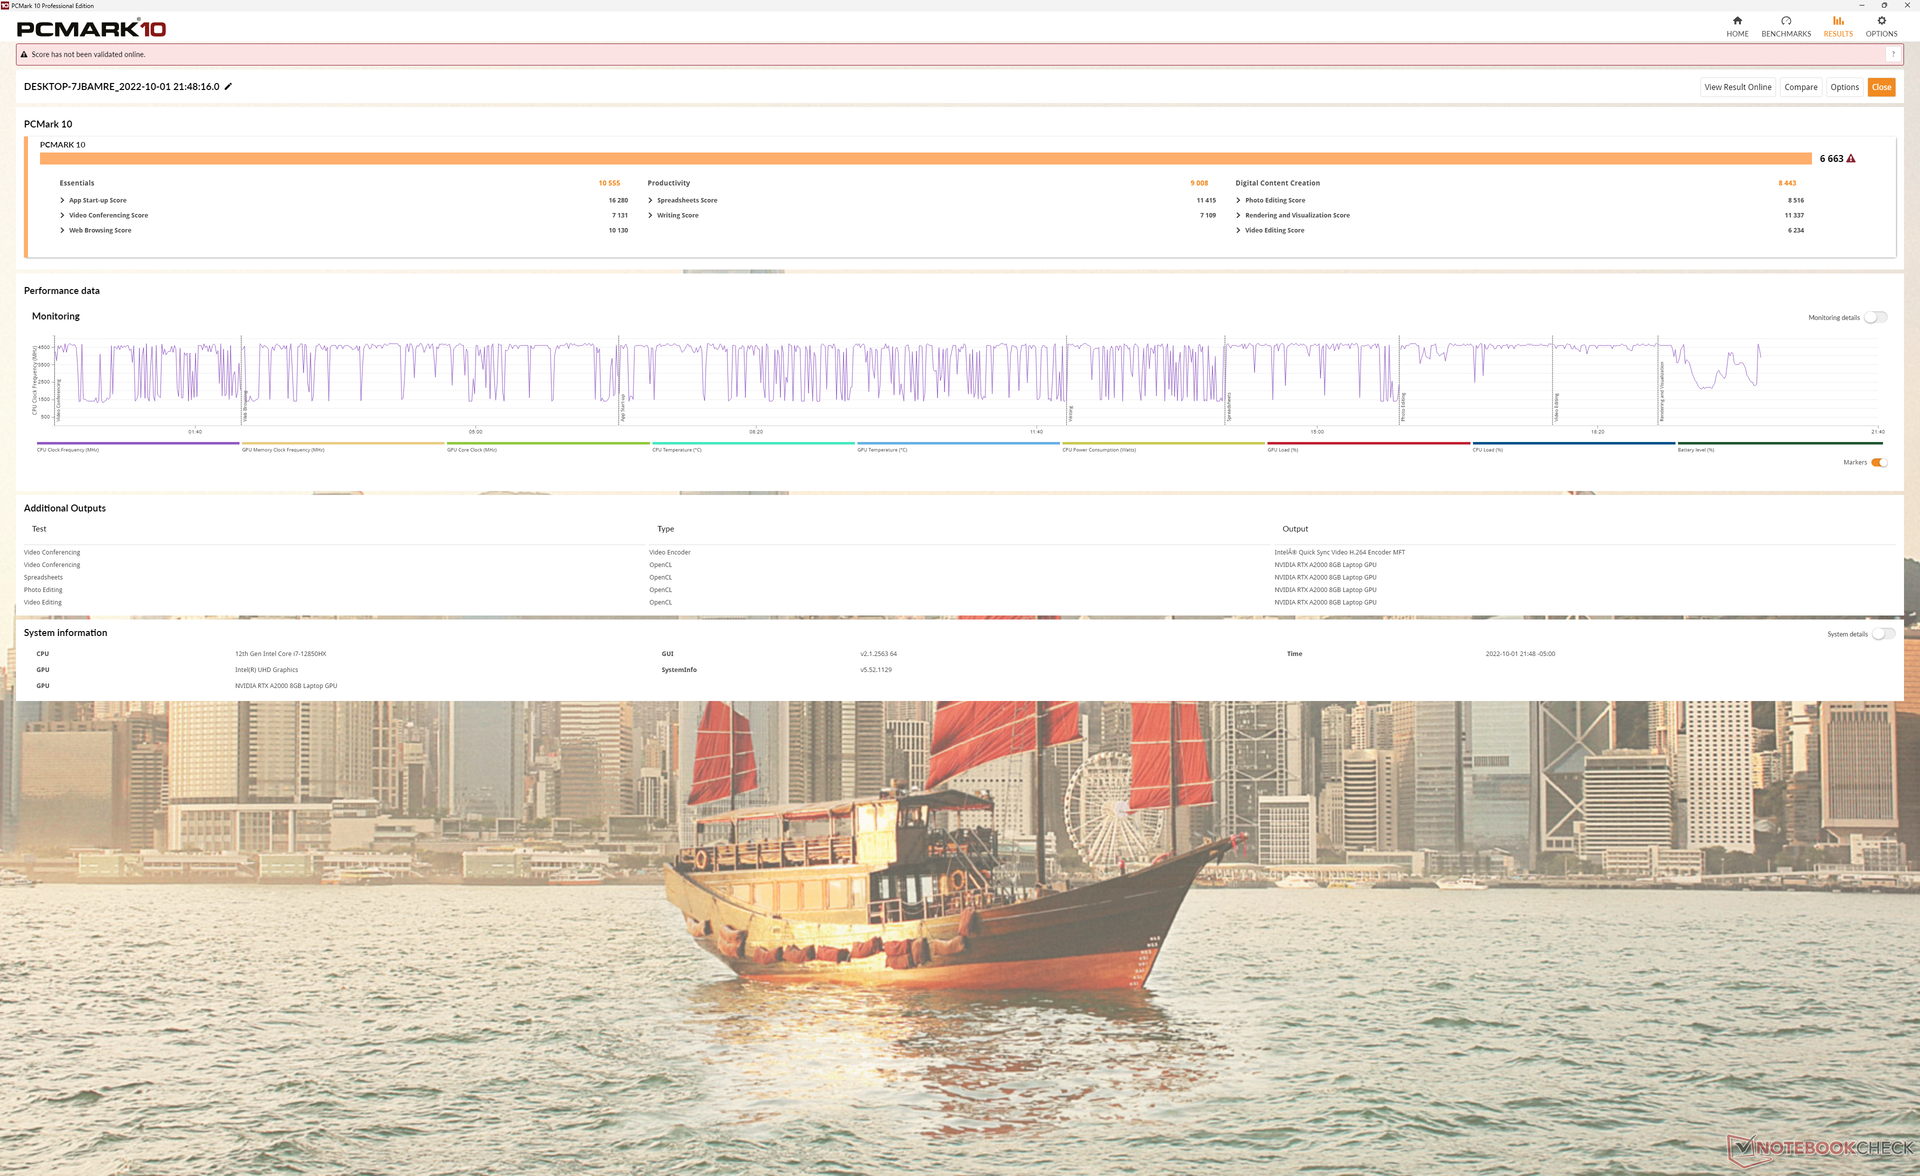
System Performance
PCMark 10 results are similar to other workstations powered by Core H-series CPUs and Nvidia Quadro GPUs. Models with the faster RTX A5000 like the HP ZBook Fury 15 G8 still outperform our Precision 7670 test unit in GPU-heavy benchmarks like Digital Content Creation.
CrossMark: Overall | Productivity | Creativity | Responsiveness
| PCMark 10 / Score | |
| Asus ProArt StudioBook 16 W7600H5A-2BL2 | |
| HP ZBook Fury 15 G8 | |
| Dell Precision 5000 5560 | |
| Dell Precision 7670 | |
| Lenovo ThinkPad P1 G4-20Y4Z9DVUS | |
| Dell Precision 7550 | |
| PCMark 10 / Essentials | |
| Dell Precision 5000 5560 | |
| Dell Precision 7670 | |
| Asus ProArt StudioBook 16 W7600H5A-2BL2 | |
| HP ZBook Fury 15 G8 | |
| Lenovo ThinkPad P1 G4-20Y4Z9DVUS | |
| Dell Precision 7550 | |
| PCMark 10 / Productivity | |
| Dell Precision 7670 | |
| Dell Precision 5000 5560 | |
| Asus ProArt StudioBook 16 W7600H5A-2BL2 | |
| HP ZBook Fury 15 G8 | |
| Lenovo ThinkPad P1 G4-20Y4Z9DVUS | |
| Dell Precision 7550 | |
| PCMark 10 / Digital Content Creation | |
| Asus ProArt StudioBook 16 W7600H5A-2BL2 | |
| HP ZBook Fury 15 G8 | |
| Dell Precision 5000 5560 | |
| Dell Precision 7670 | |
| Lenovo ThinkPad P1 G4-20Y4Z9DVUS | |
| Dell Precision 7550 | |
| CrossMark / Overall | |
| Lenovo ThinkPad P1 G4-20Y4Z9DVUS | |
| Dell Precision 7670 | |
| CrossMark / Productivity | |
| Lenovo ThinkPad P1 G4-20Y4Z9DVUS | |
| Dell Precision 7670 | |
| CrossMark / Creativity | |
| Dell Precision 7670 | |
| Lenovo ThinkPad P1 G4-20Y4Z9DVUS | |
| CrossMark / Responsiveness | |
| Lenovo ThinkPad P1 G4-20Y4Z9DVUS | |
| Dell Precision 7670 | |
| PCMark 10 Score | 6663 points | |
Help | ||
| AIDA64 / Memory Copy | |
| Dell Precision 7670 | |
| HP ZBook Fury 15 G8 | |
| Lenovo ThinkPad P1 G4-20Y4Z9DVUS | |
| AIDA64 / Memory Read | |
| Dell Precision 7670 | |
| HP ZBook Fury 15 G8 | |
| Lenovo ThinkPad P1 G4-20Y4Z9DVUS | |
| AIDA64 / Memory Write | |
| Dell Precision 7670 | |
| HP ZBook Fury 15 G8 | |
| Lenovo ThinkPad P1 G4-20Y4Z9DVUS | |
| AIDA64 / Memory Latency | |
| HP ZBook Fury 15 G8 | |
| Dell Precision 7670 | |
| Lenovo ThinkPad P1 G4-20Y4Z9DVUS | |
| Asus ProArt StudioBook 16 W7600H5A-2BL2 | |
| Asus ProArt StudioBook 16 W7600H5A-2BL2 | |
* ... smaller is better
DPC Latency
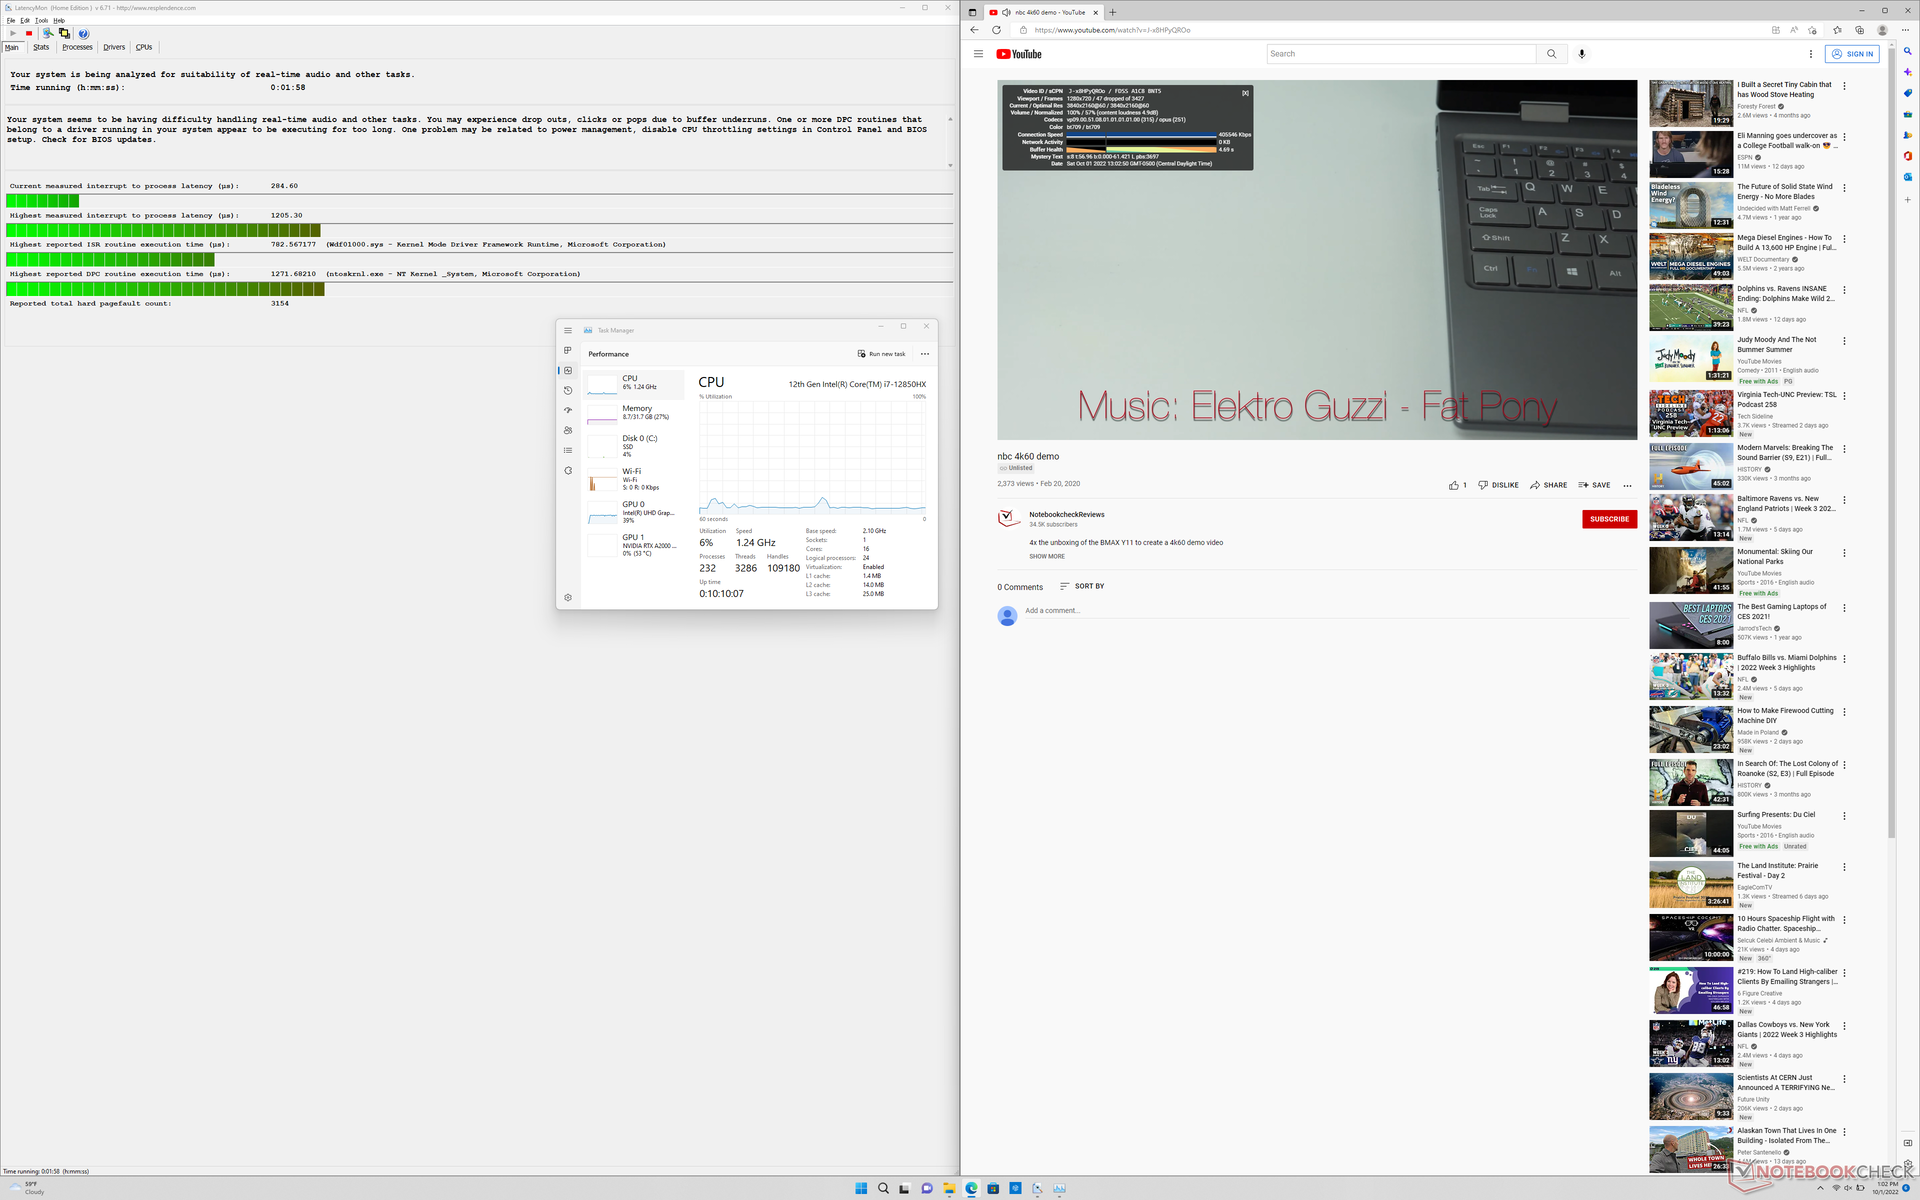
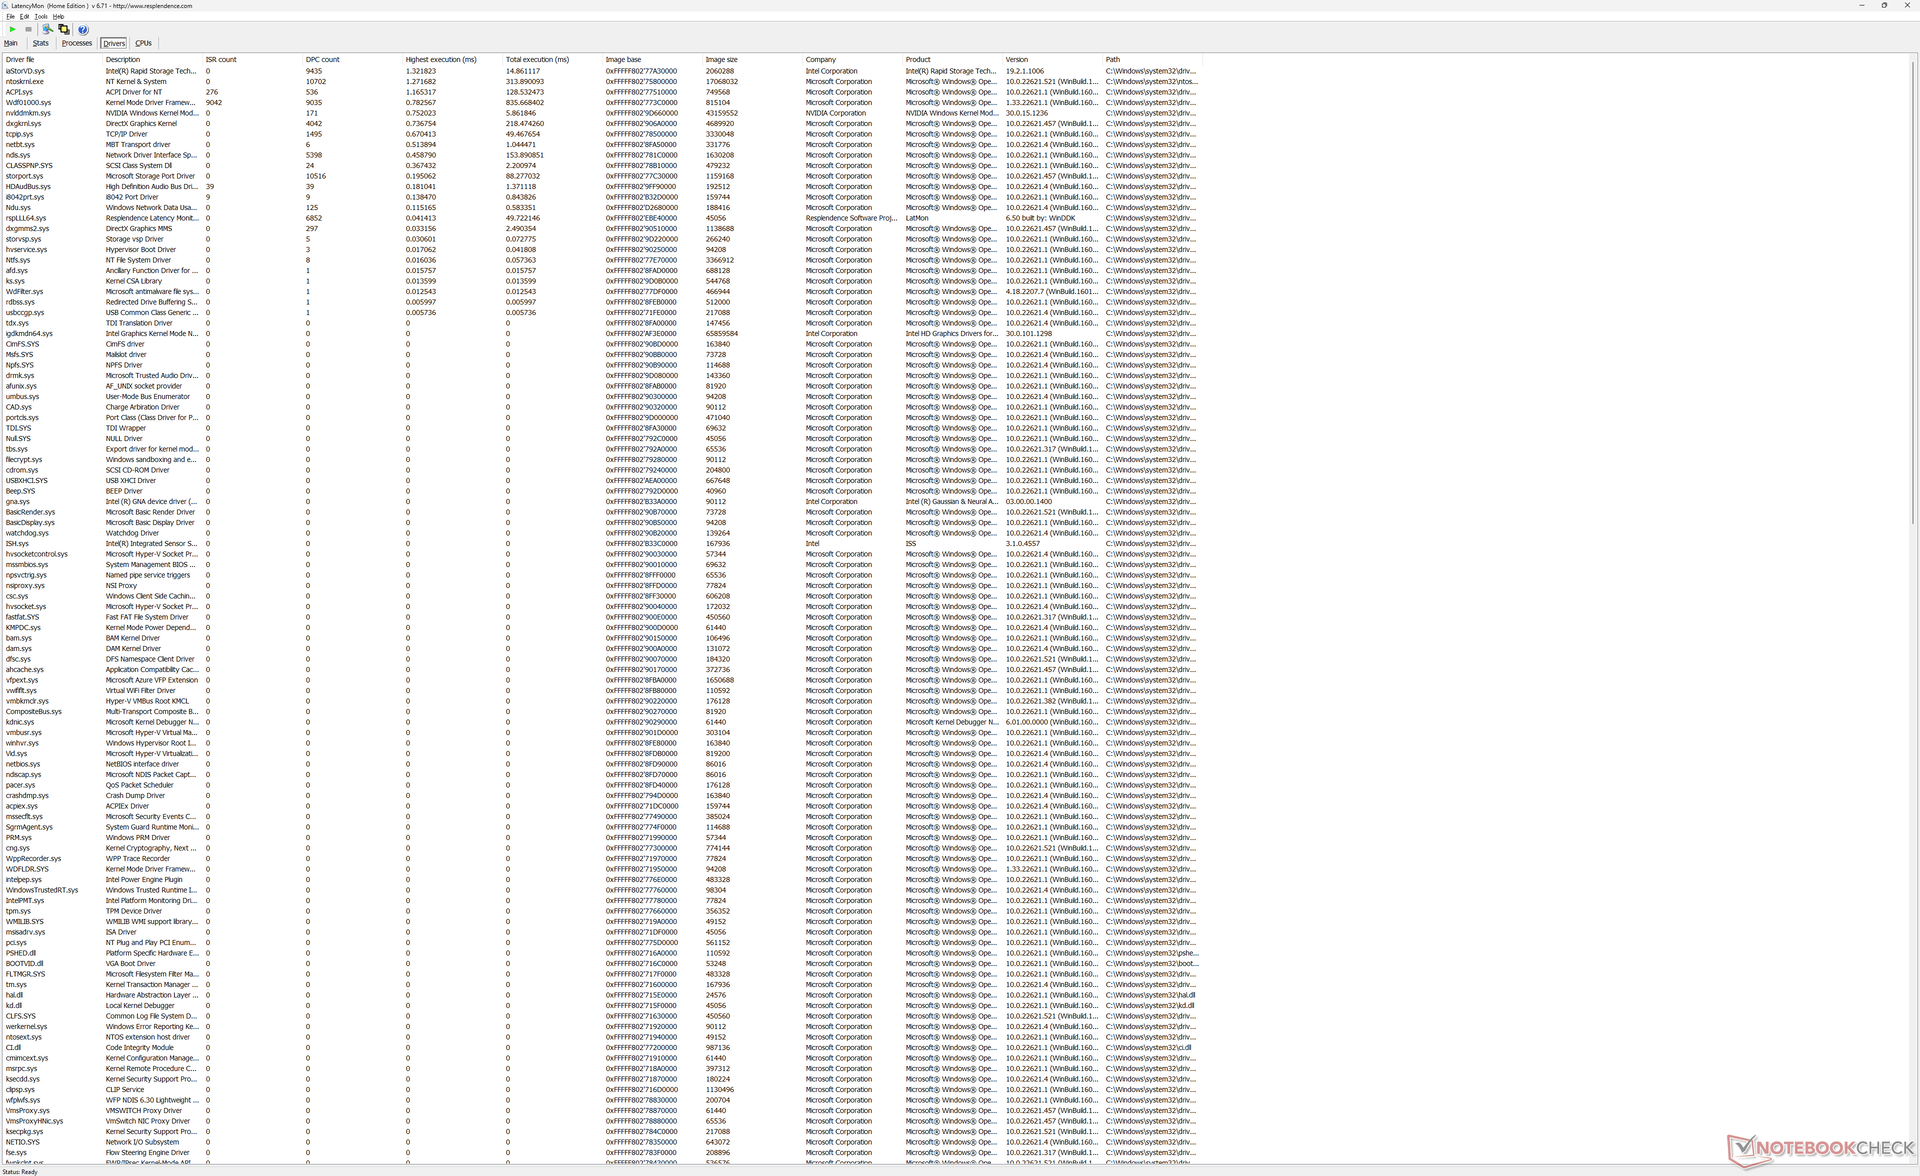
latencyMon reveals minor DPC issues when opening multiple browser tabs of our homepage. Furthermore, 4K video playback at 60 FPS is imperfect with 47 dropped frames during our minute-long test video.
| DPC Latencies / LatencyMon - interrupt to process latency (max), Web, Youtube, Prime95 | |
| Dell Precision 7550 | |
| Asus ProArt StudioBook 16 W7600H5A-2BL2 | |
| Lenovo ThinkPad P1 G4-20Y4Z9DVUS | |
| Dell Precision 7670 | |
| Dell Precision 5000 5560 | |
| HP ZBook Fury 15 G8 | |
* ... smaller is better
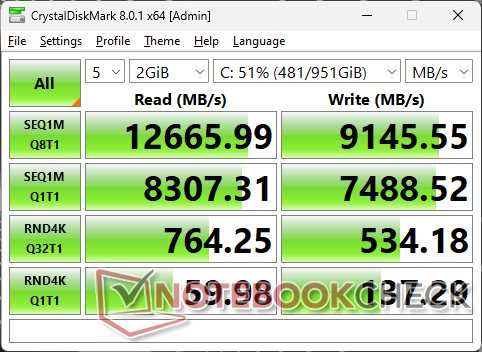
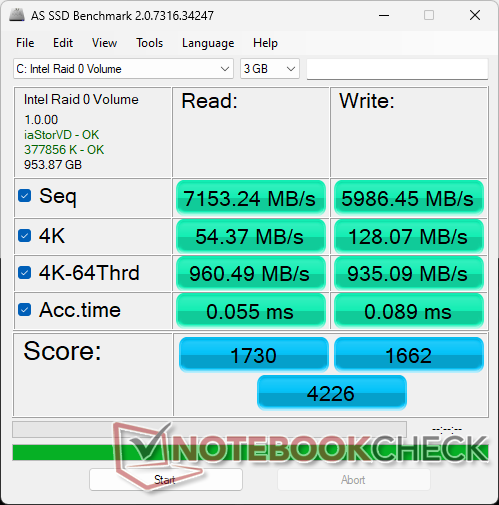
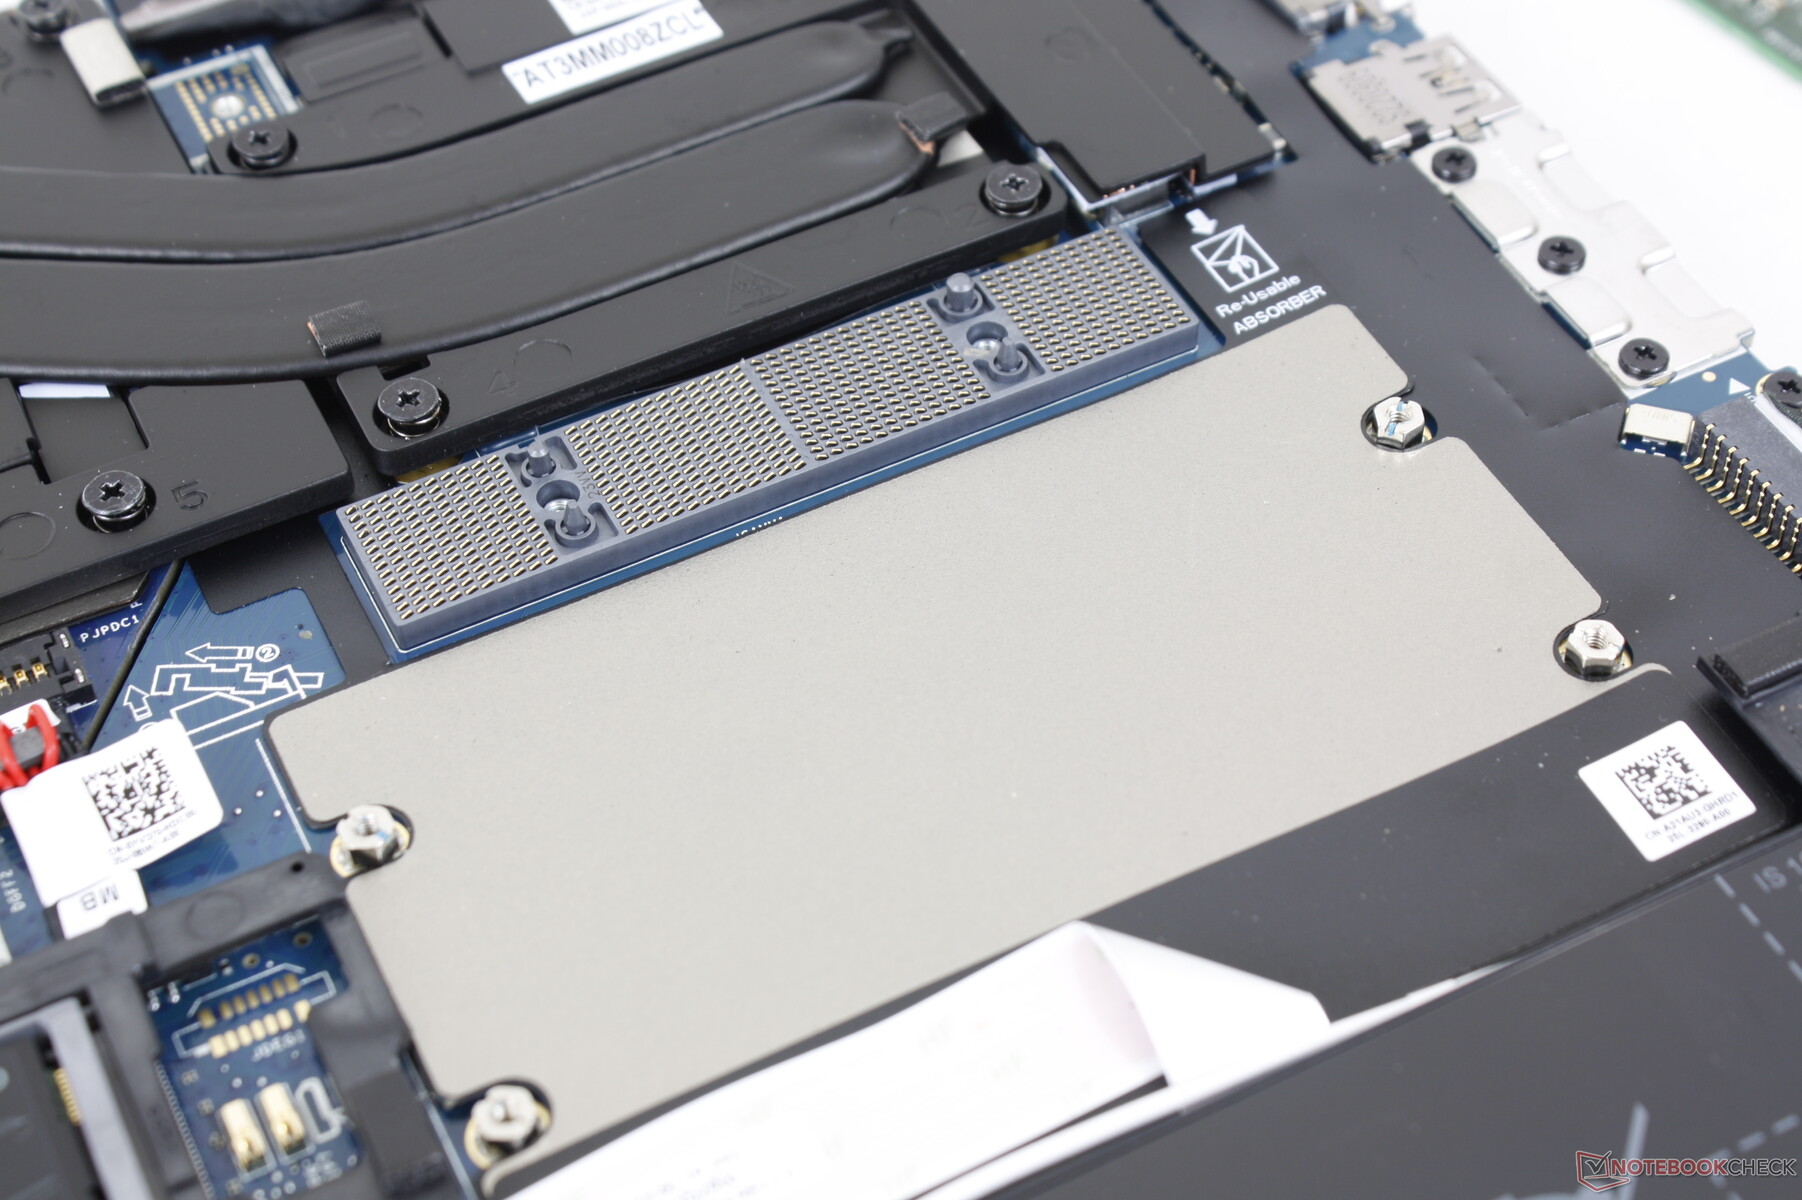
Storage Devices — Insane Speeds With PCIe4 x4 RAID 0
All configurations can support up to two M.2 SSDs with some supporting up to three. Our specific test unit comes equipped with two SK Hynix PC801 PCIe4 x4 NVMe SSDs in RAID 0 for sequential read and write rates of almost 13000 MB/s and 9200 MB/s, respectively. When stressed under DiskSpd, the drives would show no signs of performance throttling even after long periods. There are heat spreaders or thermal pads atop the included SSDs to aid in heat dissipation.

| Drive Performance rating - Percent | |
| Dell Precision 5000 5560 | |
| Dell Precision 7670 | |
| Lenovo ThinkPad P1 G4-20Y4Z9DVUS | |
| Asus ProArt StudioBook 16 W7600H5A-2BL2 | |
| HP ZBook Fury 15 G8 | |
| Dell Precision 7550 | |
* ... smaller is better
Disk Throttling: DiskSpd Read Loop, Queue Depth 8
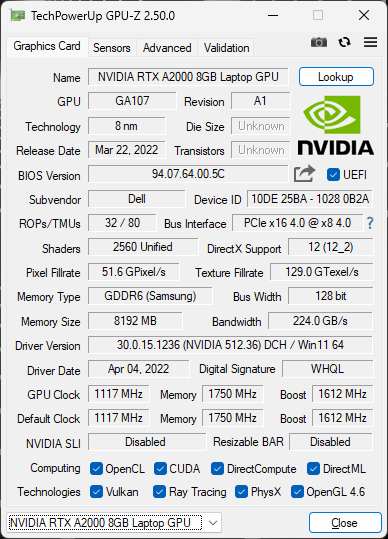
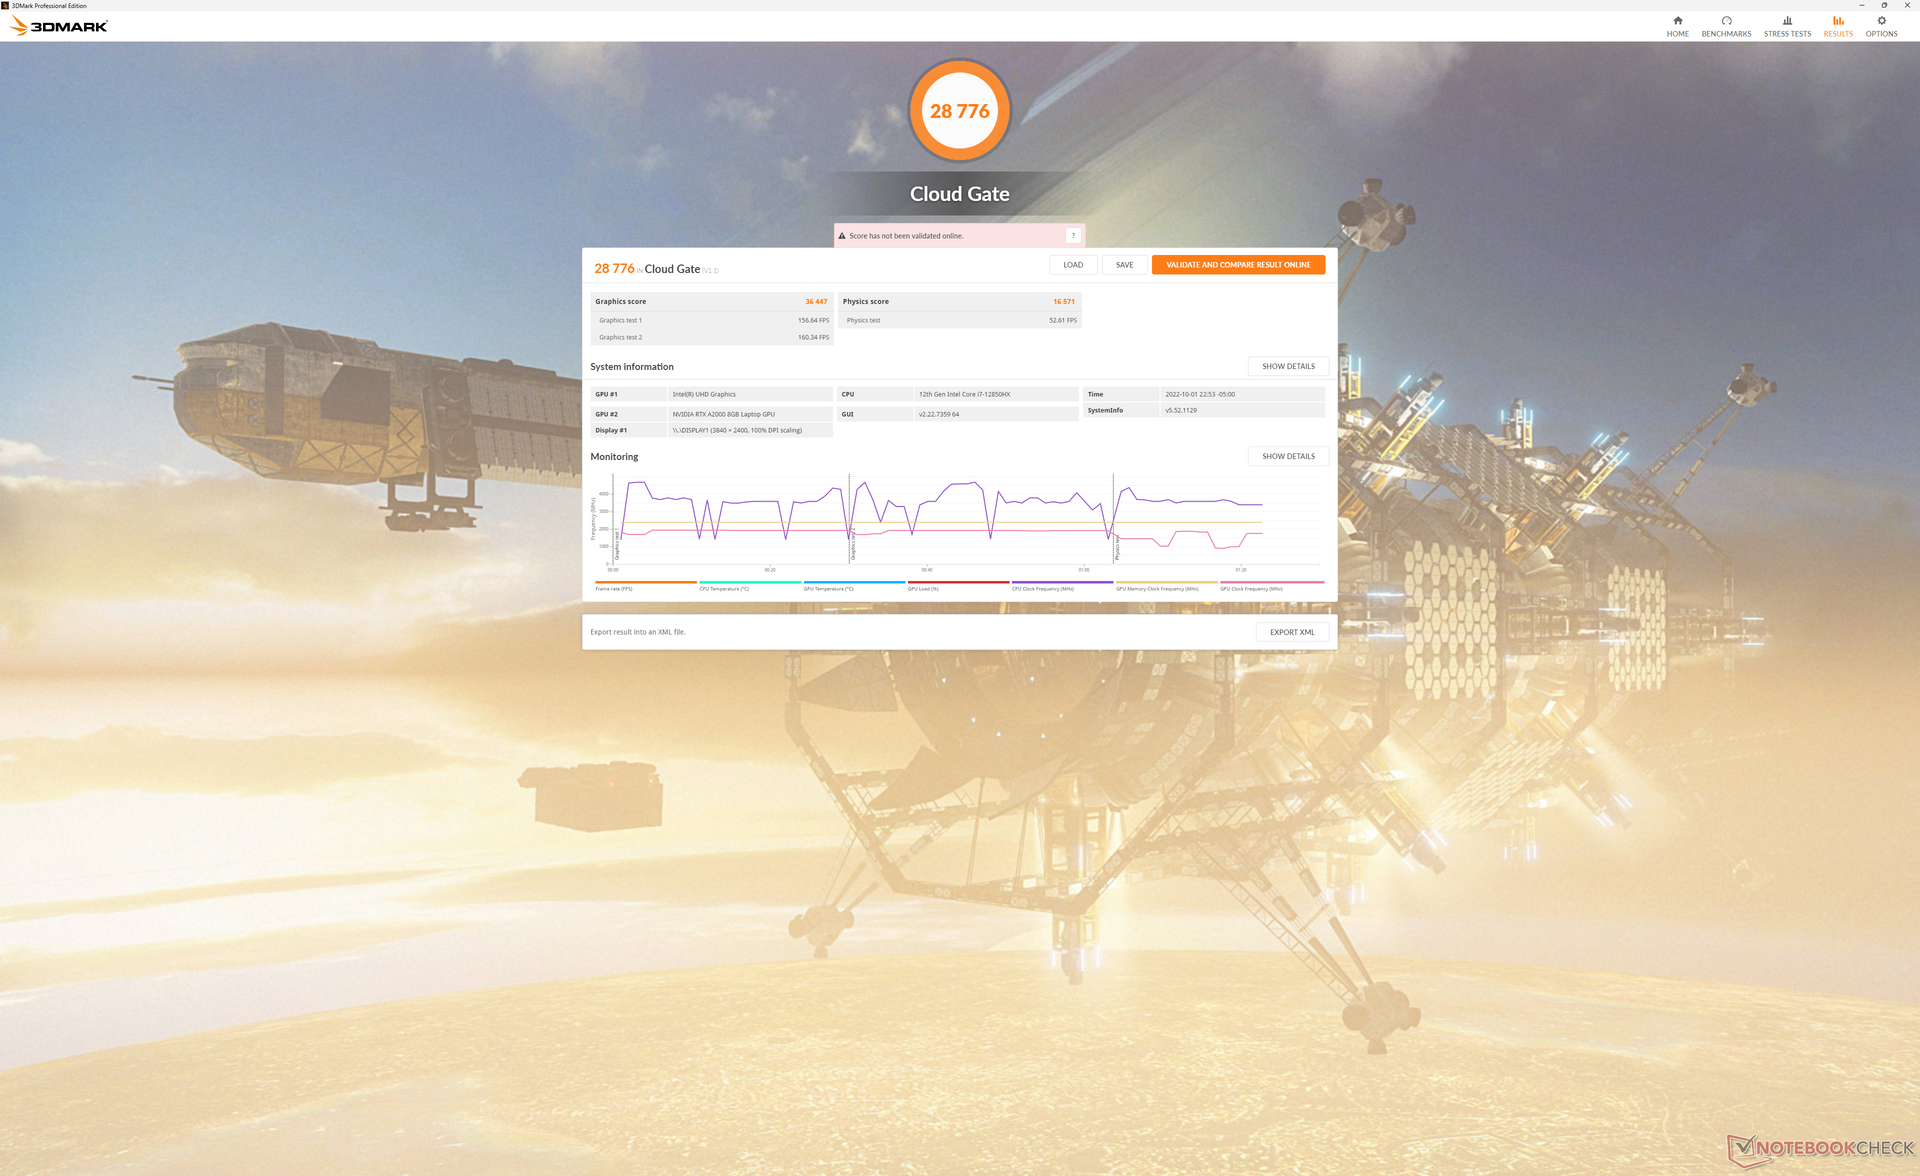
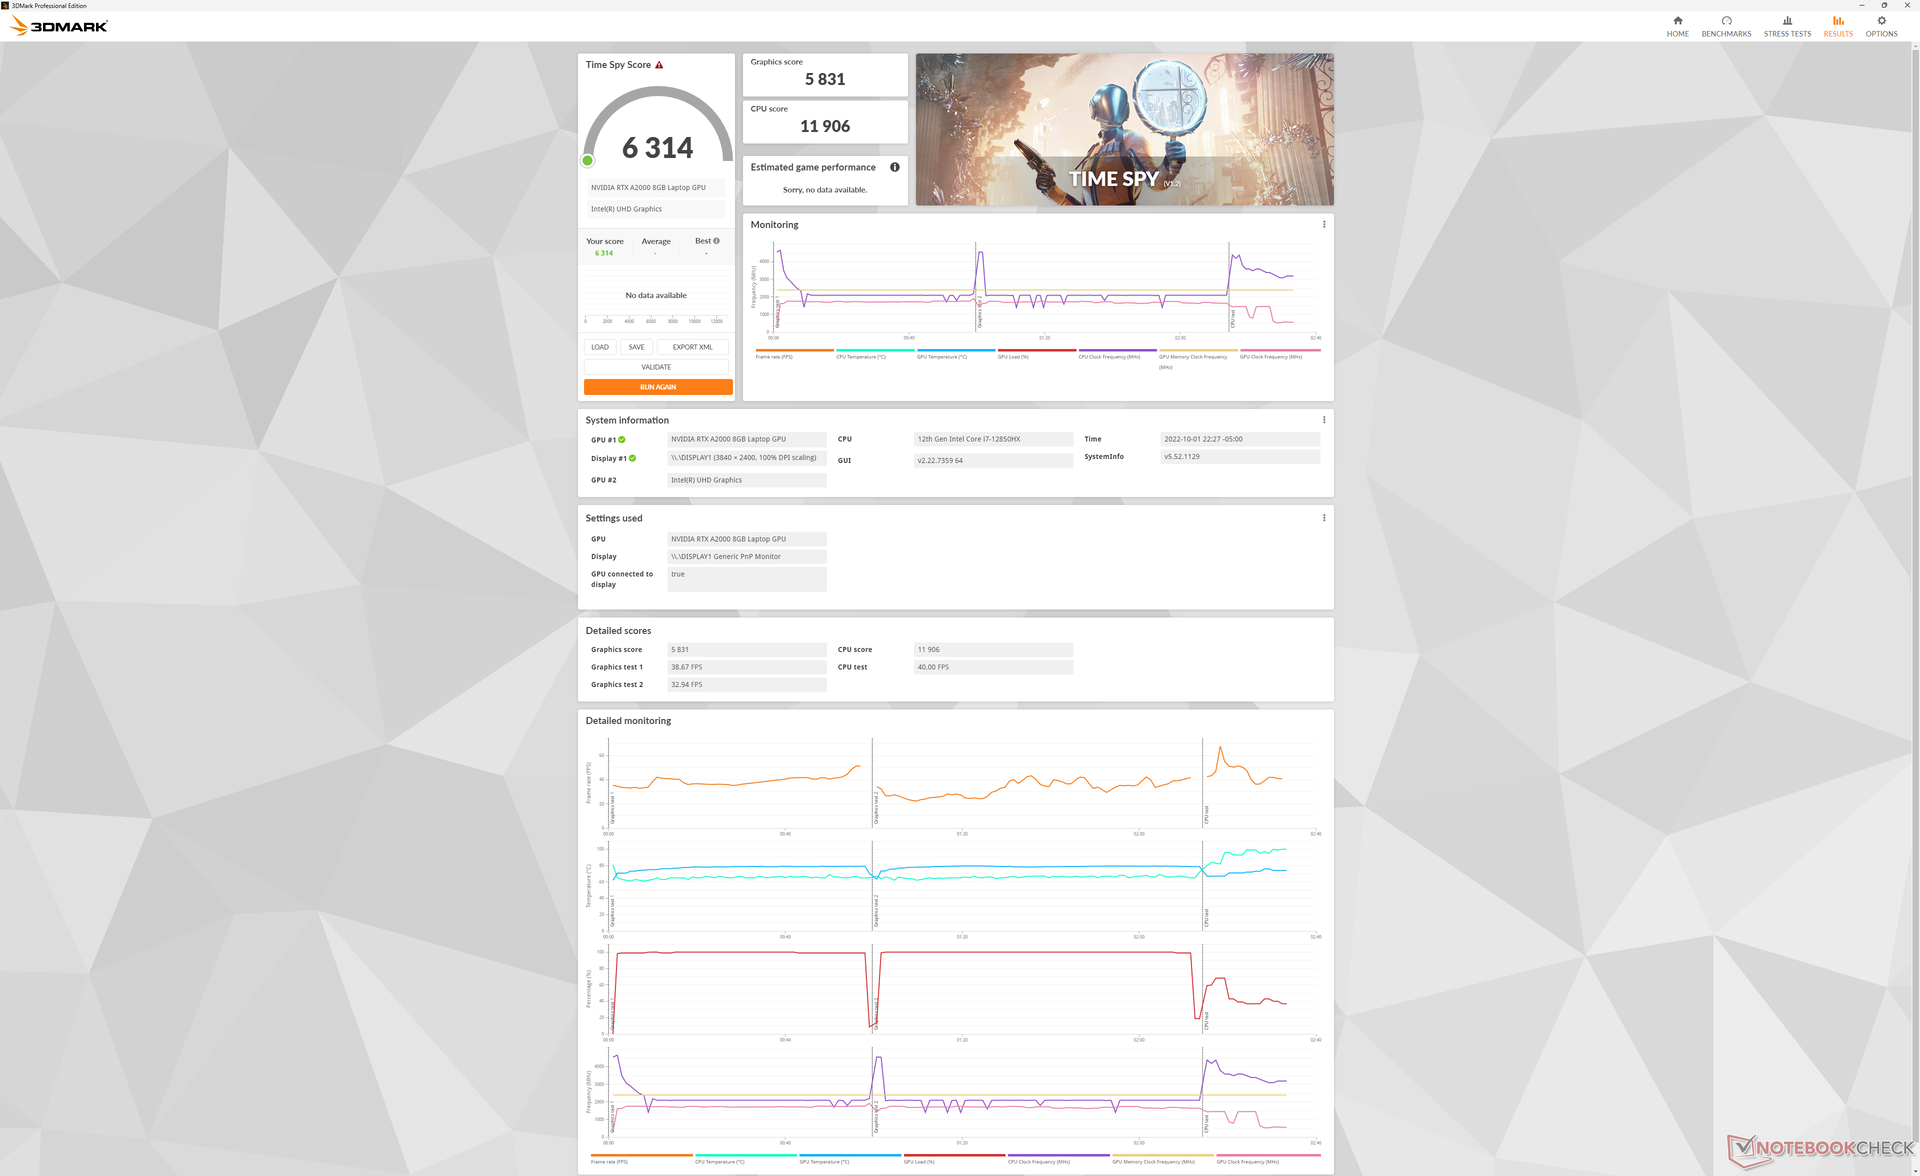
GPU Performance — 95 W TGP Graphics
The RTX A2000 is derived from the GeForce RTX 3050 Ti and so both GPUs share similar raw performance numbers. Upgrading to the RTX A3000 or RTX A5500 option is expected to boost performance by 15 to 20 percent and 70 to 90 percent, respectively.
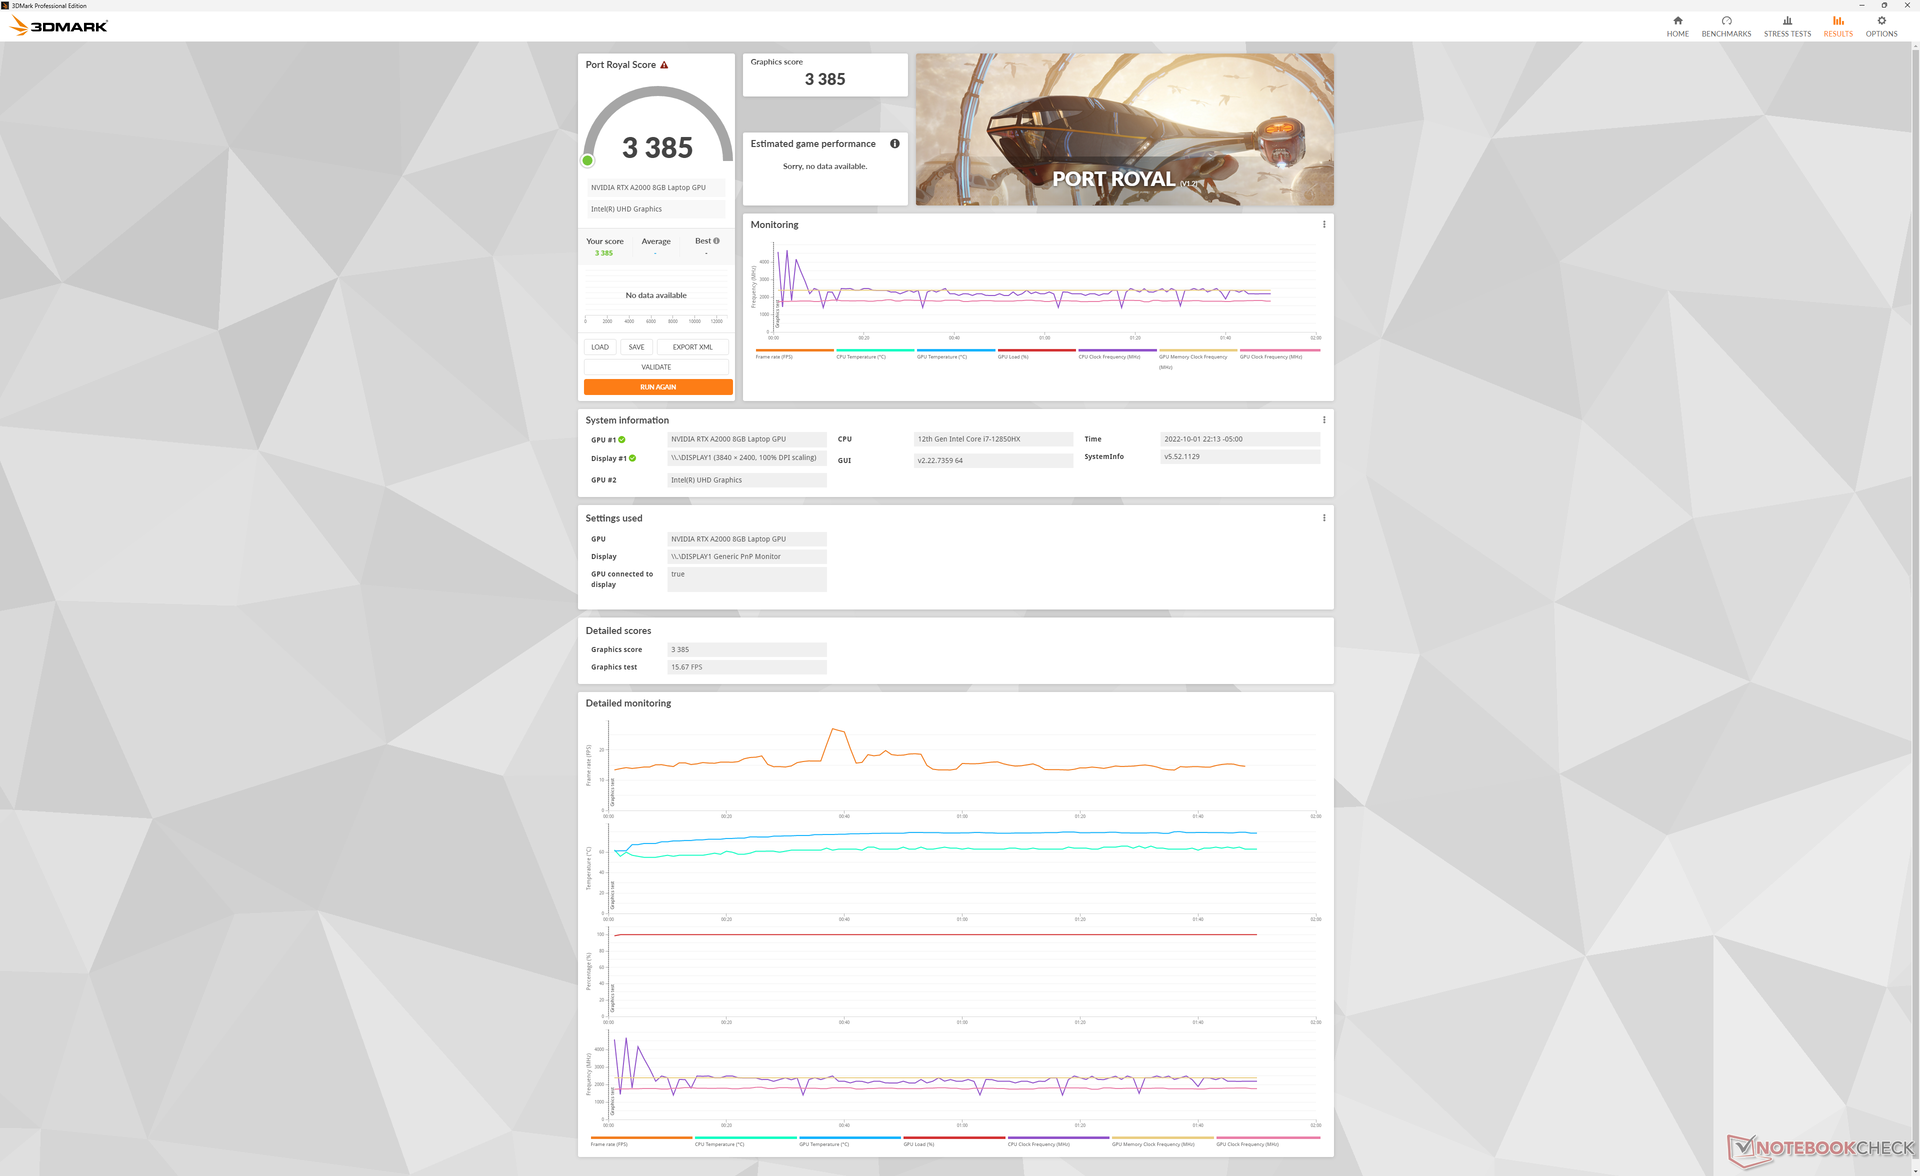
Interestingly, ray-tracing Port Royal performance is significantly better than what we recorded on the older Precision 5560 even though they share the same RTX A2000 GPU. We suspect this could be due to both the much higher TGP target (95 W vs. 45 W) and newer Nvidia driver (512.36 vs. 472.12) of our Precision 7670.
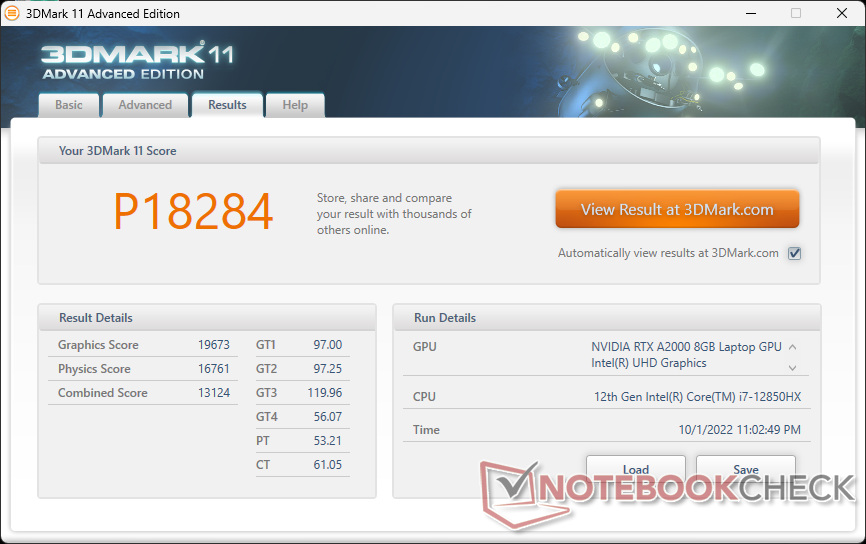
| 3DMark 11 Performance | 18284 points | |
| 3DMark Cloud Gate Standard Score | 28776 points | |
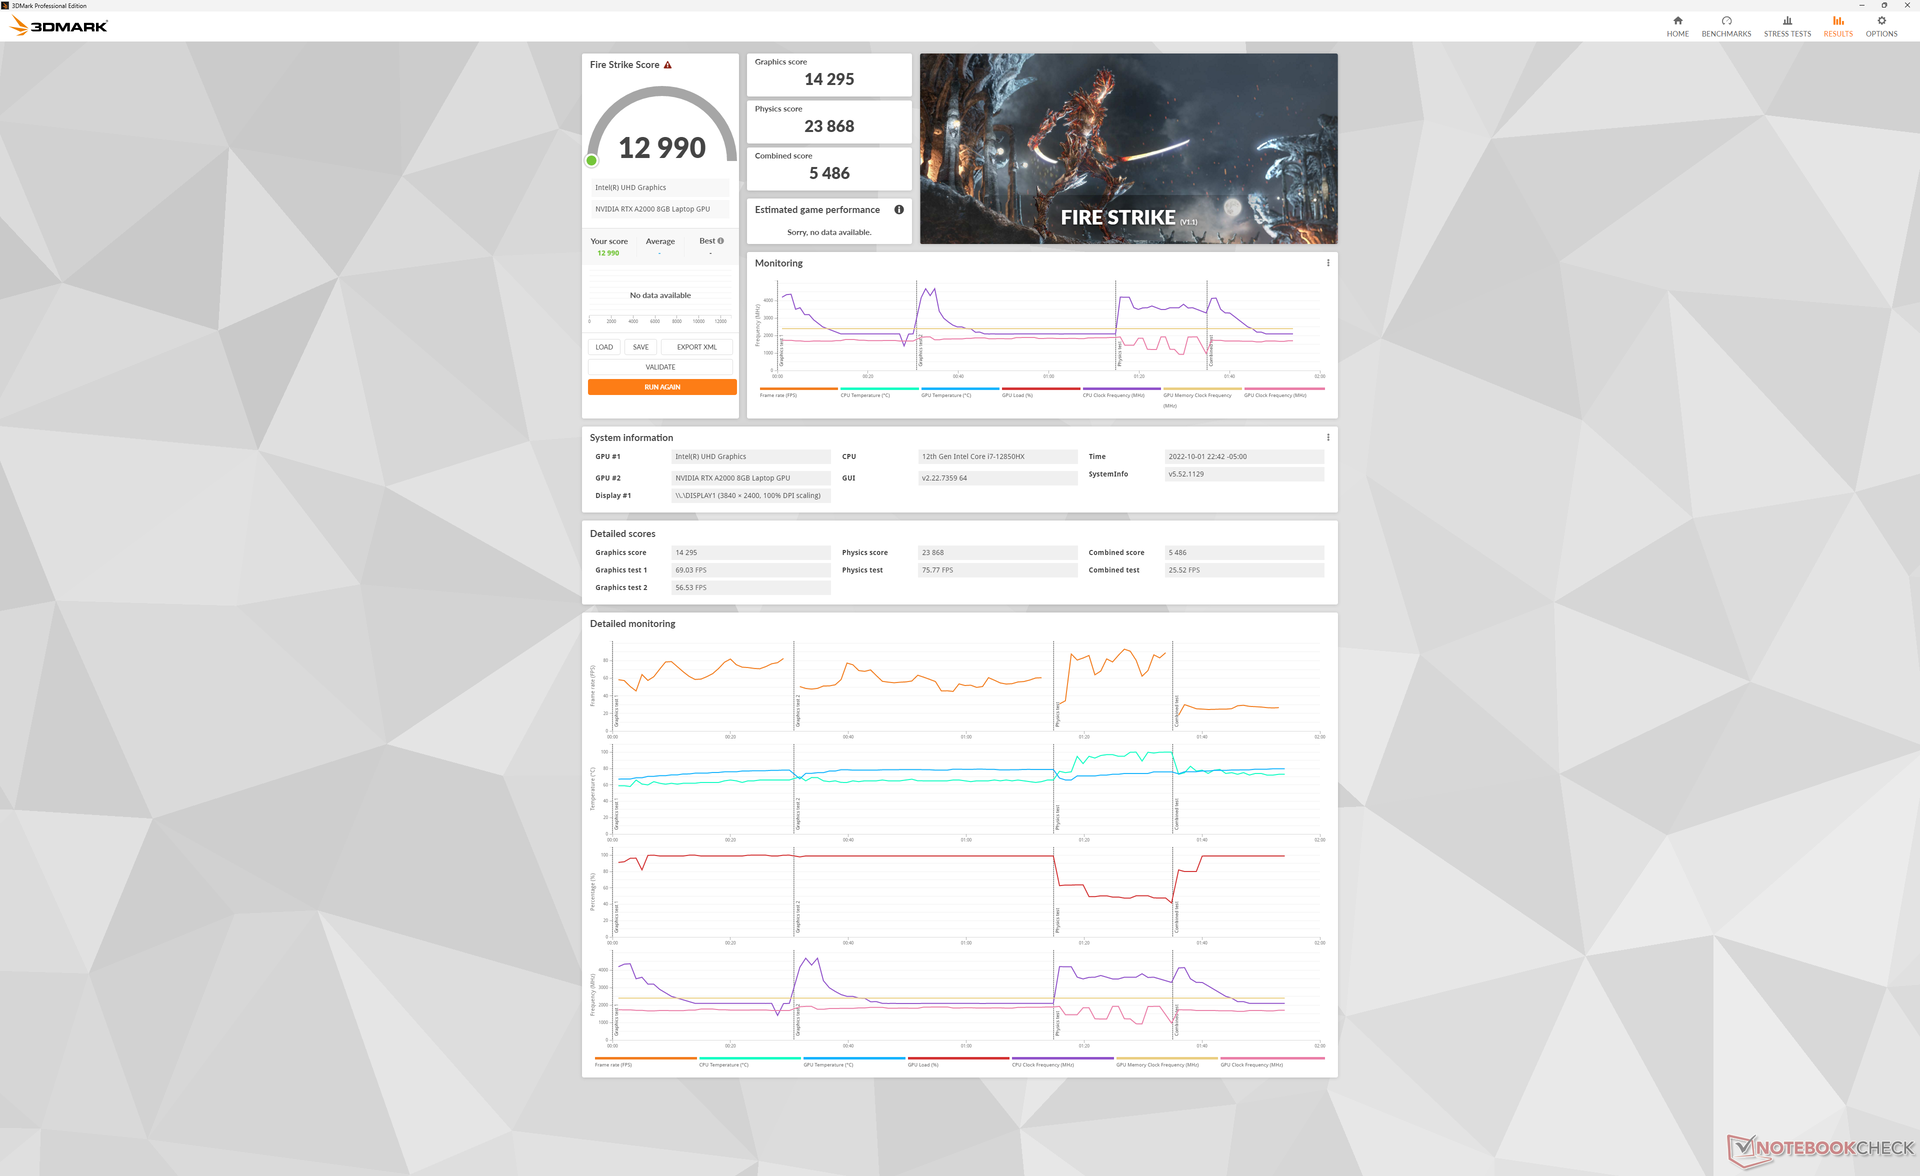
| 3DMark Fire Strike Score | 12990 points | |
| 3DMark Time Spy Score | 6314 points | |
Help | ||
| Blender | |
| v3.3 Classroom HIP/AMD | |
| Lenovo Legion 7 16ARHA7 | |
| v3.3 Classroom OPTIX/RTX | |
| Dell Precision 5000 5470 | |
| HP Envy 16 h0112nr | |
| Dell Precision 7670 | |
| v3.3 Classroom CUDA | |
| Dell Precision 5000 5470 | |
| HP Envy 16 h0112nr | |
| Dell Precision 7670 | |
| v3.3 Classroom CPU | |
| HP Envy 16 h0112nr | |
| Dell Precision 5000 5470 | |
| Lenovo Legion 7 16ARHA7 | |
| Dell Precision 7670 | |
* ... smaller is better
Witcher 3 FPS Chart
| low | med. | high | ultra | QHD | 4K | |
|---|---|---|---|---|---|---|
| GTA V (2015) | 181.7 | 177.6 | 155.1 | 79.1 | 57.1 | |
| The Witcher 3 (2015) | 297.1 | 181.7 | 108.6 | 57.4 | ||
| Dota 2 Reborn (2015) | 180.8 | 159.3 | 145.1 | 128.8 | 78.5 | |
| Final Fantasy XV Benchmark (2018) | 129.5 | 80.4 | 60.6 | 44.4 | 26 | |
| X-Plane 11.11 (2018) | 135.2 | 104.1 | 85.5 | 55.1 | ||
| Strange Brigade (2018) | 325 | 151.2 | 120.9 | 103.5 | 76.8 | |
| Cyberpunk 2077 1.6 (2022) | 78.5 | 65.1 | 55 | 44.3 | 27.4 |
Emissions
System Noise
The fans are almost never silent even when idling on desktop, but they are nonetheless quiet and difficult to notice during low loads. Expect noise levels to remain under 28 dB(A) against a silent background of 22.7 dB(A) during video playback. Fan noise is even quieter at 24.5 dB(A) if web browsing or word processing which is similar to what we observed on the ZBook Fury 15 G8 or Precision 5560.
Noise levels ramp up somewhat quickly when higher loads are introduced. The first benchmark scene of 3DMark 06, for example, would cause fan noise to be as high as 49 dB(A) even when set to the Balanced power profile. Fan noise would peak at about 52 dB(A) if running extreme loads like Prime95 and FurMark much like on the Precision 5560. In other words, the Precision 7670 runs quietly in most conditions, but it gets quite noisy if even a bit of stress is introduced.
Noise level
| Idle |
| 22.9 / 22.9 / 24.5 dB(A) |
| Load |
| 48.7 / 52.1 dB(A) |
 | ||
30 dB silent 40 dB(A) audible 50 dB(A) loud |
||
min: | ||
| Dell Precision 7670 RTX A2000 Laptop GPU, i7-12850HX, SK Hynix HFS001TEJ9X115N | Lenovo ThinkPad P1 G4-20Y4Z9DVUS T1200 Laptop GPU, i7-11800H, Samsung PM9A1 MZVL2512HCJQ | Asus ProArt StudioBook 16 W7600H5A-2BL2 RTX A5000 Laptop GPU, W-11955M, 2x Micron 2300 2TB MTFDHBA2T0TDV (RAID 0) | Dell Precision 5000 5560 RTX A2000 Laptop GPU, i7-11850H, Samsung PM9A1 MZVL22T0HBLB | Dell Precision 7550 Quadro RTX 5000 Max-Q, W-10885M, SK Hynix PC601A NVMe 1TB | HP ZBook Fury 15 G8 RTX A5000 Laptop GPU, i9-11950H, Samsung PM981a MZVLB1T0HBLR | |
|---|---|---|---|---|---|---|
| Noise | -3% | -3% | 11% | -9% | 3% | |
| off / environment * (dB) | 22.7 | 24.3 -7% | 26 -15% | 23.4 -3% | 25.8 -14% | 24.1 -6% |
| Idle Minimum * (dB) | 22.9 | 24.3 -6% | 26 -14% | 23.6 -3% | 25.8 -13% | 24.1 -5% |
| Idle Average * (dB) | 22.9 | 24.3 -6% | 26 -14% | 23.6 -3% | 25.8 -13% | 24.1 -5% |
| Idle Maximum * (dB) | 24.5 | 26.6 -9% | 26.5 -8% | 23.6 4% | 25.9 -6% | 24.8 -1% |
| Load Average * (dB) | 48.7 | 46.8 4% | 42 14% | 25.8 47% | 51.2 -5% | 37.8 22% |
| Witcher 3 ultra * (dB) | 45.2 | 46.8 -4% | 40.1 11% | 51.9 -15% | 44.2 2% | |
| Load Maximum * (dB) | 52.1 | 46.8 10% | 43 17% | 41.4 21% | 51.9 -0% | 44.2 15% |
* ... smaller is better
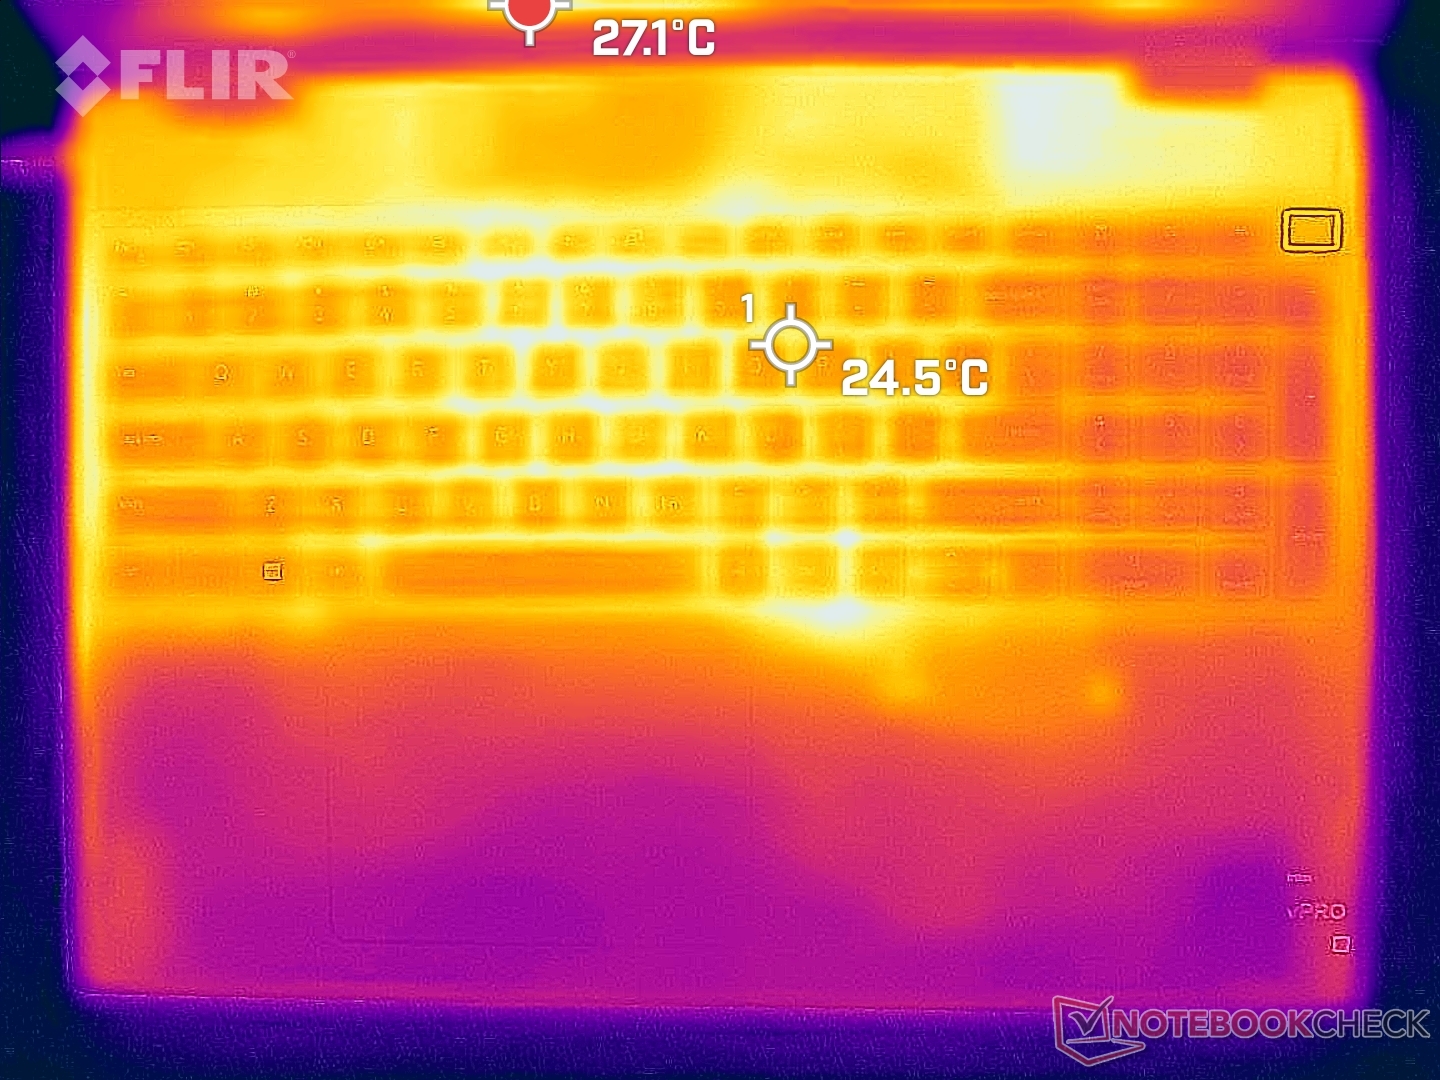
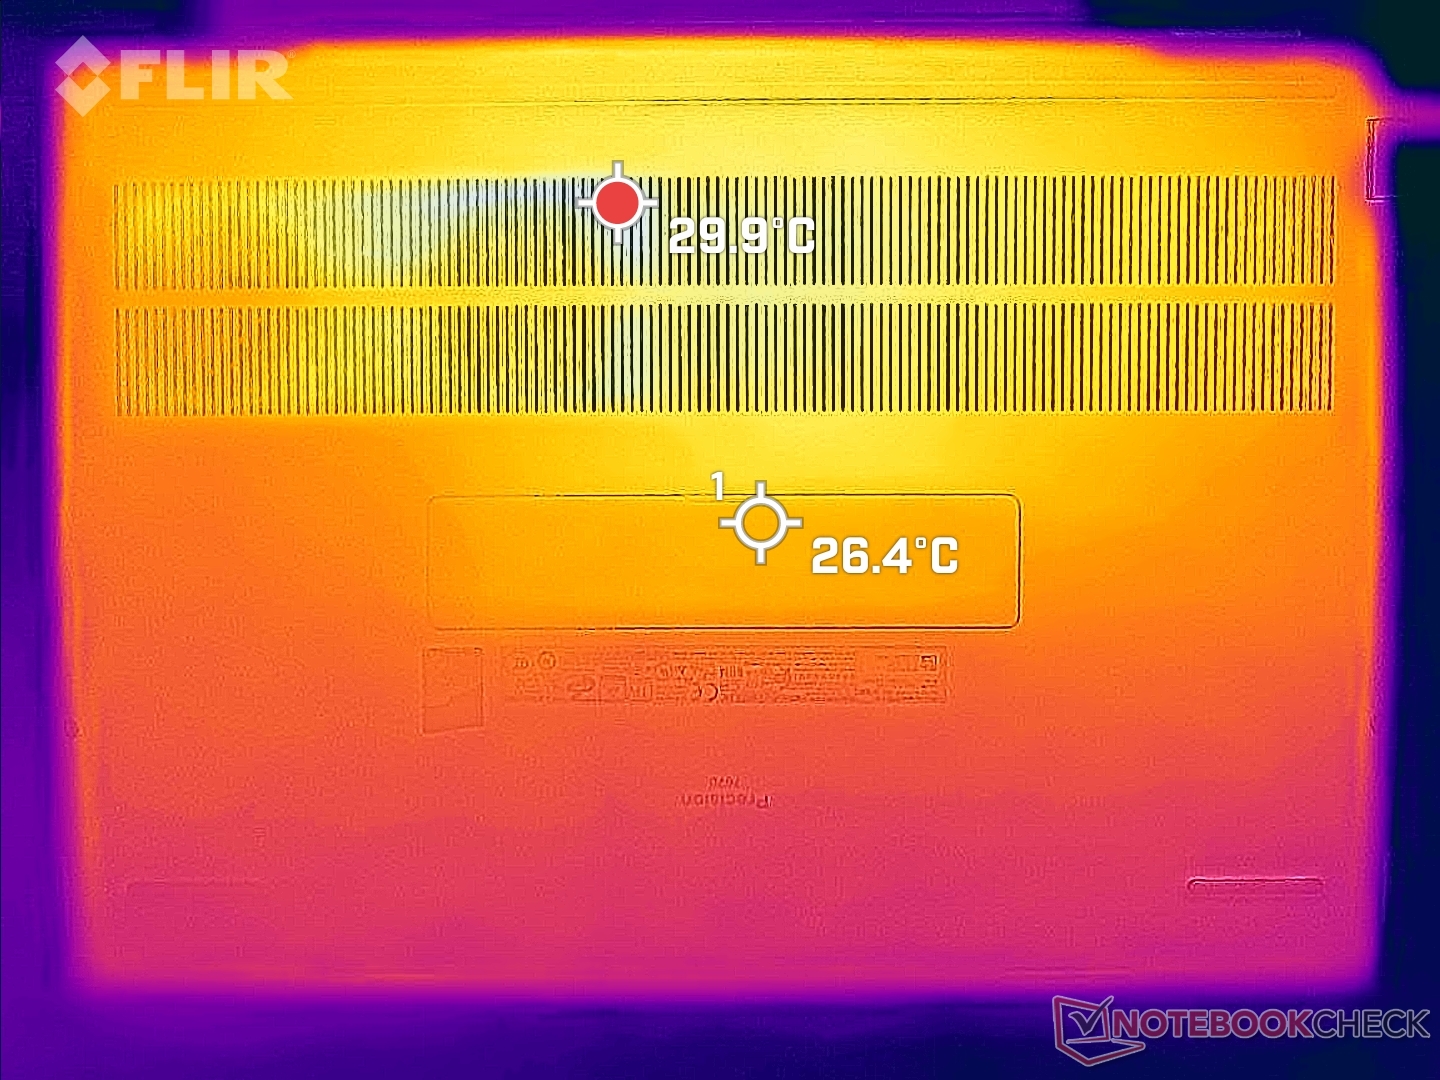
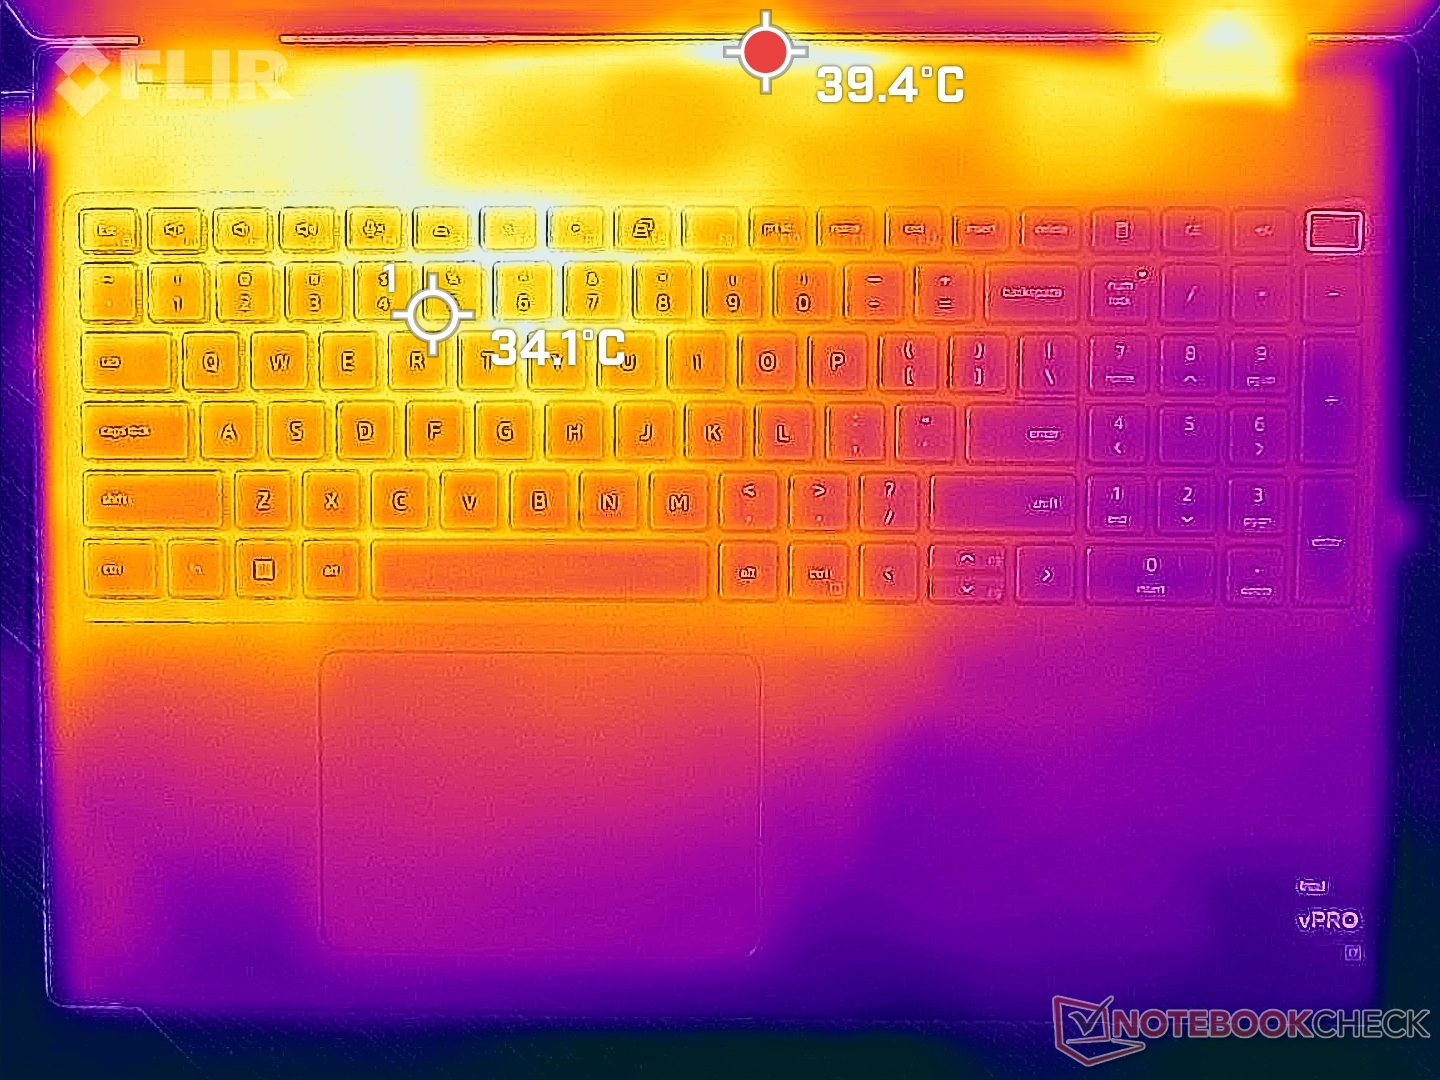
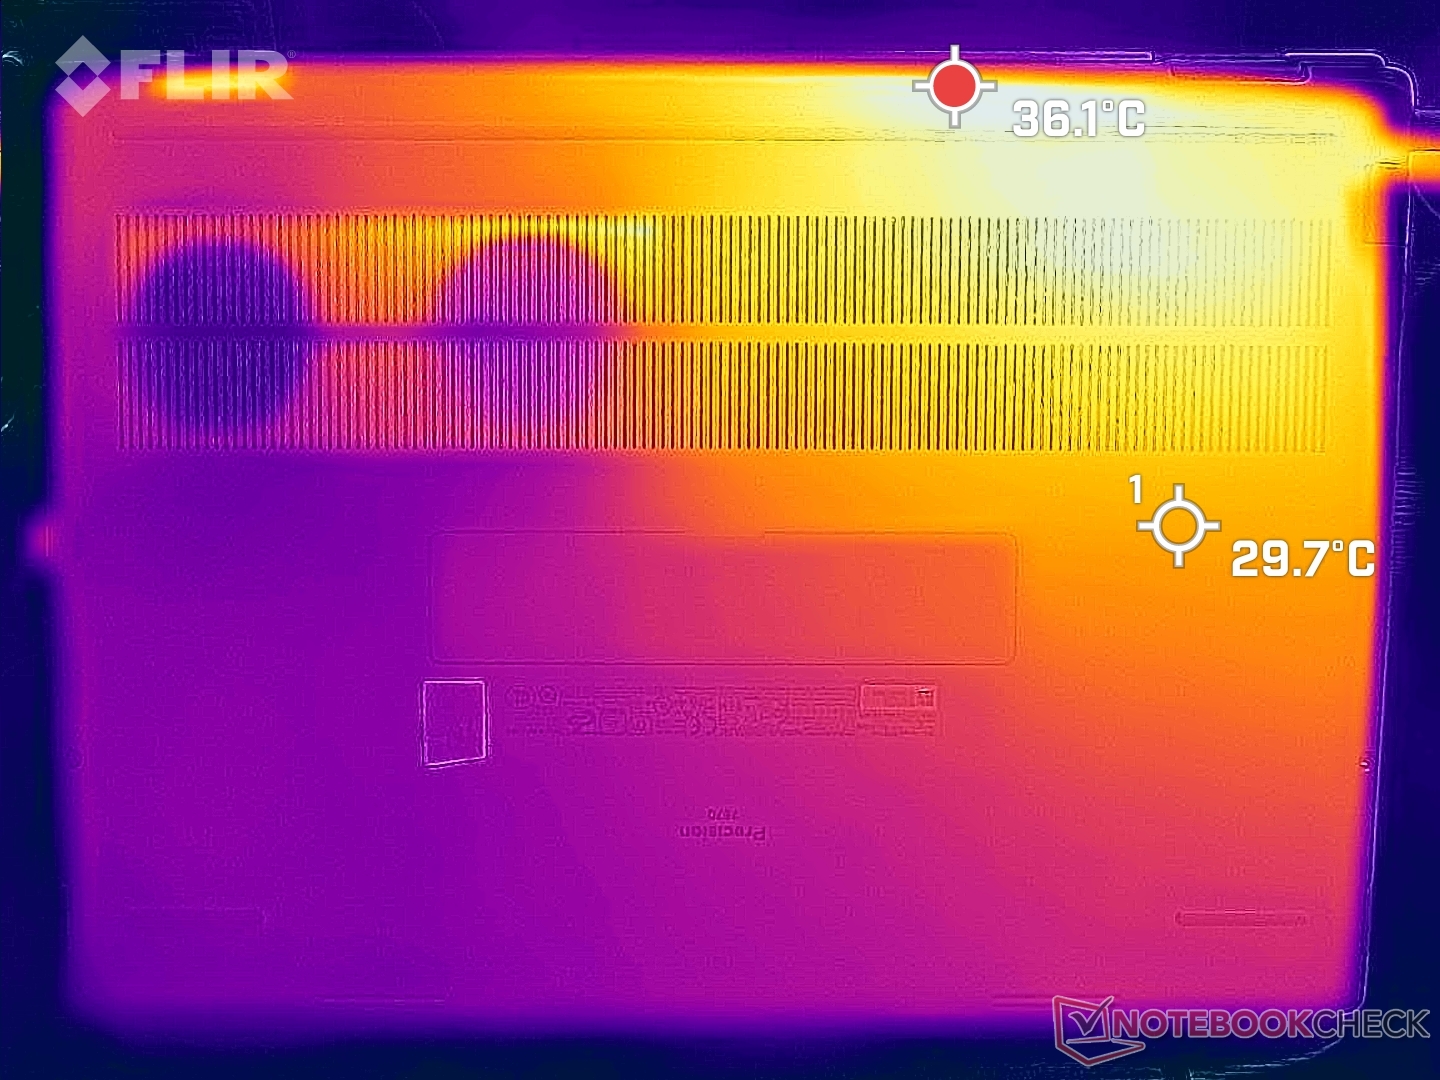
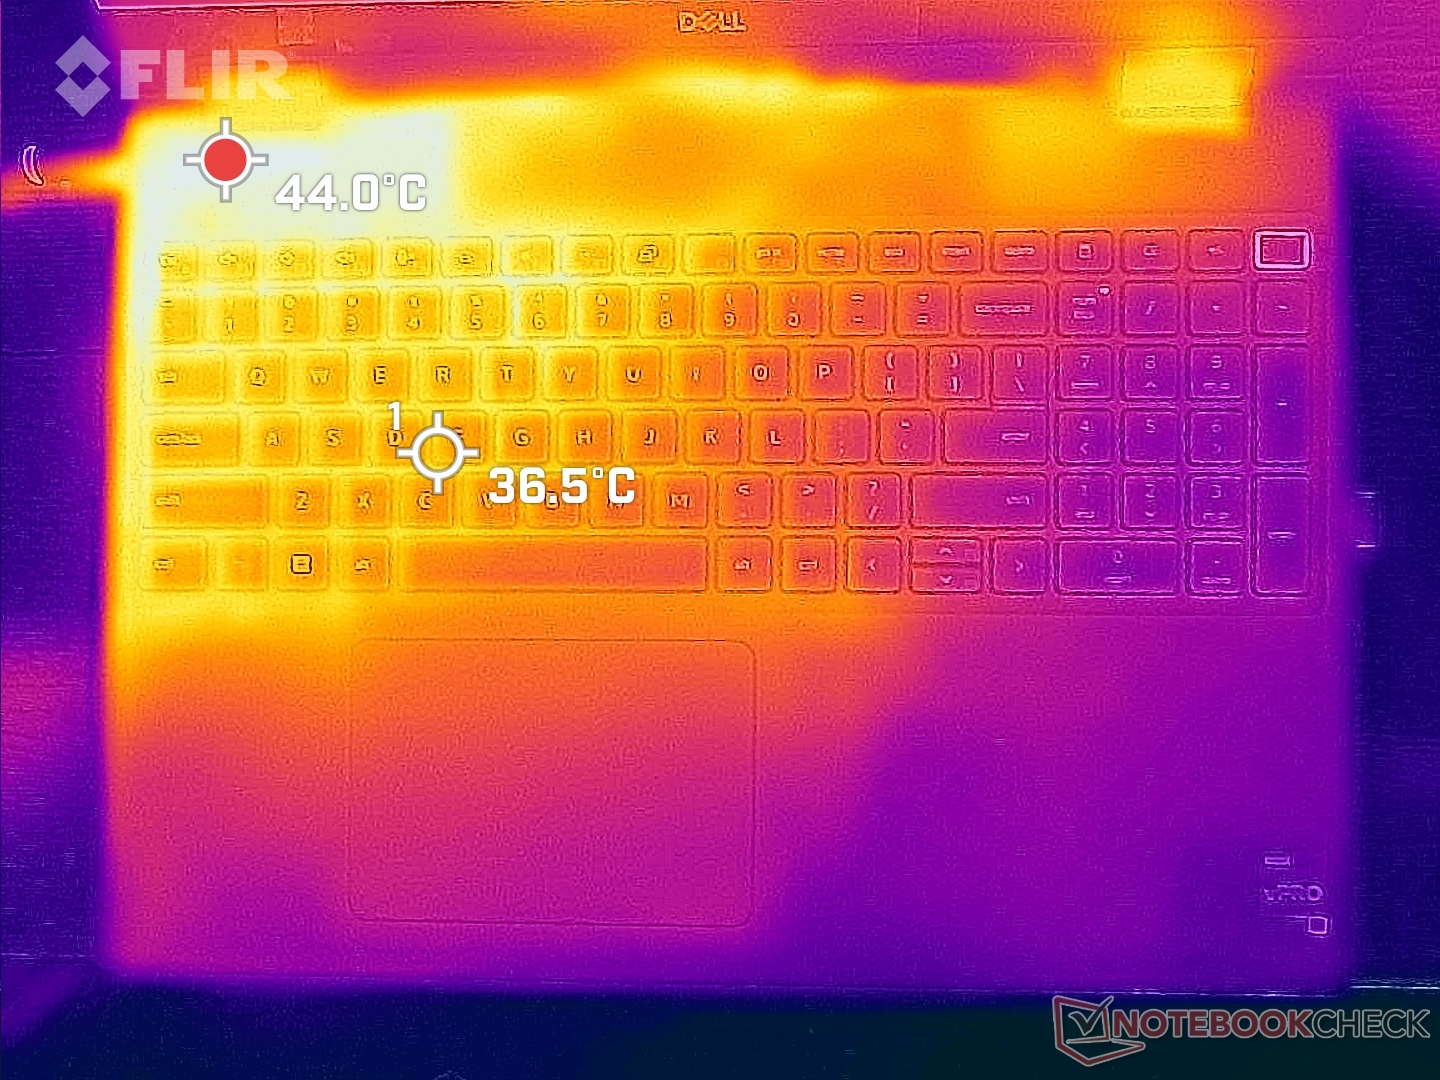
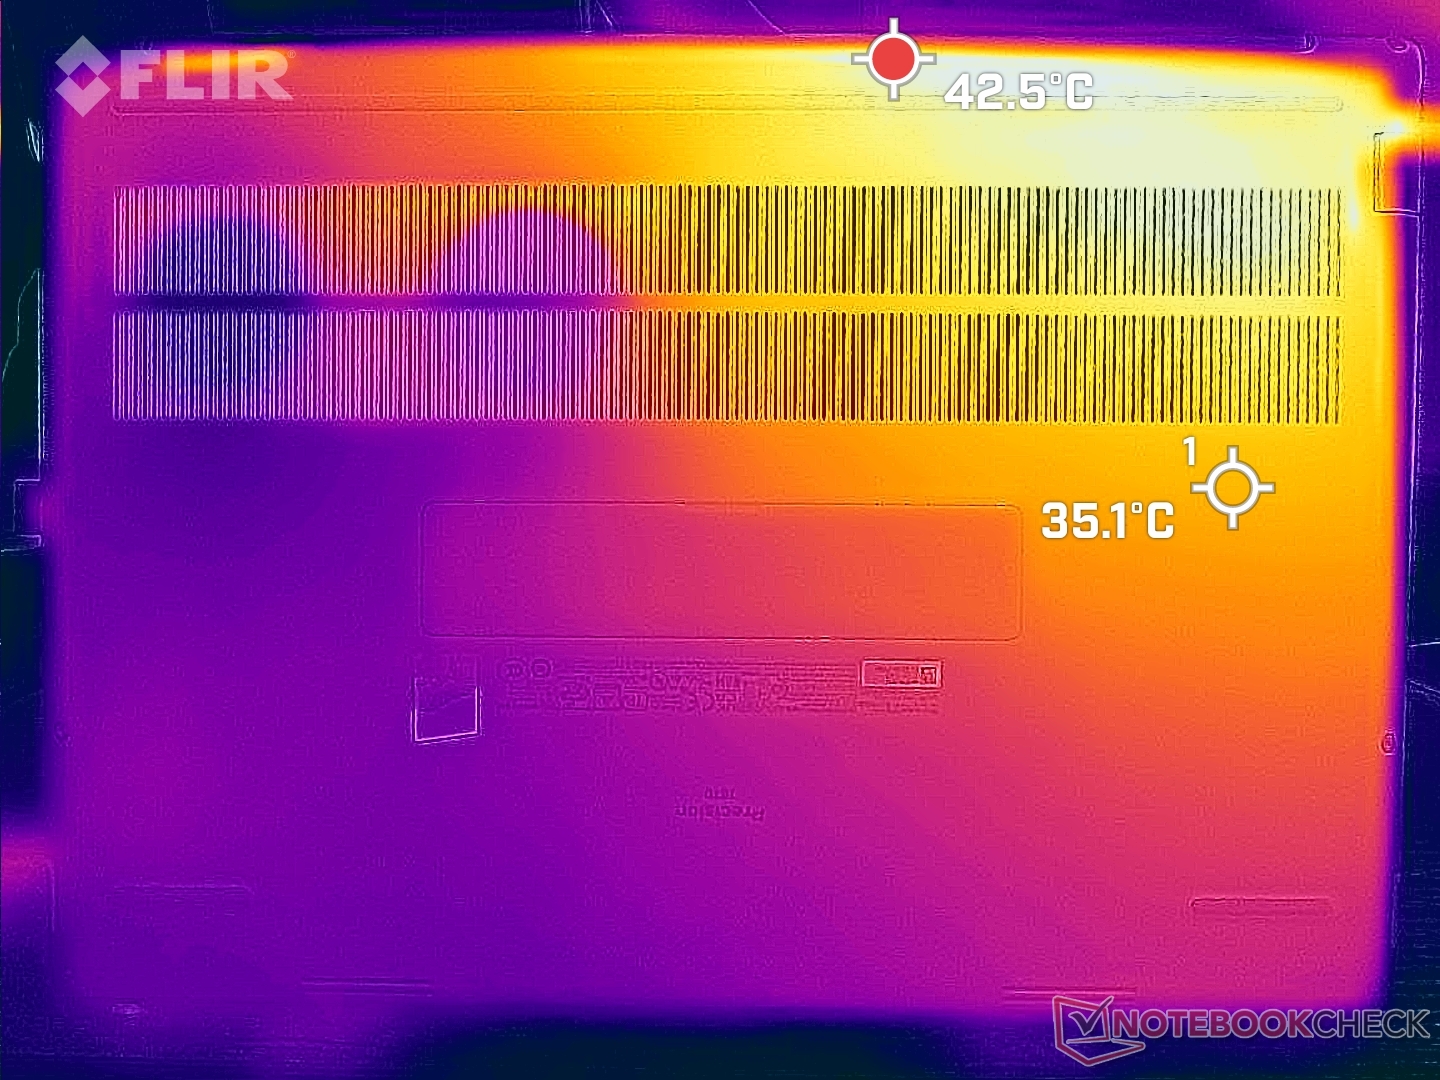
Temperature
Surface temperatures are always warm no matter the onscreen load. When idling on Power Saver mode, for example, the keyboard deck and bottom would settle at 30 C each compared to 26 C on the Lenovo ThinkPad P1 G4. The Asus ProArt StudioBook Pro 16 can be even warmer at almost 35 C under similar conditions.
We're able to record hot spots of 51 C and 46 C on the top and bottom, respectively, when running extreme loads. The left half of the chassis will always be warmer than the right due to how the cooling solution and processors are positioned inside.
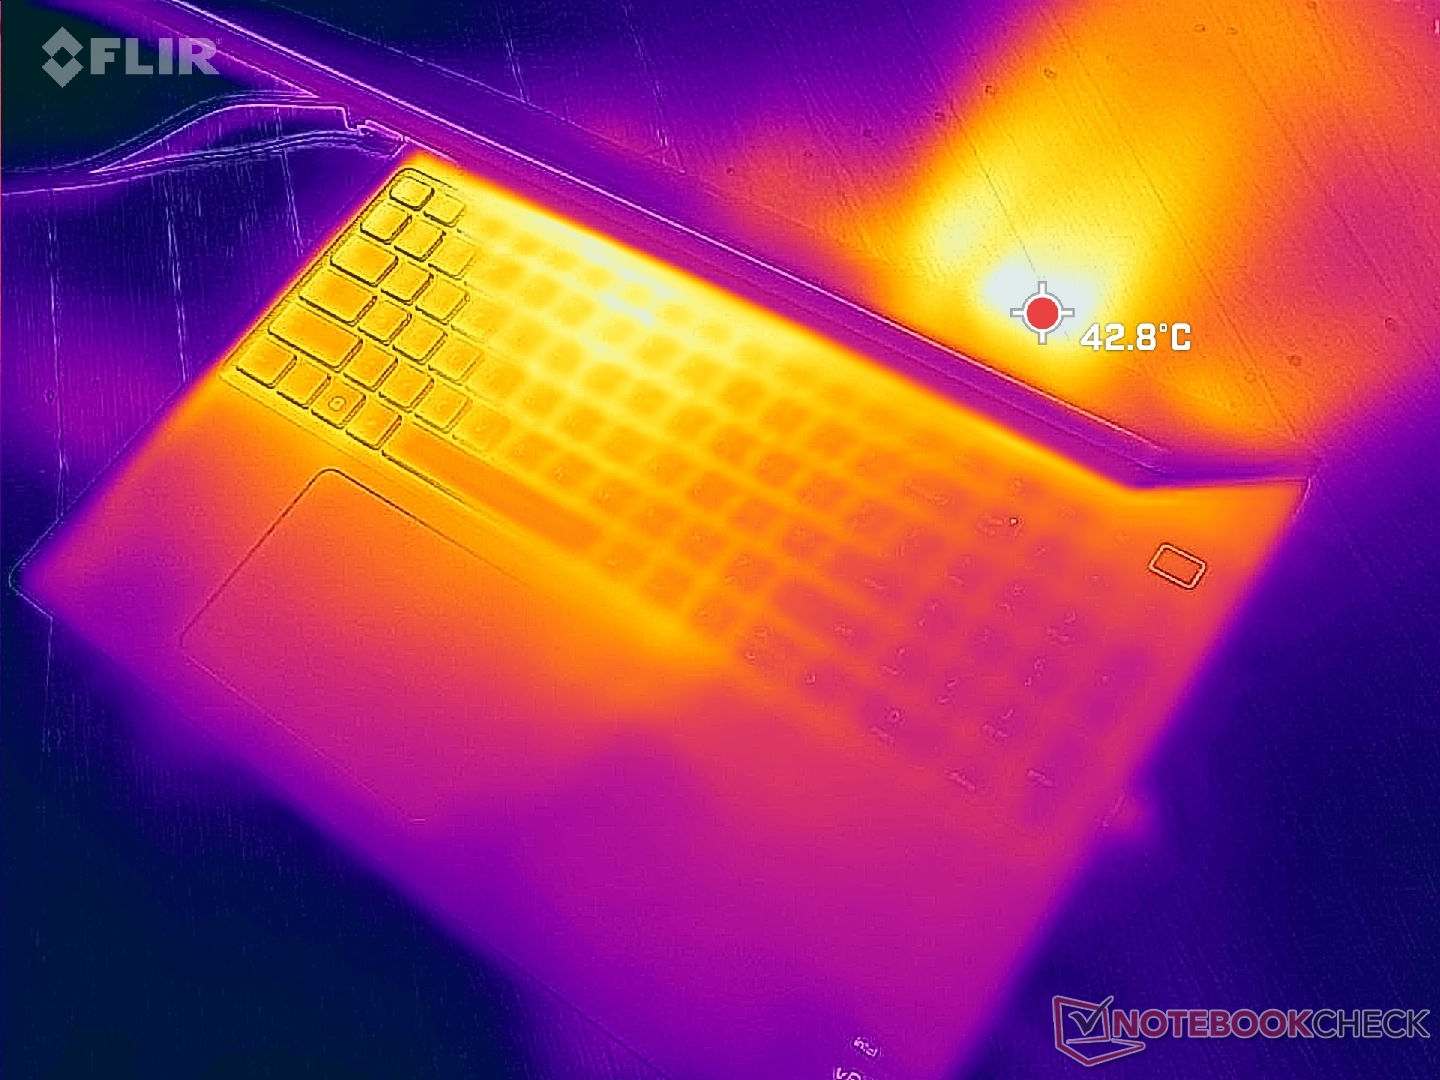
(-) The maximum temperature on the upper side is 51 °C / 124 F, compared to the average of 38.2 °C / 101 F, ranging from 22.2 to 69.8 °C for the class Workstation.
(-) The bottom heats up to a maximum of 45.8 °C / 114 F, compared to the average of 41.1 °C / 106 F
(+) In idle usage, the average temperature for the upper side is 29.8 °C / 86 F, compared to the device average of 32 °C / 90 F.
(±) Playing The Witcher 3, the average temperature for the upper side is 37.1 °C / 99 F, compared to the device average of 32 °C / 90 F.
(+) The palmrests and touchpad are reaching skin temperature as a maximum (34.2 °C / 93.6 F) and are therefore not hot.
(-) The average temperature of the palmrest area of similar devices was 27.8 °C / 82 F (-6.4 °C / -11.6 F).
| Dell Precision 7670 Intel Core i7-12850HX, NVIDIA RTX A2000 Laptop GPU | Lenovo ThinkPad P1 G4-20Y4Z9DVUS Intel Core i7-11800H, NVIDIA T1200 Laptop GPU | Asus ProArt StudioBook 16 W7600H5A-2BL2 Intel Xeon W-11955M, NVIDIA RTX A5000 Laptop GPU | Dell Precision 5000 5560 Intel Core i7-11850H, NVIDIA RTX A2000 Laptop GPU | Dell Precision 7550 Intel Xeon W-10885M, NVIDIA Quadro RTX 5000 Max-Q | HP ZBook Fury 15 G8 Intel Core i9-11950H, NVIDIA RTX A5000 Laptop GPU | |
|---|---|---|---|---|---|---|
| Heat | 5% | -3% | -1% | 2% | 4% | |
| Maximum Upper Side * (°C) | 51 | 49.9 2% | 45.7 10% | 48.2 5% | 49 4% | 45.6 11% |
| Maximum Bottom * (°C) | 45.8 | 56.7 -24% | 48.3 -5% | 42.6 7% | 51 -11% | 57.6 -26% |
| Idle Upper Side * (°C) | 31.8 | 25.5 20% | 35.3 -11% | 34.8 -9% | 28.2 11% | 26 18% |
| Idle Bottom * (°C) | 32.6 | 26.2 20% | 34.4 -6% | 35.2 -8% | 32 2% | 28.8 12% |
* ... smaller is better
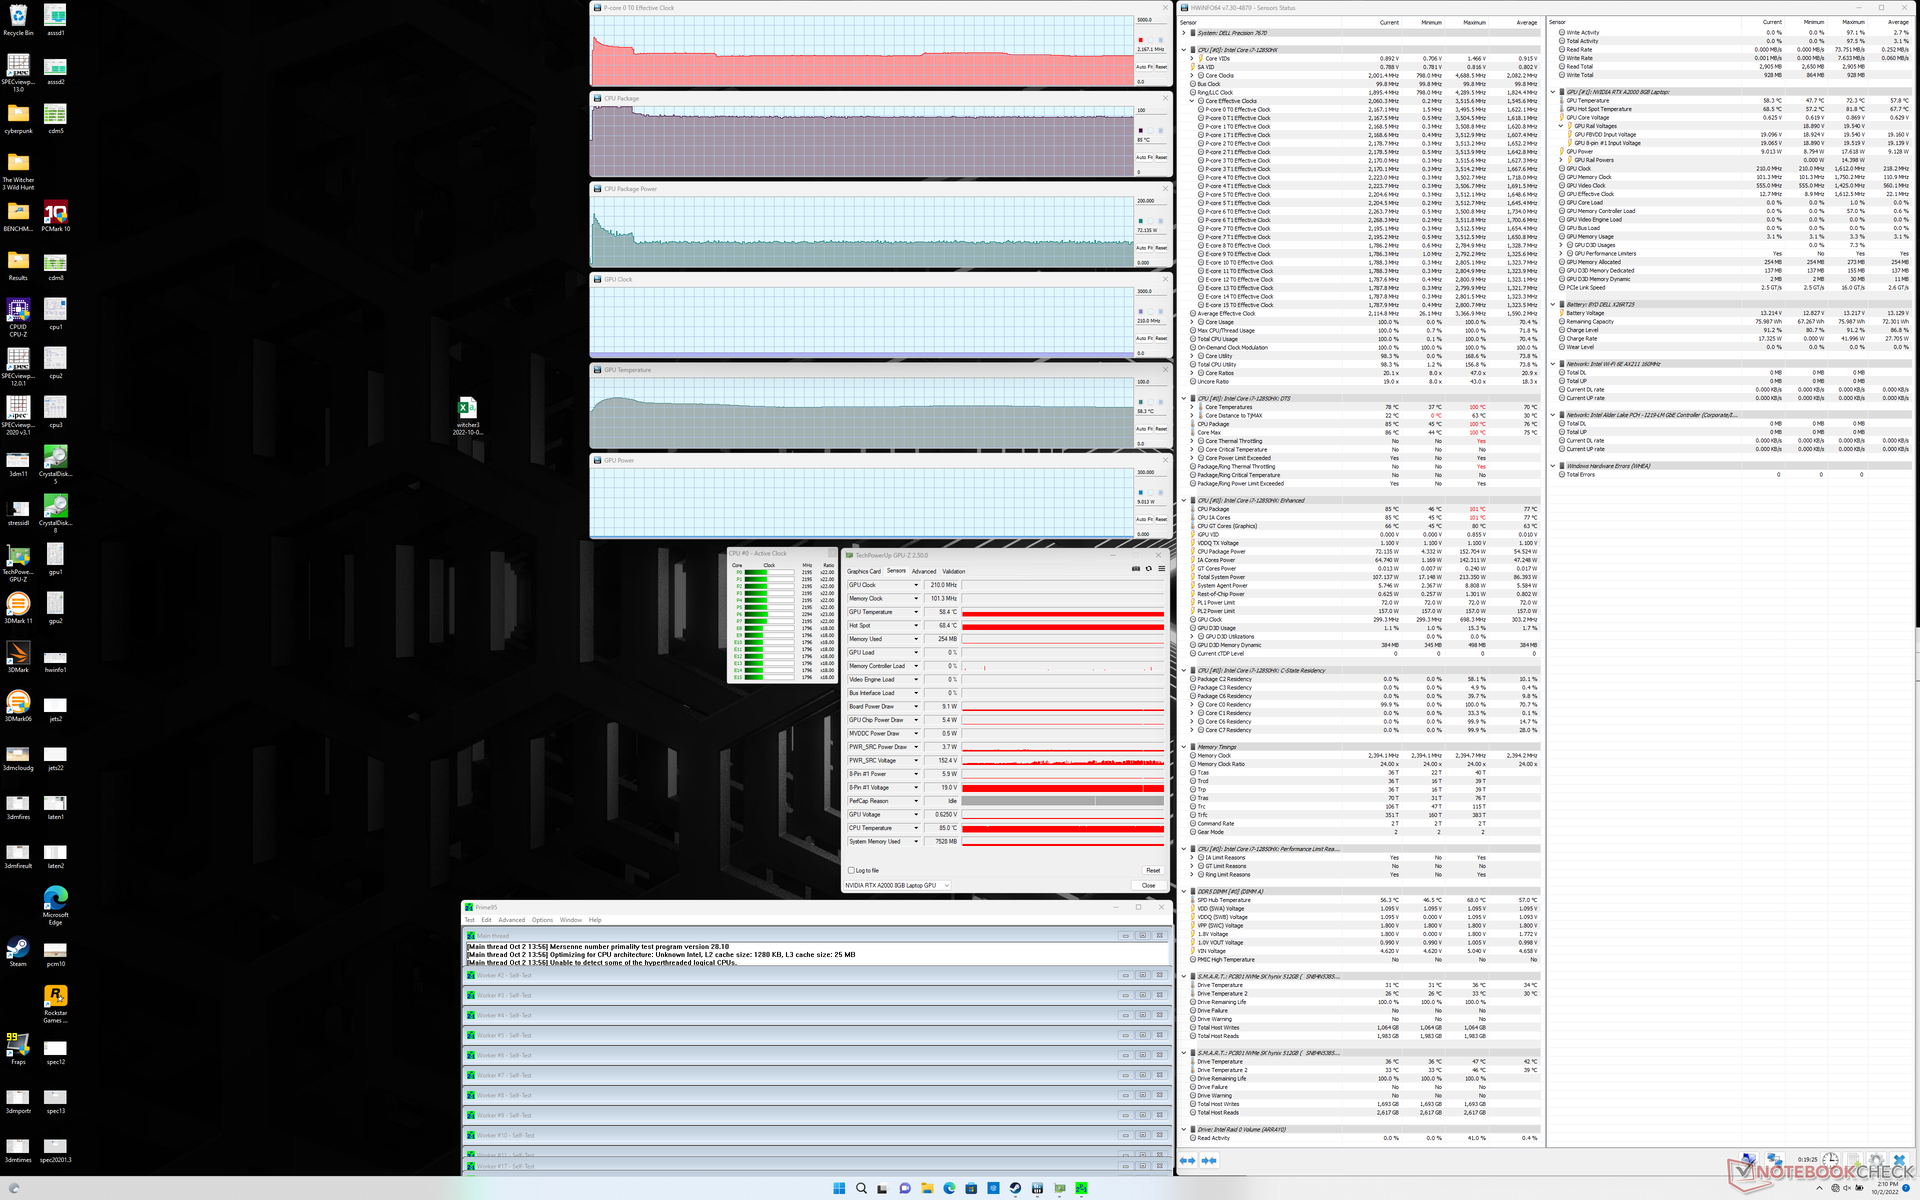
Stress Test
When running Prime95 to stress the CPU, clock rates and board power draw would spike to 3.5 GHz and 153 W, respectively, lasting for only a couple of seconds at most. Core temperature would be as high as 100 C during this brief period. Clock rates and power draw would then steadily fall before stabilizing at 2.2 to 2.4 GHz and 73 W, respectively, in order to maintain a more tolerable core temperature of 85 C. Turbo Boost performance is therefore not as good as we had hoped considering the size of this workstation.
When running Witcher 3 to represent a steady heavy load, GPU clock rates, temperature, and power draw would stabilize at 1777 MHz, 80 C, and 80 W, respectively, compared to 1462 MHz, 75 C, and 45 W, respectively, on the smaller Precision 5560 with the same RTX A2000 GPU.
Running on battery power limits performance. A Fire Strike test on batteries would return Physics and Graphics scores of 9820 and 6911 points, respectively, compared to 23868 and 14295 points when on mains.
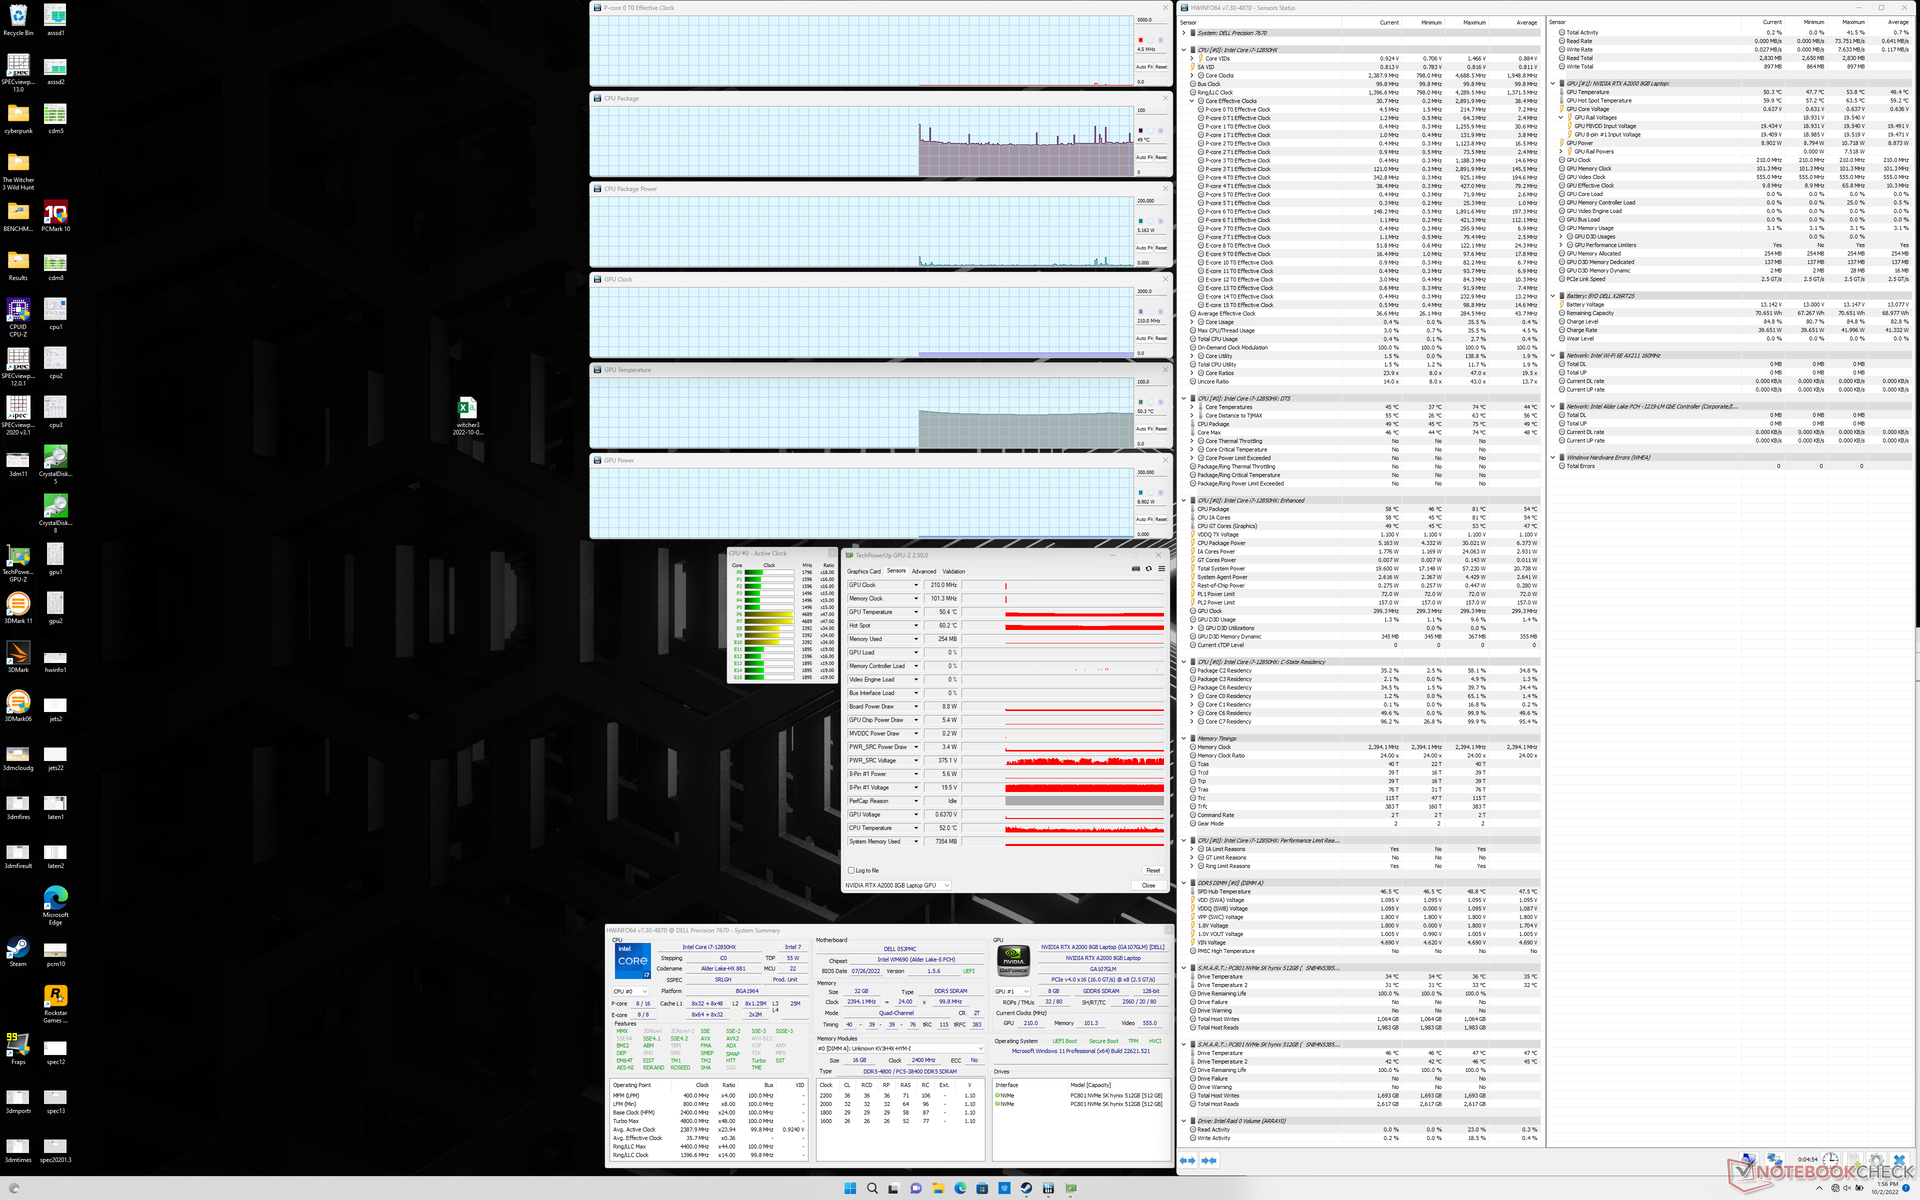
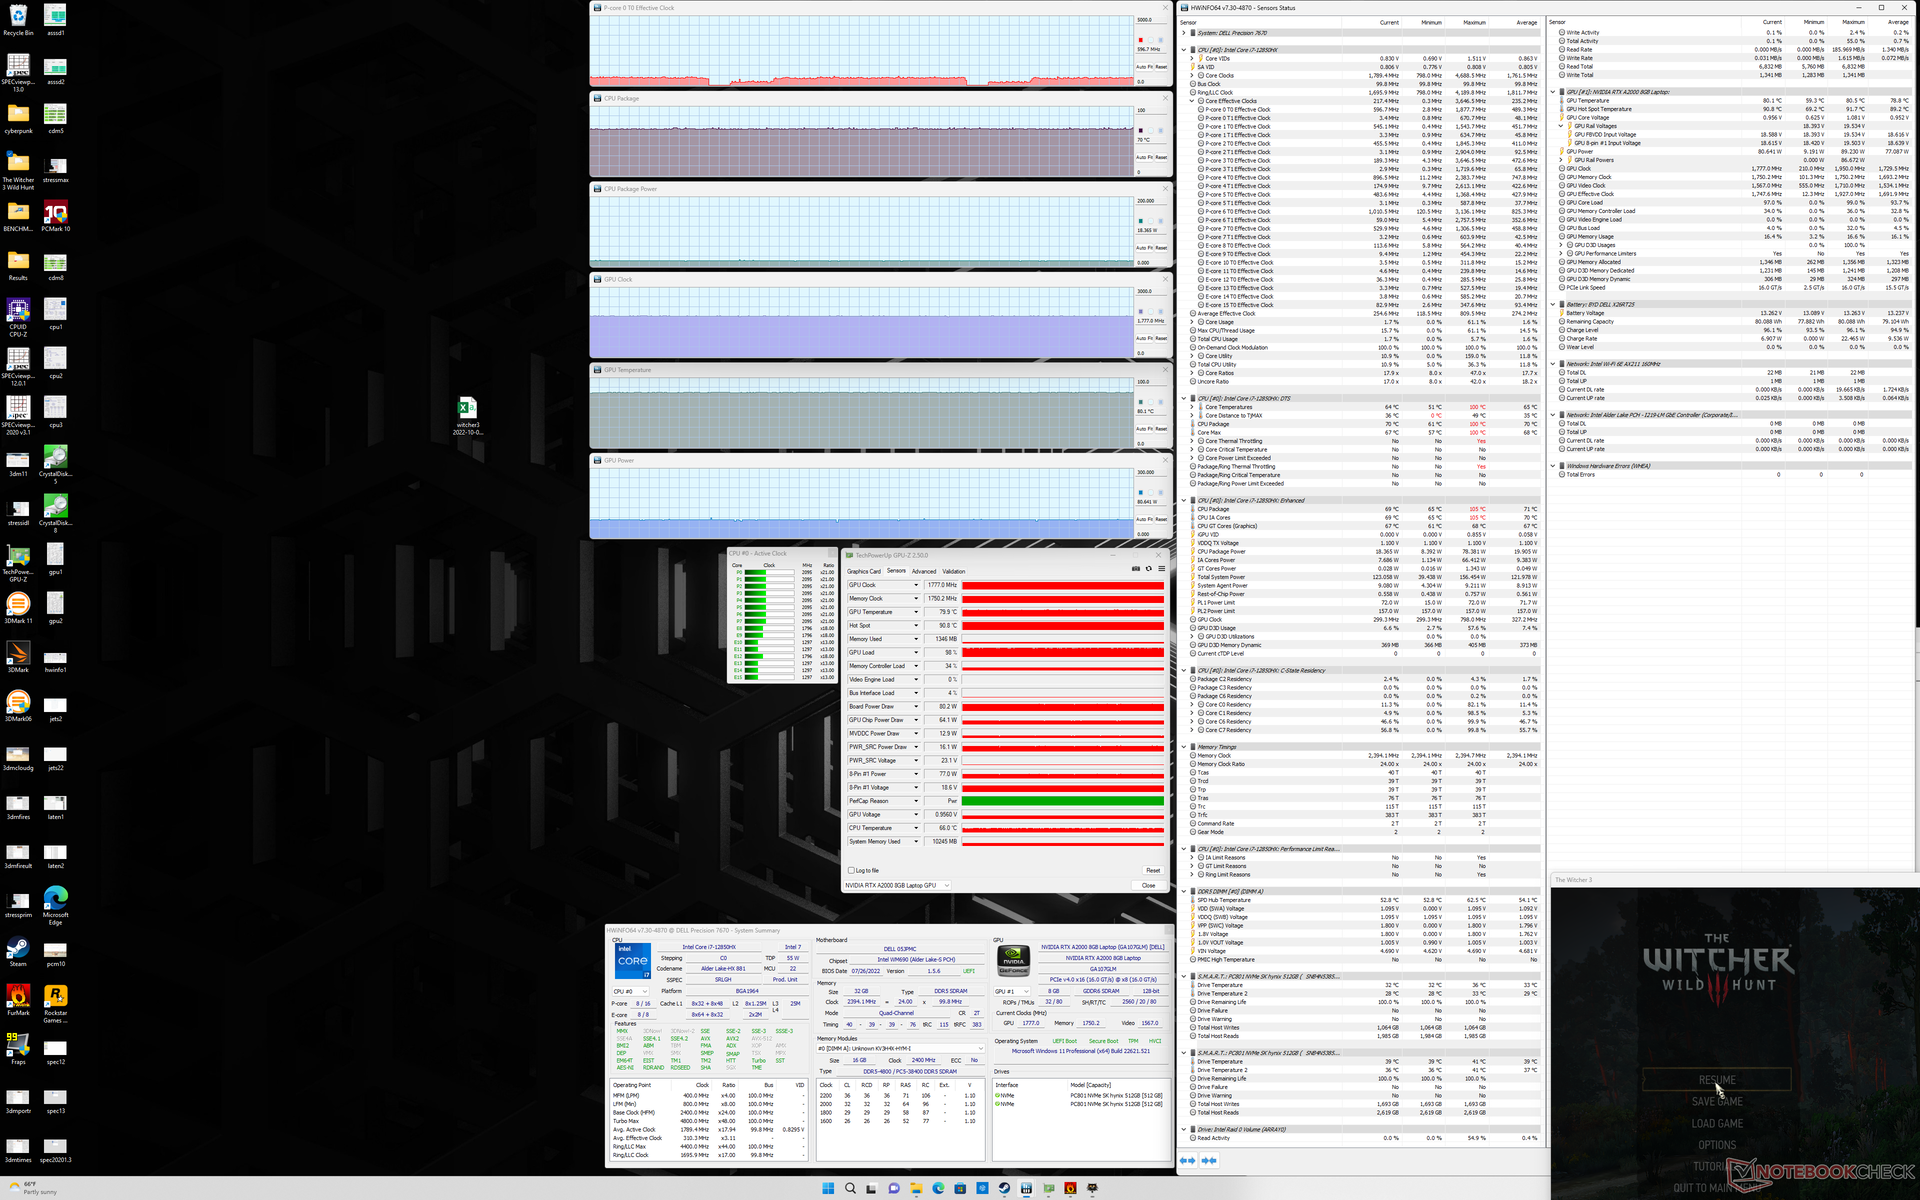
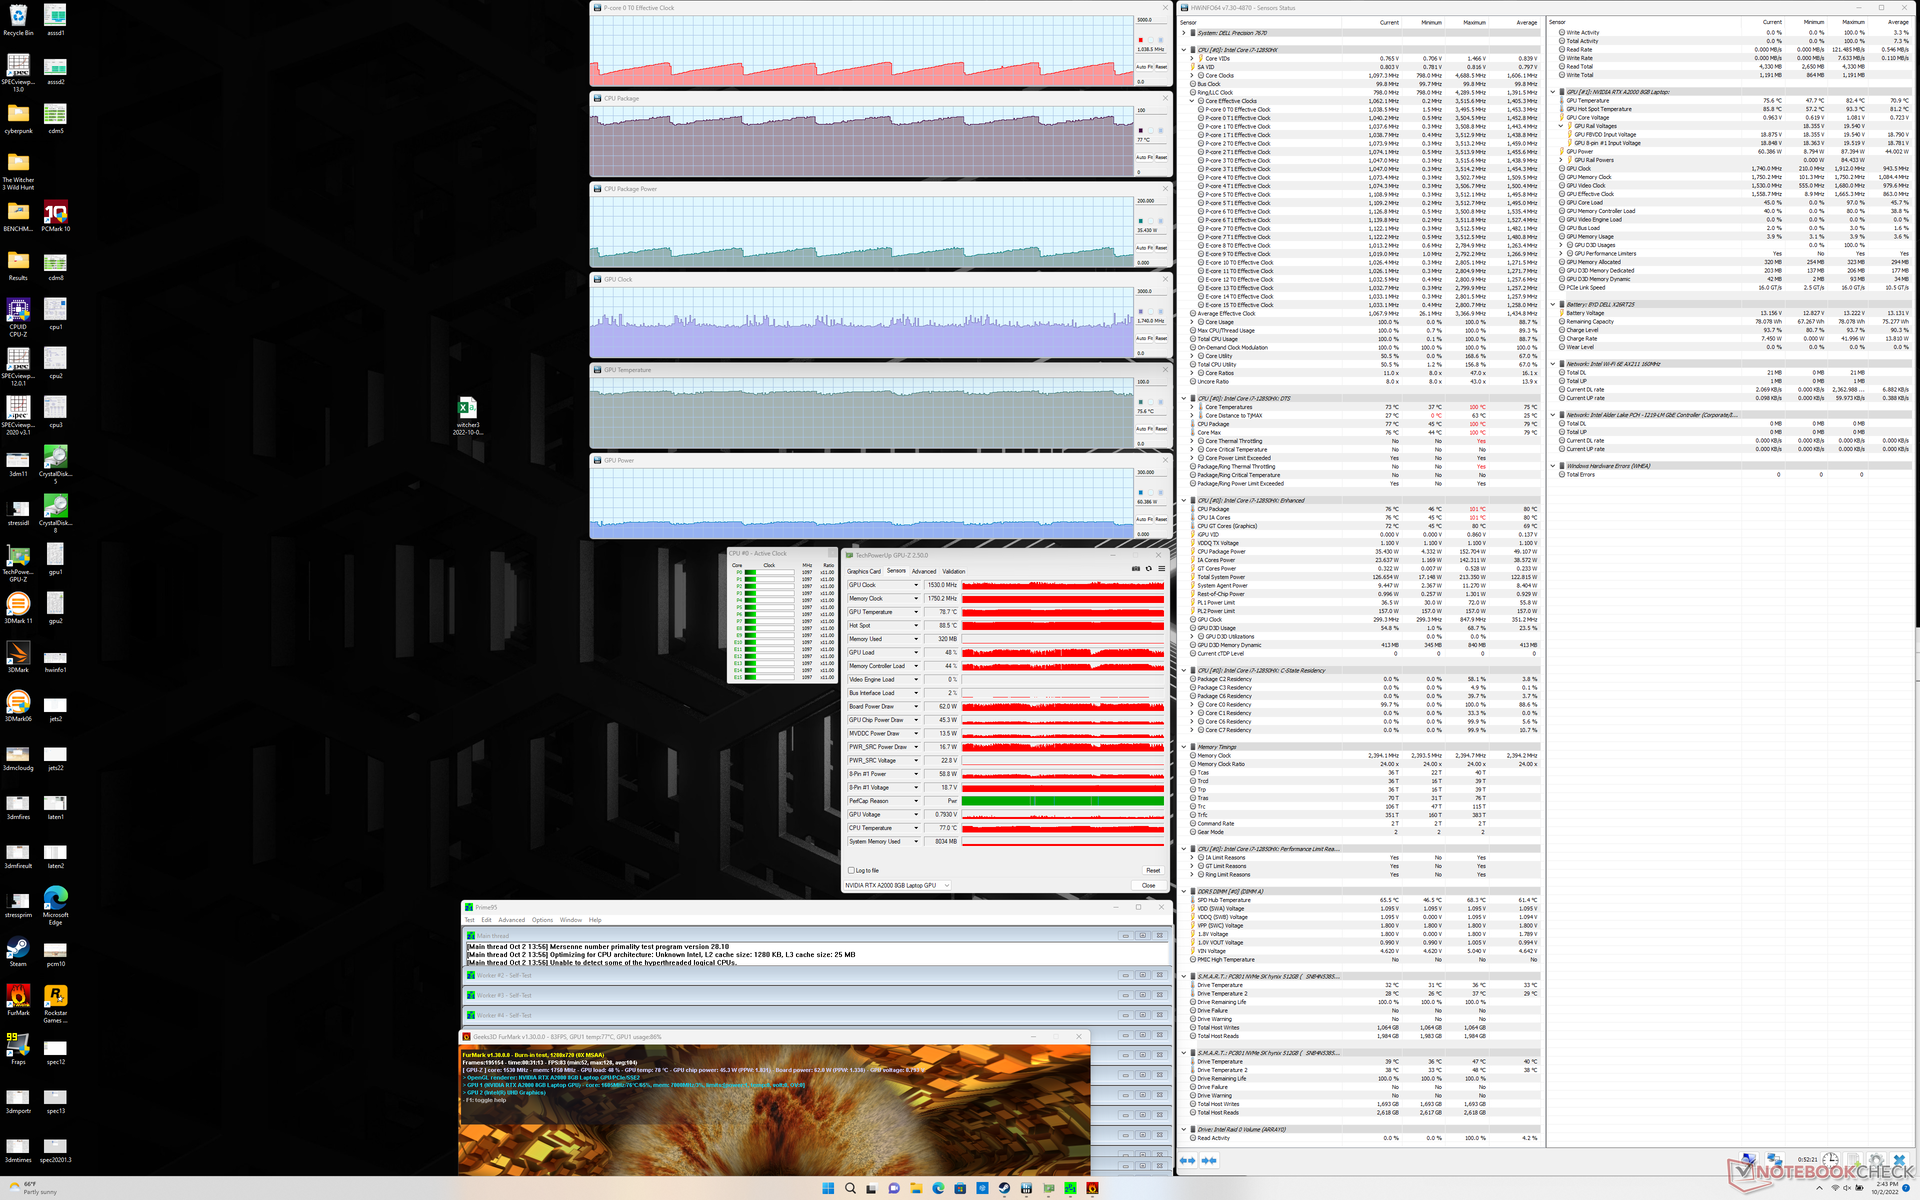
| CPU Clock (GHz) | GPU Clock (MHz) | Average CPU Temperature (°C) | Average GPU Temperature (°C) | |
| System Idle | -- | -- | 49 | 50 |
| Prime95 Stress | 2.2 | -- | 85 | 58 |
| Prime95 + FurMark Stress | 0.8 - 1.3 | ~1450 | 76 - 86 | 62 - 72 |
| Witcher 3 Stress | 0.6 | 1777 | 70 | 80 |
Speakers
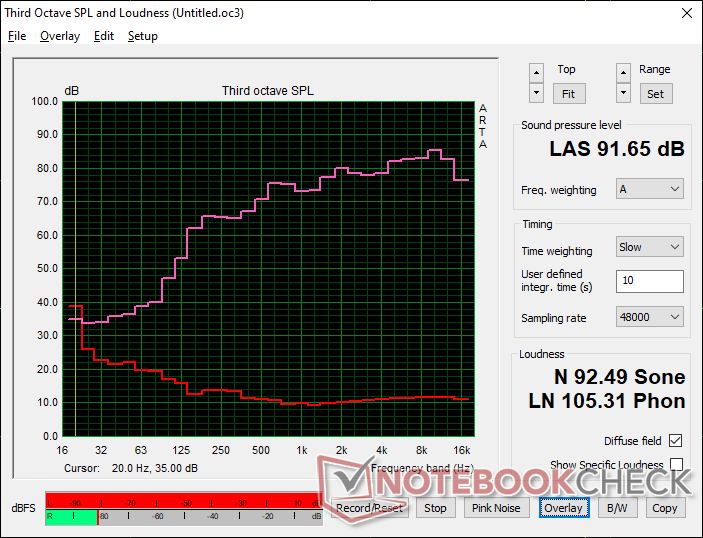
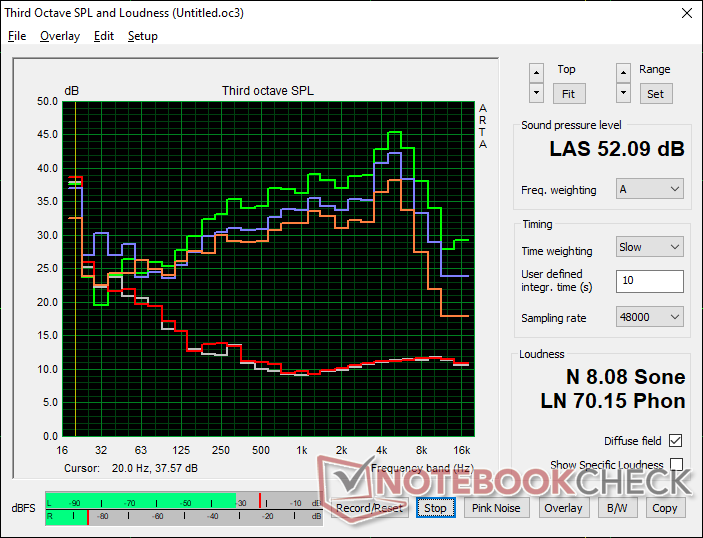
Dell Precision 7670 audio analysis
(+) | speakers can play relatively loud (91.7 dB)
Bass 100 - 315 Hz
(-) | nearly no bass - on average 16.8% lower than median
(+) | bass is linear (6.7% delta to prev. frequency)
Mids 400 - 2000 Hz
(+) | balanced mids - only 3.5% away from median
(+) | mids are linear (3.9% delta to prev. frequency)
Highs 2 - 16 kHz
(+) | balanced highs - only 4.6% away from median
(+) | highs are linear (2% delta to prev. frequency)
Overall 100 - 16.000 Hz
(+) | overall sound is linear (12.2% difference to median)
Compared to same class
» 18% of all tested devices in this class were better, 3% similar, 79% worse
» The best had a delta of 7%, average was 17%, worst was 35%
Compared to all devices tested
» 10% of all tested devices were better, 2% similar, 88% worse
» The best had a delta of 4%, average was 24%, worst was 134%
Apple MacBook Pro 16 2021 M1 Pro audio analysis
(+) | speakers can play relatively loud (84.7 dB)
Bass 100 - 315 Hz
(+) | good bass - only 3.8% away from median
(+) | bass is linear (5.2% delta to prev. frequency)
Mids 400 - 2000 Hz
(+) | balanced mids - only 1.3% away from median
(+) | mids are linear (2.1% delta to prev. frequency)
Highs 2 - 16 kHz
(+) | balanced highs - only 1.9% away from median
(+) | highs are linear (2.7% delta to prev. frequency)
Overall 100 - 16.000 Hz
(+) | overall sound is linear (4.6% difference to median)
Compared to same class
» 0% of all tested devices in this class were better, 0% similar, 100% worse
» The best had a delta of 5%, average was 17%, worst was 45%
Compared to all devices tested
» 0% of all tested devices were better, 0% similar, 100% worse
» The best had a delta of 4%, average was 24%, worst was 134%
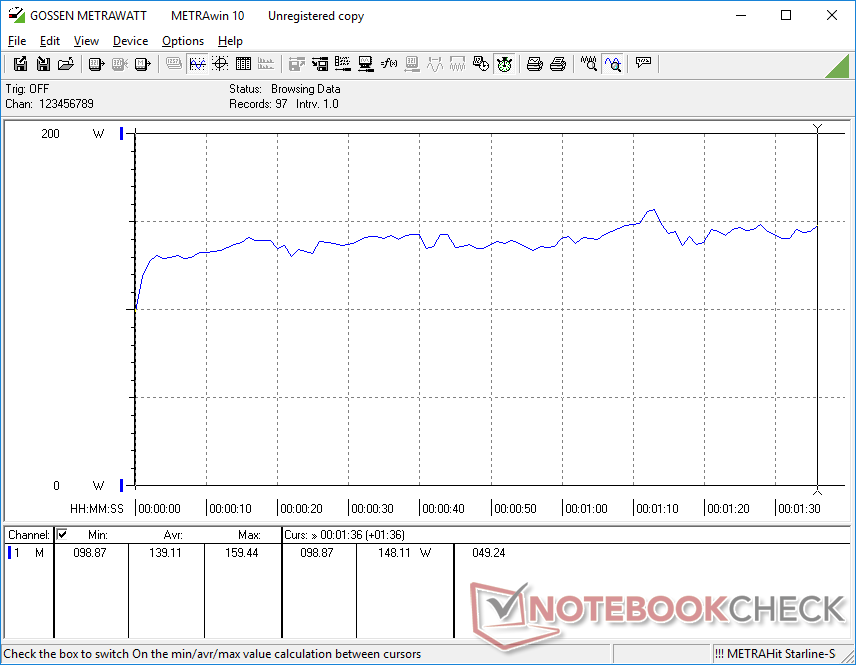
Energy Management — Very Demanding
Power Consumption
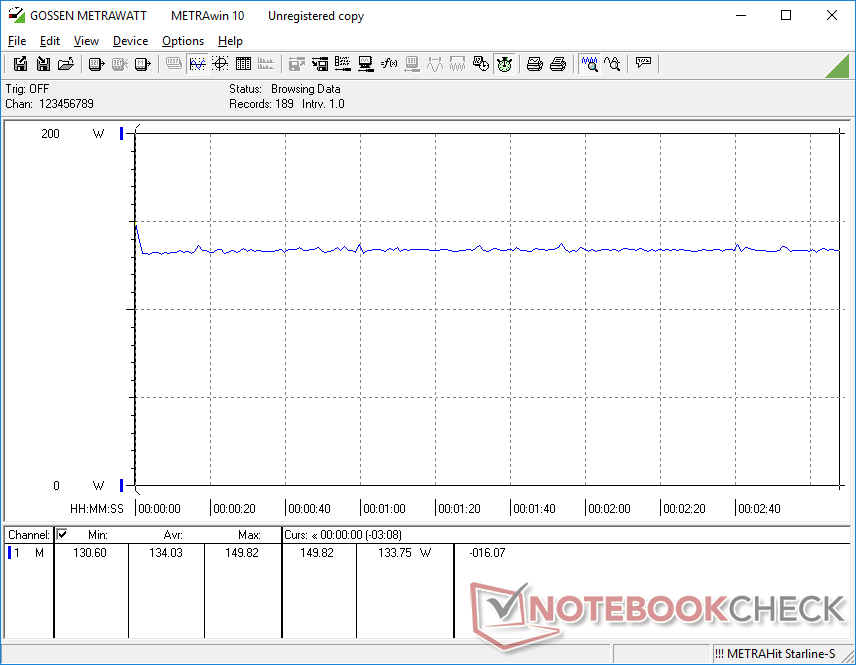
The system is quite demanding under most conditions. Power consumption ranges between 7 W and 25 W when idling on desktop while higher loads like 3DMark 06 or Witcher 3 would draw around 140 W each. The Asus ProArt StudioBook 16 or Precision 5560 would draw just 132 W or 96 W under similar conditions in comparison.
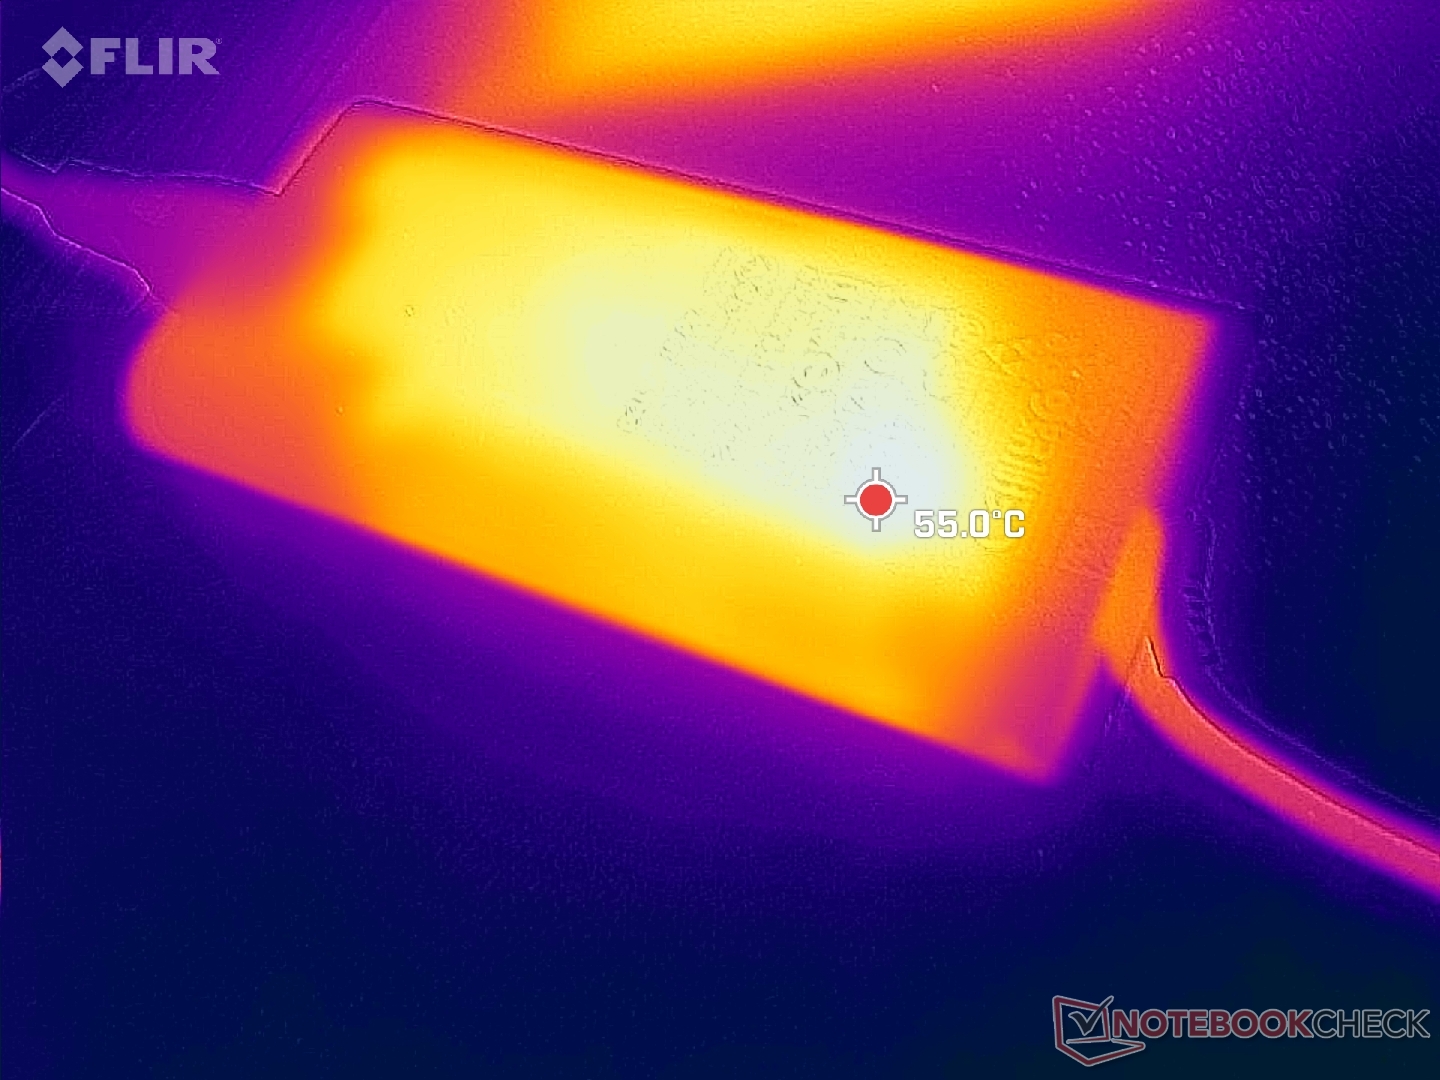
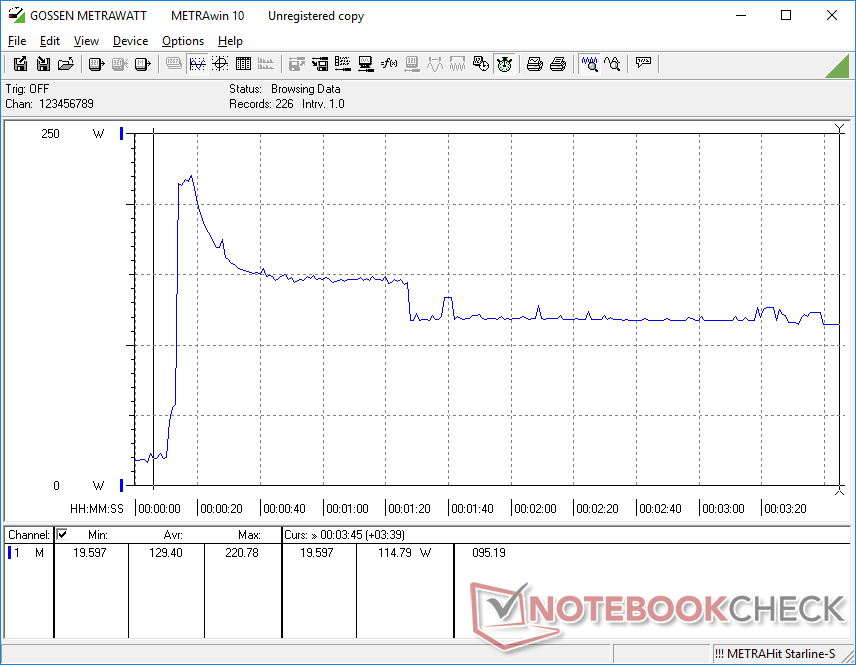
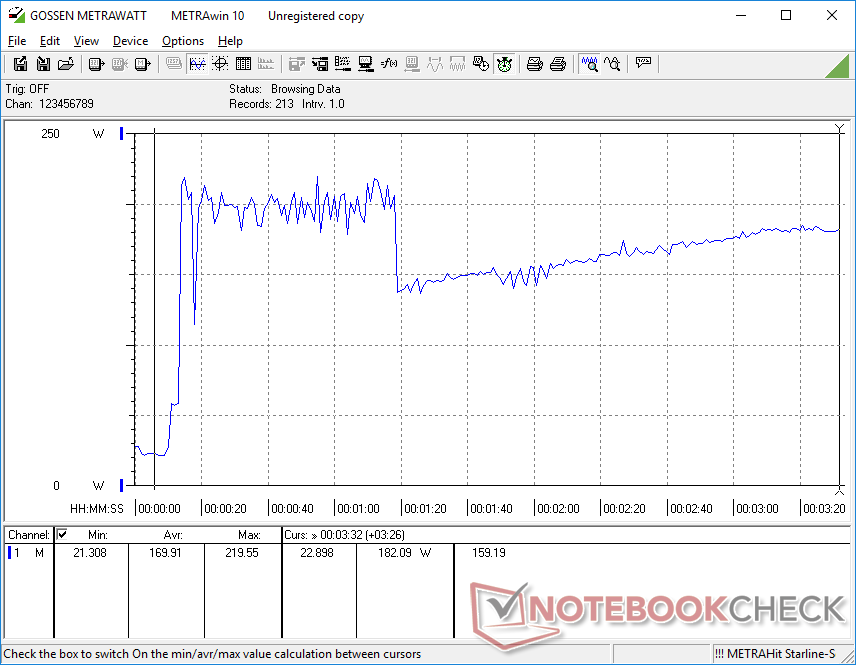
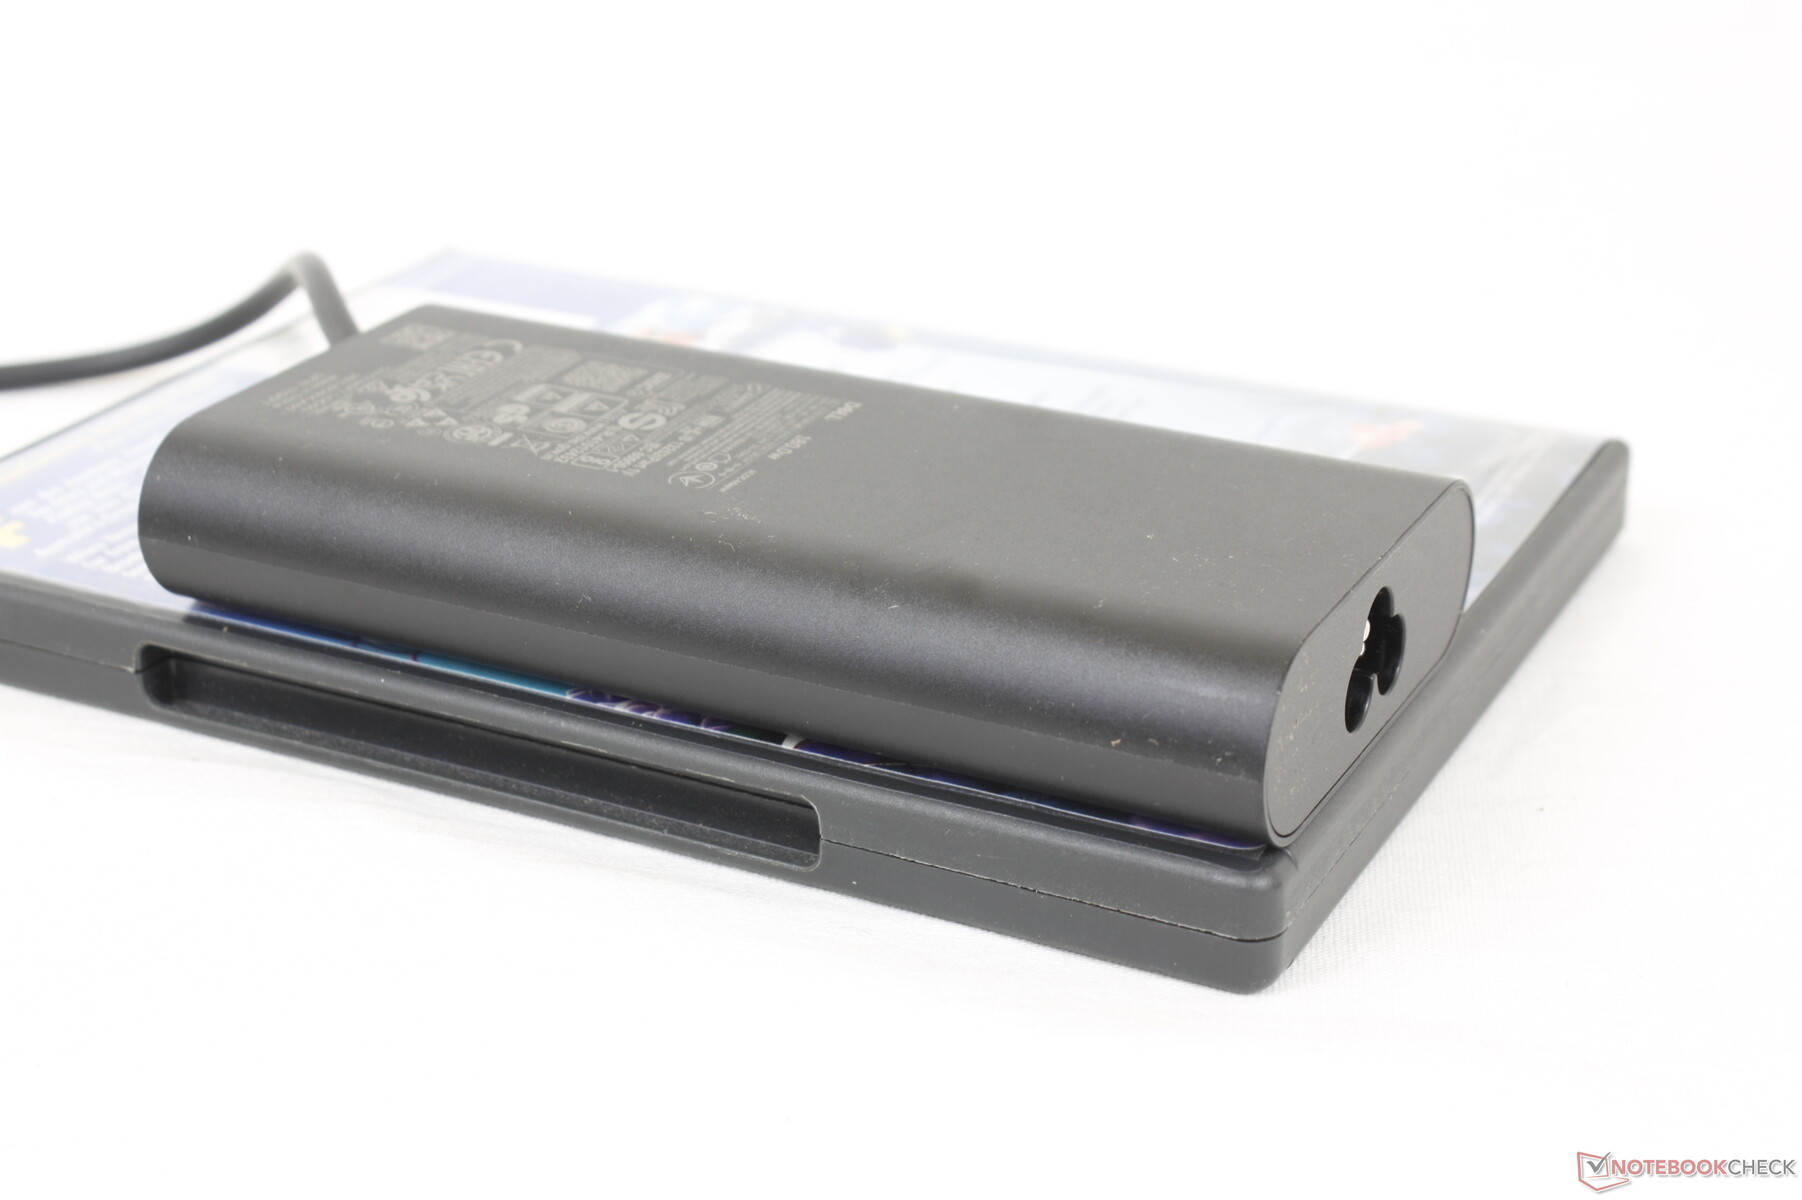
Power consumption can be as high as 221 W when the CPU and GPU are at maximum utilization despite the fact that the medium-sized AC adapter (~13.7 x 6.6 x 2.3 cm) is rated for 180 W only. This extremely high rate would last for only a minute at most before falling down to 114 W if the CPU is stressed or 180 W if both the CPU and GPU are stressed simultaneously. The charging rate of the laptop may slow to a halt if under such extreme conditions as a result.
Dell offers a more capable 240 W AC adapter if configuring the Precision 7670 with faster GPU options. Based on our findings with the 180 W AC adapter, however, perhaps the 240 W option should be standard across all Nvidia RTX configurations.
| Off / Standby | |
| Idle | |
| Load |
|
Key:
min: | |
| Dell Precision 7670 i7-12850HX, RTX A2000 Laptop GPU, SK Hynix HFS001TEJ9X115N, OLED, 3840x2400, 16" | Lenovo ThinkPad P1 G4-20Y4Z9DVUS i7-11800H, T1200 Laptop GPU, Samsung PM9A1 MZVL2512HCJQ, IPS, 2560x1600, 16" | Asus ProArt StudioBook 16 W7600H5A-2BL2 W-11955M, RTX A5000 Laptop GPU, 2x Micron 2300 2TB MTFDHBA2T0TDV (RAID 0), OLED, 3840x2400, 16" | Dell Precision 5000 5560 i7-11850H, RTX A2000 Laptop GPU, Samsung PM9A1 MZVL22T0HBLB, IPS, 3840x2400, 15.6" | Dell Precision 7550 W-10885M, Quadro RTX 5000 Max-Q, SK Hynix PC601A NVMe 1TB, IPS, 3840x2160, 15.6" | HP ZBook Fury 15 G8 i9-11950H, RTX A5000 Laptop GPU, Samsung PM981a MZVLB1T0HBLR, IPS, 3840x2160, 15.6" | |
|---|---|---|---|---|---|---|
| Power Consumption | 9% | -14% | 16% | -12% | -13% | |
| Idle Minimum * (Watt) | 7.5 | 9.9 -32% | 12.4 -65% | 6.2 17% | 8.2 -9% | 8.3 -11% |
| Idle Average * (Watt) | 9.5 | 13.9 -46% | 16.5 -74% | 13.9 -46% | 16.8 -77% | 19.9 -109% |
| Idle Maximum * (Watt) | 28.4 | 14.6 49% | 25 12% | 23.8 16% | 24.4 14% | 21.8 23% |
| Load Average * (Watt) | 139.1 | 95 32% | 132 5% | 95.7 31% | 131 6% | 110.9 20% |
| Witcher 3 ultra * (Watt) | 134 | 98.9 26% | 132 1% | 87 35% | 156.6 -17% | 165 -23% |
| Load Maximum * (Watt) | 220.8 | 170.8 23% | 134 39% | 132.6 40% | 201.8 9% | 171.8 22% |
* ... smaller is better
Power Consumption Witcher 3 / Stresstest
Power Consumption external Monitor
Battery Life
WLAN runtime is just shy of 6 hours to be shorter than on the Precision 5560 or Precision 7550. This is largely due to the OLED panel which consumes more power than IPS when displaying white colors. Since most websites are predominately white in color, the generally shorter battery life isn't unexpected.
Charging with the included AC adapter takes about 2 hours. The system cannot be recharged via USB-C because it does not support PD-in.
| Dell Precision 7670 i7-12850HX, RTX A2000 Laptop GPU, 83 Wh | Lenovo ThinkPad P1 G4-20Y4Z9DVUS i7-11800H, T1200 Laptop GPU, 90 Wh | Asus ProArt StudioBook 16 W7600H5A-2BL2 W-11955M, RTX A5000 Laptop GPU, 90 Wh | Dell Precision 5000 5560 i7-11850H, RTX A2000 Laptop GPU, 86 Wh | Dell Precision 7550 W-10885M, Quadro RTX 5000 Max-Q, 95 Wh | HP ZBook Fury 15 G8 i9-11950H, RTX A5000 Laptop GPU, 94 Wh | |
|---|---|---|---|---|---|---|
| Battery runtime | 49% | -15% | 32% | 23% | 5% | |
| Reader / Idle (h) | 7.9 | 12 52% | 11.1 41% | |||
| WiFi v1.3 (h) | 5.9 | 8.8 49% | 5 -15% | 6.3 7% | 8.9 51% | 6.2 5% |
| Load (h) | 1.3 | 1.8 38% | 1 -23% | |||
| H.264 (h) | 1.8 | |||||
| Witcher 3 ultra (h) | 1.6 |
Pros
Cons
Verdict — Powerful Without Being Too Big
The Precision 7670 competes directly against the HP ZBook Fury 16 G9. Since we've yet to review the HP model, we can only compare our Precision to the 16-inch Lenovo ThinkPad P1 G4 or Asus ProArt StudioBook Pro 16 W7600. The Dell model is able to offer significantly faster CPU performance than both alongside many more auxiliary features including easier serviceability, WAN connectivity, and more storage options.
The Precision 7670 is at its best when configured with higher-end CPU and GPU options. At lower-end options, however, you can find thinner and lighter alternatives that can offer about the same level of performance.
Weight is a key drawback of the Precision 7670 as the system is nearly as heavy as the larger 17.3-inch Precision 7550. Additionally, it's a bit disappointing that the Core i7-12850HX can't sustain Turbo Boost clock rates for extended periods in spite of the heavy weight. It's still fast, but the overlying cooling solution here is limiting its potential. The lack of any Xeon CPU options makes the Precision 7670 feel more like a Studio-type laptop than a full-fledged workstation that it's marketed to be.
The Precision 7670 is still great for power users who can benefit from having all those power-hungry 12th gen Intel cores and a high-end RTX A5500 GPU. For lower-end configurations, however, slimmer and lighter 16-inch models like the aforementioned Lenovo or Asus can still be decent alternatives.
Price and Availability
The Precision 7670 is currently available on Newegg at just one configuration. We recommend ordering directly from Dell for a wider selection of configurations and warranty options.
Dell Precision 7670
- 10/06/2022 v7 (old)
Allen Ngo
Price comparison
