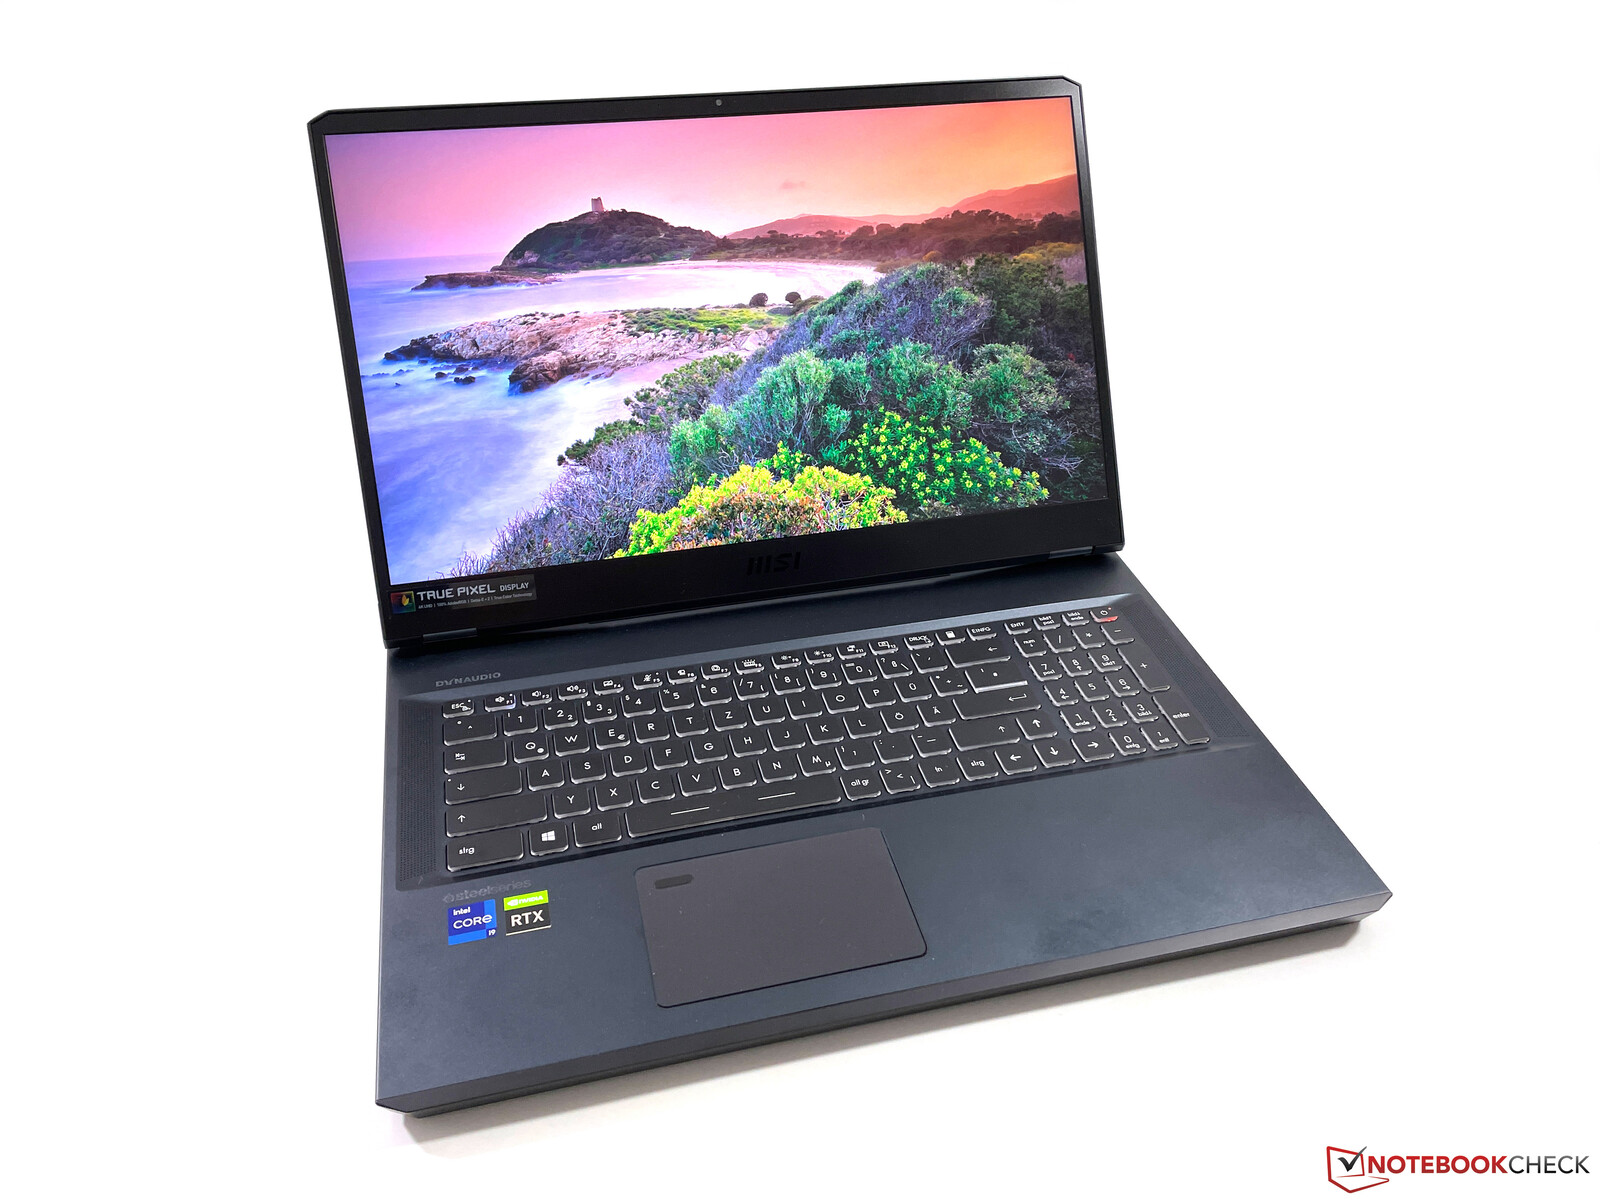
MSI WE76 in review: Mobile workstation goes for maximum performance

MSI has sold its gaming laptops with slight modifications as mobile workstations in the past. Since gaming laptops are also designed for high performance, this move makes sense. The new MSI WE76 is based on the MSI GE76, which we already reviewed. But instead of the consumer GeForce graphics units, the WE76 uses the new professional RTX A GPUs from Nvidia, providing the certifications for professional software as well.
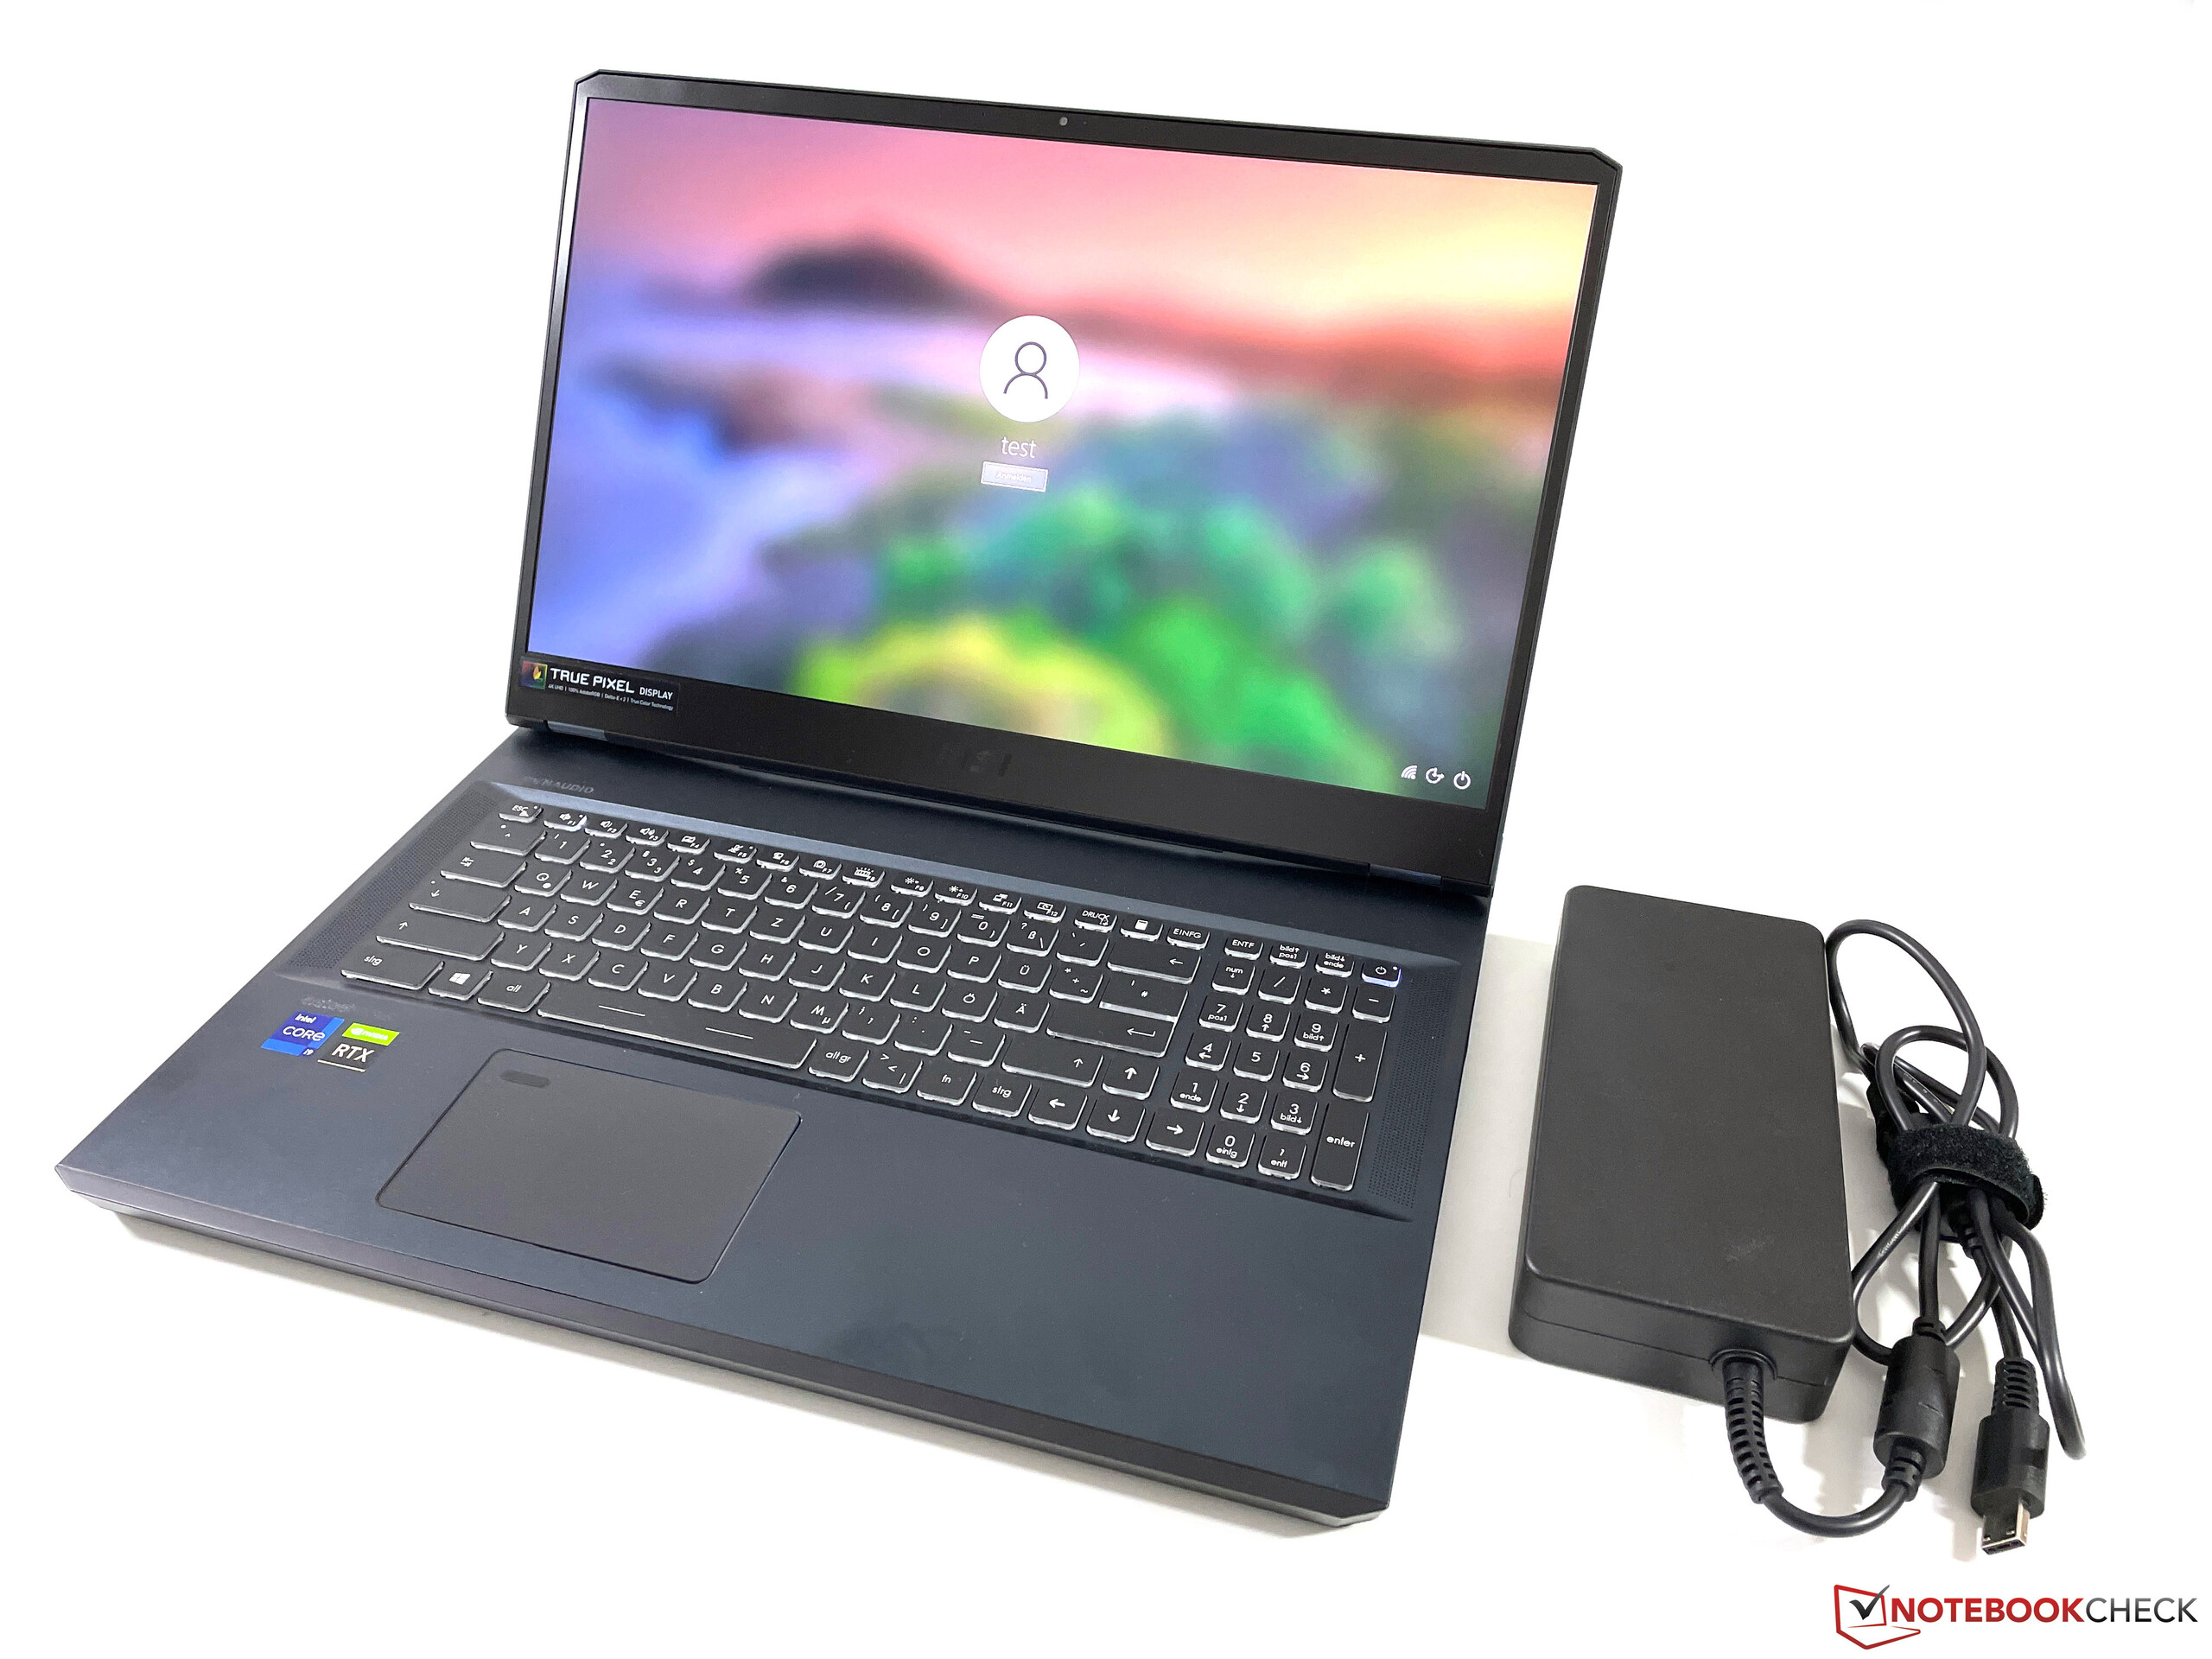
Our review unit is the WE76 11UM-456 high-end variant that costs 4,799 Euros (~$5,419) and is equipped with the Core i9-11980HK processor, the professional RTX A5000 GPU, 32 GB of RAM, a 2 TB PCIe 4.0 SSD, and a matte 4K panel with full AdobeRGB coverage. There's also the alternative WE76 11UK-464 model that comes with the Core i7-11800H, the RTX A3000, and a smaller 1 TB SSD for 3,099 Euros (~$3,499).
Possible contenders in comparison
Rating | Date | Model | Weight | Height | Size | Resolution | Price |
|---|---|---|---|---|---|---|---|
| 88.6 % v7 (old) | 12 / 2021 | MSI WE76 11UM-456 i9-11980HK, RTX A5000 Laptop GPU | 2.9 kg | 25.9 mm | 17.30" | 3840x2160 | |
| 89.8 % v7 (old) | 11 / 2021 | Lenovo ThinkPad P1 G4-20Y4S0KS00 i7-11850H, GeForce RTX 3070 Laptop GPU | 2 kg | 17.7 mm | 16.00" | 3840x2400 | |
| 90.3 % v7 (old) | 10 / 2021 | HP ZBook Fury 15 G8 i9-11950H, RTX A5000 Laptop GPU | 2.5 kg | 25.9 mm | 15.60" | 3840x2160 | |
v (old) | 12 / 2021 | Asus ProArt StudioBook 16 W7600H5A-2BL2 W-11955M, RTX A5000 Laptop GPU | 2.4 kg | 21.4 mm | 16.00" | 3840x2400 | |
| 87.8 % v7 (old) | 10 / 2021 | Lenovo ThinkPad P17 G2-20YU0025G i7-11800H, RTX A2000 Laptop GPU | 3.6 kg | 28.38 mm | 17.30" | 1920x1080 | |
| 89.8 % v7 (old) | 04 / 2021 | HP ZBook Fury 17 G7 119W5EA i9-10885H, Quadro RTX 4000 Max-Q | 2.9 kg | 26.9 mm | 17.30" | 3840x2160 |
Case - MSI does without the lighting
The case of the MSI WE76 is identical to that of the GE76 gaming model, but the manufacturer has omitted the LED strip on the front edge. The design is reminiscent of a gaming powerhouse, but the matte black and gray surfaces make the mobile workstation look quite discreet, which should also fit well in an office environment. Due to the use of a 16:9 display (which is also the case in many other 17-inch models), the screen bezel below the display looks very wide, and the ratio between the display and the case is also only 73%.
In terms of stability and workmanship, our review sample is excellent; the base unit in particular is extremely resistant to torsion. The lid is a bit more flexible, but we can't cause any image distortions. The hinges are fundamentally also properly adjusted, although they can't prevent the display from wobbling to a certain extent. Furthermore, this hinge design limits the maximum opening angle to 135 degrees, which is not as generous as in some other competitors.
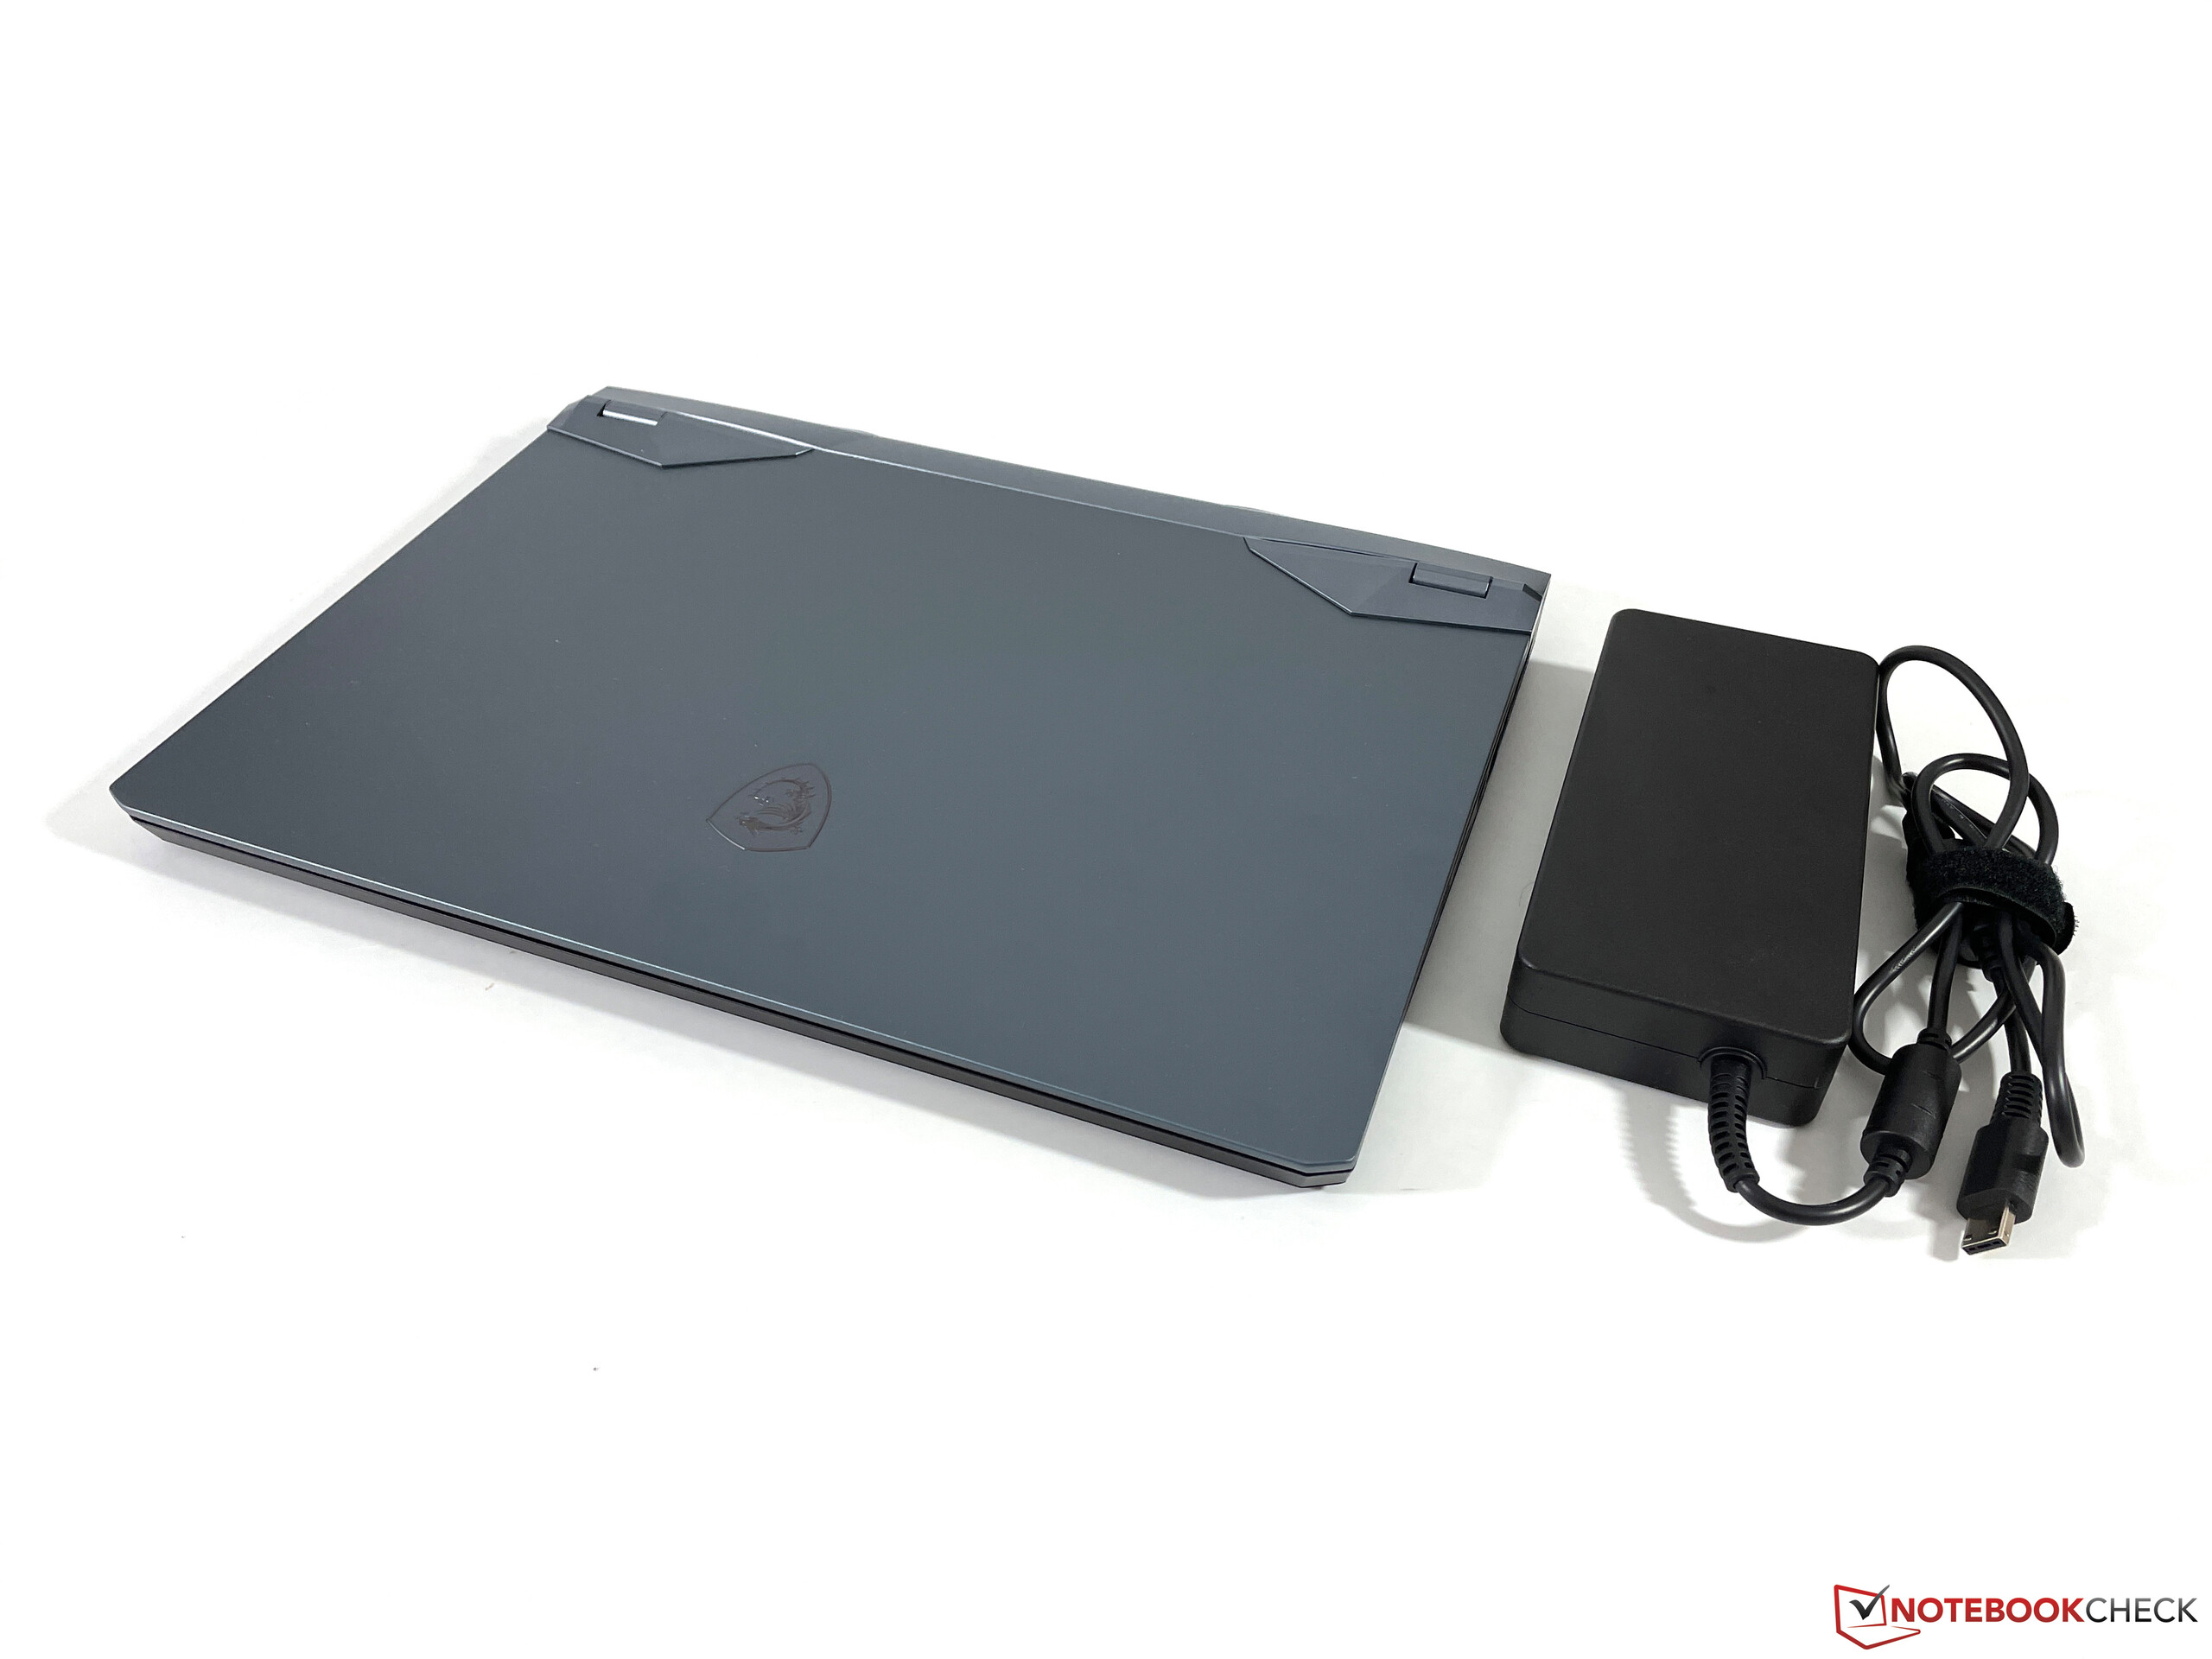
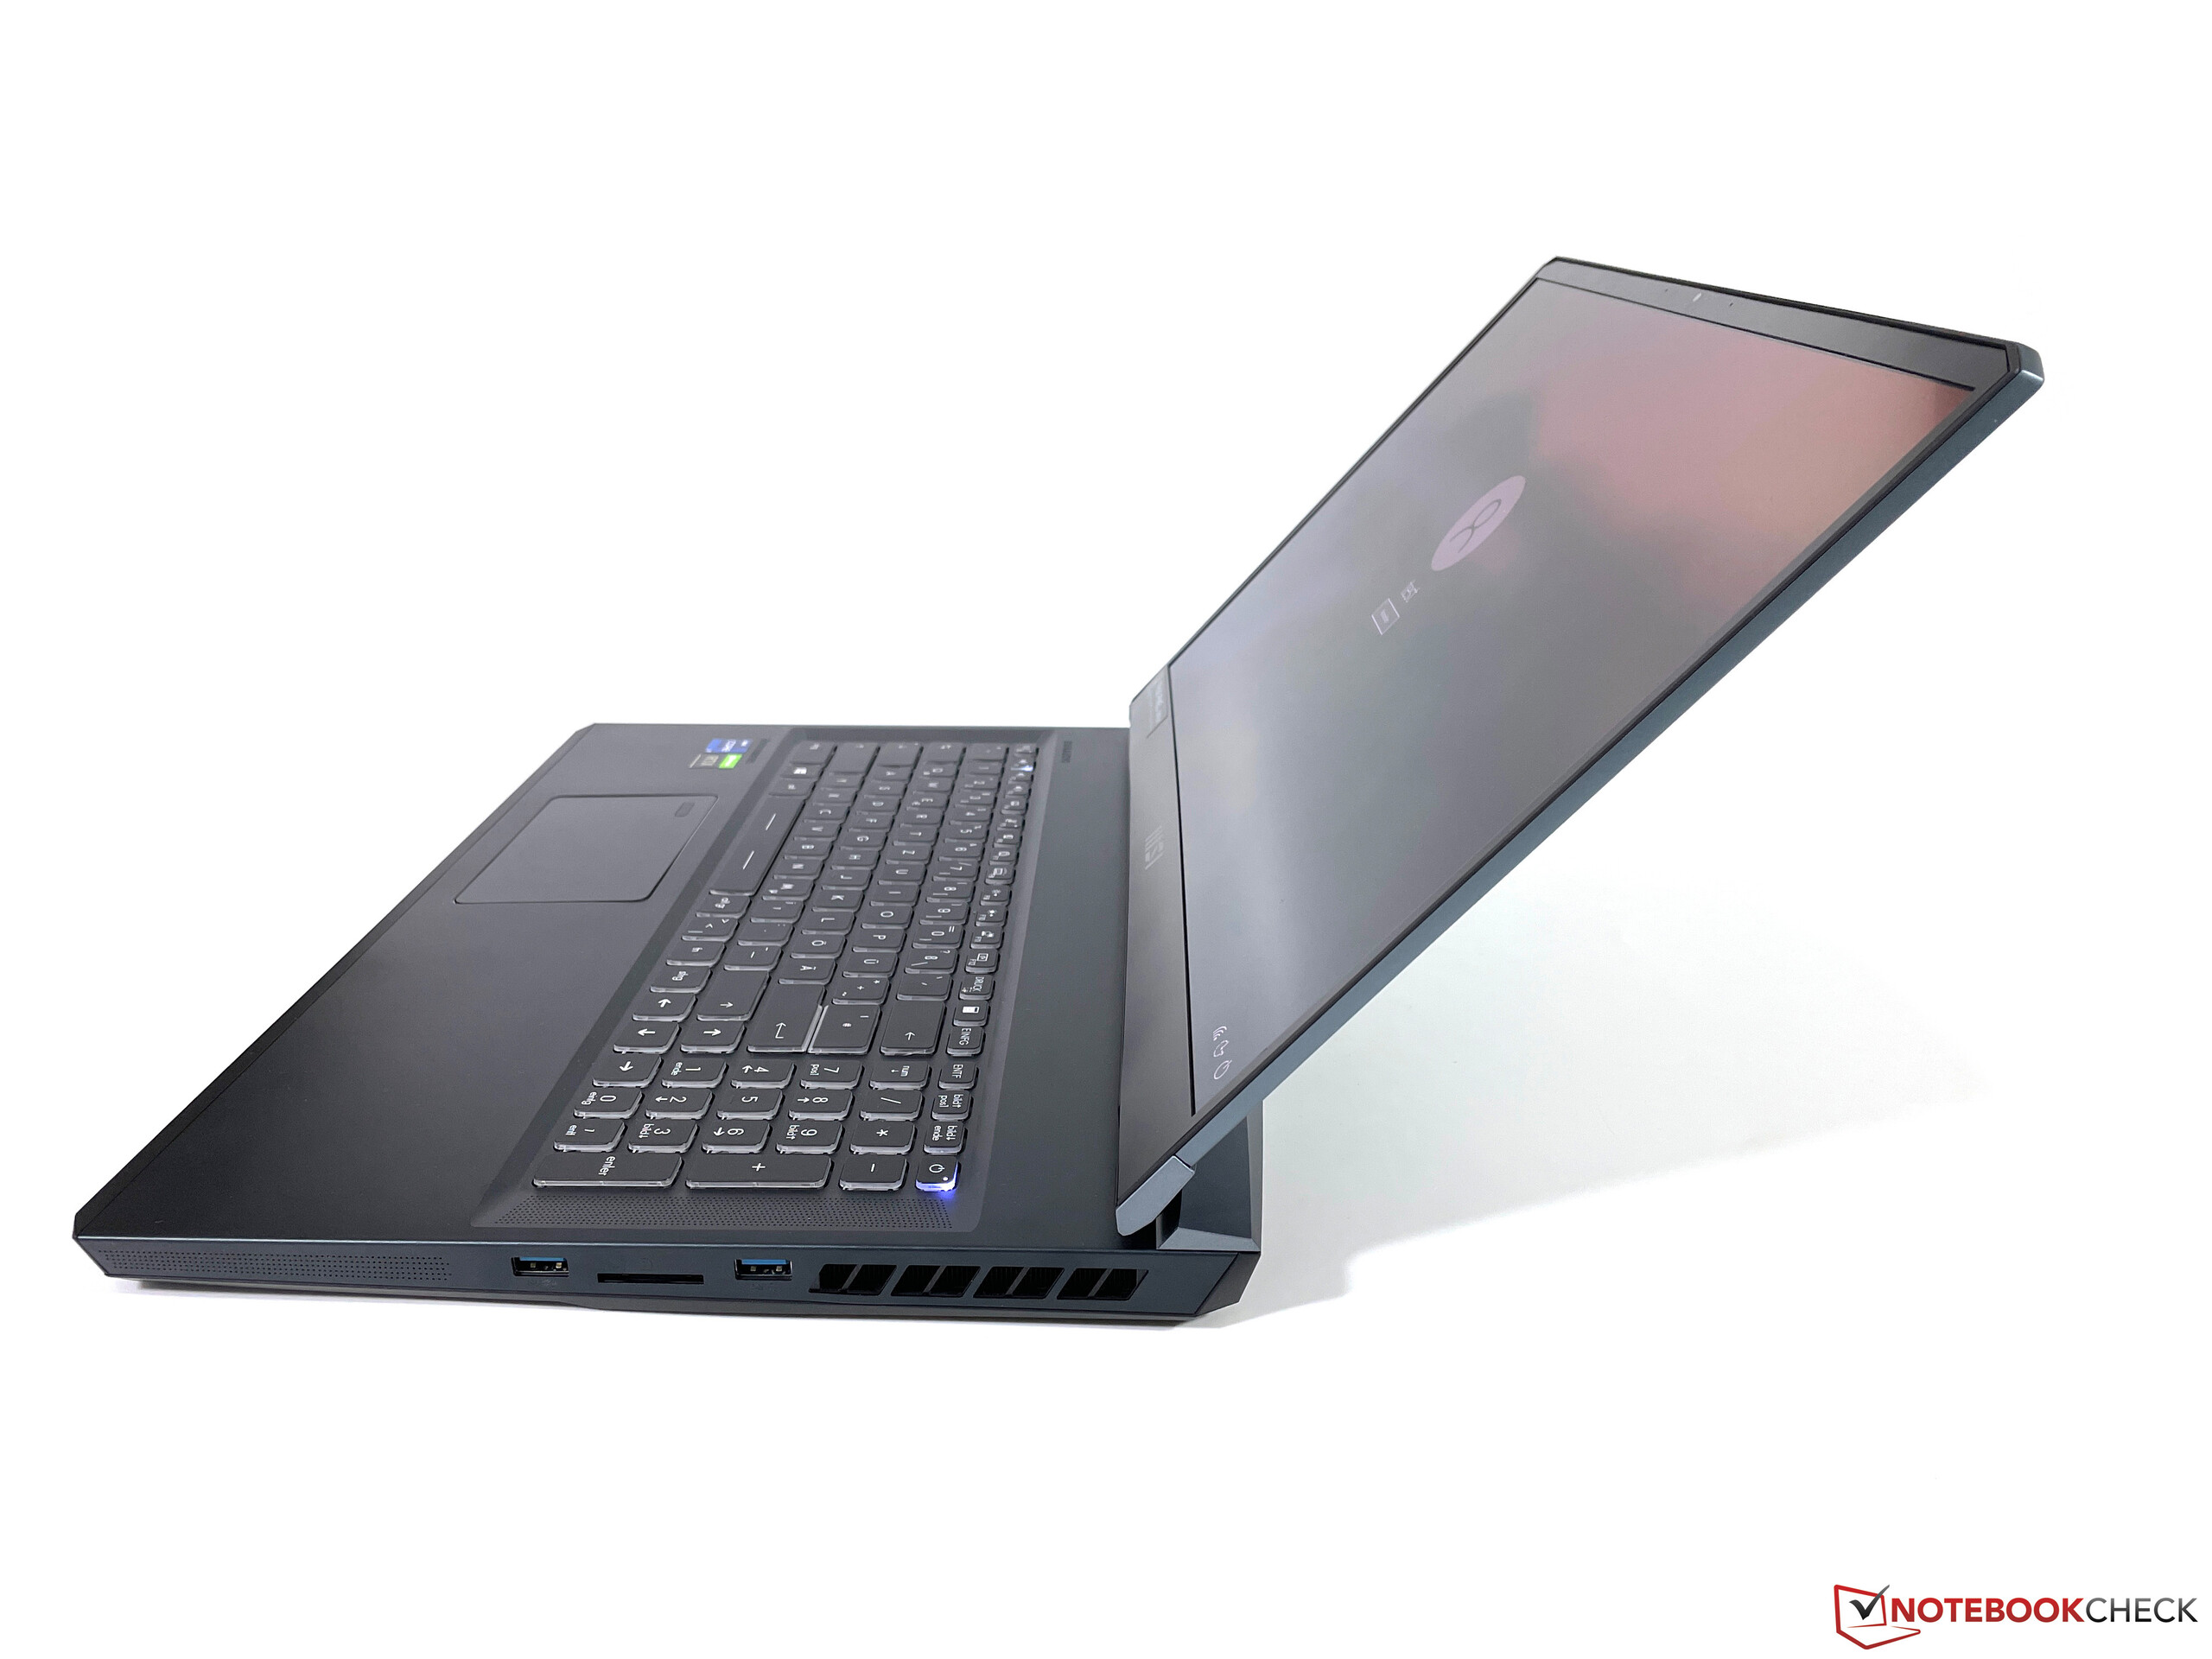
The WE76 is a conventional mobile workstation with a focus on performance. Consequently, the focus wasn't on making the device as thin and slim as possible. Nevertheless, the difference is rather small in direct comparison with our two 17-inch competitors, the ThinkPad P17 and the ZBook Fury 17. Our test device weighs 2,922 grams, but you have to add another 1,060 grams for the bulky power adapter when transporting the laptop.
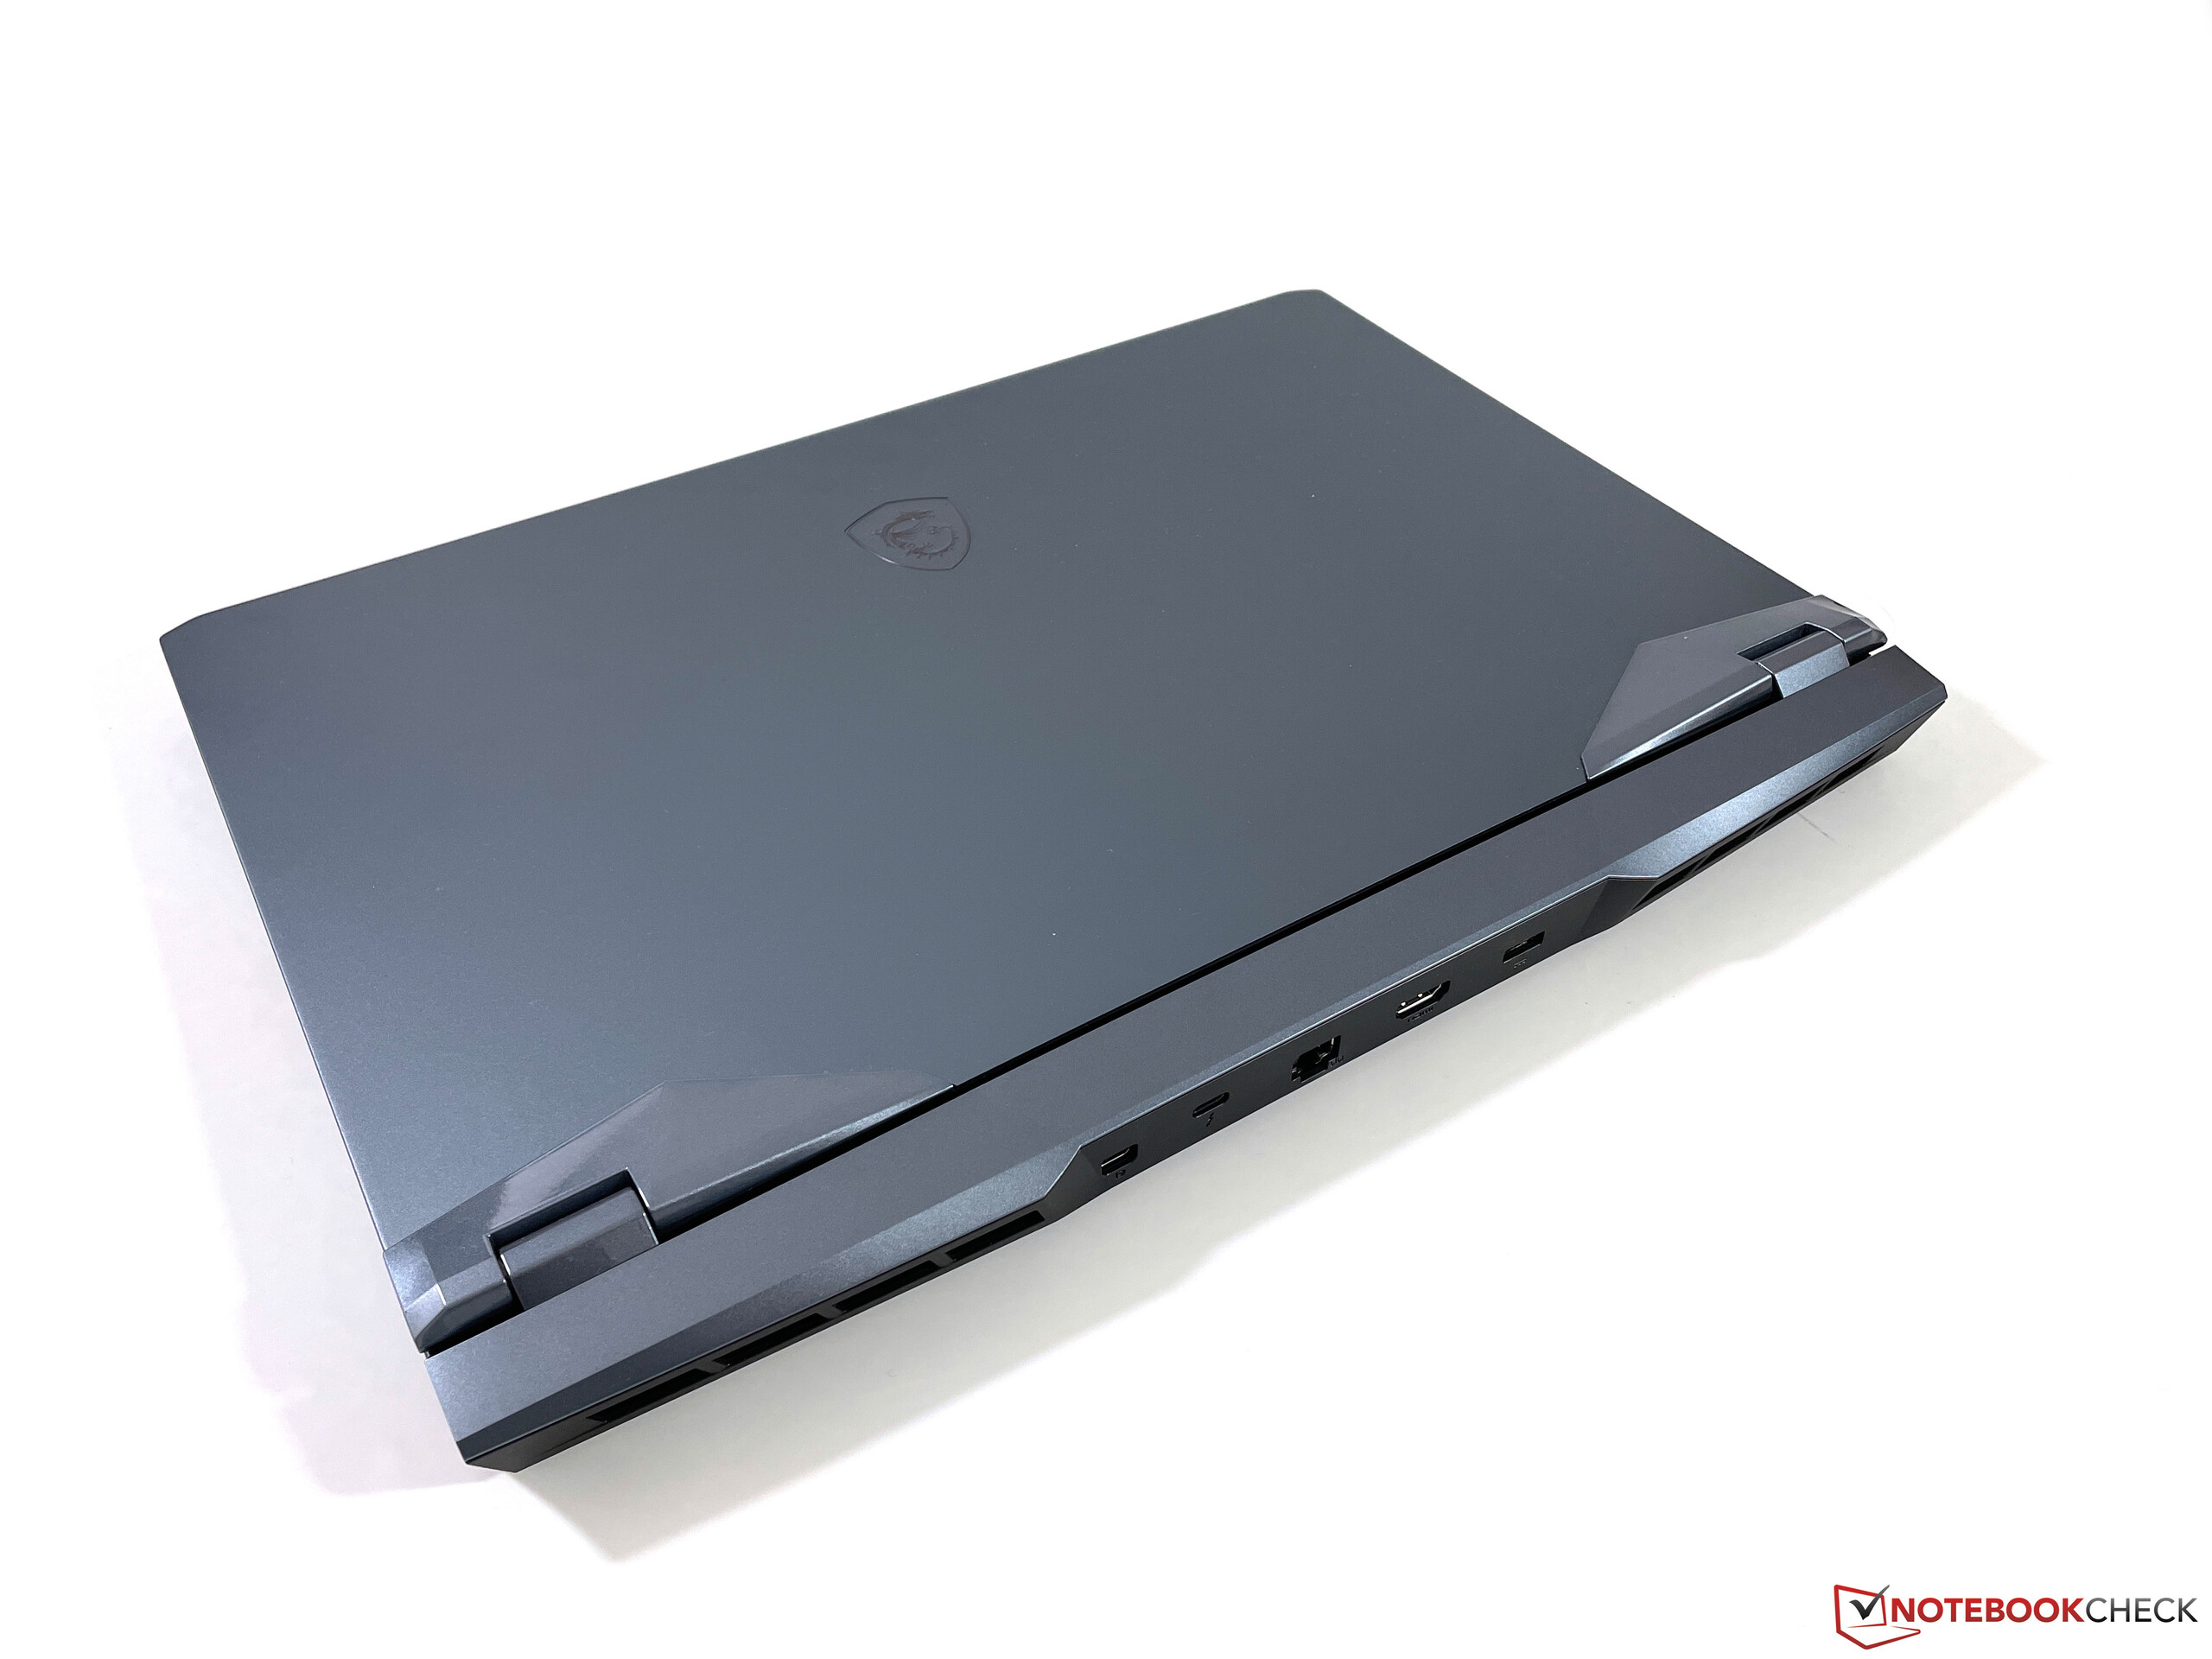
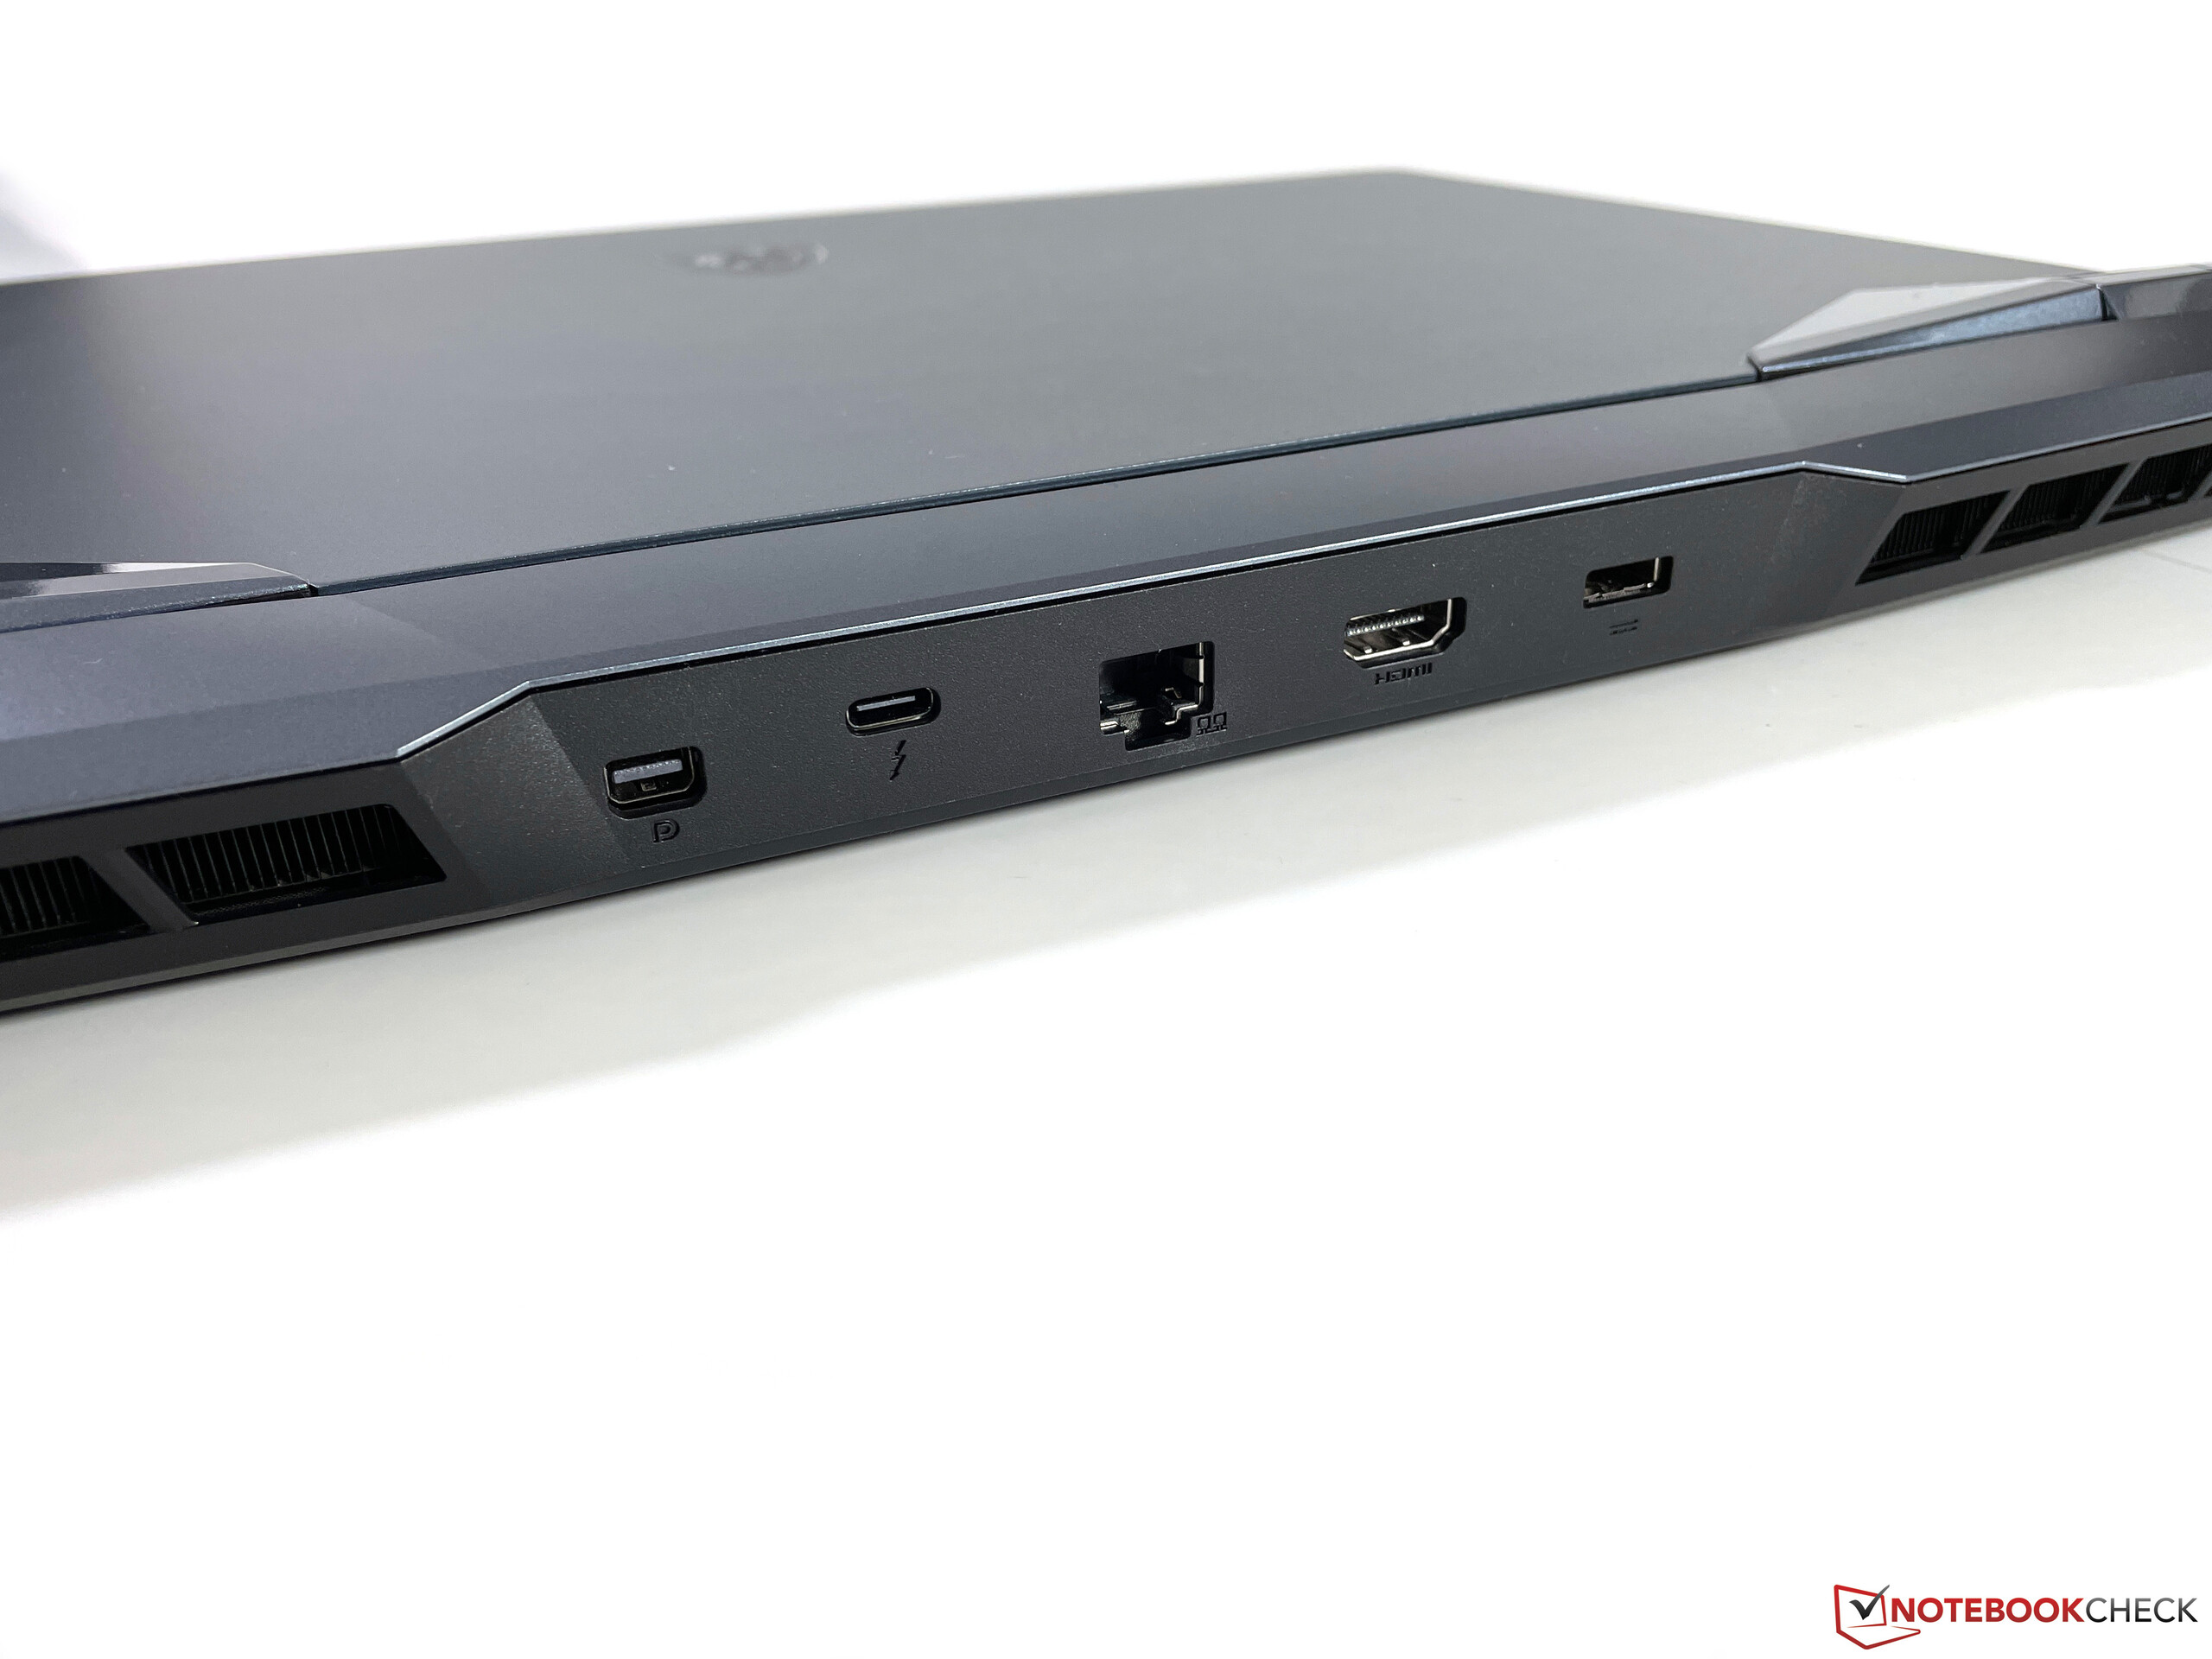
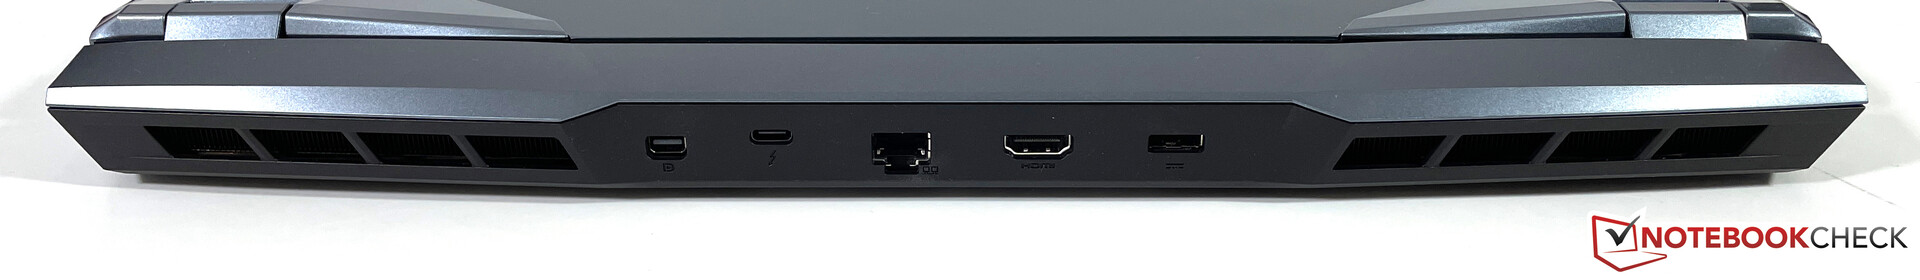
Connectivity - WE76 with Thunderbolt 4/USB 4
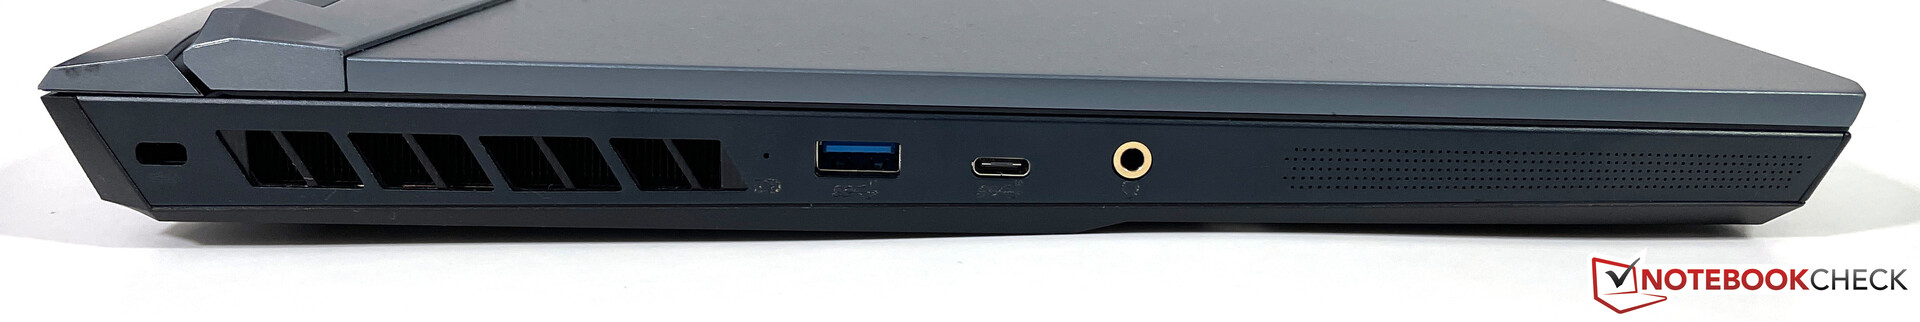
When it comes to ports, you'll find everything your heart desires, including enough USB ports and the modern Thunderbolt 4 interface. The ports for the power adapter, LAN, and external monitors (maximum of three) are on the back, while the USB ports as well as the card reader have been placed on the sides for quick access. An optional smart card reader, on the other hand, is not available.
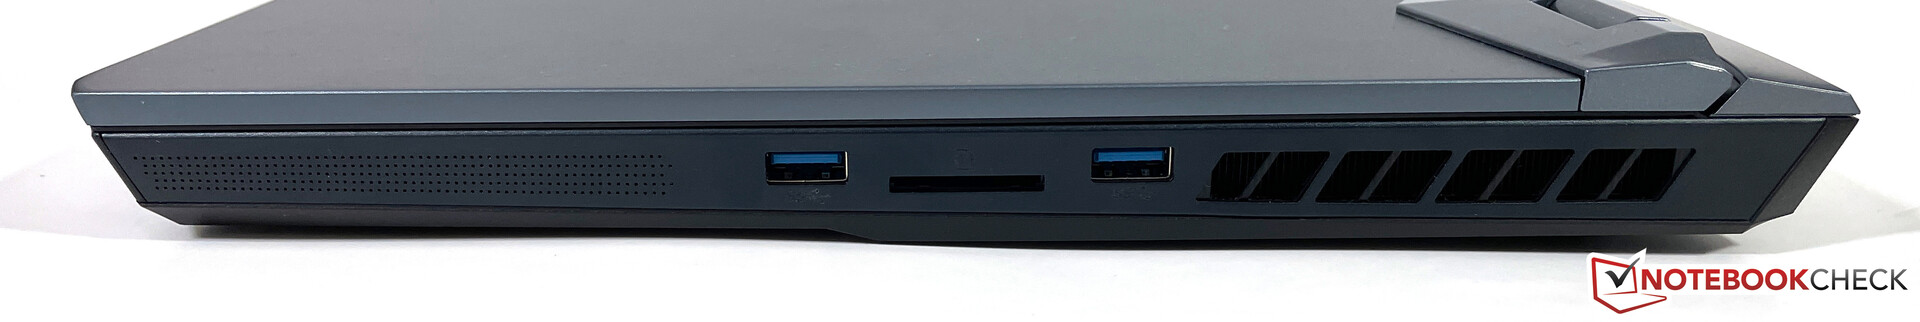
SD card reader
The full-fledged SD card reader on the right is faster than the one in the old WE75. We determine transfer rates of 80-90 MB/s with our reference card (Angelbird AV Pro V60). This is acceptable, but some of the competitors offer considerably faster modules. An inserted SD card protrudes 4 millimeters from the case.
| SD Card Reader | |
| average JPG Copy Test (av. of 3 runs) | |
| Lenovo ThinkPad P17 G2-20YU0025G (Toshiba Exceria Pro SDXC 64 GB UHS-II) | |
| HP ZBook Fury 17 G7 119W5EA (AV Pro 60) | |
| Average of class Workstation (49.6 - 681, n=14, last 2 years) | |
| MSI WE76 11UM-456 (AV Pro V60) | |
| HP ZBook Fury 15 G8 (AV Pro V60) | |
| Asus ProArt StudioBook 16 W7600H5A-2BL2 (AV Pro SD microSD 128 GB V60) | |
| MSI WE75 9TK (Toshiba Exceria Pro SDXC 64 GB UHS-II) | |
| maximum AS SSD Seq Read Test (1GB) | |
| Average of class Workstation (87.6 - 1455, n=14, last 2 years) | |
| Lenovo ThinkPad P17 G2-20YU0025G (Toshiba Exceria Pro SDXC 64 GB UHS-II) | |
| HP ZBook Fury 17 G7 119W5EA (AV Pro 60) | |
| MSI WE76 11UM-456 (AV Pro V60) | |
| HP ZBook Fury 15 G8 (AV Pro V60) | |
| Asus ProArt StudioBook 16 W7600H5A-2BL2 (AV Pro SD microSD 128 GB V60) | |
| MSI WE75 9TK (Toshiba Exceria Pro SDXC 64 GB UHS-II) | |
Communication
MSI uses the fast Killer AX1675x module, which supports the modern Wi-Fi 6E standard as well as Bluetooth 5.2. The transfer rates are very good and at the top of our comparison field in our standardized Wi-Fi test with the Netgear Nighthawk RAX120 router.
Webcam
Although the 1080p webcam above the display offers a slightly higher resolution than the usual 720p modules, the image quality is still not particularly good. We had to deal with a relatively high amount of noise in particular during our recordings. Full HD videos can be shot at 30 FPS.


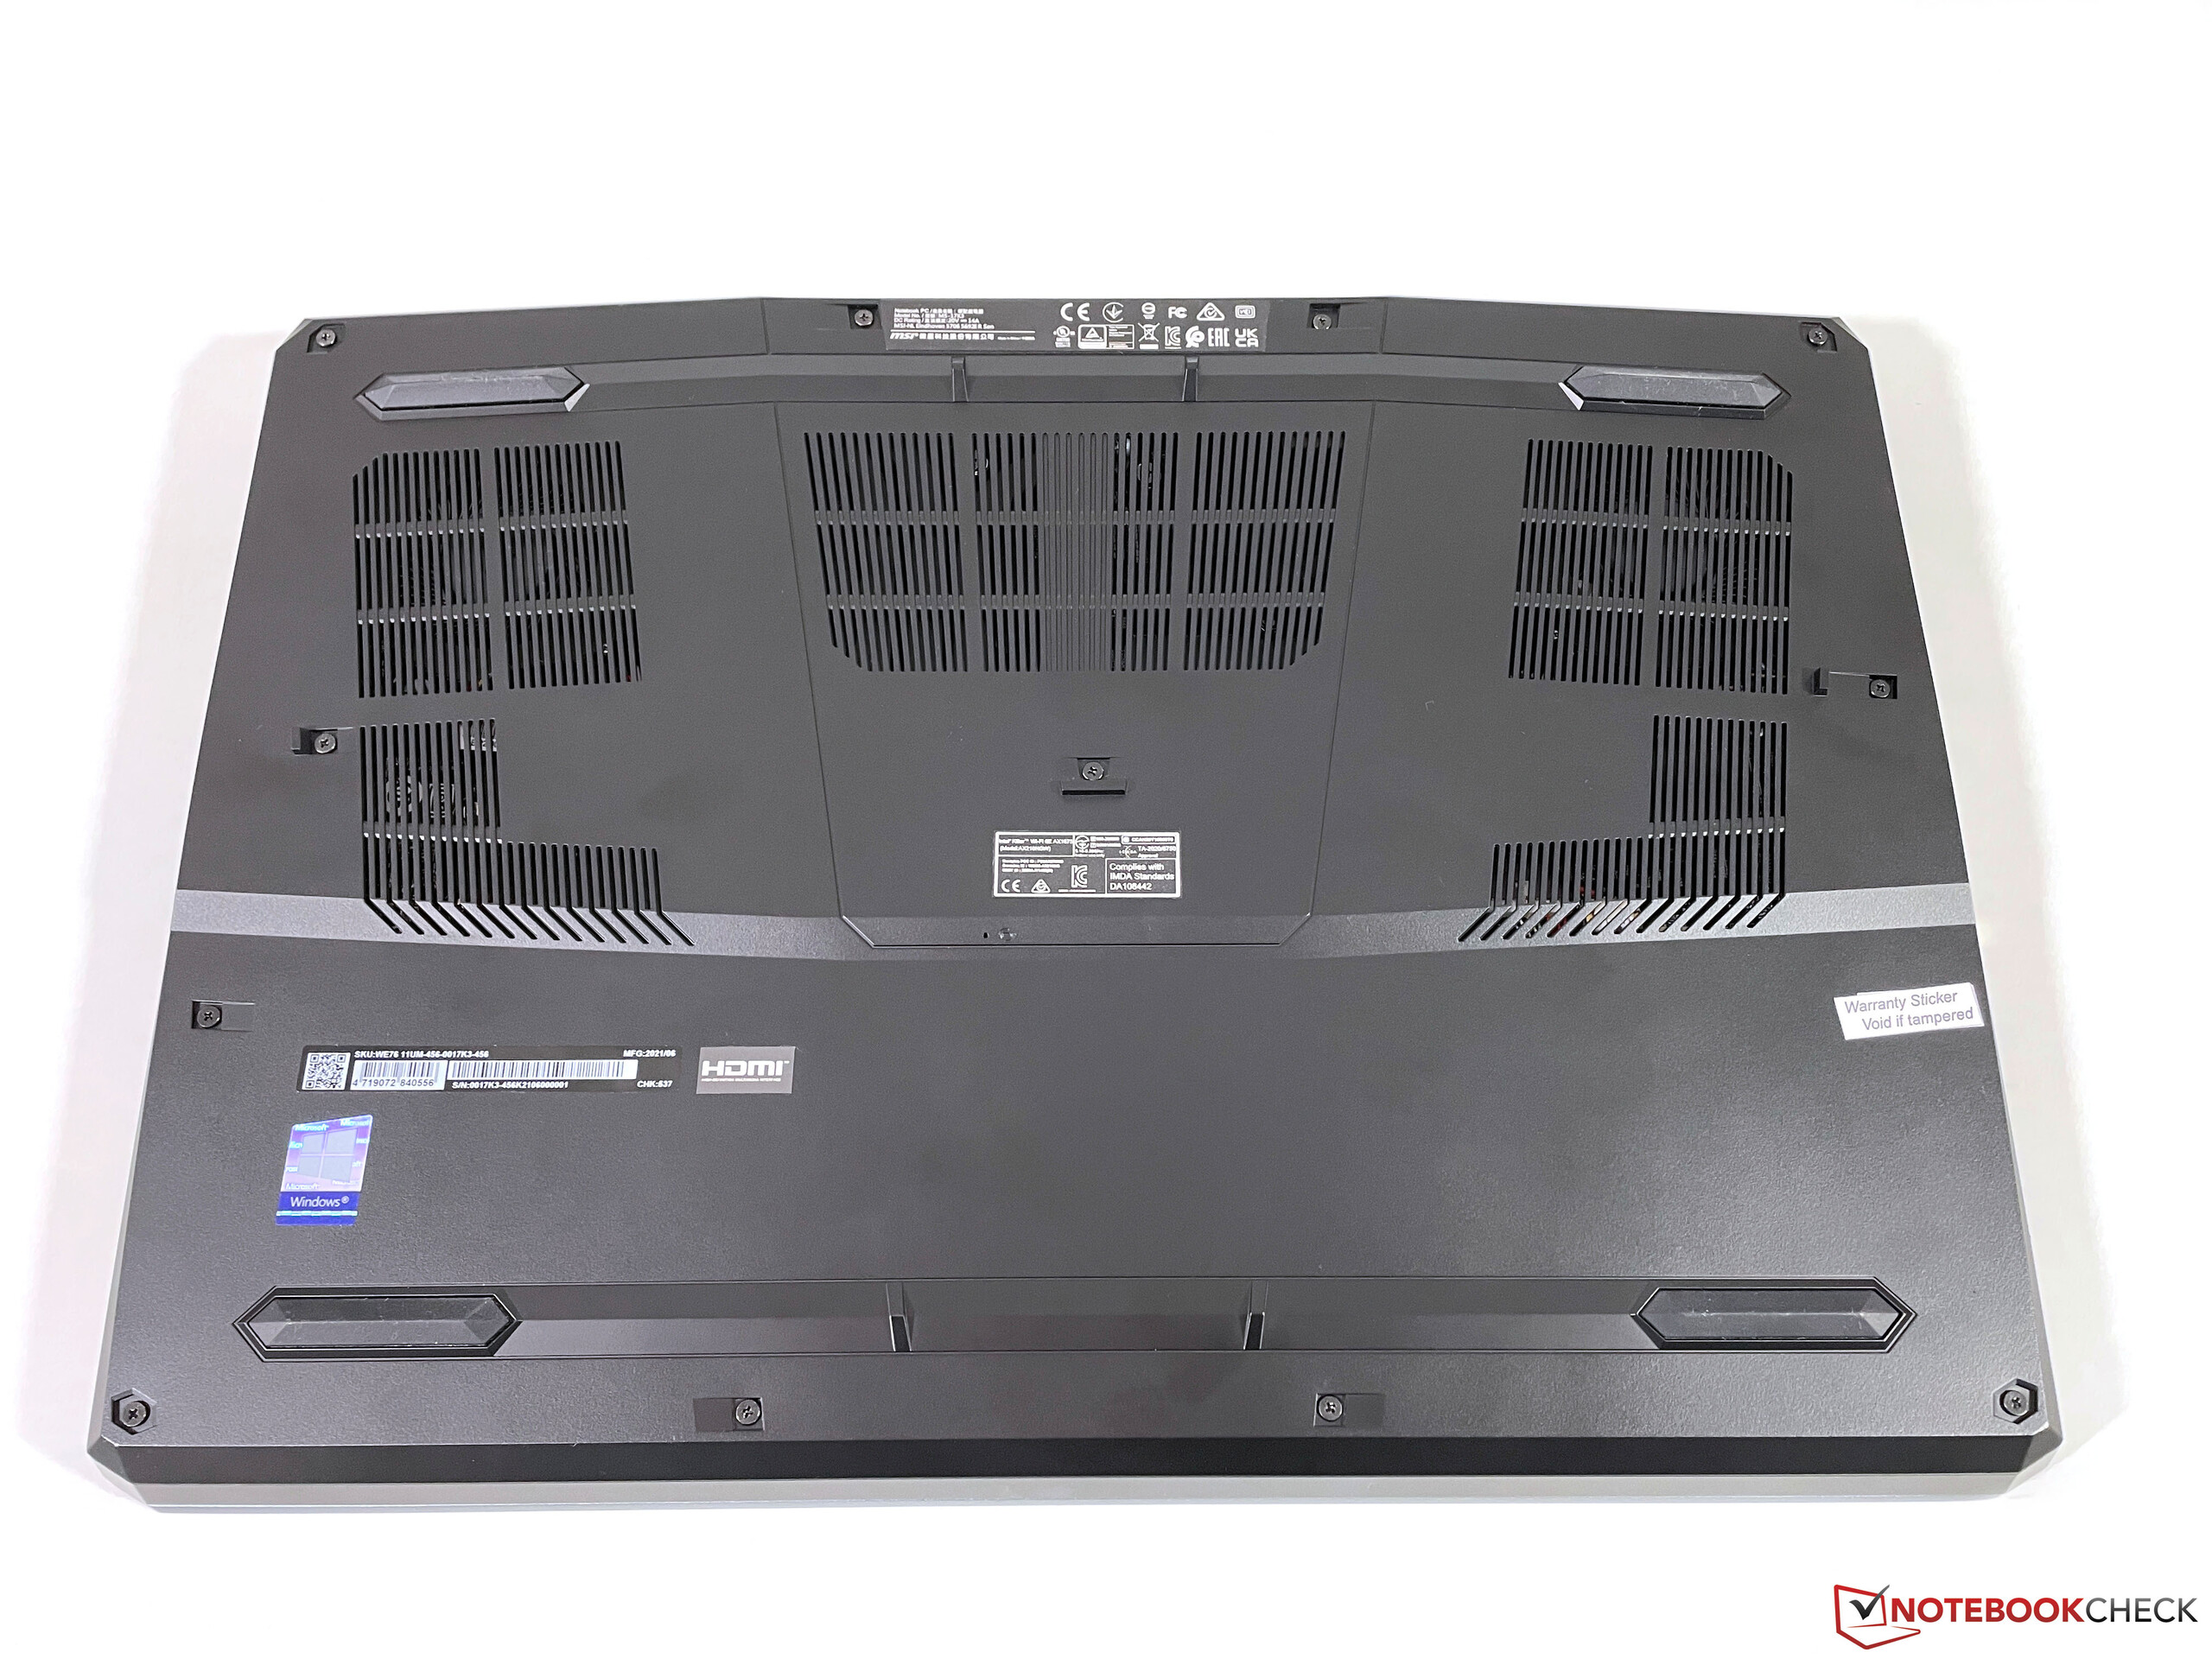
Maintenance
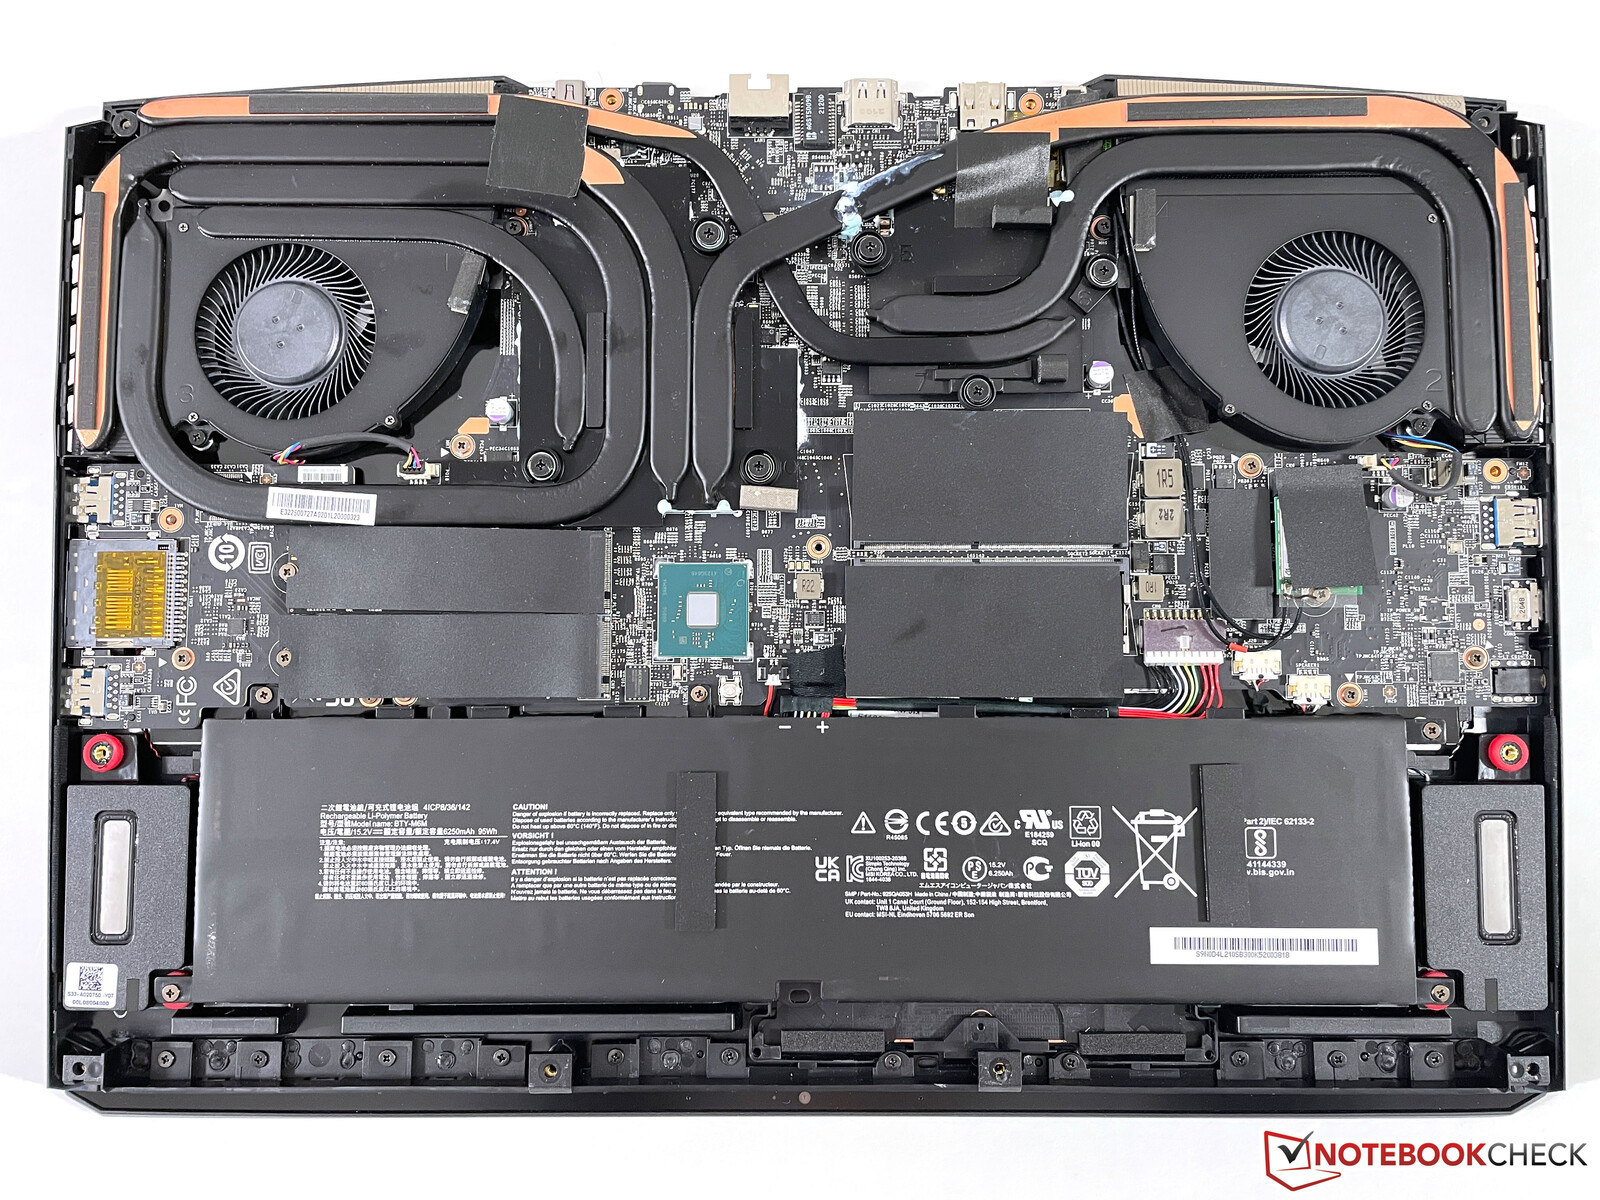
After loosening all cross screws, the complete bottom cover can be removed. Besides the two SODIMM slots, there are also two M.2-2280 slots available (1x PCIe 4.0 and 1x PCIe 3.0). The Wi-Fi module can also be replaced.
Input devices - SteelSeries with numeric keypad
Keyboard
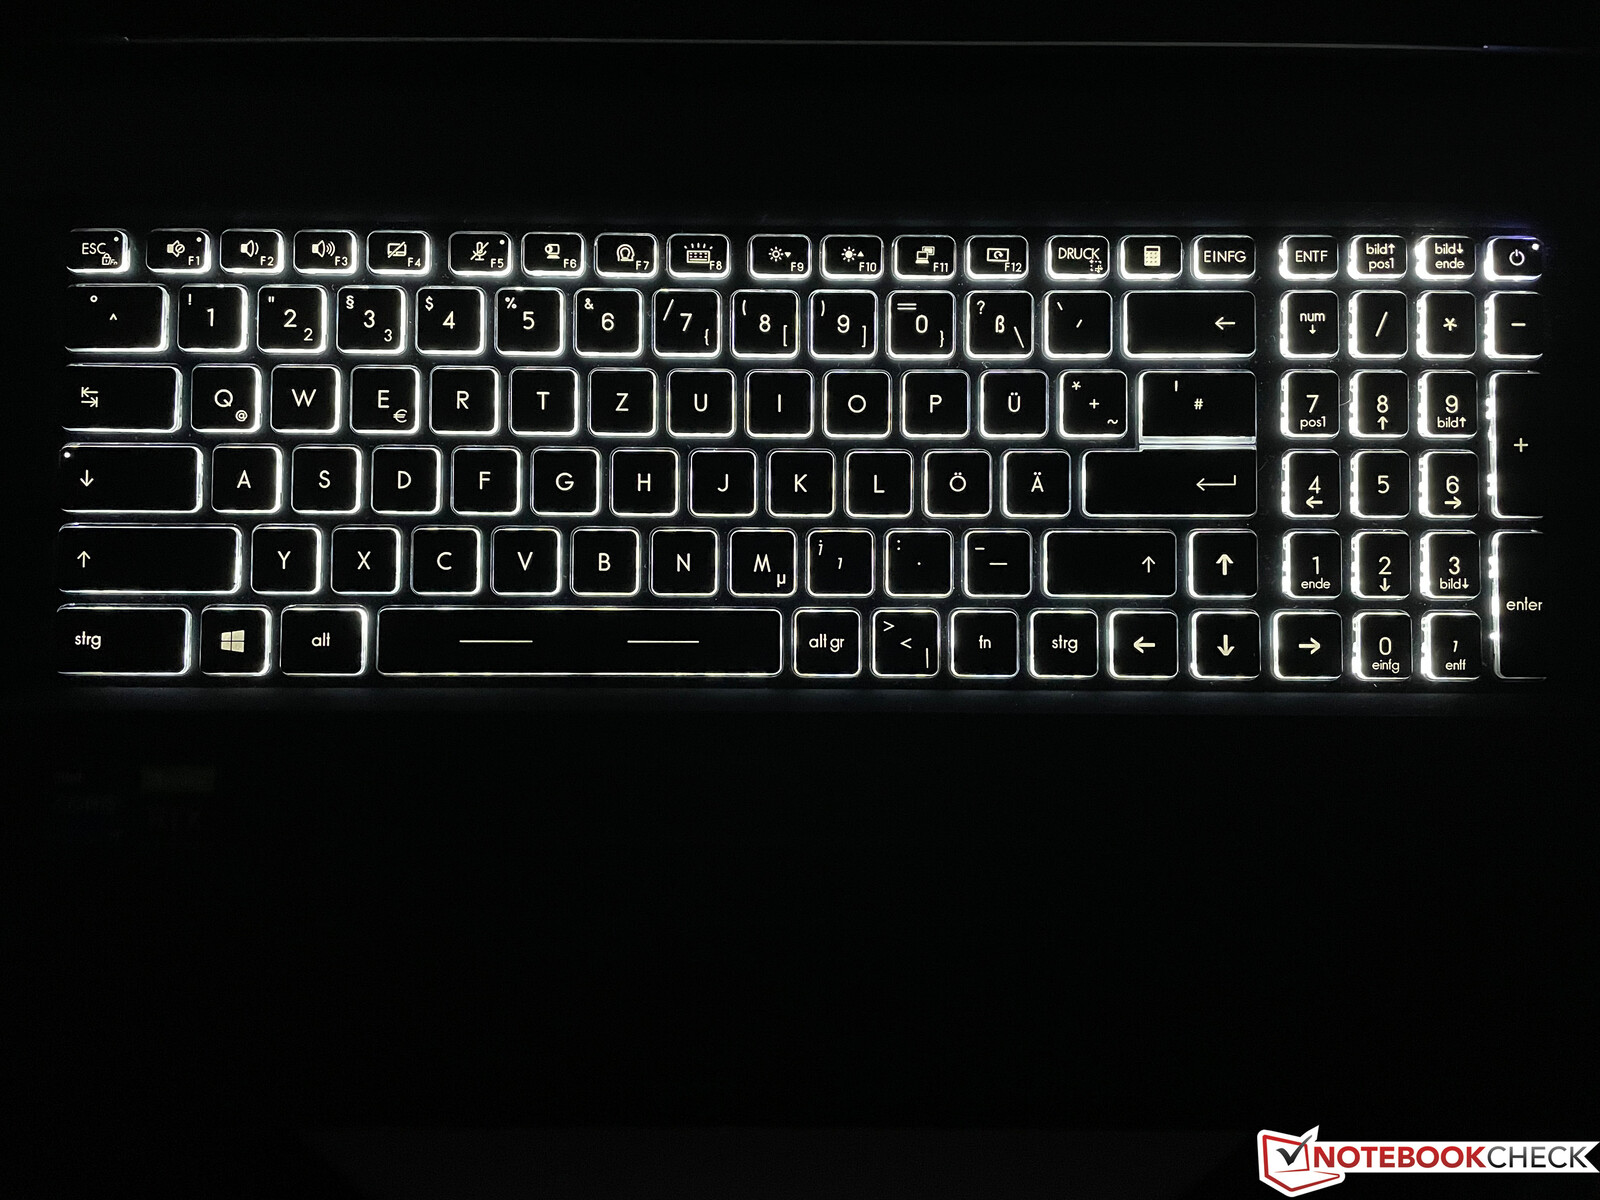
Like its gaming siblings, the WE76 workstation counterpart also features a SteelSeries keyboard. However, the colored backlight has been omitted; instead, there is only a white backlight. The keys offer a comparatively long travel, and the typing feel is very good and can easily compete with the best keyboards of the established workstation competition. In addition, a full-fledged numeric keypad is integrated on the right side. Its keys are a bit narrower, but this didn't prove to be a problem in practice.
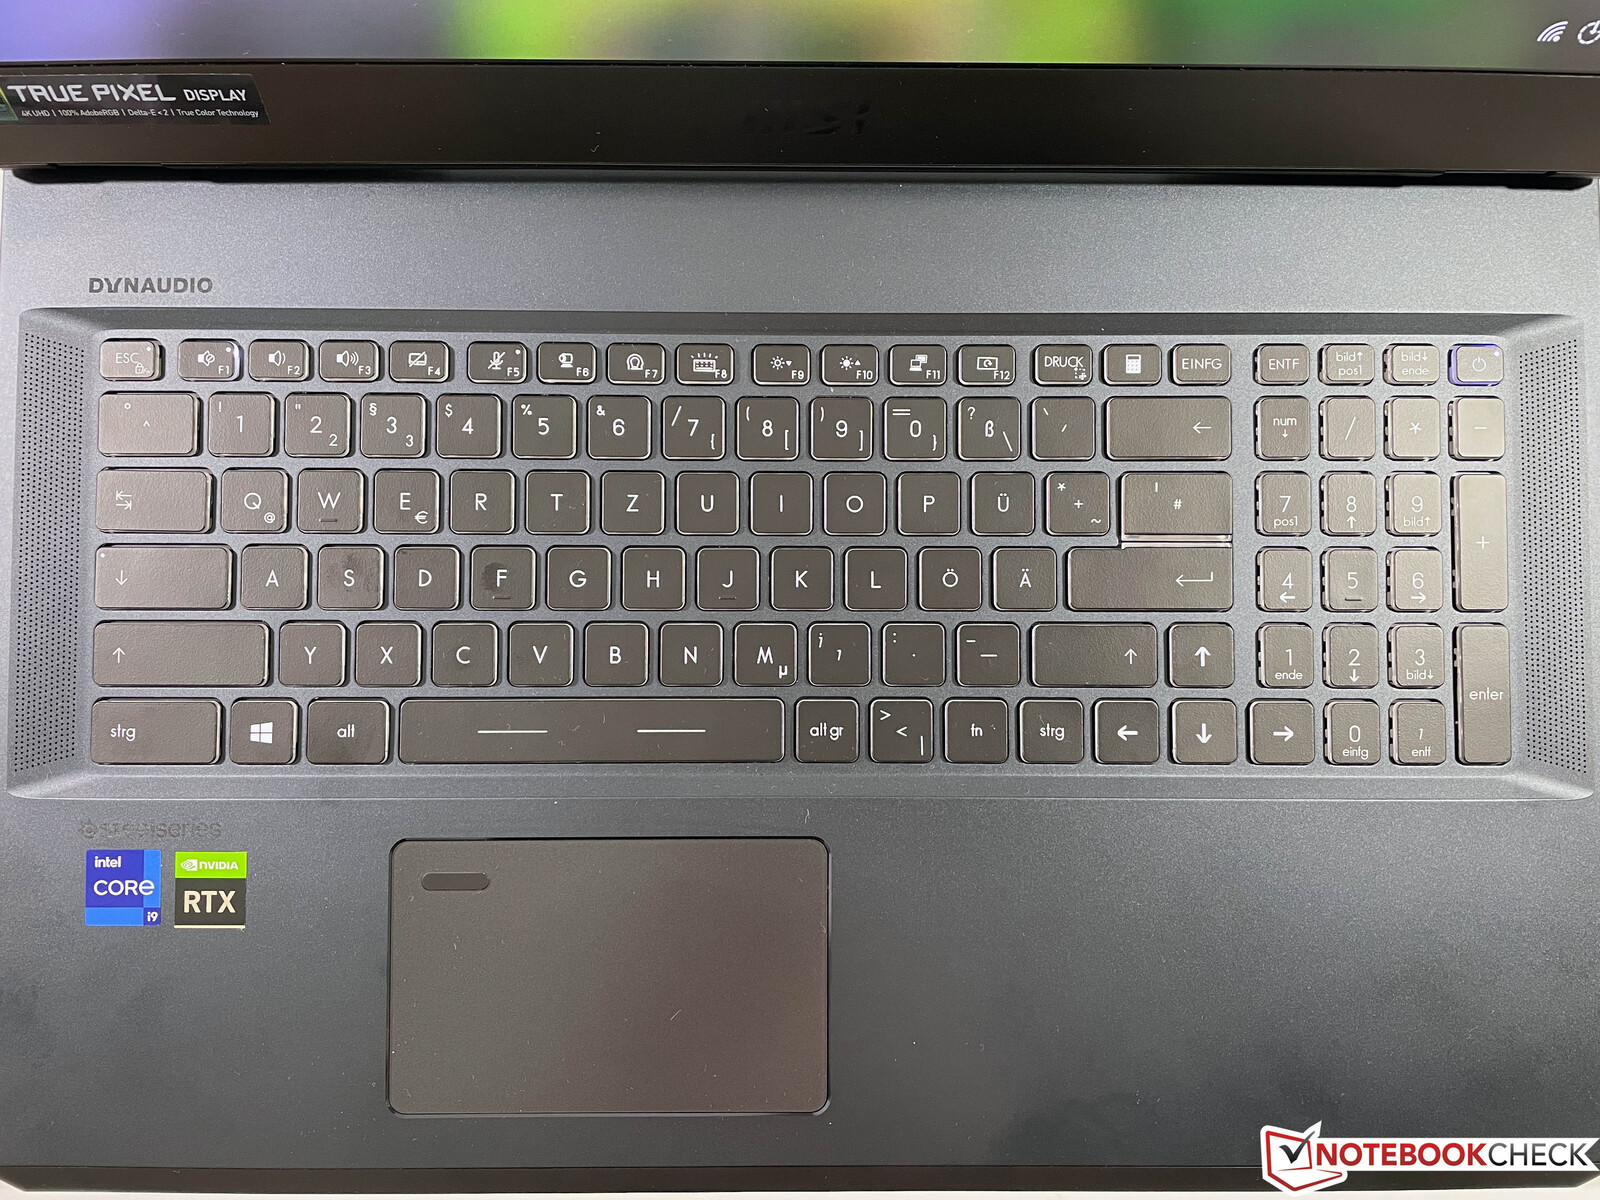
Touchpad
At 10.5 x 6.5 cm, the ClickPad isn't particularly large by today's standards, but mouse control works without issues. The smooth surface offers good gliding properties, and the built-in swipe fingerprint scanner located in the top left corner doesn't get in the way. The touchpad feels a bit clattery, though, because there's a slight gap before you reach the actual click mechanism. This means that the lower half can be pressed down noticeably without a click being triggered. Furthermore, the actual click is too loud, which makes it feel cheap.
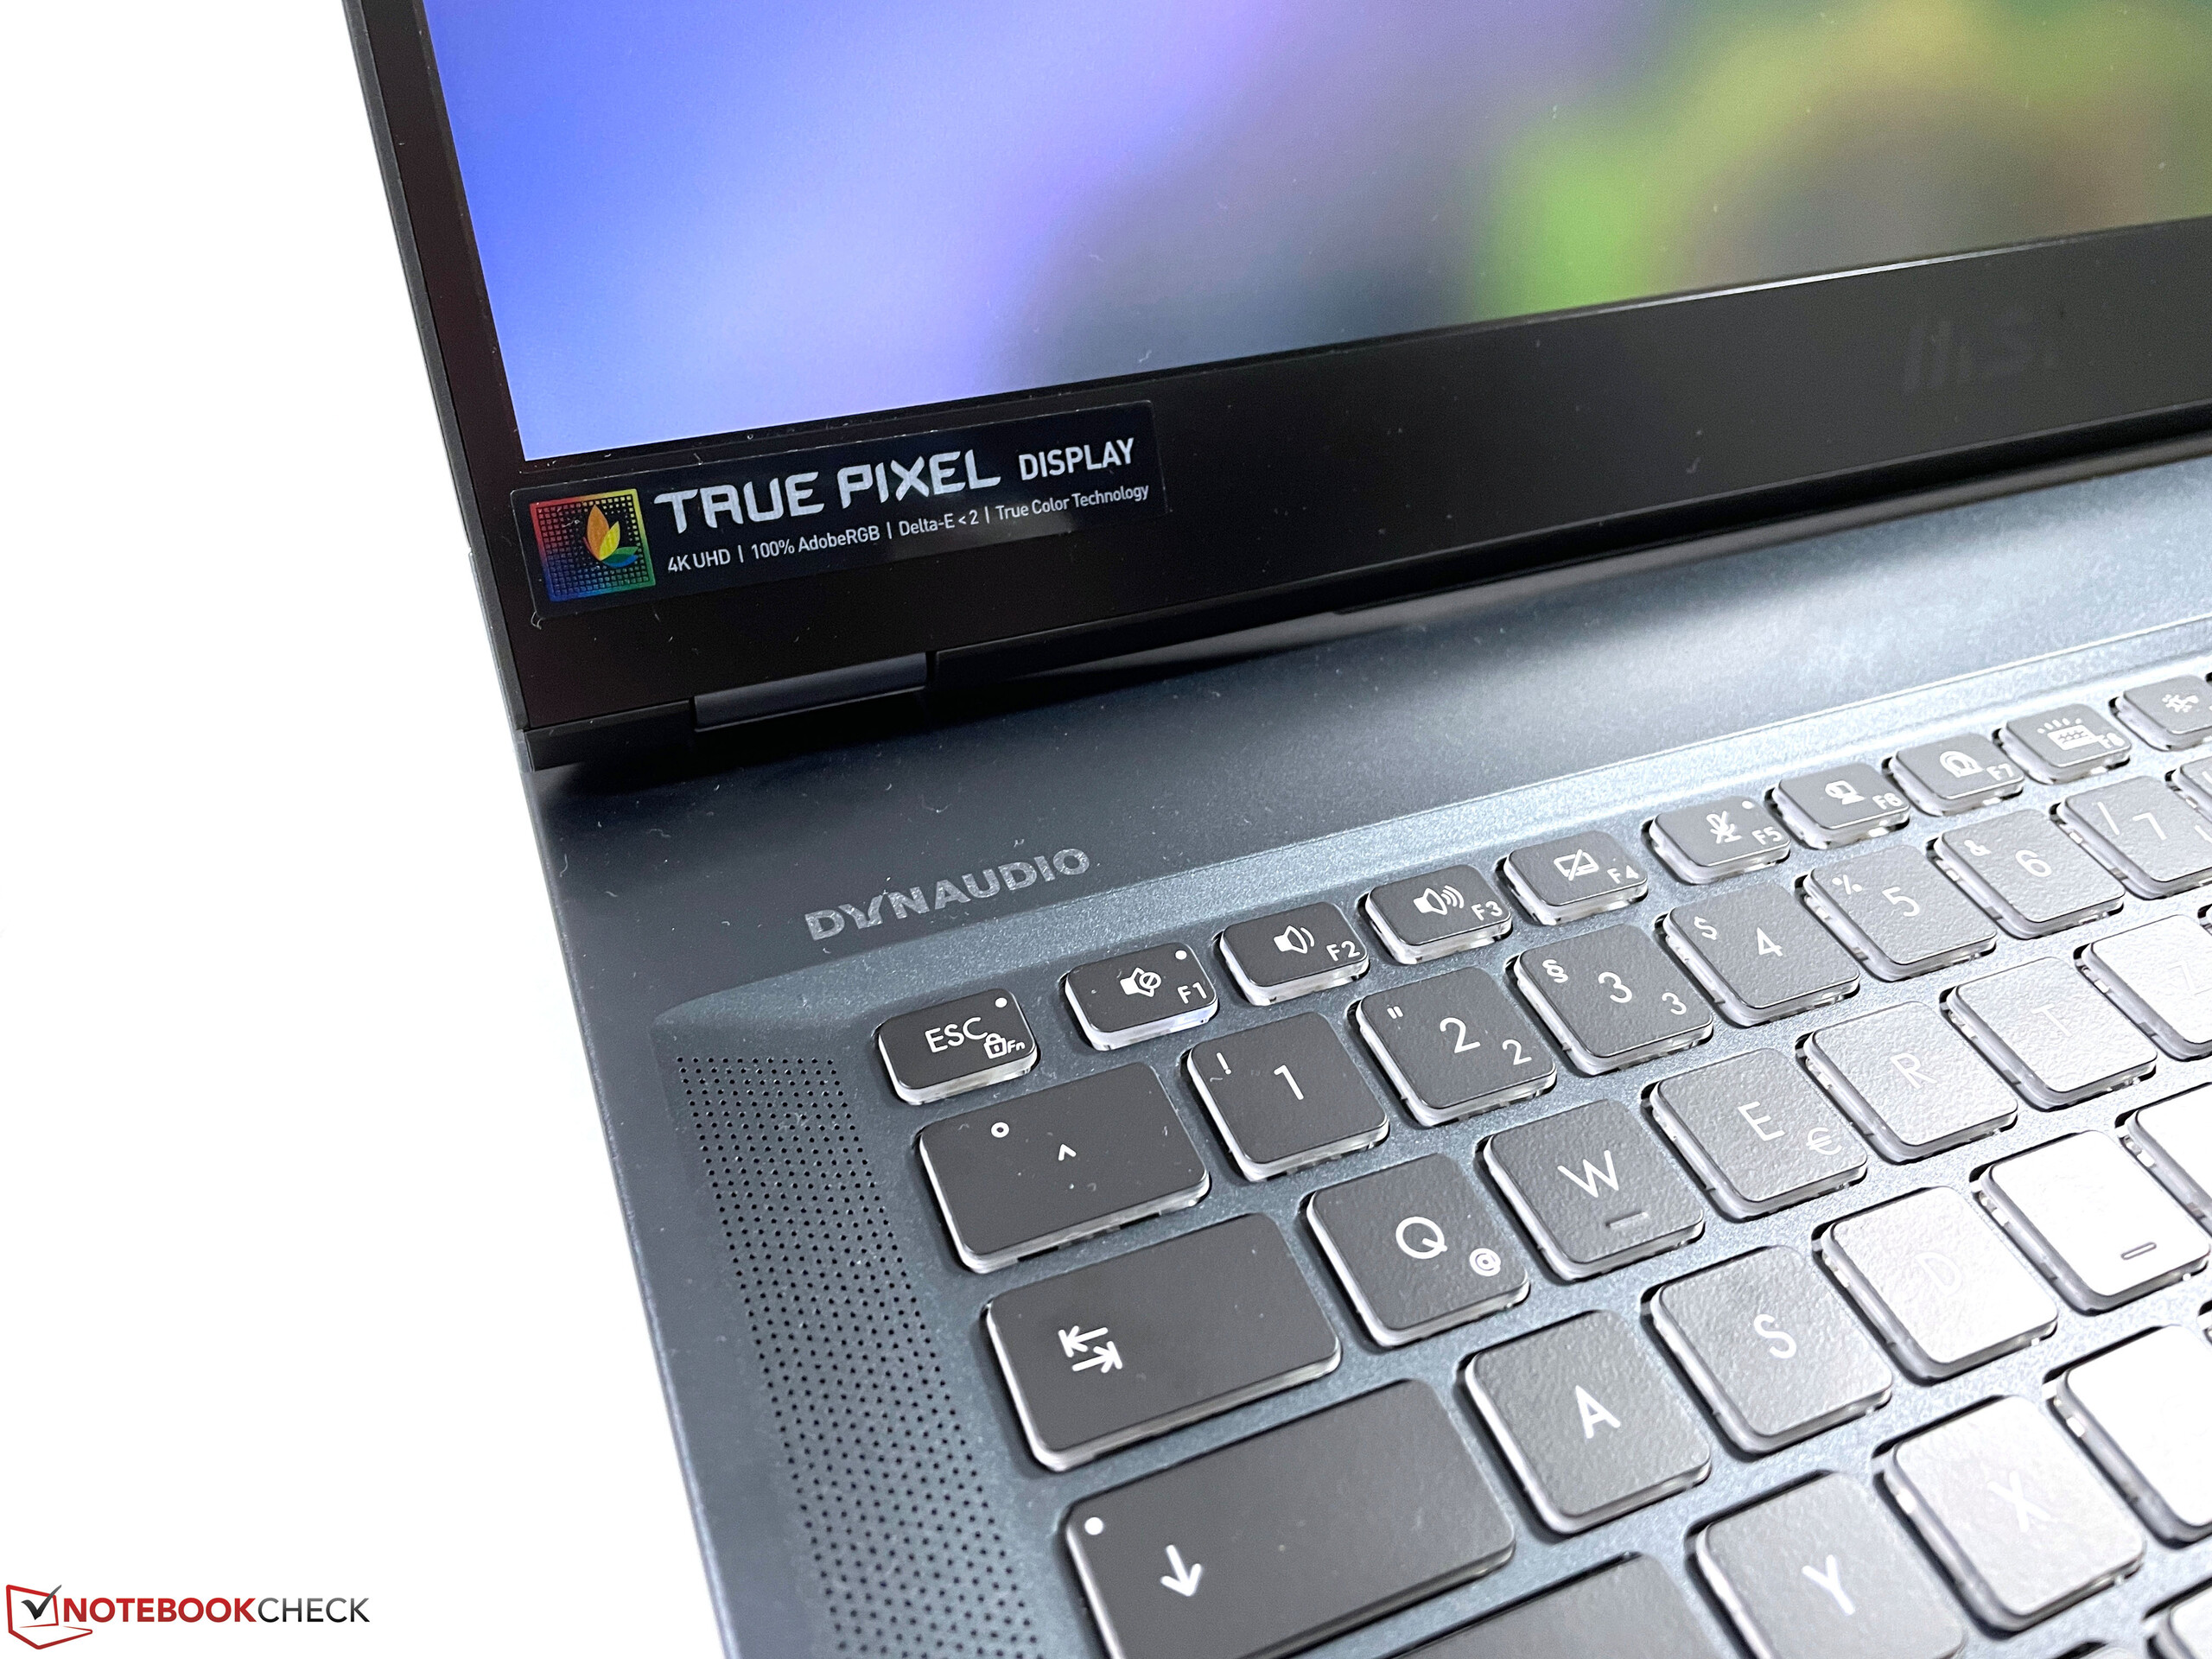
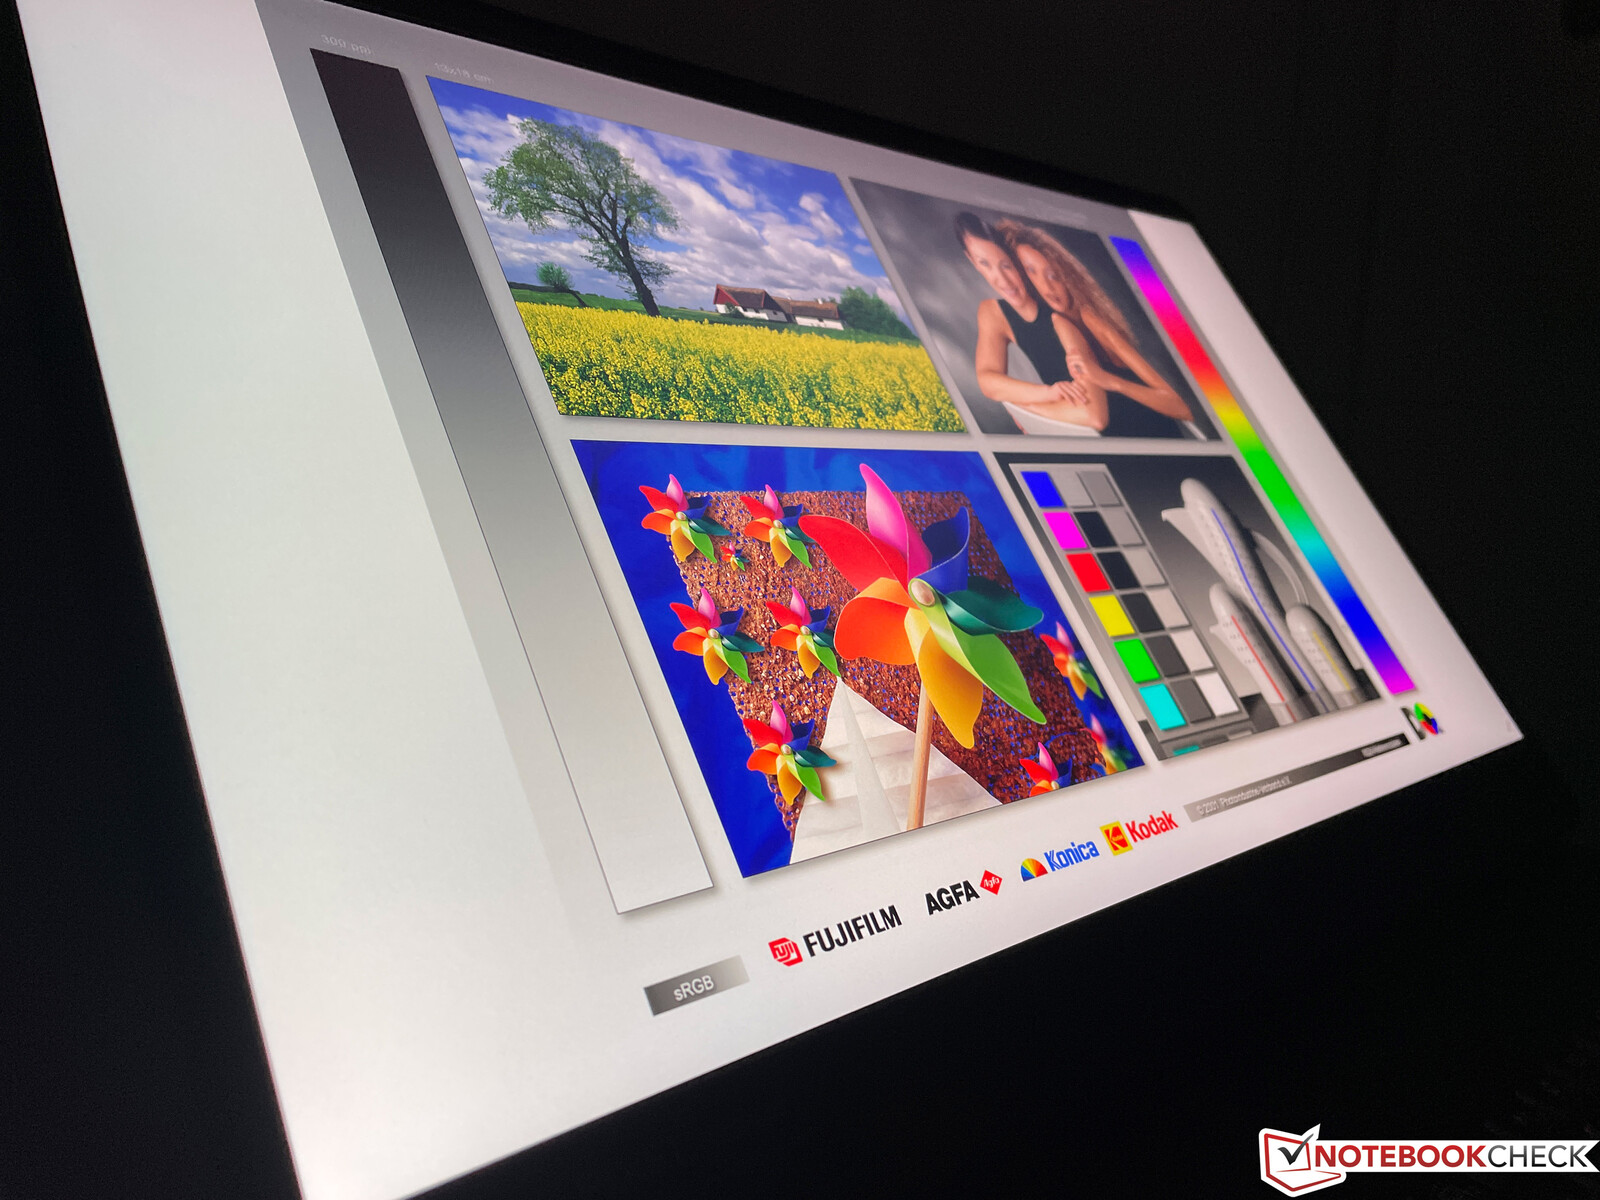
Display - Matte 4K panel with AdobeRGB and 120 Hz

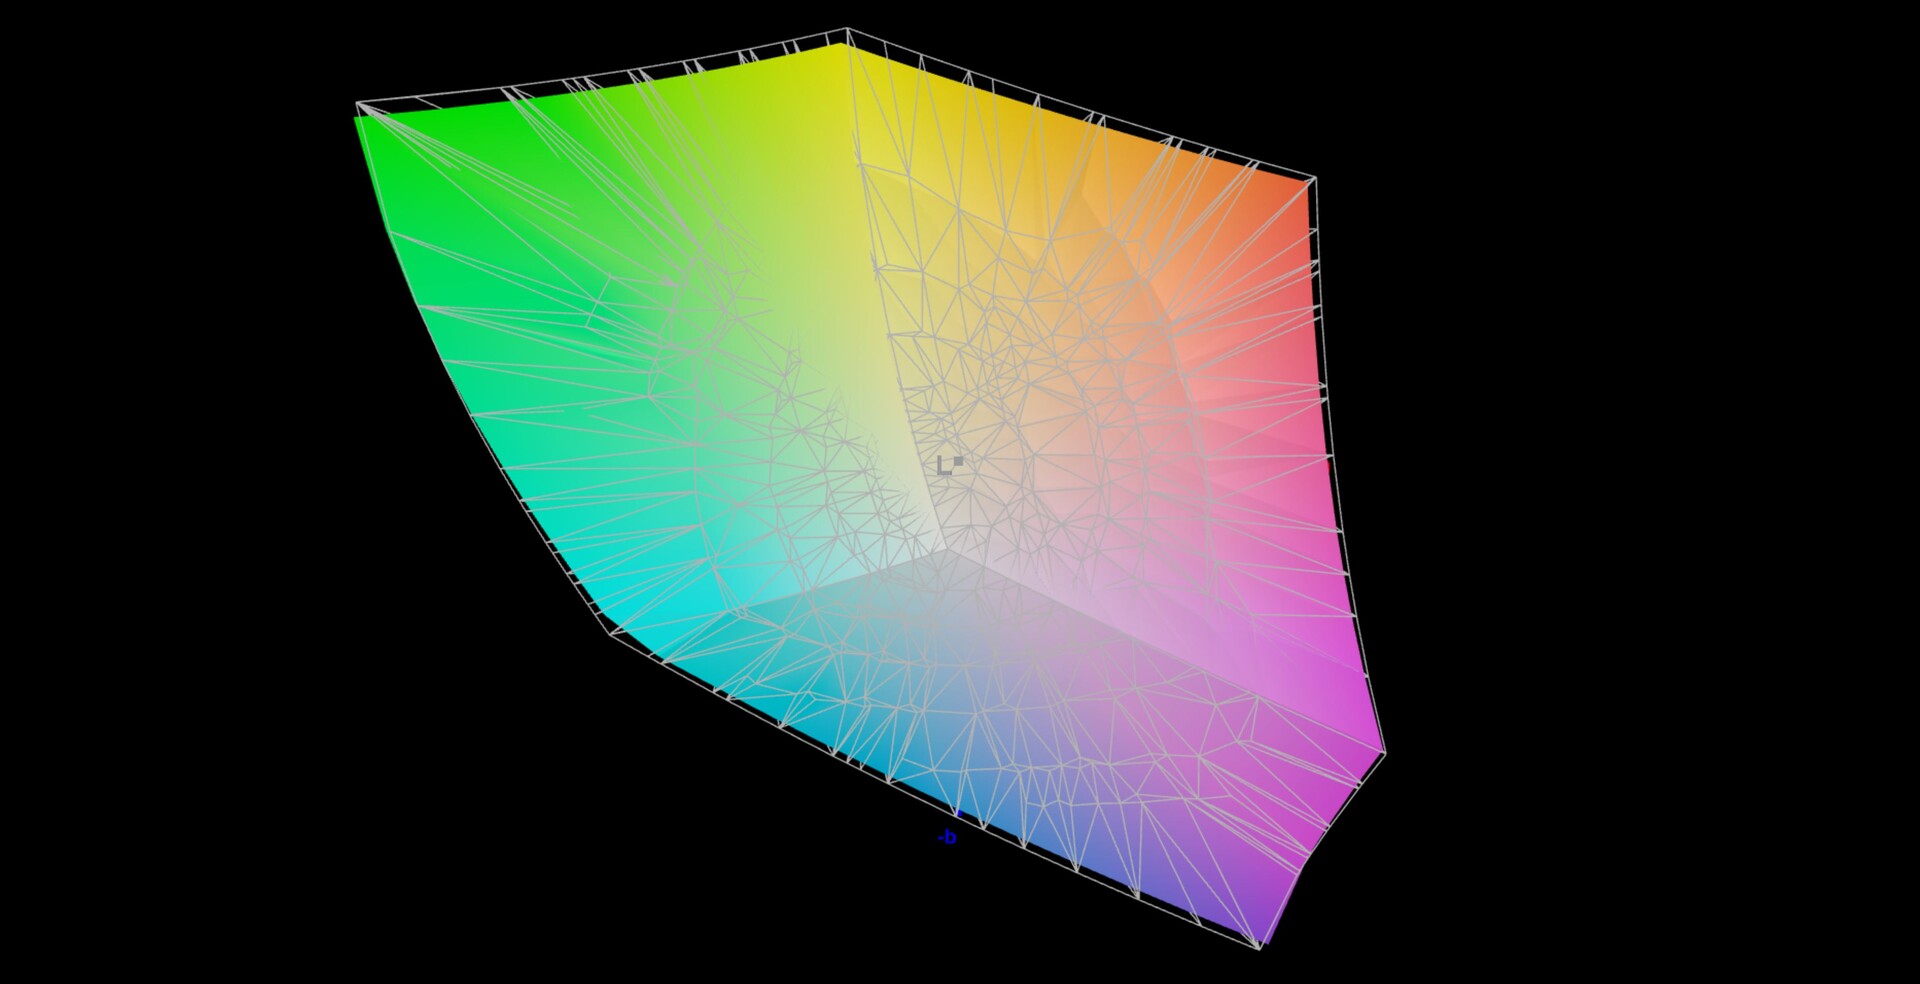
The WE76 is exclusively available with a matte 4K panel in a 16:9 aspect ratio. According to MSI, the display also covers the AdobeRGB color space in its entirety, and a refresh rate of 120 Hz ensures a smooth image, which is also enabled by default. MSI refrains from using the even faster panels of its gaming versions here, which makes sense, though.
The subjective image impression of the panel is excellent. Pictures are extremely sharp, and even bright areas don't look grainy. However, colors aren't quite as vibrant compared to high-quality OLED or mini LED panels. The average brightness is just over 400 cd/m², and the contrast ratio exceeds 1,200:1. Overall, it's a noticeable improvement over the 1080p display of the old MSI WE75, but some of the high-resolution panels from the competition provide better scores.
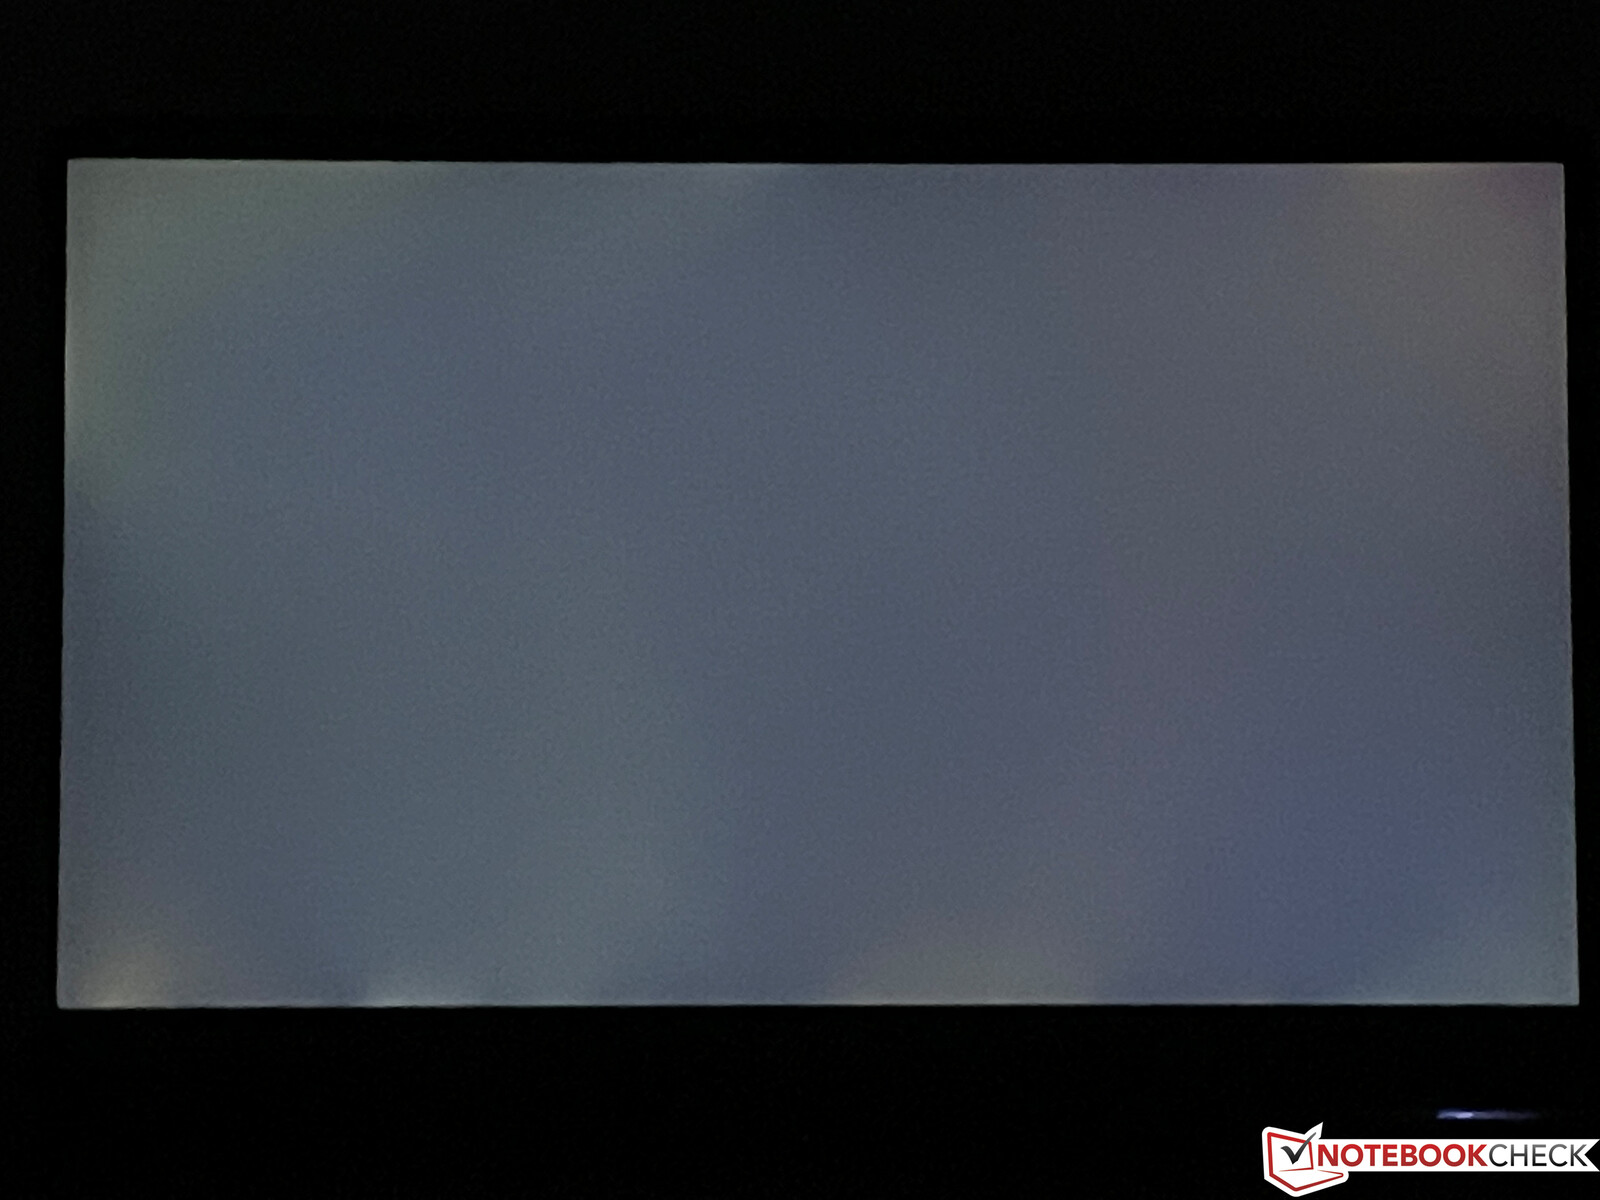
PWM is not used, and the response times are very fast, which means that there are no ghosting effects. At maximum brightness, you can notice slight screen bleeding at the edges when using a dark background, but this isn't noticeable in practice.
| |||||||||||||||||||||||||
Brightness Distribution: 93 %
Center on Battery: 420 cd/m²
Contrast: 1232:1 (Black: 0.34 cd/m²)
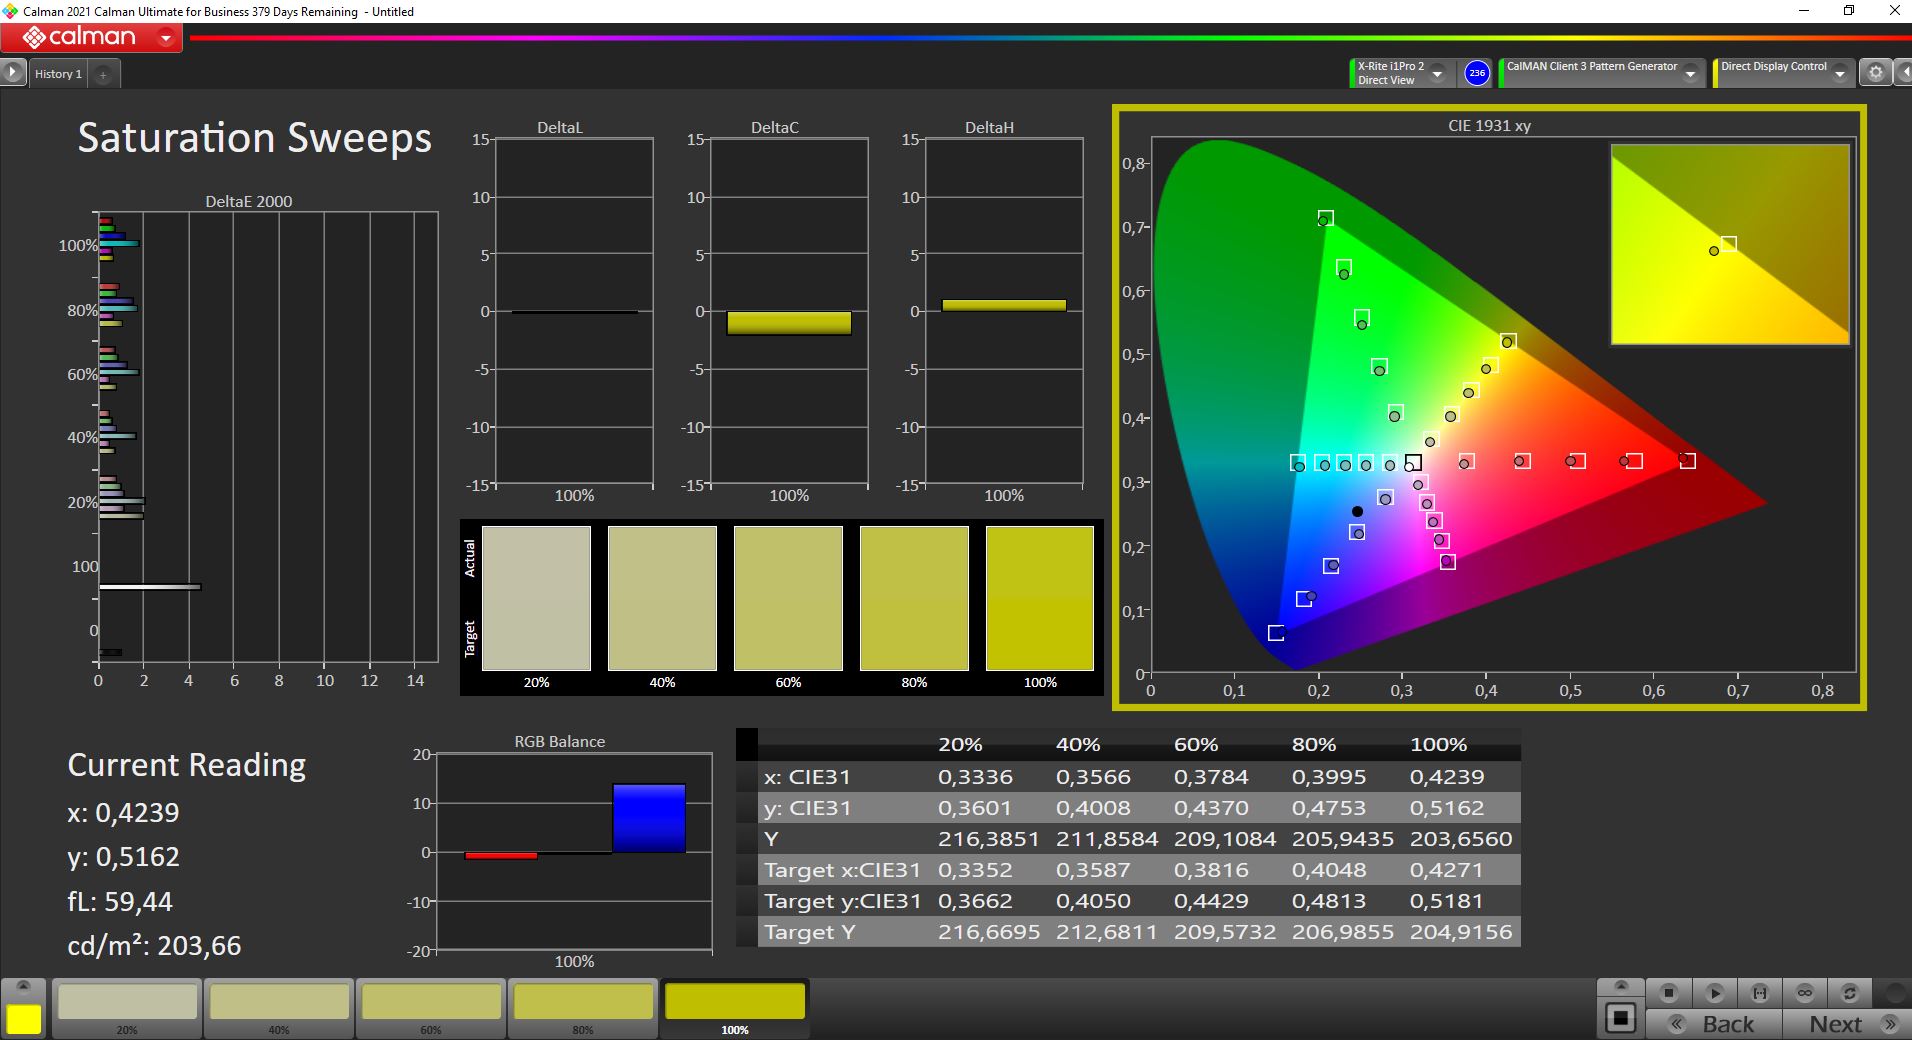
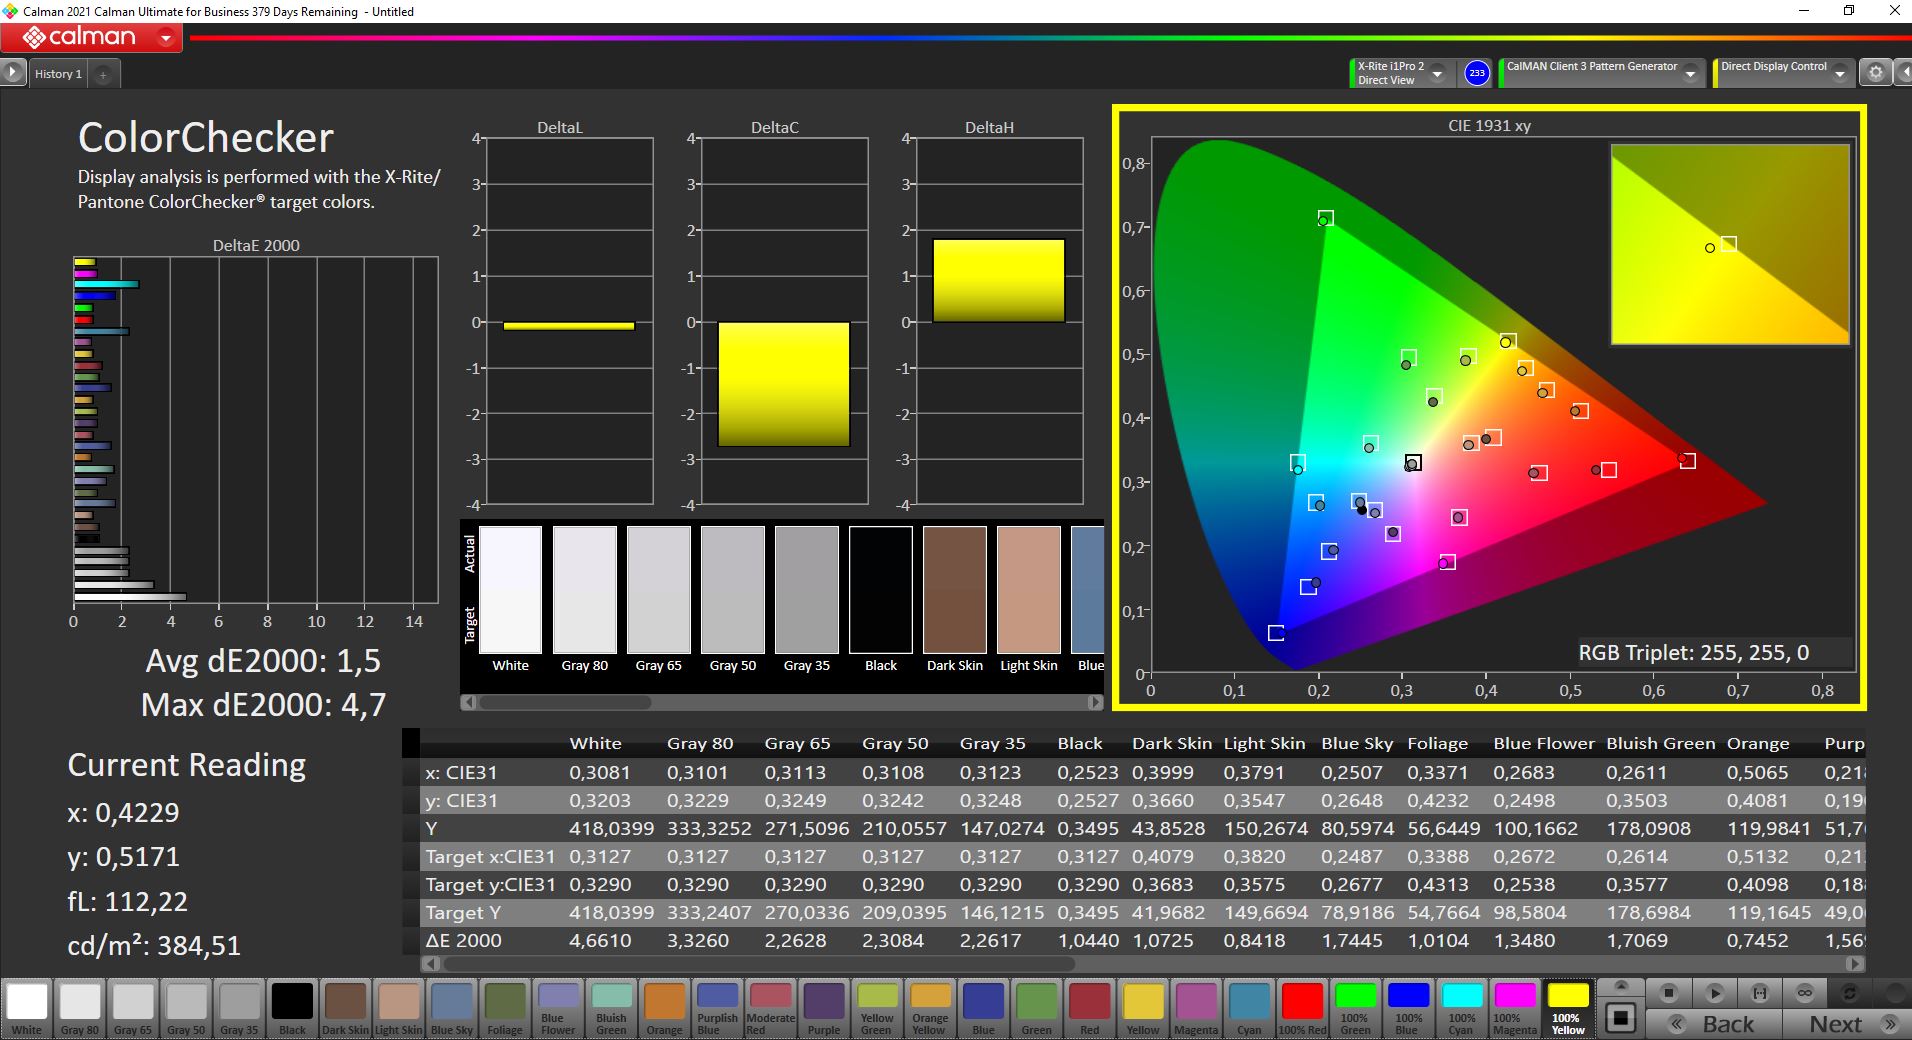
ΔE ColorChecker Calman: 1.5 | ∀{0.5-29.43 Ø4.72}
calibrated: 0.9
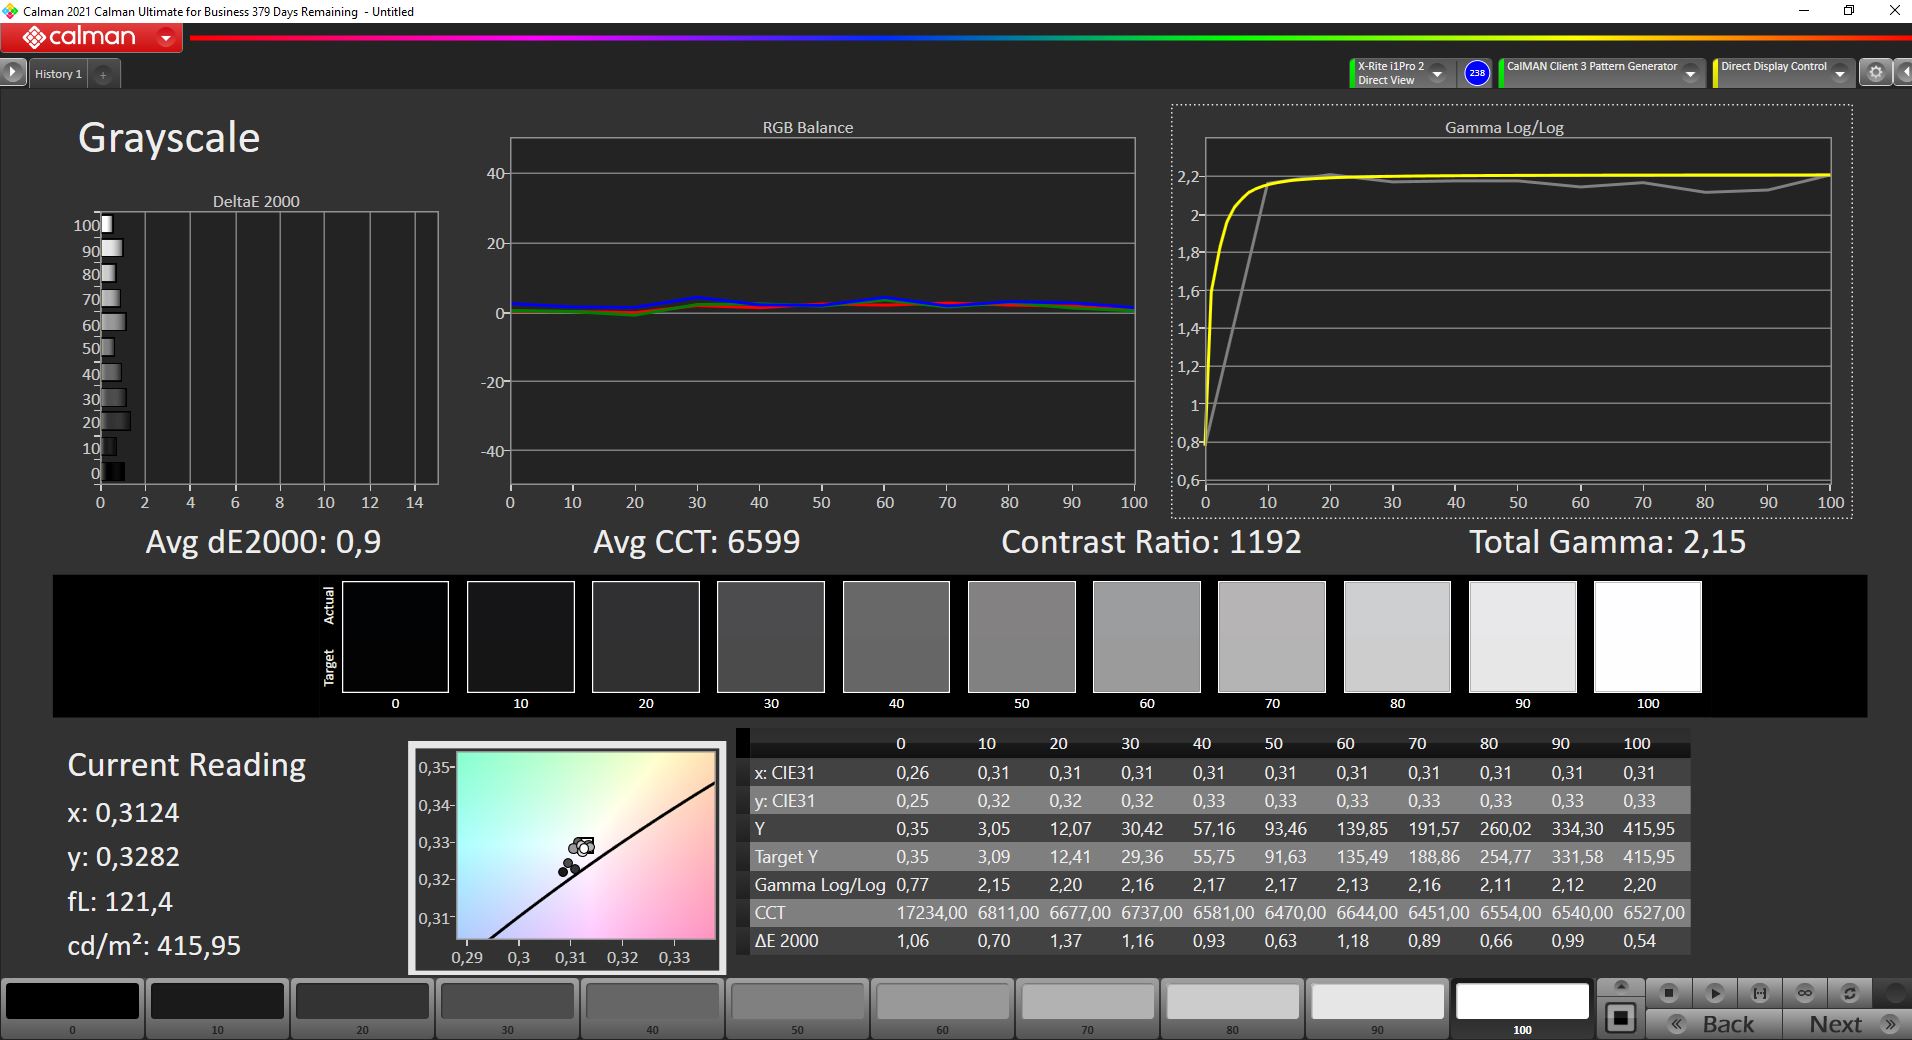
ΔE Greyscale Calman: 2 | ∀{0.09-98 Ø4.97}
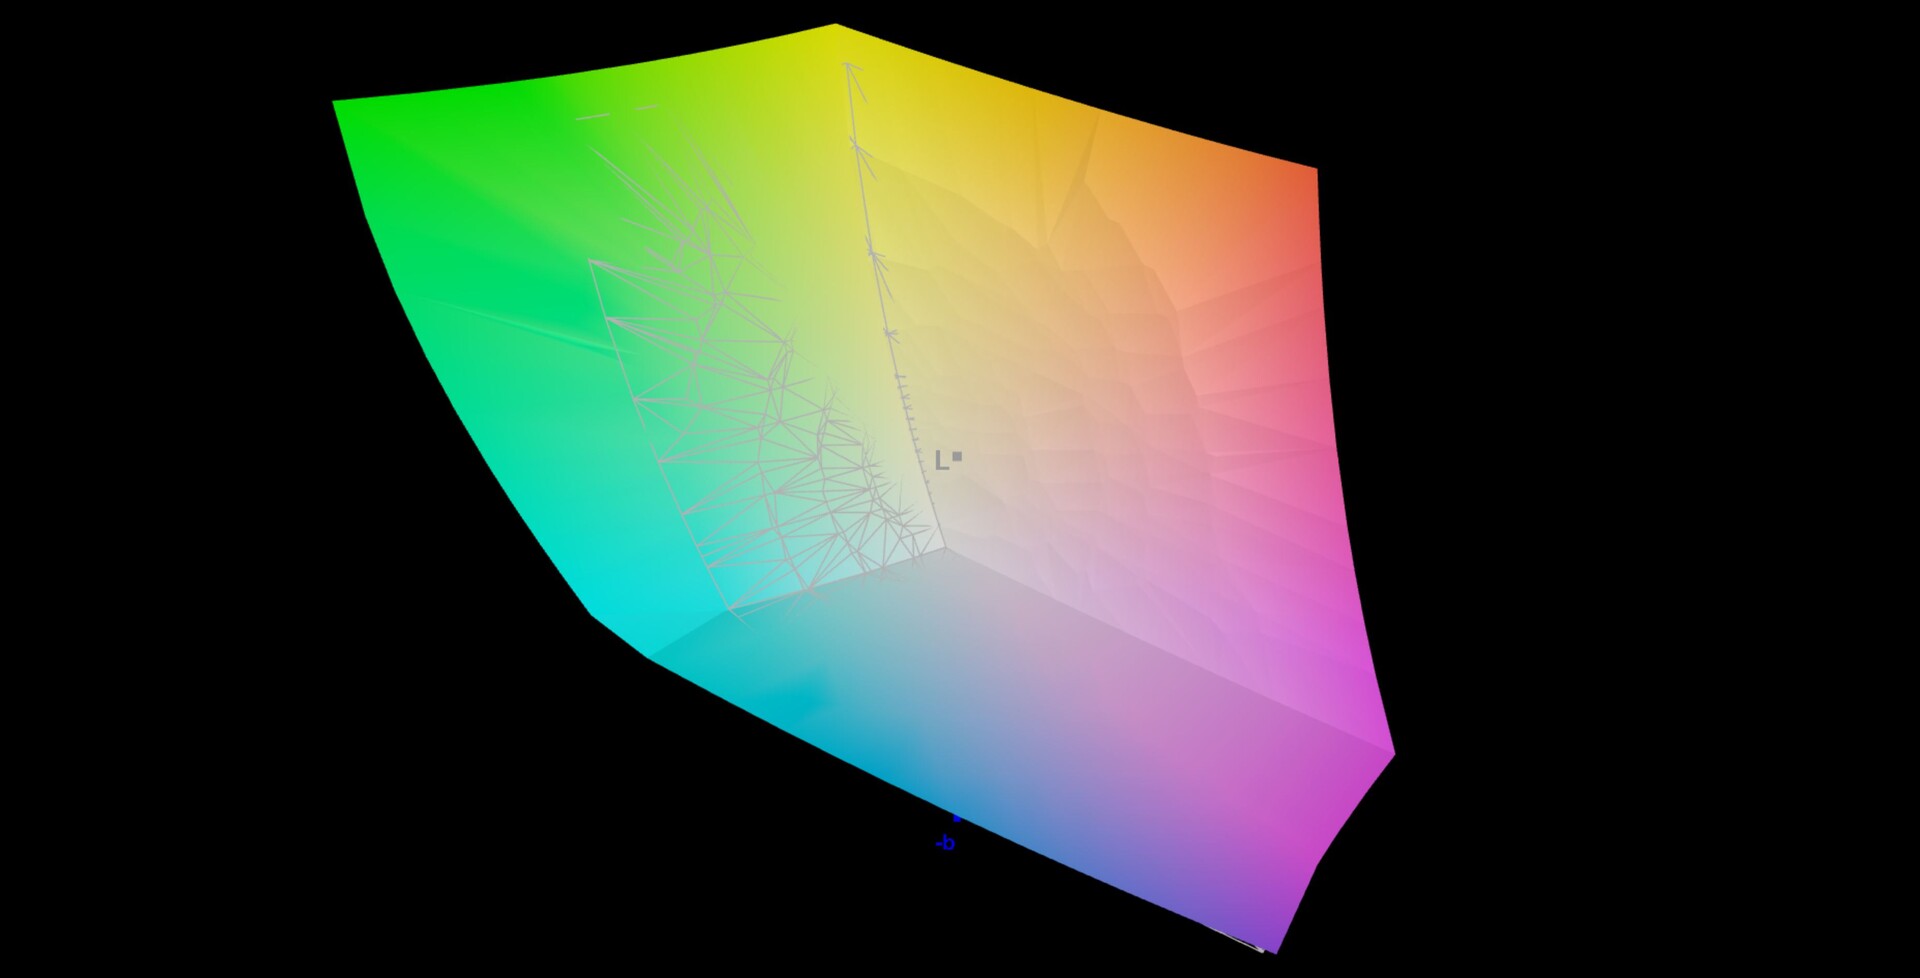
96% AdobeRGB 1998 (Argyll 3D)
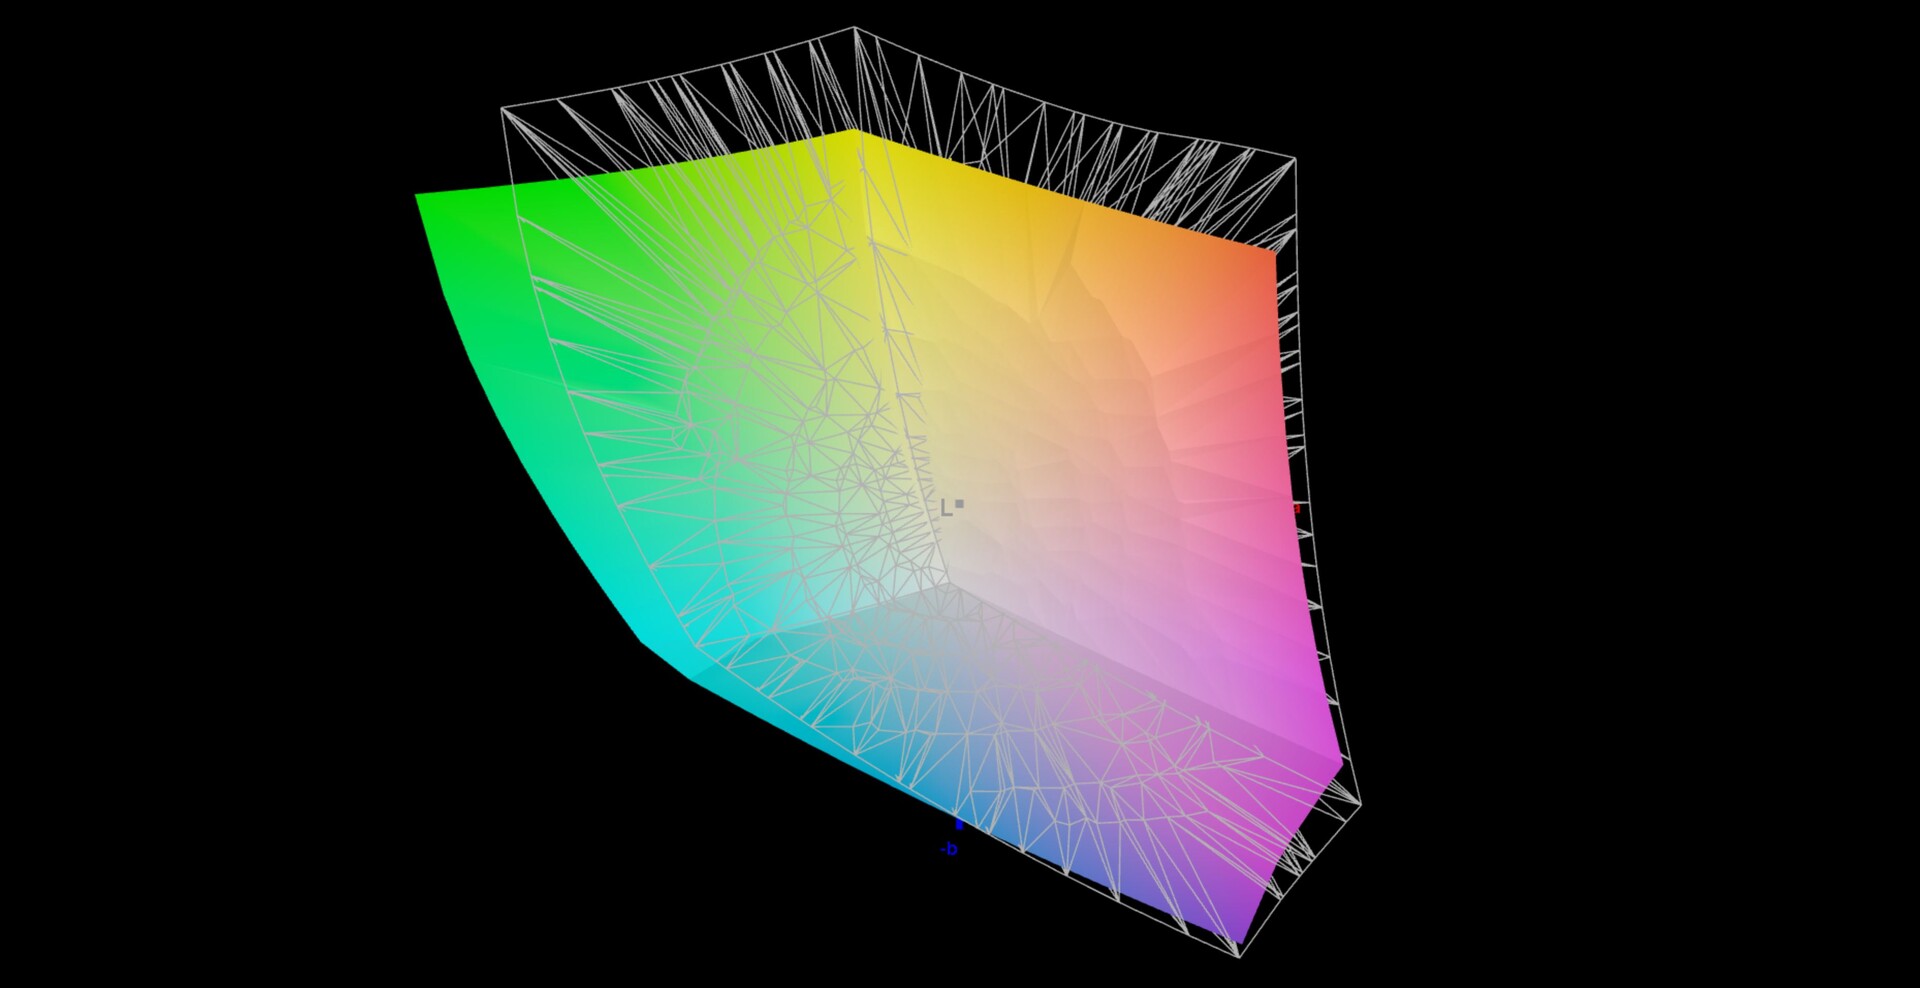
99.3% sRGB (Argyll 3D)
82.1% Display P3 (Argyll 3D)
Gamma: 2.17
CCT: 6629 K
| MSI WE76 11UM-456 B173ZAN03.3, IPS, 3840x2160, 17.3" | Lenovo ThinkPad P1 G4-20Y4S0KS00 LP160UQ1-SPB1, IPS LED, 3840x2400, 16" | HP ZBook Fury 15 G8 BOE0969, IPS, 3840x2160, 15.6" | Asus ProArt StudioBook 16 W7600H5A-2BL2 ATNA60YV02-0, OLED, 3840x2400, 16" | Lenovo ThinkPad P17 G2-20YU0025G LP173WF4-SPF7, IPS LED, 1920x1080, 17.3" | HP ZBook Fury 17 G7 119W5EA AUOCD8C, , 3840x2160, 17.3" | MSI WE75 9TK AU Optronics B173HAN04.2, IPS, 1920x1080, 17.3" | |
|---|---|---|---|---|---|---|---|
| Display | 2% | 3% | 9% | -21% | 4% | -22% | |
| Display P3 Coverage (%) | 82.1 | 85.7 4% | 95.9 17% | 99.9 22% | 67.9 -17% | 99.3 21% | 63.2 -23% |
| sRGB Coverage (%) | 99.3 | 99.4 0% | 100 1% | 100 1% | 87.3 -12% | 99.9 1% | 89.9 -9% |
| AdobeRGB 1998 Coverage (%) | 96 | 98.9 3% | 87.3 -9% | 98.6 3% | 63.9 -33% | 86.9 -9% | 64.3 -33% |
| Response Times | -202% | 7% | 85% | -115% | -244% | -132% | |
| Response Time Grey 50% / Grey 80% * (ms) | 17.6 ? | 55.2 ? -214% | 14.8 ? 16% | 2 ? 89% | 39.2 ? -123% | 56 ? -218% | 30.8 ? -75% |
| Response Time Black / White * (ms) | 10.8 ? | 31.2 ? -189% | 11 ? -2% | 2 ? 81% | 22.4 ? -107% | 40 ? -270% | 31.2 ? -189% |
| PWM Frequency (Hz) | 240 ? | ||||||
| Screen | 0% | -59% | -39% | -101% | 5% | -50% | |
| Brightness middle (cd/m²) | 419 | 630 50% | 626 49% | 353 -16% | 361 -14% | 573 37% | 287.3 -31% |
| Brightness (cd/m²) | 416 | 622 50% | 589 42% | 360 -13% | 334 -20% | 586 41% | 280 -33% |
| Brightness Distribution (%) | 93 | 90 -3% | 87 -6% | 96 3% | 87 -6% | 91 -2% | 89 -4% |
| Black Level * (cd/m²) | 0.34 | 0.41 -21% | 0.58 -71% | 0.35 -3% | 0.38 -12% | 0.26 24% | |
| Contrast (:1) | 1232 | 1537 25% | 1079 -12% | 1031 -16% | 1508 22% | 1105 -10% | |
| Colorchecker dE 2000 * | 1.5 | 2.2 -47% | 5.41 -261% | 2.45 -63% | 5.4 -260% | 1.9 -27% | 2.98 -99% |
| Colorchecker dE 2000 max. * | 4.7 | 5 -6% | 9.05 -93% | 3.75 20% | 9.9 -111% | 4.2 11% | 5.08 -8% |
| Colorchecker dE 2000 calibrated * | 0.9 | 1 -11% | 0.6 33% | 2.77 -208% | 3.2 -256% | 0.7 22% | 3.06 -240% |
| Greyscale dE 2000 * | 2 | 2.7 -35% | 6.2 -210% | 1.88 6% | 6.5 -225% | 2.9 -45% | 3 -50% |
| Gamma | 2.17 101% | 2.26 97% | 2.66 83% | 2.31 95% | 2.23 99% | 2.1 105% | 2.28 96% |
| CCT | 6629 98% | 6886 94% | 6101 107% | 6441 101% | 7351 88% | 6217 105% | 6993 93% |
| Color Space (Percent of AdobeRGB 1998) (%) | 77.6 | 58.1 | |||||
| Color Space (Percent of sRGB) (%) | 100 | 89.5 | |||||
| Total Average (Program / Settings) | -67% /
-28% | -16% /
-36% | 18% /
-6% | -79% /
-86% | -78% /
-31% | -68% /
-56% |
* ... smaller is better
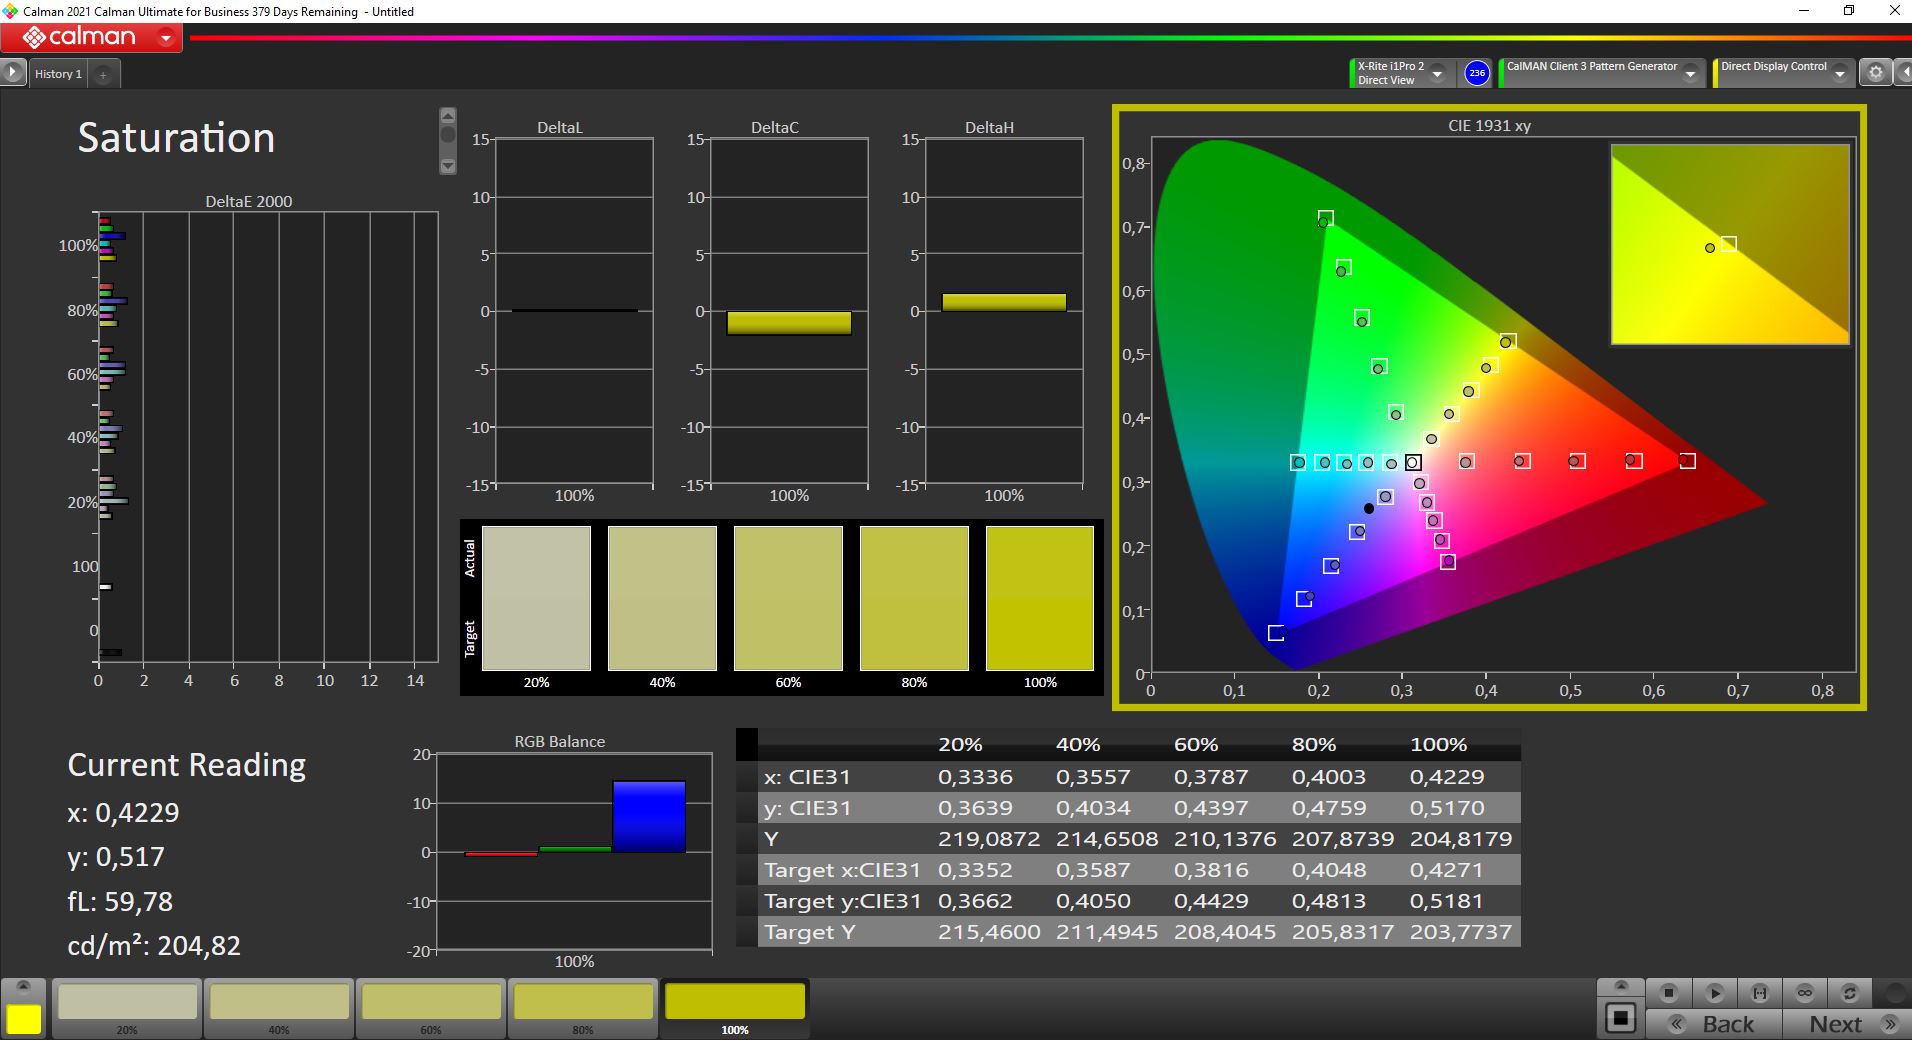
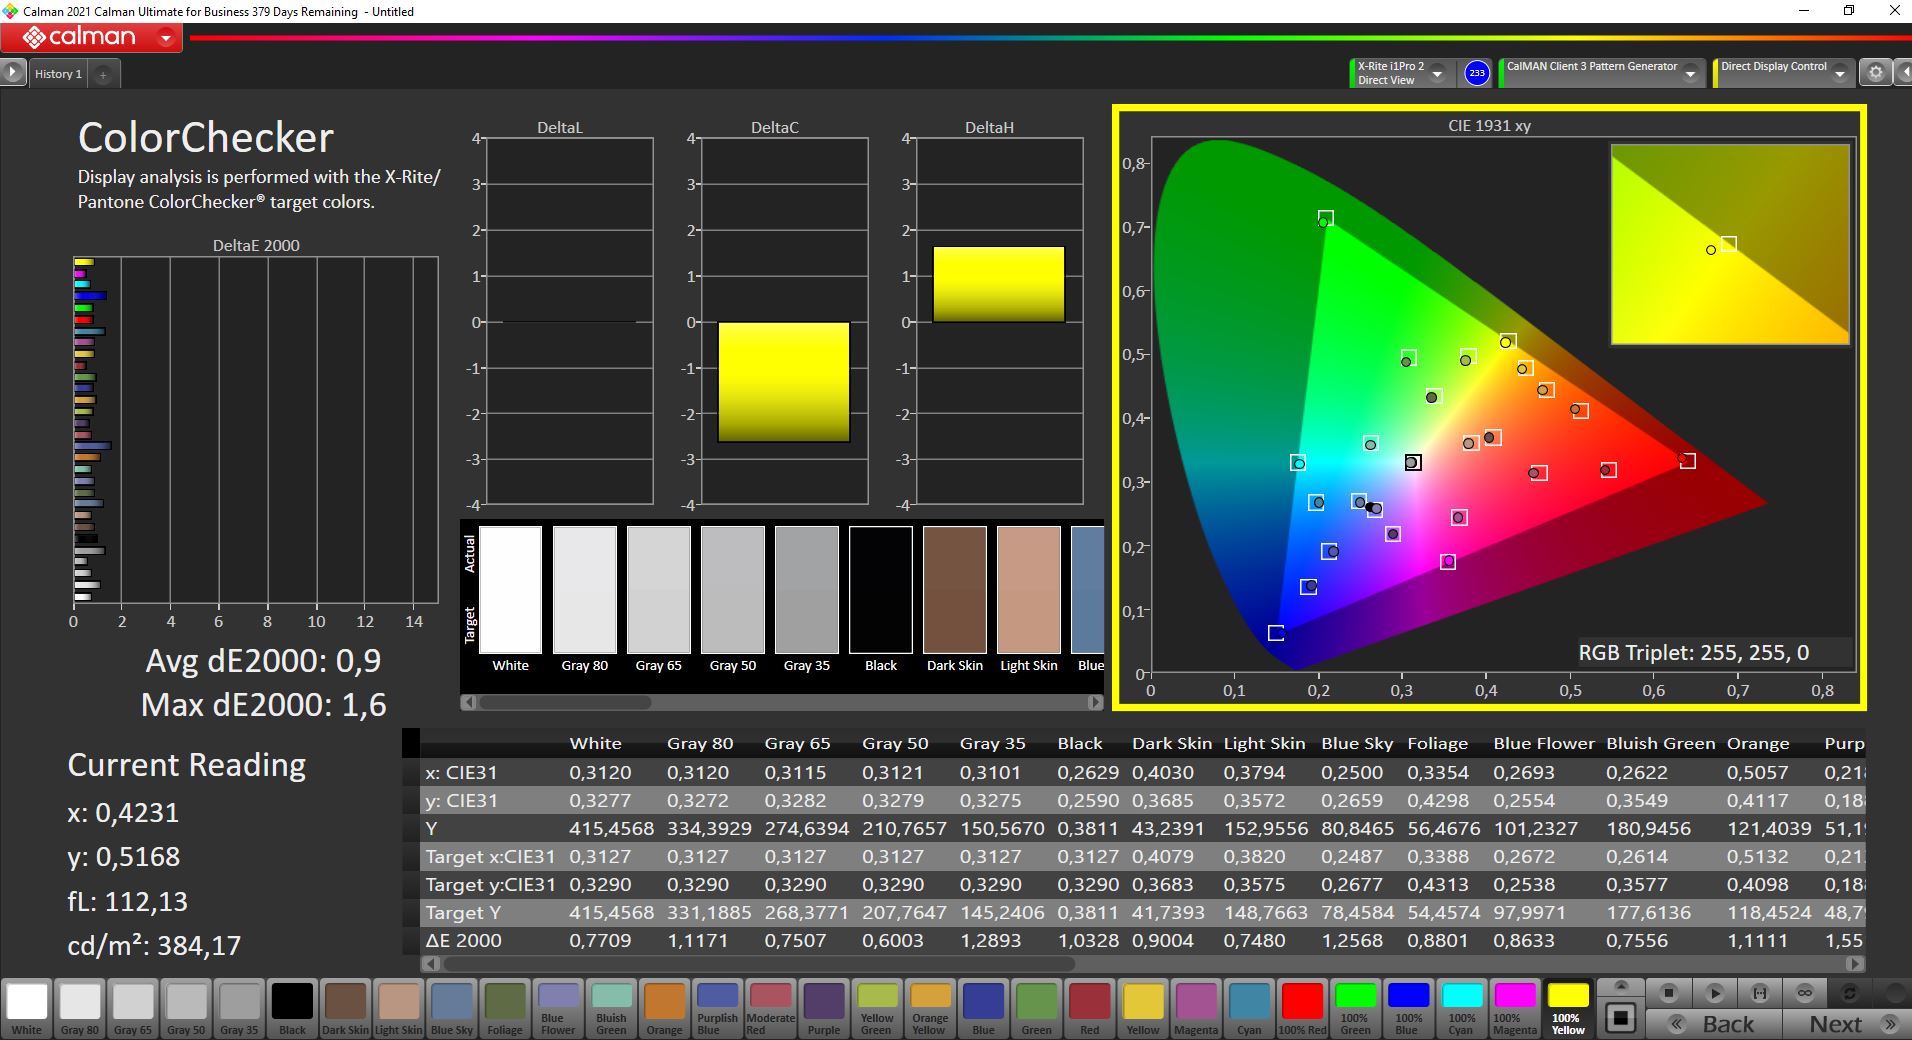
According to the manufacturer, the 4K display covers the AdobeRGB color space in its entirety; we measured a rate of 96%. MSI has installed the TrueColor software, which can be used to switch the color space. We used the default AdobeRGB mode.
Our analysis (CalMAN and X-Rite i1 Pro 2) shows that all colors are below the important deviation of 3 even out of the box. However, we were still able to improve grayscale reproduction a bit with our calibration (the corresponding profile is available for download above). Therefore, the 4K panel is suitable for editing pictures/videos without any issues, but HDR content is not supported.

Display Response Times
| ↔ Response Time Black to White | ||
|---|---|---|
| 10.8 ms ... rise ↗ and fall ↘ combined | ↗ 5.6 ms rise | 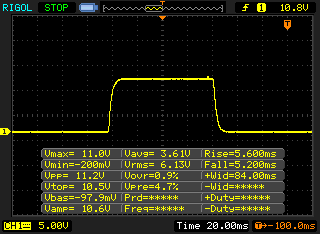 |
| ↘ 5.2 ms fall | ||
| The screen shows good response rates in our tests, but may be too slow for competitive gamers. In comparison, all tested devices range from 0.1 (minimum) to 240 (maximum) ms. » 29 % of all devices are better. This means that the measured response time is better than the average of all tested devices (19.8 ms). | ||
| ↔ Response Time 50% Grey to 80% Grey | ||
| 17.6 ms ... rise ↗ and fall ↘ combined | ↗ 8.4 ms rise | 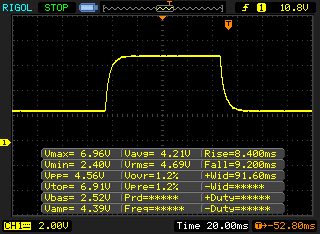 |
| ↘ 9.2 ms fall | ||
| The screen shows good response rates in our tests, but may be too slow for competitive gamers. In comparison, all tested devices range from 0.165 (minimum) to 636 (maximum) ms. » 32 % of all devices are better. This means that the measured response time is better than the average of all tested devices (31 ms). | ||
Screen Flickering / PWM (Pulse-Width Modulation)
| Screen flickering / PWM not detected | 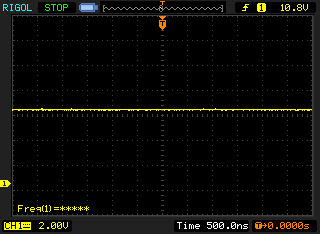 | ||
In comparison: 52 % of all tested devices do not use PWM to dim the display. If PWM was detected, an average of 7753 (minimum: 5 - maximum: 343500) Hz was measured. | |||
The WE76 is certainly not a device that will often be used on the go, but the panel's matte surface is naturally beneficial outdoors, and it's very comfortable to use it on cloudy days at least. The viewing-angle stability of the IPS display leaves no room for criticism.
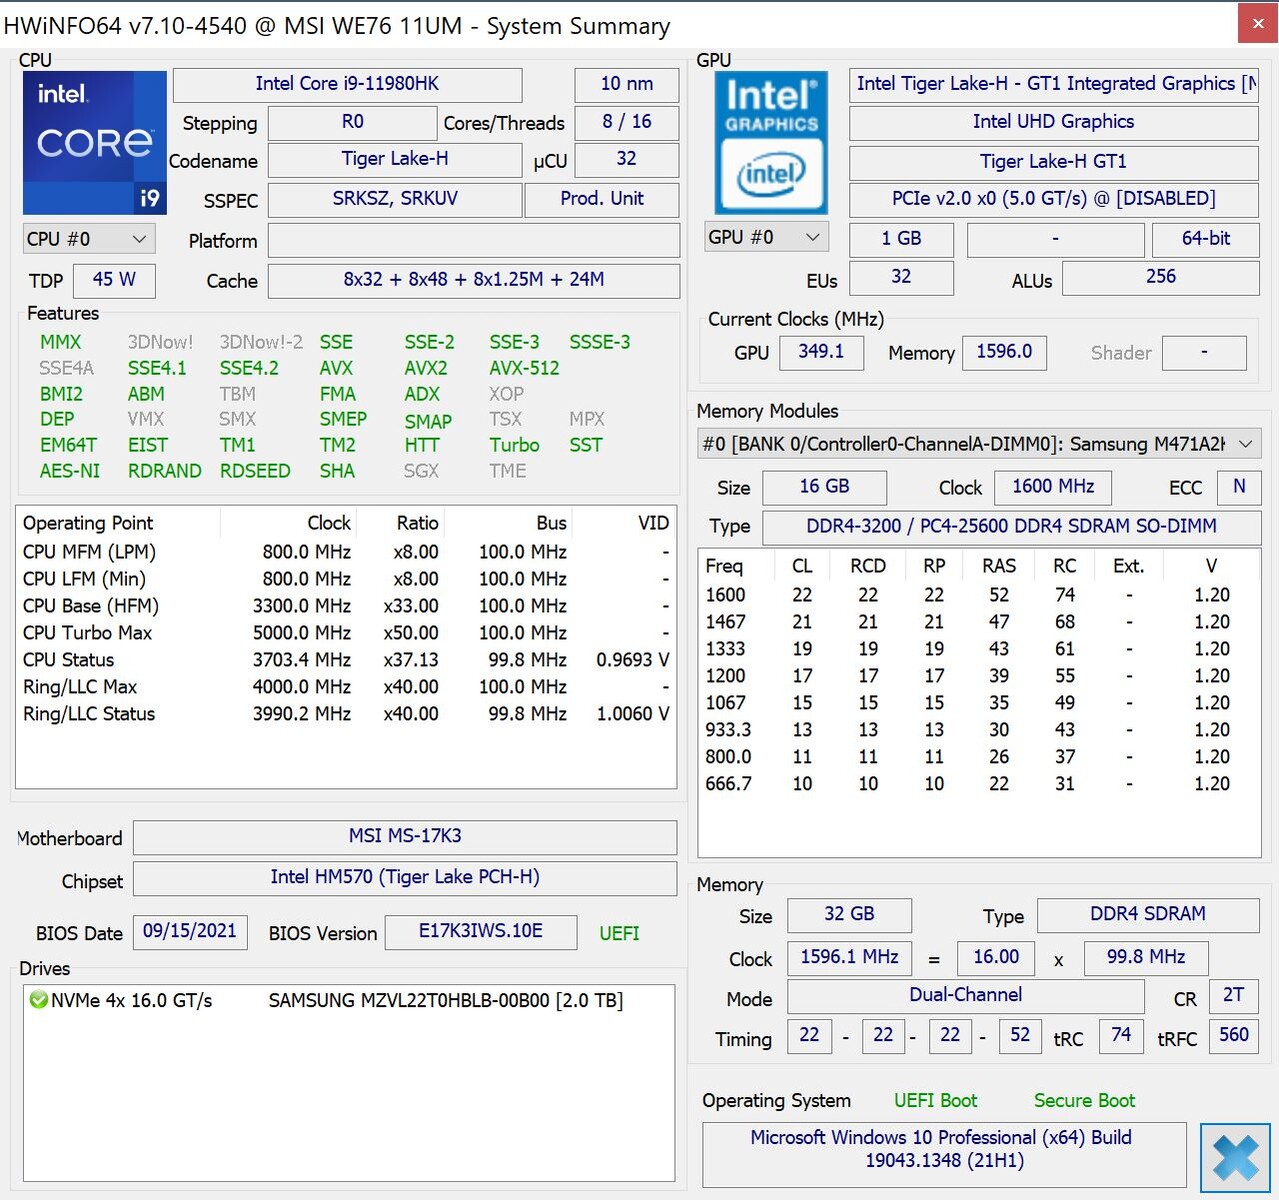
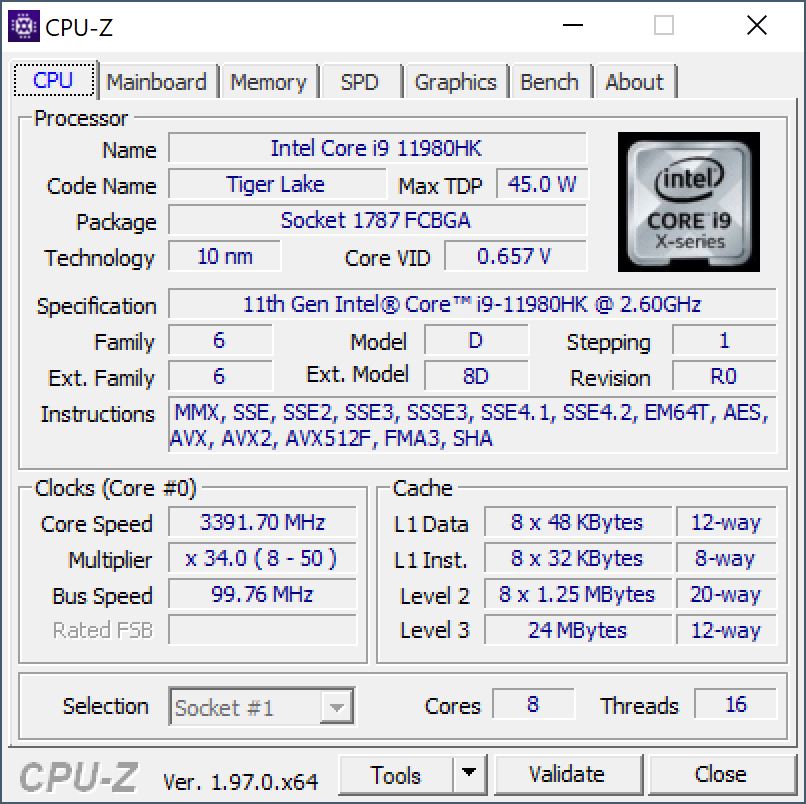
Performance - WE76 with Core i9 and RTX A5000
Test conditions
In addition to the normal Windows settings, MSI offers different performance settings with the preinstalled MSI Center Pro. We ran the following tests using the Balanced preset, but in some aspects, we'll also take a look at the effects of the other performance modes. The High Performance mode primarily affects the performance in the stress test, which is when you stress both the CPU and the GPU.
Processor
MSI has opted for the Intel Core i9-11980HK processor, which performs very well in our tests and can often place itself at the top of the comparison field. The processor can consume a maximum of 84 watts, but it quickly stabilizes at 70 watts and later at ~62 watts. This would also be possible with a normal Core i7-11800H as we can see in the ThinkPad P17 Gen 2. However, the AMD Ryzen 9 5900HX is a bit faster under a comparable TDP configuration (~64 watts in the case of the Asus ROG Zephyrus Duo 15).
The CPU performance is noticeably reduced on battery power, since the TDP quickly drops to just 45 watts and then 35 watts. Therefore, you should expect a deficit of about 30%-40% when using all cores. Further comparisons are available in our CPU Benchmarks article.
Cinebench R15 Multi endurance test
Cinebench R23: Multi Core | Single Core
Cinebench R20: CPU (Multi Core) | CPU (Single Core)
Cinebench R15: CPU Multi 64Bit | CPU Single 64Bit
Blender: v2.79 BMW27 CPU
7-Zip 18.03: 7z b 4 | 7z b 4 -mmt1
Geekbench 5.5: Multi-Core | Single-Core
HWBOT x265 Benchmark v2.2: 4k Preset
LibreOffice : 20 Documents To PDF
R Benchmark 2.5: Overall mean
| CPU Performance rating | |
| Average of class Workstation | |
| MSI WE76 11UM-456 -1! | |
| Lenovo ThinkPad P1 G4-20Y4S0KS00 | |
| Average Intel Core i9-11980HK | |
| Asus ProArt StudioBook 16 W7600H5A-2BL2 | |
| Lenovo ThinkPad P17 G2-20YU0025G | |
| HP ZBook Fury 15 G8 -2! | |
| MSI WE75 9TK -10! | |
| HP ZBook Fury 17 G7 119W5EA | |
| Cinebench R23 / Multi Core | |
| Average of class Workstation (14621 - 38520, n=24, last 2 years) | |
| MSI WE76 11UM-456 | |
| Lenovo ThinkPad P17 G2-20YU0025G | |
| HP ZBook Fury 15 G8 | |
| Lenovo ThinkPad P1 G4-20Y4S0KS00 | |
| Average Intel Core i9-11980HK (8459 - 13387, n=2) | |
| Asus ProArt StudioBook 16 W7600H5A-2BL2 | |
| HP ZBook Fury 17 G7 119W5EA | |
| Cinebench R23 / Single Core | |
| Average of class Workstation (1712 - 2228, n=24, last 2 years) | |
| MSI WE76 11UM-456 | |
| HP ZBook Fury 15 G8 | |
| Average Intel Core i9-11980HK (1505 - 1613, n=2) | |
| Lenovo ThinkPad P1 G4-20Y4S0KS00 | |
| Lenovo ThinkPad P17 G2-20YU0025G | |
| Asus ProArt StudioBook 16 W7600H5A-2BL2 | |
| HP ZBook Fury 17 G7 119W5EA | |
| Cinebench R20 / CPU (Multi Core) | |
| Average of class Workstation (5760 - 15043, n=24, last 2 years) | |
| Lenovo ThinkPad P17 G2-20YU0025G | |
| HP ZBook Fury 15 G8 | |
| Lenovo ThinkPad P1 G4-20Y4S0KS00 | |
| Average Intel Core i9-11980HK (3779 - 5256, n=8) | |
| MSI WE76 11UM-456 | |
| Asus ProArt StudioBook 16 W7600H5A-2BL2 | |
| HP ZBook Fury 17 G7 119W5EA | |
| MSI WE75 9TK | |
| Cinebench R20 / CPU (Single Core) | |
| Average of class Workstation (671 - 857, n=24, last 2 years) | |
| MSI WE76 11UM-456 | |
| HP ZBook Fury 15 G8 | |
| Lenovo ThinkPad P1 G4-20Y4S0KS00 | |
| Average Intel Core i9-11980HK (572 - 622, n=7) | |
| Lenovo ThinkPad P17 G2-20YU0025G | |
| Asus ProArt StudioBook 16 W7600H5A-2BL2 | |
| HP ZBook Fury 17 G7 119W5EA | |
| MSI WE75 9TK | |
| Cinebench R15 / CPU Multi 64Bit | |
| Average of class Workstation (2489 - 5810, n=24, last 2 years) | |
| MSI WE76 11UM-456 | |
| Lenovo ThinkPad P17 G2-20YU0025G | |
| Average Intel Core i9-11980HK (1696 - 2287, n=7) | |
| Lenovo ThinkPad P1 G4-20Y4S0KS00 | |
| Asus ProArt StudioBook 16 W7600H5A-2BL2 | |
| HP ZBook Fury 15 G8 | |
| HP ZBook Fury 17 G7 119W5EA | |
| MSI WE75 9TK | |
| Cinebench R15 / CPU Single 64Bit | |
| Average of class Workstation (191.4 - 328, n=24, last 2 years) | |
| MSI WE76 11UM-456 | |
| HP ZBook Fury 15 G8 | |
| Lenovo ThinkPad P1 G4-20Y4S0KS00 | |
| Lenovo ThinkPad P17 G2-20YU0025G | |
| Average Intel Core i9-11980HK (224 - 244, n=6) | |
| Asus ProArt StudioBook 16 W7600H5A-2BL2 | |
| HP ZBook Fury 17 G7 119W5EA | |
| MSI WE75 9TK | |
| Blender / v2.79 BMW27 CPU | |
| HP ZBook Fury 17 G7 119W5EA | |
| Asus ProArt StudioBook 16 W7600H5A-2BL2 | |
| HP ZBook Fury 15 G8 | |
| Lenovo ThinkPad P1 G4-20Y4S0KS00 | |
| Average Intel Core i9-11980HK (231 - 284, n=4) | |
| Lenovo ThinkPad P17 G2-20YU0025G | |
| Average of class Workstation (91 - 222, n=24, last 2 years) | |
| 7-Zip 18.03 / 7z b 4 | |
| Average of class Workstation (60489 - 116969, n=24, last 2 years) | |
| MSI WE76 11UM-456 | |
| Average Intel Core i9-11980HK (45226 - 56759, n=5) | |
| Lenovo ThinkPad P1 G4-20Y4S0KS00 | |
| HP ZBook Fury 15 G8 | |
| Lenovo ThinkPad P17 G2-20YU0025G | |
| Asus ProArt StudioBook 16 W7600H5A-2BL2 | |
| HP ZBook Fury 17 G7 119W5EA | |
| 7-Zip 18.03 / 7z b 4 -mmt1 | |
| Average of class Workstation (5126 - 6960, n=24, last 2 years) | |
| Lenovo ThinkPad P1 G4-20Y4S0KS00 | |
| HP ZBook Fury 15 G8 | |
| MSI WE76 11UM-456 | |
| Average Intel Core i9-11980HK (5428 - 5735, n=5) | |
| HP ZBook Fury 17 G7 119W5EA | |
| Lenovo ThinkPad P17 G2-20YU0025G | |
| Asus ProArt StudioBook 16 W7600H5A-2BL2 | |
| Geekbench 5.5 / Multi-Core | |
| Average of class Workstation (11542 - 25554, n=24, last 2 years) | |
| MSI WE76 11UM-456 | |
| Average Intel Core i9-11980HK (8786 - 10081, n=5) | |
| Lenovo ThinkPad P1 G4-20Y4S0KS00 | |
| Asus ProArt StudioBook 16 W7600H5A-2BL2 | |
| Lenovo ThinkPad P17 G2-20YU0025G | |
| HP ZBook Fury 17 G7 119W5EA | |
| Geekbench 5.5 / Single-Core | |
| Average of class Workstation (1783 - 2183, n=24, last 2 years) | |
| MSI WE76 11UM-456 | |
| Lenovo ThinkPad P1 G4-20Y4S0KS00 | |
| Average Intel Core i9-11980HK (1561 - 1679, n=5) | |
| Lenovo ThinkPad P17 G2-20YU0025G | |
| Asus ProArt StudioBook 16 W7600H5A-2BL2 | |
| HP ZBook Fury 17 G7 119W5EA | |
| HWBOT x265 Benchmark v2.2 / 4k Preset | |
| Average of class Workstation (17.8 - 40.5, n=24, last 2 years) | |
| MSI WE76 11UM-456 | |
| Average Intel Core i9-11980HK (13.1 - 16.3, n=5) | |
| Lenovo ThinkPad P17 G2-20YU0025G | |
| Lenovo ThinkPad P1 G4-20Y4S0KS00 | |
| HP ZBook Fury 15 G8 | |
| Asus ProArt StudioBook 16 W7600H5A-2BL2 | |
| HP ZBook Fury 17 G7 119W5EA | |
| LibreOffice / 20 Documents To PDF | |
| HP ZBook Fury 17 G7 119W5EA | |
| HP ZBook Fury 15 G8 | |
| Lenovo ThinkPad P17 G2-20YU0025G | |
| Average of class Workstation (37.1 - 74.7, n=24, last 2 years) | |
| MSI WE76 11UM-456 | |
| Lenovo ThinkPad P1 G4-20Y4S0KS00 | |
| Average Intel Core i9-11980HK (40.6 - 47.7, n=5) | |
| Asus ProArt StudioBook 16 W7600H5A-2BL2 | |
| R Benchmark 2.5 / Overall mean | |
| HP ZBook Fury 17 G7 119W5EA | |
| Asus ProArt StudioBook 16 W7600H5A-2BL2 | |
| Lenovo ThinkPad P17 G2-20YU0025G | |
| Average Intel Core i9-11980HK (0.545 - 0.565, n=5) | |
| MSI WE76 11UM-456 | |
| HP ZBook Fury 15 G8 | |
| Lenovo ThinkPad P1 G4-20Y4S0KS00 | |
| Average of class Workstation (0.3825 - 0.603, n=24, last 2 years) | |
* ... smaller is better
AIDA64: FP32 Ray-Trace | FPU Julia | CPU SHA3 | CPU Queen | FPU SinJulia | FPU Mandel | CPU AES | CPU ZLib | FP64 Ray-Trace | CPU PhotoWorxx
| Performance rating | |
| Average of class Workstation | |
| MSI WE76 11UM-456 | |
| Average Intel Core i9-11980HK | |
| HP ZBook Fury 15 G8 | |
| HP ZBook Fury 17 G7 119W5EA | |
| Lenovo ThinkPad P1 G4-20Y4S0KS00 -9! | |
| Asus ProArt StudioBook 16 W7600H5A-2BL2 -9! | |
| Lenovo ThinkPad P17 G2-20YU0025G -9! | |
| AIDA64 / FP32 Ray-Trace | |
| Average of class Workstation (15143 - 61611, n=24, last 2 years) | |
| MSI WE76 11UM-456 | |
| Average Intel Core i9-11980HK (14180 - 15661, n=2) | |
| HP ZBook Fury 15 G8 | |
| HP ZBook Fury 17 G7 119W5EA | |
| AIDA64 / FPU Julia | |
| Average of class Workstation (81575 - 186971, n=24, last 2 years) | |
| MSI WE76 11UM-456 | |
| Average Intel Core i9-11980HK (59177 - 64043, n=2) | |
| HP ZBook Fury 15 G8 | |
| HP ZBook Fury 17 G7 119W5EA | |
| AIDA64 / CPU SHA3 | |
| Average of class Workstation (3833 - 8975, n=24, last 2 years) | |
| MSI WE76 11UM-456 | |
| Average Intel Core i9-11980HK (3928 - 4220, n=2) | |
| HP ZBook Fury 15 G8 | |
| HP ZBook Fury 17 G7 119W5EA | |
| AIDA64 / CPU Queen | |
| Average of class Workstation (60778 - 144411, n=24, last 2 years) | |
| MSI WE76 11UM-456 | |
| Average Intel Core i9-11980HK (97901 - 98443, n=2) | |
| HP ZBook Fury 15 G8 | |
| HP ZBook Fury 17 G7 119W5EA | |
| AIDA64 / FPU SinJulia | |
| Average of class Workstation (8165 - 29343, n=24, last 2 years) | |
| MSI WE76 11UM-456 | |
| Average Intel Core i9-11980HK (10028 - 10494, n=2) | |
| HP ZBook Fury 17 G7 119W5EA | |
| HP ZBook Fury 15 G8 | |
| AIDA64 / FPU Mandel | |
| Average of class Workstation (40055 - 98153, n=24, last 2 years) | |
| MSI WE76 11UM-456 | |
| Average Intel Core i9-11980HK (35500 - 38635, n=2) | |
| HP ZBook Fury 15 G8 | |
| HP ZBook Fury 17 G7 119W5EA | |
| AIDA64 / CPU AES | |
| Average Intel Core i9-11980HK (90742 - 141352, n=2) | |
| Average of class Workstation (73133 - 187841, n=24, last 2 years) | |
| MSI WE76 11UM-456 | |
| HP ZBook Fury 15 G8 | |
| HP ZBook Fury 17 G7 119W5EA | |
| AIDA64 / CPU ZLib | |
| Average of class Workstation (929 - 2148, n=24, last 2 years) | |
| MSI WE76 11UM-456 | |
| HP ZBook Fury 15 G8 | |
| HP ZBook Fury 17 G7 119W5EA | |
| Average Intel Core i9-11980HK (769 - 839, n=5) | |
| Lenovo ThinkPad P17 G2-20YU0025G | |
| Asus ProArt StudioBook 16 W7600H5A-2BL2 | |
| Asus ProArt StudioBook 16 W7600H5A-2BL2 | |
| Lenovo ThinkPad P1 G4-20Y4S0KS00 | |
| AIDA64 / FP64 Ray-Trace | |
| Average of class Workstation (7813 - 32891, n=24, last 2 years) | |
| MSI WE76 11UM-456 | |
| Average Intel Core i9-11980HK (7662 - 8566, n=2) | |
| HP ZBook Fury 15 G8 | |
| HP ZBook Fury 17 G7 119W5EA | |
| AIDA64 / CPU PhotoWorxx | |
| Average of class Workstation (37151 - 93684, n=24, last 2 years) | |
| HP ZBook Fury 15 G8 | |
| MSI WE76 11UM-456 | |
| Average Intel Core i9-11980HK (23047 - 25908, n=2) | |
| HP ZBook Fury 17 G7 119W5EA | |
System performance
As expected, the general system performance is extremely high. This can be confirmed both from the subjective impression of performance as well as the benchmark results. There won't be any bottlenecks in the coming years here.
| PCMark 10 / Score | |
| Average of class Workstation (6563 - 10409, n=20, last 2 years) | |
| Lenovo ThinkPad P1 G4-20Y4S0KS00 | |
| MSI WE76 11UM-456 | |
| Average Intel Core i9-11980HK, NVIDIA RTX A5000 Laptop GPU (n=1) | |
| Asus ProArt StudioBook 16 W7600H5A-2BL2 | |
| HP ZBook Fury 15 G8 | |
| Lenovo ThinkPad P17 G2-20YU0025G | |
| MSI WE75 9TK | |
| HP ZBook Fury 17 G7 119W5EA | |
| PCMark 10 / Essentials | |
| Lenovo ThinkPad P1 G4-20Y4S0KS00 | |
| Average of class Workstation (9622 - 11157, n=20, last 2 years) | |
| Asus ProArt StudioBook 16 W7600H5A-2BL2 | |
| Lenovo ThinkPad P17 G2-20YU0025G | |
| HP ZBook Fury 15 G8 | |
| MSI WE75 9TK | |
| MSI WE76 11UM-456 | |
| Average Intel Core i9-11980HK, NVIDIA RTX A5000 Laptop GPU (n=1) | |
| HP ZBook Fury 17 G7 119W5EA | |
| PCMark 10 / Productivity | |
| Average of class Workstation (8789 - 20616, n=20, last 2 years) | |
| MSI WE76 11UM-456 | |
| Average Intel Core i9-11980HK, NVIDIA RTX A5000 Laptop GPU (n=1) | |
| Asus ProArt StudioBook 16 W7600H5A-2BL2 | |
| Lenovo ThinkPad P1 G4-20Y4S0KS00 | |
| HP ZBook Fury 15 G8 | |
| Lenovo ThinkPad P17 G2-20YU0025G | |
| MSI WE75 9TK | |
| HP ZBook Fury 17 G7 119W5EA | |
| PCMark 10 / Digital Content Creation | |
| Average of class Workstation (8108 - 15631, n=20, last 2 years) | |
| Lenovo ThinkPad P1 G4-20Y4S0KS00 | |
| MSI WE76 11UM-456 | |
| Average Intel Core i9-11980HK, NVIDIA RTX A5000 Laptop GPU (n=1) | |
| Asus ProArt StudioBook 16 W7600H5A-2BL2 | |
| HP ZBook Fury 15 G8 | |
| Lenovo ThinkPad P17 G2-20YU0025G | |
| HP ZBook Fury 17 G7 119W5EA | |
| MSI WE75 9TK | |
| PCMark 10 Score | 7023 points | |
Help | ||
| AIDA64 / Memory Copy | |
| Average of class Workstation (56003 - 164795, n=24, last 2 years) | |
| MSI WE76 11UM-456 | |
| Average Intel Core i9-11980HK (42653 - 47204, n=2) | |
| AIDA64 / Memory Read | |
| Average of class Workstation (55795 - 121563, n=24, last 2 years) | |
| Average Intel Core i9-11980HK (46298 - 47729, n=2) | |
| MSI WE76 11UM-456 | |
| AIDA64 / Memory Write | |
| Average of class Workstation (55663 - 214520, n=24, last 2 years) | |
| MSI WE76 11UM-456 | |
| Average Intel Core i9-11980HK (45456 - 45563, n=2) | |
| AIDA64 / Memory Latency | |
| Average of class Workstation (84.5 - 165.2, n=24, last 2 years) | |
| MSI WE76 11UM-456 | |
| Average Intel Core i9-11980HK (91.1 - 98.1, n=5) | |
* ... smaller is better
DPC latencies
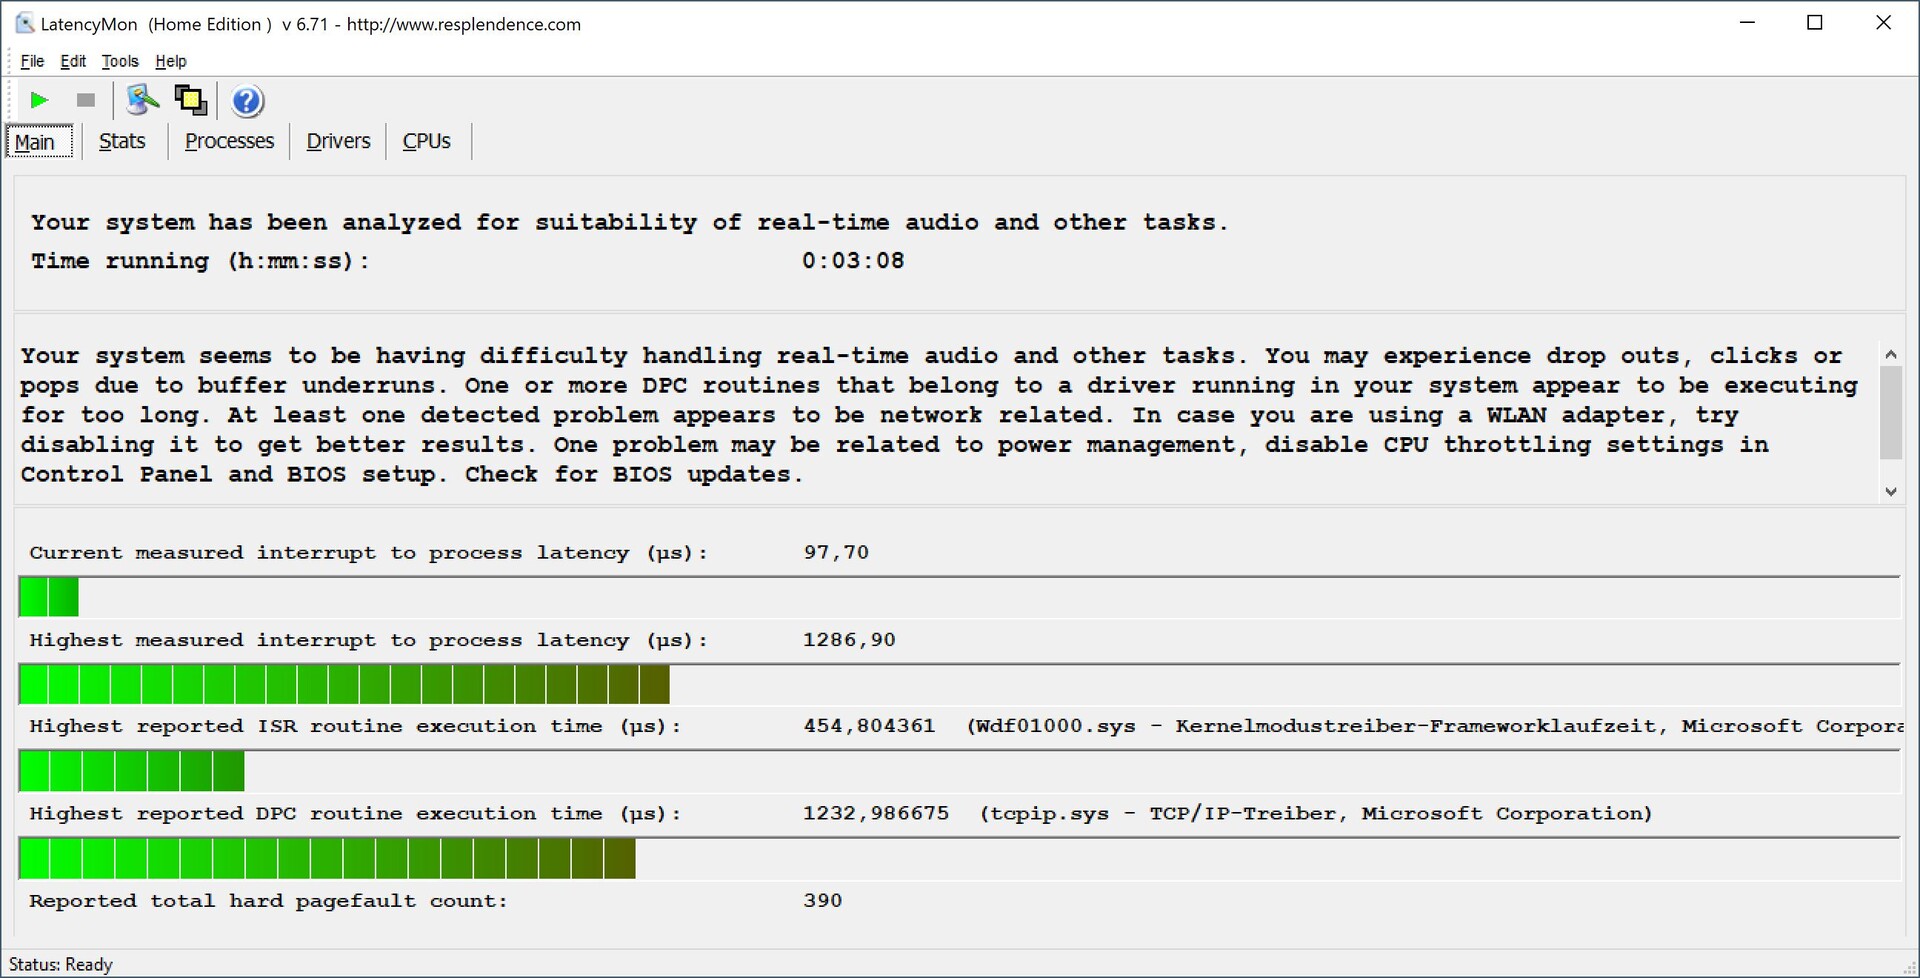
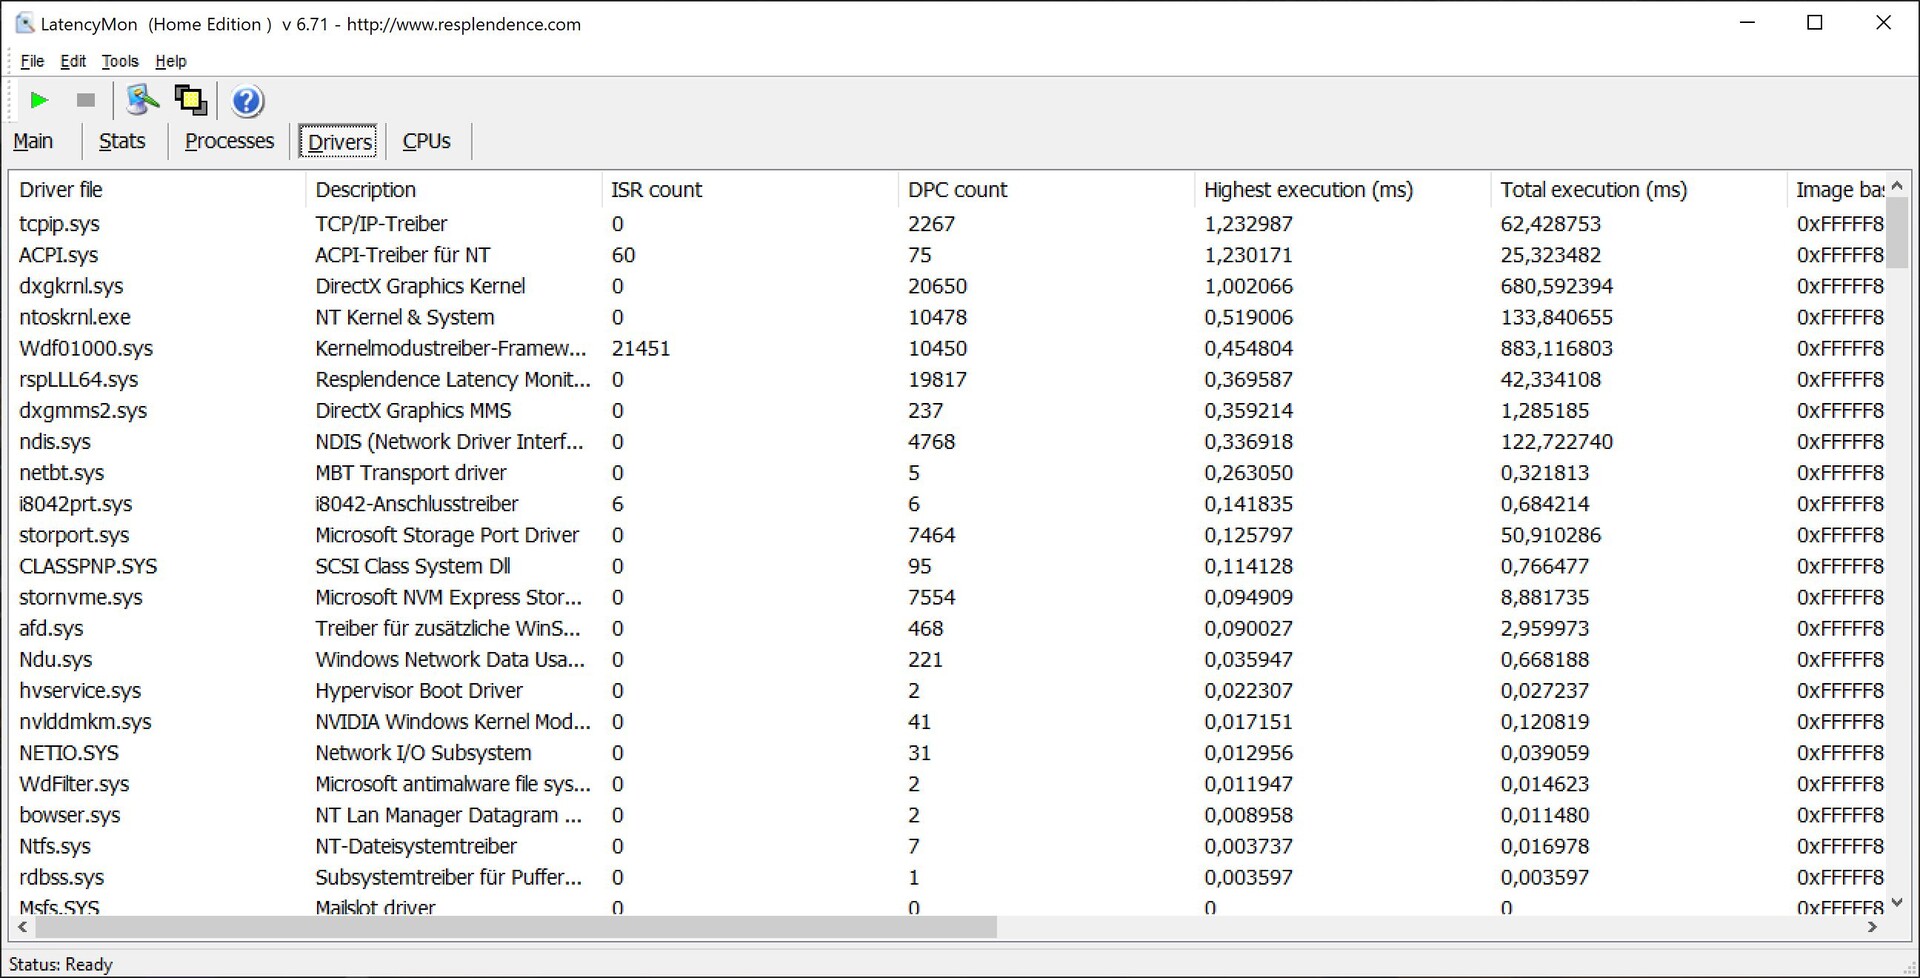
Our review sample of the WE76 shows slightly elevated latencies in our tests with the current BIOS version, and there were also some dropped frames (skipped frames) when playing a YouTube video in 4K. This means that the device isn't ideally suited for real-time audio applications, but future updates could potentially improve the situation.
| DPC Latencies / LatencyMon - interrupt to process latency (max), Web, Youtube, Prime95 | |
| Lenovo ThinkPad P17 G2-20YU0025G | |
| HP ZBook Fury 17 G7 119W5EA | |
| Asus ProArt StudioBook 16 W7600H5A-2BL2 | |
| MSI WE76 11UM-456 | |
| Lenovo ThinkPad P1 G4-20Y4S0KS00 | |
| HP ZBook Fury 15 G8 | |
* ... smaller is better
Storage
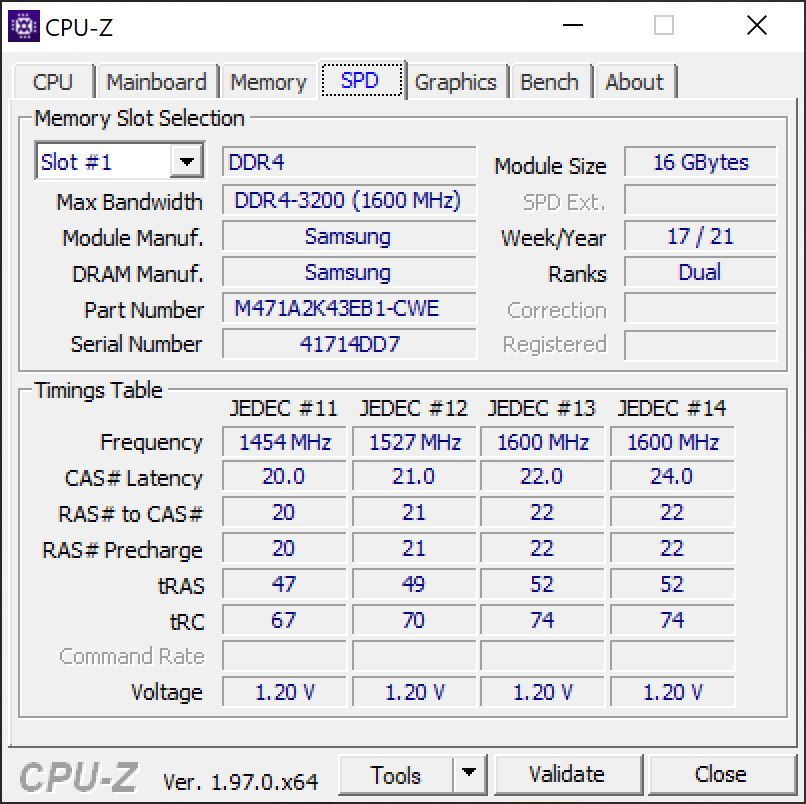
Our test device is equipped with a Samsung PM9A1 with a storage capacity of 2 TB, out of which 1.78 TB is still available after the first start-up. This is a very fast PCIe 4.0 drive that can also be appropriately taken advantage of by the WE76, since it impresses with very good transfer rates in the benchmarks. In addition, the WE76 offers another M.2-2280 slot for an easy way to expand storage, but the second slot "only" uses the PCIe 3.0 x4 interface. You can find additional SSD benchmarks here.

* ... smaller is better
Continuous load read: DiskSpd Read Loop, Queue Depth 8
Graphics card
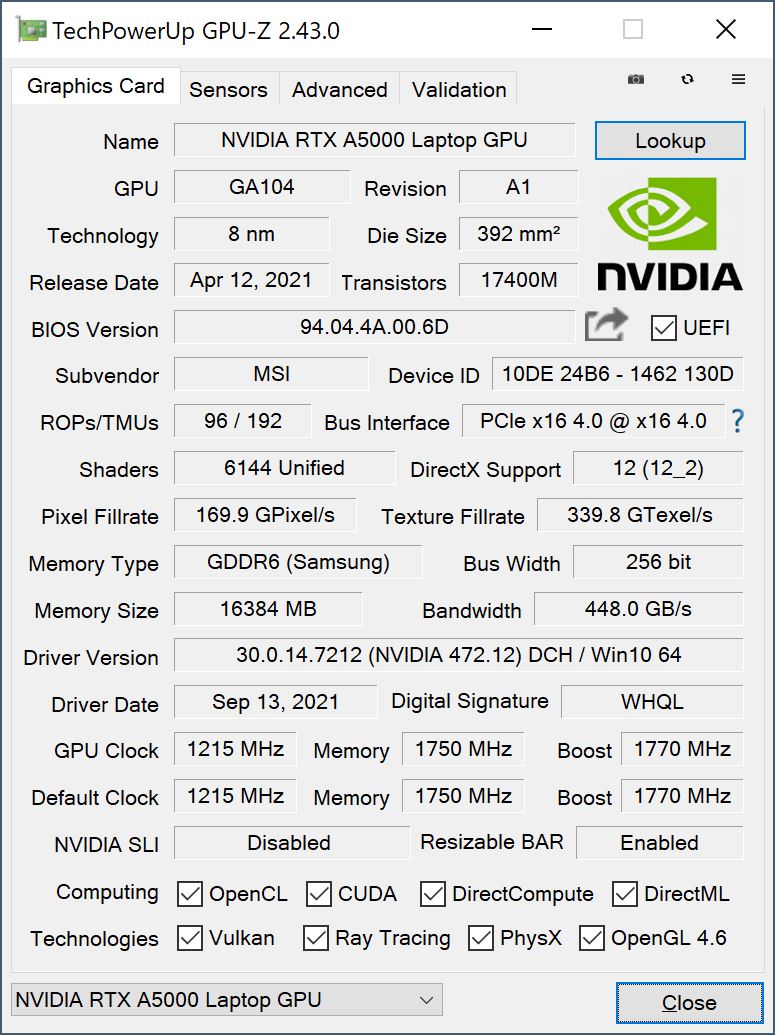
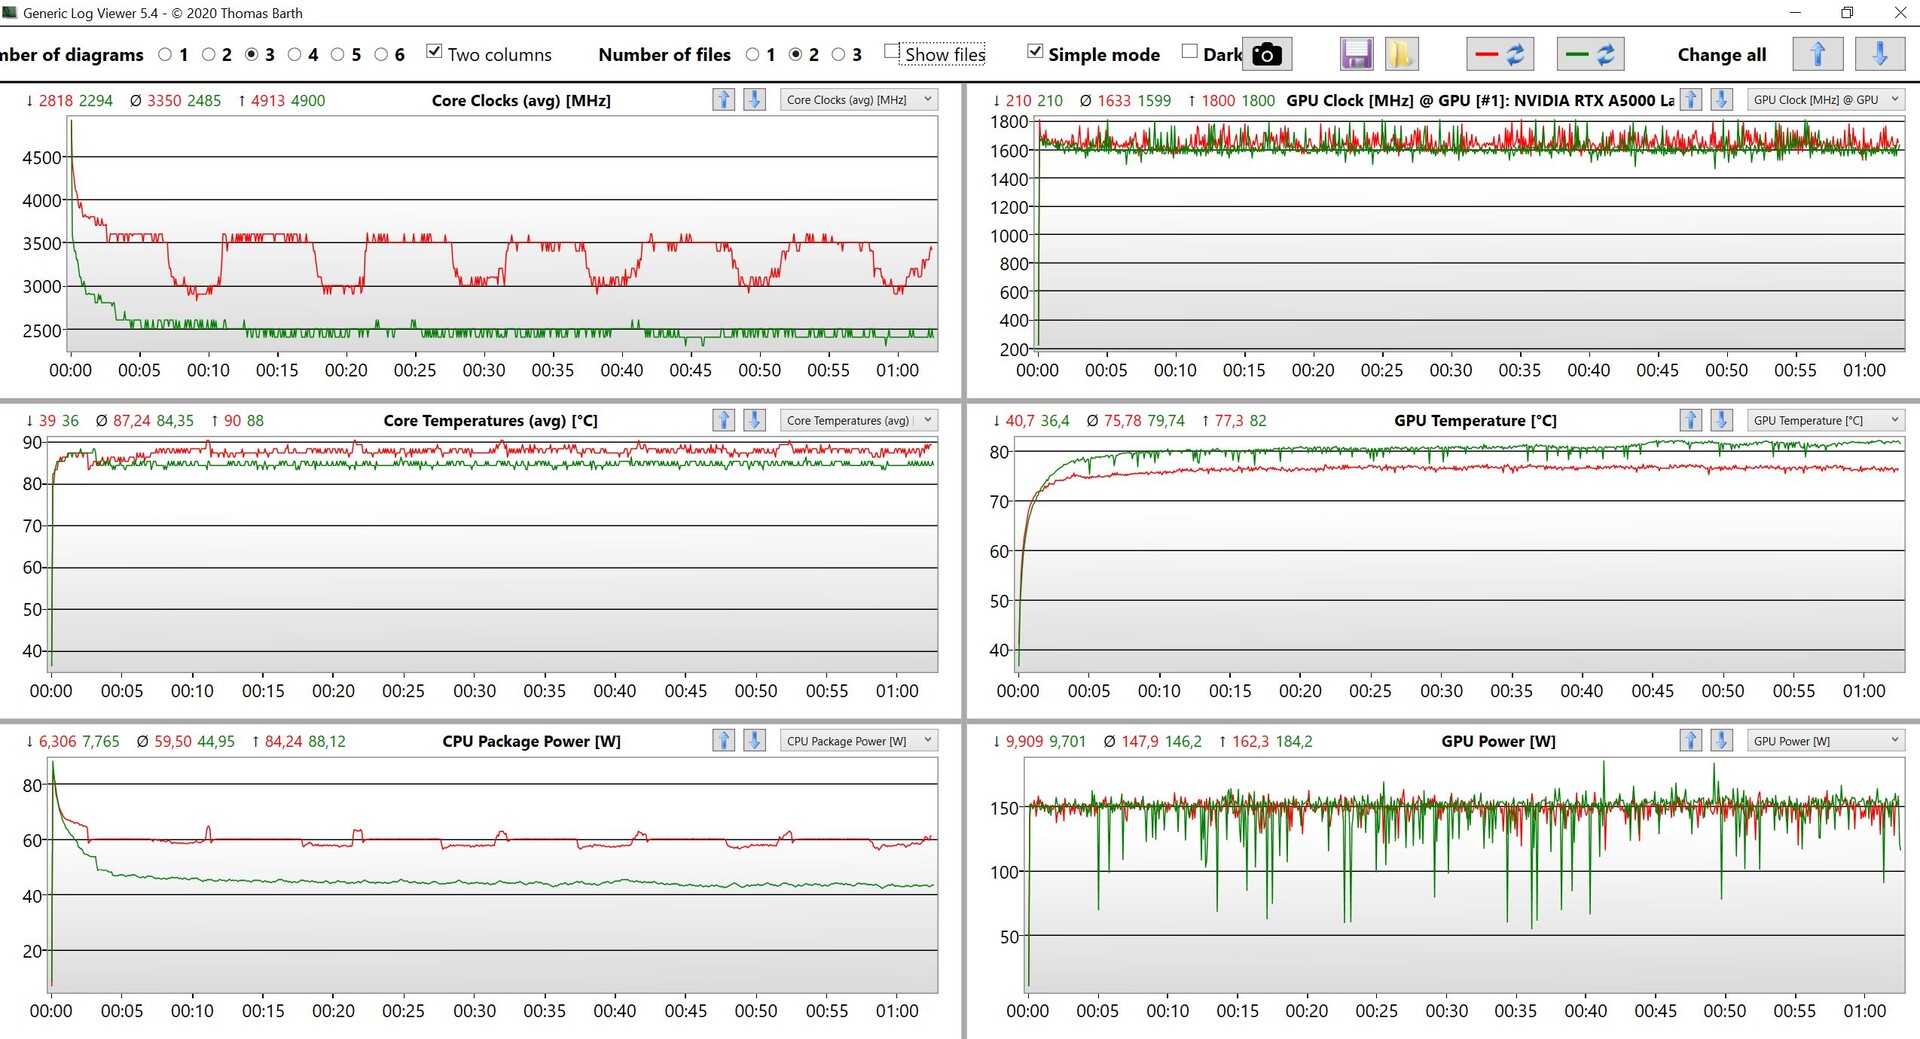
With the Nvidia RTX A5000 (Nvidia has dropped "Quadro" from the names in the meantime), MSI has installed the most powerful professional mobile GPU that is currently available on the market. With 16 GB of RAM and the professional drivers including the certifications for professional software, the WE76 is especially suitable for complex CAD/CAM applications or large graphics projects that include ray tracing. With a maximum TDP of 155 watts (although we have even seen spikes of up to 180 watts at times), the GPU is clearly one of the fastest models on the market. Nvidia's Optimus graphics-switching solution is supported, which means that the processor's iGPU is used for simple tasks.
We can also see this in the benchmarks, where the WE76 manages to place itself ahead of the competition. The RTX A5000 in the HP ZBook Fury 15 G, for example, is 10%-30% slower depending on the benchmark. The optional High Performance mode doesn't directly affect the GPU performance, and performance is stable in both modes. However, power consumption is limited to 55 watts on battery power, which leads to a performance loss of around 50%. Please refer to our GPU benchmarks article for further comparisons.
| 3DMark 11 Performance | 32211 points | |
| 3DMark Cloud Gate Standard Score | 35295 points | |
| 3DMark Fire Strike Score | 24155 points | |
| 3DMark Time Spy Score | 11185 points | |
Help | ||
Gaming performance
The gaming performance of the WE76 is also outstanding, and we didn't experience any problems with the professional drivers during our tests. Most titles can be played smoothly even at 4K and maximum details. Only very demanding titles, such as Cyberpunk 2077, require either a reduction in resolution or details to be able to run smoothly. Gaming performance is lower on battery power; in The Witcher 3 (Ultra settings), for example, performance drops from 98 to 67 FPS. More gaming benchmarks are available here.
| Cyberpunk 2077 1.0 | |
| 1920x1080 Ultra Preset | |
| MSI WE76 11UM-456 | |
| Average NVIDIA RTX A5000 Laptop GPU (58.6 - 78, n=2) | |
| Asus ProArt StudioBook 16 W7600H5A-2BL2 | |
| 1920x1080 High Preset | |
| MSI WE76 11UM-456 | |
| Average NVIDIA RTX A5000 Laptop GPU (68.1 - 90, n=2) | |
| Asus ProArt StudioBook 16 W7600H5A-2BL2 | |
| F1 2021 | |
| 1920x1080 High Preset AA:T AF:16x | |
| MSI WE76 11UM-456 | |
| Asus ProArt StudioBook 16 W7600H5A-2BL2 | |
| Average NVIDIA RTX A5000 Laptop GPU (122 - 161, n=3) | |
| HP ZBook Fury 15 G8 | |
| Lenovo ThinkPad P17 G2-20YU0025G | |
| 1920x1080 Ultra High Preset + Raytracing AA:T AF:16x | |
| MSI WE76 11UM-456 | |
| Asus ProArt StudioBook 16 W7600H5A-2BL2 | |
| Average NVIDIA RTX A5000 Laptop GPU (85 - 109, n=3) | |
| HP ZBook Fury 15 G8 | |
| Lenovo ThinkPad P17 G2-20YU0025G | |
| Far Cry 6 | |
| 1920x1080 High Graphics Quality AA:T | |
| MSI WE76 11UM-456 | |
| Average NVIDIA RTX A5000 Laptop GPU (n=1) | |
| Average of class Workstation (n=1last 2 years) | |
| 1920x1080 Ultra Graphics Quality + HD Textures AA:T | |
| MSI WE76 11UM-456 | |
| Average NVIDIA RTX A5000 Laptop GPU (n=1) | |
The Witcher 3 FPS diagram
| low | med. | high | ultra | QHD | 4K | |
|---|---|---|---|---|---|---|
| GTA V (2015) | 181 | 175 | 161 | 94.6 | 84.3 | 92.5 |
| The Witcher 3 (2015) | 354 | 271 | 179 | 98.3 | 74 | |
| Final Fantasy XV Benchmark (2018) | 184 | 144 | 108 | 83.6 | 51.1 | |
| X-Plane 11.11 (2018) | 136 | 114 | 90.5 | 65.3 | ||
| Far Cry 5 (2018) | 121 | 113 | 103 | 92 | 50 | |
| Strange Brigade (2018) | 412 | 251 | 213 | 191 | 146 | 86.8 |
| Cyberpunk 2077 1.0 (2020) | 118 | 104 | 90 | 78 | 51 | 25 |
| F1 2021 (2021) | 257 | 187 | 161 | 109 | 88.2 | 53.6 |
| Far Cry 6 (2021) | 120 | 103 | 95 | 89 | 79 | 51 |
Emissions - WE76 with powerful cooling
Noise emissions
The fan control is definitely among the WE76's weak points. Even under low load, the fans rev up audibly now and again, which is why we would always recommend using Silent mode for everyday tasks, since the fans are often deactivated then. If you need more performance (especially in terms of the GPU), you can still tweak Performance mode. In general, however, MSI's mobile workstation is either not louder or only marginally louder under load than the competition, which is often equipped with weaker components. The High Performance profile increases the maximum fan noise from just under 48 to around 54 dB(A), which can be described as annoyingly loud. With the CoolerBooster mode, you can also activate the highest fan speed, which leads to 58.9 dB(A). We would recommend checking the performance in Silent mode when gaming, since we could only measure 38.6 dB(A) in The Witcher 3, for example, which means that you don't have to resort to headphones. We were unable to detect any other electronic noises, though.
Noise level
| Idle |
| 24.7 / 24.7 / 27.5 dB(A) |
| Load |
| 43.7 / 47.7 dB(A) |
 | ||
30 dB silent 40 dB(A) audible 50 dB(A) loud |
||
min: | ||
| MSI WE76 11UM-456 RTX A5000 Laptop GPU, i9-11980HK, Samsung PM9A1 MZVL22T0HBLB | Lenovo ThinkPad P1 G4-20Y4S0KS00 GeForce RTX 3070 Laptop GPU, i7-11850H, Samsung PM9A1 MZVL21T0HCLR | HP ZBook Fury 15 G8 RTX A5000 Laptop GPU, i9-11950H, Samsung PM981a MZVLB1T0HBLR | Asus ProArt StudioBook 16 W7600H5A-2BL2 RTX A5000 Laptop GPU, W-11955M, 2x Micron 2300 2TB MTFDHBA2T0TDV (RAID 0) | Lenovo ThinkPad P17 G2-20YU0025G RTX A2000 Laptop GPU, i7-11800H, Kioxia XG7 KXG7AZNV512G | HP ZBook Fury 17 G7 119W5EA Quadro RTX 4000 Max-Q, i9-10885H, WDC PC SN730 SDBPNTY-1T00 | MSI WE75 9TK Quadro RTX 3000 (Laptop), i7-9750H, Samsung SSD PM981 MZVLB512HAJQ | |
|---|---|---|---|---|---|---|---|
| Noise | 3% | 6% | 1% | 3% | -1% | -7% | |
| off / environment * (dB) | 24.7 | 23.8 4% | 24.1 2% | 26 -5% | 26.4 -7% | 24.4 1% | 28.5 -15% |
| Idle Minimum * (dB) | 24.7 | 23.8 4% | 24.1 2% | 26 -5% | 26.4 -7% | 24.4 1% | 29 -17% |
| Idle Average * (dB) | 24.7 | 23.8 4% | 24.1 2% | 26 -5% | 26.4 -7% | 26.6 -8% | 29 -17% |
| Idle Maximum * (dB) | 27.5 | 28.3 -3% | 24.8 10% | 26.5 4% | 26.4 4% | 29 -5% | 31.5 -15% |
| Load Average * (dB) | 43.7 | 38.6 12% | 37.8 14% | 42 4% | 38.1 13% | 40.2 8% | 32 27% |
| Witcher 3 ultra * (dB) | 46.6 | 47.4 -2% | 44.2 5% | 38.1 18% | 48 -3% | 44.7 4% | |
| Load Maximum * (dB) | 47.7 | 47.4 1% | 44.2 7% | 43 10% | 45 6% | 48 -1% | 56.5 -18% |
* ... smaller is better
Temperature
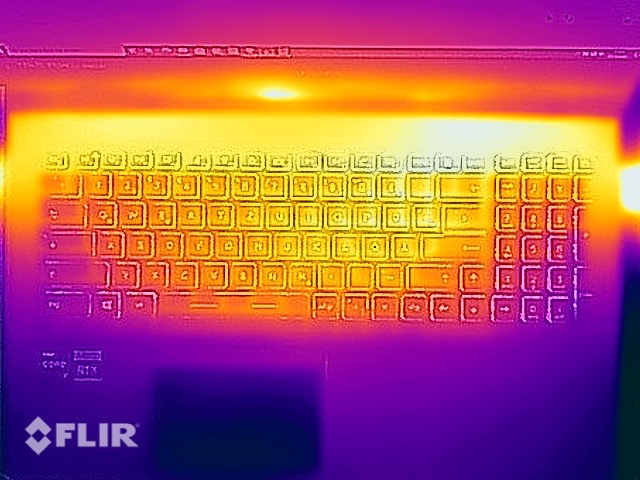
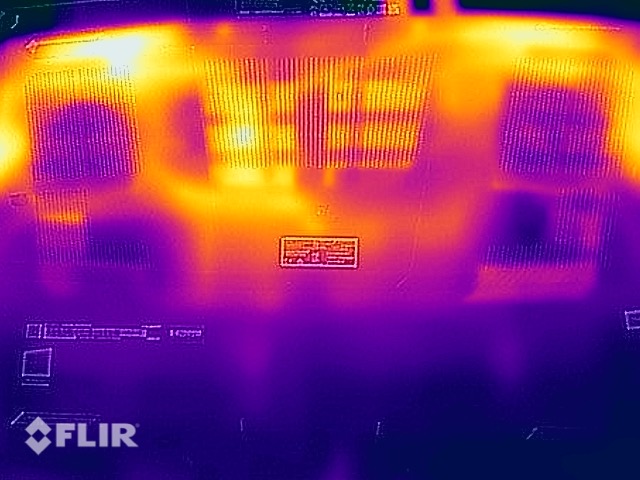
The WE76 doesn't have any temperature issues, as the entire case remains very cool during simple tasks. Although there's an area at the bottom's rear left side under load where we can measure more than 55 °C (~131 °F), we don't see this as a problem since you'll hardly ever use this mobile workstation on your lap. The keyboard also gets noticeably warmer under high load, but typing is not affected here.
You can see the difference between the performance modes in the stress test, as the optional High Performance mode increases CPU power consumption from ~42 to 60 watts. The GPU consumption is constant at ~150 watts, though, and the results are very good overall.
(-) The maximum temperature on the upper side is 48.4 °C / 119 F, compared to the average of 38.2 °C / 101 F, ranging from 22.2 to 69.8 °C for the class Workstation.
(-) The bottom heats up to a maximum of 56.2 °C / 133 F, compared to the average of 41.1 °C / 106 F
(+) In idle usage, the average temperature for the upper side is 26 °C / 79 F, compared to the device average of 32 °C / 90 F.
(±) Playing The Witcher 3, the average temperature for the upper side is 37.6 °C / 100 F, compared to the device average of 32 °C / 90 F.
(+) The palmrests and touchpad are cooler than skin temperature with a maximum of 27.5 °C / 81.5 F and are therefore cool to the touch.
(±) The average temperature of the palmrest area of similar devices was 27.8 °C / 82 F (+0.3 °C / 0.5 F).
| MSI WE76 11UM-456 Intel Core i9-11980HK, NVIDIA RTX A5000 Laptop GPU | Lenovo ThinkPad P1 G4-20Y4S0KS00 Intel Core i7-11850H, NVIDIA GeForce RTX 3070 Laptop GPU | HP ZBook Fury 15 G8 Intel Core i9-11950H, NVIDIA RTX A5000 Laptop GPU | Asus ProArt StudioBook 16 W7600H5A-2BL2 Intel Xeon W-11955M, NVIDIA RTX A5000 Laptop GPU | Lenovo ThinkPad P17 G2-20YU0025G Intel Core i7-11800H, NVIDIA RTX A2000 Laptop GPU | HP ZBook Fury 17 G7 119W5EA Intel Core i9-10885H, NVIDIA Quadro RTX 4000 Max-Q | MSI WE75 9TK Intel Core i7-9750H, NVIDIA Quadro RTX 3000 (Laptop) | |
|---|---|---|---|---|---|---|---|
| Heat | 2% | 6% | -3% | 7% | 12% | 8% | |
| Maximum Upper Side * (°C) | 48.4 | 51 -5% | 45.6 6% | 45.7 6% | 49.6 -2% | 46.1 5% | 40.6 16% |
| Maximum Bottom * (°C) | 56.2 | 53.5 5% | 57.6 -2% | 48.3 14% | 52.1 7% | 57.6 -2% | 46 18% |
| Idle Upper Side * (°C) | 28.6 | 28.8 -1% | 26 9% | 35.3 -23% | 26 9% | 23.4 18% | 29.2 -2% |
| Idle Bottom * (°C) | 31.8 | 29.3 8% | 28.8 9% | 34.4 -8% | 27.6 13% | 23.4 26% | 32.4 -2% |
* ... smaller is better
Speakers
MSI has installed a stereo sound system with an acceptable performance. However, the fan noise predominates especially when the components are under high load (regardless of whether professional applications or games are in use), so that you don't get to hear the speakers very well. So we would recommend to use headphones here.
MSI WE76 11UM-456 audio analysis
(+) | speakers can play relatively loud (84.6 dB)
Bass 100 - 315 Hz
(±) | reduced bass - on average 14.7% lower than median
(±) | linearity of bass is average (7.8% delta to prev. frequency)
Mids 400 - 2000 Hz
(±) | higher mids - on average 5% higher than median
(+) | mids are linear (3.9% delta to prev. frequency)
Highs 2 - 16 kHz
(±) | higher highs - on average 5.6% higher than median
(±) | linearity of highs is average (9.1% delta to prev. frequency)
Overall 100 - 16.000 Hz
(±) | linearity of overall sound is average (16.3% difference to median)
Compared to same class
» 44% of all tested devices in this class were better, 9% similar, 47% worse
» The best had a delta of 7%, average was 17%, worst was 35%
Compared to all devices tested
» 27% of all tested devices were better, 6% similar, 68% worse
» The best had a delta of 4%, average was 23%, worst was 134%
HP ZBook Fury 17 G7 119W5EA audio analysis
(±) | speaker loudness is average but good (78.6 dB)
Bass 100 - 315 Hz
(±) | reduced bass - on average 7.9% lower than median
(±) | linearity of bass is average (11.1% delta to prev. frequency)
Mids 400 - 2000 Hz
(+) | balanced mids - only 2.8% away from median
(+) | mids are linear (3.9% delta to prev. frequency)
Highs 2 - 16 kHz
(+) | balanced highs - only 2.7% away from median
(+) | highs are linear (4.8% delta to prev. frequency)
Overall 100 - 16.000 Hz
(+) | overall sound is linear (10.9% difference to median)
Compared to same class
» 11% of all tested devices in this class were better, 4% similar, 85% worse
» The best had a delta of 7%, average was 17%, worst was 35%
Compared to all devices tested
» 6% of all tested devices were better, 2% similar, 92% worse
» The best had a delta of 4%, average was 23%, worst was 134%
Lenovo ThinkPad P17 G2-20YU0025G audio analysis
(±) | speaker loudness is average but good (76.6 dB)
Bass 100 - 315 Hz
(±) | reduced bass - on average 14.5% lower than median
(±) | linearity of bass is average (9.6% delta to prev. frequency)
Mids 400 - 2000 Hz
(±) | higher mids - on average 6.9% higher than median
(±) | linearity of mids is average (7.7% delta to prev. frequency)
Highs 2 - 16 kHz
(+) | balanced highs - only 2.6% away from median
(+) | highs are linear (6.6% delta to prev. frequency)
Overall 100 - 16.000 Hz
(±) | linearity of overall sound is average (20.1% difference to median)
Compared to same class
» 71% of all tested devices in this class were better, 6% similar, 23% worse
» The best had a delta of 7%, average was 17%, worst was 35%
Compared to all devices tested
» 52% of all tested devices were better, 8% similar, 40% worse
» The best had a delta of 4%, average was 23%, worst was 134%
Energy management - High power consumption
Energy consumption
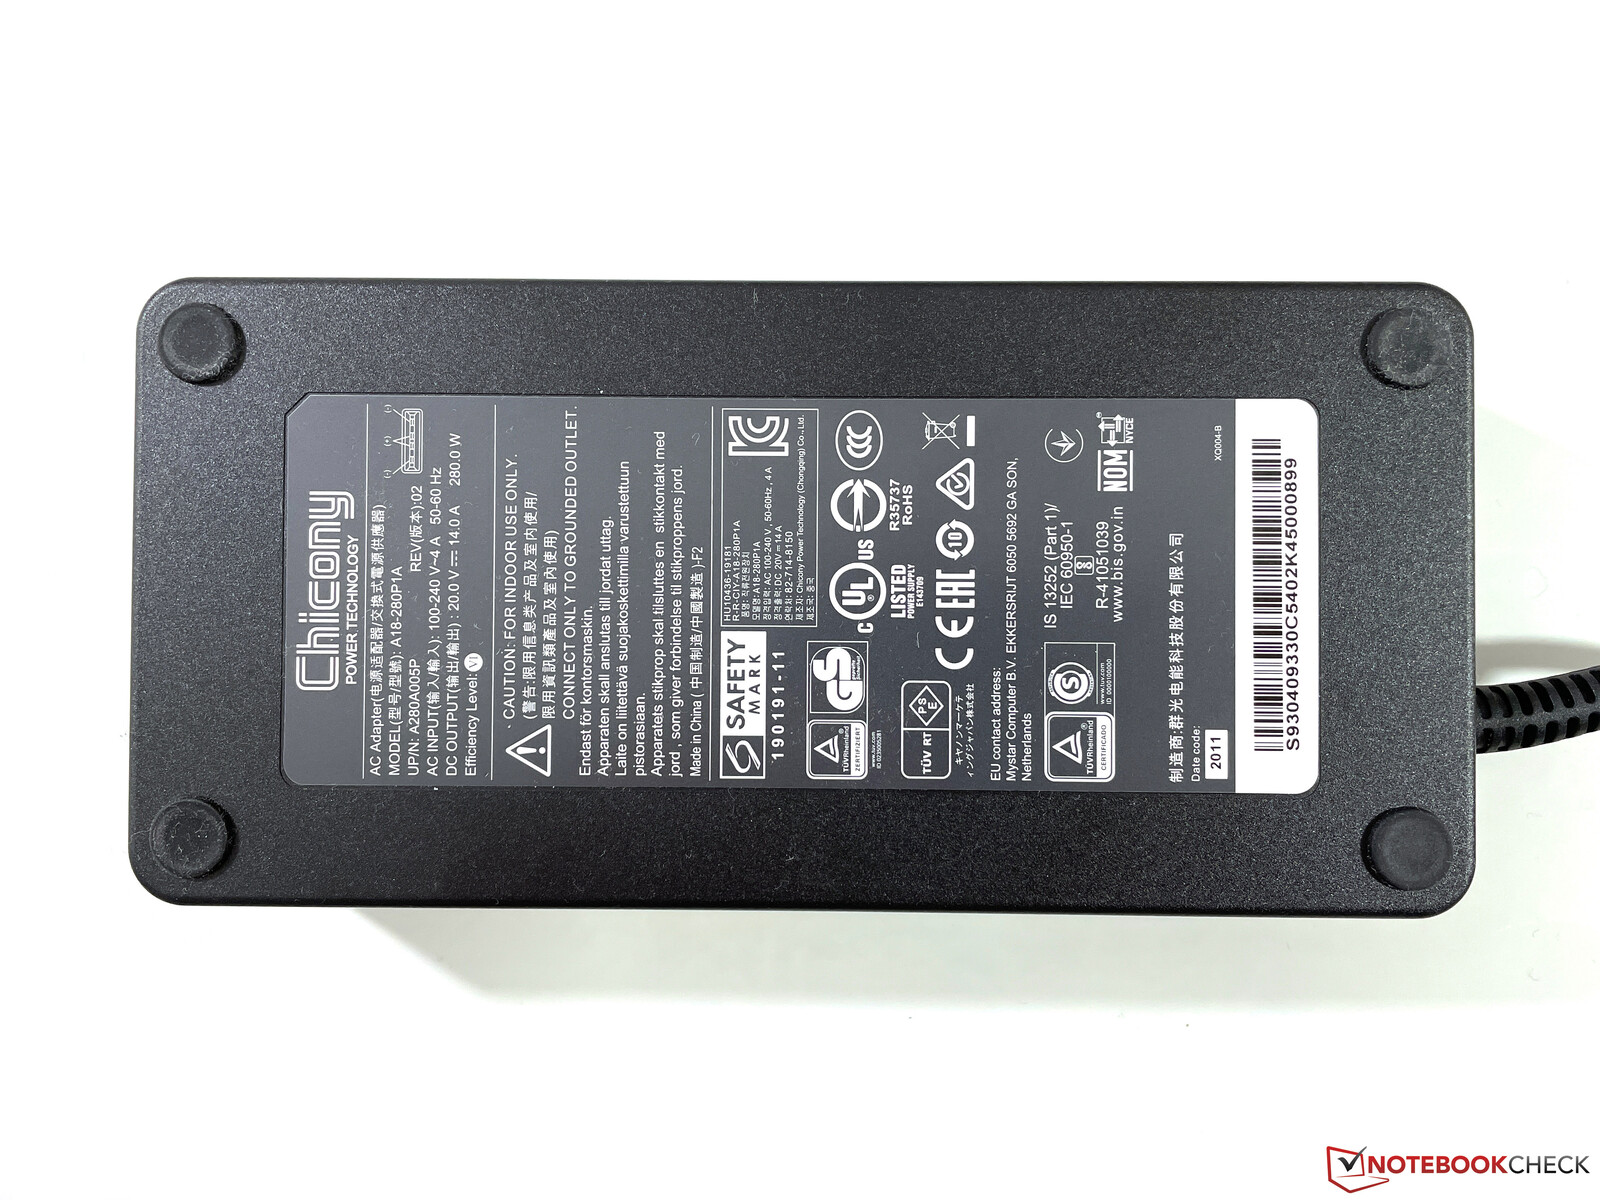
It comes as no surprise that the mobile workstation requires a lot of power. Thanks to the automatic graphics switching, the idle rates are still within limits with a maximum of 20 watts, but under load, up to 281 watts is reached, which then settle quite quickly at 245 watts (~260 watts in High Performance mode). You can expect about 230 watts when gaming. This means that the included 280-watt power adapter has an adequate capacity.
| Off / Standby | |
| Idle | |
| Load |
|
Key:
min: | |
| MSI WE76 11UM-456 i9-11980HK, RTX A5000 Laptop GPU, Samsung PM9A1 MZVL22T0HBLB, IPS, 3840x2160, 17.3" | Lenovo ThinkPad P1 G4-20Y4S0KS00 i7-11850H, GeForce RTX 3070 Laptop GPU, Samsung PM9A1 MZVL21T0HCLR, IPS LED, 3840x2400, 16" | HP ZBook Fury 15 G8 i9-11950H, RTX A5000 Laptop GPU, Samsung PM981a MZVLB1T0HBLR, IPS, 3840x2160, 15.6" | Asus ProArt StudioBook 16 W7600H5A-2BL2 W-11955M, RTX A5000 Laptop GPU, 2x Micron 2300 2TB MTFDHBA2T0TDV (RAID 0), OLED, 3840x2400, 16" | Lenovo ThinkPad P17 G2-20YU0025G i7-11800H, RTX A2000 Laptop GPU, Kioxia XG7 KXG7AZNV512G, IPS LED, 1920x1080, 17.3" | HP ZBook Fury 17 G7 119W5EA i9-10885H, Quadro RTX 4000 Max-Q, WDC PC SN730 SDBPNTY-1T00, , 3840x2160, 17.3" | MSI WE75 9TK i7-9750H, Quadro RTX 3000 (Laptop), Samsung SSD PM981 MZVLB512HAJQ, IPS, 1920x1080, 17.3" | Average NVIDIA RTX A5000 Laptop GPU | Average of class Workstation | |
|---|---|---|---|---|---|---|---|---|---|
| Power Consumption | 19% | 15% | 11% | 38% | 24% | 15% | 5% | 23% | |
| Idle Minimum * (Watt) | 10.5 | 8.1 23% | 8.3 21% | 12.4 -18% | 6.1 42% | 5.8 45% | 12.1 -15% | 10.4 ? 1% | 9.04 ? 14% |
| Idle Average * (Watt) | 18.6 | 20.2 -9% | 19.9 -7% | 16.5 11% | 10.9 41% | 14.8 20% | 18.4 1% | 18.3 ? 2% | 13.8 ? 26% |
| Idle Maximum * (Watt) | 20 | 21.9 -10% | 21.8 -9% | 25 -25% | 12.3 38% | 17 15% | 18.8 6% | 22.3 ? -12% | 17.7 ? 11% |
| Load Average * (Watt) | 132.4 | 88.2 33% | 110.9 16% | 132 -0% | 106.3 20% | 120.4 9% | 95.1 28% | 125.1 ? 6% | 96.2 ? 27% |
| Witcher 3 ultra * (Watt) | 232 | 149 36% | 165 29% | 132 43% | 124 47% | 168.4 27% | 135.5 42% | ||
| Load Maximum * (Watt) | 281.6 | 170.6 39% | 171.8 39% | 134 52% | 168.9 40% | 199.8 29% | 203.7 28% | 195.8 ? 30% | 178.5 ? 37% |
* ... smaller is better
Energy consumption during our The Witcher 3 test / stress test
Energy consumption with an external monitor
Battery life
The 99.9 Wh battery is the maximum capacity that can still be carried in airplanes. Battery runtimes are appropriate for the performance and components. With a bit over 6 hours in the Wi-Fi test at 150 cd/m² (or 4:30 hours at full brightness) and just under 7 hours in the video test, you can definitely survive somewhat longer meetings without needing a power outlet. Just under 80 minutes is possible under load, but this is only feasible because of the significantly reduced performance.
| MSI WE76 11UM-456 i9-11980HK, RTX A5000 Laptop GPU, 99.9 Wh | Lenovo ThinkPad P1 G4-20Y4S0KS00 i7-11850H, GeForce RTX 3070 Laptop GPU, 90 Wh | HP ZBook Fury 15 G8 i9-11950H, RTX A5000 Laptop GPU, 94 Wh | Asus ProArt StudioBook 16 W7600H5A-2BL2 W-11955M, RTX A5000 Laptop GPU, 90 Wh | Lenovo ThinkPad P17 G2-20YU0025G i7-11800H, RTX A2000 Laptop GPU, 94 Wh | HP ZBook Fury 17 G7 119W5EA i9-10885H, Quadro RTX 4000 Max-Q, 94 Wh | MSI WE75 9TK i7-9750H, Quadro RTX 3000 (Laptop), 65 Wh | Average of class Workstation | |
|---|---|---|---|---|---|---|---|---|
| Battery runtime | 2% | -2% | -48% | 34% | 34% | -23% | 28% | |
| H.264 (h) | 6.9 | 7.2 4% | 1.8 -74% | 9.5 38% | 10.3 49% | 9.51 ? 38% | ||
| WiFi v1.3 (h) | 6.3 | 7 11% | 6.2 -2% | 5 -21% | 9.8 56% | 7.6 21% | 4.9 -22% | 8.52 ? 35% |
| Load (h) | 1.3 | 1.2 -8% | 1.4 8% | 1.7 31% | 1 -23% | 1.429 ? 10% | ||
| Witcher 3 ultra (h) | 1.6 | |||||||
| Reader / Idle (h) | 11 | 26.1 ? |
Pros
Cons
Verdict - MSI offers a lot of performance
With the WE76, MSI clearly offers a traditional mobile workstation that provides a lot of performance and competes directly with models like the Dell Precision 7770, the HP ZBook Fury 17, and the Lenovo ThinkPad P17 Gen 2. Mobility only plays a secondary role in these devices, and the focus is on performance instead, which is where the MSI workstation excels.
The fact that the manufacturer has used a gaming laptop (GE76) as its reference is not a problem as far as we are concerned. The extensive lighting has been omitted, and there are no 360 Hz display models either, which wouldn't fit at all given the target group. Instead, there's a matte 4K panel with accurate colors, an almost full AdobeRGB coverage, and 120 Hz, which also result in a noticeably smoother picture impression in everyday use. In addition, there's a very good keyboard including a dedicated number pad.
In particular, the performance of the professional Nvidia RTX A5000 (formerly Quadro) graphics card is thoroughly compelling. The processor performance is very good as well, although it has to be said here that AMD's mobile CPUs are currently better, but they haven't been implemented in workstations yet (this is true for all manufacturers).
Extremely fast graphics card, high system performance, matte 4K display, and great keyboard: The MSI WE76 is a mobile workstation that mainly focuses on performance.
The fan behavior is one of the few weak points, because they often kick in even during normal everyday use, which makes them appear a bit erratic. The optional Silent mode is recommended here, as it keeps the device much quieter. Under load, however, the maximum fan volume is perfectly competitive and not overly loud.
Users who need maximum performance won't go wrong with the WE76, and MSI also has advantages over the aforementioned contenders here. The slightly smaller 16-inch models (the ThinkPad P1 Gen 4 or the Asus ProArt StudioBook 16, for example) are admittedly more compact and more mobile, but they also offer less performance in return.
Price and availability
At the time of writing, you can find the MSI WE76 with the Core i9-11980HK, the Quadro RTX A5000, 64 GB of RAM, a 1 TB NVME SSD, and Windows 10 Pro on Amazon starting at around $4,300.
MSI WE76 11UM-456
- 12/06/2021 v7 (old)
Andreas Osthoff
Price comparison

