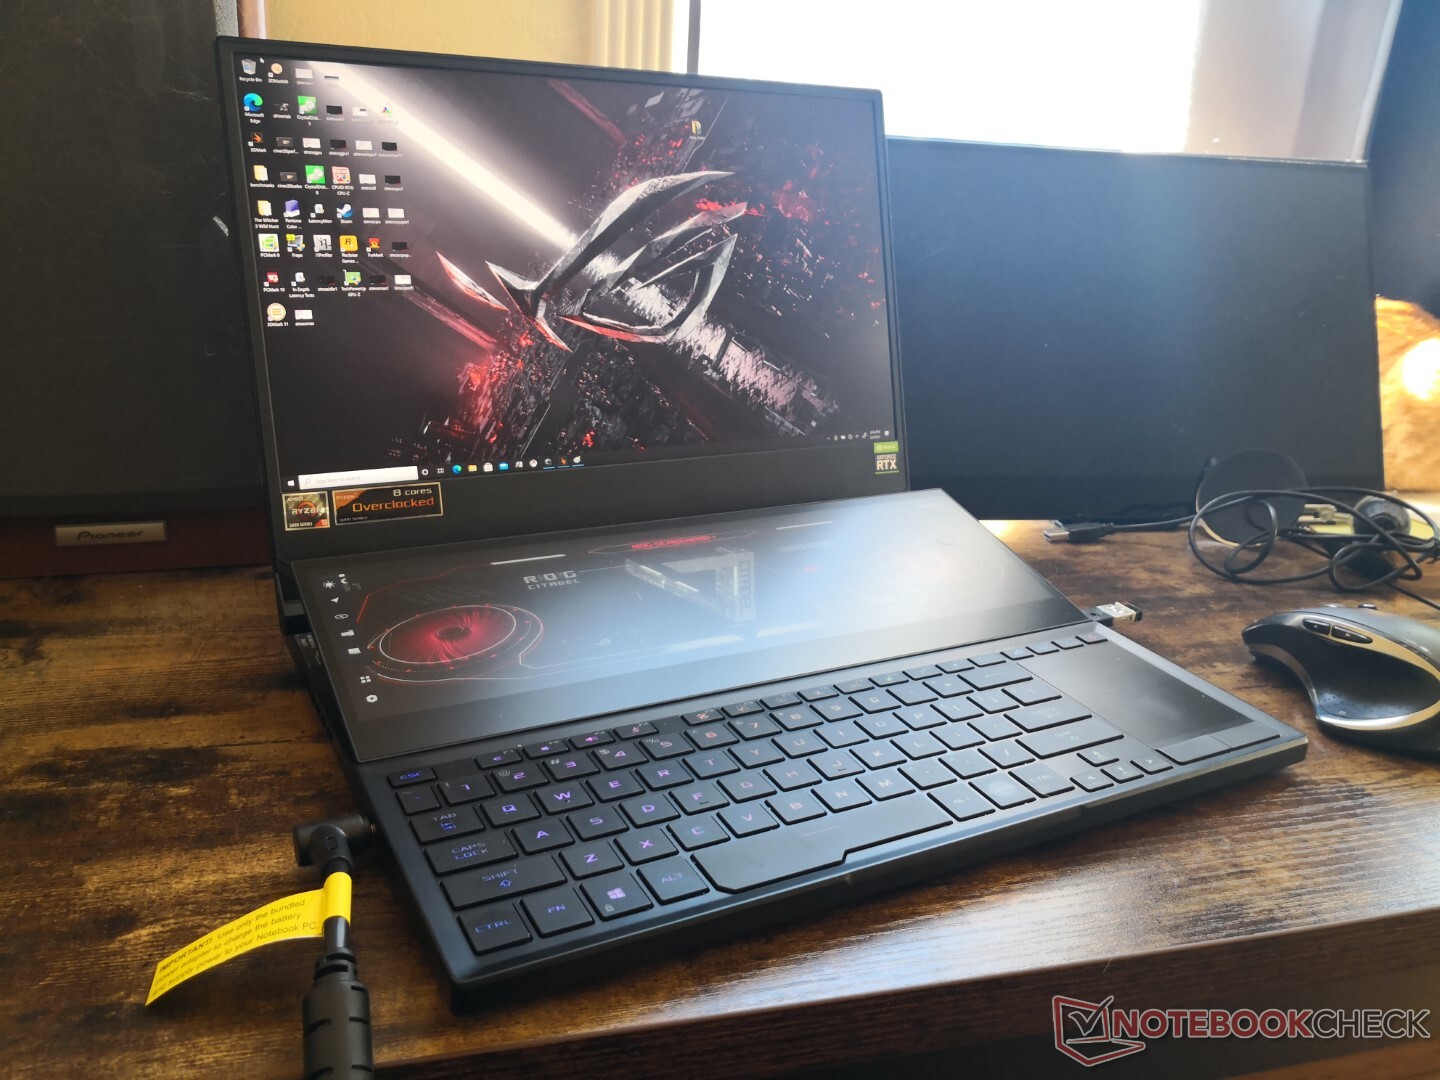
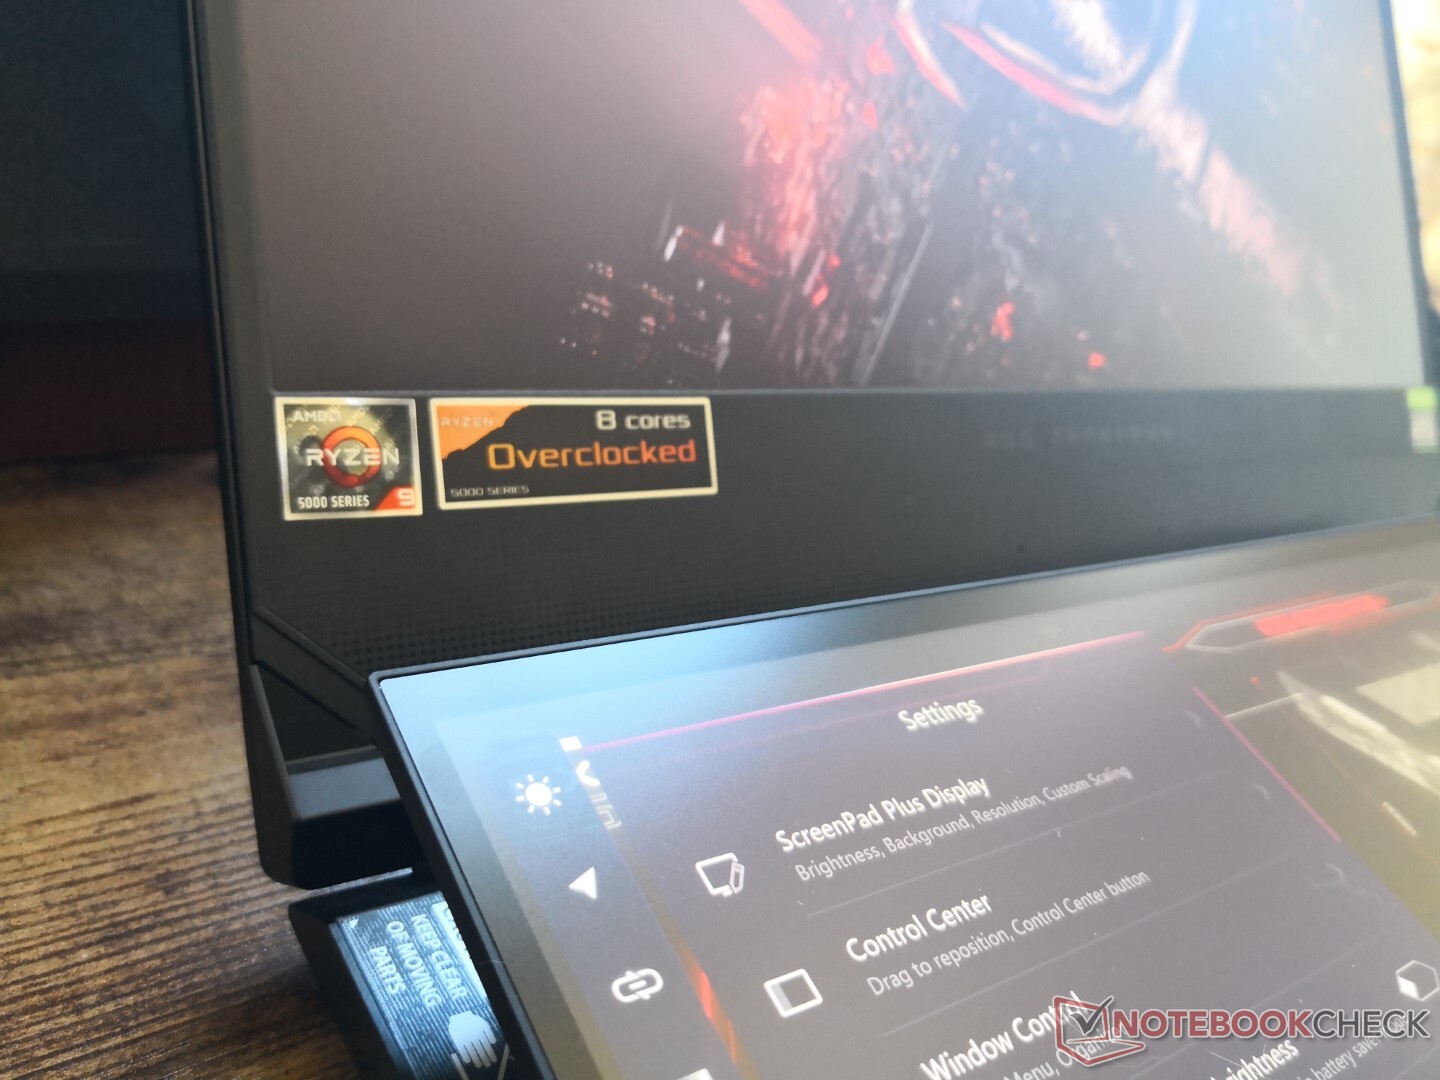
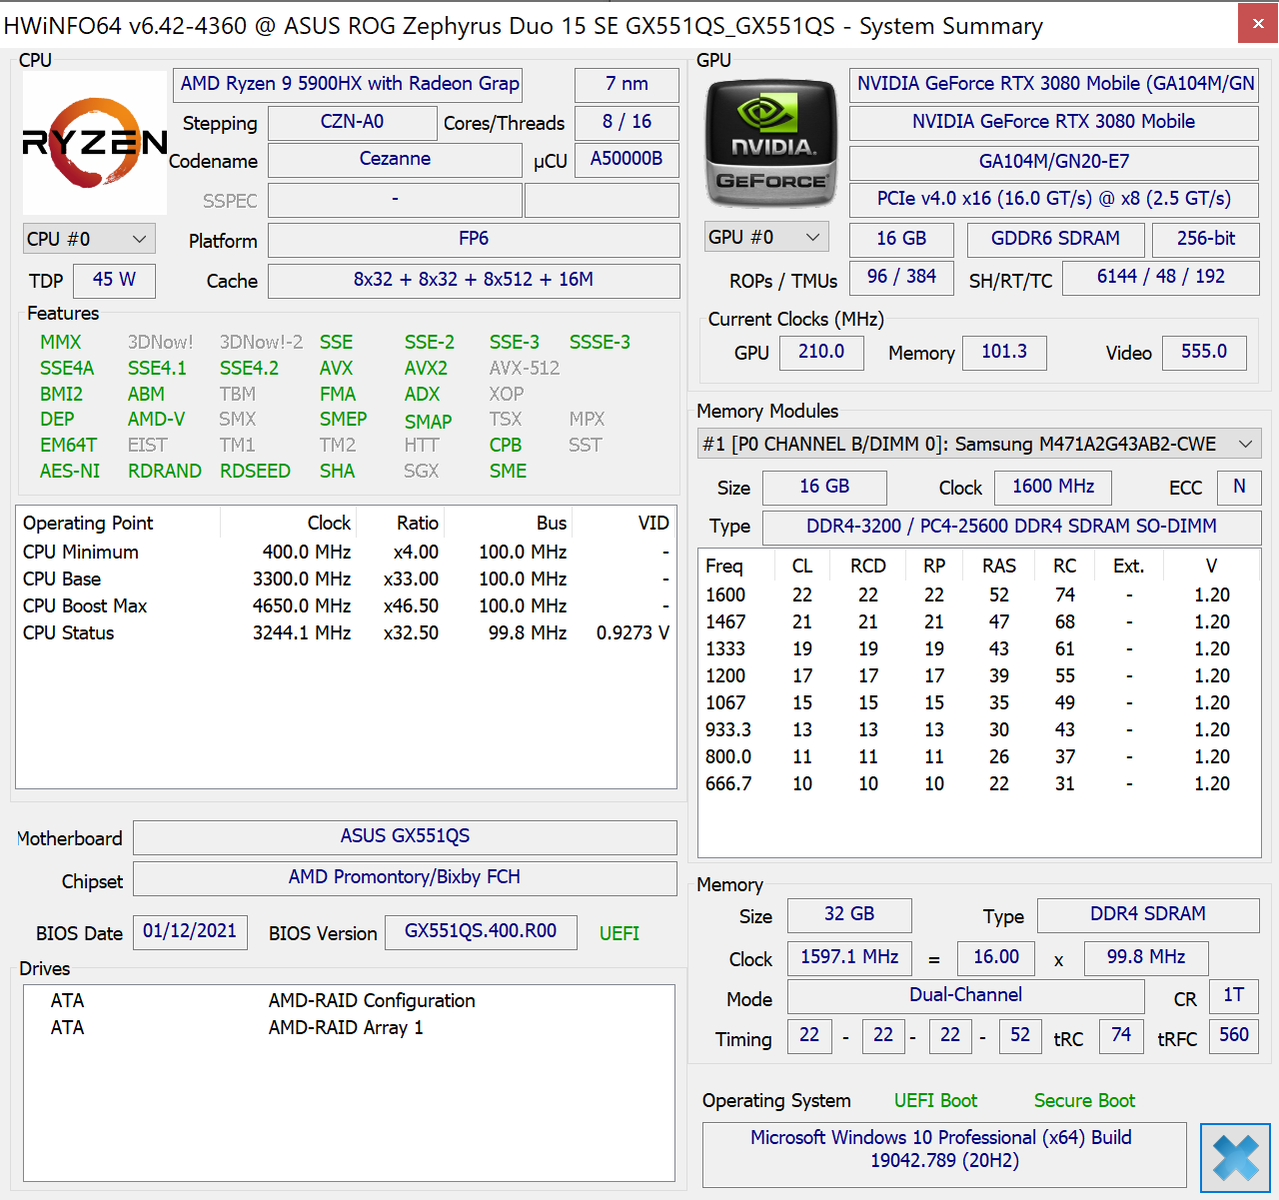
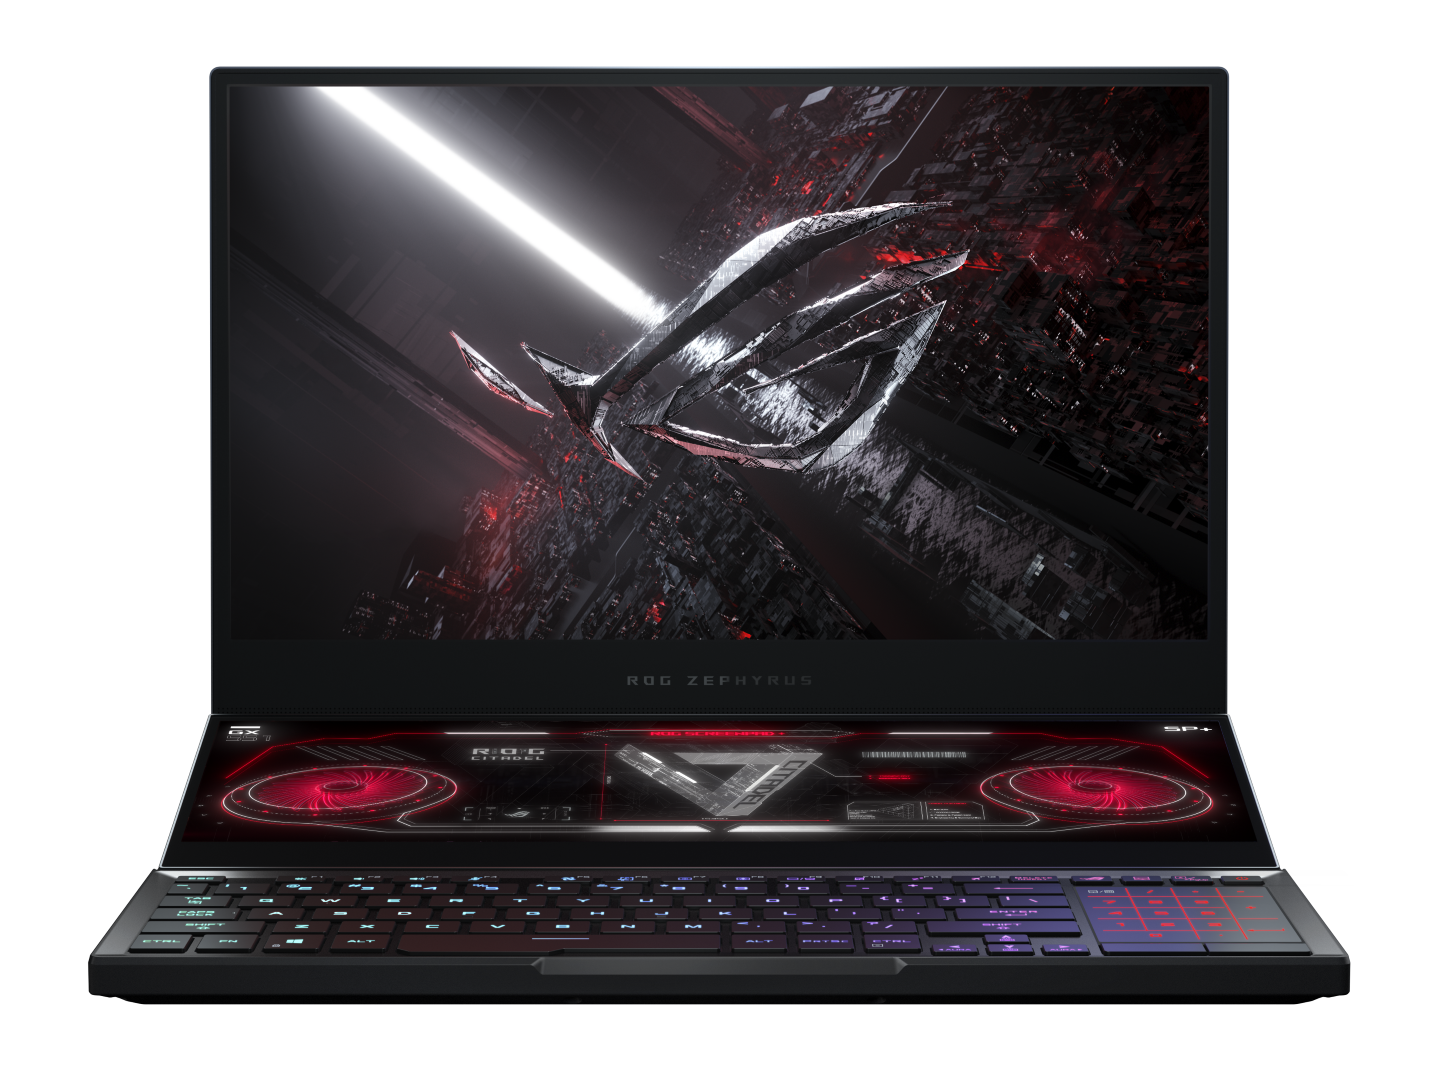
AMD Ryzen 9 5900HX is a Mobile Beast: Asus ROG Zephyrus Duo 15 SE GX551QS Laptop Review

The Zephyrus Duo 15 SE GX551 series is the AMD version of last year's Intel-powered Zephyrus Duo 15 GX550. It effectively swaps out all the 10th gen Comet Lake CPUs for Zen 3 Cezanne options including the Ryzen 7 5800H and Ryzen 9 5900HX. The GPU gets an update as well from Nvidia Turing to Ampere up to the GeForce RTX 3080 alongside new 300 Hz FHD and 120 Hz 4K panels.
Aside from the new CPUs, GPUs, and displays mentioned above, the 2021 GX551 chassis remains identical to the 2020 GX550 and so we recommend checking out our review on the GX550 here to learn more about the physical features of the system. This review will focus more on the display and performance of the GX551 as the Asus is one of the first to ship with an H-series Zen 3 CPU. Comparisons between it and Core i9 alternatives like the MSI GE66, Lenovo Legion 7, or Asus' own Strix Scar 15 are inevitable.
The configuration in review today is the highest-end SKU of the Zephyrus Duo 15 SE GX551QS for about $3700 USD retail.
More Asus reviews:
potential competitors in comparison
Rating | Date | Model | Weight | Height | Size | Resolution | Price |
|---|---|---|---|---|---|---|---|
| 86.6 % v7 (old) | 02 / 2021 | Asus ROG Zephyrus Duo 15 SE GX551QS R9 5900HX, GeForce RTX 3080 Laptop GPU | 2.5 kg | 20.9 mm | 15.60" | 3840x2160 | |
| 84.5 % v7 (old) | 07 / 2020 | Asus ROG Zephyrus Duo 15 GX550LXS i9-10980HK, GeForce RTX 2080 Super Max-Q | 2.5 kg | 20 mm | 15.60" | 3840x2160 | |
| 85.9 % v7 (old) | 08 / 2020 | Razer Blade 15 RTX 2080 Super Max-Q i7-10875H, GeForce RTX 2080 Super Max-Q | 2.2 kg | 17.8 mm | 15.60" | 1920x1080 | |
| 84.6 % v7 (old) | 11 / 2019 | Eurocom Sky X4C i9-9900KS i9-9900KS, GeForce RTX 2080 Mobile | 3.6 kg | 38 mm | 15.60" | 1920x1080 | |
| 84.6 % v7 (old) | 07 / 2020 | MSI GE66 Raider 10SFS i9-10980HK, GeForce RTX 2070 Super Mobile | 2.4 kg | 23 mm | 15.60" | 1920x1080 | |
| 82.8 % v7 (old) | 05 / 2020 | MSI GS66 Stealth 10SFS i9-10980HK, GeForce RTX 2070 Super Max-Q | 2.2 kg | 20 mm | 15.60" | 1920x1080 |
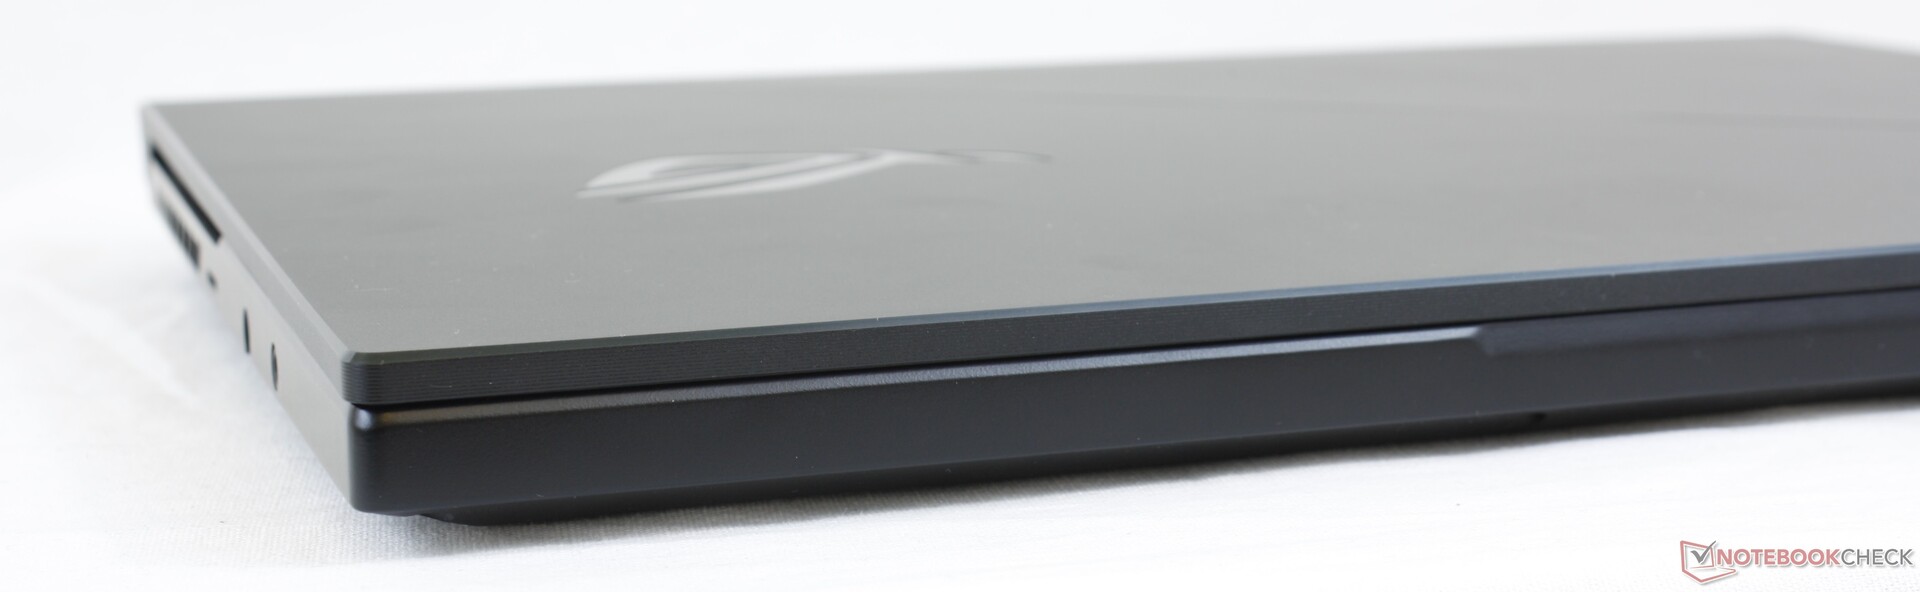
Case
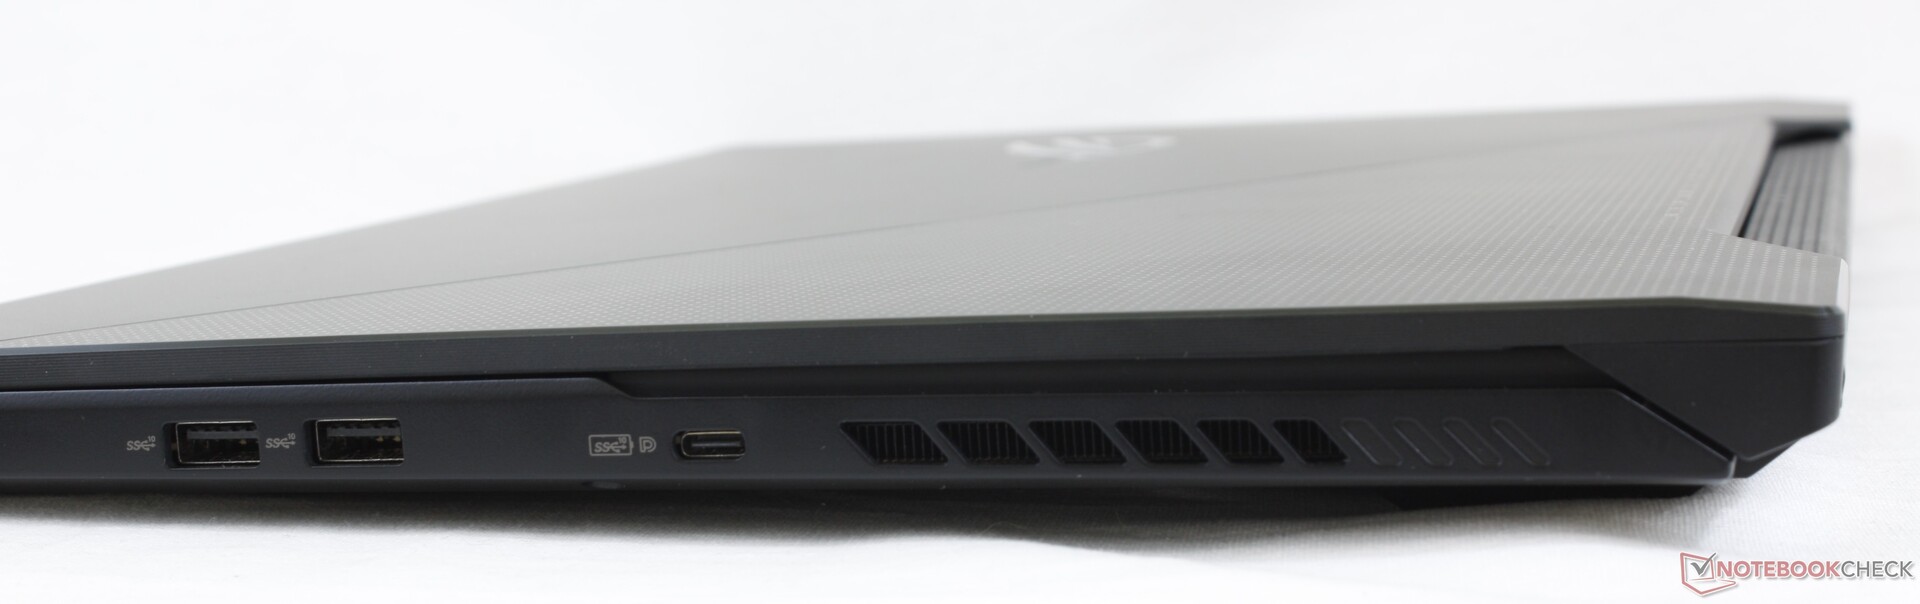
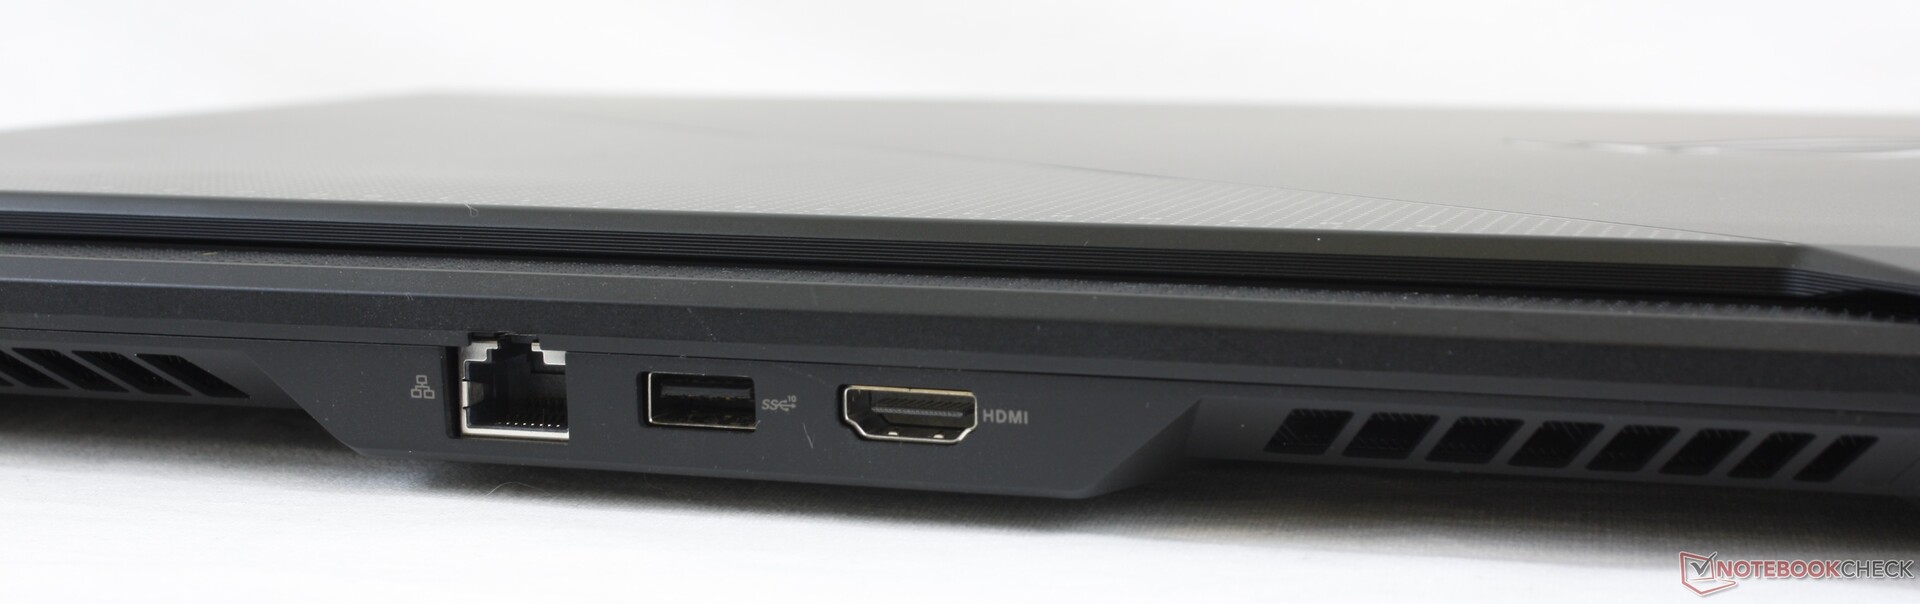
Connectivity
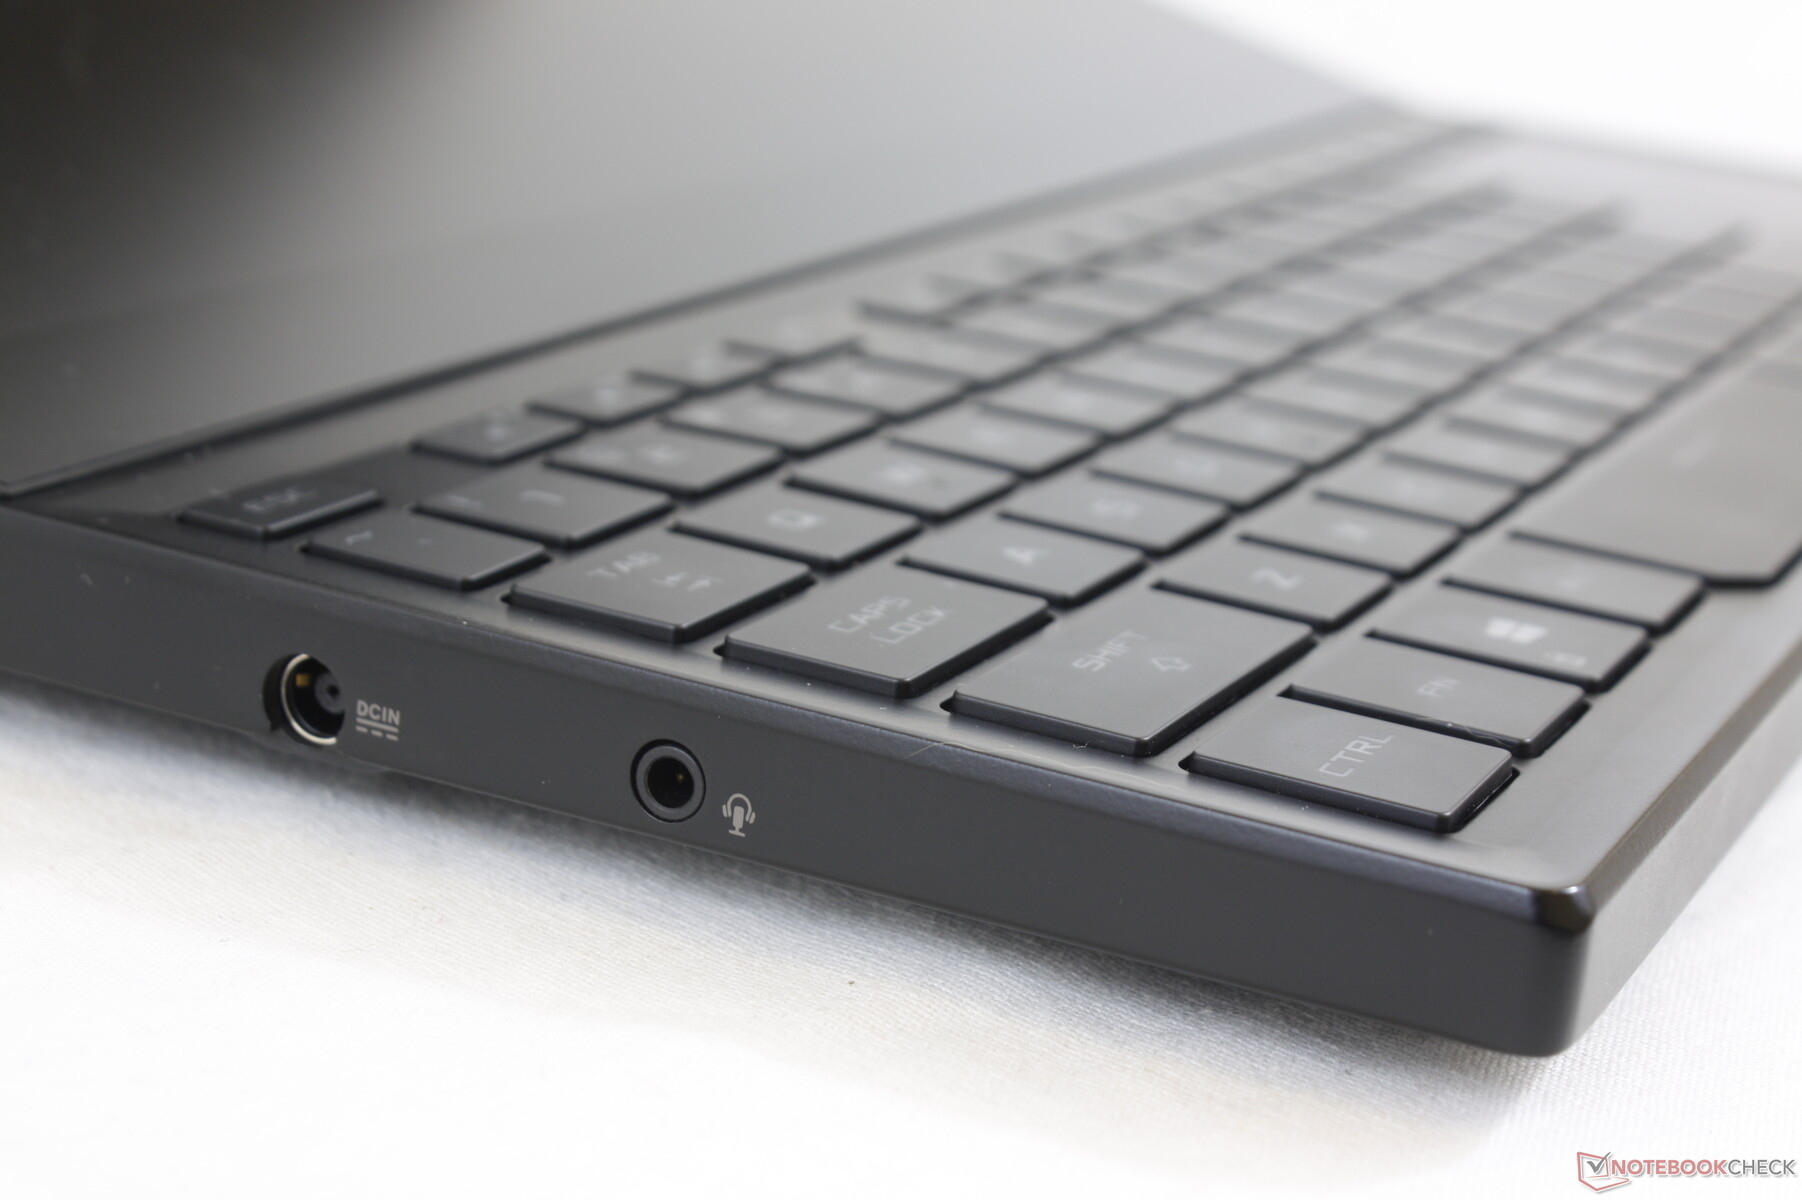
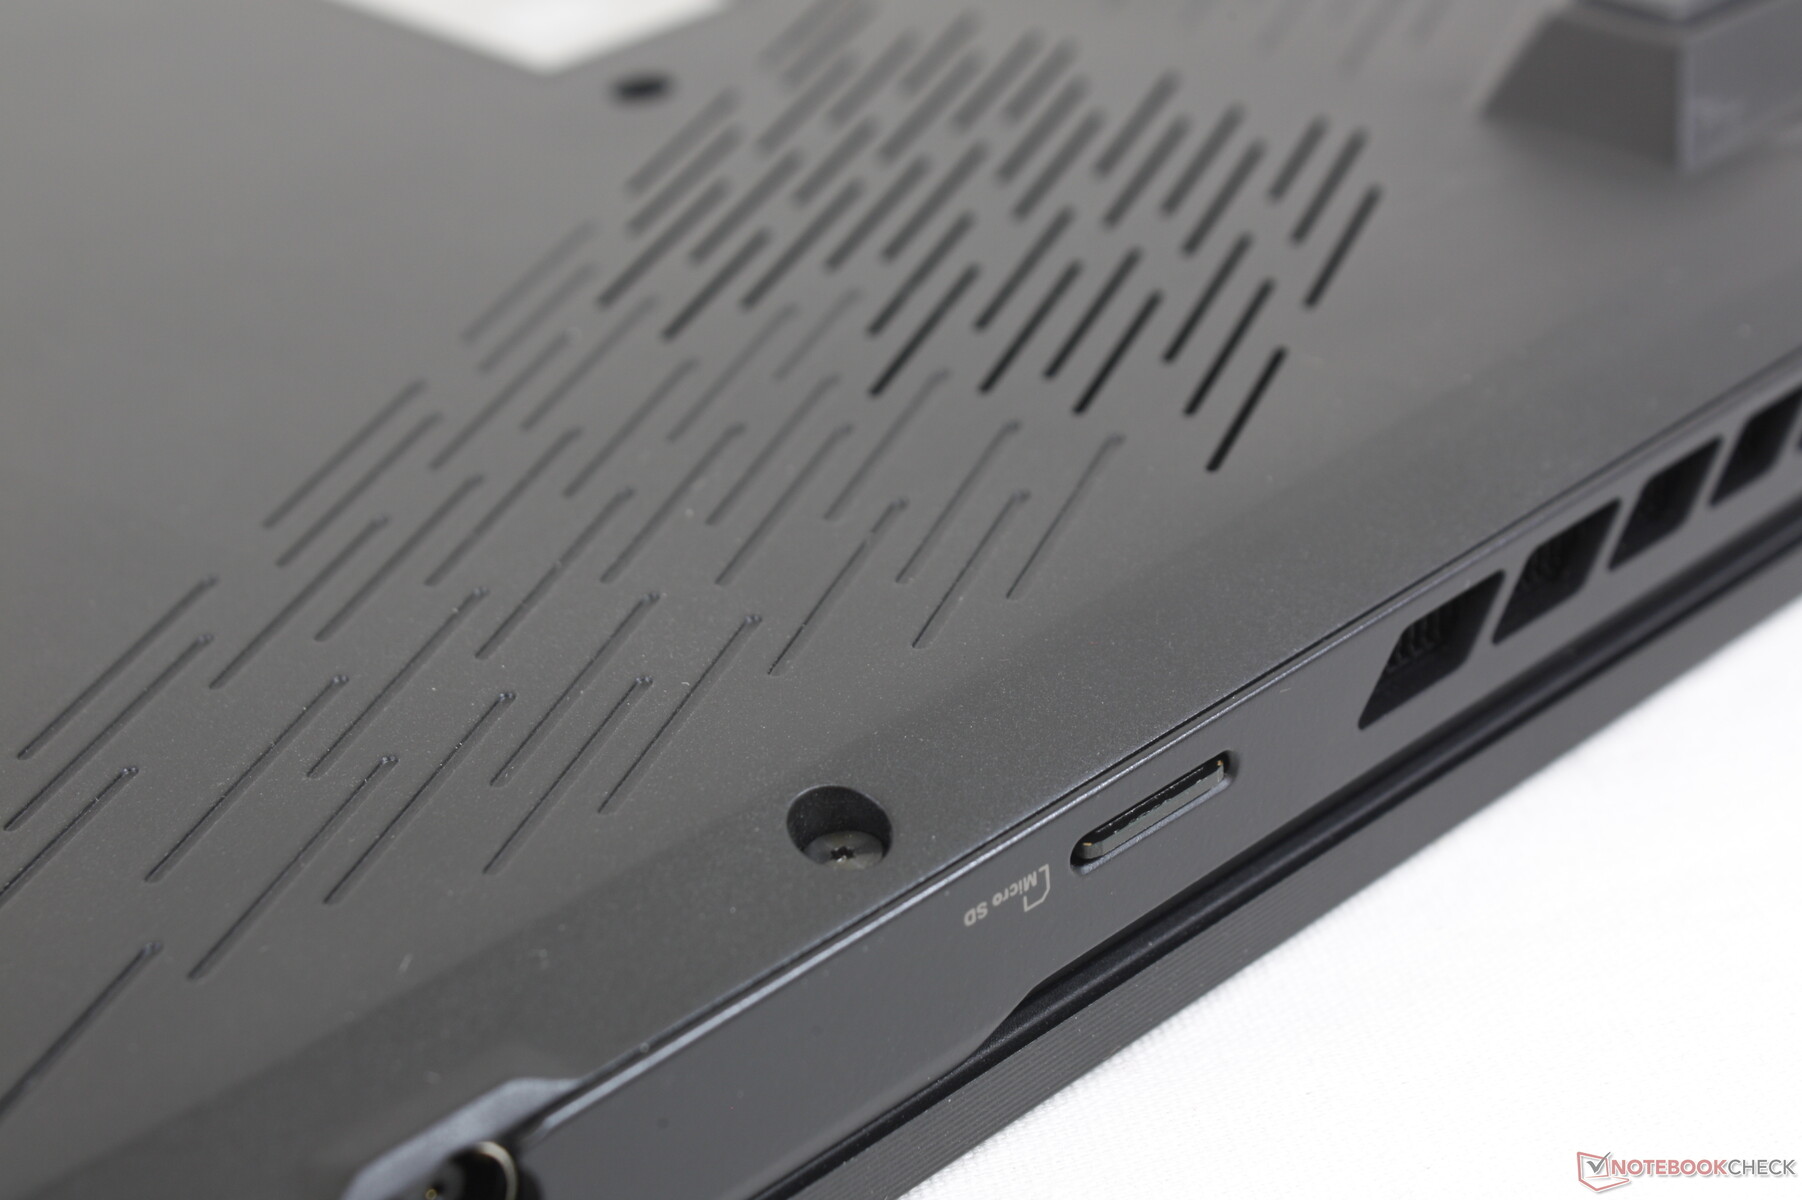
Though ports are identical to last year's GX550, the USB-C port on the GX551 does not support Thunderbolt likely due to the lack of a dedicated controller on the AMD chipset. It would've also been great to see 10 Gbit Ethernet instead of the usual 1 Gbit.
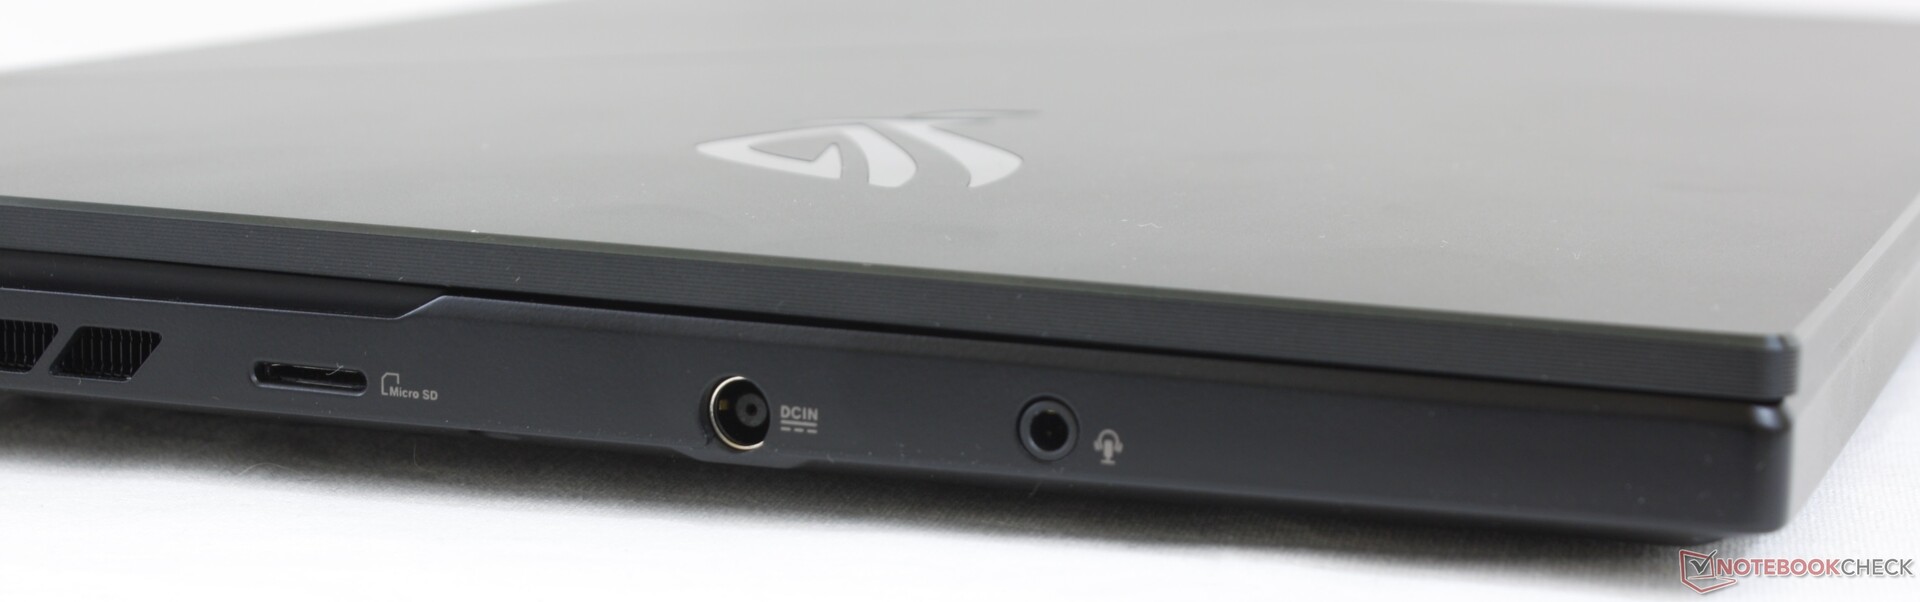
SD Card Reader
Asus advertises MicroSD transfer rates of up to 312 MB/s, but we are only able to confirm up to 217 MB/s as we are limited to our 32 GB Toshiba Exceria Pro M501 UHS-II card.
| SD Card Reader | |
| average JPG Copy Test (av. of 3 runs) | |
| Razer Blade 15 RTX 2080 Super Max-Q (Toshiba Exceria Pro SDXC 64 GB UHS-II) | |
| Eurocom Sky X4C i9-9900KS (Toshiba Exceria Pro SDXC 64 GB UHS-II) | |
| MSI GE66 Raider 10SFS (Toshiba Exceria Pro SDXC 64 GB UHS-II) | |
| Asus ROG Zephyrus Duo 15 SE GX551QS (Toshiba Exceria Pro M501 microSDXC 32GB) | |
| maximum AS SSD Seq Read Test (1GB) | |
| Asus ROG Zephyrus Duo 15 SE GX551QS (Toshiba Exceria Pro M501 microSDXC 32GB) | |
| Razer Blade 15 RTX 2080 Super Max-Q (Toshiba Exceria Pro SDXC 64 GB UHS-II) | |
| Eurocom Sky X4C i9-9900KS (Toshiba Exceria Pro SDXC 64 GB UHS-II) | |
| MSI GE66 Raider 10SFS (Toshiba Exceria Pro SDXC 64 GB UHS-II) | |
Communication
The Intel AX200 comes standard for Wi-Fi 6 and Bluetooth 5.1 connectivity. We experienced no issues when paired to our Netgear RAX200 test router.
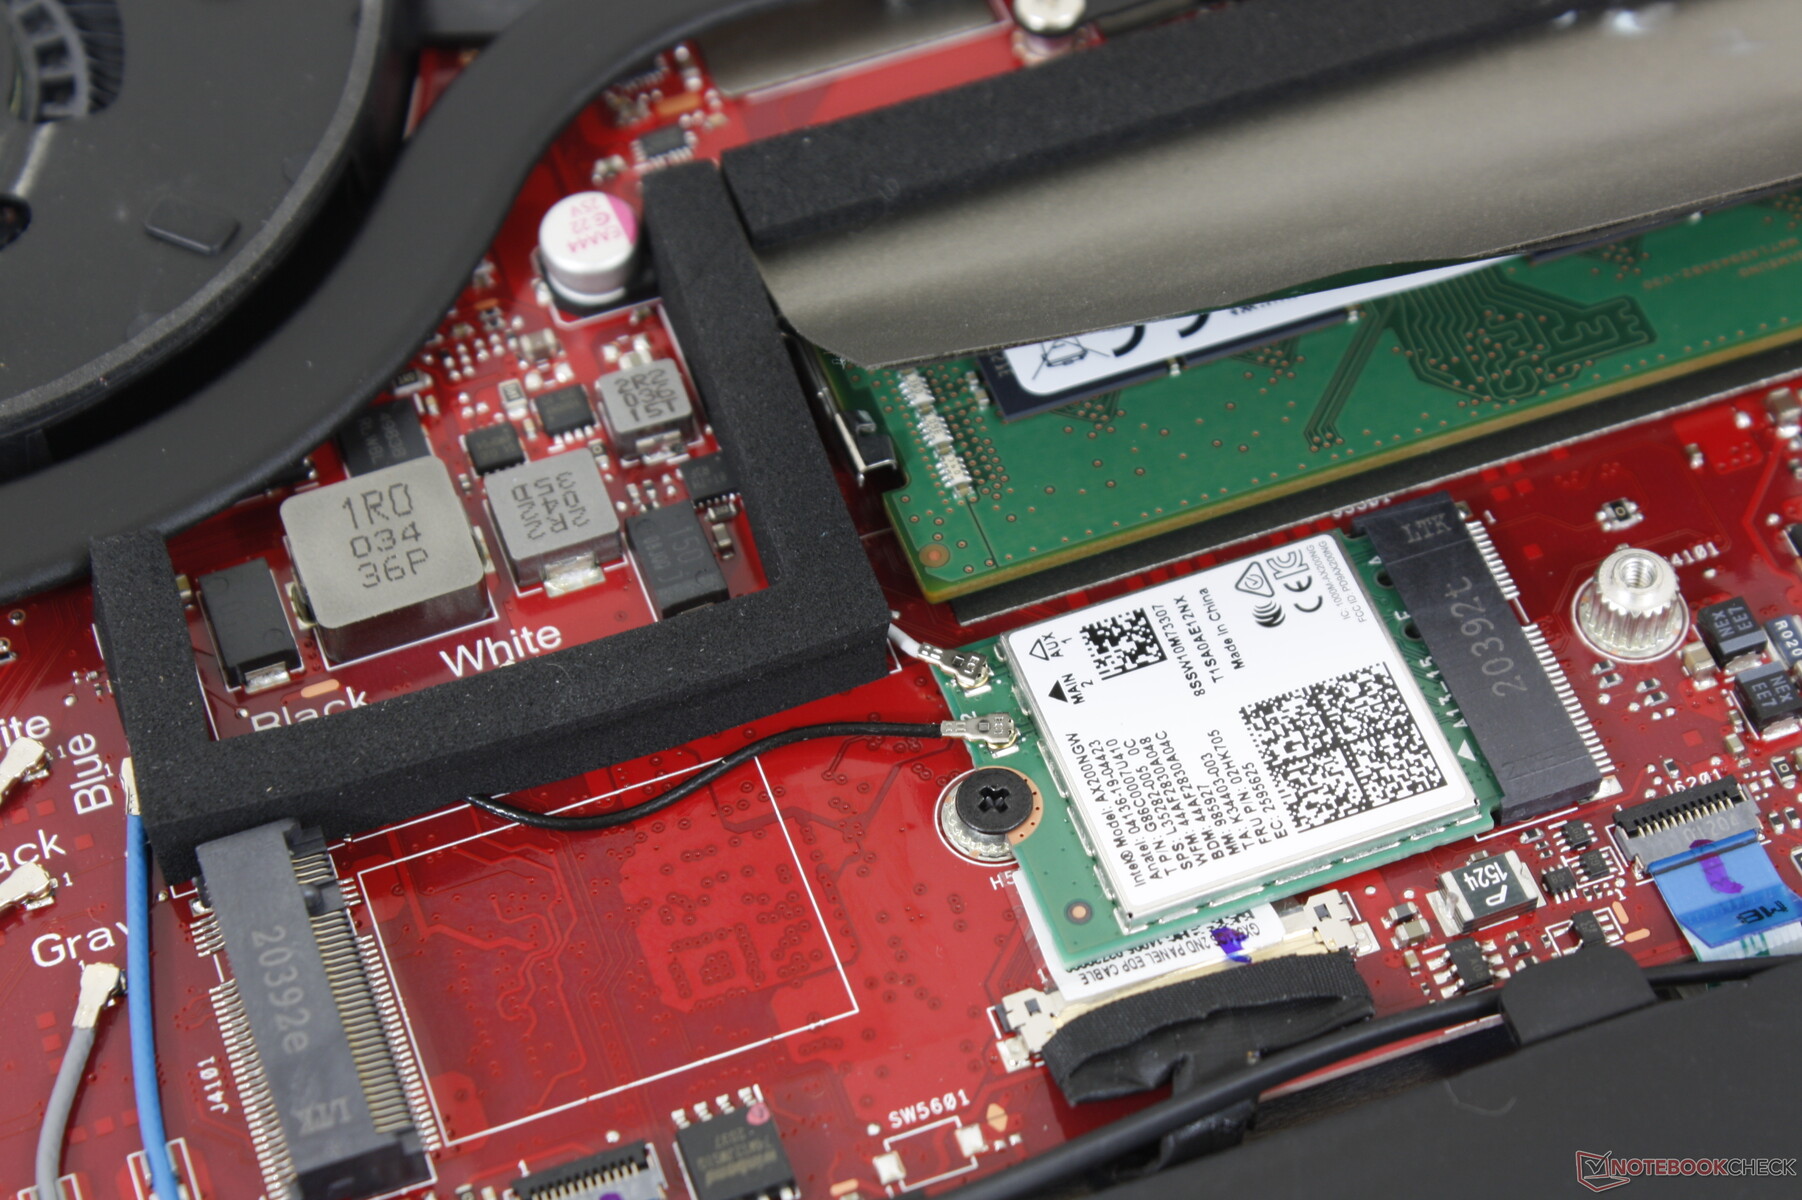
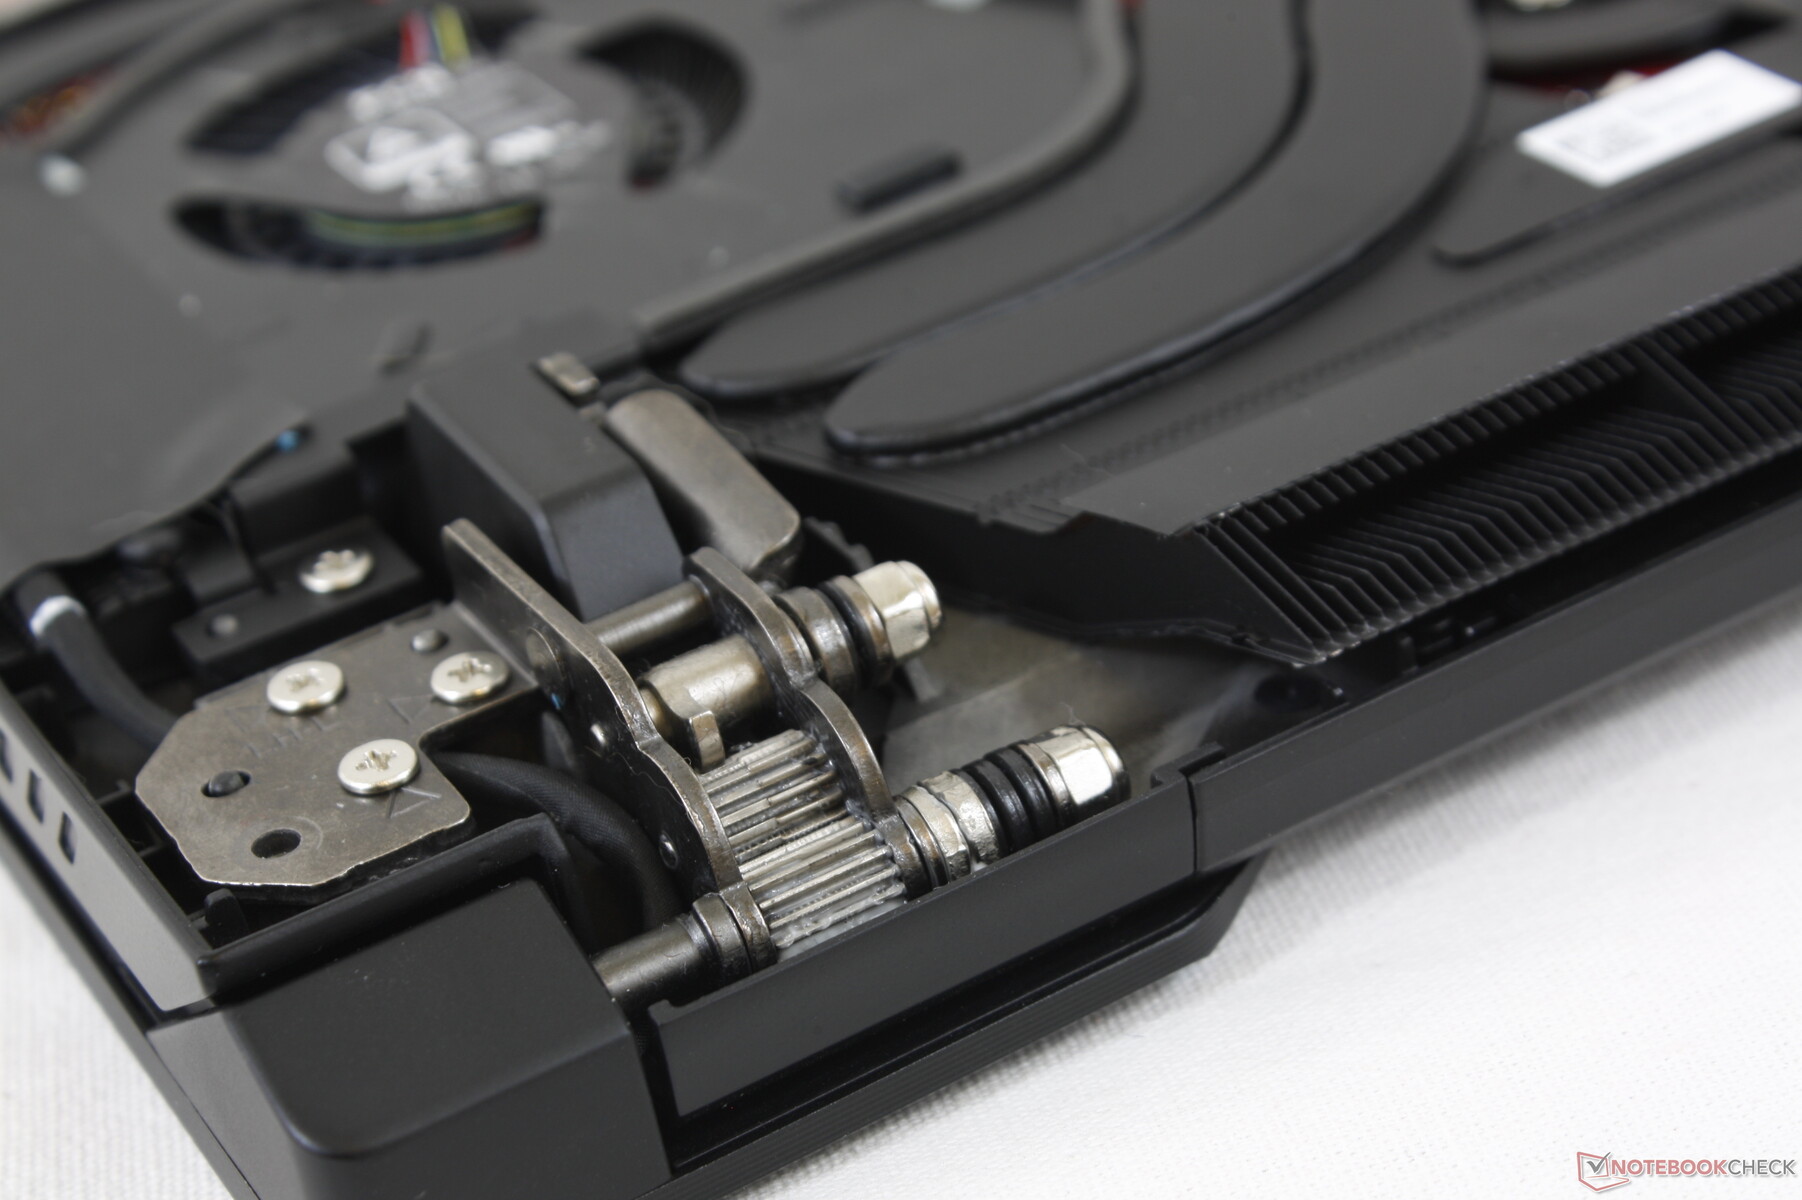
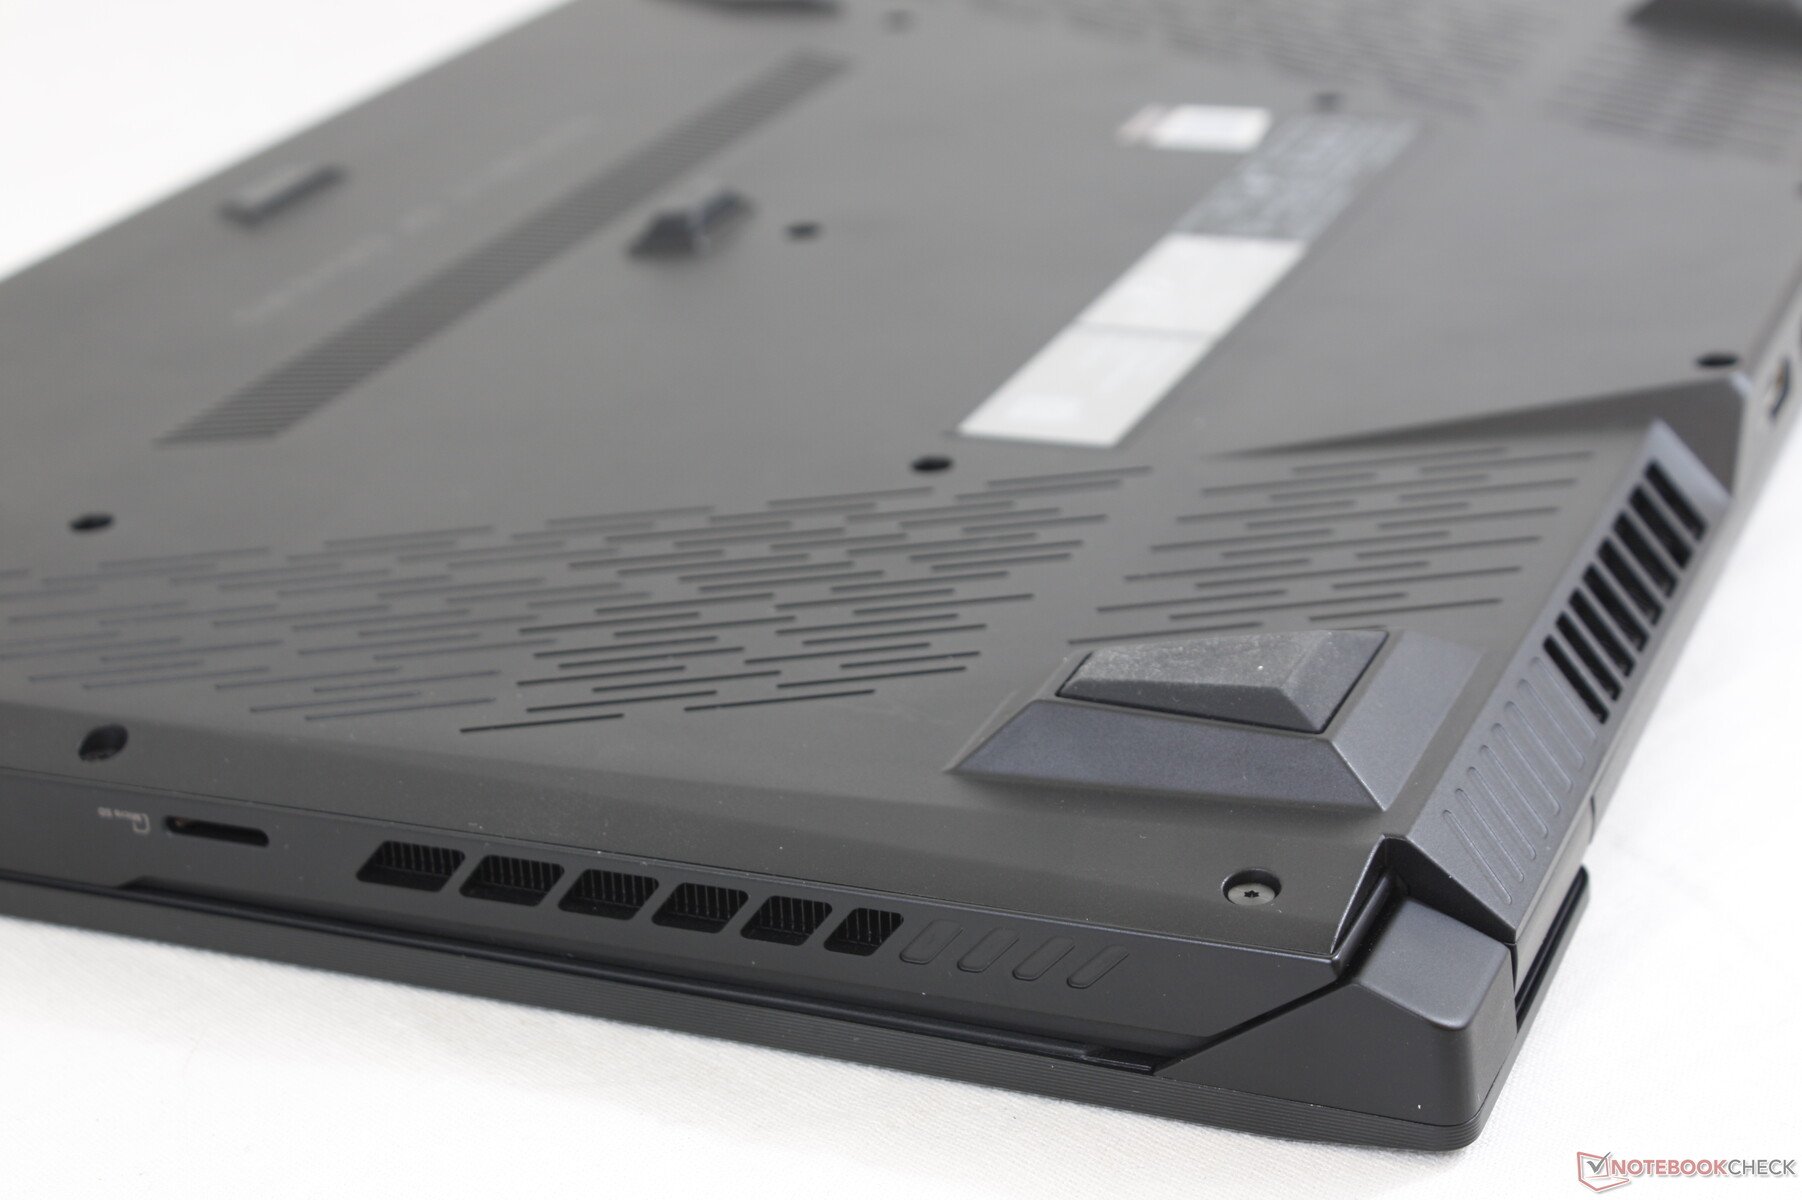
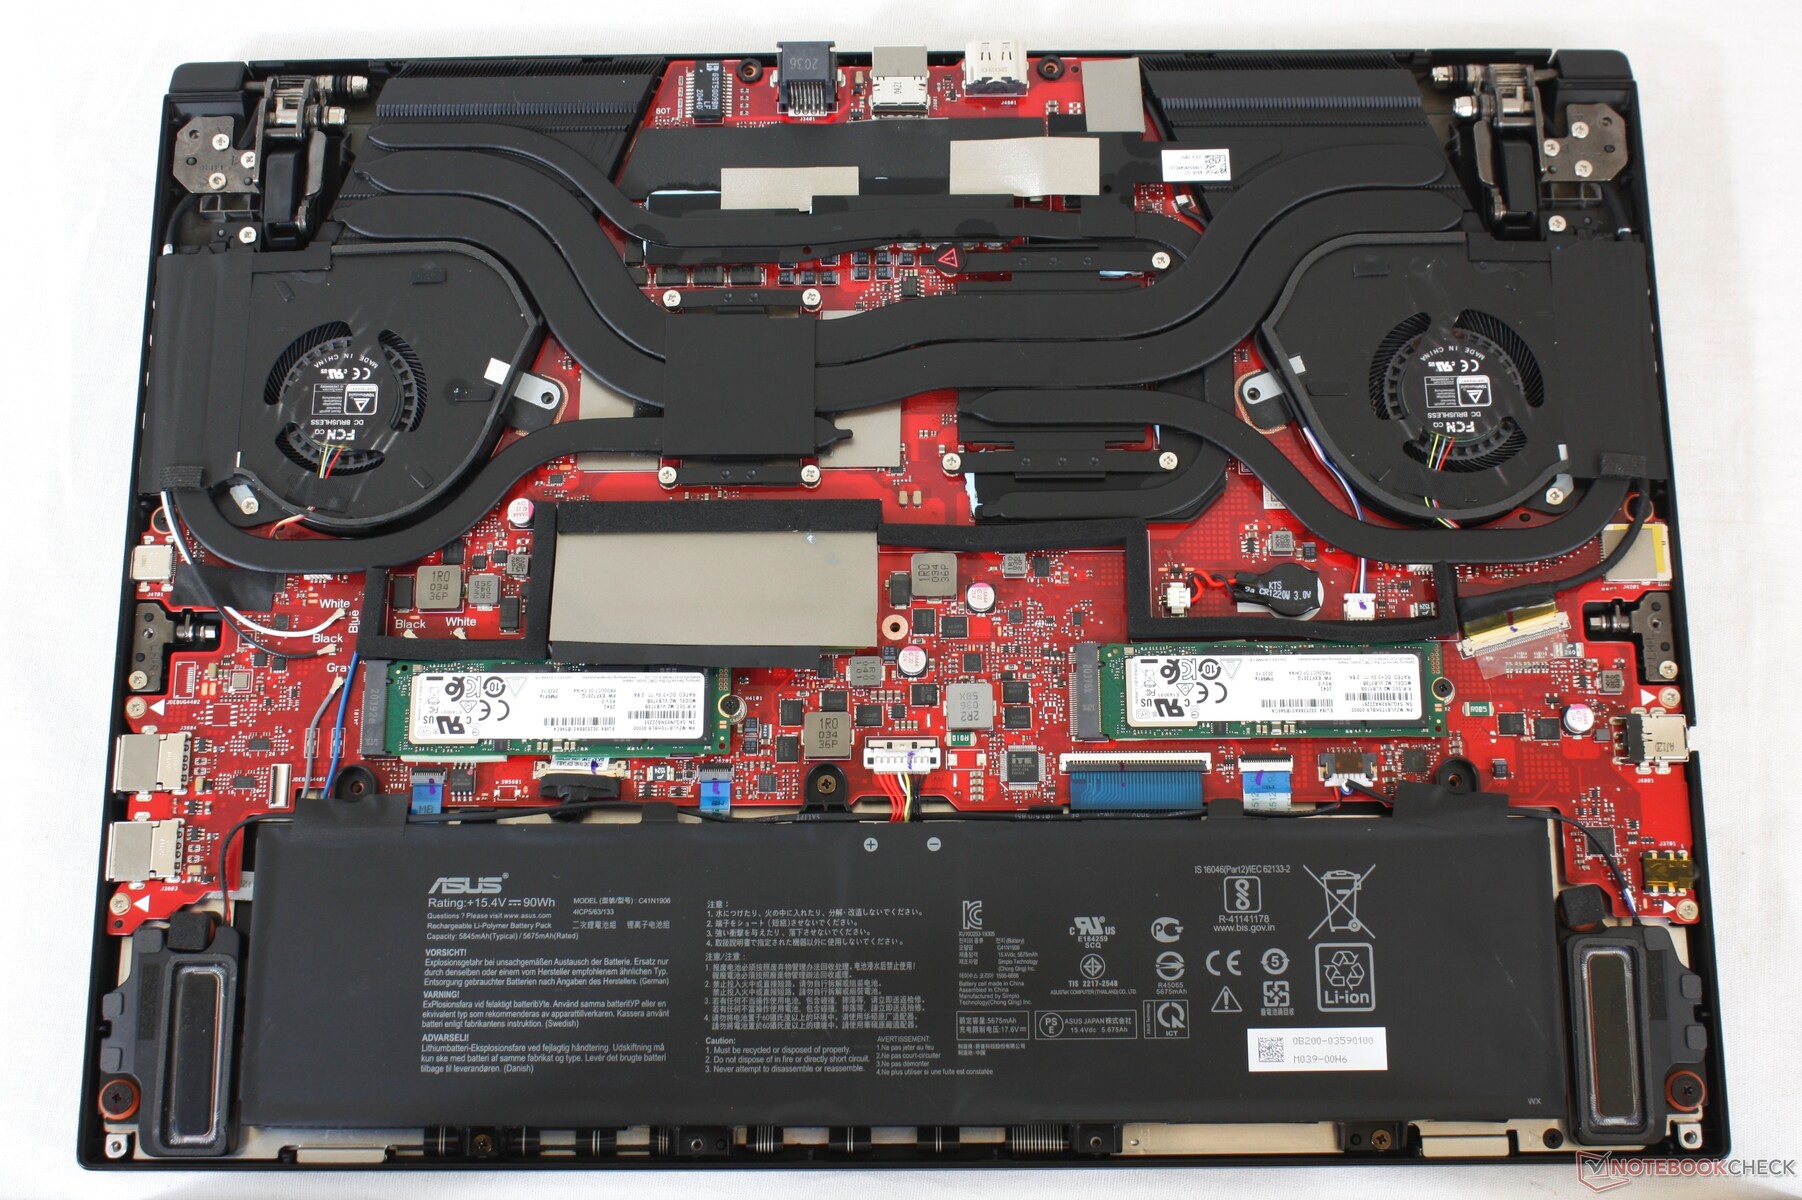
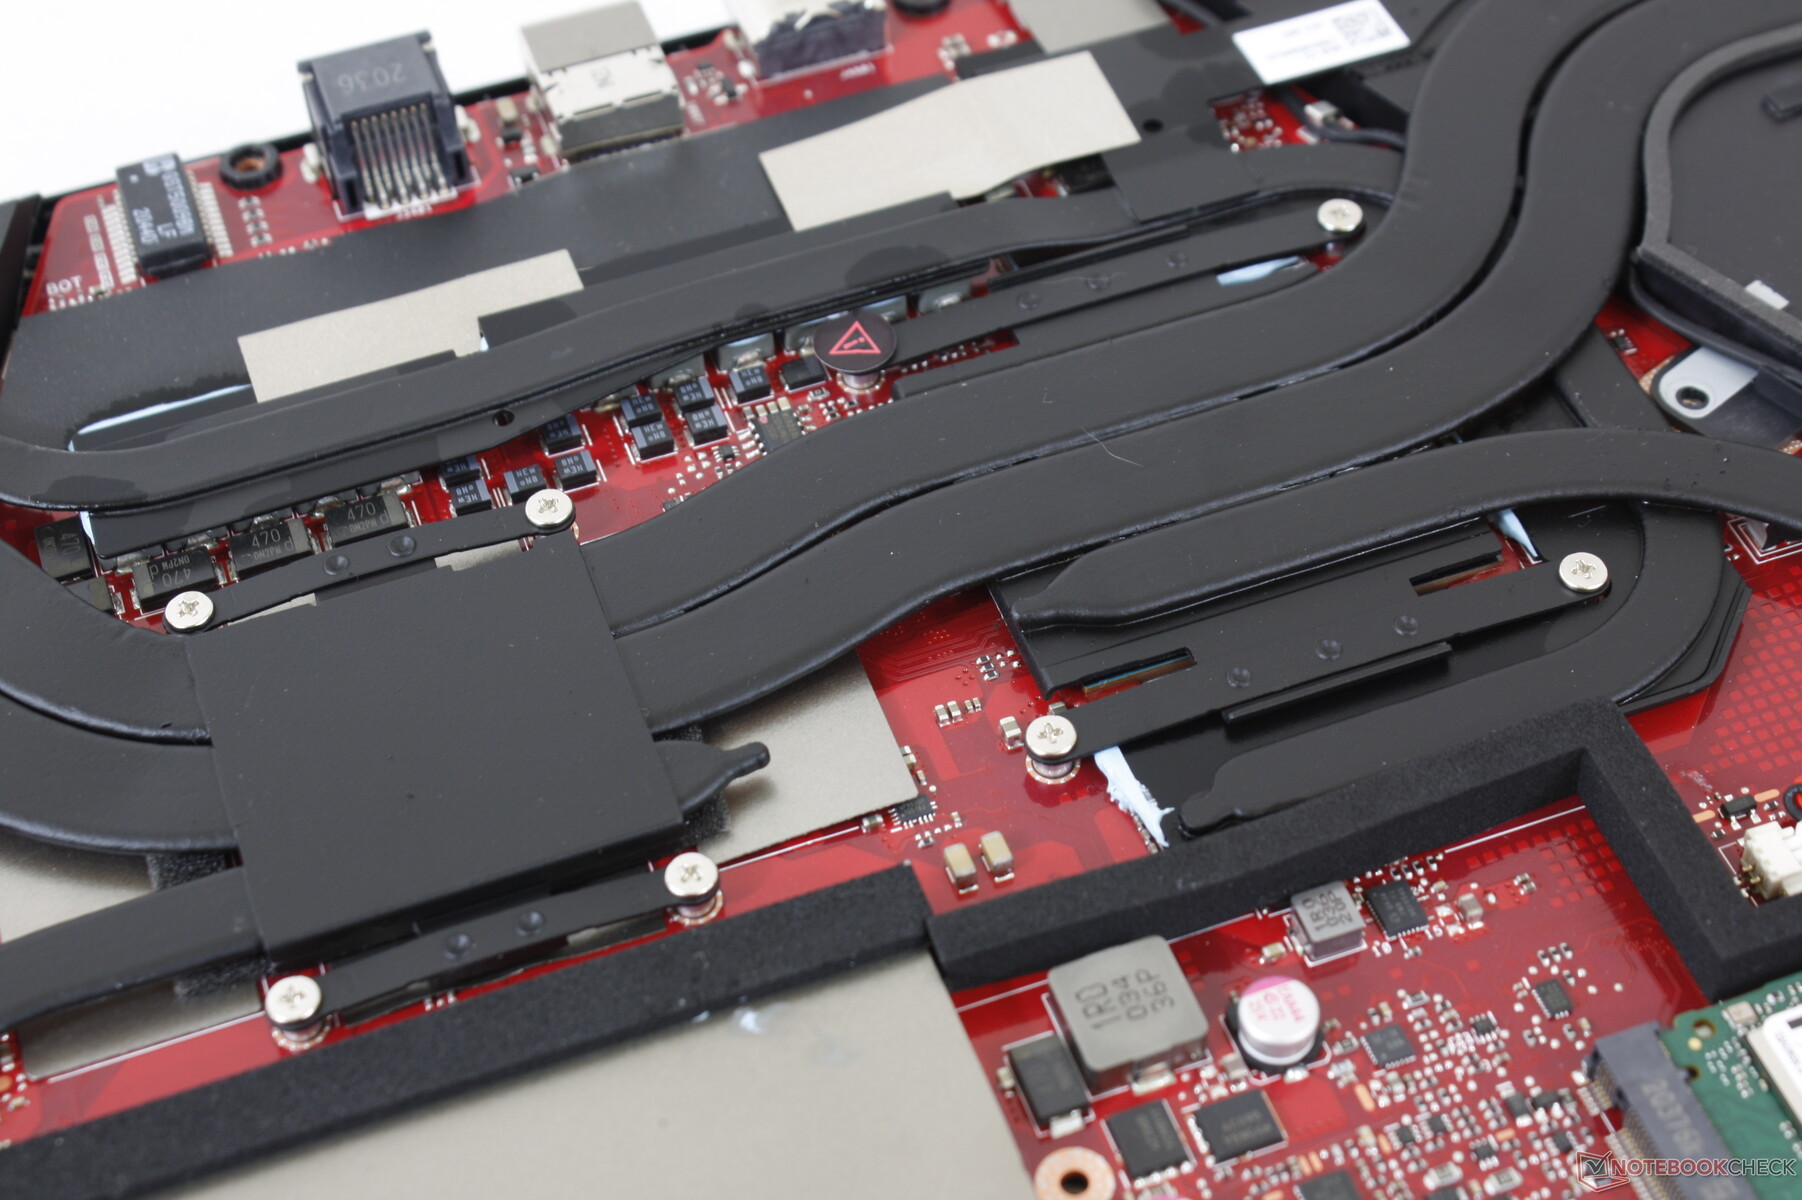
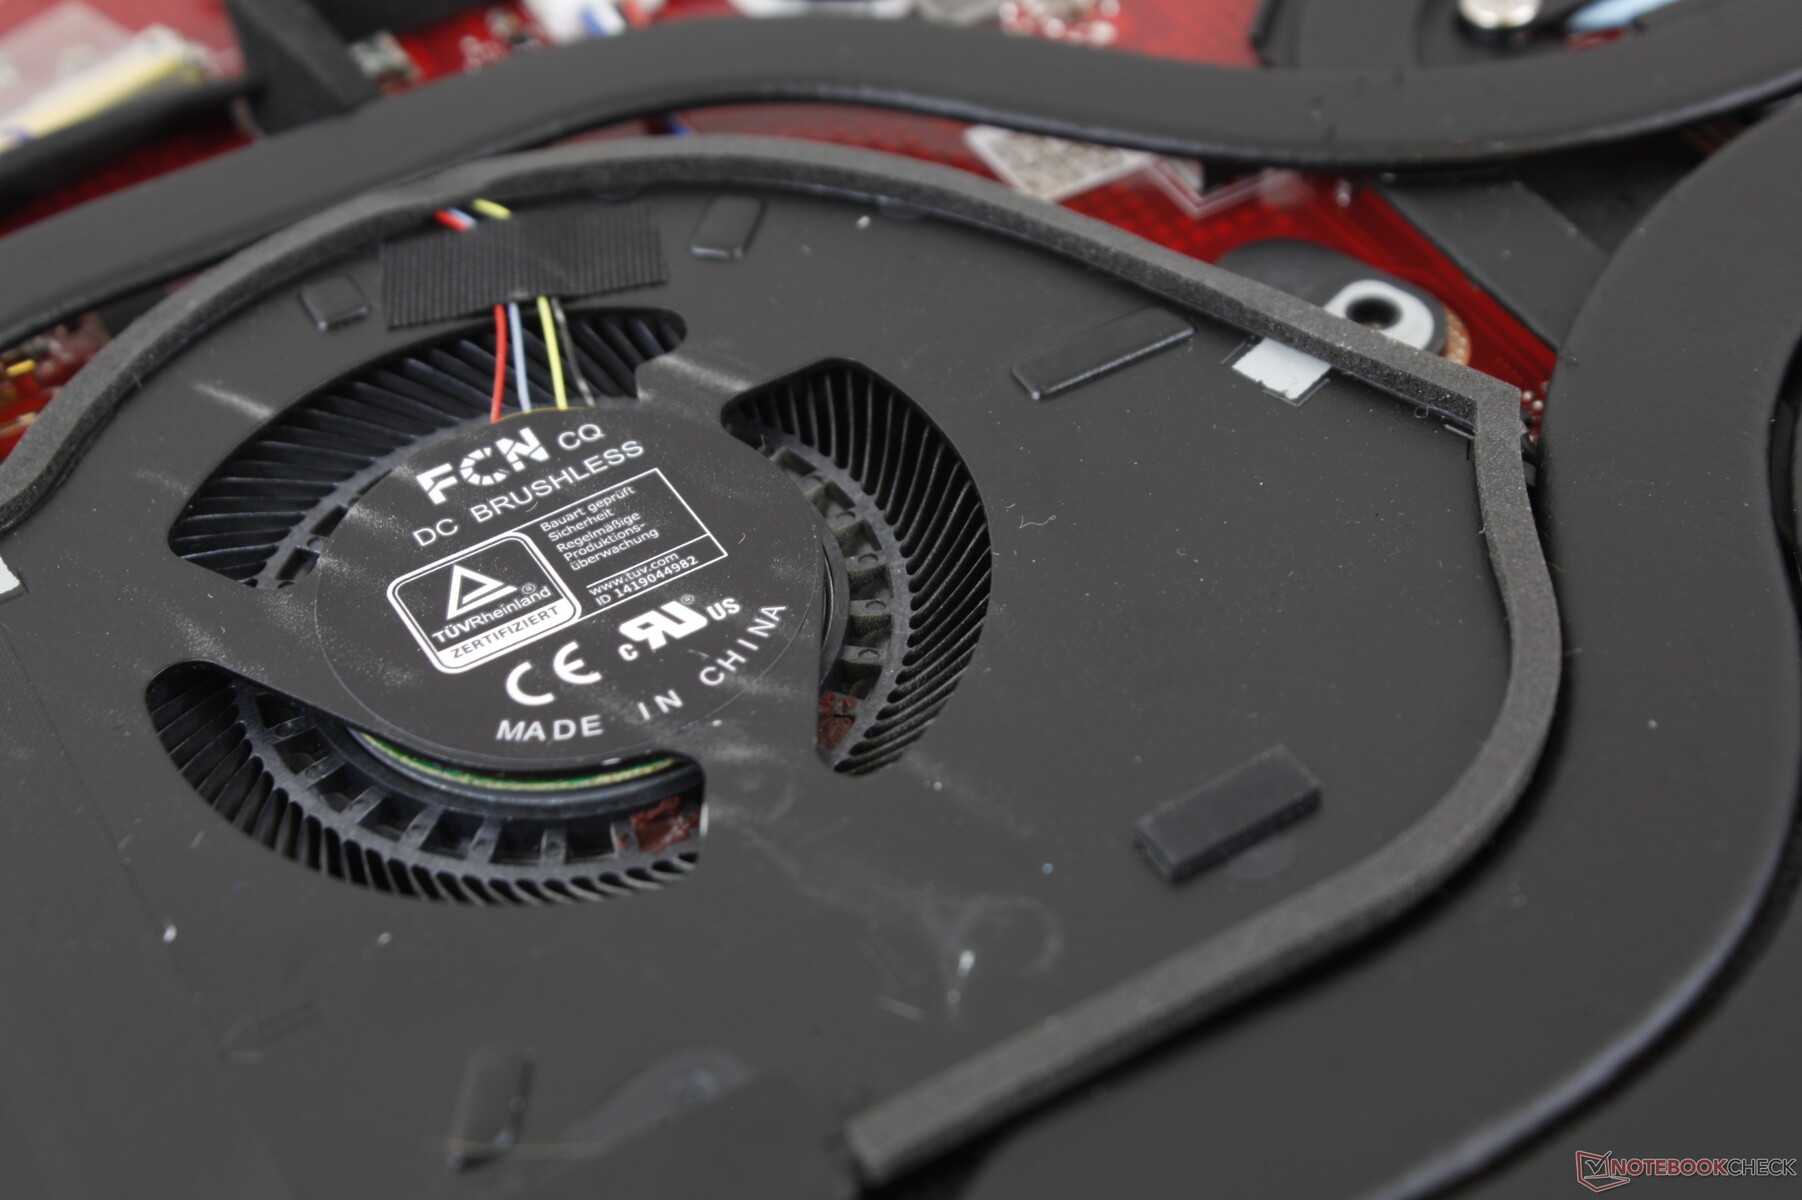
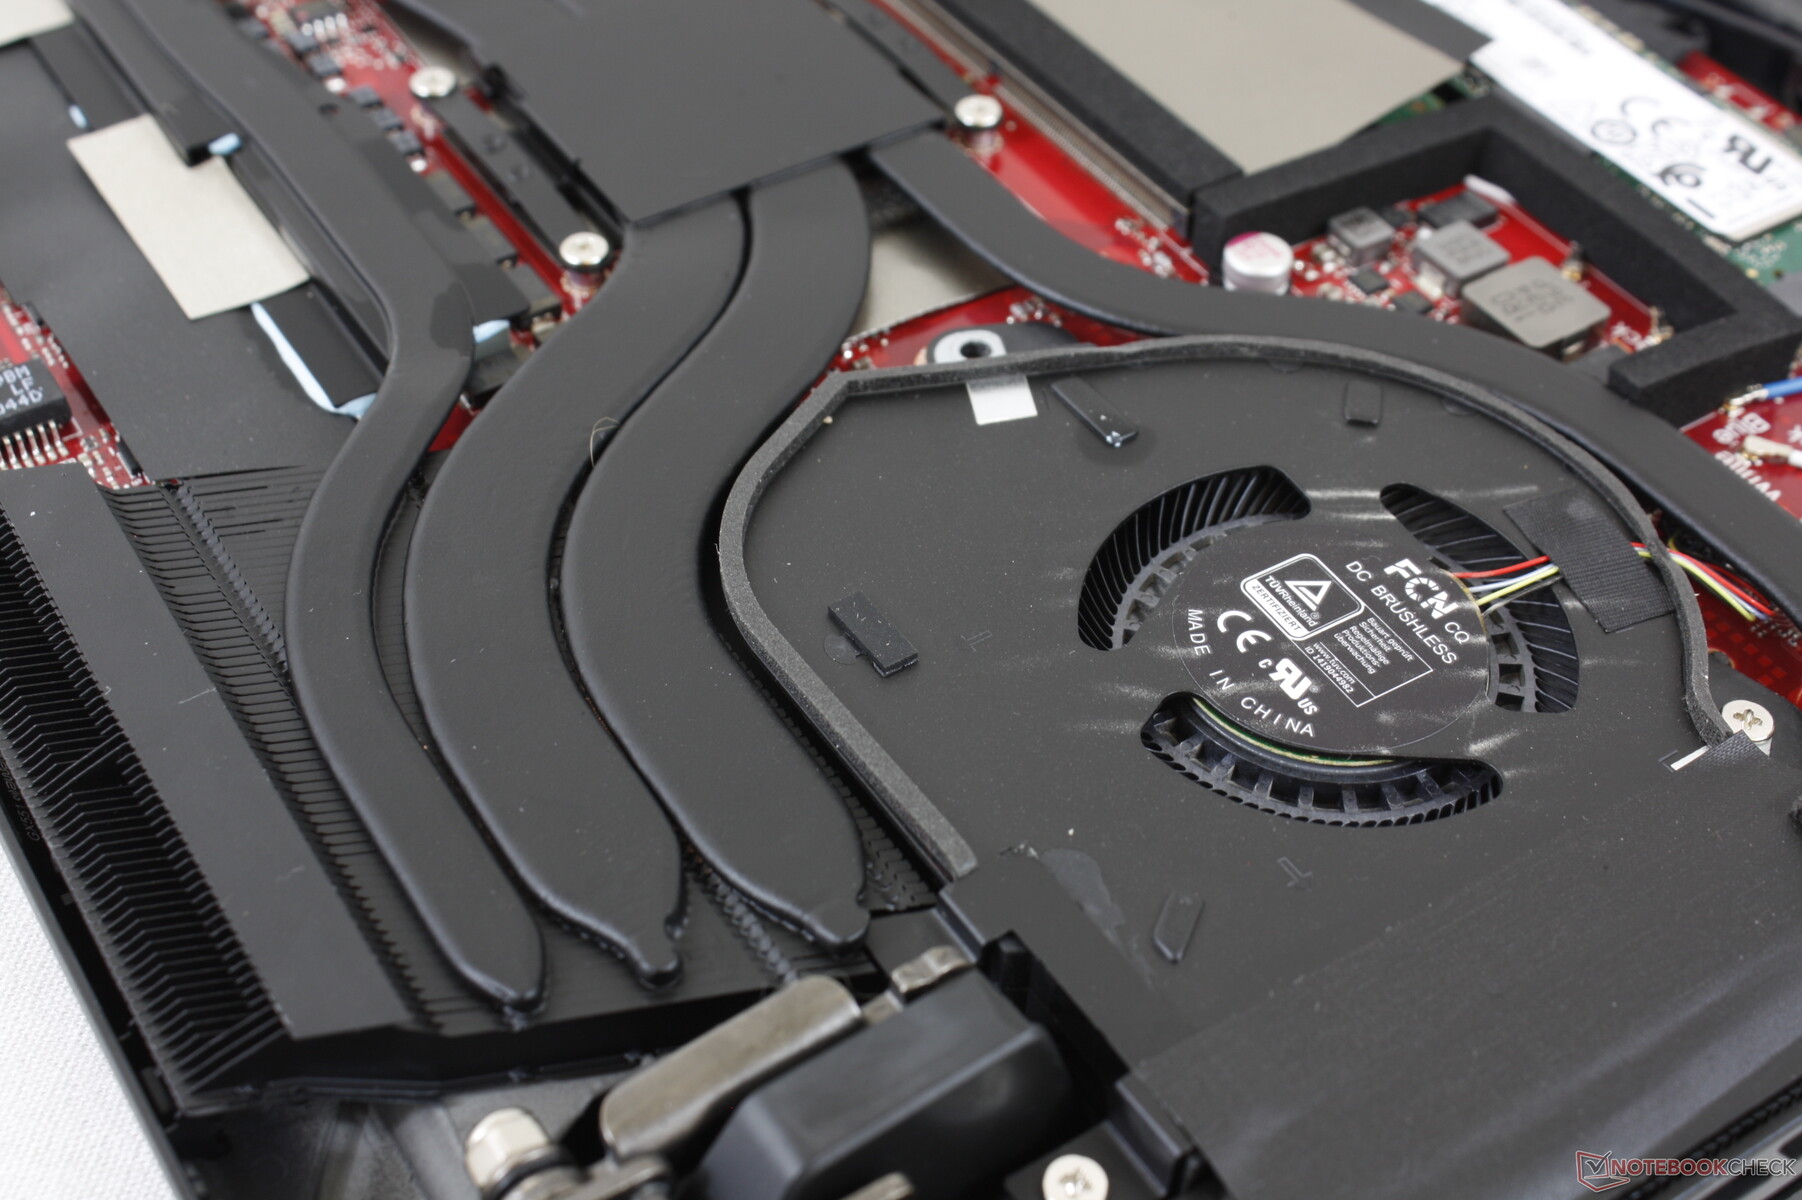
Maintenance
The bottom is secured by fourteen T5 Torx screws and one Philips screw. Servicing is relatively easy nonetheless.
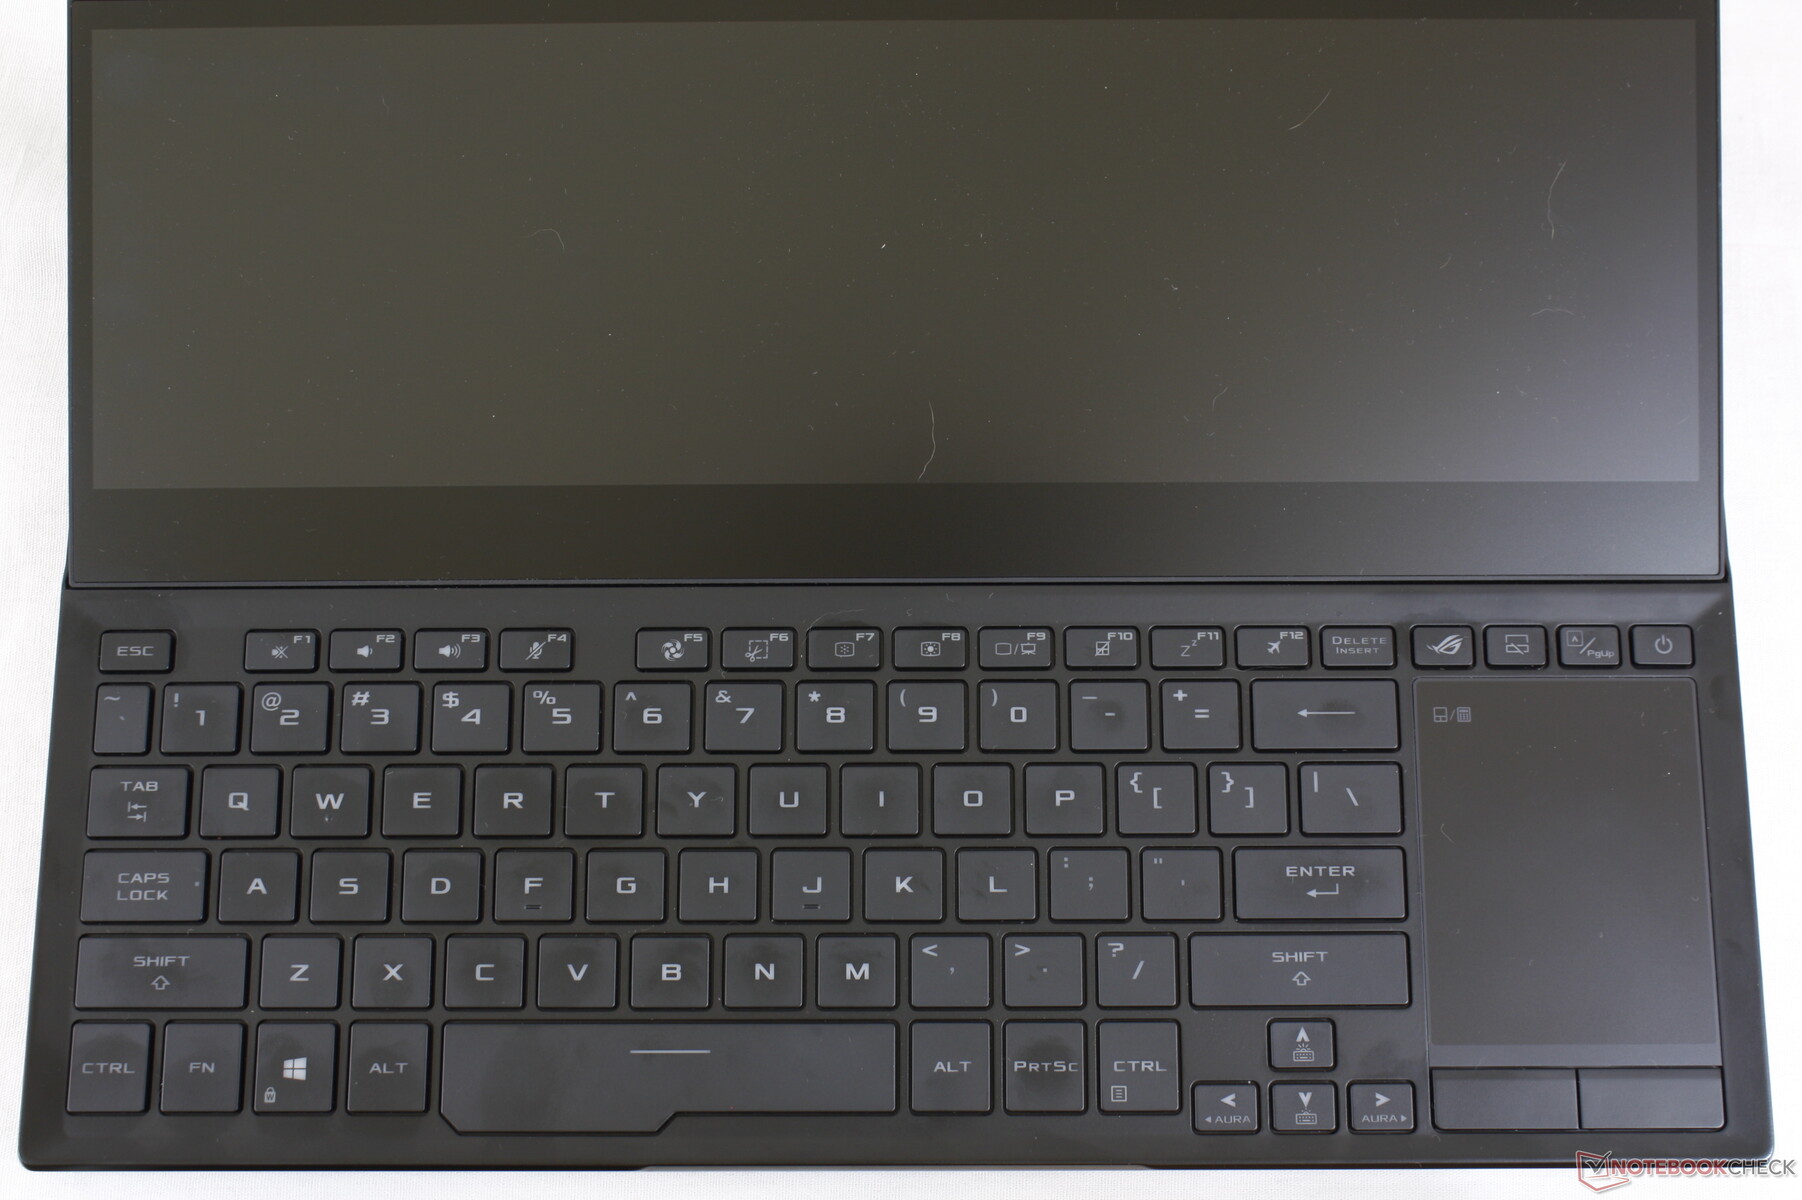
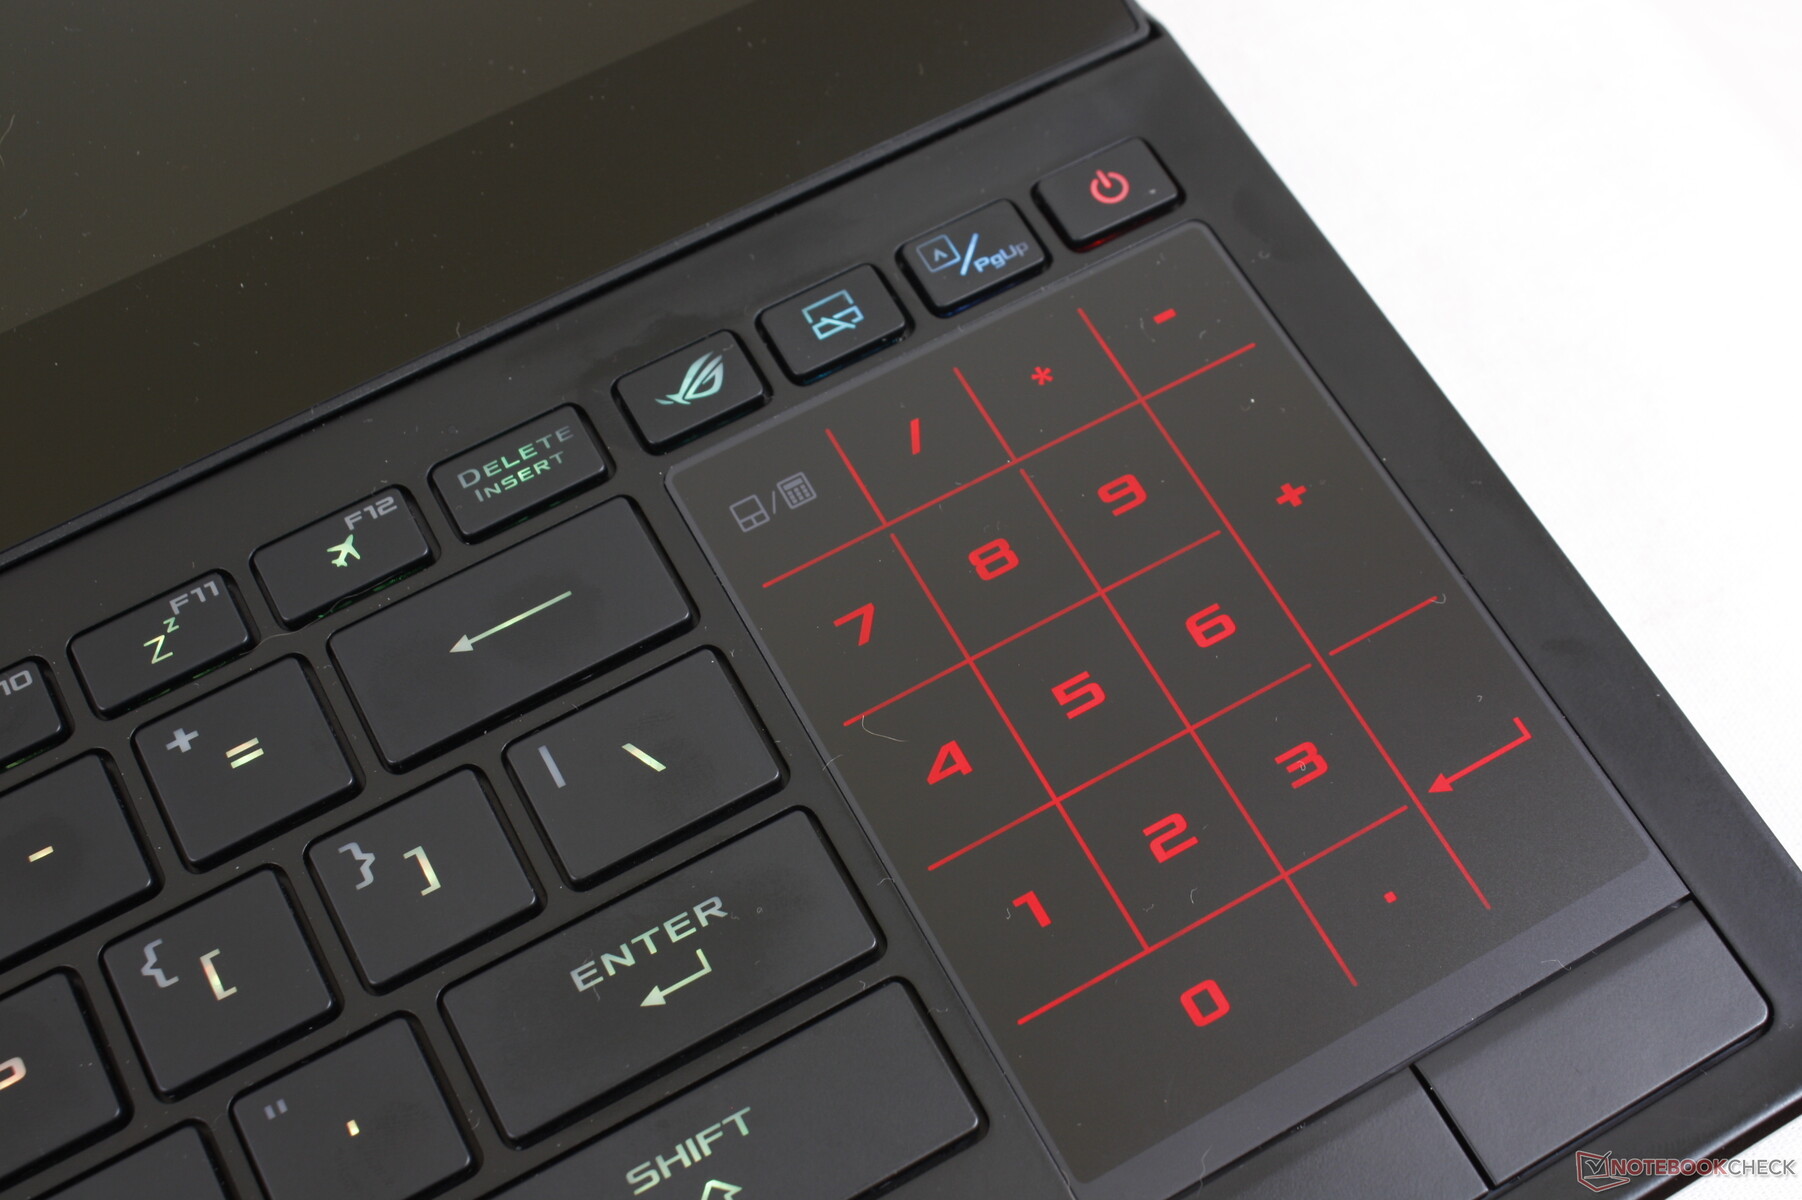
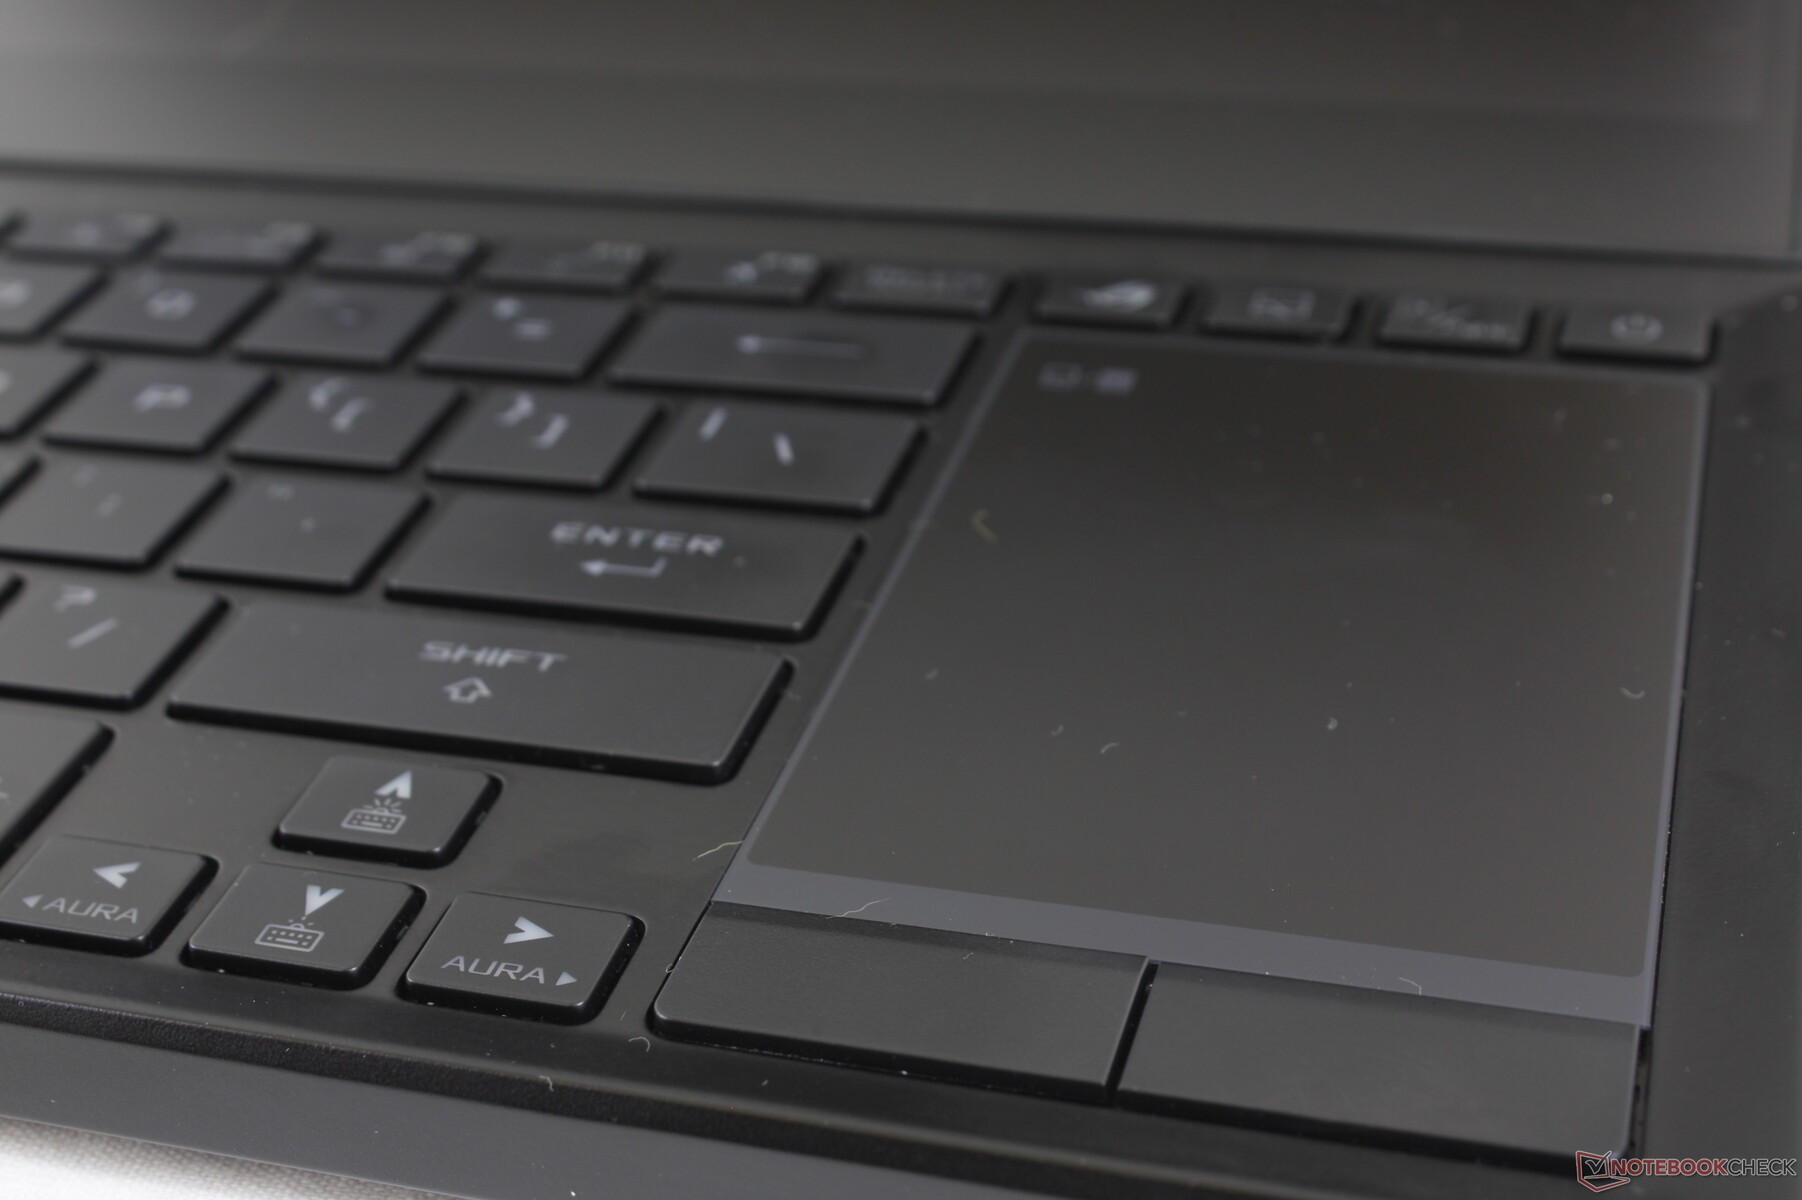
Input Devices

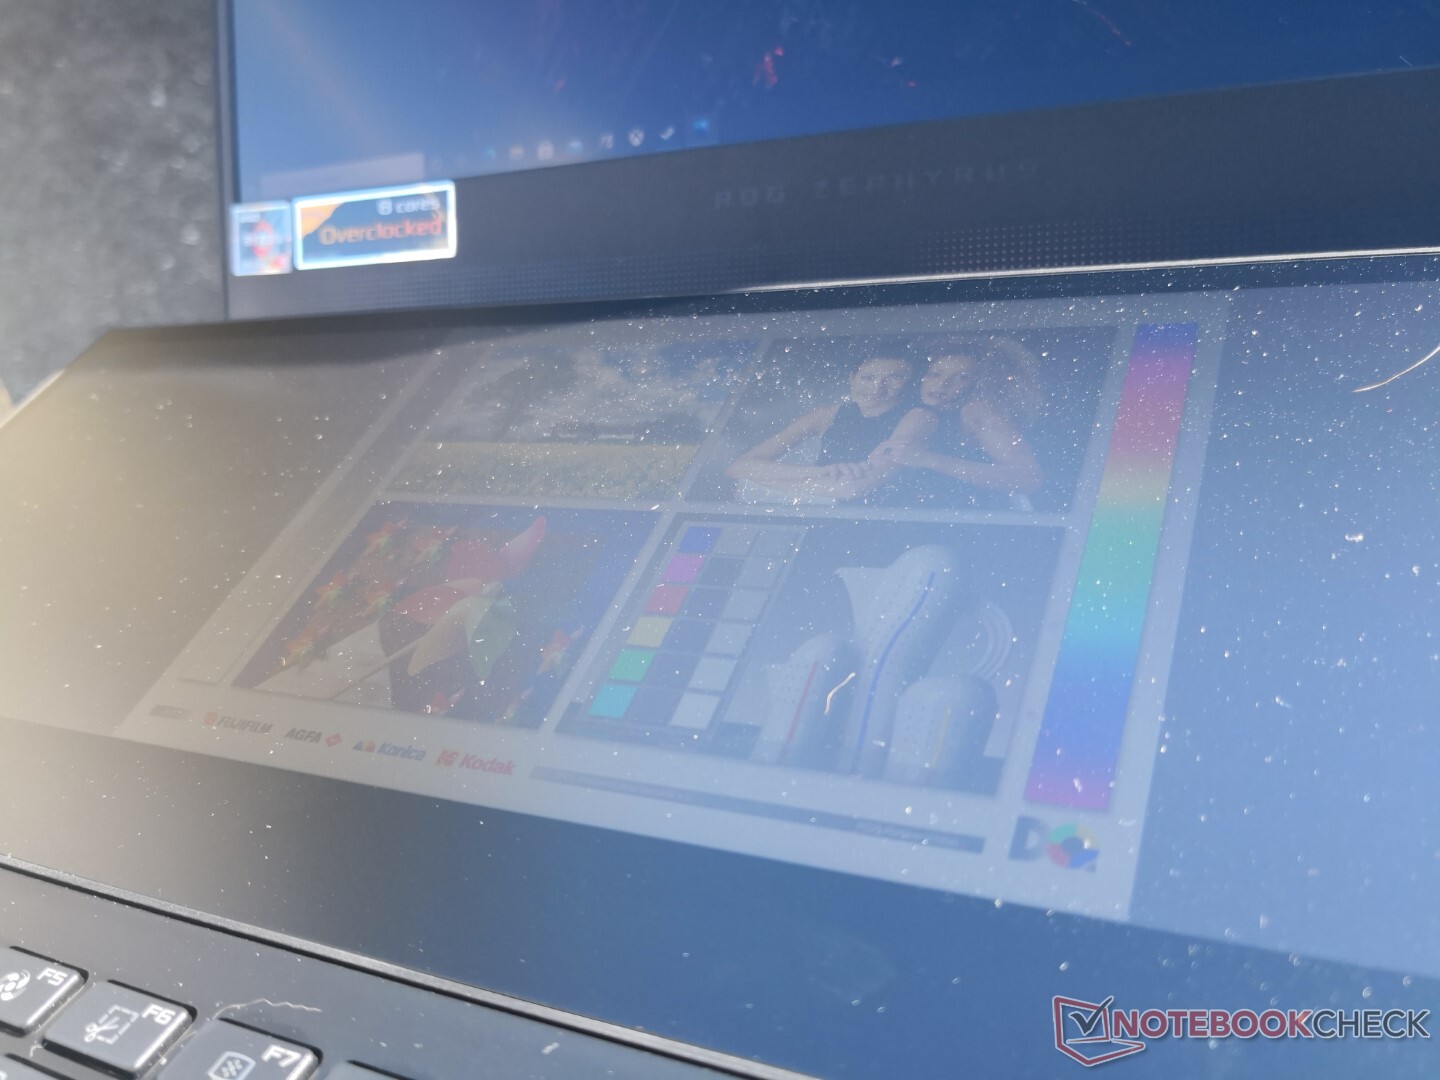
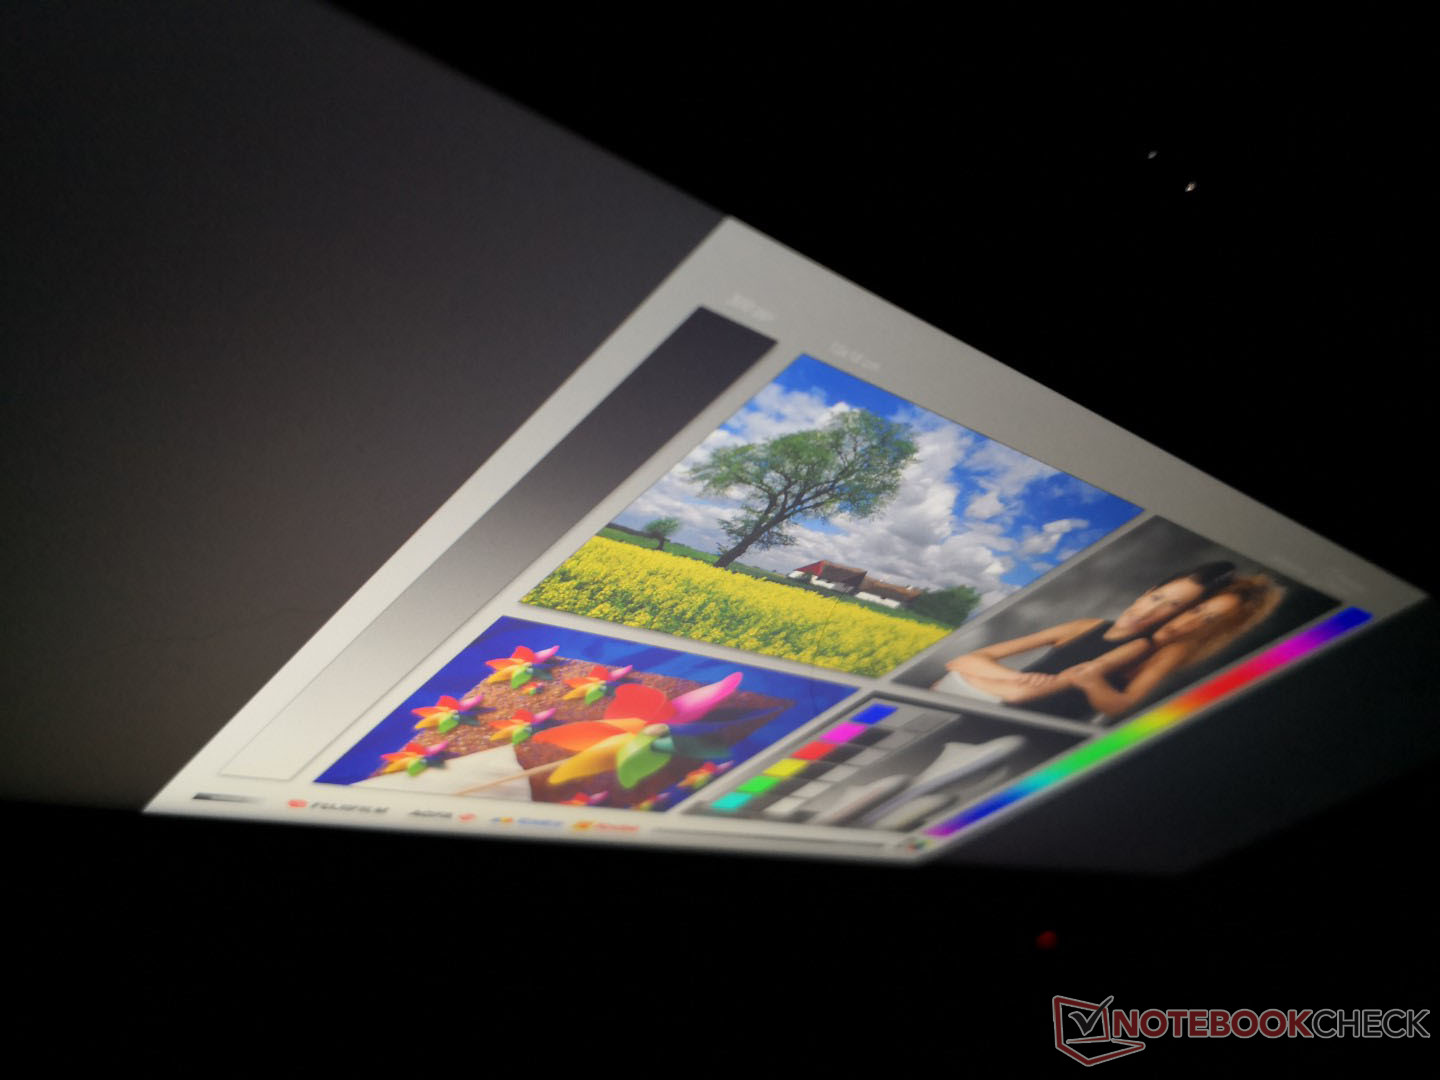
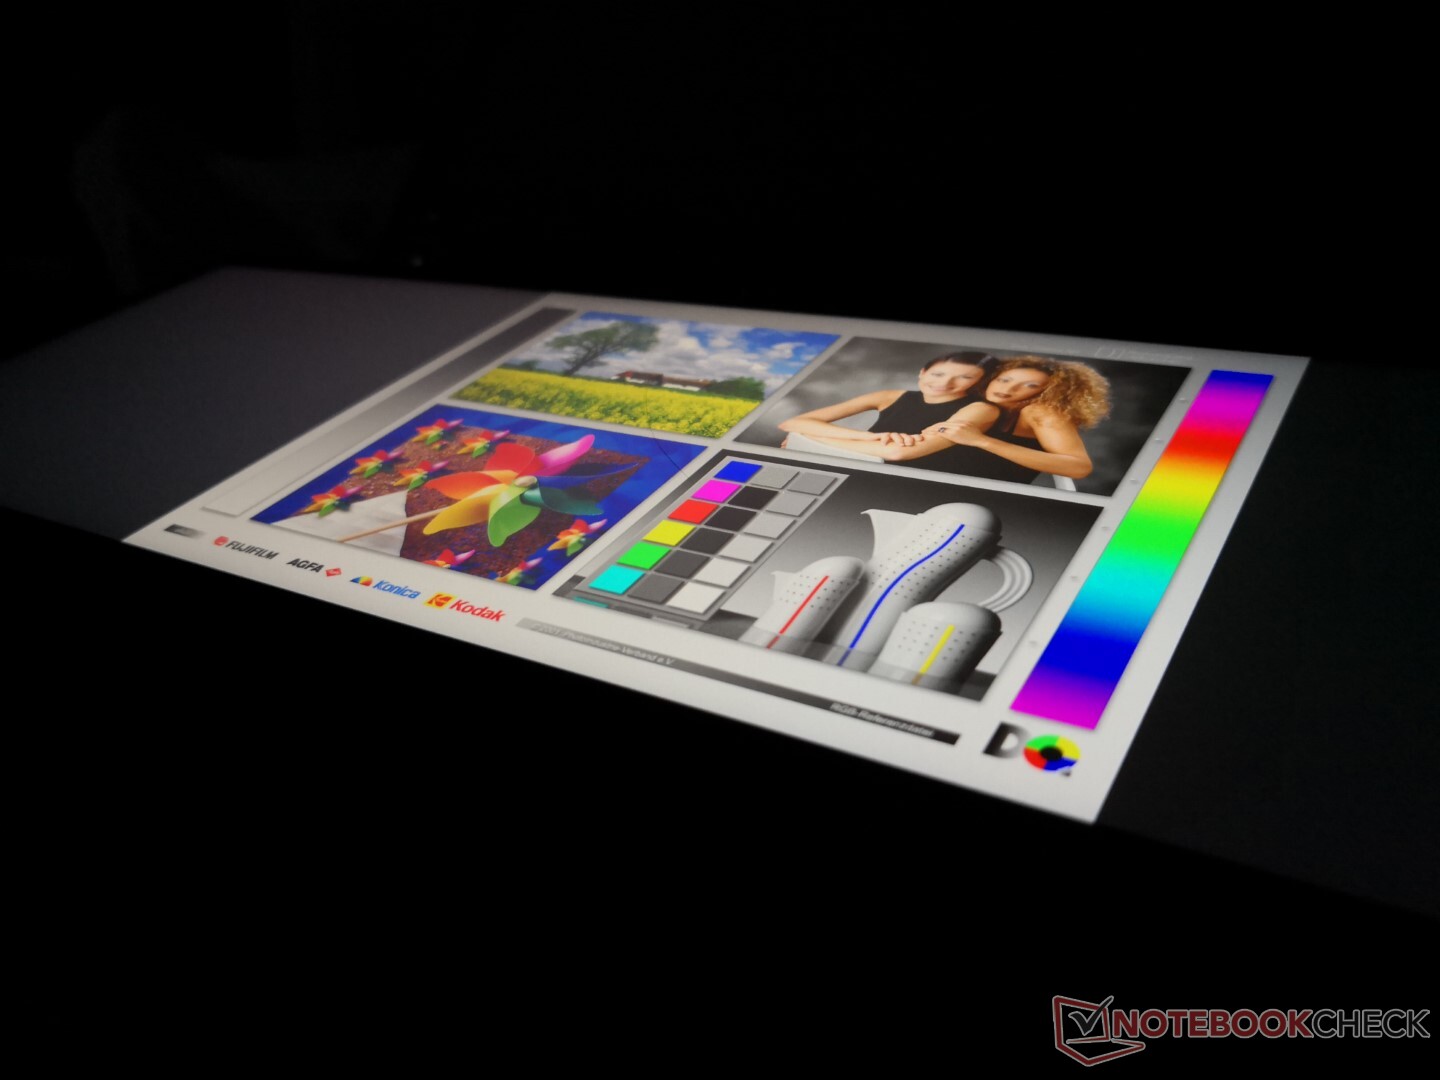
Display
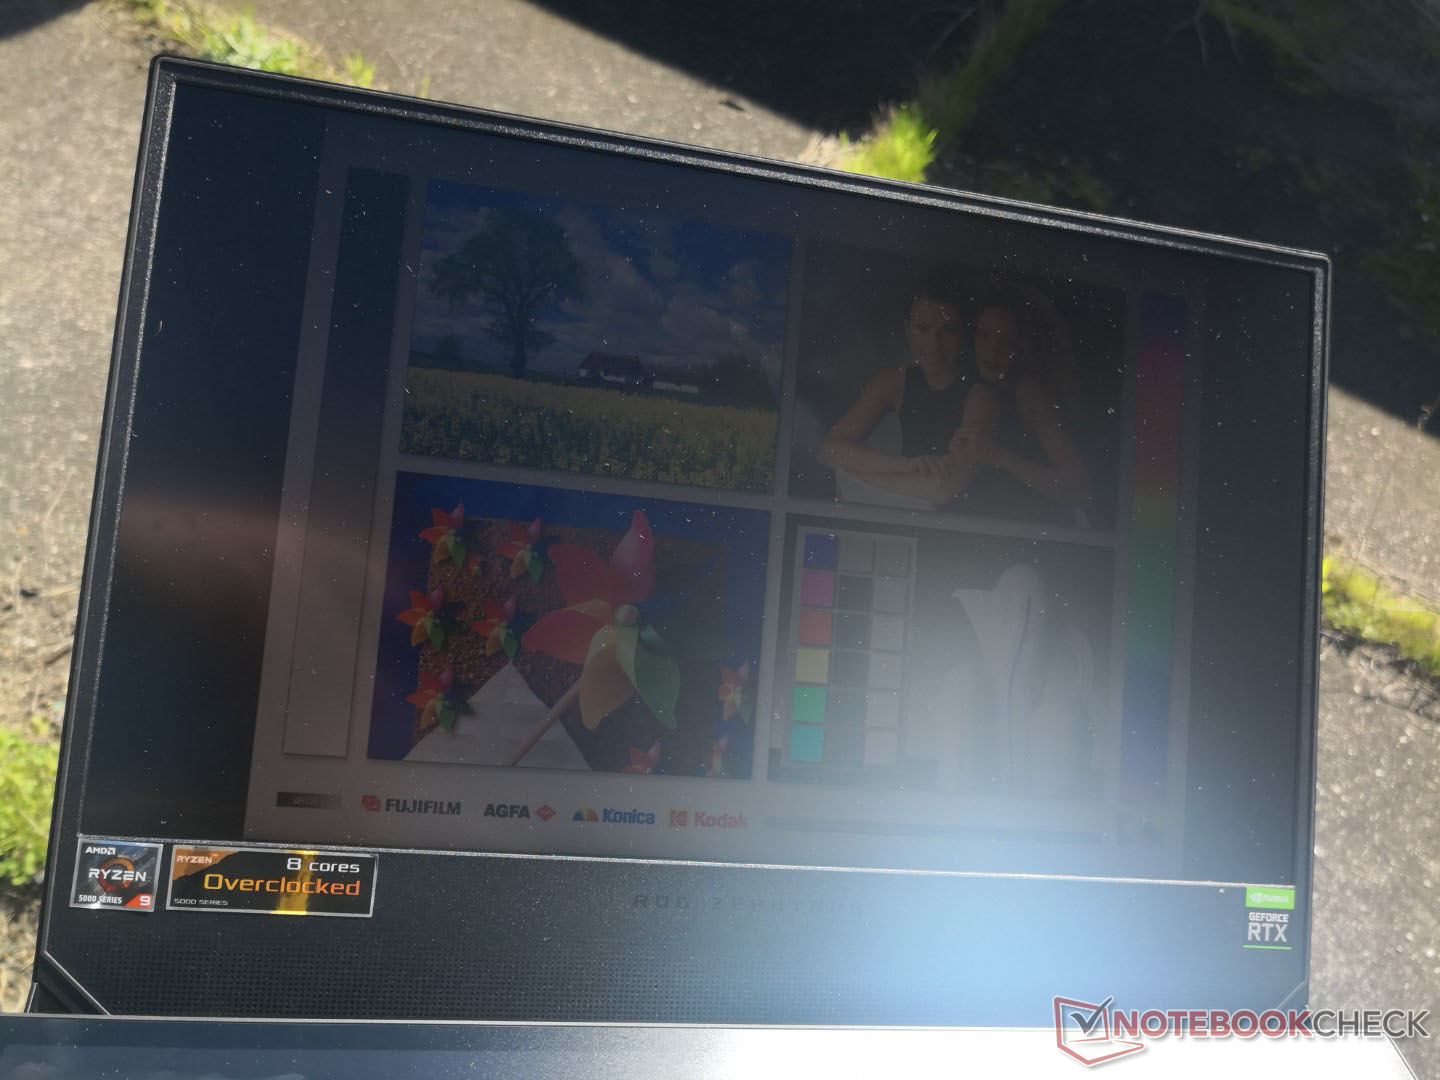
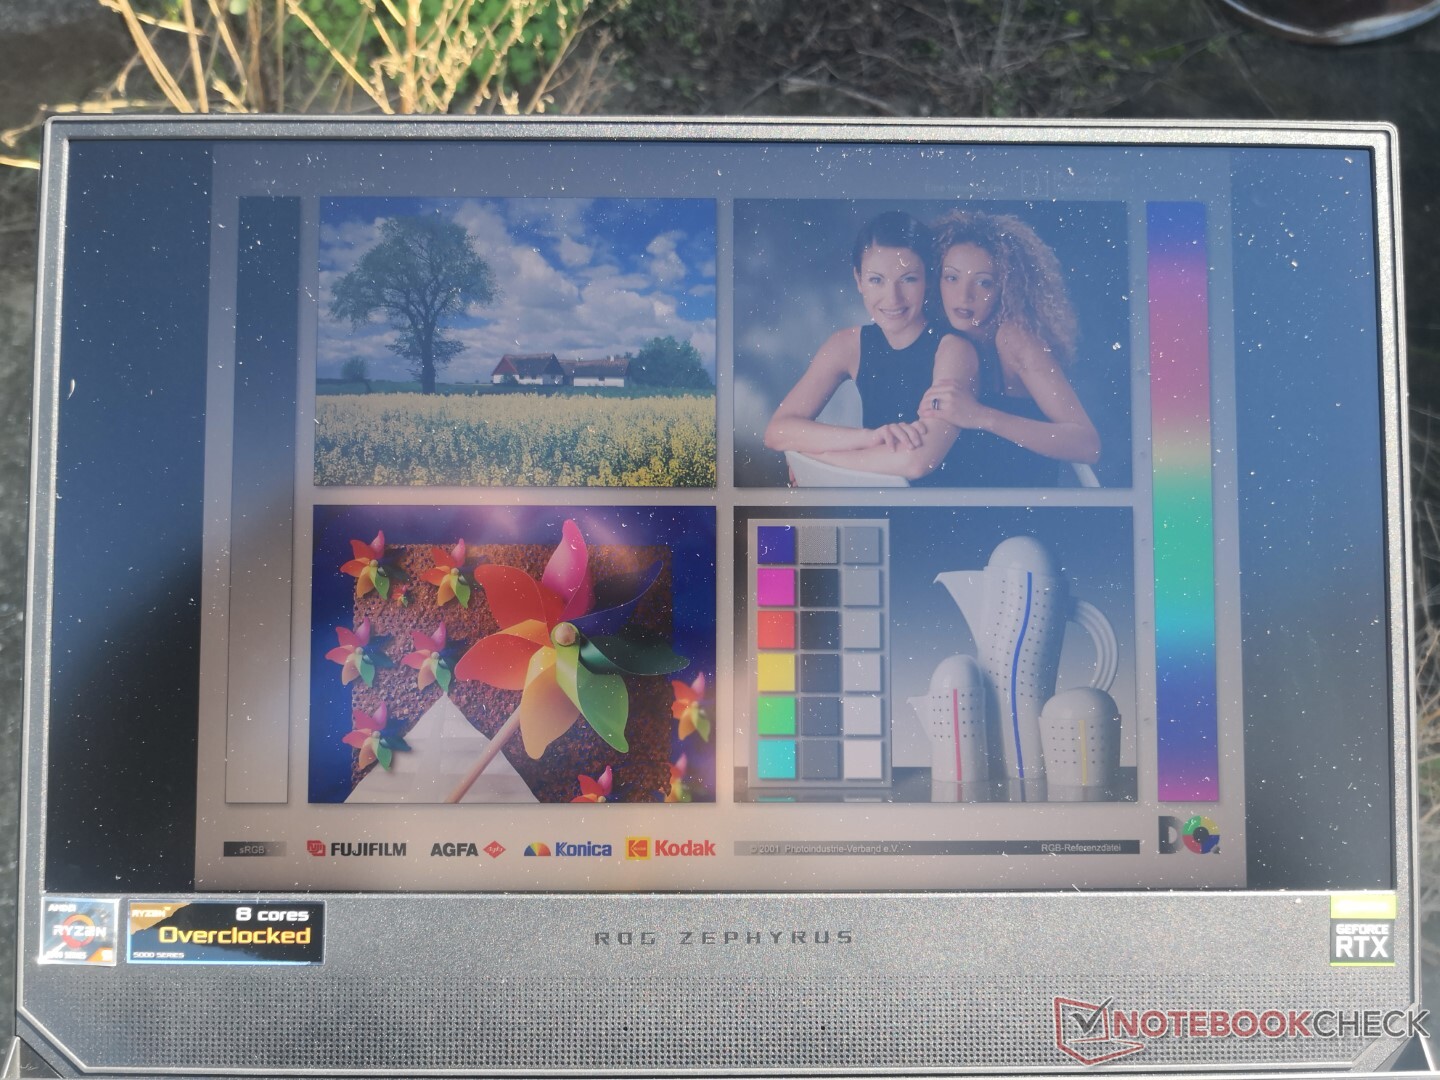
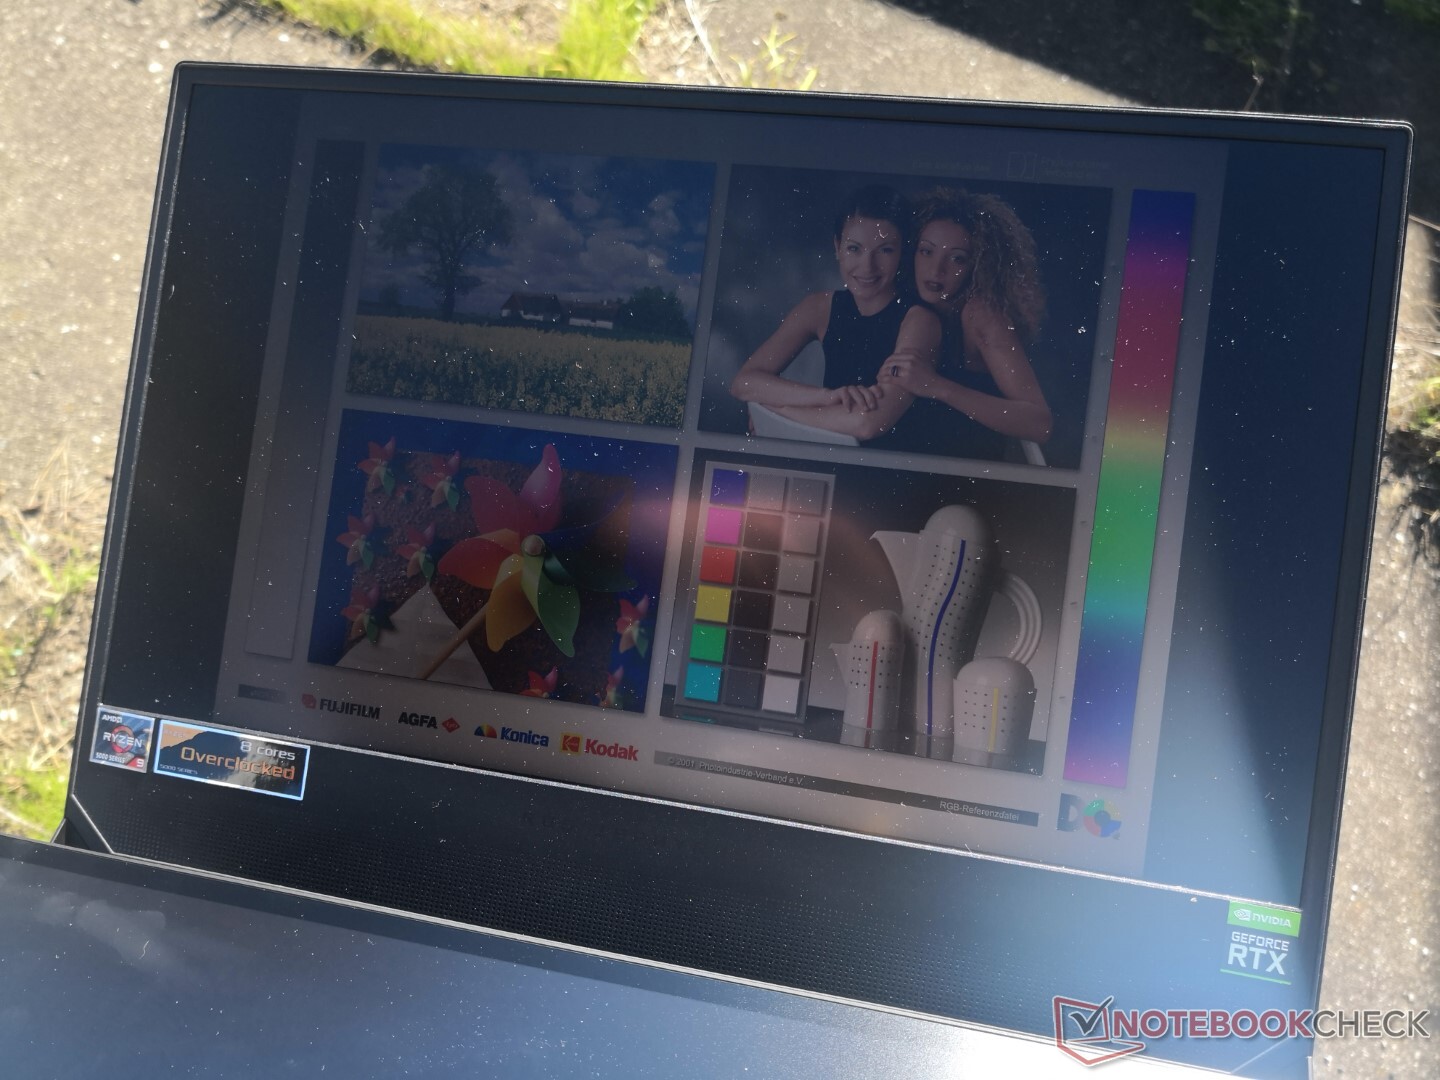
The new 120 Hz 4K display is a significant improvement over the 60 Hz 4K display on last year's GX550 beyond the obvious refresh rate upgrade. Most notably, response times have improved dramatically from 30 ms on the GX550 to just 3 ms to 5 ms on the newer panel. Gameplay and cursor movements are noticeably smoother and with almost no noticeable ghosting for a better gaming experience. Color space and brightness remain about the same gen-to-gen while contrast has dipped slightly, but that's a small price to pay when considering the advantages gained.
The panel also supports FreeSync to reduce screen tearing which certainly comes in handy as even the most powerful of GPUs can't run all titles at native 4K and a steady 120 FPS.

| |||||||||||||||||||||||||
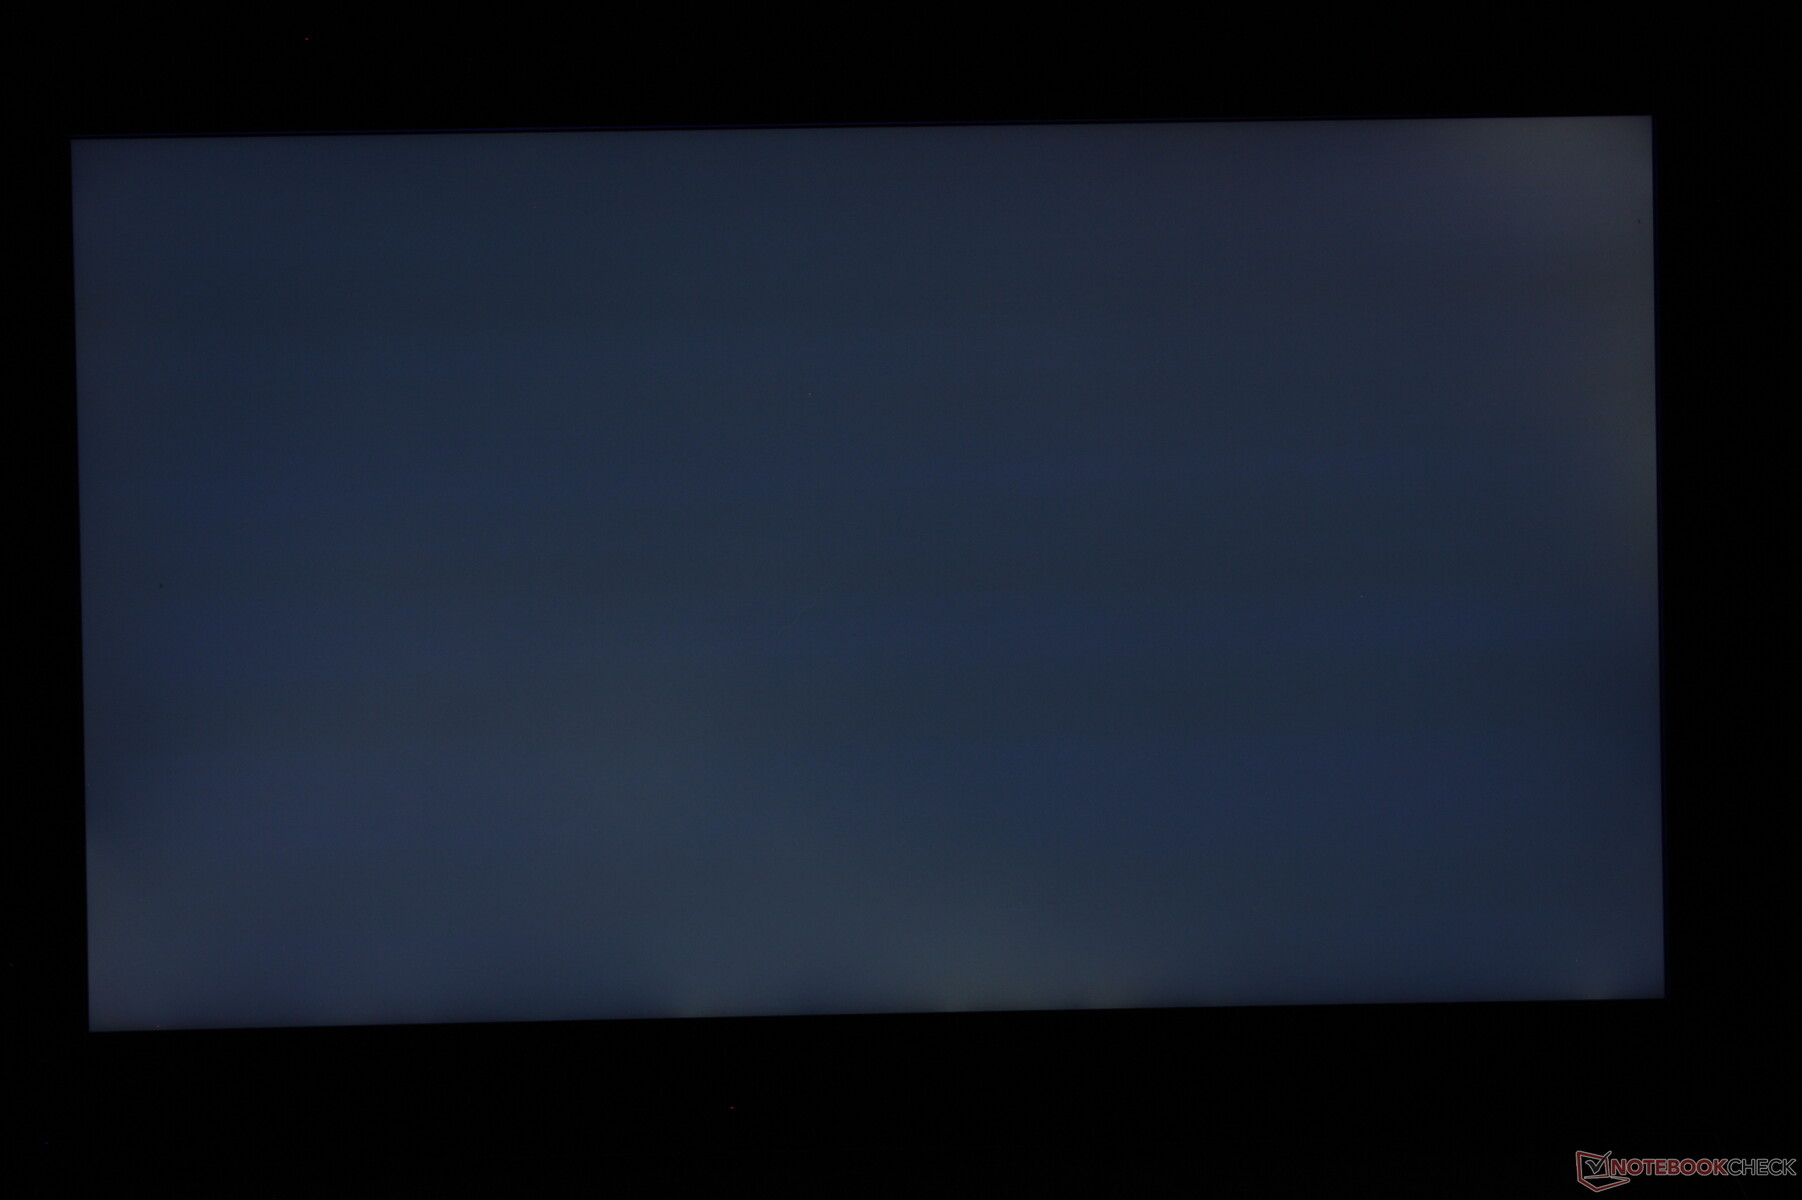
Brightness Distribution: 88 %
Center on Battery: 210 cd/m²
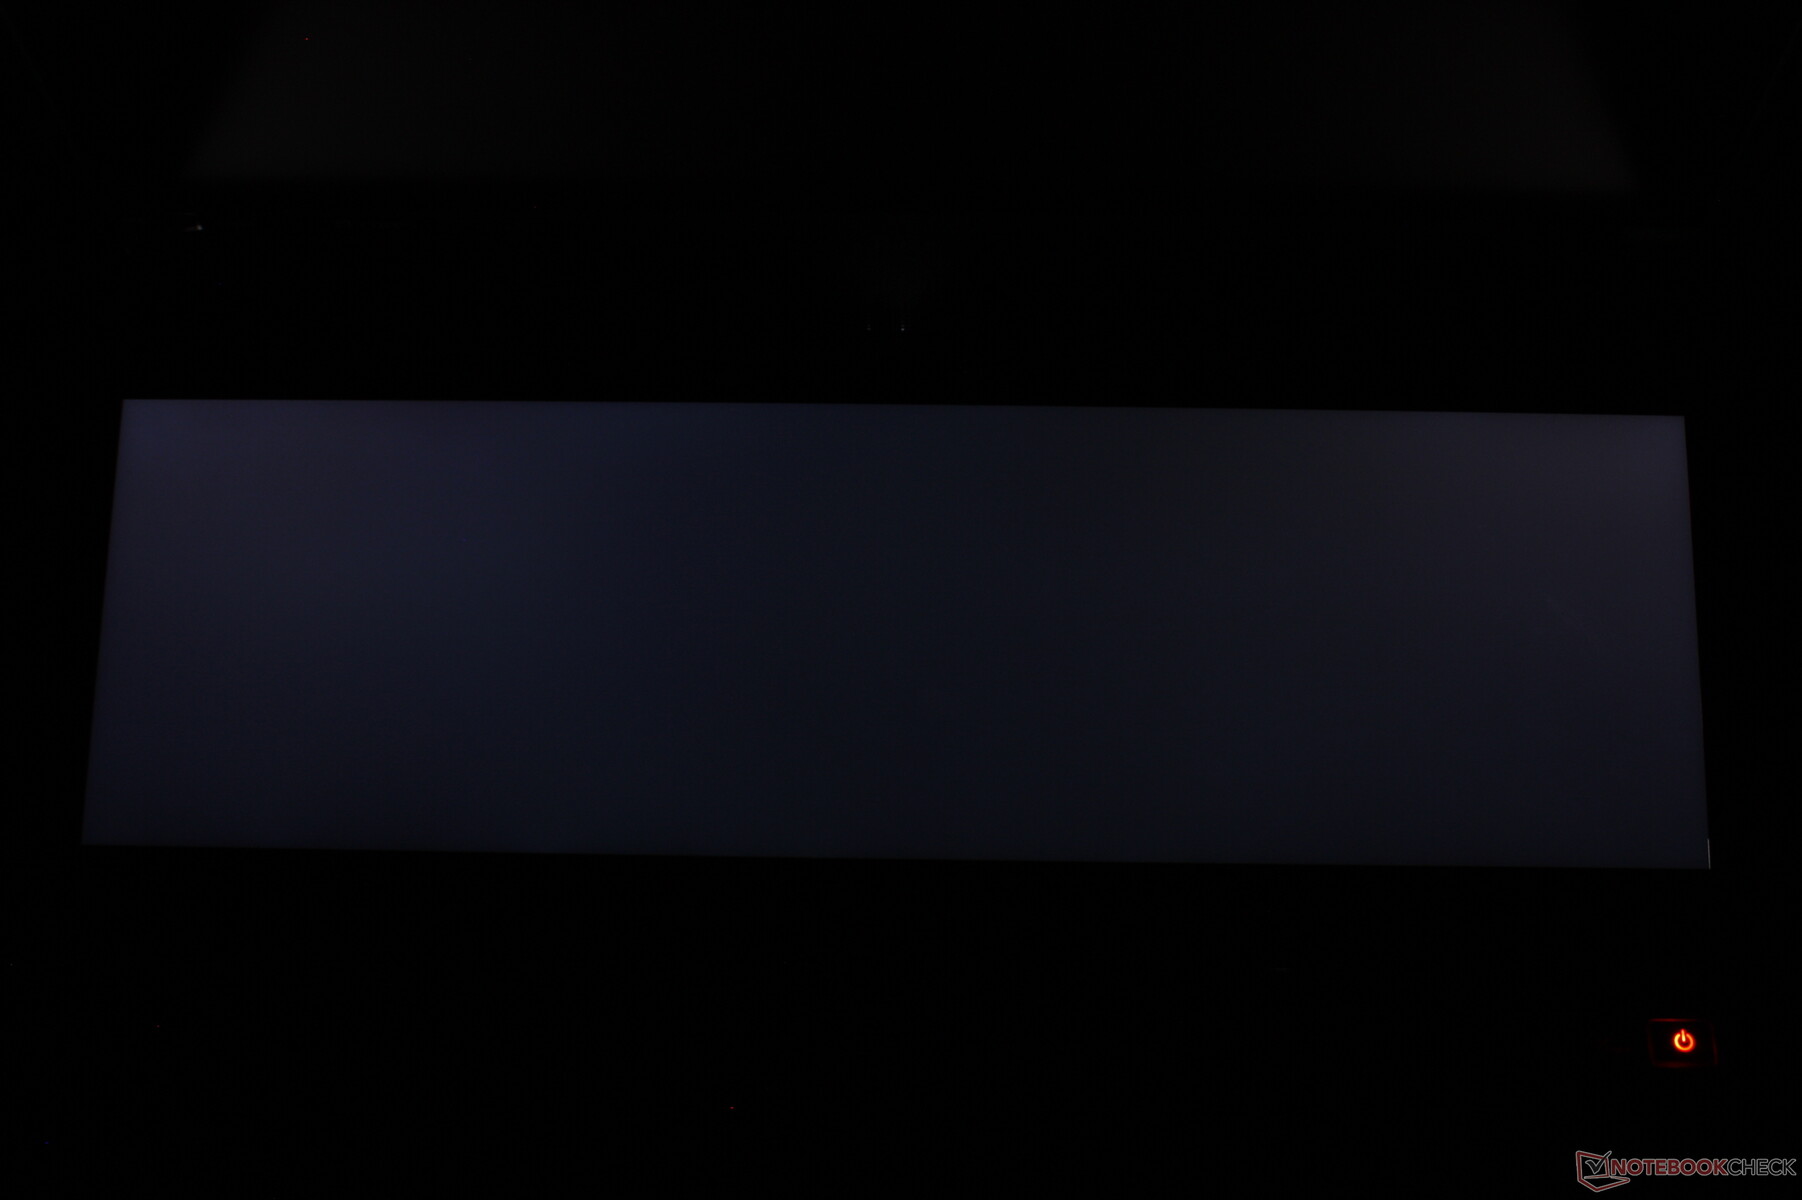
Contrast: 967:1 (Black: 0.42 cd/m²)
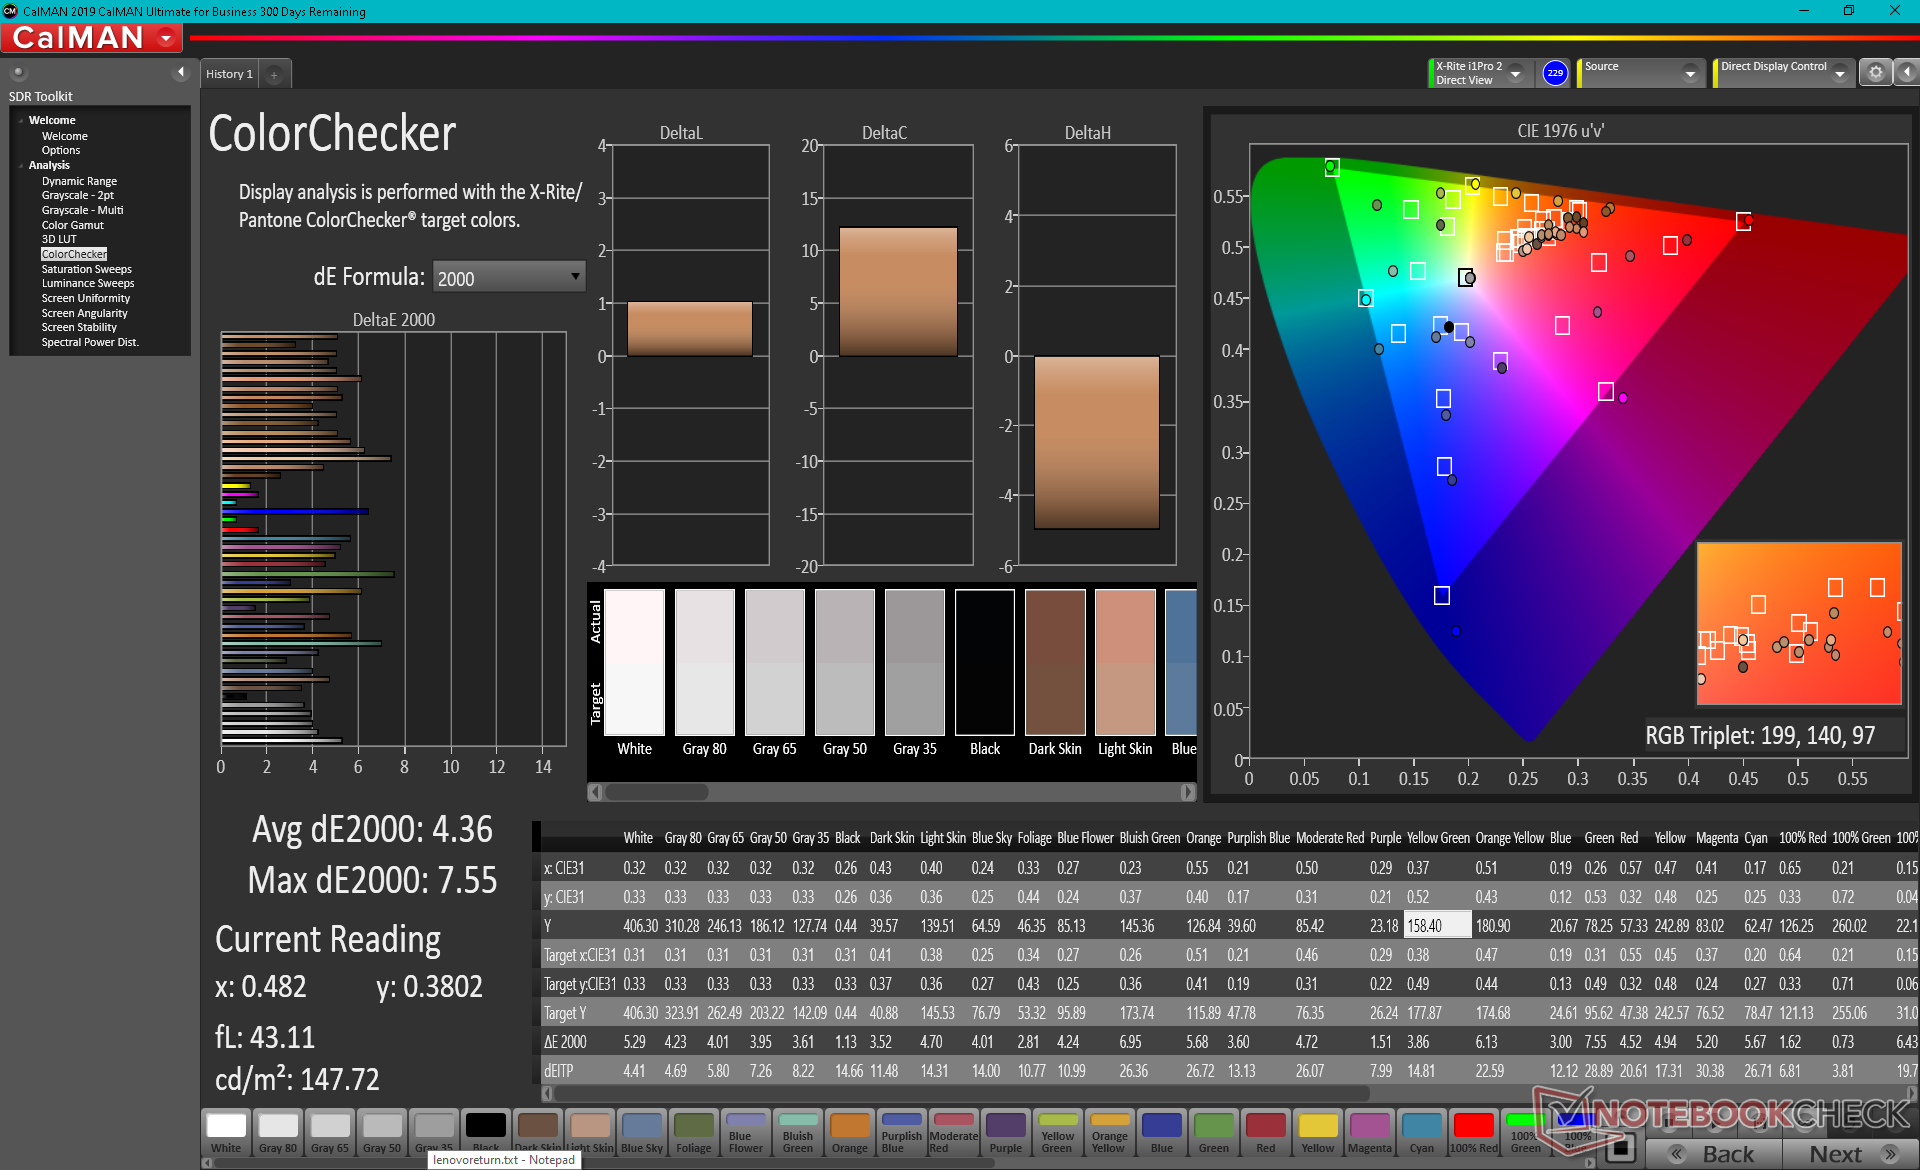
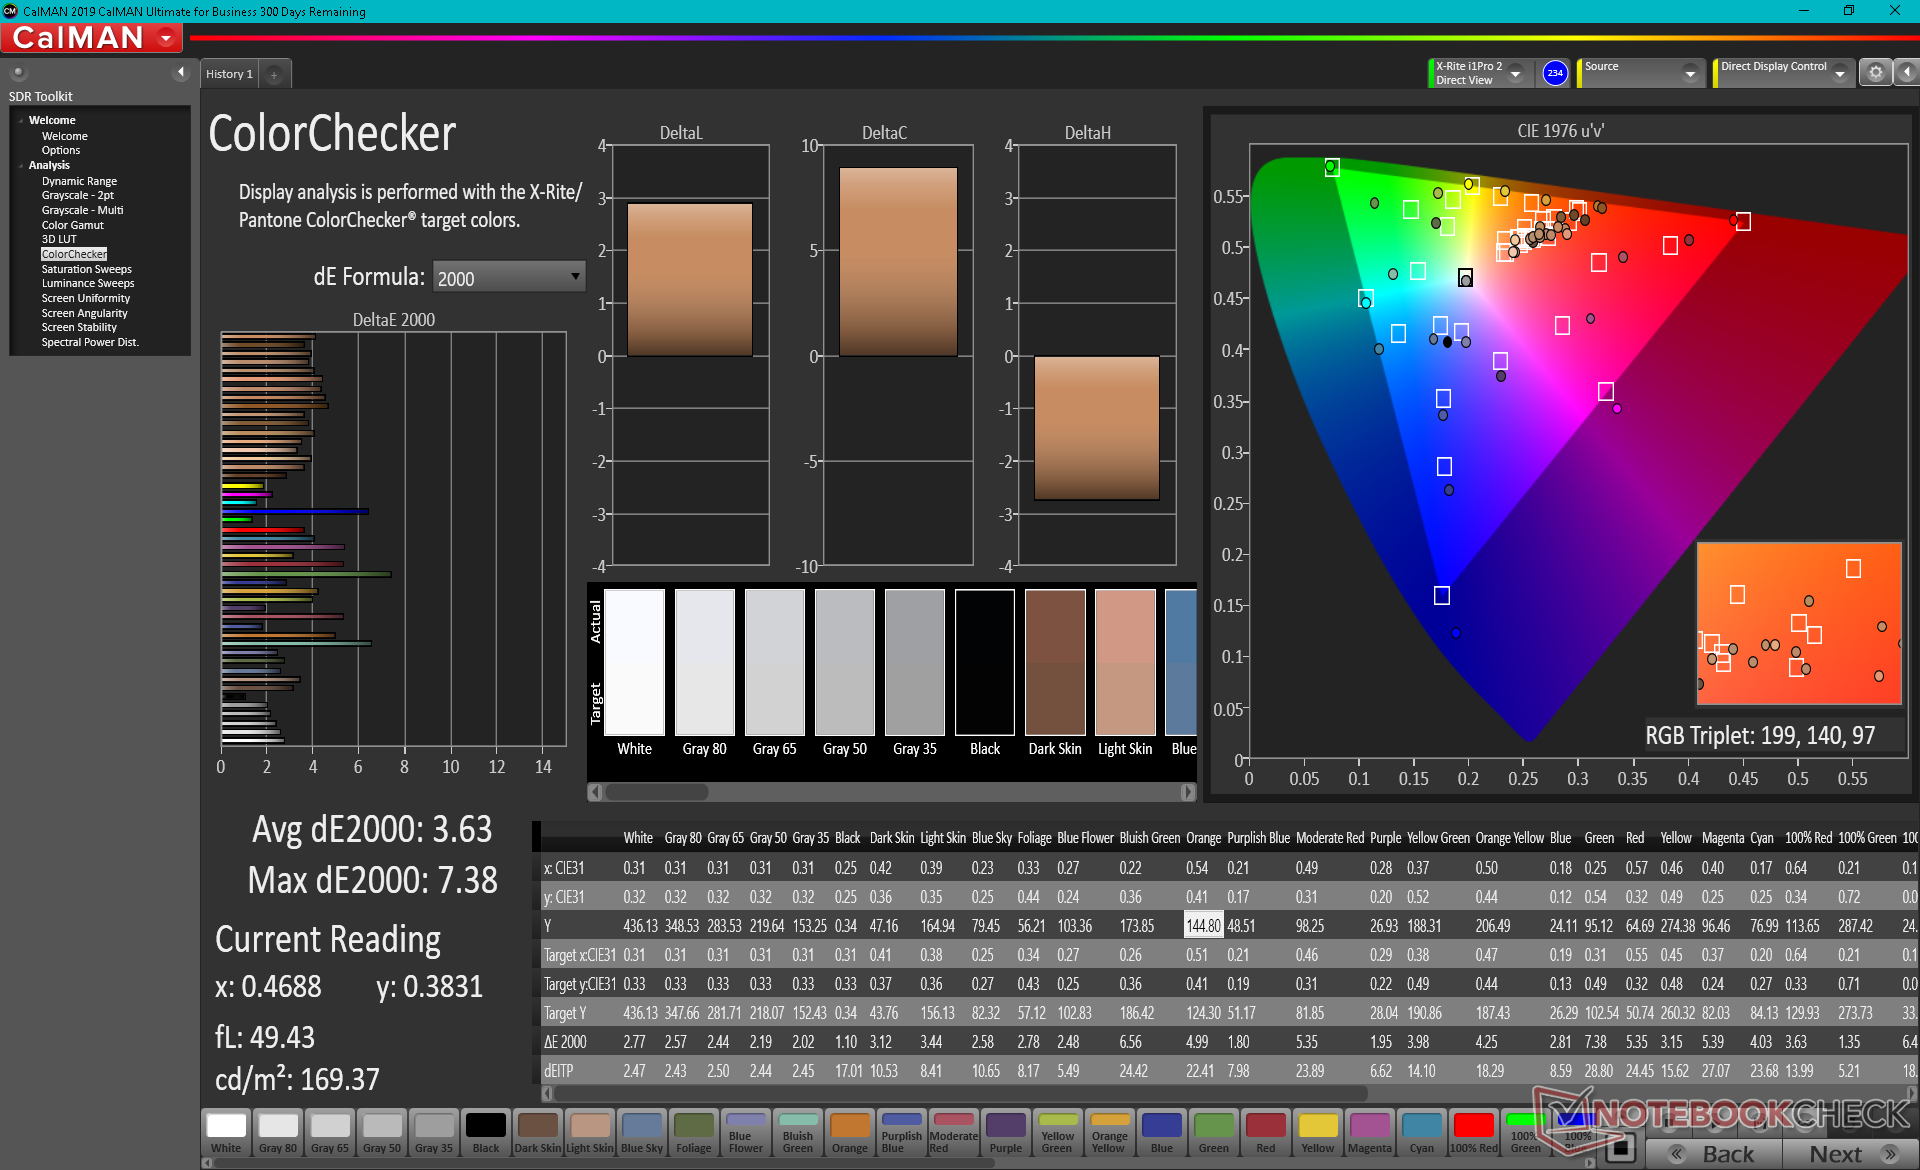
ΔE ColorChecker Calman: 4.36 | ∀{0.5-29.43 Ø4.73}
calibrated: 3.63
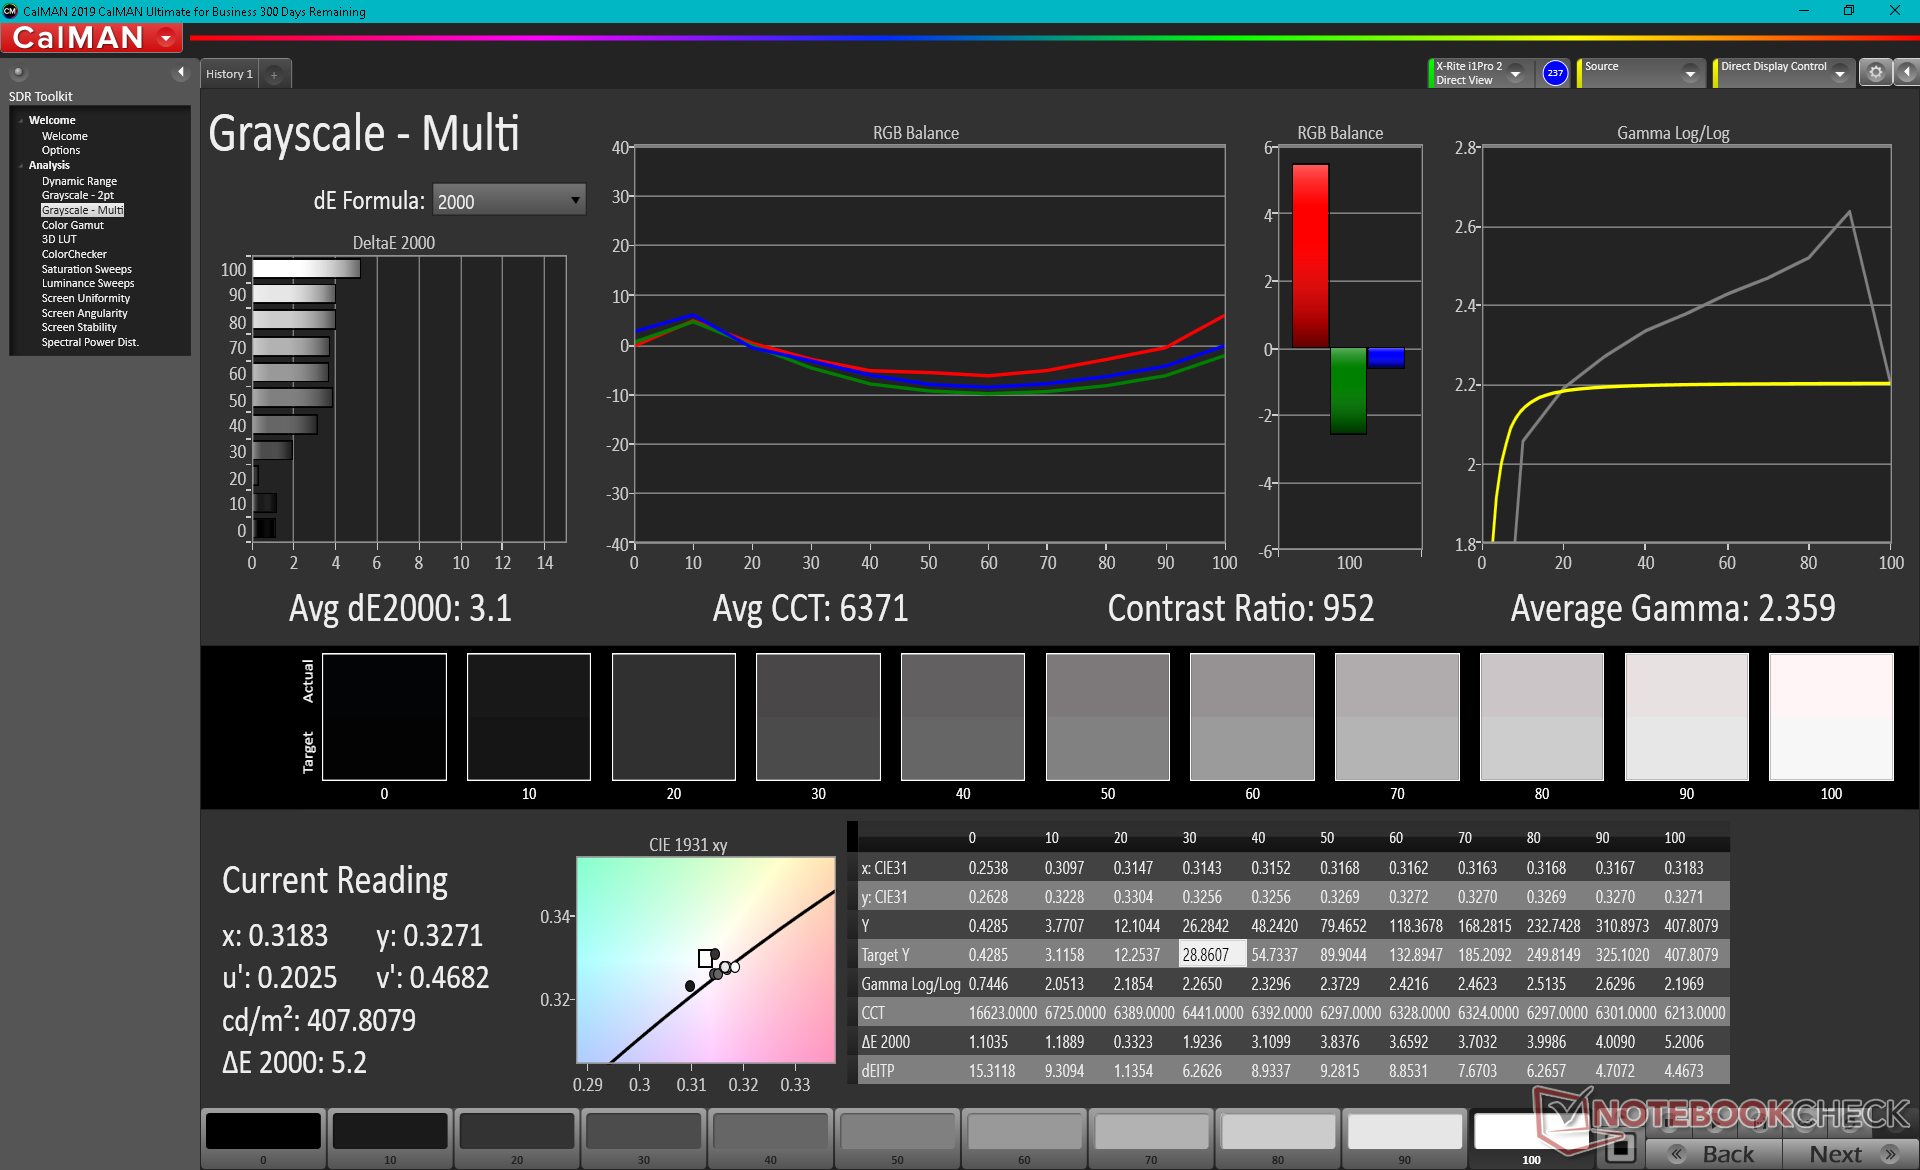
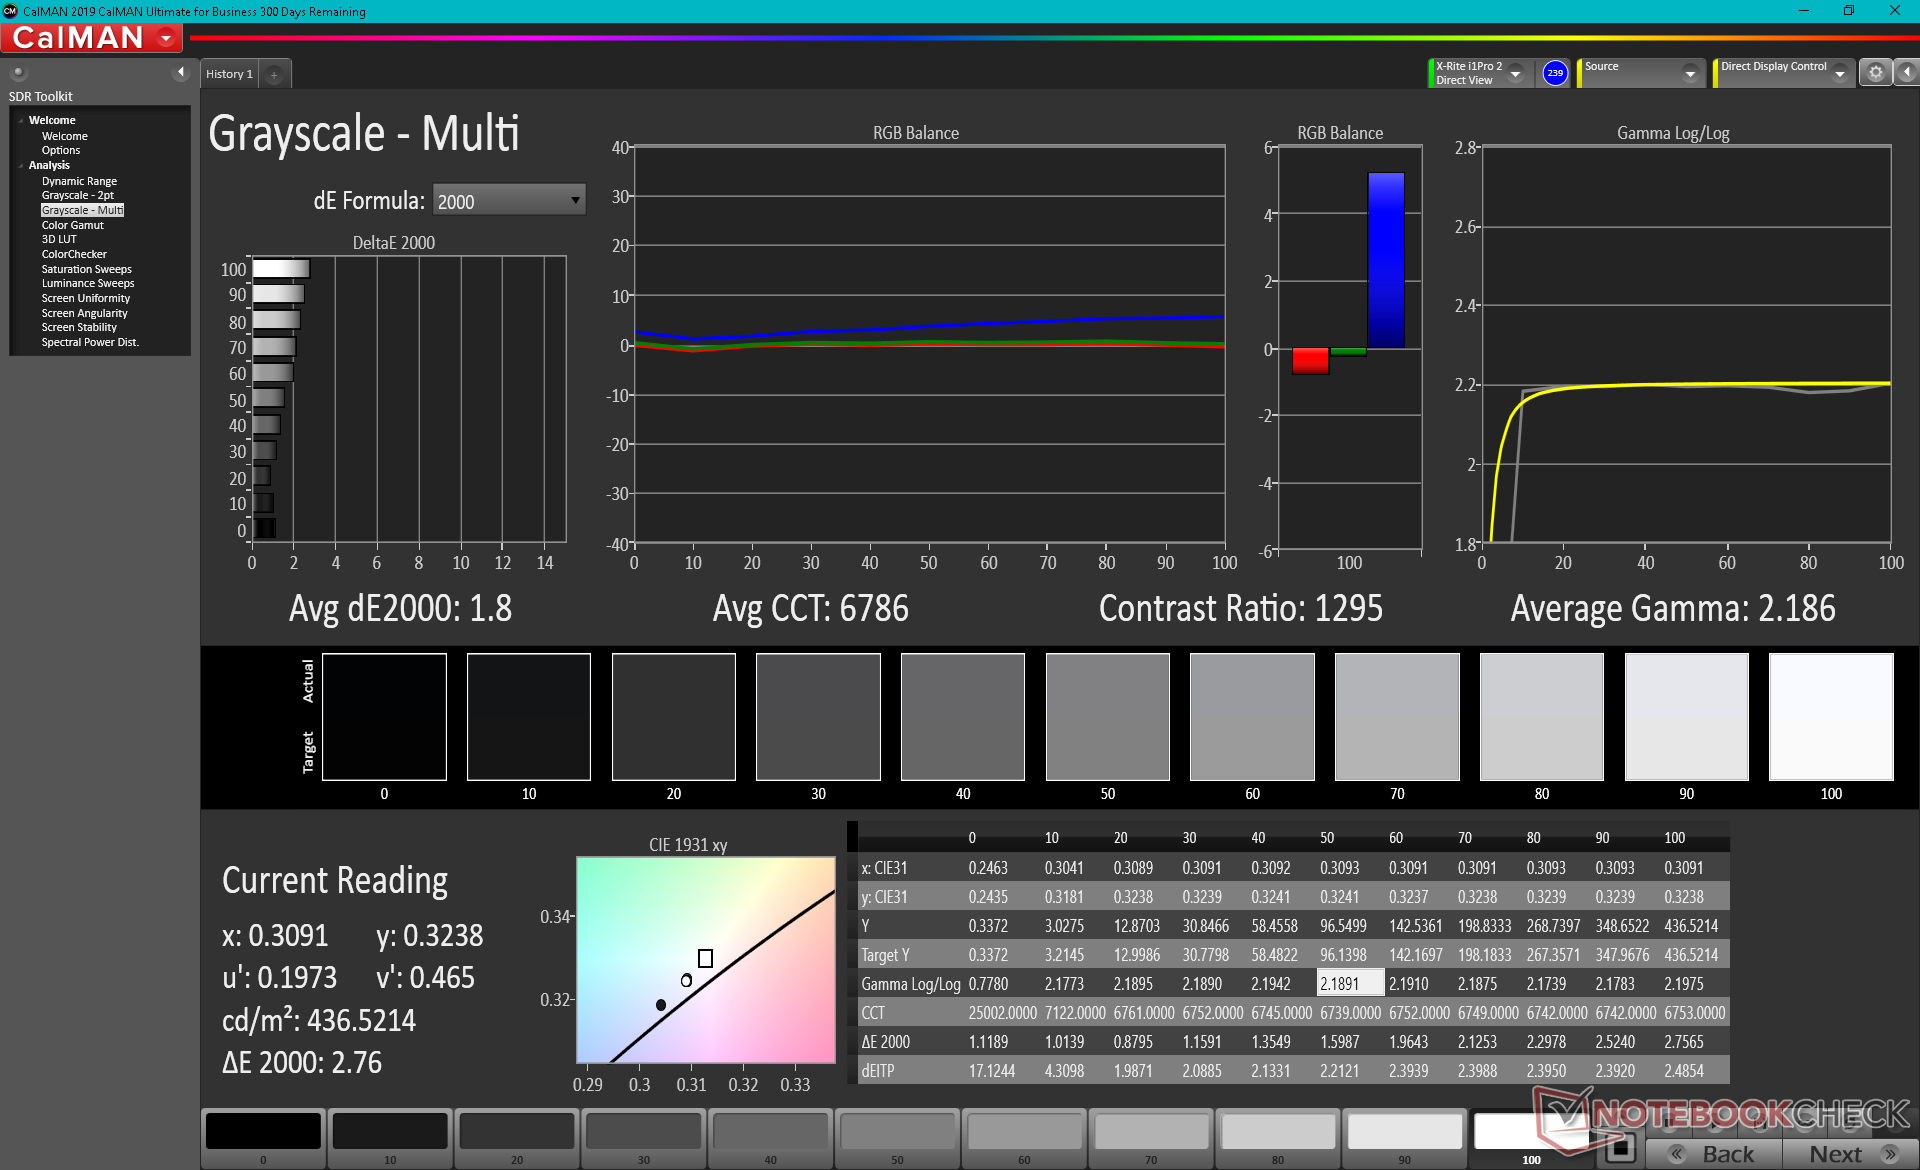
ΔE Greyscale Calman: 3.1 | ∀{0.09-98 Ø4.97}
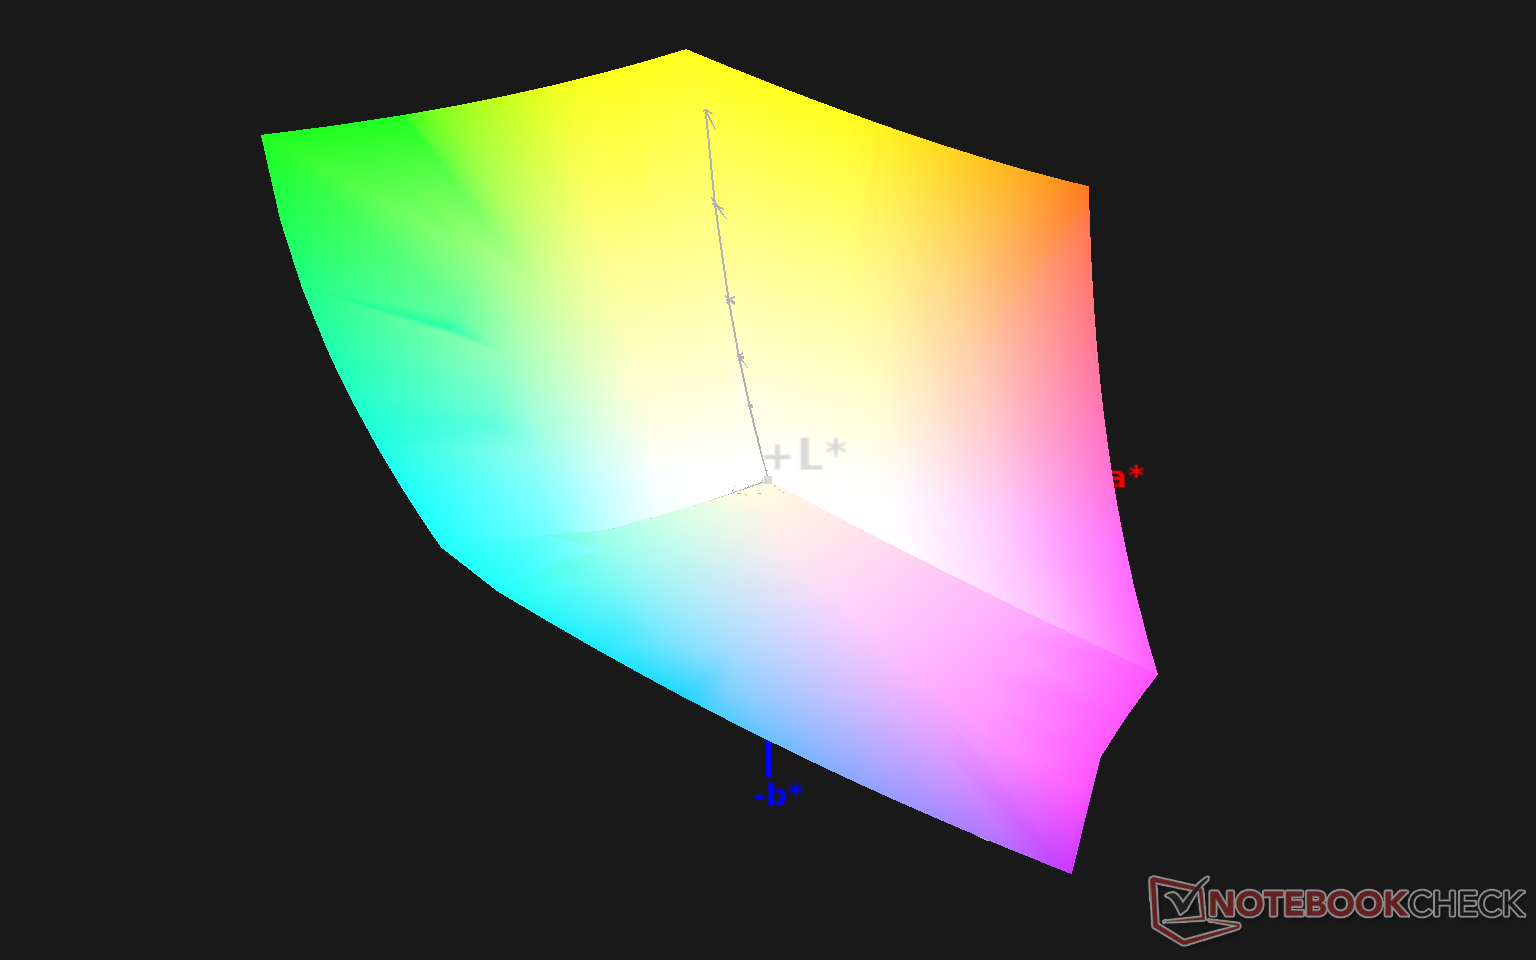
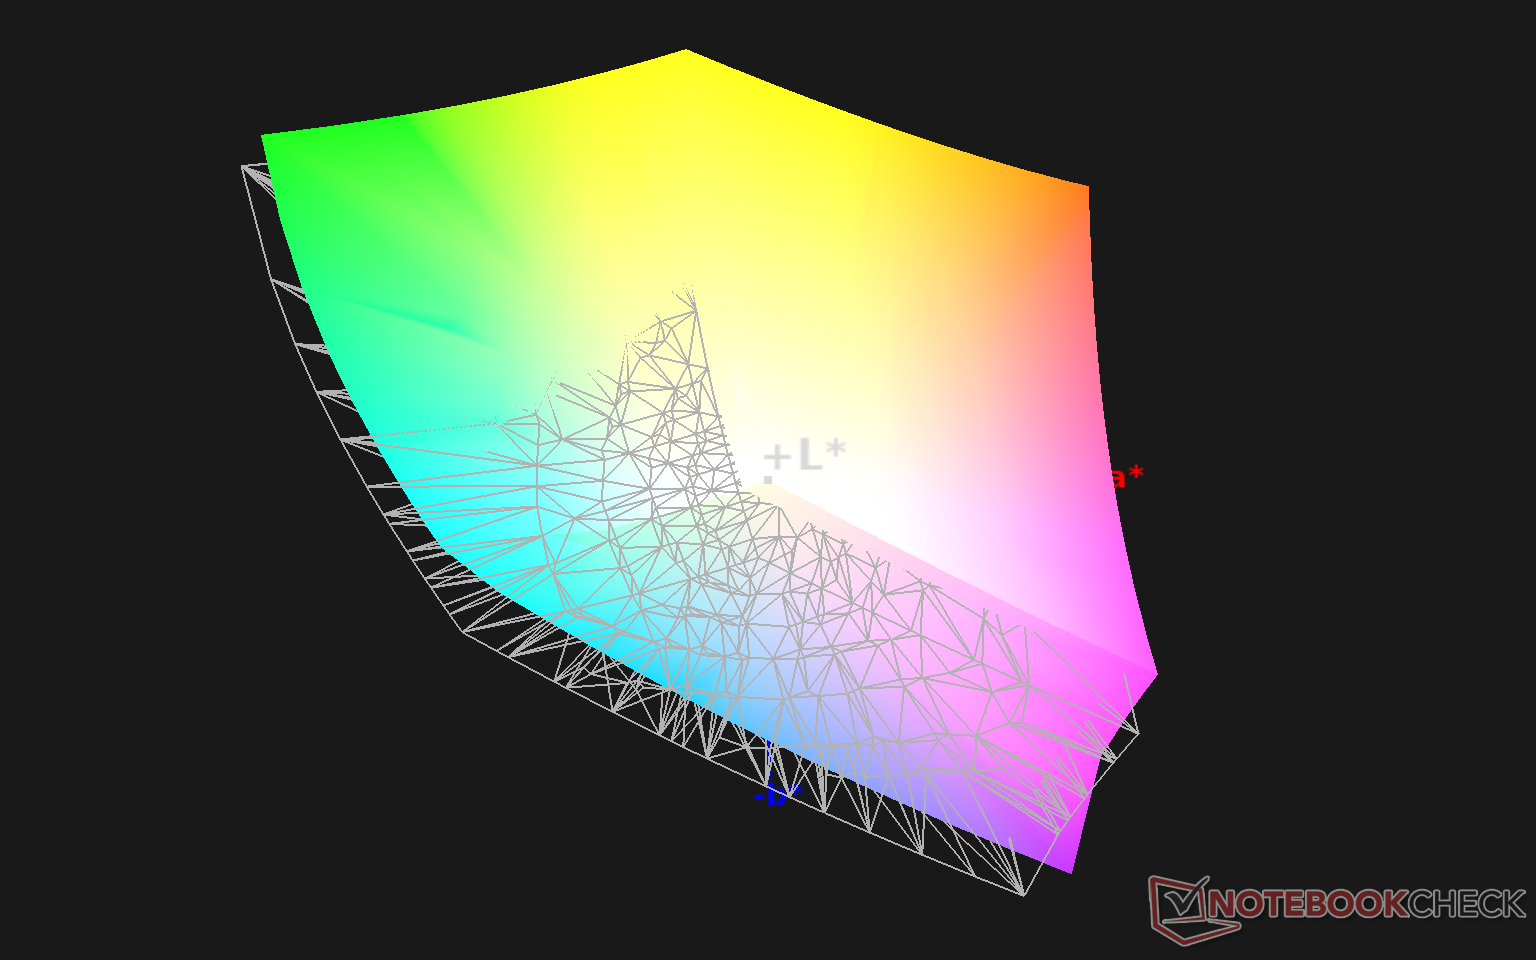
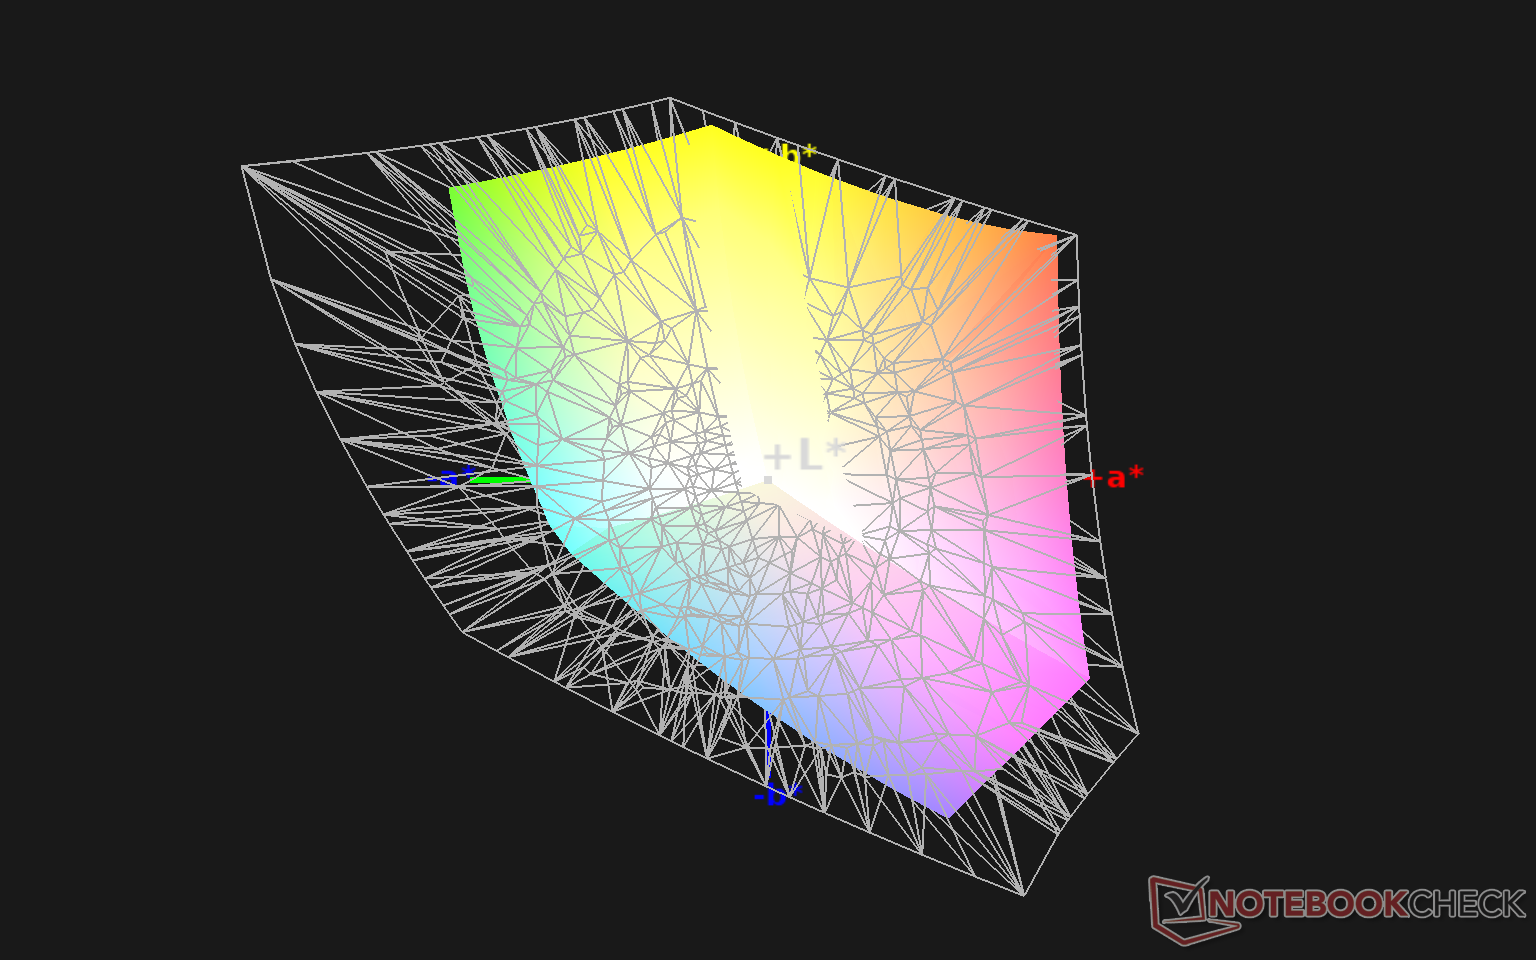
99.9% sRGB (Argyll 1.6.3 3D)
86.7% AdobeRGB 1998 (Argyll 1.6.3 3D)
99.1% AdobeRGB 1998 (Argyll 3D)
99.9% sRGB (Argyll 3D)
89.1% Display P3 (Argyll 3D)
Gamma: 2.36
CCT: 6371 K
| Asus ROG Zephyrus Duo 15 SE GX551QS AU Optronics B156ZAN05.1, IPS, 15.6", 3840x2160 | Asus ROG Zephyrus Duo 15 GX550LXS AU Optronics B156ZAN03.1, IPS, 15.6", 3840x2160 | Razer Blade 15 RTX 2080 Super Max-Q AU Optronics B156HAN12.0, IPS, 15.6", 1920x1080 | Eurocom Sky X4C i9-9900KS AU Optronics B156HAN07.0, IPS, 15.6", 1920x1080 | MSI GE66 Raider 10SFS Sharp LQ156M1JW03 (SHP14C5), IPS-Level, 15.6", 1920x1080 | Asus Zephyrus S15 GX502L B156HAN12.0 (AUOBC8C), IPS, 15.6", 1920x1080 | |
|---|---|---|---|---|---|---|
| Display | -0% | -17% | -24% | -18% | -17% | |
| Display P3 Coverage (%) | 89.1 | 87 -2% | 70.2 -21% | 63.6 -29% | 68 -24% | 69.7 -22% |
| sRGB Coverage (%) | 99.9 | 100 0% | 99 -1% | 90.9 -9% | 99 -1% | 99.7 0% |
| AdobeRGB 1998 Coverage (%) | 99.1 | 99.9 1% | 71.4 -28% | 64.7 -35% | 69.8 -30% | 71.1 -28% |
| Response Times | -362% | 20% | -55% | -50% | -32% | |
| Response Time Grey 50% / Grey 80% * (ms) | 8.2 ? | 56.4 ? -588% | 6 ? 27% | 16.8 ? -105% | 16.4 ? -100% | 14 ? -71% |
| Response Time Black / White * (ms) | 10.4 ? | 24.4 ? -135% | 9 ? 13% | 10.8 ? -4% | 10.4 ? -0% | 9.6 ? 8% |
| PWM Frequency (Hz) | 23580 ? | |||||
| Screen | 28% | 15% | -18% | 15% | 10% | |
| Brightness middle (cd/m²) | 406 | 398 -2% | 347 -15% | 258.8 -36% | 291 -28% | 283 -30% |
| Brightness (cd/m²) | 407 | 385 -5% | 328 -19% | 258 -37% | 278 -32% | 289 -29% |
| Brightness Distribution (%) | 88 | 90 2% | 89 1% | 82 -7% | 91 3% | 90 2% |
| Black Level * (cd/m²) | 0.42 | 0.28 33% | 0.285 32% | 0.28 33% | 0.25 40% | 0.24 43% |
| Contrast (:1) | 967 | 1421 47% | 1218 26% | 924 -4% | 1164 20% | 1179 22% |
| Colorchecker dE 2000 * | 4.36 | 1.53 65% | 2.35 46% | 4.45 -2% | 1.19 73% | 2.26 48% |
| Colorchecker dE 2000 max. * | 7.55 | 3.69 51% | 4.15 45% | 9.85 -30% | 3.04 60% | 5.64 25% |
| Colorchecker dE 2000 calibrated * | 3.63 | 0.77 79% | 1.16 68% | 3 17% | 1.11 69% | |
| Greyscale dE 2000 * | 3.1 | 2.4 23% | 3.04 2% | 5.8 -87% | 1.9 39% | 3.4 -10% |
| Gamma | 2.36 93% | 2.19 100% | 2.35 94% | 2.36 93% | 2.216 99% | 2.228 99% |
| CCT | 6371 102% | 6996 93% | 6658 98% | 7651 85% | 7018 93% | 7249 90% |
| Color Space (Percent of AdobeRGB 1998) (%) | 86.7 | 100 15% | 65 -25% | 58.8 -32% | 70 -19% | 71 -18% |
| Color Space (Percent of sRGB) (%) | 99.9 | 100 0% | 99 -1% | 90.5 -9% | 92 -8% | 93 -7% |
| Total Average (Program / Settings) | -111% /
-26% | 6% /
9% | -32% /
-24% | -18% /
-0% | -13% /
0% |
* ... smaller is better
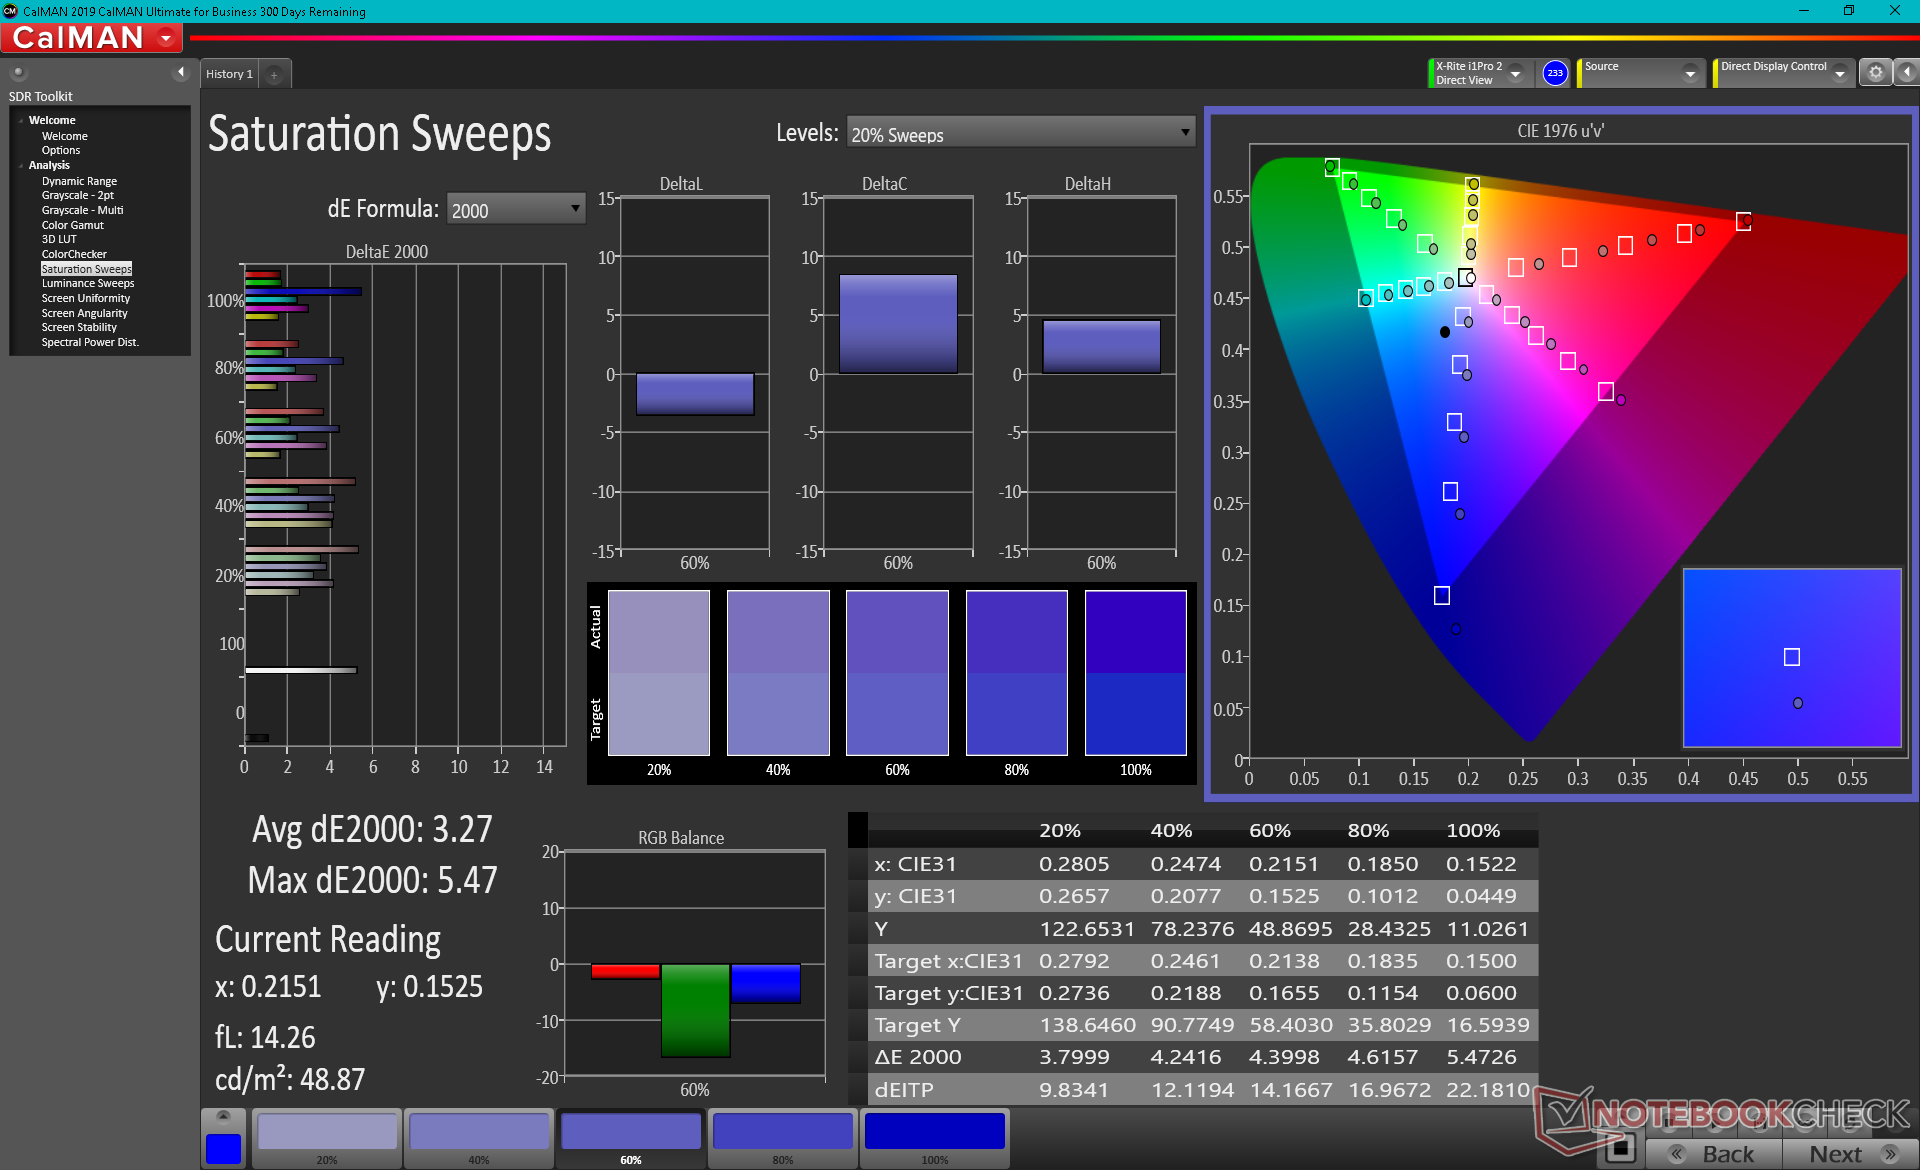
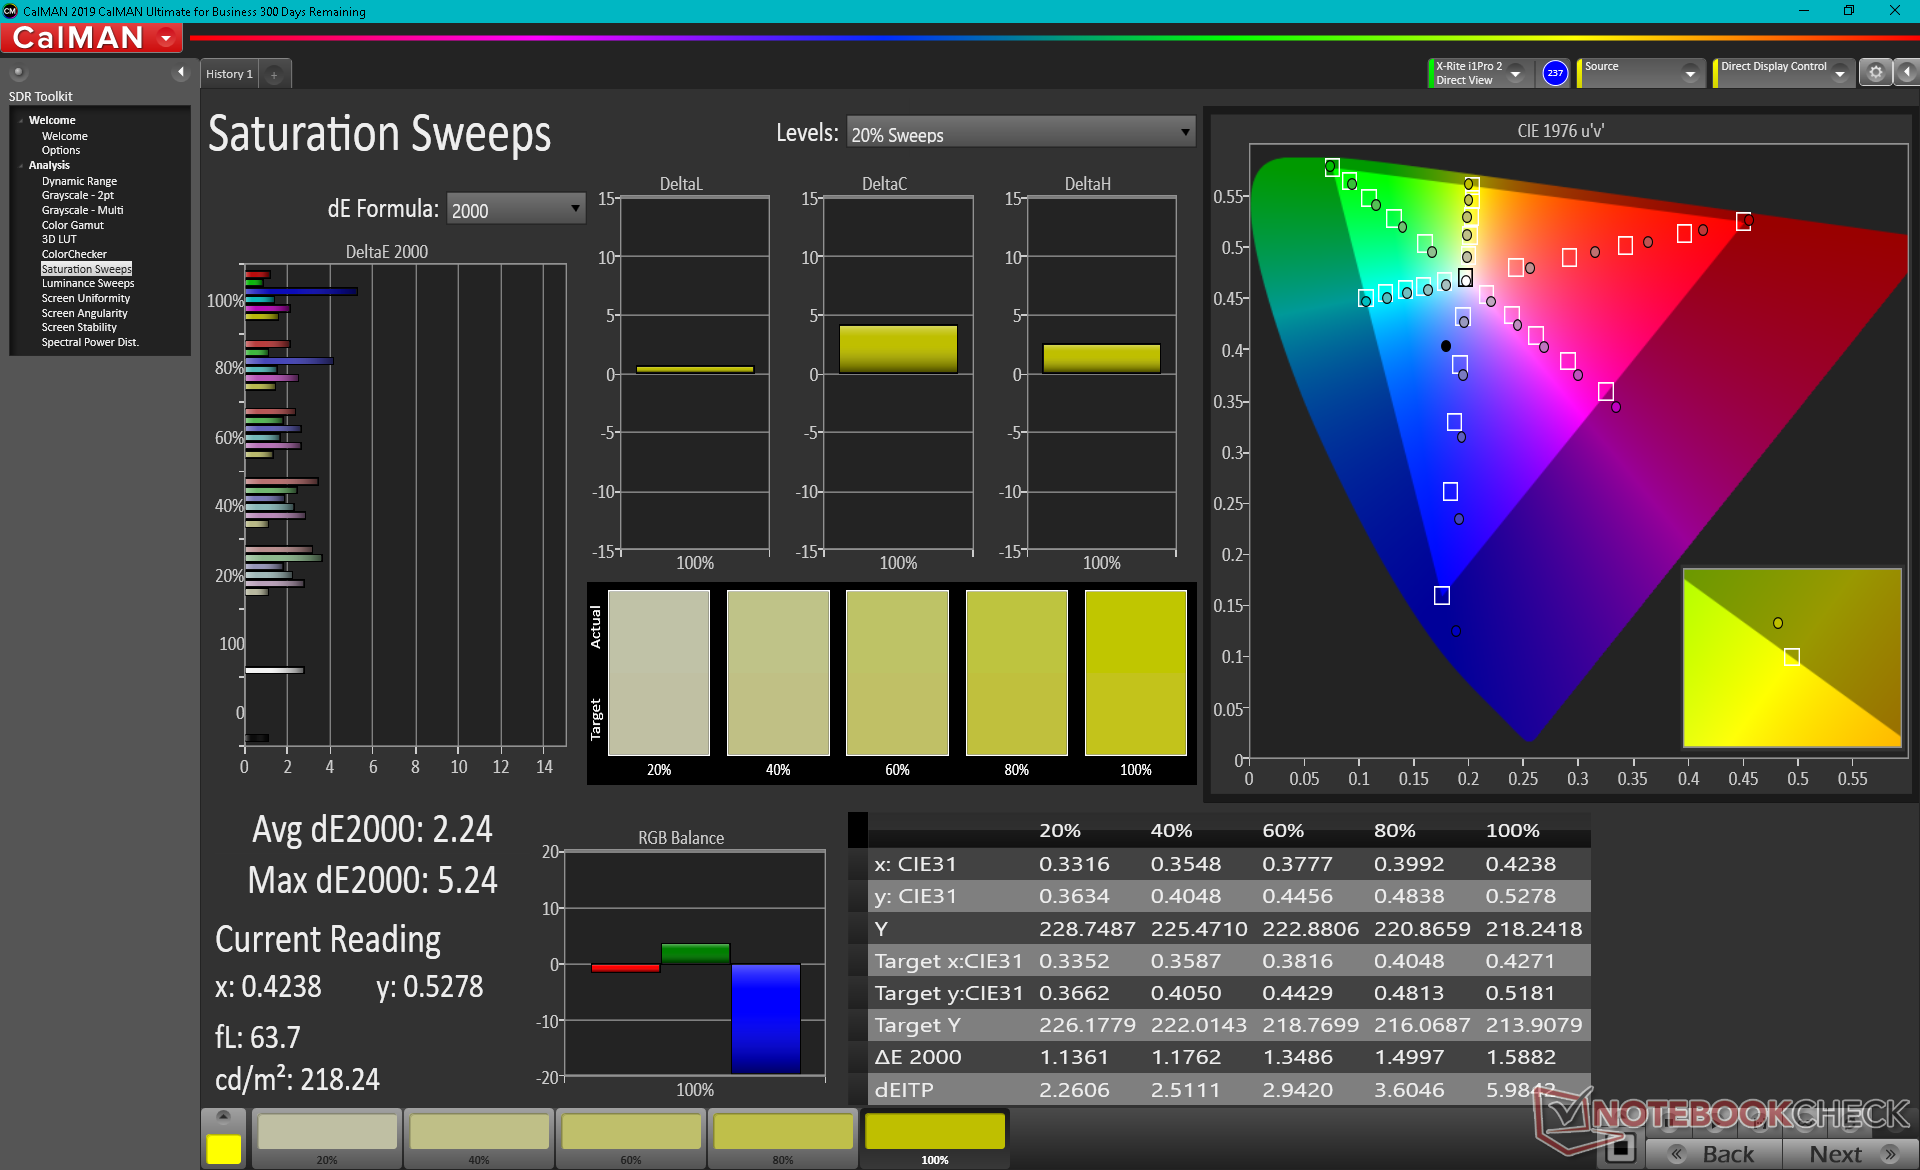
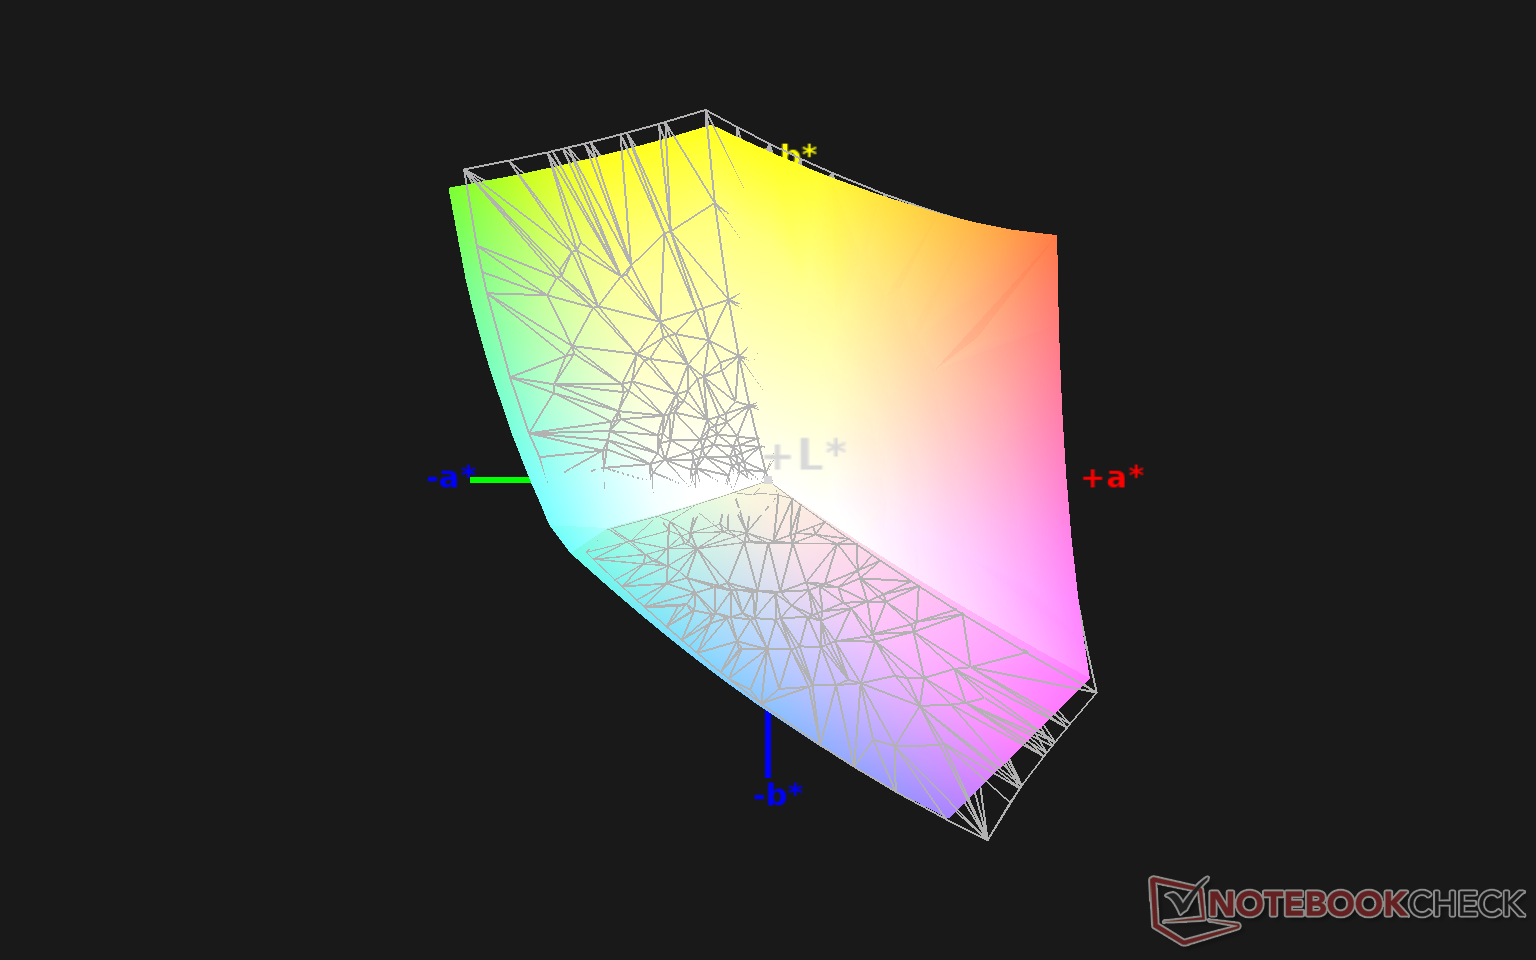
Color space covers almost all of AdobeRGB not unlike most flagship Ultrabooks and laptops with 4K panels. Accurate colors are common on such panels and so it's the fast black-white and gray-gray response times that make this one on the Asus so special.
The main panel comes pre-calibrated out of the box. Even so, our colorimeter shows a warmer color temperature than expected for an imbalanced gamma curve. Our own calibration fixes this for a lower average grayscale DetalE of just 1.8.
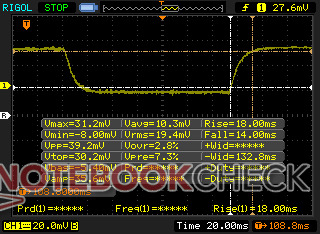
Display Response Times
| ↔ Response Time Black to White | ||
|---|---|---|
| 10.4 ms ... rise ↗ and fall ↘ combined | ↗ 5.2 ms rise | 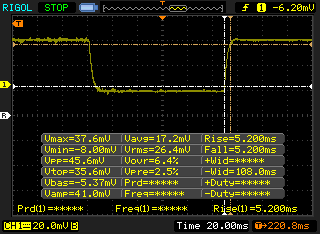 |
| ↘ 5.2 ms fall | ||
| The screen shows good response rates in our tests, but may be too slow for competitive gamers. In comparison, all tested devices range from 0.1 (minimum) to 240 (maximum) ms. » 28 % of all devices are better. This means that the measured response time is better than the average of all tested devices (19.9 ms). | ||
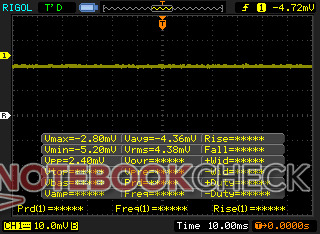
| ↔ Response Time 50% Grey to 80% Grey | ||
| 8.2 ms ... rise ↗ and fall ↘ combined | ↗ 3 ms rise | 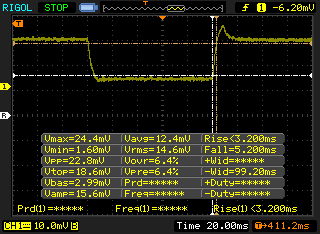 |
| ↘ 5.2 ms fall | ||
| The screen shows fast response rates in our tests and should be suited for gaming. In comparison, all tested devices range from 0.165 (minimum) to 636 (maximum) ms. » 22 % of all devices are better. This means that the measured response time is better than the average of all tested devices (31.1 ms). | ||
Screen Flickering / PWM (Pulse-Width Modulation)
| Screen flickering / PWM not detected | 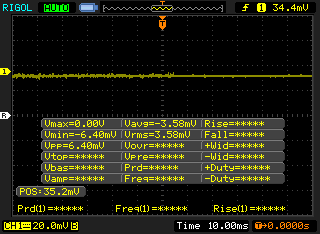 | ||
In comparison: 52 % of all tested devices do not use PWM to dim the display. If PWM was detected, an average of 7816 (minimum: 5 - maximum: 343500) Hz was measured. | |||
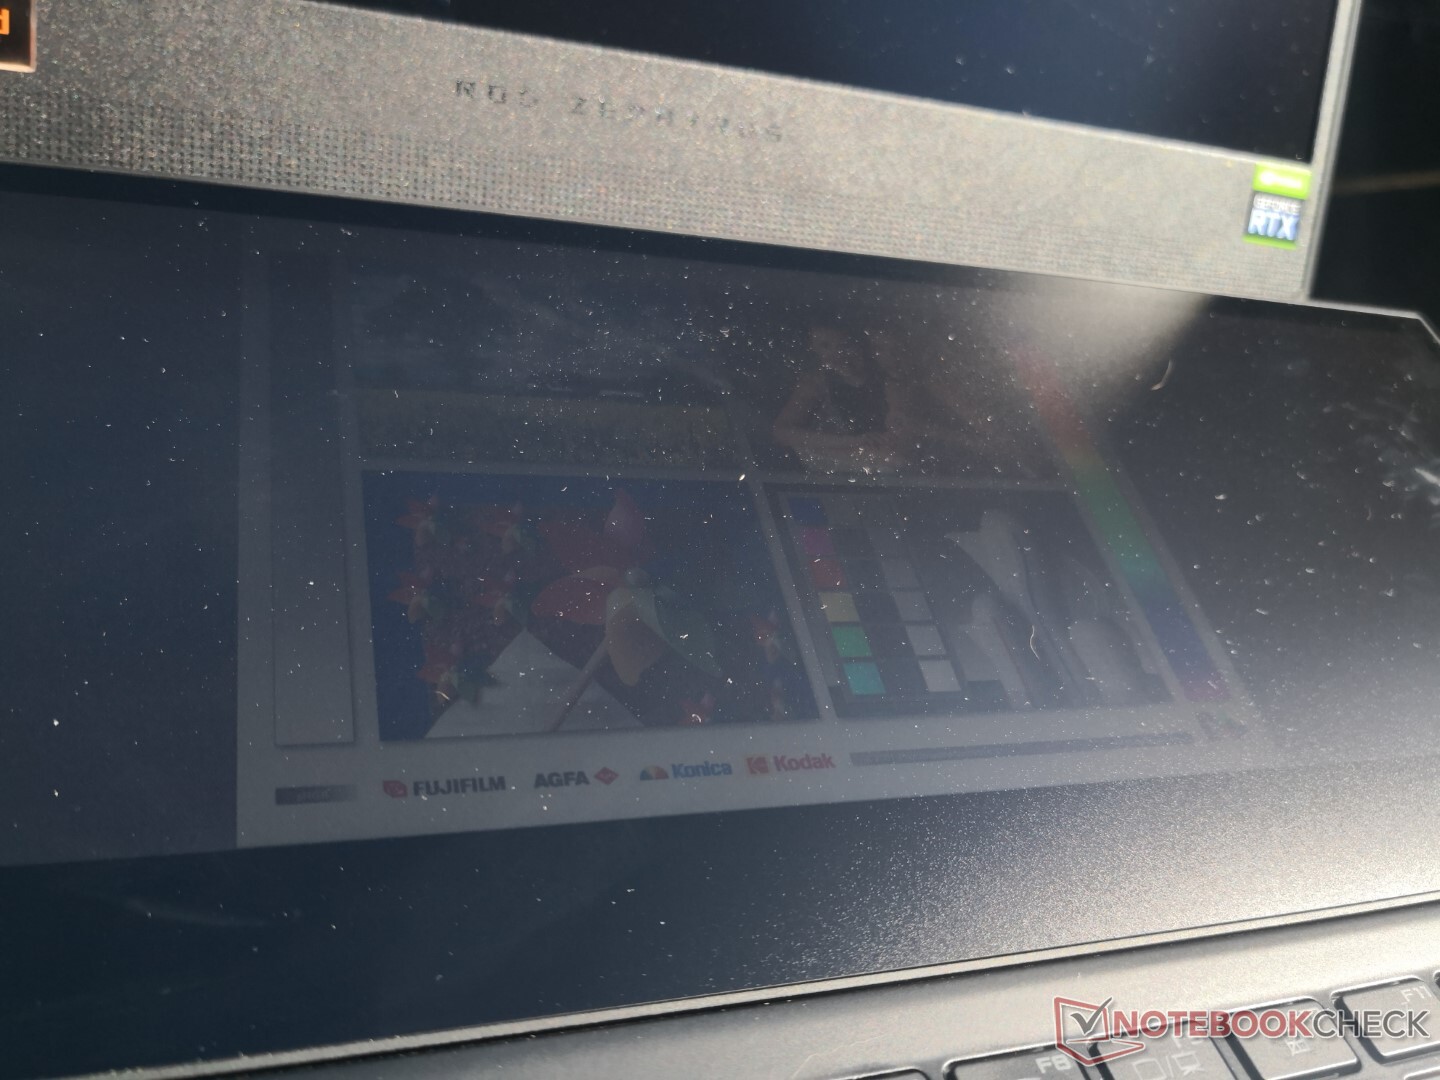


ScreenPad
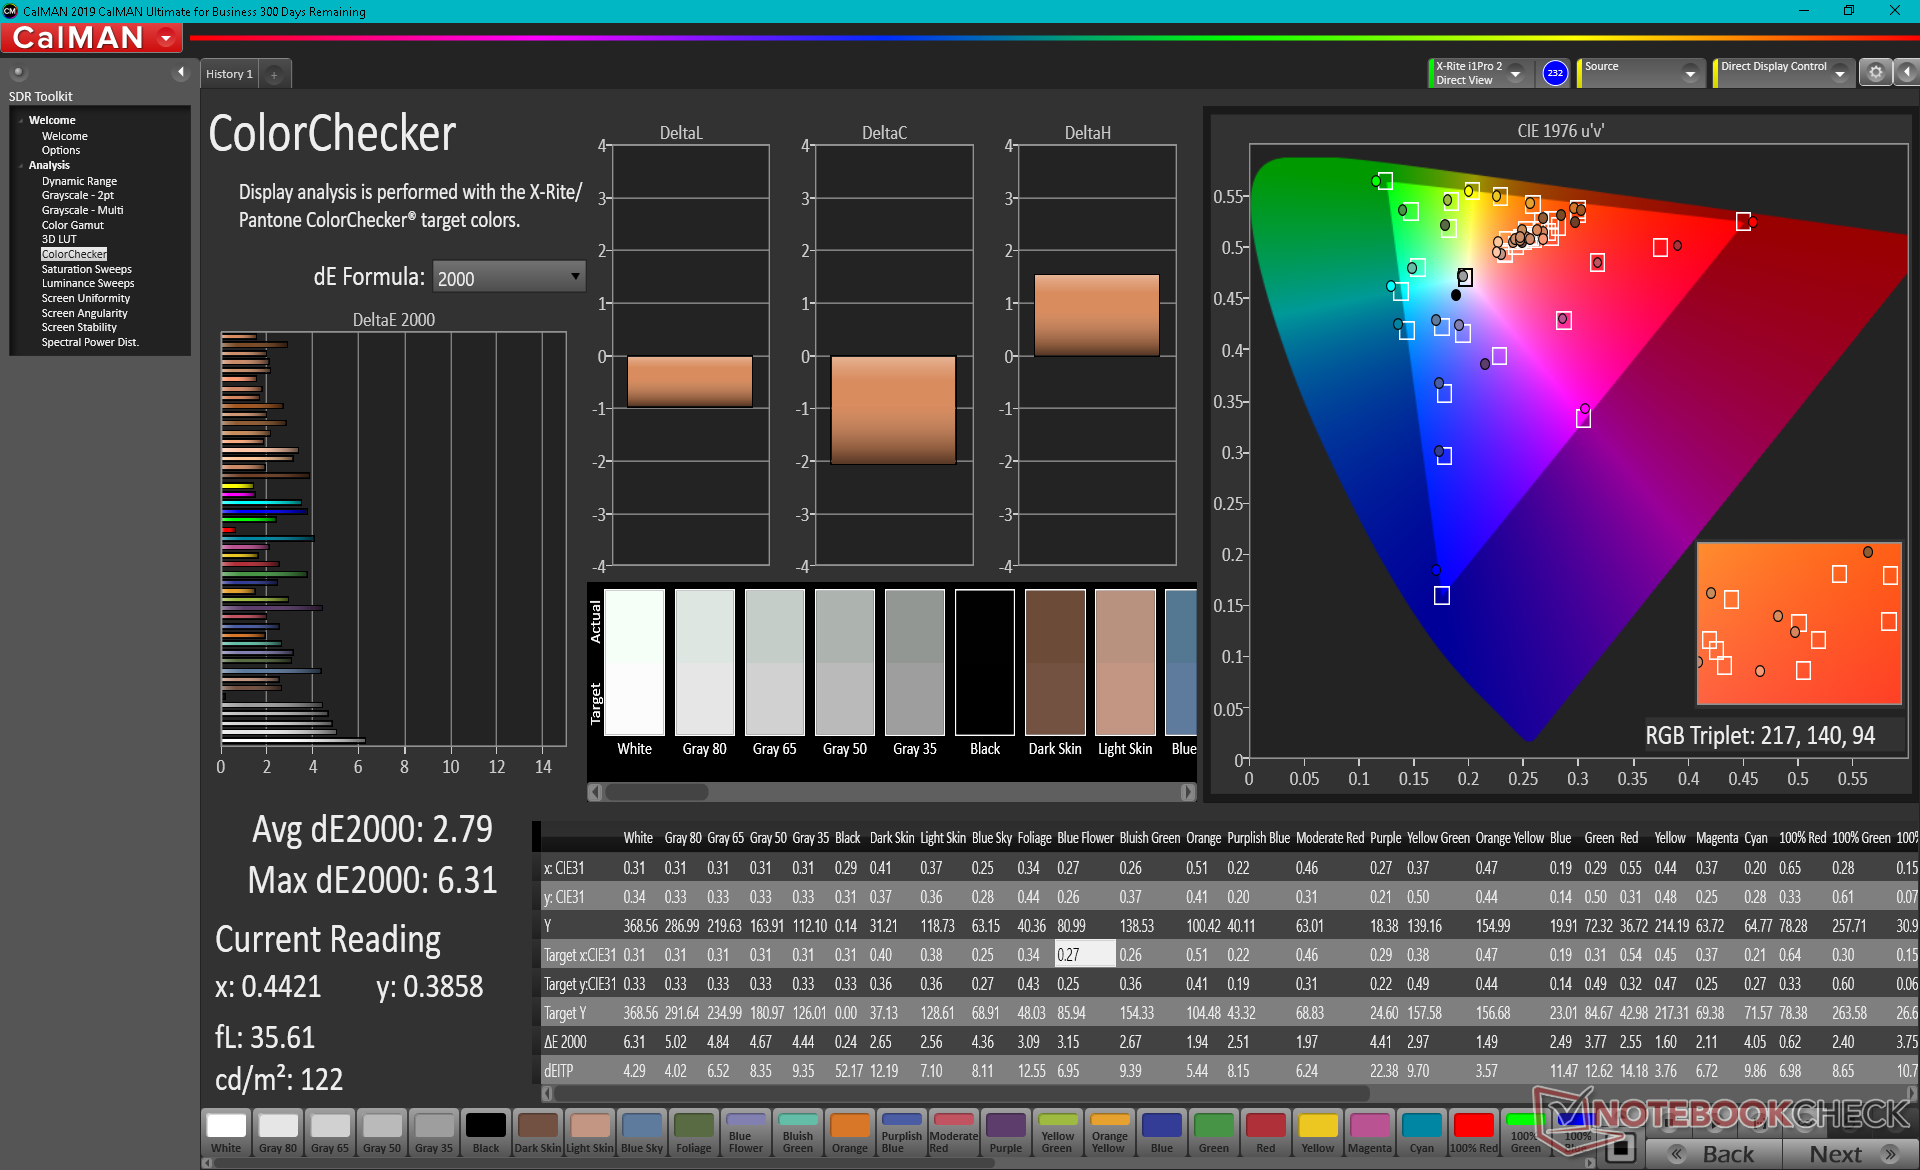
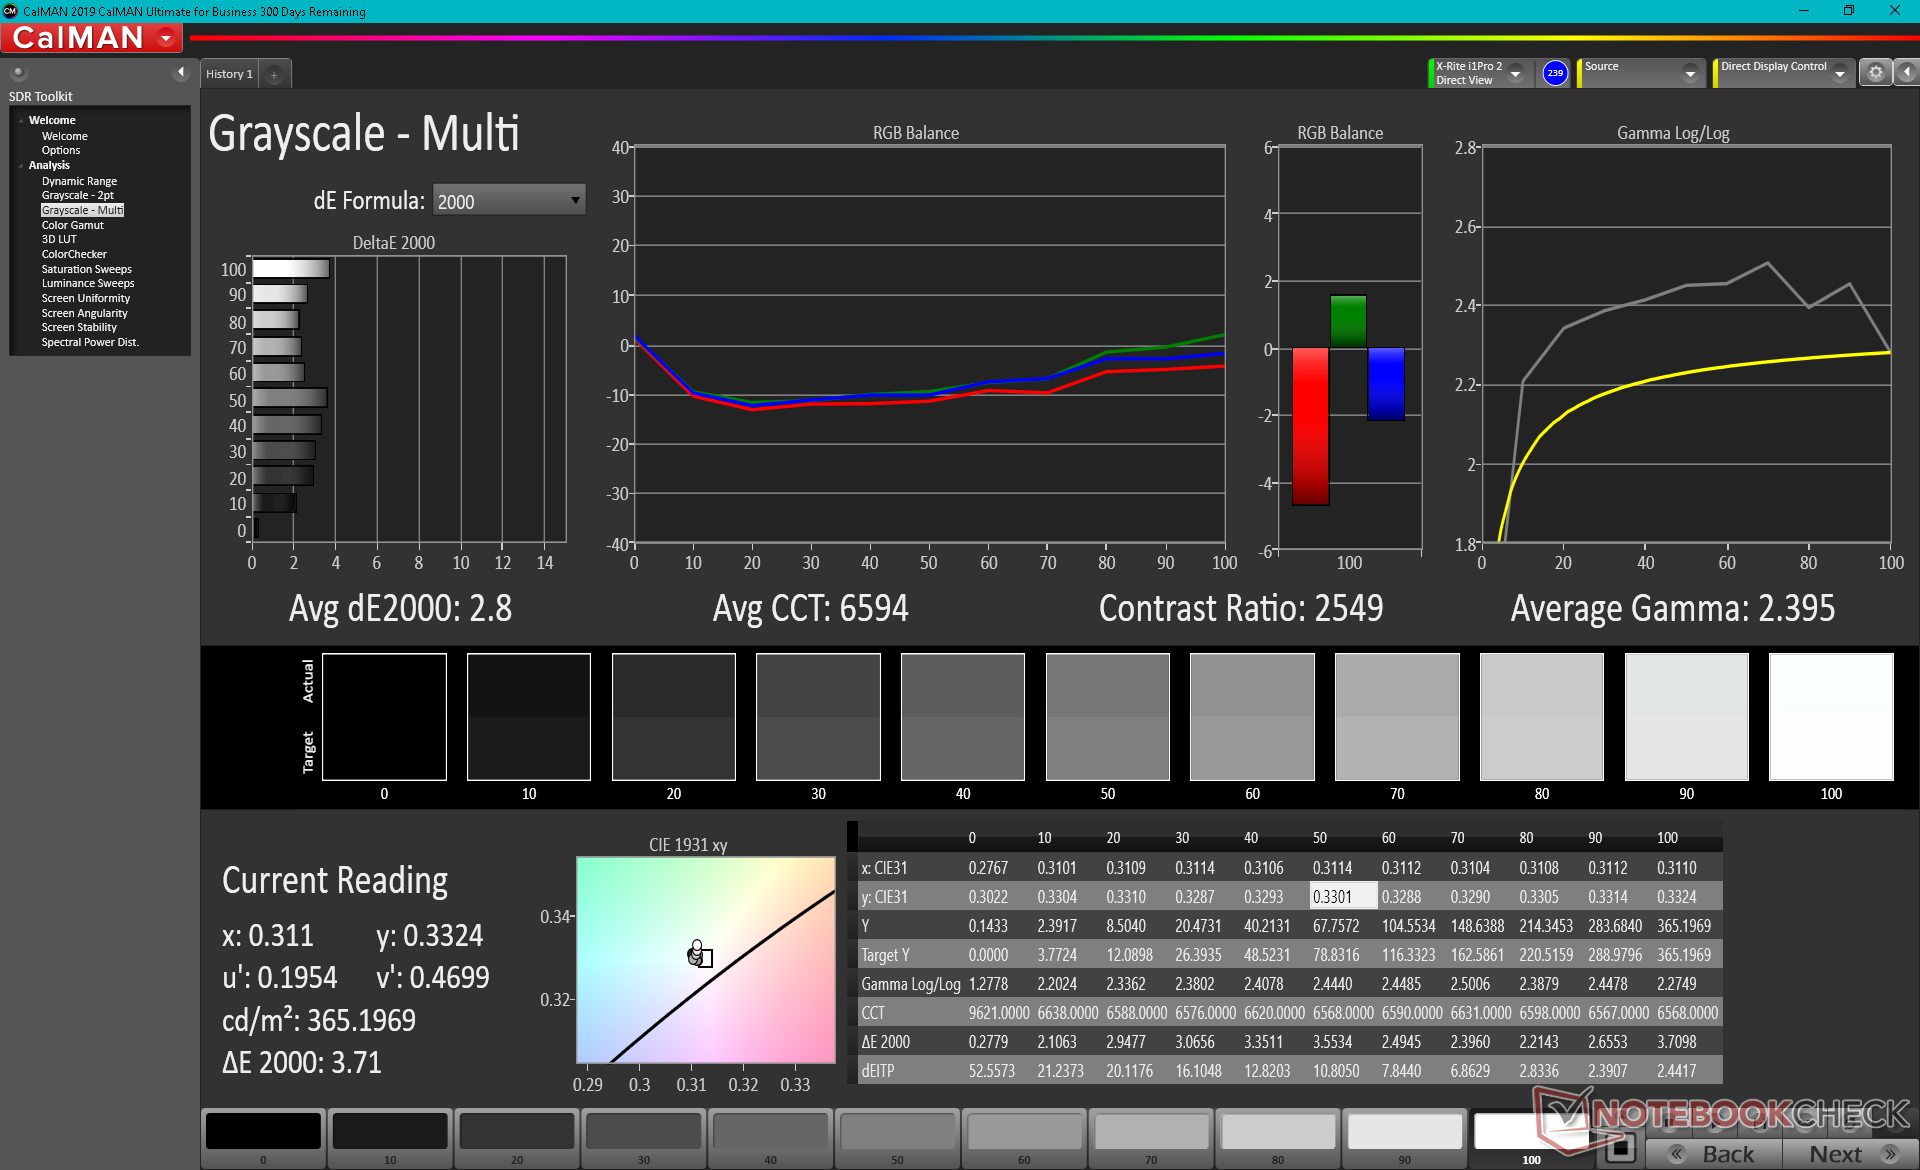
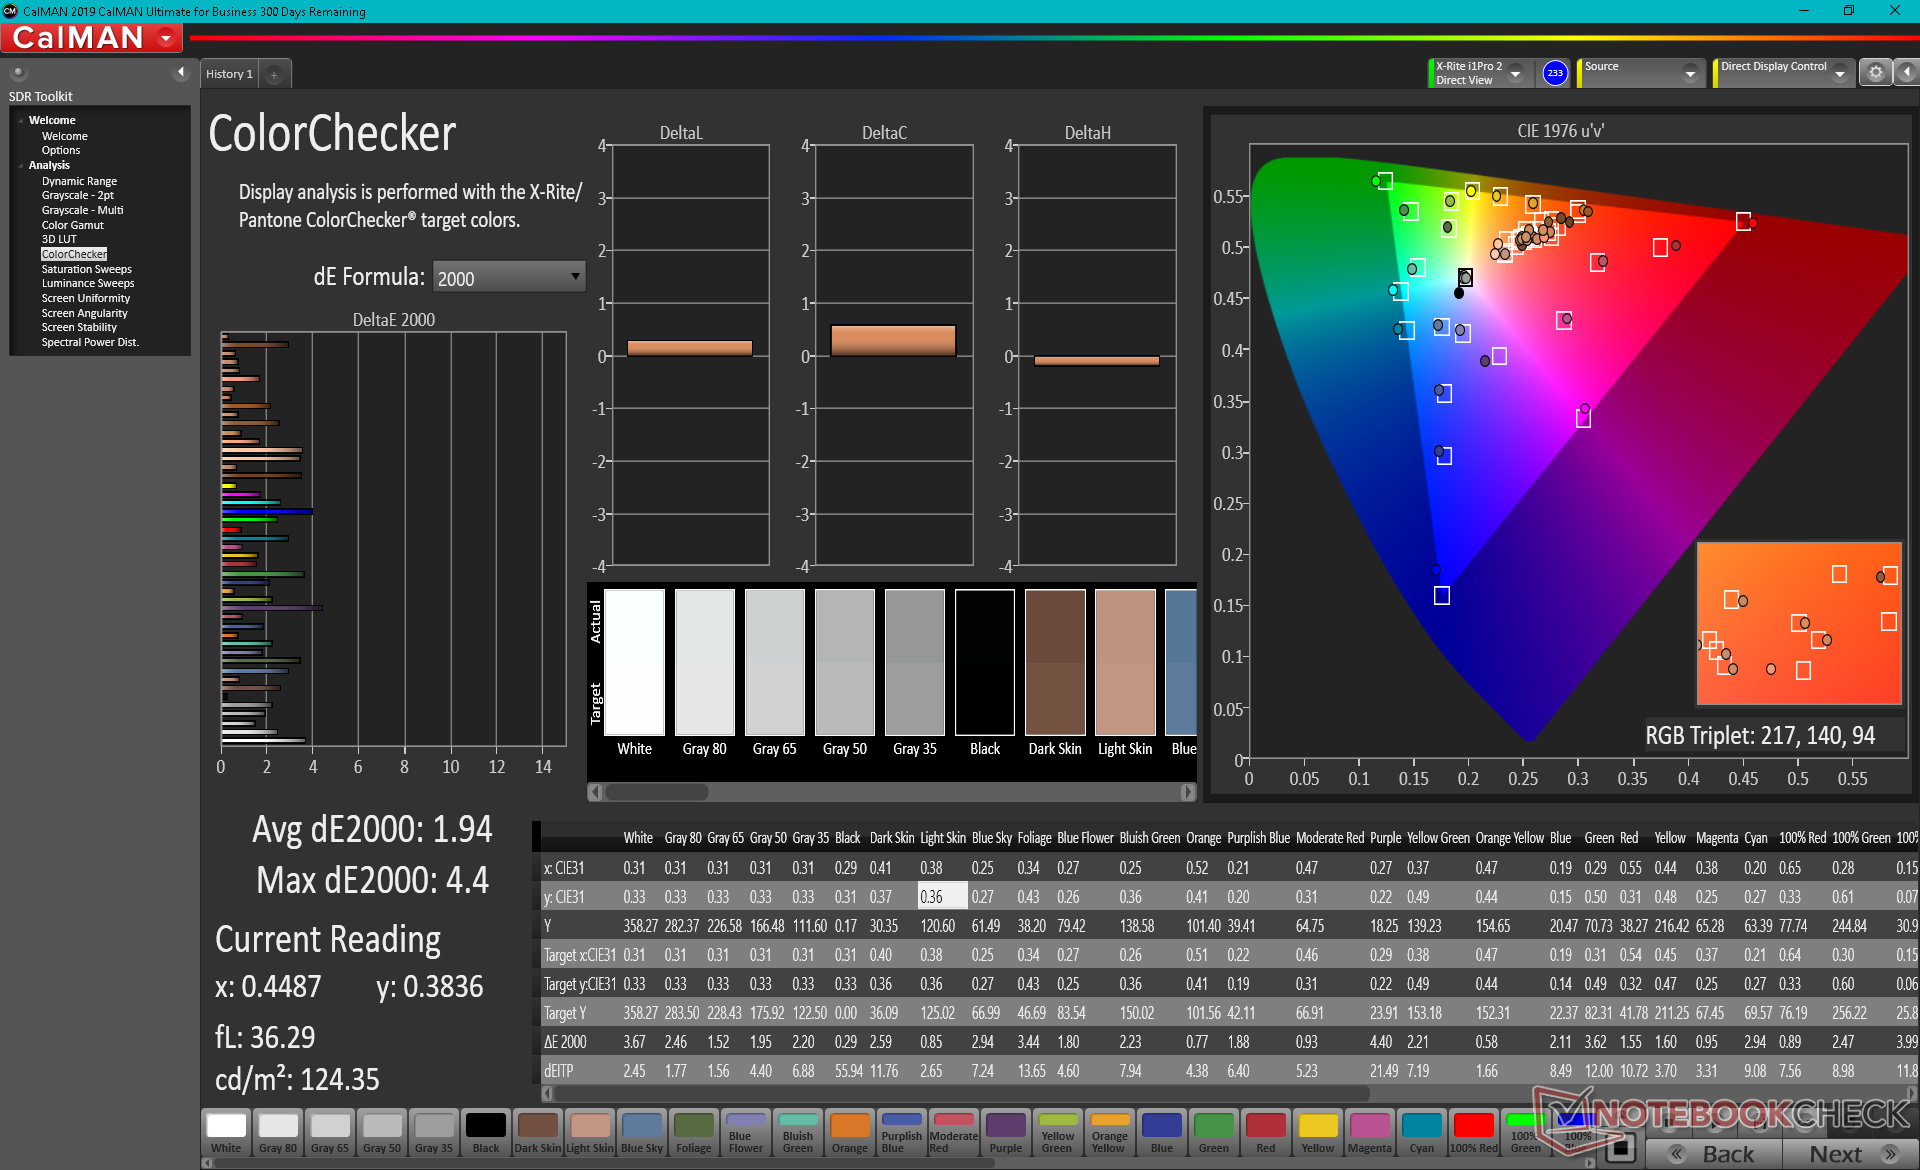
The ScreenPad panel remains exactly the same as on the GX550 and so our previous comments apply here. Most notably, gamut covers only sRGB while refresh rate is limited to 60 Hz in comparison to the full AdobeRGB coverage and 120 Hz refresh rate of the main display. Response times are measurably slower than the main display meaning ghosting will be more noticeable. Texts and images are also grainier due to the thicker overlying matte layer. The secondary display can be irreplaceable for multi-tasking, but don't expect perfect 1:1 colors, contrast, or even brightness between the two screens.
The most notable improvement to the ScreenPad is its redesigned UI which runs smoother and more responsively than the older version on the GX550. The recent ZenBook UX482 ScreenPad utilizes this updated software as well. However, Asus says the GX550 will receive the same software update at some point in the future if not already.

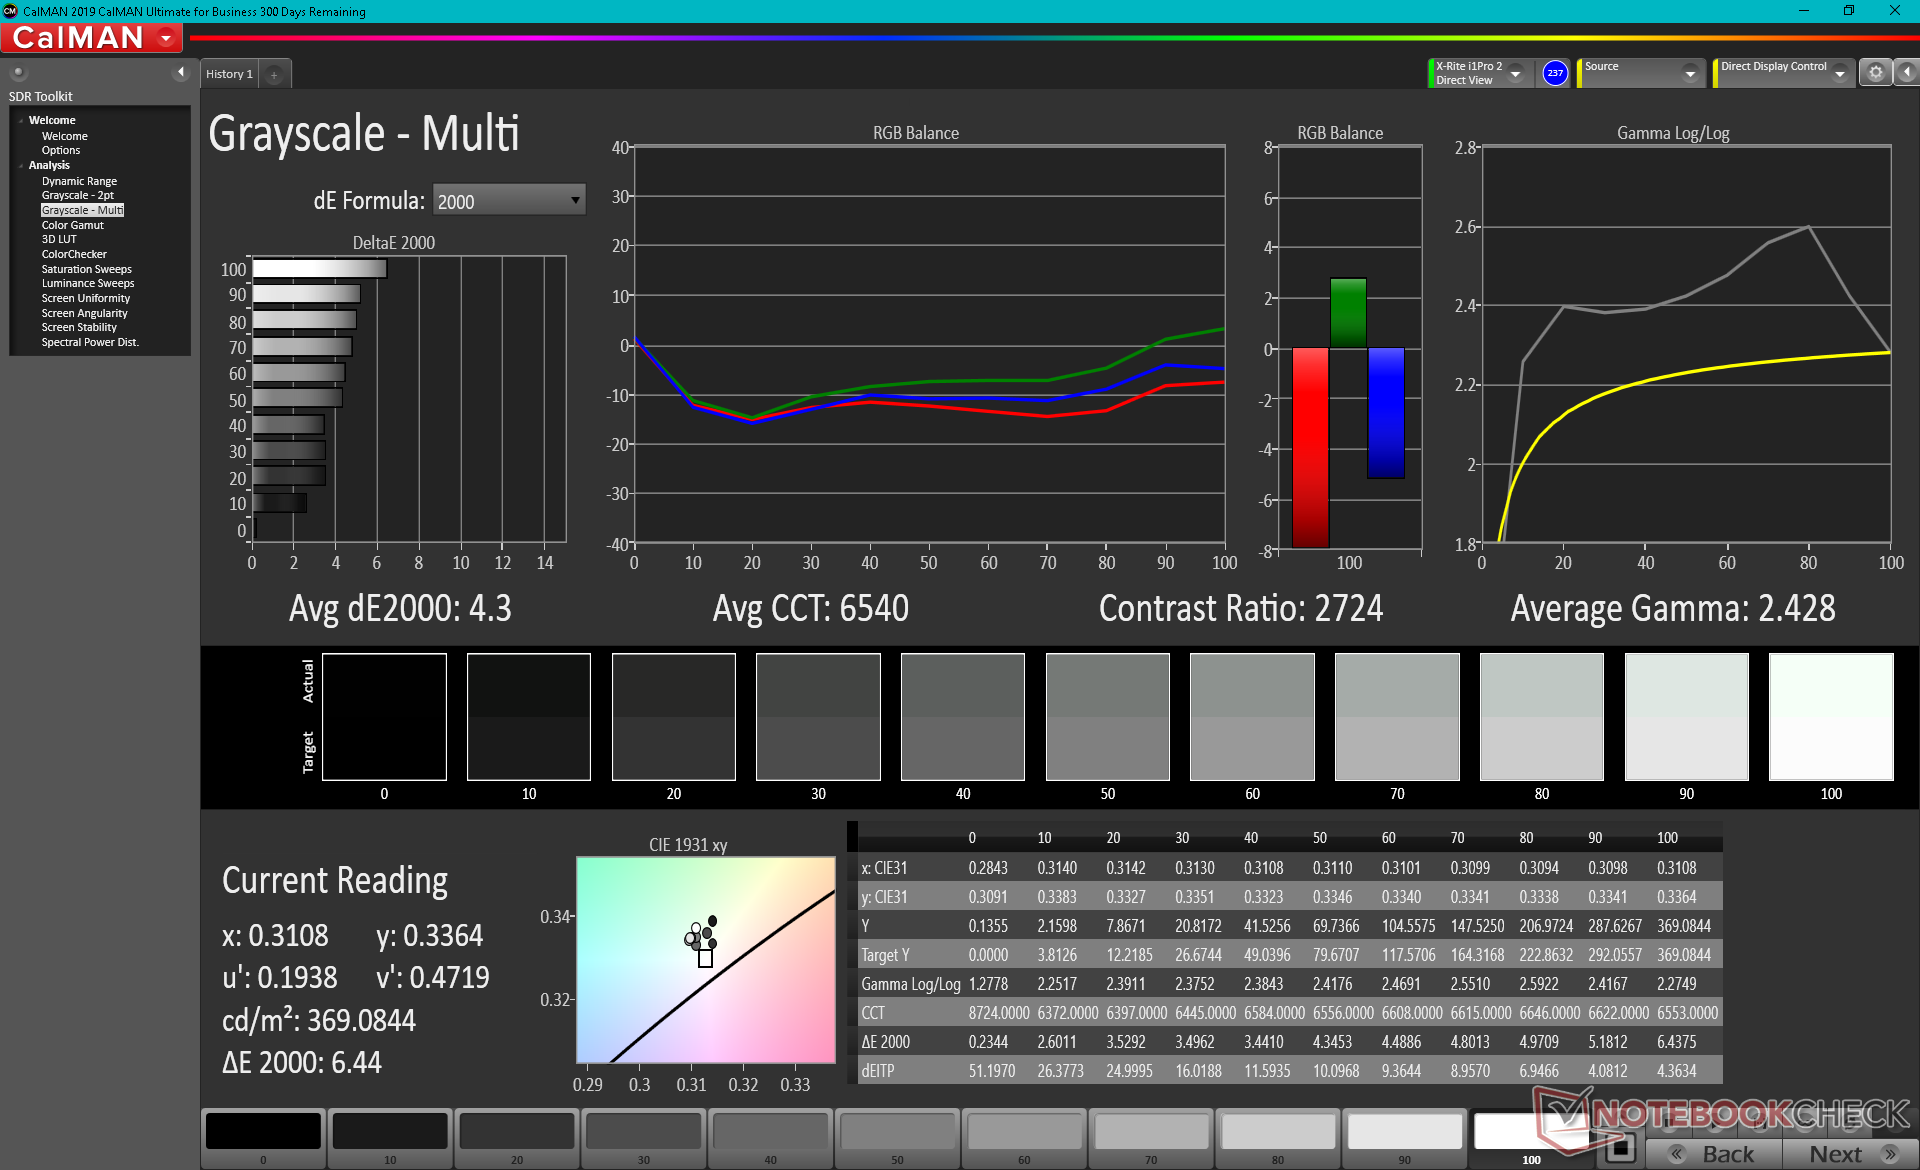
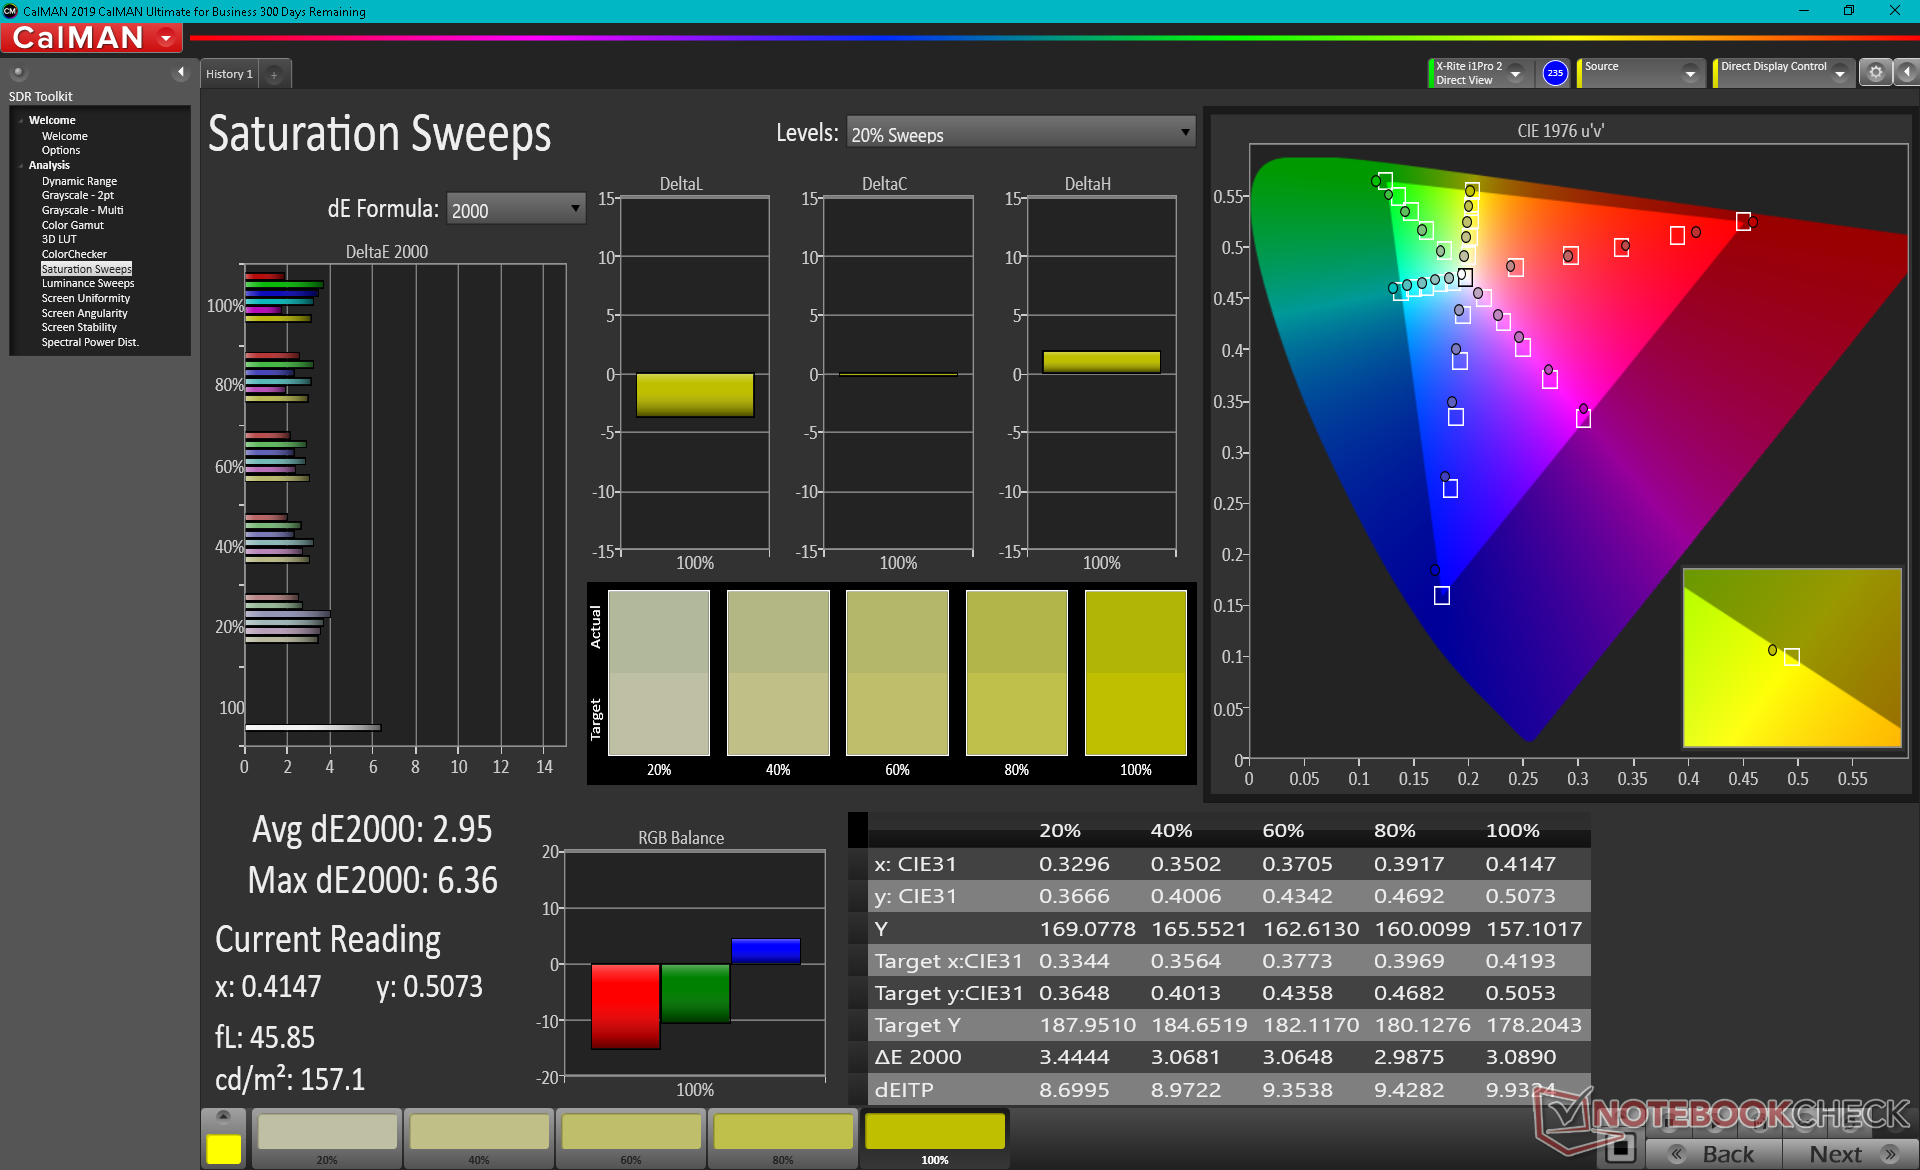


| Screen Size, Native Resolution | 14.09-inches, 3840 x 1100 (4K SKUs), 1920 x 550 (FHD SKUs) |
| Color Space | 95.3 percent sRGB, 62.6 percent AdobeRGB |
| Black-White Response Times | 18 ms rise, 14 ms fall |
| Gray-Gray Response Times | 21.2 ms rise, 19.2 ms fall |
| Maximum Brightness | 368.5 nits |
| Contrast Ratio | 2632:1 |
| Colorchecker DeltaE2000 | 2.79 |
| Greyscale DeltaE2000 | 4.3 |
| Gamma | 2.43 |
| CCT | 6540 |
Performance
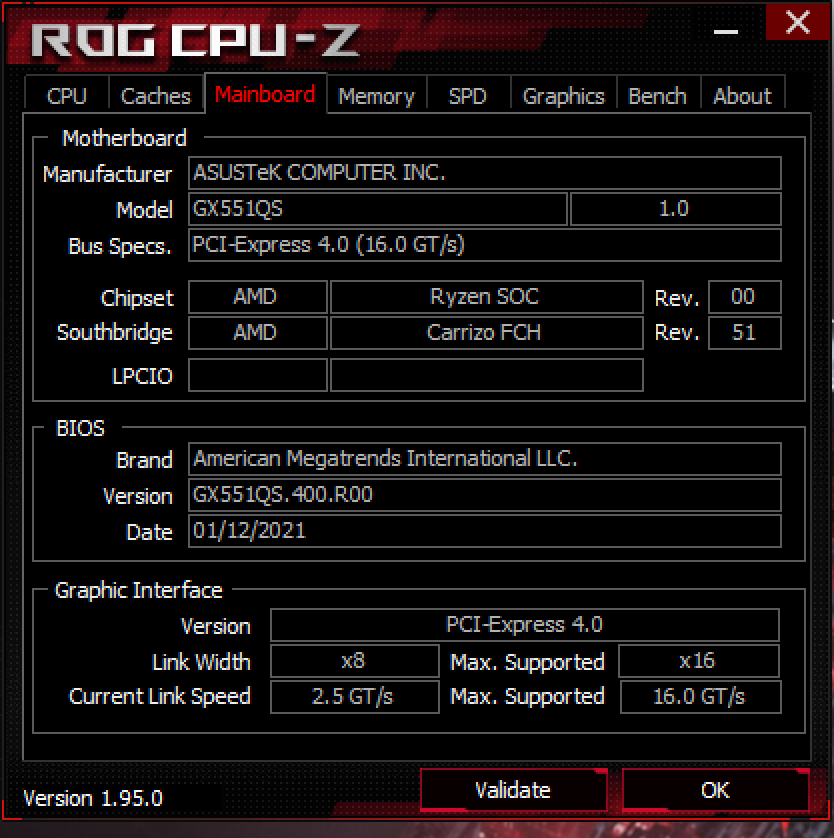
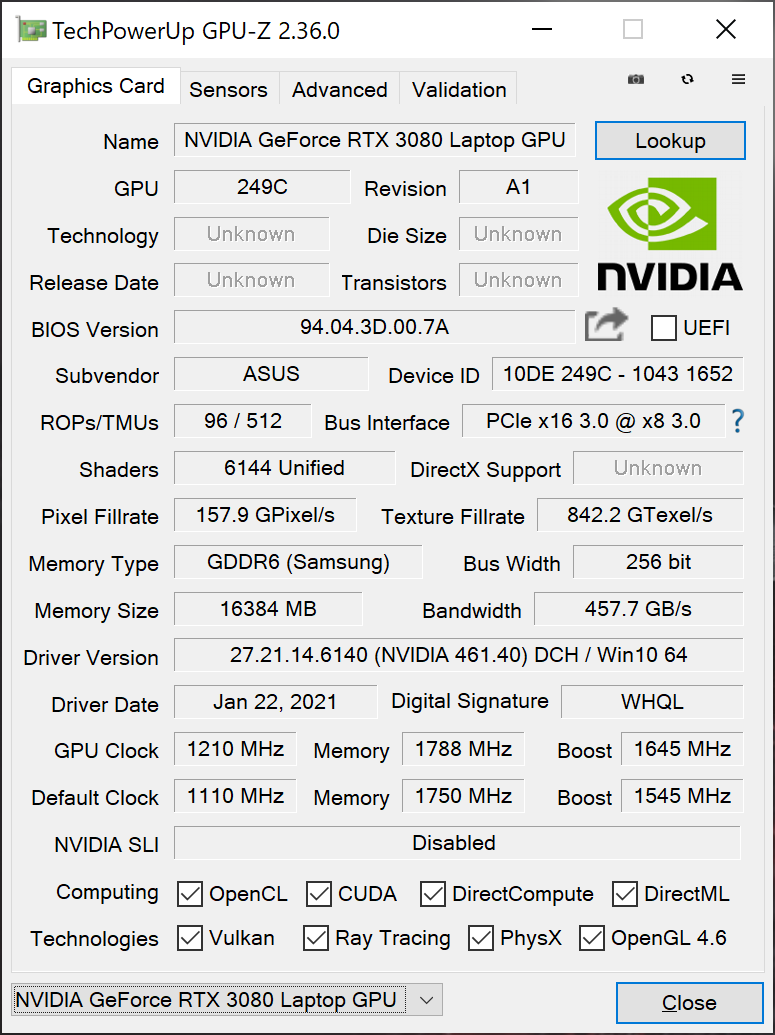
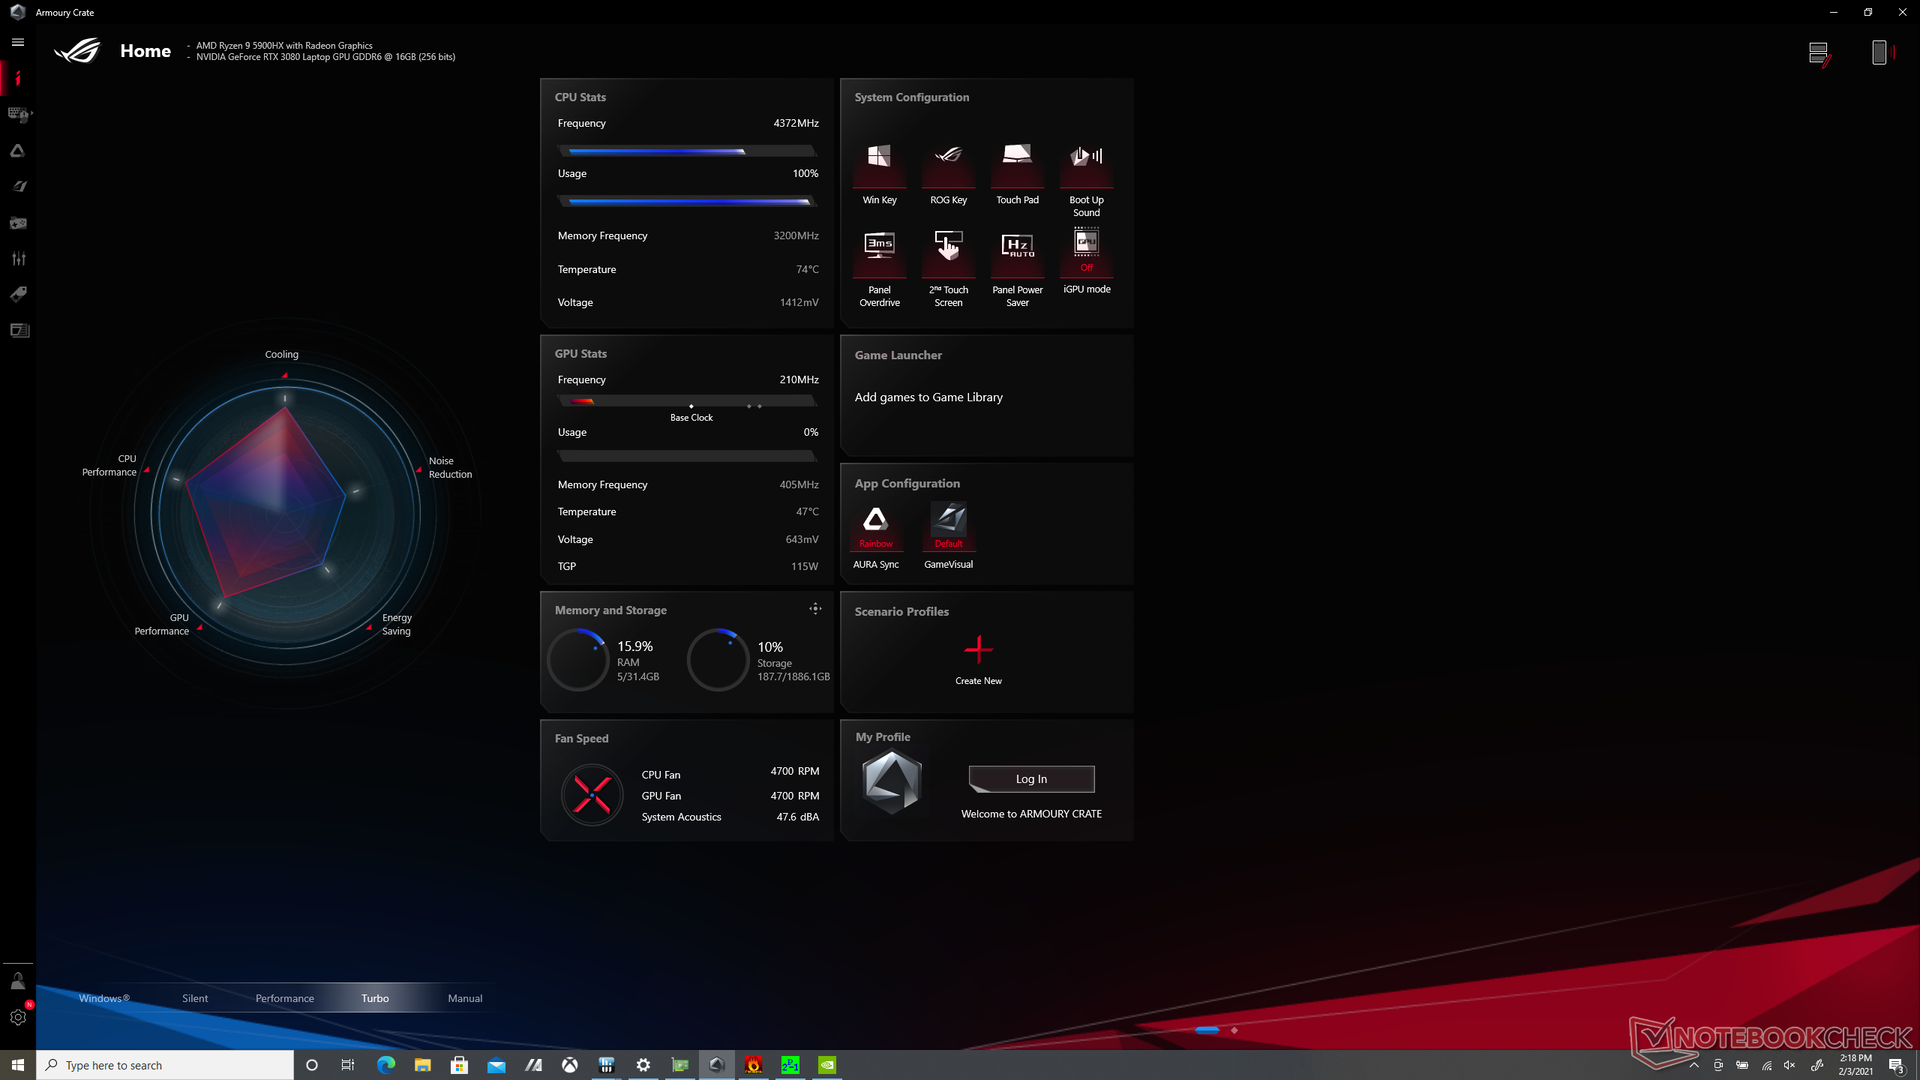
Nvidia has dropped the Max-Q branding and so there are no more Max-Q options for the GX551 unlike on the GX550. Asus has confirmed with us that the GeForce RTX 3080 in our configuration targets a TGP of 130 W.
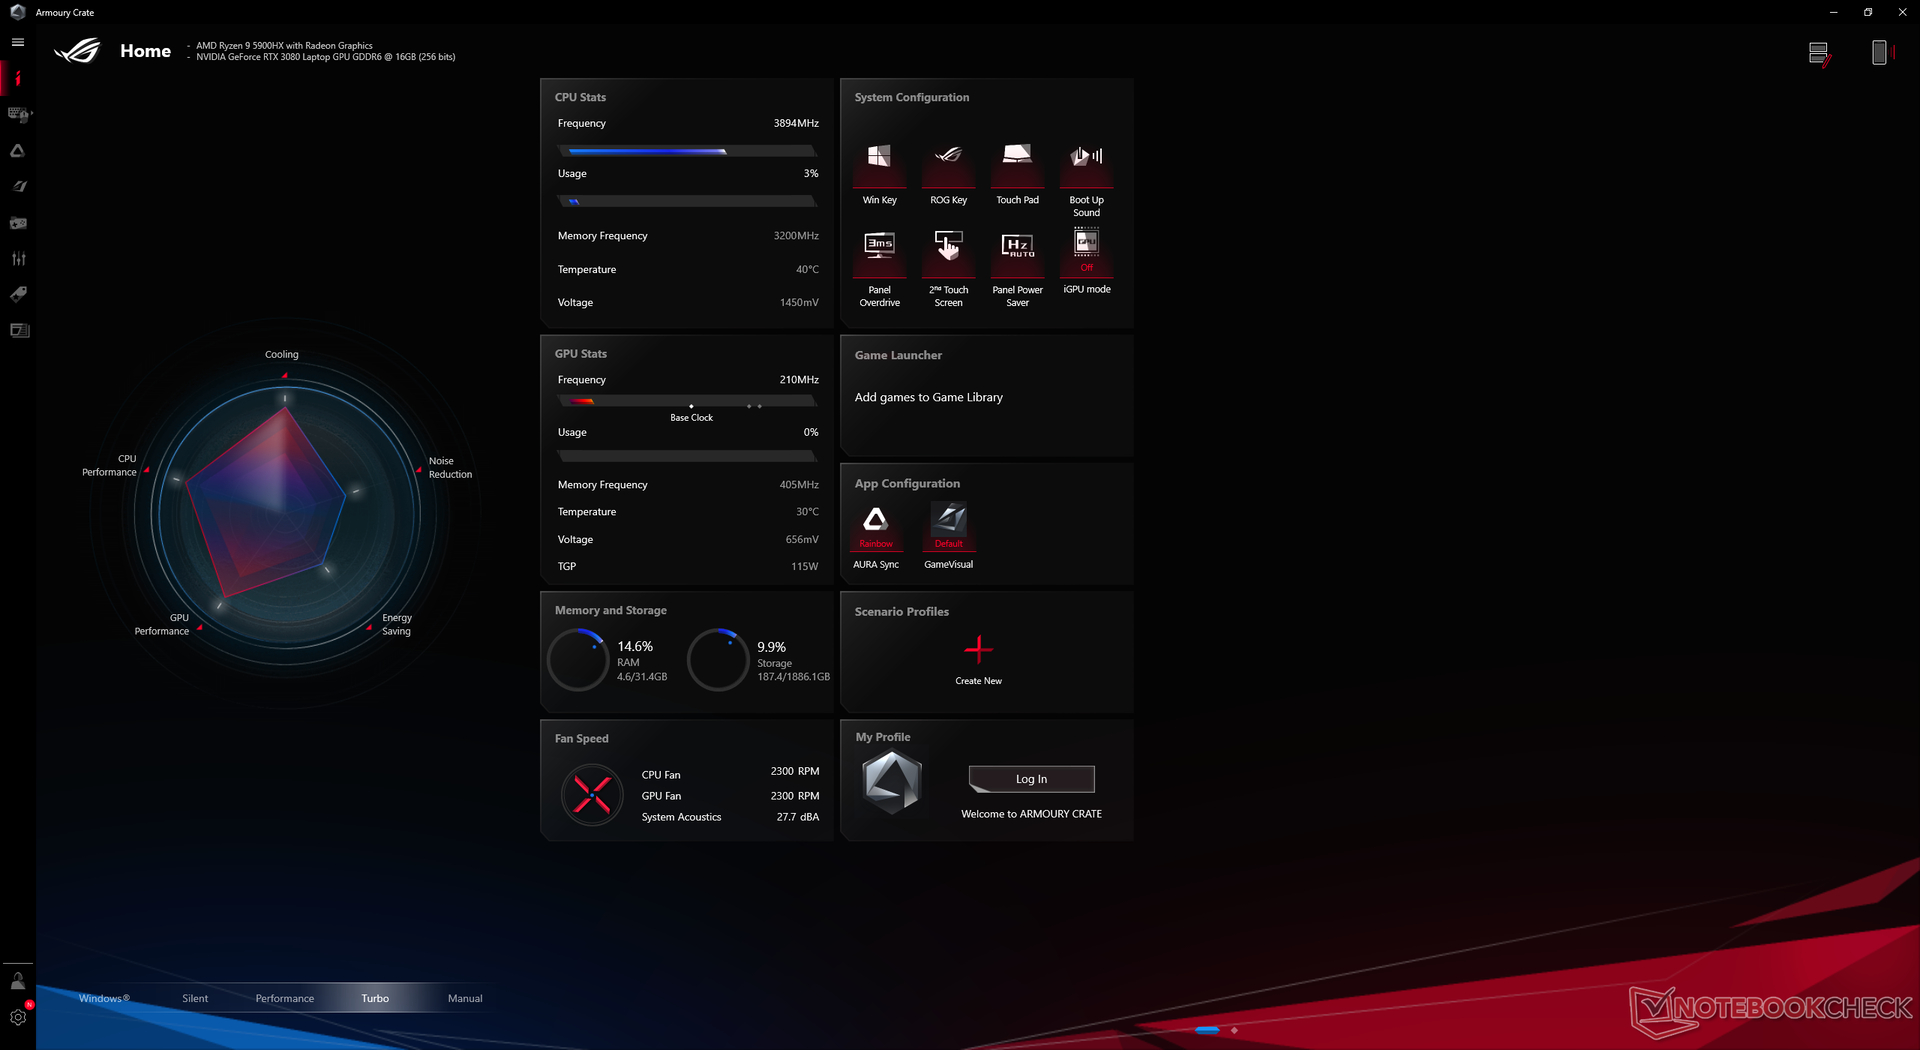
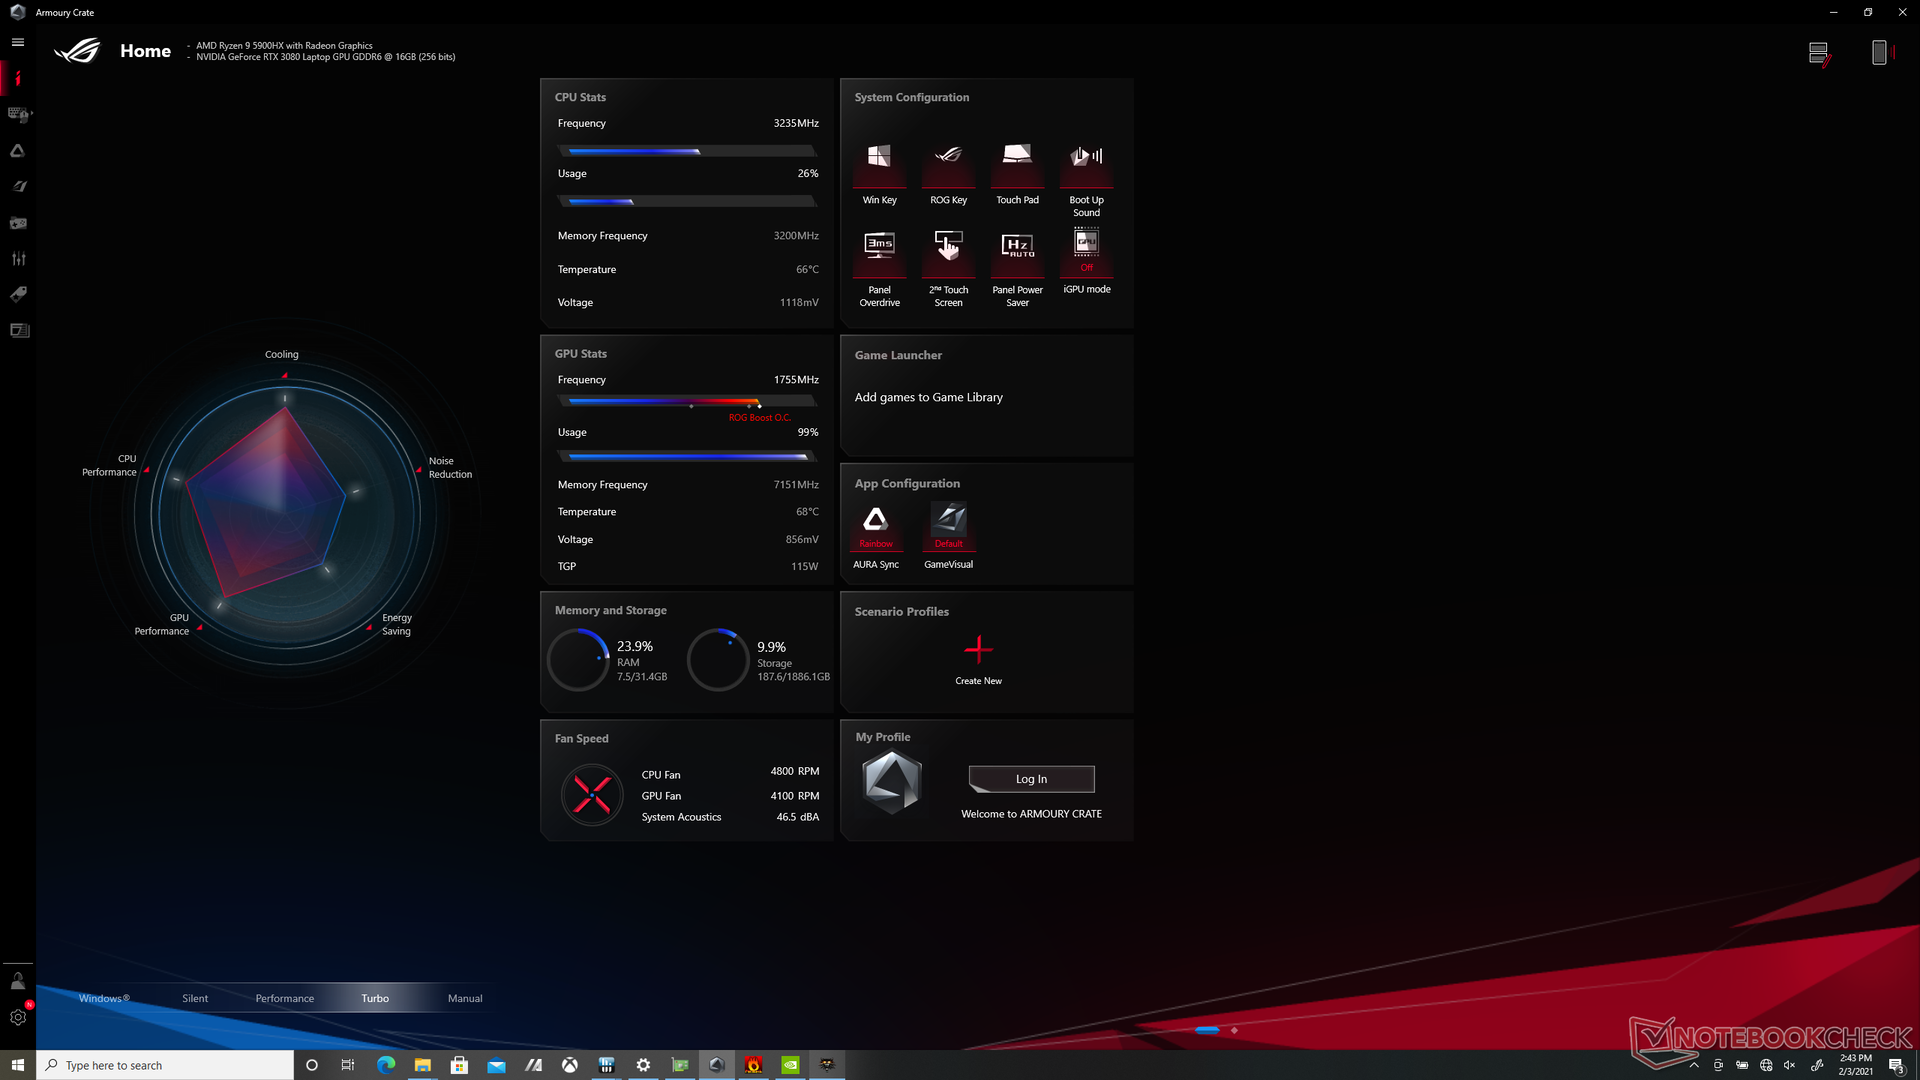
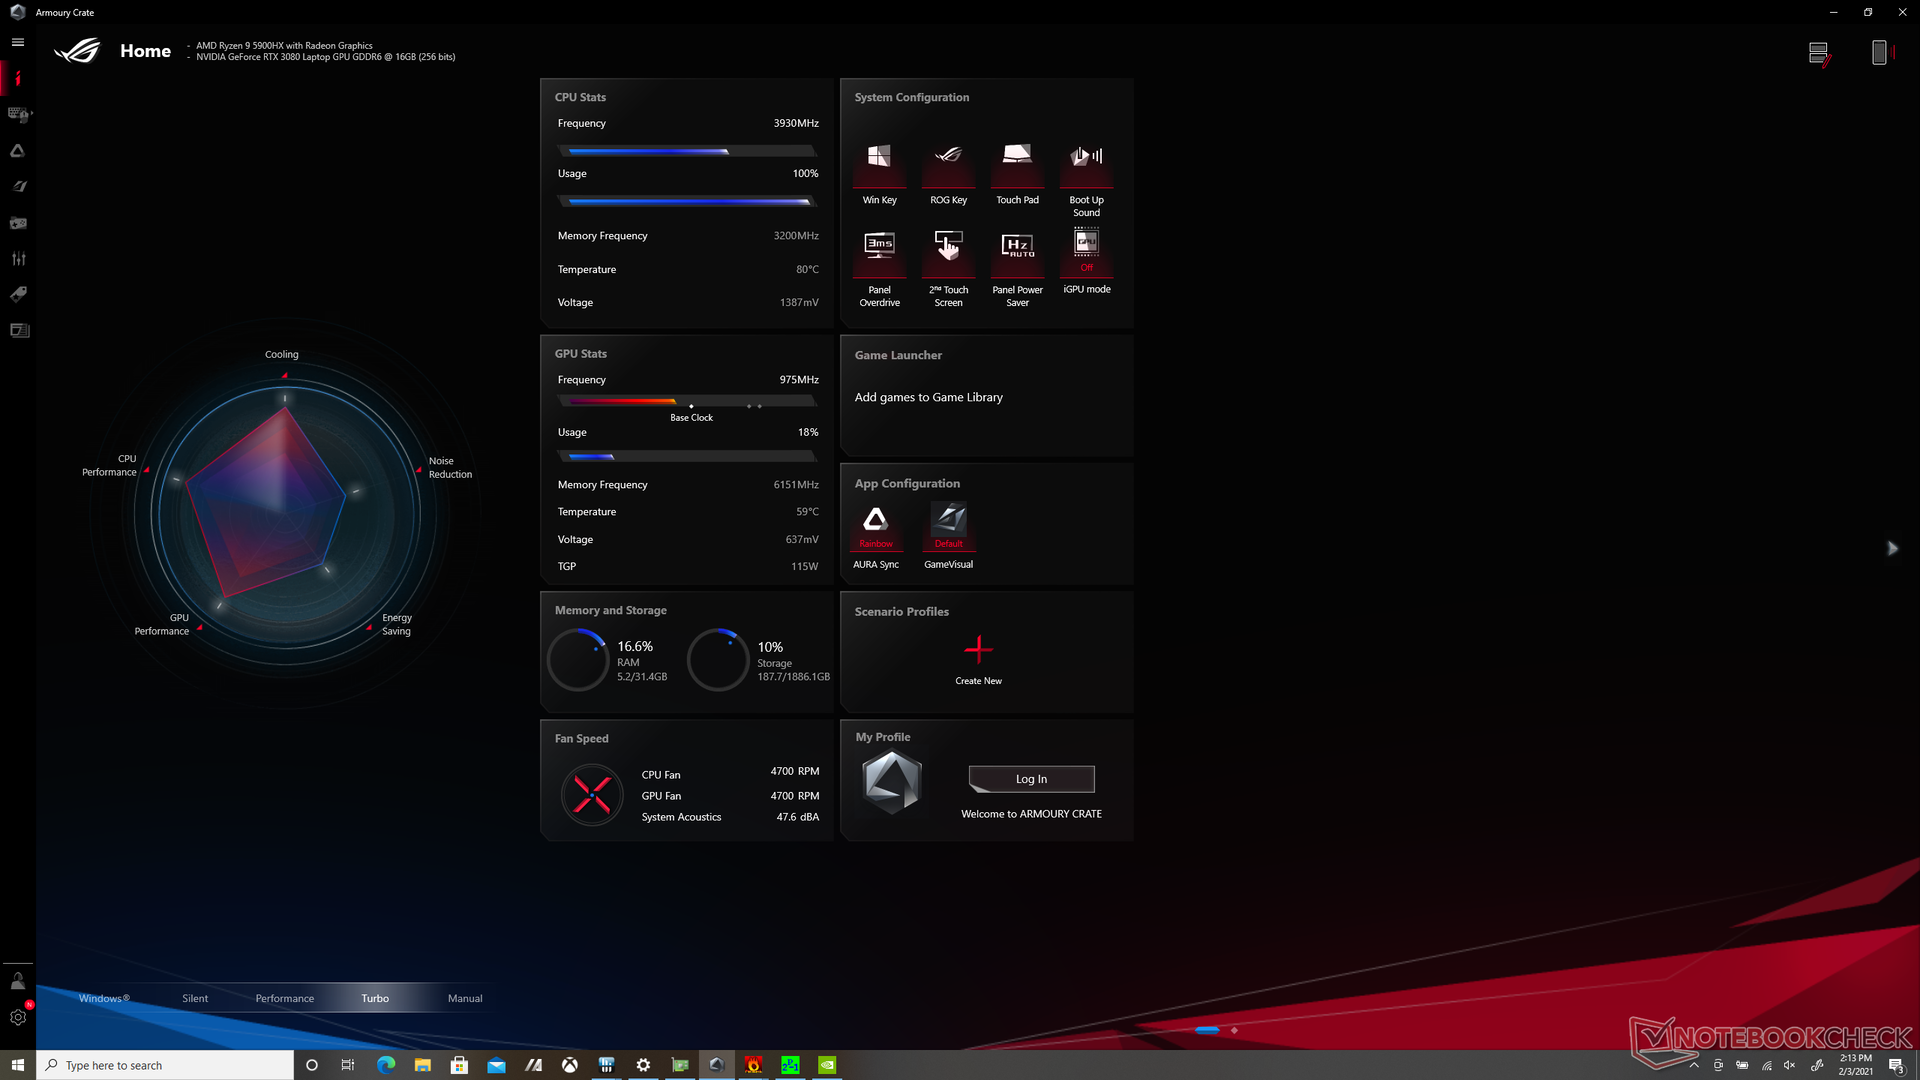
We recommend owners become familiar with the pre-installed Asus Armoury Crate software as important system features are toggled here including Performance mode and Turbo mode.
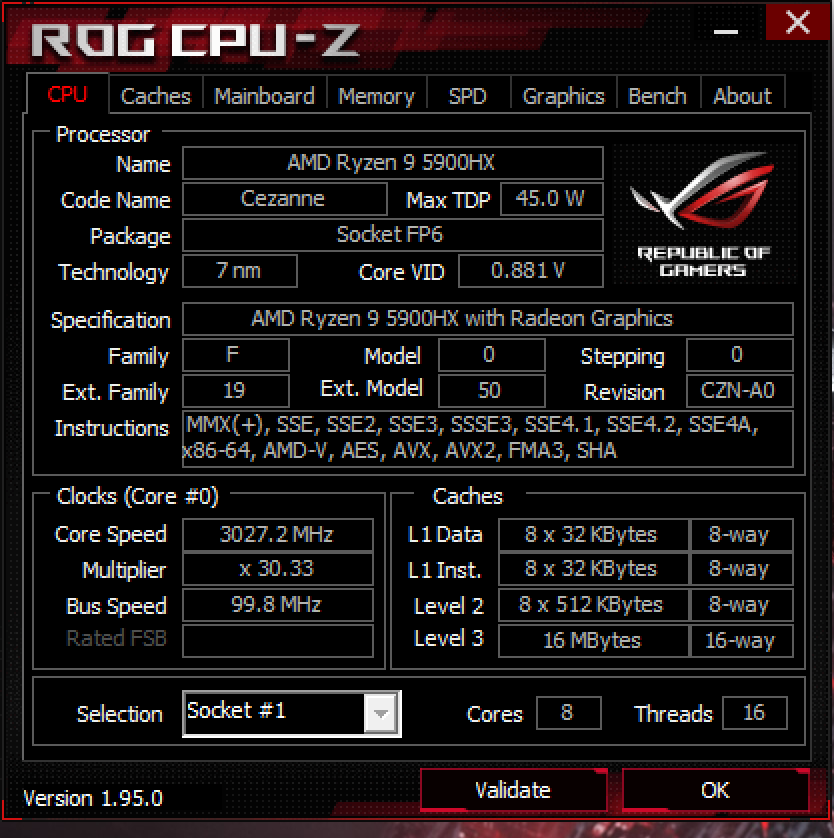
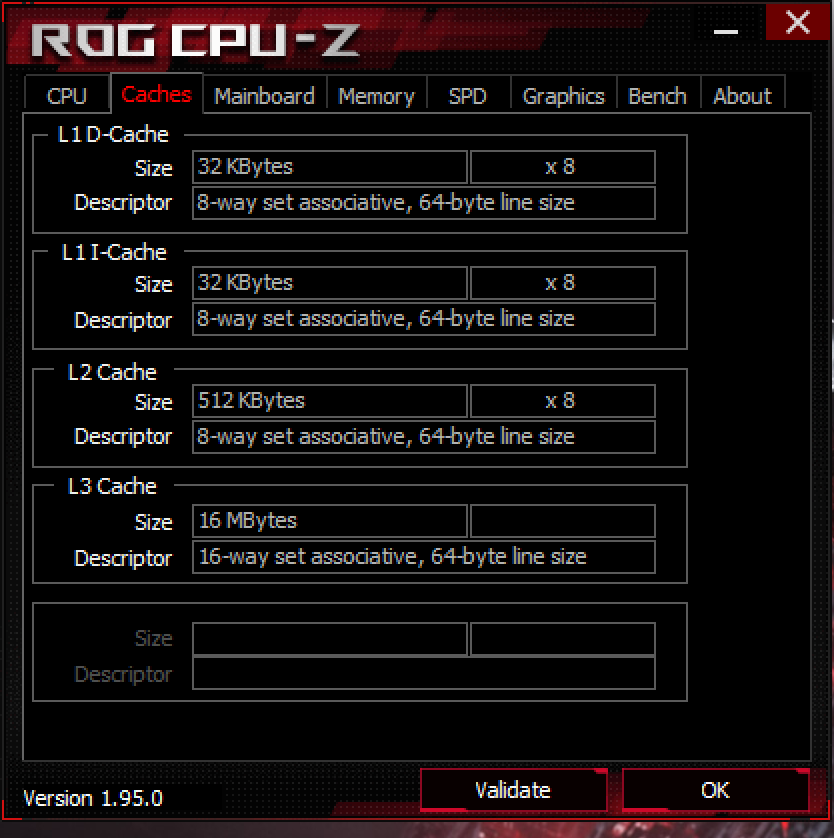
Processor
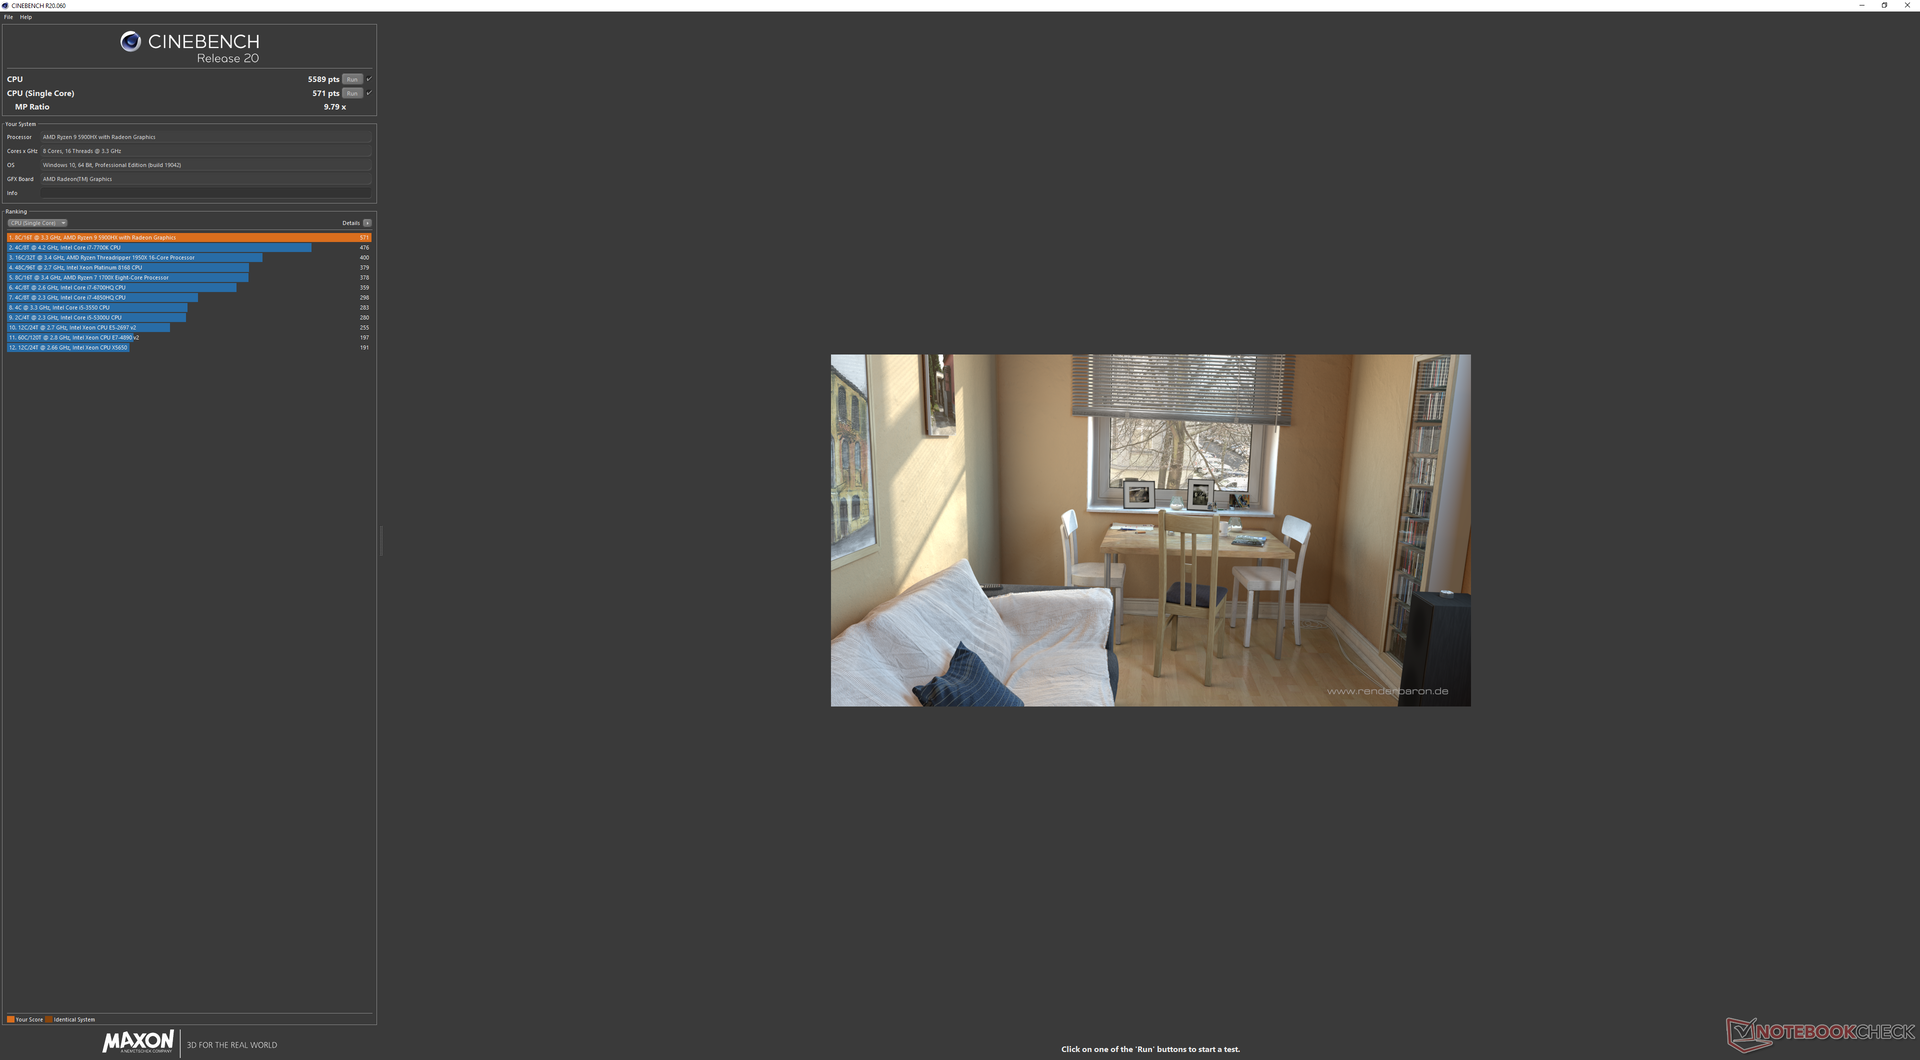
When compared to the Core i9-10980HK in the GX550, our Ryzen 9 5900HX can offer up to almost 50 percent faster multi-thread performance. The wide gap can be attributed to the excellent performance sustainability of AMD Turbo Core whereas Intel Turbo Boost is relatively short-lived on the GX550. This is exemplified by our CineBench r15 xT loop graph below where the initial score of 1800 points on the GX550 would dip by 10 to 15 percent during the second loop in contrast to our tighter Ryzen 9 scores. Single-thread advantage goes to the AMD chip as well by about 15 percent over the Core i9-10980HK. Ryzen chips have traditionally lagged behind Intel in this respect, but AMD may be finally catching up here and then some.
Note that opting for the less expensive Ryzen 7 5800H option will entail a multi-thread performance deficit of only about 7 to 18 percent. Thus, you'll be getting a faster processor than the Core i9-10980HK no matter which Zen 3 option you choose.
Running the Zephyrus in Performance mode instead of Turbo mode will incur a CPU performance deficit of just 5 to 10 percent according to CineBench R20.
See our dedicated pages on the Ryzen 9 5900HX for more technical information and benchmark comparisons.

Cinebench R15: CPU Multi 64Bit | CPU Single 64Bit
Blender: v2.79 BMW27 CPU
7-Zip 18.03: 7z b 4 -mmt1 | 7z b 4
Geekbench 5.5: Single-Core | Multi-Core
HWBOT x265 Benchmark v2.2: 4k Preset
LibreOffice : 20 Documents To PDF
R Benchmark 2.5: Overall mean
Cinebench R15: CPU Multi 64Bit | CPU Single 64Bit
Blender: v2.79 BMW27 CPU
7-Zip 18.03: 7z b 4 -mmt1 | 7z b 4
Geekbench 5.5: Single-Core | Multi-Core
HWBOT x265 Benchmark v2.2: 4k Preset
LibreOffice : 20 Documents To PDF
R Benchmark 2.5: Overall mean
* ... smaller is better
System Performance
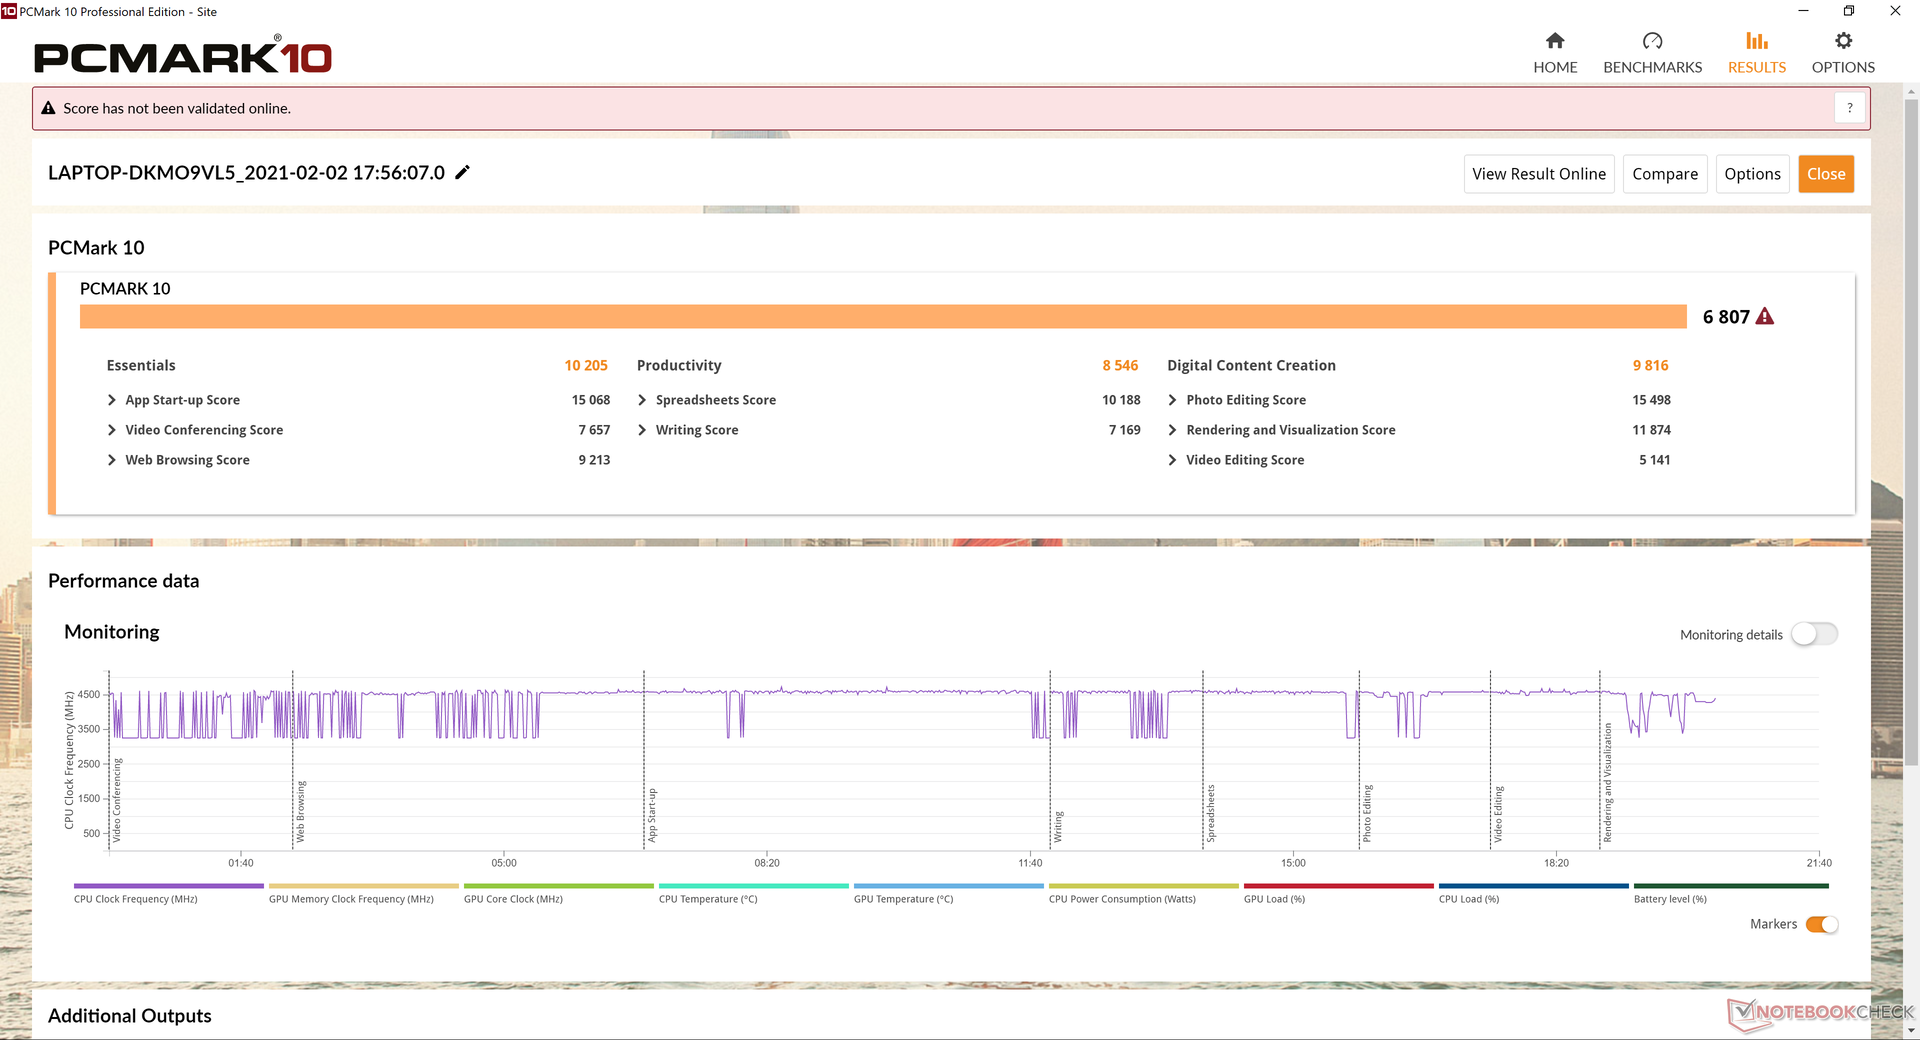
PCMark benchmarks are higher than last year's GX550 but still consistently lower than the Eurocom Sky X4C even though our Asus houses newer and faster components. We suspect that the SSDs in our unit may be partly responsible as Asus says there has been a RAID 0 driver delay for review units.
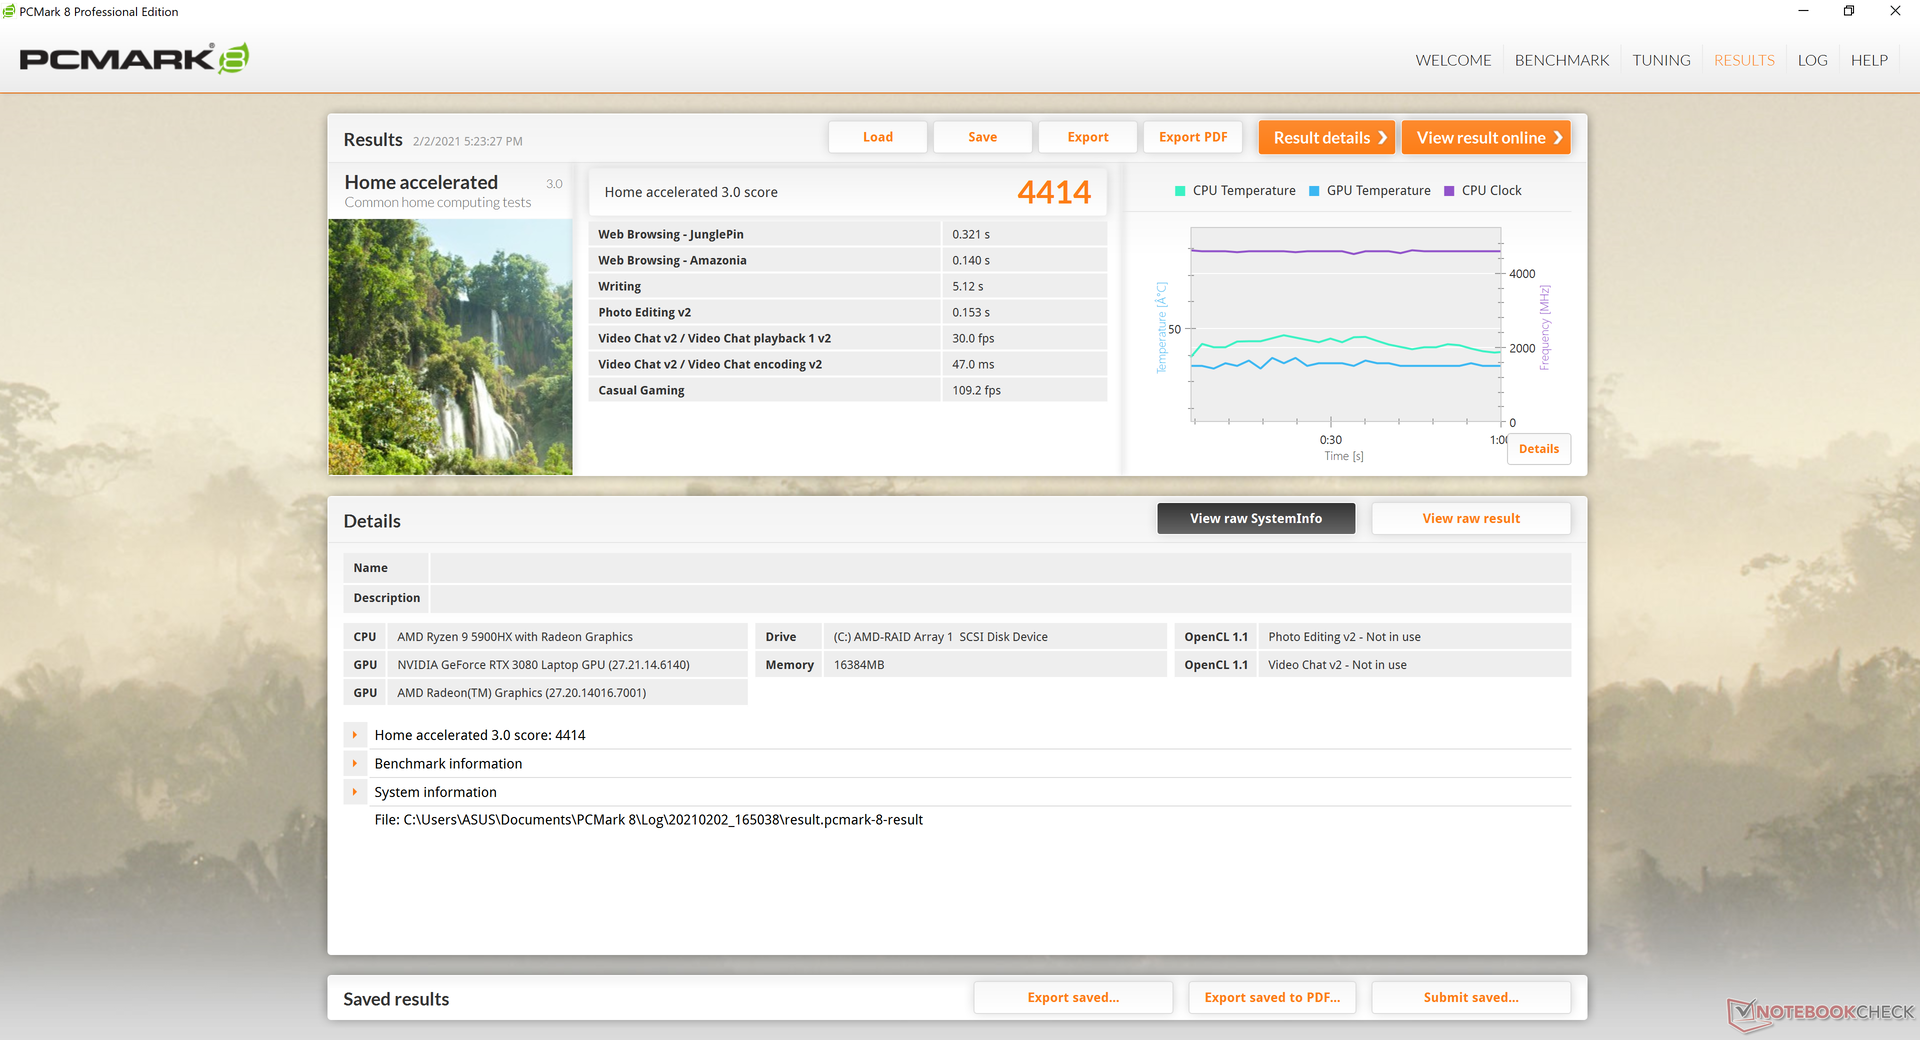
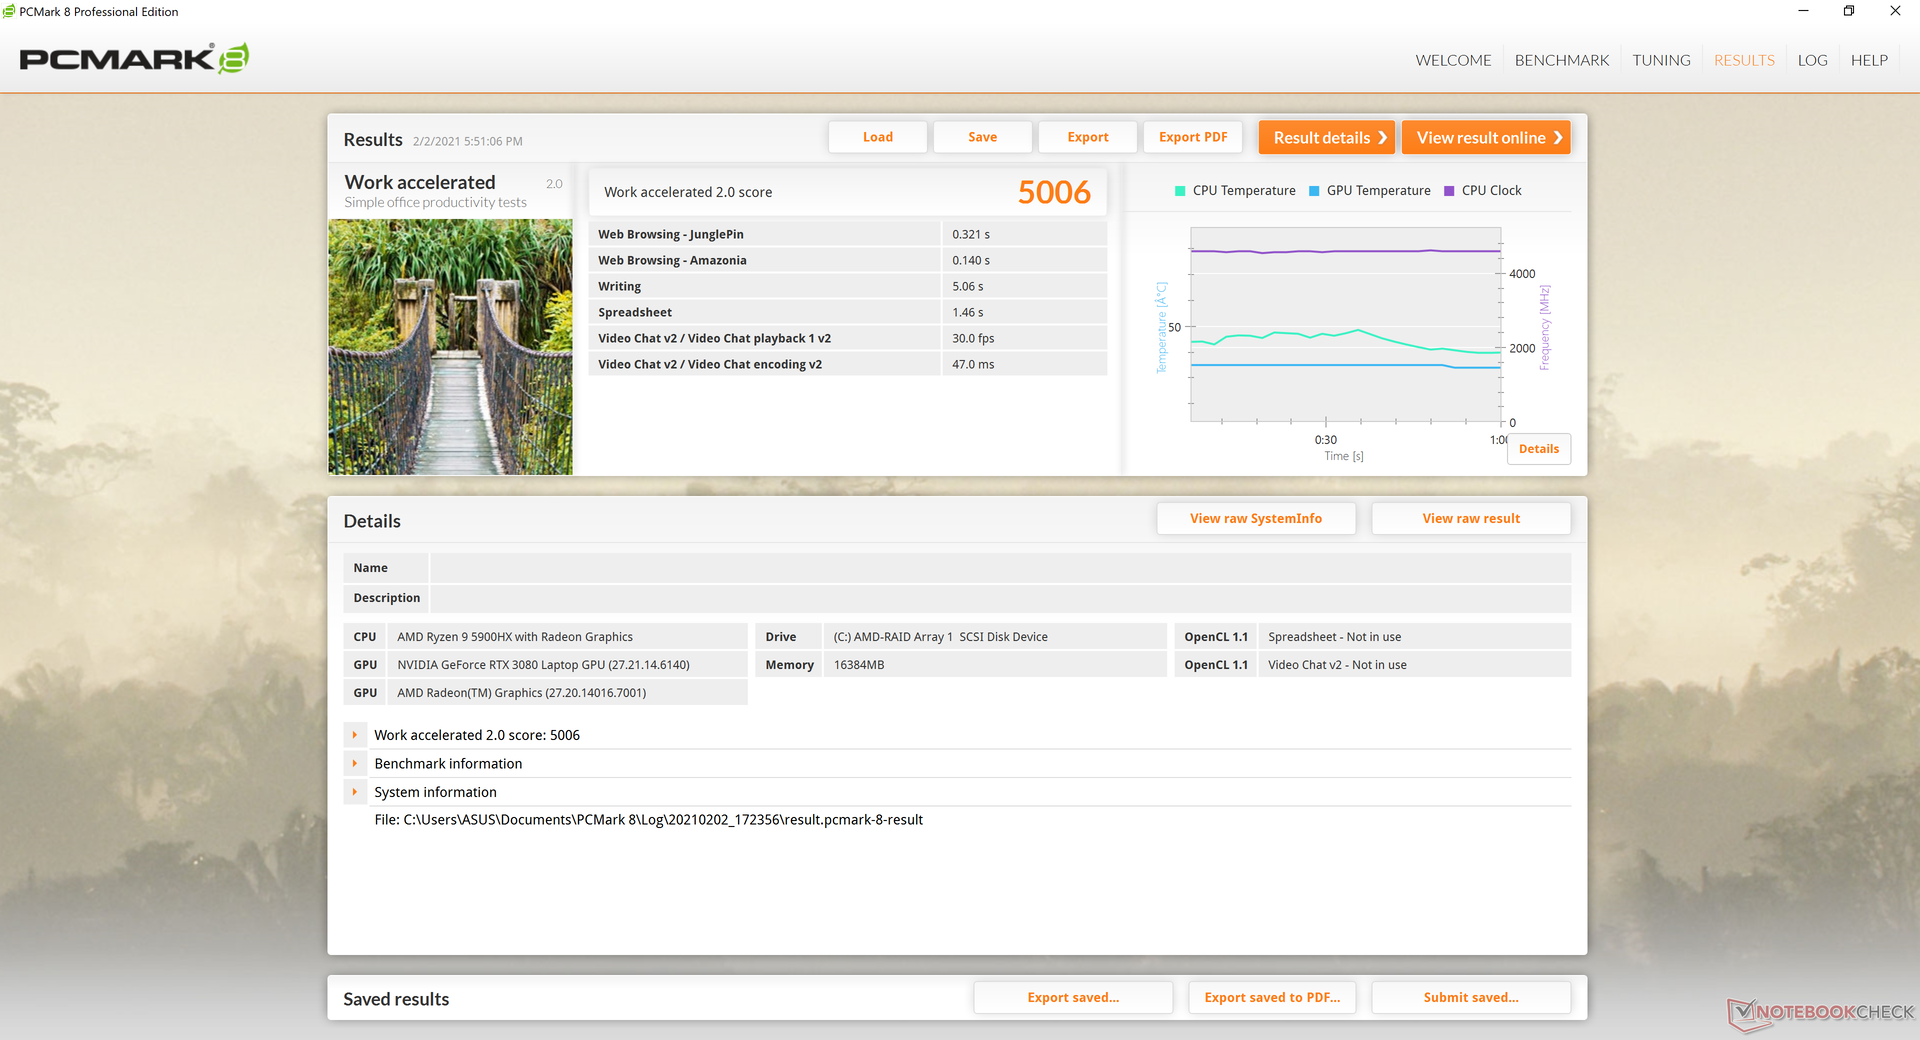
| PCMark 8 Home Score Accelerated v2 | 4414 points | |
| PCMark 8 Work Score Accelerated v2 | 5006 points | |
| PCMark 10 Score | 6807 points | |
Help | ||
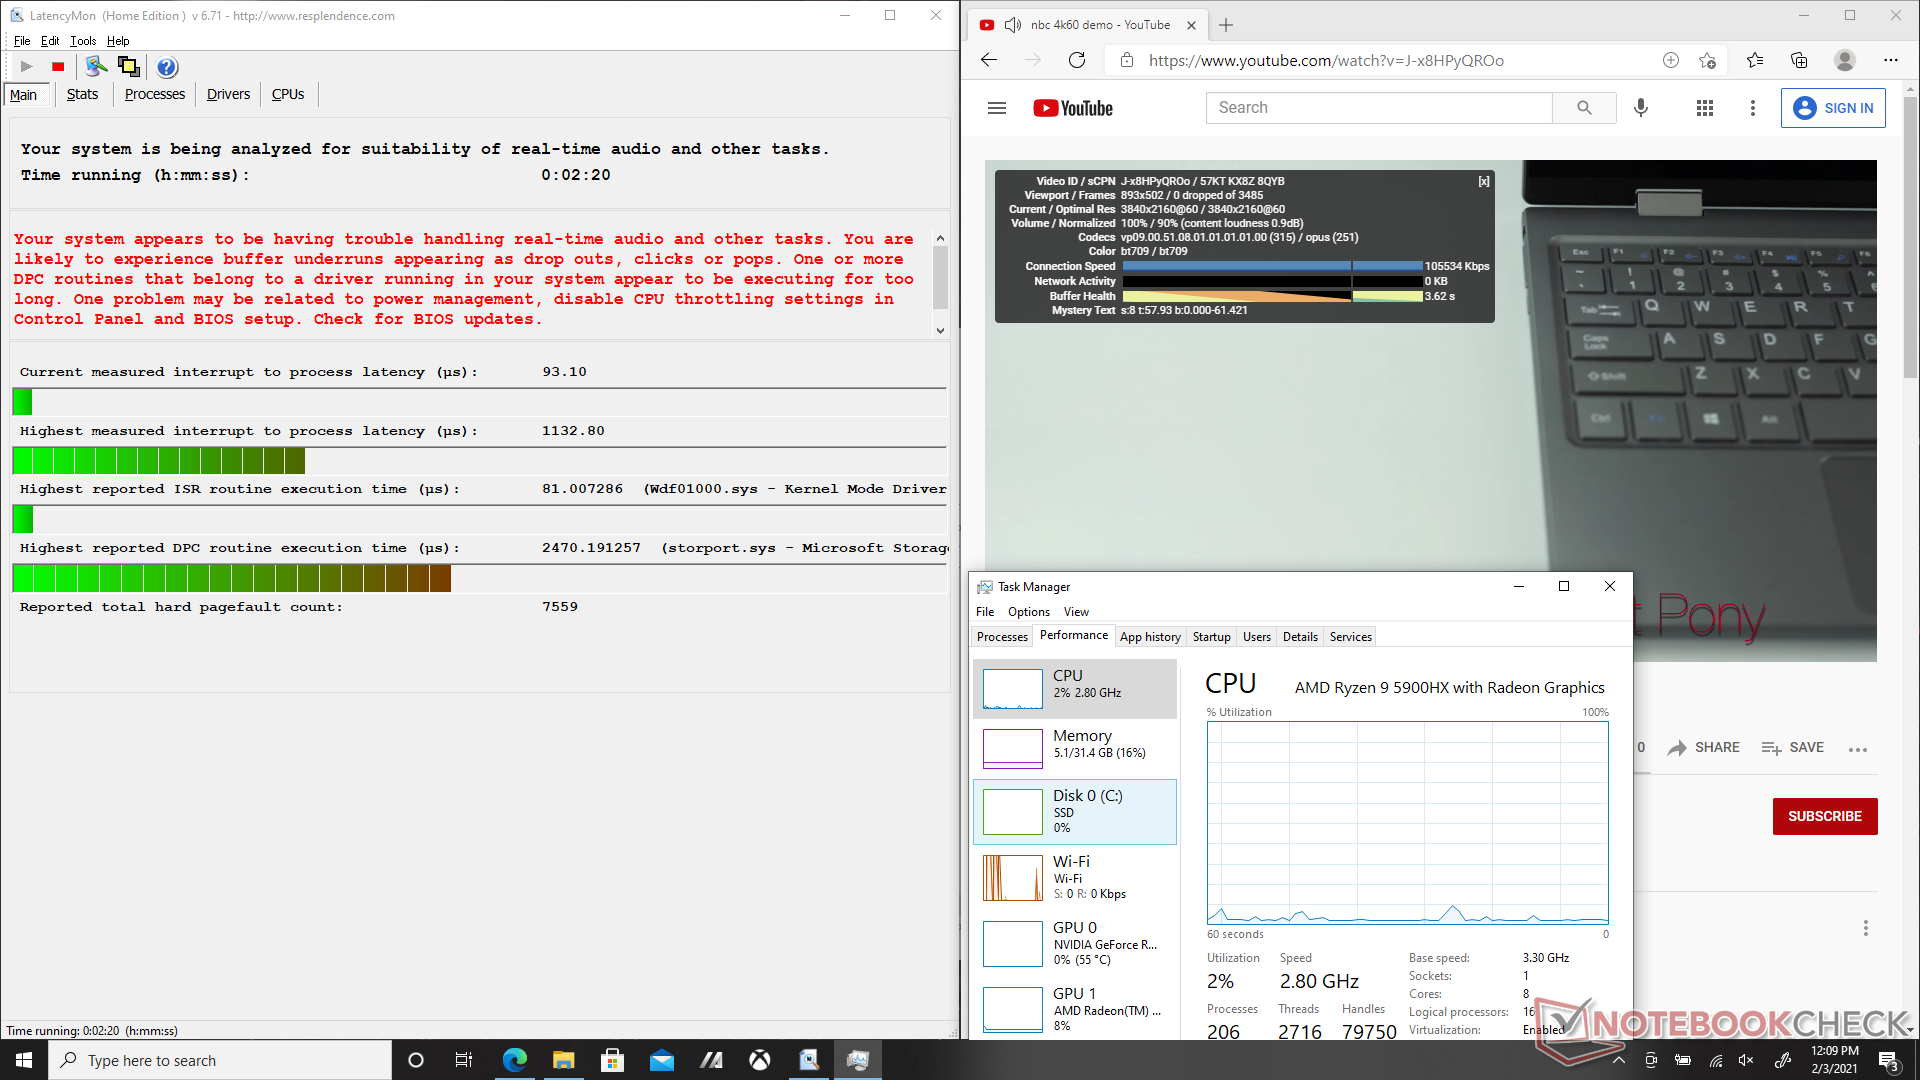
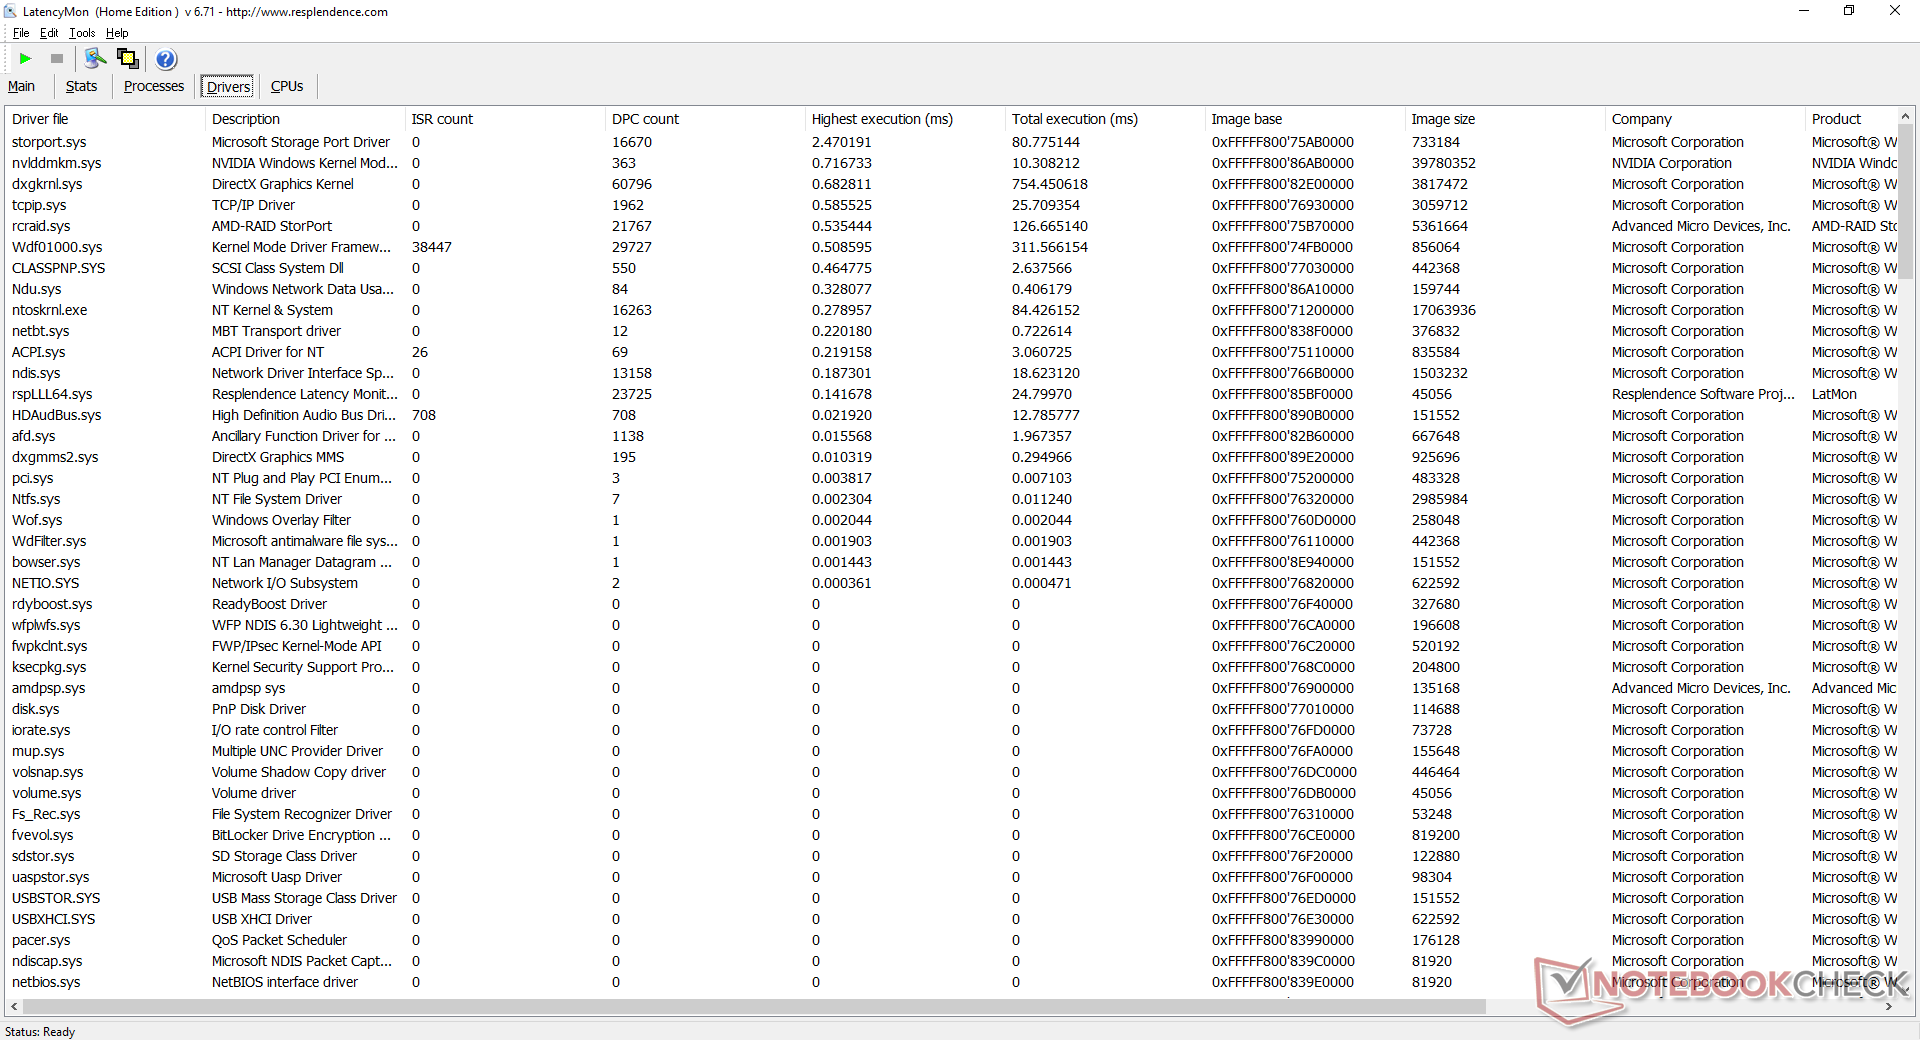
DPC Latency
LatencyMon shows steep DPC latency issues when opening multiple browser tabs on our homepage. Repeating this test on Balanced mode would not result in any improvements. 4K video playback at 60 FPS is otherwise smooth and with no dropped frames. CPU and integrated GPU utilization would each sit at single digits as expected from such high-power components. A typical Core i7 Ice Lake Ultrabook would typically stabilize at around 40 to 50 percent GPU utilization in comparison.
| DPC Latencies / LatencyMon - interrupt to process latency (max), Web, Youtube, Prime95 | |
| Asus ROG Zephyrus Duo 15 GX550LXS | |
| MSI GS66 Stealth 10SFS | |
| Asus ROG Zephyrus Duo 15 SE GX551QS | |
| MSI GE66 Raider 10SFS | |
| Razer Blade 15 RTX 2080 Super Max-Q | |
* ... smaller is better
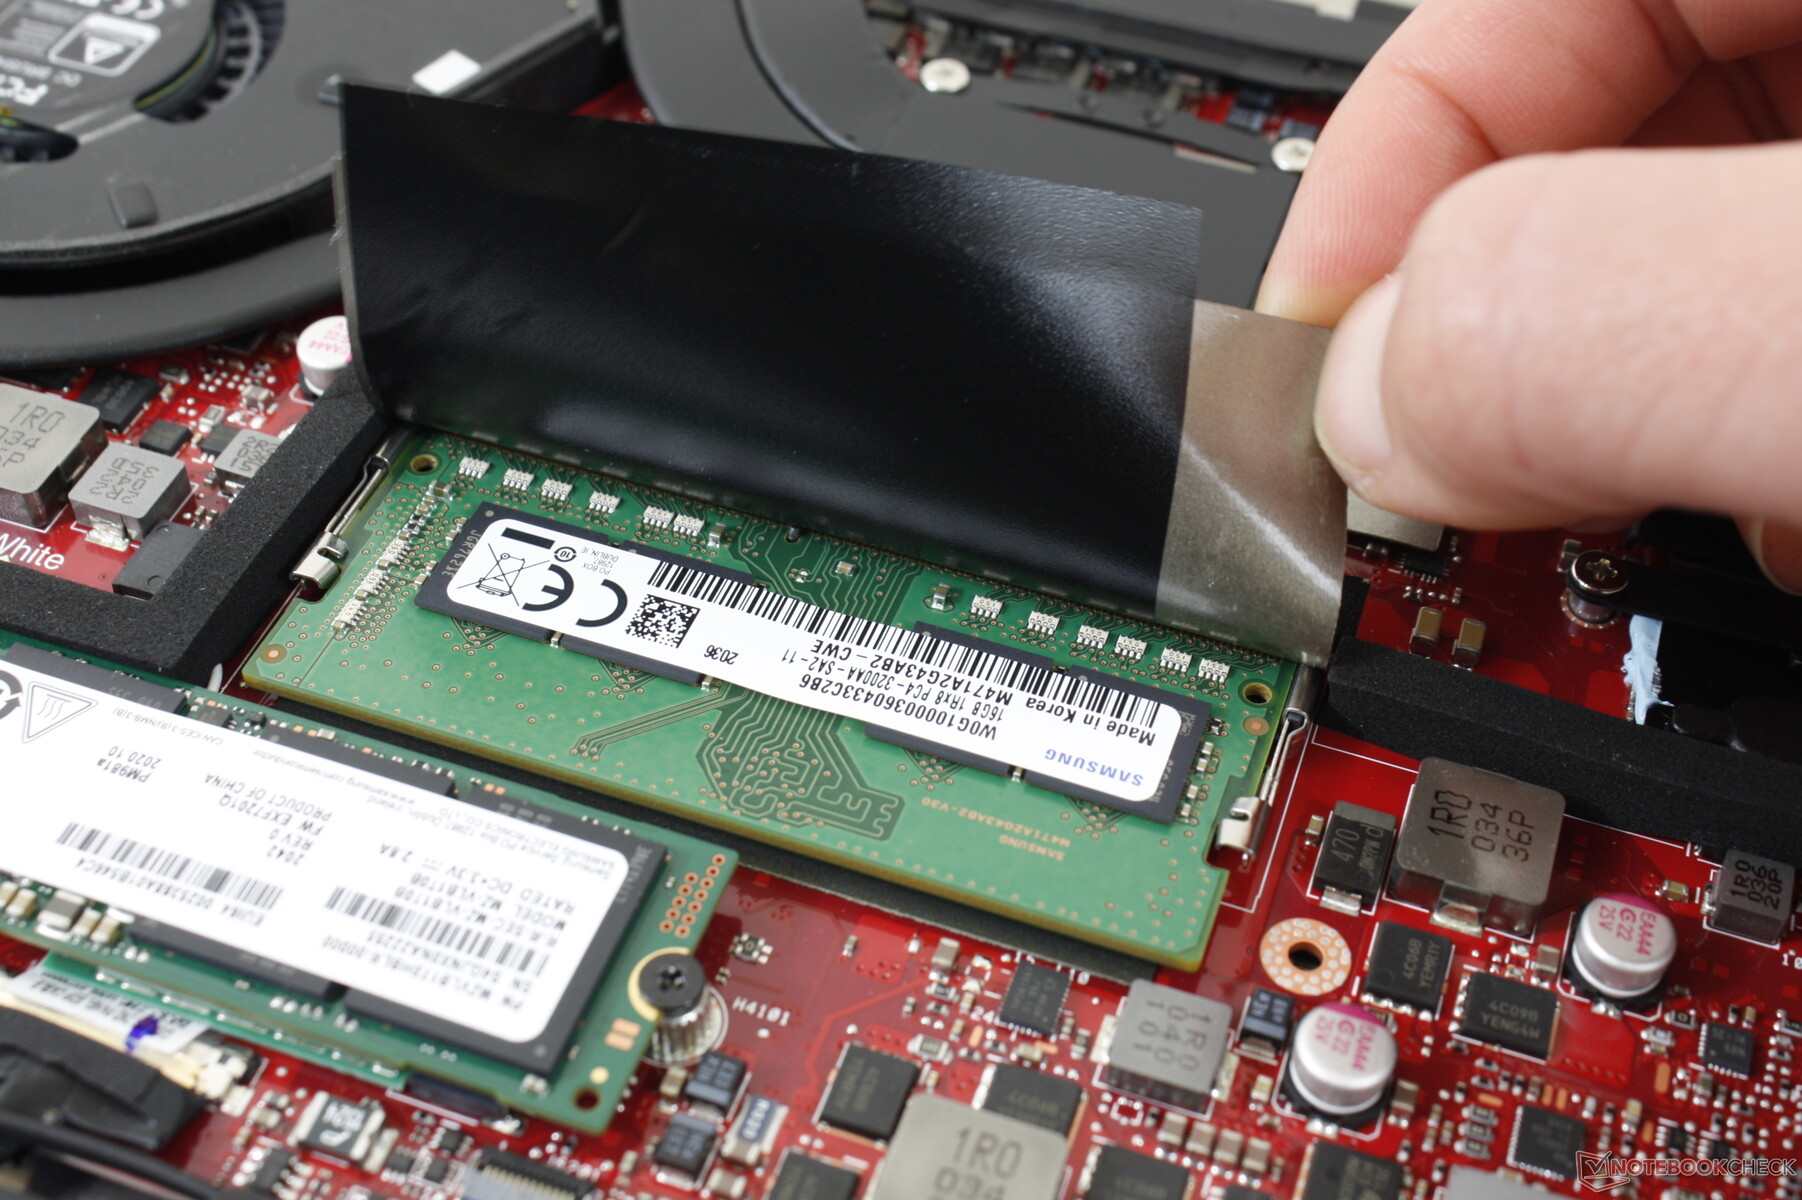
Storage Devices
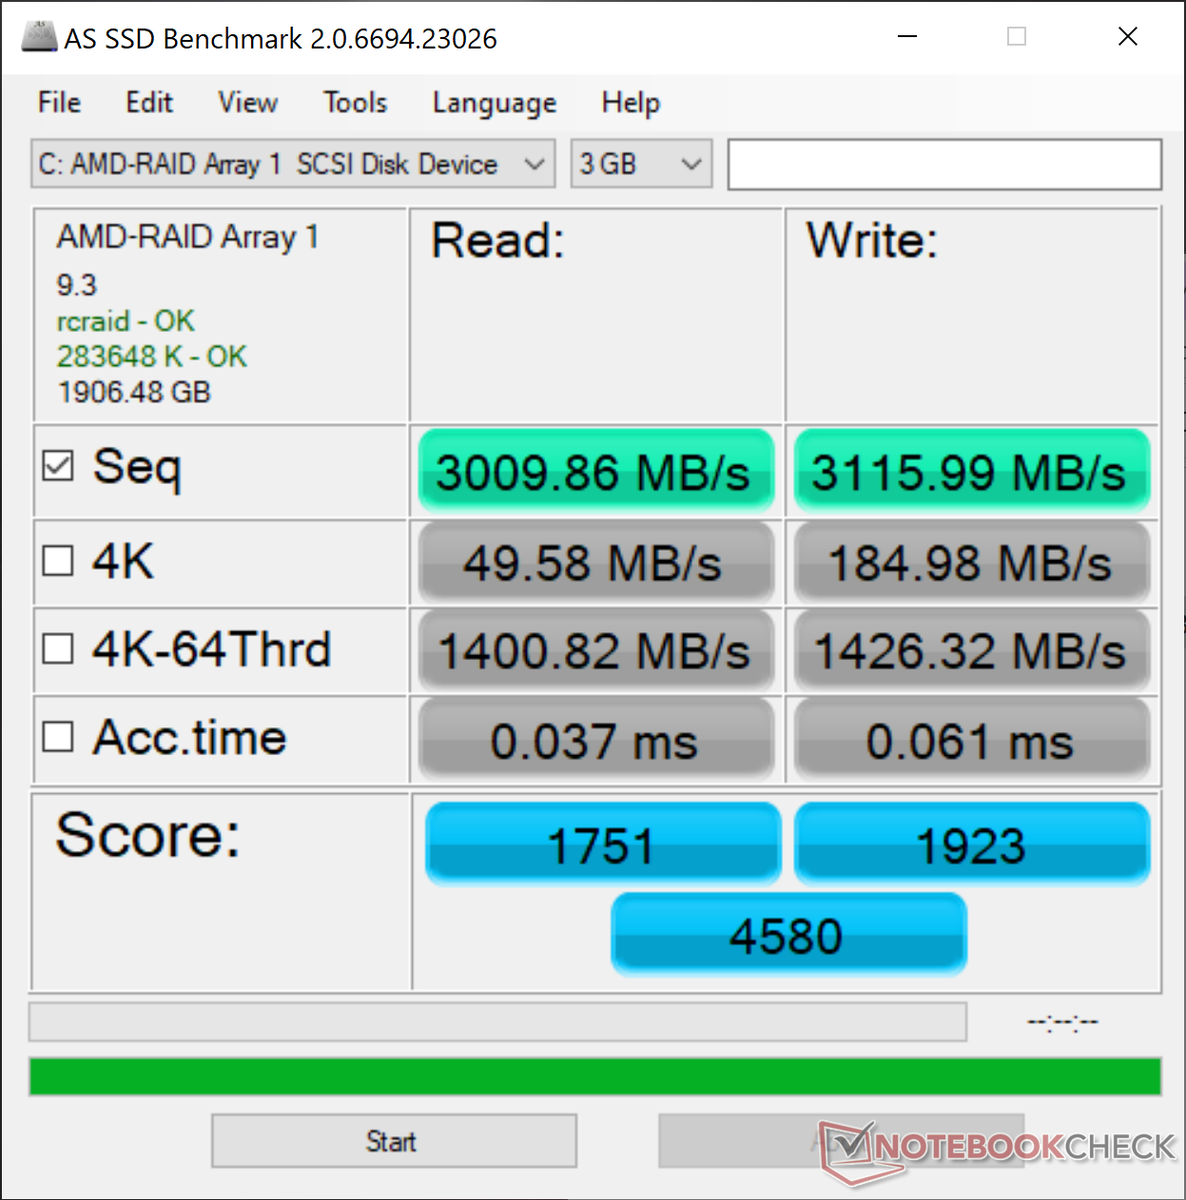
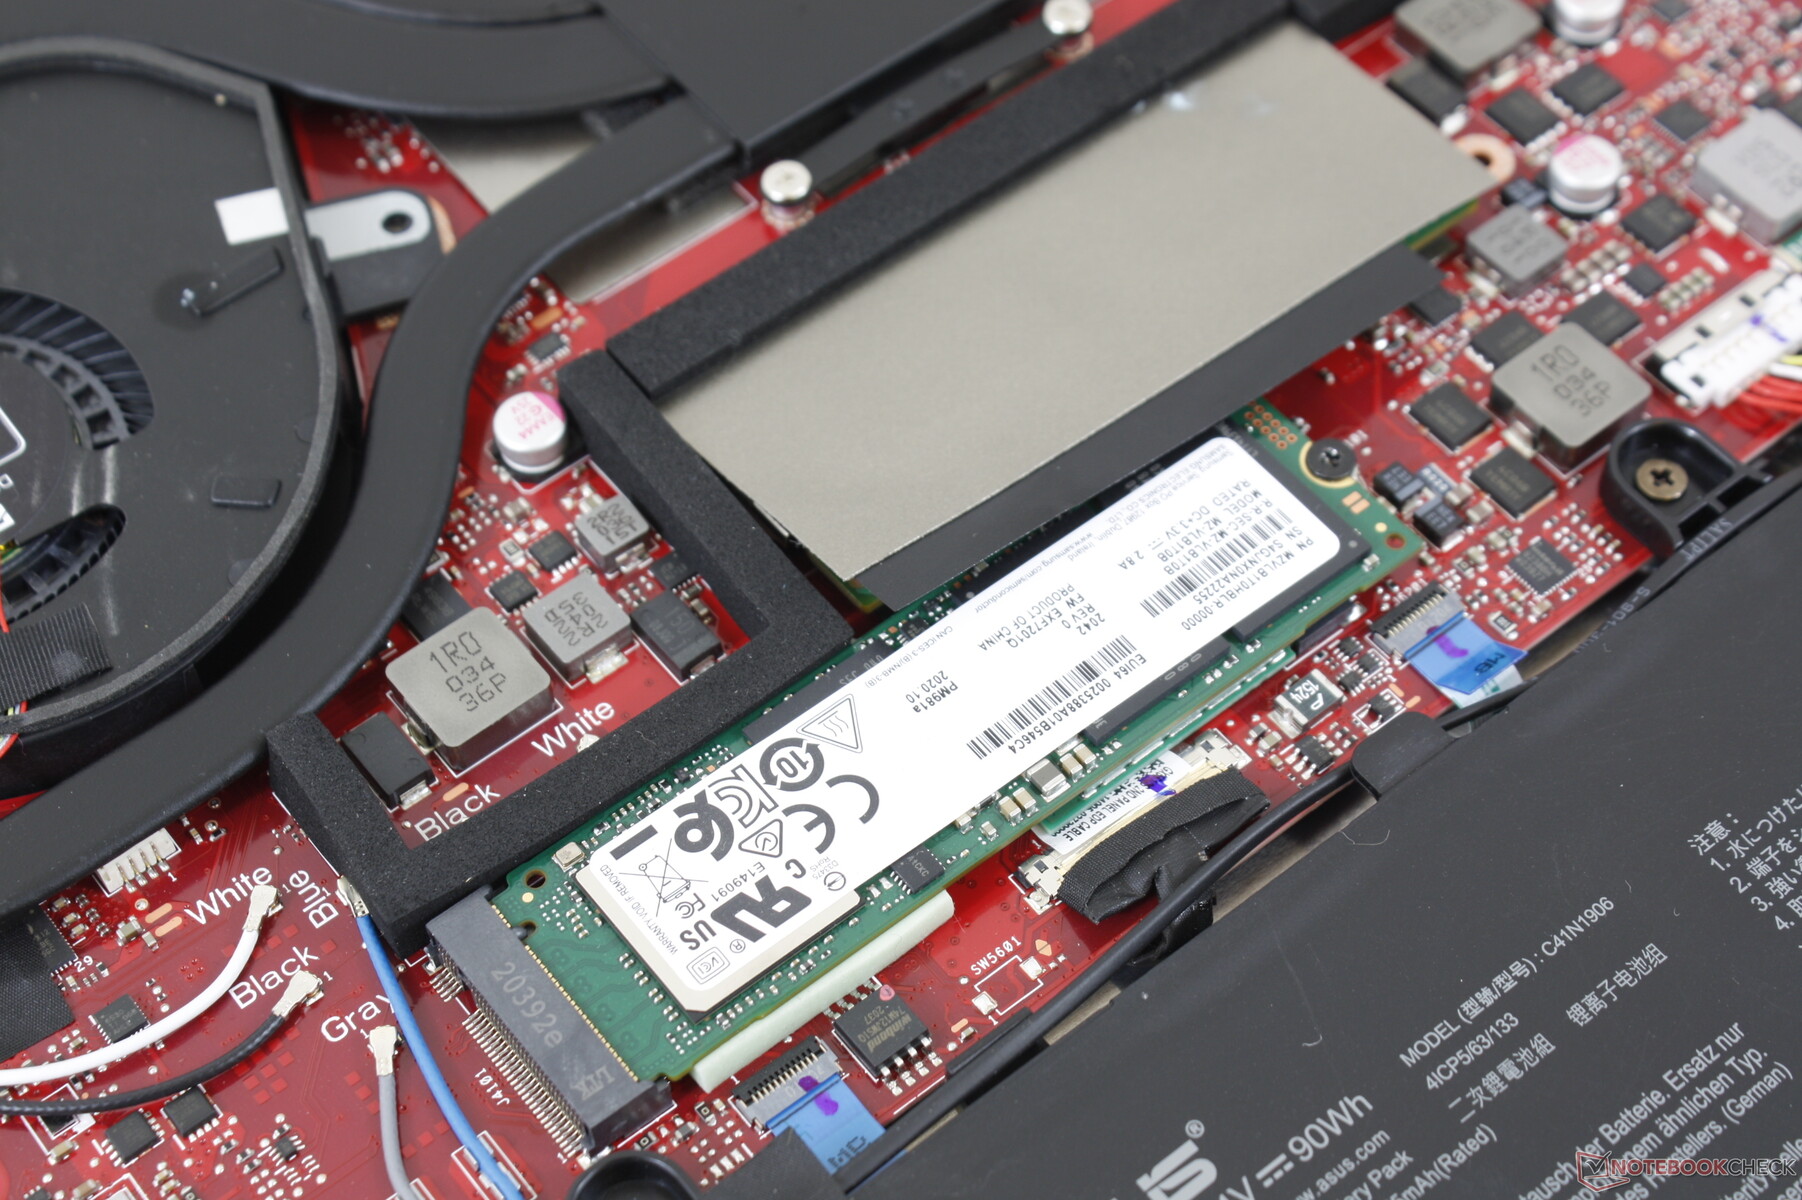
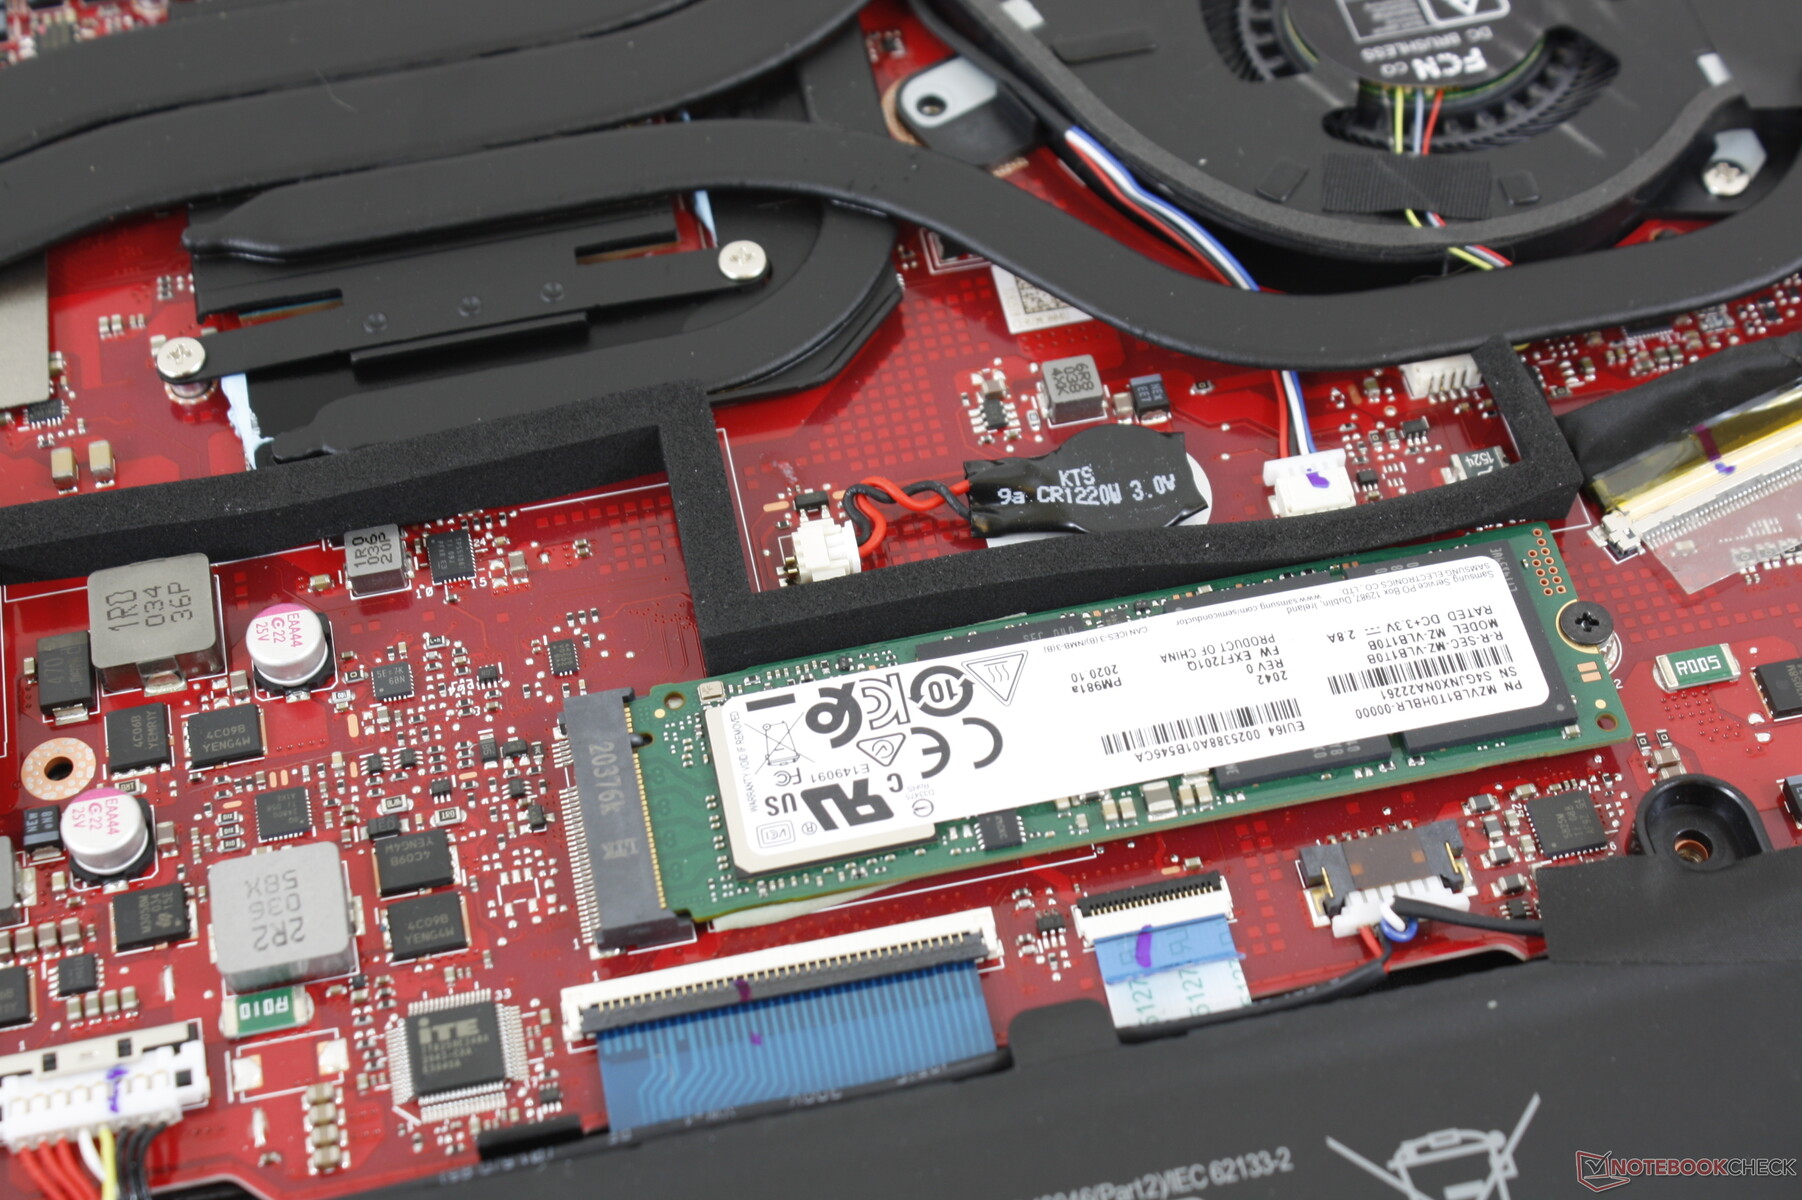
| Asus ROG Zephyrus Duo 15 SE GX551QS 2x Samsung PM981a MZVLB1T0HBLR (RAID 0) | Asus ROG Zephyrus Duo 15 GX550LXS 2x Samsung PM981a MZVLB1T0HBLR (RAID 0) | Eurocom Sky X4C i9-9900KS Samsung SSD 970 Pro 512GB | MSI GE66 Raider 10SFS WDC PC SN730 SDBPNTY-1T00 | MSI GS66 Stealth 10SFS Samsung SSD PM981 MZVLB1T0HALR | |
|---|---|---|---|---|---|
| AS SSD | -11% | -16% | 11% | -10% | |
| Seq Read (MB/s) | 3010 | 2981 -1% | 2280 -24% | 2979 -1% | 1065 -65% |
| Seq Write (MB/s) | 3116 | 2783 -11% | 2198 -29% | 2581 -17% | 2360 -24% |
| 4K Read (MB/s) | 49.58 | 43.98 -11% | 31.67 -36% | 47.33 -5% | 48.09 -3% |
| 4K Write (MB/s) | 185 | 113.9 -38% | 127.3 -31% | 140 -24% | 110.7 -40% |
| 4K-64 Read (MB/s) | 1401 | 1519 8% | 1293 -8% | 1710 22% | 1635 17% |
| 4K-64 Write (MB/s) | 1426 | 1296 -9% | 2124 49% | 2188 53% | 1829 28% |
| Access Time Read * (ms) | 0.037 | 0.062 -68% | 0.078 -111% | 0.05 -35% | 0.071 -92% |
| Access Time Write * (ms) | 0.061 | 0.033 46% | 0.098 -61% | 0.026 57% | 0.034 44% |
| Score Read (Points) | 1751 | 1861 6% | 1552 -11% | 2055 17% | 1790 2% |
| Score Write (Points) | 1923 | 1688 -12% | 2471 28% | 2586 34% | 2176 13% |
| Score Total (Points) | 4580 | 4492 -2% | 4811 5% | 5673 24% | 4950 8% |
| Copy ISO MB/s (MB/s) | 3196 | 2438 -24% | 3007 -6% | ||
| Copy Program MB/s (MB/s) | 710 | 604 -15% | 731 3% | ||
| Copy Game MB/s (MB/s) | 1669 | 1404 -16% | 1756 5% | ||
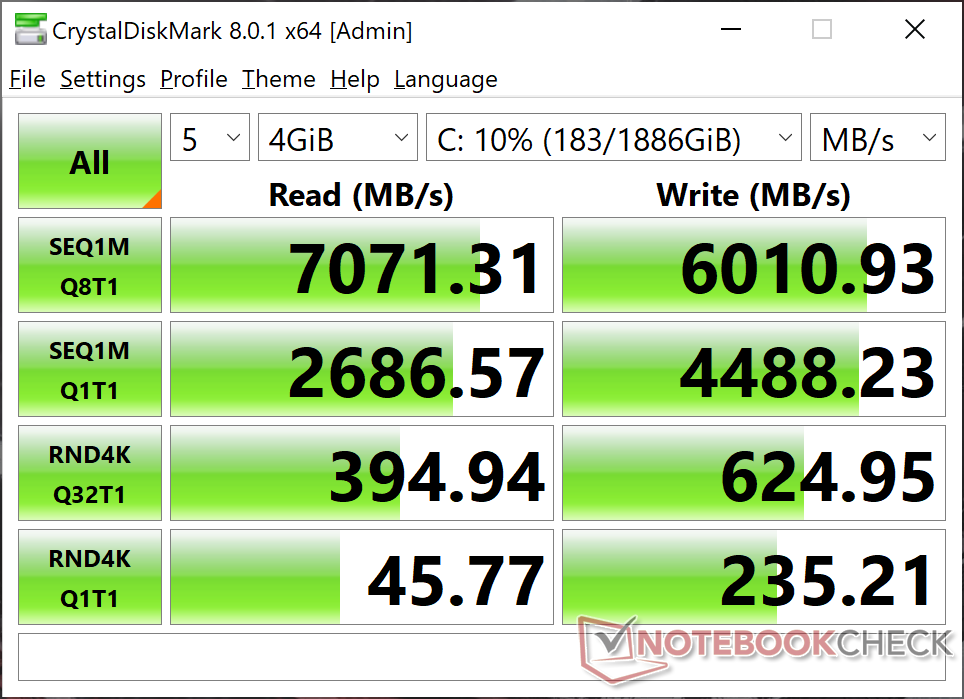
| CrystalDiskMark 5.2 / 6 | -18% | -19% | -20% | -28% | |
| Write 4K (MB/s) | 229.7 | 127.6 -44% | 188.8 -18% | 158.2 -31% | 131.3 -43% |
| Read 4K (MB/s) | 47.13 | 48.4 3% | 63.5 35% | 50.7 8% | 45.84 -3% |
| Write Seq (MB/s) | 4455 | 2958 -34% | 1836 -59% | 1790 -60% | 2370 -47% |
| Read Seq (MB/s) | 2933 | 2984 2% | 1891 -36% | 2469 -16% | 1509 -49% |
| Write 4K Q32T1 (MB/s) | 597 | 472.7 -21% | 490.5 -18% | 503 -16% | 481.5 -19% |
| Read 4K Q32T1 (MB/s) | 387 | 529 37% | 571 48% | 579 50% | 560 45% |
| Write Seq Q32T1 (MB/s) | 5623 | 3431 -39% | 2334 -58% | 3102 -45% | 2392 -57% |
| Read Seq Q32T1 (MB/s) | 7042 | 3536 -50% | 3559 -49% | 3413 -52% | 3232 -54% |
| Total Average (Program / Settings) | -15% /
-13% | -18% /
-17% | -5% /
-2% | -19% /
-18% |
* ... smaller is better

Disk Throttling: DiskSpd Read Loop, Queue Depth 8
GPU Performance
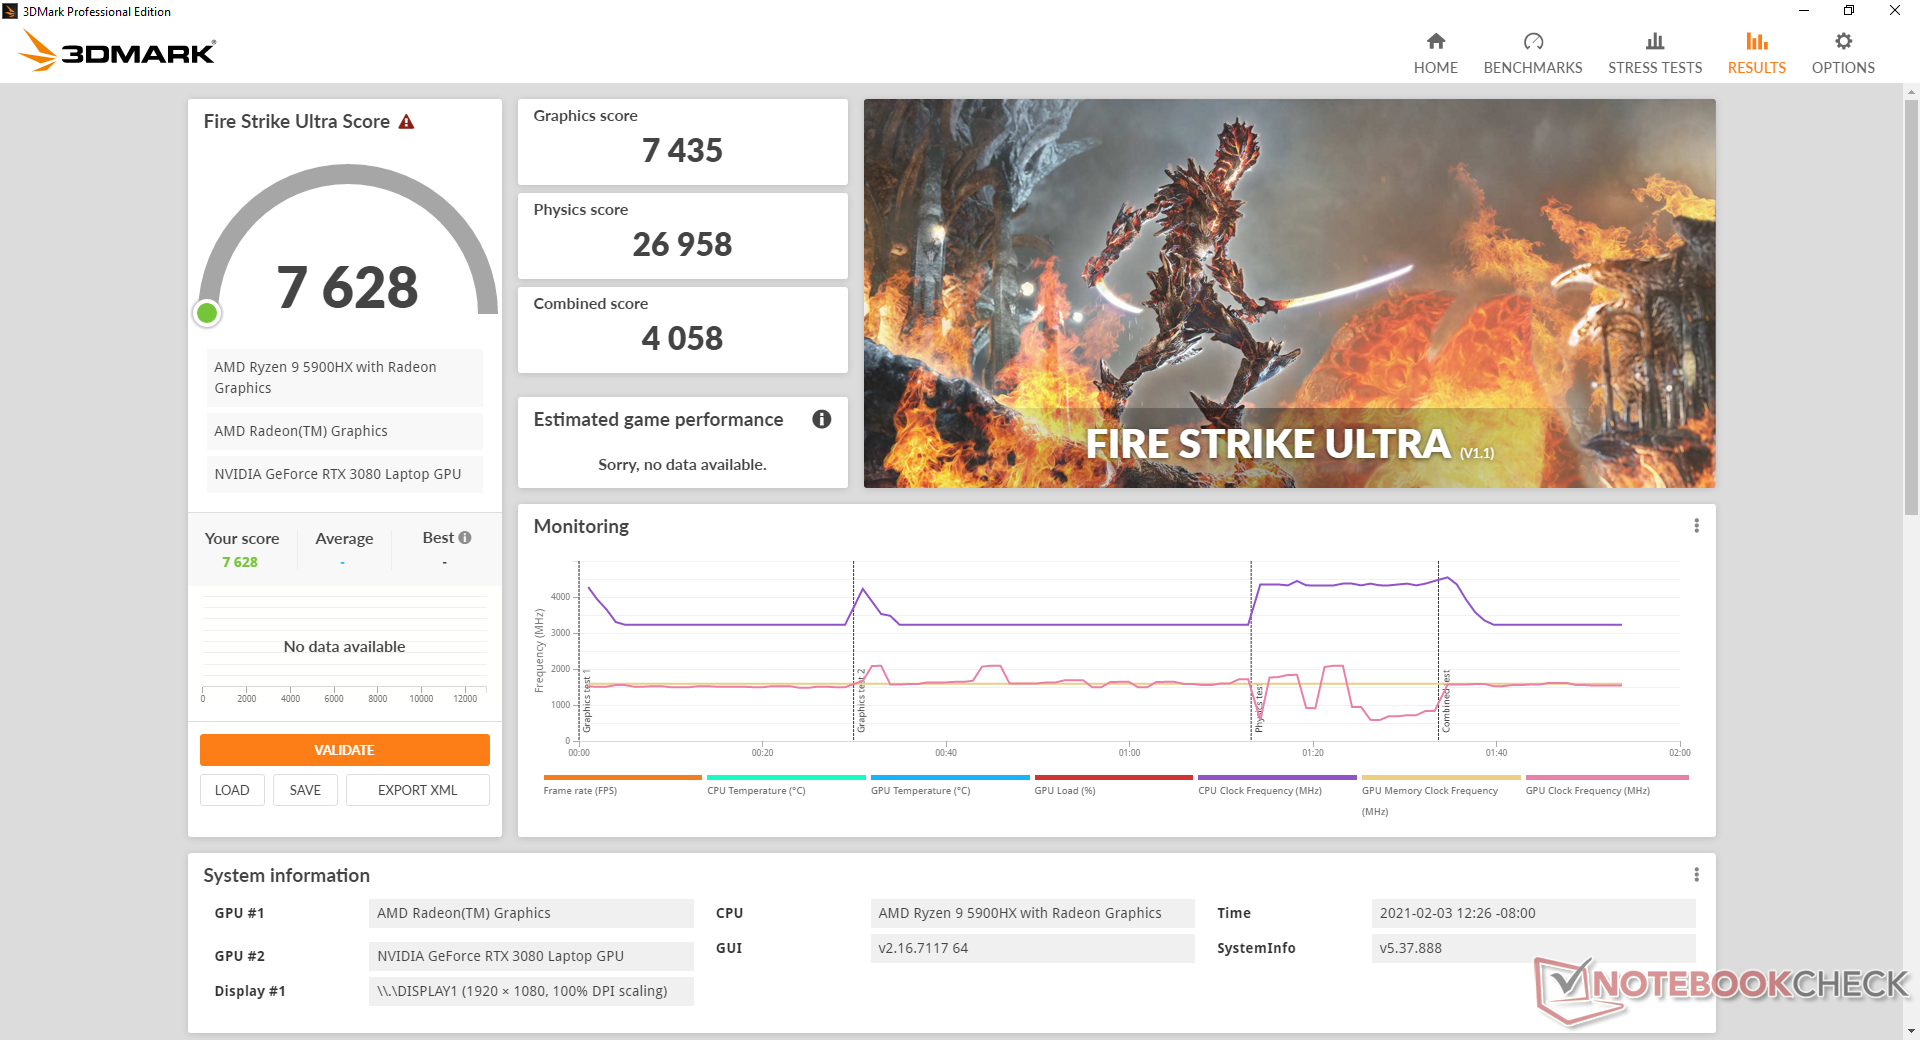
Raw Graphics performance is only about 15 percent faster than the average GeForce RTX 2080 laptop to be a far cry from the "proper" desktop GeForce RTX 3080. It's still one of the fastest mobile GPUs available, but users should definitely not expect performance to be anywhere close to the desktop version even though they may share the same name. Instead, performance will be more comparable to a desktop GeForce RTX 3060 Ti.
On the bright side, graphics performance is significantly faster than the GeForce RTX 2080 Max-Q in last year's GX550 by about 45 percent. It's not all bad news depending on how you look at the data.
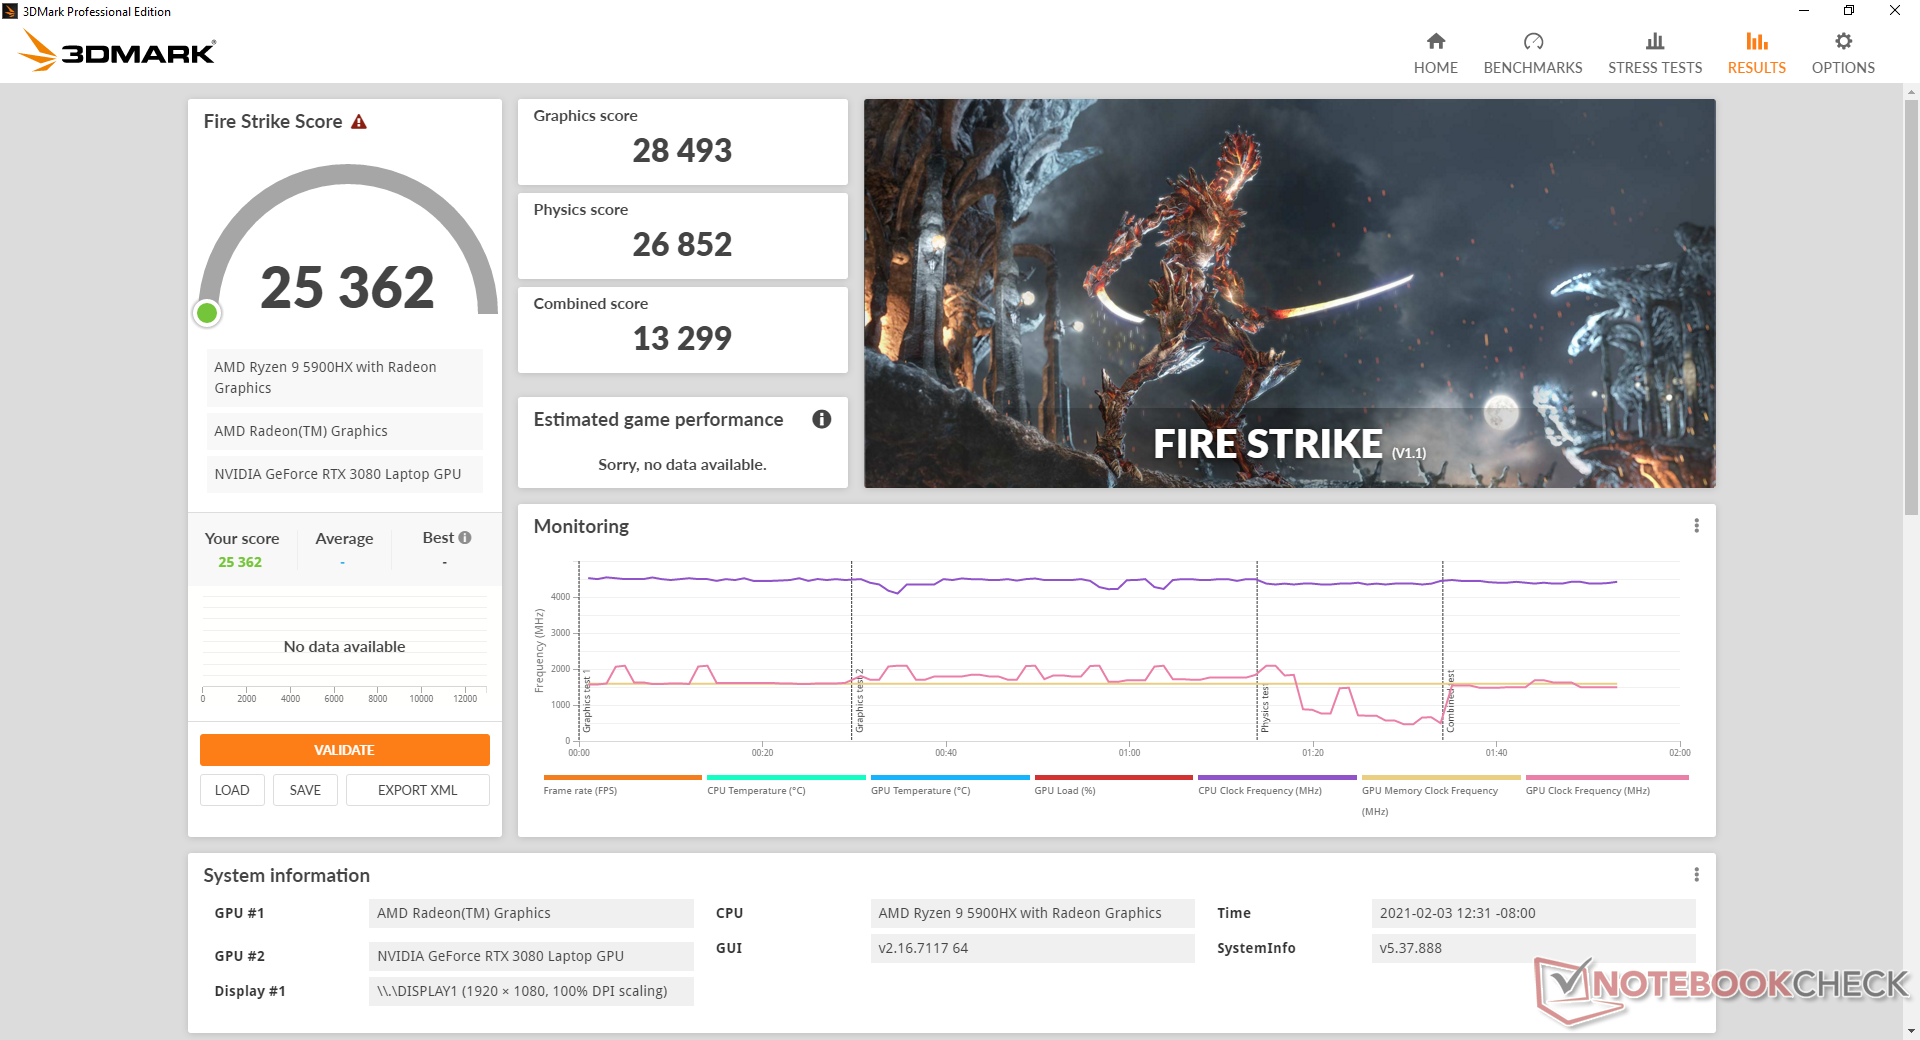
Running our Zephyrus in Performance mode instead of Turbo mode would incur a GPU performance deficit of just 5 to 10 percent according to 3DMark. If on battery power, our Fire Strike Physics and Graphics scores would drop to 24710 and 6478 points, respectively.
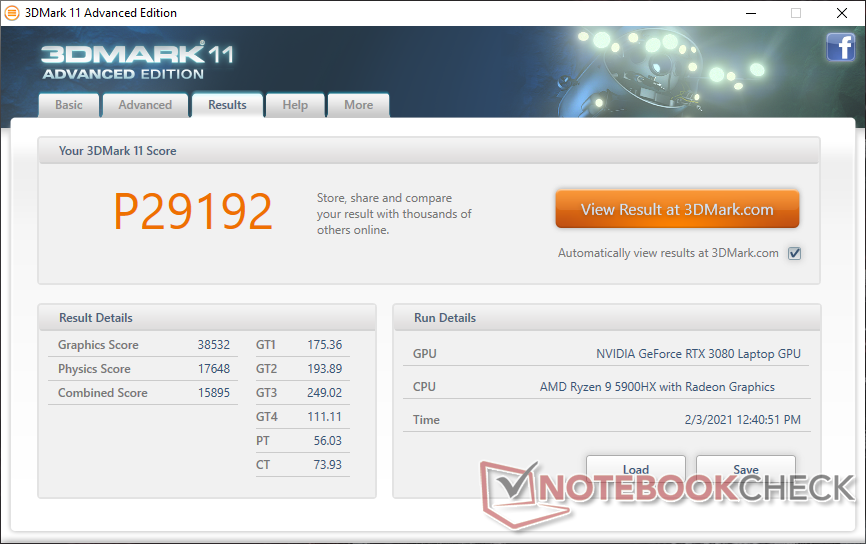
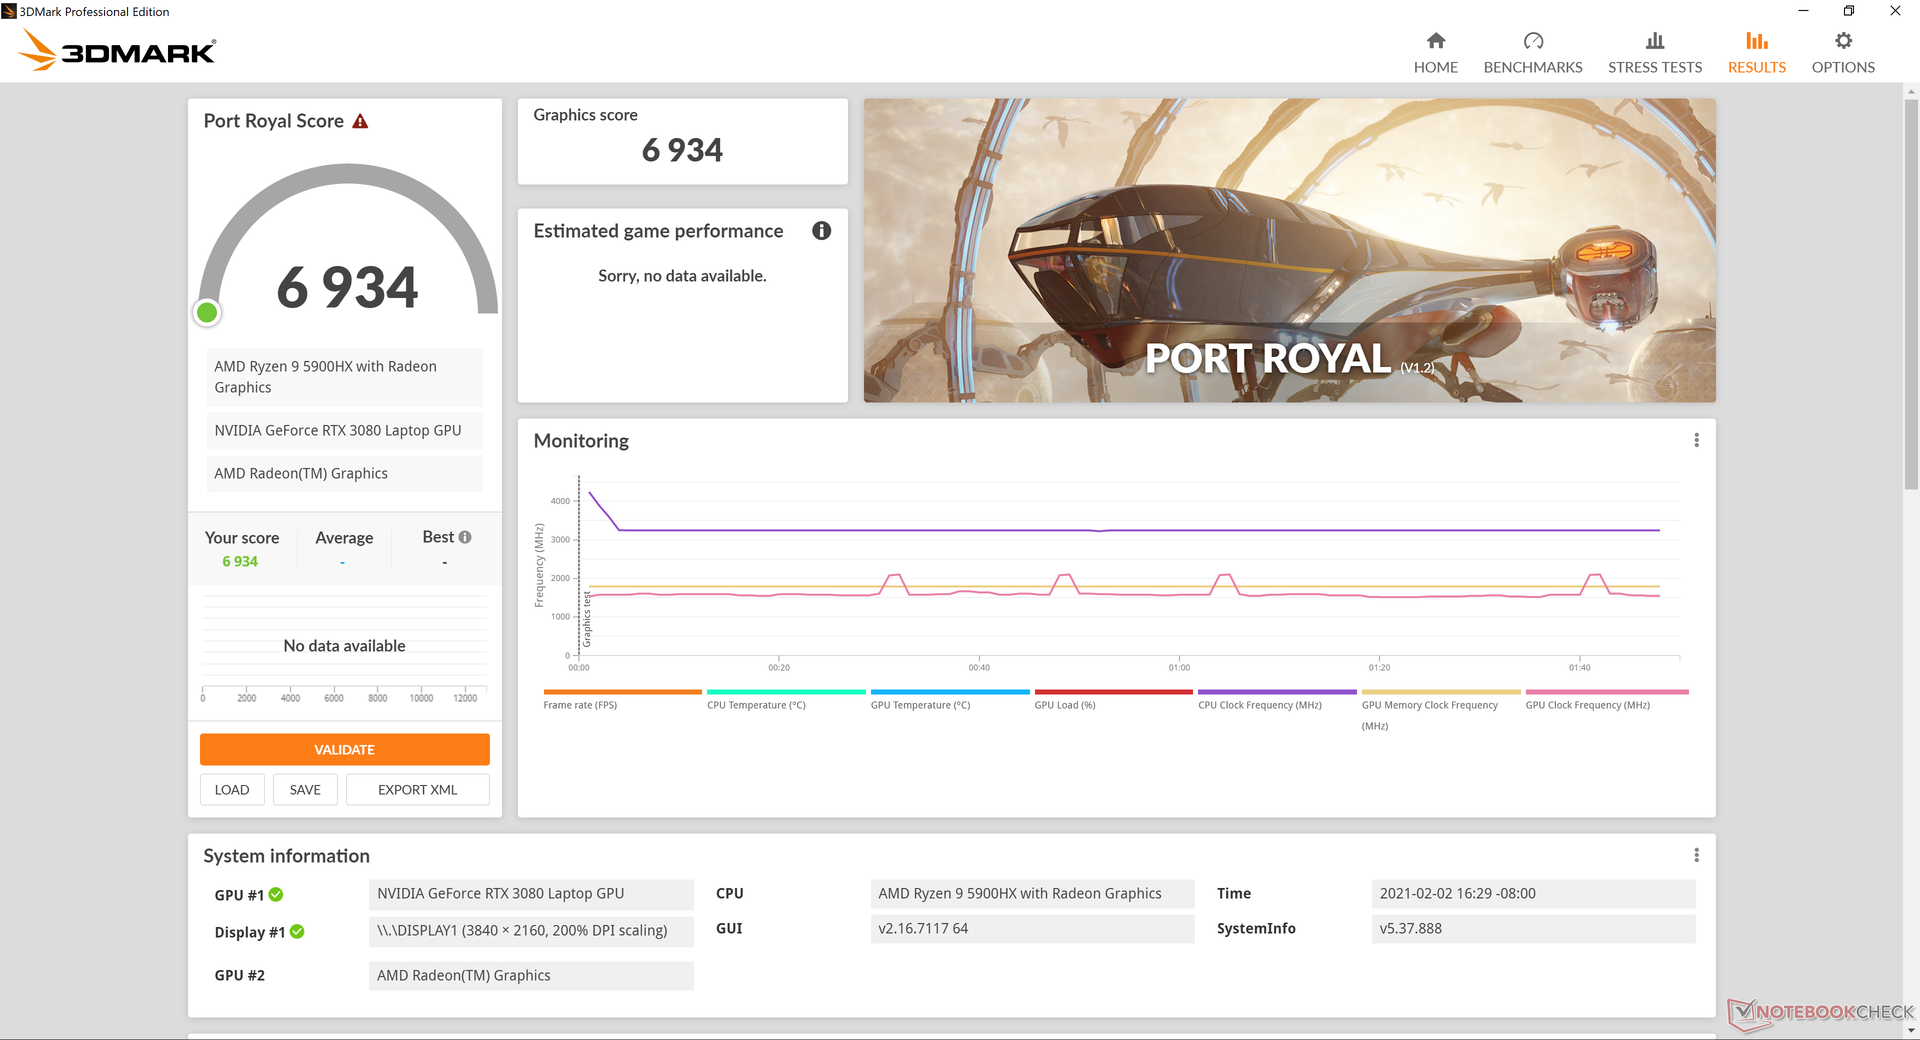
| 3DMark 11 Performance | 29192 points | |
| 3DMark Cloud Gate Standard Score | 51675 points | |
| 3DMark Fire Strike Score | 25362 points | |
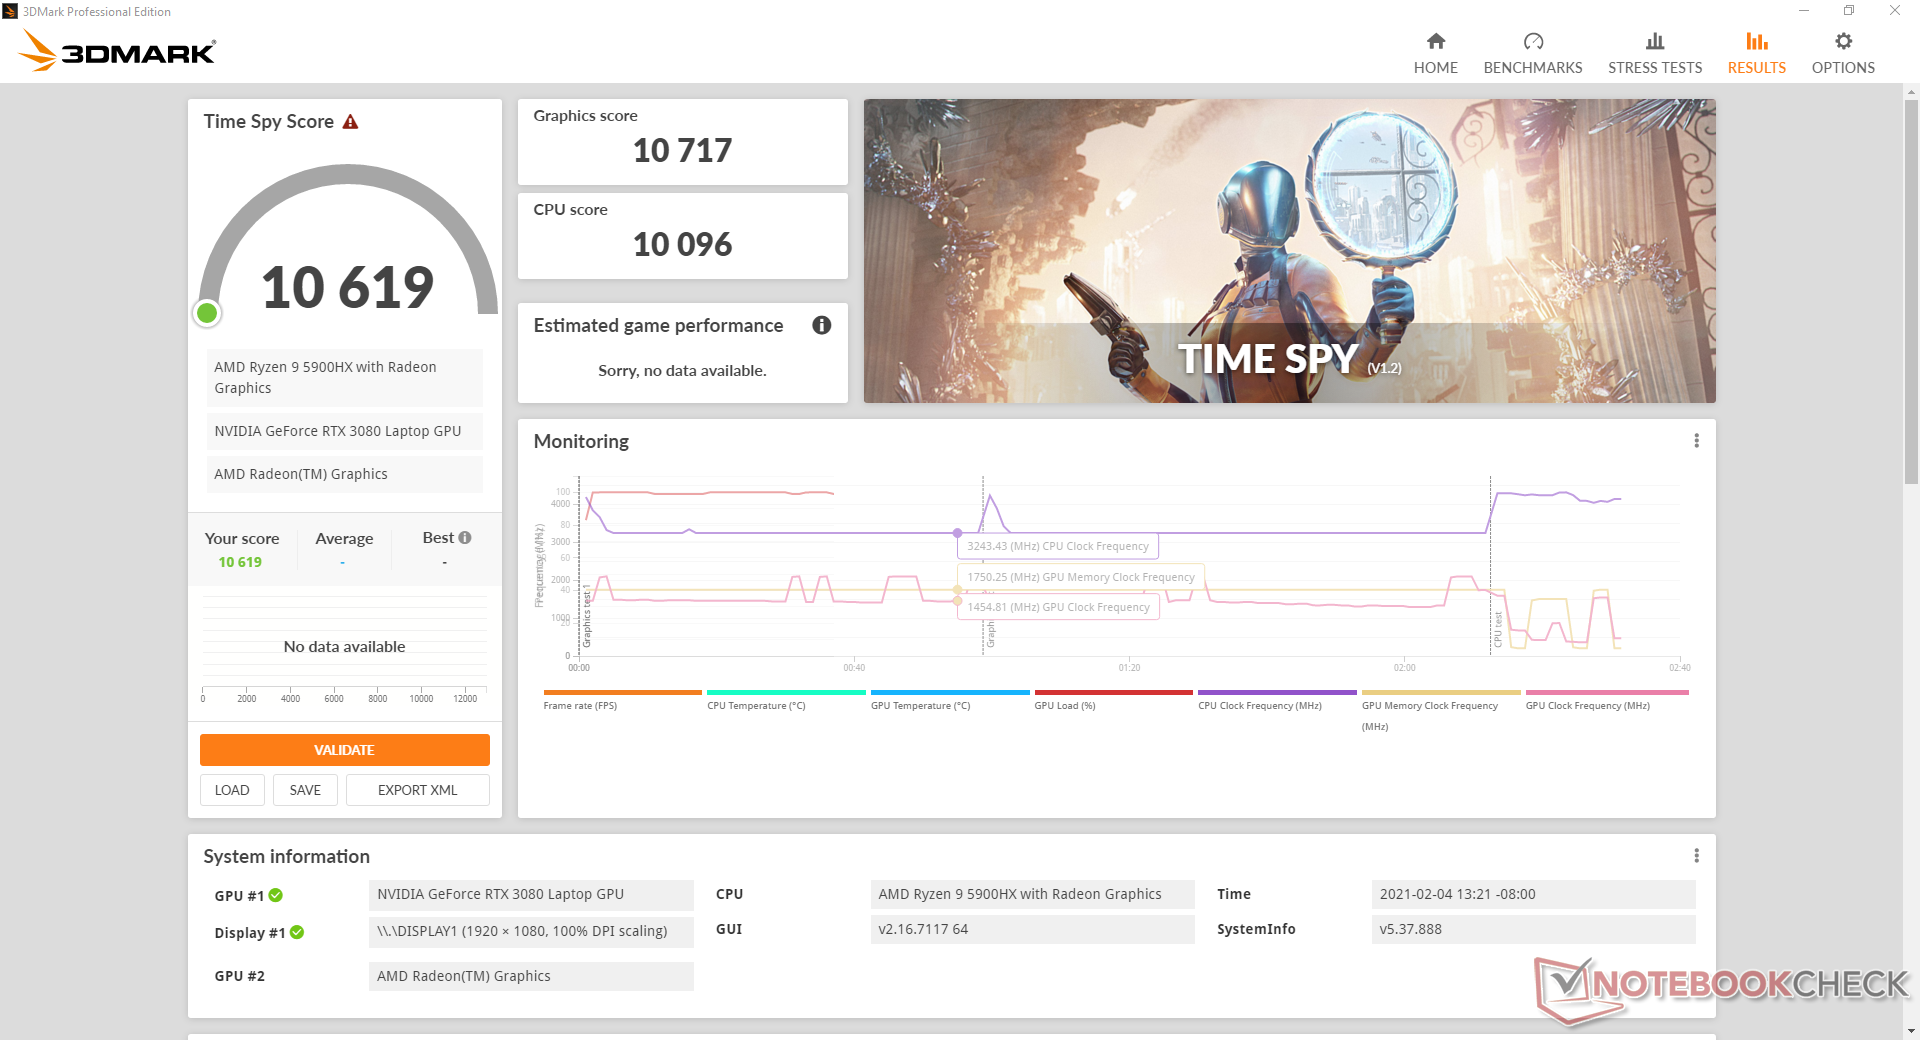
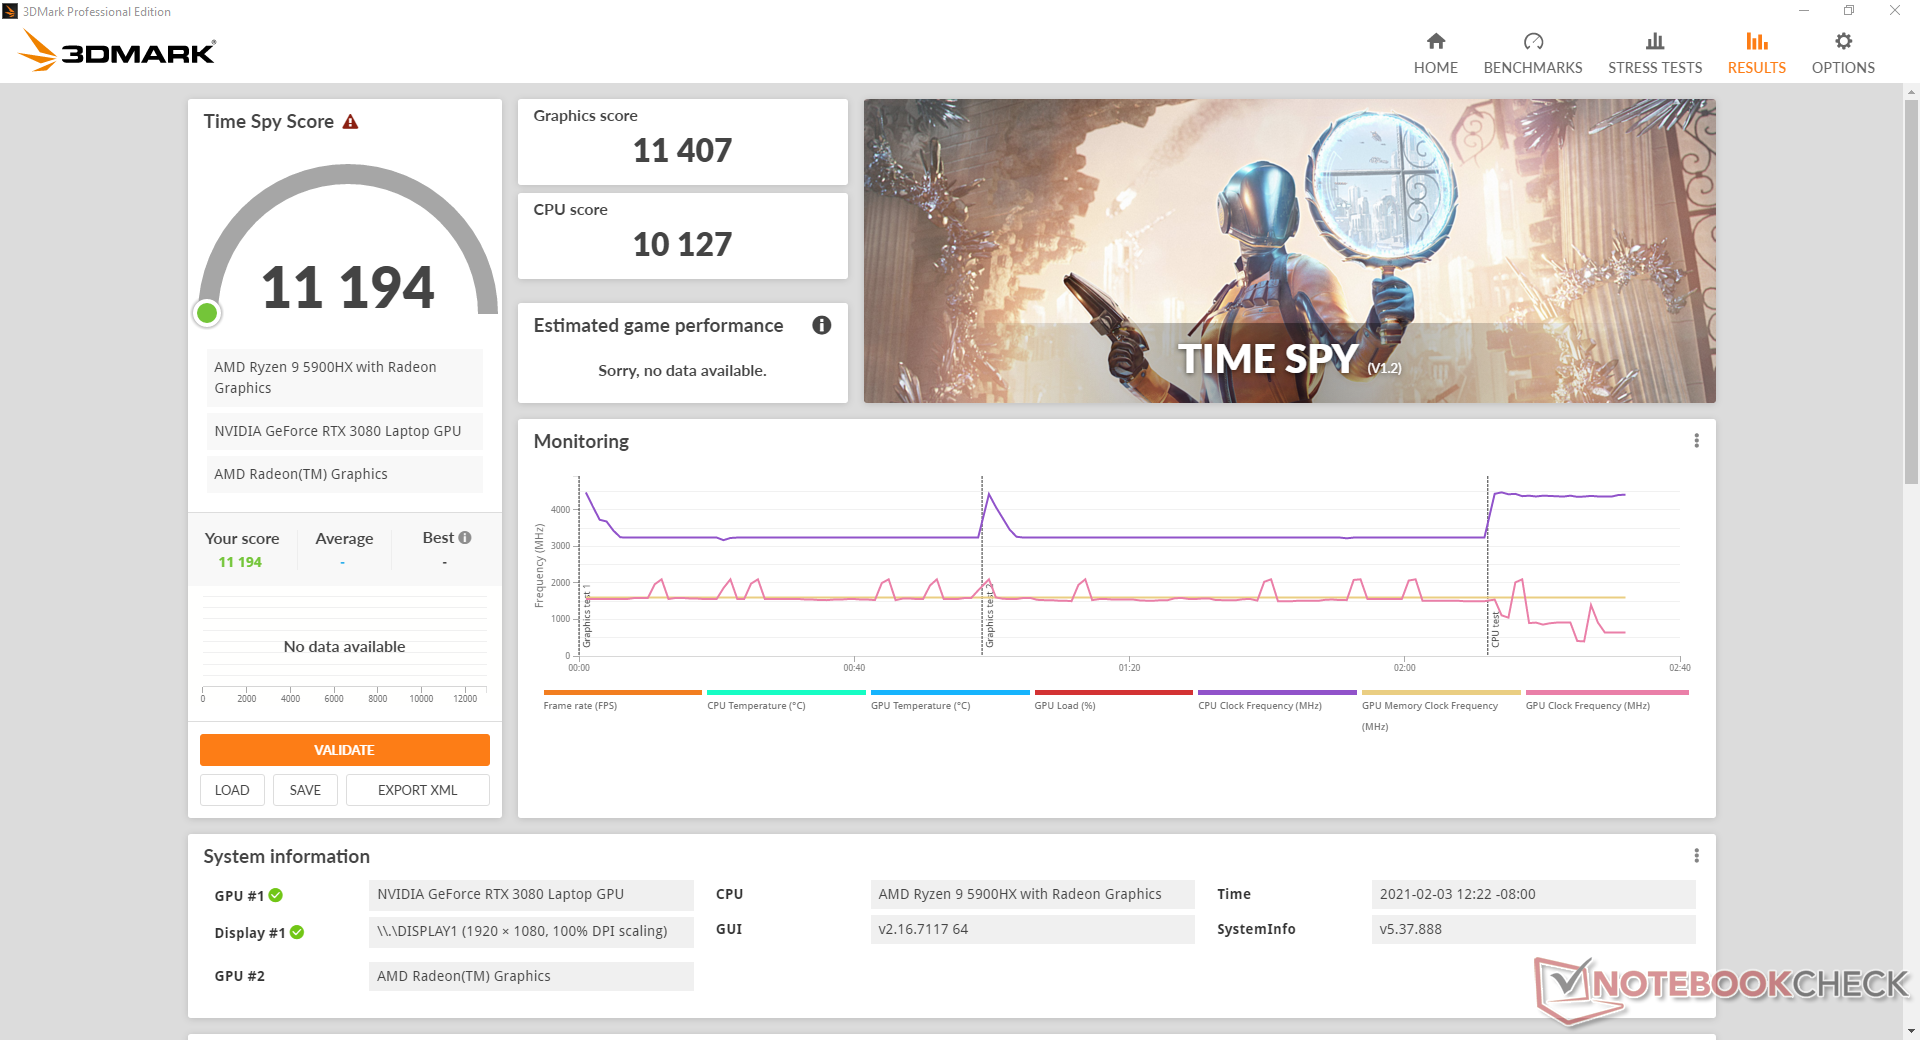
| 3DMark Time Spy Score | 11194 points | |
Help | ||
Gaming Performance
Real-world performance in games is consistently faster than the GeForce RTX 2080 Max-Q especially when playing at higher resolutions beyond 1080p. Expect up to a 50 percent boost in frame rates if running at 4K compared to 30 to 40 percent at 1080p.
GTA V would not load properly on our unit despite multiple reinstall attempts.
| low | med. | high | ultra | QHD | 4K | |
|---|---|---|---|---|---|---|
| BioShock Infinite (2013) | 374 | 186.2 | ||||
| The Witcher 3 (2015) | 341.7 | 187.2 | 104.6 | 80.4 | ||
| Dota 2 Reborn (2015) | 144 | 139 | 124 | 119 | 99.9 | |
| Final Fantasy XV Benchmark (2018) | 177 | 133 | 105 | 81.3 | 49.5 | |
| X-Plane 11.11 (2018) | 107 | 93 | 77 | 60.9 | ||
| Far Cry 5 (2018) | 138 | 119 | 114 | 107 | 96 | 59 |
| Strange Brigade (2018) | 346 | 205 | 188 | 174 | 136 | 84.2 |
| Shadow of the Tomb Raider (2018) | 140 | 123 | 121 | 116 | 93 | 55 |
| Total War: Three Kingdoms (2019) | 270.2 | 148.6 | 108.4 | 83.8 | 56.8 | 29 |
| Doom Eternal (2020) | 323.2 | 197.5 | 183.1 | 183.7 | 145.8 | 83.4 |
| Gears Tactics (2020) | 127.6 | 187.8 | 142.8 | 114.7 | 85.9 | 47.2 |
| F1 2020 (2020) | 256 | 199 | 191 | 150 | 119 | 73 |
Emissions
System Noise
Fan noise and behavior seem to have improved over the GX550. For example, both fans will actually idle at 0 RPM even if set to Turbo mode for a silent experience so long as system loads are very low. Nonetheless, it's not recommend to be on Turbo mode indefinitely as the fans will pulse more frequently when browsing the net or streaming video. Running the first benchmark scene of 3DMark 06 would bump fan noise to just 31.2 dB(A) if on Performance mode.
The fan noise difference between Performance mode and Turbo mode can be drastic. When running Witcher 3 on Performance mode, fan noise would cycle between 35 to 44.5 dB(A) whereas Turbo mode would cause fan noise to be fixed at 53.5 dB(A). Expect the fans to pulse more frequently and noticeably if gaming on Performance mode.
| Asus ROG Zephyrus Duo 15 SE GX551QS GeForce RTX 3080 Laptop GPU, R9 5900HX, 2x Samsung PM981a MZVLB1T0HBLR (RAID 0) | Asus ROG Zephyrus Duo 15 GX550LXS GeForce RTX 2080 Super Max-Q, i9-10980HK, 2x Samsung PM981a MZVLB1T0HBLR (RAID 0) | Razer Blade 15 RTX 2080 Super Max-Q GeForce RTX 2080 Super Max-Q, i7-10875H, Samsung PM981a MZVLB1T0HBLR | Eurocom Sky X4C i9-9900KS GeForce RTX 2080 Mobile, i9-9900KS, Samsung SSD 970 Pro 512GB | MSI GE66 Raider 10SFS GeForce RTX 2070 Super Mobile, i9-10980HK, WDC PC SN730 SDBPNTY-1T00 | MSI GS66 Stealth 10SFS GeForce RTX 2070 Super Max-Q, i9-10980HK, Samsung SSD PM981 MZVLB1T0HALR | |
|---|---|---|---|---|---|---|
| Noise | -20% | -13% | -9% | -30% | -25% | |
| off / environment * (dB) | 27 | 30 -11% | 30.1 -11% | 28.1 -4% | 30 -11% | 30 -11% |
| Idle Minimum * (dB) | 27 | 33 -22% | 30.1 -11% | 28.5 -6% | 30 -11% | 32 -19% |
| Idle Average * (dB) | 27 | 34 -26% | 30.1 -11% | 28.7 -6% | 35 -30% | 34 -26% |
| Idle Maximum * (dB) | 27 | 35 -30% | 30.1 -11% | 29.5 -9% | 44 -63% | 39 -44% |
| Load Average * (dB) | 31.2 | 48 -54% | 46.8 -50% | 31.2 -0% | 53 -70% | 53 -70% |
| Witcher 3 ultra * (dB) | 44.5 | 48 -8% | 48.4 -9% | 55.1 -24% | 53 -19% | 48 -8% |
| Load Maximum * (dB) | 53.5 | 49 8% | 46 14% | 59.3 -11% | 55 -3% | 53 1% |
* ... smaller is better
Noise level
| Idle |
| 27 / 27 / 27 dB(A) |
| Load |
| 31.2 / 53.5 dB(A) |
 | ||
30 dB silent 40 dB(A) audible 50 dB(A) loud |
||
min: | ||
Temperature
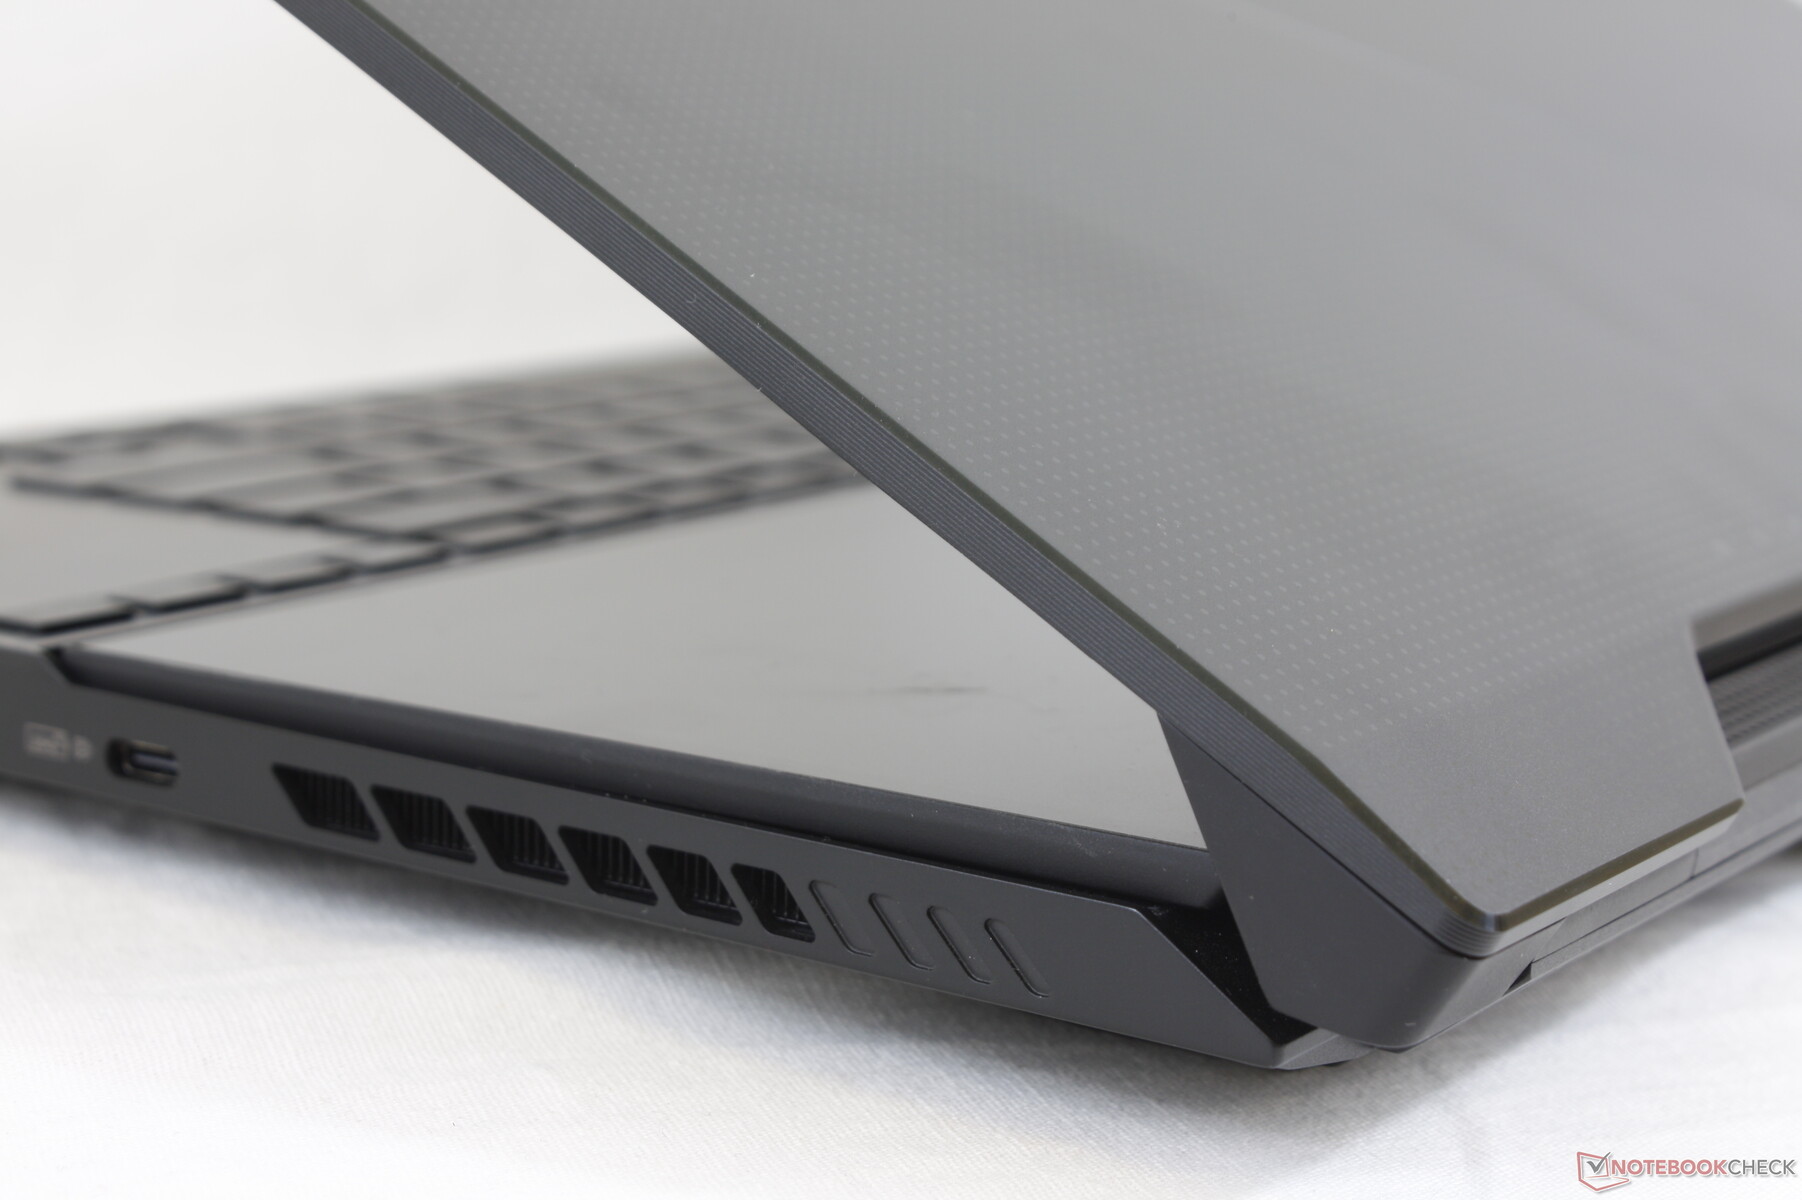
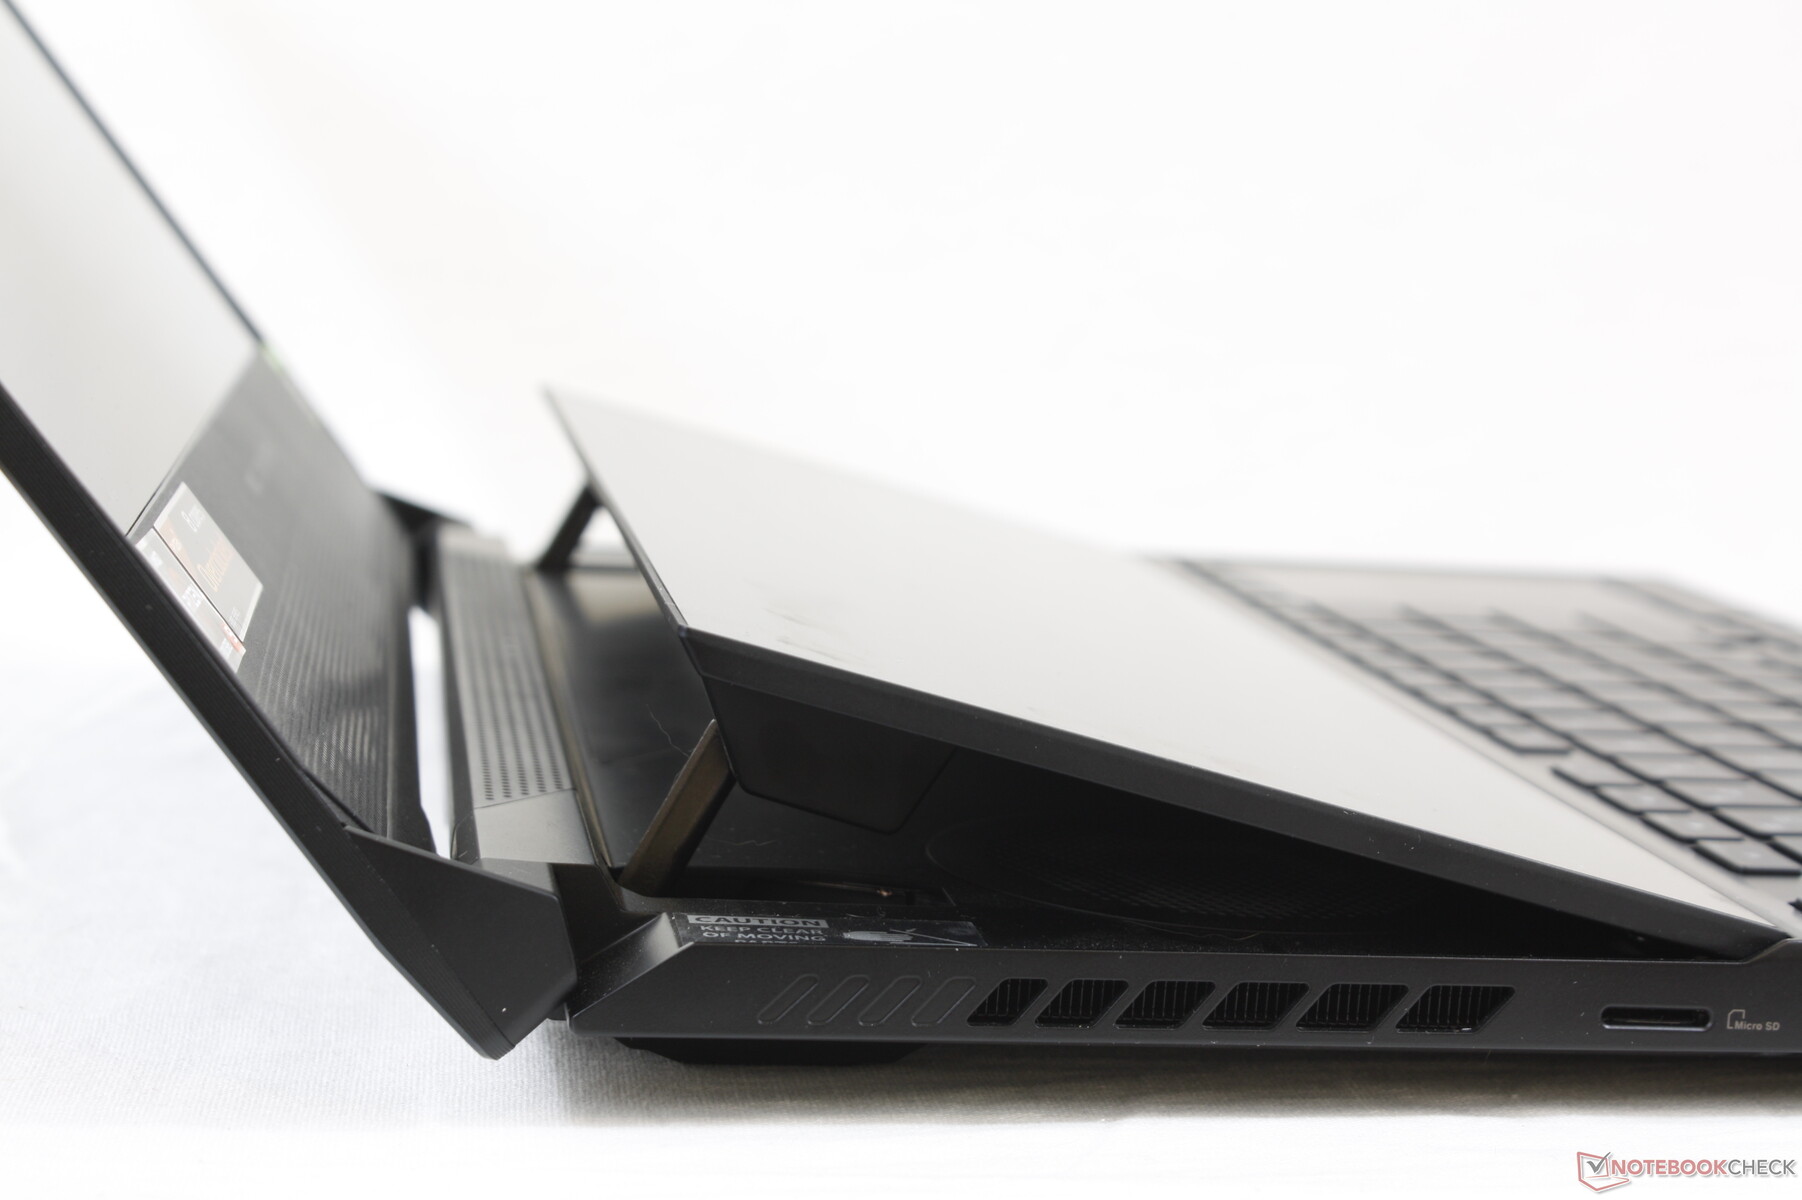
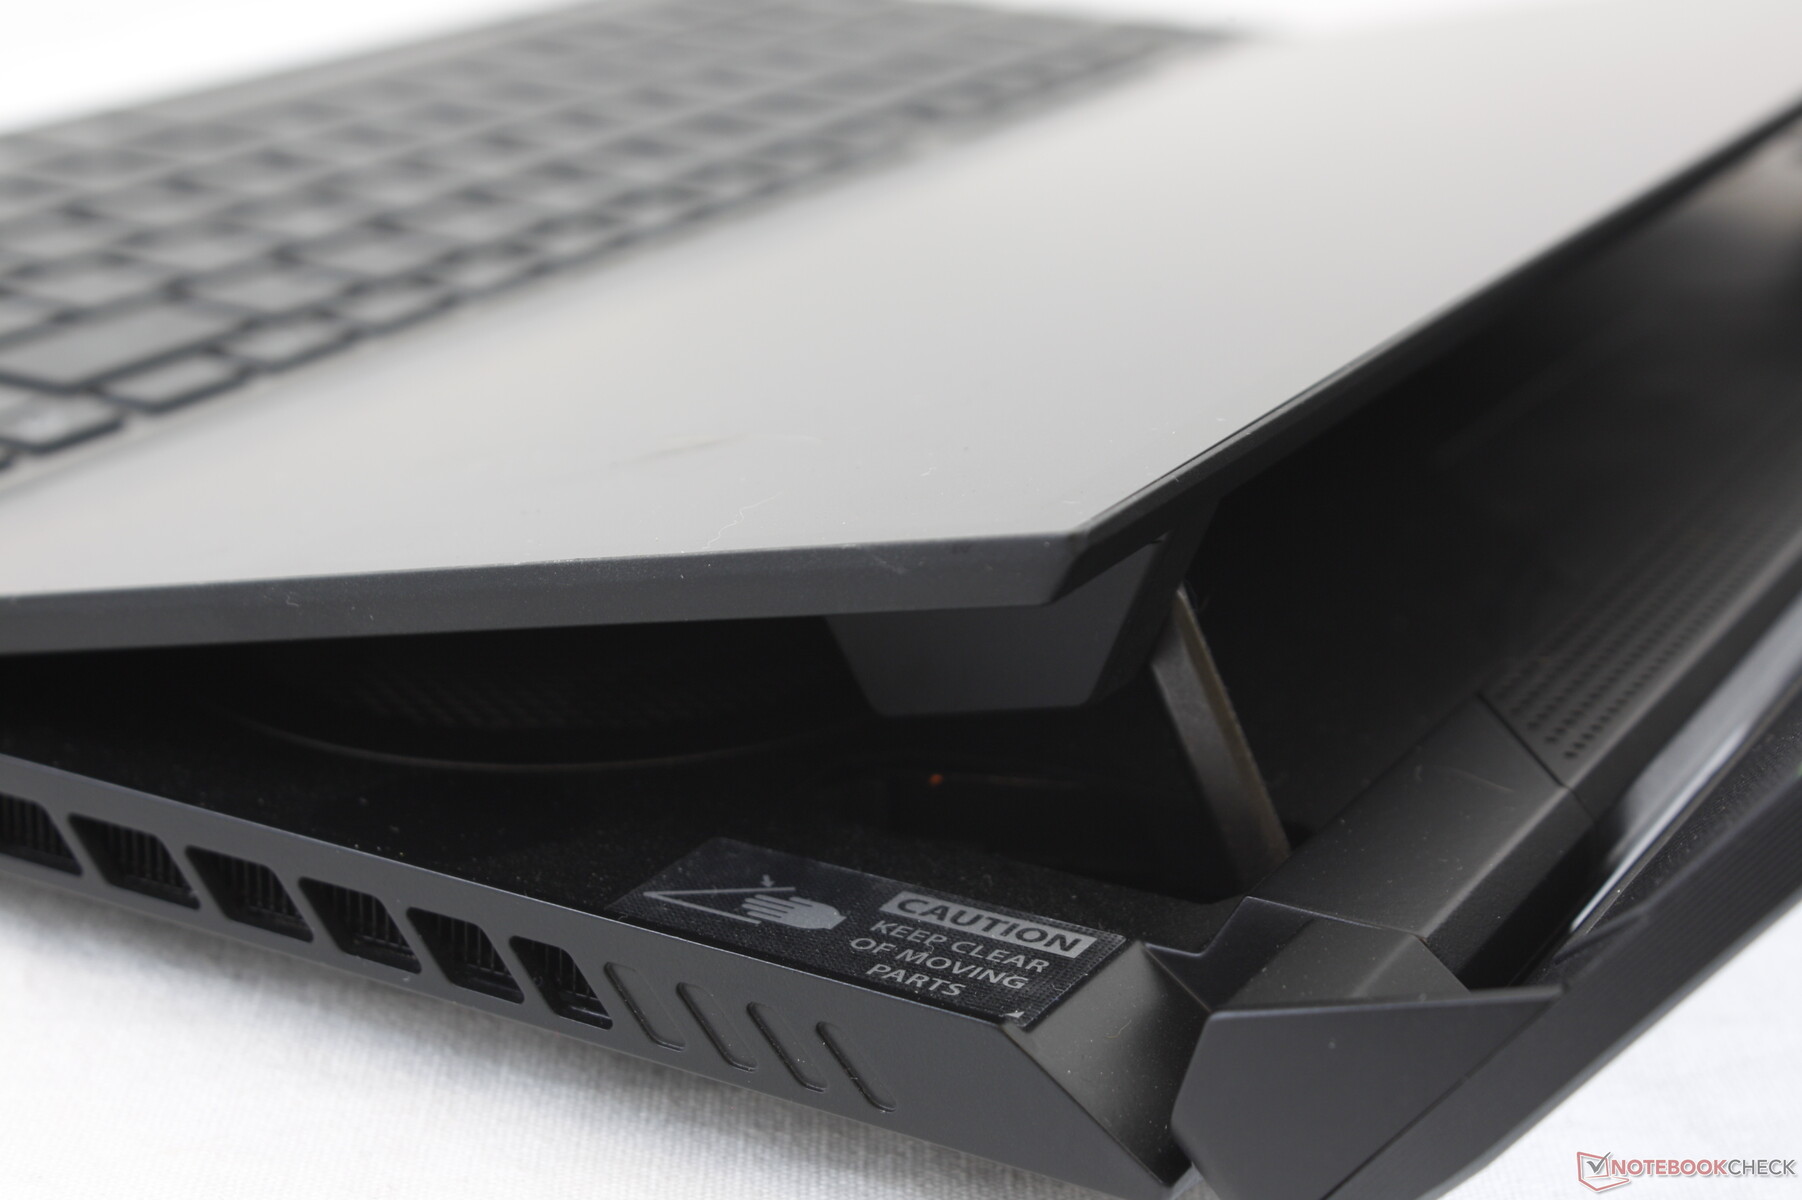
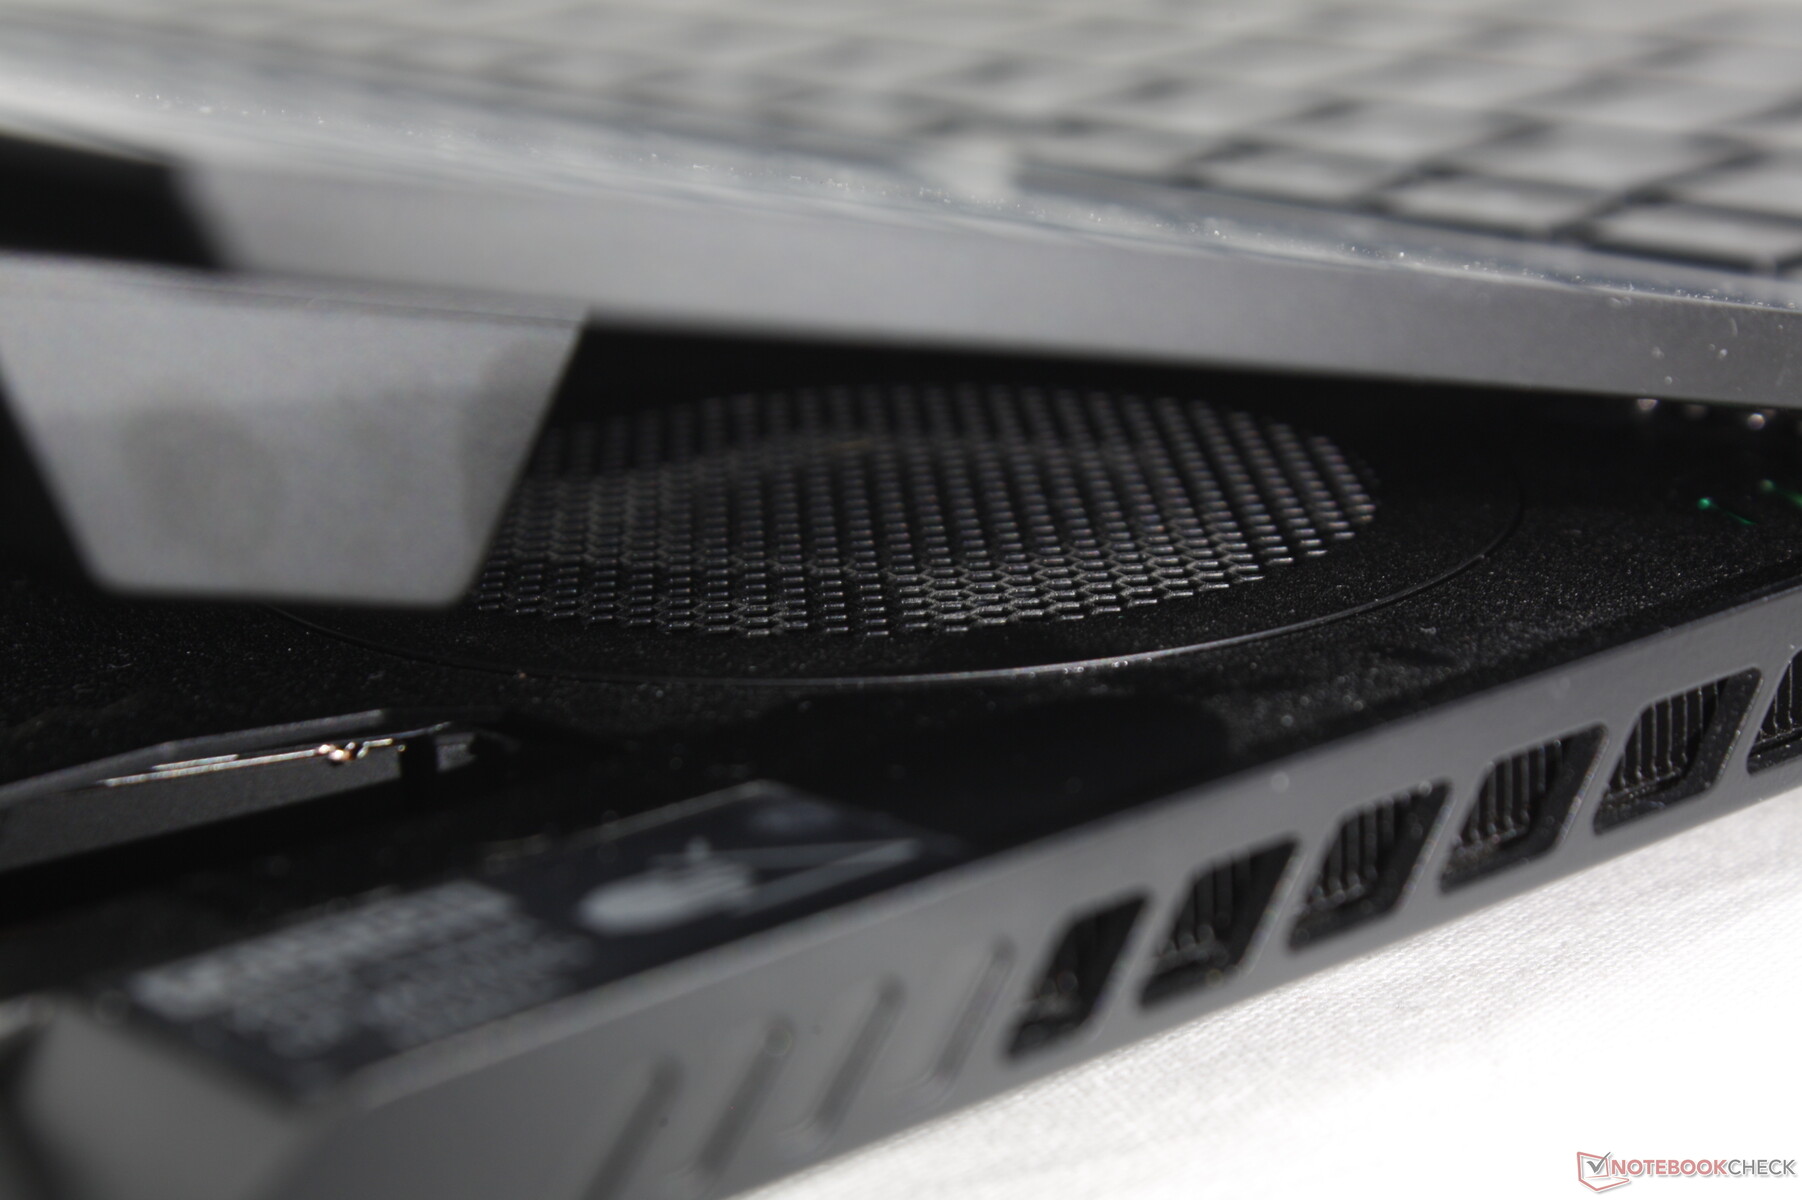
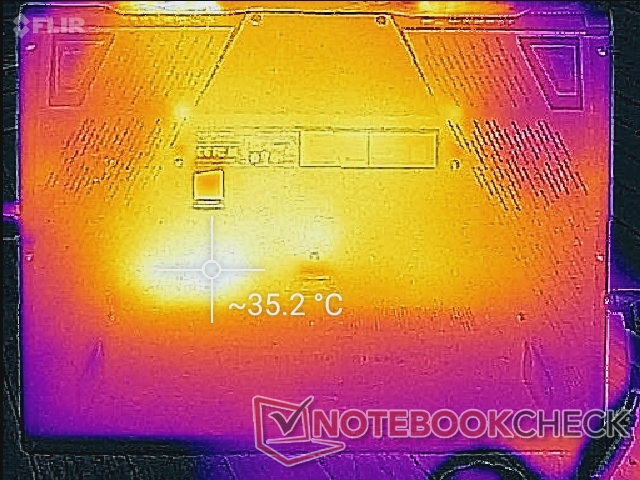
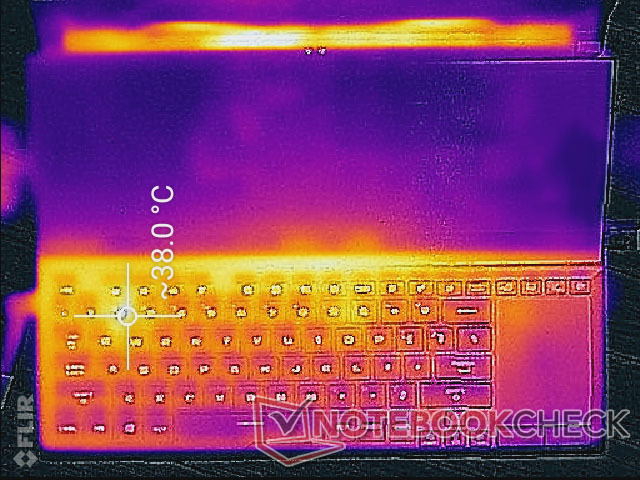
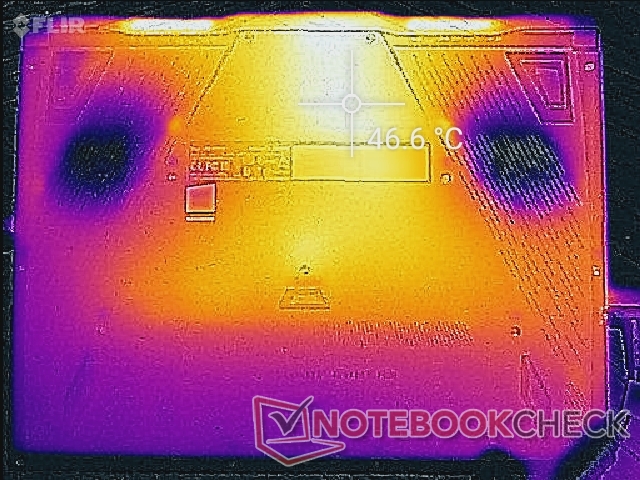
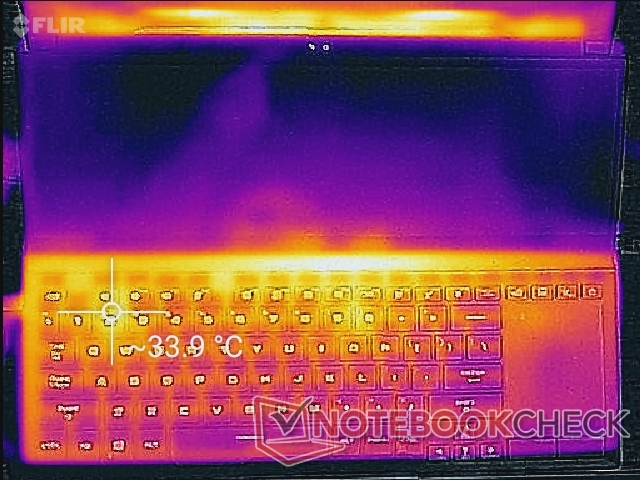
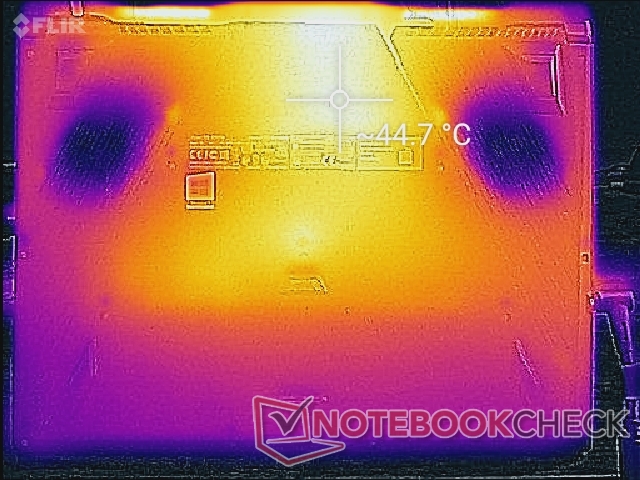
Surface temperatures are less of an issue here on the GX551 when compared to most other gaming laptops due to Asus' unique dual-screen design. Airflow is maximized through the gap between the secondary display and base with exhaust grilles on three sides of the chassis. The upfront keyboard sits far away from the processors for cooler fingers when gaming. Hot spots on the bottom can be as warm as 47 C which won't an issue if gaming on a proper desk.
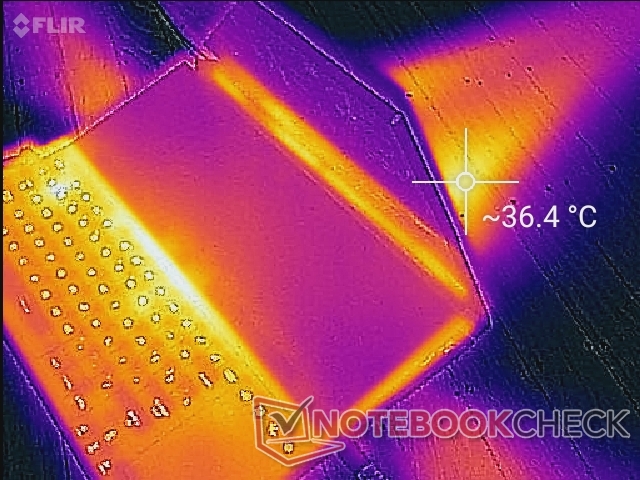
(+) The maximum temperature on the upper side is 33.4 °C / 92 F, compared to the average of 40.4 °C / 105 F, ranging from 21.2 to 68.8 °C for the class Gaming.
(±) The bottom heats up to a maximum of 45 °C / 113 F, compared to the average of 43.2 °C / 110 F
(+) In idle usage, the average temperature for the upper side is 26.7 °C / 80 F, compared to the device average of 33.9 °C / 93 F.
(+) Playing The Witcher 3, the average temperature for the upper side is 28.4 °C / 83 F, compared to the device average of 33.9 °C / 93 F.
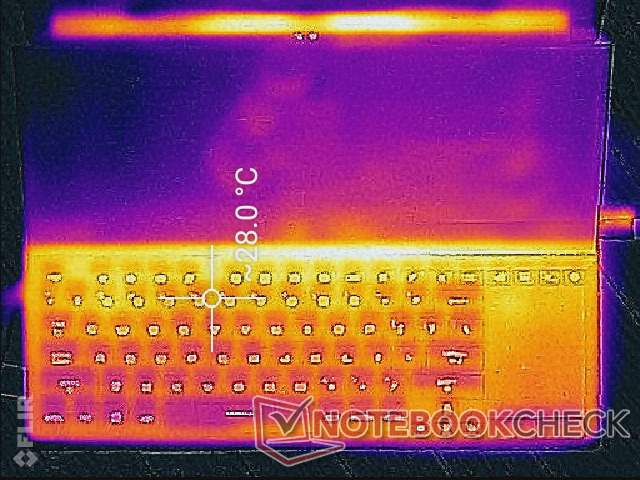
(±) The palmrests and touchpad can get very hot to the touch with a maximum of 38 °C / 100.4 F.
(-) The average temperature of the palmrest area of similar devices was 28.8 °C / 83.8 F (-9.2 °C / -16.6 F).
Stress Test
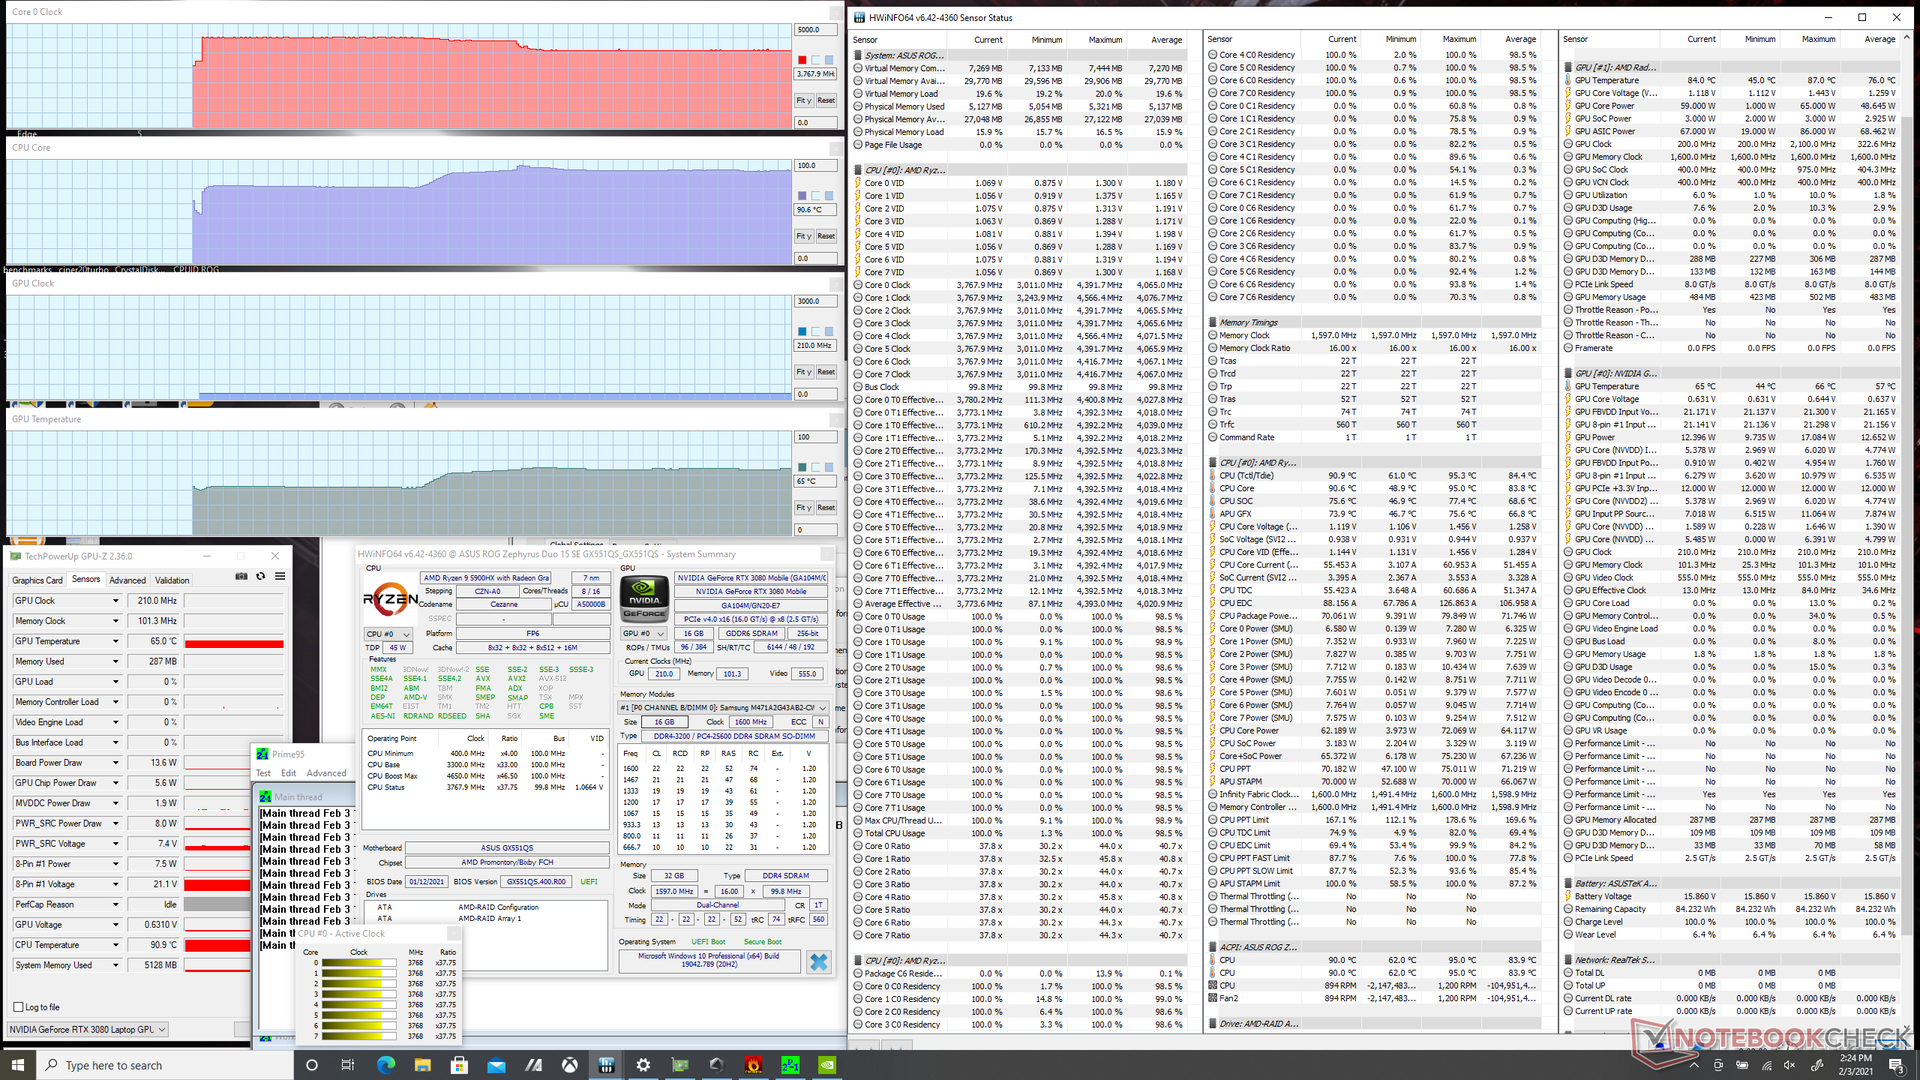
We stress the laptop under different loads to identify for any potential throttling or stability issues. When running Prime95 on Turbo mode, the CPU would boost to and stabilize at 4.4 GHz for a few minutes before dropping slightly to the 4.0 to 4.4 GHz range. Core temperature would be stable at about 75 C. If on Performance mode, clock rate would drop to 3.8 GHz instead but stabilize at a higher 91 C core temperature due to the lower fan RPMs.

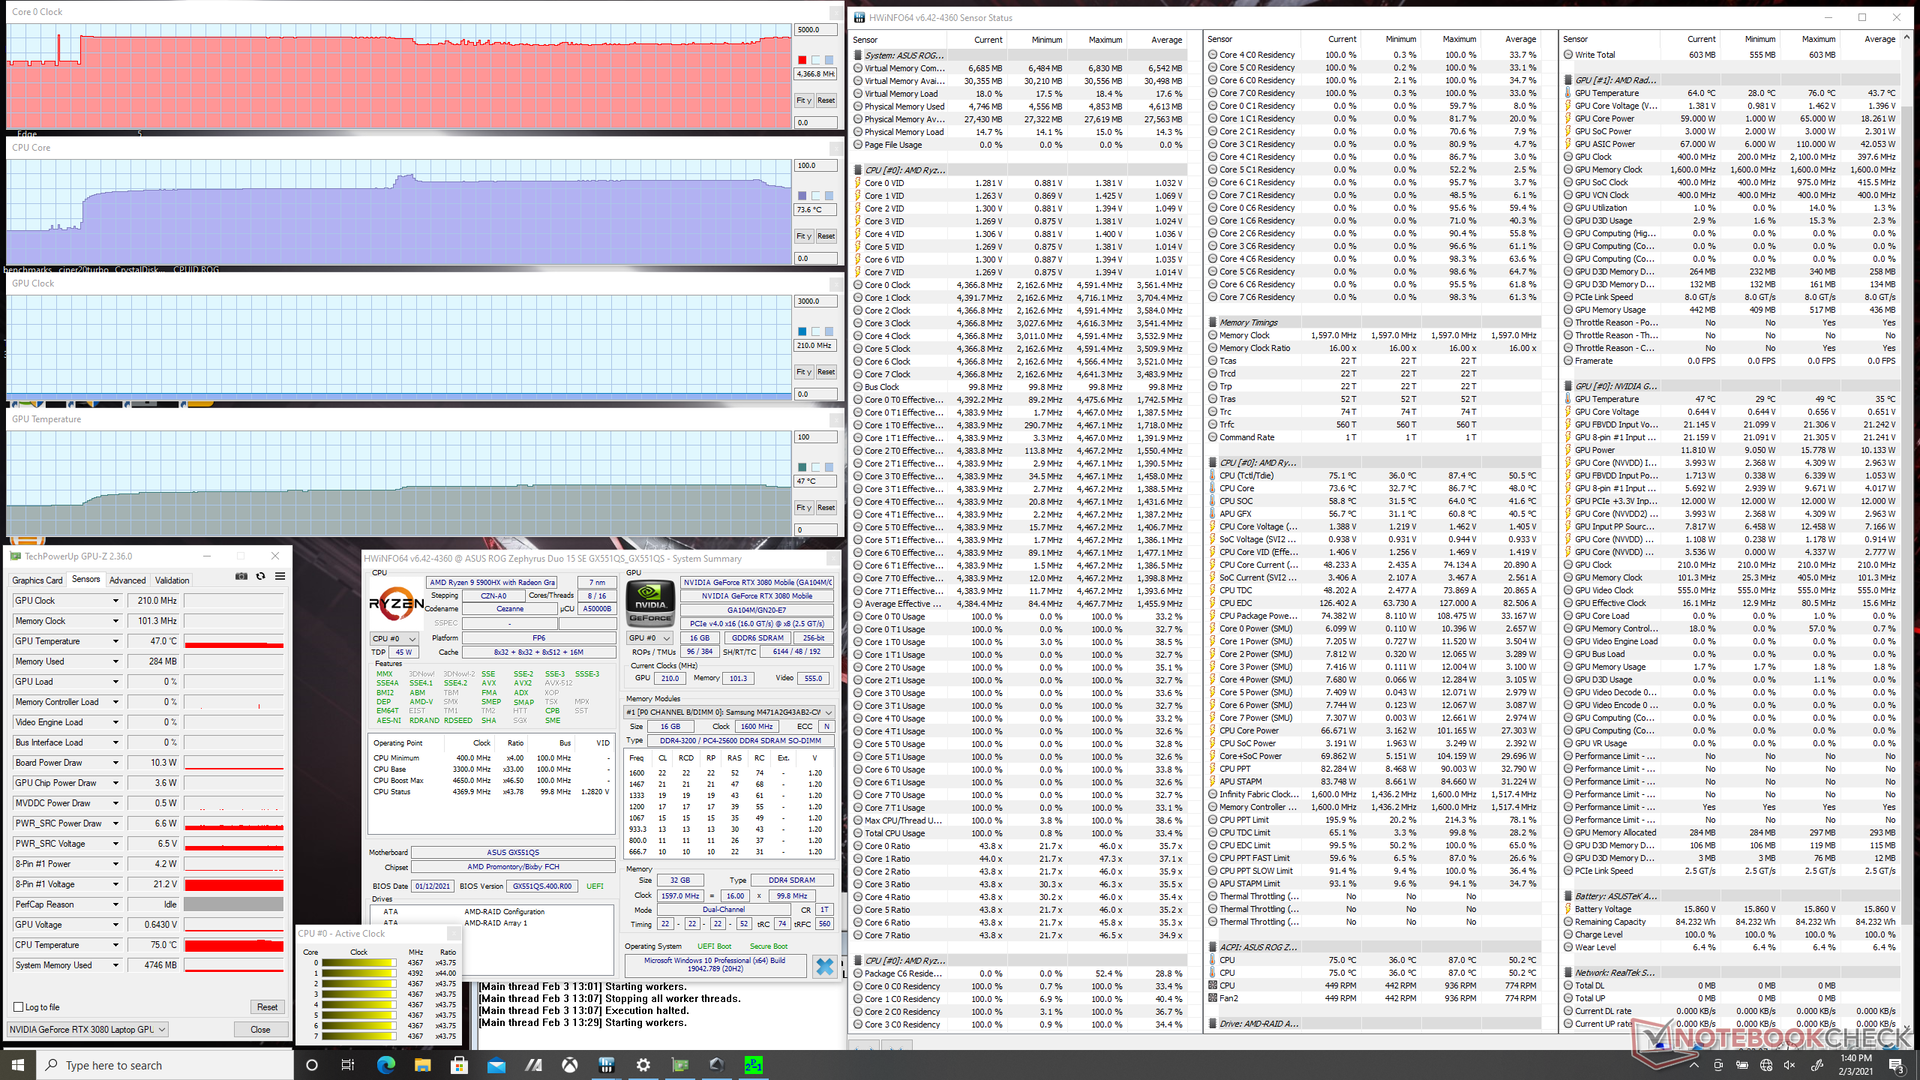
When running FurMark on Turbo mode, the GeForce RTX 3080 GPU would stabilize at just 69 C. Board power draw would also be stable at 132 W against the rated 130 W TGP.
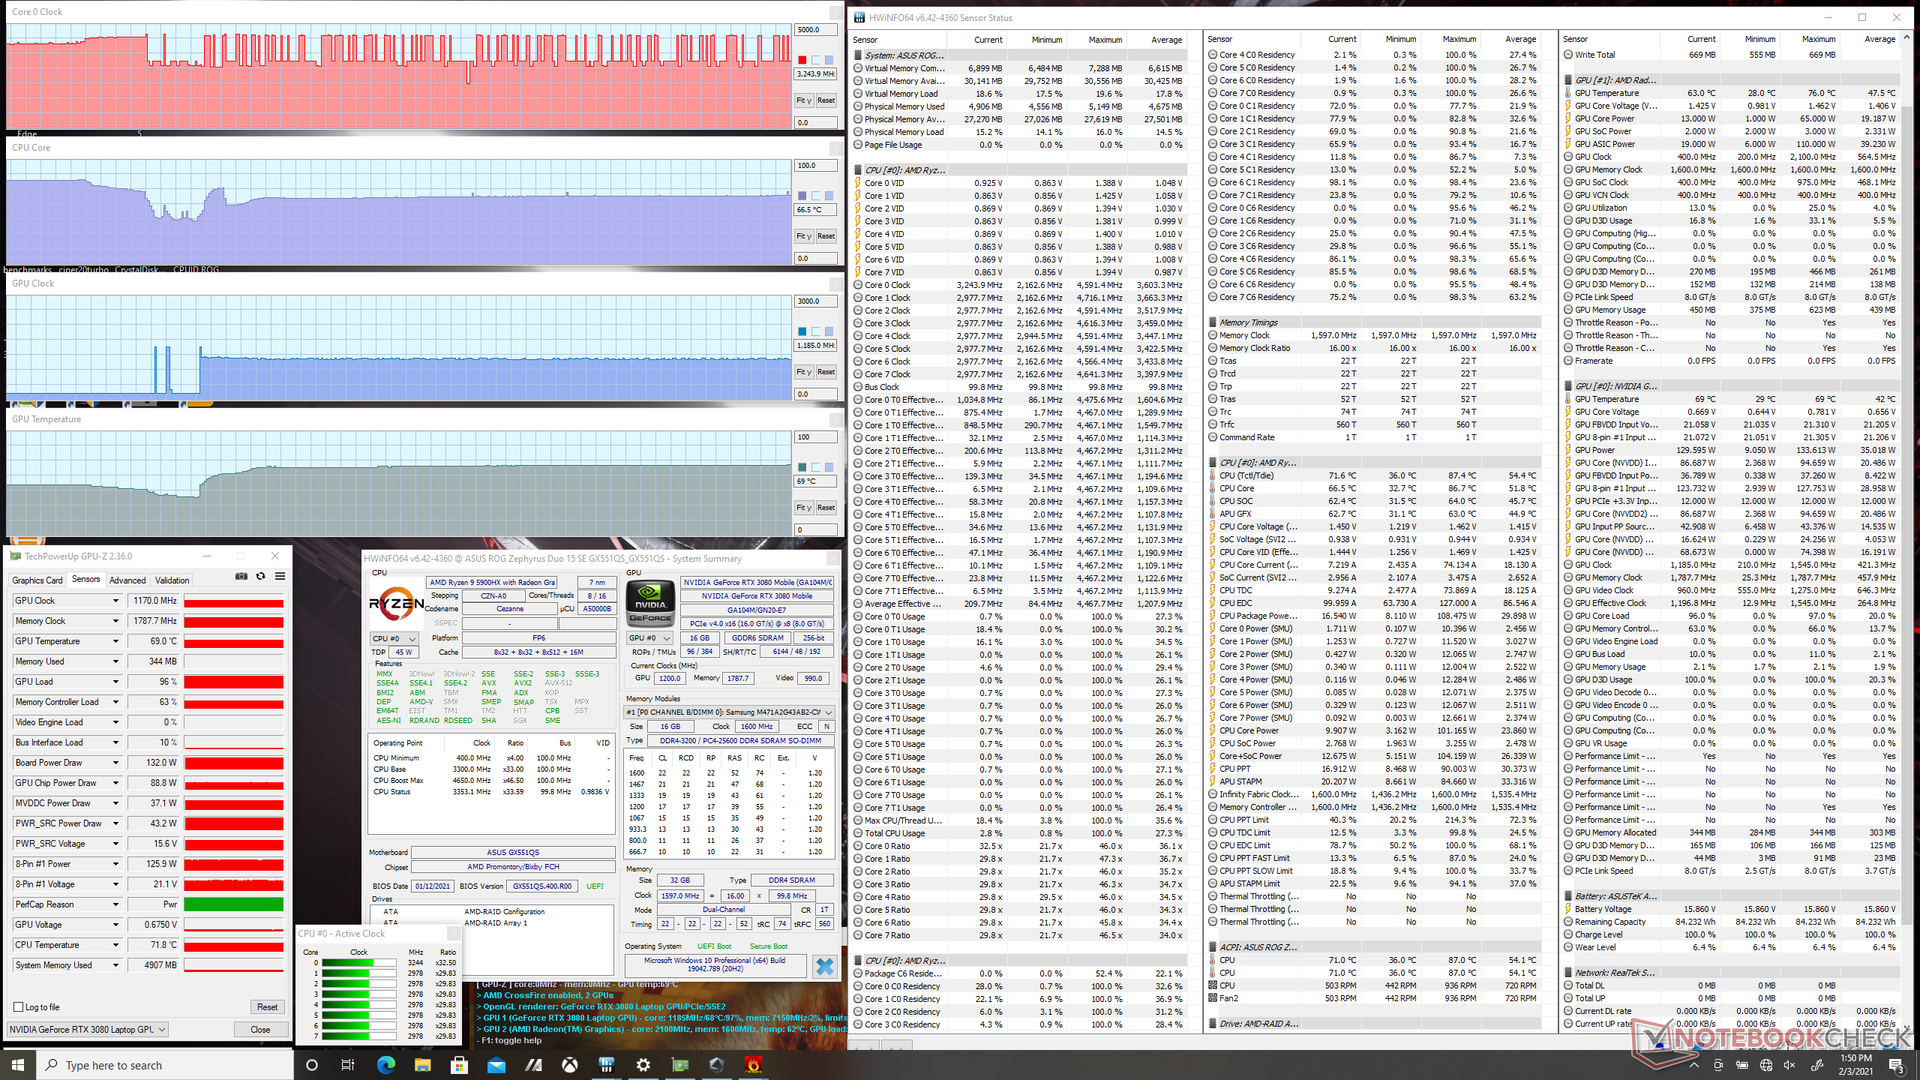
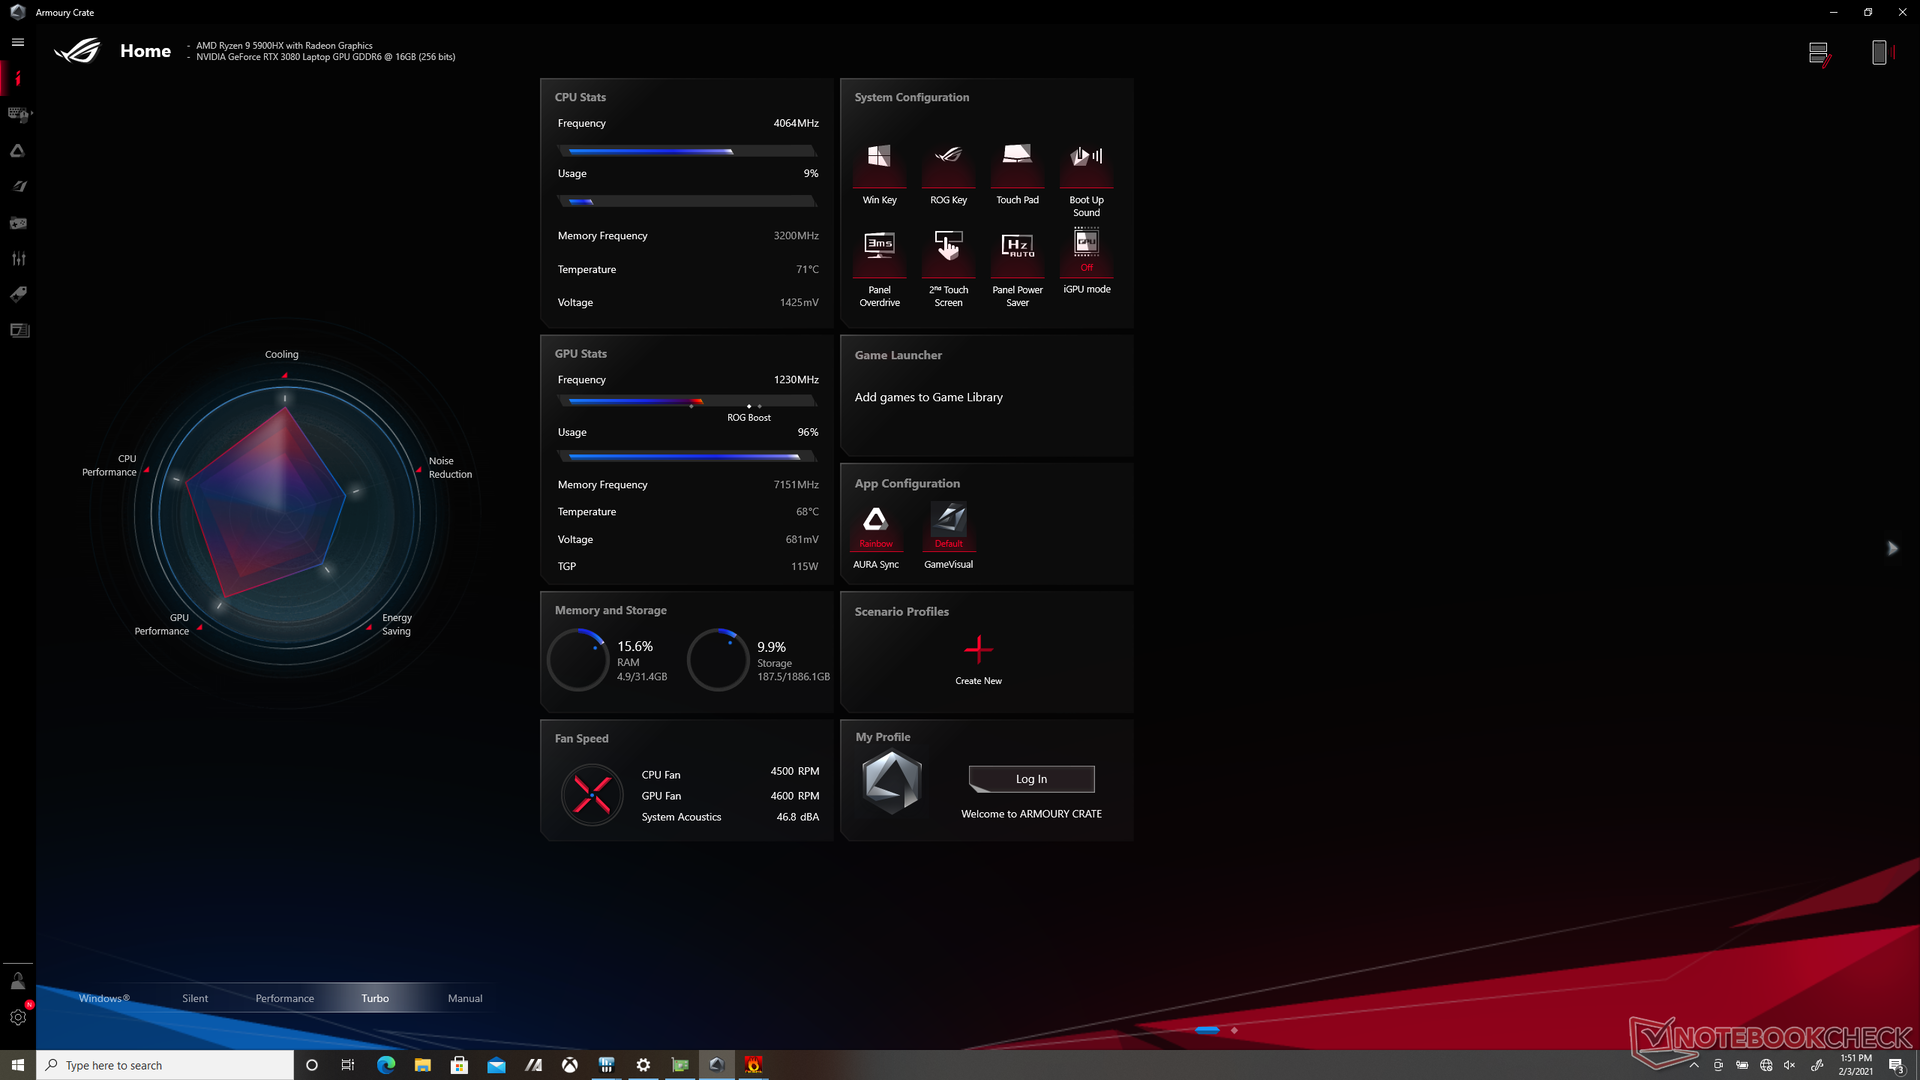
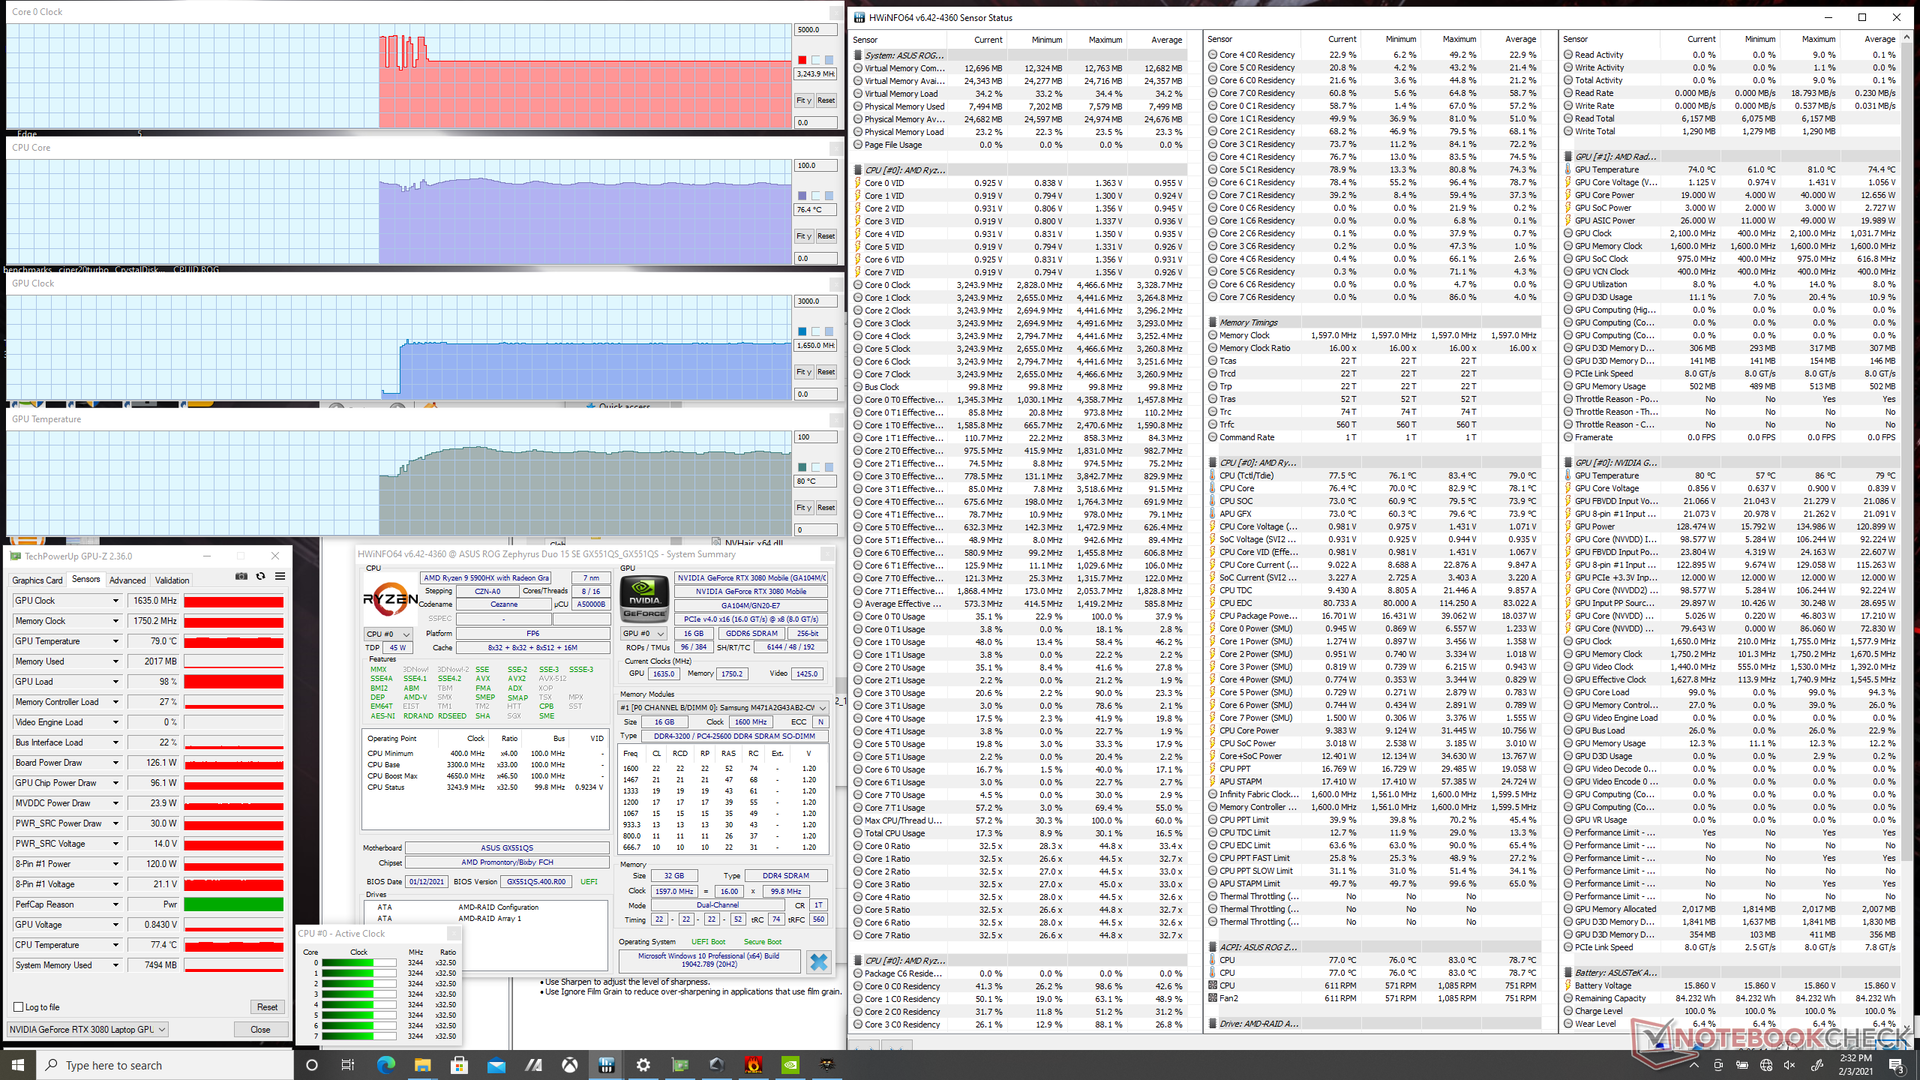
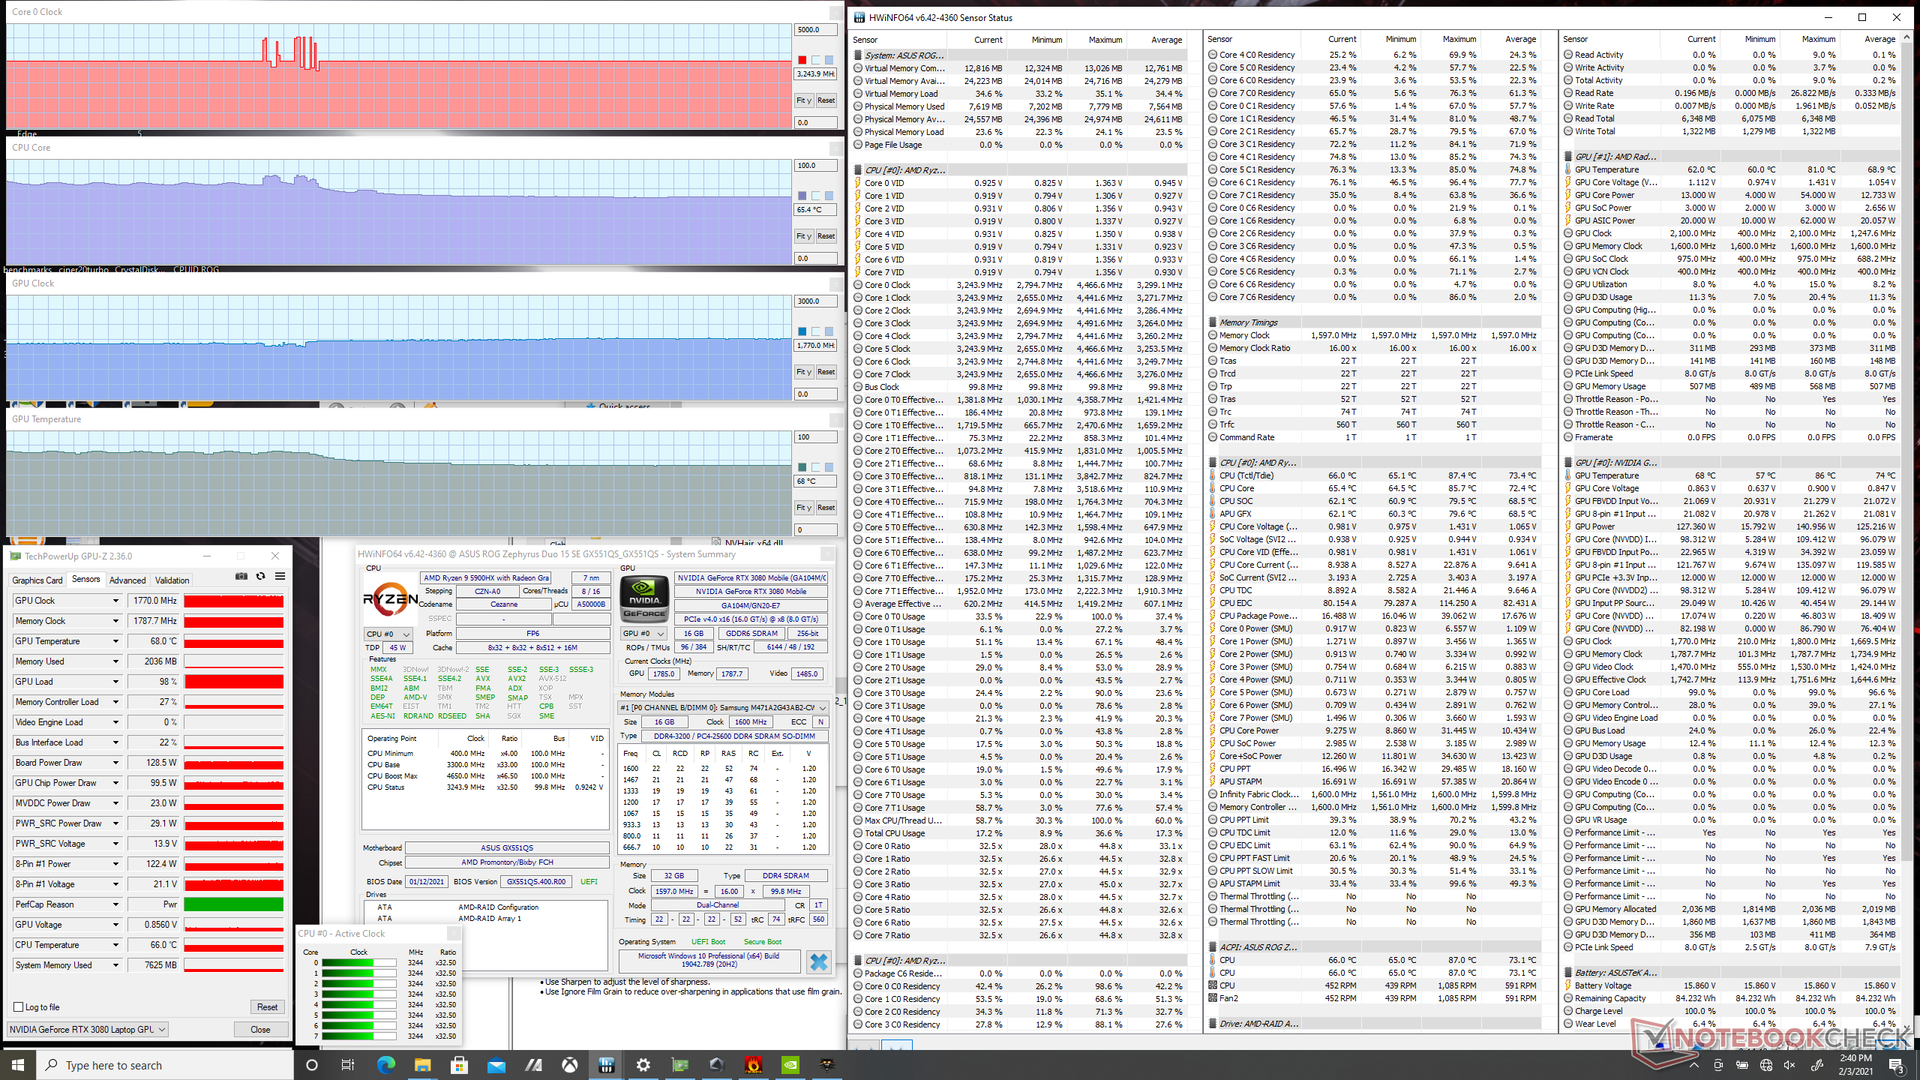
Running Witcher 3 on Turbo mode results in stable GPU clock rates and temperature of 1770 MHz and 68 C, respectively, compared to 1650 MHz and 80 C if on Performance mode. Fan RPMs, however, can range from 4100 to 4800 on Turbo mode versus only 3500 to 3600 on Performance mode. Thus, the quieter gaming experience in Performance mode might be worth the minor sacrifice in graphics power to some owners.

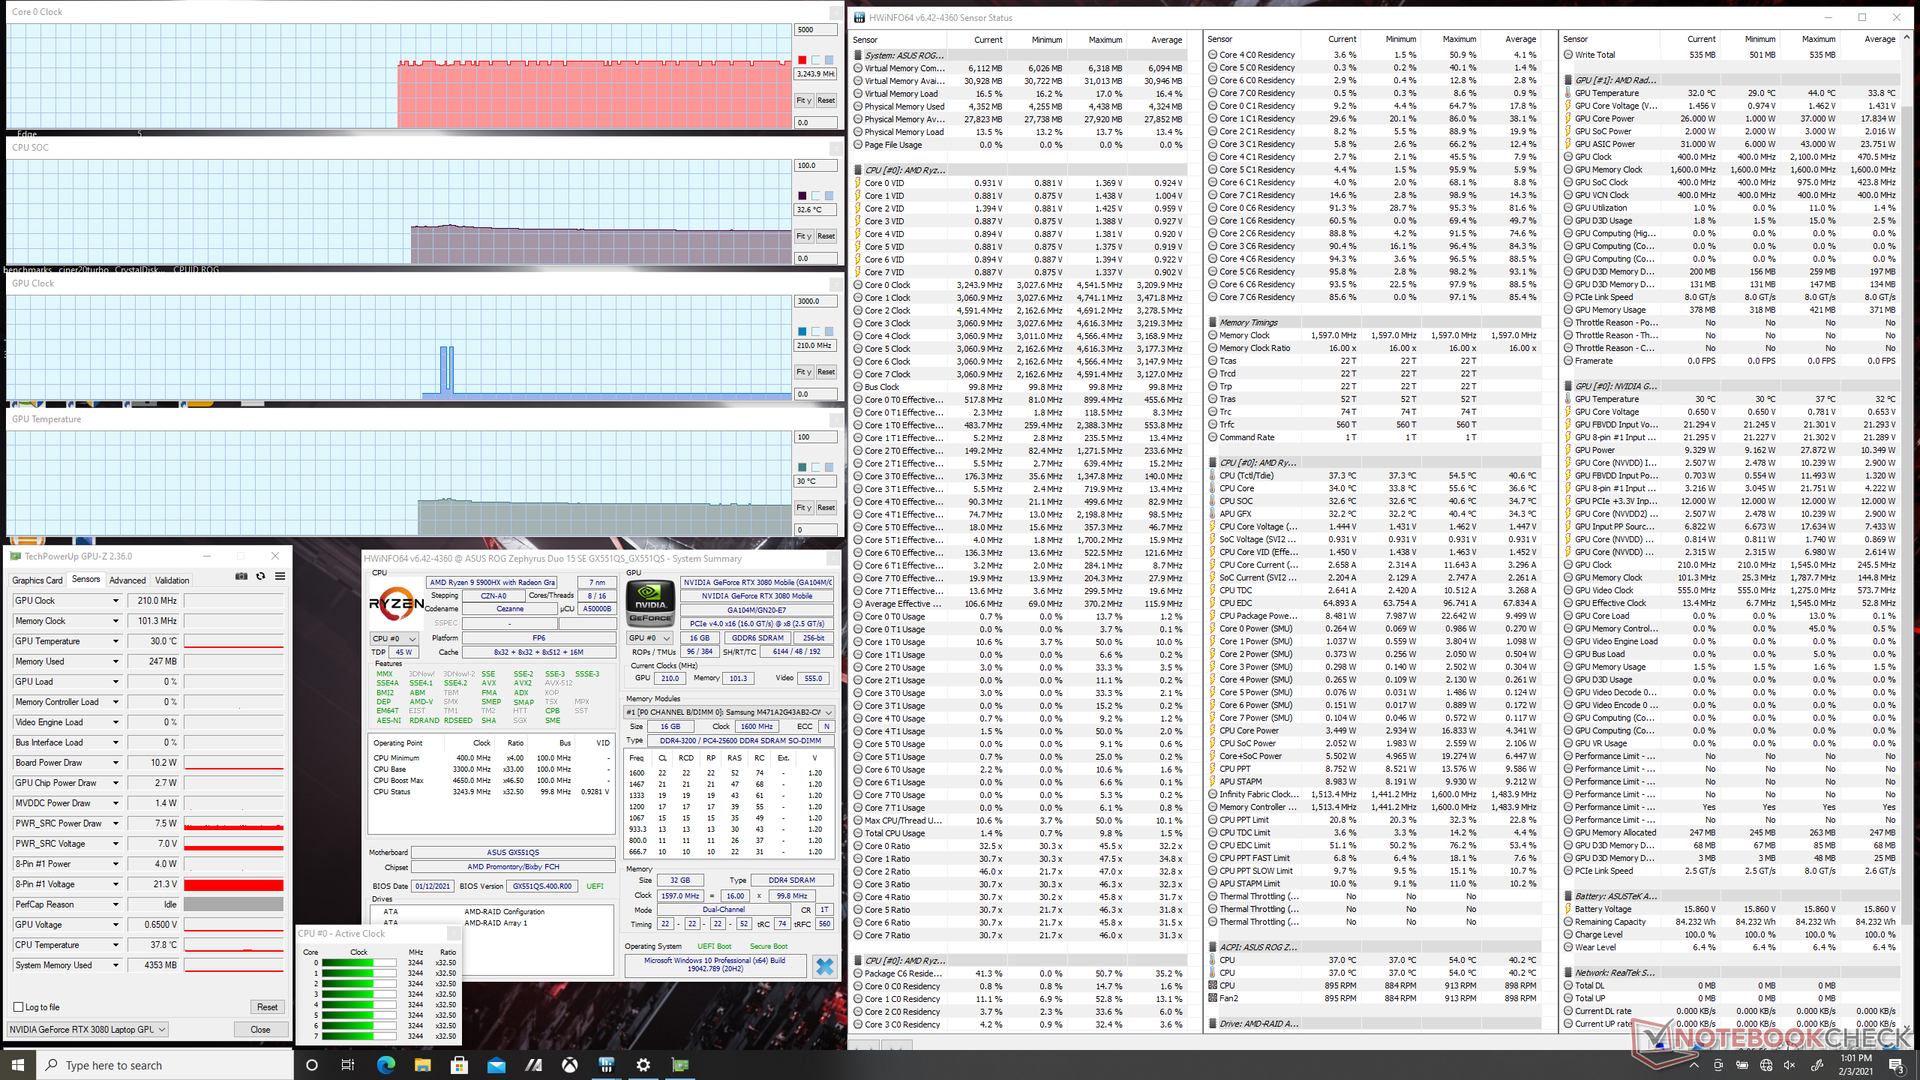
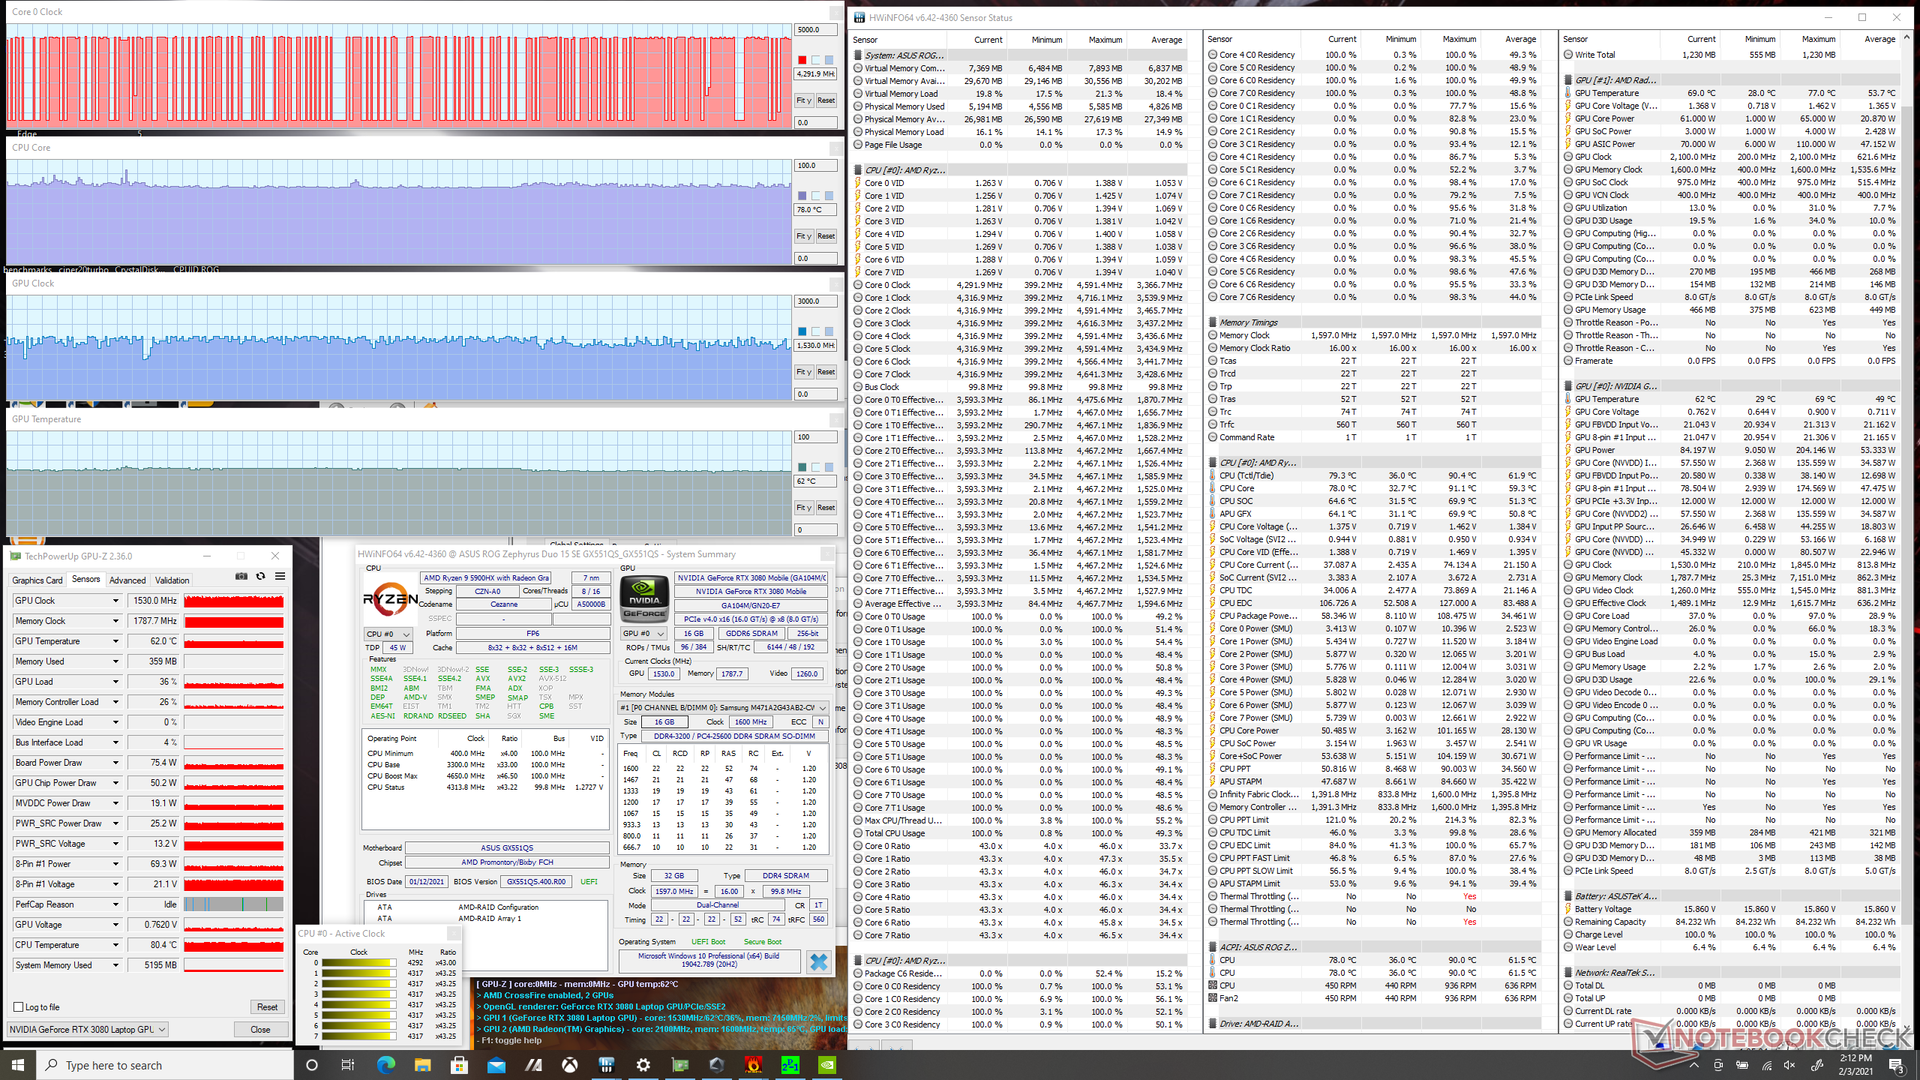
Running Prime95 and FurMark simultaneously will stress both the CPU and GPU to maximum heat output. Even so, CPU and GPU temperatures aren't all that warm at just 78 C and 62 C, respectively, likely due to the loud fans. CPU clock rates would throttle rapidly between 400 MHz and 4.4 GHz to be quite unusual as shown by the screenshot below. A steadier clock rate behavior would have been preferable.
| CPU Clock (GHz) | GPU Clock (MHz) | Average CPU Temperature (°C) | Average GPU Temperature (°C) | |
| Prime95 Stress (Performance mode) | 3.8 | -- | 91 | 65 |
| Prime95 Stress (Turbo mode) | 4.0 - 4.4 | -- | 75 | 47 |
| FurMark Stress (Turbo mode) | -- | 1185 | 67 | 69 |
| Prime95 + FurMark Stress (Turbo mode) | 0.4 - 4.4 | ~1530 | 78 | 62 |
| Witcher 3 Stress (Performance mode) | 3.2 | 1650 | 76 | 80 |
| Witcher 3 Stress (Turbo mode) | 3.2 | 1770 | 65 | 68 |
Speakers


Asus ROG Zephyrus Duo 15 SE GX551QS audio analysis
(±) | speaker loudness is average but good (79.8 dB)
Bass 100 - 315 Hz
(±) | reduced bass - on average 9.1% lower than median
(±) | linearity of bass is average (13.4% delta to prev. frequency)
Mids 400 - 2000 Hz
(+) | balanced mids - only 3.3% away from median
(+) | mids are linear (5.8% delta to prev. frequency)
Highs 2 - 16 kHz
(+) | balanced highs - only 3.2% away from median
(+) | highs are linear (5.6% delta to prev. frequency)
Overall 100 - 16.000 Hz
(+) | overall sound is linear (11.3% difference to median)
Compared to same class
» 8% of all tested devices in this class were better, 3% similar, 88% worse
» The best had a delta of 6%, average was 18%, worst was 132%
Compared to all devices tested
» 7% of all tested devices were better, 2% similar, 91% worse
» The best had a delta of 4%, average was 24%, worst was 134%
Apple MacBook 12 (Early 2016) 1.1 GHz audio analysis
(+) | speakers can play relatively loud (83.6 dB)
Bass 100 - 315 Hz
(±) | reduced bass - on average 11.3% lower than median
(±) | linearity of bass is average (14.2% delta to prev. frequency)
Mids 400 - 2000 Hz
(+) | balanced mids - only 2.4% away from median
(+) | mids are linear (5.5% delta to prev. frequency)
Highs 2 - 16 kHz
(+) | balanced highs - only 2% away from median
(+) | highs are linear (4.5% delta to prev. frequency)
Overall 100 - 16.000 Hz
(+) | overall sound is linear (10.2% difference to median)
Compared to same class
» 7% of all tested devices in this class were better, 2% similar, 91% worse
» The best had a delta of 5%, average was 18%, worst was 53%
Compared to all devices tested
» 5% of all tested devices were better, 1% similar, 94% worse
» The best had a delta of 4%, average was 24%, worst was 134%
Energy Management
Power Consumption
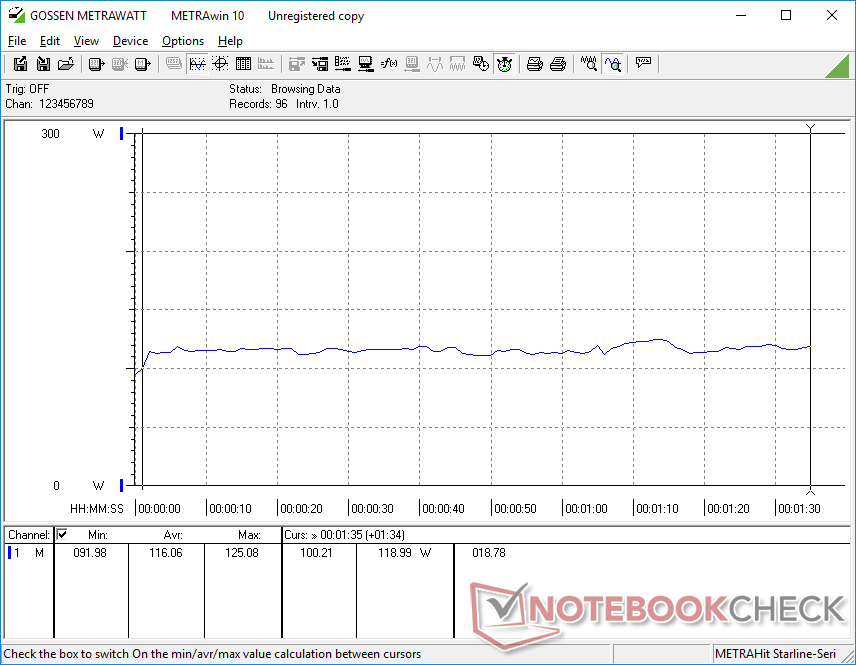
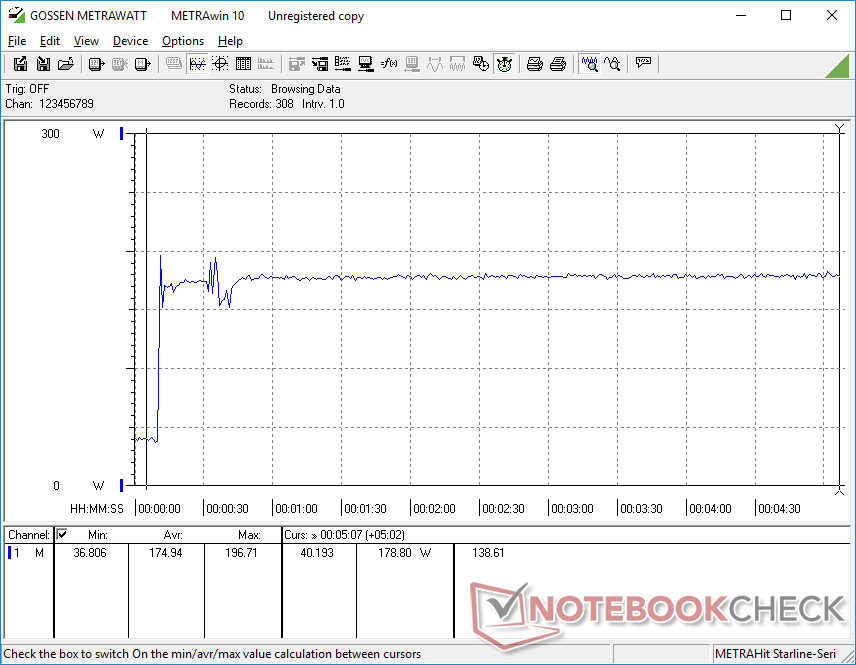
Power consumption isn't far off from what we recorded on the GX550. Idling on desktop demands between 16 W and 30 W depending on the brightness setting, which GPU (integrated or discrete) is active, and if the ScreenPad is on or not. Setting the ScreenPad to maximum brightness draws an additional 7 W when compared to simply shutting it off altogether.
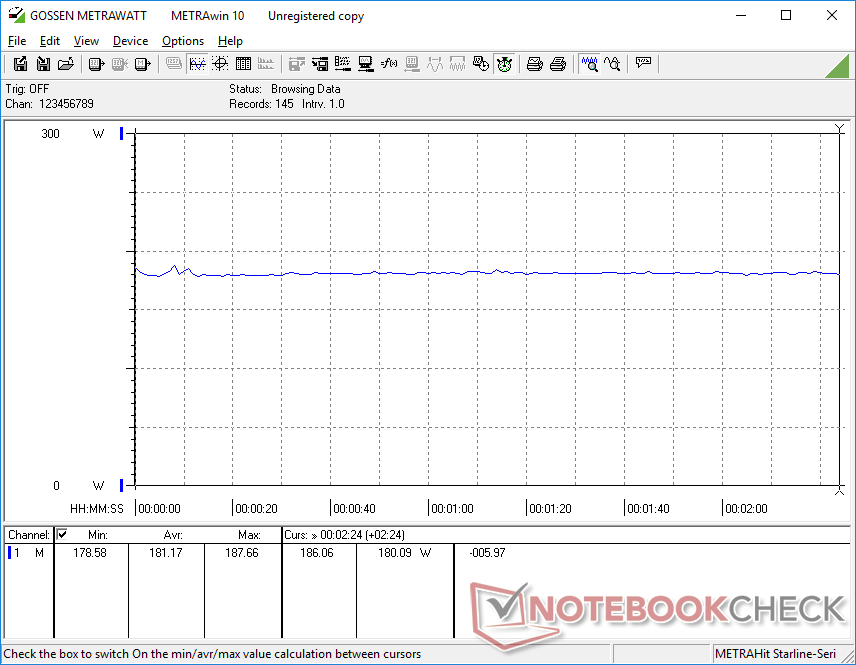
Running Witcher 3 consumes about 181 W to be 20 percent more demanding than last year's GX550. The raw graphics boost is much greater, however, meaning performance-per-watt is still in favor of the newer GX551. This is especially true if comparing CPU performance since the Ryzen 9 5900HX is within just 10 percent of the Core i9-10900K despite their massive TDP differences.
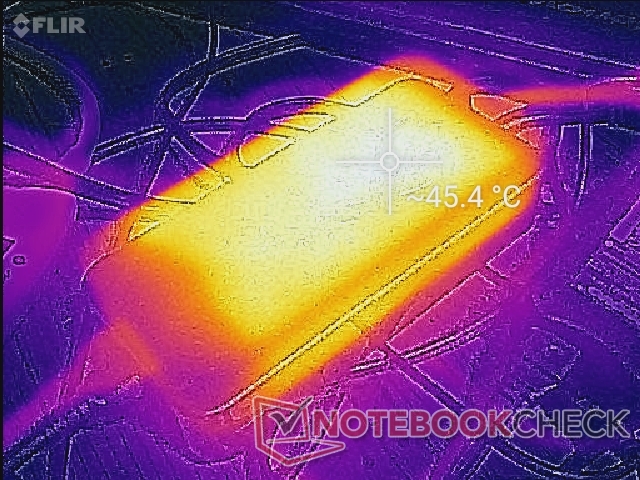
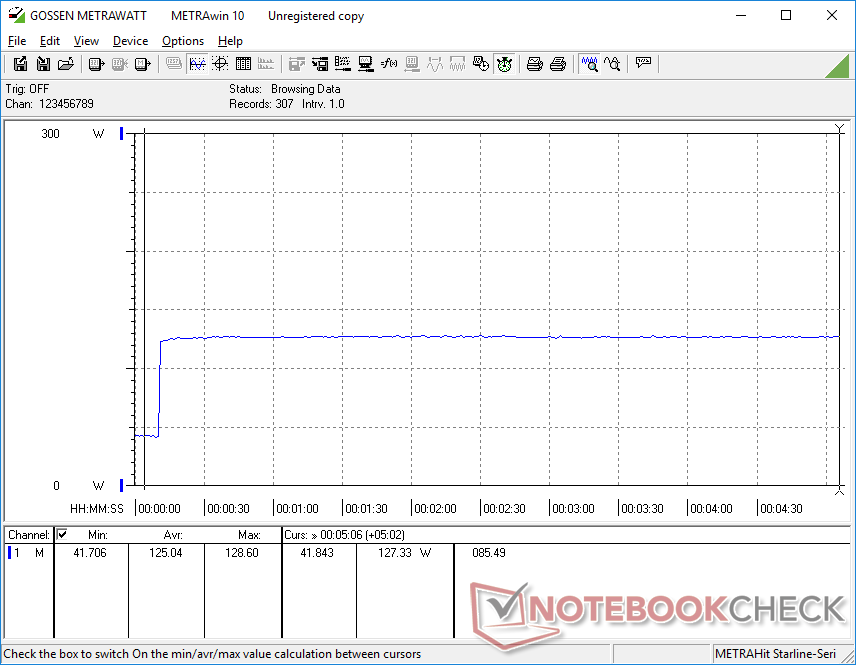
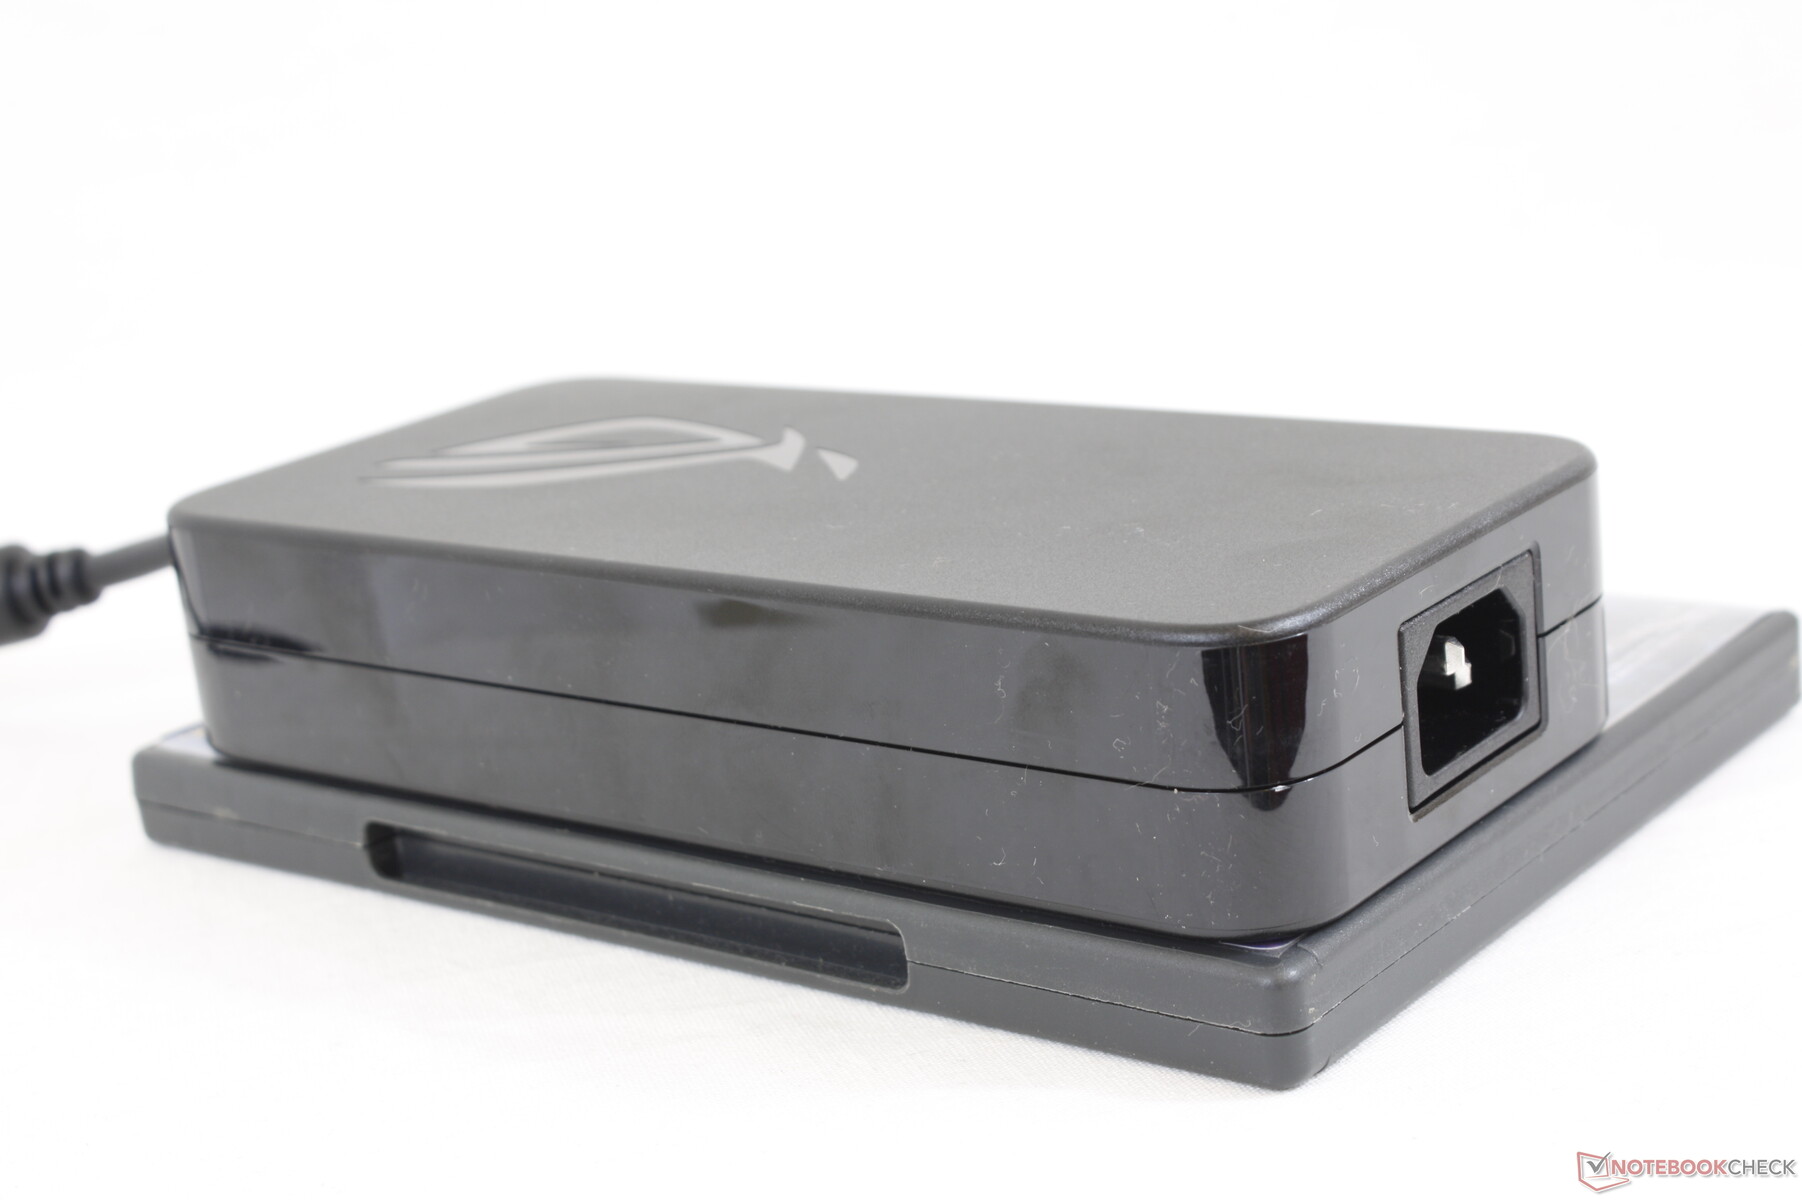
We're able to record a maximum draw of 196.7 W from the large (~17.8 x 8.4 x 3.5 cm) 280 W AC adapter when running Prime95 and FurMark simultaneously. This overhead is unusually large which makes us wonder if the steep CPU clock rate fluctuates mentioned in our Stress Test section above could be a bug. The AC adapter is definitely capable of outputting more power to the laptop and yet the laptop never seems to demand it.
| Off / Standby | |
| Idle | |
| Load |
|
Key:
min: | |
| Asus ROG Zephyrus Duo 15 SE GX551QS R9 5900HX, GeForce RTX 3080 Laptop GPU, 2x Samsung PM981a MZVLB1T0HBLR (RAID 0), IPS, 3840x2160, 15.6" | Asus ROG Zephyrus Duo 15 GX550LXS i9-10980HK, GeForce RTX 2080 Super Max-Q, 2x Samsung PM981a MZVLB1T0HBLR (RAID 0), IPS, 3840x2160, 15.6" | Razer Blade 15 RTX 2080 Super Max-Q i7-10875H, GeForce RTX 2080 Super Max-Q, Samsung PM981a MZVLB1T0HBLR, IPS, 1920x1080, 15.6" | Eurocom Sky X4C i9-9900KS i9-9900KS, GeForce RTX 2080 Mobile, Samsung SSD 970 Pro 512GB, IPS, 1920x1080, 15.6" | MSI GE66 Raider 10SFS i9-10980HK, GeForce RTX 2070 Super Mobile, WDC PC SN730 SDBPNTY-1T00, IPS-Level, 1920x1080, 15.6" | MSI GS66 Stealth 10SFS i9-10980HK, GeForce RTX 2070 Super Max-Q, Samsung SSD PM981 MZVLB1T0HALR, IPS, 1920x1080, 15.6" | |
|---|---|---|---|---|---|---|
| Power Consumption | -16% | 26% | -57% | 16% | 14% | |
| Idle Minimum * (Watt) | 16.3 | 23 -41% | 10.6 35% | 33.4 -105% | 6 63% | 13 20% |
| Idle Average * (Watt) | 22.5 | 30 -33% | 13.1 42% | 40.5 -80% | 14 38% | 16 29% |
| Idle Maximum * (Watt) | 39.9 | 39 2% | 15.8 60% | 44 -10% | 25 37% | 27 32% |
| Load Average * (Watt) | 116.1 | 156 -34% | 131 -13% | 121.9 -5% | 108 7% | 109 6% |
| Witcher 3 ultra * (Watt) | 181.2 | 152 16% | 146 19% | 258.2 -42% | 195 -8% | 155 14% |
| Load Maximum * (Watt) | 196.7 | 208 -6% | 169 14% | 397.6 -102% | 280 -42% | 236 -20% |
* ... smaller is better
Battery Life
(February 9, 2021 update: Asus has clarified its stance on USB-C charging as explained here.)
Expect a real-world WLAN runtime of over five hours when both displays are set to 150 nits on the Balanced power profile with the integrated GPU active. Results are about two hours longer than what we saw on the GX550 but it is otherwise average for a gaming laptop.
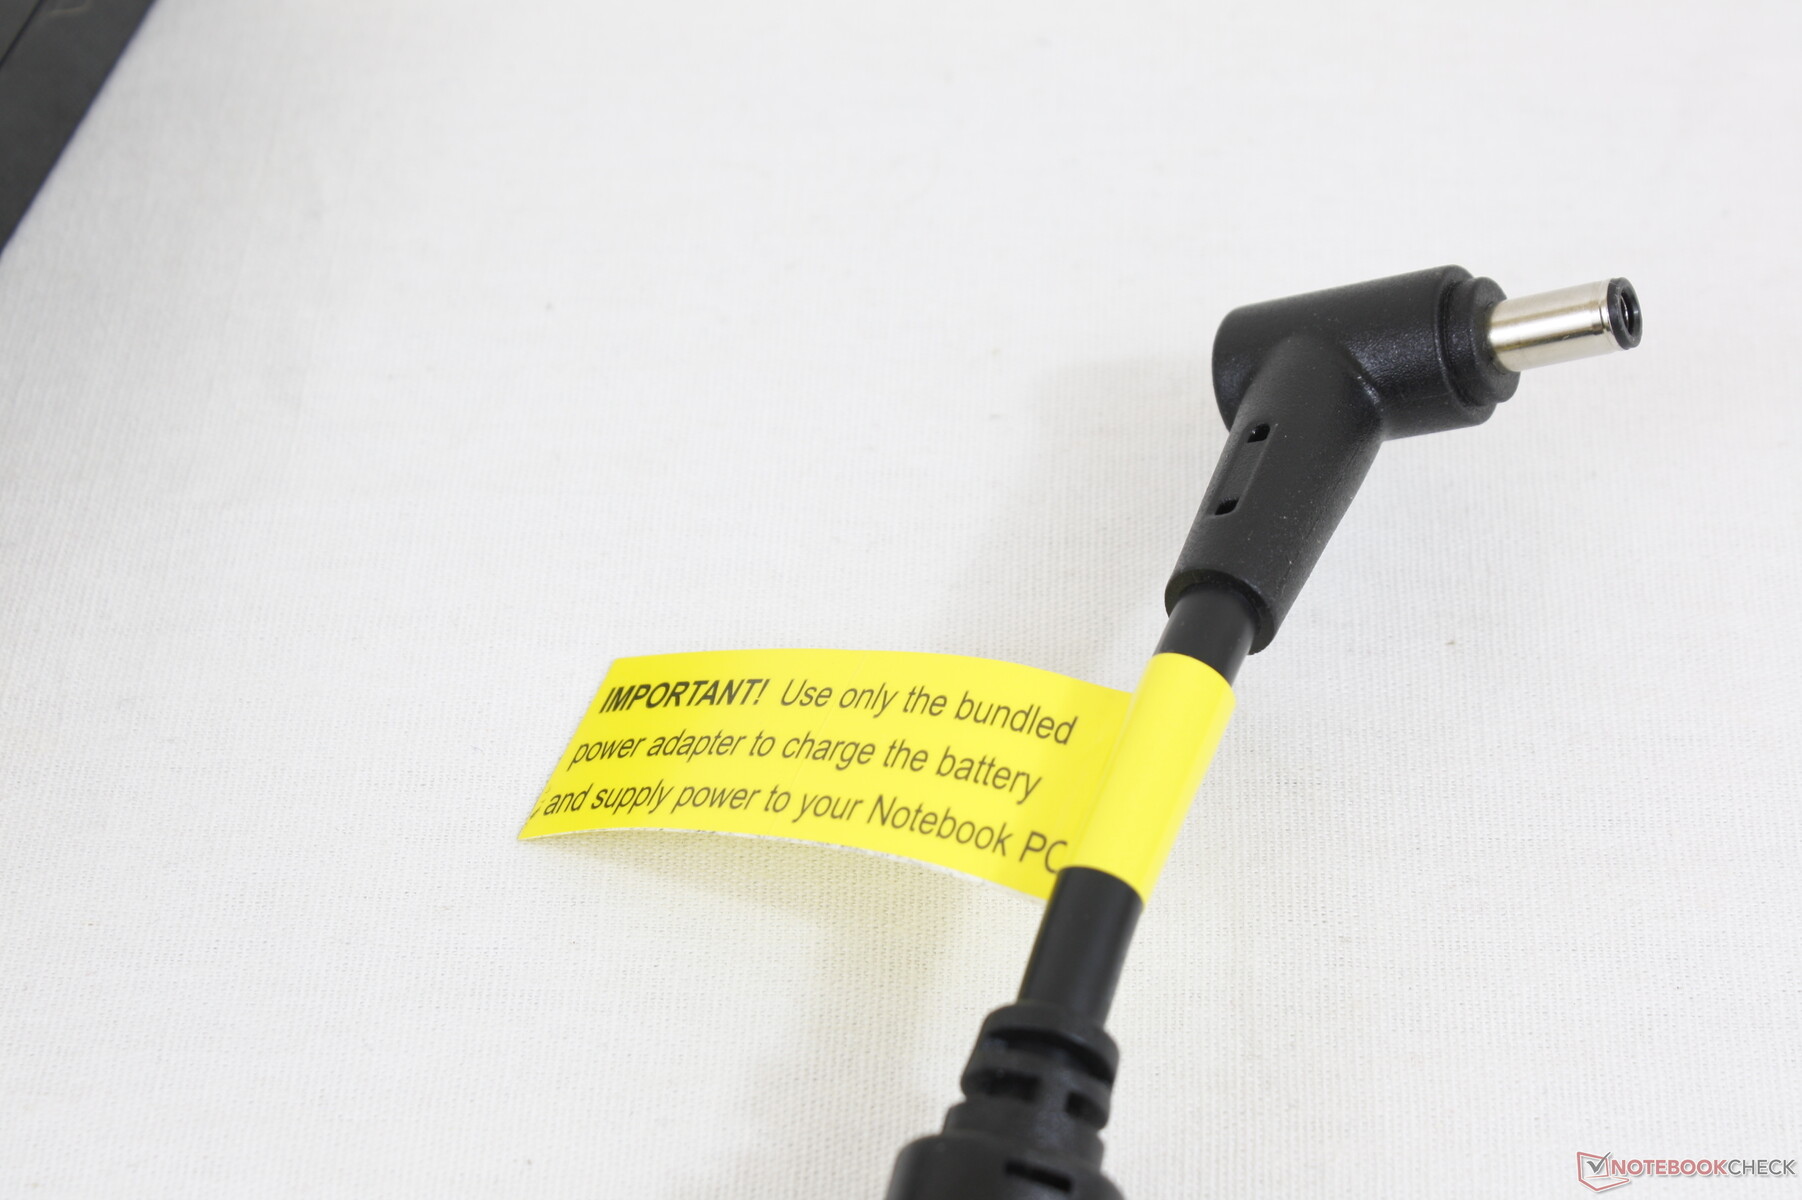
Charging from empty to full takes about 2 to 2.5 hours. The system can also recharge via USB-C with an input of up to 100 W which we can confirm on our test unit. Asus doesn't seem to recommend it, however, possibly due to existing USB-C charging issues with the Zephyrus G14.
| Asus ROG Zephyrus Duo 15 SE GX551QS R9 5900HX, GeForce RTX 3080 Laptop GPU, 90 Wh | Asus ROG Zephyrus Duo 15 GX550LXS i9-10980HK, GeForce RTX 2080 Super Max-Q, 90 Wh | Razer Blade 15 RTX 2080 Super Max-Q i7-10875H, GeForce RTX 2080 Super Max-Q, 80 Wh | Eurocom Sky X4C i9-9900KS i9-9900KS, GeForce RTX 2080 Mobile, 82 Wh | MSI GE66 Raider 10SFS i9-10980HK, GeForce RTX 2070 Super Mobile, 99.99 Wh | MSI GS66 Stealth 10SFS i9-10980HK, GeForce RTX 2070 Super Max-Q, 99.99 Wh | |
|---|---|---|---|---|---|---|
| Battery runtime | -8% | 34% | -47% | 26% | 27% | |
| Reader / Idle (h) | 6.8 | 8 18% | 8.7 28% | 7.6 12% | 8.4 24% | |
| WiFi v1.3 (h) | 5.3 | 3.1 -42% | 6.1 15% | 2.8 -47% | 6.1 15% | 6.1 15% |
| Load (h) | 1.2 | 1.2 0% | 1.9 58% | 1.8 50% | 1.7 42% |
Pros
Cons
Verdict
It may not look like it from the outside, but Asus has made major internal updates to boost performance significantly from the older GX550. High-end gaming laptops need not be exclusive to Intel Core series anymore now that mobile AMD Ryzen options have surpassed even the fastest 10th gen Core i9 systems including Asus' own Zephyrus Duo 15 GX550.
Aside from the Zen 3 CPU, the new 120 Hz 4K panel deserves recognition as well. Unlike most 15.6-inch 4K panels in the past, this new one has faster black-white and gray-gray response times that are now much closer to the common 144 Hz, 240 Hz, or 300 Hz 1080p options. The difference is noticeable mostly when playing fast-moving 3D games.
It's not cheap, but the Asus ROG Zephyrus Duo 15 SE GX551QS is densely packed with new hardware to outperform the previous model by quite a wide margin. The ScreenPad hasn't changed at all aside from its smoother UI that will also be coming to the GX550.
The main problem with the new advantages is that they are not special to the GX551. Other laptops will eventually carry the same CPU, GPU, and 4K display options, if not already, for a similar level of performance. Furthermore, the chassis and ScreenPad haven't changed meaning all the previous disadvantages on last year's GX550 remain. If you didn't like the shallow keyboard keys, small clickpad, wide dimensions, or lack of a webcam on the GX550, then your opinions aren't likely going to change about the GX551. Fan pulsing when gaming on Performance mode could have also been improved.
Price and availability
Asus ROG Zephyrus Duo 15 SE GX551QS
- 02/07/2021 v7 (old)
Allen Ngo
Price comparison
