Asus ROG Strix G15 G512LW Laptop Review: Much Better Than The G512LI
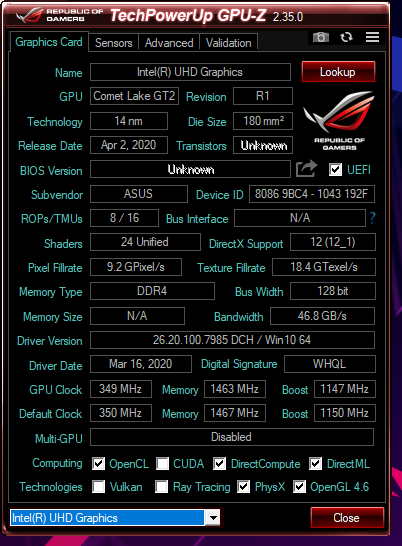
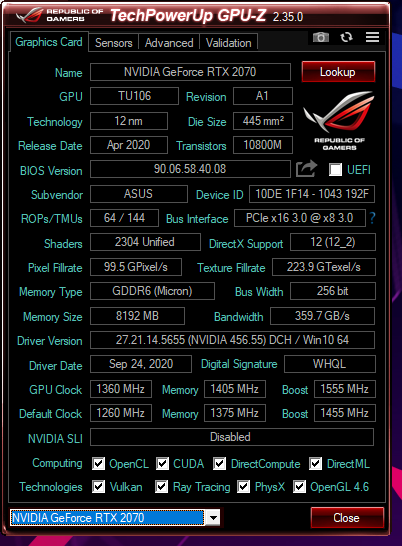
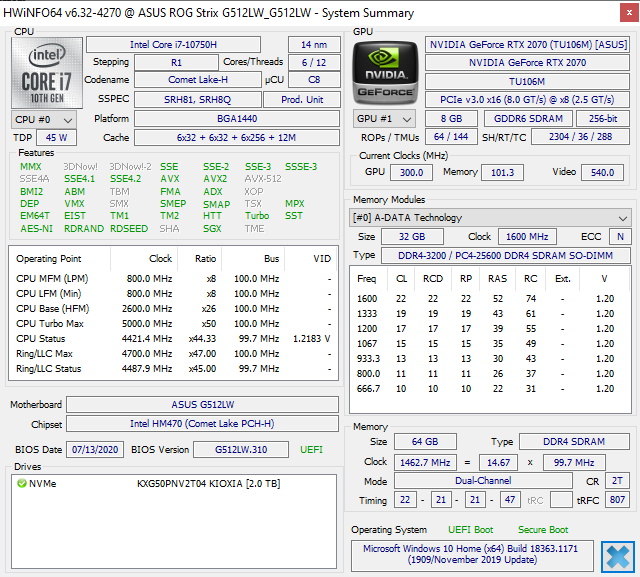
Whereas the Asus ROG Strix G15 G512LI comes with the GeForce GTX 1650 Ti and 144 Hz display, the Asus ROG Strix G15 G512LW comes with the much more powerful GeForce RTX 2070 and an even faster 240 Hz display. Both models otherwise share the same chassis but with a couple of important differences that we will note in this review.
We recommend checking out our review on the G512LI to learn more about the physical features of the G512LW since almost all of our existing comments still apply. This page will explore the performance and display differences between the G512LW and G512LI and other 15.6-inch gaming laptops like the MSI GP65 or Alienware m15 R3. Our configuration can be found on Computer Upgrade King for about $1500 USD and up depending on RAM and storage.
More Asus reviews:
Rating | Date | Model | Weight | Height | Size | Resolution | Price |
|---|---|---|---|---|---|---|---|
| 83.4 % v7 (old) | 11 / 2020 | Asus ROG Strix G15 G512LW i7-10750H, GeForce RTX 2070 Mobile | 2.3 kg | 25.8 mm | 15.60" | 1920x1080 | |
| 80.8 % v7 (old) | 07 / 2020 | Asus ROG Strix G15 G512LI i7-10750H, GeForce GTX 1650 Ti Mobile | 2.3 kg | 25.8 mm | 15.60" | 1920x1080 | |
| 86.9 % v7 (old) | 08 / 2020 | Razer Blade 15 RTX 2070 Super Max-Q i7-10875H, GeForce RTX 2070 Super Max-Q | 2.1 kg | 17.8 mm | 15.60" | 1920x1080 | |
| 83.2 % v7 (old) | 05 / 2020 | MSI GP65 10SFK-047US i7-10750H, GeForce RTX 2070 Mobile | 2.3 kg | 27.5 mm | 15.60" | 1920x1080 | |
| 84.4 % v7 (old) | 07 / 2020 | Asus ROG Strix Scar 15 G532LWS i9-10980HK, GeForce RTX 2070 Super Mobile | 2.4 kg | 24.9 mm | 15.60" | 1920x1080 | |
| 84.8 % v7 (old) | 07 / 2020 | Alienware m15 R3 P87F i7-10750H, GeForce RTX 2070 Mobile | 2.3 kg | 19.9 mm | 15.60" | 1920x1080 |
Case
Communication
The Intel AX201 comes standard for Wi-Fi 6 connectivity and Bluetooth 5.1. Average transmit rates are strangely slower this time around at 790 Mbps when connected to our Netgear RAX200 router. Results would not improve even after resetting our router and laptop.
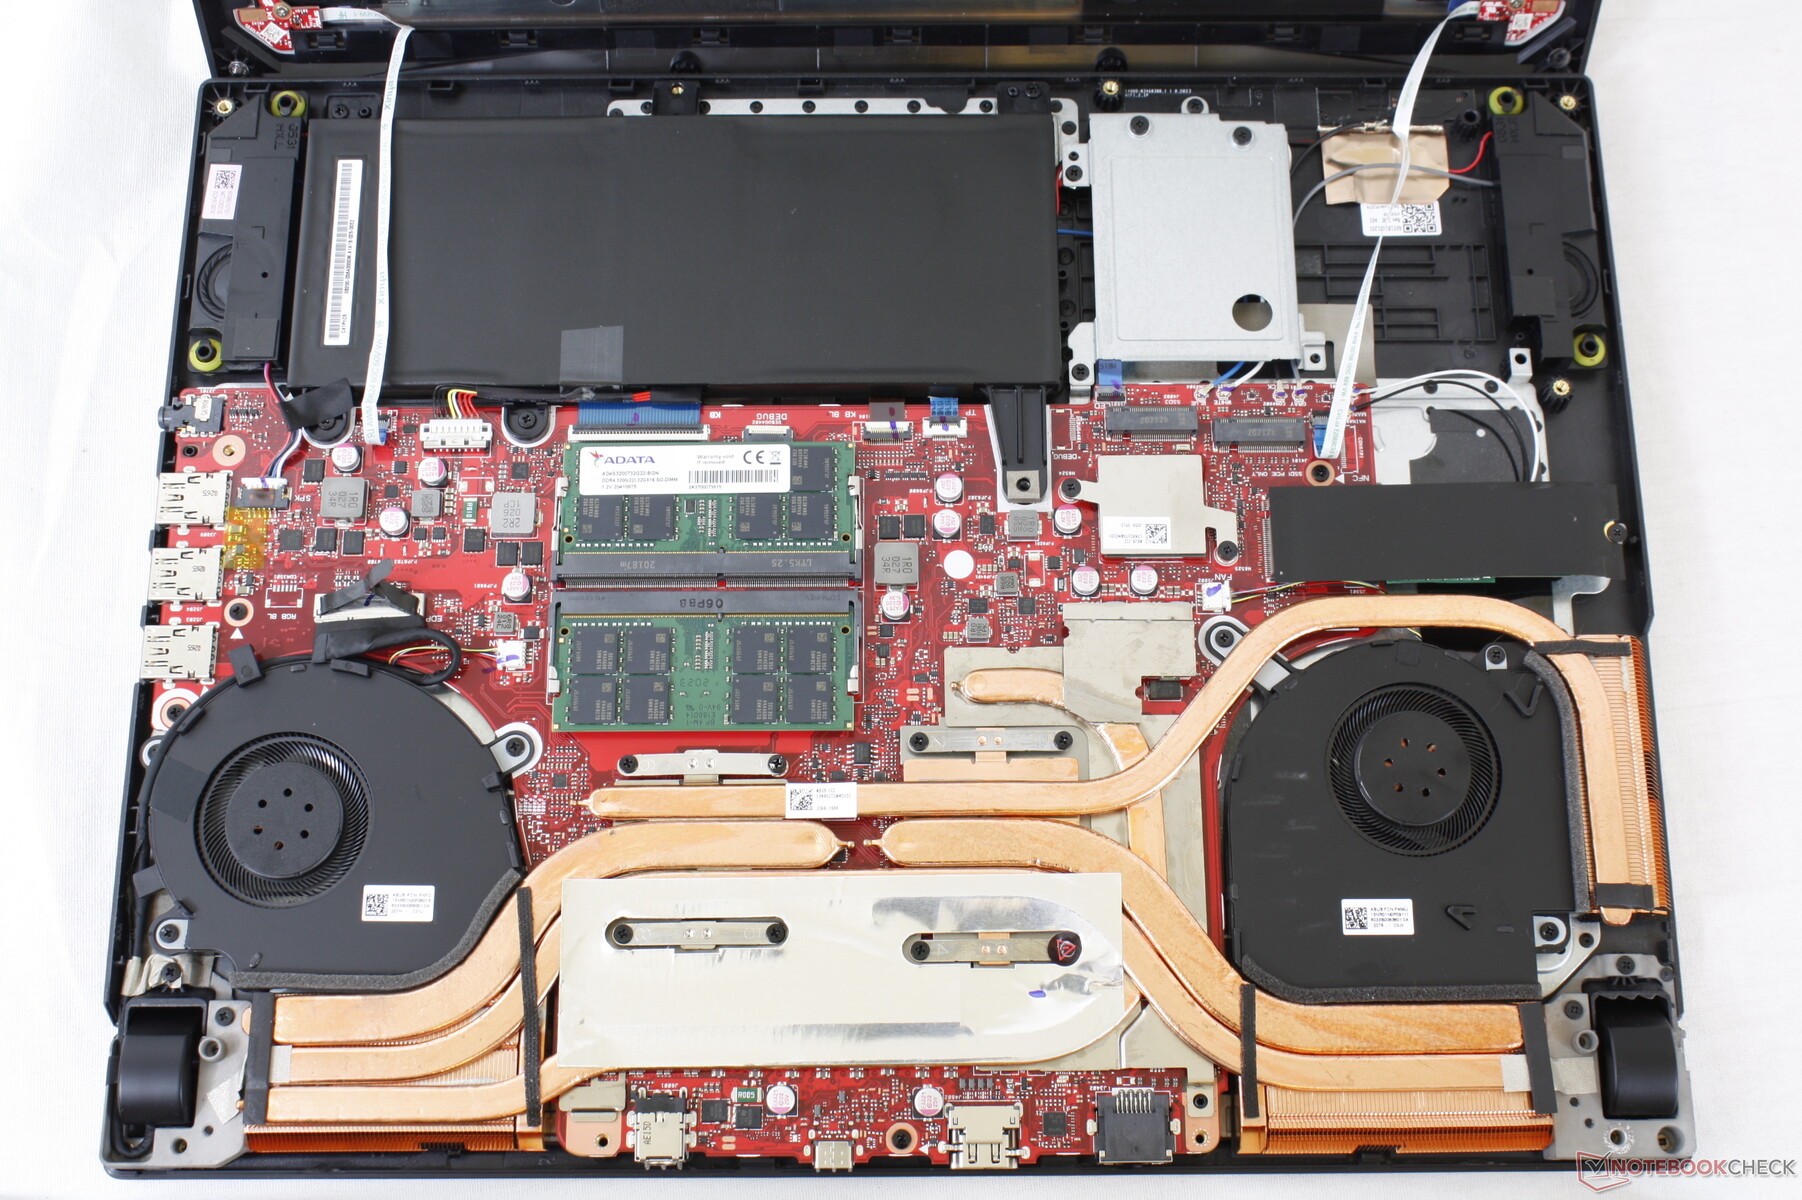
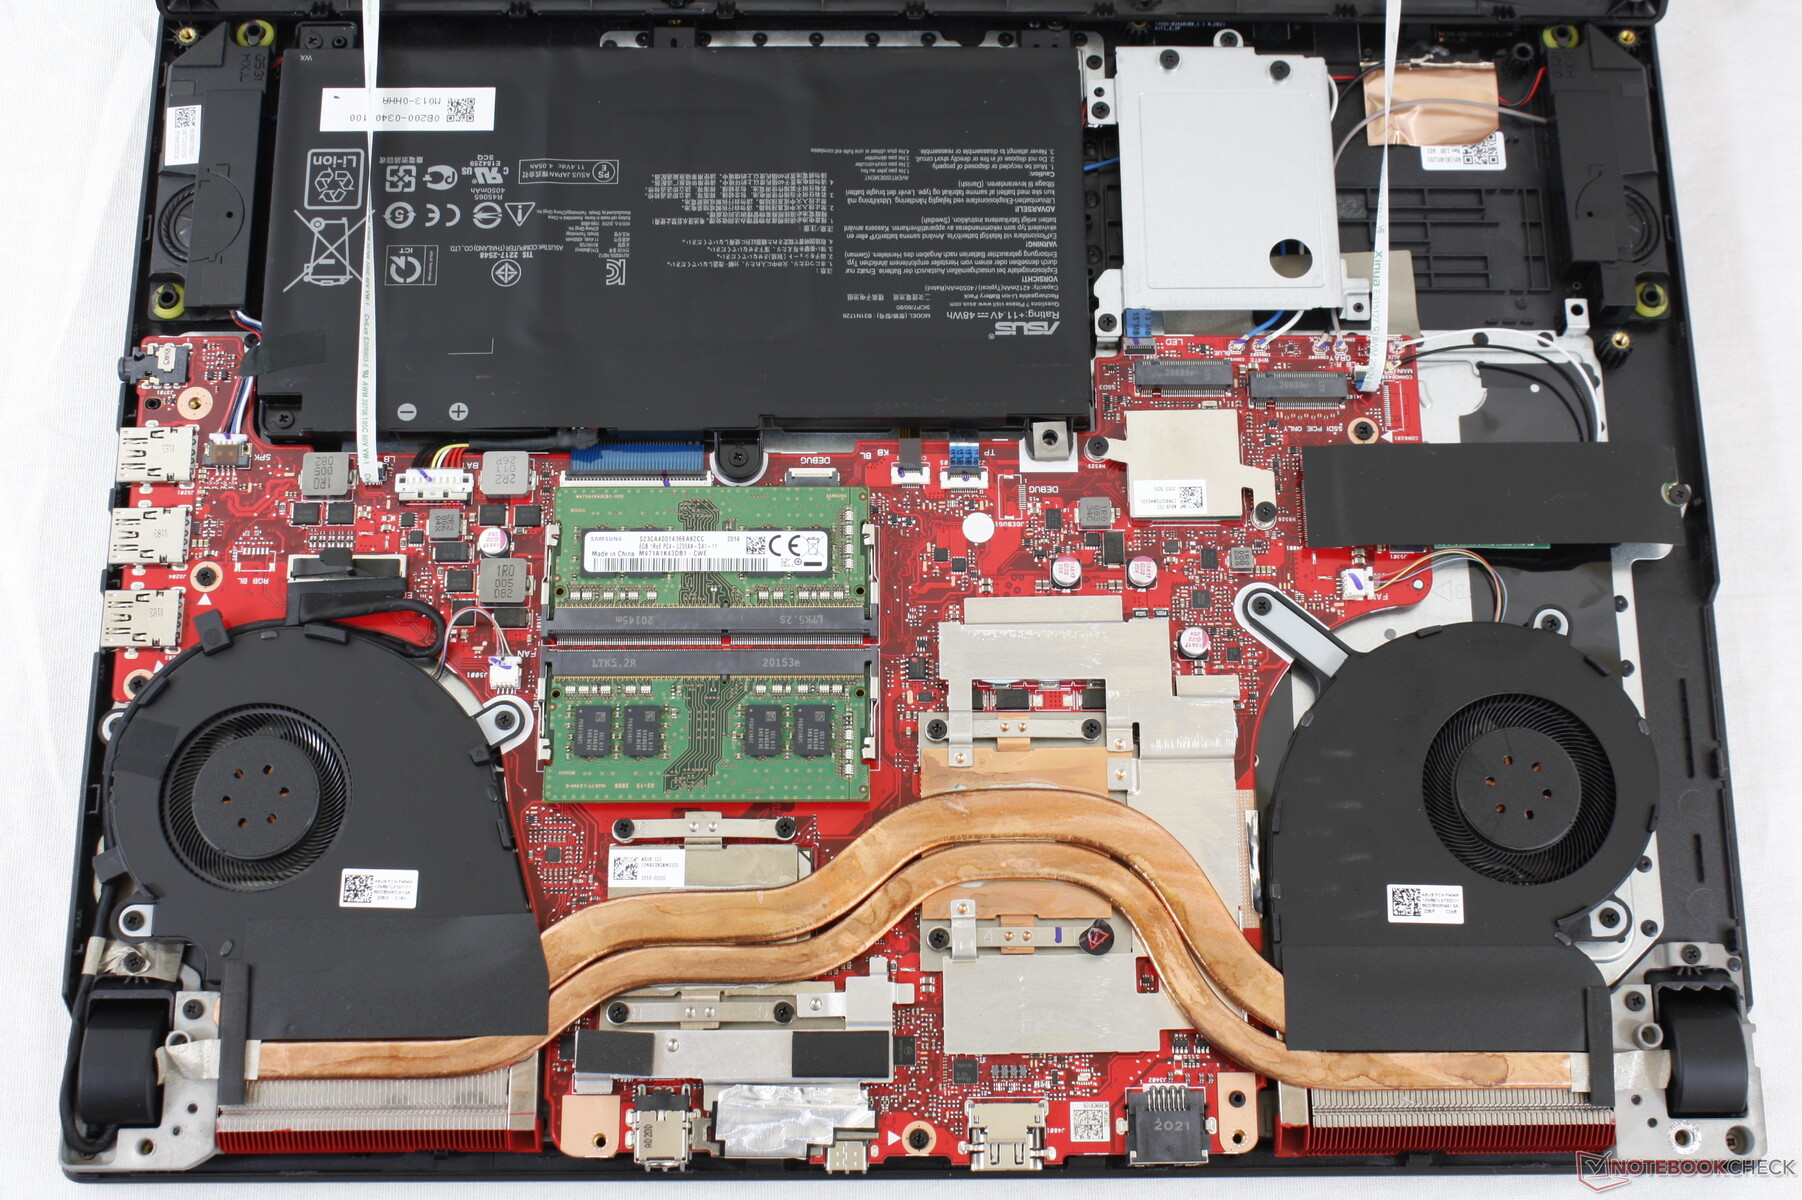
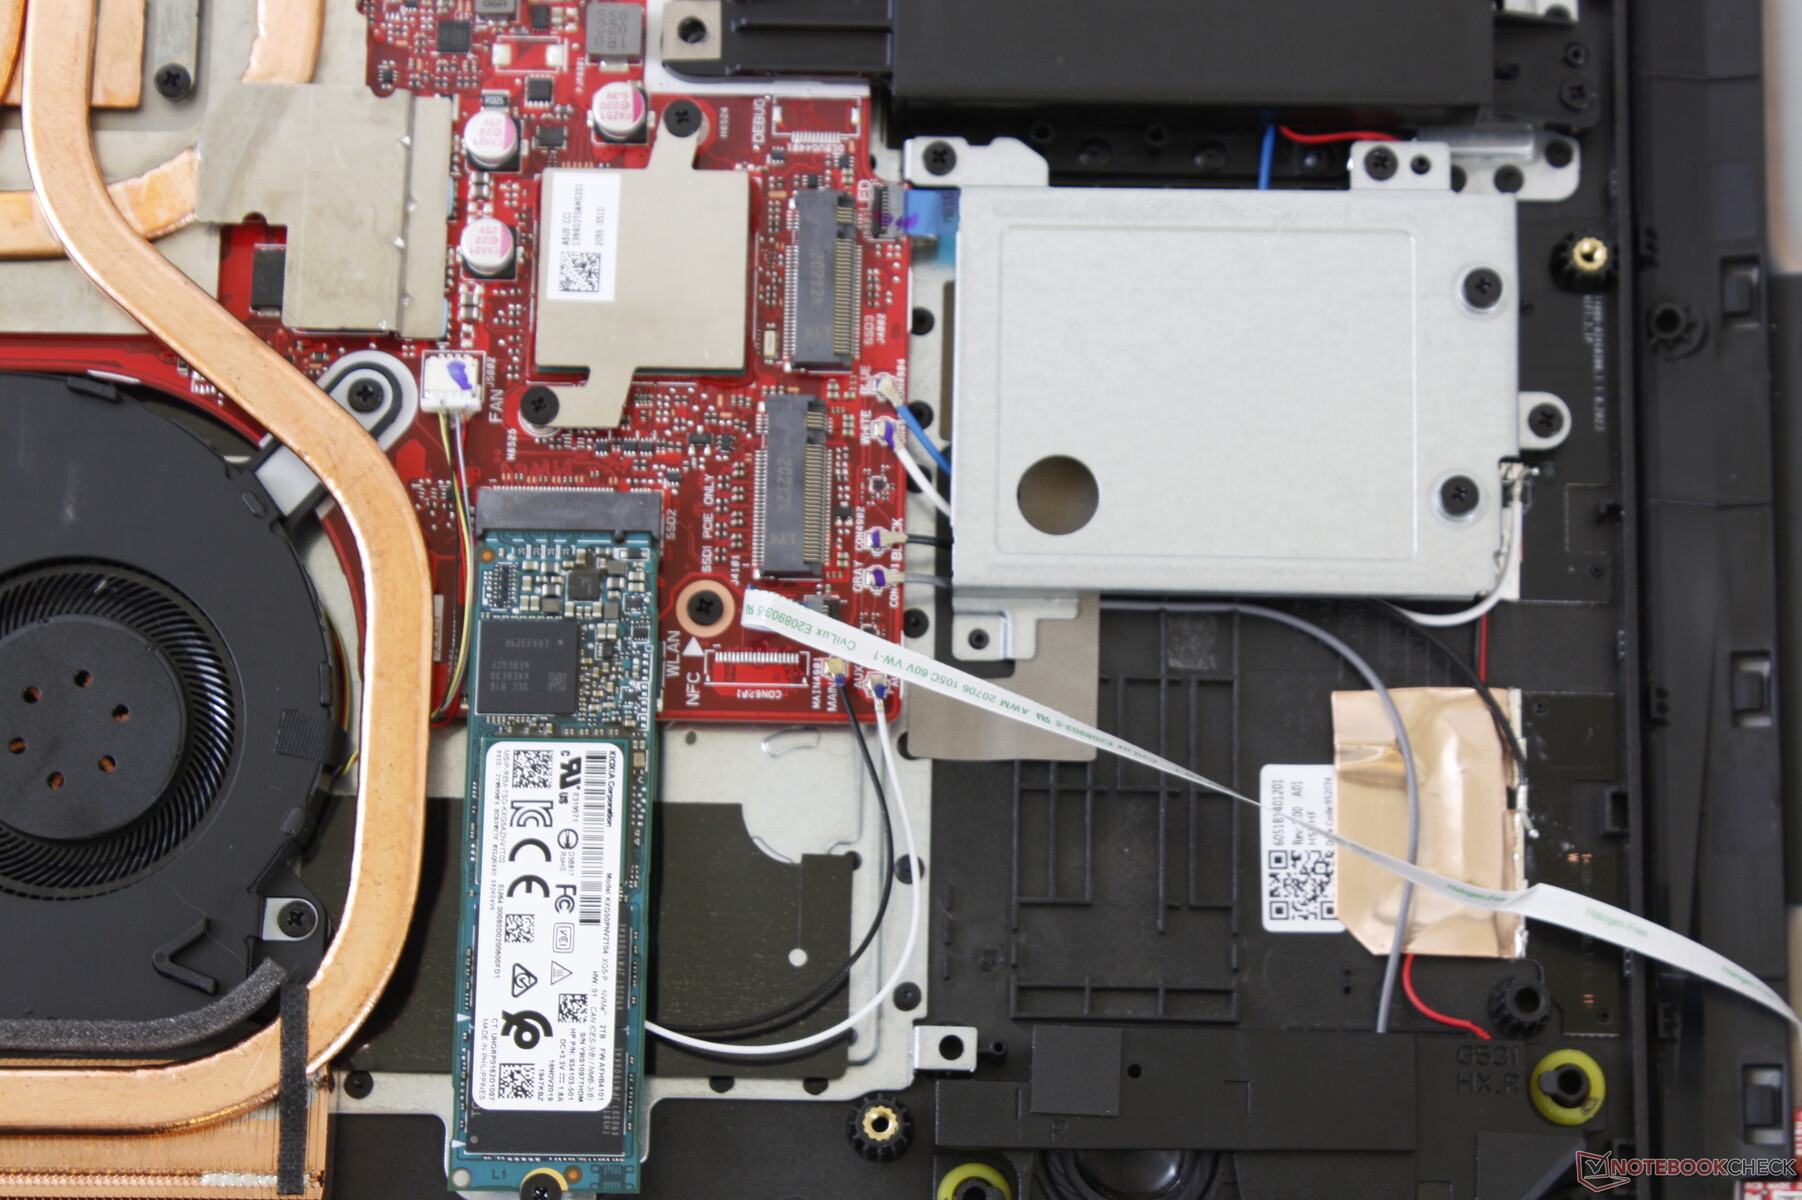
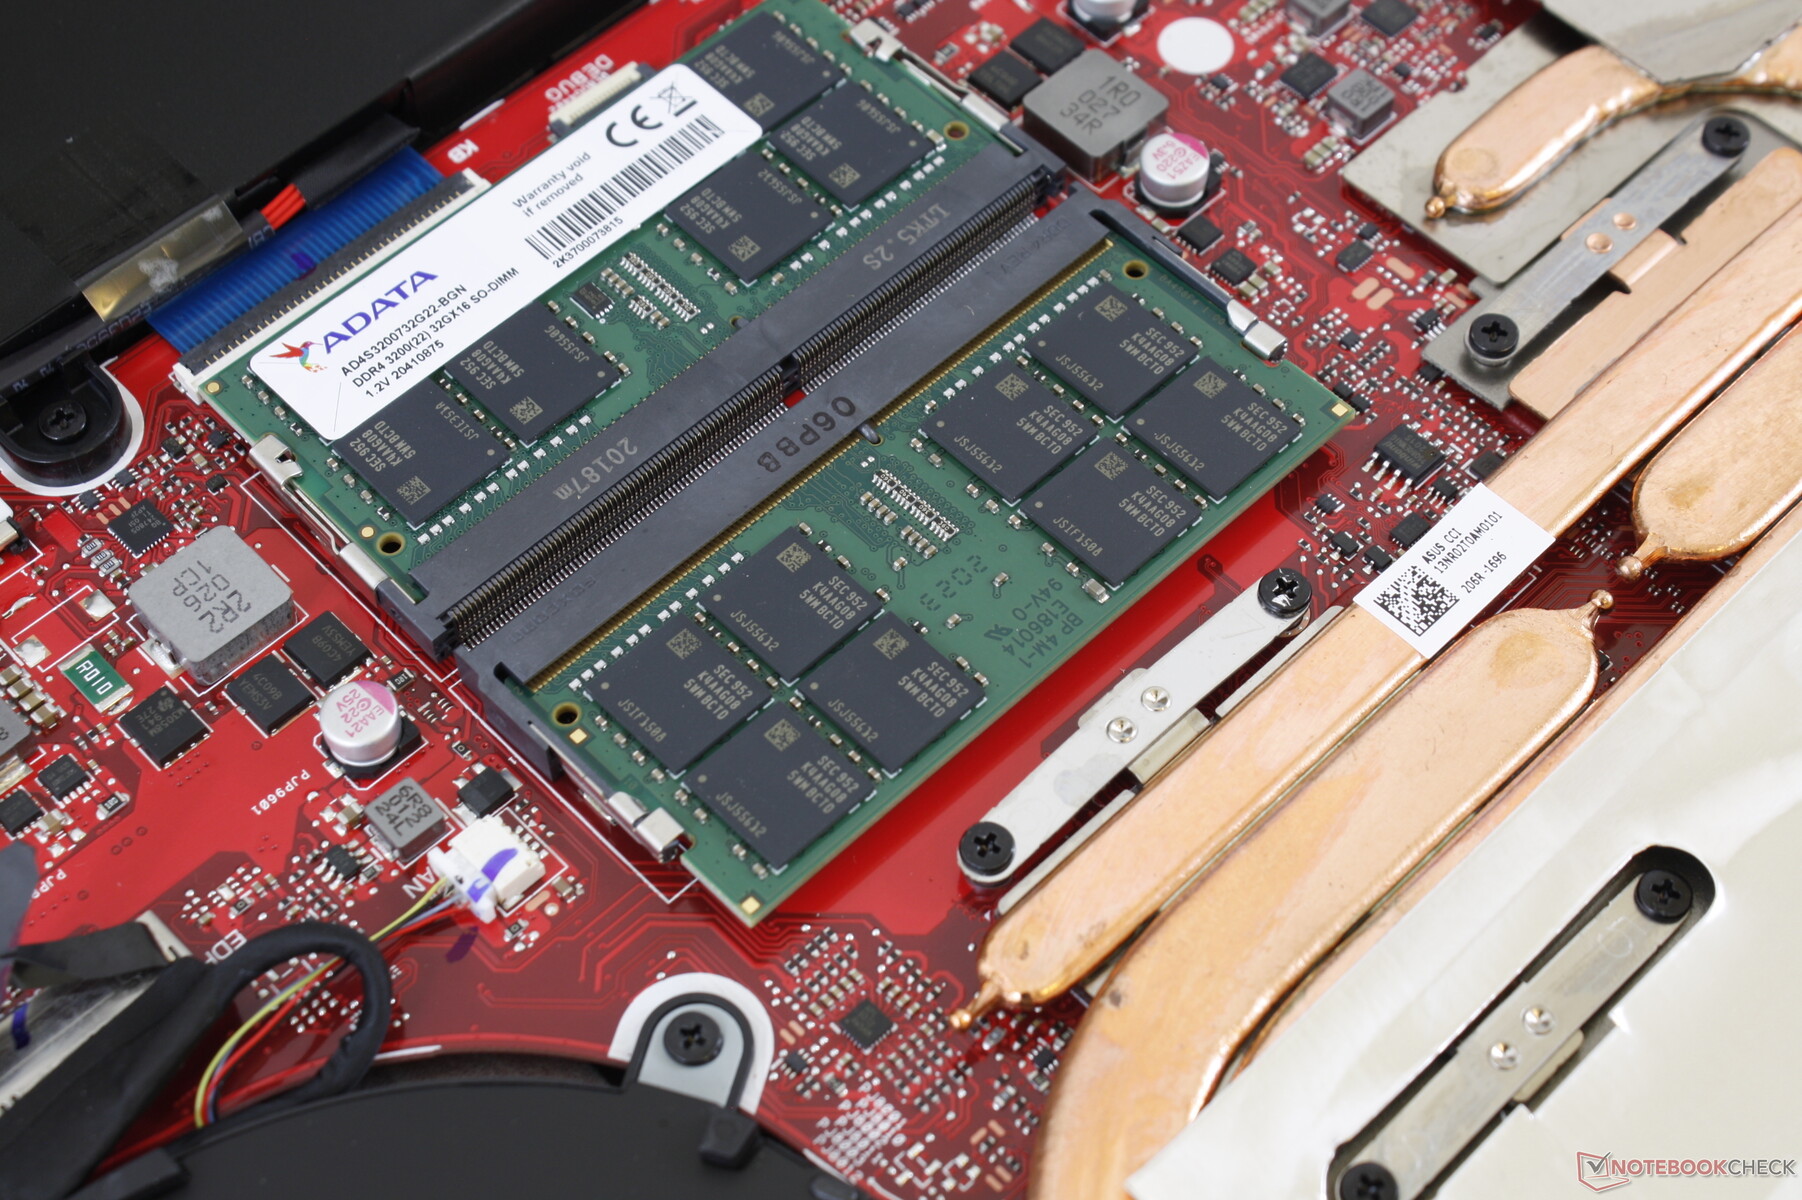
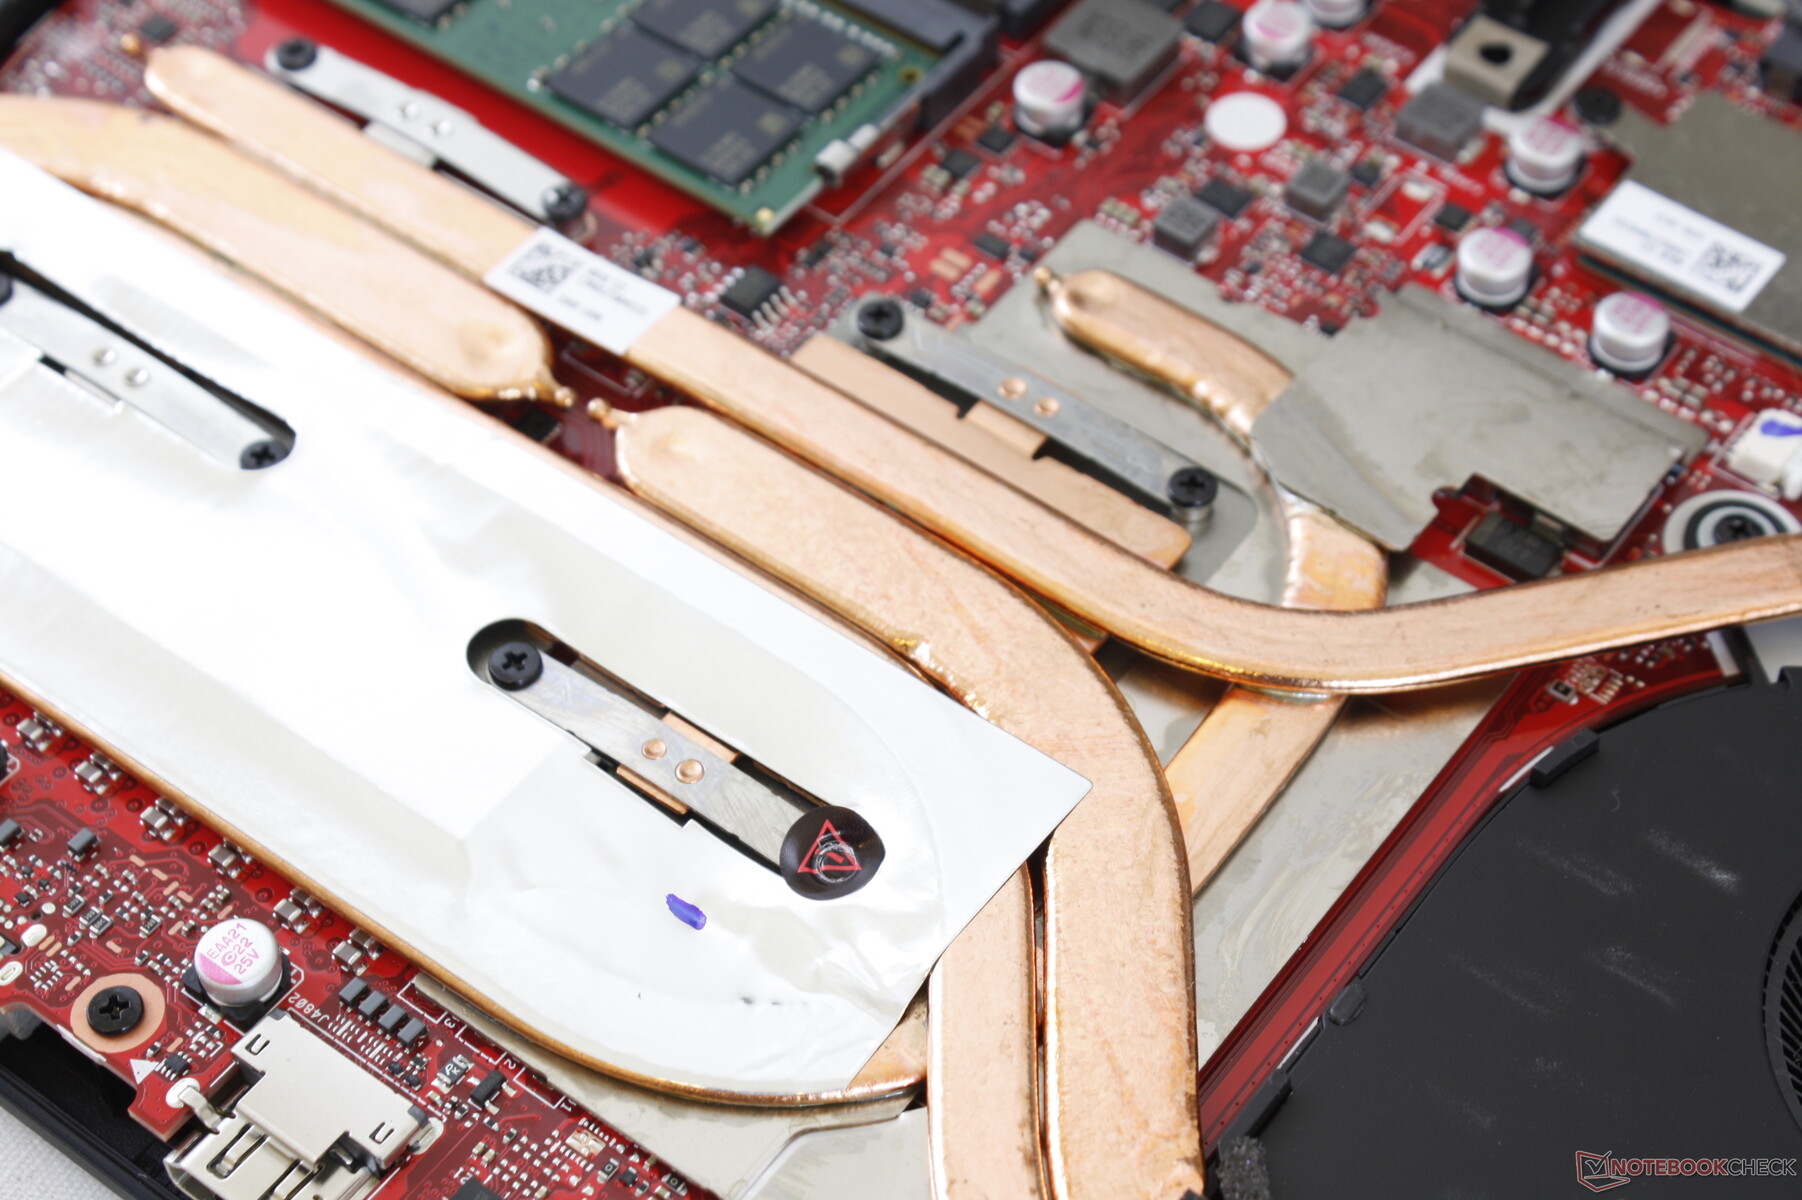
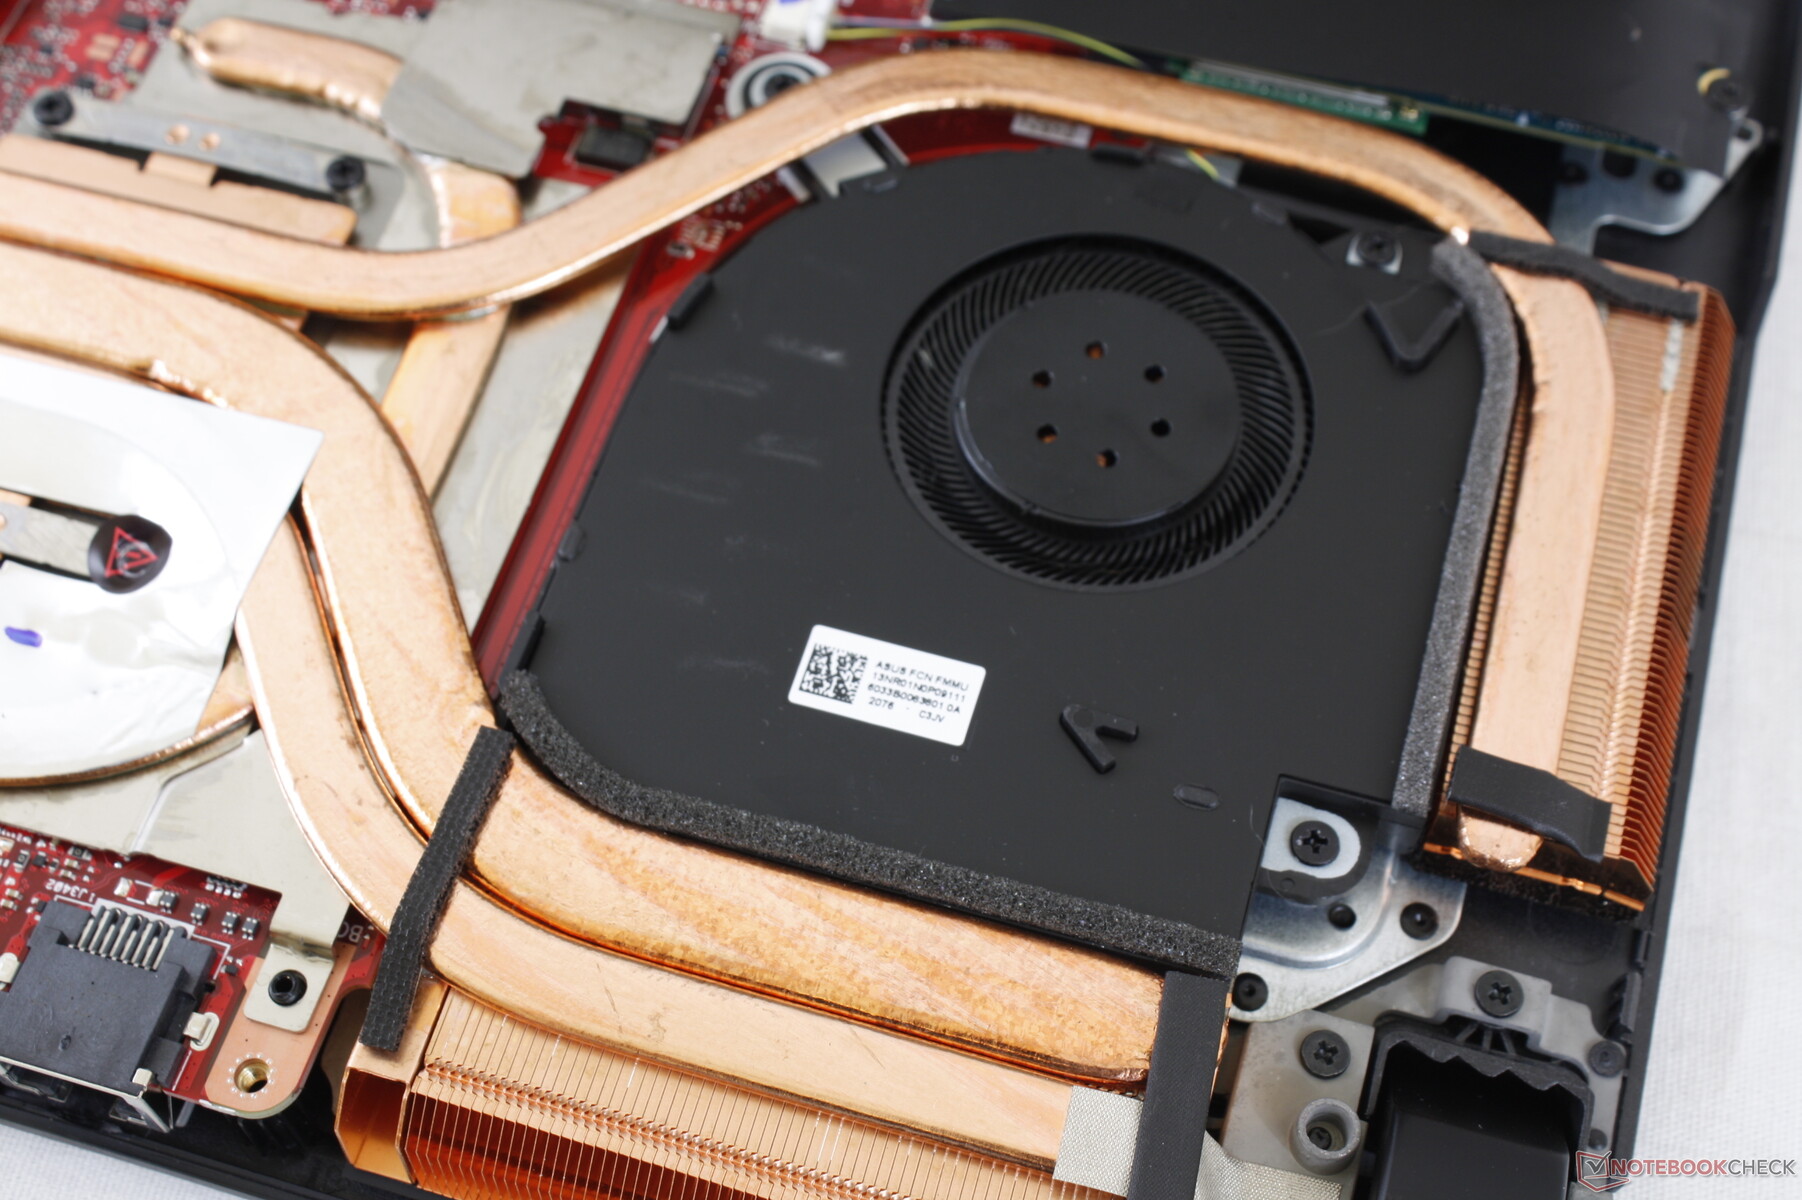
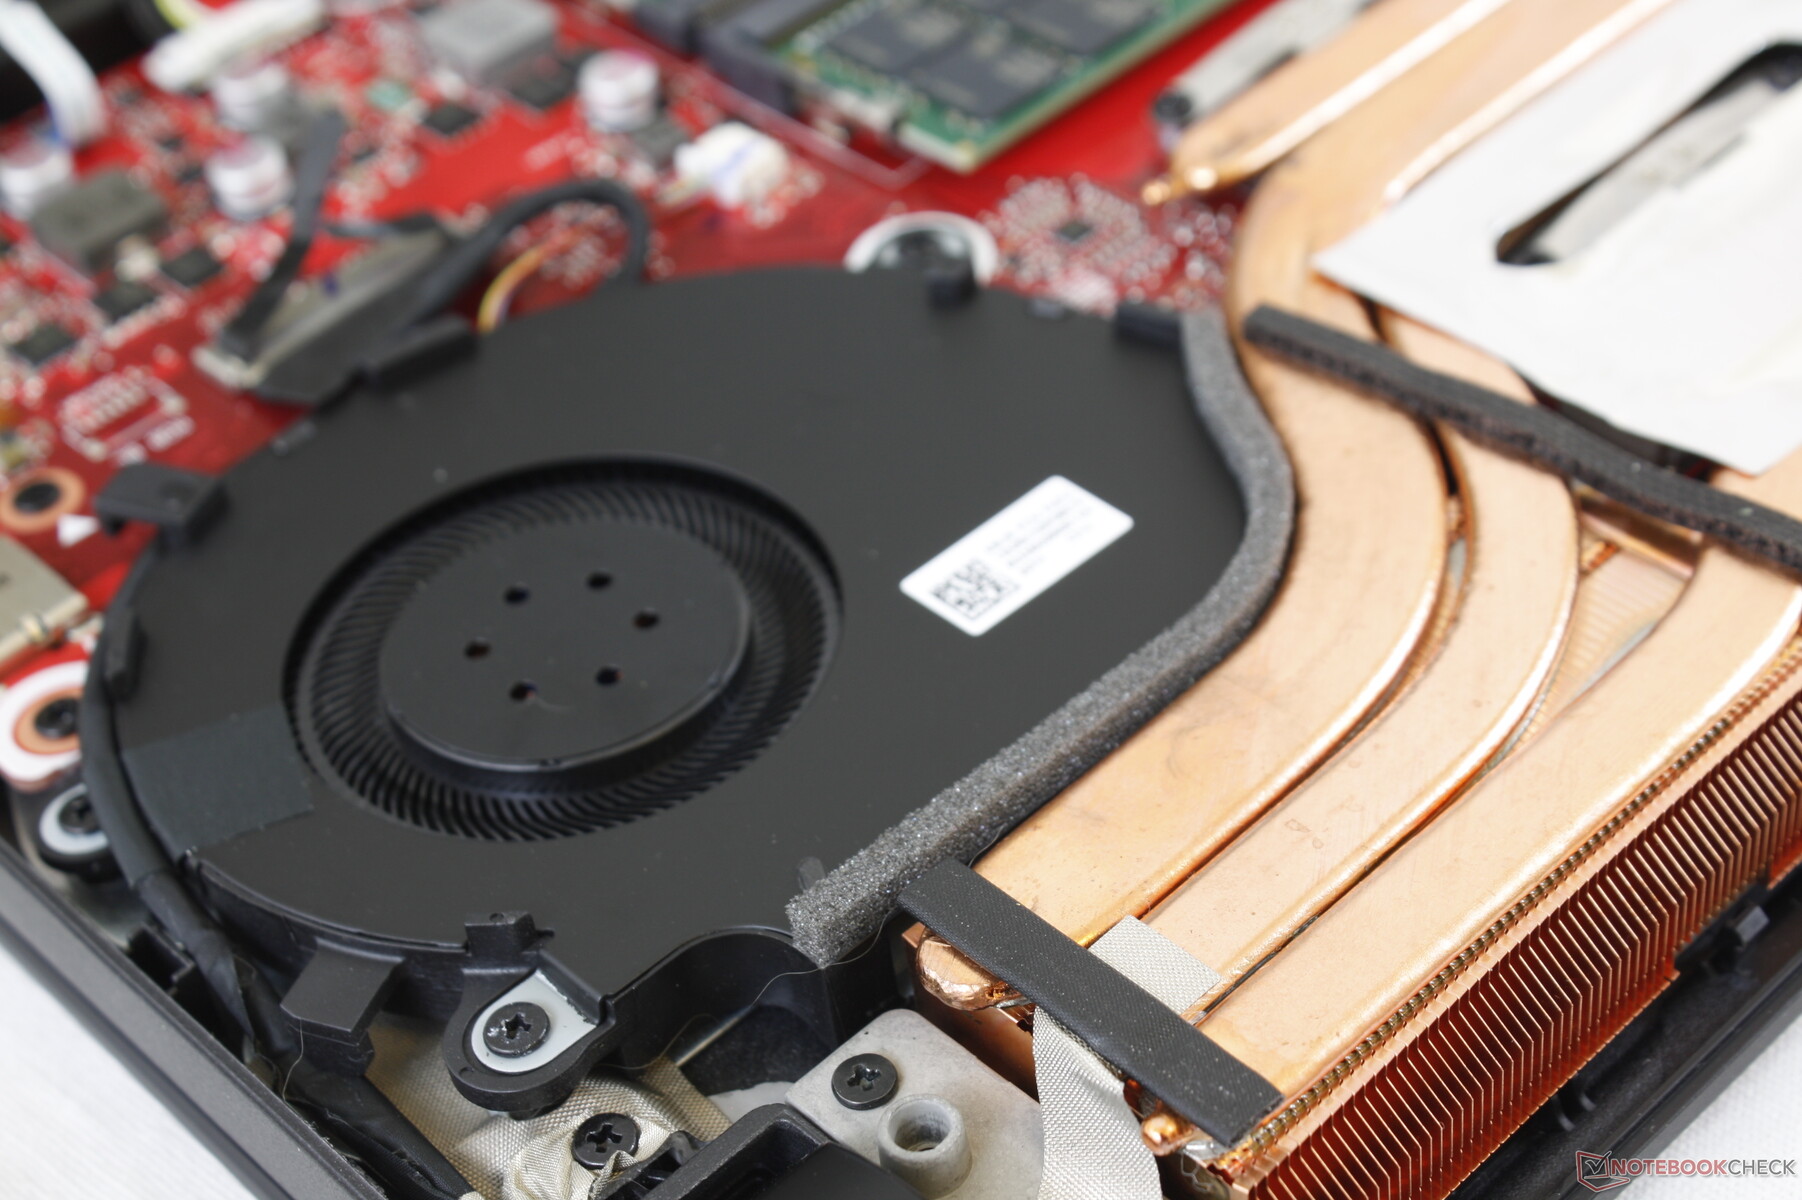
Maintenance
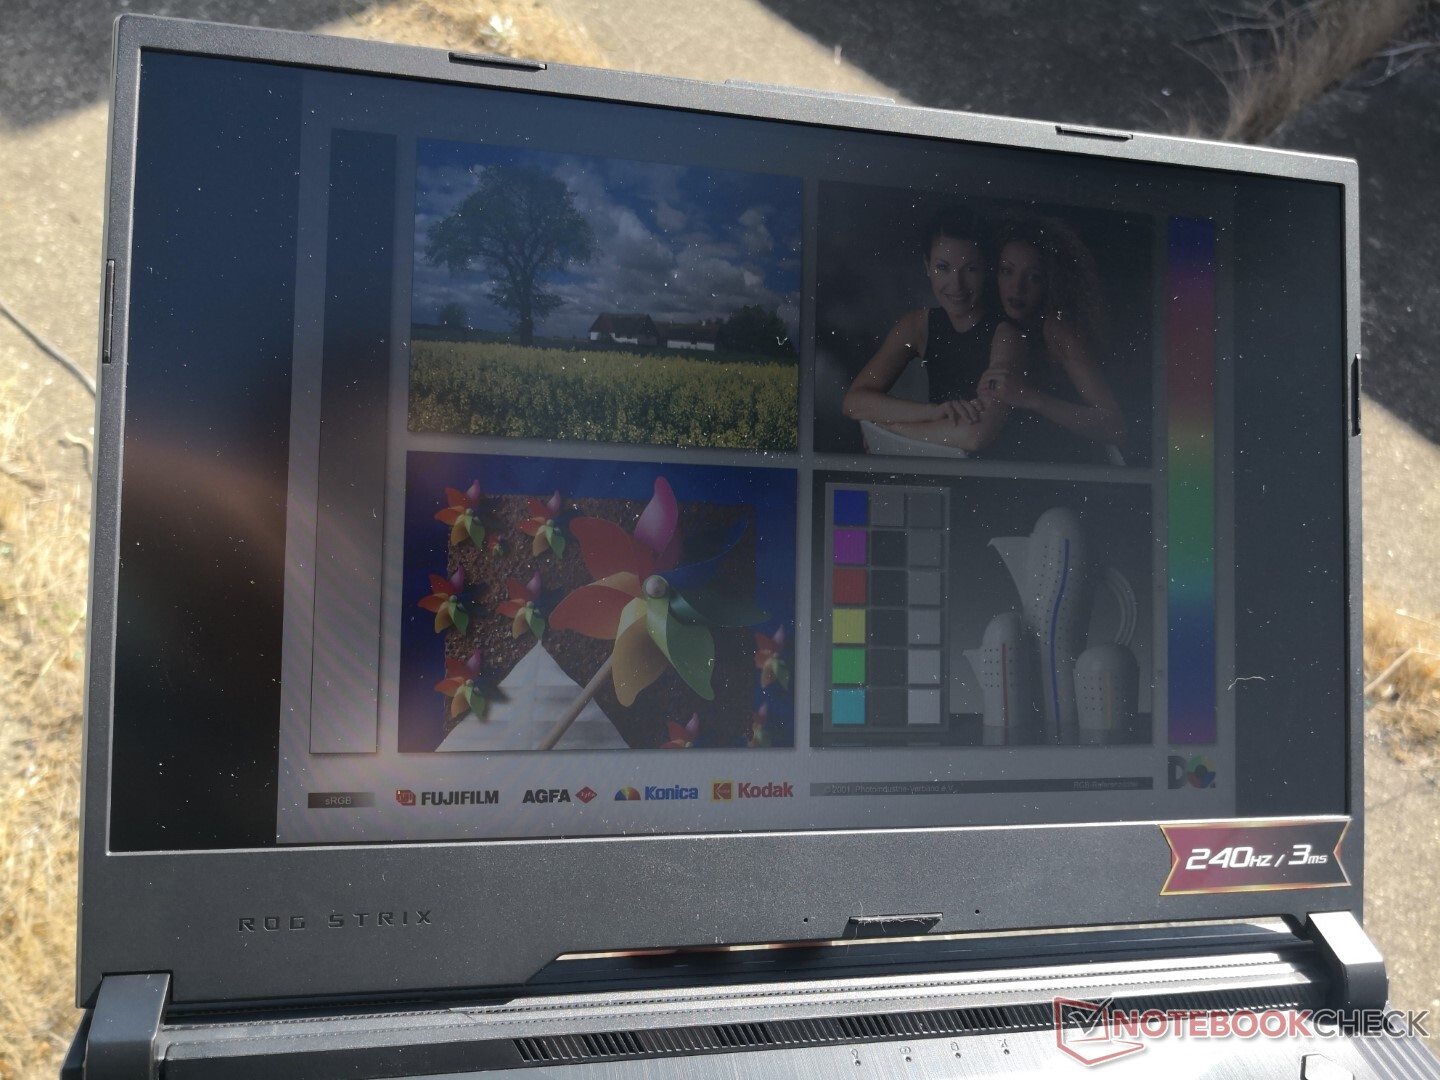
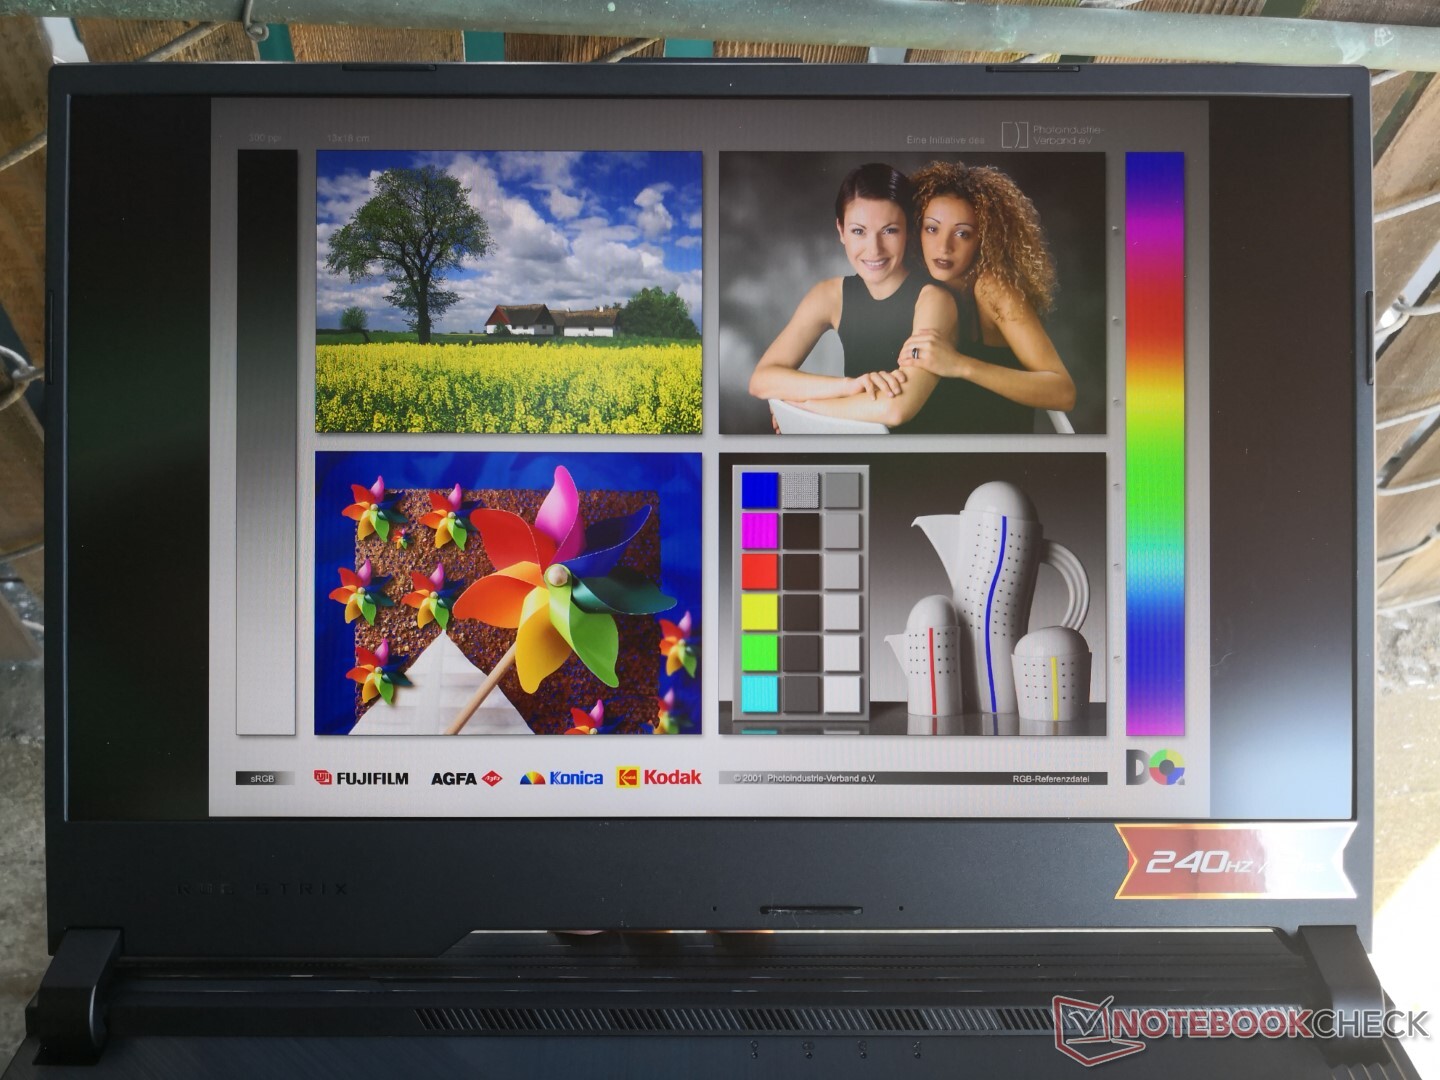
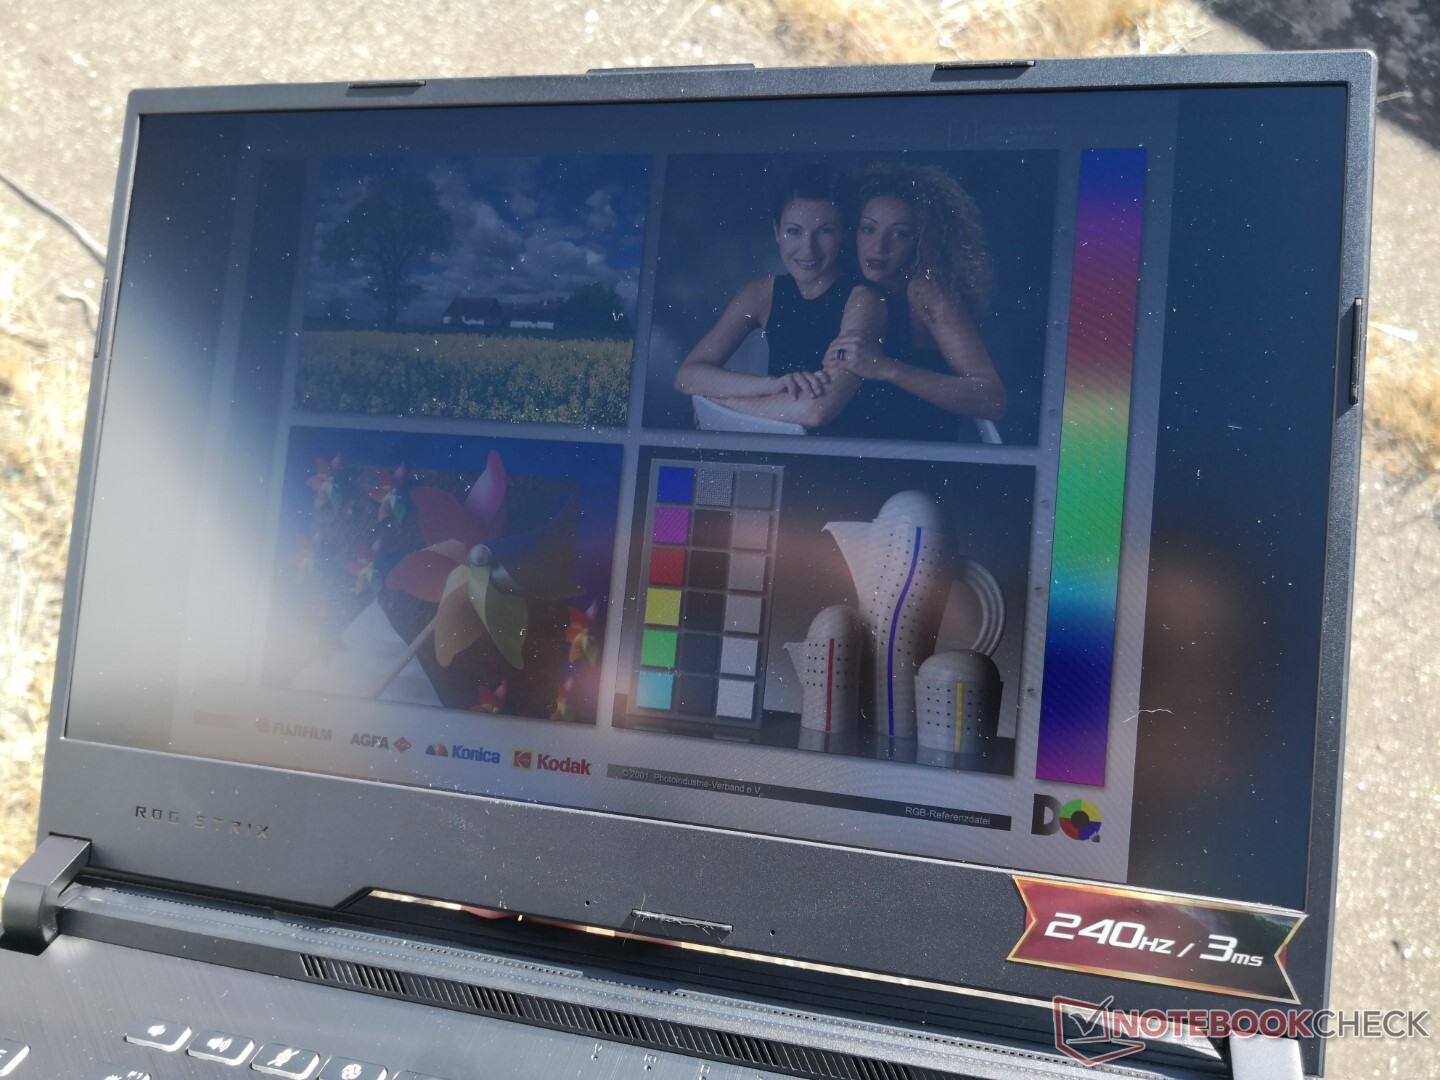
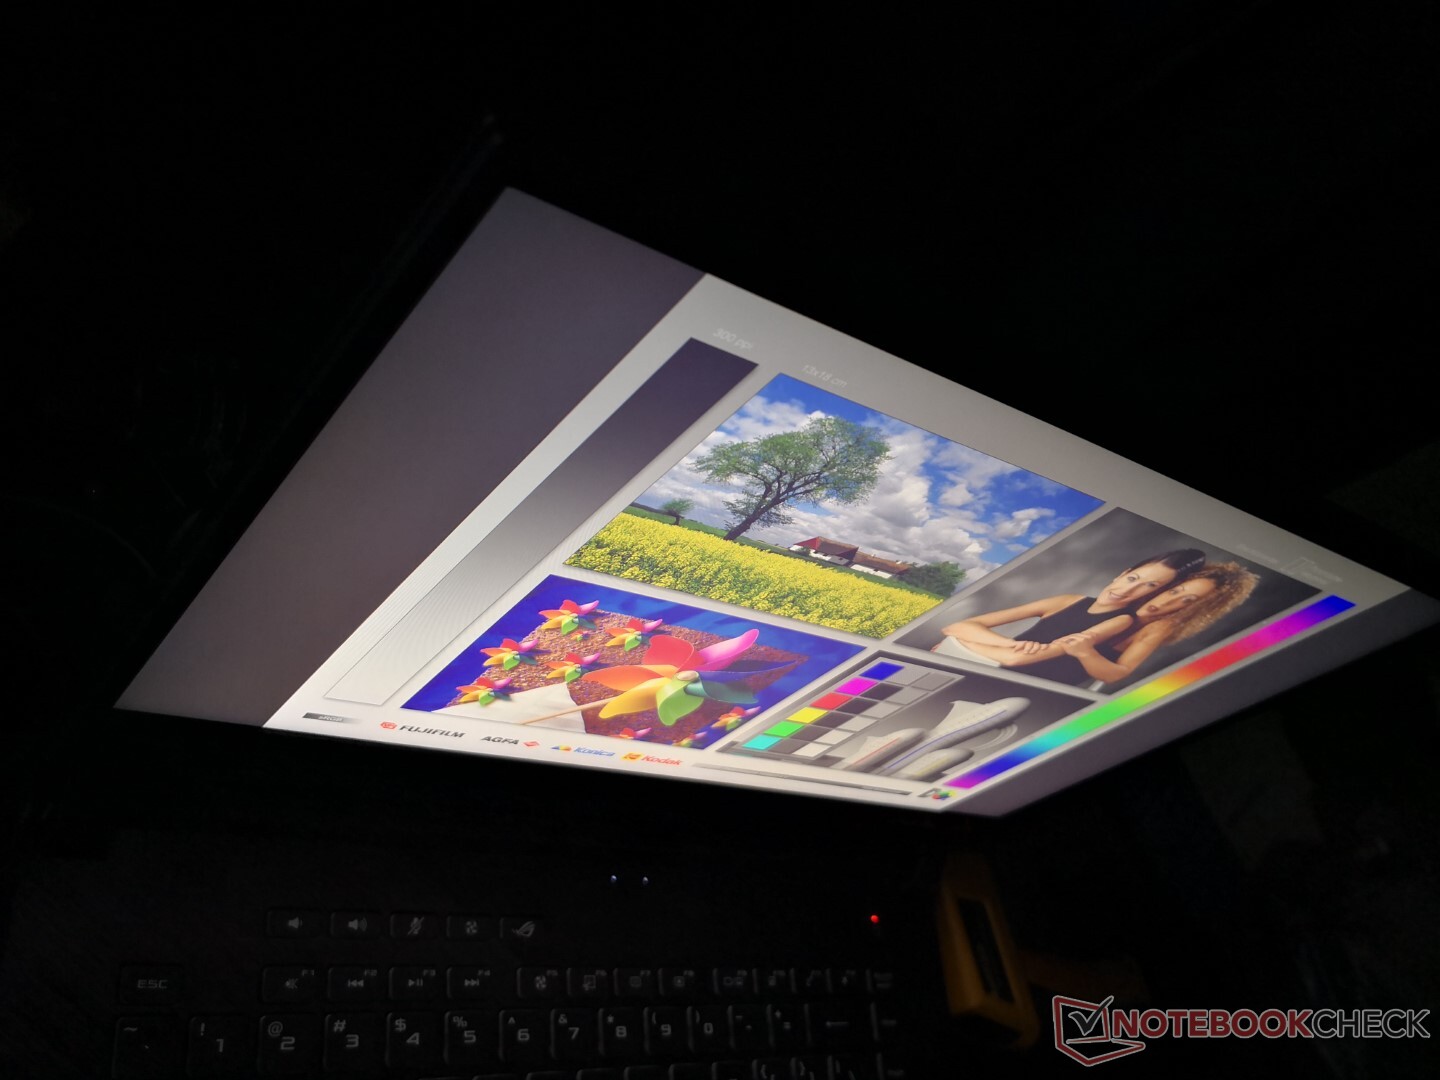
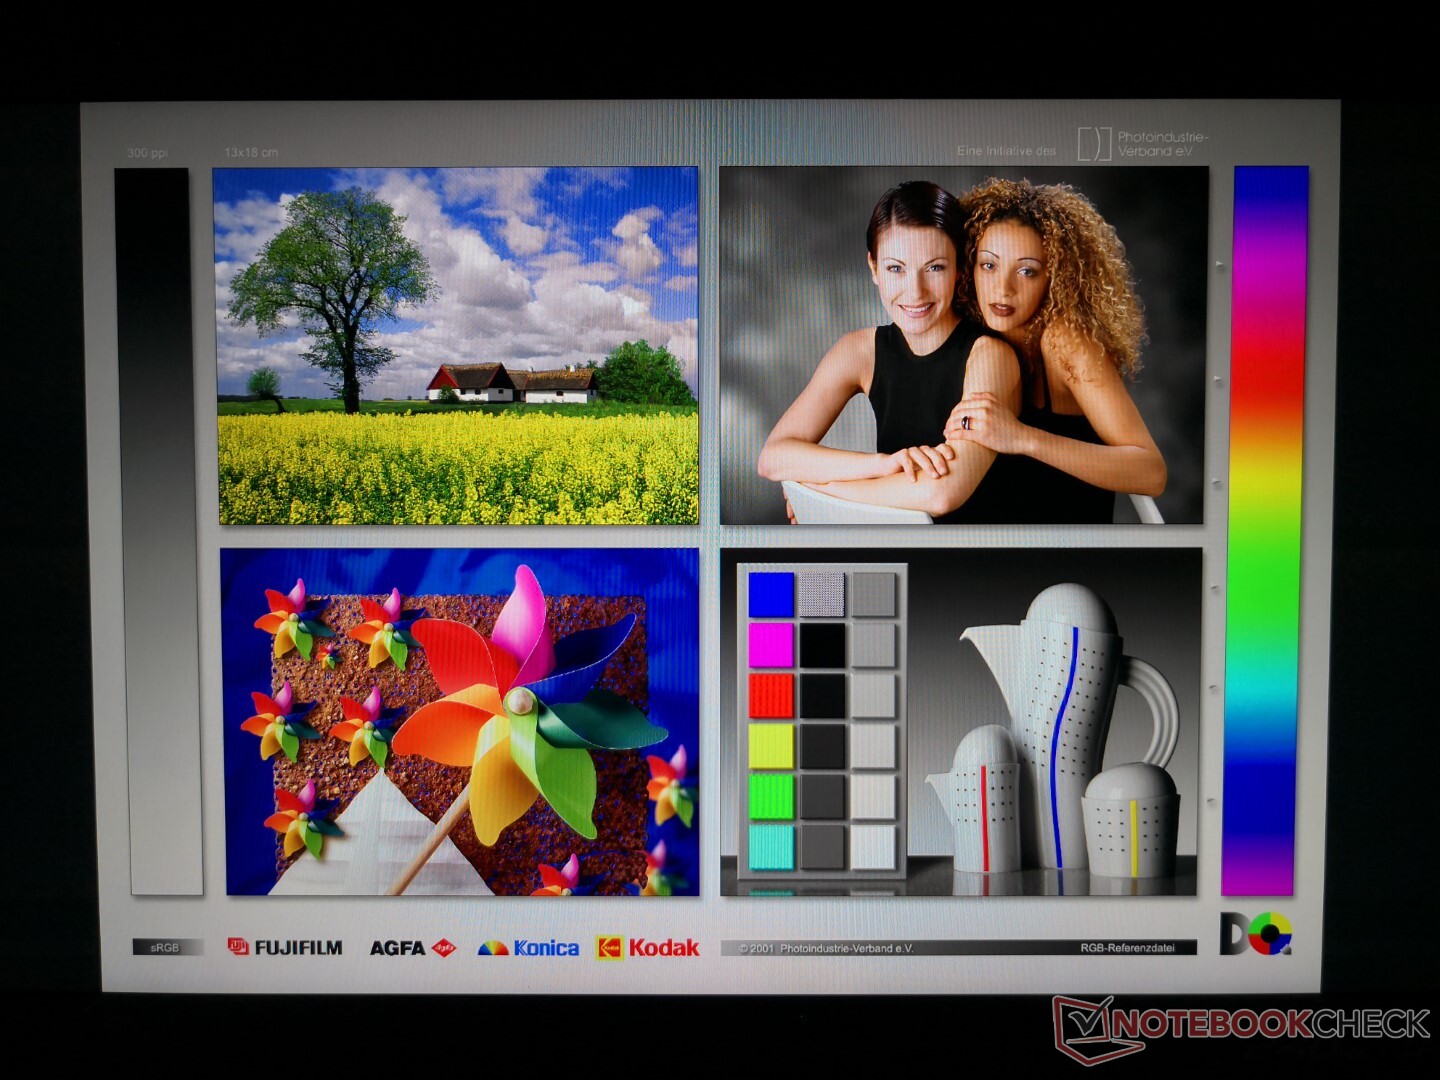
Display
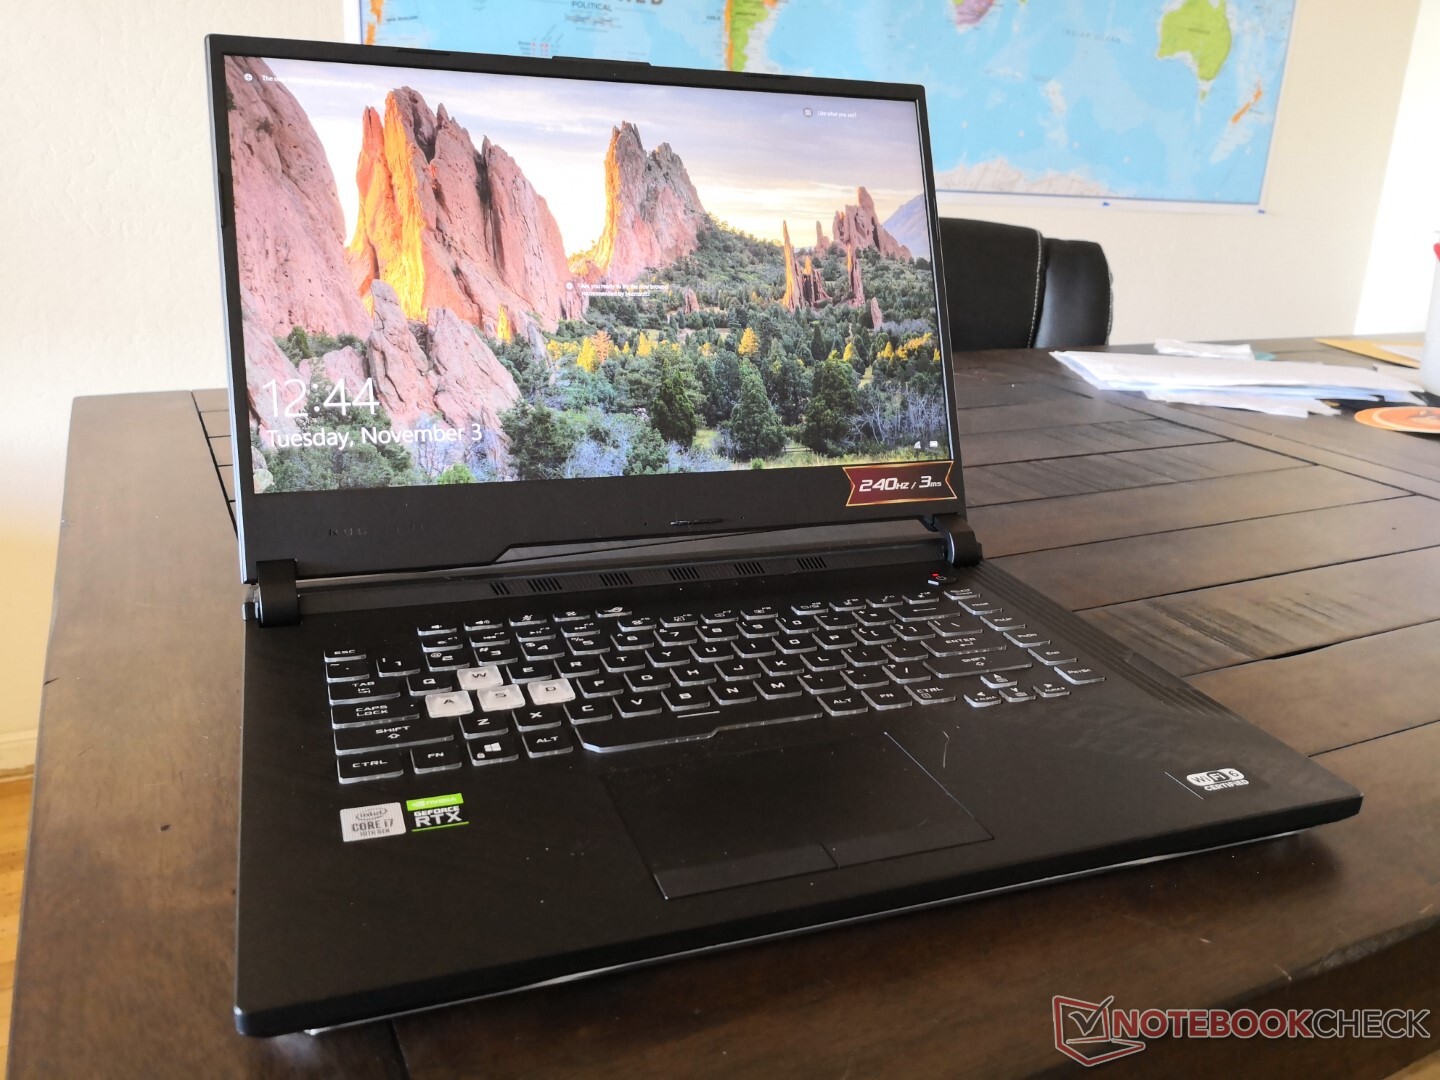
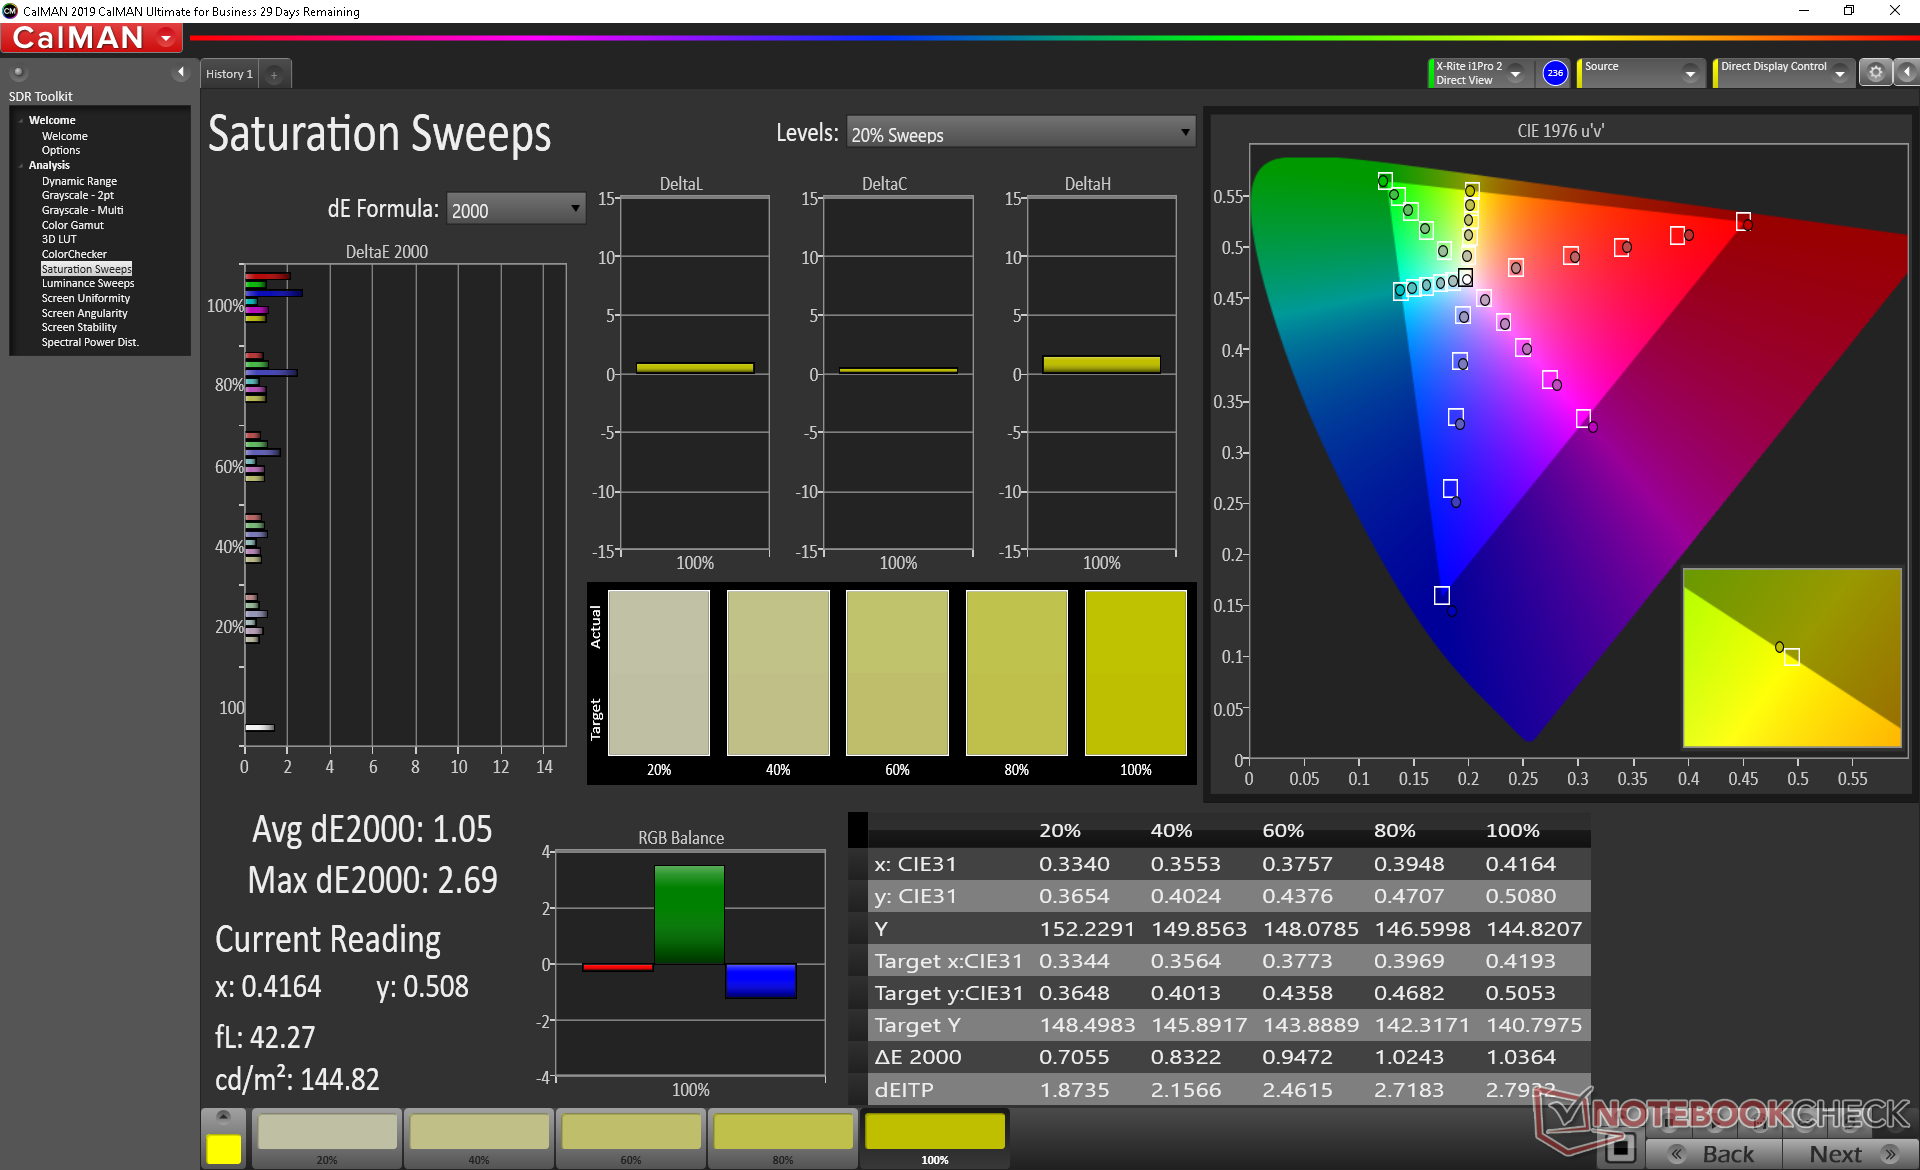
The 240 Hz Sharp panel on our G512LW is superior to the 144 Hz Panda panel on the cheaper G512LI in every way. Most importantly, contrast, color space, and black-white response times are significantly better for a visual experience that reflects the four-digit price tag. We've complained about Panda panels in the past and so it's a relief to not see one on the enthusiast-level G512LW.


| |||||||||||||||||||||||||
Brightness Distribution: 92 %
Center on Battery: 300.9 cd/m²
Contrast: 971:1 (Black: 0.31 cd/m²)
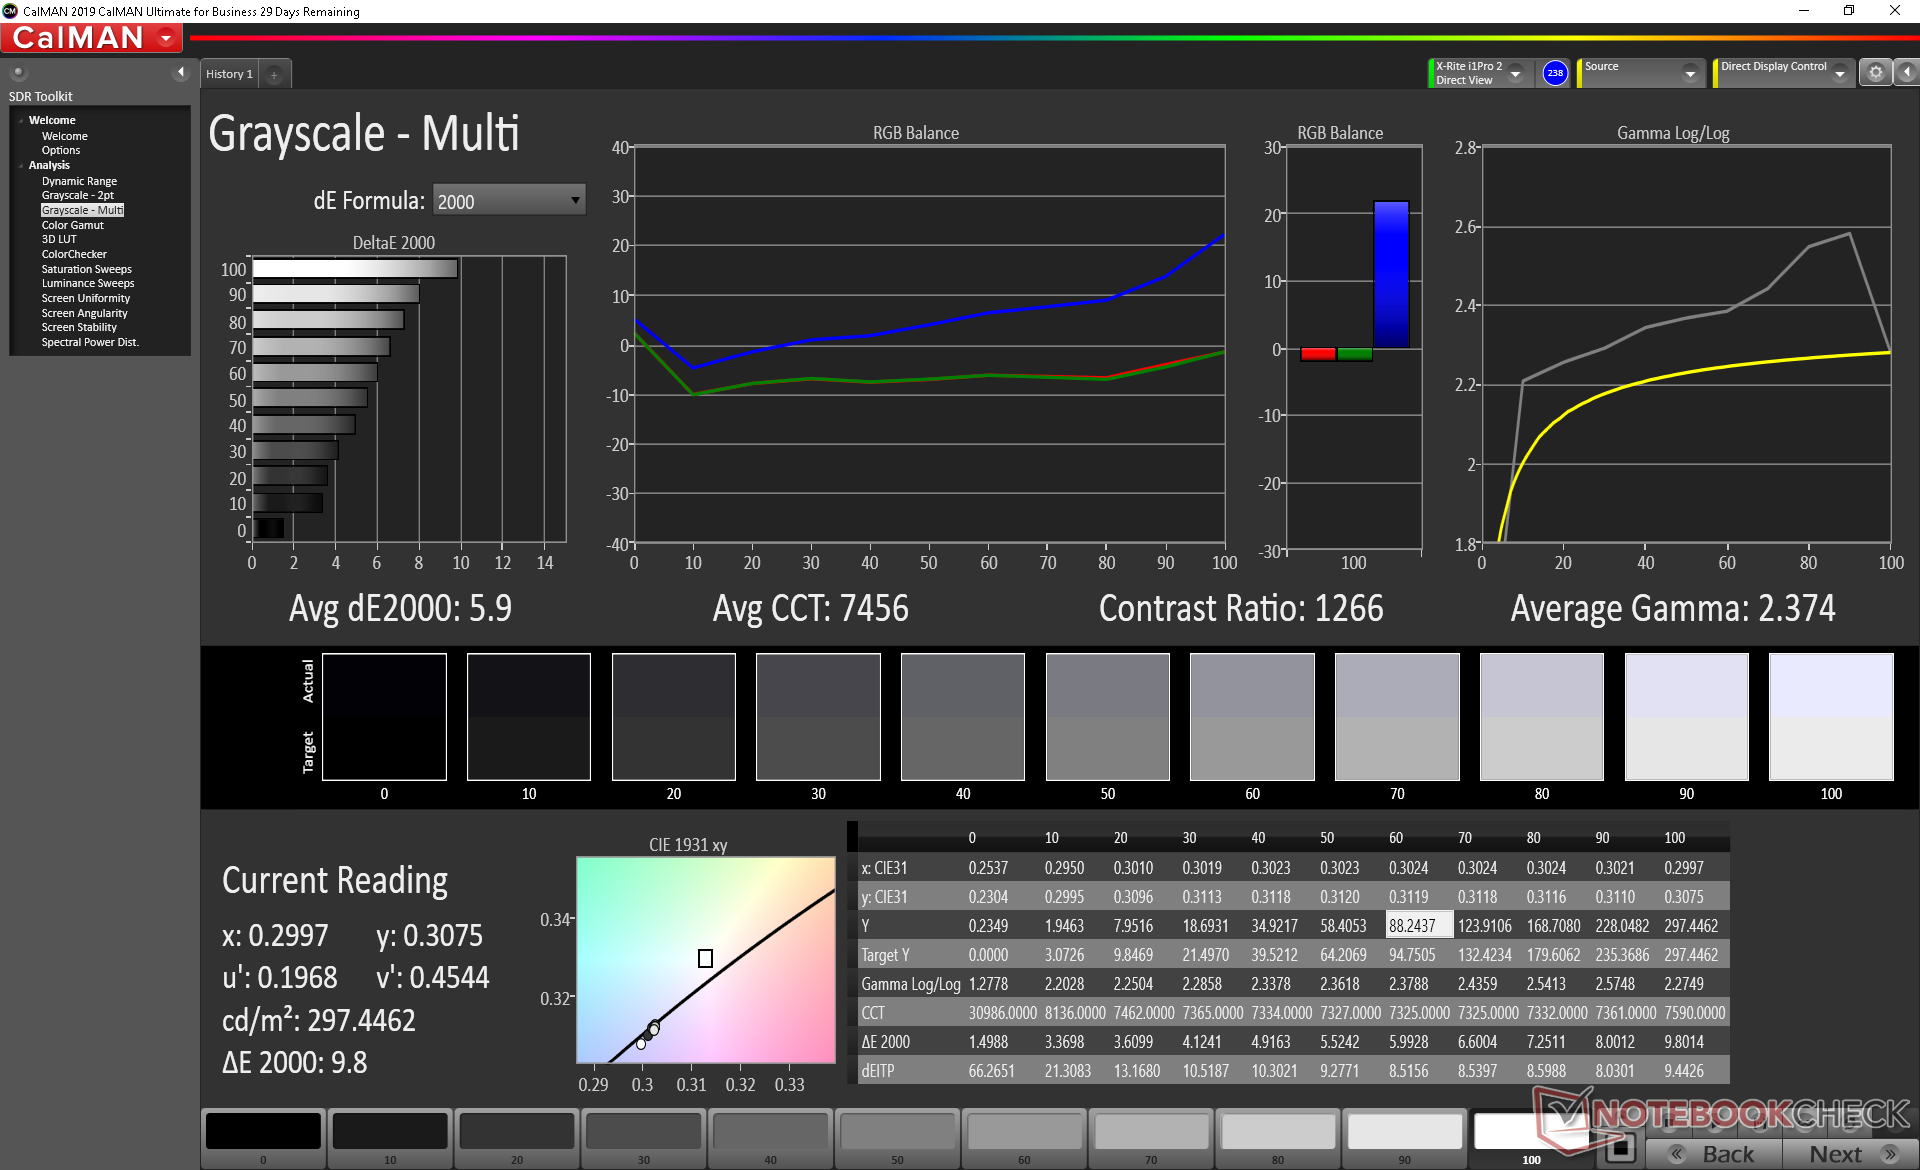
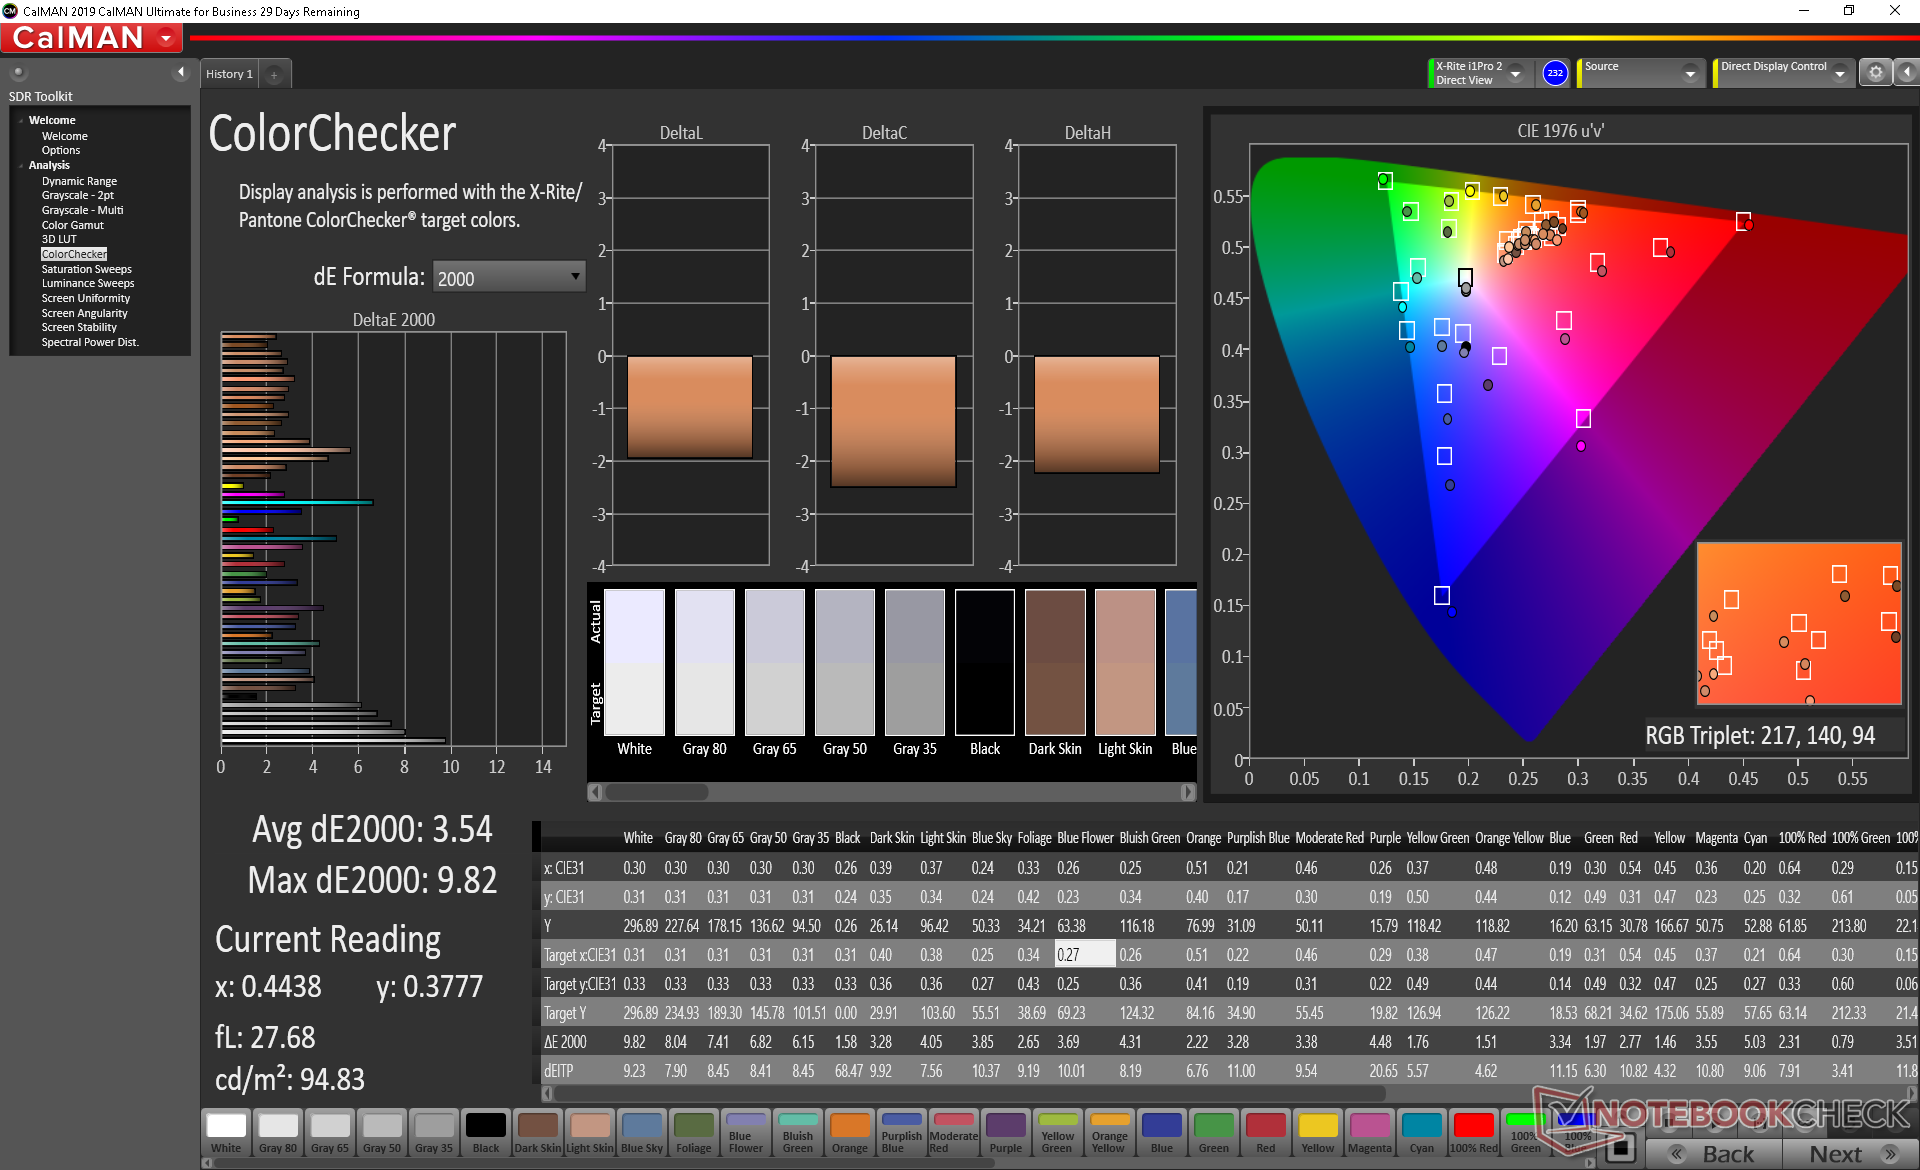
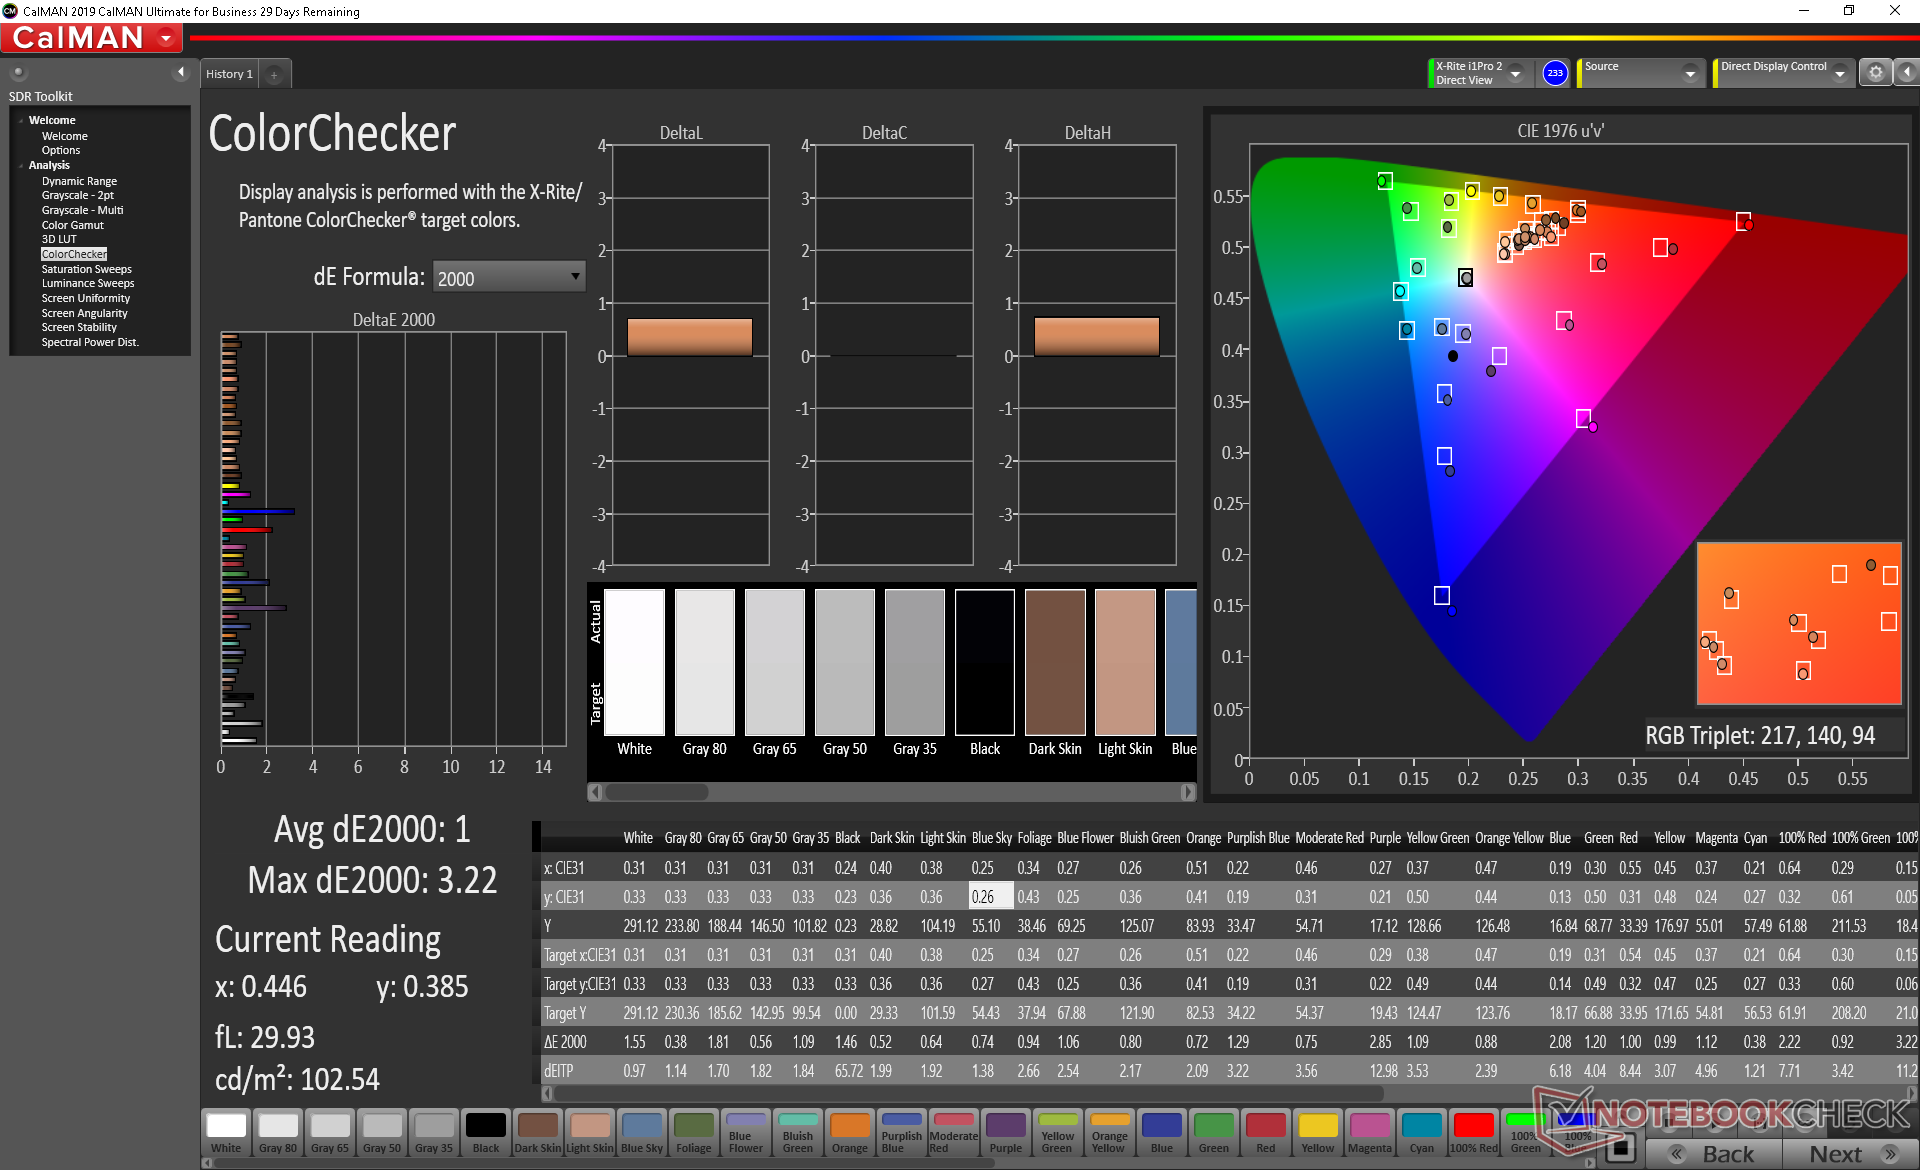
ΔE ColorChecker Calman: 3.54 | ∀{0.5-29.43 Ø4.72}
calibrated: 1
ΔE Greyscale Calman: 5.9 | ∀{0.09-98 Ø4.97}
98.3% sRGB (Argyll 1.6.3 3D)
63.3% AdobeRGB 1998 (Argyll 1.6.3 3D)
68.5% AdobeRGB 1998 (Argyll 3D)
98.3% sRGB (Argyll 3D)
67.8% Display P3 (Argyll 3D)
Gamma: 2.37
CCT: 7456 K
| Asus ROG Strix G15 G512LW Sharp LQ156M1JW09, IPS, 15.6", 1920x1080 | Asus ROG Strix G15 G512LI Panda LM156LF-2F01, IPS, 15.6", 1920x1080 | Razer Blade 15 RTX 2070 Super Max-Q AU Optronics B156HAN12.0, IPS, 15.6", 1920x1080 | MSI GP65 10SFK-047US LG Philips LP156WFG-SPB3, IPS, 15.6", 1920x1080 | Asus ROG Strix Scar 15 G532LWS AU Optronics B156HAN12.0, IPS, 15.6", 1920x1080 | Alienware m15 R3 P87F AU Optronics B156HAN, IPS, 15.6", 1920x1080 | |
|---|---|---|---|---|---|---|
| Display | -40% | 2% | -5% | 3% | 1% | |
| Display P3 Coverage (%) | 67.8 | 39.73 -41% | 69.4 2% | 63.5 -6% | 69.9 3% | 68.6 1% |
| sRGB Coverage (%) | 98.3 | 59.8 -39% | 98.8 1% | 94.4 -4% | 99.6 1% | 98.9 1% |
| AdobeRGB 1998 Coverage (%) | 68.5 | 41.06 -40% | 70.5 3% | 65.1 -5% | 71.4 4% | 69.8 2% |
| Response Times | -138% | 52% | 10% | 11% | 36% | |
| Response Time Grey 50% / Grey 80% * (ms) | 16 ? | 33.6 ? -110% | 3.2 ? 80% | 10.4 ? 35% | 14.4 ? 10% | 4 ? 75% |
| Response Time Black / White * (ms) | 10.4 ? | 27.6 ? -165% | 8 ? 23% | 12 ? -15% | 9.2 ? 12% | 10.8 ? -4% |
| PWM Frequency (Hz) | 23580 ? | |||||
| Screen | -57% | 3% | -8% | 22% | 7% | |
| Brightness middle (cd/m²) | 300.9 | 271.2 -10% | 345.4 15% | 384.9 28% | 307.2 2% | 326.7 9% |
| Brightness (cd/m²) | 289 | 252 -13% | 342 18% | 358 24% | 301 4% | 316 9% |
| Brightness Distribution (%) | 92 | 79 -14% | 90 -2% | 87 -5% | 91 -1% | 87 -5% |
| Black Level * (cd/m²) | 0.31 | 0.53 -71% | 0.34 -10% | 0.67 -116% | 0.21 32% | 0.33 -6% |
| Contrast (:1) | 971 | 512 -47% | 1016 5% | 574 -41% | 1463 51% | 990 2% |
| Colorchecker dE 2000 * | 3.54 | 5.04 -42% | 3.18 10% | 2.43 31% | 1.85 48% | 2.4 32% |
| Colorchecker dE 2000 max. * | 9.82 | 16.07 -64% | 6.57 33% | 4.58 53% | 3.92 60% | 6.06 38% |
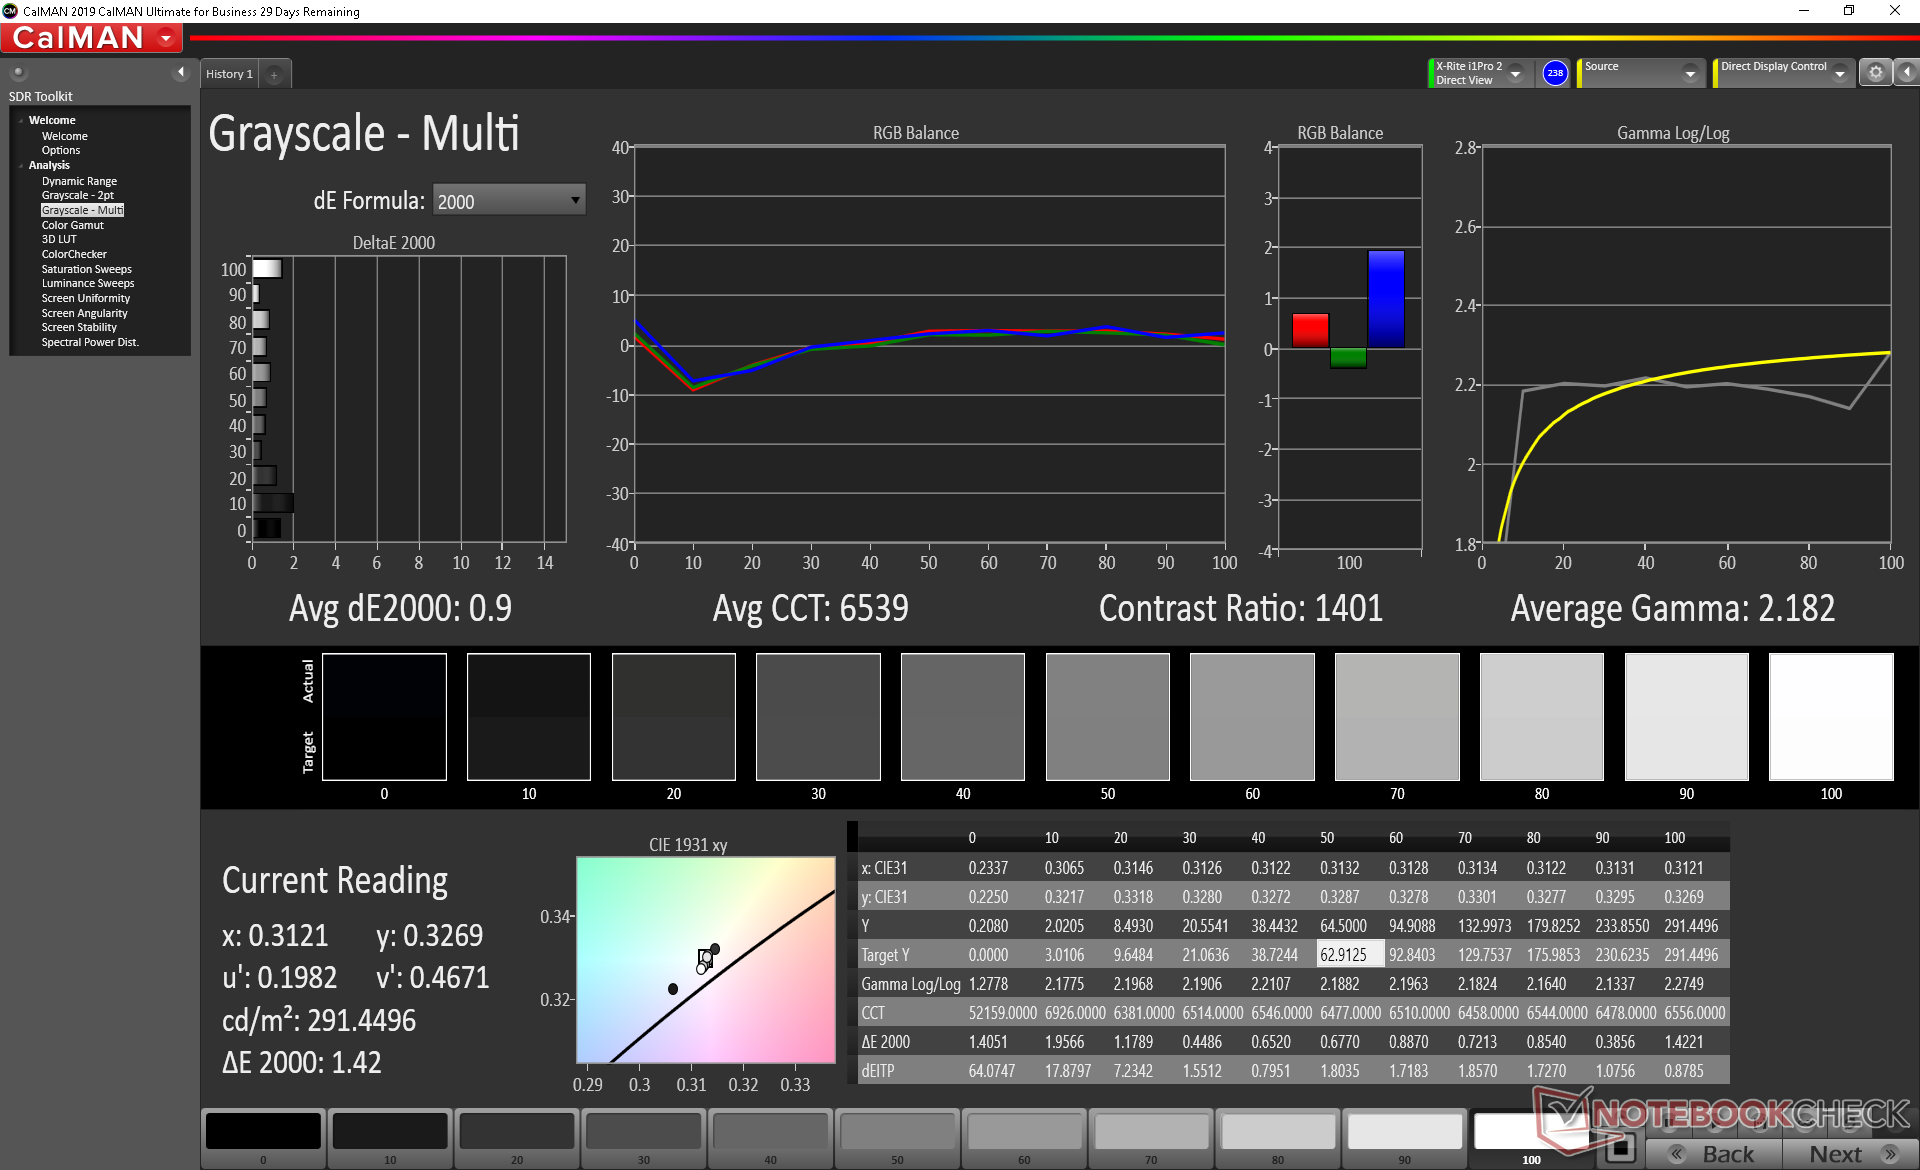
| Colorchecker dE 2000 calibrated * | 1 | 4.26 -326% | 1.77 -77% | 2.03 -103% | 1.26 -26% | 1.51 -51% |
| Greyscale dE 2000 * | 5.9 | 3.4 42% | 3.8 36% | 2.6 56% | 2 66% | 3.2 46% |
| Gamma | 2.37 93% | 2.09 105% | 2.15 102% | 2.2 100% | 2.15 102% | 2.13 103% |
| CCT | 7456 87% | 7079 92% | 7109 91% | 6981 93% | 6479 100% | 7129 91% |
| Color Space (Percent of AdobeRGB 1998) (%) | 63.3 | 37.8 -40% | 64.3 2% | 59.7 -6% | 65 3% | 63.7 1% |
| Color Space (Percent of sRGB) (%) | 98.3 | 59.5 -39% | 99 1% | 93.9 -4% | 99.7 1% | 99.2 1% |
| Total Average (Program / Settings) | -78% /
-64% | 19% /
9% | -1% /
-5% | 12% /
17% | 15% /
9% |
* ... smaller is better
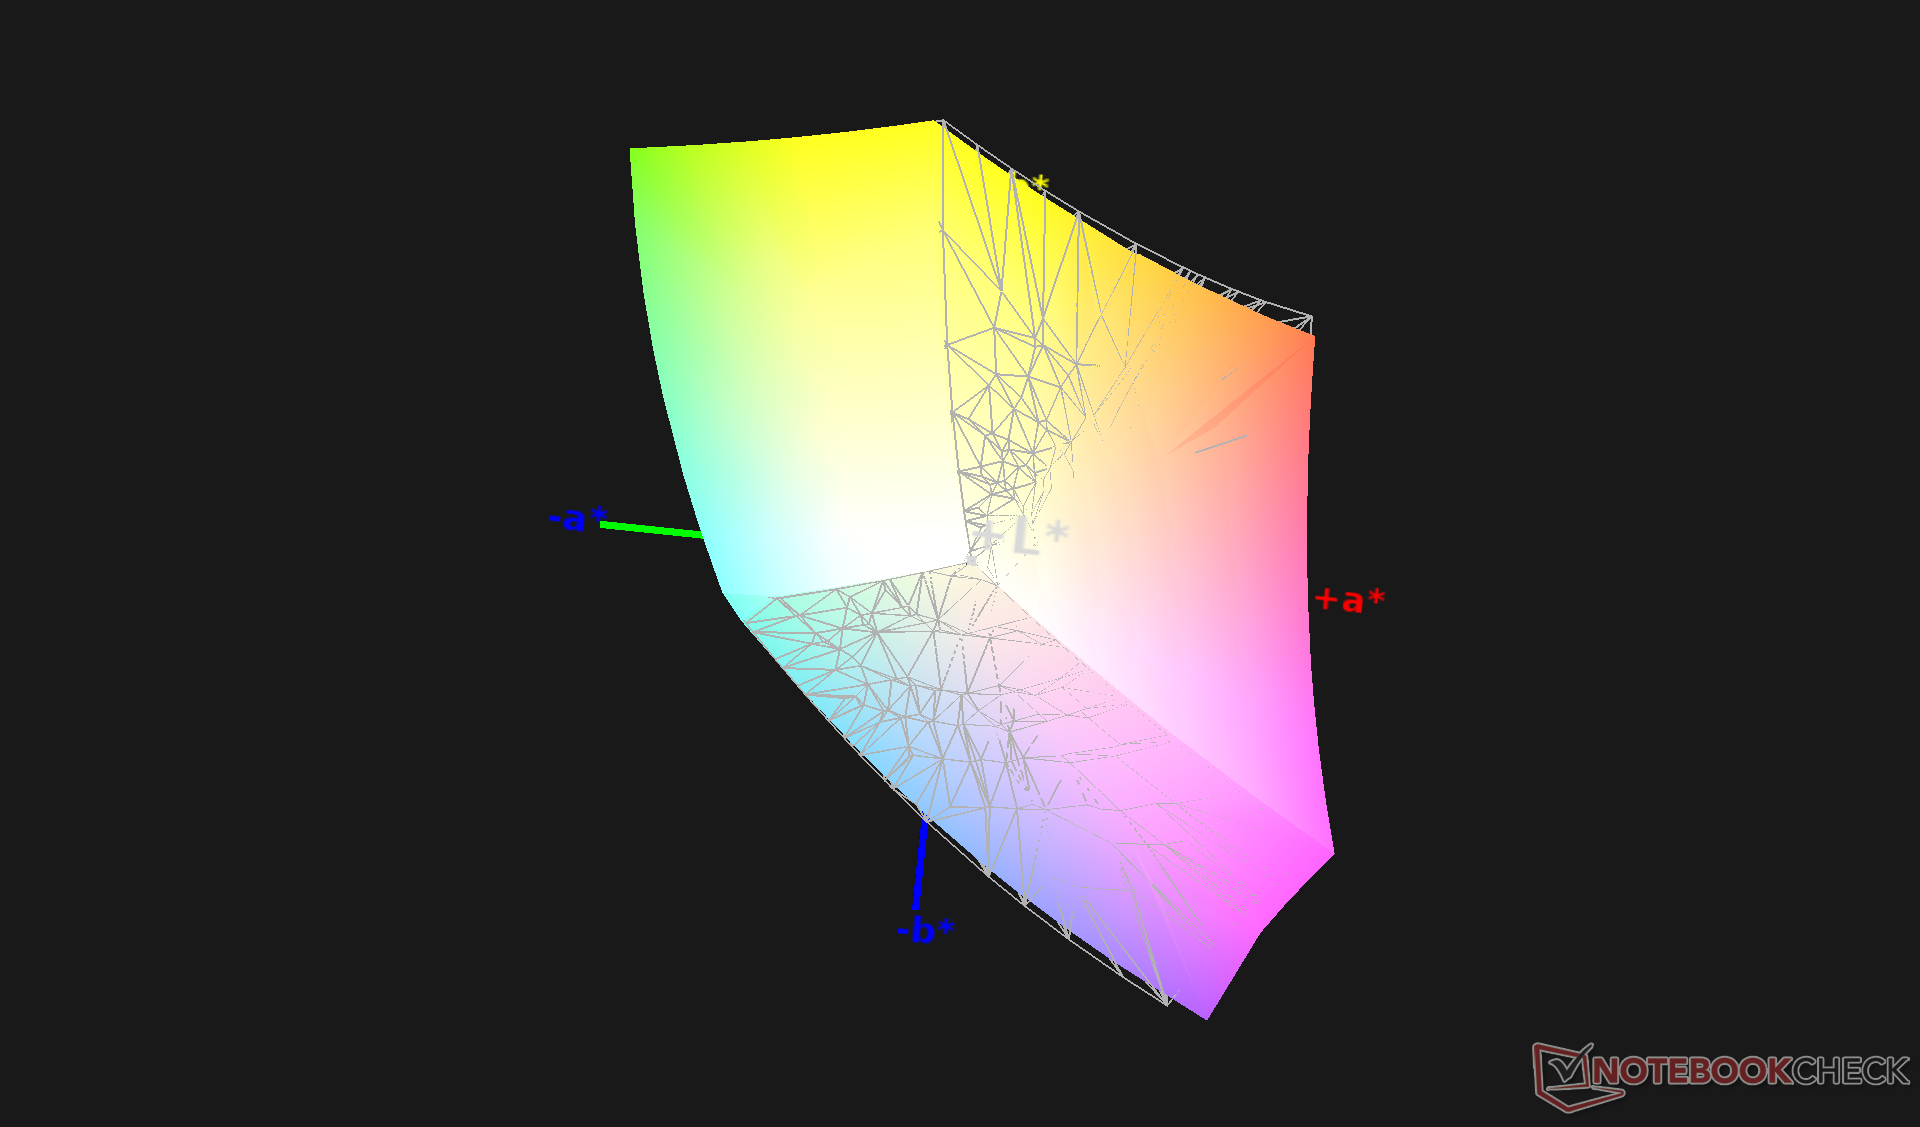
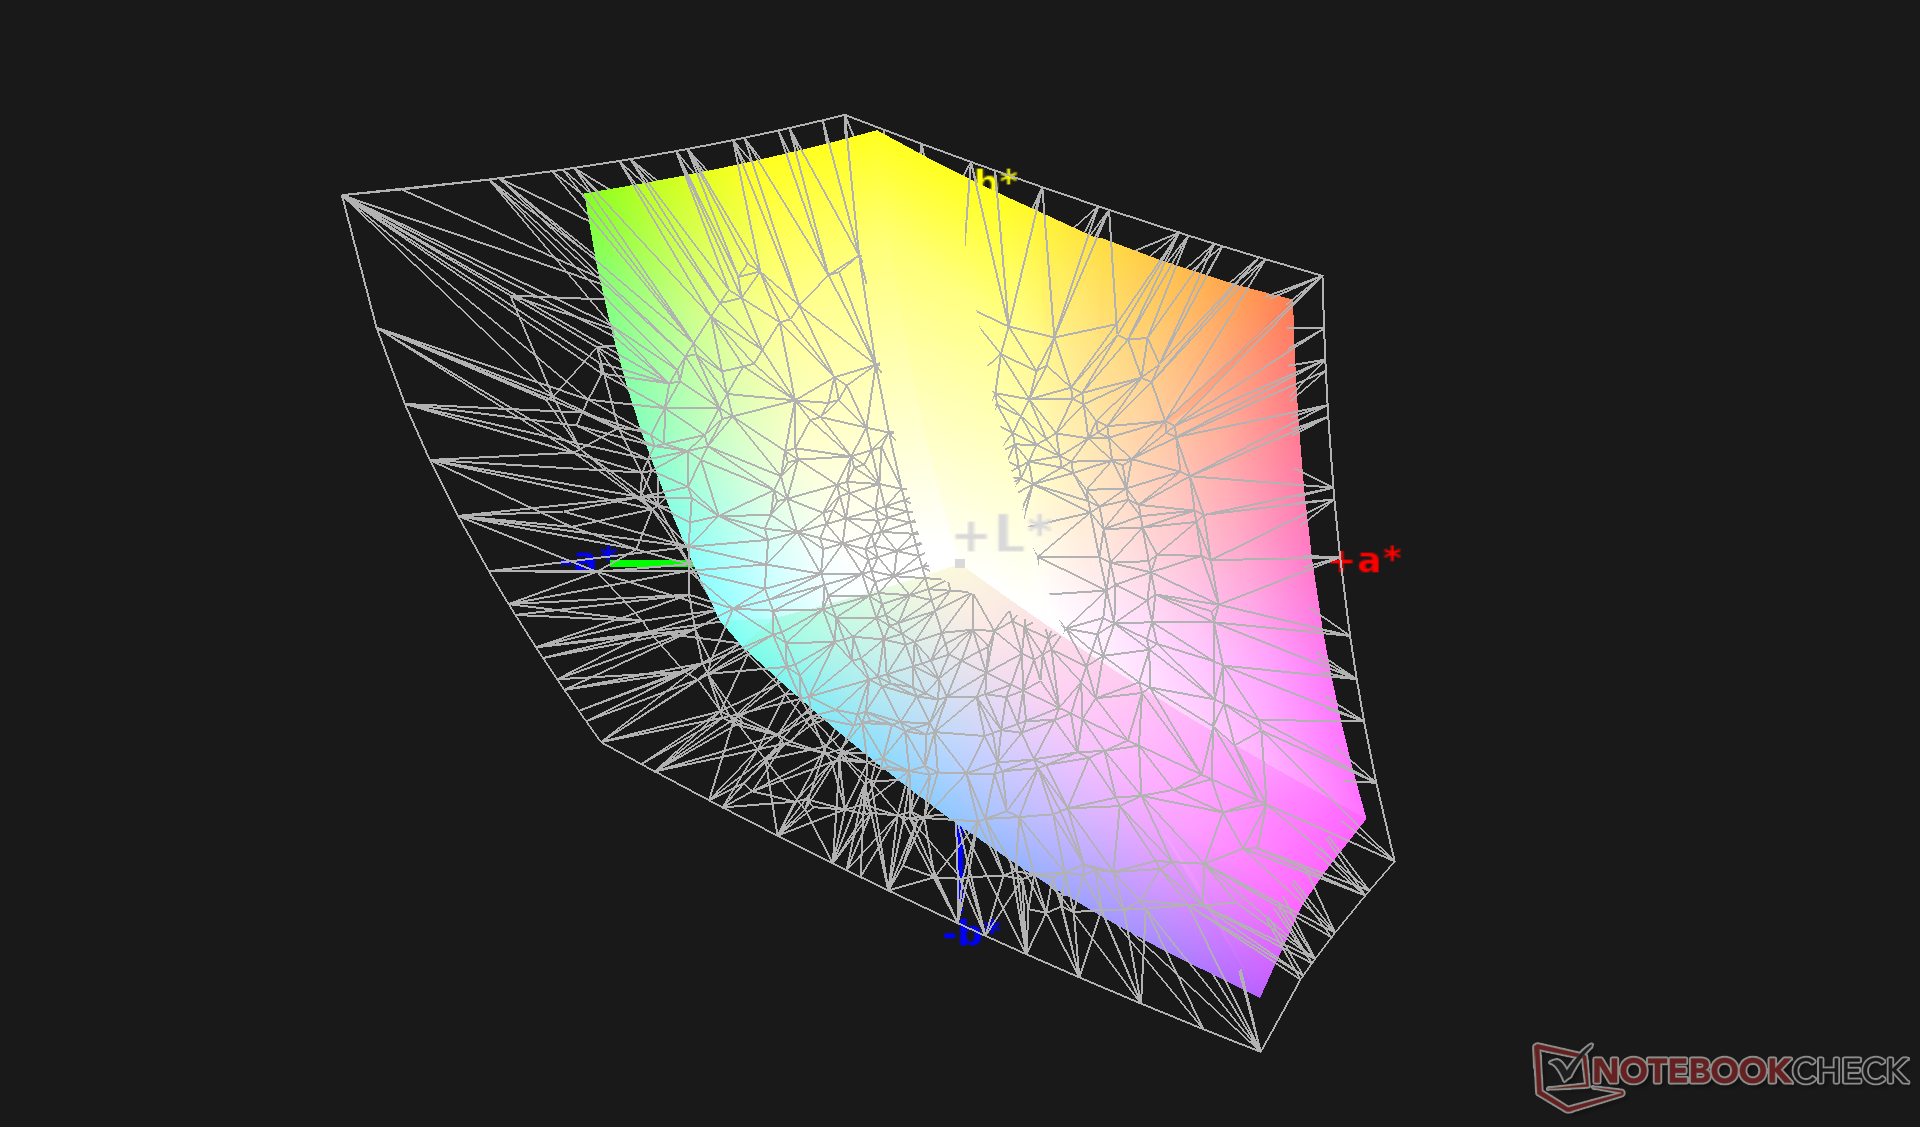
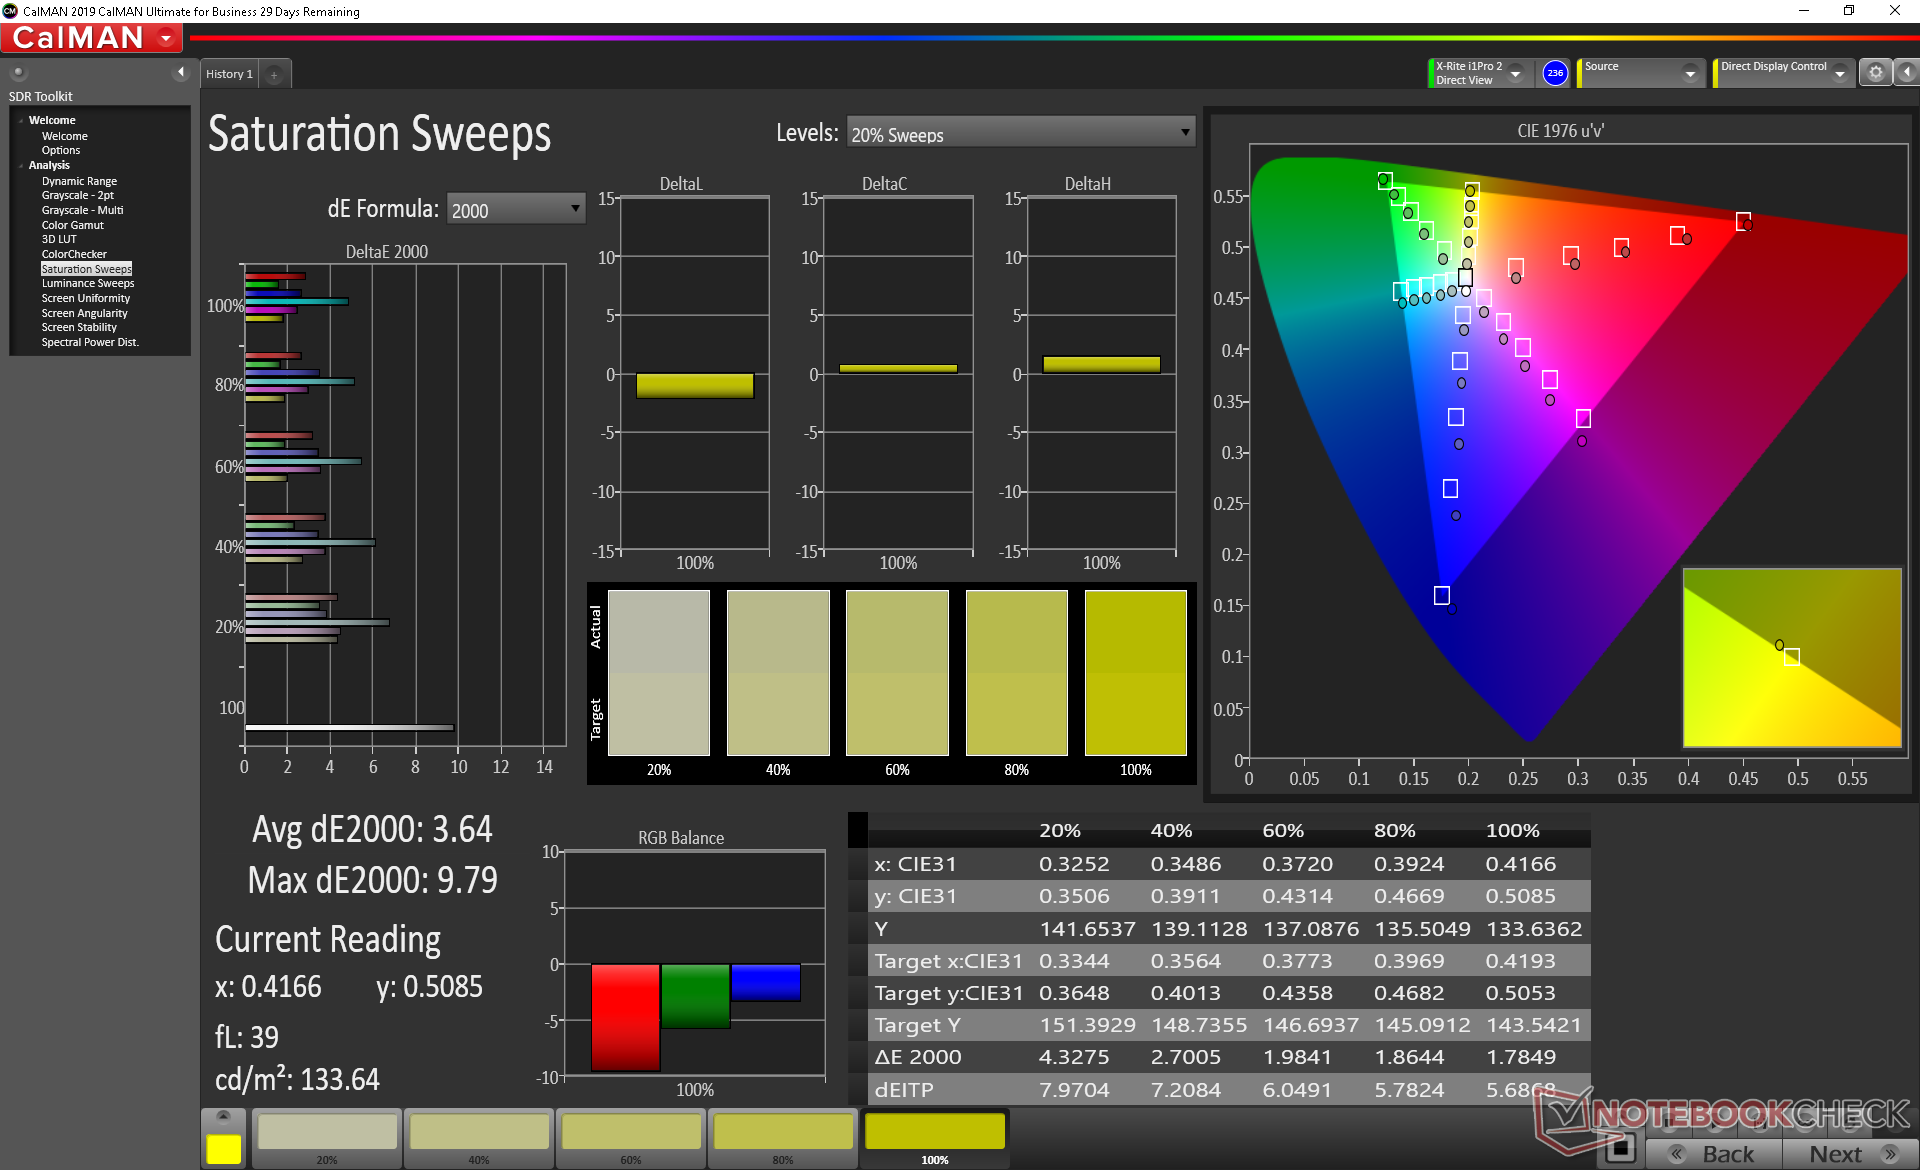
The display could have been better calibrated considering the price range. Color temperature is overly warm out of the box which impacts average grayscale and color accuracy. After calibrating the panel ourselves, accuracy would improve noticeably across the board. We recommend an end-user calibration if possible or at least manual adjustments to grayscale for a better picture.
Display Response Times
| ↔ Response Time Black to White | ||
|---|---|---|
| 10.4 ms ... rise ↗ and fall ↘ combined | ↗ 5.2 ms rise | 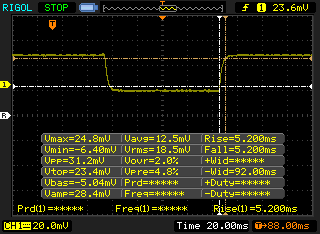 |
| ↘ 5.2 ms fall | ||
| The screen shows good response rates in our tests, but may be too slow for competitive gamers. In comparison, all tested devices range from 0.1 (minimum) to 240 (maximum) ms. » 28 % of all devices are better. This means that the measured response time is better than the average of all tested devices (19.8 ms). | ||
| ↔ Response Time 50% Grey to 80% Grey | ||
| 16 ms ... rise ↗ and fall ↘ combined | ↗ 8.4 ms rise | 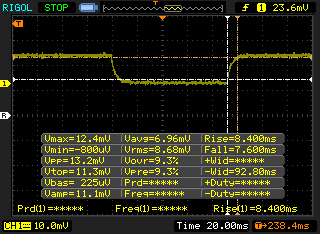 |
| ↘ 7.6 ms fall | ||
| The screen shows good response rates in our tests, but may be too slow for competitive gamers. In comparison, all tested devices range from 0.165 (minimum) to 636 (maximum) ms. » 30 % of all devices are better. This means that the measured response time is better than the average of all tested devices (31 ms). | ||
Screen Flickering / PWM (Pulse-Width Modulation)
| Screen flickering / PWM detected | 23580 Hz | ≤ 29 % brightness setting | 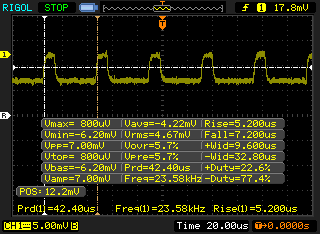 |
The display backlight flickers at 23580 Hz (worst case, e.g., utilizing PWM) Flickering detected at a brightness setting of 29 % and below. There should be no flickering or PWM above this brightness setting. The frequency of 23580 Hz is quite high, so most users sensitive to PWM should not notice any flickering. In comparison: 52 % of all tested devices do not use PWM to dim the display. If PWM was detected, an average of 7747 (minimum: 5 - maximum: 343500) Hz was measured. | |||
Performance
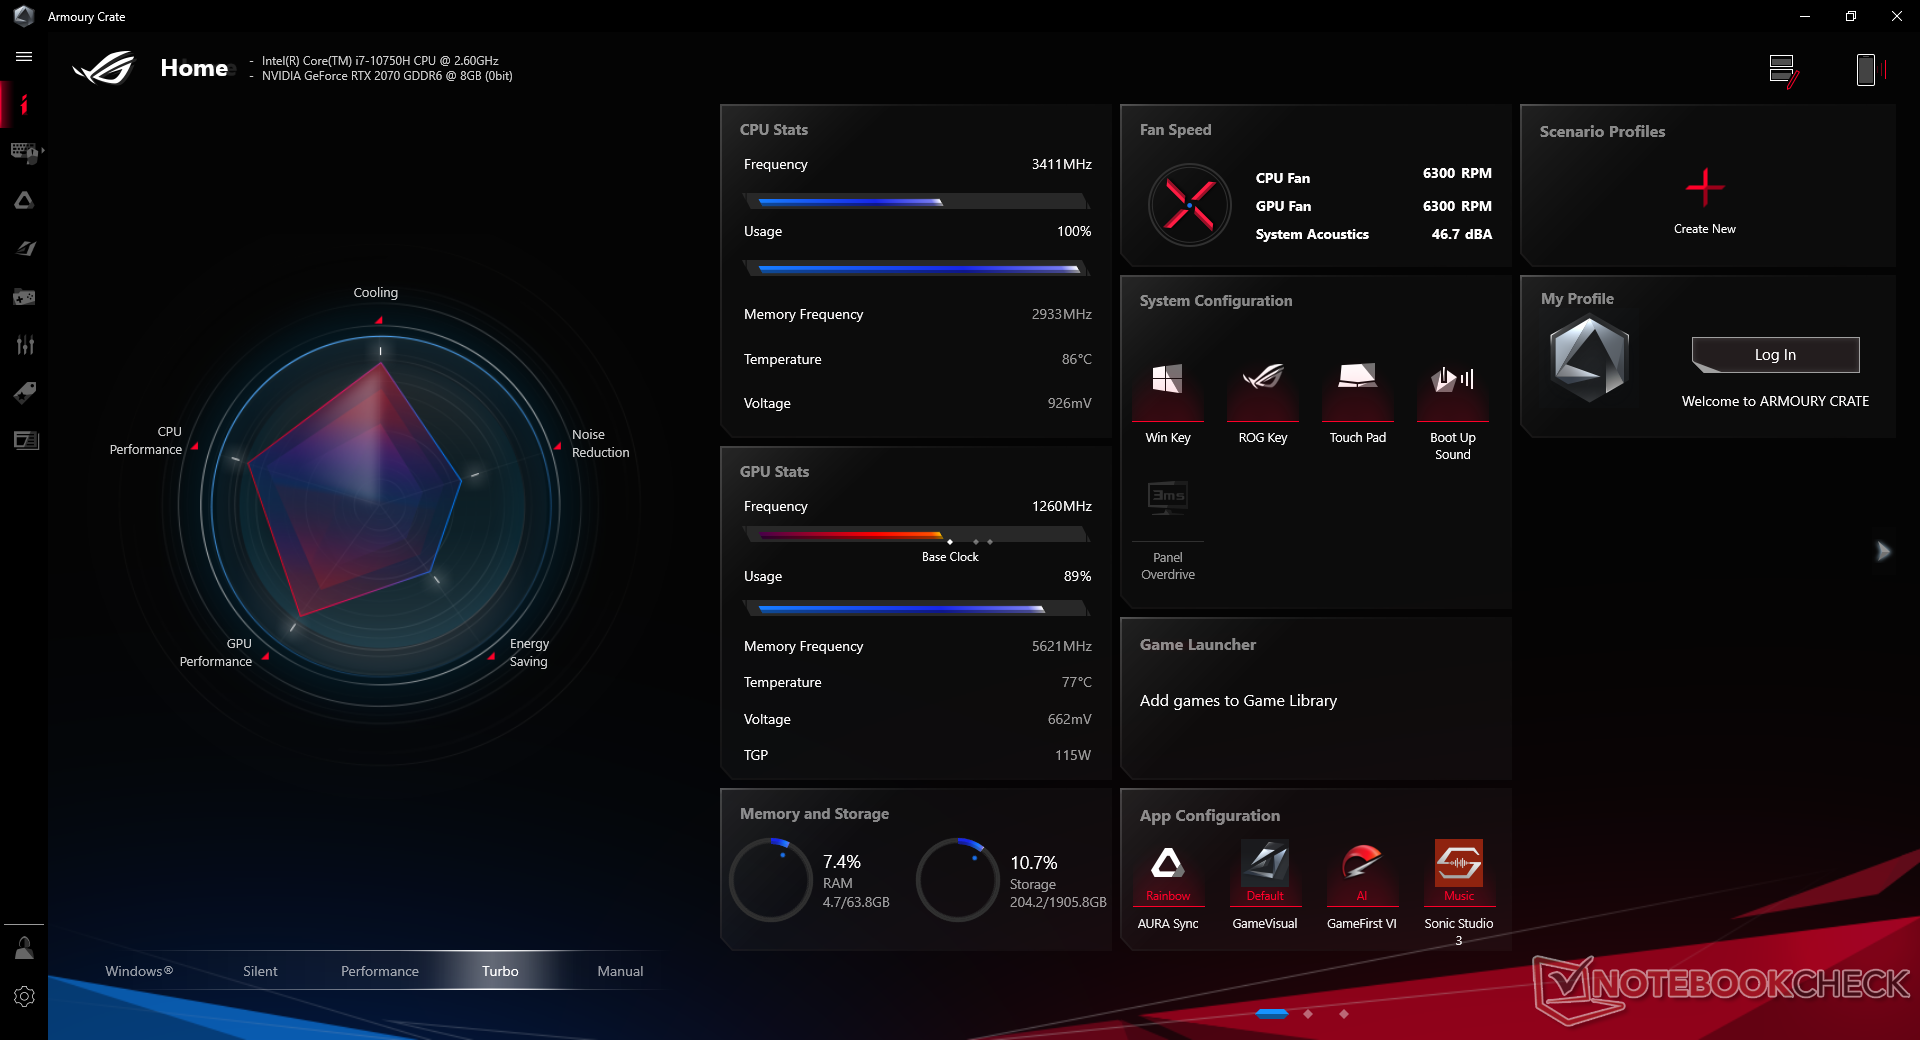
All benchmarks below were performed on Asus Turbo mode. We recommend owners become familiar with Armoury Crate as the power profiles are tied directly to this software.
Processor
Multi-thread CPU performance is about 5 to 10 percent faster than the average laptop in our database equipped with the same Core i7-10750H CPU. Performance sustainability is excellent and even a bit better than the G512LI as shown by our CineBench R15 xT loop test below.
Cinebench R15: CPU Multi 64Bit | CPU Single 64Bit
Blender: v2.79 BMW27 CPU
7-Zip 18.03: 7z b 4 -mmt1 | 7z b 4
Geekbench 5.5: Single-Core | Multi-Core
HWBOT x265 Benchmark v2.2: 4k Preset
LibreOffice : 20 Documents To PDF
R Benchmark 2.5: Overall mean
| HWBOT x265 Benchmark v2.2 / 4k Preset | |
| Asus Zephyrus S15 GX502L | |
| Asus ROG Strix Scar 15 G532LWS | |
| Eurocom Nightsky RX15 | |
| Asus ROG Zephyrus G15 GA502IU-ES76 | |
| MSI Bravo 15 A4DCR | |
| Asus ROG Strix G15 G512LW | |
| Asus ROG Strix G15 G512LI | |
| Average Intel Core i7-10750H (5.54 - 11.6, n=43) | |
| Acer Nitro 5 AN515-44-R5FT | |
| Gateway Creator Series 15.6 GWTN156-3BK | |
| LibreOffice / 20 Documents To PDF | |
| MSI Bravo 15 A4DCR | |
| Acer Nitro 5 AN515-44-R5FT | |
| Asus ROG Zephyrus G15 GA502IU-ES76 | |
| Gateway Creator Series 15.6 GWTN156-3BK | |
| Average Intel Core i7-10750H (43.1 - 99.2, n=43) | |
| Asus ROG Strix G15 G512LI | |
| Asus ROG Strix Scar 15 G532LWS | |
| Asus Zephyrus S15 GX502L | |
| Asus ROG Strix G15 G512LW | |
| R Benchmark 2.5 / Overall mean | |
| Gateway Creator Series 15.6 GWTN156-3BK | |
| Acer Nitro 5 AN515-44-R5FT | |
| Asus ROG Strix G15 G512LI | |
| Average Intel Core i7-10750H (0.578 - 0.708, n=42) | |
| Asus ROG Strix G15 G512LW | |
| MSI Bravo 15 A4DCR | |
| Asus Zephyrus S15 GX502L | |
| Asus ROG Zephyrus G15 GA502IU-ES76 | |
| Asus ROG Strix Scar 15 G532LWS | |
Cinebench R15: CPU Multi 64Bit | CPU Single 64Bit
Blender: v2.79 BMW27 CPU
7-Zip 18.03: 7z b 4 -mmt1 | 7z b 4
Geekbench 5.5: Single-Core | Multi-Core
HWBOT x265 Benchmark v2.2: 4k Preset
LibreOffice : 20 Documents To PDF
R Benchmark 2.5: Overall mean
* ... smaller is better
System Performance
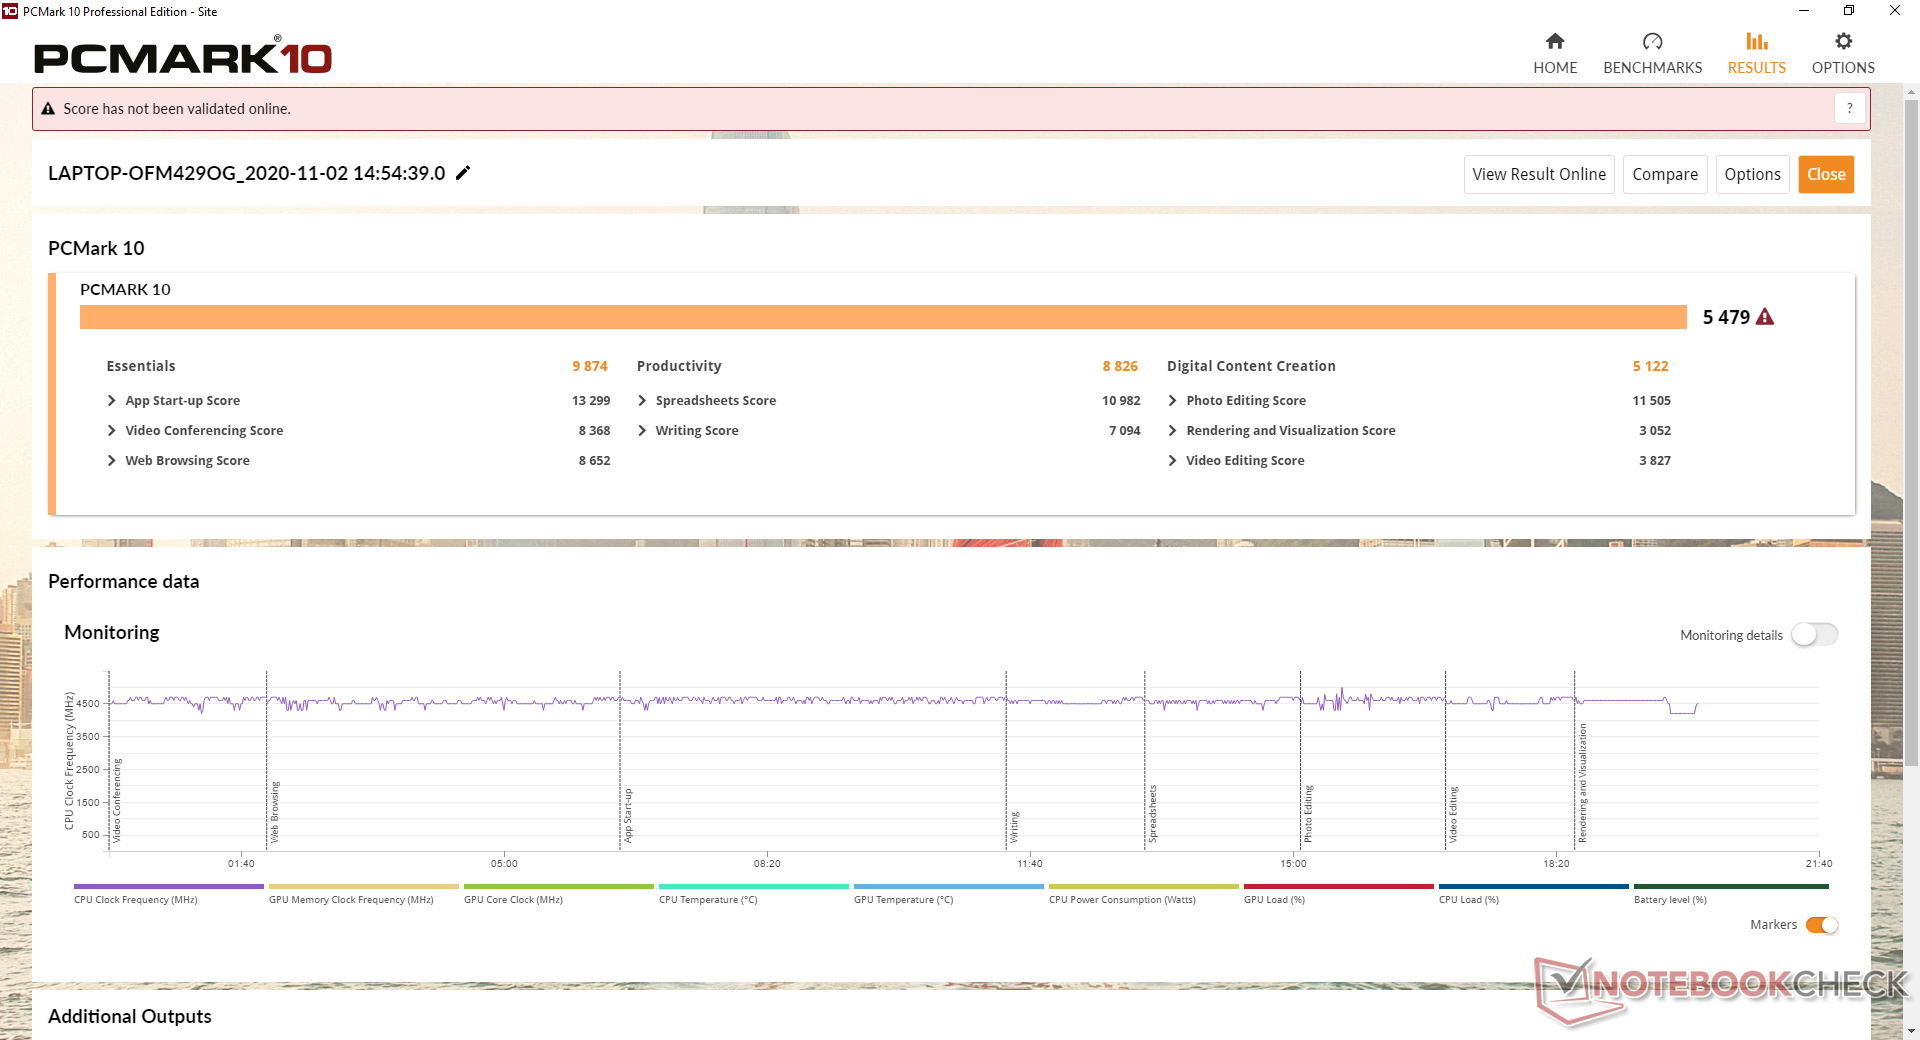
PCMark 10 scores are where we expect them to be except for Digital Content Creation where our system scores lower than the G512LI. We suspect that the slow write rates of our Toshiba M.2 SSD may be the culprit as most other laptops in this category tend to come with much faster storage drives. The Samsung PM981a, for example, is almost three times faster in this aspect.
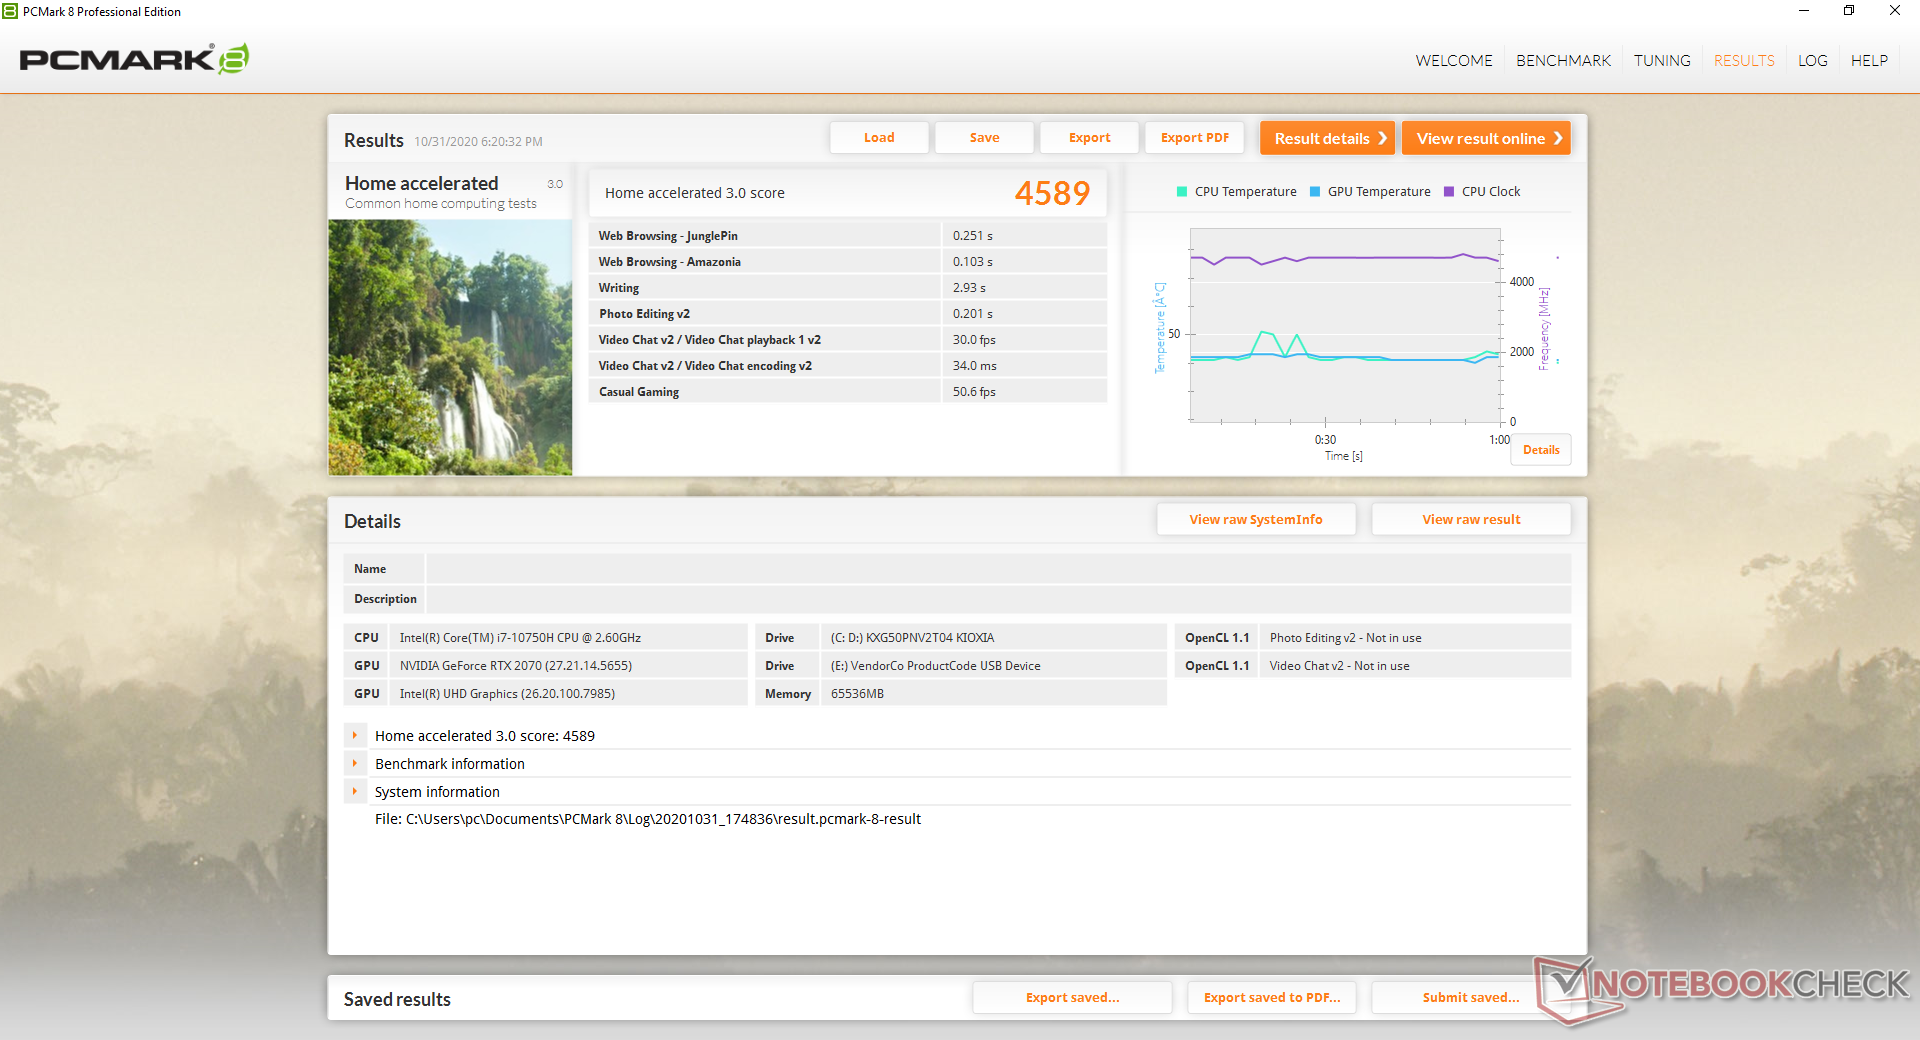
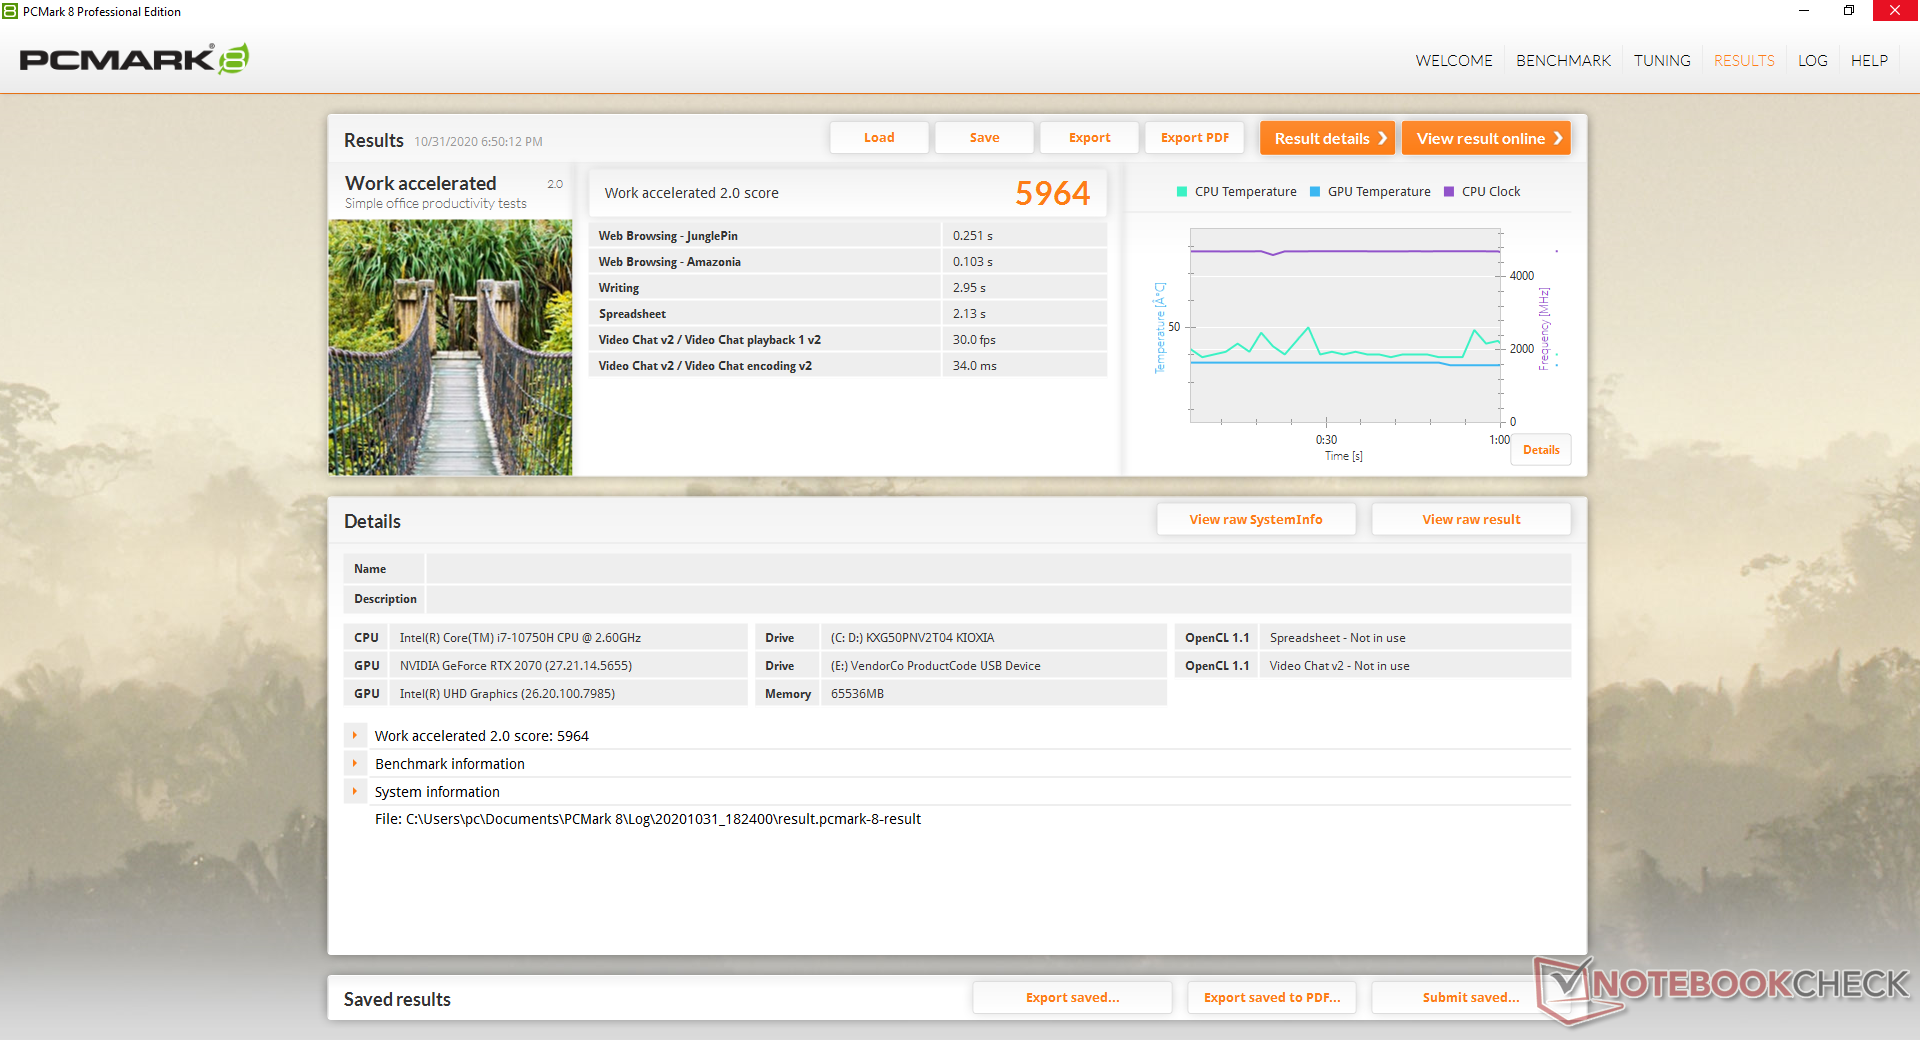
| PCMark 8 Home Score Accelerated v2 | 4589 points | |
| PCMark 8 Work Score Accelerated v2 | 5964 points | |
| PCMark 10 Score | 5479 points | |
Help | ||
DPC Latency
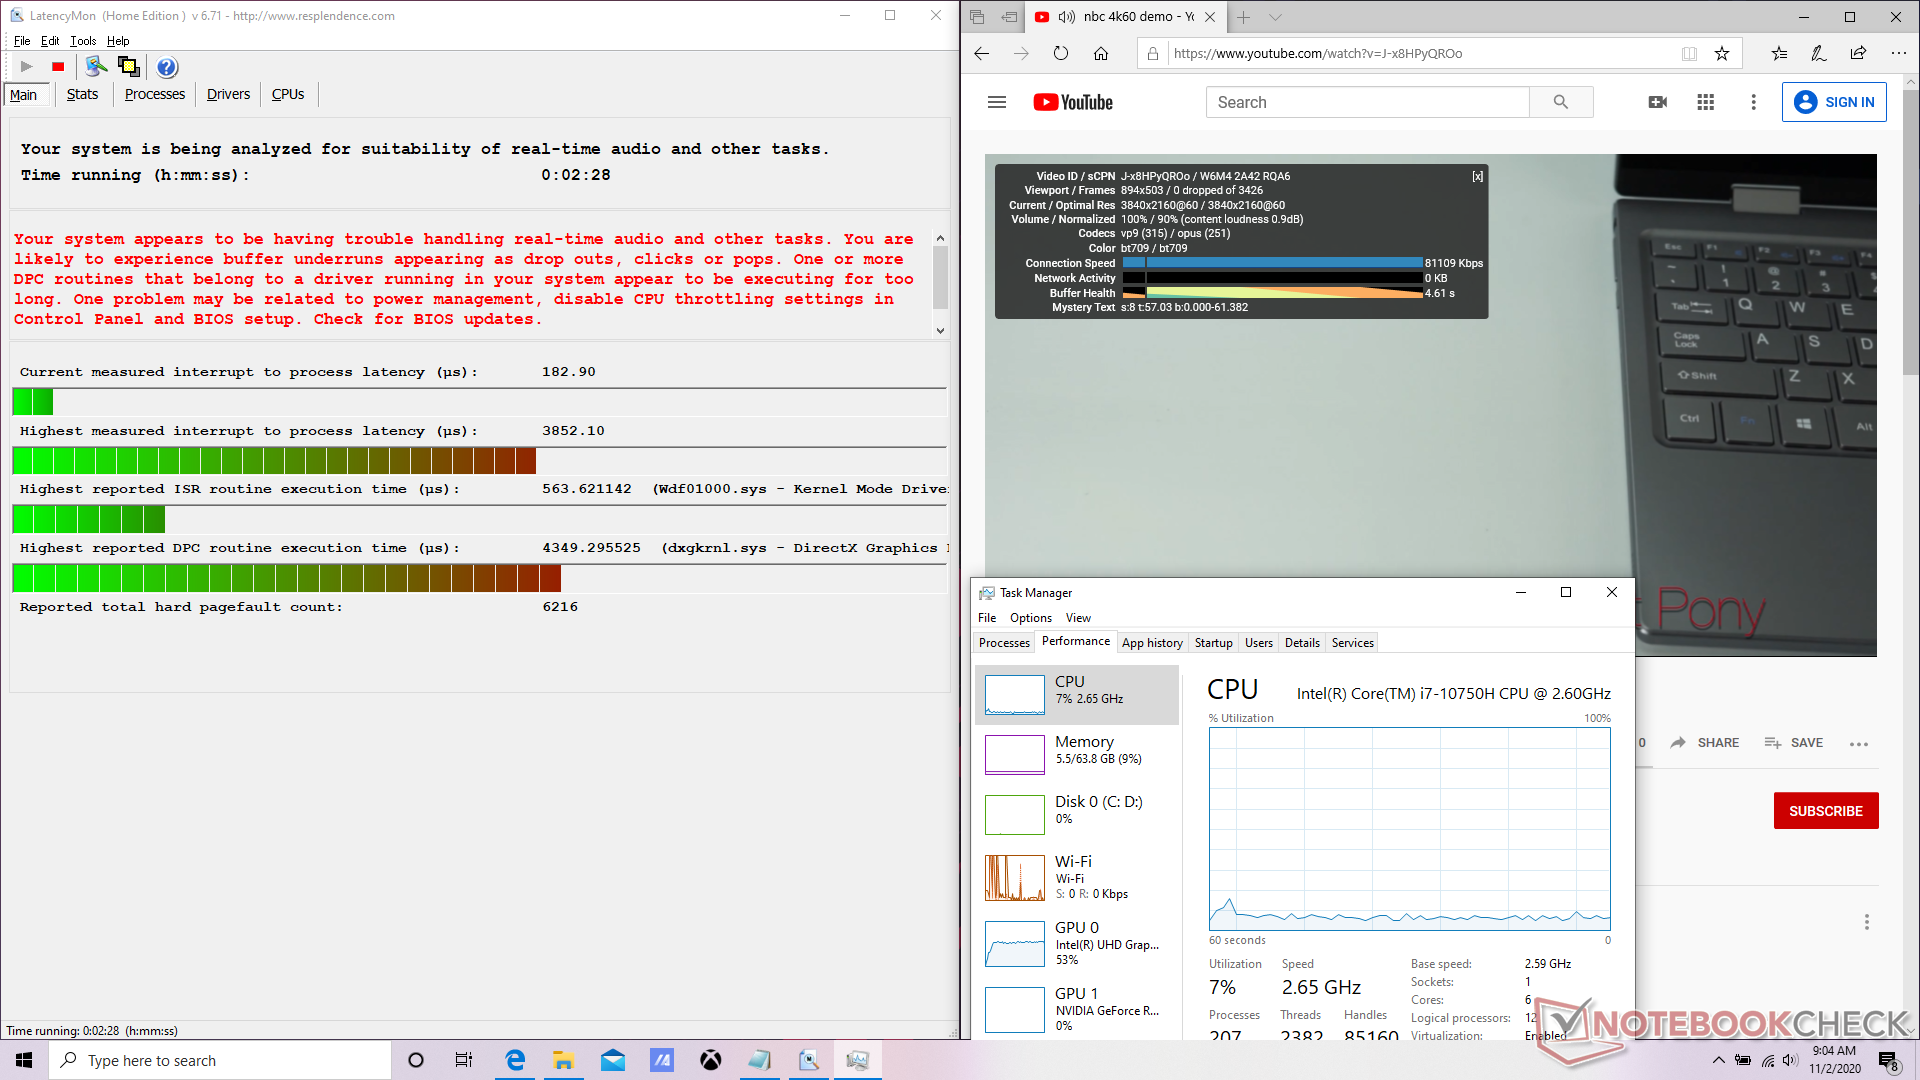
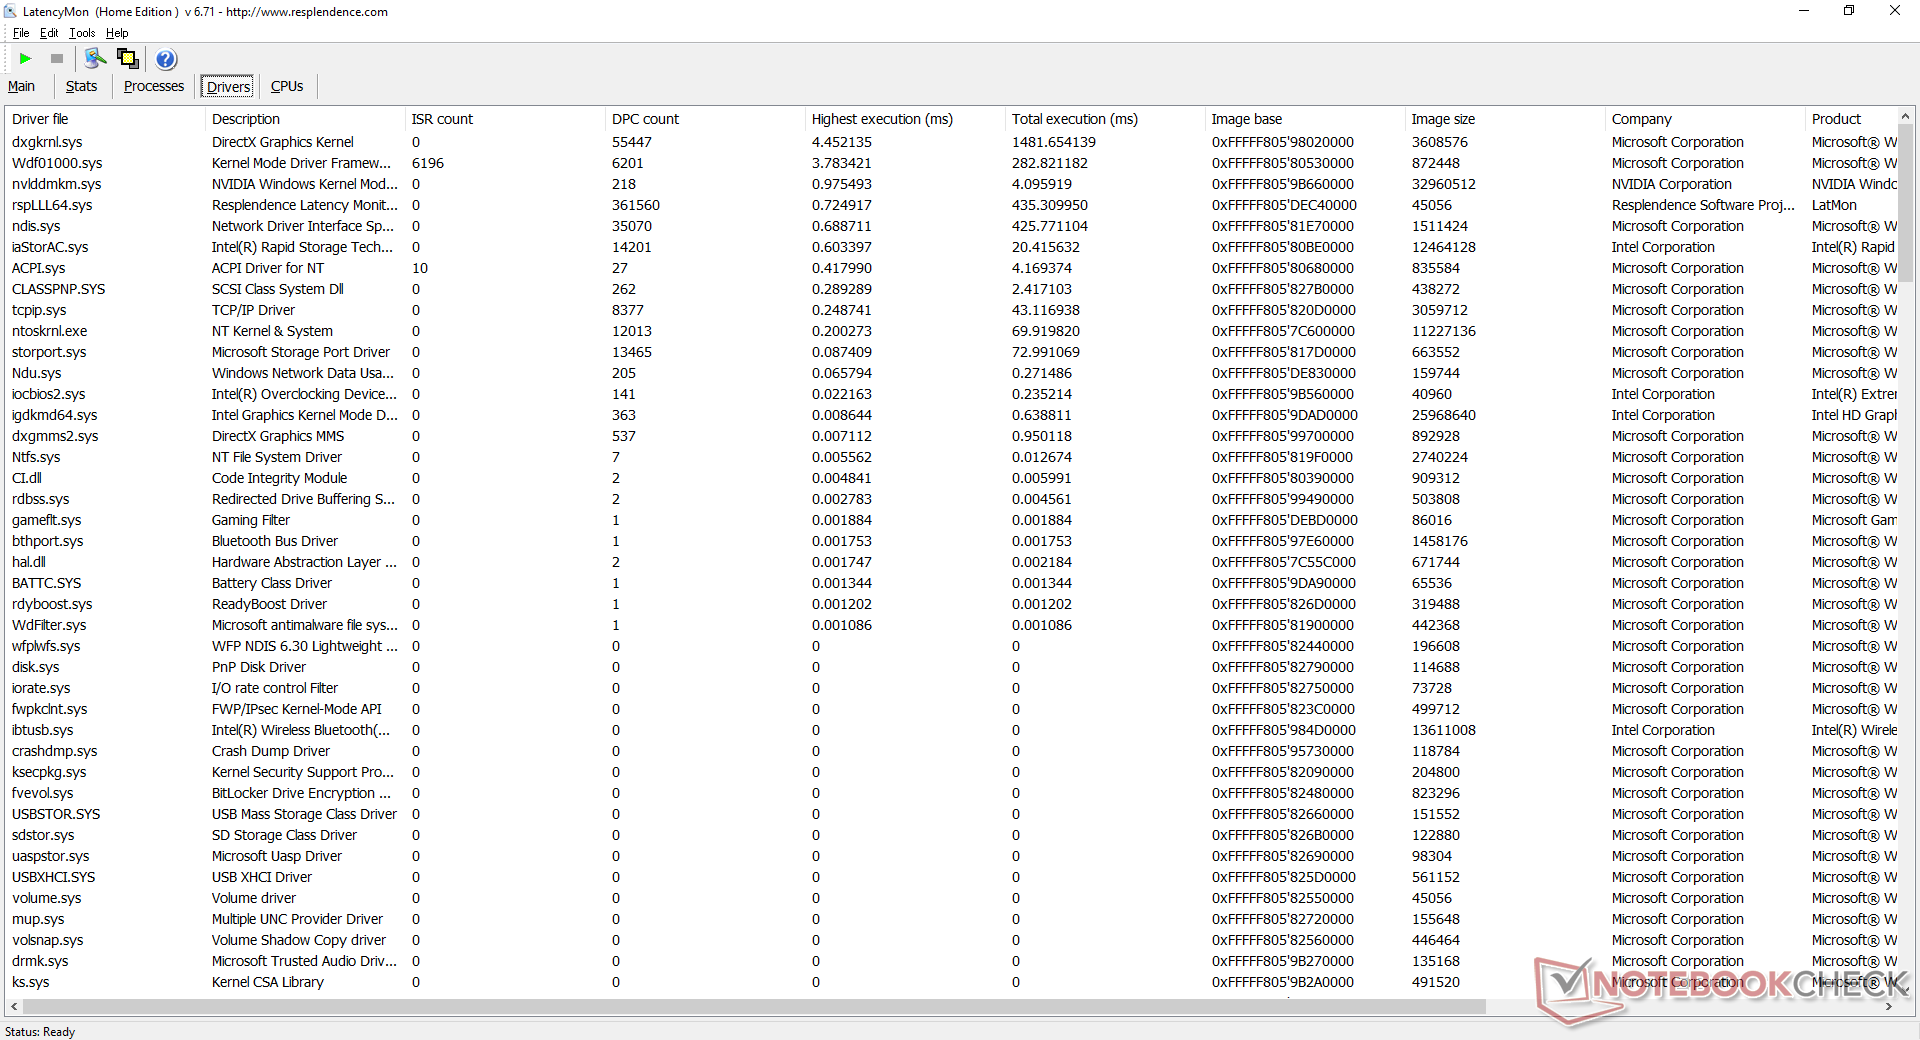
| DPC Latencies / LatencyMon - interrupt to process latency (max), Web, Youtube, Prime95 | |
| Asus ROG Strix G15 G512LW | |
| Razer Blade 15 RTX 2070 Super Max-Q | |
| Asus ROG Strix Scar 15 G532LWS | |
| Asus ROG Strix G15 G512LI | |
| Alienware m15 R3 P87F | |
| MSI GP65 10SFK-047US | |
* ... smaller is better
Storage Devices
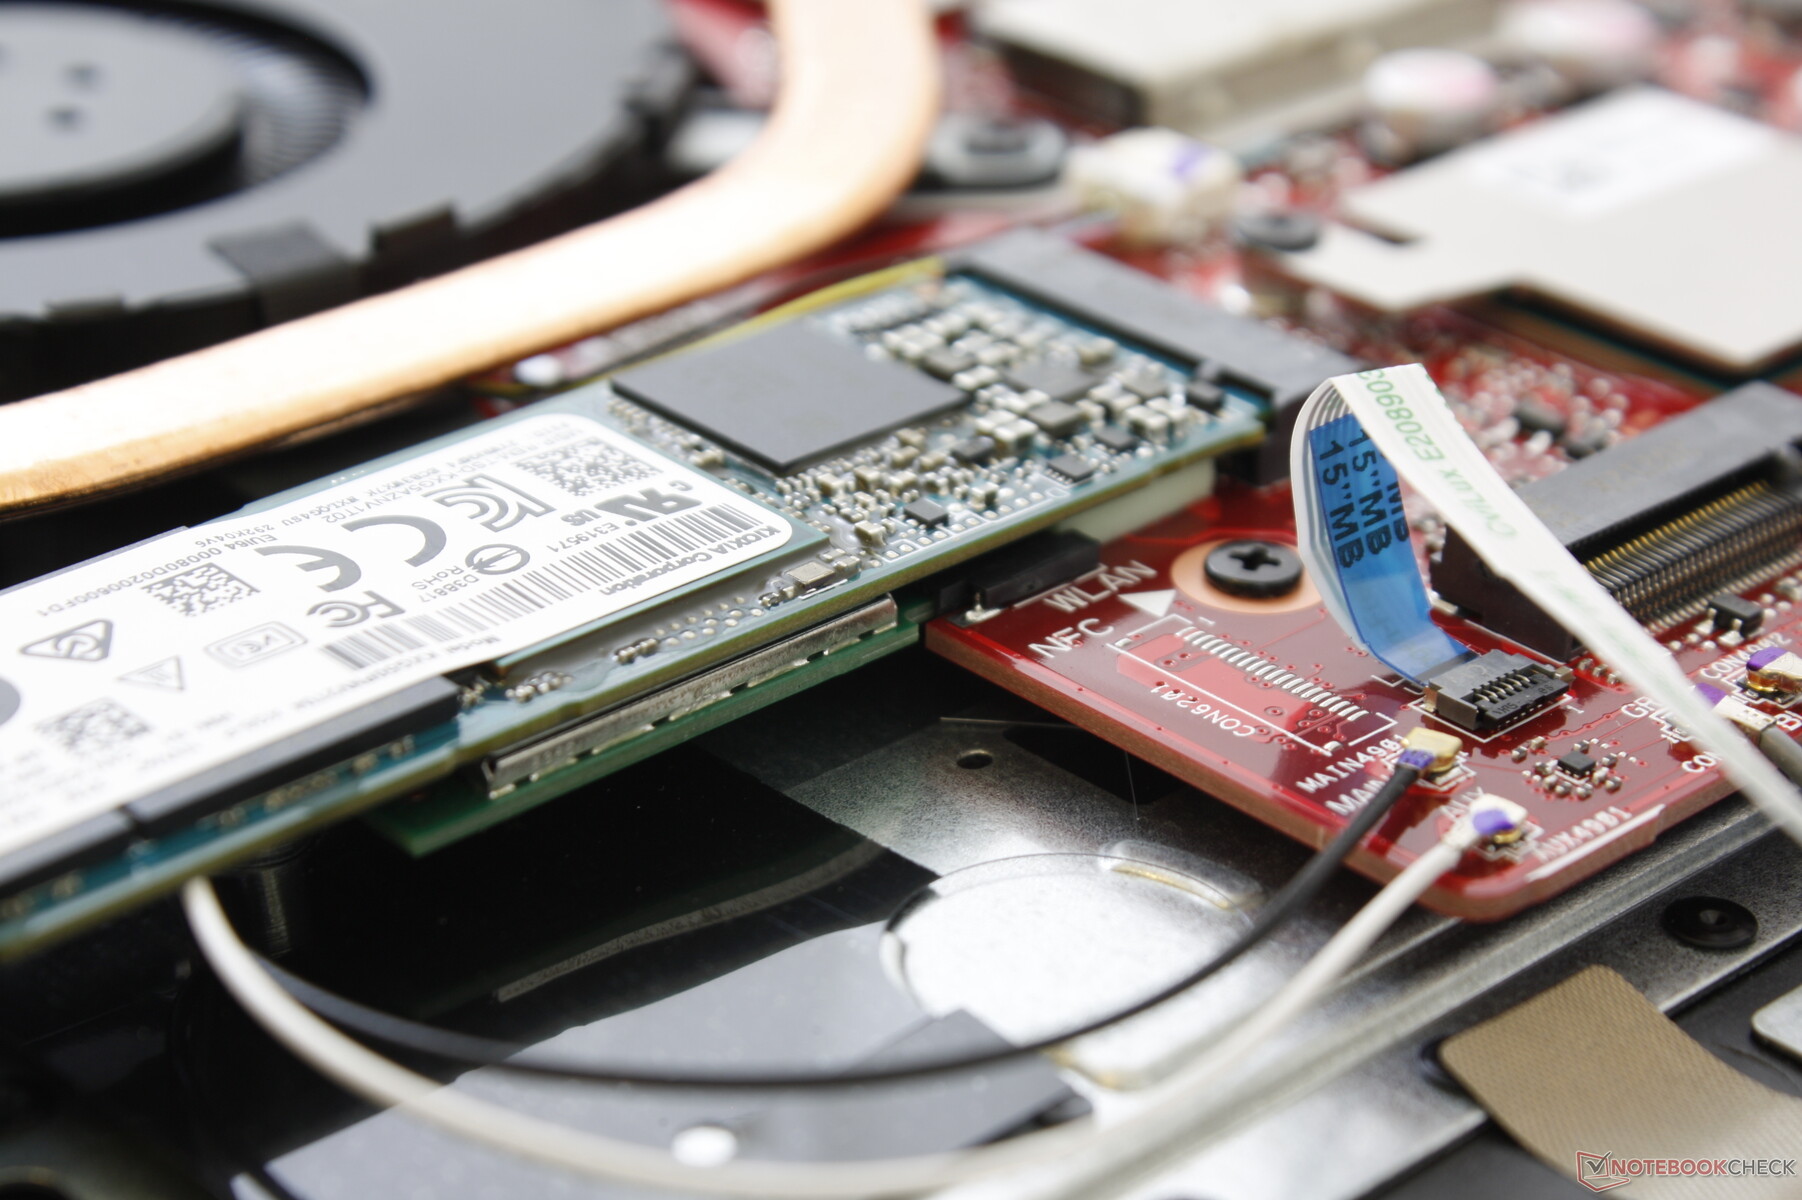
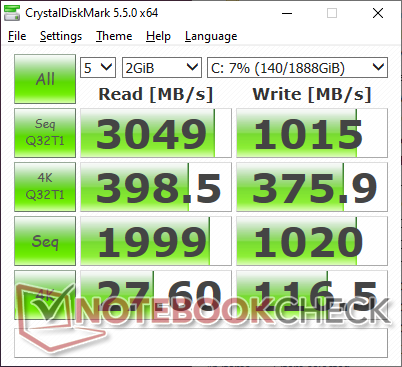
CUKUSA has configured our unit with a 2 TB Toshiba XG5-P M.2 NVMe SSD. Though sequential read rates are fast, write rates are slow for a PCIe SSD at only about 790 MB/s according to AS SSD.
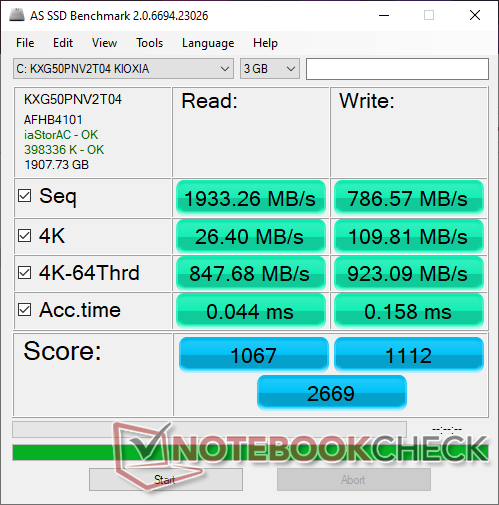
| Asus ROG Strix G15 G512LW Toshiba XG5-P KXG50PNV2T04 | Asus ROG Strix G15 G512LI Intel SSD 660p SSDPEKNW512G8 | Razer Blade 15 RTX 2070 Super Max-Q Samsung SSD PM981a MZVLB512HBJQ | Asus ROG Strix Scar 15 G532LWS 2x Intel SSD 660p 1TB SSDPEKNW010T8 (RAID 0) | Alienware m15 R3 P87F 2x Micron 2200S 512 GB (RAID 0) | |
|---|---|---|---|---|---|
| AS SSD | -24% | 46% | 29% | 14% | |
| Seq Read (MB/s) | 1933 | 1157 -40% | 1957 1% | 1982 3% | 2058 6% |
| Seq Write (MB/s) | 787 | 675 -14% | 2092 166% | 1444 83% | 2316 194% |
| 4K Read (MB/s) | 26.4 | 49.99 89% | 50.2 90% | 50.3 91% | 39.72 50% |
| 4K Write (MB/s) | 109.8 | 114 4% | 96.5 -12% | 120.1 9% | 62.9 -43% |
| 4K-64 Read (MB/s) | 848 | 322.2 -62% | 1594 88% | 1016 20% | 1334 57% |
| 4K-64 Write (MB/s) | 923 | 759 -18% | 2005 117% | 1351 46% | 1271 38% |
| Access Time Read * (ms) | 0.044 | 0.07 -59% | 0.057 -30% | 0.044 -0% | 0.062 -41% |
| Access Time Write * (ms) | 0.158 | 0.137 13% | 0.112 29% | 0.109 31% | 0.388 -146% |
| Score Read (Points) | 1067 | 488 -54% | 1840 72% | 1264 18% | 1580 48% |
| Score Write (Points) | 1112 | 940 -15% | 2310 108% | 1615 45% | 1565 41% |
| Score Total (Points) | 2669 | 1673 -37% | 5103 91% | 3510 32% | 3968 49% |
| Copy ISO MB/s (MB/s) | 3210 | 939 -71% | 1793 -44% | 3474 8% | 1685 -48% |
| Copy Program MB/s (MB/s) | 728 | 489.9 -33% | 573 -21% | 751 3% | 669 -8% |
| Copy Game MB/s (MB/s) | 1499 | 895 -40% | 1418 -5% | 1684 12% | 1493 0% |
| CrystalDiskMark 5.2 / 6 | 1% | 62% | 51% | 46% | |
| Write 4K (MB/s) | 116.5 | 125.4 8% | 139.8 20% | 128.4 10% | 67.3 -42% |
| Read 4K (MB/s) | 27.6 | 52.7 91% | 48.62 76% | 53.7 95% | 41.47 50% |
| Write Seq (MB/s) | 1020 | 943 -8% | 2260 122% | 1875 84% | 2239 120% |
| Read Seq (MB/s) | 1999 | 1383 -31% | 2135 7% | 2315 16% | 2112 6% |
| Write 4K Q32T1 (MB/s) | 375.9 | 437.9 16% | 499.3 33% | 427.2 14% | 488.9 30% |
| Read 4K Q32T1 (MB/s) | 398.5 | 334.9 -16% | 552 39% | 440.7 11% | 557 40% |
| Write Seq Q32T1 (MB/s) | 1015 | 960 -5% | 2960 192% | 2793 175% | 2654 161% |
| Read Seq Q32T1 (MB/s) | 3049 | 1530 -50% | 3269 7% | 3101 2% | 3137 3% |
| Total Average (Program / Settings) | -12% /
-15% | 54% /
52% | 40% /
37% | 30% /
26% |
* ... smaller is better

Disk Throttling: DiskSpd Read Loop, Queue Depth 8
GPU Performance
Graphics performance is within a few percentage points of the average mobile GeForce RTX 2070 in our database. A full-fledged desktop GeForce RTX 2070 is about 10 to 20 percent faster according to 3DMark benchmarks. Choosing the G512LW over the GTX 1650 Ti-powered G512LI will net users approximately two times more graphics horsepower.
Note that graphics performance is slightly faster when set to Turbo mode (7826 points in Time Spy graphics) versus Performance mode (7543 points).
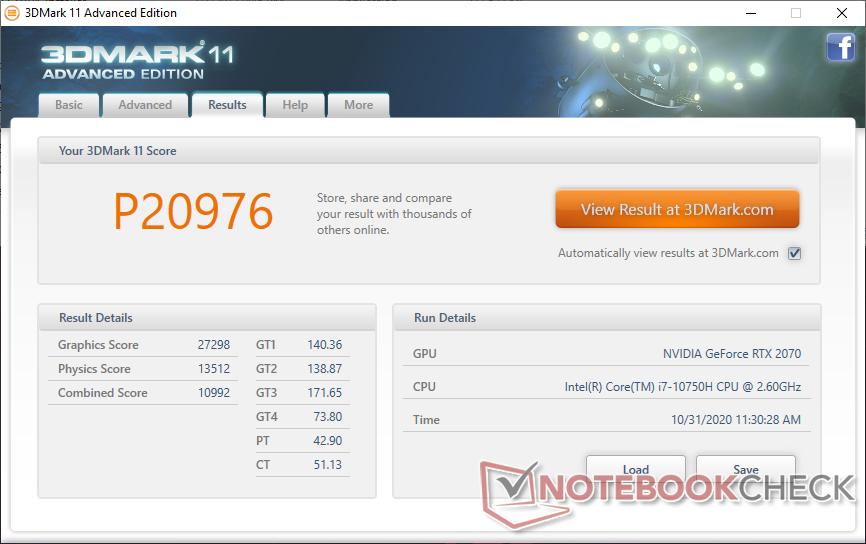
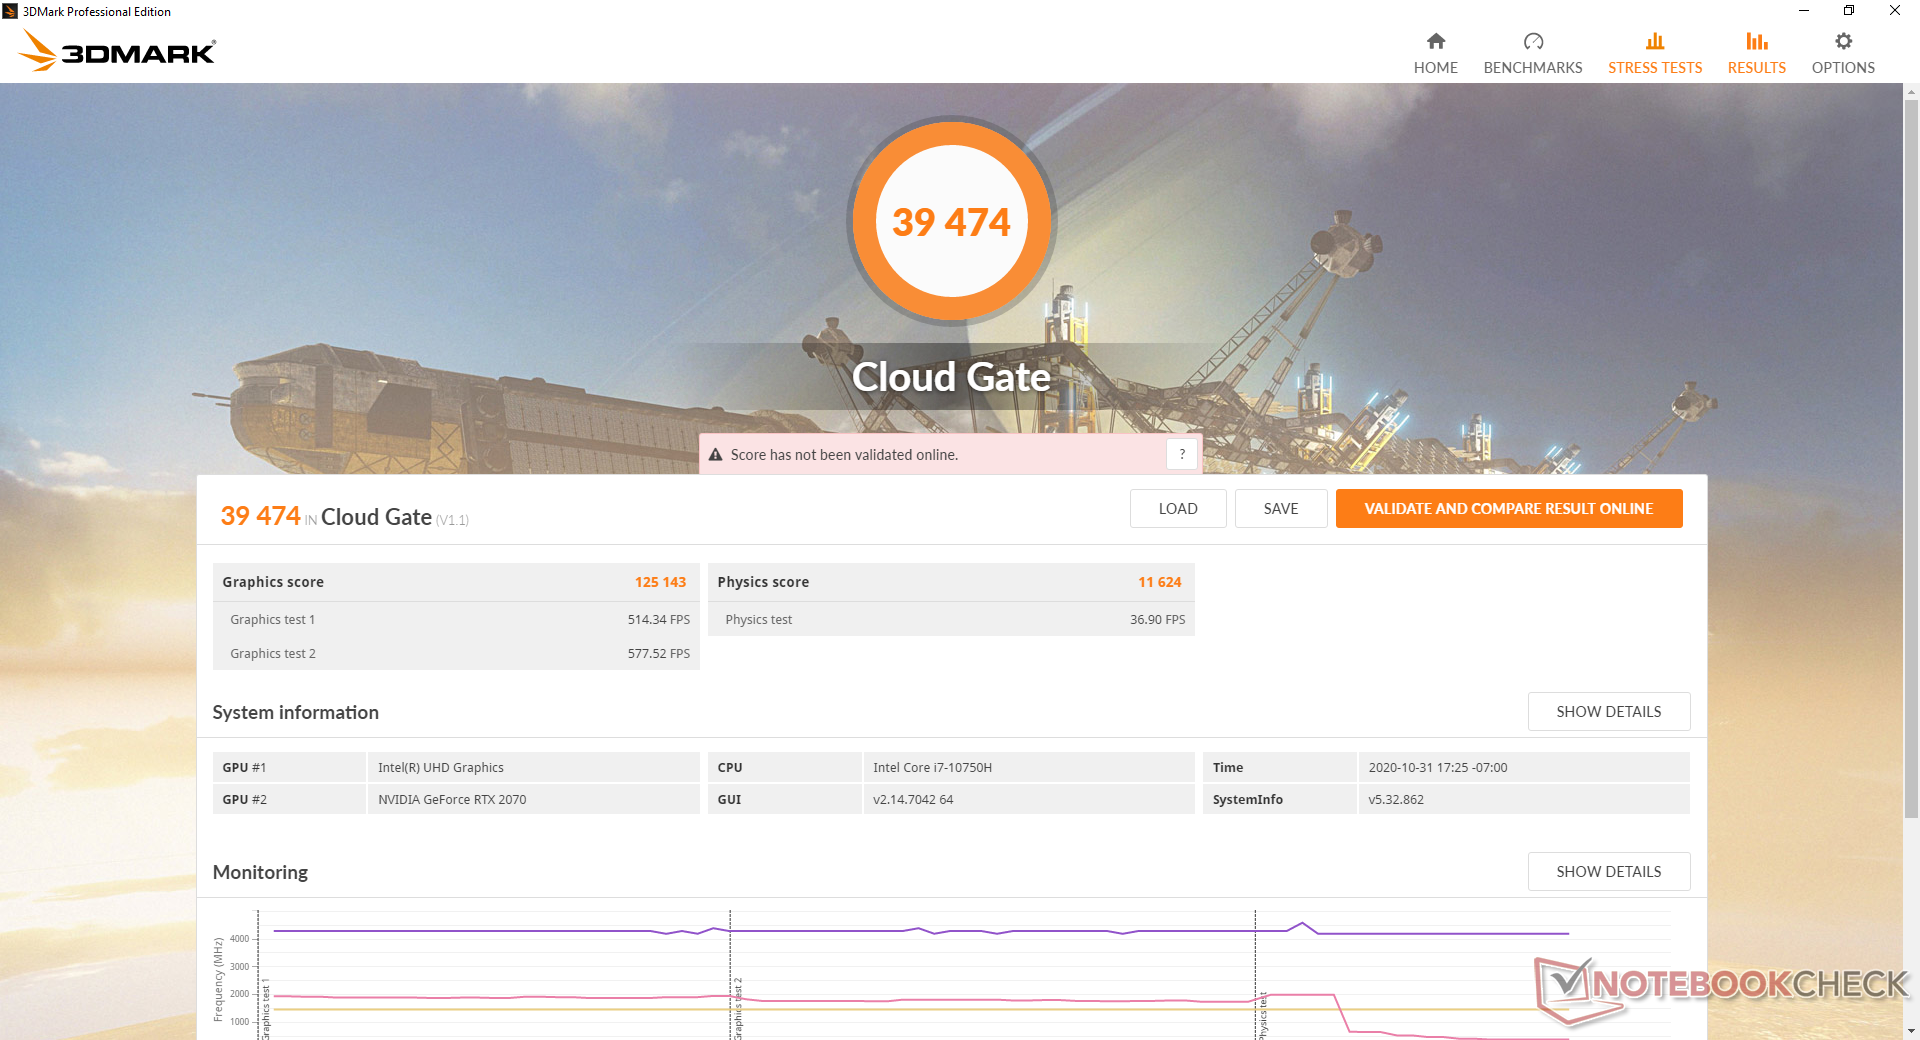
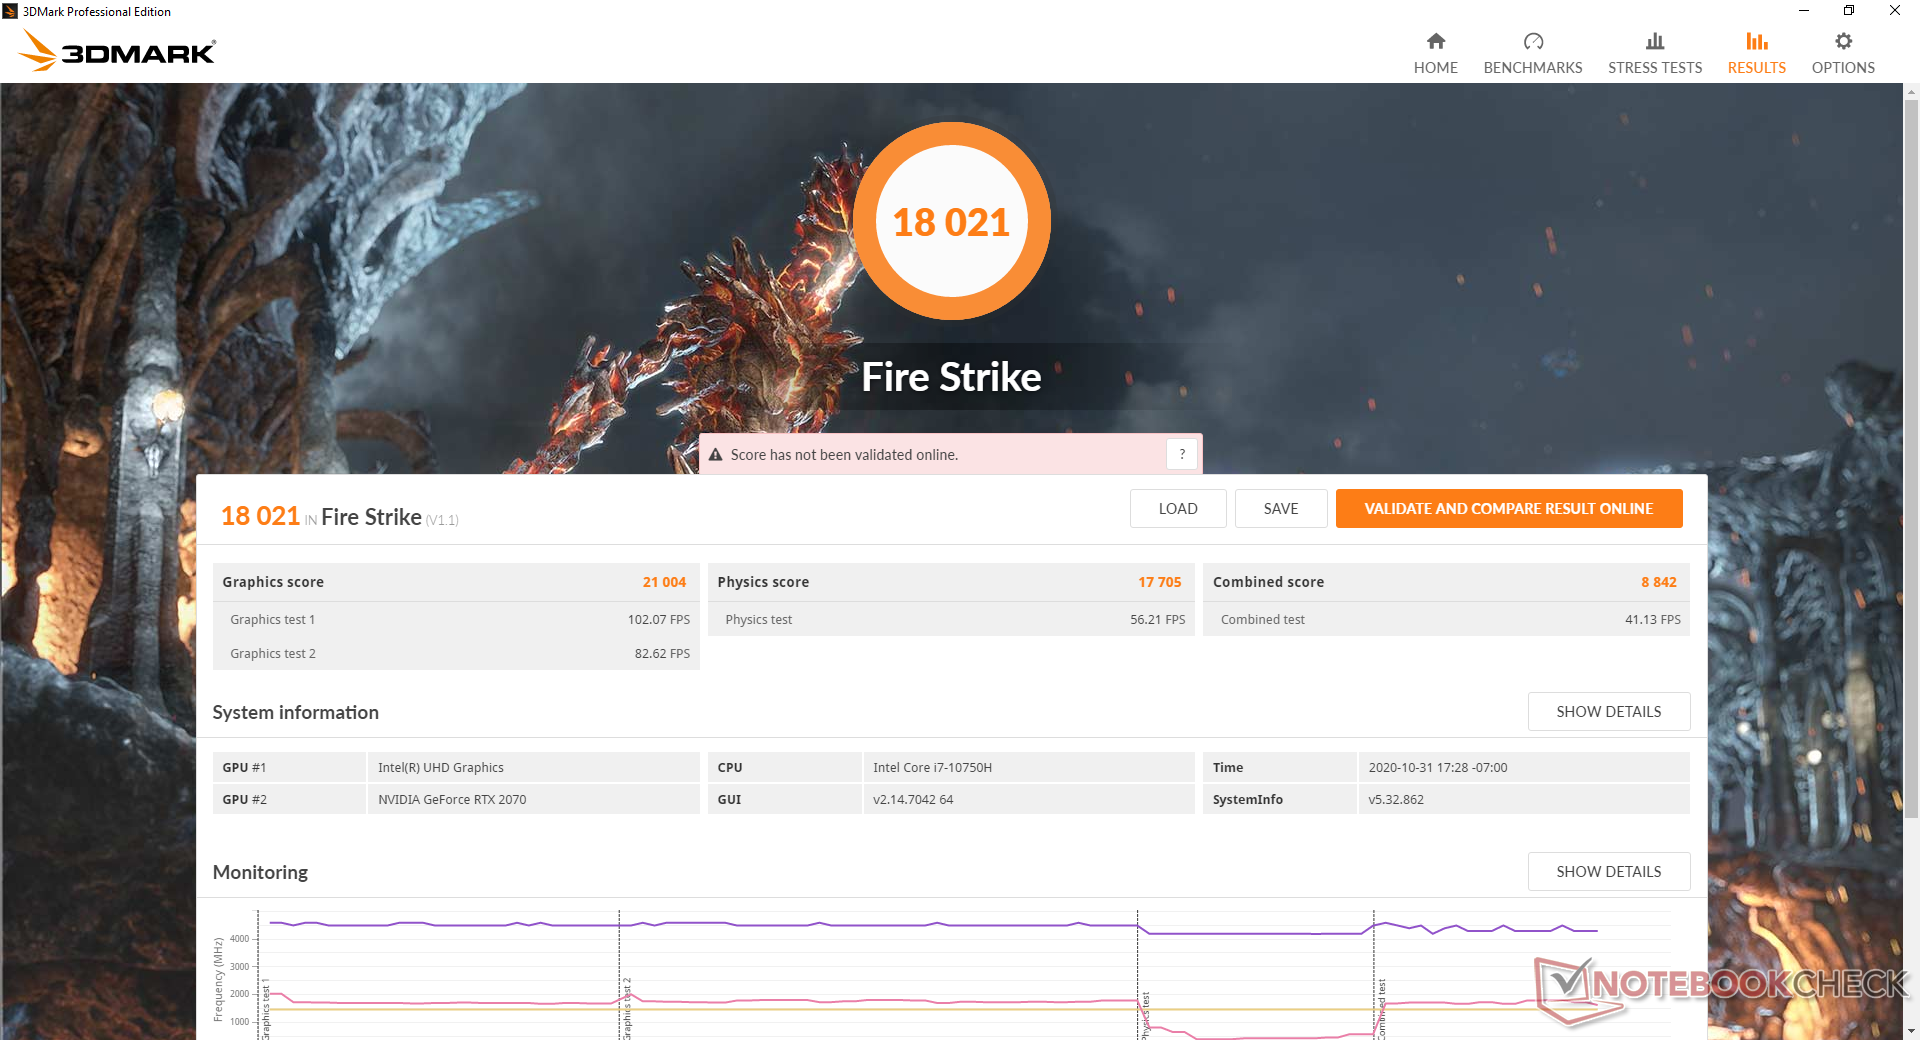
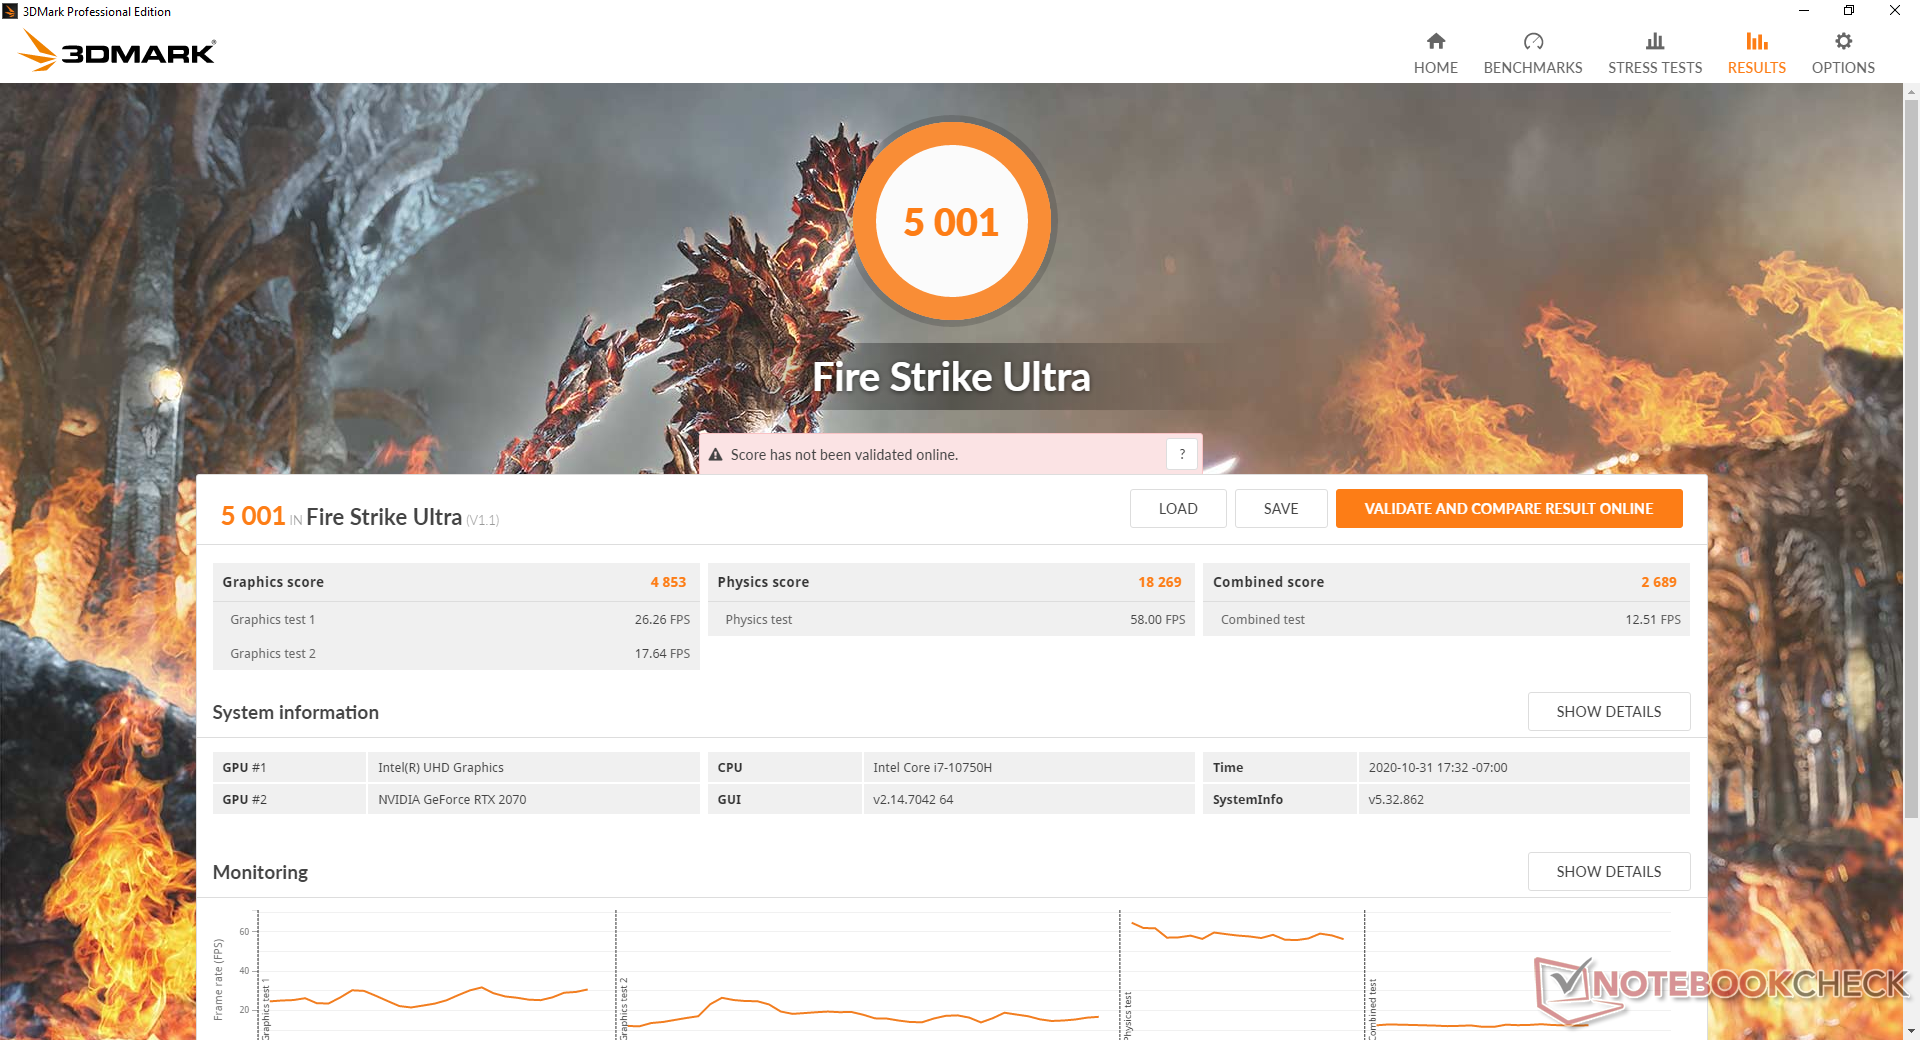
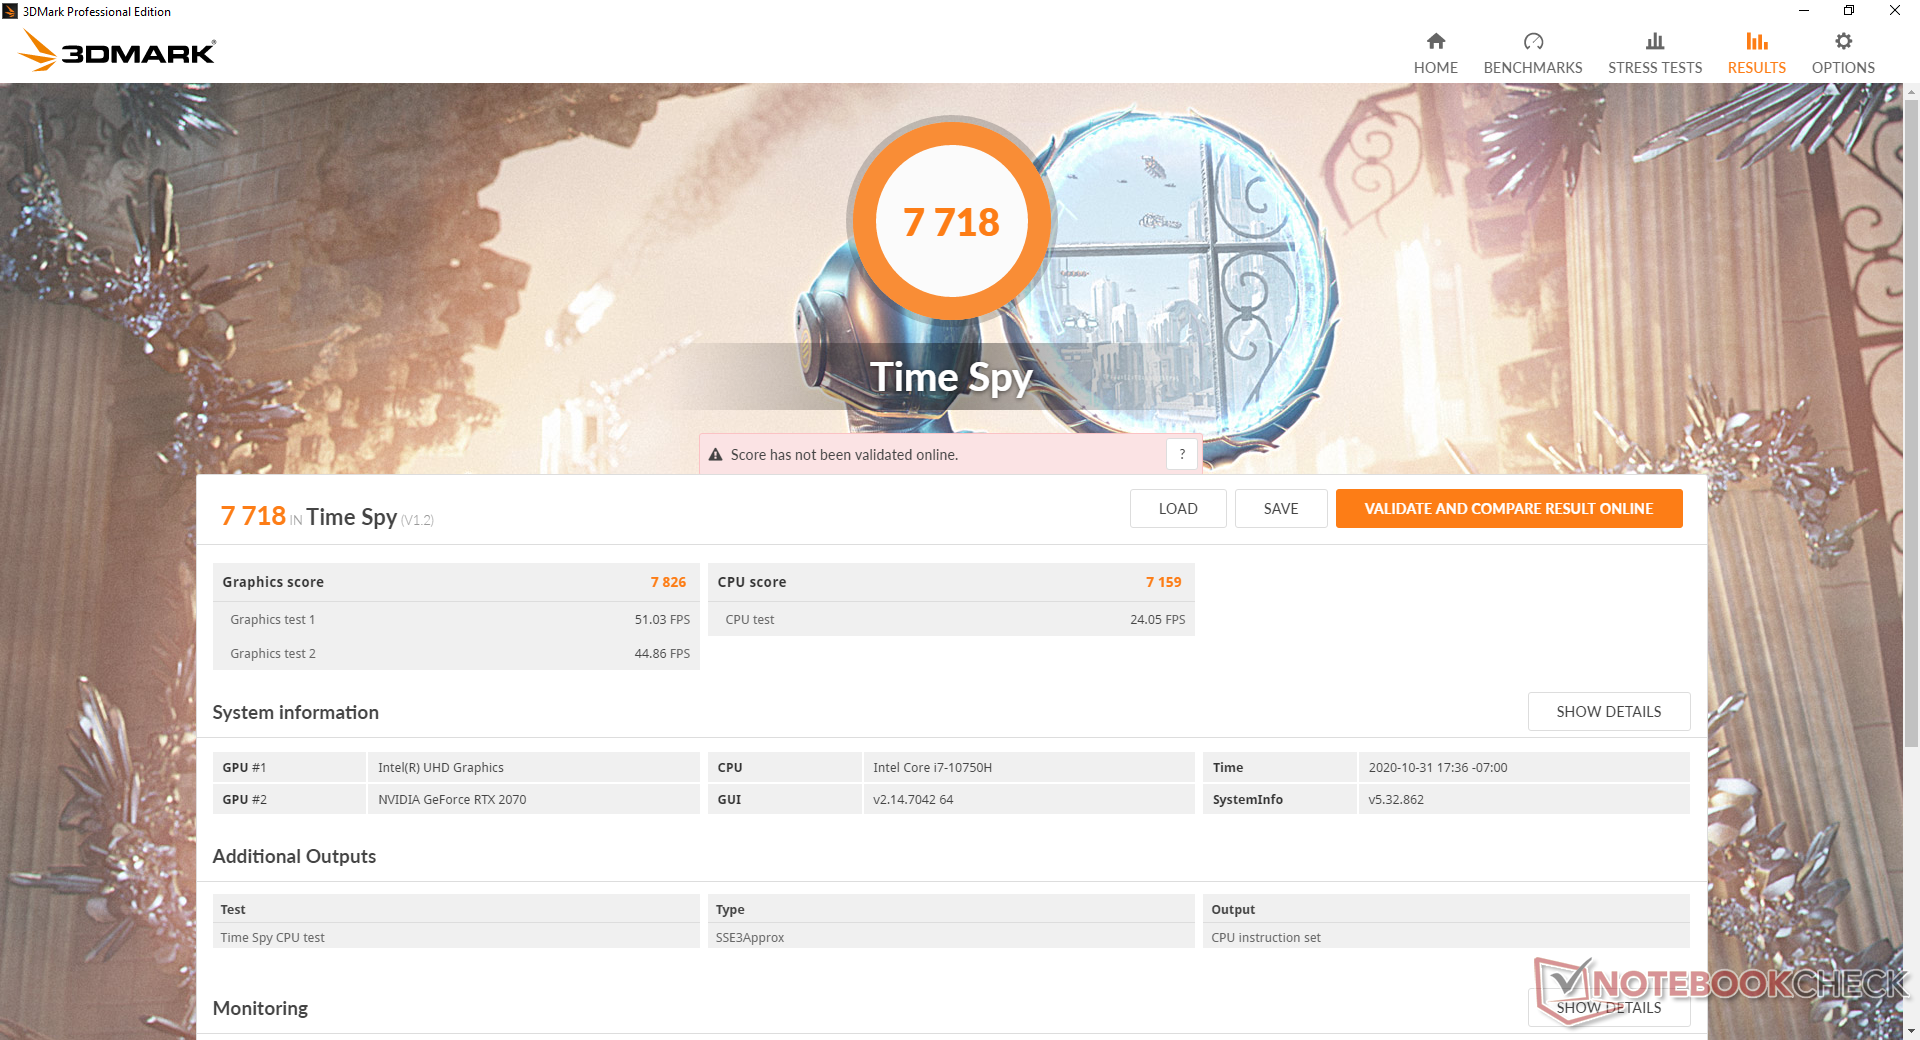

| 3DMark 11 Performance | 20976 points | |
| 3DMark Cloud Gate Standard Score | 39474 points | |
| 3DMark Fire Strike Score | 18021 points | |
| 3DMark Time Spy Score | 7718 points | |
Help | ||
| low | med. | high | ultra | |
|---|---|---|---|---|
| GTA V (2015) | 178 | 170 | 148 | 82 |
| The Witcher 3 (2015) | 303.3 | 227.2 | 144.5 | 78.2 |
| Dota 2 Reborn (2015) | 149 | 130 | 124 | 117 |
| Final Fantasy XV Benchmark (2018) | 151 | 106 | 80.6 | |
| X-Plane 11.11 (2018) | 105 | 90.5 | 77.5 | |
| Strange Brigade (2018) | 313 | 183 | 149 | 125 |
Emissions
System Noise
Fan noise is louder than what we recorded on the G512LI despite the beefed up cooling solution. Running Witcher 3 on performance mode and Turbo mode would induce a fan noise of 52.6 dB(A) and 54.1 dB(A), respectively, compared to just 47.9 dB(A) to 49.3 dB(A) on the G512LI. This is as loud or louder than the Razer Blade 15 or MSI GP65 both of which are smaller in size than the Asus.
For undemanding loads like video streaming or web browsing, the system is never truly silent even when set to "Silent" mode. Fan noise tends to hover around 30 to 34 dB(A) which, while not particularly bothersome, is certainly noticeable. We recommend running on Silent mode to reduce random fan pulsing.
| Asus ROG Strix G15 G512LW GeForce RTX 2070 Mobile, i7-10750H, Toshiba XG5-P KXG50PNV2T04 | Asus ROG Strix G15 G512LI GeForce GTX 1650 Ti Mobile, i7-10750H, Intel SSD 660p SSDPEKNW512G8 | Razer Blade 15 RTX 2070 Super Max-Q GeForce RTX 2070 Super Max-Q, i7-10875H, Samsung SSD PM981a MZVLB512HBJQ | MSI GP65 10SFK-047US GeForce RTX 2070 Mobile, i7-10750H, Samsung SSD PM981 MZVLB1T0HALR | Asus ROG Strix Scar 15 G532LWS GeForce RTX 2070 Super Mobile, i9-10980HK, 2x Intel SSD 660p 1TB SSDPEKNW010T8 (RAID 0) | Alienware m15 R3 P87F GeForce RTX 2070 Mobile, i7-10750H, 2x Micron 2200S 512 GB (RAID 0) | |
|---|---|---|---|---|---|---|
| Noise | -8% | 2% | -9% | -8% | 2% | |
| off / environment * (dB) | 25.7 | 27.7 -8% | 27 -5% | 29.3 -14% | 26.5 -3% | 26.3 -2% |
| Idle Minimum * (dB) | 25.7 | 34.2 -33% | 27 -5% | 31.9 -24% | 27.1 -5% | 26.7 -4% |
| Idle Average * (dB) | 29.7 | 36 -21% | 27 9% | 31.9 -7% | 32.2 -8% | 26.7 10% |
| Idle Maximum * (dB) | 34 | 36.6 -8% | 27 21% | 33.5 1% | 34 -0% | 30.7 10% |
| Load Average * (dB) | 38.9 | 44.3 -14% | 44.7 -15% | 47 -21% | 52.4 -35% | 40.2 -3% |
| Witcher 3 ultra * (dB) | 54.1 | 47.9 11% | 51.2 5% | 53.8 1% | 57.5 -6% | 51 6% |
| Load Maximum * (dB) | 57.4 | 49.3 14% | 54 6% | 56.7 1% | 57.5 -0% | 59.7 -4% |
* ... smaller is better
Noise level
| Idle |
| 25.7 / 29.7 / 34 dB(A) |
| Load |
| 38.9 / 57.4 dB(A) |
 | ||
30 dB silent 40 dB(A) audible 50 dB(A) loud |
||
min: | ||
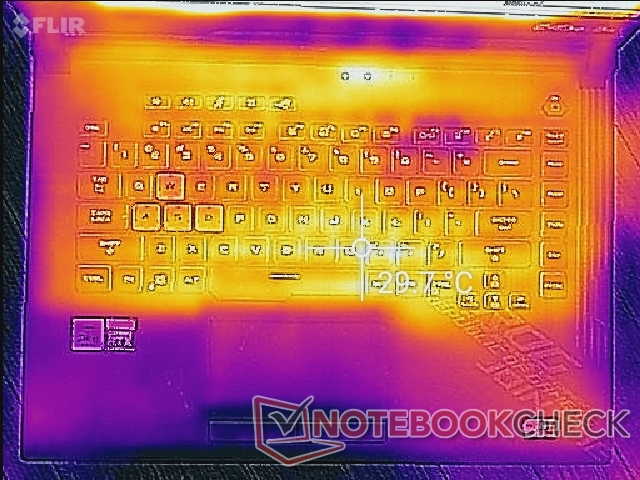
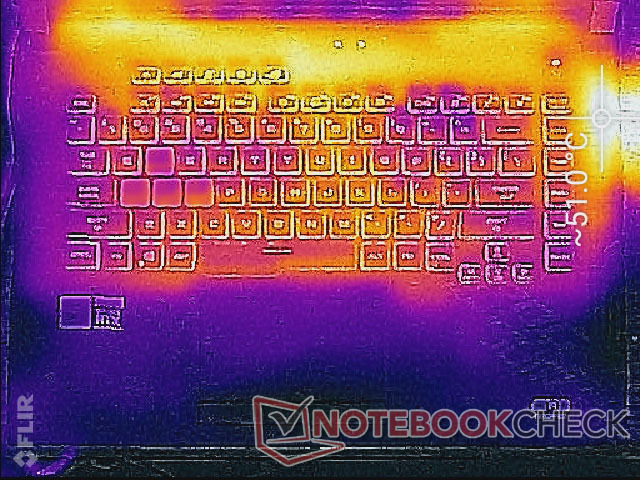
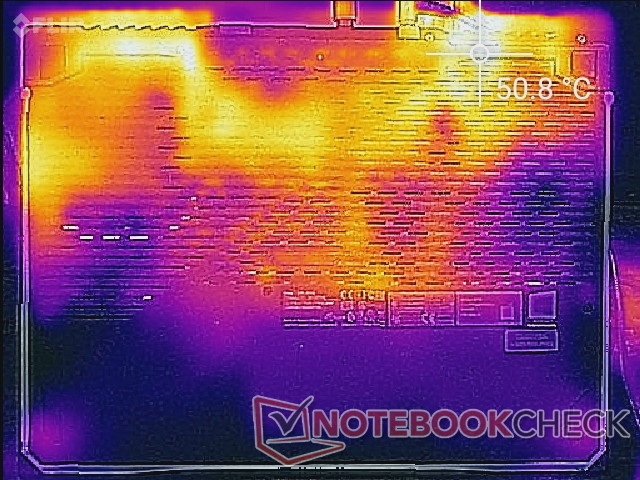
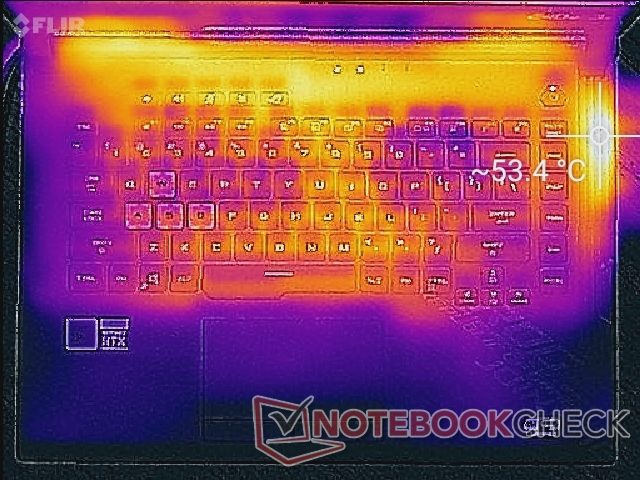
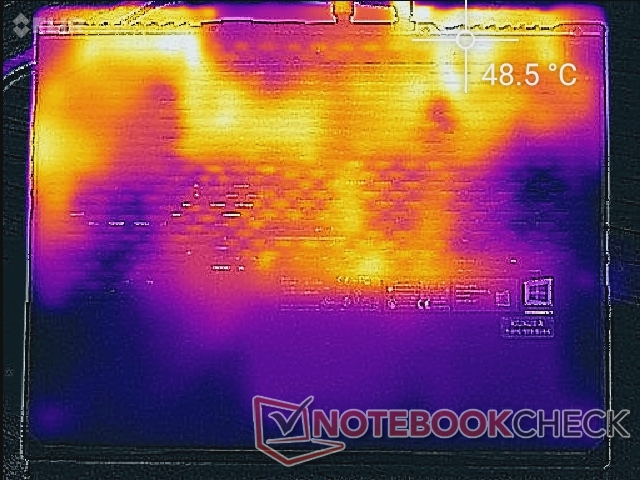
Temperature
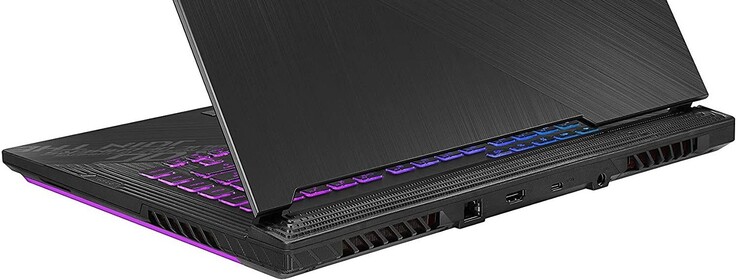
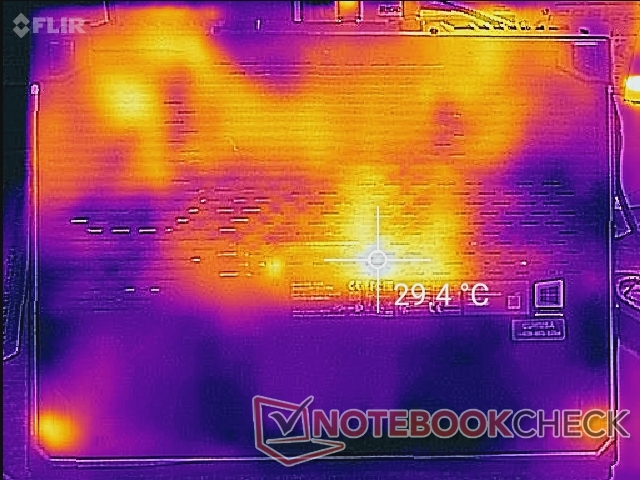
Surface temperatures are slightly different than on the G512LI because the G512LW incorporates additional ventilation along the right edge of the chassis. As a result, the right edge of the laptop will be much warmer than this same spot on the G512LI. The palm rests and most of the keyboard keys remain cooler to the touch especially when compared to ultra-thin unibody gaming laptops like the Razer Blade 15.
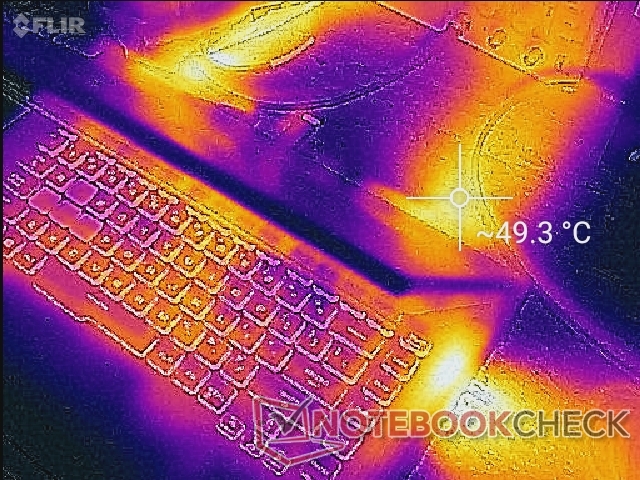
(-) The maximum temperature on the upper side is 53.4 °C / 128 F, compared to the average of 40.4 °C / 105 F, ranging from 21.2 to 68.8 °C for the class Gaming.
(-) The bottom heats up to a maximum of 49 °C / 120 F, compared to the average of 43.2 °C / 110 F
(+) In idle usage, the average temperature for the upper side is 28.4 °C / 83 F, compared to the device average of 33.9 °C / 93 F.
(±) Playing The Witcher 3, the average temperature for the upper side is 34.1 °C / 93 F, compared to the device average of 33.9 °C / 93 F.
(+) The palmrests and touchpad are cooler than skin temperature with a maximum of 27.6 °C / 81.7 F and are therefore cool to the touch.
(±) The average temperature of the palmrest area of similar devices was 28.8 °C / 83.8 F (+1.2 °C / 2.1 F).
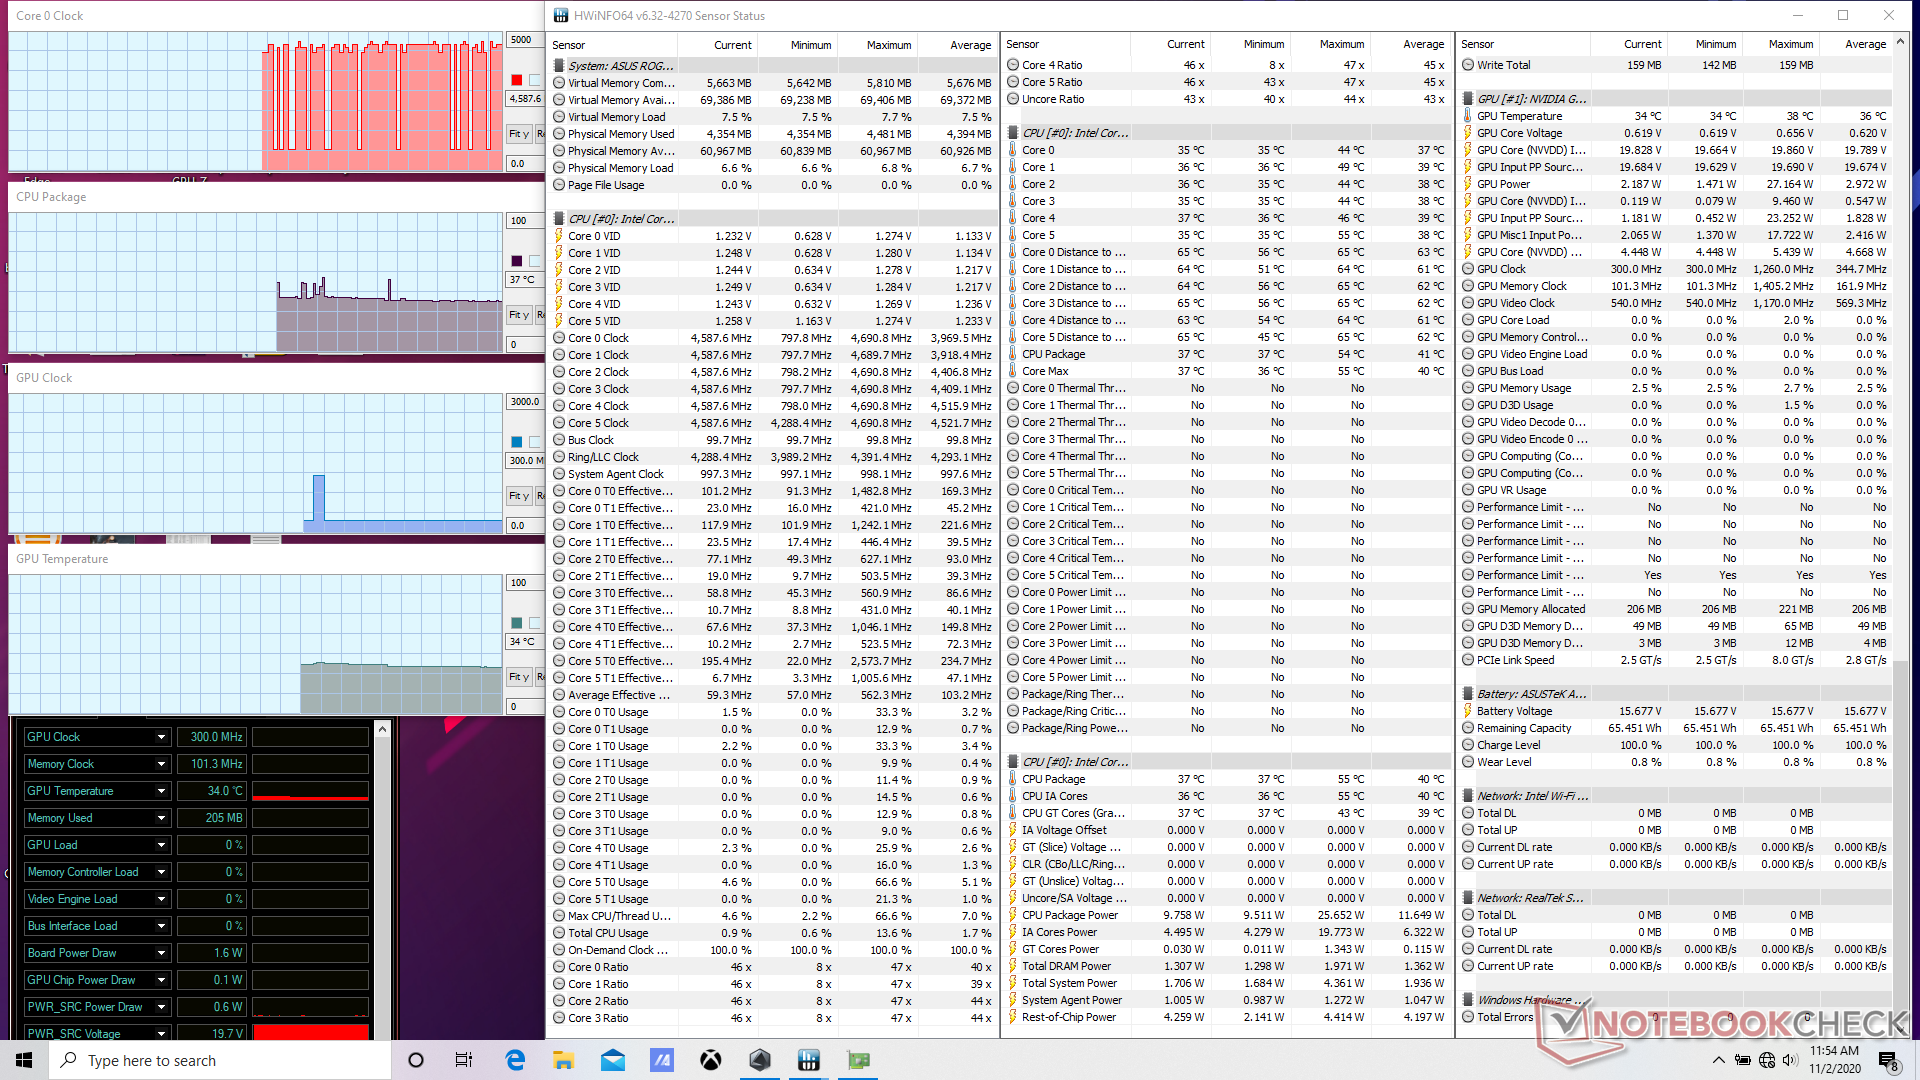
Stress Test
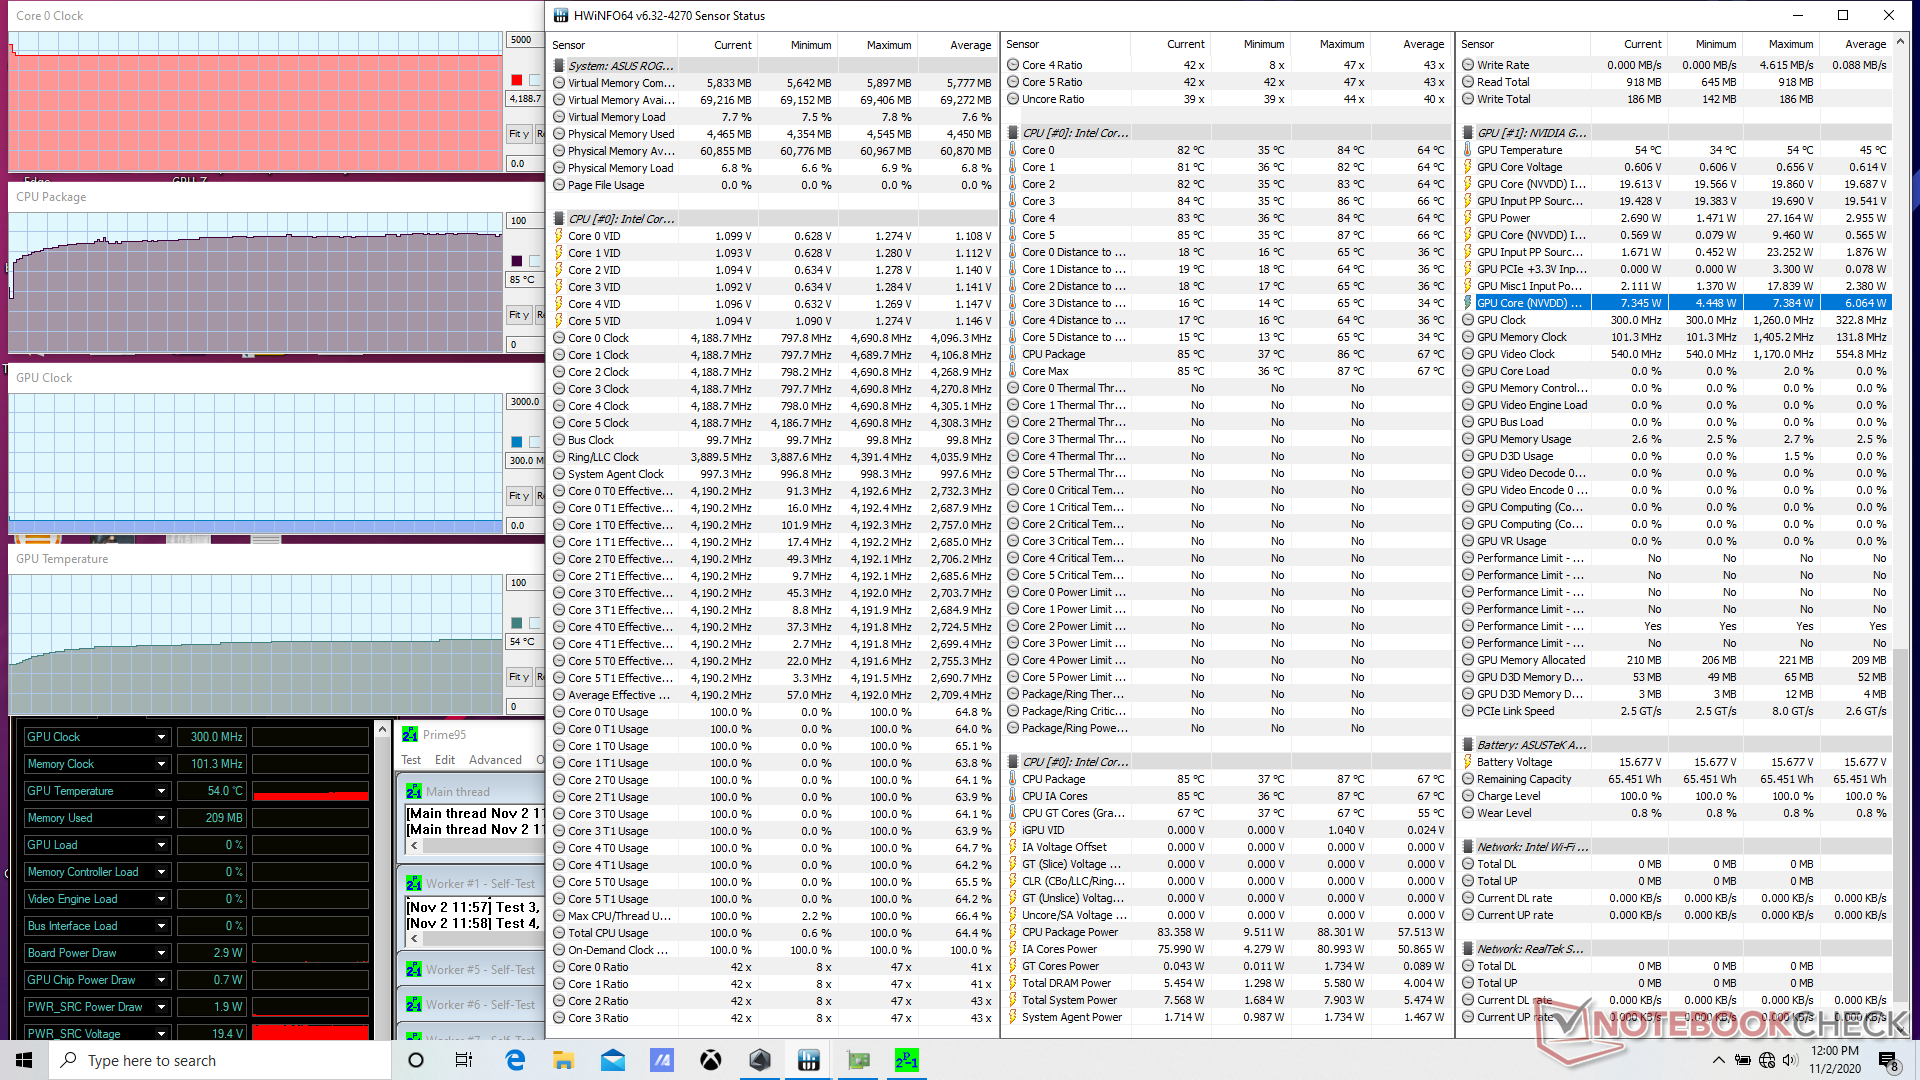
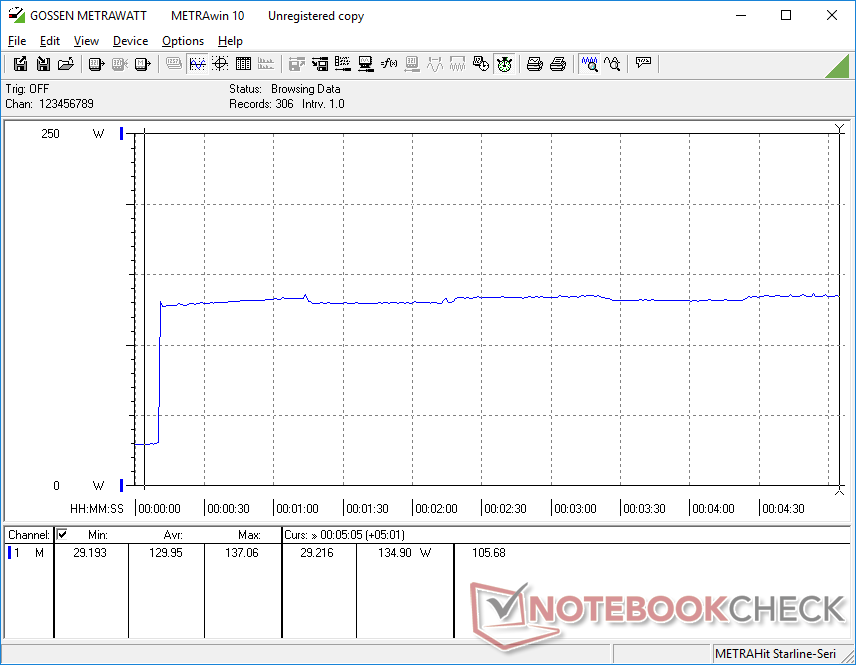
When stressed with Prime95, the CPU would boost to 4.2 GHz without dropping thereafter to mirror our CineBench R15 xT loop test results above. The laptop is able to maintain high Turbo Boost clock rates indefinitely.
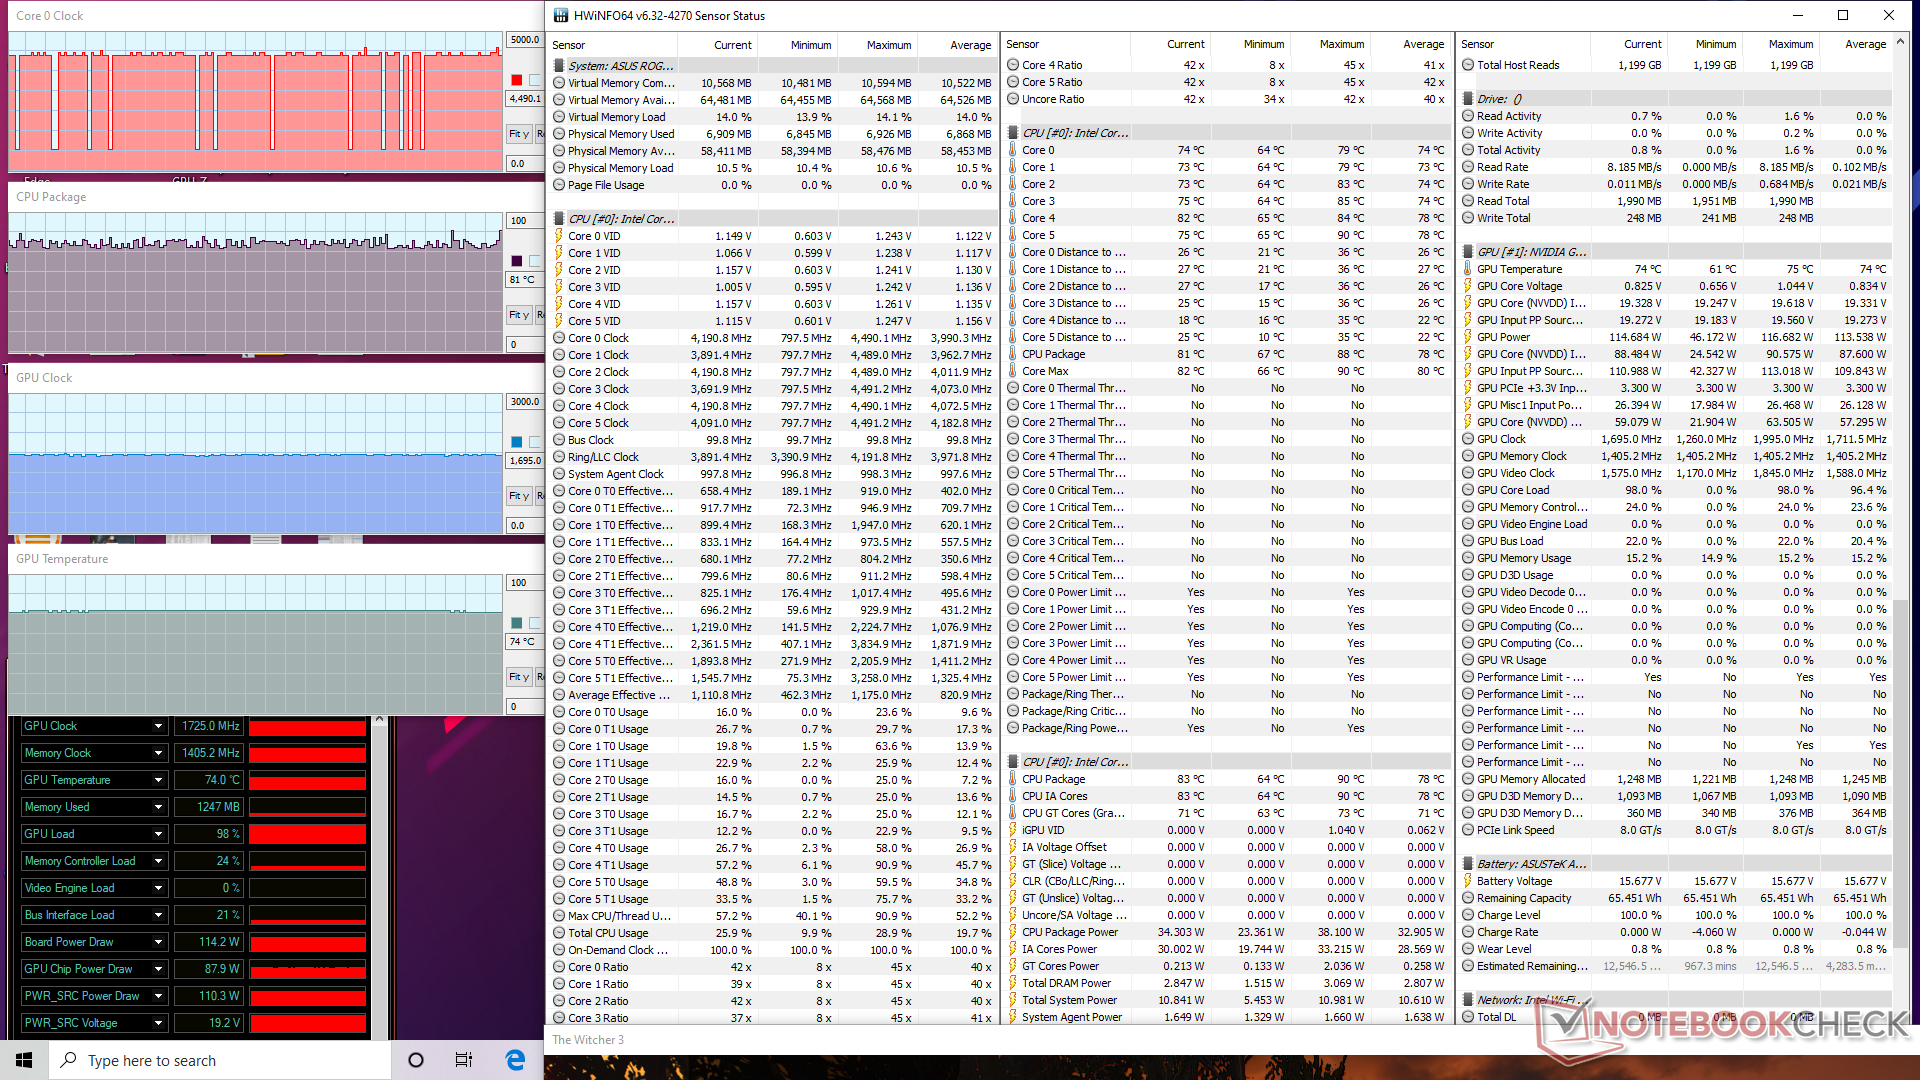
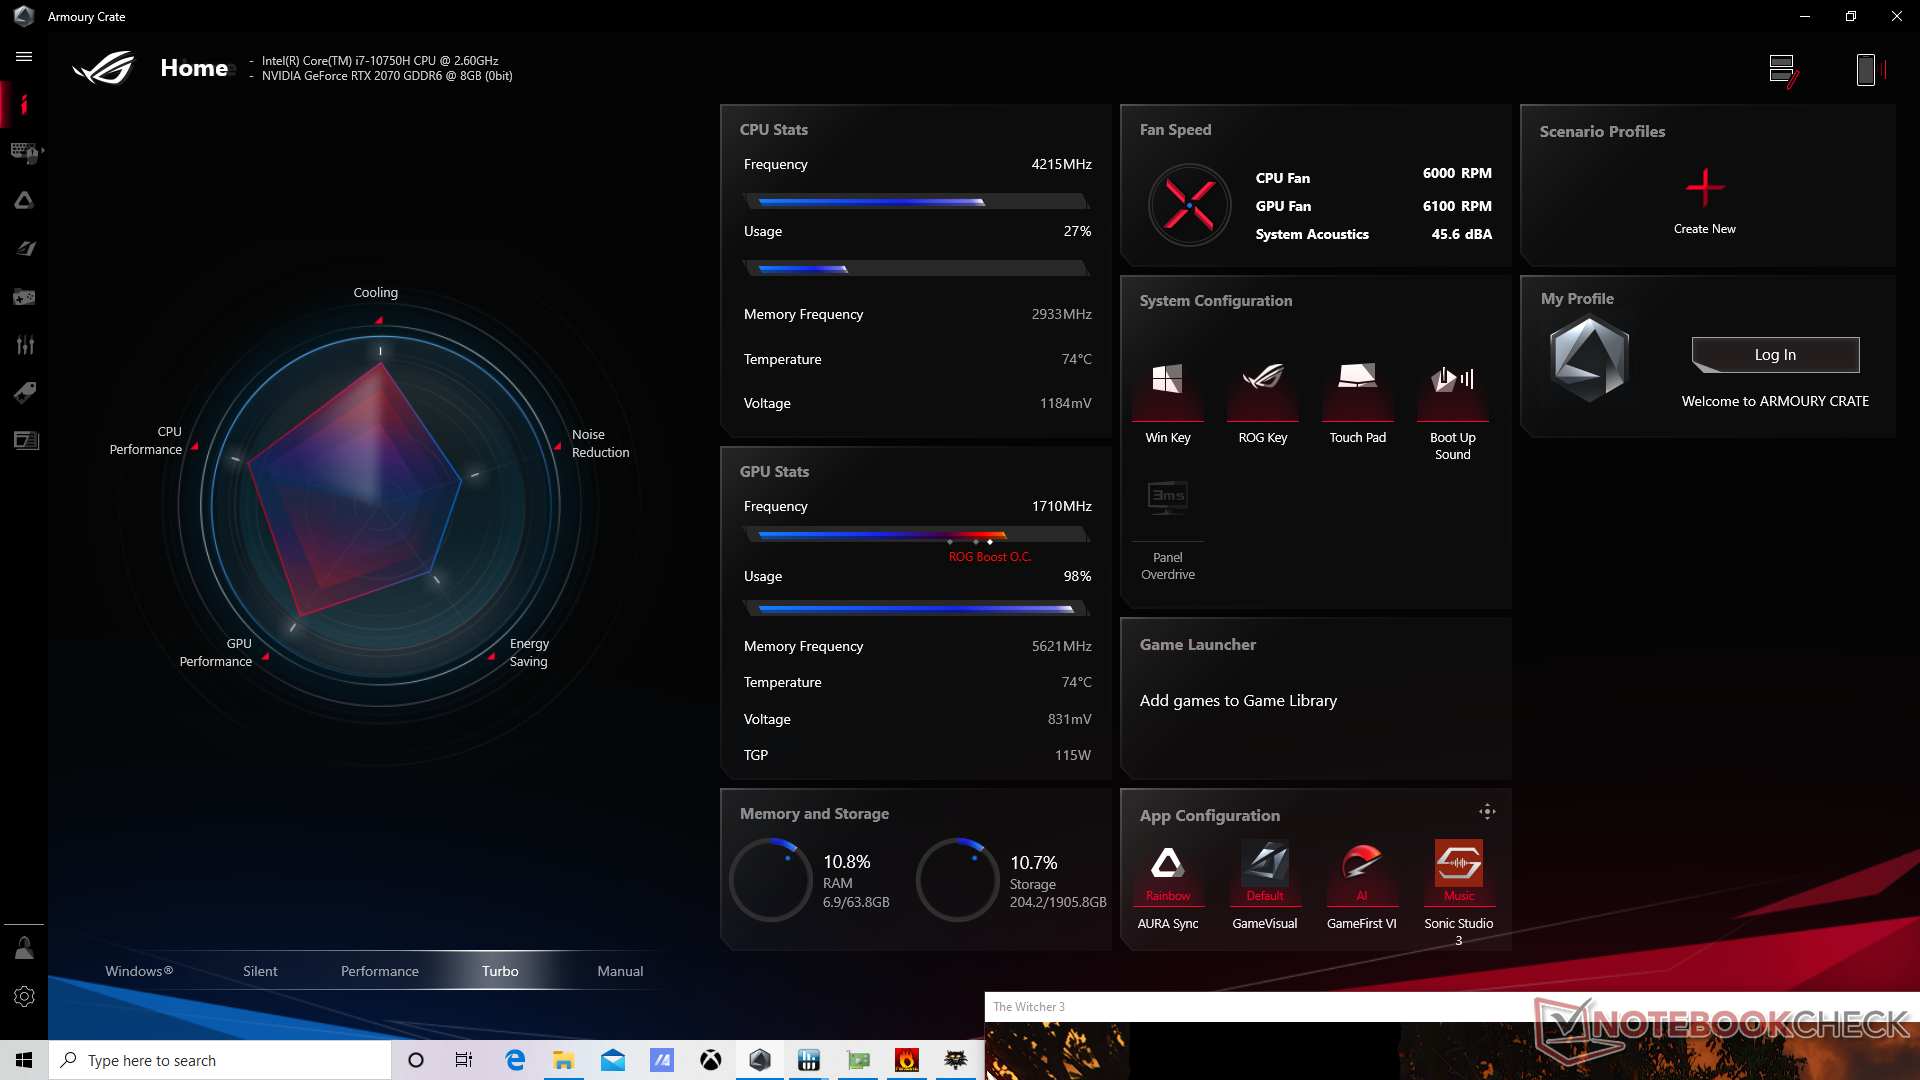
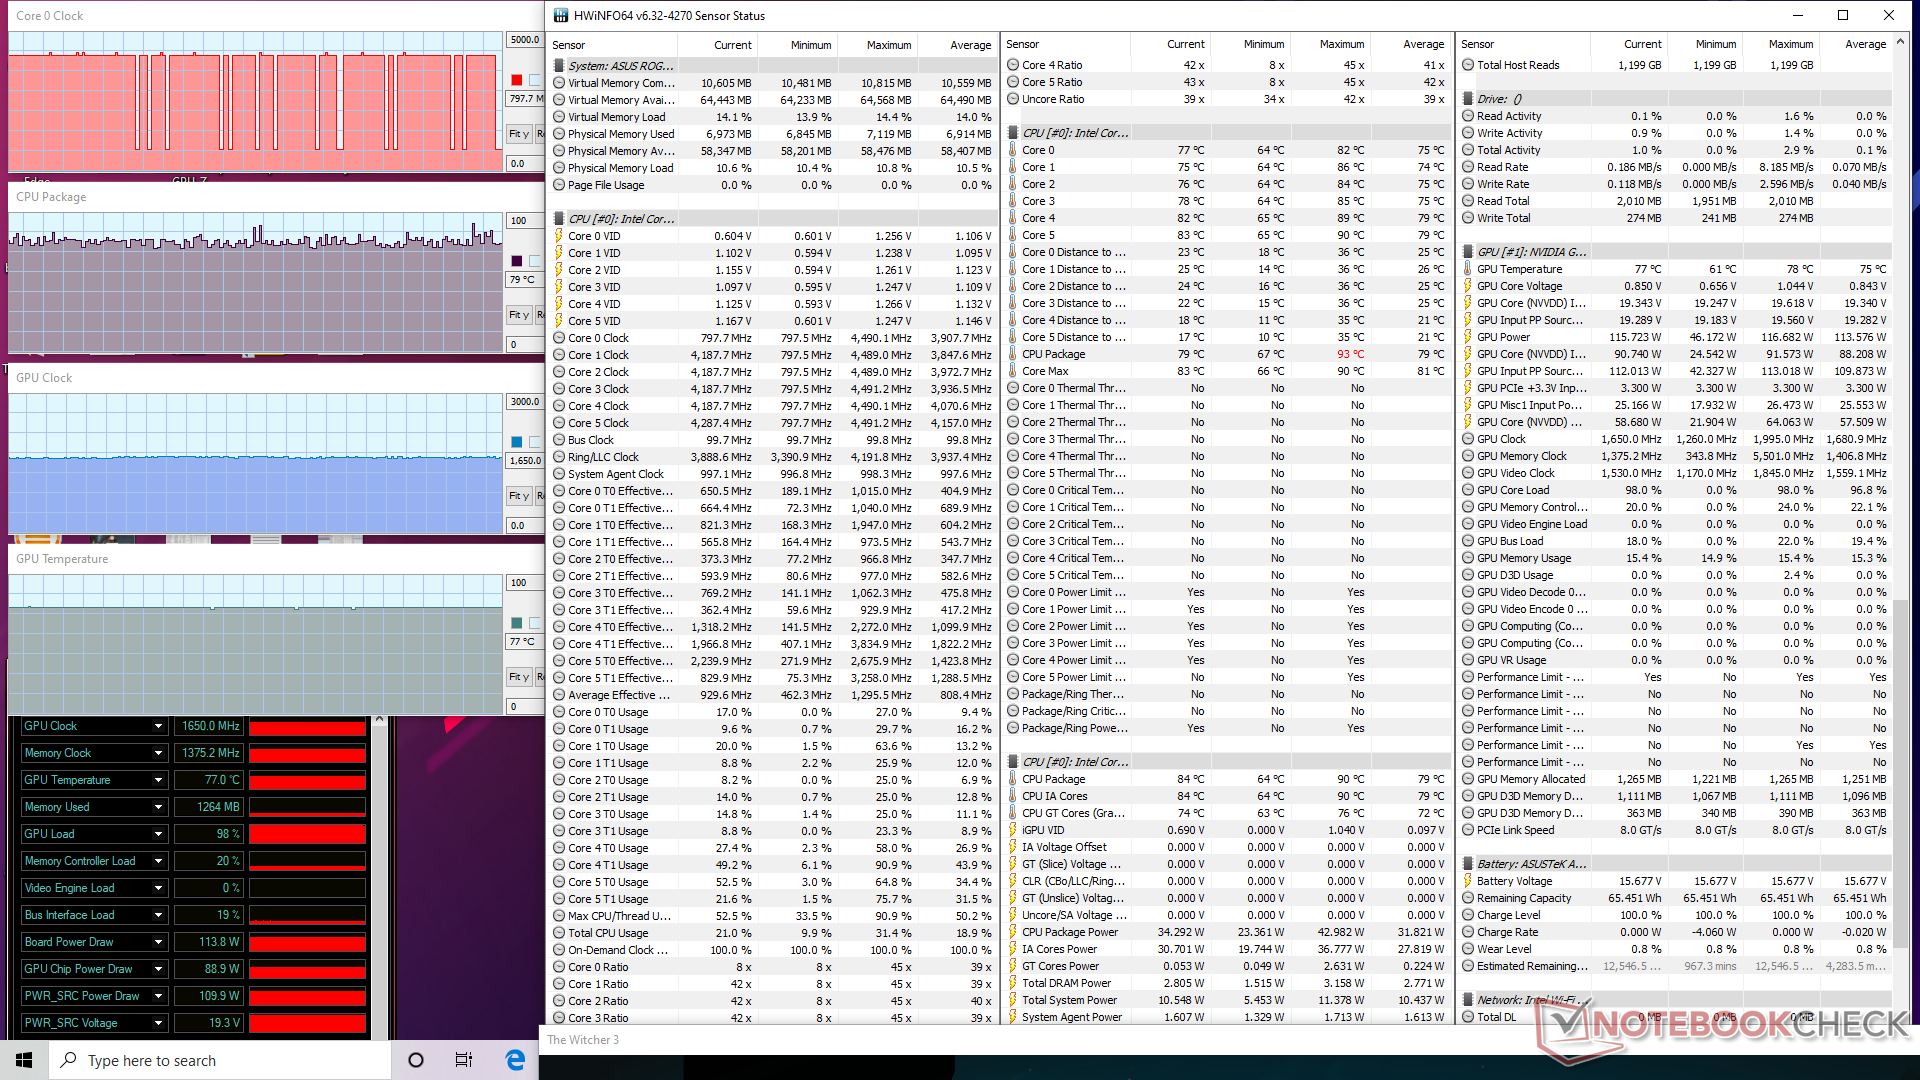
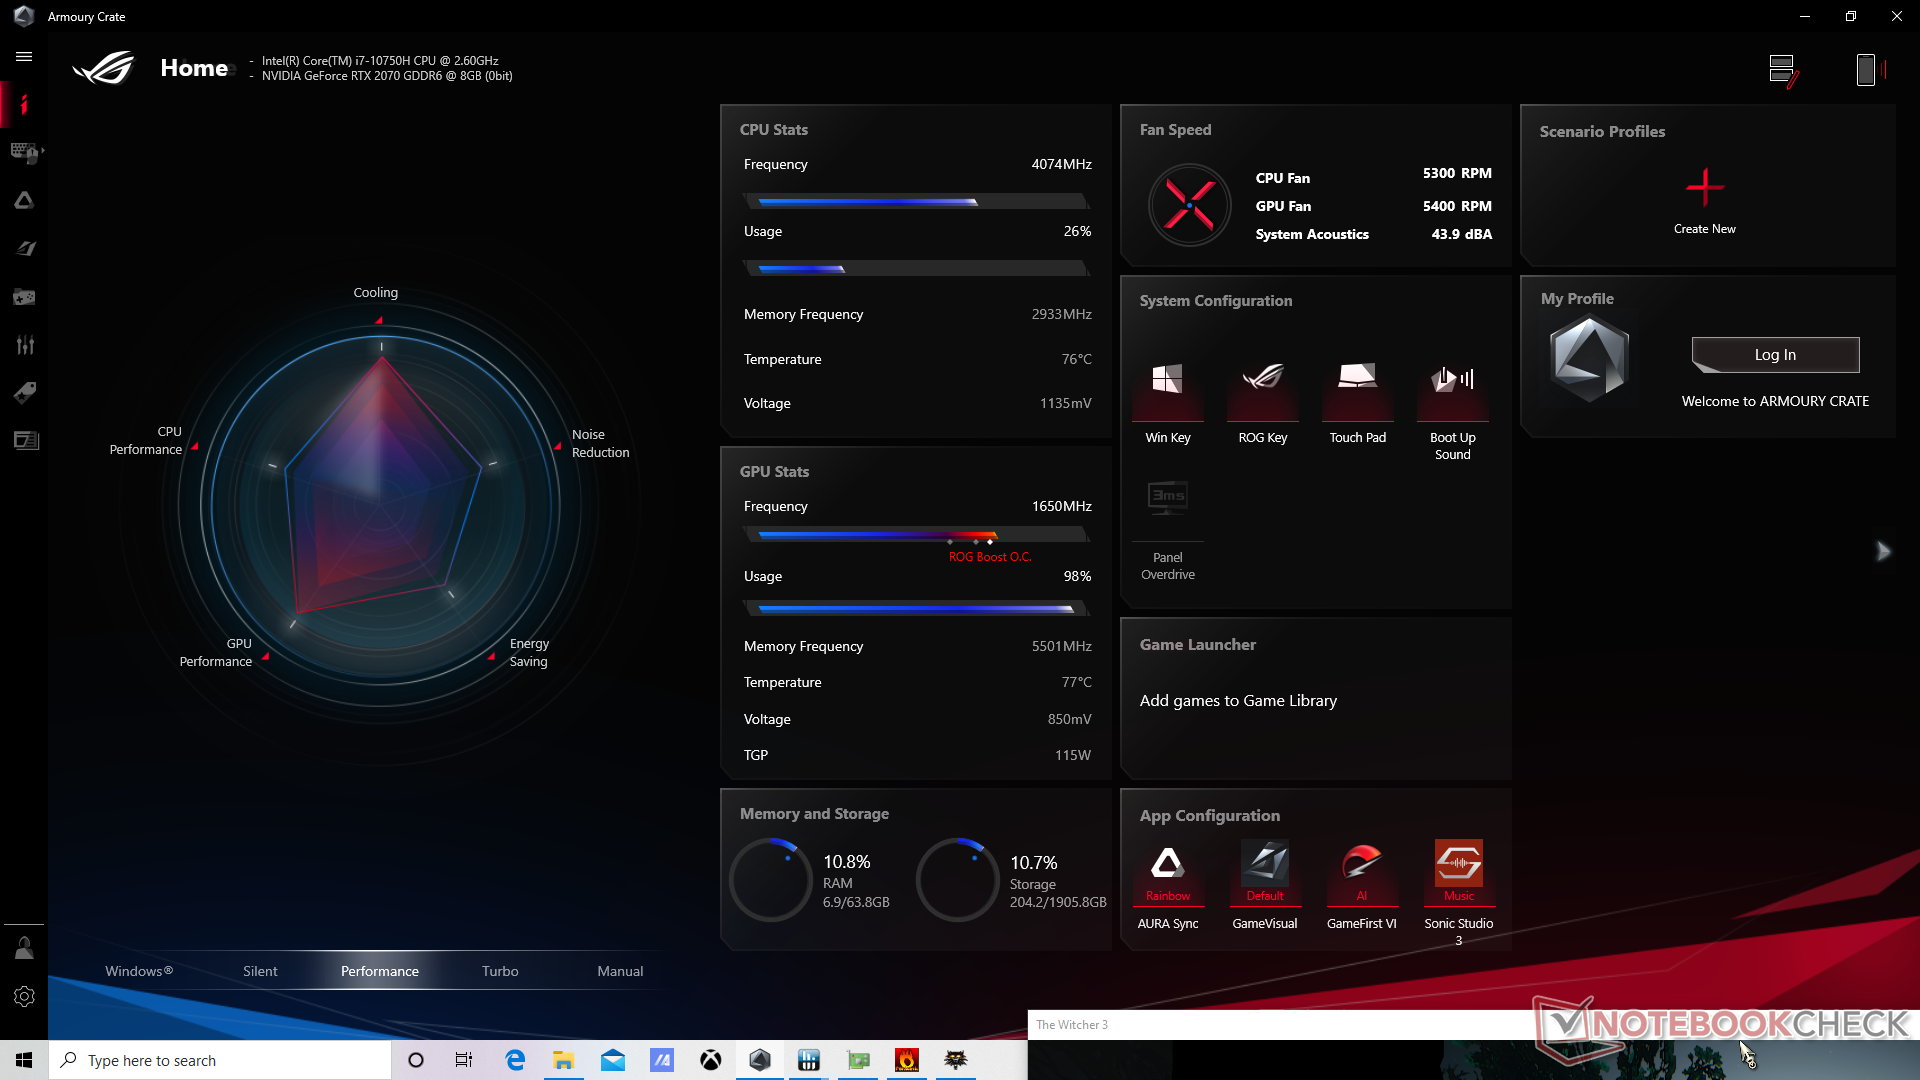
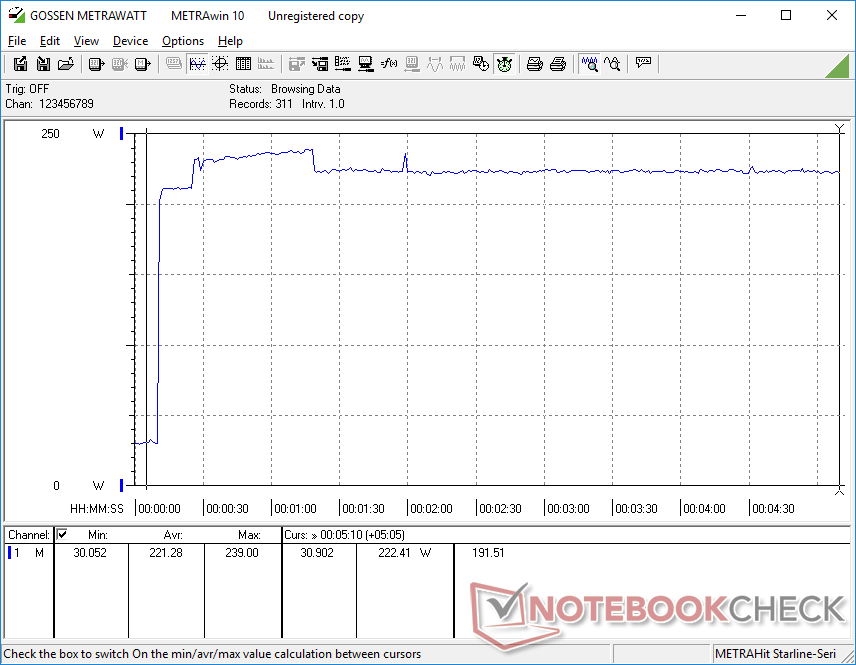
Running Witcher 3 on Turbo mode would result in slightly faster clock rates (1725 MHz vs. 1650 MHz) and memory rates (1405.2 MHz vs. 1375.2 MHz) than Performance mode without affecting core temperatures since fan RPM would also rise slightly. CPU and GPU temperatures would plateau at about 80 C and 74 C, respectively, compared to just 60 C each on the slower G512LI when under similar gaming conditions.
Running on battery power will impact performance. A 3DMark 11 test on batteries would return Physics and Graphics scores of 9811 and 10435 points, respectively, compared to 13512 and 27298 points when on mains.
| CPU Clock (GHz) | GPU Clock (MHz) | Average CPU Temperature (°C) | Average GPU Temperature (°C) | |
| System Idle | -- | -- | 37 | 34 |
| Prime95 Stress | 4.2 | -- | 85 | 54 |
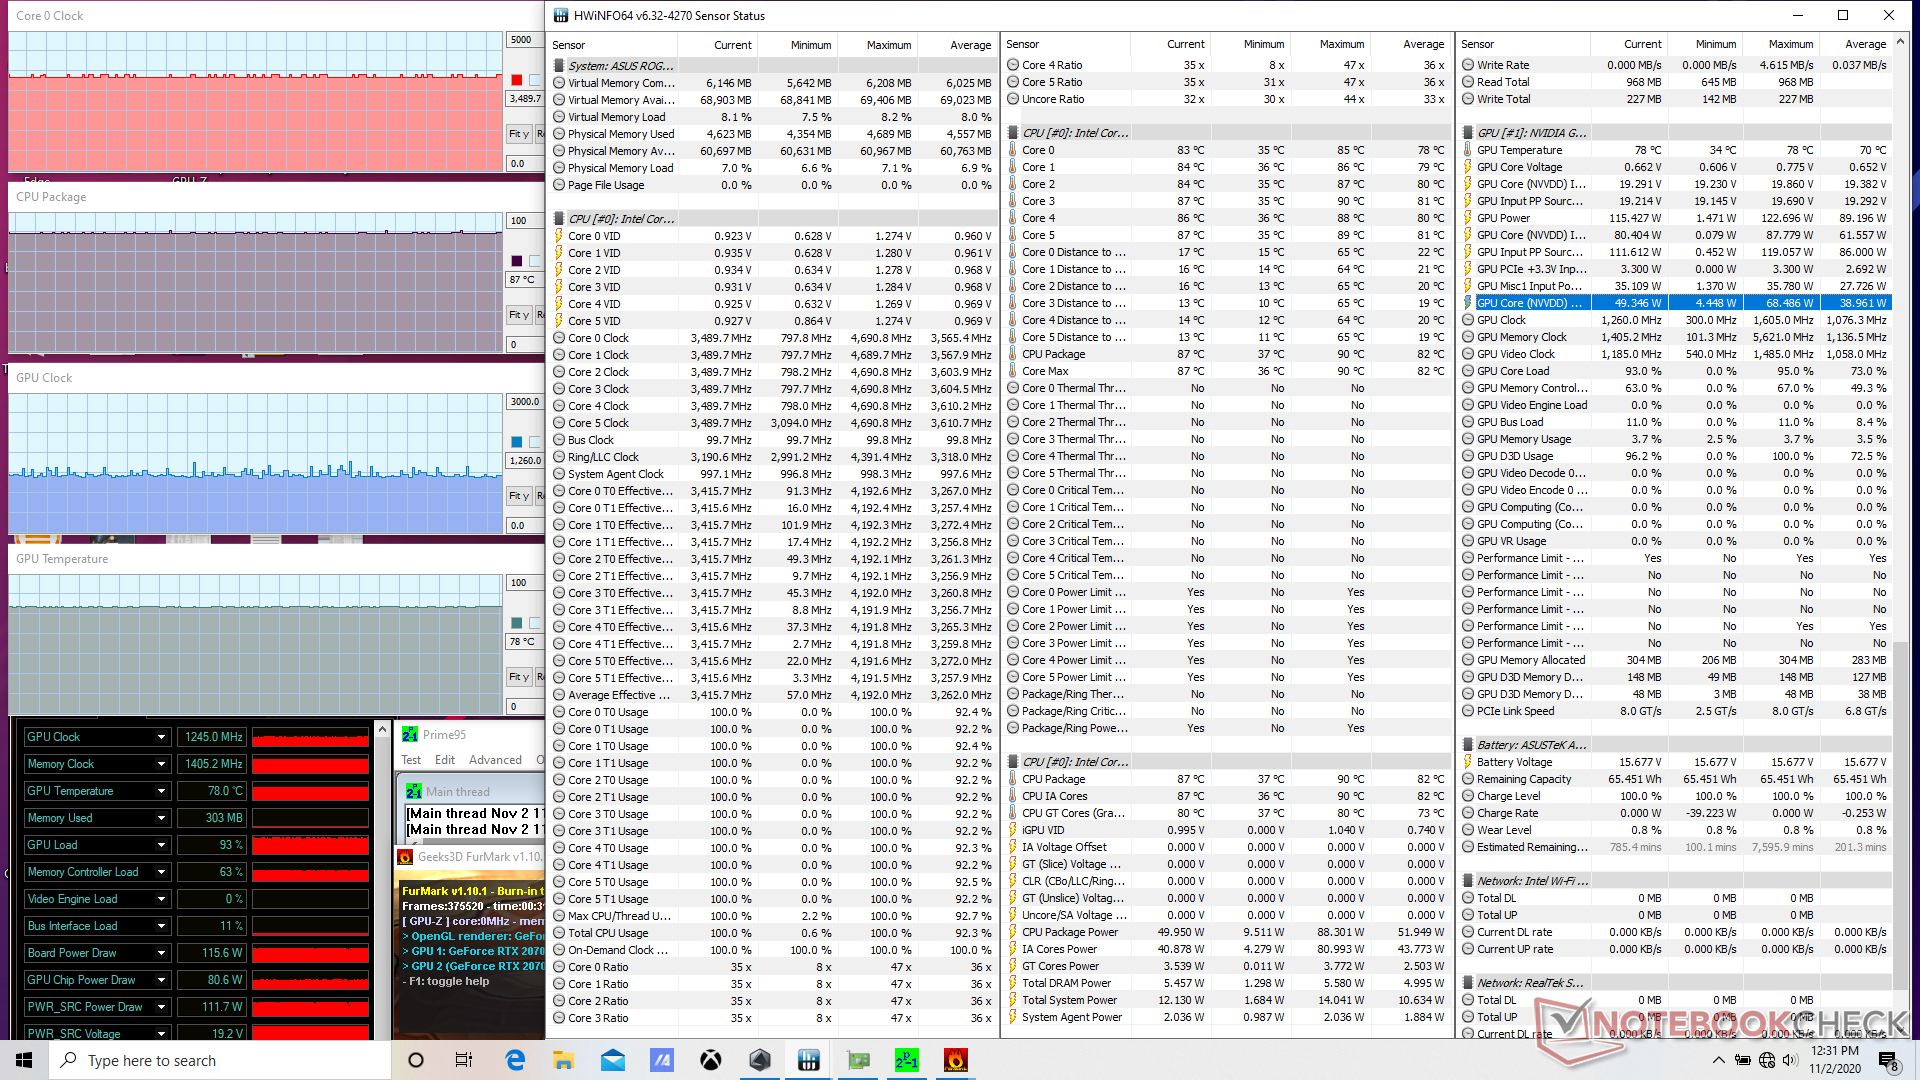
| Prime95 + FurMark Stress (Turbo mode) | 3.4 - 3.5 | 1245 | 87 | 78 |
| Witcher 3 Stress (Performance mode) | 0.8 - 4.2 | 1650 | ~79 | 77 |
| Witcher 3 Stress (Turbo mode | 0.8 - 4.2 | 1725 | ~80 | 74 |
Speakers


Asus ROG Strix G15 G512LW audio analysis
(+) | speakers can play relatively loud (83.8 dB)
Bass 100 - 315 Hz
(±) | reduced bass - on average 8.8% lower than median
(±) | linearity of bass is average (7.8% delta to prev. frequency)
Mids 400 - 2000 Hz
(±) | higher mids - on average 7.5% higher than median
(+) | mids are linear (6.2% delta to prev. frequency)
Highs 2 - 16 kHz
(+) | balanced highs - only 2.4% away from median
(+) | highs are linear (6% delta to prev. frequency)
Overall 100 - 16.000 Hz
(±) | linearity of overall sound is average (16.4% difference to median)
Compared to same class
» 42% of all tested devices in this class were better, 6% similar, 52% worse
» The best had a delta of 6%, average was 18%, worst was 132%
Compared to all devices tested
» 27% of all tested devices were better, 6% similar, 67% worse
» The best had a delta of 4%, average was 23%, worst was 134%
Apple MacBook 12 (Early 2016) 1.1 GHz audio analysis
(+) | speakers can play relatively loud (83.6 dB)
Bass 100 - 315 Hz
(±) | reduced bass - on average 11.3% lower than median
(±) | linearity of bass is average (14.2% delta to prev. frequency)
Mids 400 - 2000 Hz
(+) | balanced mids - only 2.4% away from median
(+) | mids are linear (5.5% delta to prev. frequency)
Highs 2 - 16 kHz
(+) | balanced highs - only 2% away from median
(+) | highs are linear (4.5% delta to prev. frequency)
Overall 100 - 16.000 Hz
(+) | overall sound is linear (10.2% difference to median)
Compared to same class
» 7% of all tested devices in this class were better, 2% similar, 90% worse
» The best had a delta of 5%, average was 18%, worst was 53%
Compared to all devices tested
» 5% of all tested devices were better, 1% similar, 94% worse
» The best had a delta of 4%, average was 23%, worst was 134%
Energy Management
Power Consumption
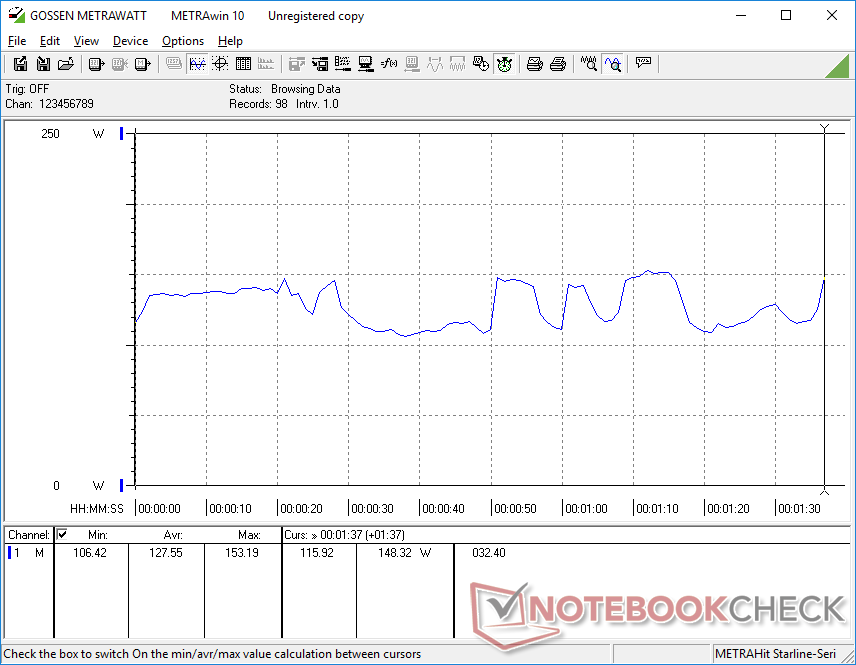
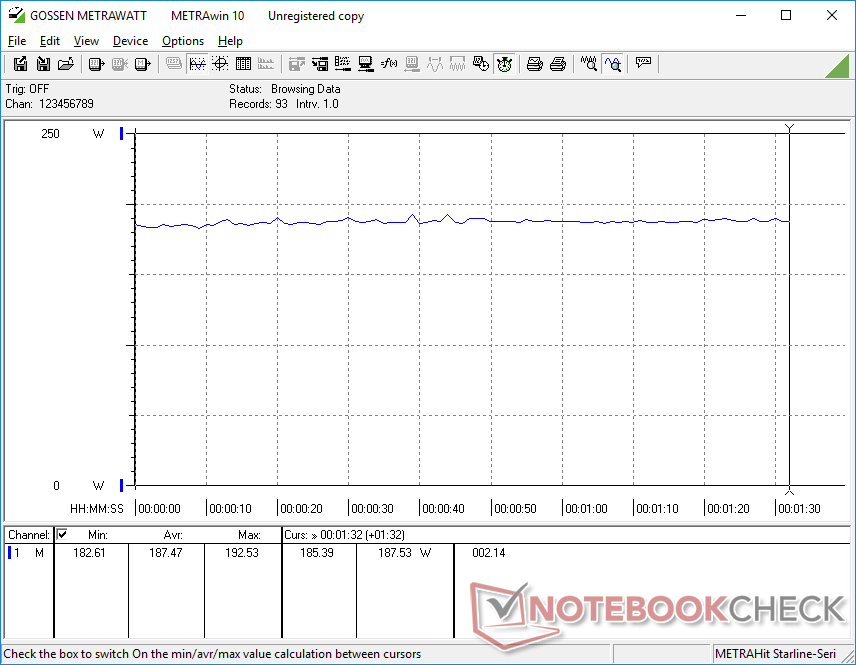
Idling on desktop will demand between 16 W and 31 W depending on the brightness and power profile. Otherwise, gaming will demand about 187 W to be similar to what we recorded on the MSI GP65 10SFK equipped with the same CPU and GPU. Consumption is about 2x greater than the G512LI which aligns with the 2x greater graphics performance mentioned above.
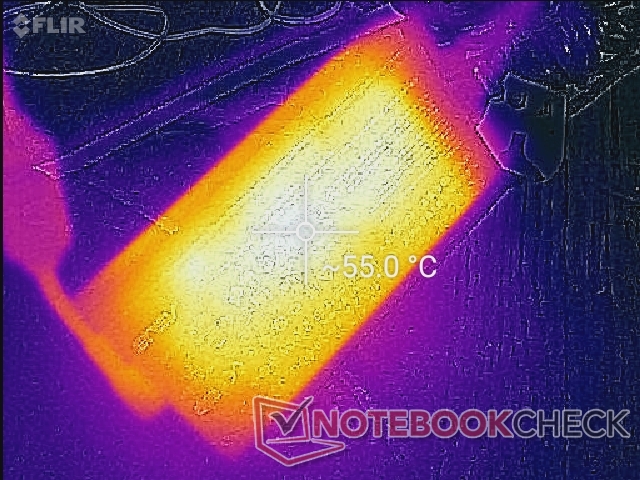
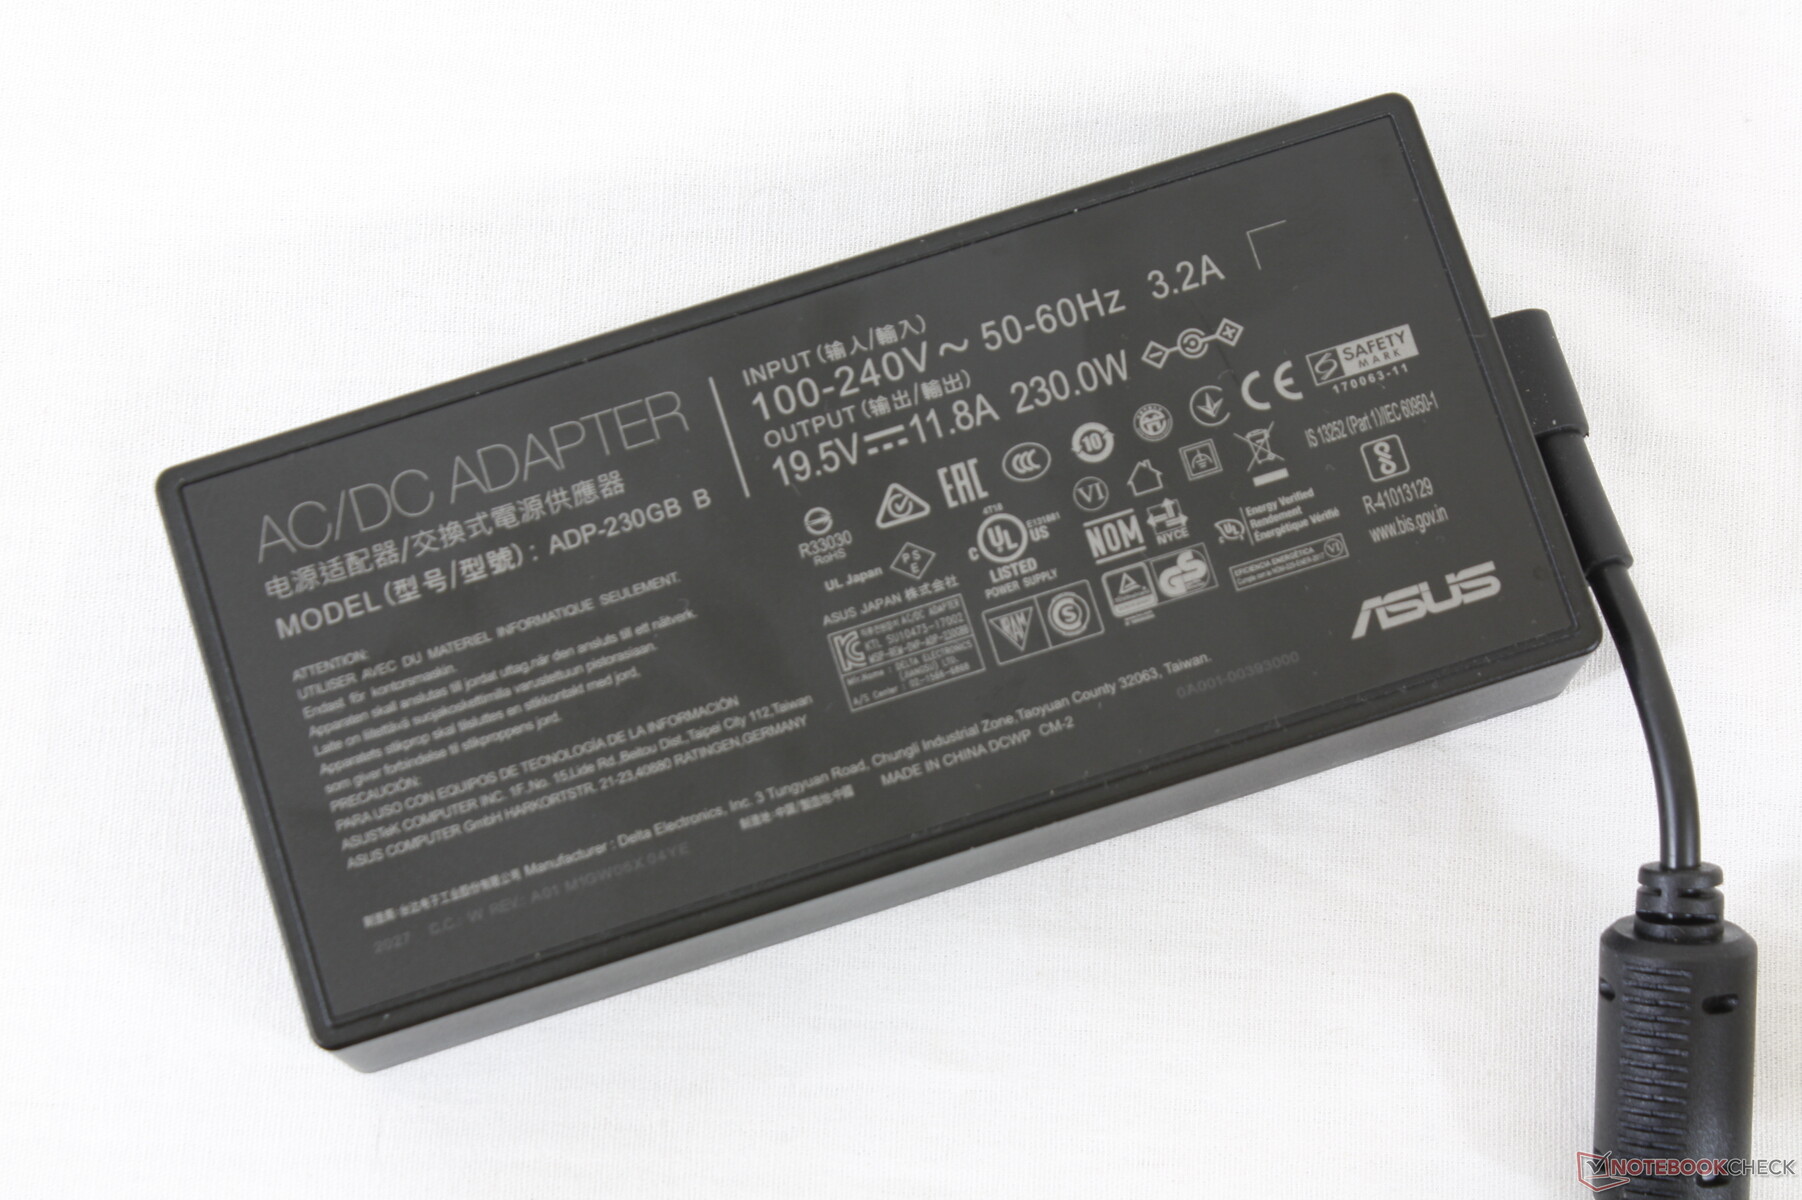
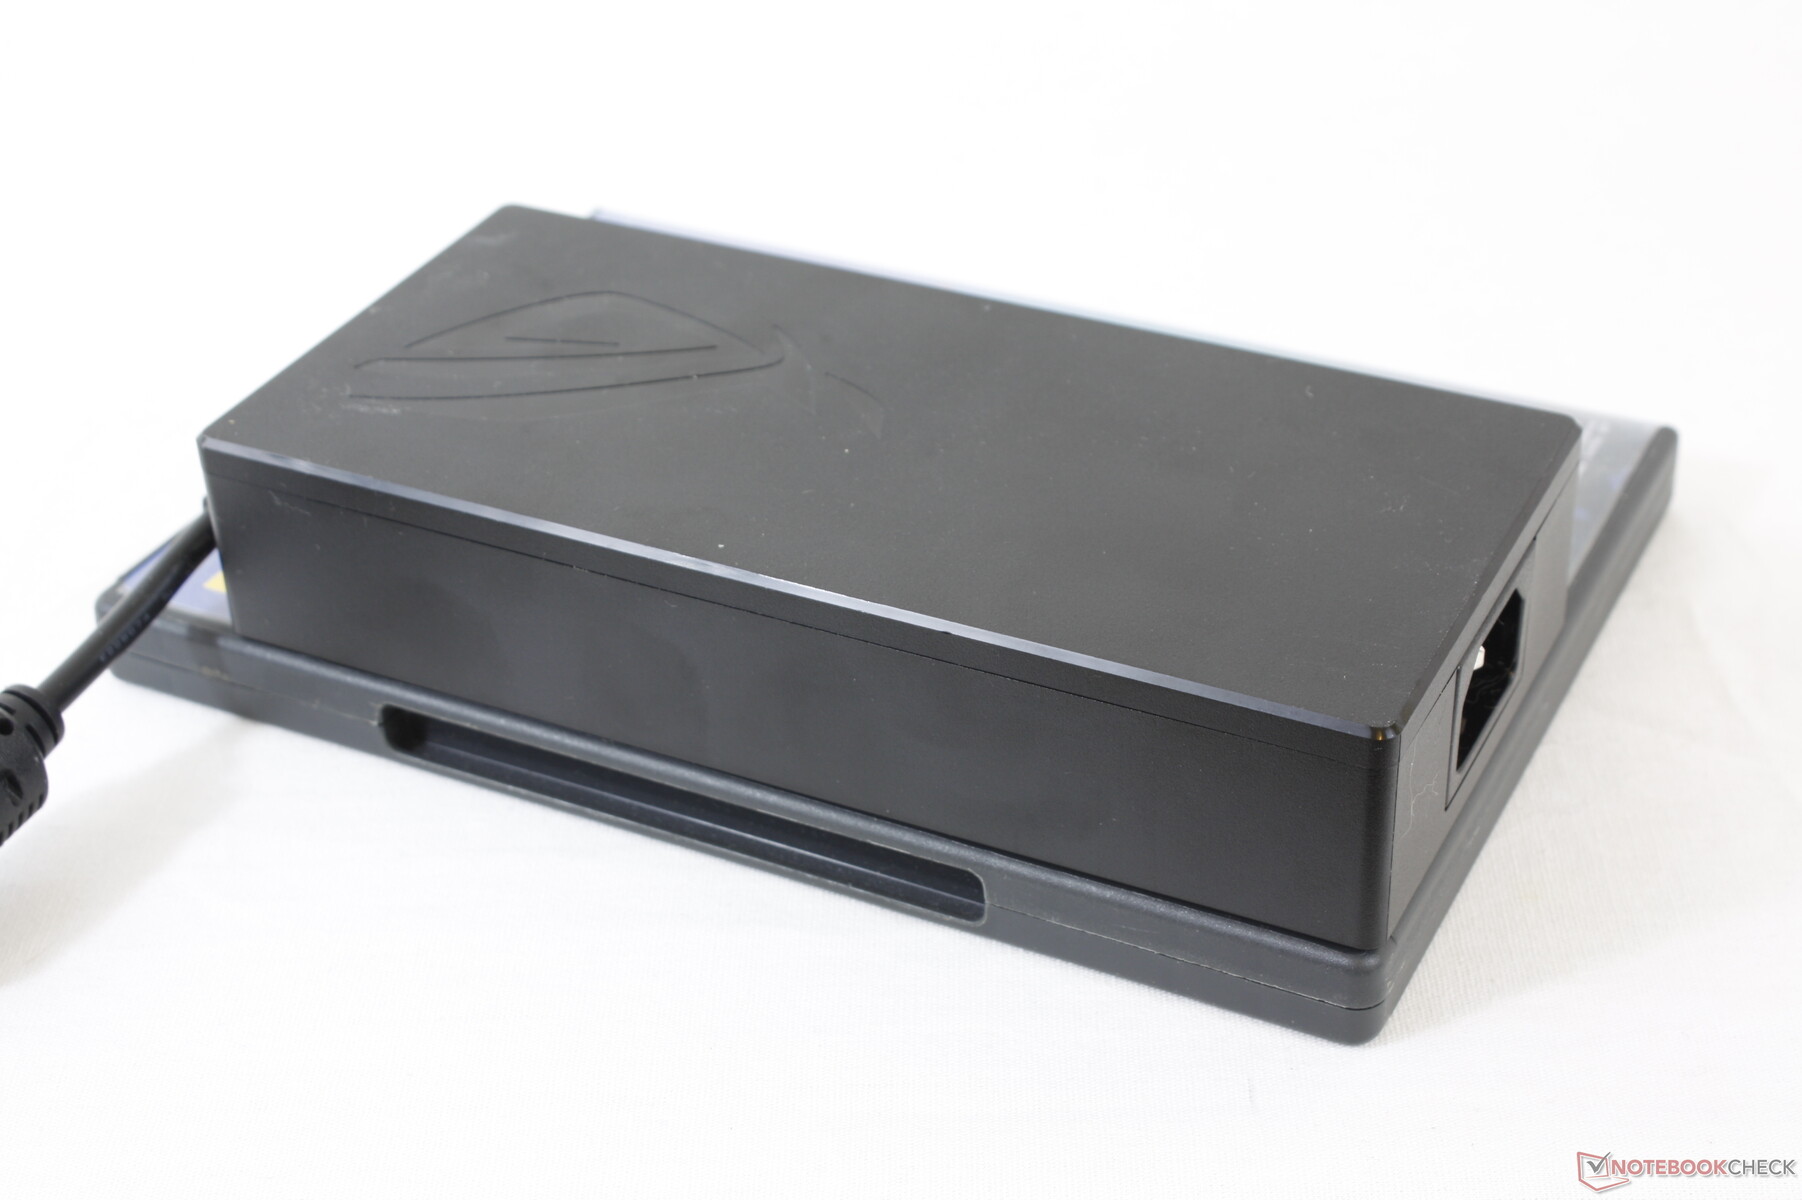
Note that the G512LW ships with a larger 240 W AC adapter (~16.5 x 7.5 x 3.2 cm) compared to the 150 W AC adapter for the G512LI due to the more demanding RTX 2070 GPU.
| Off / Standby | |
| Idle | |
| Load |
|
Key:
min: | |
| Asus ROG Strix G15 G512LW i7-10750H, GeForce RTX 2070 Mobile, Toshiba XG5-P KXG50PNV2T04, IPS, 1920x1080, 15.6" | Asus ROG Strix G15 G512LI i7-10750H, GeForce GTX 1650 Ti Mobile, Intel SSD 660p SSDPEKNW512G8, IPS, 1920x1080, 15.6" | Razer Blade 15 RTX 2070 Super Max-Q i7-10875H, GeForce RTX 2070 Super Max-Q, Samsung SSD PM981a MZVLB512HBJQ, IPS, 1920x1080, 15.6" | MSI GP65 10SFK-047US i7-10750H, GeForce RTX 2070 Mobile, Samsung SSD PM981 MZVLB1T0HALR, IPS, 1920x1080, 15.6" | Asus ROG Strix Scar 15 G532LWS i9-10980HK, GeForce RTX 2070 Super Mobile, 2x Intel SSD 660p 1TB SSDPEKNW010T8 (RAID 0), IPS, 1920x1080, 15.6" | |
|---|---|---|---|---|---|
| Power Consumption | 43% | 5% | 14% | 12% | |
| Idle Minimum * (Watt) | 16.2 | 5.7 65% | 14.3 12% | 14.2 12% | 8 51% |
| Idle Average * (Watt) | 24.1 | 9.3 61% | 22.3 7% | 18.8 22% | 9.8 59% |
| Idle Maximum * (Watt) | 30.8 | 20.9 32% | 36.9 -20% | 23.9 22% | 25.8 16% |
| Load Average * (Watt) | 127.6 | 105.1 18% | 118.4 7% | 96.9 24% | 169 -32% |
| Witcher 3 ultra * (Watt) | 187.5 | 94.5 50% | 153.7 18% | 185 1% | 201 -7% |
| Load Maximum * (Watt) | 239 | 160.8 33% | 220.8 8% | 233.4 2% | 271.6 -14% |
* ... smaller is better
Battery Life
Asus has upped the battery capacity from 48 Wh on the G512LI to 66 Wh on our G512LW. Subsequently, WLAN runtimes are almost two hours longer at just under 6.5 hours of real-world WLAN use. Recharging from empty to full capacity still takes less than 1.5 hours.
| Asus ROG Strix G15 G512LW i7-10750H, GeForce RTX 2070 Mobile, 66 Wh | Asus ROG Strix G15 G512LI i7-10750H, GeForce GTX 1650 Ti Mobile, 48 Wh | Razer Blade 15 RTX 2070 Super Max-Q i7-10875H, GeForce RTX 2070 Super Max-Q, 80 Wh | MSI GP65 10SFK-047US i7-10750H, GeForce RTX 2070 Mobile, 51 Wh | Asus ROG Strix Scar 15 G532LWS i9-10980HK, GeForce RTX 2070 Super Mobile, 66 Wh | Alienware m15 R3 P87F i7-10750H, GeForce RTX 2070 Mobile, 86 Wh | |
|---|---|---|---|---|---|---|
| Battery runtime | -30% | -2% | -42% | -23% | -56% | |
| WiFi v1.3 (h) | 6.4 | 4.5 -30% | 6.3 -2% | 3.7 -42% | 4.9 -23% | 2.8 -56% |
| Reader / Idle (h) | 13.3 | 8.1 | 5 | |||
| Load (h) | 1.4 | 1.5 | 0.7 |
Pros
Cons
Verdict

A poor display can ruin an otherwise good gaming laptop. While the less expensive ROG Strix G15 G512LI performs well, its slow display response times and limited color reproduction would make the gaming experience feel subpar. Fortunately, the G512LW uses an entirely different panel that's better fit for the target audience of hardcore or competitive gamers.
Key drawbacks remain all of which are common on the G512 series. The Armoury Crate power profiles continues to clash with the Windows power profiles. Turbo mode in particular is necessary to get the most performance out of the G512 meaning maximum fan noise will be inevitable for many gamers. Meanwhile, dimensions are large especially in length due to the protruding rear. Thunderbolt 3, webcam, SD card reader, and even Asus Keystone are all absent which may irk users who rely on these features. There's a lot of power and expandability under the hood if you can deal with the large footprint, small arrow keys, and loud fans.
Excellent performance at decent temperatures especially given the full-power GeForce RTX 2070 inside. Owners will like the 240 Hz display and expandable RAM and storage, but the loud fans could be bothersome without a pair of headphones.
Asus ROG Strix G15 G512LW
- 11/04/2020 v7 (old)
Allen Ngo
Price comparison
