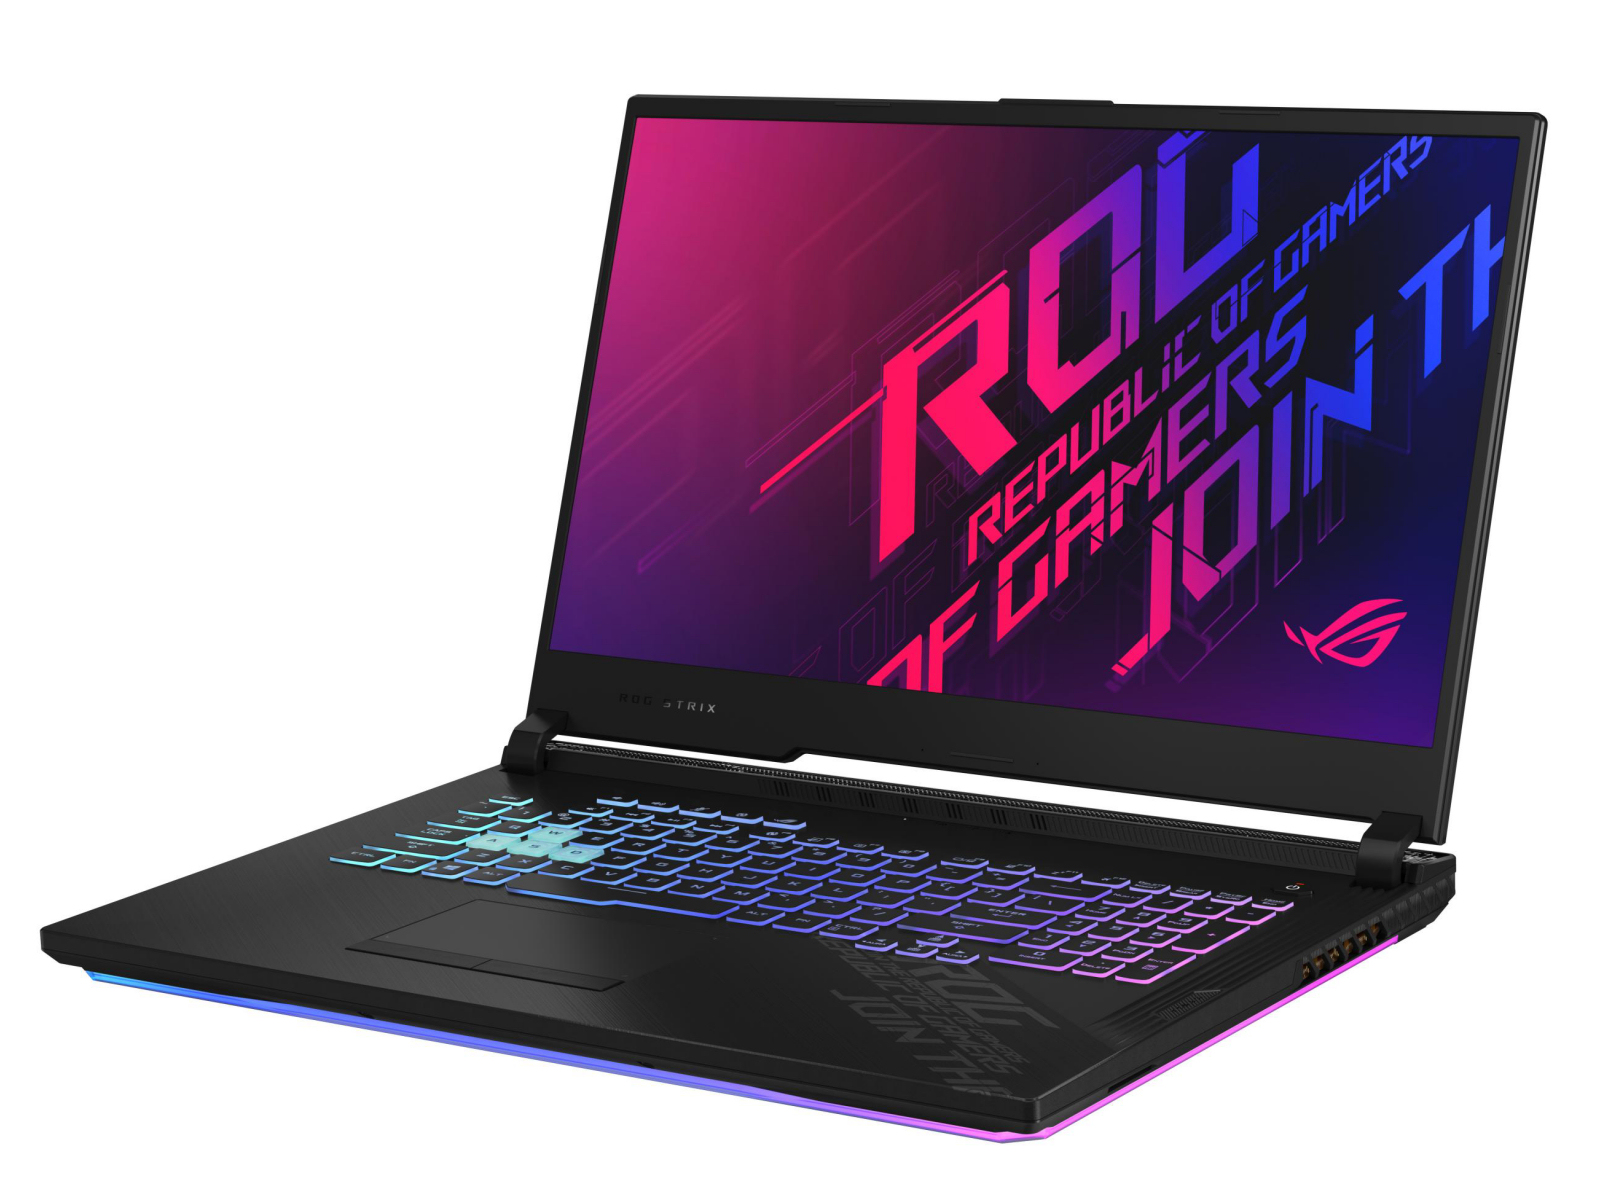
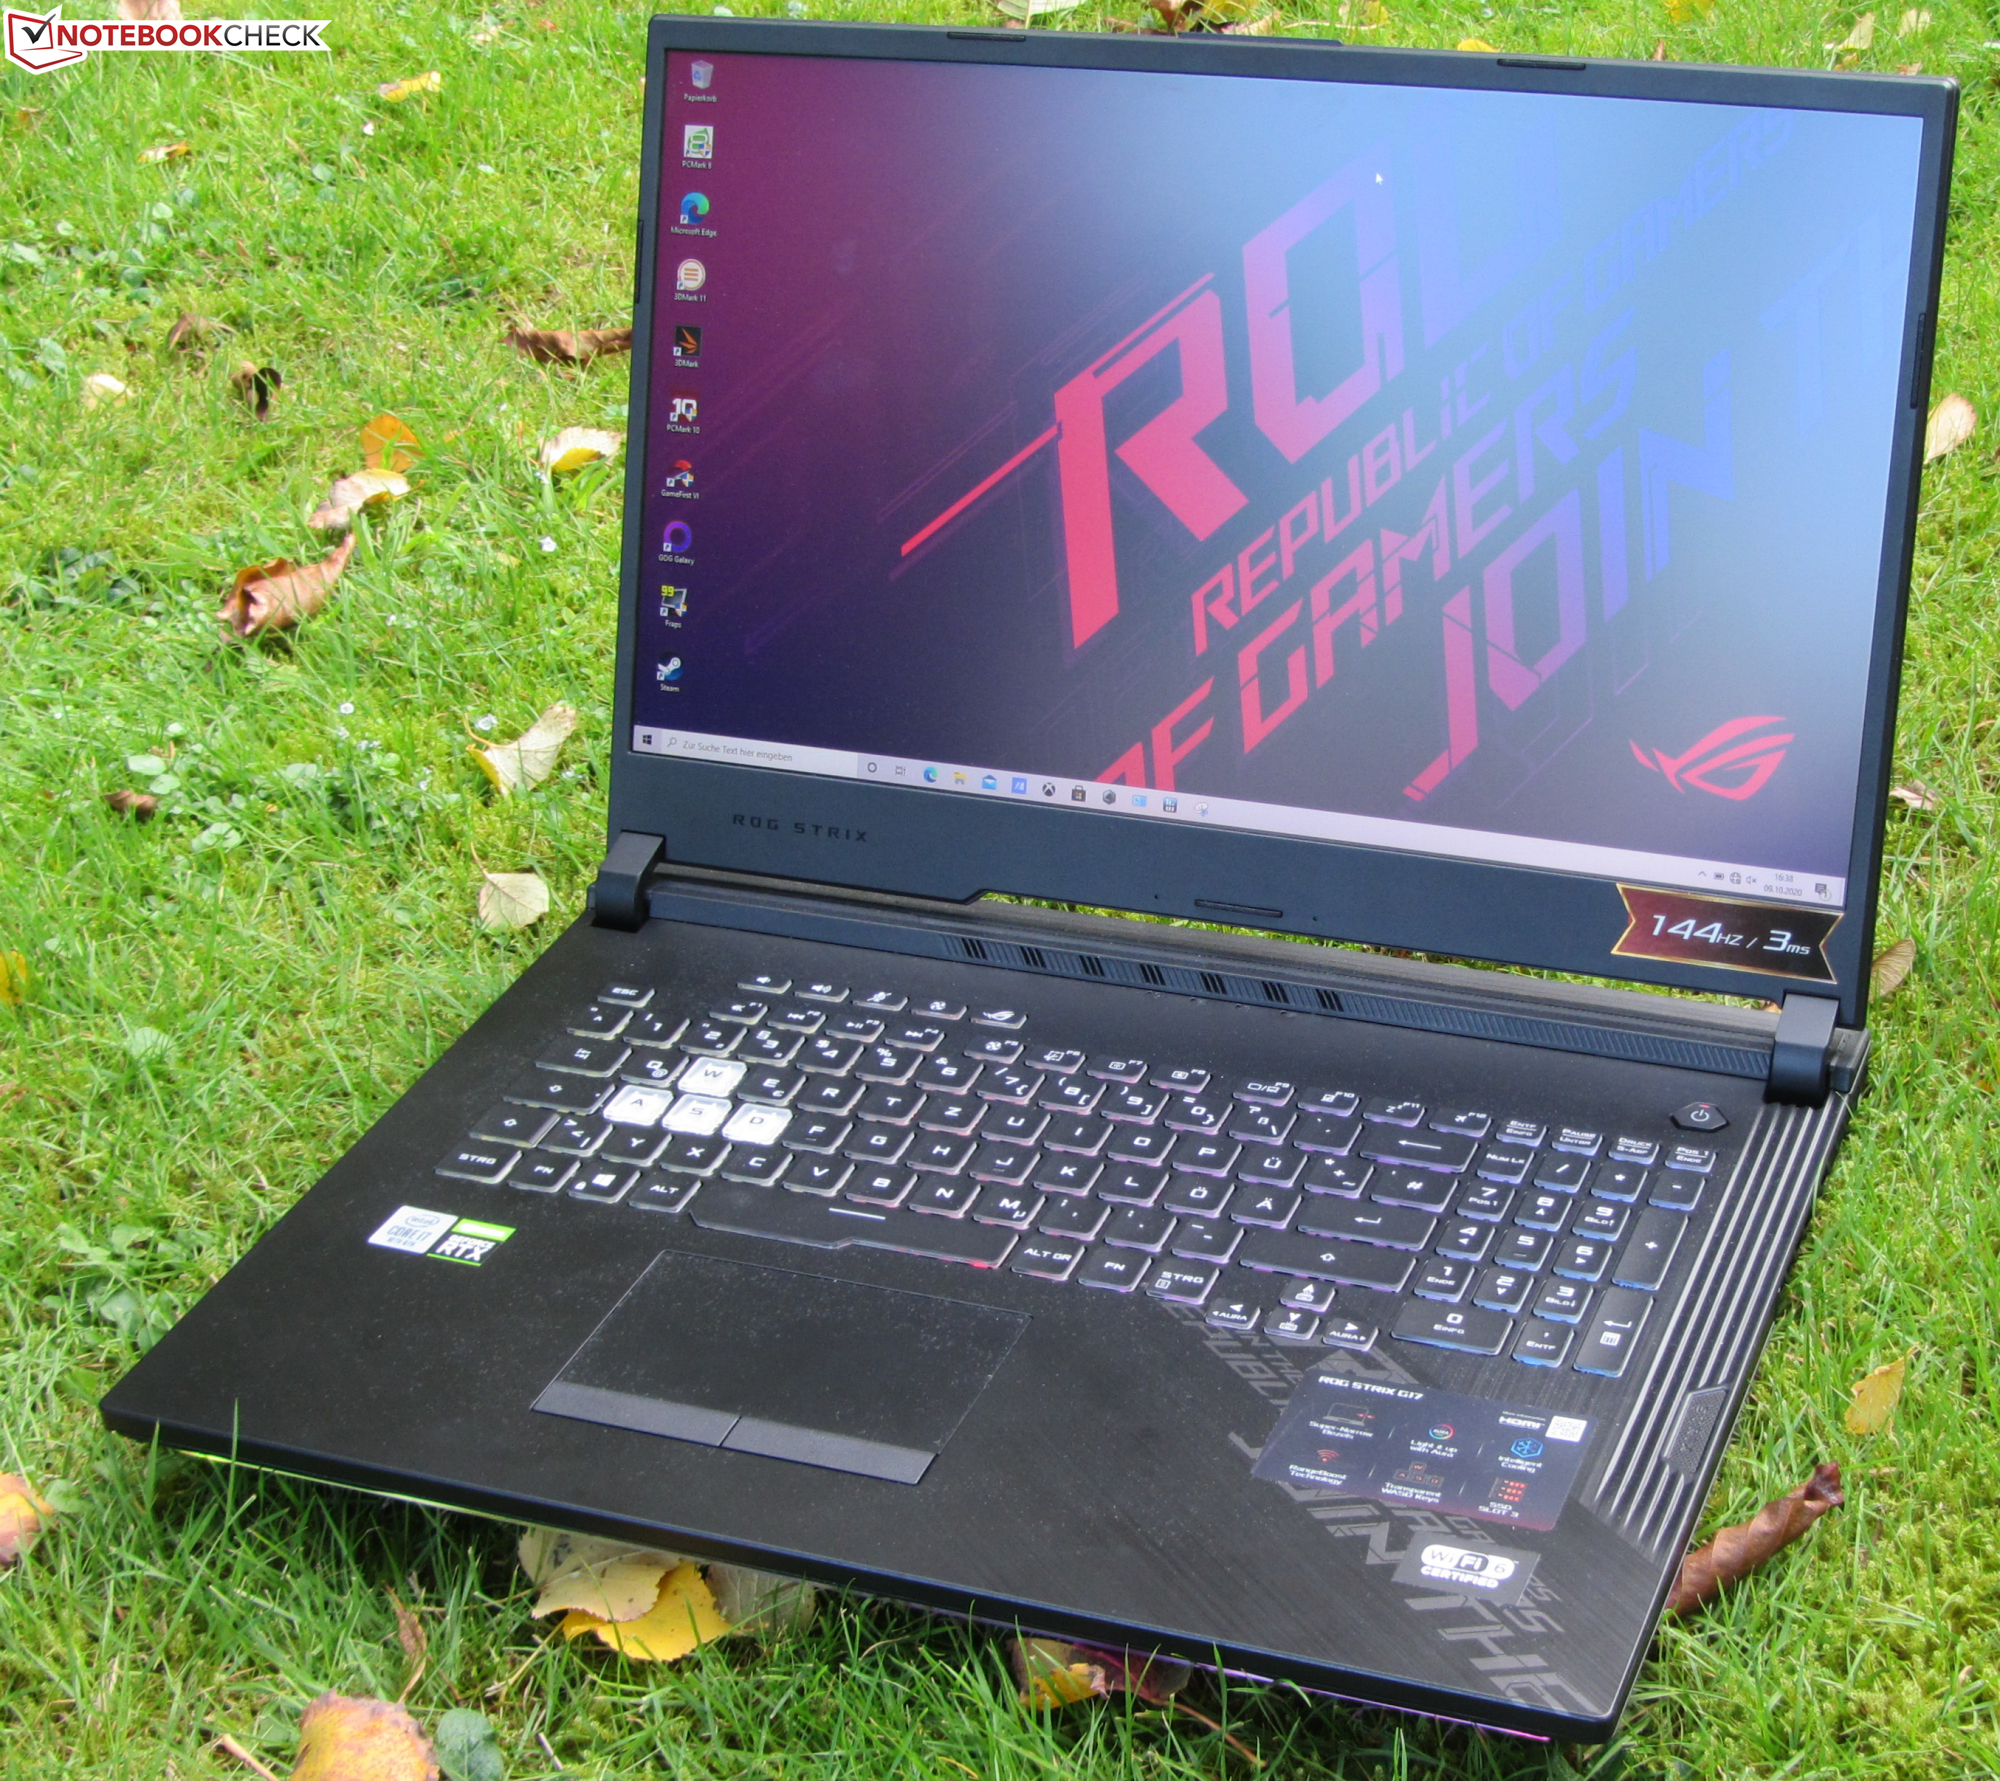
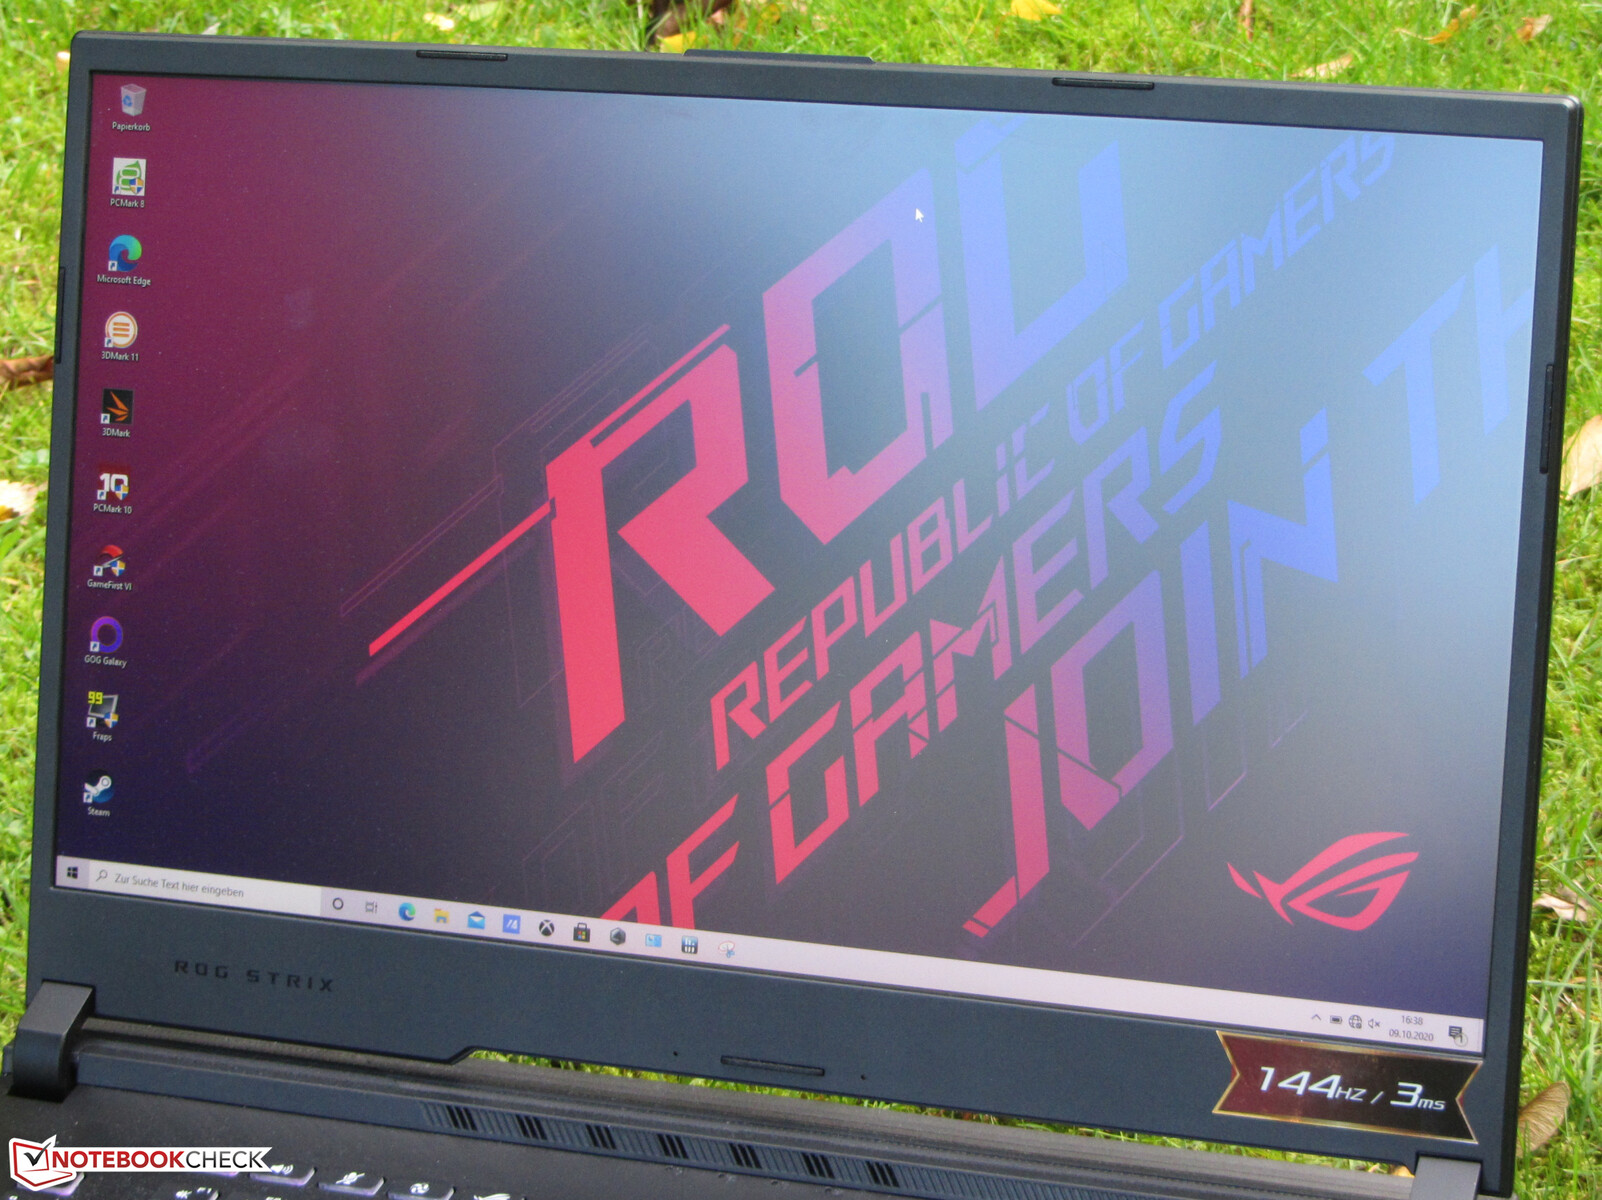
Asus ROG Strix G17 G712LWS in review: Powerful gaming machine with integrated light show

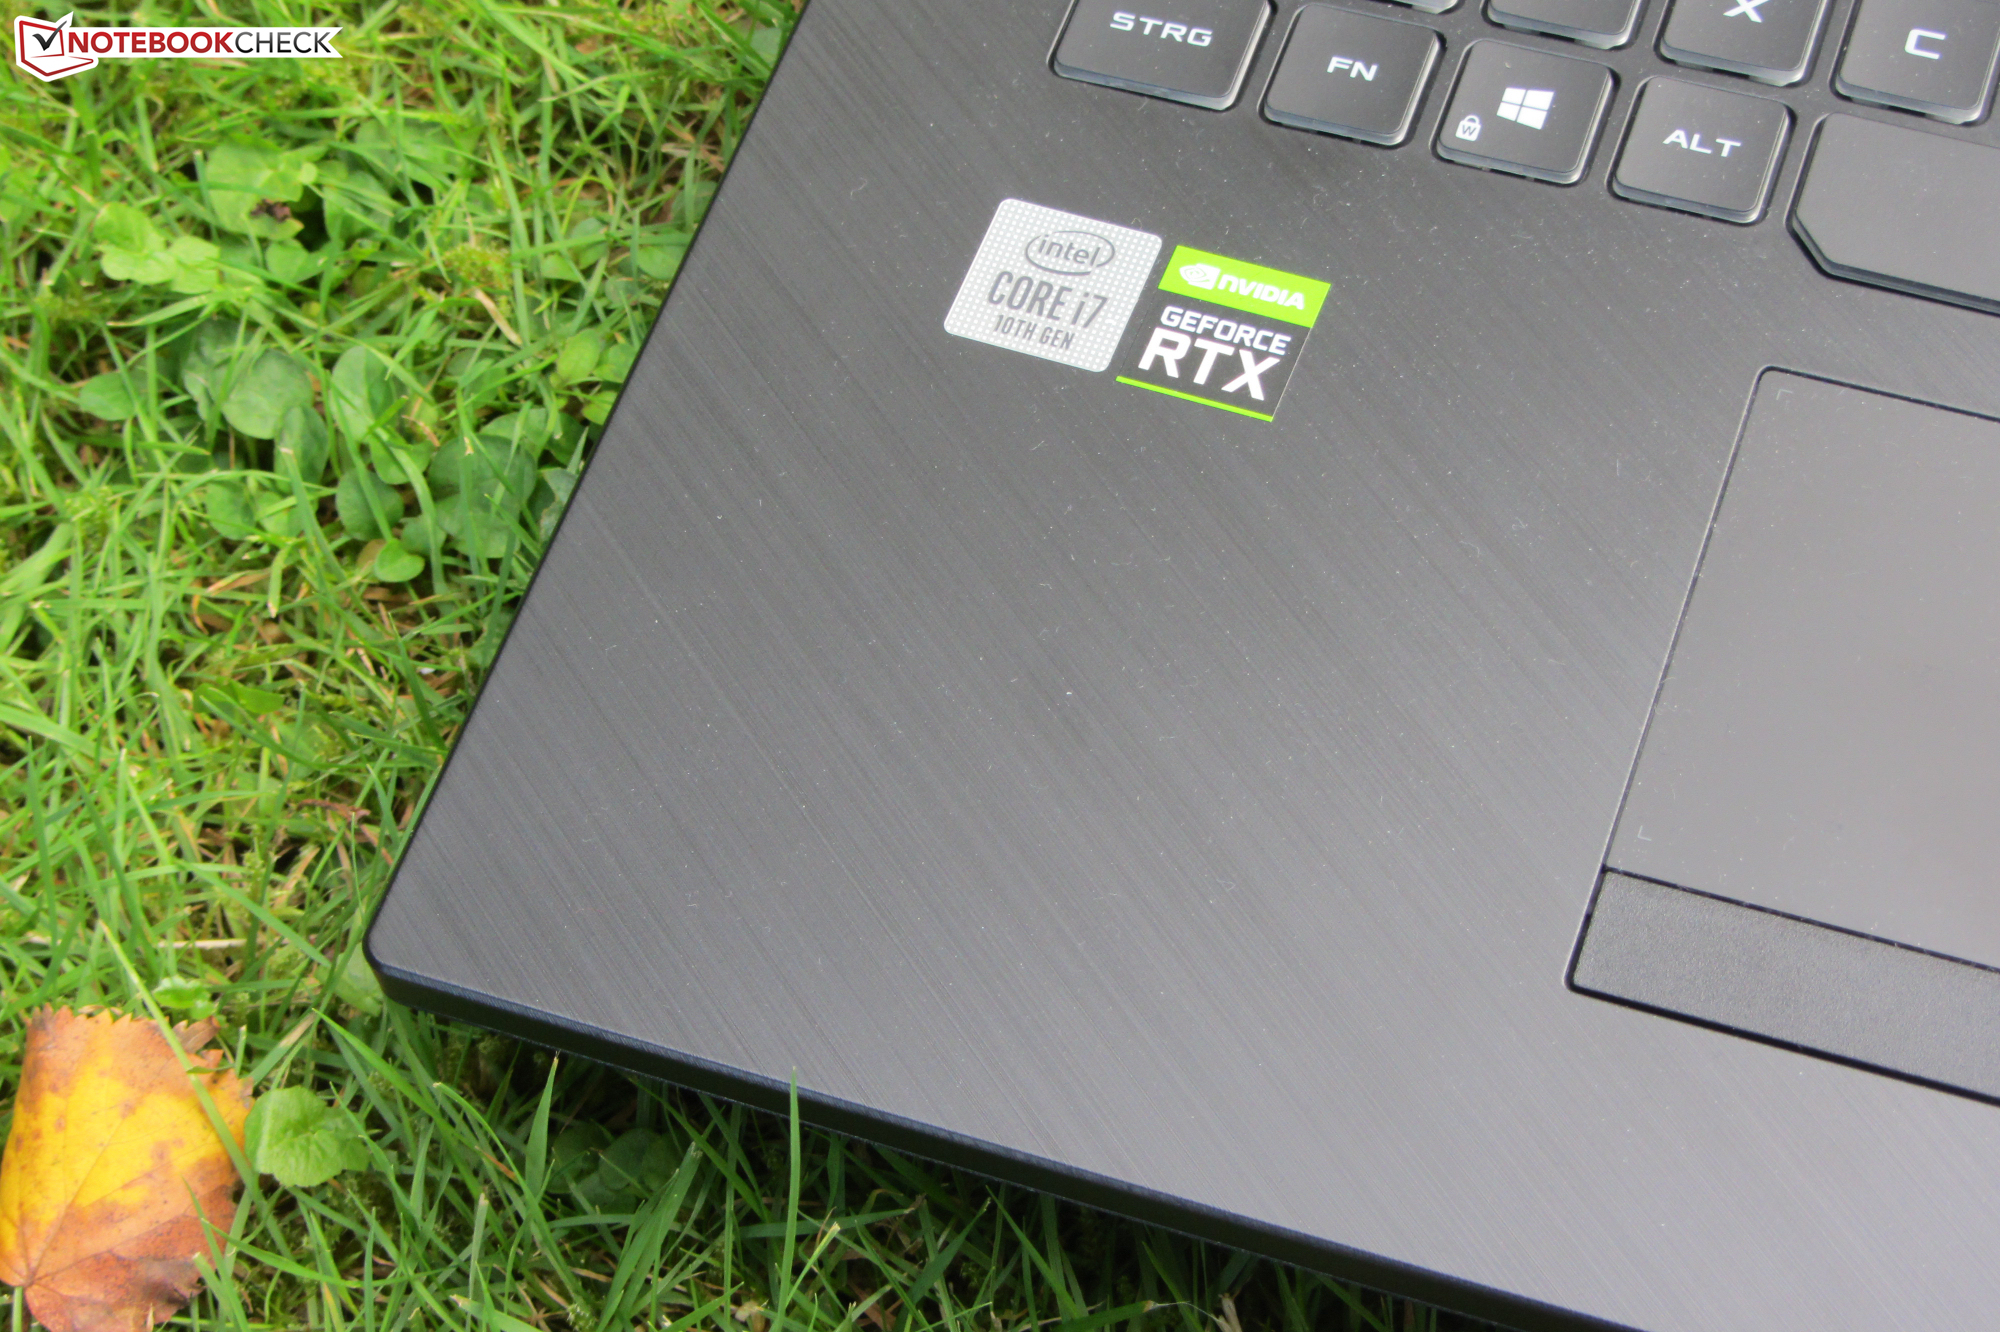
The Asus ROG Strix G17 G712LWS is a high-end 17.3-inch gaming laptop. The device is powered by a Core i7-10750H processor and a GeForce RTX 2070 Super graphics core. This is the identically built sibling model of the Asus ROG Strix G GL731GU, which we've already tested. Competitors include devices like the Schenker XMG Pro 17, the MSI GL75 10SFR, the Lenovo Legion Y740-17IRHg, and the Acer Predator Helios 300 PH317-54.
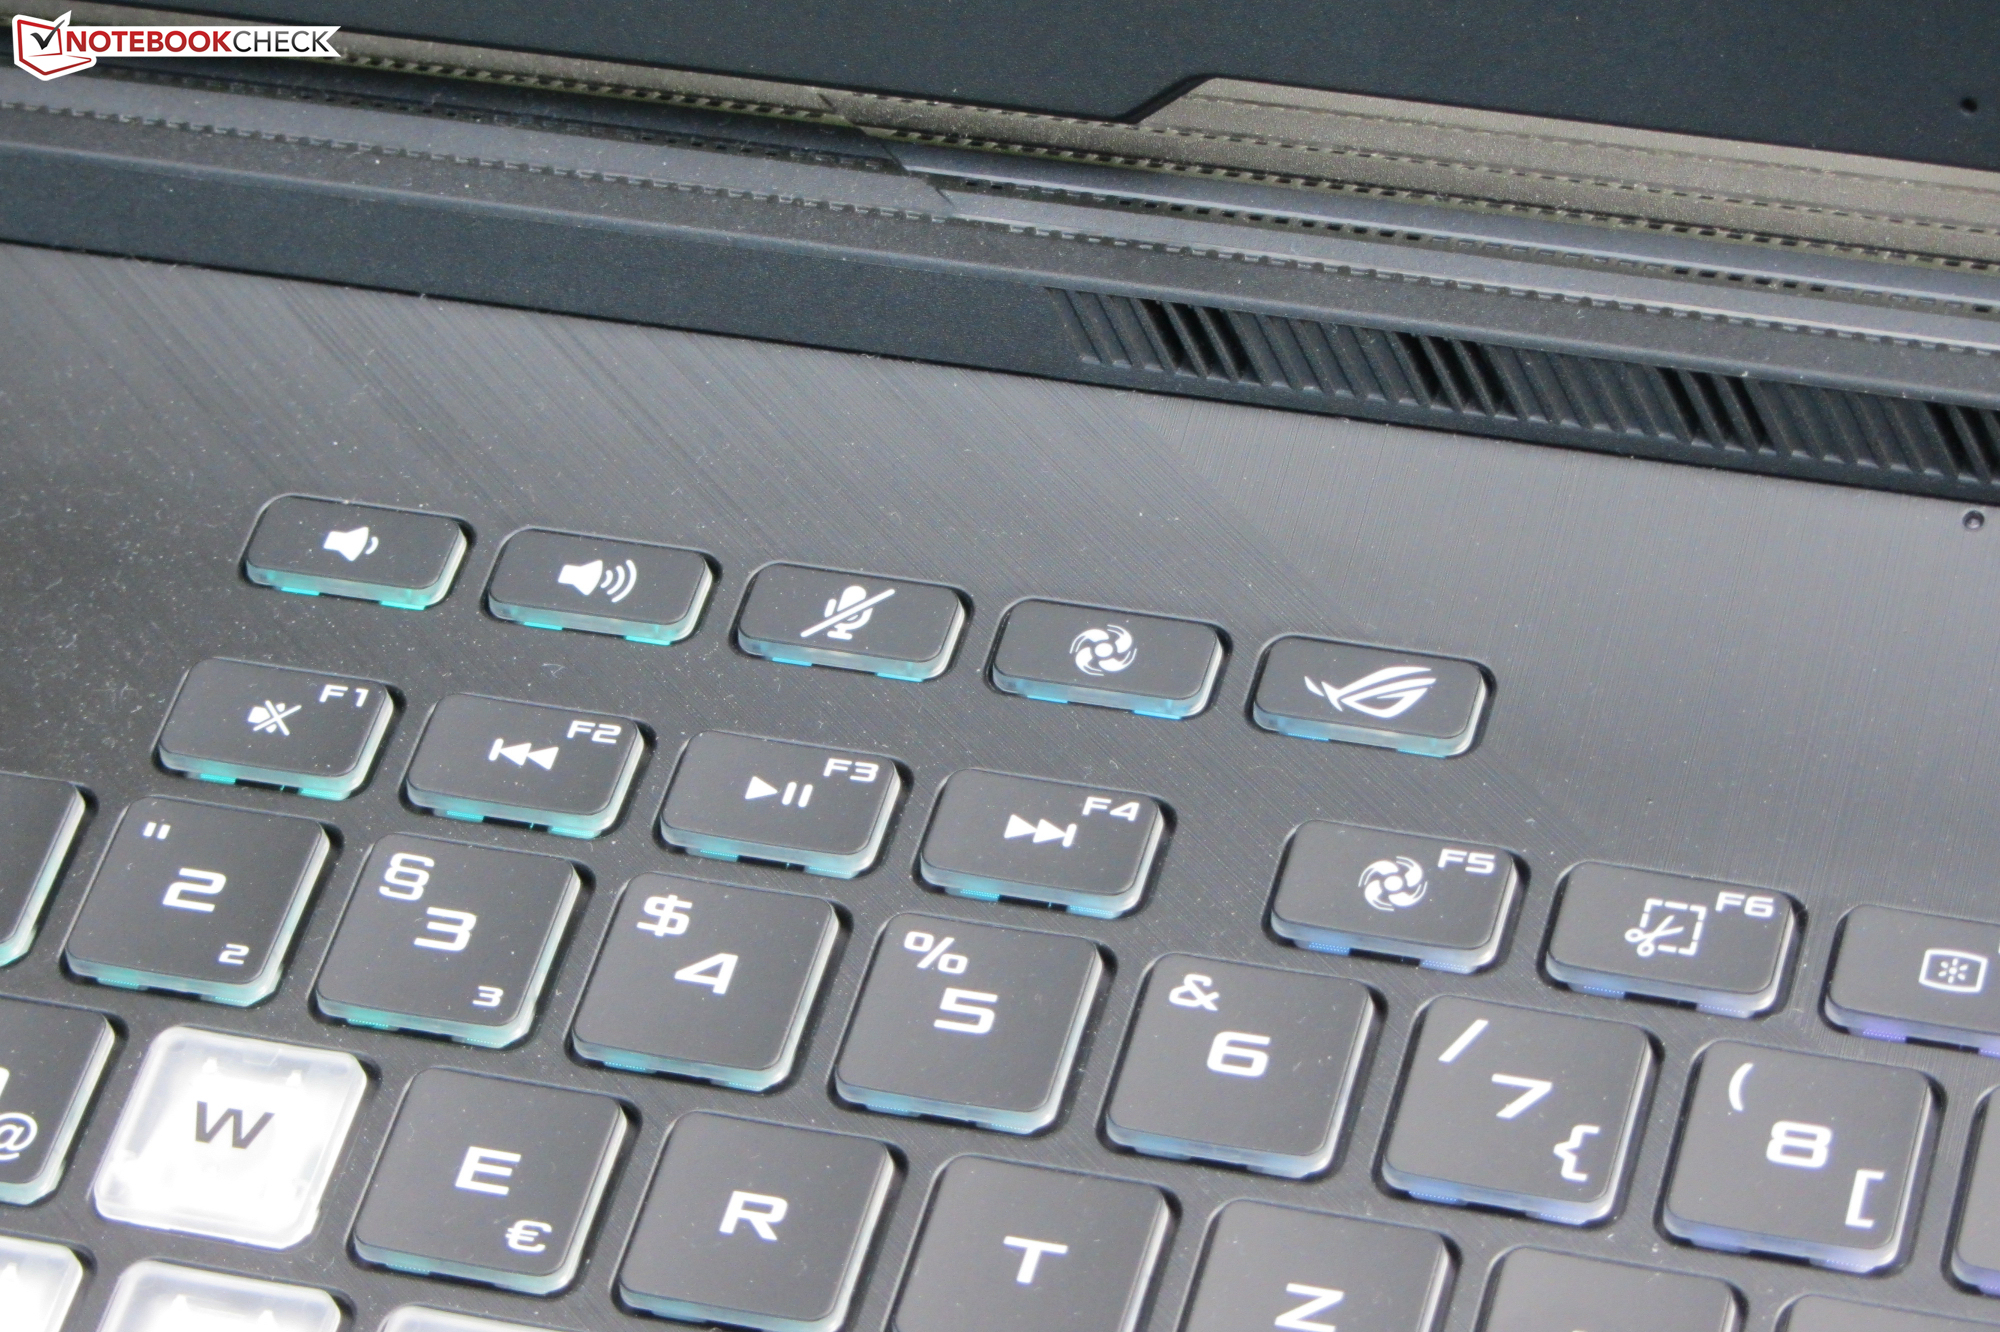
Since the G712LWS and the GL731GU are identical in construction, we won't go into further details regarding the case, connectivity, input devices, and speakers. The corresponding information can be found in the review article of the Asus ROG Strix G GL731GU.
Rating | Date | Model | Weight | Height | Size | Resolution | Price |
|---|---|---|---|---|---|---|---|
| 83.1 % v7 (old) | 10 / 2020 | Asus Strix G17 G712LWS i7-10750H, GeForce RTX 2070 Super Mobile | 2.8 kg | 26.5 mm | 17.30" | 1920x1080 | |
| 83.2 % v7 (old) | 02 / 2020 | Schenker XMG Pro 17 PB71RD-G i7-9750H, GeForce RTX 2060 Mobile | 2.8 kg | 30 mm | 17.30" | 1920x1080 | |
| 83.5 % v7 (old) | 08 / 2020 | MSI GL75 10SFR i7-10750H, GeForce RTX 2070 Mobile | 2.6 kg | 28 mm | 17.30" | 1920x1080 | |
| 84 % v7 (old) | 03 / 2020 | Lenovo Legion Y740-17IRHg-81UJ001VGE i7-9750H, GeForce RTX 2080 Max-Q | 3 kg | 25.5 mm | 17.30" | 1920x1080 | |
| 83.6 % v7 (old) | 10 / 2020 | Acer Predator Helios 300 PH317-54-75G8 i7-10750H, GeForce RTX 2060 Mobile | 2.8 kg | 25 mm | 17.30" | 1920x1080 |

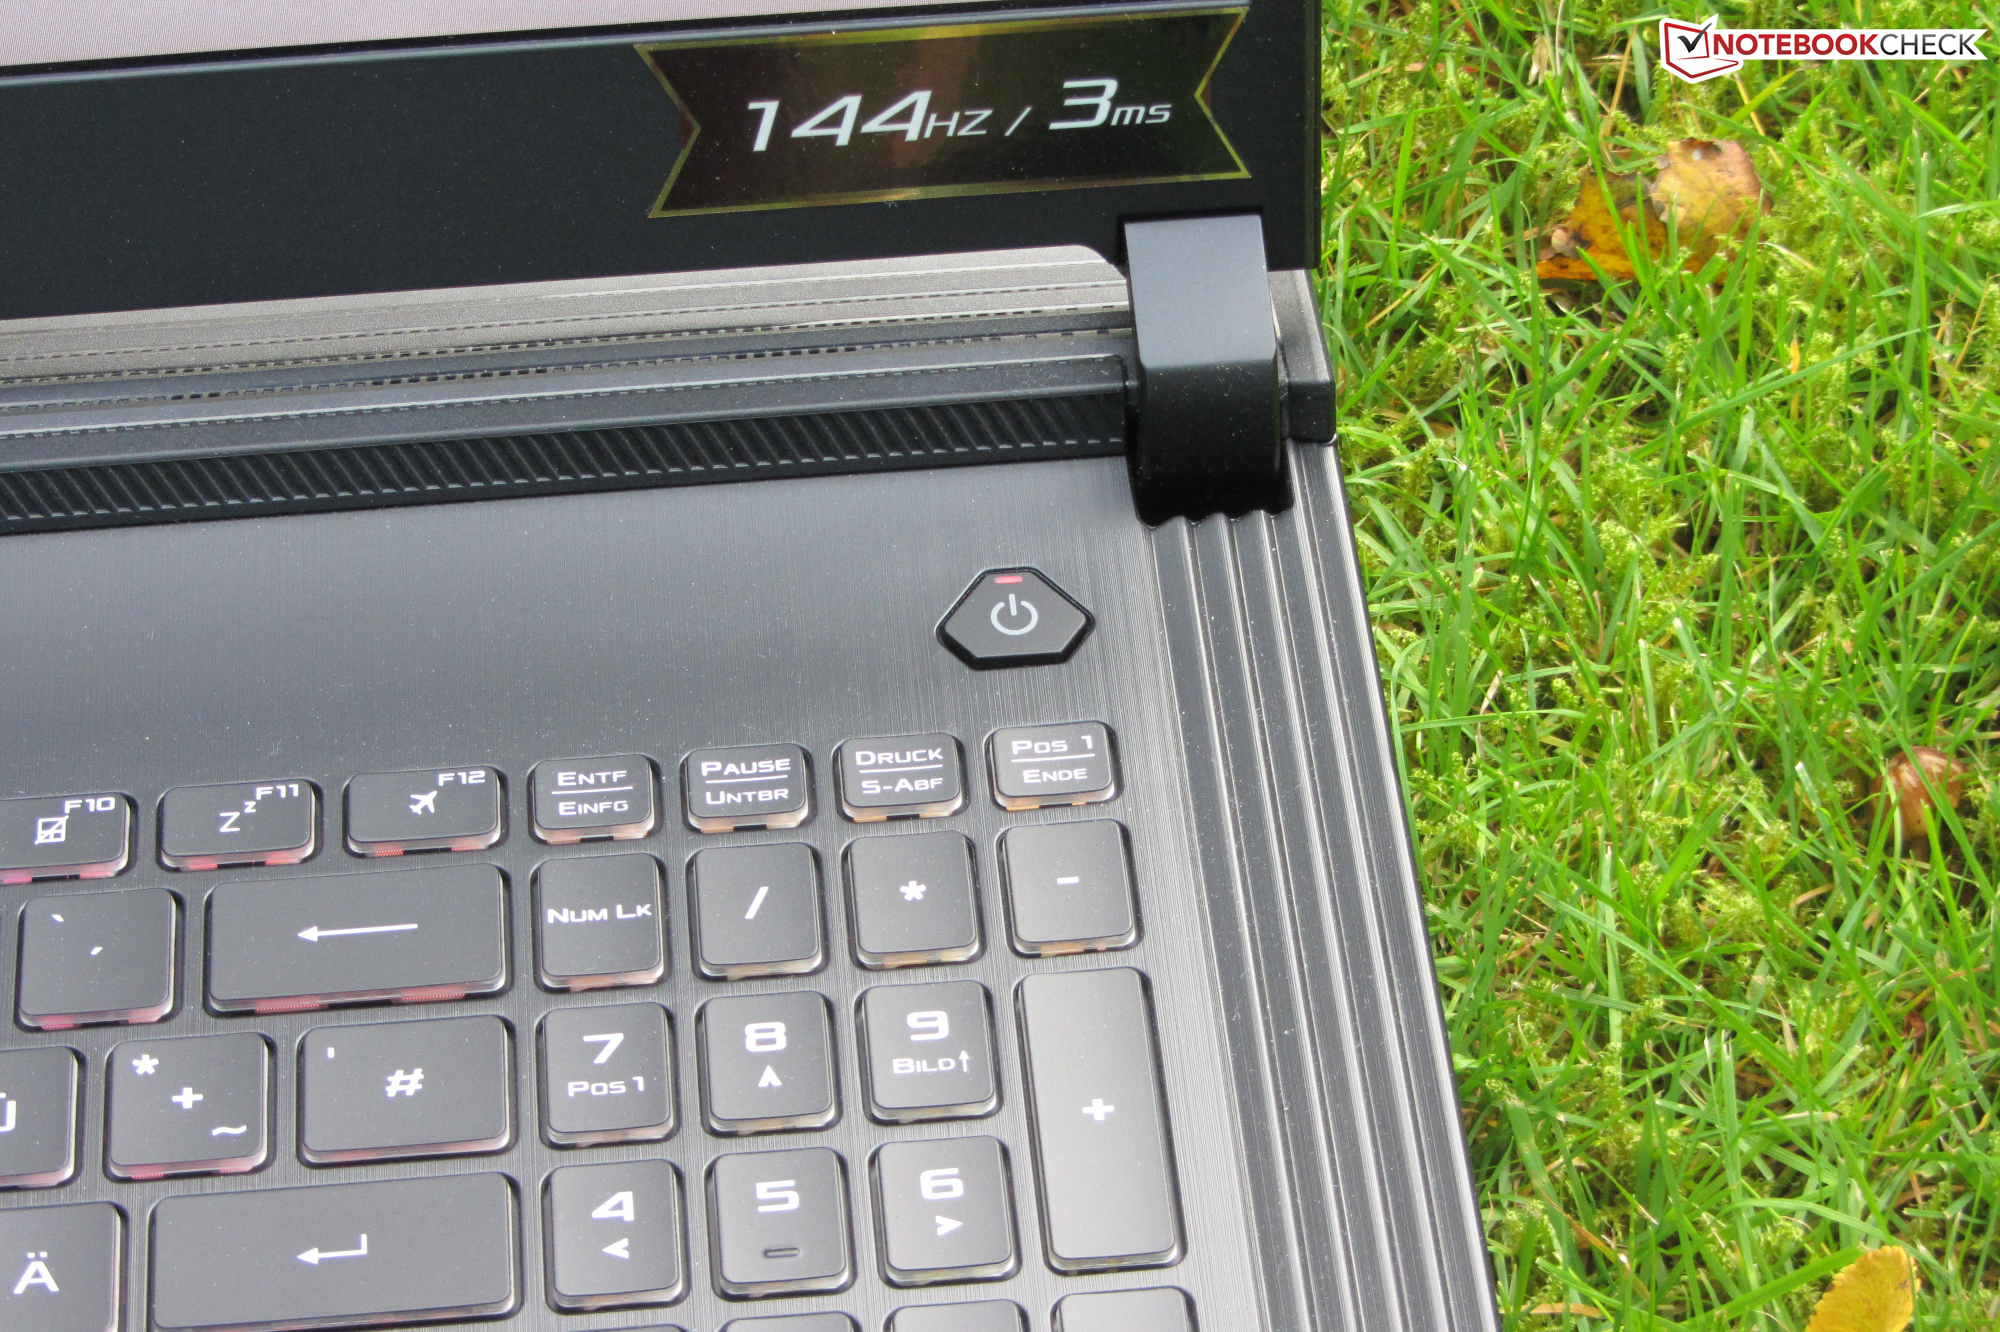
Display - 144 Hz IPS
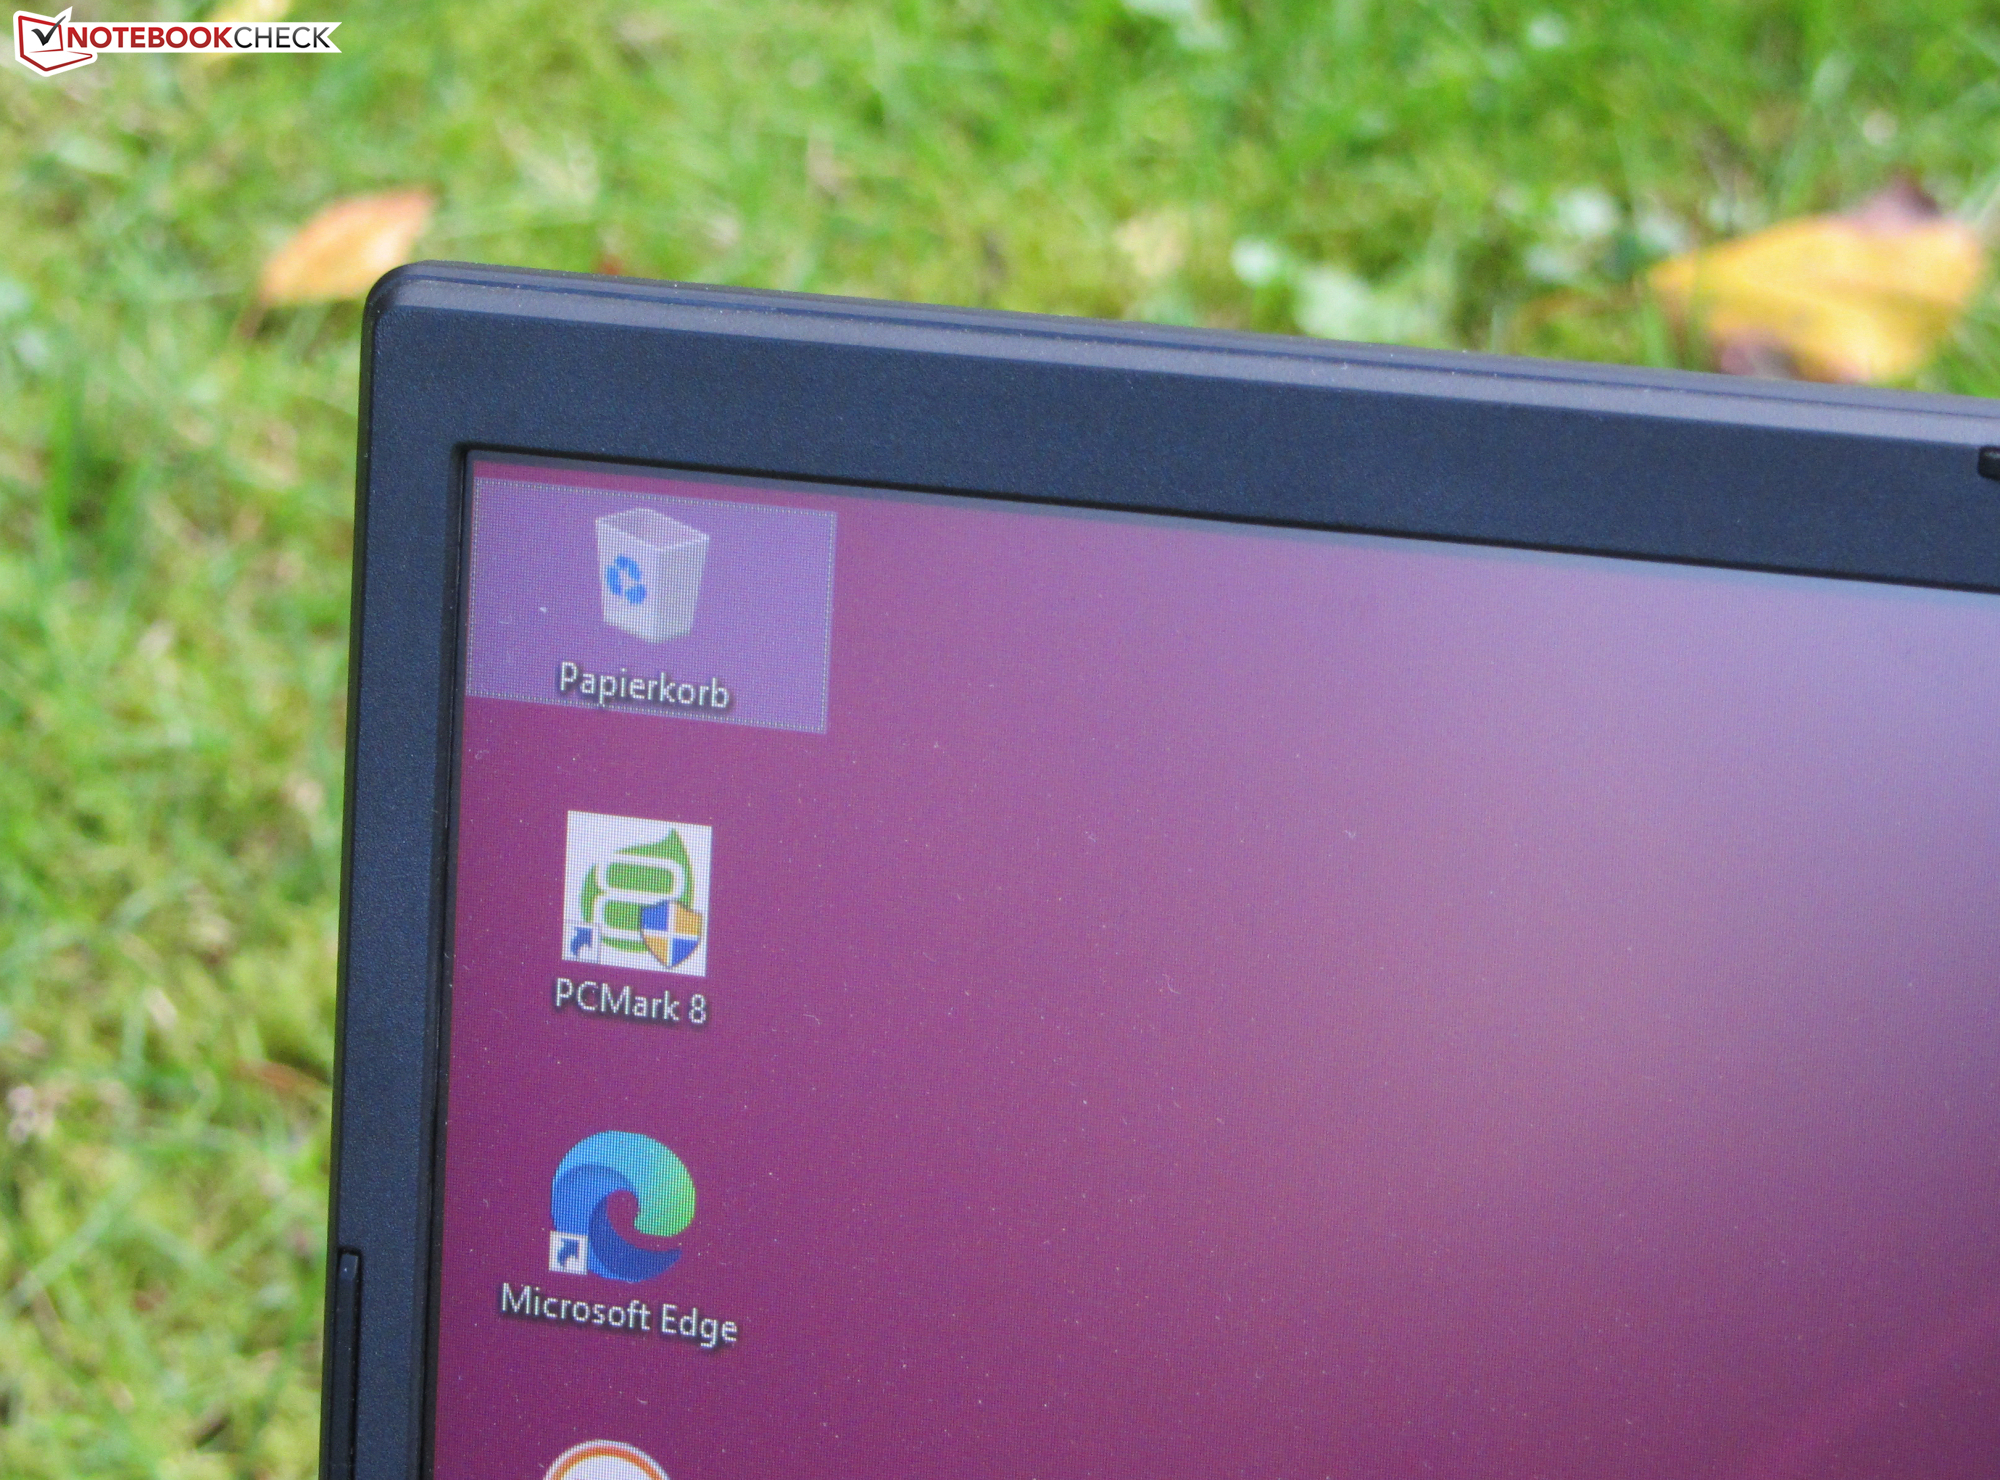
The matte 17.3-inch display has a native resolution of 1920x1080 pixels. The brightness (300 cd/m²) and contrast (1,042:1) are okay. In addition, the 144 Hz panel provides fast response times. Positive: The display shows no PWM flickering.
| |||||||||||||||||||||||||
Brightness Distribution: 89 %
Center on Battery: 323 cd/m²
Contrast: 1042:1 (Black: 0.31 cd/m²)
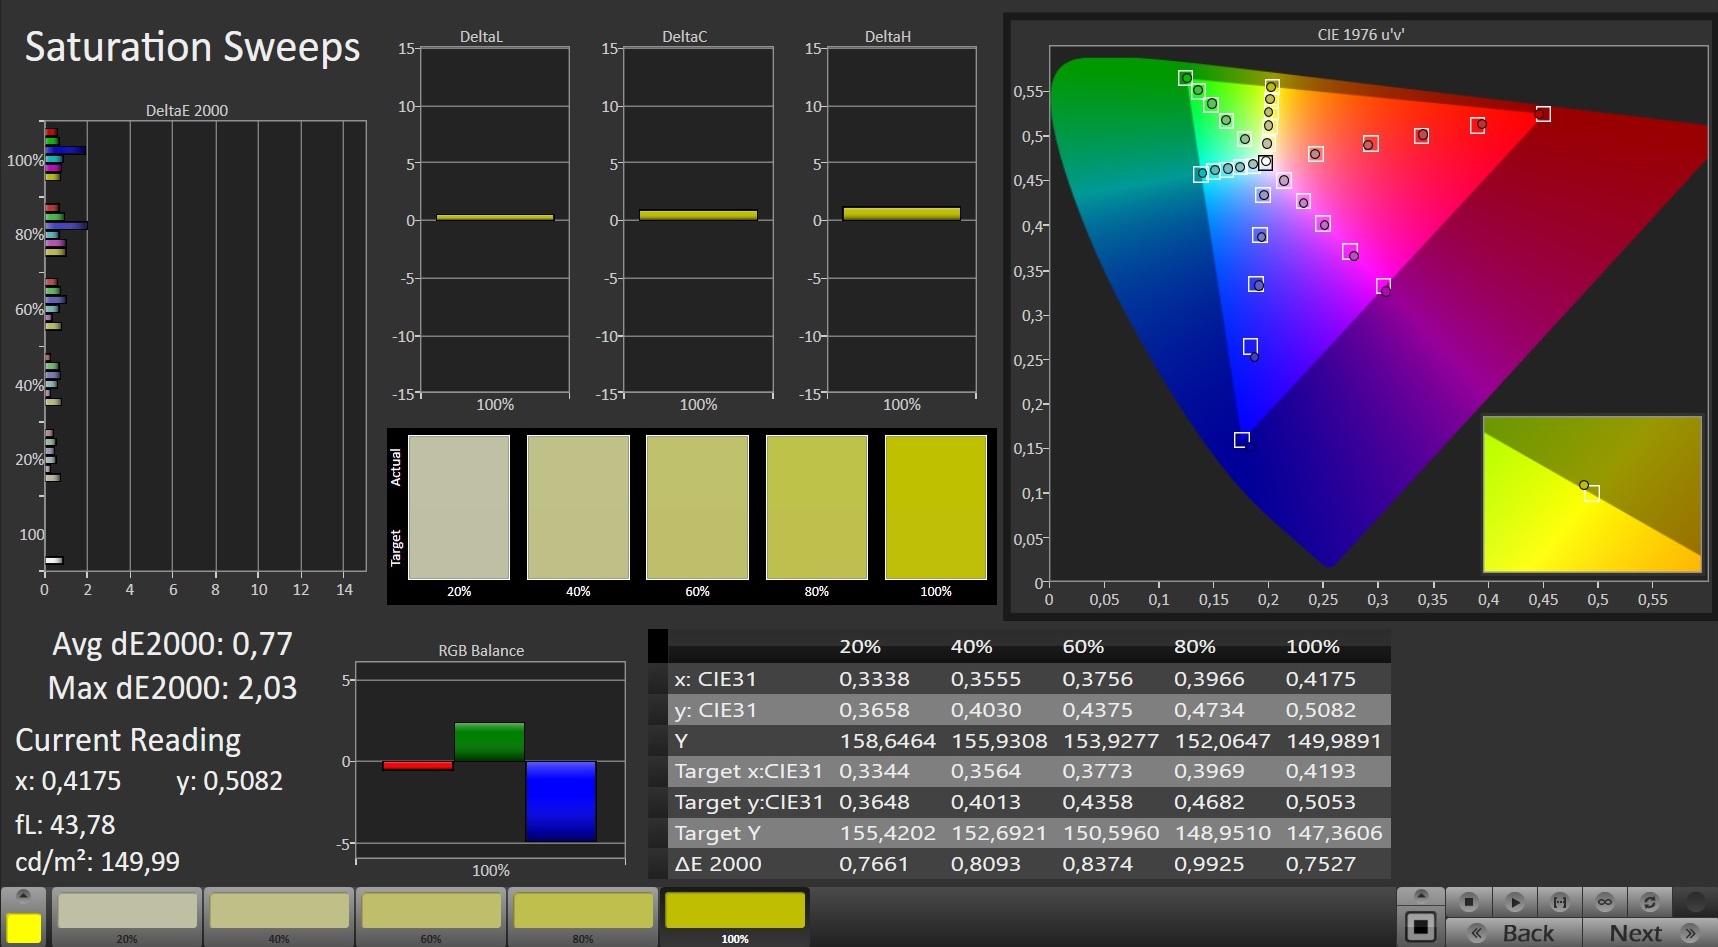
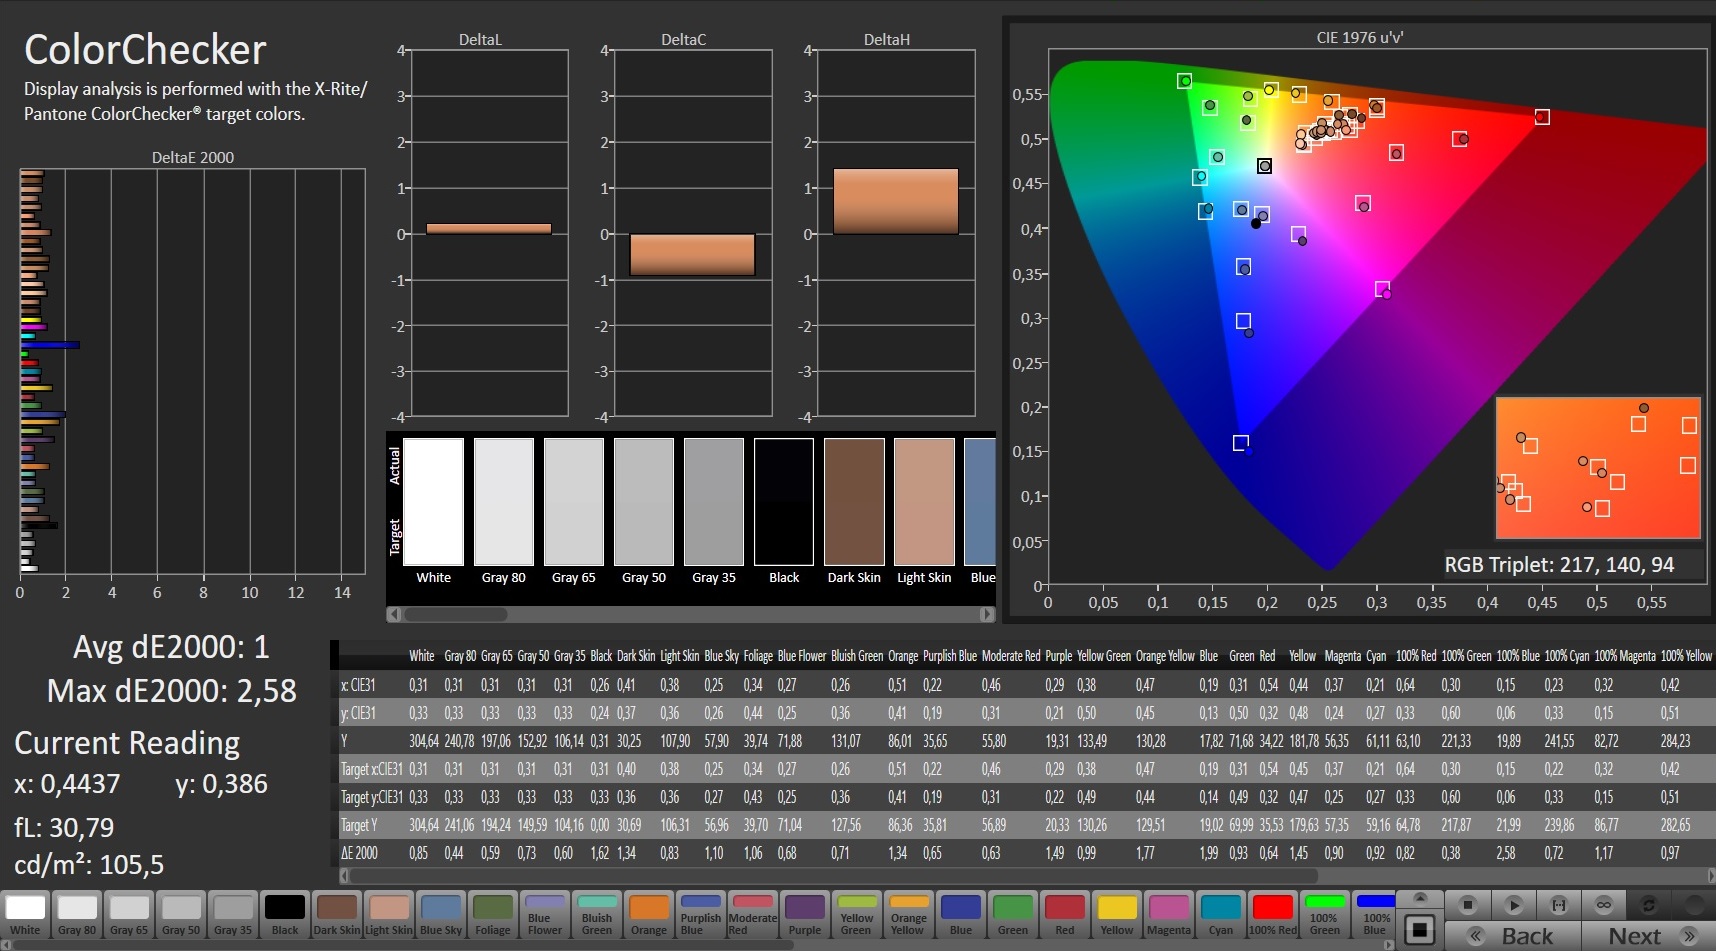
ΔE ColorChecker Calman: 3.01 | ∀{0.5-29.43 Ø4.72}
calibrated: 1
ΔE Greyscale Calman: 3.8 | ∀{0.09-98 Ø4.97}
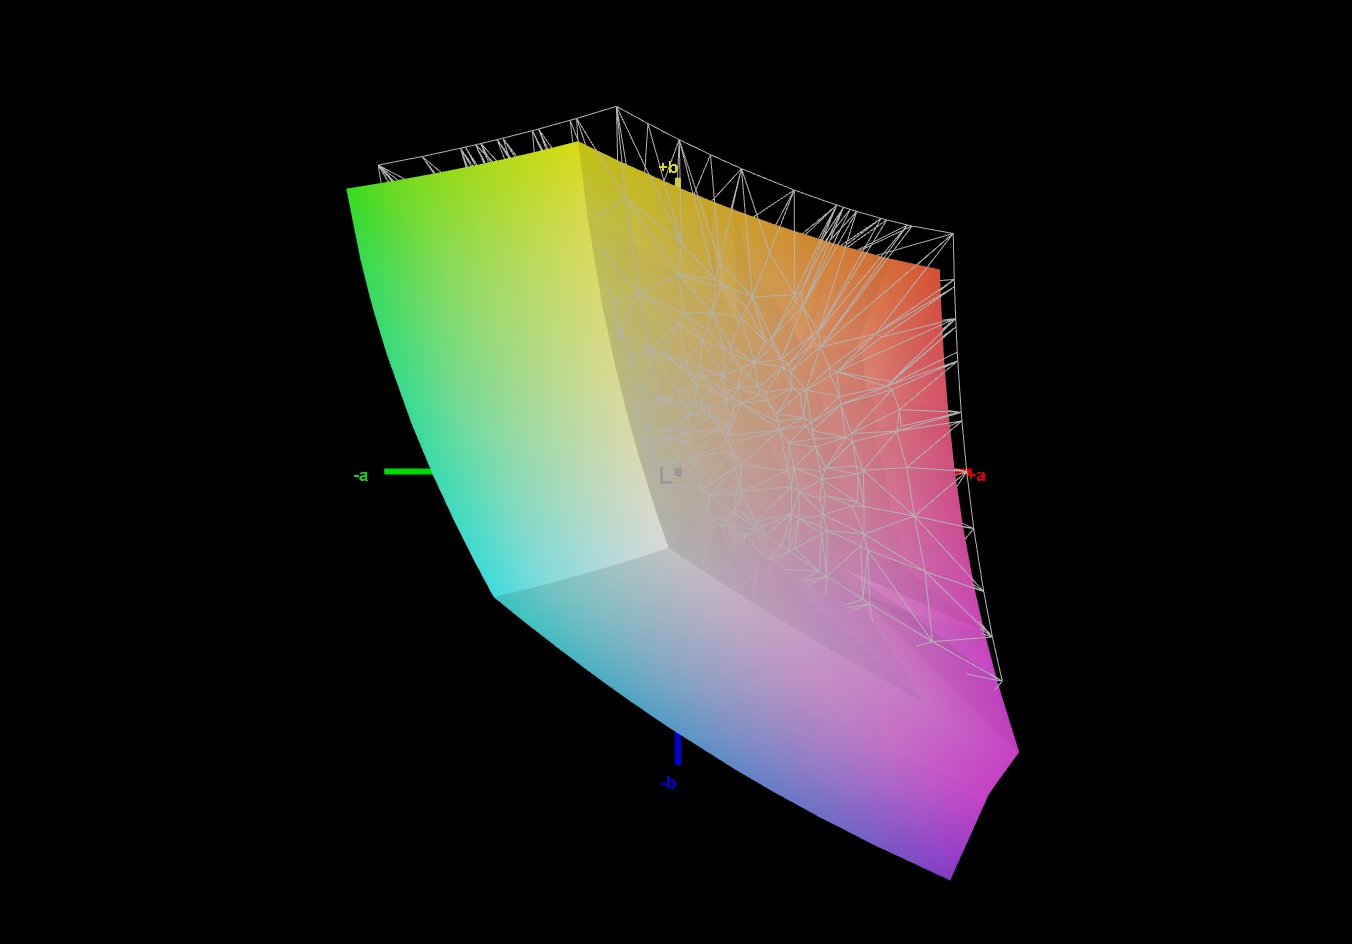
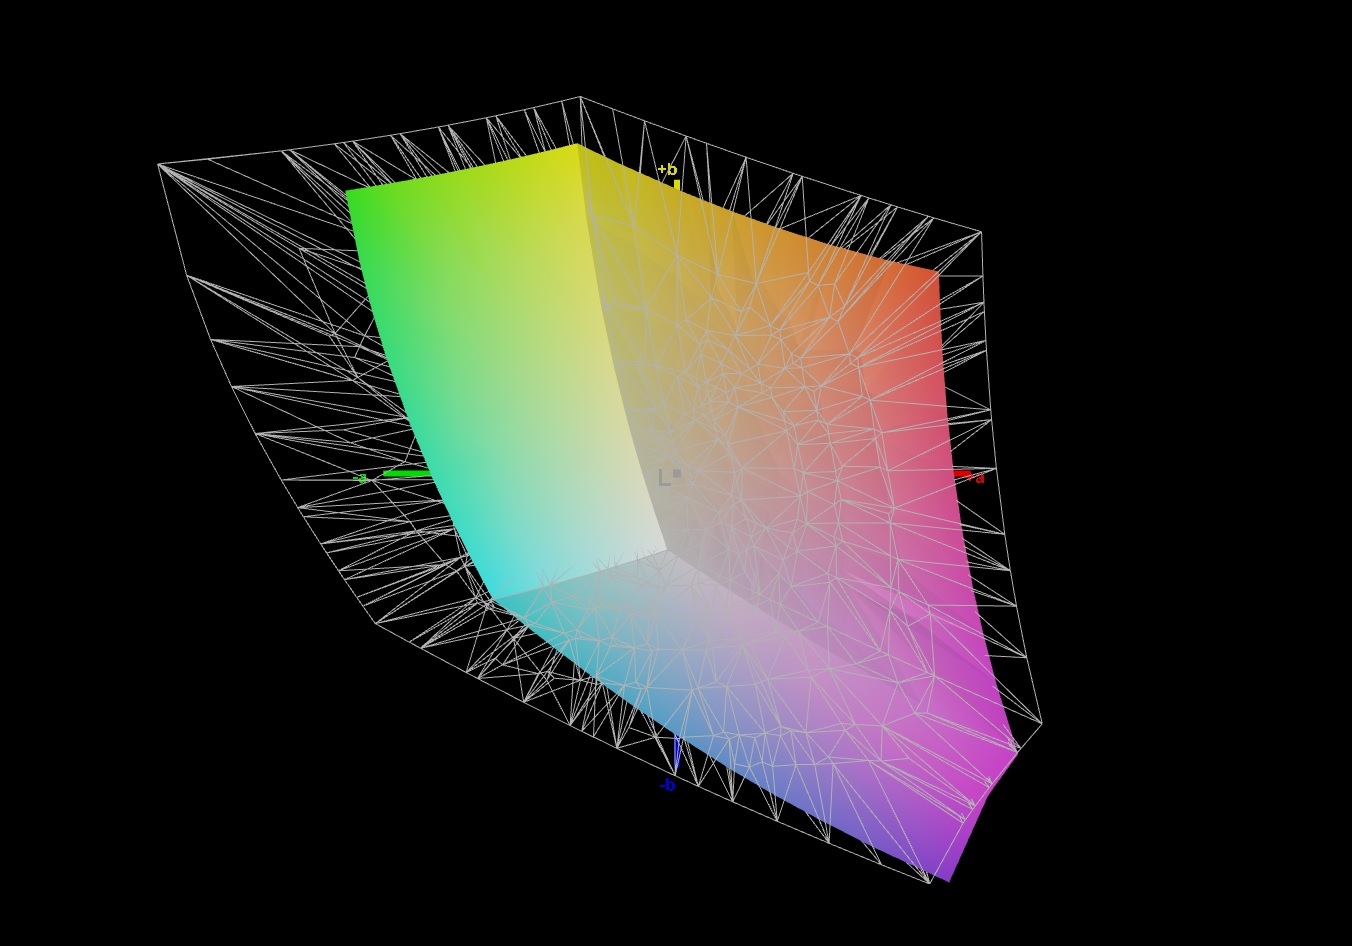
90% sRGB (Argyll 1.6.3 3D)
66% AdobeRGB 1998 (Argyll 1.6.3 3D)
66.4% AdobeRGB 1998 (Argyll 3D)
96.8% sRGB (Argyll 3D)
65.2% Display P3 (Argyll 3D)
Gamma: 2.154
CCT: 7507 K
| Asus Strix G17 G712LWS LG Philips LP173WFG-SPB3, IPS, 1920x1080, 17.3" | Asus ROG Strix G GL731GU-RB74 AU Optronics B173HAN04.0, IPS, 1920x1080, 17.3" | Acer Predator Helios 300 PH317-54-75G8 Chi Mei N173HCE-G33, IPS, 1920x1080, 17.3" | Schenker XMG Pro 17 PB71RD-G AU Optronics B173HAN04.0 (AUO409D), IPS, 1920x1080, 17.3" | MSI GL75 10SFR Chi Mei N173HCE-G33, IPS, 1920x1080, 17.3" | Lenovo Legion Y740-17IRHg-81UJ001VGE AUO_B173HAN03, IPS, 1920x1080, 17.3" | |
|---|---|---|---|---|---|---|
| Display | -6% | -3% | -5% | -1% | -3% | |
| Display P3 Coverage (%) | 65.2 | 61.9 -5% | 62.6 -4% | 62.8 -4% | 63.9 -2% | 63.8 -2% |
| sRGB Coverage (%) | 96.8 | 89.4 -8% | 94.3 -3% | 89.8 -7% | 96.2 -1% | 92.7 -4% |
| AdobeRGB 1998 Coverage (%) | 66.4 | 63.3 -5% | 64.7 -3% | 64.2 -3% | 66 -1% | 65.3 -2% |
| Response Times | 24% | -9% | -16% | 15% | -9% | |
| Response Time Grey 50% / Grey 80% * (ms) | 14.4 ? | 6.4 ? 56% | 16.4 ? -14% | 16.8 ? -17% | 12 ? 17% | 16 ? -11% |
| Response Time Black / White * (ms) | 10.4 ? | 11.2 ? -8% | 10.8 ? -4% | 12 ? -15% | 9 ? 13% | 11 ? -6% |
| PWM Frequency (Hz) | 24510 ? | 208 ? | ||||
| Screen | -23% | 27% | -18% | 7% | -7% | |
| Brightness middle (cd/m²) | 323 | 294.3 -9% | 322 0% | 274 -15% | 333 3% | 310 -4% |
| Brightness (cd/m²) | 300 | 289 -4% | 308 3% | 273 -9% | 309 3% | 281 -6% |
| Brightness Distribution (%) | 89 | 89 0% | 92 3% | 95 7% | 86 -3% | 85 -4% |
| Black Level * (cd/m²) | 0.31 | 0.3 3% | 0.18 42% | 0.26 16% | 0.215 31% | 0.31 -0% |
| Contrast (:1) | 1042 | 981 -6% | 1789 72% | 1054 1% | 1549 49% | 1000 -4% |
| Colorchecker dE 2000 * | 3.01 | 3.95 -31% | 1.53 49% | 4.62 -53% | 1.98 34% | 3.86 -28% |
| Colorchecker dE 2000 max. * | 7.65 | 6.49 15% | 3.14 59% | 7.66 -0% | 4.34 43% | 7.8 -2% |
| Colorchecker dE 2000 calibrated * | 1 | 3.08 -208% | 0.74 26% | 1.93 -93% | 2.01 -101% | |
| Greyscale dE 2000 * | 3.8 | 3.7 3% | 1.9 50% | 5.3 -39% | 2.97 22% | 4.48 -18% |
| Gamma | 2.154 102% | 2.07 106% | 2.144 103% | 2.34 94% | 2.41 91% | 2.5 88% |
| CCT | 7507 87% | 7155 91% | 6809 95% | 7619 85% | 6750 96% | 7542 86% |
| Color Space (Percent of AdobeRGB 1998) (%) | 66 | 57.7 -13% | 65 -2% | 58 -12% | 61 -8% | 60 -9% |
| Color Space (Percent of sRGB) (%) | 90 | 89 -1% | 87 -3% | 90 0% | 96 7% | 93 3% |
| Total Average (Program / Settings) | -2% /
-14% | 5% /
17% | -13% /
-15% | 7% /
7% | -6% /
-6% |
* ... smaller is better
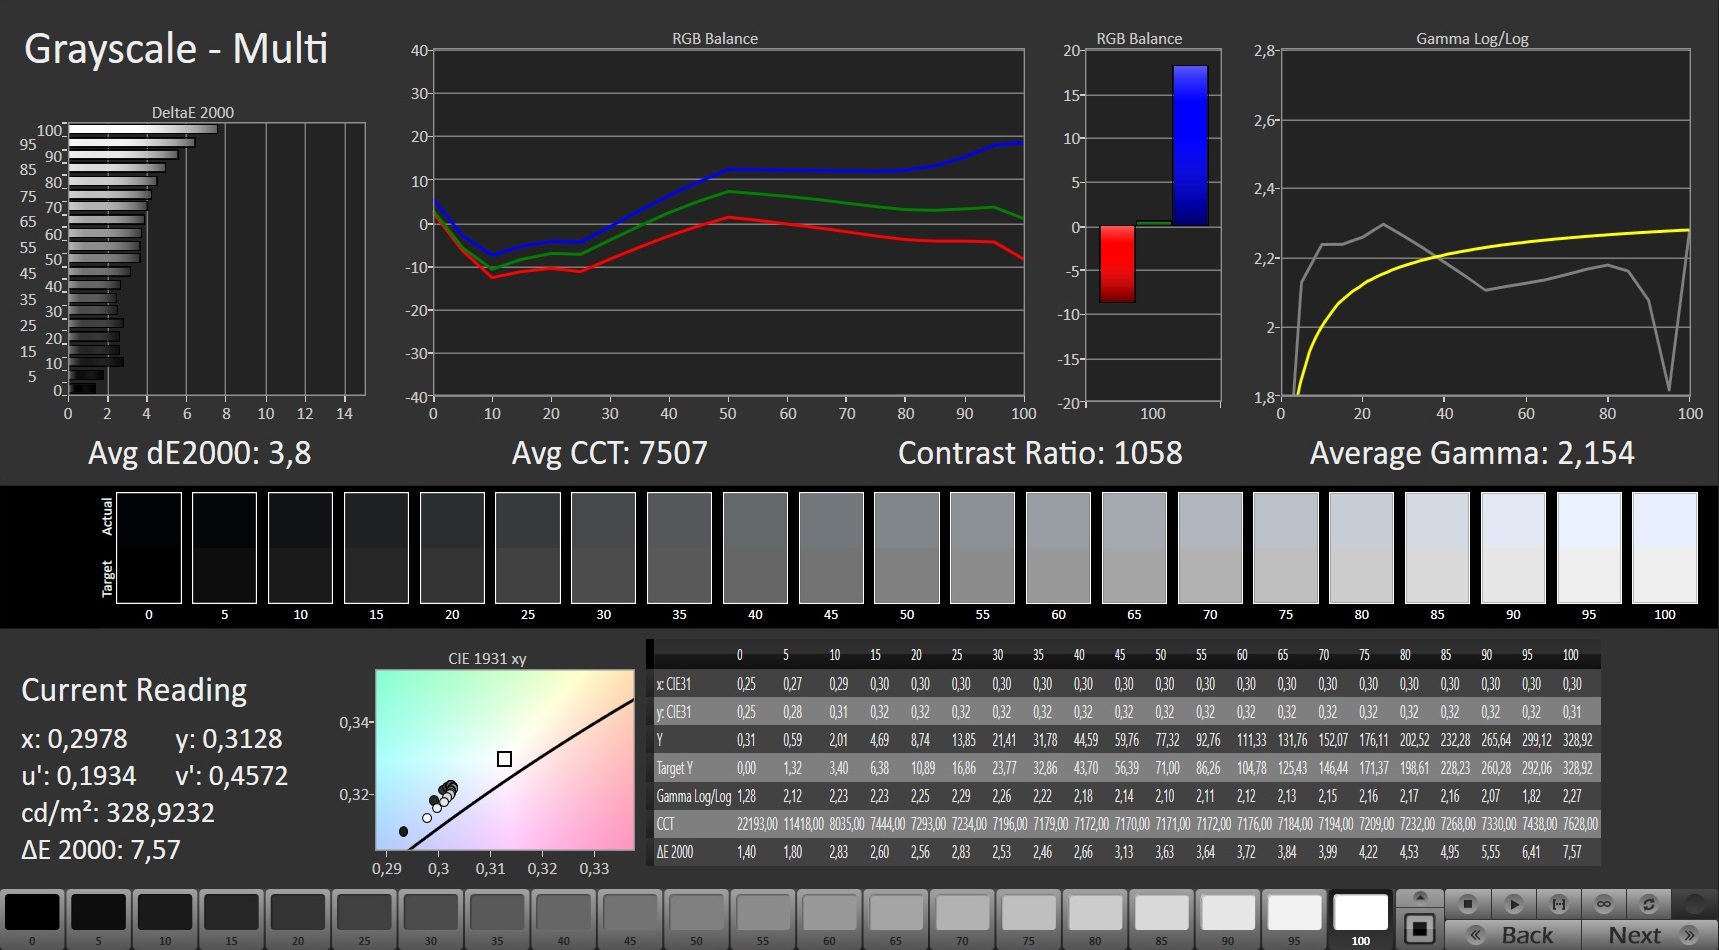
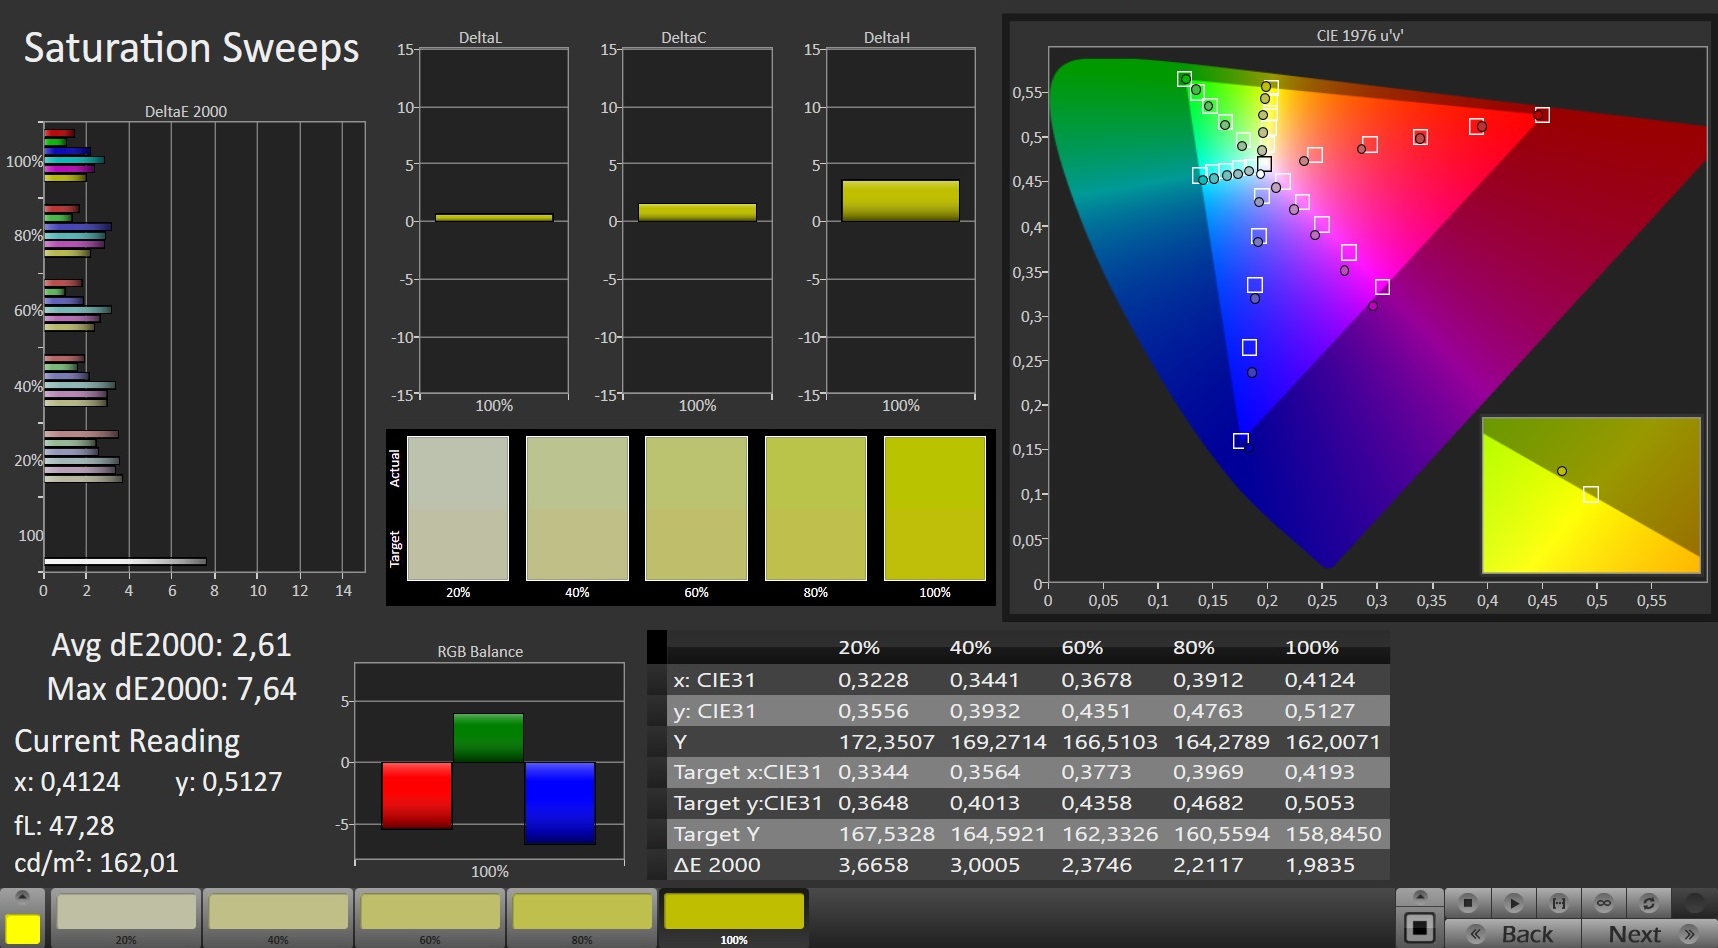
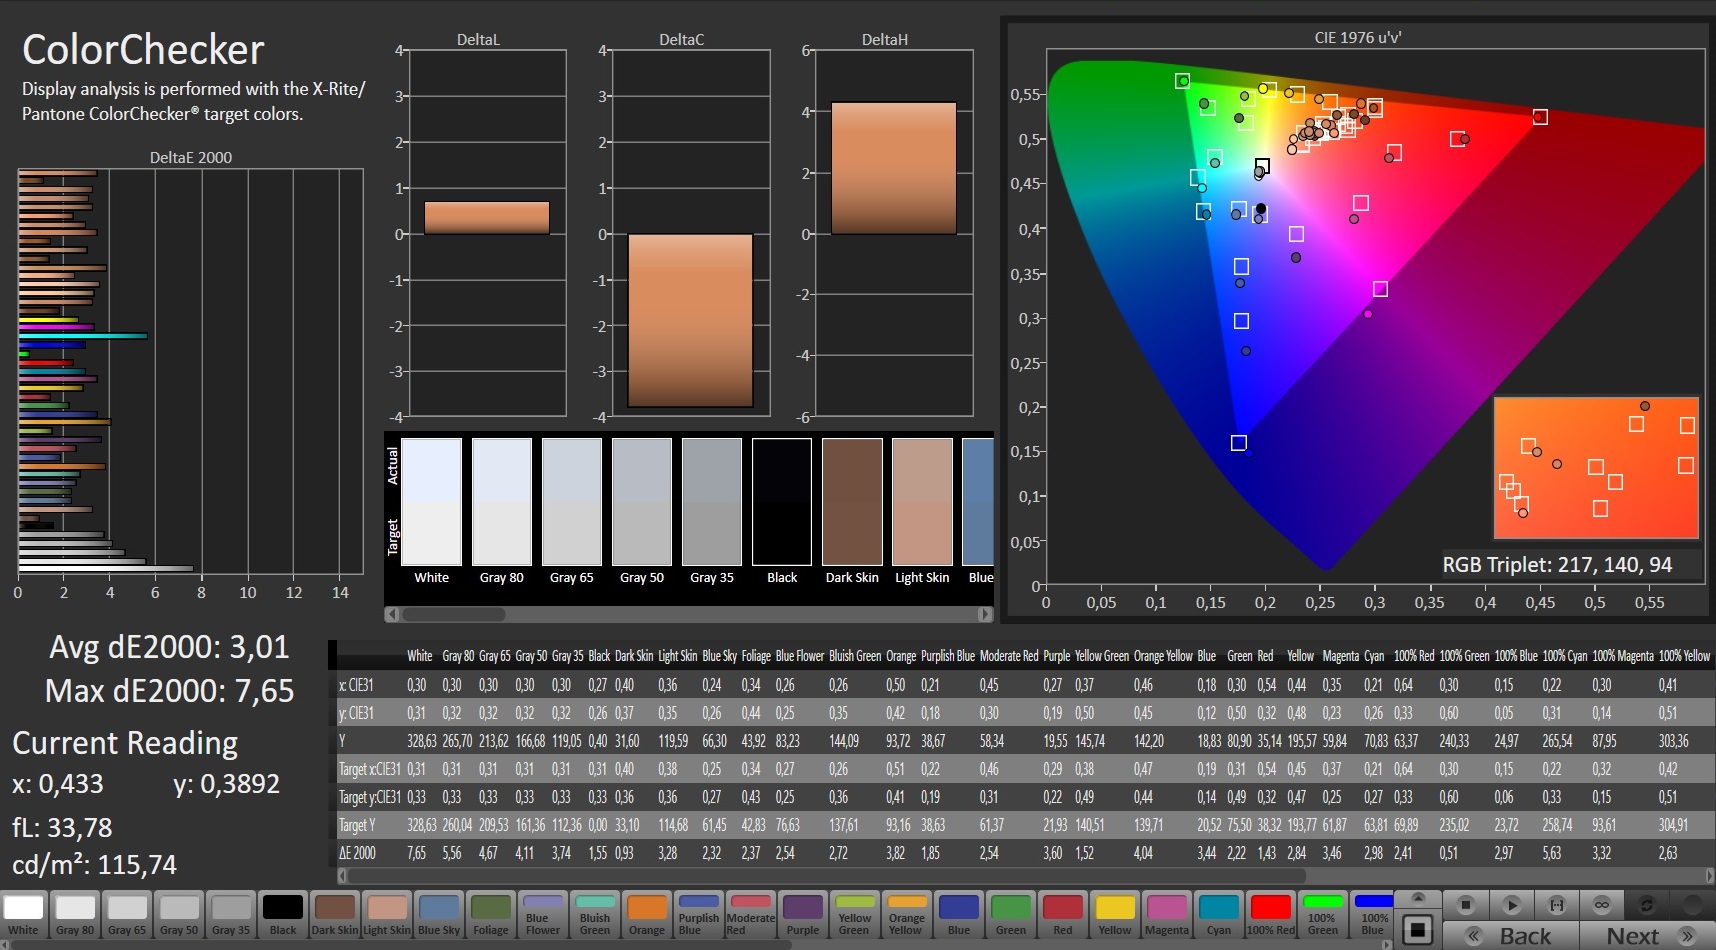
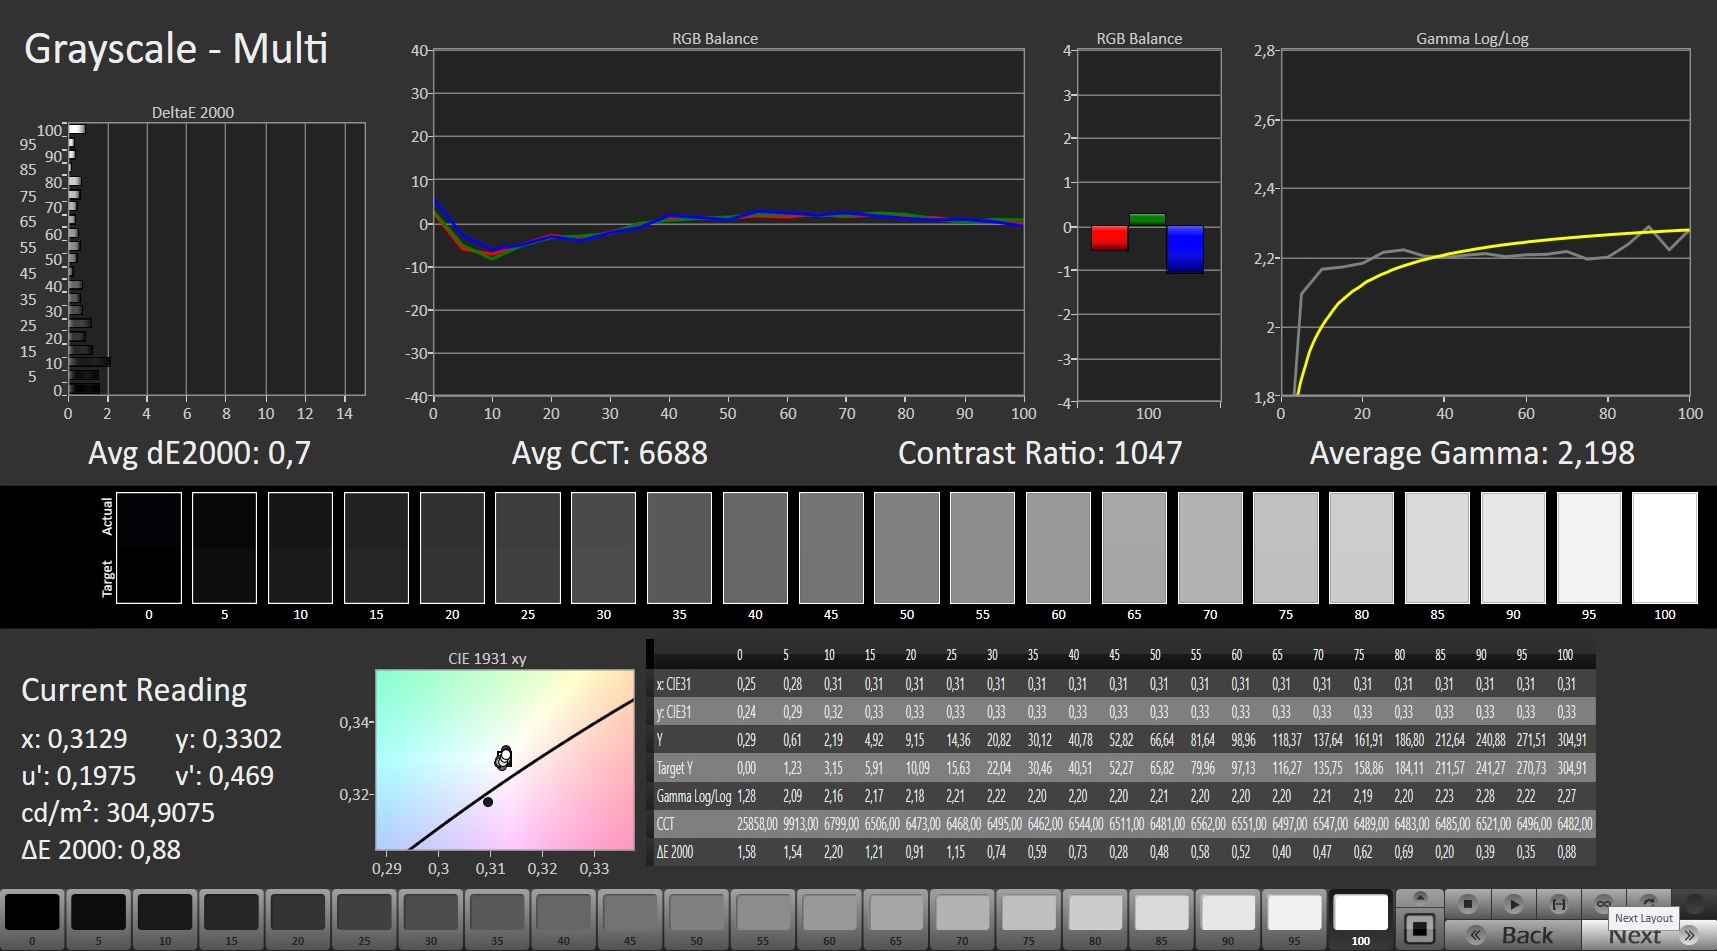
The display already shows a very decent color reproduction out of the box. With a Delta E 2000 color deviation of 3.01, the target (Delta E less than 3) is missed by a hair's breadth. The display doesn't suffer from a blue tint. Moreover, improvements are achieved by means of calibration: In this way, the color deviation is reduced to 1, and the grayscales are displayed in a more balanced way. The AdobeRGB (66%) and sRGB (90%) color spaces aren't completely reproduced.
Display Response Times
| ↔ Response Time Black to White | ||
|---|---|---|
| 10.4 ms ... rise ↗ and fall ↘ combined | ↗ 5.2 ms rise | 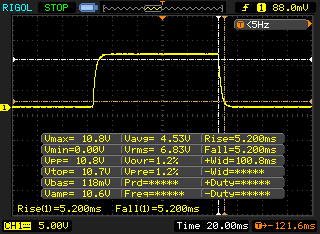 |
| ↘ 5.2 ms fall | ||
| The screen shows good response rates in our tests, but may be too slow for competitive gamers. In comparison, all tested devices range from 0.1 (minimum) to 240 (maximum) ms. » 28 % of all devices are better. This means that the measured response time is better than the average of all tested devices (19.8 ms). | ||
| ↔ Response Time 50% Grey to 80% Grey | ||
| 14.4 ms ... rise ↗ and fall ↘ combined | ↗ 6.8 ms rise | 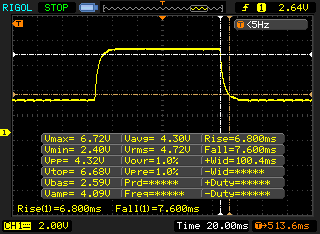 |
| ↘ 7.6 ms fall | ||
| The screen shows good response rates in our tests, but may be too slow for competitive gamers. In comparison, all tested devices range from 0.165 (minimum) to 636 (maximum) ms. » 28 % of all devices are better. This means that the measured response time is better than the average of all tested devices (31 ms). | ||
Screen Flickering / PWM (Pulse-Width Modulation)
| Screen flickering / PWM not detected | 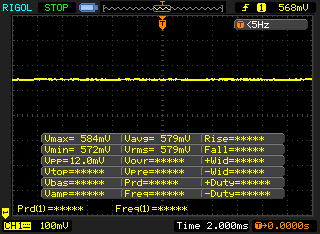 | ||
In comparison: 52 % of all tested devices do not use PWM to dim the display. If PWM was detected, an average of 7747 (minimum: 5 - maximum: 343500) Hz was measured. | |||
The display is equipped with a viewing-angle-stable IPS panel. Thus the screen can be read from any position. Outdoors, the display can be read when the sun is not too bright.

Performance - Enough for the coming years
With the ROG Strix G17 G712LWS, Asus has a 17.3-inch gaming laptop in its range that brings every modern game smoothly onto the screen. Our test device costs just under 2,000 Euros (~$2,362). In addition, other configuration variants are available.

Test conditions
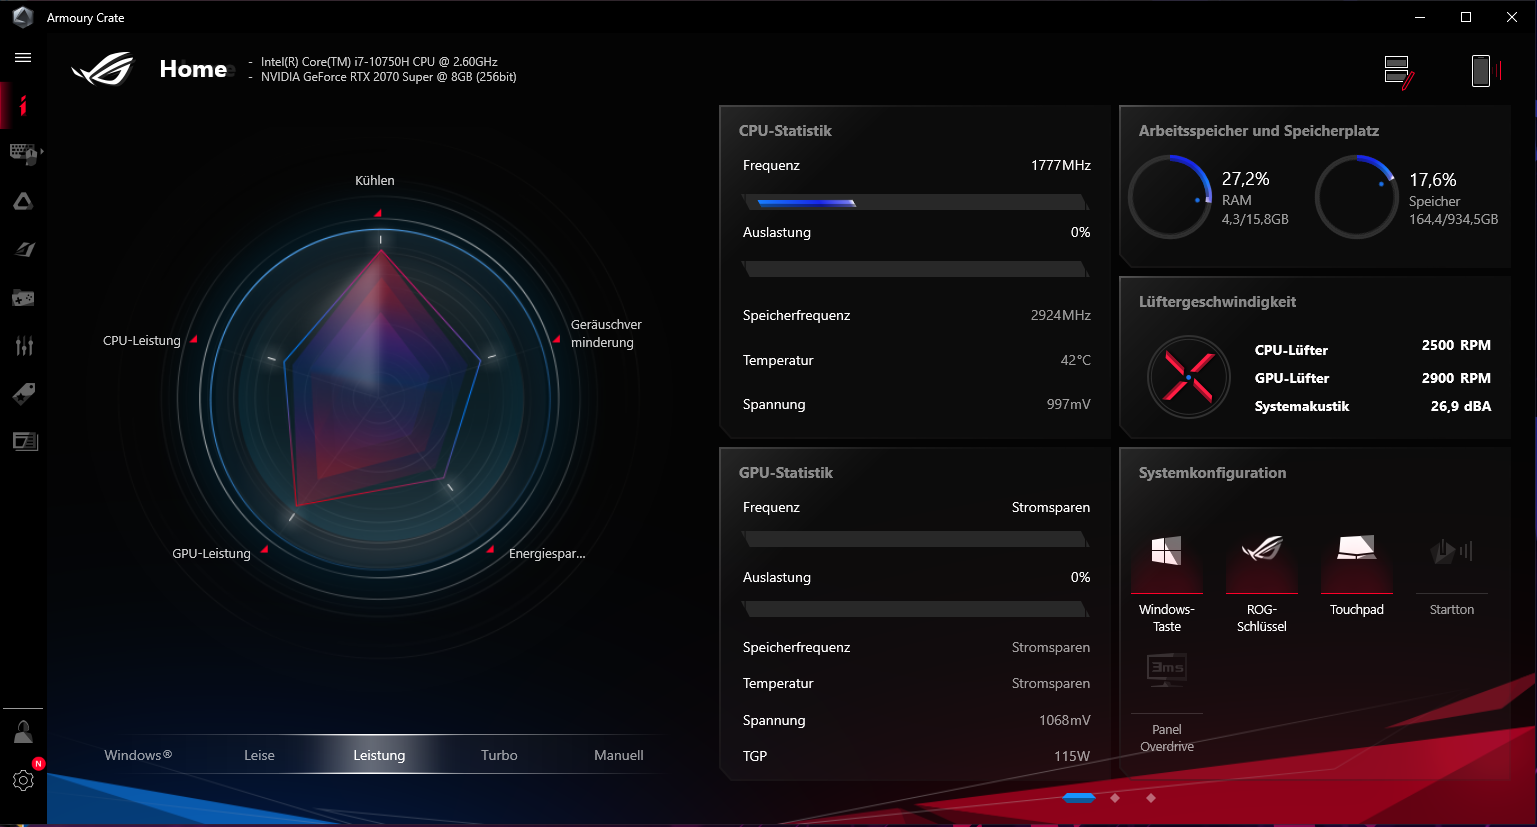
The preinstalled Armoury Crate Control Center allows the selection of an energy profile. We conducted our test with the "Performance" profile active. Some benchmarks were additionally run under the "Turbo" profile. For the battery tests, we used the Windows power plans.
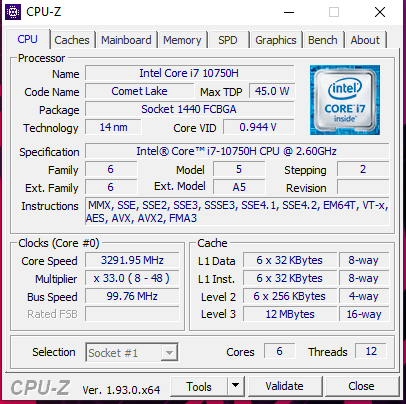
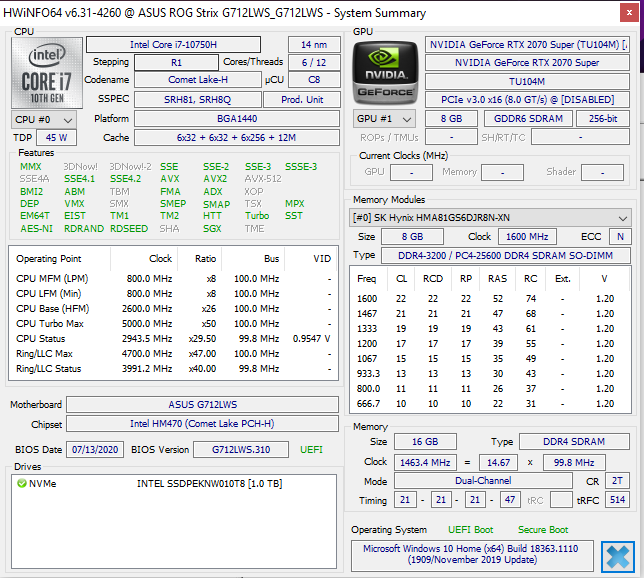
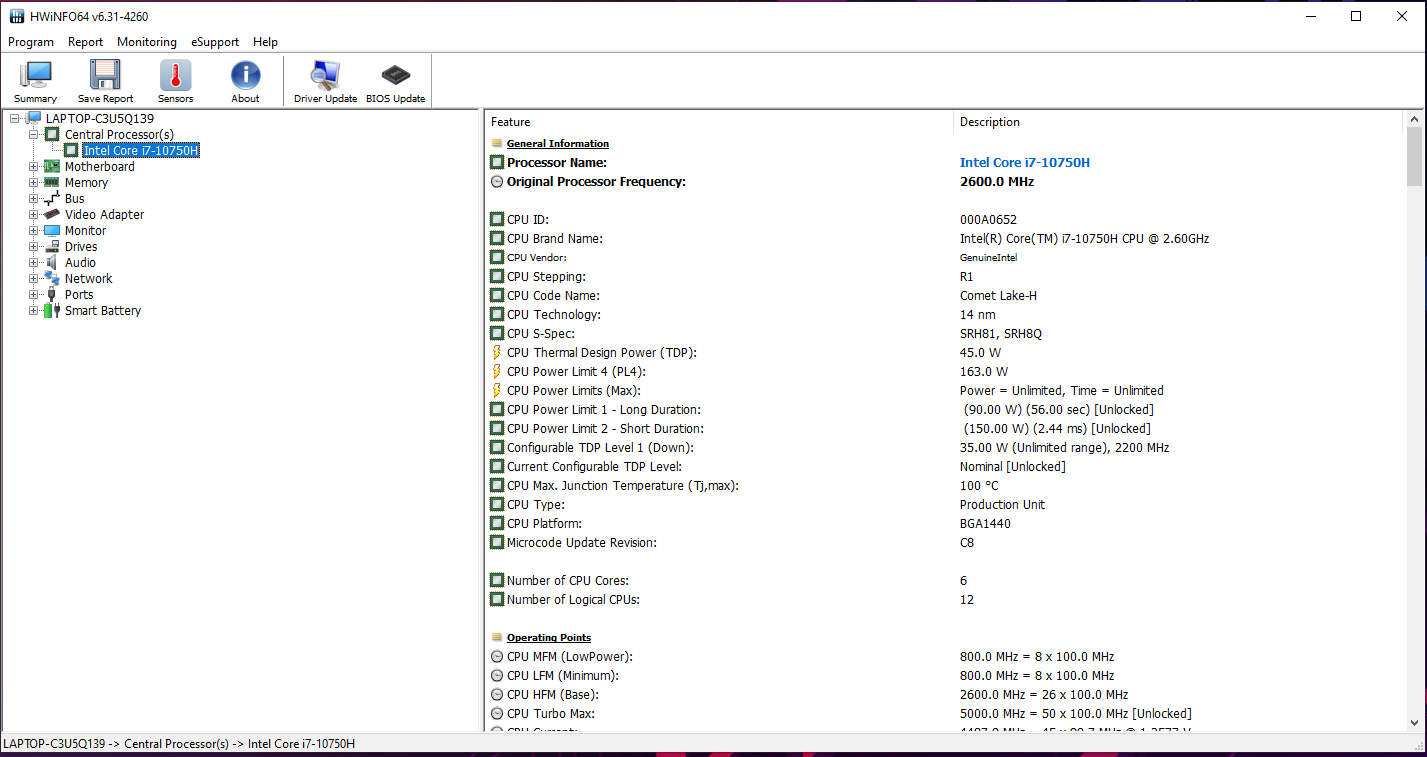
Processor
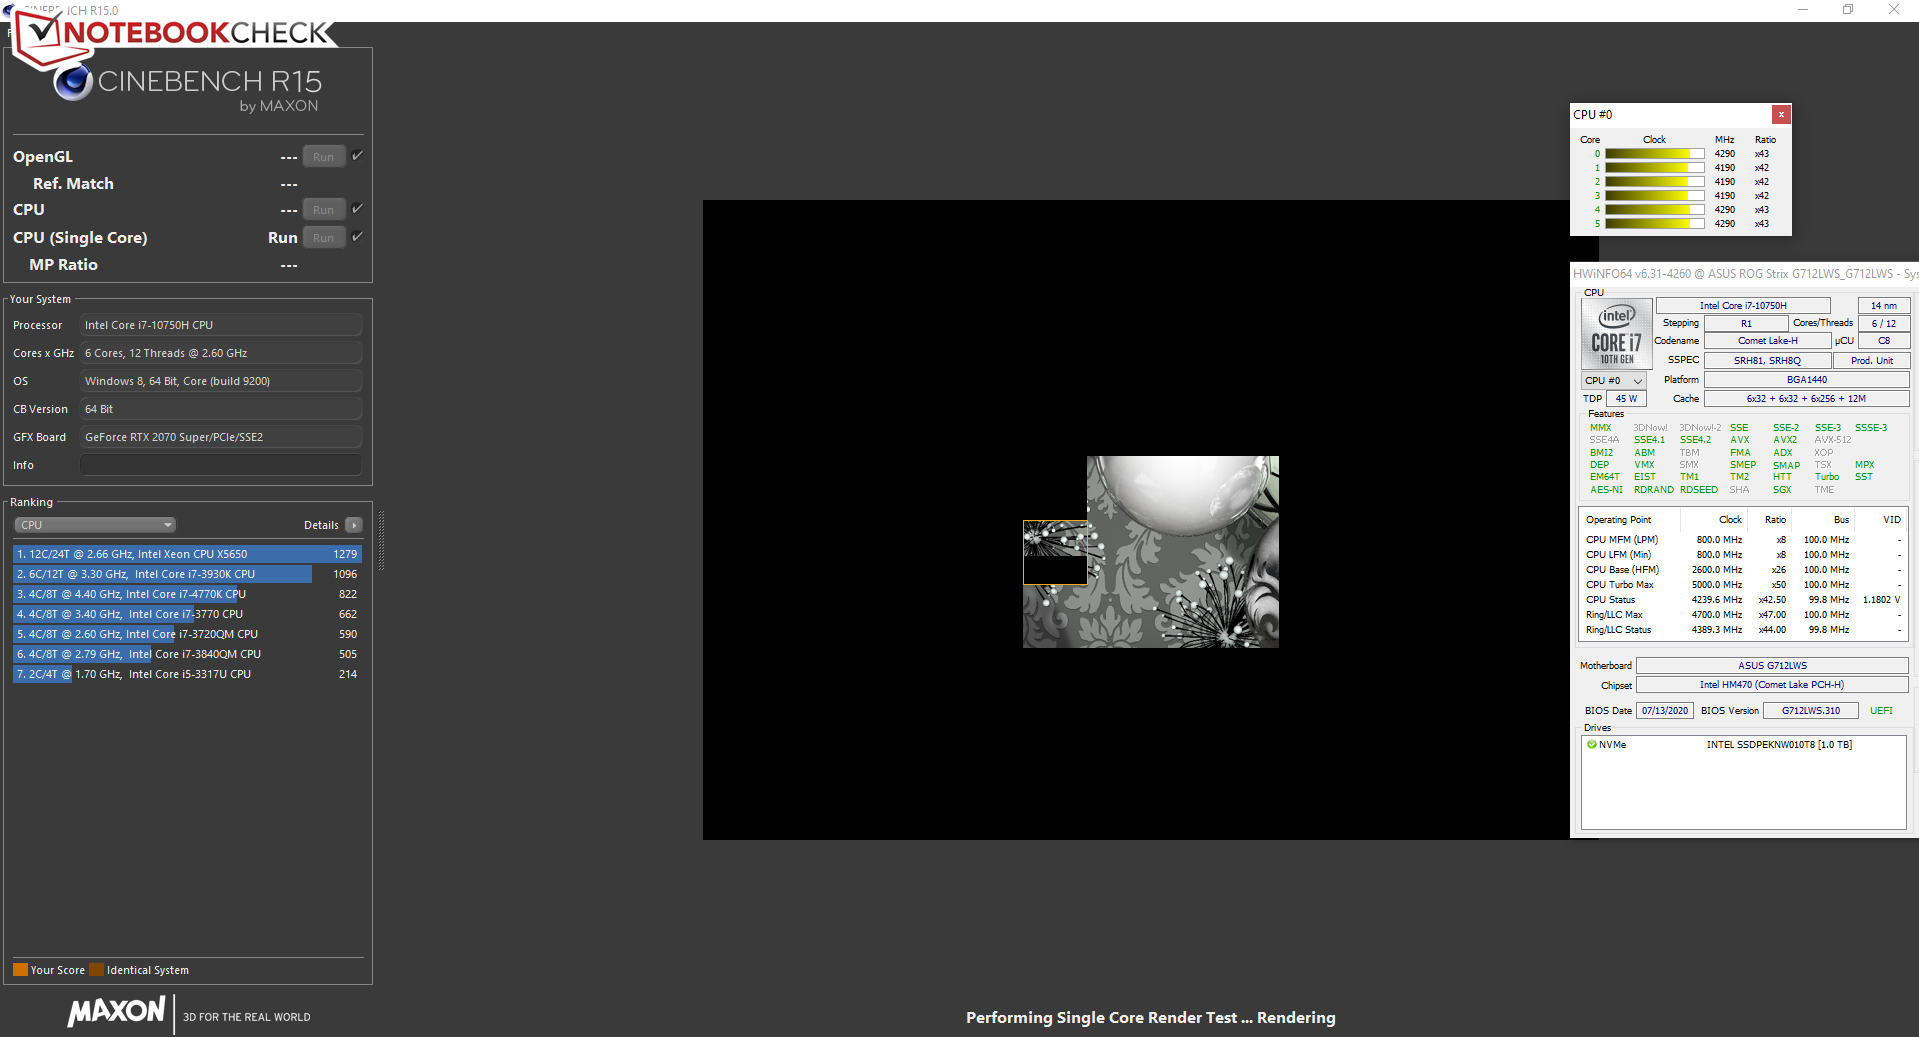
Asus equips the Strix with a Core i7-10750H hexa-core processor (Comet Lake). The CPU runs at a base speed of 2.6 GHz. The clock rate can be increased to 4.3 GHz (six cores) or 5 GHz (one core) via Turbo. Hyper-Threading (two threads per core) is supported.
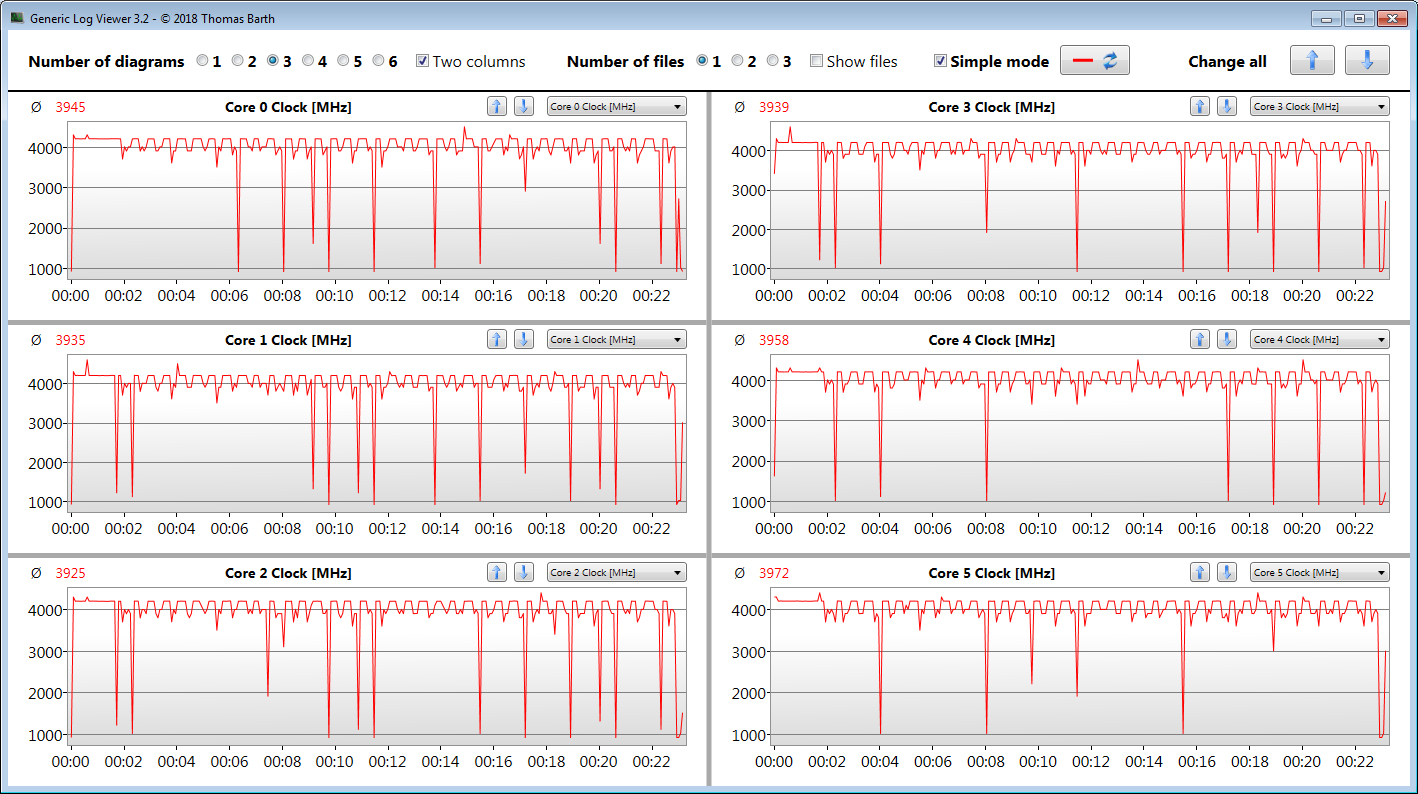
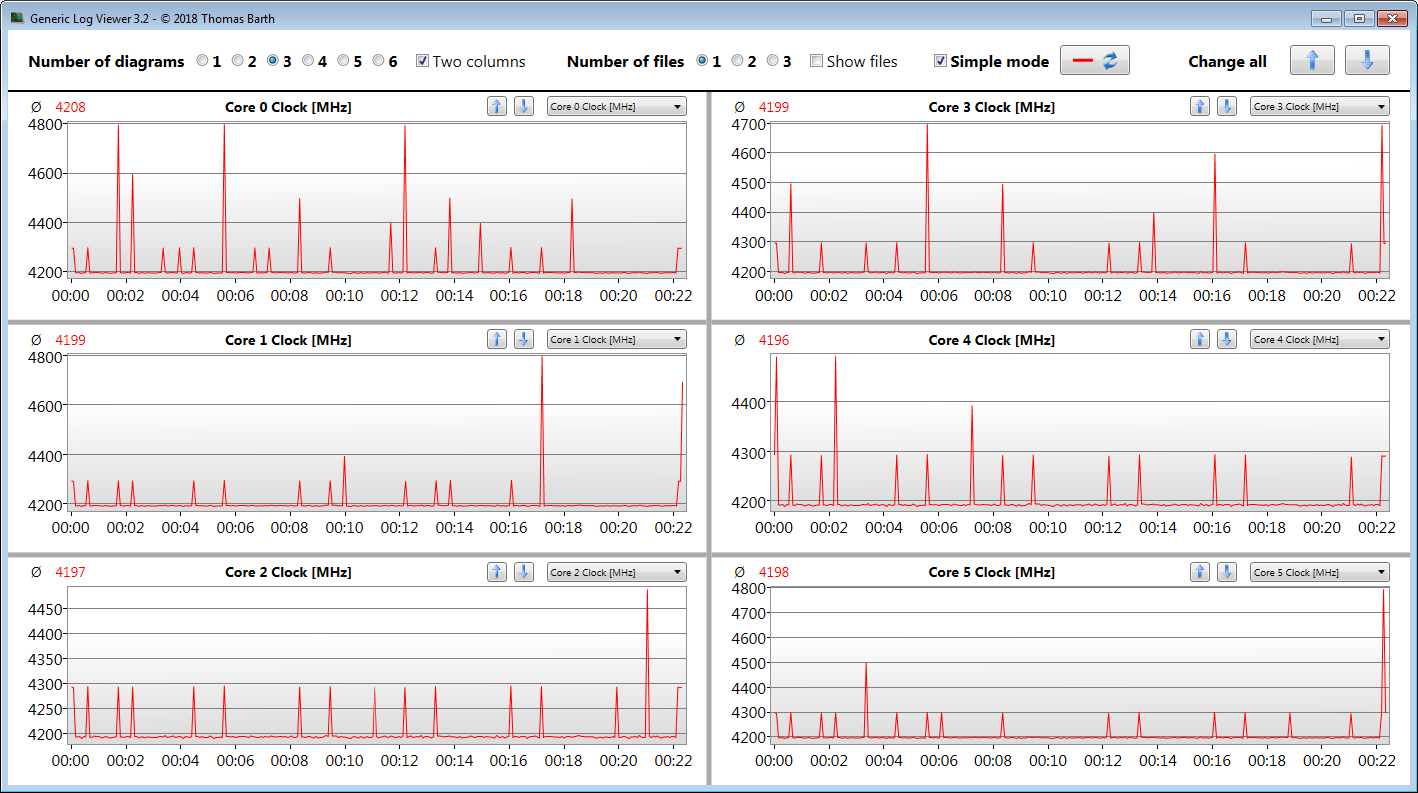
The processor works through the multithread test of the Cinebench R15 benchmark at 4.2 GHz. The single-thread test is run at 4.3 to 4.6 GHz. On battery power, the clock rates are 2.6 to 2.8 GHz (multithread) and 3.2 to 3.5 GHz (single-thread), respectively.
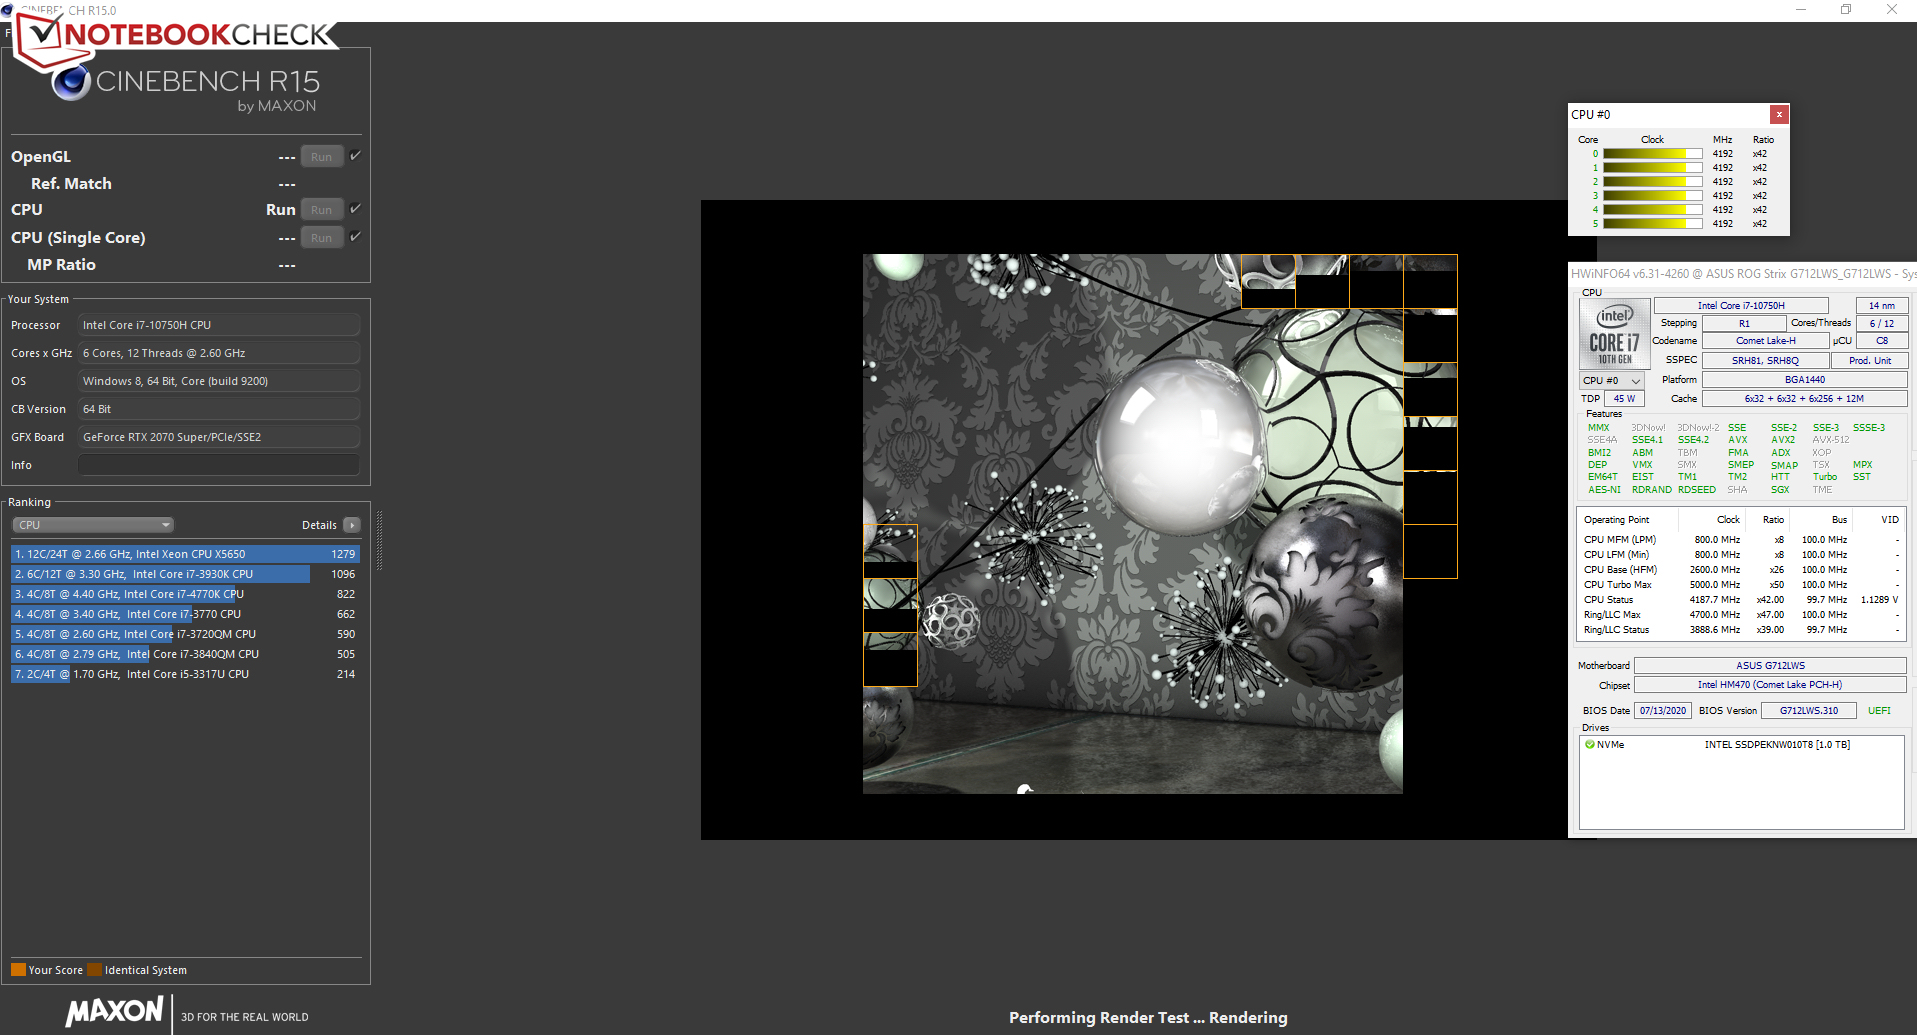
We verify if the CPU Turbo is consistently used when plugged in by running the Cinebench R15 benchmark's multithread test in a continuous loop for at least 30 minutes. The results slightly drop from the first to the third run and then remain at a relatively constant level. Turbo is used to a large extent. Slightly higher clock speeds are achieved when using the Armoury Crate software's "Turbo" profile.
* ... smaller is better
System performance
The system runs well and smoothly, and we didn't encounter any problems. The good PCMark results reveal that the laptop offers more than enough performance for all common application areas - and this should be true for the coming years as well.
| PCMark 8 Home Score Accelerated v2 | 4412 points | |
| PCMark 8 Creative Score Accelerated v2 | 4201 points | |
| PCMark 8 Work Score Accelerated v2 | 5832 points | |
| PCMark 10 Score | 5262 points | |
Help | ||
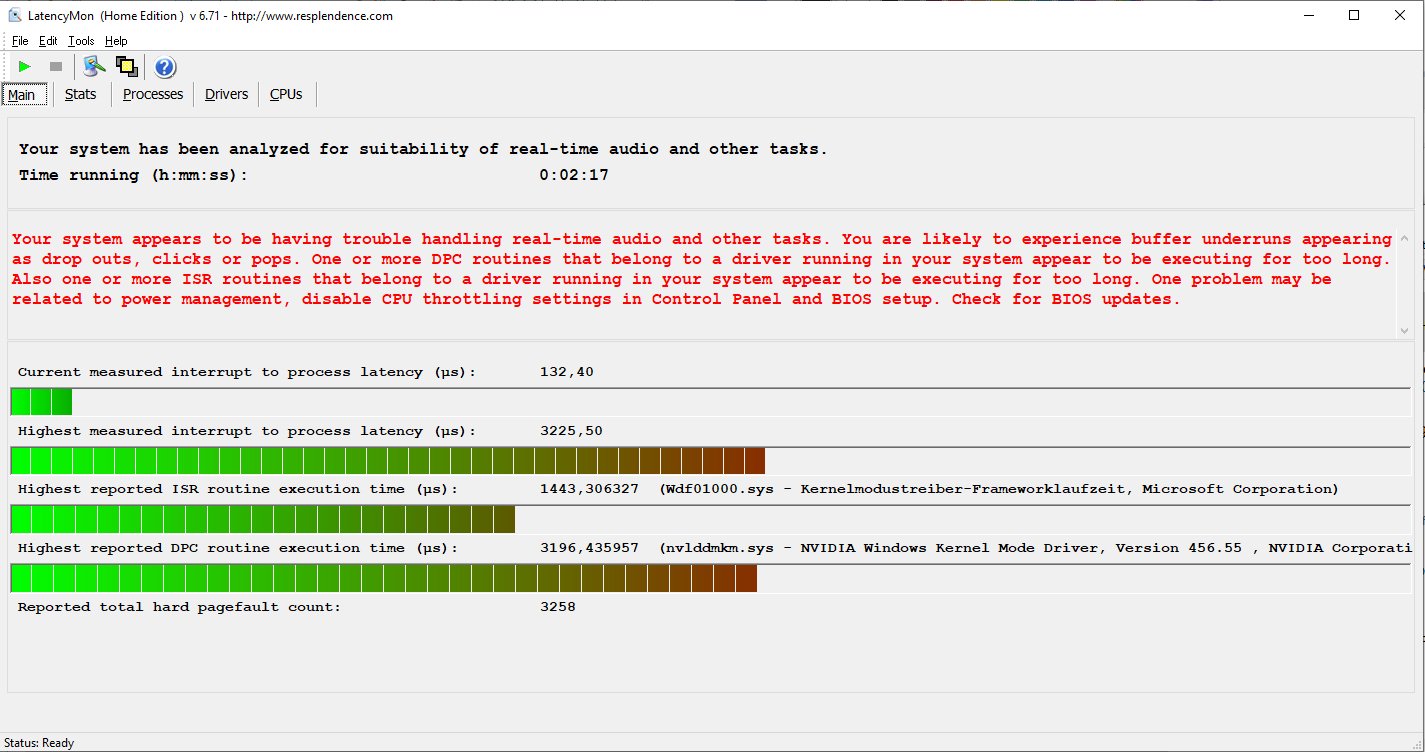
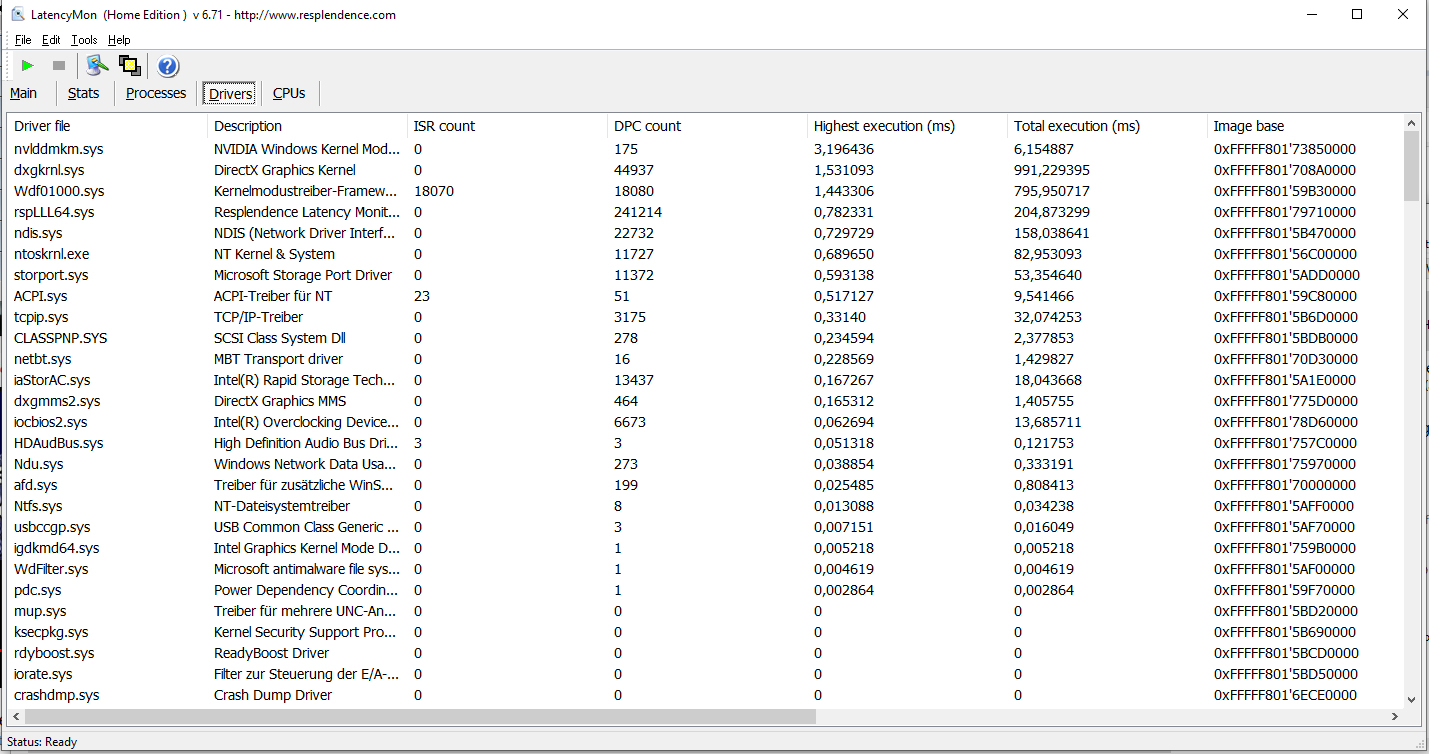
DPC latencies
In our standardized latency monitor test (web surfing, 4K video playback, high-load Prime95), we could observe issues with the DPC latencies. The system doesn't seem to be suitable for real-time video and audio-editing.
| DPC Latencies / LatencyMon - interrupt to process latency (max), Web, Youtube, Prime95 | |
| Asus Strix G17 G712LWS | |
| MSI GL75 10SFR | |
| Acer Predator Helios 300 PH317-54-75G8 | |
* ... smaller is better
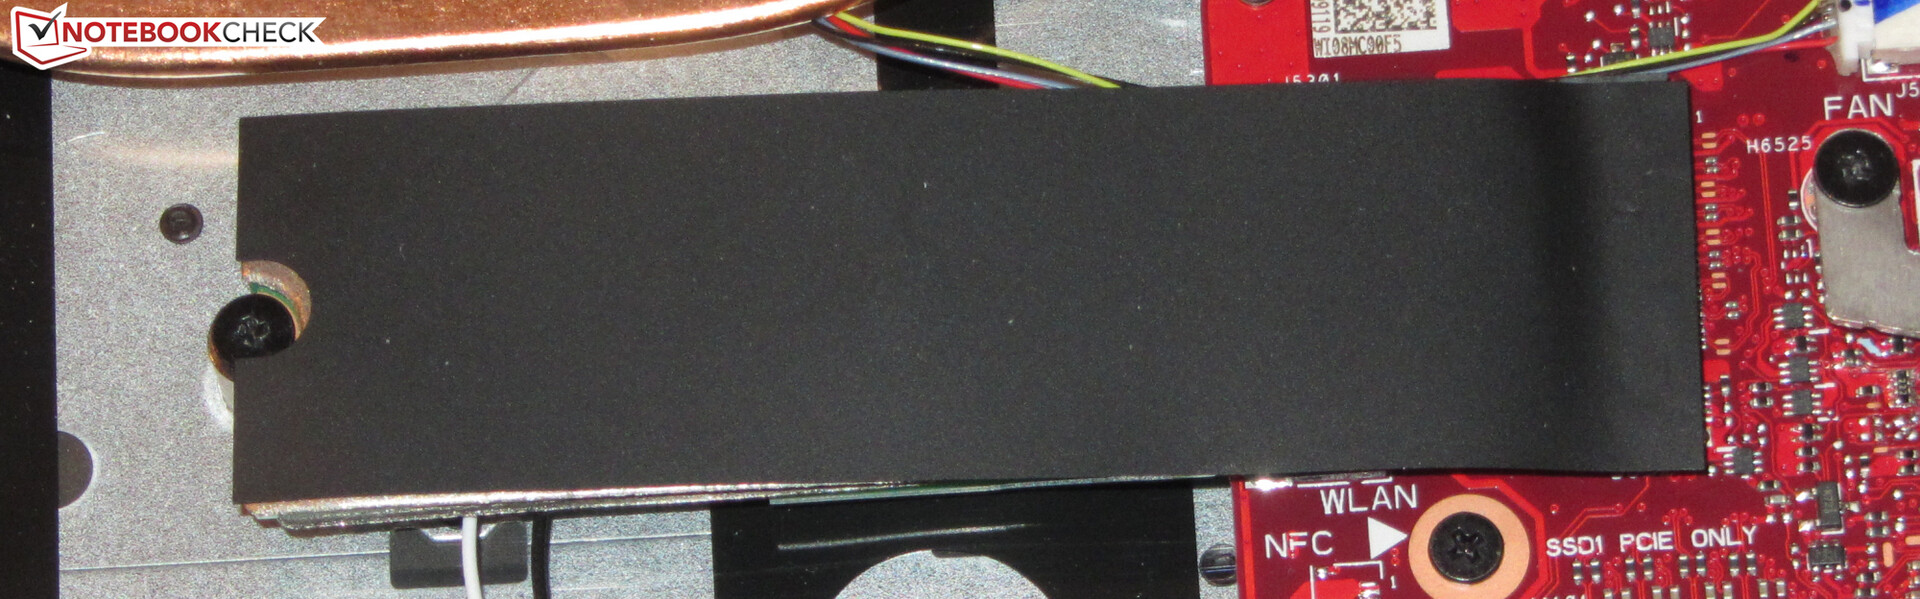
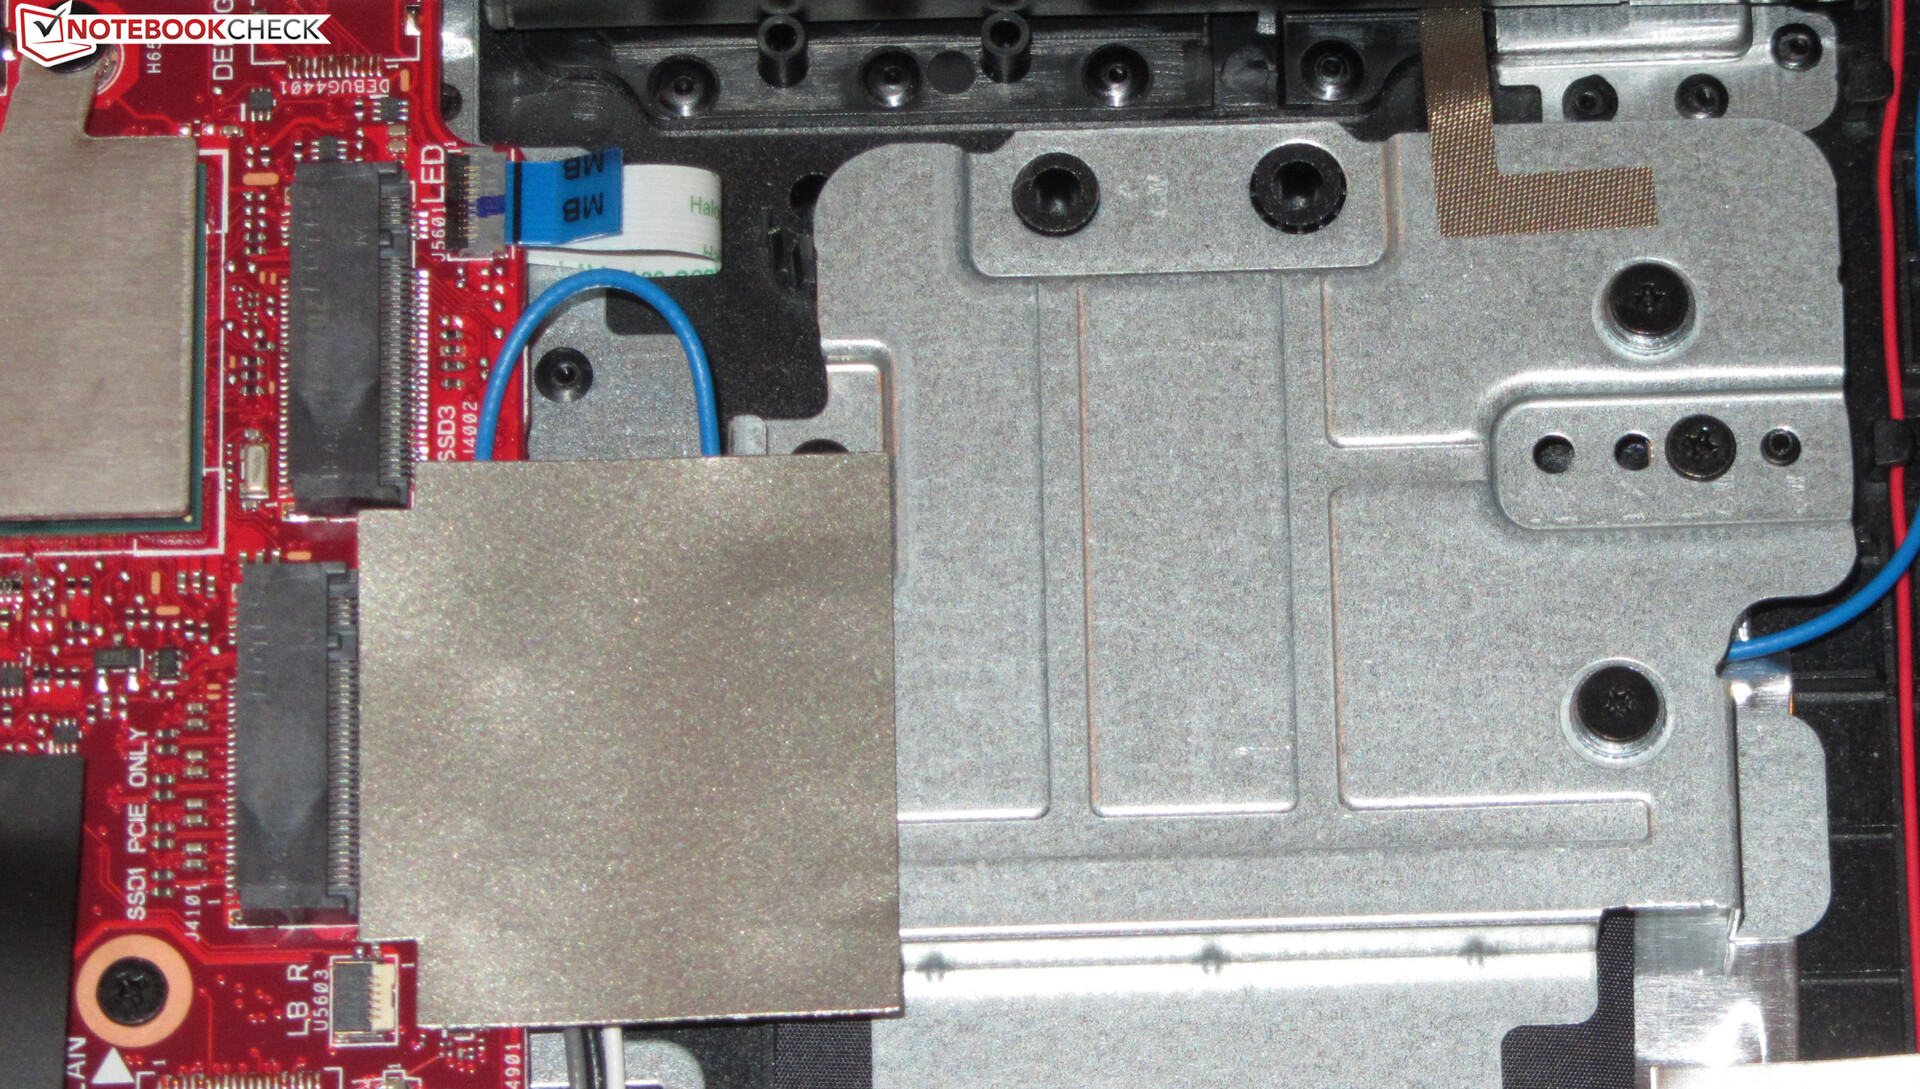
Storage
The system drive is an NVMe SSD (M.2 2280) from Intel that provides 1 TB of storage space. The SSD delivers good transfer rates overall, but it's not among the top models since there's still room for improvement. The laptop offers space for two more M.2 2280 SSDs. Furthermore, RAID 0 is supported.

| Asus Strix G17 G712LWS Intel SSD 660p 1TB SSDPEKNW010T8 | Asus ROG Strix G GL731GU-RB74 Intel SSD 660p SSDPEKNW512G8 | Acer Predator Helios 300 PH317-54-75G8 WDC PC SN730 SDBQNTY-1T00 | Schenker XMG Pro 17 PB71RD-G Samsung SSD 970 EVO Plus 500GB | MSI GL75 10SFR Lite-On CL1-8D512 | Lenovo Legion Y740-17IRHg-81UJ001VGE Samsung SSD PM981 MZVLB1T0HALR | |
|---|---|---|---|---|---|---|
| CrystalDiskMark 5.2 / 6 | -16% | 27% | 20% | -4% | 16% | |
| Write 4K (MB/s) | 141.1 | 127.6 -10% | 141.9 1% | 117.5 -17% | 132.2 -6% | 101.2 -28% |
| Read 4K (MB/s) | 60.9 | 56 -8% | 48.75 -20% | 46.47 -24% | 45.62 -25% | 44.61 -27% |
| Write Seq (MB/s) | 1681 | 986 -41% | 2734 63% | 1345 -20% | 1511 -10% | 2295 37% |
| Read Seq (MB/s) | 1602 | 1605 0% | 1921 20% | 2804 75% | 1890 18% | 2174 36% |
| Write 4K Q32T1 (MB/s) | 406.6 | 451.5 11% | 422.6 4% | 368.2 -9% | 375.9 -8% | 401.2 -1% |
| Read 4K Q32T1 (MB/s) | 470.2 | 343.3 -27% | 509 8% | 412.9 -12% | 525 12% | 475.5 1% |
| Write Seq Q32T1 (MB/s) | 1759 | 983 -44% | 3055 74% | 3248 85% | 1505 -14% | 2397 36% |
| Read Seq Q32T1 (MB/s) | 1932 | 1810 -6% | 3257 69% | 3559 84% | 2008 4% | 3337 73% |
| AS SSD | -38% | 73% | 83% | -35% | 59% | |
| Seq Read (MB/s) | 1778 | 1319 -26% | 2828 59% | 2946 66% | 1923 8% | 2800 57% |
| Seq Write (MB/s) | 1478 | 930 -37% | 2677 81% | 2627 78% | 1065 -28% | 2424 64% |
| 4K Read (MB/s) | 49.76 | 49.43 -1% | 39.94 -20% | 56.9 14% | 25.43 -49% | 42.77 -14% |
| 4K Write (MB/s) | 117.9 | 104.3 -12% | 100.9 -14% | 151.7 29% | 101.9 -14% | 94.8 -20% |
| 4K-64 Read (MB/s) | 591 | 321.9 -46% | 1562 164% | 1222 107% | 477.9 -19% | 1406 138% |
| 4K-64 Write (MB/s) | 875 | 774 -12% | 1867 113% | 2444 179% | 563 -36% | 1697 94% |
| Access Time Read * (ms) | 0.082 | 0.055 33% | 0.051 38% | 0.053 35% | 0.05 39% | |
| Access Time Write * (ms) | 0.041 | 0.138 -237% | 0.037 10% | 0.025 39% | 0.126 -207% | 0.039 5% |
| Score Read (Points) | 818 | 503 -39% | 1885 130% | 1574 92% | 696 -15% | 1729 111% |
| Score Write (Points) | 1140 | 971 -15% | 2236 96% | 2859 151% | 771 -32% | 2034 78% |
| Score Total (Points) | 2377 | 1731 -27% | 5076 114% | 5232 120% | 1785 -25% | 4630 95% |
| Total Average (Program / Settings) | -27% /
-29% | 50% /
53% | 52% /
57% | -20% /
-22% | 38% /
41% |
* ... smaller is better
Continuous load read: DiskSpd Read Loop, Queue Depth 8
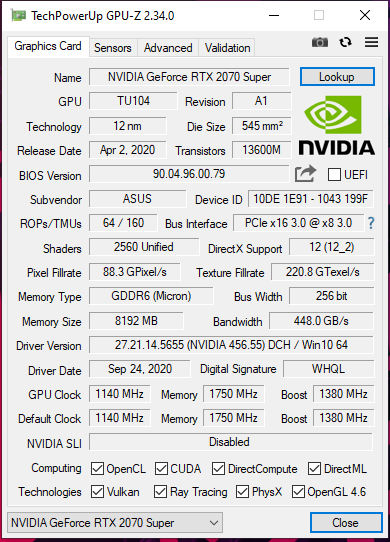
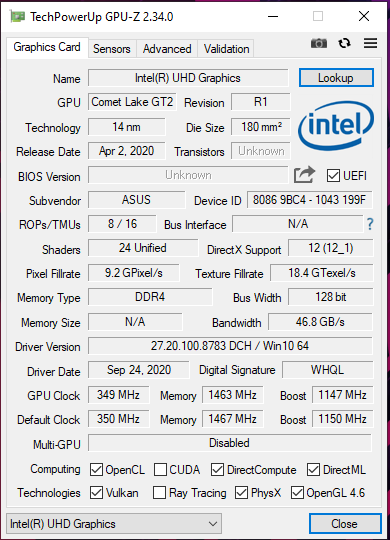
Graphics card
The GeForce RTX 2070 Super graphics core belongs to the GPU upper class. It can access fast GDDR6 graphics memory (8,192 MB). The UHD Graphics 630 chip that's integrated into the processor is active, and the laptop works with Nvidia's Optimus graphics-switching solution.
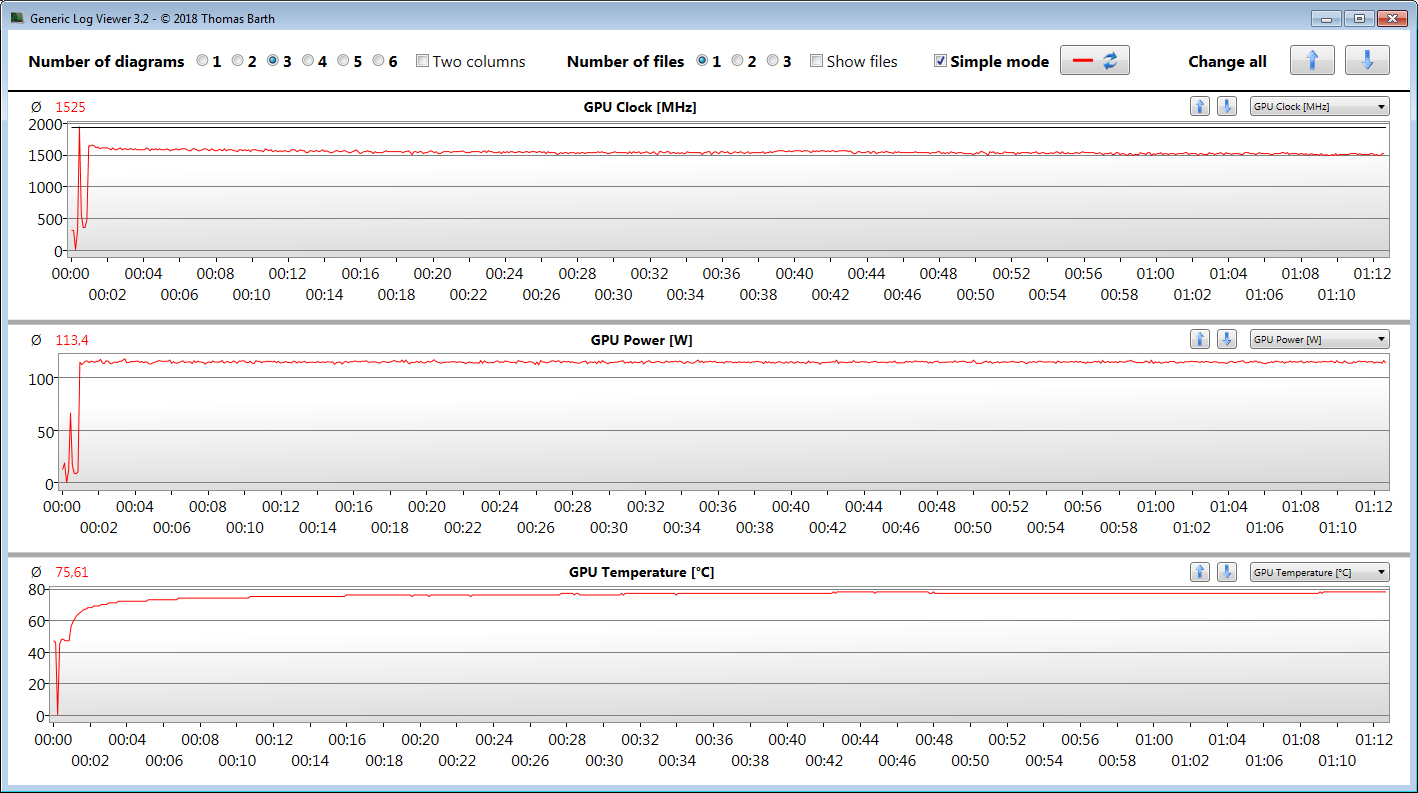
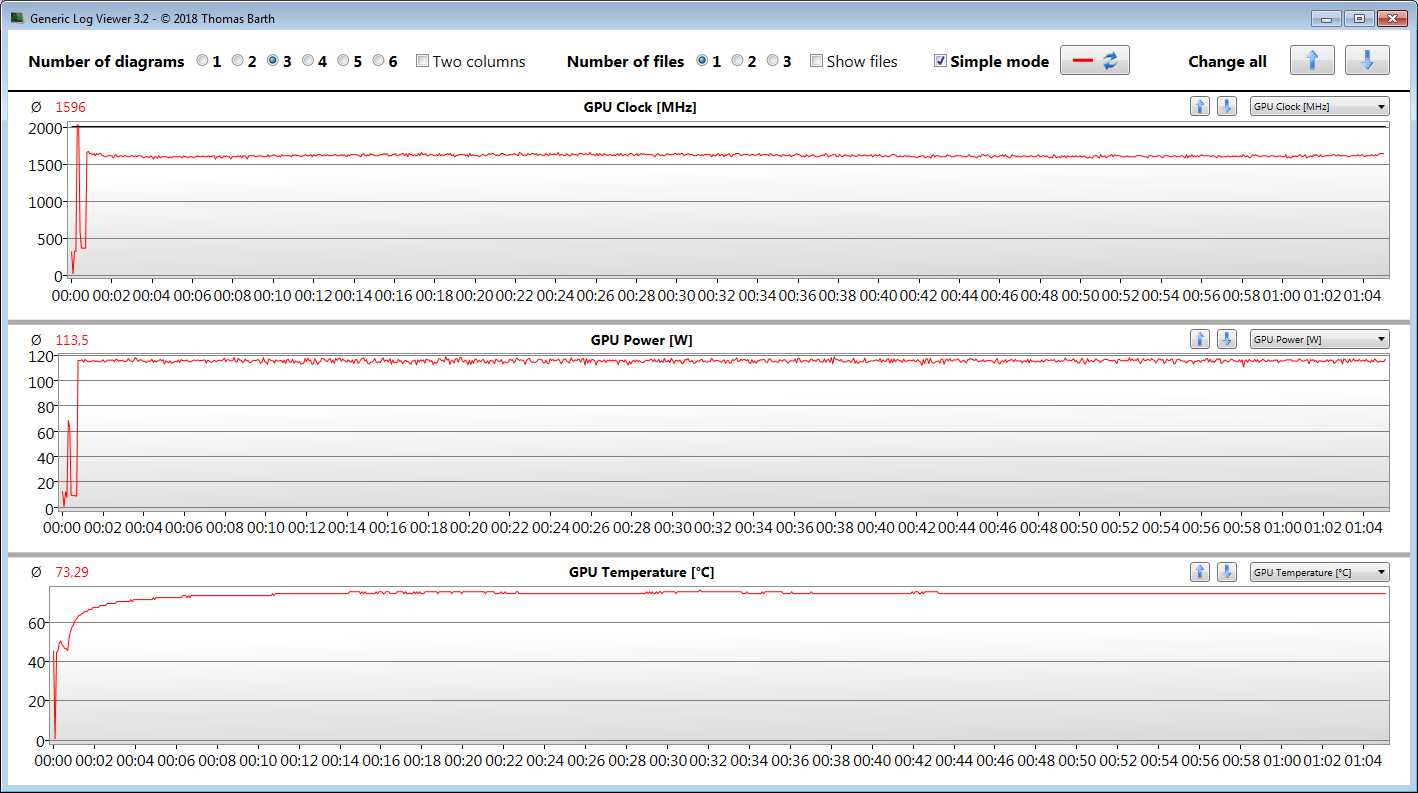
Nvidia specifies a clock range between 1,140 MHz (base) and 1,380 MHz (boost) for this DirectX 12 GPU. Higher speeds are feasible if the GPU doesn't reach a specified temperature and/or energy threshold. In this way, we register a maximum of 1,994 MHz. Moreover, our The Witcher 3 test is run at an average speed of 1,525 MHz and 1,596 MHz (Turbo), respectively.
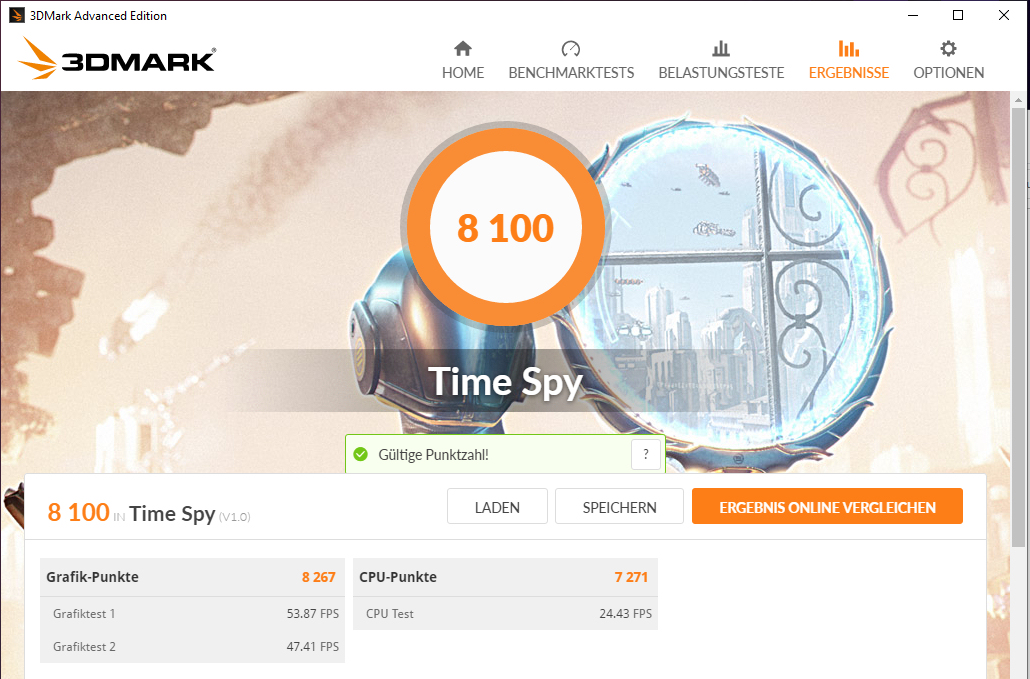
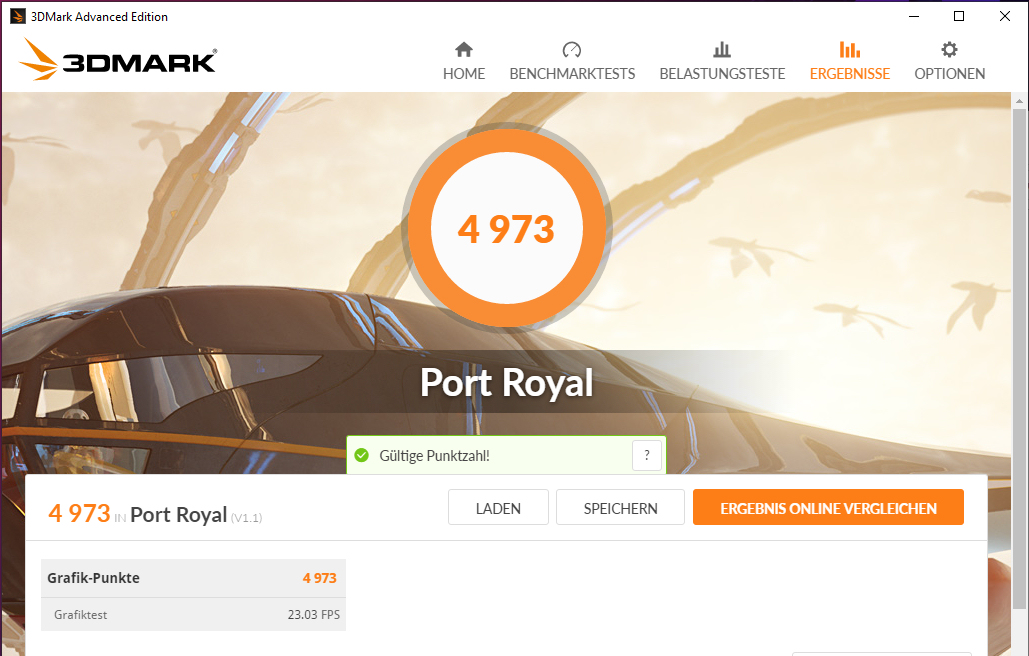
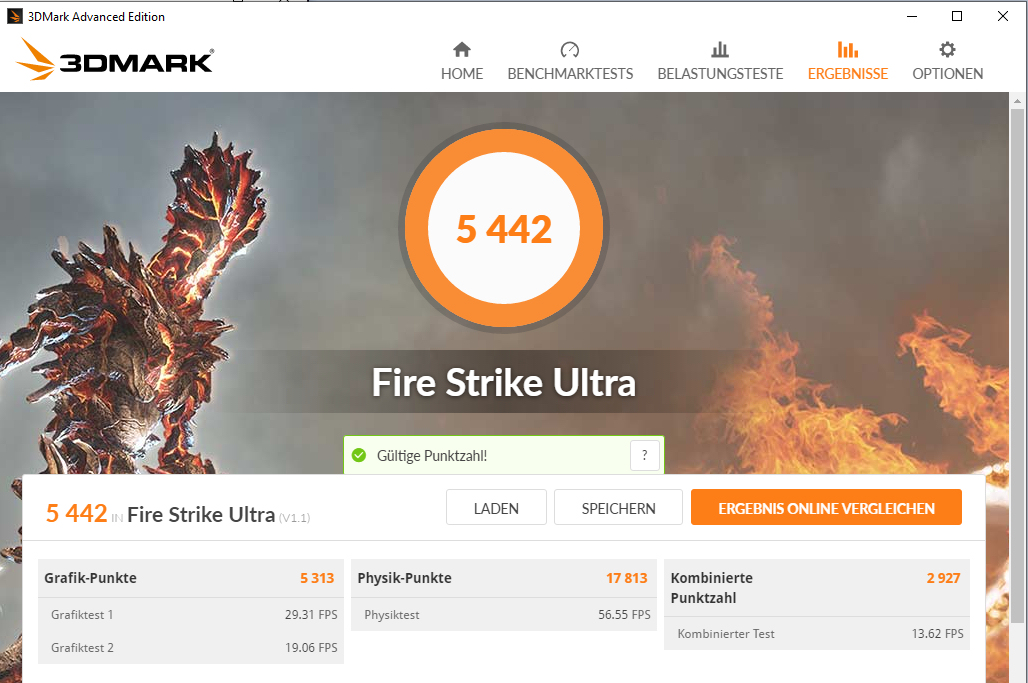
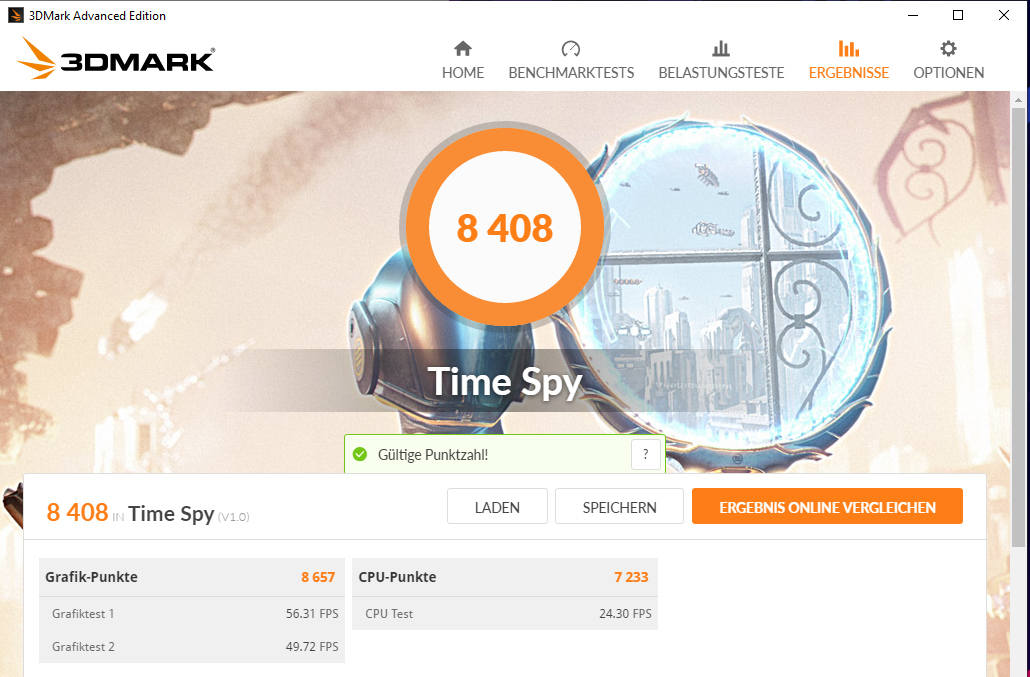
The results in the 3DMark benchmarks are at a normal level for the GPU installed here. The Armoury Crate "Turbo" profile lets the values increase slightly.


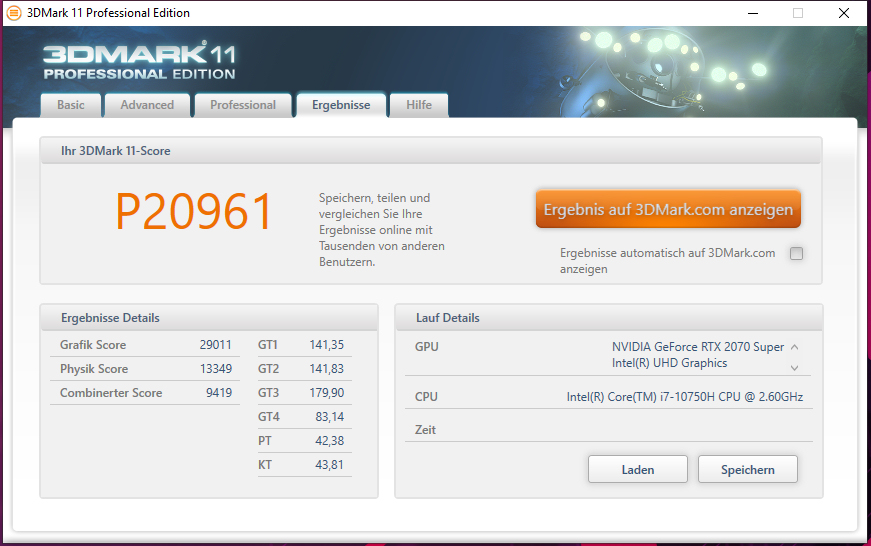
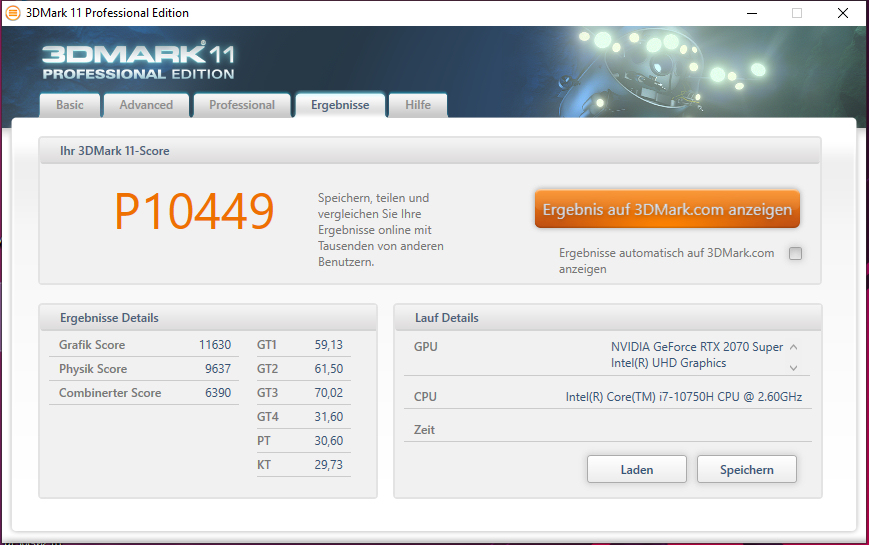

| 3DMark 11 Performance | 20961 points | |
| 3DMark Cloud Gate Standard Score | 39220 points | |
| 3DMark Fire Strike Score | 18270 points | |
| 3DMark Time Spy Score | 8100 points | |
Help | ||
Gaming performance
There are no problems on the gaming front. The built-in CPU-GPU combination brings all modern games smoothly onto the matte screen at Full HD resolution and maximum quality settings. Resolutions beyond Full HD are also possible when an appropriate monitor is connected. The "Turbo" Armoury Crate profile produces a slight increase in frame rates.
| The Witcher 3 - 1920x1080 Ultra Graphics & Postprocessing (HBAO+) | |
| Average of class Gaming (104.7 - 240, n=6, last 2 years) | |
| Asus Strix G17 G712LWS (Turbo) | |
| Asus Strix G17 G712LWS | |
| Average NVIDIA GeForce RTX 2070 Super Mobile (76.3 - 94.6, n=8) | |
| Lenovo Legion Y740-17IRHg-81UJ001VGE | |
| MSI GL75 10SFR | |
| Acer Predator Helios 300 PH317-54-75G8 | |
| Schenker XMG Pro 17 PB71RD-G | |
| Asus ROG Strix G GL731GU-RB74 | |
| Horizon Zero Dawn - 1920x1080 Ultimate Quality | |
| Average NVIDIA GeForce RTX 2070 Super Mobile (77 - 98, n=3) | |
| Asus Strix G17 G712LWS (Turbo) | |
| Asus Strix G17 G712LWS | |
| Acer Predator Helios 300 PH317-54-75G8 | |
| Doom Eternal - 1920x1080 Ultra Preset | |
| Average NVIDIA GeForce RTX 2070 Super Mobile (151 - 190.4, n=5) | |
| Asus Strix G17 G712LWS (Turbo) | |
| Asus Strix G17 G712LWS | |
| MSI GL75 10SFR | |
| Acer Predator Helios 300 PH317-54-75G8 | |
| F1 2020 - 1920x1080 Ultra High Preset AA:T AF:16x | |
| Asus Strix G17 G712LWS (Turbo) | |
| Average NVIDIA GeForce RTX 2070 Super Mobile (118 - 124, n=2) | |
| Asus Strix G17 G712LWS | |
| MSI GL75 10SFR | |
| Acer Predator Helios 300 PH317-54-75G8 | |
| Death Stranding - 1920x1080 Very High Preset | |
| Asus Strix G17 G712LWS (Turbo) | |
| Average NVIDIA GeForce RTX 2070 Super Mobile (116.2 - 123.8, n=4) | |
| Asus Strix G17 G712LWS | |
| MSI GL75 10SFR | |
| Flight Simulator 2020 - 1920x1080 High-End AA:TAA AF:8x | |
| Average NVIDIA GeForce RTX 2070 Super Mobile (48.8 - 53.3, n=2) | |
| Asus Strix G17 G712LWS | |
| Acer Predator Helios 300 PH317-54-75G8 | |
| Serious Sam 4 - 1920x1080 Ultra (DX12) AA:2xMS | |
| Average NVIDIA GeForce RTX 2070 Super Mobile (71.1 - 82.1, n=4) | |
| Asus Strix G17 G712LWS | |
| Acer Predator Helios 300 PH317-54-75G8 | |
| Mafia Definitive Edition - 1920x1080 High Preset | |
| Average NVIDIA GeForce RTX 2070 Super Mobile (92 - 96.6, n=2) | |
| Asus Strix G17 G712LWS | |
| Acer Predator Helios 300 PH317-54-75G8 | |
In order to verify whether the frame rates remain largely constant over a prolonged period of time, we let the game The Witcher 3 run for about 60 minutes at Full HD resolution and maximum quality settings. The character is not moved. A drop in frame rates wasn't found.
| low | med. | high | ultra | |
|---|---|---|---|---|
| BioShock Infinite (2013) | 371.8 | 308.3 | 299 | 173.4 |
| The Witcher 3 (2015) | 296.3 | 236.7 | 154.3 | 87.8 |
| Shadow of the Tomb Raider (2018) | 121 | 110 | 107 | 100 |
| Doom Eternal (2020) | 219.1 | 165.7 | 158.5 | 155.4 |
| Gears Tactics (2020) | 249.1 | 172.4 | 122.2 | 90 |
| F1 2020 (2020) | 227 | 168 | 147 | 118 |
| Death Stranding (2020) | 145 | 128.2 | 117.8 | 116.2 |
| Horizon Zero Dawn (2020) | 139 | 107 | 94 | 77 |
| Flight Simulator 2020 (2020) | 66.6 | 58 | 48.8 | 37.8 |
| Serious Sam 4 (2020) | 124 | 94 | 81.6 | 71.1 |
| Mafia Definitive Edition (2020) | 123.7 | 95.2 | 92 | |
| Star Wars Squadrons (2020) | 263.1 | 224.6 | 211.5 | 202.4 |
Emissions - The Strix gets loud under load
Noise emissions
The fans operate mainly at low speeds in idle usage. The resulting noise level is acceptable here. However, the fans turn up under load. Consequently, we register a maximum sound pressure level of 53 dB(A) (stress test). Playing without a headset is no fun.
Noise level
| Idle |
| 32 / 34 / 37 dB(A) |
| Load |
| 51 / 53 dB(A) |
 | ||
30 dB silent 40 dB(A) audible 50 dB(A) loud |
||
min: | ||
| Asus Strix G17 G712LWS i7-10750H, GeForce RTX 2070 Super Mobile | Asus ROG Strix G GL731GU-RB74 i7-9750H, GeForce GTX 1660 Ti Mobile | Schenker XMG Pro 17 PB71RD-G i7-9750H, GeForce RTX 2060 Mobile | MSI GL75 10SFR i7-10750H, GeForce RTX 2070 Mobile | Lenovo Legion Y740-17IRHg-81UJ001VGE i7-9750H, GeForce RTX 2080 Max-Q | Acer Predator Helios 300 PH317-54-75G8 i7-10750H, GeForce RTX 2060 Mobile | |
|---|---|---|---|---|---|---|
| Noise | -0% | -3% | -2% | 11% | 7% | |
| off / environment * (dB) | 25 | 28.2 -13% | 30 -20% | 30.1 -20% | 30.3 -21% | 24 4% |
| Idle Minimum * (dB) | 32 | 31.8 1% | 30 6% | 32.2 -1% | 30.3 5% | 25 22% |
| Idle Average * (dB) | 34 | 32 6% | 32 6% | 32.2 5% | 30.3 11% | 30 12% |
| Idle Maximum * (dB) | 37 | 40.6 -10% | 39 -5% | 32.2 13% | 30.5 18% | 37 -0% |
| Load Average * (dB) | 51 | 48 6% | 51 -0% | 52.8 -4% | 40.8 20% | 48 6% |
| Witcher 3 ultra * (dB) | 50 | 48 4% | 54 -8% | 53.8 -8% | 40.5 19% | 50 -0% |
| Load Maximum * (dB) | 53 | 51.5 3% | 54 -2% | 53.2 -0% | 40.8 23% | 52 2% |
* ... smaller is better
Temperature
Our stress test (Prime95 and FurMark run for at least an hour) is processed by the CPU and GPU at 2.5 GHz and 1,470 MHz, respectively. The stress test represents an extreme scenario that doesn't occur in everyday life. With this test, we check if the system remains stable even under full load.

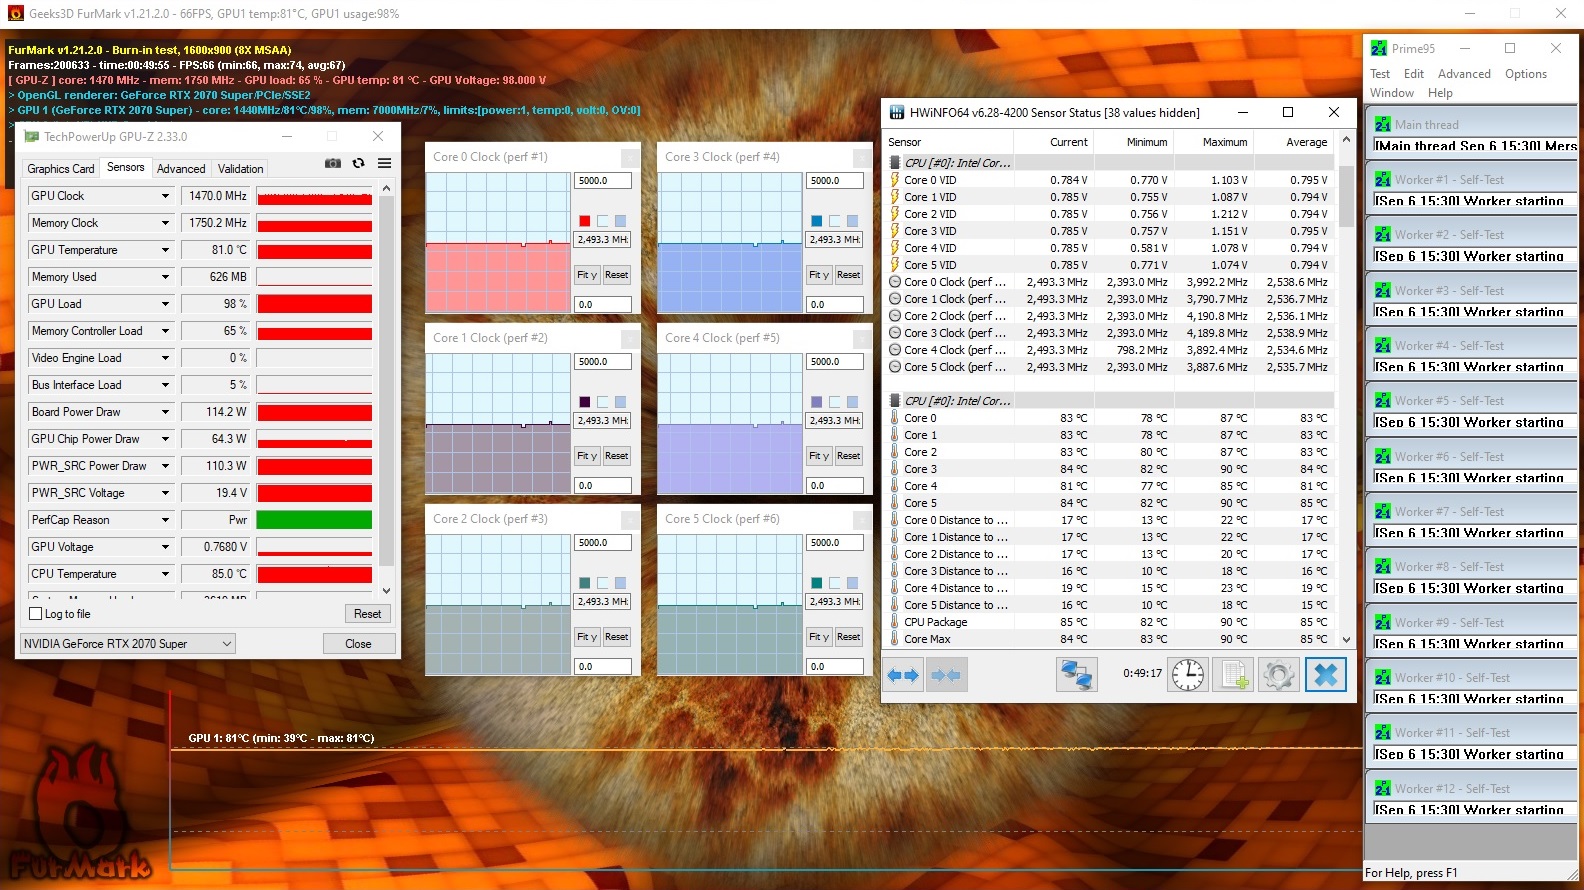
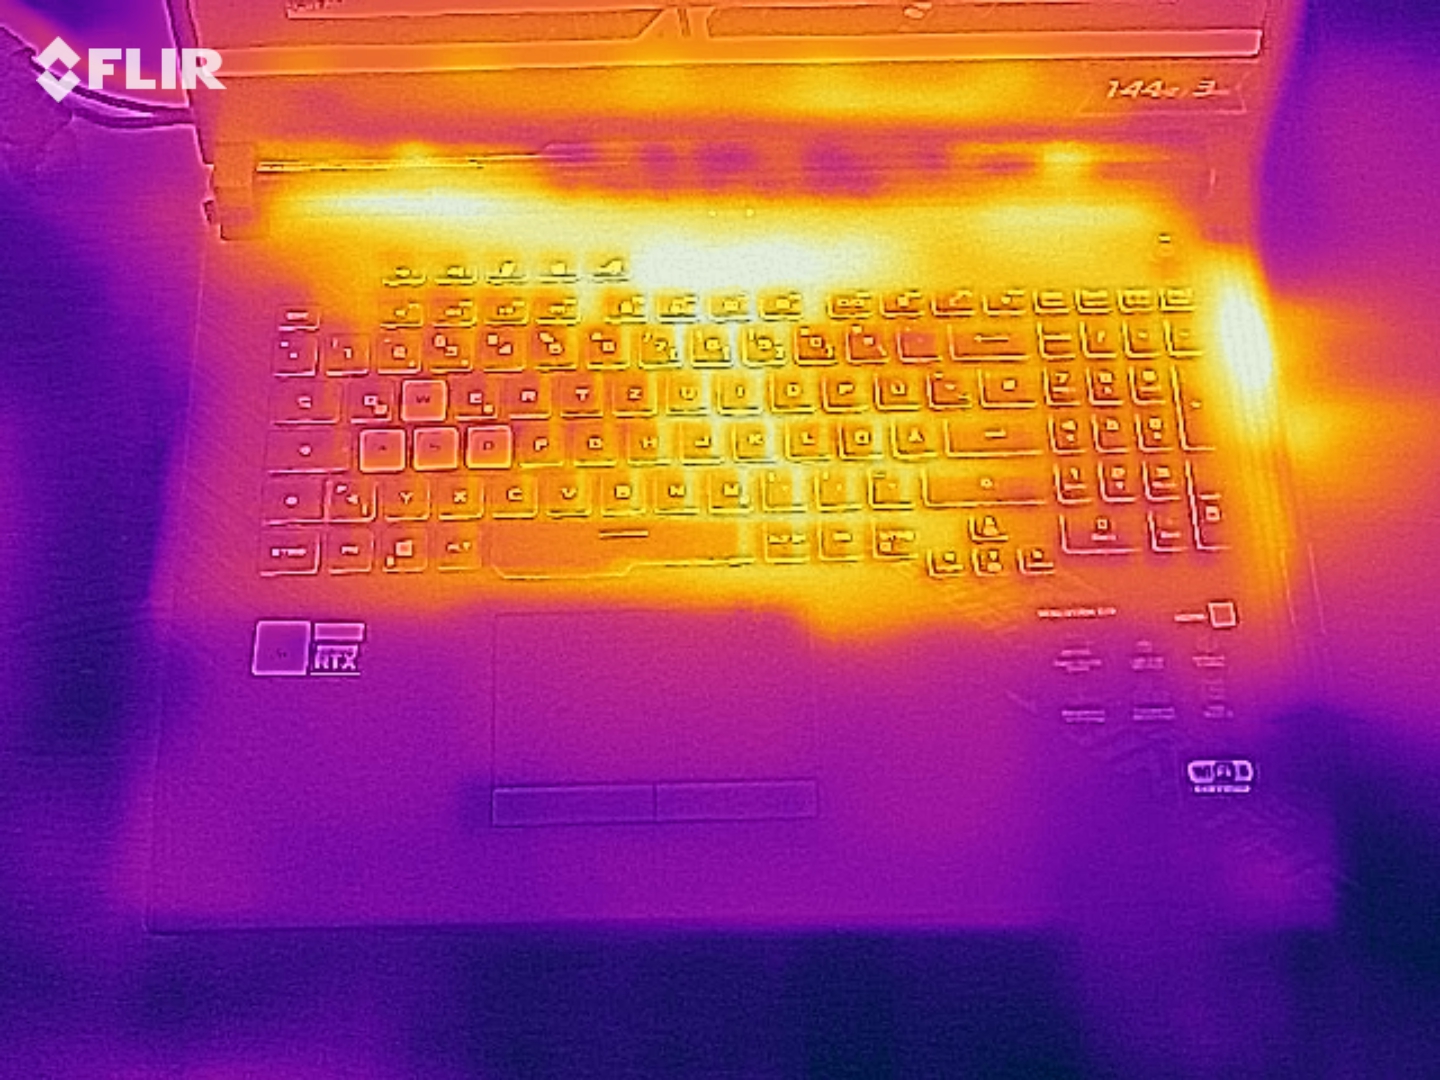
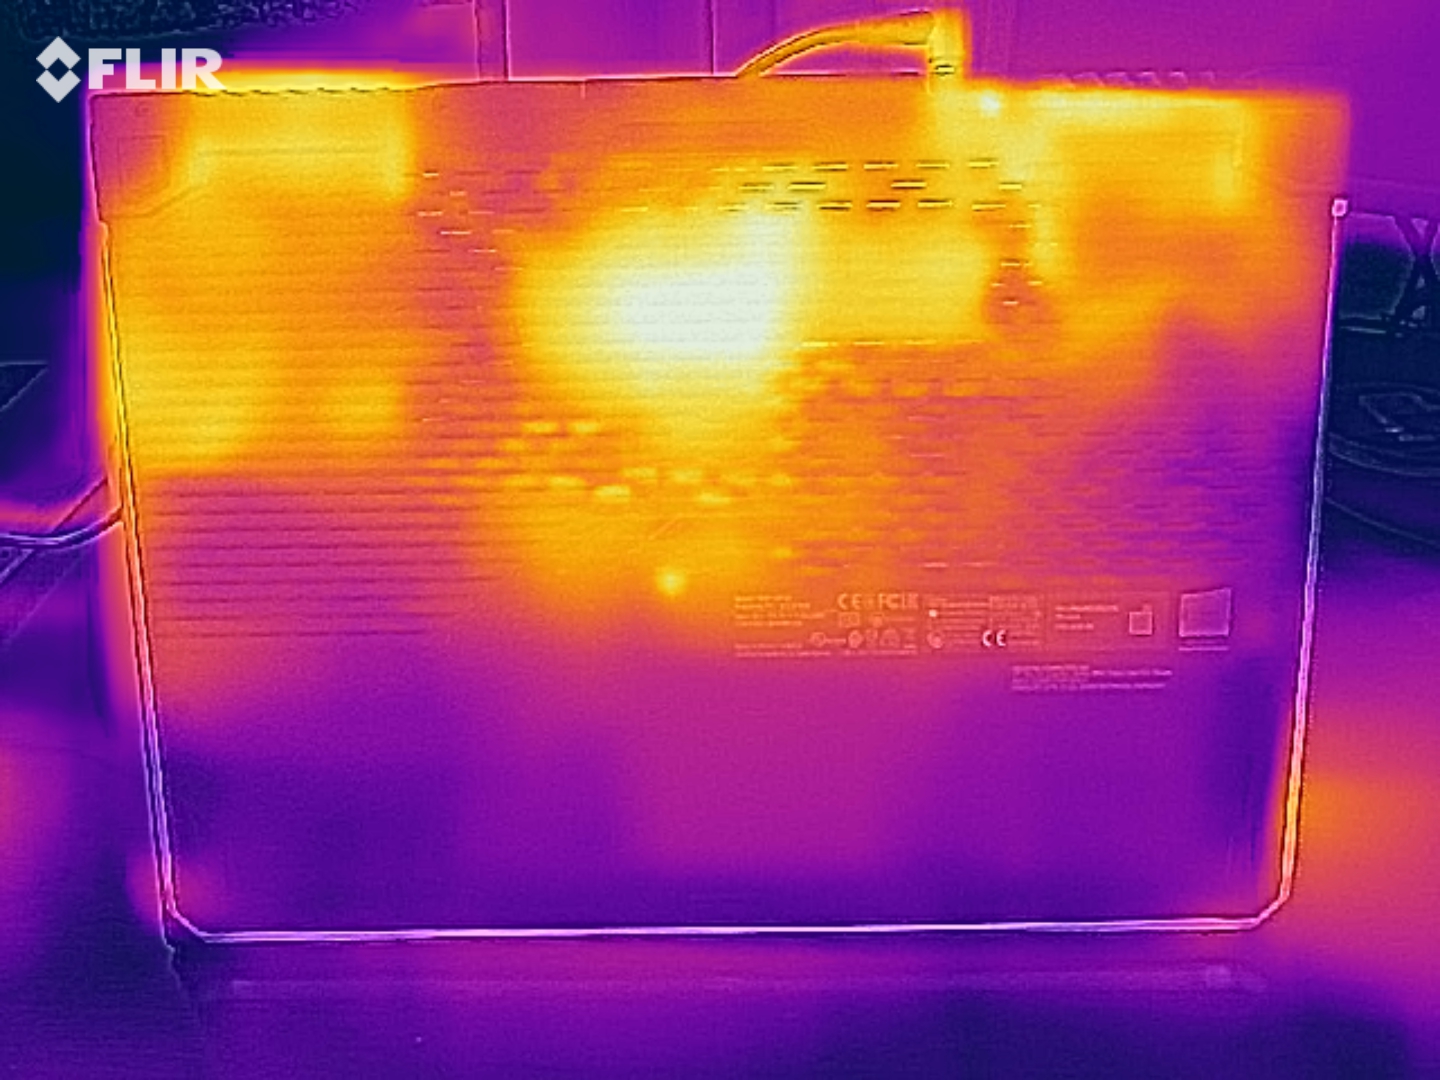
The G17 heats up noticeably but not excessively. During the stress test, we register temperatures above 50 °C (~122 °F) at two measuring points. Heat development is slightly less when performing our The Witcher 3 test. Moreover, the values are in the green range in everyday use.
(-) The maximum temperature on the upper side is 53 °C / 127 F, compared to the average of 40.4 °C / 105 F, ranging from 21.2 to 68.8 °C for the class Gaming.
(-) The bottom heats up to a maximum of 56 °C / 133 F, compared to the average of 43.2 °C / 110 F
(+) In idle usage, the average temperature for the upper side is 27.7 °C / 82 F, compared to the device average of 33.9 °C / 93 F.
(-) Playing The Witcher 3, the average temperature for the upper side is 39.6 °C / 103 F, compared to the device average of 33.9 °C / 93 F.
(+) The palmrests and touchpad are cooler than skin temperature with a maximum of 28 °C / 82.4 F and are therefore cool to the touch.
(±) The average temperature of the palmrest area of similar devices was 28.8 °C / 83.8 F (+0.8 °C / 1.4 F).
| Asus Strix G17 G712LWS i7-10750H, GeForce RTX 2070 Super Mobile | Asus ROG Strix G GL731GU-RB74 i7-9750H, GeForce GTX 1660 Ti Mobile | Schenker XMG Pro 17 PB71RD-G i7-9750H, GeForce RTX 2060 Mobile | MSI GL75 10SFR i7-10750H, GeForce RTX 2070 Mobile | Lenovo Legion Y740-17IRHg-81UJ001VGE i7-9750H, GeForce RTX 2080 Max-Q | Acer Predator Helios 300 PH317-54-75G8 i7-10750H, GeForce RTX 2060 Mobile | |
|---|---|---|---|---|---|---|
| Heat | 4% | 3% | 12% | 7% | -2% | |
| Maximum Upper Side * (°C) | 53 | 44.6 16% | 47 11% | 44 17% | 40.7 23% | 53 -0% |
| Maximum Bottom * (°C) | 56 | 51.6 8% | 48 14% | 42.5 24% | 42.2 25% | 59 -5% |
| Idle Upper Side * (°C) | 29 | 31.6 -9% | 30 -3% | 29.1 -0% | 31.9 -10% | 29 -0% |
| Idle Bottom * (°C) | 31 | 31.4 -1% | 34 -10% | 29.5 5% | 33.9 -9% | 32 -3% |
* ... smaller is better
Speakers
Asus Strix G17 G712LWS audio analysis
(±) | speaker loudness is average but good (81 dB)
Bass 100 - 315 Hz
(±) | reduced bass - on average 9.8% lower than median
(±) | linearity of bass is average (8.3% delta to prev. frequency)
Mids 400 - 2000 Hz
(±) | higher mids - on average 5.5% higher than median
(+) | mids are linear (5.8% delta to prev. frequency)
Highs 2 - 16 kHz
(+) | balanced highs - only 2.4% away from median
(+) | highs are linear (3.4% delta to prev. frequency)
Overall 100 - 16.000 Hz
(+) | overall sound is linear (12.9% difference to median)
Compared to same class
» 17% of all tested devices in this class were better, 4% similar, 79% worse
» The best had a delta of 6%, average was 18%, worst was 132%
Compared to all devices tested
» 12% of all tested devices were better, 3% similar, 85% worse
» The best had a delta of 4%, average was 23%, worst was 134%
Energy management - The battery life of the G712LWS is in order
Energy consumption
We register a maximum power consumption of 25 watts in idle usage. The stress test lets the demand increase up to 230 watts. During the execution of our The Witcher 3 test, we measure a power consumption of 186 watts on average. The power adapter's output is 230 watts.
| Off / Standby | |
| Idle | |
| Load |
|
Key:
min: | |
| Asus Strix G17 G712LWS i7-10750H, GeForce RTX 2070 Super Mobile | Asus ROG Strix G GL731GU-RB74 i7-9750H, GeForce GTX 1660 Ti Mobile | Schenker XMG Pro 17 PB71RD-G i7-9750H, GeForce RTX 2060 Mobile | MSI GL75 10SFR i7-10750H, GeForce RTX 2070 Mobile | Lenovo Legion Y740-17IRHg-81UJ001VGE i7-9750H, GeForce RTX 2080 Max-Q | Acer Predator Helios 300 PH317-54-75G8 i7-10750H, GeForce RTX 2060 Mobile | |
|---|---|---|---|---|---|---|
| Power Consumption | -18% | 1% | -2% | -20% | 25% | |
| Idle Minimum * (Watt) | 10 | 13.6 -36% | 11 -10% | 12 -20% | 15.7 -57% | 6 40% |
| Idle Average * (Watt) | 14 | 26.2 -87% | 18 -29% | 16.6 -19% | 26.3 -88% | 11 21% |
| Idle Maximum * (Watt) | 25 | 35 -40% | 28 -12% | 18 28% | 28 -12% | 19 24% |
| Load Average * (Watt) | 134 | 113.6 15% | 99 26% | 130 3% | 136 -1% | 96 28% |
| Witcher 3 ultra * (Watt) | 186 | 134.1 28% | 146 22% | 203 -9% | 160 14% | 144 23% |
| Load Maximum * (Watt) | 230 | 200.2 13% | 210 9% | 224 3% | 177 23% | 197 14% |
* ... smaller is better
Battery life
The Strix delivers very decent battery life. The 17.3-incher completes our WLAN test (accessing websites via a script) and video test (the short film Big Buck Bunny (H.264 encoding, Full HD) running in a loop) after 5:30 hours and 7:06 hours, respectively.
| Asus Strix G17 G712LWS i7-10750H, GeForce RTX 2070 Super Mobile, 66 Wh | Asus ROG Strix G GL731GU-RB74 i7-9750H, GeForce GTX 1660 Ti Mobile, 66 Wh | Schenker XMG Pro 17 PB71RD-G i7-9750H, GeForce RTX 2060 Mobile, 62 Wh | MSI GL75 10SFR i7-10750H, GeForce RTX 2070 Mobile, 51 Wh | Lenovo Legion Y740-17IRHg-81UJ001VGE i7-9750H, GeForce RTX 2080 Max-Q, 76 Wh | Acer Predator Helios 300 PH317-54-75G8 i7-10750H, GeForce RTX 2060 Mobile, 59 Wh | |
|---|---|---|---|---|---|---|
| Battery runtime | -5% | -29% | -34% | -47% | 1% | |
| Reader / Idle (h) | 9.1 | 8.6 -5% | 5.2 -43% | 6.4 -30% | 3.8 -58% | 8.2 -10% |
| H.264 (h) | 7.1 | 5.2 -27% | 2.8 -61% | 5.9 -17% | ||
| WiFi v1.3 (h) | 5.5 | 4.9 -11% | 4.1 -25% | 3.9 -29% | 3 -45% | 5.1 -7% |
| Load (h) | 1.6 | 1.6 0% | 1.3 -19% | 0.8 -50% | 1.2 -25% | 2.2 38% |
Pros
Cons
Verdict
The Strix G17's powerful hardware brings all the latest computer games smoothly onto the screen. You won't need to compromise when it comes to resolution and quality level.
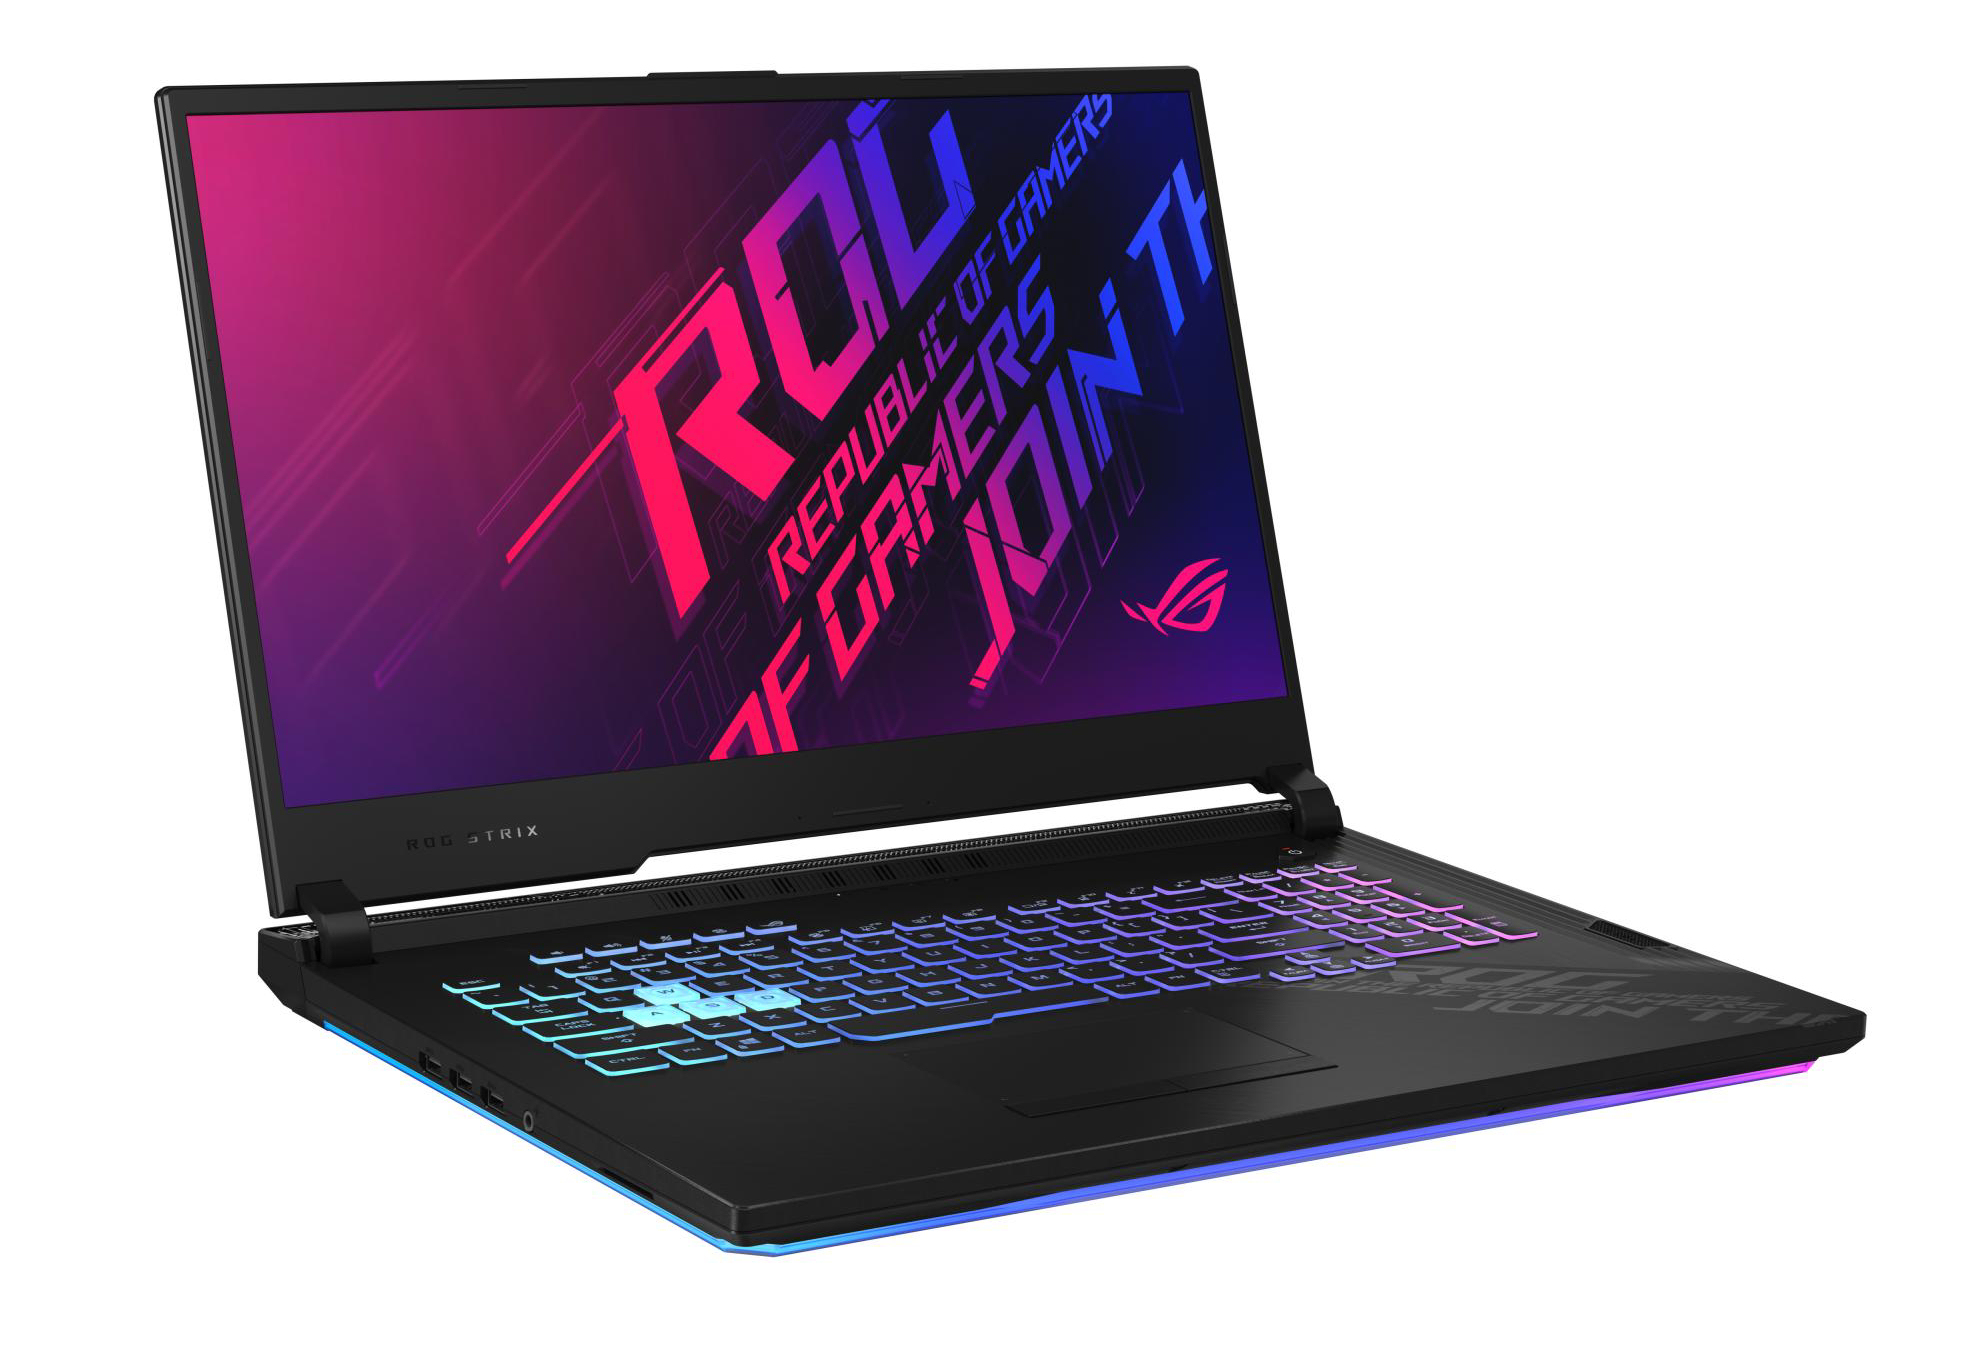
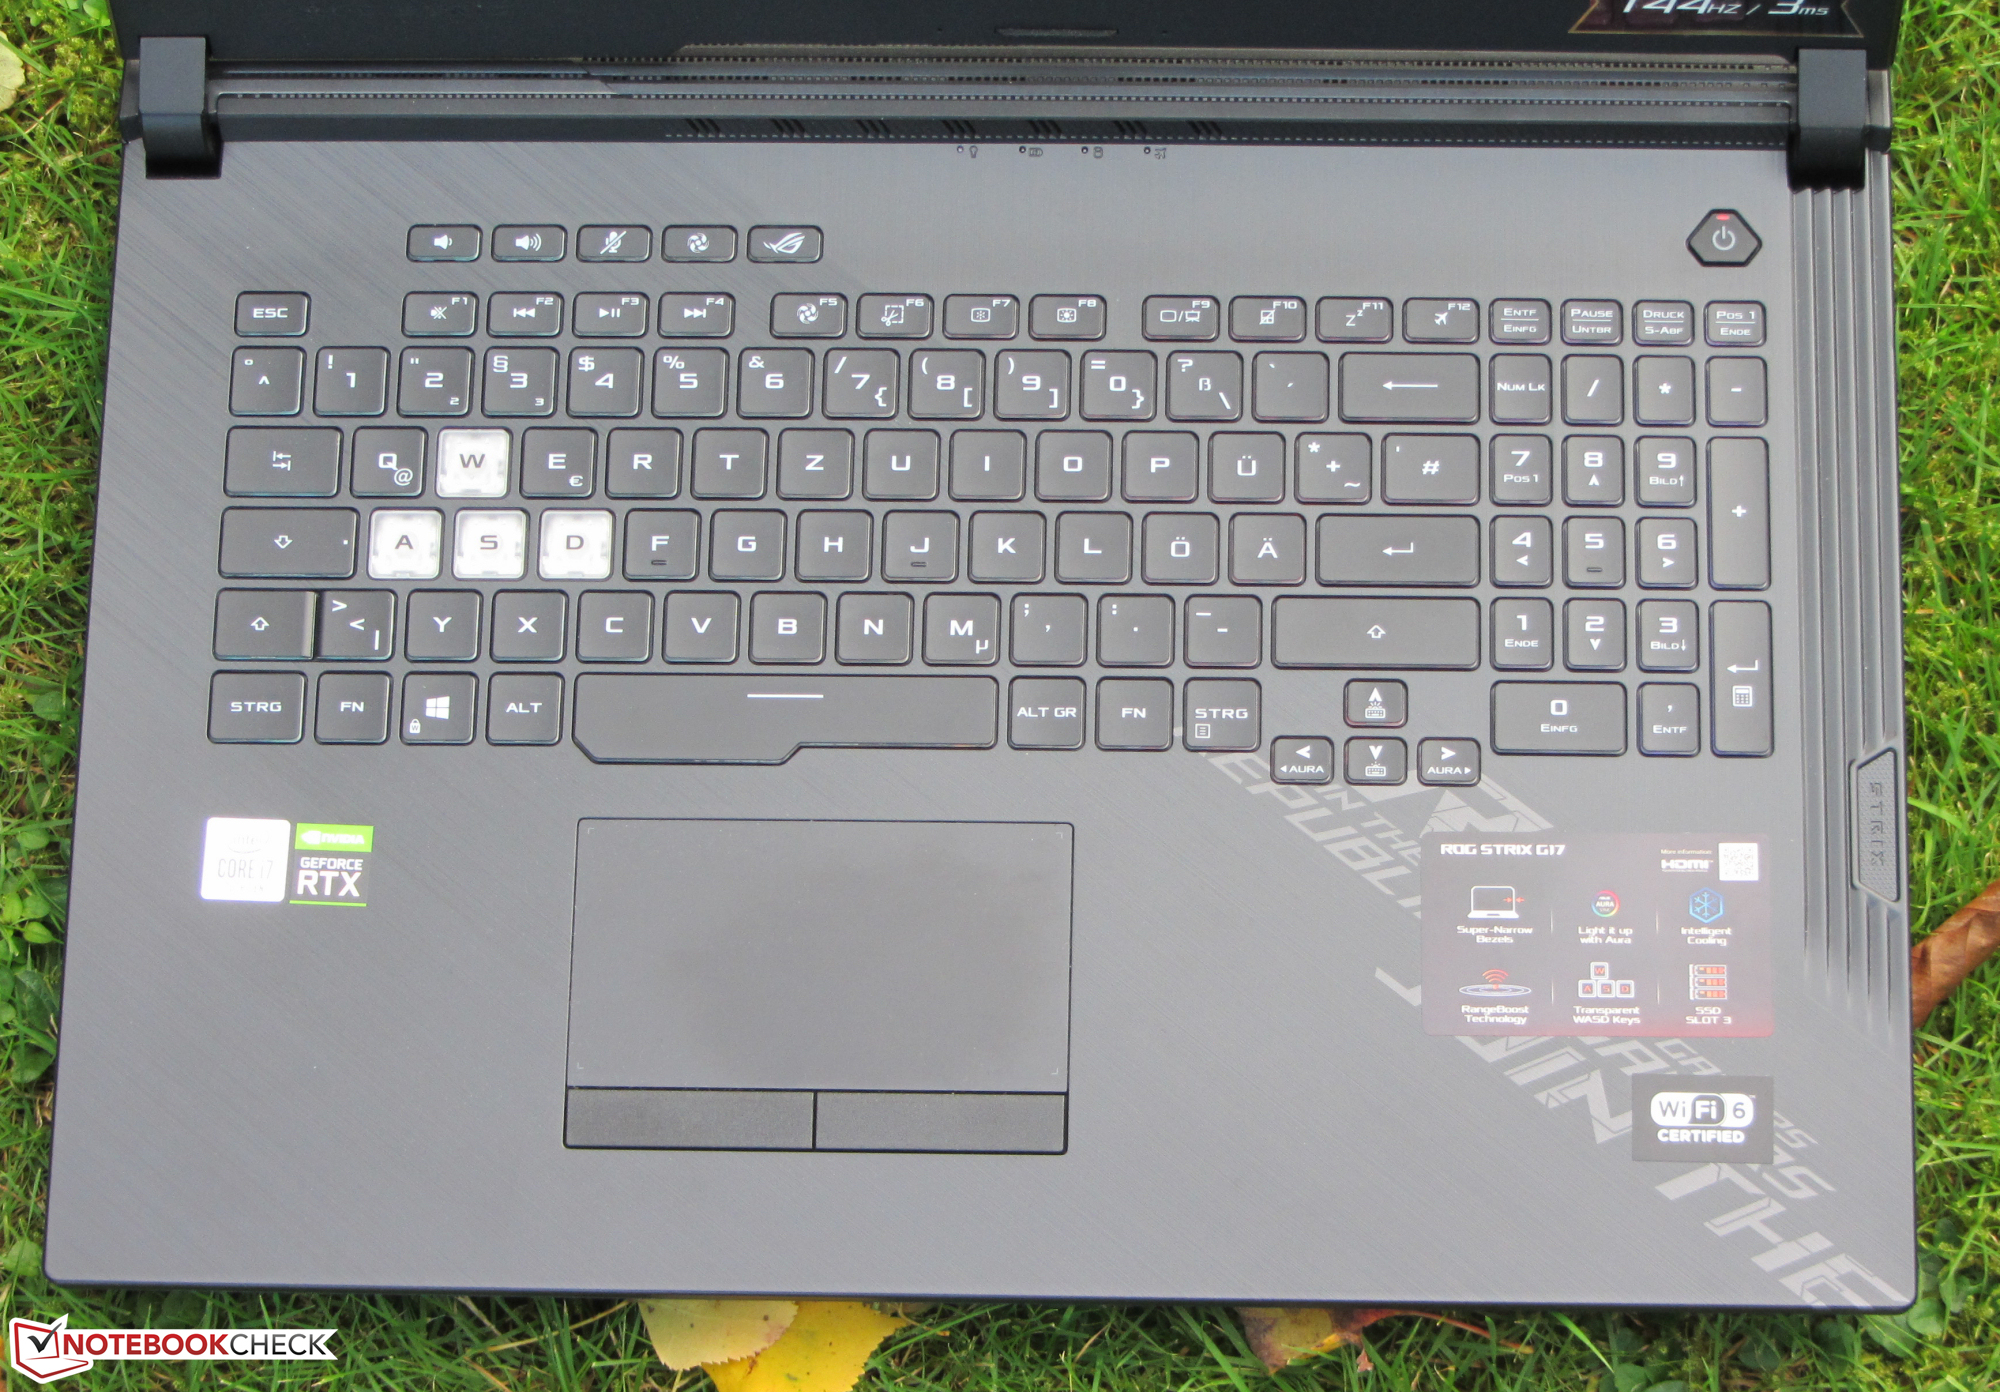
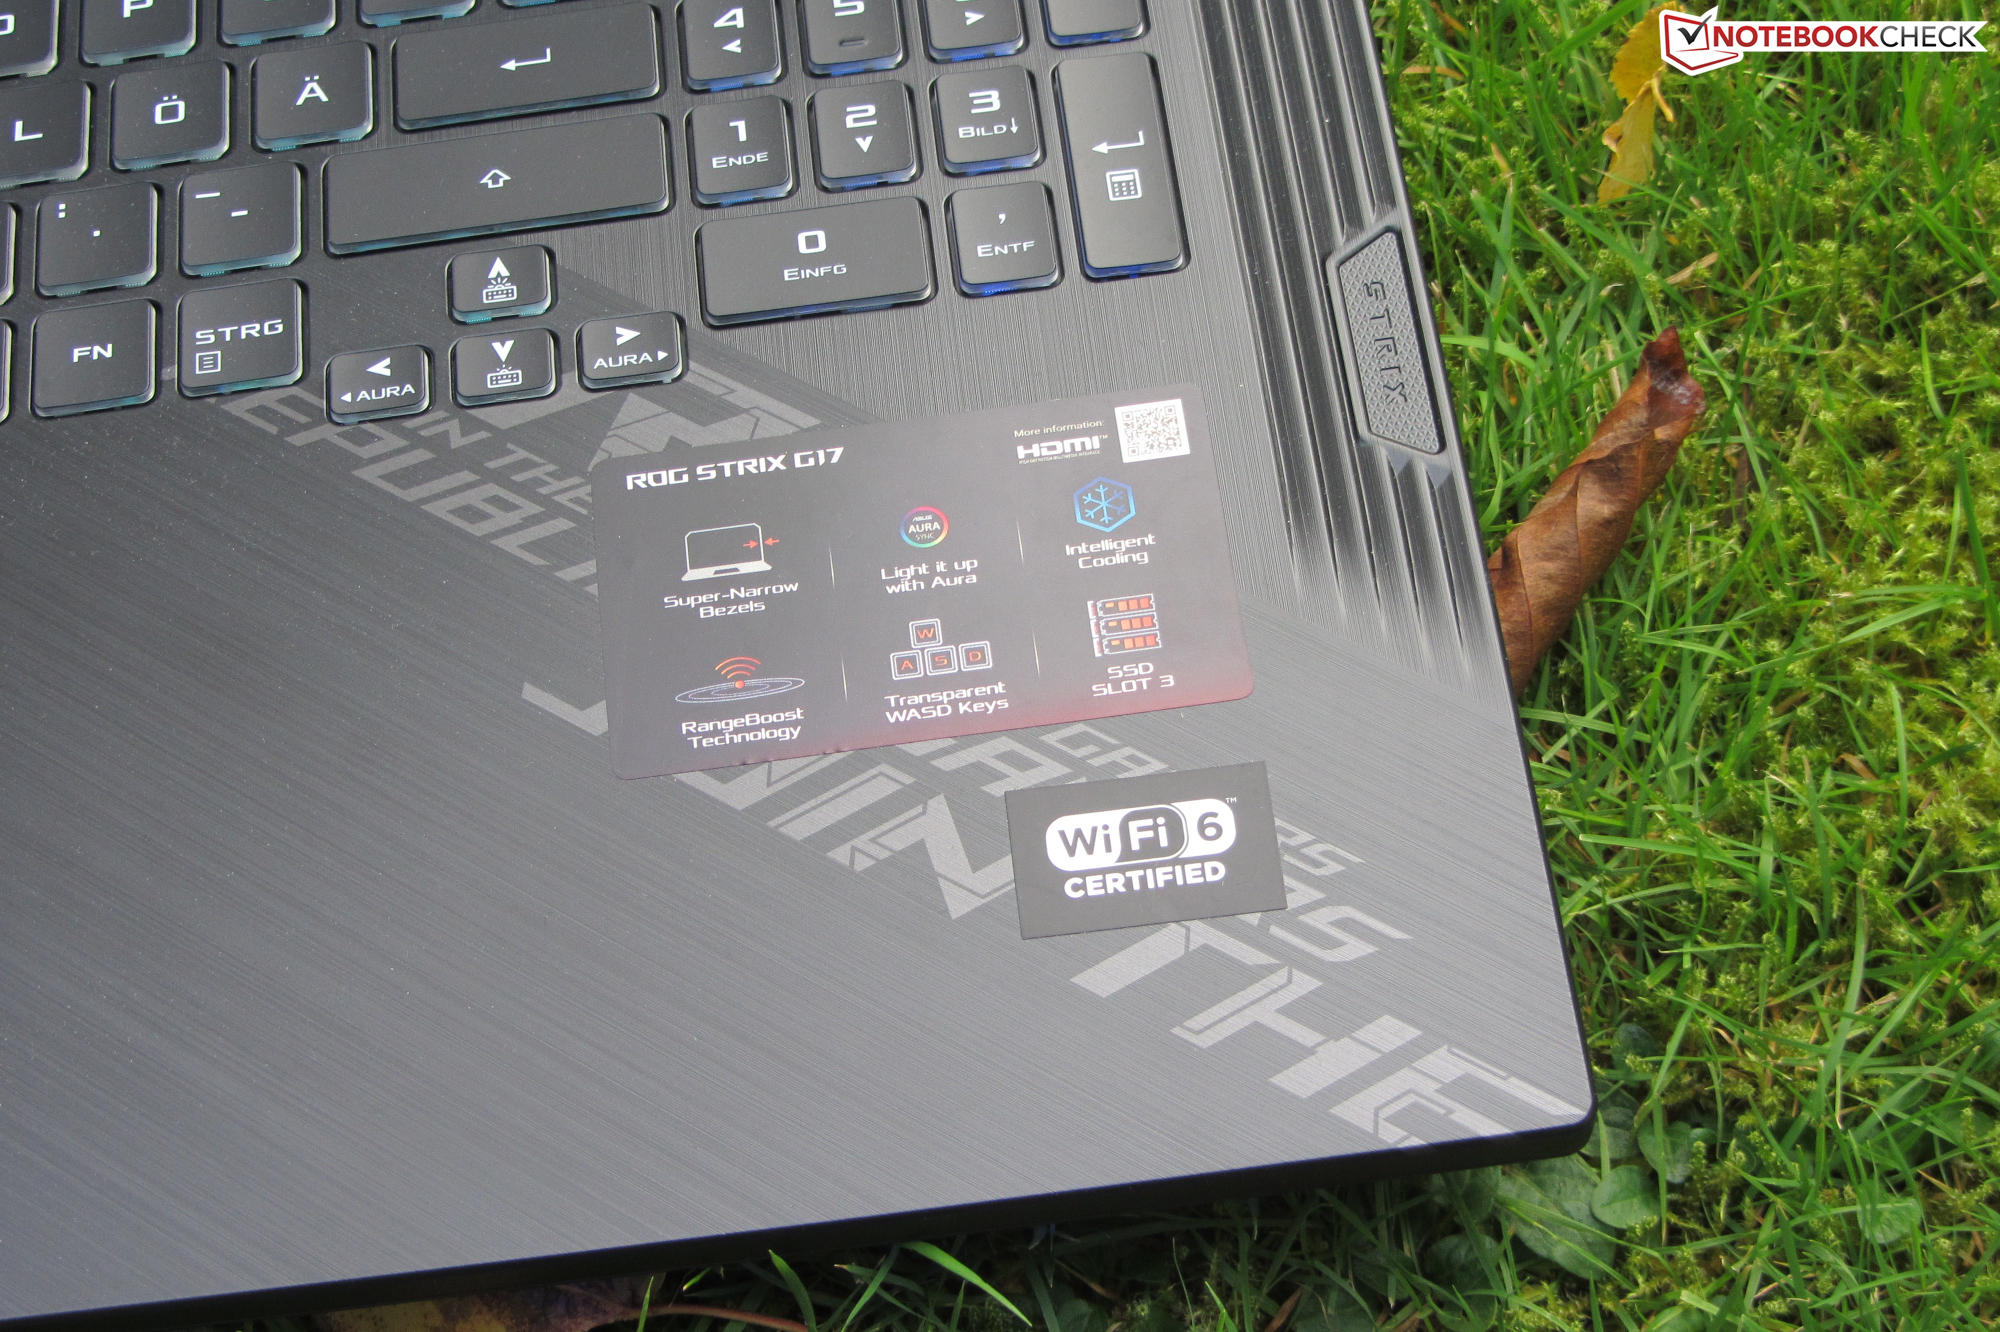
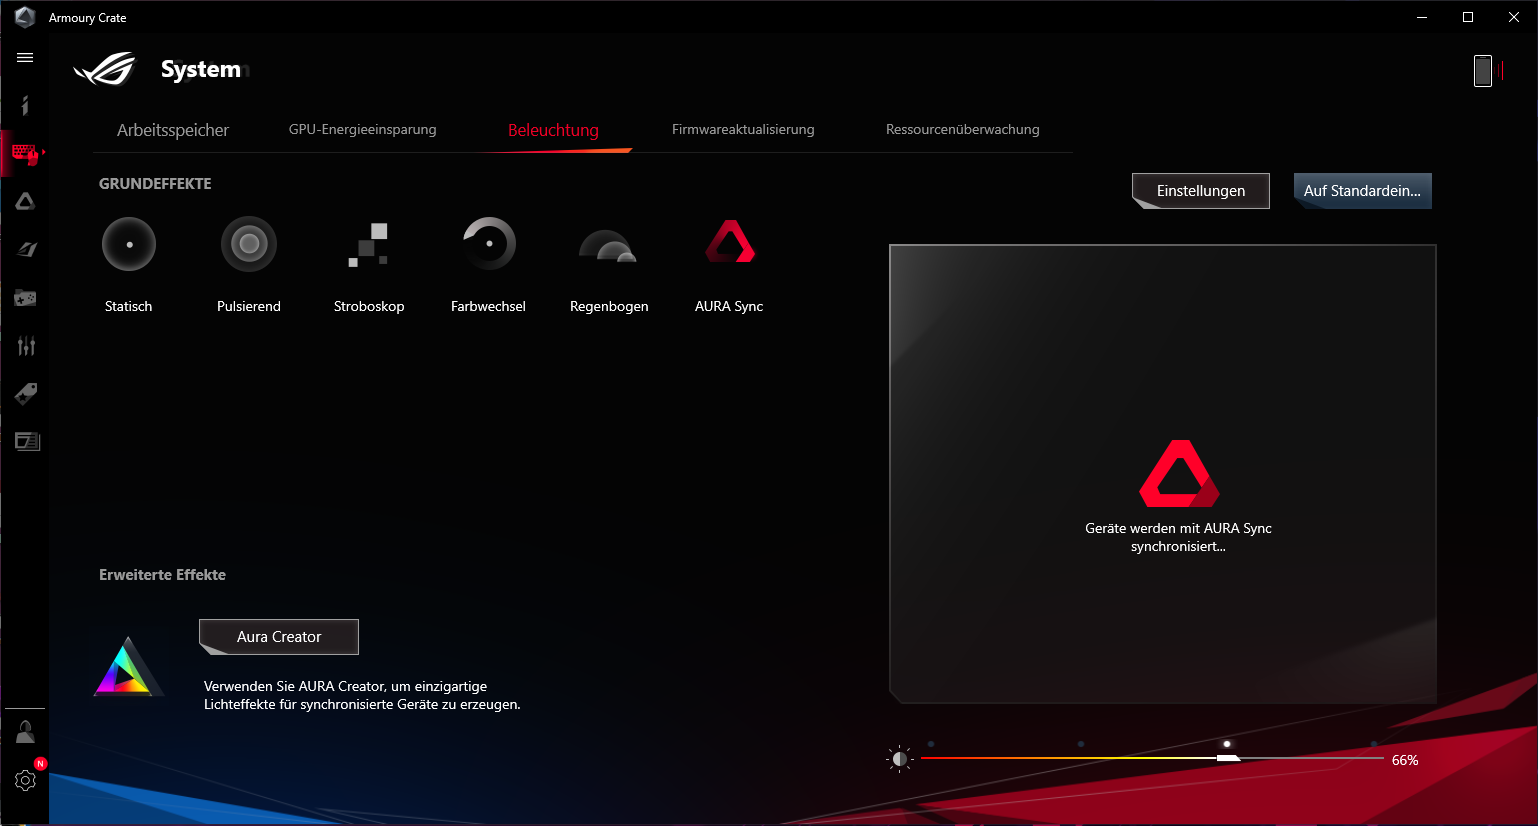
The laptop's eye-catcher is the LED bar that extends along three sides of the bottom cover. The color scheme can be individually adjusted to your own liking.
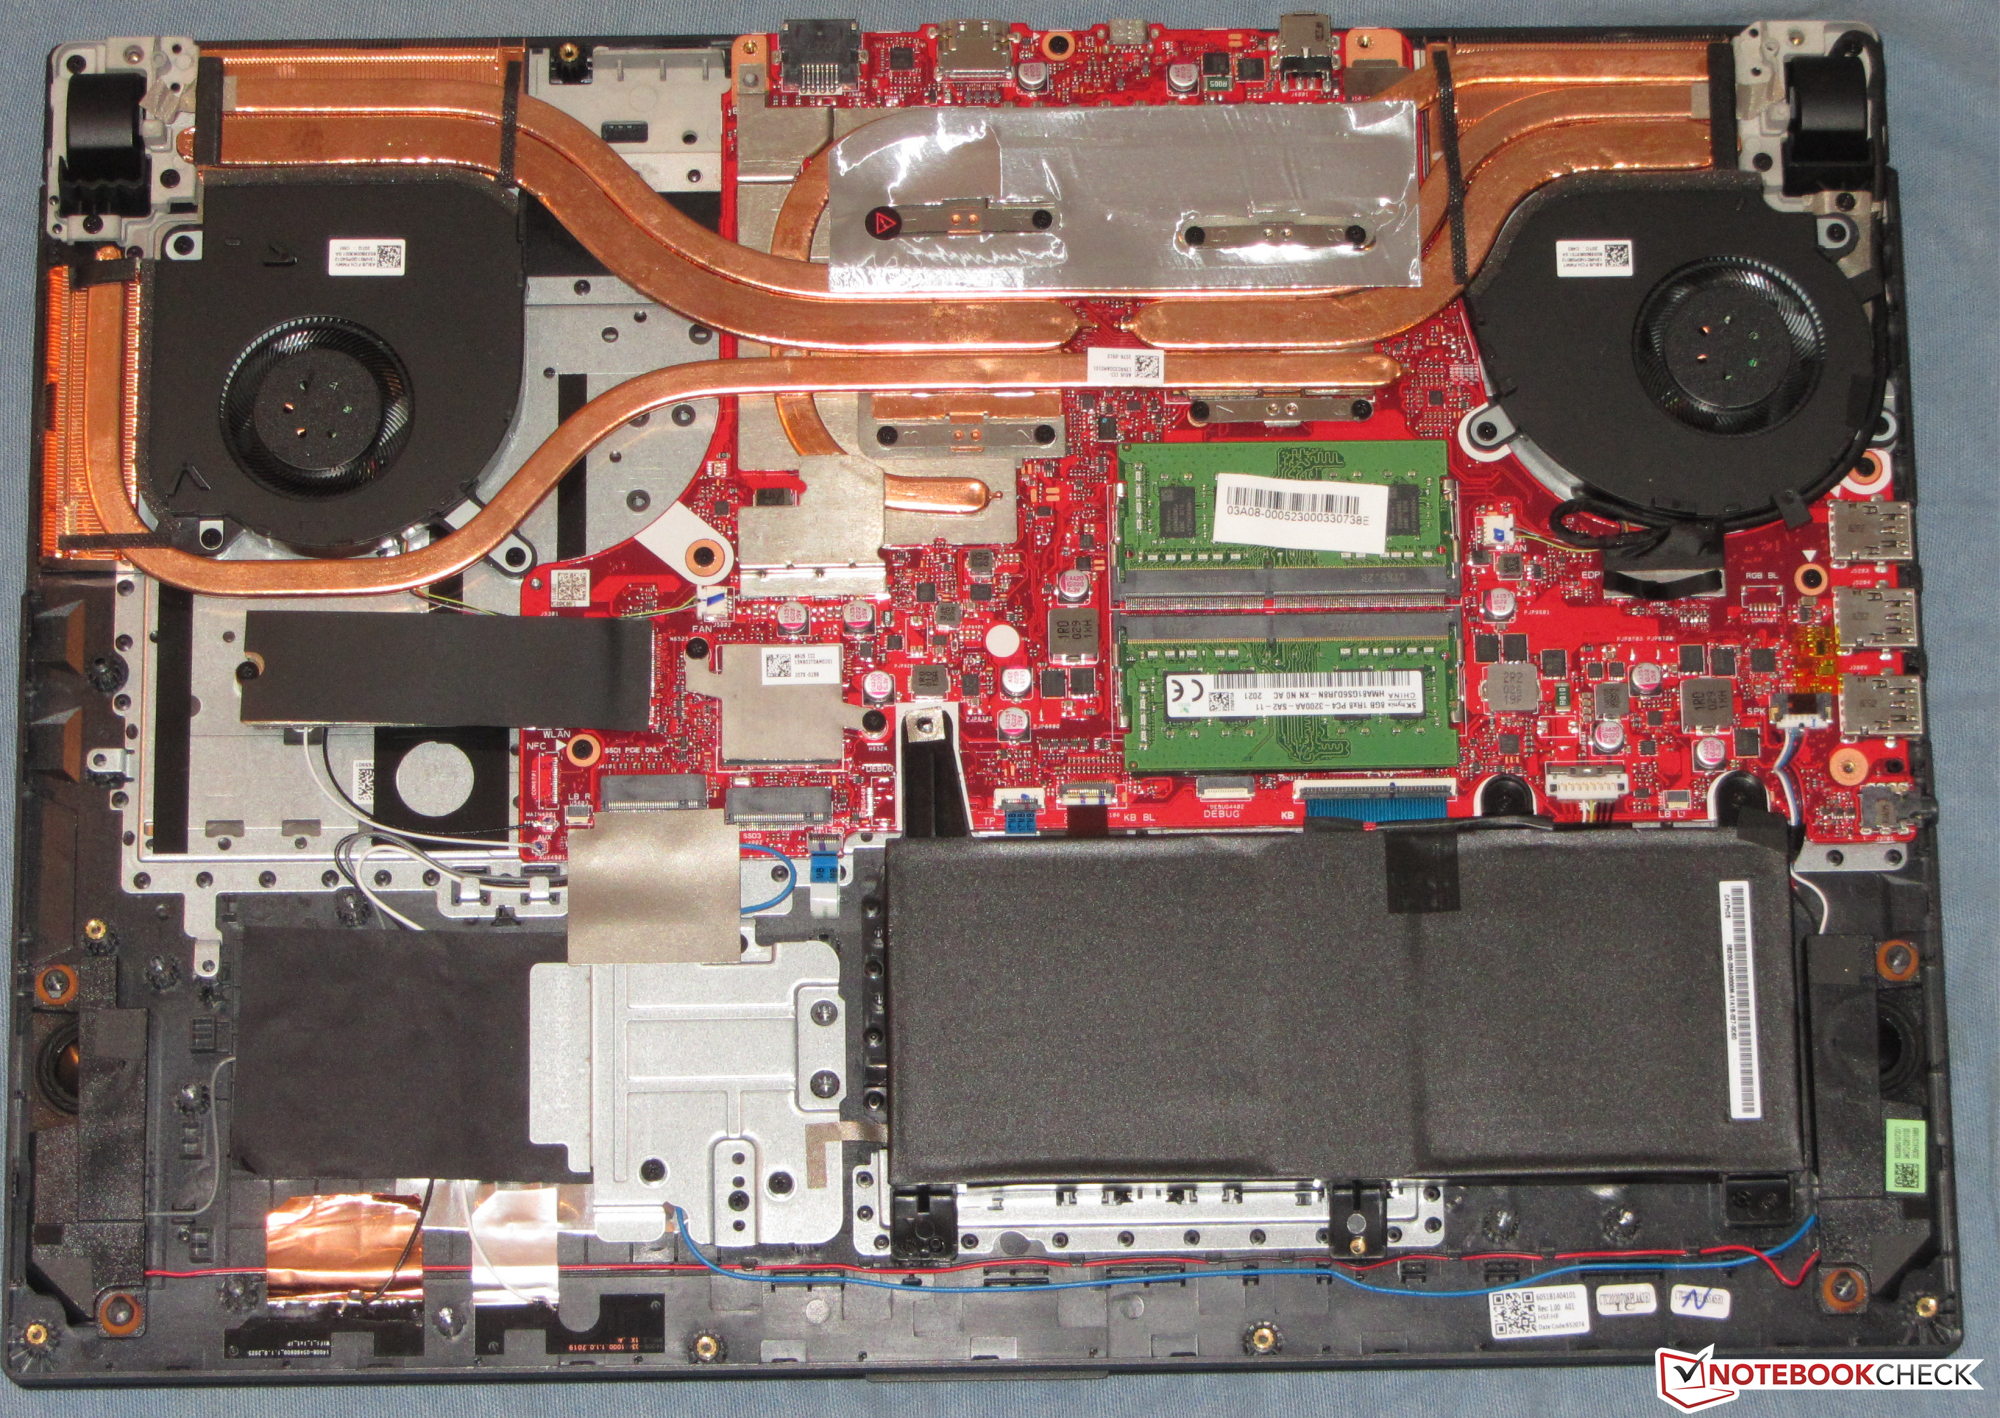
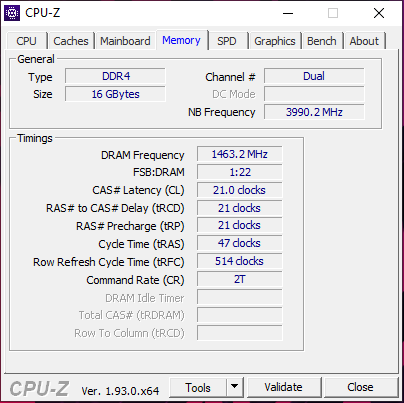
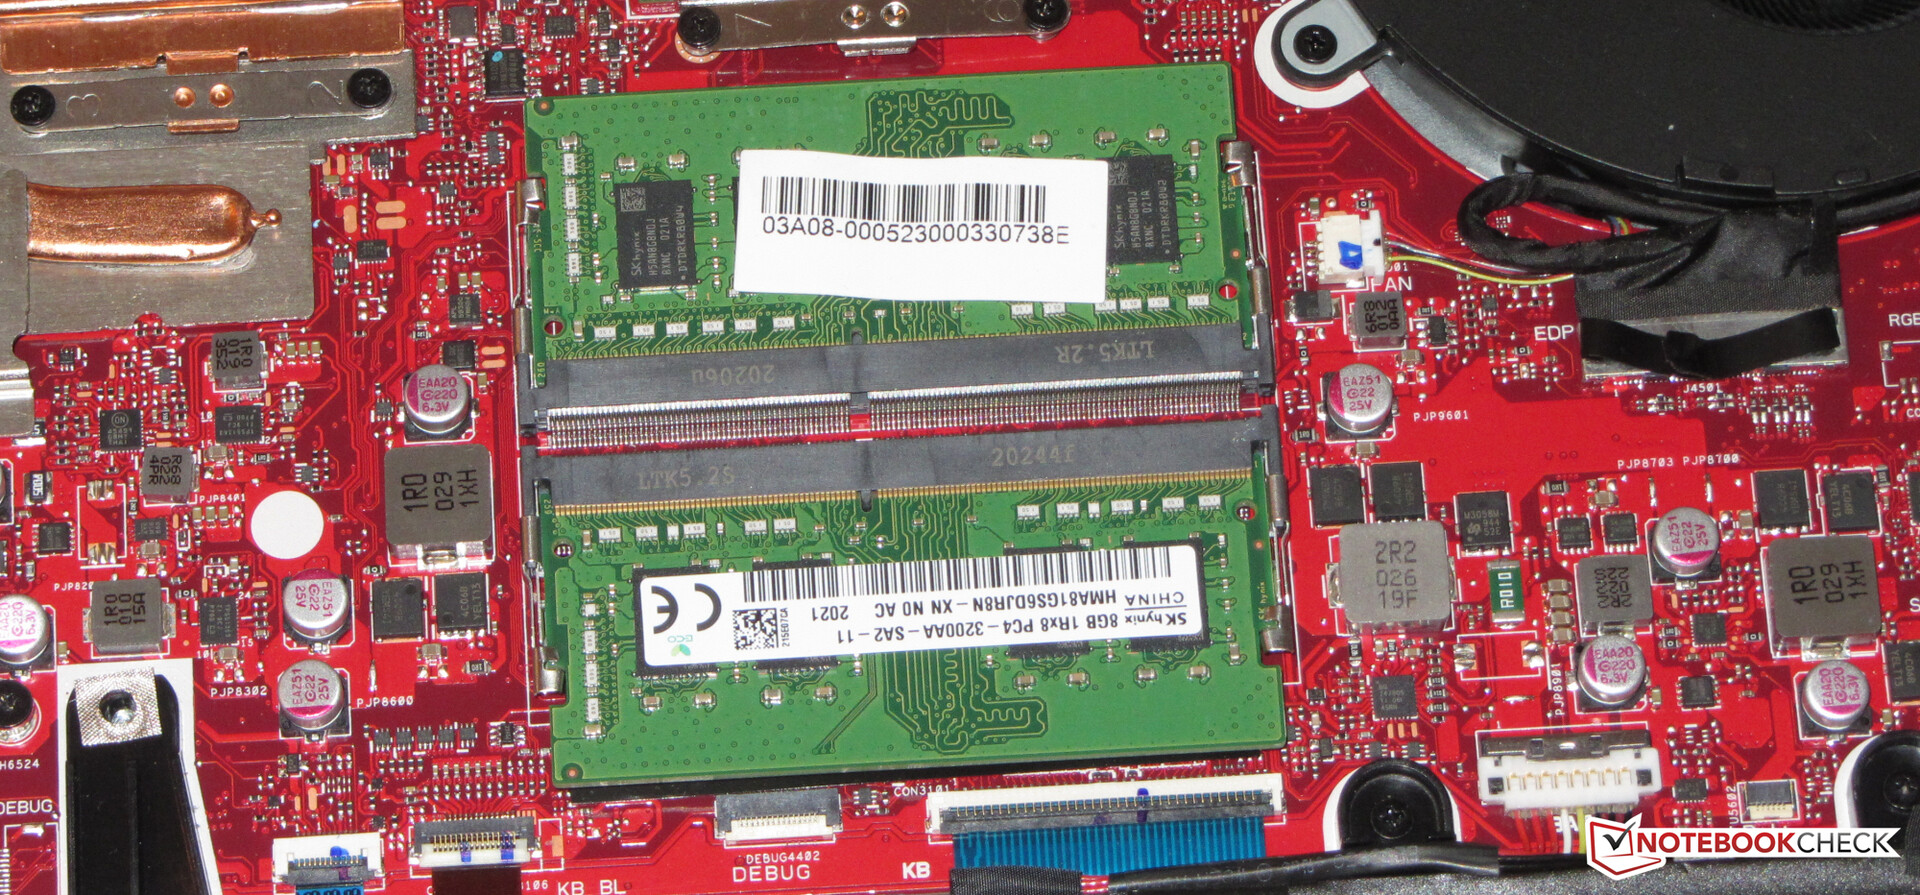
The storage capacity (1 TB) can be expanded. In addition to the existing NVMe SSD, there's room for two more M.2 models. RAID 0 is supported. Memory (2x 8 GB, dual-channel mode) can also be expanded. However, according to the Asus website, 32 GB is the limit. Many competitors support up to 64 GB.
Maintenance and upgrade procedures require removing the bottom cover. This is doable in principle. However, the bottom cover is connected to the motherboard with two ribbon cables, so you need to proceed with caution. The cables can be loosened and reattached with a bit of skill.
The Full HD display (IPS, 144 Hz) scores points with a matte surface, stable viewing angles, sufficient brightness, good contrast, quick response times, and a very decent color reproduction.
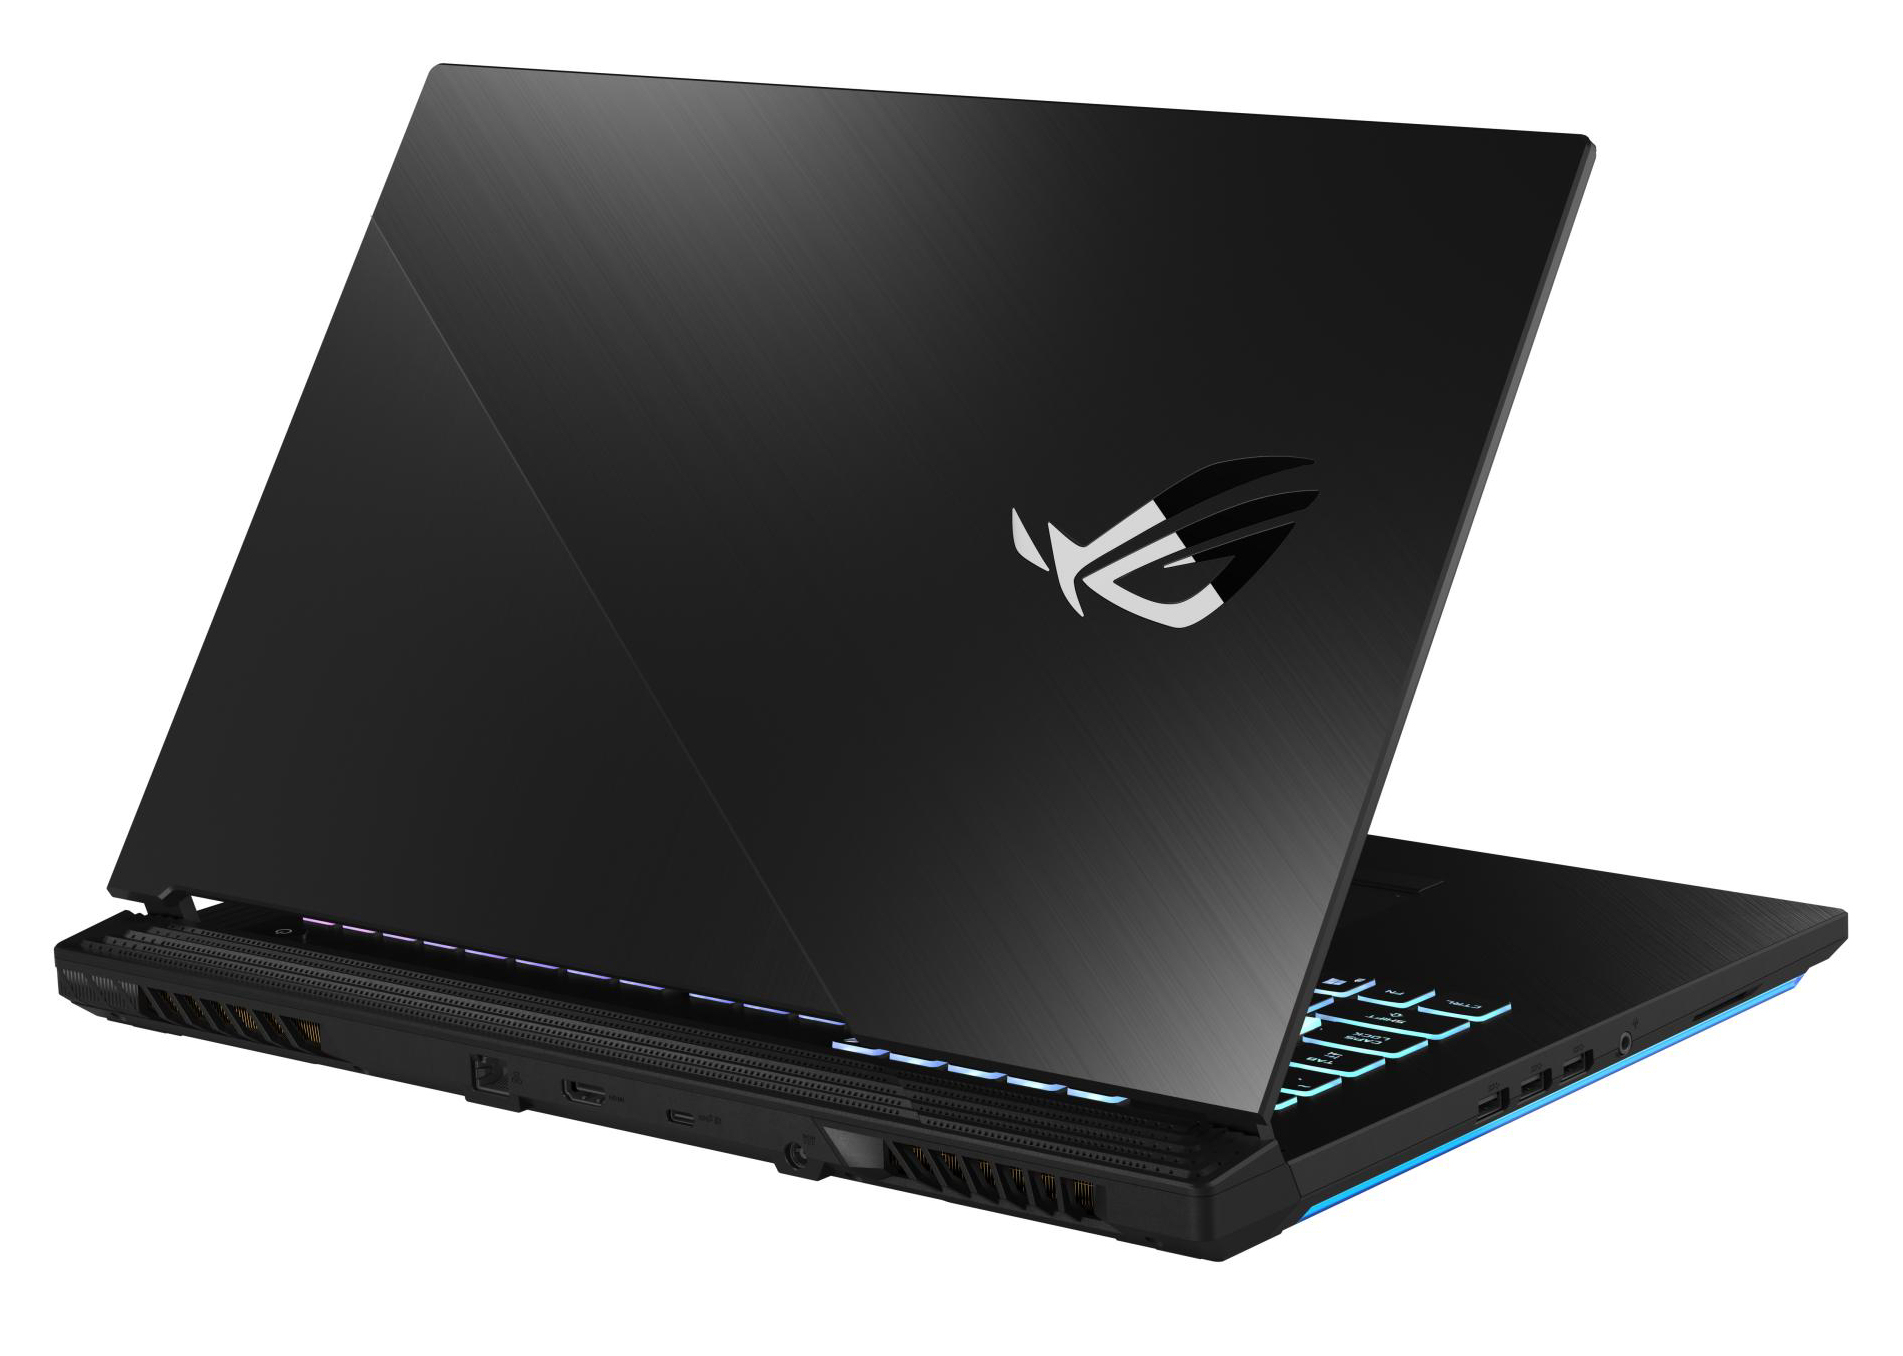
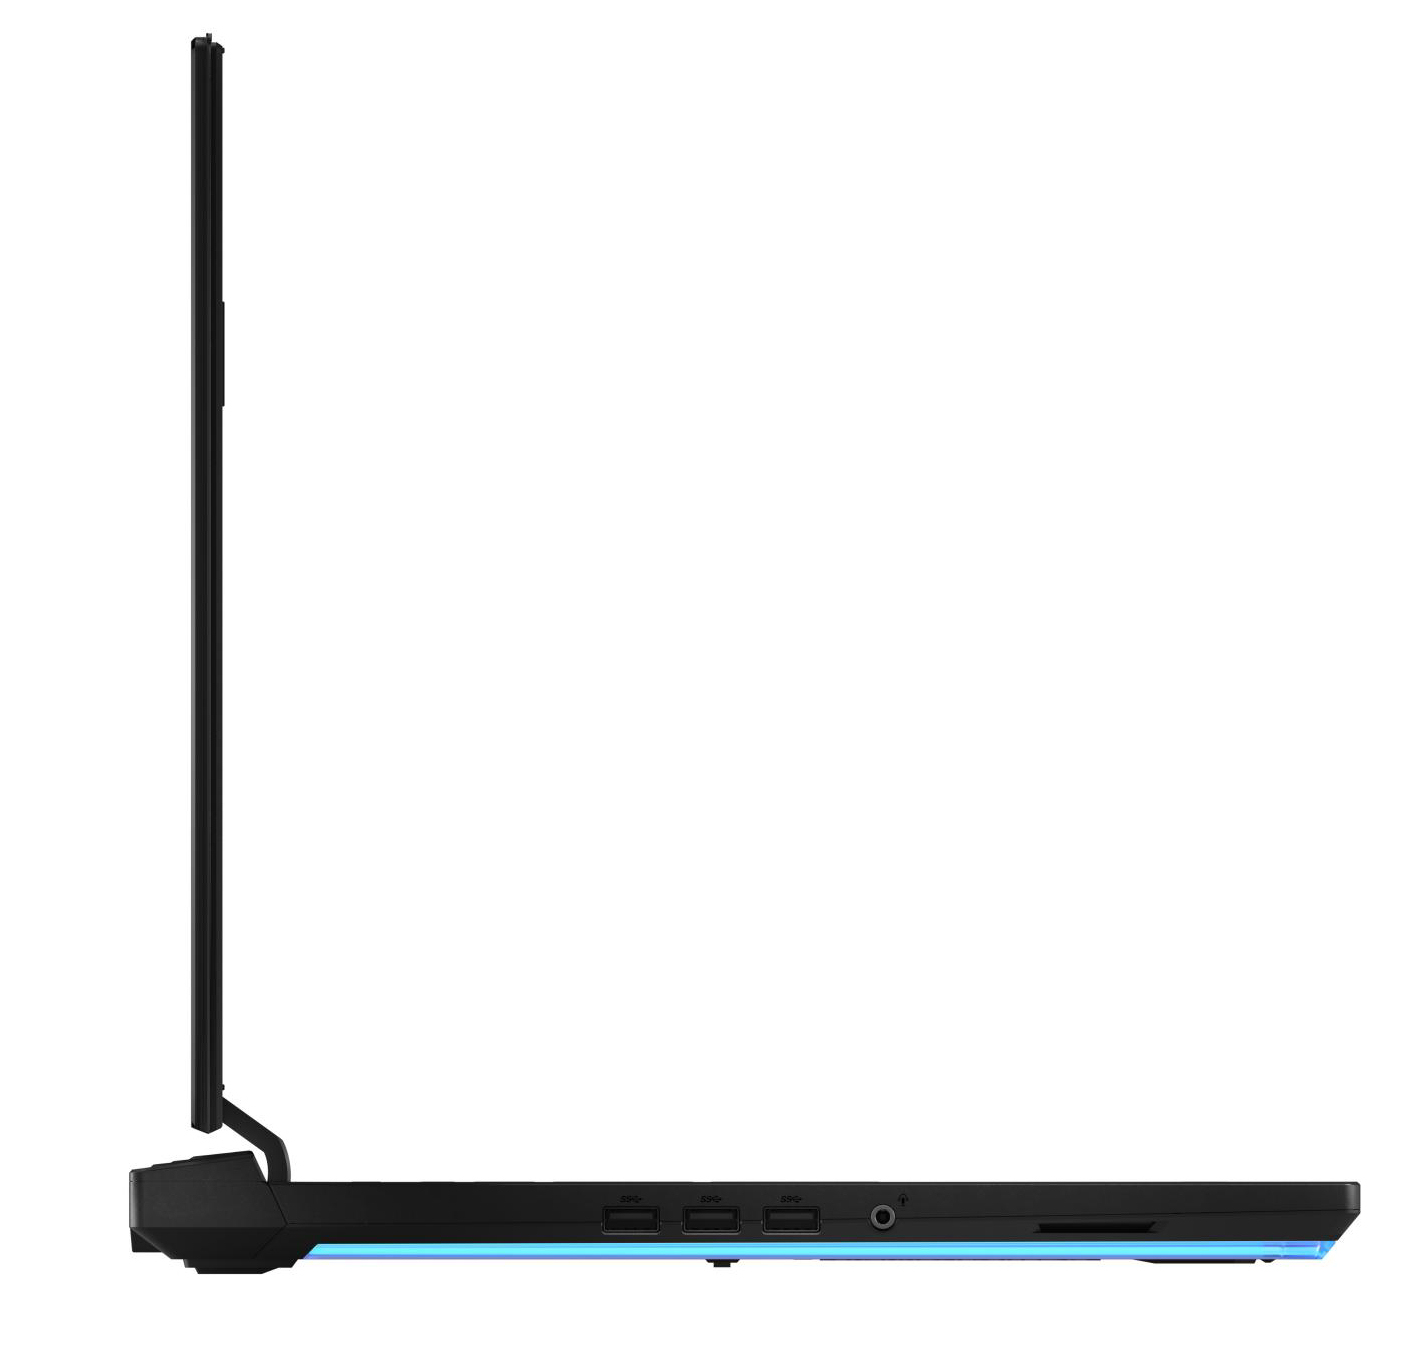
The well-rounded port selection includes three USB Type-A 3.2 Gen 1 ports, all of which are located on the left side of the case. Asus should have installed at least one port on the right side. A Thunderbolt 3 port isn't among the connections. There's only one USB Type-C 3.2 Gen 2 port that supports DisplayPort via USB-C.
Asus Strix G17 G712LWS
- 10/11/2020 v7 (old)
Sascha Mölck
Price comparison

