Acer Predator Helios 300 PH317-54 Review: GPU overclocking with a press of a button

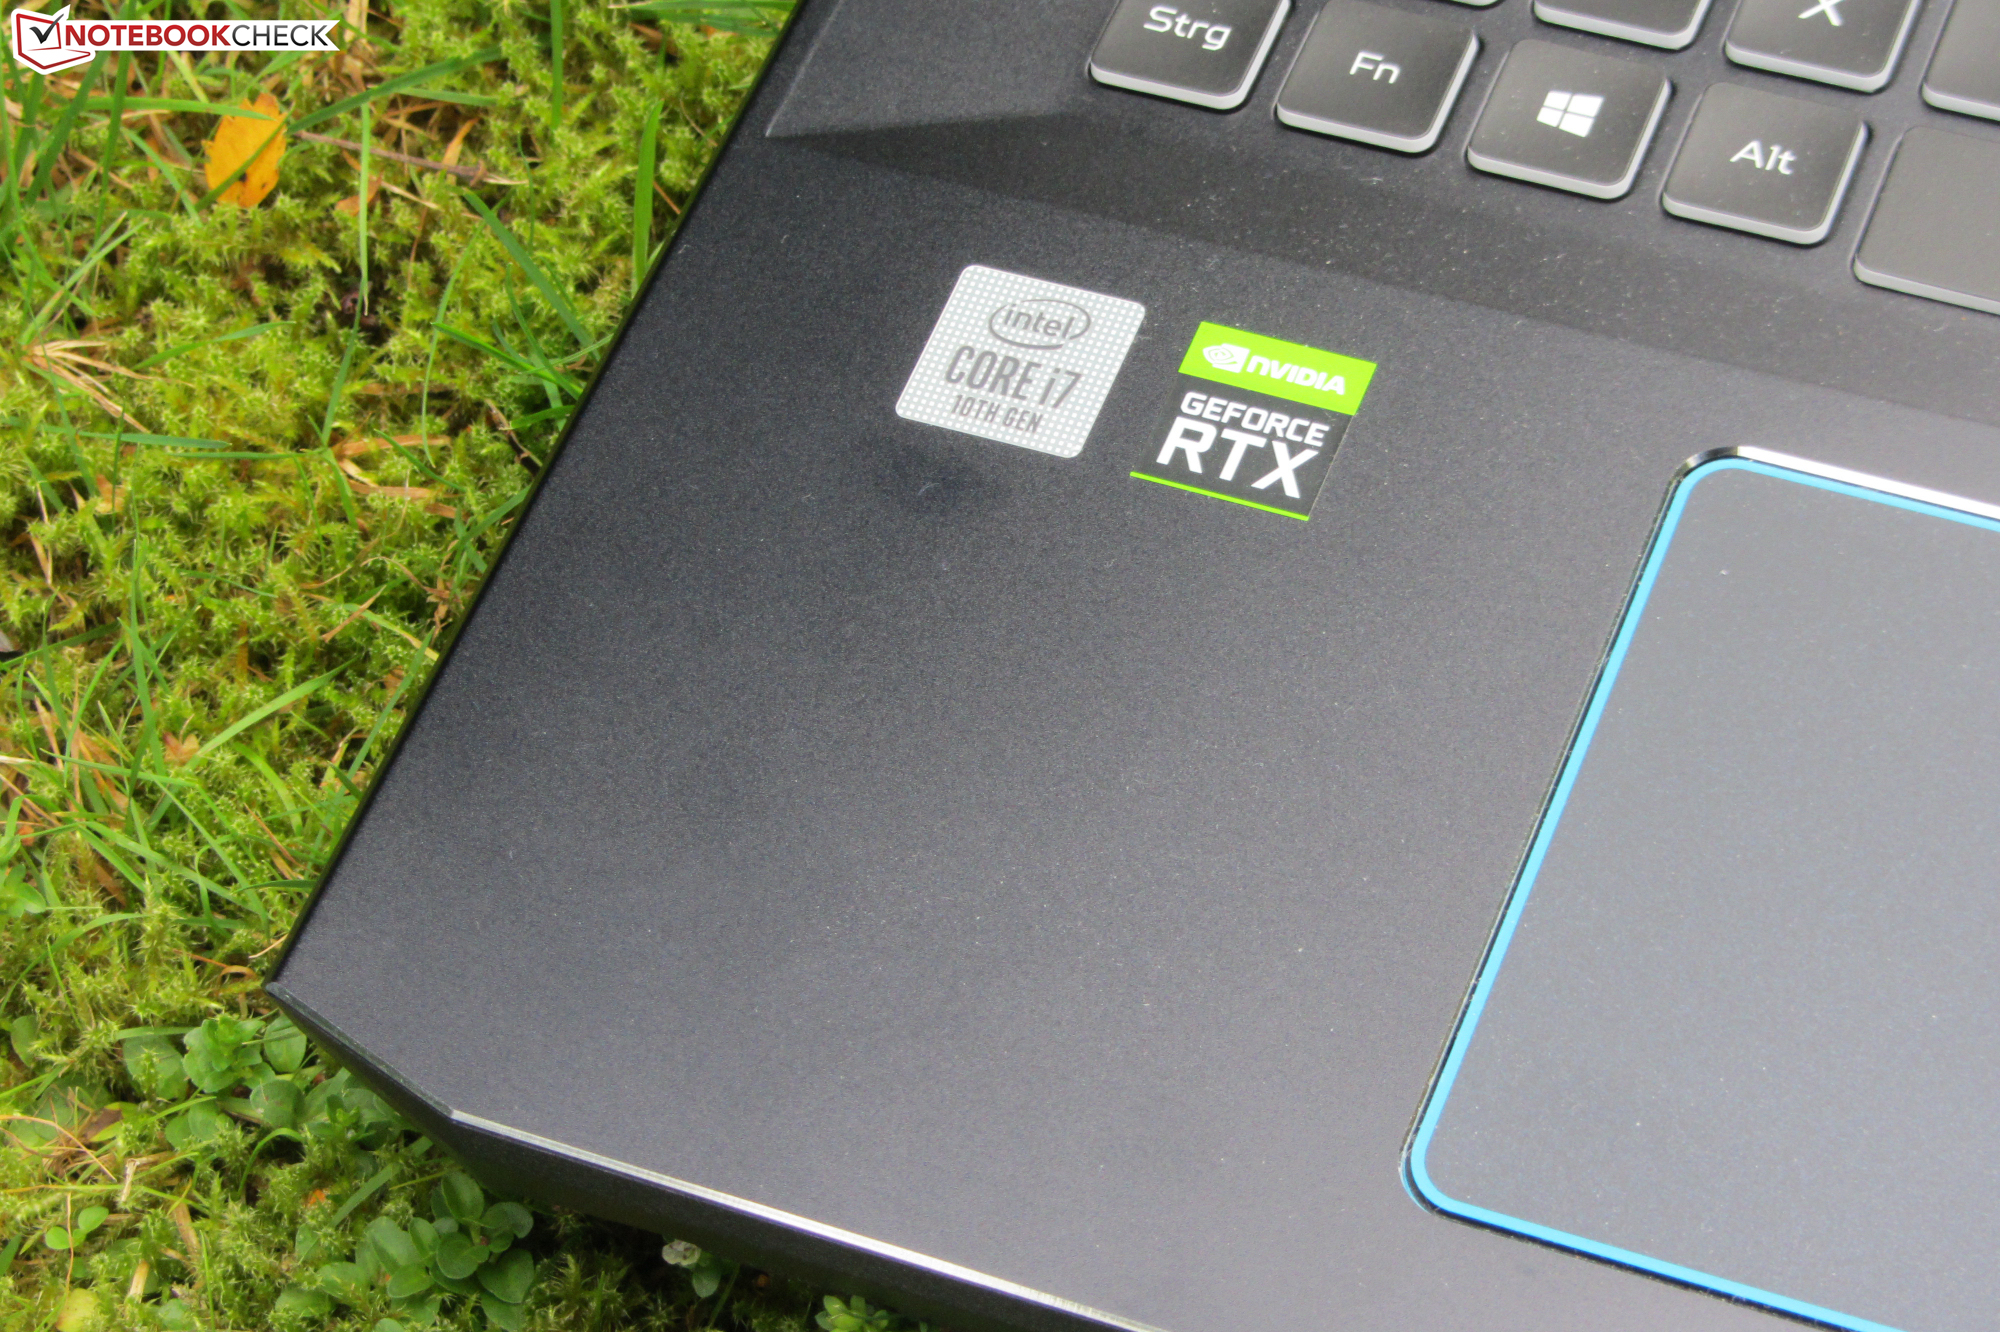
The Acer Predator Helios 300 is a 17.3-inch laptop with a Core i7-10750H and a GeForce RTX 2060. There is also a model with a GeForce RTX 2070. The competing devices include: the Nexoc GH7 716IG, the Aorus 7 KB, the MSI GE75 Raider 10SE, the MSI Bravo 17 A4DDR, the Asus TUF A17 FA706IU-AS76 and the Lenovo Legion Y740-17IRH.
Rating | Date | Model | Weight | Height | Size | Resolution | Price |
|---|---|---|---|---|---|---|---|
| 83.6 % v7 (old) | 10 / 2020 | Acer Predator Helios 300 PH317-54-75G8 i7-10750H, GeForce RTX 2060 Mobile | 2.8 kg | 25 mm | 17.30" | 1920x1080 | |
| 81.5 % v7 (old) | 09 / 2020 | Nexoc GH7 716IG i7-10750H, GeForce GTX 1660 Ti Mobile | 2.5 kg | 29.5 mm | 17.30" | 1920x1080 | |
| 81.6 % v7 (old) | 10 / 2020 | Aorus 7 KB i7-10750H, GeForce RTX 2060 Mobile | 2.5 kg | 29 mm | 17.30" | 1920x1080 | |
| 85.1 % v7 (old) | 07 / 2020 | MSI GE75 Raider 10SE-008US i7-10750H, GeForce RTX 2060 Mobile | 2.6 kg | 27.5 mm | 17.30" | 1920x1080 | |
| 80.9 % v7 (old) | 07 / 2020 | MSI Bravo 17 A4DDR R7 4800H, Radeon RX 5500M | 2.2 kg | 23 mm | 17.30" | 1920x1080 | |
| 82.9 % v7 (old) | 05 / 2020 | Asus TUF A17 FA706IU-AS76 R7 4800H, GeForce GTX 1660 Ti Mobile | 2.6 kg | 26 mm | 17.30" | 1920x1080 | |
| 83.2 % v7 (old) | 10 / 2019 | Lenovo Legion Y740-17IRH i7-9750H, GeForce RTX 2060 Mobile | 3 kg | 23 mm | 17.30" | 1920x1080 |
Case - Acer does not include a maintenance hatch
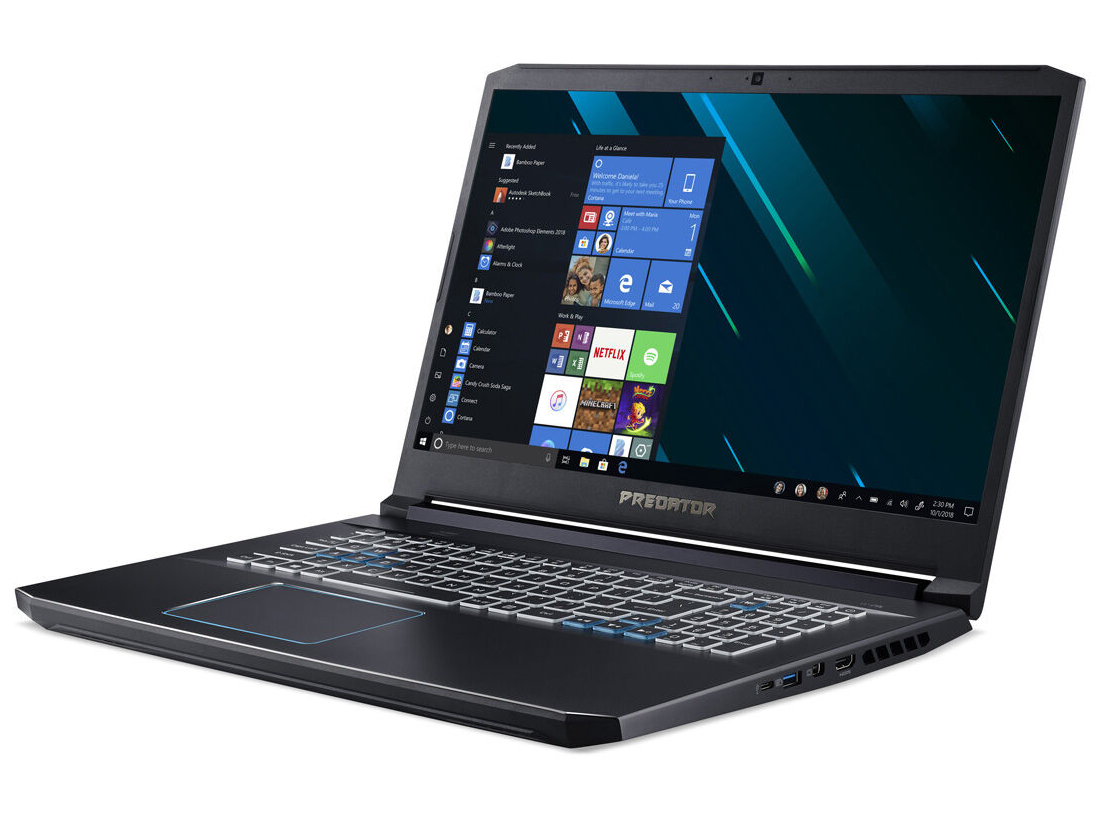
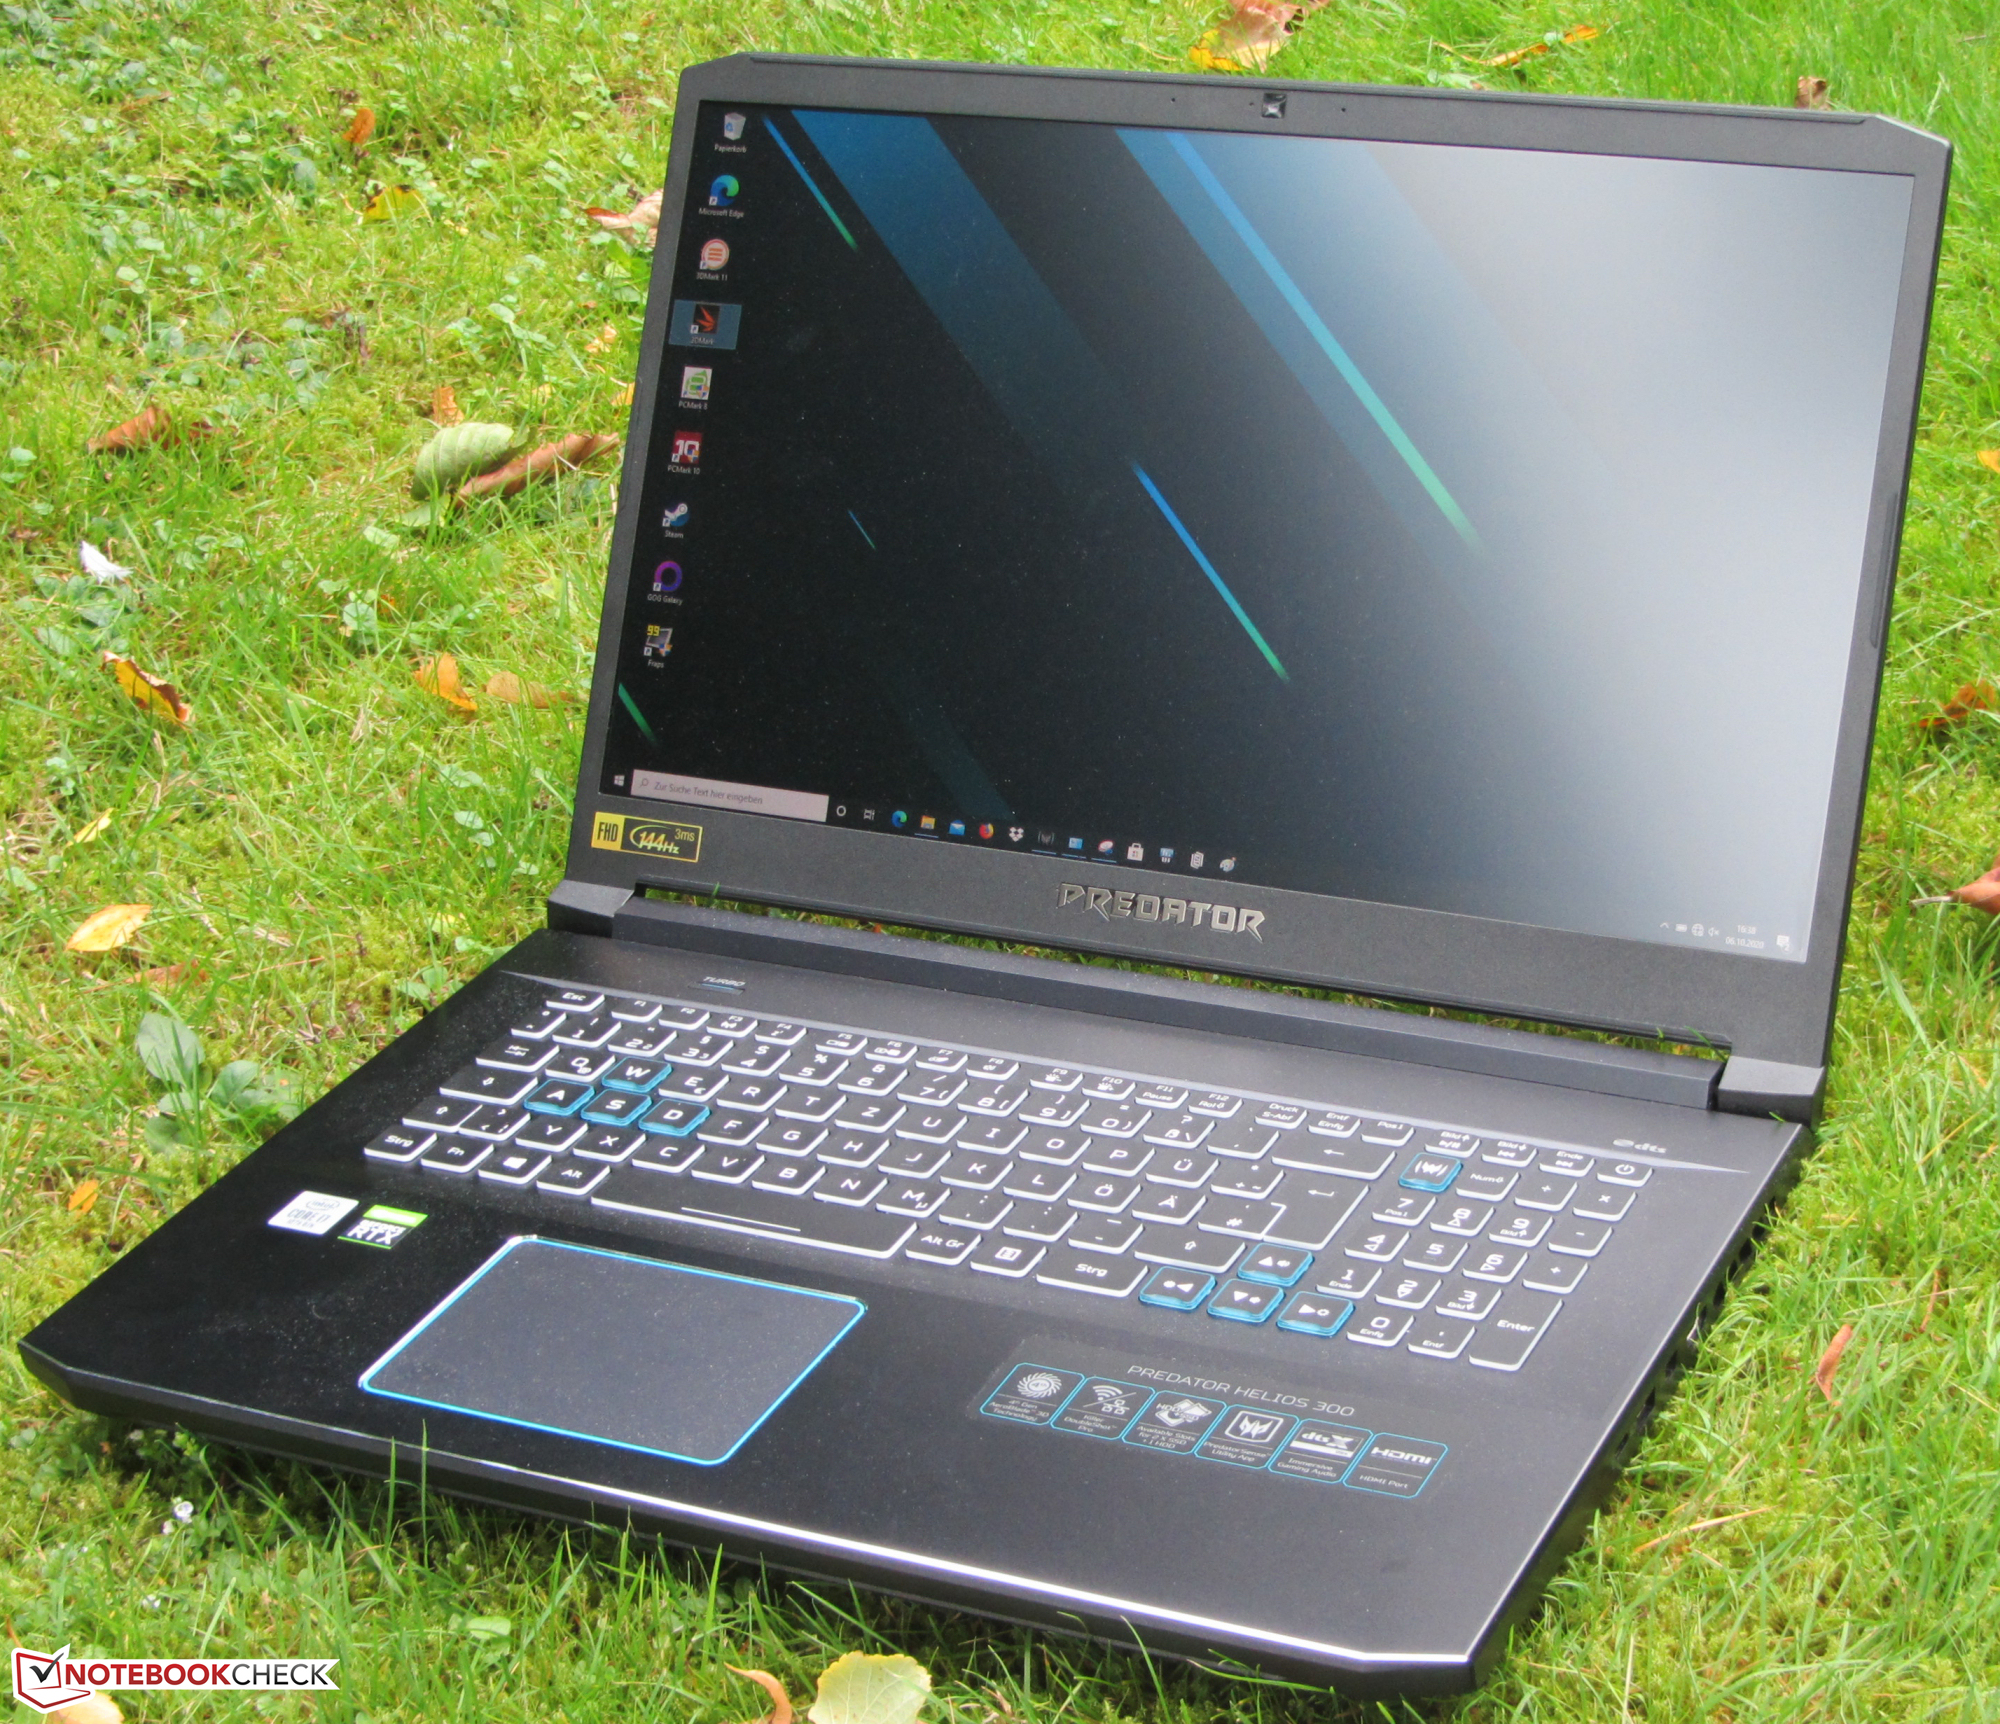
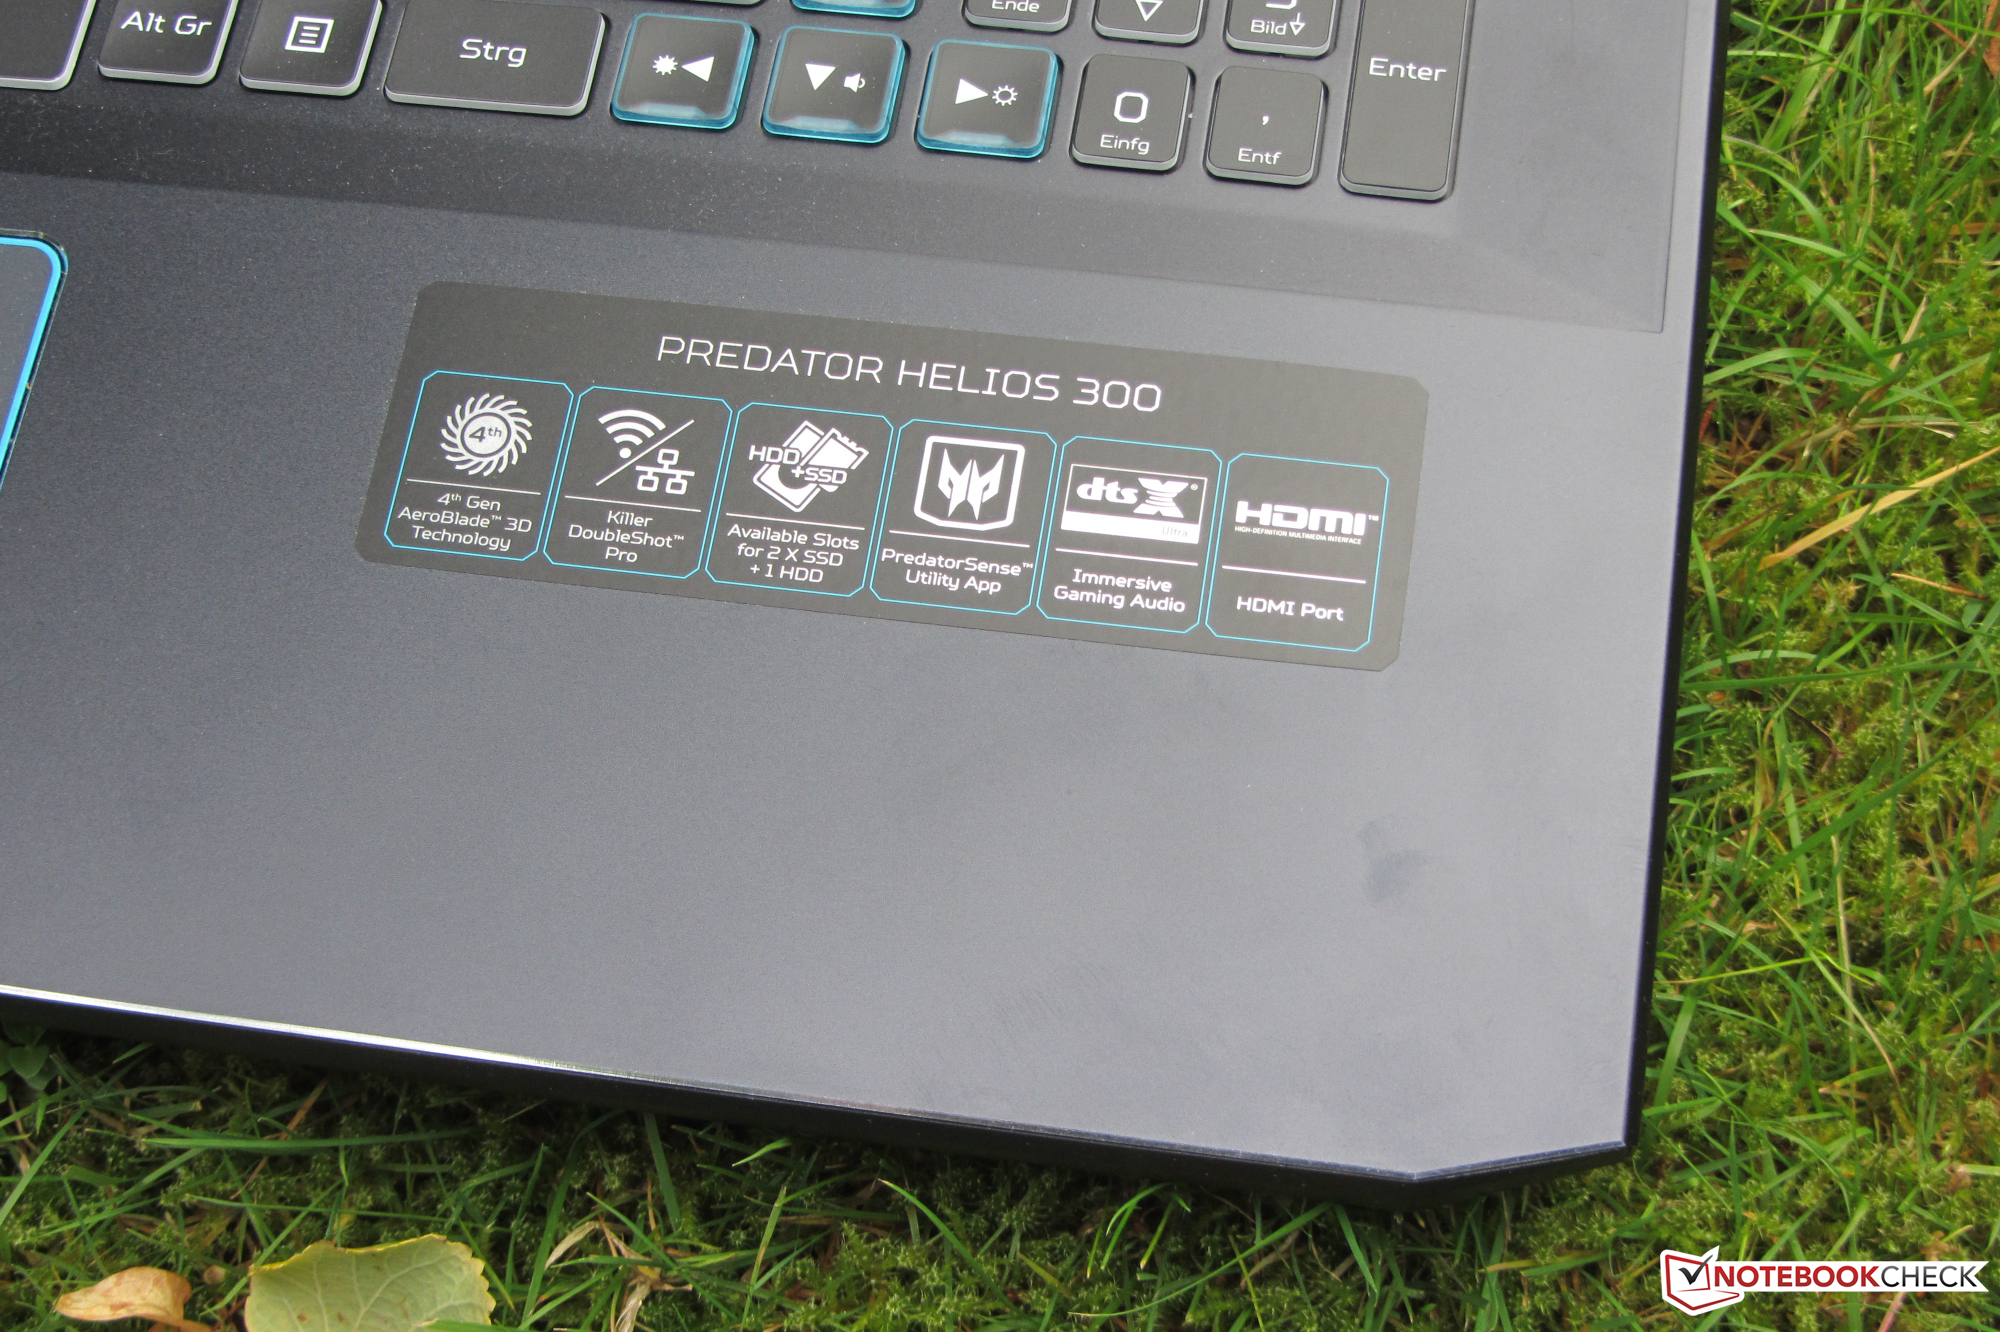
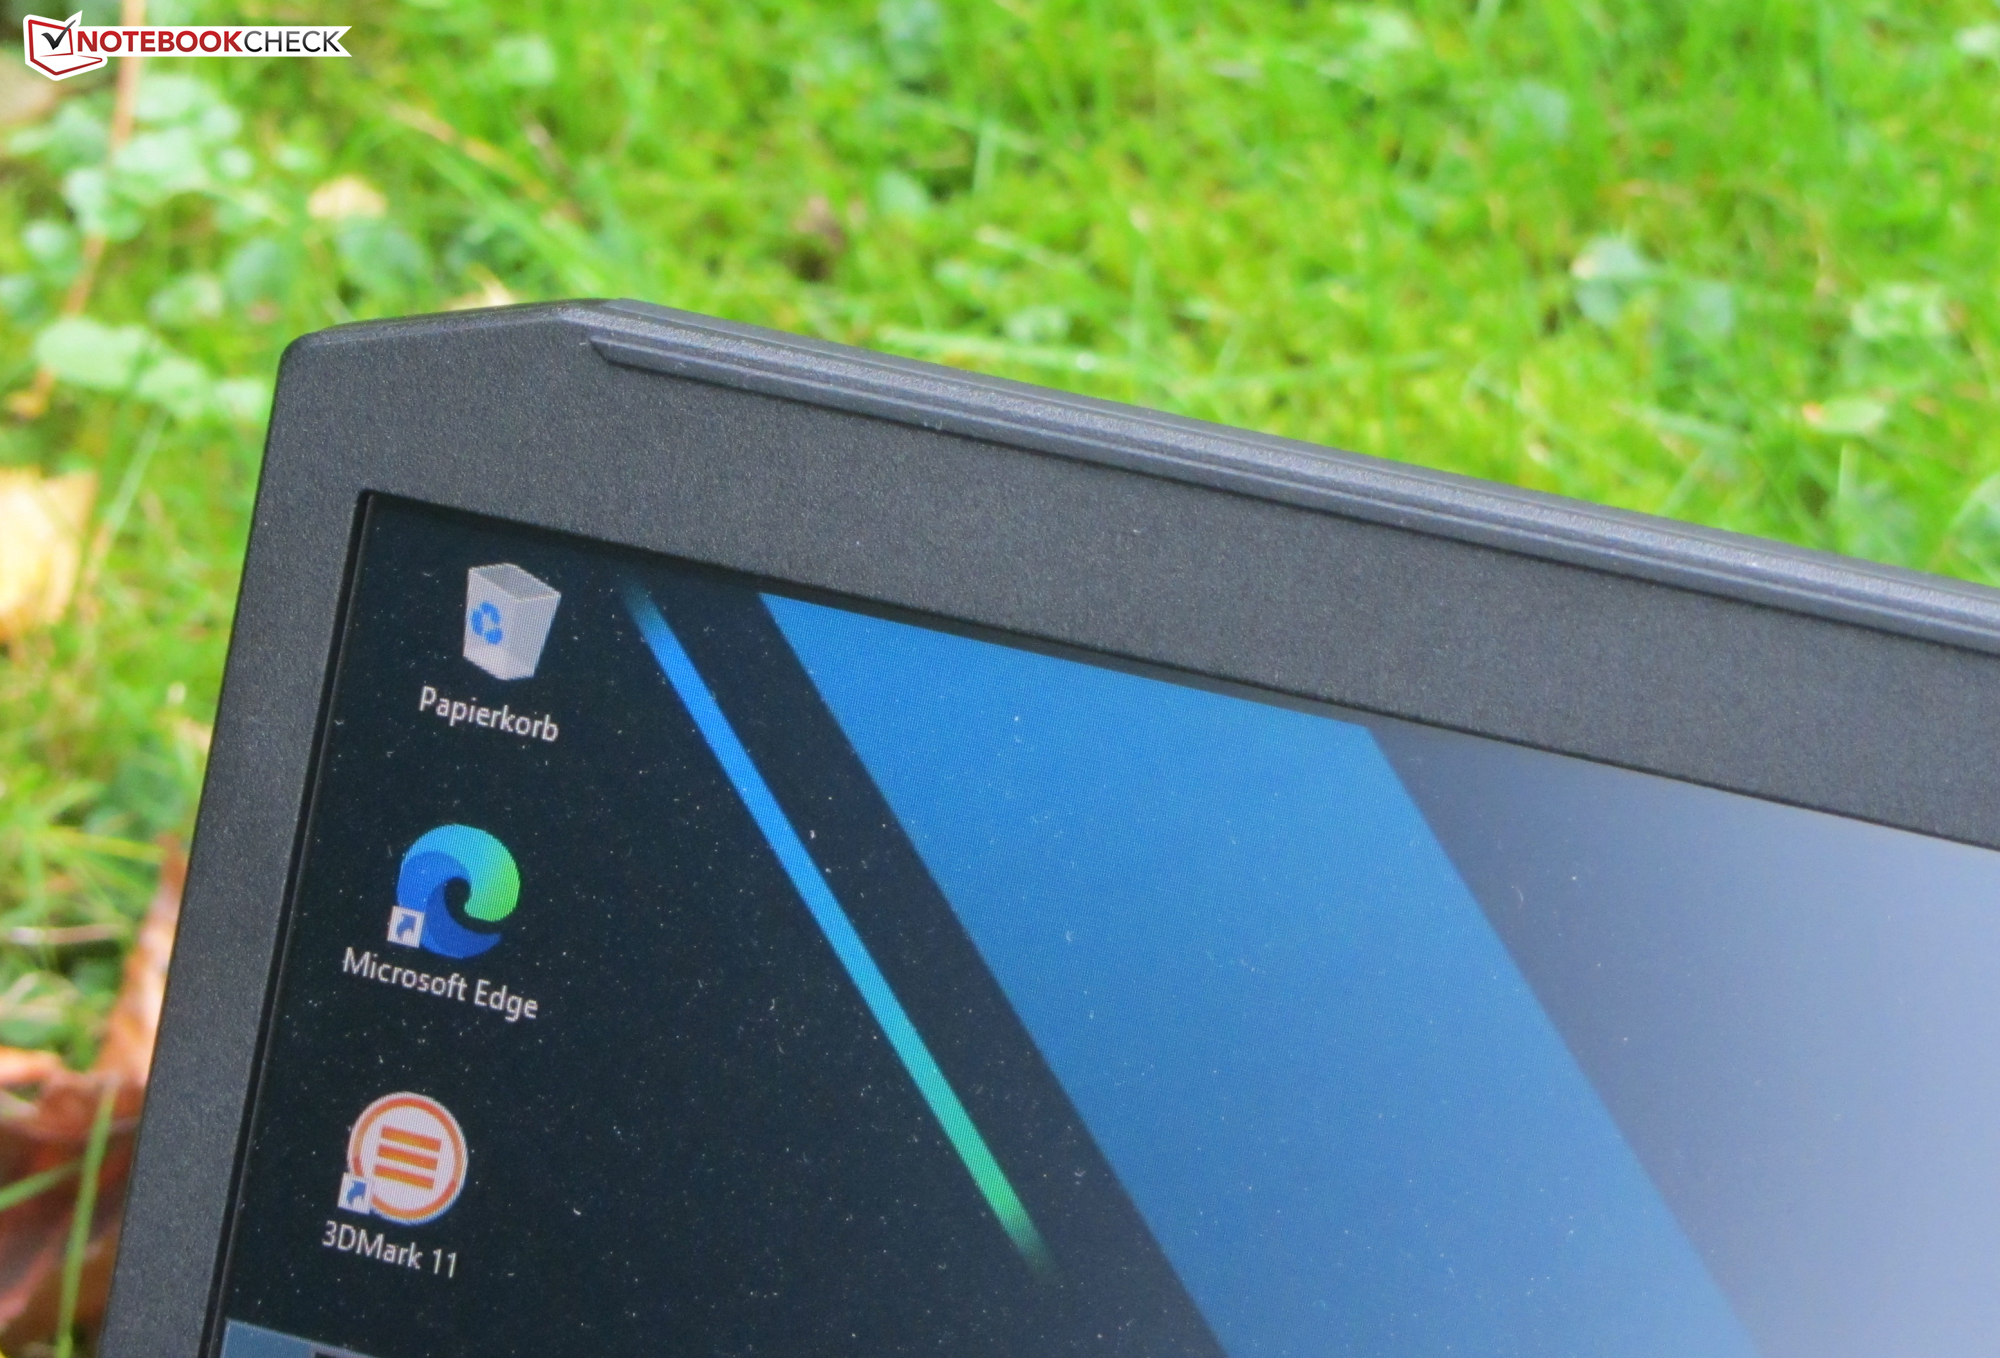
The Acer Predator Helios 300 consists of a mix of materials. The lid and the chassis are made of metal and the rest of components are made of plastic. The chassis comes in the matte black colour scheme. There are blue accents around the touchpad, around the backlit Predator logotype on the back of the display lid and around some keyboard keys. The battery is not removable. There is no maintenance hatch.
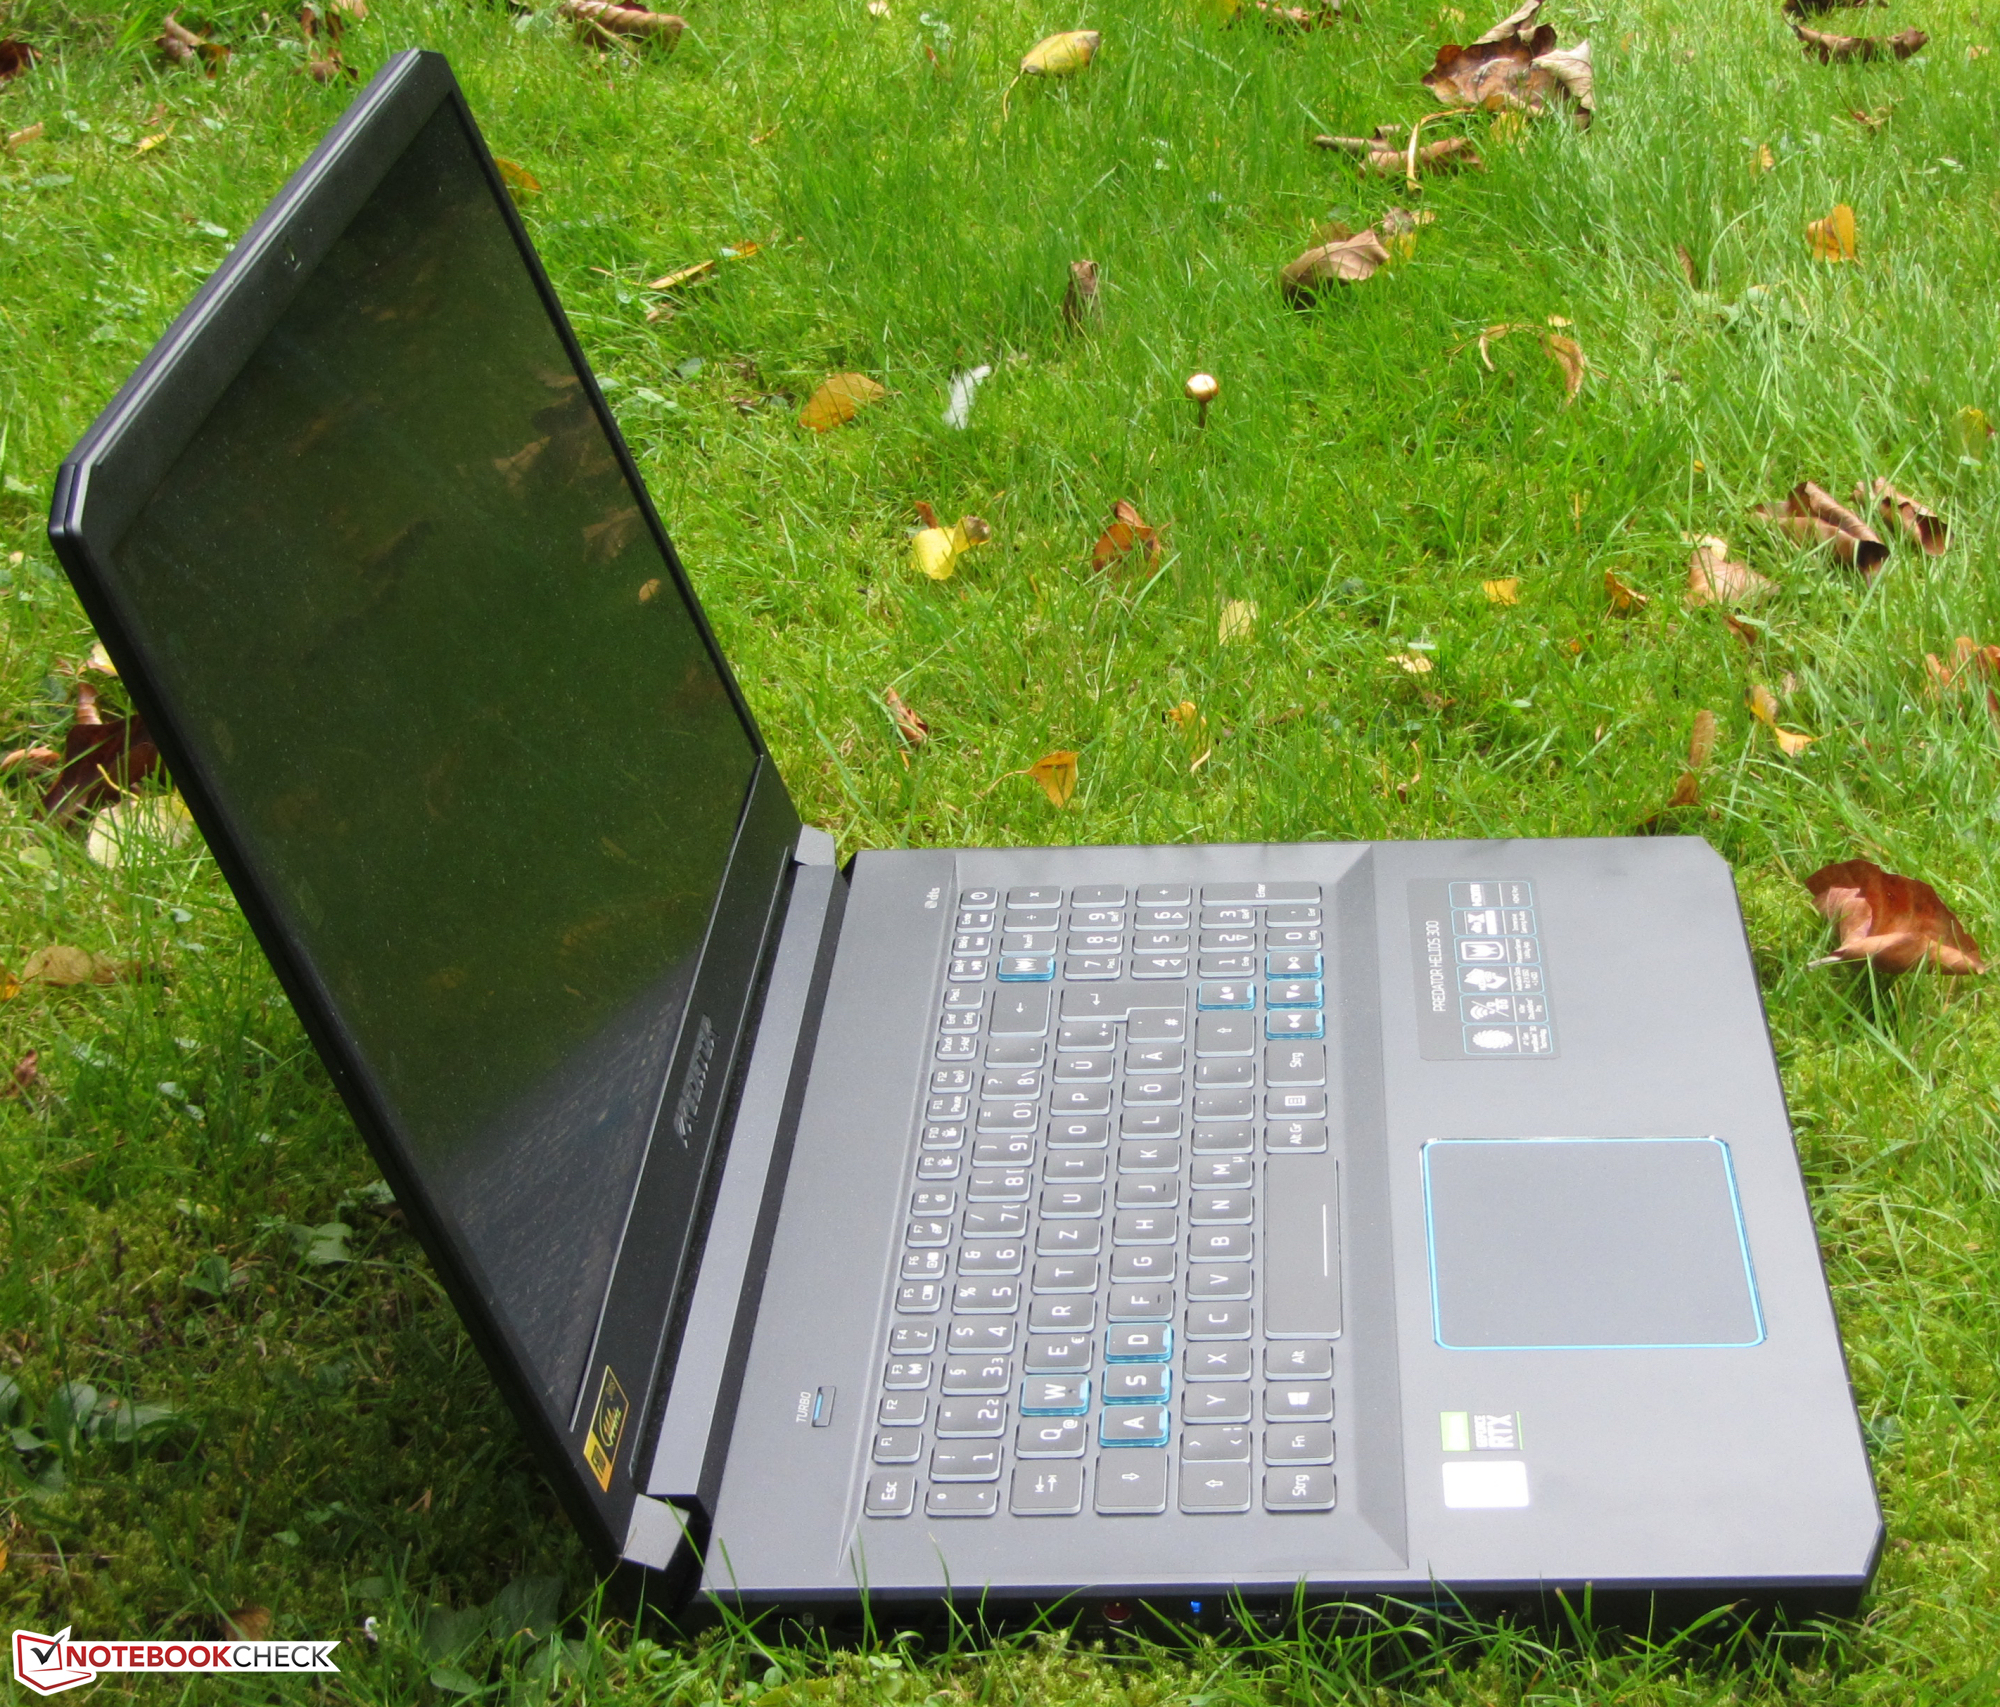
The build quality is on a good level. There are no chinks or gaps. All joints are flush with each other. Both the chassis and the display lid exhibit a small amount of flex. There are no distortions on the screen when pressure is applied to the back of the display lid. The hinges can hold the display in a set position. The maximum opening angle amounts to 150 degrees. The notebook can be opened with one hand.

The Helios 300 is one of the heaviest and largest laptops featured in this review. It is only beaten by the Lenovo Legion Y740-17IRH.
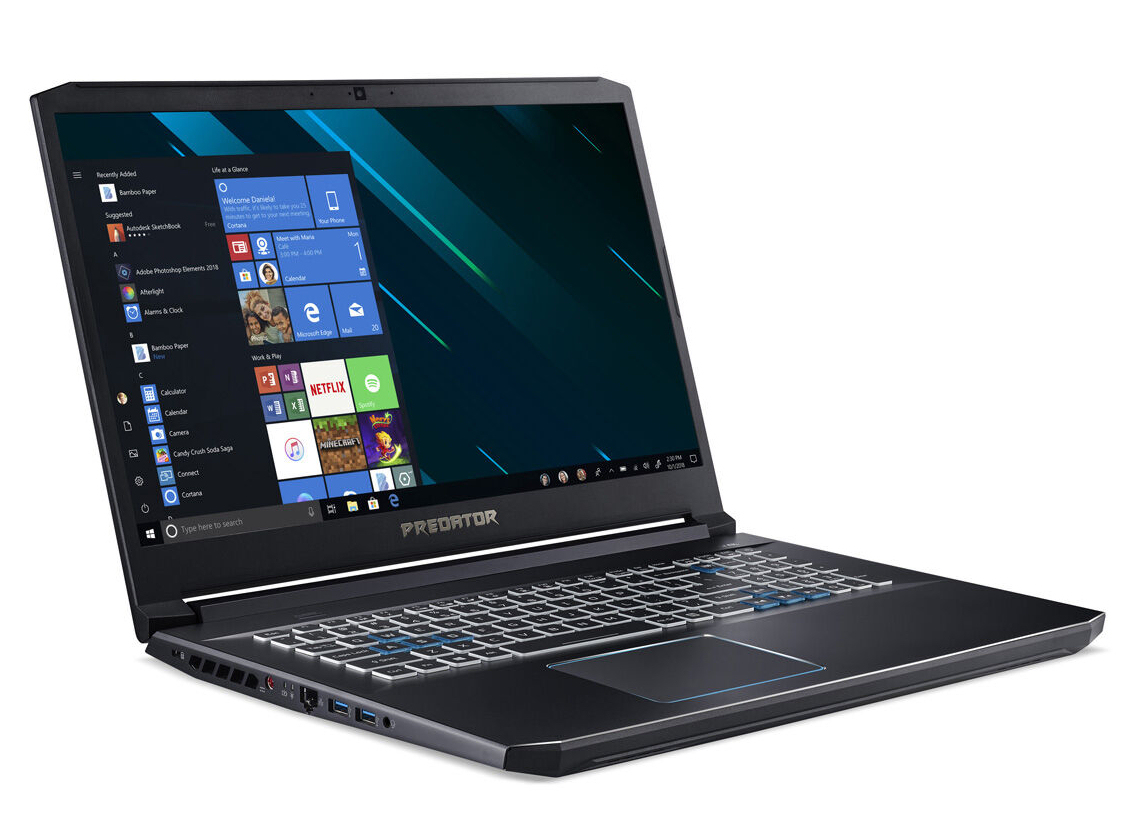
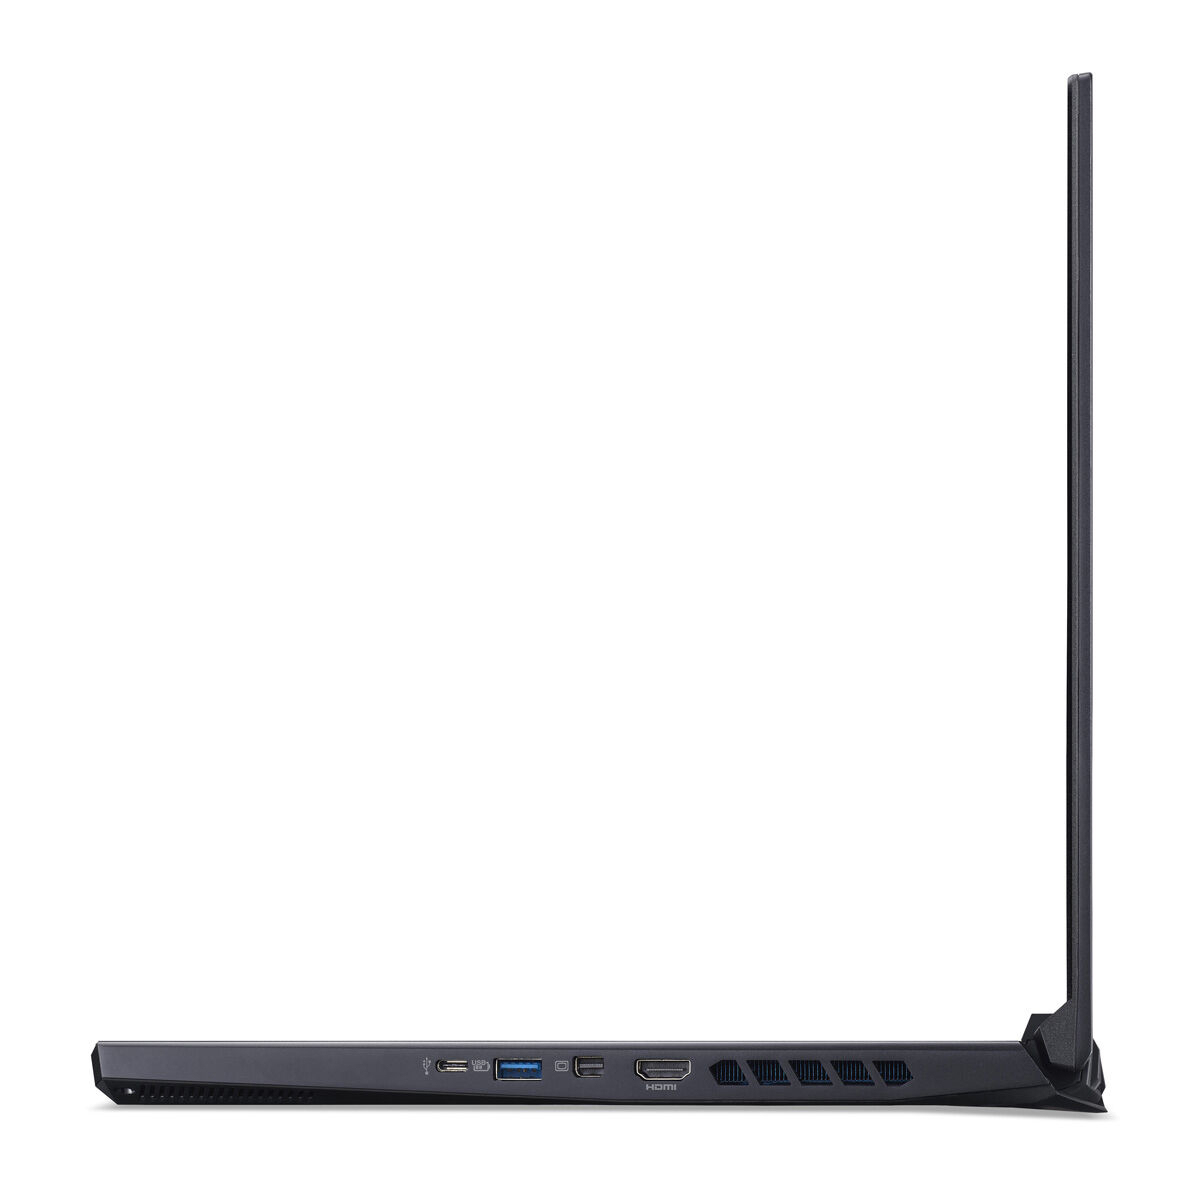
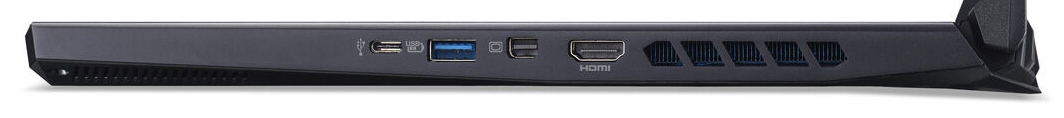
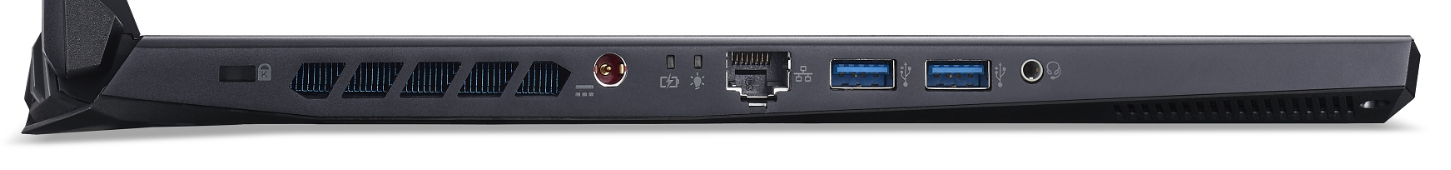
Connectivity - Helios 300 does not feature an SD card reader
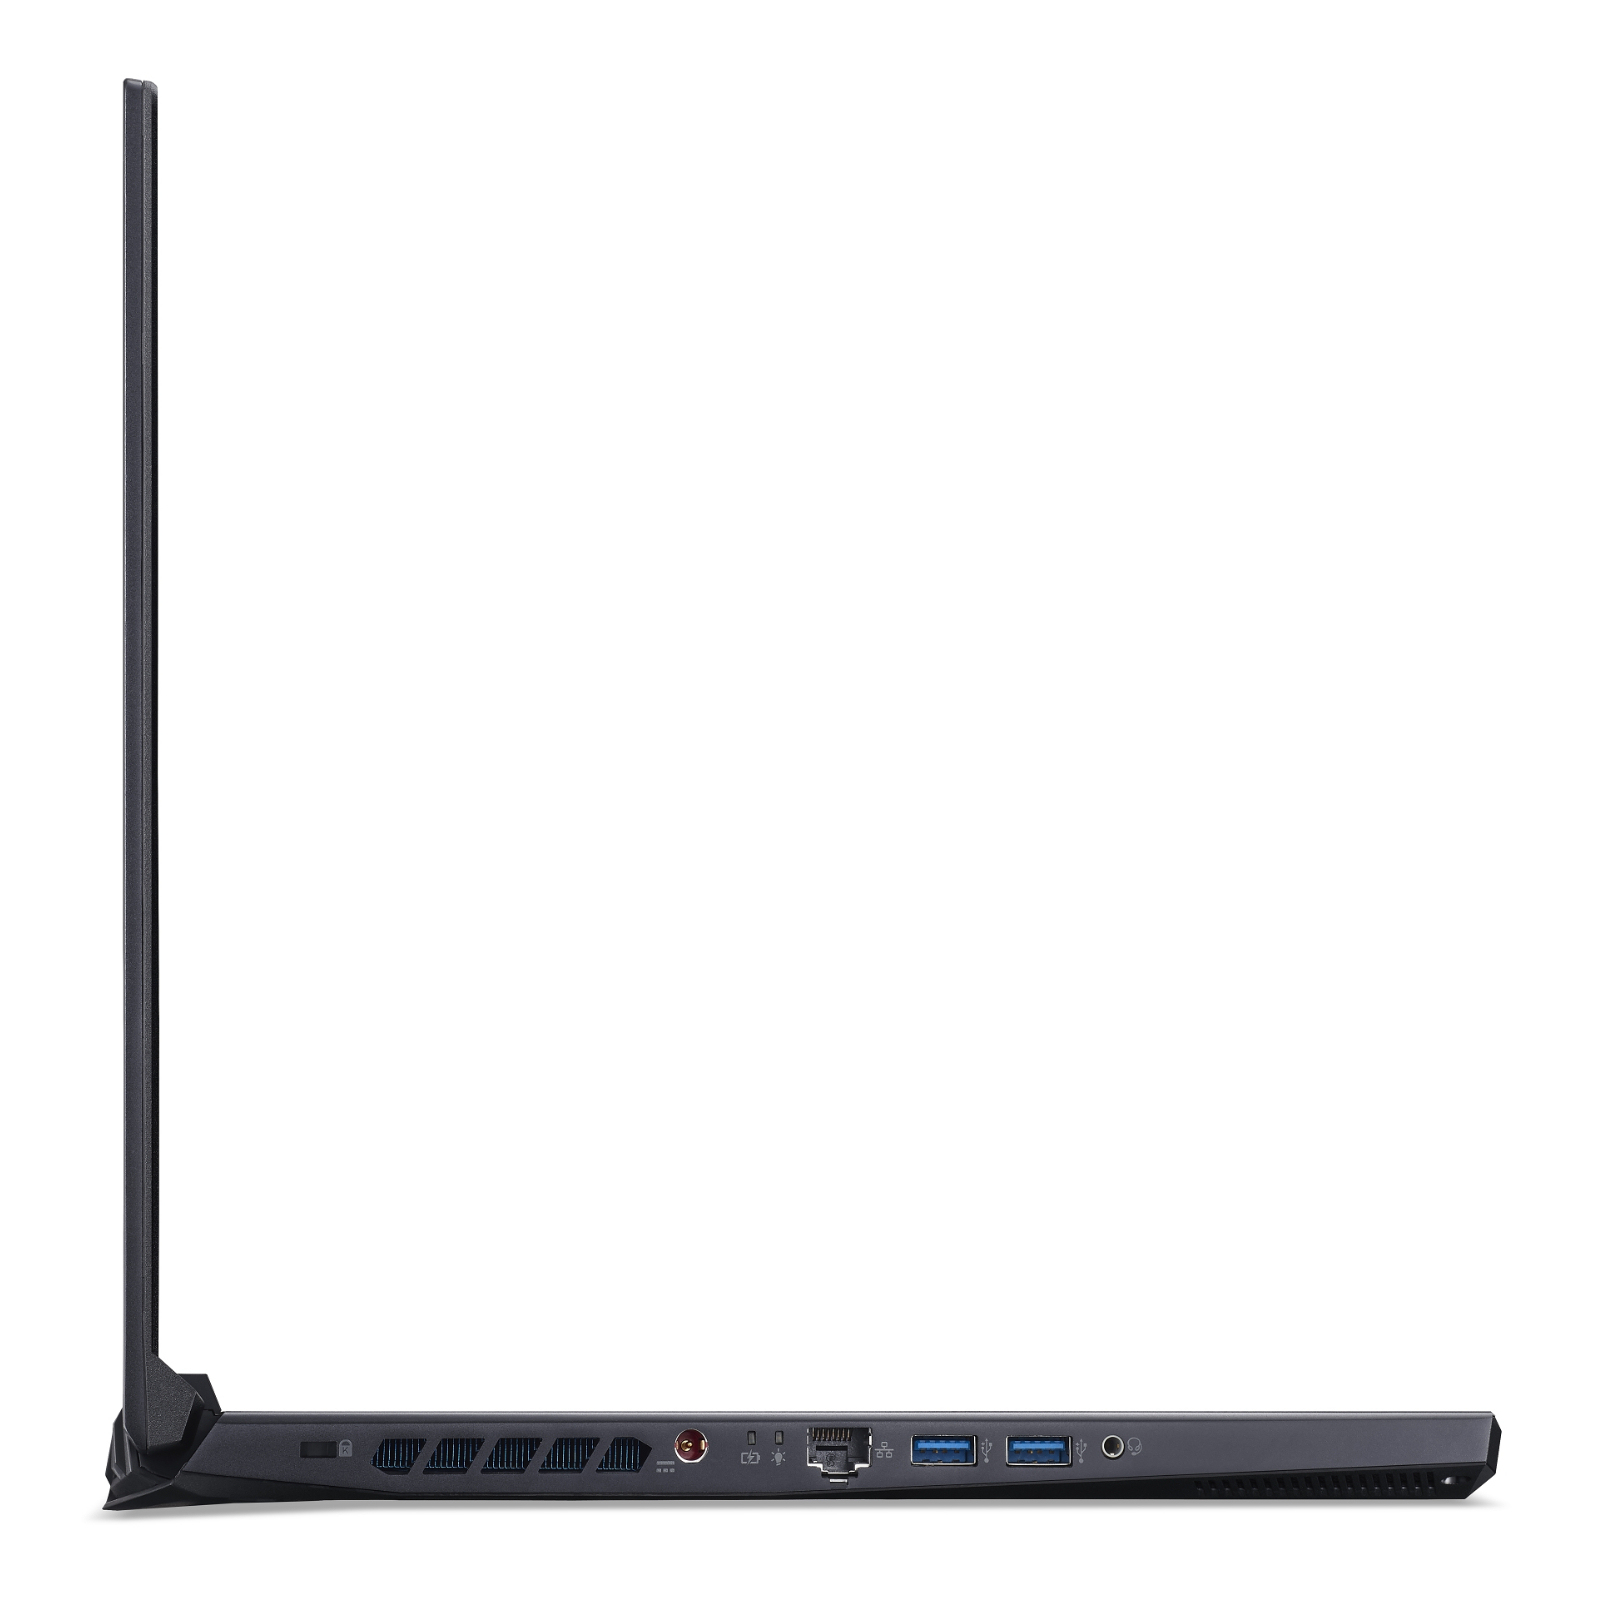
The USB Type-C port supports neither DisplayPort over USB-C functionality nor USB Power Delivery. The notebook offers two video outputs: an HDMI port and a miniDP port. There is no SD card reader.
Communication
The Wi-Fi module from Killer supports the following IEEE 802.11 standards: a, b, g, n, ac and ax. The data transfer rates that we have measured under the optimal conditions (no other Wi-Fi-enabled devices in close proximity, a short distance between the laptop and the server PC) are very good, thanks to the Killer E2500 Gigabit Ethernet controller, which works without any issues.
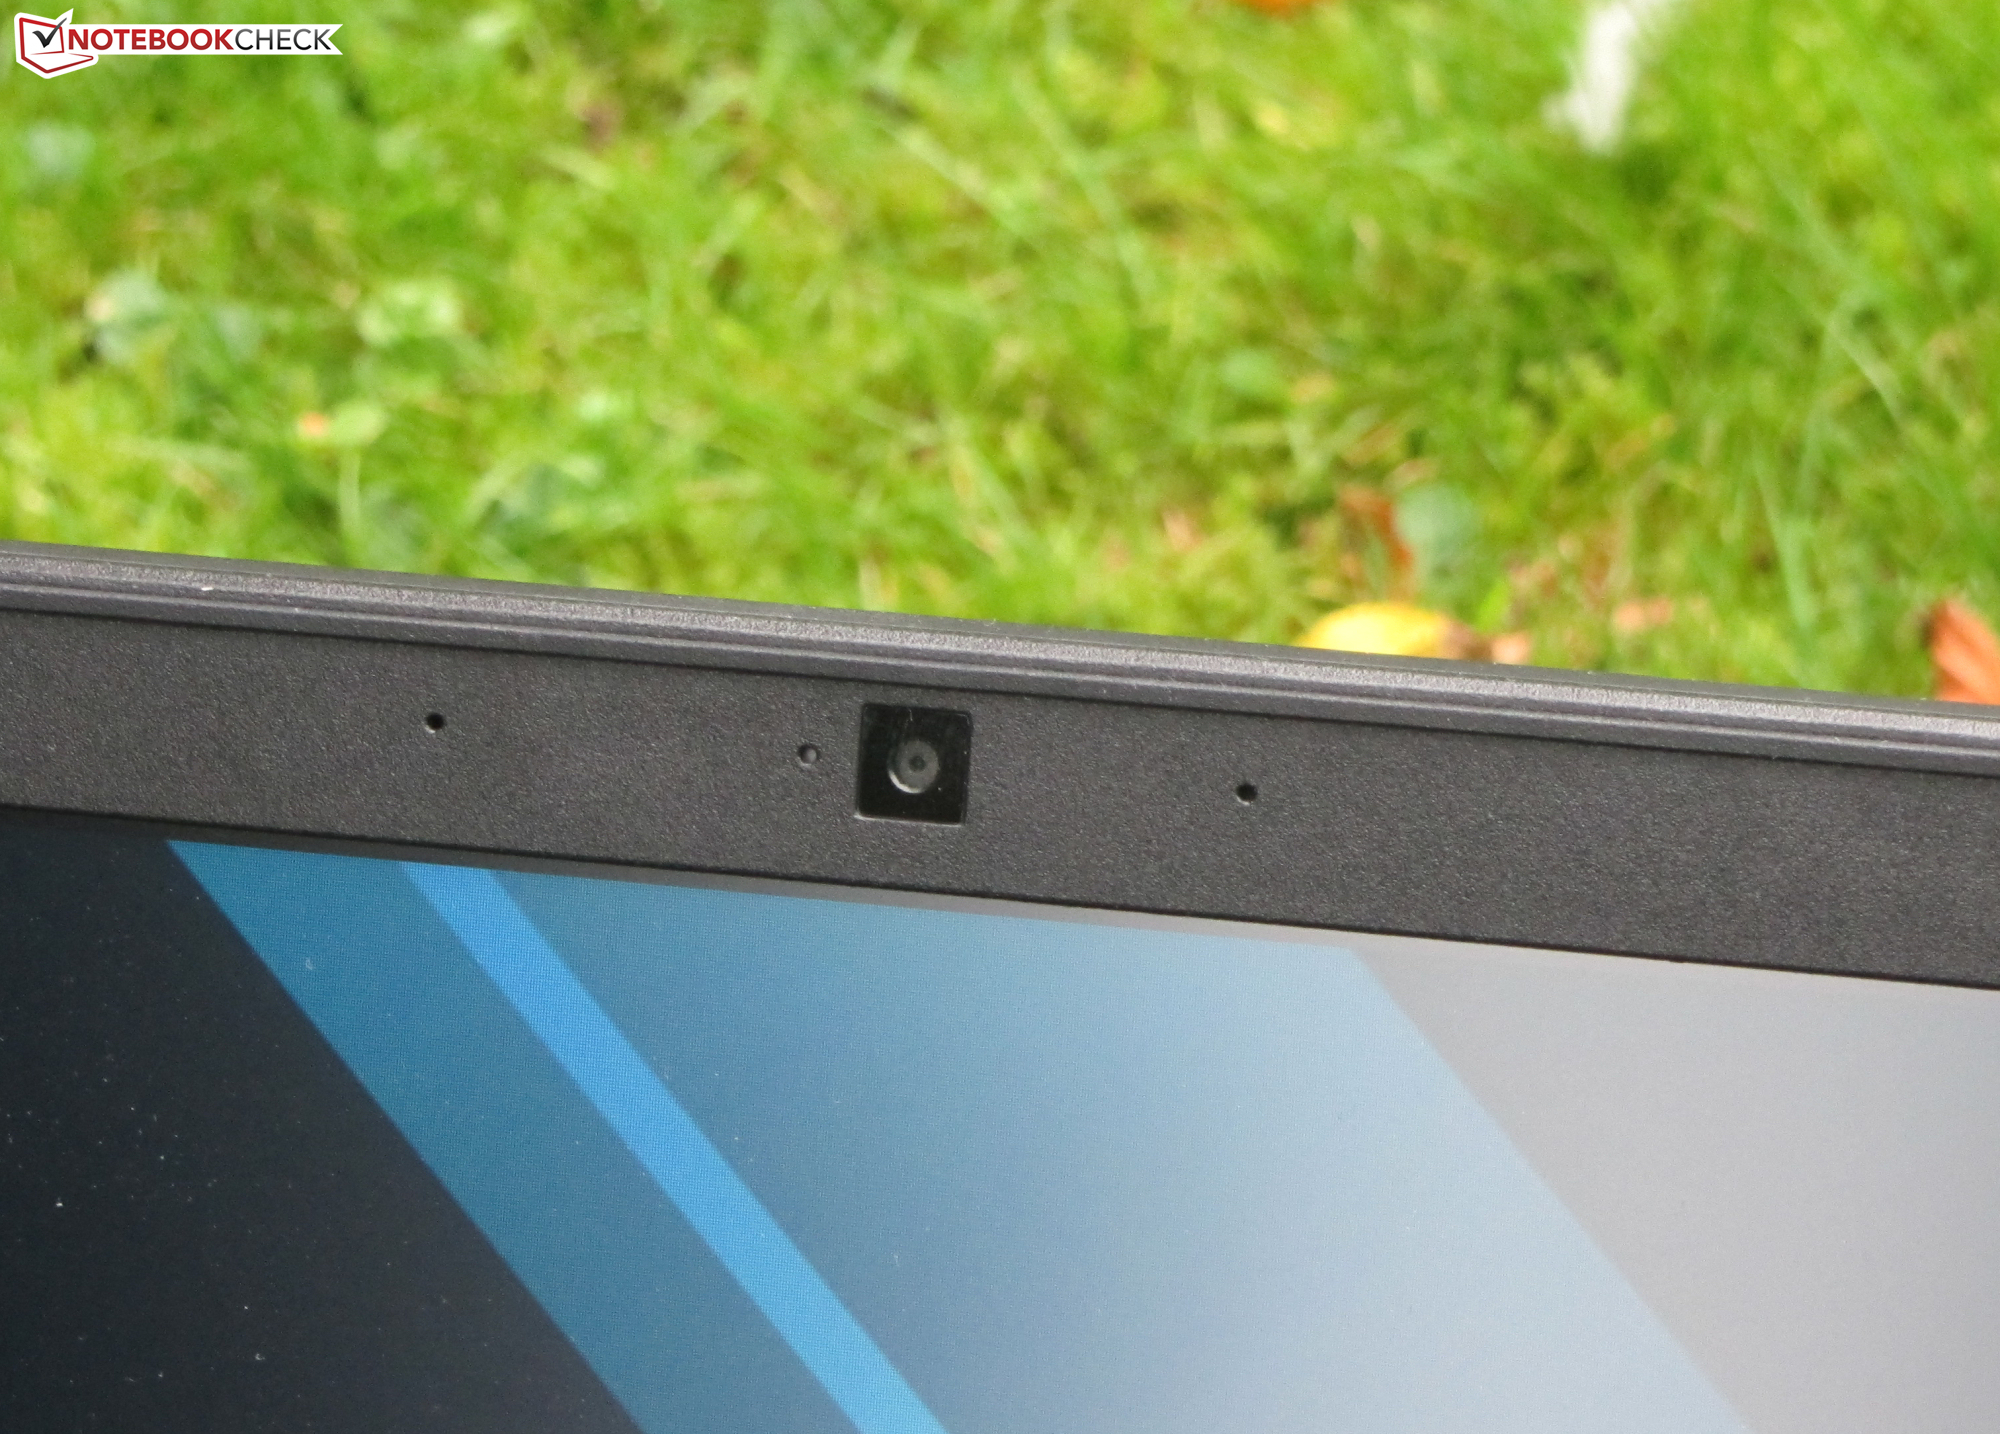
Web Camera
The 0.9-MP web camera of the PH317 can take 720p images, just like the rest of the competition. The colour reproduction is very poor. The colour deviations amount to about 14.5 (the ideal value is less than 3).


")
")


Accessories
The box contains the quick-start guide, warranty information and an installation frame for a 2.5-inch storage device with a SATA connector (a ribbon cable that plugs into the motherboard).
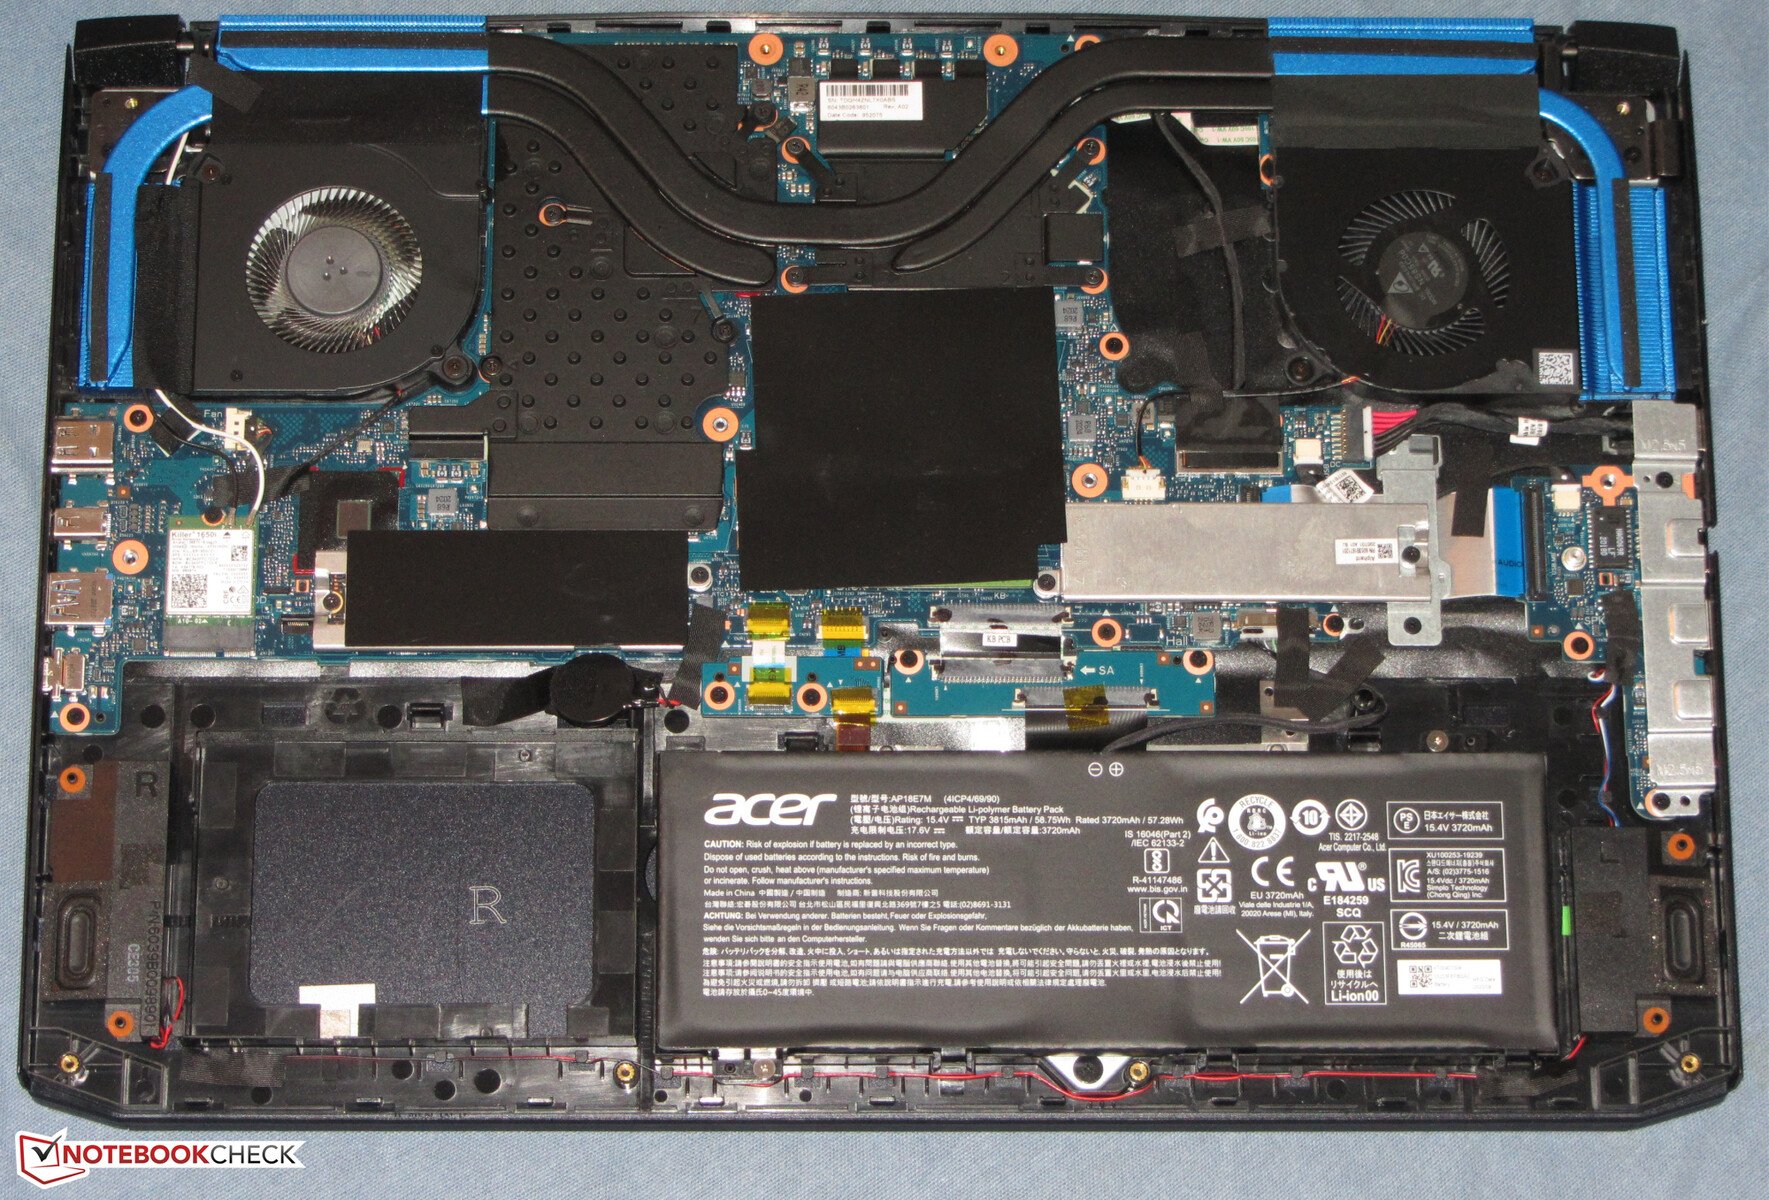
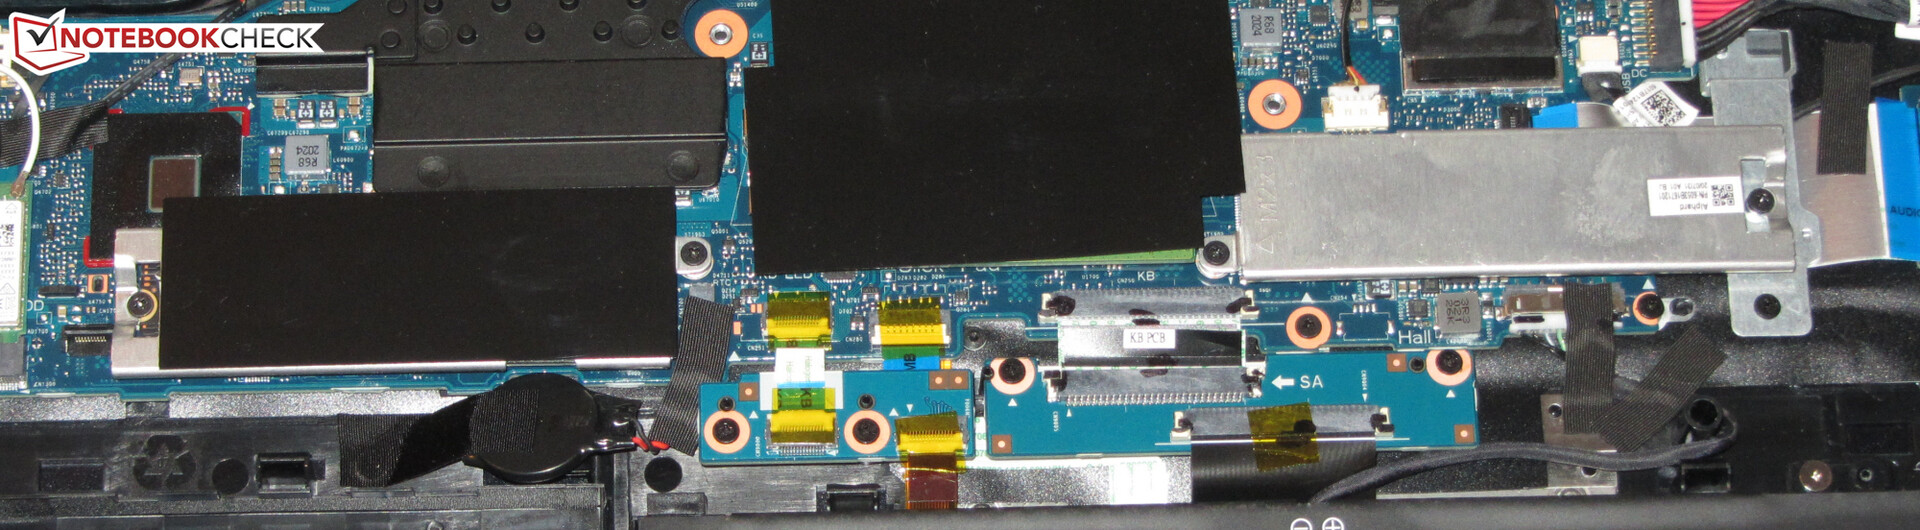
Maintenance
Our review device does not have a maintenance hatch. To reach the internal components users will have to remove the bottom cover. For this, all the screws on the bottom will have to be undone. Subsequently, the bottom cover can be removed with the help of a flat spudger or a similar prying tool. The bottom cover is firmly attached to the chassis. We recommend starting at the back.
Warranty
The Acer Predator Helios 300 comes with a two-year warranty. The scope and the duration of the warranty can be expanded. For example, a three-year warranty with on-site services will add 166 Euros (~$195) to the price tag.
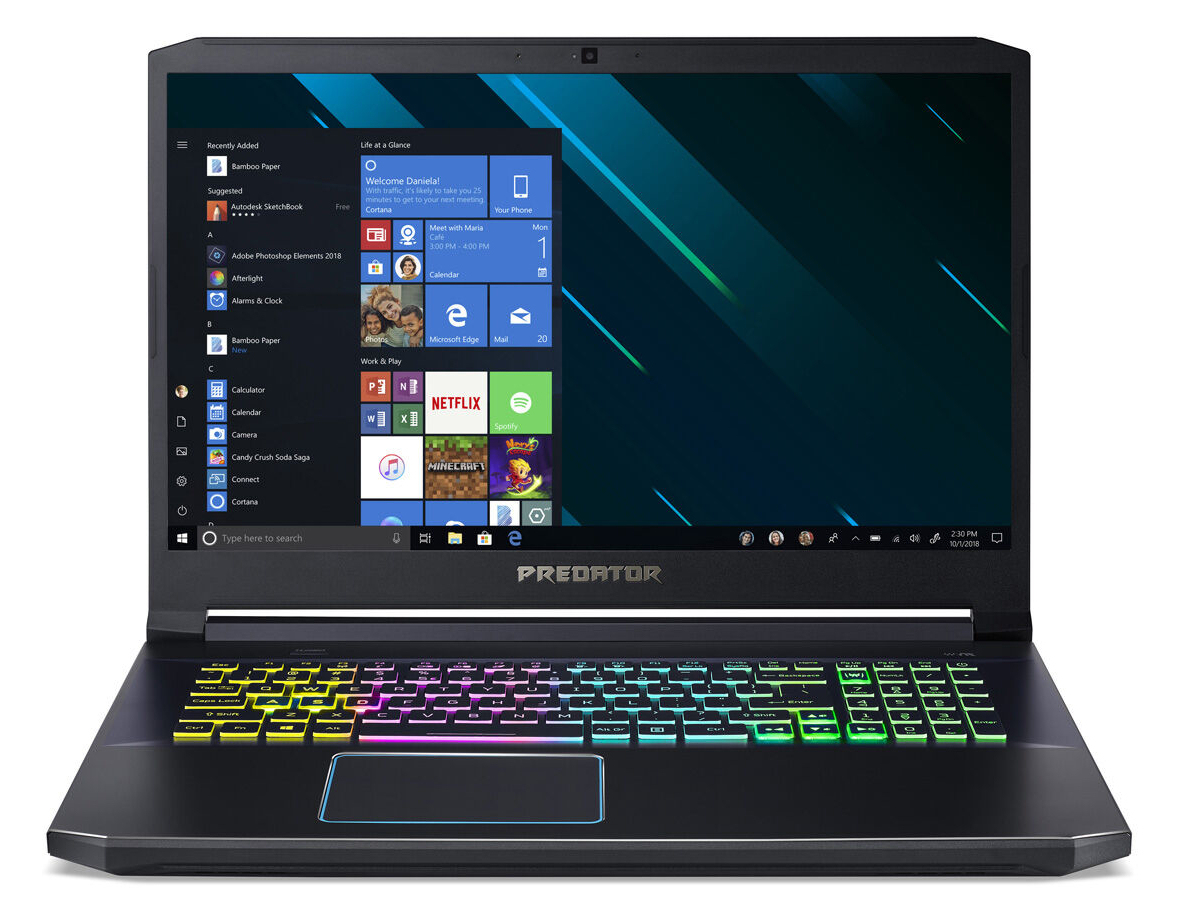
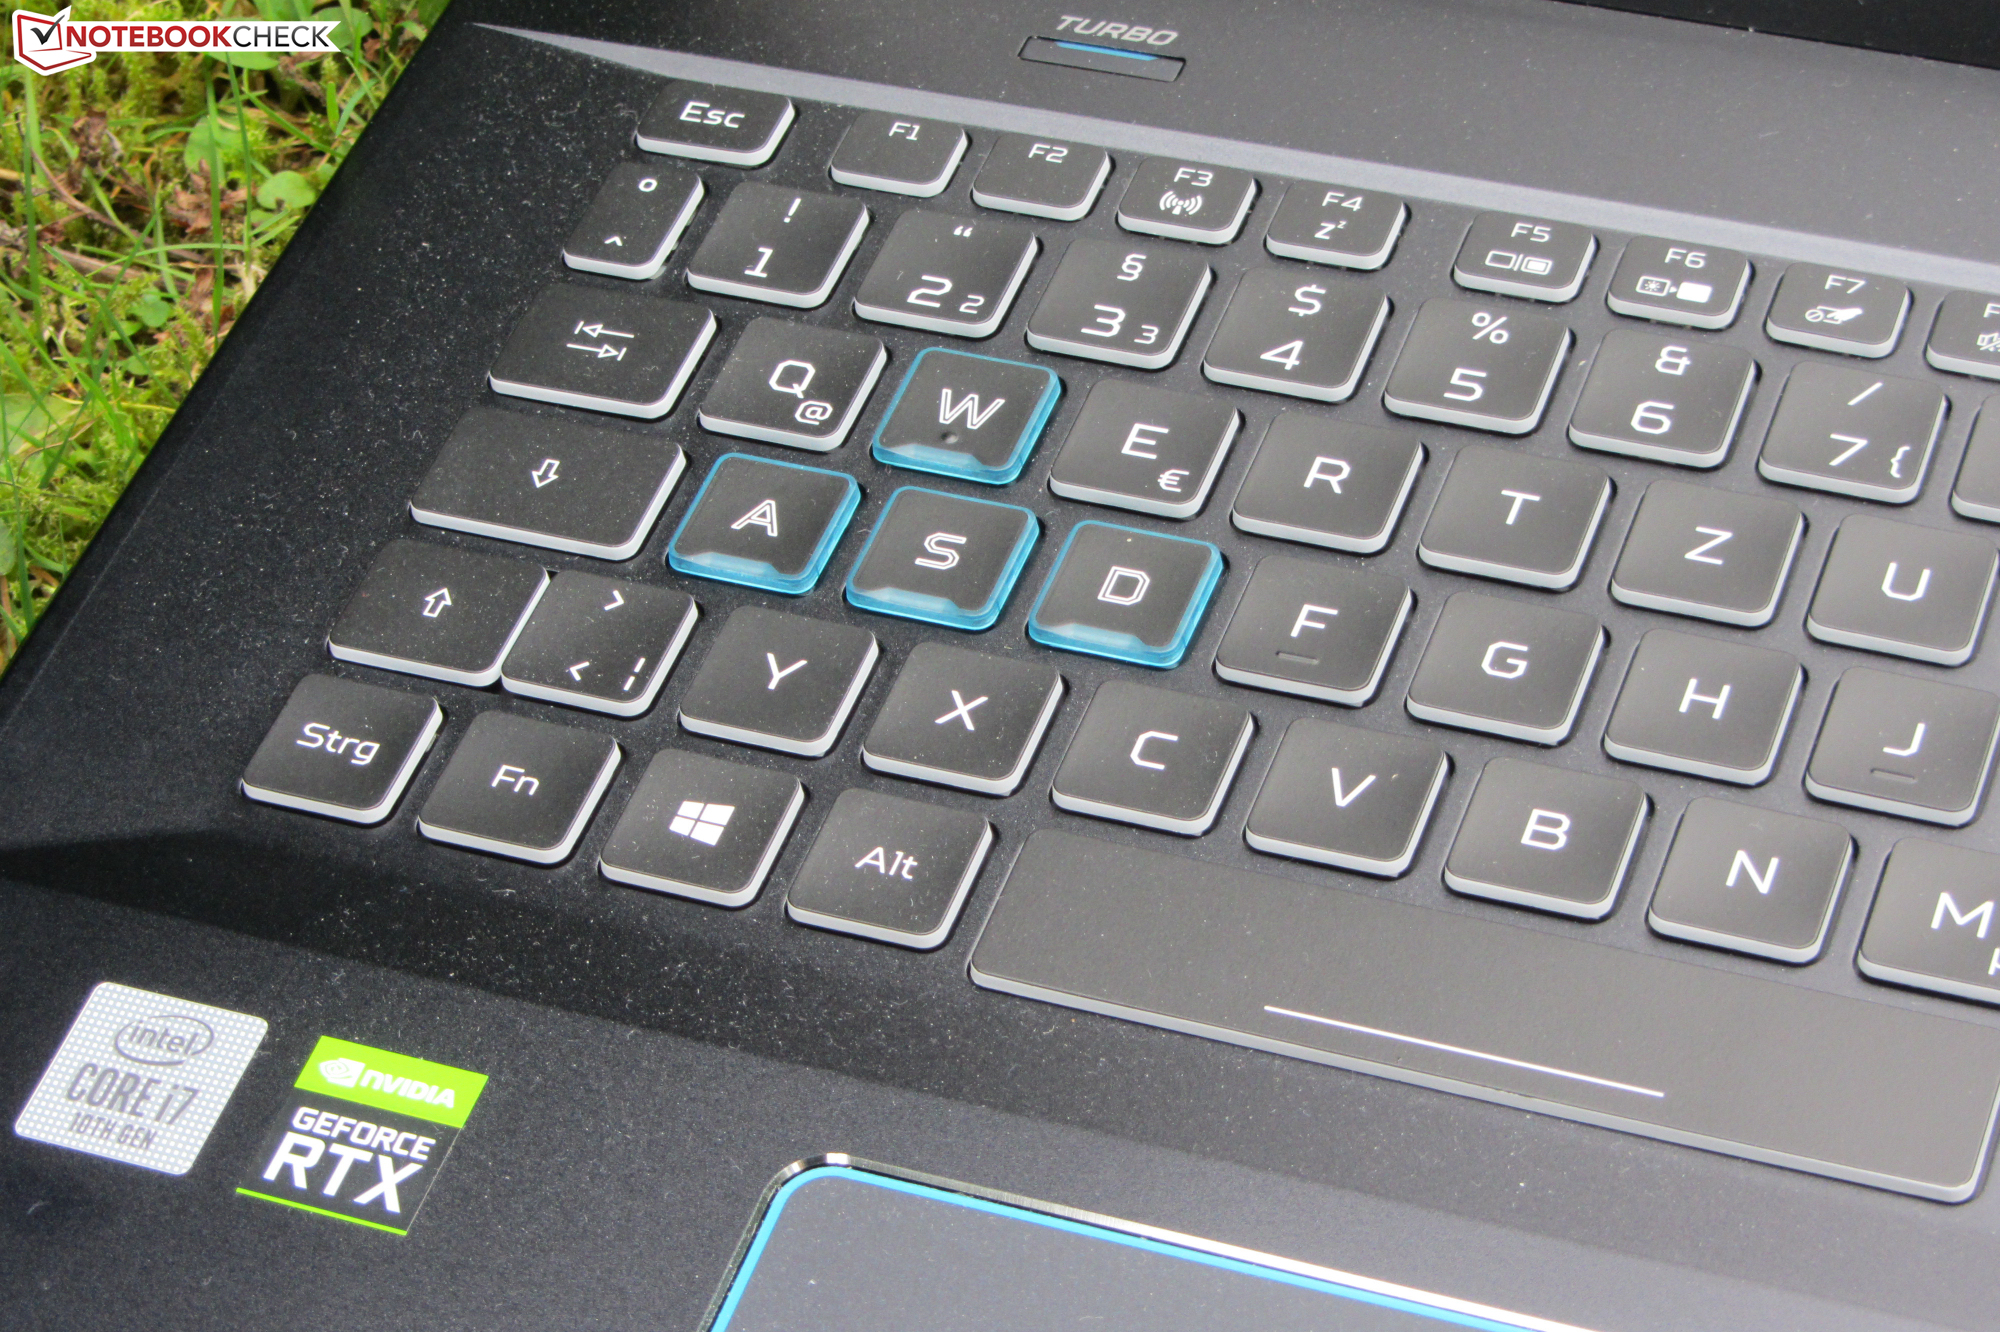
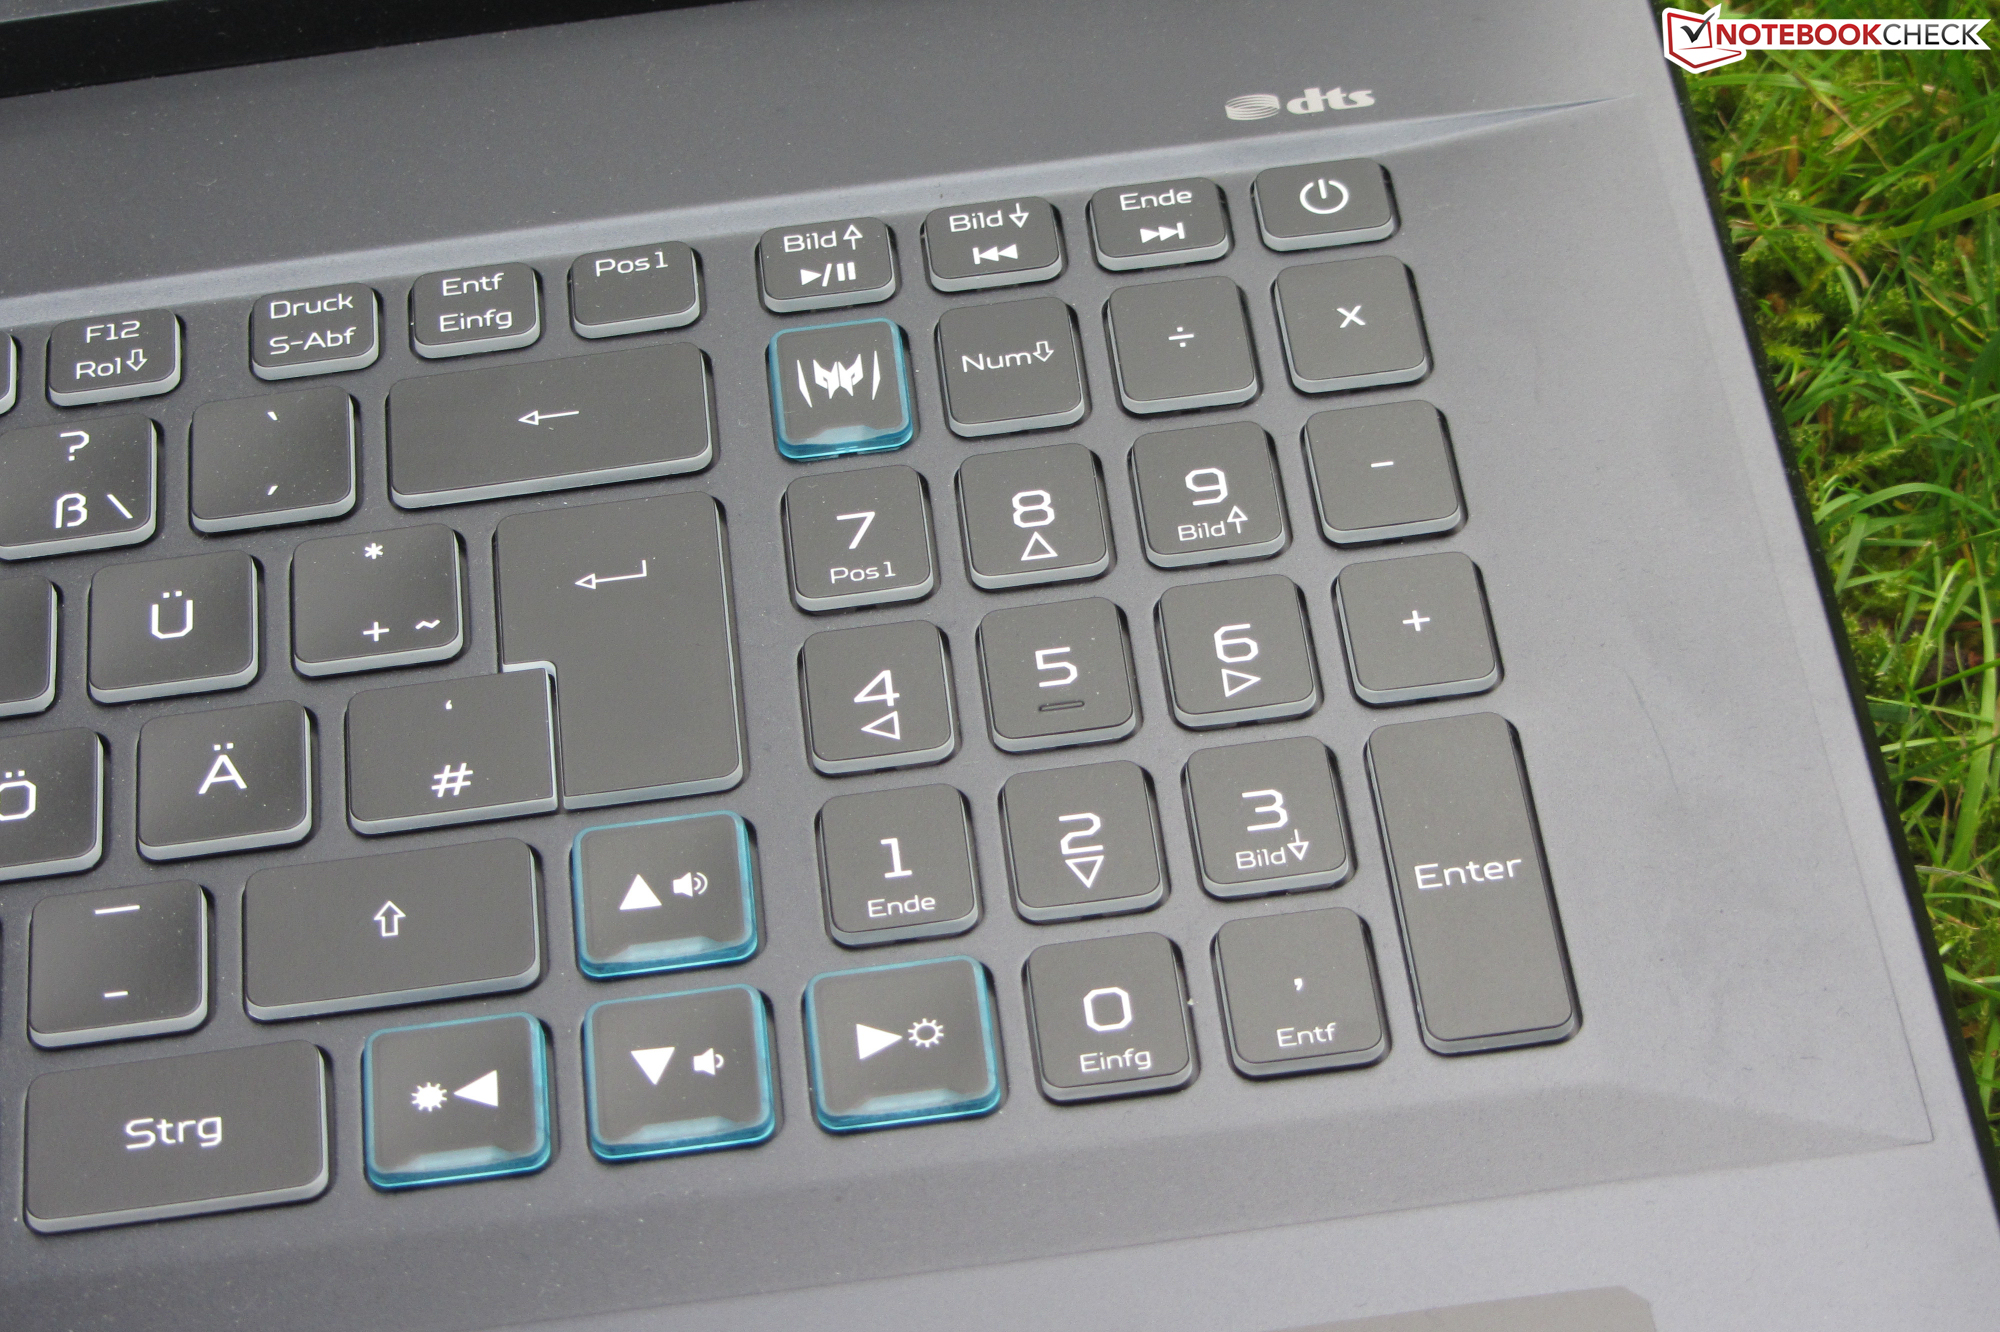
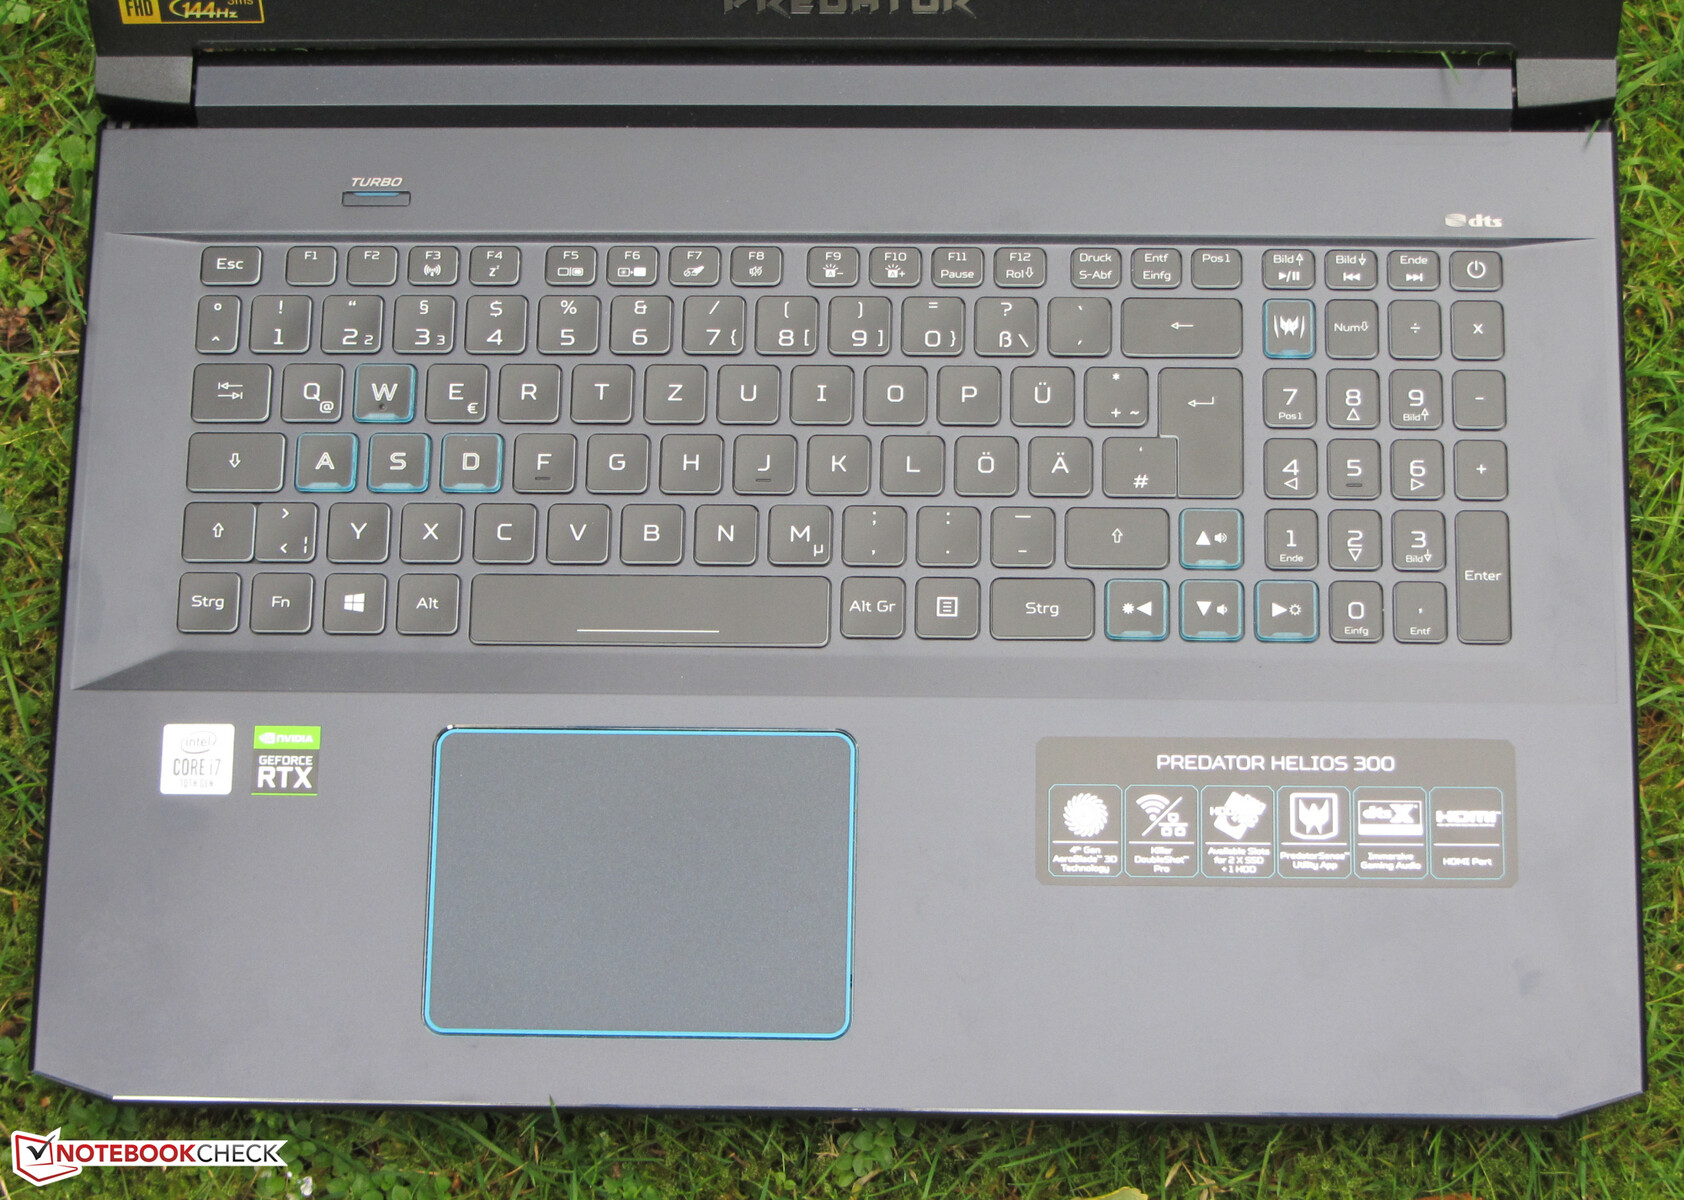
Input Devices - The keyboard offers an RGB backlight
Keyboard
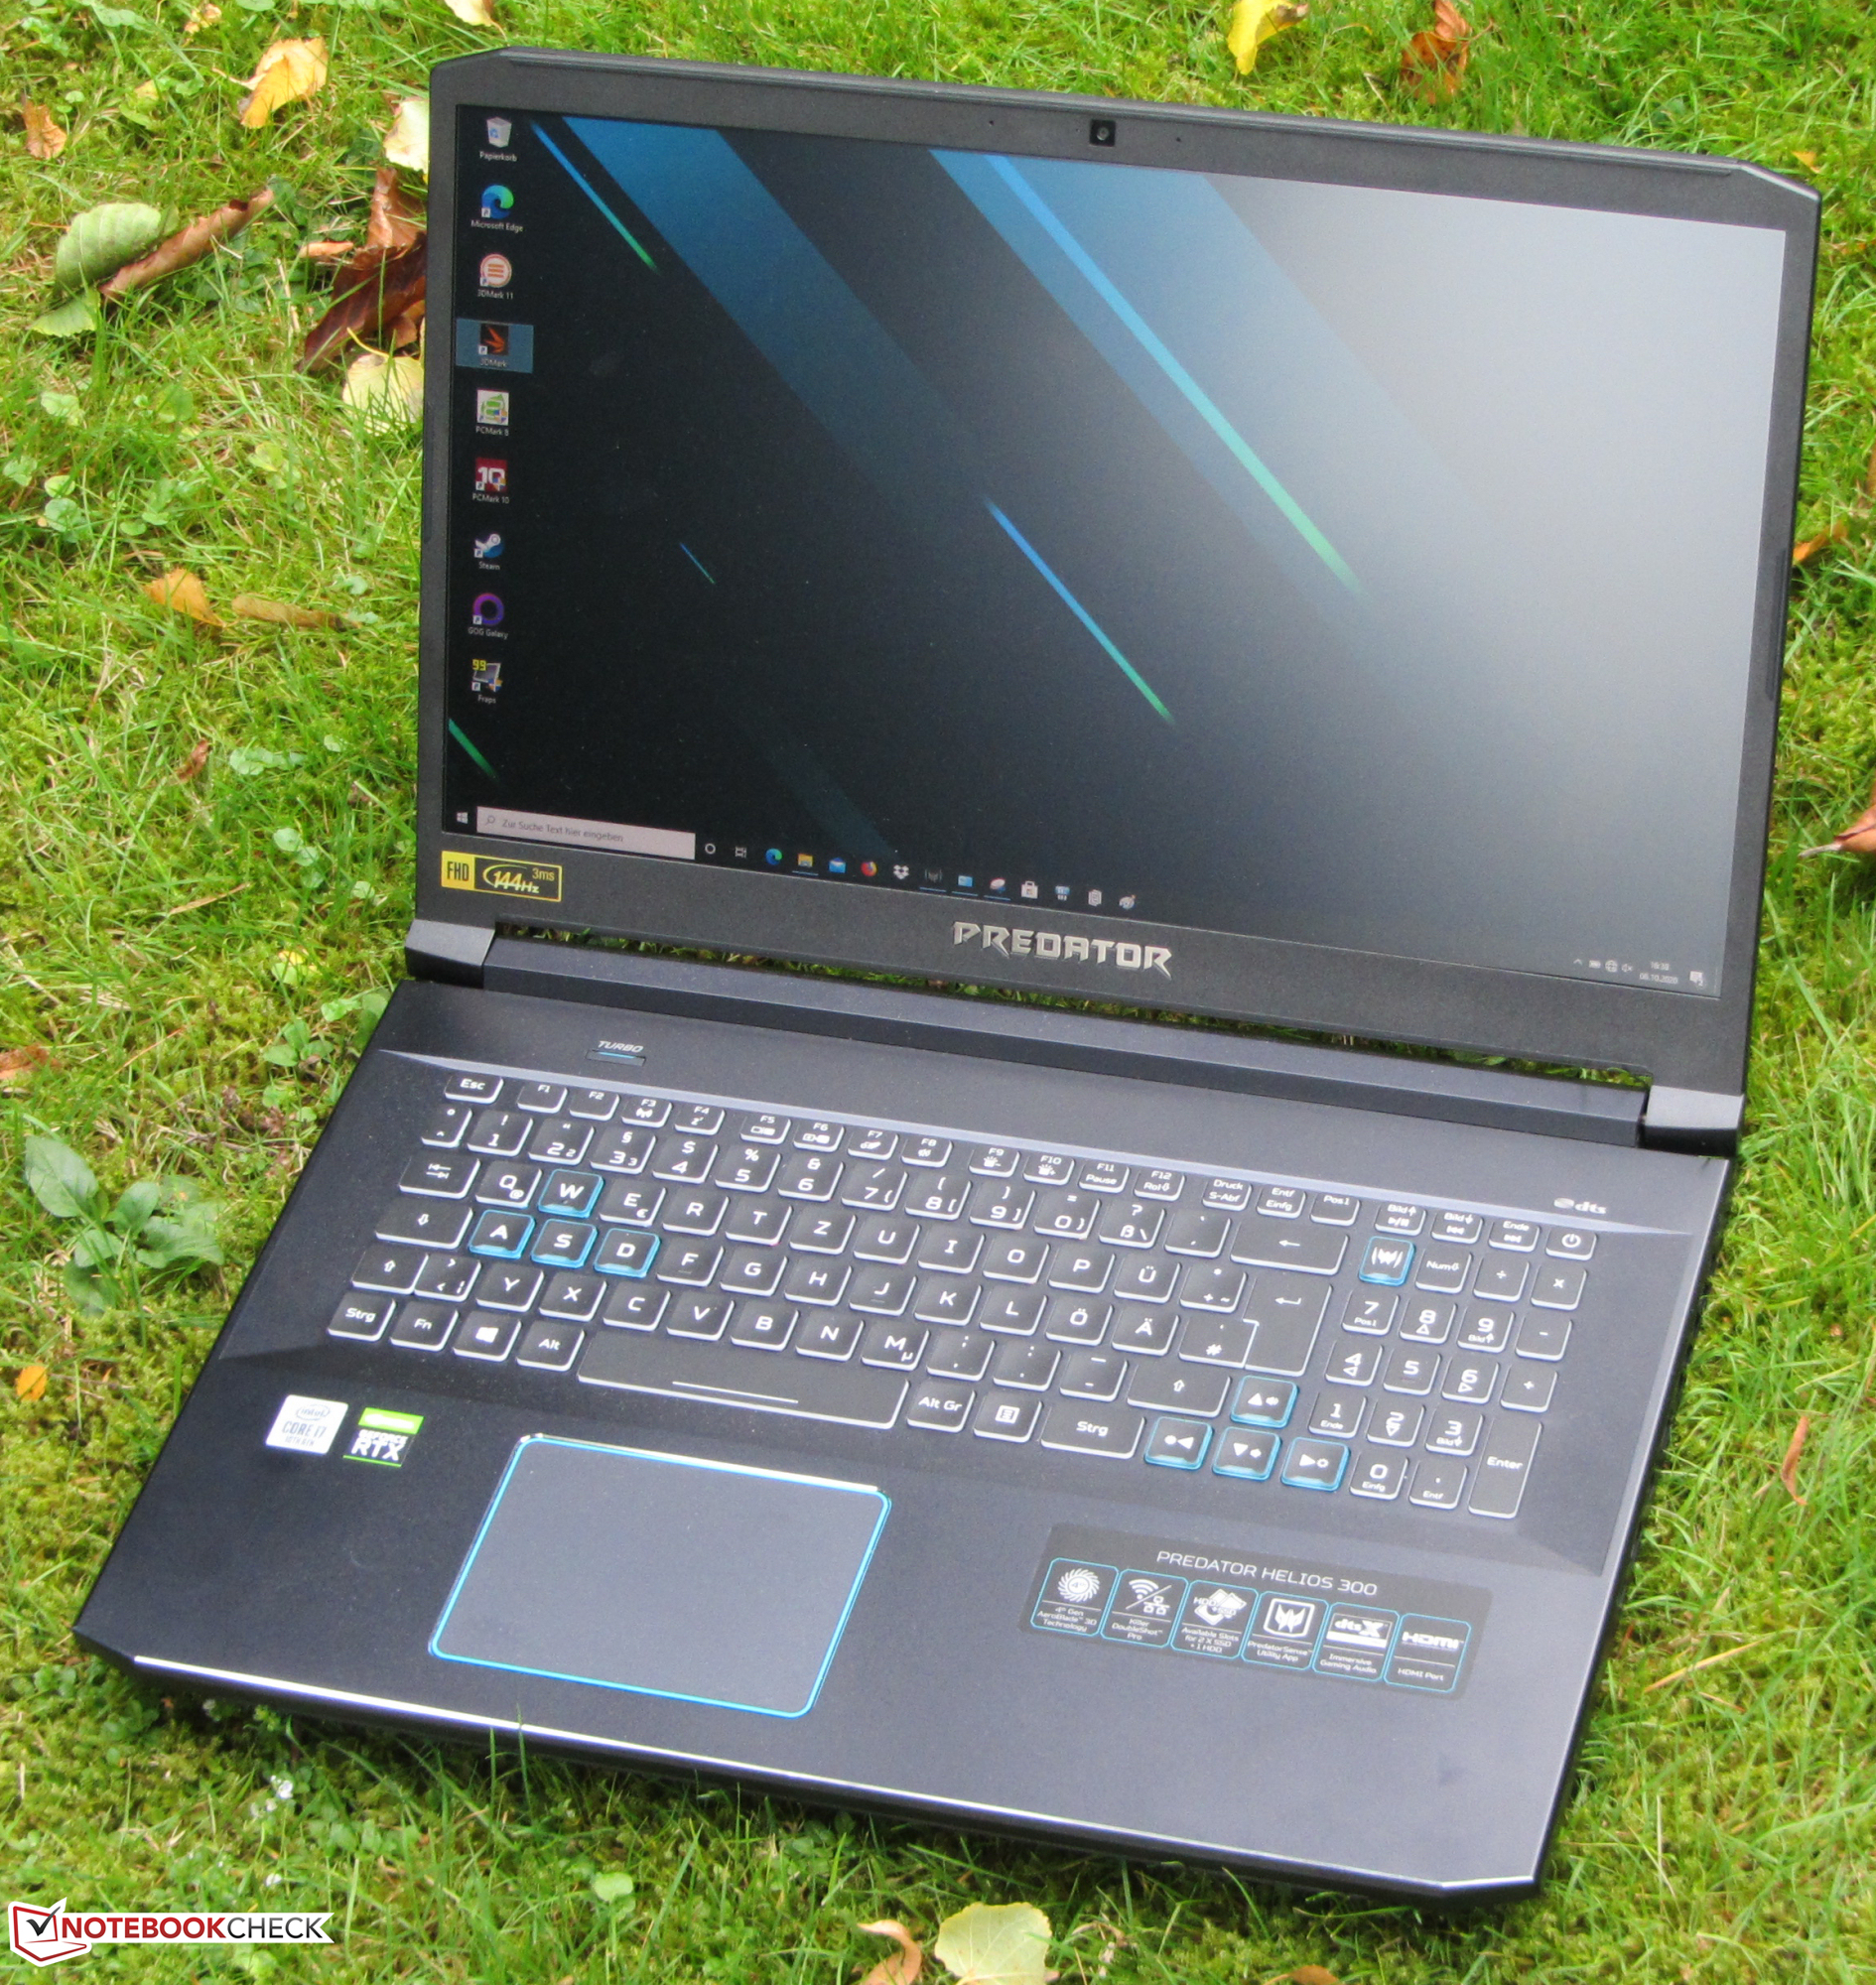
The 17.3-inch device features a backlit chiclet-style keyboard with a numeric pad. While the main keys have slight concave indentations, the function and numeric keys are flat. The actuation point is clear and the travel distance is on a normal level. The key resistance is just right. The keyboard deck does not exhibit any flex when typing. All in all, the Helios 300 has a good keyboard.
Touchpad
The multitouch-enabled ClickPad occupies an area of 10.6 x 7.8 cm (4.2 x 3 in). Therefore, there is enough space for the use of gesture controls. The corners of the touchpad register inputs well. The smooth surface of the pad makes finger-gliding easy. The touchpad offers a short travel distance and a clear actuation point.
The touchpad of our review device rattles. This could be an issue with a spring or the touchpad could have been incorrectly installed. Prospective buyers should check out the touchpad for themselves before making any purchasing decision.
Display - 144-Hz IPS panel
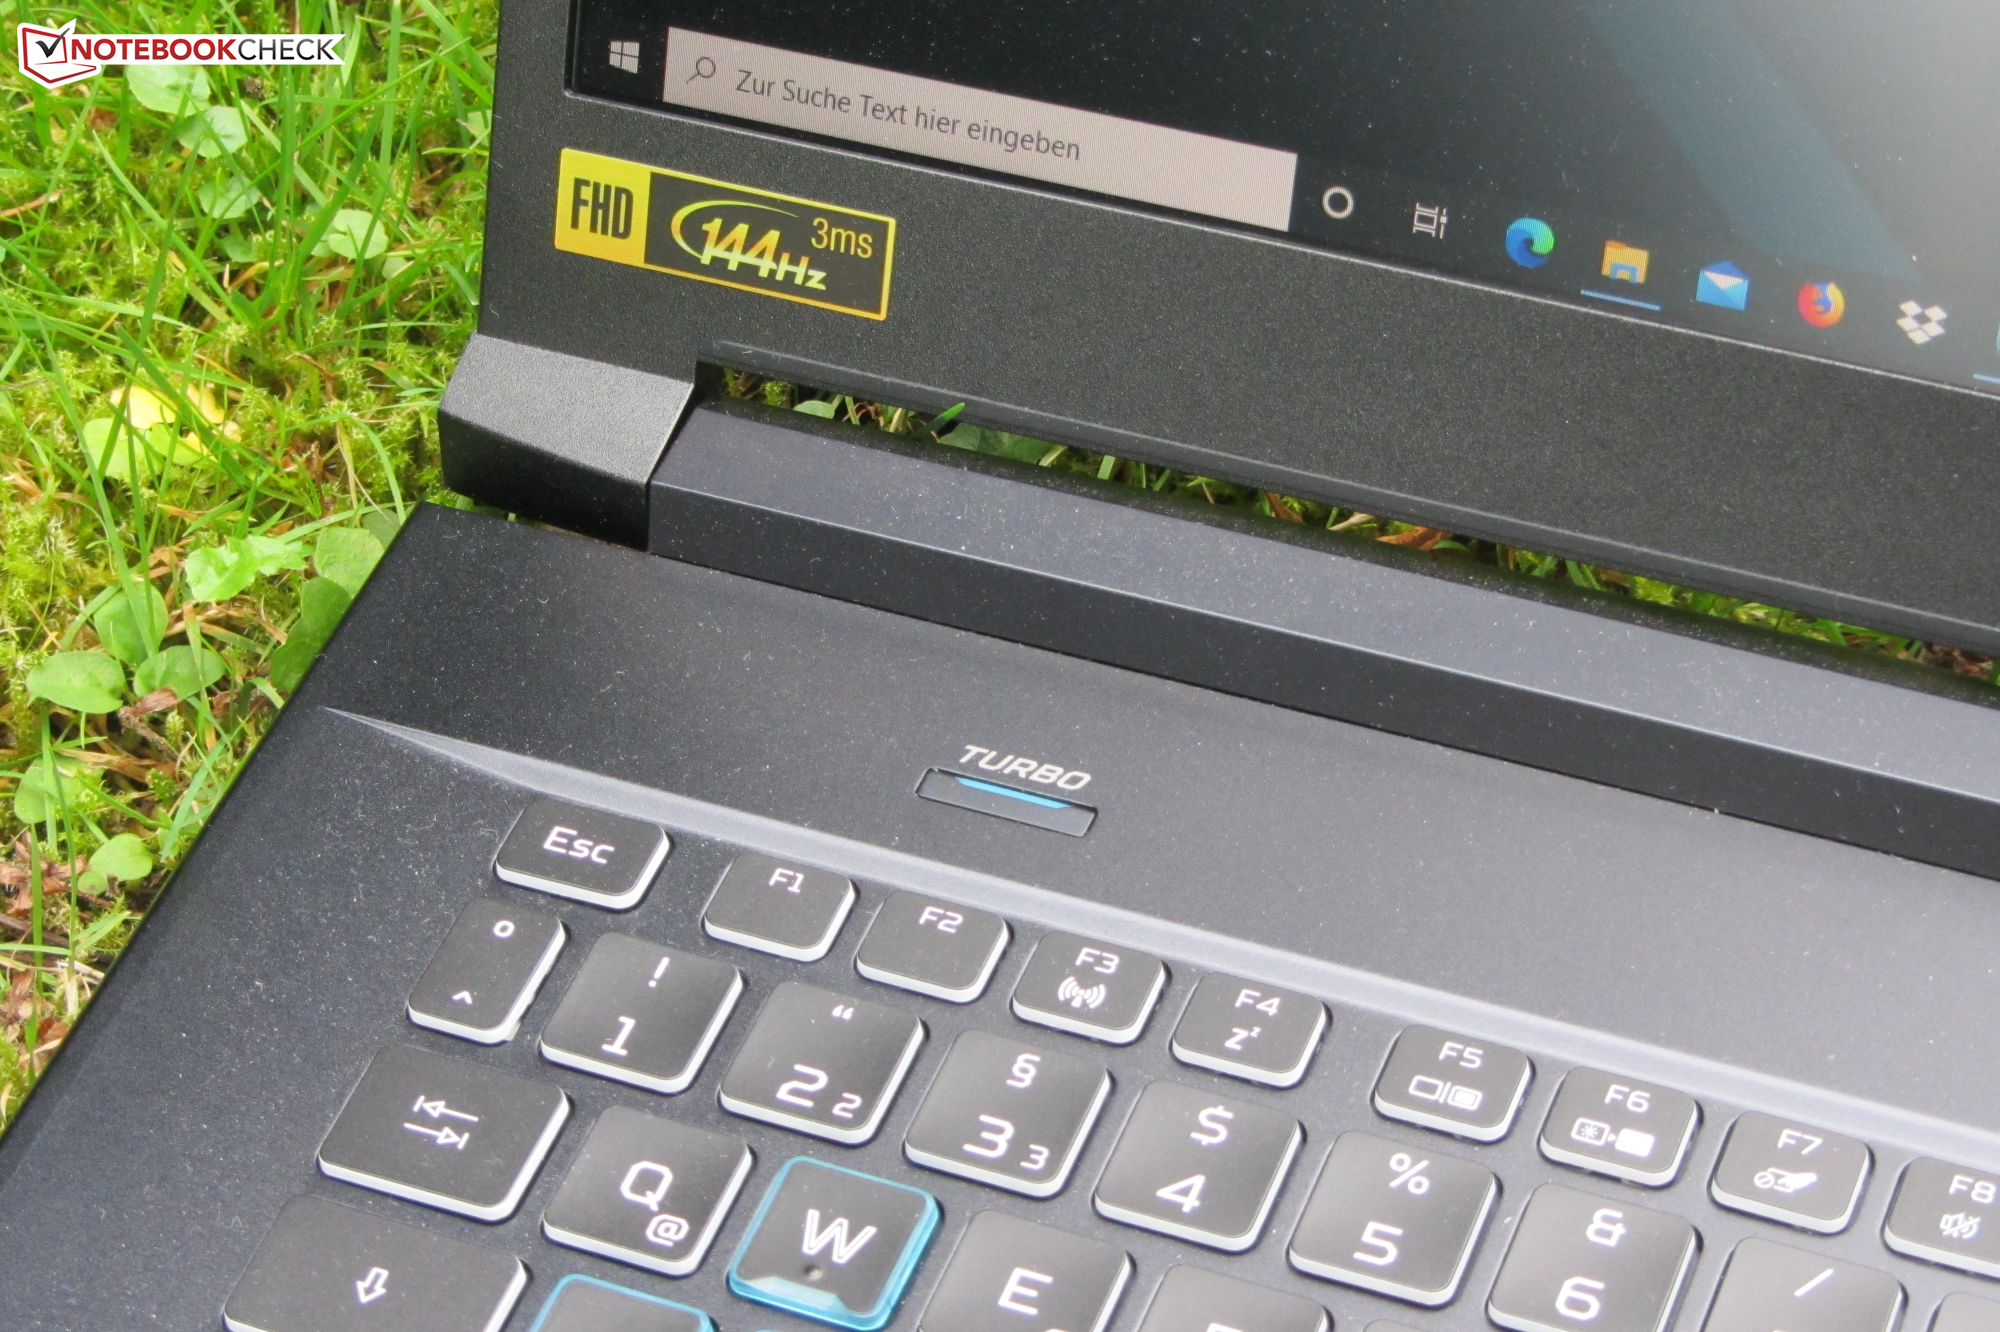
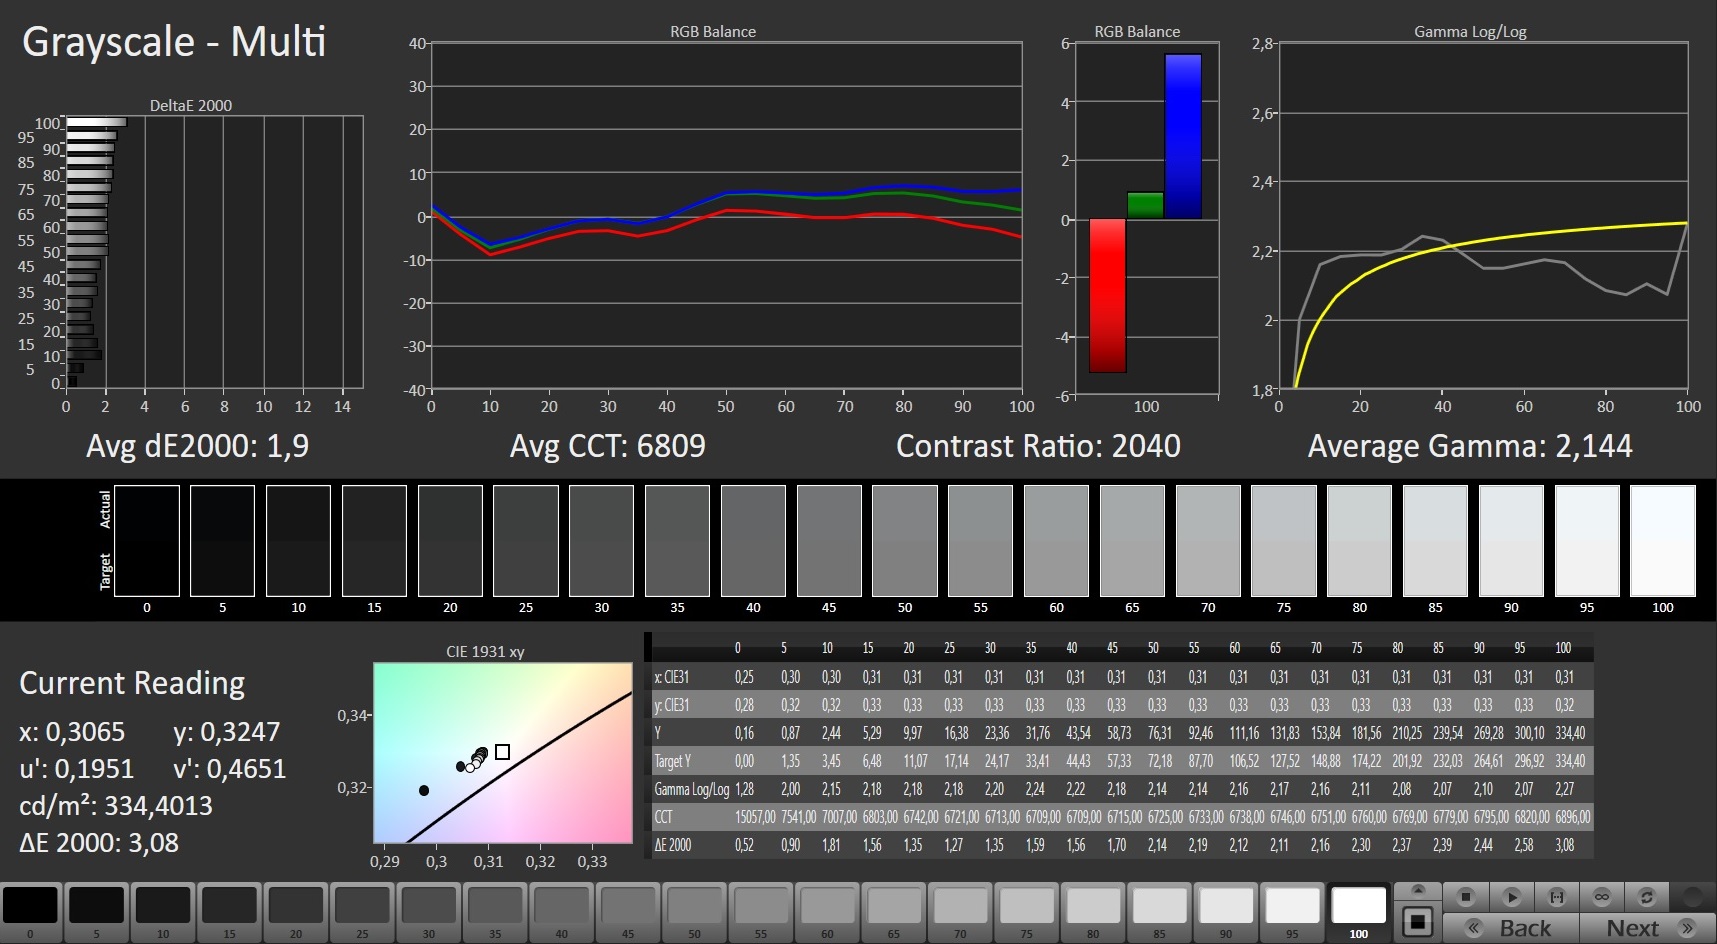
The matte 17.3-inch display of the PH317 has a native resolution of 1920x1080. Both the contrast ratio (1789:1) and the brightness (308 cd/m2) are on a good level. The 144-Hz panel offers fast response times.
Unfortunately, at 19% brightness and below, the screen exhibits PWM flickering with a frequency of 24,510 Hz. However, because the frequency is so high, susceptible individuals should not experience headaches and/or eye-strain when using the device.
| |||||||||||||||||||||||||
Brightness Distribution: 92 %
Center on Battery: 322 cd/m²
Contrast: 1789:1 (Black: 0.18 cd/m²)
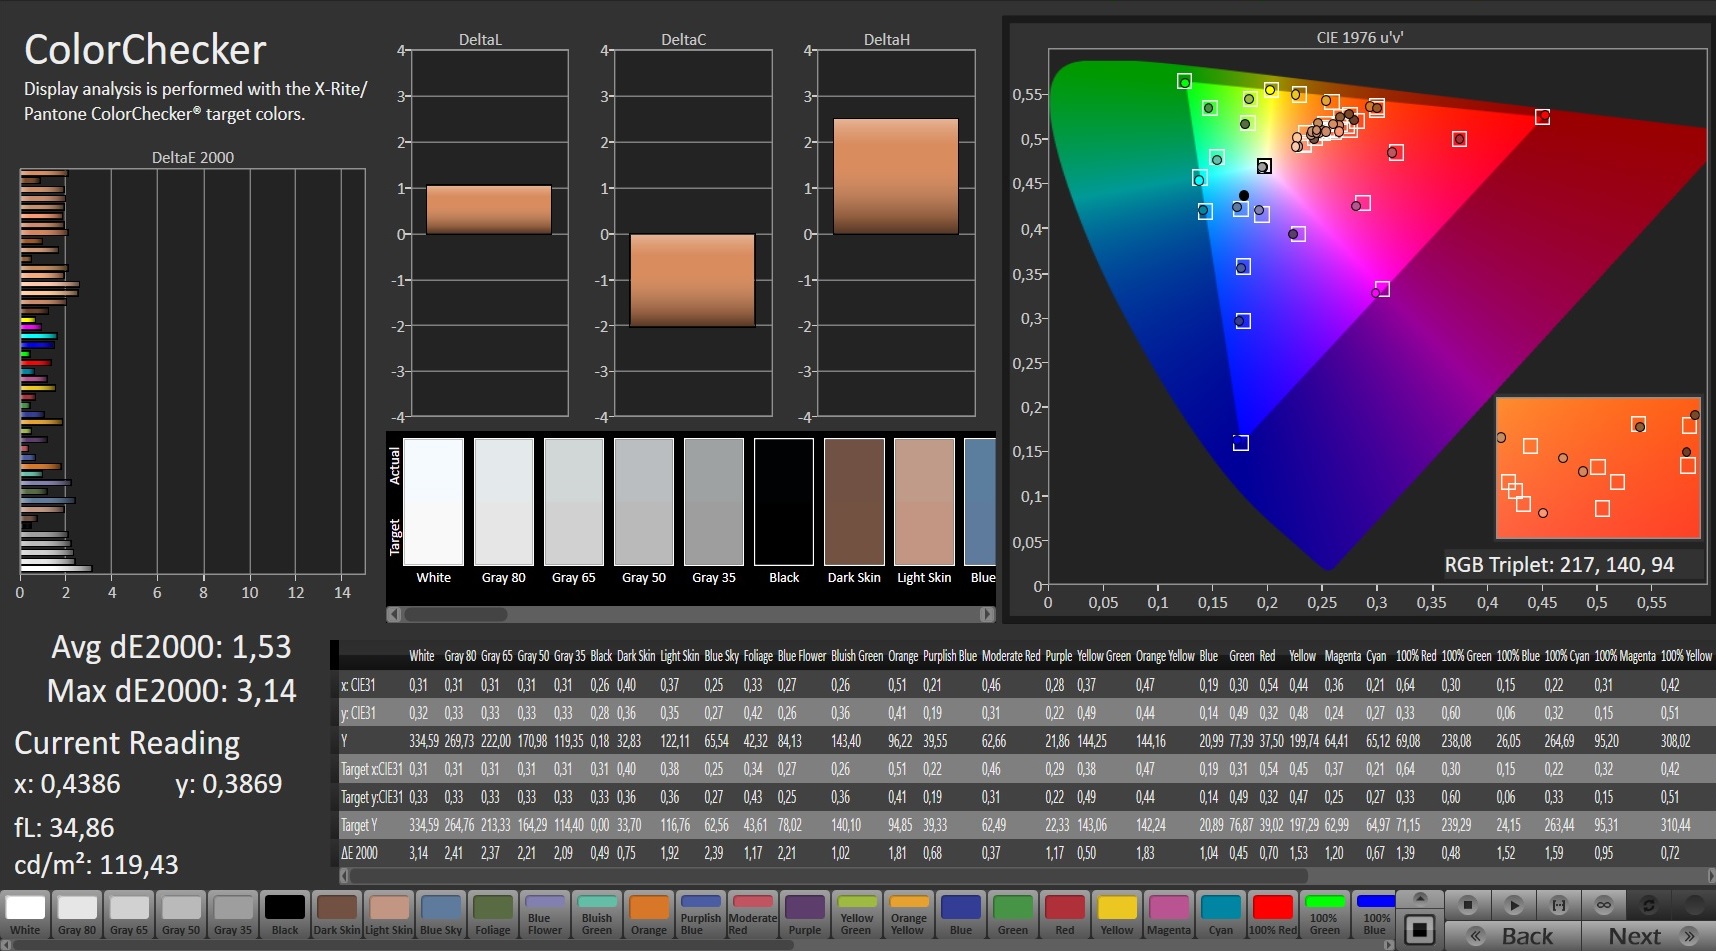
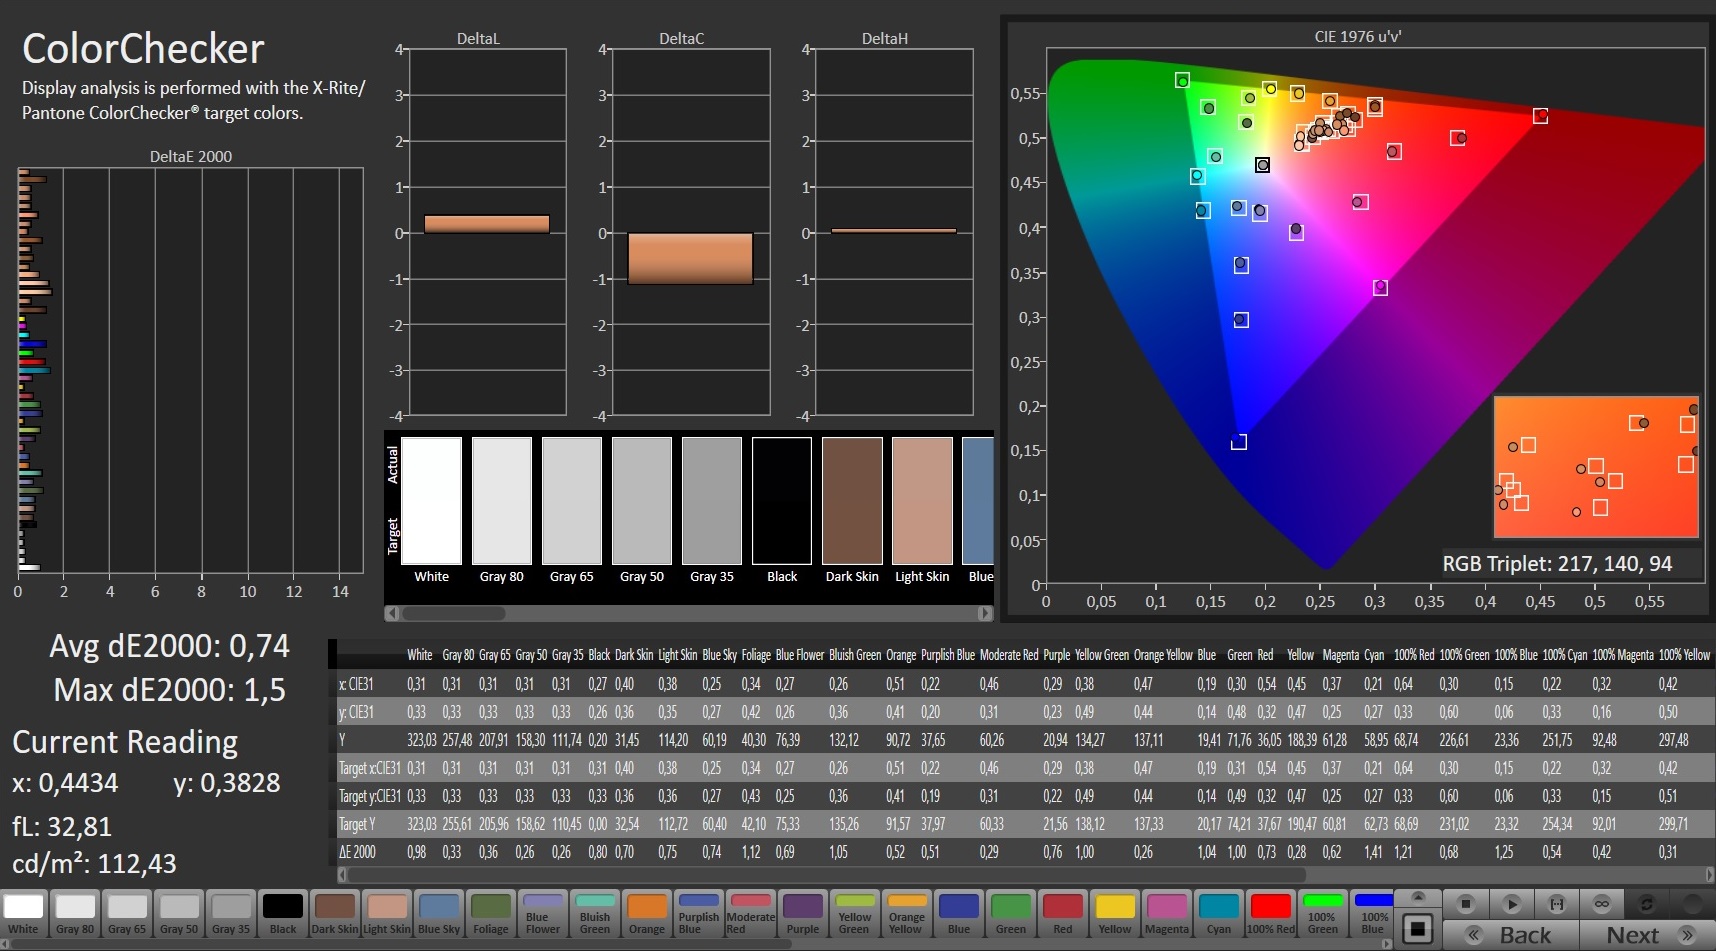
ΔE ColorChecker Calman: 1.53 | ∀{0.5-29.43 Ø4.73}
calibrated: 0.74
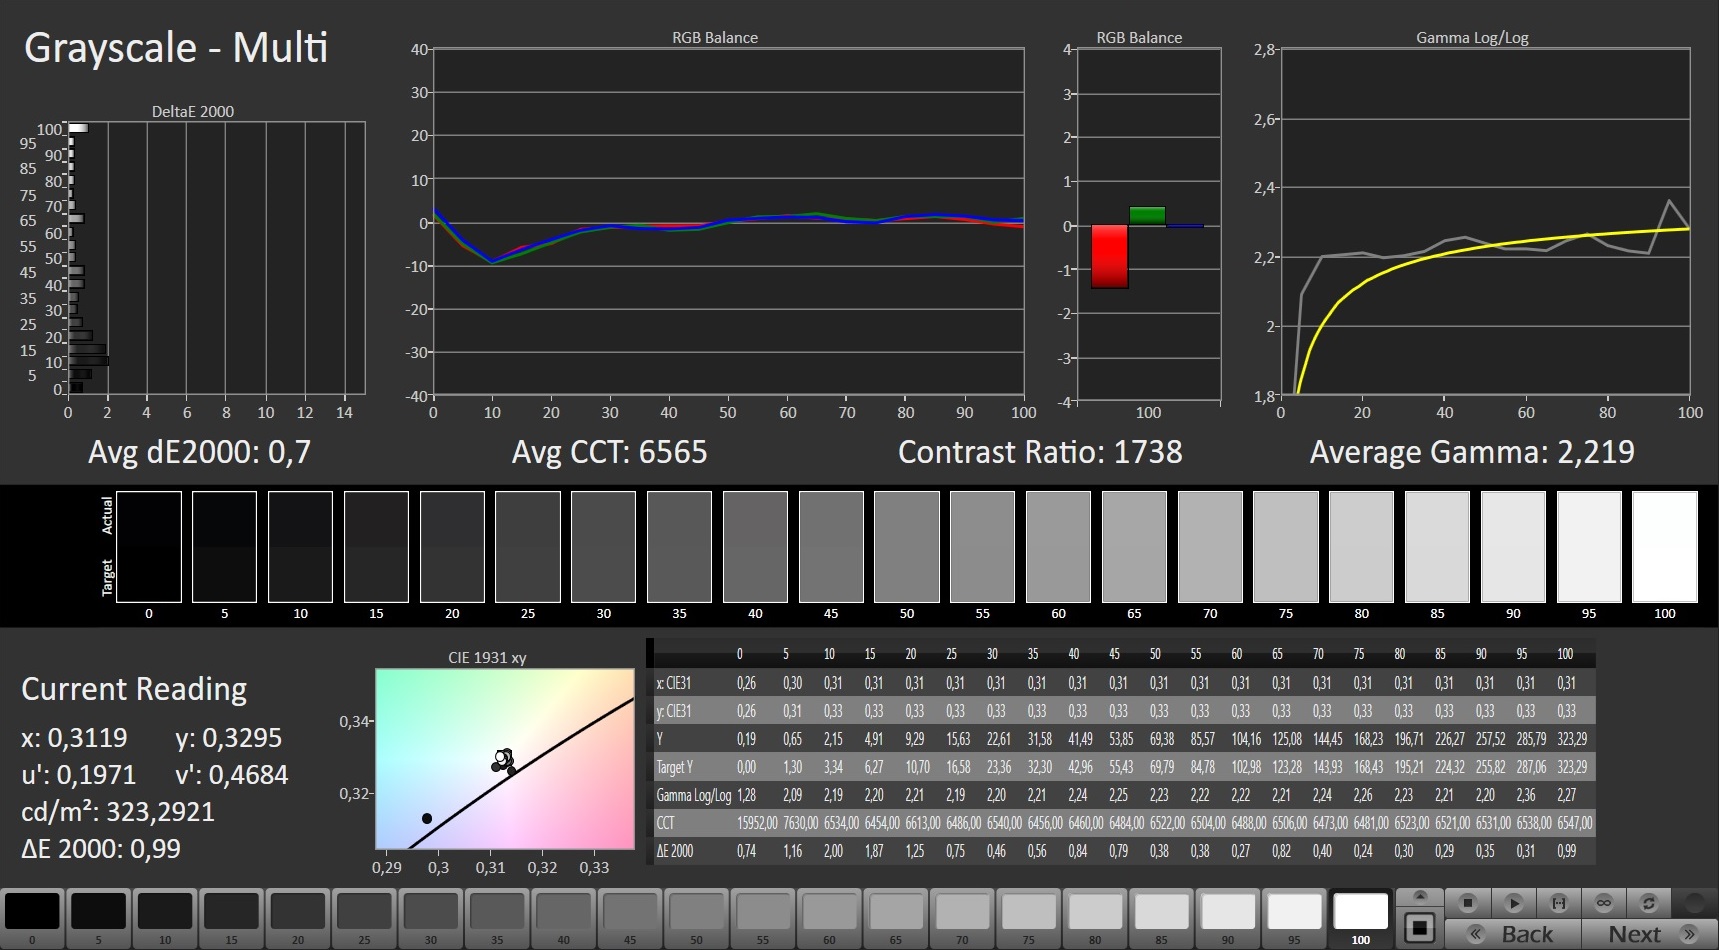
ΔE Greyscale Calman: 1.9 | ∀{0.09-98 Ø4.97}
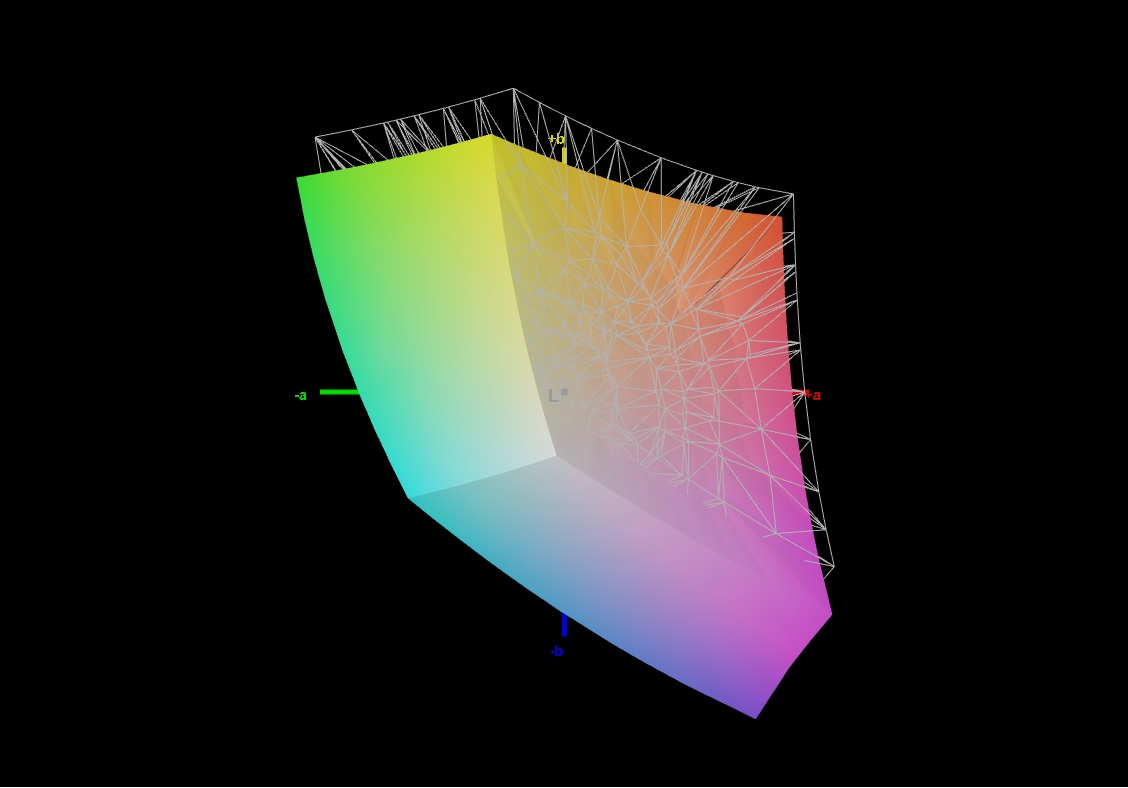
87% sRGB (Argyll 1.6.3 3D)
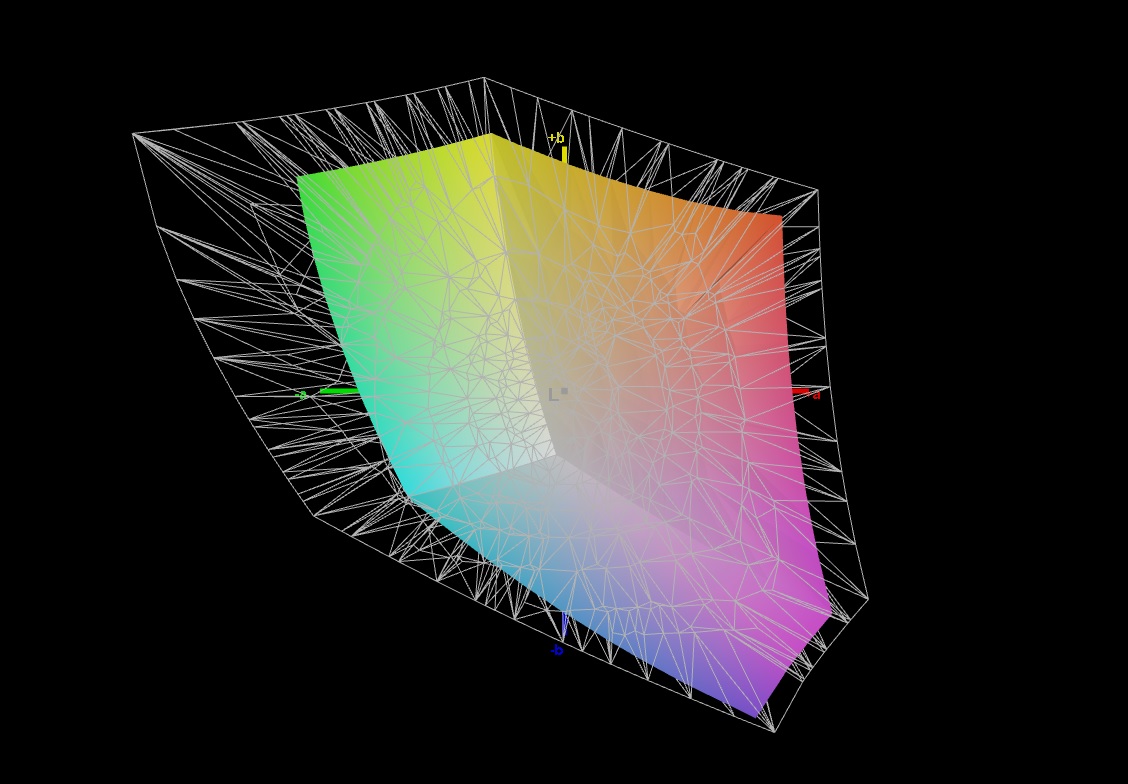
65% AdobeRGB 1998 (Argyll 1.6.3 3D)
64.7% AdobeRGB 1998 (Argyll 3D)
94.3% sRGB (Argyll 3D)
62.6% Display P3 (Argyll 3D)
Gamma: 2.144
CCT: 6809 K
| Acer Predator Helios 300 PH317-54-75G8 Chi Mei N173HCE-G33, IPS, 1920x1080, 17.3" | Nexoc GH7 716IG LG Philips LGD0615, IPS, 1920x1080, 17.3" | Aorus 7 KB LG Philips LP173WFG-SPB1, IPS, 1920x1080, 17.3" | MSI GE75 Raider 10SE-008US Chi Mei N173HCE-G33, IPS, 1920x1080, 17.3" | MSI Bravo 17 A4DDR AU Optronics B173HAN04.7 (AUO479D), IPS, 1920x1080, 17.3" | Asus TUF A17 FA706IU-AS76 BOE NV173FHM-NX1, IPS, 1920x1080, 17.3" | Lenovo Legion Y740-17IRH LG Philips LP173WFG-SPD2 (LGD05E0), IPS, 1920x1080, 17.3" | |
|---|---|---|---|---|---|---|---|
| Display | 2% | 2% | 5% | -35% | -36% | 3% | |
| Display P3 Coverage (%) | 62.6 | 64.6 3% | 64.7 3% | 65.6 5% | 40.54 -35% | 40.55 -35% | 64.8 4% |
| sRGB Coverage (%) | 94.3 | 95.8 2% | 95.6 1% | 98.1 4% | 60.1 -36% | 59.7 -37% | 96 2% |
| AdobeRGB 1998 Coverage (%) | 64.7 | 65.7 2% | 65.7 2% | 67.8 5% | 41.88 -35% | 41.89 -35% | 65.8 2% |
| Response Times | 14% | 14% | 39% | -159% | -58% | 3% | |
| Response Time Grey 50% / Grey 80% * (ms) | 16.4 ? | 15.2 ? 7% | 13.6 ? 17% | 6.8 ? 59% | 40 ? -144% | 22.4 ? -37% | 14.8 ? 10% |
| Response Time Black / White * (ms) | 10.8 ? | 8.6 ? 20% | 9.6 ? 11% | 8.8 ? 19% | 29.6 ? -174% | 19.2 ? -78% | 11.2 ? -4% |
| PWM Frequency (Hz) | 24510 ? | 25000 ? | |||||
| Screen | -64% | -35% | -20% | -80% | -132% | -49% | |
| Brightness middle (cd/m²) | 322 | 303 -6% | 303 -6% | 337.9 5% | 264 -18% | 264.8 -18% | 282 -12% |
| Brightness (cd/m²) | 308 | 277 -10% | 278 -10% | 305 -1% | 244 -21% | 253 -18% | 261 -15% |
| Brightness Distribution (%) | 92 | 86 -7% | 87 -5% | 81 -12% | 88 -4% | 90 -2% | 87 -5% |
| Black Level * (cd/m²) | 0.18 | 0.25 -39% | 0.31 -72% | 0.29 -61% | 0.23 -28% | 0.31 -72% | 0.27 -50% |
| Contrast (:1) | 1789 | 1212 -32% | 977 -45% | 1165 -35% | 1148 -36% | 854 -52% | 1044 -42% |
| Colorchecker dE 2000 * | 1.53 | 4.15 -171% | 2.13 -39% | 2.18 -42% | 3.85 -152% | 4.73 -209% | 3.18 -108% |
| Colorchecker dE 2000 max. * | 3.14 | 10.52 -235% | 7.51 -139% | 3.9 -24% | 9.13 -191% | 18.89 -502% | 8.39 -167% |
| Colorchecker dE 2000 calibrated * | 0.74 | 0.9 -22% | 0.7 5% | 0.69 7% | 3.4 -359% | 4.64 -527% | 0.95 -28% |
| Greyscale dE 2000 * | 1.9 | 5.38 -183% | 3.4 -79% | 3.1 -63% | 1.95 -3% | 1.4 26% | 4.1 -116% |
| Gamma | 2.144 103% | 2.35 94% | 2.156 102% | 2.07 106% | 2.52 87% | 2.16 102% | 2.55 86% |
| CCT | 6809 95% | 7680 85% | 6850 95% | 6882 94% | 6371 102% | 6641 98% | 7260 90% |
| Color Space (Percent of AdobeRGB 1998) (%) | 65 | 61 -6% | 66 2% | 62 -5% | 42 -35% | 38.4 -41% | 61 -6% |
| Color Space (Percent of sRGB) (%) | 87 | 96 10% | 90 3% | 98.2 13% | 60 -31% | 59.3 -32% | 96 10% |
| Total Average (Program / Settings) | -16% /
-42% | -6% /
-22% | 8% /
-8% | -91% /
-81% | -75% /
-104% | -14% /
-33% |
* ... smaller is better
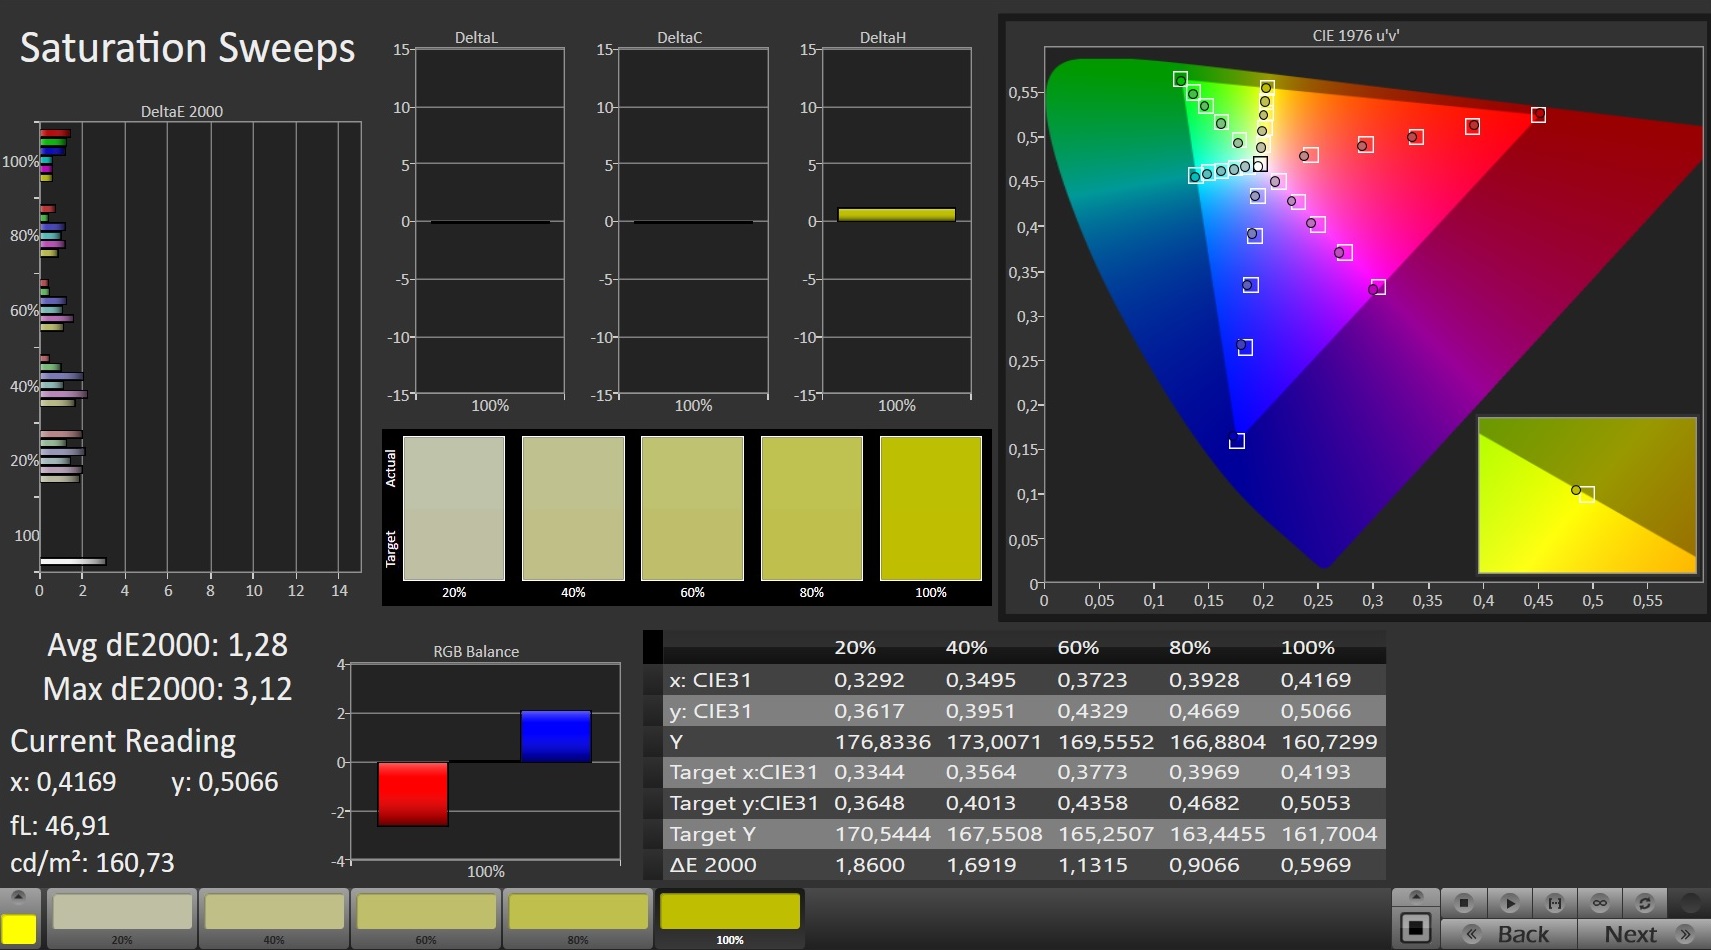
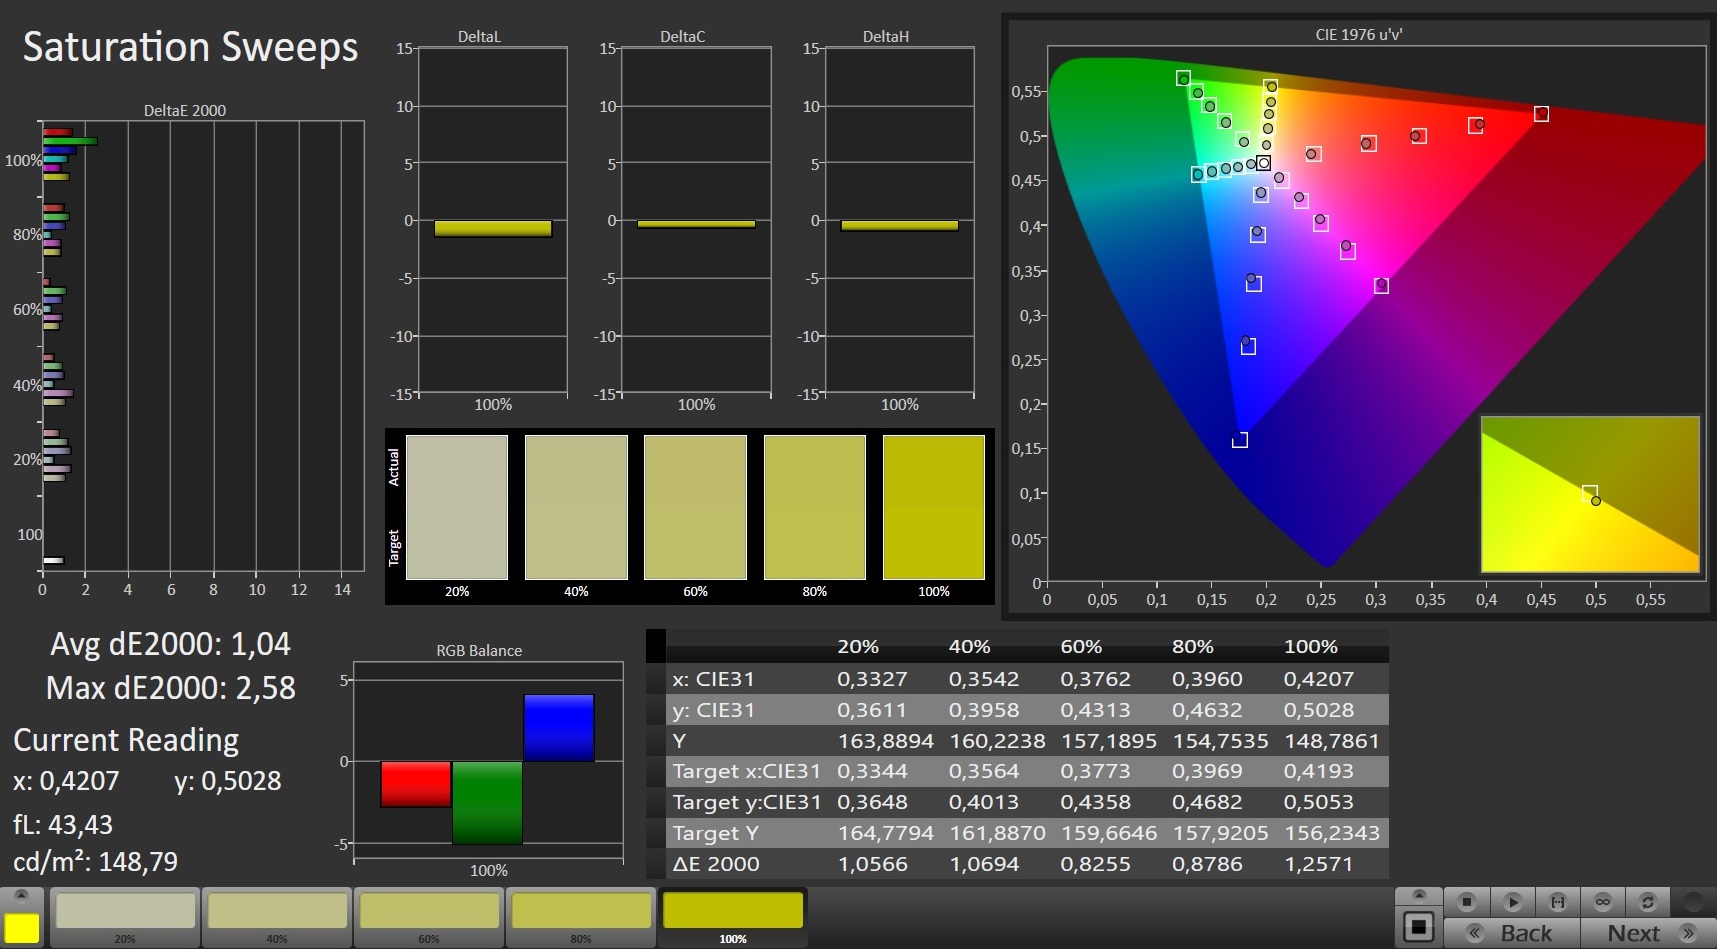
The display shines when it comes to colour accuracy. Right out of the box, we measured a DeltaE 2000 colour deviation of 1.53 (DeltaE less than 3 is the optimal value here). Moreover, the display does not suffer from a bluish cast. The display can cover only 87% of the sRGB colour space and 67% of the AdobeRGB colour space.
Display Response Times
| ↔ Response Time Black to White | ||
|---|---|---|
| 10.8 ms ... rise ↗ and fall ↘ combined | ↗ 5.6 ms rise | 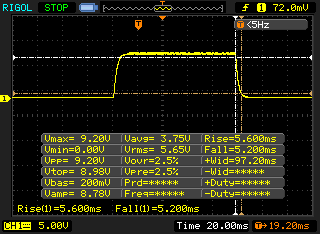 |
| ↘ 5.2 ms fall | ||
| The screen shows good response rates in our tests, but may be too slow for competitive gamers. In comparison, all tested devices range from 0.1 (minimum) to 240 (maximum) ms. » 29 % of all devices are better. This means that the measured response time is better than the average of all tested devices (19.9 ms). | ||
| ↔ Response Time 50% Grey to 80% Grey | ||
| 16.4 ms ... rise ↗ and fall ↘ combined | ↗ 8 ms rise | 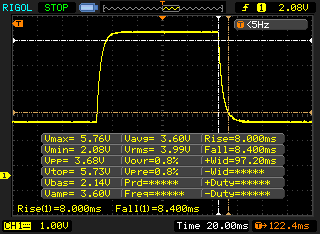 |
| ↘ 8.4 ms fall | ||
| The screen shows good response rates in our tests, but may be too slow for competitive gamers. In comparison, all tested devices range from 0.165 (minimum) to 636 (maximum) ms. » 30 % of all devices are better. This means that the measured response time is better than the average of all tested devices (31.1 ms). | ||
Screen Flickering / PWM (Pulse-Width Modulation)
| Screen flickering / PWM detected | 24510 Hz | ≤ 19 % brightness setting | 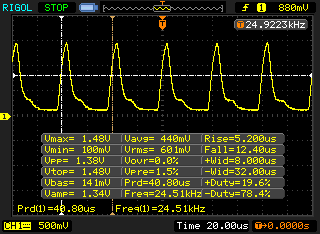 |
The display backlight flickers at 24510 Hz (worst case, e.g., utilizing PWM) Flickering detected at a brightness setting of 19 % and below. There should be no flickering or PWM above this brightness setting. The frequency of 24510 Hz is quite high, so most users sensitive to PWM should not notice any flickering. In comparison: 52 % of all tested devices do not use PWM to dim the display. If PWM was detected, an average of 7794 (minimum: 5 - maximum: 343500) Hz was measured. | |||
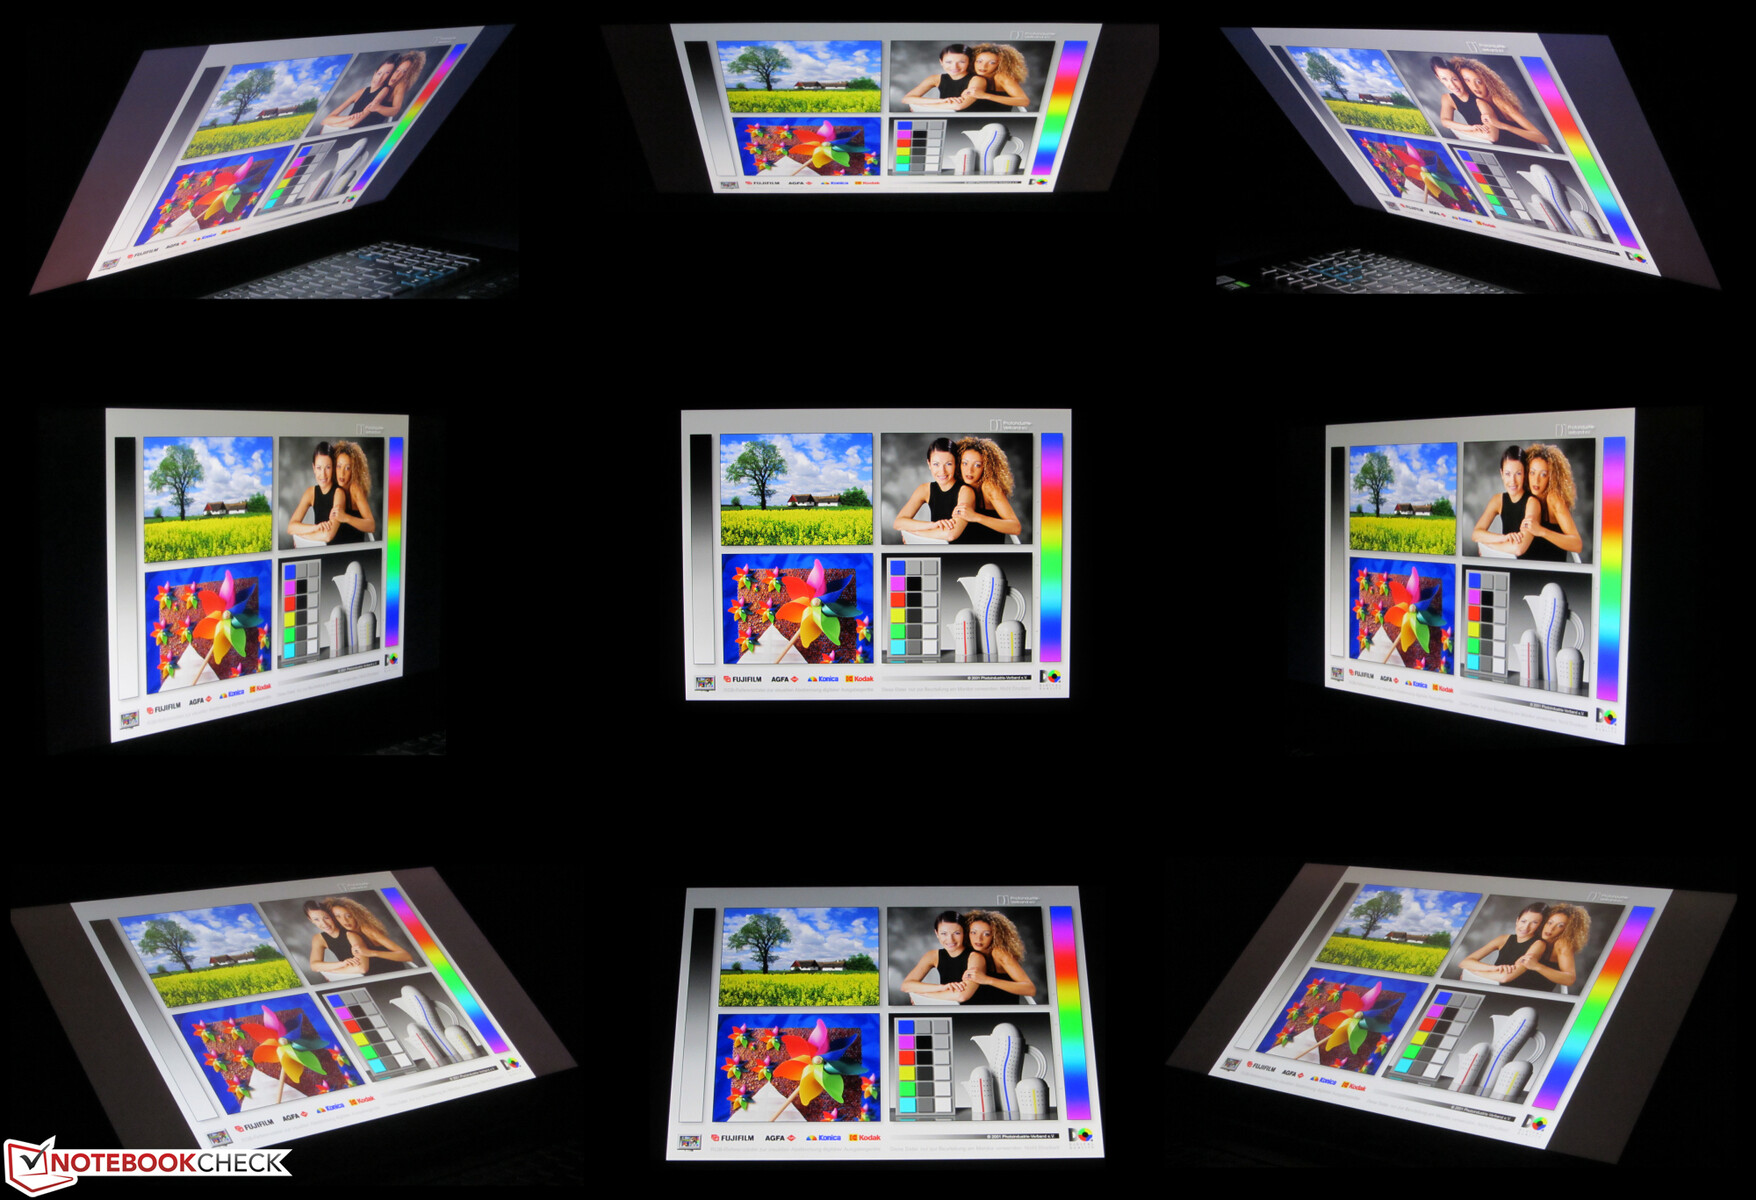
Our review device features an IPS panel with good viewing angles. Consequently, the display is legible from every position. Outdoors, the laptop can only be used when the sun does not shine too brightly.

Performance - Predator with GPU Turbo
The Predator Helios 300 from Acer is a 17.3-inch gaming laptop. It can run all current games smoothly. It can also handle all modern applications. Our hardware configuration retails for 1540 Euros (~$1814). Other hardware configurations are also available.
Review Settings
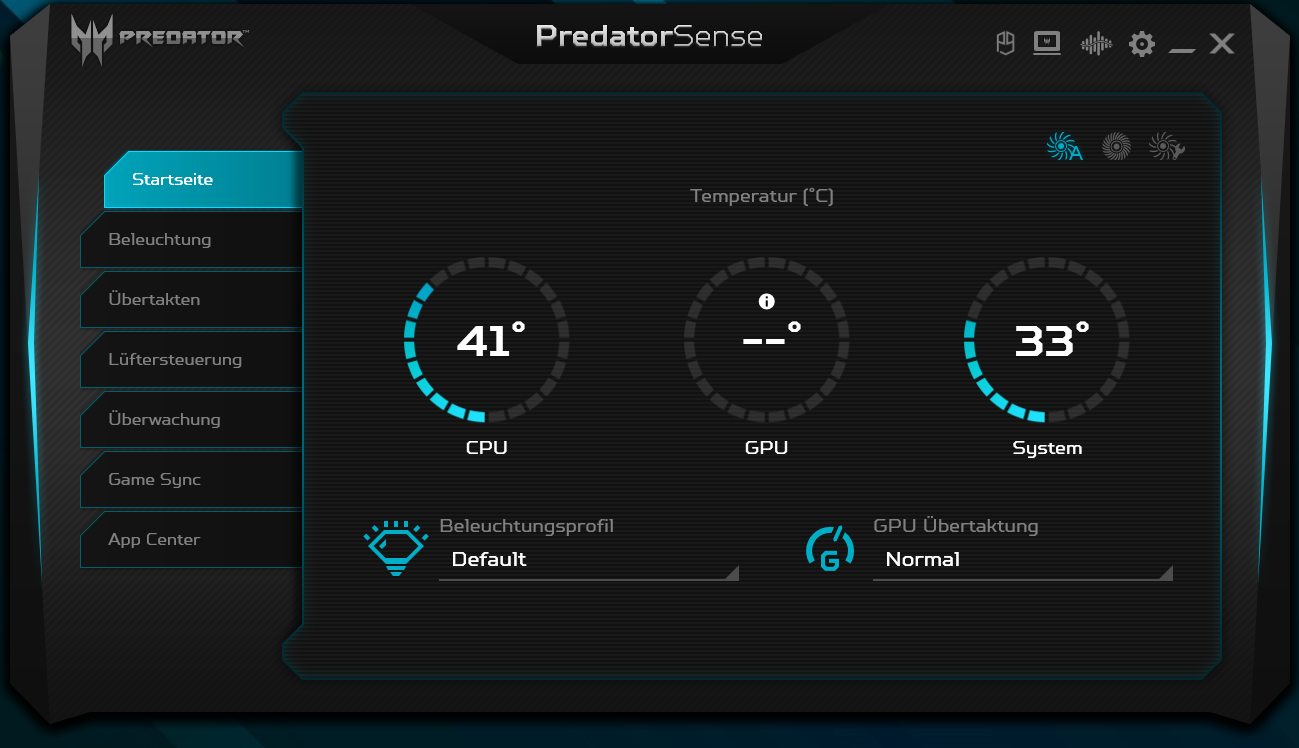
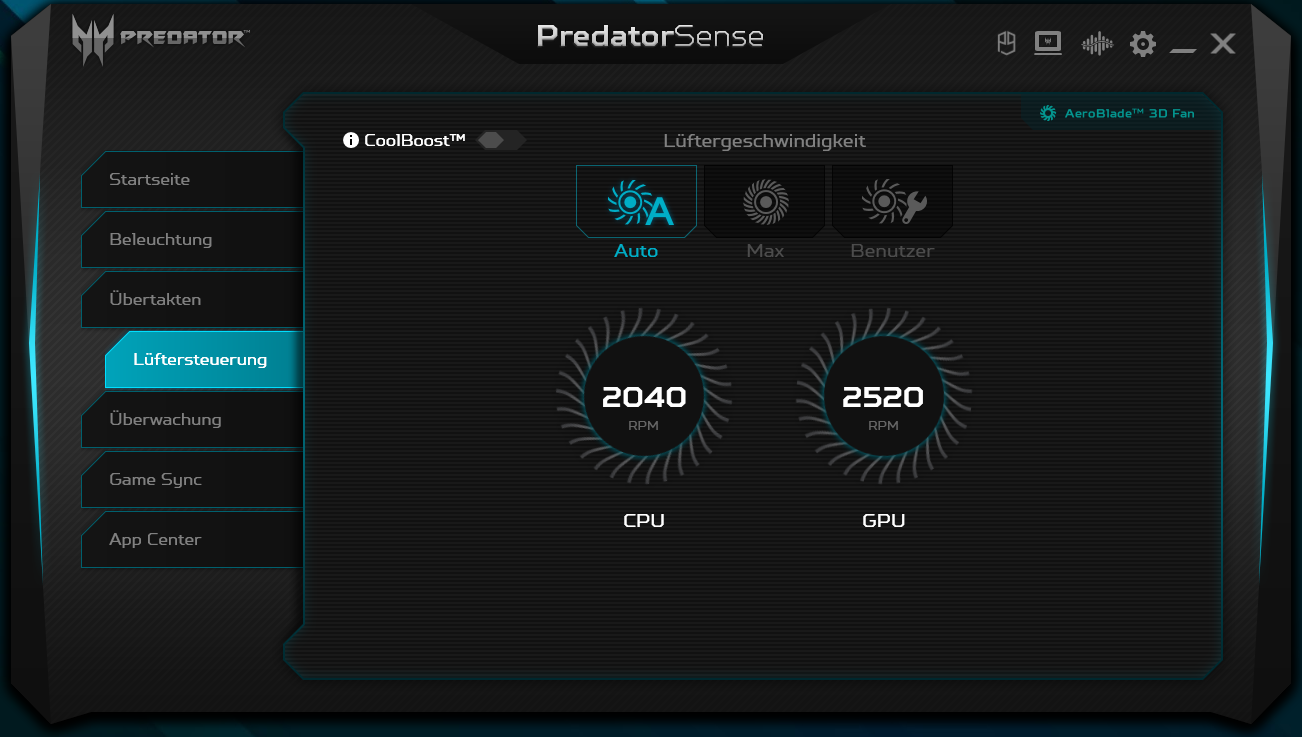
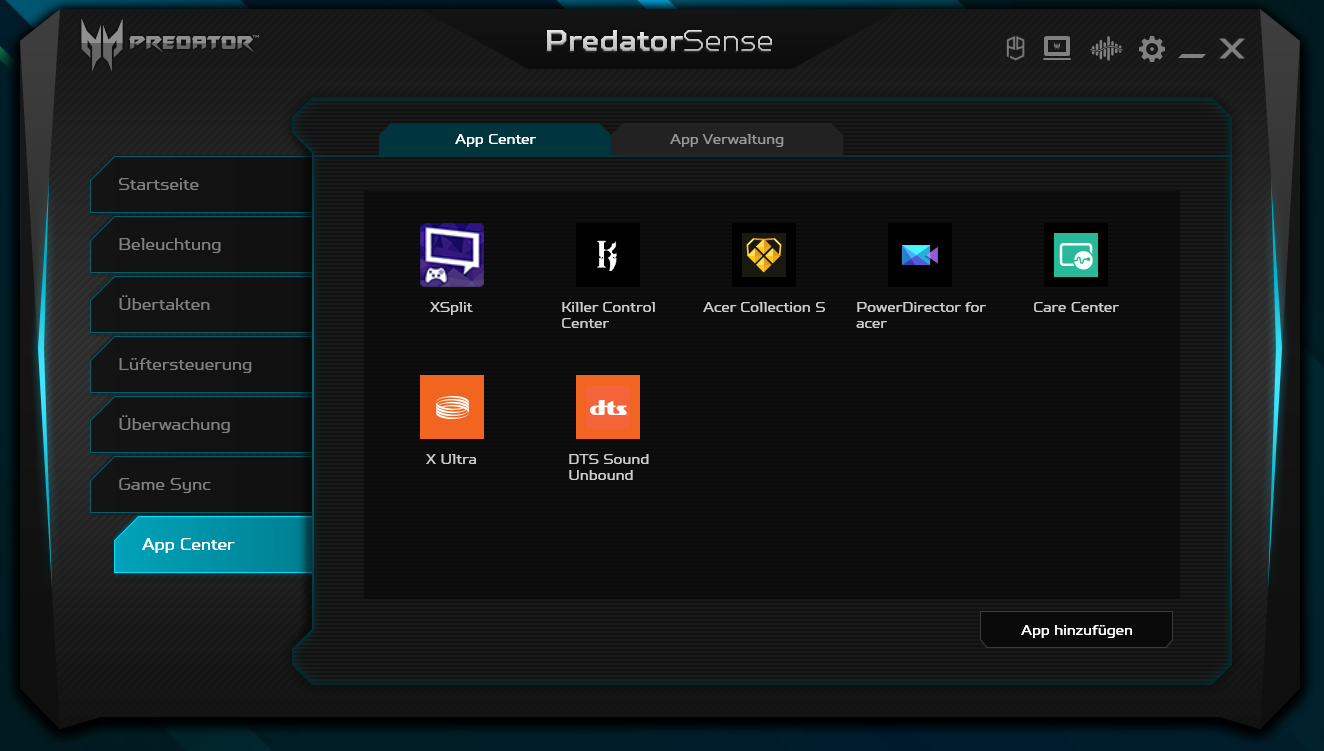
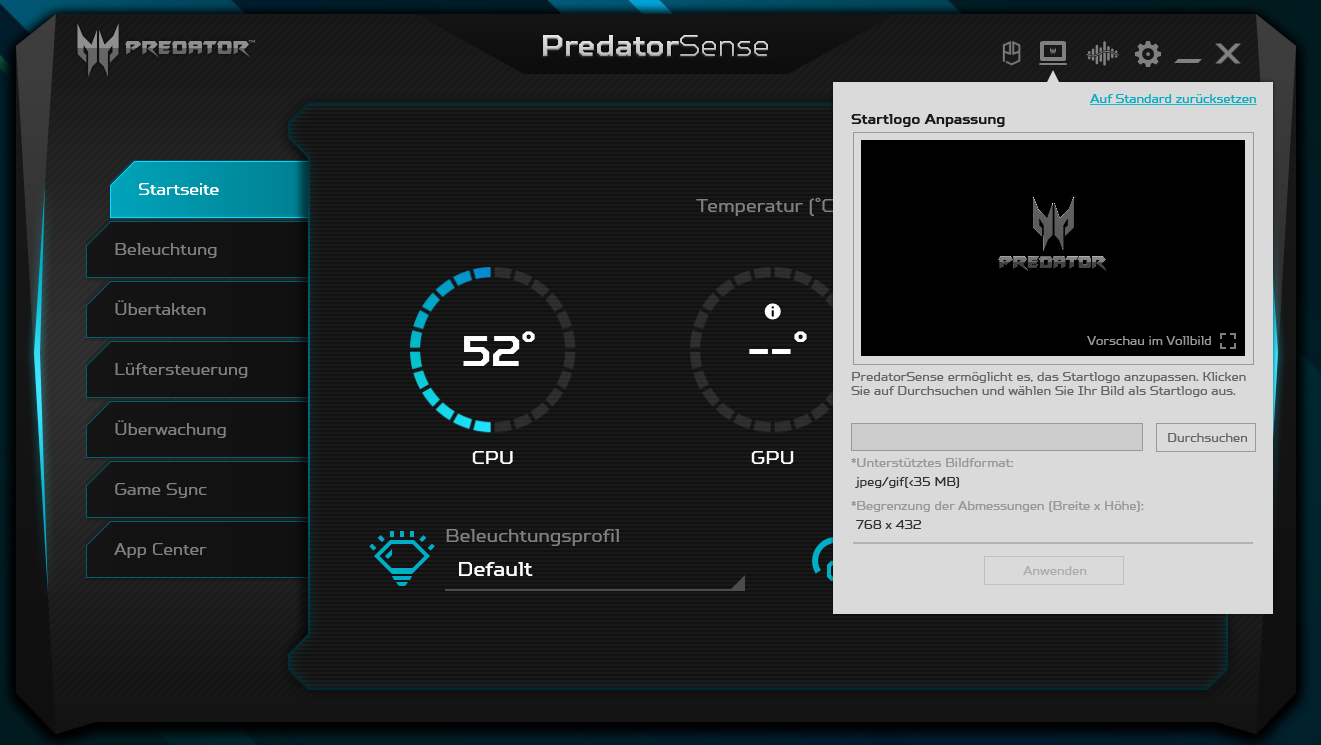
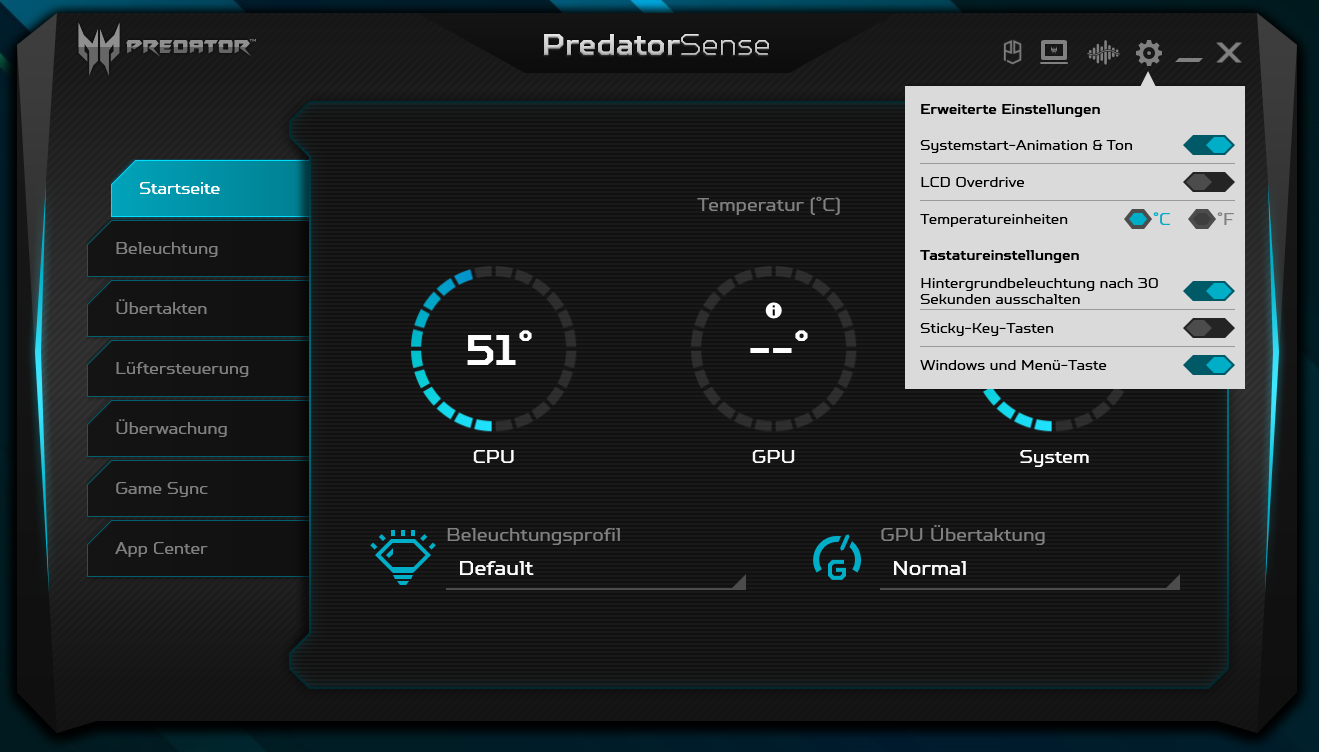
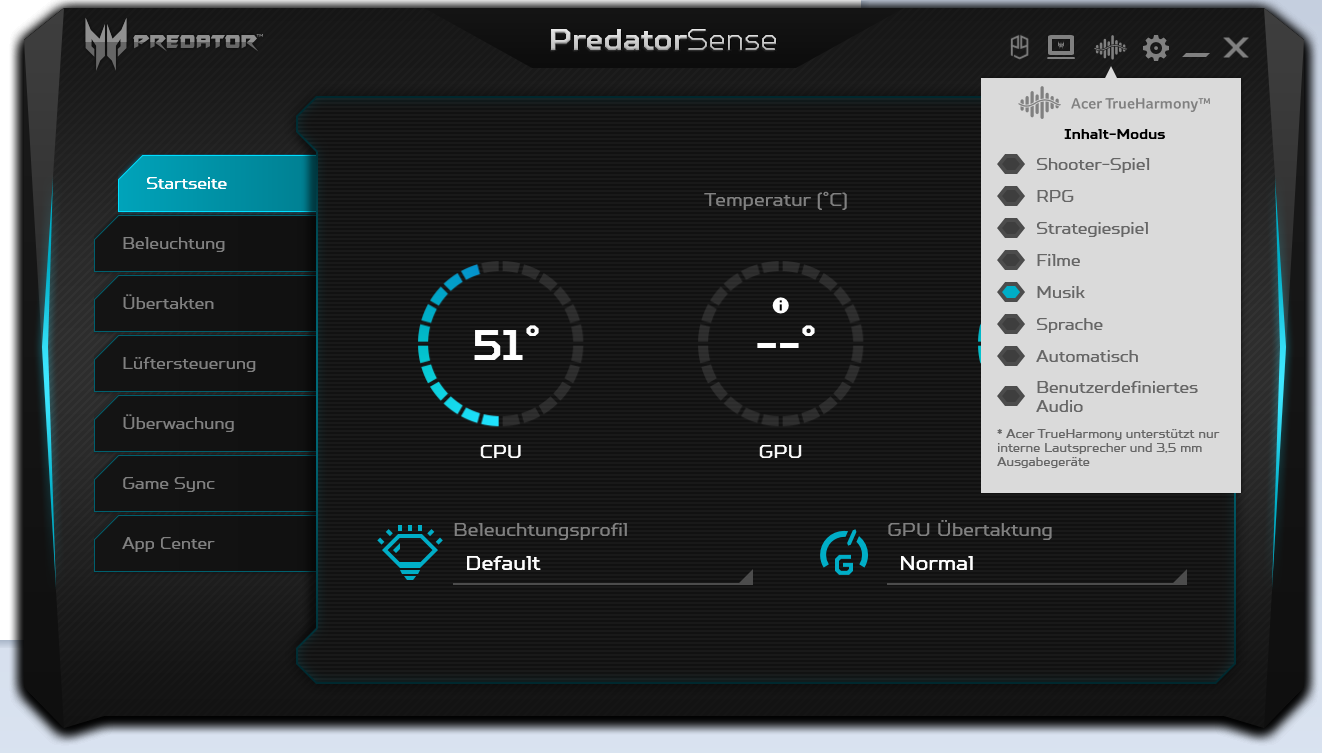
The preinstalled utility known as PredatorSense
allows users to adjust the fan curve or automatically overclock the GPU. It offers three profiles: Normal
, Fast
and Extreme
. We have conducted most of our benchmarks using the "Normal" profile. However, we have run some benchmarks with the "Extreme" profile as well.
There is a Turbo
button above the keyboard. If you press it, the fans will permanently spin at full speed and the Extreme
profile will be applied.

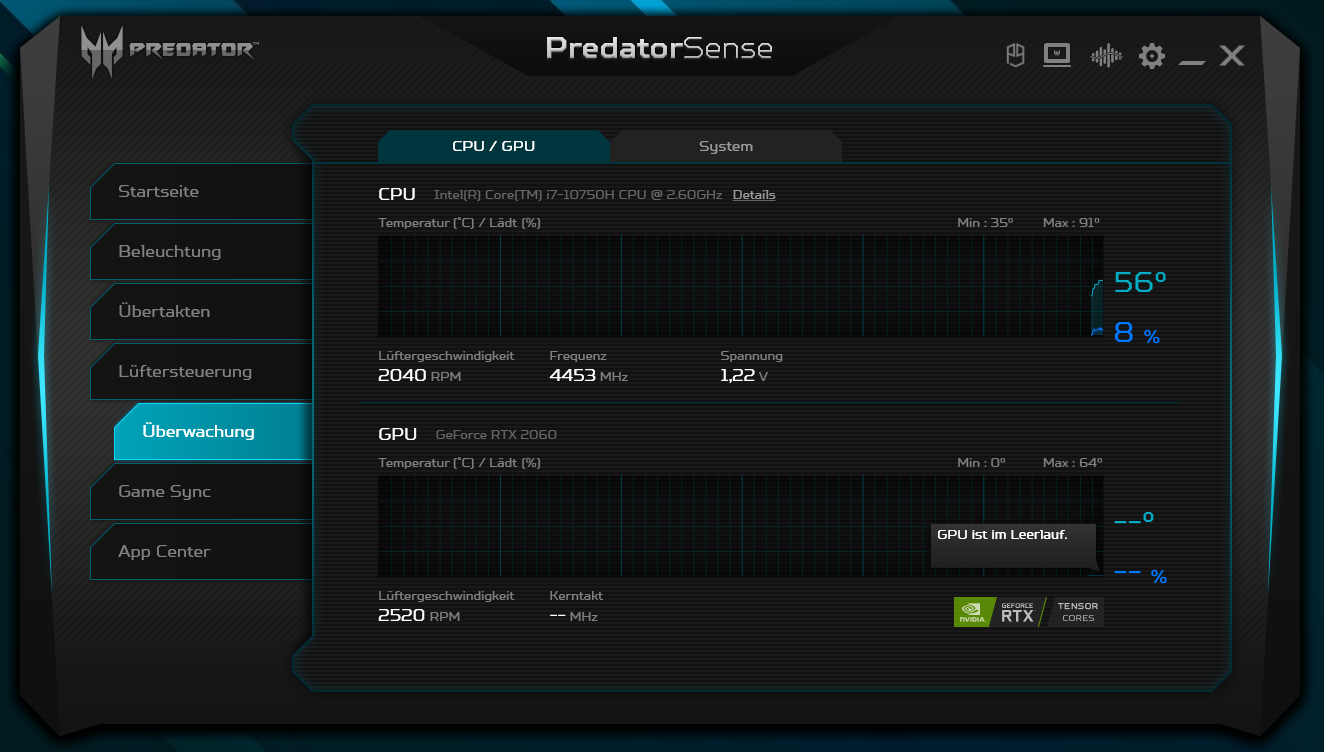

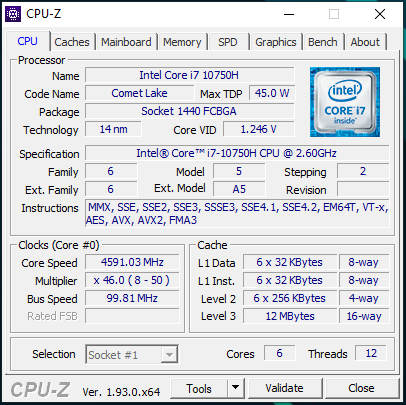
Processor
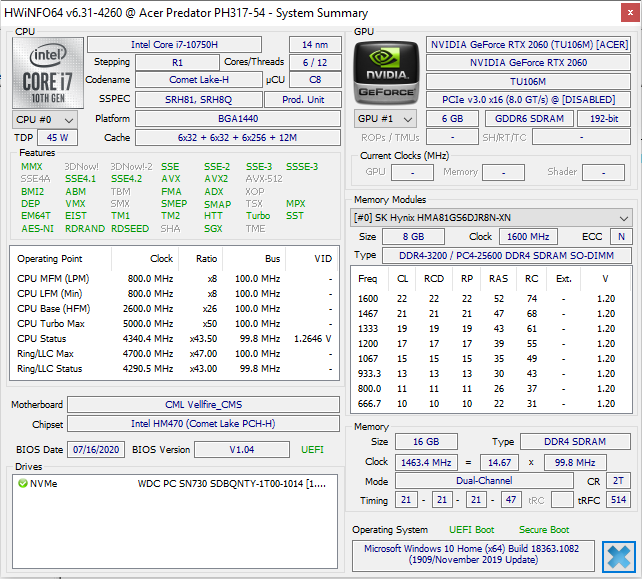
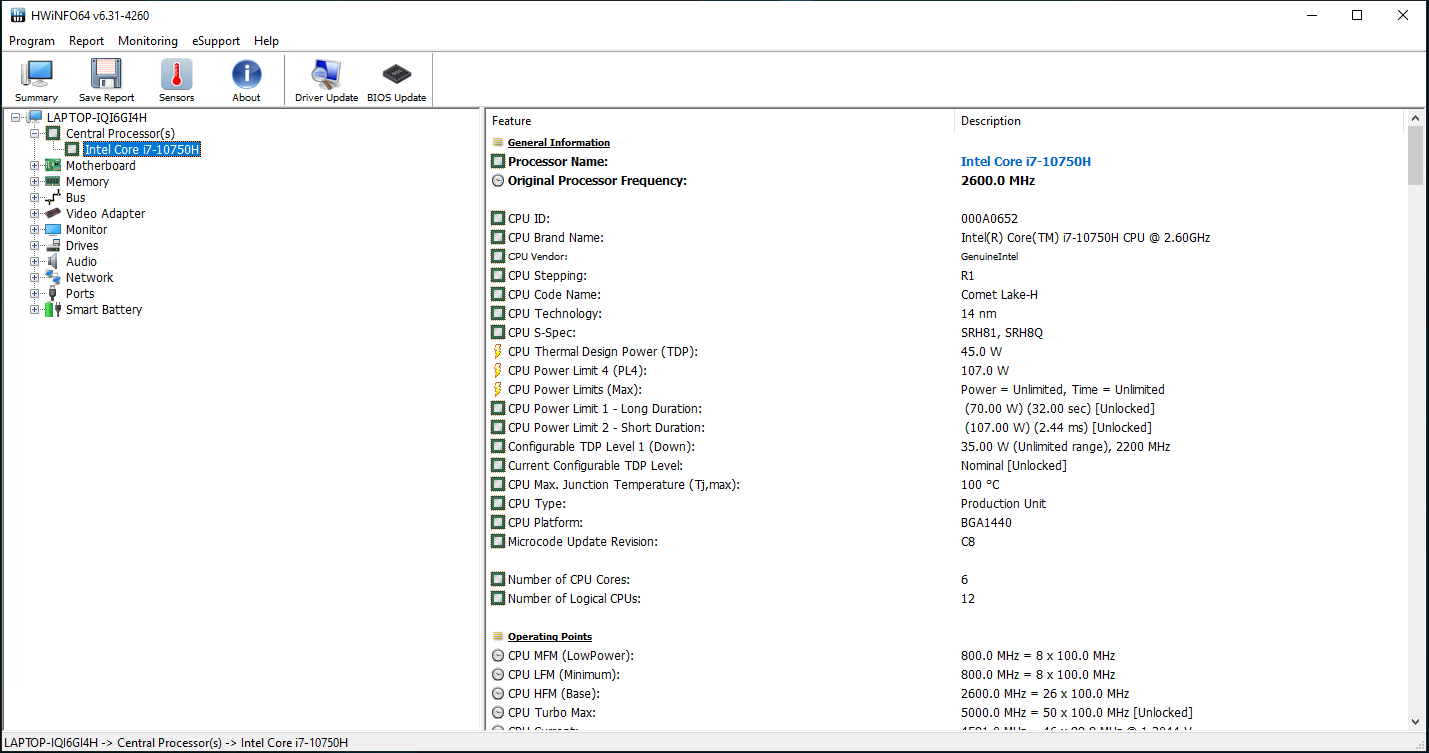
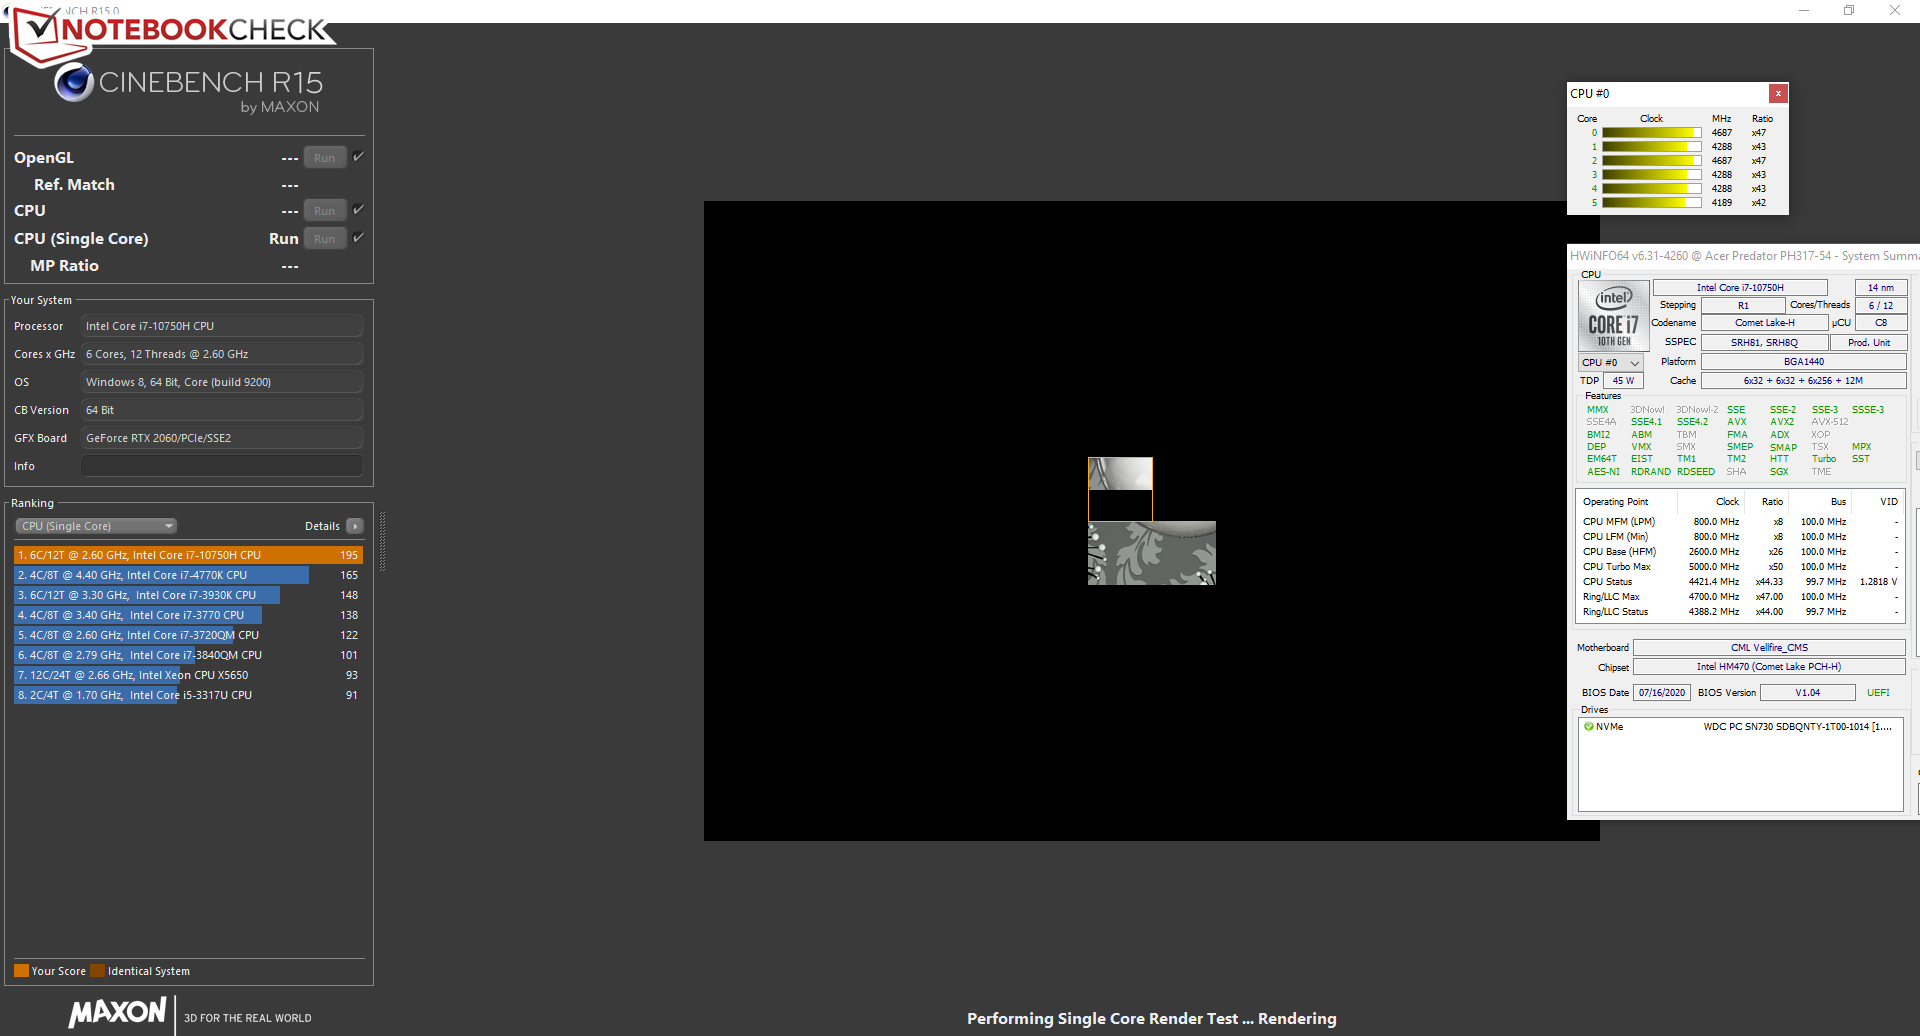
The Predator Helios 300 comes with the Core i7-10750H. It is a hexa-core CPU that offers enough performance for all current applications. The processor has a base clock rate of 2.6 GHz. Thanks to Intel’s Turbo Boost technology, the clock rate can be boosted up to 4.3 GHz for all six cores and up to 5 GHz for a single core. Thanks to Hyper-Threading, each core can process two threads at the same time.
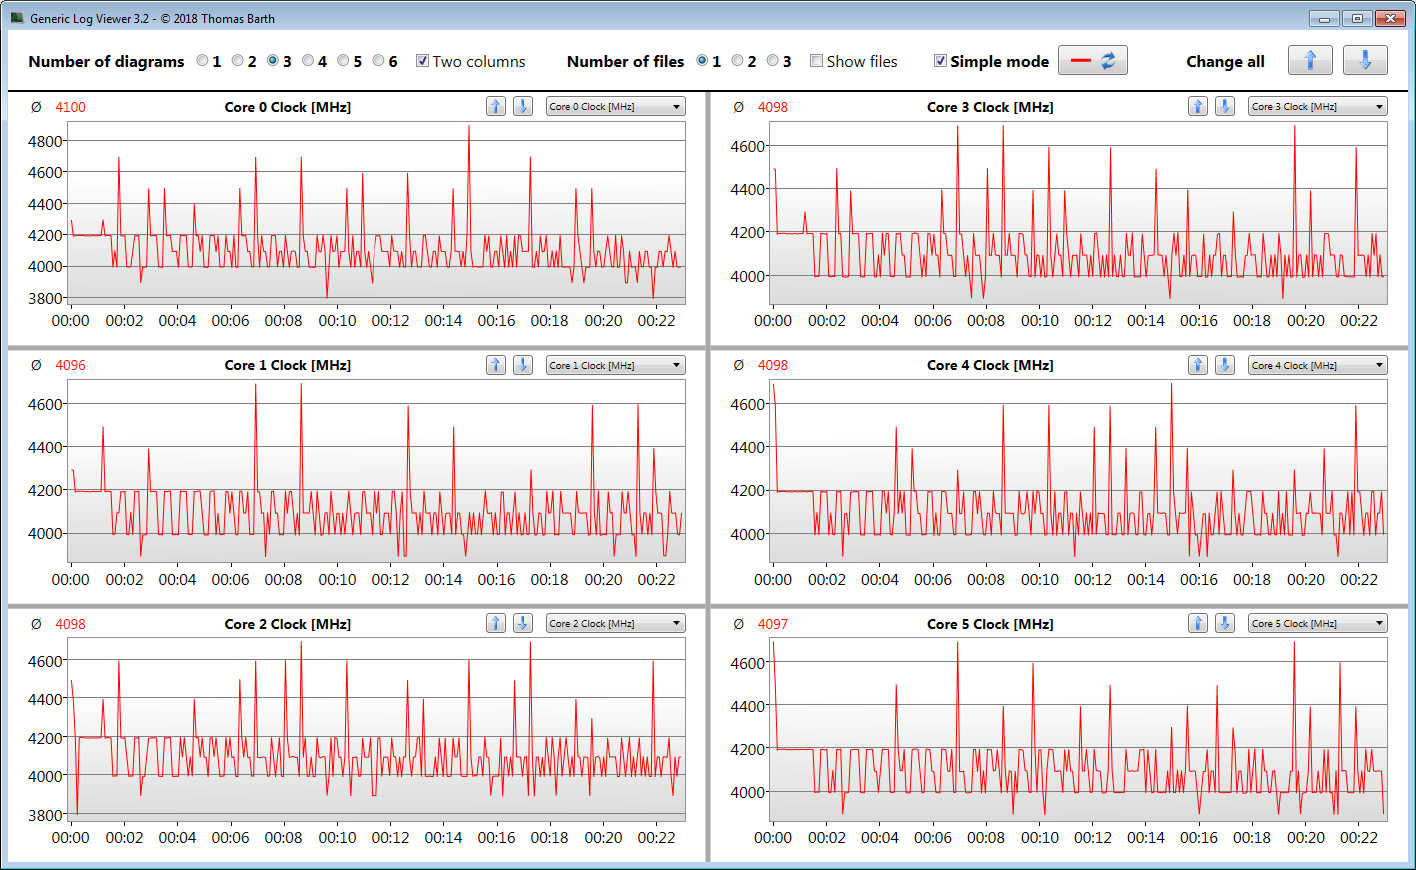
In the multi-core section of the Cinebench R15 benchmark, the CPU runs at 4.2 GHz. In the single-core benchmark, the CPU frequency fluctuates between 4.2 and 4.6 GHz. When running on battery power, the clock rates fluctuate between 1.9 and 2.9 GHz in the single-core benchmark. When not plugged in, the CPU runs at 2 GHz in the multi-core benchmark.

We check if the Turbo boost can be used over an extended period of time by running the Cinebench multi-core benchmark in a continuous loop for 30 minutes. The Turbo boost technology is utilised at a high level.
* ... smaller is better
System Performance
The Acer Predator Helios 300 feels very responsive. It offers enough computing power for gaming, video editing, and image-editing.
| PCMark 8 Home Score Accelerated v2 | 4291 points | |
| PCMark 8 Creative Score Accelerated v2 | 4210 points | |
| PCMark 8 Work Score Accelerated v2 | 5817 points | |
| PCMark 10 Score | 5109 points | |
Help | ||
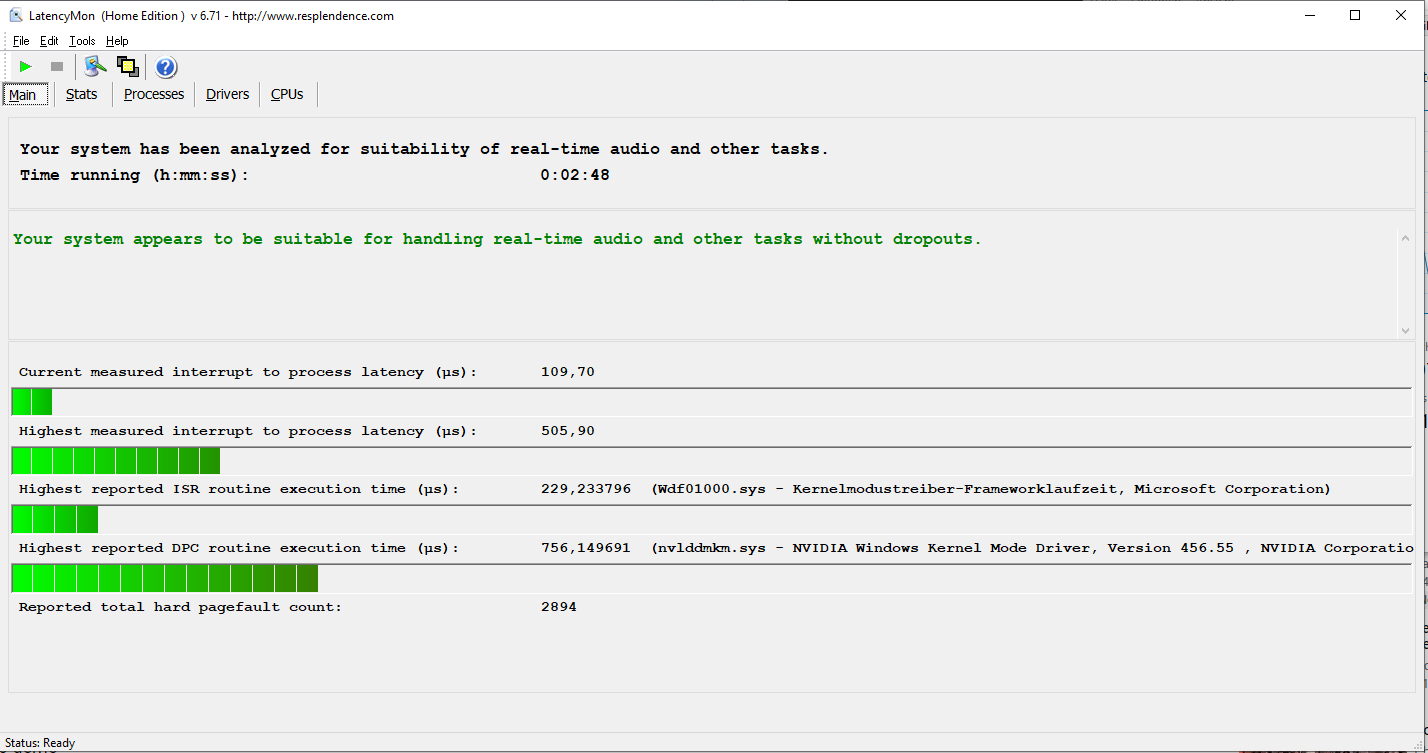
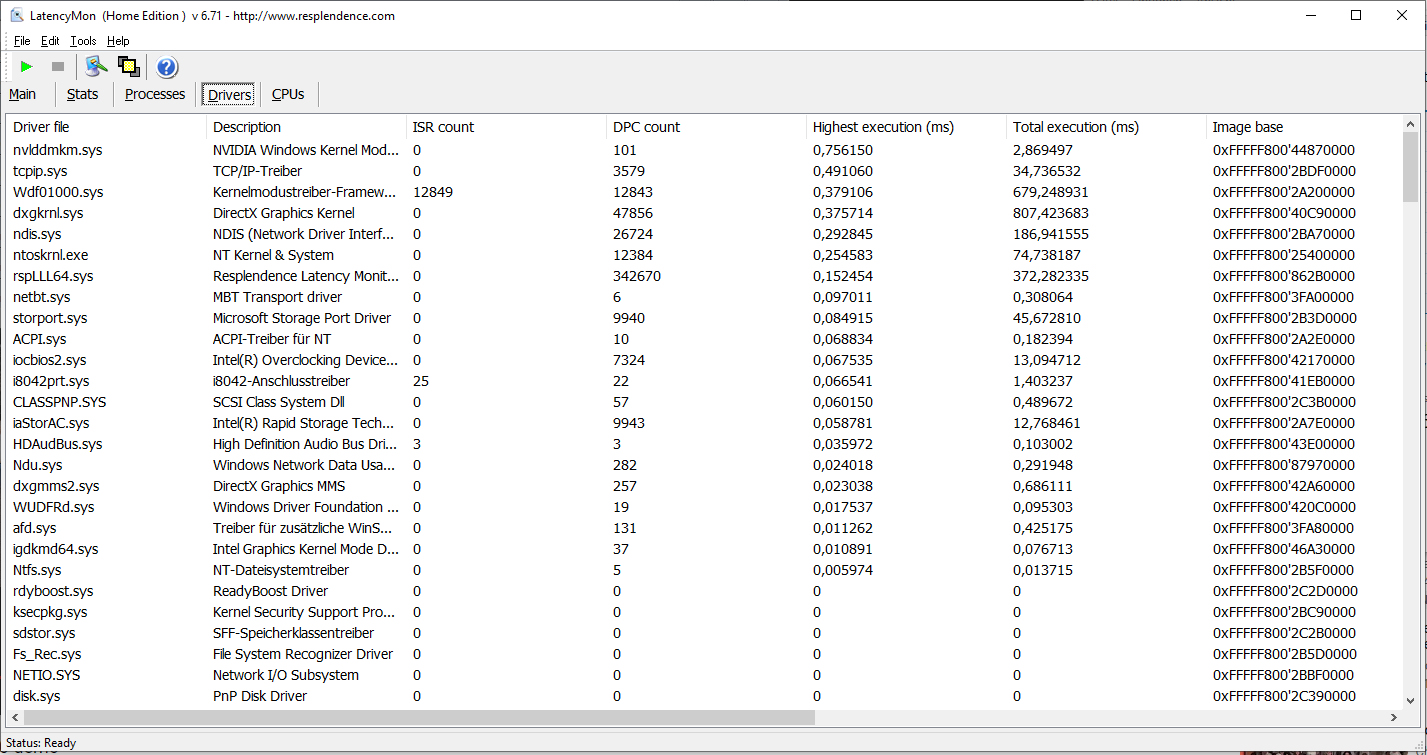
DPC Latencies
We did not encounter any issues in our standardised latency test, which includes Internet-surfing, 4K video playback and a high-load stress test (Prime95). The system appears to be fit for work with real-time audio and video.
| DPC Latencies / LatencyMon - interrupt to process latency (max), Web, Youtube, Prime95 | |
| Asus TUF A17 FA706IU-AS76 | |
| MSI GE75 Raider 10SE-008US | |
| MSI Bravo 17 A4DDR | |
| Aorus 7 KB | |
| Acer Nitro 5 AN517-52-77DS | |
| Nexoc GH7 716IG | |
| Acer Predator Helios 300 PH317-54-75G8 | |
* ... smaller is better
Storage Devices
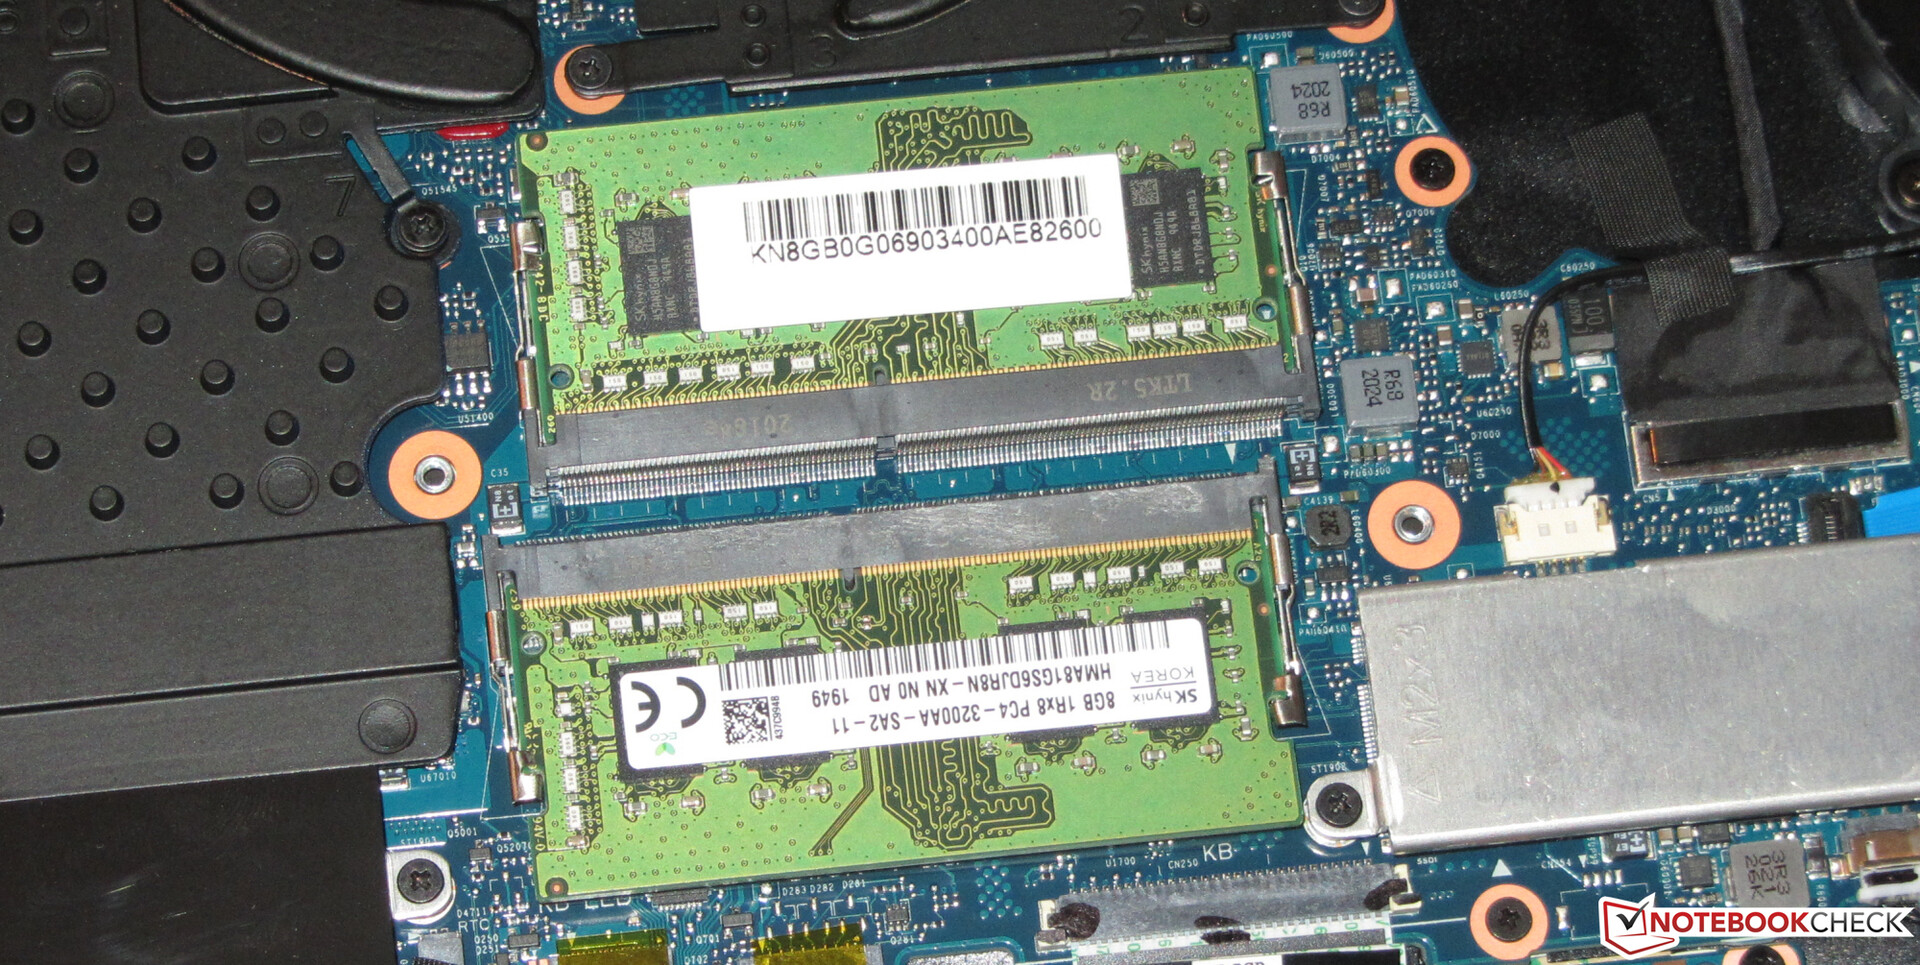
An M.2-2280 NVMe SSD from Western Digital serves as the system drive. It offers a storage capacity of 1 TB. The data transfer rates are very good.
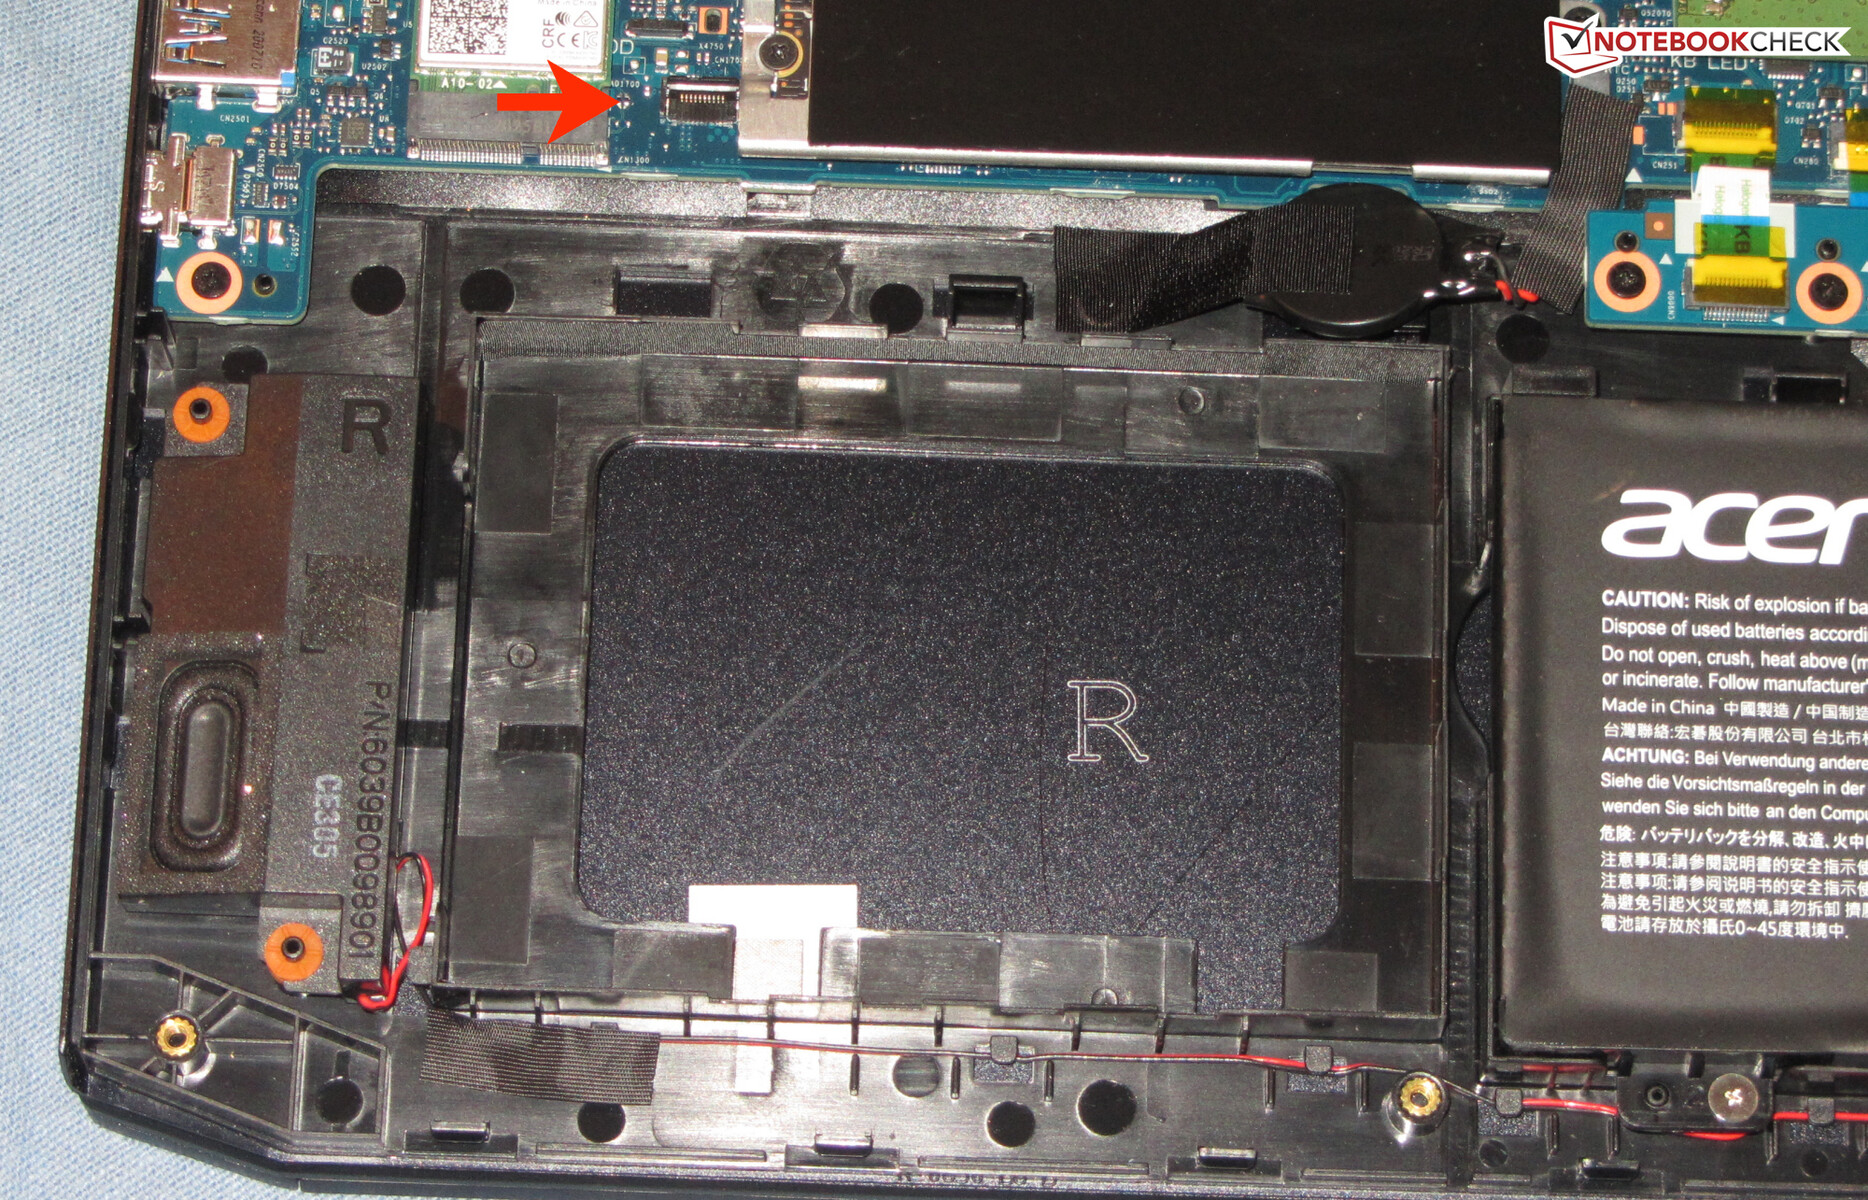
Users can install a second NVMe SSD in the Acer laptop. When both M.2 SSDs are installed, users can configure them to run in RAID 0. There is also space for an additional 2.5-inch storage device. An installation frame and a SATA connector are included in the box.

| Acer Predator Helios 300 PH317-54-75G8 WDC PC SN730 SDBQNTY-1T00 | Nexoc GH7 716IG Samsung SSD 970 EVO Plus 500GB | Aorus 7 KB ADATA XPG SX8200 Pro (ASX8200PNP-512GT) | MSI GE75 Raider 10SE-008US Samsung SSD PM981 MZVLB512HAJQ | MSI Bravo 17 A4DDR Toshiba KBG30ZMV512G | Asus TUF A17 FA706IU-AS76 Intel SSD 660p 1TB SSDPEKNW010T8 | Lenovo Legion Y740-17IRH WDC PC SN520 SDAPMUW-128G | |
|---|---|---|---|---|---|---|---|
| CrystalDiskMark 5.2 / 6 | 24% | 6% | -3% | -37% | -8% | -49% | |
| Write 4K (MB/s) | 141.9 | 201.6 42% | 158.7 12% | 139.2 -2% | 94.6 -33% | 189.7 34% | 102.7 -28% |
| Read 4K (MB/s) | 48.75 | 54.8 12% | 60.5 24% | 53 9% | 47.12 -3% | 62.3 28% | 29.12 -40% |
| Write Seq (MB/s) | 2734 | 2999 10% | 2365 -13% | 1950 -29% | 850 -69% | 1681 -39% | 362.2 -87% |
| Read Seq (MB/s) | 1921 | 3023 57% | 2696 40% | 2328 21% | 1157 -40% | 1608 -16% | 1010 -47% |
| Write 4K Q32T1 (MB/s) | 422.6 | 545 29% | 418.4 -1% | 408.9 -3% | 277.7 -34% | 468.6 11% | 298.1 -29% |
| Read 4K Q32T1 (MB/s) | 509 | 636 25% | 546 7% | 551 8% | 546 7% | 541 6% | 349.6 -31% |
| Write Seq Q32T1 (MB/s) | 3055 | 3262 7% | 2471 -19% | 1938 -37% | 908 -70% | 1770 -42% | 788 -74% |
| Read Seq Q32T1 (MB/s) | 3257 | 3550 9% | 3242 0% | 3467 6% | 1632 -50% | 1898 -42% | 1490 -54% |
| AS SSD | 22% | -15% | -14% | -78% | -48% | -58% | |
| Seq Read (MB/s) | 2828 | 3008 6% | 2844 1% | 2036 -28% | 1420 -50% | 1320 -53% | 1339 -53% |
| Seq Write (MB/s) | 2677 | 2521 -6% | 2240 -16% | 1835 -31% | 922 -66% | 1539 -43% | 688 -74% |
| 4K Read (MB/s) | 39.94 | 64.3 61% | 53.5 34% | 60.6 52% | 48.51 21% | 56.3 41% | 23.23 -42% |
| 4K Write (MB/s) | 100.9 | 142.5 41% | 121.6 21% | 127.2 26% | 116.8 16% | 158.5 57% | 98.8 -2% |
| 4K-64 Read (MB/s) | 1562 | 1664 7% | 714 -54% | 1601 2% | 928 -41% | 586 -62% | 300.9 -81% |
| 4K-64 Write (MB/s) | 1867 | 2447 31% | 1221 -35% | 1734 -7% | 345.4 -81% | 820 -56% | 204.6 -89% |
| Access Time Read * (ms) | 0.047 | 0.043 | 0.049 | 0.089 | 0.043 | 0.184 | |
| Access Time Write * (ms) | 0.037 | 0.026 30% | 0.031 16% | 0.09 -143% | 0.189 -411% | 0.113 -205% | 0.037 -0% |
| Score Read (Points) | 1885 | 2029 8% | 1052 -44% | 1865 -1% | 1119 -41% | 775 -59% | 458 -76% |
| Score Write (Points) | 2236 | 2842 27% | 1567 -30% | 2045 -9% | 554 -75% | 1132 -49% | 372 -83% |
| Score Total (Points) | 5076 | 5893 16% | 3141 -38% | 4863 -4% | 2232 -56% | 2333 -54% | 1038 -80% |
| Total Average (Program / Settings) | 23% /
23% | -5% /
-5% | -9% /
-9% | -58% /
-60% | -28% /
-30% | -54% /
-54% |
* ... smaller is better
Continuous read speed: DiskSpd Read Loop, Queue Depth 8
Graphics Card
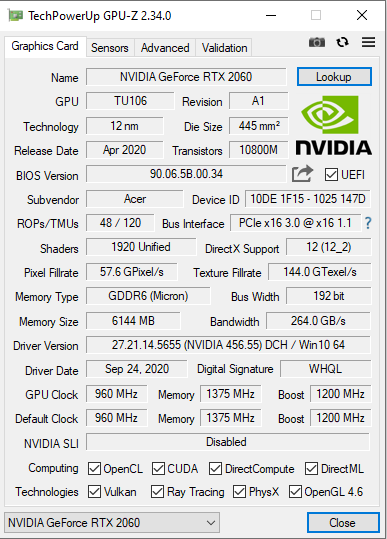
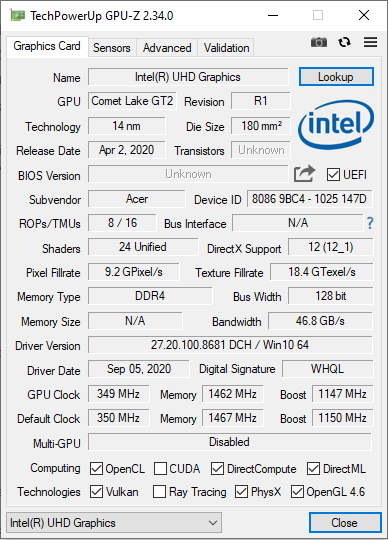
The GeForce RTX 2060 is the lowest-priced premium GPU. The graphics card comes with 6 GB of fast GDDR6 memory. The integrated UHD Graphics 630 in the Core i7-10750H is enabled and NVIDIA’s Optimus technology is utilised.
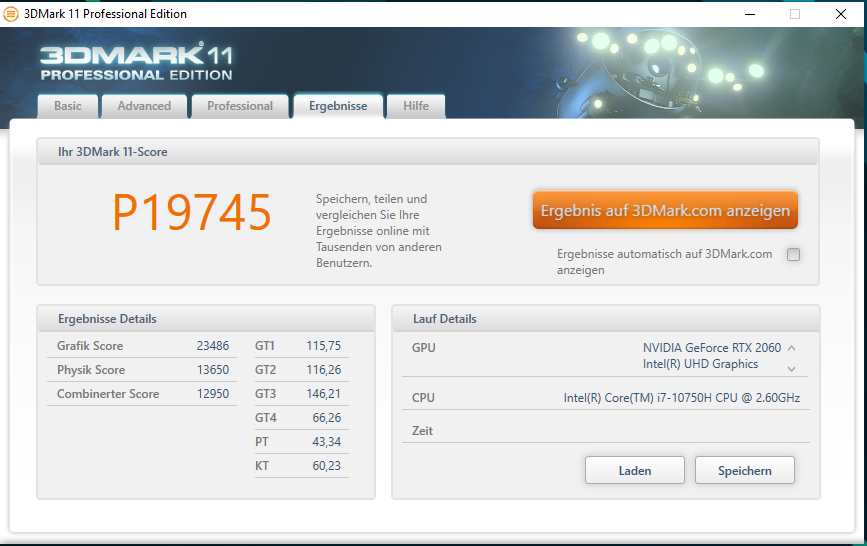
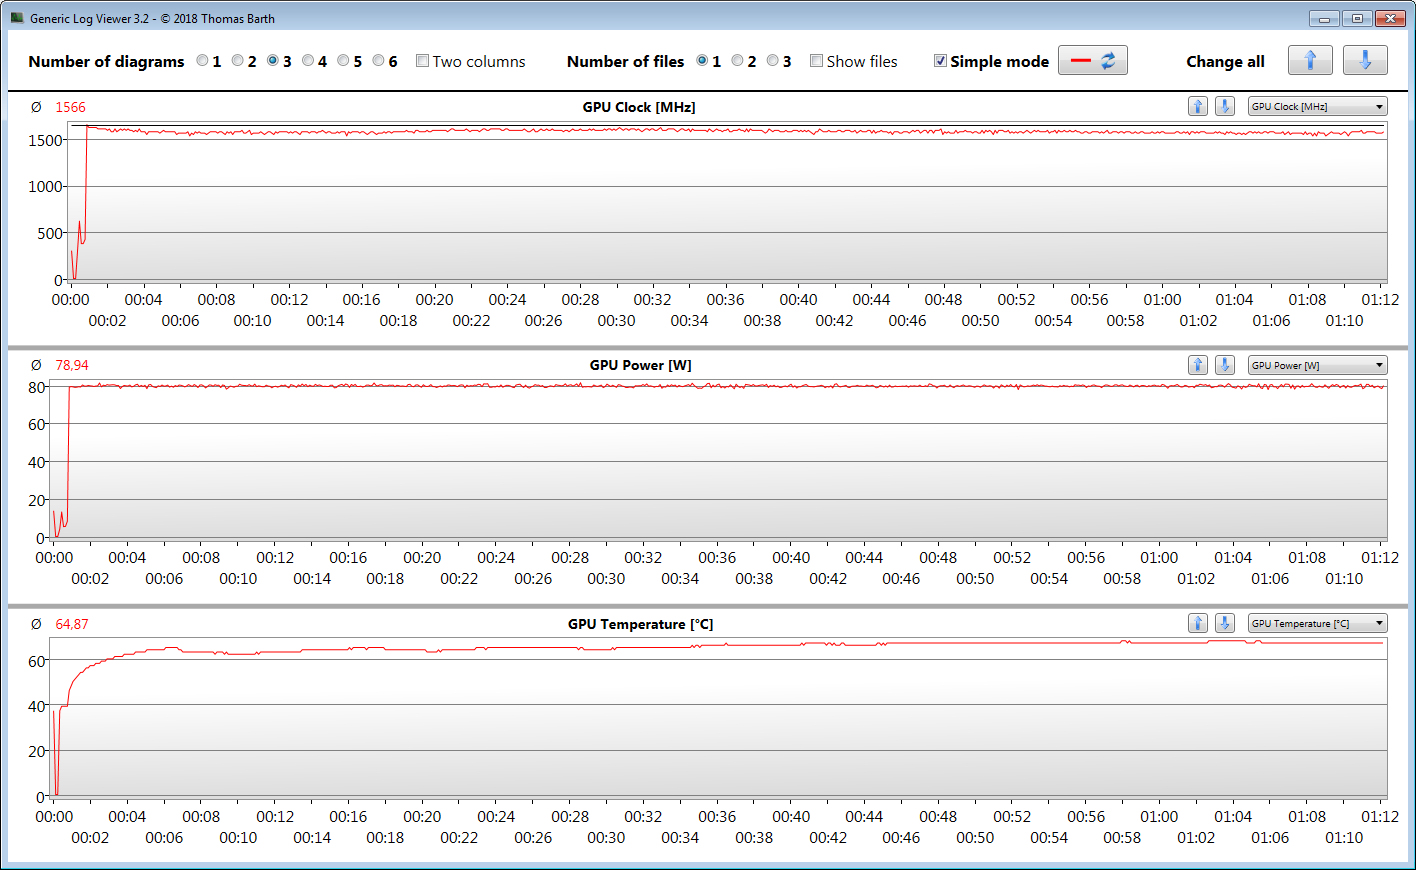
Nvidia specifies a base clock of 960 MHz and a boost clock of 1200 MHz for this DX12-enabled GPU. Higher clocks are possible as long as the GPU does not reach a thermal or power limit. The maximum clock amounts to 2062 MHz. In the benchmark with The Witcher 3, we saw average clock speeds of 1566 MHz and 1731 MHz (Extreme
profile).
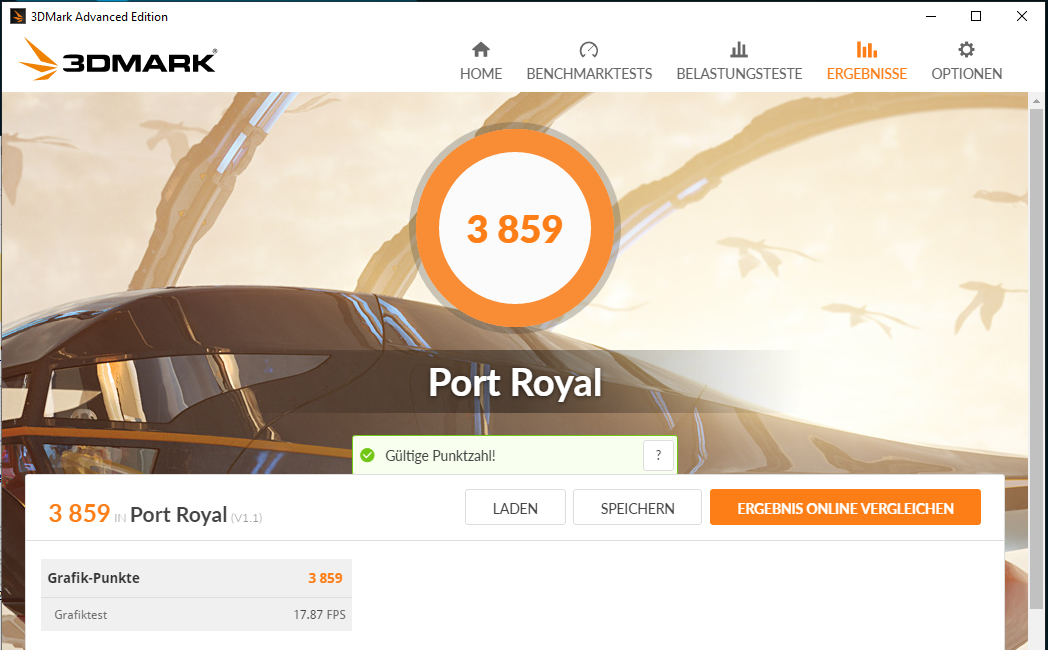
The 3DMark results are on a normal level for this kind of GPU. There is a possibility to eke more performance out of our review device. The utility known as PredatorSense
allows users to overclock the GPU in automatic mode.
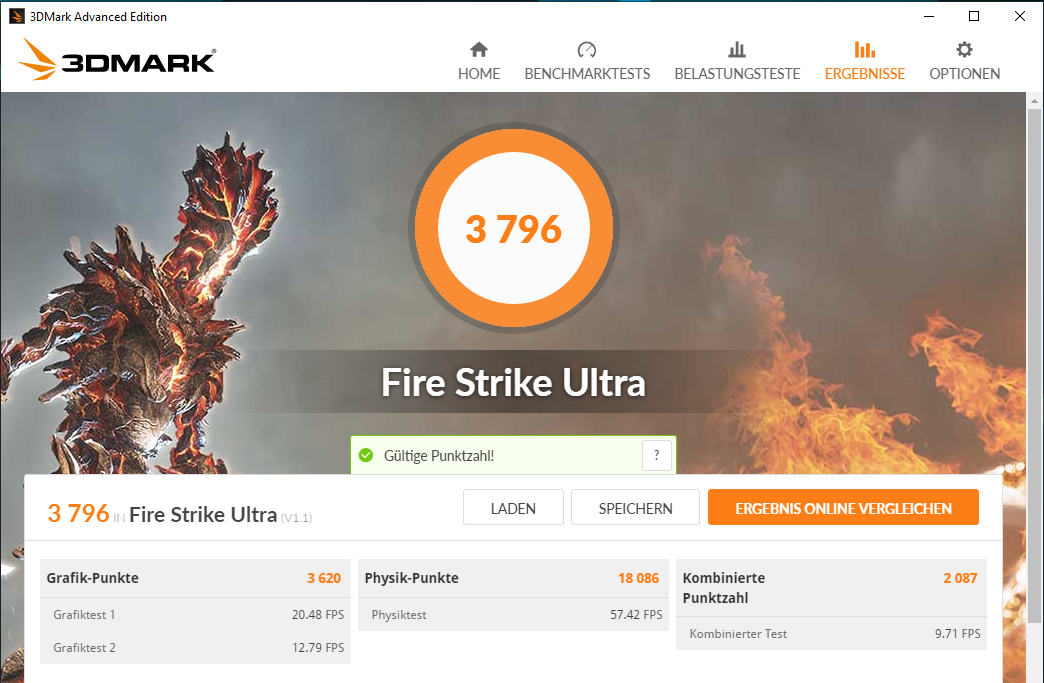
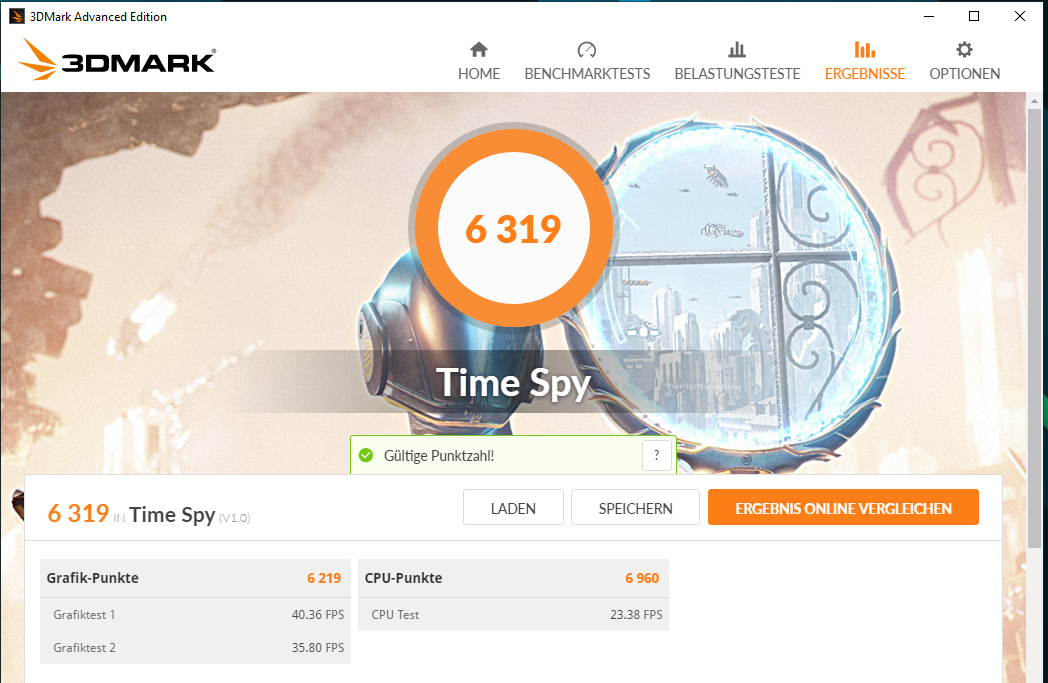


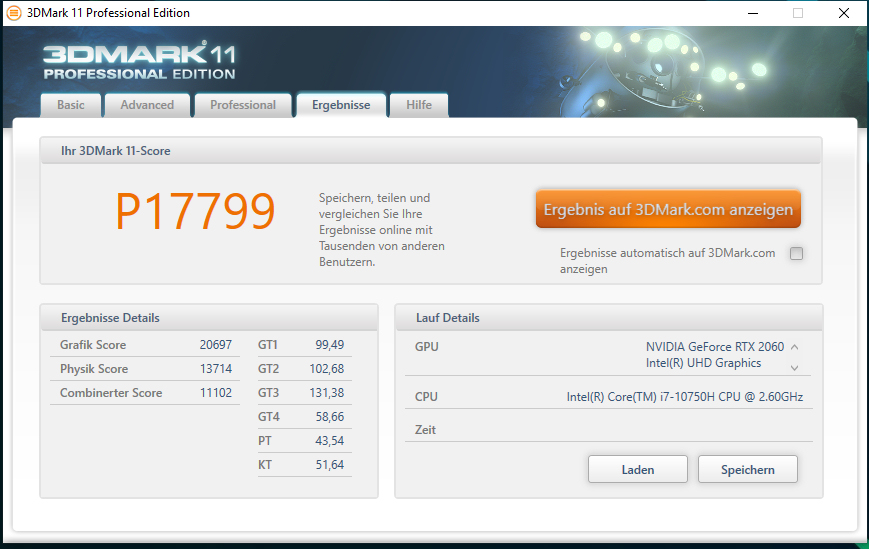
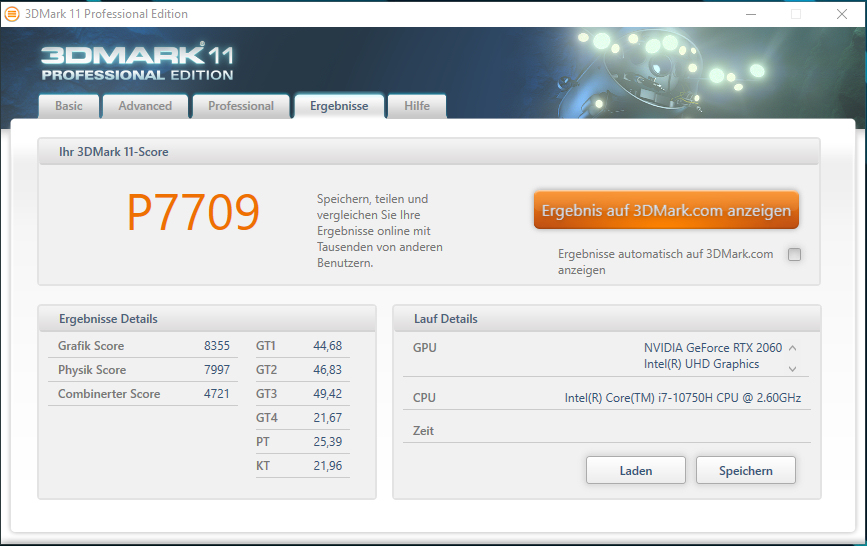
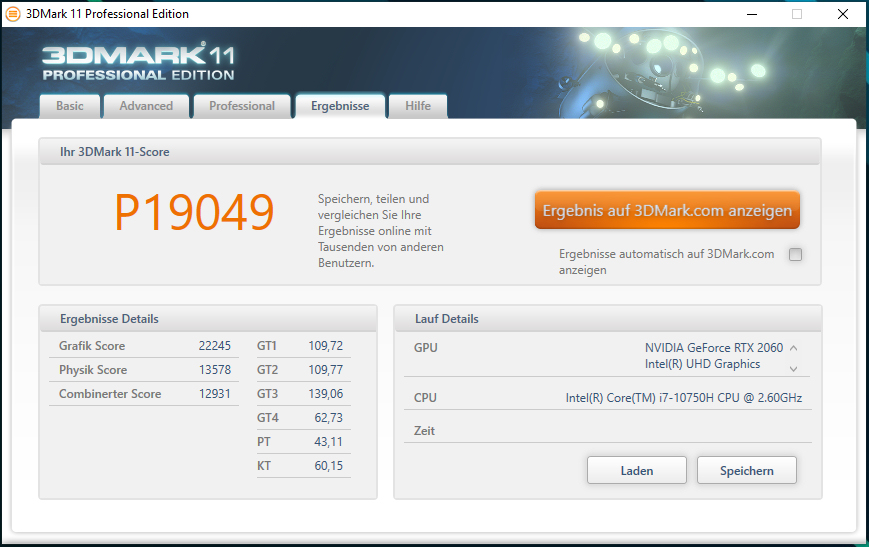
| 3DMark 11 Performance | 17799 points | |
| 3DMark Cloud Gate Standard Score | 35548 points | |
| 3DMark Fire Strike Score | 14978 points | |
| 3DMark Time Spy Score | 6319 points | |
Help | ||
| 3DMark 11 - 1280x720 Performance GPU | |
| Average of class Gaming (21841 - 80022, n=108, last 2 years) | |
| MSI GE75 Raider 10SE-008US | |
| Acer Predator Helios 300 PH317-54-75G8 (Extrem) | |
| Average NVIDIA GeForce RTX 2060 Mobile (19143 - 24662, n=40) | |
| Aorus 7 KB | |
| Asus TUF A17 FA706IU-AS76 | |
| Acer Predator Helios 300 PH317-54-75G8 | |
| Nexoc GH7 716IG | |
| Acer Nitro 5 AN517-52-77DS | |
| Lenovo Legion Y740-17IRH | |
| MSI Bravo 17 A4DDR | |
Gaming Performance
The Acer laptop can run all current games smoothly. It can usually achieve playable frame rates at 1080p on the highest settings. The GPU struggles to handle resolutions above 1080p, for which users would utilize an external monitor. To achieve playable frame rates at such resolutions, graphics settings would have to be lowered. The Extreme
profile provides only a small boost in performance.
| The Witcher 3 - 1920x1080 Ultra Graphics & Postprocessing (HBAO+) | |
| Average of class Gaming (95 - 240, n=8, last 2 years) | |
| Acer Predator Helios 300 PH317-54-75G8 (Extrem) | |
| Acer Predator Helios 300 PH317-54-75G8 | |
| MSI GE75 Raider 10SE-008US | |
| Acer Nitro 5 AN517-52-77DS | |
| Aorus 7 KB | |
| Average NVIDIA GeForce RTX 2060 Mobile (50.6 - 74, n=40) | |
| Lenovo Legion Y740-17IRH | |
| Asus TUF A17 FA706IU-AS76 | |
| Nexoc GH7 716IG | |
| MSI Bravo 17 A4DDR | |
| Mafia Definitive Edition - 1920x1080 High Preset | |
| Aorus 7 KB | |
| Average NVIDIA GeForce RTX 2060 Mobile (60.2 - 76.1, n=4) | |
| Acer Predator Helios 300 PH317-54-75G8 | |
| Serious Sam 4 - 1920x1080 Ultra (DX12) AA:2xMS | |
| Acer Predator Helios 300 PH317-54-75G8 (Extrem) | |
| Acer Predator Helios 300 PH317-54-75G8 | |
| Aorus 7 KB | |
| Average NVIDIA GeForce RTX 2060 Mobile (50.3 - 63.3, n=6) | |
| Horizon Zero Dawn - 1920x1080 Ultimate Quality | |
| Acer Predator Helios 300 PH317-54-75G8 (Extrem) | |
| Acer Predator Helios 300 PH317-54-75G8 | |
| Average NVIDIA GeForce RTX 2060 Mobile (54 - 67, n=6) | |
| Aorus 7 KB | |
| Doom Eternal - 1920x1080 Ultra Preset | |
| Acer Predator Helios 300 PH317-54-75G8 (Extrem) | |
| Acer Predator Helios 300 PH317-54-75G8 | |
| Aorus 7 KB | |
| Average NVIDIA GeForce RTX 2060 Mobile (98.7 - 138, n=10) | |
| Nexoc GH7 716IG | |
| Acer Nitro 5 AN517-52-77DS | |
| MSI Bravo 17 A4DDR | |
| F1 2020 - 1920x1080 Ultra High Preset AA:T AF:16x | |
| Average NVIDIA GeForce RTX 2060 Mobile (93 - 98, n=4) | |
| Aorus 7 KB | |
| Acer Predator Helios 300 PH317-54-75G8 | |
We use the video game The Witcher 3 to check if the frame rates can be maintained consistently over an extended period of time. For this, we run the game on the highest settings at 1080p for one hour. Over the entire run of gameplay, the player-controlled character just stands still. There are no frame-rate drops to report.

| low | med. | high | ultra | |
|---|---|---|---|---|
| BioShock Infinite (2013) | 341.8 | 302.8 | 277 | 137.4 |
| The Witcher 3 (2015) | 287.9 | 202.1 | 123.3 | 68.5 |
| Shadow of the Tomb Raider (2018) | 116 | 96 | 90 | 79 |
| Doom Eternal (2020) | 199.4 | 141.2 | 127.5 | 124.4 |
| Gears Tactics (2020) | 210.4 | 155.1 | 100.6 | 66.7 |
| F1 2020 (2020) | 218 | 148 | 132 | 94 |
| Horizon Zero Dawn (2020) | 139 | 93 | 78 | 62 |
| Flight Simulator 2020 (2020) | 66.6 | 55 | 42.5 | 30.3 |
| Serious Sam 4 (2020) | 105 | 83.4 | 69.9 | 59.8 |
| Mafia Definitive Edition (2020) | 117.9 | 74.6 | 67.1 | |
| Star Wars Squadrons (2020) | 255 | 202.7 | 176.5 | 156.8 |
Emissions - The Acer laptop gets hot
System Noise
When idle, the fans operate at a very low RPM. Sometimes, they stand completely still. Under load, the fans spin quickly. We measured 52 dB(A) during the stress test and 50 dB(A) in the gaming stability test with The Witcher 3. The fans are too loud for users to be able to enjoy a gaming experience without a headset.
Noise level
| Idle |
| 25 / 30 / 37 dB(A) |
| Load |
| 48 / 52 dB(A) |
 | ||
30 dB silent 40 dB(A) audible 50 dB(A) loud |
||
min: | ||
| Acer Predator Helios 300 PH317-54-75G8 i7-10750H, GeForce RTX 2060 Mobile | Nexoc GH7 716IG i7-10750H, GeForce GTX 1660 Ti Mobile | Aorus 7 KB i7-10750H, GeForce RTX 2060 Mobile | MSI GE75 Raider 10SE-008US i7-10750H, GeForce RTX 2060 Mobile | MSI Bravo 17 A4DDR R7 4800H, Radeon RX 5500M | Asus TUF A17 FA706IU-AS76 R7 4800H, GeForce GTX 1660 Ti Mobile | Lenovo Legion Y740-17IRH i7-9750H, GeForce RTX 2060 Mobile | |
|---|---|---|---|---|---|---|---|
| Noise | -6% | -15% | -2% | -6% | -2% | -7% | |
| off / environment * (dB) | 24 | 25 -4% | 25 -4% | 28.4 -18% | 30 -25% | 28.7 -20% | 30 -25% |
| Idle Minimum * (dB) | 25 | 30 -20% | 31 -24% | 30.2 -21% | 33 -32% | 28.7 -15% | 33 -32% |
| Idle Average * (dB) | 30 | 31 -3% | 33 -10% | 30.2 -1% | 34 -13% | 30.5 -2% | 34 -13% |
| Idle Maximum * (dB) | 37 | 33 11% | 48 -30% | 32 14% | 35 5% | 32.5 12% | 35 5% |
| Load Average * (dB) | 48 | 54 -13% | 57 -19% | 33.2 31% | 39 19% | 42.5 11% | 48 -0% |
| Witcher 3 ultra * (dB) | 50 | 53 -6% | 55 -10% | 55 -10% | 48 4% | 50.1 -0% | 46 8% |
| Load Maximum * (dB) | 52 | 57 -10% | 57 -10% | 55 -6% | 52 -0% | 53.4 -3% | 49 6% |
* ... smaller is better
Temperature
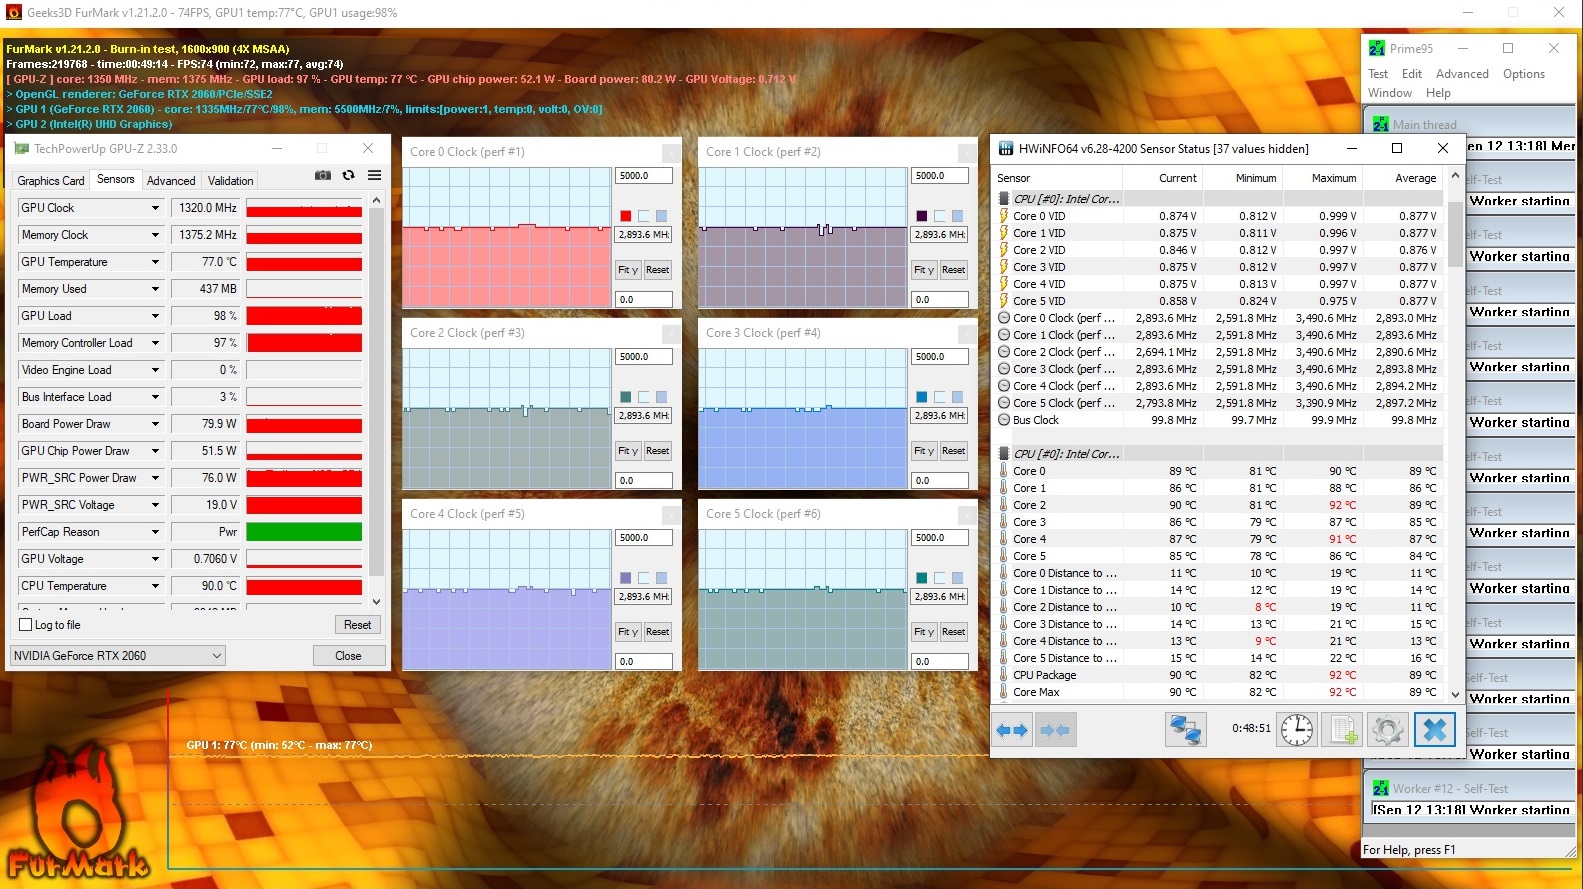
In our stress test (Prime95 and FurMark running continuously for at least one hour), the processor operated at 2.9 GHz and the graphics card ran at 1320 MHz. The stress test is an extreme case scenario, which is very unlikely to occur in real life. We use it to test system stability under full load.
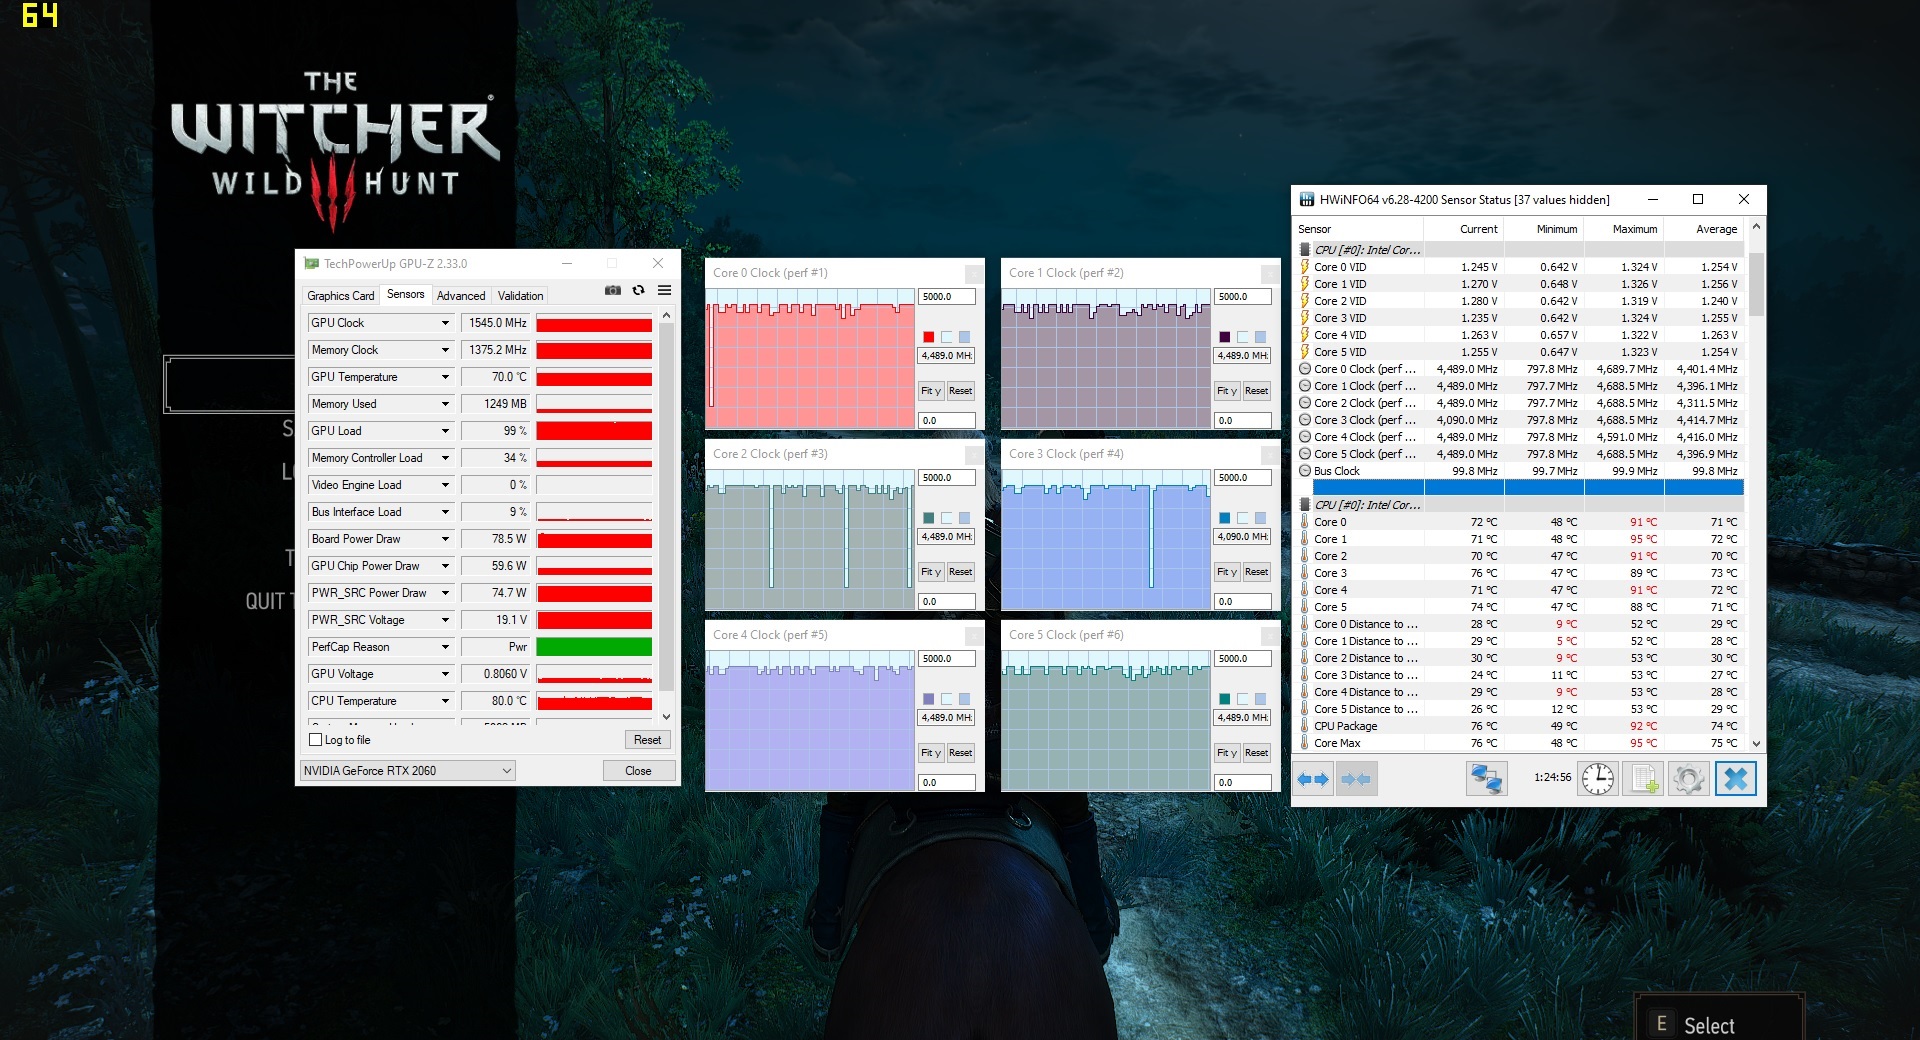
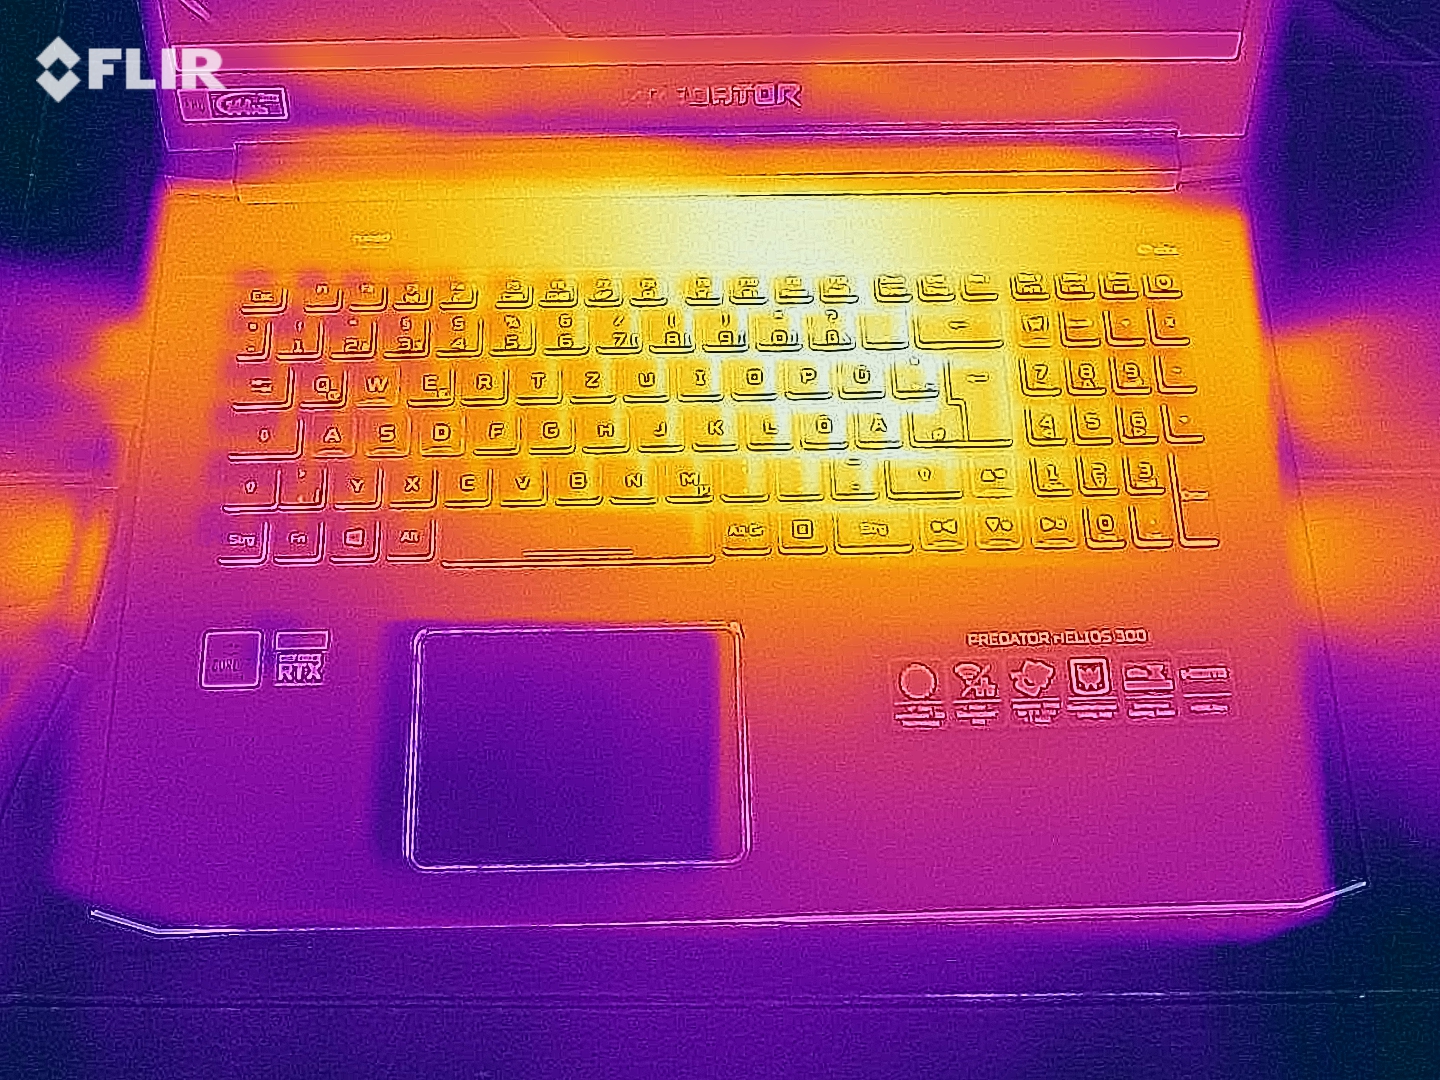
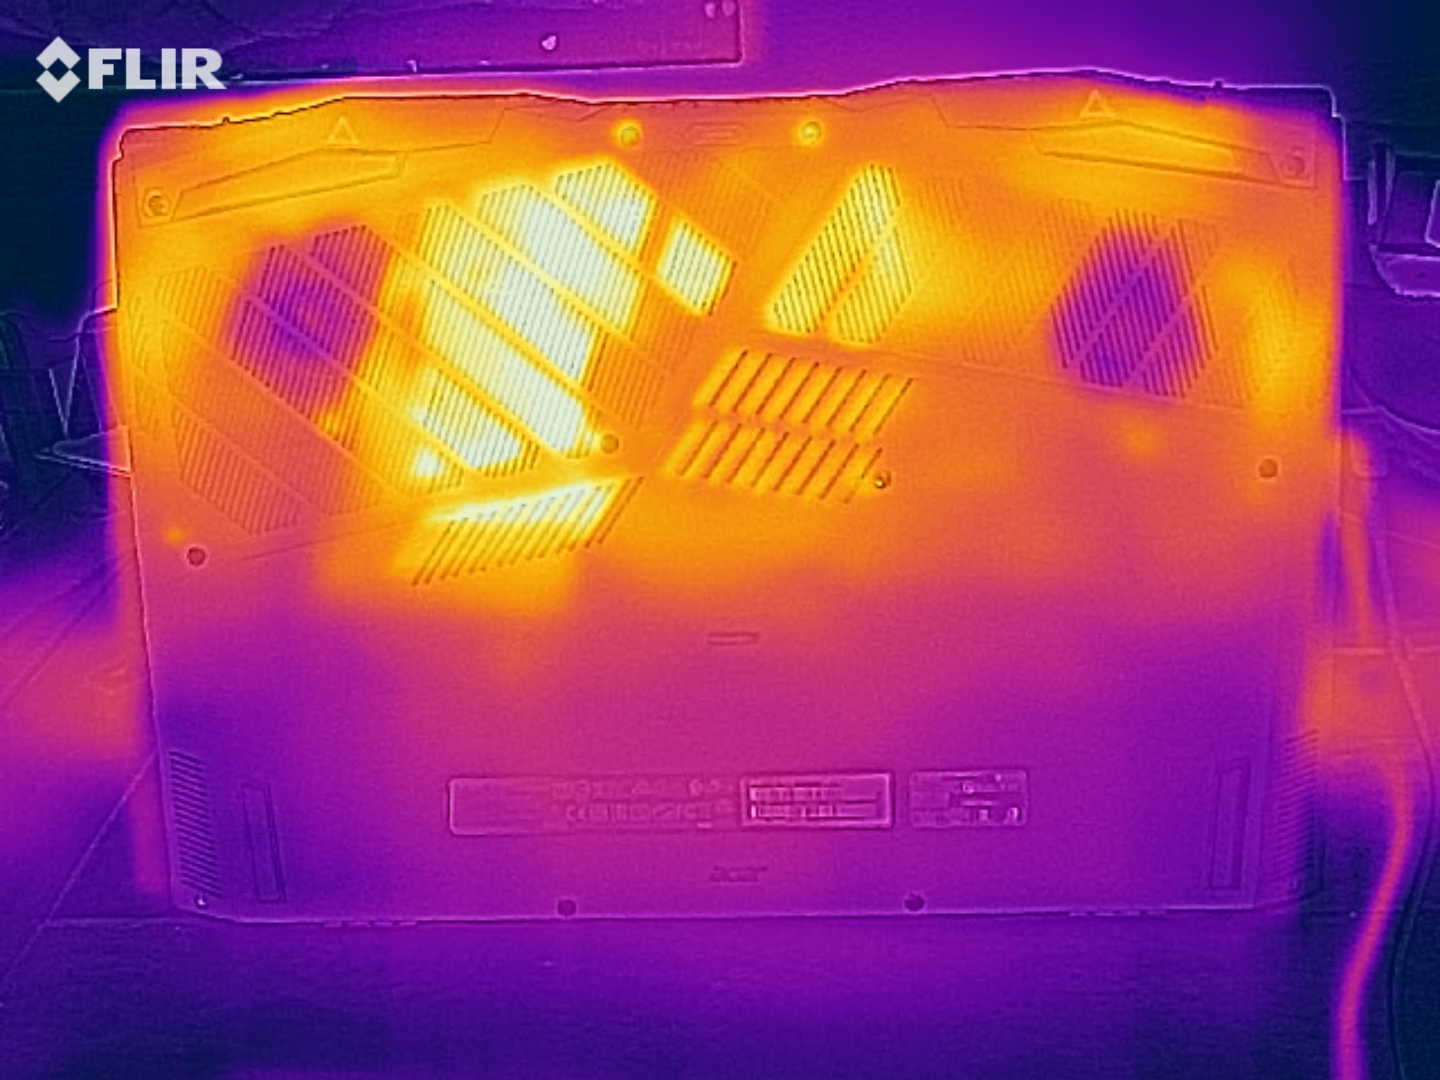
The Helios 300 gets considerably hot. During our stress test and gaming stability test with The Witcher 3, the 50-° C (122 °F) mark was exceeded at several measurement points. This is why we cannot recommend using the Acer notebook on the lap. In day-to-day use, the temperatures always remain reasonable.
(-) The maximum temperature on the upper side is 53 °C / 127 F, compared to the average of 40.4 °C / 105 F, ranging from 21.2 to 68.8 °C for the class Gaming.
(-) The bottom heats up to a maximum of 59 °C / 138 F, compared to the average of 43.2 °C / 110 F
(+) In idle usage, the average temperature for the upper side is 27.9 °C / 82 F, compared to the device average of 33.9 °C / 93 F.
(-) Playing The Witcher 3, the average temperature for the upper side is 42.8 °C / 109 F, compared to the device average of 33.9 °C / 93 F.
(±) The palmrests and touchpad can get very hot to the touch with a maximum of 39 °C / 102.2 F.
(-) The average temperature of the palmrest area of similar devices was 28.8 °C / 83.8 F (-10.2 °C / -18.4 F).
| Acer Predator Helios 300 PH317-54-75G8 i7-10750H, GeForce RTX 2060 Mobile | Nexoc GH7 716IG i7-10750H, GeForce GTX 1660 Ti Mobile | Aorus 7 KB i7-10750H, GeForce RTX 2060 Mobile | MSI GE75 Raider 10SE-008US i7-10750H, GeForce RTX 2060 Mobile | MSI Bravo 17 A4DDR R7 4800H, Radeon RX 5500M | Asus TUF A17 FA706IU-AS76 R7 4800H, GeForce GTX 1660 Ti Mobile | Lenovo Legion Y740-17IRH i7-9750H, GeForce RTX 2060 Mobile | |
|---|---|---|---|---|---|---|---|
| Heat | 6% | -7% | -2% | 14% | 5% | 7% | |
| Maximum Upper Side * (°C) | 53 | 49 8% | 48 9% | 44.2 17% | 48 9% | 47.6 10% | 43 19% |
| Maximum Bottom * (°C) | 59 | 54 8% | 52 12% | 49 17% | 50 15% | 50.8 14% | 46 22% |
| Idle Upper Side * (°C) | 29 | 29 -0% | 37 -28% | 33.6 -16% | 25 14% | 33 -14% | 31 -7% |
| Idle Bottom * (°C) | 32 | 30 6% | 38 -19% | 39.6 -24% | 26 19% | 29 9% | 34 -6% |
* ... smaller is better
Speakers
The stereo speakers are located on the underside of the device. They produce an okay sound that almost completely lacks bass. For a better listening experience, we recommend using external speakers or headphones.
Acer Predator Helios 300 PH317-54-75G8 audio analysis
(±) | speaker loudness is average but good (80 dB)
Bass 100 - 315 Hz
(-) | nearly no bass - on average 23.3% lower than median
(±) | linearity of bass is average (12% delta to prev. frequency)
Mids 400 - 2000 Hz
(+) | balanced mids - only 3.9% away from median
(+) | mids are linear (6.4% delta to prev. frequency)
Highs 2 - 16 kHz
(+) | balanced highs - only 3% away from median
(+) | highs are linear (4.2% delta to prev. frequency)
Overall 100 - 16.000 Hz
(±) | linearity of overall sound is average (17.5% difference to median)
Compared to same class
» 49% of all tested devices in this class were better, 12% similar, 40% worse
» The best had a delta of 6%, average was 18%, worst was 132%
Compared to all devices tested
» 34% of all tested devices were better, 8% similar, 58% worse
» The best had a delta of 4%, average was 24%, worst was 134%
Energy Management - The PH317-54 achieves acceptable battery runtimes
Energy Consumption
There are no anomalies when it comes to energy consumption. During the stress test (Prime95 and FurMark running for at least one hour), the power consumption peaked at 197 watts. In the gaming stability test with The Witcher 3, the power draw averaged 144 watts. The rated output of the AC adapter amounts to 180 watts.
| Off / Standby | |
| Idle | |
| Load |
|
Key:
min: | |
| Acer Predator Helios 300 PH317-54-75G8 i7-10750H, GeForce RTX 2060 Mobile | Nexoc GH7 716IG i7-10750H, GeForce GTX 1660 Ti Mobile | Aorus 7 KB i7-10750H, GeForce RTX 2060 Mobile | MSI GE75 Raider 10SE-008US i7-10750H, GeForce RTX 2060 Mobile | MSI Bravo 17 A4DDR R7 4800H, Radeon RX 5500M | Asus TUF A17 FA706IU-AS76 R7 4800H, GeForce GTX 1660 Ti Mobile | Lenovo Legion Y740-17IRH i7-9750H, GeForce RTX 2060 Mobile | |
|---|---|---|---|---|---|---|---|
| Power Consumption | -1% | -48% | -53% | 4% | 1% | -57% | |
| Idle Minimum * (Watt) | 6 | 5 17% | 15 -150% | 14.7 -145% | 9 -50% | 7.4 -23% | 20 -233% |
| Idle Average * (Watt) | 11 | 10 9% | 17 -55% | 20.4 -85% | 10 9% | 10.5 5% | 21 -91% |
| Idle Maximum * (Watt) | 19 | 20 -5% | 22 -16% | 26.9 -42% | 13 32% | 17 11% | 26 -37% |
| Load Average * (Watt) | 96 | 113 -18% | 137 -43% | 93.2 3% | 69 28% | 103.7 -8% | 97 -1% |
| Witcher 3 ultra * (Watt) | 144 | 132 8% | 161 -12% | 185.4 -29% | 128 11% | 128.1 11% | 139 3% |
| Load Maximum * (Watt) | 197 | 225 -14% | 225 -14% | 237.8 -21% | 214 -9% | 183.2 7% | 168 15% |
* ... smaller is better
Battery Life
The Predator Helios 300 does not deliver any surprises when it comes to battery life. The battery runtimes are on a normal level for a gaming laptop. Our review device lasts 5 h 6 m in our practically oriented Wi-Fi test, in which we run a script that simulates loads that are consistent with Internet browsing. The 17.3-inch laptop achieves a battery runtime of 5 h 53 m in our video test. In this test, we play the short film Big Buck Bunny (H.264, 1920x1080) in a continuous loop.

| Acer Predator Helios 300 PH317-54-75G8 i7-10750H, GeForce RTX 2060 Mobile, 59 Wh | Nexoc GH7 716IG i7-10750H, GeForce GTX 1660 Ti Mobile, 48.96 Wh | Aorus 7 KB i7-10750H, GeForce RTX 2060 Mobile, 49 Wh | MSI GE75 Raider 10SE-008US i7-10750H, GeForce RTX 2060 Mobile, 65 Wh | MSI Bravo 17 A4DDR R7 4800H, Radeon RX 5500M, 51 Wh | Asus TUF A17 FA706IU-AS76 R7 4800H, GeForce GTX 1660 Ti Mobile, 90 Wh | Lenovo Legion Y740-17IRH i7-9750H, GeForce RTX 2060 Mobile, 76 Wh | |
|---|---|---|---|---|---|---|---|
| Battery runtime | -23% | -13% | -27% | -15% | 43% | -27% | |
| Reader / Idle (h) | 8.2 | 8.9 9% | 8.6 5% | 7.7 -6% | 9.1 11% | 6.9 -16% | |
| H.264 (h) | 5.9 | 5.6 -5% | 4.3 -27% | ||||
| WiFi v1.3 (h) | 5.1 | 4.2 -18% | 4.7 -8% | 3.7 -27% | 5.2 2% | 8.5 67% | 4.3 -16% |
| Load (h) | 2.2 | 0.9 -59% | 1.2 -45% | 1.3 -41% | 3.3 50% | 1.1 -50% |
Pros
Cons
Verdict

The Core i7-10750H and the GeForce RTX 2060 can run all current games at 1080p on high or maximum settings. The graphics card can be automatically overclocked if need be.
The Predator Helios 300 PH317-54 from Acer is a well-rounded laptop that offers several upgrade options.
One of the two M.2 slots (when two NVMe solid state drives are installed, they can be configured to run in RAID 0) is occupied by a fast 1 TB NVMe SSD, which offers enough storage space for games and other applications. An additional 2.5-inch storage device can also be installed. These upgrades will require opening up the device.
The Predator Helios 300 comes with all the necessary ports. However, a Thunderbolt 3 port is not included. The USB 3.2 Gen 2 Type-C port supports neither DisplayPort over USB-C functionality nor USB Power Delivery. The 144-Hz, Full HD, IPS display offers a matte screen surface, good viewing angles, sufficient brightness, good contrast ratio, fast response times and great colour reproduction.
Acer Predator Helios 300 PH317-54-75G8
- 10/09/2020 v7 (old)
Sascha Mölck
Price comparison
