Acer Predator Helios 300 PH315-53 in review: Update provides for (slightly) more RTX 3070 power

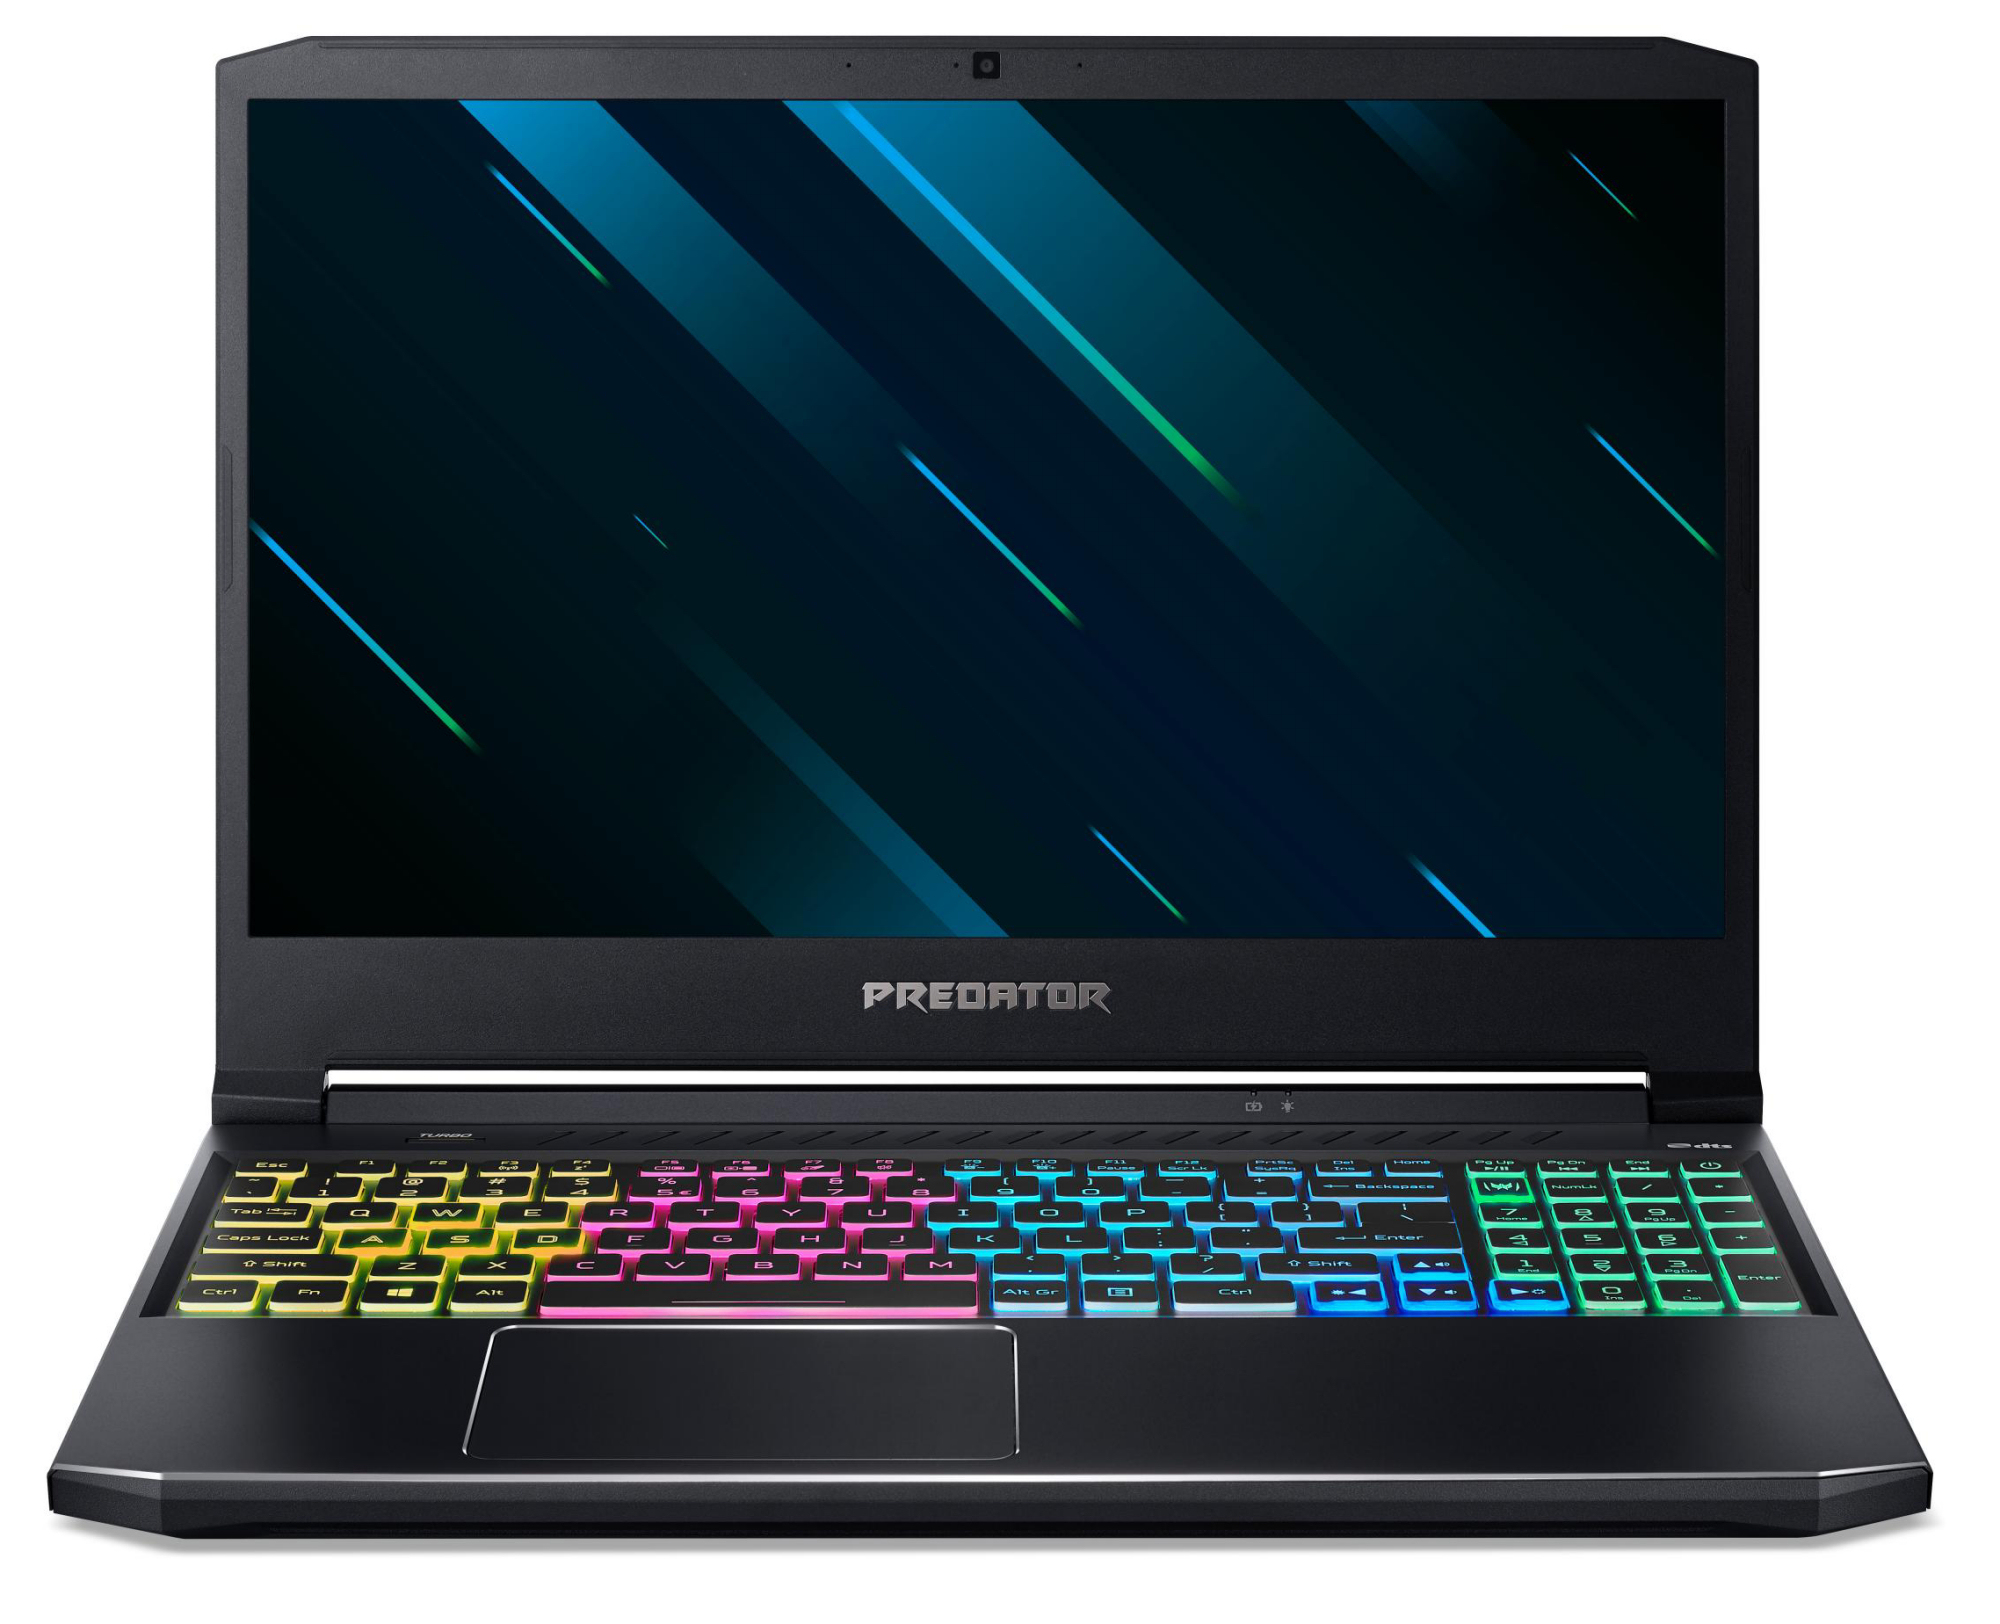
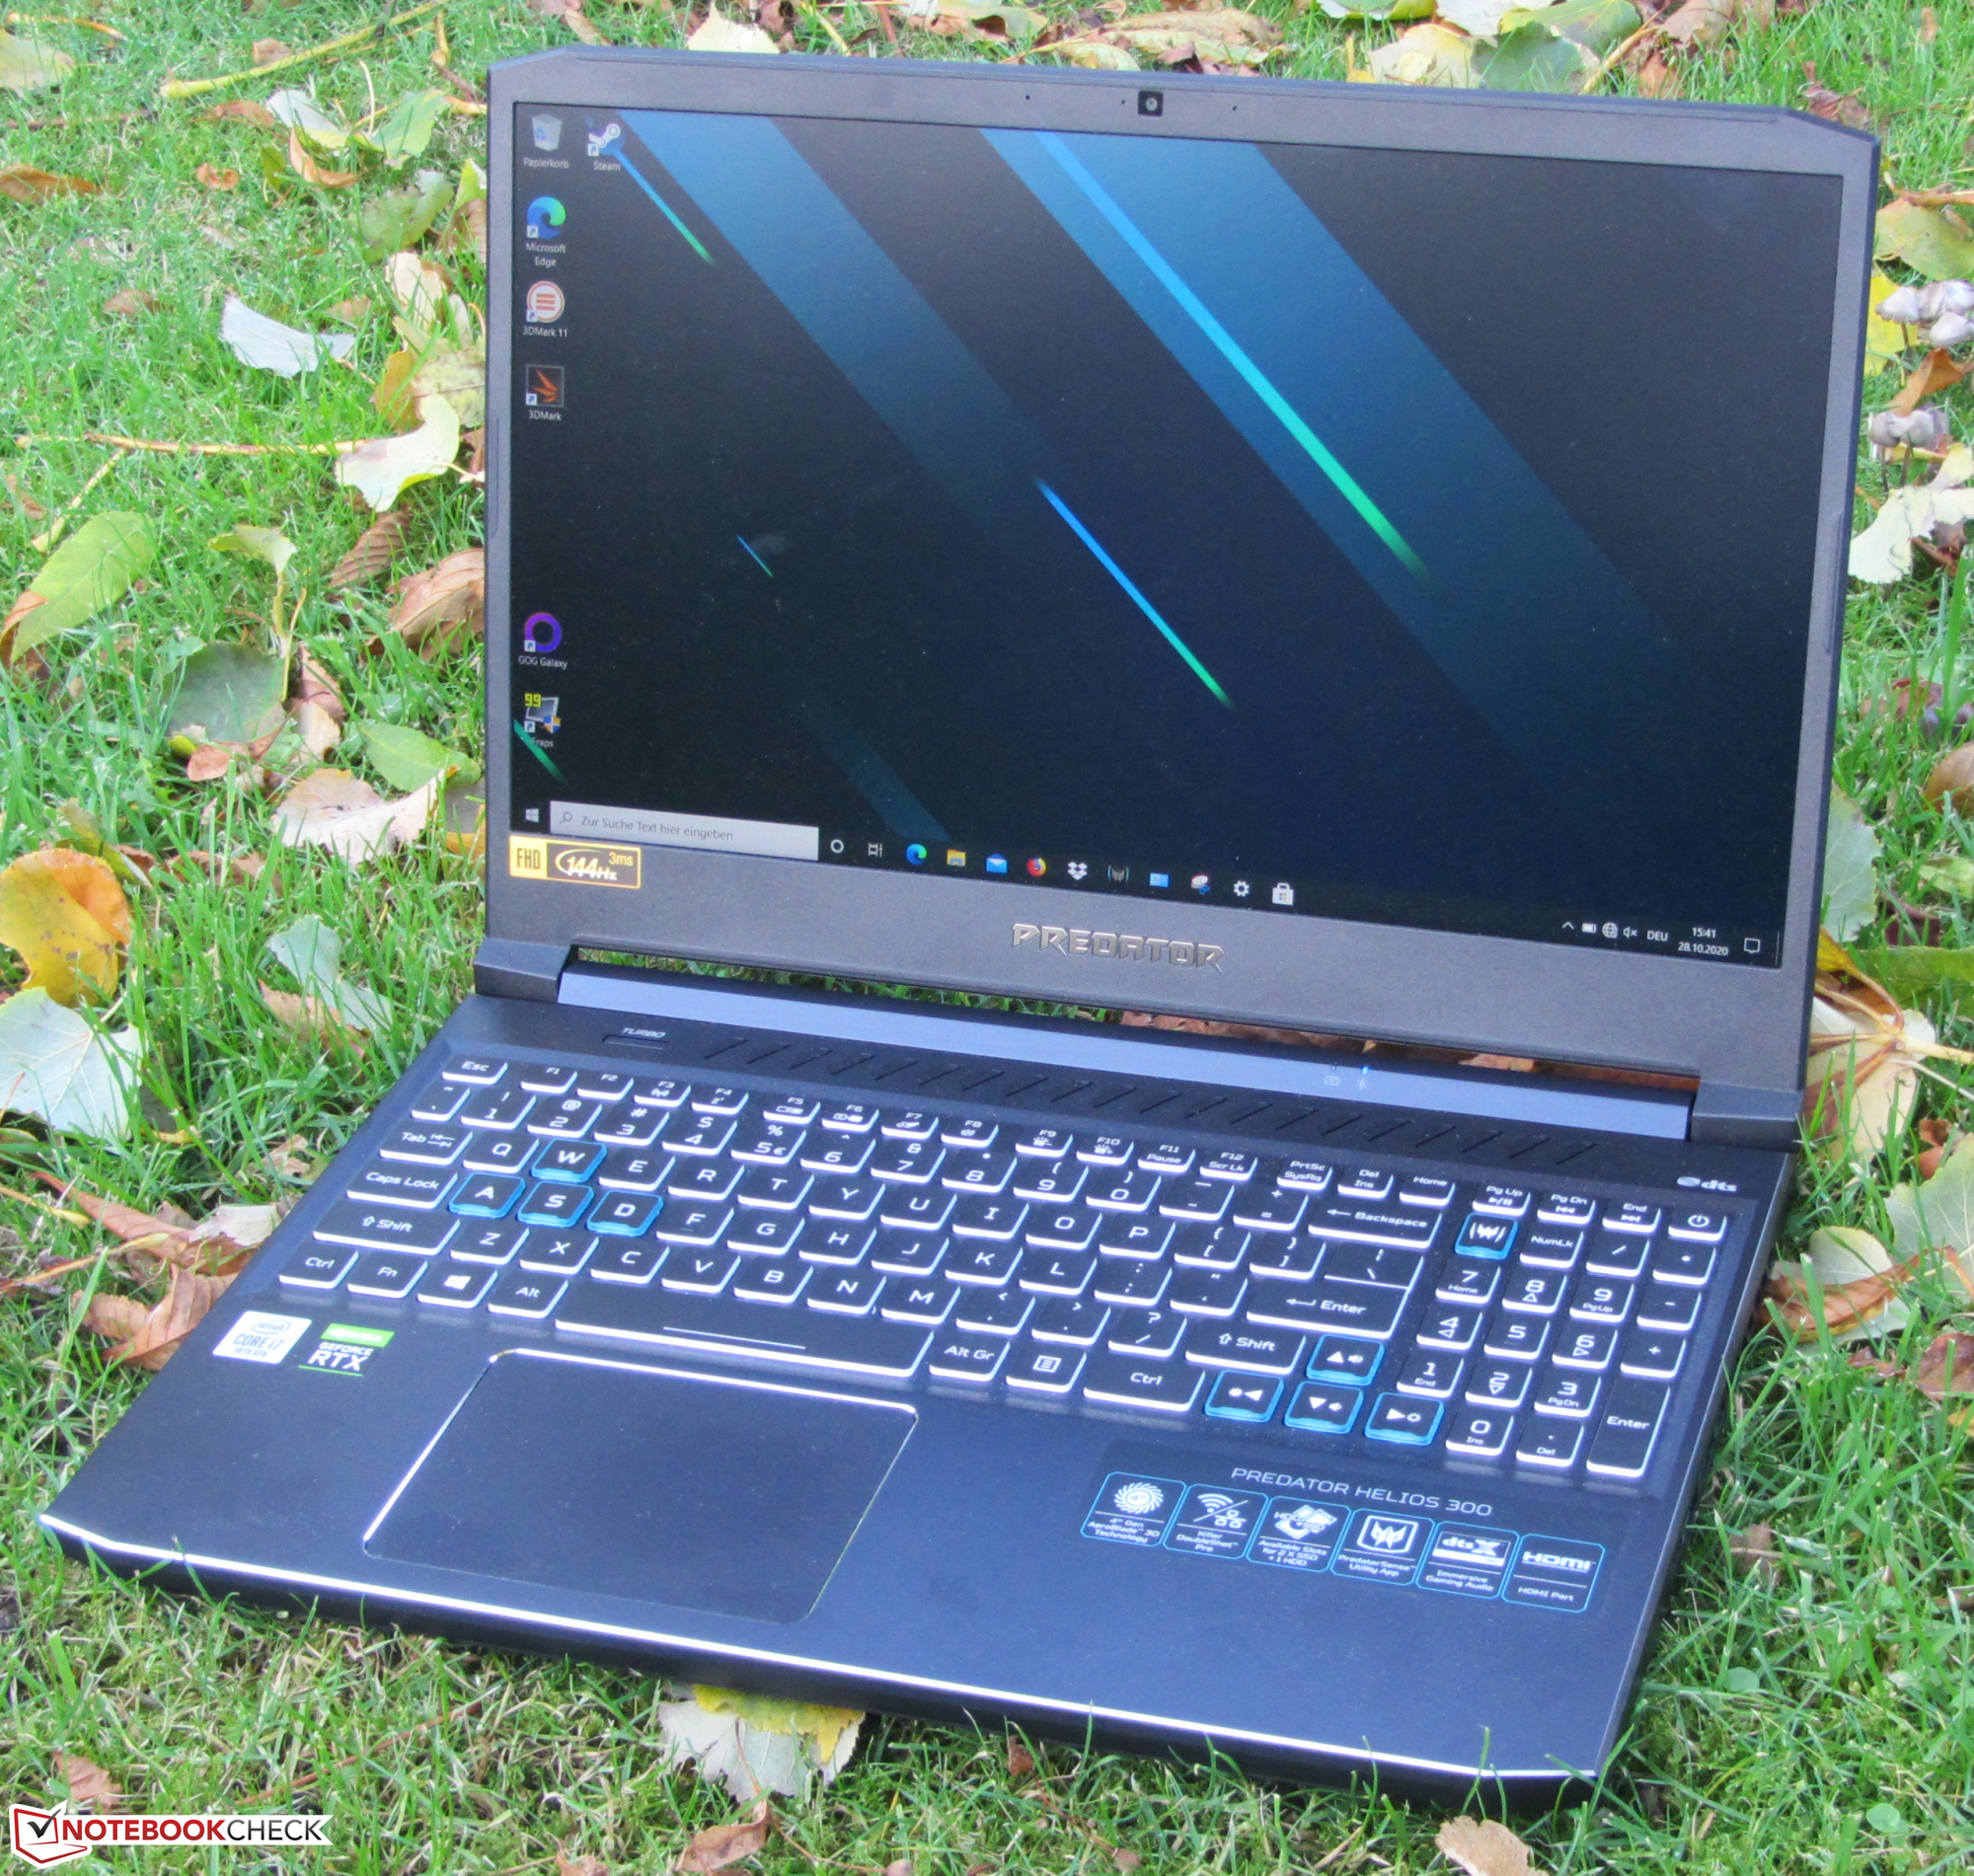
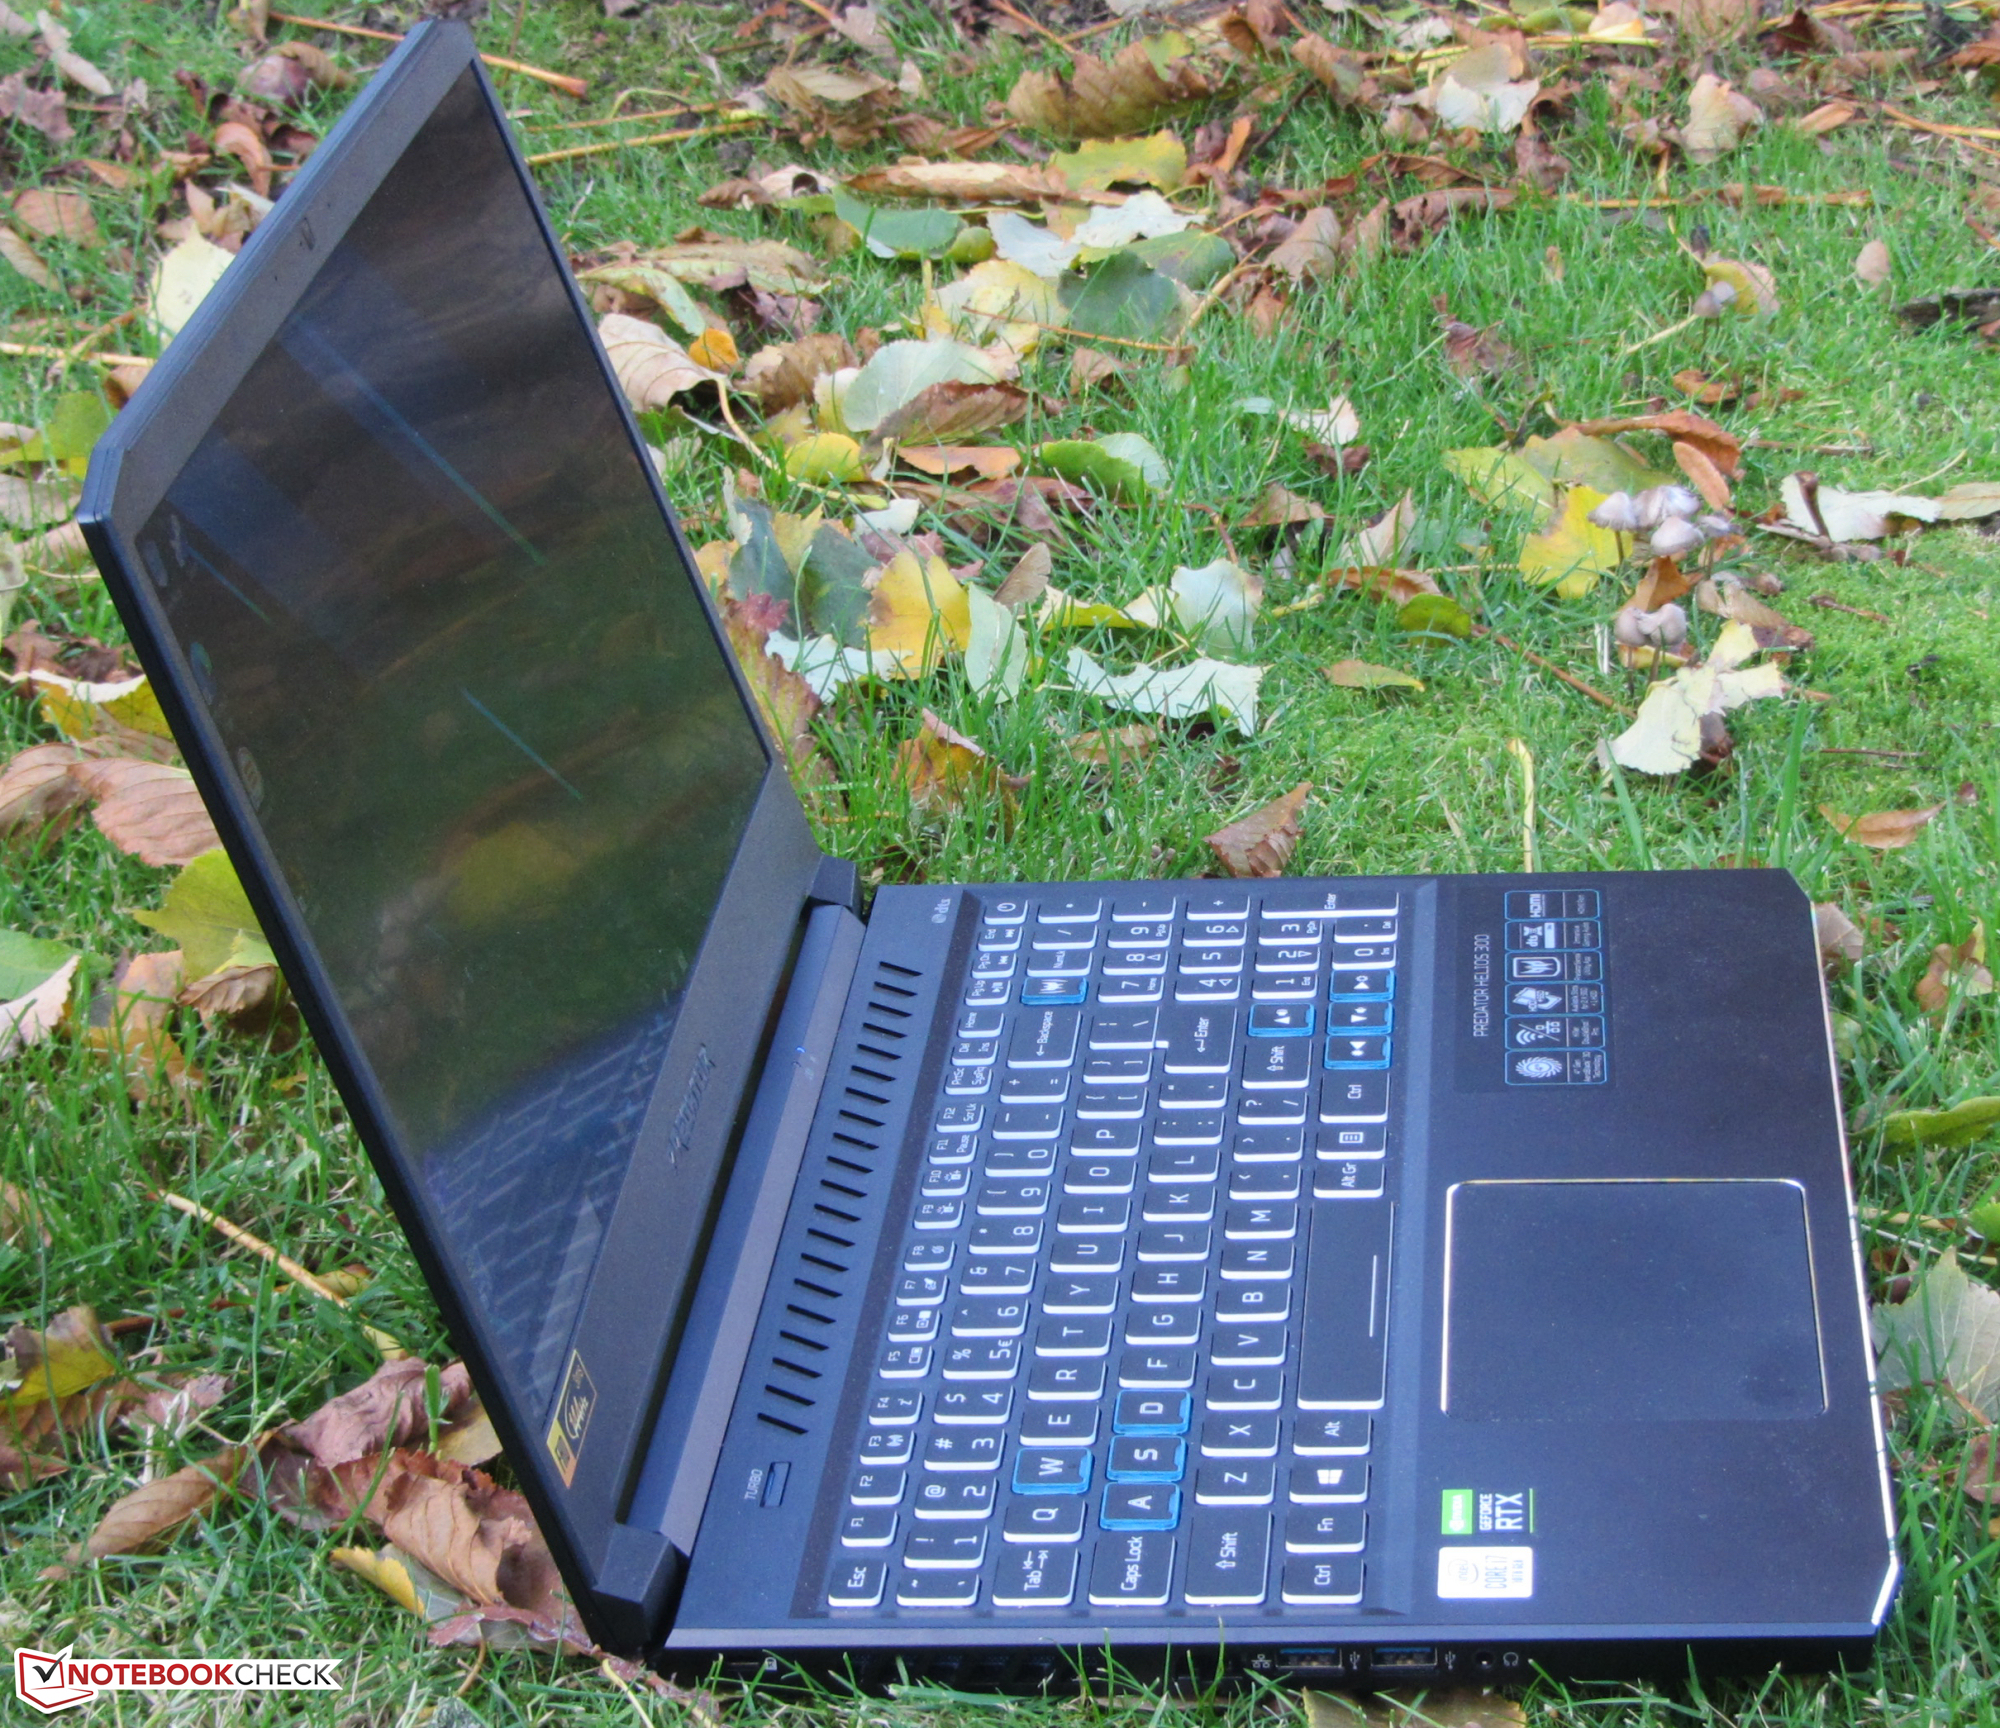
The Predator Helios 300 is a gaming laptop in the 15.6-inch format. The device is powered by a Core i7-10750H processor and a GeForce RTX 3070 laptop GPU. Competitors include devices like the Aorus 15G XC, the MSI GS66 Stealth 10UG, and the Asus ROG Strix G15 G513QR.
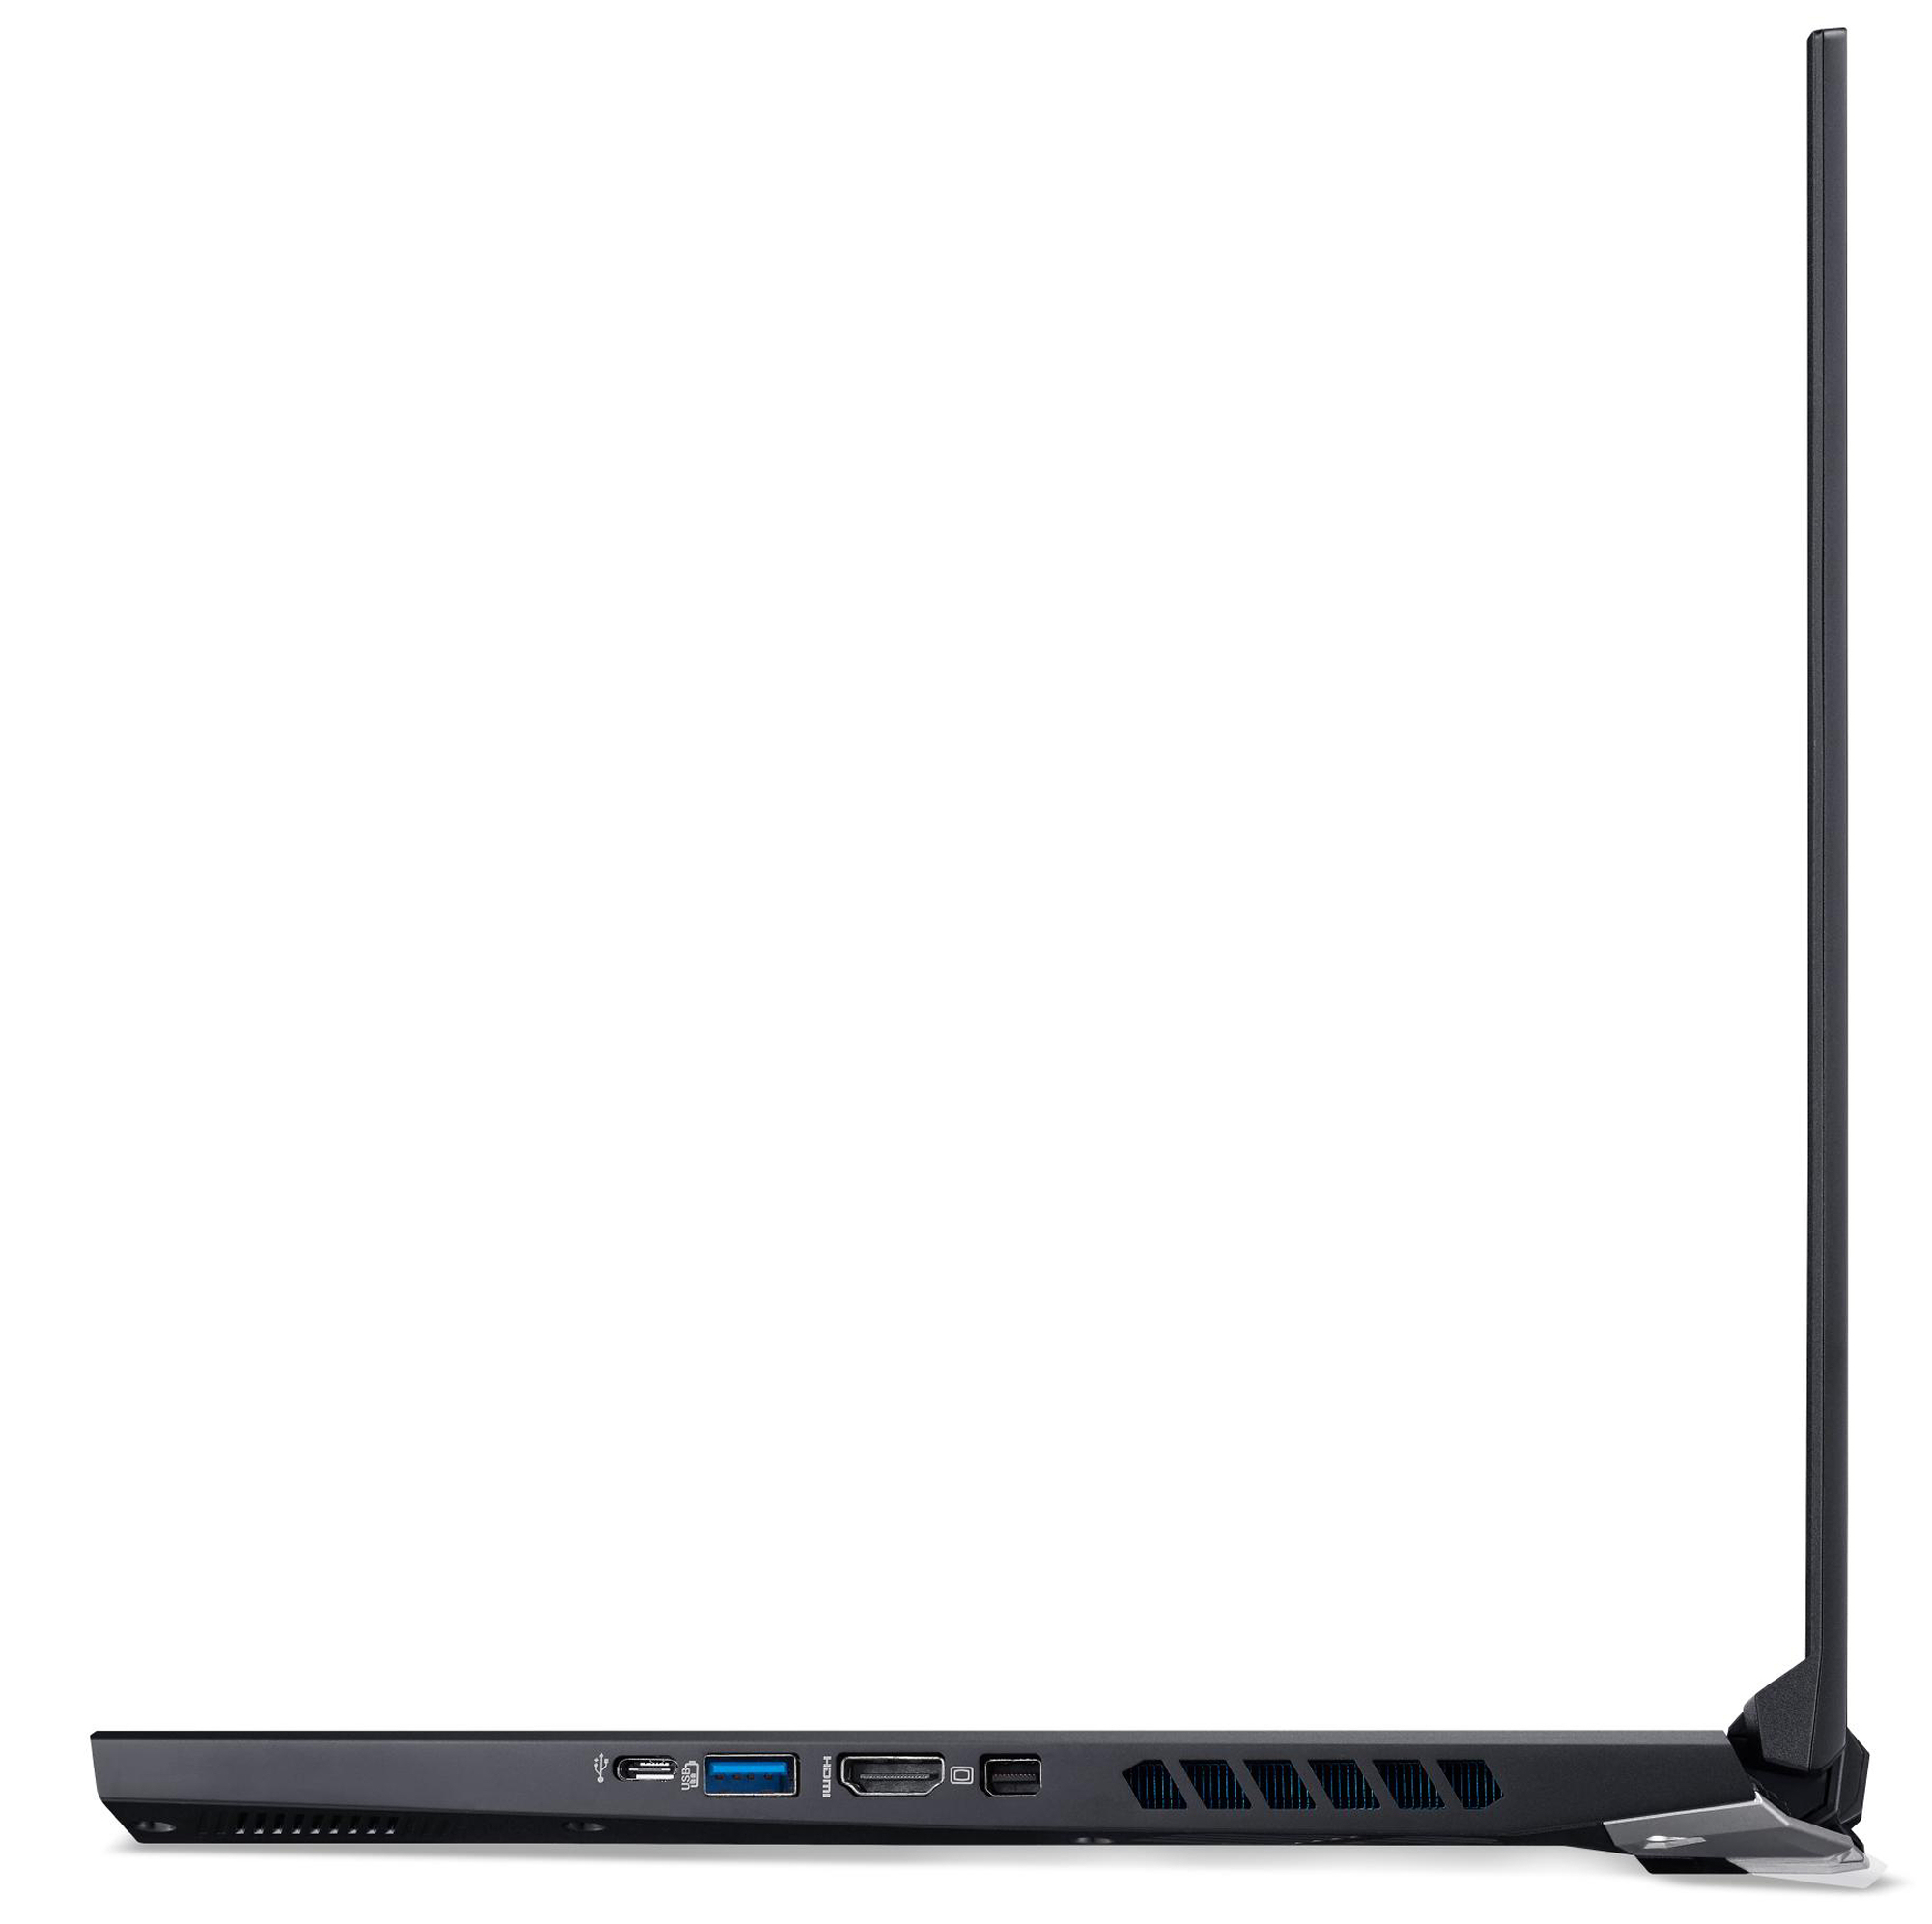
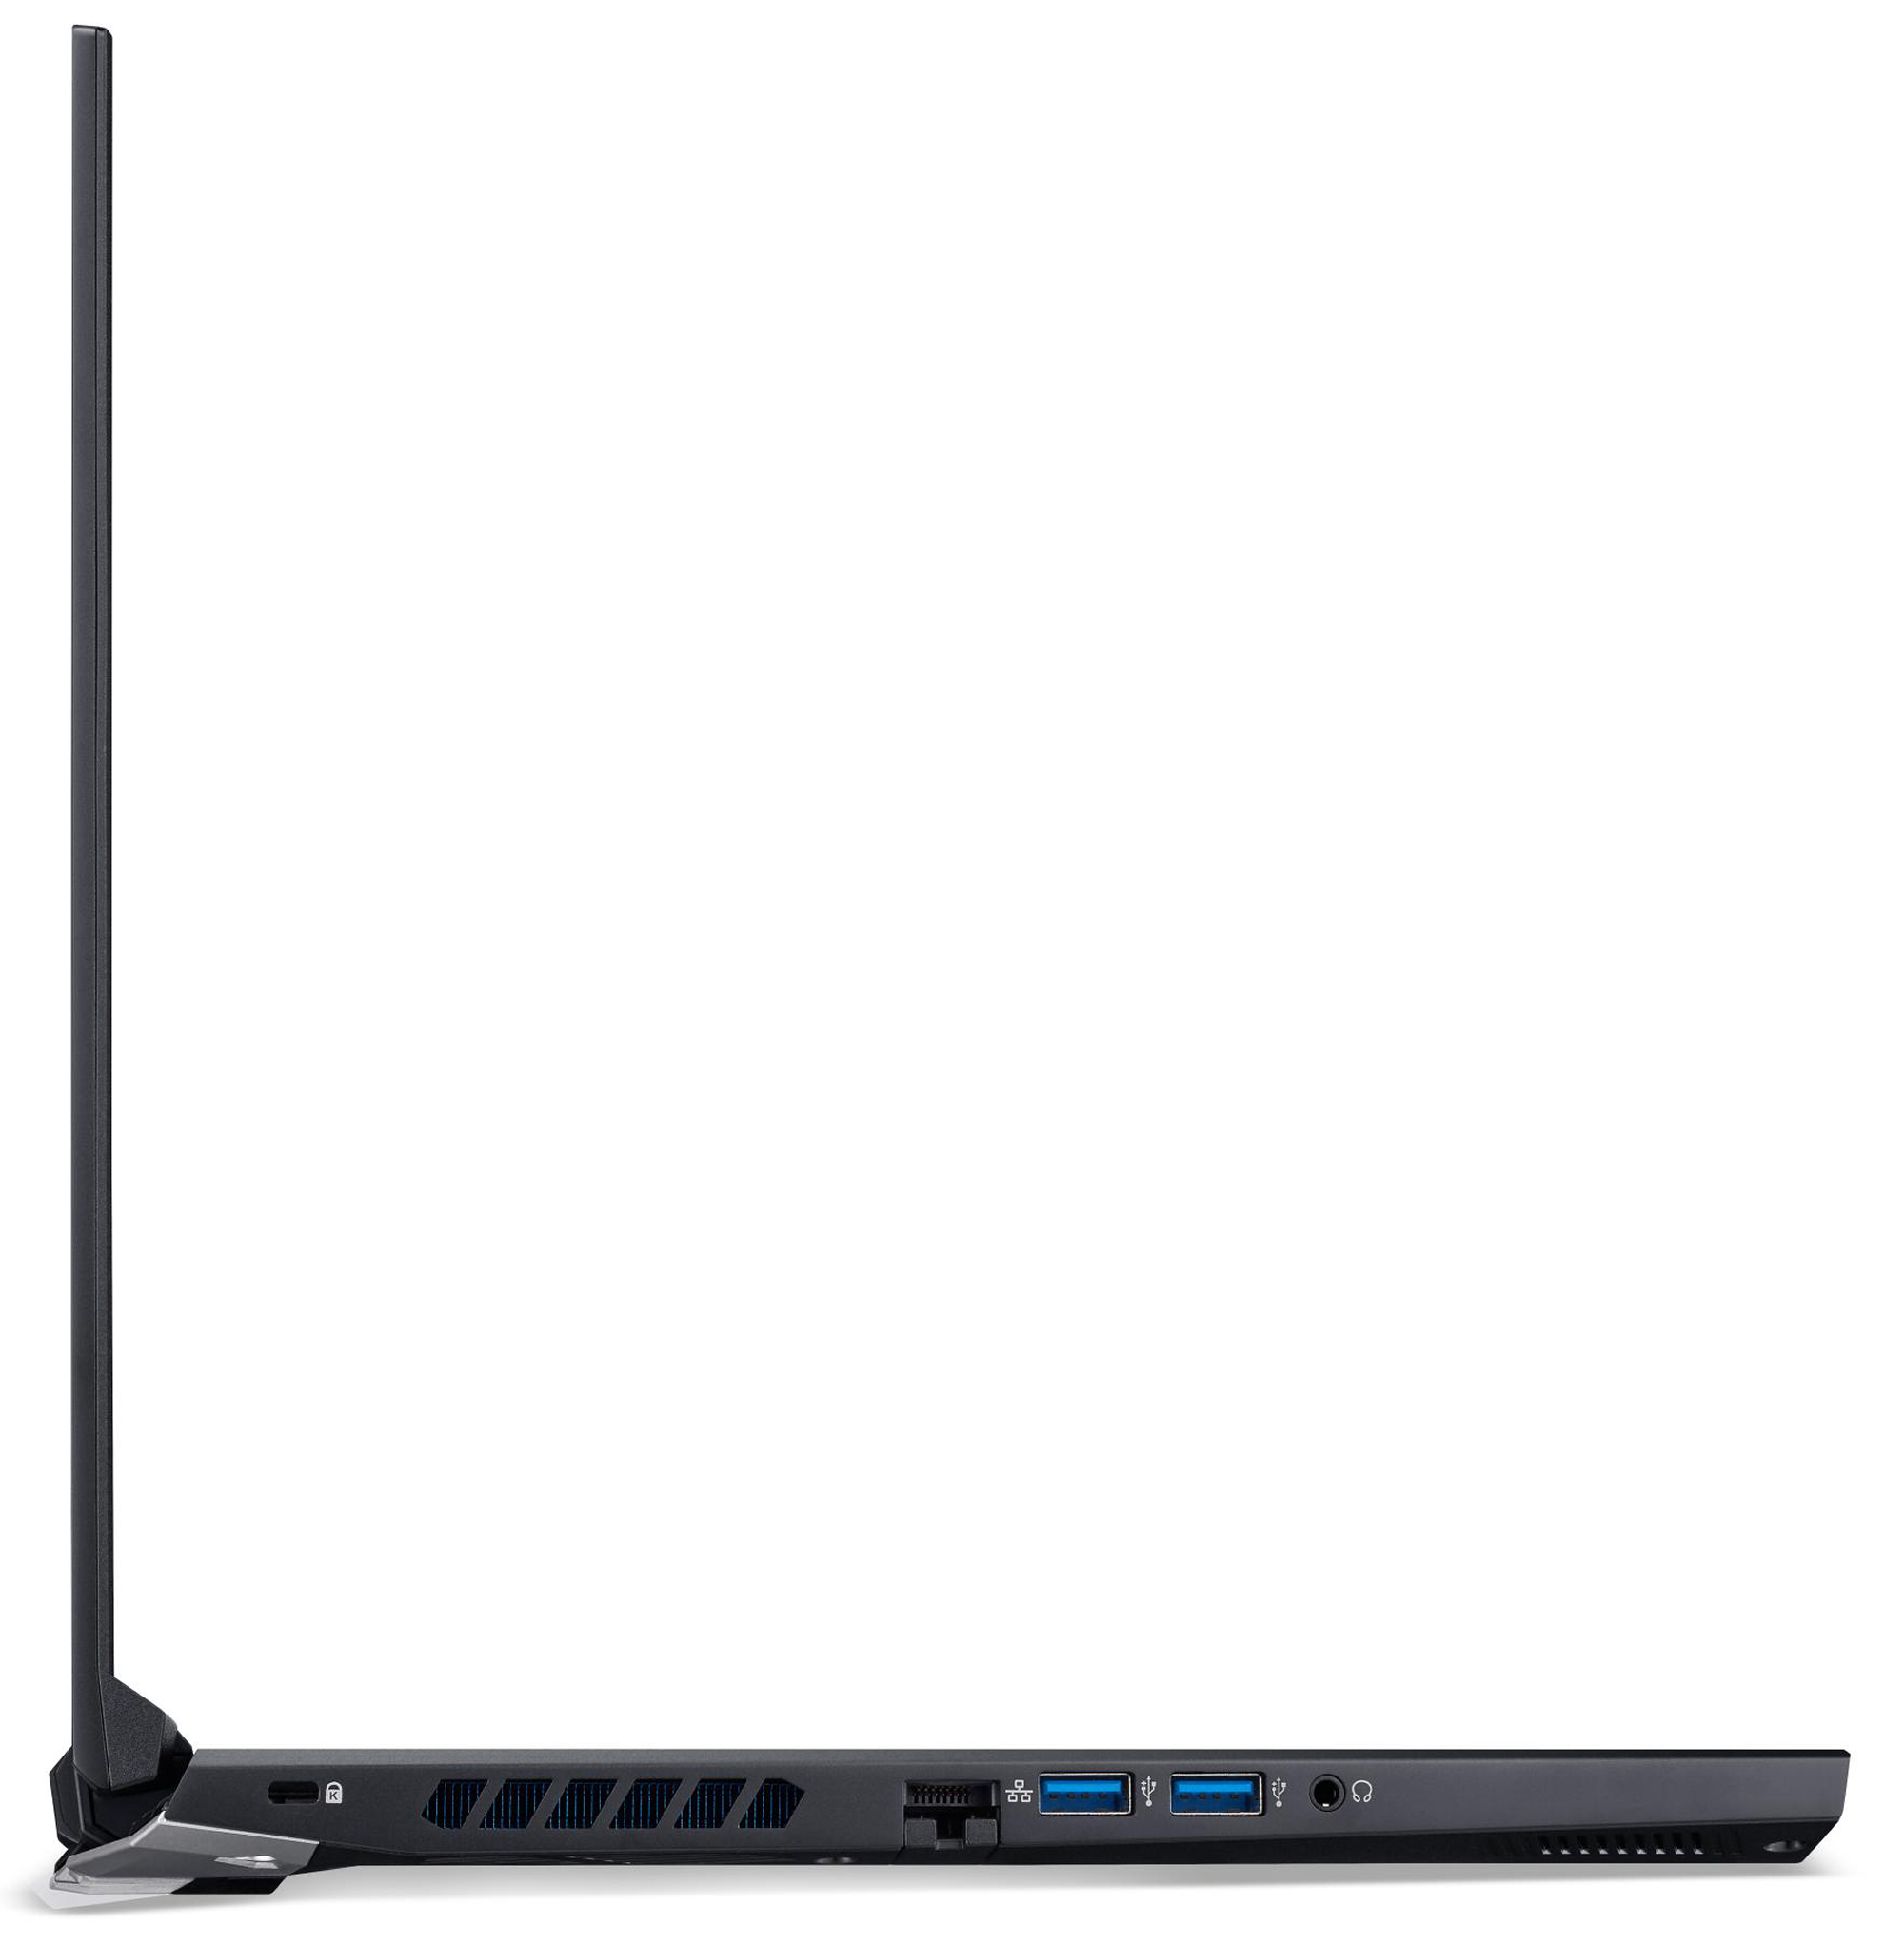
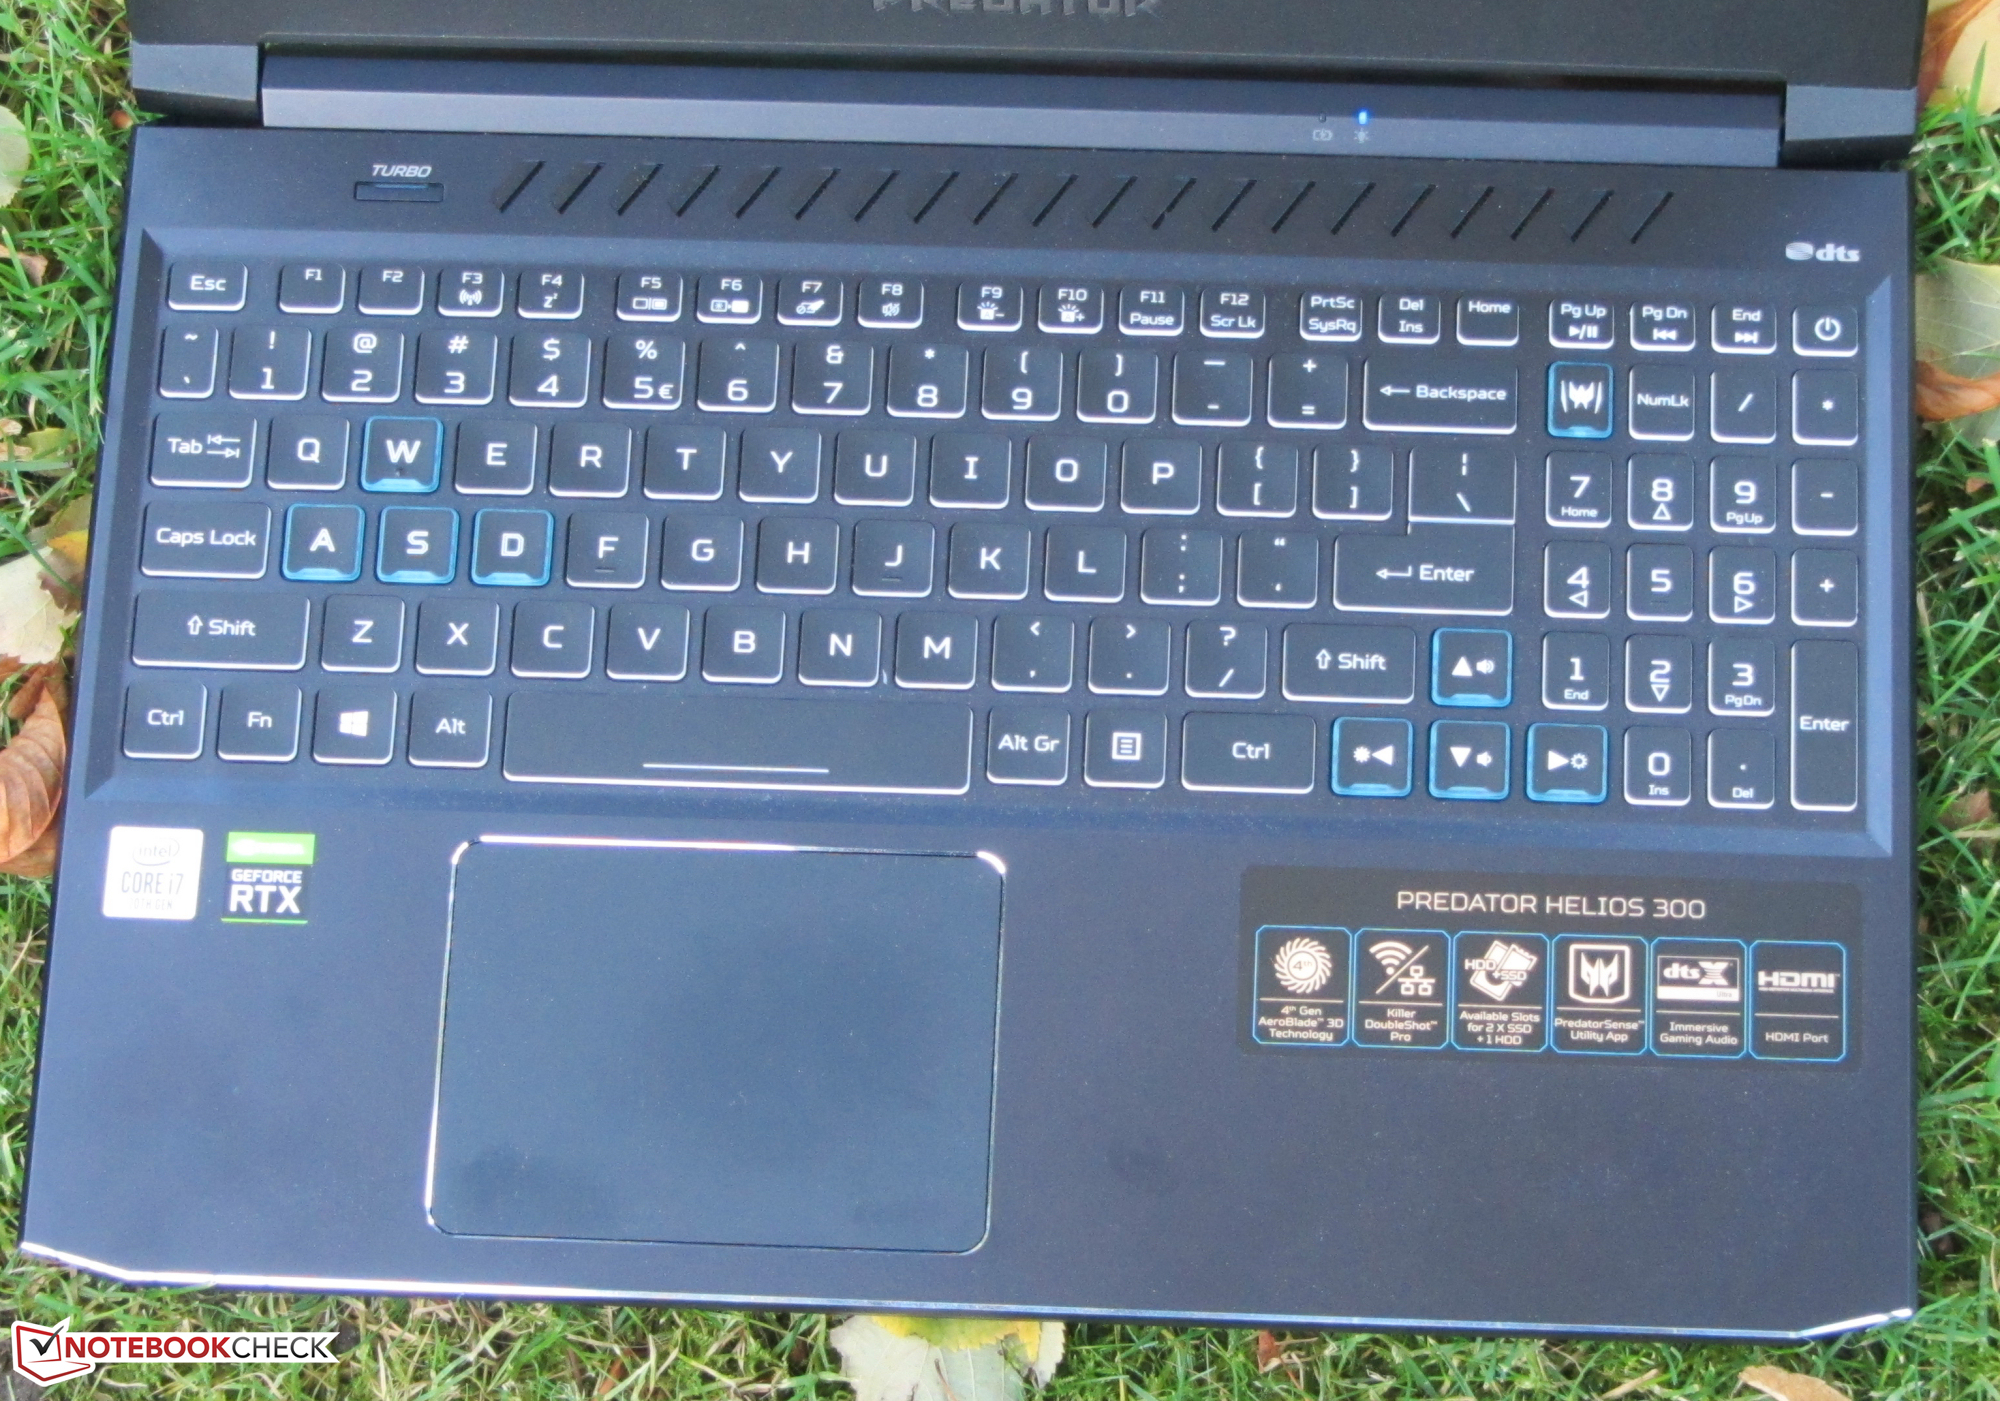
Since we've already reviewed one of the Predator's sister models, we won't go into the case, the connectivity, the input devices, and the speakers. The corresponding information can be found in the review of the Acer Predator Helios 300 PH315-53-77N5. It's also worth taking a look at the review of the similar predecessor.
Possible contenders in comparison
Rating | Date | Model | Weight | Height | Size | Resolution | Price |
|---|---|---|---|---|---|---|---|
| 83.8 % v7 (old) | 07 / 2021 | Acer Predator Helios 300 PH315-53-786B i7-10750H, GeForce RTX 3070 Laptop GPU | 2.2 kg | 22.9 mm | 15.60" | 1920x1080 | |
| 86.4 % v7 (old) | 02 / 2021 | Aorus 15G XC i7-10870H, GeForce RTX 3070 Laptop GPU | 2.1 kg | 23 mm | 15.60" | 1920x1080 | |
| 84 % v7 (old) | 02 / 2021 | MSI GS66 Stealth 10UG i7-10870H, GeForce RTX 3070 Laptop GPU | 2.1 kg | 19.8 mm | 15.60" | 1920x1080 | |
| 85 % v7 (old) | 02 / 2021 | Asus ROG Strix G15 G513QR R9 5900HX, GeForce RTX 3070 Laptop GPU | 2.3 kg | 27.2 mm | 15.60" | 1920x1080 |


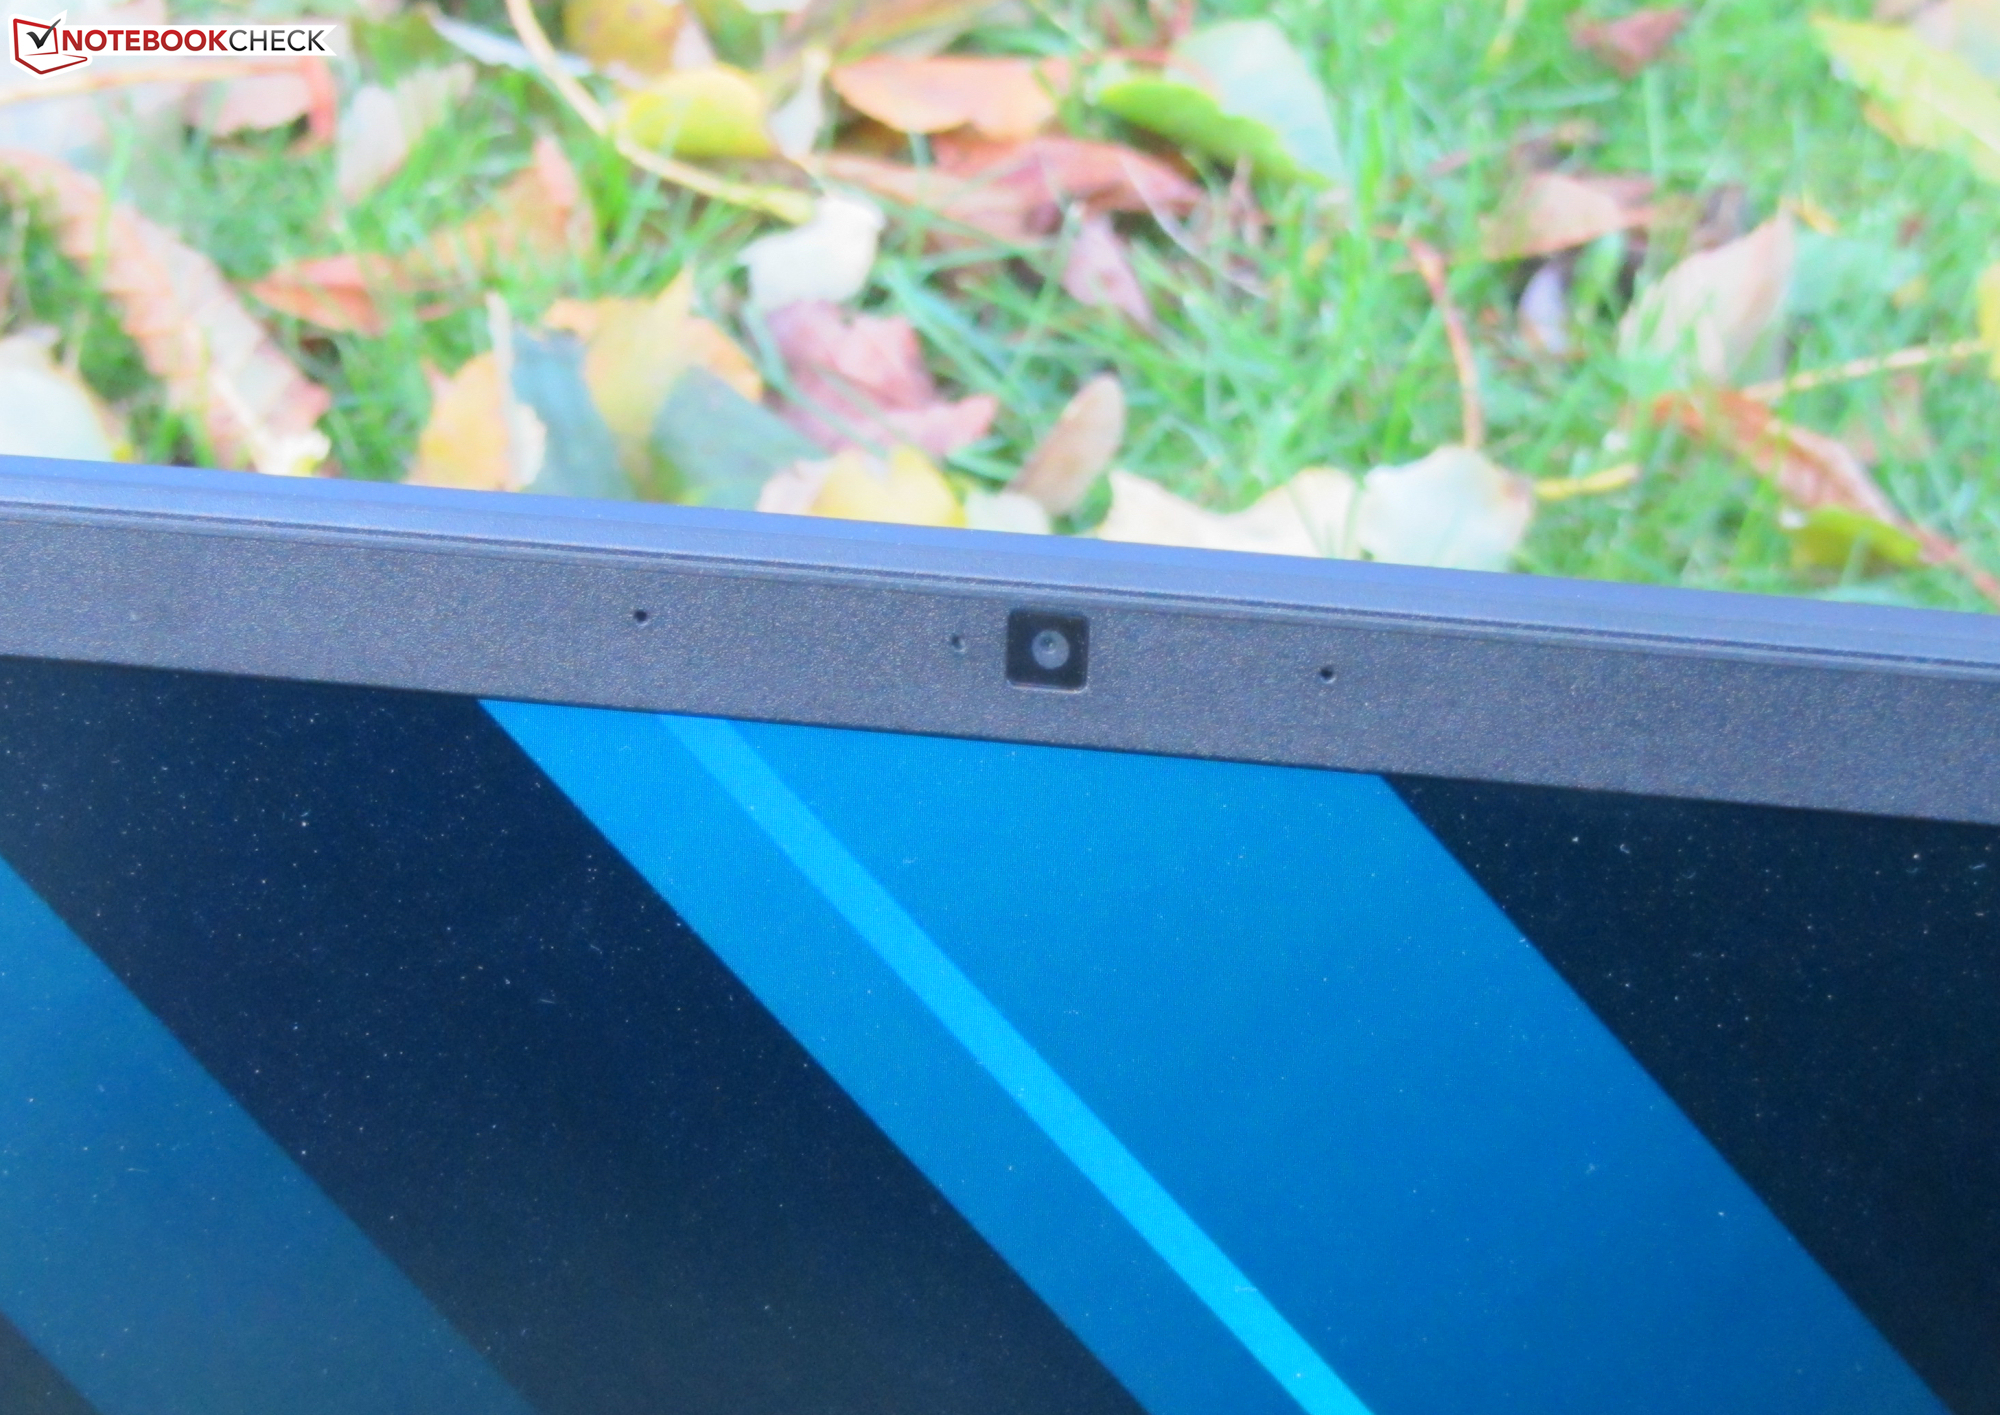


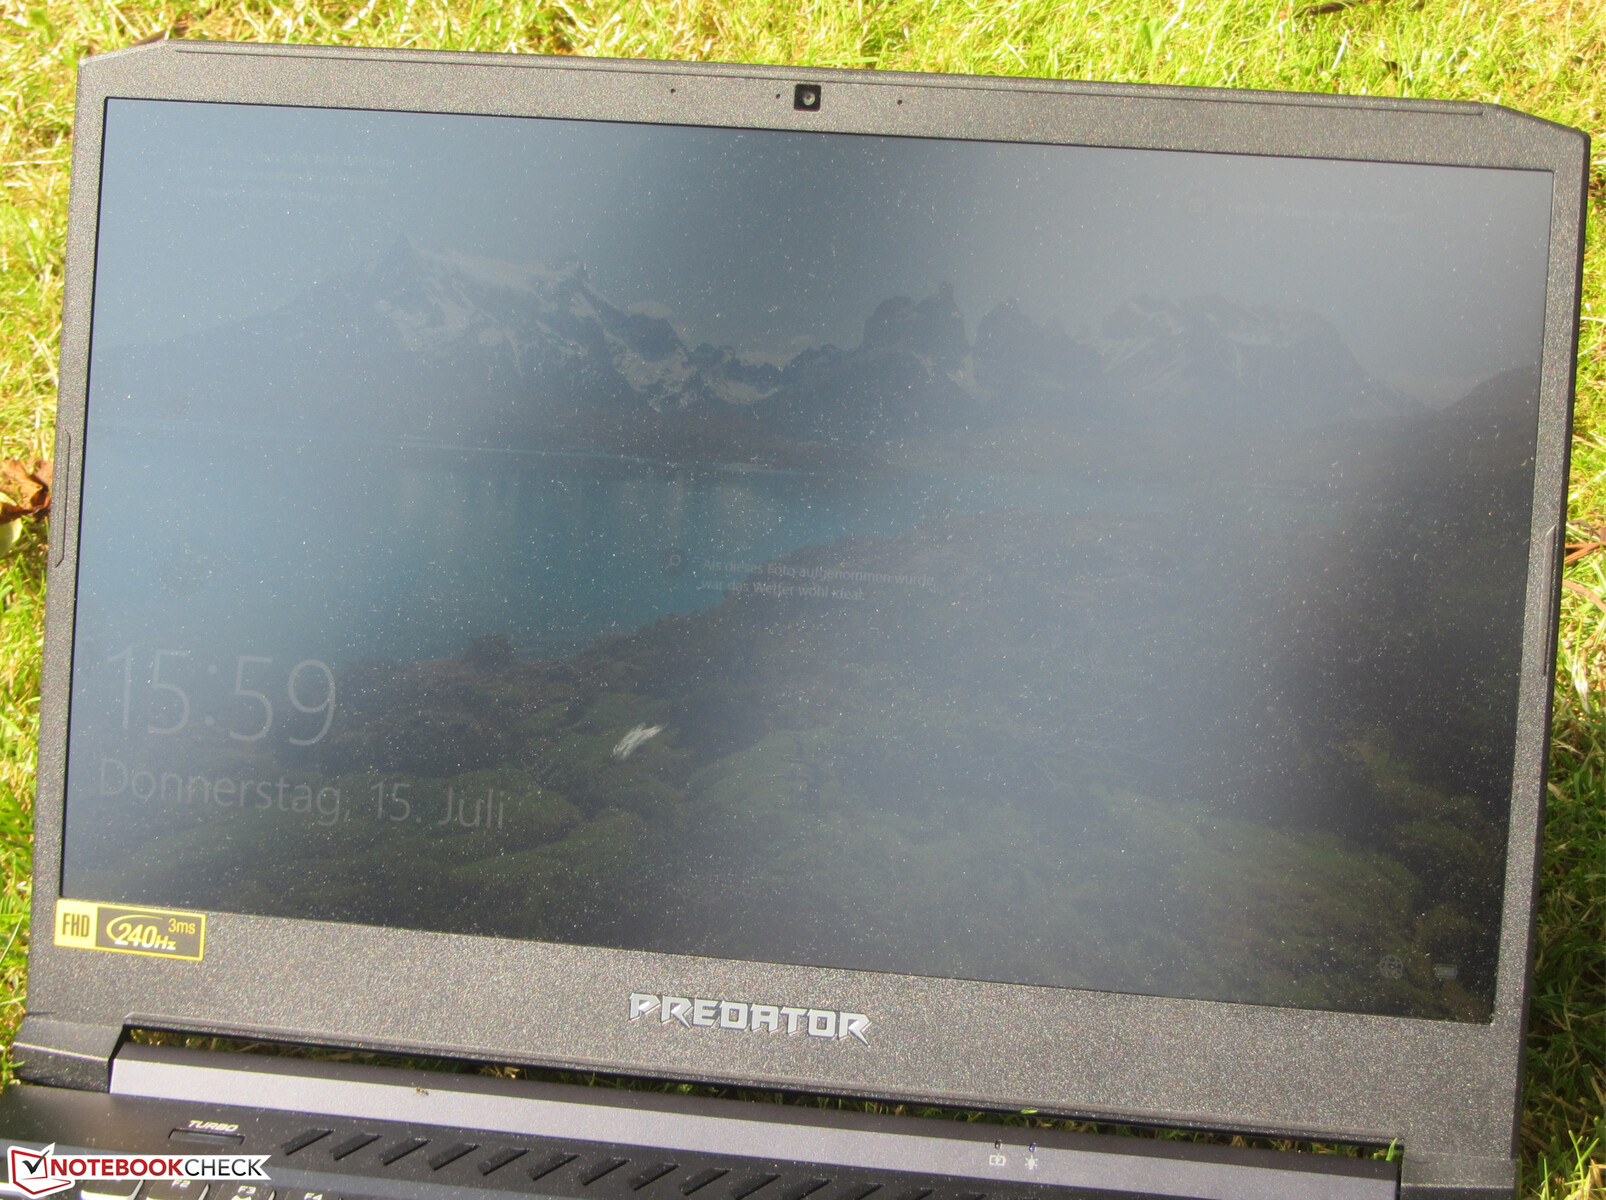
Display - 240 Hz IPS
The brightness (290.4 cd/m²) and contrast (975:1) of the matte 15.6-inch display (1920x1080 pixels) fail to meet the respective targets (300 cd/m² and 1,000:1). The 240 Hz panel has quick response times.
At brightness levels of 13% and below, flickering takes place at a frequency of 23,580 Hz. Due to the high frequency, even sensitive users should be spared from headaches and/or eye problems.
| |||||||||||||||||||||||||
Brightness Distribution: 87 %
Center on Battery: 312 cd/m²
Contrast: 975:1 (Black: 0.32 cd/m²)
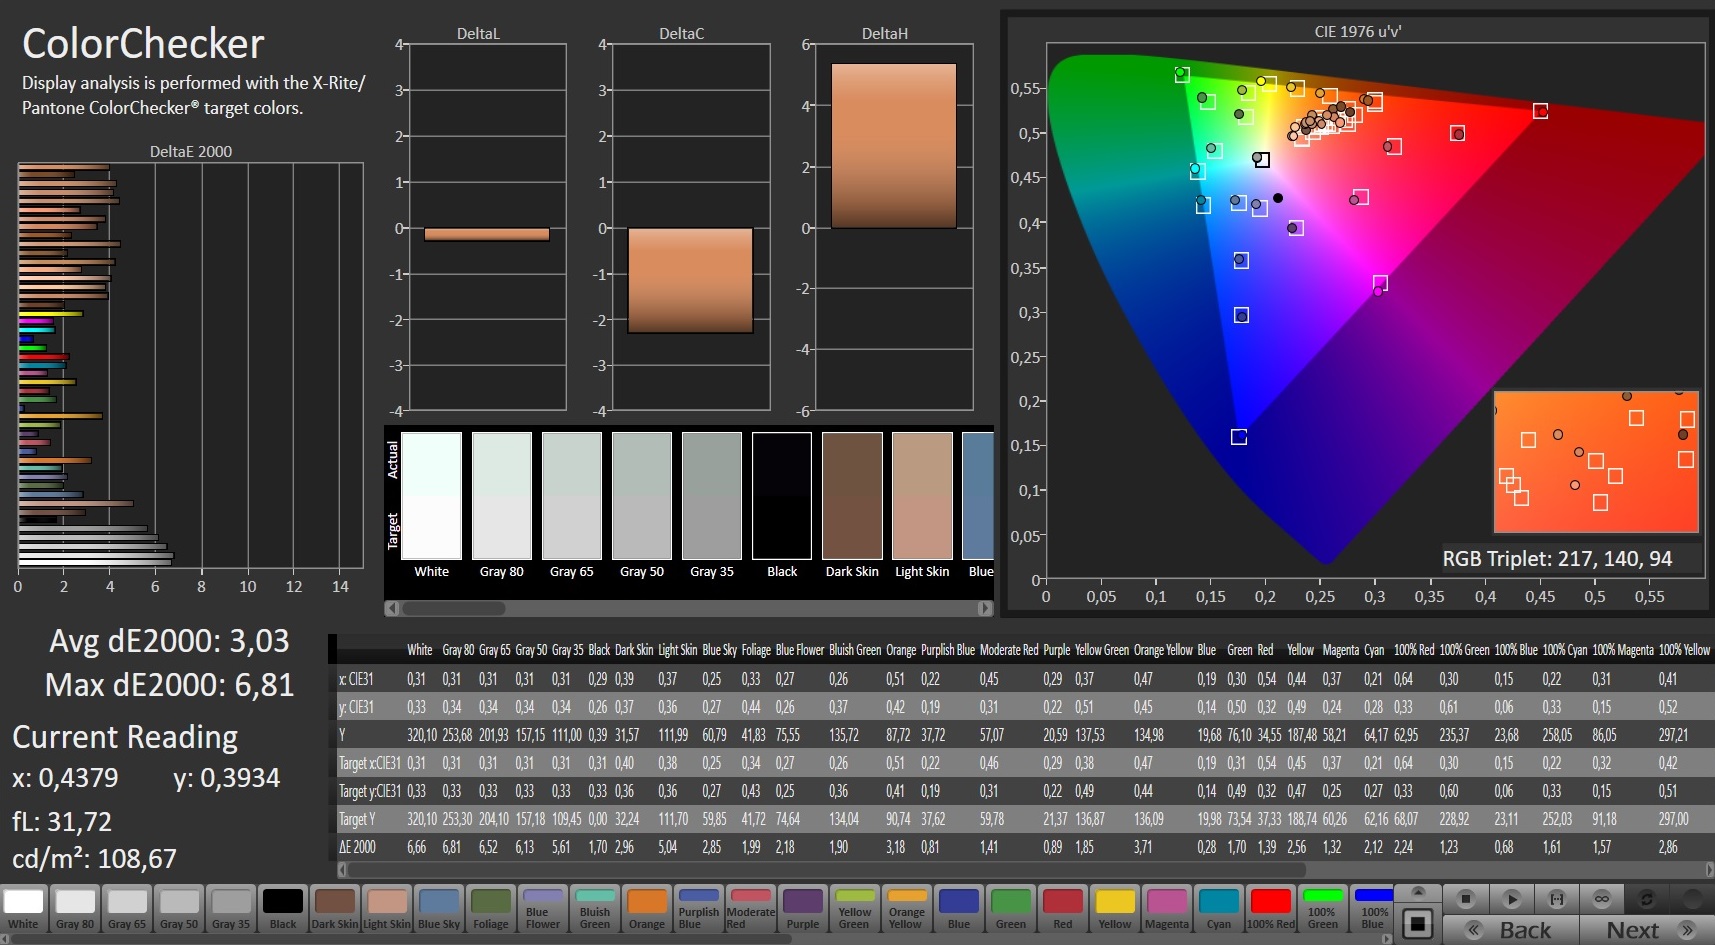
ΔE ColorChecker Calman: 3.03 | ∀{0.5-29.43 Ø4.71}
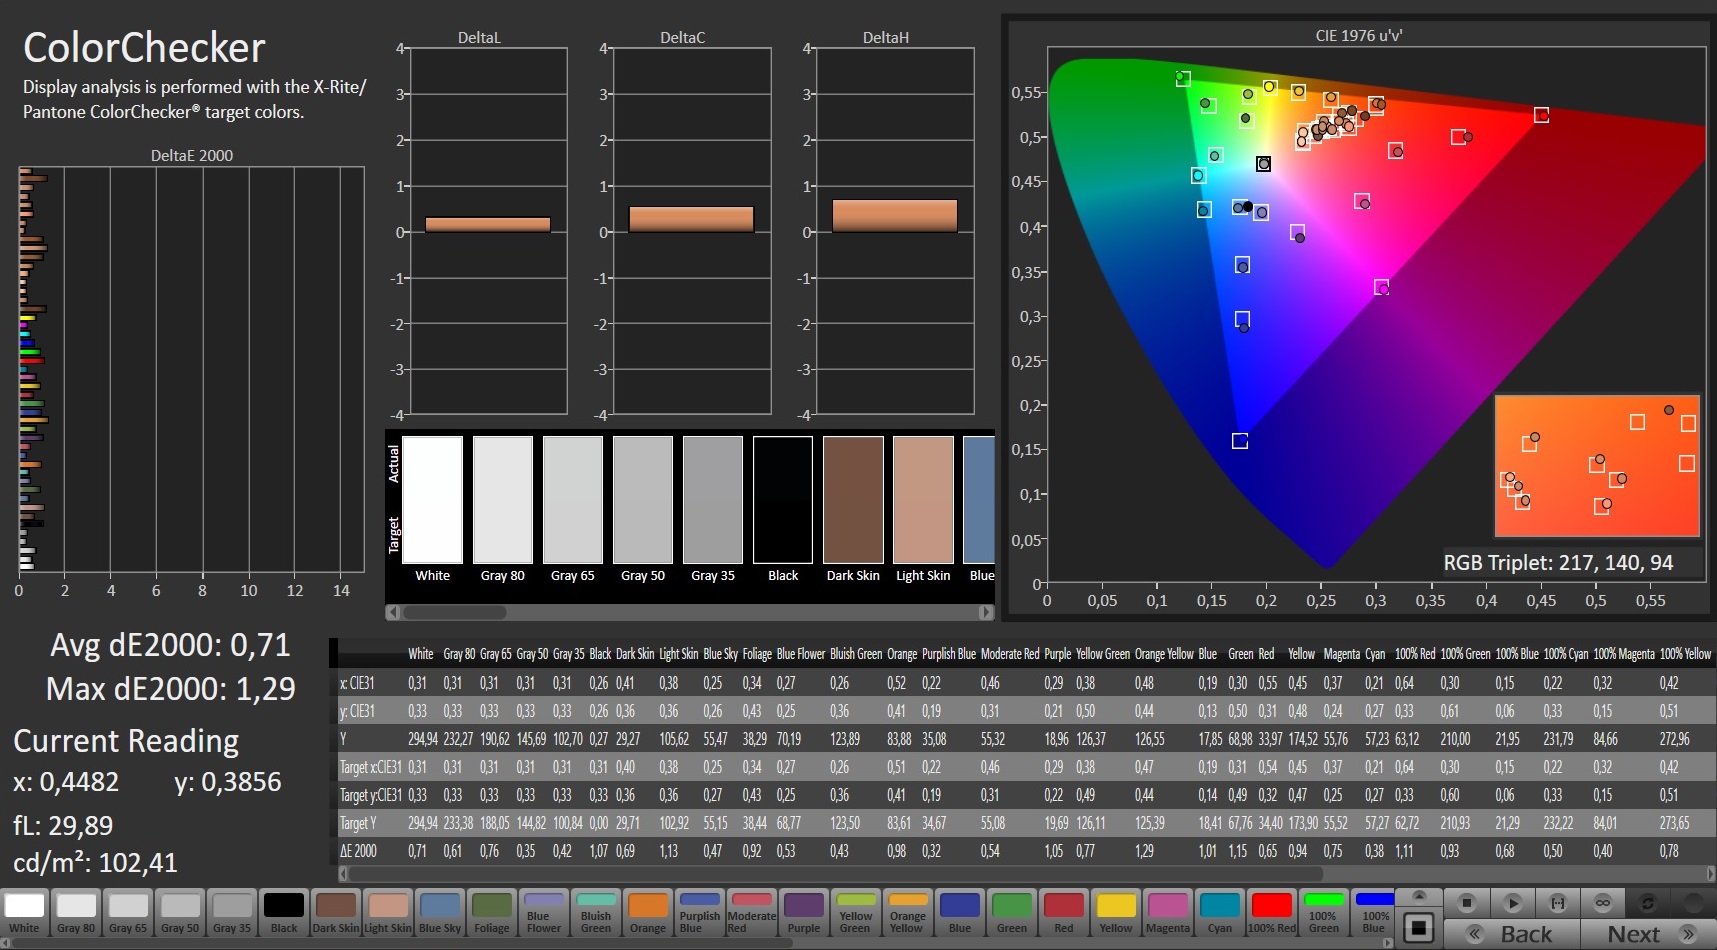
calibrated: 0.71
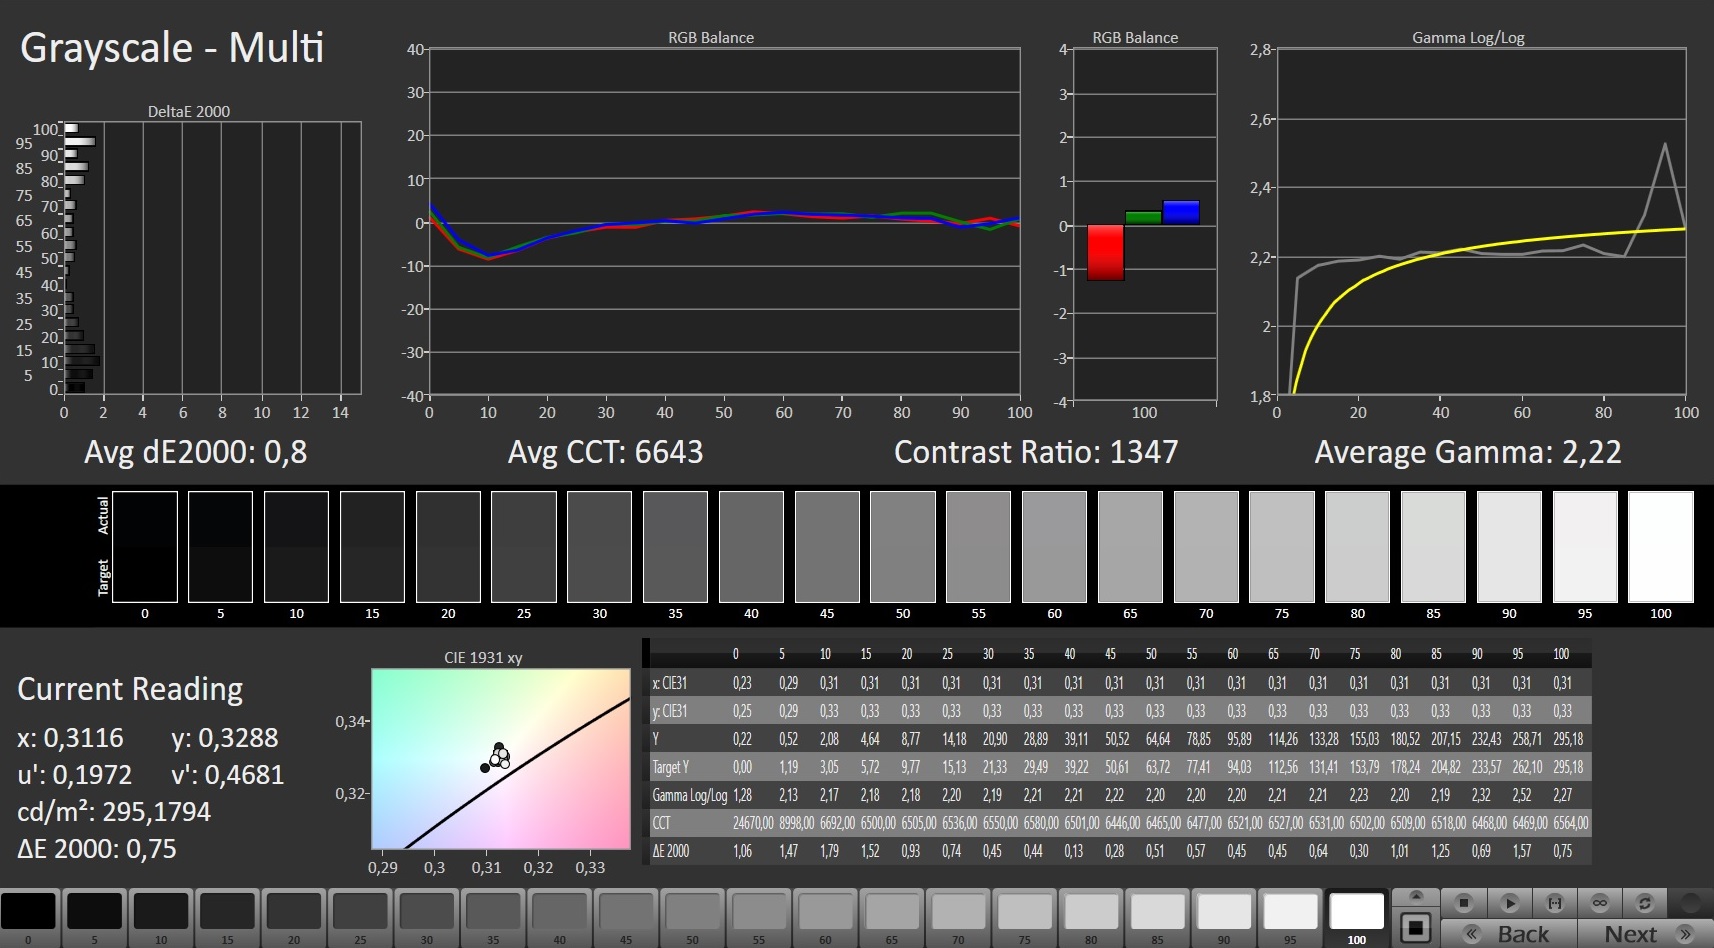
ΔE Greyscale Calman: 4.7 | ∀{0.09-98 Ø4.96}
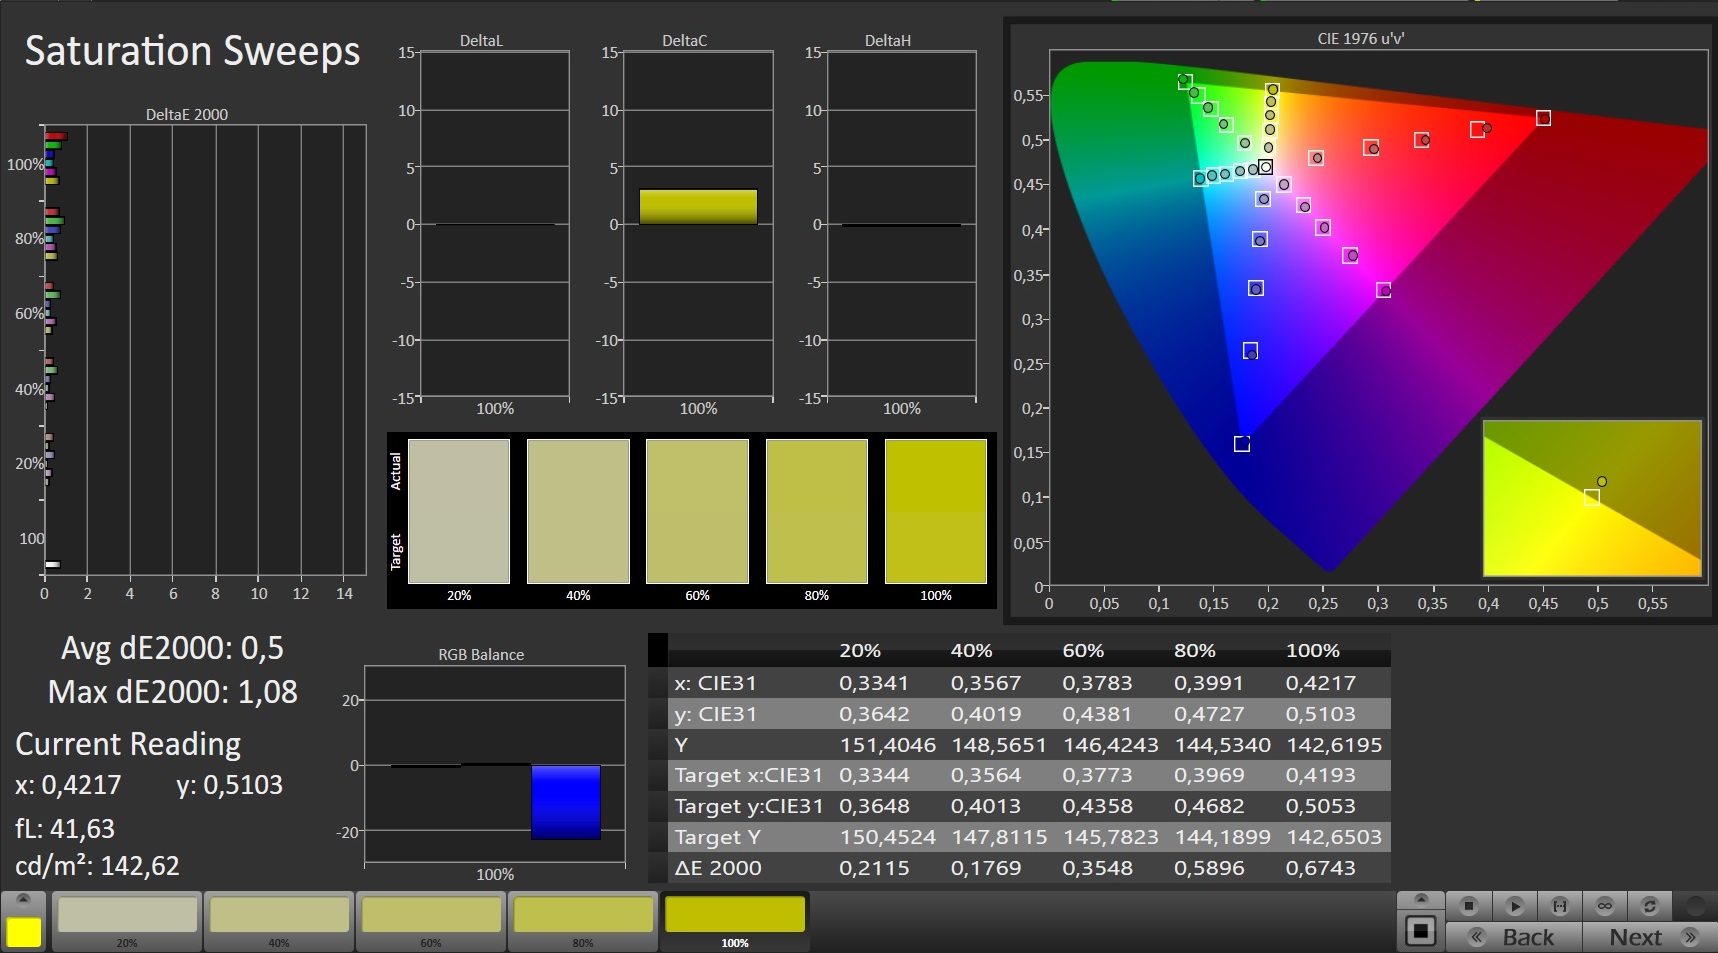
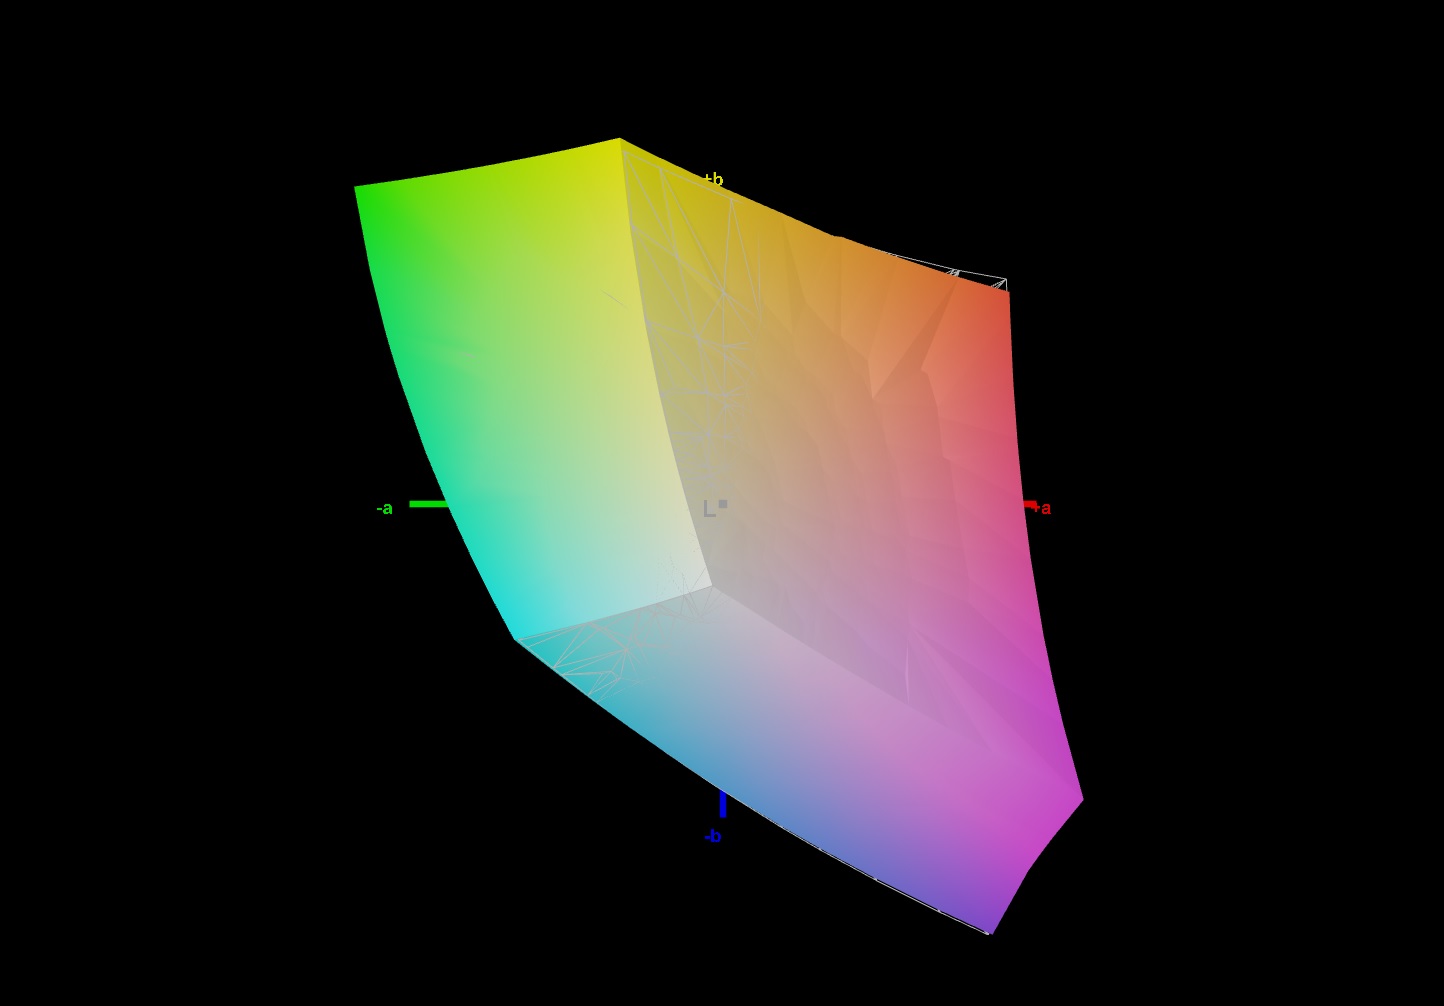
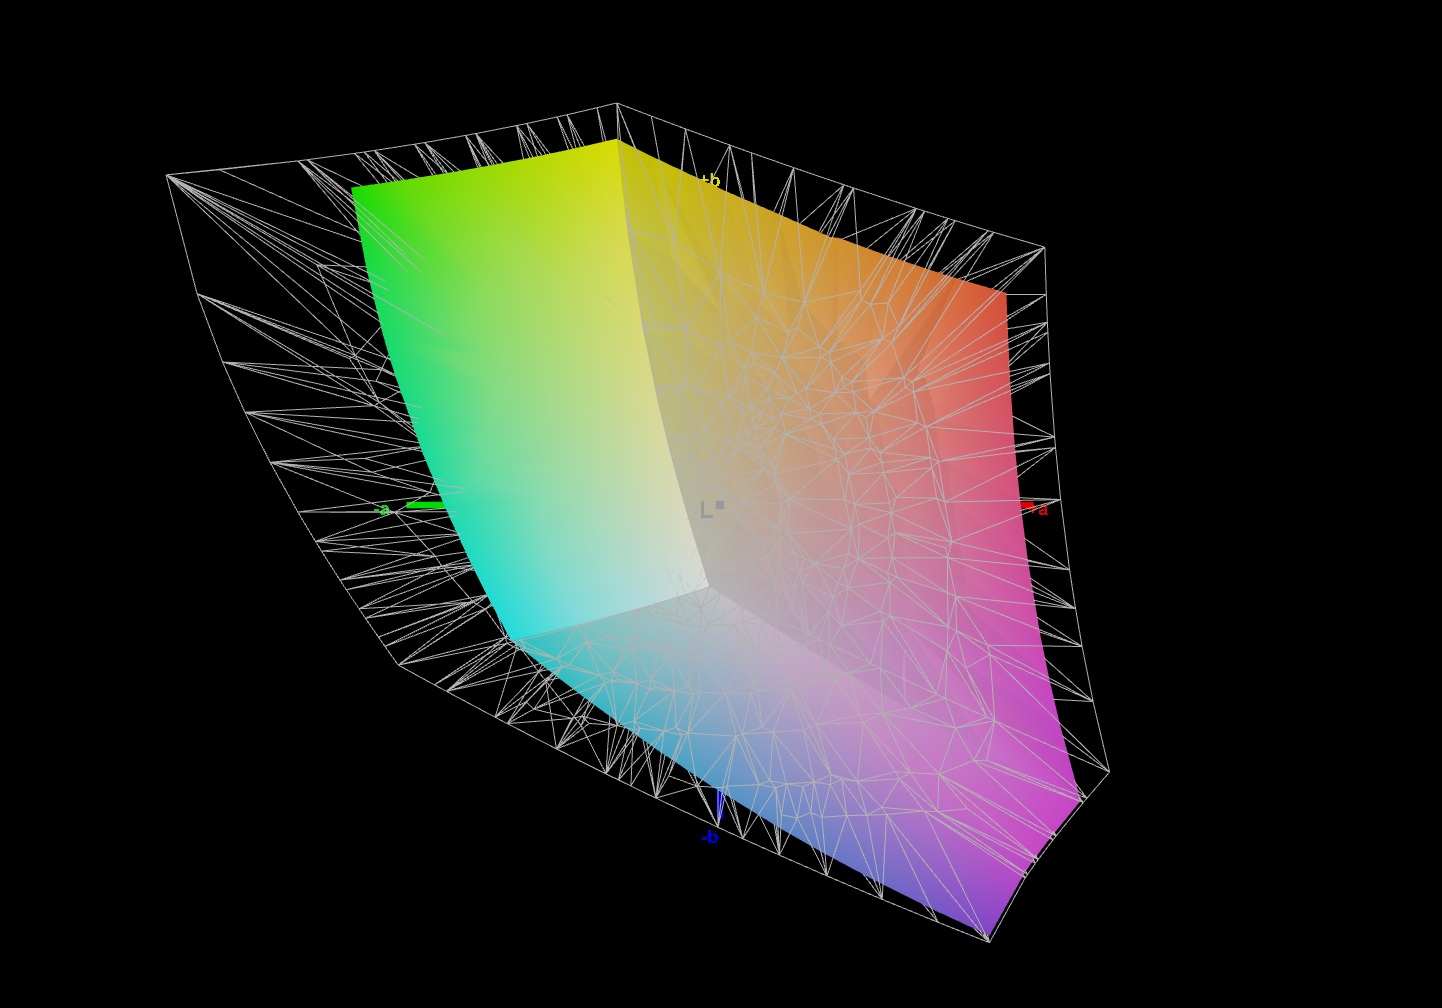
70.4% AdobeRGB 1998 (Argyll 3D)
99.4% sRGB (Argyll 3D)
68.4% Display P3 (Argyll 3D)
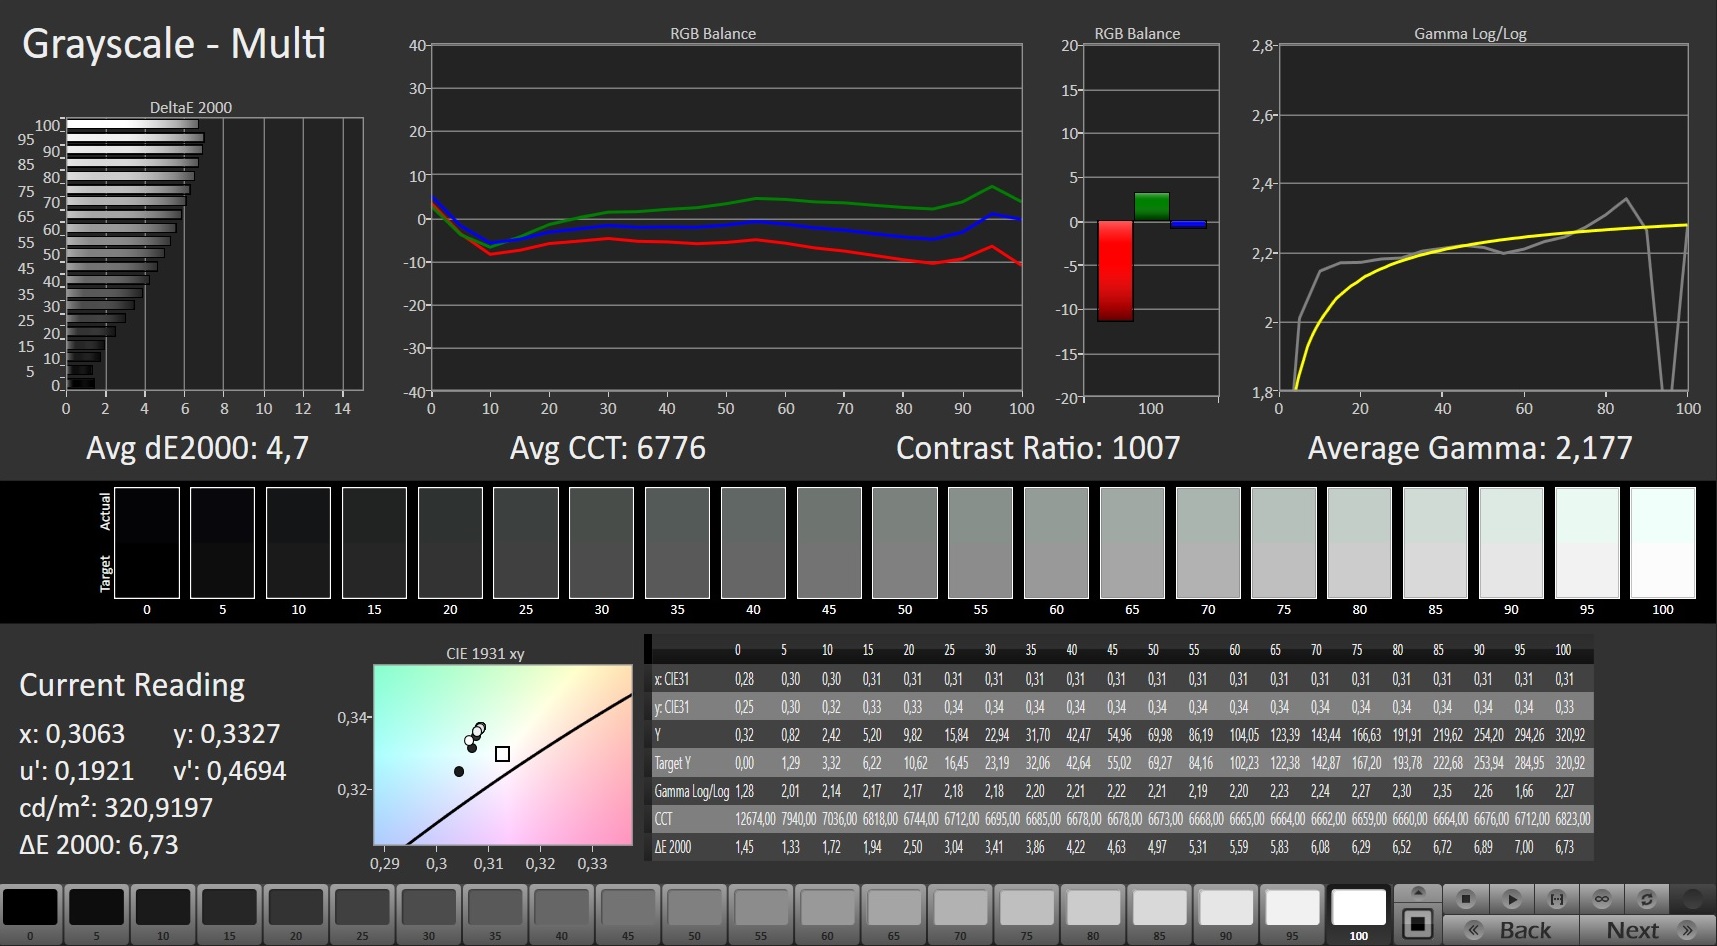
Gamma: 2.177
CCT: 6676 K
| Acer Predator Helios 300 PH315-53-786B Sharp LQ156M1JW09, IPS, 1920x1080, 15.6" | Aorus 15G XC Sharp LQ156M1JW03, IPS, 1920x1080, 15.6" | MSI GS66 Stealth 10UG AU Optronics B156HAN12.0, IPS, 1920x1080, 15.6" | Asus ROG Strix G15 G513QR LQ156M1JW25, IPS, 1920x1080, 15.6" | Acer Predator Helios 300 PH315-53-77N5 AU Optronics B156HAN08.2, IPS, 1920x1080, 15.6" | |
|---|---|---|---|---|---|
| Display | -4% | -1% | -3% | -6% | |
| Display P3 Coverage (%) | 68.4 | 65.6 -4% | 67.7 -1% | 67.7 -1% | 65.2 -5% |
| sRGB Coverage (%) | 99.4 | 97.5 -2% | 98.4 -1% | 94.3 -5% | 92.3 -7% |
| AdobeRGB 1998 Coverage (%) | 70.4 | 67.1 -5% | 69.1 -2% | 68.2 -3% | 66.3 -6% |
| Response Times | 17% | -11% | 23% | -16% | |
| Response Time Grey 50% / Grey 80% * (ms) | 15.2 ? | 9.6 ? 37% | 14.4 ? 5% | 8.2 ? 46% | 17 ? -12% |
| Response Time Black / White * (ms) | 9.2 ? | 9.6 ? -4% | 11.6 ? -26% | 9.2 ? -0% | 11 ? -20% |
| PWM Frequency (Hz) | 23580 ? | 24040 ? | |||
| Screen | 22% | -7% | 1% | 1% | |
| Brightness middle (cd/m²) | 312 | 288 -8% | 259.5 -17% | 308 -1% | 319 2% |
| Brightness (cd/m²) | 290 | 270 -7% | 264 -9% | 288 -1% | 294 1% |
| Brightness Distribution (%) | 87 | 89 2% | 90 3% | 86 -1% | 83 -5% |
| Black Level * (cd/m²) | 0.32 | 0.25 22% | 0.25 22% | 0.23 28% | 0.22 31% |
| Contrast (:1) | 975 | 1152 18% | 1038 6% | 1339 37% | 1450 49% |
| Colorchecker dE 2000 * | 3.03 | 1.19 61% | 2.52 17% | 3.28 -8% | 4.42 -46% |
| Colorchecker dE 2000 max. * | 6.81 | 3.79 44% | 5.55 19% | 8.51 -25% | 8.54 -25% |
| Colorchecker dE 2000 calibrated * | 0.71 | 0.71 -0% | 1.93 -172% | 0.83 -17% | |
| Greyscale dE 2000 * | 4.7 | 1.6 66% | 1.7 64% | 5 -6% | 4.84 -3% |
| Gamma | 2.177 101% | 2.229 99% | 2.04 108% | 2.057 107% | 2.39 92% |
| CCT | 6676 97% | 6539 99% | 6414 101% | 7393 88% | 6850 95% |
| Color Space (Percent of AdobeRGB 1998) (%) | 67 | 63.3 | 68 | 60 | |
| Color Space (Percent of sRGB) (%) | 90 | 98.8 | 90 | 92 | |
| Total Average (Program / Settings) | 12% /
16% | -6% /
-7% | 7% /
3% | -7% /
-4% |
* ... smaller is better
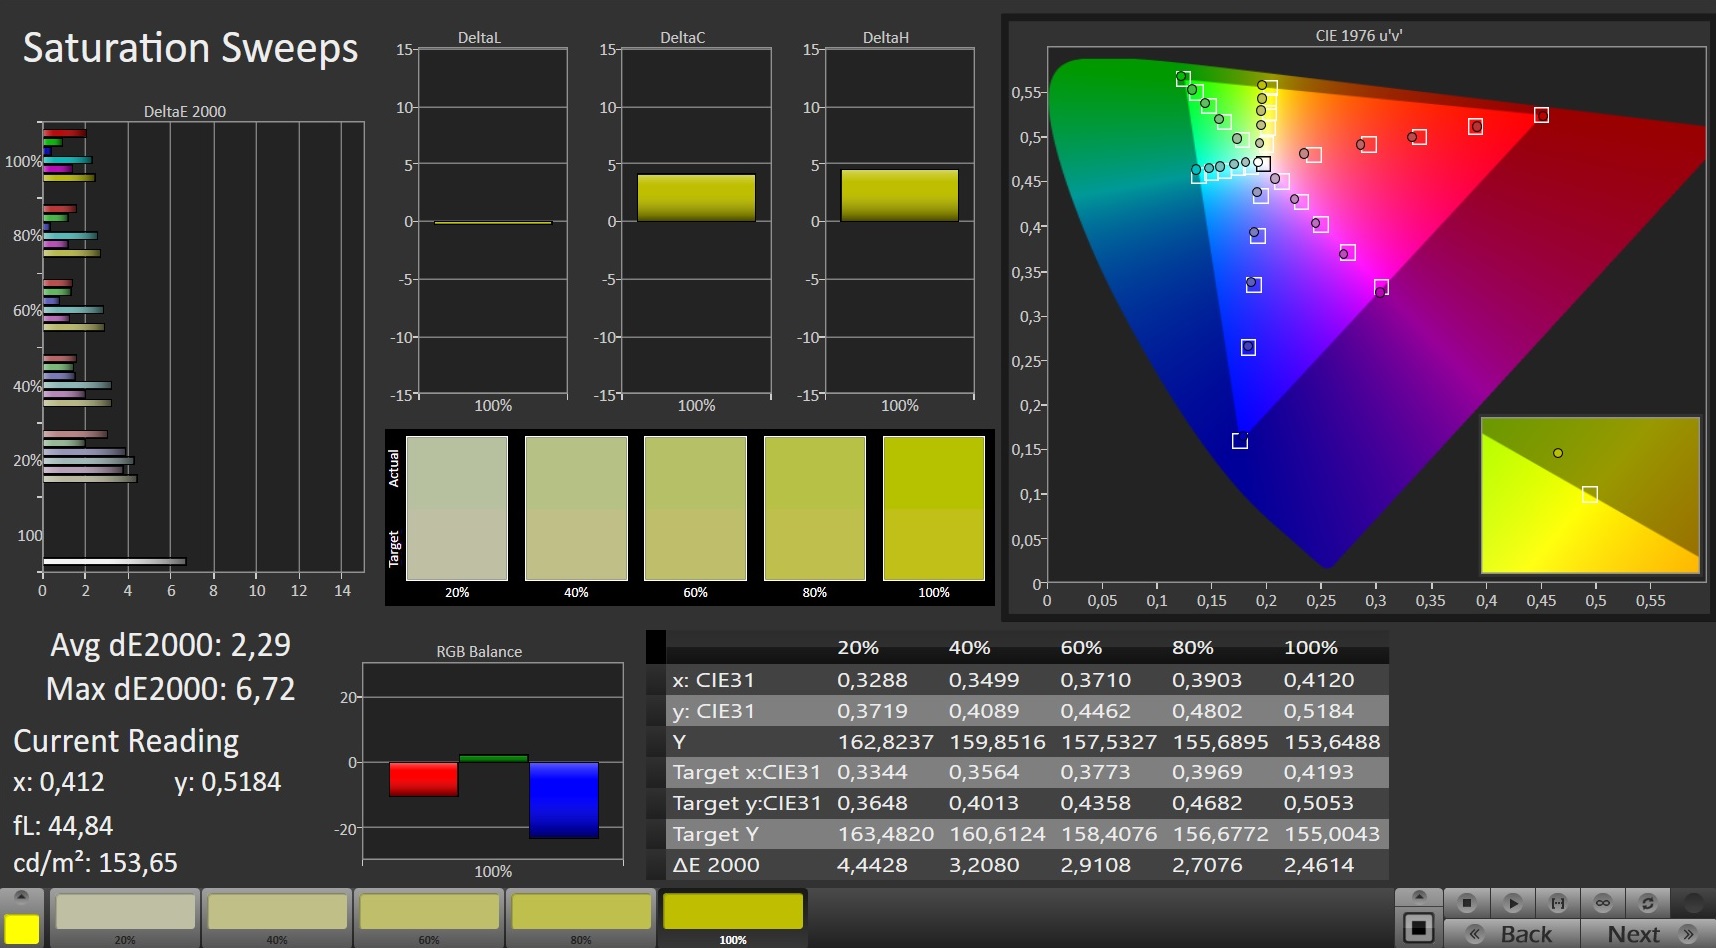
The display shows a good color reproduction out of the box, and it misses the target (DeltaE less than 3) by a hair's breadth with a color deviation of 3.03. It doesn't suffer from a blue tint, and improvements can be achieved by means of calibration: The deviation drops to 0.71, and grayscales are displayed in a more balanced way. The sRGB color space is mapped to 99%. The AdobeRGB (70%) and DCI-P3 (68%) color spaces aren't fully reproduced.
Display Response Times
| ↔ Response Time Black to White | ||
|---|---|---|
| 9.2 ms ... rise ↗ and fall ↘ combined | ↗ 4.8 ms rise | 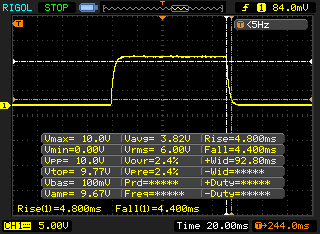 |
| ↘ 4.4 ms fall | ||
| The screen shows fast response rates in our tests and should be suited for gaming. In comparison, all tested devices range from 0.1 (minimum) to 240 (maximum) ms. » 26 % of all devices are better. This means that the measured response time is better than the average of all tested devices (19.8 ms). | ||
| ↔ Response Time 50% Grey to 80% Grey | ||
| 15.2 ms ... rise ↗ and fall ↘ combined | ↗ 7.6 ms rise | 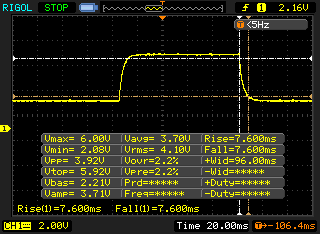 |
| ↘ 7.6 ms fall | ||
| The screen shows good response rates in our tests, but may be too slow for competitive gamers. In comparison, all tested devices range from 0.165 (minimum) to 636 (maximum) ms. » 29 % of all devices are better. This means that the measured response time is better than the average of all tested devices (31 ms). | ||
Screen Flickering / PWM (Pulse-Width Modulation)
| Screen flickering / PWM detected | 23580 Hz | ≤ 13 % brightness setting | 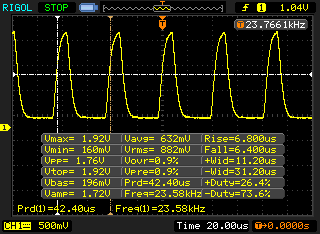 |
The display backlight flickers at 23580 Hz (worst case, e.g., utilizing PWM) Flickering detected at a brightness setting of 13 % and below. There should be no flickering or PWM above this brightness setting. The frequency of 23580 Hz is quite high, so most users sensitive to PWM should not notice any flickering. In comparison: 52 % of all tested devices do not use PWM to dim the display. If PWM was detected, an average of 7754 (minimum: 5 - maximum: 343500) Hz was measured. | |||
The viewing-angle stable IPS panel can be read from any position. Reading the display outdoors is possible if the sun isn't too bright and/or you look for places in the shade.

Performance - Sufficient for the coming years
With the Predator Helios 300, Acer has a 15.6-inch gaming laptop in its lineup that brings every modern game smoothly onto the screen.
Test conditions
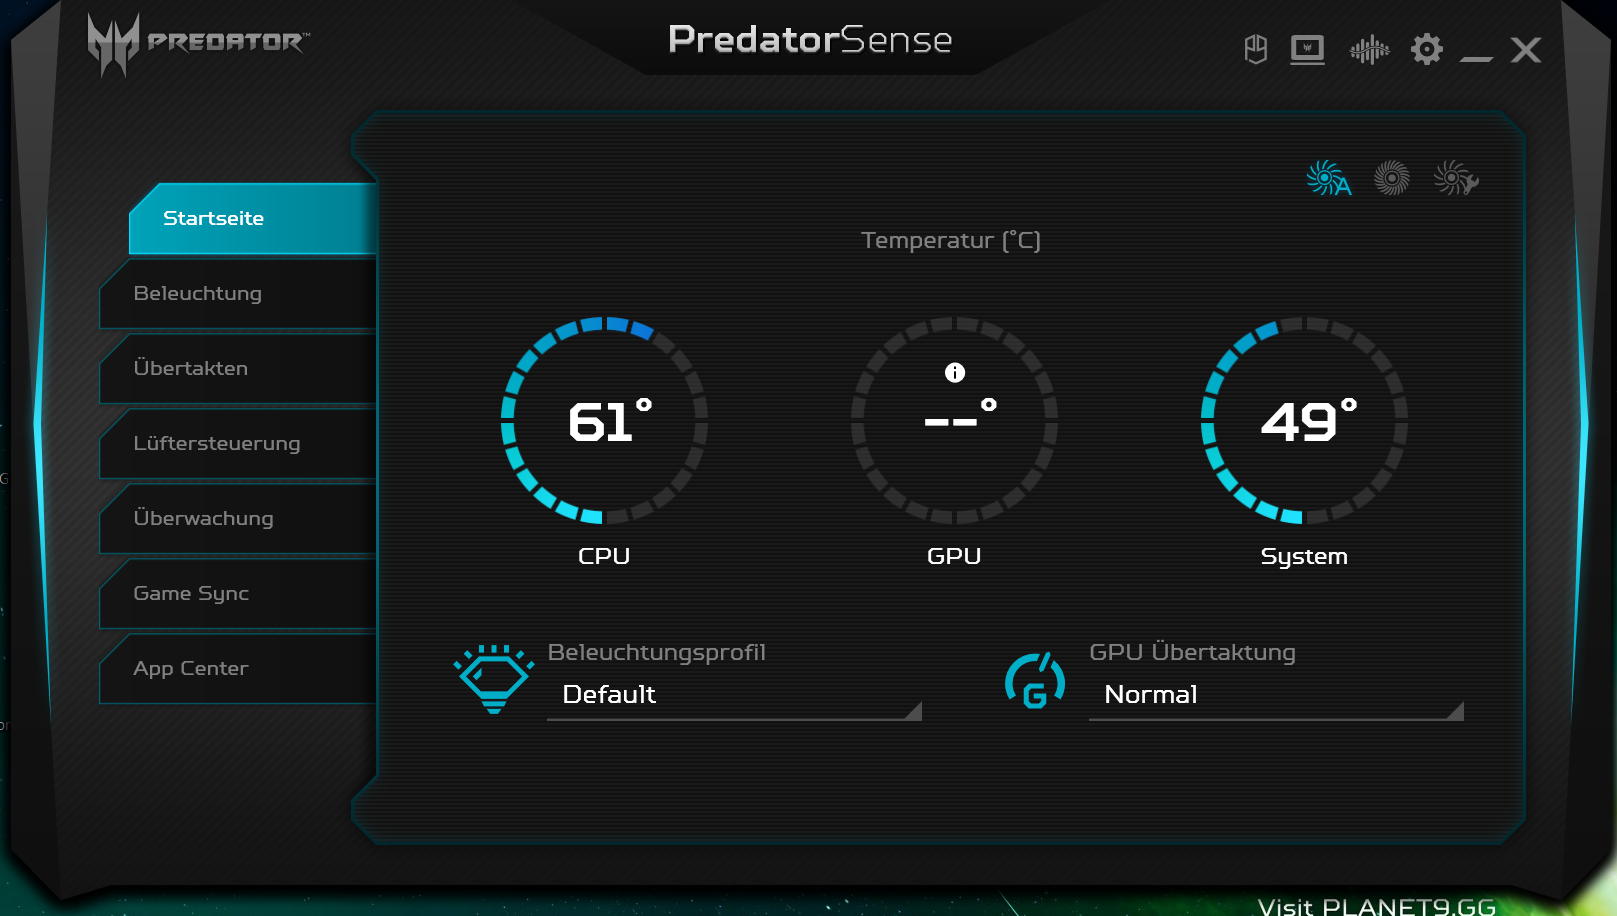
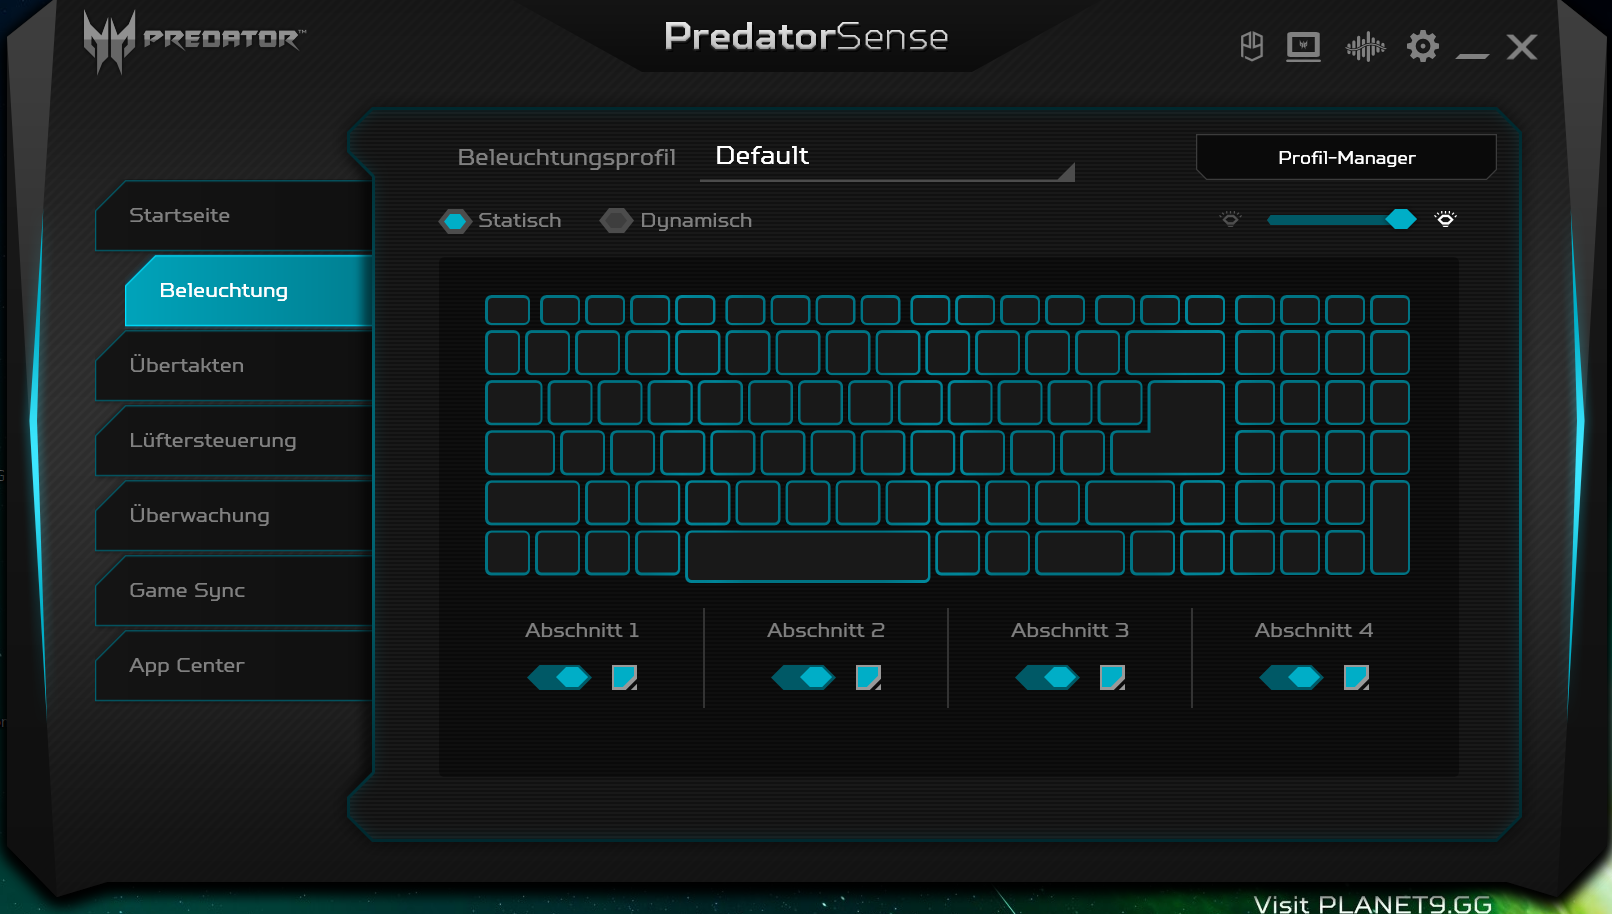
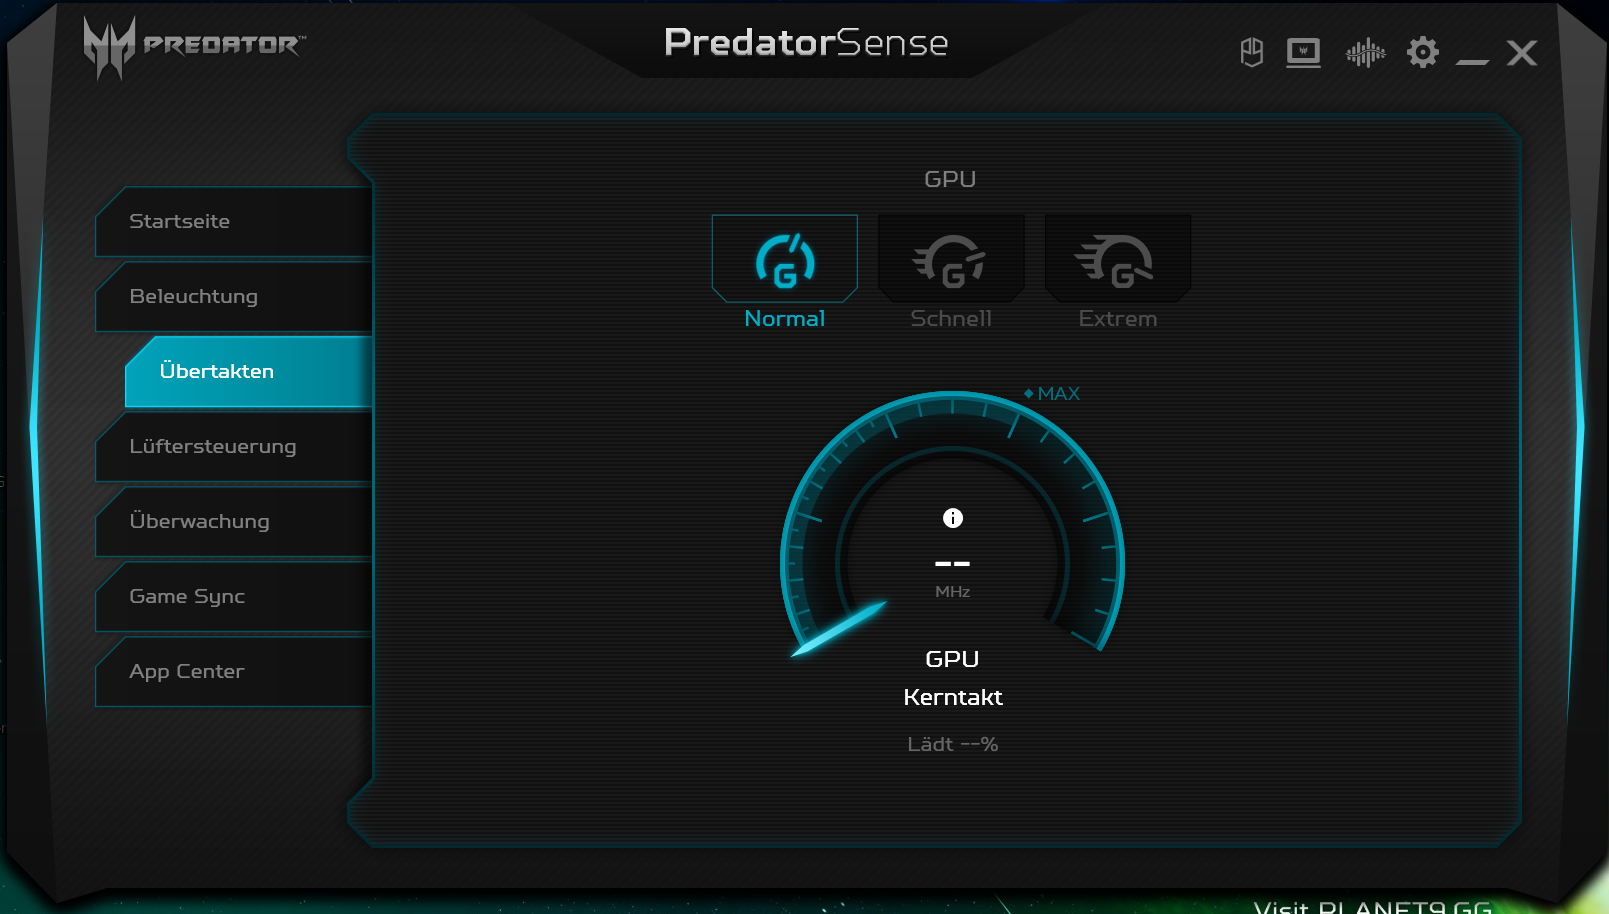
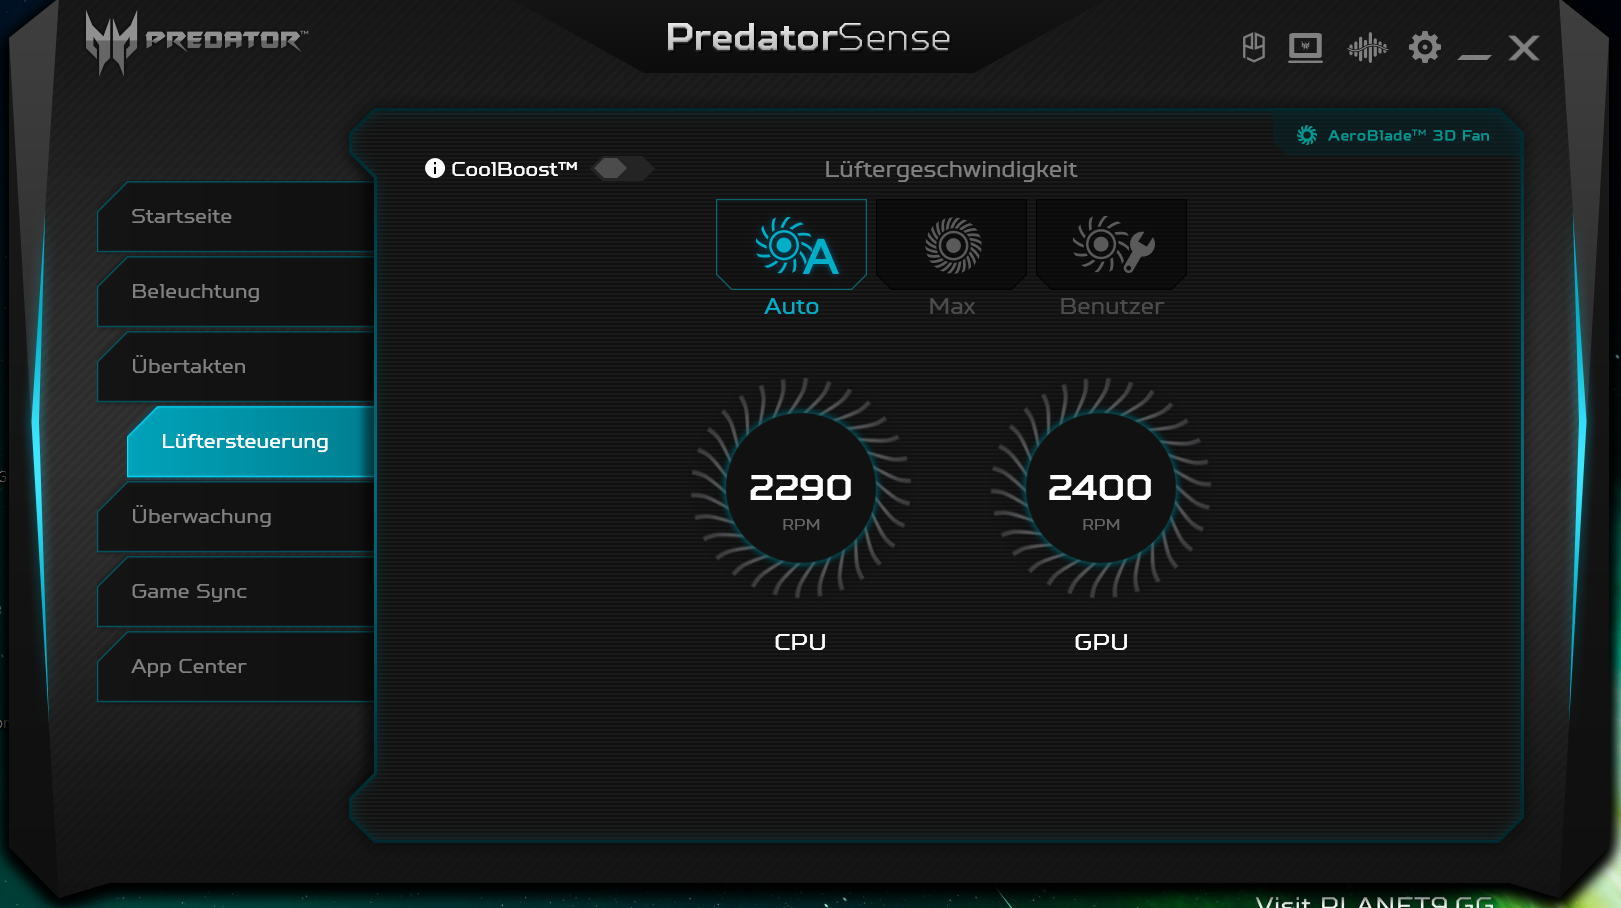
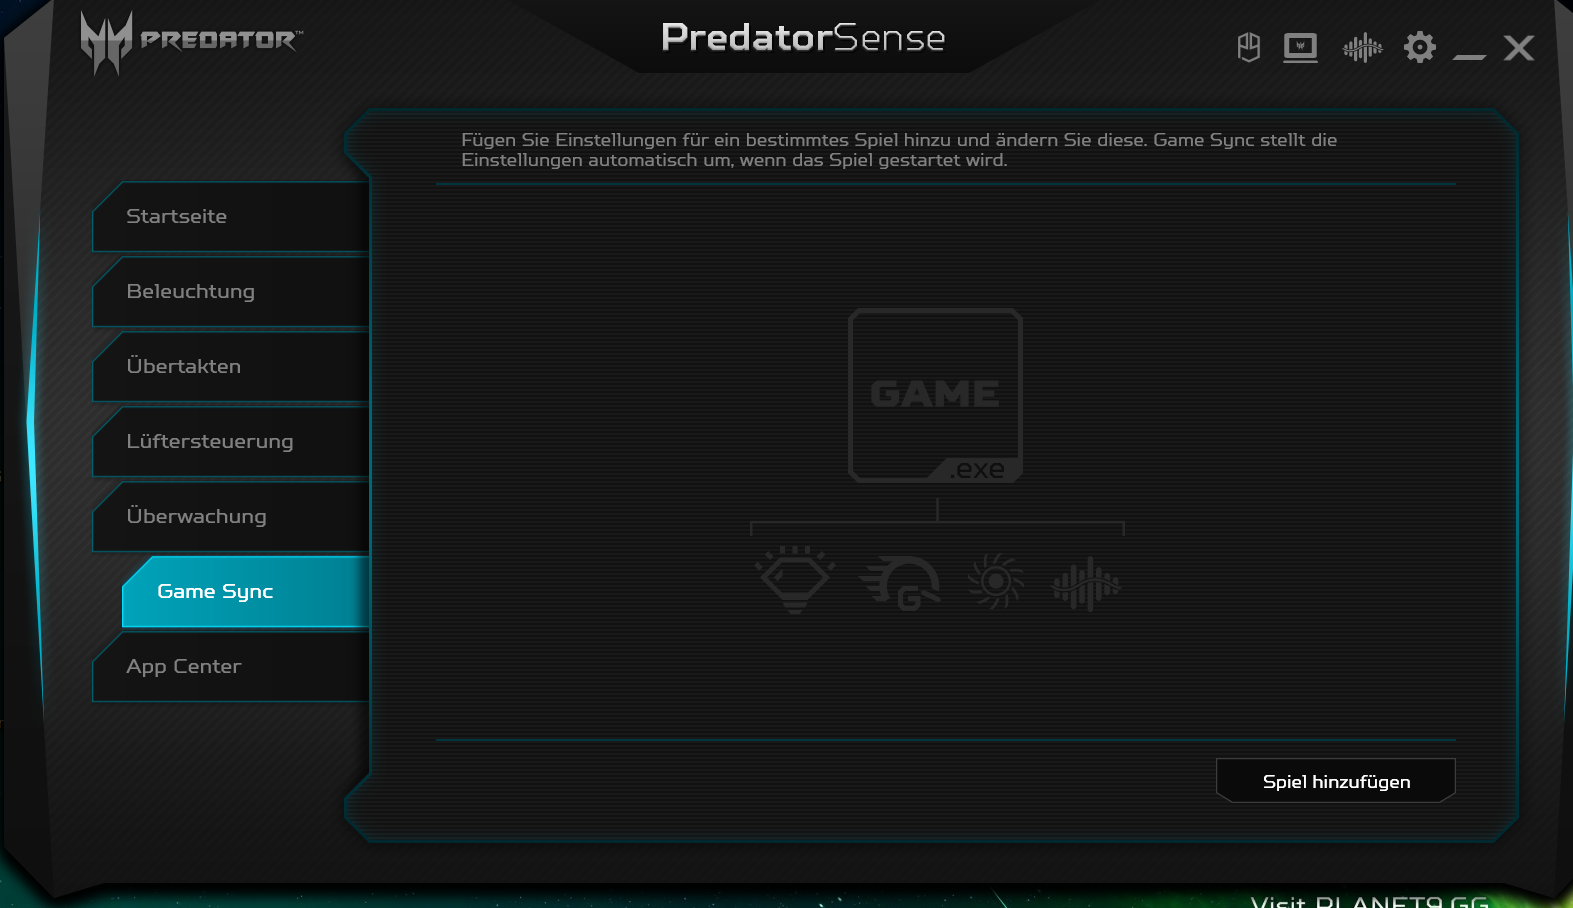
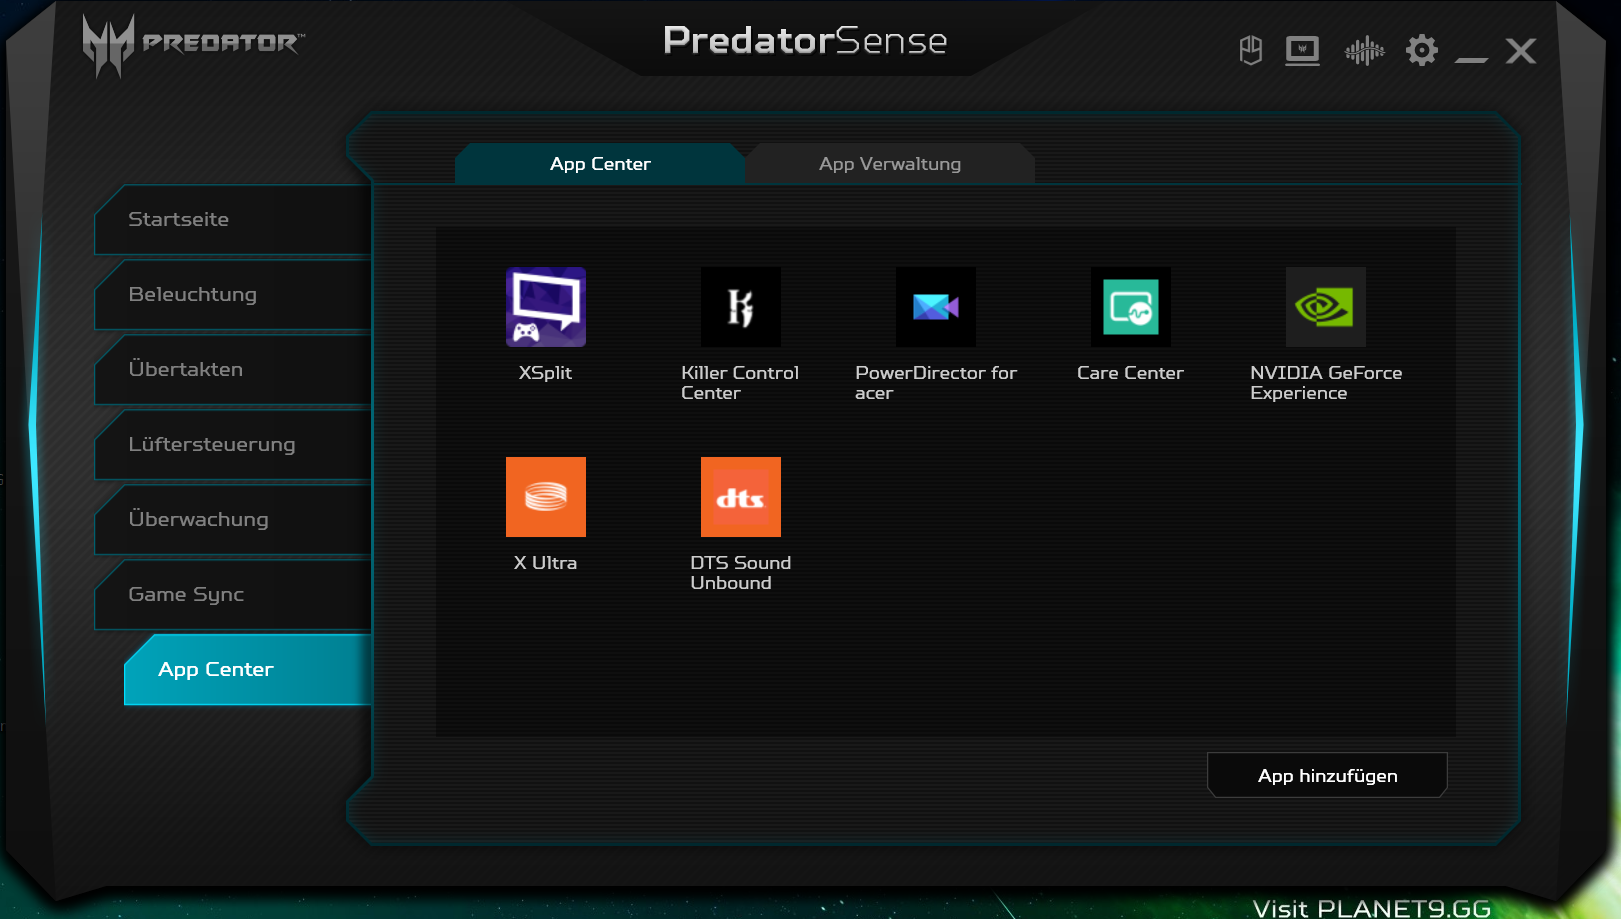
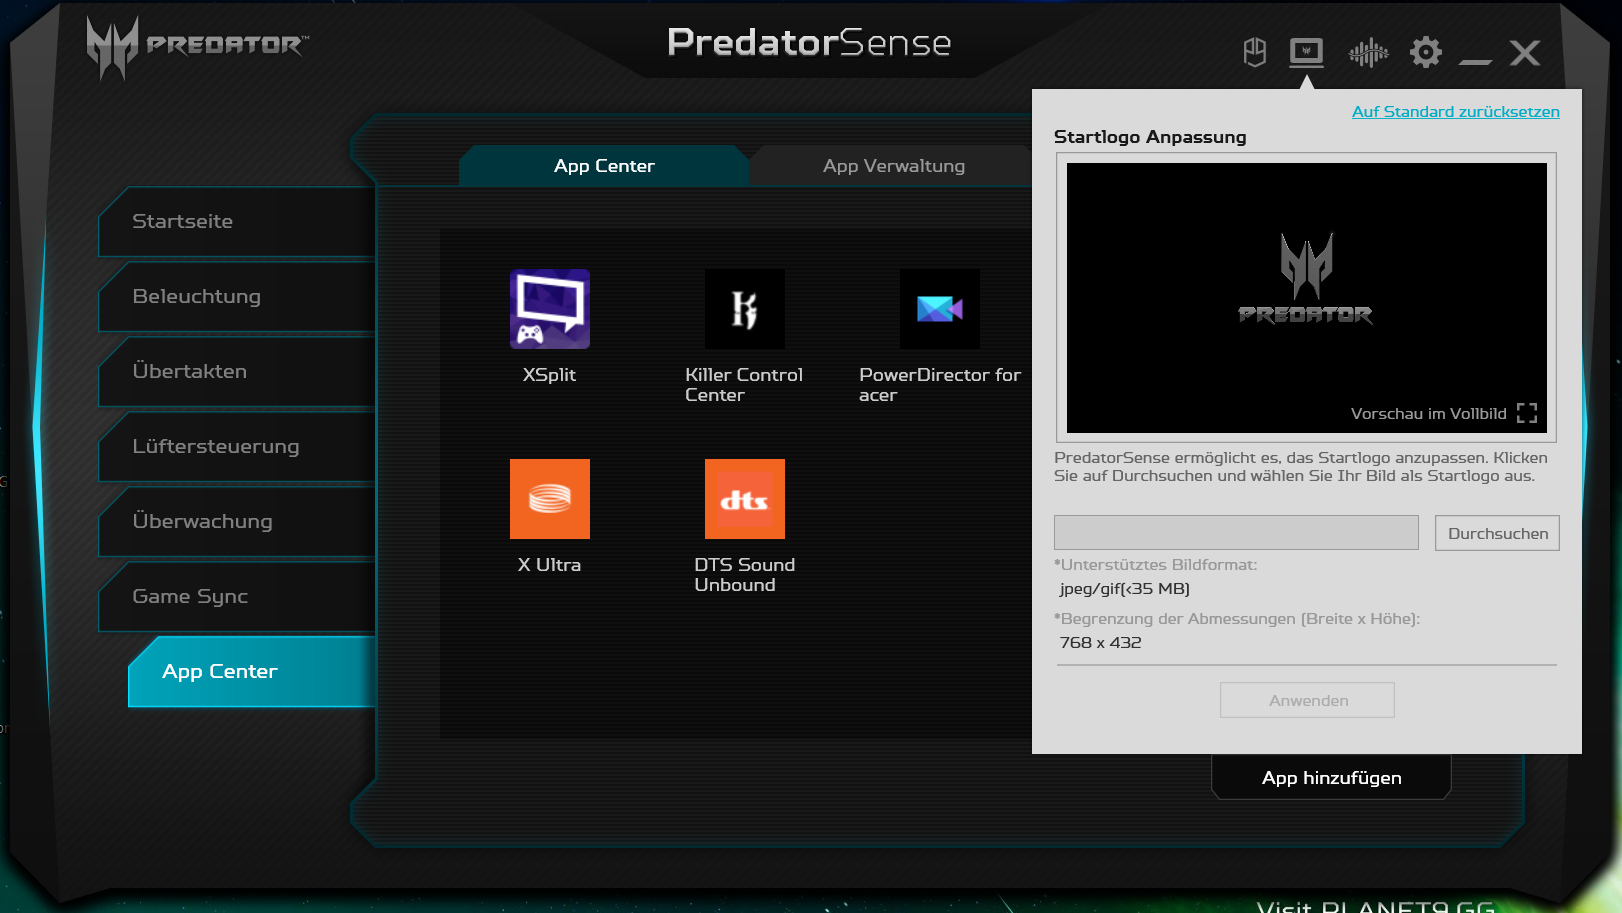
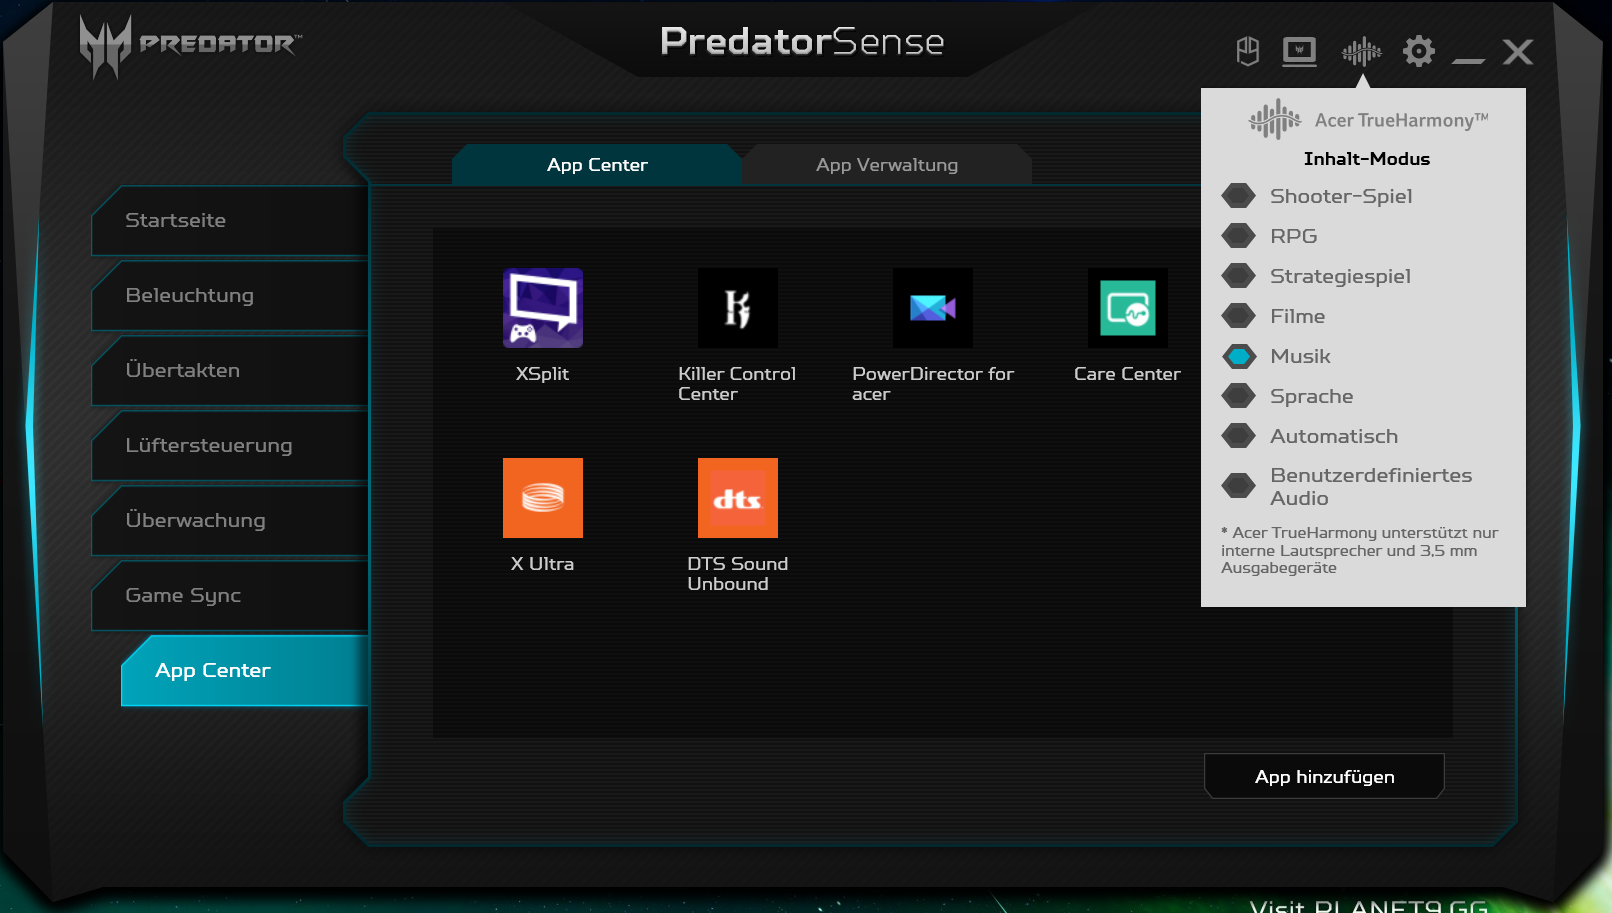
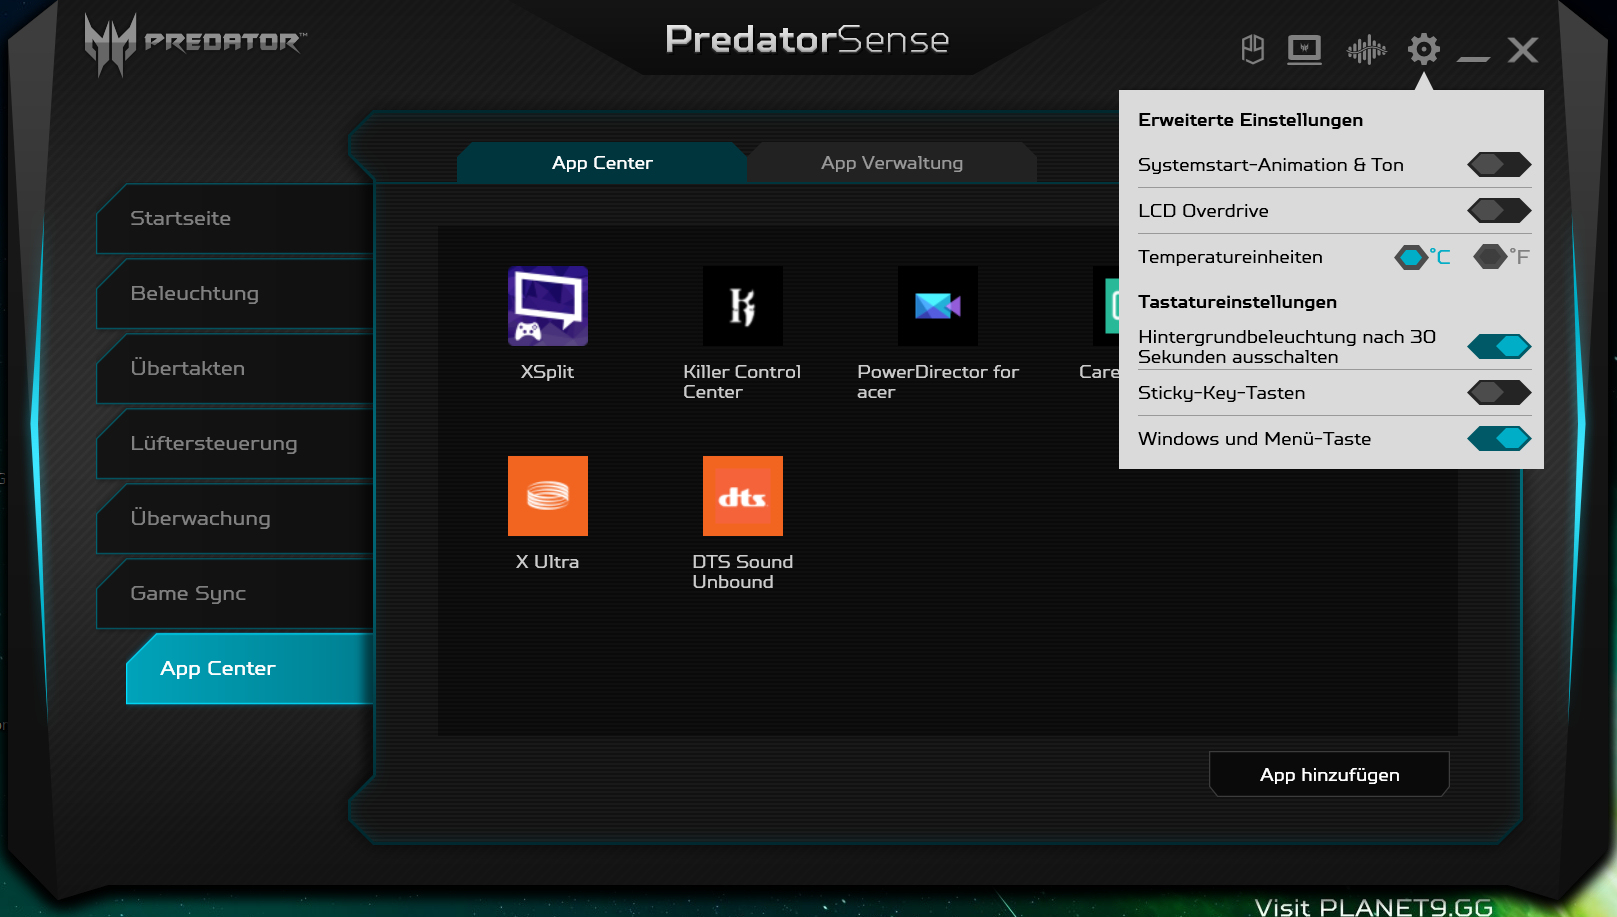
The preinstalled Predator Sense software allows users to adjust the fan control and to automatically overclock the GPU. The GPU profiles "Normal", "Fast", and "Extreme" are available. We used the automatic fan control and the "Normal" profile. Pressing the "Turbo" button (located above the keyboard) enables the "Extreme" GPU profile and lets the fans continuously run at full power.
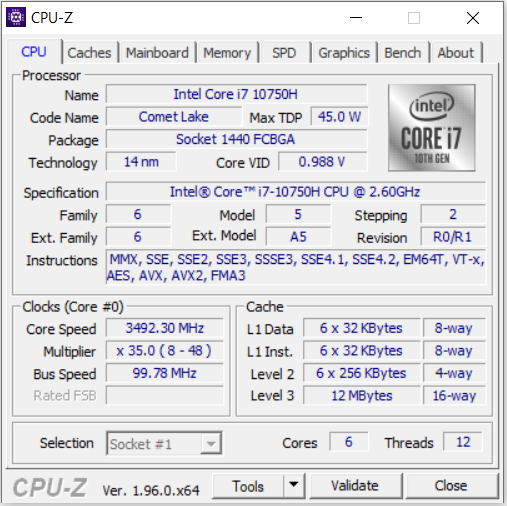
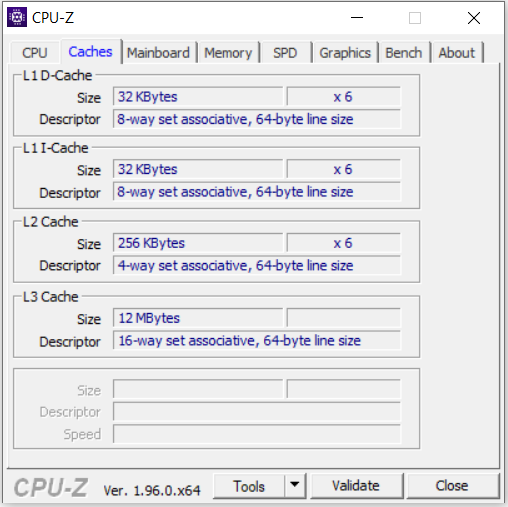
Processor
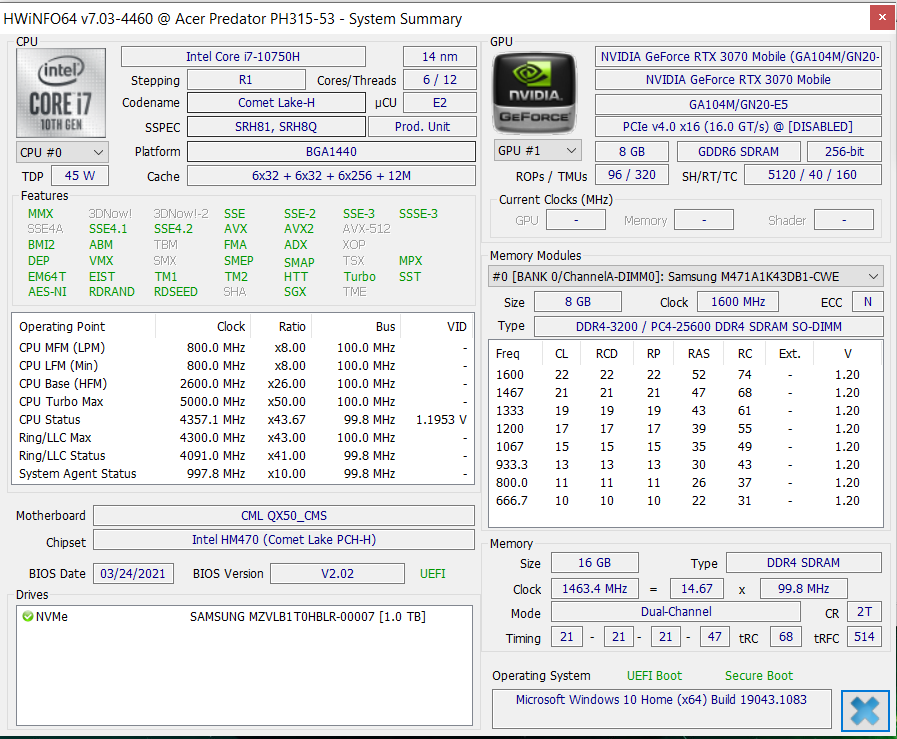
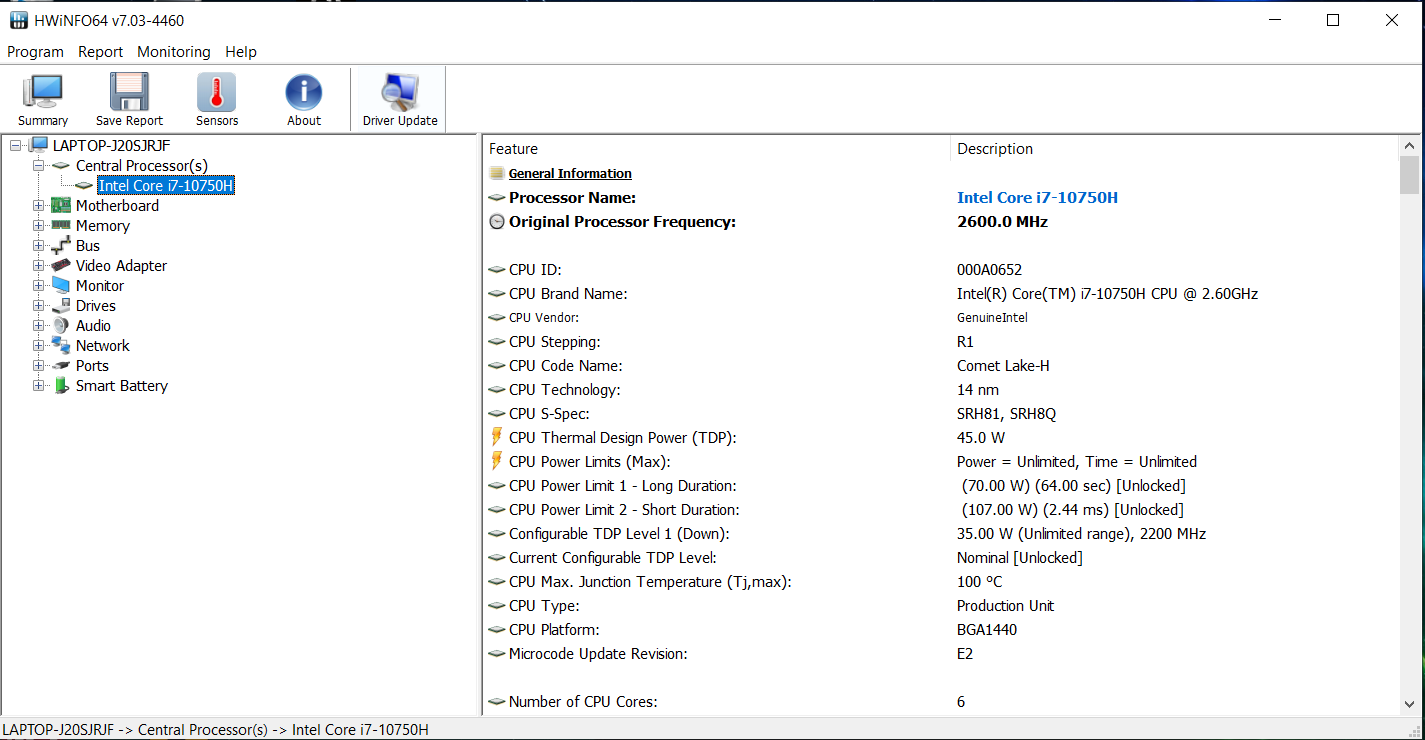
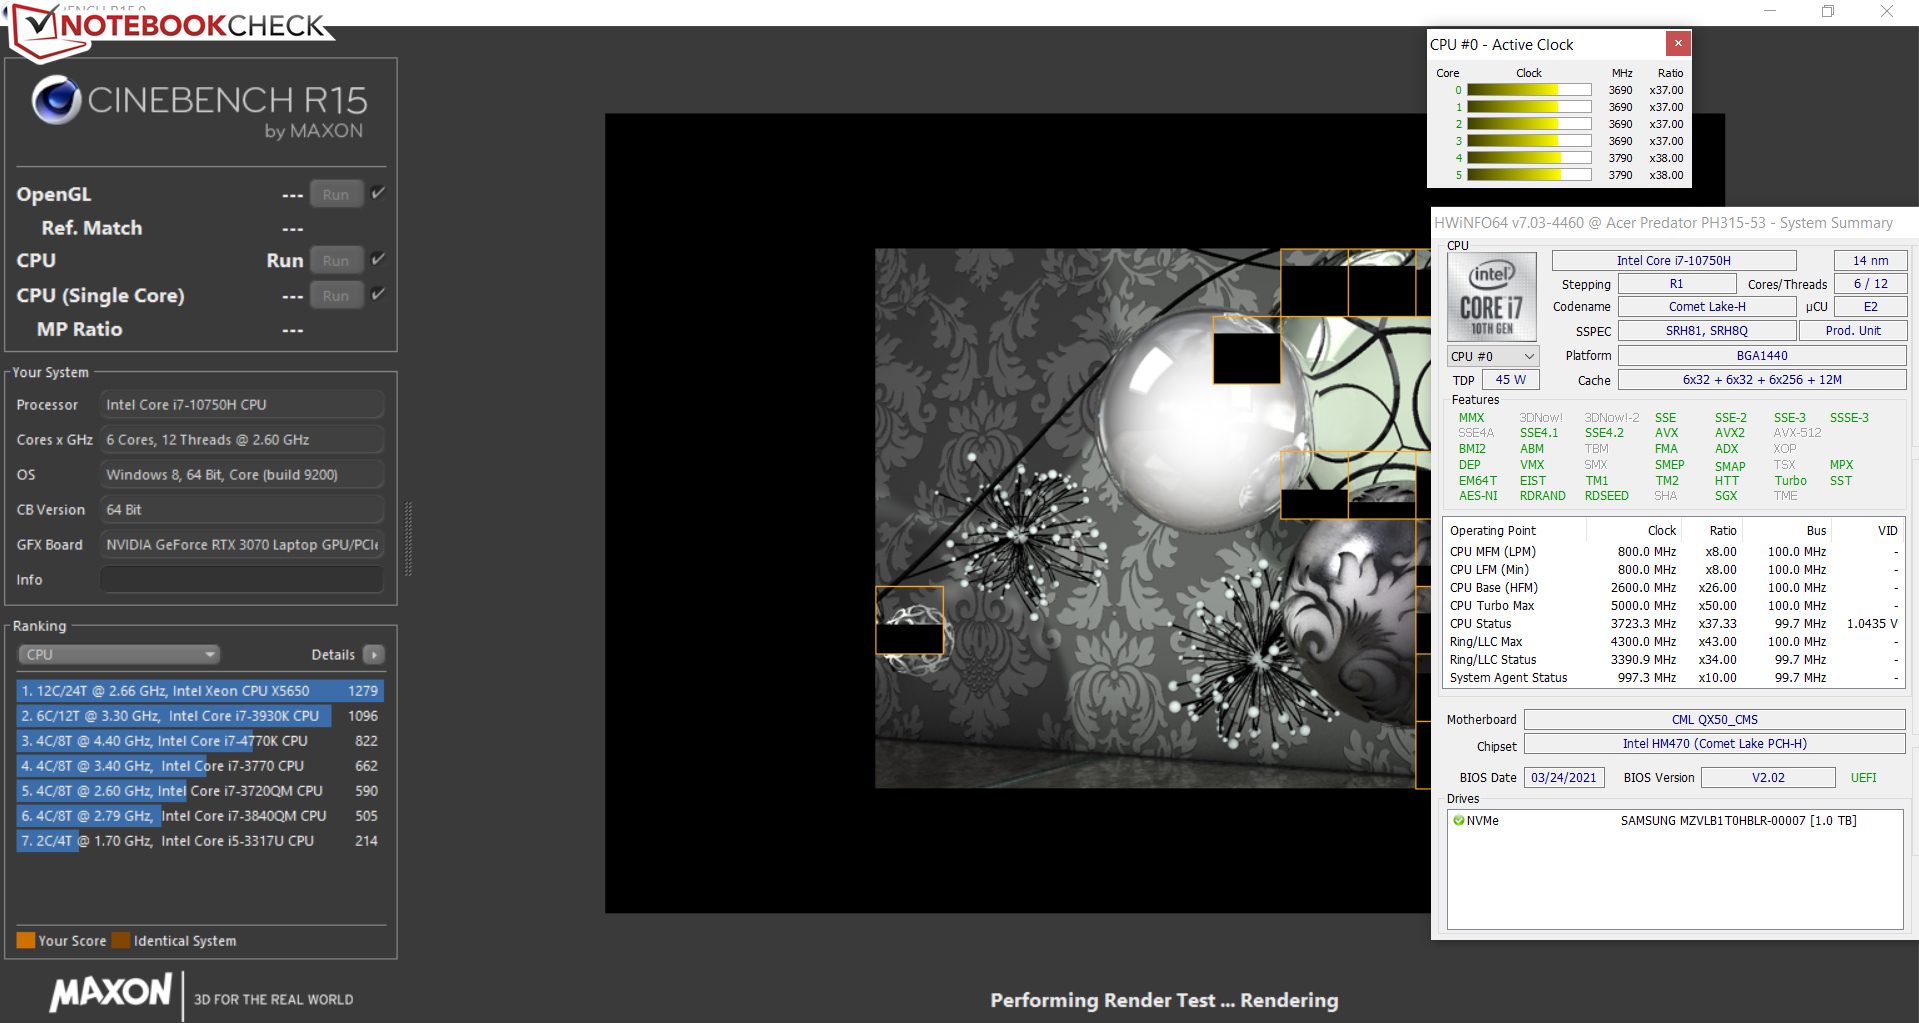
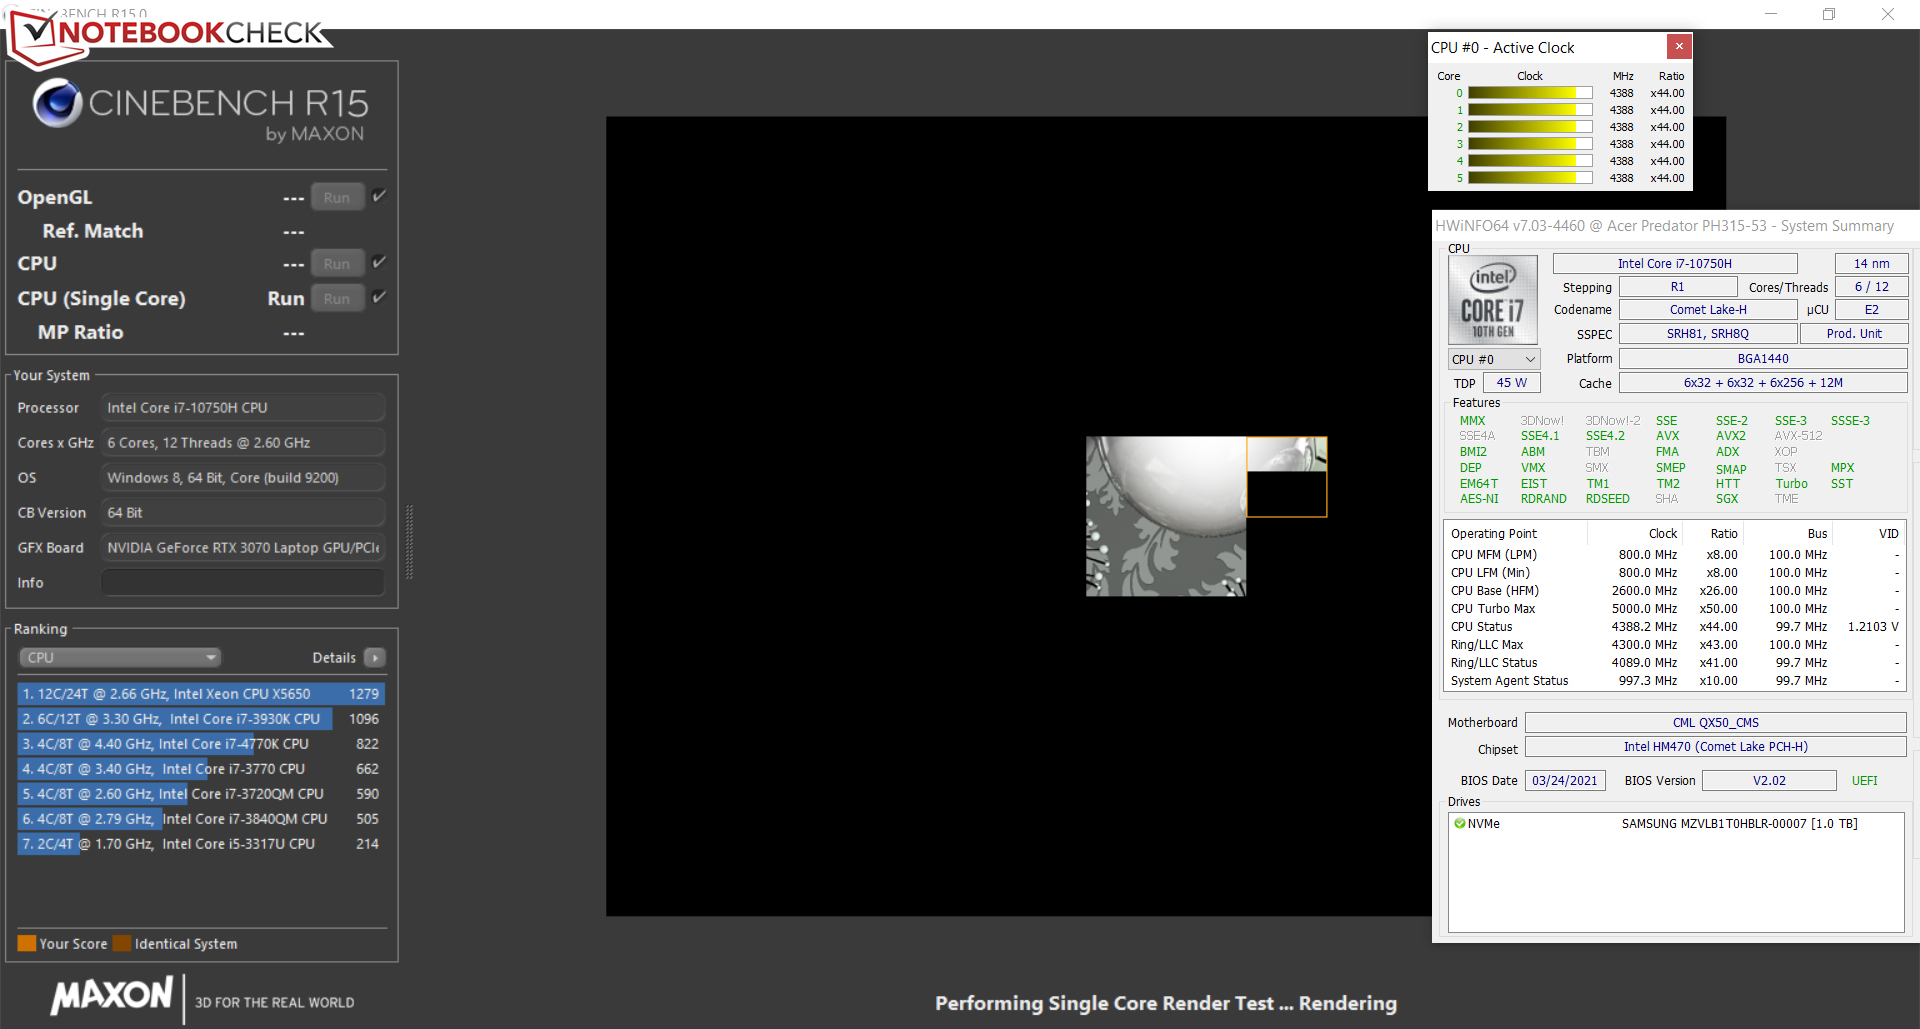
The Core-i7-10750H hexa-core processor (Comet Lake) operates at a base clock speed of 2.6 GHz. An increase to 4.3 GHz (six cores) or 5 GHz (one core) is possible via Turbo. Hyper-Threading (two threads per core) is supported.
The multithread test of the Cinebench R15 benchmark is processed at 2.8 to 4.2 GHz. The single-thread test is run at 4.2 to 4.4 GHz. On battery power, the clock rates are 1.9 to 2.7 GHz (multithread) and 2.5 to 3.2 GHz (single-thread), respectively.
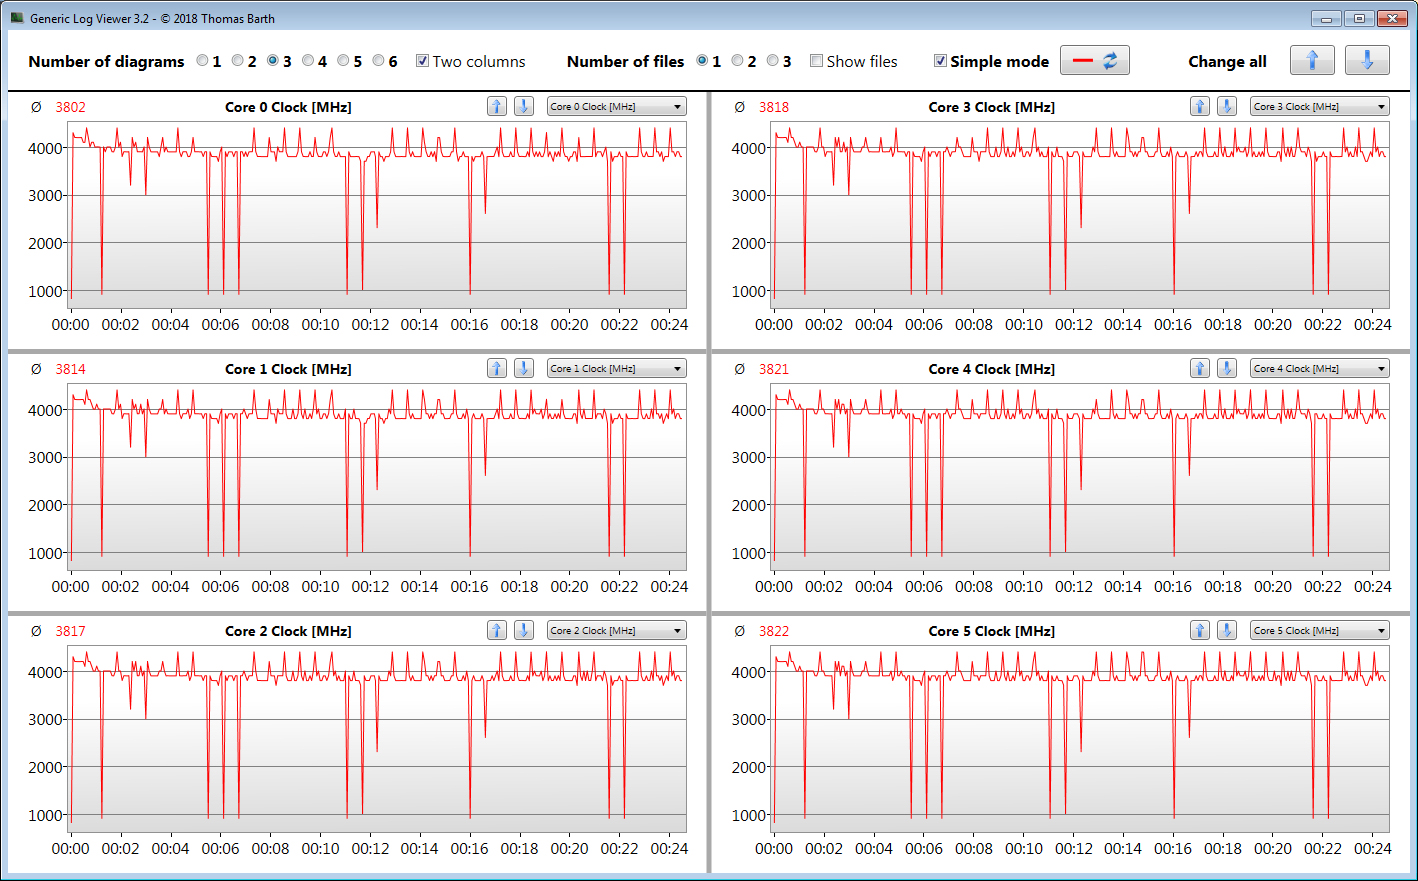
We verify if the CPU Turbo is used consistently when plugged in by running the Cinebench R15 benchmark's multithread test in a continuous loop for at least 30 minutes. Turbo kicks in at quite a high level.
* ... smaller is better
System performance
The fast and smooth system offers enough computing power for demanding applications like gaming and image editing for the coming years. This is accompanied by good PCMark results.
| PCMark 8 Home Score Accelerated v2 | 4275 points | |
| PCMark 8 Creative Score Accelerated v2 | 6202 points | |
| PCMark 8 Work Score Accelerated v2 | 5604 points | |
| PCMark 10 Score | 6034 points | |
Help | ||
| PCMark 10 / Score | |
| Average of class Gaming (5828 - 12414, n=93, last 2 years) | |
| Asus ROG Strix G15 G513QR | |
| Aorus 15G XC | |
| MSI GS66 Stealth 10UG | |
| Acer Predator Helios 300 PH315-53-786B | |
| Average Intel Core i7-10750H, NVIDIA GeForce RTX 3070 Laptop GPU (6017 - 6034, n=2) | |
| Acer Predator Helios 300 PH315-53-77N5 | |
| PCMark 10 / Essentials | |
| Average of class Gaming (8810 - 11935, n=97, last 2 years) | |
| MSI GS66 Stealth 10UG | |
| Acer Predator Helios 300 PH315-53-77N5 | |
| Aorus 15G XC | |
| Acer Predator Helios 300 PH315-53-786B | |
| Average Intel Core i7-10750H, NVIDIA GeForce RTX 3070 Laptop GPU (8652 - 8953, n=2) | |
| PCMark 10 / Productivity | |
| Average of class Gaming (6845 - 25323, n=95, last 2 years) | |
| Aorus 15G XC | |
| Average Intel Core i7-10750H, NVIDIA GeForce RTX 3070 Laptop GPU (8022 - 8657, n=2) | |
| Acer Predator Helios 300 PH315-53-77N5 | |
| Acer Predator Helios 300 PH315-53-786B | |
| MSI GS66 Stealth 10UG | |
| PCMark 10 / Digital Content Creation | |
| Average of class Gaming (7602 - 19954, n=95, last 2 years) | |
| Aorus 15G XC | |
| MSI GS66 Stealth 10UG | |
| Acer Predator Helios 300 PH315-53-786B | |
| Average Intel Core i7-10750H, NVIDIA GeForce RTX 3070 Laptop GPU (7893 - 8300, n=2) | |
| Acer Predator Helios 300 PH315-53-77N5 | |
DPC latencies
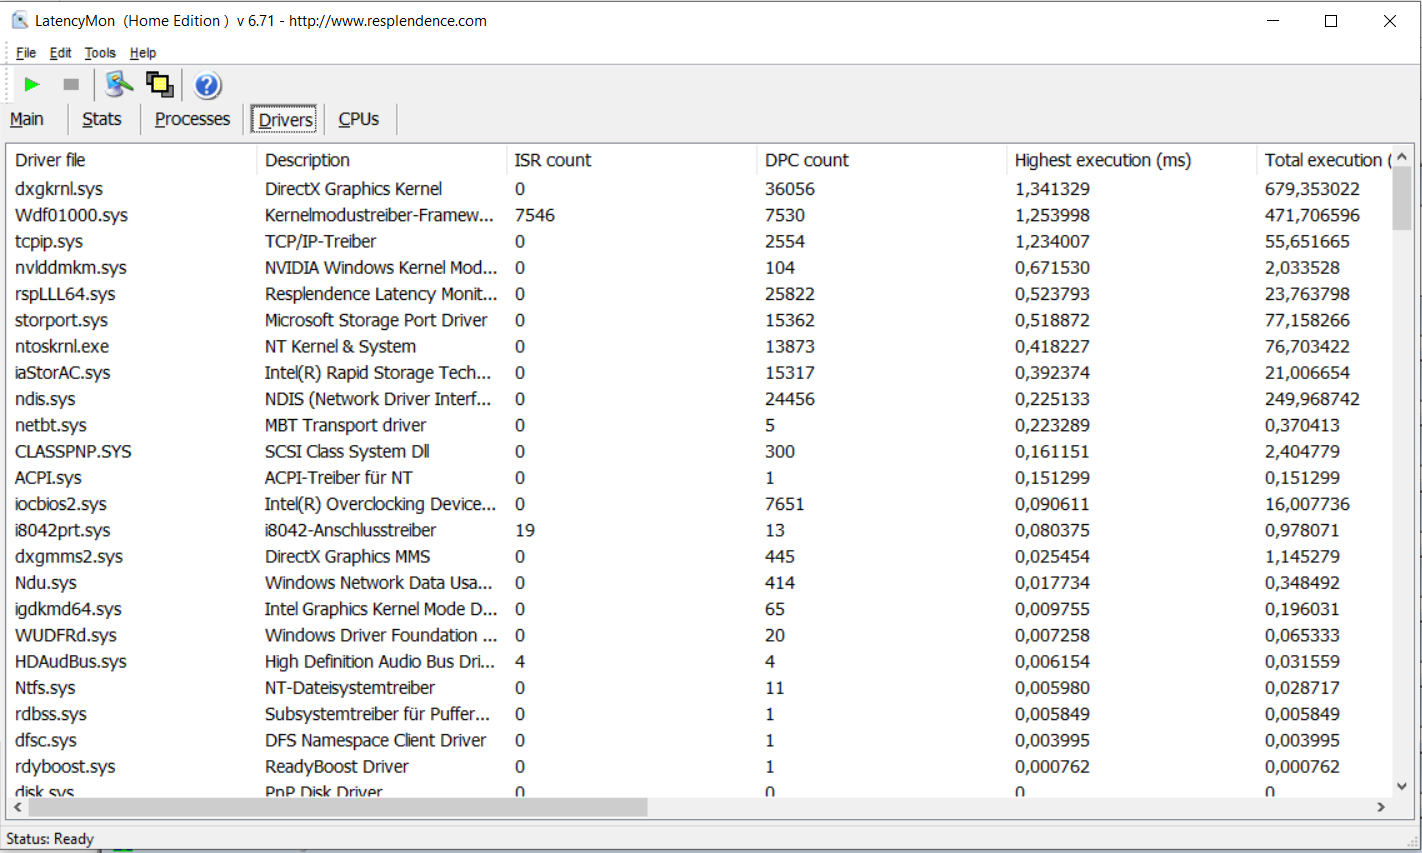
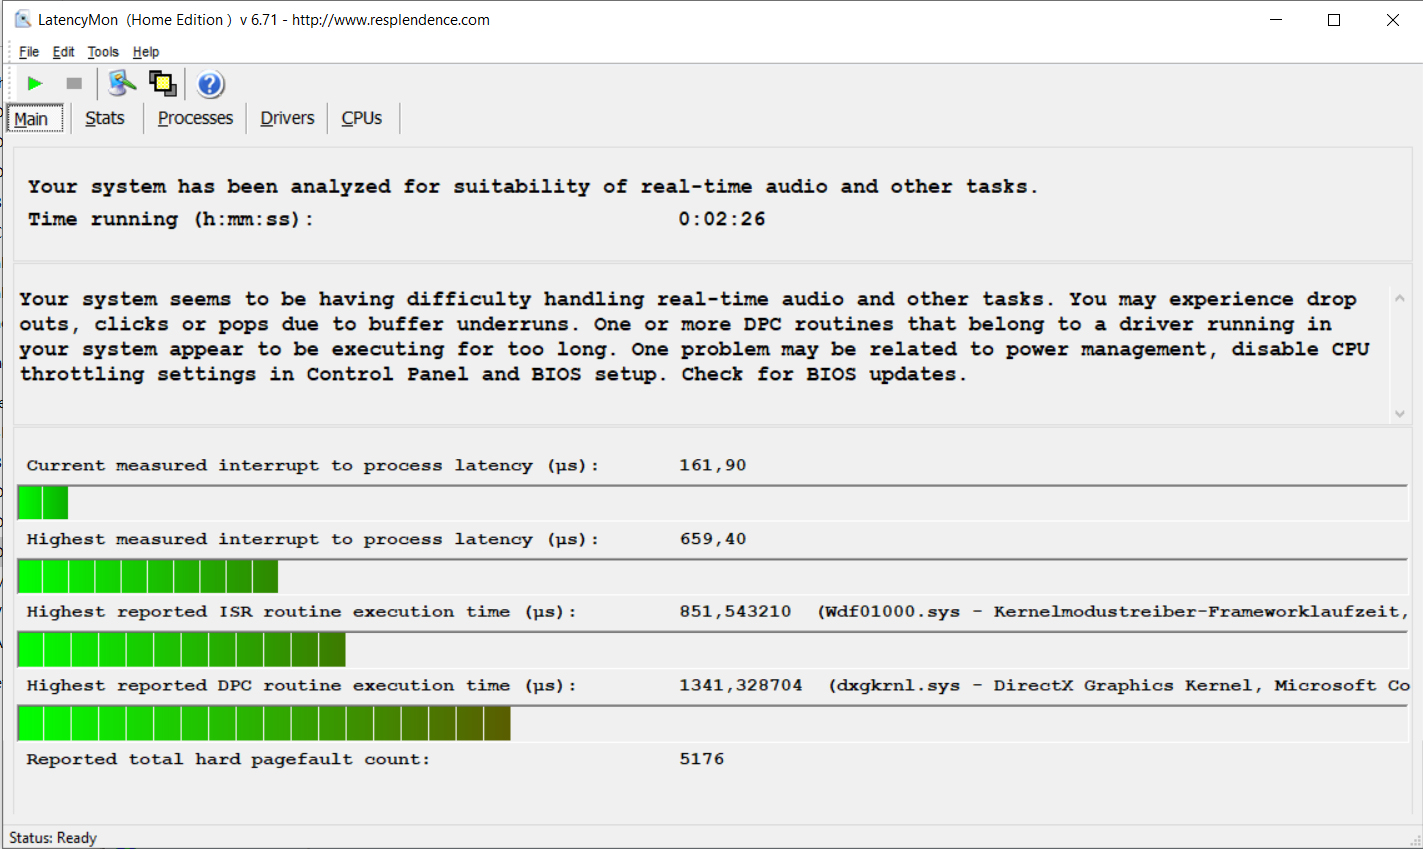
Our standardized latency monitor test (web browsing, 4K video playback, high-load Prime95) revealed irregularities in terms of DPC latencies. The system doesn't seem to be suitable for real-time video and audio editing.
| DPC Latencies / LatencyMon - interrupt to process latency (max), Web, Youtube, Prime95 | |
| Aorus 15G XC | |
| Acer Predator Helios 300 PH315-53-77N5 | |
| MSI GS66 Stealth 10UG | |
| Acer Predator Helios 300 PH315-53-786B | |
| Asus ROG Strix G15 G513QR | |
* ... smaller is better
Storage
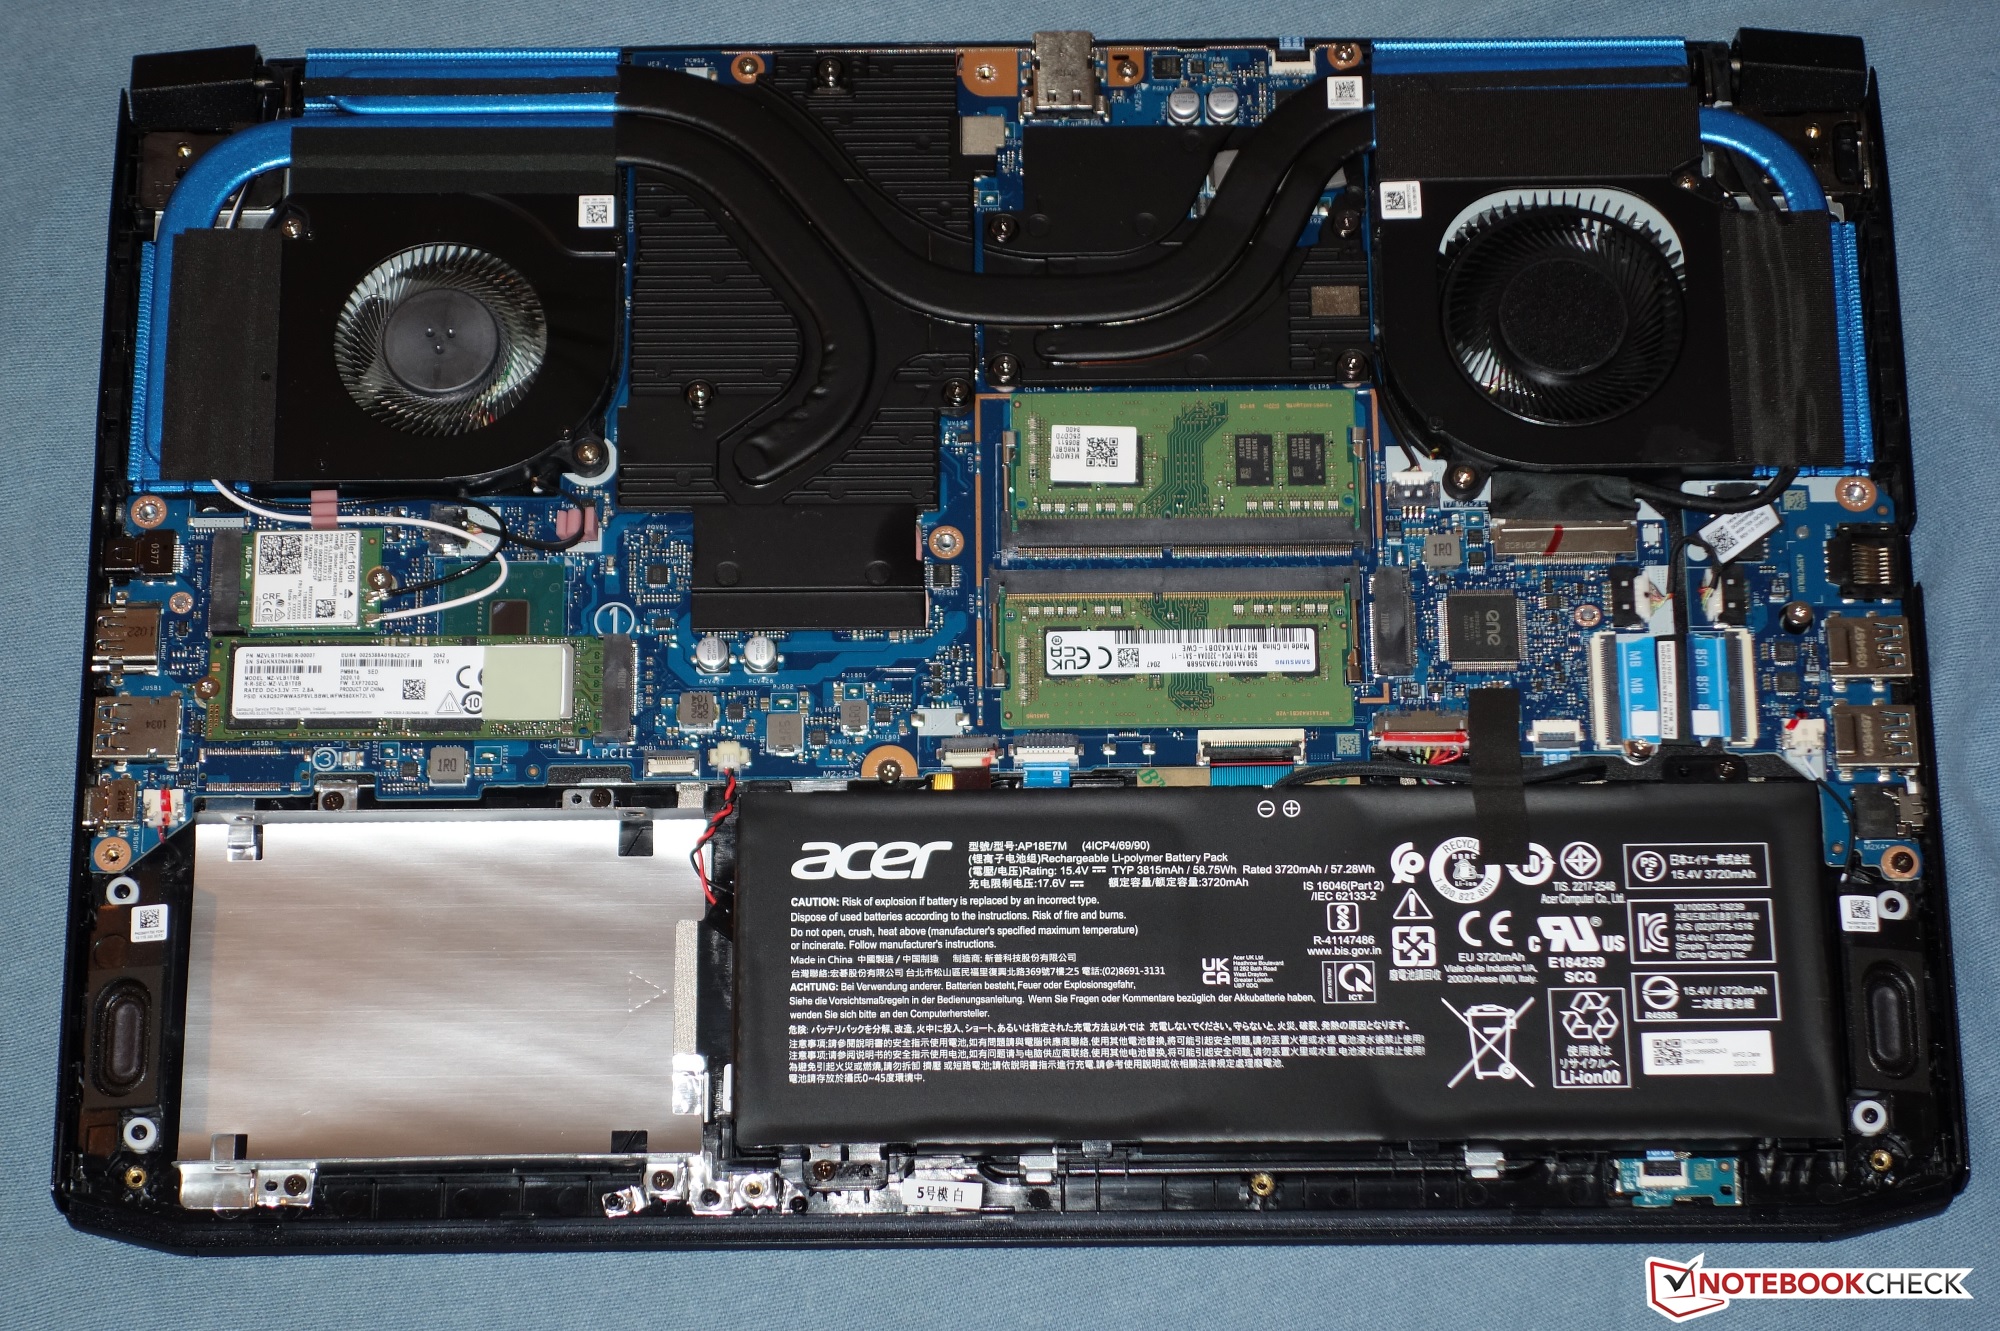
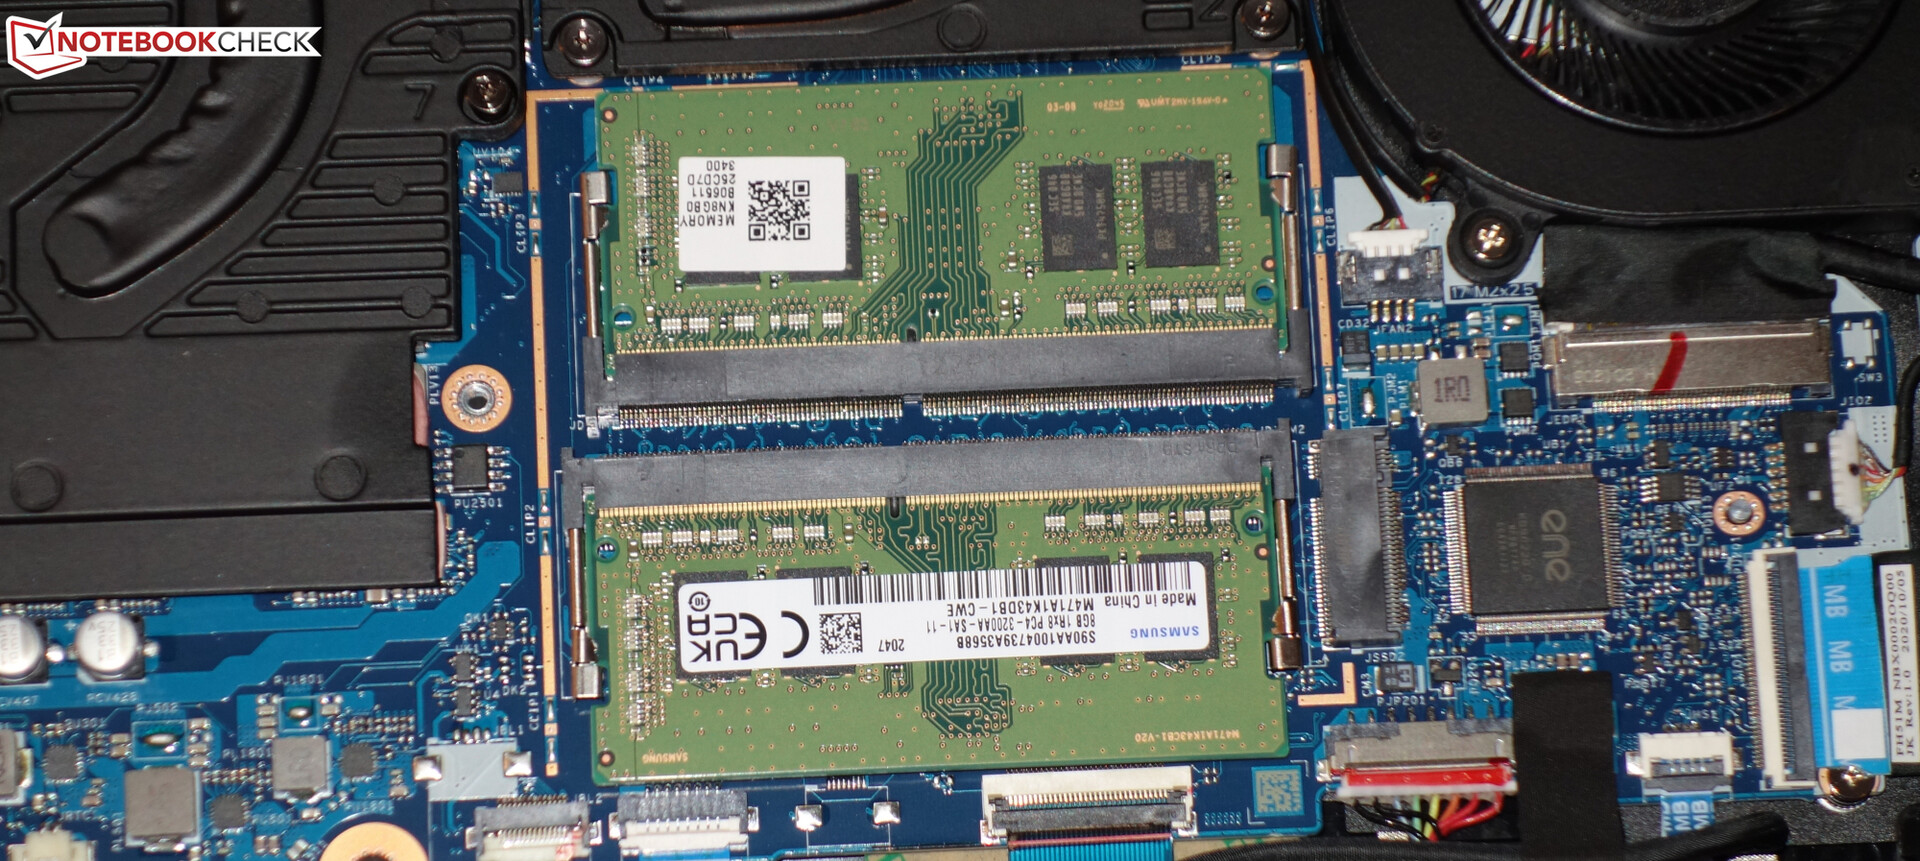
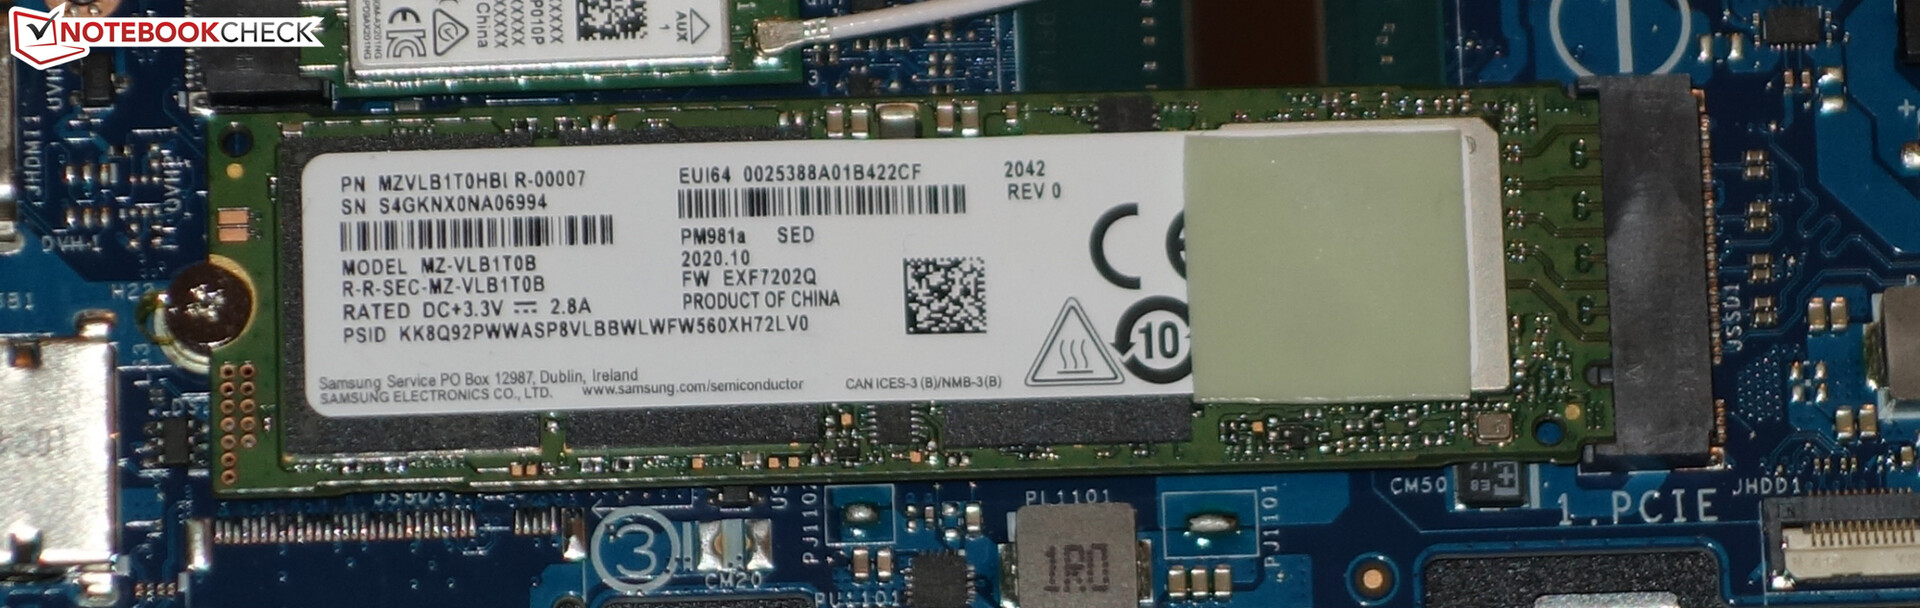
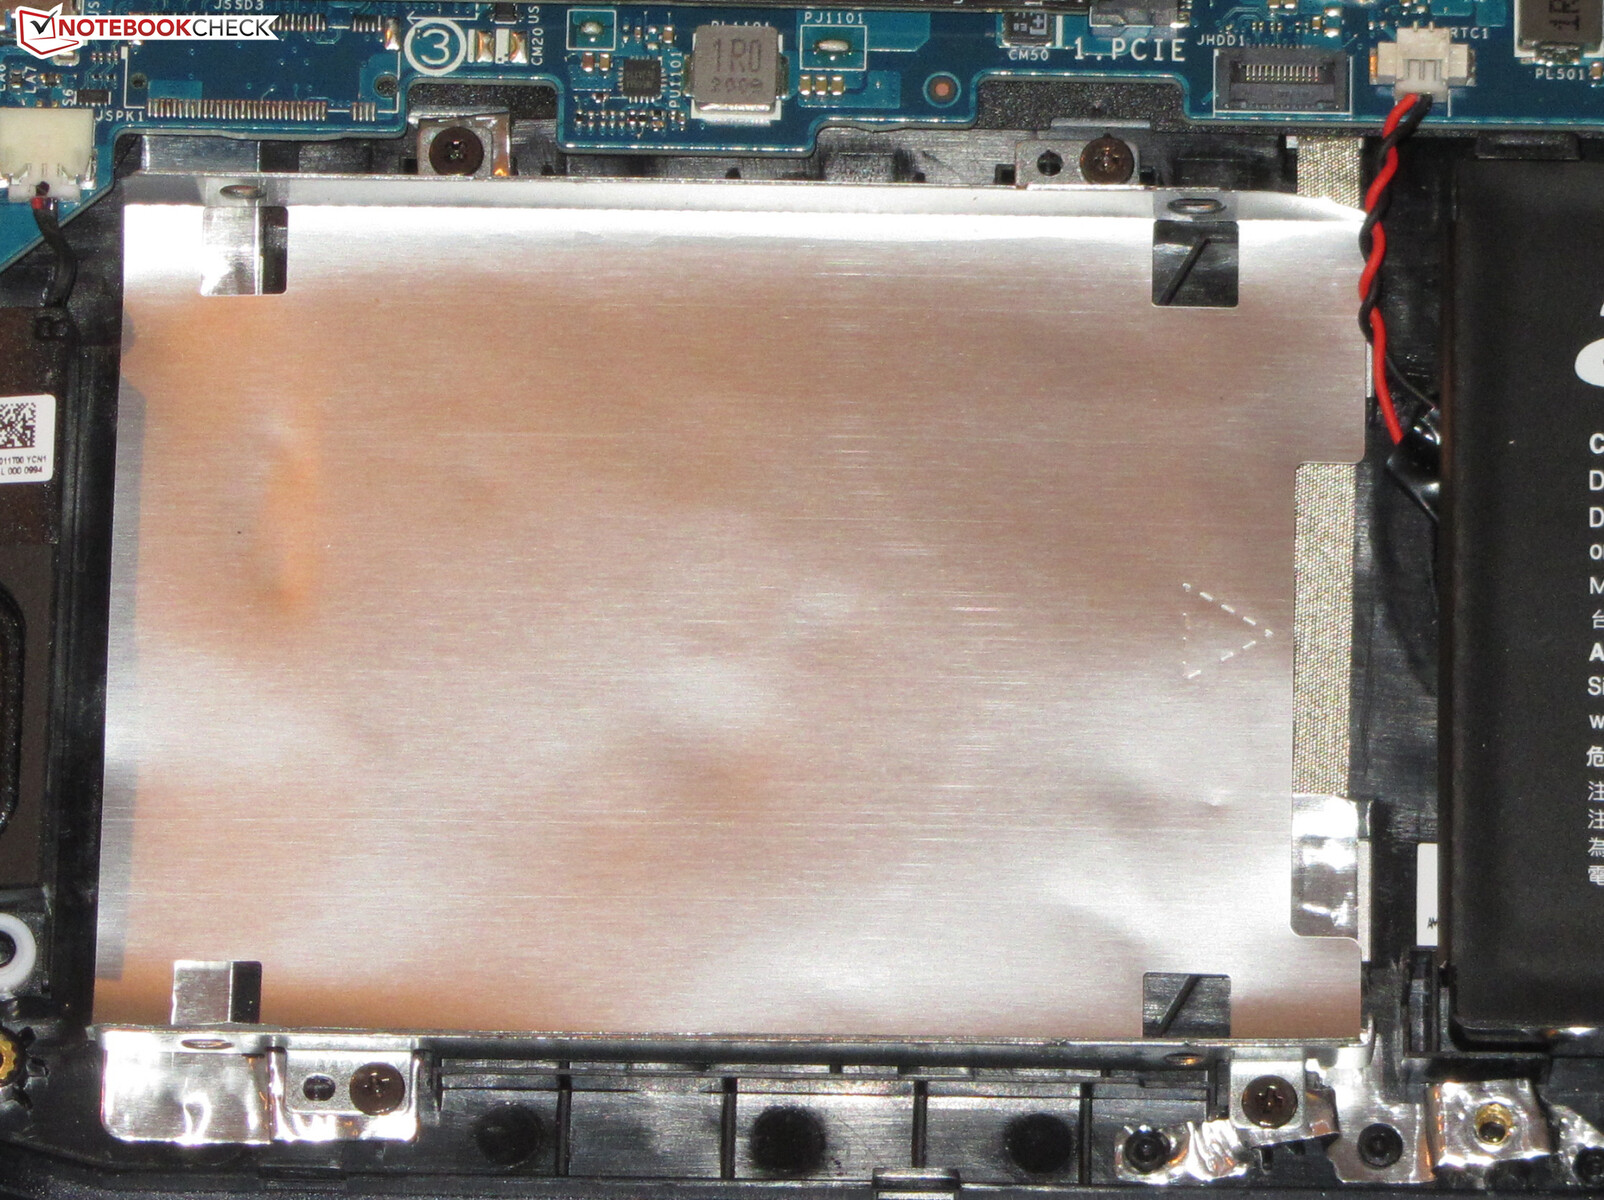
An NVMe SSD (M.2-2280) from Samsung serves as the system drive. It provides 1 TB of storage space and delivers good transfer rates. The laptop can hold a total of two NVMe SSDs. RAID 0 is supported as well. The Predator also has room for a 2.5-inch storage device. The necessary SATA slot (in the box) and the mounting frame (inside the laptop) are included.


| Acer Predator Helios 300 PH315-53-786B Samsung PM981a MZVLB1T0HBLR | Aorus 15G XC ESR512GTLCG-EAC-4 | MSI GS66 Stealth 10UG WDC PC SN730 SDBPNTY-1T00 | Asus ROG Strix G15 G513QR SK Hynix HFM001TD3JX013N | Acer Predator Helios 300 PH315-53-77N5 WDC PC SN730 SDBQNTY-512GB | |
|---|---|---|---|---|---|
| AS SSD | -11% | -4% | -1% | -15% | |
| Seq Read (MB/s) | 2792 | 2048 -27% | 2198 -21% | 2881 3% | 2753 -1% |
| Seq Write (MB/s) | 2311 | 2403 4% | 2596 12% | 1570 -32% | 2495 8% |
| 4K Read (MB/s) | 48.34 | 48.27 0% | 43.81 -9% | 52.4 8% | 38.64 -20% |
| 4K Write (MB/s) | 93.9 | 101.6 8% | 115.5 23% | 124 32% | 88.8 -5% |
| 4K-64 Read (MB/s) | 1516 | 1606 6% | 1692 12% | 1334 -12% | 952 -37% |
| 4K-64 Write (MB/s) | 1940 | 1473 -24% | 2162 11% | 2189 13% | 1568 -19% |
| Access Time Read * (ms) | 0.131 | 0.056 | 0.055 | ||
| Access Time Write * (ms) | 0.04 | 0.038 5% | 0.098 -145% | 0.03 25% | 0.044 -10% |
| Score Read (Points) | 1843 | 1859 1% | 1956 6% | 1675 -9% | 1266 -31% |
| Score Write (Points) | 2265 | 1815 -20% | 2537 12% | 2470 9% | 1906 -16% |
| Score Total (Points) | 5030 | 4645 -8% | 5513 10% | 4943 -2% | 3811 -24% |
| Copy ISO MB/s (MB/s) | 1921 | 1188 -38% | 2236 16% | 1277 -34% | 2037 6% |
| Copy Program MB/s (MB/s) | 581 | 488.1 -16% | 690 19% | 575 -1% | 475.6 -18% |
| Copy Game MB/s (MB/s) | 1454 | 878 -40% | 1546 6% | 1272 -13% | 1018 -30% |
* ... smaller is better
Continuous load read: DiskSpd Read Loop, Queue Depth 8
Graphics card
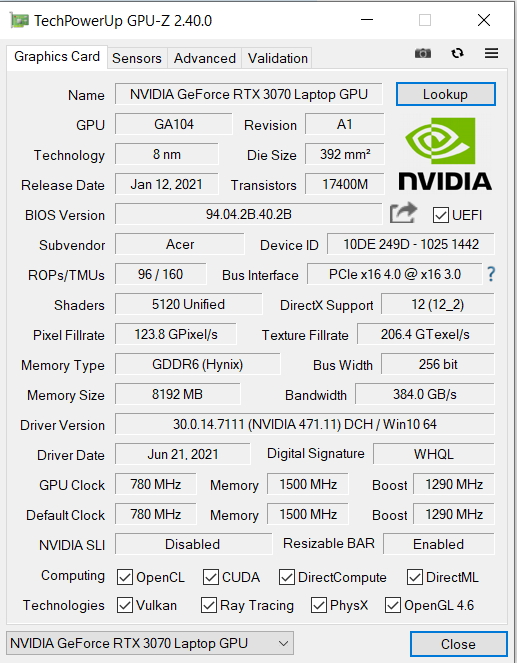
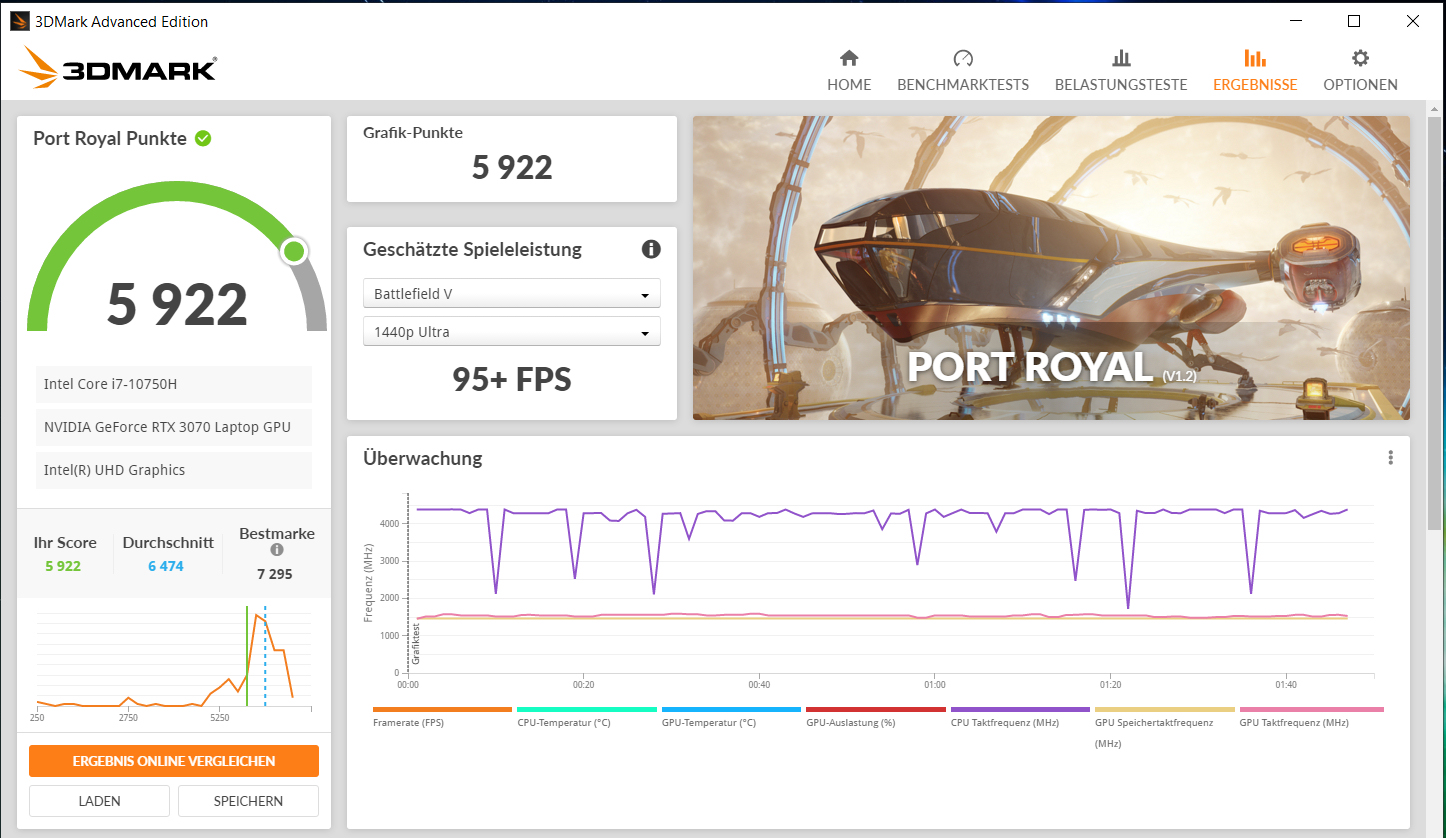
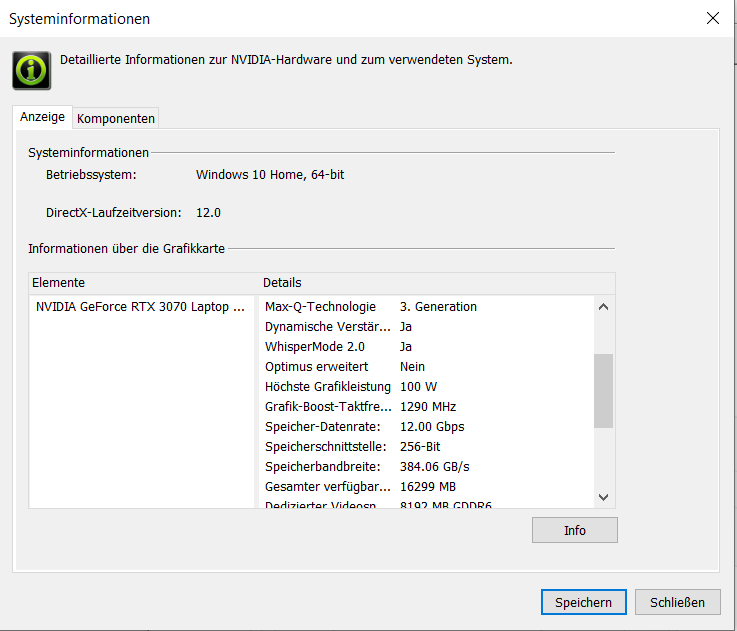
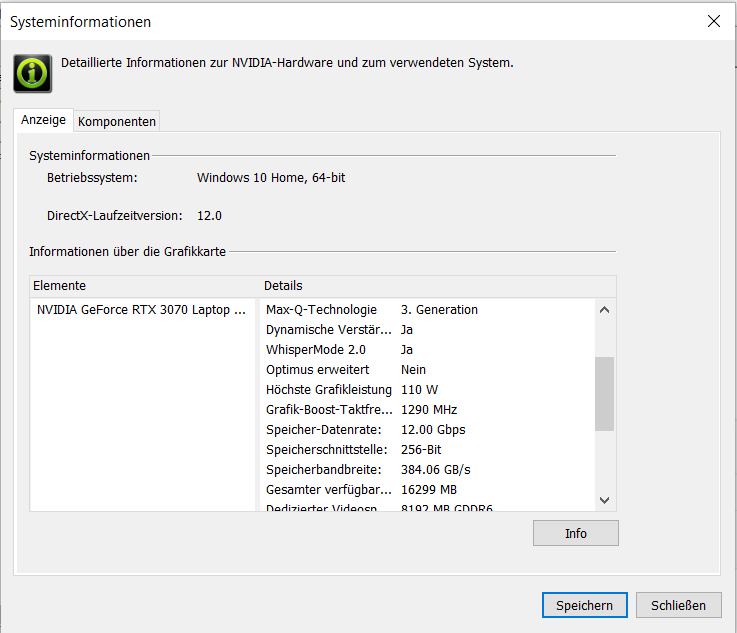
The actual performance of an RTX 3000 graphics core depends on the maximum TGP that a laptop manufacturer selects within the limits defined by Nvidia. Acer originally provided the GeForce RTX 3070 laptop GPU (overview of all RTX 3070 laptops including their TGPs) with a maximum TGP of 100 watts. A firmware update (found in the downloads section of Acer's website) increases the TGP to 110 watts - we also reported on this previously.
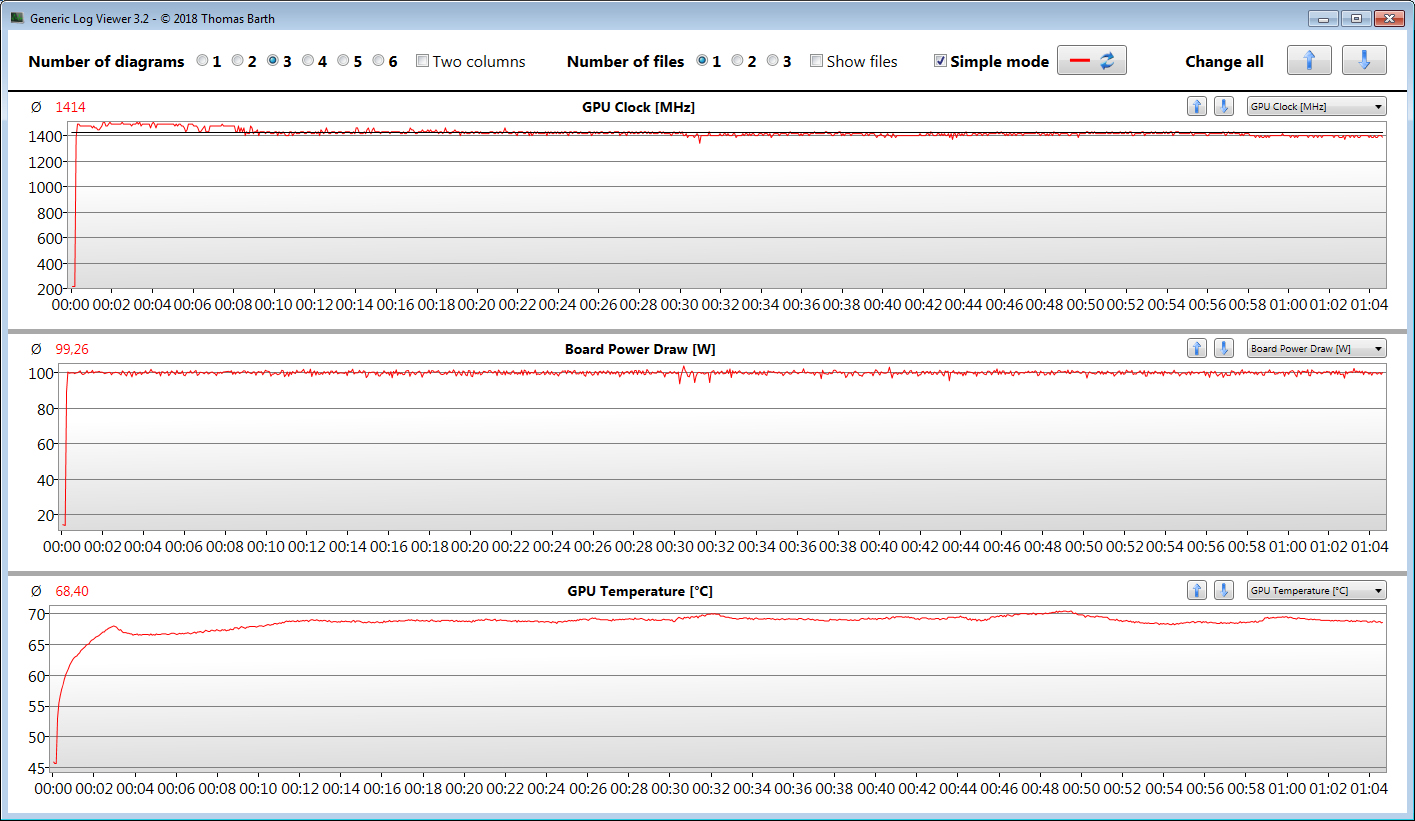
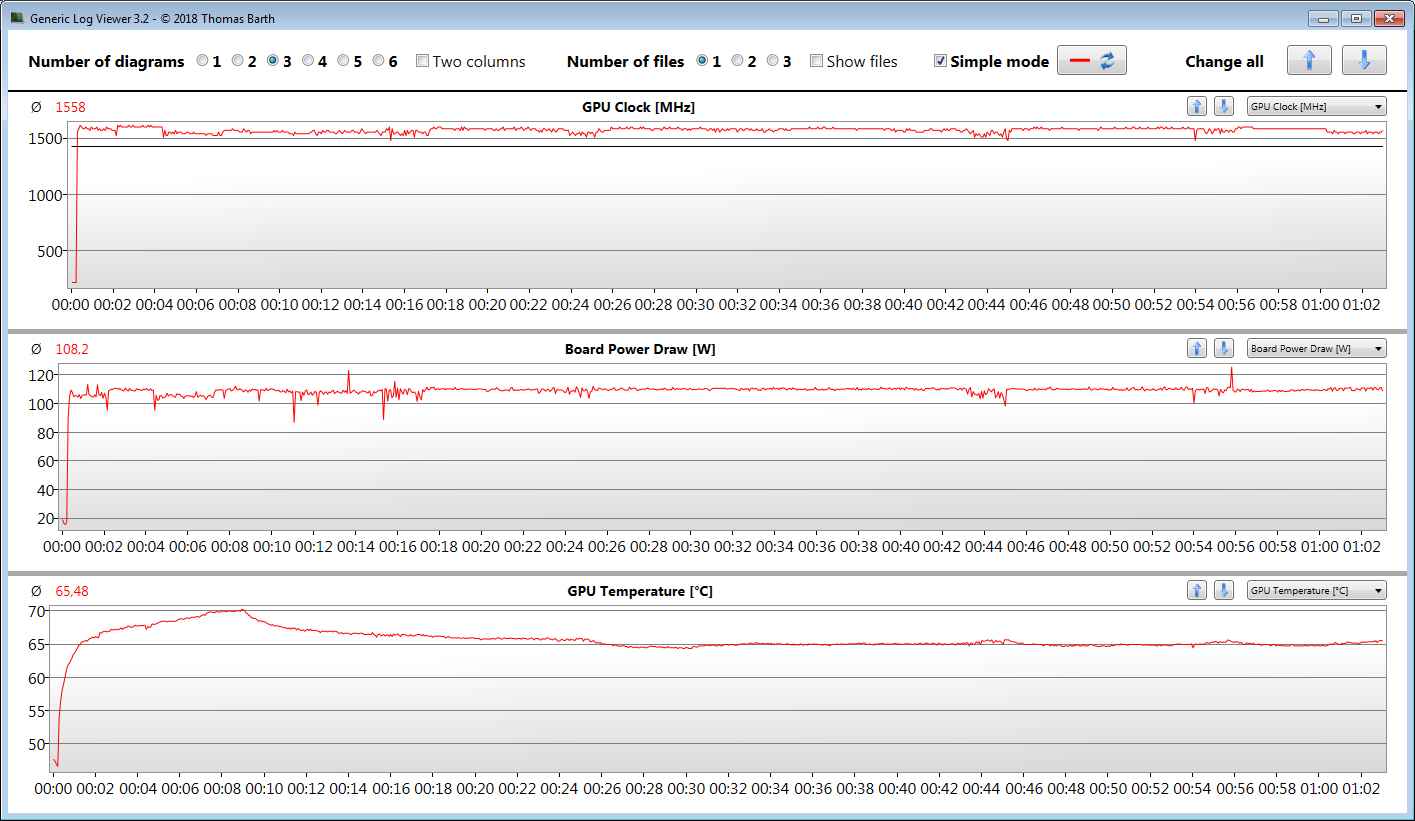
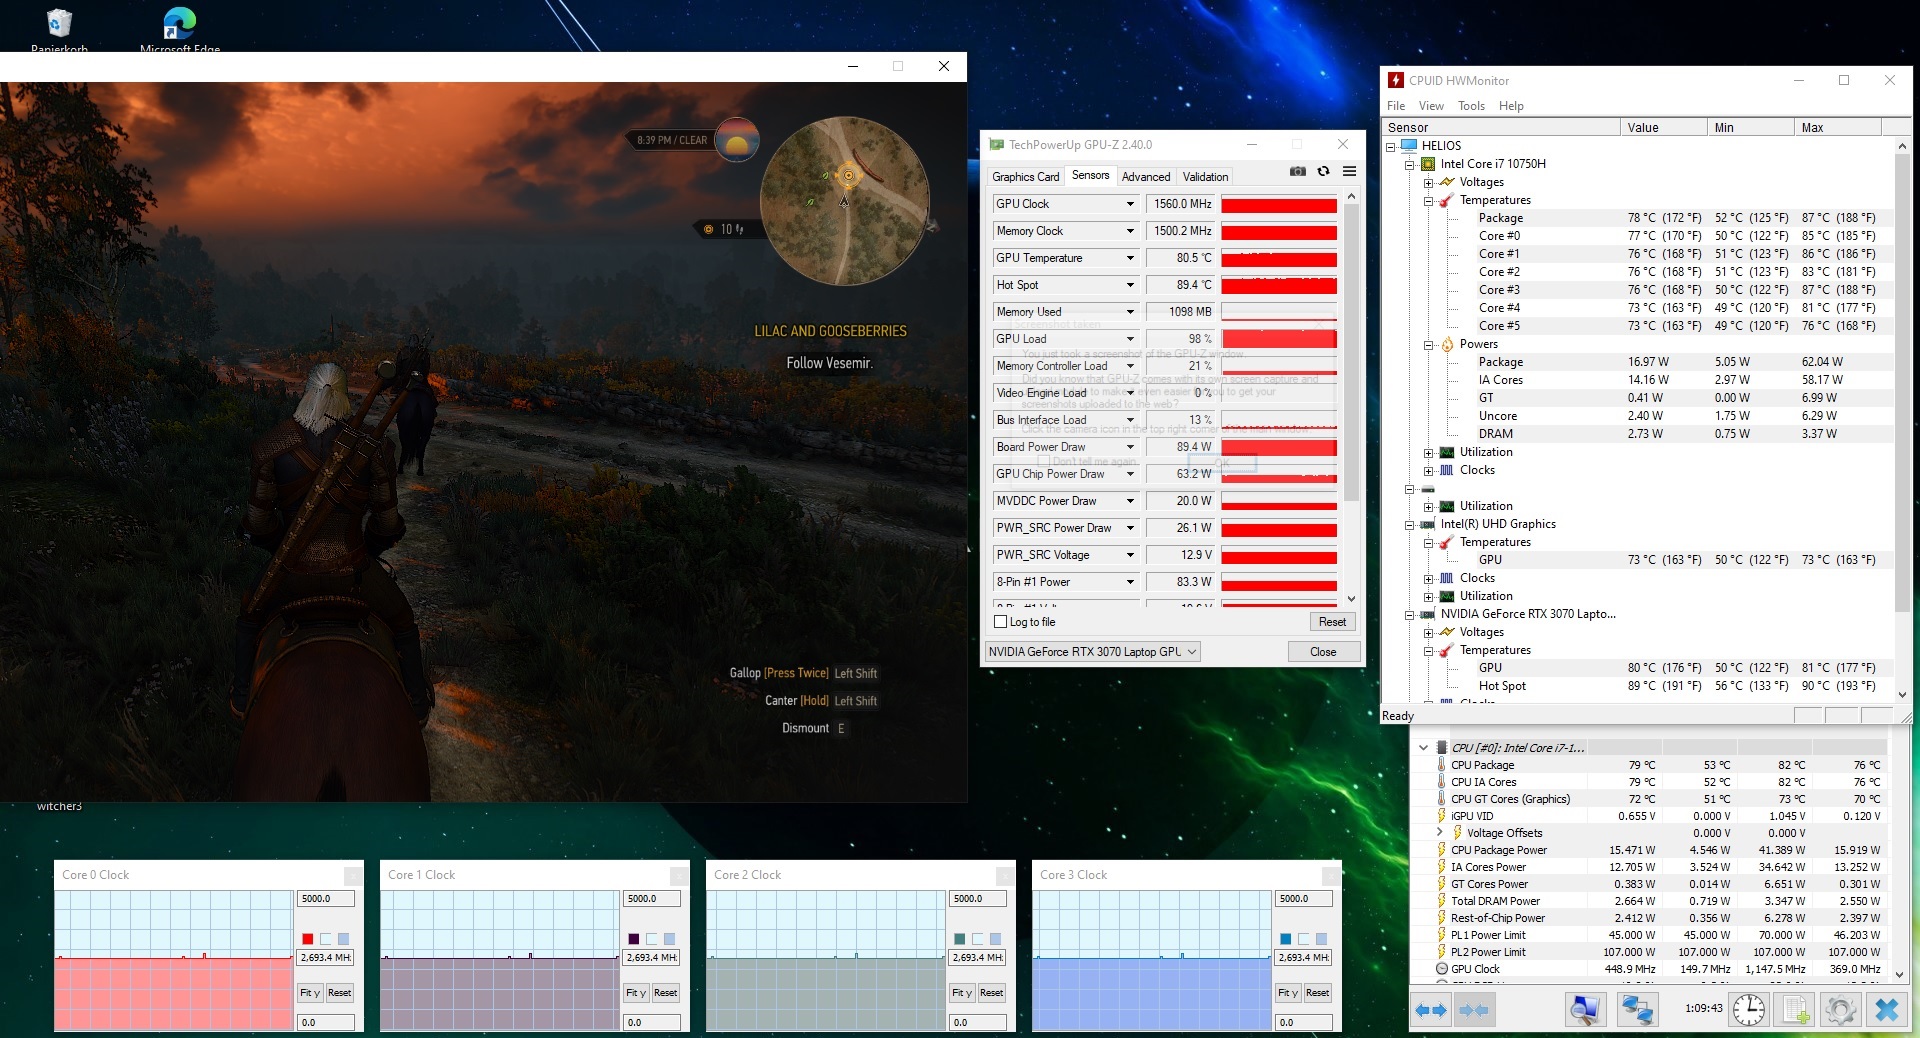
The GPU performs decently and delivers average (100-watt TGP) or slightly above-average (110-watt TGP) RTX 3070 benchmark results. The new TGP maximum of 110 watts is used when the "Extreme" GPU profile is enabled, and it can also be maintained over a prolonged period of time (see our The Witcher 3 test).
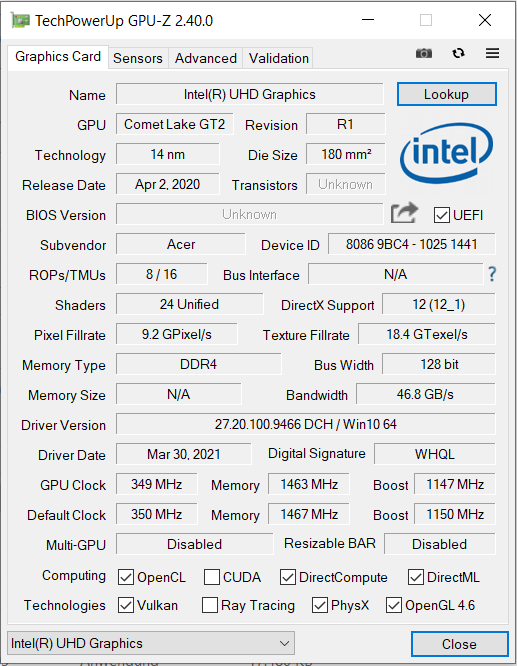
The UHD Graphics 630 GPU integrated into the processor is active, and the laptop works with Nvidia's Optimus graphics-switching solution.


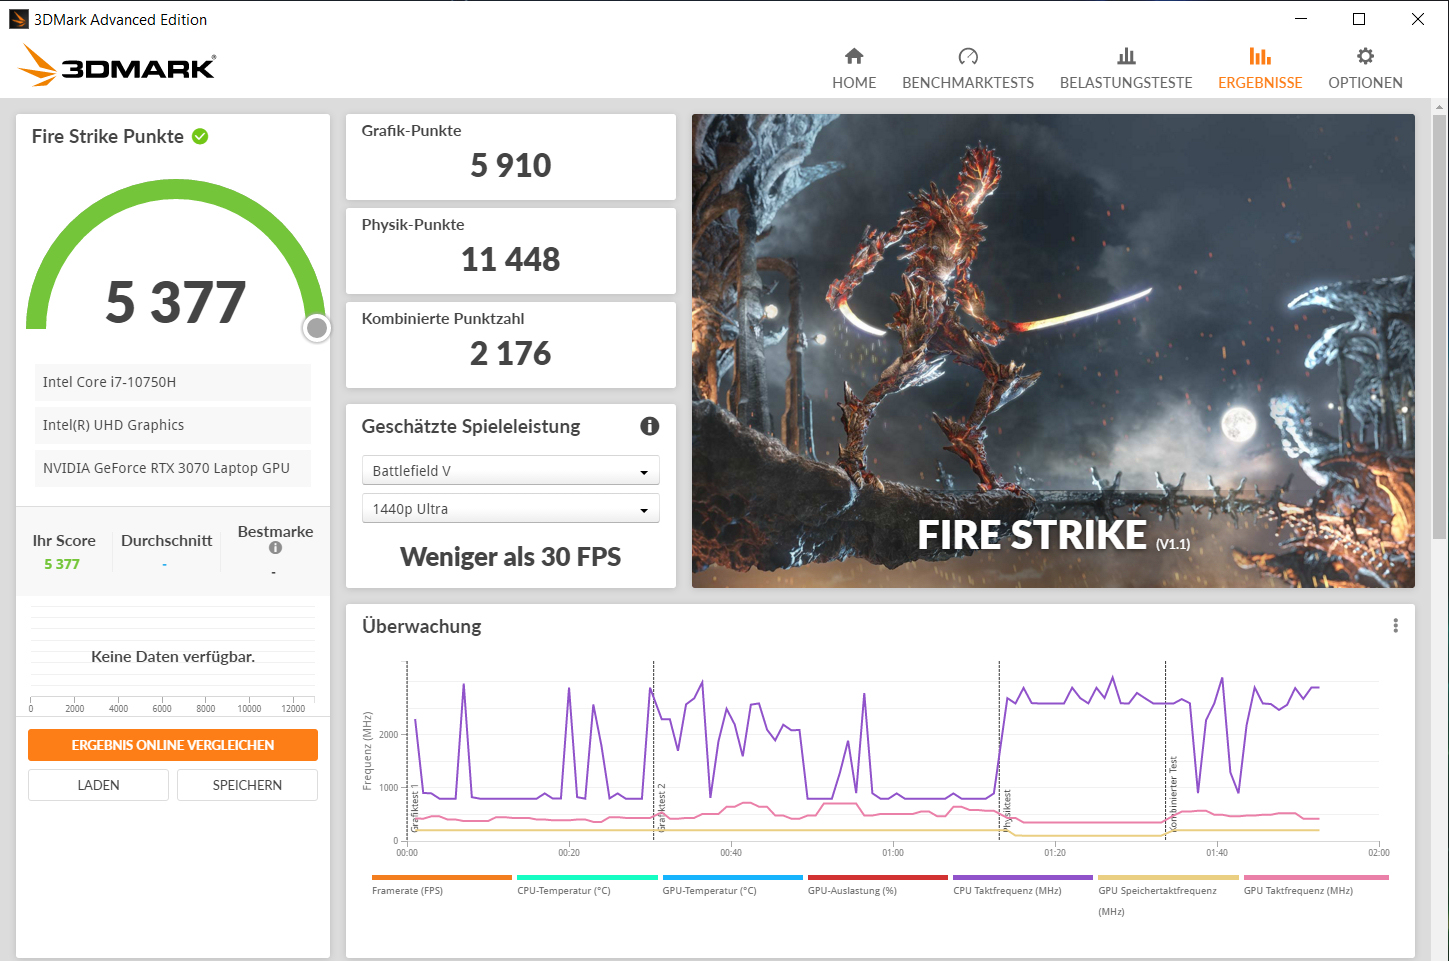
| 3DMark 11 Performance | 23408 points | |
| 3DMark Cloud Gate Standard Score | 38982 points | |
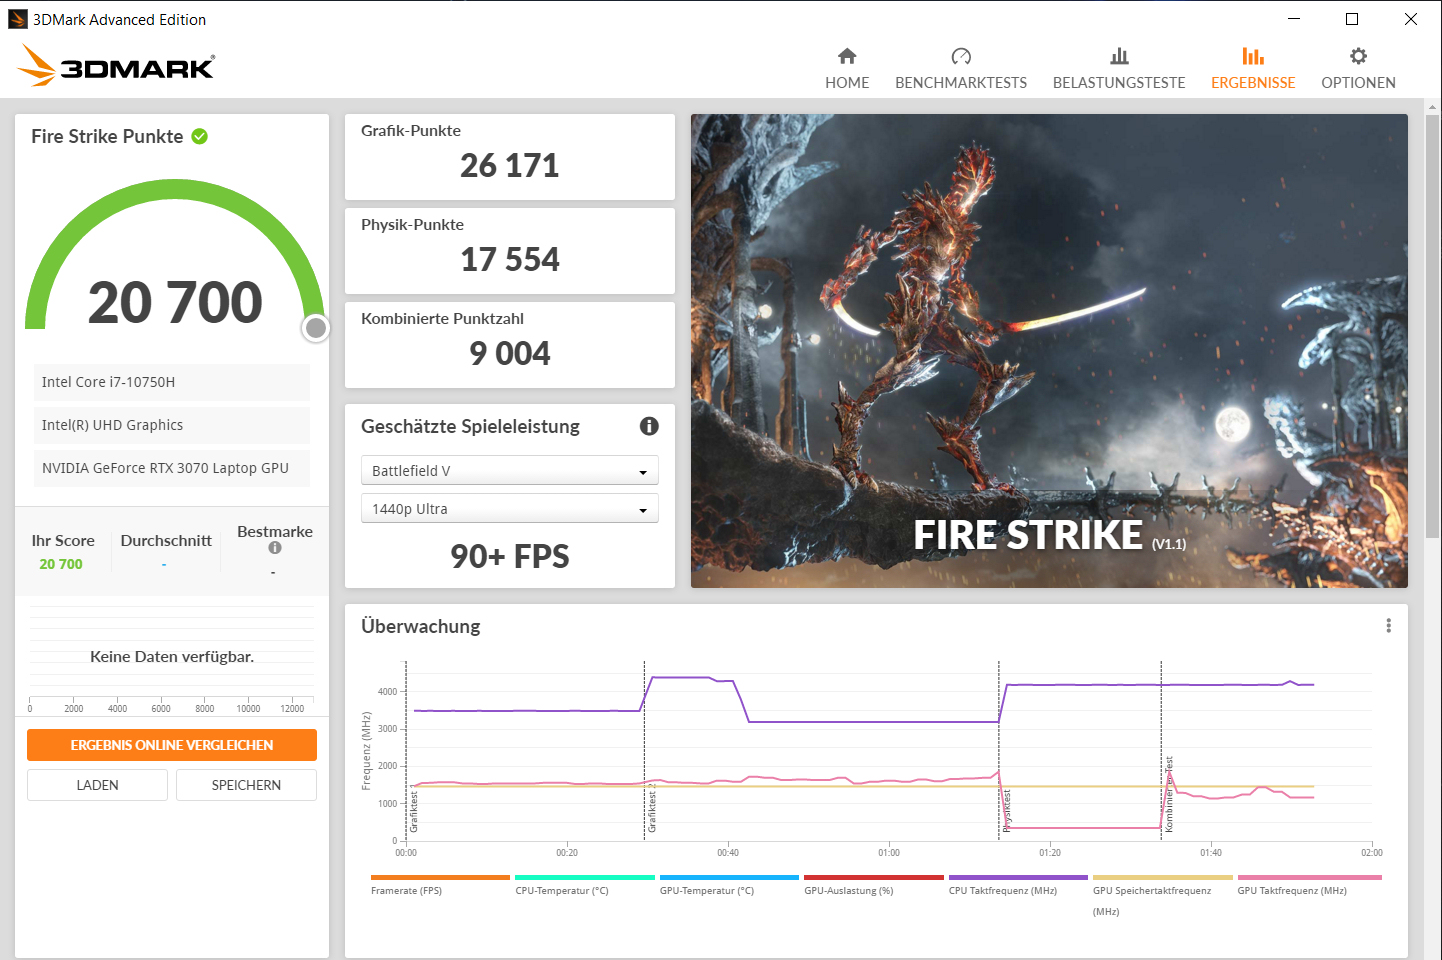
| 3DMark Fire Strike Score | 19478 points | |
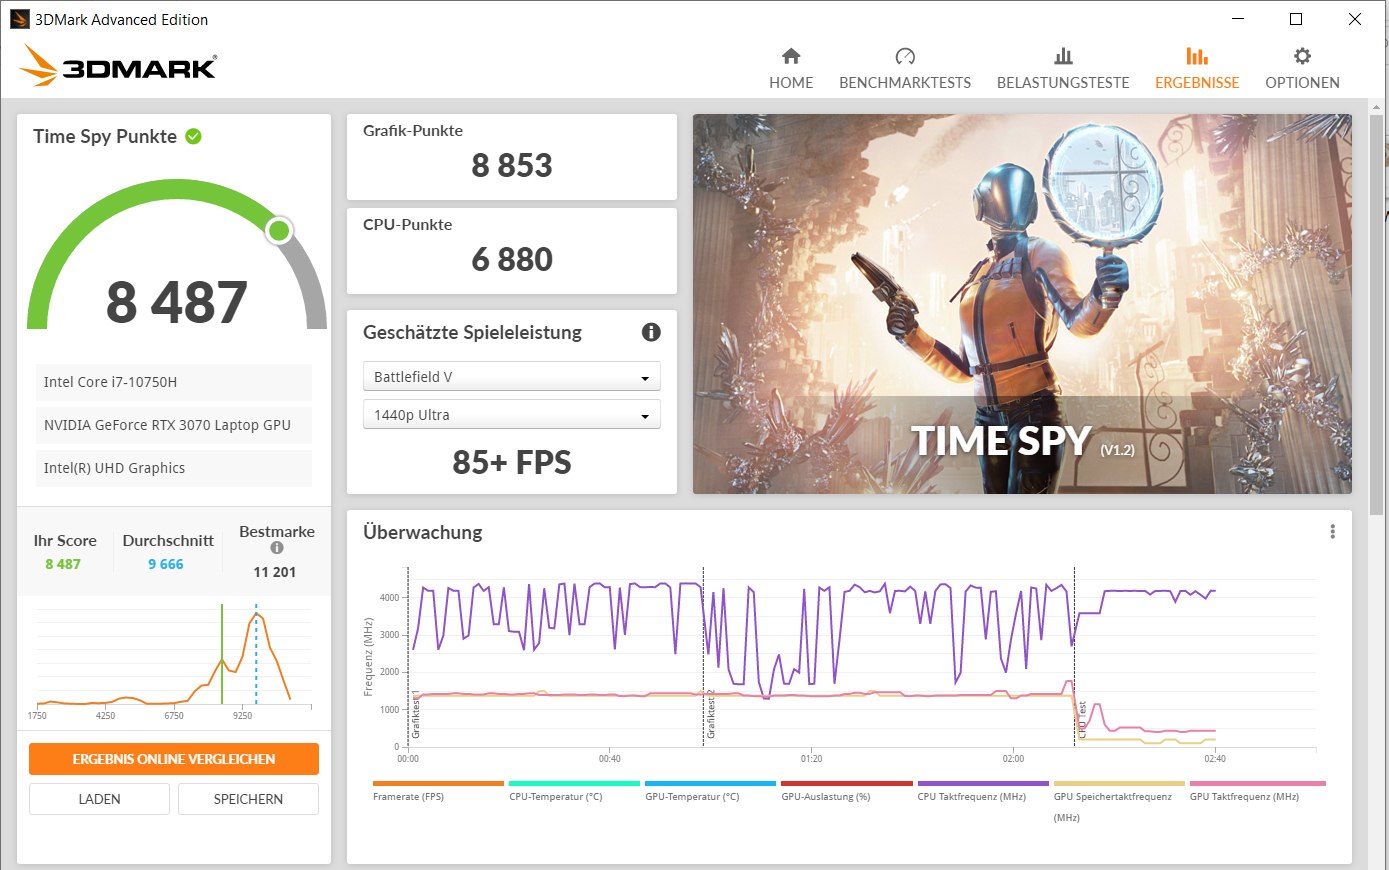
| 3DMark Time Spy Score | 8487 points | |
Help | ||
| 3DMark 11 - 1280x720 Performance GPU | |
| Average of class Gaming (21841 - 80022, n=104, last 2 years) | |
| Acer Predator Helios 300 PH315-53-786B (Extrem, TGP 110W) | |
| Asus ROG Strix G15 G513QR | |
| Aorus 15G XC | |
| Average NVIDIA GeForce RTX 3070 Laptop GPU (12535 - 38275, n=54) | |
| Acer Predator Helios 300 PH315-53-786B | |
| MSI GS66 Stealth 10UG | |
| Acer Predator Helios 300 PH315-53-77N5 | |
| 3DMark | |
| 1920x1080 Fire Strike Graphics | |
| Average of class Gaming (12242 - 62849, n=115, last 2 years) | |
| Acer Predator Helios 300 PH315-53-786B (Extrem, TGP 110W) | |
| Asus ROG Strix G15 G513QR | |
| Aorus 15G XC | |
| Acer Predator Helios 300 PH315-53-786B | |
| Average NVIDIA GeForce RTX 3070 Laptop GPU (7178 - 29128, n=52) | |
| MSI GS66 Stealth 10UG | |
| Acer Predator Helios 300 PH315-53-77N5 | |
| 2560x1440 Time Spy Graphics | |
| Average of class Gaming (5012 - 26212, n=115, last 2 years) | |
| Asus ROG Strix G15 G513QR | |
| Acer Predator Helios 300 PH315-53-786B (Extrem, TGP 110W) | |
| Aorus 15G XC | |
| Average NVIDIA GeForce RTX 3070 Laptop GPU (2644 - 11019, n=53) | |
| MSI GS66 Stealth 10UG | |
| Acer Predator Helios 300 PH315-53-786B | |
| Acer Predator Helios 300 PH315-53-77N5 | |
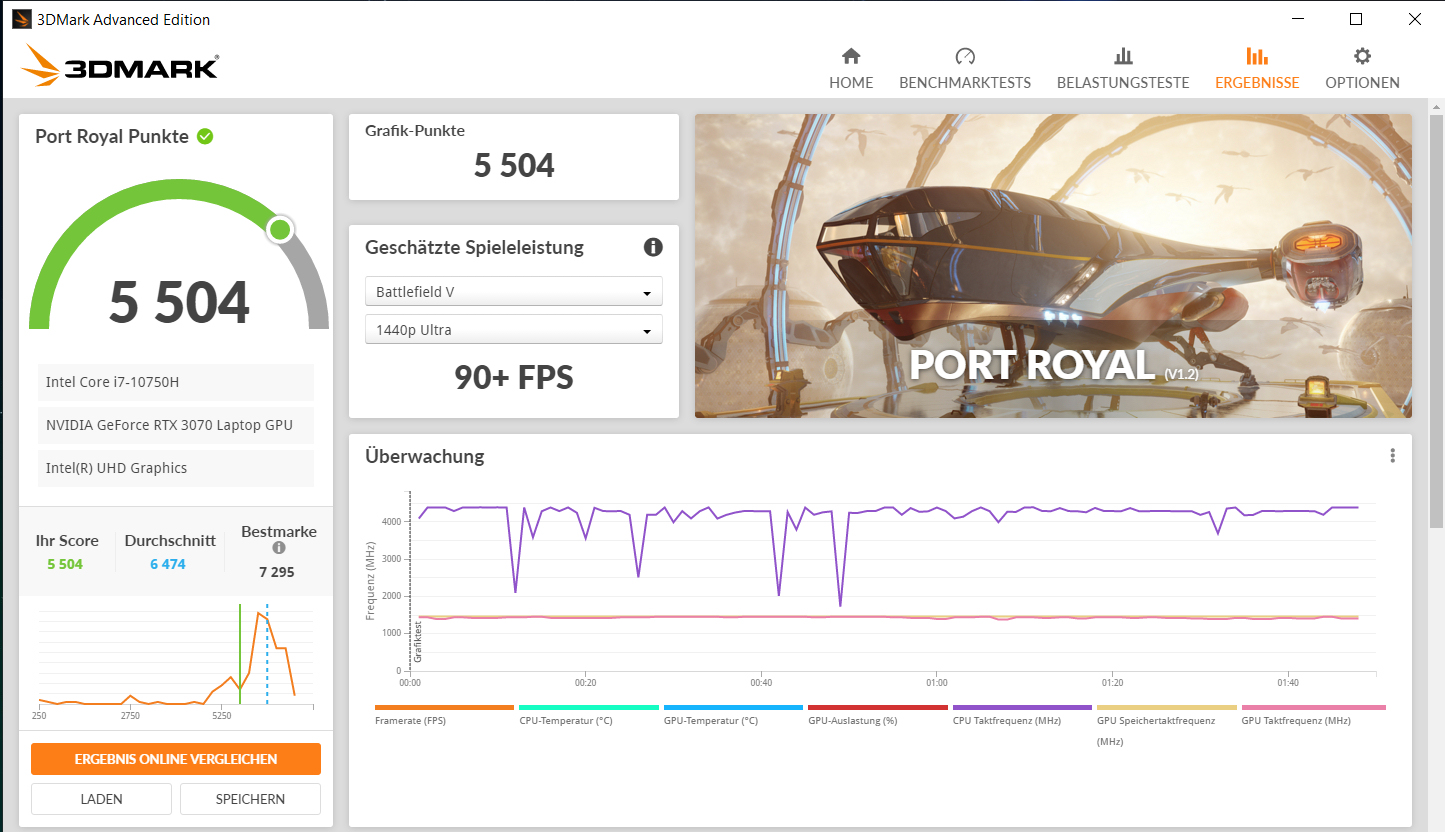
| 2560x1440 Port Royal Graphics | |
| Average of class Gaming (4395 - 17286, n=71, last 2 years) | |
| Acer Predator Helios 300 PH315-53-786B (Extrem, TGP 110W) | |
| Average NVIDIA GeForce RTX 3070 Laptop GPU (1640 - 6542, n=39) | |
| Acer Predator Helios 300 PH315-53-786B | |
| MSI GS66 Stealth 10UG | |
| Acer Predator Helios 300 PH315-53-77N5 | |
Gaming performance
The laptop brings all the latest games smoothly onto the screen. Full HD resolution (1920x1080 pixels) and maximum quality settings can usually be selected. The Predator delivers frame rates that hover around the average of the laptops that we have tested so far with the RTX 3070. The increase of the TGP to 110 watts leads to an improvement in frame rates in some titles. A general improvement isn't identifiable.
| The Witcher 3 - 1920x1080 Ultra Graphics & Postprocessing (HBAO+) | |
| Average of class Gaming (104.7 - 240, n=7, last 2 years) | |
| Acer Predator Helios 300 PH315-53-786B (Extrem, TGP 110W) | |
| Asus ROG Strix G15 G513QR | |
| Aorus 15G XC | |
| Average NVIDIA GeForce RTX 3070 Laptop GPU (34.9 - 109, n=52) | |
| Acer Predator Helios 300 PH315-53-786B | |
| MSI GS66 Stealth 10UG | |
| Acer Predator Helios 300 PH315-53-77N5 | |
| Dota 2 Reborn - 1920x1080 ultra (3/3) best looking | |
| Average of class Gaming (84.8 - 248, n=107, last 2 years) | |
| Average NVIDIA GeForce RTX 3070 Laptop GPU (26.9 - 163.9, n=58) | |
| Aorus 15G XC | |
| Acer Predator Helios 300 PH315-53-786B | |
| Acer Predator Helios 300 PH315-53-786B (Extrem, TGP 110W) | |
| MSI GS66 Stealth 10UG | |
| Asus ROG Strix G15 G513QR | |
| X-Plane 11.11 - 1920x1080 high (fps_test=3) | |
| Average of class Gaming (55.5 - 143.5, n=109, last 2 years) | |
| Average NVIDIA GeForce RTX 3070 Laptop GPU (12.4 - 118.8, n=61) | |
| Aorus 15G XC | |
| MSI GS66 Stealth 10UG | |
| Acer Predator Helios 300 PH315-53-786B | |
| Acer Predator Helios 300 PH315-53-786B | |
| Asus ROG Strix G15 G513QR | |
| Final Fantasy XV Benchmark - 1920x1080 High Quality | |
| Average of class Gaming (41 - 215, n=95, last 2 years) | |
| Asus ROG Strix G15 G513QR (1.3) | |
| MSI GS66 Stealth 10UG (1.3) | |
| Acer Predator Helios 300 PH315-53-786B (1.3, Extrem, TGP 110W) | |
| Average NVIDIA GeForce RTX 3070 Laptop GPU (27.9 - 107, n=49) | |
| Acer Predator Helios 300 PH315-53-786B (1.3) | |
| GTA V - 1920x1080 Highest AA:4xMSAA + FX AF:16x | |
| Average of class Gaming (48.3 - 186.9, n=94, last 2 years) | |
| Average NVIDIA GeForce RTX 3070 Laptop GPU (21.7 - 125.8, n=50) | |
| MSI GS66 Stealth 10UG | |
| Acer Predator Helios 300 PH315-53-786B | |
| Acer Predator Helios 300 PH315-53-786B (Extrem, TGP 110W) | |
| Asus ROG Strix G15 G513QR | |
| Strange Brigade - 1920x1080 ultra AA:ultra AF:16 | |
| Average of class Gaming (76.3 - 458, n=87, last 2 years) | |
| Acer Predator Helios 300 PH315-53-786B (1.47.22.14 D3D12, Extrem, TGP 110W) | |
| Acer Predator Helios 300 PH315-53-786B (1.47.22.14 D3D12) | |
| Average NVIDIA GeForce RTX 3070 Laptop GPU (36.2 - 194, n=46) | |
| Asus ROG Strix G15 G513QR (1.47.22.14 D3D12) | |
| MSI GS66 Stealth 10UG (1.47.22.14 D3D12) | |
| Far Cry 5 - 1920x1080 Ultra Preset AA:T | |
| Average of class Gaming (70 - 151, n=6, last 2 years) | |
| Average NVIDIA GeForce RTX 3070 Laptop GPU (89 - 140, n=36) | |
| Acer Predator Helios 300 PH315-53-786B (Extrem, TGP 110W) | |
| Acer Predator Helios 300 PH315-53-786B | |
| Asus ROG Strix G15 G513QR | |
| Dirt 5 - 1920x1080 Ultra High Preset | |
| Average NVIDIA GeForce RTX 3070 Laptop GPU (50 - 96, n=11) | |
| Acer Predator Helios 300 PH315-53-786B | |
| Acer Predator Helios 300 PH315-53-786B (Extrem, TGP 110W) | |
| Serious Sam 4 - 1920x1080 Ultra (DX12) AA:2xMS | |
| Average NVIDIA GeForce RTX 3070 Laptop GPU (66.4 - 82.1, n=5) | |
| Acer Predator Helios 300 PH315-53-786B (Extrem, TGP 110W) | |
| Acer Predator Helios 300 PH315-53-786B | |
| Acer Predator Helios 300 PH315-53-77N5 | |
| Watch Dogs Legion | |
| 1920x1080 Ultra Preset (DX12) | |
| Average NVIDIA GeForce RTX 3070 Laptop GPU (55 - 73, n=7) | |
| Acer Predator Helios 300 PH315-53-786B (Extrem, TGP 110W) | |
| Acer Predator Helios 300 PH315-53-786B | |
| 1920x1080 Ultra Preset + Ultra Ray Tracing (DX12) | |
| Average NVIDIA GeForce RTX 3070 Laptop GPU (34 - 45.4, n=7) | |
| Acer Predator Helios 300 PH315-53-786B | |
| Acer Predator Helios 300 PH315-53-786B | |
In order to verify whether the frame rates remain largely constant over a prolonged period of time, we let the game The Witcher 3 run for about 60 minutes at Full HD resolution and maximum quality settings. The character is not moved. Except for a small performance drop, a decrease in frame rates is not noticeable.
The Witcher 3 FPS diagram
| low | med. | high | ultra | |
|---|---|---|---|---|
| GTA V (2015) | 176 | 169 | 142 | 85 |
| The Witcher 3 (2015) | 259 | 216 | 154 | 91.3 |
| Dota 2 Reborn (2015) | 144 | 131 | 120 | 114 |
| Final Fantasy XV Benchmark (2018) | 137 | 110 | 85.1 | |
| X-Plane 11.11 (2018) | 101 | 86.6 | 74.4 | |
| Far Cry 5 (2018) | 134 | 108 | 103 | 99 |
| Strange Brigade (2018) | 311 | 208 | 179 | 159 |
| Death Stranding (2020) | 137 | 121 | 118 | 115 |
| Serious Sam 4 (2020) | 117 | 82.6 | 78.9 | 69 |
| Watch Dogs Legion (2020) | 79.1 | 74 | 67.8 | 59.5 |
| Dirt 5 (2020) | 176 | 113 | 93.6 | 77.3 |
| Yakuza Like a Dragon (2020) | 113 | 100 | 99.5 | 90.7 |
| Outriders (2021) | 104 | 94 | 93.6 | 89.4 |
| Mass Effect Legendary Edition (2021) | 105 | 94.3 | ||
| Days Gone (2021) | 147 | 121 | 112 | 88.6 |
| F1 2021 (2021) | 205 | 169 | 149 | 96 |
Emissions - The Acer laptop heats up noticeably
Noise emissions
The PH315 can operate silently in idle usage. The fans occasionally rev up, though. But under load, silence is history. The maximum sound pressure levels are 51 dB(A) (stress test) and 49 dB(A) (The Witcher 3 test), respectively. Gaming without a headset is not enjoyable here. One of the fans tends to pulsate under load.
Noise level
| Idle |
| 25 / 27 / 35 dB(A) |
| Load |
| 46 / 51 dB(A) |
 | ||
30 dB silent 40 dB(A) audible 50 dB(A) loud |
||
min: | ||
| Acer Predator Helios 300 PH315-53-786B i7-10750H, GeForce RTX 3070 Laptop GPU | Aorus 15G XC i7-10870H, GeForce RTX 3070 Laptop GPU | MSI GS66 Stealth 10UG i7-10870H, GeForce RTX 3070 Laptop GPU | Asus ROG Strix G15 G513QR R9 5900HX, GeForce RTX 3070 Laptop GPU | Acer Predator Helios 300 PH315-53-77N5 i7-10750H, GeForce RTX 2060 Mobile | Average of class Gaming | |
|---|---|---|---|---|---|---|
| Noise | -0% | -11% | 0% | 3% | 2% | |
| off / environment * (dB) | 25 | 25 -0% | 26.2 -5% | 24 4% | 25.2 -1% | 24.1 ? 4% |
| Idle Minimum * (dB) | 25 | 29 -16% | 34 -36% | 25 -0% | 25.2 -1% | 26 ? -4% |
| Idle Average * (dB) | 27 | 30 -11% | 34 -26% | 31 -15% | 25.2 7% | 27.4 ? -1% |
| Idle Maximum * (dB) | 35 | 31 11% | 34 3% | 33 6% | 25.2 28% | 30.1 ? 14% |
| Load Average * (dB) | 46 | 41 11% | 47.2 -3% | 45 2% | 43.5 5% | 43.6 ? 5% |
| Witcher 3 ultra * (dB) | 49 | 47 4% | 46.3 6% | 48 2% | 53.1 -8% | |
| Load Maximum * (dB) | 51 | 51 -0% | 58.2 -14% | 50 2% | 56 -10% | 54.2 ? -6% |
* ... smaller is better
Temperature
The stress test (Prime95 and FurMark run for at least an hour) is executed by the CPU and GPU at 2.7 GHz and 1,365 MHz, respectively. The stress test represents an extreme scenario. We use this test to check whether the system remains stable even under full load.
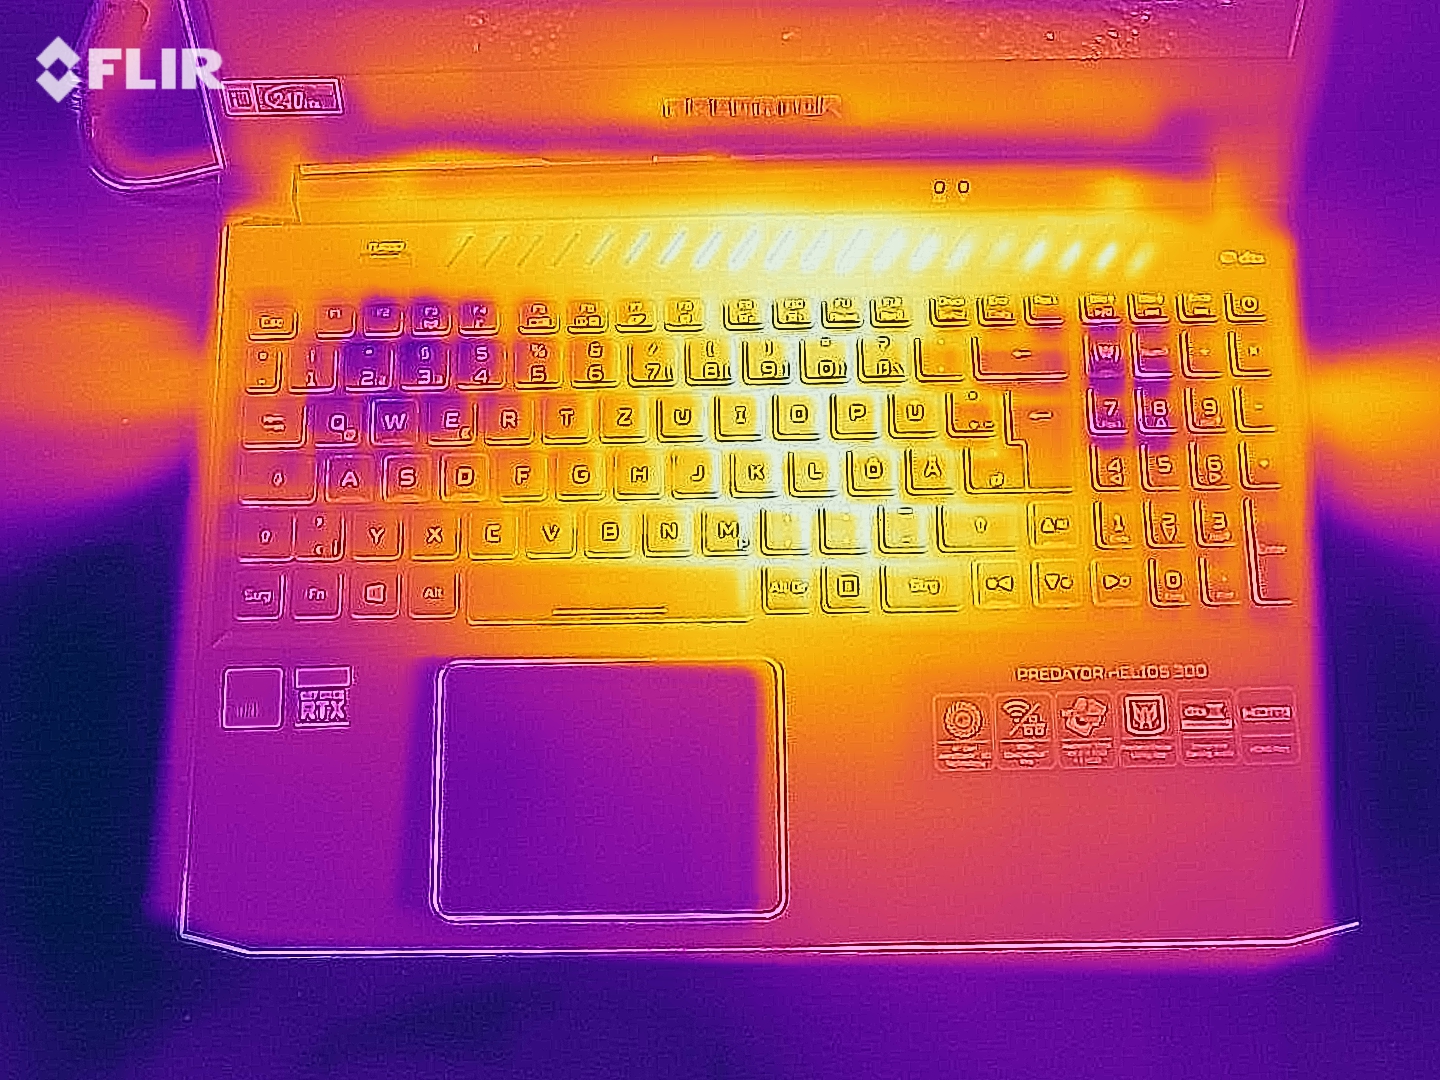
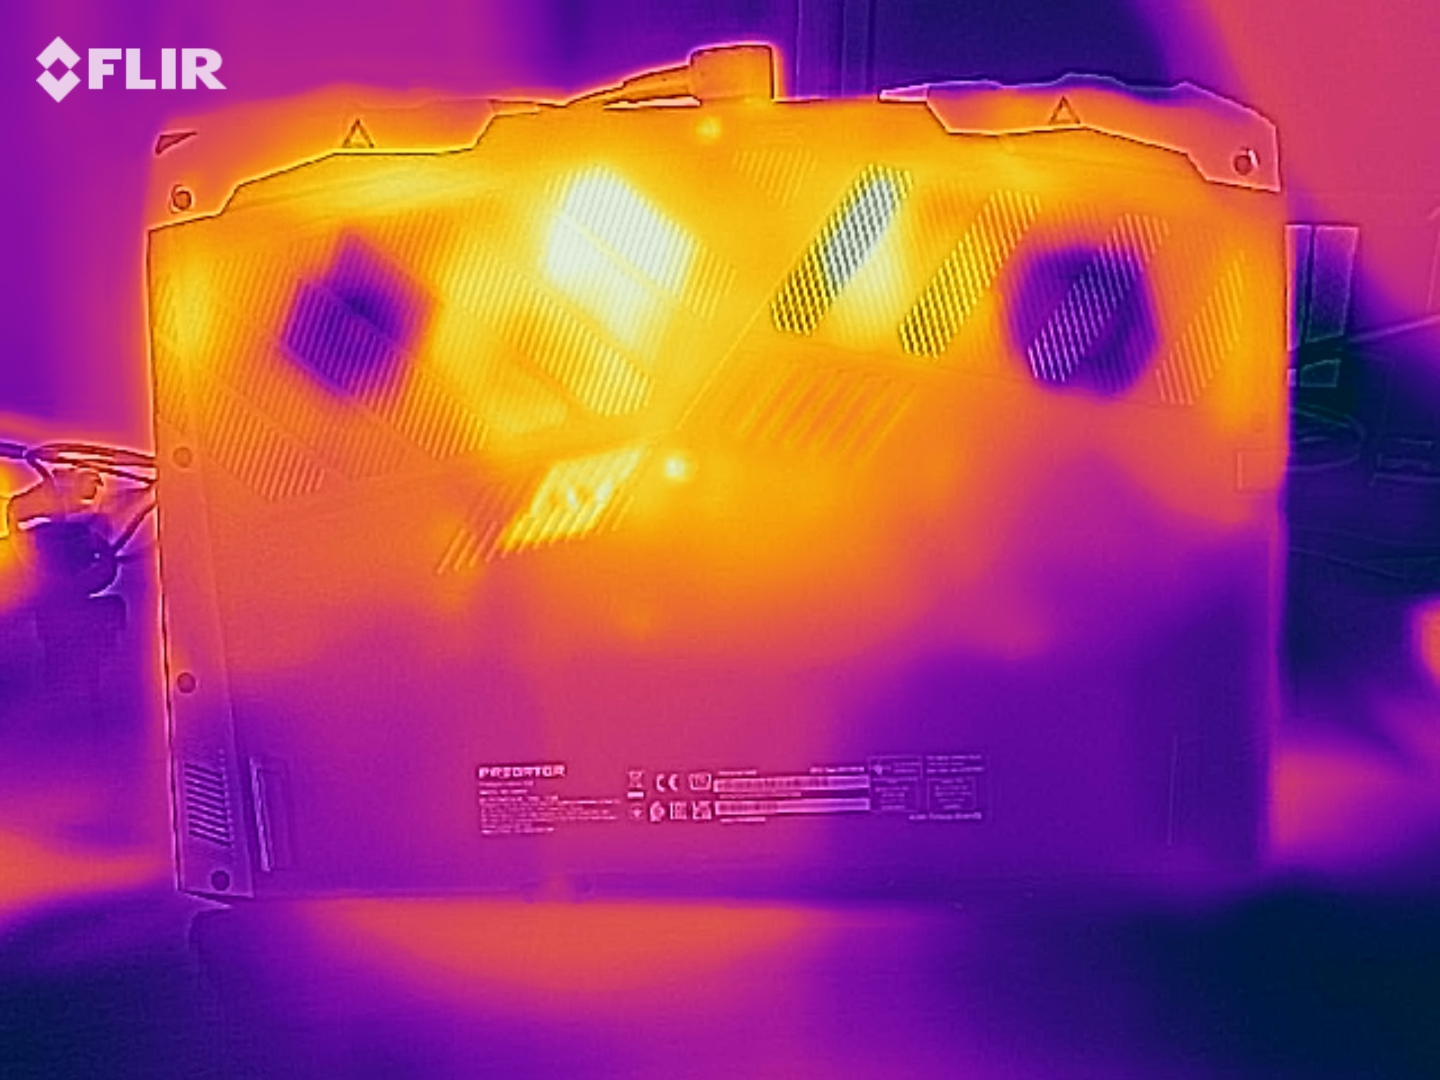
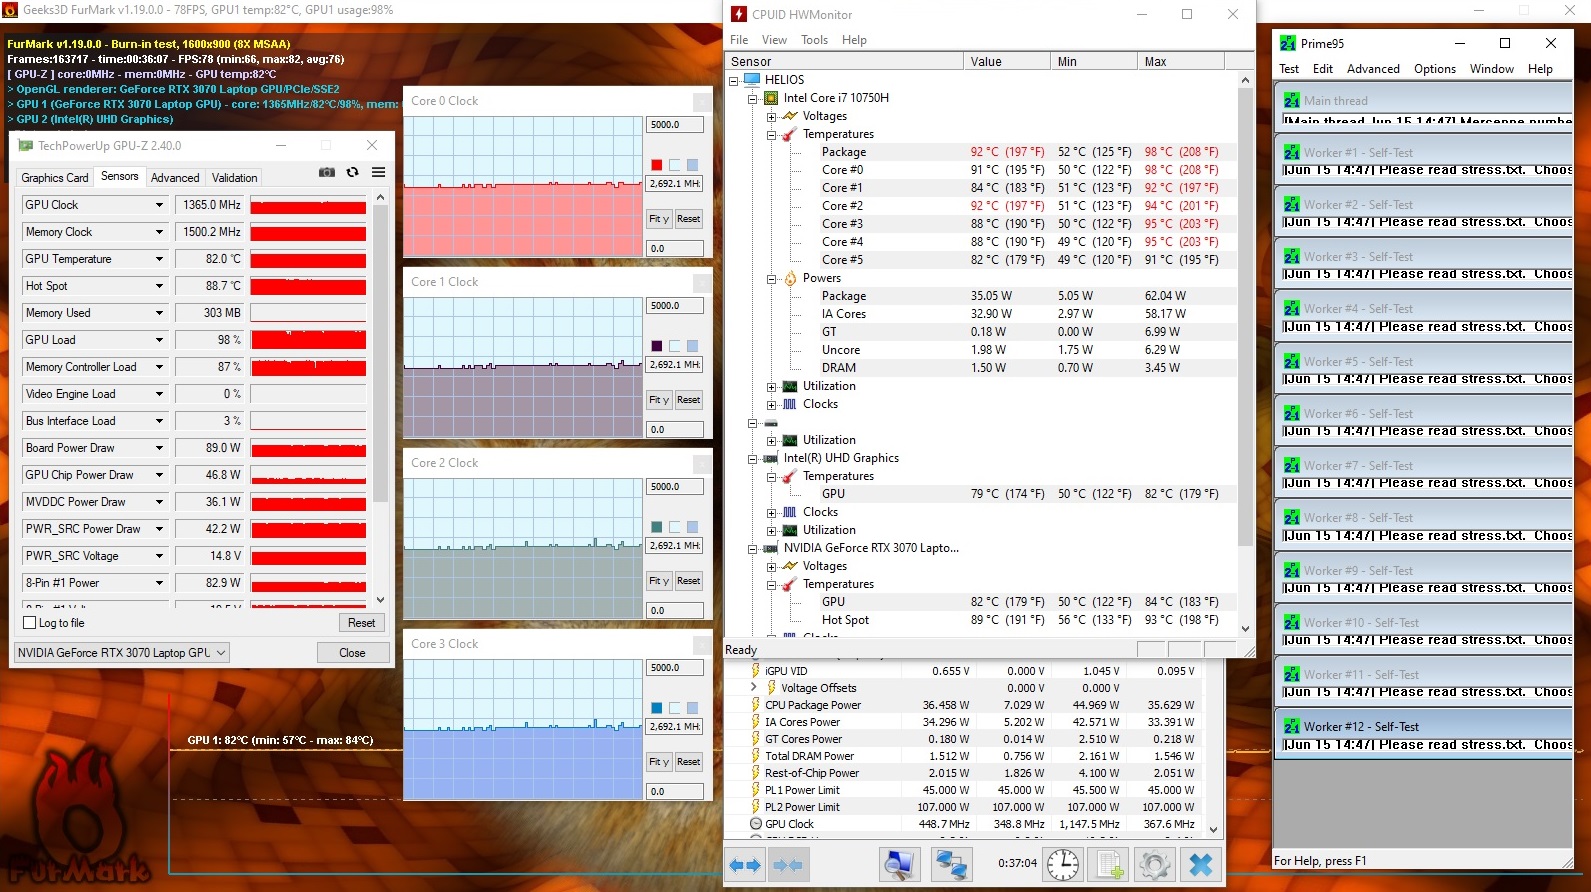
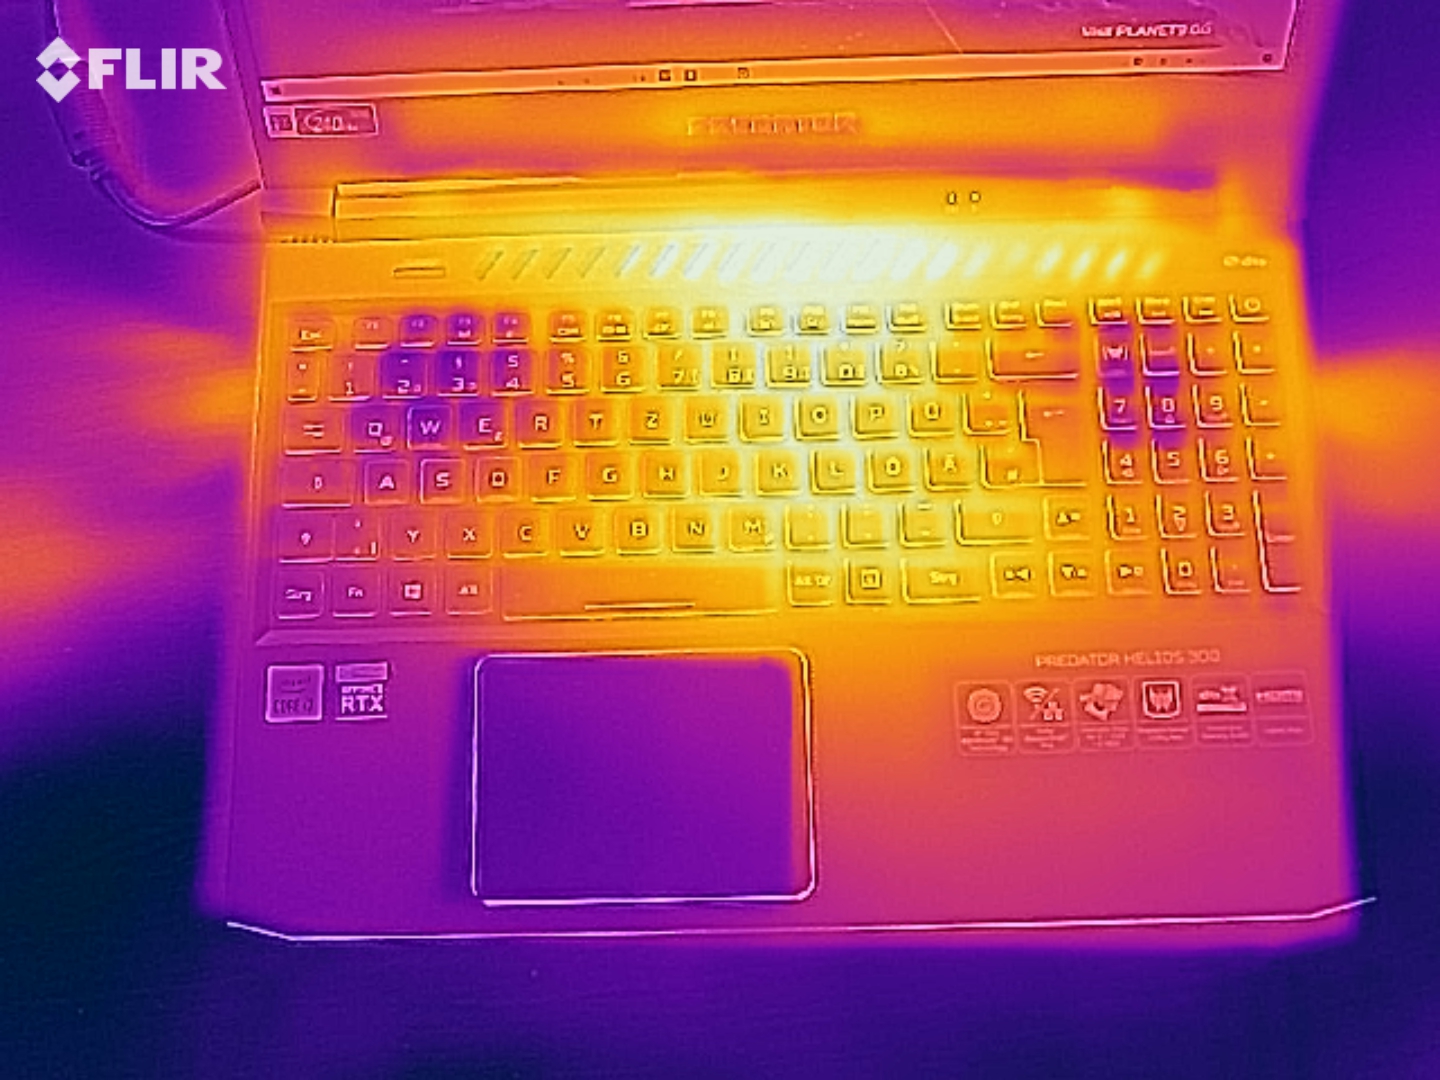
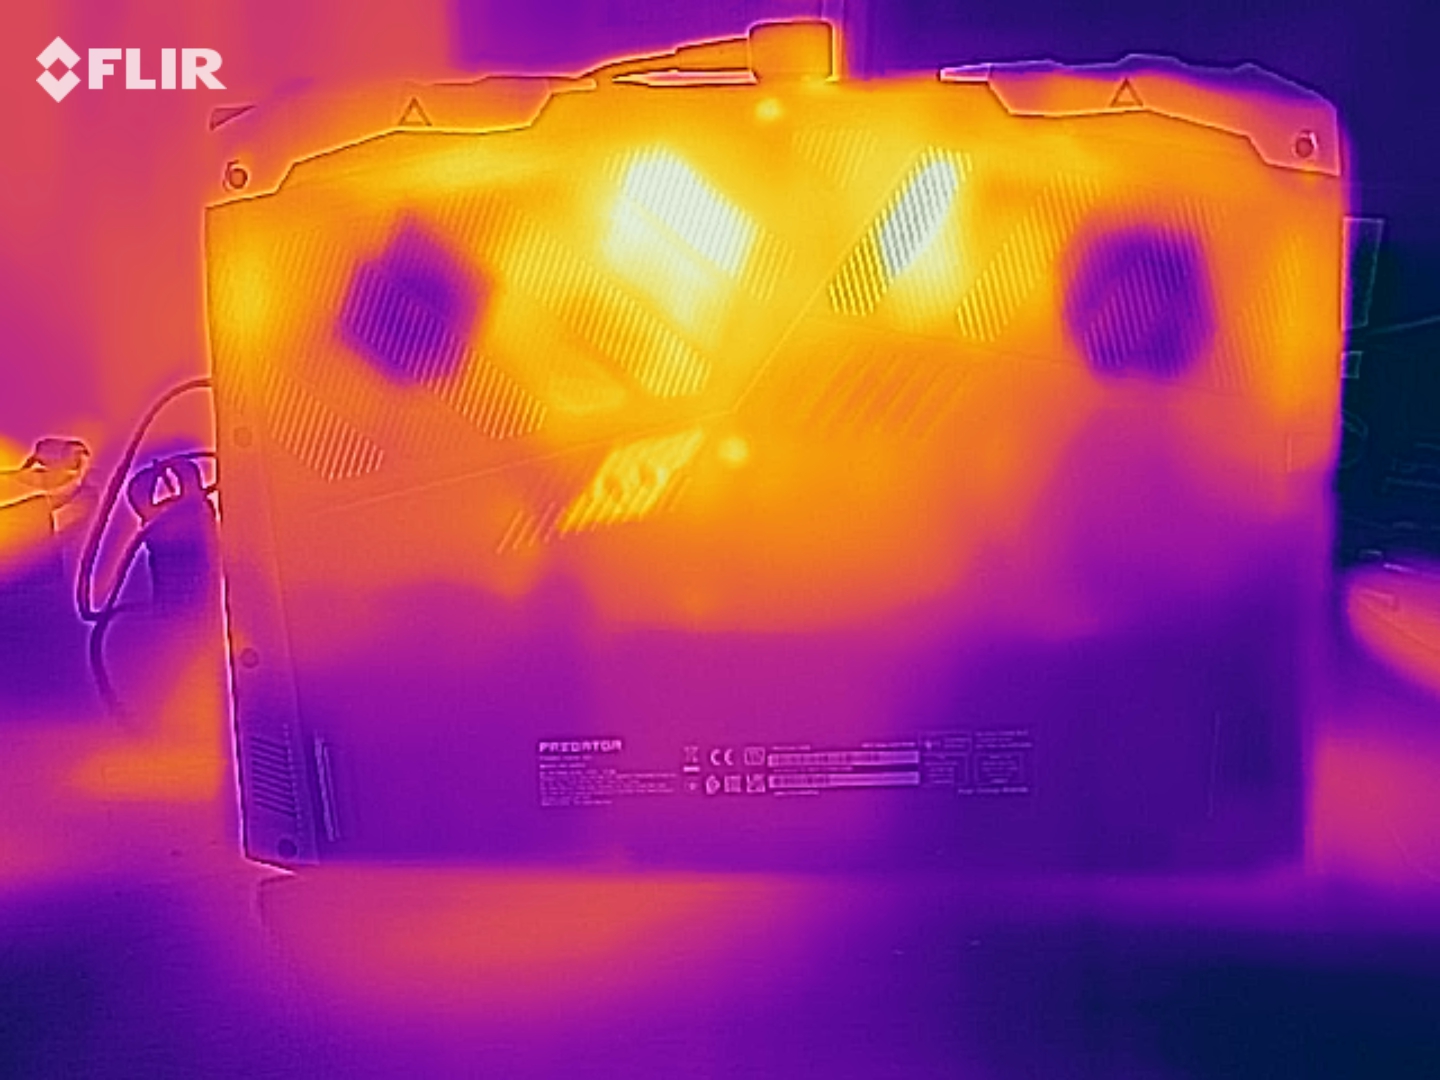
The laptop heats up very noticeably. Temperatures above the 50 °C (~122 °F) range were registered at several measuring points during the stress test, and the 60 °C (~140 °F) mark was exceeded at one measuring point. Heat development is somewhat lower when running our The Witcher 3 test. The device should not be placed on the lap under load.
(-) The maximum temperature on the upper side is 50 °C / 122 F, compared to the average of 40.4 °C / 105 F, ranging from 21.2 to 68.8 °C for the class Gaming.
(-) The bottom heats up to a maximum of 63 °C / 145 F, compared to the average of 43.2 °C / 110 F
(+) In idle usage, the average temperature for the upper side is 30.1 °C / 86 F, compared to the device average of 33.9 °C / 93 F.
(-) Playing The Witcher 3, the average temperature for the upper side is 43.9 °C / 111 F, compared to the device average of 33.9 °C / 93 F.
(-) The palmrests and touchpad can get very hot to the touch with a maximum of 40 °C / 104 F.
(-) The average temperature of the palmrest area of similar devices was 28.8 °C / 83.8 F (-11.2 °C / -20.2 F).
| Acer Predator Helios 300 PH315-53-786B i7-10750H, GeForce RTX 3070 Laptop GPU | Aorus 15G XC i7-10870H, GeForce RTX 3070 Laptop GPU | MSI GS66 Stealth 10UG i7-10870H, GeForce RTX 3070 Laptop GPU | Asus ROG Strix G15 G513QR R9 5900HX, GeForce RTX 3070 Laptop GPU | Acer Predator Helios 300 PH315-53-77N5 i7-10750H, GeForce RTX 2060 Mobile | Average of class Gaming | |
|---|---|---|---|---|---|---|
| Heat | 12% | 13% | 9% | 21% | 10% | |
| Maximum Upper Side * (°C) | 50 | 45 10% | 40.2 20% | 49 2% | 44.1 12% | 45.2 ? 10% |
| Maximum Bottom * (°C) | 63 | 61 3% | 45.6 28% | 48 24% | 48 24% | 48.1 ? 24% |
| Idle Upper Side * (°C) | 32 | 27 16% | 28.8 10% | 31 3% | 25.2 21% | 31 ? 3% |
| Idle Bottom * (°C) | 35 | 28 20% | 37.4 -7% | 33 6% | 25.7 27% | 34.2 ? 2% |
* ... smaller is better
Speakers
Acer Predator Helios 300 PH315-53-786B audio analysis
(±) | speaker loudness is average but good (81 dB)
Bass 100 - 315 Hz
(-) | nearly no bass - on average 19% lower than median
(±) | linearity of bass is average (10% delta to prev. frequency)
Mids 400 - 2000 Hz
(±) | higher mids - on average 6.4% higher than median
(±) | linearity of mids is average (9.1% delta to prev. frequency)
Highs 2 - 16 kHz
(+) | balanced highs - only 0.7% away from median
(+) | highs are linear (1.9% delta to prev. frequency)
Overall 100 - 16.000 Hz
(±) | linearity of overall sound is average (17% difference to median)
Compared to same class
» 45% of all tested devices in this class were better, 12% similar, 43% worse
» The best had a delta of 6%, average was 18%, worst was 132%
Compared to all devices tested
» 31% of all tested devices were better, 8% similar, 61% worse
» The best had a delta of 4%, average was 23%, worst was 134%
Aorus 15G XC audio analysis
(+) | speakers can play relatively loud (83 dB)
Bass 100 - 315 Hz
(-) | nearly no bass - on average 22% lower than median
(±) | linearity of bass is average (10.7% delta to prev. frequency)
Mids 400 - 2000 Hz
(±) | higher mids - on average 5.7% higher than median
(+) | mids are linear (5.5% delta to prev. frequency)
Highs 2 - 16 kHz
(+) | balanced highs - only 1.9% away from median
(+) | highs are linear (5.6% delta to prev. frequency)
Overall 100 - 16.000 Hz
(±) | linearity of overall sound is average (17.4% difference to median)
Compared to same class
» 48% of all tested devices in this class were better, 12% similar, 40% worse
» The best had a delta of 6%, average was 18%, worst was 132%
Compared to all devices tested
» 33% of all tested devices were better, 8% similar, 58% worse
» The best had a delta of 4%, average was 23%, worst was 134%
Energy management - Acer laptop with good battery life
Energy consumption
The Predator doesn't hold any surprises in store for us in terms of energy consumption. The stress test and our The Witcher 3 test push the power consumption up to 220 watts and an average of 164 watts, respectively. The power adapter's nominal output is 230 watts. The following graph illustrates the fairly constant power consumption of the laptop during our The Witcher 3 test.
| Off / Standby | |
| Idle | |
| Load |
|
Key:
min: | |
Energy consumption during The Witcher 3
| Acer Predator Helios 300 PH315-53-786B i7-10750H, GeForce RTX 3070 Laptop GPU | Aorus 15G XC i7-10870H, GeForce RTX 3070 Laptop GPU | MSI GS66 Stealth 10UG i7-10870H, GeForce RTX 3070 Laptop GPU | Asus ROG Strix G15 G513QR R9 5900HX, GeForce RTX 3070 Laptop GPU | Acer Predator Helios 300 PH315-53-77N5 i7-10750H, GeForce RTX 2060 Mobile | Average of class Gaming | |
|---|---|---|---|---|---|---|
| Power Consumption | -49% | -49% | -14% | 9% | -68% | |
| Idle Minimum * (Watt) | 4 | 13 -225% | 12.9 -223% | 4 -0% | 2.9 27% | 13 ? -225% |
| Idle Average * (Watt) | 11 | 16 -45% | 15.4 -40% | 9 18% | 13.2 -20% | 19 ? -73% |
| Idle Maximum * (Watt) | 24 | 30 -25% | 27.1 -13% | 36 -50% | 19.8 17% | 24.6 ? -3% |
| Load Average * (Watt) | 91 | 92 -1% | 98.2 -8% | 130 -43% | 105 -15% | 110.7 ? -22% |
| Witcher 3 ultra * (Watt) | 164 | 154 6% | 164.9 -1% | 174 -6% | 127 23% | |
| Load Maximum * (Watt) | 220 | 223 -1% | 232.9 -6% | 227 -3% | 177 20% | 259 ? -18% |
* ... smaller is better
Battery life
In the Wi-Fi test (accessing websites using a script) and video test (the short film Big Buck Bunny (H.264 encoding, Full HD) running in a loop), the 15.6-incher achieves runtimes of 6:26 hours and 6:46 hours, respectively. The laptop's power-saving features are disabled during both tests, and the display brightness is set to about 150 cd/m². In addition, the wireless modules are disabled for the video test.
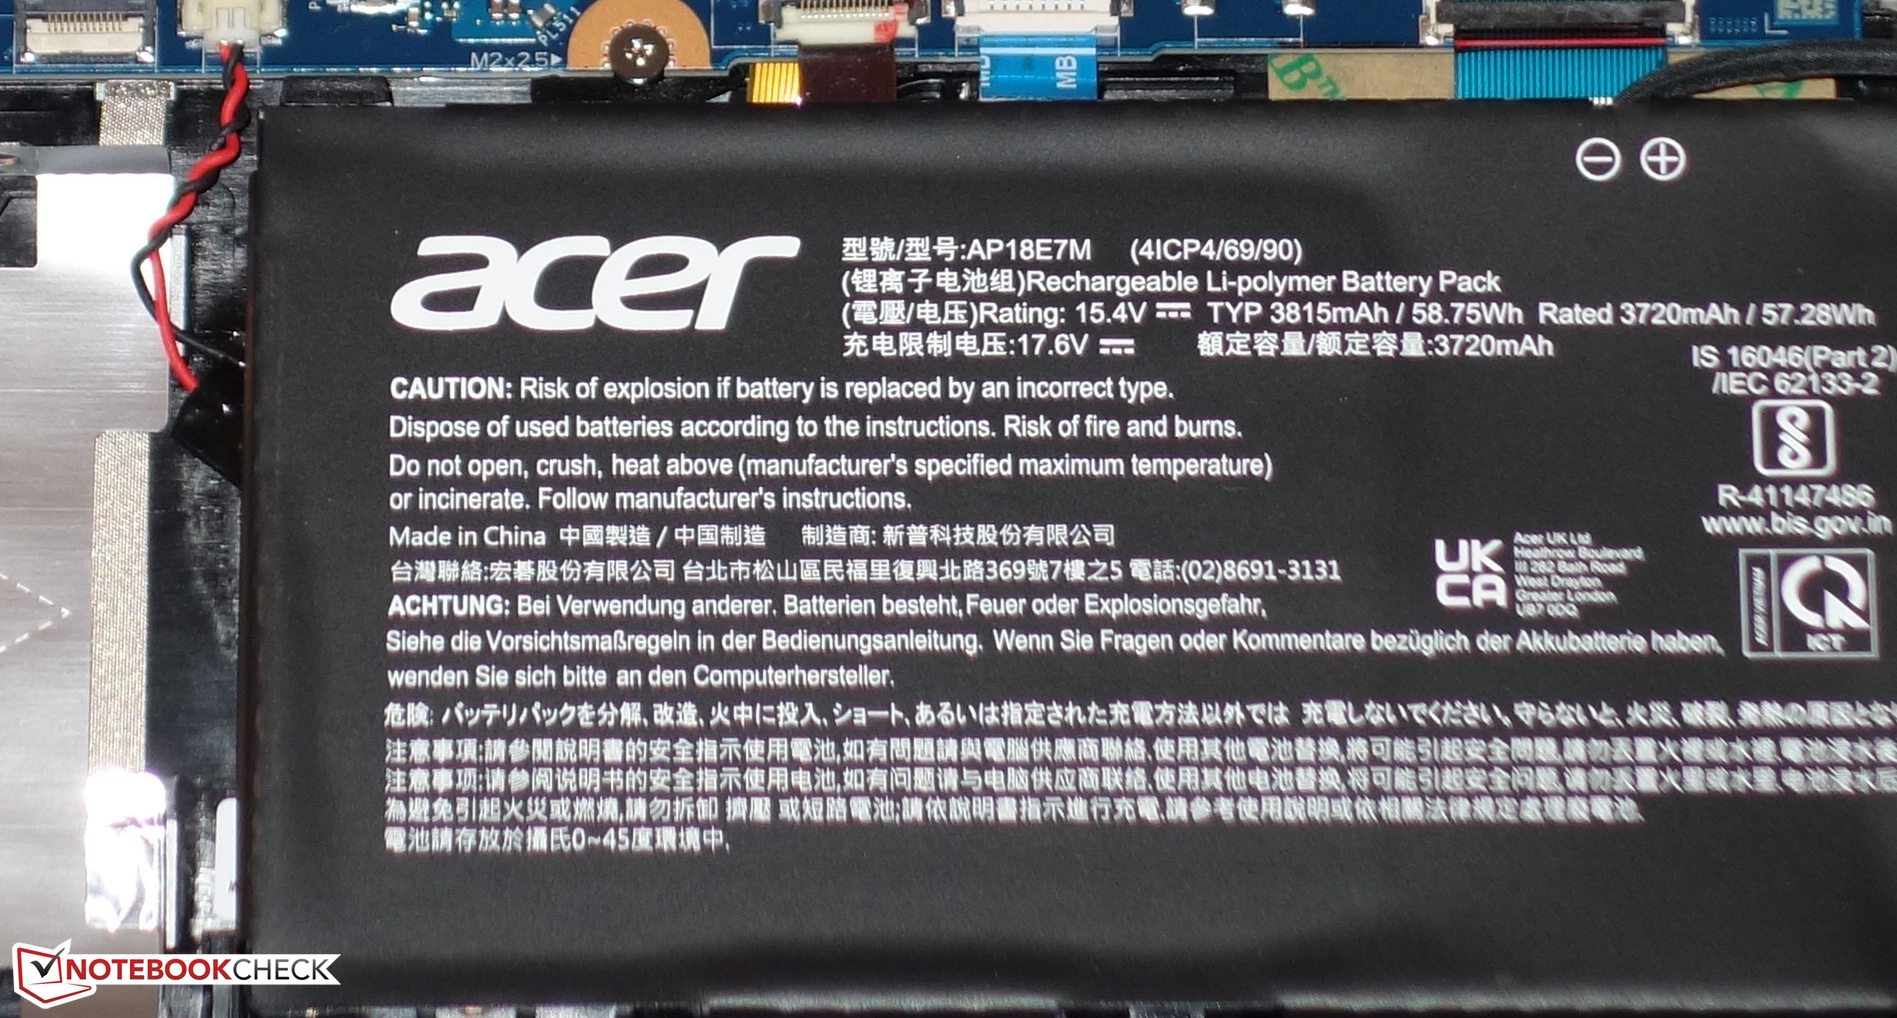
| Acer Predator Helios 300 PH315-53-786B i7-10750H, GeForce RTX 3070 Laptop GPU, 58.75 Wh | Aorus 15G XC i7-10870H, GeForce RTX 3070 Laptop GPU, 99 Wh | MSI GS66 Stealth 10UG i7-10870H, GeForce RTX 3070 Laptop GPU, 99.9 Wh | Asus ROG Strix G15 G513QR R9 5900HX, GeForce RTX 3070 Laptop GPU, 90 Wh | Acer Predator Helios 300 PH315-53-77N5 i7-10750H, GeForce RTX 2060 Mobile, 58.7 Wh | Average of class Gaming | |
|---|---|---|---|---|---|---|
| Battery runtime | 10% | 20% | 43% | -7% | 3% | |
| Reader / Idle (h) | 10.6 | 9.6 -9% | 10.8 2% | 10.4 -2% | 8.27 ? -22% | |
| H.264 (h) | 6.8 | 6.5 -4% | 13.5 99% | 5.6 -18% | 8.32 ? 22% | |
| WiFi v1.3 (h) | 6.4 | 6.3 -2% | 7.1 11% | 7.4 16% | 4.7 -27% | 7.11 ? 11% |
| Load (h) | 1.5 | 2.3 53% | 2.2 47% | 1.7 13% | 1.8 20% | 1.502 ? 0% |
Pros
Cons
Verdict - Solid 240 Hz gaming laptop

Acer's gaming laptop does very well overall and delivers average frame rates in comparison with the RTX 3070 laptops that we have tested so far. Performance still has some room for improvement: A firmware update increases the maximum TGP of the GeForce RTX 3070 laptop GPU from 100 to 110 watts - we also reported on this previously.
Acer has a well-rounded gaming laptop in its product range with the Predator Helios 300 PH315-53.
Throttling is no cause for concern. The CPU and GPU can develop their performance constantly. The laptop heats up a lot under load - more than many competitors. Noise development is at the usual class level.
Battery life is completely adequate. Surprisingly, the Predator leaves its sister model well behind in our real-world runtime tests - despite the identical battery capacities. The display (Full HD, IPS, 240 Hz) offers stable viewing angles, a matte surface, quick response times, very decent color reproduction, good color-space coverage. However, the brightness and contrast should be higher. The respective targets are narrowly missed.
The Aorus 15G XC, for example, could be an alternative to the Predator. In terms of price, it's on par with the Acer laptop, but it delivers more CPU performance overall thanks to the built-in octa-core processor.
Price and availability
At the time of writing, the Acer Predator Helios 300 is a bit hard to come by in the configuration that we reviewed. However, it's still listed on newegg (Core i7-10750H, GeForce RTX 3070, 16 GB RAM, 512 GB SSD, Windows 10 Home) for $1,699.99, albeit as "out of stock" with the option to be notified when it's available again. Alternatively, you can also keep tabs on other stores like Amazon, for example.
Acer Predator Helios 300 PH315-53-786B
- 07/20/2021 v7 (old)
Sascha Mölck
Price comparison

