Acer Predator Helios 300 Laptop Review: A modern gaming laptop with a Turing GPU

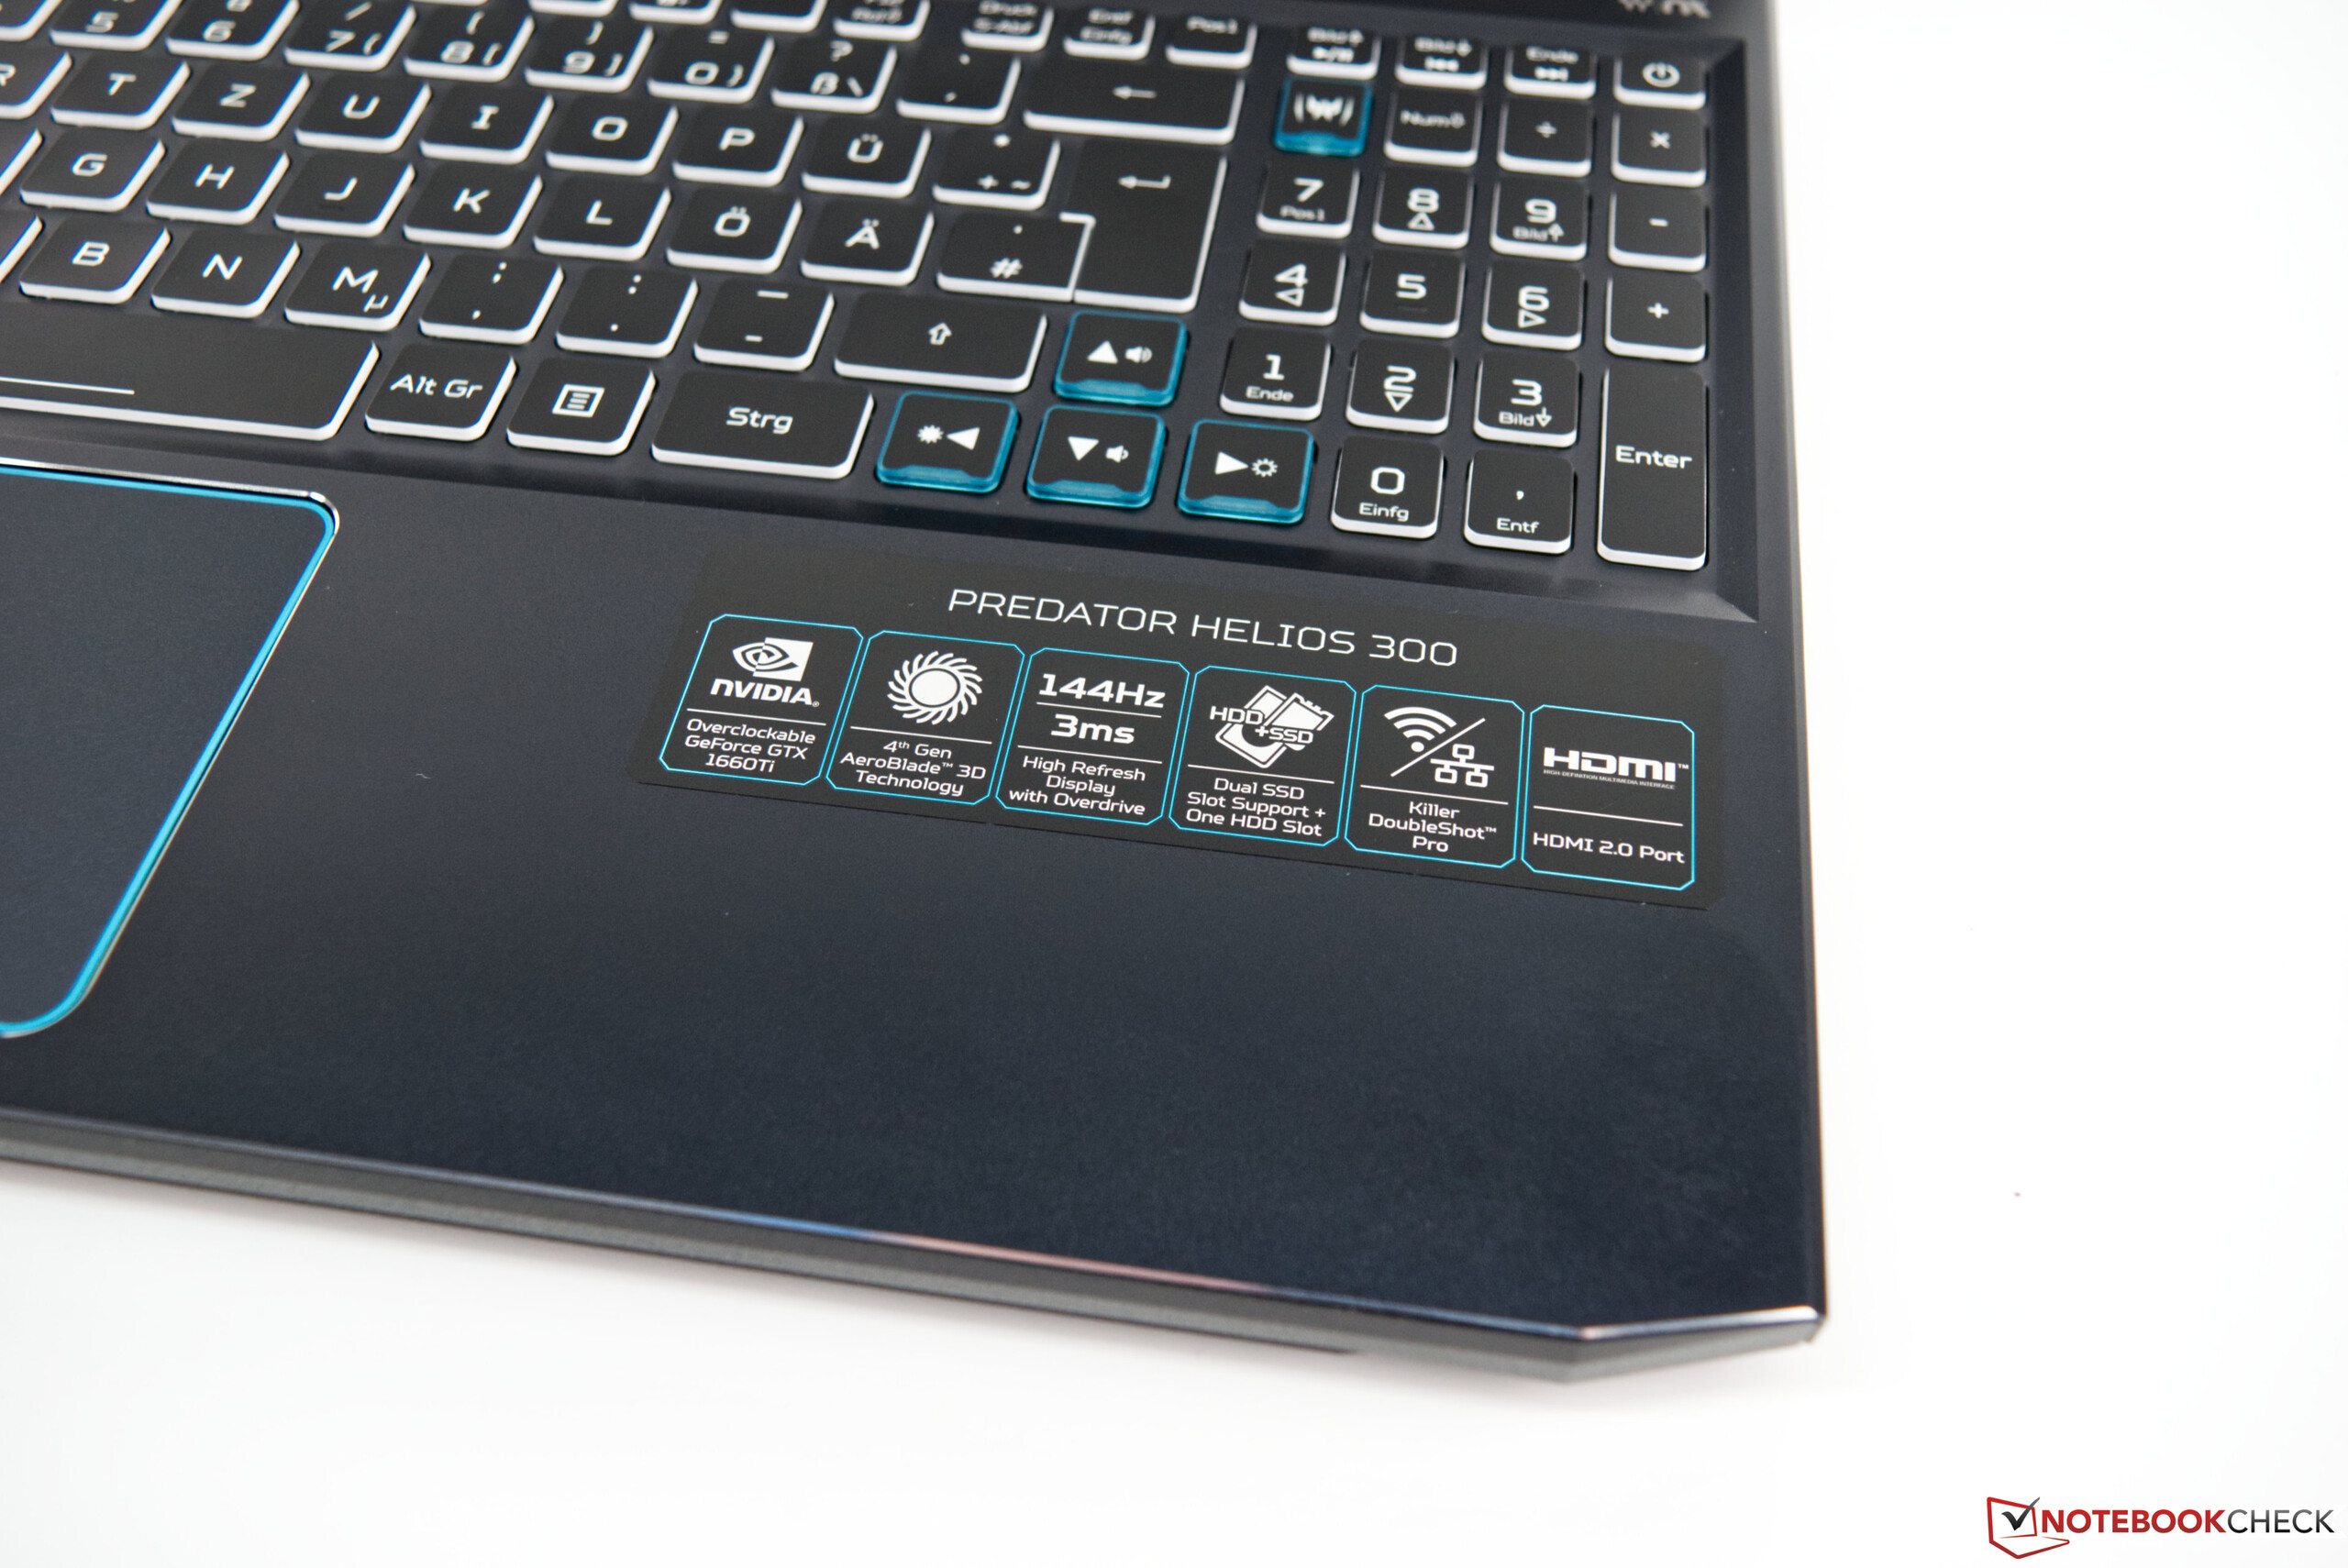
The Predator Helios 300 is well known around here, with two models in the last two years having graced our offices. Now, the company has released a new device that includes not only improved hardware but also an overhauled design. Our review unit is called the Helios 300 PH315-52-79TY and features an Intel Core i7-9750H processor along with an NVIDIA GeForce GTX 1660 Ti GPU. The device also has 8 GB of RAM and a 512 GB SSD. The latter two are the smallest that Acer offers, for reference. The Helios 300 has a 15.6-inch 144 Hz display too, as do many other gaming laptops. Our review unit currently retails for 1,400 Euros (~$1,550), which is rather expensive.
All SKUs come with hexa-core Coffee Lake processors, but there are NVIDIA GeForce RTX 20 series variants too, should you need something more powerful. The GeForce RTX 2070 is currently the strongest GPU on offer, while the Helios 300 can be configured with up to 32 GB of RAM. You can add up to two additional SSDs too if you need more storage than Acer offers.
We shall compare the new Helios 300 against comparable 15.6-inch gaming laptops. We have also chosen more expensive devices, like the Lenovo Legion Y740, but you can add others to our comparison tables too. We have included an overview of our comparison devices and our review unit below.
Rating | Date | Model | Weight | Height | Size | Resolution | Price |
|---|---|---|---|---|---|---|---|
| 82.1 % v7 (old) | 11 / 2019 | Acer Predator Helios 300 PH315-52-79TY i7-9750H, GeForce GTX 1660 Ti Mobile | 2.3 kg | 23.2 mm | 15.60" | 1920x1080 | |
| 83.9 % v7 (old) | 08 / 2019 | HP Gaming Pavilion 15-dk0009ng i7-9750H, GeForce GTX 1660 Ti Max-Q | 2.4 kg | 23.4 mm | 15.60" | 1920x1080 | |
| 82.3 % v7 (old) | 08 / 2019 | Lenovo Legion Y540-15IRH-81SX00B2GE i7-9750H, GeForce GTX 1660 Ti Mobile | 2.2 kg | 26 mm | 15.60" | 1920x1080 | |
| 83 % v7 (old) | 05 / 2019 | Dell G5 15 5590 i7-8750H, GeForce RTX 2060 Mobile | 2.7 kg | 23.7 mm | 15.60" | 1920x1080 | |
| 84.8 % v7 (old) | 10 / 2019 | Lenovo Legion Y740-15ICHg i7-9750H, GeForce RTX 2070 Max-Q | 2.3 kg | 25 mm | 15.60" | 1920x1080 | |
| 82 % v6 (old) | 06 / 2018 | Acer Predator Helios 300 PH317-52-51M6 i5-8300H, GeForce GTX 1050 Ti Mobile | 2.9 kg | 29 mm | 17.30" | 1920x1080 |
Case - A stable chassis with some flourishes
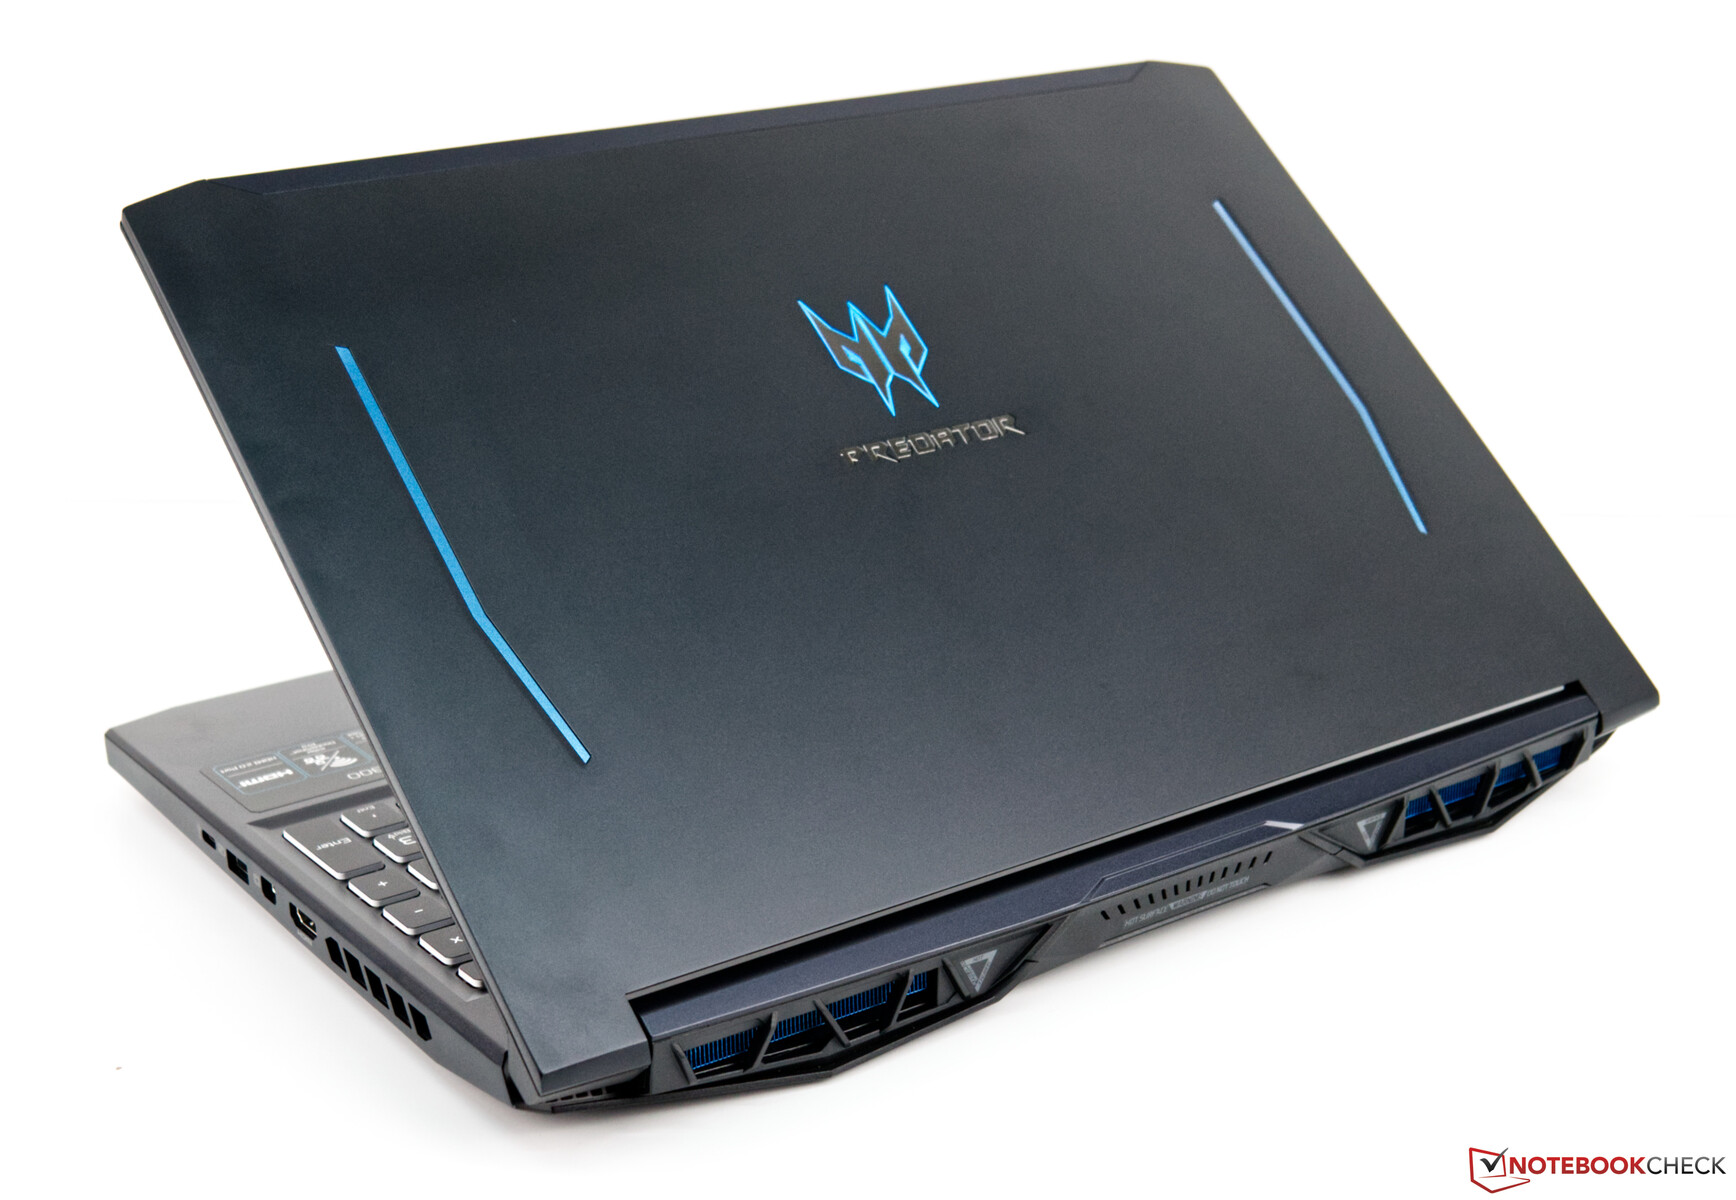
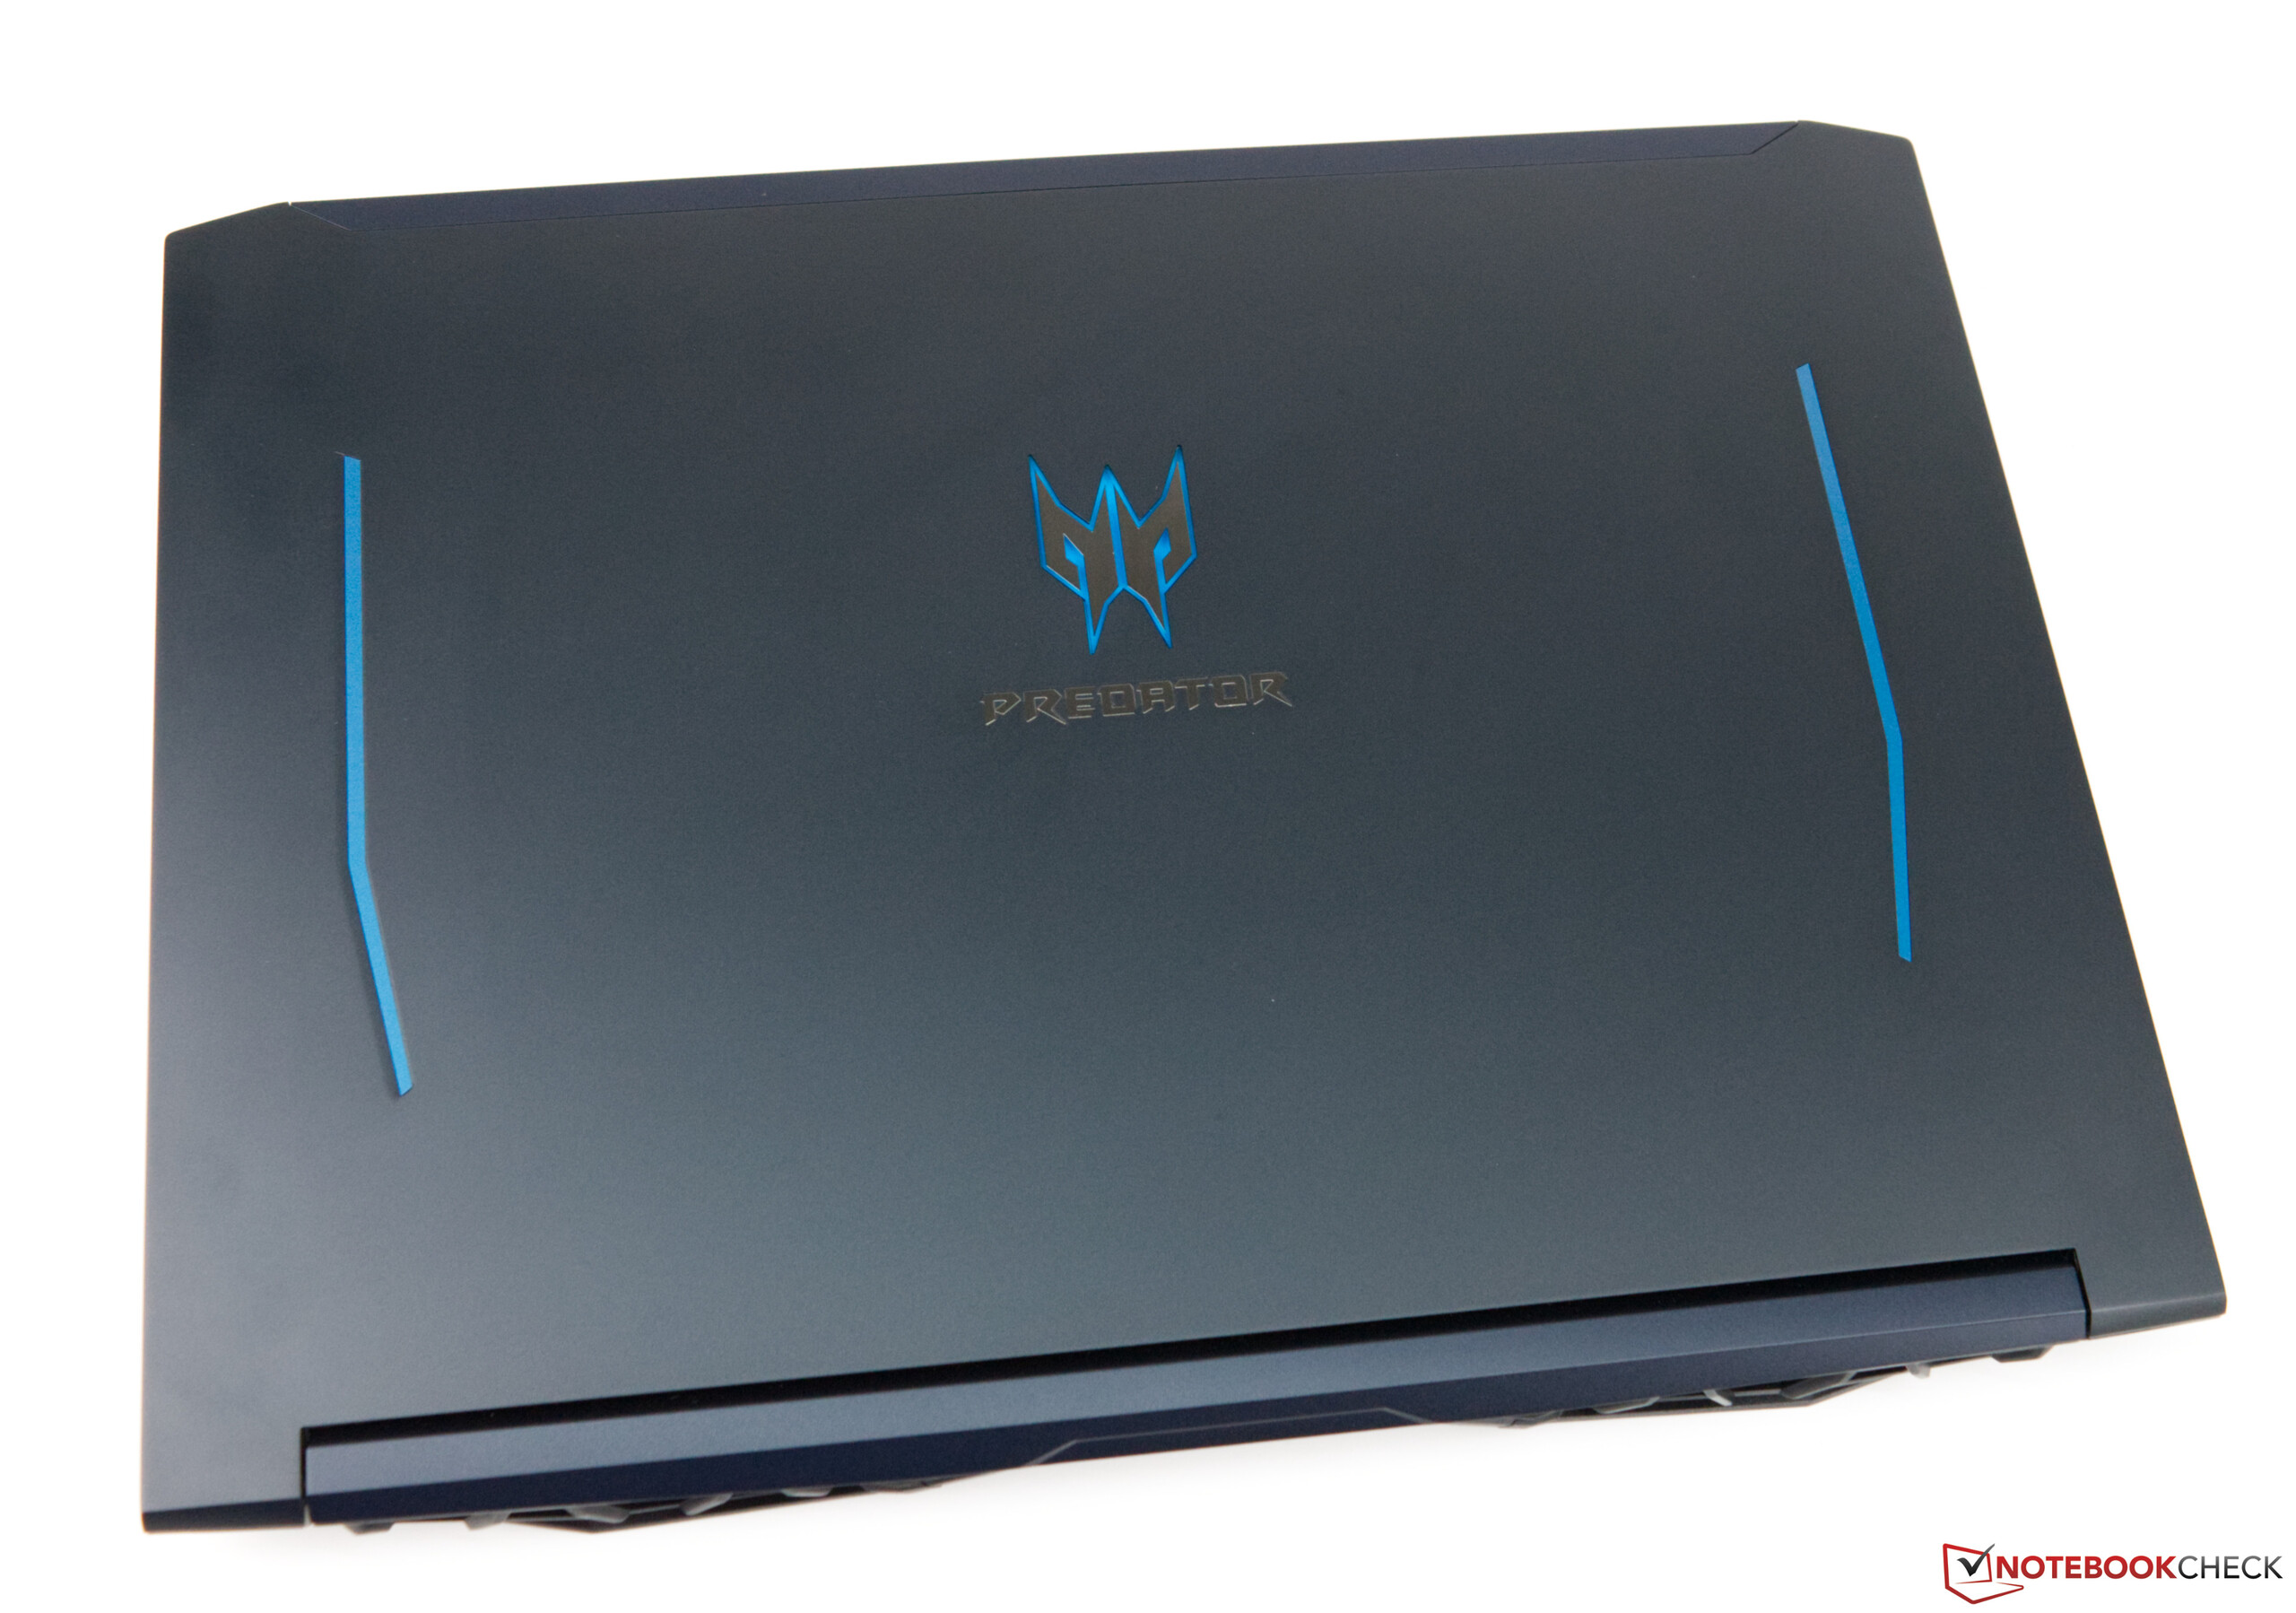
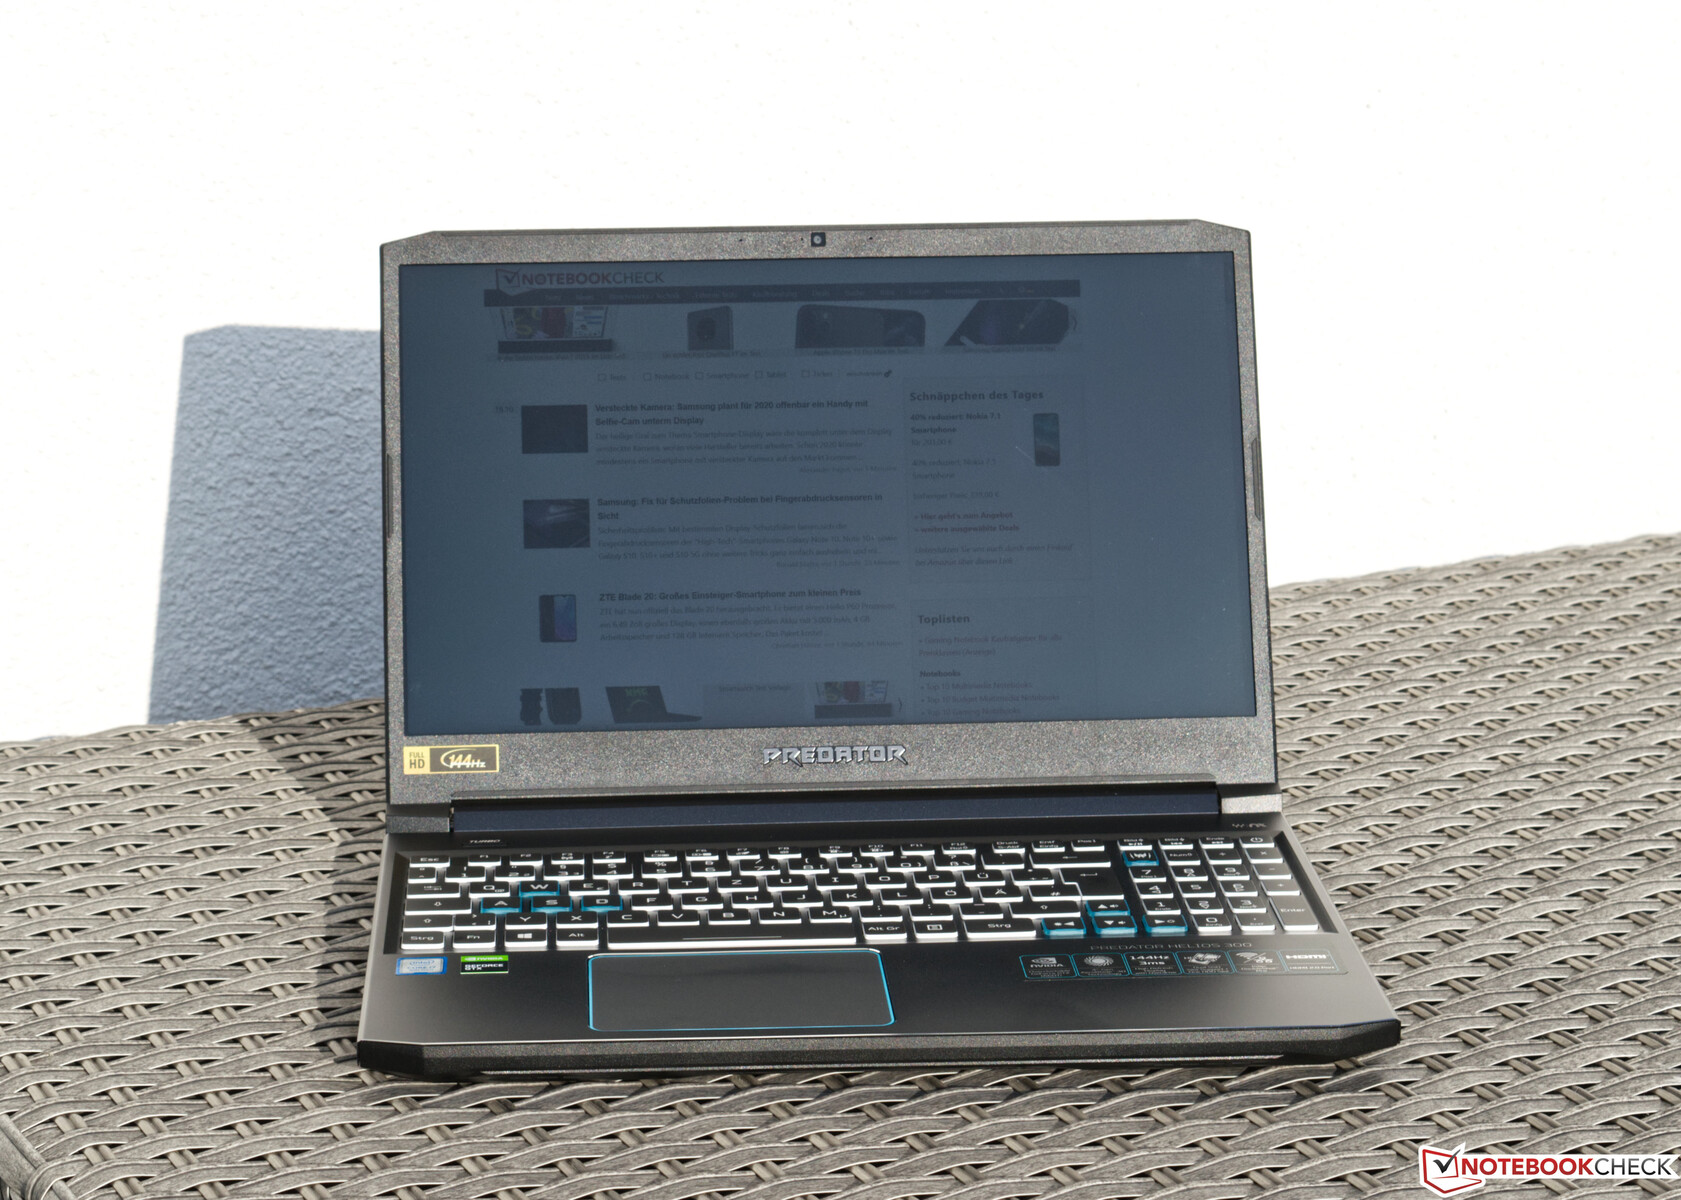
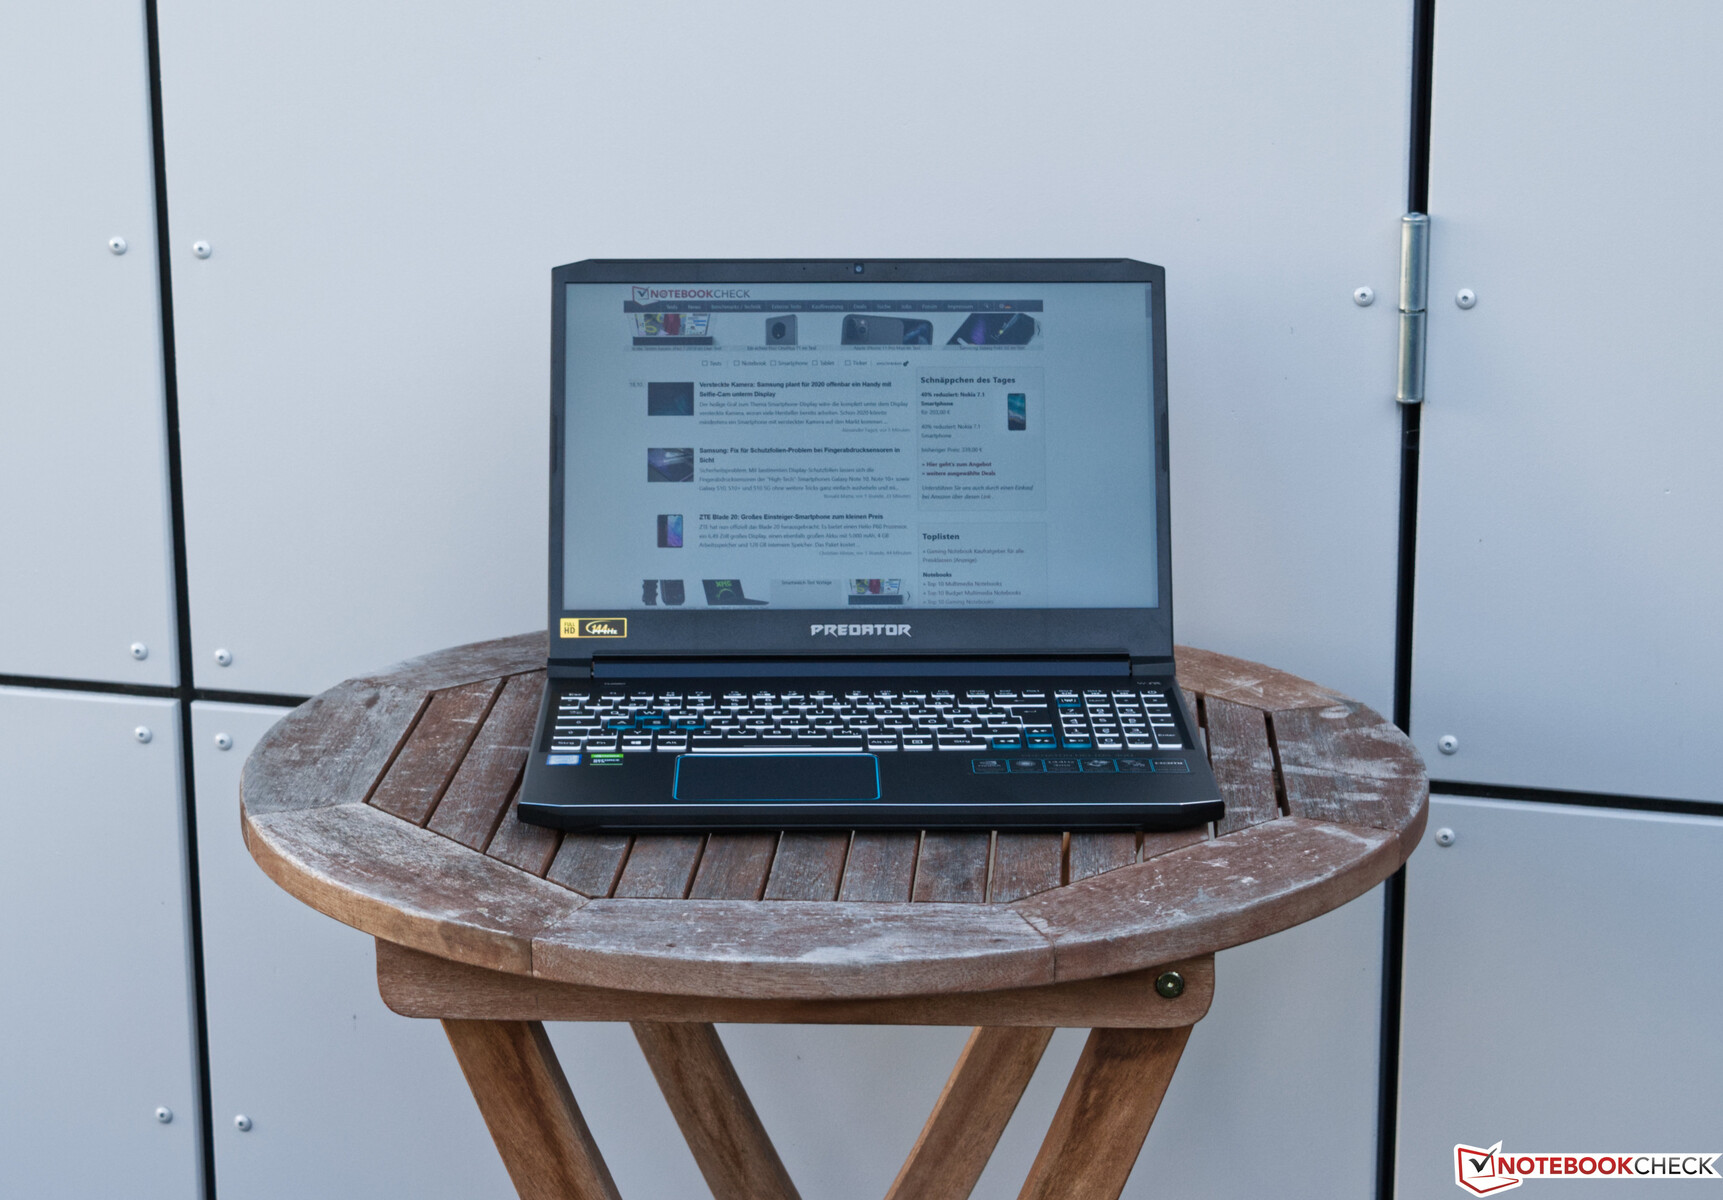
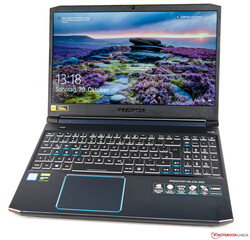
Acer no longer relies on a black and red design as it did with the last Helios 300. Instead, the company has switched to black and blue, although it has stuck with an aluminium and plastic chassis. While the aluminium keyboard deck and display lid help make the Helios 300 look premium, their matte finishes pick up fingerprints easily. Acer has adorned the device with some light blue accents too, which contrast nicely against the black aluminium. The Predator logo also has a blue backlight.
Our review unit is well made and sturdy. While our attempts to twist or dent the base unit were made in vain, we could twist the display lid slightly. The display resisted our efforts to temporarily deform it, though.
The Helios 300 has stable display hinges too. The two hinges not only hold the display tightly and keep teetering to a minimum, but they also allow for the device to be opened with one hand.
Size Comparison
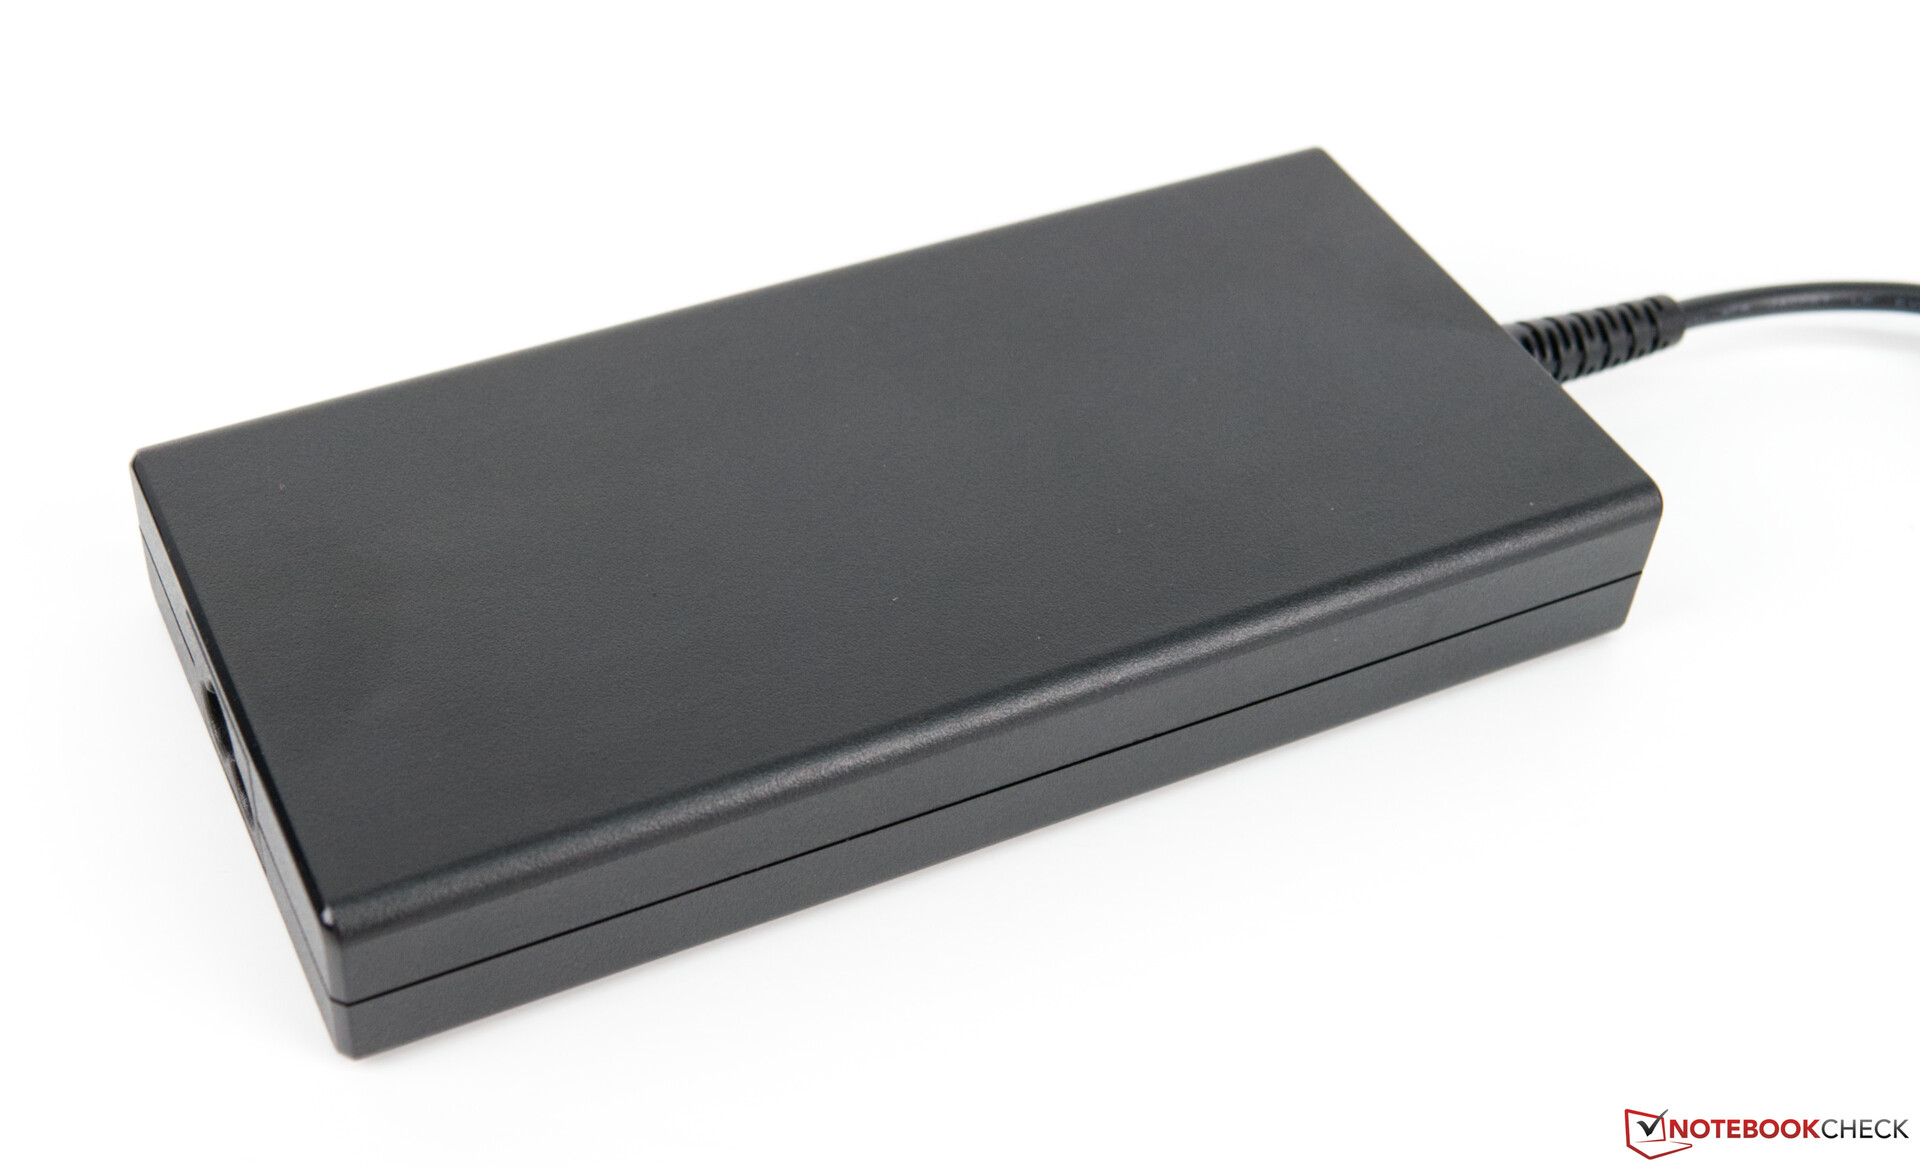
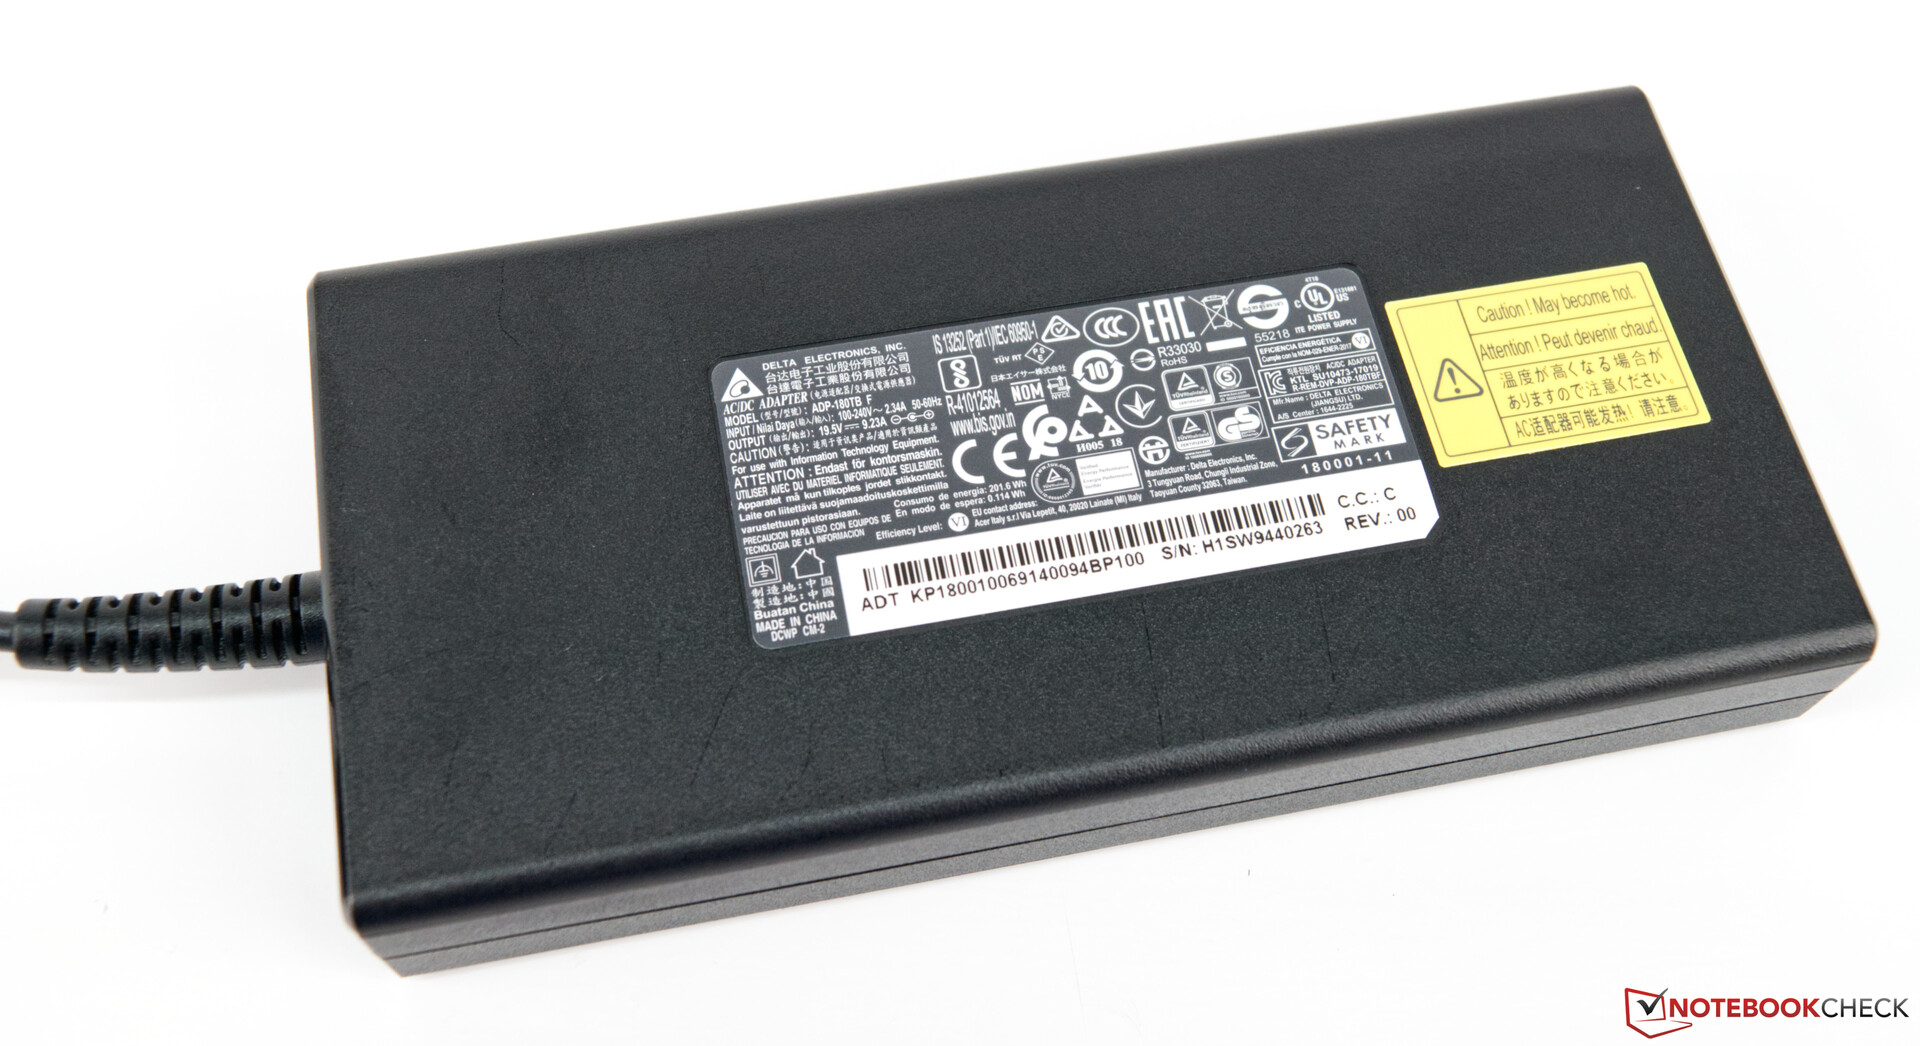
The Helios 300 is comparatively compact for a 15.6-inch gaming laptop. While it has roughly the same dimensions as our comparison device, it only weighs 2.3 kg. The 180 W power supply weighs 575 g though, which you will probably also need to carry with you; more on that in the Power Management section of this review.
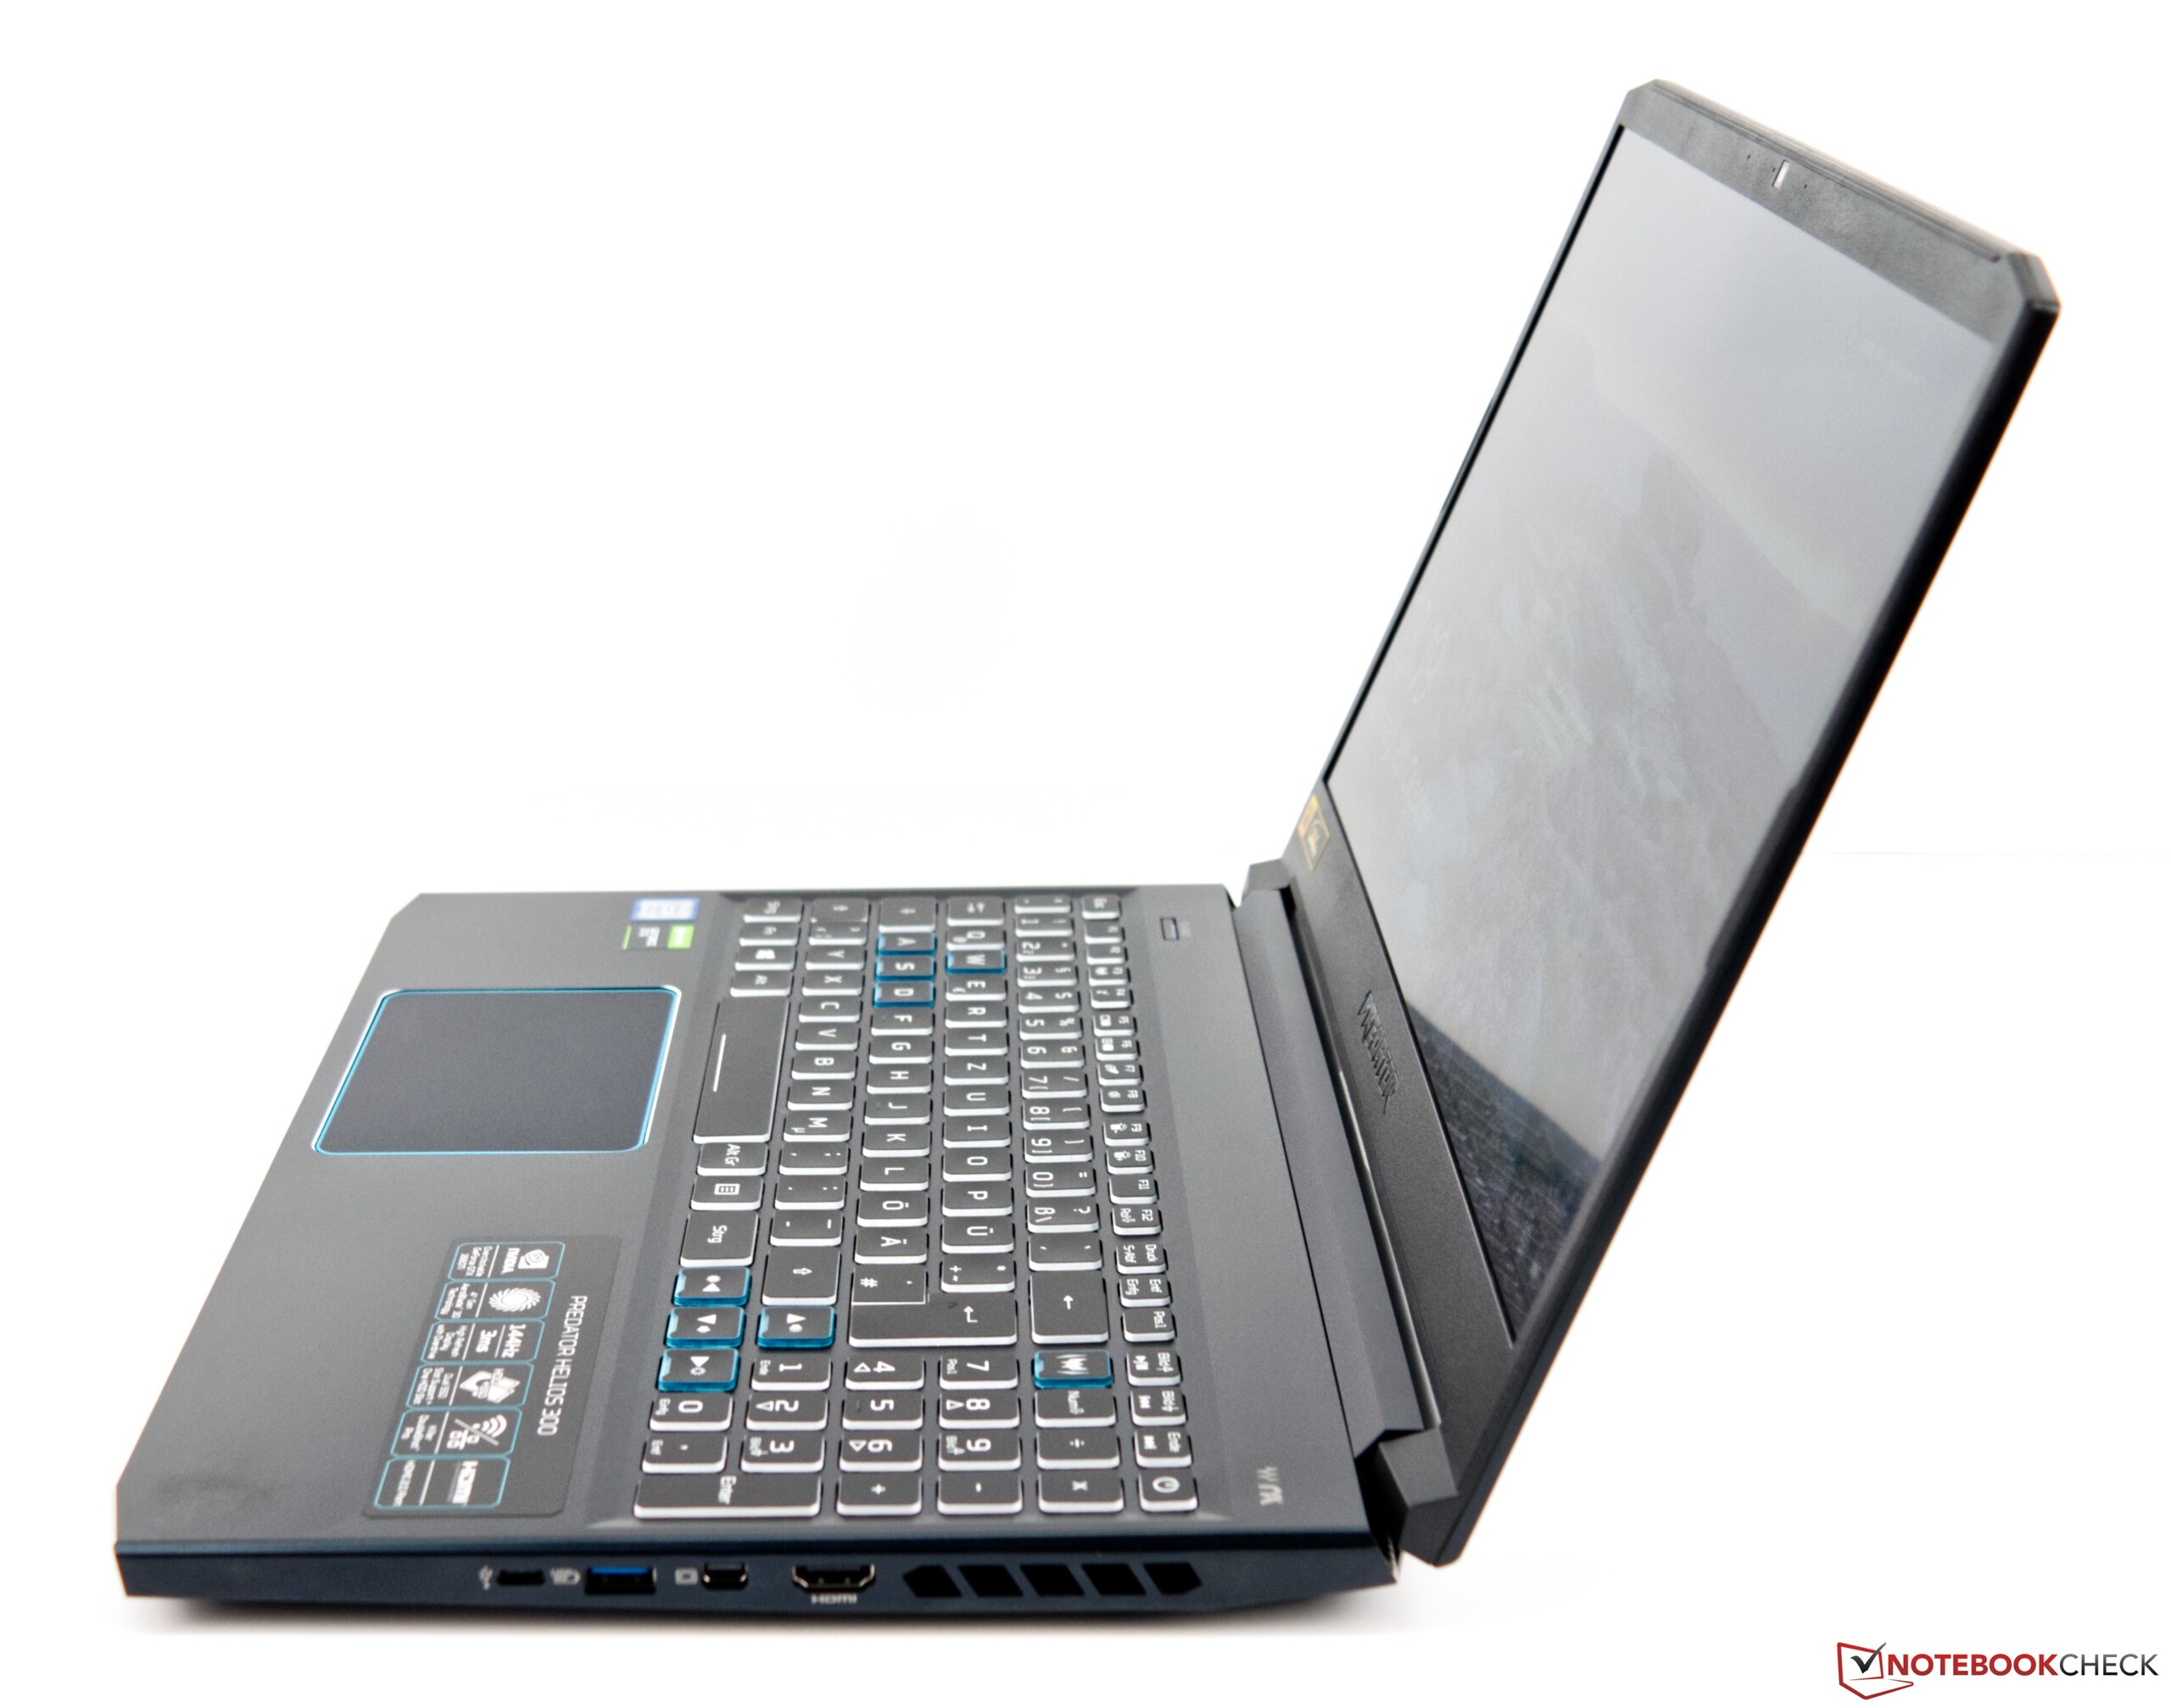
Connectivity - Plenty of ports, but no card reader
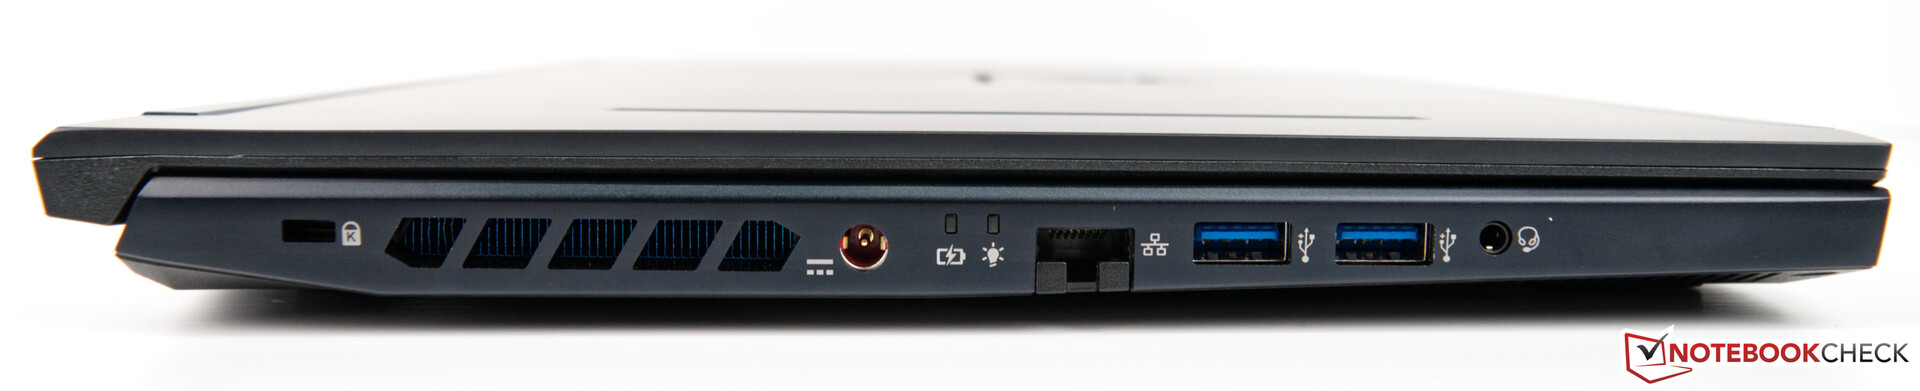
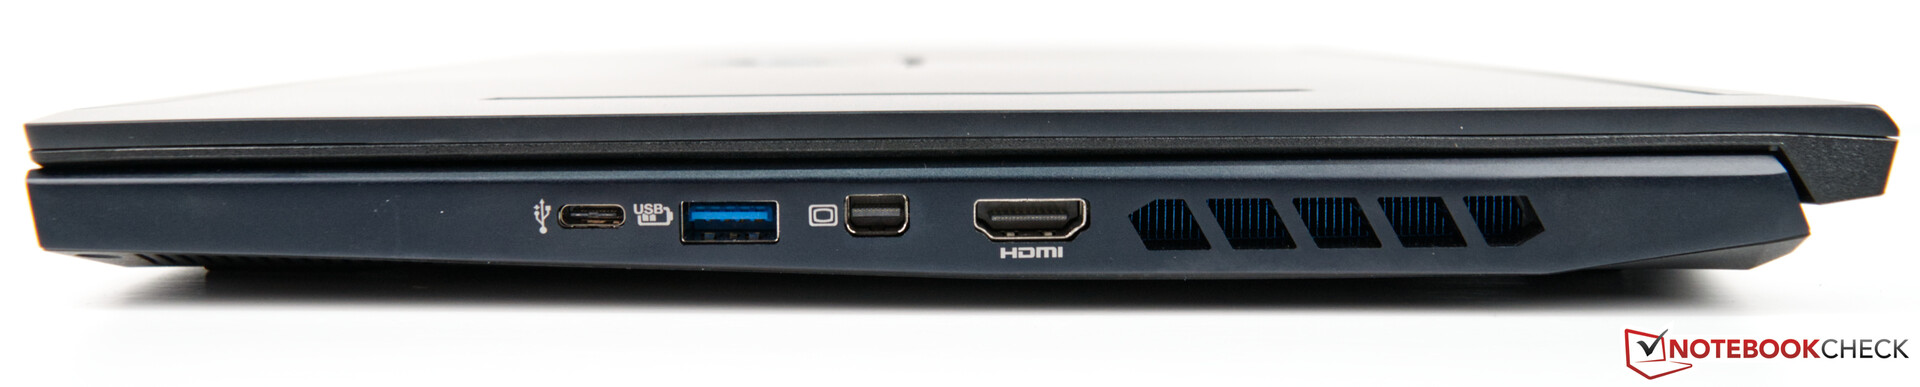
Acer has equipped the Helios 300 with all the ports that most gamers should need. The device has four USB 3.2 ports, of which one is Type-C. While you could connect the Helios 300 to an external display via its Type-C port, you could also use the dedicated HDMI and mini DisplayPort ports instead. Acer has included an Ethernet port too, but no card reader. Hence, you must have an adapter to hand if you want to transfer files from a memory card.
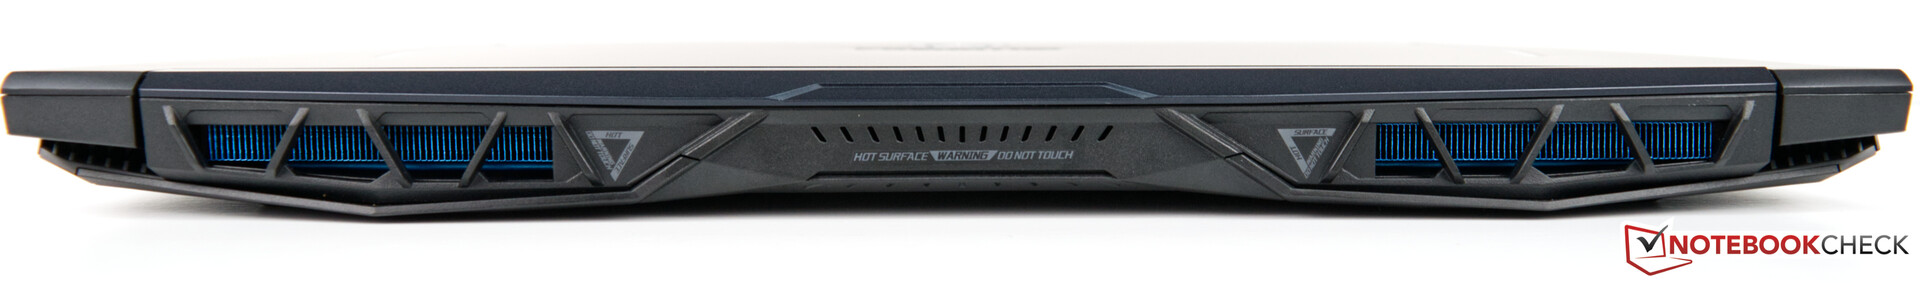
Acer has distributed the ports across the left and right sides of the device, as most OEMs do. However, these are flanked by large ventilation grilles that may exhaust warm air over your hands, regardless of with which hand you hold an external mouse. Cables may also get in your way, but both are minor gripes. There are two other ventilation grilles at the back of the device too.
Communication
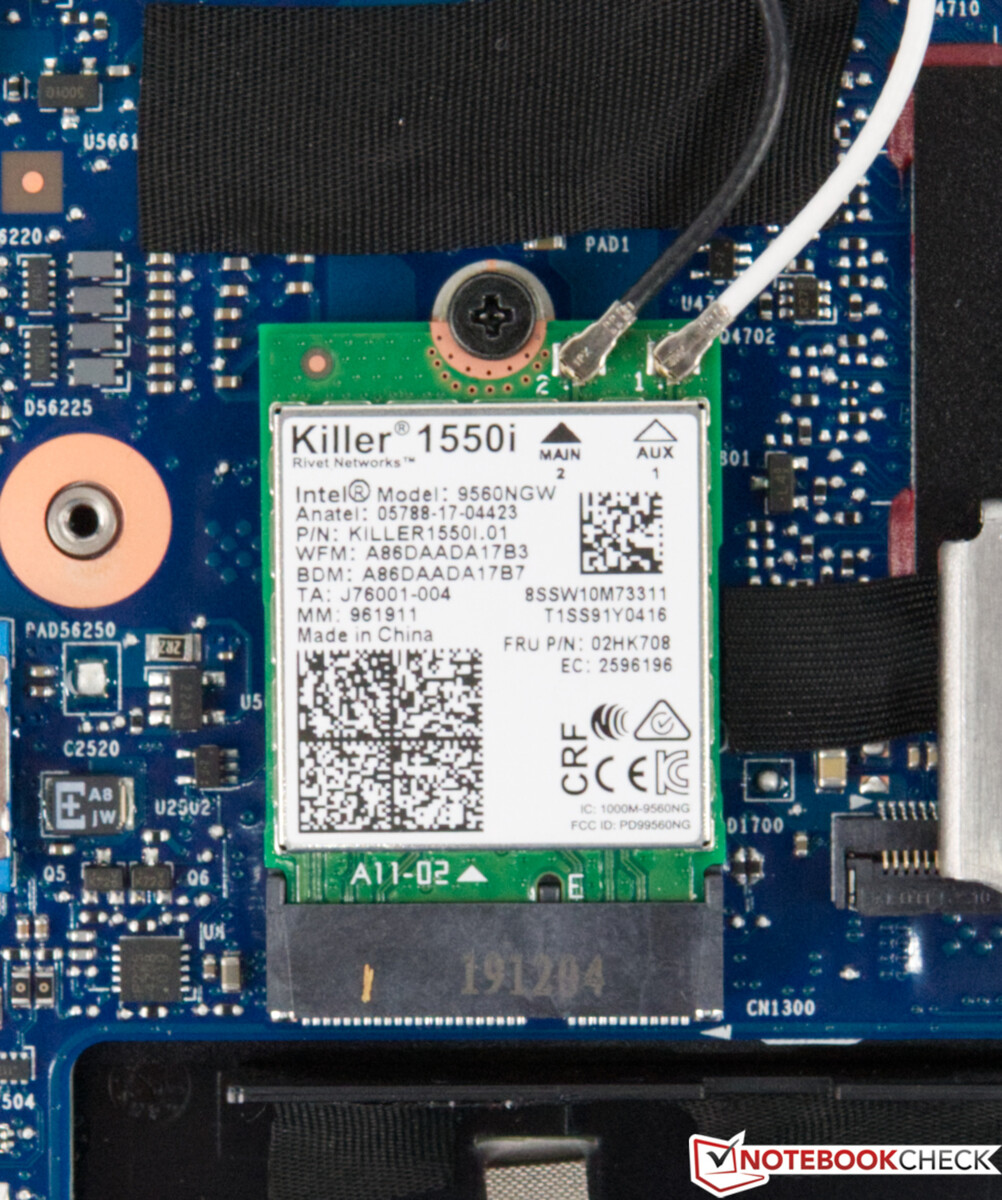
Acer has equipped our review unit with a Killer Wireless-AC 1550i chip, a picture of which we have included to the right of this section. The 1550i provided stable and fast transfer speeds during our tests, which allowed the Helios 300 to finish top of our iperf3 Client comparison tables overall. Last year's Helios 300 narrowly beat its successor in one test with its Intel Wireless-AC 9560, though.
The new Helios 300 has a Killer E2500 Ethernet controller on board too, which offers a Gigabit LAN connection. Ethernet worked just as well as Wi-Fi did during our tests.
Security
The Helios 300 does not offer many security features. There is a Kensington lock slot and a Trusted Platform Module 2.0 (TPM 2.0) on board, but Microsoft requires all OEMs include the latter in their devices if they sell them pre-loaded with Windows 10. Unfortunately, Acer does not offer a fingerprint scanner even as a configurable option.
Software
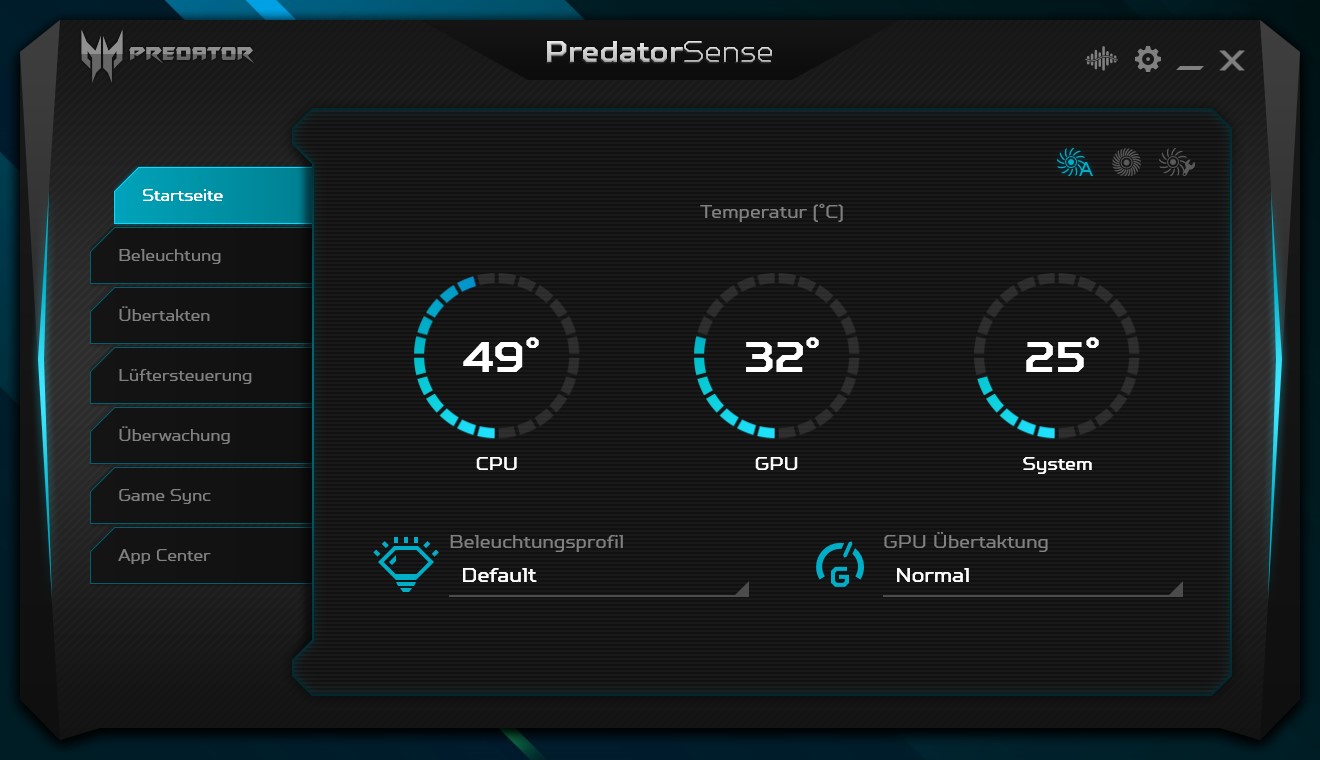
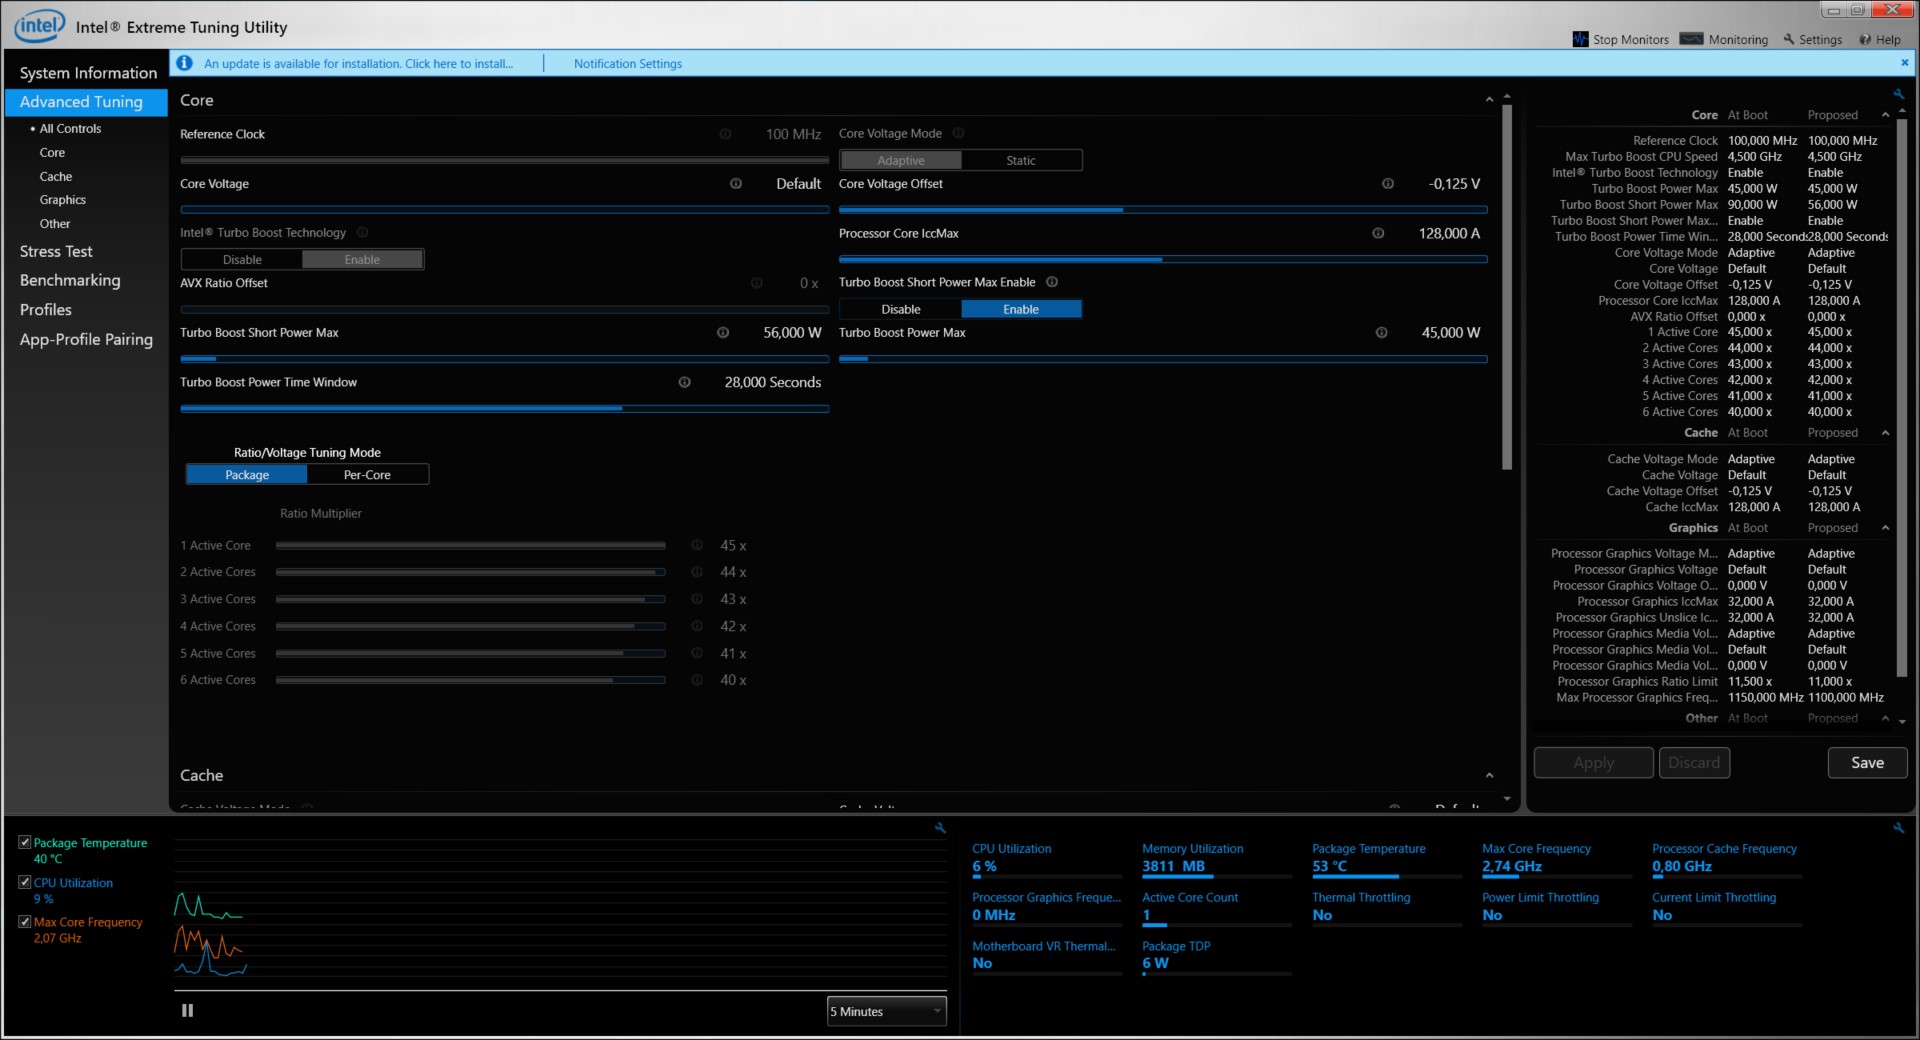
Acer preinstalls its Predator Sense software on the Helios 300, just as it has with every gaming laptop that it has sold in the last few years. The company has given the software a blue and black skin to match the colour scheme of this year's Helios 300, which is a nice touch. Predator Sense now not only allows you to monitor the CPU and GPU but also overclock them slightly. You can change the keyboard's RGB backlighting in Predator Sense too.
Accessories
Acer only includes a 180 W power supply in the box, along with various pieces of documentation. The Helios 300 comes with Windows 10 Home 64-bit too, in case you were wondering.
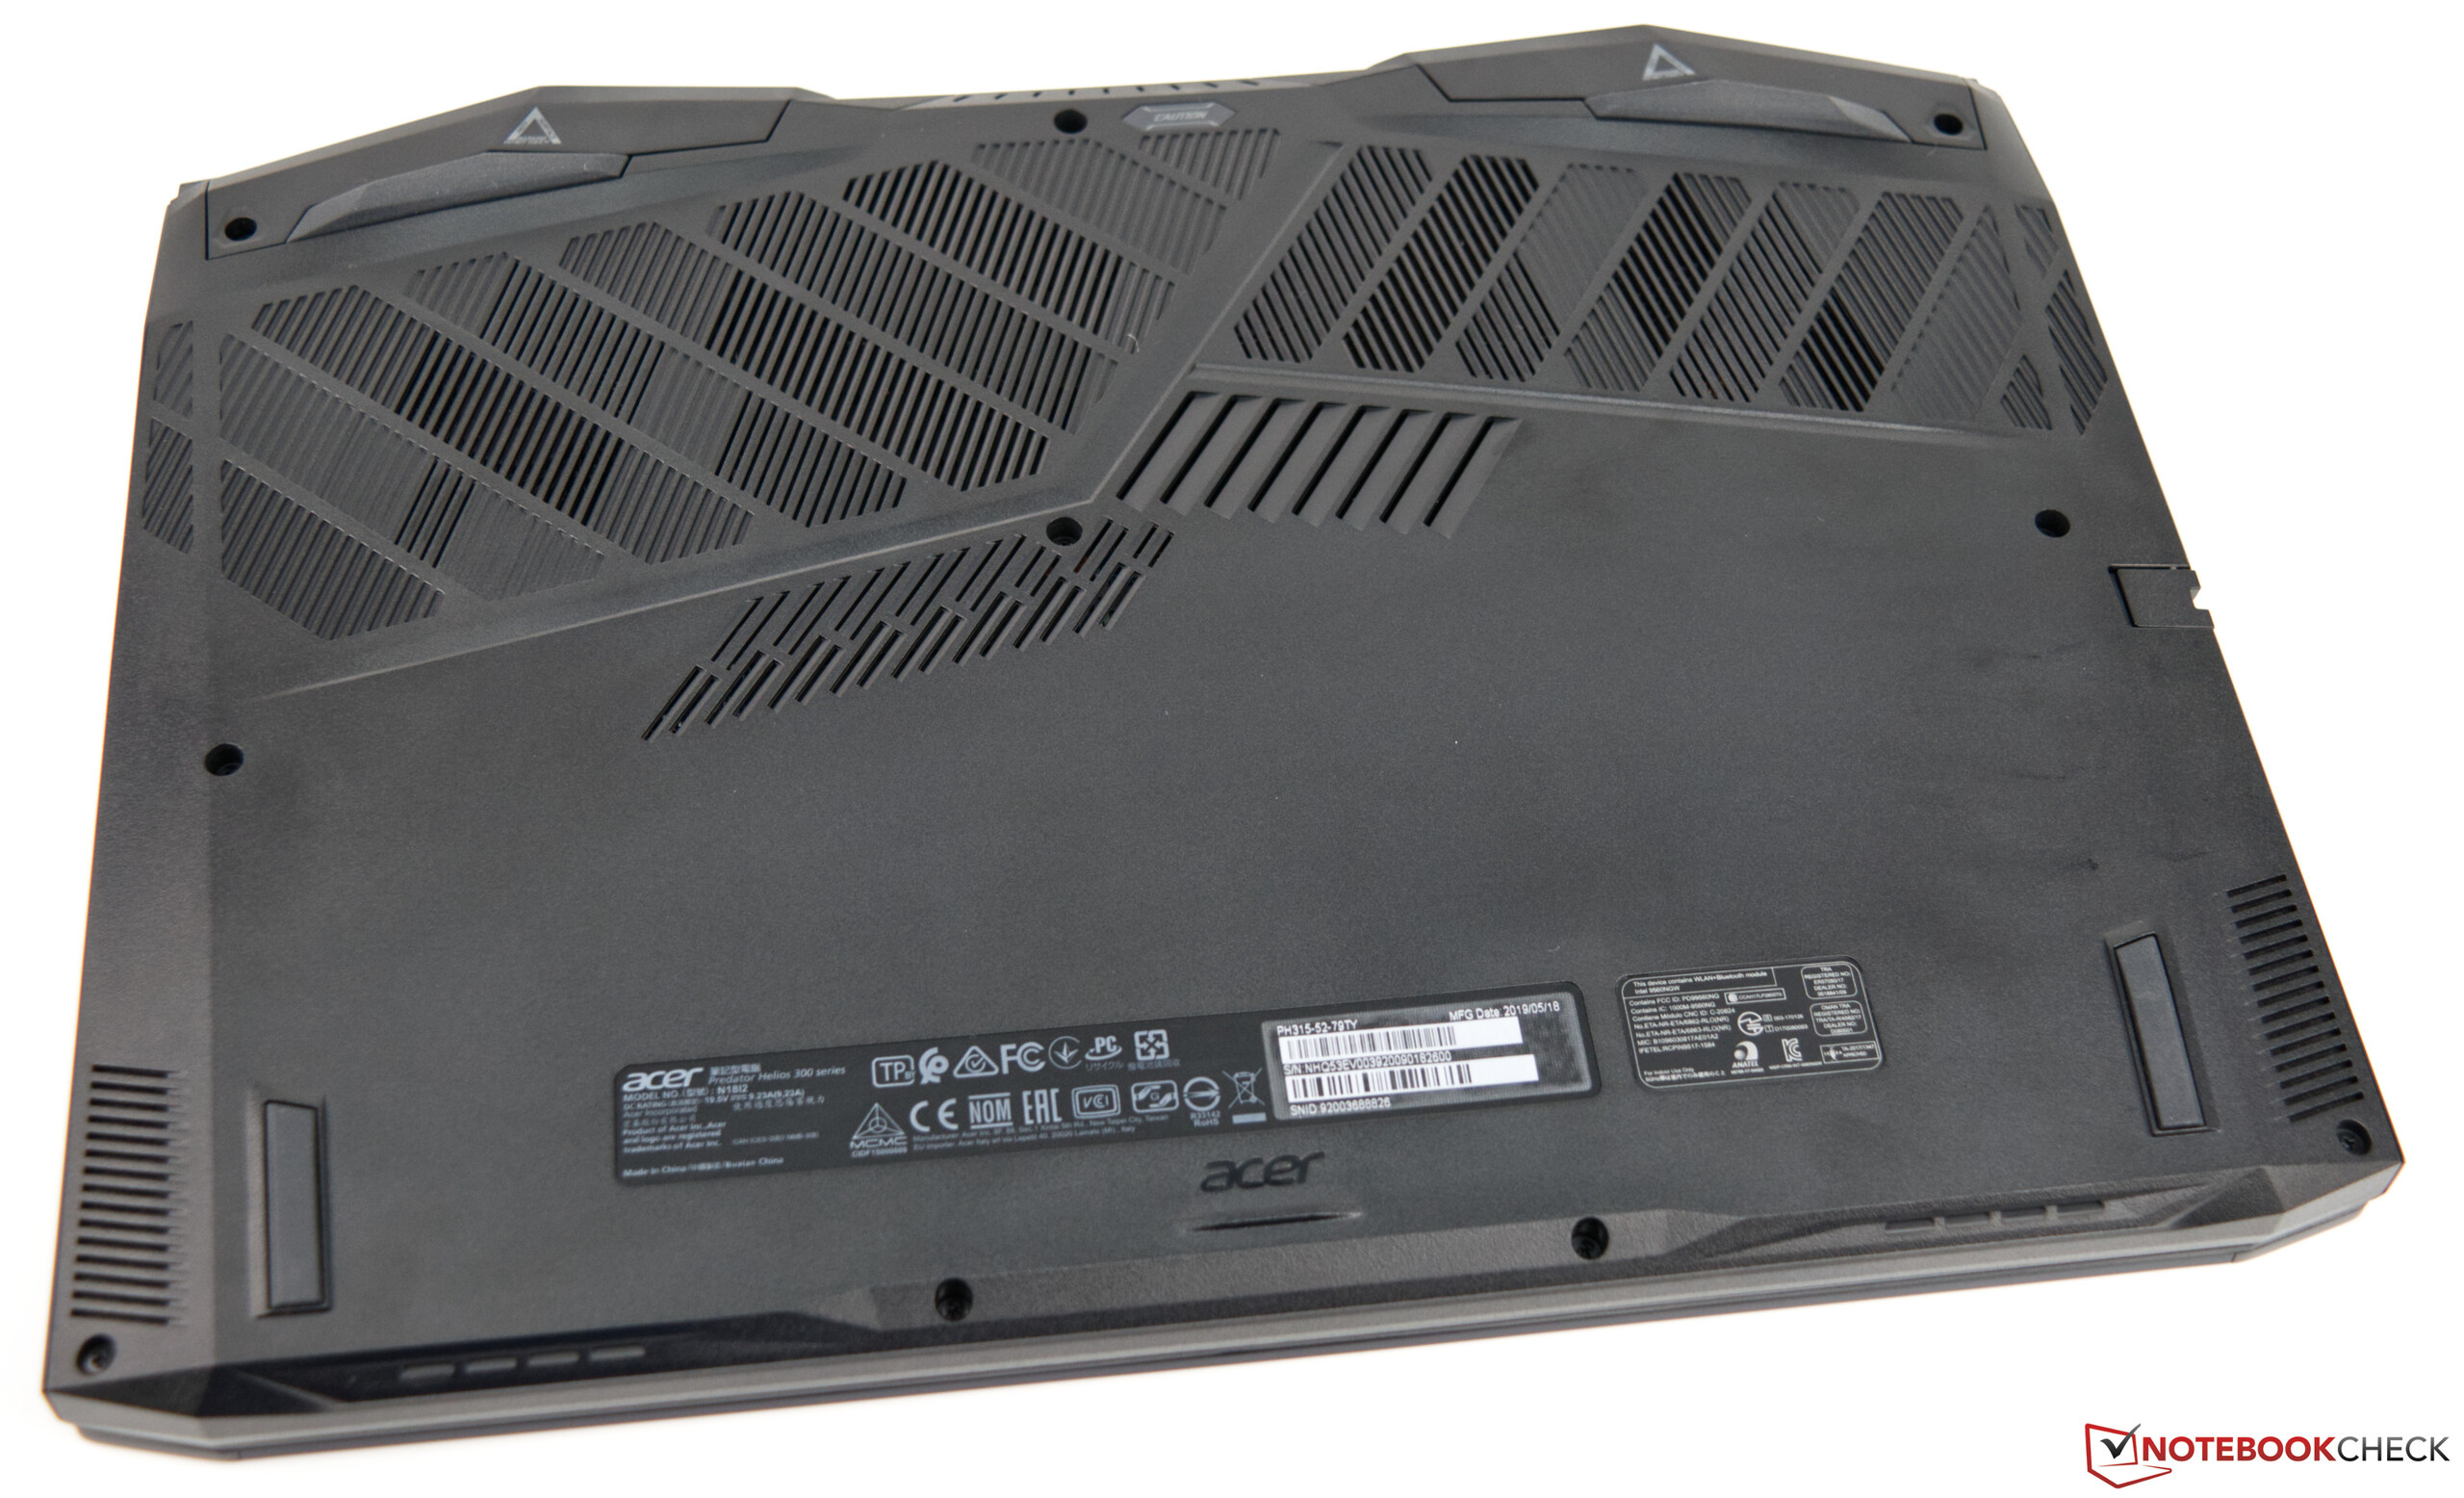
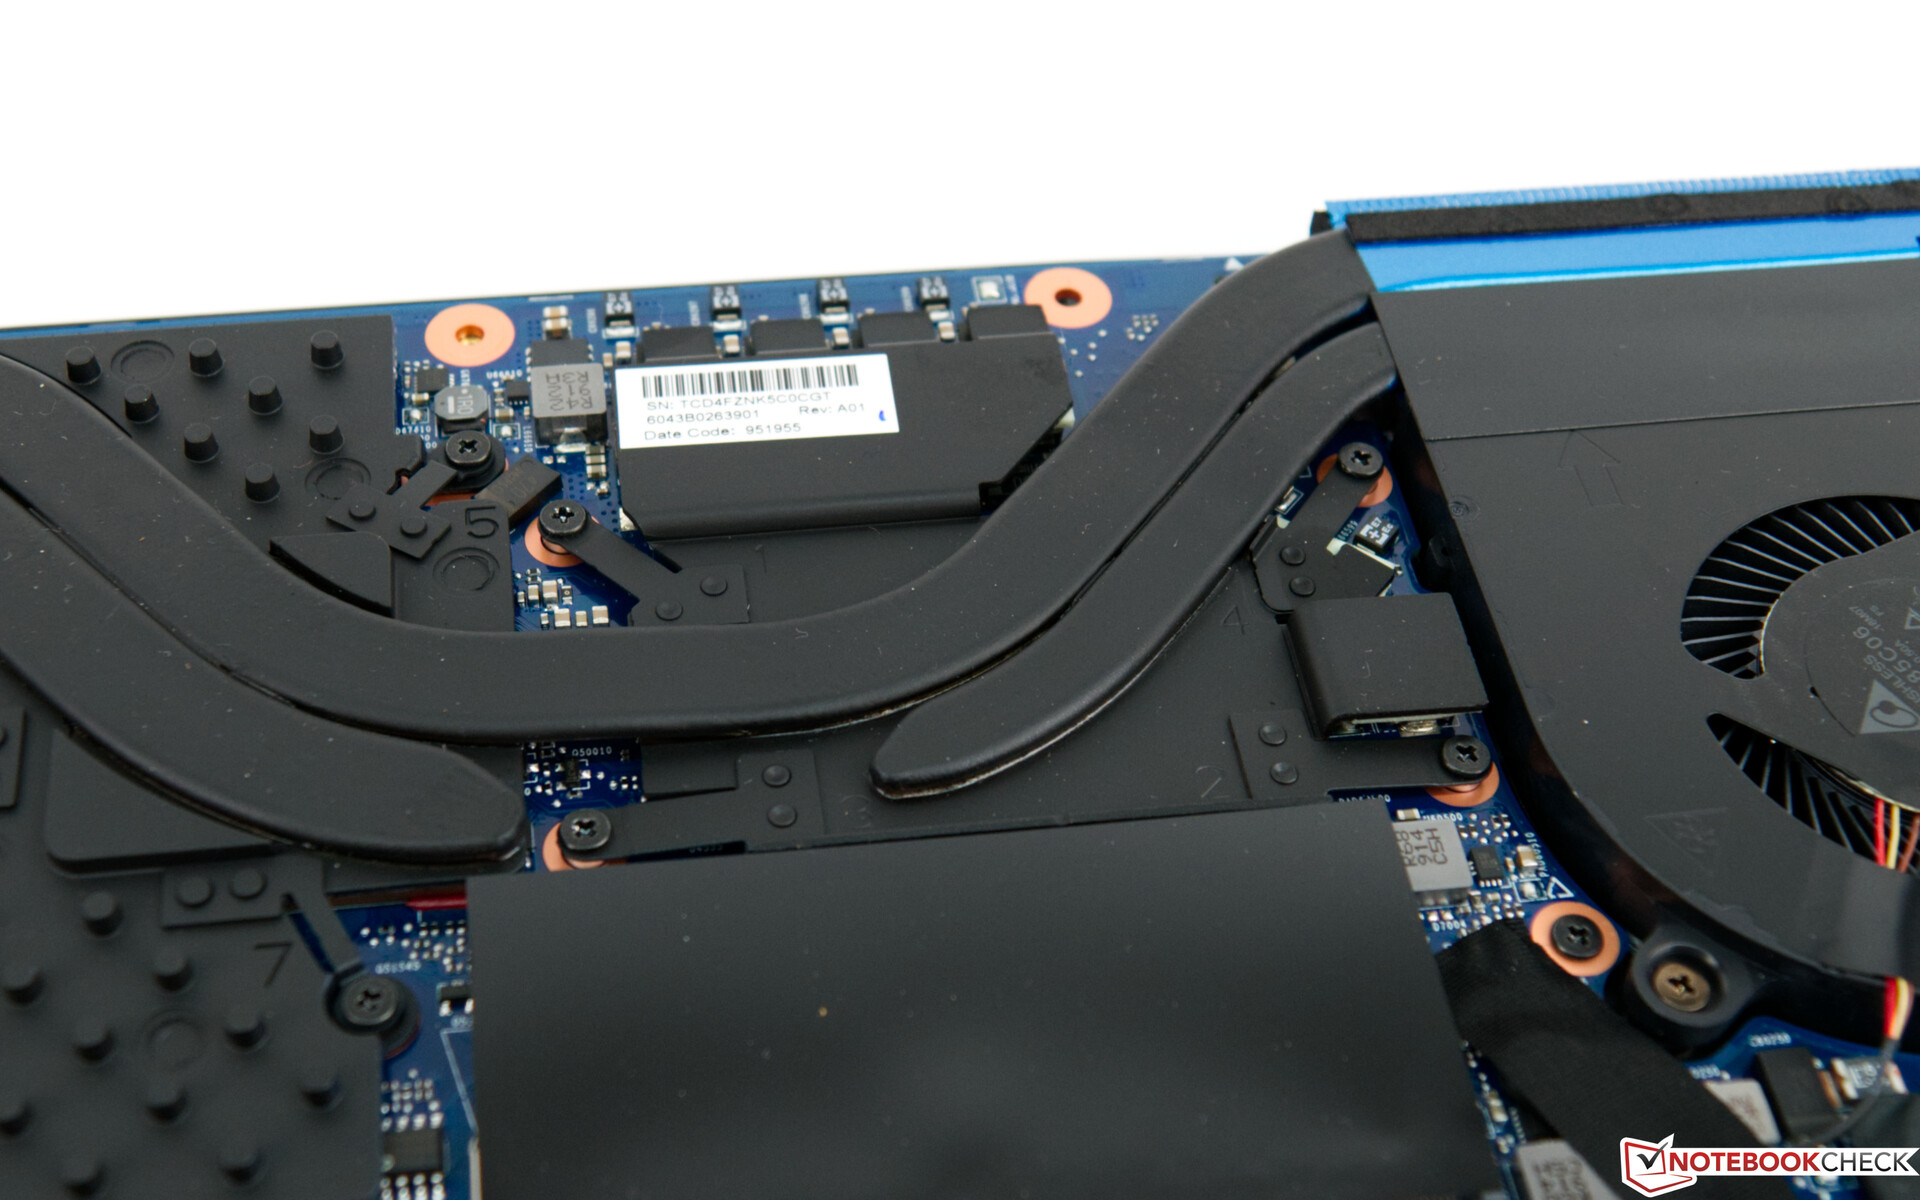
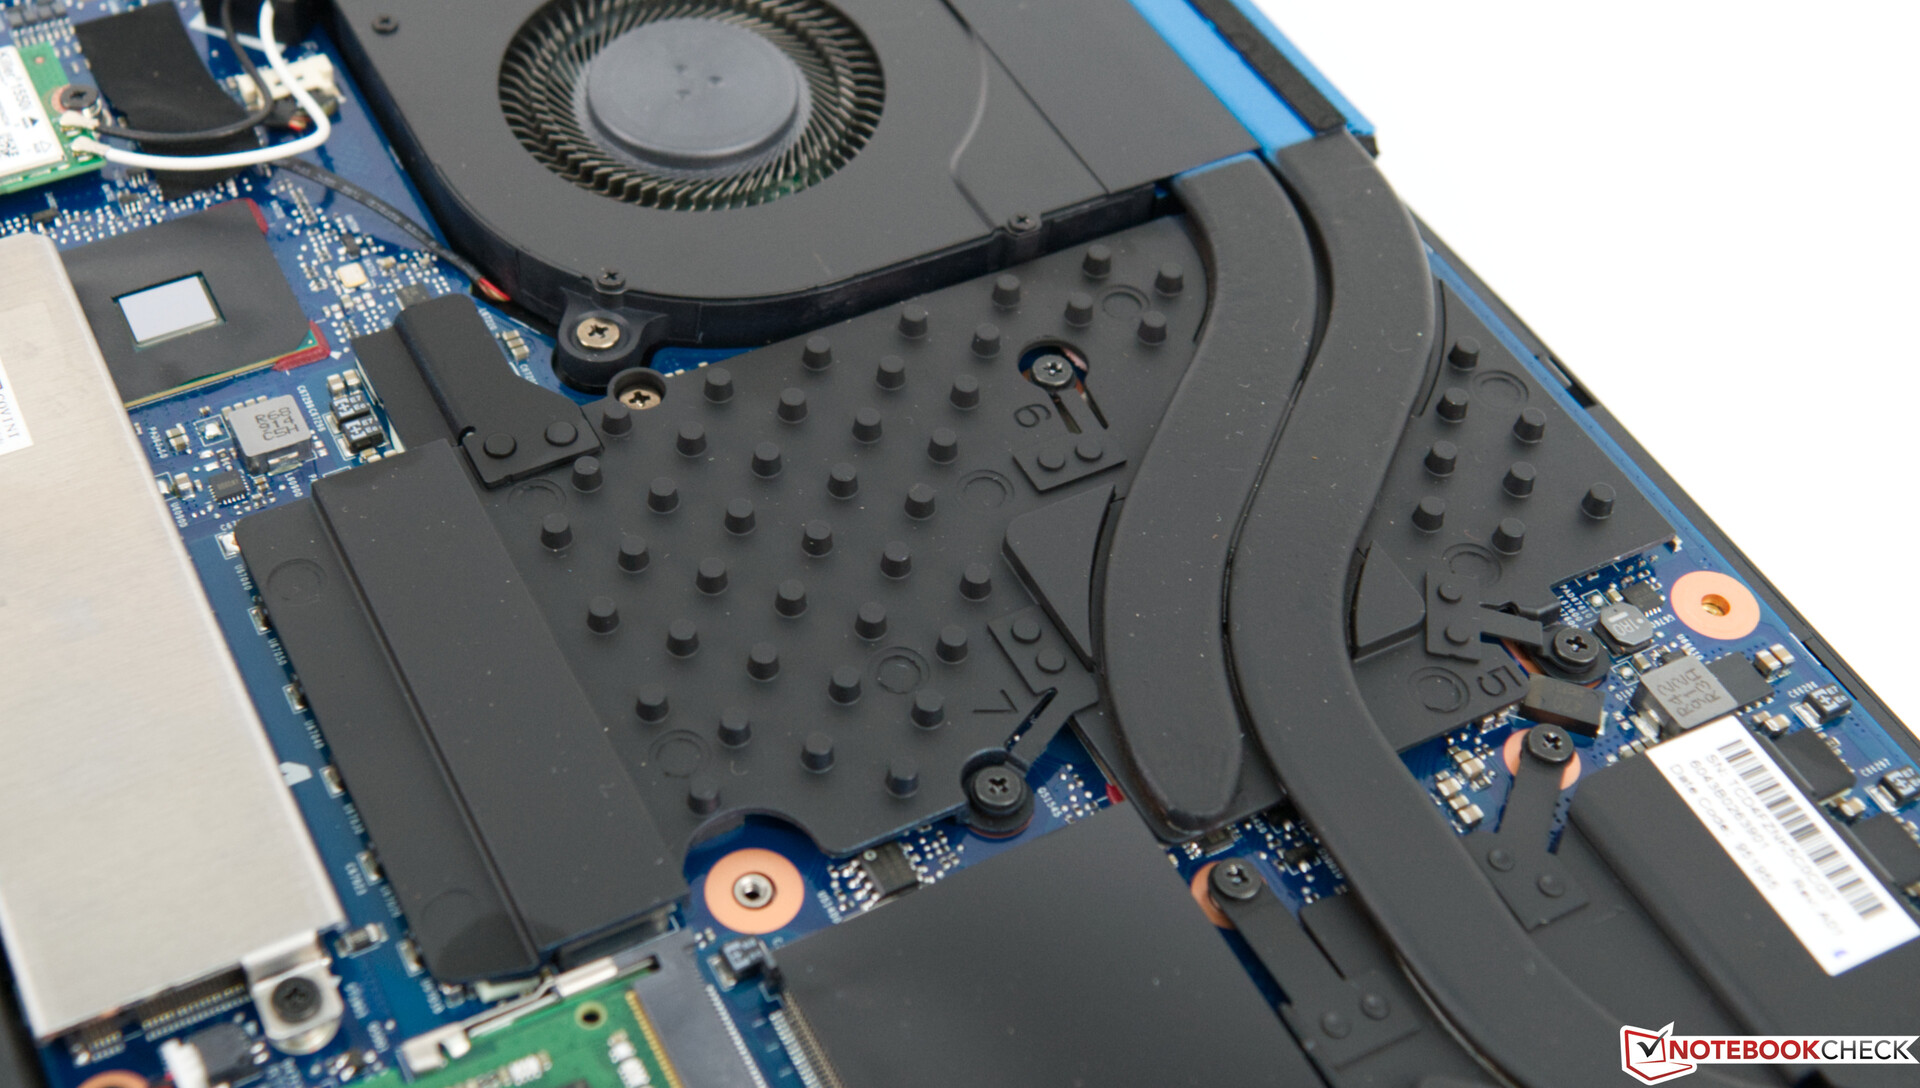
Maintenance
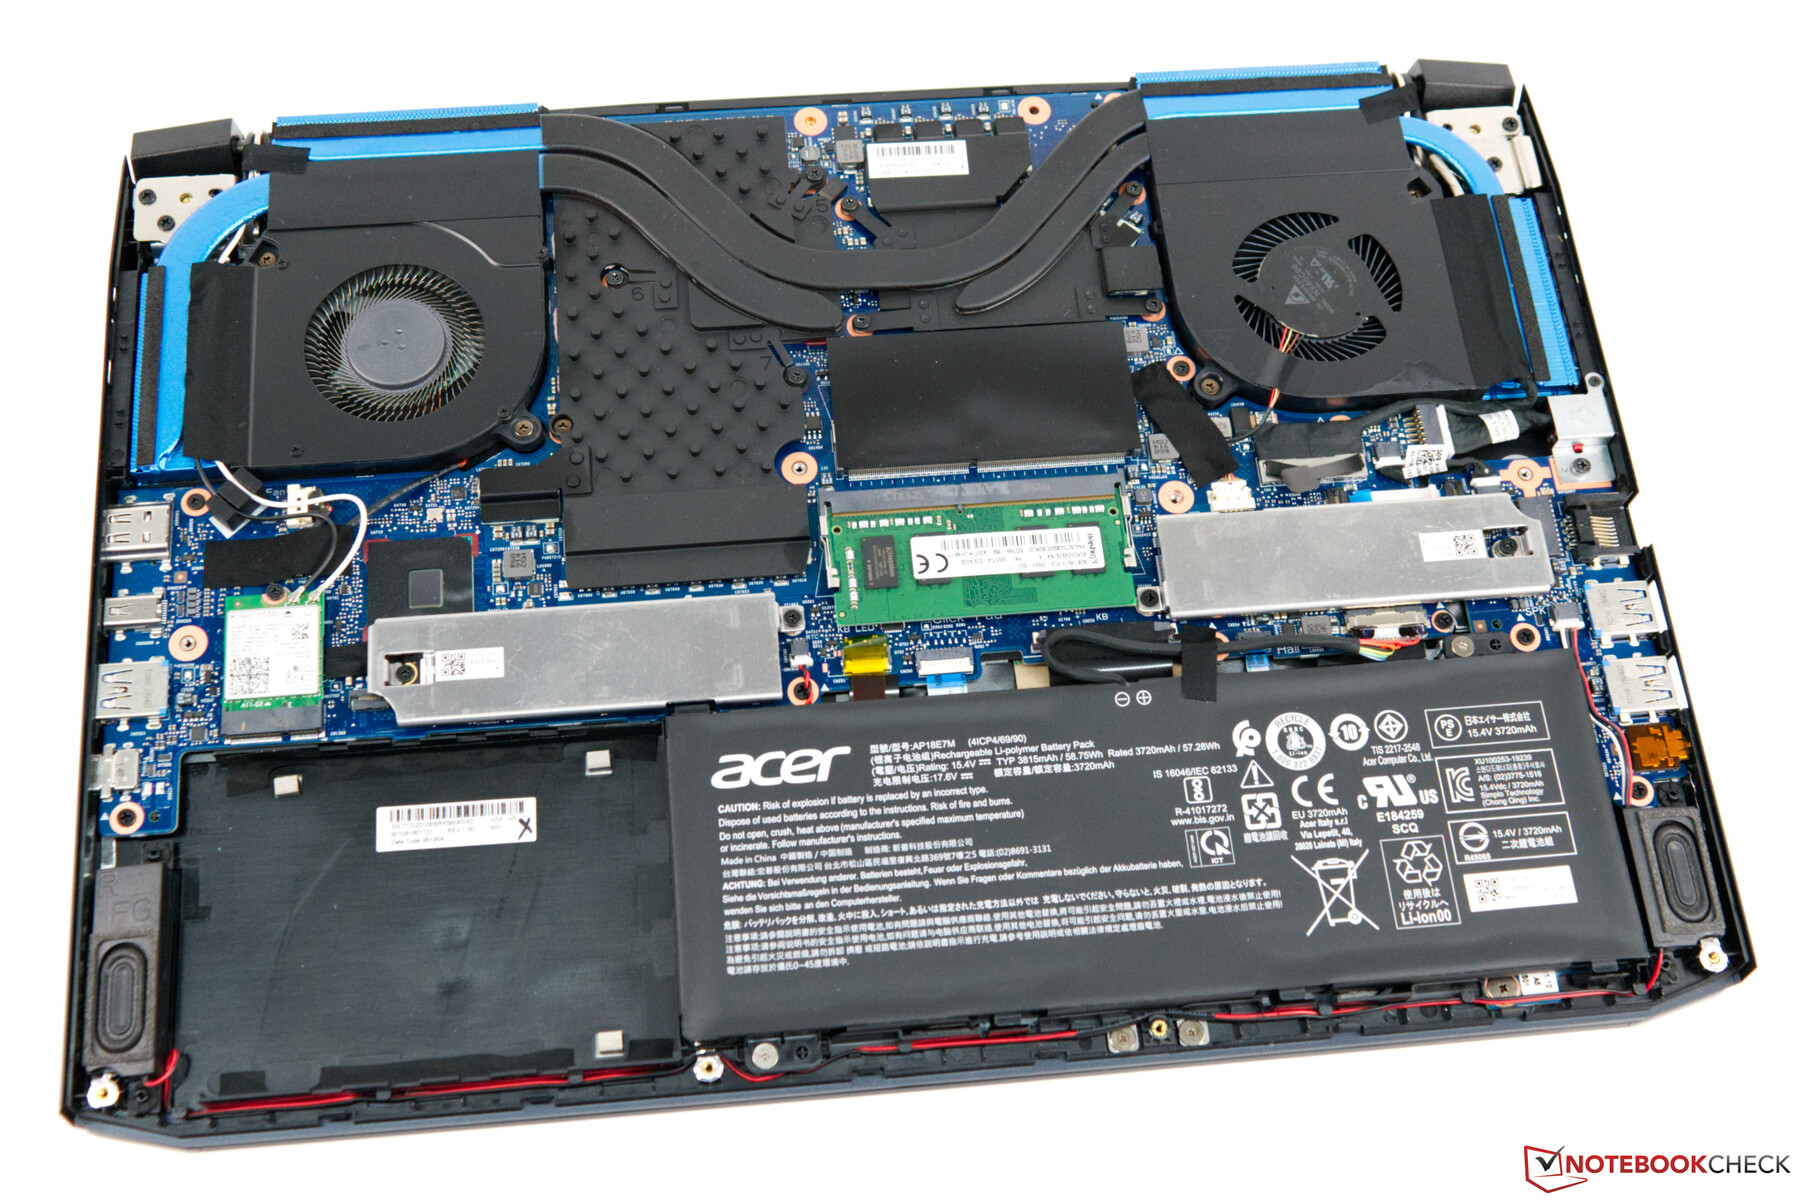
The Helios 300 does not have a maintenance cover, but that is no bad thing as removing the bottom plate is a simple process. Doing so reveals the three drive bays, battery, Wi-Fi card and socketed RAM, among other components. Acer also includes the cable needed to add a 2.5-inch drive, which is handy.
Warranty
The Helios 300 comes with 24 months' warranty. The coverage extends to a pick-up and returns service. Please see our Guarantees, Return Policies & Warranties FAQ for country-specific information.
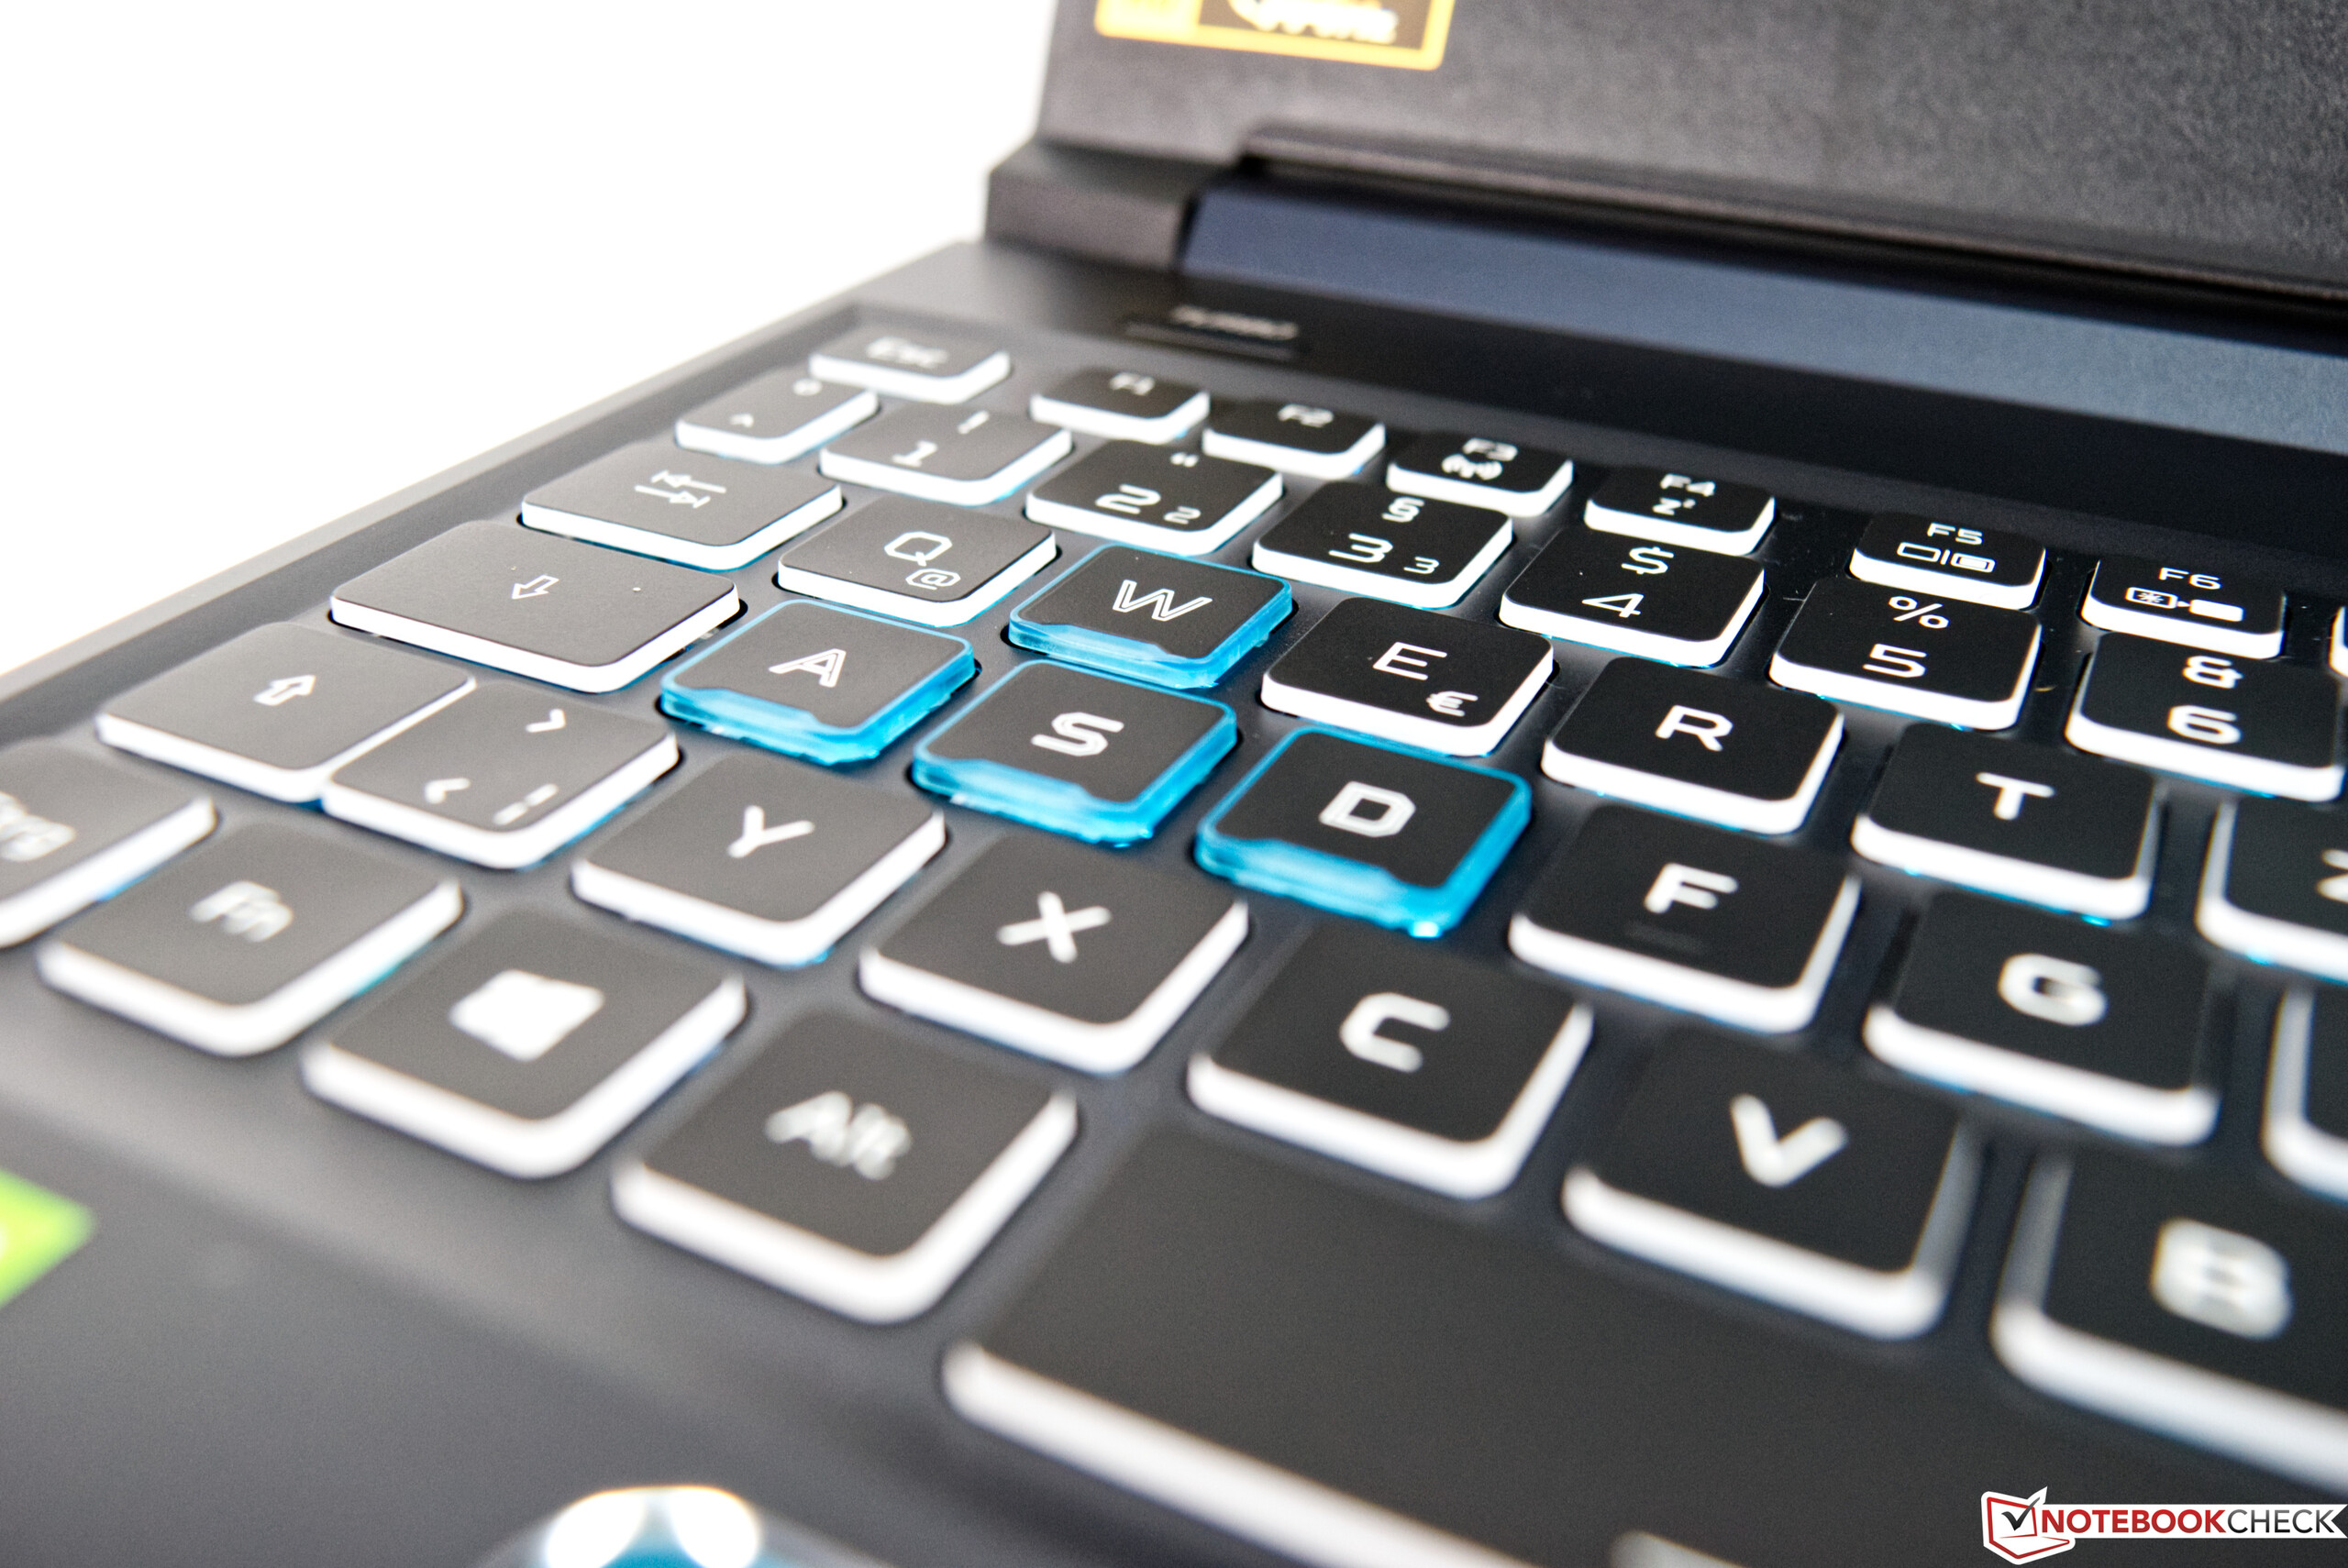
Input Devices - RGB galore
Keyboard
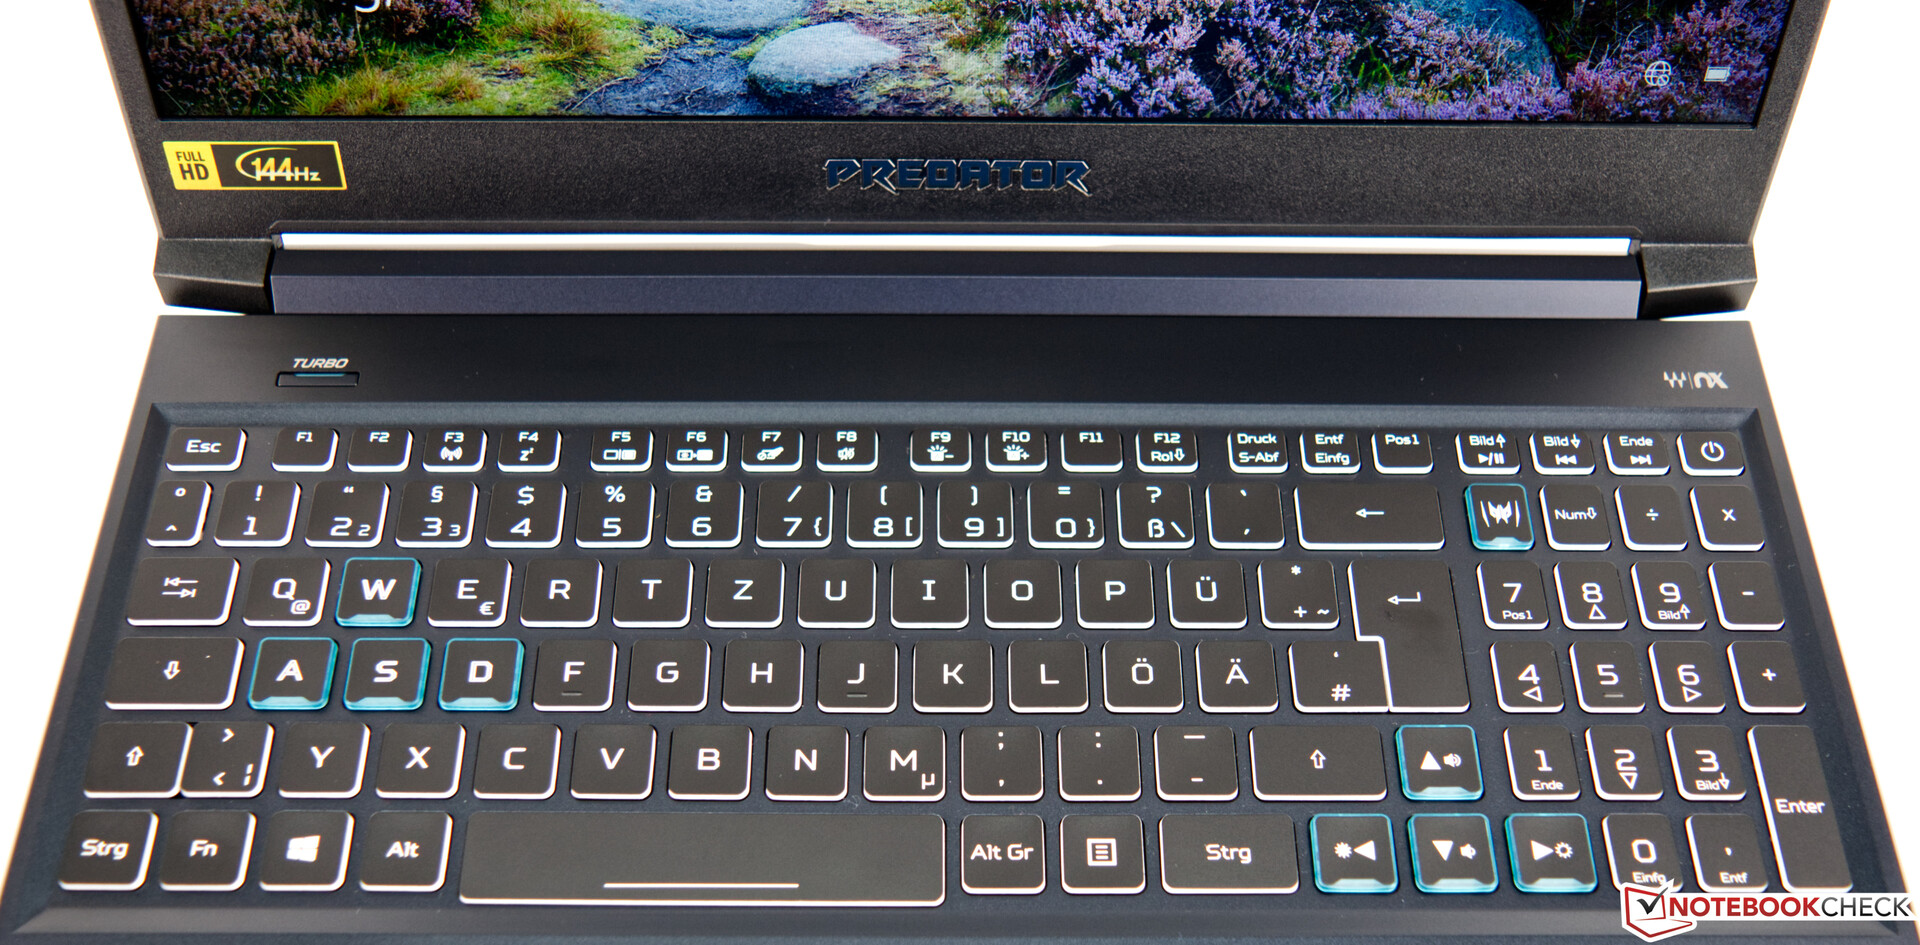
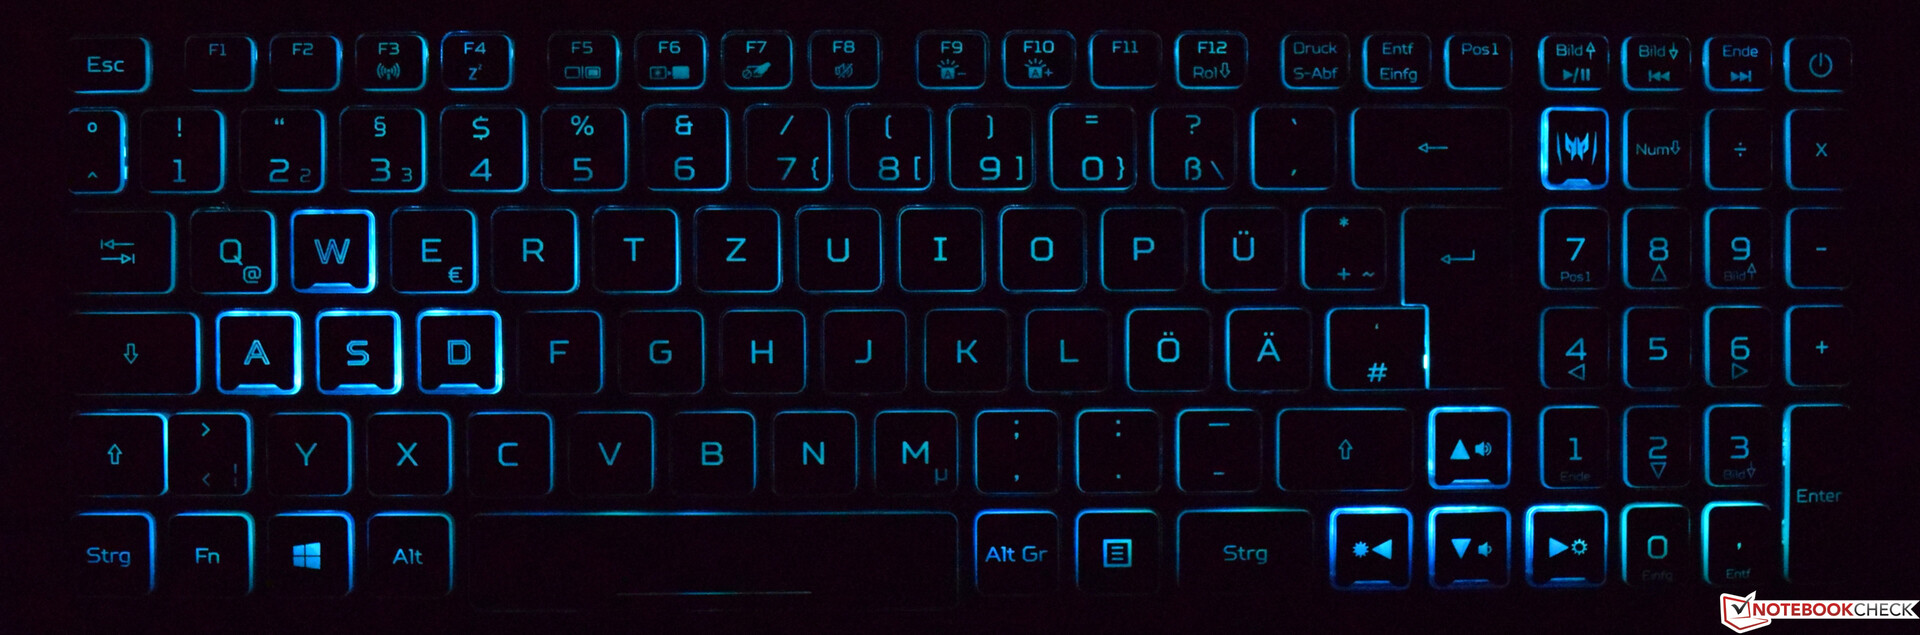
Acer equips the Helios 300 with a 6-row chiclet keyboard that is slightly recessed into the chassis. All the keys sit firmly in their housings, and nothing rattles. The main keys measure 15 mm², which should be large enough for most hands, while all have a pleasantly short travel and noticeable pressure points. They also all have a dampened stop, which ensures that the keyboard remains quiet even when typing quickly. As the photo to the right reveals, Acer accents a few keys with a blue trim, but all keys support RGB backlighting. There is a Predator button too that opens the Predator Sense tool.
Trackpad
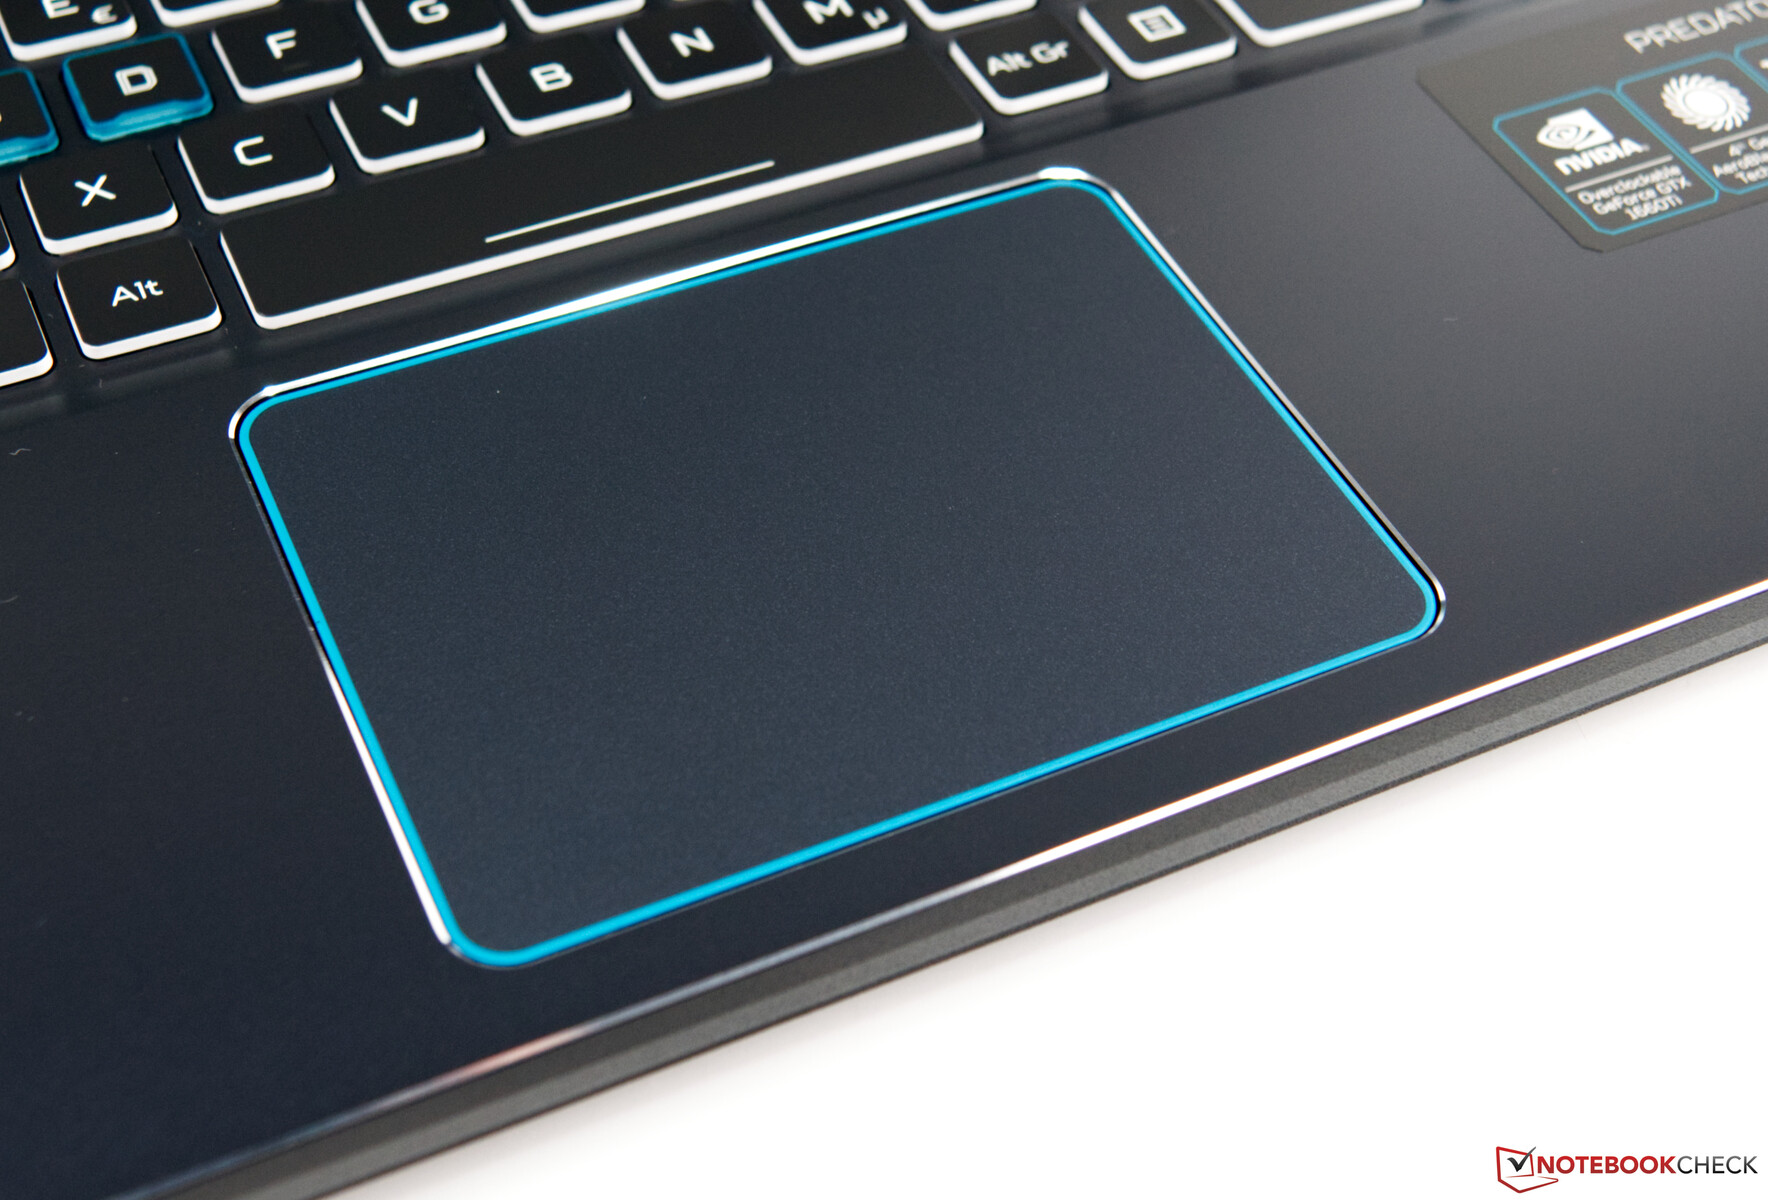
Below the keyboard sits the trackpad, which measures 10.7 x 7.8 cm. The trackpad is large enough to perform multi-finger gestures and fits the overall look of the device. The one in our review unit remains responsive and accurate even into its corners, which is not always the case with modern laptops. Acer has integrated two mouse buttons too, which deliver a soft clicking sound when pressed. In short, the Helios 300 has a decent trackpad.
Display - A colour-accurate 144 Hz panel with no PWM

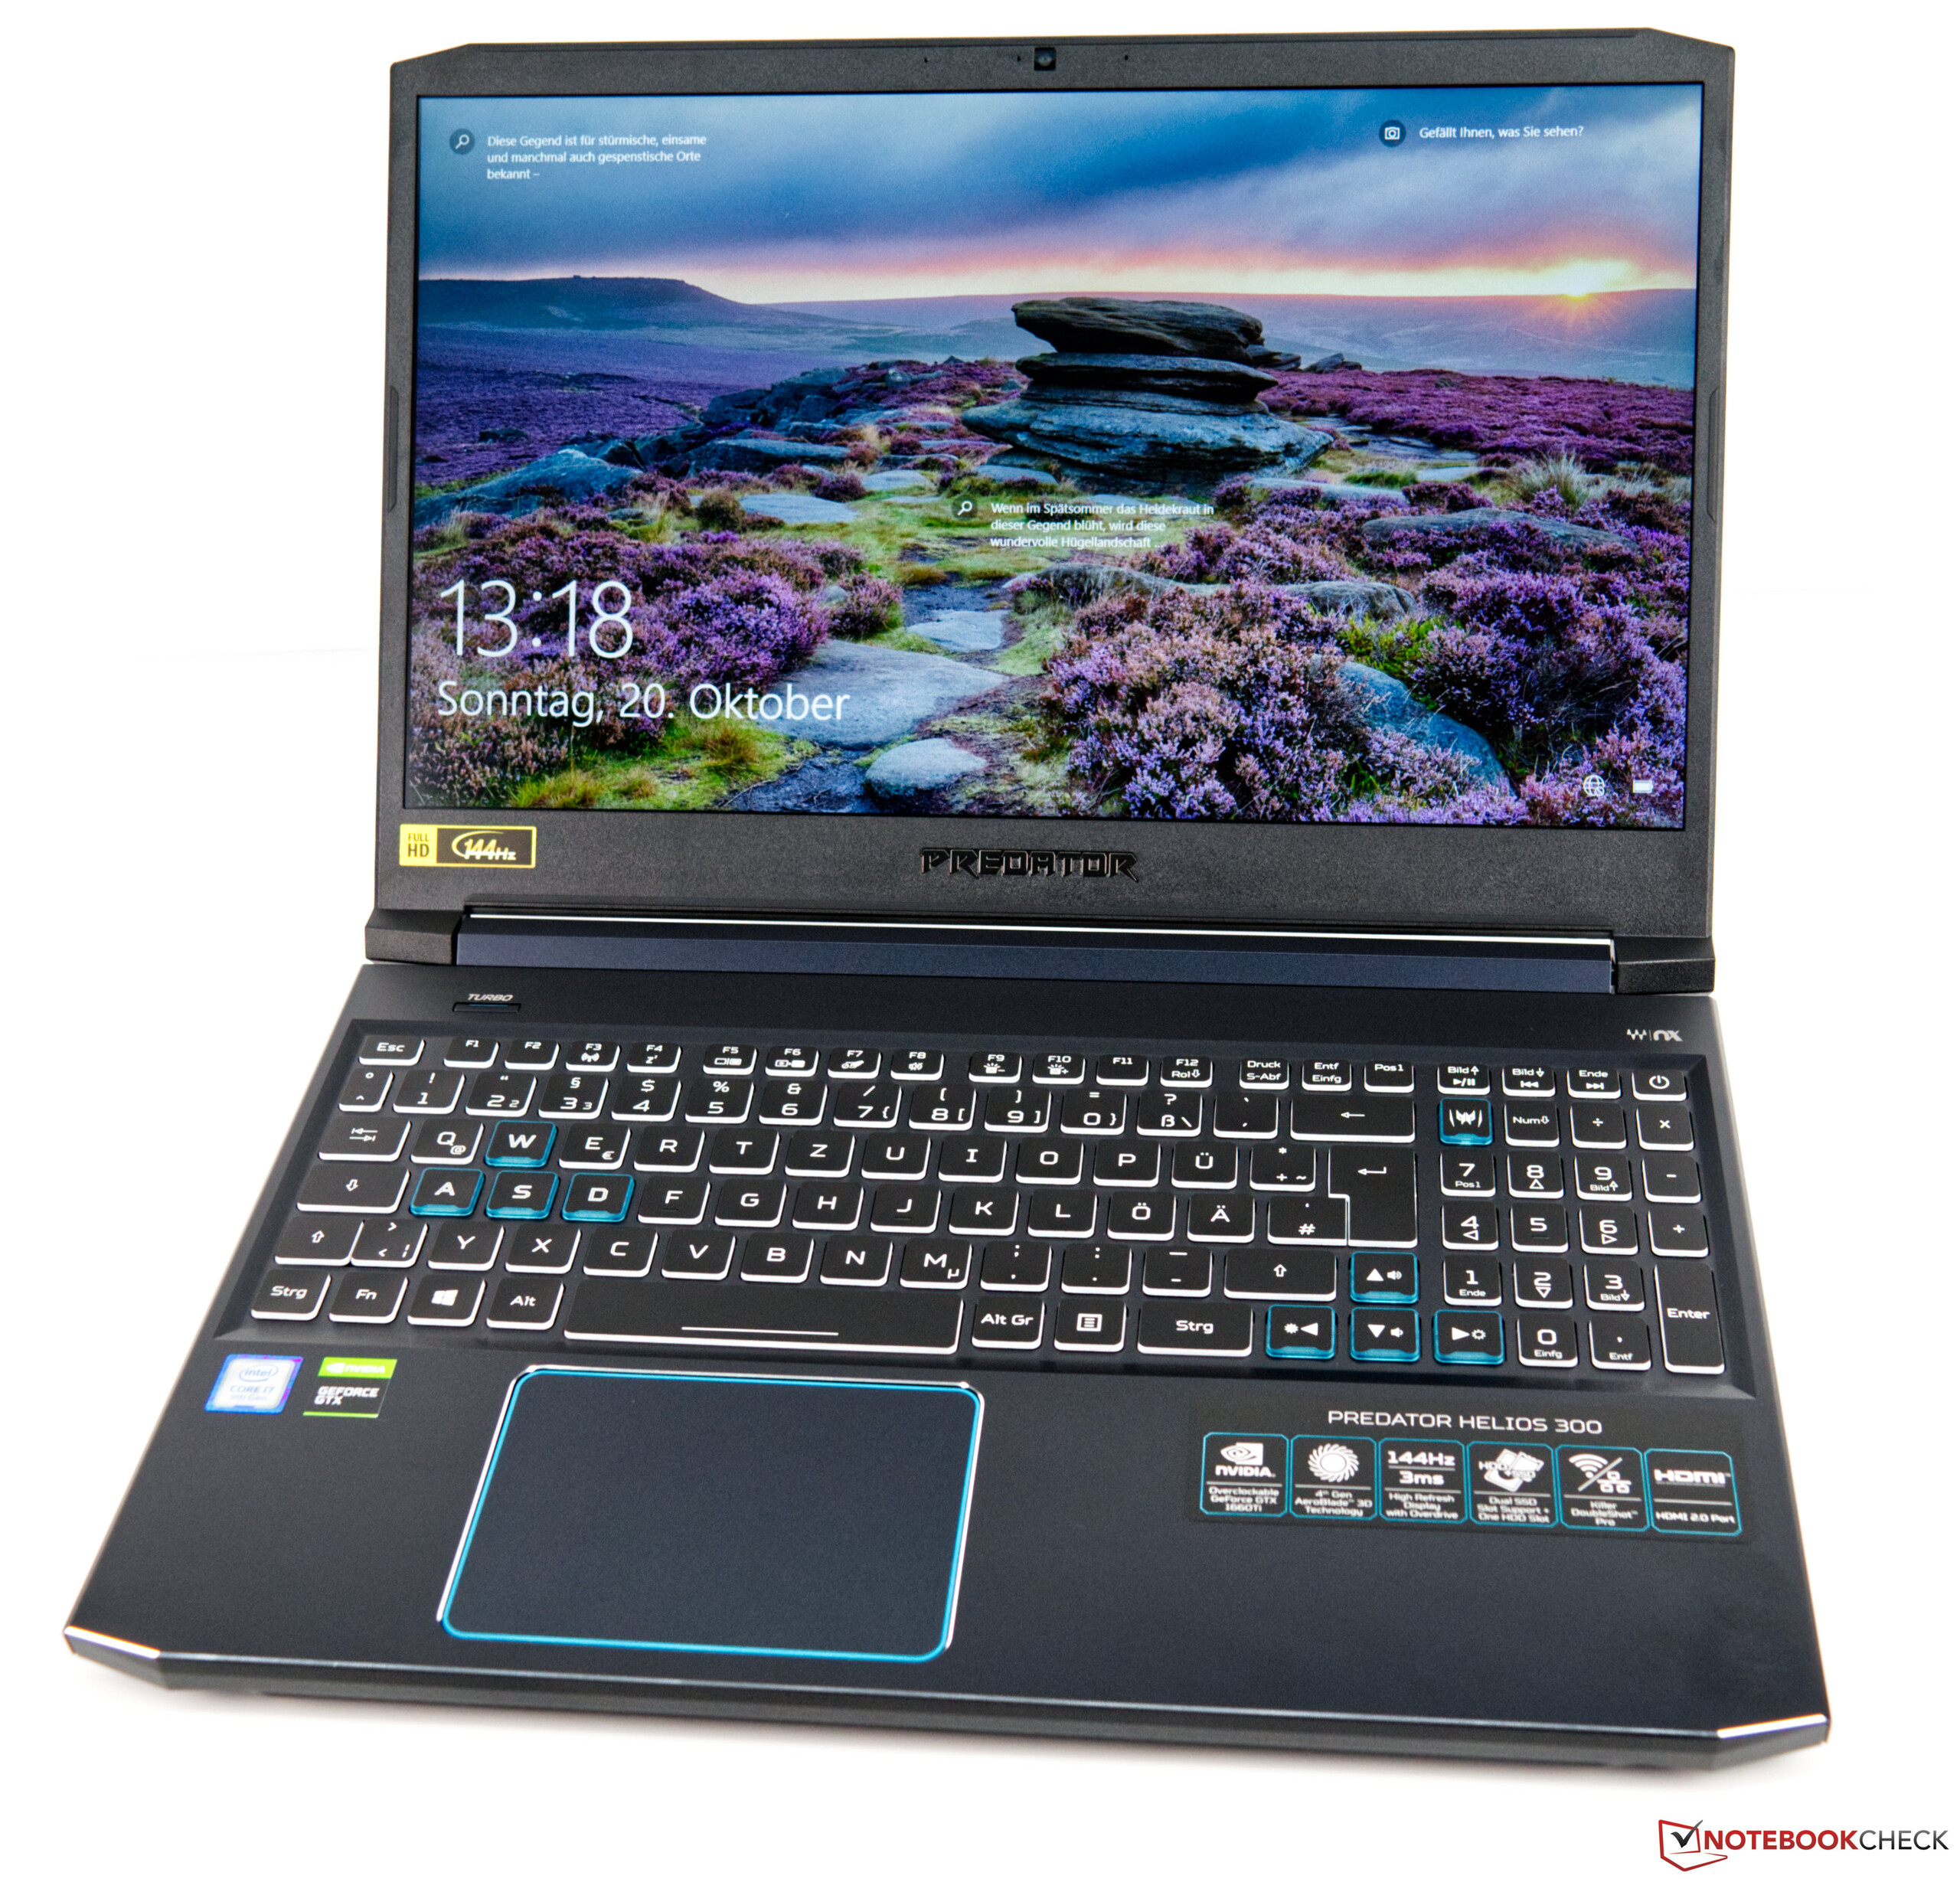
The Helios 300 has a 15.6-inch IPS display that resolves at 1920x1080. The 144 Hz panel is the only one that Acer offers with the device, but 1080p is roughly the limits of what its hardware offers.
Our review unit has an AU Optronics display, which achieved an average maximum brightness of 310 cd/m² according to X-Rite i1Pro 2. While not the darkest display in our comparison table, it is much dimmer than the one in the Lenovo Legion Y740. The display in the Helios 300 is not that evenly lit either, but its 0.255 cd/m² is relatively low. It also has a respectable 1,275:1 contrast ratio.
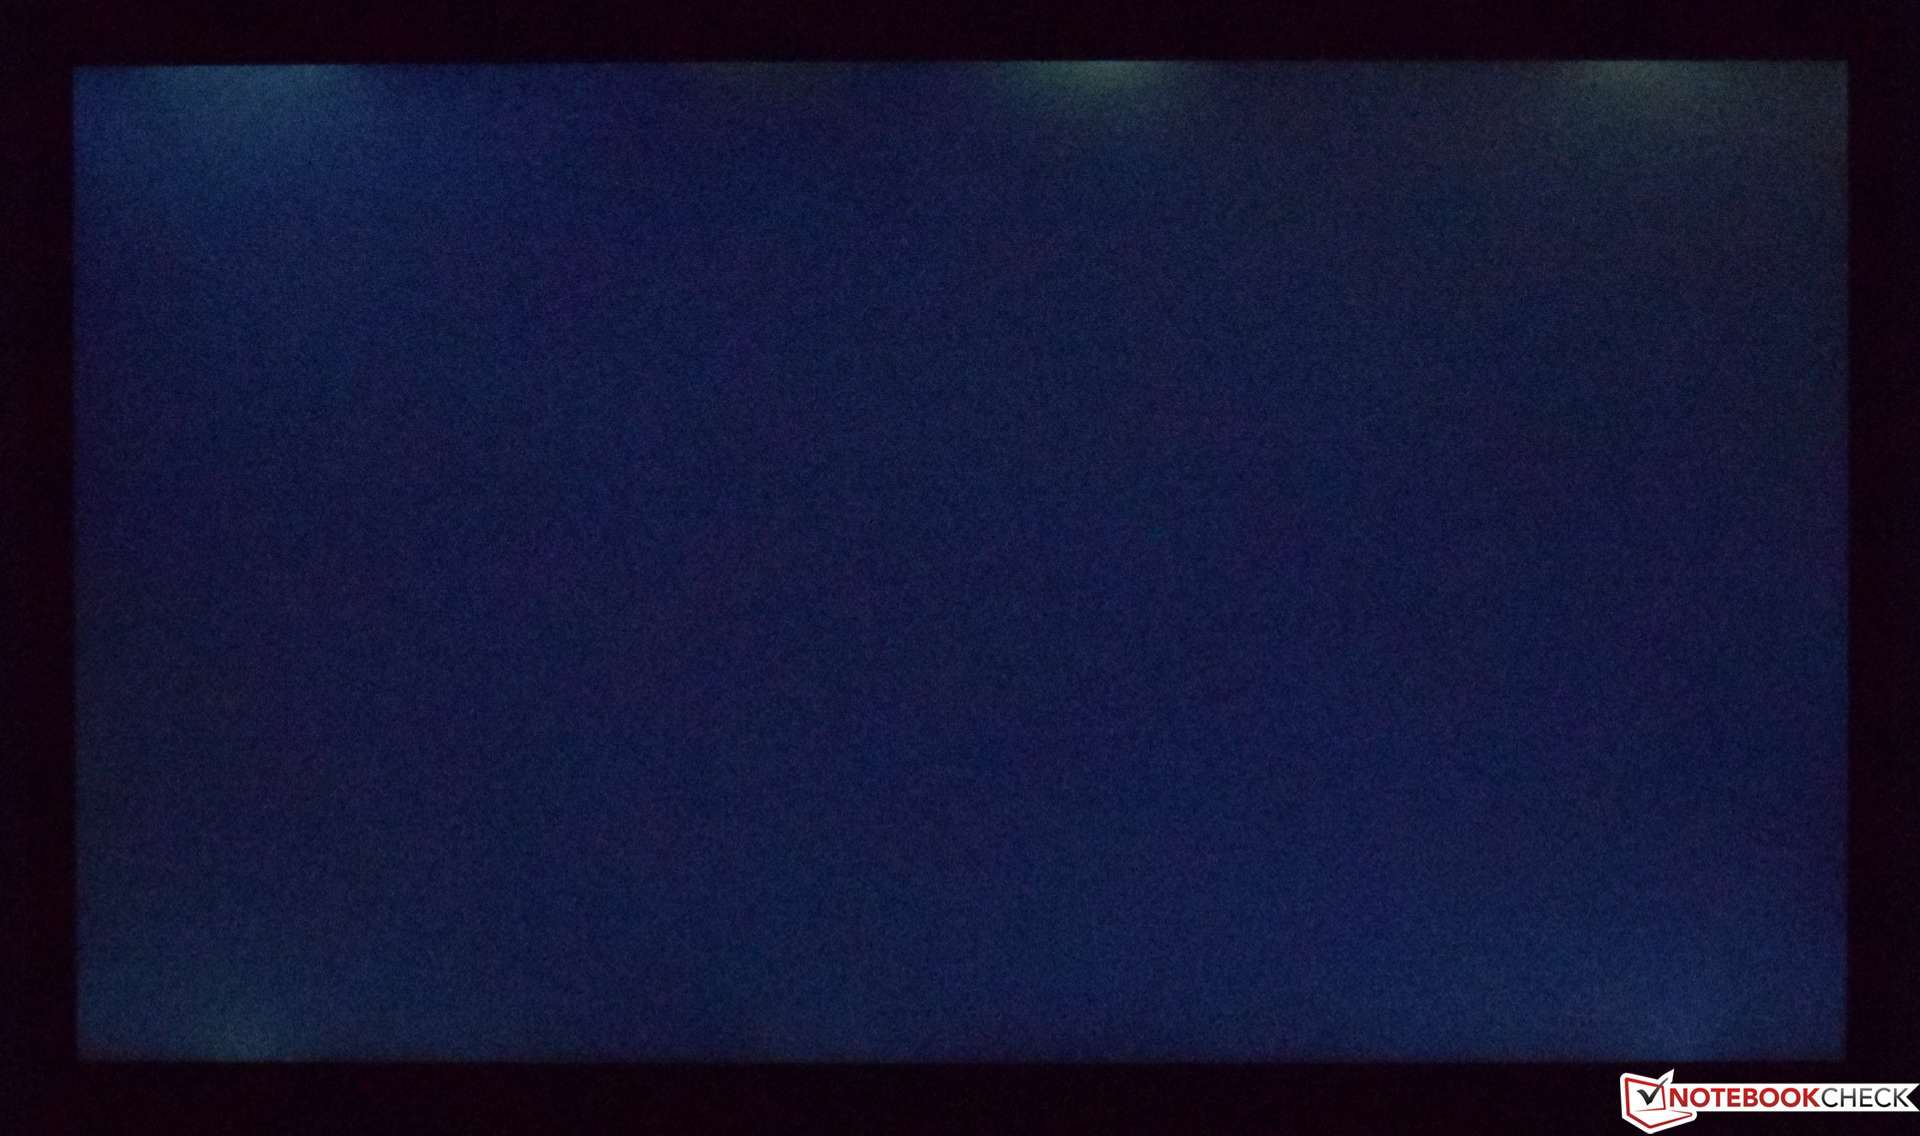
The panel does not use pulse-width modulation (PWM) to control brightness levels, which is a positive for those who are PWM sensitive. However, the one in our review unit suffers from significant backlight bleeding, as the photo to the right demonstrates.
| |||||||||||||||||||||||||
Brightness Distribution: 82 %
Center on Battery: 326 cd/m²
Contrast: 1275:1 (Black: 0.255 cd/m²)
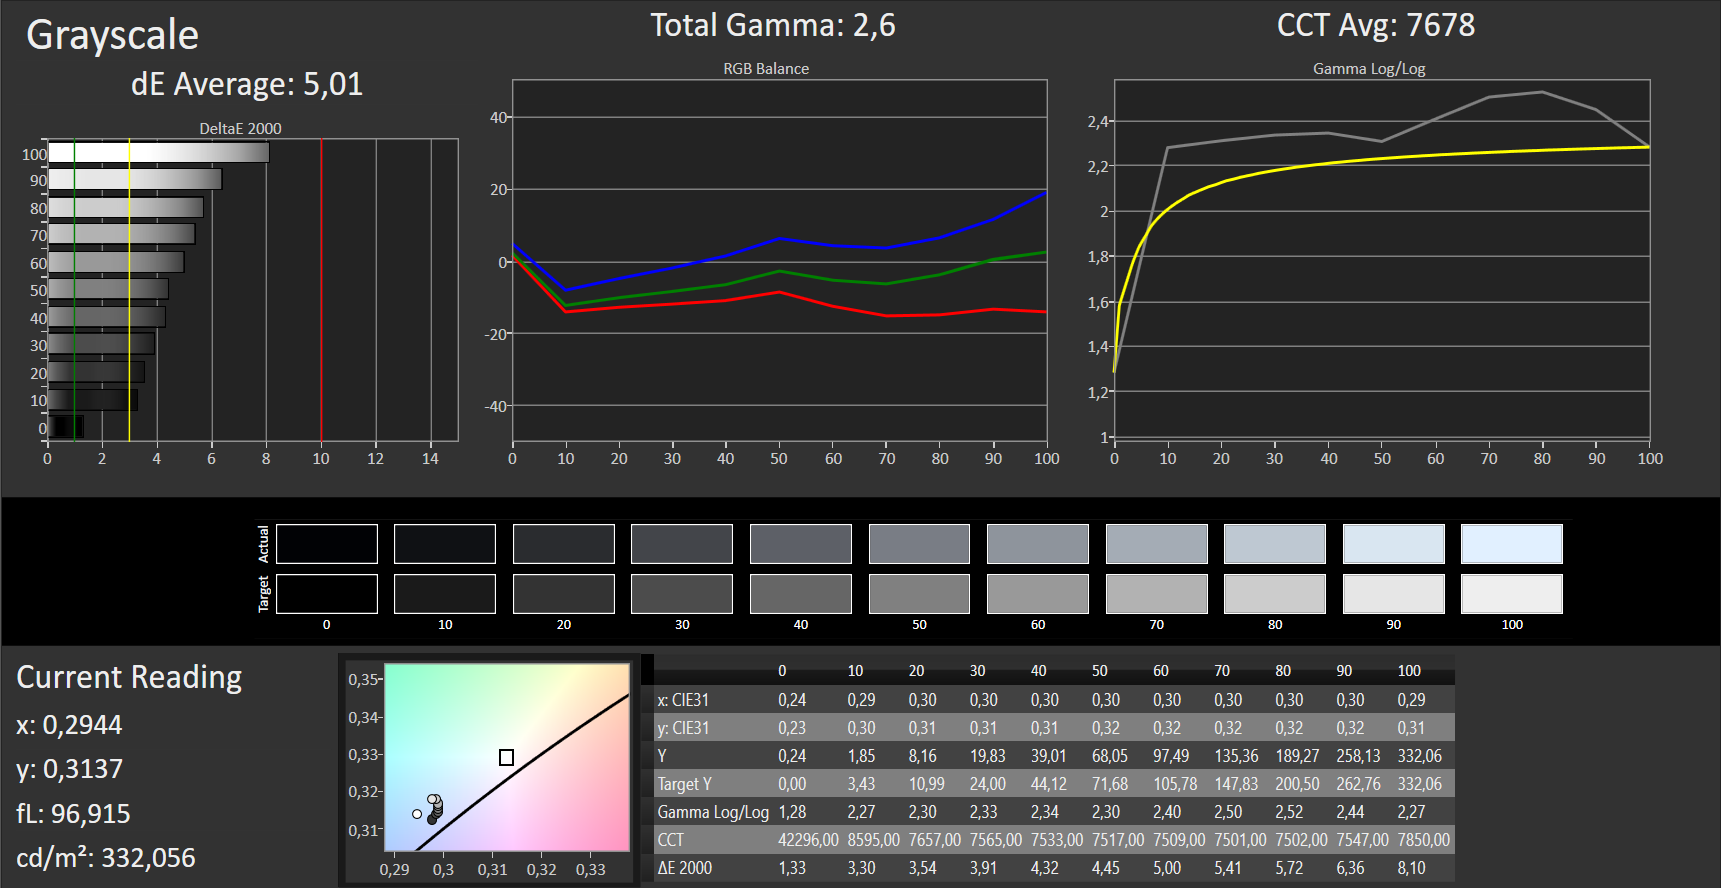
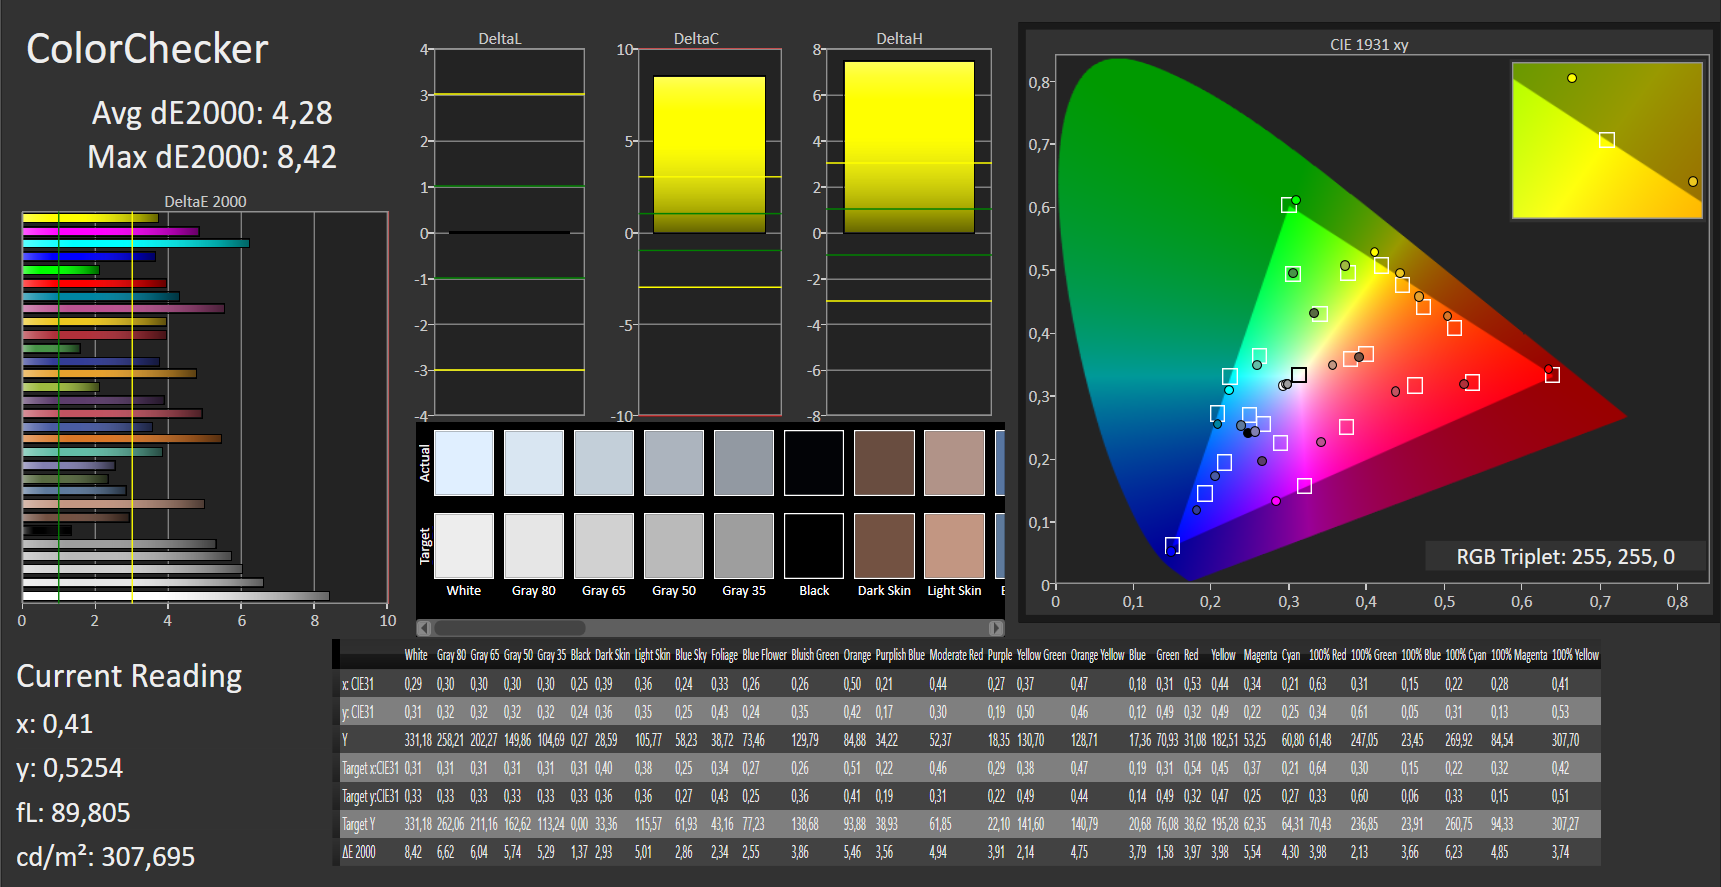
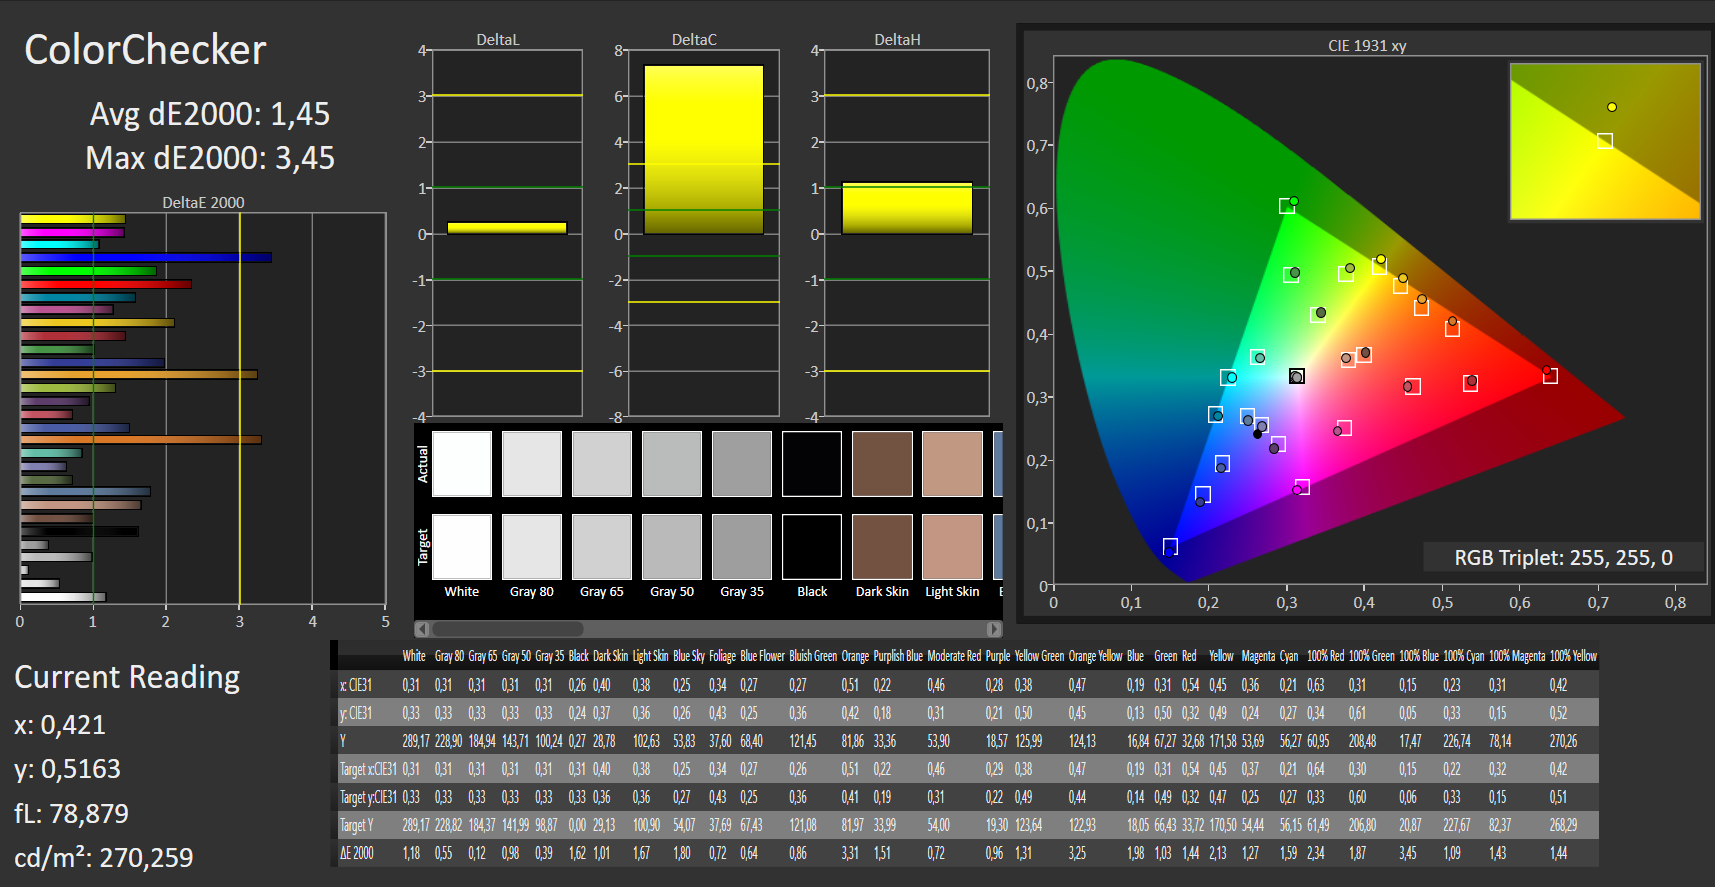
ΔE ColorChecker Calman: 4.28 | ∀{0.5-29.43 Ø4.72}
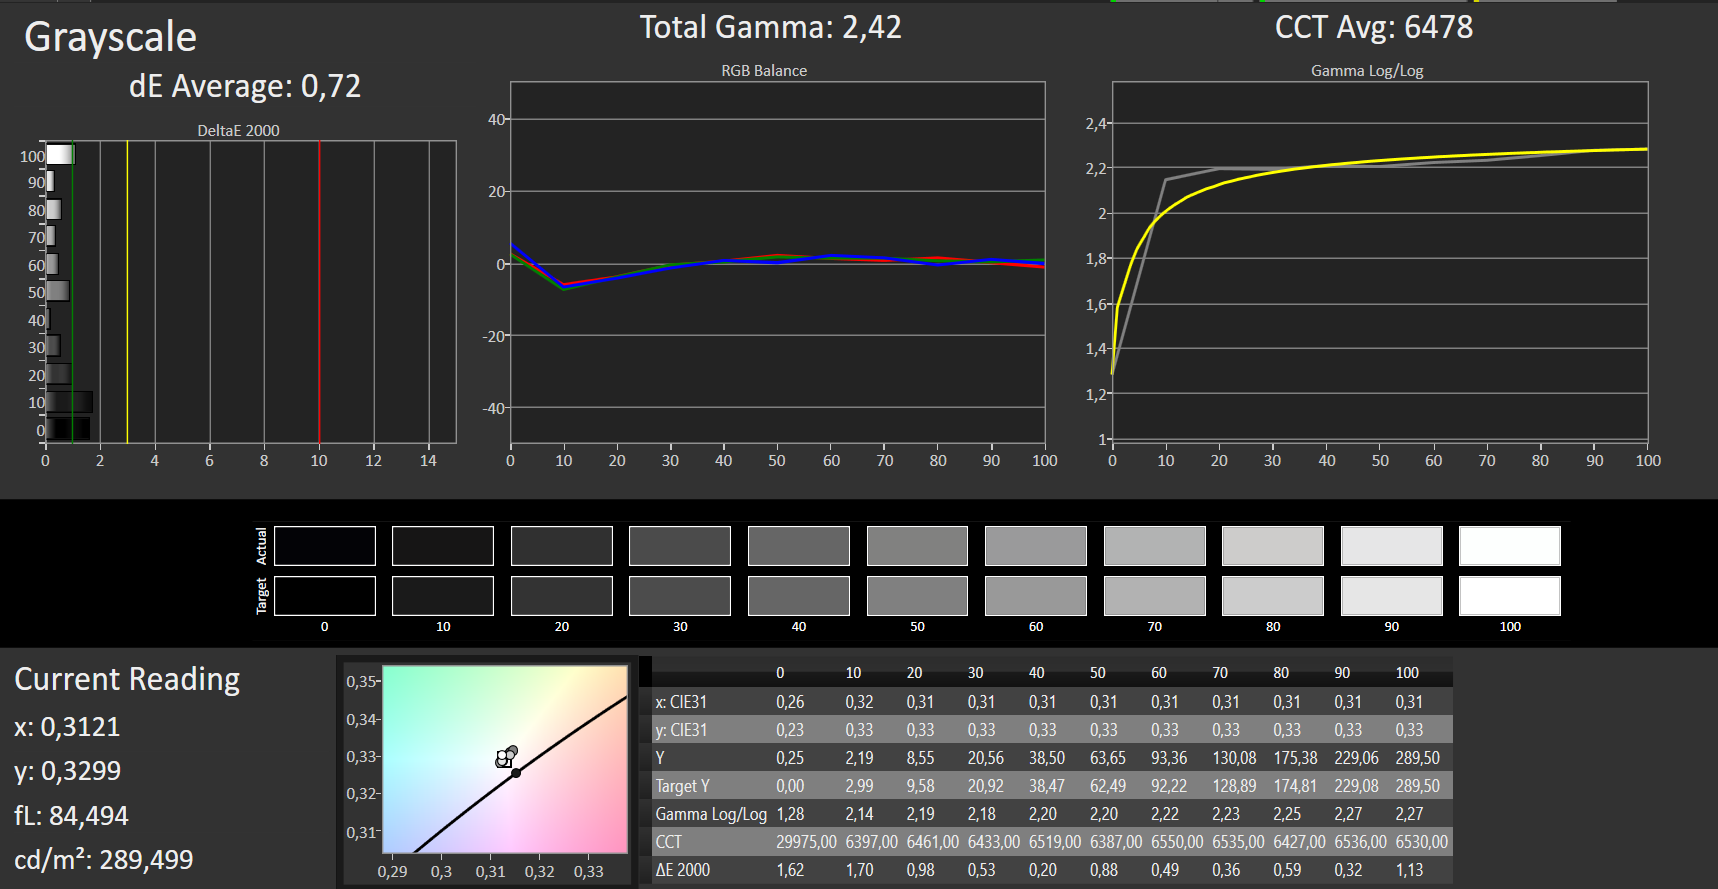
calibrated: 1.45
ΔE Greyscale Calman: 5.01 | ∀{0.09-98 Ø4.97}
93% sRGB (Argyll 1.6.3 3D)
60% AdobeRGB 1998 (Argyll 1.6.3 3D)
65.7% AdobeRGB 1998 (Argyll 3D)
93% sRGB (Argyll 3D)
64.1% Display P3 (Argyll 3D)
Gamma: 2.6
CCT: 7678 K
| Acer Predator Helios 300 PH315-52-79TY AUO, B156HAN08.2, IPS, 1920x1080, 15.6" | HP Gaming Pavilion 15-dk0009ng LG Philips LGD05FE, IPS, 1920x1080, 15.6" | Lenovo Legion Y540-15IRH-81SX00B2GE BOE 084D, IPS, 1920x1080, 15.6" | Dell G5 15 5590 AU Optronics B156HAN, IPS, 1920x1080, 15.6" | Lenovo Legion Y740-15ICHg BOE NV156FHM-N4J, IPS, 1920x1080, 15.6" | Acer Predator Helios 300 PH317-52-51M6 LG Philips LP173WF4-SPF5 (LGD056D), IPS, 1920x1080, 17.3" | |
|---|---|---|---|---|---|---|
| Display | 1% | -1% | -38% | 2% | -2% | |
| Display P3 Coverage (%) | 64.1 | 64.2 0% | 63.6 -1% | 39.26 -39% | 67.7 6% | 67.1 5% |
| sRGB Coverage (%) | 93 | 95.1 2% | 91.7 -1% | 59.1 -36% | 91.6 -2% | 86.1 -7% |
| AdobeRGB 1998 Coverage (%) | 65.7 | 65.8 0% | 65.2 -1% | 40.56 -38% | 67.1 2% | 63 -4% |
| Response Times | -13% | 4% | -217% | -19% | -142% | |
| Response Time Grey 50% / Grey 80% * (ms) | 15 ? | 16.4 ? -9% | 8.8 ? 41% | 45 ? -200% | 19 ? -27% | 36 ? -140% |
| Response Time Black / White * (ms) | 9 ? | 10.4 ? -16% | 12 ? -33% | 30 ? -233% | 10 ? -11% | 22 ? -144% |
| PWM Frequency (Hz) | 122000 ? | |||||
| Screen | 14% | -3% | -50% | 19% | -25% | |
| Brightness middle (cd/m²) | 325 | 345 6% | 299 -8% | 234 -28% | 477 47% | 365 12% |
| Brightness (cd/m²) | 310 | 324 5% | 290 -6% | 219 -29% | 431 39% | 341 10% |
| Brightness Distribution (%) | 82 | 86 5% | 89 9% | 82 0% | 84 2% | 89 9% |
| Black Level * (cd/m²) | 0.255 | 0.42 -65% | 0.29 -14% | 0.17 33% | 0.175 31% | 0.32 -25% |
| Contrast (:1) | 1275 | 821 -36% | 1031 -19% | 1376 8% | 2726 114% | 1141 -11% |
| Colorchecker dE 2000 * | 4.28 | 1.3 70% | 3.7 14% | 8.6 -101% | 4.17 3% | 6.51 -52% |
| Colorchecker dE 2000 max. * | 8.42 | 2.8 67% | 7 17% | 17.49 -108% | 6.97 17% | 12.32 -46% |
| Colorchecker dE 2000 calibrated * | 1.45 | 1.1 24% | 2 -38% | 4.06 -180% | 2.51 -73% | 2.9 -100% |
| Greyscale dE 2000 * | 5.01 | 1.2 76% | 4.1 18% | 8.55 -71% | 3.49 30% | 7.65 -53% |
| Gamma | 2.6 85% | 2.31 95% | 2.19 100% | 3.02 73% | 2.5 88% | 2.64 83% |
| CCT | 7678 85% | 6476 100% | 7166 91% | 7802 83% | 7076 92% | 8066 81% |
| Color Space (Percent of AdobeRGB 1998) (%) | 60 | 60.5 1% | 59.3 -1% | 37 -38% | 60 0% | 56 -7% |
| Color Space (Percent of sRGB) (%) | 93 | 94.9 2% | 91.5 -2% | 59 -37% | 91 -2% | 86 -8% |
| Total Average (Program / Settings) | 1% /
8% | 0% /
-2% | -102% /
-69% | 1% /
11% | -56% /
-35% |
* ... smaller is better
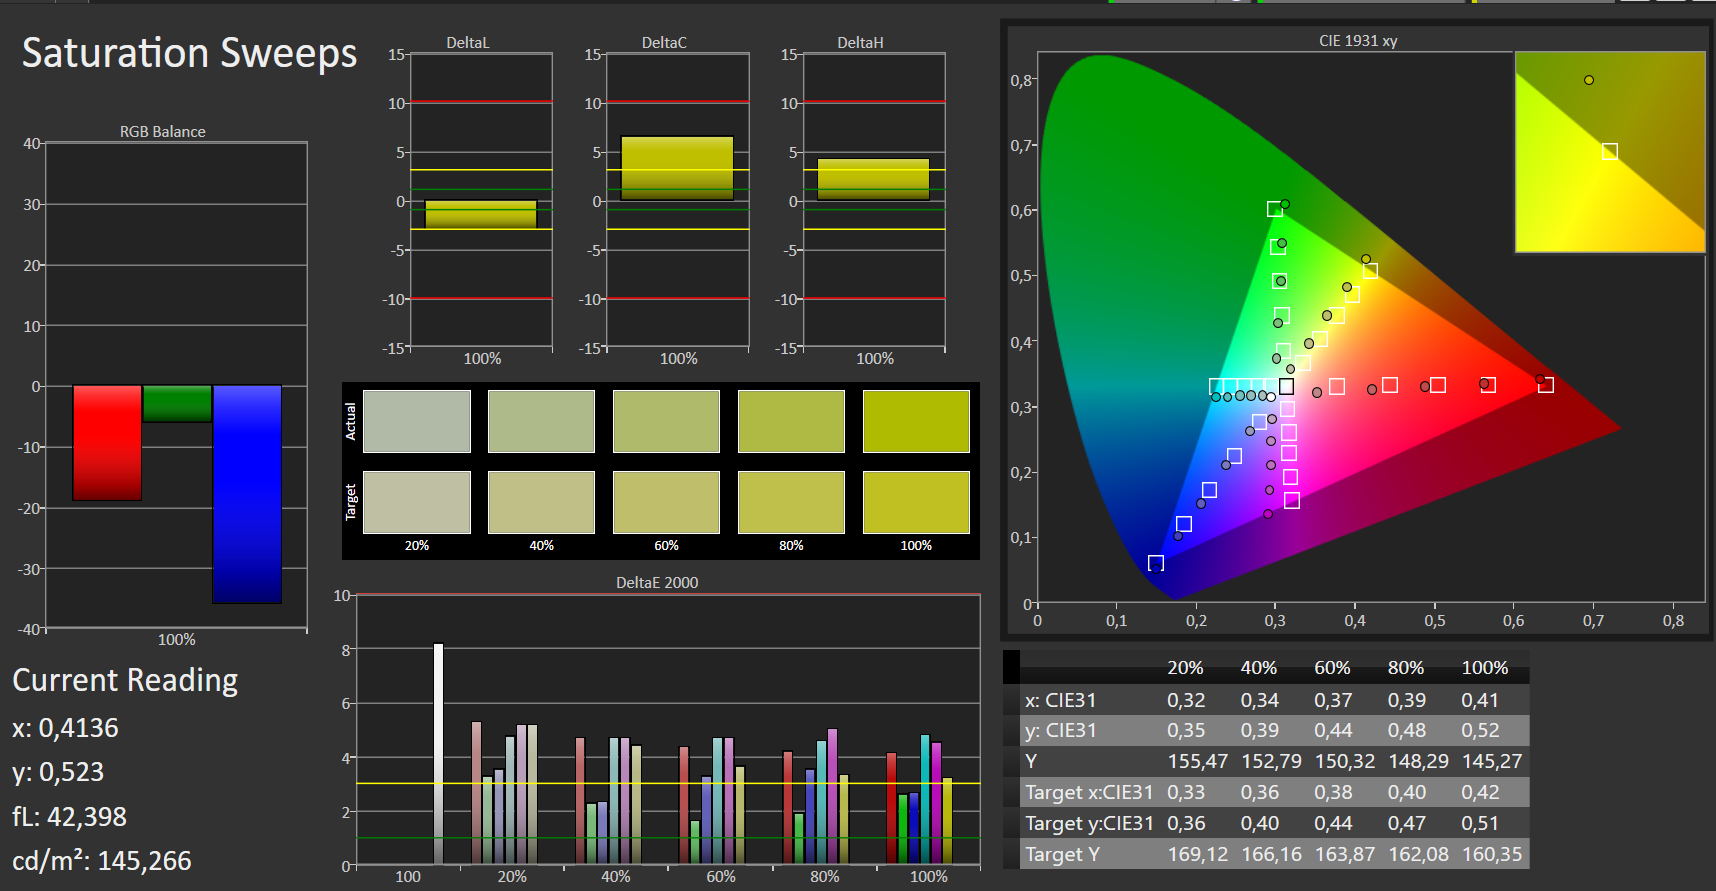
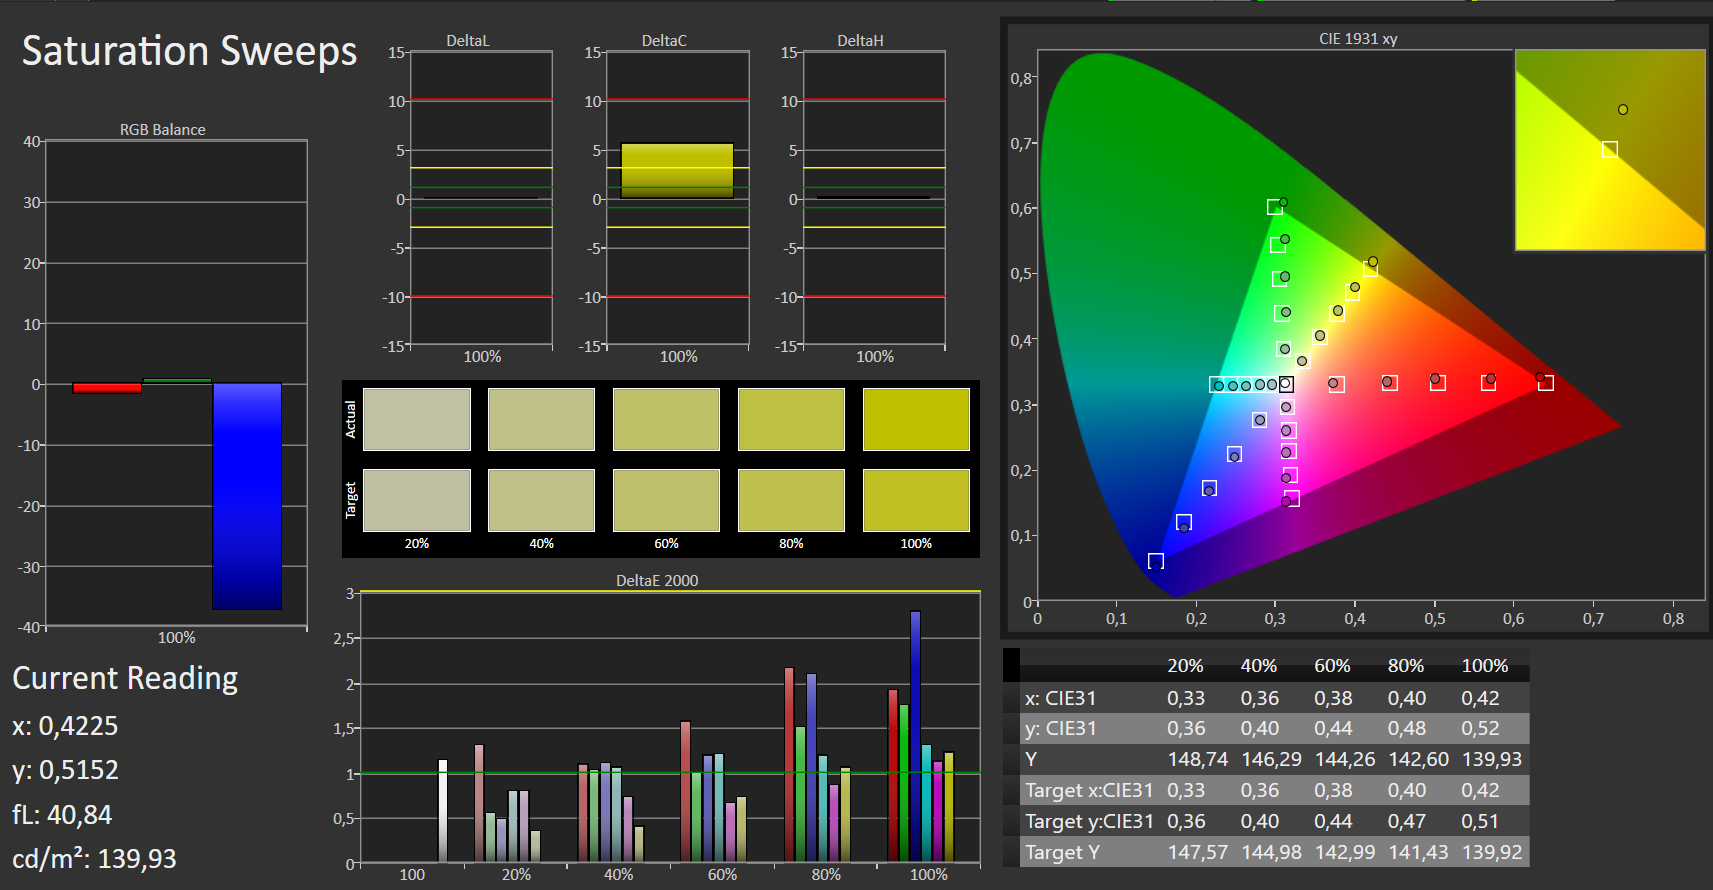
The Helios 300 is reasonably colour accurate despite this flaw, though. Acer did not factory calibrate the display in our review unit according to our tests, but its DeltaE deviations are still close to ideal values out of the box. Calibrating the display significantly improves colour accuracy and minimised the blue tint that affected our review unit, the ICC profile for which you can find in the box above our comparison table.
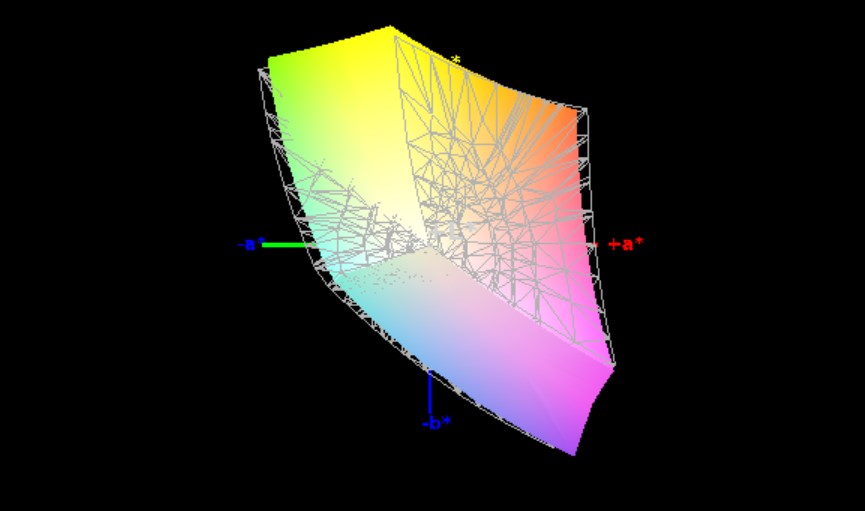
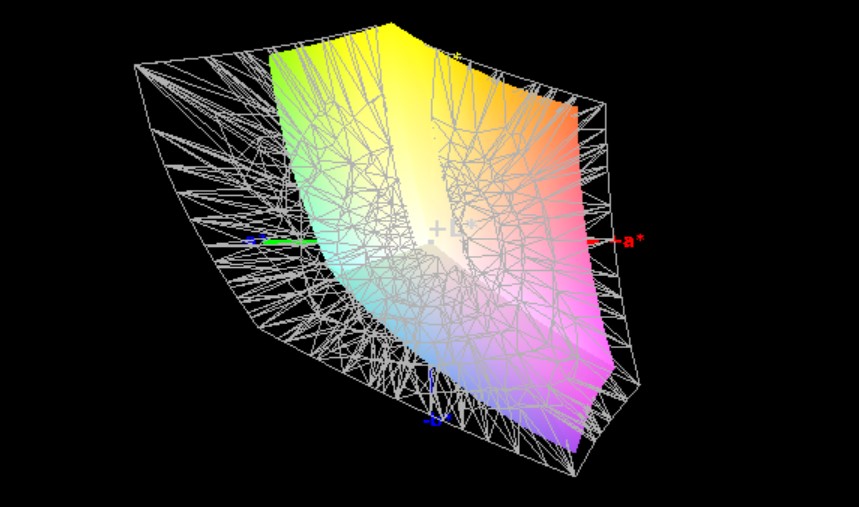
The display also covers 93% of the sRGB colour space and 60% of AdobeRGB. While neither is high enough for professional image and video-editing, they are both respectable coverages.
The matte display also gets bright enough to use the Helios 300 outdoors. We would still recommend using a shady spot where possible though as bright sunlight will make the display look washed-out.
Display Response Times
| ↔ Response Time Black to White | ||
|---|---|---|
| 9 ms ... rise ↗ and fall ↘ combined | ↗ 5 ms rise | 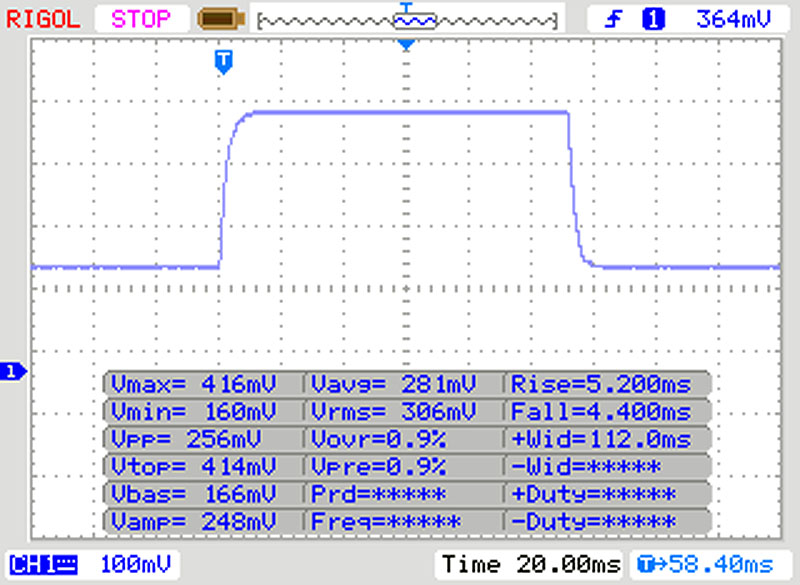 |
| ↘ 4 ms fall | ||
| The screen shows fast response rates in our tests and should be suited for gaming. In comparison, all tested devices range from 0.1 (minimum) to 240 (maximum) ms. » 25 % of all devices are better. This means that the measured response time is better than the average of all tested devices (19.8 ms). | ||
| ↔ Response Time 50% Grey to 80% Grey | ||
| 15 ms ... rise ↗ and fall ↘ combined | ↗ 8 ms rise | 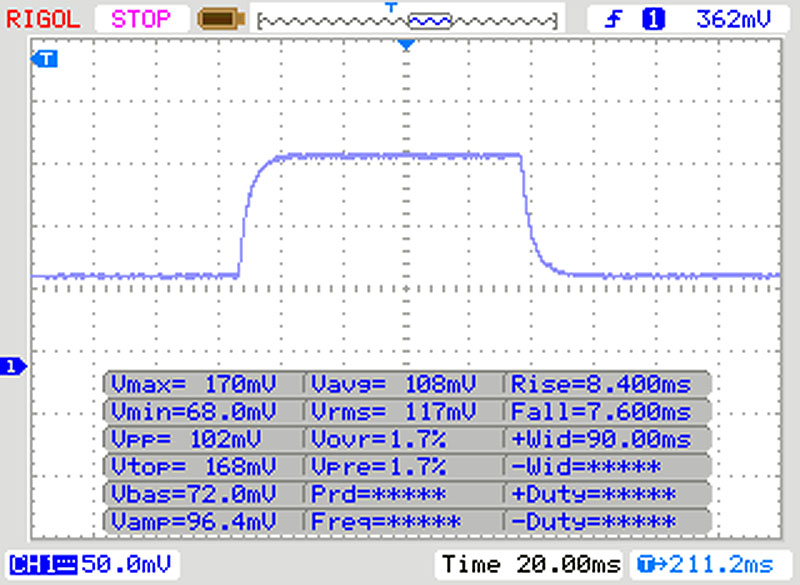 |
| ↘ 7 ms fall | ||
| The screen shows good response rates in our tests, but may be too slow for competitive gamers. In comparison, all tested devices range from 0.165 (minimum) to 636 (maximum) ms. » 29 % of all devices are better. This means that the measured response time is better than the average of all tested devices (31 ms). | ||
Screen Flickering / PWM (Pulse-Width Modulation)
| Screen flickering / PWM not detected | 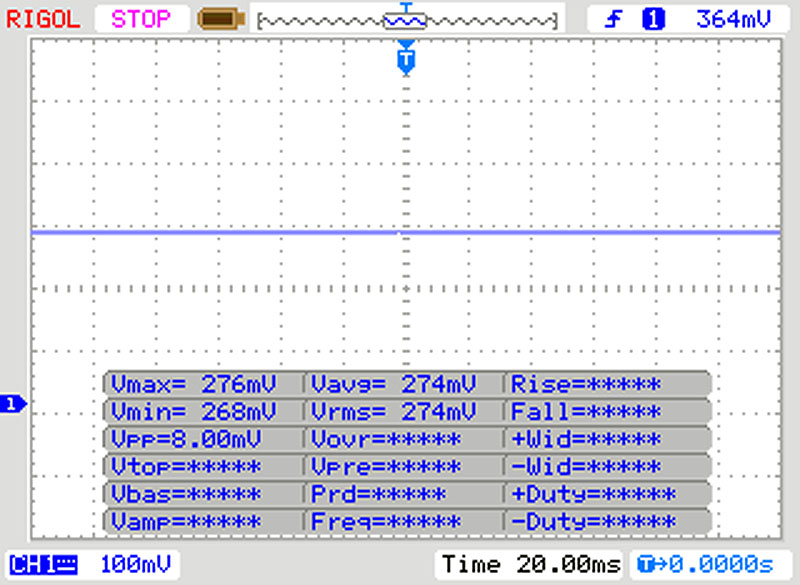 | ||
In comparison: 52 % of all tested devices do not use PWM to dim the display. If PWM was detected, an average of 7781 (minimum: 5 - maximum: 343500) Hz was measured. | |||
The display also has stable viewing angles, in part because it is an IPS panel. While some clouding is visible at certain angles, the display always remains readable.

Performance - Enough for all occasions
The Core i7-9750H is an excellent choice for gaming laptops, but it is the only CPU that Acer offers with this year's Helios 300. By contrast, you can choose between the NVIDIA GeForce GTX 1660 Ti and RTX 20 GPUs. While the former is powerful enough for 1080p gaming, RTX 20 GPUs support ray tracing and DLSS.
The hardware in our review unit proved powerful enough for all tasks during our tests. We encountered no driver instability or compatibility issues either.
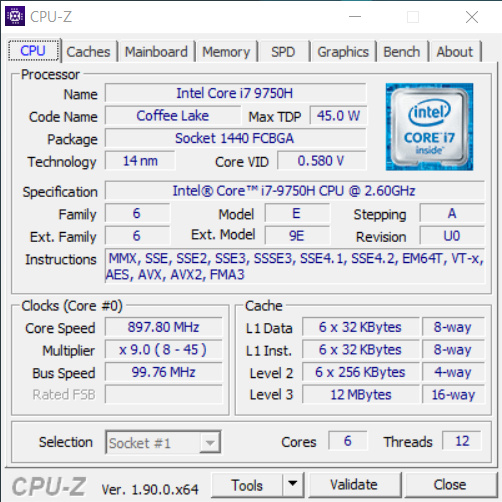
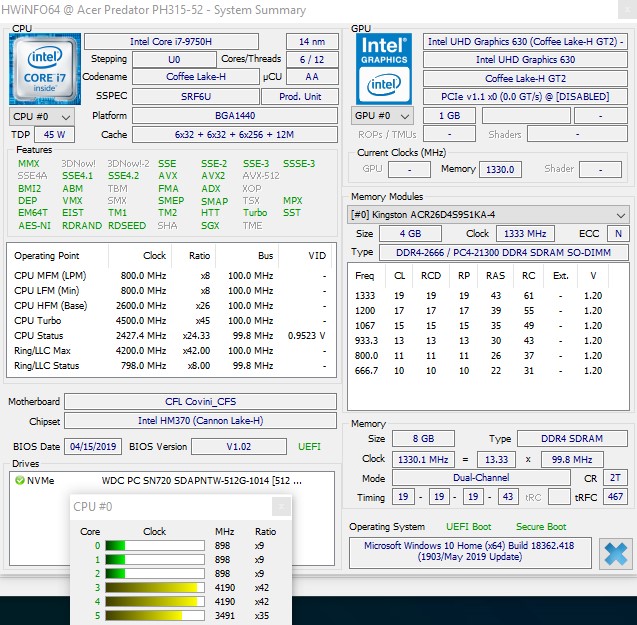
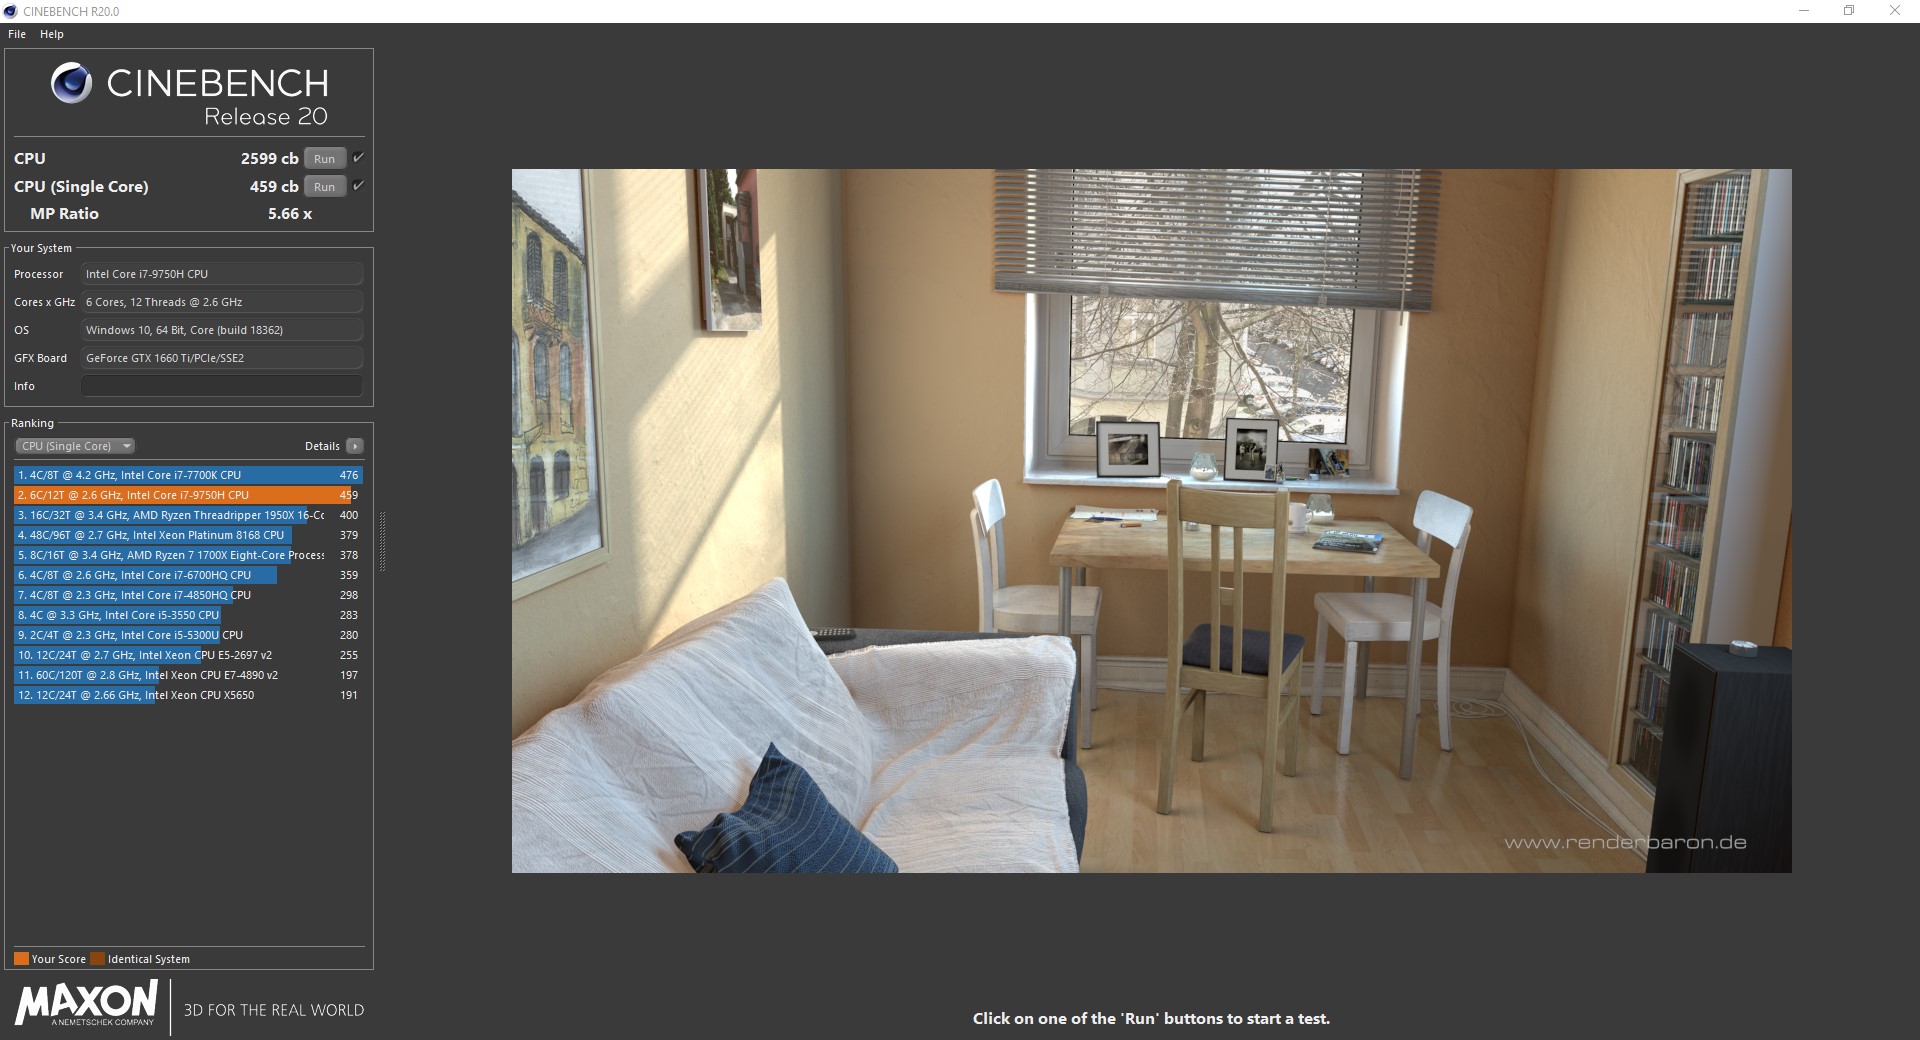
Processor
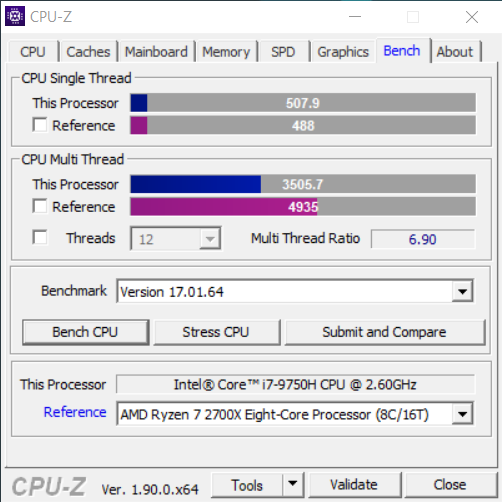
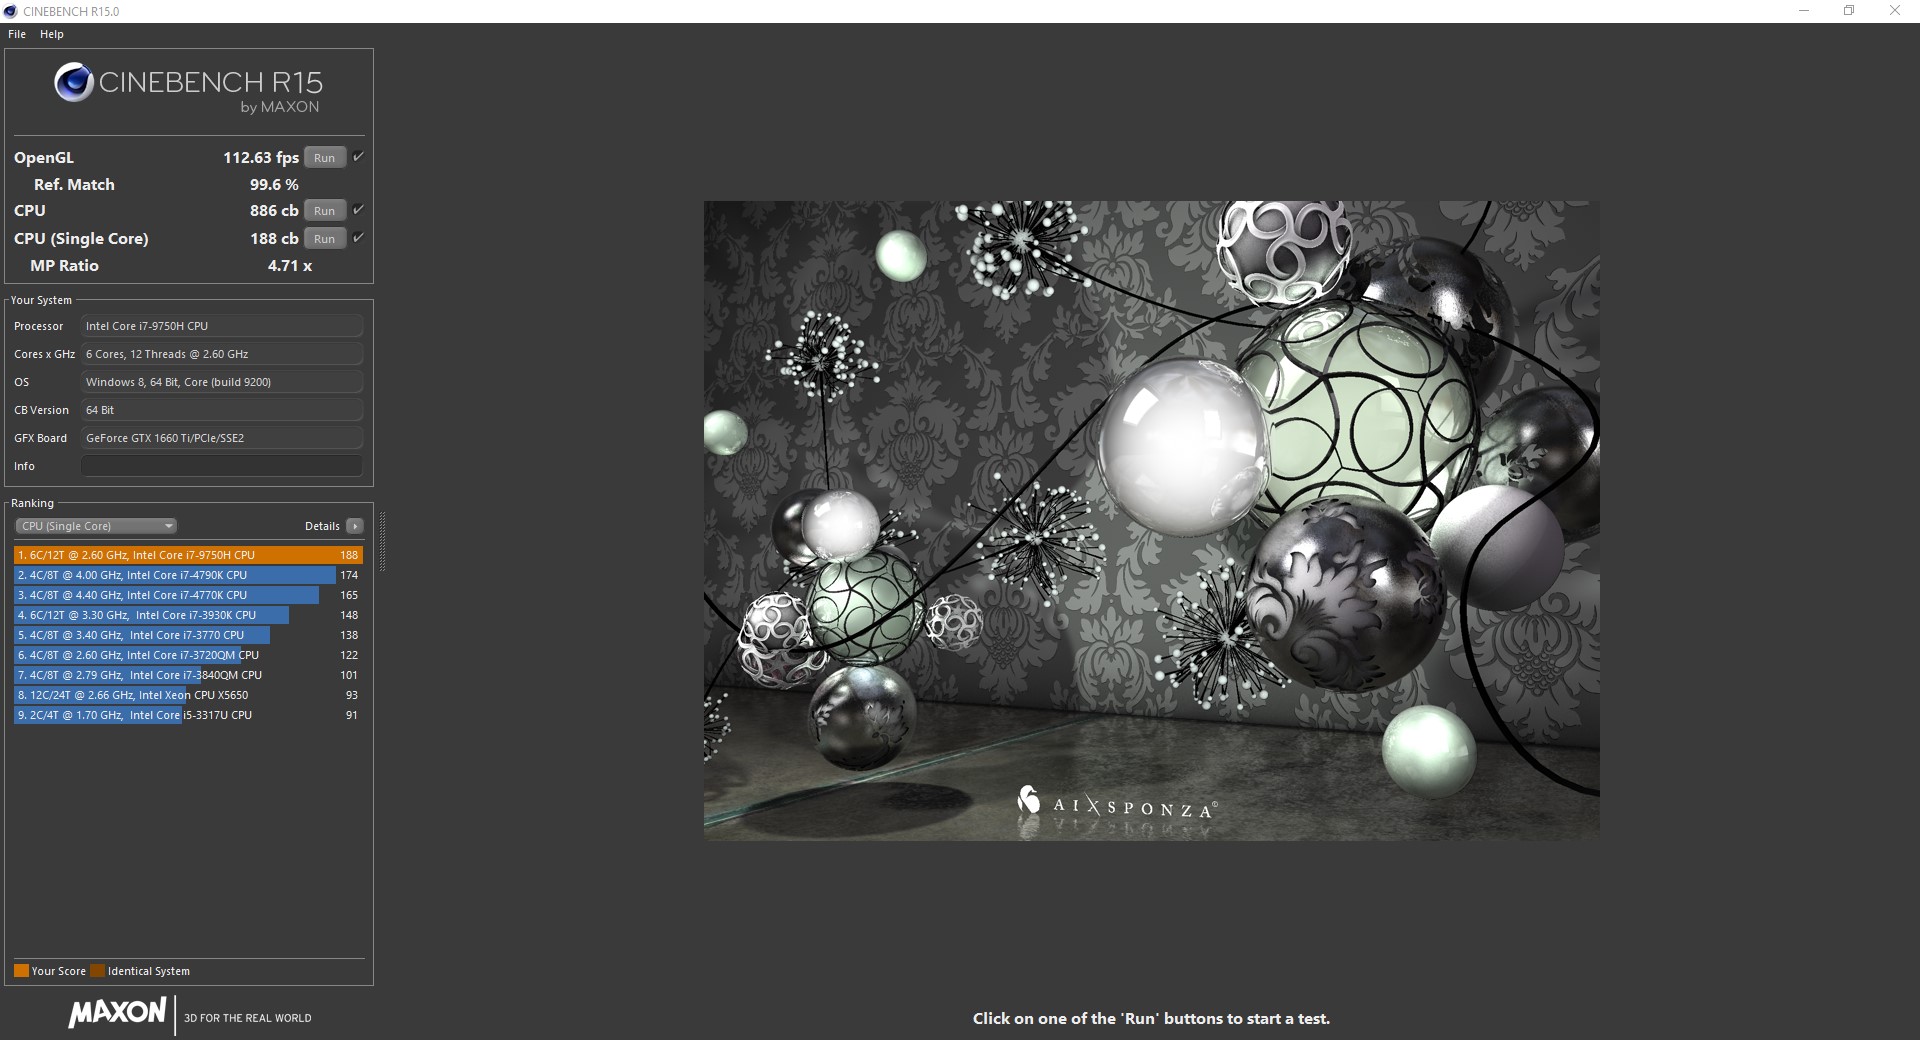
The Core i7-9750H has a 2.6 GHz base clock that it can achieve across all its six cores. The Coffee Lake series chip can also Turbo Boost up to 4.5 GHz on two cores or 4 GHz on six. The length of time that the CPU can maintain its Turbo Boost for depends on the effectiveness of the cooling system with which it is paired, though.
We subjected our review unit to a looped Cinebench R15 Multi 64Bit benchmark to discover how well the system fared under sustained load. While performance dropped slightly after the first run-through, this is no worse than the behaviour of our comparison devices. The Helios 300 averaged 1,113 points during this test, which puts it in the midfield of our comparison devices. The device throttles CPU performance by around 30% when running on battery power, though.
Please see our CPU comparison page for more information about the Core i7-9750H and how it fares against other processors.
| Blender - v2.79 BMW27 CPU | |
| Acer Predator Helios 300 PH315-52-79TY | |
| Average Intel Core i7-9750H (342 - 495, n=21) | |
| Lenovo Legion Y540-15IRH-81SX00B2GE | |
| Lenovo Legion Y740-15ICHg | |
* ... smaller is better

System Performance
The Helios 300 has solid system performance too. While we also encountered no performance issues during our tests, synthetic benchmarks did not reflect our impressions. In PCMark 10, for example, the Helios 300 finished towards the bottom of the pack, and it was up to 30% behind some of our comparison devices.
| PCMark 8 Home Score Accelerated v2 | 4688 points | |
| PCMark 8 Creative Score Accelerated v2 | 7682 points | |
| PCMark 8 Work Score Accelerated v2 | 5483 points | |
| PCMark 10 Score | 5279 points | |
Help | ||
Storage Devices
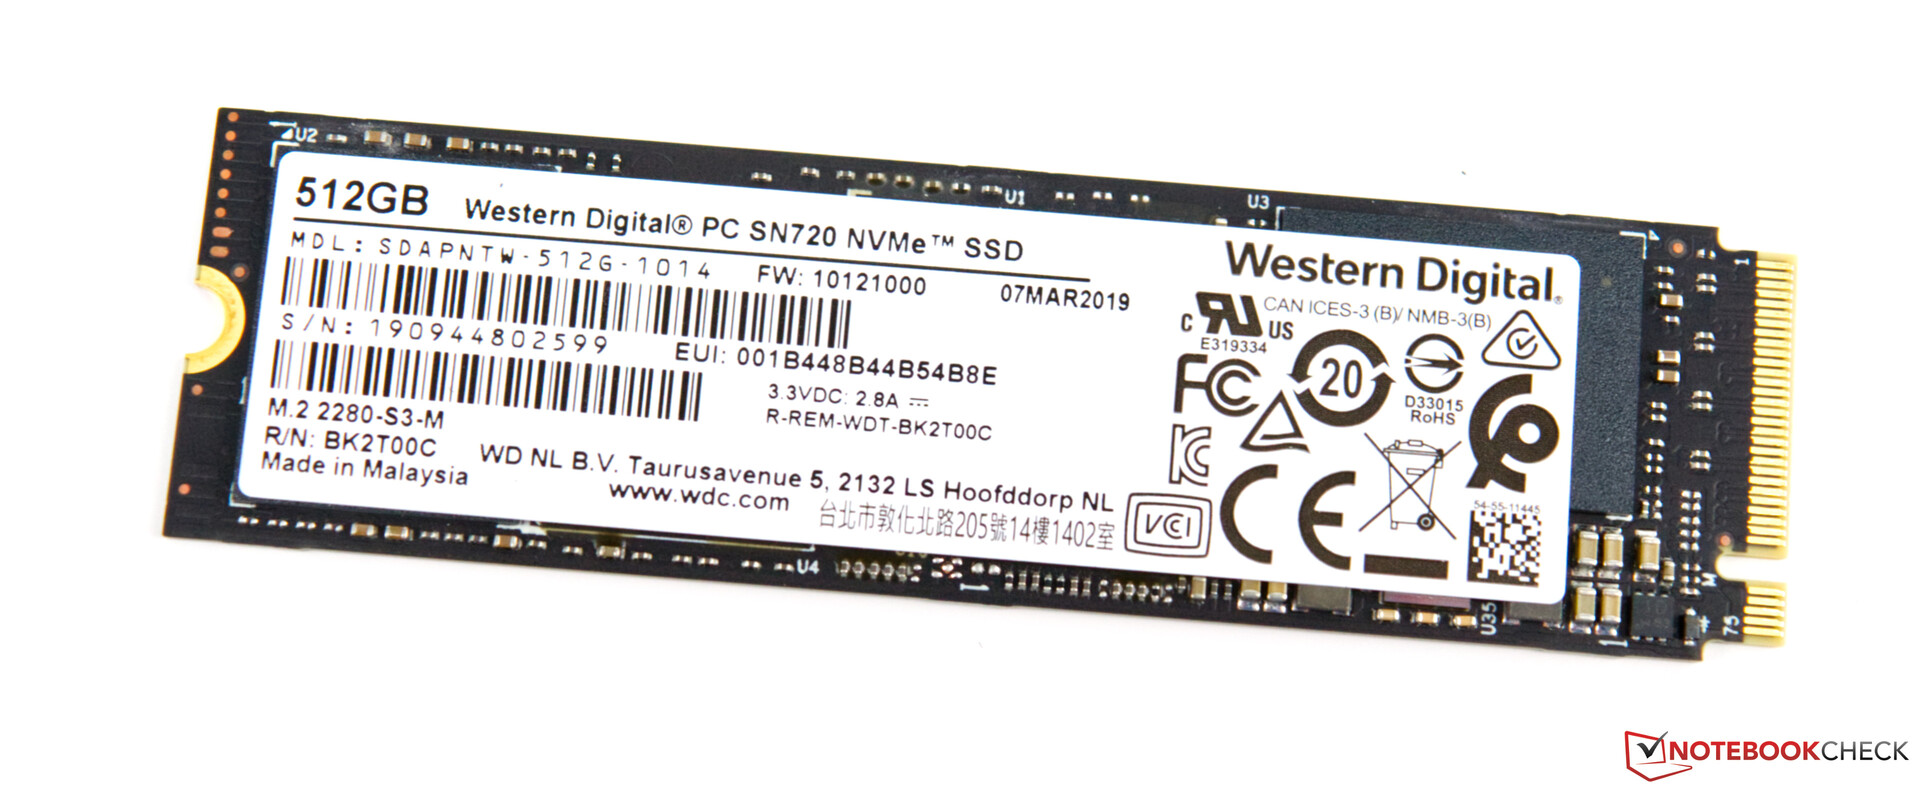
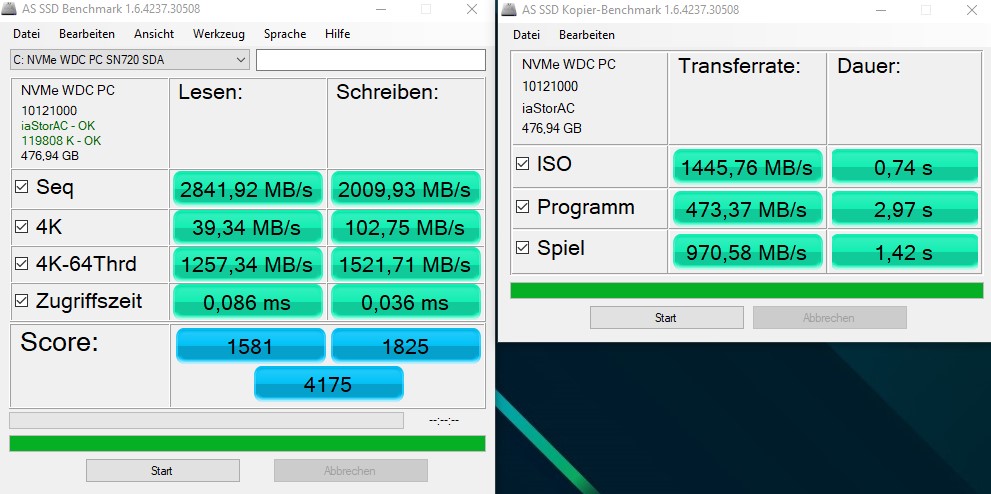
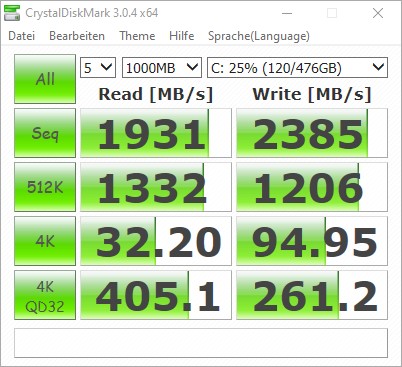
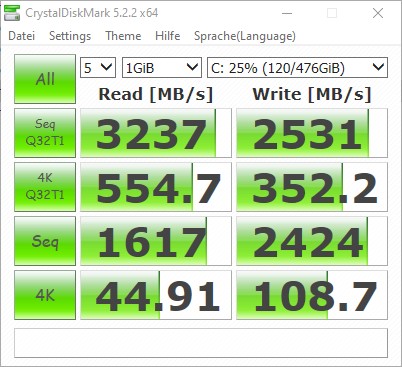
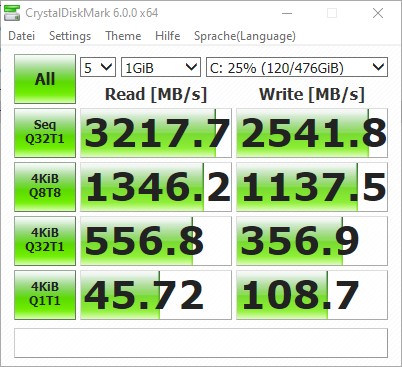
Acer has equipped our review unit with a 512 GB SSD, specifically the WDC PC SN720. The NVMe drive achieved excellent transfer speeds in AS SSD and CrystalDiskMark, blowing away all but the equally equipped Legion Y540 of our comparison devices. We particularly like that the drive offers 4K read speeds of over 40 MB/s.
The Helios 300 has two M.2 2280 slots and one 2.5-inch drive bay, which is handy. However, we would have preferred a larger drive, especially considering how much storage some games take up nowadays. You could configure or retrofit the device with a larger SSD if you plan to have several games installed simultaneously, though.
Please see our HDD/SSD comparison page for more information and benchmarks.
| Acer Predator Helios 300 PH315-52-79TY WDC PC SN720 SDAPNTW-512G | HP Gaming Pavilion 15-dk0009ng Samsung SSD PM981 MZVLB256HAHQ | Lenovo Legion Y540-15IRH-81SX00B2GE WDC PC SN720 SDAPNTW-512G | Dell G5 15 5590 KBG30ZMS128G | Lenovo Legion Y740-15ICHg WDC PC SN520 SDAPMUW-128G | Acer Predator Helios 300 PH317-52-51M6 Hynix HFS128G39TND | Average WDC PC SN720 SDAPNTW-512G | |
|---|---|---|---|---|---|---|---|
| CrystalDiskMark 5.2 / 6 | -23% | 0% | -65% | -45% | -70% | -14% | |
| Write 4K (MB/s) | 108.7 | 100 -8% | 158.8 46% | 64.3 -41% | 134.2 23% | 61.9 -43% | 110 ? 1% |
| Read 4K (MB/s) | 44.91 | 31.39 -30% | 29.11 -35% | 29.3 -35% | 37.72 -16% | 22.78 -49% | 36.9 ? -18% |
| Write Seq (MB/s) | 2424 | 1308 -46% | 1584 -35% | 131.1 -95% | 389.2 -84% | 136.1 -94% | 1976 ? -18% |
| Read Seq (MB/s) | 1617 | 1083 -33% | 1694 5% | 776 -52% | 1030 -36% | 490.1 -70% | 1710 ? 6% |
| Write 4K Q32T1 (MB/s) | 356.9 | 362.9 2% | 536 50% | 96.8 -73% | 238.9 -33% | 136.2 -62% | 339 ? -5% |
| Read 4K Q32T1 (MB/s) | 557 | 425.7 -24% | 363.9 -35% | 198.6 -64% | 343.9 -38% | 208.4 -63% | 417 ? -25% |
| Write Seq Q32T1 (MB/s) | 2542 | 1411 -44% | 2536 0% | 127.8 -95% | 789 -69% | 136 -95% | 2218 ? -13% |
| Read Seq Q32T1 (MB/s) | 3218 | 3240 1% | 3458 7% | 1044 -68% | 1502 -53% | 553 -83% | 2940 ? -9% |
| Write 4K Q8T8 (MB/s) | 1138 | 293.4 -74% | 721 ? -37% | ||||
| Read 4K Q8T8 (MB/s) | 1346 | 405.8 -70% | 993 ? -26% | ||||
| AS SSD | -33% | 10% | -227% | -46% | -128% | -9% | |
| Seq Read (MB/s) | 2841 | 2088 -27% | 2927 3% | 1036 -64% | 1372 -52% | 513 -82% | 2544 ? -10% |
| Seq Write (MB/s) | 2009 | 1347 -33% | 2149 7% | 115.1 -94% | 746 -63% | 128.2 -94% | 2034 ? 1% |
| 4K Read (MB/s) | 39.34 | 36.14 -8% | 42.43 8% | 29.6 -25% | 35.42 -10% | 26.5 -33% | 36.5 ? -7% |
| 4K Write (MB/s) | 102.8 | 96.5 -6% | 147.1 43% | 67.8 -34% | 99.9 -3% | 62.7 -39% | 110.8 ? 8% |
| 4K-64 Read (MB/s) | 1257 | 565 -55% | 1286 2% | 184.5 -85% | 302.1 -76% | 336.6 -73% | 1112 ? -12% |
| 4K-64 Write (MB/s) | 1522 | 588 -61% | 1432 -6% | 95.2 -94% | 191.4 -87% | 120.1 -92% | 1222 ? -20% |
| Access Time Read * (ms) | 0.086 | 0.093 -8% | 0.065 24% | 1.519 -1666% | 0.132 -53% | 0.0965 ? -12% | |
| Access Time Write * (ms) | 0.036 | 0.038 -6% | 0.026 28% | 0.255 -608% | 0.037 -3% | 0.259 -619% | 0.04212 ? -17% |
| Score Read (Points) | 1581 | 810 -49% | 1621 3% | 318 -80% | 475 -70% | 414 -74% | 1403 ? -11% |
| Score Write (Points) | 1825 | 819 -55% | 1794 -2% | 174 -90% | 366 -80% | 196 -89% | 1536 ? -16% |
| Score Total (Points) | 4175 | 2014 -52% | 4208 1% | 620 -85% | 1065 -74% | 811 -81% | 3633 ? -13% |
| Copy ISO MB/s (MB/s) | 1446 | 1043 -28% | 159.2 -89% | 1062 -27% | 1506 ? 4% | ||
| Copy Program MB/s (MB/s) | 473.4 | 371.7 -21% | 94.4 -80% | 426 -10% | 410 ? -13% | ||
| Copy Game MB/s (MB/s) | 971 | 399.9 -59% | 106.3 -89% | 650 -33% | 894 ? -8% | ||
| Total Average (Program / Settings) | -28% /
-30% | 5% /
6% | -146% /
-168% | -46% /
-45% | -99% /
-102% | -12% /
-11% |
* ... smaller is better

Graphics Card
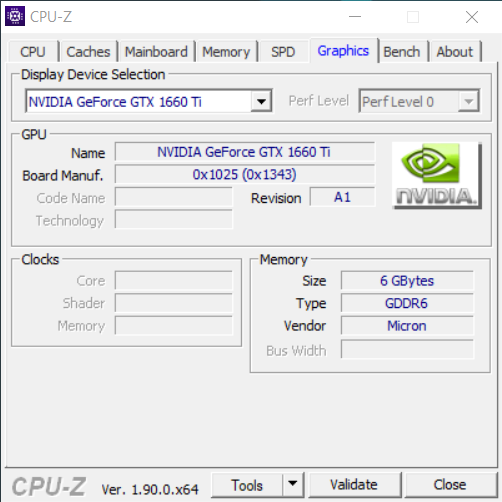
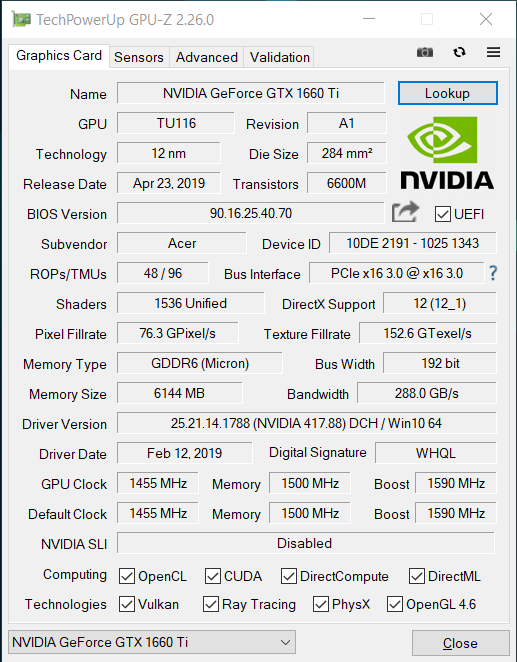
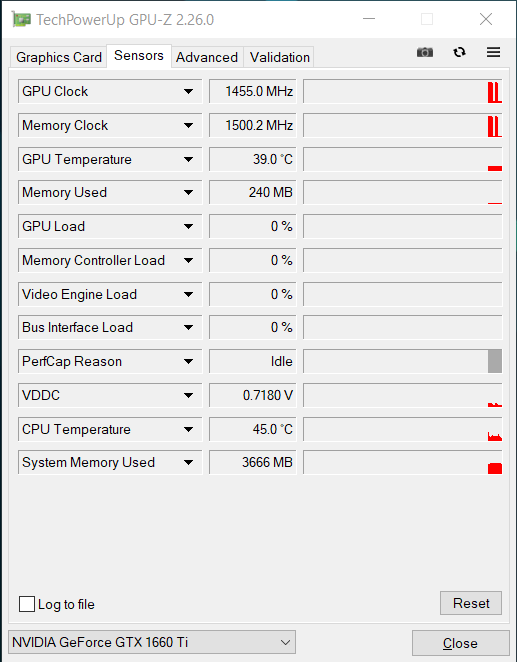
The graphics card is one of the most important components in a gaming laptop, and the new Helios 300 does not disappoint. Our review unit has a GeForce GTX 1660 Ti, a Turing architecture GPU that has 6 GB of VRAM. The card is powerful enough to play modern triple-A titles at 1080p, so you will need to step up to a GeForce RTX 2060 or GeForce RTX 2070 if you fancy gaming at 1440p or beyond on an external monitor.
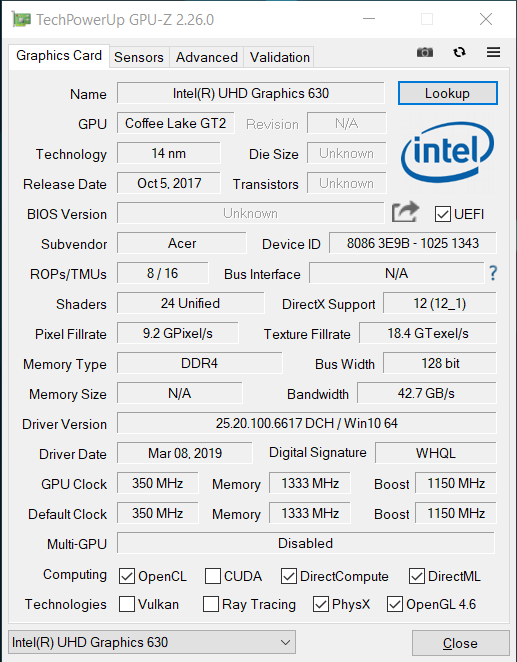
The Helios 300 also has an Intel UHD Graphics 630 onboard courtesy of its Core i7-9750H processor. This integrated GPU takes over from the GeForce GTX 1660 Ti during undemanding tasks, allowing the Helios 300 to consume less power and achieve better battery life.
Please see our GPU comparison page for more information about the GeForce GTX 1660 Ti and how it compares against other graphics cards.
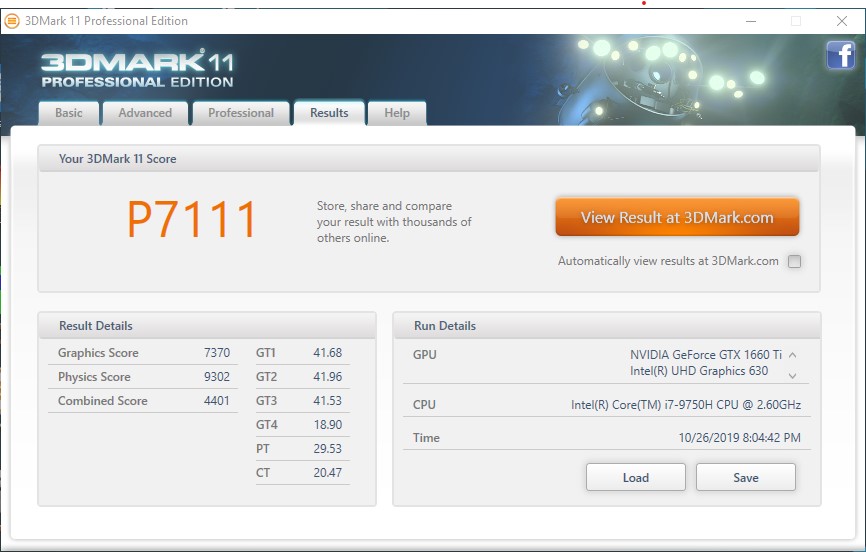
| 3DMark 11 Performance | 16344 points | |
| 3DMark Ice Storm Standard Score | 106089 points | |
| 3DMark Cloud Gate Standard Score | 35033 points | |
| 3DMark Fire Strike Score | 12903 points | |
| 3DMark Fire Strike Extreme Score | 6532 points | |
| 3DMark Time Spy Score | 5615 points | |
Help | ||
Gaming Performance
The Helios 300 performed well in all our gaming tests, although it cannot get quite as much performance from its GPU as the equally equipped HP Gaming Pavilion 15 can. The difference only equates to a few frames per second, though. Only our GeForce RTX 2060 and GeForce RTX 2070-powered comparison devices perform noticeably better than our review unit does.
Our review unit breezed through longer gaming sessions too. We verified this by letting The Witcher 3 run for an hour on the ultra preset at 1080p, during which the device achieved between 47 and 58 FPS. Hence, you should encounter no throttling when gaming for prolonged periods.
| The Witcher 3 | |
| 1024x768 Low Graphics & Postprocessing | |
| Average of class Gaming (389 - 686, n=3, last 2 years) | |
| Lenovo Legion Y740-15ICHg | |
| Average NVIDIA GeForce GTX 1660 Ti Mobile (177.3 - 298, n=14) | |
| HP Gaming Pavilion 15-dk0009ng | |
| Dell G5 15 5590 | |
| Acer Predator Helios 300 PH315-52-79TY | |
| 1366x768 Medium Graphics & Postprocessing | |
| Average of class Gaming (295 - 517, n=3, last 2 years) | |
| Lenovo Legion Y740-15ICHg | |
| Average NVIDIA GeForce GTX 1660 Ti Mobile (148 - 200, n=14) | |
| Dell G5 15 5590 | |
| HP Gaming Pavilion 15-dk0009ng | |
| Acer Predator Helios 300 PH315-52-79TY | |
| 1920x1080 High Graphics & Postprocessing (Nvidia HairWorks Off) | |
| Average of class Gaming (181 - 341, n=3, last 2 years) | |
| Lenovo Legion Y740-15ICHg | |
| Dell G5 15 5590 | |
| Average NVIDIA GeForce GTX 1660 Ti Mobile (93 - 120.4, n=17) | |
| HP Gaming Pavilion 15-dk0009ng | |
| Acer Predator Helios 300 PH315-52-79TY | |
| Acer Predator Helios 300 PH317-52-51M6 | |
| low | med. | high | ultra | |
|---|---|---|---|---|
| BioShock Infinite (2013) | 283 | 241 | 237 | 128 |
| The Witcher 3 (2015) | 204 | 151 | 93 | 54.6 |
| Dota 2 Reborn (2015) | 119.4 | 110.4 | 103.3 | 94.6 |
| Rise of the Tomb Raider (2016) | 118 | 116 | 86 | 74 |
| X-Plane 11.11 (2018) | 83 | 76 | 64 |
Emissions - Quiet, slightly too warm and underwhelming speakers
Fan Noise
Pretty much all gaming laptops have loud fans, and the new Helios 300 is no different. The two fans in our review unit reach a maximum of 31 dB(A) at idle but peak at 46.9 dB(A) under sustained load. You can typically expect fan noise to reach 41.5 dB(A) when gaming, though.
Noise level
| Idle |
| 31 / 31 / 31 dB(A) |
| Load |
| 41.5 / 46.9 dB(A) |
 | ||
30 dB silent 40 dB(A) audible 50 dB(A) loud |
||
min: | ||
| Acer Predator Helios 300 PH315-52-79TY GeForce GTX 1660 Ti Mobile, i7-9750H, WDC PC SN720 SDAPNTW-512G | HP Gaming Pavilion 15-dk0009ng GeForce GTX 1660 Ti Max-Q, i7-9750H, Samsung SSD PM981 MZVLB256HAHQ | Lenovo Legion Y540-15IRH-81SX00B2GE GeForce GTX 1660 Ti Mobile, i7-9750H, WDC PC SN720 SDAPNTW-512G | Dell G5 15 5590 GeForce RTX 2060 Mobile, i7-8750H, KBG30ZMS128G | Lenovo Legion Y740-15ICHg GeForce RTX 2070 Max-Q, i7-9750H, WDC PC SN520 SDAPMUW-128G | Acer Predator Helios 300 PH317-52-51M6 GeForce GTX 1050 Ti Mobile, i5-8300H, Hynix HFS128G39TND | |
|---|---|---|---|---|---|---|
| Noise | 12% | 6% | -2% | 1% | -1% | |
| off / environment * (dB) | 30.2 | 28.2 7% | 29.3 3% | 30.4 -1% | 30 1% | 29 4% |
| Idle Minimum * (dB) | 31 | 29.3 5% | 29.3 5% | 30.4 2% | 31.3 -1% | 29 6% |
| Idle Average * (dB) | 31 | 29.3 5% | 29.3 5% | 30.4 2% | 31.3 -1% | 31 -0% |
| Idle Maximum * (dB) | 31 | 29.3 5% | 29.3 5% | 33.4 -8% | 31.3 -1% | 33 -6% |
| Load Average * (dB) | 41.5 | 32.3 22% | 35.7 14% | 42 -1% | 42 -1% | 45 -8% |
| Witcher 3 ultra * (dB) | 46.7 | 34 27% | 44.2 5% | 42.1 10% | 45 4% | |
| Load Maximum * (dB) | 46.9 | 41.2 12% | 45.6 3% | 48.7 -4% | 46.5 1% | 51 -9% |
* ... smaller is better
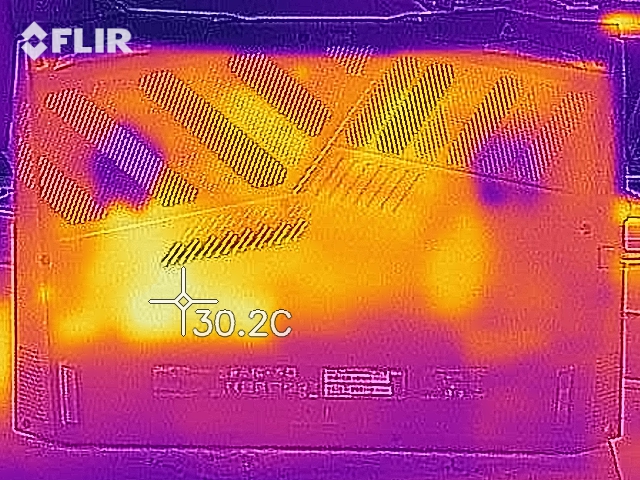
Temperature
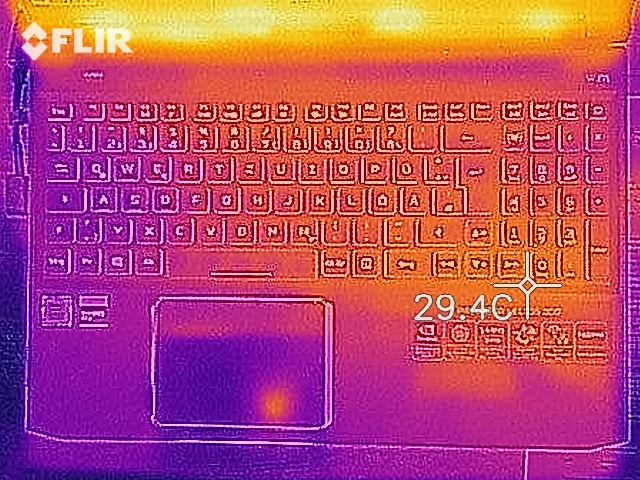
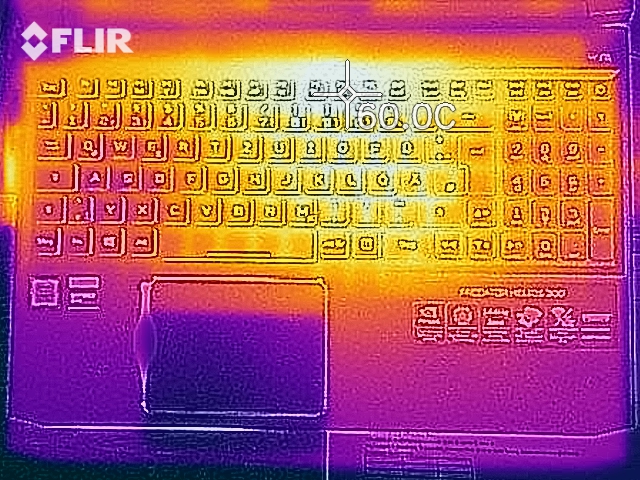
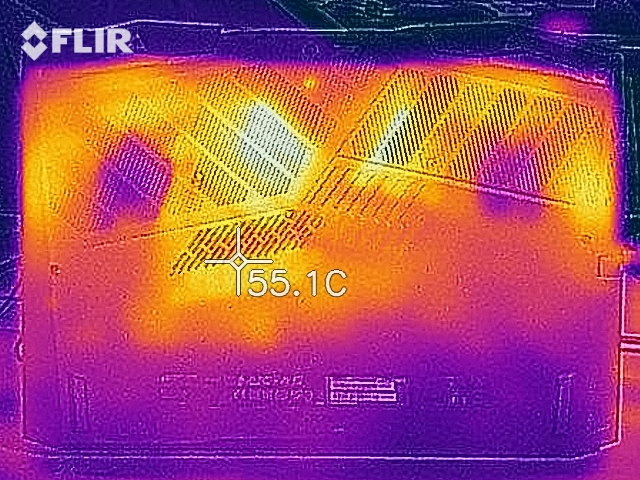
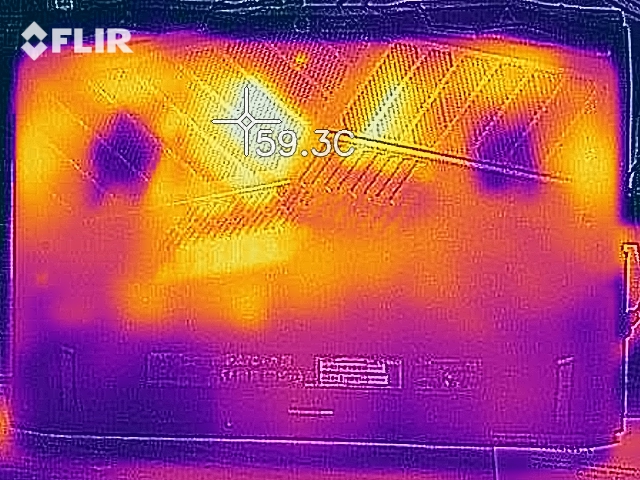
While the Helios 300 stays cool to the touch when idling, most areas get hot under sustained load. Even though the palm rest averages around 30 °C when gaming, the 52 °C hotspot that we measured during our stress tests means that the Helios 3 runs much hotter than our comparison devices.
Please keep in mind that it is possible to reduce surface and internal temperatures by manually setting the fans to run at 100% constantly. Doing so reduced peak surface temperatures to just 46 °C, although you must endure the fans at their noisiest.
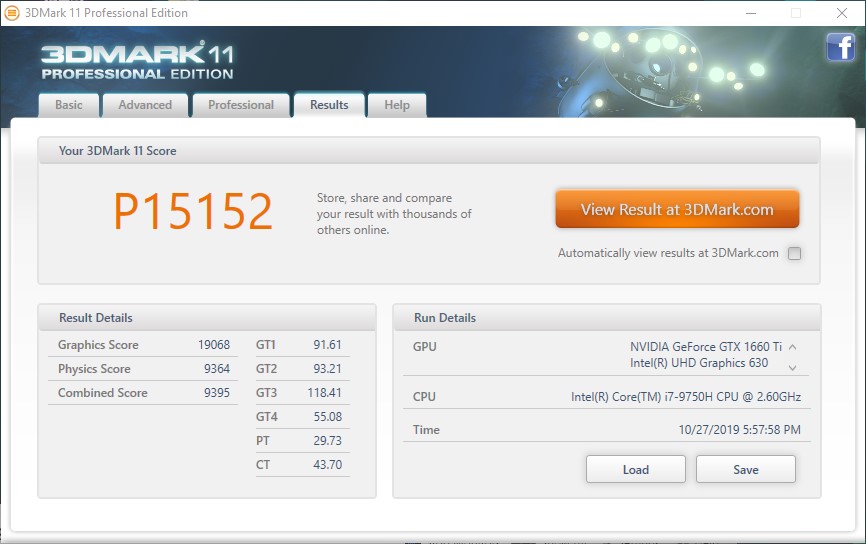
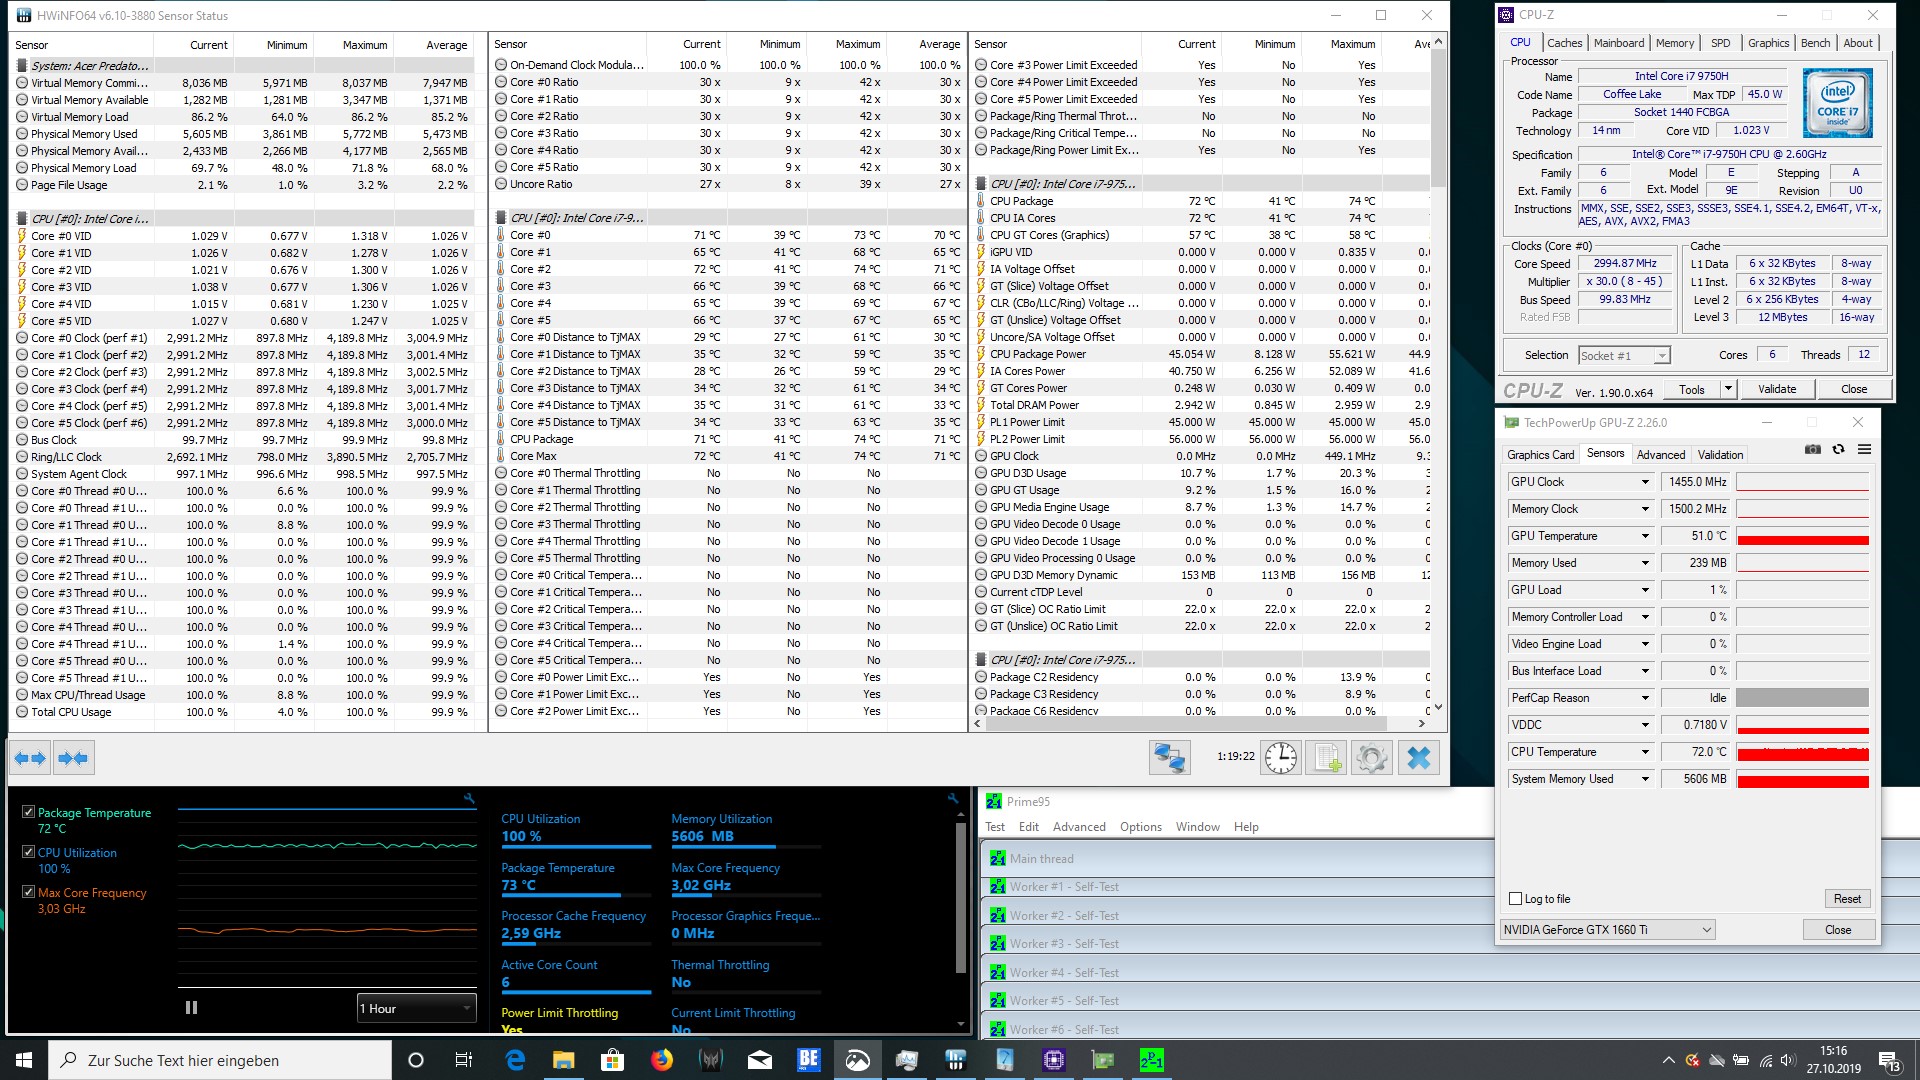
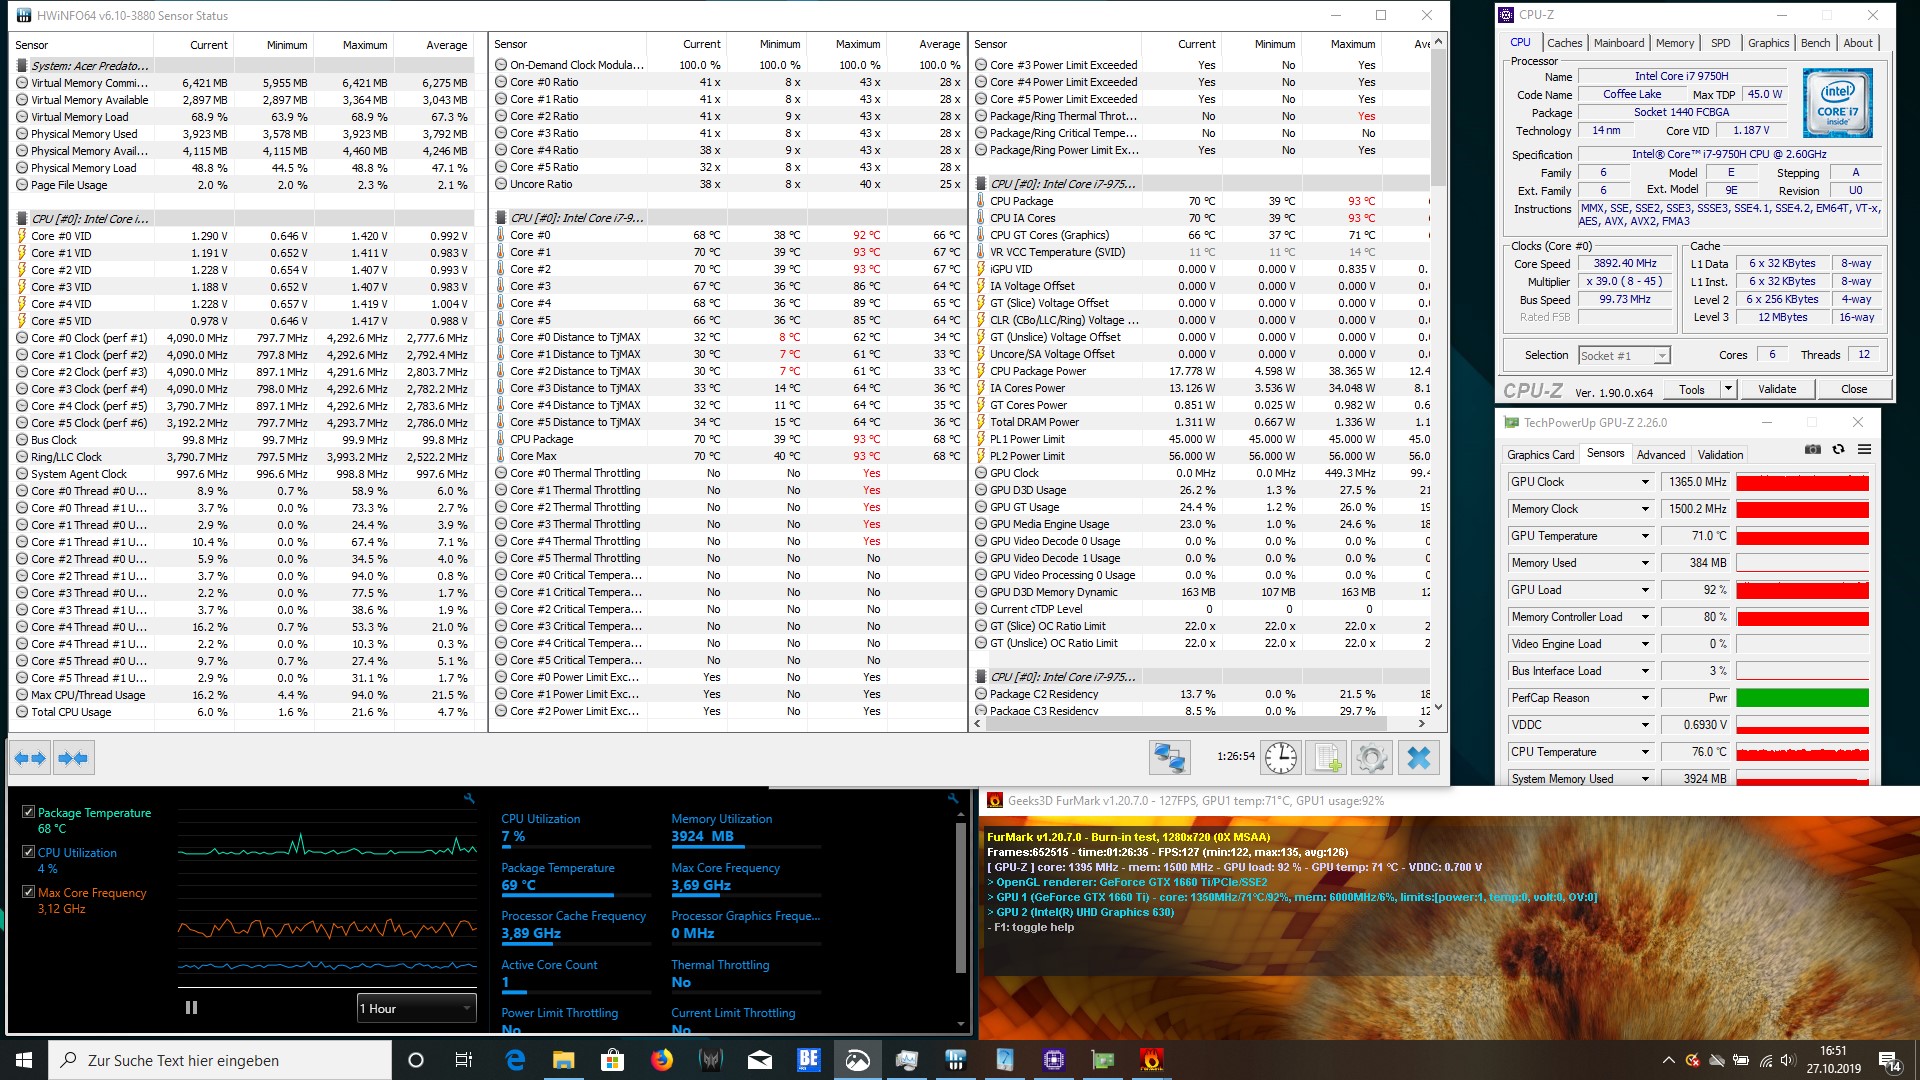
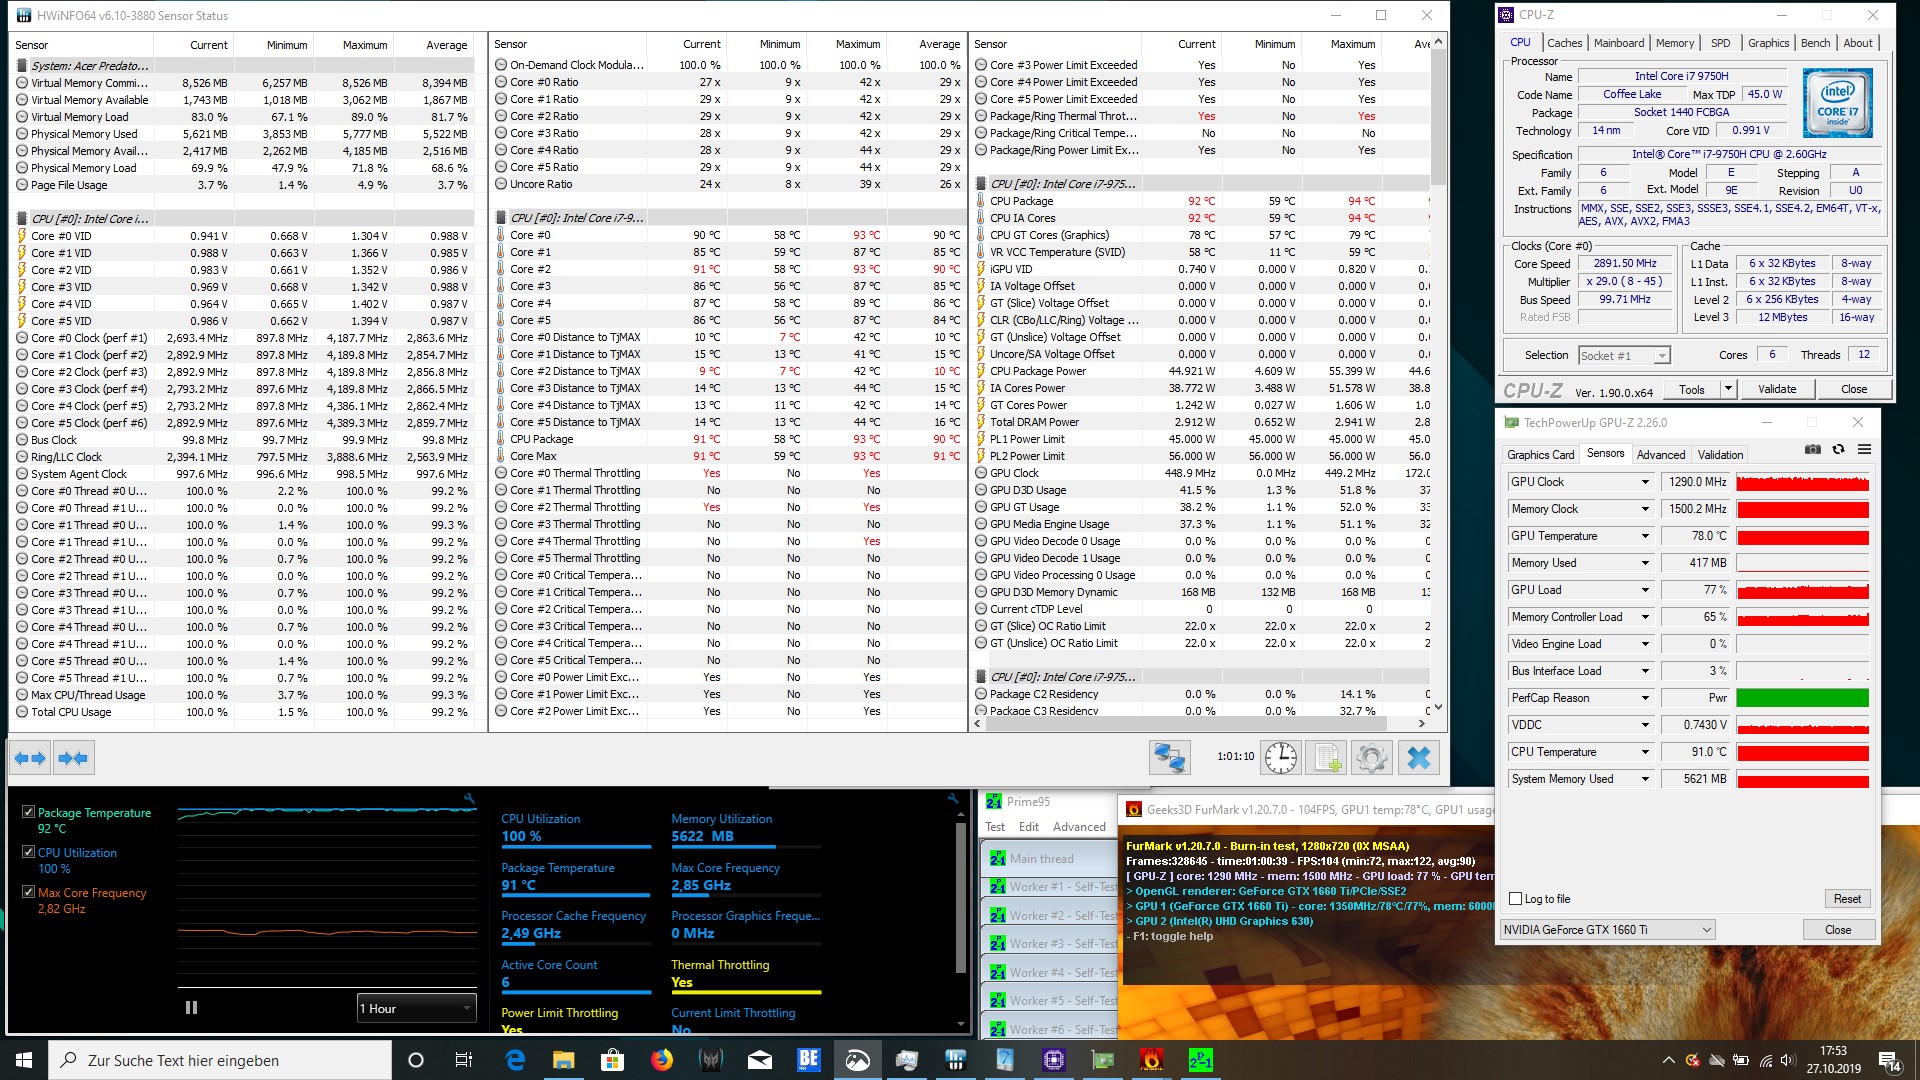
We also subjected our review unit to FurMark and Prime95 stress tests, during which CPU core temperatures reached 93 °C. The Helios 300 thermal throttled at this point, but we did not encounter this when we just ran Prime95.
The effects of our FurMark and Prime95 stress test did not last long, though. As the 3DMark 11 screenshot to the right demonstrates, the Helios 300 performed just as well as it did when we ran benchmarks from a cold start.
(-) The maximum temperature on the upper side is 52 °C / 126 F, compared to the average of 40.4 °C / 105 F, ranging from 21.2 to 68.8 °C for the class Gaming.
(-) The bottom heats up to a maximum of 46.3 °C / 115 F, compared to the average of 43.2 °C / 110 F
(+) In idle usage, the average temperature for the upper side is 24.1 °C / 75 F, compared to the device average of 33.9 °C / 93 F.
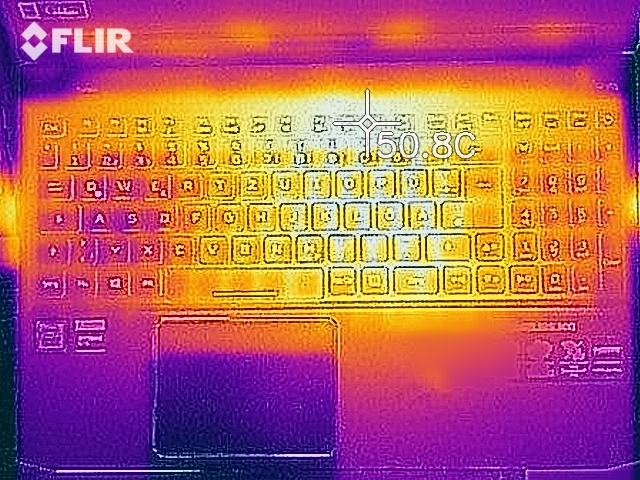
(±) Playing The Witcher 3, the average temperature for the upper side is 38 °C / 100 F, compared to the device average of 33.9 °C / 93 F.
(+) The palmrests and touchpad are reaching skin temperature as a maximum (33 °C / 91.4 F) and are therefore not hot.
(-) The average temperature of the palmrest area of similar devices was 28.8 °C / 83.8 F (-4.2 °C / -7.6 F).
| Acer Predator Helios 300 PH315-52-79TY GeForce GTX 1660 Ti Mobile, i7-9750H, WDC PC SN720 SDAPNTW-512G | HP Gaming Pavilion 15-dk0009ng GeForce GTX 1660 Ti Max-Q, i7-9750H, Samsung SSD PM981 MZVLB256HAHQ | Lenovo Legion Y540-15IRH-81SX00B2GE GeForce GTX 1660 Ti Mobile, i7-9750H, WDC PC SN720 SDAPNTW-512G | Dell G5 15 5590 GeForce RTX 2060 Mobile, i7-8750H, KBG30ZMS128G | Lenovo Legion Y740-15ICHg GeForce RTX 2070 Max-Q, i7-9750H, WDC PC SN520 SDAPMUW-128G | Acer Predator Helios 300 PH317-52-51M6 GeForce GTX 1050 Ti Mobile, i5-8300H, Hynix HFS128G39TND | |
|---|---|---|---|---|---|---|
| Heat | 1% | -23% | -5% | -26% | -15% | |
| Maximum Upper Side * (°C) | 52 | 46.7 10% | 42.7 18% | 51.5 1% | 43.9 16% | 50 4% |
| Maximum Bottom * (°C) | 46.3 | 53.7 -16% | 52.7 -14% | 48.3 -4% | 47.6 -3% | 52 -12% |
| Idle Upper Side * (°C) | 24.8 | 23.8 4% | 33.1 -33% | 27.2 -10% | 38.6 -56% | 33 -33% |
| Idle Bottom * (°C) | 25.4 | 23.7 7% | 41 -61% | 27.4 -8% | 40.8 -61% | 30 -18% |
* ... smaller is better
Speakers
Acer equips the Helios 300 with stereo speakers, although the absence of a subwoofer restricts our enjoyment somewhat. The speakers in our review unit are disappointingly quiet and struggle to reproduce any bass tones, although they have no problems with high and mid frequencies. The speakers fire downwards too, so audio will sound muffled if you place the Helios 300 on a soft surface, for example. There are a few predefined sound profiles in Predator Sense should you wish to tune how the speakers sound. While there is an audible difference between each profile, none can mitigate against the poor placement and underwhelming drivers that Acer has included in our review unit.
In short, we would recommend using external speakers or headphones when listening to music or gaming. These can be connected via the 3.5 mm jack, Bluetooth, or USB.
Acer Predator Helios 300 PH315-52-79TY audio analysis
(-) | not very loud speakers (69.2 dB)
Bass 100 - 315 Hz
(-) | nearly no bass - on average 22.4% lower than median
(±) | linearity of bass is average (12.4% delta to prev. frequency)
Mids 400 - 2000 Hz
(+) | balanced mids - only 3.8% away from median
(±) | linearity of mids is average (9.8% delta to prev. frequency)
Highs 2 - 16 kHz
(+) | balanced highs - only 2% away from median
(+) | highs are linear (6.9% delta to prev. frequency)
Overall 100 - 16.000 Hz
(±) | linearity of overall sound is average (21.4% difference to median)
Compared to same class
» 77% of all tested devices in this class were better, 5% similar, 18% worse
» The best had a delta of 6%, average was 18%, worst was 132%
Compared to all devices tested
» 60% of all tested devices were better, 7% similar, 33% worse
» The best had a delta of 4%, average was 24%, worst was 134%
Lenovo Legion Y540-15IRH-81SX00B2GE audio analysis
(±) | speaker loudness is average but good (77.4 dB)
Bass 100 - 315 Hz
(-) | nearly no bass - on average 17.7% lower than median
(±) | linearity of bass is average (11.6% delta to prev. frequency)
Mids 400 - 2000 Hz
(+) | balanced mids - only 3.7% away from median
(+) | mids are linear (4.5% delta to prev. frequency)
Highs 2 - 16 kHz
(+) | balanced highs - only 3.3% away from median
(+) | highs are linear (5.9% delta to prev. frequency)
Overall 100 - 16.000 Hz
(±) | linearity of overall sound is average (18.1% difference to median)
Compared to same class
» 57% of all tested devices in this class were better, 8% similar, 35% worse
» The best had a delta of 6%, average was 18%, worst was 132%
Compared to all devices tested
» 38% of all tested devices were better, 8% similar, 54% worse
» The best had a delta of 4%, average was 24%, worst was 134%
Power Management - High power consumption and a 58 Wh battery equals short battery life
Power Consumption
The Helios 300 falls short of our expectations here. Simply, our review unit consistently consumes more power than it should, especially when idling or under medium load. Its peak draw of 177 W makes it more economical than the competition in at least one aspect, though.
Acer pairs the Helios 300 with a 180 W power supply. While our review unit never exceeded this wattage during our tests, we noticed that the power supply could not always keep the device at 100% charge.
| Off / Standby | |
| Idle | |
| Load |
|
Key:
min: | |
| Acer Predator Helios 300 PH315-52-79TY i7-9750H, GeForce GTX 1660 Ti Mobile, WDC PC SN720 SDAPNTW-512G, IPS, 1920x1080, 15.6" | HP Gaming Pavilion 15-dk0009ng i7-9750H, GeForce GTX 1660 Ti Max-Q, Samsung SSD PM981 MZVLB256HAHQ, IPS, 1920x1080, 15.6" | Lenovo Legion Y540-15IRH-81SX00B2GE i7-9750H, GeForce GTX 1660 Ti Mobile, WDC PC SN720 SDAPNTW-512G, IPS, 1920x1080, 15.6" | Dell G5 15 5590 i7-8750H, GeForce RTX 2060 Mobile, KBG30ZMS128G, IPS, 1920x1080, 15.6" | Lenovo Legion Y740-15ICHg i7-9750H, GeForce RTX 2070 Max-Q, WDC PC SN520 SDAPMUW-128G, IPS, 1920x1080, 15.6" | Acer Predator Helios 300 PH317-52-51M6 i5-8300H, GeForce GTX 1050 Ti Mobile, Hynix HFS128G39TND, IPS, 1920x1080, 17.3" | Average NVIDIA GeForce GTX 1660 Ti Mobile | Average of class Gaming | |
|---|---|---|---|---|---|---|---|---|
| Power Consumption | 31% | 9% | 34% | -16% | 38% | 7% | -4% | |
| Idle Minimum * (Watt) | 17.2 | 6.8 60% | 14.5 16% | 3.5 80% | 22.2 -29% | 6 65% | 12.4 ? 28% | 13.1 ? 24% |
| Idle Average * (Watt) | 22.6 | 10.7 53% | 18.5 18% | 6.9 69% | 24.9 -10% | 9 60% | 18 ? 20% | 18.7 ? 17% |
| Idle Maximum * (Watt) | 25.5 | 12.5 51% | 20 22% | 8.5 67% | 30.6 -20% | 13 49% | 25.3 ? 1% | 24.4 ? 4% |
| Load Average * (Watt) | 88 | 87.2 1% | 81.6 7% | 127 -44% | 101 -15% | 95 -8% | 93.5 ? -6% | 108.1 ? -23% |
| Load Maximum * (Watt) | 177 | 191.4 -8% | 208.1 -18% | 179 -1% | 186 -5% | 134 24% | 191.9 ? -8% | 254 ? -44% |
| Witcher 3 ultra * (Watt) | 121 | 132 | 143 | 102 |
* ... smaller is better
Battery Life
Acer equips the Helios 300 with a 58 Wh battery, which achieved comparatively poor runtimes during our tests. Our review unit drains its battery in under five hours when idling, while it needed recharging after only 3.5 hours on Wi-Fi. We ran the latter test with the display set to around 150 cd/m² too, which is a level that should represent general conditions in our opinion.
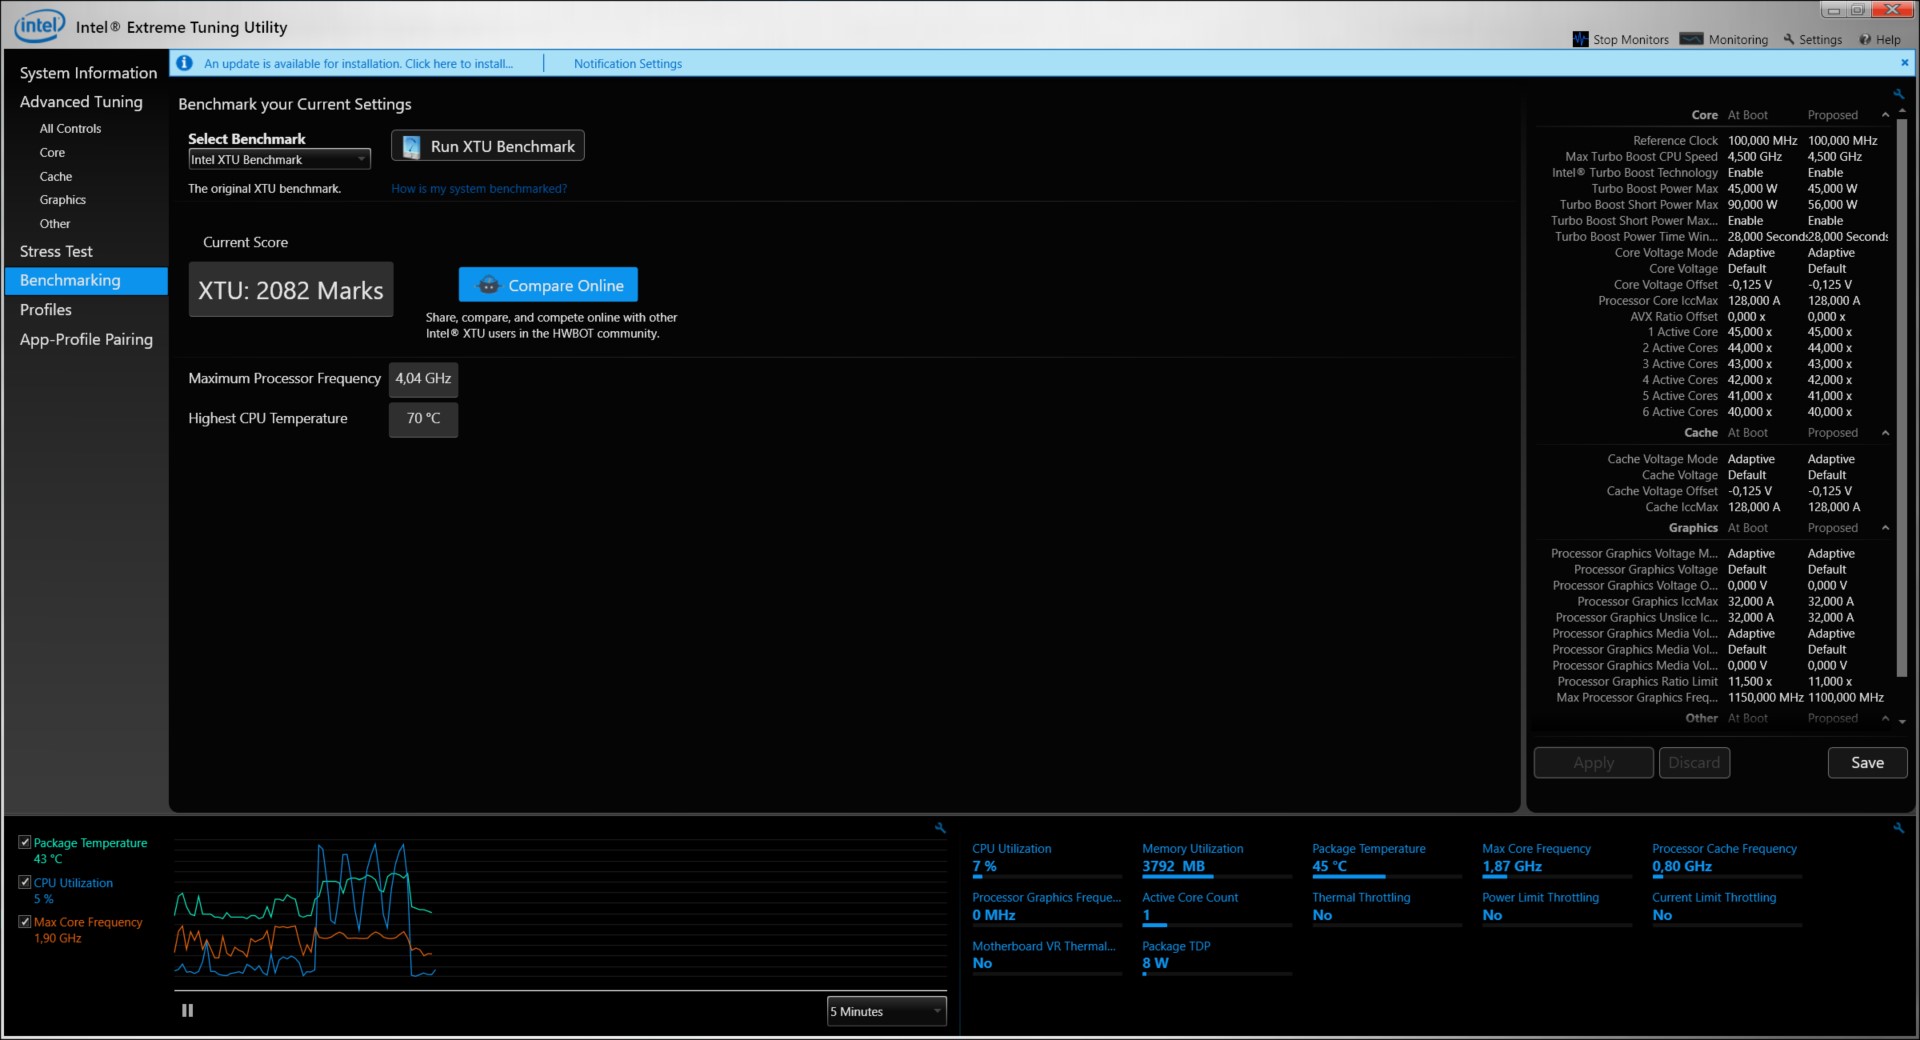
Worse still, the Helios 300 throttles its CPU and GPU performance when running on battery power. Benchmark results to the right demonstrate how drastically our review unit restricts performance on battery, which is doubly disappointing considering how poor its battery life is. Incidentally, the Helios 300 takes just over 90 minutes to recharge fully with the included power supply.


| Acer Predator Helios 300 PH315-52-79TY i7-9750H, GeForce GTX 1660 Ti Mobile, 58.75 Wh | HP Gaming Pavilion 15-dk0009ng i7-9750H, GeForce GTX 1660 Ti Max-Q, 52.5 Wh | Lenovo Legion Y540-15IRH-81SX00B2GE i7-9750H, GeForce GTX 1660 Ti Mobile, 57 Wh | Dell G5 15 5590 i7-8750H, GeForce RTX 2060 Mobile, 60 Wh | Lenovo Legion Y740-15ICHg i7-9750H, GeForce RTX 2070 Max-Q, 57 Wh | Acer Predator Helios 300 PH317-52-51M6 i5-8300H, GeForce GTX 1050 Ti Mobile, 48 Wh | Average of class Gaming | |
|---|---|---|---|---|---|---|---|
| Battery runtime | 44% | -14% | 149% | -14% | 82% | 85% | |
| Reader / Idle (h) | 5 | 8.7 74% | 4 -20% | 14.8 196% | 11.8 136% | 8.71 ? 74% | |
| H.264 (h) | 3.4 | 5.3 56% | 8.4 147% | 8.26 ? 143% | |||
| WiFi v1.3 (h) | 3.5 | 4.8 37% | 2.4 -31% | 7.7 120% | 3 -14% | 5.9 69% | 7.04 ? 101% |
| Load (h) | 1.2 | 1.3 8% | 1.3 8% | 2.8 133% | 1.7 42% | 1.47 ? 23% | |
| Witcher 3 ultra (h) | 1 |
Pros
Cons
Verdict - A powerful 1080p gaming laptop with flaws
The Acer Predator Helios 300 PH315 is a modern gaming laptop with acceptable gaming performance. The entry-level model is not competitively priced at around 1,400 Euros (~$1,550), though. Nevertheless, the overhauled 15-inch laptop is well designed and features hardware that can handle all current triple-A games natively at 1080p.
While we always like seeing OEMs include 144 Hz panels on their gaming laptops, high refresh-rate displays have now become the norm. However, the one in our review unit left us with a bit of a sour aftertaste. On the one hand, it is bright and colour accurate, both laudable qualities. On the other, it suffers from obnoxious backlight bleeding, something that we would not have expected on such an expensive laptop. Separately, including 512 GB of storage on a gaming laptop feels rather stingy, so we would recommend choosing the 1 TB option if possible. Otherwise, you may find yourself quickly needing to add a second drive, especially with some games now requiring over 100 GB of space.
The Acer Predator Helios 300 PH315 is a solid entry-level gaming laptop in a new guise. Some shortcomings remain, though.
Retrofitting additional drives is relatively simple to do, with the drive bays hiding behind a bottom plate that is easy to remove. While we have hardly any criticisms about build quality, the Helios 300 PH315 consumes more power than it should in our opinion. Overall, while the device has some downsides, like short battery life and sub-par speakers, it is ultimately a decent gaming laptop.
Acer Predator Helios 300 PH315-52-79TY
- 05/15/2020 v7 (old)
Sebastian Bade
Price comparison

