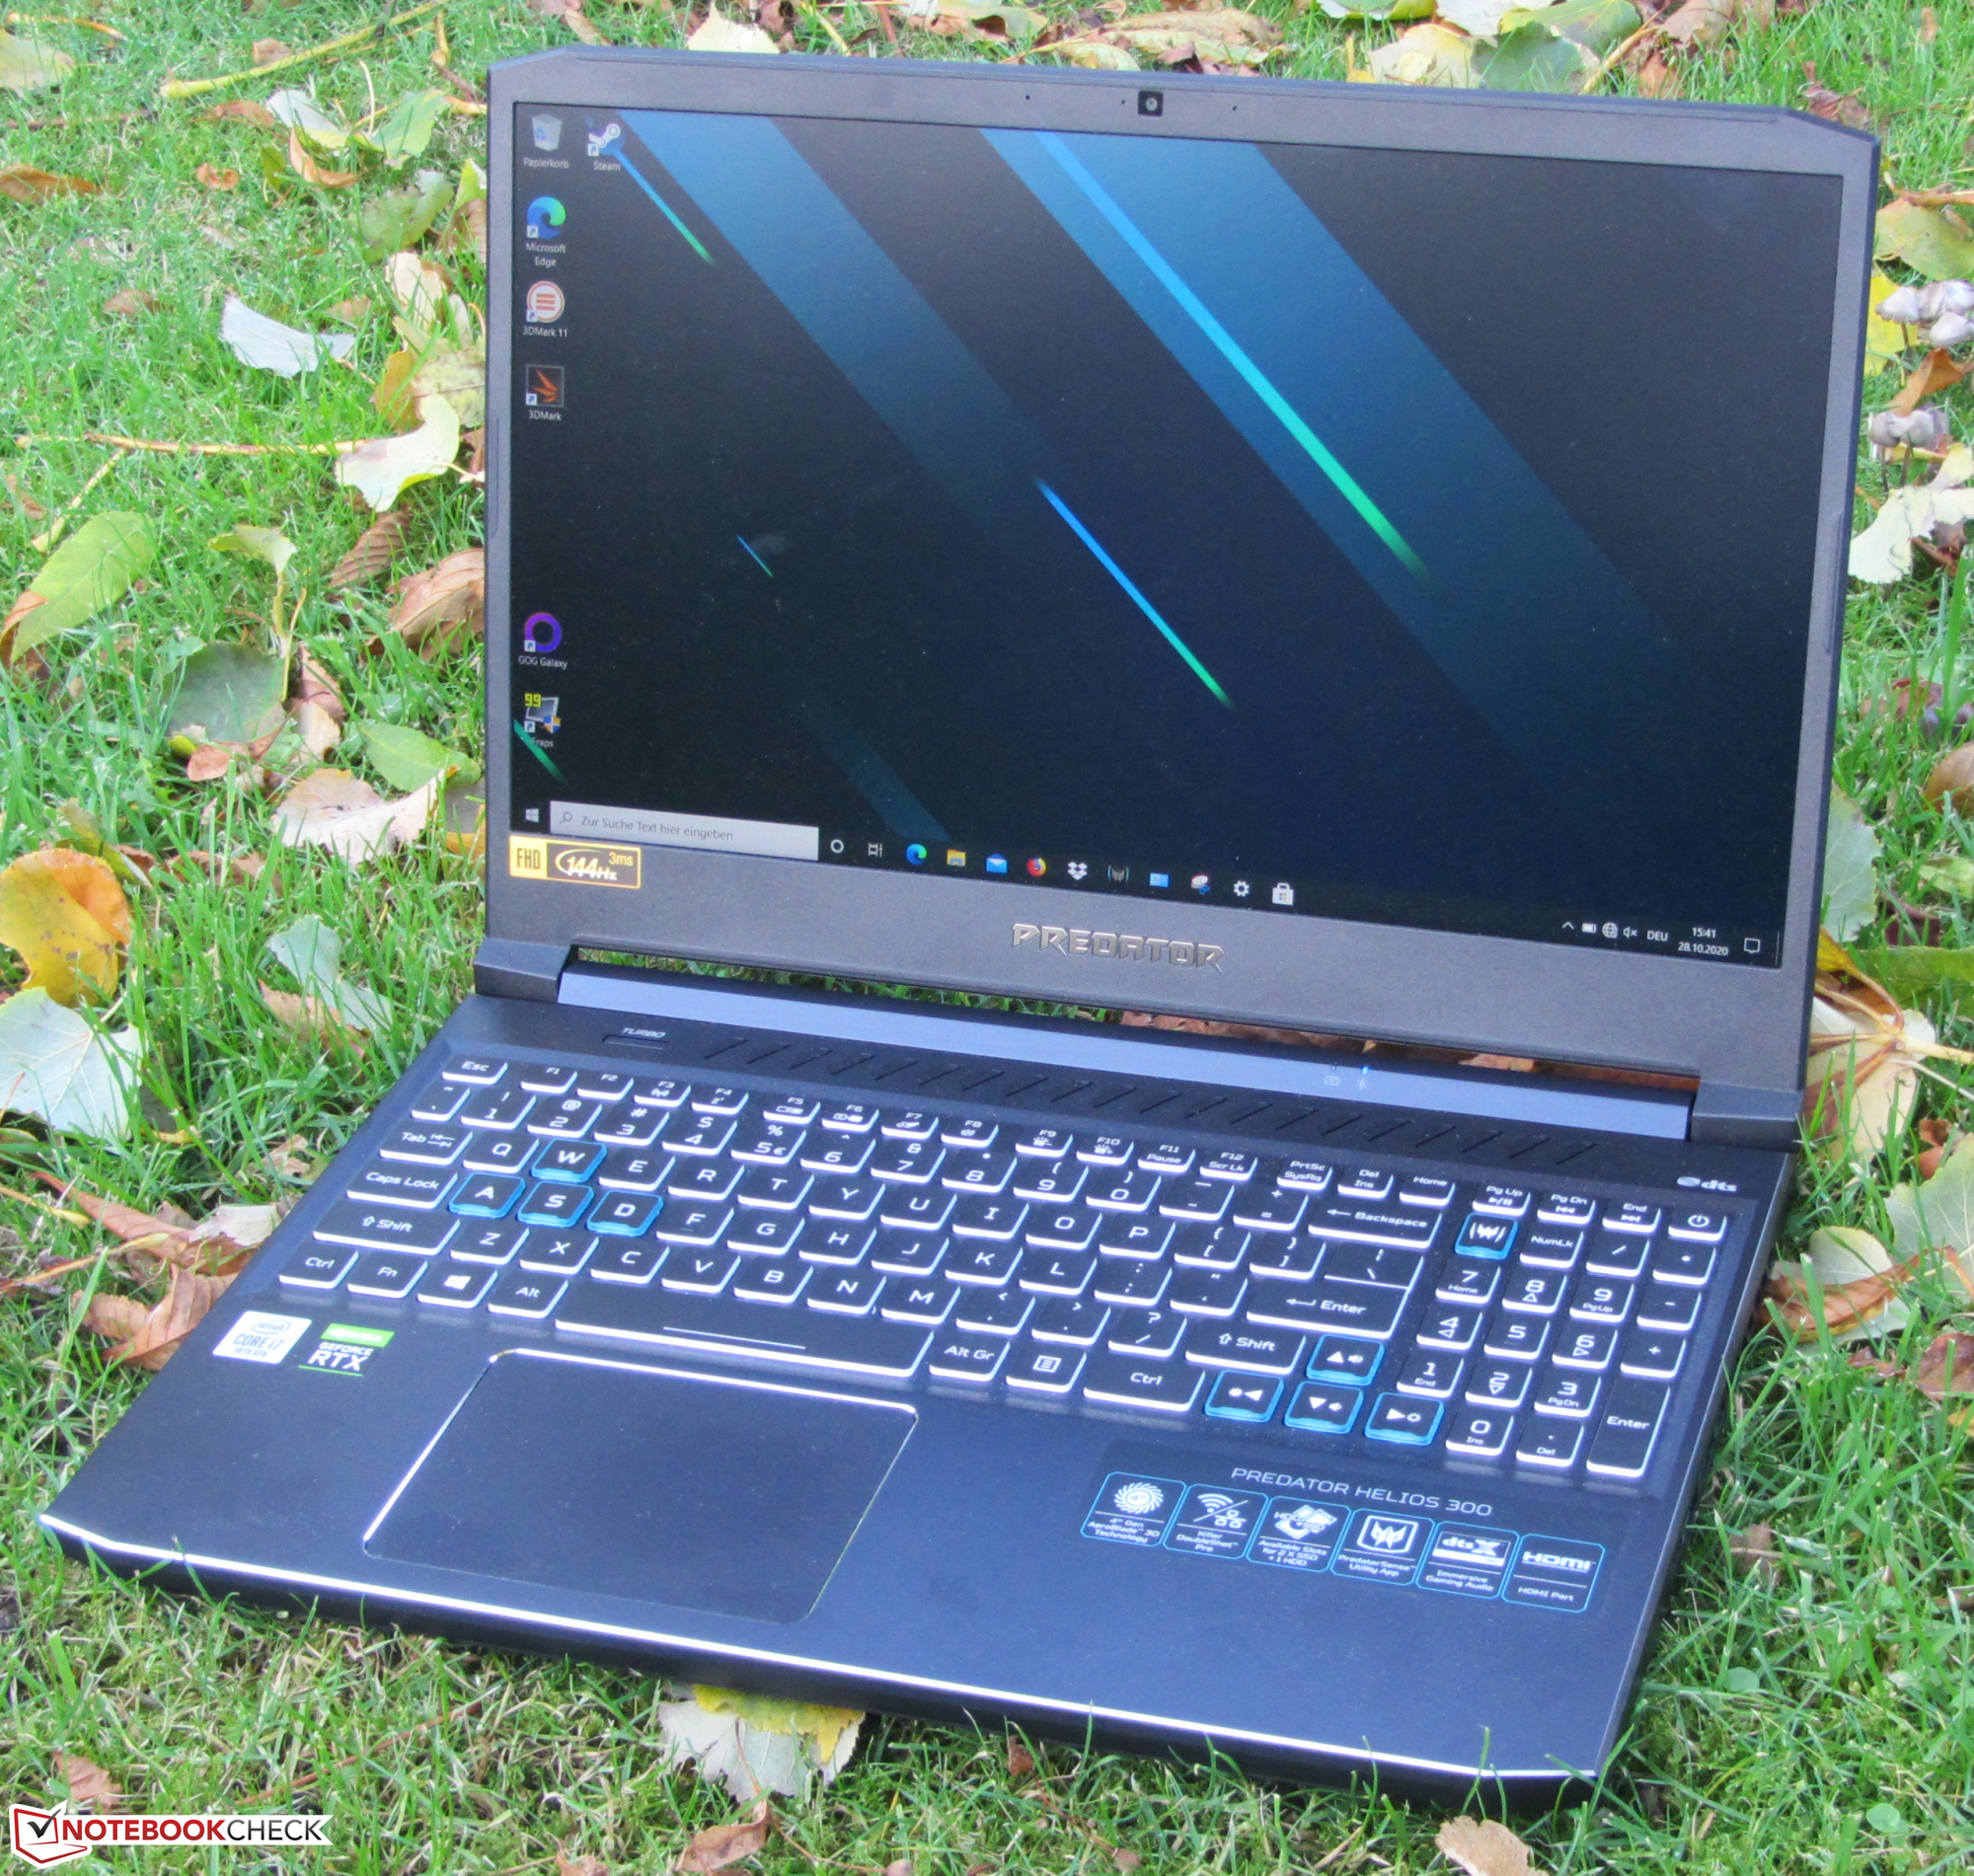
Acer Predator Helios 300 PH315-53 in review: Fast gaming machine with extra performance

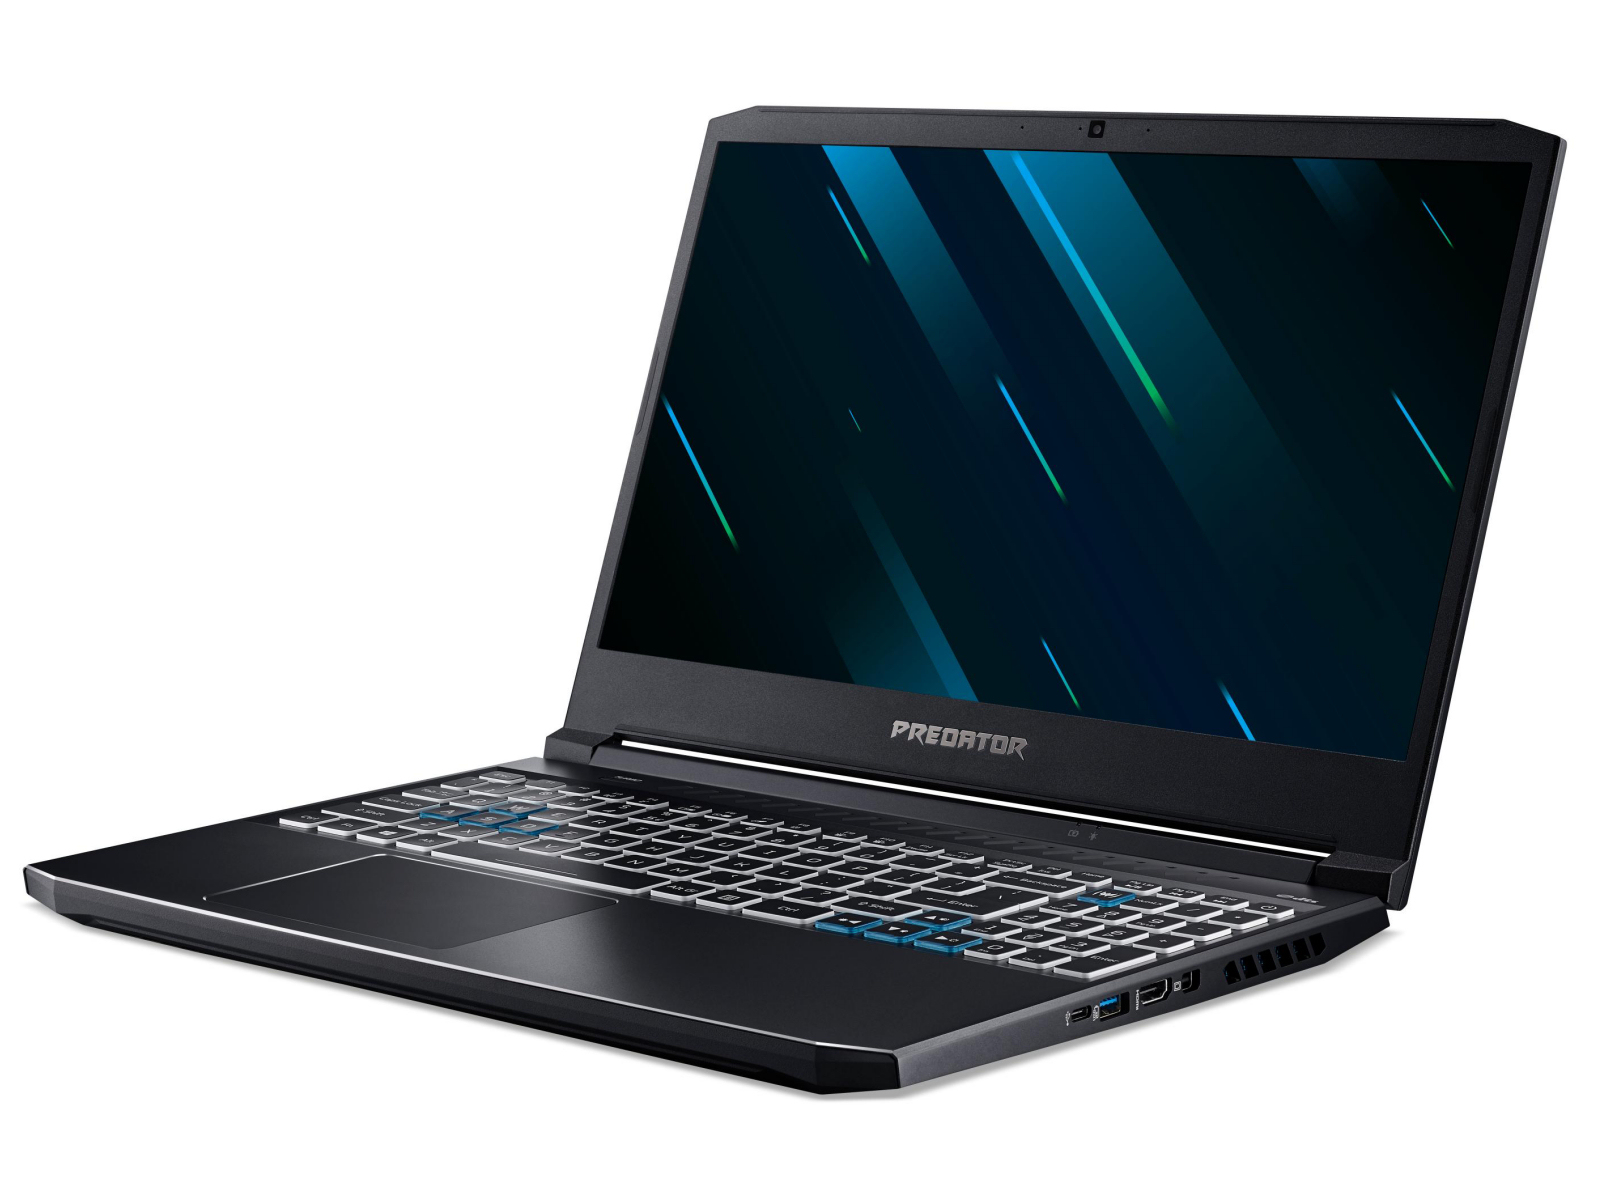
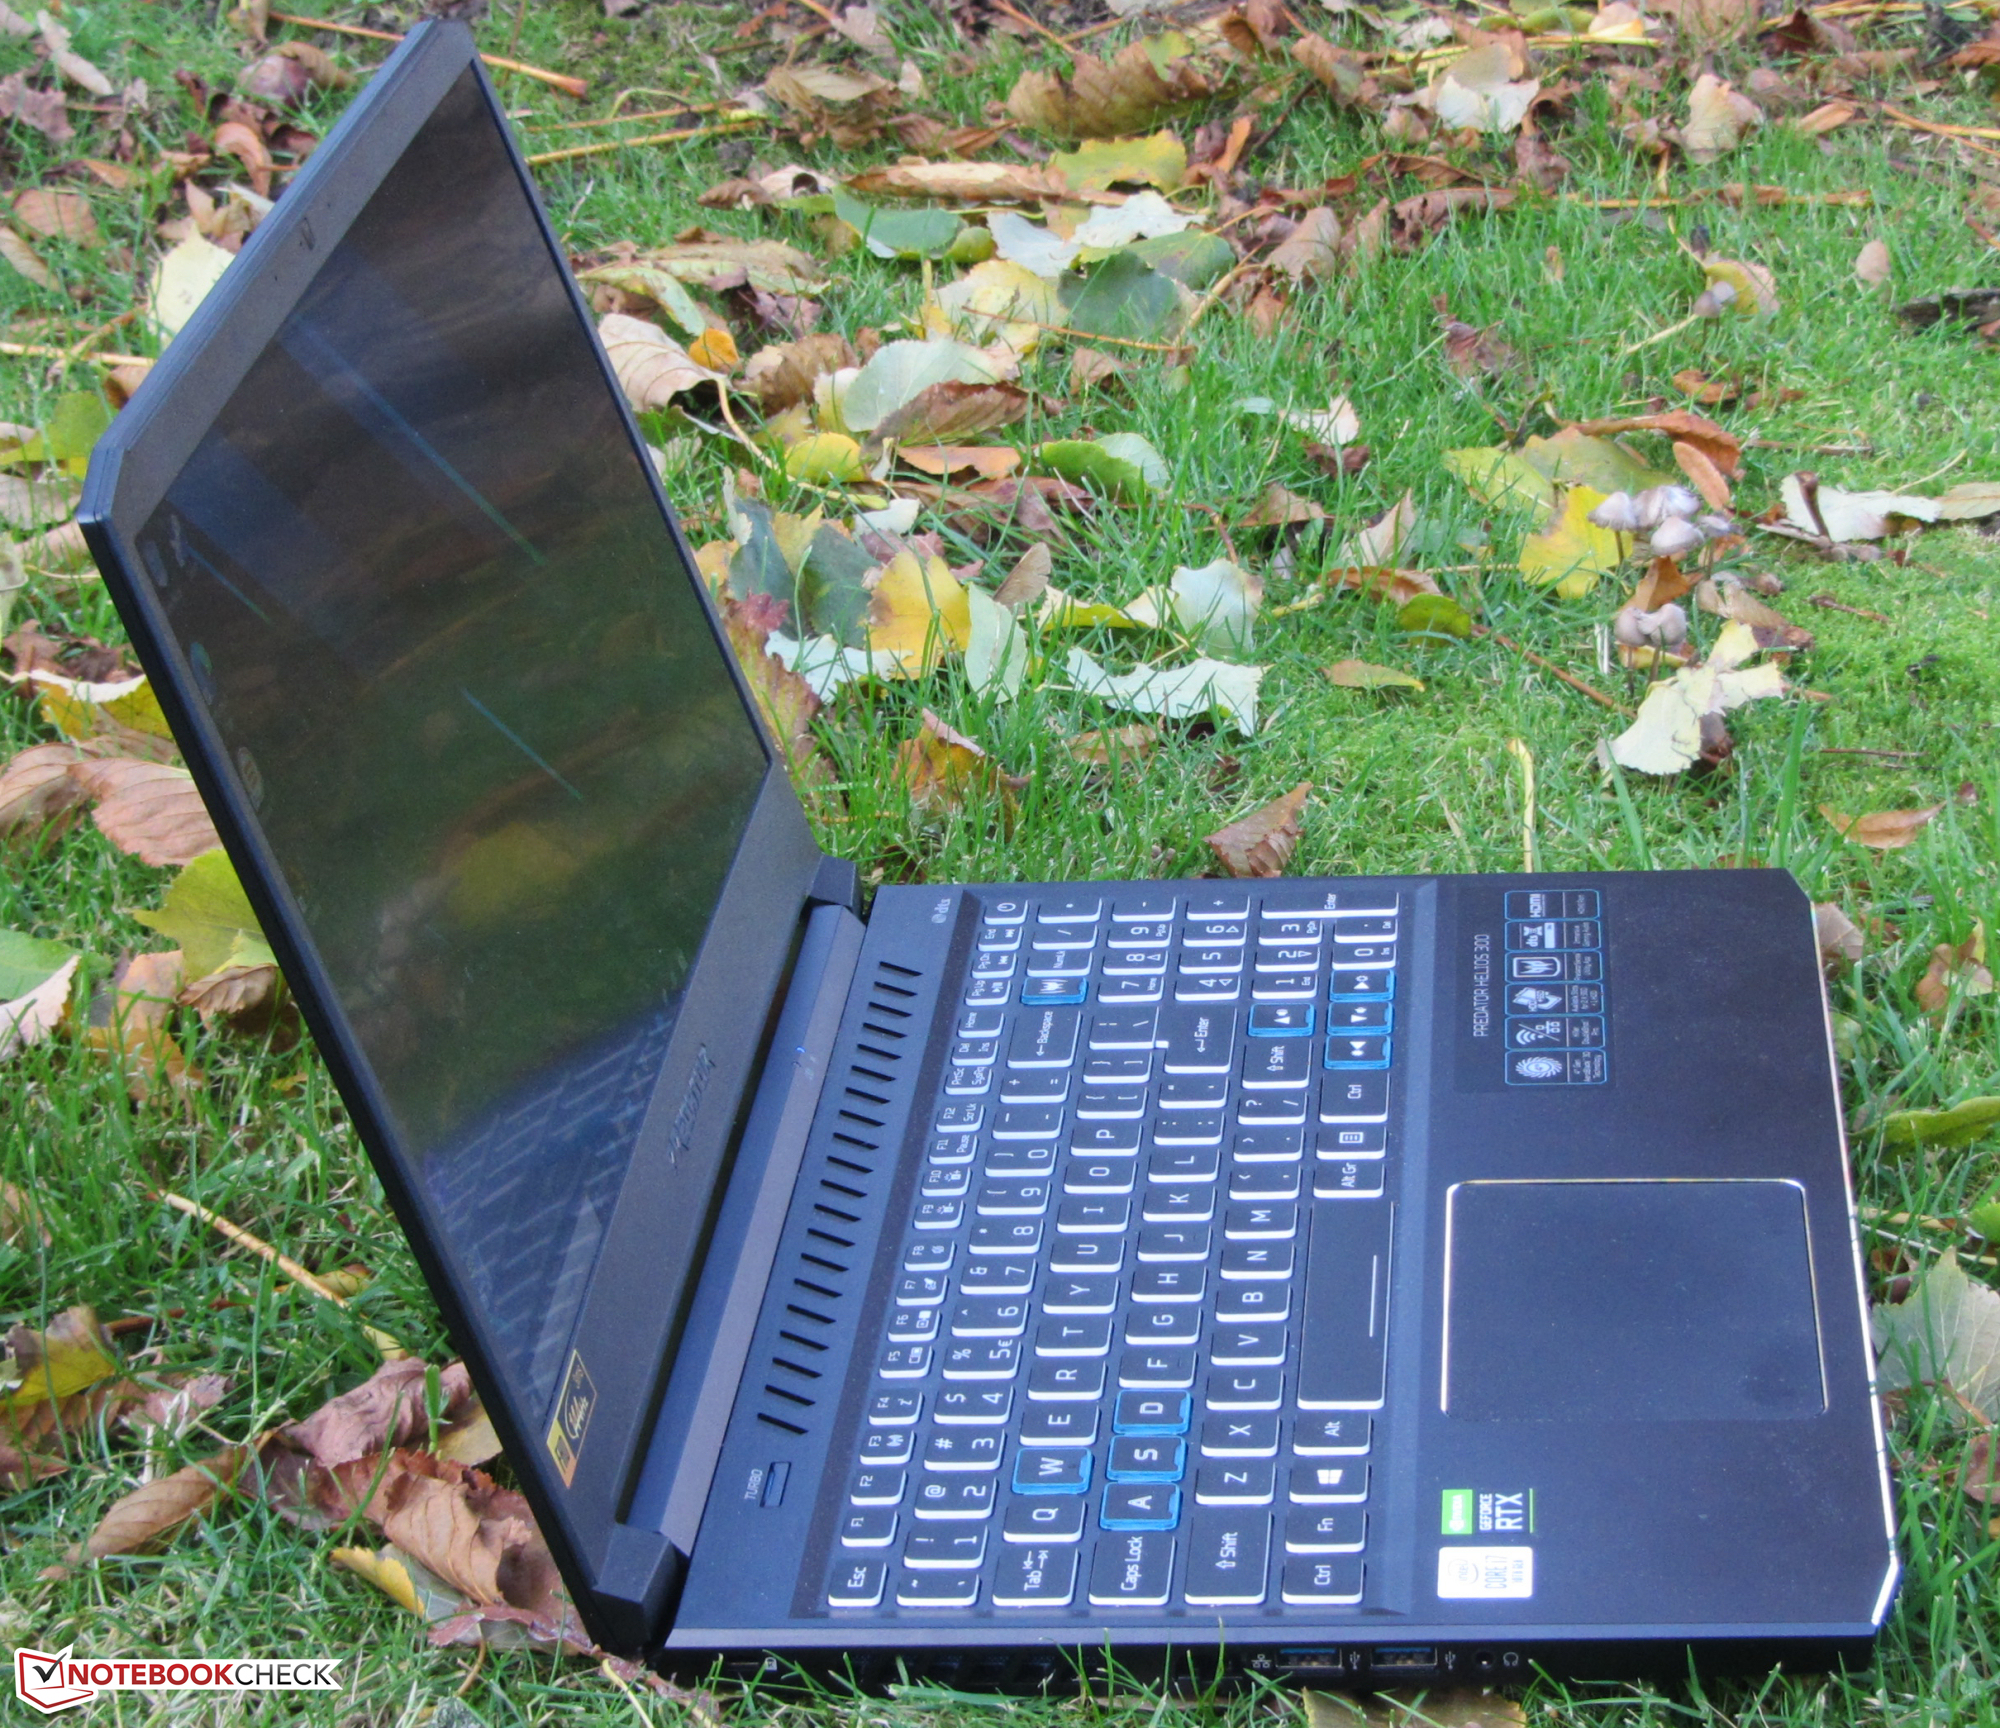
The Predator Helios is a 15.6-inch gaming laptop. The device is powered by a Core i7-10750H processor and a GeForce RTX 2060 GPU. Competitors include devices like the Dell G5 15 SE, the Aorus 5 KB, the Schenker XMG Core 15, and the Asus TUF A15 FA506IV.
Since the Predator is largely identical in construction to its predecessor, we won't go any further into the case, the connectivity, the input devices, the display, and the speakers - unless there are differences. The corresponding information can be found in the review of the Acer Predator Helios 300 PH315-52.
Rating | Date | Model | Weight | Height | Size | Resolution | Price |
|---|---|---|---|---|---|---|---|
| 82.9 % v7 (old) | 11 / 2020 | Acer Predator Helios 300 PH315-53-77N5 i7-10750H, GeForce RTX 2060 Mobile | 2.5 kg | 22.9 mm | 15.60" | 1920x1080 | |
| 83.7 % v7 (old) | 06 / 2020 | Dell G5 15 SE 5505 P89F R7 4800H, Radeon RX 5600M | 2.4 kg | 21.6 mm | 15.60" | 1920x1080 | |
| 83.7 % v7 (old) | 10 / 2020 | Aorus 5 KB i7-10750H, GeForce RTX 2060 Mobile | 2.1 kg | 28 mm | 15.60" | 1920x1080 | |
| 82.1 % v7 (old) | 09 / 2020 | Schenker XMG Core 15 GK5NR0O R7 4800H, GeForce RTX 2060 Mobile | 2 kg | 19.9 mm | 15.60" | 1920x1080 | |
| 82.7 % v7 (old) | 06 / 2020 | Asus TUF Gaming A15 FA506IV-HN172 R7 4800H, GeForce RTX 2060 Mobile | 2.2 kg | 24.9 mm | 15.60" | 1920x1080 |
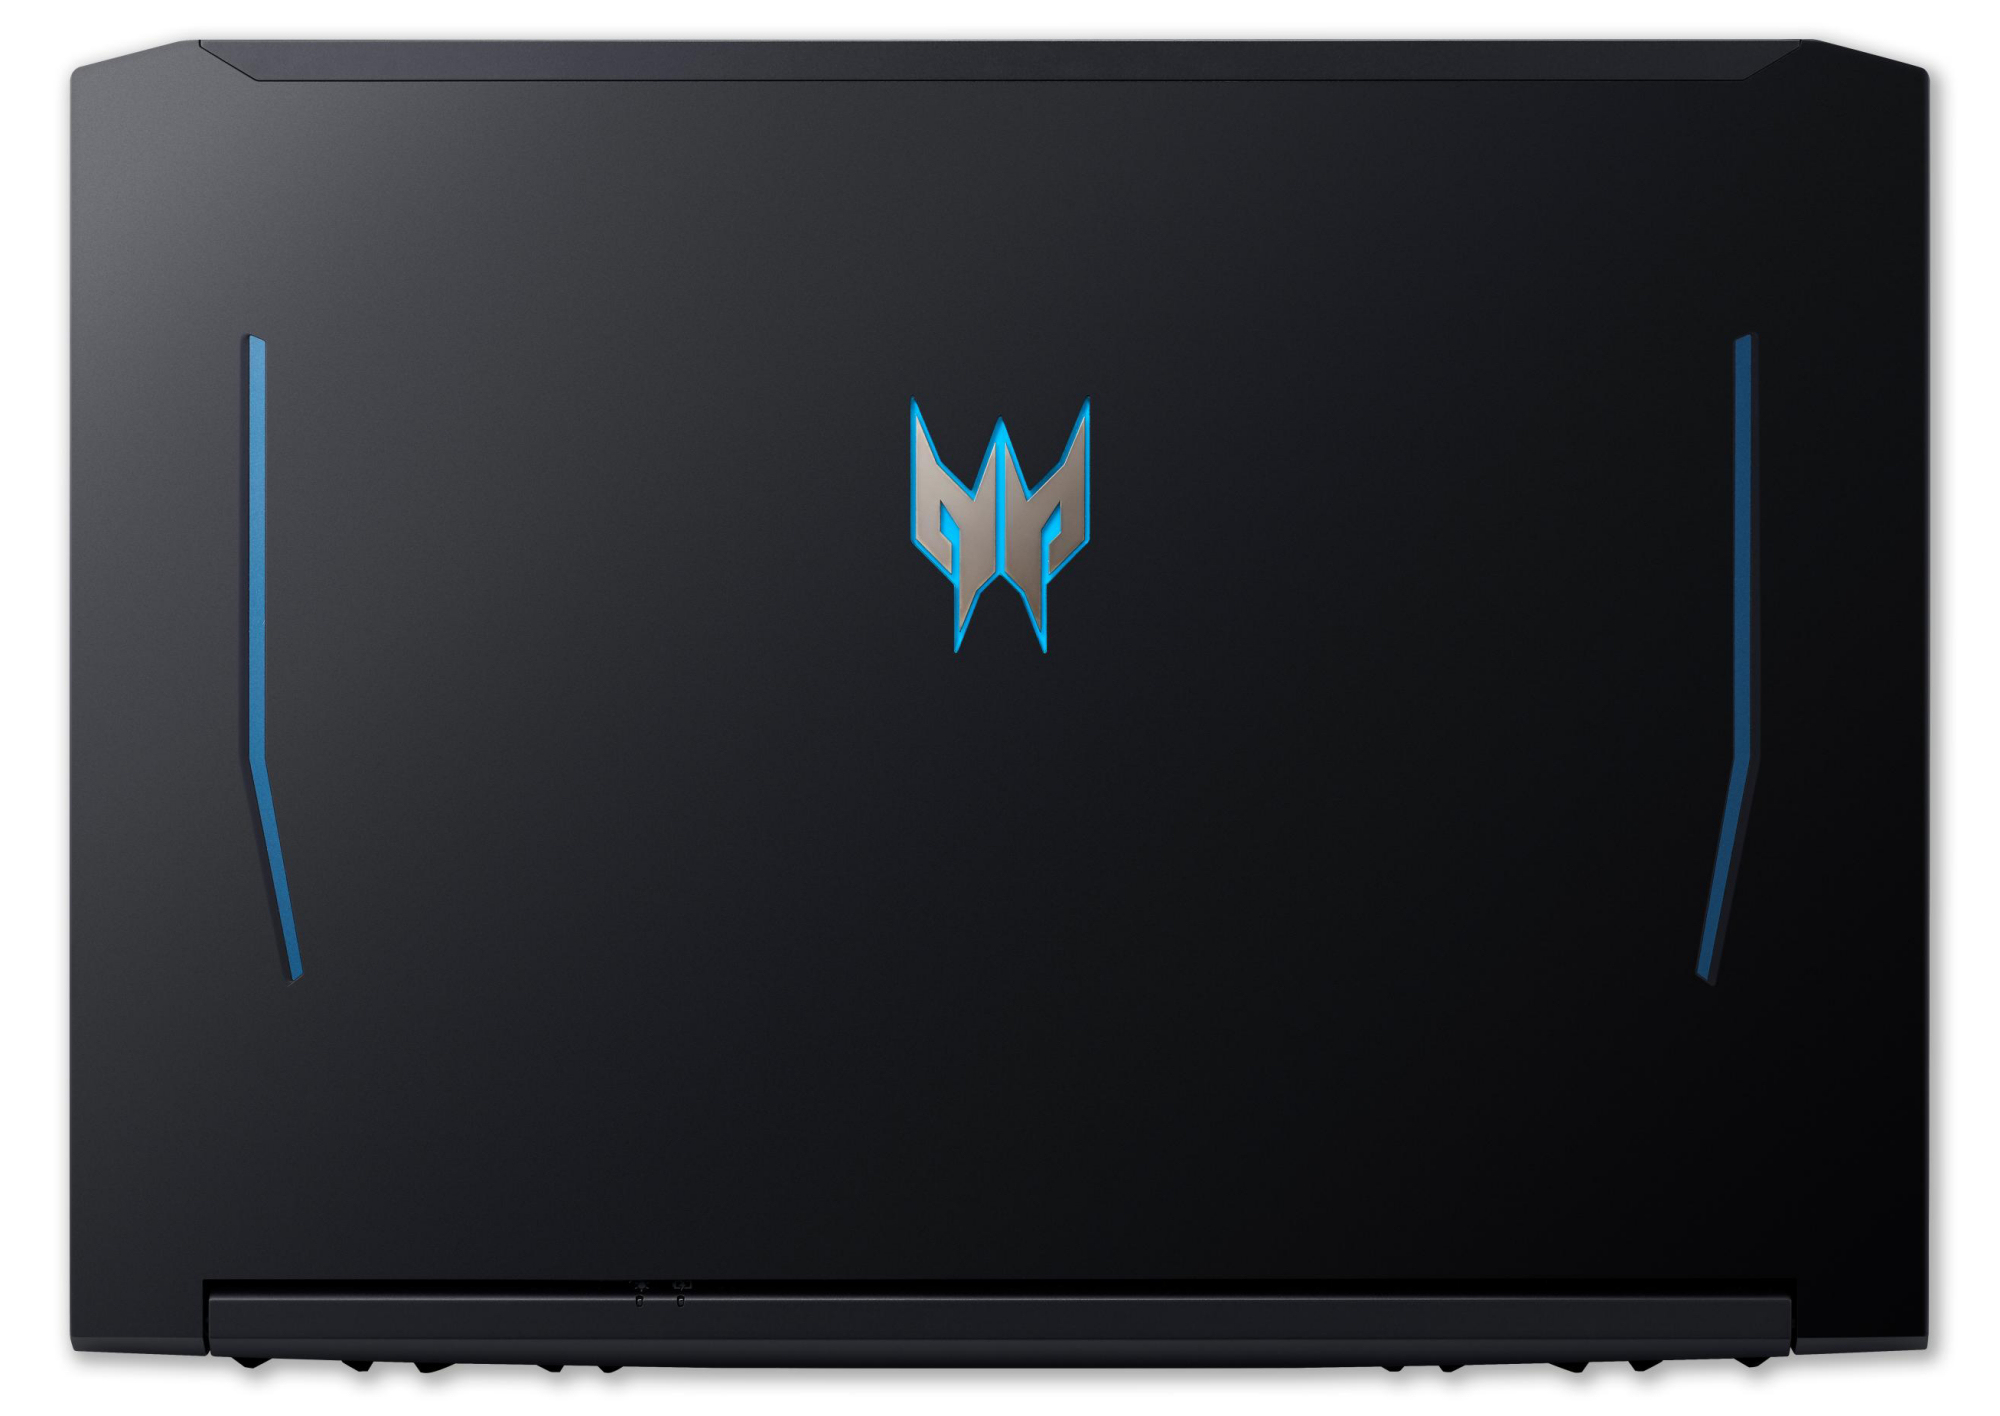
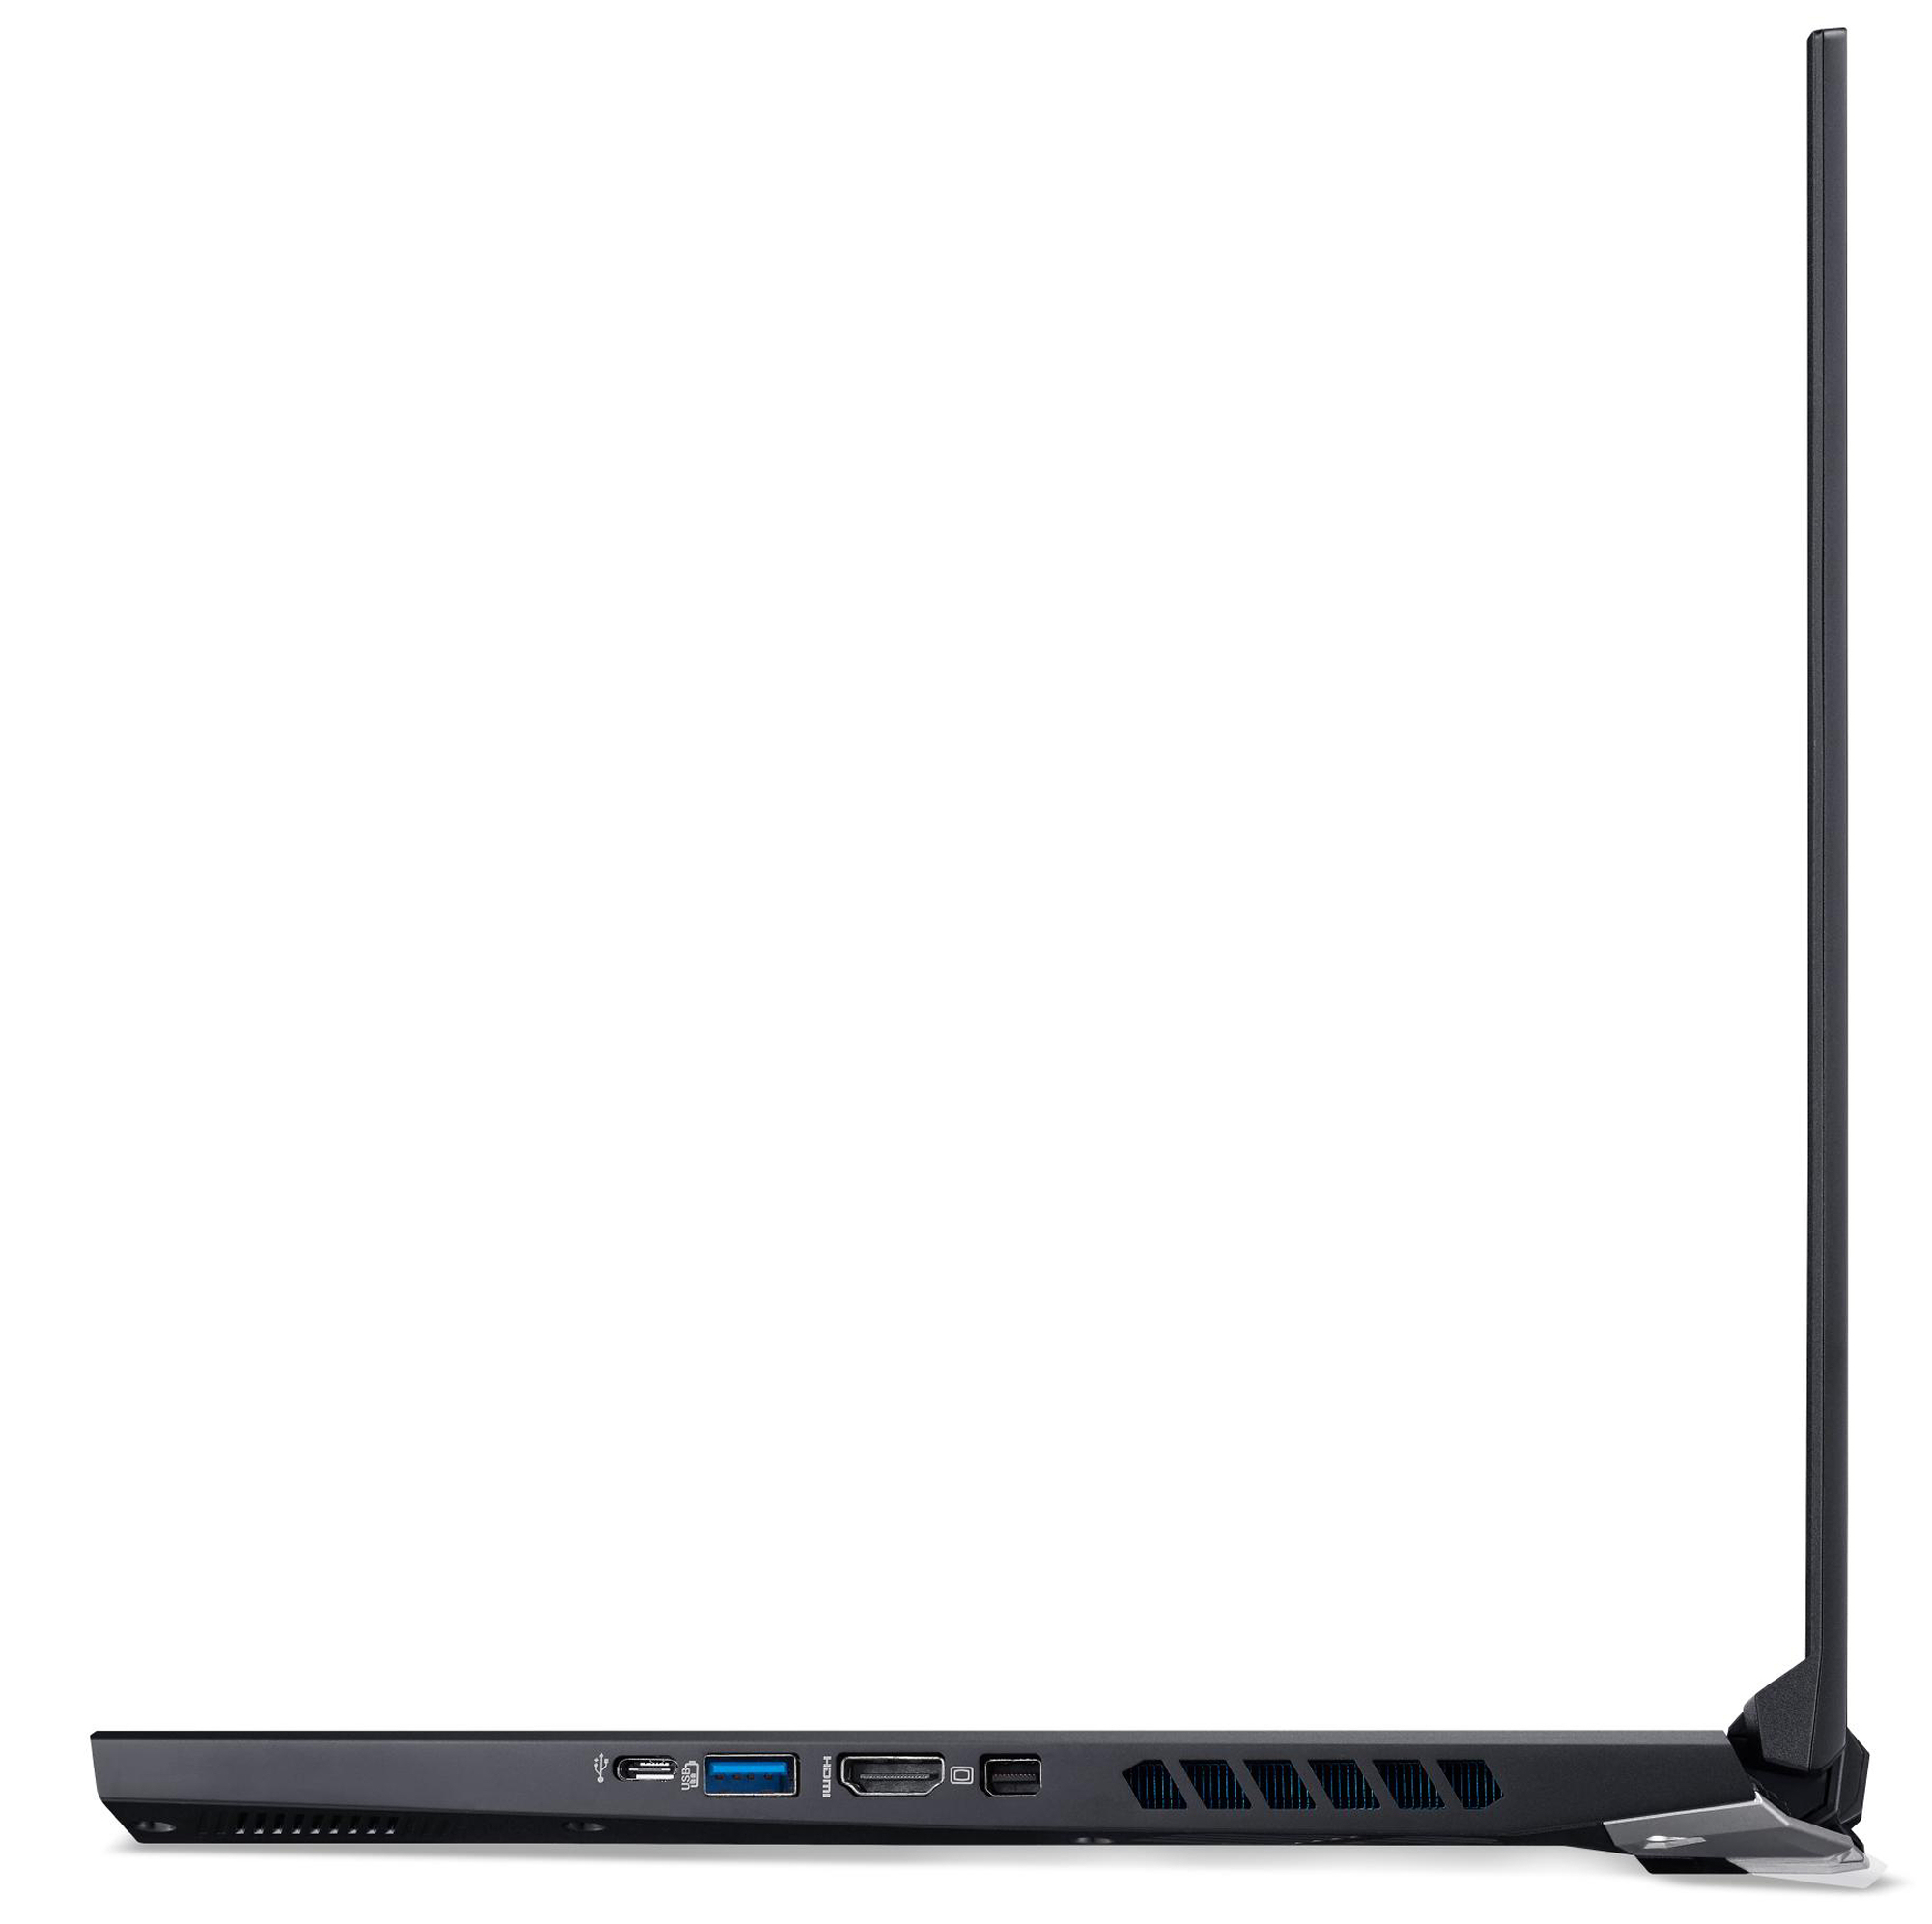
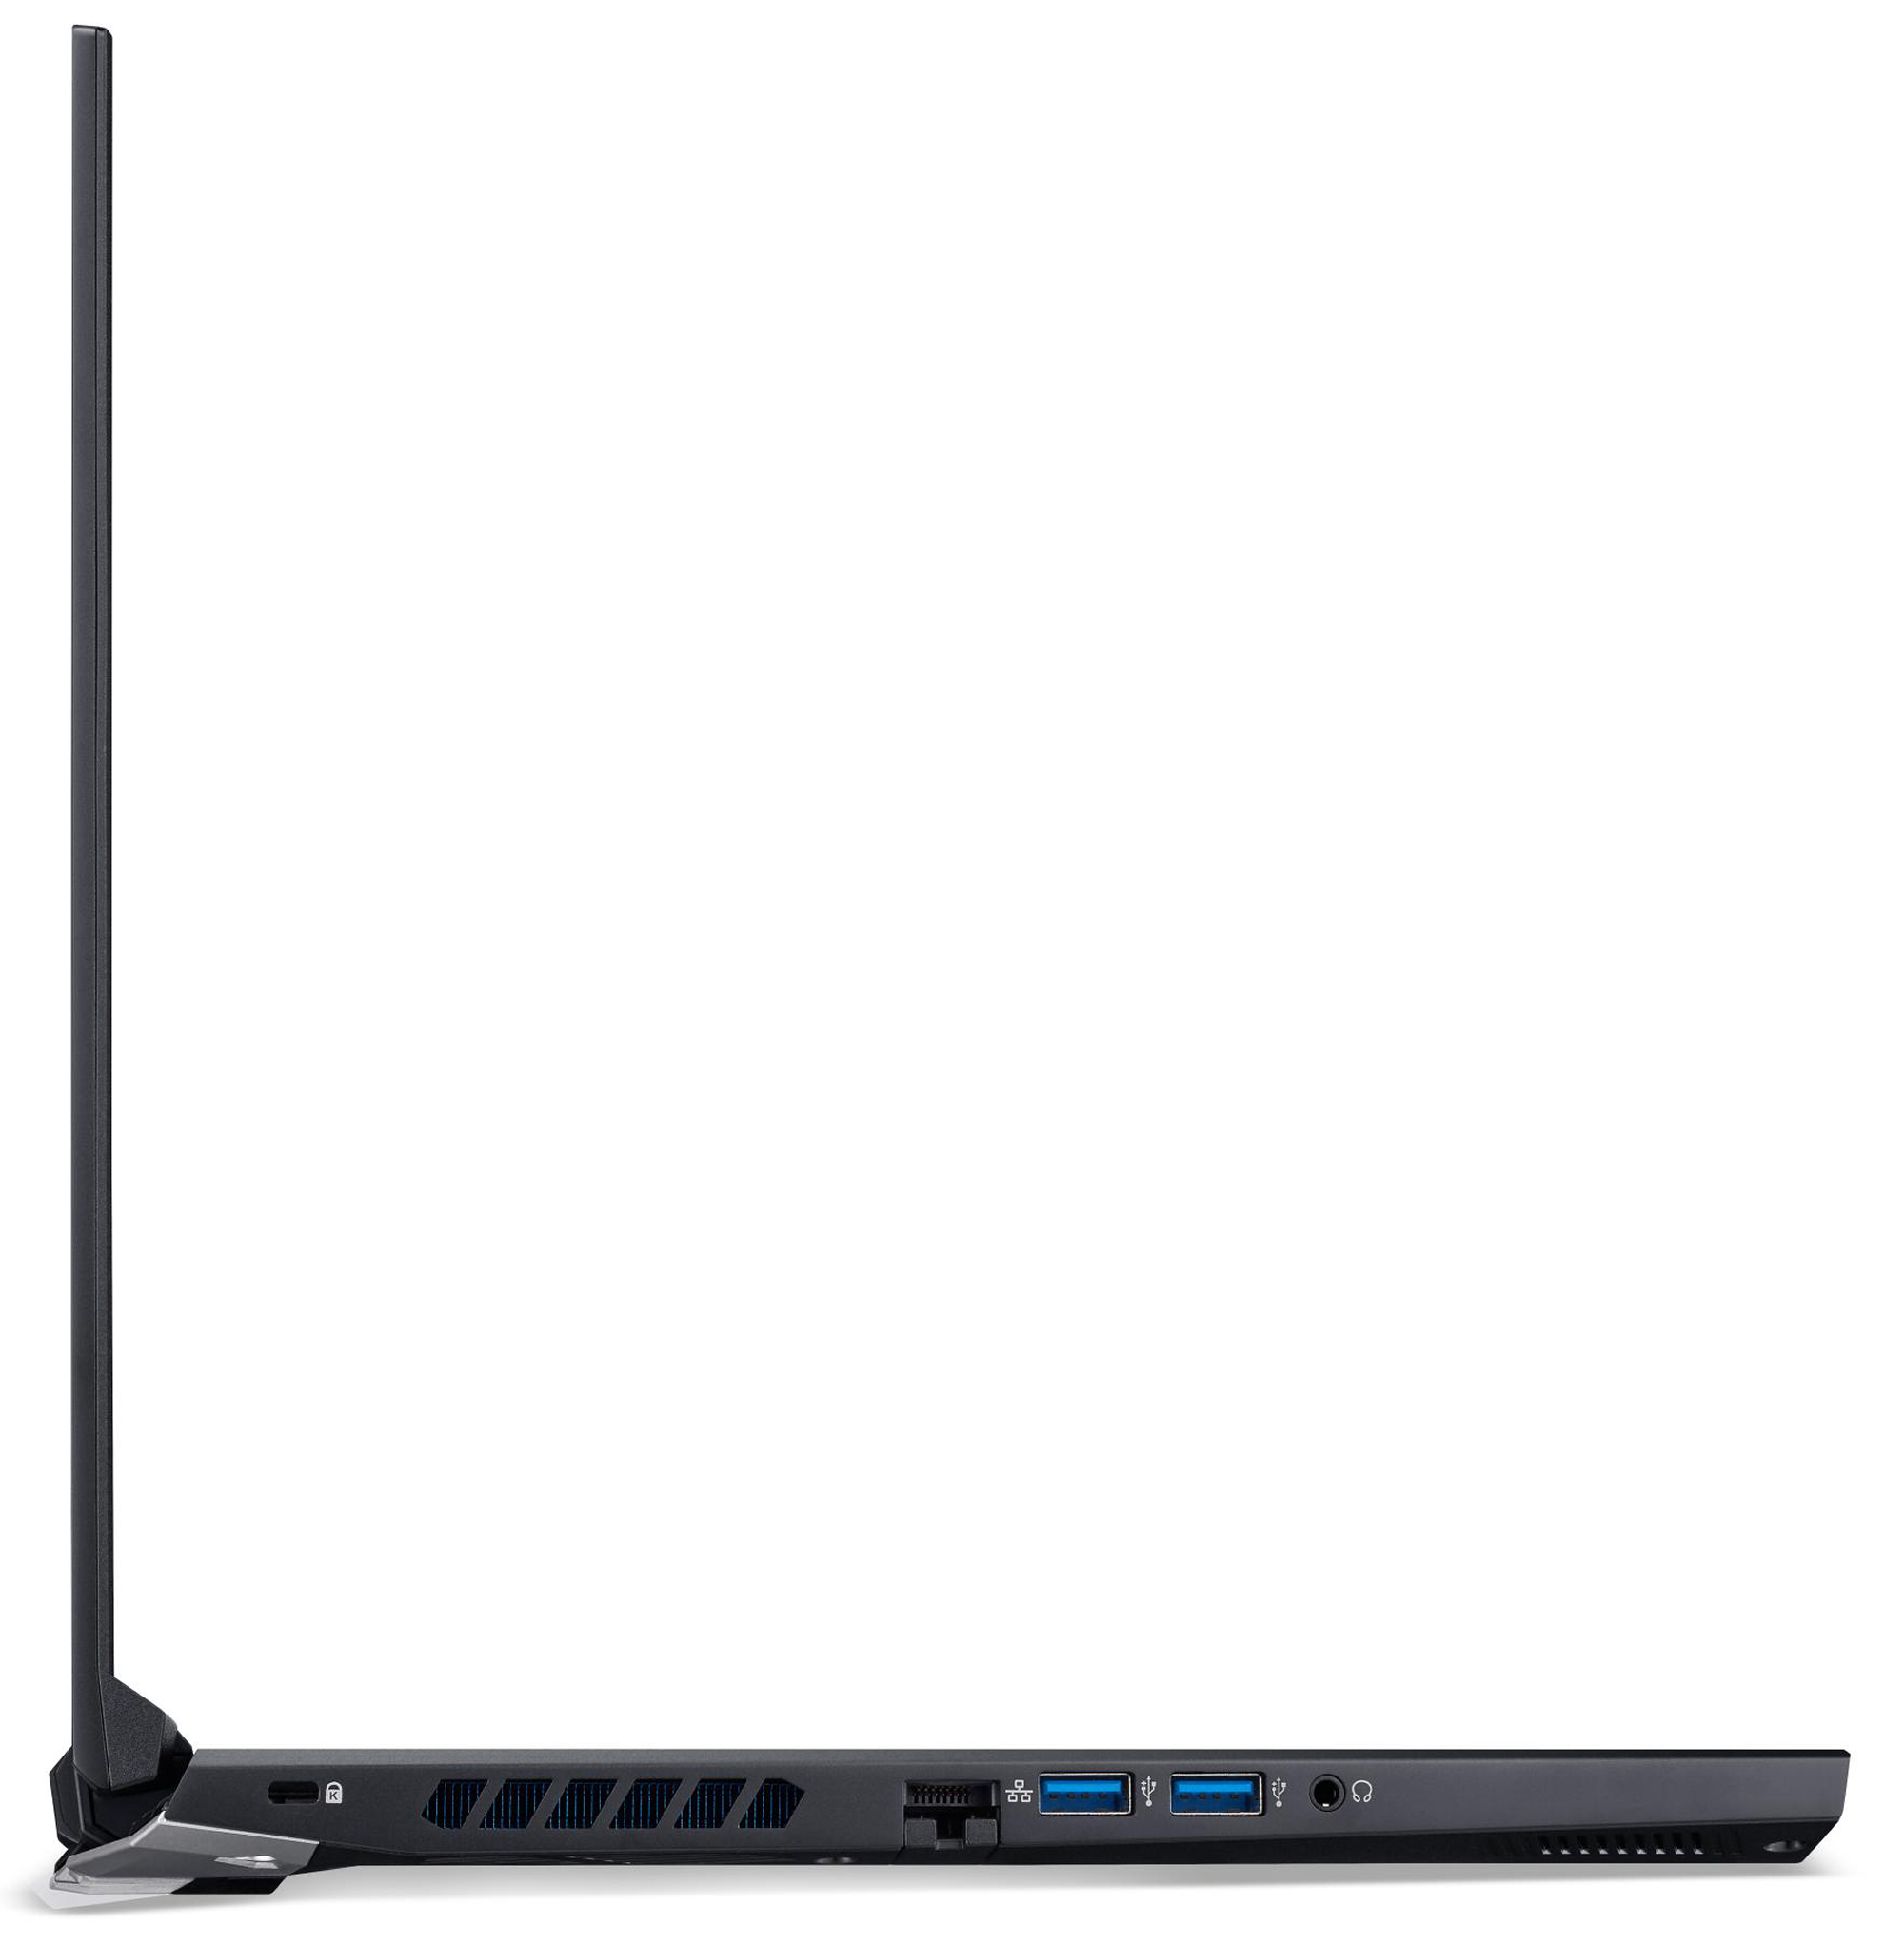
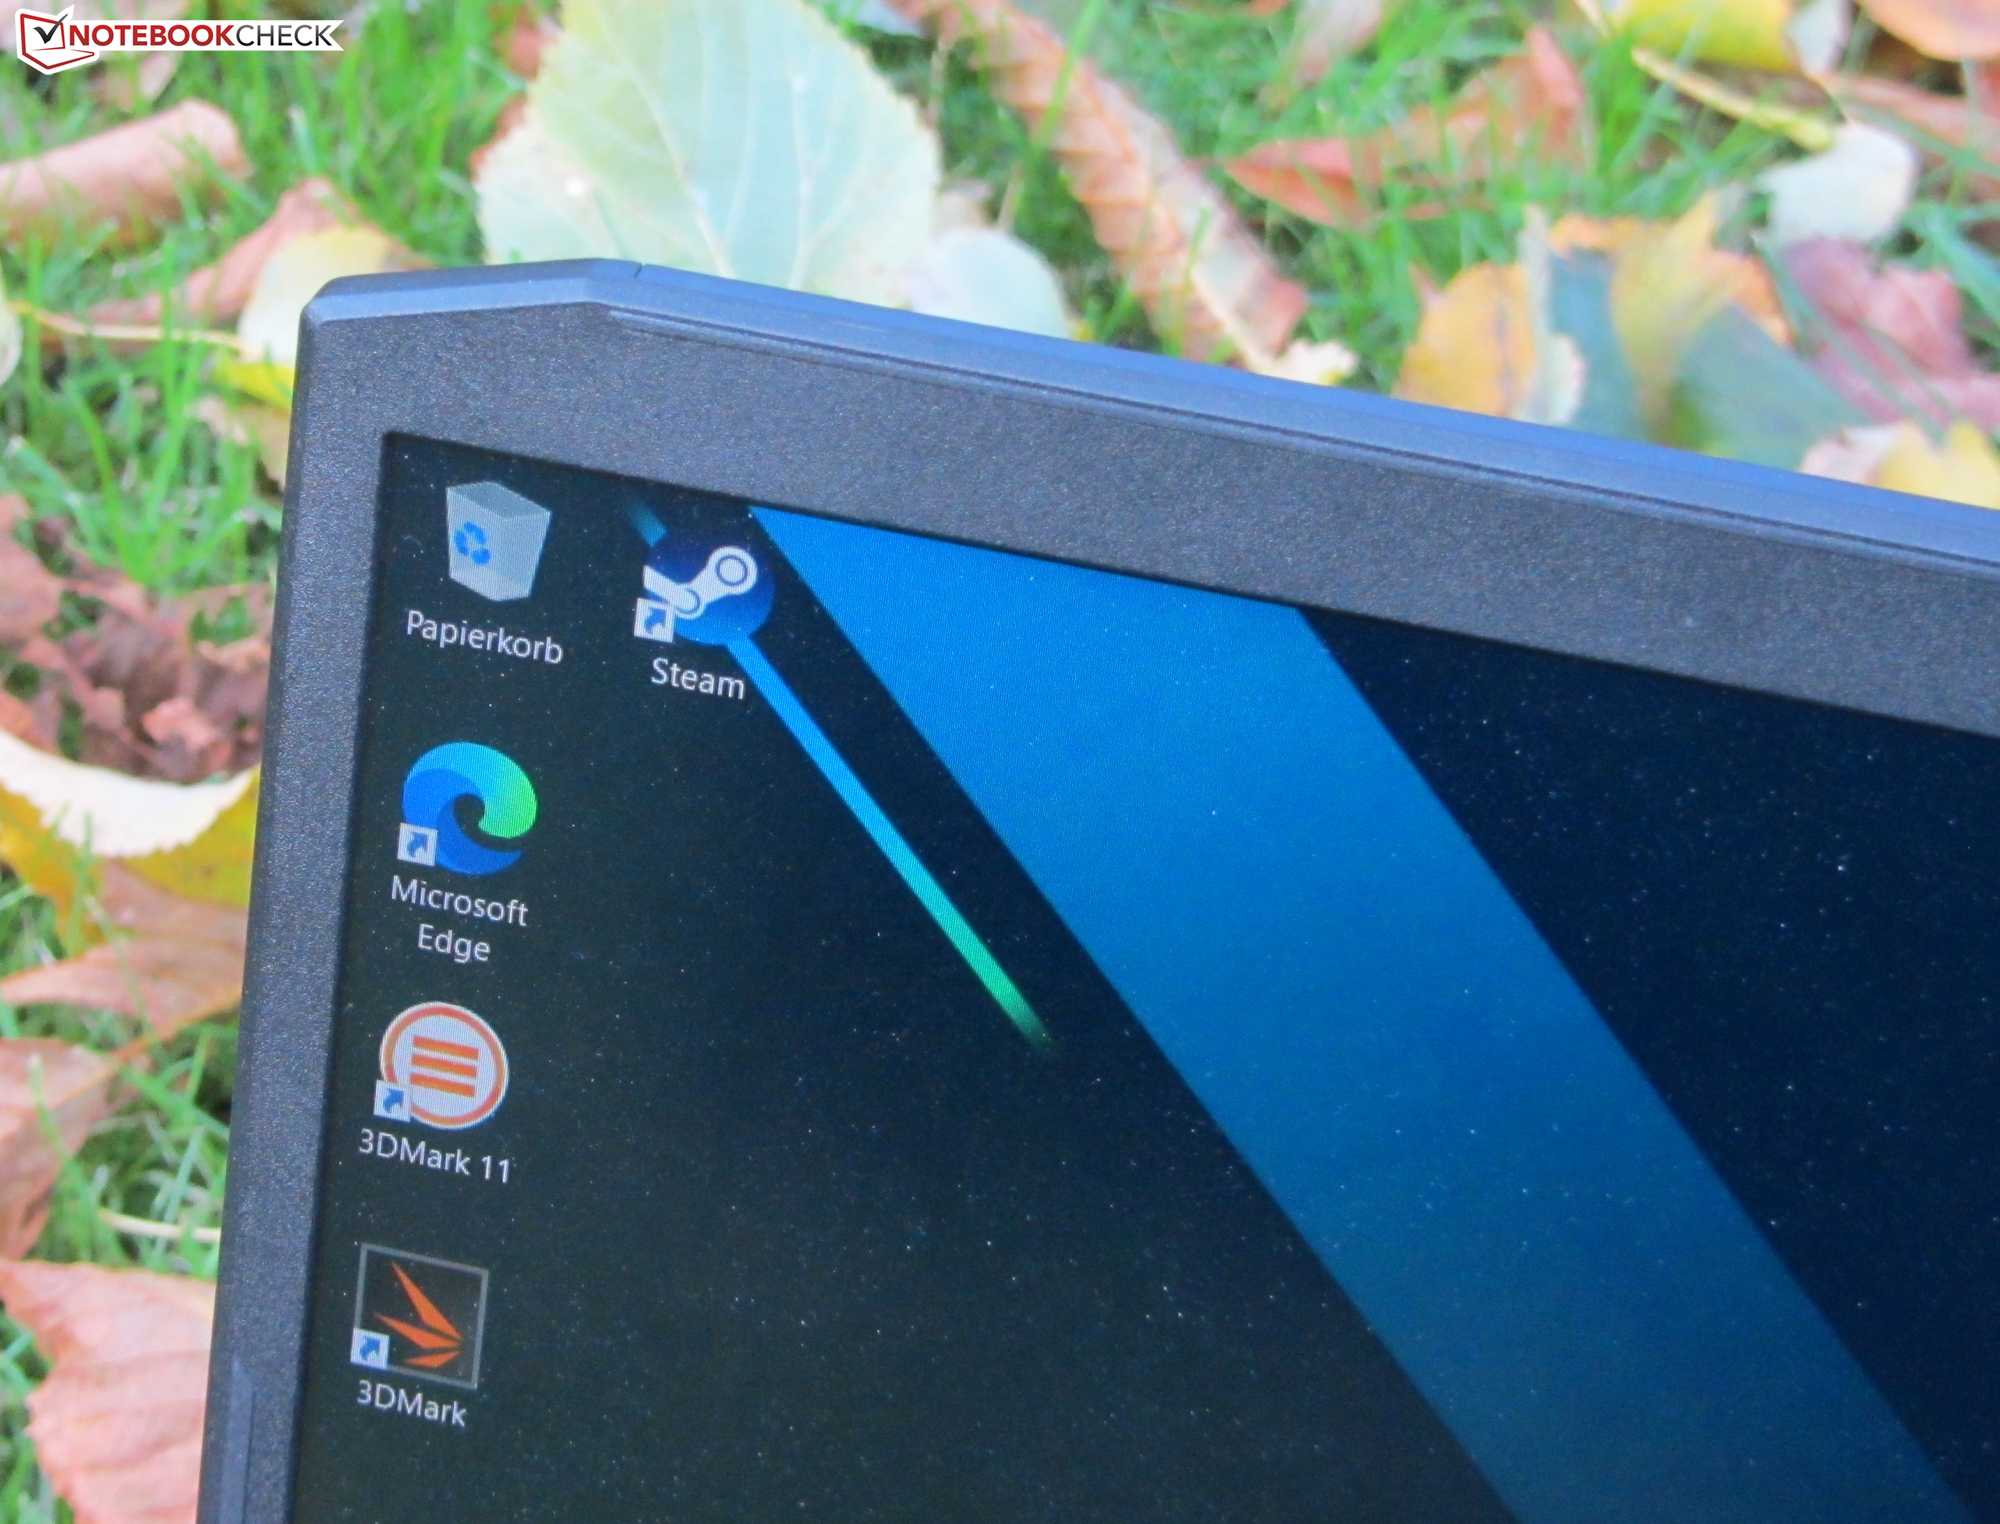
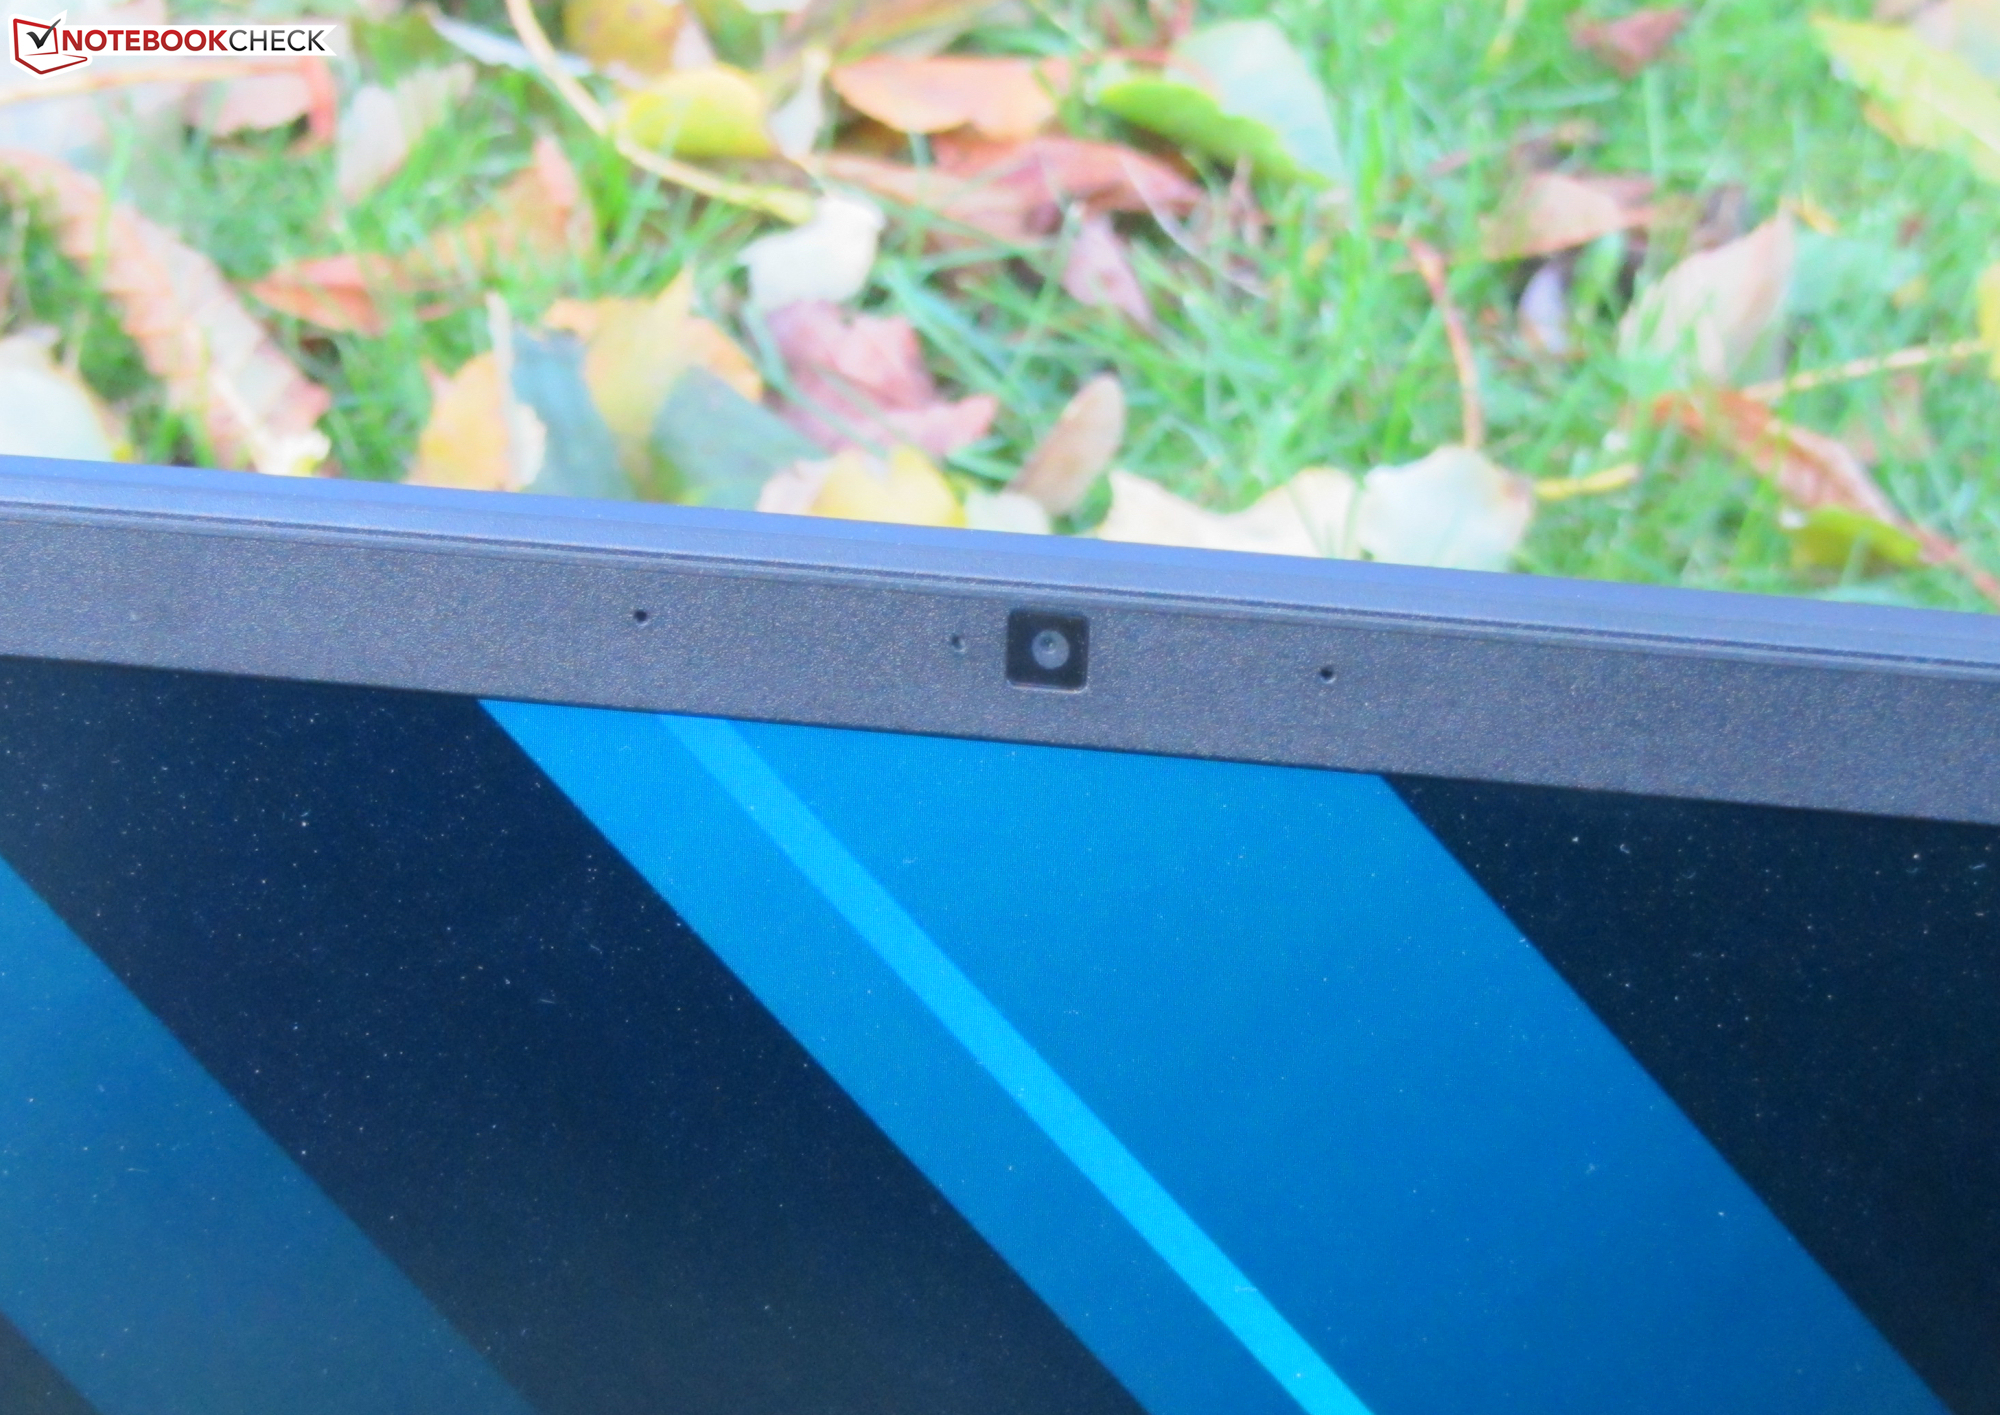
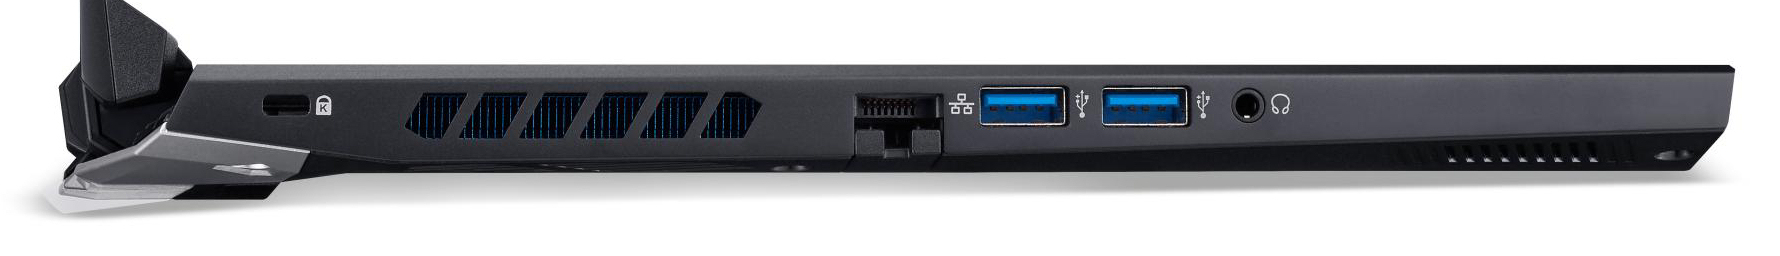
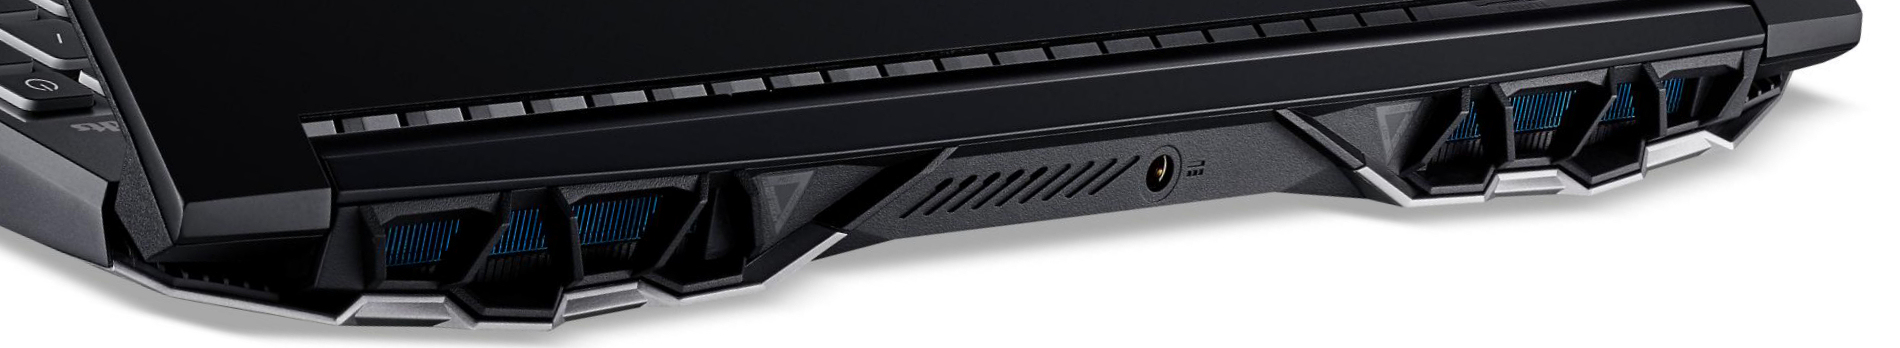
Case and connectivity - Slight changes compared to the predecessor
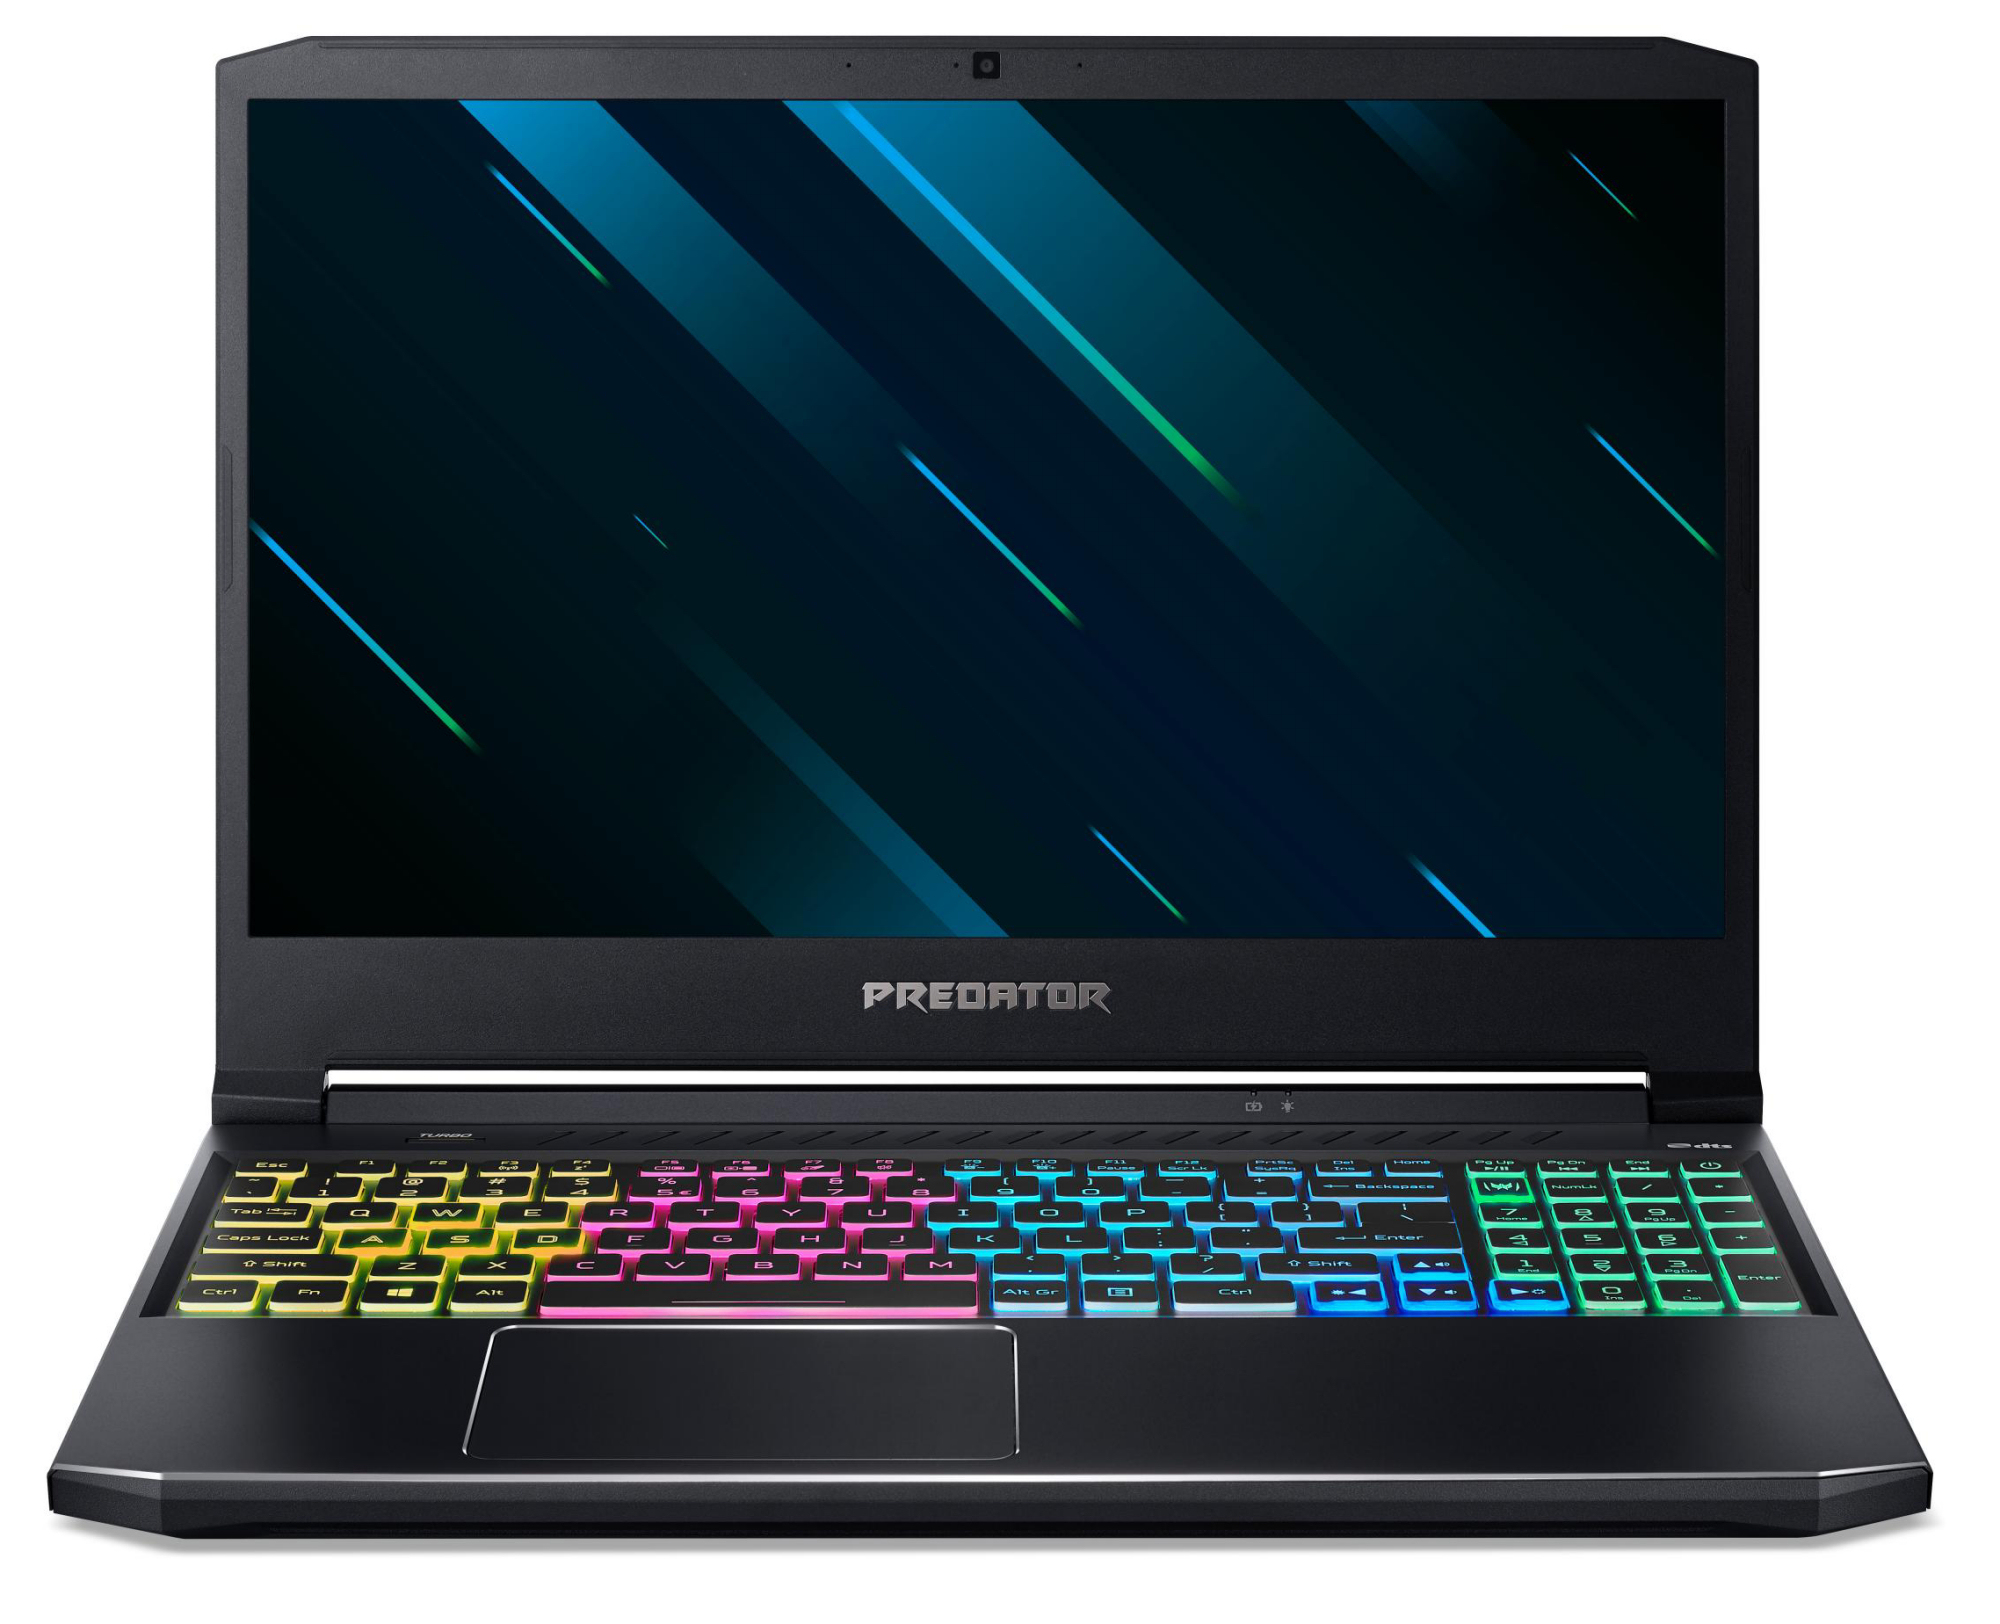
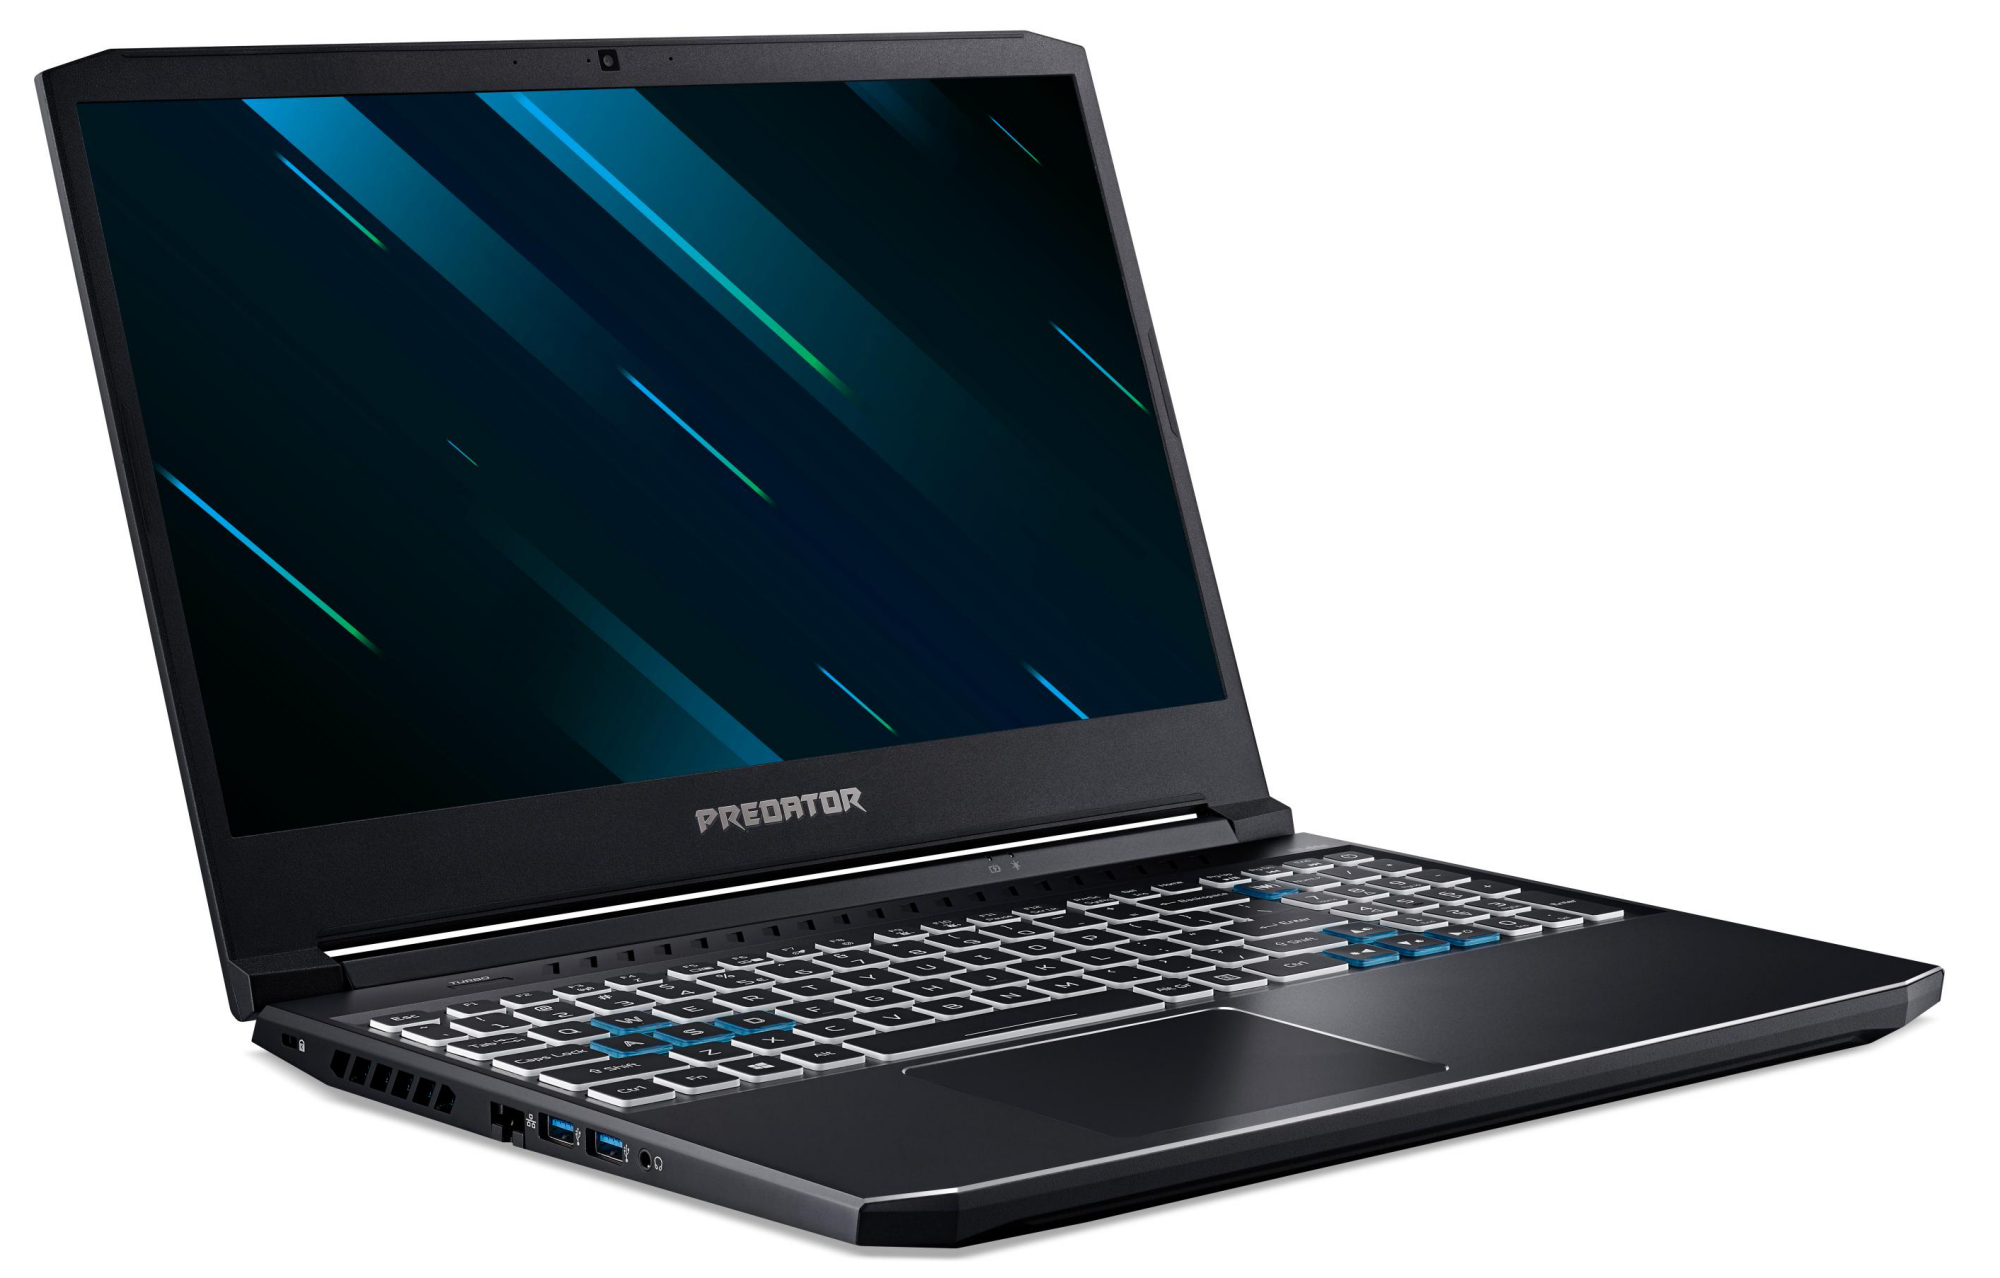
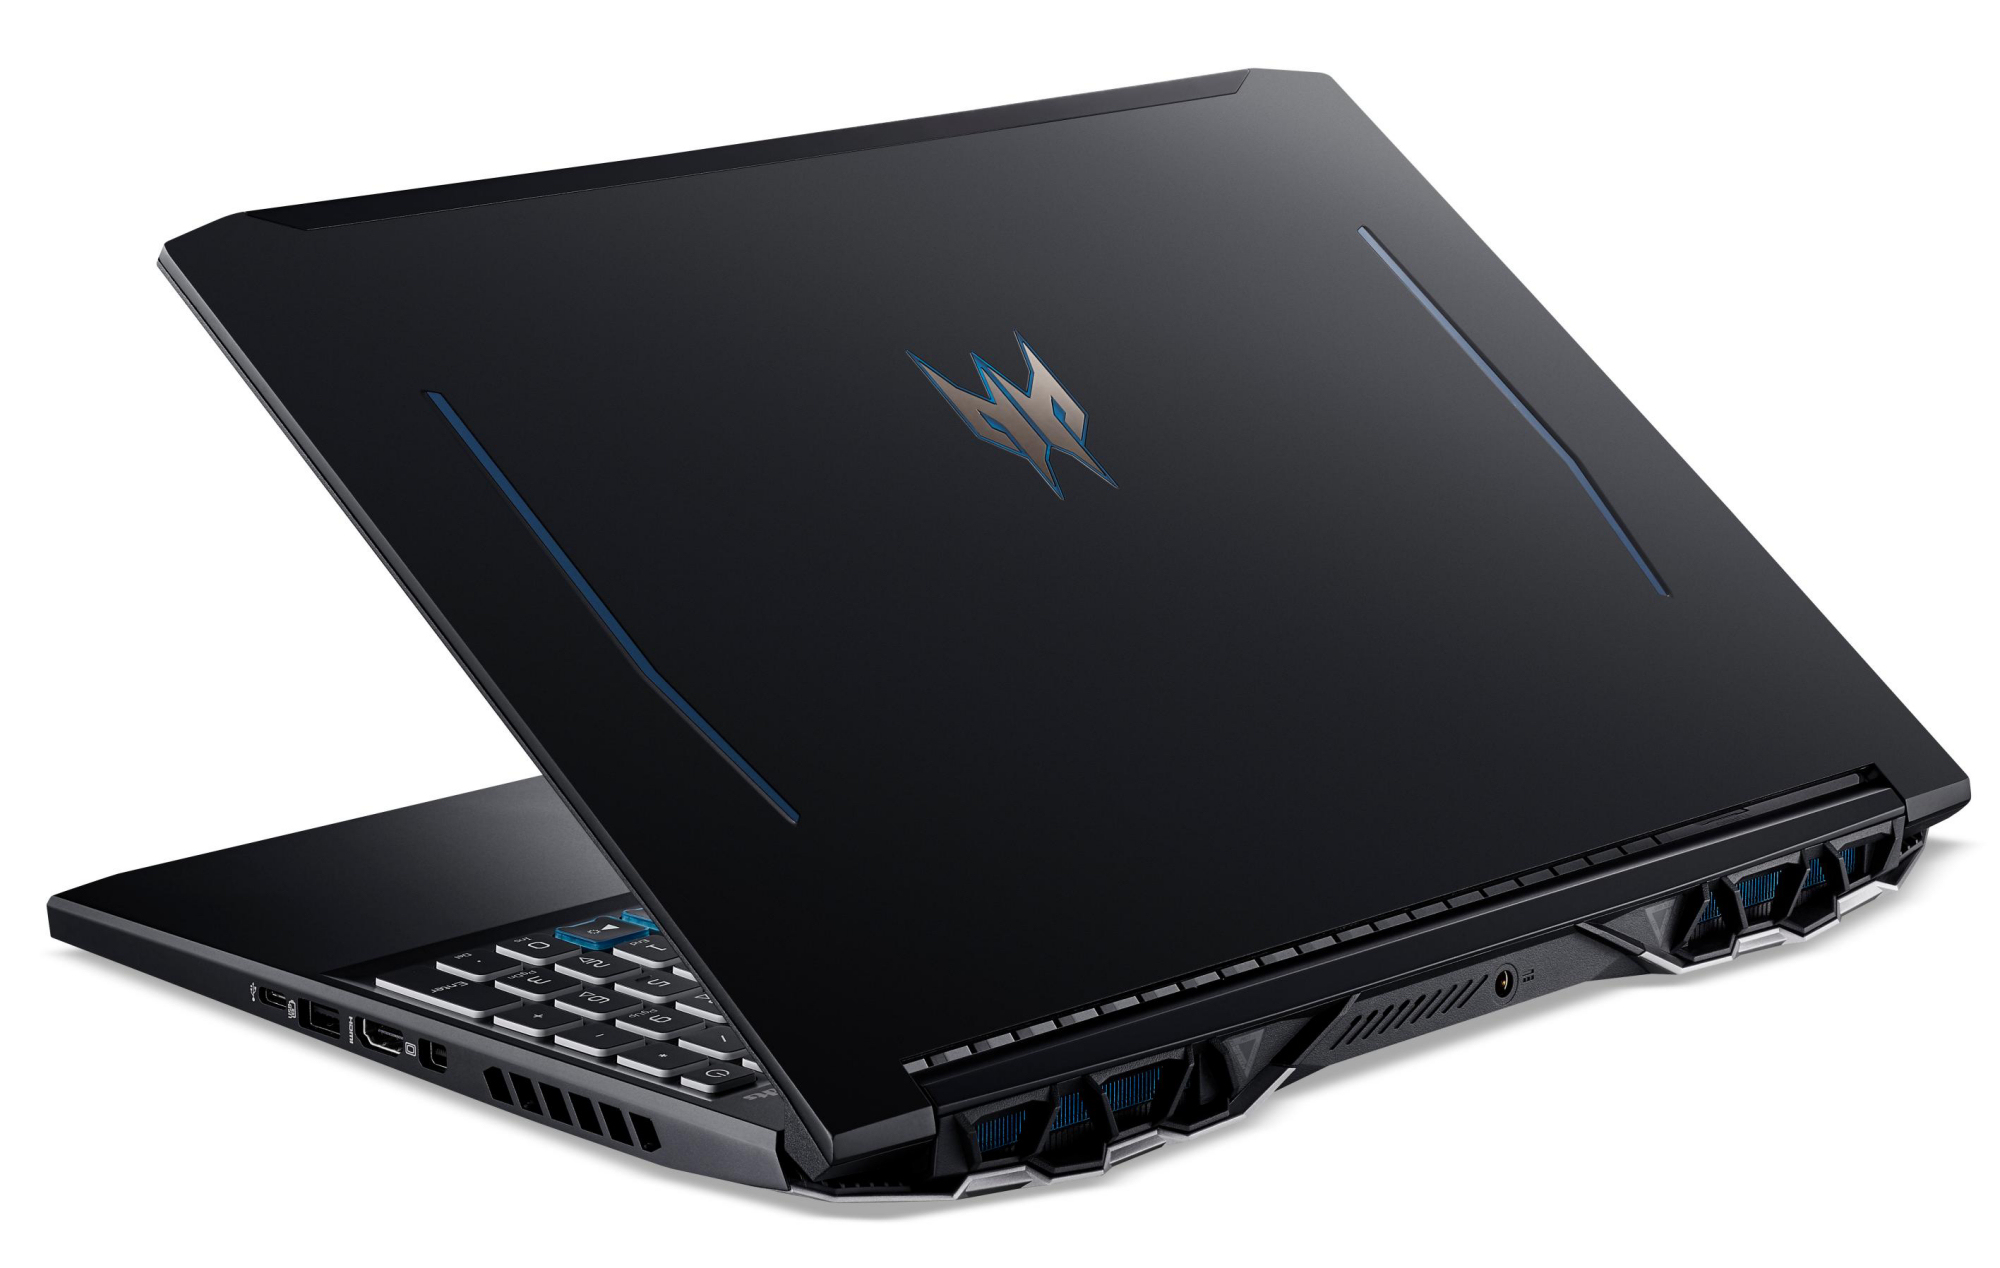
At first glance, the case resembles that of its predecessor. But there are differences. For example, the power supply connector has been moved from the center of the left side to the center of the back. The HDMI output and the Mini DisplayPort have switched places. Furthermore, additional ventilation openings have been created above the keyboard. Moreover, the current model has gained some weight. There's a new addition in terms of ports too: Instead of a USB Type-C 3.2 Gen 1 port, the current Predator model has a USB Type-C 3.2 Gen 2 port on board.


")
")


Display - 144 Hz IPS

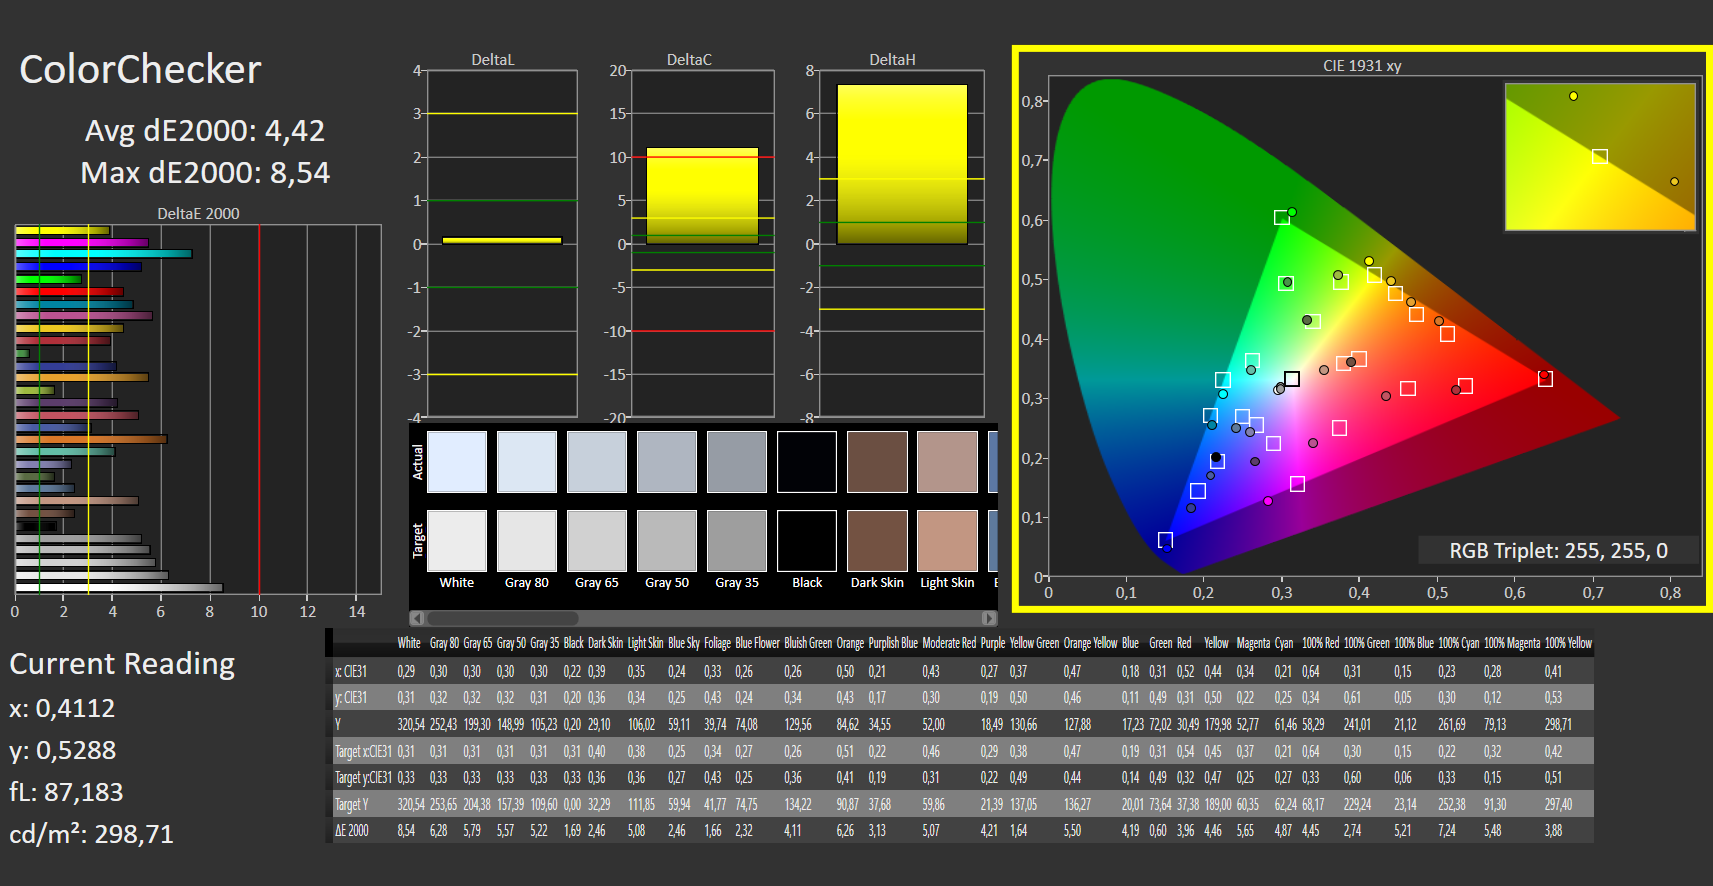
While the contrast (1,450:1) of the matte, viewing-angle stable 15.6-inch display (Full HD, IPS) is good, the brightness (294.3 cd/m²) is just about acceptable. We consider values beyond 300 cd/m² to be good. The 144 Hz panel used offers fast response times and decent color reproduction. Positive: We couldn't detect any PWM flickering.
This is the same panel that was used in the previous model. Nevertheless, the values measured differ slightly. This is a normal condition. Two identical displays will never be 100% consistent.
| |||||||||||||||||||||||||
Brightness Distribution: 83 %
Center on Battery: 254 cd/m²
Contrast: 1450:1 (Black: 0.22 cd/m²)
ΔE ColorChecker Calman: 4.42 | ∀{0.5-29.43 Ø4.72}
ΔE Greyscale Calman: 4.84 | ∀{0.09-98 Ø4.97}
92% sRGB (Argyll 1.6.3 3D)
60% AdobeRGB 1998 (Argyll 1.6.3 3D)
66.3% AdobeRGB 1998 (Argyll 3D)
92.3% sRGB (Argyll 3D)
65.2% Display P3 (Argyll 3D)
Gamma: 2.39
CCT: 6850 K
| Acer Predator Helios 300 PH315-53-77N5 AU Optronics B156HAN08.2, IPS, 1920x1080, 15.6" | Acer Predator Helios 300 PH315-52-79TY AUO, B156HAN08.2, IPS, 1920x1080, 15.6" | Dell G5 15 SE 5505 P89F BOE NV156FH, WVA, 1920x1080, 15.6" | Aorus 5 KB LG Philips LP156WFG-SPB2 (LGD05E8), IPS, 1920x1080, 15.6" | Schenker XMG Core 15 GK5NR0O LM156LF-1F02, IPS, 1920x1080, 15.6" | Asus TUF Gaming A15 FA506IV-HN172 LM156LF-2F01, IPS, 1920x1080, 15.6" | |
|---|---|---|---|---|---|---|
| Display | -1% | -3% | -1% | 3% | -39% | |
| Display P3 Coverage (%) | 65.2 | 64.1 -2% | 63 -3% | 63.4 -3% | 67.2 3% | 38.92 -40% |
| sRGB Coverage (%) | 92.3 | 93 1% | 90.1 -2% | 92.8 1% | 95.9 4% | 58.5 -37% |
| AdobeRGB 1998 Coverage (%) | 66.3 | 65.7 -1% | 64.1 -3% | 64.8 -2% | 68.5 3% | 40.22 -39% |
| Response Times | 15% | -9% | 7% | 29% | -109% | |
| Response Time Grey 50% / Grey 80% * (ms) | 17 ? | 15 ? 12% | 20.4 ? -20% | 14.4 ? 15% | 9.6 ? 44% | 34 ? -100% |
| Response Time Black / White * (ms) | 11 ? | 9 ? 18% | 10.8 ? 2% | 11.2 ? -2% | 9.6 ? 13% | 24 ? -118% |
| PWM Frequency (Hz) | 198.4 ? | |||||
| Screen | -2% | 0% | 10% | -13% | -17% | |
| Brightness middle (cd/m²) | 319 | 325 2% | 292 -8% | 318 0% | 312 -2% | 280 -12% |
| Brightness (cd/m²) | 294 | 310 5% | 290 -1% | 298 1% | 290 -1% | 254 -14% |
| Brightness Distribution (%) | 83 | 82 -1% | 77 -7% | 87 5% | 87 5% | 88 6% |
| Black Level * (cd/m²) | 0.22 | 0.255 -16% | 0.27 -23% | 0.3 -36% | 0.2 9% | 0.15 32% |
| Contrast (:1) | 1450 | 1275 -12% | 1081 -25% | 1060 -27% | 1560 8% | 1867 29% |
| Colorchecker dE 2000 * | 4.42 | 4.28 3% | 3.99 10% | 2.49 44% | 4.84 -10% | 5.89 -33% |
| Colorchecker dE 2000 max. * | 8.54 | 8.42 1% | 6.11 28% | 5.06 41% | 13.85 -62% | 19 -122% |
| Greyscale dE 2000 * | 4.84 | 5.01 -4% | 3.3 32% | 1.6 67% | 9 -86% | 4.08 16% |
| Gamma | 2.39 92% | 2.6 85% | 2.25 98% | 2.211 100% | 2.105 105% | 2.33 94% |
| CCT | 6850 95% | 7678 85% | 7047 92% | 6714 97% | 8099 80% | 7303 89% |
| Color Space (Percent of AdobeRGB 1998) (%) | 60 | 60 0% | 58.1 -3% | 65 8% | 68 13% | 37 -38% |
| Color Space (Percent of sRGB) (%) | 92 | 93 1% | 89.7 -2% | 89 -3% | 92 0% | 58 -37% |
| Colorchecker dE 2000 calibrated * | 1.45 | 3.02 | 1.53 | 1.77 | 4.79 | |
| Total Average (Program / Settings) | 4% /
0% | -4% /
-2% | 5% /
7% | 6% /
-4% | -55% /
-34% |
* ... smaller is better


Display Response Times
| ↔ Response Time Black to White | ||
|---|---|---|
| 11 ms ... rise ↗ and fall ↘ combined | ↗ 6 ms rise | 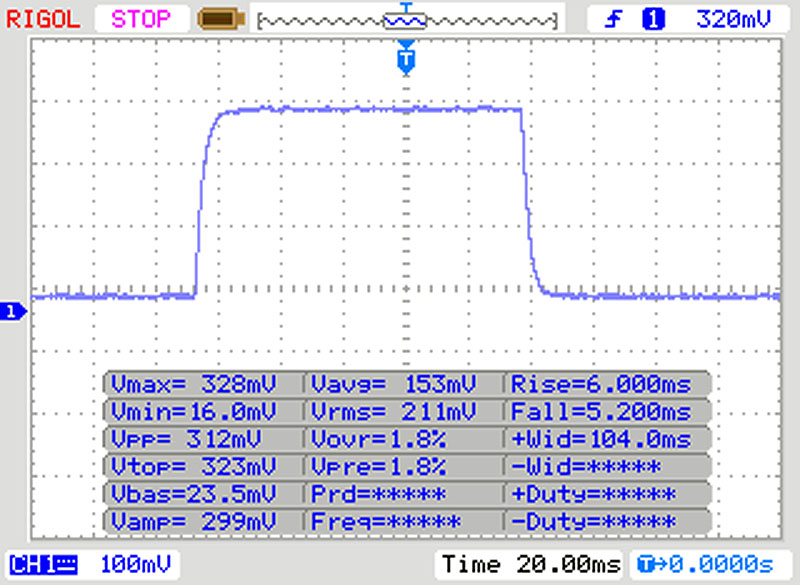 |
| ↘ 5 ms fall | ||
| The screen shows good response rates in our tests, but may be too slow for competitive gamers. In comparison, all tested devices range from 0.1 (minimum) to 240 (maximum) ms. » 30 % of all devices are better. This means that the measured response time is better than the average of all tested devices (19.8 ms). | ||
| ↔ Response Time 50% Grey to 80% Grey | ||
| 17 ms ... rise ↗ and fall ↘ combined | ↗ 9 ms rise | 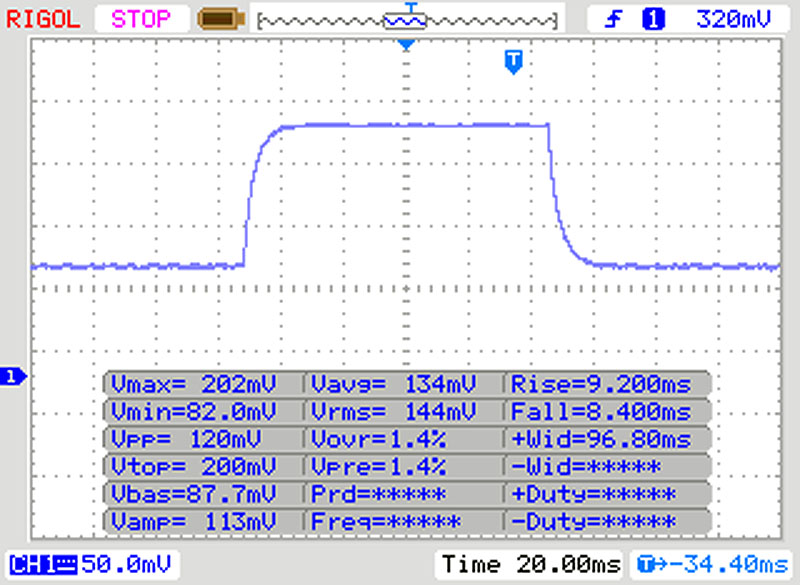 |
| ↘ 8 ms fall | ||
| The screen shows good response rates in our tests, but may be too slow for competitive gamers. In comparison, all tested devices range from 0.165 (minimum) to 636 (maximum) ms. » 31 % of all devices are better. This means that the measured response time is better than the average of all tested devices (31 ms). | ||
Screen Flickering / PWM (Pulse-Width Modulation)
| Screen flickering / PWM not detected | 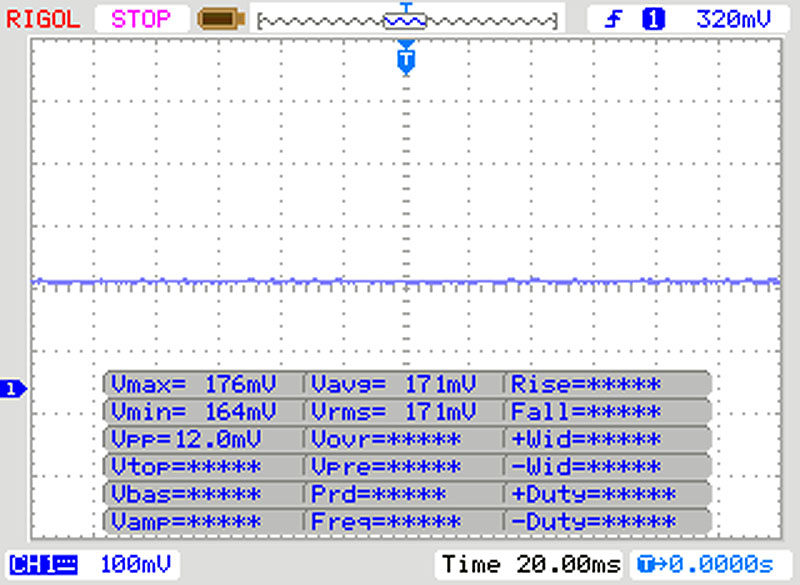 | ||
In comparison: 52 % of all tested devices do not use PWM to dim the display. If PWM was detected, an average of 7753 (minimum: 5 - maximum: 343500) Hz was measured. | |||
Performance - Predator with automatic GPU overclocking
With the Predator Helios 300, Acer has a 15.6-inch gaming laptop in its range that brings every modern game smoothly onto the screen. The price of our test device should be approximately between 1,500 and 1,600 Euros (~$1,744 and ~$1,860). Other configuration variants are available. The prices start at around 1,020 Euros (~$1,186).


Test conditions
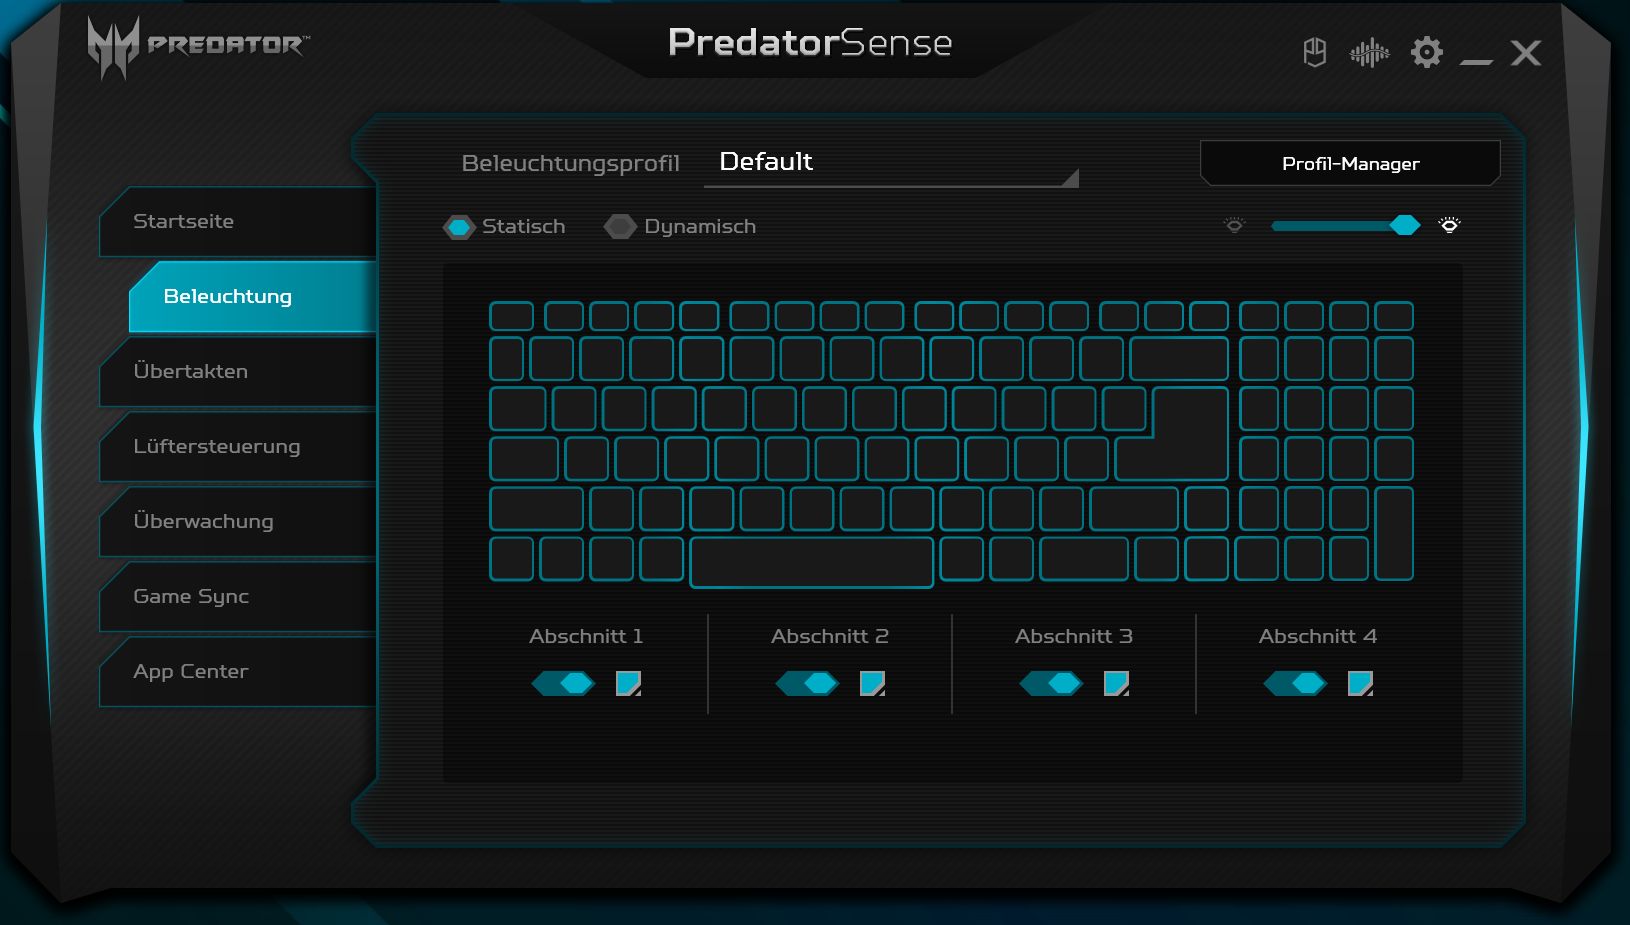
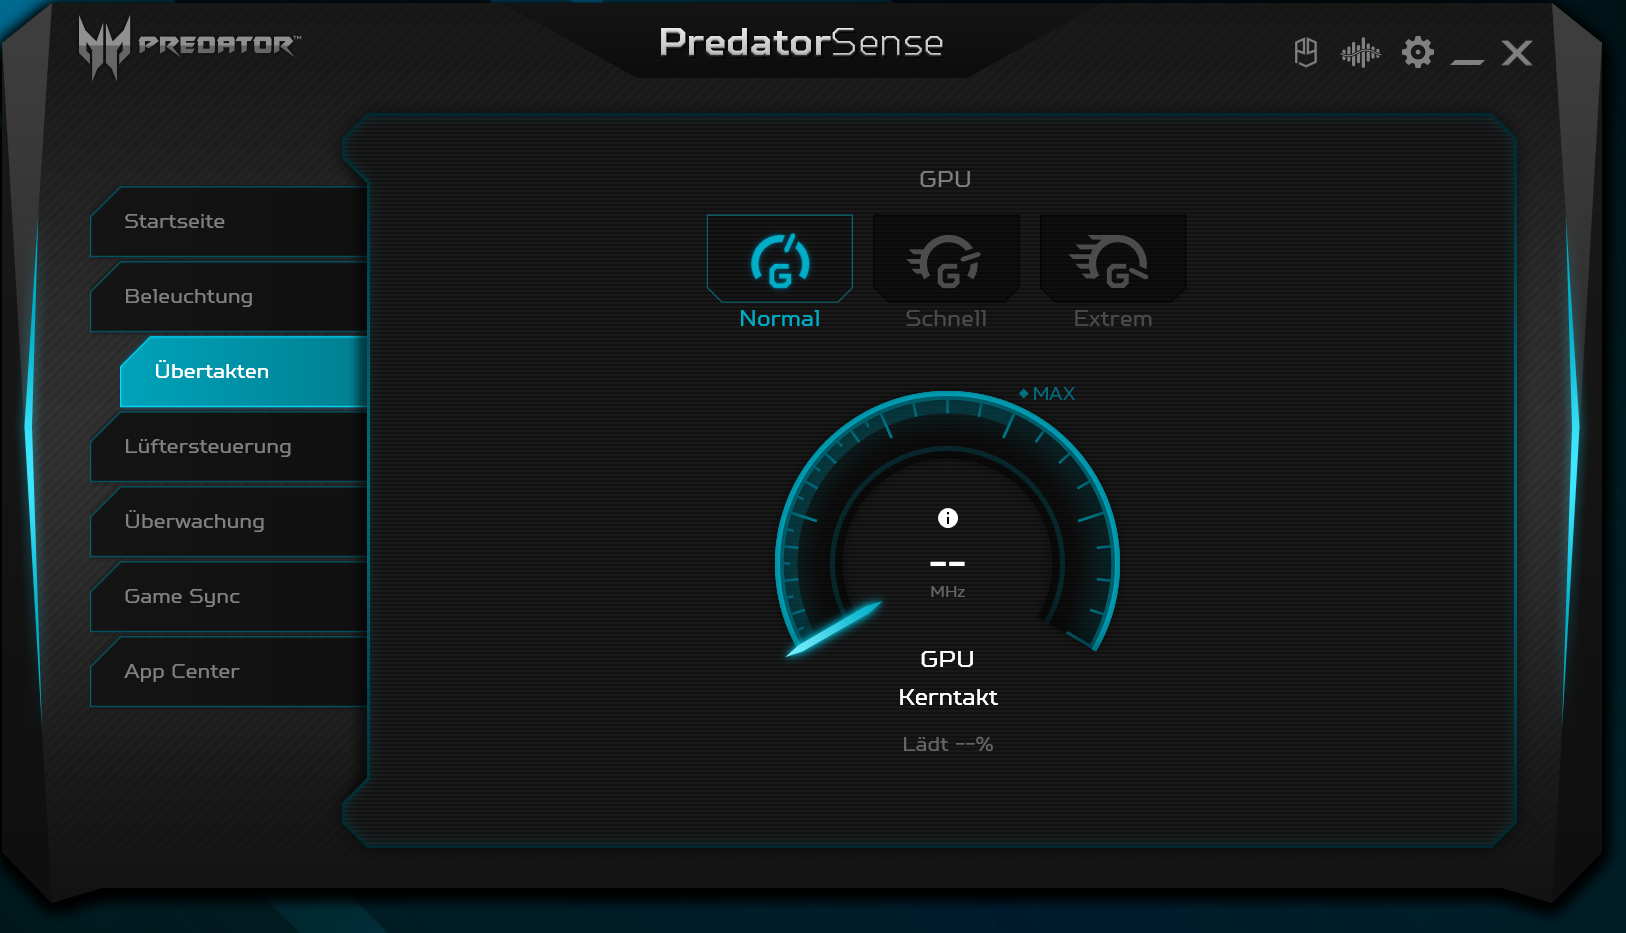
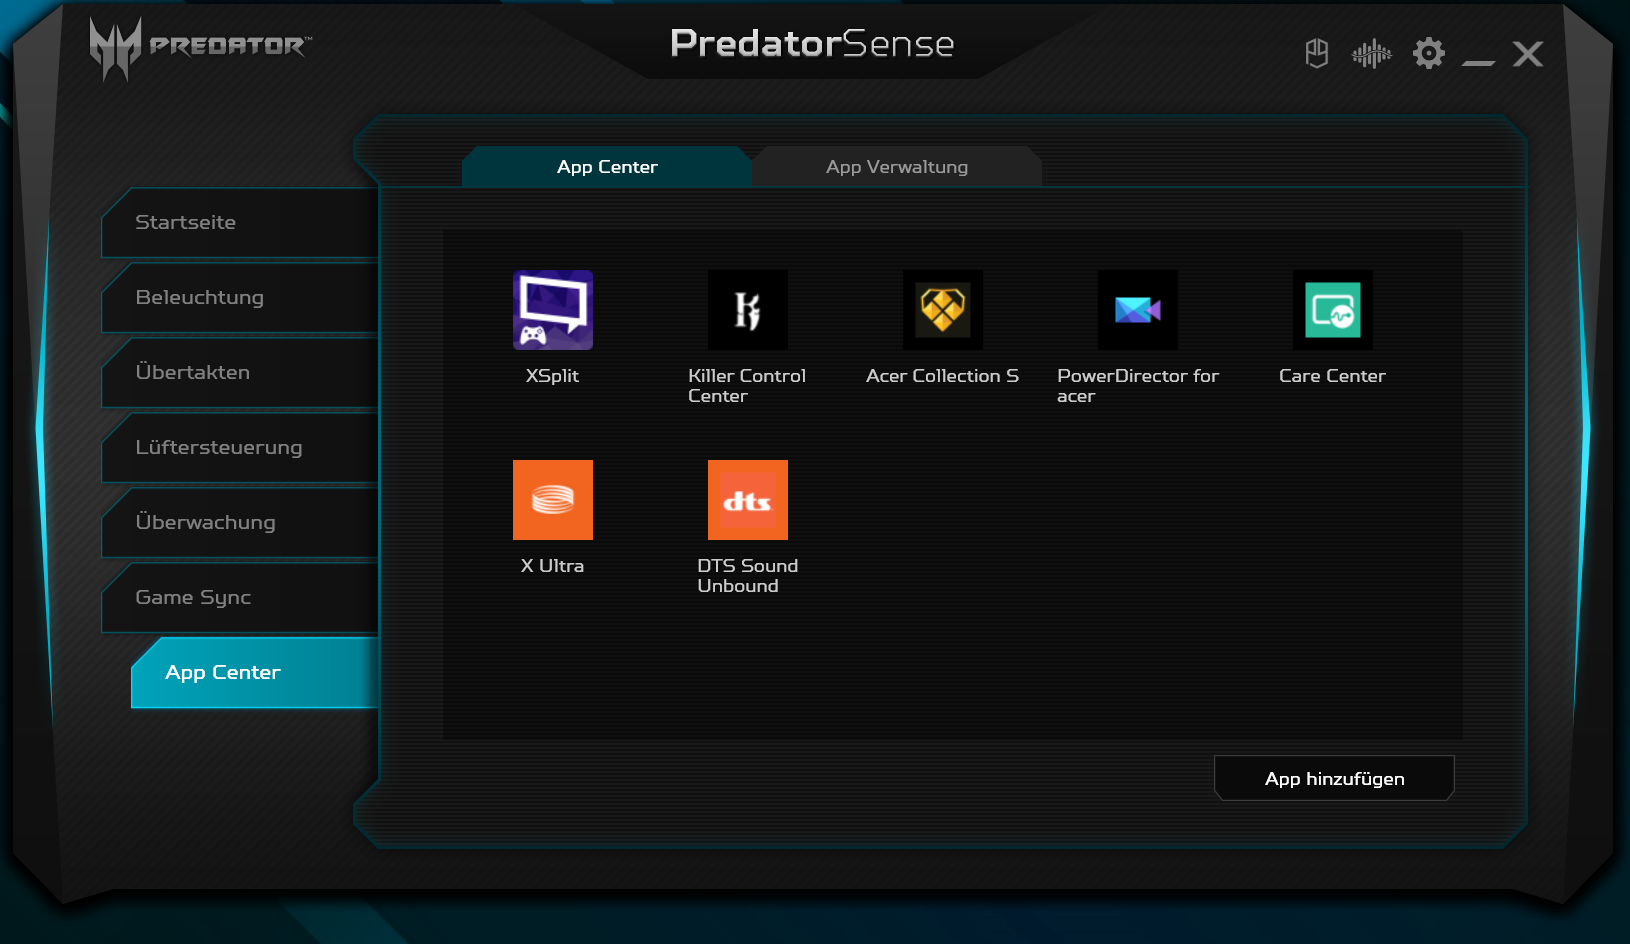
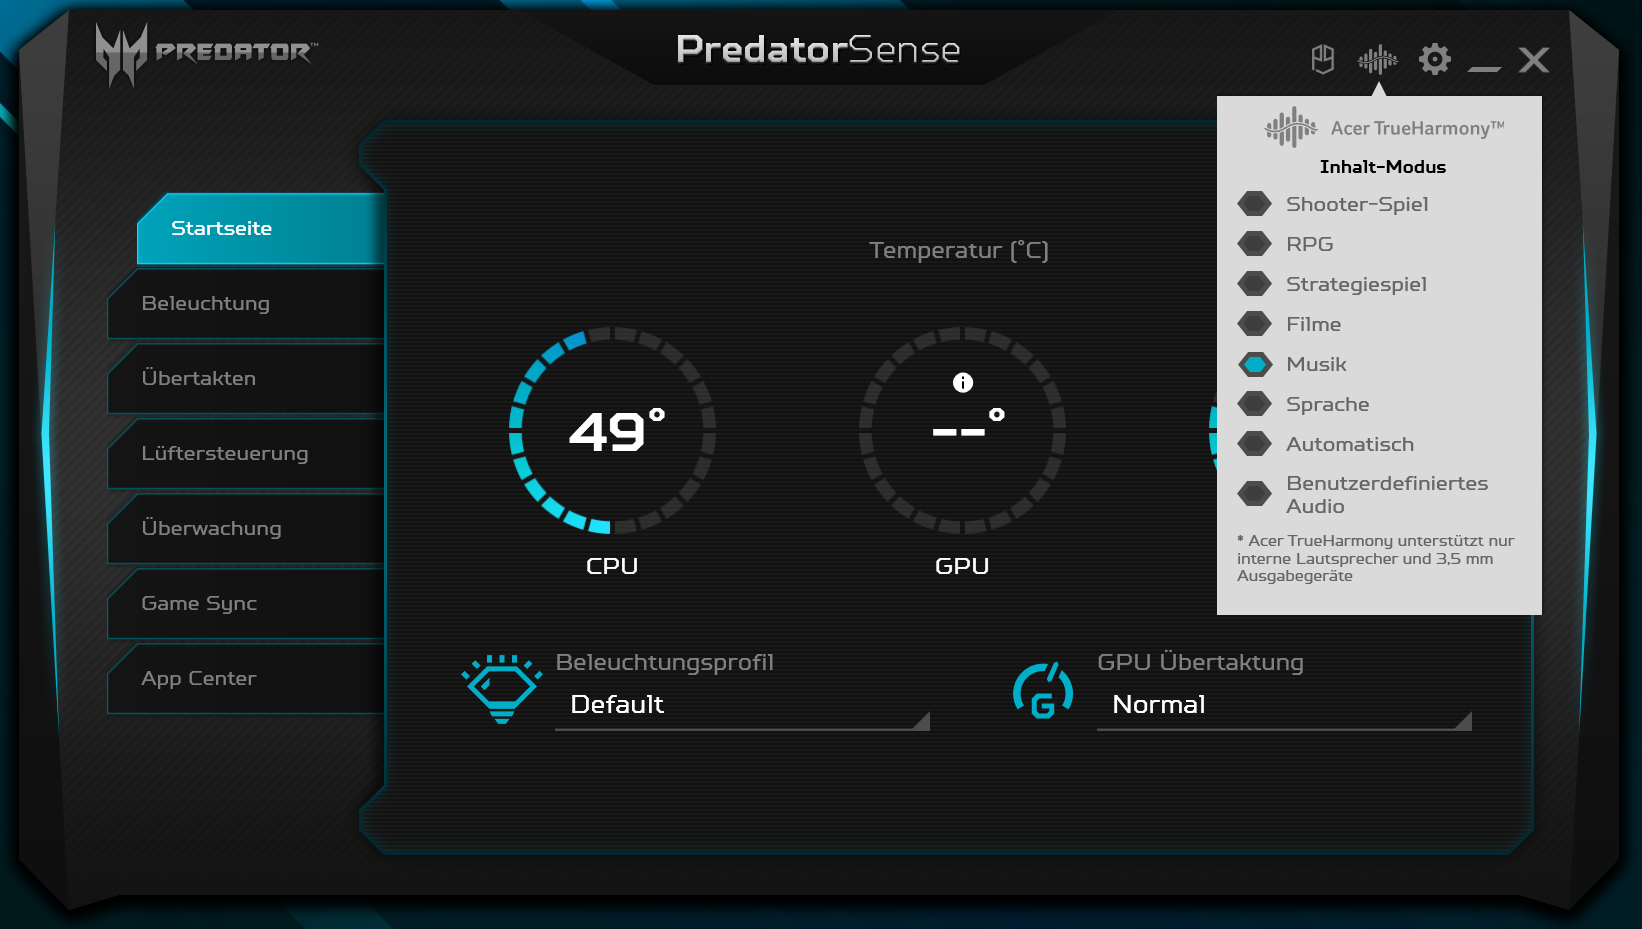
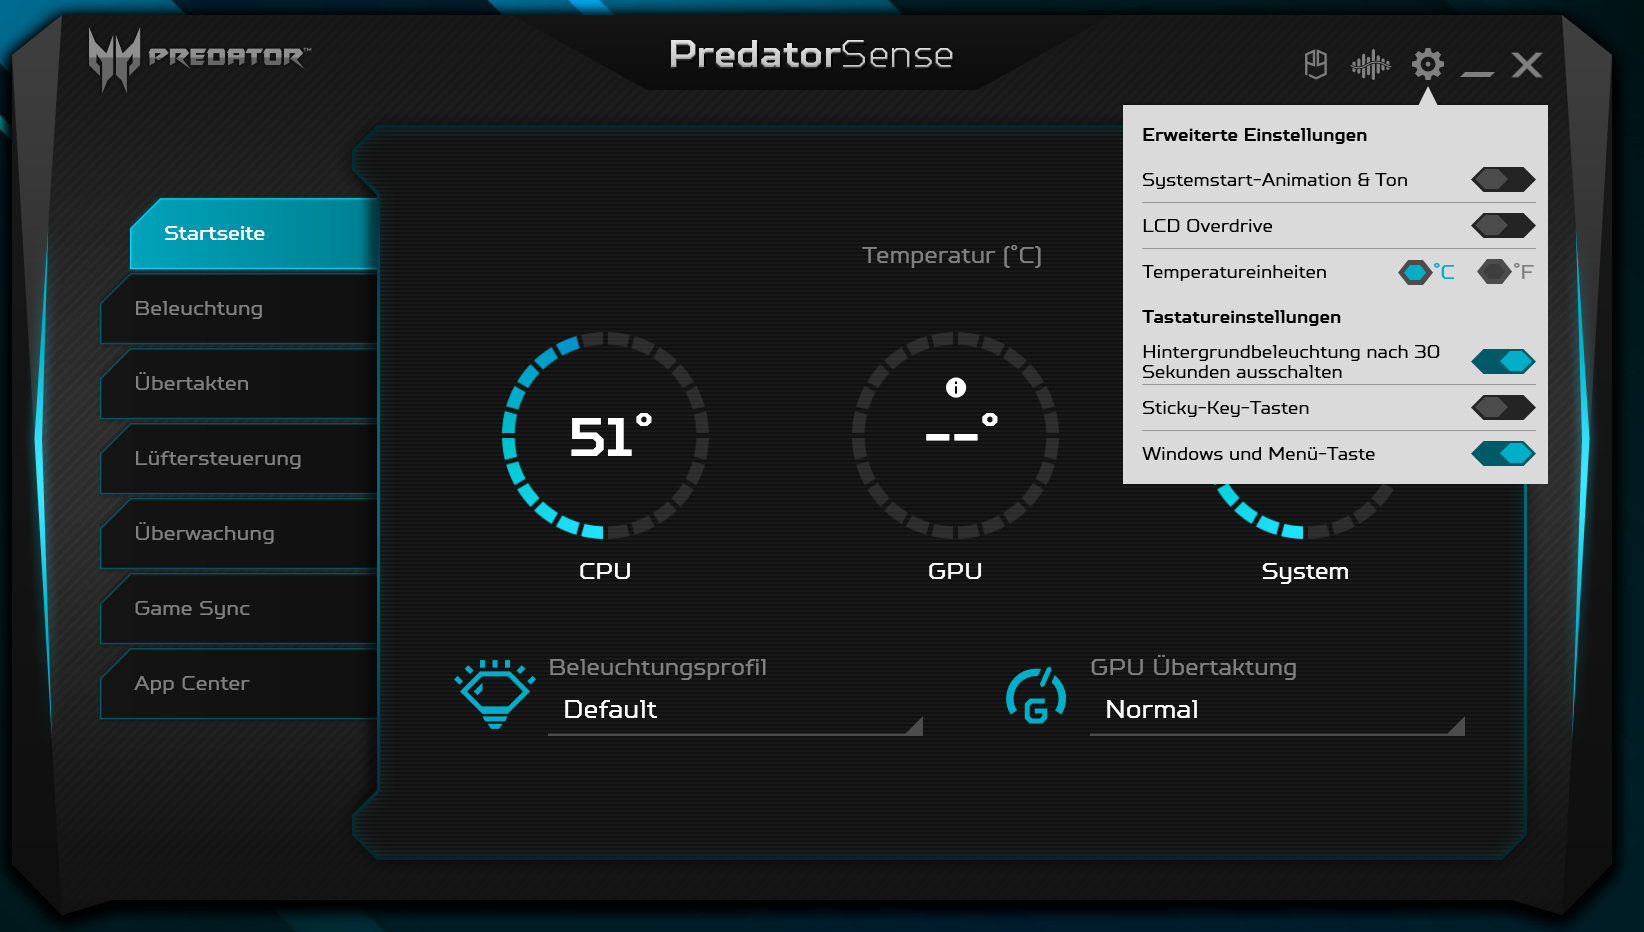
The preinstalled Predator Sense software allows fan control adjustment and automatic GPU overclocking. The GPU profiles "Normal", "Fast" and "Extreme" are available. We conducted our test with automatic fan control and under the "Normal" GPU profile. Some benchmarks were additionally run under the "Extreme" profile.
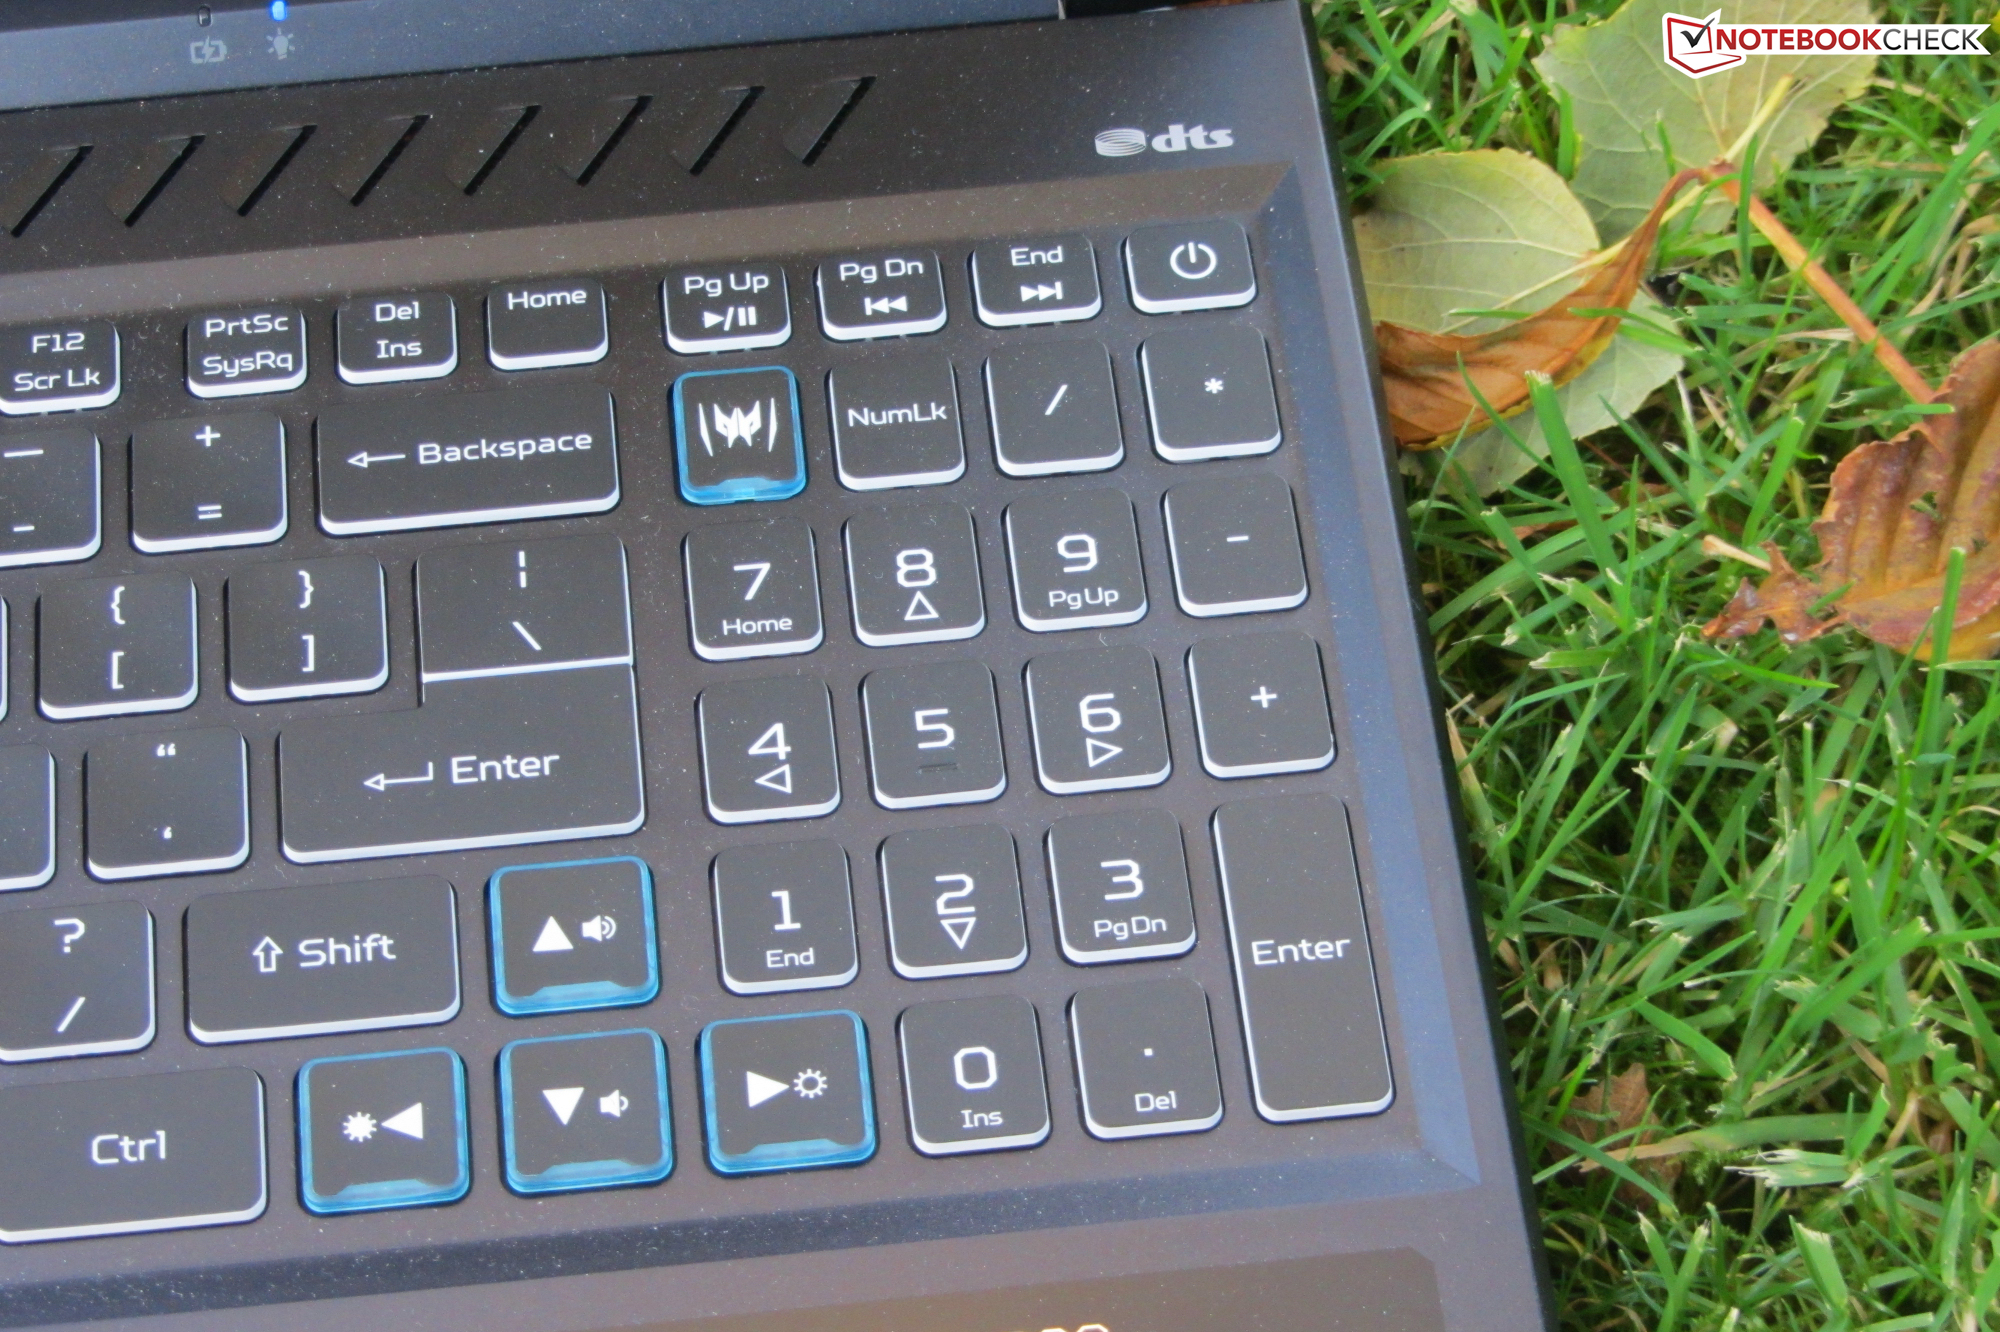
Acer has placed a "Turbo" key above the keyboard. If this button is pressed, the fans run permanently at full power, and the "Extreme" GPU profile is activated.


Processor
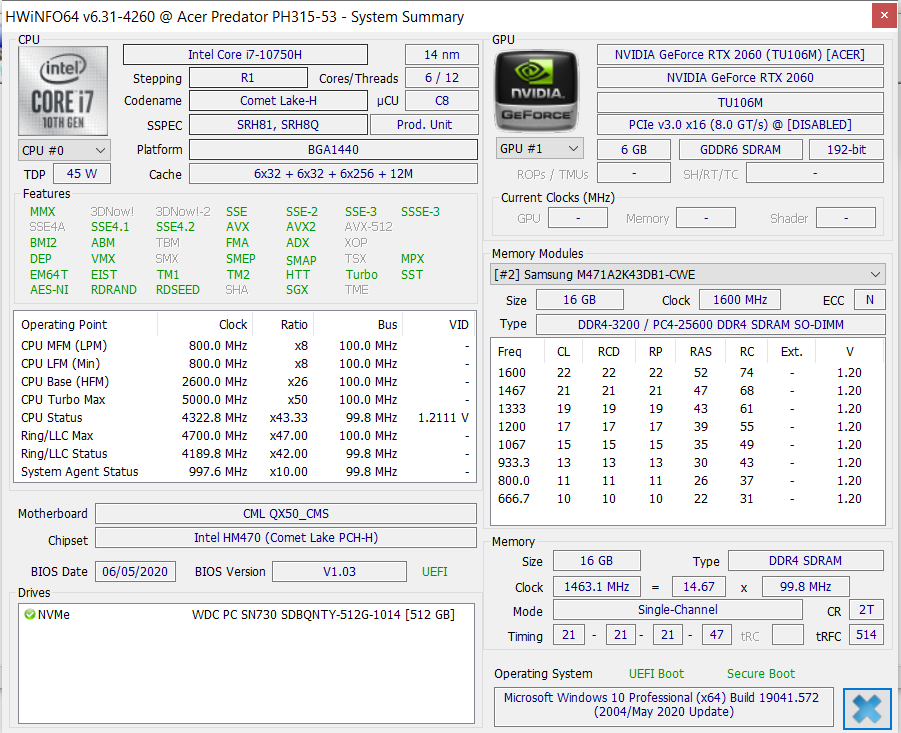
The Core i7-10750H hexa-core processor (Comet Lake) operates at a base speed of 2.6 GHz. The clock speed can be increased to 4.3 GHz (six cores) or 5 GHz (one core) via Turbo. Hyper-Threading (two threads per core) is supported.
The processor works through the CPU tests of the Cinebench R15 benchmark at 4.2 GHz (multithread) and 4.2 to 5 GHz (single-thread), respectively. On battery power, the clock rates are 2.4 to 2.6 GHz (multithread) and 2.4 to 3.2 GHz (single-thread), respectively.
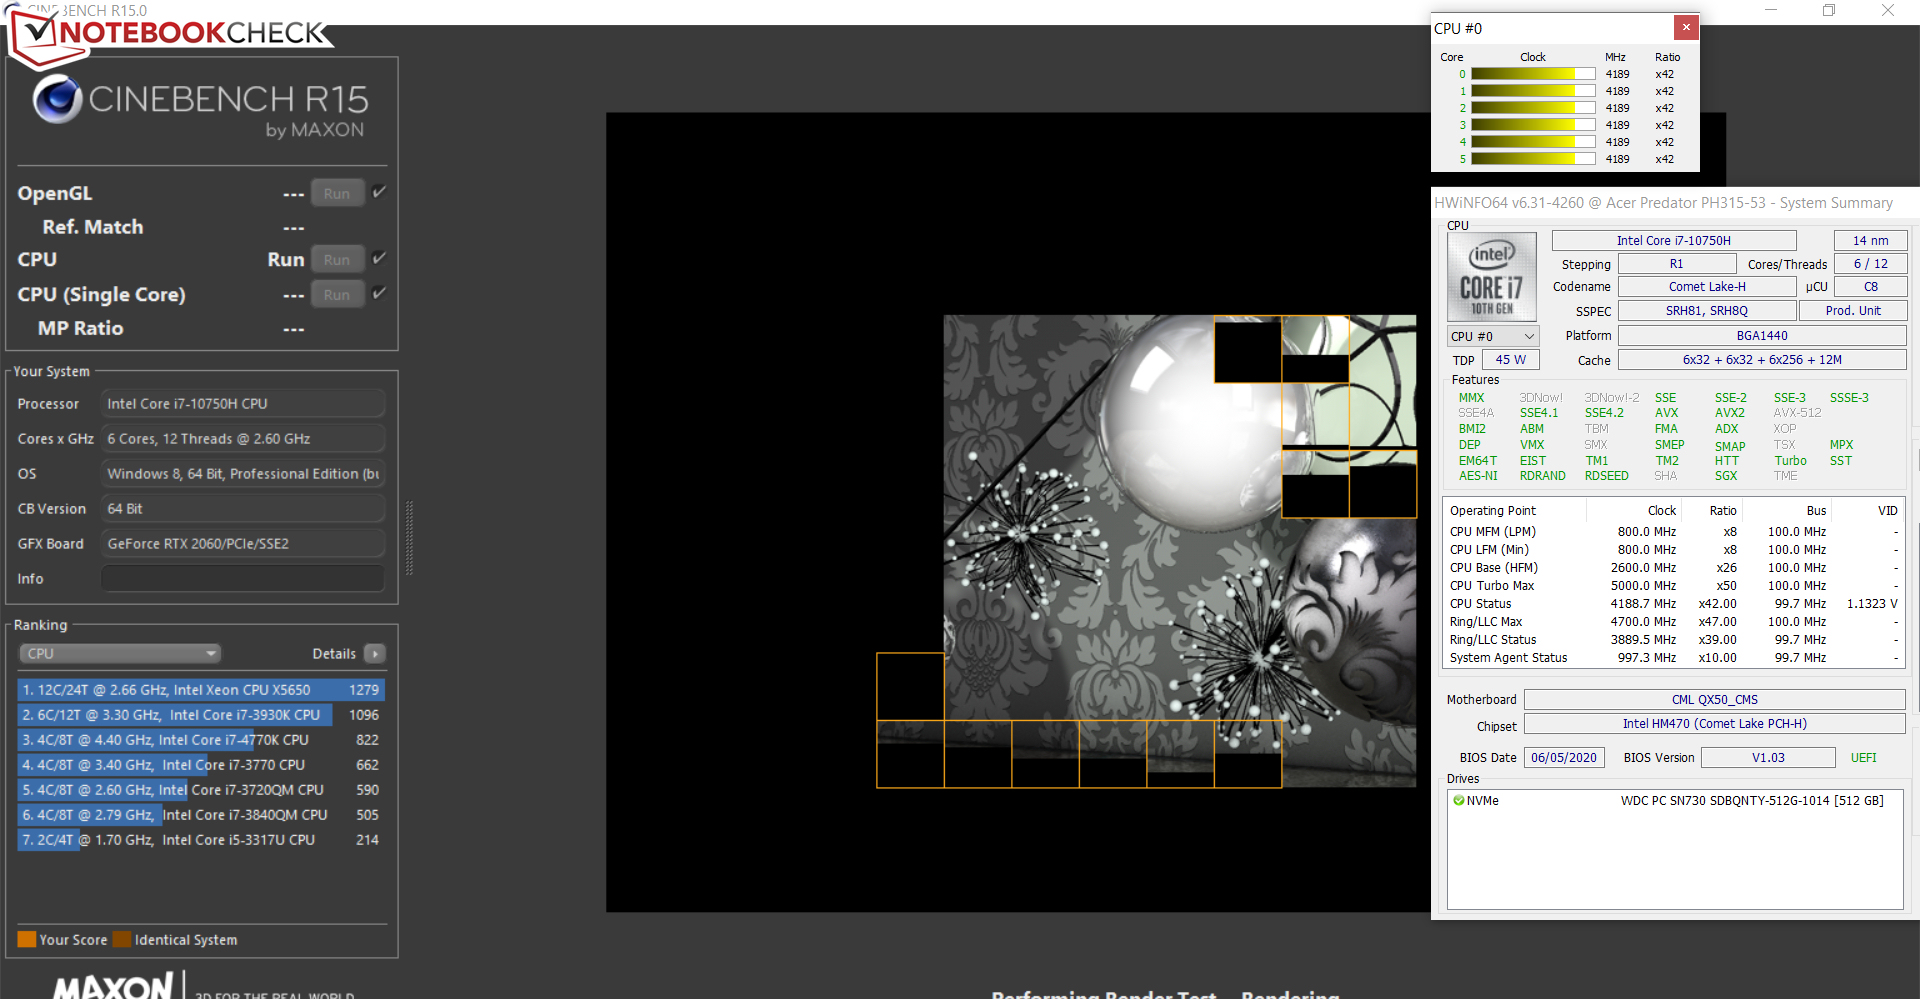
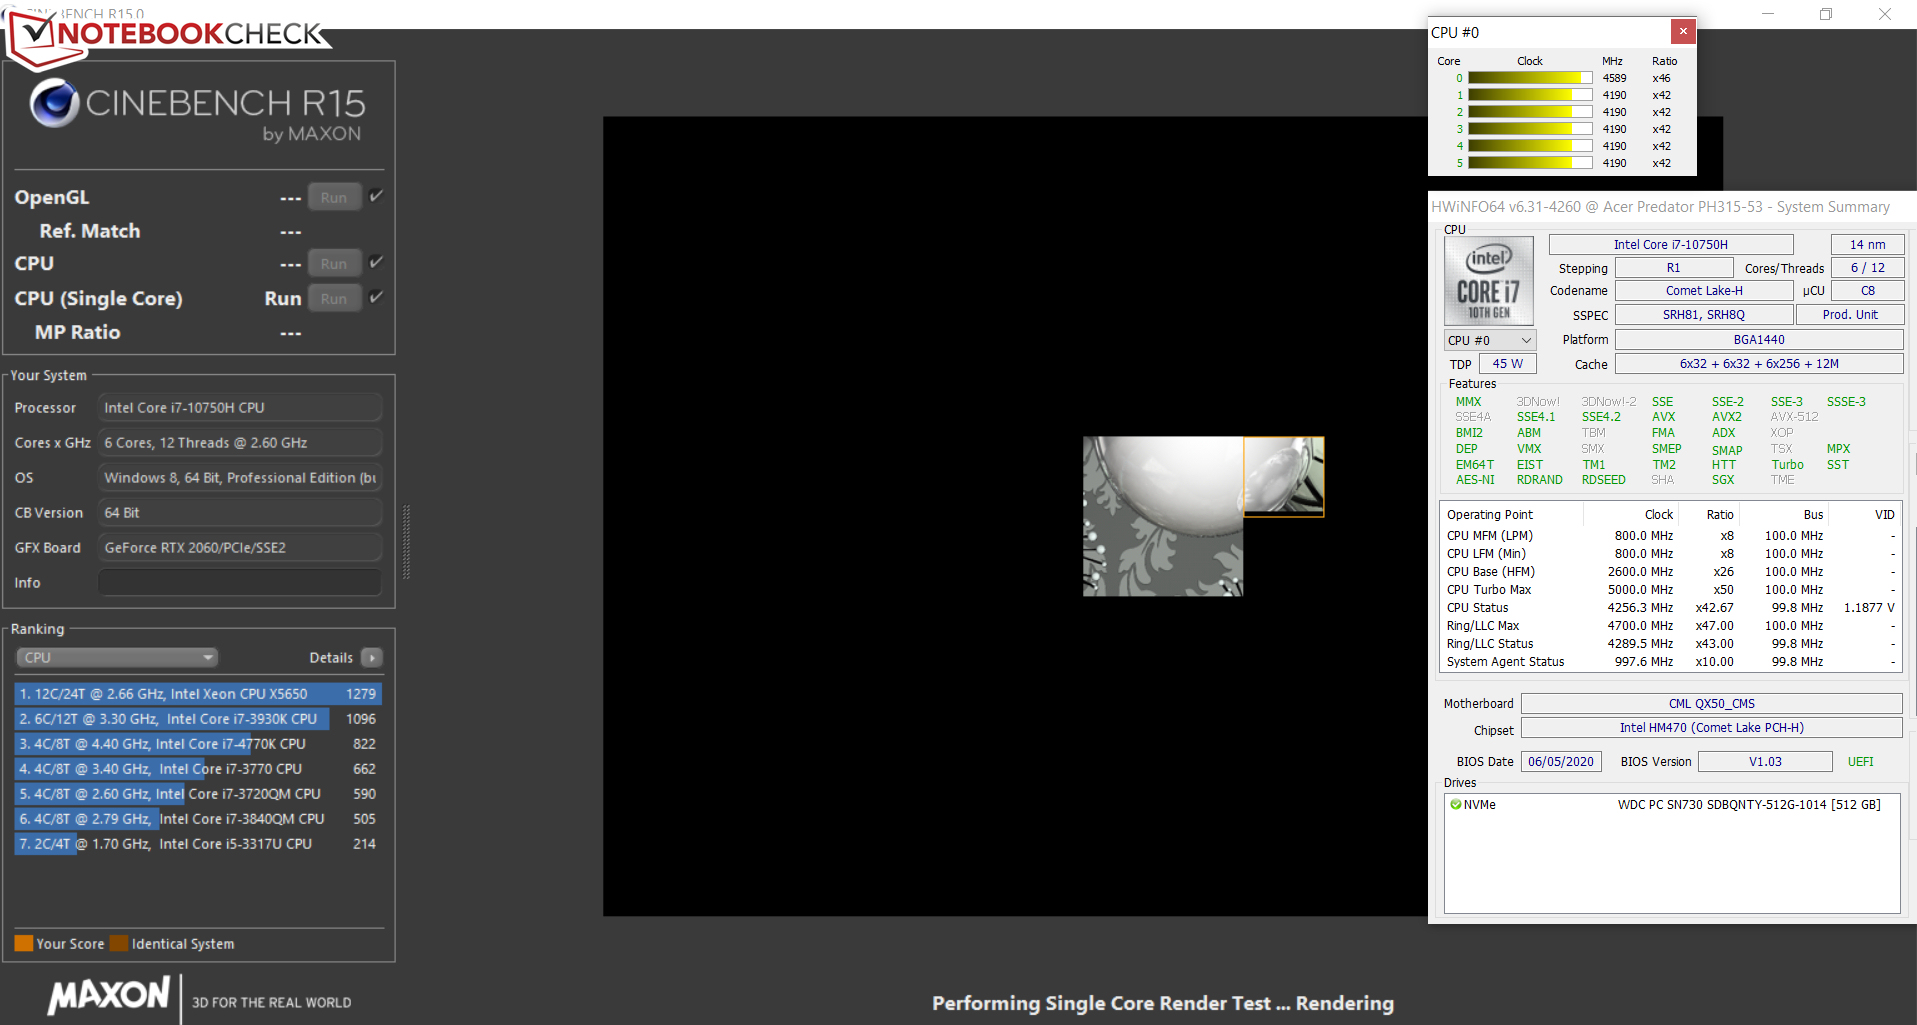
We verify if the CPU Turbo is consistently used when plugged in by running the Cinebench R15 benchmark's multithread test in a continuous loop for at least 30 minutes. Turbo is used to a large extent.

* ... smaller is better
System performance
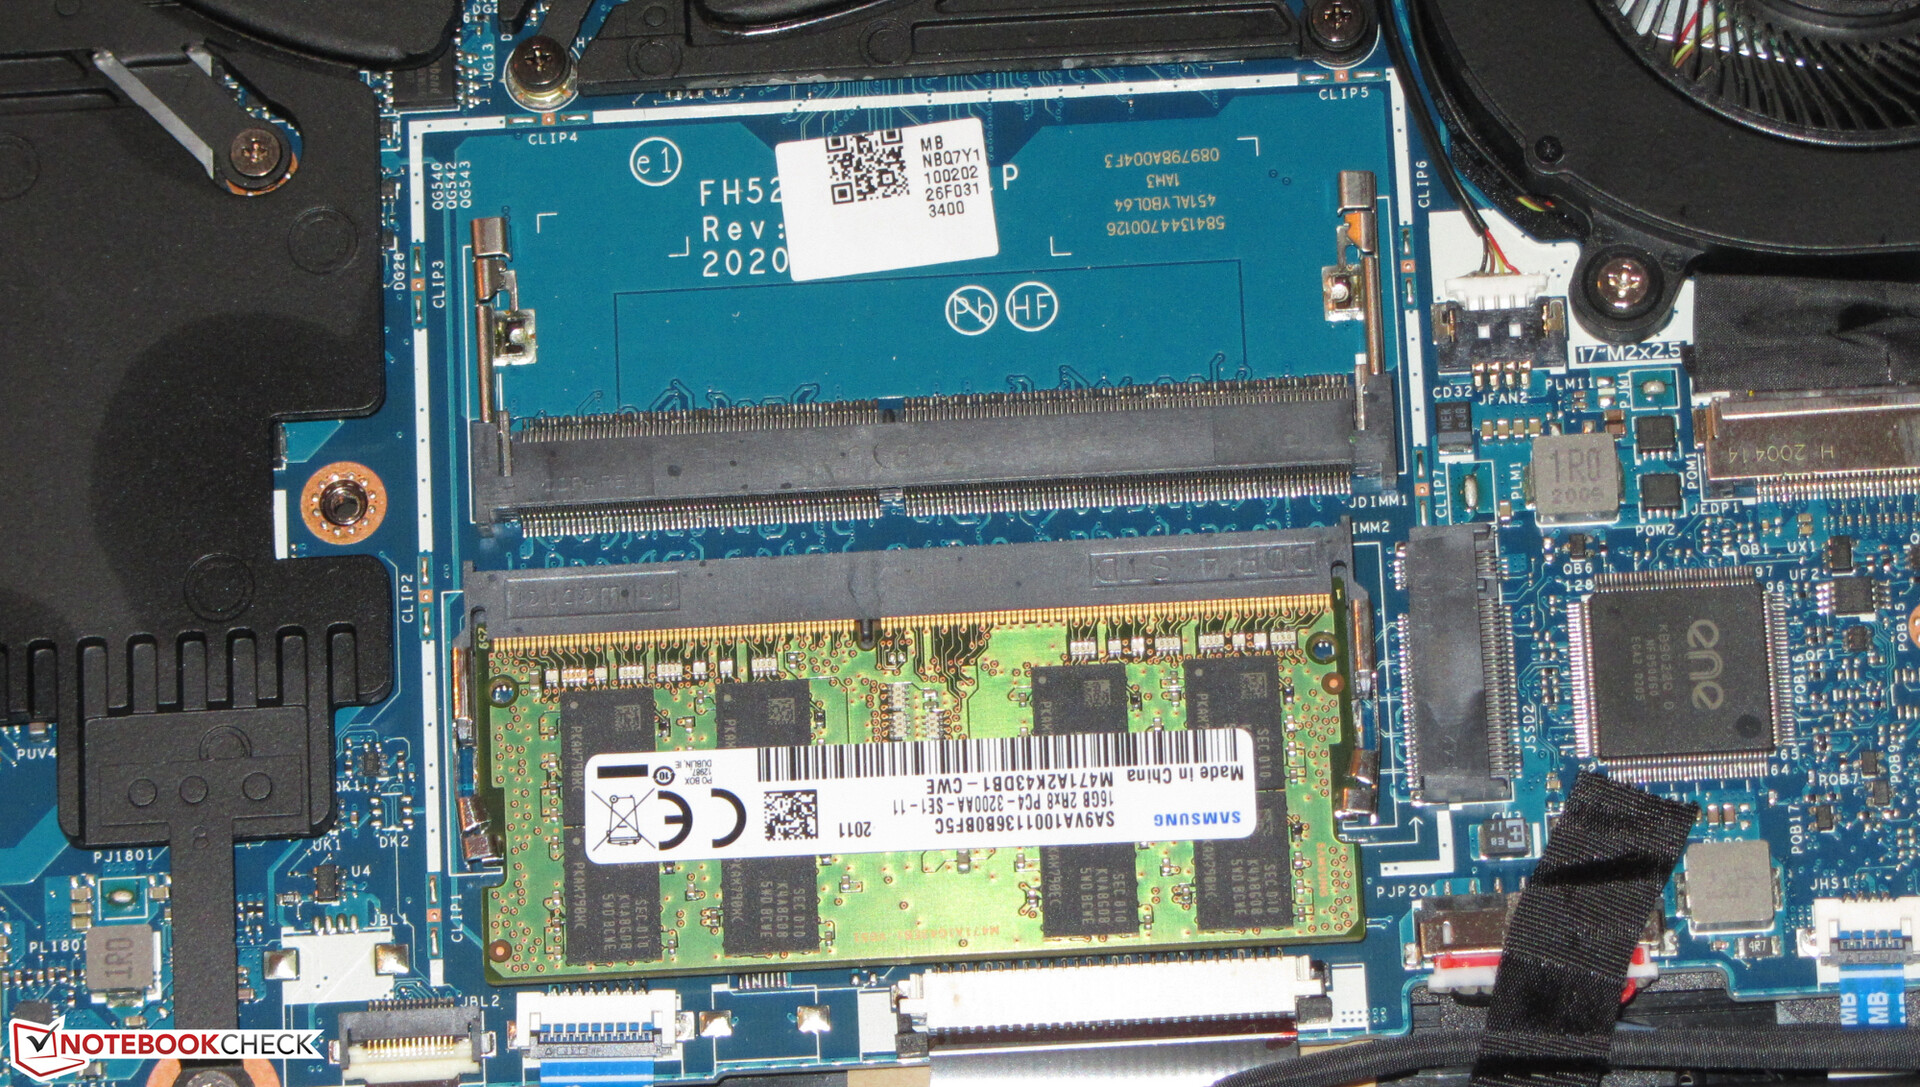
The system is fast and smooth. The PCMark results are good. The laptop offers enough computing power for performance-demanding applications such as gaming, video-editing, and image-processing for the coming years. A slight increase in performance could be achieved by activating dual-channel mode. For this purpose, the laptop would have to be equipped with a second memory module.
| PCMark 8 Home Score Accelerated v2 | 4160 points | |
| PCMark 8 Creative Score Accelerated v2 | 5899 points | |
| PCMark 8 Work Score Accelerated v2 | 5405 points | |
| PCMark 10 Score | 5921 points | |
Help | ||
DPC latencies
In our standardized latency monitor test (web surfing, 4K video playback, high-load Prime95), we could observe issues with the DPC latencies. The system doesn't seem to be suitable for real-time video and audio-editing.


| DPC Latencies / LatencyMon - interrupt to process latency (max), Web, Youtube, Prime95 | |
| Dell G5 15 SE 5505 P89F | |
| Schenker XMG Core 15 GK5NR0O | |
| MSI Bravo 15 A4DCR | |
| Aorus 5 KB | |
| Acer Predator Helios 300 PH315-53-77N5 | |
| Asus TUF Gaming A15 FA506IV-HN172 | |
| HP Pavilion Gaming 15-ec1177ng | |
* ... smaller is better
Storage
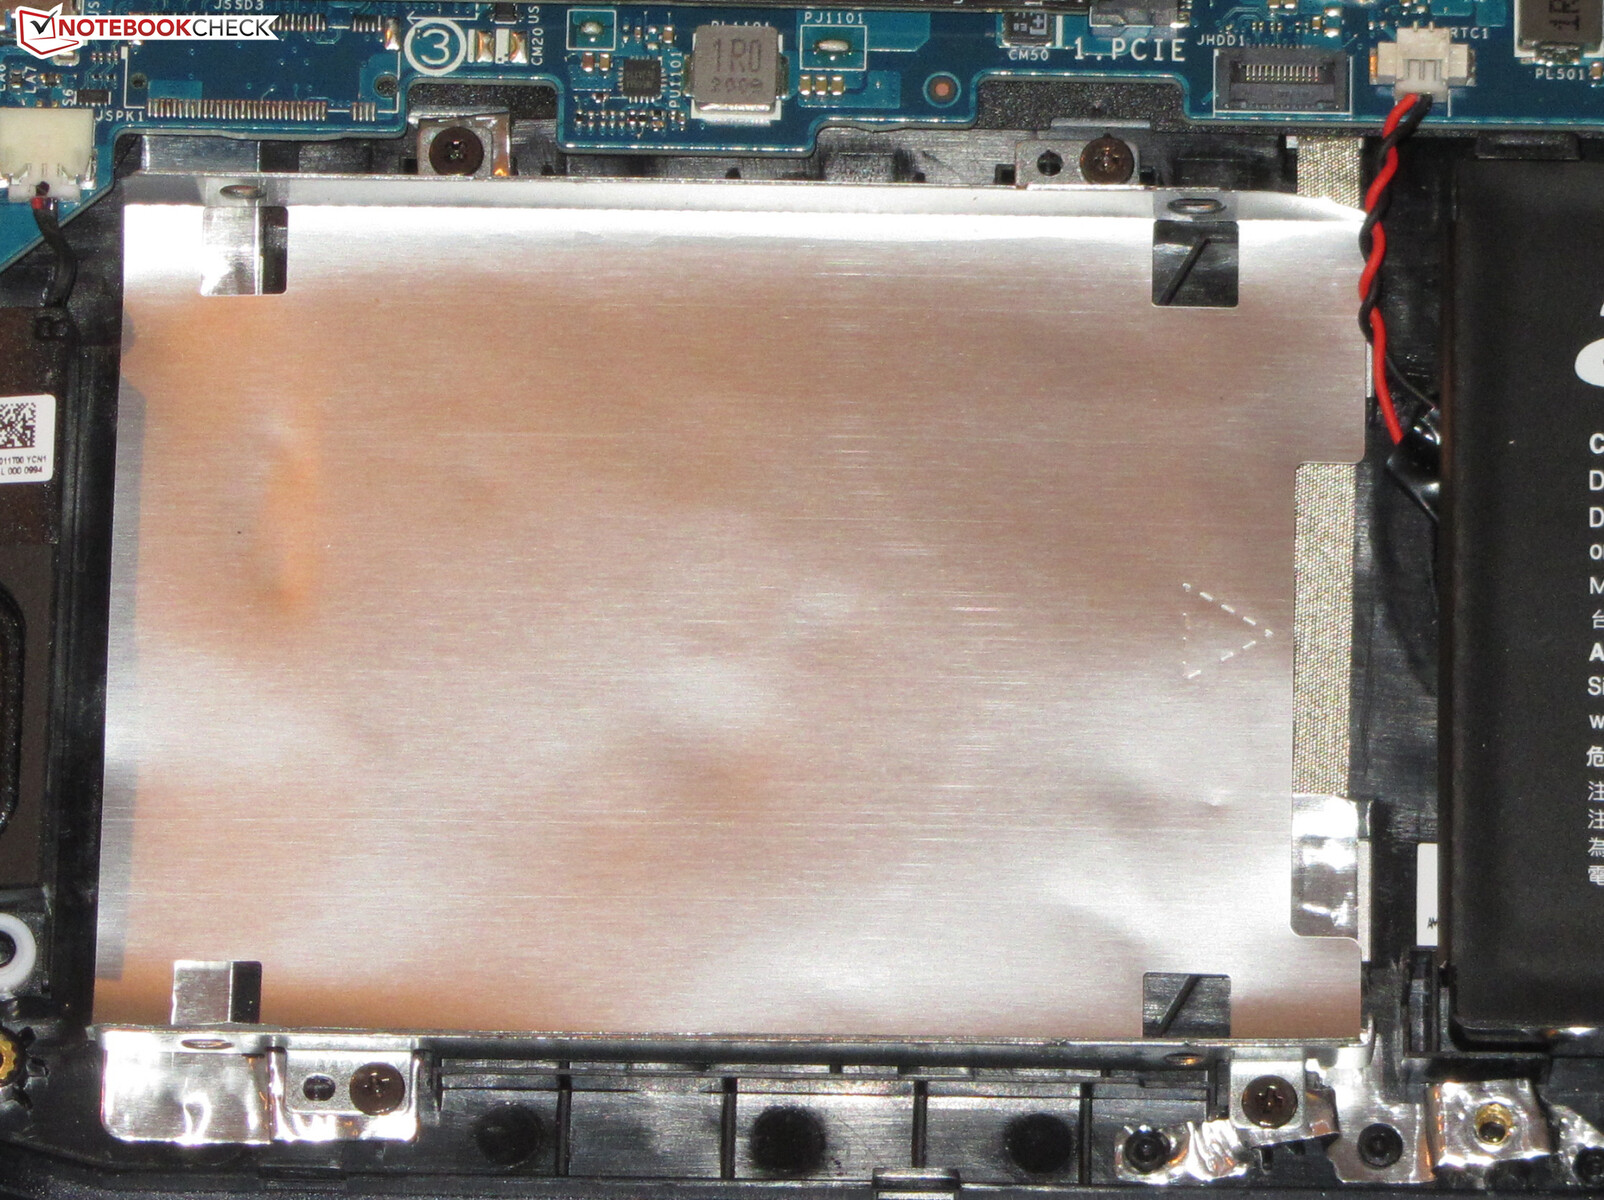
The laptop can accommodate two NVMe SSDs in the M.2 2280 format, which could form a RAID 0 array if required. Our test device is only equipped with one NVMe SSD that provides 512 GB of storage space. The transfer rates are good. Furthermore, the Predator still has room for a 2.5-inch storage medium. Our test device can't be upgraded with that type of drive, because the necessary SATA slot is not included.


| Acer Predator Helios 300 PH315-53-77N5 WDC PC SN730 SDBQNTY-512GB | Acer Predator Helios 300 PH315-52-79TY WDC PC SN720 SDAPNTW-512G | Dell G5 15 SE 5505 P89F Samsung PM991 MZ9LQ512HALU | Aorus 5 KB ADATA XPG SX8200 Pro (ASX8200PNP-512GT) | Schenker XMG Core 15 GK5NR0O Samsung SSD 970 EVO Plus 500GB | Asus TUF Gaming A15 FA506IV-HN172 Kingston OM8PCP3512F-AB | Average WDC PC SN730 SDBQNTY-512GB | |
|---|---|---|---|---|---|---|---|
| CrystalDiskMark 5.2 / 6 | -7% | -17% | 11% | 29% | -13% | -2% | |
| Write 4K (MB/s) | 137.5 | 108.7 -21% | 142.1 3% | 162.1 18% | 233 69% | 219.8 60% | 140.9 ? 2% |
| Read 4K (MB/s) | 48.24 | 44.91 -7% | 46.43 -4% | 60.7 26% | 54.5 13% | 50.2 4% | 45.6 ? -5% |
| Write Seq (MB/s) | 2644 | 2424 -8% | 1108 -58% | 2366 -11% | 3050 15% | 979 -63% | 2066 ? -22% |
| Read Seq (MB/s) | 1718 | 1617 -6% | 1622 -6% | 2633 53% | 3042 77% | 1990 16% | 2014 ? 17% |
| Write 4K Q32T1 (MB/s) | 416.6 | 356.9 -14% | 467 12% | 428.2 3% | 520 25% | 516 24% | 472 ? 13% |
| Read 4K Q32T1 (MB/s) | 525 | 557 6% | 525 0% | 582 11% | 546 4% | 298.3 -43% | 453 ? -14% |
| Write Seq Q32T1 (MB/s) | 2705 | 2542 -6% | 1203 -56% | 2480 -8% | 3241 20% | 982 -64% | 2433 ? -10% |
| Read Seq Q32T1 (MB/s) | 3213 | 3218 0% | 2288 -29% | 3121 -3% | 3538 10% | 1907 -41% | 3237 ? 1% |
| Write 4K Q8T8 (MB/s) | 1138 | 981 | |||||
| Read 4K Q8T8 (MB/s) | 1346 | 300.9 | |||||
| AS SSD | 4% | -29% | 0% | 32% | -23% | 3% | |
| Seq Read (MB/s) | 2753 | 2841 3% | 1386 -50% | 2795 2% | 2836 3% | 1682 -39% | 2506 ? -9% |
| Seq Write (MB/s) | 2495 | 2009 -19% | 1234 -51% | 2172 -13% | 2452 -2% | 904 -64% | 1655 ? -34% |
| 4K Read (MB/s) | 38.64 | 39.34 2% | 41.32 7% | 53.3 38% | 60.4 56% | 60.2 56% | 42.2 ? 9% |
| 4K Write (MB/s) | 88.8 | 102.8 16% | 128 44% | 121.3 37% | 190.5 115% | 164.8 86% | 127.5 ? 44% |
| 4K-64 Read (MB/s) | 952 | 1257 32% | 854 -10% | 714 -25% | 1283 35% | 472.5 -50% | 1061 ? 11% |
| 4K-64 Write (MB/s) | 1568 | 1522 -3% | 721 -54% | 1376 -12% | 2298 47% | 845 -46% | 1480 ? -6% |
| Access Time Read * (ms) | 0.086 | 0.098 | 0.049 | 0.034 | 0.087 | 0.1012 ? | |
| Access Time Write * (ms) | 0.044 | 0.036 18% | 0.095 -116% | 0.036 18% | 0.02 55% | 0.02 55% | 0.03833 ? 13% |
| Score Read (Points) | 1266 | 1581 25% | 1034 -18% | 1046 -17% | 1627 29% | 701 -45% | 1354 ? 7% |
| Score Write (Points) | 1906 | 1825 -4% | 973 -49% | 1714 -10% | 2734 43% | 1101 -42% | 1772 ? -7% |
| Score Total (Points) | 3811 | 4175 10% | 2536 -33% | 3279 -14% | 5184 36% | 2143 -44% | 3781 ? -1% |
| Copy ISO MB/s (MB/s) | 2037 | 1446 -29% | 1284 -37% | 2039 0% | 675 -67% | 1903 ? -7% | |
| Copy Program MB/s (MB/s) | 475.6 | 473.4 0% | 401.9 -15% | 438 -8% | 248.4 -48% | 533 ? 12% | |
| Copy Game MB/s (MB/s) | 1018 | 971 -5% | 1013 0% | 1137 12% | 535 -47% | 1074 ? 6% | |
| Total Average (Program / Settings) | -2% /
-0% | -23% /
-25% | 6% /
5% | 31% /
31% | -18% /
-19% | 1% /
1% |
* ... smaller is better
Continuous load read: DiskSpd Read Loop, Queue Depth 8
Graphics card
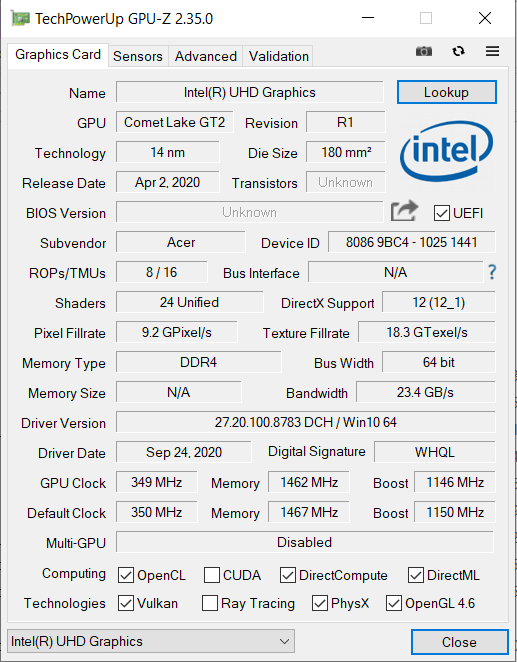
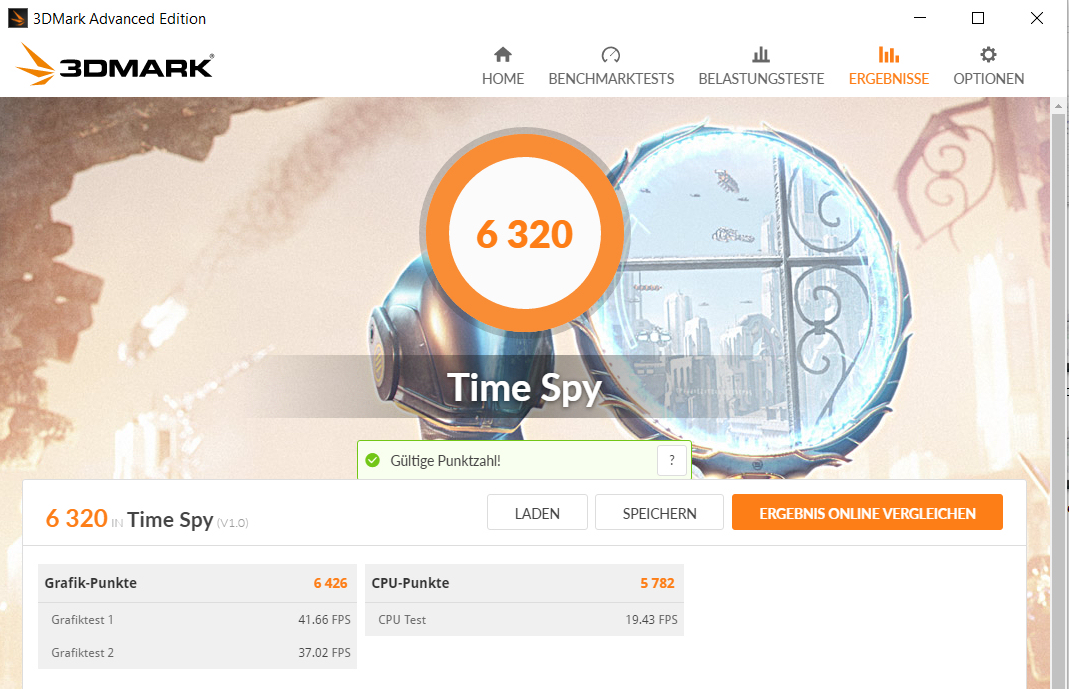
The GeForce RTX 2060 graphics core is an entry-level model in the GPU upper class. It can access fast GDDR6 graphics memory (6,144 MB). The results in the 3DMark benchmarks are at a normal level for the RTX 2060 GPU. Moreover, the "Extreme" Predator Sense GPU profile only provides a slight increase in performance. The UHD Graphics 630 chip that's integrated into the processor is active, and the laptop works with Nvidia's Optimus graphics-switching solution.
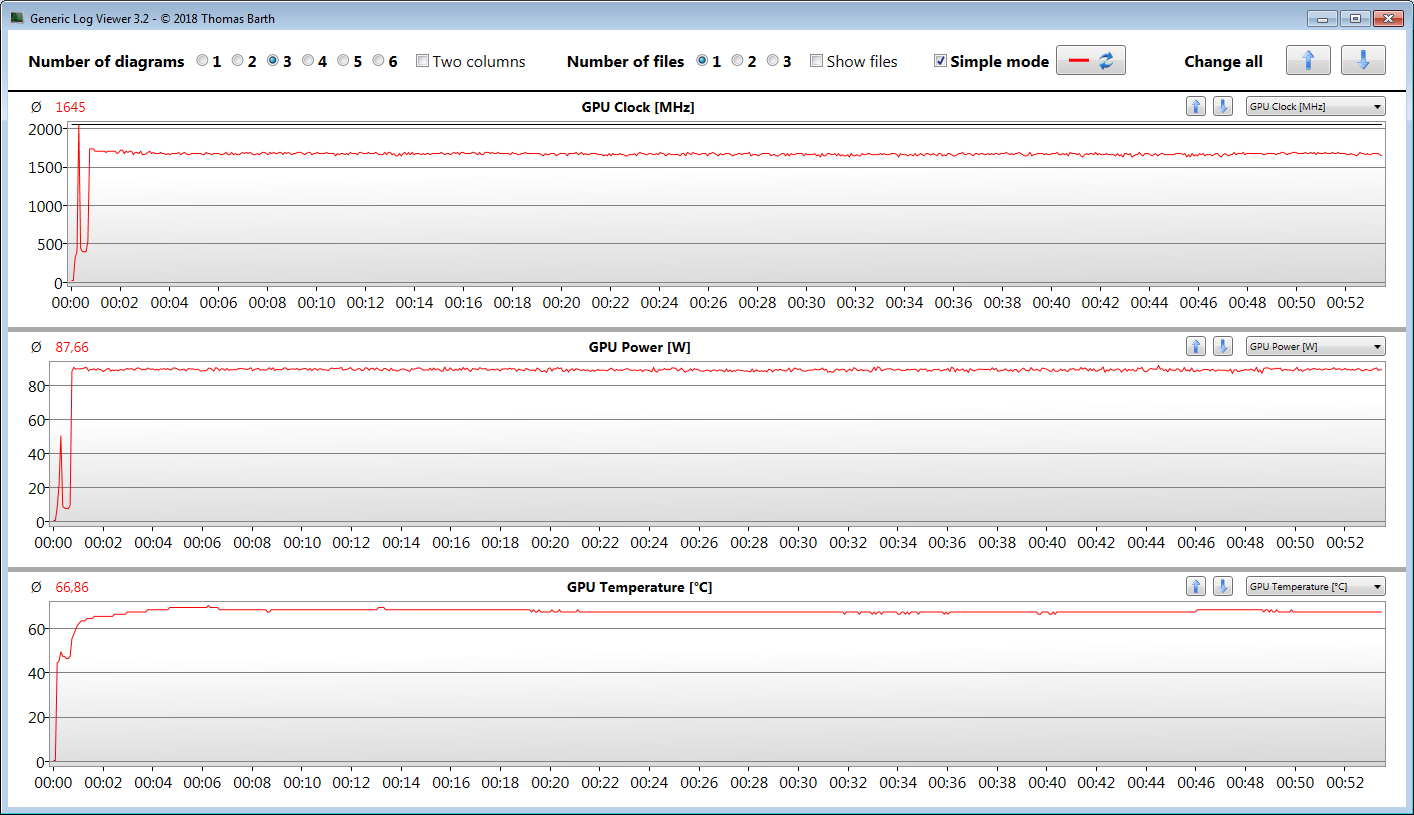
Nvidia specifies a clock range between 1,005 MHz (base) and 1,350 MHz (boost) for this DirectX 12 GPU. Higher speeds are feasible if the GPU doesn't reach a specified temperature and/or energy threshold. The maximum is 2,032 MHz. Our The Witcher 3 test is run at an average speed of 1,453 MHz and 1,645 MHz (GPU profile: Extreme), respectively.


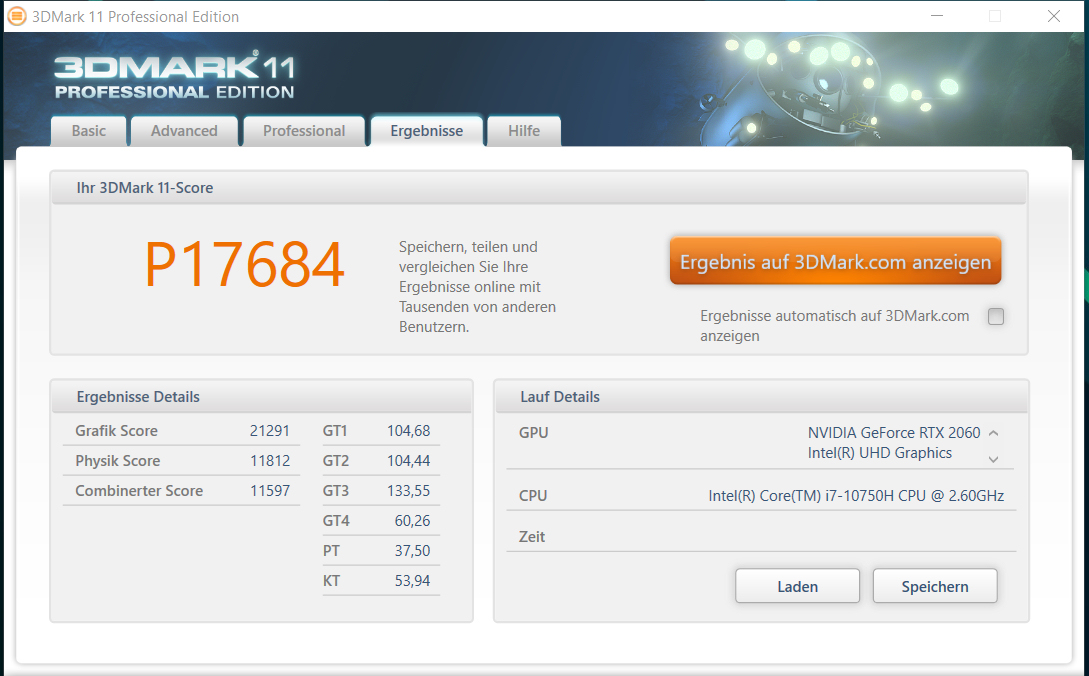


| 3DMark 11 Performance | 17684 points | |
| 3DMark Cloud Gate Standard Score | 36435 points | |
| 3DMark Fire Strike Score | 14732 points | |
| 3DMark Time Spy Score | 6011 points | |
Help | ||
| 3DMark 11 - 1280x720 Performance GPU | |
| Average of class Gaming (21841 - 80022, n=105, last 2 years) | |
| Dell G5 15 SE 5505 P89F | |
| Acer Predator Helios 300 PH315-53-77N5 (Extrem) | |
| Aorus 5 KB | |
| Schenker XMG Core 15 GK5NR0O | |
| Asus TUF Gaming A15 FA506IV-HN172 | |
| Average NVIDIA GeForce RTX 2060 Mobile (19143 - 24662, n=40) | |
| Acer Predator Helios 300 PH315-53-77N5 | |
| Acer Predator Helios 300 PH315-52-79TY | |
| HP Pavilion Gaming 15-ec1177ng | |
| MSI Bravo 15 A4DCR | |
Gaming performance
The built-in CPU-GPU combination can bring all the latest games smoothly onto the screen. Full HD resolution and high to maximum quality settings can usually be selected. Higher resolutions (an appropriate monitor would have to be plugged in for this) require a reduction of the quality level. The "Extreme" GPU profile only produces a slight increase in frame rates (see comparison diagram).
The single-channel memory is responsible for the fact that some games achieve significantly lower frame rates at low settings than on comparably equipped laptops. A second memory module (= dual-channel mode active) would provide improvements.
| Shadow of the Tomb Raider | |
| 1920x1080 Highest Preset AA:T | |
| Average of class Gaming (96 - 116, n=2, last 2 years) | |
| Acer Predator Helios 300 PH317-54-75G8 | |
| Aorus 7 KB | |
| Acer Predator Helios 300 PH315-53-77N5 (Extrem) | |
| Average NVIDIA GeForce RTX 2060 Mobile (54 - 86, n=22) | |
| Acer Predator Helios 300 PH315-53-77N5 | |
| Dell G5 15 SE 5505 P89F | |
| MSI Bravo 15 A4DCR | |
| 1280x720 Lowest Preset | |
| Dell G5 15 SE 5505 P89F | |
| Aorus 7 KB | |
| Average NVIDIA GeForce RTX 2060 Mobile (88 - 133, n=19) | |
| Acer Predator Helios 300 PH317-54-75G8 | |
| MSI Bravo 15 A4DCR | |
| Acer Predator Helios 300 PH315-53-77N5 | |
| Serious Sam 4 - 1920x1080 Ultra (DX12) AA:2xMS | |
| Acer Predator Helios 300 PH315-53-77N5 (Extrem) | |
| Acer Predator Helios 300 PH317-54-75G8 | |
| Aorus 7 KB | |
| Average NVIDIA GeForce RTX 2060 Mobile (50.3 - 63.3, n=6) | |
| Acer Predator Helios 300 PH315-53-77N5 | |
| Horizon Zero Dawn - 1920x1080 Ultimate Quality | |
| Acer Predator Helios 300 PH317-54-75G8 | |
| Acer Predator Helios 300 PH315-53-77N5 (Extrem) | |
| Average NVIDIA GeForce RTX 2060 Mobile (54 - 67, n=6) | |
| Acer Predator Helios 300 PH315-53-77N5 | |
| Aorus 7 KB | |
| HP Pavilion Gaming 15-ec1177ng | |
| Mafia Definitive Edition - 1920x1080 High Preset | |
| Aorus 7 KB | |
| Average NVIDIA GeForce RTX 2060 Mobile (60.2 - 76.1, n=4) | |
| Acer Predator Helios 300 PH317-54-75G8 | |
| Acer Predator Helios 300 PH315-53-77N5 | |
| Star Wars Squadrons - 1920x1080 Ultra Preset | |
| Average NVIDIA GeForce RTX 2060 Mobile (156.2 - 181, n=3) | |
| Acer Predator Helios 300 PH317-54-75G8 | |
| Acer Predator Helios 300 PH315-53-77N5 | |
In order to verify whether the frame rates remain largely constant over a prolonged period of time, we let the game The Witcher 3 run for about 60 minutes at Full HD resolution and maximum quality settings. The character is not moved. A drop in frame rates wasn't found.

| low | med. | high | ultra | |
|---|---|---|---|---|
| BioShock Infinite (2013) | 307.3 | 270.5 | 249.6 | 130.9 |
| The Witcher 3 (2015) | 226.4 | 172.4 | 110.7 | 64.8 |
| Shadow of the Tomb Raider (2018) | 88 | 80 | 76 | 71 |
| Doom Eternal (2020) | 171 | 126.9 | 117.9 | 114 |
| Gears Tactics (2020) | 201.6 | 128.5 | 93.4 | 66.5 |
| Horizon Zero Dawn (2020) | 106 | 72 | 67 | 57 |
| Serious Sam 4 (2020) | 113 | 75.7 | 69.9 | 56.6 |
| Mafia Definitive Edition (2020) | 94.3 | 62.5 | 60.2 | |
| Star Wars Squadrons (2020) | 262.1 | 184.5 | 172.8 | 156.2 |
Emissions - The Helios 300 becomes loud under load
Noise emissions
The fans don't make much noise in idle usage. They either stand still or operate at very low speeds. That's all over under load. In this way, we register maximum sound pressure levels of 56 dB(A) (stress test) and 53.1 dB(A) (our The Witcher 3 test), respectively.
Noise level
| Idle |
| 25.2 / 25.2 / 25.2 dB(A) |
| Load |
| 43.5 / 56 dB(A) |
 | ||
30 dB silent 40 dB(A) audible 50 dB(A) loud |
||
min: | ||
| Acer Predator Helios 300 PH315-53-77N5 i7-10750H, GeForce RTX 2060 Mobile | Acer Predator Helios 300 PH315-52-79TY i7-9750H, GeForce GTX 1660 Ti Mobile | Dell G5 15 SE 5505 P89F R7 4800H, Radeon RX 5600M | Aorus 5 KB i7-10750H, GeForce RTX 2060 Mobile | Schenker XMG Core 15 GK5NR0O R7 4800H, GeForce RTX 2060 Mobile | Asus TUF Gaming A15 FA506IV-HN172 R7 4800H, GeForce RTX 2060 Mobile | Average NVIDIA GeForce RTX 2060 Mobile | Average of class Gaming | |
|---|---|---|---|---|---|---|---|---|
| Noise | -8% | 1% | -11% | -4% | -7% | -12% | -4% | |
| off / environment * (dB) | 25.2 | 30.2 -20% | 28 -11% | 25 1% | 25 1% | 30.2 -20% | 27.9 ? -11% | 24.1 ? 4% |
| Idle Minimum * (dB) | 25.2 | 31 -23% | 28 -11% | 26 -3% | 26 -3% | 30.2 -20% | 29 ? -15% | 25.9 ? -3% |
| Idle Average * (dB) | 25.2 | 31 -23% | 28 -11% | 30 -19% | 30 -19% | 30.2 -20% | 30 ? -19% | 27.4 ? -9% |
| Idle Maximum * (dB) | 25.2 | 31 -23% | 28 -11% | 34 -35% | 32 -27% | 30.2 -20% | 33 ? -31% | 30 ? -19% |
| Load Average * (dB) | 43.5 | 41.5 5% | 28 36% | 53 -22% | 46 -6% | 40 8% | 44 ? -1% | 43.3 ? -0% |
| Witcher 3 ultra * (dB) | 53.1 | 46.7 12% | 50.6 5% | 51 4% | 48 10% | 49 8% | ||
| Load Maximum * (dB) | 56 | 46.9 16% | 50.6 10% | 56 -0% | 48 14% | 49 12% | 51.6 ? 8% | 54.1 ? 3% |
* ... smaller is better
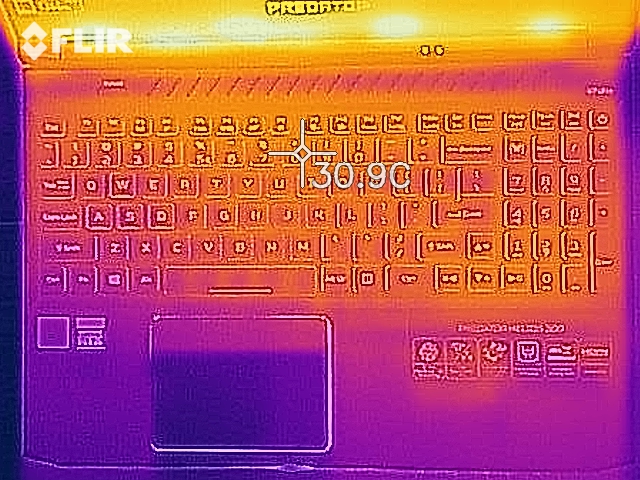
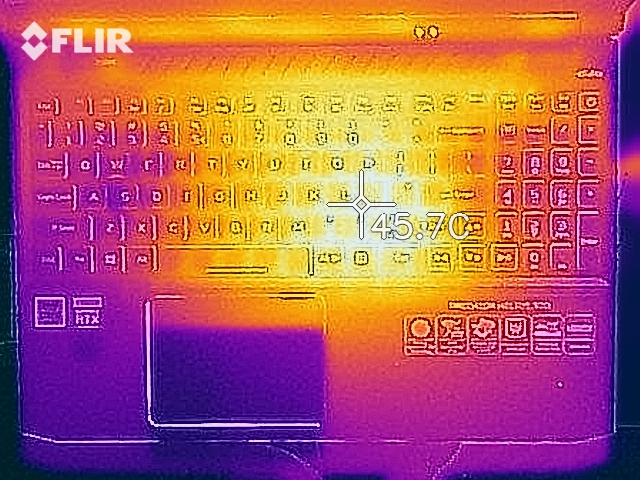
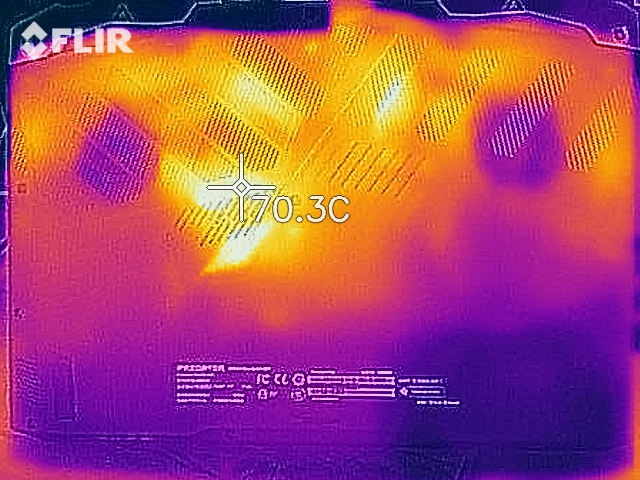
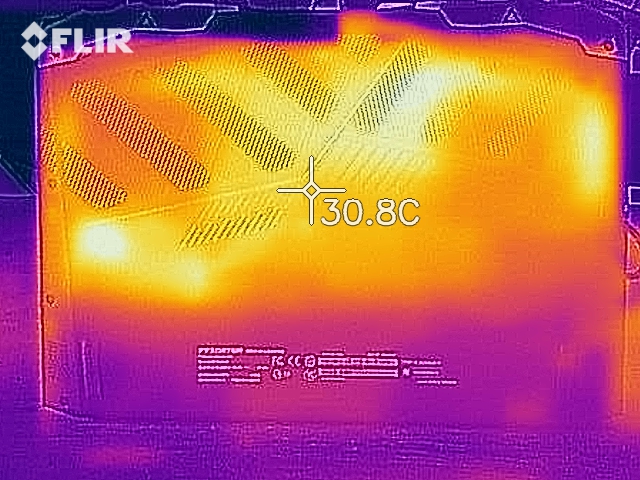
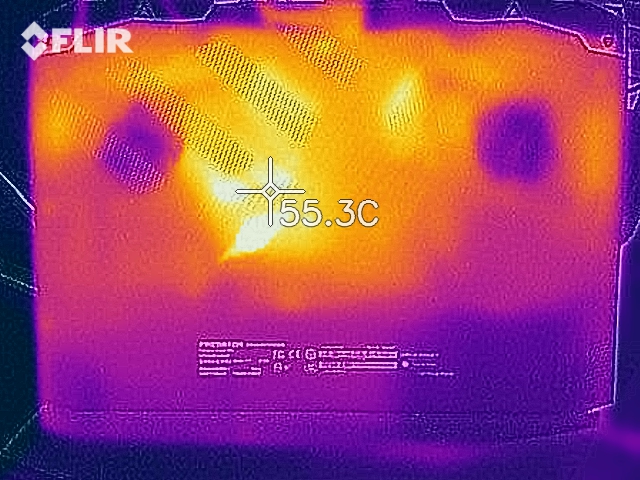
Temperature
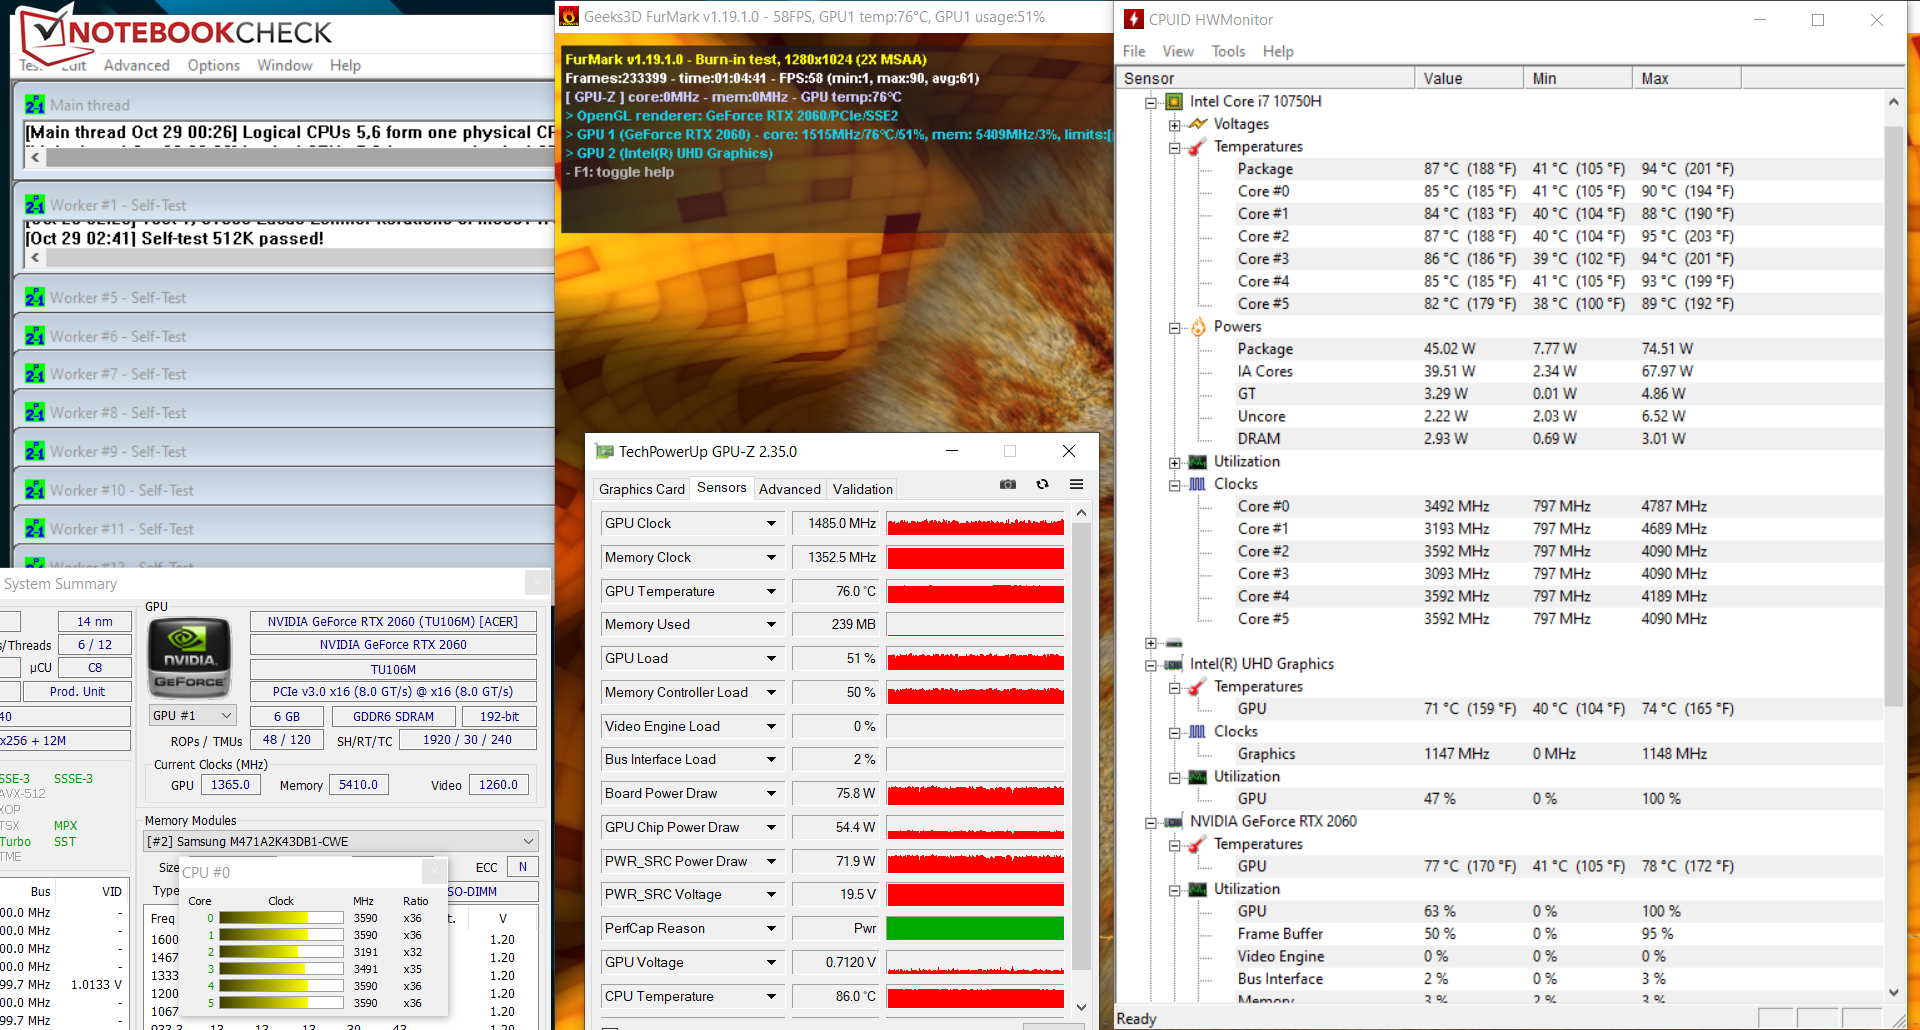
The stress test (Prime95 and FurMark run for at least an hour) is run by the CPU and the GPU at 3 to 3.5 GHz and 1.2 to 1.4 GHz, respectively. On battery power, the clock rates are 800 MHz (CPU) and 1,380 MHz (GPU). The stress test represents an extreme scenario. With this test, we check whether the system remains stable even under full load.
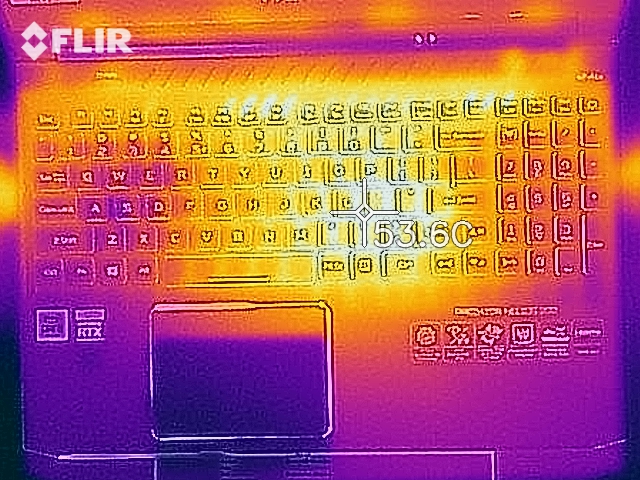
During the stress test, we register temperatures in the 40-°C (~104 °F) range at some measuring points. Heat development is significantly lower when performing our The Witcher 3 test. In everyday use, the values are in the green range.
(±) The maximum temperature on the upper side is 44.1 °C / 111 F, compared to the average of 40.4 °C / 105 F, ranging from 21.2 to 68.8 °C for the class Gaming.
(-) The bottom heats up to a maximum of 48 °C / 118 F, compared to the average of 43.2 °C / 110 F
(+) In idle usage, the average temperature for the upper side is 24.1 °C / 75 F, compared to the device average of 33.9 °C / 93 F.
(±) Playing The Witcher 3, the average temperature for the upper side is 33.9 °C / 93 F, compared to the device average of 33.9 °C / 93 F.
(+) The palmrests and touchpad are cooler than skin temperature with a maximum of 31.9 °C / 89.4 F and are therefore cool to the touch.
(-) The average temperature of the palmrest area of similar devices was 28.8 °C / 83.8 F (-3.1 °C / -5.6 F).
| Acer Predator Helios 300 PH315-53-77N5 i7-10750H, GeForce RTX 2060 Mobile | Acer Predator Helios 300 PH315-52-79TY i7-9750H, GeForce GTX 1660 Ti Mobile | Dell G5 15 SE 5505 P89F R7 4800H, Radeon RX 5600M | Aorus 5 KB i7-10750H, GeForce RTX 2060 Mobile | Schenker XMG Core 15 GK5NR0O R7 4800H, GeForce RTX 2060 Mobile | Asus TUF Gaming A15 FA506IV-HN172 R7 4800H, GeForce RTX 2060 Mobile | Average NVIDIA GeForce RTX 2060 Mobile | Average of class Gaming | |
|---|---|---|---|---|---|---|---|---|
| Heat | -3% | -18% | -19% | -22% | -4% | -17% | -15% | |
| Maximum Upper Side * (°C) | 44.1 | 52 -18% | 53 -20% | 50 -13% | 51 -16% | 42.9 3% | 47.2 ? -7% | 45.2 ? -2% |
| Maximum Bottom * (°C) | 48 | 46.3 4% | 57.6 -20% | 49 -2% | 64 -33% | 49.9 -4% | 52.7 ? -10% | 48.2 ? -0% |
| Idle Upper Side * (°C) | 25.2 | 24.8 2% | 27.4 -9% | 35 -39% | 29 -15% | 27.8 -10% | 31 ? -23% | 31 ? -23% |
| Idle Bottom * (°C) | 25.7 | 25.4 1% | 31 -21% | 31 -21% | 32 -25% | 27 -5% | 32.9 ? -28% | 34.3 ? -33% |
* ... smaller is better
Speakers
The stereo speakers are located in the front area of the bottom of the device. They produce a decent sound that lacks bass. For a better sound experience, headphones or external speakers should be used.
Acer Predator Helios 300 PH315-53-77N5 audio analysis
(±) | speaker loudness is average but good (74.4 dB)
Bass 100 - 315 Hz
(-) | nearly no bass - on average 20.9% lower than median
(±) | linearity of bass is average (10.1% delta to prev. frequency)
Mids 400 - 2000 Hz
(±) | higher mids - on average 5.7% higher than median
(±) | linearity of mids is average (10.3% delta to prev. frequency)
Highs 2 - 16 kHz
(+) | balanced highs - only 1.3% away from median
(+) | highs are linear (4.7% delta to prev. frequency)
Overall 100 - 16.000 Hz
(±) | linearity of overall sound is average (18.2% difference to median)
Compared to same class
» 57% of all tested devices in this class were better, 8% similar, 35% worse
» The best had a delta of 6%, average was 18%, worst was 132%
Compared to all devices tested
» 39% of all tested devices were better, 8% similar, 53% worse
» The best had a delta of 4%, average was 23%, worst was 134%
Energy management - The PH315's battery life is acceptable
Energy consumption
In idle usage, we register a maximum power consumption of 19.8 watts. The stress test and our The Witcher 3 test let the demand increase to 177 watts and 127 watts, respectively. The power adapter's output is 230 watts.
| Off / Standby | |
| Idle | |
| Load |
|
Key:
min: | |
| Acer Predator Helios 300 PH315-53-77N5 i7-10750H, GeForce RTX 2060 Mobile | Acer Predator Helios 300 PH315-52-79TY i7-9750H, GeForce GTX 1660 Ti Mobile | Dell G5 15 SE 5505 P89F R7 4800H, Radeon RX 5600M | Aorus 5 KB i7-10750H, GeForce RTX 2060 Mobile | Schenker XMG Core 15 GK5NR0O R7 4800H, GeForce RTX 2060 Mobile | Asus TUF Gaming A15 FA506IV-HN172 R7 4800H, GeForce RTX 2060 Mobile | Average NVIDIA GeForce RTX 2060 Mobile | Average of class Gaming | |
|---|---|---|---|---|---|---|---|---|
| Power Consumption | -115% | -10% | -38% | -54% | -7% | -71% | -91% | |
| Idle Minimum * (Watt) | 2.9 | 17.2 -493% | 6.5 -124% | 8 -176% | 12 -314% | 5.4 -86% | 11.5 ? -297% | 12.9 ? -345% |
| Idle Average * (Watt) | 13.2 | 22.6 -71% | 10.6 20% | 12 9% | 14 -6% | 10 24% | 16.5 ? -25% | 18.5 ? -40% |
| Idle Maximum * (Watt) | 19.8 | 25.5 -29% | 11 44% | 21 -6% | 20 -1% | 10.5 47% | 23.7 ? -20% | 24.1 ? -22% |
| Load Average * (Watt) | 105 | 88 16% | 84.1 20% | 128 -22% | 103 2% | 135 -29% | 107.5 ? -2% | 108.4 ? -3% |
| Witcher 3 ultra * (Watt) | 127 | 152.9 -20% | 138 -9% | 125 2% | 144 -13% | |||
| Load Maximum * (Watt) | 177 | 177 -0% | 180.4 -2% | 217 -23% | 193 -9% | 147 17% | 199.7 ? -13% | 254 ? -44% |
* ... smaller is better
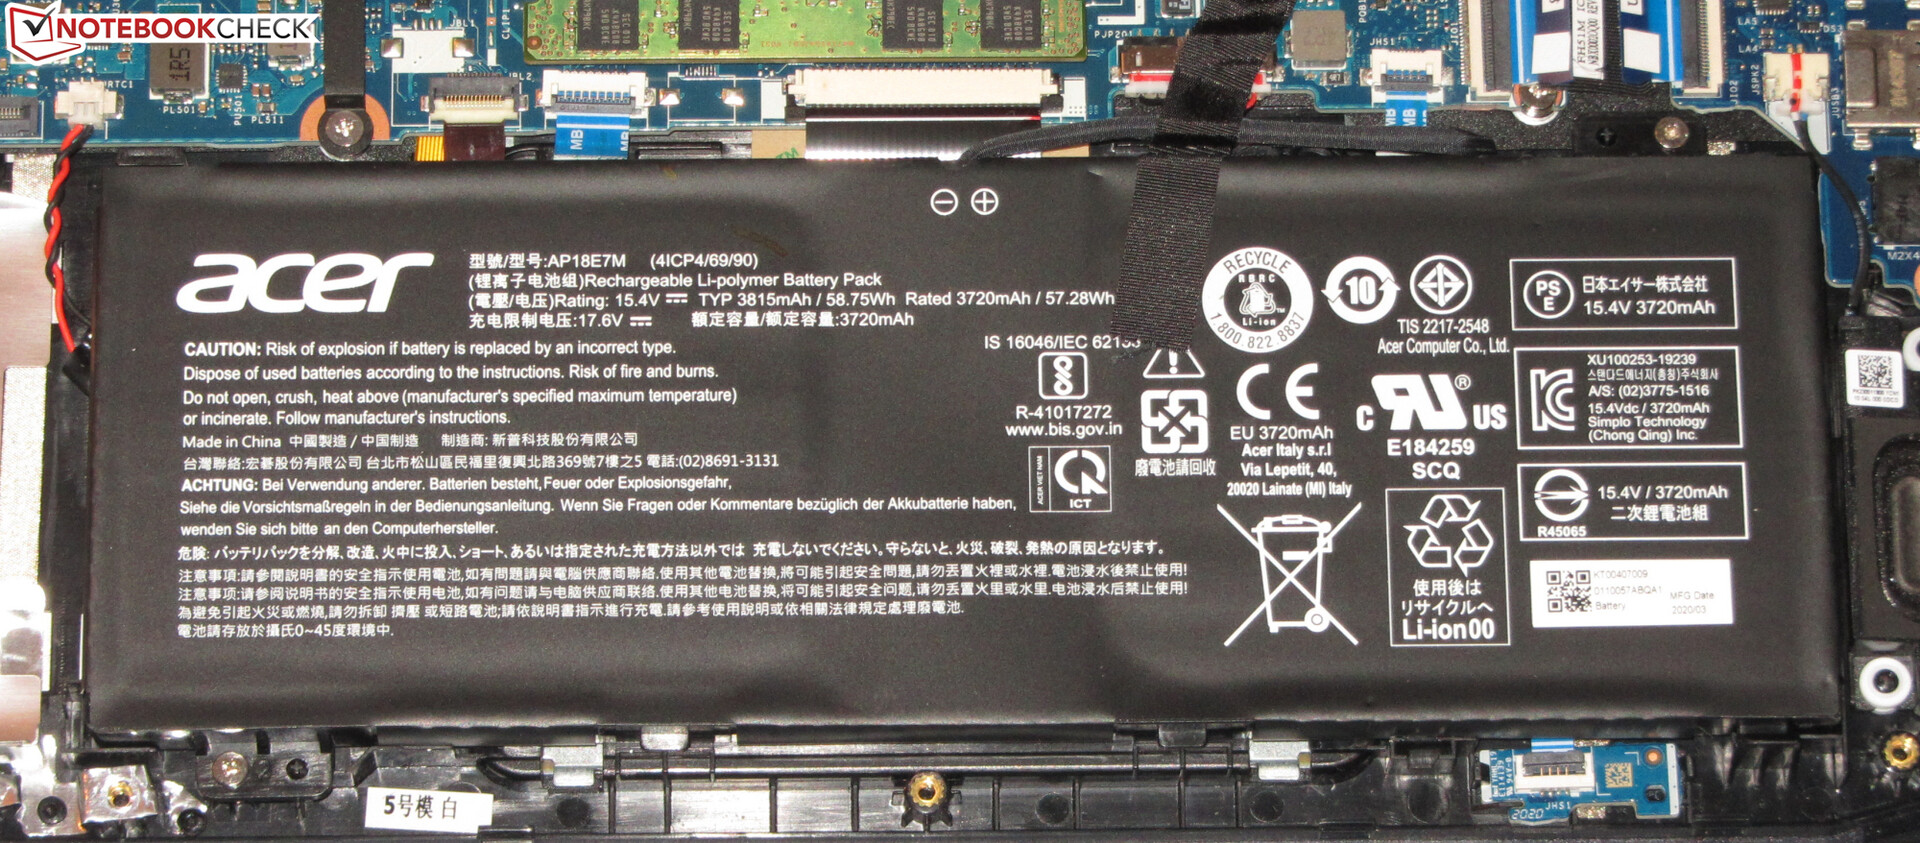
Battery life
The Acer laptop reaches runtimes of 4:40 hours and 5:38 hours, respectively, in our WLAN test (accessing websites using a script) and video test (the short film Big Buck Bunny (H.264 encoding, Full HD) running in a loop). During both tests, the energy-saving functions are deactivated, and the display brightness is adjusted to about 150 cd/m². To perform the video test, the wireless modules are also switched off.
| Acer Predator Helios 300 PH315-53-77N5 i7-10750H, GeForce RTX 2060 Mobile, 58.7 Wh | Acer Predator Helios 300 PH315-52-79TY i7-9750H, GeForce GTX 1660 Ti Mobile, 58.75 Wh | Dell G5 15 SE 5505 P89F R7 4800H, Radeon RX 5600M, 51 Wh | Aorus 5 KB i7-10750H, GeForce RTX 2060 Mobile, 48.96 Wh | Schenker XMG Core 15 GK5NR0O R7 4800H, GeForce RTX 2060 Mobile, 62 Wh | Asus TUF Gaming A15 FA506IV-HN172 R7 4800H, GeForce RTX 2060 Mobile, 48 Wh | Average of class Gaming | |
|---|---|---|---|---|---|---|---|
| Battery runtime | -38% | 8% | -18% | -1% | 7% | 20% | |
| Reader / Idle (h) | 10.4 | 5 -52% | 11.2 8% | 9 -13% | 7.8 -25% | 9.8 -6% | 8.71 ? -16% |
| H.264 (h) | 5.6 | 3.4 -39% | 6.2 11% | 5.4 -4% | 8.9 ? 59% | ||
| WiFi v1.3 (h) | 4.7 | 3.5 -26% | 6.2 32% | 4.8 2% | 5.9 26% | 6.2 32% | 7.08 ? 51% |
| Load (h) | 1.8 | 1.2 -33% | 1.5 -17% | 1 -44% | 1.5 -17% | 1.9 6% | 1.51 ? -16% |
Pros
Cons
Verdict
Acer's gaming laptop brings all the latest games smoothly onto the screen thanks to the Core i7-10750H processor and the GeForce RTX 2060 graphics core. Full HD resolution and high to maximum quality settings can usually be used here. The GPU performance can be increased if necessary.
The Acer Predator Helios 300 PH315-53 is a largely well-rounded gaming laptop that also offers some leeway.
The hardware is supported by 16 GB of RAM (1x 16 GB, single-channel mode). The laptop can and should be upgraded with a second memory module in order to activate dual-channel mode. This causes a slight increase in performance. The storage space capacity (512 GB, NVMe SSD) isn't very large for a gaming laptop. A second NVMe SSD could be installed. The Predator also supports RAID 0.
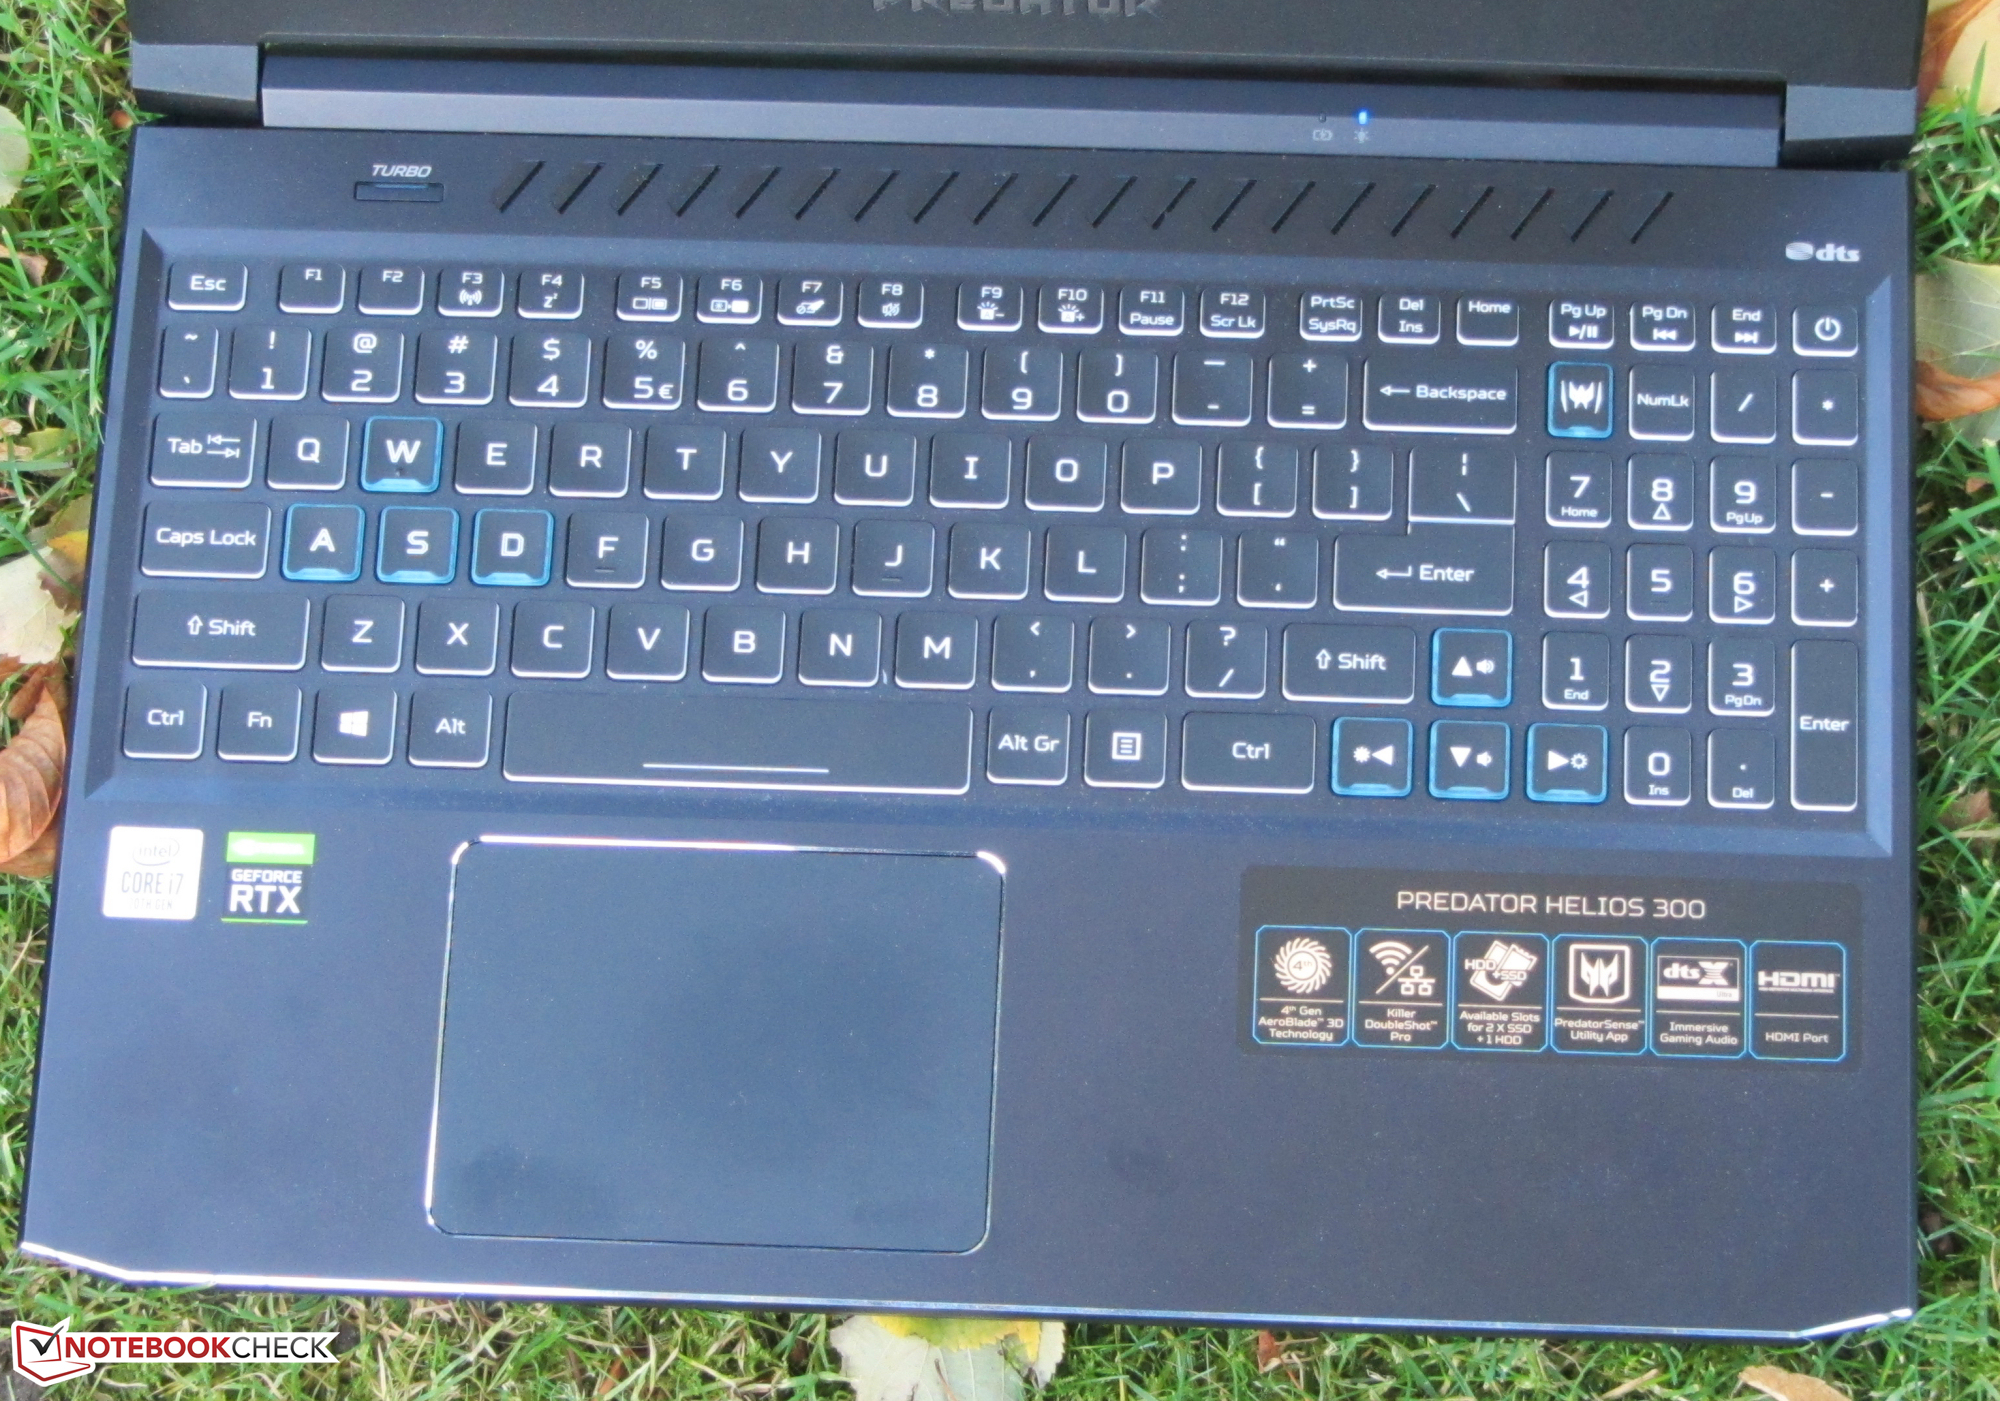
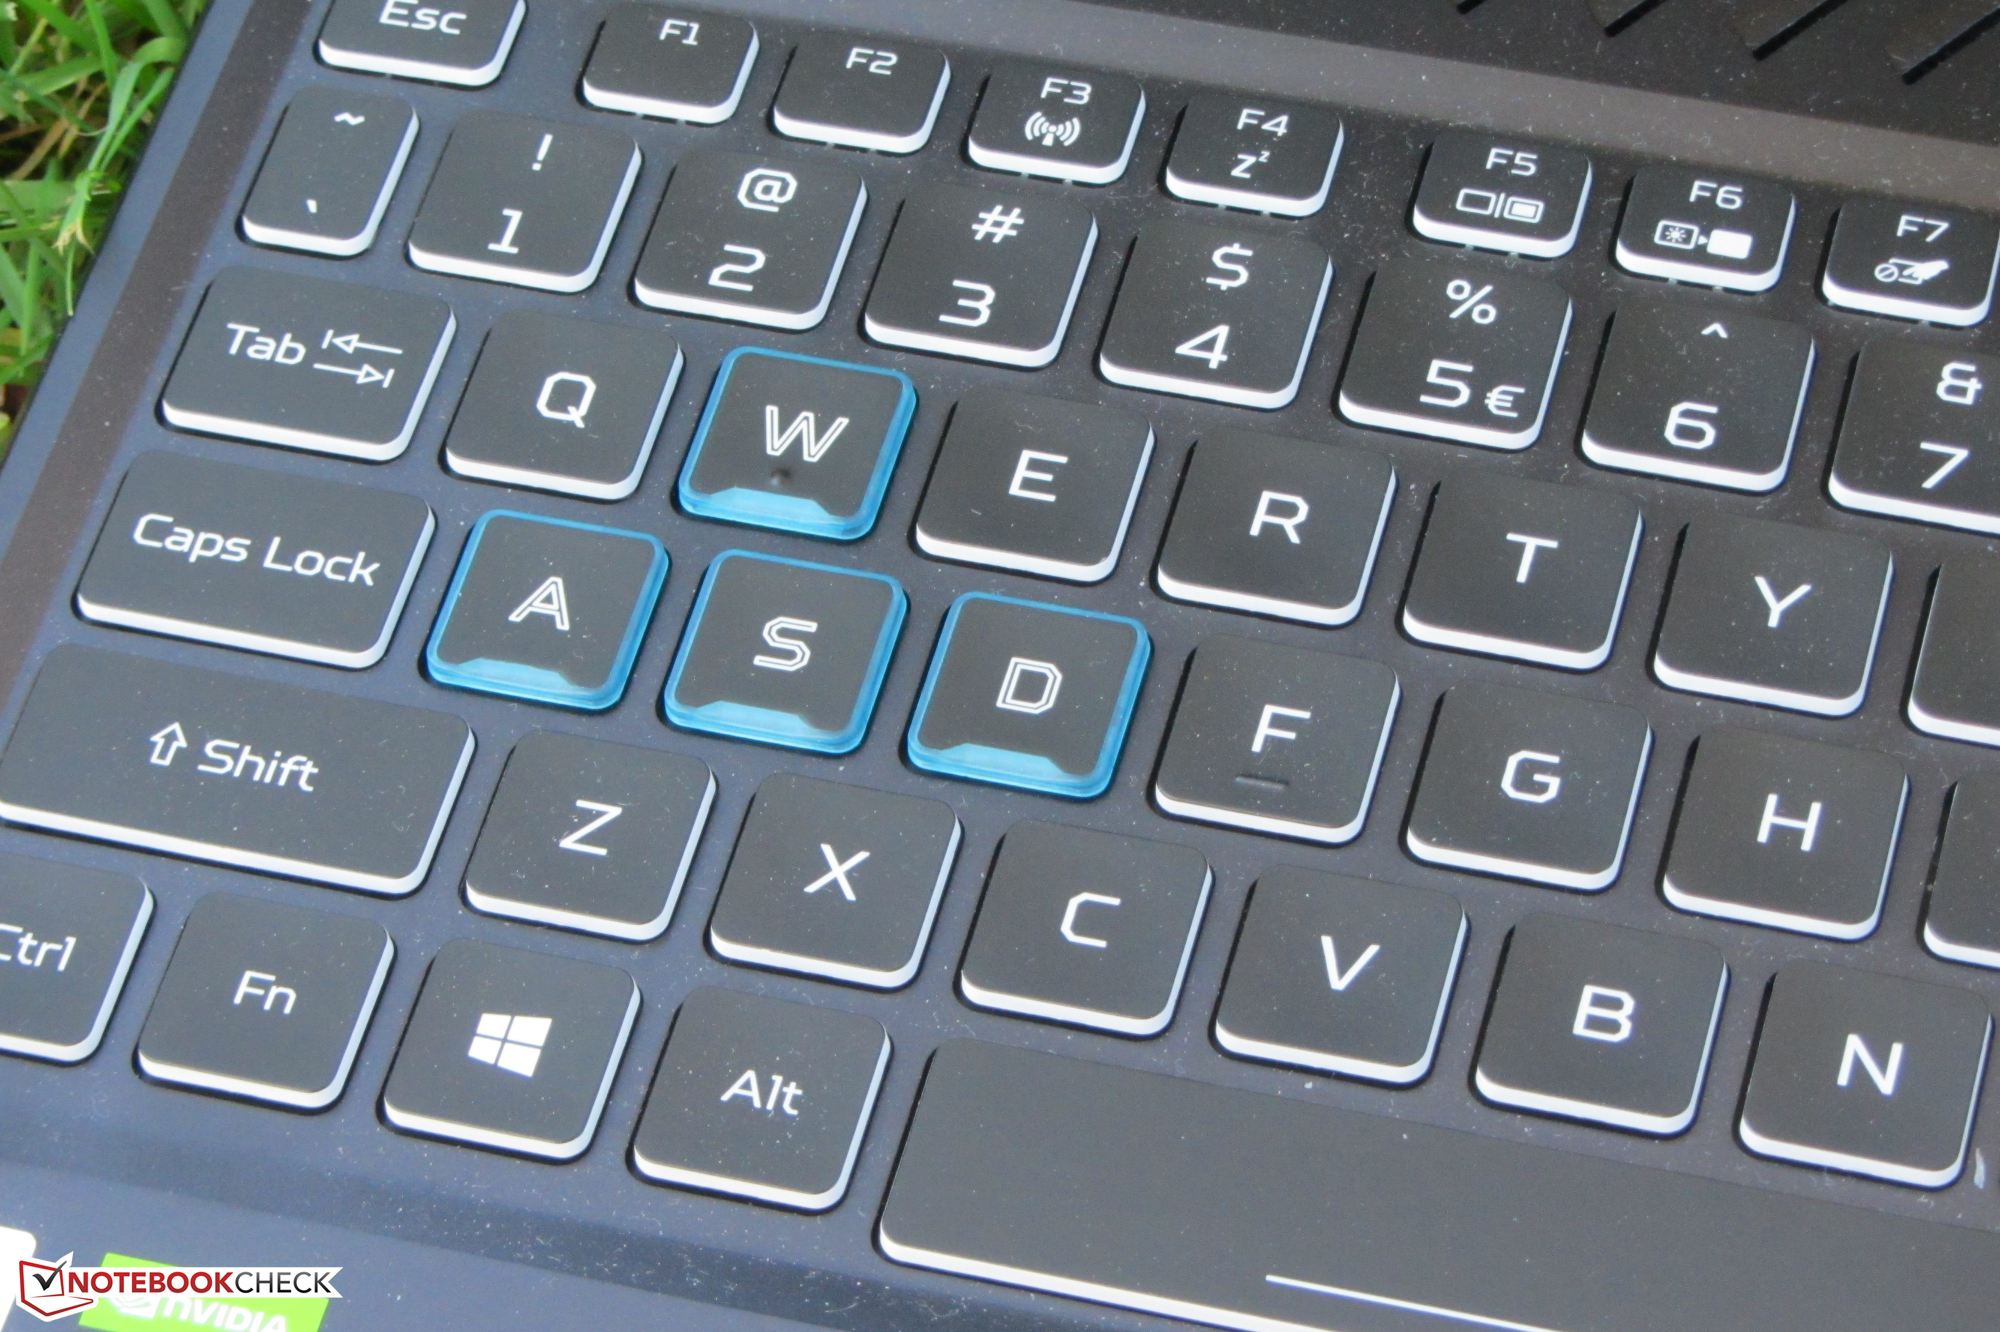
The display (Full HD, IPS, 144 Hz) offers stable viewing angles, a matte surface, good contrast, fast response times, and decent color reproduction. The maximum brightness should be higher, though. The keyboard (backlit) has proven to be suitable for everyday use. The battery life is acceptable. Moreover, the Helios doesn't have a Thunderbolt 3 port. There's only one USB Type-C 3.2 Gen 2 port, and it supports neither DisplayPort nor Power Delivery.
The Predator has made a good impression in principle. However, when it comes to memory and storage, our configuration variant isn't optimally equipped. There may be follow-up costs for a second memory module or a second NVMe SSD. If you are fundamentally interested in the Predator, we recommend buying a better equipped version.
Acer Predator Helios 300 PH315-53-77N5
- 10/30/2020 v7 (old)
Sascha Mölck
Price comparison

