Asus ROG Zephyrus Duo 15 GX550LXS in Review: Unique Gaming Laptop with Lots of Performance Below the Hood

The Asus Zephyrus Duo 15 GX550LXS is not your everyday gaming laptop. The keyboard and touchpad are not found in their usual positions; Asus has placed a secondary display with a touchscreen behind them. The octa-core Core-i9-10980HK CPU and a GeForce RTX 2080 Super Max-Q GPU provide enough performance for gaming. There are no direct competitors to the Zephyrus. Thus, we have included slim, lightweight gaming laptops such as the Acer Predator Triton 500 PT515-52, MSI GS66 Stealth 10SFS, and the Gigabyte Aero 15 OLED XB in our comparison.
Rating | Date | Model | Weight | Height | Size | Resolution | Price |
|---|---|---|---|---|---|---|---|
| 84.5 % v7 (old) | 07 / 2020 | Asus ROG Zephyrus Duo 15 GX550LXS i9-10980HK, GeForce RTX 2080 Super Max-Q | 2.5 kg | 20 mm | 15.60" | 3840x2160 | |
v (old) | 04 / 2020 | Acer Predator Triton 500 PT515-52-70N3 i7-10750H, GeForce RTX 2080 Super Max-Q | 2.1 kg | 18 mm | 15.60" | 1920x1080 | |
| 82.8 % v7 (old) | 05 / 2020 | MSI GS66 Stealth 10SFS i9-10980HK, GeForce RTX 2070 Super Max-Q | 2.2 kg | 20 mm | 15.60" | 1920x1080 | |
| 85.8 % v7 (old) | 05 / 2020 | Gigabyte Aero 15 OLED XB-8DE51B0SP i7-10875H, GeForce RTX 2070 Super Max-Q | 2.2 kg | 20 mm | 15.60" | 3840x2160 |
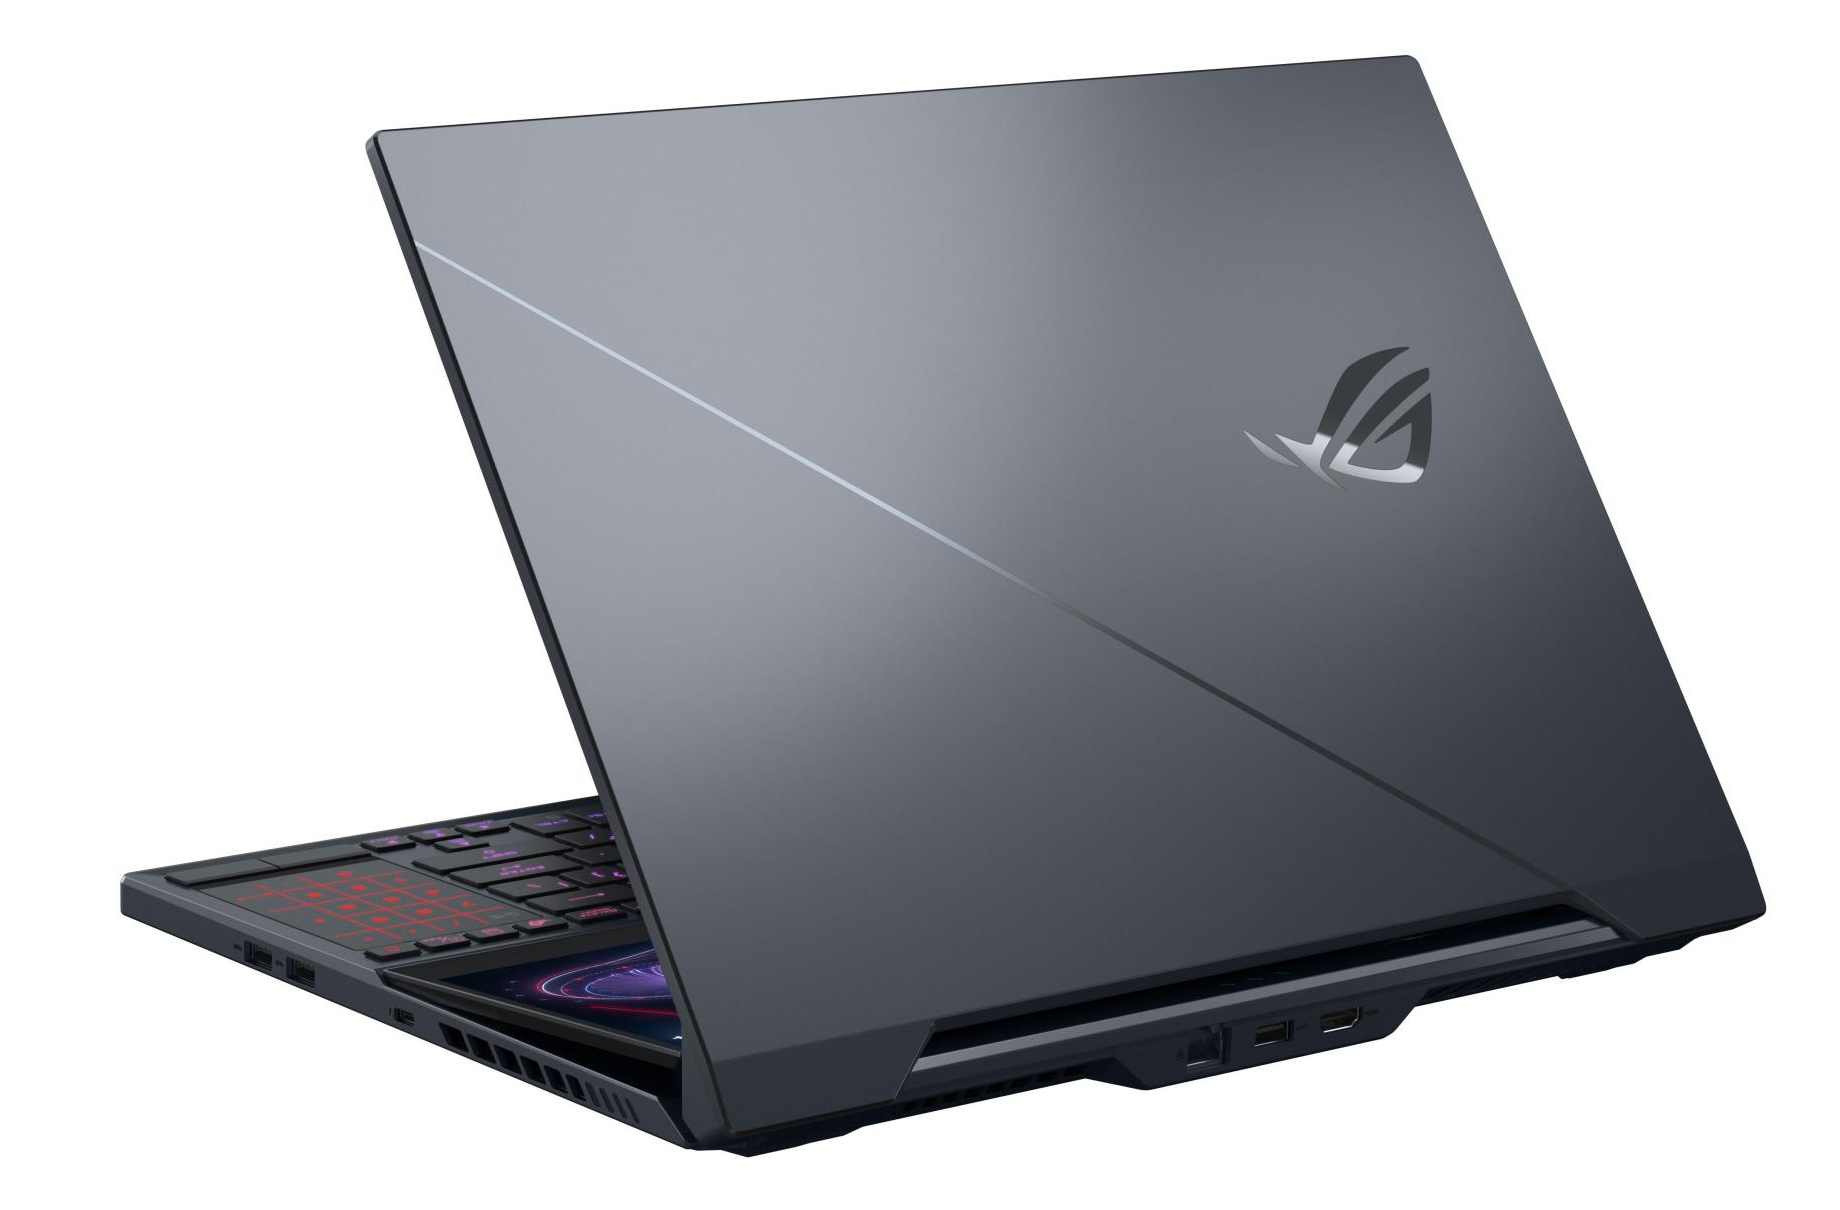
Case - Asus PC with a Sleek Metal Chassis
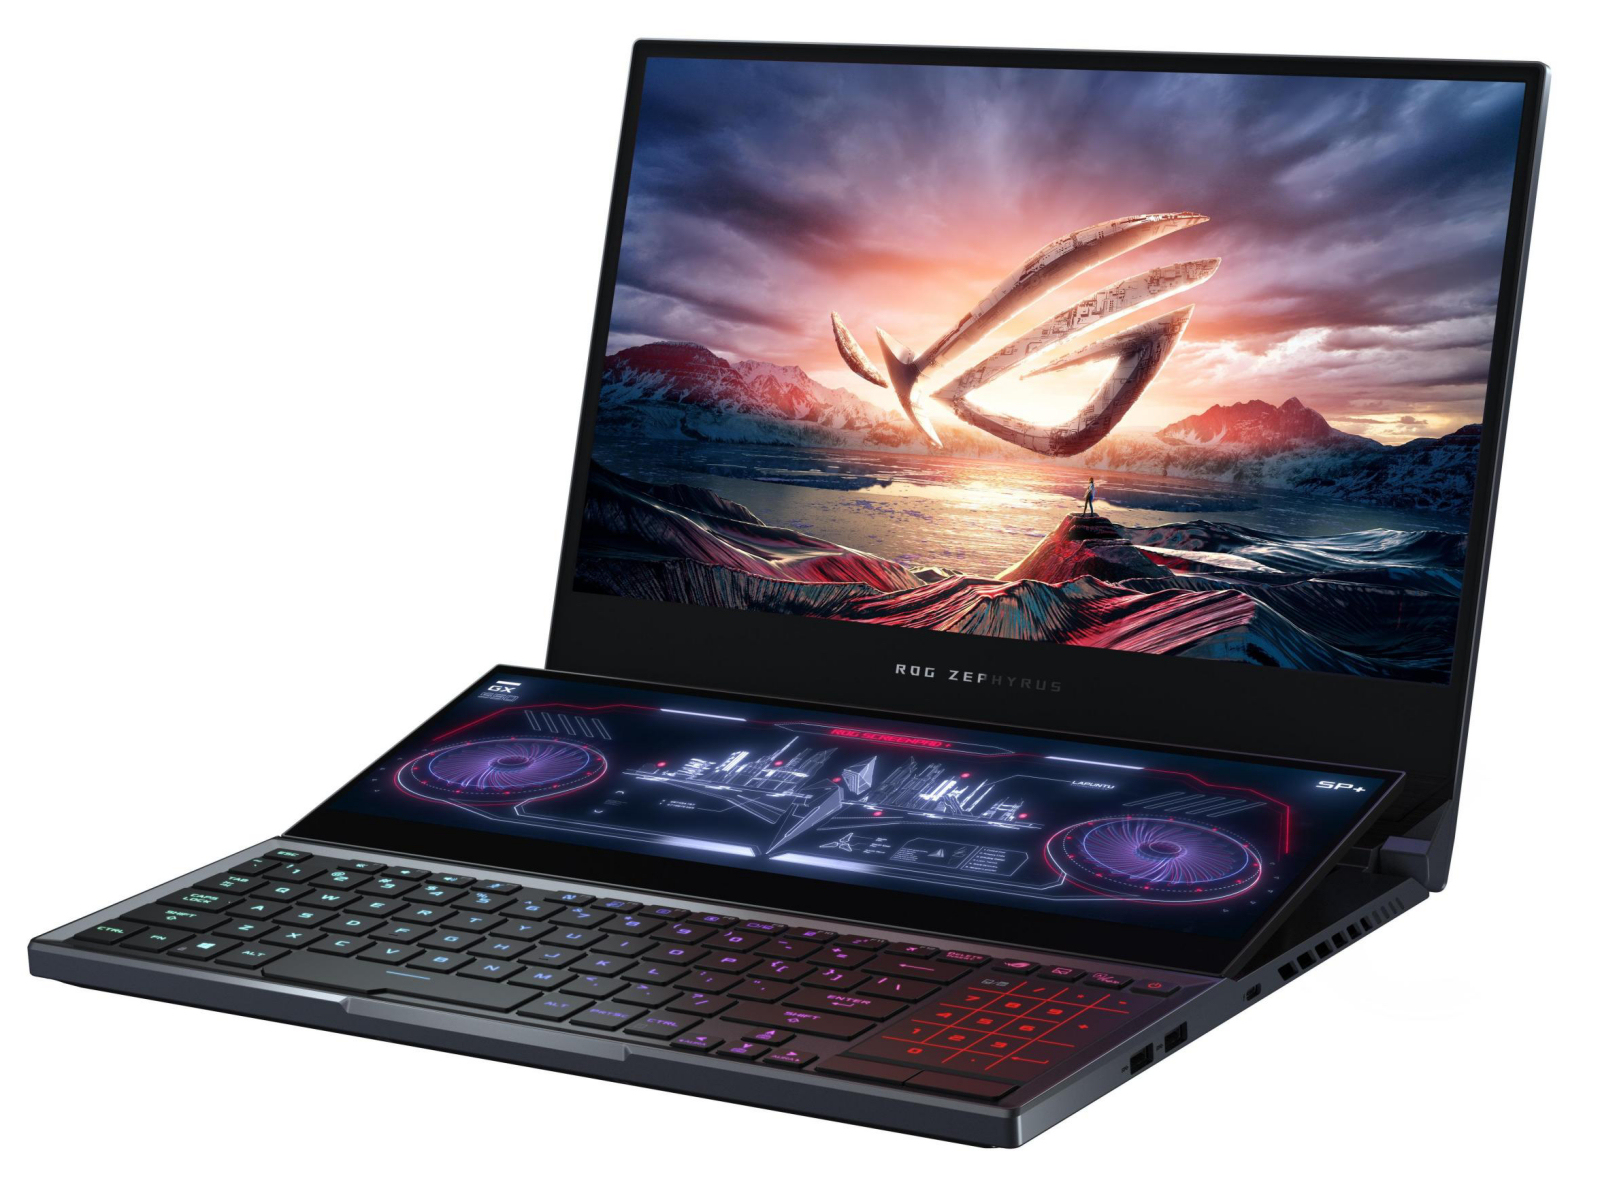
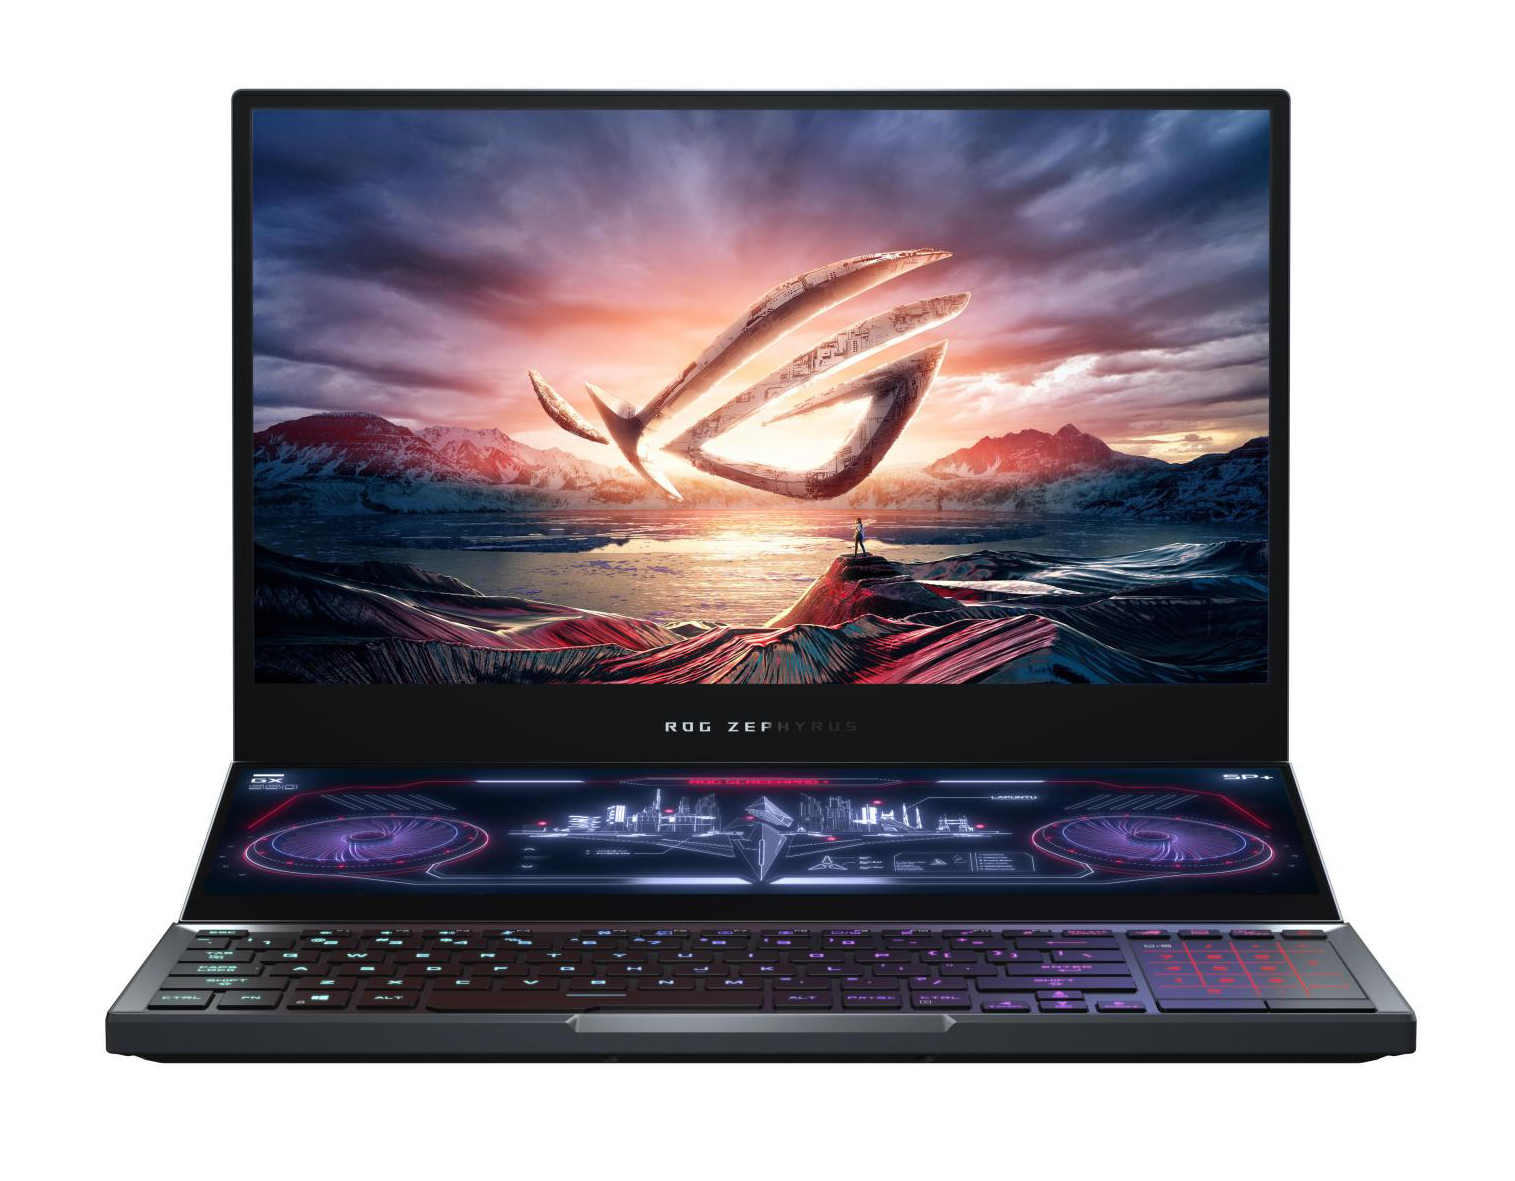
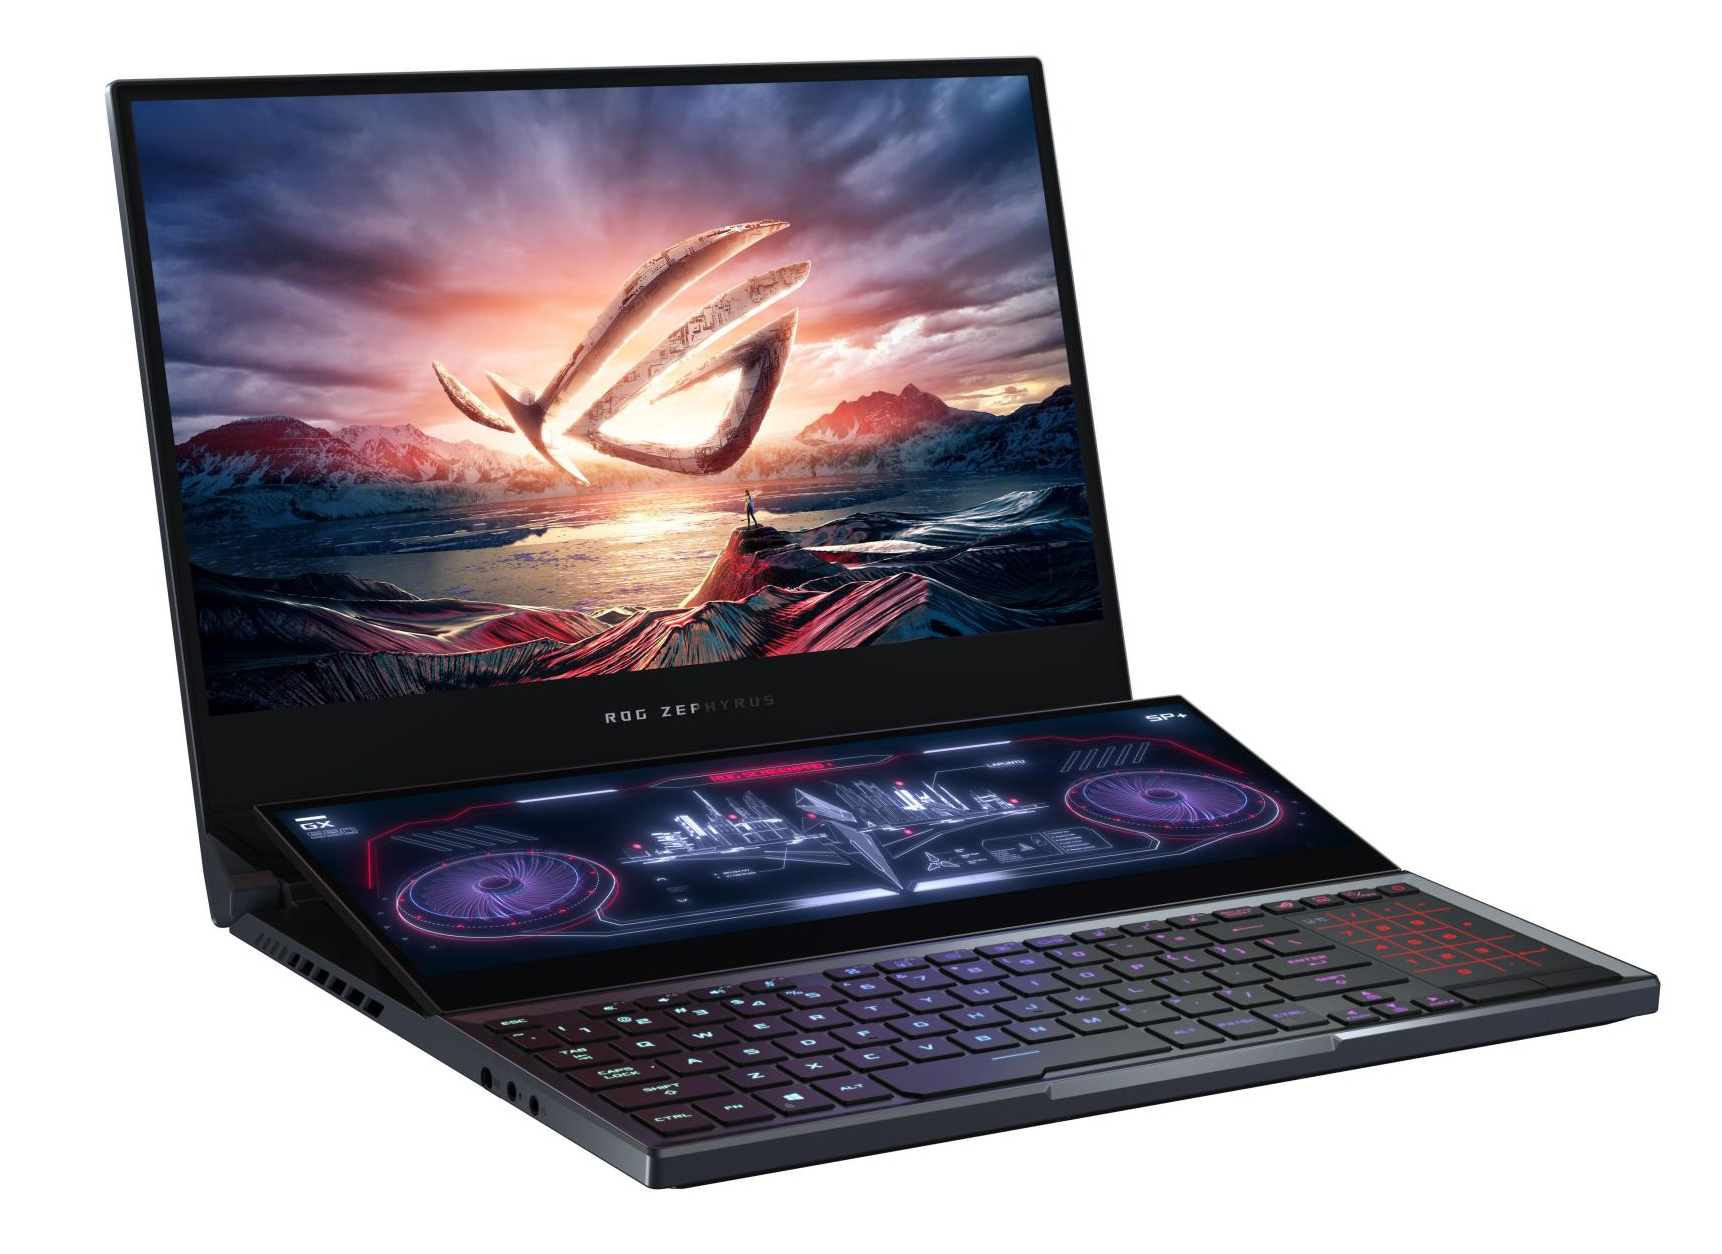
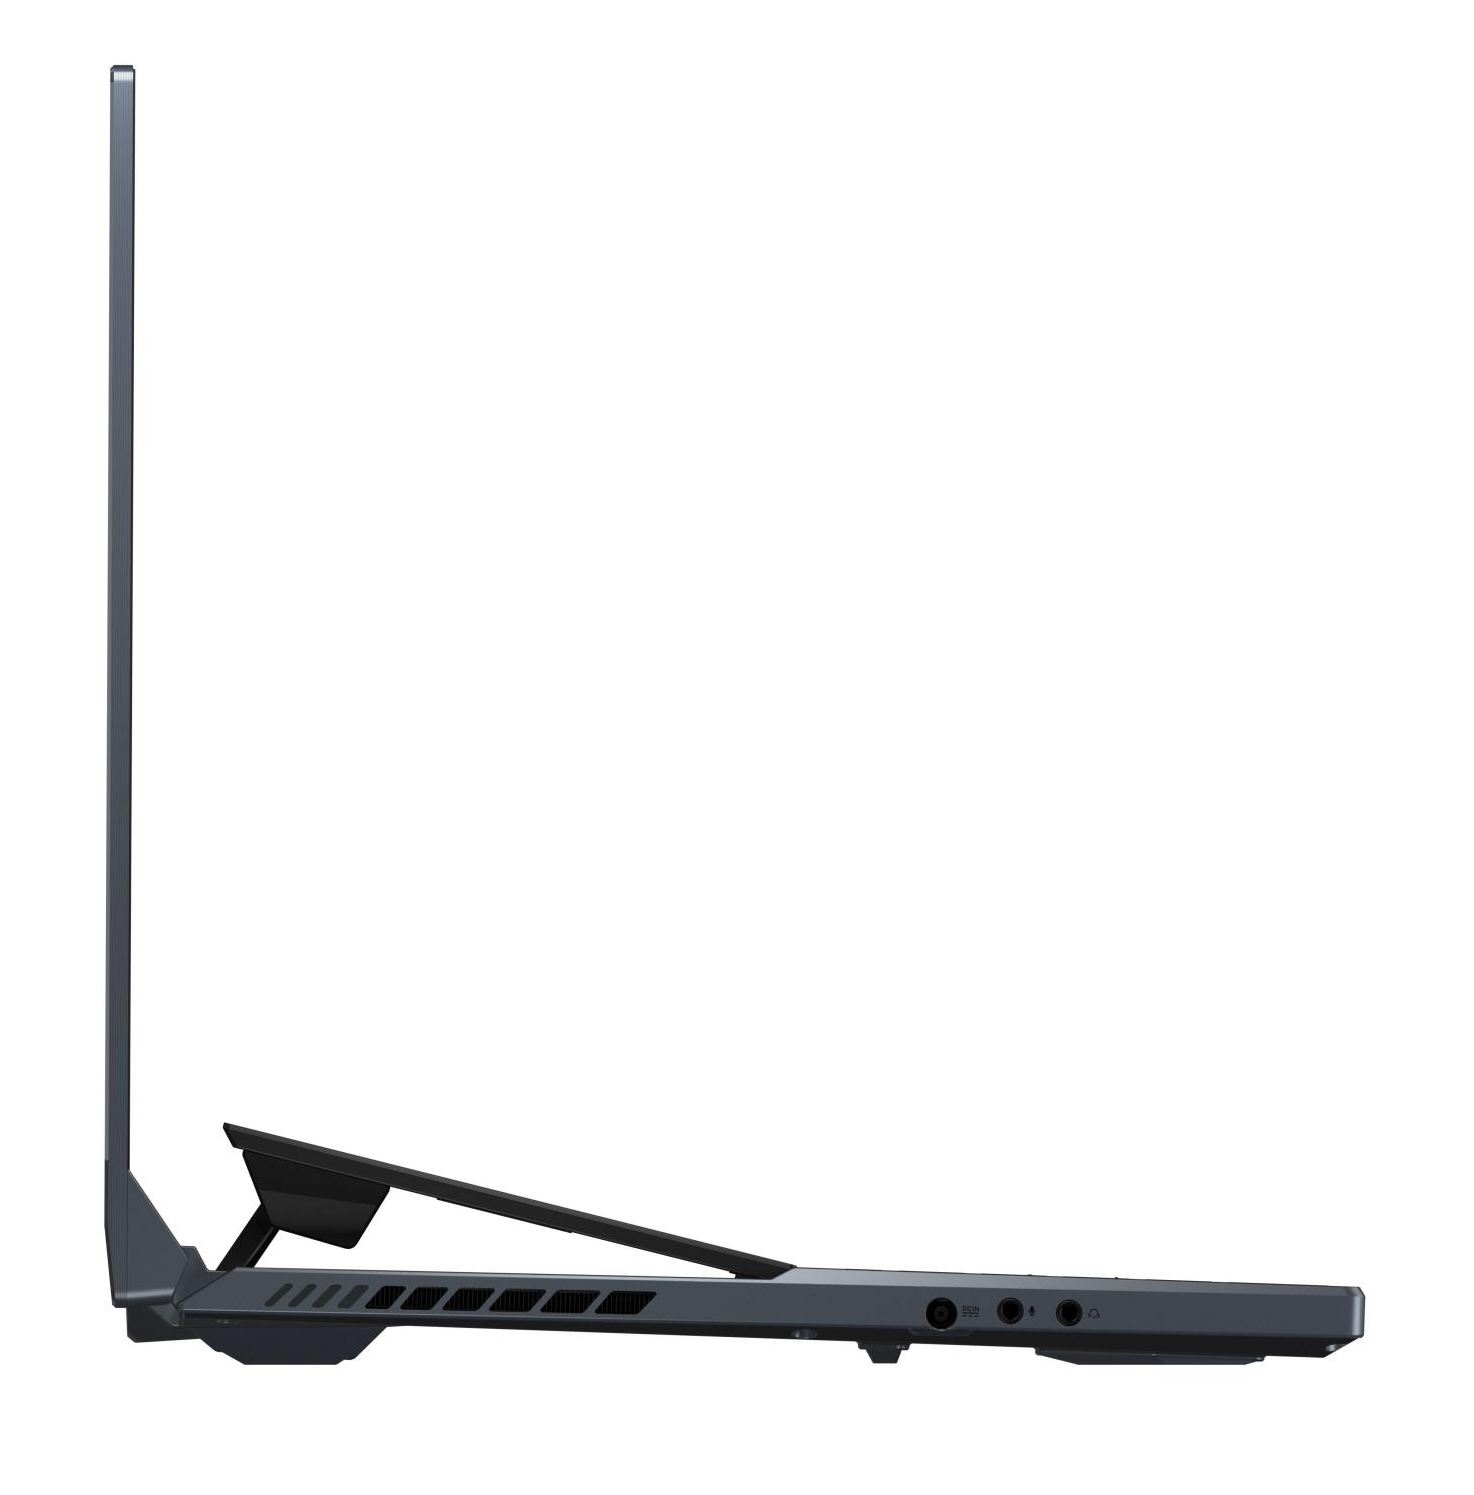
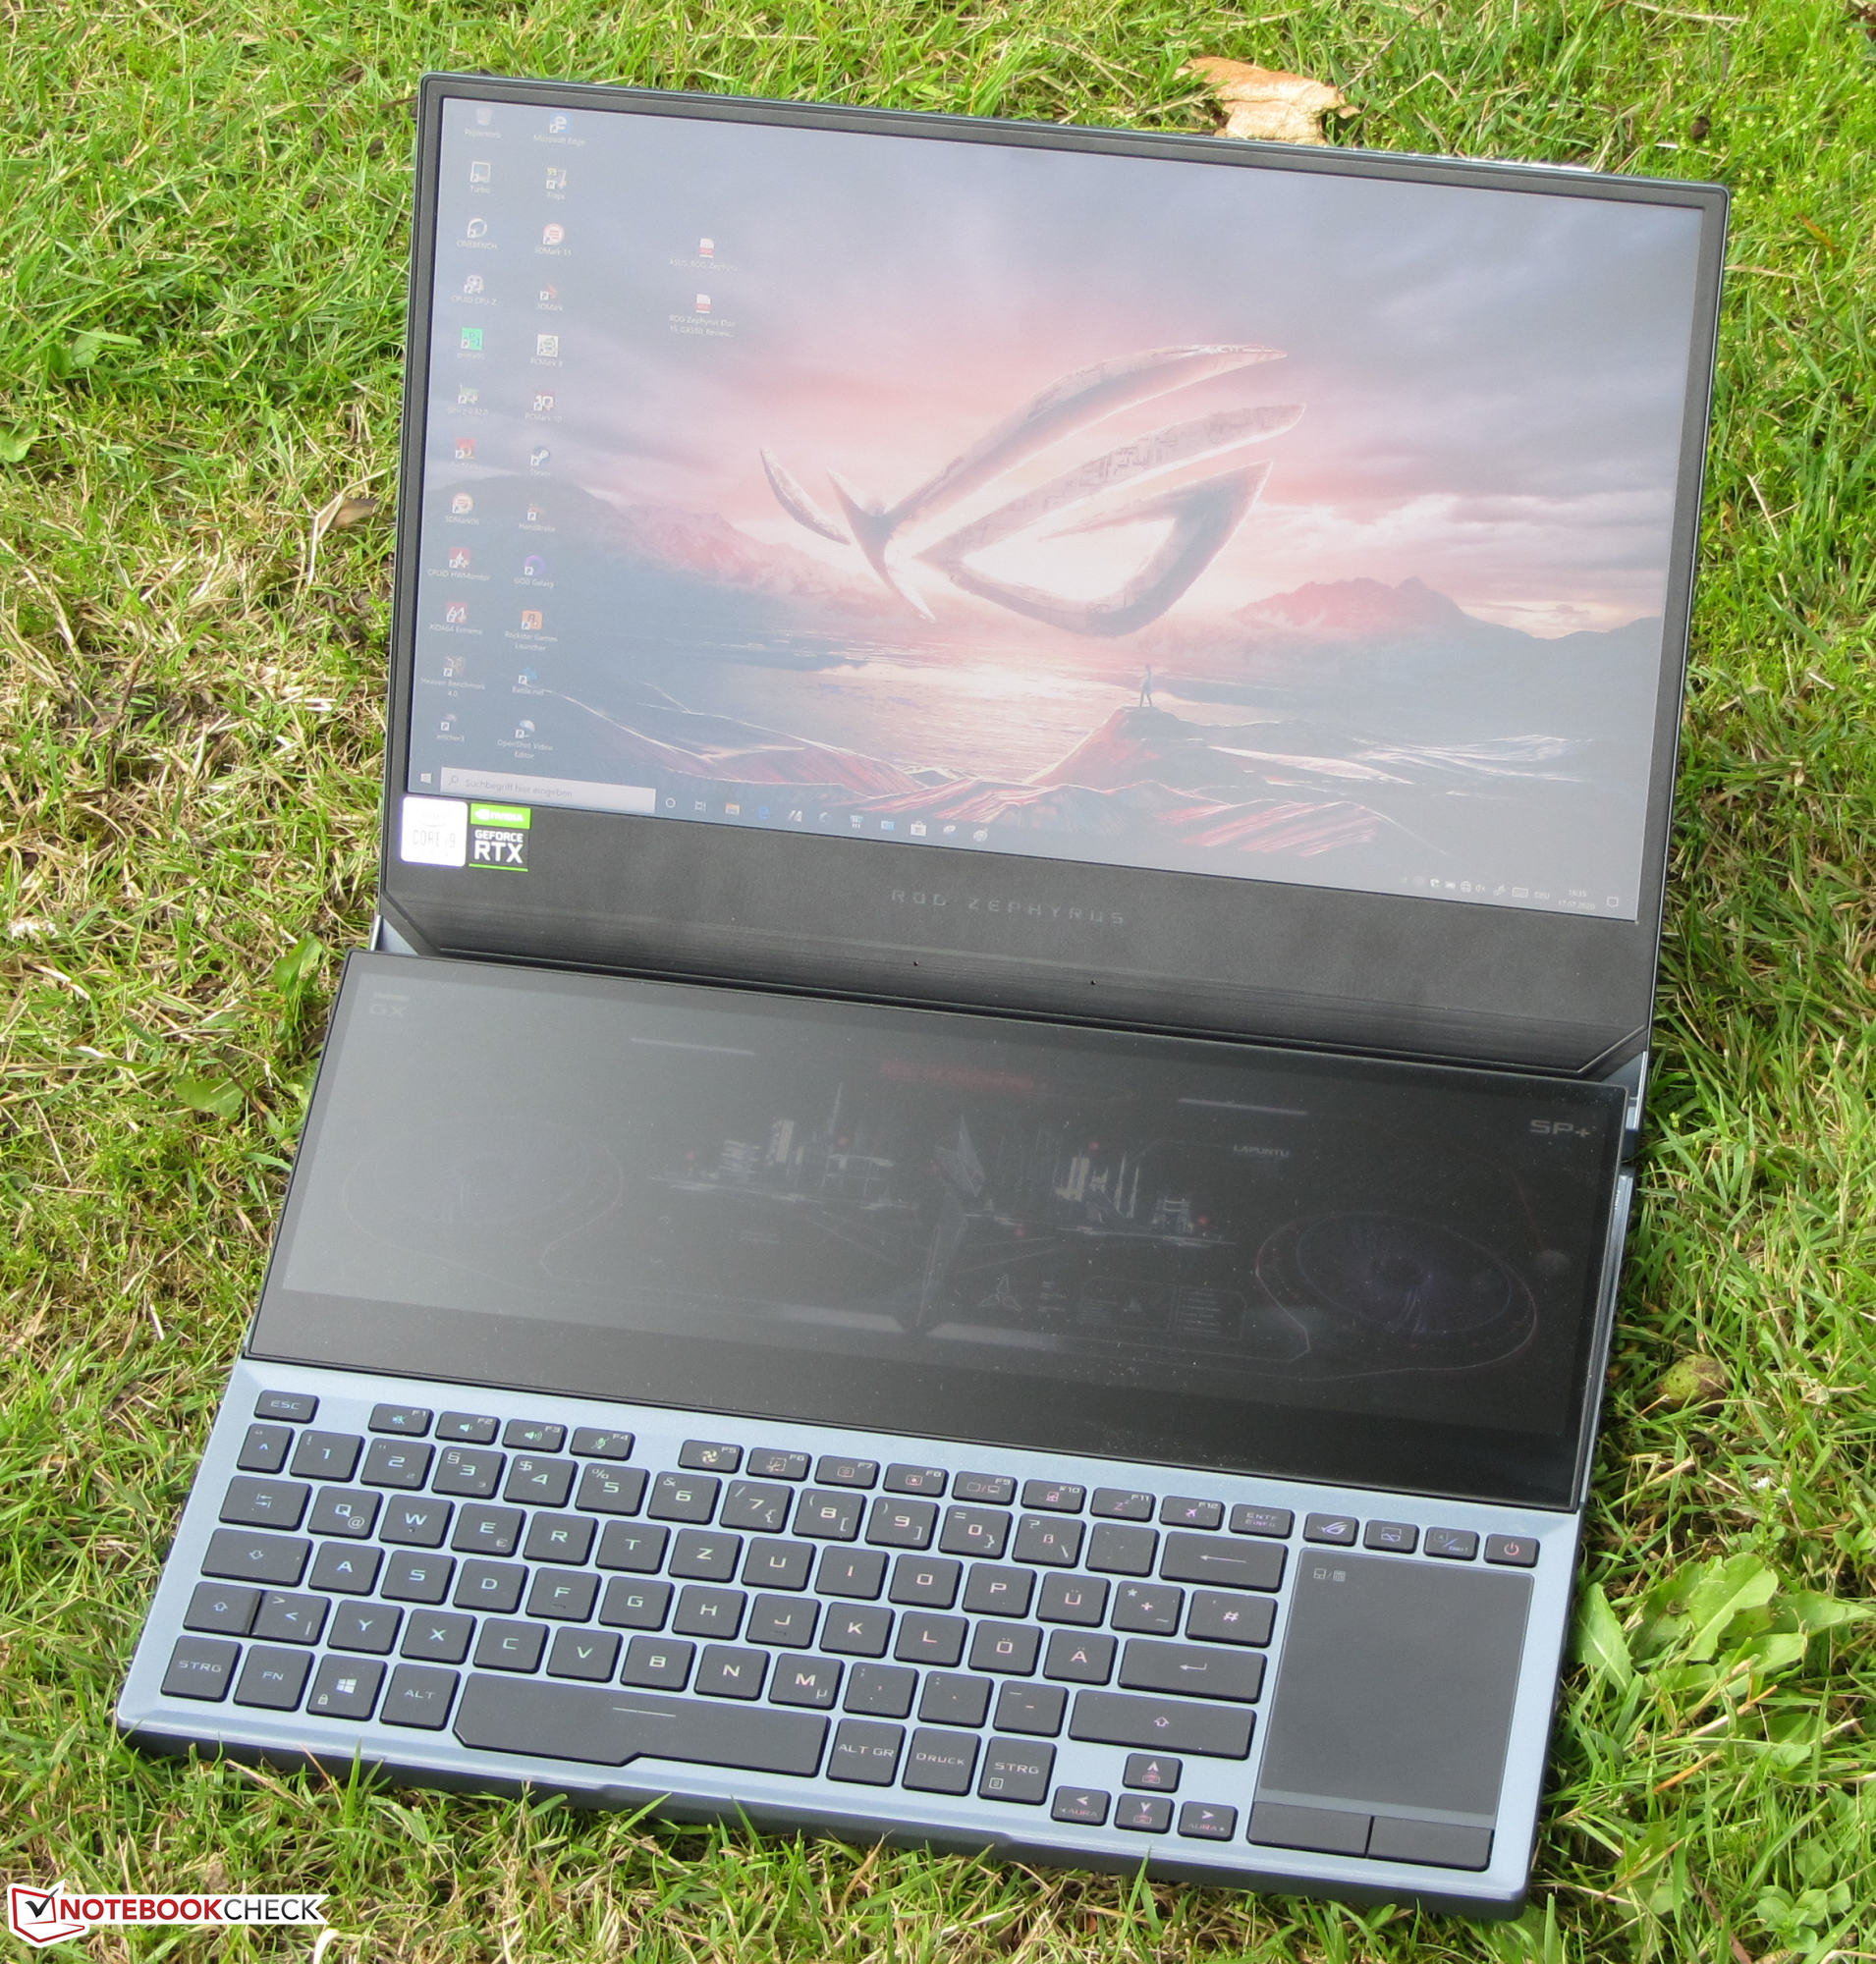
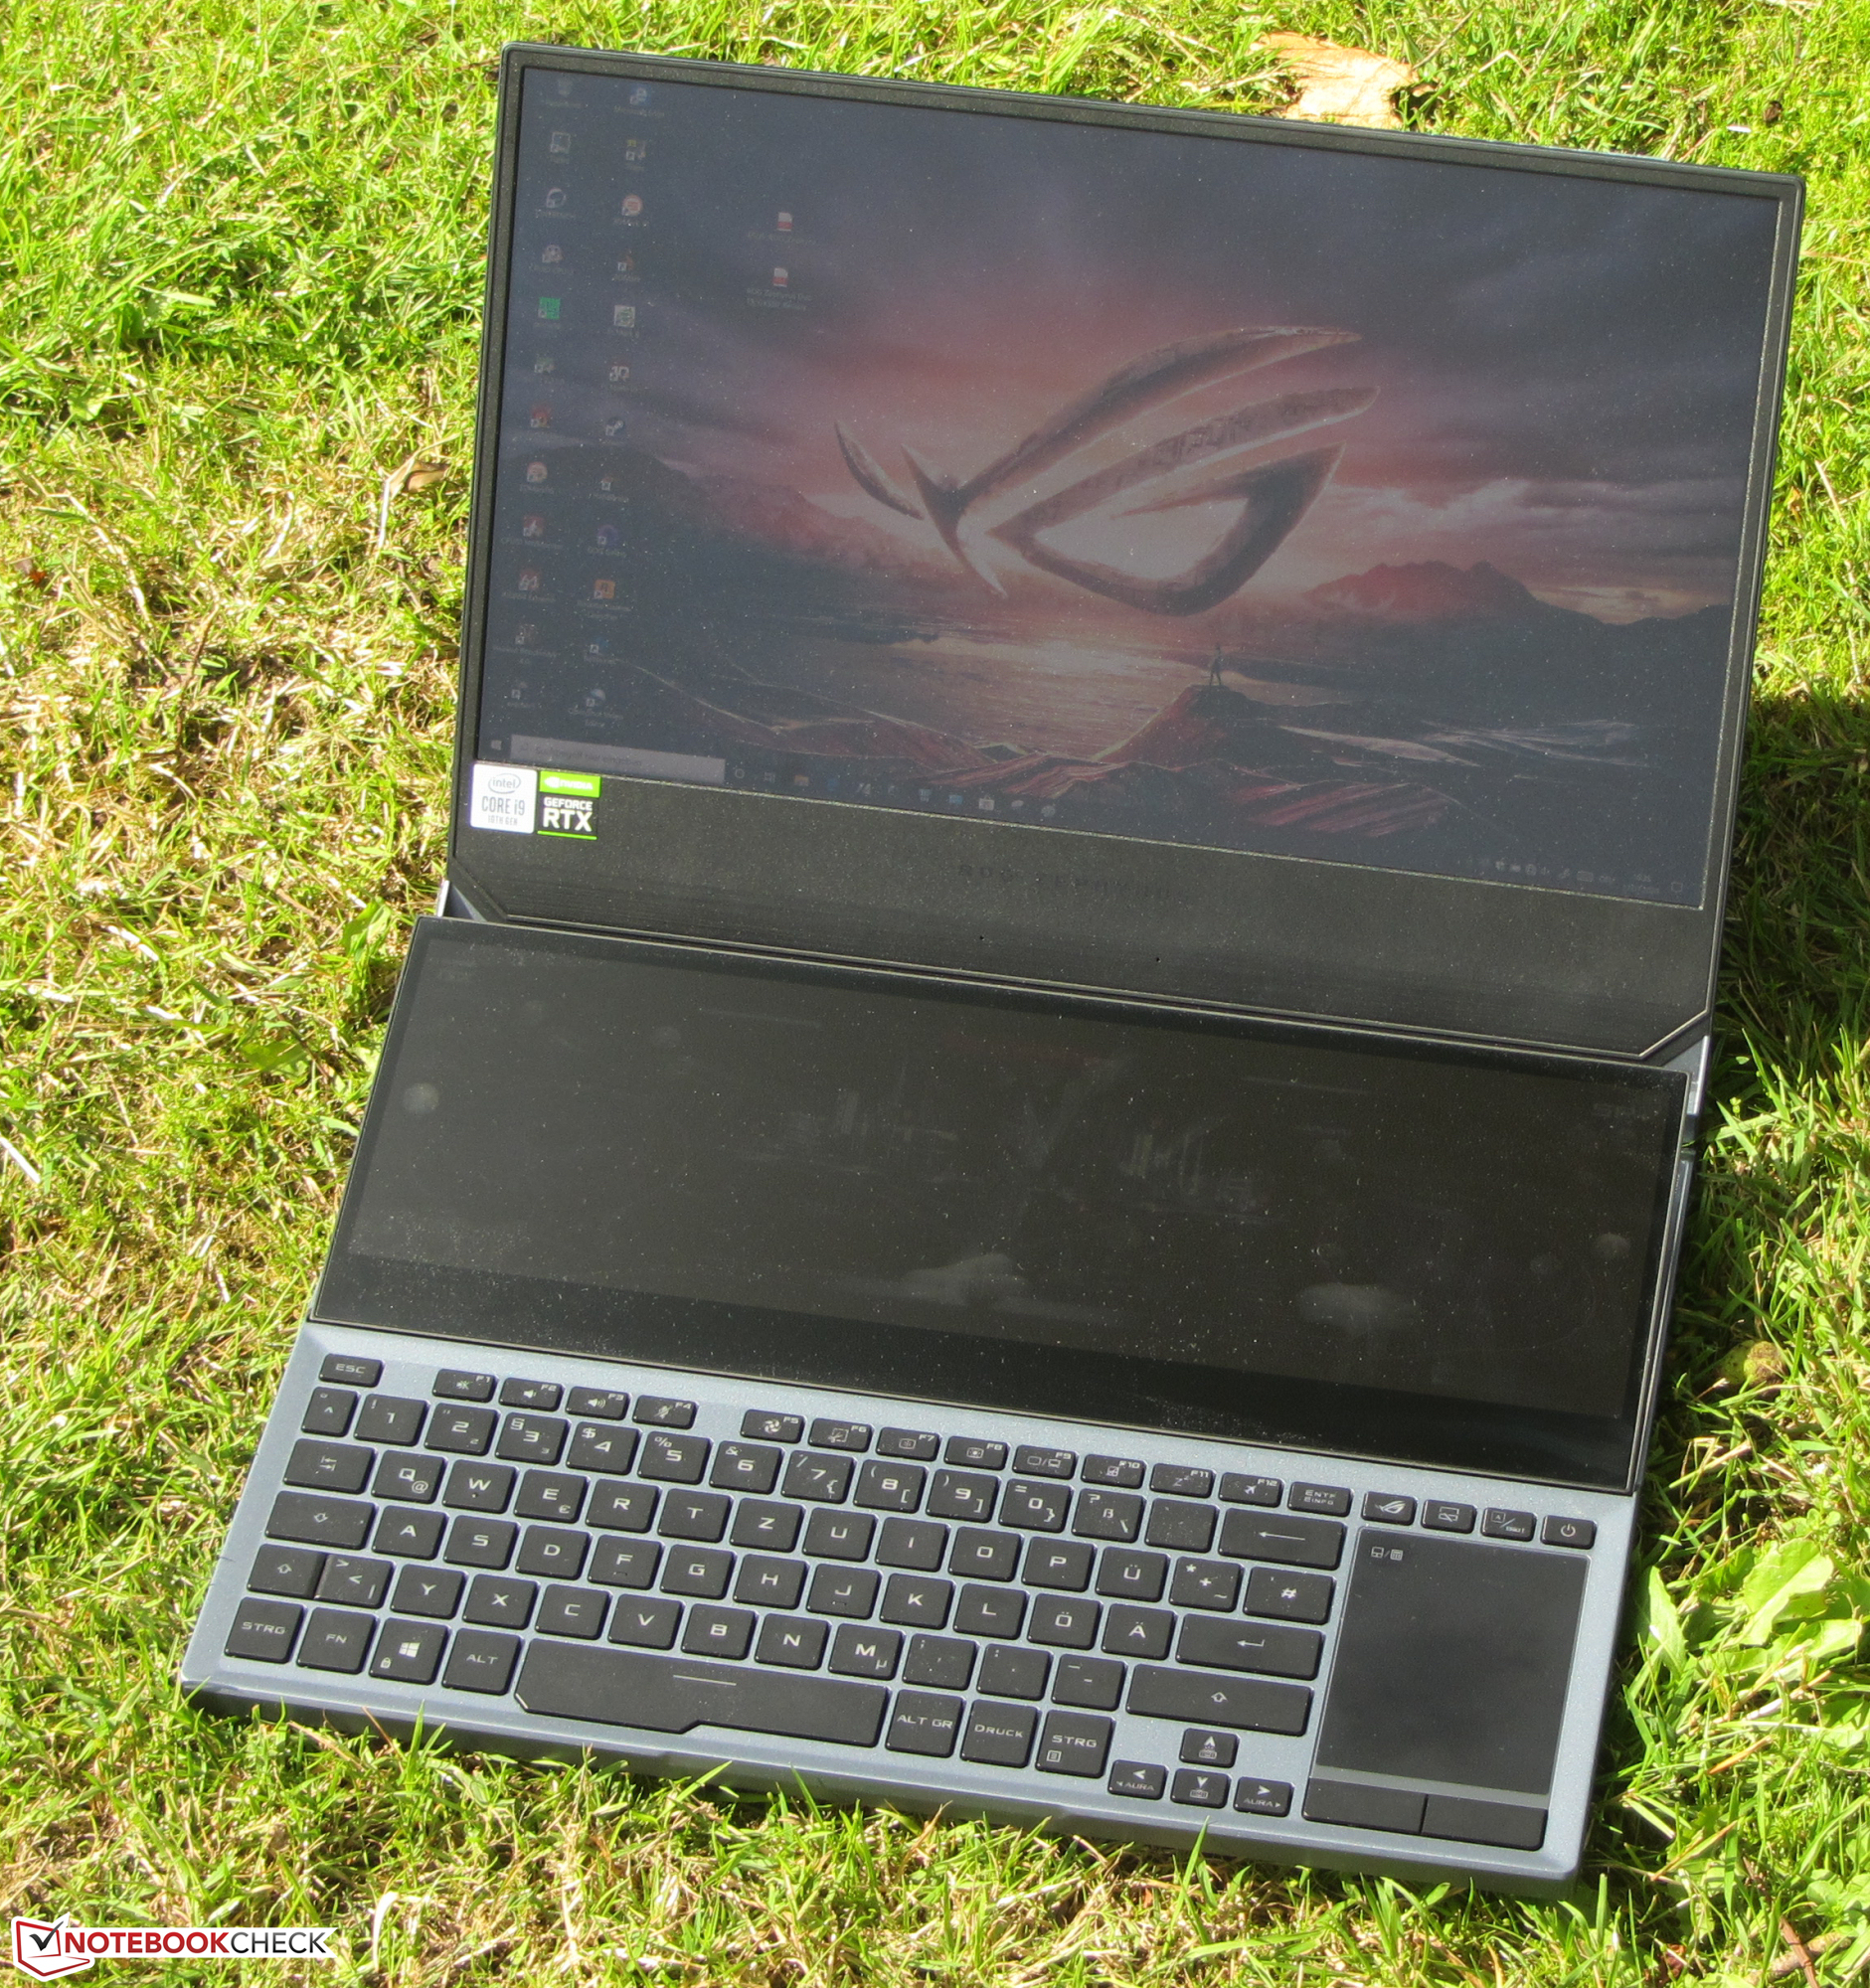
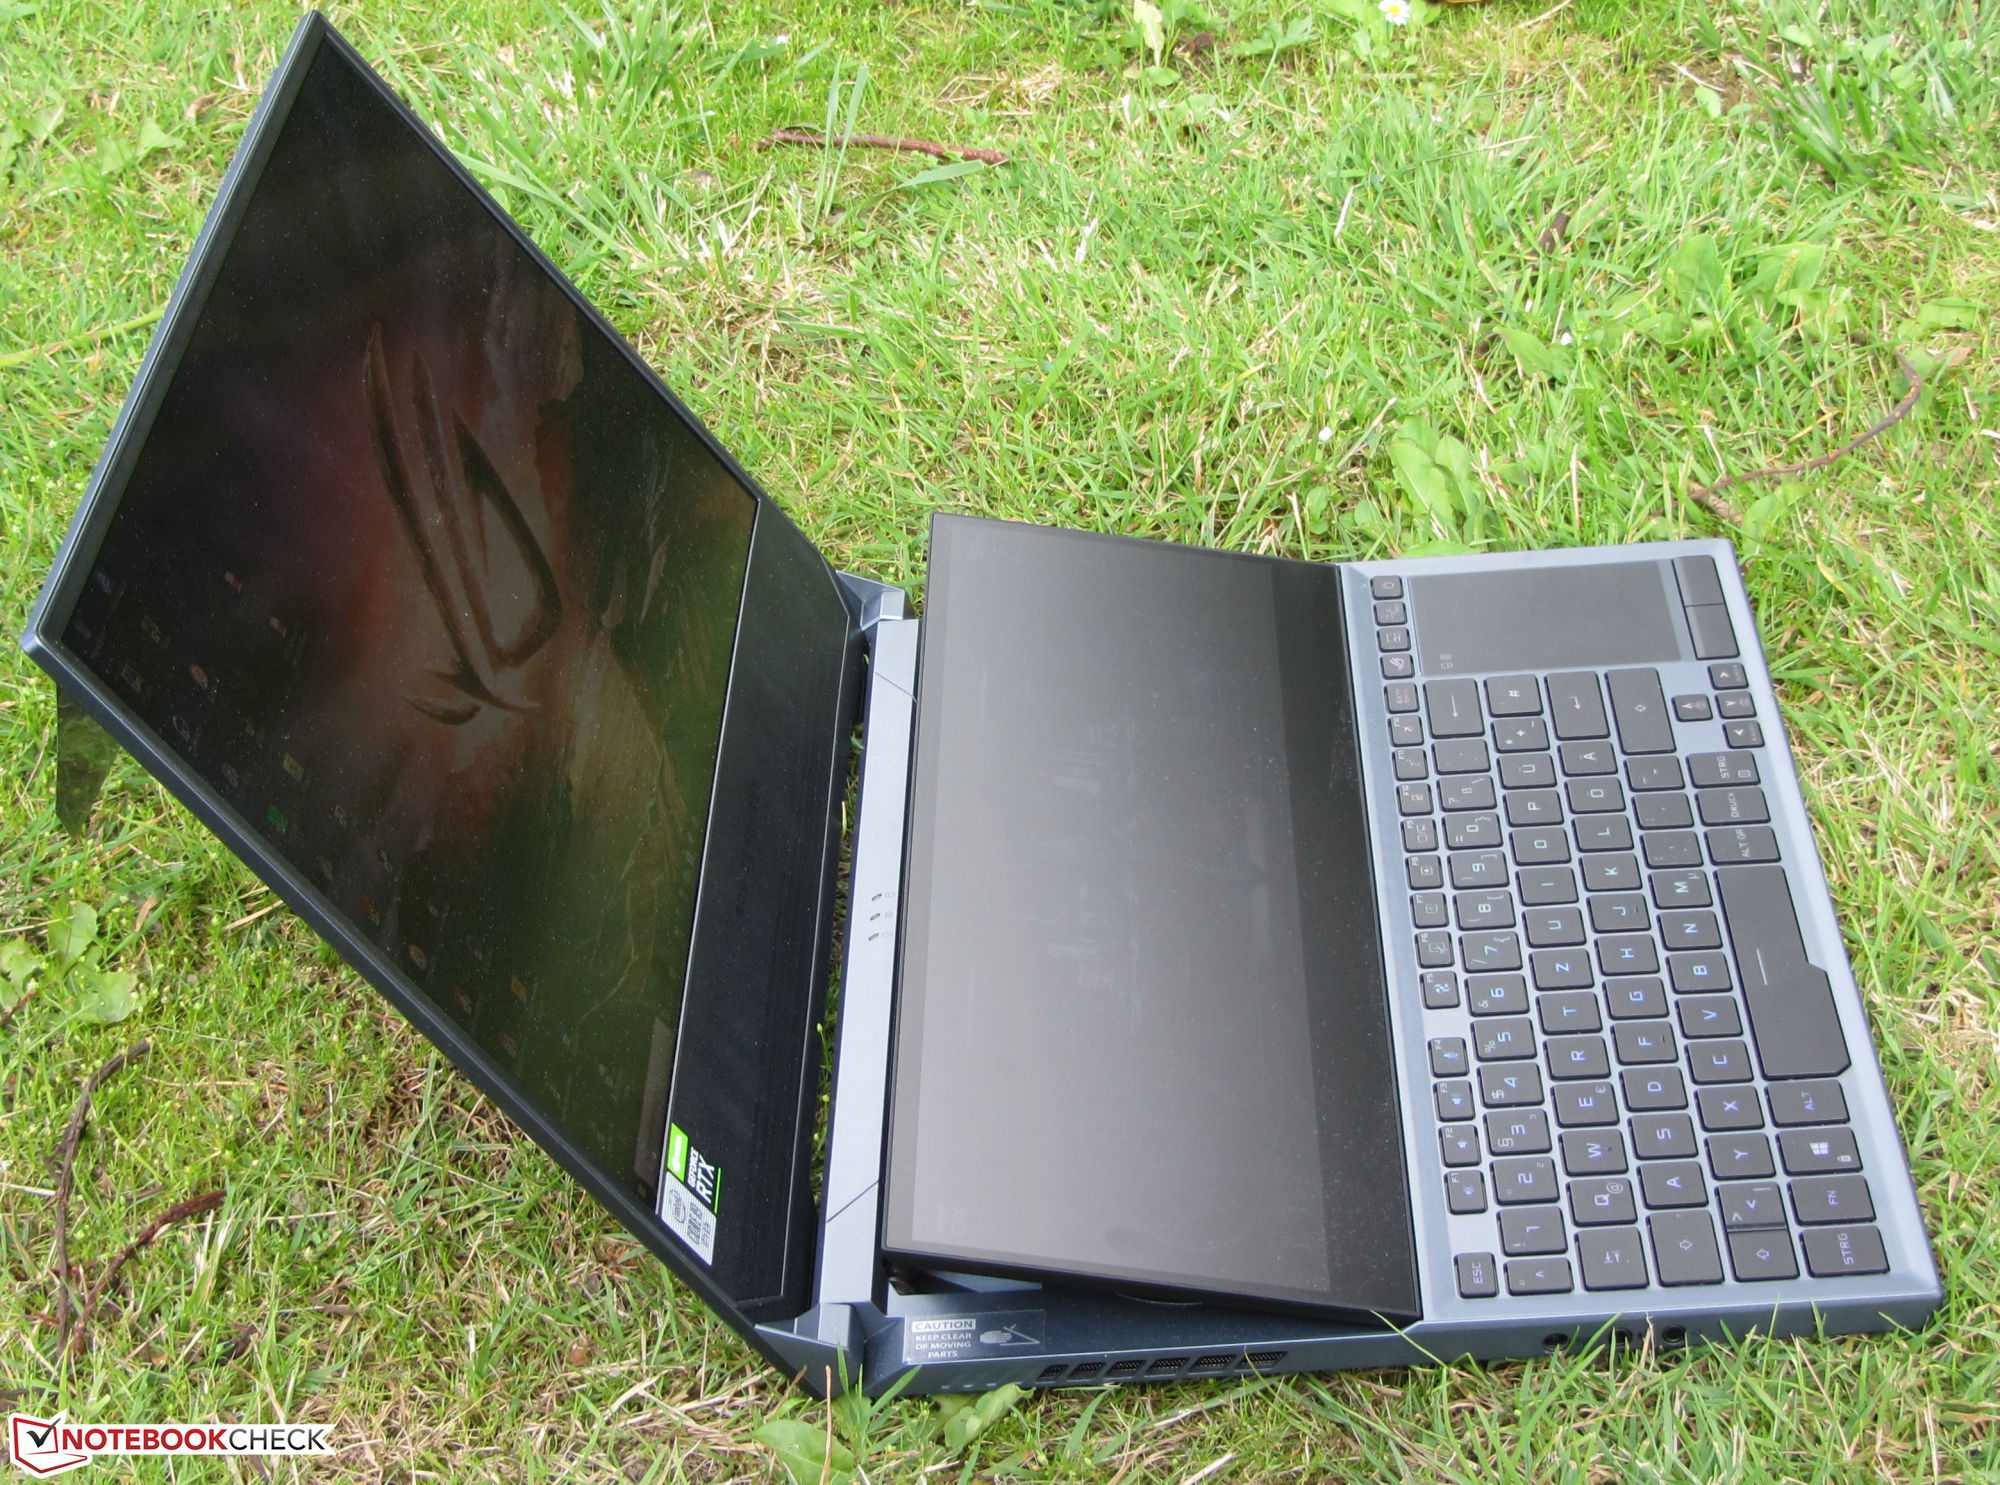
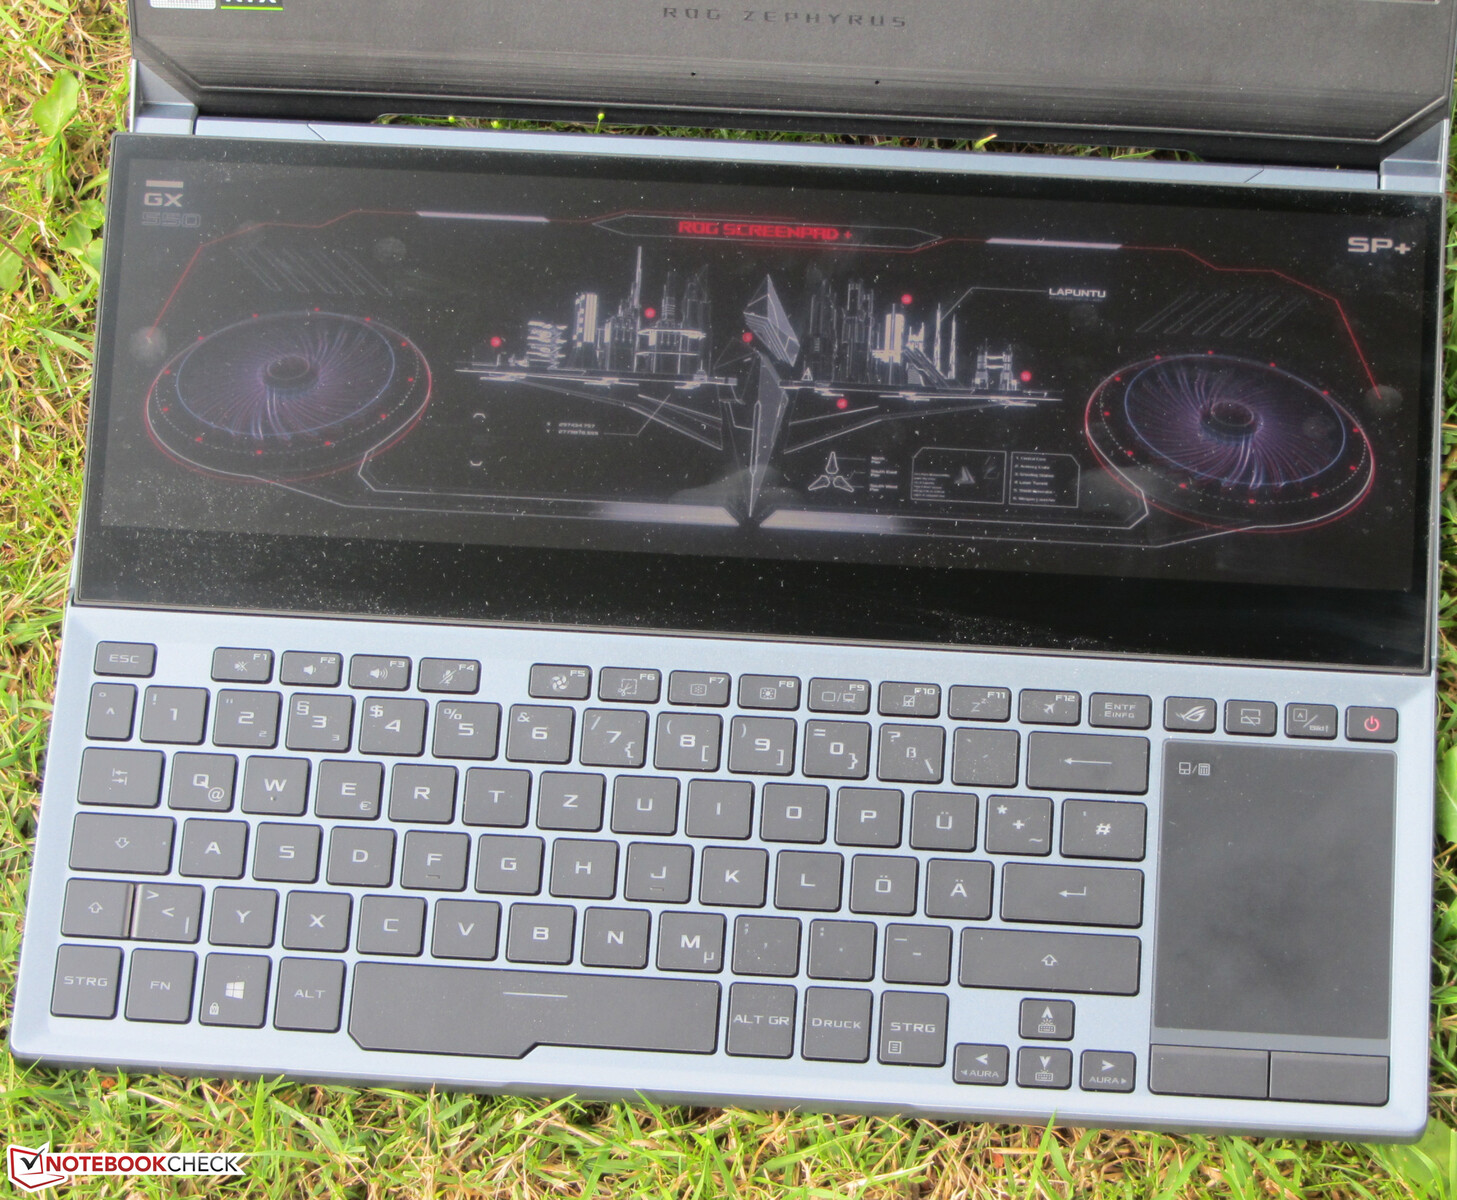
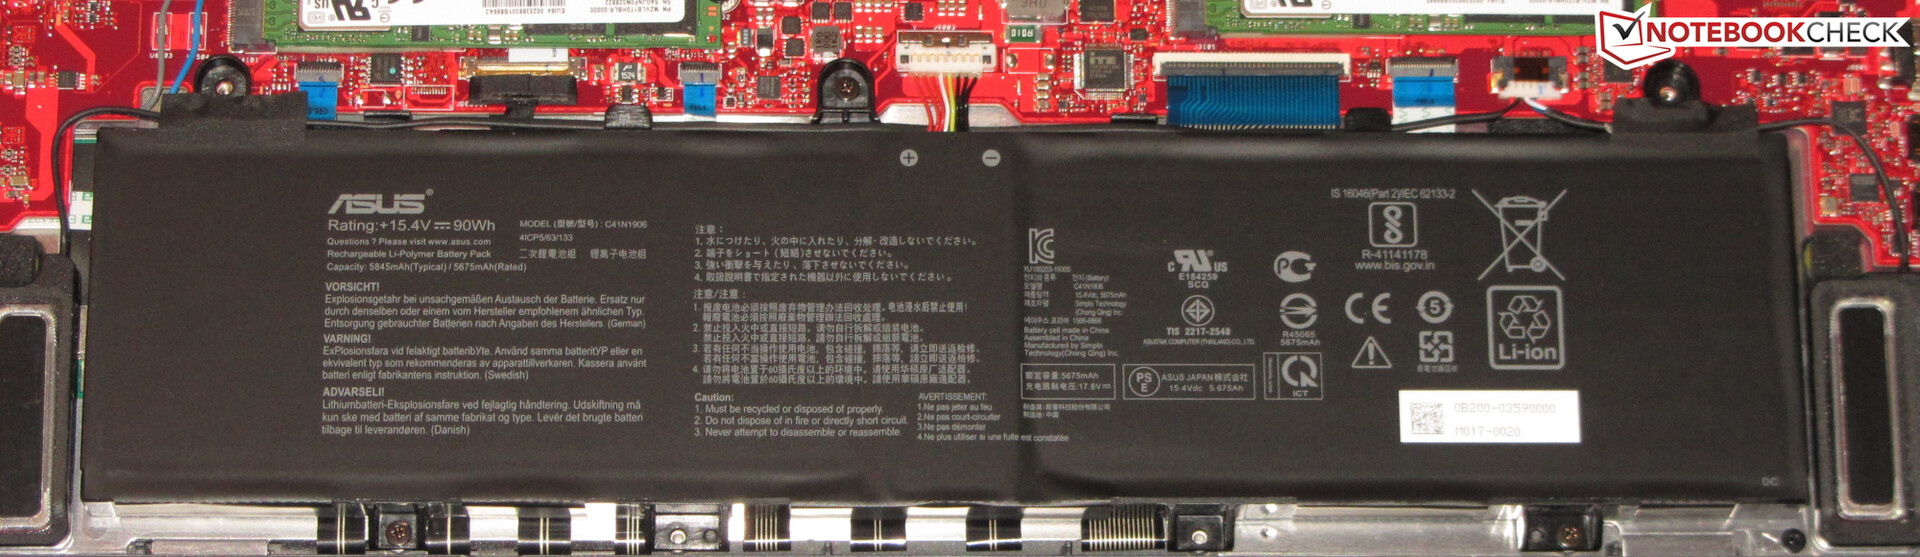
The Asus Zephyrus comes in a gray metal case. The Screenpad Plus - a secondary display with a touchscreen - is the main attraction and located above the keyboard. After opening the laptop, the Screenpad raises itself to be angled towards the user. The angle is fixed at 13 degrees and cannot be adjusted. The reasons for elevating the back of the display are not purely ergonomic. Below the Screenpad Plus, there are two airflow vents, through which cool air travels to the inside of the case. The battery is fixed. There is no maintenance hatch.
We have no complaints in terms of the build quality. The clearances are even and we did not notice any sharp edges. The base unit is very rigid and convincingly resists attempts at twisting it. Meanwhile, the lid is not as rigid. However, applying pressure to the back of the lid at least does not create distortions. The hinges hold the lid firmly in position. The display can be opened to a maximum angle of around 120 to 130 degrees. It can also be opened with just one hand.
Compared to its competitors, the Zephyrus weighs more and its dimensions are greater. This of course stems from the Screenpad and its tilt mechanism. The GX550LXS can still be considered a slim and light gaming laptop.
Features - Onboard Thunderbolt 3
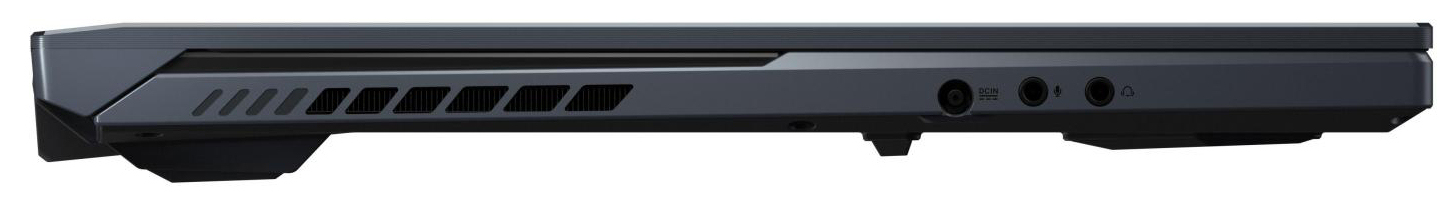
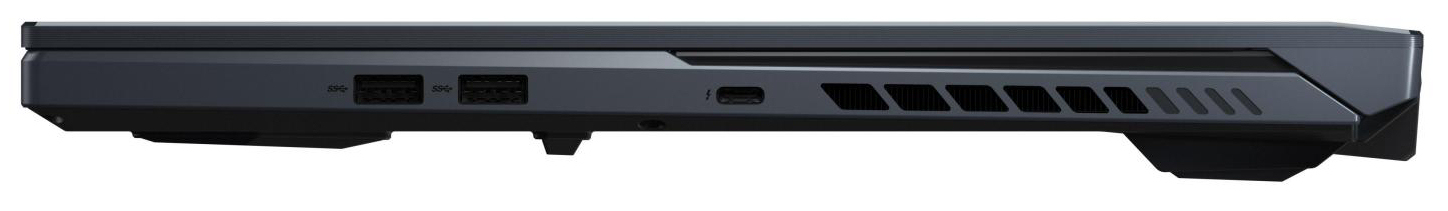
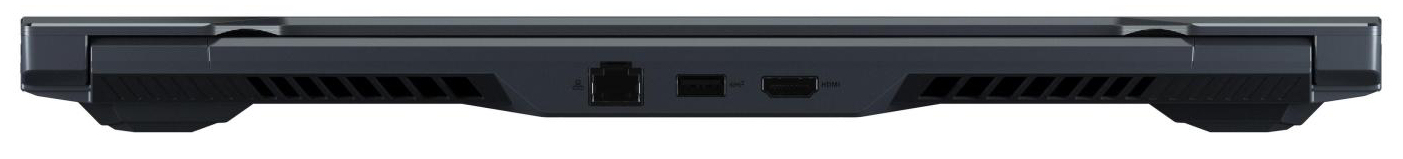
The laptop comes with three USB Type-A ports (2x USB 3.2 Gen 1, 1x USB 3.2 Gen 2). The Thunderbolt 3 port (USB Type-C form factor) opens up a wide variety of expandability options (docks, external GPU). Furthermore, it supports Power Delivery 3.0 and DisplayPort via USB-C version 1.4. According to Asus, the DisplayPort supports up to two 4K screens (60 Hz) or one 8K display. An additional monitor can be connected to the HDMI 2.0b port. The laptop does not integrate a card reader.
Communication
The integrated Intel Wi-Fi chip (Wi-Fi 6 AX201) supports the fast ax standard as well as Bluetooth version 5. We recorded excellent transfer rates under optimal conditions (no other Wi-Fi devices in proximity, short distance between the laptop and the server PC). Meanwhile, a Gigabit Ethernet controller from Realteks well-known RTL8168/8111 device family is responsible for wired networking.
Accessories
There is no shortage of accessories. The large box contains a sleeve (ROG Ranger BP2500), a headset (ROG Delta), a mouse (ROG Gladius II Impact gaming mouse), a wrist rest, a second AC adapter (65 watts, USB-C) and a webcam (ROG Eye GC21; 1080p, 60 FPS).
Maintenance
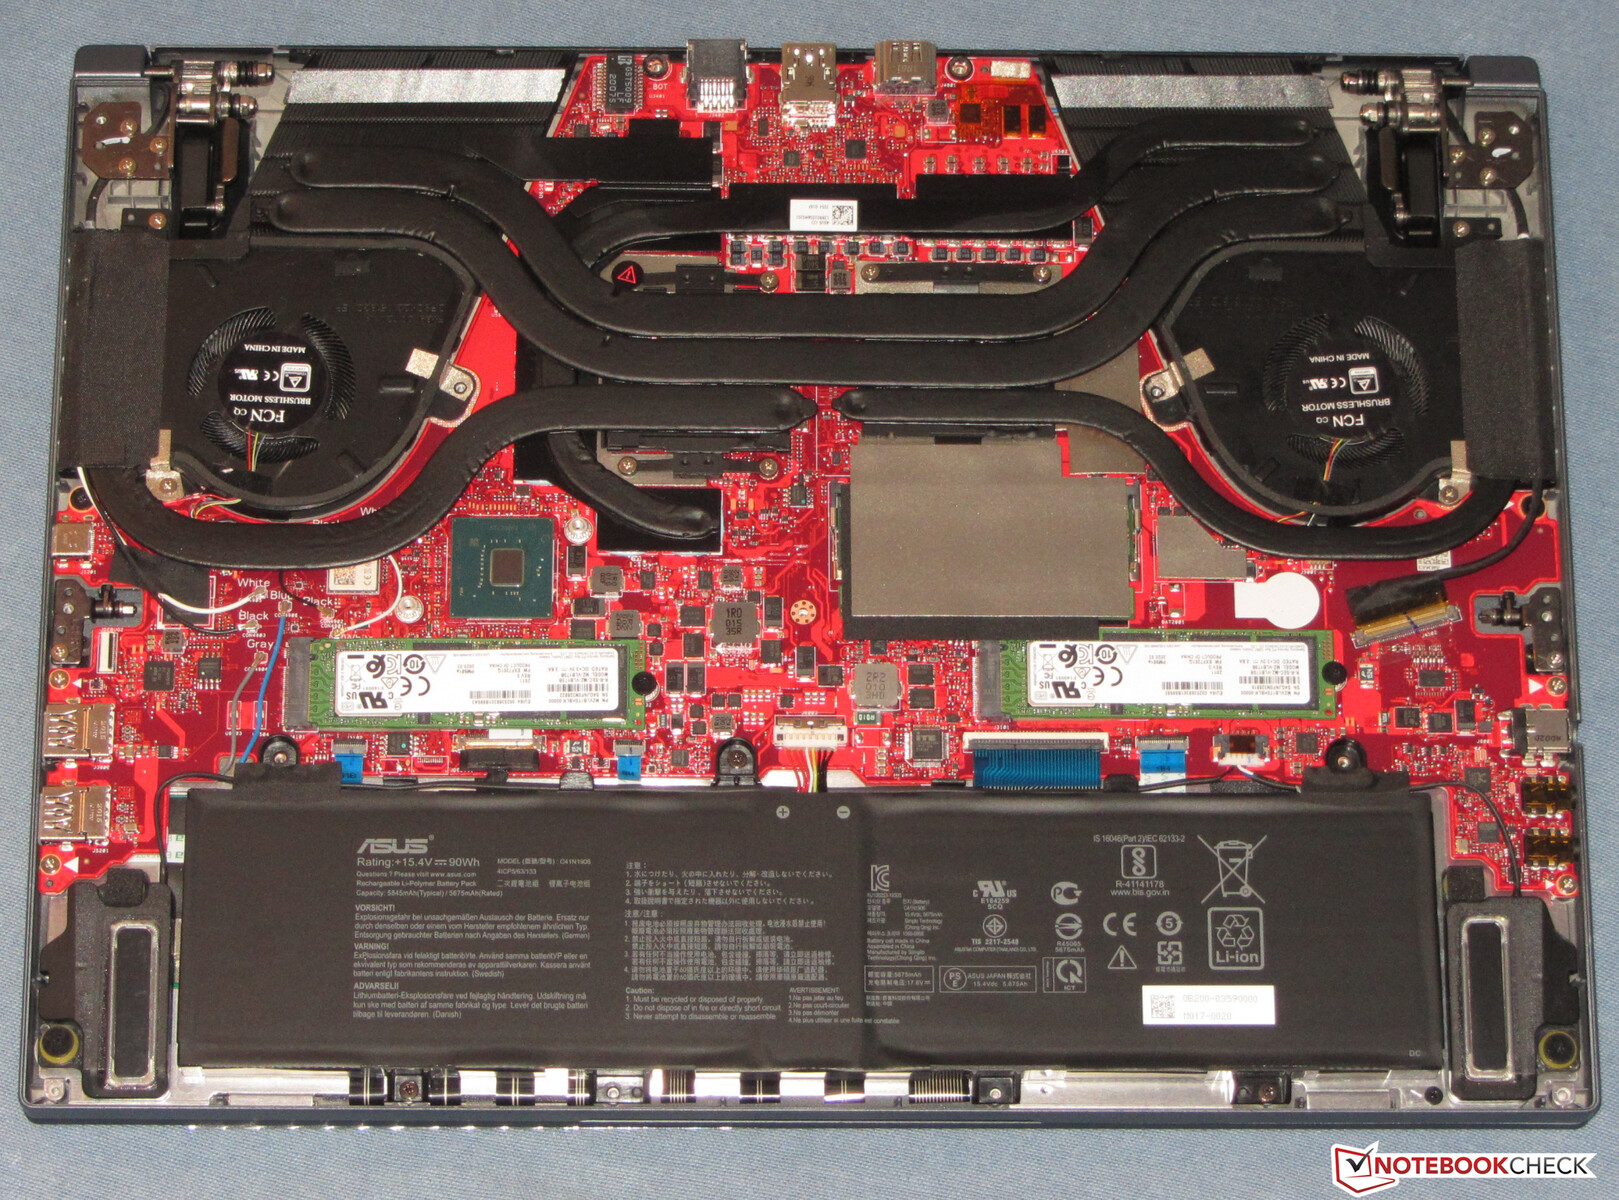
In order to access the internal hardware, the bottom plate needs to be removed. Thankfully, the entire process is fairly easy. After loosening all the screws on the bottom, the bottom plate can be removed. The screw in the bottom right corner should be removed last, since it slightly raises the bottom plate, which makes it easier to remove.
Warranty
Asus offers a two-year warranty for the Zephyrus. For a warranty extension to three years, the manufacturer charges a premium of about 55 Euros (~$64).
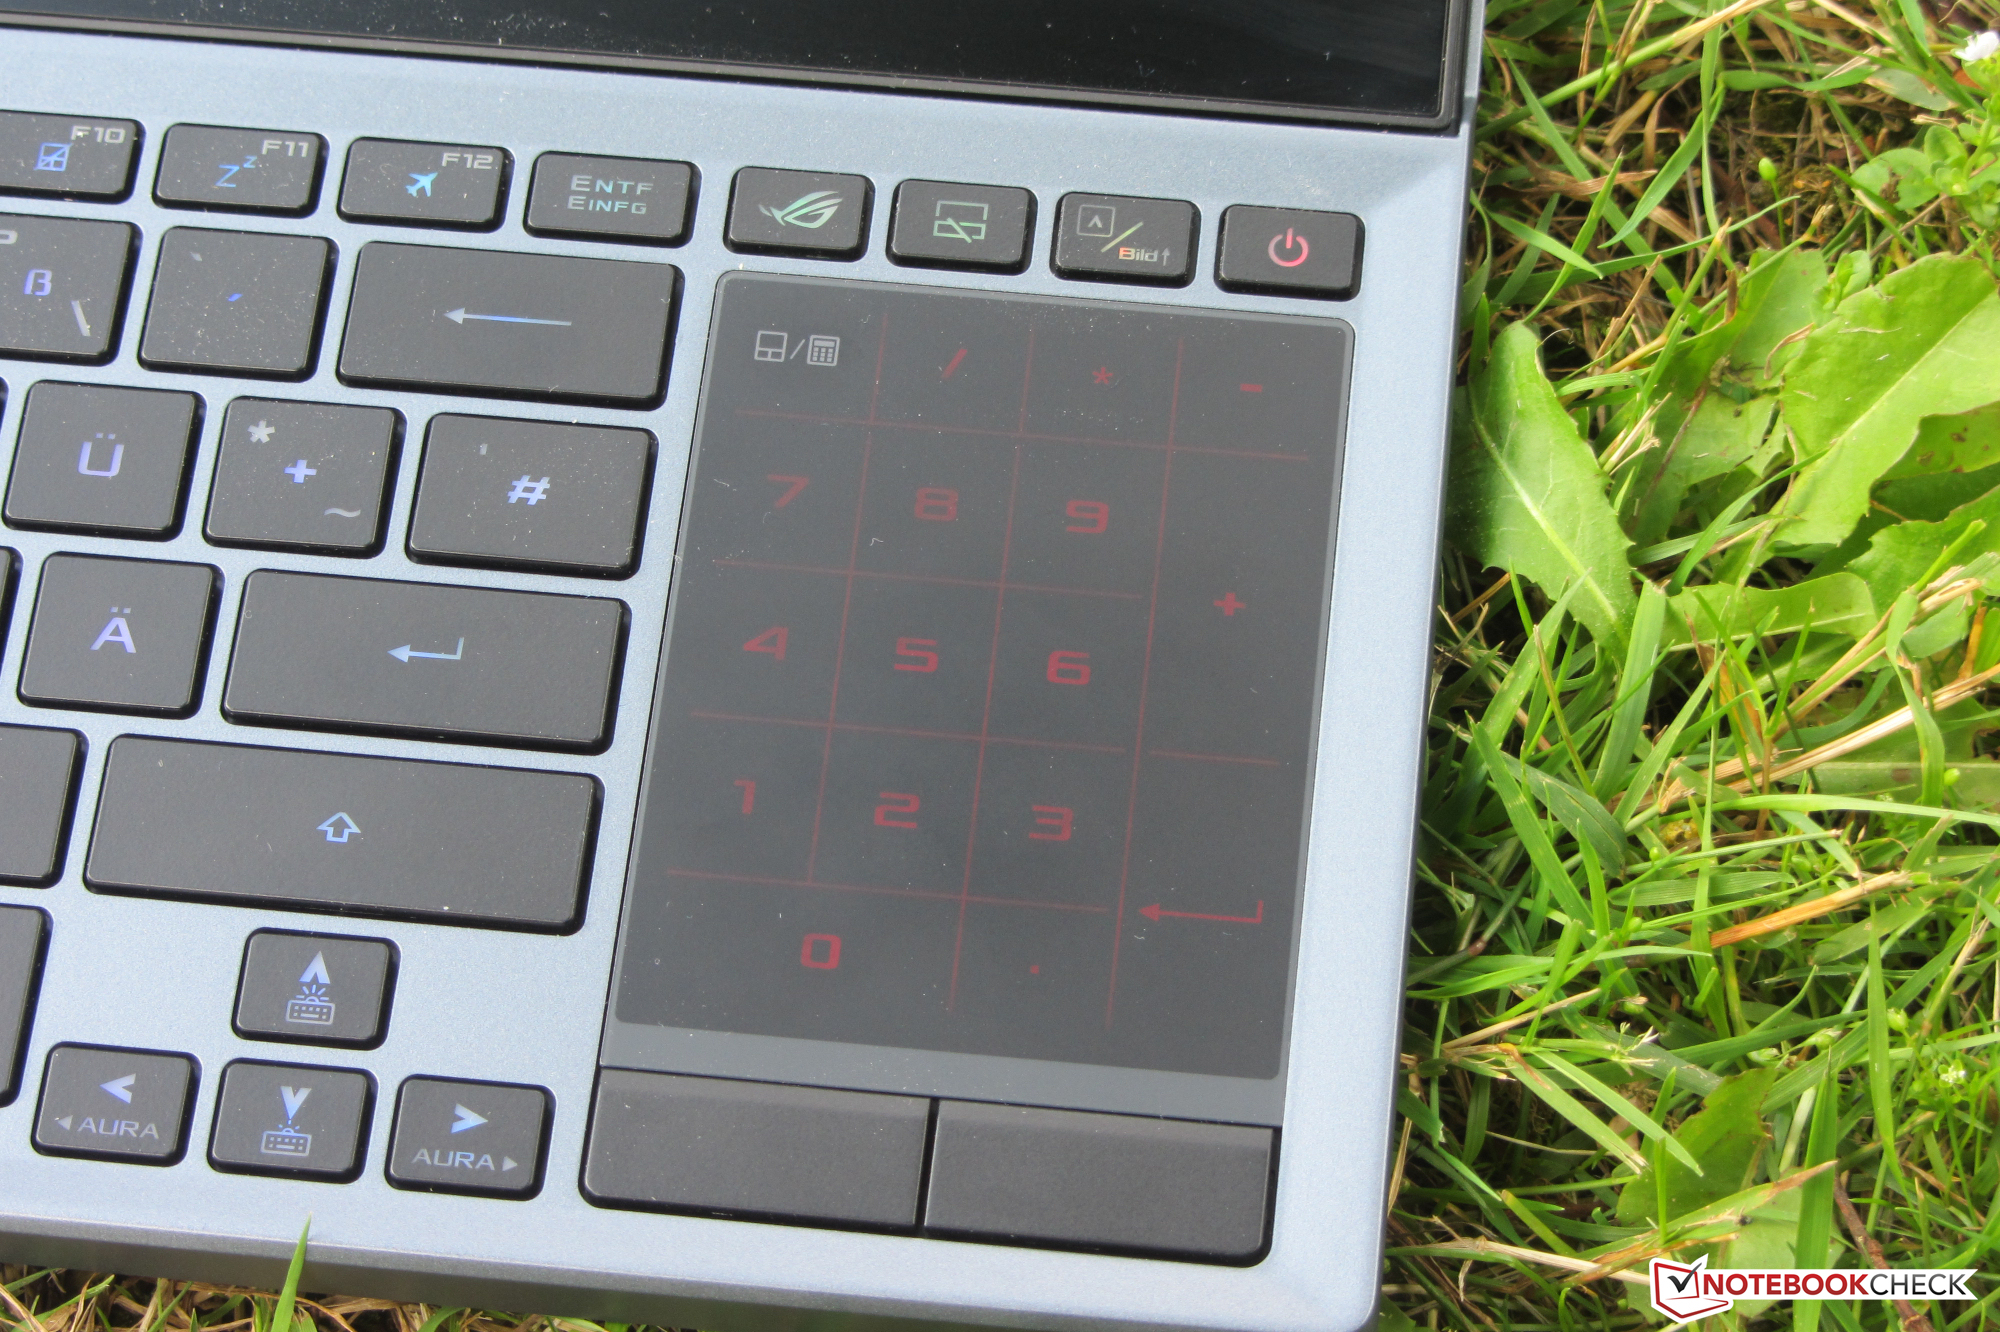
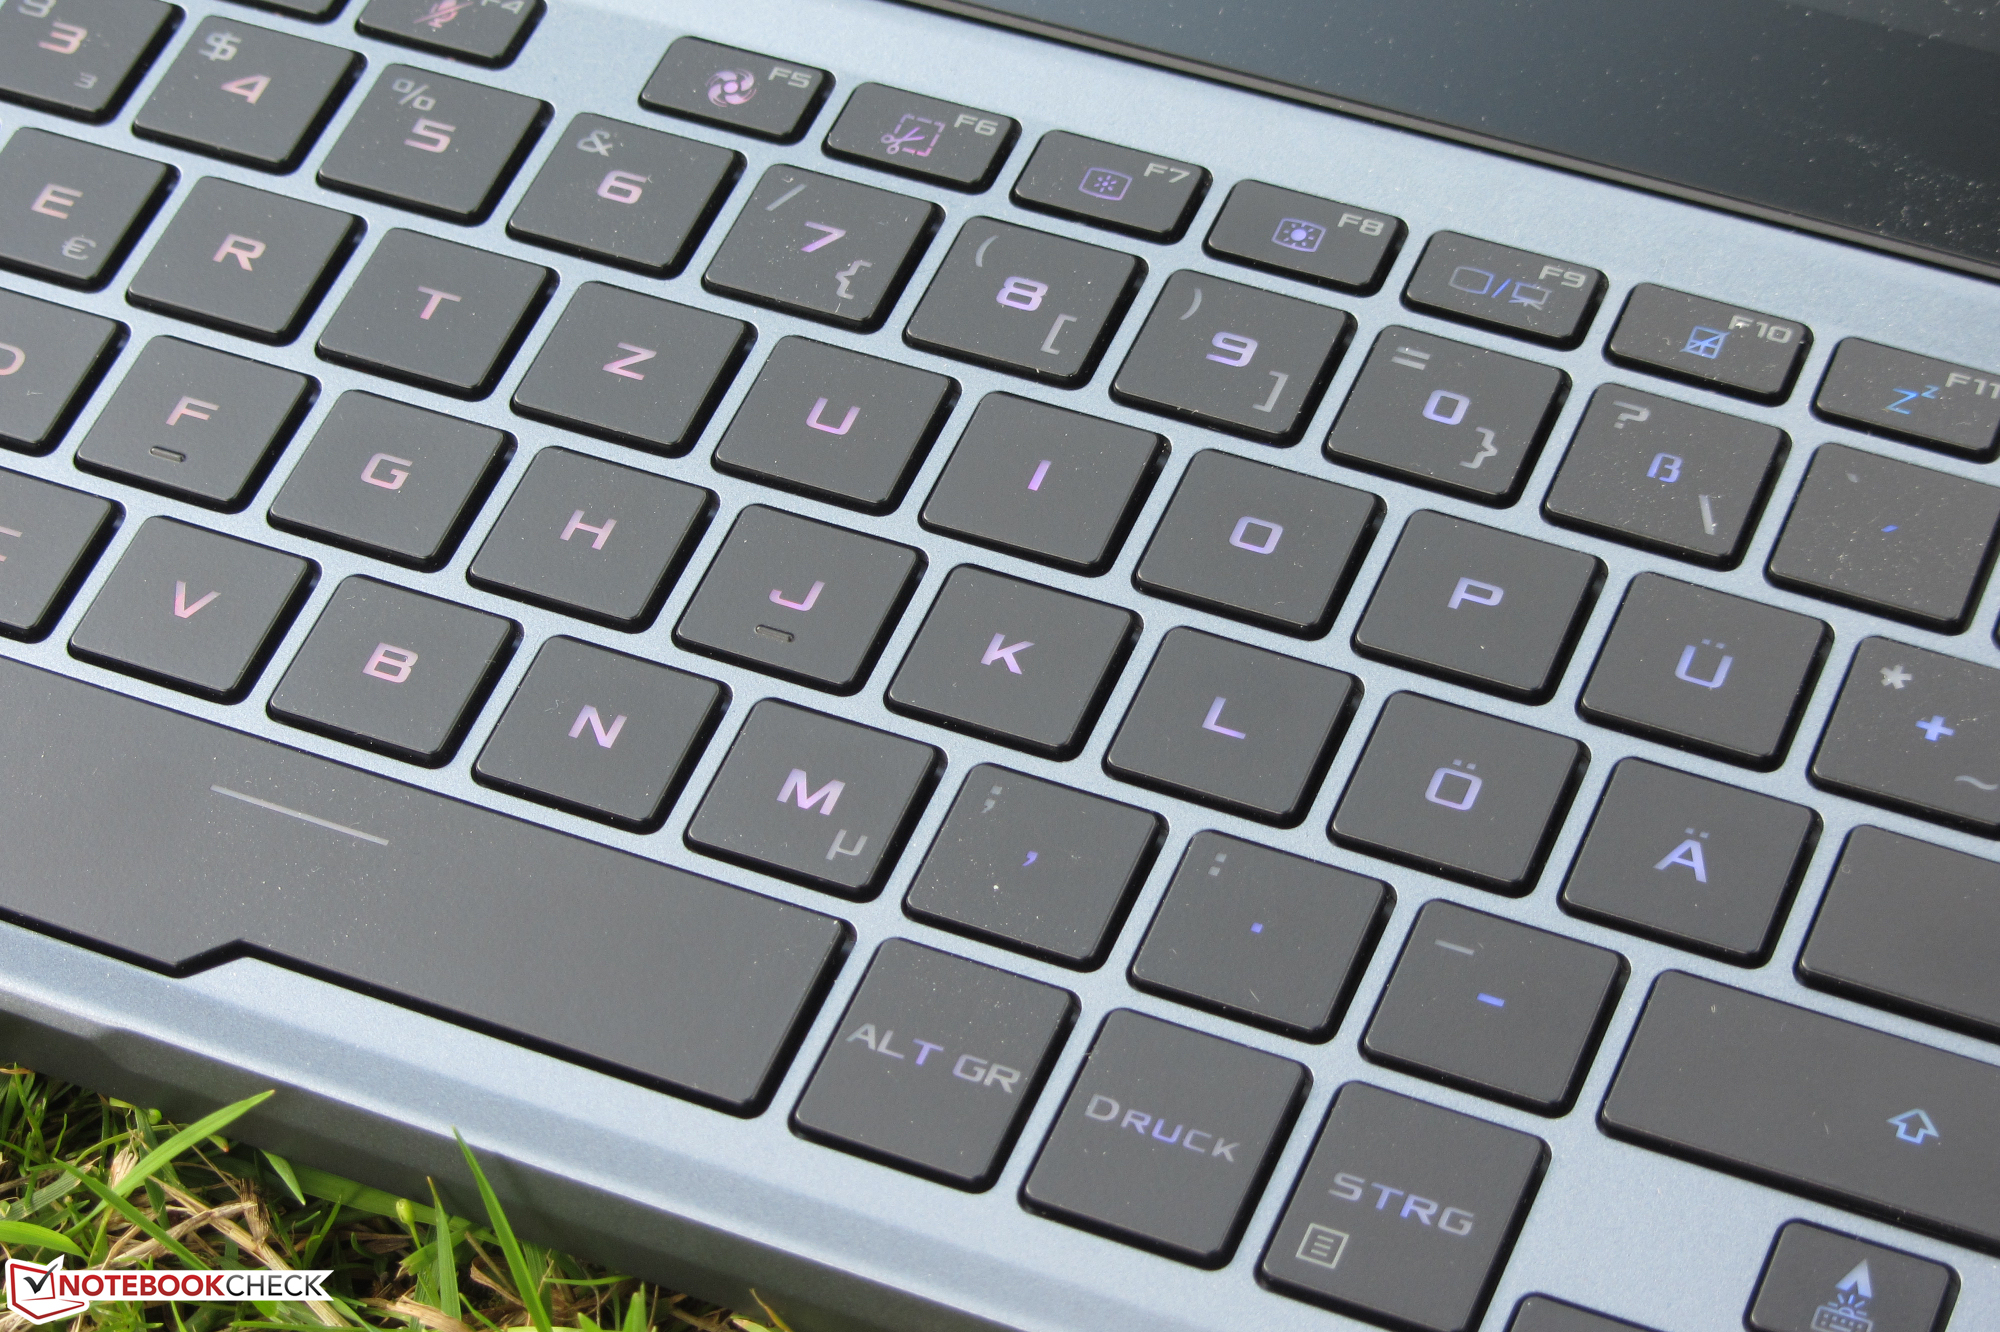
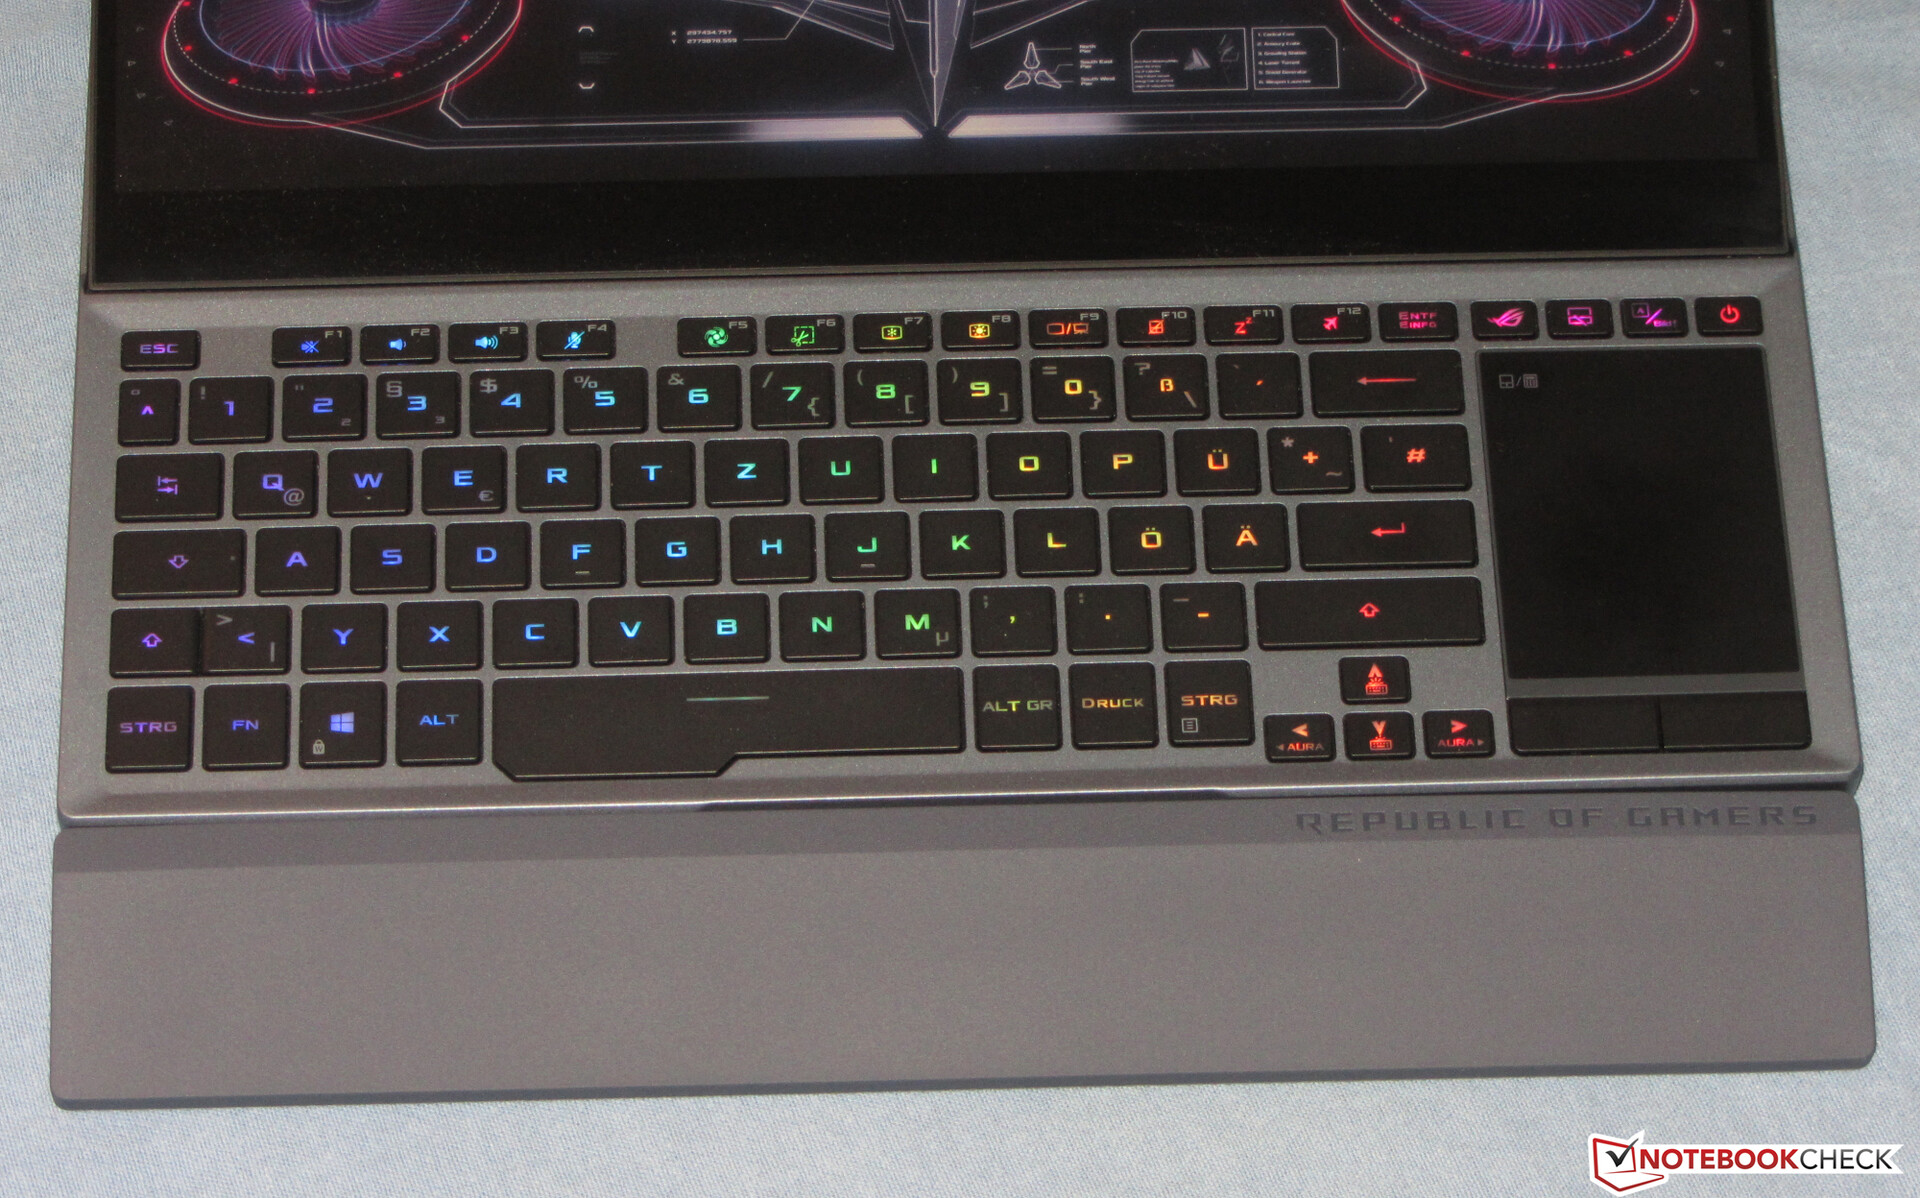
Input Devices - The Keyboard of the GX550LXS Comes with RGB Backlighting
Keyboard
Asus has equipped the Zephyrus with a backlit chiclet keyboard. The flat, smooth keys have a short travel distance and a distinct actuation point. The required actuation force is adequate. The keyboard area does not yield while typing. Since there are no palm rests, typing comfortably is impossible. A rubberized wrist rest (width of approximately 6.5 cm or ~2.56 in, angled), which can be placed in front of the laptop, is supposed to alleviate this problem. However, a firm, flat surface is required for this to work. The RGB backlighting can be adjusted according to the user's preferences with the preinstalled Asus Aura software. Asus has delivered a keyboard that is suitable for daily use. That being said, it is not a good choice for regular typing tasks.
Touchpad
The multi-touch-compatible touchpad is located to the right of the keyboard in an upright position. It occupies an area of approximately 5.8 x 7.6 cm (~2.28 x 2.99 in). The space is sufficient for gesture controls. Furthermore, fingers glide effortlessly across the smooth touchpad surface. The two dedicated mouse buttons have a short travel distance and a distinct actuation point.

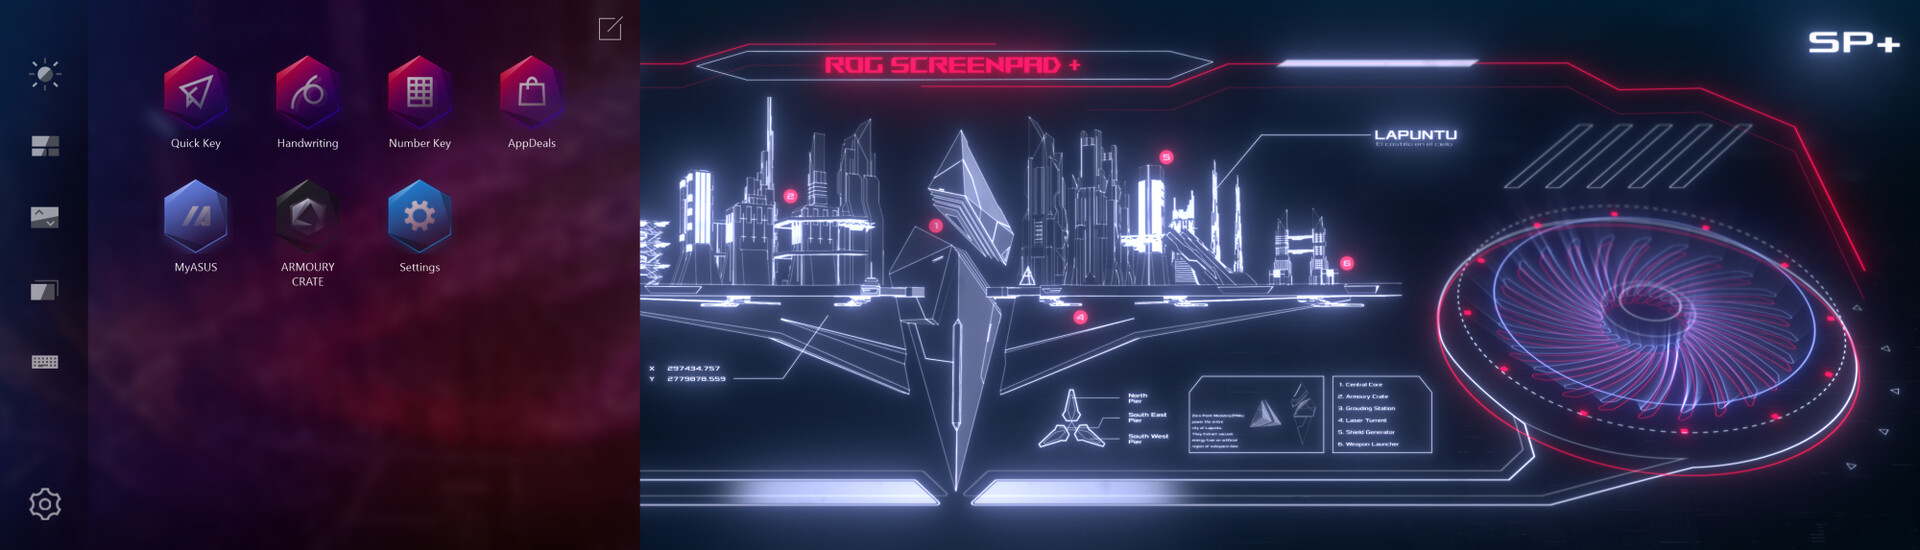
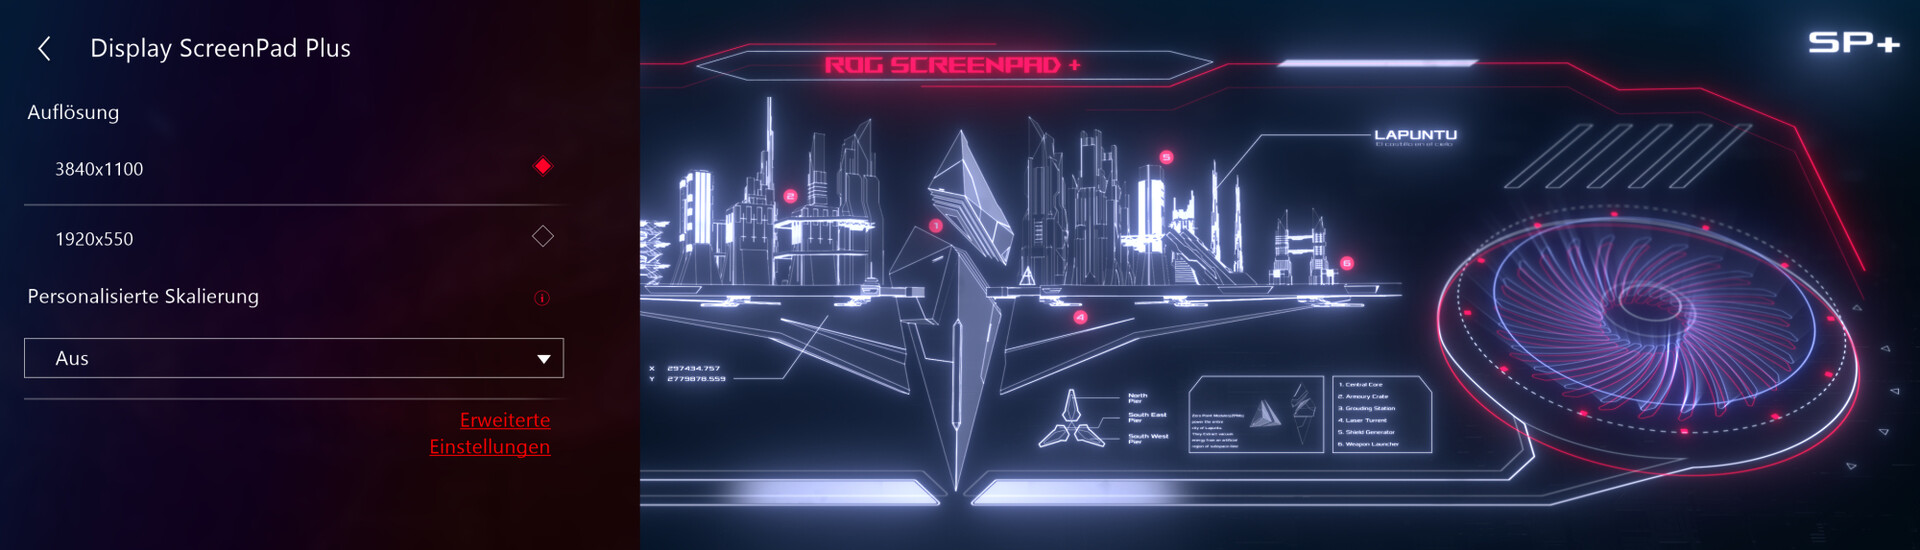
Asus Screenpad Plus - A Secondary Display for the Zephyrus
The main attraction of the System is the Asus Screenpad Plus - a secondary display with a touchscreen. It supports active pens. The Screenpad (14.1 inches) comes with a matte layer and a native resolution of 3840x1100 pixels. It acts like any other external display. A dedicated key switches it on and off.
In essence, Asus has improved upon Apple's Touchbar concept. This makes it possible to move applications or their control/navigation/input elements to the touchscreen. Support for the latter option depends on the application itself. As an example, chat windows can be moved to the Screenpad while a game runs on the main screen.
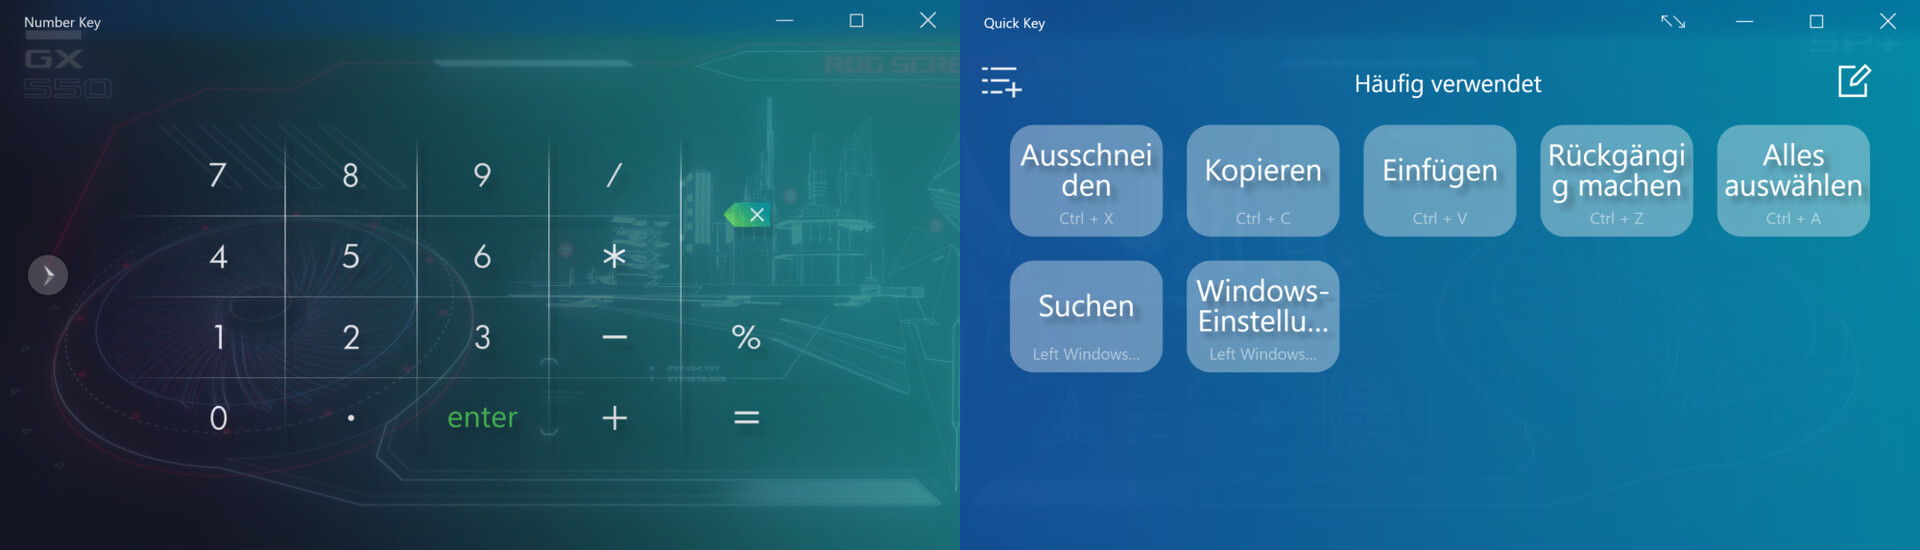
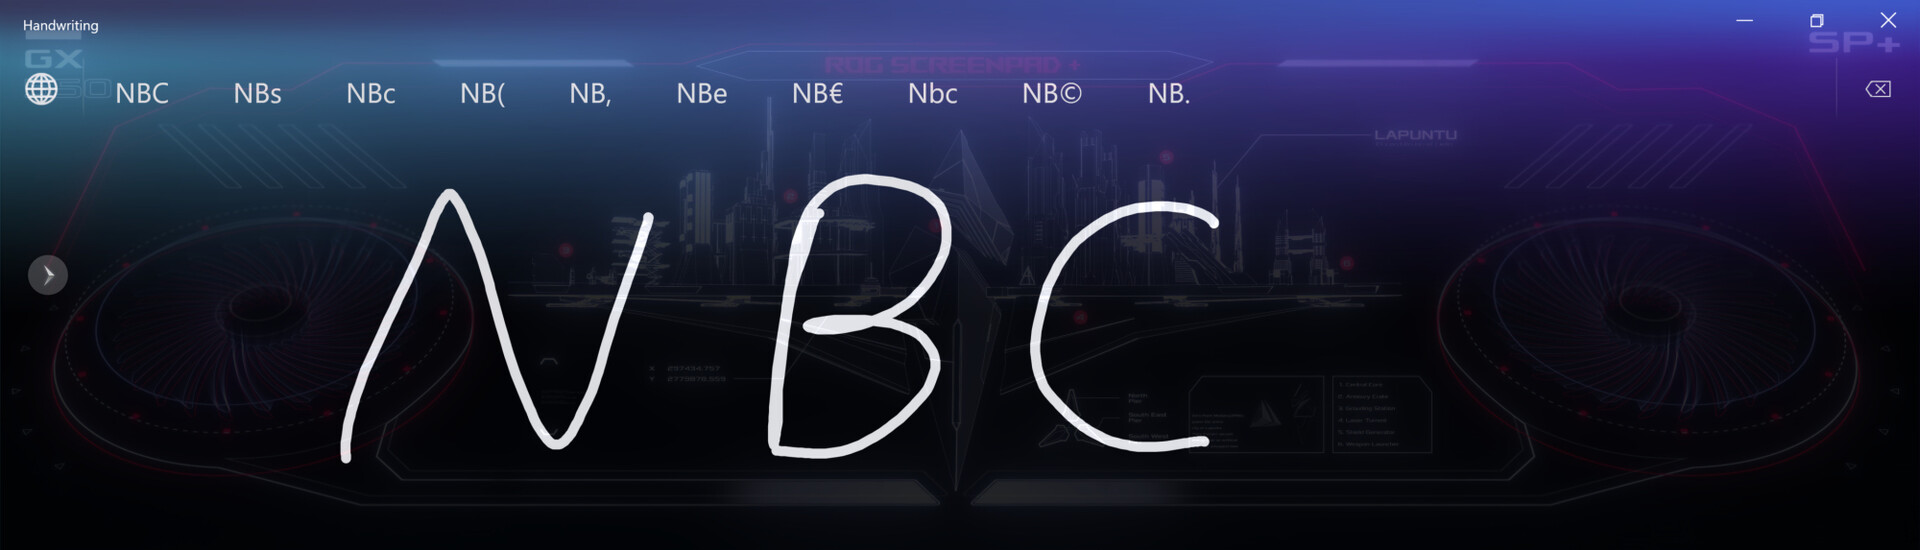
Asus has installed a few small applications that provide a look into the potential of the Screenpad. For example, it can be used for displaying a calculator or as a field for handwritten inputs. The Quick Key application displays a few frequently used operations (cut, copy, paste).
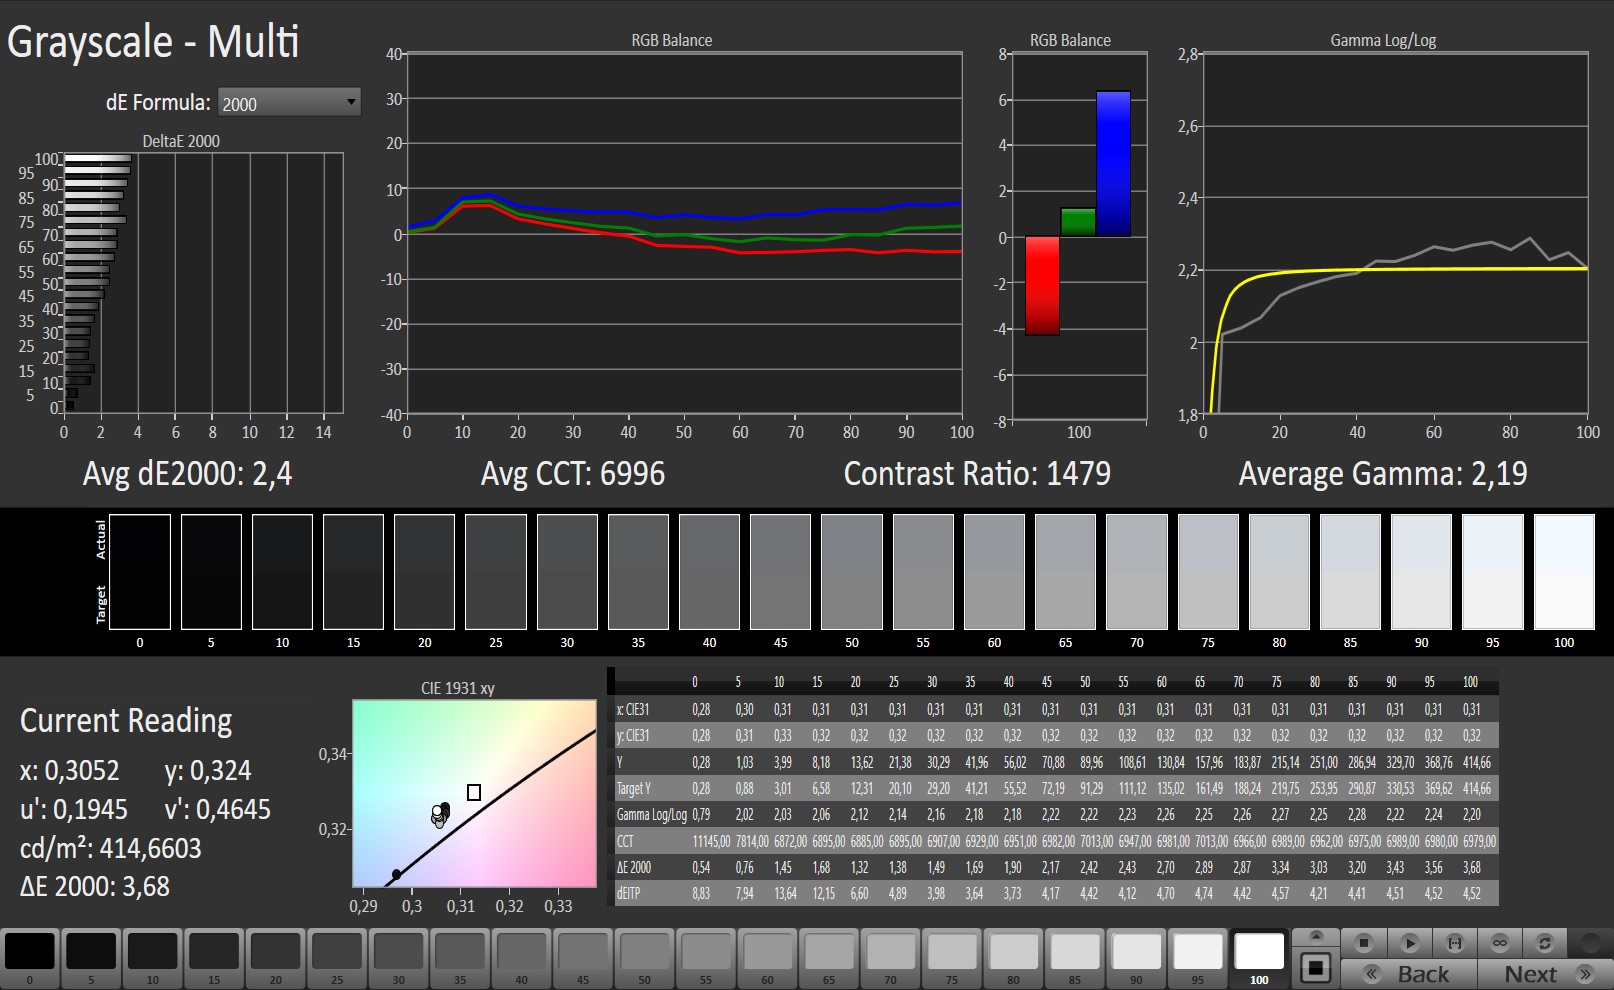
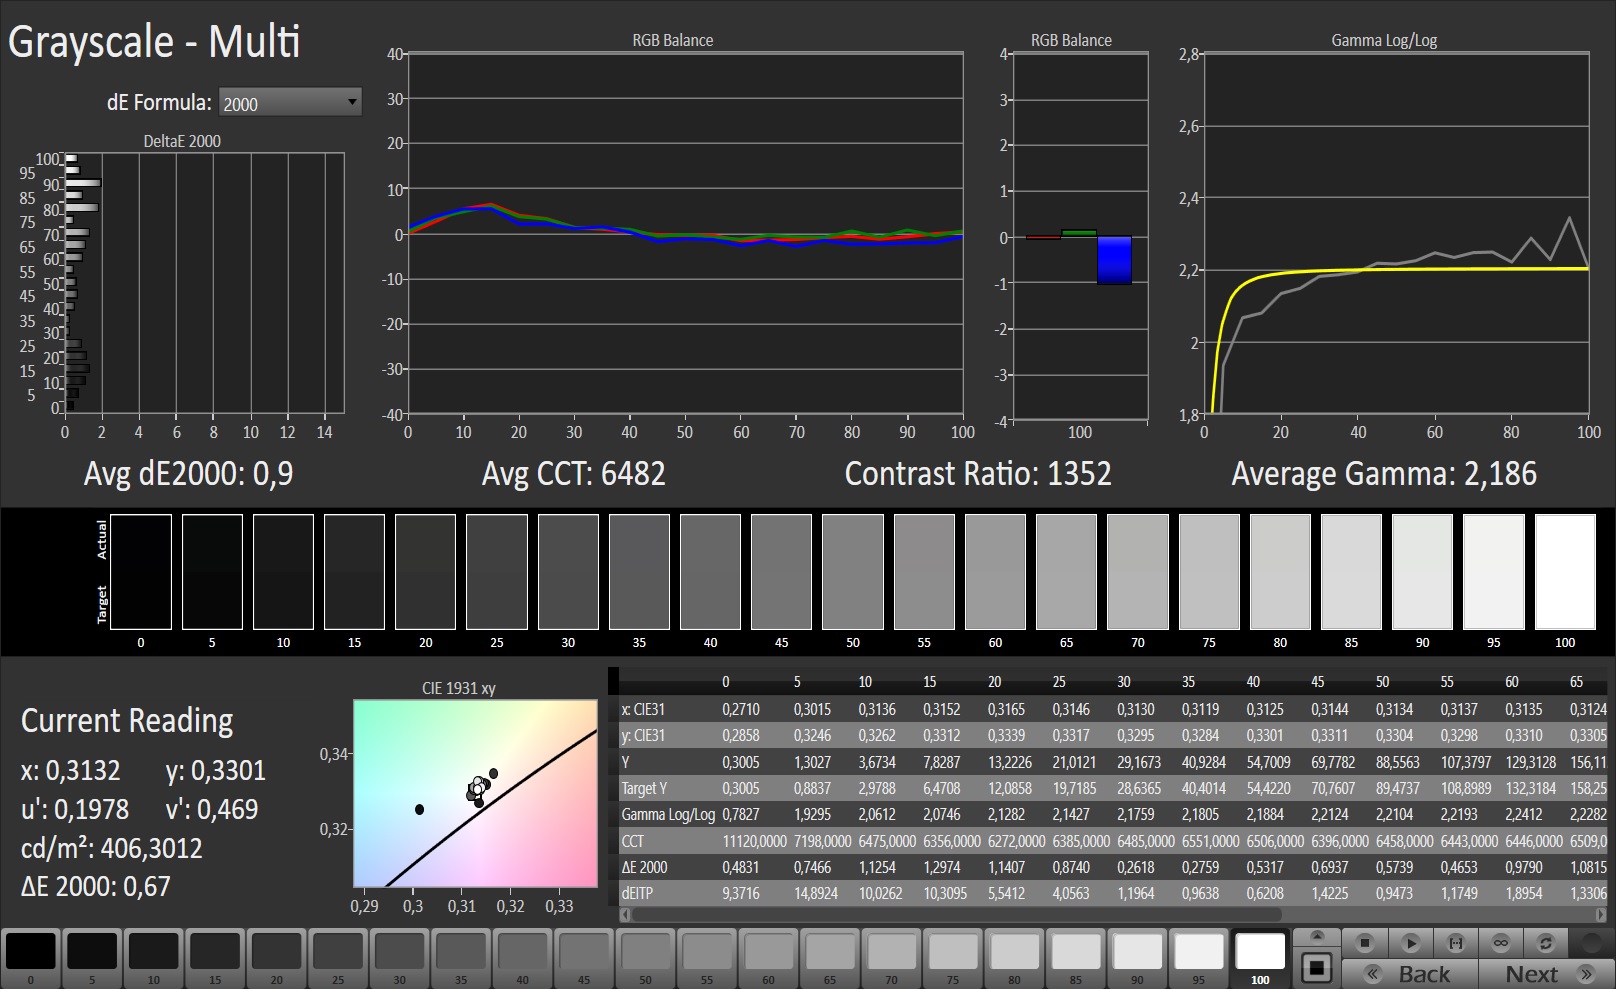
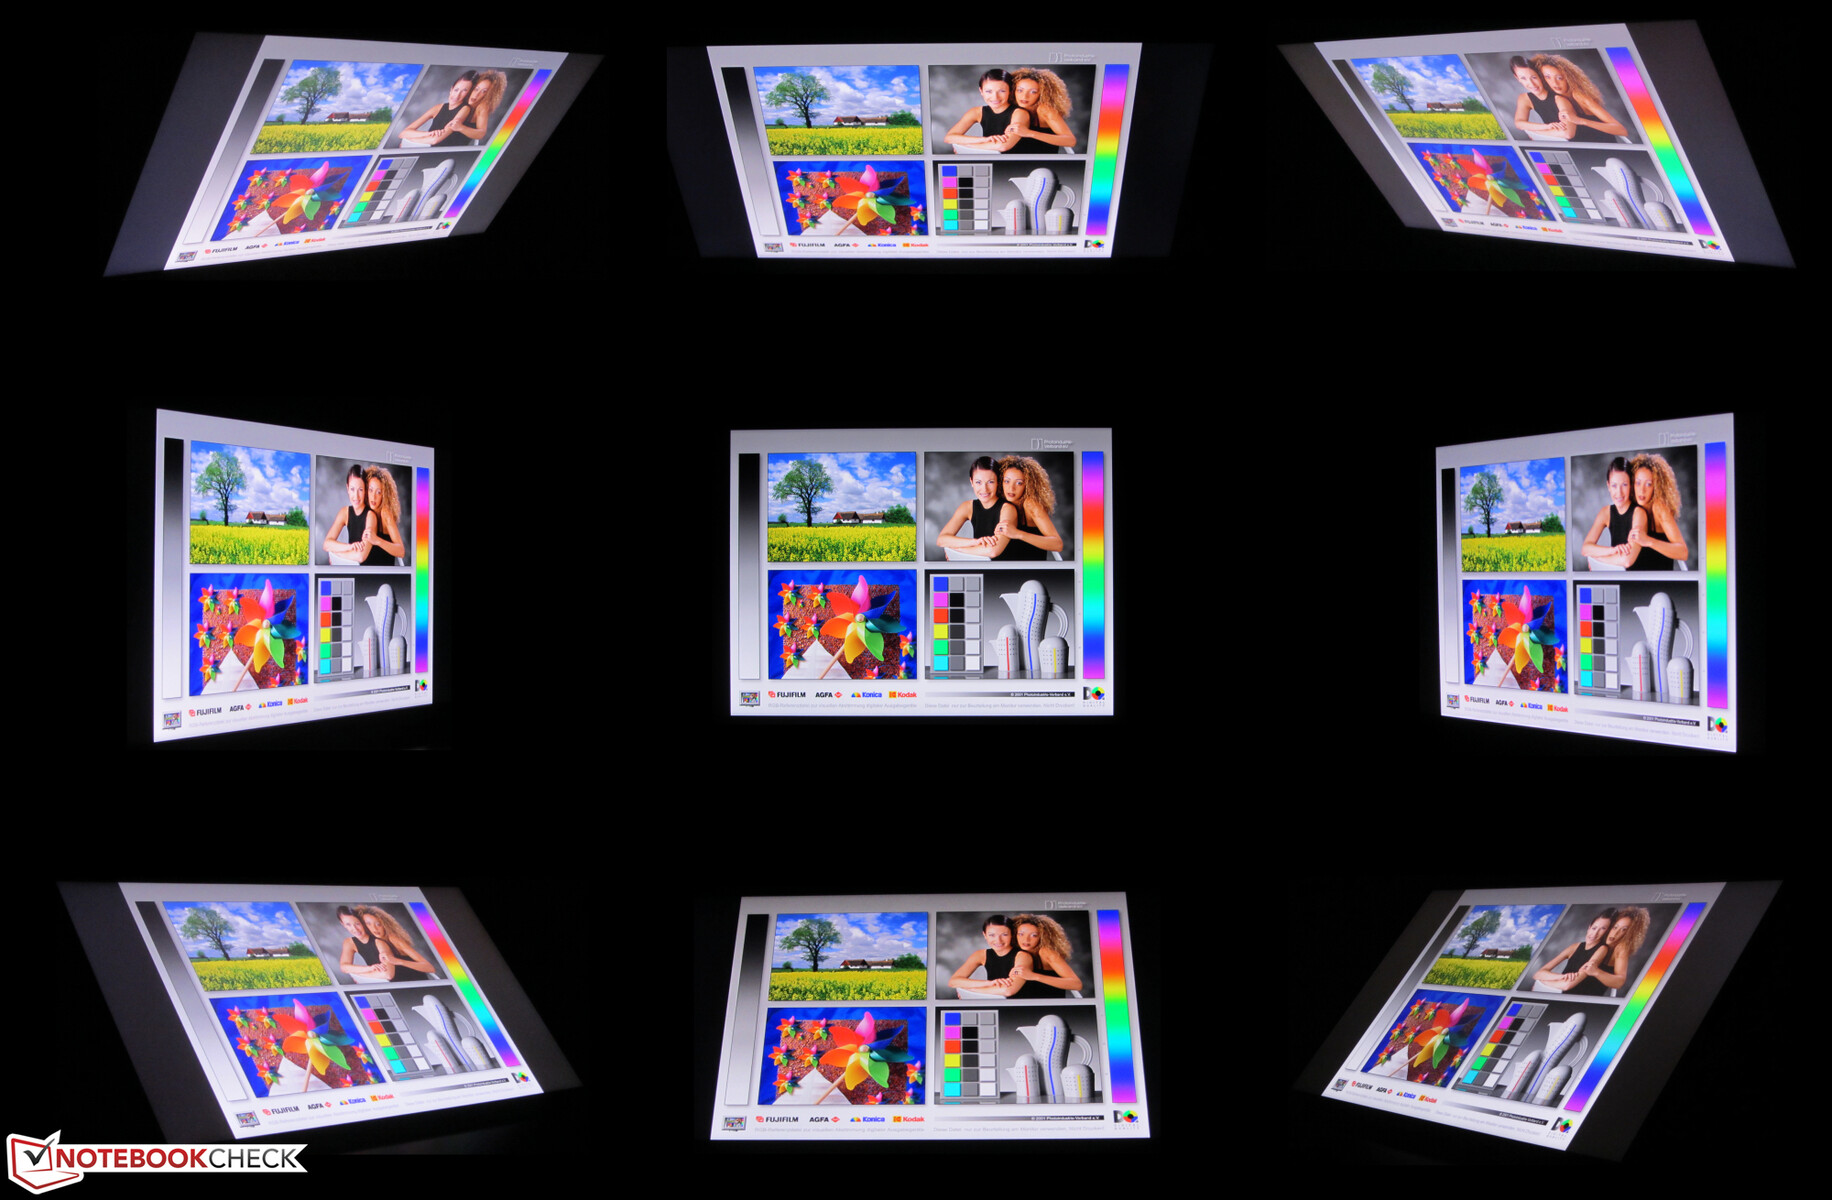
Display - Great Colors
The matte 15.6-inch display of the Zephyrus Duo has a native resolution of 3840x2160 pixels. The contrast ratio (1421:1) and brightness (385 cd/m²) are good. Positive: The display does not suffer from PWM flickering. Meanwhile, the response times of the display are nothing to write home about. Here, competing devices tend to achieve better results. However, an alternative configuration with a 300-Hz Full HD display and faster response times is also available.
Both our test device's 60-Hz panel and the aforementioned 300-Hz model support Nvidia G-Sync. It allows the display to dynamically synchronize its refresh rate to the frame rate of the GPU. This is supposed to make the image as smooth as possible - particularly while gaming.
| |||||||||||||||||||||||||
Brightness Distribution: 90 %
Center on Battery: 398 cd/m²
Contrast: 1421:1 (Black: 0.28 cd/m²)
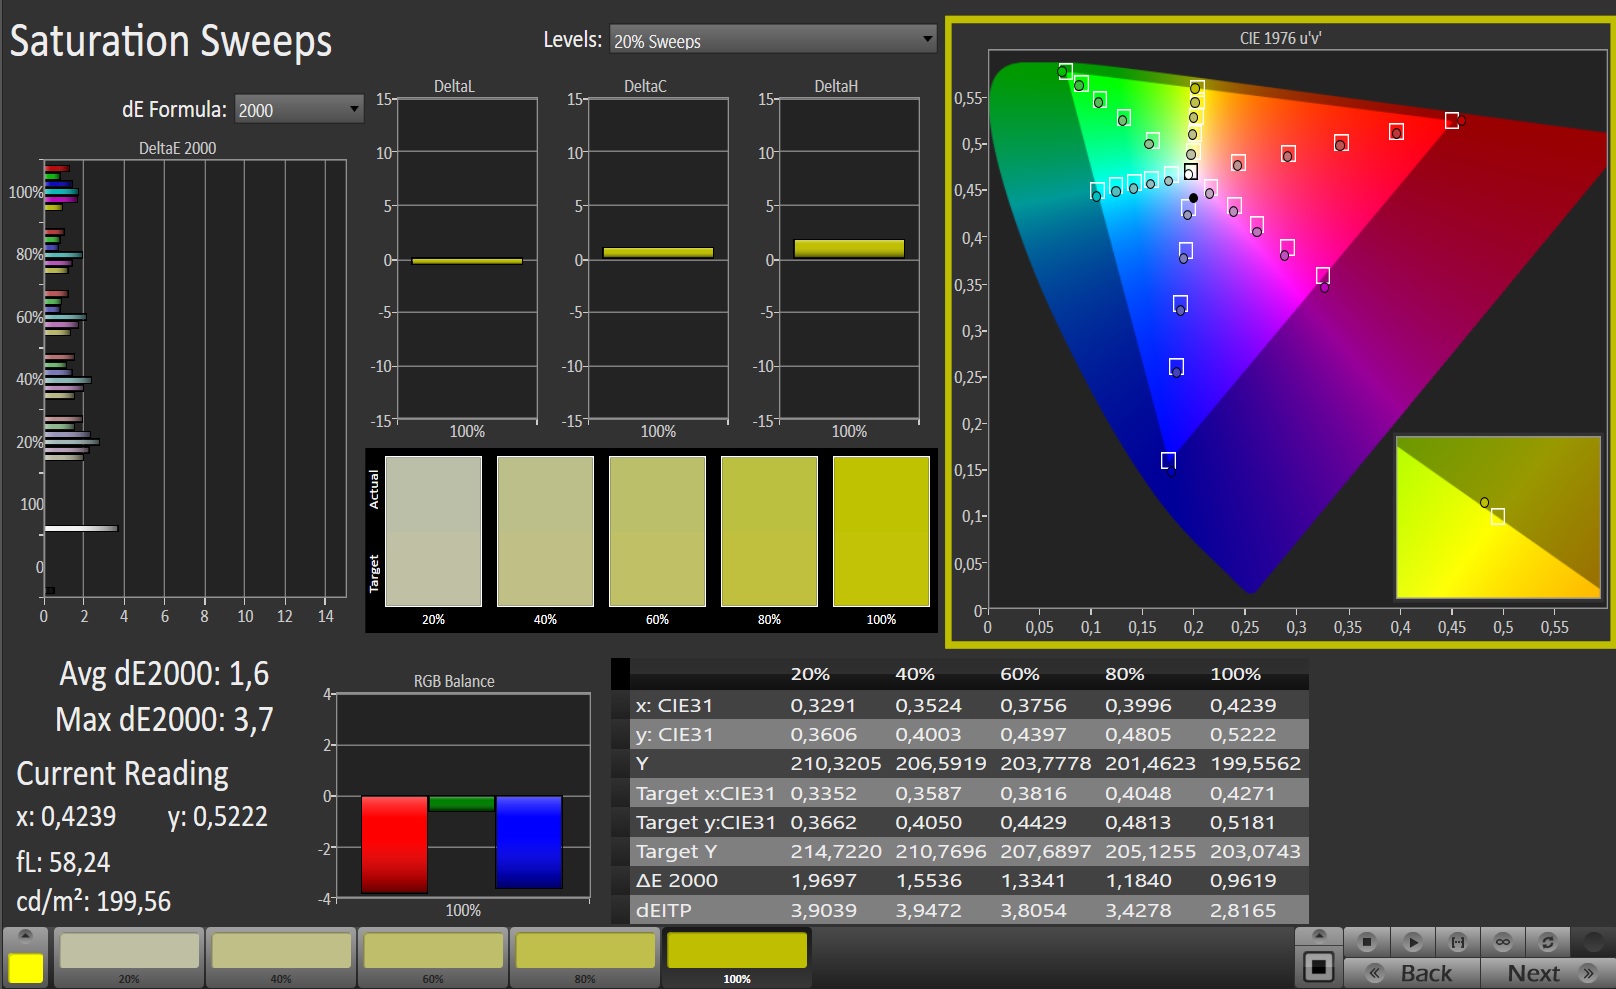
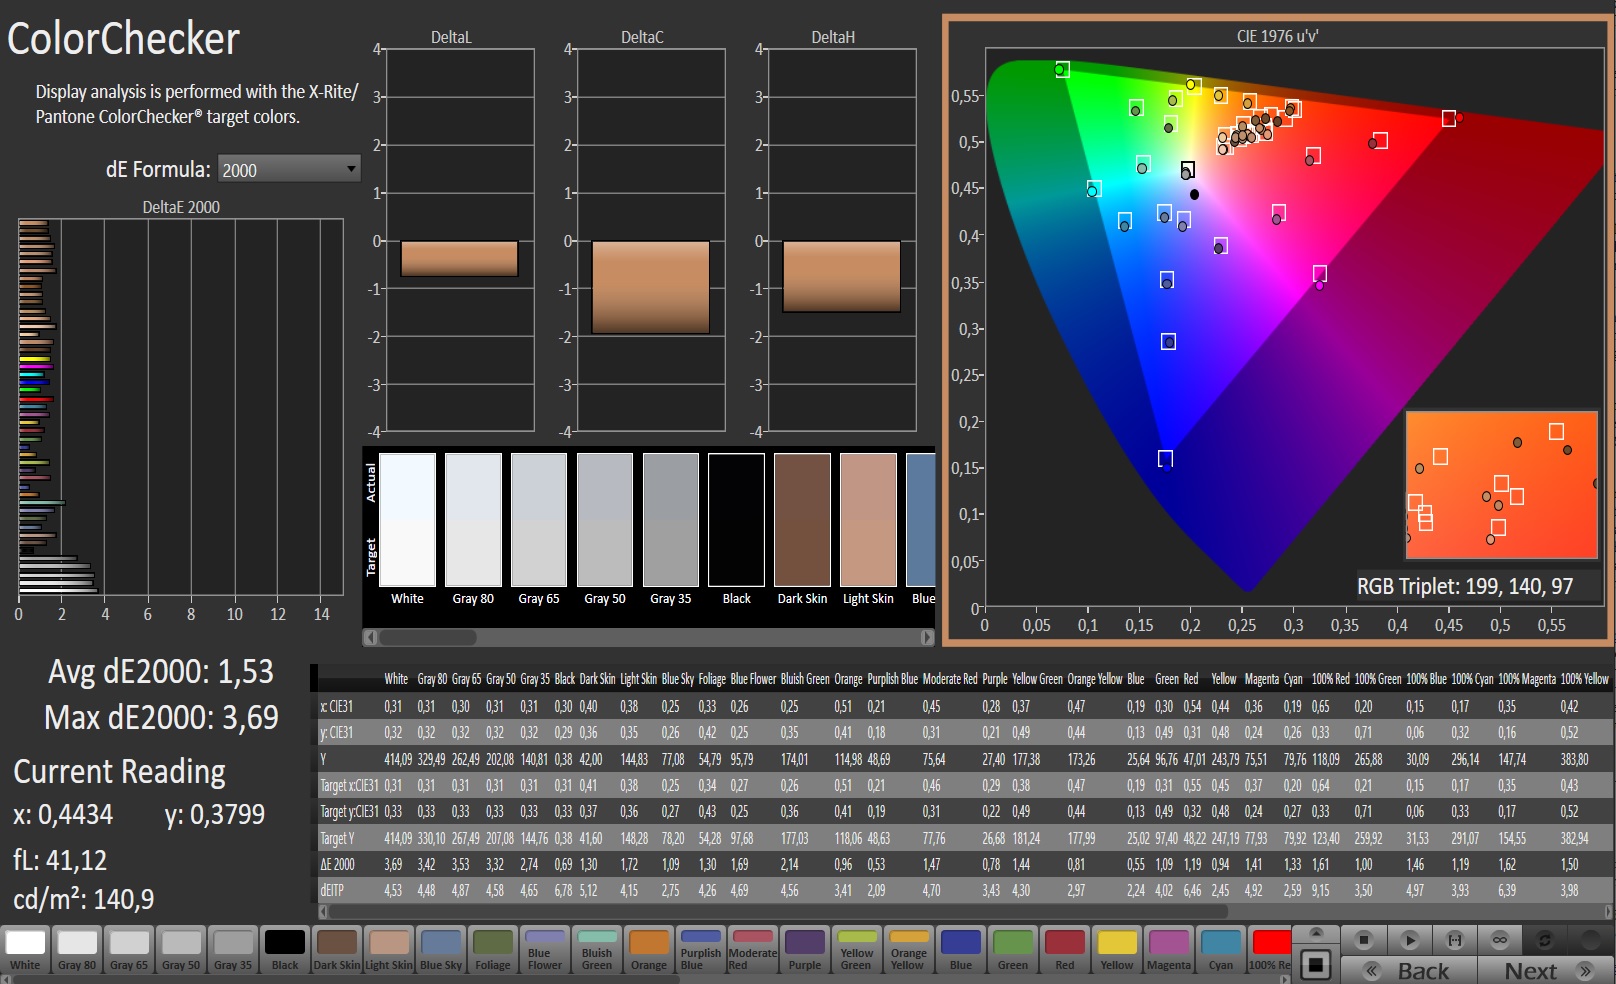
ΔE ColorChecker Calman: 1.53 | ∀{0.5-29.43 Ø4.75}
calibrated: 0.77
ΔE Greyscale Calman: 2.4 | ∀{0.09-98 Ø5}
100% sRGB (Argyll 1.6.3 3D)
100% AdobeRGB 1998 (Argyll 1.6.3 3D)
99.9% AdobeRGB 1998 (Argyll 3D)
100% sRGB (Argyll 3D)
87% Display P3 (Argyll 3D)
Gamma: 2.19
CCT: 6996 K
| Asus ROG Zephyrus Duo 15 GX550LXS AU Optronics B156ZAN03.1, IPS, 3840x2160, 15.6" | Acer Predator Triton 500 PT515-52-70N3 AUO B156HAN12.0 (AUO7A8C), IPS, 1920x1080, 15.6" | MSI GS66 Stealth 10SFS AUO B156HAN12.0 (AUO328E), IPS, 1920x1080, 15.6" | Gigabyte Aero 15 OLED XB-8DE51B0SP Samsung SDCA029, OLED, 3840x2160, 15.6" | |
|---|---|---|---|---|
| Display | -16% | -16% | 4% | |
| Display P3 Coverage (%) | 87 | 70.3 -19% | 69.5 -20% | 99.9 15% |
| sRGB Coverage (%) | 100 | 99.5 0% | 99.6 0% | 100 0% |
| AdobeRGB 1998 Coverage (%) | 99.9 | 72.2 -28% | 70.8 -29% | 98.2 -2% |
| Response Times | 66% | 68% | 95% | |
| Response Time Grey 50% / Grey 80% * (ms) | 56.4 ? | 14.4 ? 74% | 14 ? 75% | 2.2 ? 96% |
| Response Time Black / White * (ms) | 24.4 ? | 10.4 ? 57% | 9.6 ? 61% | 1.8 ? 93% |
| PWM Frequency (Hz) | 60 ? | |||
| Screen | -48% | -31% | -30% | |
| Brightness middle (cd/m²) | 398 | 320 -20% | 316 -21% | 385 -3% |
| Brightness (cd/m²) | 385 | 318 -17% | 311 -19% | 390 1% |
| Brightness Distribution (%) | 90 | 88 -2% | 92 2% | 93 3% |
| Black Level * (cd/m²) | 0.28 | 0.24 14% | 0.21 25% | |
| Contrast (:1) | 1421 | 1333 -6% | 1505 6% | |
| Colorchecker dE 2000 * | 1.53 | 4.03 -163% | 3.03 -98% | 2.46 -61% |
| Colorchecker dE 2000 max. * | 3.69 | 8.43 -128% | 7.32 -98% | 4.01 -9% |
| Colorchecker dE 2000 calibrated * | 0.77 | 0.98 -27% | 1.1 -43% | 2.6 -238% |
| Greyscale dE 2000 * | 2.4 | 5.94 -148% | 3.9 -63% | 1.39 42% |
| Gamma | 2.19 100% | 2.42 91% | 2.42 91% | 2.31 95% |
| CCT | 6996 93% | 6751 96% | 7439 87% | 6395 102% |
| Color Space (Percent of AdobeRGB 1998) (%) | 100 | 66 -34% | 65 -35% | 98 -2% |
| Color Space (Percent of sRGB) (%) | 100 | 99 -1% | 100 0% | 100 0% |
| Total Average (Program / Settings) | 1% /
-28% | 7% /
-16% | 23% /
-5% |
* ... smaller is better
The screen boasts an X-Rite Pantone validation, which guarantees a very natural color representation. With a DeltaE 2000 of 1.6, the display is already within the ideal range (DeltaE of less than three) in terms of color representation. It also does not suffer from a blue tint. We were able to improve the display further by calibrating it. This resulted in a lower color deviation of 0.73 and a more balanced grayscale. The display covers both the AdobeRGB and the sRGB color space.

Display Response Times
| ↔ Response Time Black to White | ||
|---|---|---|
| 24.4 ms ... rise ↗ and fall ↘ combined | ↗ 10 ms rise | 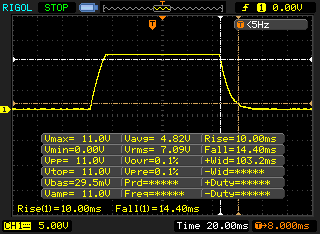 |
| ↘ 14.4 ms fall | ||
| The screen shows good response rates in our tests, but may be too slow for competitive gamers. In comparison, all tested devices range from 0.1 (minimum) to 240 (maximum) ms. » 57 % of all devices are better. This means that the measured response time is worse than the average of all tested devices (20 ms). | ||
| ↔ Response Time 50% Grey to 80% Grey | ||
| 56.4 ms ... rise ↗ and fall ↘ combined | ↗ 26.4 ms rise | 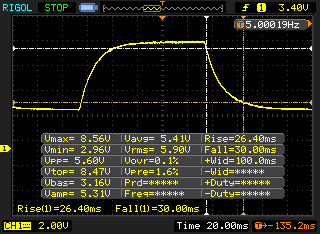 |
| ↘ 30 ms fall | ||
| The screen shows slow response rates in our tests and will be unsatisfactory for gamers. In comparison, all tested devices range from 0.165 (minimum) to 636 (maximum) ms. » 93 % of all devices are better. This means that the measured response time is worse than the average of all tested devices (31.4 ms). | ||
Screen Flickering / PWM (Pulse-Width Modulation)
| Screen flickering / PWM not detected | 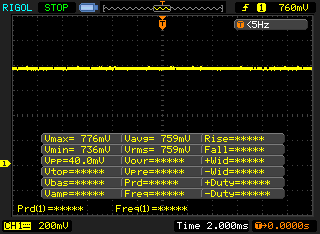 | ||
In comparison: 53 % of all tested devices do not use PWM to dim the display. If PWM was detected, an average of 7979 (minimum: 5 - maximum: 343500) Hz was measured. | |||
The laptop is equipped with an IPS with great viewing angles. As a result, the display can be read from any position. The outdoor readability of the screen is convincing thanks to its high brightness.
Performance - Asus System with High-End Components
With the Zephyrus Duo 15 GX550LXS, Asus has created a 15.6-inch gaming laptop that not only runs the latest games smoothly, but also one that performs well in all other use cases. Our test device can be purchased for about 4,500 Euros (~$5,245).

Test Conditions
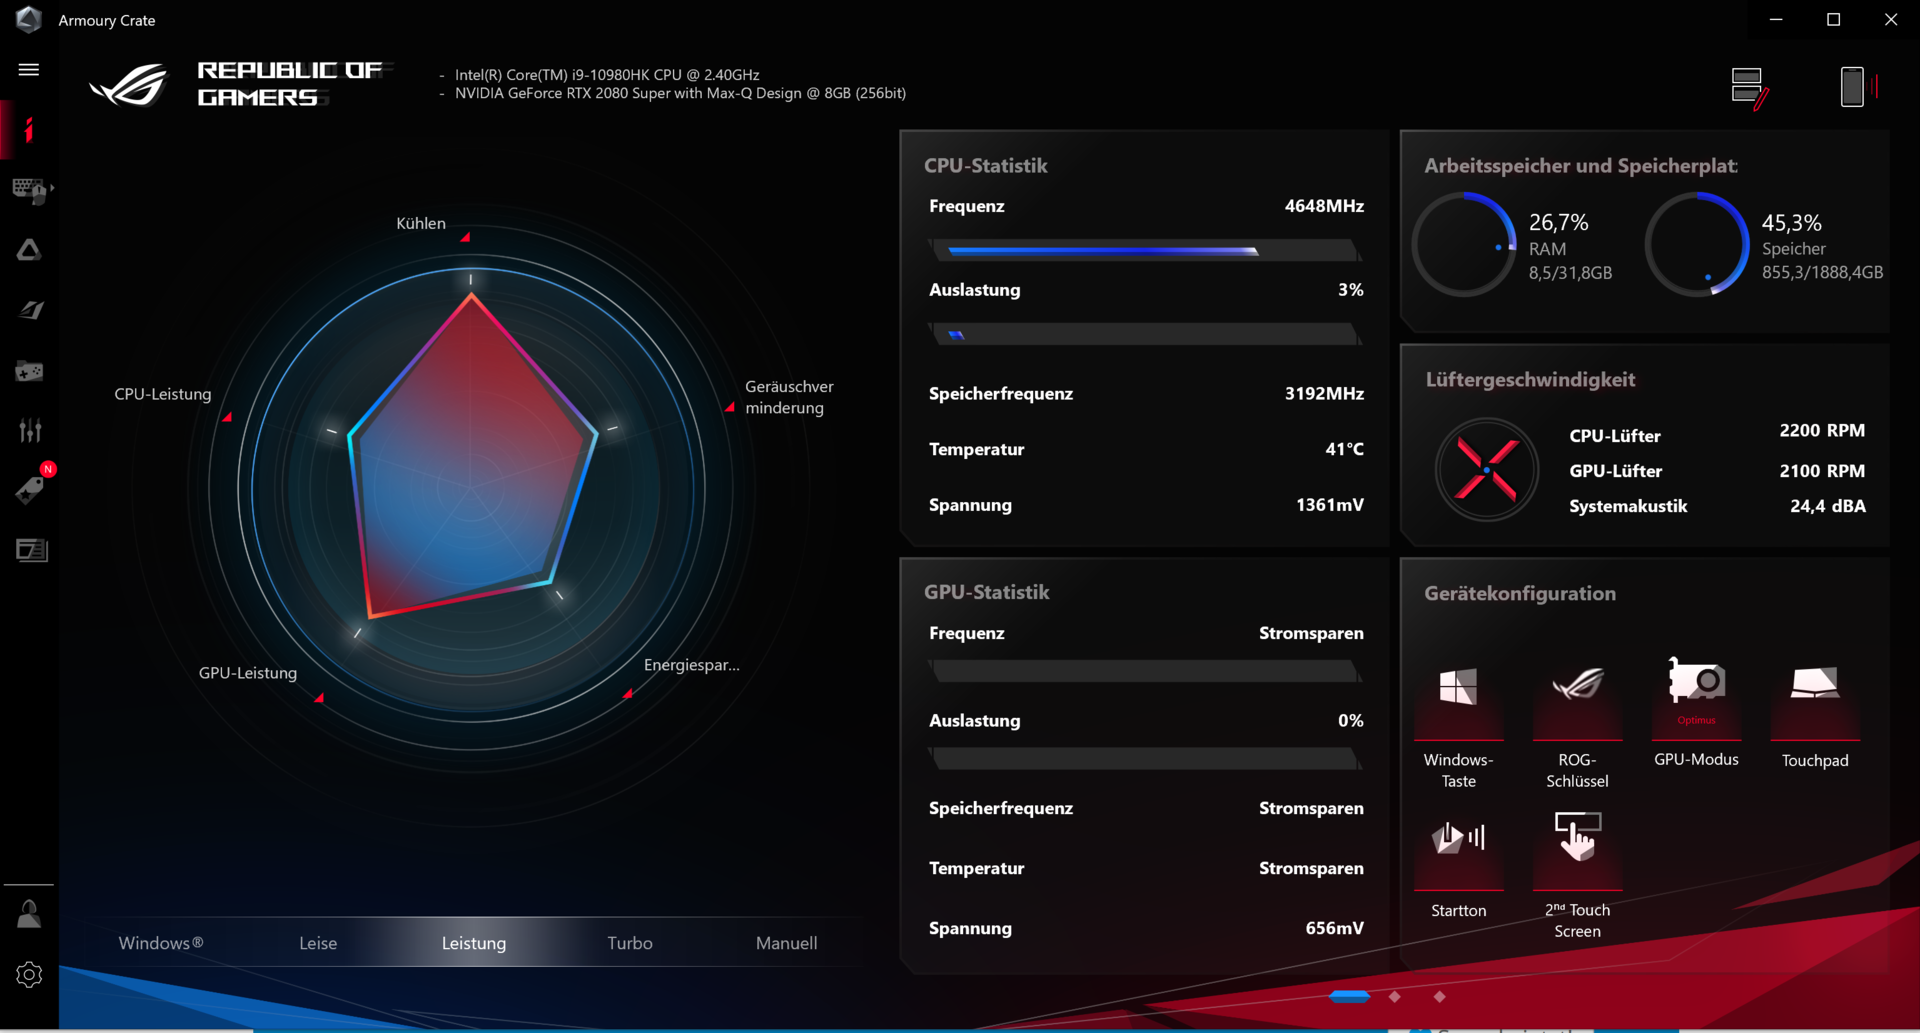
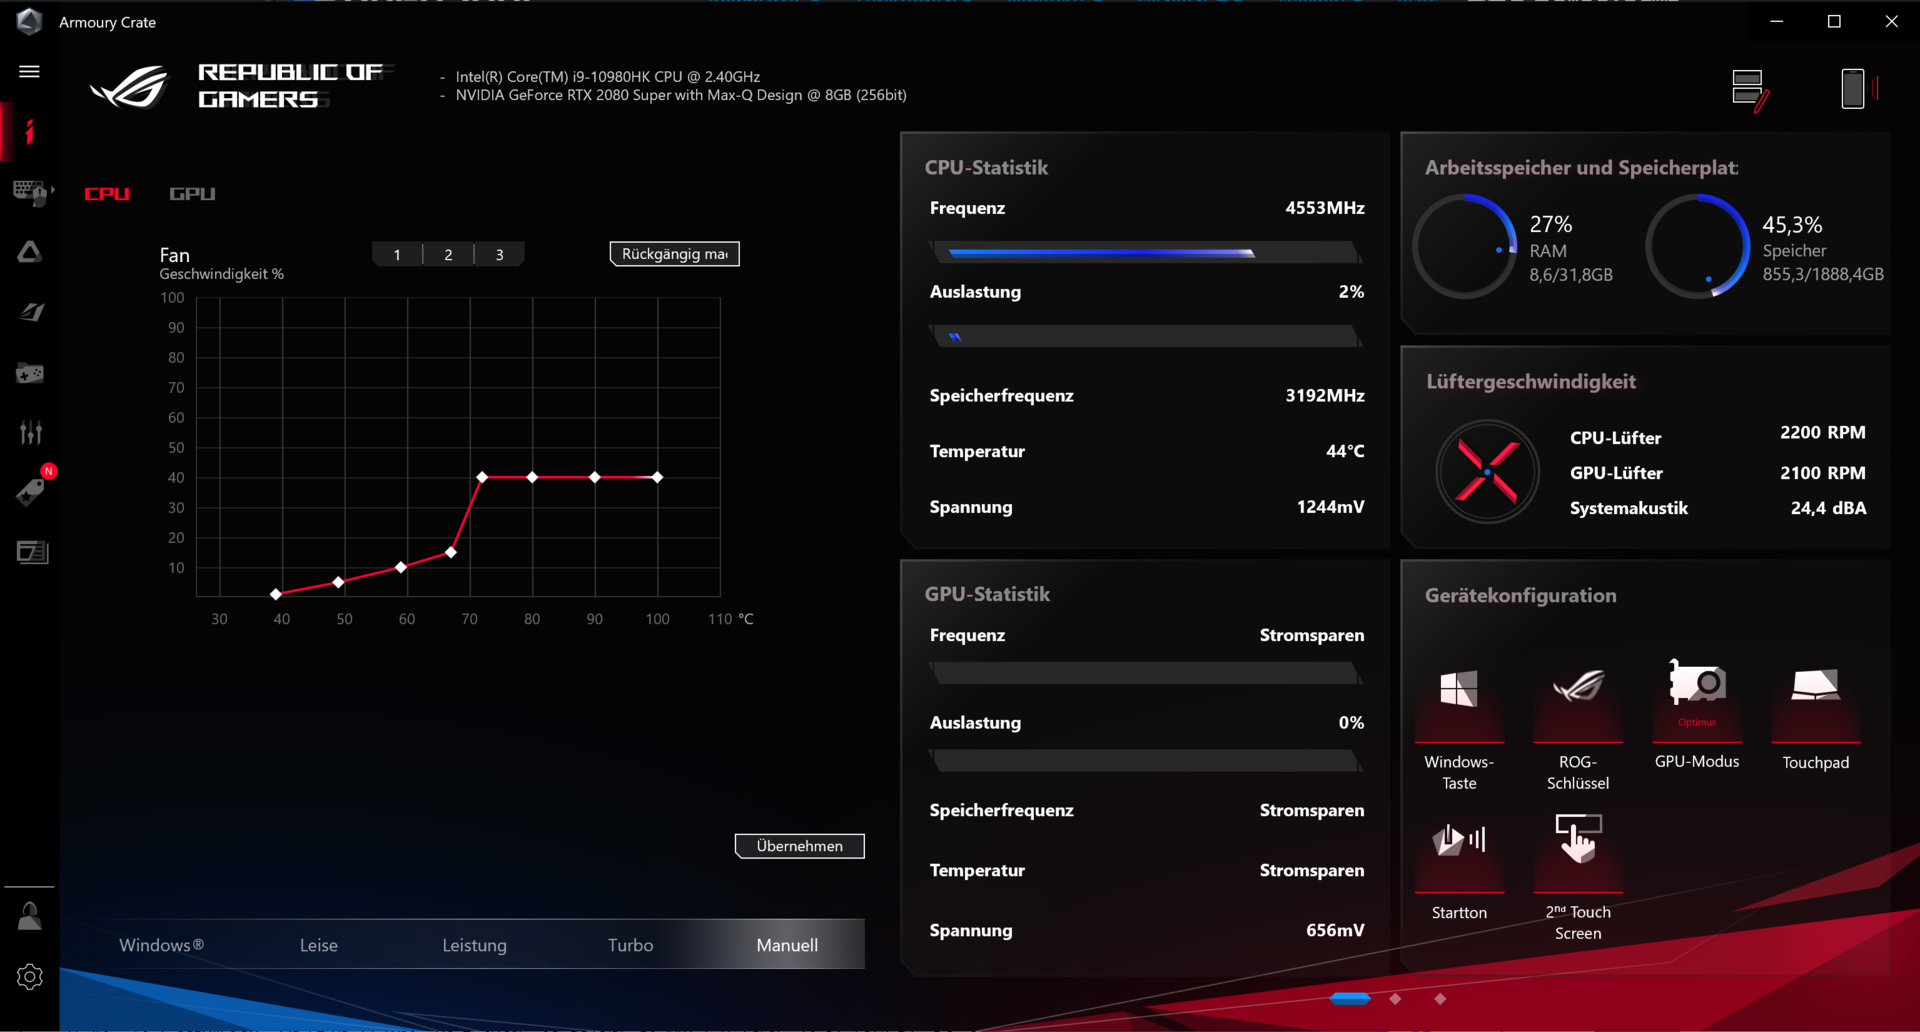
The preinstalled Armoury Crate control center allows users to choose between different power profiles ("Quiet", "Performance", "Manual", "Windows"). For this review, we selected the "Performance" profile (exception: We used the Windows power profiles for the battery tests). We repeated a few benchmarks using the "Turbo" profile, which the relevant sections will reflect.
Processor
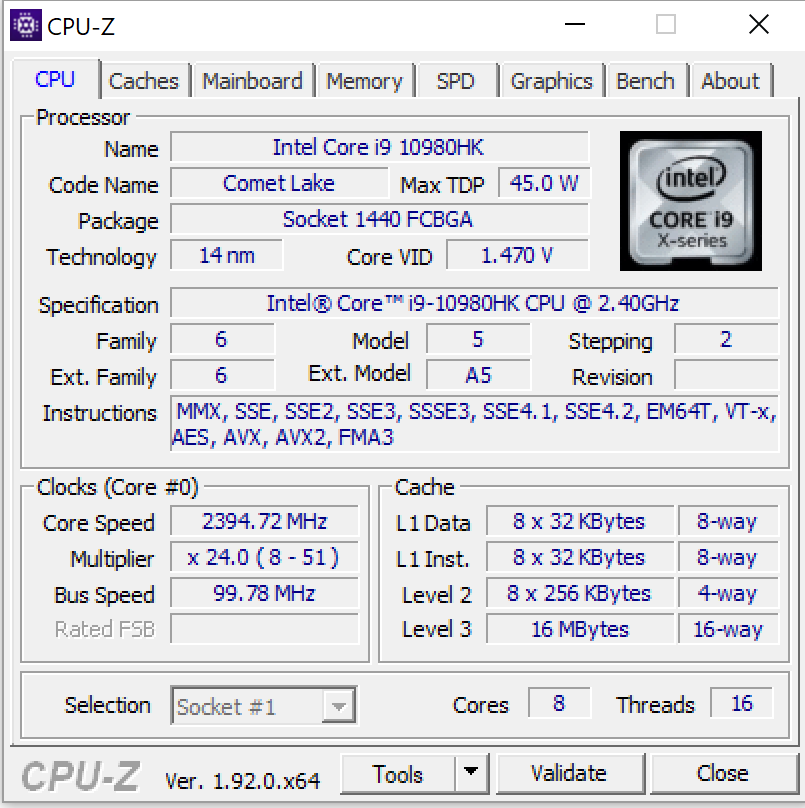
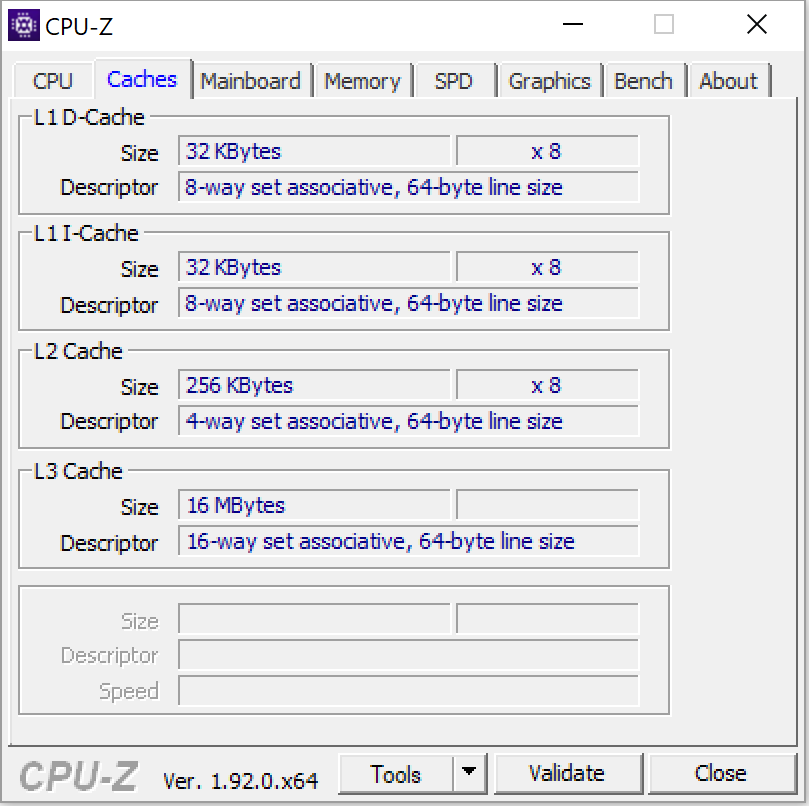
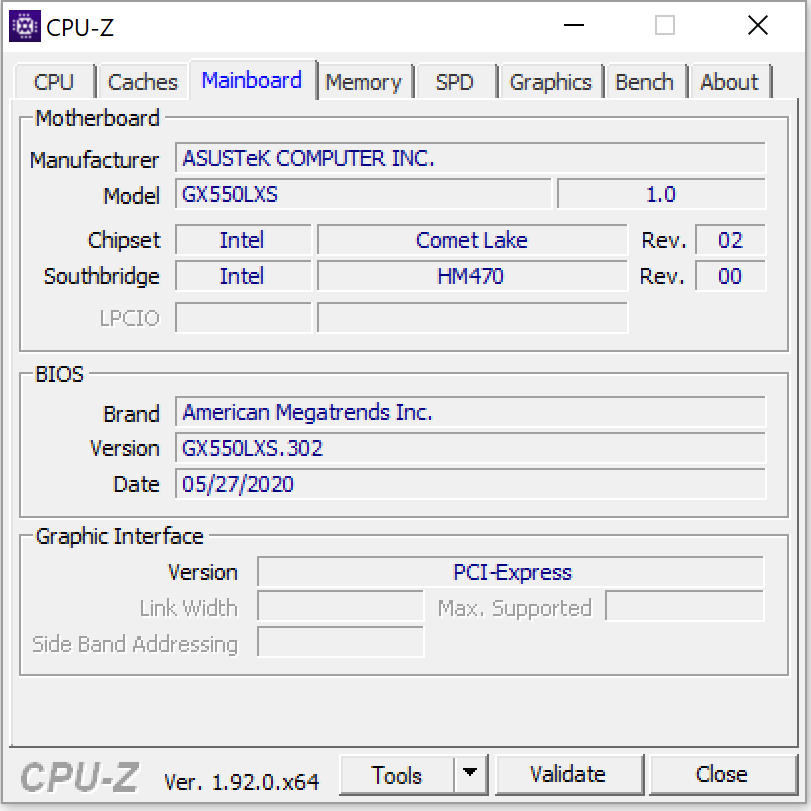
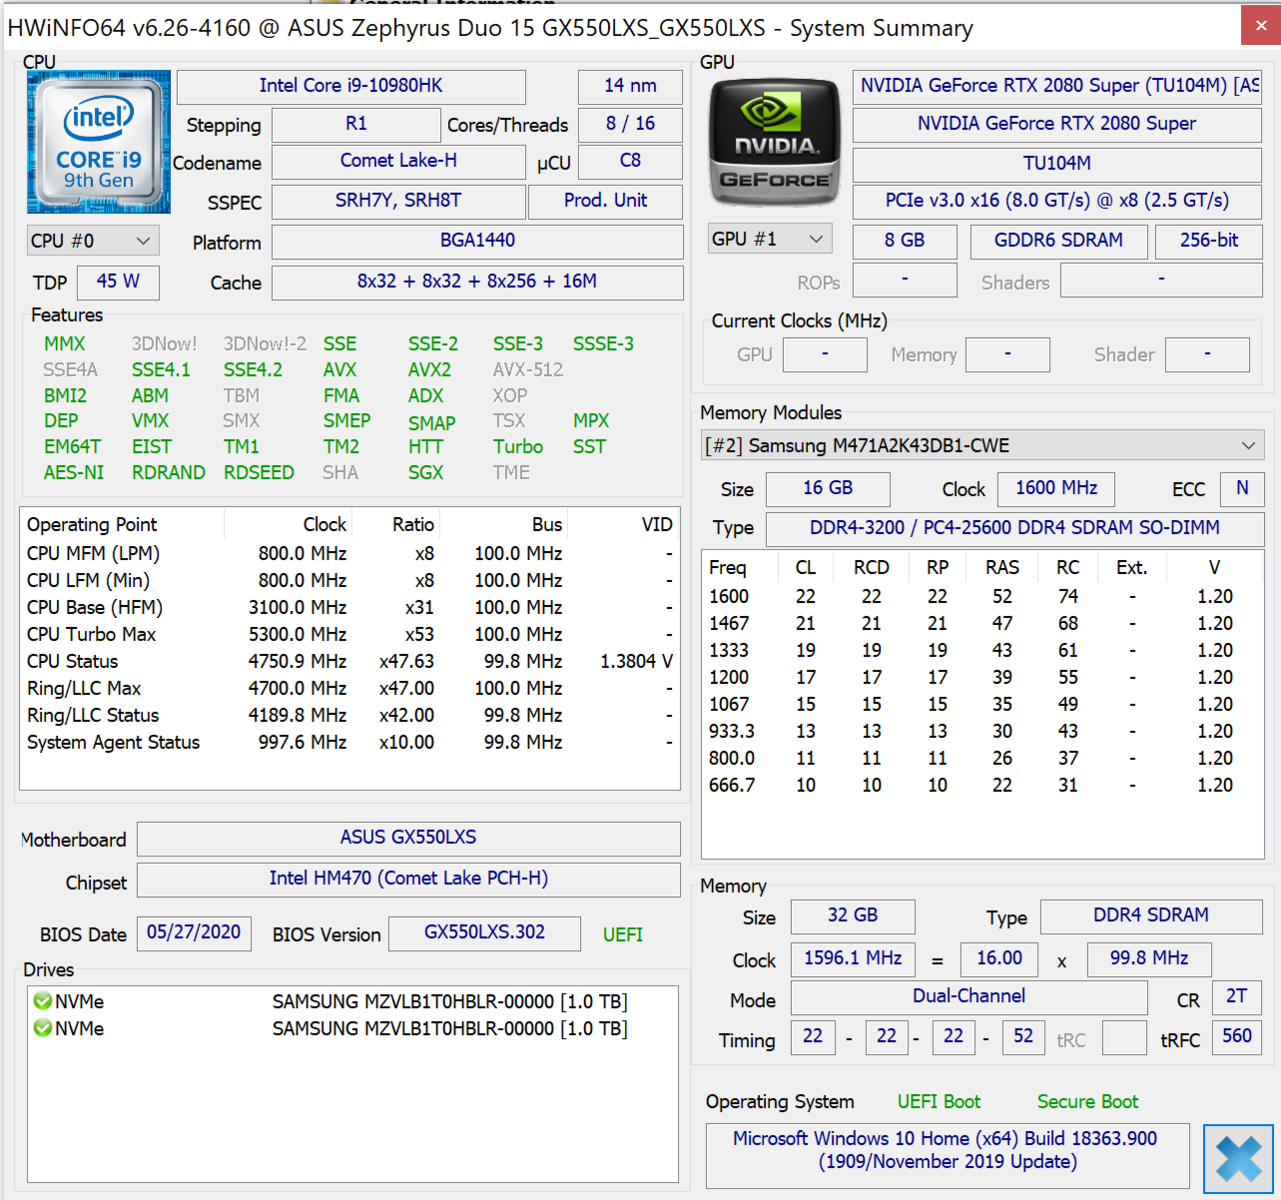
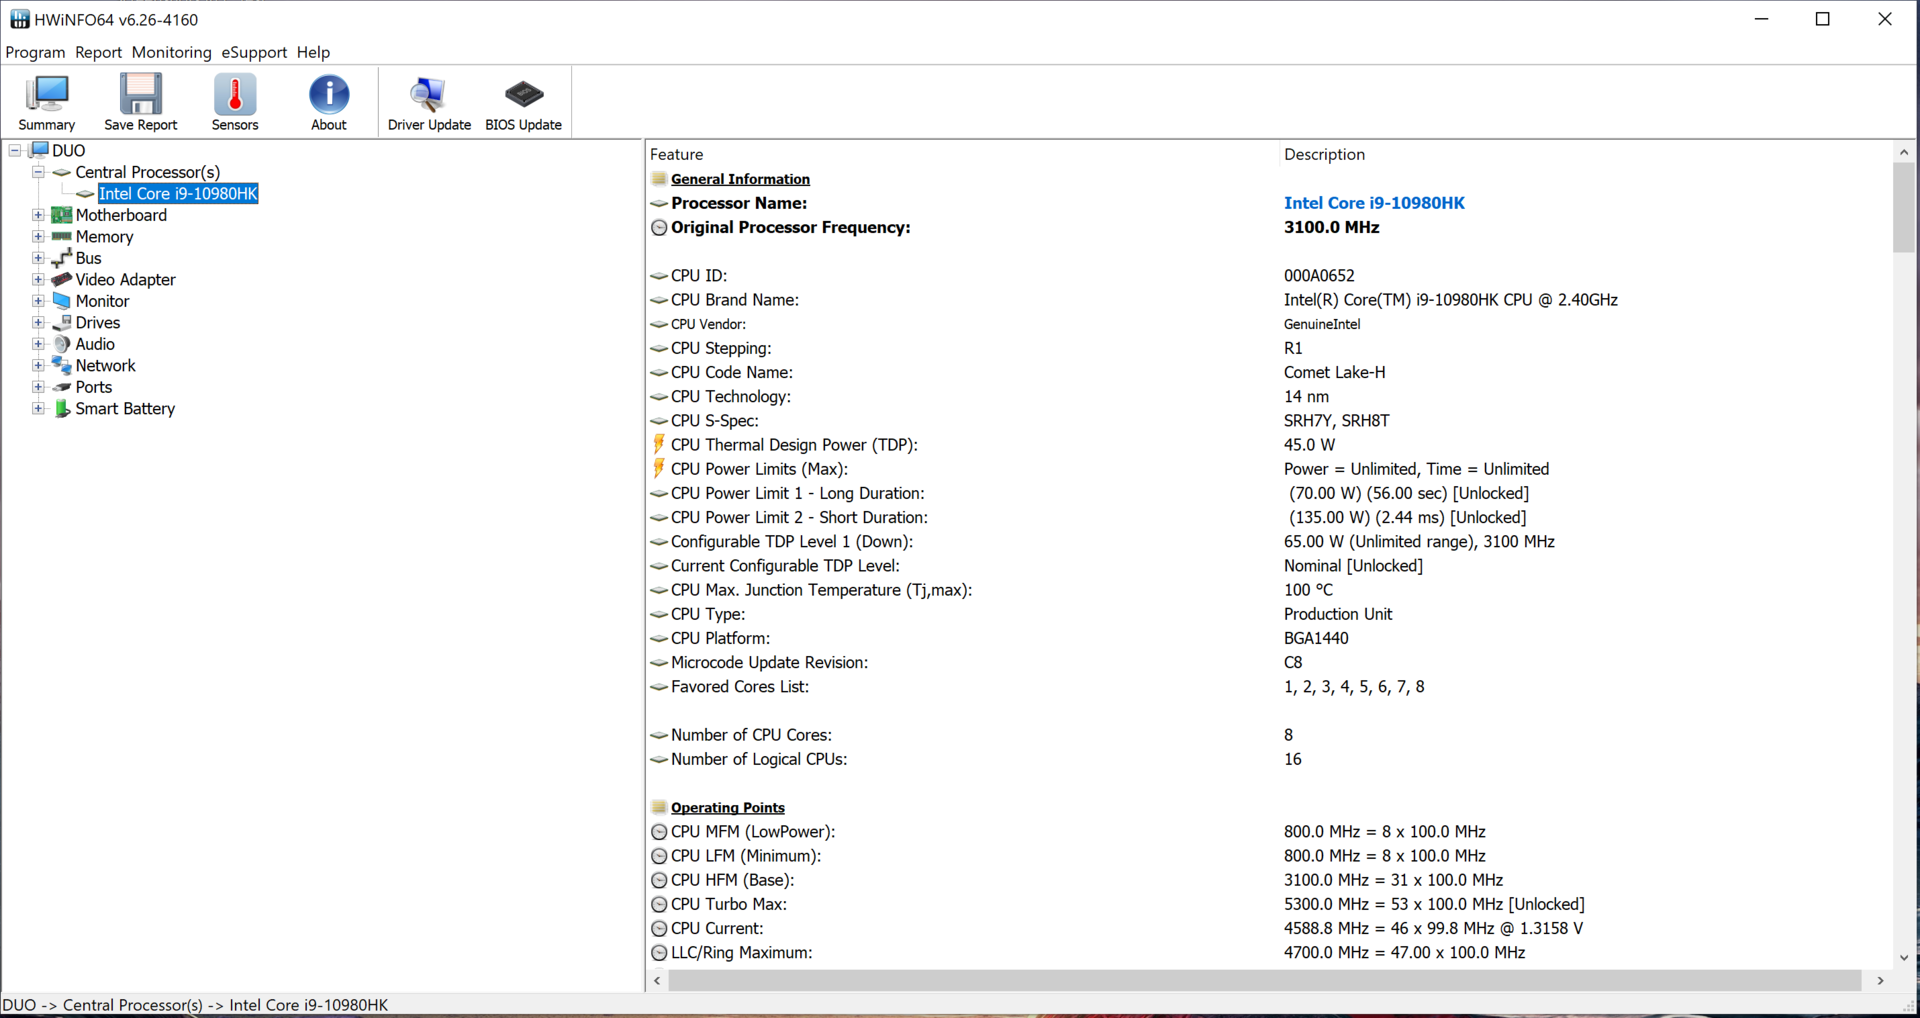
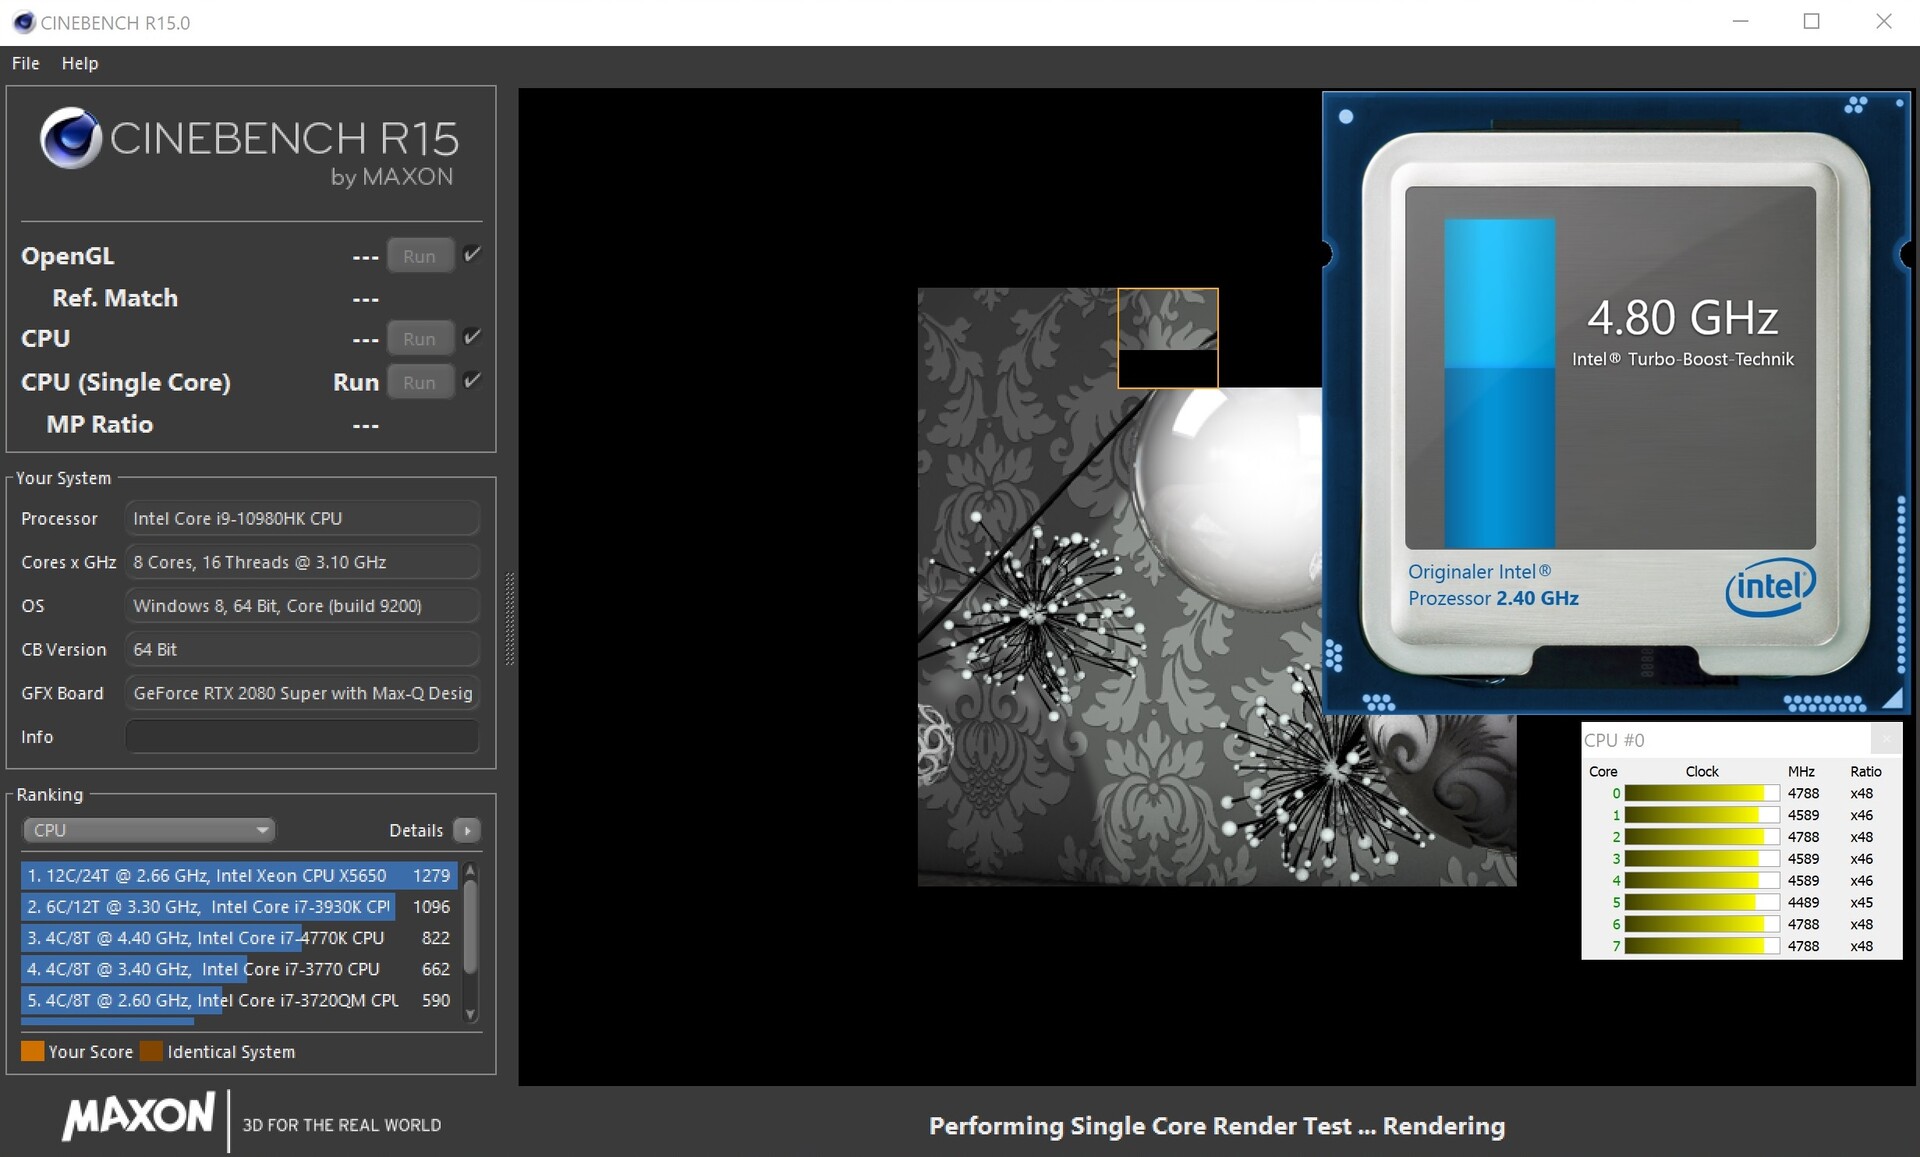
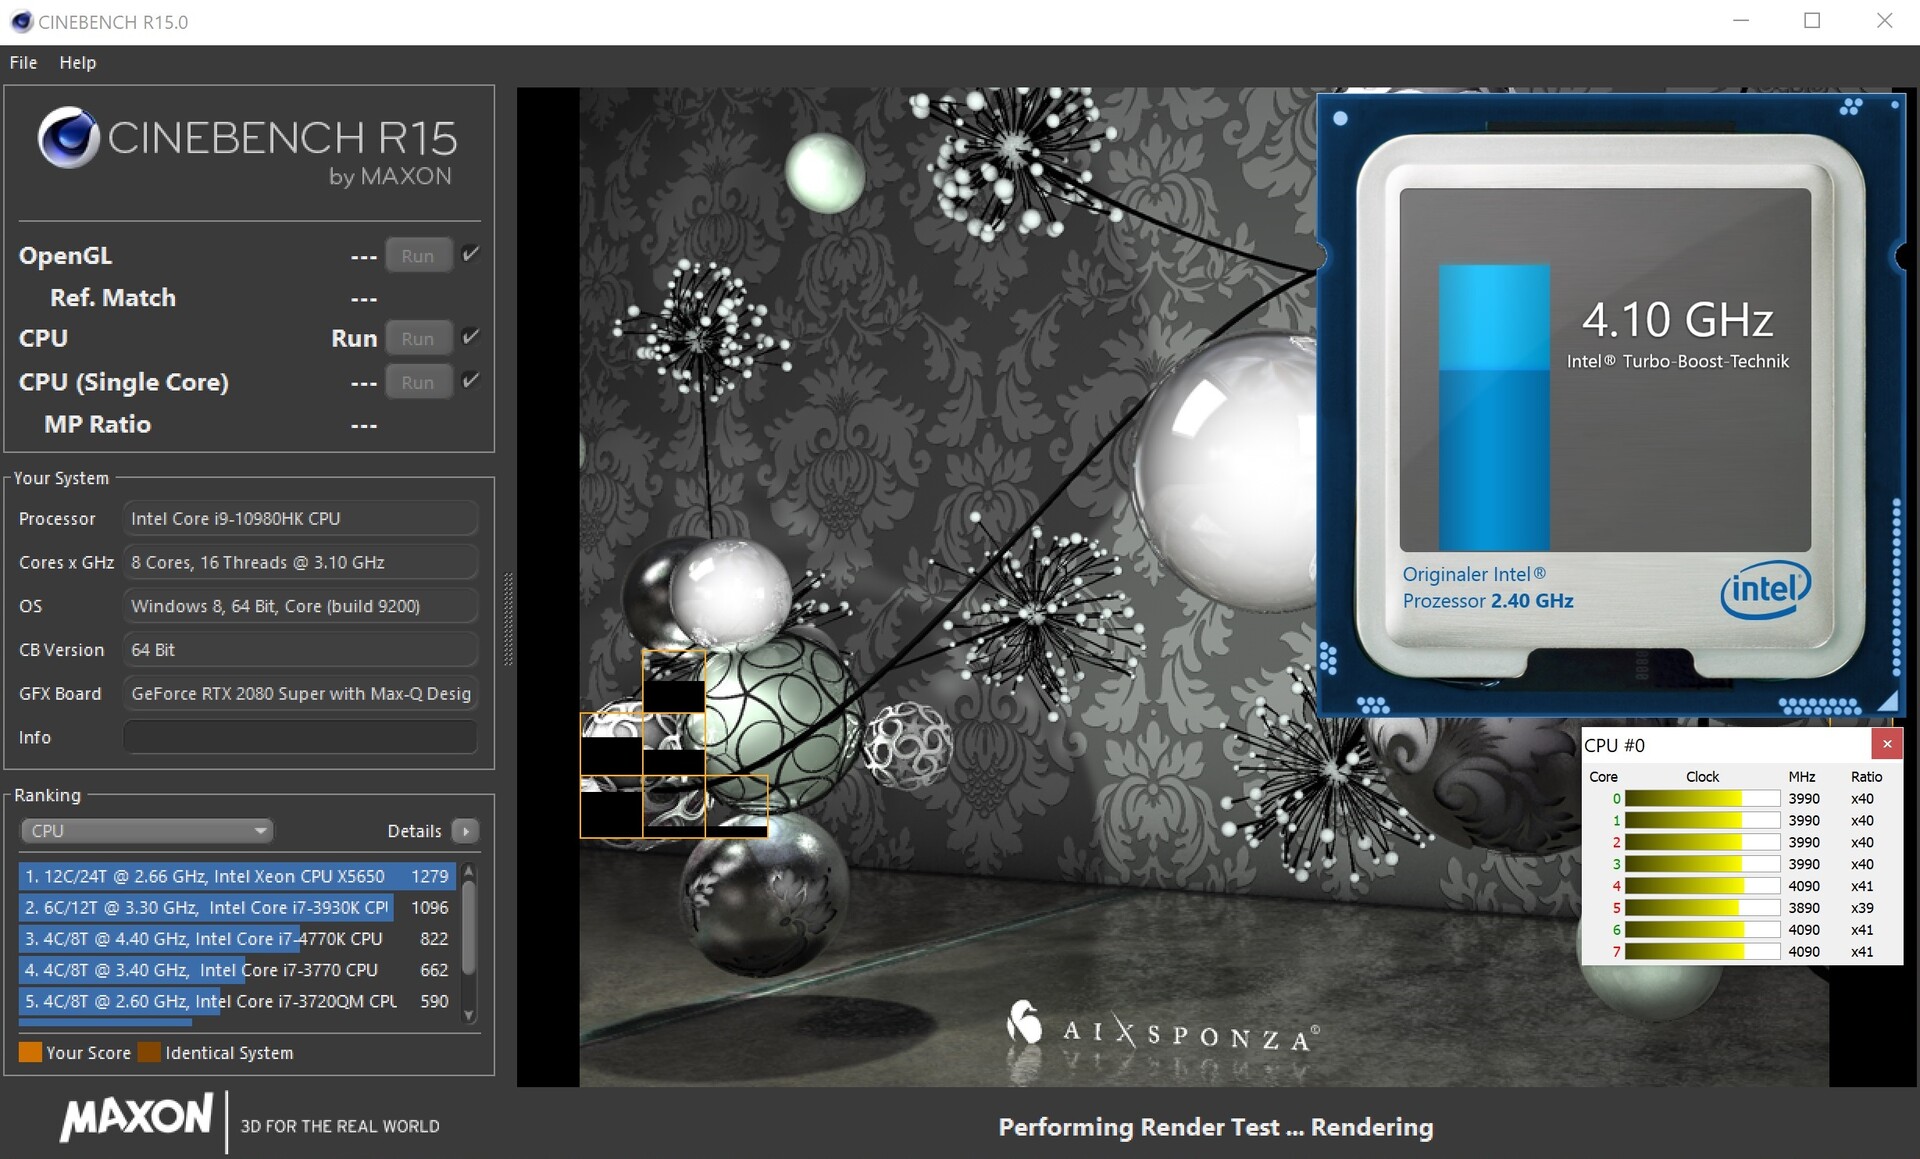
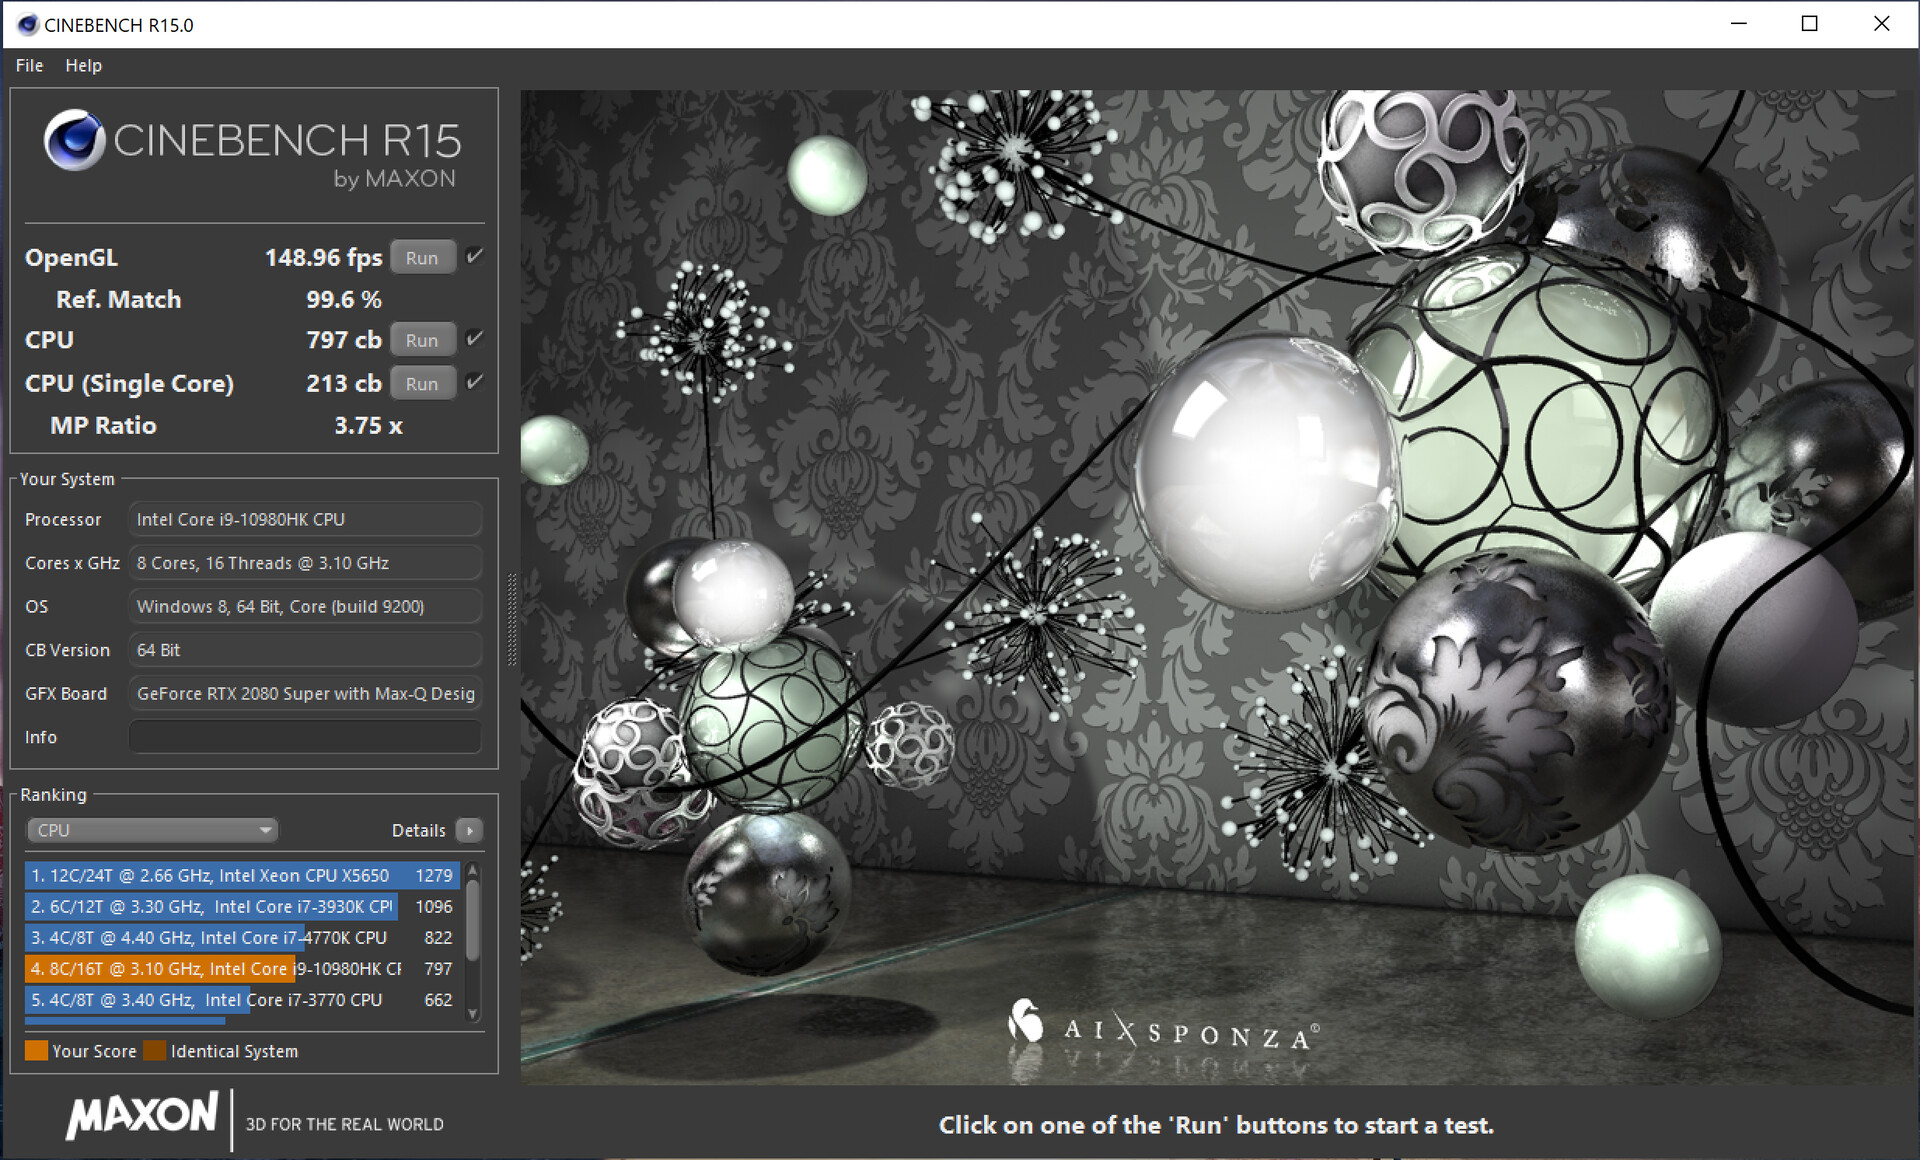
The Zephyrus Duo is powered by an octa-core Core i9-10980HK (Comet Lake) CPU with a TDP of 45 watts. The CPU has a base clock speed of 2.4 GHz. Via Turbo, the clock speeds can be increased to up to 4.4 GHz (on eight cores) or 5.3 GHz (on a single core). Hyper-Threading (two threads per core) is also supported. Lastly, the open multiplier allows for simple CPU overclocking.
During the Cinebench multi-thread benchmark tests, the processor runs at 3.5 GHz to 4.5 GHz (mains) and 2.4 GHz to 4 GHz (battery mode). During the single-thread tests, the clock rates are stable at 4.5 GHz to 4.9 GHz.
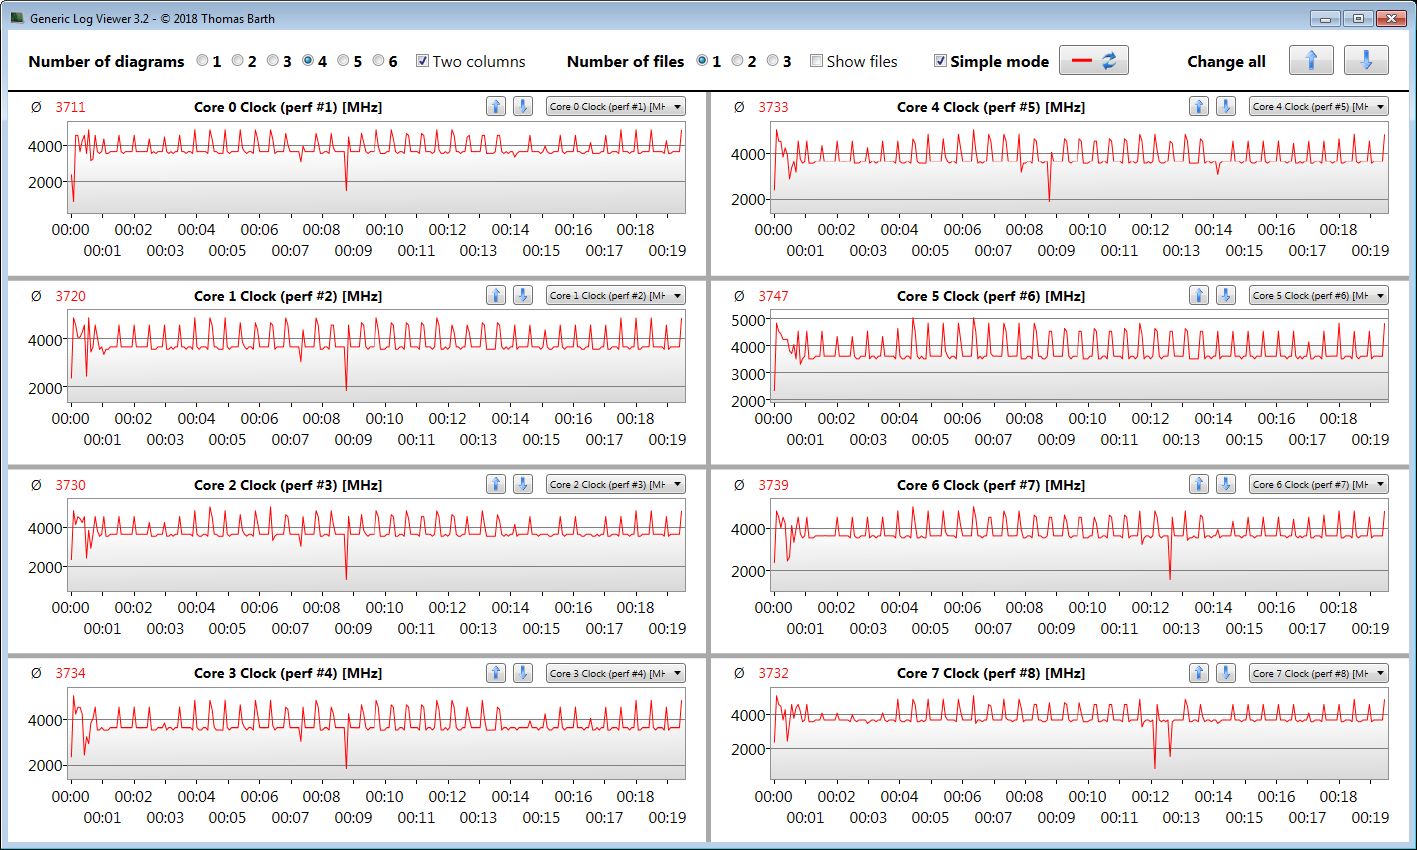
In order to determine whether the CPU Turbo is permanently active while on mains, we run the Cinebench R15 multi-thread test in a loop for at least 30 minutes. Here, the scores drop by the third loop and remain fairly consistent for the remainder of the test. Meanwhile, Turbo Boost is active.
With the "Turbo" profile is selected via the Armoury Crate software, the scores are slightly higher.

| Cinebench R15 | |
| CPU Single 64Bit | |
| Average of class Gaming (188.8 - 343, n=129, last 2 years) | |
| Asus ROG Zephyrus Duo 15 GX550LXS (Turbo) | |
| Gigabyte Aero 15 OLED XB-8DE51B0SP | |
| Average Intel Core i9-10980HK (198 - 219, n=15) | |
| Asus ROG Zephyrus Duo 15 GX550LXS | |
| MSI GS66 Stealth 10SFS | |
| Acer Predator Triton 500 PT515-52-70N3 | |
| CPU Multi 64Bit | |
| Average of class Gaming (1537 - 6271, n=130, last 2 years) | |
| Asus ROG Zephyrus Duo 15 GX550LXS (Turbo) | |
| Gigabyte Aero 15 OLED XB-8DE51B0SP | |
| Asus ROG Zephyrus Duo 15 GX550LXS | |
| Average Intel Core i9-10980HK (1606 - 1862, n=15) | |
| MSI GS66 Stealth 10SFS | |
| Acer Predator Triton 500 PT515-52-70N3 | |
| Blender - v2.79 BMW27 CPU | |
| Acer Predator Triton 500 PT515-52-70N3 | |
| MSI GS66 Stealth 10SFS | |
| Asus ROG Zephyrus Duo 15 GX550LXS (Turbo) | |
| Asus ROG Zephyrus Duo 15 GX550LXS | |
| Gigabyte Aero 15 OLED XB-8DE51B0SP | |
| Average Intel Core i9-10980HK (239 - 299, n=13) | |
| Average of class Gaming (80 - 334, n=126, last 2 years) | |
| 7-Zip 18.03 | |
| 7z b 4 -mmt1 | |
| Average of class Gaming (4199 - 7508, n=127, last 2 years) | |
| Gigabyte Aero 15 OLED XB-8DE51B0SP | |
| Average Intel Core i9-10980HK (5081 - 5542, n=13) | |
| Asus ROG Zephyrus Duo 15 GX550LXS | |
| MSI GS66 Stealth 10SFS | |
| Asus ROG Zephyrus Duo 15 GX550LXS (Turbo) | |
| Acer Predator Triton 500 PT515-52-70N3 | |
| 7z b 4 | |
| Average of class Gaming (33491 - 148086, n=127, last 2 years) | |
| Asus ROG Zephyrus Duo 15 GX550LXS | |
| Gigabyte Aero 15 OLED XB-8DE51B0SP | |
| Average Intel Core i9-10980HK (43786 - 49275, n=13) | |
| Asus ROG Zephyrus Duo 15 GX550LXS (Turbo) | |
| MSI GS66 Stealth 10SFS | |
| Acer Predator Triton 500 PT515-52-70N3 | |
| HWBOT x265 Benchmark v2.2 - 4k Preset | |
| Average of class Gaming (11 - 44.3, n=127, last 2 years) | |
| Gigabyte Aero 15 OLED XB-8DE51B0SP | |
| Average Intel Core i9-10980HK (12 - 14.6, n=13) | |
| Asus ROG Zephyrus Duo 15 GX550LXS | |
| Asus ROG Zephyrus Duo 15 GX550LXS (Turbo) | |
| MSI GS66 Stealth 10SFS | |
| Acer Predator Triton 500 PT515-52-70N3 | |
| LibreOffice - 20 Documents To PDF | |
| Asus ROG Zephyrus Duo 15 GX550LXS | |
| Average Intel Core i9-10980HK (44 - 89, n=13) | |
| MSI GS66 Stealth 10SFS | |
| Gigabyte Aero 15 OLED XB-8DE51B0SP | |
| Acer Predator Triton 500 PT515-52-70N3 | |
| Asus ROG Zephyrus Duo 15 GX550LXS (Turbo) | |
| Average of class Gaming (19 - 88.8, n=127, last 2 years) | |
| R Benchmark 2.5 - Overall mean | |
| Acer Predator Triton 500 PT515-52-70N3 | |
| Asus ROG Zephyrus Duo 15 GX550LXS (Turbo) | |
| MSI GS66 Stealth 10SFS | |
| Asus ROG Zephyrus Duo 15 GX550LXS | |
| Average Intel Core i9-10980HK (0.561 - 0.596, n=13) | |
| Gigabyte Aero 15 OLED XB-8DE51B0SP | |
| Average of class Gaming (0.3439 - 0.759, n=128, last 2 years) | |
* ... smaller is better
System Performance
A powerful octa-core processor, dual-channel memory and RAID 0 drives make for a smooth and responsive system. The GPU belongs to the high-end range as well. The excellent PCMark benchmark results attest to the laptop's ability to perform well in all common usage scenarios.
| PCMark 8 Home Score Accelerated v2 | 3821 points | |
| PCMark 8 Creative Score Accelerated v2 | 4210 points | |
| PCMark 8 Work Score Accelerated v2 | 4762 points | |
| PCMark 10 Score | 5277 points | |
Help | ||
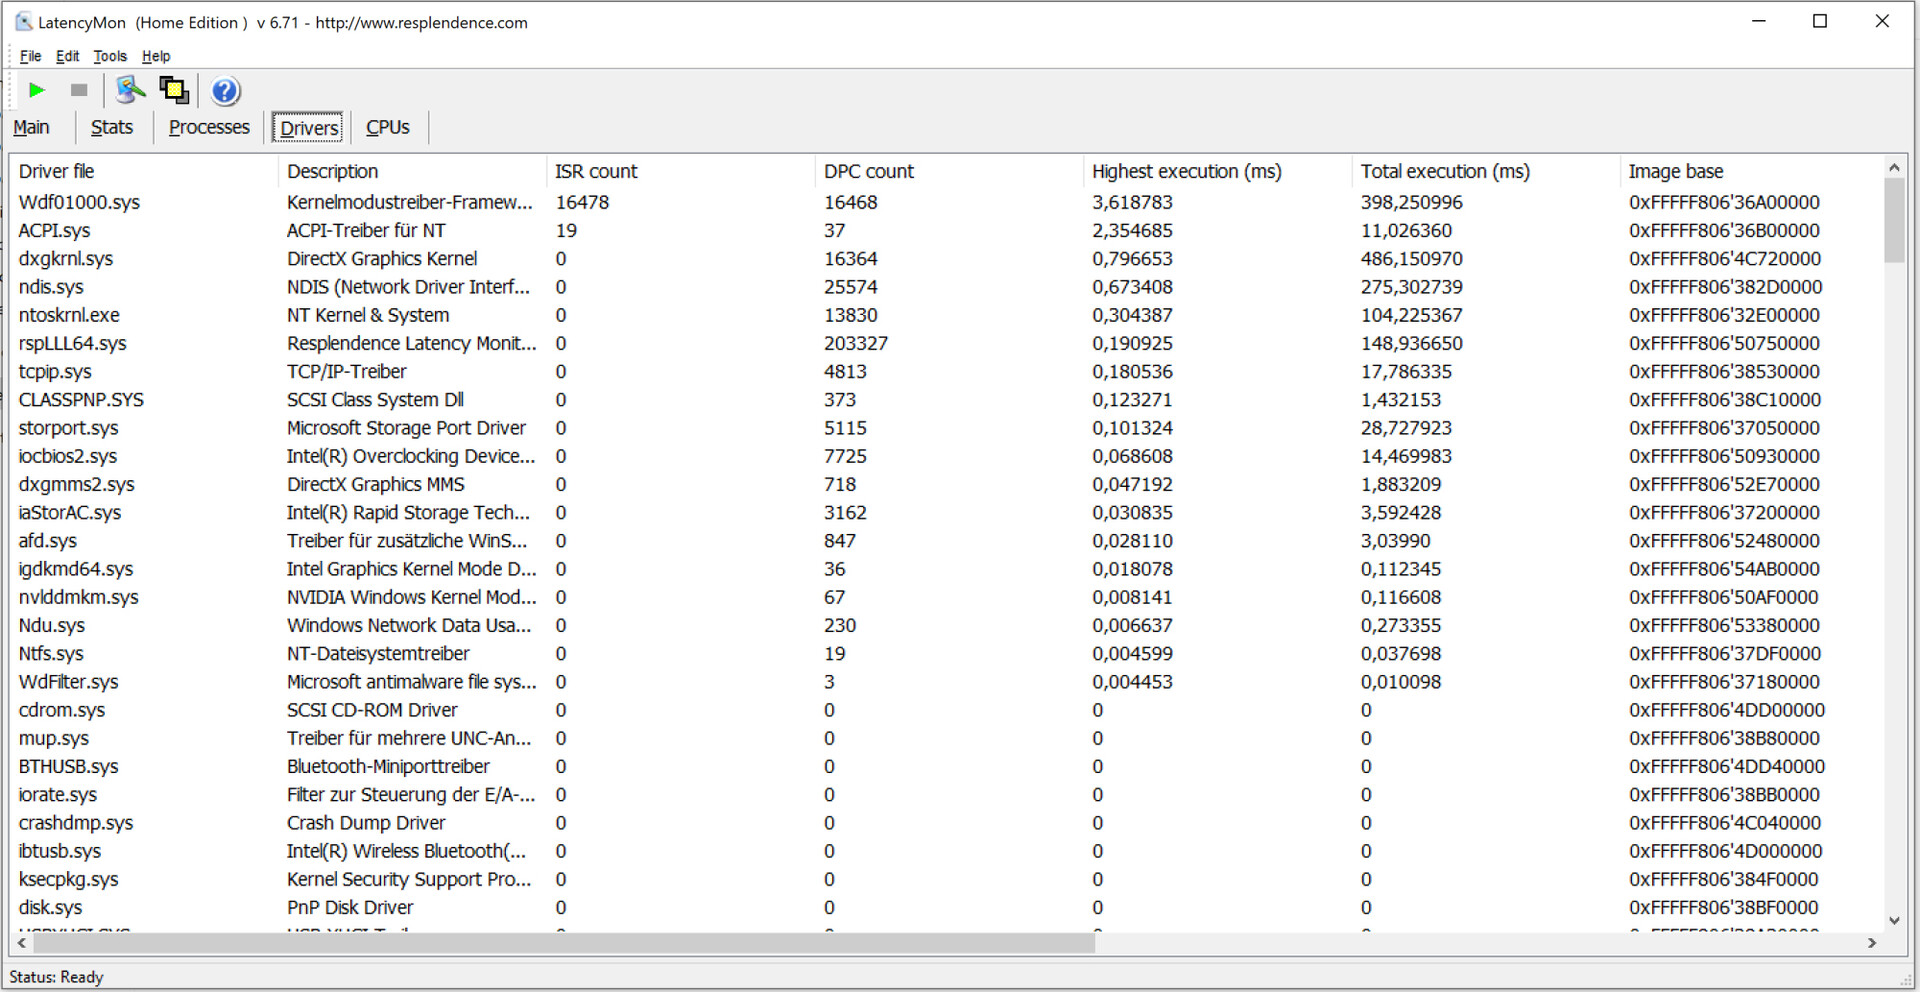
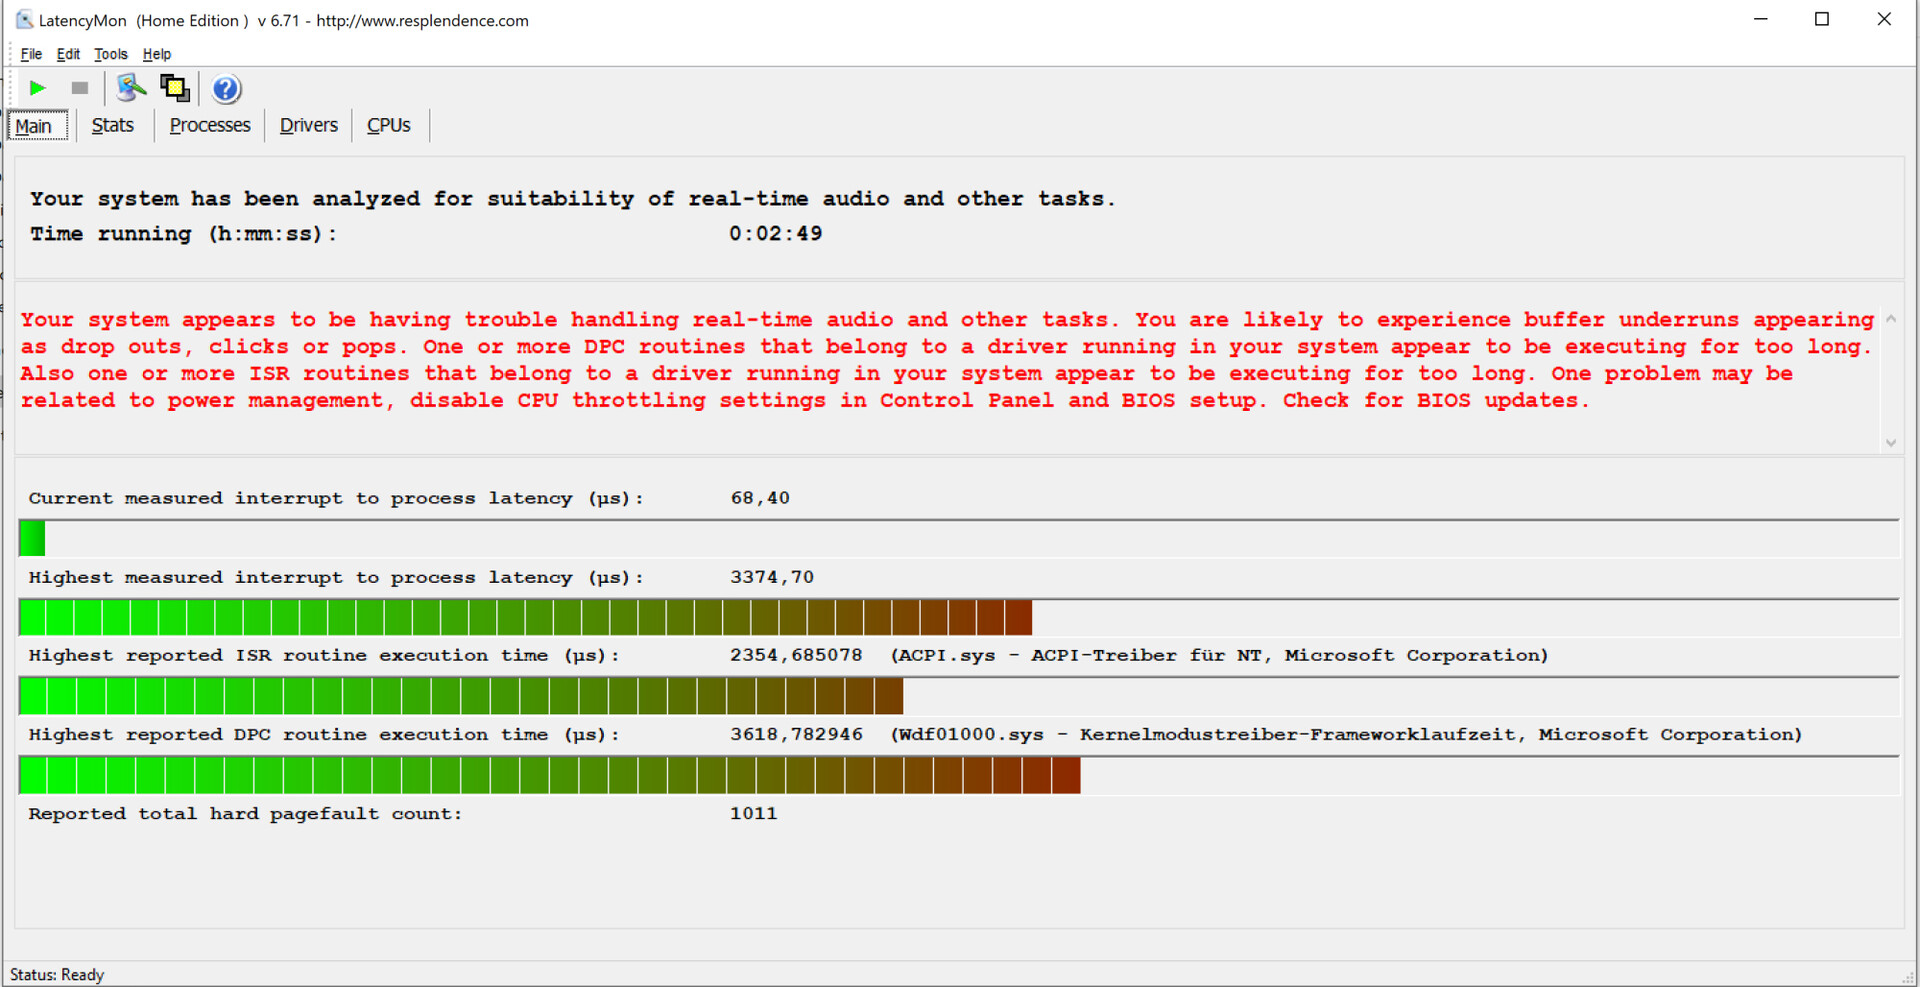
DPC Latencies
We observed high DPC latencies during our standardized Latency monitor test (web browsing, 4K video playback, Prime95 high load). Thus, the system is not suitable for real-time video and audio editing.
| DPC Latencies / LatencyMon - interrupt to process latency (max), Web, Youtube, Prime95 | |
| Acer Predator Triton 500 PT515-52-70N3 | |
| Asus ROG Zephyrus Duo 15 GX550LXS | |
| MSI GS66 Stealth 10SFS | |
| Gigabyte Aero 15 OLED XB-8DE51B0SP | |
* ... smaller is better
Storage Solution
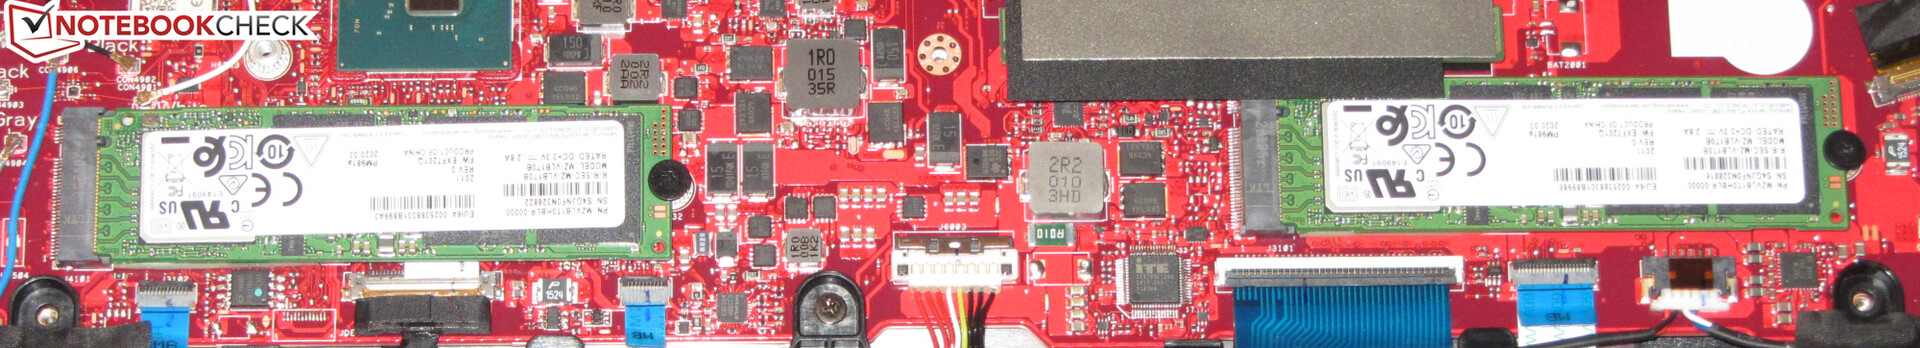
Asus has equipped the GX550LXS with two 1-TB NVMe SSDs (M.2 2280) from Samsung. Since they form a RAID 0, the operating system recognizes the two SSDs as one 2-TB SSD. All data stored on the array is distributed across both SSDs. This results in high transfer rates and short loading times - ideal for games.

| Asus ROG Zephyrus Duo 15 GX550LXS 2x Samsung PM981a MZVLB1T0HBLR (RAID 0) | Acer Predator Triton 500 PT515-52-70N3 Samsung SSD PM981a MZVLB512HBJQ | MSI GS66 Stealth 10SFS Samsung SSD PM981 MZVLB1T0HALR | Gigabyte Aero 15 OLED XB-8DE51B0SP Intel Optane Memory H10 with Solid State Storage 32GB + 512GB HBRPEKNX0202A(L/H) | Average 2x Samsung PM981a MZVLB1T0HBLR (RAID 0) | |
|---|---|---|---|---|---|
| CrystalDiskMark 5.2 / 6 | -8% | -13% | -4% | 23% | |
| Write 4K (MB/s) | 127.6 | 131.7 3% | 131.3 3% | 127.4 0% | 175.9 ? 38% |
| Read 4K (MB/s) | 48.4 | 47.34 -2% | 45.84 -5% | 147.5 205% | 49.7 ? 3% |
| Write Seq (MB/s) | 2958 | 2884 -3% | 2370 -20% | 485.9 -84% | 4078 ? 38% |
| Read Seq (MB/s) | 2984 | 2303 -23% | 1509 -49% | 1352 -55% | 3653 ? 22% |
| Write 4K Q32T1 (MB/s) | 472.7 | 423.9 -10% | 481.5 2% | 476.5 1% | 540 ? 14% |
| Read 4K Q32T1 (MB/s) | 529 | 487.7 -8% | 560 6% | 531 0% | 456 ? -14% |
| Write Seq Q32T1 (MB/s) | 3431 | 2822 -18% | 2392 -30% | 1061 -69% | 4457 ? 30% |
| Read Seq Q32T1 (MB/s) | 3536 | 3478 -2% | 3232 -9% | 2552 -28% | 5307 ? 50% |
| AS SSD | 2% | -1% | -36% | 9% | |
| Seq Read (MB/s) | 2981 | 2767 -7% | 1065 -64% | 1200 -60% | 3515 ? 18% |
| Seq Write (MB/s) | 2783 | 2613 -6% | 2360 -15% | 836 -70% | 2878 ? 3% |
| 4K Read (MB/s) | 43.98 | 47.55 8% | 48.09 9% | 65.8 50% | 48.4 ? 10% |
| 4K Write (MB/s) | 113.9 | 98.9 -13% | 110.7 -3% | 103.8 -9% | 165.6 ? 45% |
| 4K-64 Read (MB/s) | 1519 | 1205 -21% | 1635 8% | 789 -48% | 1419 ? -7% |
| 4K-64 Write (MB/s) | 1296 | 2007 55% | 1829 41% | 929 -28% | 1348 ? 4% |
| Access Time Read * (ms) | 0.062 | 0.065 -5% | 0.071 -15% | 0.103 -66% | 0.0455 ? 27% |
| Access Time Write * (ms) | 0.033 | 0.038 -15% | 0.034 -3% | 0.045 -36% | 0.04375 ? -33% |
| Score Read (Points) | 1861 | 1529 -18% | 1790 -4% | 975 -48% | 1818 ? -2% |
| Score Write (Points) | 1688 | 2367 40% | 2176 29% | 1117 -34% | 1801 ? 7% |
| Score Total (Points) | 4492 | 4677 4% | 4950 10% | 2594 -42% | 4521 ? 1% |
| Copy ISO MB/s (MB/s) | 2438 | 2919 ? 20% | |||
| Copy Program MB/s (MB/s) | 604 | 706 ? 17% | |||
| Copy Game MB/s (MB/s) | 1404 | 1560 ? 11% | |||
| Total Average (Program / Settings) | -3% /
-2% | -7% /
-6% | -20% /
-22% | 16% /
14% |
* ... smaller is better
Continuous read performance: DiskSpd Read Loop, Queue Depth 8
GPU Performance
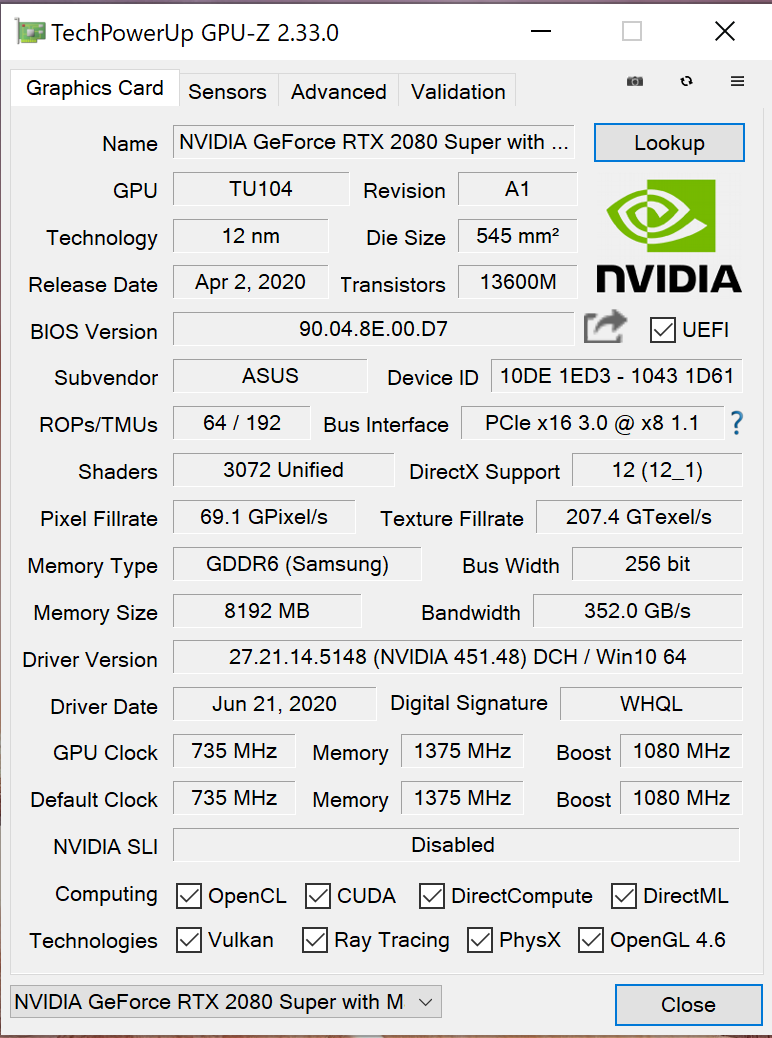
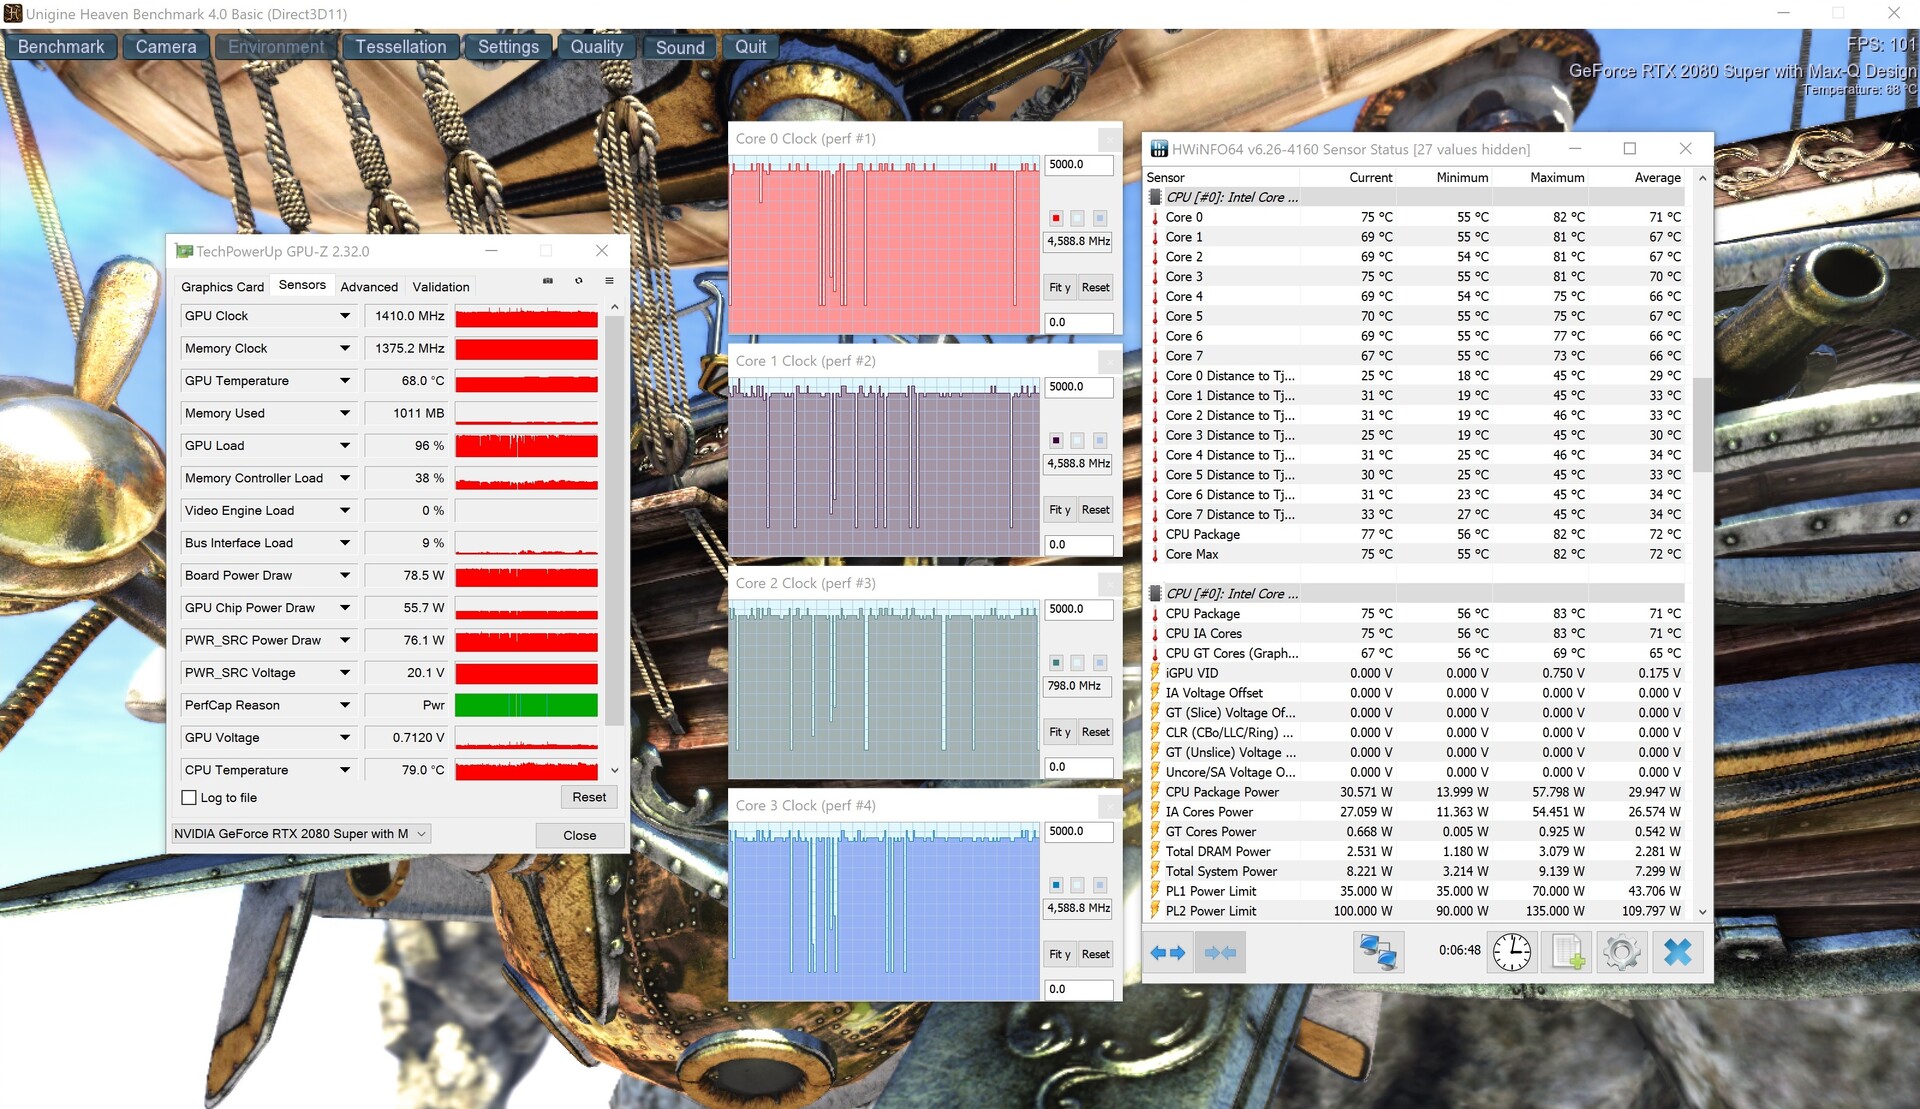
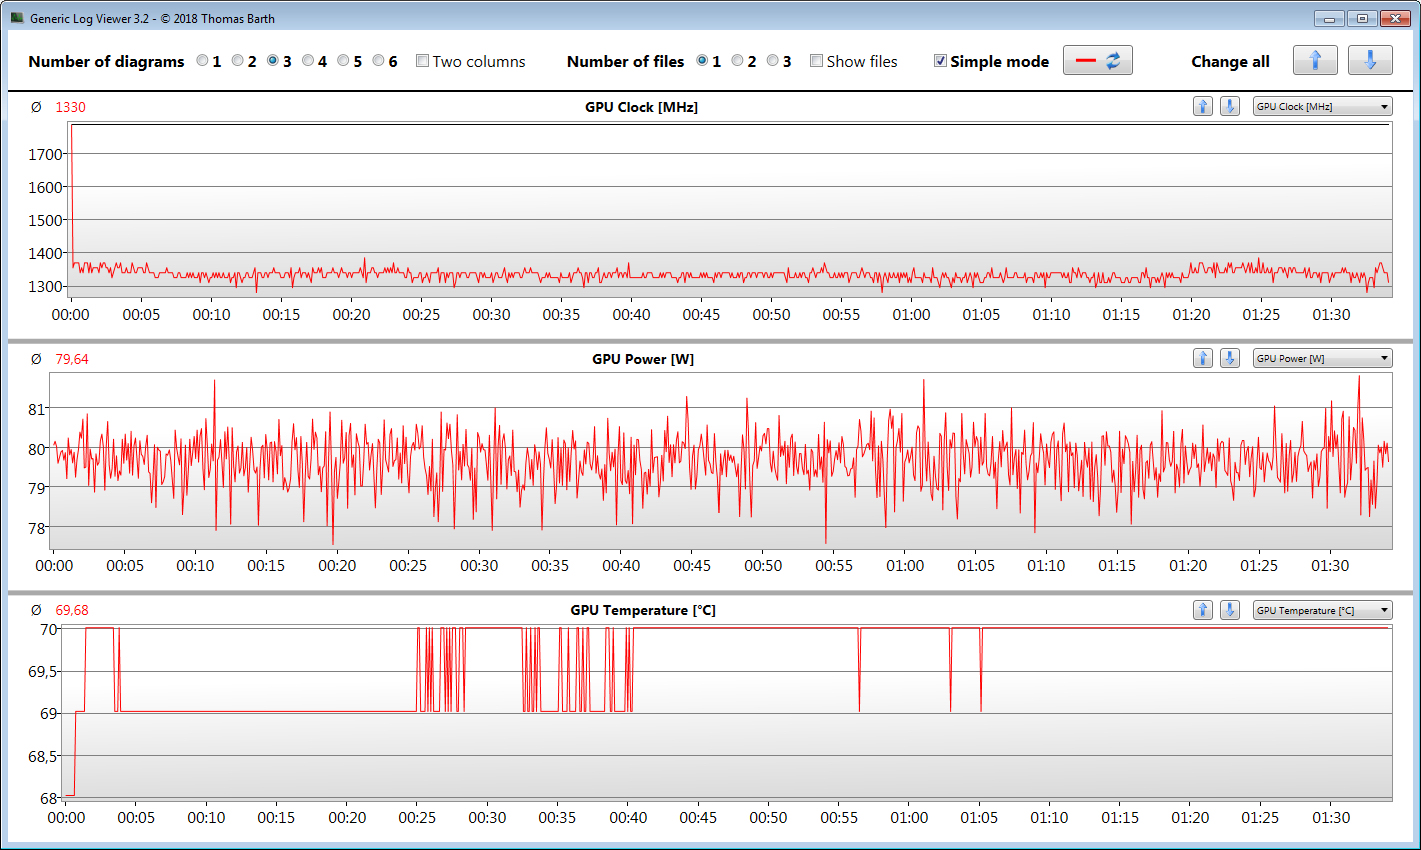
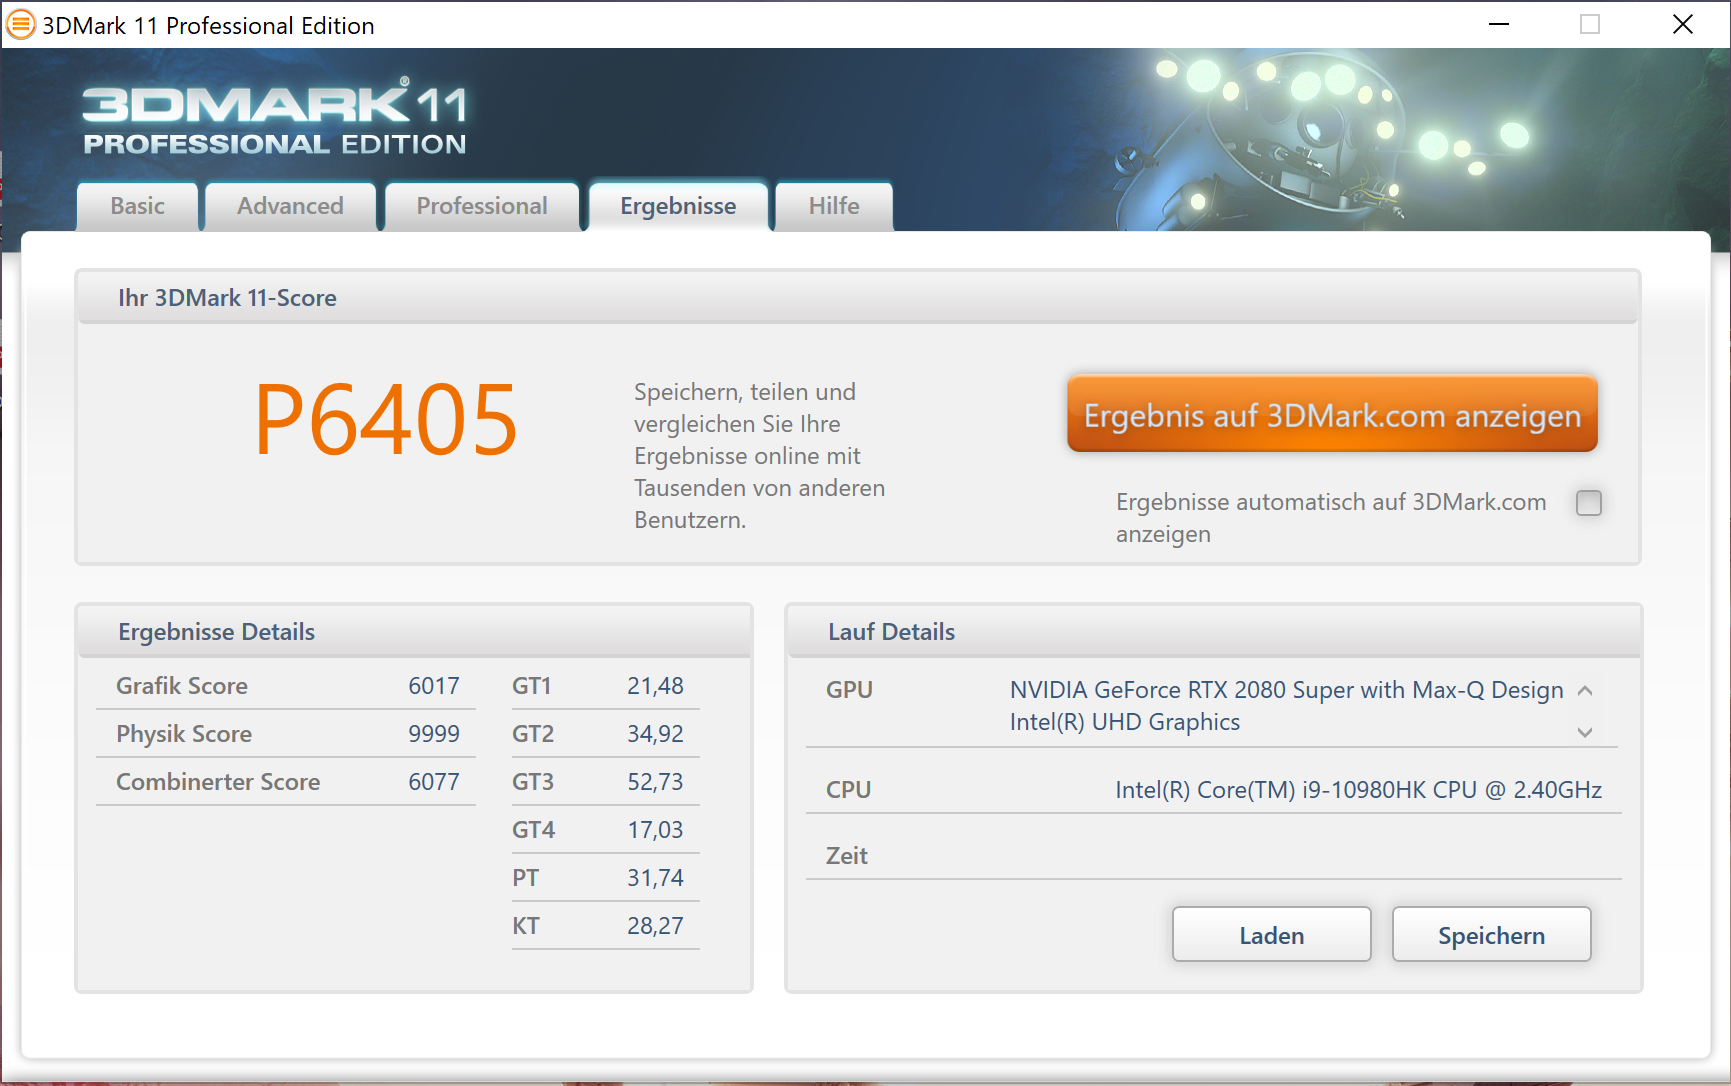
The GeForce RTX 2080 Super Max-Q graphics card supports DirectX 12 and runs at a base clock speed of 735 MHz. Via boost, it is able to increase its clock speed to up to 1080 MHz. Higher speeds are possible, provided the GPU does not cross certain predefined temperature or energy consumption thresholds. We registered a peak of 1785 MHz. During our "The Witcher 3" test, it runs at an average clock rate of 1330 MHz. The GPU has access to fast GDDR6 video memory (8192 MB).
The 3DMark benchmark results match our expectations for this GPU. The integrated UHD Graphics 630 is active and the laptop uses Nvidia's graphics switching technology Optimus. Optimus - and with it, the iGPU - can be disabled via the Armoury Crate software.
Within the Armoury Crate software, the power profile "Turbo" can be selected to increase the graphics performance. This results in approximately 15% to 20% higher 3DMark benchmark scores.

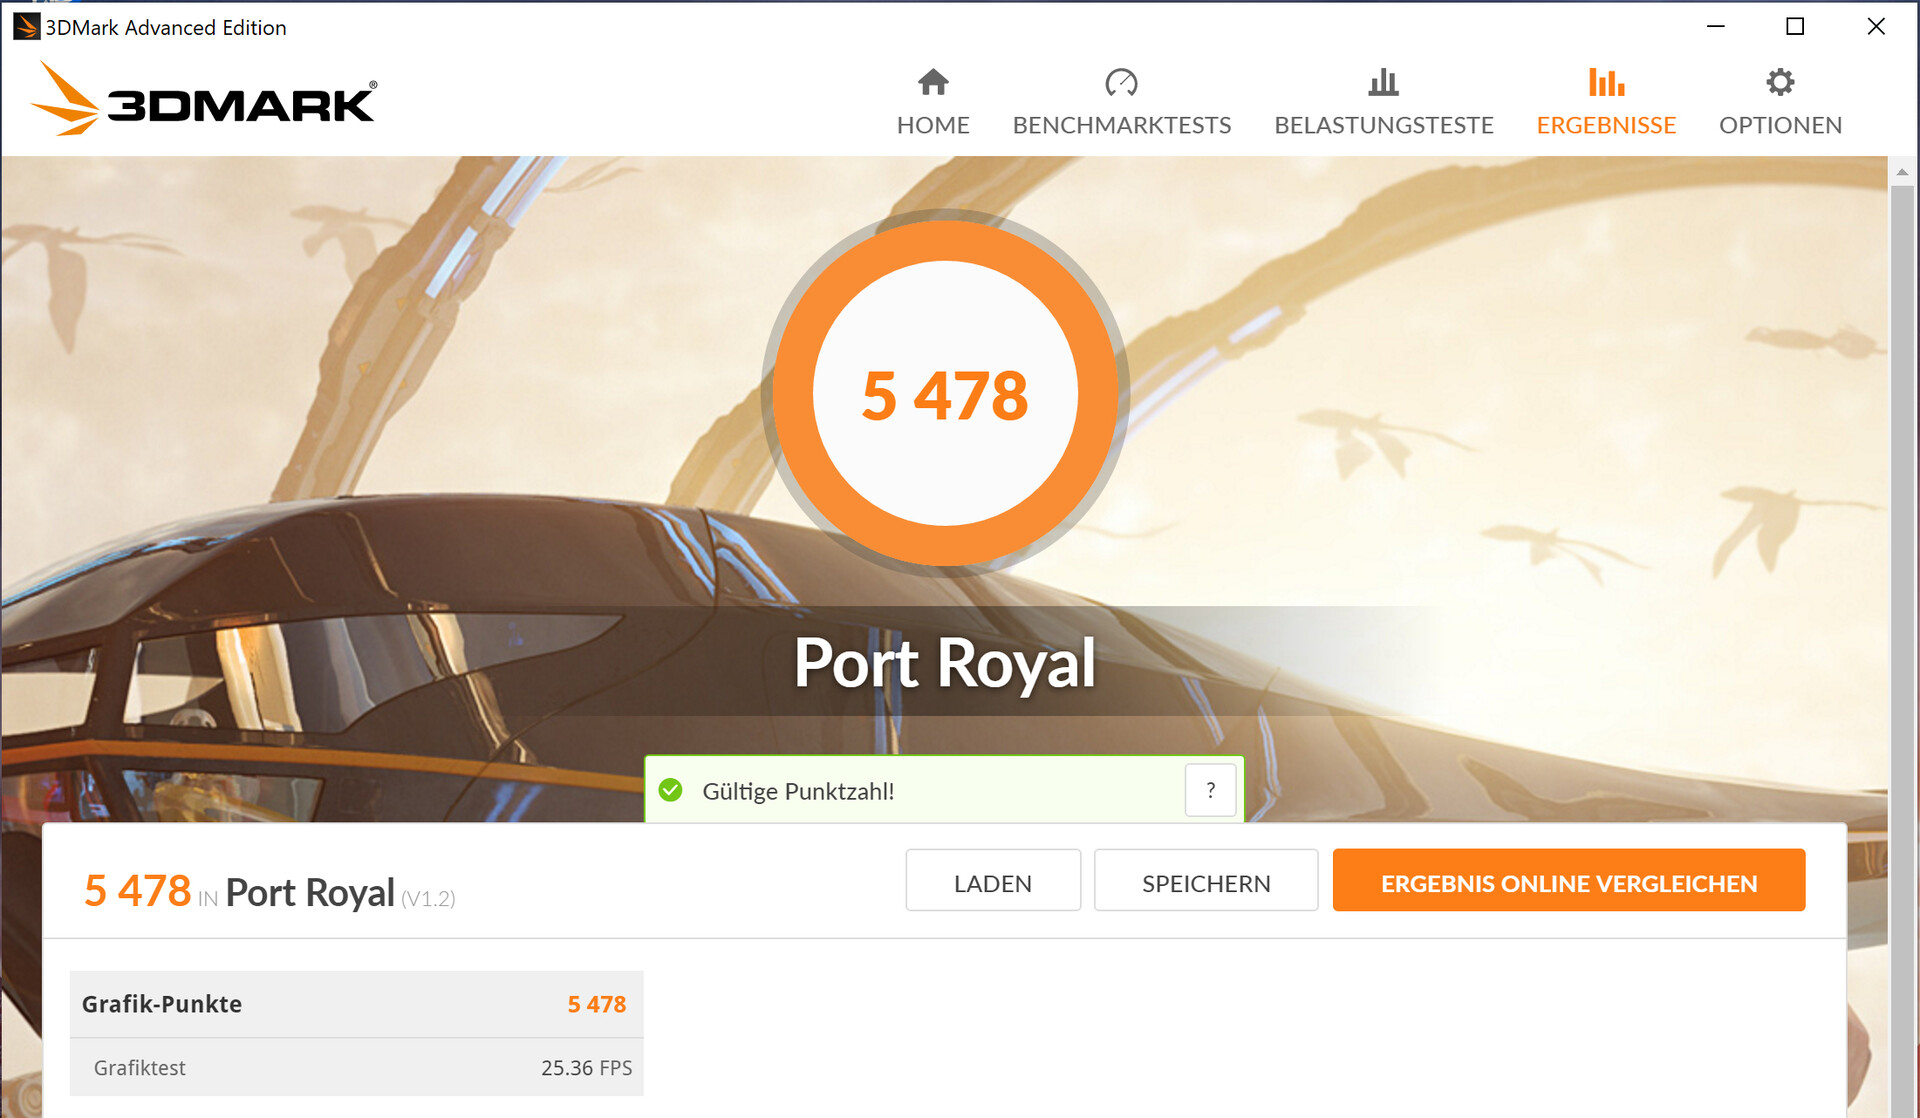
| 3DMark 11 Performance | 23526 points | |
| 3DMark Cloud Gate Standard Score | 44534 points | |
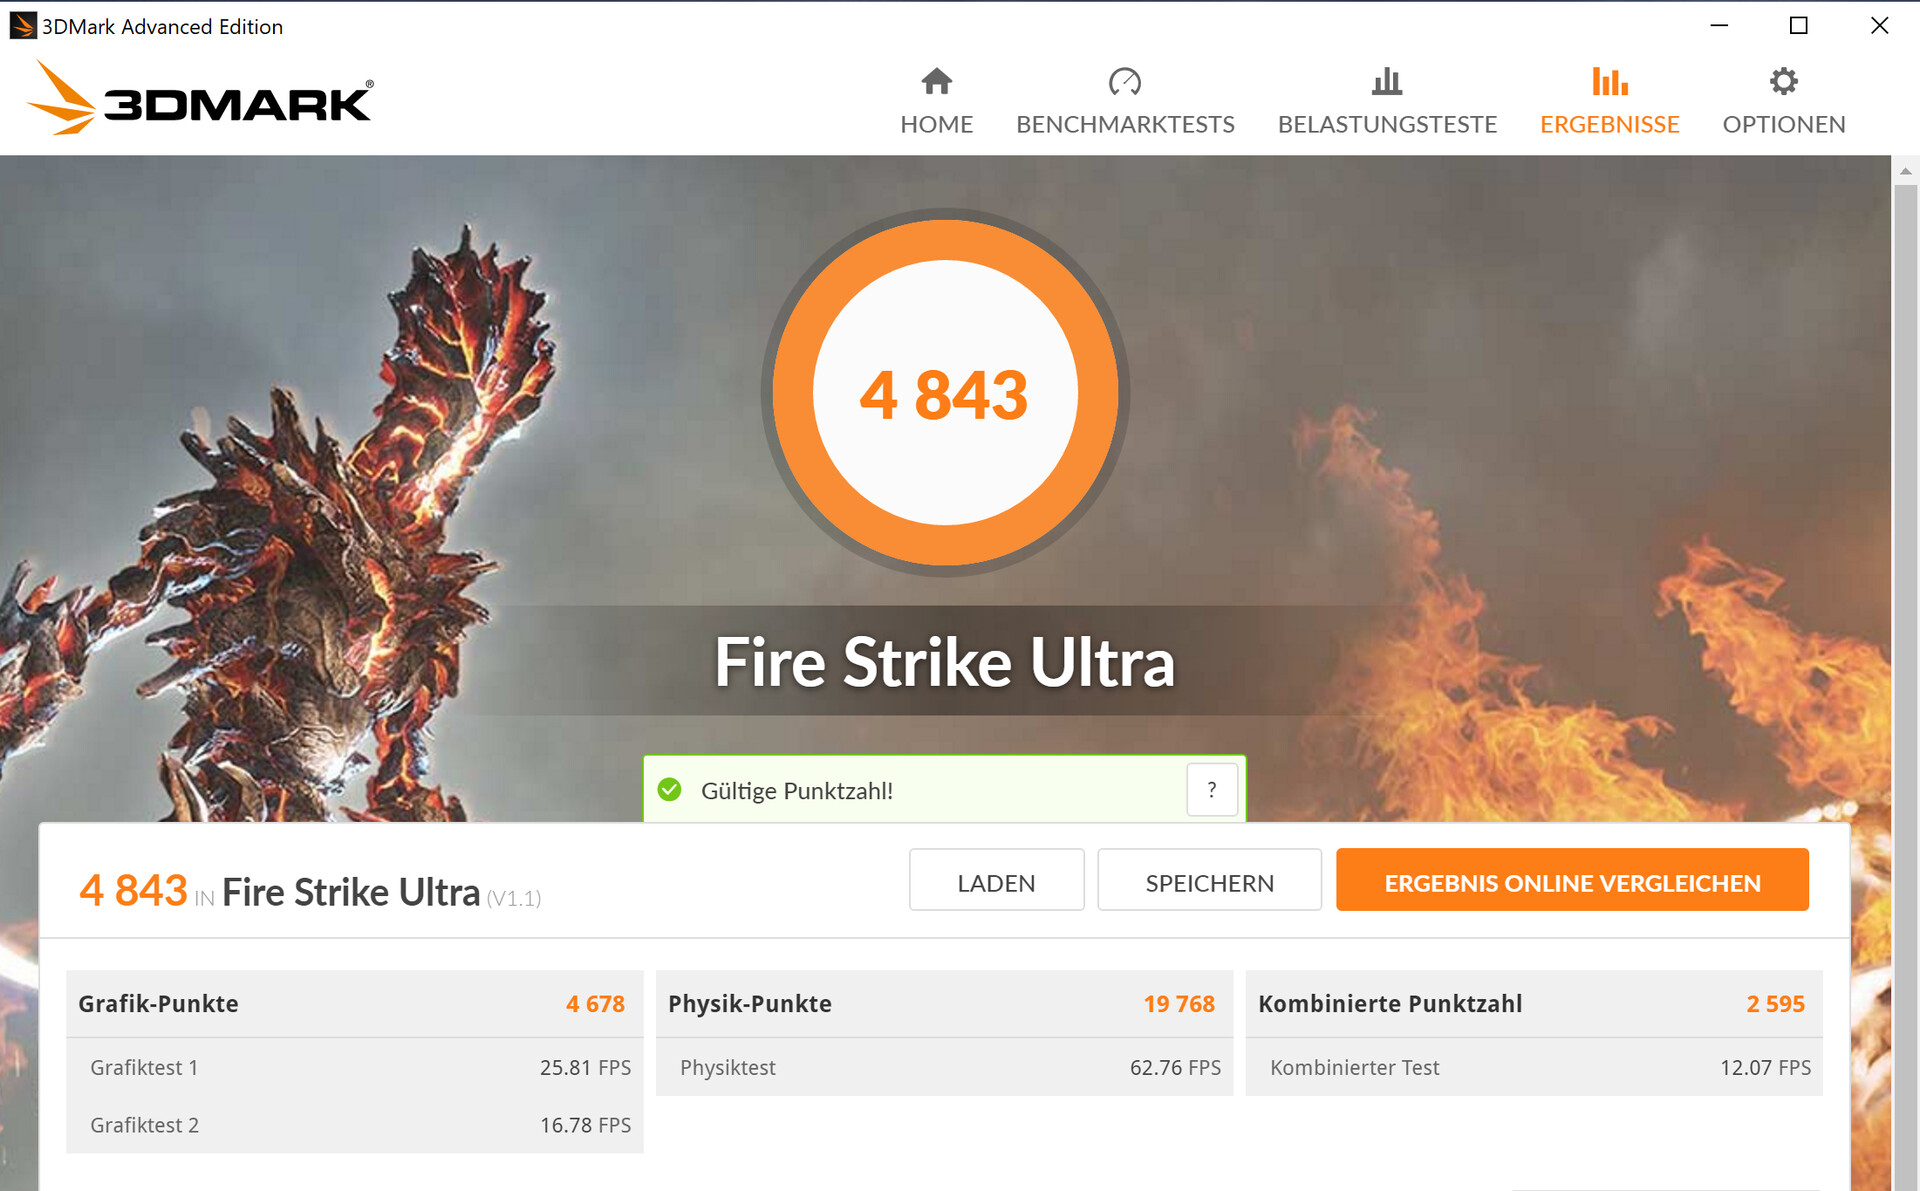
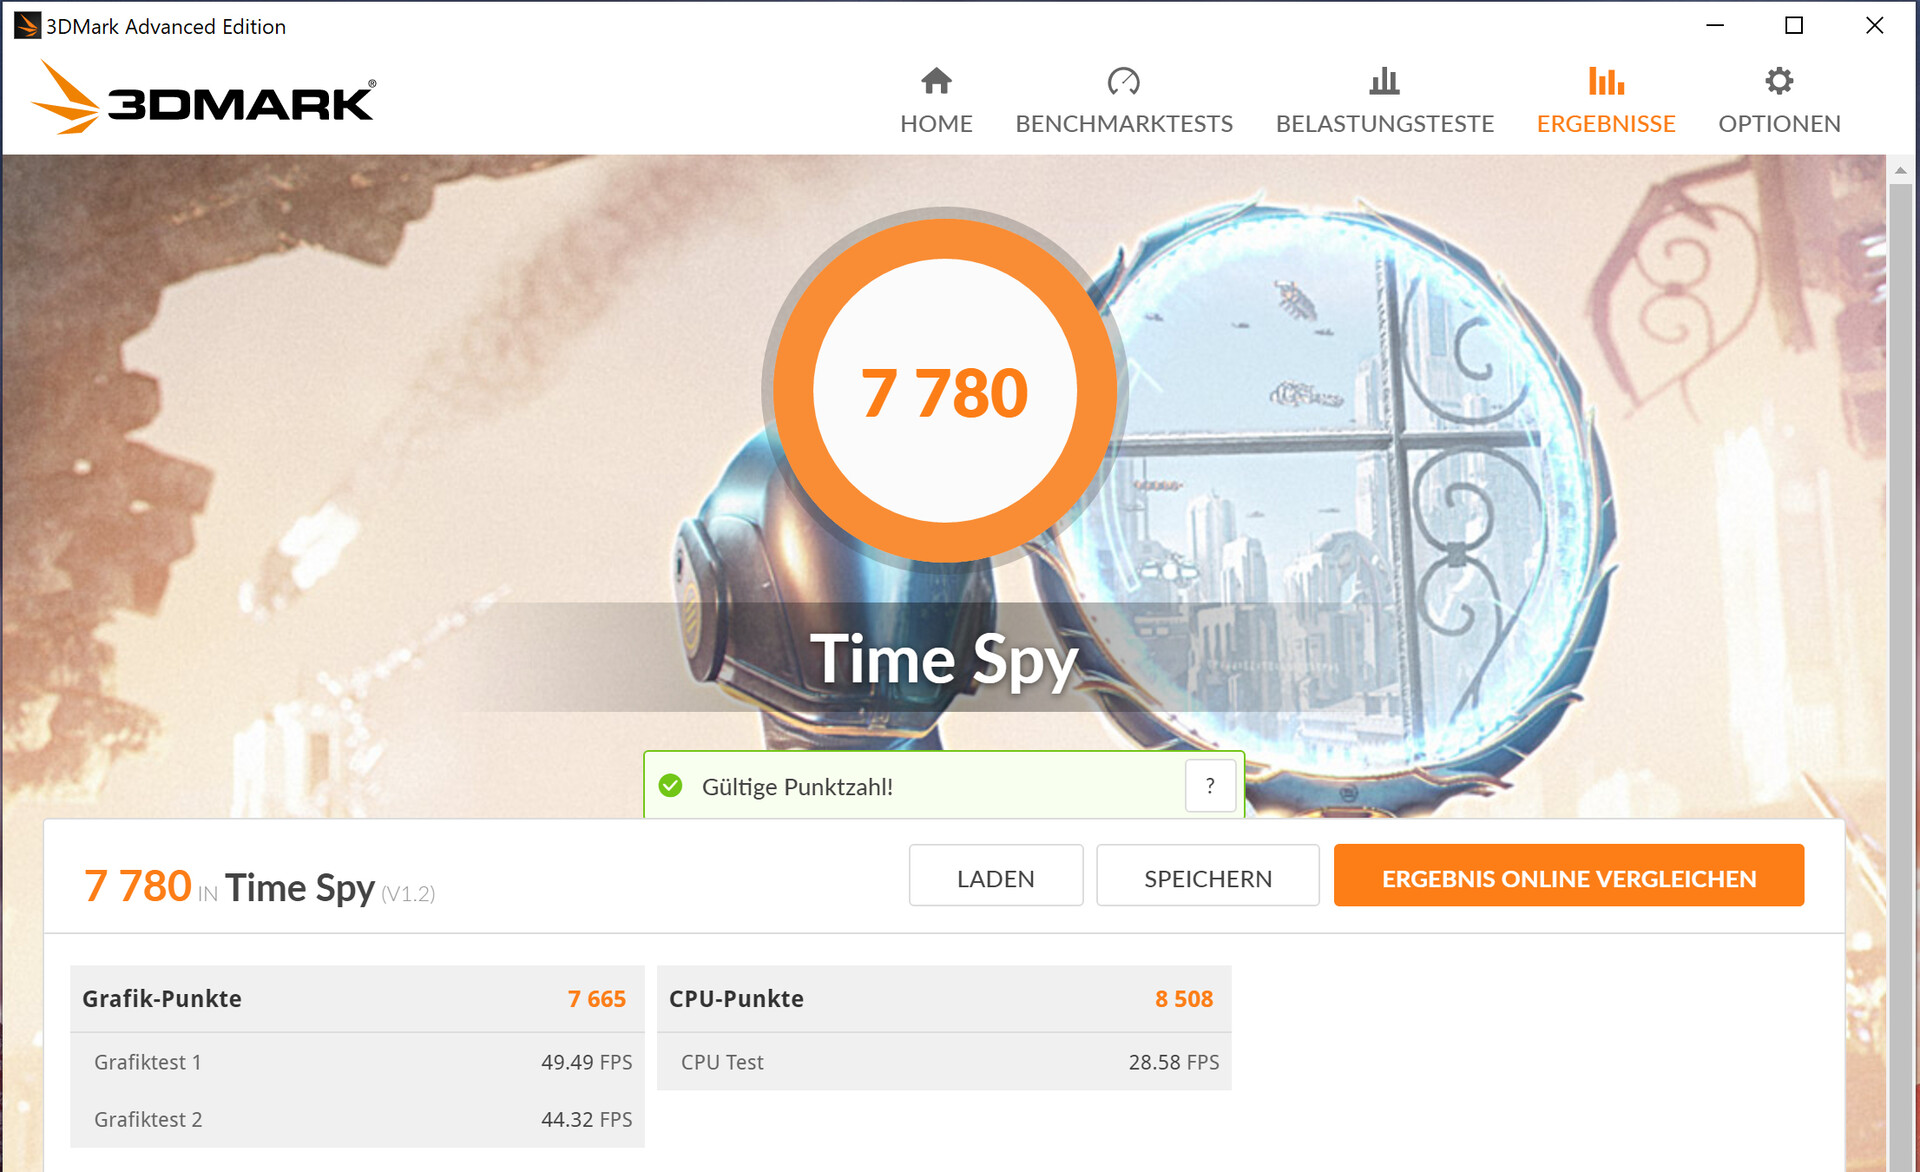
| 3DMark Fire Strike Score | 17714 points | |
| 3DMark Time Spy Score | 7780 points | |
Help | ||
| 3DMark 11 - 1280x720 Performance GPU | |
| Average of class Gaming (19488 - 80022, n=123, last 2 years) | |
| Asus ROG Zephyrus Duo 15 GX550LXS (Turbo) | |
| Acer Predator Triton 500 PT515-52-70N3 | |
| Average NVIDIA GeForce RTX 2080 Super Max-Q (26292 - 32995, n=10) | |
| Gigabyte Aero 15 OLED XB-8DE51B0SP | |
| Asus ROG Zephyrus Duo 15 GX550LXS | |
| MSI GS66 Stealth 10SFS | |
| 3DMark | |
| 1920x1080 Fire Strike Graphics | |
| Average of class Gaming (12242 - 62849, n=137, last 2 years) | |
| Asus ROG Zephyrus Duo 15 GX550LXS (Turbo) | |
| Acer Predator Triton 500 PT515-52-70N3 | |
| Average NVIDIA GeForce RTX 2080 Super Max-Q (19655 - 23649, n=10) | |
| Gigabyte Aero 15 OLED XB-8DE51B0SP | |
| Asus ROG Zephyrus Duo 15 GX550LXS | |
| MSI GS66 Stealth 10SFS | |
| 2560x1440 Time Spy Graphics | |
| Average of class Gaming (4310 - 25984, n=134, last 2 years) | |
| Asus ROG Zephyrus Duo 15 GX550LXS (Turbo) | |
| Acer Predator Triton 500 PT515-52-70N3 | |
| Average NVIDIA GeForce RTX 2080 Super Max-Q (7372 - 8979, n=11) | |
| Gigabyte Aero 15 OLED XB-8DE51B0SP | |
| Asus ROG Zephyrus Duo 15 GX550LXS | |
| MSI GS66 Stealth 10SFS | |
Gaming Performance
All the latest games run smoothly on the Asus system. For the most part, the FHD resolution and maximum graphics settings can be chosen. Although naturally, the installed GPU is powerful enough to also handle resolutions above Full HD, the quality settings may then have to be dialed back - particularly at 4K.
Selecting the power profile "Turbo" from within the Armoury Crate software results in higher frame rates. The FPS gain depends on the game, resolution and the graphics settings. Specifying a fixed value is not possible. The following comparison table also reflects this.
| The Witcher 3 - 1920x1080 Ultra Graphics & Postprocessing (HBAO+) | |
| Average of class Gaming (83.7 - 240, n=29, last 2 years) | |
| Asus ROG Zephyrus Duo 15 GX550LXS (Turbo) | |
| Average NVIDIA GeForce RTX 2080 Super Max-Q (74.3 - 96, n=11) | |
| Acer Predator Triton 500 PT515-52-70N3 | |
| Gigabyte Aero 15 OLED XB-8DE51B0SP | |
| Asus ROG Zephyrus Duo 15 GX550LXS | |
| MSI GS66 Stealth 10SFS | |
| BioShock Infinite - 1920x1080 Ultra Preset, DX11 (DDOF) | |
| Asus ROG Zephyrus Duo 15 GX550LXS (Turbo) | |
| Average NVIDIA GeForce RTX 2080 Super Max-Q (170.2 - 181.1, n=4) | |
| Asus ROG Zephyrus Duo 15 GX550LXS | |
| Doom Eternal - 1920x1080 Ultra Preset | |
| Asus ROG Zephyrus Duo 15 GX550LXS (Turbo) | |
| Average NVIDIA GeForce RTX 2080 Super Max-Q (140 - 177.7, n=8) | |
| Asus ROG Zephyrus Duo 15 GX550LXS | |
| Acer Predator Triton 500 PT515-52-70N3 | |
| MSI GS66 Stealth 10SFS | |
| Red Dead Redemption 2 - 1920x1080 Maximum Settings | |
| Asus ROG Zephyrus Duo 15 GX550LXS | |
| Acer Predator Triton 500 PT515-52-70N3 | |
| Average NVIDIA GeForce RTX 2080 Super Max-Q (40.6 - 45, n=5) | |
| Gigabyte Aero 15 OLED XB-8DE51B0SP | |
| Call of Duty Modern Warfare 2019 - 1920x1080 Maximum Settings AA:T2X Filmic SM | |
| Acer Predator Triton 500 PT515-52-70N3 | |
| Average NVIDIA GeForce RTX 2080 Super Max-Q (91.2 - 107, n=4) | |
| Asus ROG Zephyrus Duo 15 GX550LXS | |
| Far Cry 5 - 1920x1080 Ultra Preset AA:T | |
| Average of class Gaming (70 - 172, n=27, last 2 years) | |
| Asus ROG Zephyrus Duo 15 GX550LXS | |
| Average NVIDIA GeForce RTX 2080 Super Max-Q (91 - 110, n=4) | |
| Shadow of the Tomb Raider - 1920x1080 Highest Preset AA:T | |
| Average of class Gaming (96 - 212, n=4, last 2 years) | |
| Gigabyte Aero 15 OLED XB-8DE51B0SP | |
| Acer Predator Triton 500 PT515-52-70N3 | |
| Average NVIDIA GeForce RTX 2080 Super Max-Q (89 - 106, n=10) | |
| MSI GS66 Stealth 10SFS | |
| Asus ROG Zephyrus Duo 15 GX550LXS (Turbo) | |
| Asus ROG Zephyrus Duo 15 GX550LXS | |
In order to assess whether the frame rates remain consistent over a longer period of time, we ran "The Witcher 3" for about 60 minutes at Full HD resolution and maximum graphics settings. During the test, the character portrayed by the player was not moved. We did not observe any frame rate drops.
| low | med. | high | ultra | QHD | 4K | |
|---|---|---|---|---|---|---|
| BioShock Infinite (2013) | 425.1 | 349.2 | 324.2 | 173.1 | ||
| The Witcher 3 (2015) | 330.5 | 237 | 143.4 | 75.8 | 53.5 | |
| Far Cry 5 (2018) | 143 | 115 | 108 | 102 | 77 | 42 |
| Shadow of the Tomb Raider (2018) | 103 | 95 | 93 | 89 | 67 | 36 |
| Total War: Three Kingdoms (2019) | 245.5 | 136.4 | 86.5 | 62.5 | 39.9 | 19.6 |
| Ghost Recon Breakpoint (2019) | 128 | 93 | 87 | 65 | 49 | 29 |
| Call of Duty Modern Warfare 2019 (2019) | 172.3 | 123.6 | 104.3 | 91.2 | 64.7 | 36.3 |
| Red Dead Redemption 2 (2019) | 131.4 | 99.7 | 68.3 | 44.9 | 36.2 | 23.5 |
| Doom Eternal (2020) | 205 | 168.3 | 154 | 152.1 | 116.7 | 64 |
| Gears Tactics (2020) | 210.4 | 161.2 | 110.6 | 89.7 | 57.9 | 30.3 |
| F1 2020 (2020) | 253 | 167 | 149 | 118 | 89 | 51 |
Emissions - Acceptable Heat and Noise Levels
System Noise
The twin fans permanently run at low speeds during idle. This causes a tolerable amount of noise. Under load, their RPM increases. We registered maximum sound pressure levels of 49 dB(A) (stress test) and 48 dB(A) (The Witcher 3 test). Using a headset is almost mandatory.
Noise level
| Idle |
| 33 / 34 / 35 dB(A) |
| Load |
| 48 / 49 dB(A) |
 | ||
30 dB silent 40 dB(A) audible 50 dB(A) loud |
||
min: | ||
| Asus ROG Zephyrus Duo 15 GX550LXS i9-10980HK, GeForce RTX 2080 Super Max-Q | Acer Predator Triton 500 PT515-52-70N3 i7-10750H, GeForce RTX 2080 Super Max-Q | MSI GS66 Stealth 10SFS i9-10980HK, GeForce RTX 2070 Super Max-Q | Gigabyte Aero 15 OLED XB-8DE51B0SP i7-10875H, GeForce RTX 2070 Super Max-Q | Average NVIDIA GeForce RTX 2080 Super Max-Q | Average of class Gaming | |
|---|---|---|---|---|---|---|
| Noise | 0% | -4% | -5% | 4% | 13% | |
| off / environment * (dB) | 30 | 30 -0% | 30 -0% | 30 -0% | 27.9 ? 7% | 24.1 ? 20% |
| Idle Minimum * (dB) | 33 | 30 9% | 32 3% | 34 -3% | 29.7 ? 10% | 25.9 ? 22% |
| Idle Average * (dB) | 34 | 33 3% | 34 -0% | 36 -6% | 30.8 ? 9% | 27.5 ? 19% |
| Idle Maximum * (dB) | 35 | 36 -3% | 39 -11% | 41 -17% | 35.4 ? -1% | 29.9 ? 15% |
| Load Average * (dB) | 48 | 50 -4% | 53 -10% | 48 -0% | 47.2 ? 2% | 43.5 ? 9% |
| Witcher 3 ultra * (dB) | 48 | 48 -0% | 48 -0% | 48 -0% | ||
| Load Maximum * (dB) | 49 | 50 -2% | 53 -8% | 54 -10% | 49.6 ? -1% | 53.8 ? -10% |
* ... smaller is better
Temperature
The processor runs at 2 GHz during our stress test (running Prime95 and FurMark for at least one hour). Meanwhile, the graphics card runs at approximately 1215 MHz. In battery mode, the speeds fluctuate between 800 MHz and 2.4 GHz to 4 GHz (CPU) and 300 MHz to 1500 MHz (GPU). The stress test represents an extreme scenario that does not occur during daily use. We use this test to determine whether the system is stable under maximum load.
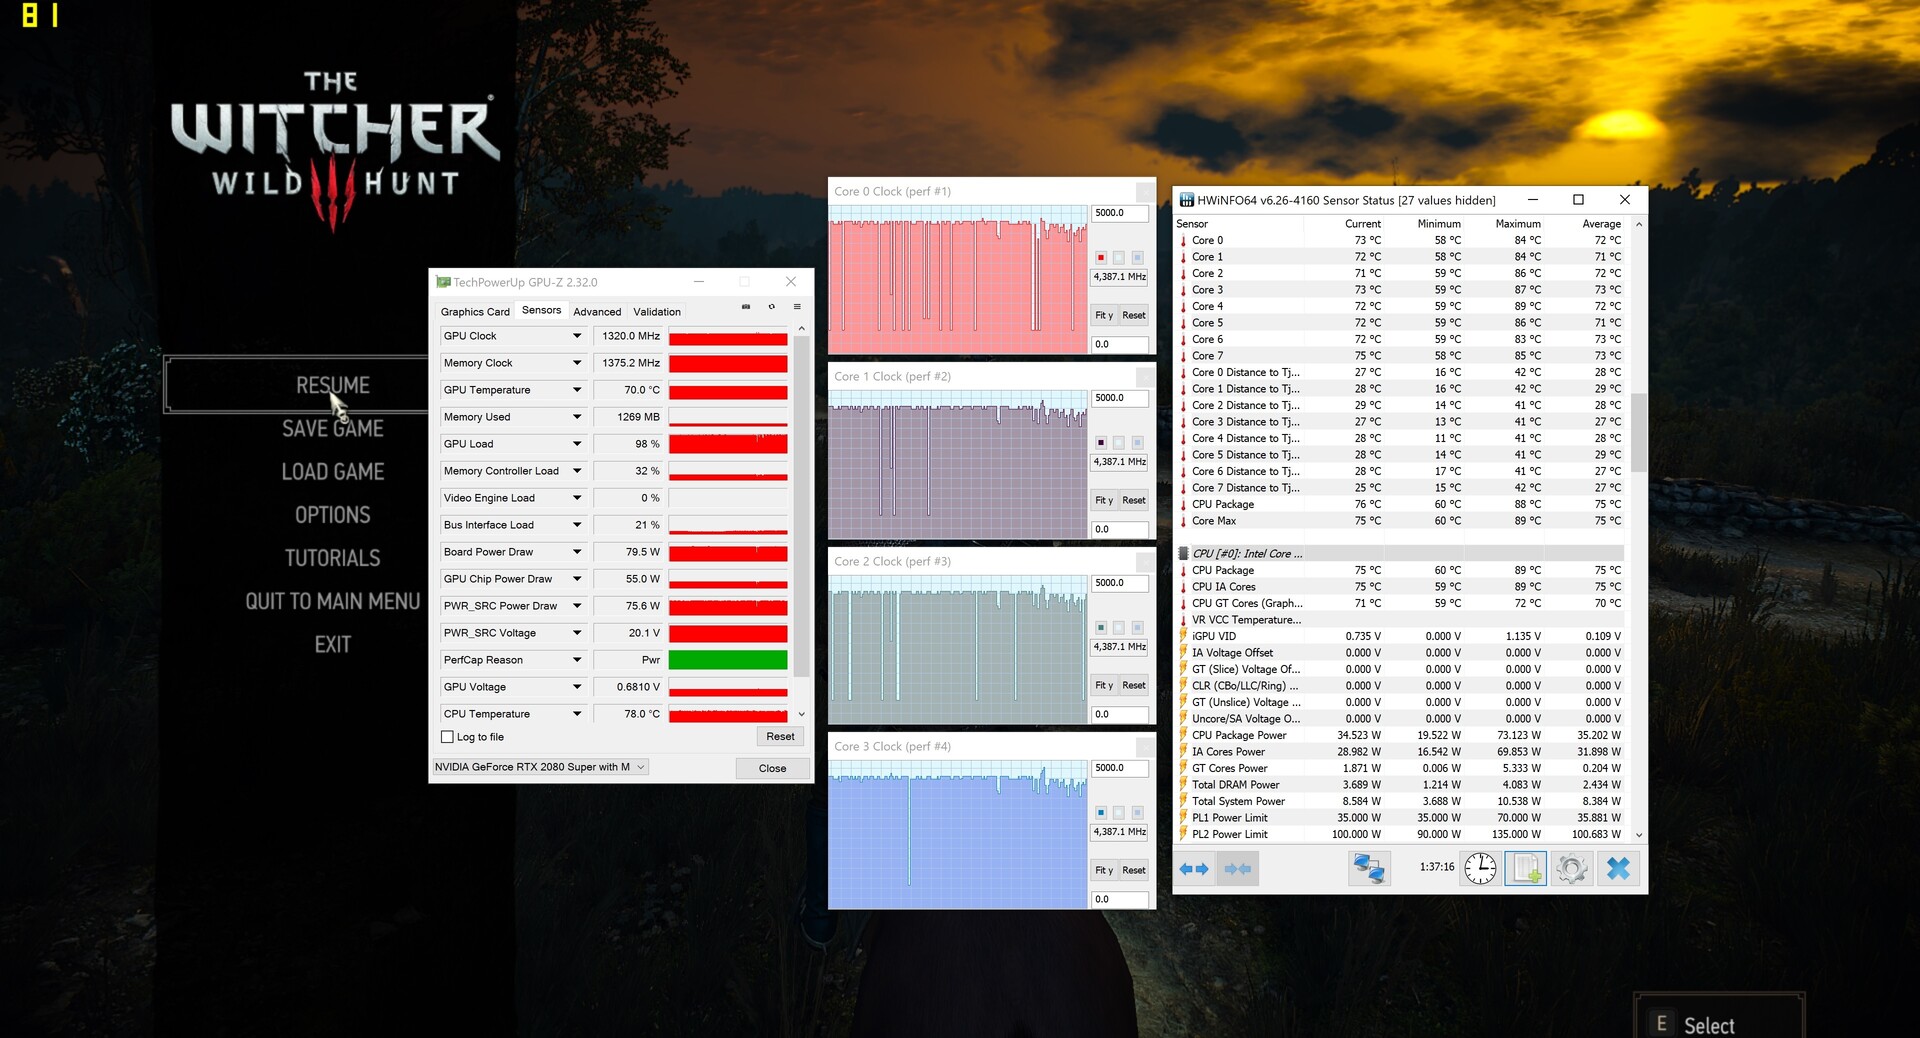

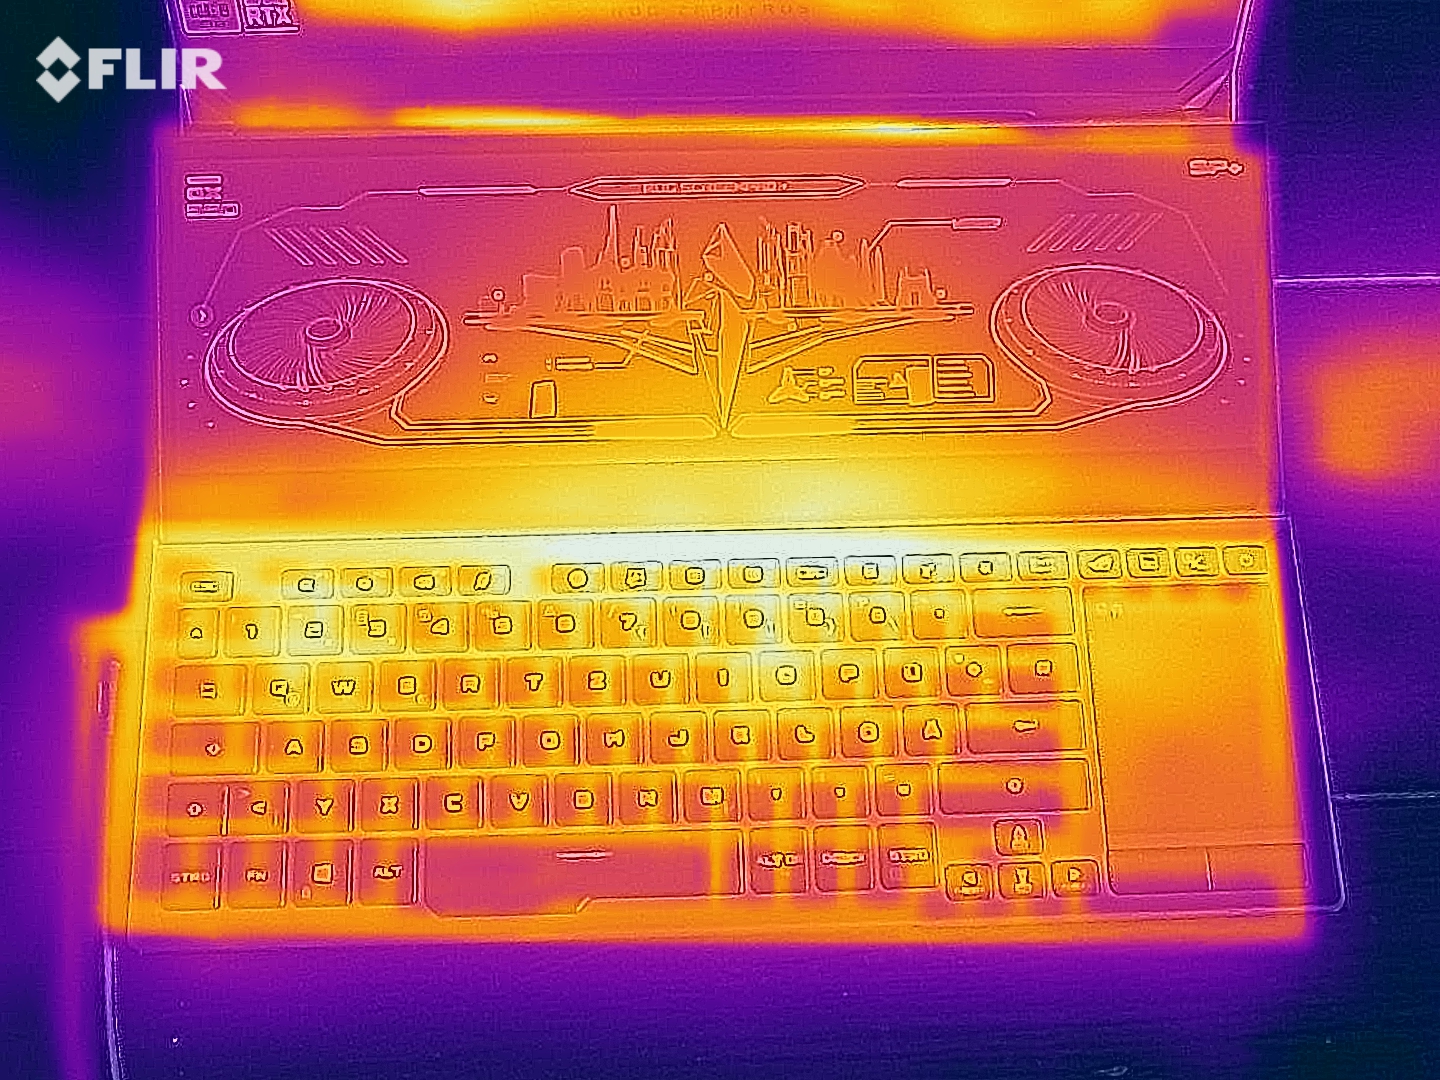
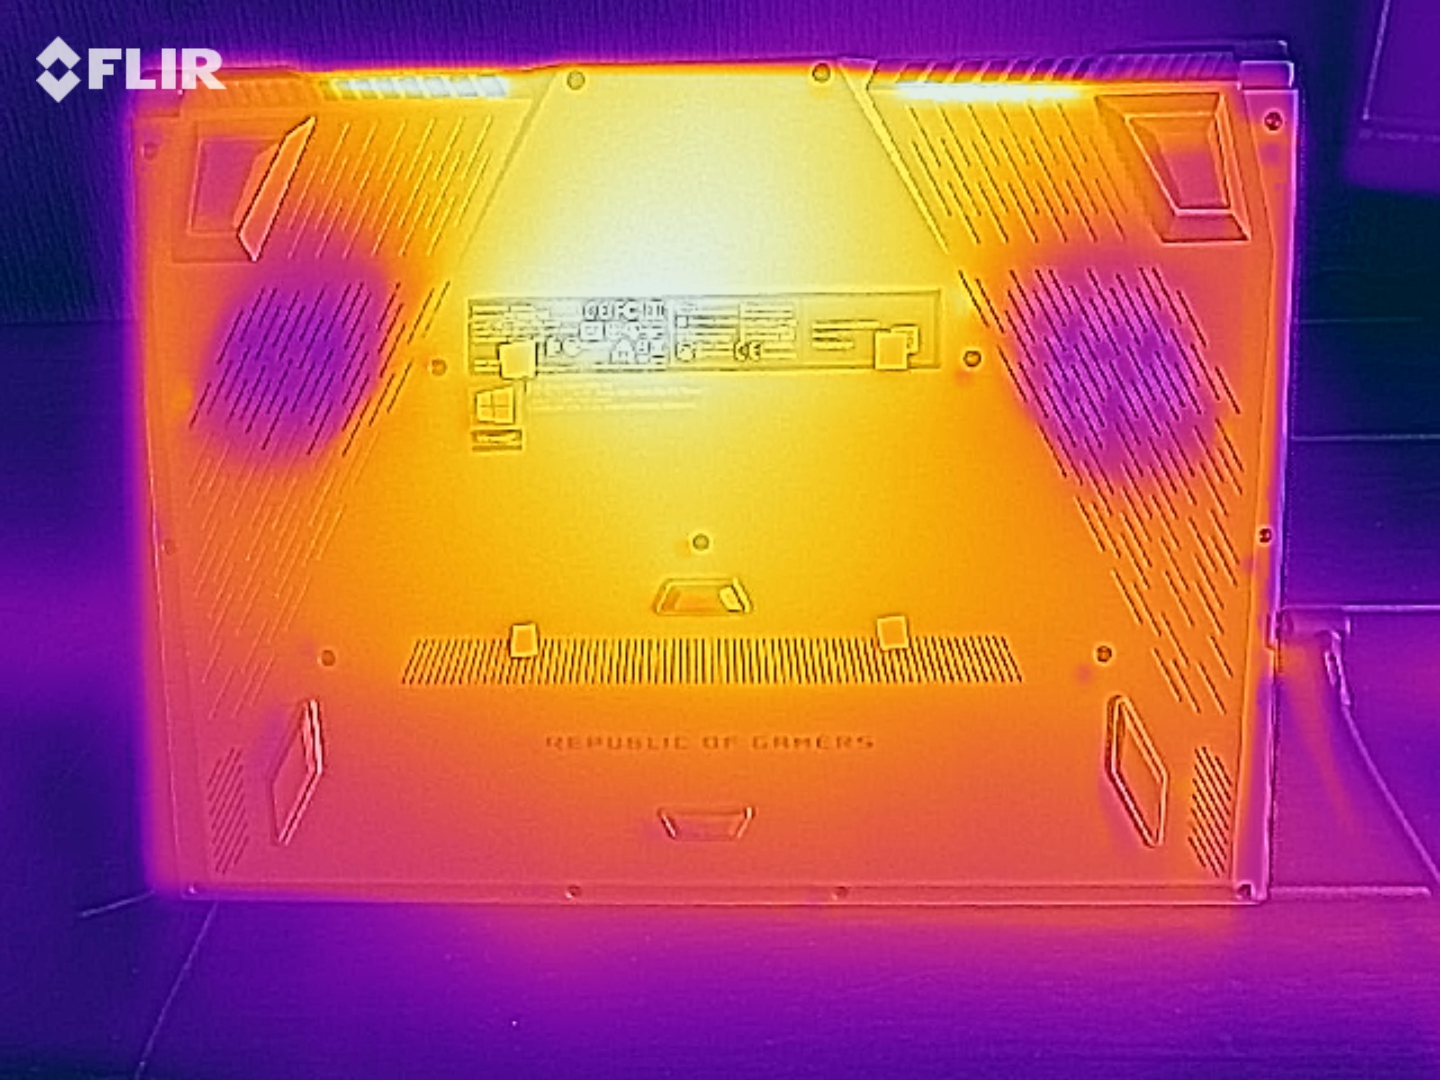
We recorded multiple hot spots with temperatures in excess of 50 °C (122 °F) during our stress test and our "The Witcher 3" test. These values are fairly moderate when considering the powerful hardware inside the laptop. That being said, the device is not fit for use on one's lap. Users will not need to worry about the temperatures during day-to-day use.
(±) The maximum temperature on the upper side is 43 °C / 109 F, compared to the average of 40.4 °C / 105 F, ranging from 21.2 to 68.8 °C for the class Gaming.
(-) The bottom heats up to a maximum of 53 °C / 127 F, compared to the average of 43.3 °C / 110 F
(+) In idle usage, the average temperature for the upper side is 29.4 °C / 85 F, compared to the device average of 33.9 °C / 93 F.
(-) Playing The Witcher 3, the average temperature for the upper side is 40.1 °C / 104 F, compared to the device average of 33.9 °C / 93 F.
(-) The palmrests and touchpad can get very hot to the touch with a maximum of 44 °C / 111.2 F.
(-) The average temperature of the palmrest area of similar devices was 28.8 °C / 83.8 F (-15.2 °C / -27.4 F).
| Asus ROG Zephyrus Duo 15 GX550LXS i9-10980HK, GeForce RTX 2080 Super Max-Q | Acer Predator Triton 500 PT515-52-70N3 i7-10750H, GeForce RTX 2080 Super Max-Q | MSI GS66 Stealth 10SFS i9-10980HK, GeForce RTX 2070 Super Max-Q | Gigabyte Aero 15 OLED XB-8DE51B0SP i7-10875H, GeForce RTX 2070 Super Max-Q | Average NVIDIA GeForce RTX 2080 Super Max-Q | Average of class Gaming | |
|---|---|---|---|---|---|---|
| Heat | 3% | -2% | -2% | -1% | -2% | |
| Maximum Upper Side * (°C) | 43 | 44 -2% | 53 -23% | 49 -14% | 47.9 ? -11% | 45.7 ? -6% |
| Maximum Bottom * (°C) | 53 | 50 6% | 55 -4% | 61 -15% | 51.9 ? 2% | 48.8 ? 8% |
| Idle Upper Side * (°C) | 32 | 29 9% | 28 12% | 27 16% | 30 ? 6% | 31.3 ? 2% |
| Idle Bottom * (°C) | 31 | 31 -0% | 29 6% | 29 6% | 31 ? -0% | 34.4 ? -11% |
* ... smaller is better
Speakers
The stereo speakers are located near the front corners on the bottom of the device. While they produce decent sound, they are somewhat lacking in terms of bass. The maximum volume level of the speakers is relatively high.
Asus ROG Zephyrus Duo 15 GX550LXS audio analysis
(+) | speakers can play relatively loud (87 dB)
Bass 100 - 315 Hz
(-) | nearly no bass - on average 15.2% lower than median
(+) | bass is linear (6.2% delta to prev. frequency)
Mids 400 - 2000 Hz
(+) | balanced mids - only 3.8% away from median
(+) | mids are linear (5.2% delta to prev. frequency)
Highs 2 - 16 kHz
(±) | higher highs - on average 5.6% higher than median
(+) | highs are linear (4.5% delta to prev. frequency)
Overall 100 - 16.000 Hz
(+) | overall sound is linear (14.5% difference to median)
Compared to same class
» 27% of all tested devices in this class were better, 7% similar, 66% worse
» The best had a delta of 6%, average was 18%, worst was 132%
Compared to all devices tested
» 18% of all tested devices were better, 4% similar, 78% worse
» The best had a delta of 4%, average was 24%, worst was 134%
Energy Management - Zephyrus Duo with Mediocre Battery Life
Energy Consumption
While idling, the GX550LXS consumes up to 39 watts. This is a consumption value we would have expected to see after disabling Optimus. The Gigabyte Aero 15 OLED XB draws about the same amount of power. During the stress test and our "The Witcher 3" test, this value jumps to up to 208 watts and an average of 152 watts, respectively. The AC adapter is rated for 230 watts.
| Off / Standby | |
| Idle | |
| Load |
|
Key:
min: | |
| Asus ROG Zephyrus Duo 15 GX550LXS i9-10980HK, GeForce RTX 2080 Super Max-Q | Acer Predator Triton 500 PT515-52-70N3 i7-10750H, GeForce RTX 2080 Super Max-Q | MSI GS66 Stealth 10SFS i9-10980HK, GeForce RTX 2070 Super Max-Q | Gigabyte Aero 15 OLED XB-8DE51B0SP i7-10875H, GeForce RTX 2070 Super Max-Q | Average NVIDIA GeForce RTX 2080 Super Max-Q | Average of class Gaming | |
|---|---|---|---|---|---|---|
| Power Consumption | 31% | 23% | 10% | 28% | 24% | |
| Idle Minimum * (Watt) | 23 | 11 52% | 13 43% | 18 22% | 12.9 ? 44% | 13.6 ? 41% |
| Idle Average * (Watt) | 30 | 15 50% | 16 47% | 21 30% | 17.3 ? 42% | 19.4 ? 35% |
| Idle Maximum * (Watt) | 39 | 25 36% | 27 31% | 38 3% | 26.9 ? 31% | 24.8 ? 36% |
| Load Average * (Watt) | 156 | 95 39% | 109 30% | 113 28% | 123.9 ? 21% | 109 ? 30% |
| Witcher 3 ultra * (Watt) | 152 | 140 8% | 155 -2% | 149 2% | ||
| Load Maximum * (Watt) | 208 | 211 -1% | 236 -13% | 256 -23% | 205 ? 1% | 254 ? -22% |
* ... smaller is better
Battery Life
The gaming laptop lasts 3:05 hours in our real-world Wi-Fi test (periodically loading web pages via a script). The 15.6-inch device completes our video test after 5:25 hours. For this test, we play the short film Big Buck Bunny (H.264 codec, 1920x1080 pixels) in a continuous loop. Test conditions: The energy saver features and the wireless modules (only applies to the video test) are disabled and the display brightness is set to around 150 cd/m².
| Asus ROG Zephyrus Duo 15 GX550LXS i9-10980HK, GeForce RTX 2080 Super Max-Q, 90 Wh | Acer Predator Triton 500 PT515-52-70N3 i7-10750H, GeForce RTX 2080 Super Max-Q, 84 Wh | MSI GS66 Stealth 10SFS i9-10980HK, GeForce RTX 2070 Super Max-Q, 99.99 Wh | Gigabyte Aero 15 OLED XB-8DE51B0SP i7-10875H, GeForce RTX 2070 Super Max-Q, 94.2 Wh | Average of class Gaming | |
|---|---|---|---|---|---|
| Battery runtime | 38% | 48% | 79% | 51% | |
| Reader / Idle (h) | 8 | 8.3 4% | 8.4 5% | 8.6 8% | 8.99 ? 12% |
| H.264 (h) | 5.4 | 7.93 ? 47% | |||
| WiFi v1.3 (h) | 3.1 | 6.3 103% | 6.1 97% | 6.1 97% | 6.76 ? 118% |
| Load (h) | 1.2 | 1.3 8% | 1.7 42% | 2.8 133% | 1.502 ? 25% |
A Second Charger for Traveling
Aside from the 230-watt AC adapter (625 grams/~1.4 lb), Asus has included a smaller USB Type-C 65-watt charger (225 grams/~7.9 oz). The latter provides an alternative to the heavy AC adapter that can be used to power the laptop via the Thunderbolt 3 port during non-stationary operation.
The CPU and GPU performance is limited when the USB charger is connected. However, the performance is still sufficient for common day-to-day tasks. Even gaming is possible.
Pros
Cons
Verdict
With this Zephyrus device and its Screenpad Plus, Asus is trying to provide additional value to the target group of gamers, streamers, and content creators. Generally, the Screenpad tends to be useful in one way or another. However, this comes at a cost: Compared to other gaming laptops without a secondary display, the weight of the Zephyrus is higher and dimensions are greater.
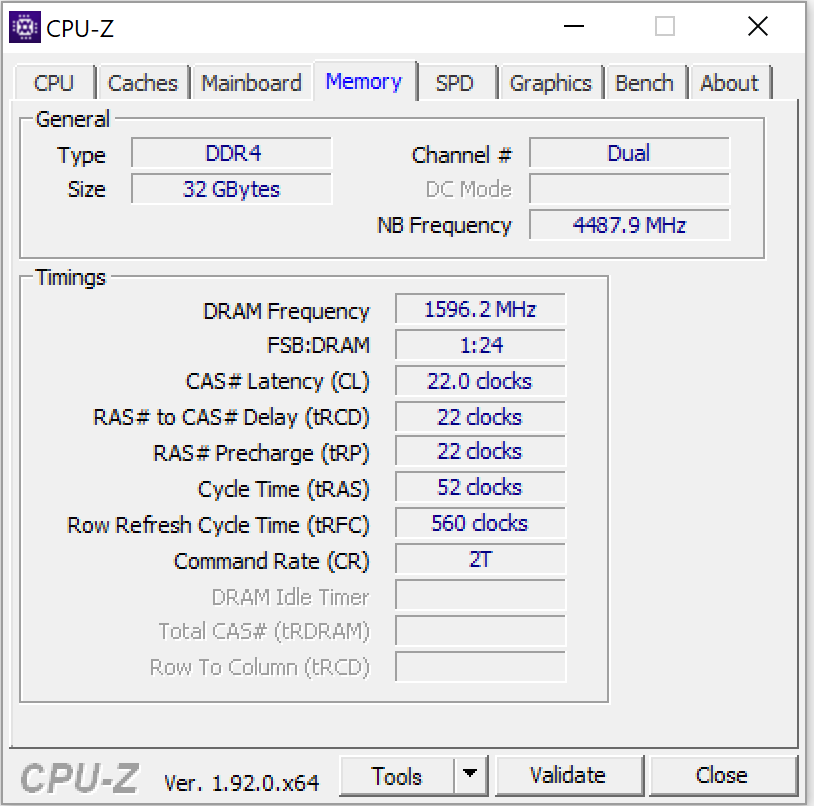
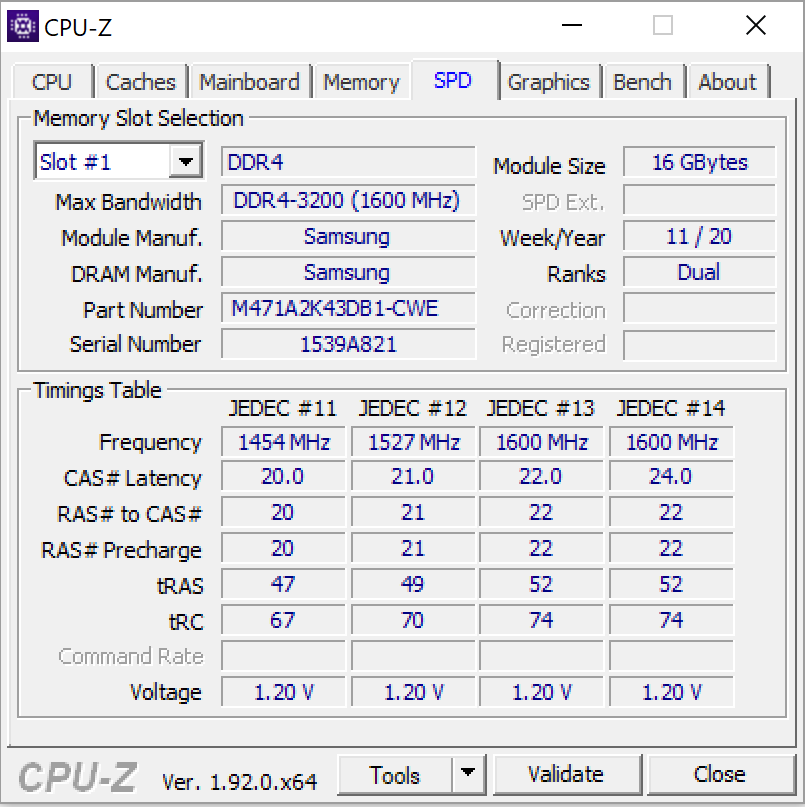
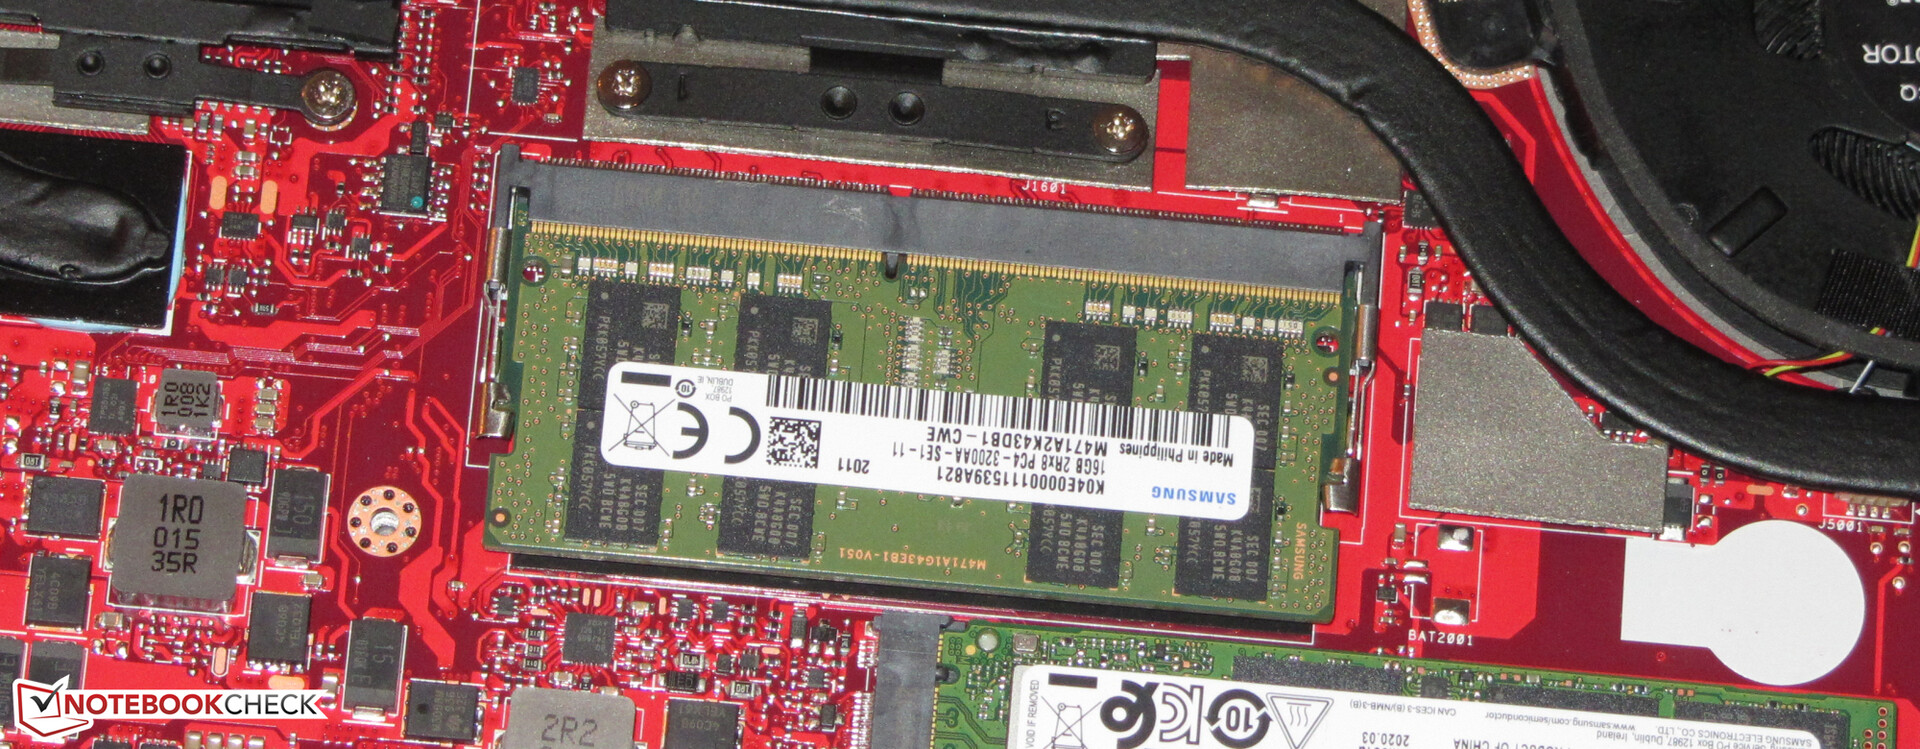
Thanks to the octa-core Core i9-10980HK CPU and the GeForce RTX 2080 Super Max-Q GPU, the laptop does not lack performance. The processing cores are accompanied by 32 GB of RAM (in dual-channel mode), which is comprised of a 16-GB module and 16 GB of soldered memory. Upgrades to up to 48 GB are possible. The two NVMe SSDs in RAID 0 offer high transfer speeds and a lot of storage (2 TB).
All the latest games run smoothly on the Asus Zephyrus Duo 15 GX550LXS.
The G-Sync-enabled IPS 4K display shines with high brightness, a good contrast ratio, good viewing angles, and - thanks to the Pantone validation - great colors. Additionally, it covers the entire AdobeRGB color space. The response times are mediocre. For better response times, an alternative 300-Hz Full HD display option is also available.
The generous port selection notably includes a Thunderbolt 3 port. It can be used to connect feature-rich docks or external GPUs. Additionally, the port can be used to power the device at a reduced performance level, for example when travelling, with the included second AC adapter (65 watts).
Asus ROG Zephyrus Duo 15 GX550LXS
- 07/22/2020 v7 (old)
Sascha Mölck
Price comparison

