HP Pavilion Gaming 15 in review: Budget gaming laptop offers long battery life

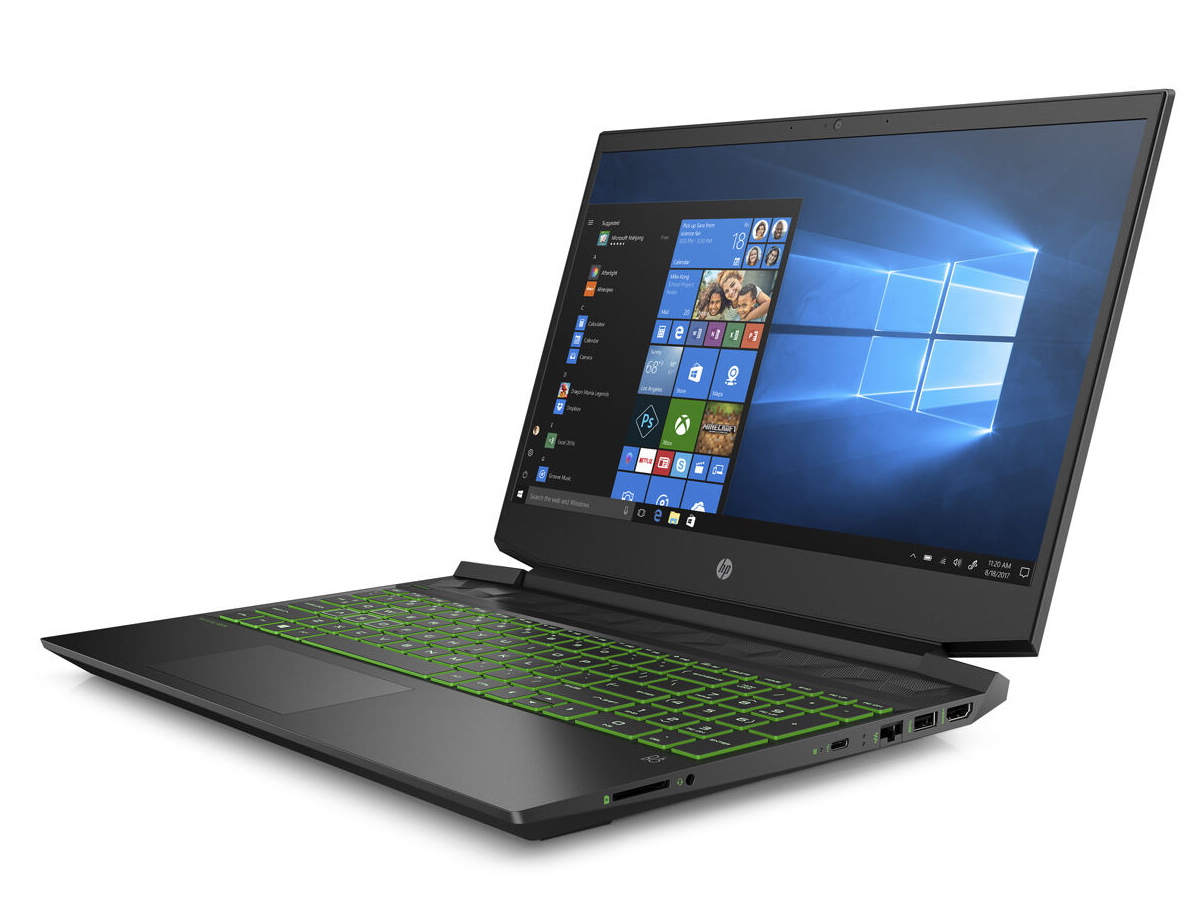
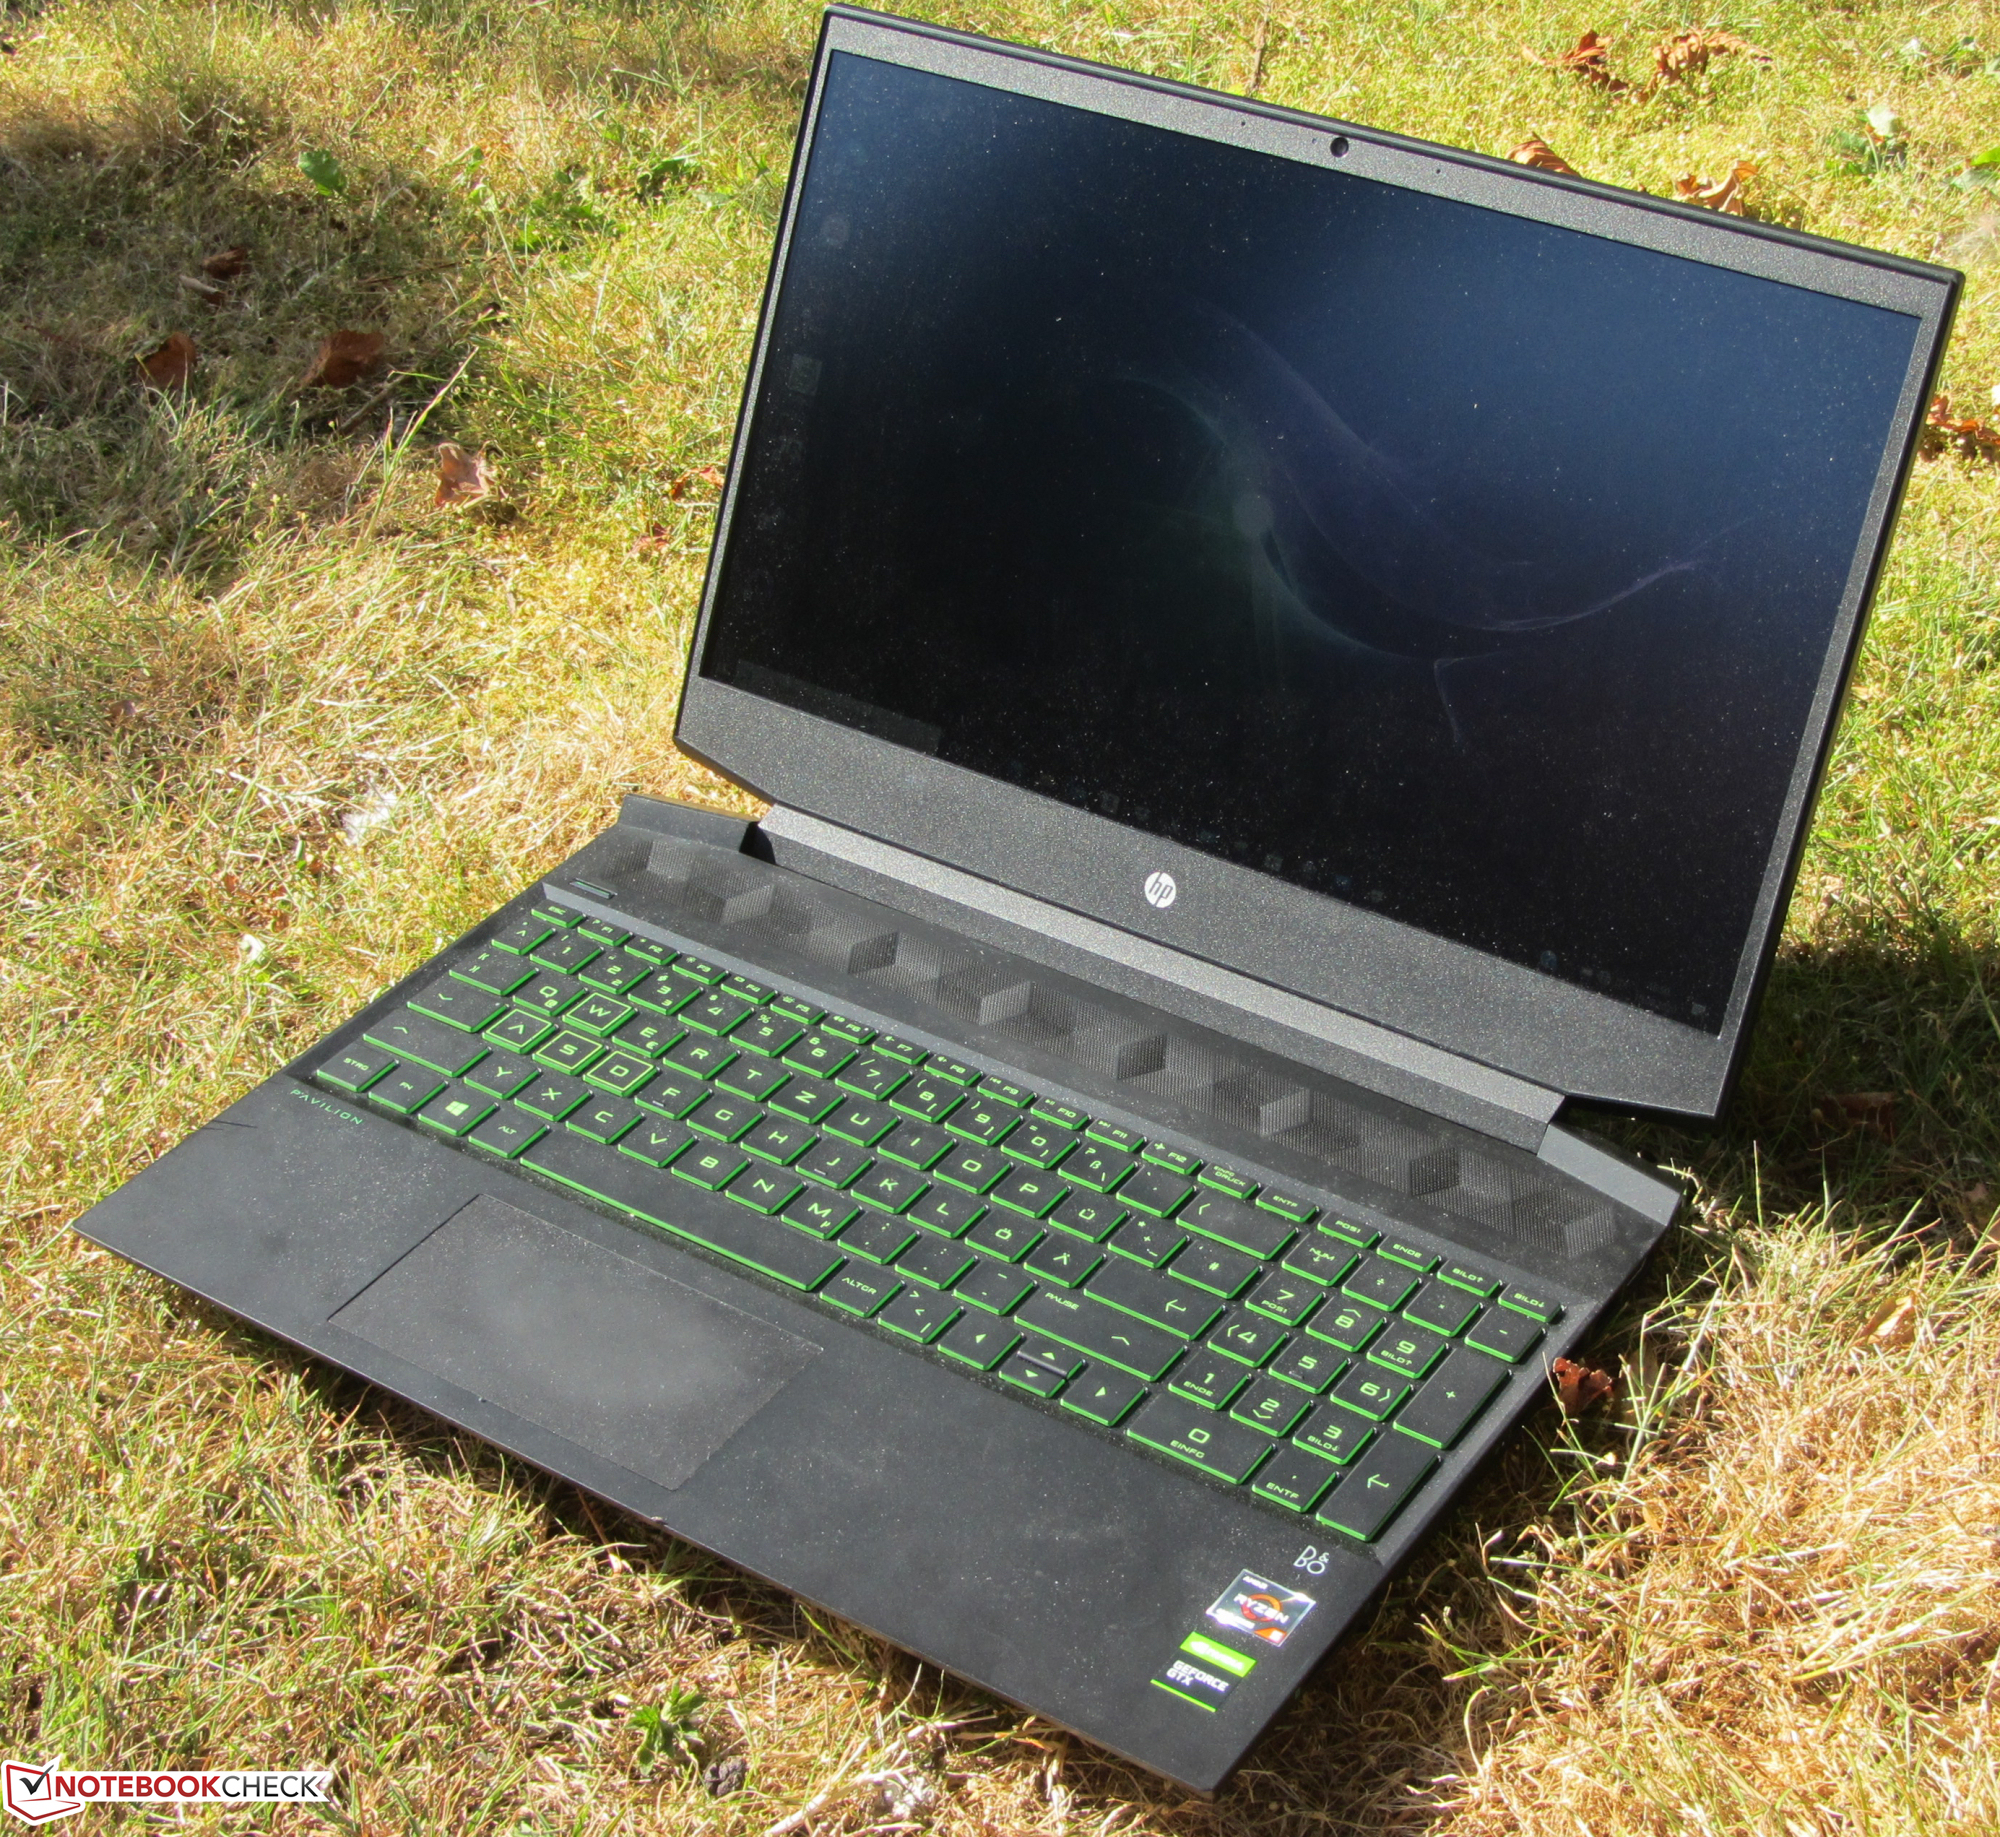
The Pavilion Gaming 15 series offers 15.6-inch entry-level gaming laptops equipped with mid-range hardware. Our test device is powered by a Ryzen 5 4600H APU and a GeForce GTX 1650 GPU. As a result, the laptop has significantly more powerful hardware than its sibling model, which we have already tested. Competitors include devices like the Nexoc GH5 515IG, the Lenovo IdeaPad Gaming 3i 15IMH05, the Asus TUF FX505DT, the Dell G5 15 5590, the Acer Nitro 5 AN515-44, and the MSI Bravo 15.
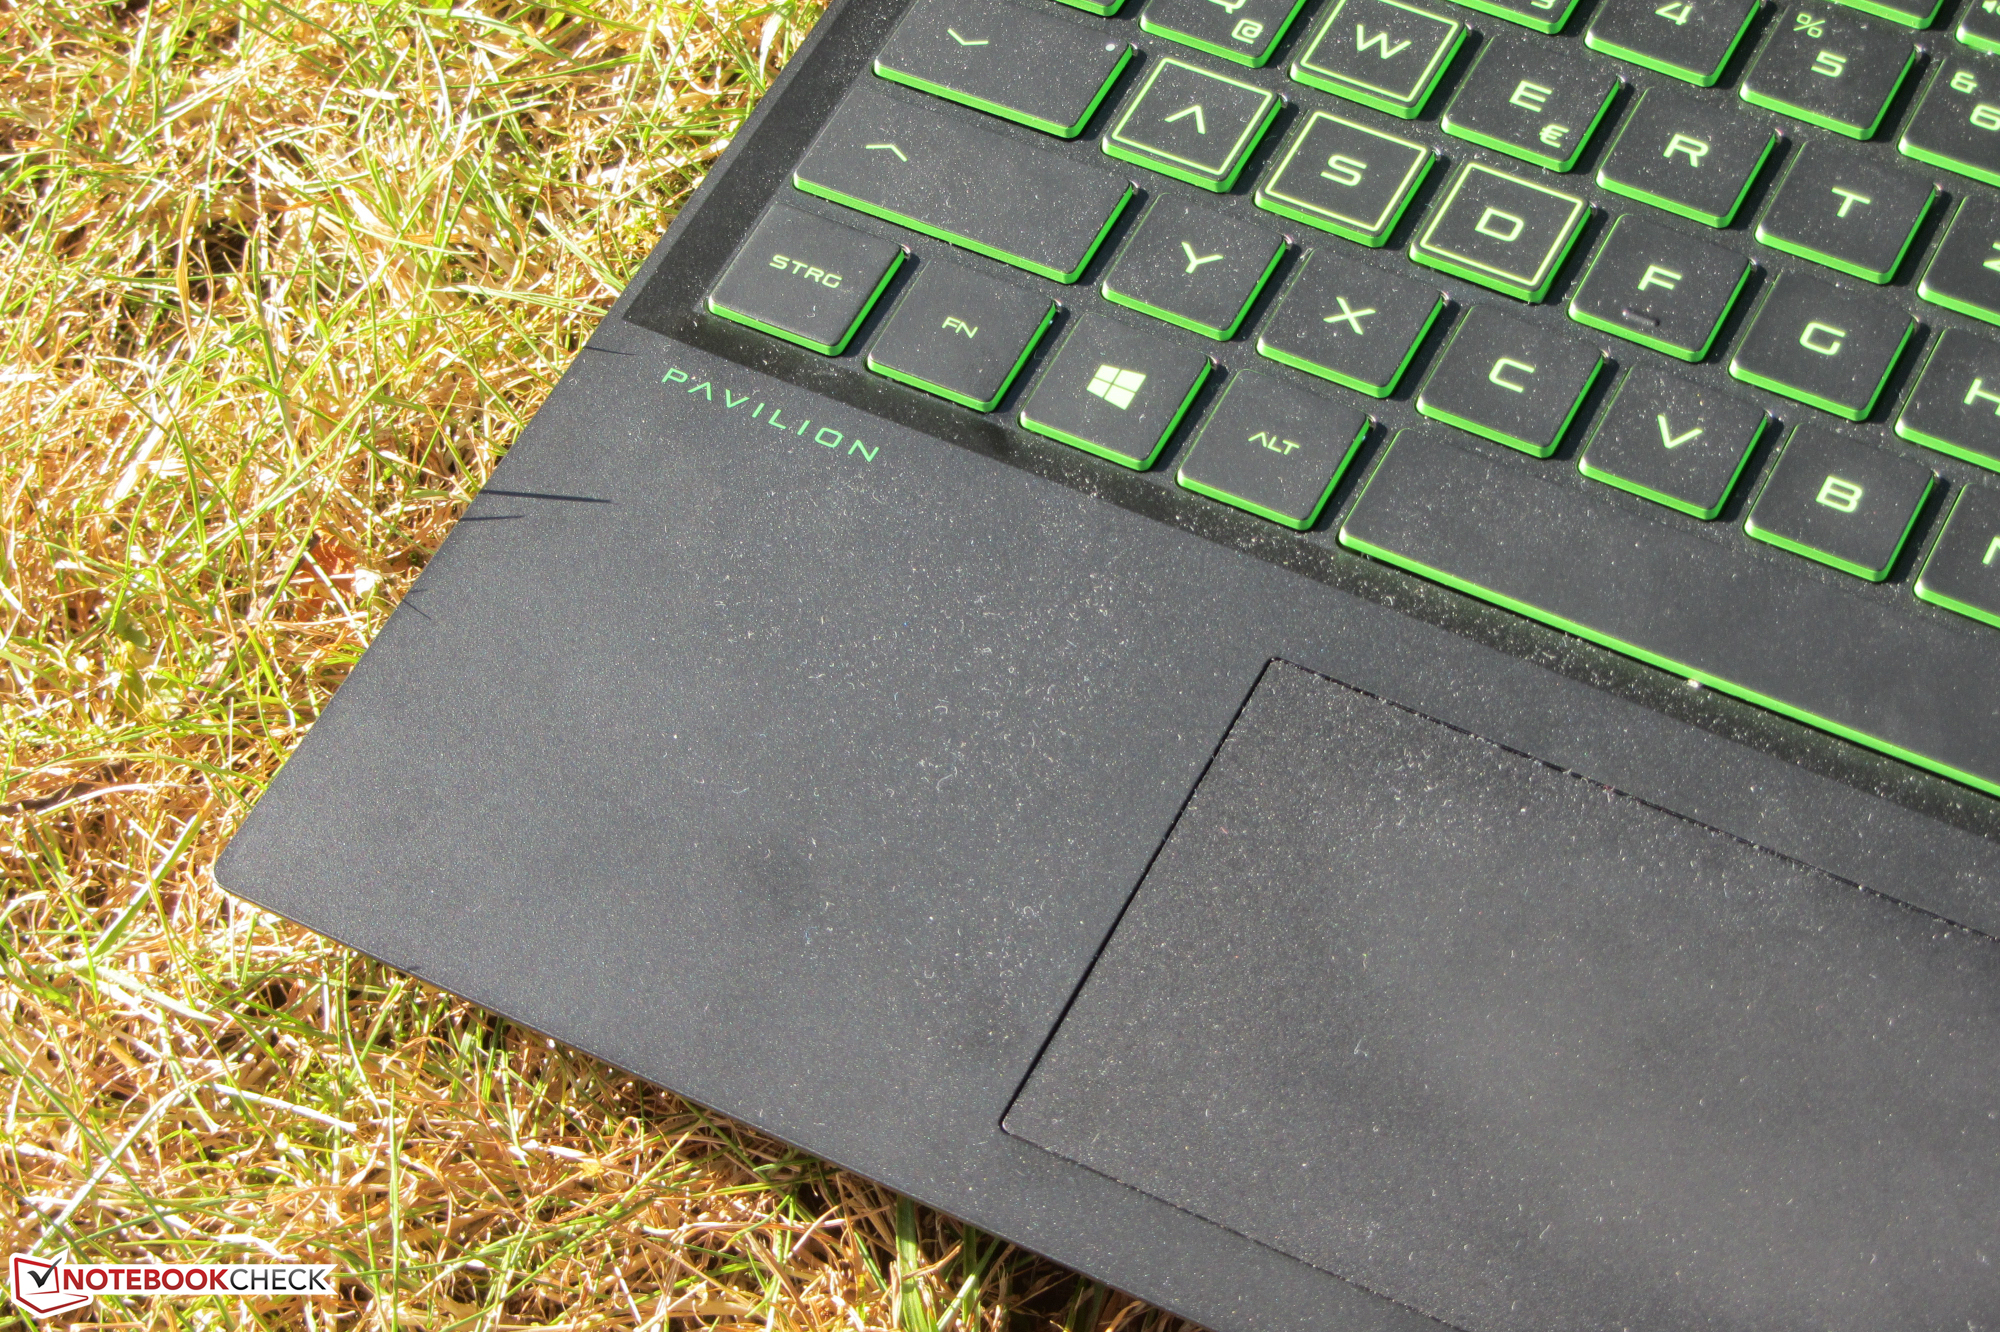
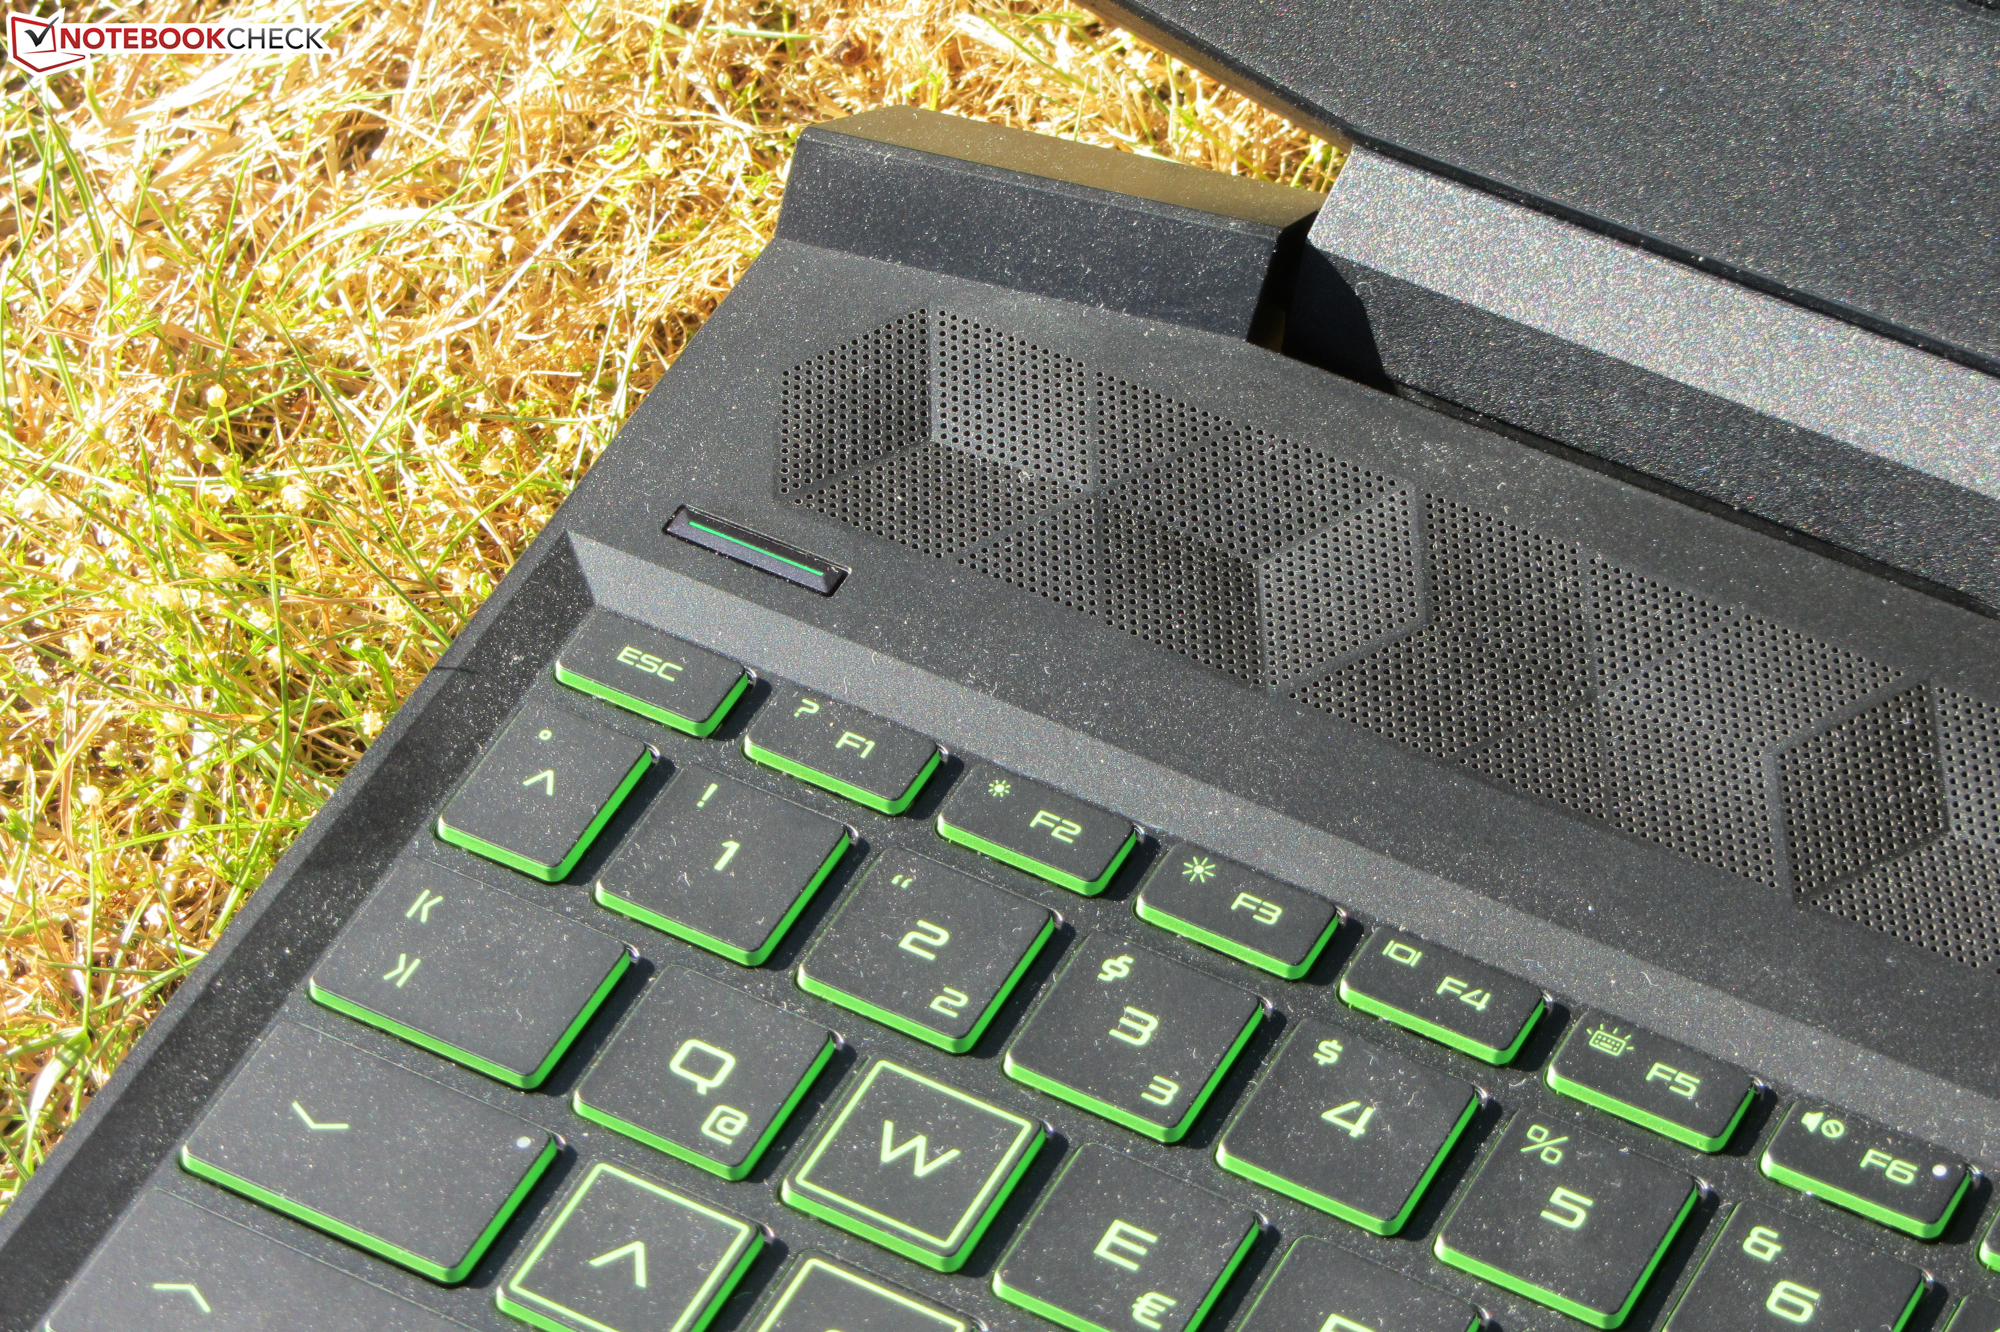
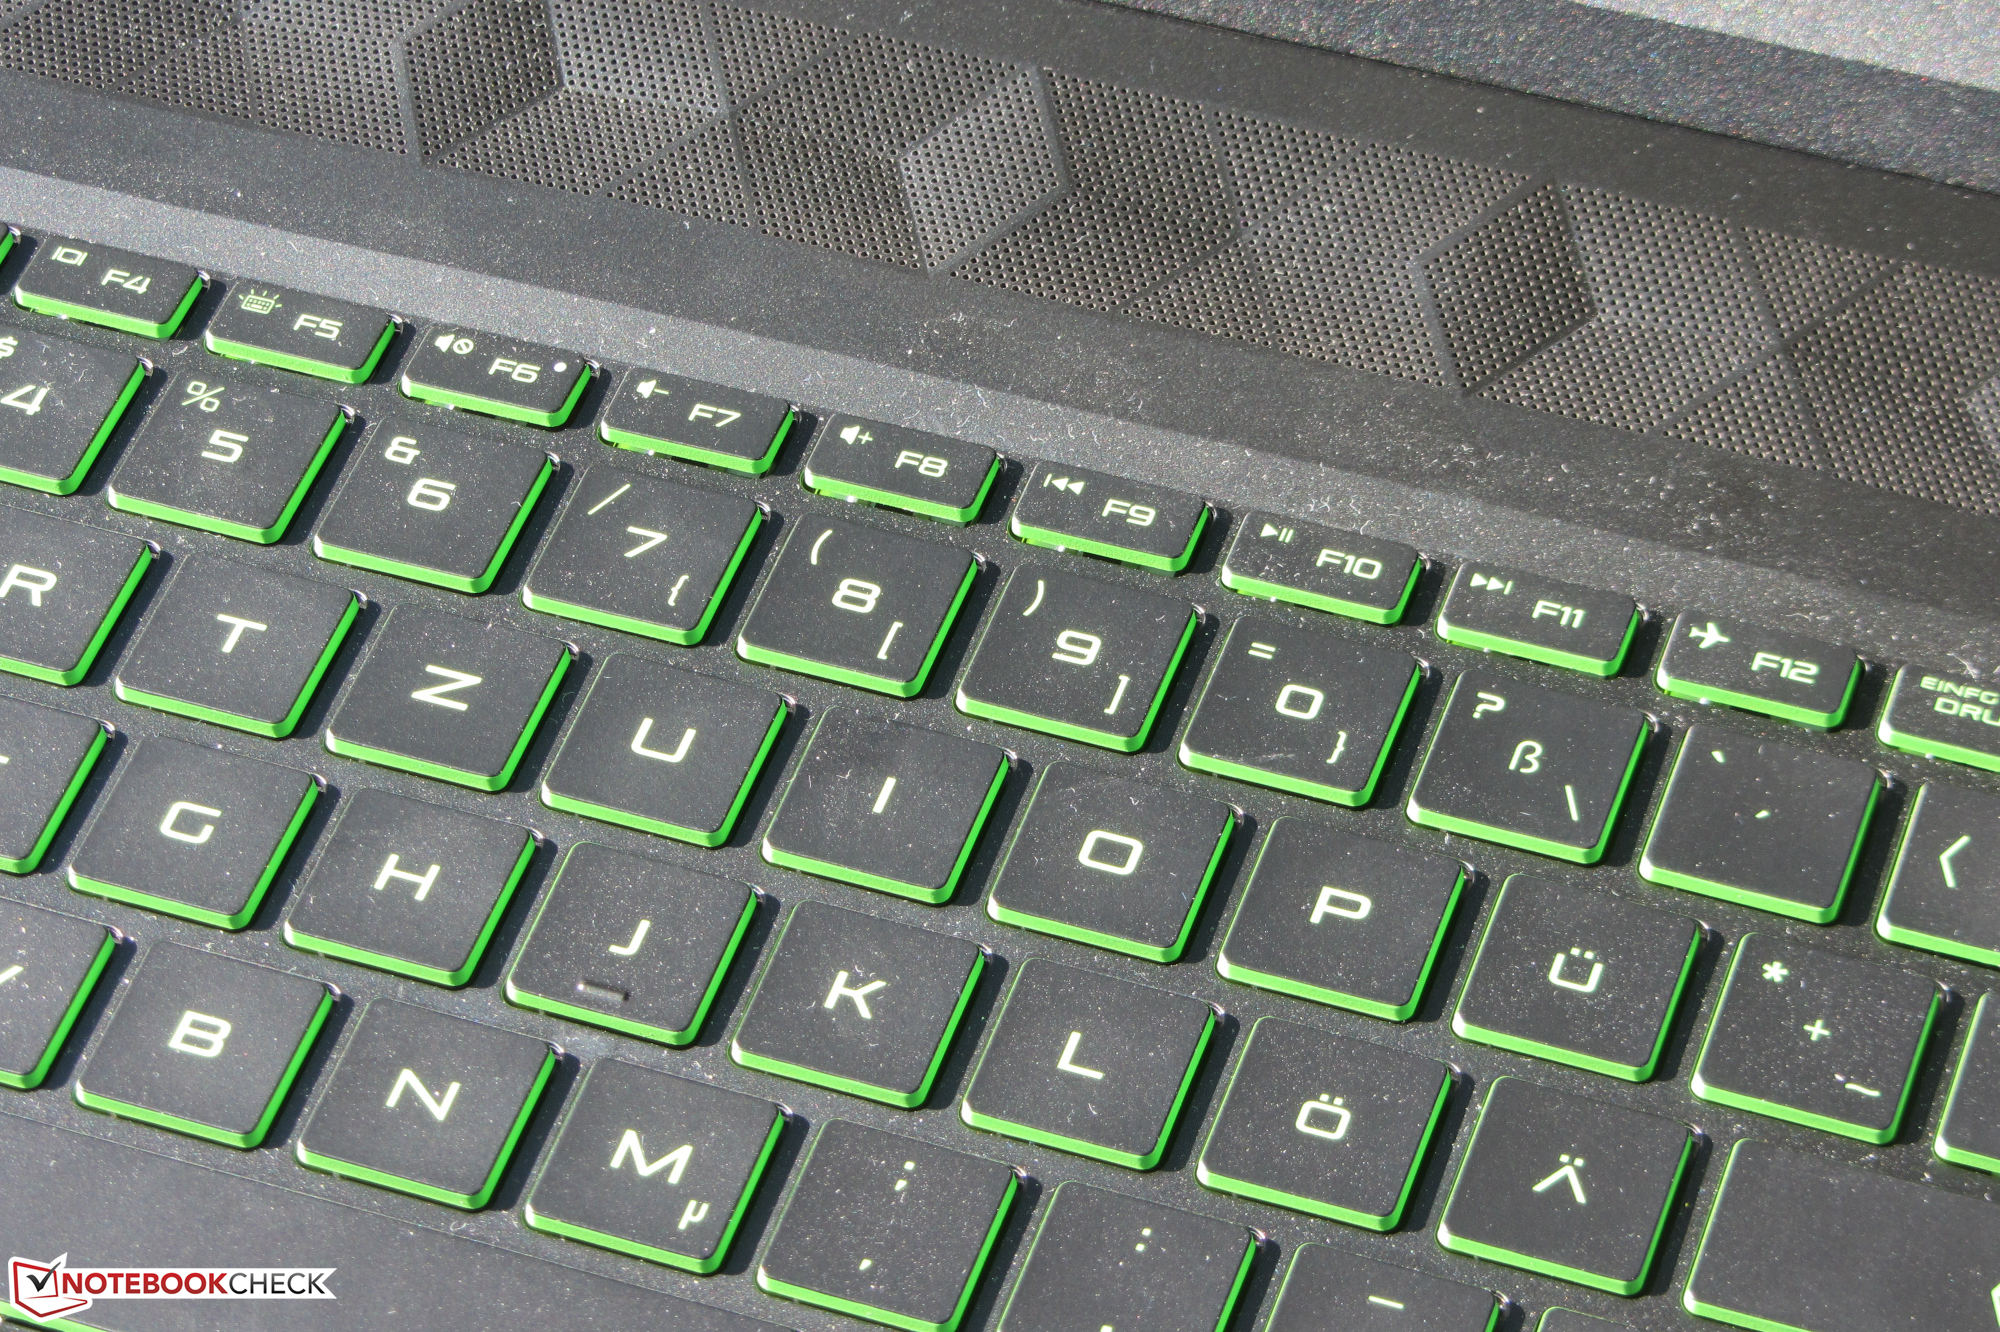
Since the Pavilion is identical in construction to its sibling model, we won't go any further into the case, connectivity, input devices, and speakers. You can find the corresponding information in our review of the HP Pavilion Gaming 15-ec0002ng.
Rating | Date | Model | Weight | Height | Size | Resolution | Price |
|---|---|---|---|---|---|---|---|
| 81.2 % v7 (old) | 08 / 2020 | HP Pavilion Gaming 15-ec1206ng R5 4600H, GeForce GTX 1650 Mobile | 2.1 kg | 23.5 mm | 15.60" | 1920x1080 | |
| 81.2 % v7 (old) | 08 / 2020 | Nexoc GH5 515IG i5-10300H, GeForce GTX 1650 Mobile | 2.1 kg | 24.9 mm | 15.60" | 1920x1080 | |
| 78.4 % v7 (old) | 07 / 2020 | Lenovo IdeaPad Gaming 3i 15IMH05 i5-10300H, GeForce GTX 1650 Mobile | 2.2 kg | 24.9 mm | 15.60" | 1920x1080 | |
| 80.4 % v6 (old) | 07 / 2019 | Asus TUF FX505DT-EB73 R7 3750H, GeForce GTX 1650 Mobile | 2.2 kg | 26.8 mm | 15.60" | 1920x1080 | |
| 79.6 % v7 (old) | 10 / 2019 | Dell G5 15 5590-PCNJJ i5-9300H, GeForce GTX 1650 Mobile | 2.7 kg | 23.7 mm | 15.60" | 1920x1080 | |
| 79.8 % v7 (old) | 06 / 2020 | Acer Nitro 5 AN515-44-R5FT R5 4600H, GeForce GTX 1650 Ti Mobile | 2.2 kg | 24 mm | 15.60" | 1920x1080 | |
| 79.5 % v7 (old) | 07 / 2020 | MSI Bravo 15 A4DCR R7 4800H, Radeon RX 5300M | 2 kg | 22 mm | 15.60" | 1920x1080 |
| SD Card Reader | |
| average JPG Copy Test (av. of 3 runs) | |
| Average of class Gaming (20.9 - 210, n=54, last 2 years) | |
| Nexoc GH5 515IG (Toshiba Exceria Pro SDXC 64 GB UHS-II) | |
| HP Pavilion Gaming 15-ec1206ng (Toshiba Exceria Pro SDXC 64 GB UHS-II) | |
| HP Pavilion Gaming 15-ec0002ng (Toshiba Exceria Pro SDXC 64 GB UHS-II) | |
| Dell G5 15 5590-PCNJJ (Toshiba Exceria Pro SDXC 64 GB UHS-II) | |
| maximum AS SSD Seq Read Test (1GB) | |
| Average of class Gaming (25.5 - 261, n=51, last 2 years) | |
| Nexoc GH5 515IG (Toshiba Exceria Pro SDXC 64 GB UHS-II) | |
| HP Pavilion Gaming 15-ec0002ng (Toshiba Exceria Pro SDXC 64 GB UHS-II) | |
| HP Pavilion Gaming 15-ec1206ng (Toshiba Exceria Pro SDXC 64 GB UHS-II) | |
| Dell G5 15 5590-PCNJJ (Toshiba Exceria Pro SDXC 64 GB UHS-II) | |


Display - HP laptop with IPS panel
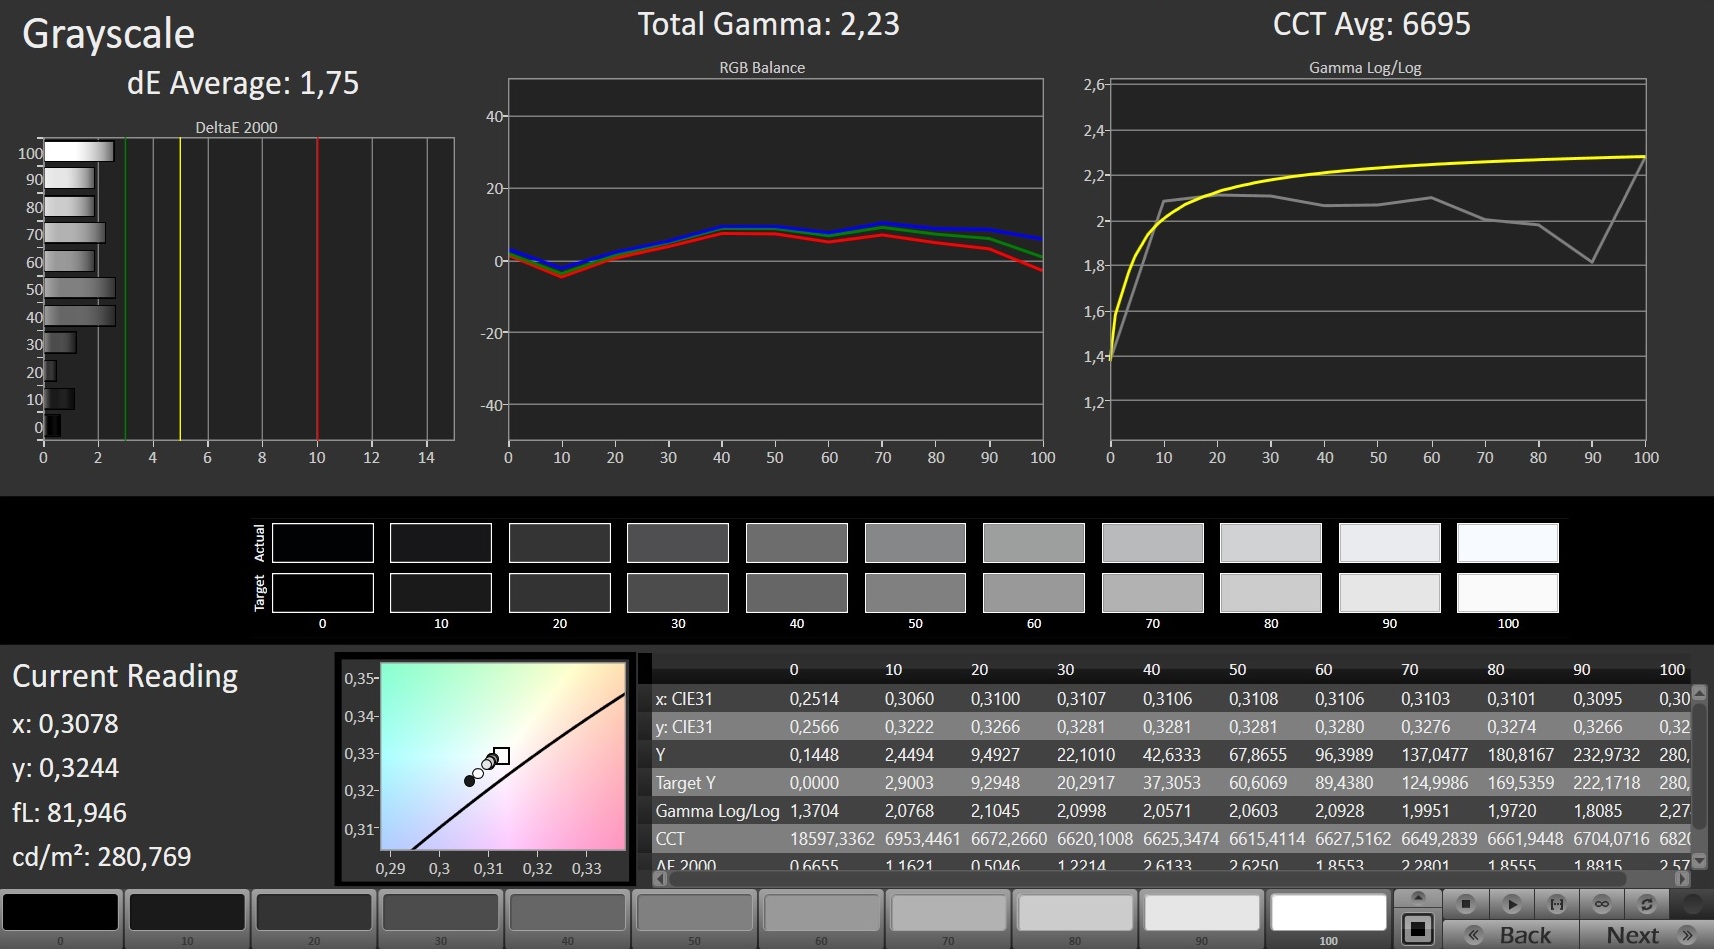
The matte 15.6-inch display has a native resolution of 1920x1080 pixels. While the contrast (1,731:1) is fully within the target (greater than 1,000:1), the maximum brightness (248.4 cd/m²) is too low. We consider values beyond 300 cd/m² to be good.
The display flickers at a frequency of 24,750 Hz at brightness levels of 42% and below. Thanks to the high frequency, even sensitive users shouldn't be troubled by headaches and/or eye problems.
| |||||||||||||||||||||||||
Brightness Distribution: 83 %
Center on Battery: 277 cd/m²
Contrast: 1731:1 (Black: 0.16 cd/m²)
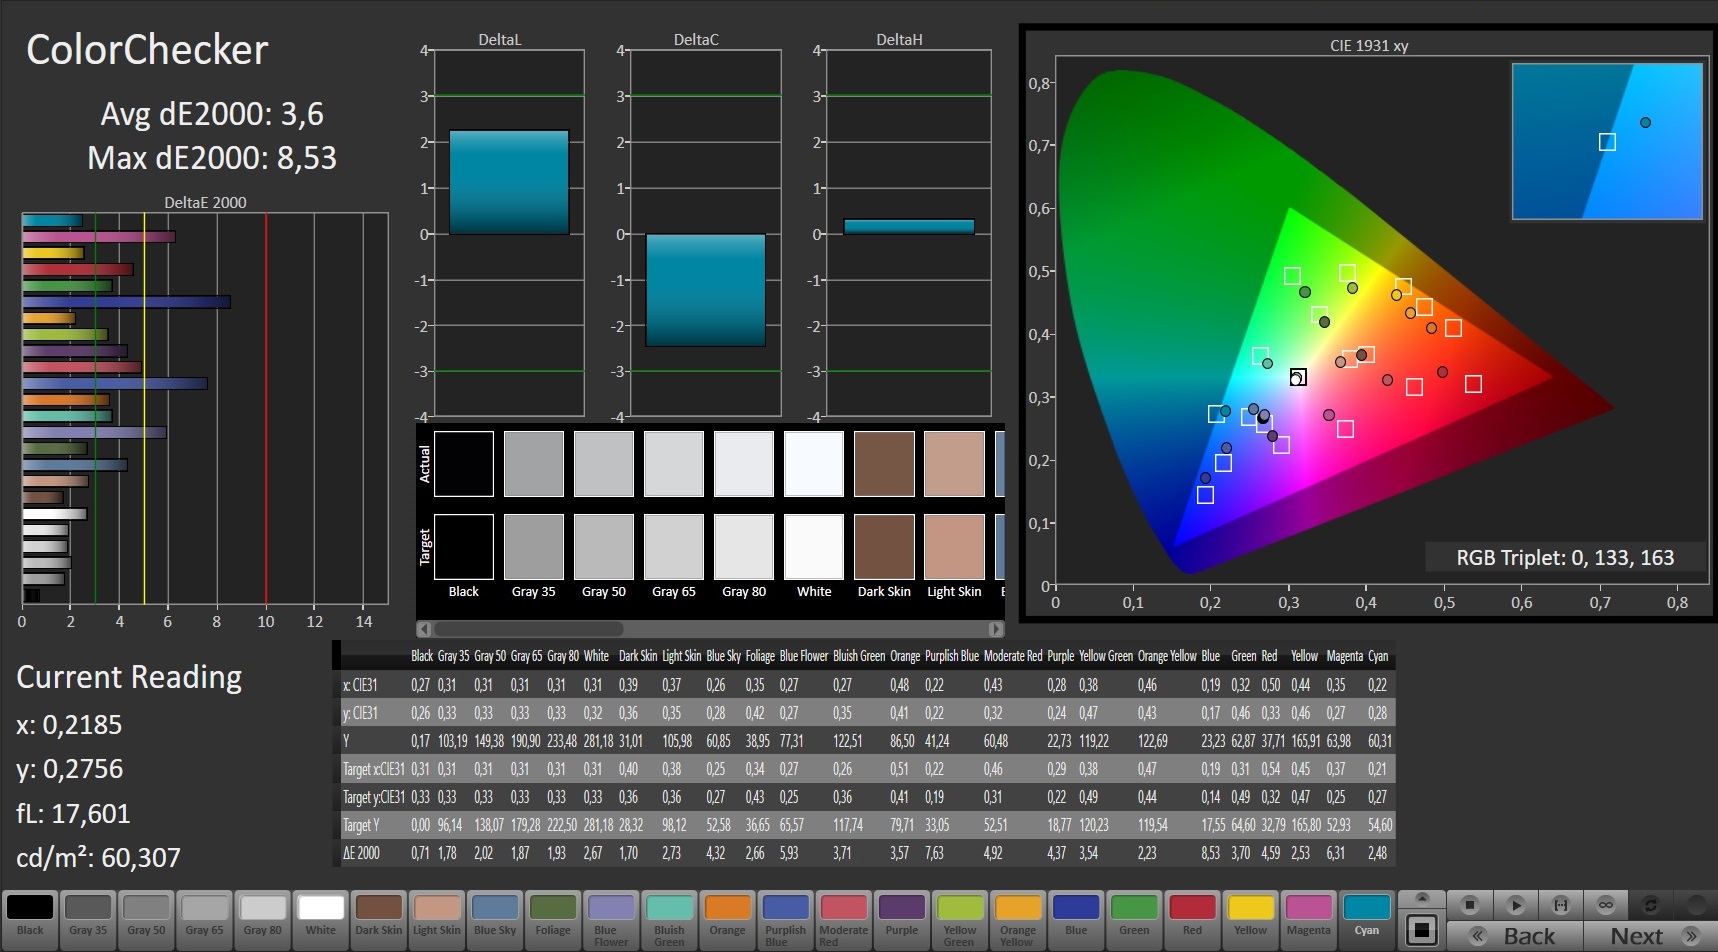
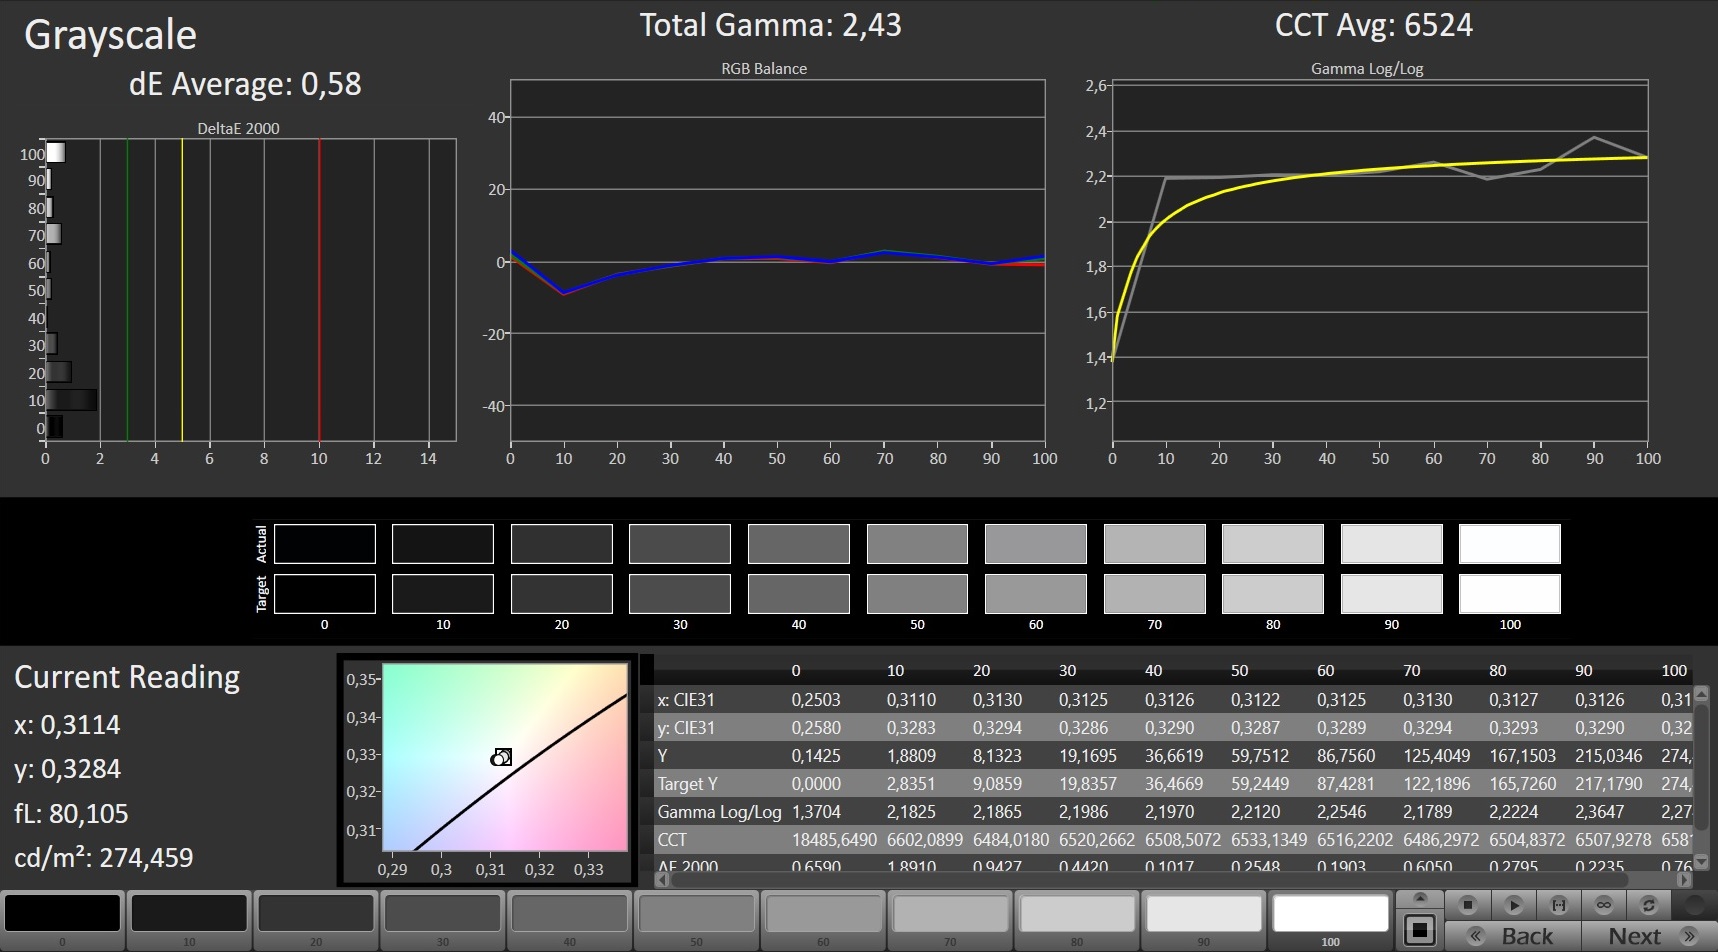
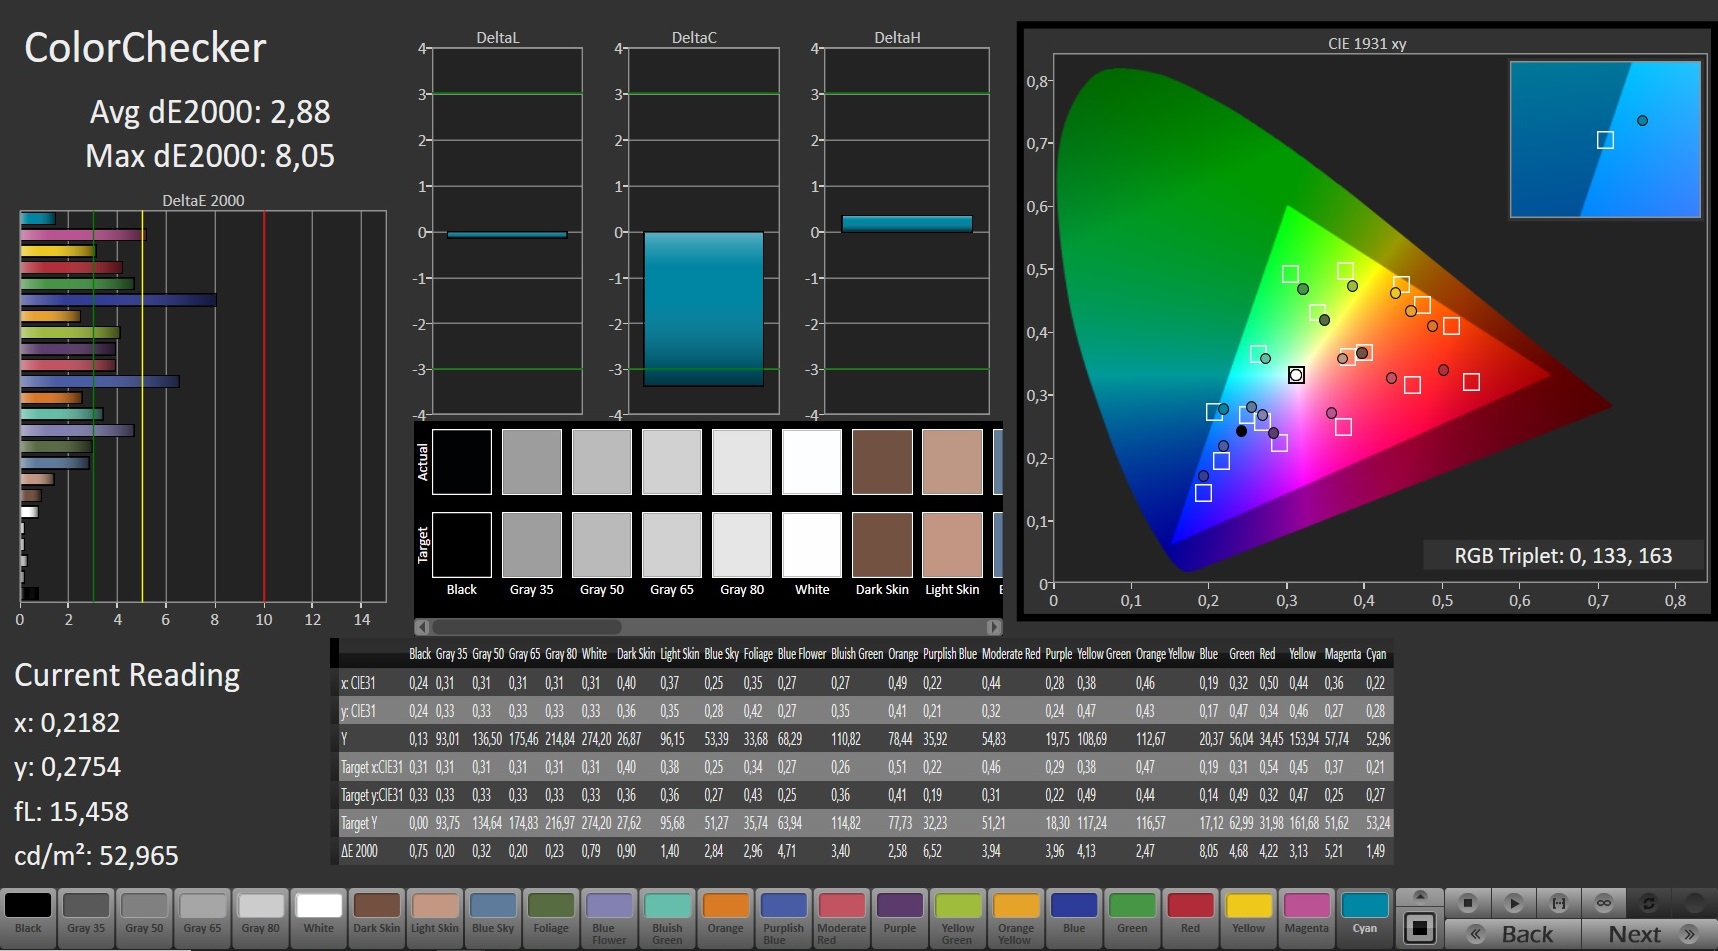
ΔE ColorChecker Calman: 3.6 | ∀{0.5-29.43 Ø4.71}
calibrated: 2.88
ΔE Greyscale Calman: 1.75 | ∀{0.09-98 Ø4.96}
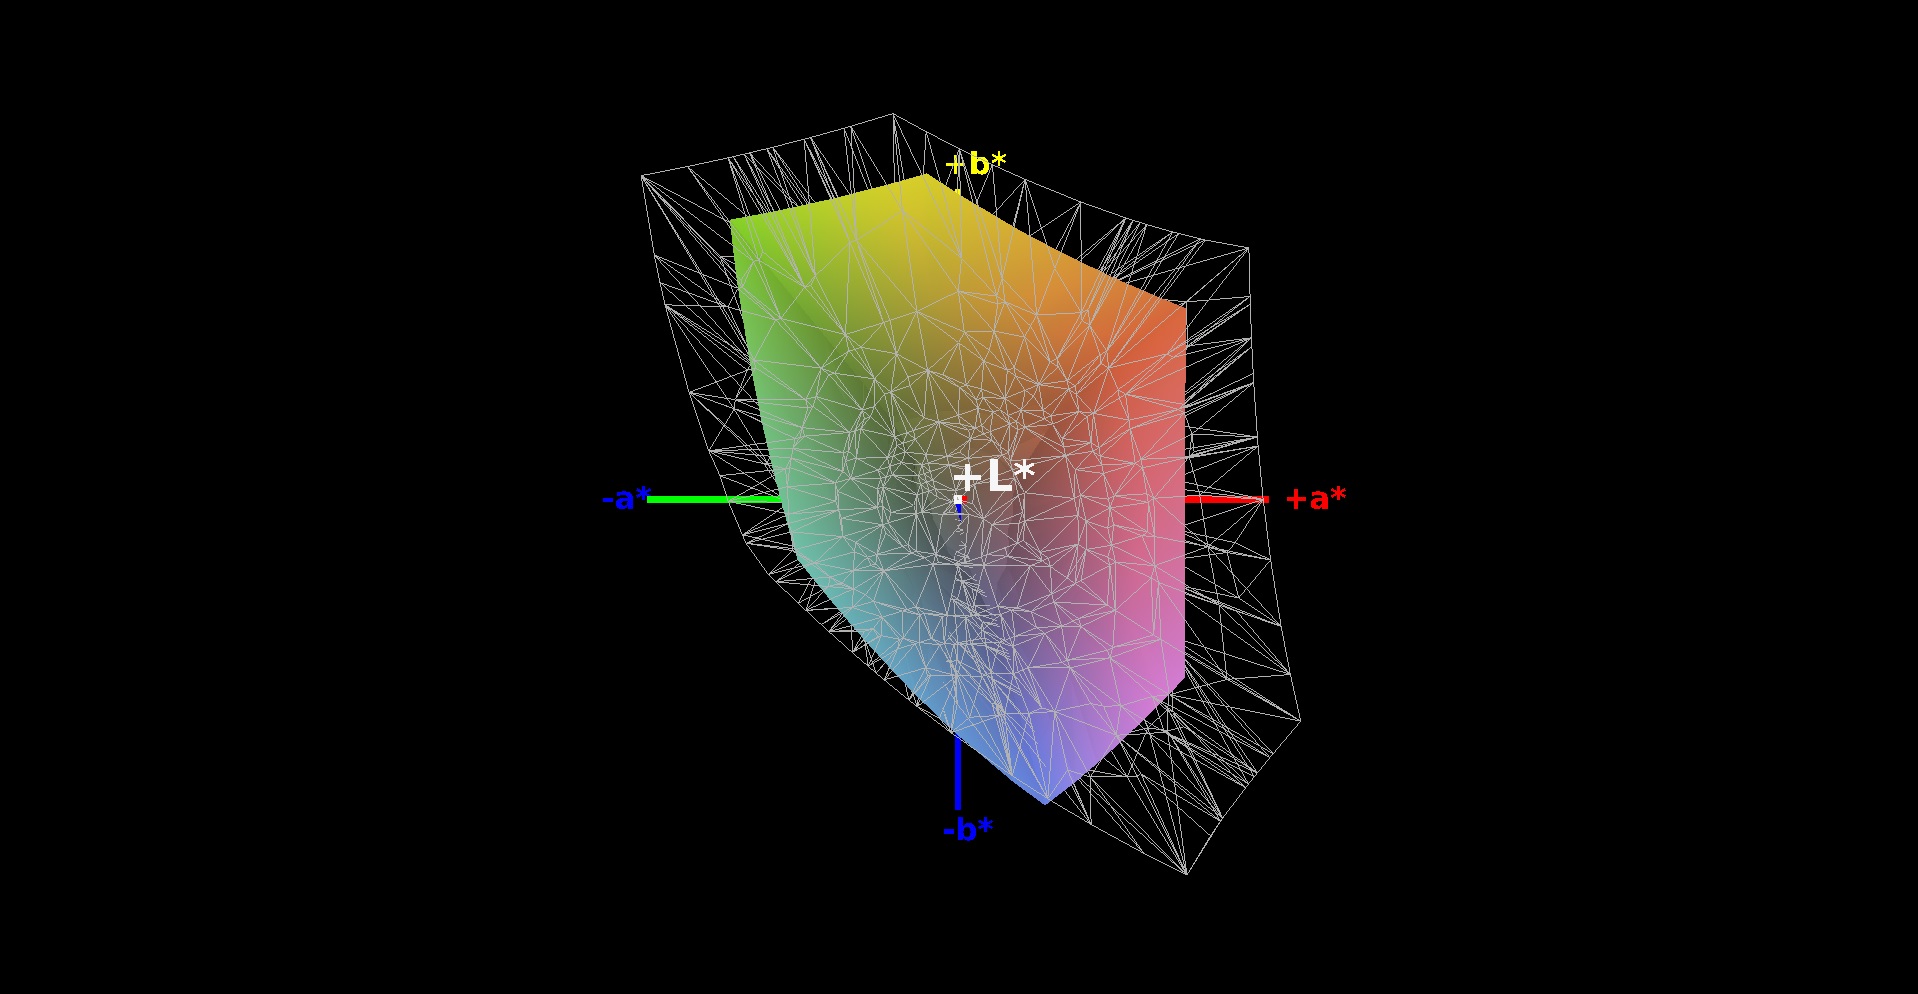
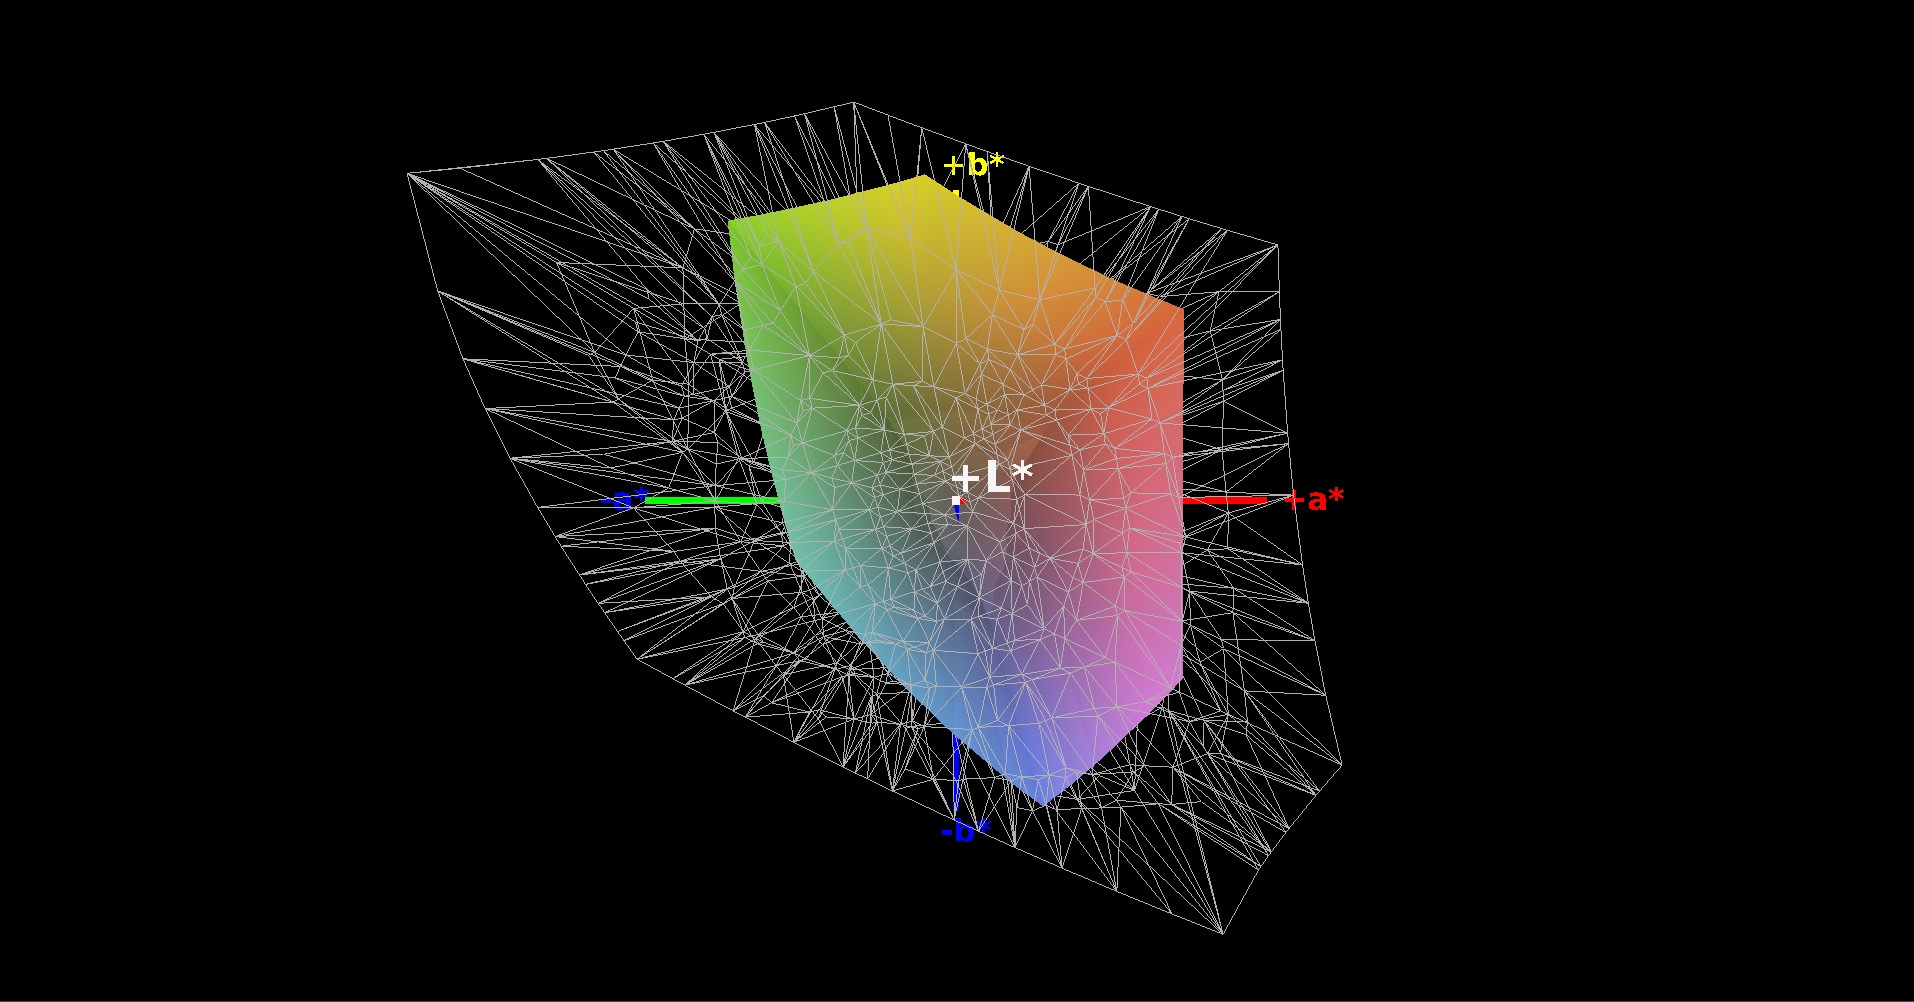
62% sRGB (Argyll 1.6.3 3D)
39% AdobeRGB 1998 (Argyll 1.6.3 3D)
42.76% AdobeRGB 1998 (Argyll 3D)
62% sRGB (Argyll 3D)
41.36% Display P3 (Argyll 3D)
Gamma: 2.23
CCT: 6695 K
| HP Pavilion Gaming 15-ec1206ng Chi Mei CMN150D, IPS, 1920x1080, 15.6" | HP Pavilion Gaming 15-ec0002ng Chi Mei N156HGA-EA3, TN LED, 1920x1080, 15.6" | Nexoc GH5 515IG LG Philips LP156WFC-SPD1, IPS, 1920x1080, 15.6" | Lenovo IdeaPad Gaming 3i 15IMH05 BOE CQ NV156FHM-NX1, IPS, 1920x1080, 15.6" | Asus TUF FX505DT-EB73 Panda LM156LF-GL, IPS, 1920x1080, 15.6" | Dell G5 15 5590-PCNJJ AU Optronics B156HAN (AUO23ED), IPS, 1920x1080, 15.6" | Acer Nitro 5 AN515-44-R5FT Panda LM156LF-2F01 (NCP004D), IPS, 1920x1080, 15.6" | MSI Bravo 15 A4DCR AU Optronics B156HAN08.0 (AUO80ED), IPS-Level, 1920x1080, 15.6" | |
|---|---|---|---|---|---|---|---|---|
| Display | 0% | -8% | -8% | -4% | 96% | 0% | 46% | |
| Display P3 Coverage (%) | 41.36 | 41.22 0% | 37.91 -8% | 38.04 -8% | 39.56 -4% | 83.1 101% | 41.16 0% | 62 50% |
| sRGB Coverage (%) | 62 | 61.8 0% | 57 -8% | 56.6 -9% | 59.5 -4% | 99.9 61% | 61.8 0% | 86.8 40% |
| AdobeRGB 1998 Coverage (%) | 42.76 | 42.62 0% | 39.19 -8% | 39.3 -8% | 40.91 -4% | 96.8 126% | 42.56 0% | 62.7 47% |
| Response Times | 1% | -9% | 25% | -7% | -39% | -28% | 53% | |
| Response Time Grey 50% / Grey 80% * (ms) | 33.6 ? | 44 ? -31% | 34.8 ? -4% | 25 ? 26% | 30.4 ? 10% | 48 ? -43% | 40.8 ? -21% | 16 ? 52% |
| Response Time Black / White * (ms) | 22.4 ? | 15 ? 33% | 25.2 ? -13% | 17 ? 24% | 27.6 ? -23% | 30 ? -34% | 30 ? -34% | 10.4 ? 54% |
| PWM Frequency (Hz) | 24750 ? | 250 ? | ||||||
| Screen | -98% | -18% | -55% | -52% | -41% | -26% | -16% | |
| Brightness middle (cd/m²) | 277 | 233 -16% | 261 -6% | 305 10% | 286.2 3% | 234 -16% | 287 4% | 311 12% |
| Brightness (cd/m²) | 248 | 211 -15% | 254 2% | 294 19% | 267 8% | 216 -13% | 271 9% | 313 26% |
| Brightness Distribution (%) | 83 | 82 -1% | 93 12% | 70 -16% | 84 1% | 87 5% | 88 6% | 88 6% |
| Black Level * (cd/m²) | 0.16 | 0.405 -153% | 0.23 -44% | 0.405 -153% | 0.33 -106% | 0.22 -38% | 0.25 -56% | 0.43 -169% |
| Contrast (:1) | 1731 | 575 -67% | 1135 -34% | 753 -56% | 867 -50% | 1064 -39% | 1148 -34% | 723 -58% |
| Colorchecker dE 2000 * | 3.6 | 8.22 -128% | 4.71 -31% | 6.01 -67% | 5.45 -51% | 6.52 -81% | 4.77 -33% | 4.5 -25% |
| Colorchecker dE 2000 max. * | 8.53 | 18.6 -118% | 7.6 11% | 21.9 -157% | 18.08 -112% | 10.58 -24% | 17.15 -101% | 7.97 7% |
| Colorchecker dE 2000 calibrated * | 2.88 | 3.67 -27% | 5.12 -78% | 4.47 -55% | 3.56 -24% | 3.73 -30% | 2.65 8% | |
| Greyscale dE 2000 * | 1.75 | 10.13 -479% | 2.76 -58% | 3.23 -85% | 5.3 -203% | 5.33 -205% | 2.7 -54% | 3.3 -89% |
| Gamma | 2.23 99% | 2.27 97% | 2.42 91% | 2.43 91% | 2.1 105% | 2.86 77% | 2.115 104% | 2.129 103% |
| CCT | 6695 97% | 11323 57% | 7090 92% | 6818 95% | 7679 85% | 5983 109% | 7187 90% | 7227 90% |
| Color Space (Percent of AdobeRGB 1998) (%) | 39 | 39 0% | 36 -8% | 36 -8% | 37.6 -4% | 36 -8% | 43 10% | 63 62% |
| Color Space (Percent of sRGB) (%) | 62 | 62 0% | 56 -10% | 56 -10% | 59.1 -5% | 57 -8% | 61 -2% | 86 39% |
| Total Average (Program / Settings) | -32% /
-65% | -12% /
-15% | -13% /
-36% | -21% /
-37% | 5% /
-15% | -18% /
-21% | 28% /
4% |
* ... smaller is better
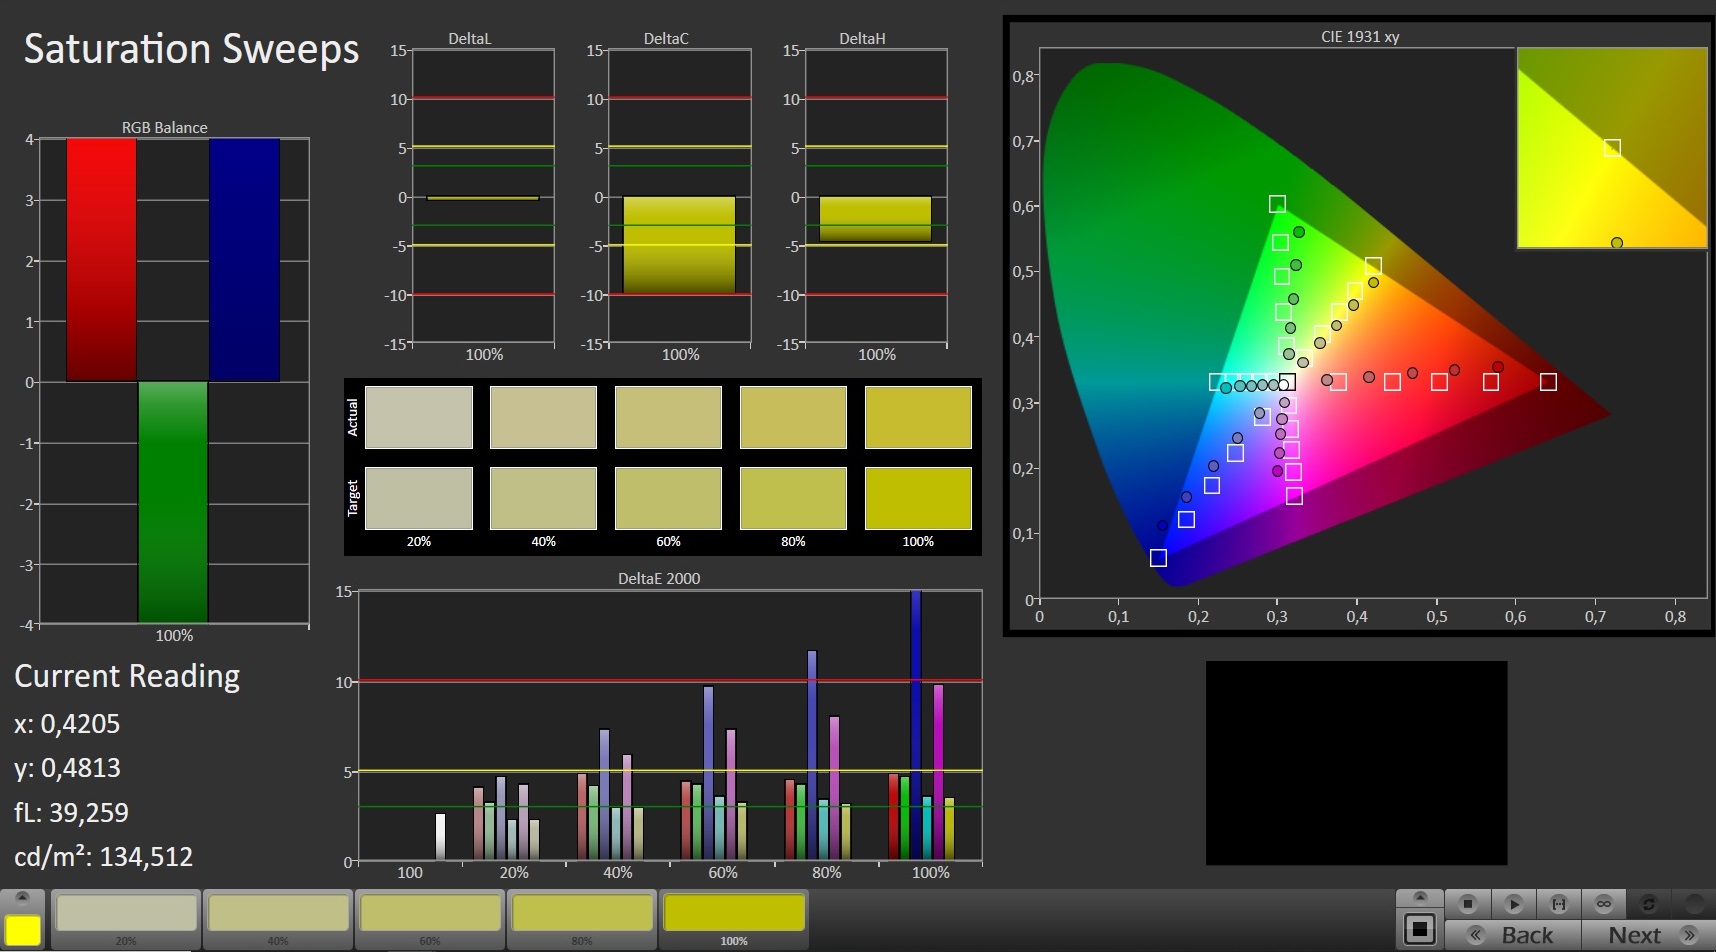
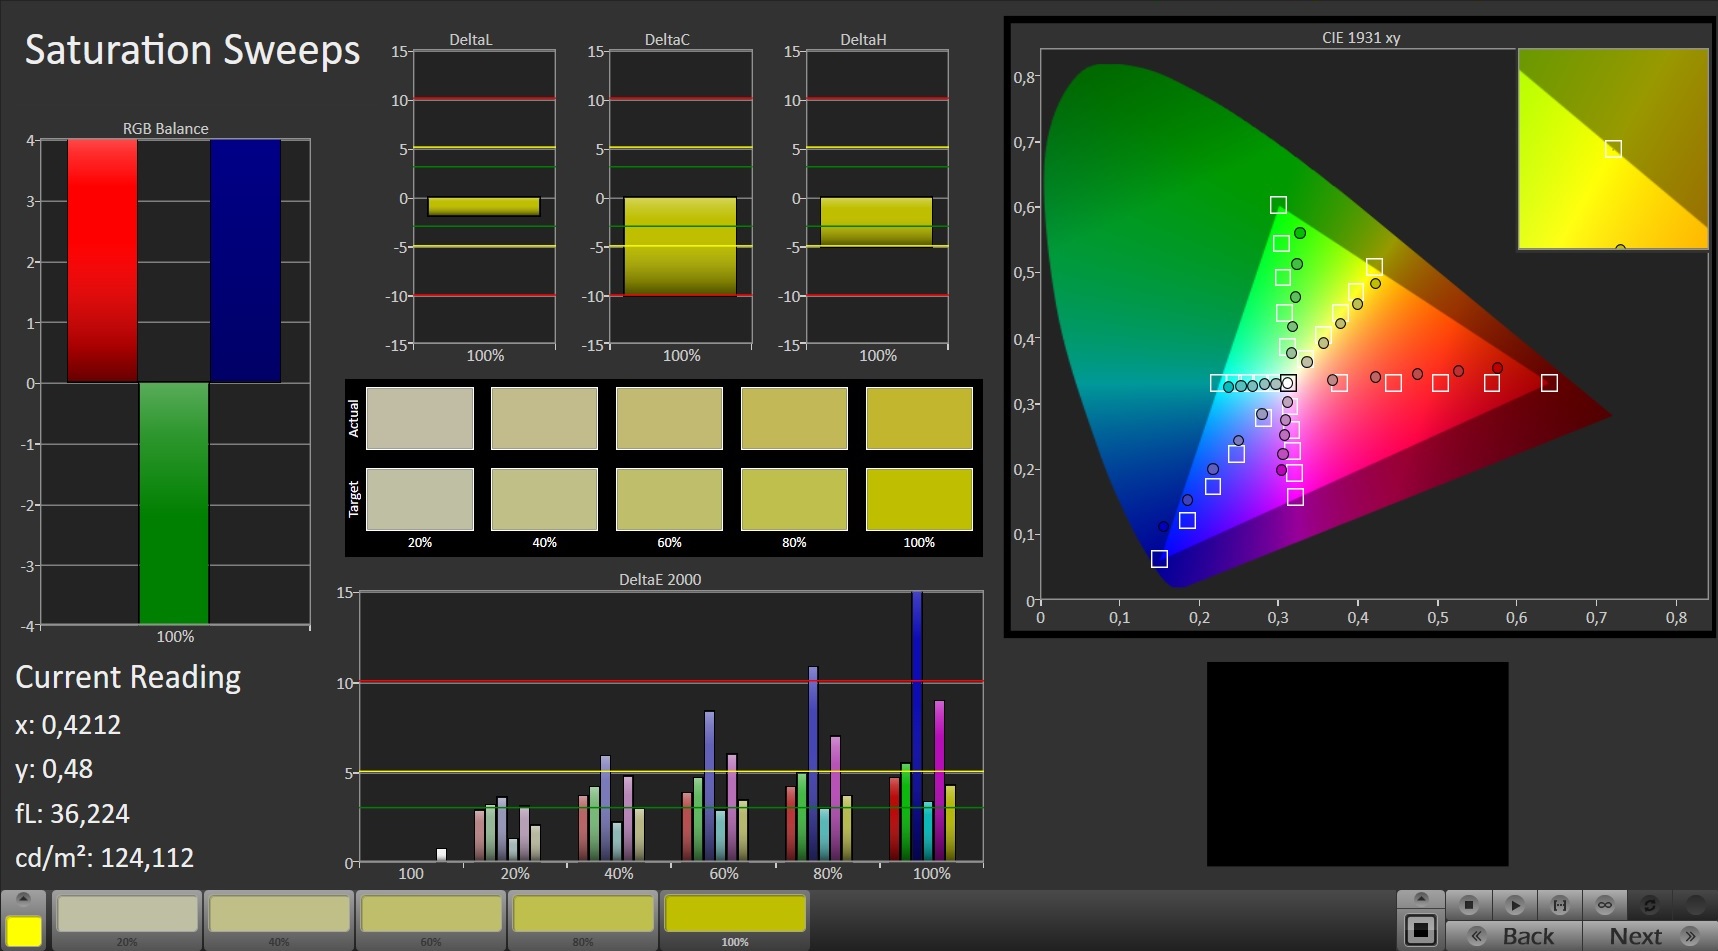
Out of the box, the display shows a very decent color reproduction. With a Delta E 2000 color deviation of 3.6, the target (Delta E less than 3) is only just missed. The display doesn't suffer from a blue tint. Moreover, calibration provides for slight improvements. The AdobeRGB (39%) and sRGB (62%) color spaces aren't fully mapped.
Display Response Times
| ↔ Response Time Black to White | ||
|---|---|---|
| 22.4 ms ... rise ↗ and fall ↘ combined | ↗ 12.8 ms rise | 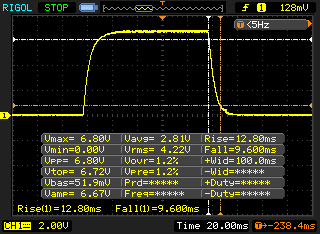 |
| ↘ 9.6 ms fall | ||
| The screen shows good response rates in our tests, but may be too slow for competitive gamers. In comparison, all tested devices range from 0.1 (minimum) to 240 (maximum) ms. » 51 % of all devices are better. This means that the measured response time is worse than the average of all tested devices (19.8 ms). | ||
| ↔ Response Time 50% Grey to 80% Grey | ||
| 33.6 ms ... rise ↗ and fall ↘ combined | ↗ 17.2 ms rise | 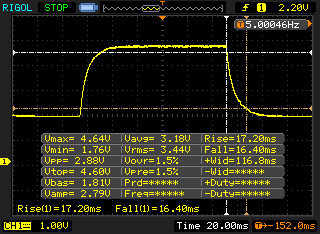 |
| ↘ 16.4 ms fall | ||
| The screen shows slow response rates in our tests and will be unsatisfactory for gamers. In comparison, all tested devices range from 0.165 (minimum) to 636 (maximum) ms. » 46 % of all devices are better. This means that the measured response time is similar to the average of all tested devices (30.9 ms). | ||
Screen Flickering / PWM (Pulse-Width Modulation)
| Screen flickering / PWM detected | 24750 Hz | ≤ 42 % brightness setting | 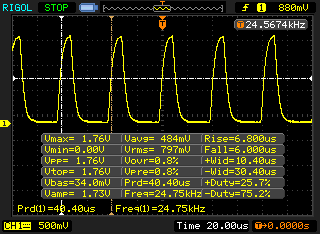 |
The display backlight flickers at 24750 Hz (worst case, e.g., utilizing PWM) Flickering detected at a brightness setting of 42 % and below. There should be no flickering or PWM above this brightness setting. The frequency of 24750 Hz is quite high, so most users sensitive to PWM should not notice any flickering. In comparison: 52 % of all tested devices do not use PWM to dim the display. If PWM was detected, an average of 7741 (minimum: 5 - maximum: 343500) Hz was measured. | |||
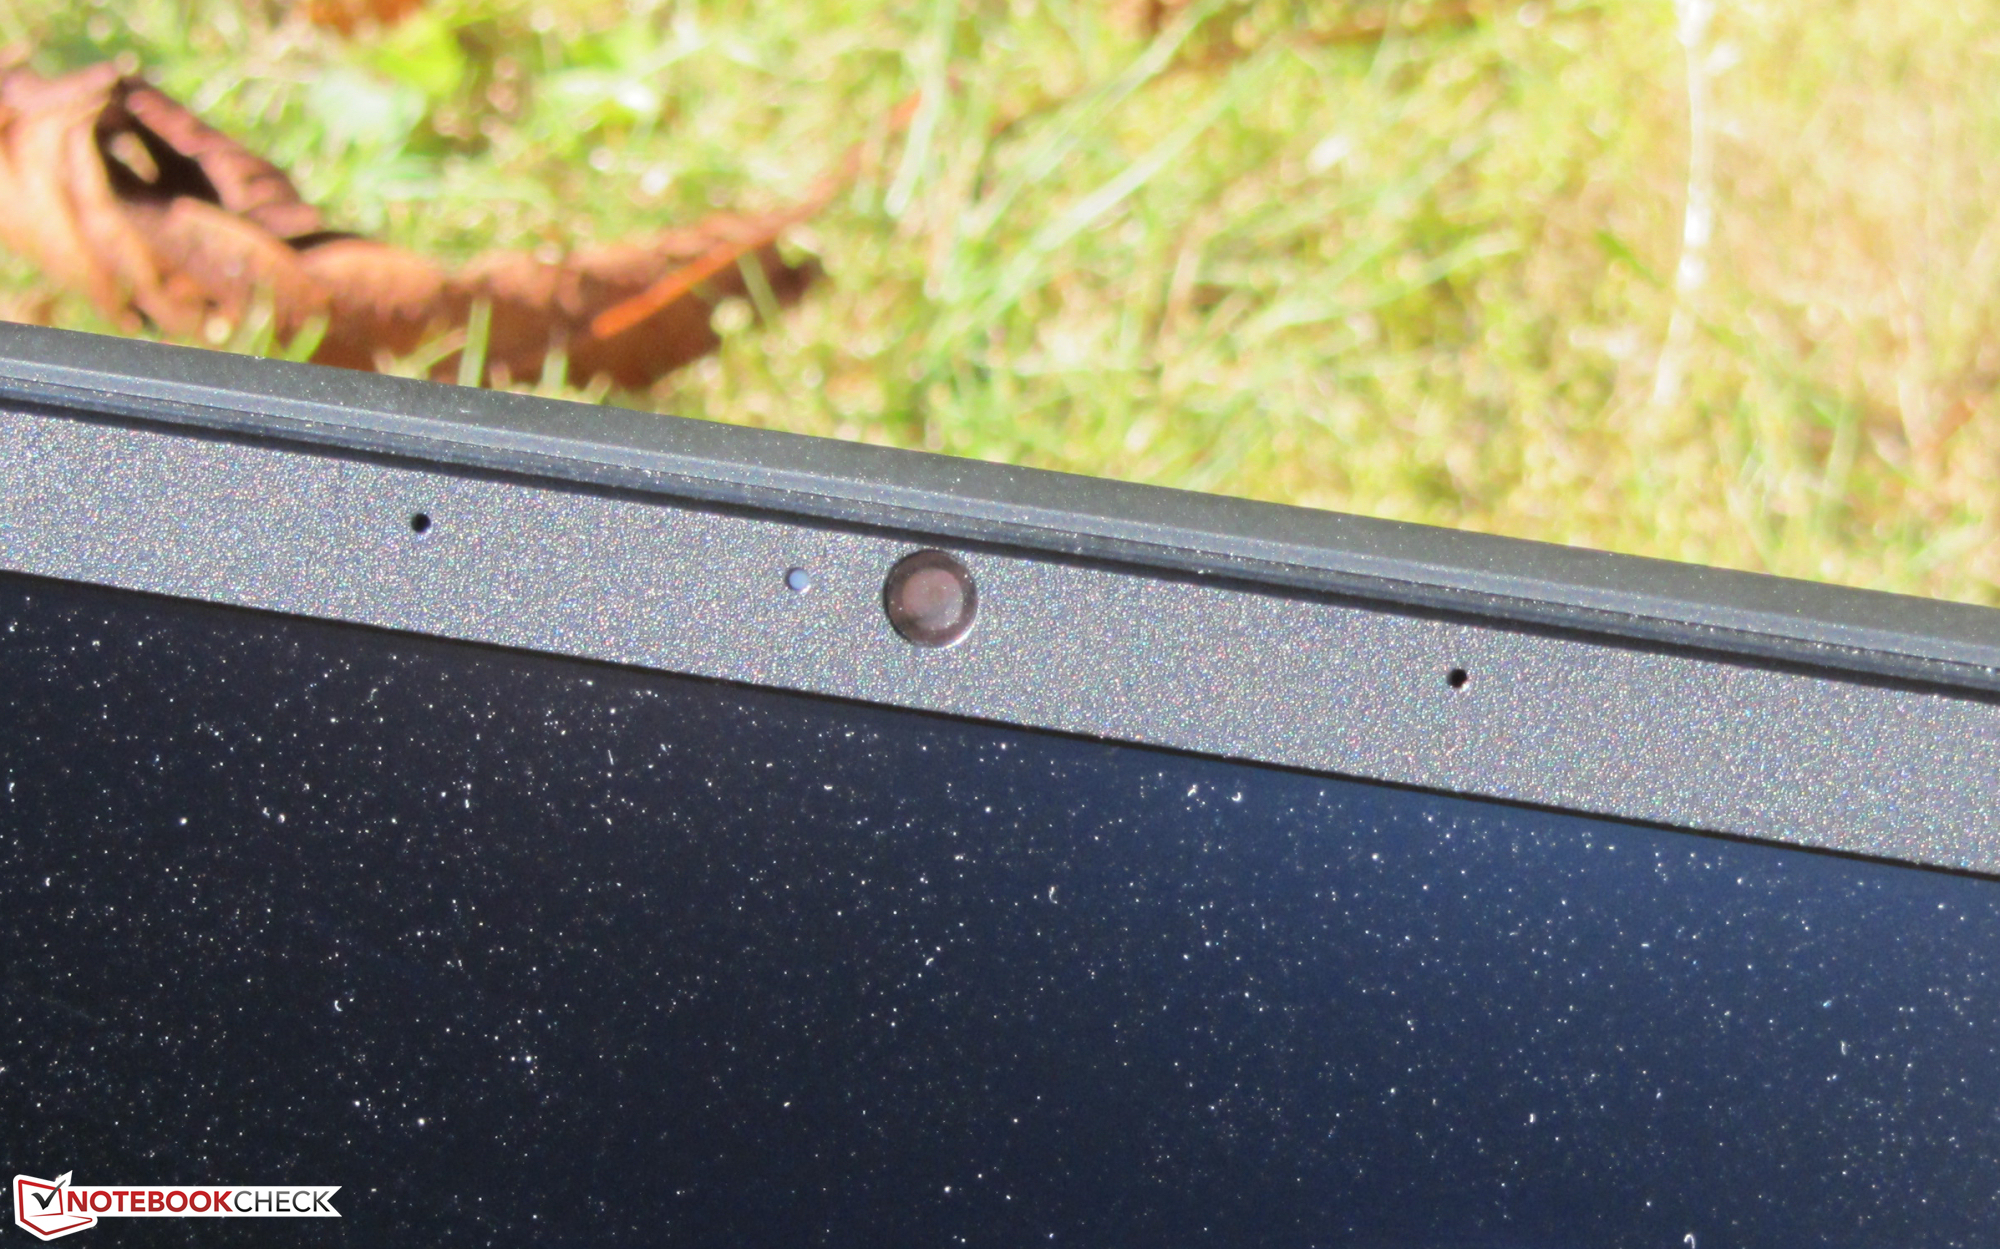
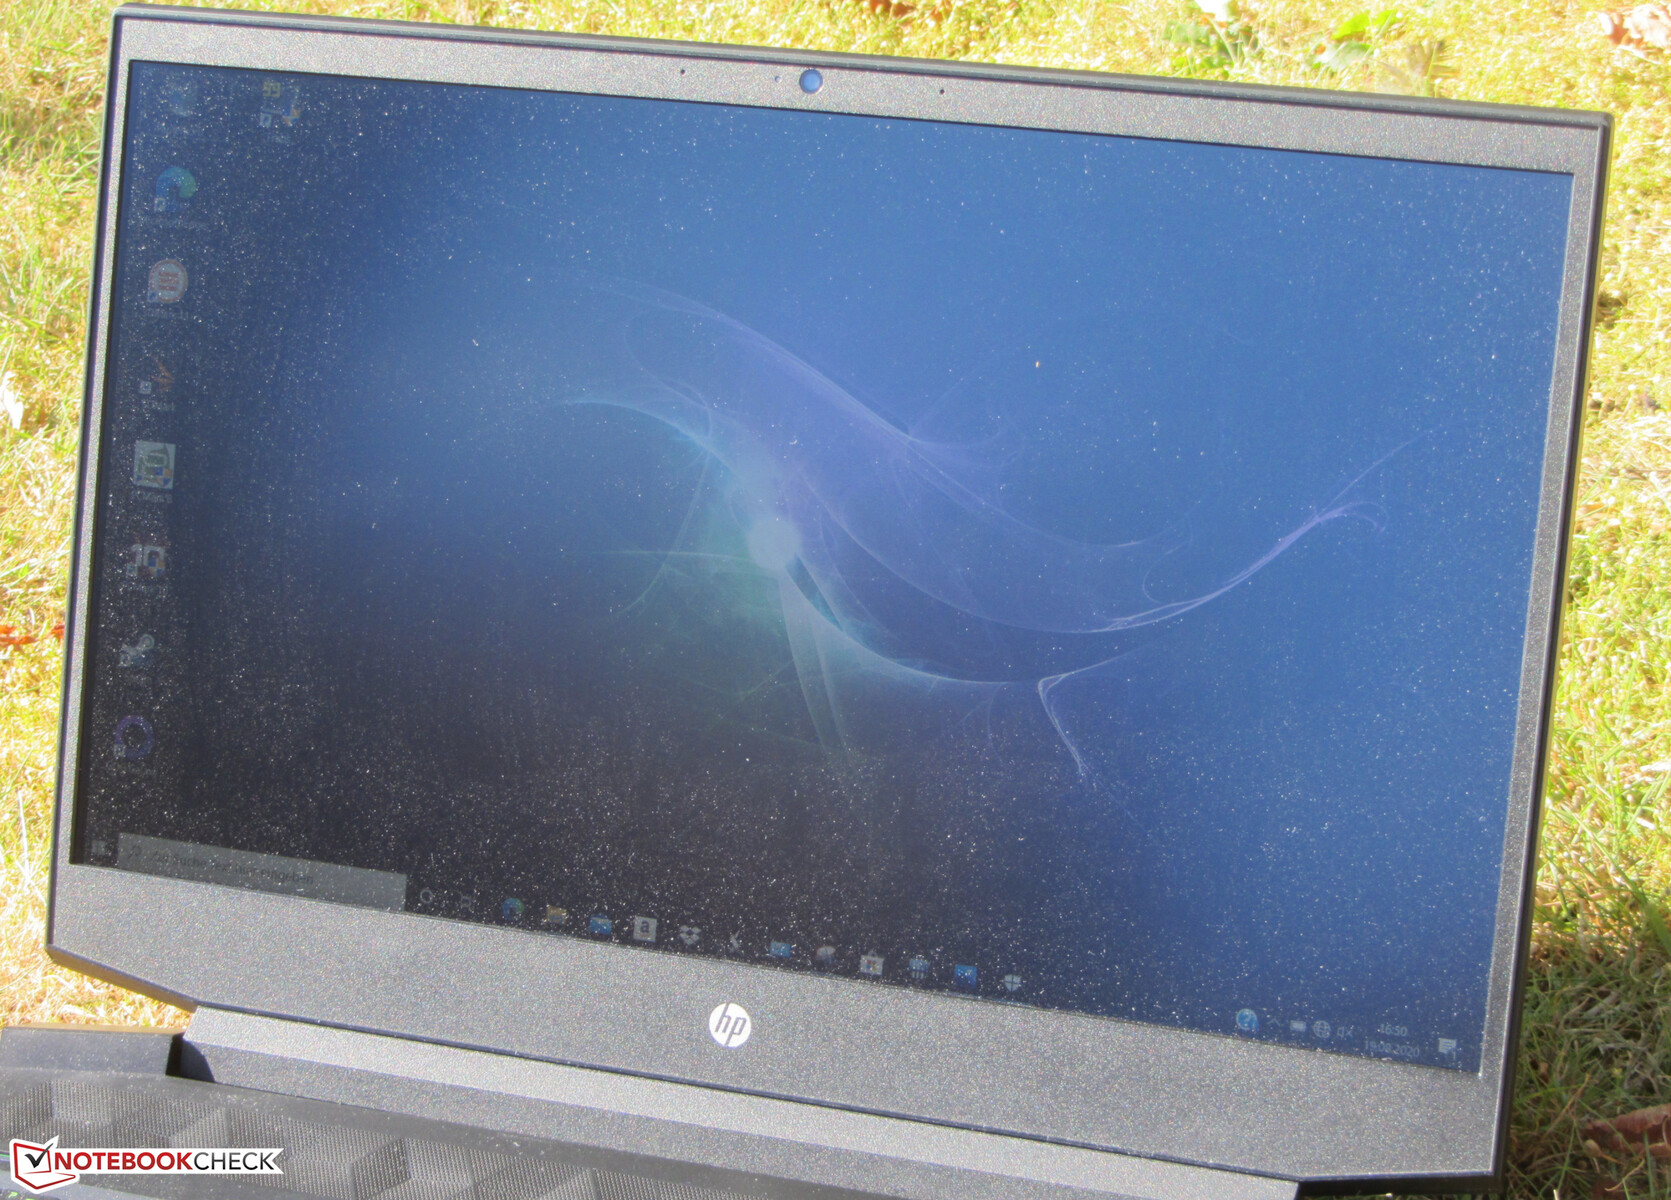
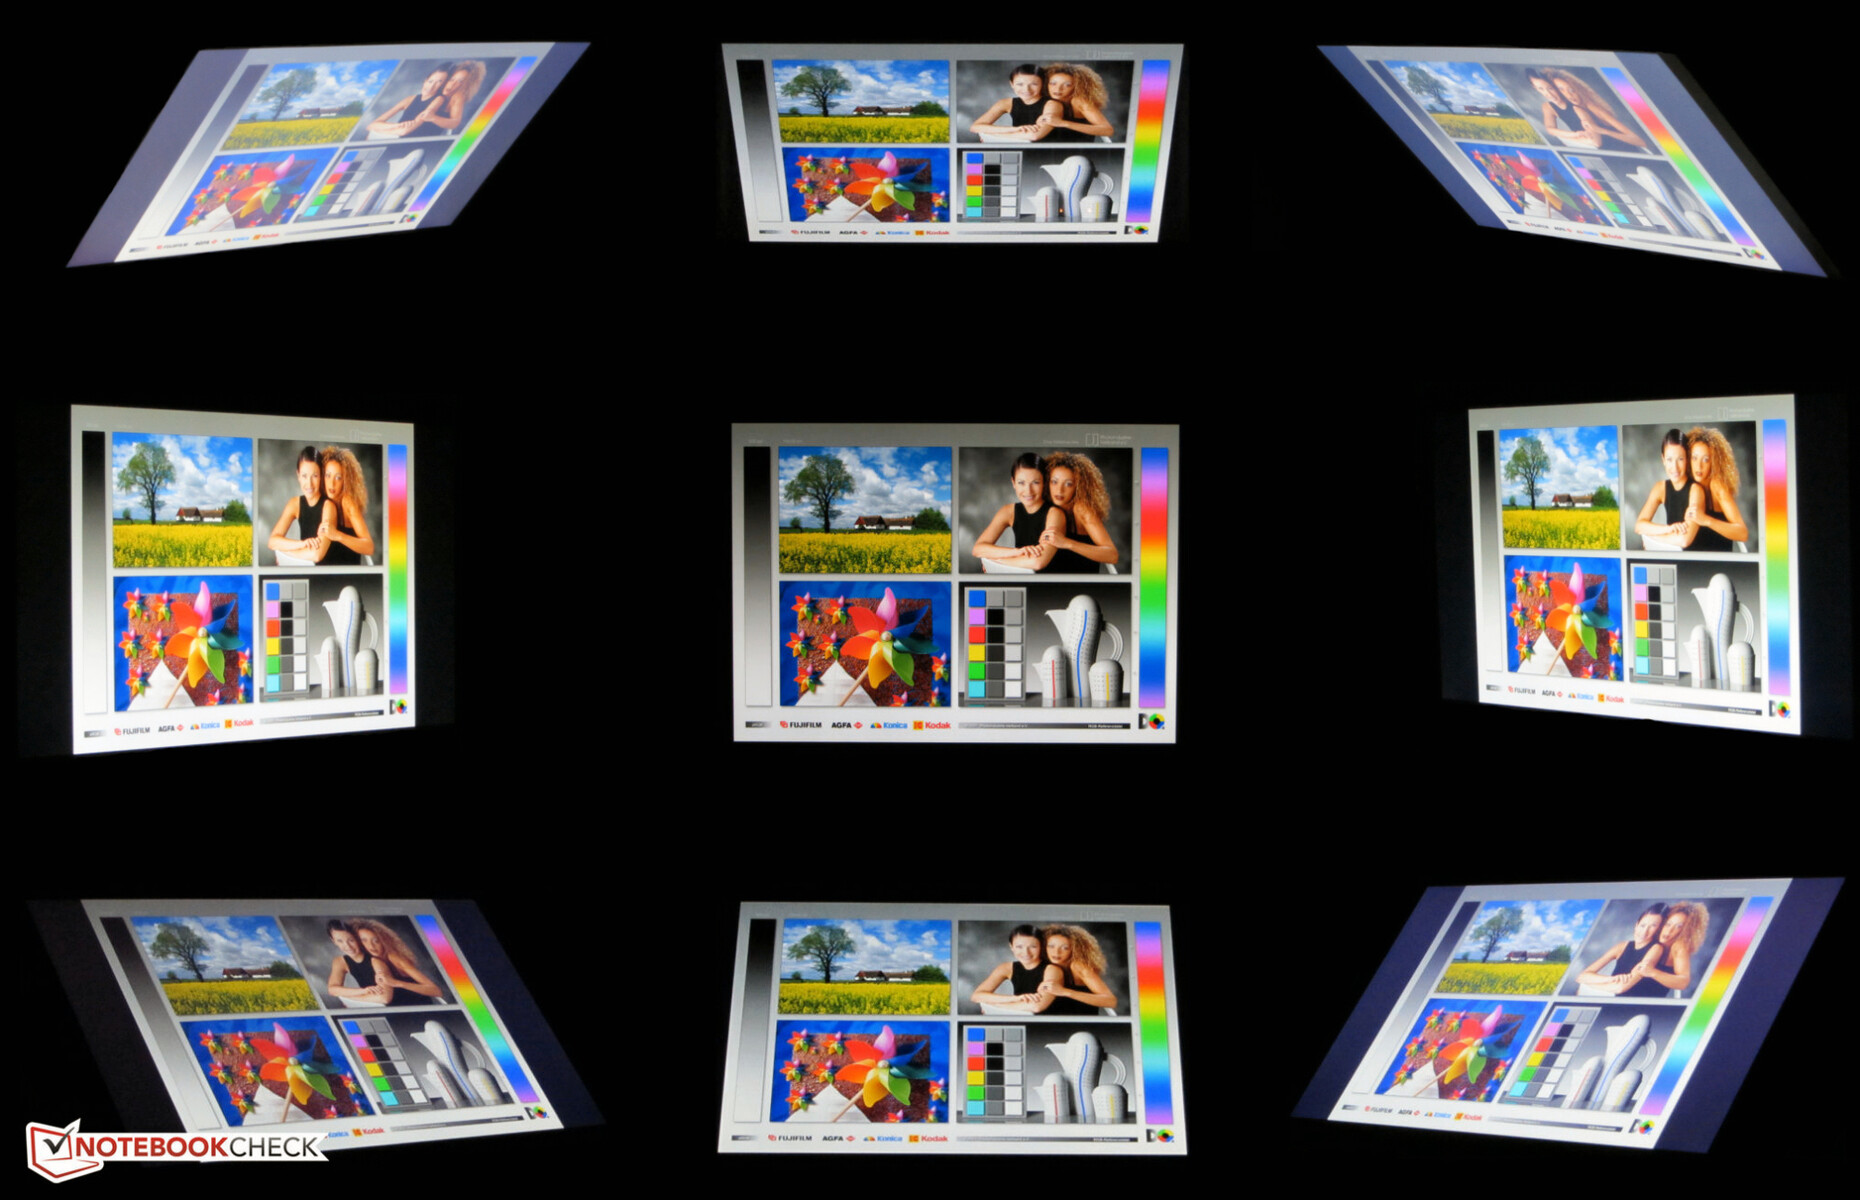
HP has equipped the Pavilion Gaming with a viewing-angle-stable IPS panel. Consequently, the screen can be read from any position. Reading the display outdoors is only possible when the sun is not too bright.
Performance - Ryzen power
With the Pavilion Gaming 15, HP delivers a 15.6-inch gaming laptop that brings all modern computer games smoothly onto the screen, and thanks to a very strong CPU, it also cuts a fine figure in all other application areas. Our test device costs almost 800 Euros (~$947). In addition, other configuration variants are available.
Processor
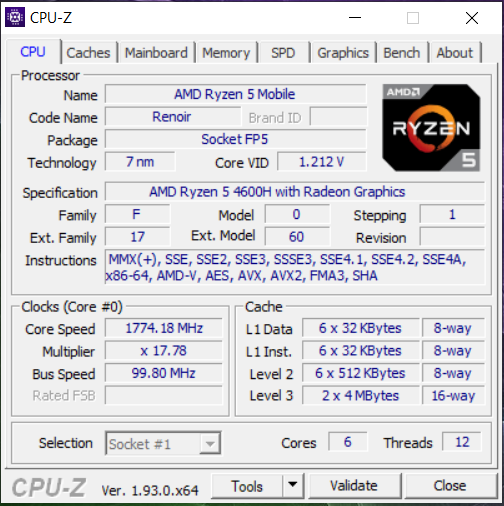
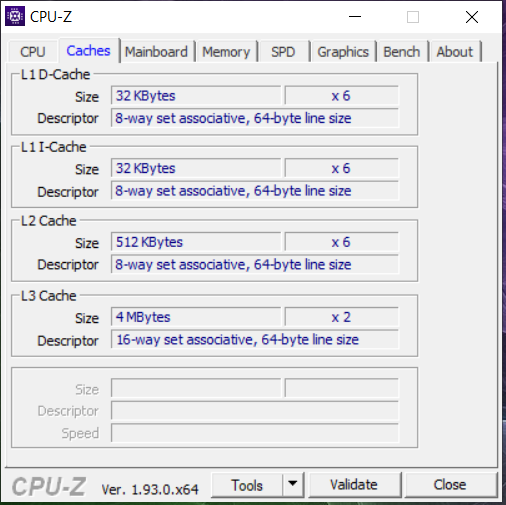
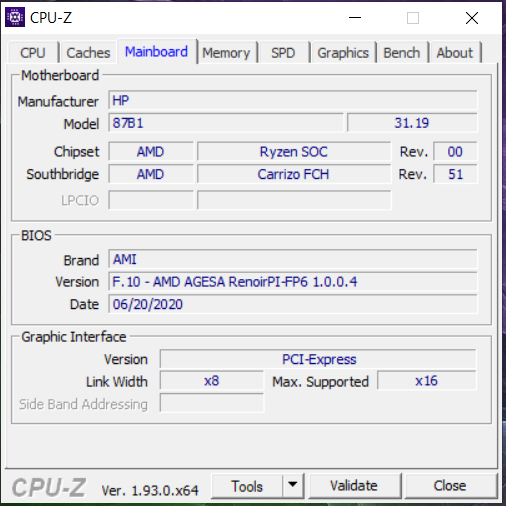
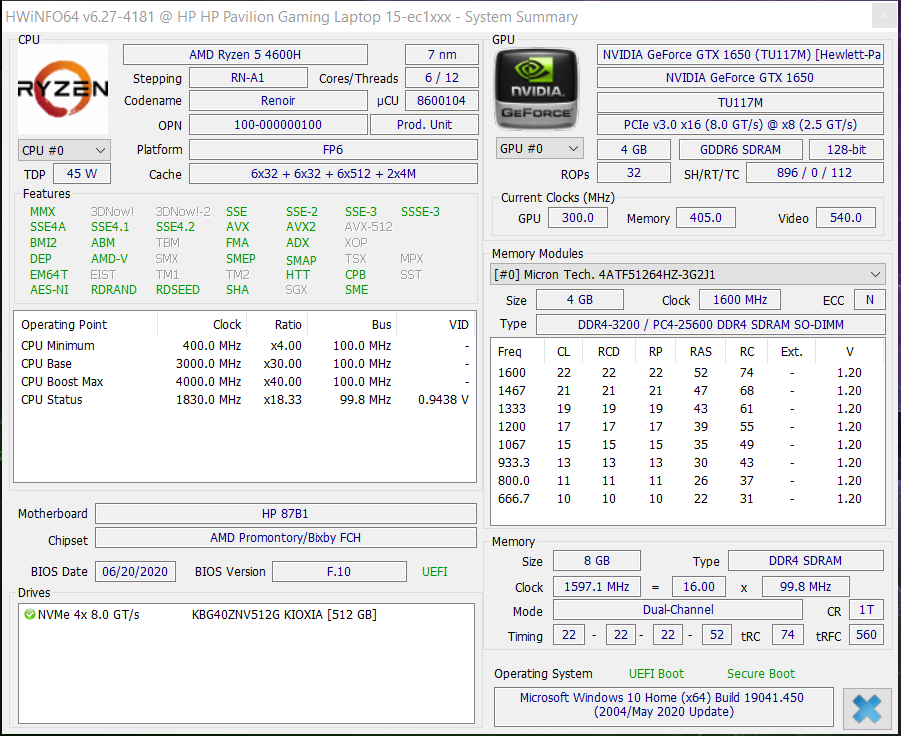
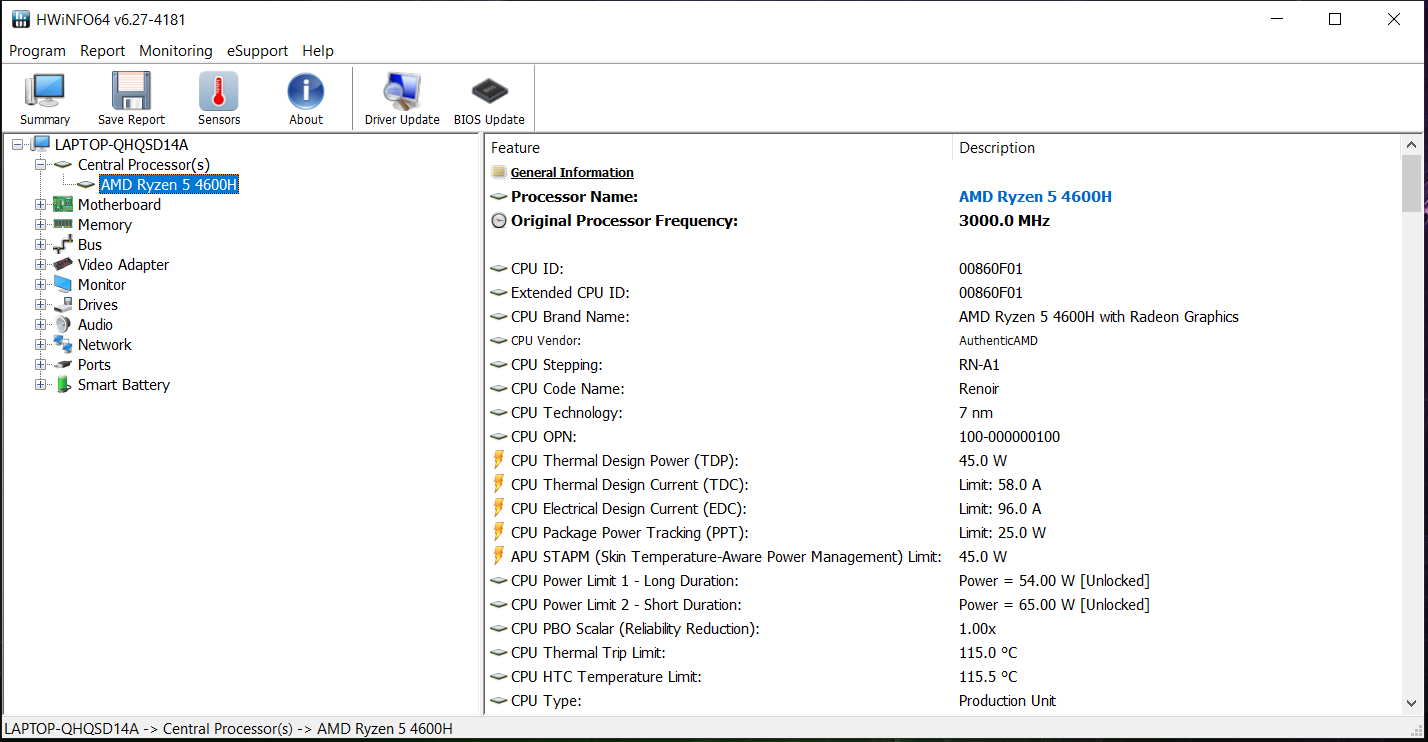
The Pavilion is powered by a Ryzen 5 4600H (Renoir) APU. The CPU part of the APU consists of a hexa-core processor that runs at a base speed of 3 GHz. An increase up to 4 GHz is possible via Turbo. Furthermore, simultaneous multithreading (two threads can be processed per core) is supported.
The CPU tests of the Cinebench benchmarks are run at 3.7 to 3.9 GHz (multithread) and 1.4 to 4 GHz (single-thread), respectively. On battery power, the clock speeds are 1.4 to 3.1 GHz (multithread) and 1.4 to 4 GHz (single-thread).
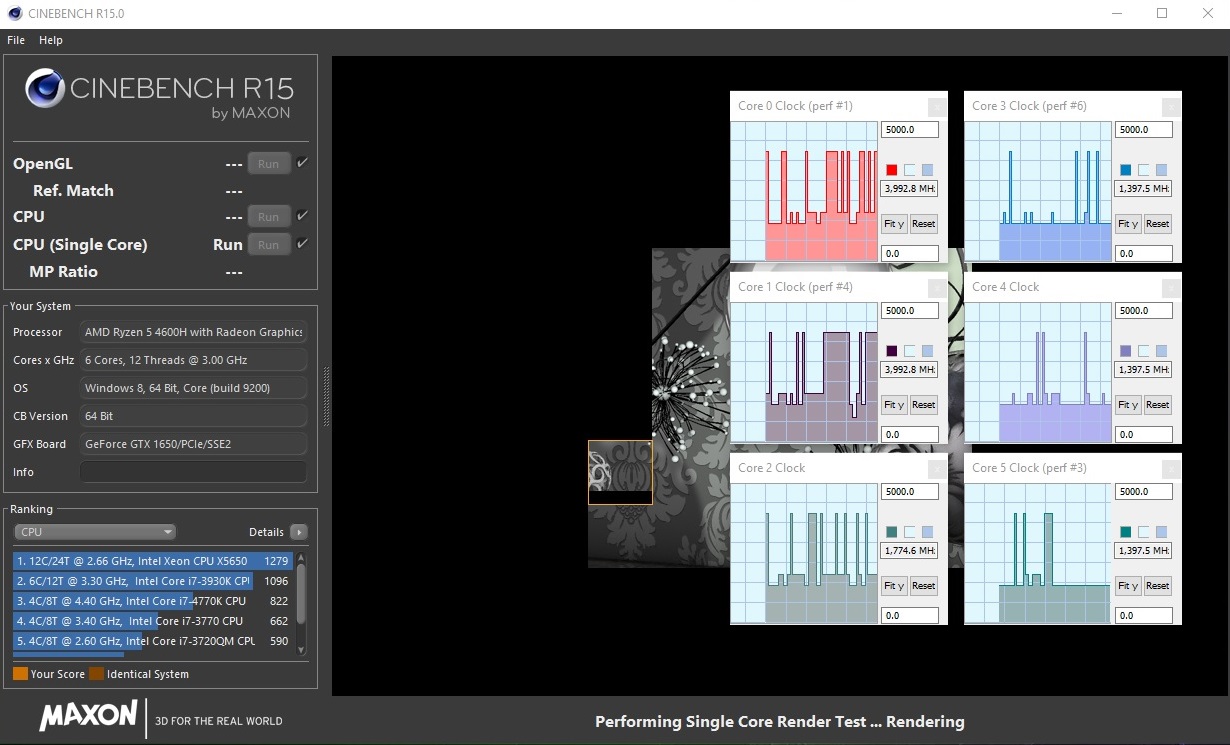
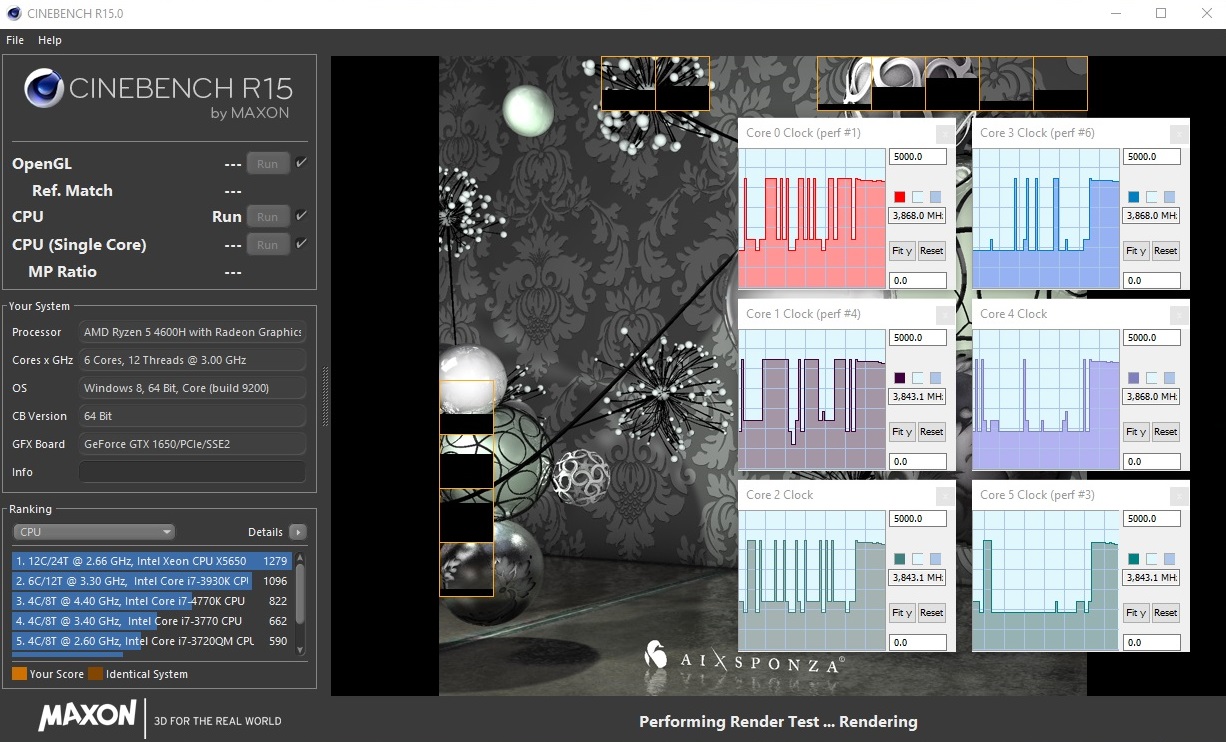
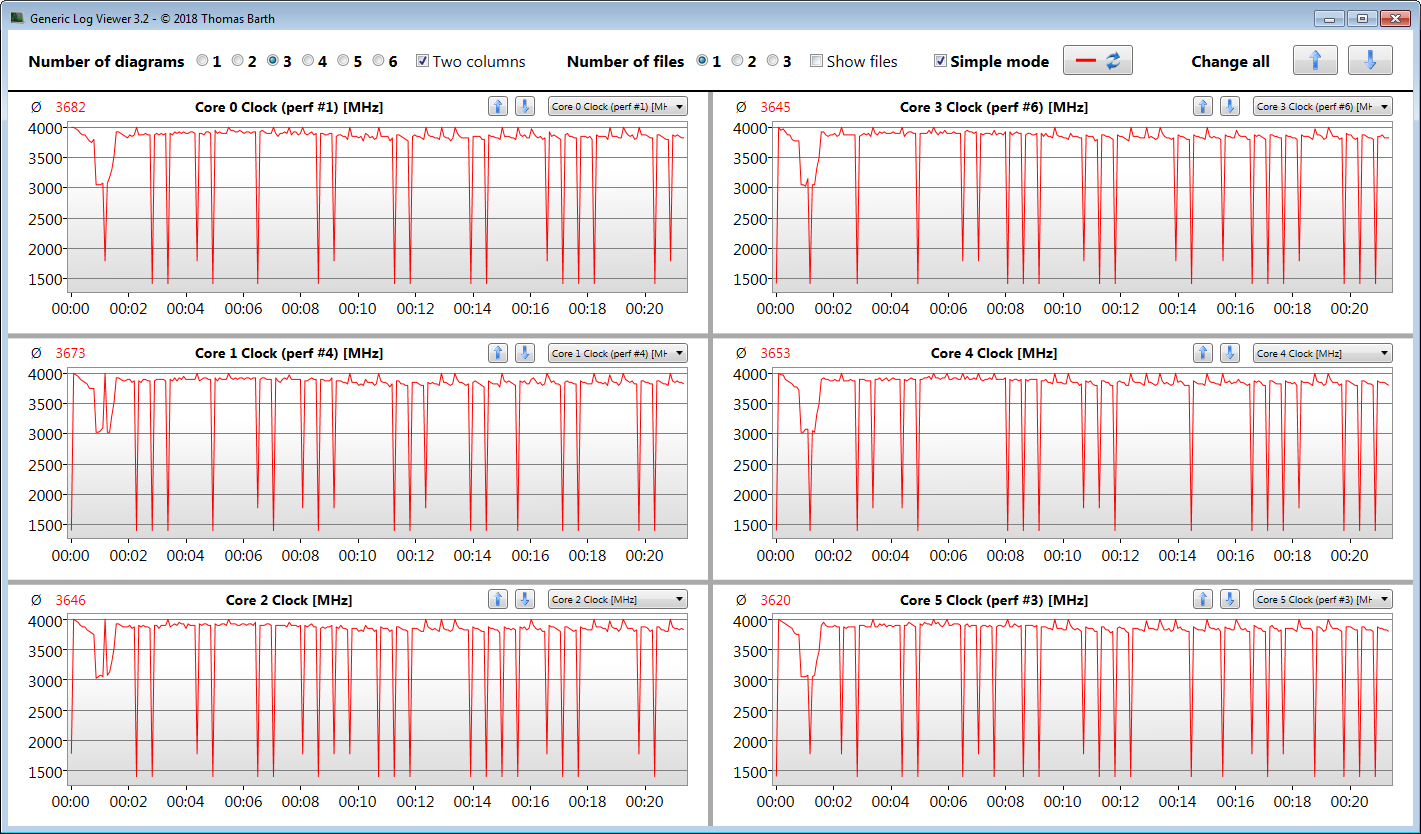
We verify if the CPU Turbo is also consistently used when plugged in by running the Cinebench R15 benchmark's multithread test in a continuous loop for at least 30 minutes. The Turbo speeds drop slightly in the second run and recover again afterwards.
| Blender - v2.79 BMW27 CPU | |
| Nexoc GH5 515IG | |
| Lenovo IdeaPad Gaming 3i 15IMH05 | |
| Acer Nitro 5 AN515-44-R5FT | |
| HP Pavilion Gaming 15-ec1206ng | |
| MSI Bravo 15 A4DCR | |
| HWBOT x265 Benchmark v2.2 - 4k Preset | |
| MSI Bravo 15 A4DCR | |
| HP Pavilion Gaming 15-ec1206ng | |
| Acer Nitro 5 AN515-44-R5FT | |
| Lenovo IdeaPad Gaming 3i 15IMH05 | |
| Nexoc GH5 515IG | |
| LibreOffice - 20 Documents To PDF | |
| MSI Bravo 15 A4DCR | |
| HP Pavilion Gaming 15-ec1206ng | |
| Acer Nitro 5 AN515-44-R5FT | |
| Nexoc GH5 515IG | |
| Lenovo IdeaPad Gaming 3i 15IMH05 | |
| R Benchmark 2.5 - Overall mean | |
| Lenovo IdeaPad Gaming 3i 15IMH05 | |
| Acer Nitro 5 AN515-44-R5FT | |
| Nexoc GH5 515IG | |
| HP Pavilion Gaming 15-ec1206ng | |
| MSI Bravo 15 A4DCR | |
* ... smaller is better
System performance
The built-in hardware ensures a fast and smooth system, and the CPU provides more than enough computing power for all common application areas. The dedicated graphics core enables the use of computer games. This is accompanied by good results in the PCMark benchmarks.
| PCMark 8 Home Score Accelerated v2 | 4332 points | |
| PCMark 8 Creative Score Accelerated v2 | 5215 points | |
| PCMark 8 Work Score Accelerated v2 | 5164 points | |
| PCMark 10 Score | 5221 points | |
Help | ||
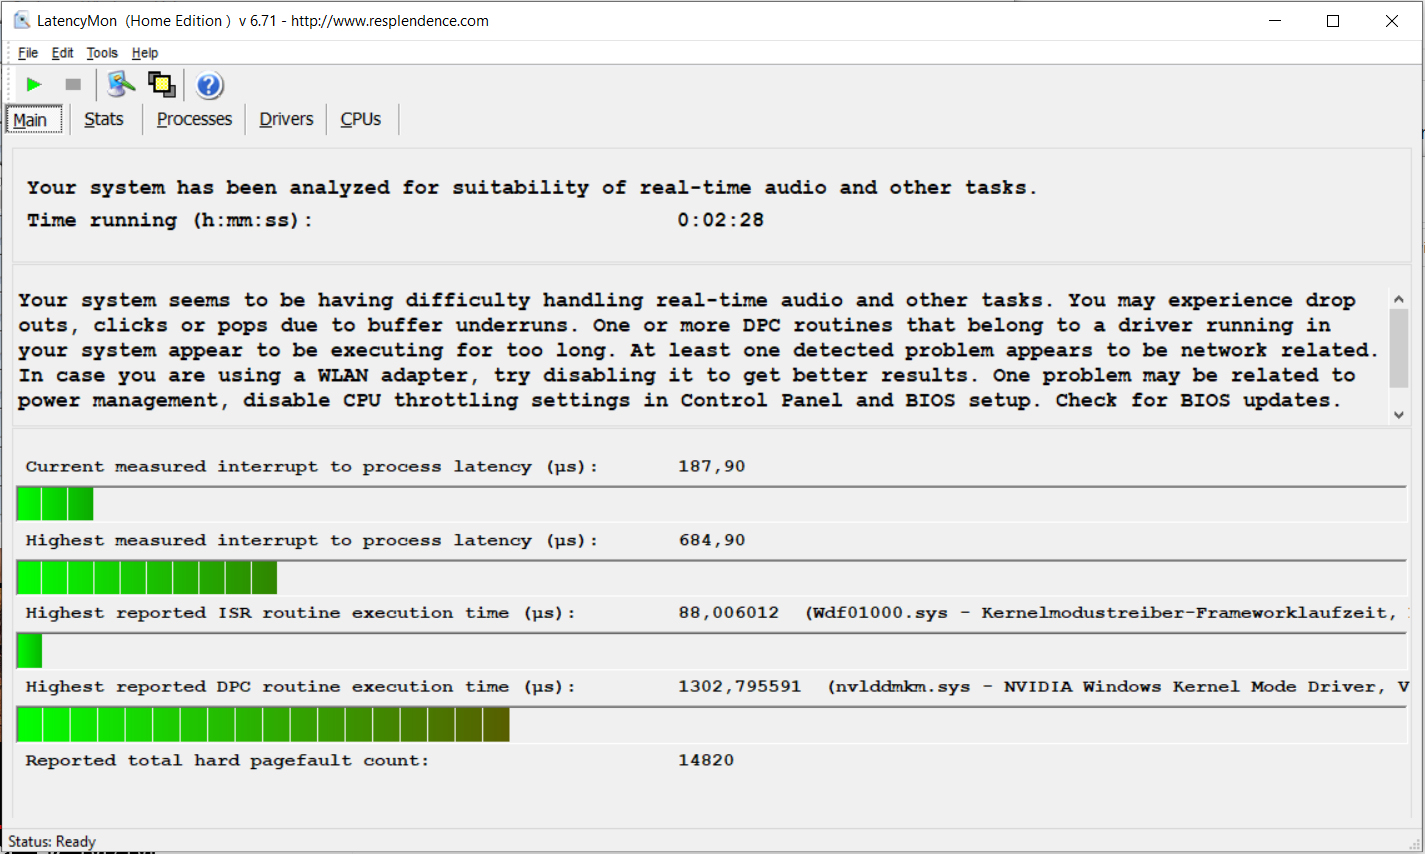
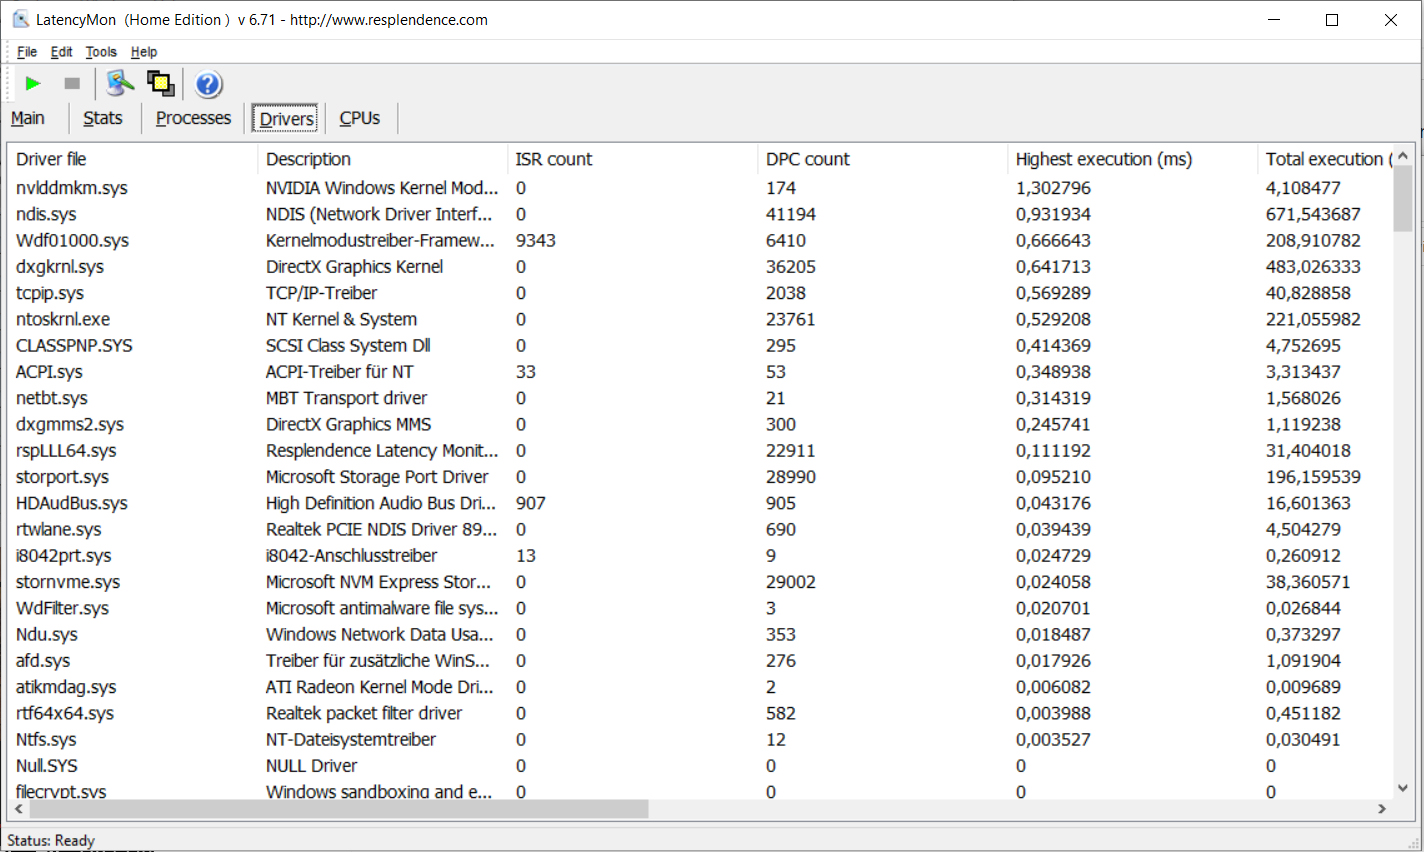
DPC latencies
In our standardized latency monitor test (web surfing, 4K video playback, high-load Prime95), we could observe issues with the DPC latencies. The system doesn't seem to be suitable for real-time video and audio-editing.
| DPC Latencies / LatencyMon - interrupt to process latency (max), Web, Youtube, Prime95 | |
| MSI Bravo 15 A4DCR | |
| Acer Nitro 5 AN515-44-R5FT | |
| Lenovo IdeaPad Gaming 3i 15IMH05 | |
| HP Pavilion Gaming 15-ec1206ng | |
| Nexoc GH5 515IG | |
* ... smaller is better
Storage
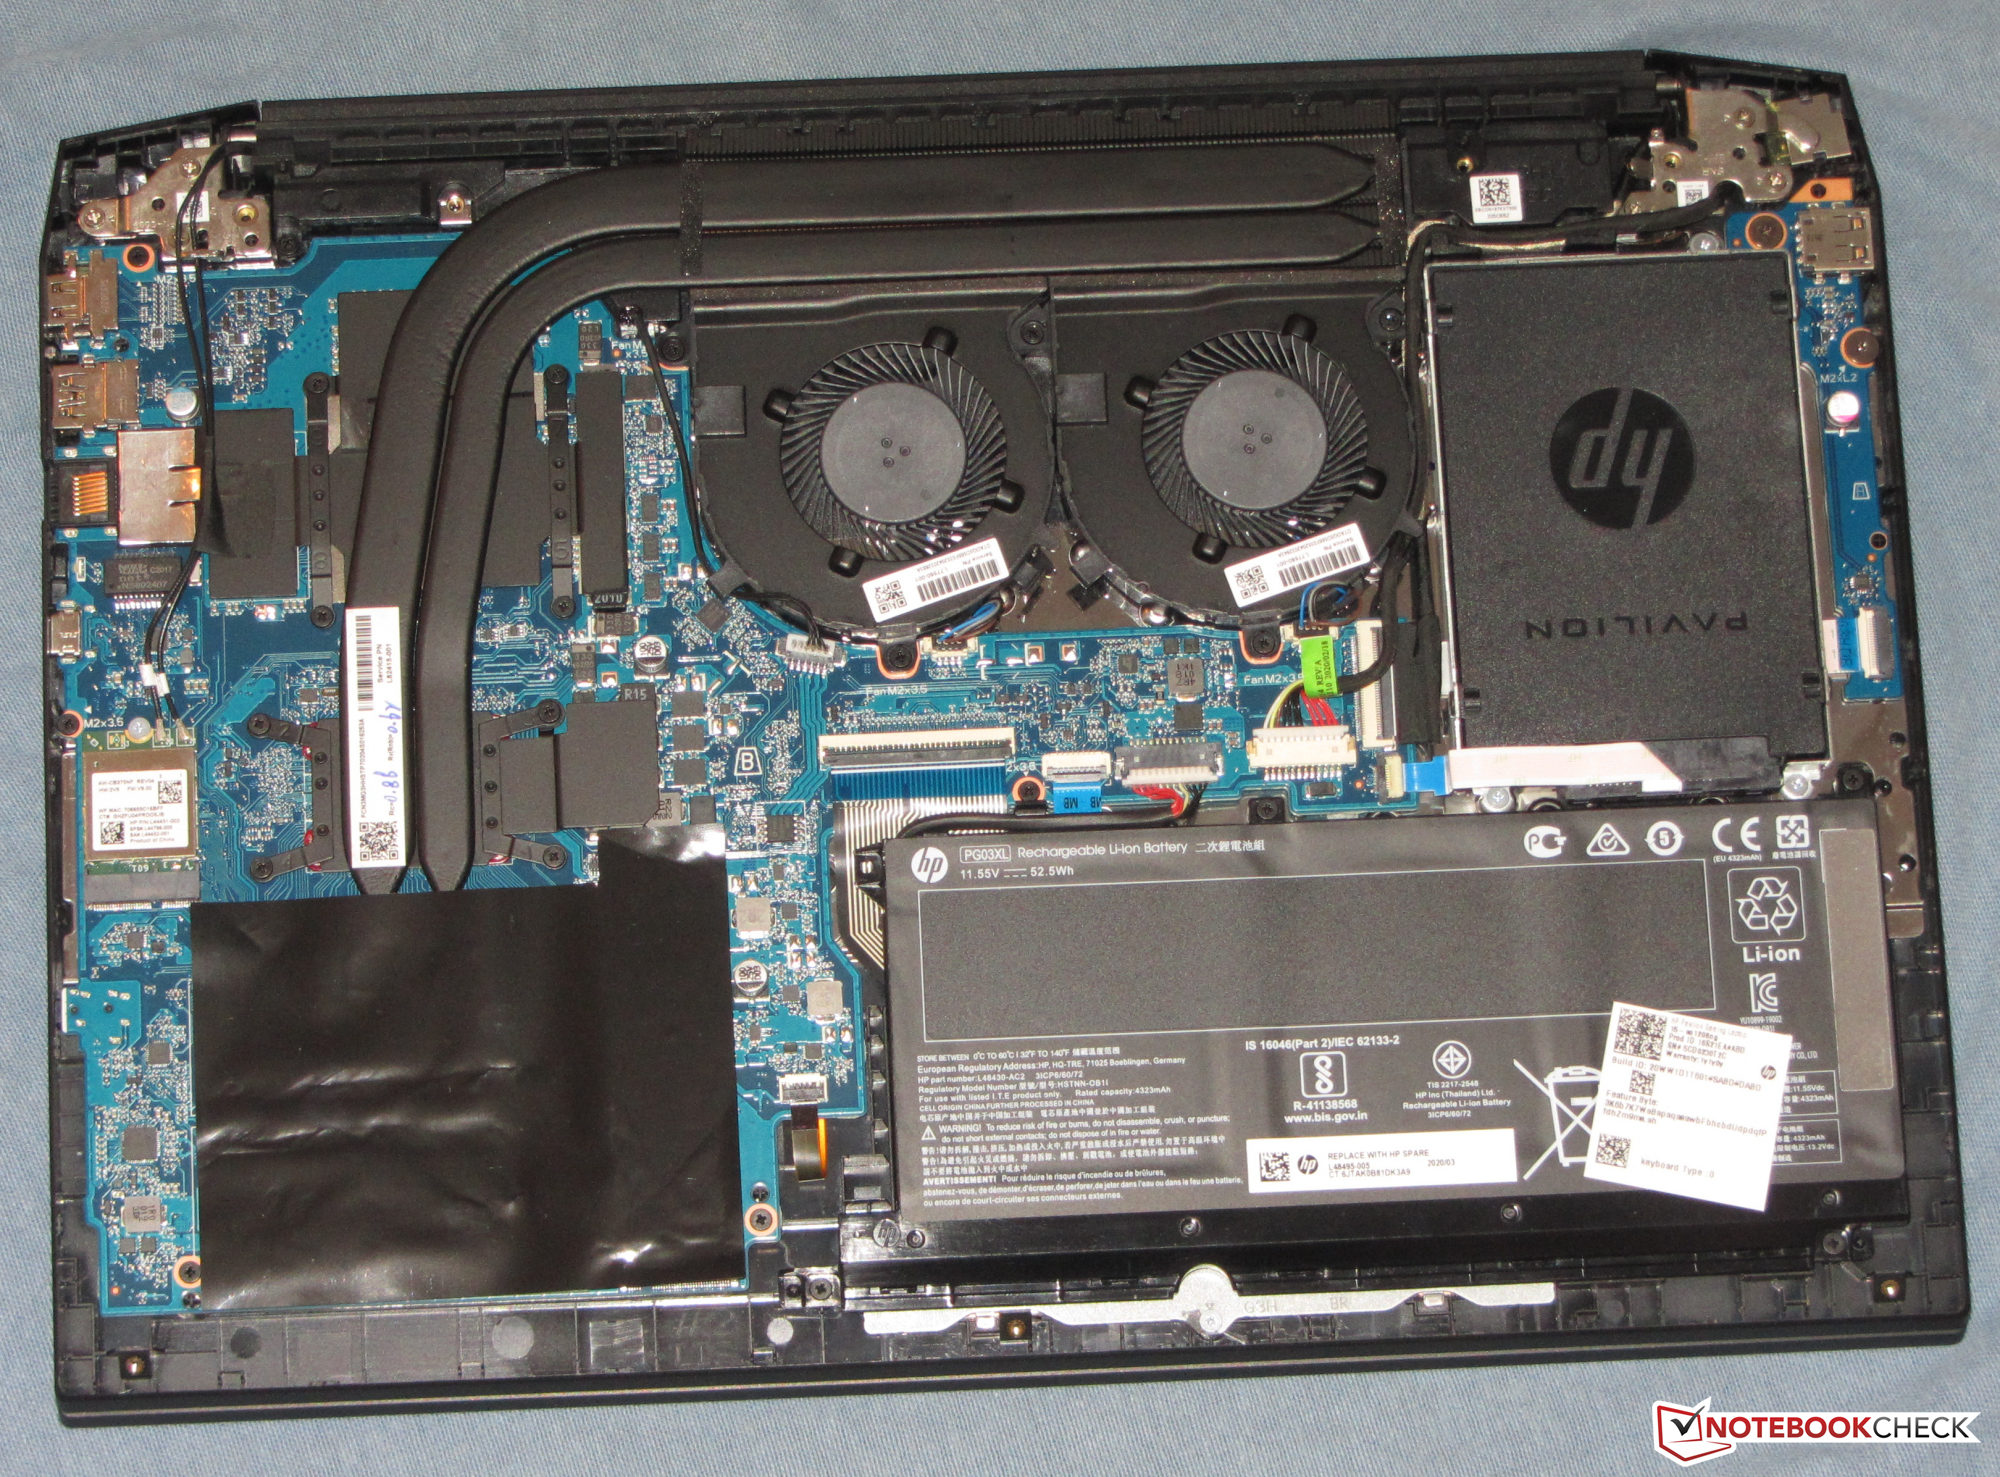
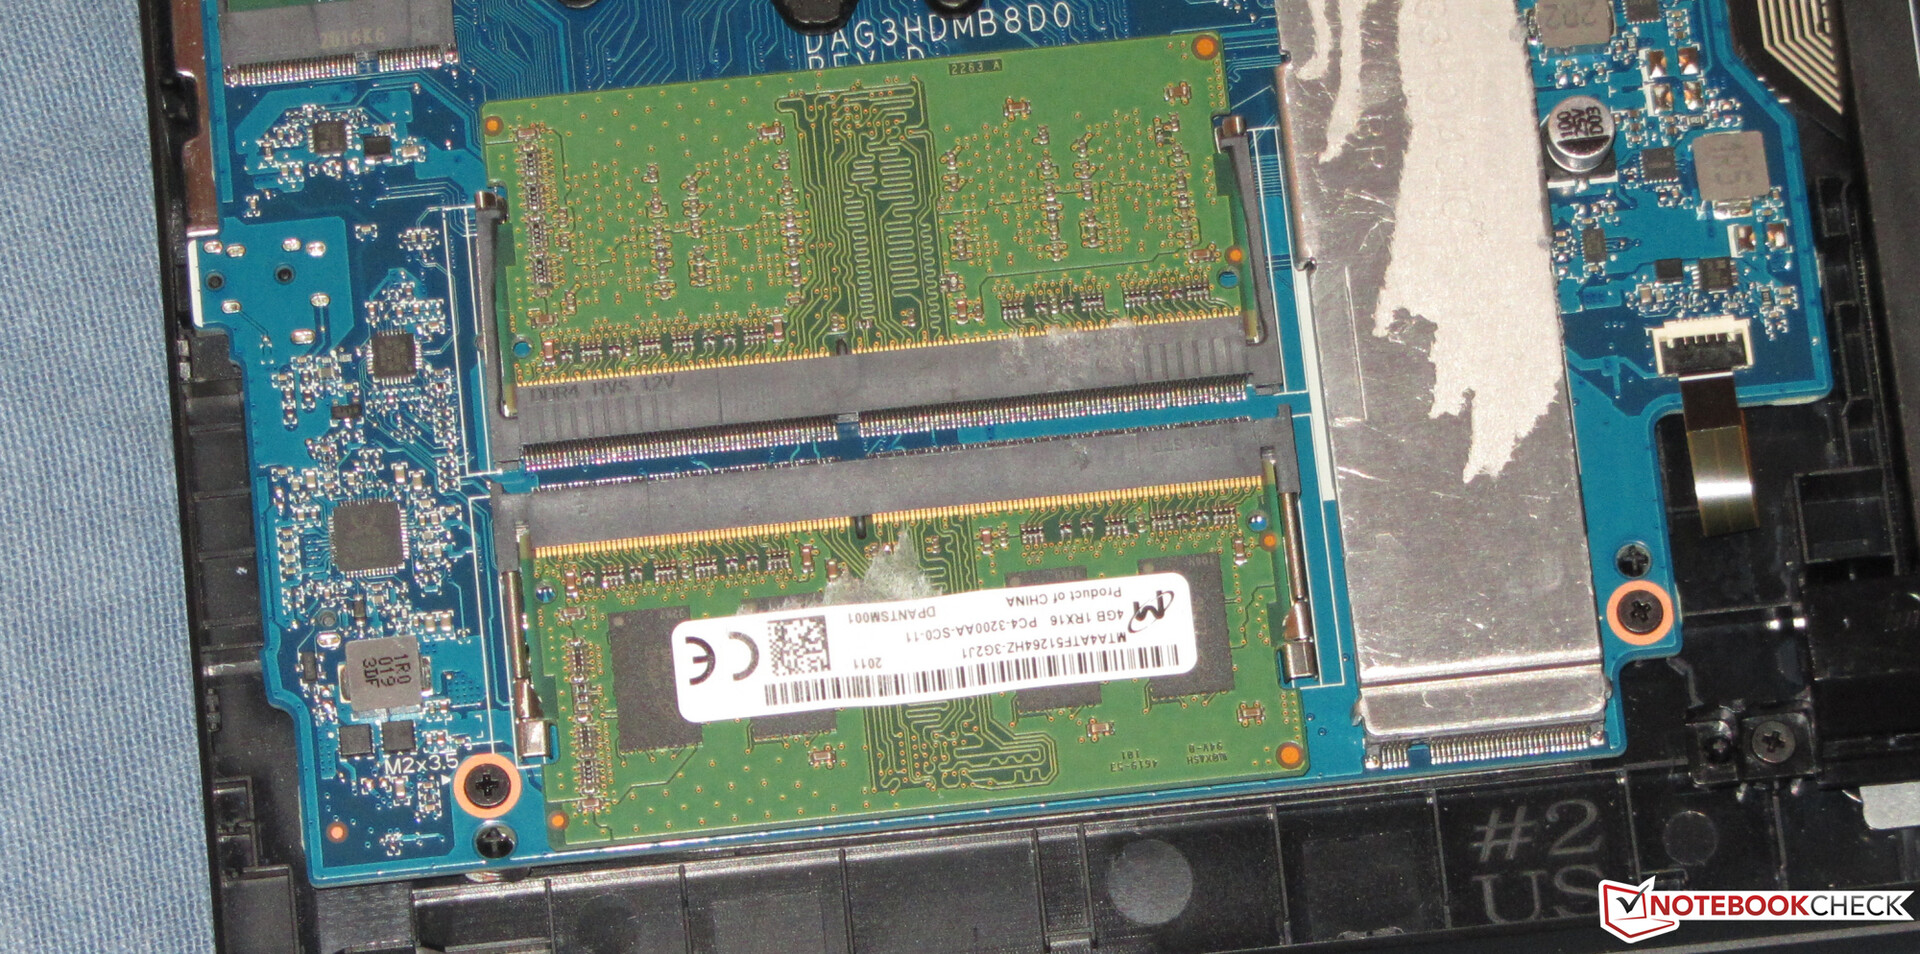
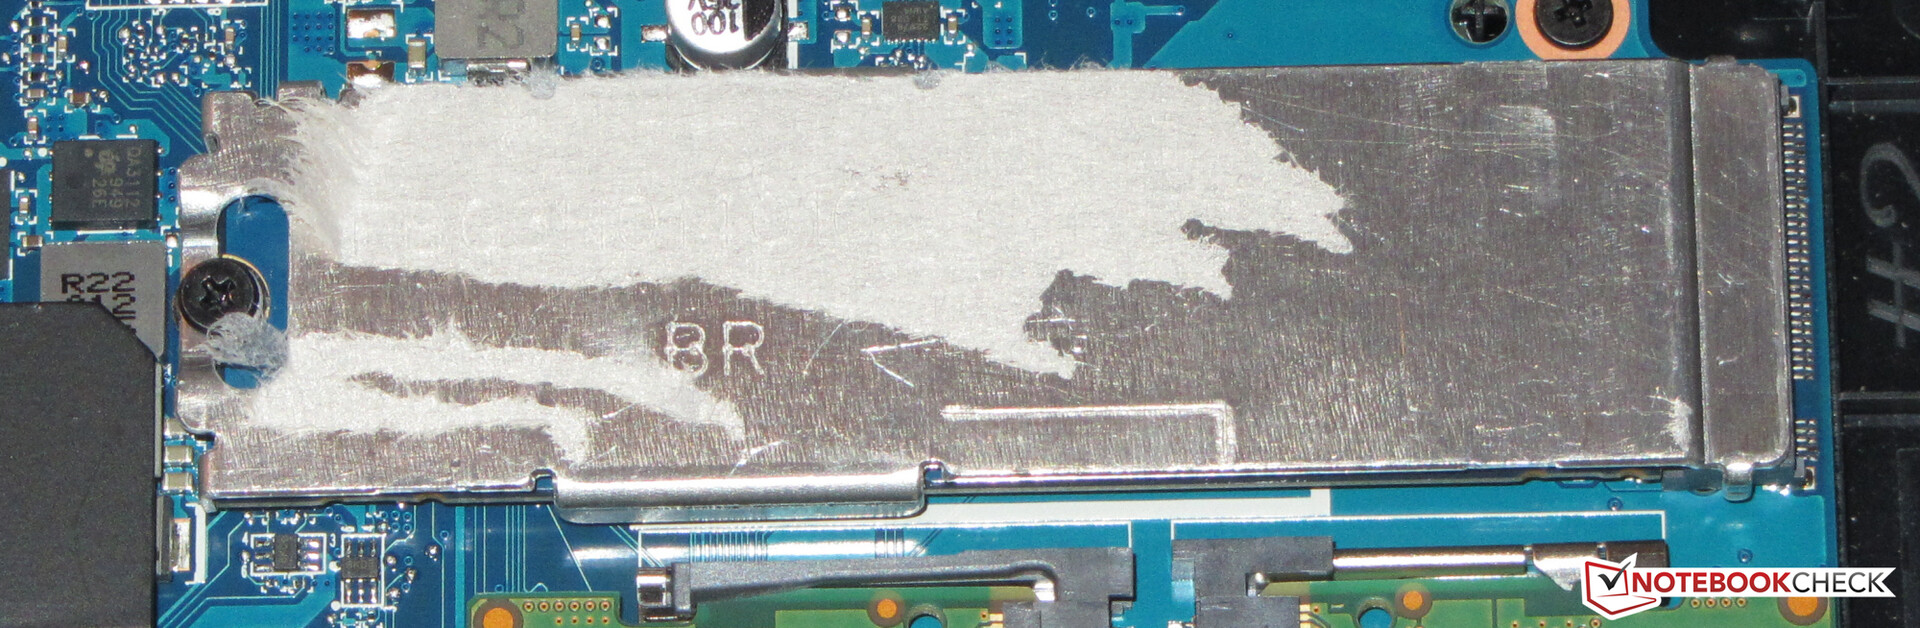
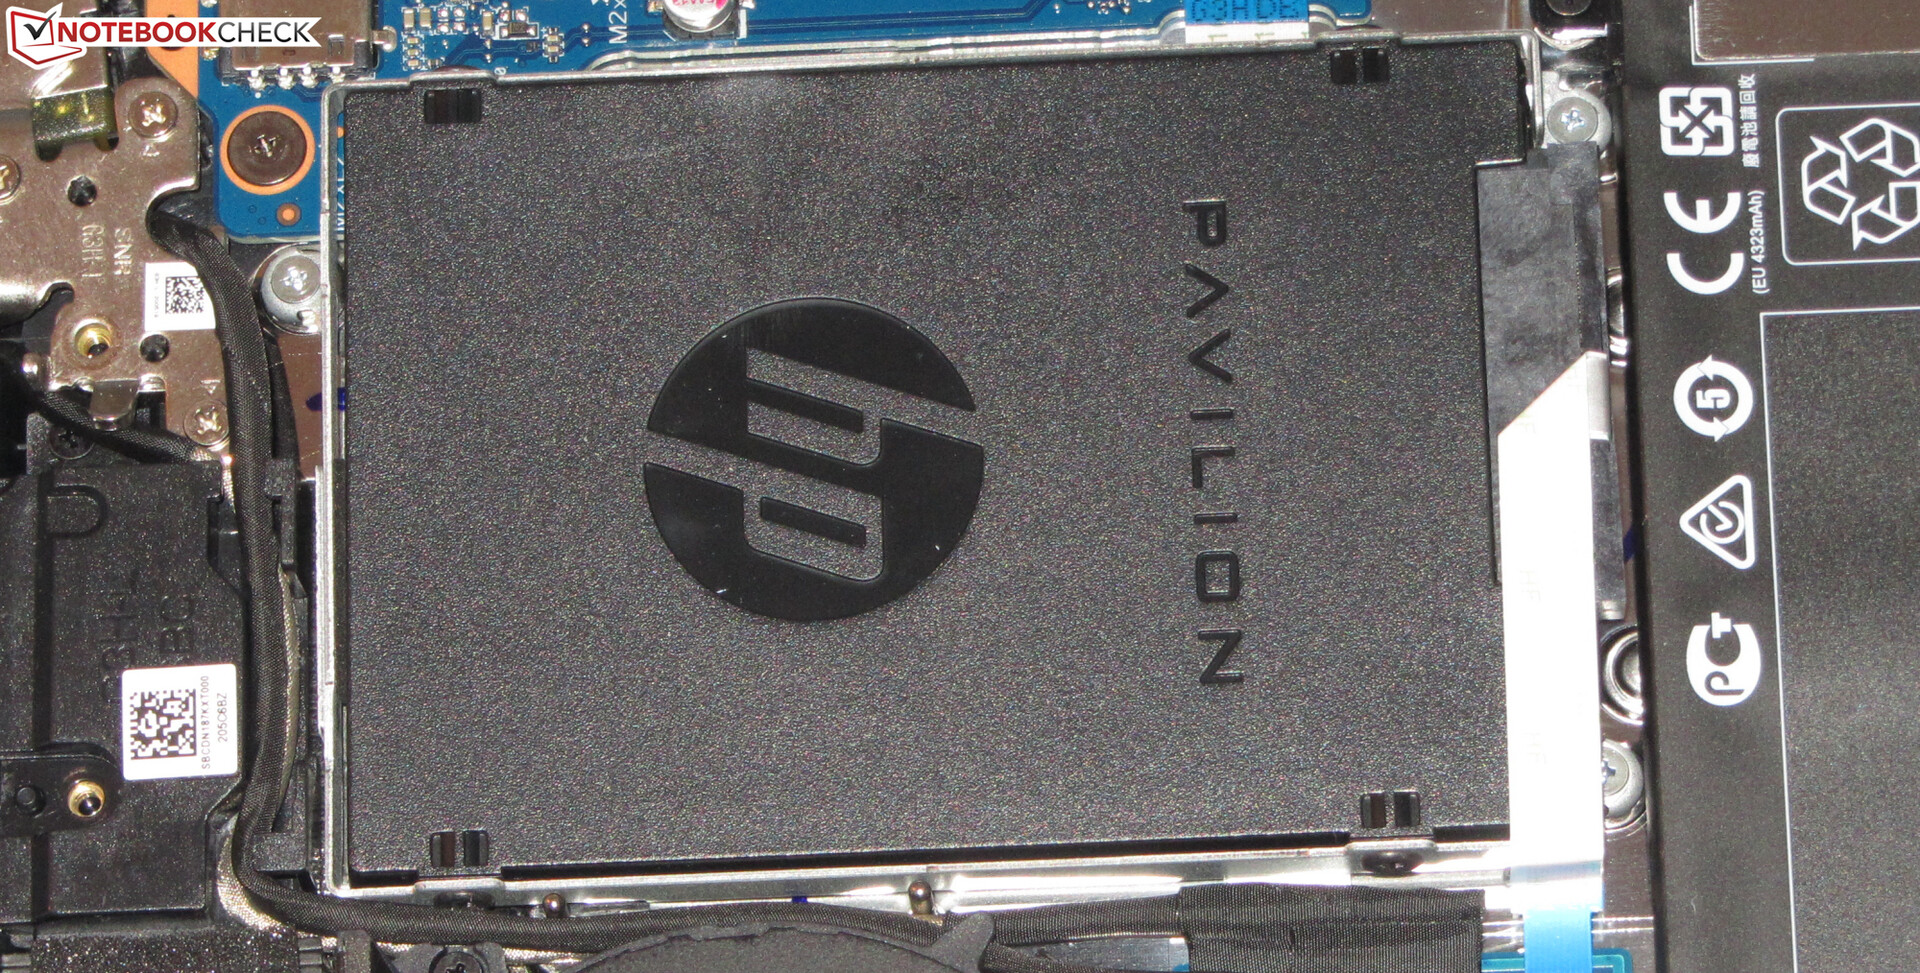
The system drive is a 512 GB NVMe SSD (M.2 2280) from Kioxia/Toshiba that delivers good transfer speeds. However, it's not one of the top models among SSDs. Moreover, there's still room for a 2.5-inch storage drive inside the laptop. The SATA slot and mounting frame are available.

| HP Pavilion Gaming 15-ec1206ng Toshiba KBG40ZNV512G | Nexoc GH5 515IG Samsung SSD 860 Evo 512GB | Lenovo IdeaPad Gaming 3i 15IMH05 SK hynix BC511 HFM512GDHTNI-87A0B | Asus TUF FX505DT-EB73 Intel SSD 660p SSDPEKNW512G8 | Dell G5 15 5590-PCNJJ KBG30ZMS128G | Acer Nitro 5 AN515-44-R5FT SK Hynix BC511 HFM512GDJTNI | MSI Bravo 15 A4DCR Samsung PM981a MZVLB1T0HBLR | HP Pavilion Gaming 15-ec0002ng Intel SSD 660p SSDPEKNW512G8 | |
|---|---|---|---|---|---|---|---|---|
| CrystalDiskMark 5.2 / 6 | -42% | -8% | -12% | -59% | -11% | 41% | -11% | |
| Write 4K (MB/s) | 111.5 | 89.6 -20% | 130 17% | 137.5 23% | 65.3 -41% | 94.7 -15% | 118.3 6% | 136.9 23% |
| Read 4K (MB/s) | 38.17 | 40.88 7% | 44.44 16% | 57 49% | 29.71 -22% | 38.91 2% | 43.73 15% | 57 49% |
| Write Seq (MB/s) | 1515 | 518 -66% | 1059 -30% | 984 -35% | 128.8 -91% | 1056 -30% | 2854 88% | 968 -36% |
| Read Seq (MB/s) | 1576 | 539 -66% | 1105 -30% | 1564 -1% | 859 -45% | 1183 -25% | 2302 46% | 1631 3% |
| Write 4K Q32T1 (MB/s) | 365.4 | 304 -17% | 490.3 34% | 237.4 -35% | 95.8 -74% | 445.3 22% | 418.5 15% | 237 -35% |
| Read 4K Q32T1 (MB/s) | 504 | 329 -35% | 309.2 -39% | 340.7 -32% | 197.6 -61% | 477.7 -5% | 517 3% | 337.1 -33% |
| Write Seq Q32T1 (MB/s) | 1493 | 529 -65% | 1053 -29% | 959 -36% | 132.5 -91% | 1063 -29% | 3008 101% | 963 -35% |
| Read Seq Q32T1 (MB/s) | 2340 | 561 -76% | 2261 -3% | 1732 -26% | 1208 -48% | 2154 -8% | 3568 52% | 1863 -20% |
| AS SSD | -32% | -2% | -1% | -62% | -2% | 70% | -36% | |
| Seq Read (MB/s) | 2048 | 524 -74% | 1348 -34% | 1019 -50% | 1022 -50% | 1504 -27% | 2730 33% | 1623 -21% |
| Seq Write (MB/s) | 1039 | 495 -52% | 1000 -4% | 889 -14% | 117 -89% | 1064 2% | 2513 142% | 891 -14% |
| 4K Read (MB/s) | 52.8 | 38.93 -26% | 48.04 -9% | 48.22 -9% | 30.03 -43% | 51.5 -2% | 61.4 16% | 48.06 -9% |
| 4K Write (MB/s) | 146 | 87.3 -40% | 103.3 -29% | 115.5 -21% | 65.1 -55% | 123.2 -16% | 156.1 7% | 102.1 -30% |
| 4K-64 Read (MB/s) | 1285 | 380 -70% | 755 -41% | 321.5 -75% | 181.4 -86% | 703 -45% | 1780 39% | 325.6 -75% |
| 4K-64 Write (MB/s) | 758 | 335.7 -56% | 749 -1% | 787 4% | 87.1 -89% | 730 -4% | 1920 153% | 94.1 -88% |
| Access Time Read * (ms) | 0.155 | 0.073 53% | 0.061 61% | 0.065 58% | 0.152 2% | 0.064 59% | 0.063 59% | 0.171 -10% |
| Access Time Write * (ms) | 0.202 | 0.039 81% | 0.036 82% | 0.047 77% | 0.25 -24% | 0.031 85% | 0.025 88% | 0.048 76% |
| Score Read (Points) | 1543 | 471 -69% | 938 -39% | 472 -69% | 314 -80% | 905 -41% | 2114 37% | 536 -65% |
| Score Write (Points) | 1008 | 472 -53% | 952 -6% | 992 -2% | 164 -84% | 960 -5% | 2327 131% | 285 -72% |
| Score Total (Points) | 3298 | 1198 -64% | 2365 -28% | 1717 -48% | 604 -82% | 2321 -30% | 5518 67% | 1077 -67% |
| Copy ISO MB/s (MB/s) | 691 | 500 -28% | 749 8% | 942 36% | 566 -18% | |||
| Copy Program MB/s (MB/s) | 345.8 | 283.8 -18% | 342.5 -1% | 444.5 29% | 223.8 -35% | |||
| Copy Game MB/s (MB/s) | 517 | 319.6 -38% | 571 10% | 867 68% | 104.3 -80% | |||
| Total Average (Program / Settings) | -37% /
-36% | -5% /
-4% | -7% /
-5% | -61% /
-61% | -7% /
-6% | 56% /
58% | -24% /
-27% |
* ... smaller is better
Continuous load read: DiskSpd Read Loop, Queue Depth 8
Graphics card
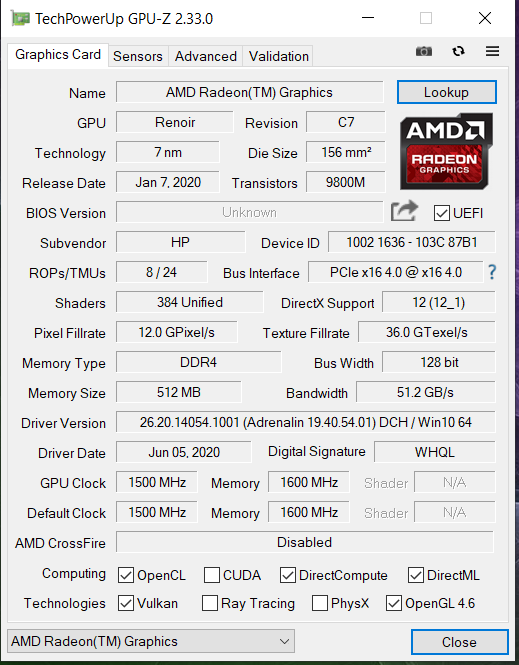
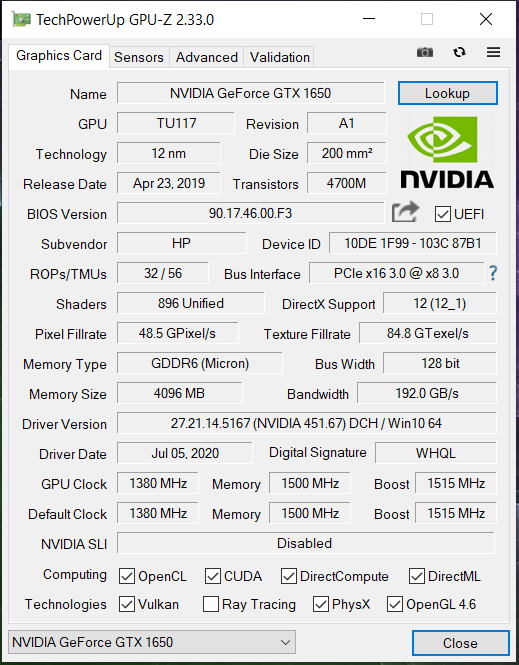
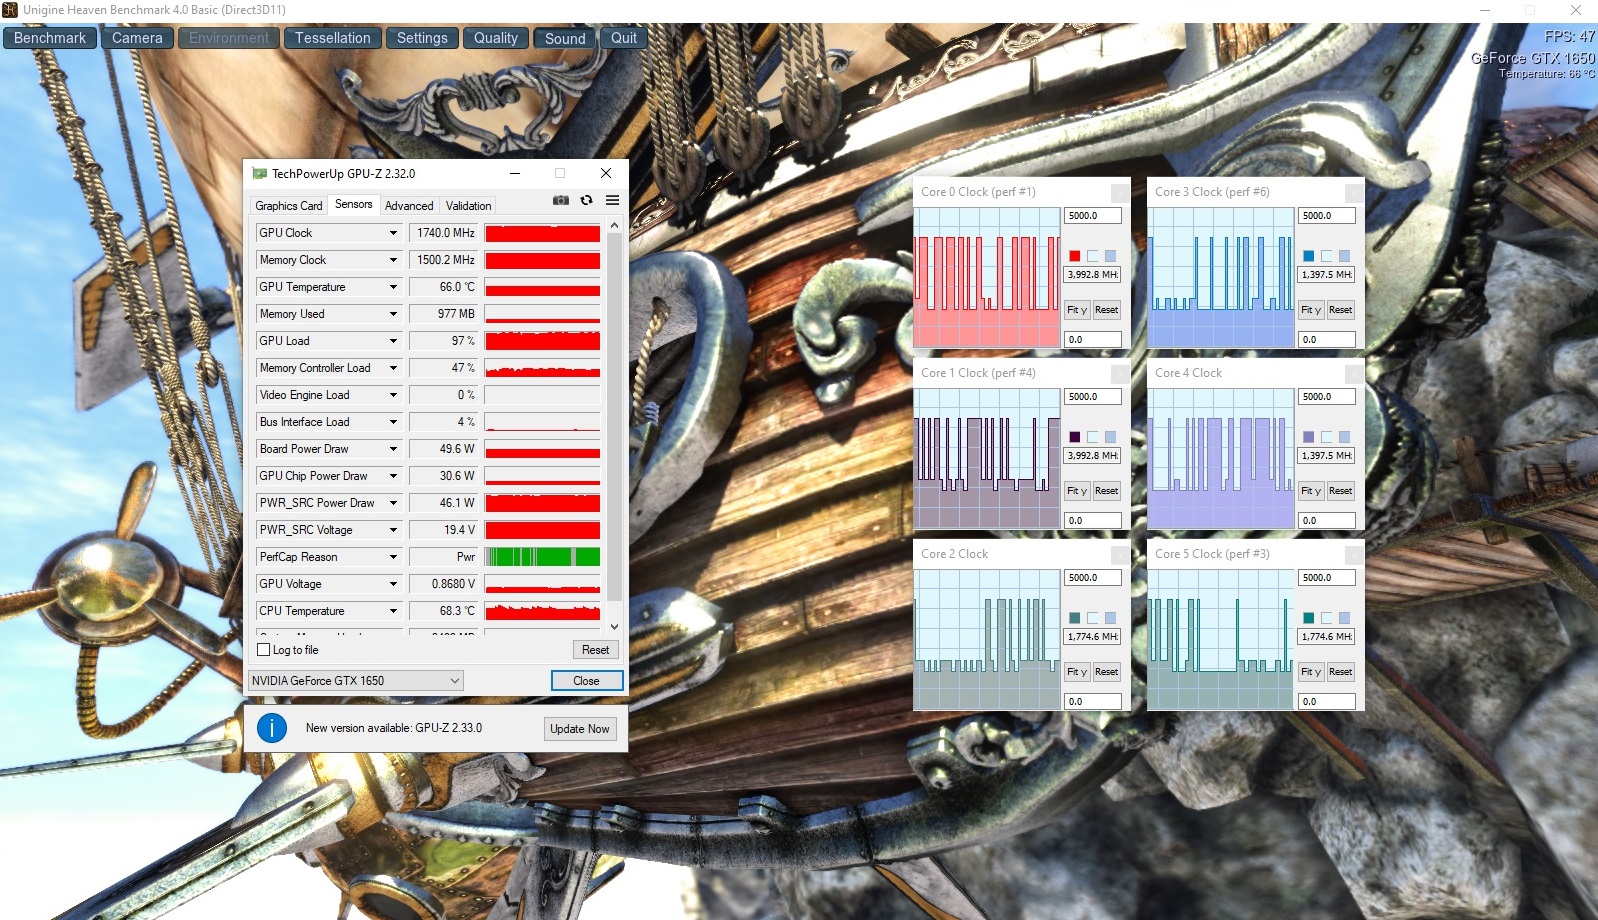
The GeForce GTX 1650 graphics core is based on Nvidia's Turing architecture and belongs to the GPU mid-range. Nvidia specifies a speed level between 1,380 MHz (base) and 1,515 MHz (boost) for this DirectX 12 GPU.
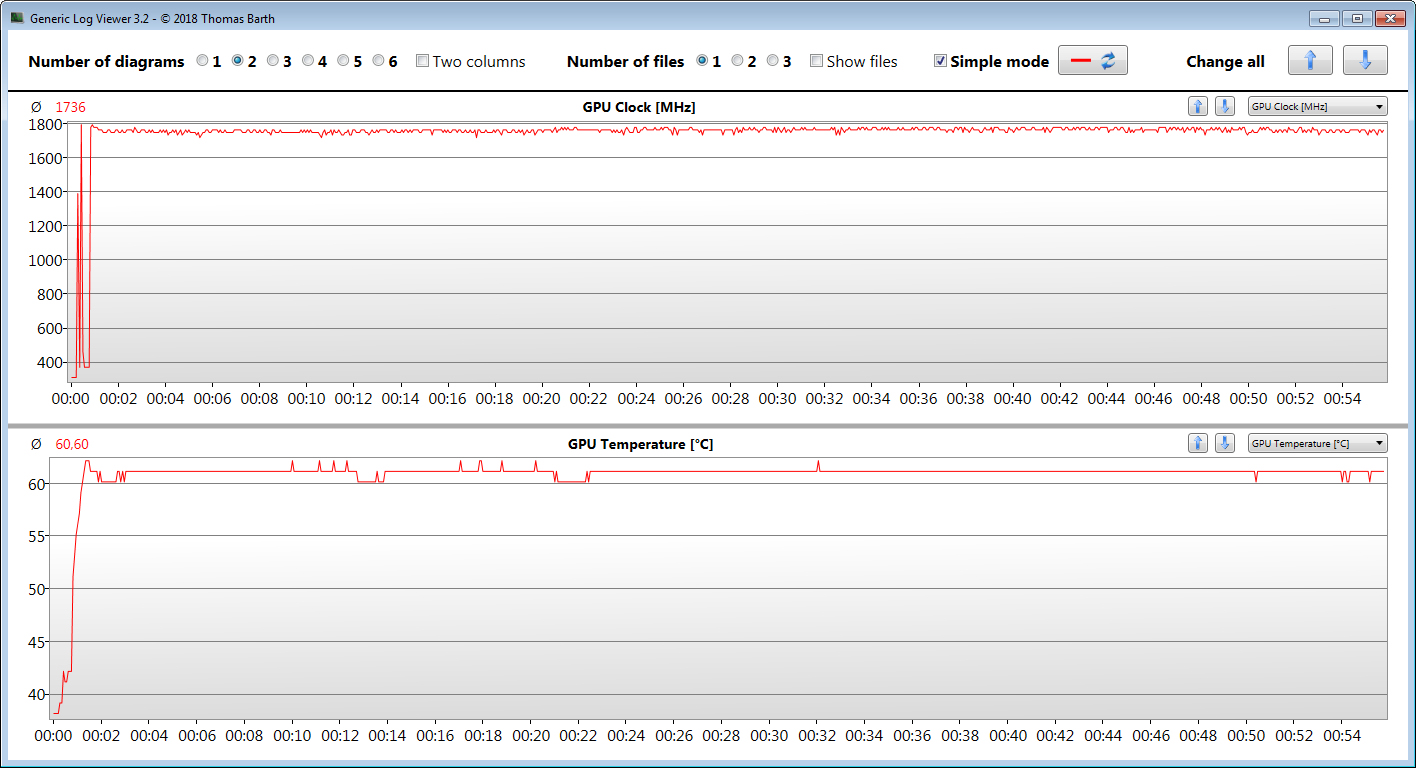
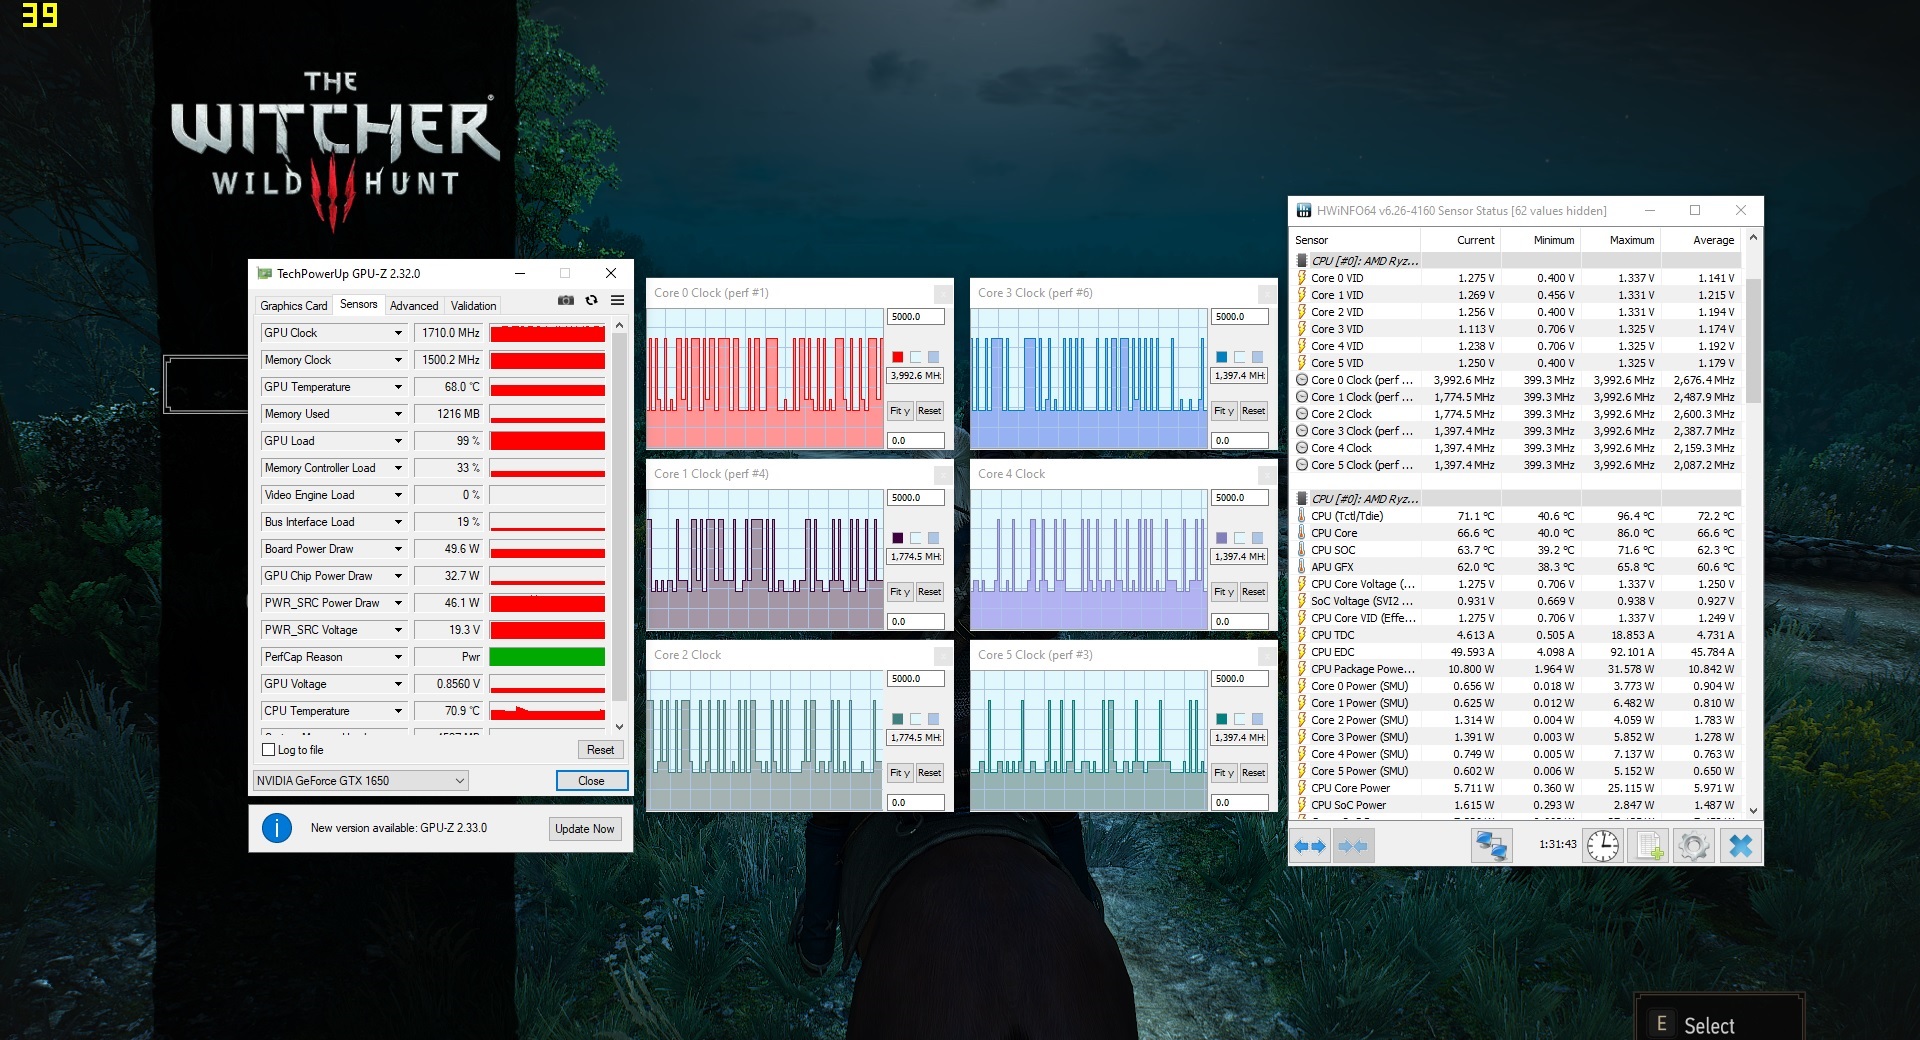
Higher clock rates are feasible if the GPU doesn't reach a specified temperature and/or energy threshold. In this way, we register a maximum of 1,785 MHz. Our The Witcher 3 test is run at an average speed of 1,736 MHz. Furthermore, the GPU can access fast GDDR6 graphics memory (4,096 MB).
The results in the 3DMark benchmarks are at a normal level for this GPU. The RX Vega 6 GPU that's integrated into the processor is active, and the laptop works with Nvidia's Optimus graphics-switching solution.

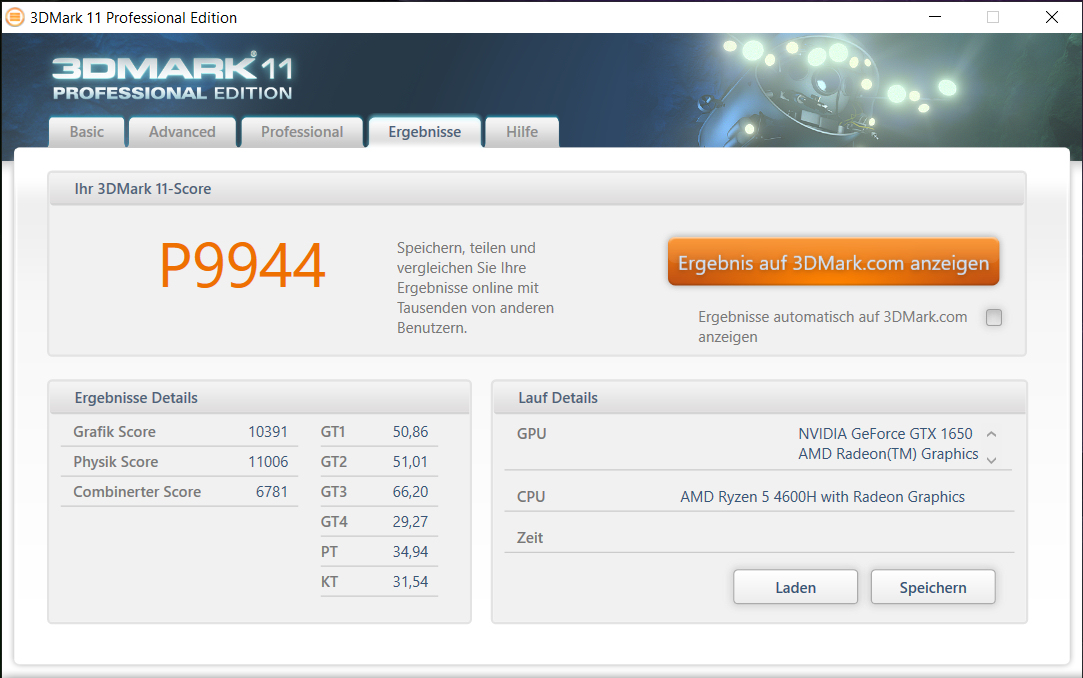
| 3DMark 11 Performance | 12463 points | |
| 3DMark Cloud Gate Standard Score | 30251 points | |
| 3DMark Fire Strike Score | 8985 points | |
| 3DMark Time Spy Score | 3765 points | |
Help | ||
Gaming performance
The built-in hardware brings all the games in our database smoothly onto the screen. Usually, Full HD resolution and medium to high quality settings can be used, and more is possible in some cases.
| The Witcher 3 - 1920x1080 High Graphics & Postprocessing (Nvidia HairWorks Off) | |
| HP Pavilion Gaming 15-ec1206ng | |
| Acer Nitro 5 AN515-44-R5FT | |
| Nexoc GH5 515IG | |
| Lenovo IdeaPad Gaming 3i 15IMH05 | |
| Asus TUF FX505DT-EB73 | |
| MSI Bravo 15 A4DCR | |
| Dell G5 15 5590-PCNJJ | |
| HP Pavilion Gaming 15-ec0002ng | |
| BioShock Infinite - 1920x1080 Ultra Preset, DX11 (DDOF) | |
| Lenovo IdeaPad Gaming 3i 15IMH05 | |
| Nexoc GH5 515IG | |
| HP Pavilion Gaming 15-ec1206ng | |
| Dell G5 15 5590-PCNJJ | |
| Asus TUF FX505DT-EB73 | |
| HP Pavilion Gaming 15-ec0002ng | |
| Shadow of the Tomb Raider - 1920x1080 Highest Preset AA:T | |
| Acer Nitro 5 AN515-44-R5FT | |
| Lenovo IdeaPad Gaming 3i 15IMH05 | |
| HP Pavilion Gaming 15-ec1206ng | |
| Nexoc GH5 515IG | |
| Dell G5 15 5590-PCNJJ | |
| Asus TUF FX505DT-EB73 | |
| MSI Bravo 15 A4DCR | |
| HP Pavilion Gaming 15-ec0002ng | |
| Call of Duty Modern Warfare 2019 - 1920x1080 Maximum Settings AA:T2X Filmic SM | |
| Acer Nitro 5 AN515-44-R5FT | |
| MSI Bravo 15 A4DCR | |
| Lenovo IdeaPad Gaming 3i 15IMH05 | |
| HP Pavilion Gaming 15-ec1206ng | |
| Nexoc GH5 515IG | |
| HP Pavilion Gaming 15-ec0002ng | |
| Doom Eternal - 1920x1080 High Preset | |
| Lenovo IdeaPad Gaming 3i 15IMH05 | |
| HP Pavilion Gaming 15-ec1206ng | |
| Nexoc GH5 515IG | |
| MSI Bravo 15 A4DCR | |
| F1 2020 - 1920x1080 Ultra High Preset AA:T AF:16x | |
| HP Pavilion Gaming 15-ec1206ng | |
| Nexoc GH5 515IG | |
| Death Stranding - 1920x1080 Very High Preset | |
| HP Pavilion Gaming 15-ec1206ng | |
| Nexoc GH5 515IG | |
| Horizon Zero Dawn - 1920x1080 Favor Quality | |
| Nexoc GH5 515IG | |
| HP Pavilion Gaming 15-ec1206ng | |
In order to verify whether the frame rates remain largely constant even over a prolonged period of time, we let the game The Witcher 3 run for about 60 minutes at Full HD resolution and maximum quality settings. The character embodied by the player is not moved during this whole period. A drop in frame rates wasn't found.
| low | med. | high | ultra | |
|---|---|---|---|---|
| BioShock Infinite (2013) | 251.9 | 213.5 | 195.4 | 92.6 |
| The Witcher 3 (2015) | 189.4 | 118.5 | 68.9 | 39.8 |
| Shadow of the Tomb Raider (2018) | 95 | 62 | 52 | 45 |
| Total War: Three Kingdoms (2019) | 162.9 | 65.5 | 39.9 | 26.6 |
| Call of Duty Modern Warfare 2019 (2019) | 98.3 | 58.1 | 51.4 | 44.6 |
| Doom Eternal (2020) | 118.9 | 78.6 | 62.9 | |
| Gears Tactics (2020) | 161.6 | 100.4 | 66.4 | 43.6 |
| F1 2020 (2020) | 185 | 104 | 83 | 58 |
| Death Stranding (2020) | 105.6 | 64.2 | 60.4 | 57.8 |
| Horizon Zero Dawn (2020) | 84 | 52 | 44 | 34 |
Emissions - Normal heat and noise development
Noise emissions
In idle usage, the two fans don't make much noise. They are often quiet and silence prevails. But they turn up under load. In this way, we register a maximum sound pressure level of 47 dB(A). The laptop is considerably quieter in our The Witcher 3 test at a level of 39 dB(A).
Noise level
| Idle |
| 25 / 26 / 33 dB(A) |
| Load |
| 41 / 47 dB(A) |
 | ||
30 dB silent 40 dB(A) audible 50 dB(A) loud |
||
min: | ||
| HP Pavilion Gaming 15-ec1206ng R5 4600H, GeForce GTX 1650 Mobile | Nexoc GH5 515IG i5-10300H, GeForce GTX 1650 Mobile | Lenovo IdeaPad Gaming 3i 15IMH05 i5-10300H, GeForce GTX 1650 Mobile | Asus TUF FX505DT-EB73 R7 3750H, GeForce GTX 1650 Mobile | Dell G5 15 5590-PCNJJ i5-9300H, GeForce GTX 1650 Mobile | Acer Nitro 5 AN515-44-R5FT R5 4600H, GeForce GTX 1650 Ti Mobile | MSI Bravo 15 A4DCR R7 4800H, Radeon RX 5300M | HP Pavilion Gaming 15-ec0002ng R5 3550H, GeForce GTX 1050 Mobile | |
|---|---|---|---|---|---|---|---|---|
| Noise | -12% | -15% | -8% | -18% | -15% | -20% | -7% | |
| off / environment * (dB) | 25 | 25 -0% | 30.7 -23% | 28.2 -13% | 30 -20% | 30 -20% | 30 -20% | 30.3 -21% |
| Idle Minimum * (dB) | 25 | 25 -0% | 30.7 -23% | 28.2 -13% | 31 -24% | 30 -20% | 31 -24% | 30.3 -21% |
| Idle Average * (dB) | 26 | 31 -19% | 30.7 -18% | 28.2 -8% | 32 -23% | 32 -23% | 32 -23% | 30.3 -17% |
| Idle Maximum * (dB) | 33 | 33 -0% | 30.7 7% | 31.4 5% | 35 -6% | 34 -3% | 40 -21% | 31 6% |
| Load Average * (dB) | 41 | 53 -29% | 49.7 -21% | 39.8 3% | 49 -20% | 46 -12% | 48 -17% | 39.3 4% |
| Witcher 3 ultra * (dB) | 39 | 48 -23% | 47 -21% | 47 -21% | 47 -21% | 47 -21% | 48 -23% | 42.9 -10% |
| Load Maximum * (dB) | 47 | 53 -13% | 50.3 -7% | 50.2 -7% | 53 -13% | 49 -4% | 54 -15% | 43.3 8% |
* ... smaller is better
Temperature
Our stress test (Prime95 and FurMark run for at least an hour) is run by the processor and graphics core at 2.8 GHz and 1,320 MHz, respectively. On battery power, the clock rates are 2.4 to 2.5 GHz (CPU) and 700 to 1,700 MHz (GPU). The stress test represents an extreme scenario that doesn't occur in everyday life. With this test we check whether the system remains stable even under full load.
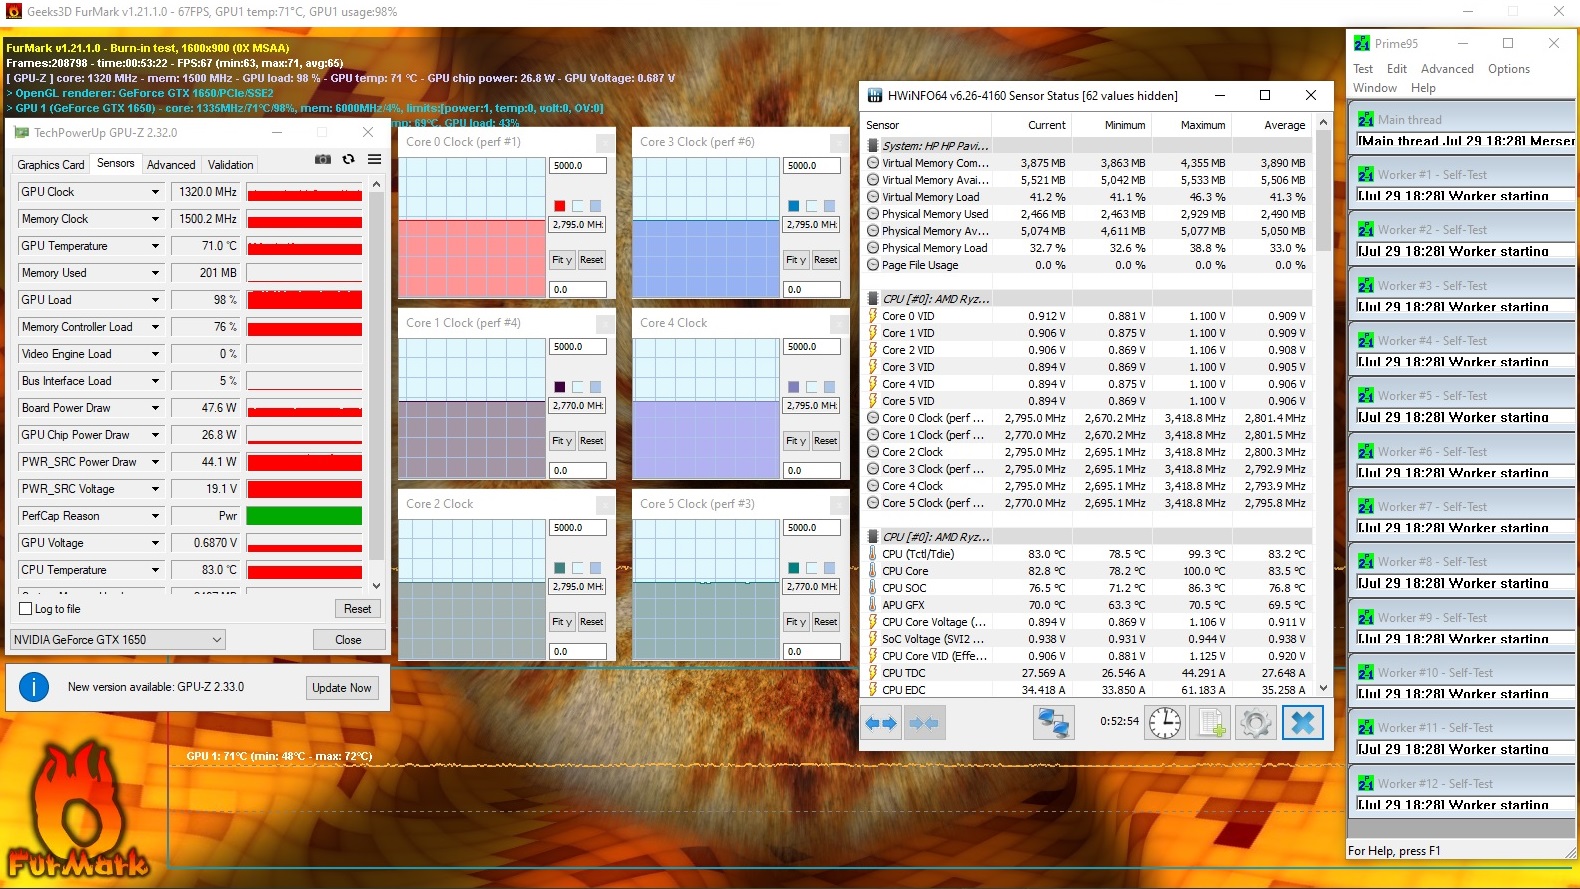
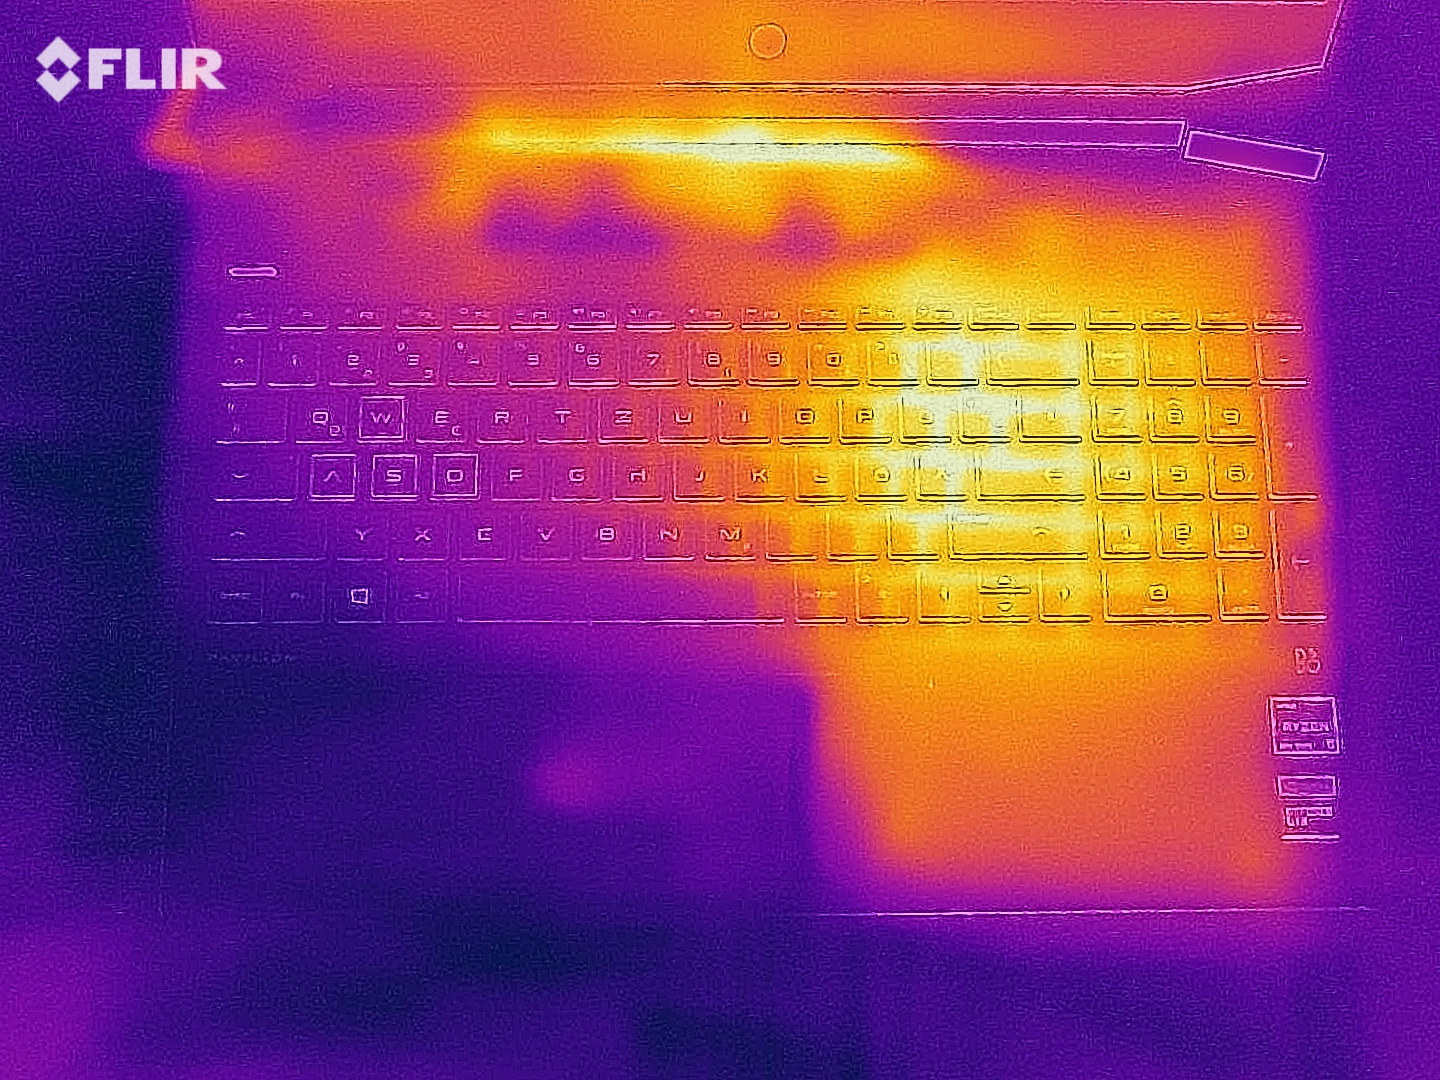
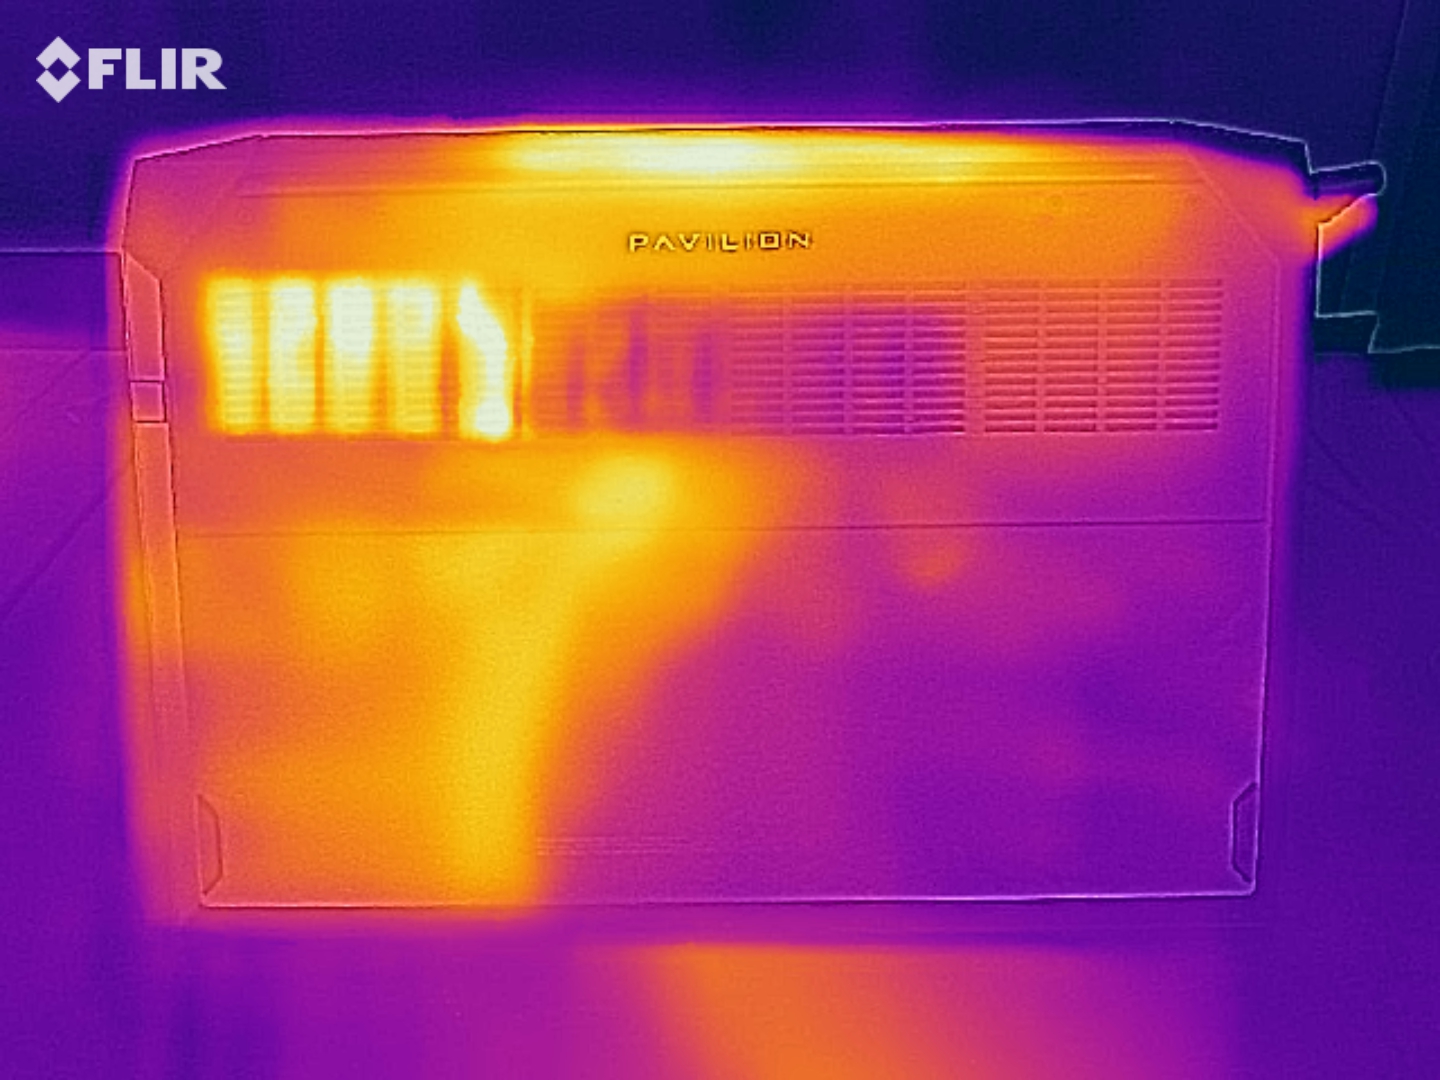
The laptop doesn't heat up excessively. We register temperatures in the upper 40-°C range (~104 °F) at several measuring points during the stress test. Moreover, heat development is slightly lower when performing our The Witcher 3 test. In everyday use, the temperatures are in the green range.
(-) The maximum temperature on the upper side is 49 °C / 120 F, compared to the average of 40.4 °C / 105 F, ranging from 21.2 to 68.8 °C for the class Gaming.
(-) The bottom heats up to a maximum of 49 °C / 120 F, compared to the average of 43.2 °C / 110 F
(+) In idle usage, the average temperature for the upper side is 27.7 °C / 82 F, compared to the device average of 33.9 °C / 93 F.
(-) Playing The Witcher 3, the average temperature for the upper side is 40.7 °C / 105 F, compared to the device average of 33.9 °C / 93 F.
(-) The palmrests and touchpad can get very hot to the touch with a maximum of 40 °C / 104 F.
(-) The average temperature of the palmrest area of similar devices was 28.8 °C / 83.8 F (-11.2 °C / -20.2 F).
| HP Pavilion Gaming 15-ec1206ng R5 4600H, GeForce GTX 1650 Mobile | Nexoc GH5 515IG i5-10300H, GeForce GTX 1650 Mobile | Lenovo IdeaPad Gaming 3i 15IMH05 i5-10300H, GeForce GTX 1650 Mobile | Asus TUF FX505DT-EB73 R7 3750H, GeForce GTX 1650 Mobile | Dell G5 15 5590-PCNJJ i5-9300H, GeForce GTX 1650 Mobile | Acer Nitro 5 AN515-44-R5FT R5 4600H, GeForce GTX 1650 Ti Mobile | MSI Bravo 15 A4DCR R7 4800H, Radeon RX 5300M | HP Pavilion Gaming 15-ec0002ng R5 3550H, GeForce GTX 1050 Mobile | |
|---|---|---|---|---|---|---|---|---|
| Heat | 2% | 4% | -2% | 2% | 0% | -5% | 13% | |
| Maximum Upper Side * (°C) | 49 | 48 2% | 43 12% | 41.2 16% | 49 -0% | 49 -0% | 51 -4% | 41 16% |
| Maximum Bottom * (°C) | 49 | 47 4% | 50.6 -3% | 40 18% | 55 -12% | 50 -2% | 50 -2% | 39.1 20% |
| Idle Upper Side * (°C) | 29 | 28 3% | 27.2 6% | 34.6 -19% | 25 14% | 28 3% | 30 -3% | 26 10% |
| Idle Bottom * (°C) | 28 | 28 -0% | 27.5 2% | 34.4 -23% | 26 7% | 28 -0% | 31 -11% | 26.5 5% |
* ... smaller is better
Speakers
HP Pavilion Gaming 15-ec1206ng audio analysis
(±) | speaker loudness is average but good (79 dB)
Bass 100 - 315 Hz
(-) | nearly no bass - on average 17.3% lower than median
(±) | linearity of bass is average (12.1% delta to prev. frequency)
Mids 400 - 2000 Hz
(+) | balanced mids - only 4.1% away from median
(+) | mids are linear (4% delta to prev. frequency)
Highs 2 - 16 kHz
(+) | balanced highs - only 3.9% away from median
(+) | highs are linear (5.7% delta to prev. frequency)
Overall 100 - 16.000 Hz
(±) | linearity of overall sound is average (17.9% difference to median)
Compared to same class
» 55% of all tested devices in this class were better, 9% similar, 36% worse
» The best had a delta of 6%, average was 18%, worst was 132%
Compared to all devices tested
» 37% of all tested devices were better, 8% similar, 55% worse
» The best had a delta of 4%, average was 23%, worst was 134%
Energy management
Energy consumption
The energy requirement is at a good level over the entire load range for the hardware installed here. In idle usage, we register maximum power consumption of 11 watts, and during our stress test, the value rises up to 142 watts. In gaming mode (The Witcher 3 test), the demand is lower at an average of 76 watts. Moreover, the power adapter's rated output is 150 watts.
| Off / Standby | |
| Idle | |
| Load |
|
Key:
min: | |
| HP Pavilion Gaming 15-ec1206ng R5 4600H, GeForce GTX 1650 Mobile | Nexoc GH5 515IG i5-10300H, GeForce GTX 1650 Mobile | Lenovo IdeaPad Gaming 3i 15IMH05 i5-10300H, GeForce GTX 1650 Mobile | Asus TUF FX505DT-EB73 R7 3750H, GeForce GTX 1650 Mobile | Dell G5 15 5590-PCNJJ i5-9300H, GeForce GTX 1650 Mobile | Acer Nitro 5 AN515-44-R5FT R5 4600H, GeForce GTX 1650 Ti Mobile | MSI Bravo 15 A4DCR R7 4800H, Radeon RX 5300M | HP Pavilion Gaming 15-ec0002ng R5 3550H, GeForce GTX 1050 Mobile | |
|---|---|---|---|---|---|---|---|---|
| Power Consumption | -22% | -51% | -55% | -26% | -30% | -125% | 3% | |
| Idle Minimum * (Watt) | 2 | 3 -50% | 5.1 -155% | 7 -250% | 4 -100% | 5 -150% | 11 -450% | 1.9 5% |
| Idle Average * (Watt) | 6 | 7 -17% | 8.2 -37% | 9.9 -65% | 7 -17% | 8 -33% | 14 -133% | 7.2 -20% |
| Idle Maximum * (Watt) | 11 | 16 -45% | 10.6 4% | 12 -9% | 12 -9% | 13 -18% | 25 -127% | 9.6 13% |
| Load Average * (Watt) | 77 | 85 -10% | 128 -66% | 68.4 11% | 95 -23% | 69 10% | 72 6% | 74 4% |
| Witcher 3 ultra * (Watt) | 76 | 86 -13% | 109 -43% | 94.9 -25% | 86 -13% | 78 -3% | 100 -32% | 75 1% |
| Load Maximum * (Watt) | 142 | 134 6% | 150 -6% | 130.9 8% | 135 5% | 124 13% | 163 -15% | 124 13% |
* ... smaller is better
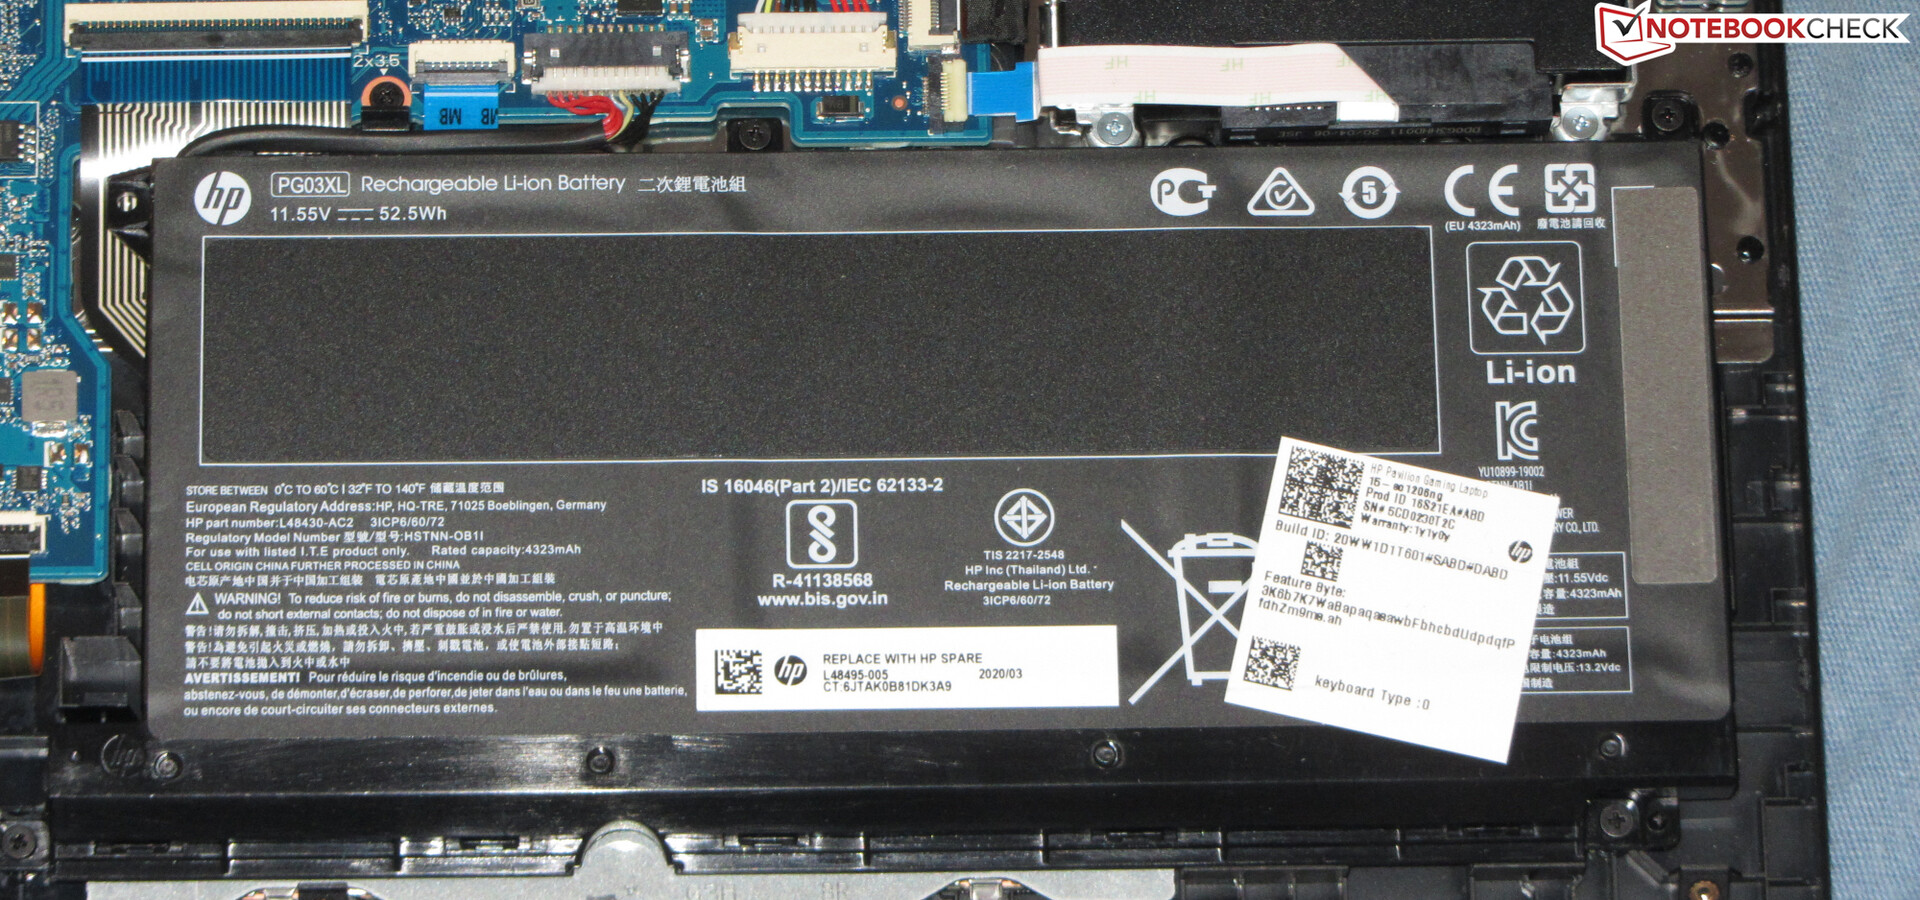
Battery life
The battery life is excellent. Our WLAN test (accessing websites using a script) and video test (short film Big Buck Bunny (H.264 encoding, Full HD) running in a loop) are completed by the 15.6-incher after 9:03 h and 10:51 h, respectively.
| HP Pavilion Gaming 15-ec1206ng R5 4600H, GeForce GTX 1650 Mobile, 52.5 Wh | Nexoc GH5 515IG i5-10300H, GeForce GTX 1650 Mobile, 48.96 Wh | Lenovo IdeaPad Gaming 3i 15IMH05 i5-10300H, GeForce GTX 1650 Mobile, 45 Wh | Asus TUF FX505DT-EB73 R7 3750H, GeForce GTX 1650 Mobile, 48 Wh | Dell G5 15 5590-PCNJJ i5-9300H, GeForce GTX 1650 Mobile, 60 Wh | Acer Nitro 5 AN515-44-R5FT R5 4600H, GeForce GTX 1650 Ti Mobile, 57.48 Wh | MSI Bravo 15 A4DCR R7 4800H, Radeon RX 5300M, 51 Wh | HP Pavilion Gaming 15-ec0002ng R5 3550H, GeForce GTX 1050 Mobile, 52.5 Wh | |
|---|---|---|---|---|---|---|---|---|
| Battery runtime | -18% | -5% | -19% | 28% | 2% | -42% | -8% | |
| Reader / Idle (h) | 19.4 | 14.9 -23% | 12.4 -36% | 7.8 -60% | 14.5 -25% | 13.8 -29% | 7 -64% | |
| H.264 (h) | 10.9 | 6.5 -40% | 7.3 -33% | |||||
| WiFi v1.3 (h) | 9.1 | 6.4 -30% | 6.3 -31% | 4.8 -47% | 8 -12% | 8.7 -4% | 4.5 -51% | 8.4 -8% |
| Load (h) | 1 | 1.2 20% | 1.8 80% | 1.5 50% | 2.2 120% | 1.4 40% | 0.9 -10% |
Pros
Cons
Verdict
At a price slightly below 800 Euros (~$947), the Pavilion 15-ec1206ng belongs to the category of budget gaming laptops. The device does what it should do: It brings every modern game smoothly onto the screen. However, the highest resolutions and quality settings shouldn't be expected from the built-in hardware combination consisting of the Ryzen 5 4600H APU and the GeForce GTX 1650 GPU.
With the Pavilion Gaming 15-ec1206ng, HP delivers a well-rounded gaming laptop at an attractive price.
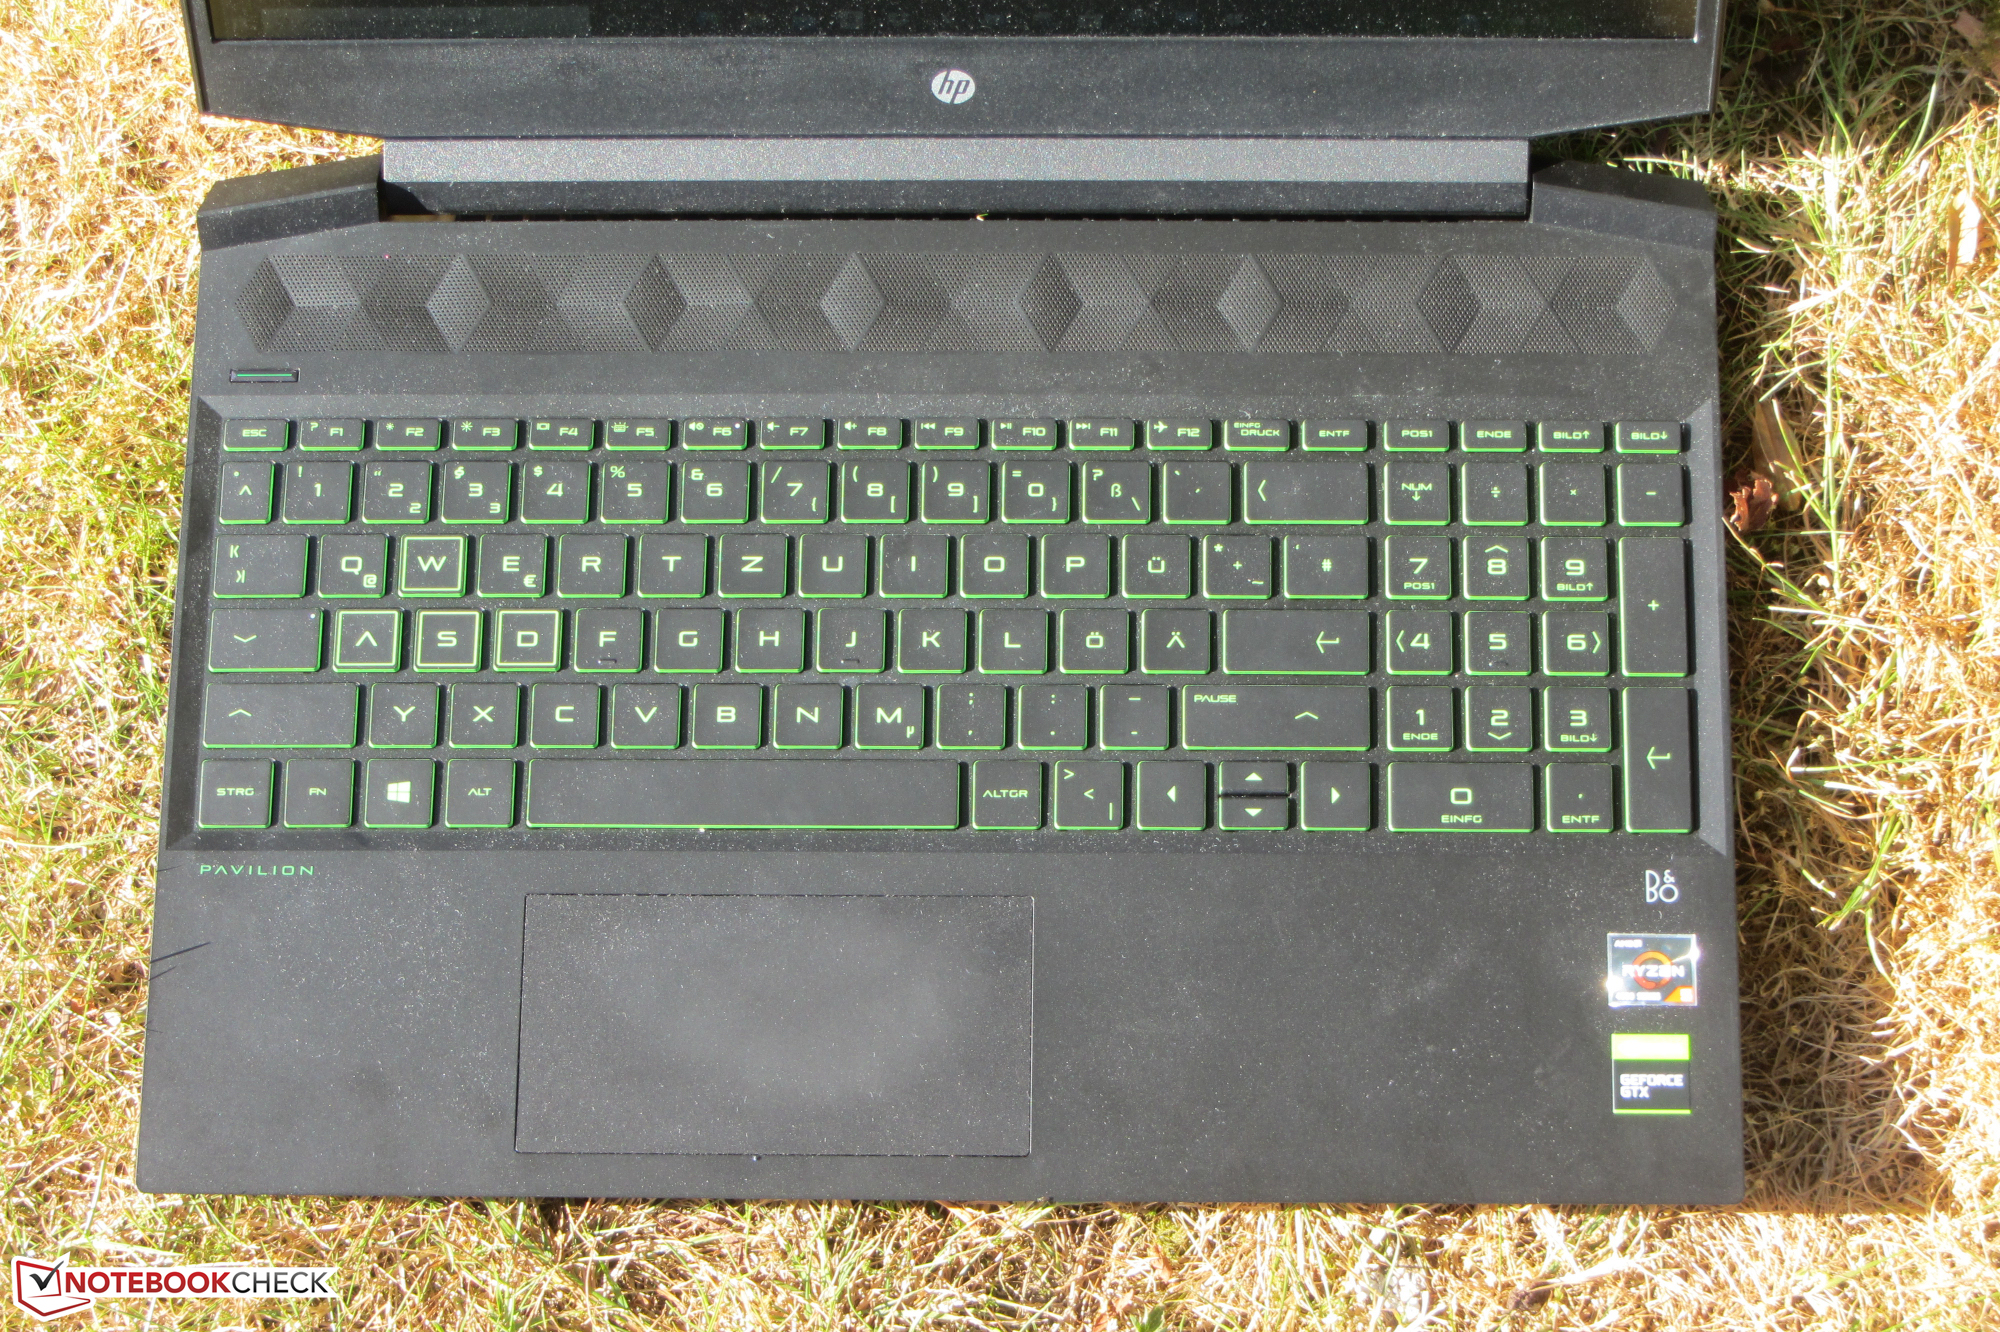
In spite of the high computing power, you don't have to give up long battery life. With one battery charge, the HP laptop reaches practical runtimes of 9 to 11 hours - many office laptops can't achieve this. In combination with the decent keyboard (backlit), the laptop also cuts a passable figure as a mobile typing and web-surfing device.
A 512 GB NVMe SSD (M.2 2280) ensures a fast system. Should the storage space run out, the SSD can be replaced, and/or a 2.5-inch storage drive can be installed in the laptop. The SATA slot and mounting frame are available. Since the device doesn't have a maintenance hatch, the case would have to be opened for the installation.
The Full HD IPS display offers stable viewing angles, a matte surface, good contrast, and very decent color reproduction. However, the maximum brightness is too low. There's also still room for improvement in terms of color-space coverage.
HP Pavilion Gaming 15-ec1206ng
- 08/25/2020 v7 (old)
Sascha Mölck
Price comparison

